Embed Size (px)
Citation preview

51
ECOTOURISM DEVELOPMENT IN OKOMU NATIONAL PARK, NIGERIA
1Oluwatobi Emmanuel Olaniyi, 1Babafemi George Ogunjemite and 2Shadrach Olufemi Akindele
1Department of Ecotourism and Wildlife Management, Federal University of Technology, Akure, Nigeria.
2Department of Forestry and Wood Technology, Federal University of Technology, Akure, Nigeria.
ABSTRACT
We determined the impact of ecotourism infrastructural development on the woody components of Okomu National Park. This
necessitated identifying the ecotourism attractions/facilities, interviewing of respondents and on-site observation and quadrant
method were employed in acquiring information on ecotourism attractions/facilities and vegetation assessment respectively.
Significant variations were observed in the tree growth variables measured between the ecotourism built-up and the control
areas. The abundance distribution model, kernel density and species accumulation curves itinerated the pictorial disparity in
distribution of woody vegetations’ abundance between the areas. Furthermore, the IUCN Red data endangered species of
Diospyros crassiflora had been eroded from the ecotourism built-up areas; while the vulnerable species of Anopyxis klaineana
were conspicuously absent in the control areas. These differences depicted the non eco-friendly approaches taken in the design,
implementation and maintenance of ecotourism attractions and facilities. However, concerted efforts had to be taken by relevant
stakeholders to forestall this inimical growth towards sustainable ecotourism development.
Keywords: Ecotourism Development, Okomu National Park, Woody Vegetation, Species Accumulation Curves, Southwest
Nigeria.
Journal of Sustainable Development in Africa (Volume 17, No.7, 2015)
ISSN: 1520-5509
Clarion University of Pennsylvania, Clarion, Pennsylvania

52
INTRODUCTION
Ecotourism’s perceived potential as an effective tool for sustainable development is the main reason why developing countries
are now embracing it and including it in their economic development and conservation strategies (Kiper, 2013). It helps in
community development by providing the alternate source of livelihood to local community. Sustainable packaging of the
ecotourism attractions in an ecotourism destination without disturbing the ecosystem is a concerning issue in the world today.
Many countries have ensured their regional development by this concept, while very few countries are still far-fetched.
Increased human interference in ecologically fragile areas can cause irreversible change in the existing ecological processes.
These problems can be reflected in degrading natural resources, vegetation structure and the size of the habitat patch, increasing
deforestation and decreasing upstream water flow (Tourism Queensland, 2002). In achieving sustainability of ecotourism
development, Brown et al. (1997) opined that it is contingent to reconcile on tourism activities with local socio-economic
values and environmental protection.
The rapid development and widening appeal of ecotourism has raised significant challenges for the sector (Reynolds and
Braithwaite, 2001). The construction of ecotourism infrastructures such as roads, tracks, car parks, toilets, visitor centers and
accommodation causes irreversible loss of extensive areas of vegetation, with direct and indirect impacts in adjacent
undisturbed natural vegetation (Pickering, 2007). Although, the total area allocated to infrastructure may be relatively small
compared to the total area of the park, the impacts at that site could be severe and often permanent (Smith and Newsome, 2002;
Pickering and Buckley, 2003; Turton, 2005). Okomu National Park is becoming one of the ’foremost ecotourism destinations
among the protected areas of Nigeria. Therefore, caution had to be taken by stakeholders to mitigate the negative effects of
ecotourism development due to the presence of some vulnerable animal species such the Nigerian White-throated Guenon
(Cercopithecus erythrogaster pococki), African Forest Elephant (Loxodonta africana cyclotis) in the park. Steps had to be
taken in order to preserve these ecological components.
Moreover, if concerted efforts are not made towards its sustainable development, there will be a time when such developments
will raise questions on the acceptable balance between satisfying the short-term physical and social needs of humans for
economic welfare and leisure, and the longer-term need to protect the environment. Despite ecotourism’s sustaining capability,
it’s not enough to neglect the possible negative effects that could emanate from the injudicious biodiversity management of
ecotourism destinations. Therefore, this necessitated ascertaining the ecotourism attractions and facilities being developed, as
well as assessing the impacts of the infrastructural development towards ecotourism on the woody vegetation of the park.
METHODOLOGY
Geographical description
Okomu National Park was established by Decree 46 of 1999 and located between Latitude 60 15’N and 60 25’ N and longitude
of 50 90’E and 50 23’ N (Figure 1). The Park covers an area of 202.24 km² (Okomu National Park, 2010). The topography is
gentle ranging between 30m and 60 m above sea level. Rainfall is between 1,524 and 2,540mm. The park's dry season occurs

53
from December to February and the wet season lasts from March to November (Soladoye and Oni, 2000). Vegetation is Guinea-
Congo lowland rain forest, including areas of swamp-forest, high forest, secondary forest and open shrub (Okomu National
Park, 2010).
METHOD
Information on the ecotourism attractions/facilities and infrastructures of the study area were collected using interview method
and on-site observation. Officers in the Ecotourism Unit of the park were interviewed. Quadrant method was used in the
assessment of the vegetation of the park (FAO, 2009). Floristic Dissimilarity (FD; Cole, 1978) was calculated. Ecotourism
infrastructures/attractions/facilities /scenic spots were selected to measure the impacts of ecotourism development on the woody
vegetation. Twenty five plots (25 × 25 m2) were marked out in each of the spots identified in order to determine the floristic
dissimilarity. The same number of largely undisturbed ‘control’ areas that are 100 m away from the development sites were
also assessed.
Floristic Dissimilarity, i = 1~n (1)
Pi1 and Pi2 are the amount of species i in a control site and developed site respectively, and n is the number of species. The
value of FD can vary between 0 and 100%, where 0 means that an impacted site and its control site are identical in terms of the
species and their relative abundance; a value of 100% means that the two sites have no species in common (Hammitt and Cole,
1998).
Figure 2: Location of Okomu National Park in Edo State, Nigeria

54
RESULTS
Table 1 presents the ecotourism attractions/facilities in Okomu National Park, Nigeria. Eighteen (18) ecotourism attractions/
facilities were identified. These include: hanging foot bridge, old tree house, Iron bridge, Lakes 36, 52, 61, 64 (New tree house)
and 94, Arakhuan stream, restaurant/bar, children playing ground, swimming pool, chalets, museum, sitting ground, Rangers'
quarters, Osse River and Okomu River. Fourteen (14) of the ecotourism attractions/ facilities were located in ArakhuanRange,
Julius Creek and Babui Ranges had of one (1) ecotourism facility each – Iron bridge and Lake 94 respectively. Ecotourism
attractions/ facilities with natural and human-made buildings, structures and sites that were designed for a purpose other than
attracting visitors had the highest frequency of occurrence (8) each, while human-made buildings, structures and sites that are
designed to attract visitors and are purposely-built to accommodate visitors’ needs had the least frequency of occurrence (2).
Table 2 shows the phyto-sociological variables of woody vegetation in the ecotourism built-up area of Okomu National Park,
Nigeria. Eighteen (18) woody species had the least frequency of occurrence (1), while Antonata microphylla had the highest
frequency of occurrence (27). Cola smittii had the least mean tree height (2.60 ± 0.0000 m) at 95% Confidence limit, while
Basqua angolese had the highest mean tree height (50.30 ± 0.0000 m). Anoa claenena had the least mean girth size (5.30 ±
0.0000 cm), while Basqua angolese had the highest mean girth size (290.50 ± 0.0000 cm). Rothmania whitefidei had the least
mean canopy size (1.17 ± 0.27 m), while Mangifera indica had the highest mean canopy size (15.55 ± 1.05 m). Family
Leguminosae had the highest number of woody vegetation species (7) - Albizia ferruginea, Afzelia africana, Anthonotha
macrophylla, Baphia nitida, Baphia pubescens, Hylodendron gabunense and Pentaclethra macrophylla.
Table 3 shows the phyto-sociological variables of woody vegetation in the ecotourism control area of Okomu National Park,
Nigeria. Seventeen (17) woody species had the least frequency of occurrence (1), while Strombosia grandifolia had the highest
frequency of occurrence (47). Trichilia africana had the least mean tree height (4.50 ± 0.0000 m) at 95% Confidence limit,
while Irvingia gabonesis had the highest mean tree height (42.20 ± 0.0000 m). Canarium schweifurthii had the least mean girth
size (3.20 ± 0.0000 cm), while Strombosia postulata had the highest mean girth size (182.45 ± 15.45 cm). Terminalia superba
had the least mean canopy size (0.40 ± 0.0000 m), while Strombosia postulata had the highest mean canopy size (18.35 ± 0.55
m). Family Leguminosae had the highest number of woody vegetation species (10) - Albizia ferruginea, Afzelia africana,
Anthonotha macrophylla, Baphia nitida, Baphia pubescens, Distemonanthus benthamianus, Hylodendron gabunense,
Pentaclethra macrophylla, Piptadeniastrum africanum and Tetrapleura tetraptera.
Table 4 presents the independent T-test for the tree growth variables of woody species in the vegetation of the ecotourism built-
up and control areas of Okomu National Park, Nigeria. Built-up areas had the least mean tree height (10.66 ± 1.40 m) at 95%
confidence limit, while the control areas had the highest mean tree height (15.95 ± 1.23 m). There is significant difference (P
< 0.05) in the tree height between ecotourism built-up and controlled areas (T = -2.53, P = 0.01). Built-up areas had the least
mean girth size (35.70 ± 5.55 cm) at 95% confidence limit, while the control areas had the highest mean girth size (35.58 ±
3.99 cm). There is no significant difference (P > 0.05) in the tree girth size between ecotourism built-up and controlled areas
(T = 0.02, P = 0.99). Built-up areas had the least mean canopy size (2.53 ± 0.37 m) at 95% confidence limit, while the control

55
areas had the highest mean canopy size (3.98 ± 0.39 m). There is significant difference (p < 0.05) in the tree canopy size
between ecotourism built-up and controlled areas.
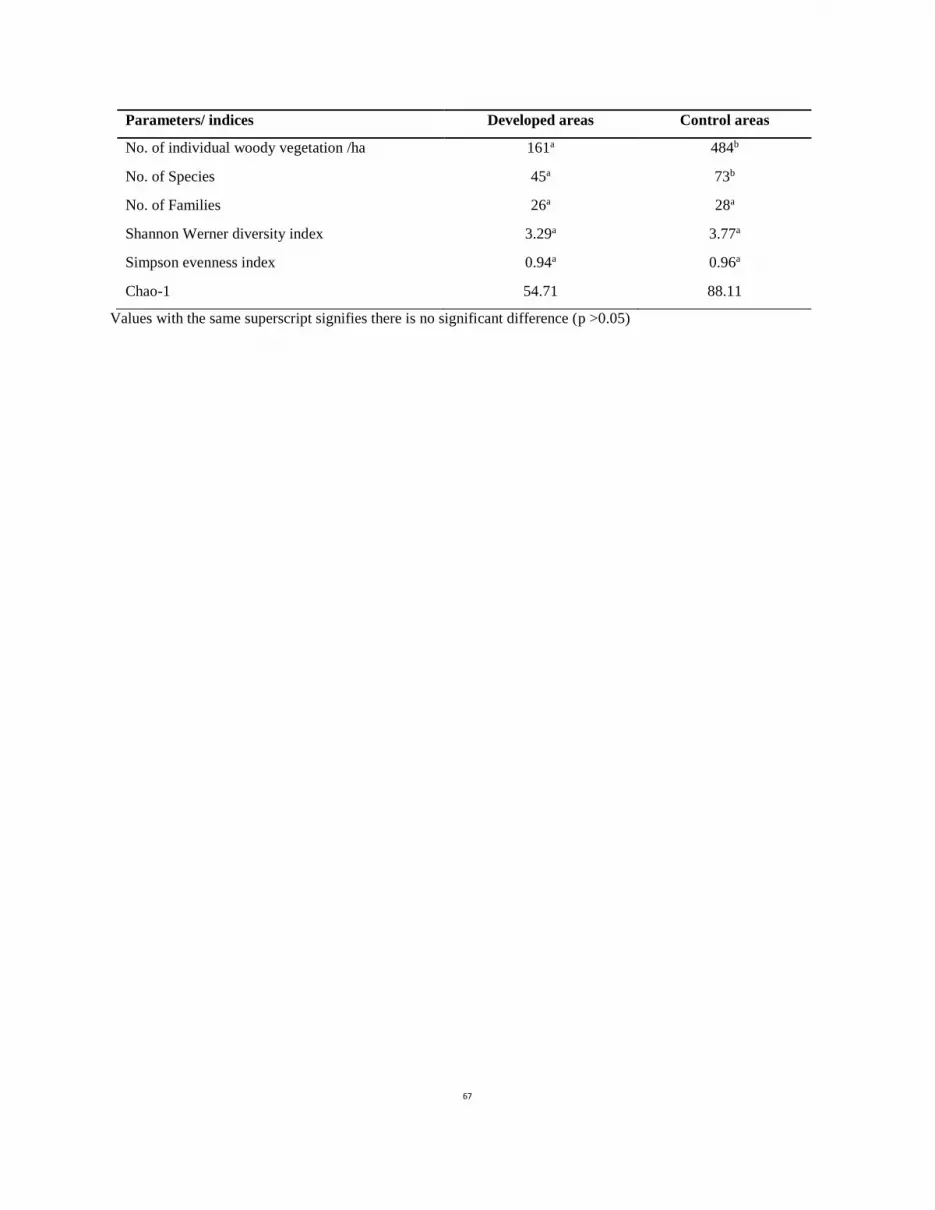
Table 5 shows the summary of the phyto-sociological characteristics of woody vegetation in the developed and controlled areas
of Okomu National Park, Nigeria. A total of one hundred and sixty one (161) stands of woody trees belonging to forty five (45)
different species and twenty six (26) families were observed in the developed areas, while total of four hundred and eighty four
(484) stands of woody trees belonging to seventy three (73) different species and twenty eight (28) families were recorded in
the controlled areas. The built-up areas recorded the least Shannon Werner diversity index (3.29), while the control areas
recorded the highest Shannon Werner diversity index (3.77). The least Simpson evenness index was recorded in the developed
areas, while the highest Simpson evenness index was recorded in the control areas. The built-up areas recorded the least Chao-
1 (54.71), while the control areas recorded the highest Chao-1 (88.11).
Figure 2 presents abundance distribution model of woody vegetation in the ecotourism built-up and controlled areas of Okomu
National Park, Nigeria. The built-up areas had an evenly distributed and significantly related (p < 0.05) abundance of woody
vegetation species (K = 0.06, χ2
= 49.20, P = 0.00), while the controlled areas had an evenly distributed and significantly related
(p < 0.05) abundance of woody vegetation species (K = 0.05, χ2
= 67.14, P = 0.04).
Figure 3 shows kernel density of woody vegetation in the ecotourism built-up and control areas of Okomu National Park,
Nigeria. The built-up areas had the least density of woody vegetation species per hectare (- Log likelihood = -55.22, Akaike IC
= 119.40), while the control areas had highest density of woody vegetation species per hectare (- Log likelihood = -157.10,
Akaike IC = 322.80).
Figure 4 presents the species accumulation curves of woody vegetation in the ecotourism built-up and control areas of Okomu
National Park, Nigeria. The least richness (45) was recorded in the built-up areas, while the highest richness (73) was recorded
in the control areas.
Table 6 present the floristic dissimilarity between the ecotourism built-up and control areas of Okomu National Park, Nigeria.
Woody floristic compostion of eight (8) ecotourism attractions/facilities with their control areas were assessed. Iguowan gate
had the least occurrence (3) of woody vegetation species in the developed areas, while Arakhuan tourist camp had the highest
occurrence (18) of woody vegetation species in the developed areas. Lakes 61 and 94 gate had the least occurrence (18) of
woody vegetation species each in the control areas, while Arakhuan tourist camp had the highest occurrence (34) of woody
vegetation species in the control areas. The least floristic dissimilarity index (2.5) was recorded at the Iron Bridge with more
species and their relative abundance in common, while the highest floristic dissimilarity index (11.5) was recorded at the
Iguowan gate with lesser species and their relative abundance in common.
DISCUSSION

56
Vegetation of Okomu National Park
The vegetation of Okomu National Park shows some potential for conservation and ecotourism purposes with eighty-four (84)
species of plants recorded. Species composition of the ecotourism built-up and control areas shows the expression of the extent
of infrastructural development’s impact through ecotourism on the park. This was due to the fact that environmental impacts
can be associated with tourism infrastructure (Newsome et al., 2002a; Turton, 2005). The presence of Elaeis guineensis, Citrus
sinensis, Mangifera indica and Carica papaya confirmed the human activities that had taken place in the site. Ogunjemite et
al. (2013) opined that the preponderance of Elaeis guineensis in a protected area could have demonstrated a level of cultivation
around the site and the ability of wild fauna resources of the site in the dispersal and regeneration of the forest. Primates and
birds which were more diverse in the site are good agents of dispersal and regeneration therefore aid to healthy growth of forest
(Wahungu et al., 2012; Wiafe and Amoah, 2012). Also, the presence of Treculia africana in the control areas shows that the
site may have been protected traditionally in the past (Ogunjemite et al., 2013), and the ecotourism development could have
been one of the greatest factors for its absence in the ecotourism built-up areas.
There was slight difference in the species and family compositions recorded during the study [eighty-four (84) species
belonging to thirty-three (33) families of plants] to that recorded by Oduwaiye et al., (2002) - sixty seven species from twenty
five families in Okomu National Park. The increment was a reflection of the succession that had taken place within a time span.
However, the woody vegetation in the ecotourism built-up areas (forty five (45) different species and twenty six (26) families)
were observed in the developed areas was observed to be lesser than the previous vegetation assessment result, which was a
clear indication of forest destruction posed by non-ecofriendly approach of infrastructural development in the site towards
ecotourism.
The transitional phases in the early management of the park (Forest Reserve-Wildlife Sanctuary-National Park) through various
human influences were demonstrated by the occurrence of the exotic species such as Gmelina arborea and Tectona grandis in
the built-up areas. As such, these exotic species were more frequent in the ecotourism built-up areas such as chalets, museums,
restaurant/bar, swimming pool and children playing ground. Nevertheless, the forest still compare well with some secondary
forests of southwest Nigeria that are currently been considered for conservation purposes in the region.
The vegetation of Okomu National Park contains IUCN Red data listed species such as Entandrophragma angolense, Lovoa
trichilioides, Anopyxis klaineana, Nauclea diderrichii (vulnerable), and Diospyros crassiflora (endangered). It showed the
great potential of the site for conservation, ecotourism and research purposes. The endangered species of Diospyros crassiflora
had been eroded from the ecotourism built-up areas; while the vulnerable species of Anopyxis klaineana were conspicuously
absent in the control areas. Sun and Walsh (1998) and Pickering (2005) opined that the most obvious and direct impact of
ecotourism development is vegetation clearance, and the damage is not only restricted to the initial removal of native vegetation,
but also to usually indirect effects in adjacent natural vegetation. However, the ecological disparity can be connected to
developmental and maintenance approaches in the site. Therefore, it calls for more ecological considerations in the ecotourism
developmental processes in order to ensure ecological sustainability.

57
Implications of diverse Ecotourism attractions/facilities on national development, cultural integration and livelihood
improvement
The diverse nature of the ecotourism attractions and facilities (natural, human-made and even cultural) of Okomu National
Park is an indicator of its great potential to contribute into National development in Nigeria including cultural integration and
livelihood improvement of the host communities. Ecotourism development had been discovered to be a panacea to national
development (Honey, 1999; Lindberg, 2001; Matthews, 2002). Presently, Nigeria is yet to seek for an alternative means to oil
exploration in revenue generation (Ijeh, 2010; Anwana, 2011; Akujuru, 2015). However, the presence of these ecotourism
virtues in the park amidst other ecotourism destinations in the country depicted a greater future for the nation. These ecotourism
potentials toward national development can fully be attained in an atmosphere of sustainable packaging the ecotourism
attractions in such a way there will be little or no negative impact to the ecosystems. Much more, at certain periods of the year,
the people of Udo – one of the largest and most important traditional host communities to the ecotourism destination- exercised
some traditional rituals and worship the Arakhuan River. This river is one of the natural attractions in the park with some
cultural and historical importance to the community. Also, it served as cultural attractions during the ritual periods, during
which indigenes and non-indigenes that were born as a result of worshipping the river come to pay their homage. Friends and
relatives of these people were present to witness the cultural activities, and it usually gives the on-site tourists the privilege to
gain a sense of satisfaction witnessing the cultural event.
Ecotourism development and phyto-sociological characteristics
The composition of woody vegetation is important to determining the influence of development on an ecotourism destination
(Pickering and Hill, 2007; Okech and Bob, 2009; Olaniyi and Ogunjemite, 2015). Presently, due to the pressing needs for
alternative means of revenue generation in Nigeria (Uzonwanne, 2015), little or no considerations had been given to sustainable
development by balancing infrastructural development and ecosystem maintenance. Ecotourism is being rooted on the principle
of its conservation capability. The process of its development had raised a question whether it had been a curse or a blessing to
the woody vegetation of Okomu National Park – the largest home to the vulnerable Cercopithecus erythrogaster pococki in
Southwest Nigeria. In the study, significant variations were observed in the tree growth variables (height and canopy size) and
phyto-sociological characteristics (number of individual woody vegetation /ha, number of species and families, Shannon
Werner diversity index, Simpson evenness index and Chao-1) of woody vegetation between the ecotourism built-up and control
areas. Furthermore, the abundance distribution model, kernel density and species accumulation curves itinerated the pictorial
disparsity in distribution of woody vegetations’ abundance between the ecotourism built-up and control areas.
It was observed that the infrastructural development towards ecotourism had significant effect on the vertical strata and
connectivity of the forest canopy cover. The control areas still maintained higher tree height in course of their ecological
succession. However, the development is yet to have significant effect on the trees girth size. Also, floristic dissimilarity indices
were observed to decrease with the reduced gradient in concentration of ecotourism attractions and facilities from Arakhuan

58
range to the Iron bridge (the most remote ecotourism attraction). Therefore, concentration of ecotourism attractions and
facilities in an ecotourism destination can be one of the driving forces to its floristic dissimilarity.
CONCLUSION
It is pertinent that ecotourism can be considered as a tool in the integration of leisure, conservation and socio-cultural wellbeing
of host communities towards sustainable development on a local, national, regional and international scale. However, poor
planning, implementation, maintenance and monitoring processes of ecotourism development had been the germane issues in
tapping into its blessing in Okomu National Park. The observed differences in the trees vertical strata, connectivity of the forest
canopy cover and floristic dissimilarity between the ecotourism built-up and control areas depicted the non eco-friendly
approaches taken by the park authority in the design, implementation and maintenance of ecotourism attractions and facilities.
Therefore, there will be need for the park management to draft an ecotourism management plan for the sustainable development
of the ecotourism destination. Major stakeholders such as the National Park Service, host communities, non-governmental
organizations, international organizational, researchers, and private tour operators amidst others should be involved in the
planning process. Complete bush clearing towards infrastructural development in ecotourism, and maintenance of the existing
ecotourism attractions/facilities should be highly discouraged. Although, the humid nature of the park had been the rationale
behind clearing bushes close to the structures for their longetivity during maintenance exercise, more researches should be
undertaken by ecologists and building professionals for the design of suitable lodges with appropriate building materials in
order to mitigate the negativity of this natural climatic phenomenon.
Table 1: Ecotourism attractions/facilities in Okomu National Park, Nigeria
Ecotourism attractions/facilities Locations/
Ranges Types of attractions1
Objects of attraction/
Activities
Hanging foot bridge Arakhuan Human-made (1)
Old tree house Arakhuan Human-made (2)
Iron bridge Julius Creek Human-made (1)
Lake 52 Arakhuan Natural Crocodile
Lake 36 Arakhuan Natural Elephant, Warthog, Red River
hog
Lake 94 Babui Natural Different birds
Lake 64 (New tree house) Arakhuan Natural Bats
Lake 61 Arakhuan Natural Buffalo, Elephant
Arakhuan stream Arakhuan Natural Arakhuan festival
Restaurant/Bar Arakhuan Human-made (1)
Children playing ground Arakhuan Human-made (1)
Swimming pool Arakhuan Human-made (1)

59
Chalets Arakhuan Human-made (1)
Museum Arakhuan Human-made (2)
Sitting ground Arakhuan Human-made (1)
Rangers' quarters Arakhuan Human-made (1)
Osse River Boundary Natural Boat cruising
Okomu River Periphery Natural Boat cruising, sport fishing
1Swarbrooke (2002)
Human-made (1) signifies human-made buildings, structures and sites that were designed for a purpose other than attracting
visitors, but which now attract substantial numbers of visitors who use them as leisure amenities.
Human-made (2) signifies human-made buildings, structures and sites that are designed to attract visitors and are purpose-
built to accommodate their needs.

60
Table 2: Phyto-sociological parameters of woody vegetation in the ecotourism built-up areas of Okomu National Park, Nigeria
Family Composition Species Composition Frequency Tree height (m) Girth (cm) Canopy size ( m)
Anacardiaceae Mangifera indica 2 20.05 ± 0.85 116.75 ± 13.65 15.55 ± 1.05
Annonaceae Annona muricata 1 5.60 ± 0.00 5.30 ± 0.00 1.90 ± 0.00
Cleistopholis patens 9 29.18 ± 4.37 73.62 ± 27.43 4.38 ± 1.18
Apocynaceae Alstonia boonei 4 26.18 ± 8.08 87.50 ± 48.85 4.10 ± 1.70
Funtumia elastica 1 30.60 ± 0.00 20.90 ± 0.00 2.10 ± 0.00
Bombacaceae Ceiba pentandra 9 31.20 ± 4.41 134.29 ± 57.33 4.42 ± 1.35
Burseraceae Dacryodes edulis 1 3.50 ± 0.00 17.10 ± 0.00 1.30 ± 0.00
Caricaceae Carica papaya 1 7.30 ± 0.00 66.20 ± 0.00 4.40 ± 0.00
Combretaceae Terminalia superb 2 31.25 ± 9.05 106.40 ± 93.70 3.20 ± 3.00
Irvingiaceae Irvingia smithii 5 15.70 ± 5.40 49.22 ± 9.98 6.52 ± 0.51
Lecythidaceae Combretodendron africanum 1 42.20 ± 0.00 138.40 ± 0.00 2.60 ± 0.00
Leguminosae Albizia ferruginea 1 40.20 ± 0.00 60.40 ± 0.00 3.10 ± 0.00
Afzelia Africana 5 13.44 ± 3.42 33.82 ± 9.18 3.56 ± 0.77
Anthonotha macrophylla 27 19.12 ± 1.45 40.86 ± 4.10 4.09 ± 0.58
Baphia nitida 3 18.97 ± 1.98 107.87 ± 43.35 6.67 ± 0.93
Baphia pubescens 1 19.70 ± 0.00 50.40 ± 0.00 2.90 ± 0.00
Hylodendron gabunense 1 16.80 ± 0.00 95.30 ± 0.00 6.90 ± 0.00
Pentaclethra macrophylla 2 25.20 ± 10.10 62.90 ± 27.70 6.50 ± 1.80
Meliaceae Entandrophragma angolense 2 35.00 ± 4.30 118.15 ± 93.05 12.20 ± 9.00
Lovoa trichilioides 1 15.70 ± 0.00 10.30 ± 0.00 1.50 ± 0.00
Moraceae Bosqueia angolensis 1 50.30 ± 0.00 290.50 ± 0.00 3.30 ± 0.00
Ficus exasperata 1 11.60 ± 0.00 121.30 ± 0.00 14.10 ± 0.00
Musanga cecropioides 3 25.13 ± 10.29 36.37 ± 27.07 3.57 ± 2.42
Values signify Mean ± Standard error at 95% Confidence limit

61
Table 2 (Contd.): Phyto-sociological parameters of woody vegetation in the ecotourism built-up areas of Okomu National Park, Nigeria
Family Composition Species Composition Frequency Tree height (m) Girth (cm) Canopy size ( m)
Ochnaceae Lophira alata 5 40.22 ± 2.46 188.48 ± 4.47 7.38 ± 2.06
Olacaceae Stombosia grandifolia 15 22.30 ± 2.84 66.18 ± 14.43 4.26 ± 0.72
Palmae Elaeis guineensis 5 12.62 ± 1.68 63.92 ± 22.78 6.08 ± 1.95
Raphia veriphera 2 32.70 ± 2.60 65.40 ± 5.40 5.30 ± 0.10
Passifloraceae Barteria nigritana 4 13.38 ± 3.10 15.10 ± 1.83 2.63 ± 0.43
Rhizophoraceae Anopyxis klaineana 2 36.25 ± 6.65 178.30 ± 17.50 14.10 ± 0.90
Rhomnaceae Maesopsis eminii 1 20.30 ± 0.00 36.60 ± 0.00 2.80 ± 0.00
Rubiaceae Canthium subcordatum 1 16.10 ± 0.00 55.40 ± 0.00 2.60 ± 0.00
Mitragyna ciliate 2 32.10 ± 3.40 60.30 ± 9.90 3.15 ± 0.45
Nauclea diderrichii 7 34.71 ± 4.66 139.34 ± 25.50 7.03 ± 1.04
Porterandia clandantha 6 26.38 ± 6.76 69.42 ± 15.73 5.87 ± 0.83
Rothmannia whitfieldii 11 19.74 ± 3.93 21.95 ± 3.40 1.17 ± 0.27
Rutaceae Citrus sinensis 2 9.70 ± 3.40 53.95 ± 39.75 4.05 ± 3.15
Zanthoxylum zanthoxyloides 2 15.40 ± 3.00 45.30 ± 24.80 4.60 ± 3.00
Sapindaceae Blighia sapida 2 17.05 ± 2.35 37.40 ± 27.70 4.00 ± 2.70
Simaroubaceae Hannoa klaineana 1 12.30 ± 0.00 45.10 ± 0.00 2.50 ± 0.00
Sterculiaceae Cola millenii 1 2.60 ± 0.00 5.60 ± 0.00 1.60 ± 0.00
Theobroma cacao 2 8.70 ± 0.40 52.05 ± 7.15 5.85 ± 0.55
Tiliaceae Desplatsia subericarpa 1 6.30 ± 0.00 10.70 ± 0.00 2.20 ± 0.00
Ulmaceae Celtis zenkeri 2 25.50 ± 5.20 45.50 ± 35.30 4.65 ± 2.15
Verbenaceae Gmelina arborea 1 22.60 ± 0.00 105.30 ± 0.00 12.10 ± 0.00
Tectona grandis 2 19.65 ± 0.95 79.50 ± 0.10 9.85 ± 0.65
Values signify Mean ± Standard error at 95% Confidence limit

62
Table 3: Phyto-sociological parameters of woody vegetation in the ecotourism control areas of Okomu National Park, Nigeria
Family Composition Species Composition Frequency Tree height (m) Girth (cm) Canopy size ( m)
Annonaceae Enantia chlorantha 5 20.40 ± 5.76 36.02 ± 16.80 7.38 ± 3.05
Annona muricata 4 27.35 ± 11.09 38.38 ± 18.48 1.80 ± 0.64
Anonidium mannii 13 15.87 ± 2.75 36.25 ± 10.27 3.60 ± 0.98
Cleistopholis patens 6 32.62 ± 4.86 81.78 ± 17.49 5.90 ± 1.50
Monodora myristica 2 12.05 ± 6.85 12.80 ± 5.50 2.00 ± 1.80
Xylopia aethiopica 1 25.60 ± 0.00 30.20 ± 0.00 0.60 ± 0.00
Apocynaceae Alstonia boonei 5 39.56 ± 4.09 134.86 ± 27.13 7.44 ± 1.33
Pleiocarpa pycnantha 1 21.90 ± 0.00 75.60 ± 0.00 6.50 ± 0.00
Funtumia elastica 8 12.31 ± 2.00 17.48 ± 2.67 4.31 ± 1.02
Rauvolfia vomitoria 8 8.90 ± 1.22 9.31 ± 2.22 1.89 ± 0.61
Voacanga africana 16 14.01 ± 2.03 25.51 ± 6.82 3.58 ± 0.46
Bombacaceae Ceiba pentandra 3 23.43 ± 6.03 81.47 ± 12.01 6.60 ± 1.95
Burseraceae Canarium schweinfurthii 1 6.70 ± 0.00 3.20 ± 0.00 0.50 ± 0.00
Capparaceae Boscia augustifolia 1 30.90 ± 0.00 15.50 ± 0.00 2.60 ± 0.00
Buchholzia coriacea 6 21.48 ± 2.63 20.78 ± 4.01 2.68 ± 0.71
Combretaceae Terminalia superb 1 20.70 ± 0.00 15.30 ± 0.00 0.40 ± 0.00
Ebenaceae Diospyros crassiflora 7 16.85 ± 2.97 31.39 ± 10.49 5.01 ± 1.33
Diospyros insculpta 24 14.50 ± 1.55 22.84 ± 3.17 2.88 ± 0.69
Diospyros mespiliformis 2 5.75 ± 0.95 10.30 ± 1.40 3.40 ± 1.00
Euphorbiaceae Jatropha multifida 3 30.37 ± 2.98 115.50 ± 37.53 4.83 ± 1.33
Macaranga barteri 4 31.80 ± 2.39 45.70 ± 6.39 3.20 ± 0.41
Margaritaria descoidea 6 31.90 ± 3.86 88.48 ± 34.62 8.03 ± 2.26
Values signify Mean ± Standard error at 95% Confidence limit
Table 3 (Contd.): Phyto-sociological parameters of woody vegetation in the ecotourism control areas of Okomu National Park, Nigeria

63
Family Composition Species Composition Frequency Tree height (m) Girth (cm) Canopy size ( m)
Guttiferae Allanblackia floribunda 4 16.87 ± 2.30 33.80 ± 9.68 5.67 ± 0.32
Harungana madagascariensis 1 40.80 ± 0.00 80.50 ± 0.00 8.70 ± 0.00
Irvingiaceae Irvingia smithii 1 42.20 ± 0.00 0.60 ± 0.00 5.30 ± 0.00
Lecythidaceae Combretodendron africanum 4 17.45 ± 4.36 29.48 ± 8.03 3.65 ± 1.91
Napoleonaea imperialis 5 10.34 ± 3.10 12.62 ± 4.53 3.28 ± 0.54
Leguminosae Albizia ferruginea 4 19.08 ± 2.74 31.30 ± 5.51 1.90 ± 0.78
Afzelia africana 10 13.99 ± 3.13 37.34 ± 9.93 4.96 ± 1.36
Anthonotha macrophylla 7 22.63 ± 5.05 44.44 ± 25.01 2.33 ± 0.60
Baphia nitida 1 6.40 ± 0.00 7.70 ± 0.00 3.30 ± 0.00
Baphia pubescens 1 6.40 ± 0.00 12.60 ± 0.00 3.80 ± 0.00
Distemonanthus benthamianus 3 19.07 ± 1.60 28.97 ± 8.00 6.70 ± 0.12
Hylodendron gabunense 5 35.50 ± 0.00 20.90 ± 0.00 2.30 ± 0.00
Pentaclethra macrophylla 5 11.44 ± 2.65 30.22 ± 10.86 4.88 ± 1.59
Piptadeniastrum africanum 1 33.50 ± 0.00 168.10 ± 0.00 16.30 ± 0.00
Tetrapleura tetraptera 2 15.85 ± 4.75 58.30 ± 47.60 7.25 ± 4.15
Meliaceae Carapa procera 16 5.66 ± 0.53 9.34 ± 0.99 1.43 ± 0.39
Entandrophragma angolense 17 15.36 ± 2.71 40.25 ± 11.33 2.96 ± 0.71
Guarea cedrata 10 16.71 ± 1.04 33.30 ± 6.09 4.44 ± 0.88
Guarea thompsonii 11 26.70 ± 3.45 52.89 ± 15.13 4.36 ± 0.65
Khaya ivorensis 4 28.15 ± 8.66 73.10 ± 29.04 4.88 ± 3.27
Lovoa trichilioides 8 21.15 ± 5.42 56.89 ± 25.78 3.28 ± 1.18
Lovoa trichilioides 3 10.10 ± 4.40 27.07 ± 14.82 4.43 ± 2.51
Trichilia heudelotii 4 30.40 ± 1.13 146.40 ± 25.23 12.65 ± 1.11
Values signify Mean ± Standard error at 95% Confidence limit
Table 4 (Contd.): Phyto-sociological parameters of woody vegetation in the ecotourism control areas of Okomu National Park, Nigeria

64
Family Composition Species Composition Frequency Tree height (m) Girth (cm) Canopy size ( m)
Menispermaceae Sphenocentrum jollyanum 23 12.44 ± 0.41 9.67 ± 0.73 1.37 ± 0.05
Moraceae Antiaris africana 2 11.10 ± 1.70 12.50 ± 3.90 5.10 ± 0.40
Myrianthus arboreus 3 12.83 ± 5.13 41.77 ± 27.04 8.23 ± 4.71
Treculia africana 1 4.50 ± 0.00 5.40 ± 0.00 1.50 ± 0.00
Myristicaceae Pycnanthus angolensis 7 16.64 ± 5.13 33.10 ± 16.93 2.93 ± 0.76
Staudtia stipitata 3 34.90 ± 2.08 69.60 ± 19.32 9.67 ± 2.07
Ochnaceae Lophira alata 6 27.35 ± 4.79 38.83 ± 11.98 3.23 ± 0.64
Olacaceae Strombosia grandifolia 47 17.39 ± 1.61 37.98 ± 4.74 4.00 ± 0.50
Strombosia postulata 2 28.75 ± 4.45 182.45 ± 15.45 18.35 ± 0.55
Passifloraceae Barteria fistolosa 15 11.98 ± 2.41 15.03 ± 2.50 1.58 ± 0.38
Barteria nigritana 1 5.20 ± 0.00 6.20 ± 0.00 1.20 ± 0.00
Rhomnaceae Maesopsis eminii 1 13.40 ± 0.00 15.80 ± 0.00 4.20 ± 0.00
Rubiaceae Nauclea diderrichii 1 19.40 ± 0.00 71.10 ± 0.00 14.30 ± 0.00
Canthium glabriflorum 2 41.20 ± 4.50 72.70 ± 22.60 6.25 ± 2.45
Pausinystalia johimbe 8 12.16 ± 2.84 23.68 ± 11.81 4.30 ± 0.71
Porterandia clandantha 11 24.00 ± 3.29 56.85 ± 9.26 6.63 ± 1.79
Rothmannia whitfieldii 3 11.37 ± 0.62 24.20 ± 1.79 1.07 ± 0.13
Rutaceae Zanthoxylum zanthoxyloides 11 22.95 ± 2.82 47.15 ± 9.01 4.19 ± 0.50
Zanthoxylum leprieuri 1 8.60 ± 0.00 16.40 ± 0.00 2.20 ± 0.00
Sapindaceae Blighia sapida 1 40.20 ± 0.00 85.30 ± 0.00 4.20 ± 0.00
Sapotaceae Chrysophyllum albidum 13 9.27 ± 1.41 12.52 ± 2.12 1.45 ± 0.37
Simaroubaceae Hannoa klaineana 3 16.00 ± 7.12 41.83 ± 28.71 6.27 ± 3.77
Values signify Mean ± Standard error at 95% Confidence limit
Table 4 (Contd.): Phyto-sociological parameters of woody vegetation in the ecotourism control areas of Okomu National Park, Nigeria

65
Family Composition Species Composition Frequency Tree height (m) Girth (cm) Canopy size ( m)
Sterculiaceae Cola nitida 1 6.30 ± 0.00 8.60 ± 0.00 4.90 ± 0.00
Cola millenii 4 21.90 ± 8.09 51.48 ± 20.04 4.00 ± 1.10
Sterculia obloga 14 20.46 ± 3.11 49.93 ± 13.35 4.17 ± 0.70
Tiliaceae Desplatsia subericarpa 2 5.50 ± 0.30 8.35 ± 1.15 2.45 ± 0.25
Ulmaceae Celtis zenkeri 44 17.23 ± 1.70 31.55 ± 7.81 3.29 ± 0.43
Values signify Mean ± Standard error at 95% Confidence limit

66
Table 4: Independent T test for the tree growth variables of woody vegetation in the ecotourism built-up and control
areas of Okomu National Park, Nigeria
Vegetative parameters Developed areas Control areas T value Significant level
Mean height (m) 10.66 ± 1.40a 15.95 ± 1.23b -2.53 0.01*
Mean girth size (cm) 35.70 ± 5.55a 35.58 ± 3.99a 0.02 0.99ns
Mean canopy size (m) 2.53 ± 0.37a 3.98 ± 0.39b -2.30 0.02*
* implies significant difference (p < 0.05), ns implies non- significant difference (p > 0.05)
Mean ± Standard error with the same superscript signifies there is no significant difference (P > 0.05)
Table 5: Summary of the phyto-sociological characteristics of woody vegetation in the built-up and control areas of
Okomu National Park, Nigeria
67
Parameters/ indices Developed areas Control areas
No. of individual woody vegetation /ha 161a 484b
No. of Species 45a 73b
No. of Families 26a 28a
Shannon Werner diversity index 3.29a 3.77a
Simpson evenness index 0.94a 0.96a
Chao-1 54.71 88.11
Values with the same superscript signifies there is no significant difference (p >0.05)

68
Figure 2: Abundance distribution model of woody vegetation in the ecotourism built-up and control areas of Okomu
National Park, Nigeria

69
Figure 3: Kernel density of woody vegetation in the ecotourism built-up and control area of Okomu National Park,
Nigeria

70
Figure 4: Species accumulation curves of woody vegetation in the ecotourism built-up and control areas of Okomu
National Park, Nigeria

71
Table 6: Floristic dissimilarity between the ecotourism built-up and control areas of Okomu National Park, Nigeria
Ecotourism attractions/facilities Number of species
(Developed areas)
Number of species (Control
areas) Floristic dissimilarity index (%) Ranking
Arakhuan tourist camp 18 34 8 3rd
Arakhuan Rangers’ quarters 5 25 10 2nd
Iguowan gate 3 26 11.5 1st
Iron bridge 16 21 2.5 7th
Lake 94 8 18 5 6th
Lake 61 4 18 7 4th
Lake 36 13 29 8 3rd
Old tree house 9 21 6 5th

72
ACKNOWLEDGEMENTS
We would like to thank A.G. Leventis Foundation, Switzerland for providing an Education grant to the corresponding
author for his PhD research, from which this manuscript was written. Also, our profound gratitude goes to the Nigeria
National Park Service for issuing the entry permit into Okomu National Park in order to undertake this research.
REFERENCES
Akujuru, C.A. (2015). Revenue allocation in Nigeria and the dependency on oil revenue: the need for alternative
solutions. Global Journal of Arts Humanities and Social Sciences, 3(2): 19-36.
Anwana, E. O. (2011). Impact of oil exploitation on sustainable development and green economy in Nigeria: The
Niger Delta Case. International Journal of Economic Development Research and Investment, 2(2): 155-167
Brown, K., Turner, R.K., Hameed, H., Bateman, I. (1997). Environmental Carrying Capacity and Tourism
Development in the Maldives and Nepal. Environmental Conservation, 24 (4): 316–325.
Cole, D.N. (1978). Estimating the susceptibility of wildland vegetation to trailside alteration. Journal of Applied
Ecology 15, 281–286.
FAO, (2009). FAO National Forest Monitoring and Assessment. Manual for Local Level Assessment of Land
Degradation , Sustainable Land Management and Livelihoods, Land Degradation Assessment In Drylands (LADA)
Project, pp39- 66
Honey, M. (1999). Ecotourism and Sustainable Development: Who Owns Paradise? Washington, DC: Island Press.
Ijeh, C.A. (2010). Assessing the impact of overdependence on Oil Revenue to Nigeria Economy. Master of Business
Administration (MBA) submitted to the Department of Management, Faculty of Business Administration, University
of Nigeria, Enugu Campus. Pp117
Kiper, T. (2013). Role of Ecotourism in Sustainable Development. Advances in Landscape Architecture. 773-802
Lindberg, K. (2001). Economic Impacts. In D. B. Weaver (Ed.), The Encyclopedia of Ecotourism. New York: CABI
International.
Matthews, E.J. (2002). Ecotourism: Are current practices delivering desired outcomes? A comparative case study
analysis. Master’s thesis submitted to the Faculty of the Virginia Polytechnic Institute and State University. Pp110.
Newsome, D. Moore, S.A. and Dowling, R. K. (2002). Natural Area Tourism: Ecology, Impacts and Management.
Channel View Publications, Sydney.
Ogunjemite, B.G., Olaniyi, O.E. and Akinwumi, O.O. (2013): Maintenance of ecological integrity of a Warmspring
site: The role of vegetation composition and cover of Ikogosi Warmspring, Ekiti State, Nigeria. Proceedings of 36th
Annual Conference on Green economy: Balancing Environmental sustainability and livelihoods in an emerging
economy held at University of Uyo, Akwa Ibom State, Nigeria 4th- 9th November, 2013; pp553- 562
Okech, R.N. and Bob, U. (2009): Sustainable Ecotourism Management in Kenya. Ethiopian Journal of Environmental
Studies and Management 2(1): 57-65.
Okomu National Park, (2010). Nigeria National Park Service. Retrieved 4 November 2010.
Olaniyi, O.E. and Ogunjemite, B.G. (2015). Ecotourism development in Ikogosi Warmspring, Ekiti State, Nigeria:
Implication on woody species composition and structure. Applied Tropical Agriculture. 20(2): In press

73
Pickering, C. and Hill, W. (2007): Impacts of recreation and tourism on plants in protected areas in Australia. CRC
for Sustainable Tourism Pty Ltd. pp30.
Pickering, C.M. (2007). Impacts of recreation and tourism on plants in protected areas in Australia. CRC for
Sustainable Tourism Pty Ltd. Pp30.
Pickering, C.M. and Buckley, R.C. (2003). Swarming to the summit: managing tourists at Mt Kosciuszko, Australia.
Mountain Research and Development. 23:230-233.
Reynolds, P. C. and Braithwaite, D. (2001). Towards a conceptual framework for wildlife tourism. Tourism
Management 22(1): 31-42.
Smith, A. and Newsome, D. (2002). An integrated approach to assessing, managing and monitoring campsite impacts
in Warren National Park, Western Australia. Journal of Sustainable Tourism, 10: 343-359.
Soladoye, M. O. and Oni, O. (2000). Biodiversity studies at Okomu Forest Reserve in Edo State. A report of the
National Agricultural Research Project. 128
Sun, D. and Walsh, D. (1998). Review of studies on environmental impacts of recreation and tourism in Australia.
Journal of Environmental Management, 53: 323-338.
Swarbrooke, J. (2002). The Development and Management of Visitor Attractions (2nd Ed). Oxford: Butterworth-
Heinemann.
Tourism Queenland, (2002). Queensland Ecotourism Plan 2003–2008; Tourism Queensland: Brisbane, Australia,
2002. Online [Available]: http://www.tq.com.au/fms/tq_ corporate/ special interests /ecotourism2/Queensland %20).
Turton, S.M. (2005) Managing environmental impacts of recreation and tourism in rainforests at the Wet Tropics of
Queensland World Heritage Area. Geographical Research, 43: 140-151.
Uzonwanne, M.C. (2015). Economic Diversification in Nigeria in the Face of Dwindling Oil Revenue. Journal of
Economics and Sustainable Development, 6(4): 61-67.
Wahungu, G.M., Kimuyu, D.M., Mureu, L.K., Ogutu, M.O. and Owino, B. (2012). Primates seed dispersal enhances
forest regeneration and connectivity; Results from coastal forest fragments, Kenya. In Forest and trees: serving the
people of Africa and the world, Kenya Forestry Research Institute, Nairobi, Kenya. Pp206.
Wiafe, E.D. and Amoah, M. (2012). Impact of conservation measures on Lowe’s Guenon (Cercopithecus campbelli
lowei) in a previously logged moist Forest Reserve in Ghana. In Forest and trees: serving the people of Africa and the
world, Kenya Forestry Research Institute, Nairobi, Kenya. pp261.

74
ABOUT THE AUTHORS
OLANIYI, Oluwatobi Emmanuel: He is currently a lecturer and a PhD Student at the Department of Ecotourism
and Wildlife Management, Federal University of Technology, P.M.B 704, Akure, Nigeria. E-mail:
OGUNJEMITE, Babafemi George: He is a Professor of Primate Ecology and Community at the Department of
Ecotourism and Wildlife Management, Federal University of Technology, P.M.B 704, Akure, Nigeria.
AKINDELE, Shadrach Olufemi: He is currently a Professor of Forest Biometrics at the Department of Forestry and
Wood Technology, Federal University of Technology, P.M.B 704, Akure, Nigeria.


