Embed Size (px)
Citation preview

Edge Affinity for Pose-Contour Matching �
V. Shiv Naga Prasad a,∗ Larry S. Davis a Son Dinh Tran a
Ahmed Elgammal b
aUniversity of Maryland - Institute of Advanced Computer Studies (UMIACS),College Park, MD 20742, U.S.A.
bDept. of Computer Science, Rutgers University,Piscataway, NJ 08854-8019, U.S.A.
Abstract
We present an approach for whole-body pose contour matching. Contour matching in nat-ural images in the absence of foreground-background segmentation is difficult. Usually anasymmetric approach is adopted, where a contour is said to match well if it aligns witha subset of the image’s gradients. This leads to problems as the contour can match witha portion of an object’s outline and ignore the remainder. We present a model for usingedge-continuity to address this issue. Pairs of edge elements in the image are linked withaffinities if they are likely to belong to the same object. A contour that matches with a setof image gradients is constrained to also match with other gradients having high affinitieswith the chosen ones. Experimental results show that this improves matching performance.
Key words: edge continuity, contour matching
1 Introduction
This paper explores the use of edge continuity for improving contour matching innatural images. The domain of application is human pose matching and gesturerecognition. Given a set of human poses in the form of contour points and an imagecontaining a person in one of the poses with some deformation, we seek to computelikelihoods for each pose to have occurred in the image.
� We thank the U.S. Government for supporting the research described in this paper.∗ [email protected]
Preprint submitted to Elsevier Science 22 May 2006
1.1 Studies on Contour Matching
Contour matching is used extensively in computer vision for human pose detectionand recognition tasks. When applied for action or gesture recognition, it is usedto compute pose observation likelihoods, which are then modelled using HiddenMarkov Models (HMMs) [1], Markov Chain Monte Carlo (MCMC) [2], etc. Con-tour matching has also been used for object detection e.g. [3,4], etc. There are threestages to contour matching:
(1) Edge features of the objects in the images are detected.(2) A pose-contour is imposed on the image for matching.(3) The score for the match is generated by computing distance between the im-
age’s edge features and the imposed pose-contour.
Many studies - including ours - use gradient-based operators such as Canny edge-detector, Gaussian derivatives, etc., for detecting edge features. Reliably detectingobject boundaries in general illumination conditions is difficult. Recent research onboundary detection has focussed on using region segmentation as a pre-processingstep for generating “super-pixels” - relatively small groups of pixels that have ho-mogenous features and are highly likely to belong to the same object. Boundaries ofthe super-pixels are used for matching object boundaries. For example, Mori et.al.use normalized-cuts (n-cuts) to obtain super-pixels and then analyze their config-urations to detect baseball players [5]. Sharon et.al. use a multigrid approach forobtaining segment boundaries [6].
The pose-contour to be matched with the test image could either be collected duringtraining or generated using a model. Whole-body contours have been used for hu-man pose-matching in [7–10,1], etc. Zhang et al. use a Bayes-nets based articulatedmodel for pedestrian detection [11]. Ronfard et al. follow a bottom-up part-basedapproach to detecting people [12]. They train Support Vector Machines (SVMs) ongradients of limbs obtained from training images. In the present study, the pose-contours correspond to the whole body of the subject and are collected during atraining phase.
Rosin and West presented a continuous form of chamfer distance which includesthe saliency of the edges in the matching [13]. Their method avoids setting thresh-old on the gradient magnitudes, which is a difficult issue. Butt and Maragos pre-sented an efficient approach for computing chamfer distance while minimizing er-rors due to discretization [14]. Toyama and Blake use sets of exemplar contours andchamfer distance for tracking pedestrians and mouth movements [9]. Mori and Ma-lik introduced the Shape Context technique for matching human pose contours [10].Olson and Huttenlocher used the Hausdorff distance for object recognition [7].Leibe et.al. present a study comparing contour-based and appearance-based objectrecognition in [15].
2

1.2 Pose Matching in Cluttered Images
Images of people in natural scenes have significant edge clutter present in the back-ground in addition to the subject’s figure. Ideally, these background edges shouldbe ignored when matching pose-contours. However, reliable background suppres-sion in natural images in the presence of camera and subject motion is difficult.There are three general ways of handling this:
1.2.1 Asymmetric Approach
Not perform the difficult task of background subtraction but rather compromisewith asymmetric matching, which only measures how well a model pose-contourmatches with the image’s gradients. It does not verify whether these matching gra-dients form a coherent object. Current contour matching schemes either follow thisasymmetric approach or assume background subtracted images, e.g. [1,3,4,7,14,9–11]. Predictably, this leads to problems as a contour can match well with a subset ofthe edges of an object and ignore the rest of it. Consider the case shown in Fig. 1.Fig.s 1(a) and (e) show an image and the edges of the subject. Fig.s 1(c) and (g)show two pose-contours in the database extracted from training images shown inFig.s 1(b) and (f) respectively. Clearly, the contour in Fig. 1(c) is the correct pose.However, when the poses are matched with the image (Fig.s 1(d) and (h)) usingChamfer matching, the wrong pose obtains a better score. The reason is that it hassmaller extent at the arms, which - due to articulation - are the zones of highesterrors in matching. Normalizing the error w.r.t. the length of the boundary does notameliorate the situation.
1.2.2 Segmentation Followed by Recognition
The second approach uses segmentation as a pre-processing step and then analyzesthe segment boundaries for matching.Edge continuity cues in region segmentation: Typically, the continuity con-straints are imposed on the segment boundaries - high curvatures are penalized andstraight boundaries are promoted. Leung and Malik proposed a pairwise pixel affin-ity which takes into account intervening gradients between them [16]. N-cuts wasused to obtain the final region segmentation. Ren and Malik presented a segmen-tation scheme in which super-pixels were computed as a pre-processing step forsegmentation [17]. The continuity of super-pixel edges along a segment’s bound-ary were included as part of the segment’s goodness value. Yu and Shi generalizedthe n-cuts algorithm to partition both the pixels and edge elements [18]. The graphnodes corresponding to edge elements are connected by affinities based on con-tinuation. However, obtaining segments that directly correspond to holistic objectsis a challenge. Usually, over-segmentation followed by recognition on groups of
3

(a) (b) (c) (d)
(e) (f) (g) (h)
Fig. 1. (a,e) The test image and the subject’s edges. (b,c,d) Training image showing thecorrect pose, the pose extracted from it, and the gradient map of the test image with thepose overlayed. (f-h) Similar to (b-d) but for a wrong pose.
segments is favored e.g. [5], etc.
Jermyn and Ishikawa proposed an energy function for segmentation which includesboth region and boundary cues [19]. The basic idea is to integrate the function alongboundaries of segments and choose the segment with lowest energy. There has beenrelated work on integrating segments using region and boundary cues [20,21].
Part-based Detection: A closely related approach is based on detecting limbs ascomponents shaped as rectangles and combining them using graphs or trees. Therectangles are detected using templates with uniform interior color and contrast-ing color in the periphery [22–24]. In [25], the components are combined using acascade. It is not clear how these techniques could prevent errors due to asymmet-ric matching - the case shown in Figure 1. These methods can easily ignore theextended arm in Figure 1(a) and confine themselves to the torso - leading to anerroneous match.
1.2.3 Use Edge Continuity during Recognition
The third approach - the one followed here - is to avoid performing segmentationwhile still taking into consideration edge continuity constraints. Given an imageand a pose-contour to be matched, we find the set of gradients in the image thatare likely to belong to the subject. If the given pose-contour is correct then this setmust belong to the foreground. However, this “initial” set might be closely linkedwith other gradients in the image - which must also belong to the foreground. Edge
4

continuity is used to expand the initial set to include other linked gradients. Forthe given pose-contour to be a good match to the image, it should match with theexpanded set of gradients. The matching is performed using a modified form ofchamfer distance. This framework provides a large measure of resistance to spuri-ous matches in the case of highly textured scenes, and to incorrect matches whensome poses match only partially with the subject but obtain a high score by avoidingintegrating errors in articulated parts of the body (as illustrated in Figure 1).
A closely related approach for detecting lakes in satellite imagery was proposed byElder et.al. [26]. Here, edge continuity constraints are included in a probabilisticmodel to detect closed contours in edge maps. The authors also describe a methodfor learning the edge continuity priors in the context of detecting lakes. In ourproblem, the goal is to match a given set of contours with an image - this is differentfrom the detection problem addressed in [26].
Thayananthan et.al. [27] proposed an improvement to the Shape Context techniqueby enforcing neighborhood constraints on the matchings between point sets. Theyrequire that neighboring points on the pose-contour be mapped to neighboringpoints on the image. However, it is not clear whether this would guarantee thatthe mapped gradients also form a holistic object.
Region-based Segmentation and Recognition: Additionally, there have beenmany recent studies on linking segmentation and object recognition. Cremers et.al.introduced a variational framework for combining segmentation and recognition [28].Yu et.al. introduced a generalized version of the normalized-cuts algorithm in whichthe graph affinities include body-part configuration constraints along with spa-tial continuity criteria [29]. Borenstein et.al. extended the multiscale segmentationalgorithm to enable object recognition by using the segments’ saliency as con-straints [30,31]. These approaches employ region-based segmentation and appear-ance modelling. We complement them by introducing a model for combining edgegrouping with contour matching.
1.3 Overview of Present Work
Our model for matching a pose-contour to an image combines two measures:
(1) The first one measures how well the pose-contour aligns with the gradientsin the image. This is computed using an extended form of chamfer matchingapplied to a continuous gradient magnitude field instead of a discrete edgemap. We refer to this as cp→i.
(2) The second measures how well the subject’s gradients in the image align withthe pose-contour. It verifies whether the image gradients underlying the testpose-contour form a holistic object, or are part of a larger object. This measureis computed from the expanded set of gradients obtained from edge continuity.
5

It is referred to as ci→p.
We propose an edge-affinity model for grouping edge elements in natural imagesdepending upon whether they could belong to the same object. A pair of edge ele-ments have high affinity if their orientations have good continuity and their neigh-borhoods have similar color statistics. Given an image and a pose-contour to bematched, an initial set of edge elements matching with the pose-contour is ob-tained. An iterative process is then used to expand this set to include other edgeelements having high affinity with its members. The measure, ci→p, is computedfrom the degree of mismatch between the estimated outline of the subject and thepose-contour being considered.
The pose contours used in the present study were collected as part of a gesturerecognition system. The training database consists of 14 gestures performed by 5subjects (c.f. Section 5). The subjects stand upright and the arms are the principalmodes of gesticulation. The proposed pose-matching system is tested both with stillimages and in a gesture recognition application.
We first review work on edge continuity and then describe the edge affinity model.Section 3 describes the algorithm for using the edge affinities to compute ci→p. Theextended form of Chamfer matching is described in section 4.
2 Edge Affinity
Two edge elements in a given image are said to have high affinity if they are likelyto be part of an object’s boundary. This depends upon:
(1) The “goodness” of the contour that could pass between them, with the con-tour’s orientation constrained by the orientation of the edge elements.
(2) The color statistics in their neighborhoods.
The proposed edge affinity model is presented in stages. First the dependence on thecurvature of the contour connecting the two edge elements is described (c.f. eq. (2)).Next, the orientation of the edge elements w.r.t. this contour is included (c.f. eq. (3)).Finally, color statistics in the neighborhood of the edge elements are factored in (c.f.eq. (4)).
2.1 Edge Continuity
Given two edge elements, edge continuity criteria measure how likely it is that theyare connected. This has been extensively studied in computer vision for detectingsalient figures in images and for forming subjective contours [32]. Sha’ Ashua and
6

Ullman computed the saliency of edges by building a network of edge elementsand use curvature and curvature variations to formulate a measure of saliency [33].Parent and Zucker used the concept of an osculating circle for edge continuity [34].Guy and Medioni combined this with tensor voting to obtain saliency maps for theedges in an image [35]. Williams et.al. proposed a stochastic completion model tocompute the probability that a contour connecting one point to another would passthrough a given intermediate point. The obtained probability fields show interestingresemblance to subjective contours [36]. Although edge-continuity has been stud-ied in the context of perceptual grouping, we are not aware of any work in linkingit with recognition. We use the model proposed by Parent and Zucker for our edgeaffinity model.
2.1.1 Osculating Circles
zr
2θ
θy
Fig. 2. Osculating circle given two points y and z lying on it and the tangent to the curveat y.
Edge-continuity constraints typically assume that curves with low curvature aremore likely to occur. In the case of [34], given two points and the orientation of thecontour at one of them, the most likely contour to pass through them is assumedto be a circle. The reasoning being, for closed contours with fixed lengths, a circlewill have minimum curvature. The circle so defined is called an osculating circle.This is illustrated in Figure 2 - y and z are the two given points on the image planeand the orientation of the contour at y is fixed. It can be shown that the radius ofthe circle - denoted by r(y, z) - is given by:
r(y, z) =‖y − z‖2 sin θ
(1)
where θ is as shown in Figure 2(a). The curvature of a circle is the reciprocal of itsradius. The smaller the curvature, the better connected are the two edge elementsat y and z.
Let ey denote the edge element at y on the image plane. We denote the affinity be-tween two edge elements ey and ez by a(ey, ez). It’s variation w.r.t. r(y, z) woulddepend upon the statistics of the curvature of the contours of humans. The com-puted statistics are local in nature and depend upon the curves typically observedon outlines of cloths. We analyzed the pose-contours of 5 human subjects while
7

performing the “Turn Left” gesture (Figure 11). See Appendix A for details. Basedon this analysis, the affinity a(.) is formulated as a sigmoidal function of r(y, z)
a(ey, ez) =1
1 + exp(− r(y,z)−6.9
)(2)
Figure 3 shows a plot of its variation w.r.t. the radius. The subjects’ heights in theimages in our application varied from 170 to 200 pixel units - the parameters ofthe function were kept constant for all experiments. For applications with pose-contours of a substantially different scale: (a) The r(y, z)’s can be scaled linearlyw.r.t. the subjects’ scales, or (b) statistics of the new contour set can be collectedand the constraints on a(.) adjusted according to them.
0 5 10 150
0.25
0.5
0.75
1
Radius of the Osculating Circle
Ind
uce
d A
ffin
ity
Fig. 3. Variation of the induced affinity for different radii of the osculating circles.
Until now we have ignored the orientation of ez when computing a(ey, ez). Letn̂(z) denote the unit vector tangent to the osculating circle at z. If ez is orthogonalto n̂(z) then the affinity should be 0. On the other hand, the affinity should bemaximal when ez is tangential to the osculating circle at z. In general, the affinityis proportional to the magnitude of the normalized projection of ez onto n̂(z). Let∆I(z) denote the gradient vector at z - it would be perpendicular to ez. Includingthe orientation factor into the affinity yields
a(ey, ez) =1
1 + exp(− r(y,z)−6.9
)
∥∥∥∥∥n̂(z) × ∆I(z)
‖∆I(z)‖
∥∥∥∥∥ (3)
2.2 Including Color Statistics
The large amount of edge clutter present in natural images makes edge continuityalone unreliable for determining edge affinities. Color statistics in the neighbor-hoods of the edges form an important low level cue for grouping. In the case ofedges bordering an object, only one side of the edge (the foreground side) shouldhave similar colors. The other side, belonging to the background, can have arbitrarycolors. Therefore, we collect statistics on both sides of the edges but constrain onlythe side indicated by a candidate contour to be the foreground. The color statisticsare collected by averaging the color in 5 × 5 windows on either side of the edgeelements - see Figure 4(a).
8

We label the sides adjacent to an edge as +ive and −ive depending upon the ori-entation of ∆I at that point. Accordingly, the color statistics at an edge elementey are denoted by c+(ey) and c−(ey). Now consider two edge elements ey and ez,and, without loss of generality, suppose that the +ive side of ey belongs to the fore-ground. When extending the contour from y to z, the side of the osculating circlecorresponding to the +ive side of ey will be the foreground and hence should ex-hibit color constancy - see Figure 4(b). Depending upon the angle made by ∆I(z)with the tangent to the osculating circle (n̂(z)), one of c+(ez) and c−(ez) is cho-sen for comparison with c+(ey); in the shown example c−(ez) would be chosen.For computing the orientation of ∆I(z) w.r.t. n̂(z), we compute the cross-product∆I(z) × n̂(z), which is perpendicular to the image plane. Let cs(y) be chosen asforeground. There are two cases:
(1) ∆I(z) × n̂(z) points upwards: in this case cs(z) should be used for compari-son.
(2) The cross-product points downwards: in this case c−s(z) should be used forcomparison.
In other words, if cs(y) is chosen as foreground then cs′(z) is chosen for compar-ison, with s′ = s sgn((∆I(z) × ˆn(z)) · (k̂)). Here k̂ is a unit vector perpendicularto the image plane, pointing upwards.
∆
_
c+
c_(y)
(y)+c
n(z)^
c_(z)
(a)
5
(b)
z
I
5
5
3
+ive side
−ive side
53 I∆
∆y
Foreground
+c (z)
I
c
Fig. 4. (a) Collecting color statistics in 5×5 windows on either side of edge elements. (b) Asc−(z) lies on the foreground side of the osculating circle, it is chosen for comparison withc+(y).
Let the color statistics chosen at y and z be denoted by cy and cz respectively. Weallow for additive Gaussian noise in the color statistics, and correspondingly extendthe edge affinity model as:
a(ey, ez) =1
1 + exp(− r(y,z)−6.9
)
∥∥∥∥∥n̂(z) × ∆I(z)
‖∆I(z)‖
∥∥∥∥∥ exp
(−‖cy − cz‖2
σ2c
)(4)
σc was kept at 0.003.
9
2.3 Using Edge Affinities to Propagate Edges
When a contour is placed on an image, the gradients in the image lying underneaththe contour are said to match with it. These are called the activated gradients. It ispossible that the activated gradients are actually part of a larger object in the image.In this case, they would have high affinities with other gradients not activated bythe pose. Let us call these the propagated gradients. The activated and propagatedgradients together constitute the net saliency induced by the pose on the image. Theterm salient gradients is used to indicate the union of activated and propagated gra-dients. They would highlight the outline of the object whose edges were activatedby the contour under consideration.
An iterative approach is followed for obtaining the salient gradients, where theprevious stage’s salient gradients propagate to other gradients through the edgeaffinities. Let A0(ey) denote the activation field defined on the image plane - itquantifies the degree of activation of the various edge elements in an image bya contour. This would form the initial saliency field in the iterative process. A(.)ranges over [0, 1]. At each iteration, the salient gradients in the neighborhood of anedge element induce saliency to it - the higher the affinity, the greater the saliencyinduced. For simplicity, we consider only pairwise interactions and use the maxoperator to combine the saliency induced by the different neighbors of a point. Thesaliency field at the tth iteration (t = 0 . . . Γ) is denoted by At(ez), and is computedas
At(ez) = E(ez) maxy∈N(z)
[a(ey, ez)Ψ(At−1(ey))
](5)
E(ez) ∈ [0, 1] quantifies the confidence of edge element ez to belong to the fore-ground. In the absence of additional information, e.g. foreground color statistics,E(ez) is simply the gradient magnitude of ez. N(.) defines an 11 × 11 neighbor-hood around a point in the image plane. Ψ(.) is in general a nondecreasing functionwith range [0, 1]. In our implementation it was a step function:
Ψ(q) =
1 q ≥ δ
0 otherwise(6)
The threshold helps in reducing computational complexity as points with very lowactivation can be ignored. In all our experiments, δ was kept constant at 0.005.
For the purposes of illustrating the functionality of the edge affinities, consider theimage and its gradient magnitude map shown in Figures 5(a) and (b) respectively.We activate a point on the edge of the torso of the subject and extend its edge usingthe edge affinities. The activated point’s coord.s are (128, 105) and it is marked with
10

a circle in Figures 5(a) and (b). Thus, the initial saliency field, A0(.) is as follows:
A0(ey) =
1 y = (128, 105)
0 otherwise(7)
Figure 5(c) shows the saliency field obtained after 4 iterations, i.e. A4(.), whenthe torso side of the initiating edge is made the foreground. Figure 5(d) shows thesalient points in A4(.) marked with dots. Figure 5(e) shows A4(.) when the wrongside, i.e. the one on the brick wall, is made the foreground. Figure 5(f) shows thesalient points in this case. Depending upon the choice of foreground, either the sub-ject or the wall’s edges are propagated. Figure 6 shows propagation at intermediatestages when the subject’s torso is chosen as foreground. Figure 7 shows more ex-amples of images and propagations obtained from a single seed edge (marked witha circle) - for these cases the foreground is always chosen to be inside the subject.The edge affinity model is effective in confining the saliency propagations to thesubject’s edges and prevents the background edges from being highlighted. In thethird case, the saliency “jumps” across the subject’s sleeve as the edges of the sleeveare parallel and obey constraints on color statistics. Note that we do not expect thewhole figure of the subject to be highlighted by just one seed edge. The examplesare used to illustrate how the edge affinities characterize the grouping among theedges.
(a) (c) (e)
(b) (d) (f)
Fig. 5. (a) Image and (b) its gradient magnitude map with the seed edge element markedwith a circle. (c) Saliency field obtained when the side inside the subject is consideredforeground - the subject’s edges are made salient, (d) to clearly highlight the propagation,points with saliency greater than 0.1 are marked with dots. (e) The case when the side onthe brick wall is considered foreground so the wall’s gradients are made salient, (f) pointswith saliency greater than 0.1 marked with dots.
11

Iteration (1) (2) (3) (4)
Fig. 6. Propagation of saliency at different iterations for the image in Fig. 5(a) with subject’storso as foreground. Points with saliency greater than 0.1 are marked with dots.
(1) (2) (3) (4)
Fig. 7. Images with the initial seed edge element marked with a circle, and the correspond-ing salient gradients (A4(.)) obtained when the side inside the subject is chosen to be fore-ground (activated points marked with white dots). Best viewed on color monitor.
3 Computing ci→p
Obtaining the Activation Fields: In most pose tracking and gesture recognitionapplications, a bootstrap subject-detection phase is used to locate the subject in thefield of view. This provides the approximate location and scale of the subject forpose matching. However, when a pose-contour is placed on an image, it will not co-incide exactly with the subject’s gradients in the image. This could be due to varia-tion in subject morphology, apparel, gesticulation style, etc. We allow for Gaussianadditive noise in the location of the points on the pose-contours. Each pose pk isspecified as a set of points {xk
i } outlining the subject’s figure in the training data.The Gaussian noise kernel for each xk
i follows a multi-variate distribution, with Σki
as the covariance matrix. Let A0k(ey) denote the activation field induced by pose pk
on the image plane. The degree of activation induced by a pose at a point on theimage plane is the maximum over the activation induced by individual points of thepose-contour.
A0k(ey) = E(ey) max
xki ∈pk
exp[−(xki − y)T (Σk
i )−1(xk
i − y)] (8)
Figure 8 shows examples of activation fields induced by two poses. Here, E(ey) = 1
12

for illustrative purposes. The Σki ’s are computed from the displacement of different
points on the pose-contours in the training images.
Fig. 8. Examples of activation fields induced by poses.
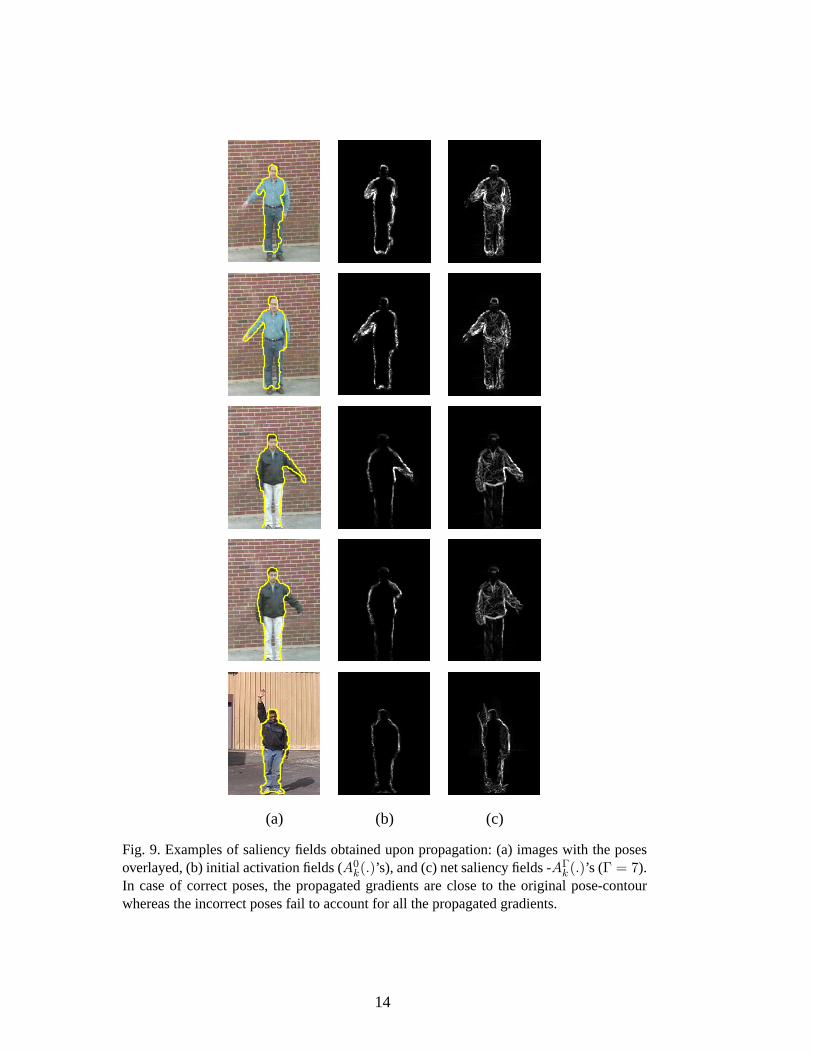
The net saliency induced by a pose is obtained by propagating the activation fieldsin the iterative manner described above. Figure 9 shows some examples of imageswith the pose-contours overlayed, the initial activation fields A0
k(.)’s, and the netsaliency fields AΓ
k (.)’s. The contours were obtained from the pose database of thegesture recognition system and were manually imposed on the images for illustra-tive purposes. We see that the objective of highlighting the figure of the subject isachieved. Moreover, in the cases of correct poses, the net saliency fields lie closeto the pose-contours whereas the incorrect poses cannot “explain” the net saliencyfields.
The next step is to measure the quality of the match between each pose pk and itsnet saliency field AΓ
k (.). This is achieved using the Chamfer distance approach. LetDk(y) denote the distance transform constructed from pose pk. For the kth pose,cki→p is computed as
cki→p =
∑y AΓ
k (y) exp(−Dk(y))∑y AΓ
k (y)(9)
ci→p will be high when the salient gradients in AΓk (.) are located close to the pose-
contour pk - this corresponds well with our intuitive notion of a good match.
4 Extended Chamfer Matching for Computing cp→i
In classical chamfer matching, an image is first reduced to a map of feature pointsand a distance map is constructed from this feature map. The pose-contour to bematched is placed on the distance map and the distances are integrated along thecontour. If the pose-contour matches well with a subset of features in the imagethen this integral would be small. The feature maps could be edge maps generatedby thresholded gradient magnitudes, etc.
The basic form of chamfer matching is limited because:
13
(a) (b) (c)
Fig. 9. Examples of saliency fields obtained upon propagation: (a) images with the posesoverlayed, (b) initial activation fields (A0
k(.)’s), and (c) net saliency fields -AΓk (.)’s (Γ = 7).
In case of correct poses, the propagated gradients are close to the original pose-contourwhereas the incorrect poses fail to account for all the propagated gradients.
14

(1) It is difficult to choose a threshold so that only the subject’s edges are presentin the feature map.
(2) The method does not incorporate any prior information about the subject’sappearance. In many applications, the subject’s color profile does not changeduring a session. Therefore, color statistics could be used to eliminate someof the background clutter.
(3) The integration of the errors (distances) is unweighted - i.e. the method doesnot take into account any prior knowledge about the uncertainty in the locationof different points on the pose-contours. Human arms are the principle modesof gesticulation, causing the contour points on the arms to have the greatesterrors in location. However, in spite of being difficult to match, the arms arethe key distinguishing features between poses. Therefore, we would like togive less weight to errors at points on the arms.
We address the first two of the issues by using an analog form of the feature map,denoted by E(ey), which quantifies the confidence that the edge element at a pointy on the image plane belongs to the subject. This is computed using the subject’scolor statistics collected at the person-location phase. In the absence of such infor-mation, E(.) is the gradient magnitude field. The issue of weighing the errors inlocation is handled using Gaussian kernels on the points of the pose-contour. Thecovariance matrix for the Gaussian kernel at point xk
i is Σki - the same as the one
used for computing the activation values.
Let ski denote the confidence value for point xk
i on pose-contour pk to be present ina given image. It is computed as a weighted average of the confidence values forxk
i to be located at different points on the image plane. This is simply:
ski =
∑y
E(ey)e(−(xk
i −y)T (Σki )−1(xk
i −y))
√2π|Σk
i |(10)
We might also take into account the information provided by the orientation of thepose-contour, denoted by O(xk
i ). A point xki on a pose-contour can correspond to a
point y on the image plane only if the orientation of gradient at y (∆I(y)) is similarto the orientation of the pose-contour at xk
i . For this, ski (R) can be expanded to
include a function φ(∆I(y), O(xki )) which quantifies the similarity in orientation.
ski =
∑y
E(ey)φ(∆I(y), O(xk
i )) e(−(xk
i −y)T (Σki )−1(xk
i −y))
√2π|Σk
i |(11)
φ(.) is defined as
φ(v1,v2) =
∣∣∣∣∣ v1 · v2
‖v1‖‖v2‖
∣∣∣∣∣ (12)
15

This gives the confidence value for individual points on the pose-contours. Theckp→i’s are obtained by averaging over the pose-contour’s points.
ckp→i =
1
Nk
Nk∑i
ski (13)
where Nk is the number of points on the pose-contour pk.
Net Confidence for a PoseThe net confidence for a pose is denoted by ck and is computed as
ck = ckp→i + ck
i→p (14)
5 Experimental Results
5.1 Still Images
We tested the pose matching model with 103 natural images to observe the im-provement due to the edge affinity model and ck
p→i. The test images had clutteredbackgrounds, including brick walls, grass, parking lots, etc. The pose-database con-sisted of 1847 poses performed by 5 subjects (a subset of the database is shown inFigure 11). The poses in the database are registered to one another w.r.t. the headsof the subjects. The test images were generated by 4 subjects, 3 of whom werenot present in the pose-database; the one common subject was wearing differentclothing. The height of the subjects in the images varied from 170 to 200 pixelunits.
In pose tracking and gesture recognition applications, the objective of pose-matchingis to generate likelihoods for the poses, which are then used by methods like Hid-den Markov Models (HMMs), etc. to perform the actual tracking or recognition.Therefore, the following metrics were used for evaluating the pose matching:
(1) The relative confidence of the correct pose - given by the ratio of its confidencevalue w.r.t. the highest matched (possibly incorrect) pose. This should be asclose to 1 as possible, and would ensure that the correct pose is assigned ahigh confidence.
(2) Rank of the correct pose based on its confidence value. This would ensure thatthe correct pose “stands out” in the pose-database.
For each test image, the confidence values were computed for all poses in the pose-database. The correct pose in the database was manually selected and its ranking
16

0.5 0.55 0.6 0.65 0.7 0.75 0.8 0.85 0.9 0.95 10
10
20
30
40
50
60
70
80
90Ext. ChamferExt. Chamfer + Edge affinity
Relative Scores of Correct Poses 0 200 400 600 800 1000
0
10
20
30
40
50
60
70
80
90
100 Ext. ChamferExt. Chamfer + Edge affinity
Ranks of the Correct Poses
(a) (b)
Fig. 10. (a) Histogram of the relative confidences of the correct poses - the distributionmoves substantially towards 1 upon including edge affinities (ci→p). (b) Histogram of theranks of the correct poses - the distribution has a significant shift towards 1 upon inclusionof ci→p.
and relative confidence were noted. In the case of multiple correct poses, the bestmatch was considered.
Table 1 shows the frequency of occurrence of the relative confidences in severalhigh confidence ranges, with and without the inclusion of edge affinities (ck
i→p’s).The frequency counts are boosted by more than 2.5 times when ck
i→p’s are included.With the inclusion of ck
i→p’s, the correct pose had relative confidence greater than0.95 in all but 3 test images. Moreover, the mean of the relative confidences of thecorrect poses increased from 0.865 to 0.987 and the standard deviation decreasedfrom 0.127 to 0.018 - an improvement of an order of magnitude.
Range of rel. conf. ckp→i ck
p→i + cki→p
= 1 16.5% 44.6%
[.975, 1] 23.3% 76.7%
[.95, 1] 32.0% 97.1%Table 1Frequency of occurrence of relative confidences of correct poses in some ranges.
Figure 10(a) shows the histogram of the relative confidences of the correct posesfor the test images, with and without ck
i→p’s. There is a clear shift in the distribu-tion towards 1 upon inclusion of edge affinities. In all but 6 cases, there was animprovement in the relative confidences upon including edge affinities.
Table 2 shows the frequency of occurrence of the ranks of the correct poses in lowrank ranges. The frequency counts improve by more than two times upon includingcki→p’s. Moreover, with 0.94 probability the correct poses are ranked in the top 30
matches as opposed to .40 without cki→p. Figure 10(b) shows the histogram of the
ranks of the correct poses, with and without the inclusion of cki→p’s. There is a
17

50 100 150 200 250 300
50
100
150
200
50 100 150 200 250 300
50
100
150
200
50 100 150 200 250 300
50
100
150
200
50 100 150 200 250 300
50
100
150
200
50 100 150 200 250 300
50
100
150
200
50 100 150 200 250 300
50
100
150
200
50 100 150 200 250 300
50
100
150
200
Turn Left Turn right Flap Stop left Stop right Stop both Attention left
50 100 150 200 250 300
50
100
150
200
50 100 150 200 250 300
50
100
150
200
50 100 150 200 250 300
50
100
150
200
50 100 150 200 250 300
50
100
150
200
50 100 150 200 250 300
50
100
150
200
50 100 150 200 250 300
50
100
150
200
50 100 150 200 250 300
50
100
150
200
Attention right Attention both Start Engine Speed up Come near Go back Close Distance
Fig. 11. Shape exemplars for each gesture overlayed over the images
significant shift in the distribution towards 1 upon inclusion of edge affinities.
Range of rank ckp→i ck
p→i + cki→p
= 1 16.5% 44.6%
[1, 10] 32.0% 79.6%
[1, 20] 38.8% 90.3%
[1, 30] 39.8% 94.2%Table 2Frequency of occurrence of the ranks of correct poses in some ranges.
Thus, the edge affinity model significantly improves the confidences of the correctposes w.r.t. the rest of the pose-database.
5.2 Gesture Recognition Results
The contour matching model was used for the gesture recognition application de-scribed in [1,37]. We considered 11 of the 14 gestures in the database as the other 3required motion features for good discrimination. For each gesture we collected 25sequences, 5 of which were used as exemplars, and 20 for testing. The classificationaccuracy was 68.64% when only ck
p→i’s were used. This improved to 79.55% whenedge affinities (ck
i→p’s) were also included 1 . The confusion matrix for the recogni-tion of the test sequences, with and without ck
i→p’s, is given in Table 3. Inclusion ofedge affinities improves the recognition rates of the gestures.
6 Conclusion
We presented a model for combining edge-continuity with contour matching, andillustrated its utility in the context of human pose matching. The experiments in-
1 In practice we would include motion features to improve the recognition accuracy; theresults presented here are based only on shape.
18

Tur
n-L
eft
Tur
n-R
ight
Flap
Stop
-Lef
t
Stop
-Rig
ht
Stop
-Bot
h
Atte
ntio
n-L
eft
Atte
ntio
n-R
ight
Atte
ntio
n-B
oth
Star
tEng
ines
Spee
dU
p
Turn-Left 13/16 0/0 3/3 0/0 0/0 1/0 0/0 0/0 1/0 1/1 1/0
Turn-Right 0/0 3/8 16/12 0/0 0/0 1/0 0/0 0/0 0/0 0/0 0/0
Flap 0/0 0/0 20/20 0/0 0/0 0/0 0/0 0/0 0/0 0/0 0/0
Stop-Left 1/0 0/0 0/0 9/13 0/1 10/5 0/0 0/0 0/0 0/0 0/1
Stop-Right 0/0 0/0 0/0 0/0 14/17 6/3 0/0 0/0 0/0 0/0 0/0
Stop-Both 0/0 0/0 0/0 0/0 0/0 20/20 0/0 0/0 0/0 0/0 0/0
Attention-Left 1/0 0/0 0/0 0/0 0/0 0/0 18/18 0/0 1/1 0/1 0/0
Attention-Right 0/0 0/0 0/0 0/0 0/0 0/1 0/0 18/18 2/1 0/0 0/0
Attention-Both 0/0 0/0 0/0 0/0 0/0 0/0 1/0 6/4 13/16 0/0 0/0
Start Engines 0/0 0/0 0/0 3/0 0/0 4/2 0/0 0/0 1/0 12/18 0/0
Speed Up 1/1 0/0 0/0 0/0 0/0 2/3 3/1 0/0 3/4 0/0 11/11
Table 3Confusion matrix for the gesture recognition. Entry a/b in the ith row and jth columnindicates that a sequences actually depicting gesture i got classified as gesture j when onlyckp→i’s were used, and b indicates the number of classifications when edge affinities were
also considered. Correct classifications are indicated in bold face.
dicate that the model is able to characterize the inherent grouping of the edges -e.g. Figures 5 and 7. The tests show that the use of edge affinities leads to signif-icant improvements in matching. This demonstrates the importance of perceptualorganization for object recognition.
Appendix A: Dependence of Edge Affinity on Radius of Osculating Circle
The edge affinity function, a(y, z)’s, variation w.r.t. r(y, z) would depend upon thestatistics of the curvature of the contours of humans. These statistics are local innature and depend upon the curves typically observed on outlines of cloths. Weanalyzed the pose-contours of 5 human subjects while performing the “Turn Left”gesture. For this, the radii of the osculating circles connecting pairs of points alongthe pose-contour were computed. The distance between the points in each pair, i.e.‖y − z‖, was kept at 2, 3 and 4 pixel units. Figure 12(a) shows the normalizedfrequency of occurrence of osculating circles of different radii for each separationdistance. The radii values are in pixel units and were capped at 100 units. Thereare two modes in the distribution, the first one is formed by radii between 5 and 20units, and the second mode corresponds to straight segments with radii greater than100 units. Figure 12(b) shows the cumulative normalized frequency of the samevalues.
The following observations can be made regarding the dependence of a(ey, ez) onr(y, z):
19

0 10 20 30 40 50 60 70 80 90 1000
0.05
0.1
0.15
0.2
0.25
0.3
0.35
2 pixel separation3 pixel separation4 pixel separation
Radius of Osculating Circle
Nor
mal
ized
Fre
quen
cy
0 10 20 30 40 50 60 70 80 90 1000
0.1
0.2
0.3
0.4
0.5
0.6
0.7
0.8
0.9
1
2 pixel separation3 pixel separation4 pixel separation
Radius of Osculating Circle
Cum
ulat
ive
Nor
mal
ized
Fre
quen
cy
(a) (b)
Fig. 12. (a) The normalized frequency of occurrence of osculating circles of different radii,for pairs of points along contours of whole body. The three plots correspond to point-pairsseparated by 2, 3 and 4 pixel units. (b) The cumulative normalized frequency of occurrenceof osculating circles of different radii, for pairs of points along contours of whole body. Thethree plots correspond to point-pairs separated by 2, 3 and 4 pixel units.
• a(.) ∈ [0, 1].• As curvature increases, a(.) rapidly tends to 0. a(ey, ez) ≈ 0 for r(y, z) ≤ 3.• a(ey, ez) → 1 as r(y, z) → ∞. As curvature becomes 0, a(.) asymptotically
approaches 1.• Nearly 90% of the observed radii were ≥ 10. To ensure that a majority of the
edge elements on the subjects’ outlines are strongly linked, we kept a(ey, ez) ≈ 1for r(y, z) ≥ 10.
• The edge affinity is computed in an 11 × 11 neighborhood around each pixel.Therefore, the maximum value of ‖y−z‖ is 5.5
√2. To allow for some joint artic-
ulation, a(ey, ez) was fixed at 0.5 for 90◦ bends, i.e. θ = 45◦. For ‖y − z‖ = 5.5√
2,this would correspond to an osculating circle with radius ≈ 6 pixel units. To al-low for such bends a(ey, ez) = 0.5 for r(y, z) = 6.
The affinity a(.) is formulated as a sigmoidal function of r(y, z) - the values of theparameters are determined from the mentioned constraints.
a(ey, ez) =1
1 + exp(− r(y,z)−6.9
)(15)
Figure 3 shows a plot of this function.
References
[1] A. Elgammal, V. D. Shet, Y. Yacoob, L. S. Davis, Learning dynamics for exemplar-based gesture recognition, in: Proc. IEEE Conf. Computer Vision and PatternRecognition (CVPR-2003), Vol. 1, June 18-20, 2003, pp. 571–578.
20

[2] M. W. Lee, I. Cohen, Proposal maps driven MCMC for estimating human body pose instatic images, in: Proc. IEEE Conf. Computer Vision and Pattern Recognition (CVPR-2004), Vol. 2, 2004, pp. 334–341.
[3] D. Gavrila, Multi-feature hierarchical template matching using distance transforms,in: Proc. Int’l Conf. Pattern Recognition (ICPR-1998), 1999, pp. 439–444.
[4] A. Mohan, B. Papageorgiou, T. Poggio, Example based object detection in images bycomponents, IEEE Trans. Pattern Anal. and Machine Intell. 20 (4) (2001) 349–361.
[5] G. Mori, X. Ren, A. A. Efros, J. Malik, Recovering human body configurations:Combining segmentation and recognition, in: Proc. IEEE Conf. Computer Vision andPattern Recognition (CVPR-2004), Vol. 2, June 2004, pp. 326–333.
[6] E. Sharon, A. Brandt, R. Basri, Segmentation and boundary detection usingmultiscale intensity measurements, in: Proc. IEEE Conf. Computer Vision and PatternRecognition (CVPR-2001), Vol. 1, 2001, pp. 469–476.
[7] C. F. Olson, D. P. Huttenlocher, Automatic target recognition by matching orientededge pixels, IEEE Trans. Image Proc. 6 (1) (1997) 103–113.
[8] D. Gavrila, V. Philomin, Real-time object detection for “smart” vehicles, in: Proc.IEEE Int’l Conf. Computer Vision (ICCV-1999), 1999, pp. 87–93.
[9] K. Toyama, A. Blake, Probabilistic tracking in a metric space, in: Proc. Int’l Conf.Computer Vision (ICCV’01), 2001, pp. 50–59.
[10] G. Mori, J. Malik, Estimating human body configurations using shape contextmatching, in: Proc. European Conf. Computer Vision, (ECCV’02), Vol. 3, 2002, pp.666–680.
[11] J. Zhang, R. Collins, Y. Liu, Representation and matching of articulated shapes, in:Proc. IEEE Conf. Computer Vision and Pattern Recognition (CVPR-2004), Vol. 2,June 2004, pp. 342–349.
[12] R. Ronfard, C. Schmid, B. Triggs, Learning to parse pictures of people, in: Proc.European Conf. Computer Vision (ECCV-2002), 2002.
[13] P. L. Rosin, G. West, Salience distance transforms, Computer Vision, Graphics andImage Processing - Graphical Models and Image Processing 57 (6) (1995) 483–521.
[14] M. A. Butt, P. Maragos, Optimum design of chamfer distance transforms, IEEE Trans.Image Proc. 7 (10) (1998) 1477–1484.
[15] B. Leibe, B. Schiele, Analyzing appearance and contour based methods for objectcategorization, in: Proc. IEEE Conf. Computer Vision and Pattern Recognition(CVPR-2003), Vol. 2, 2003, pp. 409–415.
[16] T. K. Leung, J. Malik, Contour continuity in region based image segmentation, in:Proc. European Conf. Computer Vision (ECCV’98), Vol. 1, 1998, pp. 544–559.
[17] X. Ren, J. Malik, Learning a classification model for segmentation, in: Proc. IEEEInt’l Conf. Computer Vision (ICCV-2003), Vol. 1, 2003, pp. 10–17.
21

[18] S. Yu, J. Shi, Perceiving shapes through region and boundary interaction, Tech. Rep.CMU-RI-TR-01-21, Robotics Institute, Carnegie Mellon Univ., Pittsburgh, PA (July2001).
[19] I. H. Jermyn, H. Ishikawa, Globally optimal regions and boundaries as minimum ratioweight cycles, IEEE Trans. Pattern Anal. and Machine Intell. 23 (10) (2001) 1075–1088.
[20] C.-C. Chu, J. K. Aggarwal, The integration of image segmentation maps using regionand edge information, IEEE Trans. Pattern Anal. and Machine Intell. 15 (12) (1993)1241–1252.
[21] J. Luo, C. Guo, Perceptual grouping of segmented regions in color images, PatternRecognition 36 (2003) 2781–2792.
[22] T. J. Roberts, S. J. McKenna, I. W. Ricketts, Human pose estimation using learntprobabilistic region similarities and partial configurations, in: Proc. European Conf.Computer Vision (ECCV-2004), Vol. 4, Apr. 2004, pp. 291–303.
[23] D. Ramanan, D. A. Forsyth, Finding and tracking people from the bottom up, in: Proc.IEEE Conf. Computer Vision and Pattern Recognition (CVPR-2003), Vol. 2, June 18-20, 2003, pp. 467–474.
[24] D. Ramanan, D. A. Forsyth, A. Zisserman, Strike a pose: Tracking people by findingstylized poses, in: Proc. IEEE Conf. Computer Vision and Pattern Recognition(CVPR-2005) (To appear), 2005.
[25] P. Viola, M. Jones, Rapid object detection using a boosted cascade of simple features,in: Proc. IEEE Conf. Computer Vision and Pattern Recognition (CVPR-2001), Vol. 1,2001, pp. 511–518.
[26] J. H. Elder, A. Krupnik, L. A. Johnston, Contour grouping with prior models, IEEETrans. Pattern Anal. and Machine Intell. 25 (6) (2003) 661–674.
[27] A. Thayananthan, B. Stenger, P. Torr, R. Cipolla, Shape context and chamfer matchingin cluttered scenes, in: Proc. IEEE Conf. Computer Vision and Pattern Recognition(CVPR-2003), Vol. 1, June 18-20, 2003, pp. 127–133.
[28] D. Cremers, N. A. Sochen, C. Schnorr, Multiphase dynamic labeling for variationalrecognition-driven image segmentation, in: Proc. European Conf. Computer Vision(ECCV-2004), Vol. 4, 2004, pp. 74–86.
[29] S. X. Yu, R. Gross, J. Shi, Concurrent object recognition and segmentation by graphpartitioning, in: Neural Information Processing Systems, 3-8 Dec., 2001, pp. 1383–1390.
[30] E. Borenstein, S. Ullman, Class-specific, top-down segmentation, in: Proc. EuropeanConf. Computer Vision (ECCV-2002), Vol. 2, 2002, pp. 109–124.
[31] E. Borenstein, E. Sharon, S. Ullman, Combining top-down and bottom-upsegmentation, in: Proc. IEEE Workshop on Perceptual Organization in ComputerVision, IEEE Conf. on Computer Vision and Pattern Recognition (CVPR-2004), June,2004.
22

[32] G. Kanizsa, Subjective contours, Sci. Am. 234 (1976) 48–52.
[33] A. Sha’Ashua, S. Ullman, Structural saliency: The detection of globally salientstructures using a locally connected network, in: Proc. IEEE Int’l Conf. ComputerVision (ICCV-1988), 1988, pp. 321–327.
[34] P. Parent, S. W. Zucker, Trace inference, curvature consistency and curve detection,IEEE Trans. Pattern Anal. and Machine Intell. 11 (8) (1989) 823–839.
[35] G. Guy, G. Medioni, Inferring global perceptual contour from local features, Int’l J.Computer Vision 20 (1-2) (1996) 113–133.
[36] L. R. Williams, D. W. Jacobs, Local parallel computation of stochastic completionfields, Neural Computation 9 (1997) 859–881.
[37] V. D. Shet, V. S. N. Prasad, A. Elgammal, Y. Yacoob, L. S. Davis, Multi-cue exemplar-based nonparametric model for gesture recognition, in: Proc. Indian Conf. ComputerVision, Graphics and Image Processing (ICVGIP) 2004, 16-18 Dec., 2004.
23


