Embed Size (px)
Citation preview
EDITORIAL
1. JOURNAL OF INNOVATION FOR INCLUSIVE DEVELOPMENT, VOL. 2, NO. 1, 22 FEBRUARY 2017
The importance of Education for ensuring equity, equality
and an egalitarian society cannot be overemphasized.
Nelson Mandela, the late South African President and
Nobel Peace Prize winner had declared Education as the
most powerful weapon which can be used to change the
world. Years later, Pakistan born Malala Yousafzai, also
a Nobel Peace Prize winner echoed the sentiments of
Nelson Mandela and stated, “One child, one teacher, one
book, one pen can change the world.” The importance of
Education can also be understood by the fact that the
United Nations has included the Right to Education in its
Universal Declaration of Human Rights document (UN,
1948). Prior to this, Mahatma Gandhi, the strongest
symbol of peace and non-violence, though never awarded
with the Nobel Peace Prize, also highlighted the
importance of Education for growth and prosperity. A
sustainable development pioneer himself, Mahatma
Gandhi believed that true education must correspond to
the surrounding circumstances or it will not lead to
healthy growth.
From the above it is clear that Education is indeed the
solution to all problems, be it social, economic or
environmental. Interestingly, the latter are also the three
cornerstones on which the concept of sustainable
development rests. The three main pillars of sustainable
development are social equality, economic growth and
environmental protection. Sustainable development can
be achieved by creating a balance between these three
factors. Thus, Education is an essential pre-requisite for
ensuring sustainability and Education for Sustainable
Development is the need of the hour. Fortunately, the
United Nations realizes this well so much so that the
2005-2015 decade was declared as the UN Decade of
Education for Sustainable Development (DESD). The
vision behind DESD was mainly to emphasize to the
world and to world leaders that education is an
indispensable element for achieving sustainable
development. The post-DESD Report lauds the initiative
for bringing increased recognition at the international
policy level that education is essential to the advancement
of sustainable development (UNESCO, 2014). However,
there is enough literature to show that post-DESD, at the
end it was business as usual (Huckle and Wals, 2015). It
is perhaps this reason why Quality Education has been
listed as the one among the 17 Sustainable Development
Goals which needs to be achieved between 2016 and 2030
(Singh, 2016).
Education for Sustainable Development may be
interpreted in two very different ways. First, it implies that
all individuals, from all sections of the society, -
irrespective of their caste, class, gender - are provided
with basic and quality education. Providing quality
education to all citizens would mean creating a
thoughtful, responsible society which would then be
careful about its present and future. Large number of
educated citizens would mean greater protection and
preservation of environment and judicial use of natural
resources. It is also hoped that Quality Education will
accompany better livelihood opportunities for all
resulting in an increase in the average per capita income
of respective nation states. This may further help
respective nation states by pushing them down the
Environmental Kuznets curve on the right side of the
graph (Stern et al., 1996).
The second inference of Education for Sustainable
Development focuses more on the transformative role
education needs to play for achieving sustainable
development. This also includes the promotion of
transformative learning and research at all levels of
education. This may require developing of learning
resource materials, creating innovative pedagogy, -
introducing research based teaching and taking the class
Education for Sustainable Development:
Need of the Hour
Govind Singh
Editor, Journal of Innovation for Inclusive Development, Centre for Earth Studies &
Department of Environmental Studies, Indraprastha College for Women, University of Delhi
Email for correspondence: [email protected]
EDITORIAL
2. JOURNAL OF INNOVATION FOR INCLUSIVE DEVELOPMENT, VOL. 2, NO. 1, 22 FEBRUARY 2017
out of the classroom. An important point that needs to be
kept in mind here is that Education for Sustainable
Development must not be seen as similar to
Environmental Education. Indeed that has been the case
more often than not and is perhaps the reason why the
entire burden of ensuring sustainable development has
fallen only on the subject of Environmental Studies. The
Environmental Education sector may at best spearhead
the shift to Education for Sustainable Development. It
has, in fact, already taken the lead. What needs to be
reiterated is that it should not be isolated by the two other
pillars of sustainability, viz. economic growth and social
equality.
Much needs to be done today for augmenting the existing
education system to accommodate the teaching of the
principles of sustainable development. While on the one
hand, existing syllabi have to be retrofitted; on the other,
new literature and study material needs to be prepared at
all levels of education. Since sustainable development is
an emerging and dynamic field, its educators will have to
make consistent efforts for keeping themselves and their
teaching materials updated. Education for Sustainable
Development would also mean policy level changes in
terms of what to teach and how to teach, which may
require considerable consultation and advocacy. Targeted
strategies will need to be formulated to ensure adoption
and implementation of Education for Sustainable
Development lessons at all levels of education, right from
primary to higher education. While at the school level,
sustainable development lessons may be amalgamated
with existing and ongoing teaching, higher education
institutions may consider designing courses for teaching
sustainability.
Irrespective of the interpretation or the method followed,
what is important is that centres of all learning adopt and
shift to Education for Sustainable Development as soon
as possible. It is only in making this shift that the world
can achieve the Education for Sustainable Development
milestone, as envisioned by UNESCO. That is, creating a
world where everyone has the opportunity to benefit from
quality education and learn the values, behaviour and
lifestyles required for a sustainable future and for positive
societal transformation. The Journal of Innovation for
Inclusive Development (JIID) remains dedicated towards
furthering our understanding for achieving the 17
Sustainable Development Goals, of which Quality
Education is one.
References
United Nations (UN) Assembly. 1948. Universal
declaration of human rights. UN General Assembly.
A/RES/217(III).
United Nations Educational Scientific and Cultural
Organisation (UNESCO). 2014. Shaping the future
we want. UN Decade of Education for Sustainable
Development. UNESCO Paris, France.
Huckle, J. and Wals, A.E. 2015. The UN Decade of
Education for Sustainable Development: business as
usual in the end. Environmental Education Research.
21 (3): 491-505.
Singh. G. 2016. Sustainable Development Goals 2016-
2030: Easier Stated Than Achieved. Journal of
Innovation for Inclusive Development. 1 (1): 1-2.
Stern, D.I., Common, M.S. and Barbier, E.B. 1996.
Economic growth and environmental degradation:
the environmental Kuznets curve and sustainable
development. World Development. 24 (7): 1151-
1160.
RESEARCH ARTICLE
3. JOURNAL OF INNOVATION FOR INCLUSIVE DEVELOPMENT, VOL. 2, NO. 1, 22 FEBRUARY 2017
Abstract: The need for imparting environmental
education in school students has been well understood in
Delhi, India and efforts have been made to incorporate
environmental education (EE) in the curriculum. At the
same time, increasing interest in the protection and
conservation of environment, nature and natural resources
has led to the initiation and adoption of several
campaigns, programmes and projects by various schools.
Consequently, the integration of EE in the curriculum as
well as through extra-curricular activities is exposing the
school students to contemporary environmental
challenges and their solutions. This research work is an
attempt at exploring the various measures being taken to
promote environmental awareness and create better
attitude towards the environment in the schools in Delhi,
India.
Keywords: environmental education, school level,
education policy, India.
1. Introduction
Environment is an essential entity of life in the sense that
the survival of life depends on it in one way or the other.
However, man and his activities have led to the present
deteriorating condition of the environment. There is an
increasing need to ameliorate the situation which makes
it extremely essential to promote Environmental
Education as a tool for life and learning right from
childhood. Environmental Education (EE) can be defined
as the process of recognising values and clarifying
concepts in order to develop skills and attitude necessary
to understand and appreciate the inter-relatedness among
humans, their culture and their bio-physical surroundings
(IUCN, 1970). It is a process of developing a world
population that is aware of and is concerned about the
total environment and its associated problems and which
Email for correspondence: [email protected]
has the knowledge, attitudes, commitments and skills to
work individually and collectively towards ameliorating
the current problems and preventing the creation of new
ones.
Growing evidence of the nature and scale of global
environmental change, which particularly is a result of
technological growth and its application, is provoking
concern in places across the world. Questions about
global inequalities, the vulnerability of ecosystems and
sustainability of existing lifestyles are at the forefront of
national and international agendas. Hence, in order to
create an environmentally aware population, well
equipped with the most comprehensive knowledge and
understanding of the environment and a will or attitude to
make a difference, EE is being considered and promoted
as an integral part of education and being incorporated in
the structure, pedagogy and curriculum of academic
institutions. This need for incorporating EE at the school
level is even more important and therefore EE needs to
begin from a primary level to generate sensitivity towards
the environment in young minds.
2. Origin of Modern Environmental Education
Efforts to define and adopt environmental education as a
specific endeavour began in 1960s and were given
international support at the United Nations Conference on
the Human Environment (UNCHE) held in Stockholm in
1972. At the Stockholm Conference, participating
governments recommended that EE be recognized and
promoted on an international scale through the United
Nations. One of the initial tasks undertaken as part of the
Stockholm Conference was to develop a consensus on
what environmental education could and should become,
and to assist governments in implementing relevant
programmes as soon as practicable. Subsequent to the
Stockholm Conference, two major conferences,
supported by regional meetings of experts, were hosted by
the then newly formed UNESCO-UNEP International
Status and Evolution of Environmental
Education at School Level in Delhi, India
Sudarshana Kalita
Wipro BPS Limited, Delhi - 110044, India
RESEARCH ARTICLE
4. JOURNAL OF INNOVATION FOR INCLUSIVE DEVELOPMENT, VOL. 2, NO. 1, 22 FEBRUARY 2017
Environmental Education Programme. The purpose of the
first conference was to draft concepts and a vision for
environmental education (in Belgrade in 1975). The
second conference, an Intergovernmental Conference on
Environmental Education, formally approved the scope
and action plans put forward from the previous
conference (in Tbilisi in 1977). The second conference
concluded with the 'Tbilisi Declaration on the role,
objectives and characteristics of environmental
education'. The provisions of this Declaration remain in
wide international use even today and have sustained their
role as a guiding influence over the past two decades.
Another major milestone with respect to promoting and
adopting EE was the IUCN World Conservation Strategy
(1980). The latter suggested requirements for human
survival and prosperity, putting forward the
conservationist concept of sustainable development.
Prior to the declaration of the IUCN World Conservation
Strategy (1980), a UNESCO-Thessaloniki Declaration
(1997) took place which was an umbrella document under
the title, ‘Educating for a Viable Future: a
Multidisciplinary Vision for Concerted Action’. The
UNESCO-Thessaloniki Declaration sought to further
clarify the concept of Education for Sustainable
Development. It presented sustainability as an ethical and
moral imperative and the objective to which education
should devote itself as an instrument of choice. It also
declared that Education is described as an ongoing
process aimed at developing the capability of adapting to
rapid changes in the world, but first and foremost as a
process of transmitting knowledge and information to
make the public understand the problems and to stimulate
awareness.
The United Nations Intergovernmental Conference on
Environmental Education held at Tbilisi, Georgia, in the
former USSR, in the year 1977 developed a series of
fundamental concepts which EE organizations and
institutions have accepted as their definition of EE. A
single goal statement written in Belgrade, Yugoslavia in
1975 has been adopted as a widely accepted goal
statement for EE according to the North American
Association for Environmental Education (NAAEE,
1996; UNESCO, 1978; Athman and Monroe, 2000).
Environmental education is a process of developing a
world population that is aware of and concerned about the
total environment and its associated problems, and which
has the knowledge, skills, attitudes, motivations and
commitment to work individually and collectively toward
solutions of current problems and the prevention of new
ones. According to Gough (1997), the work done by
Harvey (1976) in synthesizing a definition from many
professional papers, defines the term EE as: the process
of developing an environmentally literate, competent, and
dedicated citizenry which actively strives to resolve
values conflicts in the man-environment relationship, in a
manner which is ecologically and humanistically sound,
in order to reach the superordinate goal of a homeostasis
between quality of life and quality of environment
(Gough, 1997).
This definition ultimately formed the basis for the
declaration at Tbilisi and was the ultimate goal for
curriculum development in EE proposed in the landmark
publication Goals for curriculum development in
environmental education (Hungerford et al., 1980). It is
important here to mention the goals and objectives of EE
recommended at the UNESCO-UNEP Tbilisi
intergovernmental conference on EE. The goals are as
following:
1. Goals of environmental education are:
To foster clear awareness of, and concern about,
economic, social, political and ecological
interdependence in urban and rural areas;
To provide every person with opportunities to
acquire the knowledge, values, attitudes,
commitment and skills needed to protect and
improve the environment;
To create new patterns of behaviour of
individuals, groups and society as a whole
towards the environment.
2. Categories of environmental education objectives are:
Awareness: to help social groups and individuals
acquire an awareness of and sensitivity to the
total environment and its allied problems
Knowledge: to help social groups and individuals
gain a variety of experience in, and acquire a
basic understanding of, the environment and its
associate problems
Attitude: to help social groups and individuals
acquire a set of values and feelings of concern for
the environment, and the motivation for actively
participating in environmental improvement and
protection
Skills: to help social groups and individuals
acquire the skills for identifying and solving
environmental problems
Participation: to provide social groups and
individuals with an opportunity to be actively
involved at all levels in working toward
resolution of environmental problems
(UNESCO, 1978).
RESEARCH ARTICLE
5. JOURNAL OF INNOVATION FOR INCLUSIVE DEVELOPMENT, VOL. 2, NO. 1, 22 FEBRUARY 2017
Fishbein and Ajzen (1975) defined attitude as an
evaluative mediating response, predisposing the
individual to display various overt behaviour. Attitudes
are formed and changed by the continuous process of
having a concrete experience, making observations and
reflecting on that experience, then forming abstract
concepts and generalisations based on these reflections
(Lewin, 1947).
Within the environmental education research there is a
long tradition of addressing individuals’ attitude towards
the environment where, in general, students’
environmental attitudes have been examined in regards to
environmental knowledge, behaviour and socio-
economic variables (Cavas et al., 2009; Hens et al., 2010;
Kullmuss and Agyeman, 2002). Some examples of these
approaches include: how to increase awareness in the
class room (Chapman and Sharma, 2001; Madruga and da
Silveira, 2003; Yilmaz et al., 2000) the association for
positive environmental attitudes regarding personal
environmentally responsible behaviour (Scott and Gough,
2003) and environmental sensitivity as an important issue
of environmental awareness (Chawla, 1992; Chawla,
1999).
Madsen (1996) emphasized the concept that awareness is
the ultimate driving force that stimulates knowledge. He
emphasized the power behind the awareness factor by
categorizing three levels of awareness as: basic belief of
an environmental problem, factual and scientific
knowledge, and a commitment to solve environmental
problems. Awareness was studied along with
environmental knowledge and concern by Hausbeck et al.
(1992). In this study, the authors concluded that
awareness and concern scores were significantly higher
than knowledge levels in high school students. They
linked this result with the fact that a primary source of
environmental information is electronic media (NEETF,
1998), whereas awareness and concern can be picked up
with little substantive knowledge.
Studies have also shown that environmental education
must be implemented on a profound level in the pre-
school and primary level of education wherein the prime
objective should be to awaken the sensibility of the child
to the environment (Caciuc, 2013). A study in North
Bengal on the evaluation of EE in higher school education
system has emphasized upon the importance of EE as a
key to solve environmental problems and to maintain
sustainability globally (Halder and Somenath, 2012). EE
has a significant contribution to increasing awareness and
knowledge and in shaping attitudes among students. A
study on environmental knowledge, attitudes, consumer
behaviour and pro-environmental activities of Hungarian
high school students, which explores the relationship
strength between environmental education and
knowledge and attitude, have shown a strong correlation
between intensity of environmental education and
environmental knowledge of students (Zsoka et al., 2012).
3. Environmental Education in India
In India, social values and attitudes have, historically and
culturally been in harmony with the environment. One
can find this in the classical literatures, the writings of
sages, the religious texts, all of these reflect the
recognition that all life forms on earth - human life
include is intimately dependent on the quality of the
environment as well as the need and responsibility to
protect it.
The Constitution of India captured much of these deep-
rooted values and further strengthened them by giving
responsibility to its citizens to protect the environment.
The constitution enjoins the “state to take measures to
protect and improve the environment and to safeguard the
forests and wildlife of the country” (Article 48-A) (Joshi,
1975). It also makes it a “Fundamental Duty of every
citizen to protect and improve the natural environment
including forests, lakes, rivers and wildlife and to have
ecological compassion for living creatures” (Article 519).
While India is fortunate in its sheer beauty, it is also
replete with natural resource issues across the country.
Ranging from a rapidly growing population and
deforestation to soil erosion and water pollution, overall
environmental degradation continues to worsen. Rapid
industrialization and urbanization in India is booming, as
the middle classes are also expanding. Urban
communities are draining the limits of municipal services
and causing severe air pollution problems. All this, and
more, has placed significant pressure on India’s
infrastructure and natural resources contributing to
ongoing efforts towards education and seeking overall
pro-environmental behaviors (India Together,
www.indiatogether.org/environment). The general
rationale for providing environmental education
programmes in India includes helping school children
develop environmental awareness such that they grow up
to be citizens who are conscious and sensitive to threats
being faced by the environment (Dhavse, 2003).
India has always recognized the beneficial effects of
environmentally-focused instructional programs as an
essential part of education. According to Sarabhai et al.
(2002), with over a billion people and at least 17 major
languages, the diversity of India in terms of culture and
RESEARCH ARTICLE
6. JOURNAL OF INNOVATION FOR INCLUSIVE DEVELOPMENT, VOL. 2, NO. 1, 22 FEBRUARY 2017
biological wealth is enormous. In spite of rapidly
changing lifestyles, the traditions of living in harmony
with nature and of environmentally sound practices
underpin the lives of most people. It is against this
backdrop that the country’s environmental education
strategy has evolved. India has always had a rich and
inspiring history of environmental activism, the Chipko
Movement (1970) being the most influential among them.
In contrast, at the formal level however, schools, colleges
and universities have only recently taken up
environmental education. Teacher training with an
environmental orientation began to emerge across India
in the early 1990s, under the aegis of the Ministry of
Human Resources Development.
The concept and substance of environmental education,
as well as the need for revised curricula and teaching
methodologies, was the subject of a study conducted by
the Pune-based Bharati Vidyapeeth Institute for
Environmental Education and Research (BVIEER) in
1999. The two-year long study led to observations on the
efficacy of the then school environment education
curricula at the state and national level. Another focus of
the study was the issue of motivating students to care
about environmental preservation. Once existing
environmental concepts in school curricula were
identified and major gaps found, a pilot study was
launched with textbook revisions made in 800 schools in
eight states, to ensure that the concept of the environment
and its preservation were taught to students. BVIEER’s
recommended programme was subsequently
implemented in 100 schools in Maharashtra, Goa, Andhra
Pradesh, Assam, Jammu and Kashmir, Punjab, Orissa and
Uttaranachal (now Uttarakhand). The situation has
changed in recent times with the directive of the Supreme
Court of India on the matter of implementing compulsory
EE at the formal school education system.
3.1 EE and India’s National Policy of Education
The concept of EE is now widely spreading in India as
more emphasis is given on spreading the importance of an
environmentally aware and sensitive young generation
which is well equipped with the requisite knowledge and
skills to cope with the ever-rising environmental
concerns. Taking motivation from the Stockholm Summit
1972, India incorporated environmental concern in the
Constitution through the 42nd Amendment in 1976.
Environment has become a priority in policy statements,
plans and strategies especially after 1980 with the
establishment of a full-fledged Ministry of Environment
and Forests (MoEF) (now renamed Ministry of
Environment, Forest and Climate Change). Subsequently,
the need for implementing EE in India has gained
consistent momentum and its importance was recognized
by the Government and policy was planned subsequently
to introduce EE in schools.
EE has always been a part of the school curriculum for
several years. However, the present status of EE in school
education system has had its genesis in the National
Policy of Education (NPE) 1986 (modified in 1992), in
which ‘Protection of the Environment’ is stated as a
common core around which a National Curriculum
Framework (NCF) has been woven. The national system
of education, The NPE 1986, states that “Protection of the
environment” is a value which, along with certain other
values, must form an integral part of curriculum at all
stages of education. Para 8.15 of the policy states: “There
is a paramount need to create awareness of environmental
concerns by integrating it in the educational process at all
stages of education and for all sections of the society
beginning with the child” (DoE-MHRD, 1998).
According to the National Curriculum for Elementary and
Secondary Education: A Framework (1988): “the school
curriculum should highlight the measures for protection
and care of the environment, prevention of pollution and
conservation of energy”. In consonance with these
documents, Environmental Studies was introduced as a
subject at the primary level. As per the National
Curriculum Framework 2000, understanding the
environment, both natural and social and their interactive
processes, the problems as well as means and solutions to
preserve the environment was one of the General
Objectives of Education as per NCF 2000.
EE at primary and upper primary stages: At the primary
stages, environmental concepts have been integrated into
different subjects like Mathematics and Language
courses. In the NCERT curriculum, the teaching of
Language and Mathematics has been woven around the
children’s immediate environment in classes I–II and EE
has been reinforced as a component of the Art of Healthy
and Productive Living (AHPL). In classes III-V however,
separate textbooks for environmental studies have been
provided instead of separate subjects like Science and
Social Studies.
EE at the secondary stage: The concept of EE has been
prescribed in the textbooks through Science and the
Social Sciences whether taught as integrated or separate
subjects. NCERT textbooks of Science and Technology
and Social Sciences include various concepts of EE. EE
at higher secondary stage: A majority of concepts related
to EE are found in the textbooks of Biology, Chemistry,
Physics, Geography, Economics, Sociology and Political
Science in the NCERT curriculum.
RESEARCH ARTICLE
7. JOURNAL OF INNOVATION FOR INCLUSIVE DEVELOPMENT, VOL. 2, NO. 1, 22 FEBRUARY 2017
3.2 The NCERT Approach
Despite the initiatives mentioned above, there are several
shortcomings in the proposed curriculum. The National
Council of Educational Research and Training (NCERT)
has, since then, gone ahead to create a new syllabi for EE
which was later reviewed and revised in the light of the
National Curriculum Framework of 2005. This was a
result of a Public Interest Litigation (PIL) initiated by Shri
M.C. Mehta and subsequent directive of the Supreme
Court (SC). The latter was a big leap forward as it helped
attract attention of the public to the importance of EE and
helped in structuring the implementation of EE in formal
education. On 18 December 2003, the SC directed the
NCERT to prepare a module syllabus for enforcing
compulsory education on environment for creating
awareness. Further on 13 of July 2004, the SC directed
that “the syllabus prepared by NCERT for classes I to XII
shall be adopted by every state in their respective
schools”. It further appointed NCERT as the nodal agency
to supervise the implementation of the Court’s order.
In December 2010, the final pronouncements on the
matter of the writ petition was given by the SC after
NCERT filed an affidavit stating in detail, the approach
which it had identified for implementing EE in the school
education system. In the document submitted to the SC,
the NCERT explained in detail the infusion approach,
which meant that an environmental perspective was to be
added to all subjects, from standards I to XII, compulsory
evaluation of EE content with at least 10% of the total
marks devoted to EE, no written exams for XII standard
and major emphasis on project-based learning. NCERT
clarified that in order to have compliance, a separate
subject was not necessary. It further stated that infusion
of EE would be done with subjects like Science, Social
Science, Mathematics, Language and other subjects, and/
or through a separate subject. Following the acceptance of
the affidavit, NCERT published the ‘Handbook on
Environmental Education’ which provides source
material for the core course at the XI and XII standards.
Project books were also been developed for standards VI
to X.
3.3 Sequence of Events
A. Writ Petition, 1991: In 1991, Shri M C Mehta filed an
application in the public interest (Writ Petition (Civil) No.
860 of 1991), requesting the Supreme Court to:
Issue direction to cinema halls that they show
slides with information on the environment;
Issue direction for spread of information relating
to the environment on All India Radio and
Issue direction that the study of the environment
becomes a compulsory subject in schools and
colleges. This consequent order of the Supreme
Court was dated 22 Nov1991.
B. Directive to NCERT to Prepare EE Syllabus, 2003: On
18 December 2003, the Hon’ble Supreme Court ordered,
“We also direct the NCERT…to prepare a module
(model) syllabus and directed that “We accept on
principle that through the medium of education awareness
of the environment and its problems related to pollution
should be taught as a compulsory subject. The University
Grants Commission (UGC) will take appropriate steps
immediately to give effect to what we have said, i.e.
requiring the Universities to prescribe a course on
environment. So far as education up to the college level is
concerned, we would require every State Government and
every Education Board connected with education up to
the matriculation stage or even intermediate college to
immediately take steps to enforce compulsory education
on environment in a graded way”. Subsequent to that, the
NCERT developed a graded syllabus for Environment
Education for 1 to 12 standards, which was accepted by
the SC (the syllabus has subsequently been revised for
Standards XI and XII to incorporate contemporary
environmental issues).
C. NCERT as Nodal Agency for EE, 2004
On 13 July 2004, the SC directed that “the syllabus
prepared by the NCERT for Class I to XII shall be adopted
by every state in their respective schools”. It further
directed that “NCERT be appointed as a nodal agency to
supervise the implementation of this Court’s order”.
Compliance to Supreme Court order is mandatory and
desirable, and applies to all states and Union Territories
(in fact, it is one of the few things that apply to education
uniformly all over India)
D. EE and the National Curriculum Framework, 2005
In 2004, MHRD set up a nationwide process towards the
development of the National Curriculum Framework
2005. This included the setting-up of a national steering
committee and 21 national focus groups. One of these was
a Focus Group on Habitat and Learning. In substance and
spirit, this group was to look into the area of EE. The
group delineated the objective as, ‘The main focus of EE
should be to expose students to the real-life world, natural
and social, in which they live; to enable them to analyze,
evaluate, and draw inferences about problems and
concerns related to the environment; to add, where
possible, to our understanding of environmental issues;
and to promote positive environmental actions in order to
facilitate the move towards sustainable development. The
Group recommended a systematic infusion of
components of EE into the curricula of all disciplines
RESEARCH ARTICLE
8. JOURNAL OF INNOVATION FOR INCLUSIVE DEVELOPMENT, VOL. 2, NO. 1, 22 FEBRUARY 2017
while ensuring that adequate time is earmarked for
pertinent activities. The NCERT prepared its new syllabi
and textbooks in accordance with the NCF 2005.
E: NCERT Affidavit, 2007
The NCERT submitted an Affidavit in October 2007 to
the Supreme Court describing the spirit of the NCF 2005
and clarifying that to have compliance with the earlier
order of the Supreme Court, a separate subject for EE is
not a necessity. It can be done through infusion, in
Science, Social Studies, Mathematics, language and other
subjects, and/ or through a separate subject. It does,
however, have to be part of the compulsory curriculum.
This Affidavit is a key document outlining the sequence
of relevant events subsequent to the PIL up to the proposal
for how EE may be transacted from Standards I and XII.
It was drafted after detailed discussions between the
petitioner (Shri MC Mehta), the respondent (NCERT),
and the experts appointed by the petitioner and NCERT
(Menon, 2013).
F. Acceptance of Affidavit, December 2010
The Affidavit was accepted by the SC on 3 December
2010 and the writ petition WPC 860/1991 has been
disposed of. Now, all school education boards are
expected to follow the approach to EE described in the
Affidavit. NCERT is coordinating the effort to enhance
implementation EE in the spirit of the NCF 2005 as it is
the basis of the affidavit.
G. New Approach to EE Implementation - NCF 2005
Classes I and II – EE concerns are transacted through
activities; Classes III to V – EE is being imparted through
a subject namely EVS (Environmental Studies); Classes
VI to X – Follows infusion approach for EE. 10 percent
of assessment of grand total is based on EE besides
project and field work in separate time carved out from
existing timetable; Classes XI and XII – Besides infusion
in electives, a separate compulsory course 50 marks based
on core syllabus and projects work is for all. Marks to be
reflected/ added to the total marks. Time to be carved out
of existing time table (such as time allocated to General
Studies).
It is important to note that the infusion approach has many
advantages since EE draws from the different subjects of
Science, Social Sciences, Geography, Mathematics, etc.
However there are indeed a number of constraints in
infusion as well, the main being the lack of opportunities
for synthesis of the learning that may take place in
different subjects. Another limitation is the absence of a
common course at the higher secondary level into which
EE content can be induced. To add to its existing
constraints, there also appears an urgent need to discuss
the amount of time and space for EE along with the
infusion approach.
There is a need to provide for a strengthening of this
approach where content on Environment in different
subjects can be dealt meaningfully thereby avoiding a
dilution of focus. Instead of conducting unconnected
project-based activities and routine teaching of a set of
materials to be memorized in class, there is a need to shift
the focus to a more meaningful approach, one which
inspires a sense of awareness and sensitivity towards the
environment in totality. Furthermore, exclusive time and
space should be built in the school time table to translate
the EE content into EE experience, using observations,
project based activities and going out in nature; thus
allowing learning beyond what textbooks have to offer.
Moreover, measures also need to be developed to
determine the effectiveness of infusion and projects,
quality of teaching and learning. The strategy to succeed
needs capacity building of the whole school through
trainings and materials.
H. Expert Viewpoint:
This research contribution would like to bring forth some
of the viewpoints of experts in the field of Education and
Environment. Prof. Krishna Kumar, Former Director of
NCERT is of the belief that a fresh approach needs to be
taken up wherein the text books of all classes have to be
revised to plug the gaps which existed in the earlier
models. This has been done and a link between the
different components of environment with real life has
been lucidly explained in the chapters. He has also
clarified that for Classes IX to XII, a separate issue based
project guide is being provided and that project-work had
been made compulsory for the students which will be
graded. M.C Mehta, Environmental lawyer, strongly
believes that unless and until a discipline is recognized it
remains on the sidelines with very few serious takers. He
has also emphasized the importance of the state to
recognize the subject for the citizens to realize its
importance. (Source: multiple pages from cseindia.org,
Accessed on 23 April, 2016).
According to an interview by Dr. Jaishree Sharma, Nodal
Officer for Environment Education at NCERT, following
the NCF 2005, a workshop was held to orient textbook
writers of the NCERT Textbook on how to approach to
EE and the syllabus. Detailed discussions were done on
how infusion may take place. Subsequently, a report was
also prepared on how the infusion has been done (Source:
http://education-for-change.blogspot.in/2012/06/ncert-
RESEARCH ARTICLE
9. JOURNAL OF INNOVATION FOR INCLUSIVE DEVELOPMENT, VOL. 2, NO. 1, 22 FEBRUARY 2017
approach-dr-jaishree-sharma-nodal, Accessed on 23
April, 2016).
The Ministry of Environment and Forestry (MoEF) also
has key stake in EE, with more than 27 years of
experience that has engaged state Nodal agencies, Centres
of excellence and various associated expert institutions. It
has a stake in keeping the priorities of environment and
sustainable development at the core of education systems
in order to keep the citizens aware of the concerns and
actions required to resolve them. MoEF is providing the
expertise gained over the years particularly with school
systems, through programmes like Environmental
Education in the School System (EESS) and
Strengthening Environmental Education in the School
System (SrEESS). The EESS targets capacity building of
teacher trainers, textbook writers and curriculum
development. The flagship programmes of the MoEF like
National Green Corps (Co-Curricular Eco Club
approach), offer great insights and opportunities to
support universalisation of EE.
4. Environmental Education Beyond Curriculum
In 1990, Hungerford and Volk presented a benchmark
paper on Changing Learner Behavior through
Environmental Education which affirms the convictions
of many Children's Environment readers/ books that vital
environmental learning takes place outside the classroom
in children's homes and neighborhoods. Studies widely
done across the world have repeatedly shown that
knowledge about ecology and environmental problems,
the main content of school curricula is not enough to
produce environmentally responsible behaviour.
Hungerford and Volk note the paradox that most
environmental education modules focus on imparting
information; a strategy that tends to be ineffective by itself
in changing behavior. In contrast, committed
environmental action depends on a combination of factors
that are usually acquired outside of school rather than in
the classroom. Environmental sensitivity, defined as an
empathetic connection with the environment, strongly
correlates with behavior; and several studies suggest that
children acquire sensitivity through positive outdoor
experiences over extended periods of time in wild or
semi-wild places, either during solitary play or activities
with friends or family. Thus, it is necessary to recognize
the importance of imparting EE outside the confines of
the classroom in order to impart a deeper and more
meaningful insight into the immediate environment of a
student, while simultaneously promoting awareness and
encouraging participation for its protection and
maintenance.
4.1 National Green Corps (Eco Clubs)
India’s National Green Corps (NGC) or the Eco Clubs
Scheme is a unique opportunity to educate the youth on
environmental issues. It is a national programme across
India conceptualized and initiated by the Ministry of
Environment, Forest and Climate Change (MoEFCC),
Government of India. The MoEFCC is ‘the nodal agency
in the administrative structure of the central government,
for planning, promotion, co-ordination and overseeing the
implementation of environmental and forestry programs’
(www.envfor.nic.in). The four major objectives for Eco-
Clubs are to: (1) educate children about their immediate
environment by increasing awareness; (2) impart
knowledge about eco-systems, their interdependence and
need for survival, through visits and demonstrations; (3)
mobilize youth by instilling a spirit of scientific inquiry
into environmental problems; and (4) involve youth in
active environmental preservation efforts.
In 2001, the National Green Corps (NGC) programme
was developed and provided the framework needed for
the Eco Clubs to succeed. The NGC is implemented
countrywide with an overall goal of ‘spreading
environmental awareness among school children’. Five
years after the NGC program’s launch in 2001, during the
academic year 2005-2006, Eco-Clubs existed in nearly
68,000 schools across India, representing 150 Eco-Clubs
per district. The goal for the MoEFCC in subsequent years
was to reach an even higher participation level of 90,000
schools. This goal was reached in 2007, when the NGC
Eco Clubs operated in 91,447 schools, engaging
thousands of committed teachers and more than three
million students in conservation efforts, making this one
of the MoEFCC’s most successful programs (MoEF
Annual Report, 2007). In case of the NCT of Delhi, more
than 2,000 Eco Clubs have been established in
Government, Aided, Private and Public schools since its
inception (personal communication with Department of
Environment, Government of NCT of Delhi).
More specifically, the aim of the NGC is: ‘to impart
environmental education and to encourage and mobilize
participation of school children in various environment
education activities in their localities’ (MoEF Annual
Report, 2007). Furthermore, pursuant to this purpose, the
following statement about NGC provides support for the
MoEFCC initiatives for strengthening non-formal
environmental education: “to educate children about their
immediate environment and impart knowledge about the
eco-systems, their inter-dependence and their need for
survival, through visits and demonstrations and to
mobilise youngsters by instilling in them the spirit of
scientific inquiry into environmental problems and
RESEARCH ARTICLE
10. JOURNAL OF INNOVATION FOR INCLUSIVE DEVELOPMENT, VOL. 2, NO. 1, 22 FEBRUARY 2017
involving them in the efforts of environmental
preservation” (Source: envfor.nic.in/divisions/ee/ngc
Accessed on 23 April, 2014).
This aforementioned goal is being achieved by
establishing Eco-Clubs in every district across India with
an emphasis on action-oriented environmental programs.
The respective governments are free to set up as many
Eco-Clubs as desired, yet financial assistance is only
provided by the MoEFCC to a certain number of Clubs
per district. The NGC-Eco Club scheme, as originally
developed, operated through Eco Clubs formed in
participating schools as follows:
Each Eco Club needs to have 30–50 children
expressing interest in environment-related issues.
Each Eco Club is supervised by a teacher-in-
charge (TIC), who is selected from among the
teachers of the member school, based on interest
in environment-related issues (or through
appointment by the school Principal).
Each Eco Club should be provided with resource
material in the preferred language apart from a
small monetary grant (seed allocation) of 2,500
Rupees per annum beginning from school year
2005–2006 (this amount in Delhi in the ongoing
year is Rs. 20,000/- per Eco Club per year).
A district implementation and monitoring
committee supervises the programme, organizes
training for TICs and periodically monitors the
implementation of the scheme at district level.
There are one or two master trainers in each
district to assist TICs for smooth functioning of
the Eco Club activities.
A state steering committee oversees the
implementation of the scheme.
The state nodal agency coordinates the scheme’s
implementation in the state and organizes related
activities (e.g., training for master trainers).
The national steering committee gives overall
direction to the program and ensures linkages at
all levels.
4.2 Vasundhara – A Lead Eco Club
To understand the functioning of an Eco Club,
Vasundhara, the Eco Club of Kulachi Hansraj Model
School (KHMS), located in Ashok Vihar, Phase III,
Delhi, was extensively studied. Vasundhara is one of the
lead Eco Club Schools in Delhi as selected by the
Department of Environment, Government of NCT of
Delhi (DoE, GNCTD). The School in which is located is
one of the first EMS 14001-2004 certified school of
Delhi. There are 17 other schools attached to this Eco
Club and together they constantly works towards
protection of the environment and achieving a sustainable
future through awareness generation and participation.
The Vasundhara Eco Club, led by KHMS, has been
working meticulously in collaboration with various
organizations/ NGOs. A key initiative by the Vasundhara
Eco Club is the campaign on awareness about electronic
waste recycling and management, setting up of waste
collection bins in the offices nearby areas as well as in the
school. The focus here has been to collect e-waste and
prevent it from entering landfills. A total of 135 kg of e-
waste was collected by the Eco Club in 2014, which was
given to NOKIA for safe handling and disposal of this
otherwise hazardous waste. Other projects of Vasundhara
include practicing of composting wherein a sizeable
compost pit has been prepared in the school nursery where
dried leaves and grasses from the school lawn and
vegetable peels from the canteen and home science lab are
regularly fed. Vasundhara, along with the students of
Manovikas Kendra, a Centre for the specially-abled
children of the school and in collaboration with
DEEKSHA NGO, maintain a herbal garden in which
different varieties of herbal plants are grown and
maintained by students.
As a lead Eco Club, Vasundhara conducts training
programmes for teachers and students of all other 17
schools attached to it. Recycling of paper, rainwater
harvesting, installation of wind-powered exhaust fans in
the school to save electricity, segregation of wastes, R.O
water purification plant wherein waste water from the
plant is recycled and used in toilets and watering plants
and use of Micro-Analysis Kits in labs to reduce the usage
and release of chemicals into the environment are some
other initiative of the Vasundhara Eco Club. In addition,
tree plantation drives, adoption of a park, nature and
biodiversity trails and celebration of significant
environmental days are some other regular features of
Vasundhara Eco Club.
Based on the interview conducted with the representative
of the Eco Club as well as the students involved, it can
positively be concluded that the students and the teachers
were very proud of all their contribution towards the
environment. The students of the school were also found
to be effectively engaging in the activities of the Eco Club
and displayed a responsible behavior towards the
environment as they took care of the gardens in the
school, looked after the work of composting and even
conducted studies to find solutions to environmental
issues. For example, students of IX grade of the school
conducted a study to identify the principal sources of
noise pollution in three countries namely India, Australia
RESEARCH ARTICLE
11. JOURNAL OF INNOVATION FOR INCLUSIVE DEVELOPMENT, VOL. 2, NO. 1, 22 FEBRUARY 2017
and some parts of UK and did a comparative study by
exploring the laws and policies set by the governments of
the respective countries to regulate this problem. The
results of the survey were presented in the school
followed by an awareness campaign focused on making
the world noise pollution-free.
It is clear that at least in the case of KHMS, students have
been made considerably more awareness about
environmental issues due to the presence of a functioning
Eco Club. It can certainly be said with absolute surety that
the adoption of the Eco Club scheme by Kulachi Hansraj
Model School has been a positive step in ensuring
consistent and long-term awareness generation on
environmental issues in the students of this school.
5. Conclusion
With the introduction of formal Environmental Education
at the School Level, and the simultaneous implementation
of the NGC/ Eco Club Scheme, the Government of India
has played its part in promoting and raising environmental
awareness and sensitivity among the students. The
implementation of EE in schools needs further research
and improvement as it can be made better through further
improvements in the syllabuses and branching out on the
kinds of issues/ challenges taught in schools.
Furthermore, to shape responsible attitudes of students
towards the environment, compulsory field projects to
environmentally sensitive sites may be taken up at the
classroom level to introduce the students to the actual
scenario of the environment. It is also felt that there may
be a separate slot in the time-table for work solely
dedicated to the environment in which discussions and
debates on environmental issues can be taken up. In this
way, every student can be sensitized and inspired to act
responsibly towards the environment.
While a lot more can be done to encourage school
students to work towards the protection of the
environment, the first steps in this direction have been
taken. Further research in this direction could shed light
on the role of teachers as well as peers and projects, all of
which could help foster a deeper understanding about the
importance of nurturing and caring for ‘our common
environment’ by students who are the future citizens and
leaders of tomorrow.
6. Acknowledgement
The author would like to thank Dr. Govind Singh of the
Department of Environmental Studies, Indraprastha
College for Women, University of Delhi for supervising
her Master’s dissertation, which made this research paper
possible.
7. References
Athman, J. and Monroe, M. 2000. Elements of effective
environmental education programs. Retrieved
November 12, 2003 from Recreational Boating
Fishing. Foundation:
http://www.rbff.org/educational/reports.cfm
(Accessed on 1 January 2017).
Caciuc, V.T. 2013. The role of virtue ethics in training
students’ environmental attitudes. Procedia-Social
and Behavioral Sciences. 92: 122-127.
Cavas, B., Cavas, P., Tekkaya, C., Cakiroglu, J. and
Kesercioglu, T. 2009. Turkish student’s views on
environmental challenges with respect to gender: an
analysis of ROSE data. Science Education
International. 20 (1-2): 69-78.
Chapman, D. and Sharma, K., 2001. Environmental
attitudes and behaviour of primary and secondary
students in Asian cities: an overview strategy for
implementing and eco-club programme. The
Environmentalist. 21: 265-272.
Chawla, L., 1992 Research Priorities In: Environmental
Education. Children’s Environments. 9 (1): 68-71.
Chawla, L., 1999. Life paths into effective environmental
action. Journal of Environmental Education. 31 (1):
15-26.
Department of Education, Ministry of Human Resource
Development (DoE-MHRD). 1998. National Policy
on Education 1986. Government of India.
Dhavse, R. 2003. Environmental education - revised
curricula. URL:
http://www.indiatogether.org/curricula-education
(Accessed on 1 January 2017).
Fishbein, M. and Ajzen, I. 1975. Belief, Attitude,
Intention, And Behaviour: An Introduction to Theory
And Research. Addison-Wesley, Reading, MA.
Gough, A. 1997. Education and the environment: Policy,
trends and the problems of marginalisation. Australian
Education Review No. 39. Melbourne, Australia: The
Australian Council for Educational Research Ltd
Halder, S. 2012. An appraisal of environmental education
in higher school education system: A case study of
North Bengal, India. International Journal of
Environmental Sciences, 2(4): 2223.
Hausbeck, K., Milbrath, L., and Enright, S. 1992.
Environmental knowledge, awareness and concern
among 11th grade students: New York State. The
Journal of Environmental Education, 24 (27-34).
Hens, L., Wiedemann, T., Raath, S., Stone, R., Renders,
P., Craenhals, E. and Richter, B., 2010. Monitoring
environmental management at primary schools in
South Africa. Journal of Cleaner Production. 18 (7):
666-677.
RESEARCH ARTICLE
12. JOURNAL OF INNOVATION FOR INCLUSIVE DEVELOPMENT, VOL. 2, NO. 1, 22 FEBRUARY 2017
Hungerford, H. R. and Volk, T.L. 1990. Changing learner
behaviour through environmental education. Journal
of Environmental Education. 21 (3): 8-21.
Hungerford, H., Peyton, R. and Wilke, R. 1980. Goals for
curriculum Development In: Environmental
Education. The Journal of Environmental Education,
11: 42-47.
IUCN. 1970. Environmental Education Workshop.
Nevada, USA.
Joshi, G.N. 1975. The Constitution of India. Delhi:
Macmillan Company of India.
Kullmuss, A. and Agyeman, J., 2002. Mind the Gap: why
do people act environmentally and what are the
barriers to pro-environmental behaviour?
Environmental Education Research 8 (3): 239-260.
Lewin, K. 1947. Frontiers in group dynamics. Concept,
method and reality in social science, social equilibria
and social change. Human Relations. 1 (1): 5-41.
Madruga, K., and da Silveira, C.F.B. 2003. Can teenagers
educate children concerning environmental issues?
Journal of Cleaner Production. 11 (5): 519-525.
Madsen, P. 1996. What can universities and professional
schools do to save the environment? In J. B. Callicott
and F. J. da Rocha (Eds.), Earth Summit Ethics:
toward a reconstructive postmodern philosophy of
environmental education. 71-91. NY: Albany State
University of New York Press.
Menon, S. 2013. EE in School Curriculum. URL:
ceeindia.academia.edu/SanskritiMenon (Accessed on
1 January 2017).
MoEF, 2007. Annual Report. Ministry of Environment
and Forest, Government of India, India.
North American Association for Environmental
Education (NAAEE). 1996. Environmental education
materials: Guidelines for excellence. Troy, Ohio:
NAAEE.
Sarabhai, V.K., Raghunathan, M. and Jain, S. 2002
Strategies in Environmental Education - Experiences
from India. The Path to Success: Some Pioneering
Examples of Environmental Education. Institute for
Global Environmental Strategies, Japan.
Scott, W., Gough, S., 2003. Sustainable Development and
Learning: Framing the Issues. Rouetledge-Falmer.
London.
UNESCO 1978. Intergovernmental conference on
environmental education. Tbilisi (USSR), 14-26.
Final Report. Paris: UNESCO.
Winne, M. 2008. Closing the Food Gap. Boston: Beacon
Press.
Yilmaz, O., Boone, W.J. and Anderson, O., 2004. Views
of elementary and middle School Turkish students
towards environmental issues. International Journal of
Science Education. 26 (12): 1527-1546.
Zsoka, A., Szerenyi, MZ., Szechy, A. and Kocsis. T.,
2012. Greening due to environmental education?
Environmental knowledge, attitudes, consumer
behaviour and everyday pro-environmental activities
of Hungarian high school and university students.
Journal of Cleaner Production 48: 128-138.
RESEARCH ARTICLE
13. JOURNAL OF INNOVATION FOR INCLUSIVE DEVELOPMENT, VOL. 2, NO. 1, 22 FEBRUARY 2017
Abstract: Cities are the geographic nodes around which
people gather for their livelihood activities. Various
factors like resources, technology, education, medical
innovations and environmental developments have
shaped modern cities. However, with rapid urbanization
and population growth, many cities are facing the
problems of degradation, pollution, diseases and a poor
quality of life. The major challenges before the urban
growth centers have necessitated the formation of smart
cities. Sustainable future of a city lies in the development
of transport, infrastructure, environment, energy, ICT and
people with a sustainability approach. The Government of
India has launched a scheme to create hundred smart cities
across the country, among which the National Capital of
Delhi is a frontrunner. This paper attempts to study the
existing infrastructure and facilities in Delhi in order to
assess its readiness to be a smart city. It also attempts to
analyze the citizens’ perception about Delhi as a smart
city through a primary survey. Although there are
limitations in the current scenario of economic and
environmental performances and people’s perceptions,
Delhi makes a strong case for becoming a smart city.
Keywords: smart city, urban infrastructure, Delhi,
sustainable development.
1. Introduction
Cities are the greatest of human inventions. With the
history in backdrop, cities manifest our technological
innovations, socio-cultural interactions, economic
structures and political systems. Cities are often equated
with the idea of progress of mankind because it is the city
in which the concept of a citizen was born. Anonymity,
social order, civil society, economic progress and the
ability to produce and consume are certain attainments of
a city which make its existence special to human beings.
__________________________________________ *Corresponding author. Email: [email protected]
Starting from the early small size to house a few people,
cities have grown to bigger areas with walls, boundaries,
markets, production areas, streets, residential areas and
civic facilities. With the rising population, almost half of
the world’s population lives in urban areas today (UN,
2011). The increasing urbanization rates suggest that
people have looked at cities as places of leisure and work
at a faster pace than ever before in human history. With
the rapid growth of cities, there has arisen a variety of
risks and problems in terms of resource scarcity,
degradation, diseases and a basic quality of life. The
situation has created an urgency to find ‘smarter ways’ to
address the upcoming challenges. The search today is for
sustainable pathways for growth and balance on the basis
of experience and knowledge.
The most recent prescription for the sustainability of cities
is to be ‘smart’. This suggests the use of the best ideas to
create an urban future that not only uplifts quality of life
but continues to make cities vibrant, progressive and
energetic spaces meant for citizens along with their
interactions, production and communication processes.
This needs to be done in a way that it is least costly to the
economy and the environment. The concept of smart
cities is essentially a manifestation of all such solutions
towards urban problems centered around sustainability. It
is important here to define as to what is a Smart City.
While there is no single answer, there are certain
multidimensional components and core factors which
describe a smart city. There are a number of accepted
definitions which attempt to define its framework and
characteristics. According to Accenture, a Smart City
delivers public and civic services to citizens and
businesses in an integrated and resource efficient way
while enabling innovative collaborations to improve
quality of life and grow the local and national economy
(NIUA, 2015). Smart cities are part of a process rather
than a static outcome, in which increased citizen
engagement, hard infrastructure, social capital and digital
Smart City for a Sustainable Future: Is Delhi
Ready?
Anindita Roy Saha1* and Neha Singh2
1Department of Economics, Indraprastha College for Women, University of Delhi 2Malihabad Block Administration (District Lucknow), Government of Uttar Pradesh, India
RESEARCH ARTICLE
14. JOURNAL OF INNOVATION FOR INCLUSIVE DEVELOPMENT, VOL. 2, NO. 1, 22 FEBRUARY 2017
technologies make cities more livable, resilient and better
able to respond to challenges. According to the British
Standards Institute, smart city is the effective integration
of physical, digital and human systems in the built
environment to deliver sustainable, prosperous and
inclusive future of its citizens. IBM defines a smart city
as one that makes optimal use of all the interconnected
information available today to better understand and
control its operations and optimize the use of limited
resources. CISCO defines smart cities as those who adopt
scalable solutions that take advantage of information and
communications technology (ICT) to increase
efficiencies, reduce costs and enhance the quality of life
(NIUA, 2015). Since smartness is dependent on the
people’s perception, smart cities should be more user-
friendly and are required to adapt to the customized needs.
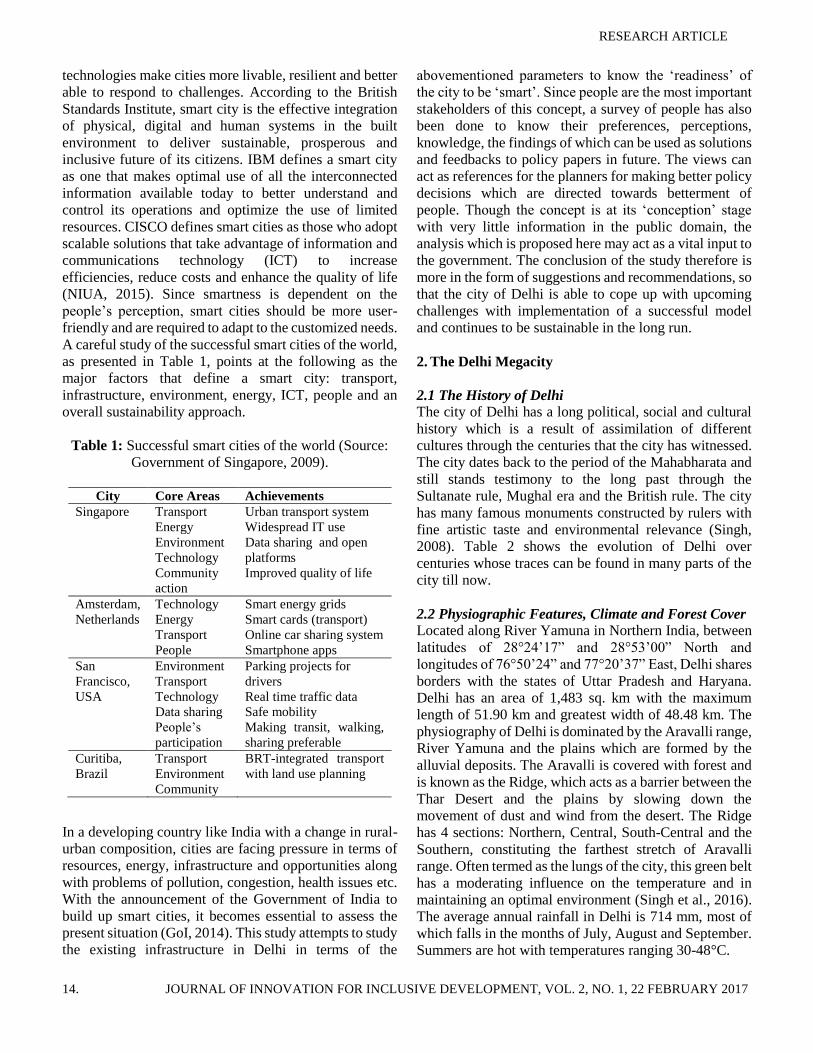
A careful study of the successful smart cities of the world,
as presented in Table 1, points at the following as the
major factors that define a smart city: transport,
infrastructure, environment, energy, ICT, people and an
overall sustainability approach.
Table 1: Successful smart cities of the world (Source:
Government of Singapore, 2009).
City Core Areas Achievements
Singapore Transport
Energy
Environment
Technology
Community
action
Urban transport system
Widespread IT use
Data sharing and open
platforms
Improved quality of life
Amsterdam,
Netherlands
Technology
Energy
Transport
People
Smart energy grids
Smart cards (transport)
Online car sharing system
Smartphone apps
San
Francisco,
USA
Environment
Transport
Technology
Data sharing
People’s
participation
Parking projects for
drivers
Real time traffic data
Safe mobility
Making transit, walking,
sharing preferable
Curitiba,
Brazil
Transport
Environment
Community
BRT-integrated transport
with land use planning
In a developing country like India with a change in rural-
urban composition, cities are facing pressure in terms of
resources, energy, infrastructure and opportunities along
with problems of pollution, congestion, health issues etc.
With the announcement of the Government of India to
build up smart cities, it becomes essential to assess the
present situation (GoI, 2014). This study attempts to study
the existing infrastructure in Delhi in terms of the
abovementioned parameters to know the ‘readiness’ of
the city to be ‘smart’. Since people are the most important
stakeholders of this concept, a survey of people has also
been done to know their preferences, perceptions,
knowledge, the findings of which can be used as solutions
and feedbacks to policy papers in future. The views can
act as references for the planners for making better policy
decisions which are directed towards betterment of
people. Though the concept is at its ‘conception’ stage
with very little information in the public domain, the
analysis which is proposed here may act as a vital input to
the government. The conclusion of the study therefore is
more in the form of suggestions and recommendations, so
that the city of Delhi is able to cope up with upcoming
challenges with implementation of a successful model
and continues to be sustainable in the long run.
2. The Delhi Megacity
2.1 The History of Delhi
The city of Delhi has a long political, social and cultural
history which is a result of assimilation of different
cultures through the centuries that the city has witnessed.
The city dates back to the period of the Mahabharata and
still stands testimony to the long past through the
Sultanate rule, Mughal era and the British rule. The city
has many famous monuments constructed by rulers with
fine artistic taste and environmental relevance (Singh,
2008). Table 2 shows the evolution of Delhi over
centuries whose traces can be found in many parts of the
city till now.
2.2 Physiographic Features, Climate and Forest Cover
Located along River Yamuna in Northern India, between
latitudes of 28°24’17” and 28°53’00” North and
longitudes of 76°50’24” and 77°20’37” East, Delhi shares
borders with the states of Uttar Pradesh and Haryana.
Delhi has an area of 1,483 sq. km with the maximum
length of 51.90 km and greatest width of 48.48 km. The
physiography of Delhi is dominated by the Aravalli range,
River Yamuna and the plains which are formed by the
alluvial deposits. The Aravalli is covered with forest and
is known as the Ridge, which acts as a barrier between the
Thar Desert and the plains by slowing down the
movement of dust and wind from the desert. The Ridge
has 4 sections: Northern, Central, South-Central and the
Southern, constituting the farthest stretch of Aravalli
range. Often termed as the lungs of the city, this green belt
has a moderating influence on the temperature and in
maintaining an optimal environment (Singh et al., 2016).
The average annual rainfall in Delhi is 714 mm, most of
which falls in the months of July, August and September.
Summers are hot with temperatures ranging 30-48°C.
RESEARCH ARTICLE
15. JOURNAL OF INNOVATION FOR INCLUSIVE DEVELOPMENT, VOL. 2, NO. 1, 22 FEBRUARY 2017
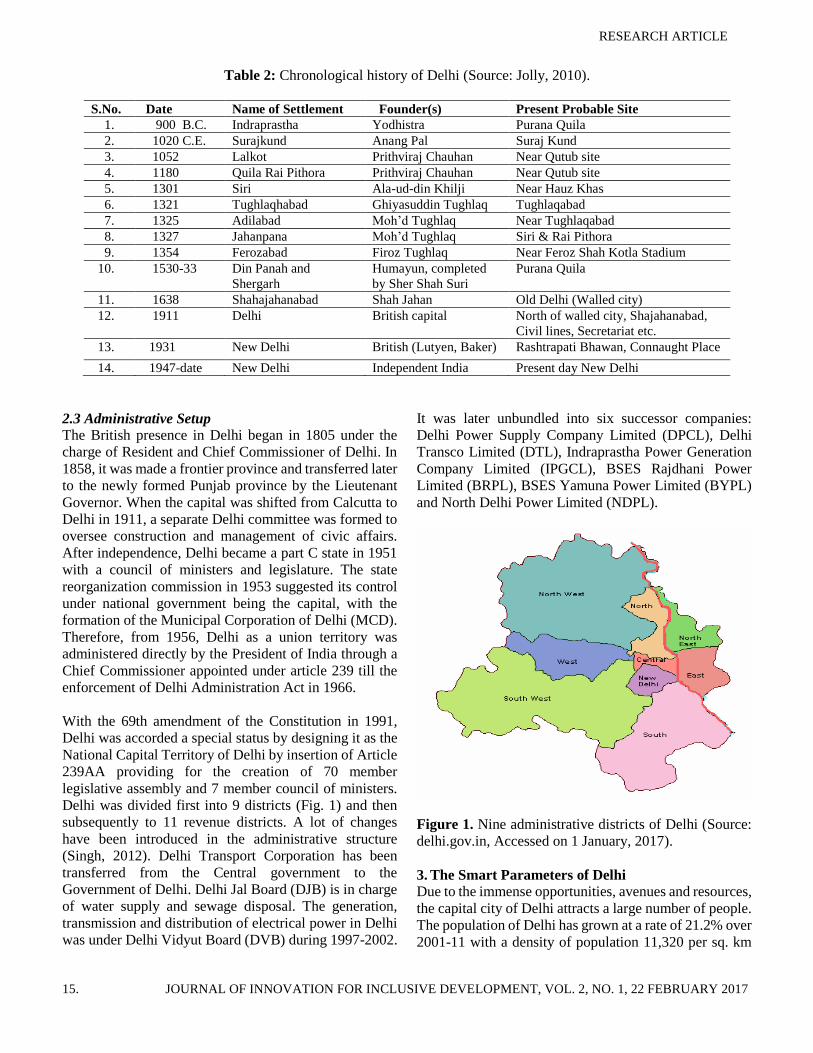
Table 2: Chronological history of Delhi (Source: Jolly, 2010).
S.No. Date Name of Settlement Founder(s) Present Probable Site
1. 900 B.C. Indraprastha Yodhistra Purana Quila
2. 1020 C.E. Surajkund Anang Pal Suraj Kund
3. 1052 Lalkot Prithviraj Chauhan Near Qutub site
4. 1180 Quila Rai Pithora Prithviraj Chauhan Near Qutub site
5. 1301 Siri Ala-ud-din Khilji Near Hauz Khas
6. 1321 Tughlaqhabad Ghiyasuddin Tughlaq Tughlaqabad
7. 1325 Adilabad Moh’d Tughlaq Near Tughlaqabad
8. 1327 Jahanpana Moh’d Tughlaq Siri & Rai Pithora
9. 1354 Ferozabad Firoz Tughlaq Near Feroz Shah Kotla Stadium
10. 1530-33 Din Panah and
Shergarh
Humayun, completed
by Sher Shah Suri
Purana Quila
11. 1638 Shahajahanabad Shah Jahan Old Delhi (Walled city)
12. 1911 Delhi British capital North of walled city, Shajahanabad,
Civil lines, Secretariat etc.
13. 1931 New Delhi British (Lutyen, Baker) Rashtrapati Bhawan, Connaught Place
14. 1947-date New Delhi Independent India Present day New Delhi
2.3 Administrative Setup
The British presence in Delhi began in 1805 under the
charge of Resident and Chief Commissioner of Delhi. In
1858, it was made a frontier province and transferred later
to the newly formed Punjab province by the Lieutenant
Governor. When the capital was shifted from Calcutta to
Delhi in 1911, a separate Delhi committee was formed to
oversee construction and management of civic affairs.
After independence, Delhi became a part C state in 1951
with a council of ministers and legislature. The state
reorganization commission in 1953 suggested its control
under national government being the capital, with the
formation of the Municipal Corporation of Delhi (MCD).
Therefore, from 1956, Delhi as a union territory was
administered directly by the President of India through a
Chief Commissioner appointed under article 239 till the
enforcement of Delhi Administration Act in 1966.
With the 69th amendment of the Constitution in 1991,
Delhi was accorded a special status by designing it as the
National Capital Territory of Delhi by insertion of Article
239AA providing for the creation of 70 member
legislative assembly and 7 member council of ministers.
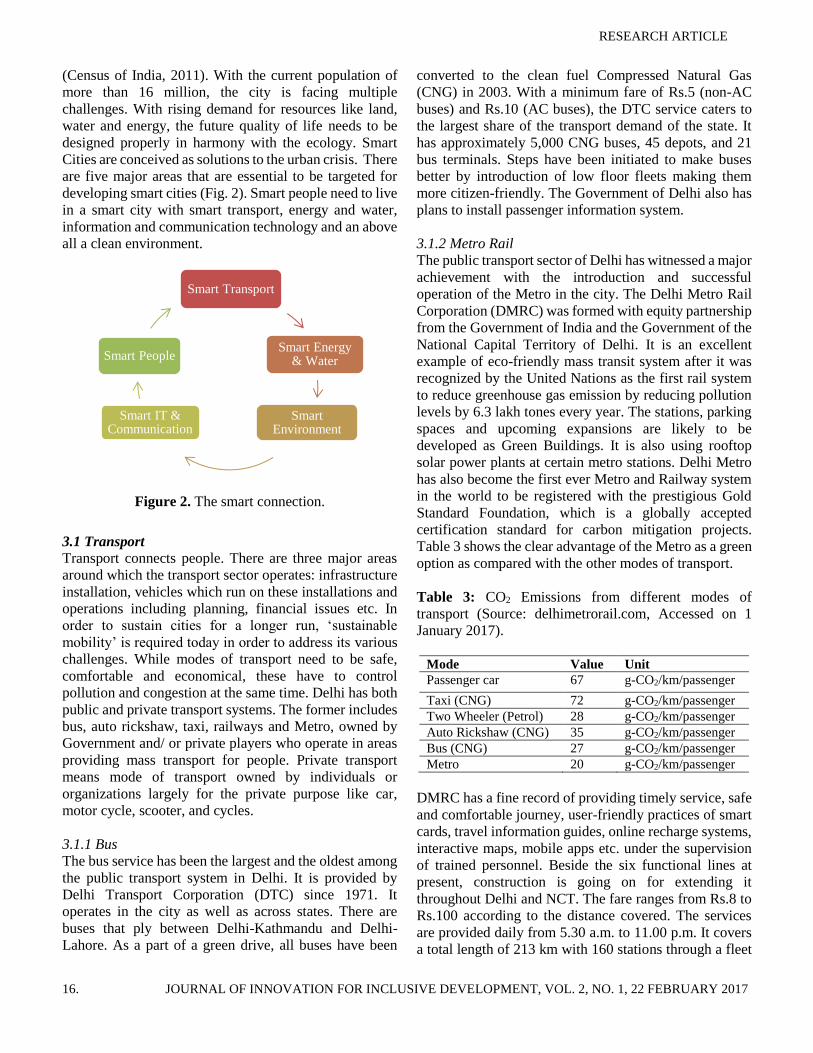
Delhi was divided first into 9 districts (Fig. 1) and then
subsequently to 11 revenue districts. A lot of changes
have been introduced in the administrative structure
(Singh, 2012). Delhi Transport Corporation has been
transferred from the Central government to the
Government of Delhi. Delhi Jal Board (DJB) is in charge
of water supply and sewage disposal. The generation,
transmission and distribution of electrical power in Delhi
was under Delhi Vidyut Board (DVB) during 1997-2002.
It was later unbundled into six successor companies:
Delhi Power Supply Company Limited (DPCL), Delhi
Transco Limited (DTL), Indraprastha Power Generation
Company Limited (IPGCL), BSES Rajdhani Power
Limited (BRPL), BSES Yamuna Power Limited (BYPL)
and North Delhi Power Limited (NDPL).
Figure 1. Nine administrative districts of Delhi (Source:
delhi.gov.in, Accessed on 1 January, 2017).
3. The Smart Parameters of Delhi
Due to the immense opportunities, avenues and resources,
the capital city of Delhi attracts a large number of people.
The population of Delhi has grown at a rate of 21.2% over
2001-11 with a density of population 11,320 per sq. km
RESEARCH ARTICLE
16. JOURNAL OF INNOVATION FOR INCLUSIVE DEVELOPMENT, VOL. 2, NO. 1, 22 FEBRUARY 2017
(Census of India, 2011). With the current population of
more than 16 million, the city is facing multiple
challenges. With rising demand for resources like land,
water and energy, the future quality of life needs to be
designed properly in harmony with the ecology. Smart
Cities are conceived as solutions to the urban crisis. There
are five major areas that are essential to be targeted for
developing smart cities (Fig. 2). Smart people need to live
in a smart city with smart transport, energy and water,
information and communication technology and an above
all a clean environment.
Figure 2. The smart connection.
3.1 Transport
Transport connects people. There are three major areas
around which the transport sector operates: infrastructure
installation, vehicles which run on these installations and
operations including planning, financial issues etc. In
order to sustain cities for a longer run, ‘sustainable
mobility’ is required today in order to address its various
challenges. While modes of transport need to be safe,
comfortable and economical, these have to control
pollution and congestion at the same time. Delhi has both
public and private transport systems. The former includes
bus, auto rickshaw, taxi, railways and Metro, owned by
Government and/ or private players who operate in areas
providing mass transport for people. Private transport
means mode of transport owned by individuals or
organizations largely for the private purpose like car,
motor cycle, scooter, and cycles.
3.1.1 Bus
The bus service has been the largest and the oldest among
the public transport system in Delhi. It is provided by
Delhi Transport Corporation (DTC) since 1971. It
operates in the city as well as across states. There are
buses that ply between Delhi-Kathmandu and Delhi-
Lahore. As a part of a green drive, all buses have been
converted to the clean fuel Compressed Natural Gas
(CNG) in 2003. With a minimum fare of Rs.5 (non-AC
buses) and Rs.10 (AC buses), the DTC service caters to
the largest share of the transport demand of the state. It
has approximately 5,000 CNG buses, 45 depots, and 21
bus terminals. Steps have been initiated to make buses
better by introduction of low floor fleets making them
more citizen-friendly. The Government of Delhi also has
plans to install passenger information system.
3.1.2 Metro Rail
The public transport sector of Delhi has witnessed a major
achievement with the introduction and successful
operation of the Metro in the city. The Delhi Metro Rail
Corporation (DMRC) was formed with equity partnership
from the Government of India and the Government of the
National Capital Territory of Delhi. It is an excellent
example of eco-friendly mass transit system after it was
recognized by the United Nations as the first rail system
to reduce greenhouse gas emission by reducing pollution
levels by 6.3 lakh tones every year. The stations, parking
spaces and upcoming expansions are likely to be
developed as Green Buildings. It is also using rooftop
solar power plants at certain metro stations. Delhi Metro
has also become the first ever Metro and Railway system
in the world to be registered with the prestigious Gold
Standard Foundation, which is a globally accepted
certification standard for carbon mitigation projects.
Table 3 shows the clear advantage of the Metro as a green
option as compared with the other modes of transport.
Table 3: CO2 Emissions from different modes of
transport (Source: delhimetrorail.com, Accessed on 1
January 2017).
Mode Value Unit
Passenger car 67 g-CO2/km/passenger
Taxi (CNG) 72 g-CO2/km/passenger
Two Wheeler (Petrol) 28 g-CO2/km/passenger
Auto Rickshaw (CNG) 35 g-CO2/km/passenger
Bus (CNG) 27 g-CO2/km/passenger
Metro 20 g-CO2/km/passenger
DMRC has a fine record of providing timely service, safe
and comfortable journey, user-friendly practices of smart
cards, travel information guides, online recharge systems,
interactive maps, mobile apps etc. under the supervision
of trained personnel. Beside the six functional lines at
present, construction is going on for extending it
throughout Delhi and NCT. The fare ranges from Rs.8 to
Rs.100 according to the distance covered. The services
are provided daily from 5.30 a.m. to 11.00 p.m. It covers
a total length of 213 km with 160 stations through a fleet
Smart Transport
Smart Energy & Water
Smart Environment
Smart IT & Communication
Smart People
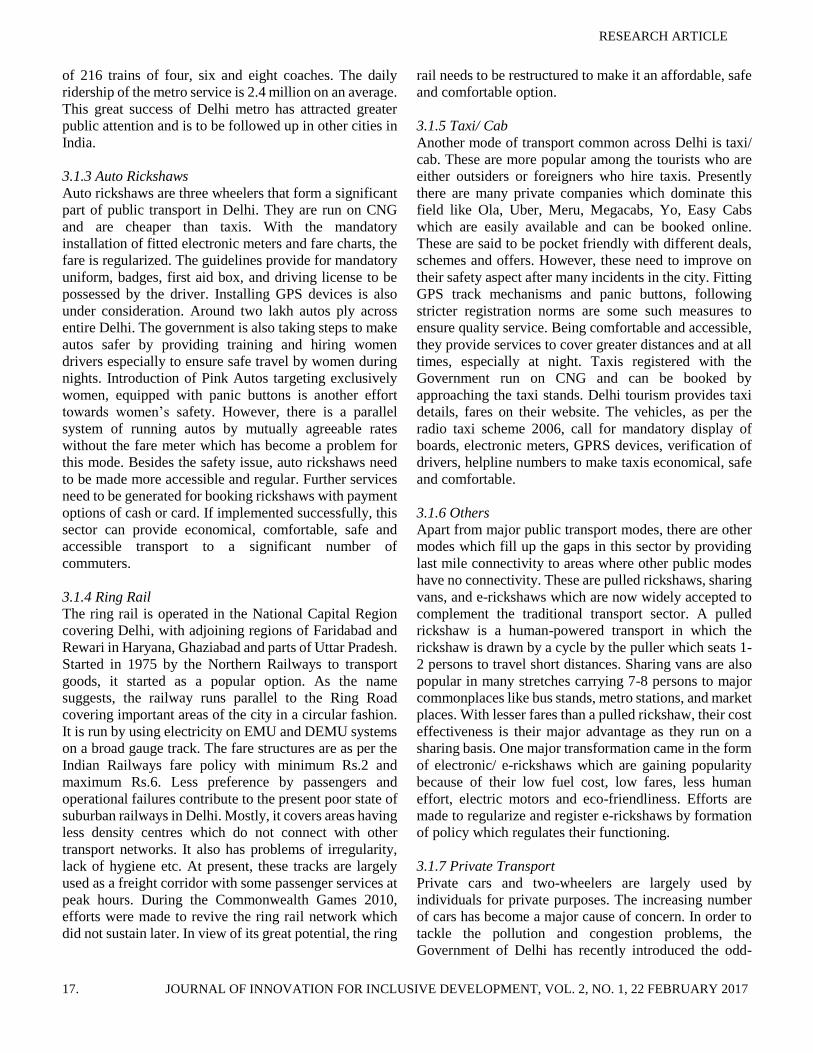
RESEARCH ARTICLE
17. JOURNAL OF INNOVATION FOR INCLUSIVE DEVELOPMENT, VOL. 2, NO. 1, 22 FEBRUARY 2017
of 216 trains of four, six and eight coaches. The daily
ridership of the metro service is 2.4 million on an average.
This great success of Delhi metro has attracted greater
public attention and is to be followed up in other cities in
India.
3.1.3 Auto Rickshaws
Auto rickshaws are three wheelers that form a significant
part of public transport in Delhi. They are run on CNG
and are cheaper than taxis. With the mandatory
installation of fitted electronic meters and fare charts, the
fare is regularized. The guidelines provide for mandatory
uniform, badges, first aid box, and driving license to be
possessed by the driver. Installing GPS devices is also
under consideration. Around two lakh autos ply across
entire Delhi. The government is also taking steps to make
autos safer by providing training and hiring women
drivers especially to ensure safe travel by women during
nights. Introduction of Pink Autos targeting exclusively
women, equipped with panic buttons is another effort
towards women’s safety. However, there is a parallel
system of running autos by mutually agreeable rates
without the fare meter which has become a problem for
this mode. Besides the safety issue, auto rickshaws need
to be made more accessible and regular. Further services
need to be generated for booking rickshaws with payment
options of cash or card. If implemented successfully, this
sector can provide economical, comfortable, safe and
accessible transport to a significant number of
commuters.
3.1.4 Ring Rail
The ring rail is operated in the National Capital Region
covering Delhi, with adjoining regions of Faridabad and
Rewari in Haryana, Ghaziabad and parts of Uttar Pradesh.
Started in 1975 by the Northern Railways to transport
goods, it started as a popular option. As the name
suggests, the railway runs parallel to the Ring Road
covering important areas of the city in a circular fashion.
It is run by using electricity on EMU and DEMU systems
on a broad gauge track. The fare structures are as per the
Indian Railways fare policy with minimum Rs.2 and
maximum Rs.6. Less preference by passengers and
operational failures contribute to the present poor state of
suburban railways in Delhi. Mostly, it covers areas having
less density centres which do not connect with other
transport networks. It also has problems of irregularity,
lack of hygiene etc. At present, these tracks are largely
used as a freight corridor with some passenger services at
peak hours. During the Commonwealth Games 2010,
efforts were made to revive the ring rail network which
did not sustain later. In view of its great potential, the ring
rail needs to be restructured to make it an affordable, safe
and comfortable option.
3.1.5 Taxi/ Cab
Another mode of transport common across Delhi is taxi/
cab. These are more popular among the tourists who are
either outsiders or foreigners who hire taxis. Presently
there are many private companies which dominate this
field like Ola, Uber, Meru, Megacabs, Yo, Easy Cabs
which are easily available and can be booked online.
These are said to be pocket friendly with different deals,
schemes and offers. However, these need to improve on
their safety aspect after many incidents in the city. Fitting
GPS track mechanisms and panic buttons, following
stricter registration norms are some such measures to
ensure quality service. Being comfortable and accessible,
they provide services to cover greater distances and at all
times, especially at night. Taxis registered with the
Government run on CNG and can be booked by
approaching the taxi stands. Delhi tourism provides taxi
details, fares on their website. The vehicles, as per the
radio taxi scheme 2006, call for mandatory display of
boards, electronic meters, GPRS devices, verification of
drivers, helpline numbers to make taxis economical, safe
and comfortable.
3.1.6 Others
Apart from major public transport modes, there are other
modes which fill up the gaps in this sector by providing
last mile connectivity to areas where other public modes
have no connectivity. These are pulled rickshaws, sharing
vans, and e-rickshaws which are now widely accepted to
complement the traditional transport sector. A pulled
rickshaw is a human-powered transport in which the
rickshaw is drawn by a cycle by the puller which seats 1-
2 persons to travel short distances. Sharing vans are also
popular in many stretches carrying 7-8 persons to major
commonplaces like bus stands, metro stations, and market
places. With lesser fares than a pulled rickshaw, their cost
effectiveness is their major advantage as they run on a
sharing basis. One major transformation came in the form
of electronic/ e-rickshaws which are gaining popularity
because of their low fuel cost, low fares, less human
effort, electric motors and eco-friendliness. Efforts are
made to regularize and register e-rickshaws by formation
of policy which regulates their functioning.
3.1.7 Private Transport
Private cars and two-wheelers are largely used by
individuals for private purposes. The increasing number
of cars has become a major cause of concern. In order to
tackle the pollution and congestion problems, the
Government of Delhi has recently introduced the odd-
RESEARCH ARTICLE
18. JOURNAL OF INNOVATION FOR INCLUSIVE DEVELOPMENT, VOL. 2, NO. 1, 22 FEBRUARY 2017
even car formula on an experimental basis. It has been a
success and is going to be implemented again.
3.2 Energy and Water Resources
3.2.1 Energy
With rising population in Delhi, demand for energy is
increasing rapidly. All sectors like industrial clusters,
residential areas, office spaces, educational zones,
transportation require energy. Energy consumption has
increased from 19,666 million units in 2002 to 27,234
million units in 2013 with the per capita consumption of
electricity being much higher than the national average.
The domestic sector has the largest share in energy
consumption at 44%, followed by industry at 25%,
commercial 13% and agriculture 1%. The Government
establishments and public works in the National Capital
have a combined share of 17%. While the generation,
transmission and distribution companies are responsible
for the power supply to the city, Delhi Electricity
Regulatory Commission (DERC) looks after regulatory
matters, such as, rationalization of tariffs, transparency in
subsidy policies and promotion of efficient and
environmentally benign options. The state also has waste-
to-energy plants with an installed capacity of 16 MW. It
has 681 biogas plants with 90 solar photovoltaic pumps
with present installed capacity of 2.53 MW. Although the
energy sector is dominated by thermal power, alternative
sources are under development. The net availability of
power from the seven local power plants in Delhi is 1,213
MW whereas the central power projects supply 2,873
MW. With peak load during summer going as high as
5,653 MW, providing electricity to all is a serious
challenge. Table 4 presents the peak load power demand
of Delhi.
Table 4. Power Demand during peak load in Delhi
(Source: DES, GNCT of Delhi 2014).
Year Peak Load (MW)
2010-11 4720
2011-12 5028
2012-13 5642
2013-14 5653
The solution to this crisis is the development of alternate
sources like solar power which the Government is
considering. The outlay in annual plan in 2013-14 is
Rs.100 lakh for promotion of energy efficiency and
energy conservation. This includes promotion of solar
energy by providing subsidy, mandatory adoption of
energy conservation measures in buildings like building
codes, smart grids etc. Awareness campaigns have also
been initiated.
3.2.2 Water
With only one natural source of water, River Yamuna,
Delhi sources its water from River Yamuna, Ganga, Beas
and Ravi and Bhakra storage and Munak canal. There are
five water treatment plants to distribute water across the
city. Delhi Jal Board is responsible for procurement and
treatment of allocated raw water and provide bulk supply
of treated potable water. As per the Master Plan of Delhi,
the water demand is around 1,380 million gallons per day
(MGD) for the projected 23 million population (MPD,
2021, 2007). Water production on a regular scale is
estimated around 1,290 MGD, thereby leaving a gap of
about 90 MGD. The grim water situation of Delhi is
reflected in Table 5.
Table 5: Water situation in Delhi (delhijalboard.nic.in
Accessed on 1 January, 2017).
Year Demand
(MGD)
Production
(MDG)
Shortfall
(MGD)
2000 792 630 162
2005 918 650 258
2009 1020 810 210
2010 1080 845 235
2011 1380 1290 90
Apart from the scarcity, the state of River Yamuna is
worrisome because of the increased pollution to an extent
that the river has been declared almost ‘ecologically
dead’. This means there is now a greater dependence on
groundwater and supply from neighboring states like
Haryana and Uttar Pradesh. With greater exploitation of
groundwater, the quality and quantity of water is not
proportional to the requirement. The ground water
situation in Delhi is alarming. With low water table in
almost every region except central and north districts, the
quality of water is also deteriorating. The water is polluted
by the presence of heavy metals, calcium, magnesium
salts and untreated sewage which render it unfit for
drinking (Singh, 2012). Thus, the management and
regulations will be critical in future to secure human and
environmental health both of which are part of the
millennium development goals.
Sustainable water management in Delhi requires
optimized resource utilization, regulations banning
withdrawal of ground water, storage of rain water in
Yamuna and rain water harvesting. The Government is
planning to build up additional capacity by constructing
three new reservoirs and two new water treatment plants.
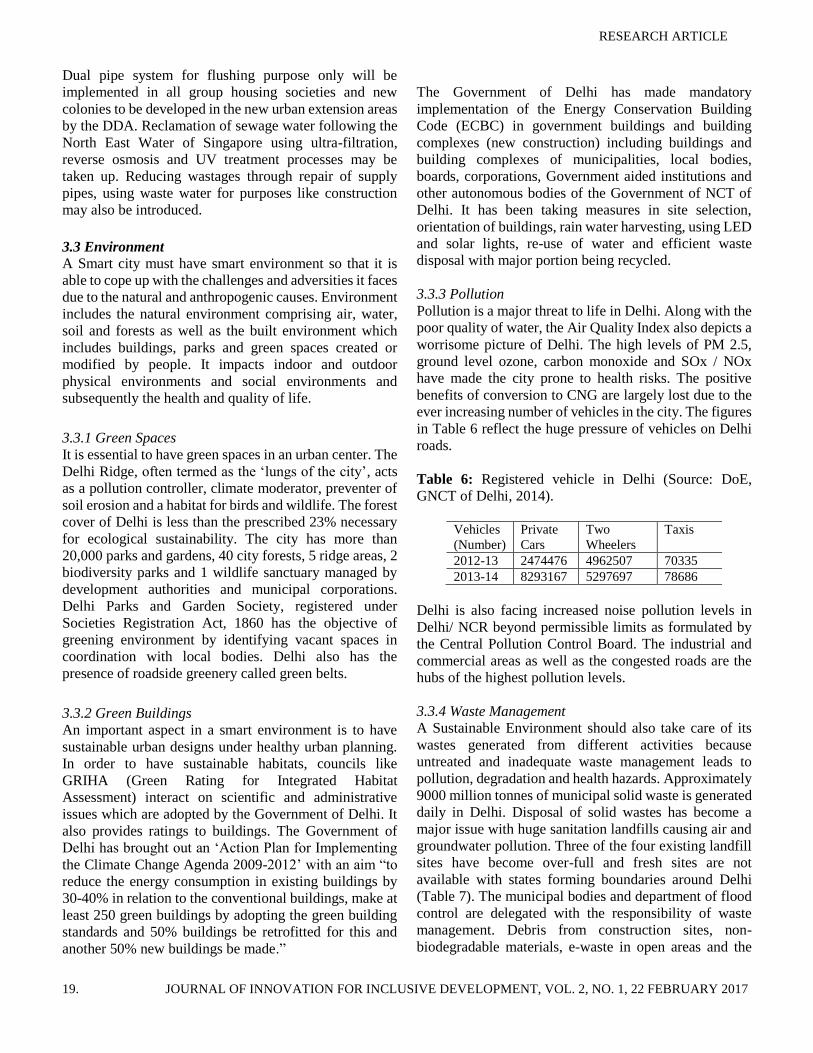
RESEARCH ARTICLE
19. JOURNAL OF INNOVATION FOR INCLUSIVE DEVELOPMENT, VOL. 2, NO. 1, 22 FEBRUARY 2017
Dual pipe system for flushing purpose only will be
implemented in all group housing societies and new
colonies to be developed in the new urban extension areas
by the DDA. Reclamation of sewage water following the
North East Water of Singapore using ultra-filtration,
reverse osmosis and UV treatment processes may be
taken up. Reducing wastages through repair of supply
pipes, using waste water for purposes like construction
may also be introduced.
3.3 Environment
A Smart city must have smart environment so that it is
able to cope up with the challenges and adversities it faces
due to the natural and anthropogenic causes. Environment
includes the natural environment comprising air, water,
soil and forests as well as the built environment which
includes buildings, parks and green spaces created or
modified by people. It impacts indoor and outdoor
physical environments and social environments and
subsequently the health and quality of life.
3.3.1 Green Spaces
It is essential to have green spaces in an urban center. The
Delhi Ridge, often termed as the ‘lungs of the city’, acts
as a pollution controller, climate moderator, preventer of
soil erosion and a habitat for birds and wildlife. The forest
cover of Delhi is less than the prescribed 23% necessary
for ecological sustainability. The city has more than
20,000 parks and gardens, 40 city forests, 5 ridge areas, 2
biodiversity parks and 1 wildlife sanctuary managed by
development authorities and municipal corporations.
Delhi Parks and Garden Society, registered under
Societies Registration Act, 1860 has the objective of
greening environment by identifying vacant spaces in
coordination with local bodies. Delhi also has the
presence of roadside greenery called green belts.
3.3.2 Green Buildings
An important aspect in a smart environment is to have
sustainable urban designs under healthy urban planning.
In order to have sustainable habitats, councils like
GRIHA (Green Rating for Integrated Habitat
Assessment) interact on scientific and administrative
issues which are adopted by the Government of Delhi. It
also provides ratings to buildings. The Government of
Delhi has brought out an ‘Action Plan for Implementing
the Climate Change Agenda 2009-2012’ with an aim “to
reduce the energy consumption in existing buildings by
30-40% in relation to the conventional buildings, make at
least 250 green buildings by adopting the green building
standards and 50% buildings be retrofitted for this and
another 50% new buildings be made.”
The Government of Delhi has made mandatory
implementation of the Energy Conservation Building
Code (ECBC) in government buildings and building
complexes (new construction) including buildings and
building complexes of municipalities, local bodies,
boards, corporations, Government aided institutions and
other autonomous bodies of the Government of NCT of
Delhi. It has been taking measures in site selection,
orientation of buildings, rain water harvesting, using LED
and solar lights, re-use of water and efficient waste
disposal with major portion being recycled.
3.3.3 Pollution
Pollution is a major threat to life in Delhi. Along with the
poor quality of water, the Air Quality Index also depicts a
worrisome picture of Delhi. The high levels of PM 2.5,
ground level ozone, carbon monoxide and SOx / NOx
have made the city prone to health risks. The positive
benefits of conversion to CNG are largely lost due to the
ever increasing number of vehicles in the city. The figures
in Table 6 reflect the huge pressure of vehicles on Delhi
roads.
Table 6: Registered vehicle in Delhi (Source: DoE,
GNCT of Delhi, 2014).
Vehicles
(Number)
Private
Cars
Two
Wheelers
Taxis
2012-13 2474476 4962507 70335
2013-14 8293167 5297697 78686
Delhi is also facing increased noise pollution levels in
Delhi/ NCR beyond permissible limits as formulated by
the Central Pollution Control Board. The industrial and
commercial areas as well as the congested roads are the
hubs of the highest pollution levels.
3.3.4 Waste Management
A Sustainable Environment should also take care of its
wastes generated from different activities because
untreated and inadequate waste management leads to
pollution, degradation and health hazards. Approximately
9000 million tonnes of municipal solid waste is generated
daily in Delhi. Disposal of solid wastes has become a
major issue with huge sanitation landfills causing air and
groundwater pollution. Three of the four existing landfill
sites have become over-full and fresh sites are not
available with states forming boundaries around Delhi
(Table 7). The municipal bodies and department of flood
control are delegated with the responsibility of waste
management. Debris from construction sites, non-
biodegradable materials, e-waste in open areas and the
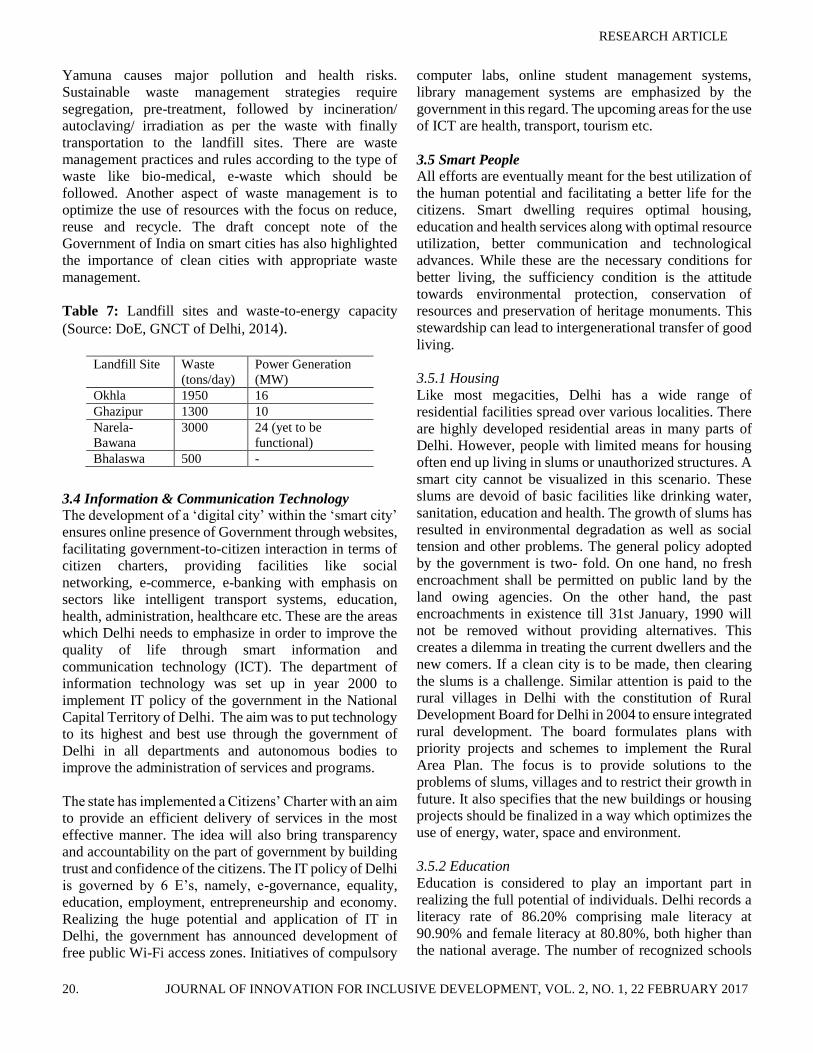
RESEARCH ARTICLE
20. JOURNAL OF INNOVATION FOR INCLUSIVE DEVELOPMENT, VOL. 2, NO. 1, 22 FEBRUARY 2017
Yamuna causes major pollution and health risks.
Sustainable waste management strategies require
segregation, pre-treatment, followed by incineration/
autoclaving/ irradiation as per the waste with finally
transportation to the landfill sites. There are waste
management practices and rules according to the type of
waste like bio-medical, e-waste which should be
followed. Another aspect of waste management is to
optimize the use of resources with the focus on reduce,
reuse and recycle. The draft concept note of the
Government of India on smart cities has also highlighted
the importance of clean cities with appropriate waste
management.
Table 7: Landfill sites and waste-to-energy capacity
(Source: DoE, GNCT of Delhi, 2014).
Landfill Site Waste
(tons/day)
Power Generation
(MW)
Okhla 1950 16
Ghazipur 1300 10
Narela-
Bawana
3000 24 (yet to be
functional)
Bhalaswa 500 -
3.4 Information & Communication Technology
The development of a ‘digital city’ within the ‘smart city’
ensures online presence of Government through websites,
facilitating government-to-citizen interaction in terms of
citizen charters, providing facilities like social
networking, e-commerce, e-banking with emphasis on
sectors like intelligent transport systems, education,
health, administration, healthcare etc. These are the areas
which Delhi needs to emphasize in order to improve the
quality of life through smart information and
communication technology (ICT). The department of
information technology was set up in year 2000 to
implement IT policy of the government in the National
Capital Territory of Delhi. The aim was to put technology
to its highest and best use through the government of
Delhi in all departments and autonomous bodies to
improve the administration of services and programs.
The state has implemented a Citizens’ Charter with an aim
to provide an efficient delivery of services in the most
effective manner. The idea will also bring transparency
and accountability on the part of government by building
trust and confidence of the citizens. The IT policy of Delhi
is governed by 6 E’s, namely, e-governance, equality,
education, employment, entrepreneurship and economy.
Realizing the huge potential and application of IT in
Delhi, the government has announced development of
free public Wi-Fi access zones. Initiatives of compulsory
computer labs, online student management systems,
library management systems are emphasized by the
government in this regard. The upcoming areas for the use
of ICT are health, transport, tourism etc.
3.5 Smart People
All efforts are eventually meant for the best utilization of
the human potential and facilitating a better life for the
citizens. Smart dwelling requires optimal housing,
education and health services along with optimal resource
utilization, better communication and technological
advances. While these are the necessary conditions for
better living, the sufficiency condition is the attitude
towards environmental protection, conservation of
resources and preservation of heritage monuments. This
stewardship can lead to intergenerational transfer of good
living.
3.5.1 Housing
Like most megacities, Delhi has a wide range of
residential facilities spread over various localities. There
are highly developed residential areas in many parts of
Delhi. However, people with limited means for housing
often end up living in slums or unauthorized structures. A
smart city cannot be visualized in this scenario. These
slums are devoid of basic facilities like drinking water,
sanitation, education and health. The growth of slums has
resulted in environmental degradation as well as social
tension and other problems. The general policy adopted
by the government is two- fold. On one hand, no fresh
encroachment shall be permitted on public land by the
land owing agencies. On the other hand, the past
encroachments in existence till 31st January, 1990 will
not be removed without providing alternatives. This
creates a dilemma in treating the current dwellers and the
new comers. If a clean city is to be made, then clearing
the slums is a challenge. Similar attention is paid to the
rural villages in Delhi with the constitution of Rural
Development Board for Delhi in 2004 to ensure integrated
rural development. The board formulates plans with
priority projects and schemes to implement the Rural
Area Plan. The focus is to provide solutions to the
problems of slums, villages and to restrict their growth in
future. It also specifies that the new buildings or housing
projects should be finalized in a way which optimizes the
use of energy, water, space and environment.
3.5.2 Education
Education is considered to play an important part in
realizing the full potential of individuals. Delhi records a
literacy rate of 86.20% comprising male literacy at
90.90% and female literacy at 80.80%, both higher than
the national average. The number of recognized schools
RESEARCH ARTICLE
21. JOURNAL OF INNOVATION FOR INCLUSIVE DEVELOPMENT, VOL. 2, NO. 1, 22 FEBRUARY 2017
in Delhi is 5,453 with the number of enrolled students in
schools as 43.95 lakh in 2013-14 with a student: teacher
ratio of 32:1. Government schemes like Mid-day Meal,
Sarva Shiksha Abhiyan (drive for universal education)
have been able to increase the enrollment rate. Delhi also
has the best institutions of higher learning in the country,
namely, universities, colleges, technological, medical and
management institutes. The sector needs to be coupled
with technology to make education more effective which
provides future opportunities for employment in different
sectors. The city has 9 district employment exchanges
with one online portal giving details about the upcoming
jobs and preparation of employment manual by
jobseekers who register at the employment portal.
Therefore, applying the IT in these sectors can yield better
results leading to improvement in quality of life.
3.5.3 Health
Being healthy is a right of every citizen which includes
physical, social and psychological wellbeing. With
congestion, changed lifestyles, and problems of pollution,
citizens in the city are facing severe health problems like
obesity, cardiovascular diseases, mental stress,
respiratory disorders that inhibit individuals to realize
their full potential. A megacity like Delhi has a greater
burden. Being the capital city, people from neighboring
states come to Delhi for getting better treatments. It has
the location of major hospitals with specialized wards and
clinics. There are 95 government hospitals, 1,451
dispensaries, 267 maternity homes and sub-centers with a
total capacity of approximately 47,398 beds. The current
state of the health sector needs improvements in terms of
its functioning which is largely affected by overcrowding,
especially at the government hospitals which are more
economical. Units for women and child care also need
improvement by enhancing public confidence through
people-friendly approaches. Cleanliness is yet another
issue which needs to be addressed. The health sector at
present is largely dominated by private hospitals which
are by far more costly. One transformation could be the
use of ICT in this sector. Another aspect of better health
implies a healthier life style, exercising, cycling etc.
People should be encouraged to opt for bicycles to
commute shorter distances by making cycling safe in the
city. Ensuring cycling tracks will serve the dual purpose
of healthy living and eco-friendly ambience. Walking as
a practice is also helpful. This needs commitment by
people to make efforts to have smart health.
3.5.4 Heritage Sites
Though heritage or monuments have greater historical
significance and are a part of built environment, the fact
that it is meant for people makes it significant. Delhi has
a rich history and monuments are found all over the city.
The city has a great potential for being developed as a
‘heritage city’ within the broader concept of smart city.
The government alone cannot realize the idea in practice,
it needs equal participation and support of citizens who
should cooperate to maintain and preserve the present
state of our heritage. As guardians of the city, they have
to inculcate a habit of ensuring their cleanliness and a
sense of stewardship towards the future citizens.
Therefore, heritage is another aspect which needs to be
taken care of in the proposed model of smart city. ‘Smart
people’ is a two way approach. Along with government
initiatives, it needs a citizen-centric view to make people
feel a sense of ownership that will make their participation
voluntary and broad-based.
4. Citizens’ Perception: The Survey
A smart city should not only be a public policy, it should
also be in people’s perception. A survey was conducted to
assess how the citizens of Delhi rate the status of
transport, energy, water, waste, ICT, environment and
awareness about being smart. A random sample of about
50 people from different groups of income, age and
professions were chosen for the same. The findings of the
survey are furnished below.
1) Knowledge about smart city: 60% of the respondents
were aware and 40% were not. 2) Sources of knowledge:
Newspaper, television, internet are the dominant sources
of information as compared to magazines and radio. 3)
Mode of transport: Ridership in metro 32%, bus 22%,
auto rickshaw 14%, taxi 6%, car 9%, two wheelers 10%
and others 7%. 80% of the respondents felt that metro and
bus are cost effective, safe and comfortable modes of
transport. Bicycle is not a preferred mode for the majority
of the sample because of traffic congestion, inadequate
cycling lanes and insecurity despite its environmental
benefits. Among those owning vehicles, 37% of the
households have at least one vehicle and 31% having 2
vehicles, of which around 41% of the vehicles are older
than 10 years. 4) Energy use pattern: The electricity bill
depends on the use of electrical gadgets and family size.
More than half of the population surveyed pay a bill
ranging between Rs.200 and Rs.3000 per month which
they feel is justified. The dominant (73%) type of cooking
fuel is LPG cylinders while 23% use piped gas and only
4% use firewood, kerosene etc. 5) Water availability:
83% of the total water use comes from the municipal
supply, 15% hand pumps and the rest from water tankers.
The average water bill is Rs.100-200 per month while a
large section of the poor do not pay any charge. The
duration of water supply in general varies between 6 to 16
hours per day. 6) Environment: 87% of the respondents
RESEARCH ARTICLE
22. JOURNAL OF INNOVATION FOR INCLUSIVE DEVELOPMENT, VOL. 2, NO. 1, 22 FEBRUARY 2017
are aware of the problem of pollution in air, water, noise
and soil. 11% of them felt that the solution is the
responsibility of the state, 17% voted for the
communities, 6% for individuals and 66% felt all
agencies need to collaborate for mitigation of pollution.
7) Waste Management: Most people use dustbins for
kitchen waste and general household waste. Newspapers
and e-wastes are mostly sent to scraps and polythene is
generally reused. Burning and open disposal were found
to be very rare. 8) Heritage City: While everyone felt
the need for protecting historical monuments, only 14%
were in favor of strict laws, 26% for economic fines, 12%
for individual awareness and 48% for all of these. 9) IT
and communication: 84% of the respondents use the
internet for various purposes. While 30% use it for
education, 26% use for social networking, 25% for
professional reasons and 19% for e-commerce and e-
banking. 10) Miscellaneous: People revealed strong
preference for government initiatives in areas of health
and education. They showed willingness to install energy
efficient devices and participate in citizen-friendly
initiatives towards environmental protection. 11) Delhi
as a smart city: 37% of the respondents felt that Delhi
should be a smart city while the others are either ignorant
or indifferent.
The citizens of Delhi have revealed reasonably good
awareness about the concept of smart cities. The current
scenario of water and energy resources is not at the
expected level. The transport sector has problems of
availability, safety, economy and pollution too. However,
the people of Delhi have clean habits regarding the choice
of fuel and waste management. They are exposed to the
use of smart ICT and e-services. There is a definite need
for improvement in the social sectors. The role of the
government is also felt strongly. Those who are aware of
the smart city concept are ready to participate in this new
venture that the government has already initiated. With
requirements for certain developments and some already
initiated steps, Delhi can surely be visualized as a future
smart city.
5. Concluding Remarks
5.1 Recent Developments
Delhi Government has announced to develop Rohini,
Dwarka, and Narela areas as sectors of the smart city with
improvements in water, electricity and Wi-Fi
connectivity. Operational and business models of public
bicycle sharing scheme is under process. Pollution will be
reduced by 25% by repair of roads and broken footpaths.
The plan includes grass to be planted on dusty patches
with a plan to evolve a unified air quality monitoring
system. The plasma gasification system and the water
recycling model of Singapore is being studied for possible
implementation. The National Green Tribunal (NGT) has
planned to ban all diesel vehicles that are older than 10
years, construction activities on road and open burning of
crop remnants in neighboring states of Delhi. The odd-
even car formula is also in place to curb vehicular
pollution. Companies have been invited to devise best
practices of a smart city. Installation of roof-top solar
panels is being promoted on a priority basis. The Union
Cabinet has given nod for building 100 Smart cities after
it was announced in the Union Budget 2014-15 with an
outlay of Rs.48,000 crores. Each city will be given an
assistance of Rs.100 crores per year for 5 years. “The
mission is to recast the urban landscape of countries by
making cities more livable and inclusive besides driving
economic growth”. The projects for future smart cities
will also be invited through ‘smart city challenge’.
5.2 The Draft Concept Note
The Government of India has prepared a draft note
available in the public domain which discusses the
scheme of setting up hundred smart cities. With its focus
on the smart parameters, it tries to design a sustainable
growth plan. Largely, it needs to prepare a master plan
with a broad vision with small plans in its ambit so that
each sector is focused in this larger approach. State
Governments will be supplemented with financial
resources for capacity building. This will be
supplemented by building a program which encompasses
training, education, database and personnel for effective
implementation. The draft plan discusses the key
strategies of the project encompassing the planning,
organizing, and implementation of smart cities.
5.3 A Strong Case for Delhi
People make cities and thus smart people make smart
cities. The city of Delhi is unique in terms of its history,
heritage, demography and culture. Being the capital it has
continued to attract people like any other city. With
challenges posed due to the issues of urbanization, it has
to strive towards making future goals of social and
environmental sustainability, achievable with an aim to be
economically competent. Therefore, it has to modify its
present growth pattern and move towards the idea of a
smart city. As observed from the secondary information,
Delhi has high potentials to come up as smart city.
Although the current state of resource use, transport
systems, environmental standards etc. are not at par with
the best international standards, there is a large scope to
improve upon those and move towards a smarter solution.
This micro-level study also revealed that the citizens of
Delhi are ready to take part in this endeavour in every
RESEARCH ARTICLE
23. JOURNAL OF INNOVATION FOR INCLUSIVE DEVELOPMENT, VOL. 2, NO. 1, 22 FEBRUARY 2017
possible way. The macro motive of building this city will
serve the micro purpose of its stakeholders by providing
a better quality of life. The smart city model has been
successful in some major cities of world. With the
proposal of the same in India, a city like Delhi represents
a strong case. It has the crucial presence of infrastructure
which has the potential to transform the scenario. From
deficient resources to effective resources, from restricted
to open access, from degraded to improved state of
environment, from worse to better quality of life, all can
be achieved with this visionary idea. This needs not only
effective planning, finances, vision and implementation
but also a constant support from the citizens who are the
major stakeholders in any urban endeavour. The
Government is the major actor which needs constant
dialogue, interaction with people and cities that have
previously been successful in this initiative. With the
Government of Delhi taking a great initiative, a bright
future is expected when Delhi will become a smart city
with smart people living a smart life.
6. References
Census of India. 2011. Ministry of Home Affairs.
Government of India.
Department of Economics and Statistics. 2014. Delhi
Statistical Handbook. Government of National
Capital Territory of Delhi.
Government of India, Ministry of Urban Development
2014. Draft Concept Note of Smart City Initiative,
URL: moud.gov.in and indiansmartcities.gov.in
(Accessed on 1 January 2017).
Government of Singapore. 2009. A Lively and Livable
Singapore: Strategies for Sustainable Growth.
Ministry of Environment and Water Resources and
Ministry of National Development.
Jolly, U. S. 2010. Challenges of a Megacity (Delhi A
Planned City with Unplanned Growth), Concept
Publishing, Delhi.
Master Plan of Delhi (MPD) 2021. 2007. Notified Vide
S.O. 141.by the Ministry of Urban Development,
Government of India (Delhi Division).
National Institute of Urban Affairs (NIUA), 2015.
Building Smart Cities with ISPAT GROUP. URL:
niua.org/sites/all/files/consultation-
workshop/Ispat_BuildingSmartCities.pdf (Accessed
on 15 February, 2017).
Singh, G. 2008. Delhi Urban Water Woes Meet Lessons
from Environmental History. URL:
http://delhigreens.com/2008/10/13/delhi-urban-
water-woes-meet-lessons-from-environmental-
history (Accessed on 15 February, 2017)
Singh, G. 2012. Surface and sub-surface water quality in
the NCT of Delhi and its implications on the urban
environments. Doctoral thesis. Retrieved from
http://shodhganga.inflibnet.ac.in/handle/10603/283
17 (Accessed on 15 January, 2017).
Singh, G., Sharma, A., Gupta, I., & Baveja, P. 2016.
Sustainability Appraisal and Economic Valuation of
North Delhi Ridge Using Participatory Research
Approach. Journal of Innovation for Inclusive
Development, 1(1), 11-19.
United Nations, 2011. World Urbanisation Prospects: The
2010 Revision. United Nations, New York.
RESEARCH ARTICLE
24. JOURNAL OF INNOVATION FOR INCLUSIVE DEVELOPMENT, VOL.2, NO. 1, 22 FEBRUARY 2017
Abstract: The present research contribution attempts to
study the increasing dependency of households in Delhi
on R.O. devices and brings forward its implications on
Delhi’s urban water scenario. The research focuses on
five colonies in Delhi where preliminary water quality
assessment was carried out so as to conduct a need
assessment of installing R.O. devices versus the actual
installation of these devices in individual households.
Reverse osmosis is essentially a technique to reduce the
hardness of water and the process involves de-
mineralization or de-ionization of water by pushing it
under pressure through a semi-permeable membrane.
Consequently, an R.O. device is effective in households
receiving water with high Total Dissolved Solids (TDS).
However, an R.O. is neither required nor effective in
households receiving water with low TDS, which were
noted in the study area. This is because R.O. devices are
not an effective method against biological impurities.
Despite this limitation, over 78% of the households in the
study area were found to rely on R.O. devices as a coping
strategy against impaired municipal water supply. While
some of these R.O. devices are also fitted with UV-filters
(which help address biological impurities in water), the
large-scale use of R.O. devices in households that do not
require this technology poses a serious threat to urban
water sustainability in Delhi.
Keywords: urban water, water supply, Delhi, R.O., water
management.
1. Introduction
Water is a basic human requirement and a critical resource
for the survival and sustainability of any urban centre.
India’s National Capital Territory (NCT) of Delhi is well
aware of this fact and has been struggling to bridge the
gap between water demand and supply (Singh, 2011).
Email for correspondence: [email protected]
With a Census population above 17 million and rising
(Census of India, 2011), supplying drinking water to all
the households of Delhi is becoming an increasing
challenge for the Delhi administration each passing day.
The high water demand of the NCT of Delhi is also the
reason for the high pollution of River Yamuna which
flows through the city and is the principal source of its
freshwater supply (Singh, 2016). Despite consuming a
major part of the flow of River Yamuna, the Delhi
administration is still not able to meet the water demand
of the city. Water shortage, as well as issues related to
water quality in the municipal supply, have led to the
development of coping strategies by the households in
Delhi households (Zérah, 2000). One such coping
strategy, mainly against impaired water quality, is the
installation of reverse osmosis (R.O.) devices.
A Household R.O. device is a water treatment device
which takes water supply from the tap as the intake,
pushes the water through a semi-permeable membrane
which retains most of the solid dissolved in water and
provides largely chemical-free water as output (for
drinking), along with releasing “reject water”, which is
rich in dissolved solids, as waste water. Reverse Osmosis
can be defined as a process by which a solvent (in this
case, water) passes through porous membrane in the
direction opposite to that of natural osmosis when
hydrostatic pressure > the osmotic pressure. Reverse
Osmosis (R.O.) devices thus help reduce Total Dissolved
Solids (TDS) in water. Despite their high cost (both
installation and maintenance) R.O. devices are becoming
increasingly popular in urban households across Delhi as
water purification devices. Their popularity can indeed be
also attributed to the fierce marketing as well as instilling
doubt in the mind of the user over consistency in the
ability of city administration to supply clean drinking
water (Eureka Forbes, 2017).
Implication of Household Use of R.O. Devices
for Delhi’s Urban Water Scenario
Govind Singh
Department of Environmental Studies, Indraprastha College for Women, University of Delhi
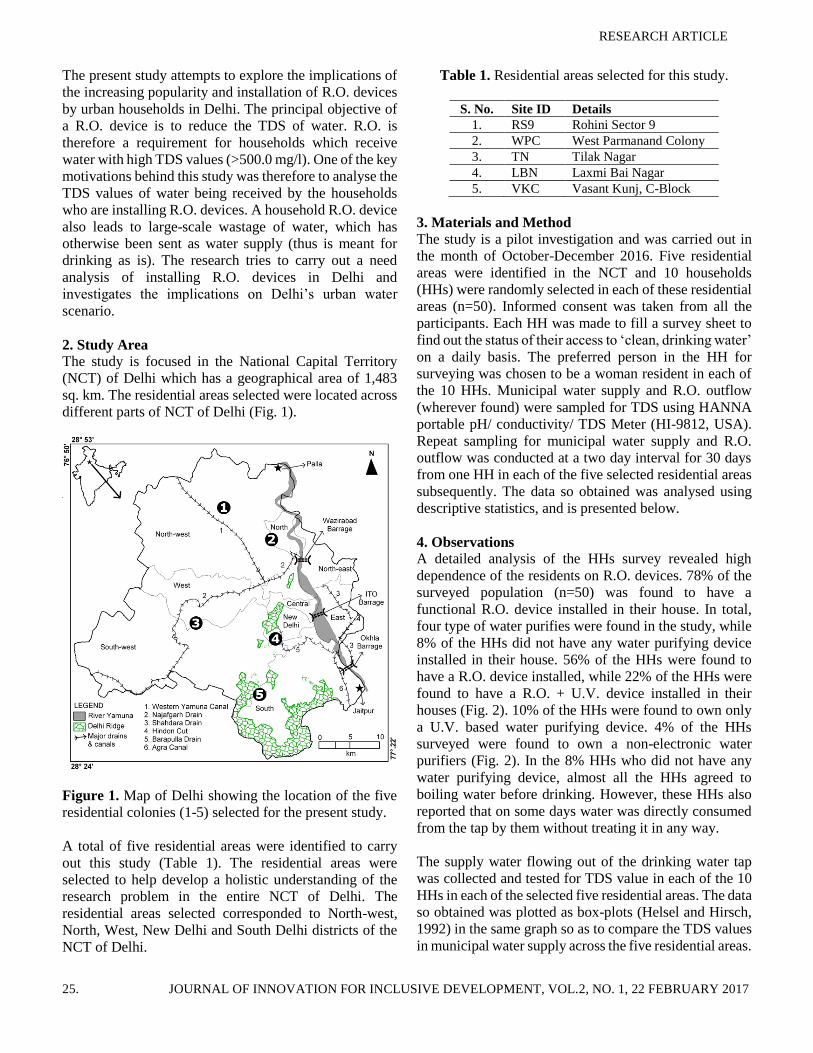
RESEARCH ARTICLE
25. JOURNAL OF INNOVATION FOR INCLUSIVE DEVELOPMENT, VOL.2, NO. 1, 22 FEBRUARY 2017
The present study attempts to explore the implications of
the increasing popularity and installation of R.O. devices
by urban households in Delhi. The principal objective of
a R.O. device is to reduce the TDS of water. R.O. is
therefore a requirement for households which receive
water with high TDS values (>500.0 mg/l). One of the key
motivations behind this study was therefore to analyse the
TDS values of water being received by the households
who are installing R.O. devices. A household R.O. device
also leads to large-scale wastage of water, which has
otherwise been sent as water supply (thus is meant for
drinking as is). The research tries to carry out a need
analysis of installing R.O. devices in Delhi and
investigates the implications on Delhi’s urban water
scenario.
2. Study Area
The study is focused in the National Capital Territory
(NCT) of Delhi which has a geographical area of 1,483
sq. km. The residential areas selected were located across
different parts of NCT of Delhi (Fig. 1).
Figure 1. Map of Delhi showing the location of the five
residential colonies (1-5) selected for the present study.
A total of five residential areas were identified to carry
out this study (Table 1). The residential areas were
selected to help develop a holistic understanding of the
research problem in the entire NCT of Delhi. The
residential areas selected corresponded to North-west,
North, West, New Delhi and South Delhi districts of the
NCT of Delhi.
Table 1. Residential areas selected for this study.
S. No. Site ID Details
1. RS9 Rohini Sector 9
2. WPC West Parmanand Colony
3. TN Tilak Nagar
4. LBN Laxmi Bai Nagar
5. VKC Vasant Kunj, C-Block
3. Materials and Method
The study is a pilot investigation and was carried out in
the month of October-December 2016. Five residential
areas were identified in the NCT and 10 households
(HHs) were randomly selected in each of these residential
areas (n=50). Informed consent was taken from all the
participants. Each HH was made to fill a survey sheet to
find out the status of their access to ‘clean, drinking water’
on a daily basis. The preferred person in the HH for
surveying was chosen to be a woman resident in each of
the 10 HHs. Municipal water supply and R.O. outflow
(wherever found) were sampled for TDS using HANNA
portable pH/ conductivity/ TDS Meter (HI-9812, USA).
Repeat sampling for municipal water supply and R.O.
outflow was conducted at a two day interval for 30 days
from one HH in each of the five selected residential areas
subsequently. The data so obtained was analysed using
descriptive statistics, and is presented below.
4. Observations
A detailed analysis of the HHs survey revealed high
dependence of the residents on R.O. devices. 78% of the
surveyed population (n=50) was found to have a
functional R.O. device installed in their house. In total,
four type of water purifies were found in the study, while
8% of the HHs did not have any water purifying device
installed in their house. 56% of the HHs were found to
have a R.O. device installed, while 22% of the HHs were
found to have a R.O. + U.V. device installed in their
houses (Fig. 2). 10% of the HHs were found to own only
a U.V. based water purifying device. 4% of the HHs
surveyed were found to own a non-electronic water
purifiers (Fig. 2). In the 8% HHs who did not have any
water purifying device, almost all the HHs agreed to
boiling water before drinking. However, these HHs also
reported that on some days water was directly consumed
from the tap by them without treating it in any way.
The supply water flowing out of the drinking water tap
was collected and tested for TDS value in each of the 10
HHs in each of the selected five residential areas. The data
so obtained was plotted as box-plots (Helsel and Hirsch,
1992) in the same graph so as to compare the TDS values
in municipal water supply across the five residential areas.
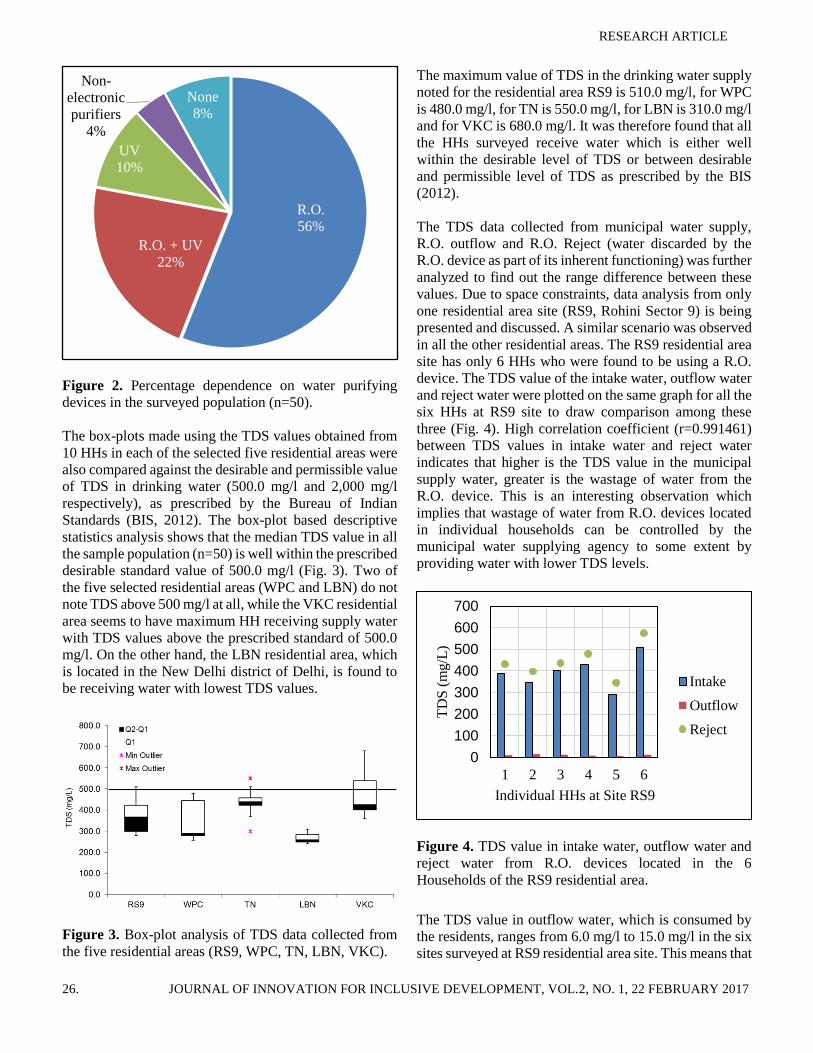
RESEARCH ARTICLE
26. JOURNAL OF INNOVATION FOR INCLUSIVE DEVELOPMENT, VOL.2, NO. 1, 22 FEBRUARY 2017
Figure 2. Percentage dependence on water purifying
devices in the surveyed population (n=50).
The box-plots made using the TDS values obtained from
10 HHs in each of the selected five residential areas were
also compared against the desirable and permissible value
of TDS in drinking water (500.0 mg/l and 2,000 mg/l
respectively), as prescribed by the Bureau of Indian
Standards (BIS, 2012). The box-plot based descriptive
statistics analysis shows that the median TDS value in all
the sample population (n=50) is well within the prescribed
desirable standard value of 500.0 mg/l (Fig. 3). Two of
the five selected residential areas (WPC and LBN) do not
note TDS above 500 mg/l at all, while the VKC residential
area seems to have maximum HH receiving supply water
with TDS values above the prescribed standard of 500.0
mg/l. On the other hand, the LBN residential area, which
is located in the New Delhi district of Delhi, is found to
be receiving water with lowest TDS values.
Figure 3. Box-plot analysis of TDS data collected from
the five residential areas (RS9, WPC, TN, LBN, VKC).
The maximum value of TDS in the drinking water supply
noted for the residential area RS9 is 510.0 mg/l, for WPC
is 480.0 mg/l, for TN is 550.0 mg/l, for LBN is 310.0 mg/l
and for VKC is 680.0 mg/l. It was therefore found that all
the HHs surveyed receive water which is either well
within the desirable level of TDS or between desirable
and permissible level of TDS as prescribed by the BIS
(2012).
The TDS data collected from municipal water supply,
R.O. outflow and R.O. Reject (water discarded by the
R.O. device as part of its inherent functioning) was further
analyzed to find out the range difference between these
values. Due to space constraints, data analysis from only
one residential area site (RS9, Rohini Sector 9) is being
presented and discussed. A similar scenario was observed
in all the other residential areas. The RS9 residential area
site has only 6 HHs who were found to be using a R.O.
device. The TDS value of the intake water, outflow water
and reject water were plotted on the same graph for all the
six HHs at RS9 site to draw comparison among these
three (Fig. 4). High correlation coefficient (r=0.991461)
between TDS values in intake water and reject water
indicates that higher is the TDS value in the municipal
supply water, greater is the wastage of water from the
R.O. device. This is an interesting observation which
implies that wastage of water from R.O. devices located
in individual households can be controlled by the
municipal water supplying agency to some extent by
providing water with lower TDS levels.
Figure 4. TDS value in intake water, outflow water and
reject water from R.O. devices located in the 6
Households of the RS9 residential area.
The TDS value in outflow water, which is consumed by
the residents, ranges from 6.0 mg/l to 15.0 mg/l in the six
sites surveyed at RS9 residential area site. This means that
R.O.
56%
R.O. + UV
22%
UV
10%
Non-
electronic
purifiers
4%
None
8%
0
100
200
300
400
500
600
700
1 2 3 4 5 6
TD
S (
mg/L
)
Individual HHs at Site RS9
Intake
Outflow
Reject
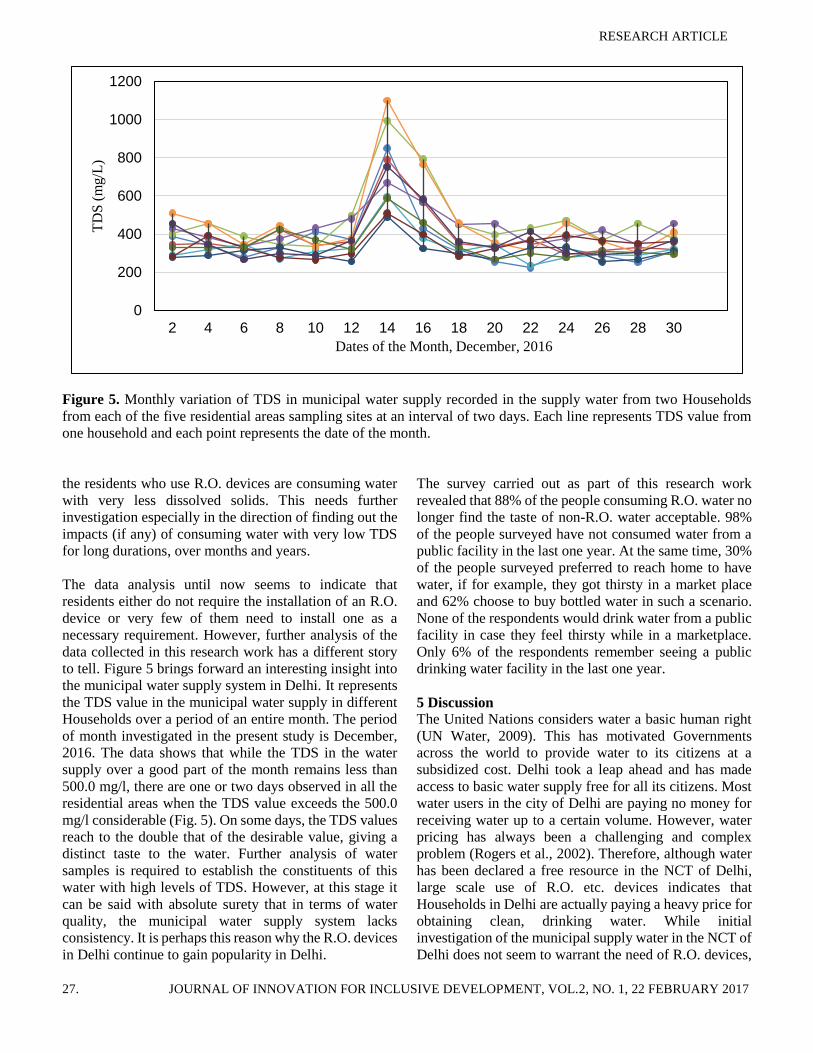
RESEARCH ARTICLE
27. JOURNAL OF INNOVATION FOR INCLUSIVE DEVELOPMENT, VOL.2, NO. 1, 22 FEBRUARY 2017
Figure 5. Monthly variation of TDS in municipal water supply recorded in the supply water from two Households
from each of the five residential areas sampling sites at an interval of two days. Each line represents TDS value from
one household and each point represents the date of the month.
the residents who use R.O. devices are consuming water
with very less dissolved solids. This needs further
investigation especially in the direction of finding out the
impacts (if any) of consuming water with very low TDS
for long durations, over months and years.
The data analysis until now seems to indicate that
residents either do not require the installation of an R.O.
device or very few of them need to install one as a
necessary requirement. However, further analysis of the
data collected in this research work has a different story
to tell. Figure 5 brings forward an interesting insight into
the municipal water supply system in Delhi. It represents
the TDS value in the municipal water supply in different
Households over a period of an entire month. The period
of month investigated in the present study is December,
2016. The data shows that while the TDS in the water
supply over a good part of the month remains less than
500.0 mg/l, there are one or two days observed in all the
residential areas when the TDS value exceeds the 500.0
mg/l considerable (Fig. 5). On some days, the TDS values
reach to the double that of the desirable value, giving a
distinct taste to the water. Further analysis of water
samples is required to establish the constituents of this
water with high levels of TDS. However, at this stage it
can be said with absolute surety that in terms of water
quality, the municipal water supply system lacks
consistency. It is perhaps this reason why the R.O. devices
in Delhi continue to gain popularity in Delhi.
The survey carried out as part of this research work
revealed that 88% of the people consuming R.O. water no
longer find the taste of non-R.O. water acceptable. 98%
of the people surveyed have not consumed water from a
public facility in the last one year. At the same time, 30%
of the people surveyed preferred to reach home to have
water, if for example, they got thirsty in a market place
and 62% choose to buy bottled water in such a scenario.
None of the respondents would drink water from a public
facility in case they feel thirsty while in a marketplace.
Only 6% of the respondents remember seeing a public
drinking water facility in the last one year.
5 Discussion
The United Nations considers water a basic human right
(UN Water, 2009). This has motivated Governments
across the world to provide water to its citizens at a
subsidized cost. Delhi took a leap ahead and has made
access to basic water supply free for all its citizens. Most
water users in the city of Delhi are paying no money for
receiving water up to a certain volume. However, water
pricing has always been a challenging and complex
problem (Rogers et al., 2002). Therefore, although water
has been declared a free resource in the NCT of Delhi,
large scale use of R.O. etc. devices indicates that
Households in Delhi are actually paying a heavy price for
obtaining clean, drinking water. While initial
investigation of the municipal supply water in the NCT of
Delhi does not seem to warrant the need of R.O. devices,
0
200
400
600
800
1000
1200
2 4 6 8 10 12 14 16 18 20 22 24 26 28 30
TD
S (
mg/L
)
Dates of the Month, December, 2016
RESEARCH ARTICLE
28. JOURNAL OF INNOVATION FOR INCLUSIVE DEVELOPMENT, VOL.2, NO. 1, 22 FEBRUARY 2017
a more detailed investigation highlights the need of these
devices in the households of NCT of Delhi. Due to this,
the sale and use of R.O. devices will only continue to rise.
This has two direct implications, one that large volumes
of municipal supply water will be further “purified” in
R.O. devices at the household level and will be wasted as
reject water. Second, the residents of Delhi will continue
to consume water with very low TDS value. It is therefore
no exaggeration to say that improvement in existing
Water Treatment Plants, and provision of better quality
water to the citizens can help optimize Delhi’s water
demand and also reduce the waste water load of River
Yamuna. At the same time, there is a need to initiate
further research on studying the impact of continuous
consumption of water with very low (5-15 mg/l) TDS on
human health.
The health risks from drinking demineralized (or water
with very low TDS) are now fully known in the present
day (Kozisek, 2005). While some scientists believe our
body can obtain some minerals from water only, others
are of the opinion that lack of any minerals in drinking
water can be accommodated through having a balanced
diet (Pelican News, 2016). A consensus needs to be built
on this before a policy decision in this direction can be
taken. At the same time, there is a need to carry out
detailed investigation of the reasons behind high TDS
values in the municipal water supply in Delhi on some
days. Water samples need to be regularly analyzed to
ensure that high TDS values are not because of a toxic
substance that has somehow entered the water supply
system. The apathy shown by the residents of Delhi
towards public water distribution outside their households
is equally concerning. The Government of NCT of Delhi
needs to take urgent measures for restoring the faith of the
people of Delhi in the municipal water supply. This is also
needed to be done since in the absence of such faith, the
residents of Delhi are fully capable of exploring private
acquisition of water using bore wells, etc. Indeed, greater
dependency of residents on ground water is not healthy
due to polluted ground water in various parts of Delhi
(Singh, 2012).
Since the R.O. devices will only gain more popularity in
coming years, the Government and citizens need to take
innovative steps in ensuring that the R.O. reject water is
reused perhaps for cleaning or other non-drinking
purposes. The study clearly shows that the TDS value of
reject water from R.O. devices is also mostly within the
desirable value (500.0 mg/l) of TDS. While the reasons
(chemical species) of high TDS are not known (since the
original source of water is municipal supply, the reject
water should not have any toxic substances under ideal
conditions), this water may not be used for drinking but is
safe for any other use. Citizens should therefore take
proactive measures, and Government should focus on
formulating a policy at the residential area level such that
the reject water from R.O. devices is reused/ recycled and
is not directly sent to the sewer.
6. Conclusion
Drinking water supply in the NCT of Delhi is managed by
the Delhi Jal Board under the Government of NCT of
Delhi. Although the water supply in Delhi seems to be
state controlled, there is considerable micro-scale
privatization of water in the city. A principal reason
behind this is the lack of consistent supply of drinking
water from the DJB. The fluctuating TDS of municipal
water supplied to the residents of Delhi needs immediate
Government attention. Citizens must be provided clean
drinking water consistently, lest it will promote further
penetration of R.O. devices which come with their
inherent shortcomings. Large-scale use of R.O. devices
not only increase Delhi’s water footprint but also its
electricity demand. This Water-Energy Nexus needs
further investigation.
7. References
Bureau of Indian Standard (BIS). 2012. Indian standard
specification for drinking water/ Draft. Publication no.
IS: 10500. New Delhi, India.
Census of India. 2011. Ministry of Home Affairs.
Government of India.
Eureka Forbes. 2017. FAQs. URL:
http://www.eurekaforbes.com (Accessed on
03/03/2017).
Helsel, D.R. and Hirsch, R.M., 1992. Statistical methods
in water resources (Vol. 49). Elsevier.
Kozisek, F. 2005. Health risks from drinking
demineralised water. Nutrients in Drinking Water.
148-163.
Pelican News. 2016. Myths and Facts: Is RO Water Bad
for You? Website: https://www.pelicanwater.com
(Accessed on 08/02/2017).
Rogers, P., De Silva, R. and Bhatia, R., 2002. Water is an
economic good: How to use prices to promote equity,
efficiency, and sustainability. Water policy, 4 (1): 1-
17.
Singh, G. 2012. Surface and sub-surface water quality in
the NCT of Delhi and its implications on the urban
environments. Doctoral thesis. Retrieved from
http://shodhganga.inflibnet.ac.in/handle/10603/2831
7 (Accessed on 1 August, 2016).
Singh, G. Mihir Deb and Chirashree Ghosh. 2016. Urban
Metabolism of River Yamuna in the National Capital
RESEARCH ARTICLE
29. JOURNAL OF INNOVATION FOR INCLUSIVE DEVELOPMENT, VOL.2, NO. 1, 22 FEBRUARY 2017
Territory of Delhi, India. Int. J. of Adv. Res. 4 (8).
1240-1248.
Singh, G., Deb, M., Ghosh, C. 2011. Challenges in
optimizing urban water footprint: the case of the
Delhi conurbation. Proceedings of the V World Aqua
Congress on Adaptive & Integrated Water
Management. 2: 252-265
Water, U.N., 2009. The United Nations World Water
Development Report 3–Water in a Changing World.
United Nations Educational Scientific and Cultural
Organization, Paris.
Zérah, M.H., 2000. Household strategies for coping with
unreliable water supplies: the case of Delhi. Habitat
International, 24 (3): 295-307.
GENERAL ARTICLE
30. JOURNAL OF INNOVATION FOR INCLUSIVE DEVELOPMENT, VOL. 2, NO. 1, 22 FEBRUARY 2017
Abstract: Wetlands are highly productive ecosystems
which provide multiple-value ecosystem services. The
Loktak Lake wetland is located in the Bishnupur district
of the Indian state of Manipur, and is the largest
freshwater wetland in Northeast India. The lake is used
extensively by local people as a source of water for
irrigation and domestic use and is an important wintering
and staging area for water birds, particularly ducks. The
Loktak Lake has a socioeconomic and cultural
relationship with the people of Manipur. However, of late,
the impacts of increase in population, urbanisation and the
rapid pace of development have started being felt on
Loktak Lake. The once over 266 sq. km large Loktak
Lake is now showing signs of shrinking and reduction in
wetland spread. The lake had a seasonal and pulsating
characteristic which kept it clean and healthy. However,
changes in its hydrology due to regulation of water flow
for development purpose are now showing a detrimental
effect on the health of this wetland. The following article
is an attempt at putting greater focus on the lifeline of
Manipur, the Loktak Lake and a floating island paradise
where tourism is wanting.
Keywords: Loktak Lake, wetland, ecosystem services,
Manipur.
1. Introduction
Loktak Lake is the largest freshwater wetland in
Northeast (NE) India and was declared a wetland of
international importance by the Ramsar Convention in the
year 1990. Loktak Lake is considered the lifeline of
Manipur and is an integral part of the socioeconomic and
cultural life of the people in the state. It plays an important
role in flood control as well. A characteristic feature of
Loktak Lake are phumdis or the ‘floating islands’.
Phumdis are floating heterogeneous mass of entangled
Email for correspondence: [email protected]
vegetation, formed by the accumulation of organic debris
and biomass with soil particles, which have been
concentrated in solid form. Floating islands are a common
phenomenon in lakes and wetlands around the world
(Kaul and Zutshi, 1966; Trivedy et al., 1978; Sasser et al.,
1995; Mallison et al., 2001) and are also known as
tussocks (Hujik, 1994), floatons, floatant (Sasser and
Gosselink, 1984) or suds (Alam et al. 1996; Haller, 1996).
Floating islands are composed of native or exotic plants
growing on a buoyant mat consisting of plant roots and
organic matter (detritus). This definition of floating
islands includes small (less than 0.01 ha) free-floating
islands and extensive, stationary, vegetated mats which
may cover hundreds of hectares of water (Mallison et al.,
2001). Phumdis of Loktak Lake are basically
heterogeneous mass of soil, vegetation and organic matter
at various stages of decomposition (Trisal and Manihar,
2002). The phumdis occur in different sizes and thickness
and in the natural state, occupy almost half of the wetland
area. The southern part of Loktak Lake wetland forms the
Keibul Lamjao National Park, which is the one of the
largest ‘floating island’ wildlife protected areas in the
world. It is composed of a continuous mass of floating
phumdis occupying an area of approx. 40 sq. km (Prasad
and Chhabra, 2001).
Loktak Lake was indexed as a Ramsar site (Site No. 463)
(Wetland of International Importance) on the 23rd of
March, 1990 (Ramsar, 2012). Loktak Lake has also been
added to the Montreux Record since 16th June 1993. The
Montreux Record is a register of wetland sites on the list
of wetlands of international importance where changes in
ecological character have occurred, are occurring, or are
likely to occur as a result of technological developments,
pollution or other human interference (Ramsar, 2012).
Loktak Lake wetland was added in the Montreux Record
largely because of the ecological problems it faces such
as deforestation in the catchment area, infestation of water
hyacinth and pollution. According to the Ramsar listing,
A Wetland and a Lifeline: the Importance of
Loktak Lake for Manipur, India
Konsam Nirmala Devi
Shri Ram College of Commerce, University of Delhi
GENERAL ARTICLE
31. JOURNAL OF INNOVATION FOR INCLUSIVE DEVELOPMENT, VOL. 2, NO. 1, 22 FEBRUARY 2017
the construction of the Ithai barrage (in 1979) at one end
of the Loktak Lake, largely for hydroelectric power
generation and irrigation purposes, has caused the local
extinction of several native fish species.
The Loktak Lake is an important source of water, fisheries
and vegetation providing sustenance to a large population
dependent upon lake resources for their sustenance. The
lake water is used for irrigation, domestic purposes and
power generation. The lake vegetation is harvested for use
as food, fodder, fiber, fuel, handicrafts and medicinal
purposes. The lake water is also used for power
generation by the National Hydro Electric Power
Corporation (NHPC) which has installed a hydroelectric
power project with a total installed capacity of 105 MW
(Trisal and Manihar, 2002).
The increase in population and greater dependency on
Loktak Lake in recent years is deteriorating the ecological
balance of the lake leading to a reduction in ecosystem
services. There is no comprehensive seasonal assessment
of the ecosystem services provided by Loktak Lake. The
ecological and socio-economic significance of the
phumdis does not form a part of contemporary
management plan for Loktak Lake. At the same time,
detailed investigation of human dependency on Loktak
Lake is wanting and is required for developing a more
inclusive management plan. There are no detailed studies
of direct impact of Loktak Lake and its changing
conditions on the neighbouring human populations. This
article is therefore an attempt to collate the various
benefits that are being obtained from the Loktak Lake and
a forewarning that apathy and ignorance towards the now
increasing pollution of Loktak Lake will only result in
greater misery for the people of Manipur and Northeast
India.
2. A Note on Wetlands
Wetlands are areas subject to permanent or periodic
inundation or prolonged soil saturation sufficient for
establishment of hydrophytes and/or the development of
hydric soils. They are places where a recurrent excess of
water imposes controlling influences on all biota (plants,
animals and microbes) (Tiner, 1999). Cowardin (1979)
defines wetlands as land where an excess of water is the
dominant factor determining the nature of soil
development and the types of animals and plant
communities living at the soil surface and spanning a
continuum of environments where terrestrial and aquatic
systems integrate. Burton and Tiner (2009) have defined
wetlands as lands that are either inundated by shallow
water less than 2 m deep during low water events or have
soils that are saturated long enough during the growing
season to become anoxic and support specialized wetland
plants (hydrophytes). In addition to this, wetlands could
be of marine or estuarine nature and even include lake and
streams which are greater than 2 m deep. However, the
latter is the case only when such wetlands support
persistent emergent plant diversity (Burton and Tiner,
2009). Due to the regional differences in hydrologic
regimes, climate, soil-forming processes and
geomorphologic settings in areas marked by the
aforementioned characteristics, a vast diversity of
wetlands have evolved worldwide. Consequently, there is
no single, indisputable and ecologically sound definition
for wetlands, primarily because of the diversity of
wetlands (Cowardin, 1979).
One of the most widely accepted definition of wetlands
has been given by the Ramsar Convention on Wetlands of
the International Union for the Conservation of Nature
and Natural Resources (IUCN) (Lehner and Dӧll, 2004).
The Ramsar Convention is an inter-governmental treaty
that embodies the commitments of its member countries
to maintain the ecological character of pre-defined
‘Wetlands of International Importance’ and to plan for
sustainable use of the wetlands in the member countries’
territories. The Convention and its underlying principles
came into force in 1971 in the city of Ramsar in Iran.
According to the Ramsar Convention, wetlands can be
defined as “areas of marsh, fen, peatland or water,
whether natural or artificial, permanent or temporary,
with water that is static or flowing, fresh, brackish or salt,
including areas of marine water the depth of which at low
tide does not exceed six metres” (Article 1.1). Also,
wetlands "may incorporate riparian and coastal zones
adjacent to the wetlands, and islands or bodies of marine
water deeper than six metres at low tide lying within the
wetlands" (Article 2.1) (Ramsar, 2012). It needs to be
mentioned here that wetlands are known to be one of the
most important and productive ecosystems in the world
(Mitsch and Gosselink, 2000). They occur in all climatic
zones, from boreal to tropical, and include bogs, fens,
herbaceous marshes, woody swamps, shallow water
bodies, riverine floodplains, and coastal beaches (Gopal
and Ghosh, 2008).
The existence of the above mentioned large-scale
diversity of wetlands necessitates the classification of
wetlands into different types. Consequently, wetlands
have been classified for various purposes by different
authors from time to time. These classifications have been
made largely for one or all of the following reasons: 1) to
provide common terminology to describe similarities and
differences among wetlands, (2) to group them for
scientific studies and comparison, (3) to provide the
GENERAL ARTICLE
32. JOURNAL OF INNOVATION FOR INCLUSIVE DEVELOPMENT, VOL. 2, NO. 1, 22 FEBRUARY 2017
foundation for conducting wetland inventories that report
on the status, trends, functions, and condition of wetlands
in specific geographic areas, or (4) for their conservation,
use, and management (Tiner, 1999). The underlying
objective of all classification systems is to ensure
effective and efficient natural resource management and
conservation of wetlands. The criteria for wetlands
classification systems developed for natural resource
management is based on factors such as vegetation,
hydrology, water chemistry, soils/substrate, and
geomorphology. Some prominent wetlands classification
schemes and approaches are the Ramsar multinational
classification system, its regional modification for East
Africa, wetland classifications from the United States,
Canada, and New Zealand: a geomorphic approach to
global wetland classification and a hydrogeomorphic
approach used in the United States (Tiner, 1999). It needs
to be noted here that two sets of environmental factors
determine the principal types of wetlands. These are water
regime and nutrient supply. The term “water regime”
refers to hydrological factors including depth and
duration of flooding while “nutrient supply” refers to
chemical factors including available nitrogen,
phosphorous and calcium (Keddy, 2010).
3. Appraisal of Natural Resources of Loktak Lake
Brühl and Biswas (1926) studied the algae of the Loktak
Lake wetland while Biswas (1936) made an inventory of
the diatoms of the Loktak Lake wetland. Chaudhuri and
Benerjea (1965) have reported on the fisheries of Loktak
Lake with special reference to the development of Takmu
beel area of Loktak Lake for pisciculture. The fauna of the
Loktak Lake has been reported by Annandale and Hora
(1921). The 40.5 sq. km Keibul Lamjao National Park,
which forms part of the Loktak Lake wetland is the last
remaining natural habitat of the Manipuri brow-antlered
deer (Rucervus eldi eldi) (Gee, 1960).
The phytosociology, primary production and nutrient
status of the macrophytes of Loktak Lake have been
investigated in great detail by Devi (1993). Santosh and
Bidan (2002) studied the distribution of aquatic
vegetation of Loktak Lake. The characteristics and
classification of soils in the Loktak Catchment Area was
carried out by Sarkar et al. (2002). The soils in this area
were found to be deep, moderate to slightly acidic (pH
4.6–5.4) in the surface, rich in organic carbon, low to
medium in exchange capacities with higher clay and low
base status in the subsurface horizon. Soils were high in
available nitrogen, medium to high in available potassium
and low in available phosphorus. Available iron and
manganese were high, Cu and Zn were low particularly in
subsurface horizon (Sarkar et al., 2002). The habitat
heterogeneity of the Loktak Lake wetland has been
reported by Sanjit et al. (2005) with a special focus on
avifauna.
The actinomycetes in the Loktak Lake wetland were
isolated and screened for antimicrobial activities by Singh
et al. (2006). A total of 37 actinomycetes with distinct
characteristics were isolated from the soil samples
collected from the phumdis in the Loktak Lake. 12 of
these isolates (which belonged to genus Streptomyces)
were found to have broad spectrum of activity against the
tested microorganisms which underlines the potential of
the phumdis of the Loktak Lake as a source of novel
antibiotics (Singh et al., 2006). Ningombam and Bordoloi
(2008) conducted a survey of the amphibian diversity of
Loktak Lake wetland and checked the inventory with the
conservation status of individual species. They have
reported a total of 25 different species of amphibians
belonging to 7 families. Some rare frogs belonging to the
Megophyridae family have also been reported in the
Loktak Lake (Ningombam and Bordoloi, 2007). The
rotifers of Loktak Lake wetland were extensively studied
by Sharma (2009).
4. Anthropogenic Dependency on Loktak Lake
Leima et al. (2008) studied the dependency of lakeshore
communities for livelihood (especially aquatic
vegetation) on the floating islands of Keibul Lamjao
National Park. The socioeconomic conditions of residents
of six villages located in close proximity to the National
Park were analyzed using appropriate survey
methodology. The villages selected are Thanga Salam,
Sagram, Keibul Mayai Leikei, Wapokpi, Nongmaikhong
and Khordak. They found that aquatic vegetation
collection from the Park alone contributes as high as
89.70% of the average annual household income in
Keibul Mayai Leikei village (with 111 number of
households) while fishing in and around the Park
contributes 67.2% of the average annual income in
Thanga Salam village (with 116 number of households)
(Leima et al., 2008).
They have also documented the collection pattern of non-
wood forest products for livelihood generation by the
lakeshore communities residing around the Keibul
Lamjao National Park. Sunanda et al. (2014) carried out
an assessment of the Sustainable Livelihoods of Loktak
Lake Islanders in Bishnupur District of Manipur. They
found that majority of the Islanders had medium level of
livelihood on different aspects of sustainability factors.
Indeed further, and more comprehensive studies are
required to establish the resource dependency of the
people living around the Loktak Lake on its resources.
GENERAL ARTICLE
33. JOURNAL OF INNOVATION FOR INCLUSIVE DEVELOPMENT, VOL. 2, NO. 1, 22 FEBRUARY 2017
5. Sustainable Management Challenges
The Loktak Development Authority (A Government of
India undertaking) has analysed the ecological and socio-
economic features of the Loktak Lake wetland. The
analysis was based on a holistic study of the integrated
catchment as well as institutional arrangement to deduce
the following key issues in the conservation and
management of Loktak Lake wetland (LDA, 2011):
Enhanced soil erosion leading to wetland
sedimentation due to shifting cultivation and loss
of vegetal cover in the catchment area
Reduction in water holding capacity of wetlands
as a consequence of siltation, encroachments, and
prolific growth of aquatic vegetation
Flooding in peripheral areas leading to inundation
of agricultural areas and damage to life and
property
Deterioration of water quality due to inflow of
sewage from urbanized and peripheral areas
Decline in fish resources thereby affecting the
livelihoods of the fisher communities
Degradation of phumdis in KLNP affecting the
biodiversity of the national park particularly the
flagship species, Rucervus eldi eldi
Poverty due to resource degradation and limited
opportunities of livelihood diversification.
The impacts of climate change upon river discharge
within three sub-catchments of Loktak Lake wetland was
carried out by Singh et al. (2010). Two groups of climate
change scenarios are investigated by them. Group 1 uses
results from seven different Global Climate Models
(GCMs) for an increase in global mean temperature of
2°C, the purported threshold of “dangerous” climate
change. Group 2 is based on results for increases in global
mean temperature between 1°C and 6°C. Results from the
Group 1 scenarios show varying responses between the
three sub-catchments. The majority of scenario-sub-
catchment combinations indicate increases in discharge
will vary from <1% to 42%. Six of the GCMs suggest
overall increases in river flow to Loktak Lake (2–27%)
whilst the other results in a modest (6%) decline. In
contrast, Group 2 scenarios lead to an almost linear
increase in total river flow to Loktak Lake with increasing
temperature (up to 27% for 6°C), although two sub-
catchments are modeled to experience reductions in mean
discharge for the smallest temperature increases.
Further, they have noted that although elevated water
levels may permit enhanced abstraction for irrigation and
domestic uses, future increases in hydropower generation
are limited by existing infrastructure (Singh et al, 2010).
They also warn that higher water levels in the Loktak
Lake wetland in the near future are likely to exacerbate
existing ecological deterioration as well as enhance
problems of flooding of lakeside communities.
Since the construction of the Ithai barrage in 1979, the
water levels in the Loktak Lake have been constantly
regulated to maintain the generation of hydropower. High
water levels in the Loktak Lake have impacted the
ecological conditions of the wetland, and the floating
vegetated islands (phumdis) are the worst affected (Singh
et al., 2011). Singh et al. (2011) have put forward an
integrated solution to this problem by recommending the
balancing of hydropower and agricultural abstractions of
water with respect to optimizing wetland water-level
requirements. The effects on the fluvial system of Loktak
Lake sub-basin due to the bi-directional inter-exchange of
flows between the Loktak Lake wetland and the Manipur
River have been studied by Singh et al. (2008). The flow
in two inter-linking channels, viz. Khordak and Ungamel,
is examined with a modeling approach. They report that
silt transport dominates the fluvial entity of Loktak Lake
by more than 80% (relative to clay and sand) in exchange
of flows with the main drainage river in the basin.
The pollution status and aquatic bio-resources of the
Moirang River near its mouth in the Loktak Lake was
evaluated by Kosygin et al. (2007). The river water was
found to be polluted noting high concentration of free CO2
(14.8 mg/l), nitrite-nitrogen (0.040 mg/l), inorganic
phosphorus (0.107 mg/l) and faecal coliform bacteria
(162 /100 ml). Aquatic bio-resources of the river included
24 species of fish representing 20 genera of 13 families
and 16 species of macrophytes representing 14 genera of
9 families (Kosygin et al., 2007).
Banerjee et al. (1983) carried out a comparison of
seasonal and diurnal patterns of some physic-chemical
parameters of the open and closed parts of Loktak Lake to
investigate the impact of human activities on these
variations. The study was carried out from 1976 to 1978.
They found that the closed part of the lake, used for
controlled fishing, was well protected while the open part
was subject to considerable human activities.
Simultaneously, they found that the variation in the
physico-chemical parameters in the open lake were
different from those of the closed lake in that (a) there was
distinct seasonal variation in dissolved oxygen which was
not evident in the closed lake and (b) there was direct
relationship between diurnal variation of CO2 and pH
instead of an indirect relationship in the closed lake. A
similar pattern was found in the case of pH, electrical
conductivity, bicarbonate, free carbon dioxide and
GENERAL ARTICLE
34. JOURNAL OF INNOVATION FOR INCLUSIVE DEVELOPMENT, VOL. 2, NO. 1, 22 FEBRUARY 2017
chloride thus indicating significant impact of human
activity on the Loktak Lake wetland (Banerjee et al.,
1983).
Singh and Khundrakpam (2009) carried out a case study
of the phumdi proliferation in the Loktak Lake wetland.
The study was based on remotely sensed data of 1989 and
2002 and field surveys covering eight villages and 377
households. Their results showed that the phumdi area has
increased from 1989 to 2002 and the main causes for
phumdi proliferation are the construction of the Ithai
Barrage Dam, increase in athaphum fishing, pollution and
growth of settlements on phumdis. Thus, the growth of
phumdis is largely a result of the demographic pressure
on the Loktak Lake wetland (Singh and Khundrakpam,
2009). The impacts of high water level in the Loktak Lake
wetland throughout the year due to the Ithai barrage and
the need to regulate such a high intensity of man-made
intervention has been discussed by Singh (2010).
The major and trace elements in the water samples of
Loktak lake and Nambul River, the most polluted river
draining into the Loktak Lake were determined by
using Energy Dispersive X -ray Fluorescence
(EDXRF) technique by Singh et al. (2013). They found
that despite the polluted Nambul River drains into the
Loktak Lake, the concentration of some toxic elements
are within the permissible level in the Lake (Singh et al.,
2013). The Loktak Lake thus has been able to buffer
against the increasing pollution and large-scale
degradation taking place around it. However, this may not
be the case for long and concerted steps and urgent
measures need to be taken today for protecting and
preserving the Loktak Lake and its natural resources.
6. Conclusion
The Loktak Lake is an important wetland for the people
of Manipur and as is the case with other natural resources,
Loktak Lake is also witnessing the increasing pressure of
rising population and unplanned developmental activities.
Indiscriminate removal of phumdis is being done in the
Loktak Lake without understanding the ecological or
social relevance of these masses of vegetation. A
sustainable amount of phumdis should always be left to
sustain the needs of the local communities and ensure the
ecological functioning of the Lake. Studies have shown
that phumdis can be utilized for conversion to fuel and
compost (Devi et.al, 2002; Meitei and Prasad, 2012;
Singh and Kalamdhad, 2014). This can be explored to
maximise the utilisation of the unique phumdis. A natural
resource management solution has to be promoted which
will improve the sustainability of the Loktak Lake and
which would enhance the sustainable livelihood of the
local communities. This can be possible only when all
stakeholders are involved in the management process. A
viable combination of the traditional knowledge of the
local communities and the scientific knowledge of the
Manipur administration is the only way forward for
sustainable management and development of Loktak
Lake.
7. References
Alam, S. K., L. A. Ager, T. M. Rosegger, and T. R. Lange.
1996. The effects of mechanical harvesting of floating
plant tussock communities on water quality in Lake
Istokpoga, Florida. Lake Reserve Management. 12:
455-461.
Annandale, N. and Hora, S. L. 1921. The fauna of Loktak
lake in Manipur. Proceedings of Indian Science
Congress. 147.
Banerjee, D.K., Bhatia, B. and Haq, I. 1983. Comparison
of seasonal and diurnal patterns of some physic-
chemical parameters of the open and closed parts of
Loktak Lake, Manipur, India. International Journal of
Environmental Studies. 21 (3-4): 243-250.
Biswas, K. 1936. Common diatoms of the Loktak Lake,
Manipur, Journal of Asiatic Society. 2: 171-175.
Brühl, P. and Biswas, K. 1926. Algae of the Loktak lake.
Asiatic society of Bengal.
Burton, T.M. and Tiner, R.W. 2009. Ecology of
Wetlands. In: Gene E. Likens, G.E. Encyclopedia of
Inland Waters. Academic Press, Oxford. 507-515.
Chaudhuri, H. and Benerjea, S.M. 1965. Report on the
fisheries of Manipur with special reference to the
development of the Takmu beel area of Loktak lake.
Miscellaneous Contribution. Central Inland Fish
Research Institute, Barrackpore. (4): 29.
Cowardin, L. M. 1979. Classification of wetlands and
deepwater habitats of the United States. Diane
Publishing Company.
Devi, N.B. 1993. Phytosociology, primary production and
nutrient status of macrophytes of Loktak lake,
Manipur, PhD thesis. Manipur: Manipur University
Devi, V., Chanakya, H.N., deAlwis, A.A.P., Deepa, G.B.
and Modak, J.M. 2002 Management of non-point
organic and inorganic pollution of water bodies using
decentralized installation of bioreactors. Proceedings
of the Lake 2002 Conference, CES, IISc, Bangalore
Gee, E. P. 1960. Report on the status of brow- antlered
deer of Manipur (India). Journal of Bombay Natural
History Society. 57: 597-617.
Gopal, B. and Ghosh, D. 2008. Natural Wetlands. In:
Jorgensen, S.E. and Fath, B. Encyclopedia of
Ecology. Academic Press, Oxford. 2493-2504.
Haller, W.T. 1996. Evaluation of the Kelpin 800 aquatic
weed harvester, Florida 1995. Aquatics 18 (3): 10-15.
GENERAL ARTICLE
35. JOURNAL OF INNOVATION FOR INCLUSIVE DEVELOPMENT, VOL. 2, NO. 1, 22 FEBRUARY 2017
Hujik, B. 1994. Invasion of the tussocks. Aquatics 16 (2):
4-8.
Kaul, V. and D.P. Zutshi. 1966. Some ecological
considerations of floating islands in Srinagar lakes.
Proceedings of National Academy of Science. India
36: 273-280.
Keddy, P.A. 2010. Wetland ecology: principles and
conservation. Cambridge University Press.
Kosygin, L., Dhamendra, H. and Gyaneshwari, R. 2007.
Pollution status and conservation strategies of
Moirang river, Manipur with a note on its aquatic bio-
resources. Journal of Environmental Biology. 28 (3):
669-673.
Lehner, B. and Döll, P. 2004. Development and validation
of a global database of lakes, reservoirs and wetlands.
Journal of Hydrology, 296(1): 1-22.
Leima, T.A., Pebam, R. and Hussain, S.A. 2008.
Dependence of lakeshore communities for livelihood
on the floating islands of Keibul Lamjao National
Park, Manipur, India. In: Sengupta, M. and Dalwani,
R.(Eds.) Proceedings of Taal 2007: The 12th World
lake Cnference. 2088-2090.
Loktak Development Authority. 2011. Loktak
Development Authority Annual Administrative
Report 2010-11
Mallison, C.T., Stocker, R.K. and Cichra, C.E. 2001.
Physical and vegetative characteristics of floating
islands. Journal of Aquatic Plant Management. 39:
107-111.
Meitei, M.D and Prasad, M.N.V. 2013.
Phytotechnological applications of ‘phoomdi’, Loktak
lake, Manipur, Northeast India Current Science 105
(5): 569-570.
Mitsch, W.J. and Gosselink, J.G. 2000. The value of
wetlands: importance of scale and landscape setting.
Ecological Economics. 35 (1): 25-33.
Ningombam, B. and Bordoloi, S. 2007. Amphibian fauna
of Loktak Lake, Manipur, India with ten new records
for the State. Zoos’ Print Journal. 22 (5): 2688-2690.
Prasad, B and Chhabra, S.S. 2001. Management Plan for
Keibul Lamjao National Park, Manipur, Forest
Department, Manipur, India.
Ramsar 2012. http://www.ramsar.org/cda/en/ramsar-
activities-cepa-classification-system/main/ramsar/1-
63-69%5E21235_4000_0. (Accessed on 20/10/2016).
Sanjit, L. Bhatt, D. And Sharma, R.K. 2005. Habitat
heterogeneity of the Loktak lake, Manipur. Current
Science. 88 (7): 1027-1028.
Santosh, S. and Bidan, C. 2002. Distribution of aquatic
vegetation in Loktak Lake. Management of Phumdis
in Loktak. Wetlands International South Asia. 9-12.
Sarkar, D., Baruah, U., Gangopadhyay, S. K., Sahoo, A.
K. and Velayutham, M. 2002. Characteristics and
classification of soils of Loktak Catchment Area of
Manipur for sustainable land use planning. Journal of
the Indian Society of Soil Science. 50(2): 196-204.
Sasser, C.E., J.M. Visser, D.E. Evers, and J. G. Gosselink.
1995. The role of environmental variables on
interannual variation in species composition and
biomass in a subtropical minerotrophic floating
marsh. Canadian Journal of Botany 73: 413-424.
Sasser, C.E. and Gosselink, J.G. 1984. Vegetation and
primary production in floating freshwater marsh in
Louisiana. Aquatic Botany. 20: 245-255.
Sharma, B.K. 2009. Diversity of rotifers (Rotifera,
Eurotatoria) of Loktak lake, Manipur, North-eastern
India. Tropical Ecology. 50 (2): 277.
Singh, A.L. and Khundrakpam, M.L. 2011. Phumdi
proliferation: a case study of Loktak lake, Manipur.
Water and Environment Journal. 25 (1): 99-105.
Singh, C.R., Thompson, J.R., Kingston, D. G. and French,
J.R. 2011. Modelling water-level options for
ecosystem services and assessment of climate change:
Loktak Lake, northeast India, Hydrological Sciences
Journal, 56 (8): 1518-1542
Singh, C. R., Thompson, J. R., French, J. R., Kingston, D.
G. and Mackay, A. W. 2010. Modelling the impact of
prescribed global warming on runoff from headwater
catchments of the Irrawaddy River and their
implications for the water level regime of Loktak
Lake, northeast India. Hydrology and Earth System
Sciences. 14 (9): 1745-1765.
Singh, L.S., Baruah, I., Bora, T.C. 2006. Actinomycetes
of Loktak habitat: Isolation and screening for
antimicrobial activities. Biotech. 5: 217-221.
Singh, N.S., Devi, C.B., Sudarshan, M., Meetei, N.S.,
Singh, T.B., and Singh, N.R., 2013. Influence of
Nambul River on the quality of fresh water in Loktak
Lake. International Journal of Water Resources and
Environmental Engineering. 5(6): 321-327.
Sunanda, T., Singh, M.K., Ram, D. and Chaudhary, K.P.,
2014. Assessment of the Sustainable Livelihoods of
Loktak Lake Islanders in Bishnupur District of
Manipur. Indian Res. J. Ext. Edu, 14 (3) 70-74.
Tiner, R.W. 1999. Wetland indicators: A guide to wetland
identification, delineation, classification and
mapping. CRC.
Tiner, R.W. 2009. Ecology of Wetlands: Classification
Systems. In: Likens, G.E.. Encyclopedia of Inland
Waters. Academic Press. 516-525.
Trisal, C.L. and Manihar, T. 2002. The Atlas of Loktak.
Wetlands International – South Asia, New Delhi
Trivedy, R. K., Sharma, K. P., Goel, P. K. and Gopal, B.
1978. Some ecological observations on floating
islands. Hydrobiologia. 60: 187-190.
REVIEW ARTICLE
36. JOURNAL OF INNOVATION FOR INCLUSIVE DEVELOPMENT, VOL. 2, NO. 1, 22 FEBRUARY 2017
Abstract: The activity of growing food is an integral part
of human civilization and survival. The present paper
attempts at exploring the psychological impact of
growing edible greens in the context of urban
environment. The review focuses on the impact of
growing food, with primary focus on psychological
impact and mental health. The findings indicate an
encouraging trend in urban farming, though research
activity and academic interest in the area of psychological
impact of growing food seems limited. Additionally, the
review throws light on the sparse research in developing
countries on the said topic.
Keywords: urban farming, psychological impact, mental
health.
1. Introduction
Contact with nature in it numerous forms - through
viewing landscapes that have an abundance of vegetation
(Ward Thompson, 2011; Velarde et al., 2007), by being
close to a lake (Song, 2015), by spending time walking on
beautiful sandy beaches, by growing flowers in the
balcony – ameliorates stress and has health benefits. This
belief has a rich, long history. It goes back to Cyprus the
Great, who - some 2,500 years ago - built gardens for
relaxation in the busy town of Persia. Paracelsus, the 16th
century German-Swiss physician, gave voice to the same
when he wrote, “The art of healing comes from nature,
not from the physician.” In the Republic of Ireland, care
was given to ‘troubled people’ by monks way back in the
14th century, through their involvement in monastery
gardens. The Friends’ Hospital in Philadelphia, USA, first
opened a horticultural therapeutic unit in 1817, which is
still running. In the UK, by the mid nineteenth century,
local authorities were noticing that the well-being of
patients involved in gardening work in the grounds was
Email for correspondence: [email protected]
better than that of their co-residents who were
incarcerated indoors, largely in seclusion and looked after
by servants. This led to the Dorset County Asylum
regulations in 1856 actually making it obligatory for
inmates to be involved in outdoor work (Ryan, 1993).
We have long believed, experienced and lived the many
restorative effects of living close to nature. In India, there
are festivities to mark the sowing as well as harvest
seasons, most of which are celebrated in the fields
symbolizing peoples’ intimacy with nature (Shiva, 1993).
The increasing urbanization is leading to a systematic
reduction of the natural, green, forest cover and is also
creating a greater physical distance between man and
nature. Numerous researchers have asserted that
separation from nature is detrimental to human
development, health and well-being (Stilgoe, 2001).
Urban environments are seen as inducing stress, too much
artificial stimulation and lack of exposure to natural
environments, such as parks, can cause exhaustion and
reduce vitality (Stilgoe, 2001). On the other hand,
interacting with nature has been proven to be beneficial
for human health. There have been noted numerous
positive physiological effects that occur when humans
encounter, observe or otherwise positively interact with
animals, plants, landscapes or wilderness. (Ulrich et al.
1991).
2. Theoretical Perspectives on Mental Health and
Contact with Nature
The impact of contact with nature can be understood from
various perspectives. The first section of the paper
explores briefly, some theoretical positions regarding the
impact of nature, specifically impact of active
involvement with nature, on mental health. The Biophillia
Hypothesis was originally referred to as an ‘innate
tendency to focus on life and lifelike processes’ (Wilson,
1984), meaning that we gain the most satisfaction from
processes that mimic the nature of life on many levels, be
Food in the City: Review of Psychological
Impact of Growing Food in Urban Spaces
Surabhika Maheshwari
Department of Psychology, Indraprastha College for Women, University of Delhi
REVIEW ARTICLE
37. JOURNAL OF INNOVATION FOR INCLUSIVE DEVELOPMENT, VOL. 2, NO. 1, 22 FEBRUARY 2017
they cognitive or emotional. The hypothesis revolves
around the concept that people possess an inherent
inclination to affiliate with natural processes and
diversity, and this affinity continues to be instrumental in
humans’ physical and mental development. Burls (2007)
highlighted the benefits of human-nature interaction in
terms of nine values as follows: a) Aesthetic Value
(physical attraction and beauty of nature): adaptability,
awareness, harmony, balance, curiosity, creativity and an
antidote to pressures of modern living. b) Dominionistic
value (mastery and control of nature): coping and
mastering adversity, capacity to resolve unexpected
problems, leading to self-esteem. c) Humanistic Value
(affection and emotional attachment to nature): fondness
and attachment, connection and relationship, cooperation,
sociability and ability to develop alliances. d) Moralistic
Value (Spiritual and ethical importance of nature):
understanding the relationship between human wholeness
and the integrity of the natural world, leading to a sense
of harmony and logic. e) Naturalistic Value (immersion
and direct involvement with nature): immersion in the
sense of authenticity of natural rhythms and systems,
leading to mental acuity and physical fitness. f)
Negitavistic value (fear and aversion of nature):
developing a healthy respect for risk, powers and dangers
inherent in nature with an equal sense of awe, reverence
and wonder, leading to deal with fears and apprehensions
in a constructive way. g) Scientific value (knowledge and
understanding of nature): developing a cognitive capacity
for critical thinking, analytical abilities and problem
solving skills, leading to competence. h) Symbolic value
(metaphorical and figurative significance of nature):
being able to access the limitless opportunities offered by
the processes in the natural world to develop
understanding of one’s circumstances, leading to
cognitive growth and adaptability. i) Utilitarian value
(material and practical importance of nature):
emphasizing the practical and material importance of the
natural world upon which we rely for survival.
There is support for the Biophillia hypothesis in the fact
that this sort of attunement with nature has survival value.
Additionally, it implies that people feel most comfortable
in settings where they can identify with life processes
(Gullone, 2000). The other theoretical postulations
include, the need hierarchy model that draws upon
Maslow’s (1970) hierarchy of needs model. Townsend
and Ebden (2006) created an intervention framework
titled, ‘Feel blue, touch green’ wherein individuals
suffering from mood disorders were given made to
directly interact with natural environments, through
which higher order needs were met. Also, an interesting
observation of Maslow’s description of ‘peak’
experiences is that it often occurs in natural settings. The
Environmental self-regulation hypothesis in the current
context implies that physical activity in natural settings
improves positive emotions, self-esteem and behaviours
(Boldeman et al., 2004). This implies that natural settings
have the power to offset negative emotional states and
help in augmenting positivity.
The present paper attempts to take the discourse further
and attempts at exploring the psychological impact of
growing edible greens in the context of urban
environment. The paper reviews the impact of growing
food, with primary focus on psychological impact and
mental health. The psychological impact of growing
greens has further been thematically presented to
facilitate clear conceptualization and understanding.
Understanding food production in urban spaces in itself
can be challenging owing to the activity not being entirely
organized, by its dynamic nature and the fact that the land
and resource use in urban farming in always clearly
identifiable or quantifiable. A working definition of
Growing Food could be understood as involvement in the
process of sowing, nurturing, harvesting and facilitating
the activities of growing edible plants; for the purpose of
the current paper the activity of growing food has been
concentrated to the urban areas.
3. Understanding Prevalence
Growing food for personal and family consumption is a
significant global activity that has received insufficient
academic attention (Church et al., 2015). People grow, or
could grow, their own food for personal consumption in
many and diverse settings such as allotments, balconies,
community gardens, fire escapes, indoor surfaces, pots on
patios, private gardens, rooftops and school gardens
(Grewal and Grewal, 2012; Kortright and Wakefield,
2011). In an extensive review of domestic gardens in
Europe, Church et al. (2015) made some interesting
observations. In the UK, it is estimated that 87% of
households have access to a private garden (Davies et al.,
2009), although individual gardens are becoming smaller
and there has been a tendency to pave over front garden
plots, reducing actual or potential food growing space
(Freeman et al., 2012). The decline in the proportion of
garden owners who grow vegetables, from 35% in 1986
to 20% in 1996 may be associated with this reduction in
available growing space. However, a Canadian study
based on semi-structured interviews with people who
grow their own food (Kortright and Wakefield, 2011)
noted that “more garden space does not necessarily lead
to more food growing some of the largest supported the
smallest amounts of food”. Rather than access to growing
space, therefore, the authors concluded that the principal
REVIEW ARTICLE
38. JOURNAL OF INNOVATION FOR INCLUSIVE DEVELOPMENT, VOL. 2, NO. 1, 22 FEBRUARY 2017
barriers to food growing were necessary skills and time.
Although far less substantial than private gardens in
number and area, allotment gardens are also significant,
numbering around three million in Europe (Barthel et al.,
2010). Another extensive review has been compiled by
Golden in 2013 focusing on the impacts of Urban
Agriculture (Golden, 2013). The review is situated in
America and focuses primarily on American data and
academic work in the field.
There is evidence to suggest that demand for community
gardens may be increasing in the UK and Ireland, with a
65% increase in the number of these gardens registered by
the Federation of Urban Farms and Community Gardens
in 2011 compared to 2010 (Clavin, 2011). How many of
these are used for food production is not clear but, as a
comparator, Taylor and Lovell (2012) found that only
13% of community gardens in Chicago were being used
for food production. In an interesting book on domestic
food production in Australia, the author notes that home
food production in the 1990s was more common than it
seemed (Gaynor, 2005) and also mentions a 1941
"Melbourne University Social Survey" saying that "48%
of sampled households produced food of some kind".
There is extremely limited information currently available
on urban domestic gardens outside of cities in the west.
Urban food production is central to the existence of many
poorer cities across the globe (Ellis and Sunberg, 1998;
FAO, 1998; Tewari, 2000; Bakker et al., 2001), but
academic interest still remains scanty. In a study done on
the composition, diversity, density and distribution of
plant vegetation in urban domestic gardens in the rapidly
expanding south Indian city of Bangalore, researchers
found high proportion of species had uses as food or as
spices, medicinal properties, and/ or religious significance
(Jaganmohan et al., 2012). In many metropolises like
Delhi, Mumbai, Hyderabad and Chennai or small cities
like Nashik and Nagpur, people are forming gardening
groups to learn from each other. The movement has
caught on well in Bengaluru, which has an estimated
7,000 terrace or rooftop gardens (Pallavi, 2014). The
available literature surely points to an encouraging food
production trend in urban areas world-wide.
Gardeners appear to be aware that gardening is good for
their mental health; in a study based in USA, gardeners
involved with the Philadelphia Gardening Programme
were asked why they gardened (Blair et al., 1991).
Interviewing a total of 144 gardeners, Blair et al. found
that recreation (21%) was the most important reason
followed by health benefits including ‘mental health’
(19%), ‘physical health and exercise’ (17%) and ‘produce
quality and nutrition’ (14%). A similar study in Toronto,
Canada (Wakefield et al., 2007) collected data on the
perceived health impacts of community gardening
through participant observation, focus groups and in-
depth interviews. Results suggest that community gardens
were perceived by gardeners to provide numerous health
benefits, including improved access to food, improved
nutrition, increased physical activity and improved
mental health. Community gardens were also seen to
promote social health and community cohesion.
4. Physical Health Impact
Physical health and psychological well-being are
intrinsically related to one another. The two areas in
which physical benefits of growing food can be studied
are - at the level of consumption and at the level of
exercise. Gardening not only facilitates the consumption
of superior quality, fresh food but also increases the
likelihood of consumption of fruits and vegetables. In a
survey conducted on 799 adults in Michigan it was found
that adults with a household member who participated in
a community food garden consumed fruits and vegetables
1.4 more times per day than those who did not participate,
and they were 3.5 times more likely to consume fruits and
vegetables at least 5 times daily (Alaimo et al., 2008).
Gardening helps in health promotion (Armstrong, 2000).
The act of gardening requires physical strength,
endurance and flexibility. Since it is an outdoor activity it
also facilitates the intake of fresh air and Vitamin D. The
Centre for Disease Control and Prevention considers
gardening a moderate intensity level activity, and can help
achieve that 2.5 hour goal each week, that can aid in
reducing the risk for obesity, high blood pressure, type 2
diabetes, osteoporosis, heart disease, stroke, depression,
colon cancer and premature death (State, 2014).
Additionally, those who choose gardening as their
moderate-intensity exercise are more likely to exercise
40-50 minutes longer on average than those who choose
activities like walking or biking.
5. Stress Management
Growing plants - tending and nurturing a live space has
understood to promote stress relief. There is a lack of
direct research material on the psychological impact of
food growing on stress. Gardening has also emerged, in
the recent years, as a scientifically proven stress reliever.
Stress can cause irritability, headaches, stomach aches,
heart attacks and worsen pre-existing conditions in the
body. An experiment published in the Journal of Health
Psychology compared gardening to reading as a stress-
relieving activity; test subjects that gardened experienced
a more significant decrease in stress when compared to
the subjects that were assigned to read (Van Den Berg and
Custers, 2010). Research carried out in Sweden found that
REVIEW ARTICLE
39. JOURNAL OF INNOVATION FOR INCLUSIVE DEVELOPMENT, VOL. 2, NO. 1, 22 FEBRUARY 2017
people with access to a garden had significantly fewer
stress occasions per year (Stigsdotter and Grahn, 2011).
They reported that people living in apartment blocks with
no balcony or outdoor area had an average of 193 stress
occasions per year. This was reduced to 126 stress
occasions if respondents had a balcony. Those with a
small garden had 86 stress occasions, while the least stress
was reported by those with a large leafy garden, who only
reported an average of 65 stress occasions per year. They
also found that the more often people used their gardens,
the fewer stress occasions they suffered per year. In
comparing gardens with other urban green spaces, they
found that while both were important for health, having a
private garden was more important.
Hawkins et al. (2013) found a significant difference in
perceived stress levels between the activities groups of
‘indoor exercise’, ‘walkers’, ‘allotment gardeners’, and
‘home gardeners’. Allotment gardeners reported
significantly less perceived stress than participants of
indoor exercise. In a second study, Hawkins et al. (2013)
had an older adult sample of community allotment
gardening with a particular emphasis on stress recovery
and again results indicate that allotment gardeners
appreciate both ‘doing’ the gardening as well as ‘being’
in the garden/ allotment landscape with a wide range of
benefits to their health and wellbeing.
Gardening can thus be recognized as an important way of
dealing with stress. For some gardeners, food growing is
valuable time to be with friends and escape personal and
work problems. For others, the opportunity to be alone, in
an alive space, is often an essential way of coping with
the pressures of daily life in a complex society.
6. Treatment of Specific Psychological Disorders
Research focus on specific psychological disorders and
their treatment using nature, natural settings and
involvement in greening and growing activities is recent
and limited.
Attention Deficit Disorder: A study focusing on children
with Attention Deficit Disorder (ADD) examined the
relationship between children’s nature exposure through
leisure activities and their attentional functioning using
both within and between-subjects comparisons (Taylor et
al., 2001). Parents were surveyed regarding their child’s
attentional functioning after activities in several settings.
Results indicate that children function better than usual
after activities in green settings and that the “greener” a
child’s play area, the less severe his or her attention deficit
symptoms. The study concluded that contact with nature
may support attentional functioning in a population of
children who desperately need attentional support.
A number of studies have shown the benefits of
horticultural activities for patients with dementia. In a
review of the literature of the evidence to support the use
of therapeutic gardens for the elderly, Detweiler et al.
(2012) concluded that many preliminary studies have
reported benefits of horticultural therapy and garden
settings in reduction of pain, improvement in attention,
lessening of stress, modulation of agitation, lowering of
medications and antipsychotics and reduction in falls.
Gigliotti and Jarrot (2005) studied whether planting,
cooking or craft activities engender differential responses
from adult day service participants with dementia, and in
a later study the same author team (Jarrot and Gigliotti,
2010) evaluated responses to horticultural based activities
for randomly assigned groups in eight care homes and
compared with responses to traditional activities. They
showed that horticultural activities reached groups of
participants who would often be difficult to engage in
activities and resulted in higher levels of adaptive
behaviour and in active and passive engagement.
Luk et al. (2011), studying horticultural activities in a
nursing home in Hong Kong, found no significant effect
on the reduction of agitation among the home residents
with dementia. However, a significant decrease in
aggressive behaviour was noticed. Hewitt et al. (2013)
evaluated the impact of therapeutic gardening for people
with young-onset dementia, measuring outcomes for both
participants with dementia and their careers. The
conclusion from their preliminary study suggested that
structured gardening over a 12 months period had a
positive impact on the wellbeing, cognition and mood of
people with young-onset dementia. Specific attention was
drawn to the relationship between the wellbeing of
participants and their cognition as the results of the study
suggested that wellbeing can be maintained despite the
presence of a cognitive deterioration. Self-identity and
purposeful activity were reported as common themes as
benefits of the gardening group, participants felt useful
and valued and had a sense of achievement.
7. Impact on Specific Populations
Results of a web-based study that covered 1,28,836
children (youth under 18 years old) involved in
gardening, primarily with teachers in school gardens,
where children involved were generally 12 years of age or
under and were growing food crops showed that adults
gardening with children reported benefits to children's
self-esteem and reduction in stress levels (Waliczek et al.,
2000). Many schools are including growing food as an
REVIEW ARTICLE
40. JOURNAL OF INNOVATION FOR INCLUSIVE DEVELOPMENT, VOL. 2, NO. 1, 22 FEBRUARY 2017
important addition to the curriculum. Miller (2007) has
suggested that when young children are participating in
garden activities, they are: (1) communicating their
knowledge about the world to others, (2) conveying (and
learning to process and manage) emotions, and (3)
developing important skills (e.g., initiative, self-
confidence, literacy, math, science skills) that will help
them be more successful in school and better navigate the
world.
Geriatric population and gardening is growing food in an
area where the elderly are often more skilled than younger
people. Wang and MacMillan (2013) reviewed 22 articles
that assessed the benefits of gardening for both
community-dwelling and institutionalized older adults.
Through various research designs (quantitative and
qualitative) and measurements utilized, the results reveal
that gardening can be an activity that promotes overall
health and quality of life, physical strength, fitness and
flexibility, cognitive ability, and socialization. The
implementation of various aspects of gardening as health-
promoting activities transcend contexts of practice and
disciplines and can be used in urban and rural
communities as both individual and group activities.
Drawing from understanding from Erikson’s (1985)
Stages of Psychosocial Development, the stage of
Generativity vs Stagnation (45 to 60 years) has particular
importance. The act of growing food could be used as one
of the engagements for healthy negotiation of this stage.
Providing and working towards a larger meaning and goal
aid in building self-reliance and self-esteem at this stage
of life.
A research team from King’s College, London, concluded
that one of the most powerful factors in curbing crime and
vandalism on problem housing estates was the presence
of a garden (Lord, 1995). Schools have also reported a
decrease in vandalism and an improvement in behaviour
when children participate in greening the school grounds.
Where primary prevention is too late, food growing can
play a valuable role in helping to prevent reoffending.
Few people realize that the prison service is already the
third largest farmer in the country, and nearly self-
sufficient in food. And although food growing is not seen,
officially, as having a therapeutic role for many prisoners
it undoubtedly does have one (Garnett et al., 1996). Given
that 5,000 prisoners are referred for treatment of mental
illness each year, there is real potential for linking up the
farming work that prisons already do with the needs of the
mentally ill. Food growing can also stimulate links
between inmates and the community. Such activities help
in the development of empathy and foster responsibility.
8. Social Interaction
Gardening appeals to people across demographic lines,
community gardens can increase the interactions between
people who would not normally meet or socialize. Older
members of the community work alongside younger
members, and all members can be welcoming to people
across racial, religious, or ethnic boundaries (Bellows,
2003; Winne, 2008). These benefits have proven to be
pervasive through time. Community gardens (Hou et al.,
2009) are an important intervention to ensure social
interaction and community building.
Many of the community food-growing projects in London
have undoubtedly helped improve participants’ quality of
life, such as the Healing Gardens and Natural Growth
projects which have enabled marginalised people to come
together, develop skills, confidence and friendships
(Garrnet, 1999). The Dartford Road allotment site just
beyond Greater London in Kent has grown into a hub of
community activity. It is now so popular that there is a
waiting list. Social events such as barbecues attract many
people, and reciprocal arrangements such as bulk-buying
and sharing manure are common (Dartford Roads
Allotment Association, 1999). Many food growers, in
turn, contribute directly to others in society and to the
environment. Almost all community projects rely heavily
on volunteers. Many allotment gardeners help each other
with the work, or share produce.
9. Horticulture Therapy
The Horticulture therapy model refers to the use of plants
and work in gardens to meet clinically defined goals.
Research suggests that Horticulture therapy mediates
emotional, cognitive and/ or sensory motor functional
improvement, increased social participation, health, well-
being and life satisfaction (Söderback et al., 2004).
However, the effectiveness, especially of the interacting
and acting forms, needs investigation. Growing food has
the potential to be used in reformative spaces – it
combines the important aspects of physical labour,
community building and working, understanding of
nurturance and patience, and an intrinsically built in
reward system. In 1986/7, over 7,000 people with mental
health problems were involved in horticulture. Gardening
can be therapeutic for a number of reasons. Gardening
therapy meets quite specific government criteria for
mental health promotion (Mansell, 1993). These are:
Community presence: Too often, mentally ill
people are segregated, kept away from everyday
settings. The advantage of many horticultural
REVIEW ARTICLE
41. JOURNAL OF INNOVATION FOR INCLUSIVE DEVELOPMENT, VOL. 2, NO. 1, 22 FEBRUARY 2017
projects is that they are in public places; a
volunteer working on such a project in the middle
of Battersea Park (Ryan, 1993) commented that
after four years, he still had no idea what his
fellow gardeners’ difficulties were - if any. Such
integration helps lessen the stigma attached to
people who are ‘different’.
Community participation: Gardening requires
some form of co-operation, while providing the
opportunity for individuals to form more private
friendships.
Choice: Horticulture offers a choice of how to
work - alone, with a friend, or as part of a team -
and what to do. Even small decisions - such as
what to plant, or where - can help people attain a
sense of independence.
Competence: The opportunity to perform
meaningful activities leads to a sense of
satisfaction and of self-worth. Gardening requires
competence, in simple routines such as scattering
seeds, or in complex tasks like pruning or plot
design, as does cooking the produce grown.
Indeed, many horticultural projects throughout
the UK provide training for employment, both in
sheltered and in commercial work places.
Respect: Horticultural projects provide a
situation where respect for self, others and all
forms of life can be learned. The officer at the
Battersea project above remarked that even those
clients with a history of violent behaviour rarely
act in this way in the garden.
10. Understandings and Implications
The present work is an attempt to understand the
psychological impacts of growing food in urban spaces.
The review facilitates some understandings and fosters
curiosity on multiple levels.
1. Urban food growing is very much prevalent and
is growing. This may be concluded from the
various mentioned researches and the fast
expanding informal gardeners’ networks that are
mushrooming in many metropolitans across the
world.
2. There are numerous health benefits of growing
food. Sustained research and academic interest
will help uncover the many potential benefits
urban farming has.
3. Agrarian countries like India and other
developing nations, that are witnessing rapid
urbanization, need be an important focus area.
The interest, possibility and impact are bound to
be manifold. The historical, cultural relevance
and practice of agriculture, the spaces that have
been transformed from farm lands to urban
dwellings and the collective psyche in which
agriculture is integral component are all factors
that make urban farming in developing countries
enriching and essential.
4. Mainstream psychology needs to integrate the
practice of growing foods and exploring its
various benefits in obliterating stress and
enhancing well-being. Varied methodologies
such as case studies and experiments need to be
conducted to better appreciate and understand the
impacts of a long practiced healing activity.
5. Community gardening in educational institutes,
parks and allotted spaces as well as private food
growing initiatives should receive
encouragement and support from the state.
6. Research and interdisciplinary academic
collaborations will help augment the
understanding of the psychological impact of
growing food and provide it the much needed
impetus and encouragement.
11. References
Alaimo, K., Packnett, E., Miles, R.A. and Kruger, D.J.
2008. Fruit and vegetable intake among urban
community gardeners. Journal of Nutrition Education
and Behavior. 40 (2): 94–101.
Armstrong, D.L. 2000. A community diabetes education
and gardening project to improve diabetes care in a
northwest American Indian tribe. The Diabetes
Educator. 26 (1): 113–120.
Bakker, N., Dubbeling, M., Guendel, S., Sabel-
Koshchella, U. and de Zeeuw, H. (Eds.) 2001. Growing
Cities, Growing Food: Urban Agriculture on the Policy
Agenda (Feldading, Die Stifung fur Internationale
Entwicklung).
Barthel, S., Folke, C. and Colding, J. 2010. Social–
ecological memory in urban gardens—retaining the
capacity for management of ecosystem services.
Global Environmental Change. 20 (2): 255–265.
Bellows, A.C. 2003. Health Benefits of Urban
Agriculture. Journal of Agricultural and Environmental
Ethics. 16 (3): 249–279.
Blair, D., Giesecke, C.C. and Sherman, S. 1991. A dietary,
social and economic evaluation of the Philadelphia
urban gardening project. Journal of Nutrition
Education. 23 (4): 161–167.
Boldeman, C., Dal, H. and Wester, U. 2004. Swedish pre-
school children’s UVR exposure - a comparison
between two outdoor environments. Photodermatology,
Photoimmunology and Photomedicine. 20 (1): 2–8.
Burls, A. 2007. People and green spaces: Promoting
public health and mental well‐being through
REVIEW ARTICLE
42. JOURNAL OF INNOVATION FOR INCLUSIVE DEVELOPMENT, VOL. 2, NO. 1, 22 FEBRUARY 2017
ecotherapy. Journal of Public Mental Health. 6 (3): 24–
39.
Church, A., Mitchell, R., Ravenscroft, N. and Stapleton,
L.M. 2015. Growing your own: A multi-level
modelling approach to understanding personal food
growing trends and motivations in Europe. Ecological
Economics. 110 (71–80).
Clavin, A. 2011. Realising ecological sustainability in
community gardens: A capability approach. Local
Environment. 16 (10): 945–962.
Dartford Roads Allotment Association Secretary. 1999.
Personal communication (January 1999) In: Garnett, T.
Urban Agriculture in London: Rethinking Our Food
Economy. City Case Study London, URL:
http://www.ruaf.org/sites/default/files/London_1.PDF.
Retrieved on 30.01.2017.
Davies, Z.G., Fuller, R.A., Loram, A., Irvine, K.N., Sims,
V. and Gaston, K.J. 2009. A national scale inventory of
resource provision for biodiversity within domestic
gardens. Biological Conservation. 142 (4): 761–771.
Detweiler, M.B., Sharma, T., Detweiler, J.G., Murphy,
P.F., Lane, S., Carman, J., Chudhary, A.S., Halling,
M.H. and Kim, K.Y. 2012. What is the evidence to
support the use of therapeutic gardens for the elderly?
Psychiatry Investigation. 9 (2): 100.
Ellis, F. and Sunberg, J. 1998. Food production, urban
areas and policy responses. World Development. 26:
213–225.
Erikson, E.H. 1985. The life cycle completed: A review.
New York: W.W. Norton & Company.
Food and Agriculture Organization (FAO). 1998. The
State of Food and Agriculture. Rome, Food and
Agriculture Organization Publications.
Freeman, C., Dickinson, K.J.M., Porter, S. and van
Heezik, Y. 2012. My garden is an expression of me:
Exploring householders’ relationships with their
gardens. Journal of Environmental Psychology. 32 (2):
135–143.
Garnett, T. 1999. Urban Agriculture in London:
Rethinking Our Food Economy, City Case Study
London. URL:
http://www.ruaf.org/sites/default/files/London_1.PDF.
Retrieved on 30.01.2017.
Garnett, T., Alliance, the N.F. and Alliance, S. 1996.
Growing food in cities: A report to highlight and
promote the benefits of urban agriculture in the UK.
London: National Food Alliance.
Gaynor, A. 2005. Harvest of the suburbs: An
environmental history of growing food in Australian
cities. Crawley: University of Western Australia
Publishing.
Gigliotti, C.M. and Jarrott, S.E. 2005. Effects of
horticulture therapy on engagement and affect.
Canadian Journal on Aging / La Revue canadienne du
vieillissement. 24 (04): 367.
Golden, S. 2013. Urban Agriculture Impacts: Social,
Health, and Economic: An Annotated Bibliography.
Technical Report Funded by funded by the University
of California Agriculture and Natural Resources
Competitive Grants Program. URL:
http://asi.ucdavis.edu/programs/sarep/publications/foo
d-and-society/uaannotatedbiblio-2013.pdf. Retrieved
on 27.02.2017.
Grewal, S.S. and Grewal, P.S. 2012. Can cities become
self-reliant in food? Cities. 29 (1): 1–11.
Gullone, E. 2000. The Biophilia hypothesis and life in the
21st century: Increasing mental health or increasing
pathology? Journal of Happiness Studies. 1 (3): 293–
322.
Hawkins, J.L., Mercer, J., Thirlaway, K.J. and Clayton,
D.A. 2013. Doing” gardening and Being at the
allotment site: Exploring the benefits of allotment
gardening for stress reduction and healthy aging.
Ecopsychology. 5 (2): 110–125.
Hewitt, P., Watts, C., Hussey, J., Power, K. and Williams,
T. 2013. Does a structured gardening programme
improve well-being in young-onset dementia? A
preliminary study. The British Journal of Occupational
Therapy. 76 (8): 355–361.
Hou, J., Johnson, J.M. and Lawson, L.J. 2009. Greening
cities, growing communities: Learning from Seattle’s
urban community gardens. Washington, D.C.:
Landscape Architecture Foundation in association with
University of Washington Press, Seattle & London.
Jaganmohan, M., Vailshery, L.S., Gopal, D. and
Nagendra, H. 2012. Plant diversity and distribution in
urban domestic gardens and apartments in Bangalore,
India. Urban Ecosystems. 15 (4): 911–925.
Jarrott, S.E. and Gigliotti, C.M. 2010. Comparing
responses to horticultural-based and traditional
activities in dementia care programs. American Journal
of Alzheimer’s Disease and Other Dementias. 25 (8):
657–665.
Kortright, R. and Wakefield, S. 2010. Edible backyards:
A qualitative study of household food growing and its
contributions to food security. Agriculture and Human
Values. 28 (1): 39–53.
Lord, D.N. 1995. In: Garnett, T., Alliance, the N.F. and
Alliance, S. 1996. Growing food in cities: A report to
highlight and promote the benefits of urban agriculture
in the UK. London: National Food Alliance.
Luk, K.Y., Lai, K.Y.C., Li, C.C., Cheung, W.H., Lam,
S.M.R., Li, H.Y., Ng, K.P., Shiu, W.H., So, C.Y. and
Wan, S.F. 2011. The effect of horticultural activities on
agitation in nursing home residents with dementia.
REVIEW ARTICLE
43. JOURNAL OF INNOVATION FOR INCLUSIVE DEVELOPMENT, VOL. 2, NO. 1, 22 FEBRUARY 2017
International Journal of Geriatric Psychiatry. 26 (4):
435–436.
Mansell, J. L. 1993. In: Garnett, T., Alliance, the N.F. and
Alliance, S. 1996. Growing food in cities: A report to
highlight and promote the benefits of urban agriculture
in the UK. London: National Food Alliance.
Maslow, A.H. 1970. Motivation and personality. 2nd Edn.
New York: Addison-Wesley Educational Publishers.
Miller, D.L. 2007. The seeds of learning: Young children
develop important skills through their gardening
activities at a midwestern early education program.
Applied Environmental Education & Communication.
6 (1): 49–66.
Pallavi, A. 2014. Grow food anywhere. Down to Earth.
New Delhi, India. URL:
http://www.downtoearth.org.in/coverage/grow-food-
anywhere-44765. Retrieved on: 1 February 2017.
Ryan. 1993. In: Garnett, T., Alliance, the N.F. and
Alliance, S. 1996. Growing food in cities: A report to
highlight and promote the benefits of urban agriculture
in the UK. London: National Food Alliance.
Shiva, V. 1993. The Violence of the Green Revolution:
Third World Agriculture, Ecology and Politics. 2nd Ed.
London, UK: Zed Books Ltd.
Söderback, I., Söderström, M. and Schälander, E. 2004.
Horticultural therapy: The healing garden and
gardening in rehabilitation measures at Danderyd
hospital rehabilitation clinic, Sweden. Developmental
Neurorehabilitation. 7 (4): 245–260.
Song, C. 2015. Physiological and psychological effects of
walking around and viewing a lake in a Forest
Environment. Journal of Korean Forest Society. 104
(1): 140–149.
State, M. 2014. What are the physical and mental benefits
of gardening? URL:
http://msue.anr.msu.edu/news/what_are_the_physical_
and_mental_benefits_of_gardening Retrieved on 30.
01.2017.
Stigsdotter, U.K. and Grahn, P. 2011. Stressed
individuals’ preferences for activities and
environmental characteristics in green spaces. Urban
Forestry & Urban Greening. 10 (4): 295–304.
Stilgoe, J.R. 2001. Gone barefoot lately? URL:
www.elsevier.com/locate/ajpmonline American
Journal of Preventive Medicine. 20 (3): 243–244.
Taylor, A.F., Kuo, F.E. and Sullivan, W.C. 2001. Coping
with add: The surprising connection to green play
settings. Environment and Behavior. 33 (1): 54–77.
Taylor, J.R. and Lovell, S.T. 2012. Mapping public and
private spaces of urban agriculture in Chicago through
the analysis of high-resolution aerial images in Google
earth. Landscape and Urban Planning. 108 (1): 57–70.
Tewari, V. 2000. The Role of Urban and Peri-Urban
Agriculture in Metropolitan City Management in the
Developing Cities (New Delhi, National Institute of
Urban Agriculture).
Townsend, M. and Edben, M. 2006. Feel Blue, Touch
Green. URL:
http://www.deakin.edu.au/__data/assets/pdf_file/0017/
523133/Feel-Blue,-Touch-Green.pdf Retrieved on
30.01.2017.
Ulrich, R.S., Simons, R.F., Losito, B.D., Fiorito, E.,
Miles, M.A. and Zelson, M. 1991. Stress recovery
during exposure to natural and urban environments.
Journal of Environmental Psychology. 11 (3): 201–230.
Van Den Berg, A.E. and Custers, M.H.G. 2010.
Gardening promotes Neuroendocrine and Affective
restoration from stress. Journal of Health Psychology.
16 (1): 3–11.
Velarde, M.D., Fry, G. and Tveit, M. 2007. Health effects
of viewing landscapes – landscape types in
environmental psychology. Urban Forestry & Urban
Greening. 6 (4): 199–212.
Wakefield, S., Yeudall, F., Taron, C., Reynolds, J. and
Skinner, A. 2007. Growing urban health: Community
gardening in south-east Toronto. Health Promotion
International. 22 (2): 92–101.
Waliczek, T.M., Lineberger, R.D., Zajicek, J.M. and
Bradley, J.C. 2000. Using a web-based survey to
research the benefits of children gardening.
HortTechnology. 10 (1): 71–76.
Wang, D. and MacMillan, T. 2013. The benefits of
gardening for older adults: A systematic review of the
literature. Activities, Adaptation & Aging. 37 (2): 153–
181.
Ward Thompson, C. 2011. Linking landscape and health:
The recurring theme. Landscape and Urban Planning.
99 (3-4): 187–195.
Wilson, E.O.O. 1984. Biophilia. Cambridge, MA:
Harvard University Press.
Winne, M. 2008. Closing the Food Gap. Boston: Beacon
Press.
RESEARCH COMMUNICATION
44. JOURNAL OF INNOVATION FOR INCLUSIVE DEVELOPMENT, VOL. 2, NO. 1, 22 FEBRUARY 2017
Abstract: Mobile phones have become the most common
gadget in the world today and are found in the hands of
students most of the time. With advancement in mobile
technology, usage of mobile phones has increased
significantly. Mobile phone functioning uses
electromagnetic radiation in the microwave range, which
may be harmful to human health. Research has focused
on this aspect since the invention of mobile phones and
there seems to be a consensus that mobile phone
radiations have an impact on human beings. However, no
concrete scientific assessment of the impact of mobile
phone radiation (MPR) on human beings has been made
available. As a result, impact of MPR on human health is
a research area requiring greater investigation. The
following research contribution attempts to assess the
awareness of undergraduate student community about
radiation threat posed by the usage of mobile phones. We
find that while students are concerned about various
specifications of their mobile phones, the knowledge and
awareness about MPRs is wanting.
Keywords: mobile phone radiation, human health,
student community.
A mobile phone is a portable telephone that can make and
receive calls over a radio frequency link while the user is
moving within a telephone service area. Mobile phones
have become a significant part of our daily life, especially
for students for whom it is the key to their virtual world.
Mobile phones operation requires electromagnetic
radiations in the microwave range. The World Health
Organization reviewed studies on mobile phone safety
and has classified these radiations as "possibly
carcinogenic to humans" (WHO, 2014). WHO places
mobile phones in Group 2B, i.e. 'possible' human
carcinogen. A categorization in 2B implies that there is
convincing evidence that the agent causes cancer in
_____________________________________________ Email for correspondence: [email protected]
experimental animals but little or no information about
whether it causes cancer in humans (IARC, 2015).
An overview of literature on the impact of mobile phone
radiation (MPR) on human beings provides a confusing
picture. Dreyer et al. (1999) have reported that exposure
to MPR caused cultured human cells to shrink. However,
AlOrainy (2003) found no association between brain
tumour and MPR. Hardell (1999) found that exposure to
MPR made a type of worm more fertile. These studies
have indeed at least pointed out that exposure to heat is
not the only potential threat to brain cells from mobile
phones. Huber (2003) demonstrated that the exposure to
Radio Frequency Electromagnetic Fields (RF EMF)
emitted by mobile phones has an effect on brain
physiology. In India, the Department of Telecom
(Government of India) has been running a campaign to
inform the citizens that, “most laboratory studies were
unable to find a direct link between exposure to Radio
Frequency radiation and (human) health” (DoT-GoI,
2012).
Although the debate whether MPRs cause cancer or not is
far from over, its initial arguments are convincing enough
to urge us to reduce our exposure to MPRs. An obvious
way to accomplish this is by choosing a phone with a
lower Specific Absorption Rate or SAR. SAR is a
measure of the maximum energy absorbed by the unit
mass of exposed tissue of a mobile phone user over a
given time. SAR values are usually expressed in units of
Watts per kilogram in either 1.0 g or 10.0 g of human
tissue. The SAR standard value for mobile phones has
been set to 1.6 Watts of energy absorbed per kilogram of
body weight (1.6 W/Kg averaged over 1.0 g of human
tissue). Because there is no conclusive evidence of the
impact of MPR on human health (Jokela et al., 1999), the
SAR limit has been set due to the thermal effects of MPR
(any kind of RF radiation can heat up human body tissue
considerably) and not to mitigate other radiation related
impacts such as DNA damage or cancer.
SAR and Mobile Phone Radiation Hazard.
How Aware are College Students in Delhi?
Daminee Saini
Department of Computer Science, Indraprastha College for Women, University of Delhi
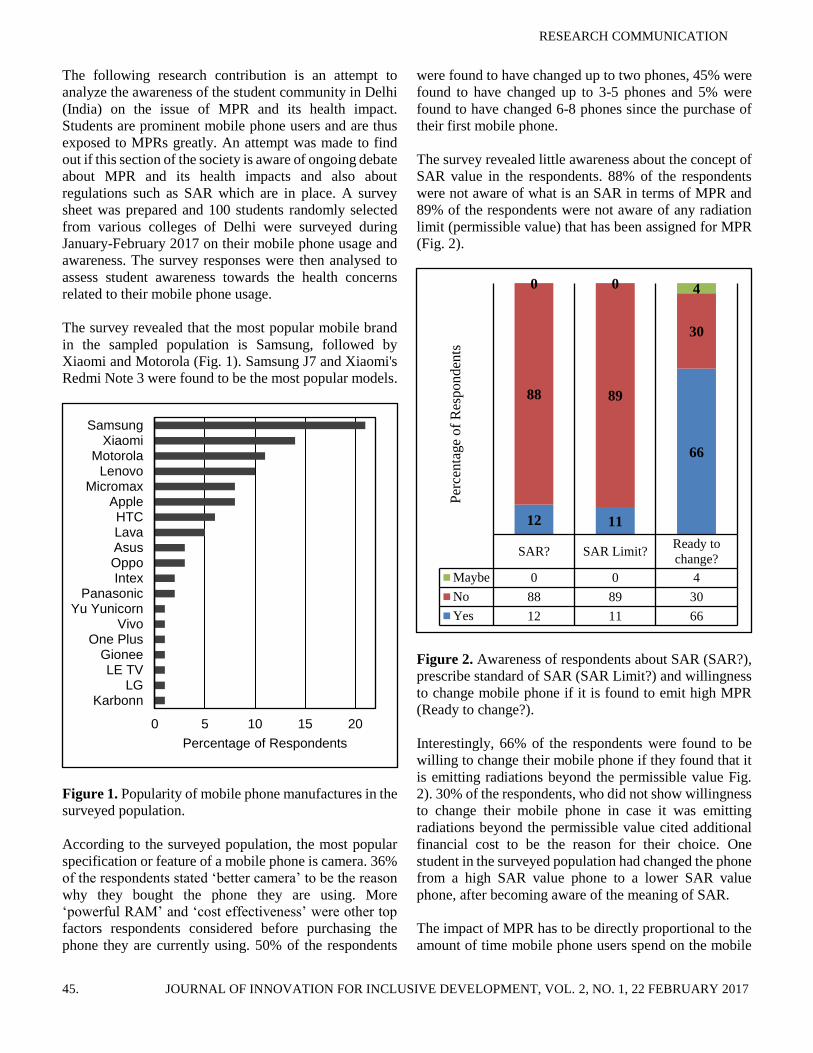
RESEARCH COMMUNICATION
45. JOURNAL OF INNOVATION FOR INCLUSIVE DEVELOPMENT, VOL. 2, NO. 1, 22 FEBRUARY 2017
The following research contribution is an attempt to
analyze the awareness of the student community in Delhi
(India) on the issue of MPR and its health impact.
Students are prominent mobile phone users and are thus
exposed to MPRs greatly. An attempt was made to find
out if this section of the society is aware of ongoing debate
about MPR and its health impacts and also about
regulations such as SAR which are in place. A survey
sheet was prepared and 100 students randomly selected
from various colleges of Delhi were surveyed during
January-February 2017 on their mobile phone usage and
awareness. The survey responses were then analysed to
assess student awareness towards the health concerns
related to their mobile phone usage.
The survey revealed that the most popular mobile brand
in the sampled population is Samsung, followed by
Xiaomi and Motorola (Fig. 1). Samsung J7 and Xiaomi's
Redmi Note 3 were found to be the most popular models.
Figure 1. Popularity of mobile phone manufactures in the
surveyed population.
According to the surveyed population, the most popular
specification or feature of a mobile phone is camera. 36%
of the respondents stated ‘better camera’ to be the reason
why they bought the phone they are using. More
‘powerful RAM’ and ‘cost effectiveness’ were other top
factors respondents considered before purchasing the
phone they are currently using. 50% of the respondents
were found to have changed up to two phones, 45% were
found to have changed up to 3-5 phones and 5% were
found to have changed 6-8 phones since the purchase of
their first mobile phone.
The survey revealed little awareness about the concept of
SAR value in the respondents. 88% of the respondents
were not aware of what is an SAR in terms of MPR and
89% of the respondents were not aware of any radiation
limit (permissible value) that has been assigned for MPR
(Fig. 2).
Figure 2. Awareness of respondents about SAR (SAR?),
prescribe standard of SAR (SAR Limit?) and willingness
to change mobile phone if it is found to emit high MPR
(Ready to change?).
Interestingly, 66% of the respondents were found to be
willing to change their mobile phone if they found that it
is emitting radiations beyond the permissible value Fig.
2). 30% of the respondents, who did not show willingness
to change their mobile phone in case it was emitting
radiations beyond the permissible value cited additional
financial cost to be the reason for their choice. One
student in the surveyed population had changed the phone
from a high SAR value phone to a lower SAR value
phone, after becoming aware of the meaning of SAR.
The impact of MPR has to be directly proportional to the
amount of time mobile phone users spend on the mobile
0 5 10 15 20
KarbonnLG
LE TVGionee
One PlusVivo
Yu YunicornPanasonic
IntexOppoAsusLavaHTC
AppleMicromax
LenovoMotorola
XiaomiSamsung
Percentage of Respondents
SAR? SAR Limit?Ready to
change?
Maybe 0 0 4
No 88 89 30
Yes 12 11 66
12 11
66
88 89
30
0 0 4
Per
centa
ge
of
Res
ponden
ts
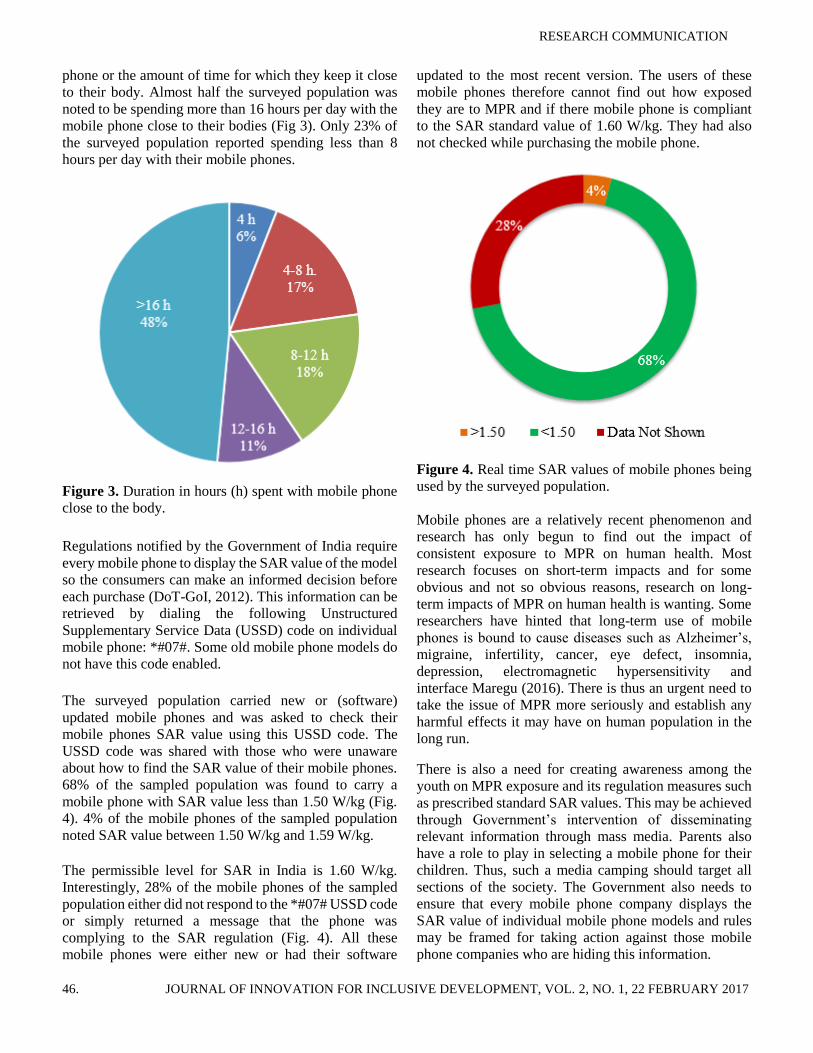
RESEARCH COMMUNICATION
46. JOURNAL OF INNOVATION FOR INCLUSIVE DEVELOPMENT, VOL. 2, NO. 1, 22 FEBRUARY 2017
phone or the amount of time for which they keep it close
to their body. Almost half the surveyed population was
noted to be spending more than 16 hours per day with the
mobile phone close to their bodies (Fig 3). Only 23% of
the surveyed population reported spending less than 8
hours per day with their mobile phones.
Figure 3. Duration in hours (h) spent with mobile phone
close to the body.
Regulations notified by the Government of India require
every mobile phone to display the SAR value of the model
so the consumers can make an informed decision before
each purchase (DoT-GoI, 2012). This information can be
retrieved by dialing the following Unstructured
Supplementary Service Data (USSD) code on individual
mobile phone: *#07#. Some old mobile phone models do
not have this code enabled.
The surveyed population carried new or (software)
updated mobile phones and was asked to check their
mobile phones SAR value using this USSD code. The
USSD code was shared with those who were unaware
about how to find the SAR value of their mobile phones.
68% of the sampled population was found to carry a
mobile phone with SAR value less than 1.50 W/kg (Fig.
4). 4% of the mobile phones of the sampled population
noted SAR value between 1.50 W/kg and 1.59 W/kg.
The permissible level for SAR in India is 1.60 W/kg.
Interestingly, 28% of the mobile phones of the sampled
population either did not respond to the *#07# USSD code
or simply returned a message that the phone was
complying to the SAR regulation (Fig. 4). All these
mobile phones were either new or had their software
updated to the most recent version. The users of these
mobile phones therefore cannot find out how exposed
they are to MPR and if there mobile phone is compliant
to the SAR standard value of 1.60 W/kg. They had also
not checked while purchasing the mobile phone.
Figure 4. Real time SAR values of mobile phones being
used by the surveyed population.
Mobile phones are a relatively recent phenomenon and
research has only begun to find out the impact of
consistent exposure to MPR on human health. Most
research focuses on short-term impacts and for some
obvious and not so obvious reasons, research on long-
term impacts of MPR on human health is wanting. Some
researchers have hinted that long-term use of mobile
phones is bound to cause diseases such as Alzheimer’s,
migraine, infertility, cancer, eye defect, insomnia,
depression, electromagnetic hypersensitivity and
interface Maregu (2016). There is thus an urgent need to
take the issue of MPR more seriously and establish any
harmful effects it may have on human population in the
long run.
There is also a need for creating awareness among the
youth on MPR exposure and its regulation measures such
as prescribed standard SAR values. This may be achieved
through Government’s intervention of disseminating
relevant information through mass media. Parents also
have a role to play in selecting a mobile phone for their
children. Thus, such a media camping should target all
sections of the society. The Government also needs to
ensure that every mobile phone company displays the
SAR value of individual mobile phone models and rules
may be framed for taking action against those mobile
phone companies who are hiding this information.
RESEARCH COMMUNICATION
47. JOURNAL OF INNOVATION FOR INCLUSIVE DEVELOPMENT, VOL. 2, NO. 1, 22 FEBRUARY 2017
Acknowledgement
The author would like to acknowledge the mentorship of
Dr. Govind Singh from the Department of Environmental
Studies, Indraprastha College for Women, University of
Delhi for the ongoing research project with the same title.
References
AlOrainy, A., 2003. Recent research on mobile phones
effects. In: Proceedings of the International
Conference on Non-Ionizing Radiation at UNITEN.
(ICNIR 2003).
Department of Technology, Government of India (DoT-
GoI). 2012. Ensuring Safety from Radiations: Mobile
Towers and Handsets. URL:
http://www.dot.gov.in/sites/default/files/advertiseme
nt_0.pdf (Accessed on 15.02.2017).
Dreyer N.A., Loughlin, J. E. and Rothman, K.J. 1999.
Cause-specific mortality in cellular telephone users.
Jama, 282 (19): 1814-1816
Hardell, L., Nasman, A., Pahlson, A., Hallquist, A.R.N.
E. and Mild, K. H. 1999. Use of cellular telephones
and the risk for brain tumours: A case-control study.
International Journal of Oncology. 15 (1): 113-116.
Health. Journal of Information Engineering and
Applications. 6 (8): 22-30.
Huber, R., Schuderer, J., Graf, T., Jütz, K., Borbely, A.A.,
Kuster, N. and Achermann, P., 2003. Radio frequency
electromagnetic field exposure in humans: Estimation
of SAR distribution in the brain, effects on sleep and
heart rate. Bioelectromagnetics, 24 (4): 262-276.
International Agency for Research on Cancer (IARC).
2015. Evaluation of five organophosphate insecticides
and herbicides. URL: https://www.iarc.fr/en/media-
centre/iarcnews/pdf/MonographVolume112.pdf
(Accessed on 15.02.2017).
Jokela, K., Leszczynski, D., Paile, W., Salomaa, S.,
Puranen, L. and Hyysalo, P. 1999. Radiation safety of
handheld mobile phones and base stations. Finnish
Centre for Radiation and Nuclear Safety. STUK–A
161.
Maregu, N. 2016. Long Term Exposure of Mobile Phone
Radiation and Human Health. Journal of Information
Engineering and Applications. 6 (8): 22-30.
WHO. 2014. Electromagnetic fields and public health:
mobile phones data and factsheet. URL:
http://www.who.int/mediacentre/factsheets/fs193/en/
(Accessed on 15.02.2017).
RESEARCH COMMUNICATION
48. JOURNAL OF INNOVATION FOR INCLUSIVE DEVELOPMENT, VOL. 2, NO. 1, 22 FEBRUARY 2017
Abstract: Bollywood is the popular name which
encapsulates the Hindi film industry which is based in
Mumbai in the Central Indian state of Maharashtra. Indian
cinema, as is true for any other cinema in any other part
of the world, is a reflection of the society it is located in.
Film makers in Bollywood have always remained
sensitive towards societal issues. At the same time, the
films made in Bollywood have been such that the average
Indian citizen can relate to them physically and/or
emotionally. One theme that Bollywood has constantly
explored and relied on is nature - flower and birds. The
following paper attempts to analyze and explore the
depiction of birds in Bollywood in the over 100 years long
history of the latter. The paper also attempts to assess the
changing trend in depiction of birds in Bollywood over
this time period.
Keywords: Bollywood, birds, films, environmental
awareness, human emotions.
Cinema in India is dominated by its Hindi speaking
version, known as Bollywood. Indian cinema began much
before the Independence of India (1947). The first feature
film was shot by Dadasaheb Phalke in 1913 in Marathi,
and was titled "Raja Harishchandra" (based on a Sanskrit
script). First sound movie of Indian cinema was made by
Ardeshir Irani in 1931, with the title "Alam Ara", a South
India production. Films continued to be made before
independence, though the Golden age of Indian cinema
started only after India’s independence. Thus, the Indian
film industry has been a witness to over 100 years of
history and transformation of India, right from 1913 till
the present day. It is for this reasons that several
researchers have used the depictions in Bollywood as a
case study for addressing various research questions on
the Indian society (Rao, 2007; Rajadhyaksha, 2009).
_____________________________________________ *Corresponding author. Email: [email protected]
A characteristic feature of Bollywood, which sets it apart
from certain other film industries, is the ubiquitous
inclusion of songs in the films. The following research
communication is an attempt to study the depiction of
birds in the songs of Bollywood films over the last
hundred years. The representation of birds is studied from
the perspective of the species depicted and the
expressions these depictions are used for. The Indian sub-
continent has been home to a large number of birds since
the very beginning (Ali and Ripley, 1990). Delhi, the
National Capital Territory of India, itself boasts of being
one of the most bird diversity rich capital city in the
world. However, of late, unplanned urbanization and
environmental pollution have led to the reduction in birds’
number and diversity in Delhi. It is for this reason that
sparrow, an otherwise commonly found bird, was
declared the State Bird of Delhi in 2012. The research
work therefore also attempts to explore the possibility of
using film media as a tool for raising awareness for the
conservation of avian diversity.
The research work was begun by making a database of all
the songs which included the mentioning of birds in them.
This was done by using the Internet as well as discussions
with senior relatives. A total of 100 songs could be
identified in this process. The songs were later searched
on YouTube for further observation and the database was
maintained. The database was then analyzed to check
which bird species is being mentioned and what
expression the depicted species depicts.
The rich avian biodiversity of India finds its mention in
Indian cinema. Bollywood holds an important position in
world cinema and has indeed provided adequate inclusion
to India’s bird diversity, which also has cultural
relevance. At the very outset, the research finds that many
of the films have titles which include names of birds or
mention birds in general. Some of these are Hum Panchhi
Ek Dal Ke (1957), Aas Ke Panchhi (1961), Pyase Panchhi
Exploring 100 Years of Bollywood’s
Infatuation with Birds
Reeny Modi* and Ruchi Saini
Department of Economics, Indraprastha College for Women, University of Delhi
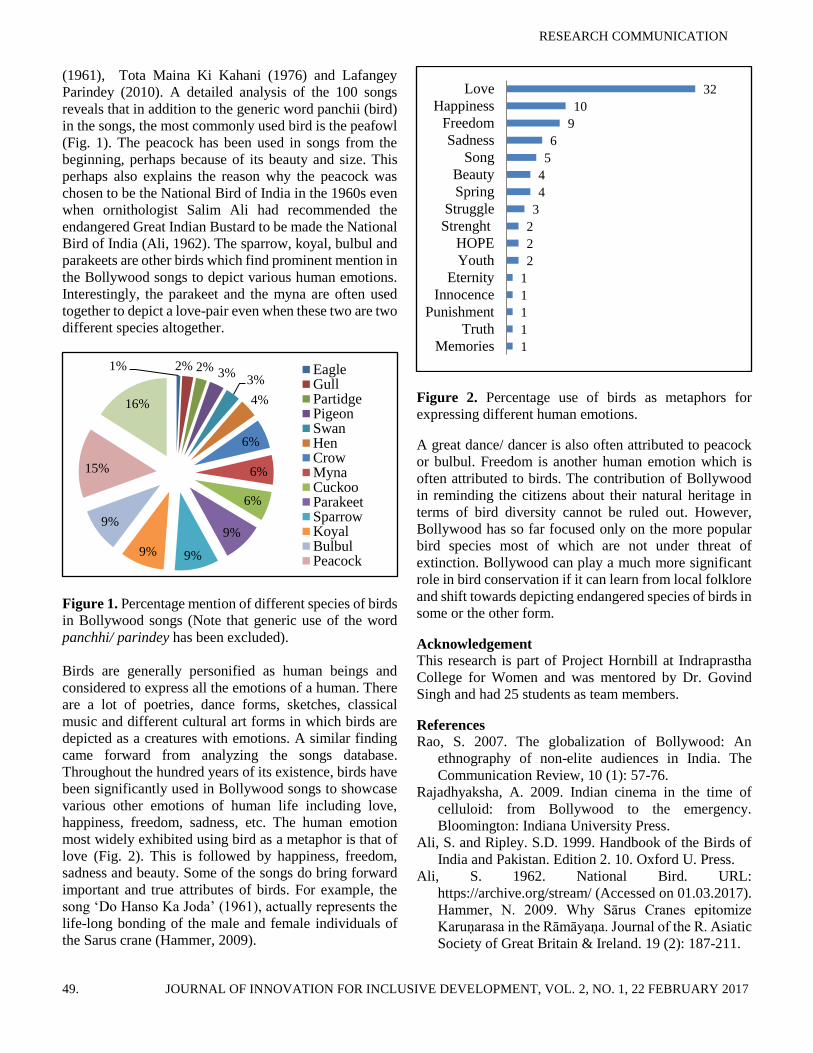
RESEARCH COMMUNICATION
49. JOURNAL OF INNOVATION FOR INCLUSIVE DEVELOPMENT, VOL. 2, NO. 1, 22 FEBRUARY 2017
(1961), Tota Maina Ki Kahani (1976) and Lafangey
Parindey (2010). A detailed analysis of the 100 songs
reveals that in addition to the generic word panchii (bird)
in the songs, the most commonly used bird is the peafowl
(Fig. 1). The peacock has been used in songs from the
beginning, perhaps because of its beauty and size. This
perhaps also explains the reason why the peacock was
chosen to be the National Bird of India in the 1960s even
when ornithologist Salim Ali had recommended the
endangered Great Indian Bustard to be made the National
Bird of India (Ali, 1962). The sparrow, koyal, bulbul and
parakeets are other birds which find prominent mention in
the Bollywood songs to depict various human emotions.
Interestingly, the parakeet and the myna are often used
together to depict a love-pair even when these two are two
different species altogether.
Figure 1. Percentage mention of different species of birds
in Bollywood songs (Note that generic use of the word
panchhi/ parindey has been excluded).
Birds are generally personified as human beings and
considered to express all the emotions of a human. There
are a lot of poetries, dance forms, sketches, classical
music and different cultural art forms in which birds are
depicted as a creatures with emotions. A similar finding
came forward from analyzing the songs database.
Throughout the hundred years of its existence, birds have
been significantly used in Bollywood songs to showcase
various other emotions of human life including love,
happiness, freedom, sadness, etc. The human emotion
most widely exhibited using bird as a metaphor is that of
love (Fig. 2). This is followed by happiness, freedom,
sadness and beauty. Some of the songs do bring forward
important and true attributes of birds. For example, the
song ‘Do Hanso Ka Joda’ (1961), actually represents the
life-long bonding of the male and female individuals of
the Sarus crane (Hammer, 2009).
Figure 2. Percentage use of birds as metaphors for
expressing different human emotions.
A great dance/ dancer is also often attributed to peacock
or bulbul. Freedom is another human emotion which is
often attributed to birds. The contribution of Bollywood
in reminding the citizens about their natural heritage in
terms of bird diversity cannot be ruled out. However,
Bollywood has so far focused only on the more popular
bird species most of which are not under threat of
extinction. Bollywood can play a much more significant
role in bird conservation if it can learn from local folklore
and shift towards depicting endangered species of birds in
some or the other form.
Acknowledgement
This research is part of Project Hornbill at Indraprastha
College for Women and was mentored by Dr. Govind
Singh and had 25 students as team members.
References
Rao, S. 2007. The globalization of Bollywood: An
ethnography of non-elite audiences in India. The
Communication Review, 10 (1): 57-76.
Rajadhyaksha, A. 2009. Indian cinema in the time of
celluloid: from Bollywood to the emergency.
Bloomington: Indiana University Press.
Ali, S. and Ripley. S.D. 1999. Handbook of the Birds of
India and Pakistan. Edition 2. 10. Oxford U. Press.
Ali, S. 1962. National Bird. URL:
https://archive.org/stream/ (Accessed on 01.03.2017).
Hammer, N. 2009. Why Sārus Cranes epitomize
Karuṇarasa in the Rāmāyaṇa. Journal of the R. Asiatic
Society of Great Britain & Ireland. 19 (2): 187-211.
1% 2% 2% 3%3%
4%
6%
6%
6%
9%
9%9%
9%
15%
16%
EagleGullPartidgePigeonSwanHenCrowMynaCuckooParakeetSparrowKoyalBulbulPeacock
1
1
1
1
1
2
2
2
3
4
4
5
6
9
10
32
Memories
Truth
Punishment
Innocence
Eternity
Youth
HOPE
Strenght
Struggle
Spring
Beauty
Song
Sadness
Freedom
Happiness
Love
RESEARCH COMMUNICATION
50. JOURNAL OF INNOVATION FOR INCLUSIVE DEVELOPMENT, VOL. 2, NO. 1, 22 FEBRUARY 2017
Abstract: Language is not only a way to express or
communicate but is also a heritage for a community which
communicates in a particular language. Language also
provides an identity to a person. Various emotions and
sentiments of an individual can be best expressed in her/
his mother tongue. Due to these reasons, language is
always one of the dearest things for people, which
civilizations have always strived to keep safe with them
forever and also to pass on to the next generation. This
paper attempts to study the status and appreciation of
Hindi and other regional languages of India among the
youth of the country.
Keywords: Hindi, India, national language, linguistic
diversity.
India is a nation full of linguistic diversity. With the
advent of British in the Indian sub-continent in the
seventeenth century, the people of the sub-continent were
introduced to English culture and language. Initially, the
British came to the Indian sub-continent for trade, which
perhaps motivated them to learn the native languages of
India so they could communicate with native people of
India. Some among the Indian sub-continent gradually
acquired colloquial knowledge of English. These were
called Indo-Britons who subsequently began
communicating in English even in their day-to-day life.
Except for the Indo-Britons, others native people of the
Indian sub-continent seldom used English unless they had
to communicate with the Europeans for purpose of trade,
etc. A subsequent rapid increase of British domination
over the Indian sub-continent made English a lucrative
language to learn. Eventually, knowledge of English
language became an indispensable qualification in the
Indian sub-continent and also led to an increasing demand
for English education (Allen, 1854). Due to the great
linguistic diversity in Indian sub-continent, the British
_____________________________________________ Email for correspondence: [email protected]
continued to feel the need for having a common/ general
language (Allen, 1854). The need for having a common/
general language for India continues to be felt even today.
Considerable debates and arguments revolve around this
issue creating much confusion and disarray. According to
Rao (1978), Hindi could be the official language but
written in both Devanagari and Roman scripts. Further,
English could be the second official language to be used
by non-Hindi speaking states, if desired, and Hindustani
should be the oral communication link for the masses
(Rao, 1978). On the contrary, according to Srivastava
(2000), Hindi is merely a Sanskritised version of English
and by submerging many other dialects in Hindi, it has
become inevitably dependent on English (Srivastava,
2000). Mishra (1972) has raised clear opposition to
English even being considered as an official language
although its study may be continued (Mishra, 1972).
A constant emphasis on study and knowledge of English
had been advocated by many scholars, even those who
support other native languages. According to Orsini
(1999), Hindi, ‘the people's language', is the only one
language fit for the mass education (Orsini, 1999). On the
other hand, Dutt et al. (1985) have been of the view that
Hindi is incompetent at higher level of education and it
has to become more liberal in order to prepare for its
wider role. Schools and Universities in India should
therefore nurture Hindi and it should be enriched by
assimilation of vocabulary and styles from other regional
languages mentioned in the eighth schedule of the
Constitution of India (Datt, 1968). The present research
contribution explores the historical debates revolving
around language discourse in India amidst the emergence
of an alien language appearing in the scenario. The paper
tries to analyze how and to what extent English language
has affected native Indian languages and whether it is a
colonial hangover or a will of the Indian people that such
a suppression continues in the present day.
English Versus Hindi and Other Regional
Languages – A Survey Based Analysis
Amulya Hans
Department of B.A. Programme, Indraprastha College for Women, University of Delhi
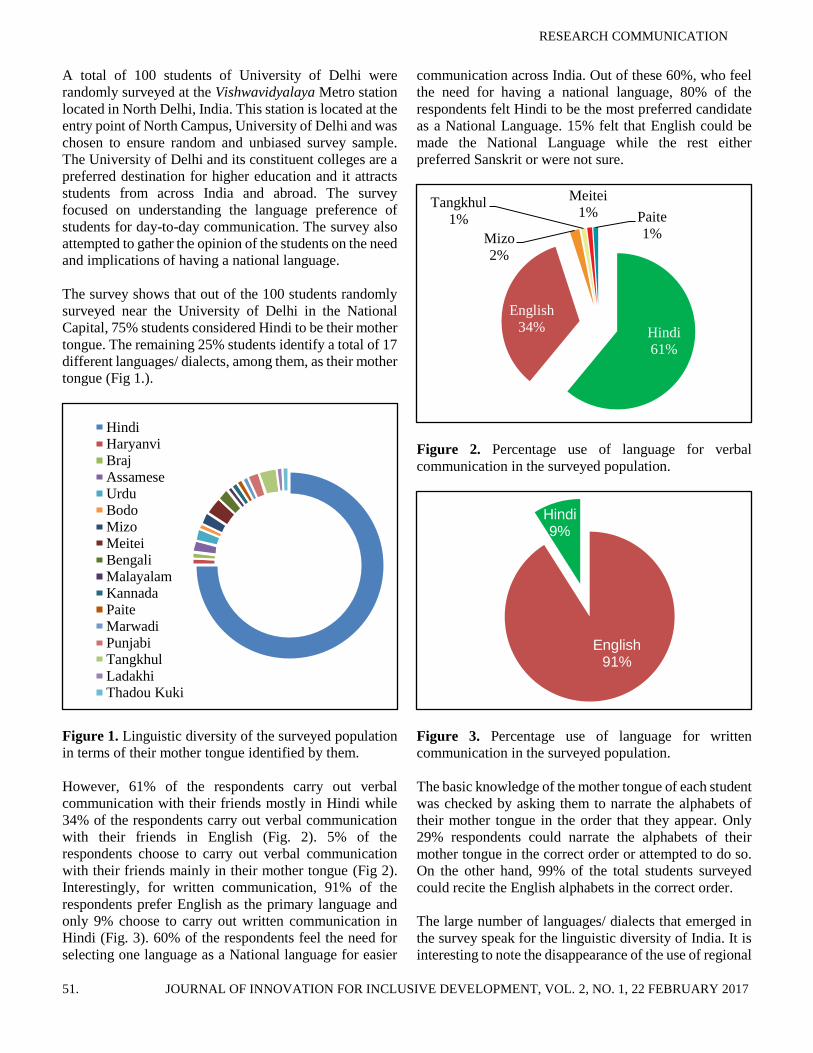
RESEARCH COMMUNICATION
51. JOURNAL OF INNOVATION FOR INCLUSIVE DEVELOPMENT, VOL. 2, NO. 1, 22 FEBRUARY 2017
A total of 100 students of University of Delhi were
randomly surveyed at the Vishwavidyalaya Metro station
located in North Delhi, India. This station is located at the
entry point of North Campus, University of Delhi and was
chosen to ensure random and unbiased survey sample.
The University of Delhi and its constituent colleges are a
preferred destination for higher education and it attracts
students from across India and abroad. The survey
focused on understanding the language preference of
students for day-to-day communication. The survey also
attempted to gather the opinion of the students on the need
and implications of having a national language.
The survey shows that out of the 100 students randomly
surveyed near the University of Delhi in the National
Capital, 75% students considered Hindi to be their mother
tongue. The remaining 25% students identify a total of 17
different languages/ dialects, among them, as their mother
tongue (Fig 1.).
Figure 1. Linguistic diversity of the surveyed population
in terms of their mother tongue identified by them.
However, 61% of the respondents carry out verbal
communication with their friends mostly in Hindi while
34% of the respondents carry out verbal communication
with their friends in English (Fig. 2). 5% of the
respondents choose to carry out verbal communication
with their friends mainly in their mother tongue (Fig 2).
Interestingly, for written communication, 91% of the
respondents prefer English as the primary language and
only 9% choose to carry out written communication in
Hindi (Fig. 3). 60% of the respondents feel the need for
selecting one language as a National language for easier
communication across India. Out of these 60%, who feel
the need for having a national language, 80% of the
respondents felt Hindi to be the most preferred candidate
as a National Language. 15% felt that English could be
made the National Language while the rest either
preferred Sanskrit or were not sure.
Figure 2. Percentage use of language for verbal
communication in the surveyed population.
Figure 3. Percentage use of language for written
communication in the surveyed population.
The basic knowledge of the mother tongue of each student
was checked by asking them to narrate the alphabets of
their mother tongue in the order that they appear. Only
29% respondents could narrate the alphabets of their
mother tongue in the correct order or attempted to do so.
On the other hand, 99% of the total students surveyed
could recite the English alphabets in the correct order.
The large number of languages/ dialects that emerged in
the survey speak for the linguistic diversity of India. It is
interesting to note the disappearance of the use of regional
HindiHaryanviBrajAssameseUrduBodoMizoMeiteiBengaliMalayalamKannadaPaiteMarwadiPunjabiTangkhulLadakhiThadou Kuki
Hindi
61%
English
34%
Mizo
2%
Tangkhul
1%
Meitei
1% Paite
1%
English91%
Hindi9%
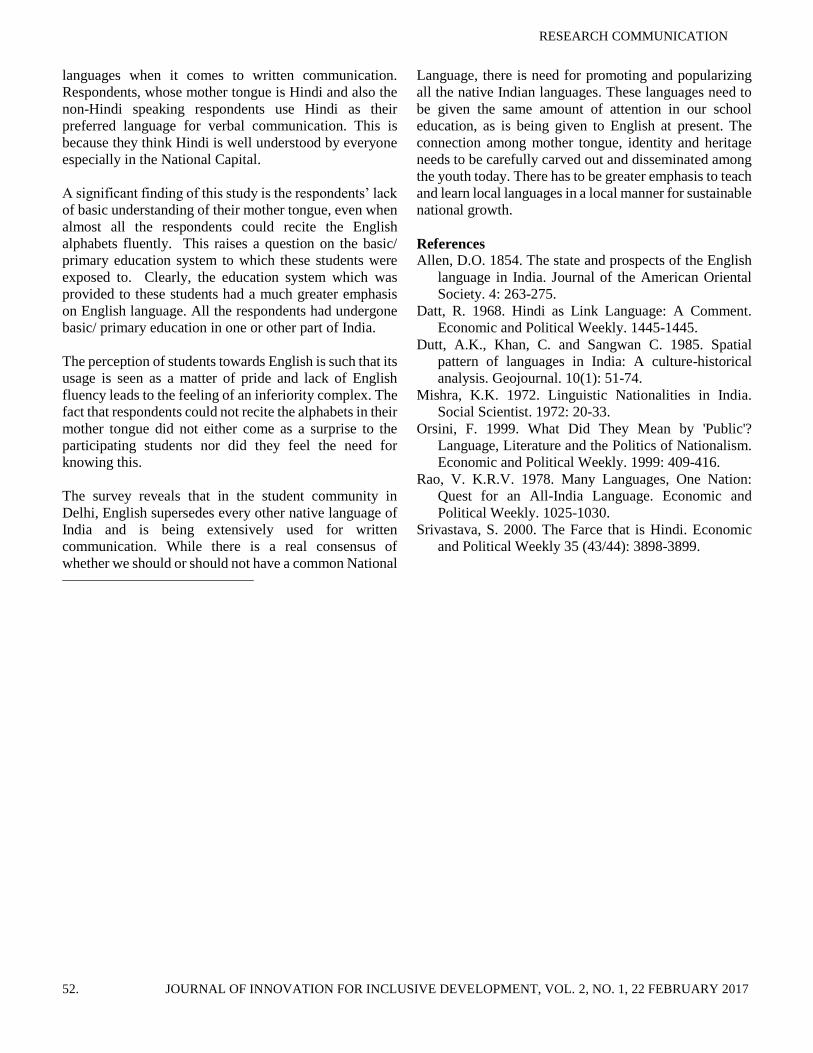
RESEARCH COMMUNICATION
52. JOURNAL OF INNOVATION FOR INCLUSIVE DEVELOPMENT, VOL. 2, NO. 1, 22 FEBRUARY 2017
languages when it comes to written communication.
Respondents, whose mother tongue is Hindi and also the
non-Hindi speaking respondents use Hindi as their
preferred language for verbal communication. This is
because they think Hindi is well understood by everyone
especially in the National Capital.
A significant finding of this study is the respondents’ lack
of basic understanding of their mother tongue, even when
almost all the respondents could recite the English
alphabets fluently. This raises a question on the basic/
primary education system to which these students were
exposed to. Clearly, the education system which was
provided to these students had a much greater emphasis
on English language. All the respondents had undergone
basic/ primary education in one or other part of India.
The perception of students towards English is such that its
usage is seen as a matter of pride and lack of English
fluency leads to the feeling of an inferiority complex. The
fact that respondents could not recite the alphabets in their
mother tongue did not either come as a surprise to the
participating students nor did they feel the need for
knowing this.
The survey reveals that in the student community in
Delhi, English supersedes every other native language of
India and is being extensively used for written
communication. While there is a real consensus of
whether we should or should not have a common National
Language, there is need for promoting and popularizing
all the native Indian languages. These languages need to
be given the same amount of attention in our school
education, as is being given to English at present. The
connection among mother tongue, identity and heritage
needs to be carefully carved out and disseminated among
the youth today. There has to be greater emphasis to teach
and learn local languages in a local manner for sustainable
national growth.
References
Allen, D.O. 1854. The state and prospects of the English
language in India. Journal of the American Oriental
Society. 4: 263-275.
Datt, R. 1968. Hindi as Link Language: A Comment.
Economic and Political Weekly. 1445-1445.
Dutt, A.K., Khan, C. and Sangwan C. 1985. Spatial
pattern of languages in India: A culture-historical
analysis. Geojournal. 10(1): 51-74.
Mishra, K.K. 1972. Linguistic Nationalities in India.
Social Scientist. 1972: 20-33.
Orsini, F. 1999. What Did They Mean by 'Public'?
Language, Literature and the Politics of Nationalism.
Economic and Political Weekly. 1999: 409-416.
Rao, V. K.R.V. 1978. Many Languages, One Nation:
Quest for an All-India Language. Economic and
Political Weekly. 1025-1030.
Srivastava, S. 2000. The Farce that is Hindi. Economic
and Political Weekly 35 (43/44): 3898-3899.
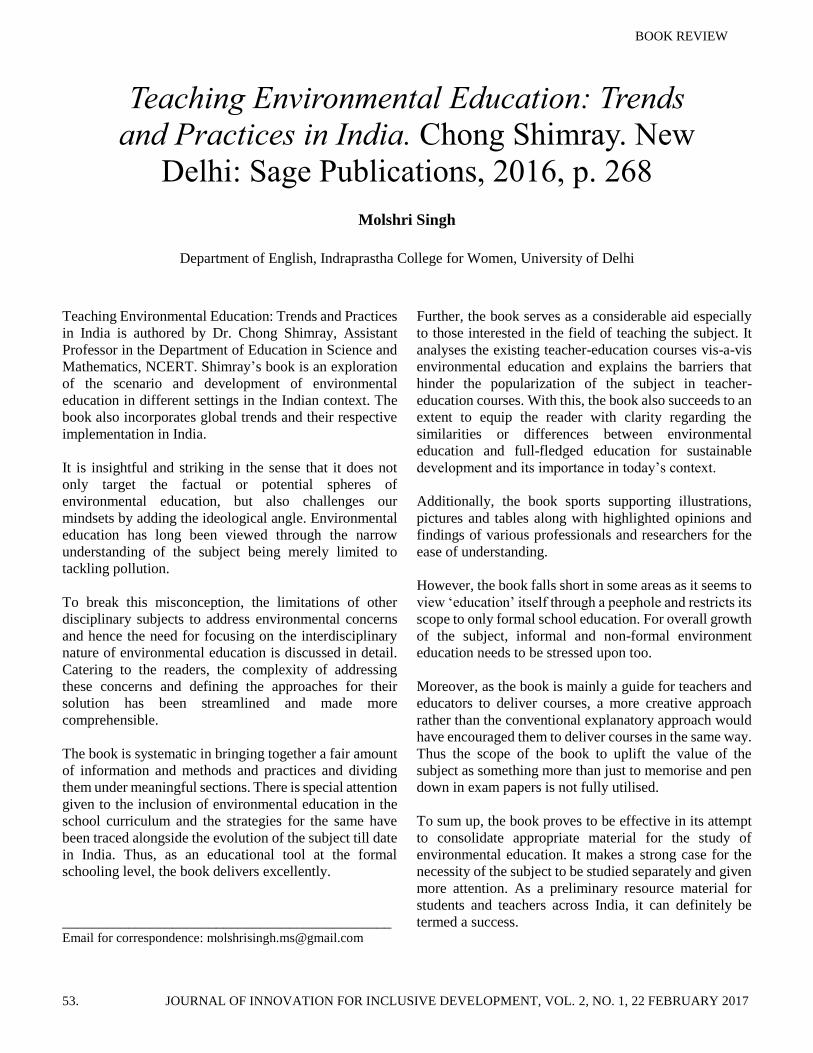
BOOK REVIEW
53. JOURNAL OF INNOVATION FOR INCLUSIVE DEVELOPMENT, VOL. 2, NO. 1, 22 FEBRUARY 2017
Teaching Environmental Education: Trends and Practices
in India is authored by Dr. Chong Shimray, Assistant
Professor in the Department of Education in Science and
Mathematics, NCERT. Shimray’s book is an exploration
of the scenario and development of environmental
education in different settings in the Indian context. The
book also incorporates global trends and their respective
implementation in India.
It is insightful and striking in the sense that it does not
only target the factual or potential spheres of
environmental education, but also challenges our
mindsets by adding the ideological angle. Environmental
education has long been viewed through the narrow
understanding of the subject being merely limited to
tackling pollution.
To break this misconception, the limitations of other
disciplinary subjects to address environmental concerns
and hence the need for focusing on the interdisciplinary
nature of environmental education is discussed in detail.
Catering to the readers, the complexity of addressing
these concerns and defining the approaches for their
solution has been streamlined and made more
comprehensible.
The book is systematic in bringing together a fair amount
of information and methods and practices and dividing
them under meaningful sections. There is special attention
given to the inclusion of environmental education in the
school curriculum and the strategies for the same have
been traced alongside the evolution of the subject till date
in India. Thus, as an educational tool at the formal
schooling level, the book delivers excellently.
_____________________________________________ Email for correspondence: [email protected]
Further, the book serves as a considerable aid especially
to those interested in the field of teaching the subject. It
analyses the existing teacher-education courses vis-a-vis
environmental education and explains the barriers that
hinder the popularization of the subject in teacher-
education courses. With this, the book also succeeds to an
extent to equip the reader with clarity regarding the
similarities or differences between environmental
education and full-fledged education for sustainable
development and its importance in today’s context.
Additionally, the book sports supporting illustrations,
pictures and tables along with highlighted opinions and
findings of various professionals and researchers for the
ease of understanding.
However, the book falls short in some areas as it seems to
view ‘education’ itself through a peephole and restricts its
scope to only formal school education. For overall growth
of the subject, informal and non-formal environment
education needs to be stressed upon too.
Moreover, as the book is mainly a guide for teachers and
educators to deliver courses, a more creative approach
rather than the conventional explanatory approach would
have encouraged them to deliver courses in the same way.
Thus the scope of the book to uplift the value of the
subject as something more than just to memorise and pen
down in exam papers is not fully utilised.
To sum up, the book proves to be effective in its attempt
to consolidate appropriate material for the study of
environmental education. It makes a strong case for the
necessity of the subject to be studied separately and given
more attention. As a preliminary resource material for
students and teachers across India, it can definitely be
termed a success.
Teaching Environmental Education: Trends
and Practices in India. Chong Shimray. New
Delhi: Sage Publications, 2016, p. 268
Molshri Singh
Department of English, Indraprastha College for Women, University of Delhi
OPINION
54. JOURNAL OF INNOVATION FOR INCLUSIVE DEVELOPMENT, VOL. 2, NO. 1, 22 FEBRUARY 2017
Environmental education at undergraduate level is
comprehensive and inter-disciplinary which draws its
input and content from a variety of subjects. A large part
of conceptual framework generated through classroom
teaching has an important application to real life problems
and scenarios. This necessitates the in-situ (on-site)
training of students regarding several components and
processes of environment. To develop the correct attitude
towards classroom education and make connections
between study and application, field work is very
important for students. Field based enquiry brings
students into direct contact with the nature. Students are
allowed to apply their own knowledge, skills and
classroom teaching to make observations, order their
experiences and set their own priorities towards becoming
autonomous, self-directed learners.
Field activities require application of information and
skills from investigative approaches to explain natural
phenomenon and occurrences, which broadens the
investigators awareness and emphasize connections
between ideas and practical realities. Being a group
learning experience, field work also enhances the ability
of students to work together to create a common
meaningful understanding of the subject at hand.
A field visit undertaken by students to Keoladeo National
Park, Bharatpur (Rajasthan) was particularly useful in
providing necessary and delightful insight to the students
regarding biodiversity, especially avian diversity, the
importance of variety of habitats including wetland and
various associated ecological processes. Keoladeo
National Park, Bharatpur (27° 10.085'N; 77° 31.470'E) is
a large marsh (~30 sq. km) situated at the confluence of
__________________________________________ *Corresponding author. Email: [email protected]
Banganga and Gambhir River. The park, which once
served as a private hunting ground for the local ruler, was
declared as a reserved forest area in 1967 and later
upgraded to a National Park in 1981. With its formal
inclusion in the protected area network, cattle grazing was
completely banned inside the park in 1982, which later
turned out to be an ecological disaster as the park’s habitat
started to deteriorate and the bird diversity was also on
decline (Vijyan, 1987). In absence of the regulatory
pressure of herbivory, the wetlands of Bharatpur were on
a slow move towards climax communities and several
weeds and tall grasses were filling the wetlands,
ultimately reducing the bird habitat and food. Fortunately,
with several studies pointing out this problem and with
active efforts of Bombay Natural History Society
(BNHS), cattle ban was lifted from the park in 1991.
Since then the park has been an active breeding site for
several heronry birds and also a wintering ground for
large number of migratory waterfowls. This park once use
to be the only known wintering site for the central
population of critically endangered Siberian Crane
(Leucogeranus leucogeranus), but the last pair was
reported way back in 2002.
Keoladeo National Park is divided into a number of
blocks by embankments which receives water through an
intricate network of canals and a few solar powered
ground-water pumps. In the marshes between these
embankments, clumps of Acacia sp. trees growing on
mounds are used by Painted Storks and other colonial
waterbirds for nesting (Tiwary and Urfi, 2016). These
heronries are known to have existed at this site for more
than 100 years (Ali, 1953; Ali and Vijayan, 1983;
Sankhala 1990). Some of the nesting species observed
during our visit were Painted Stork (Mycteria
leucocephala), Little Cormorant (Phalacrocorax niger),
Indian Cormorant (Phalacrocorax fuscicollis), Great
Importance of Field Studies in Environmental
Education: An Experience from Keoladeo
National Park, Rajasthan
Nawin Kumar Tiwary1*, Debina Moirangthem2, Gurnoor Kaur2
1Department of Environmental Studies, Indraprastha College for Women, University of Delhi 2Department of Political Science, Indraprastha College for Women, University of Delhi
OPINION
55. JOURNAL OF INNOVATION FOR INCLUSIVE DEVELOPMENT, VOL. 2, NO. 1, 22 FEBRUARY 2017
Cormorant (Phalacrocorax carbo), Intermediate Egret
(Egretta intermedia), LE: Little Egret (Egretta garzetta),
Indian Pond Heron (Ardeola grayii) and Black-headed
Ibis (Threskiornis melanocephalus). Along with several
species of resident herons, storks, darters, cormorants and
egrets this park also receives large number of migratory
ducks and geese. Some of the waterfowls sighted during
our visit were Greylag Goose (Anser anser), Bar-headed
Goose (Anser indicus), Ruddy Shelduck (Tadorna
ferruginea), Gadwall (Anas strepera), Eurasian Wigeon
(Anas Penelope), Spot-billed Duck (Anas
poecilorhyncha), Northern Pintail (Anas acuta),
Garganey (Anas querquedula) and Common Teal (Anas
crecca).
Apart from having a rich wetland habitat, the park also
has a unique mosaic of habitats including forests,
grasslands and scrub woodlands. The forested area which
is dominated by Kadam (Mitragyna parvifolia), Babul
(Acacia nilotica) and Jamun (Syzygium cuminii) supports
a rich diversity of arboreal and woodland avifauna.
During our visit we observed several woodland species
like Grey Francolin (Francolinus pondicerianus), Indian
Peafowl (Pavo cristatus), Eurasian Collared Dove
(Streptopelia decaocto), Yellow-legged green Pigeon
(Treron phoenicopterus), Laughing Dove (Streptopelia
senegalensis), Rose-ringed Parakeet (Psittacula krameri),
Greater coucal (Centropus sinensis), Ashy Prinia (Prinia
socialis), Red whiskered Bulbul (Pycnonotus jocosus),
Red-vented Bulbul (Pycnonotus cafer), Oriental Magpie-
robin (Copsychus saularis), Indian Robin (Saxicoloides
fulicatus) and Purple Sunbird (Cinnyris asiaticus). We
also sighted open area species like Red-wattled Lapwing
(Vanellus indicus), Green Bee-eater (Merops orientalis)
and Black Drongo (Dicrurus macrocercus).
The Keoladeo National Park is also included in the
‘Important Bird Area’ network for supporting more than
20,000 individuals of around 350 species of birds (Islam
and Rahmani, 2004). Some of the common herbivores
sighted from the park were Sambar (Cervus unicolor) and
Bluebull (Boselaphus tragocamelus). Owing to the
presence of variety of habitats and enormous avifaunal
diversity, Keoladeo receives large number of visitors
every year which leads to a significant revenue generation
from entry tickets and transportation within the park.
During the financial year 2014-15, 1.35 Lakh tourists
visited the park generating an approx. earning of 1.13
Crore. With an effective scientific management strategy,
active involvement of researchers and people’s interest,
this park can continue to be, what Kailash Sankhala
(1990) envisioned, as the ‘Gardens of God’.
References
Ali, S. 1953. The Keoladeo Ghana of Bharatpur
(Rajasthan). Journal of the Bombay Natural History
Society. 51: 531–536.
Ali, S. and Vijayan, V. S. 1983. Hydrobiological
(ecological) research at Keoladeo National Park,
Bharatpur (first interim report). Bombay Natural
History Society, Mumbai
Islam, M. Z. and Rahmani, A. R. 2004. Important Bird
Areas in India. Priority Sites for Conservation.
Indian Bird Conservation Network, Bombay Natural
History Society and BirdLife International (UK).
Sankhala, K. 1990. Gardens of God. The waterbird
sanctuary at Bharatpur. Vikas Publishing House,
New Delhi.
Tiwary, N. K., and Urfi, A. J. 2016. Nest Survival in
Painted Stork (Mycteria leucocephala) Colonies of
North India: the Significance of Nest Age, Annual
Rainfall and Winter Temperature. Waterbirds. 39
(2): 146-155.
Vijayan, V.S. 1987. Keoladeo National Park Ecology
Study. Bombay: Bombay Natural History Society.


