Embed Size (px)
Citation preview

IEEE
Proof
IEEE TRANSACTIONS ON ENERGY CONVERSION 1
Effect of Control Strategies and Power Take-OffEfficiency on the Power Capture From Sea Waves
1
2
Elisabetta Tedeschi, Member, IEEE, Matteo Carraro, Marta Molinas, Member, IEEE,
and Paolo Mattavelli, Member, IEEE
3
4
Abstract—The choice of the most suitable control strategy for5
wave energy converters (WECs) is often evaluated with reference6
to the sinusoidal assumption for incident waves. Under this hy-7
pothesis, linear techniques for the control of the extracted power,8
as passive loading and optimum control, are well known and widely9
analyzed. It can be shown, however, how their performances are10
fundamentally different when irregular waves are considered and11
the theoretical superiority of optimum control is questionable un-12
der real wave conditions. Moreover, the global optimization of13
WECs implies a rational design of the power electronics equip-14
ment. This requires the analysis of the instantaneous extracted15
power in addition to the average one. In this paper, the impact16
of irregular waves on the power extraction when using different17
control techniques is analyzed in the case of a point absorber in18
heave. It is also shown how a convenient tradeoff between high19
average power extraction and limited power electronics overrating20
can be obtained by applying simple power saturation techniques.21
Moreover, the impact of power conversion efficiency on the control22
strategy is analyzed.23
Index Terms—Control strategies, irregular waves, power take-24
off (PTO), wave energy.25
I. INTRODUCTION26
AMONG renewable energies, the exploitation of ocean27
waves is certainly one of the most recent. In spite of its28
consistent potential [1], due to high availability and stability of29
the source and low environmental impact, a single leading tech-30
nology has not yet been established and different concepts are31
being studied and tested worldwide. Among them, a promising32
solution [2]–[4] is represented by point absorbers, i.e., floating33
buoys having small dimensions compared to the wavelength of34
incident sea waves. The principle of the power extraction lies35
in creating some kind of destructive interference between the36
Manuscript received December 17, 2010; revised April 2, 2011 and June 13,2011; accepted July 5, 2011. Paper no. TEC-00495-2010.E. Tedeschi was with the Norwegian University of Science and Technology,
Trondheim 7491, Norway. She is now with Tecnalia Research and Innovation,Bilbao 48012, Spain (e-mail: [email protected]).M. Carraro is with the University of Padova, Vicenza 36100, Italy (e-mail:
[email protected]).M. Molinas is with the Norwegian University of Science and Technology,
Trondheim 7491, Norway (e-mail: [email protected]).P. Mattavelli is with the Center for Power Electronics Systems, Virginia
Polytechnic Institute and State University, Blacksburg, VI 24060 USA (e-mail:[email protected]).Color versions of one or more of the figures in this paper are available online
at http://ieeexplore.ieee.org.Digital Object Identifier 10.1109/TEC.2011.2164798
incident wave and the oscillation of the buoy. This requires an 37
active control of the device that needs to be tuned according to 38
the sea state. Thus, the control of the motion is one of the cru- 39
cial aspects to improve the power performance of wave energy 40
converters (WECs), andmany scientific contributions have been 41
devoted to this topic [5]–[12]. The most of them focus on linear 42
control techniques that are quite easy to implement and have 43
been systematically studied in order to maximize the power ex- 44
traction. It is worth noting that a large number of these studies 45
are developed under the ideal assumption of sinusoidal incident 46
waves [6]–[9]. It will be shown in the following, however, that 47
this can lead to misleading conclusions when real waves are 48
considered. On the other hand, some studies on practical con- 49
trol techniques to improve power performance have also been 50
proposed, but being limited to few very specific applications, 51
without necessarily claim to generality [10]–[12]. 52
Moreover, when dealing with WEC performance analysis, 53
the attention is usually focused mainly on mechanical and hy- 54
drodynamic aspects, while the issues related to the sizing and 55
efficiency of electric and electronic equipment are often over- 56
simplified, except for a few specific cases [13]–[15]. The goal of 57
this paper is at first to underline the impact of irregular waves on 58
the performance of linear control techniques. Following, some 59
considerations on the relationship between the choice of the con- 60
trol strategy and the rating of power electronics equipment are 61
presented. Consequently, the usefulness of simple power satura- 62
tion techniques [15] in order to maximize the average extracted 63
power, while avoiding excessive over ratings of the converter, 64
is analyzed and exemplified through computer simulations. The 65
attention is then focused on the effects of a nonideal power con- 66
version efficiency, and its influence on the choice of the best 67
control strategy is also shown. Finally, a complete model of the 68
system, including the electrical machine and power electronics 69
interface, has been developed in MATLAB/Simulink; hence, 70
the proposed control solutions have been tested, confirming the 71
validity of the previous analyses. 72
II. MODEL OF THEWEC 73
A. Hydrodynamic Model 74
The following analysis is focused on a spherical point ab- 75
sorber in heave [16], i.e., a single-degree-of-freedom device 76
as the one schematically depicted in Fig. 1, which is directly 77
connected to the electric power take-off (PTO) without any in- 78
termediate hydraulic or pneumatic stage. 79
Under the assumption of plane progressivewaves propagating 80
in an infinite water depth and if small motion is assumed, linear 81
0885-8969/$26.00 © 2011 IEEE

IEEE
Proof
2 IEEE TRANSACTIONS ON ENERGY CONVERSION
Fig. 1. Simplified model of the point absorber wave energy converter.
TABLE IDATA OF THE SELECTED SIMULATION TEST CASE
theory can be applied and the hydrodynamic diffraction model82
can be used to represent the interaction between the buoy and83
the waves [17].84
1) Frequency-Domain Model: If sinusoidal incident waves85
(regular waves) are considered, the system behavior can be de-86
scribed in the frequency domain as87
−ω2(M + a(ω))⌢
S + jω B(ω)⌢
S + K⌢
S =⌢
FE +⌢
FL (1a)
where ω is the angular frequency of the incident wave, S is88
the buoy position, and “⌢. ” denotes complex quantities. M is89
the mass of the device, including also the contribution of the90
generator inertia Jm , scaled by the gear ratio, n. Moreover, a is91
the added mass at the considered frequency. Added mass takes92
into account the water mass involved in the device movement93
and depends on the radiation force caused by device oscillation.94
B(ω) is the mechanical damping, also including the radiation95
resistance b, which is frequency dependent, too; K is the hydro-96
dynamic stiffness. Finally, FE is the excitation wave force and97
FL is the force applied by the PTO. Hydrodynamic parameters98
for the reference test case are listed in Table I and refer to the99
point absorber described in [7].100
Fig. 2. Electric analogue of a point absorber wave energy converter.
2) Time-Domain Model: In order to analyze the WEC be- 101
havior in irregular waves and to cope with any nonlinearity, a 102
time-domain model [18] is required, as the following one based 103
on the Cummins equation [19]: 104
(M + a∞)s(t) +
∫ t
−∞
Hrad(t − τ)s(τ)dτ + Ks(t)
= FE (t) + FL (t). (1b)
In (1b), “.” is time derivation operation, while a∞ represents 105
the value of added mass for ω→∞, i.e., 106
a∞ = limω→∞
a(ω).
Moreover, Hrad is the radiation impulse response function 107
(RIRF). 108
B. Electric Analogue of the WEC Under Sinusoidal Condition 109
The system described by (1a) corresponds to a mass–spring– 110
damper system and, in order to gain a better understanding of its 111
behavior, it can be useful to introduce its electric analogue (see 112
Fig. 2), which is valid as long as regular waves are assumed. 113
The excitation force FE corresponds to the sinusoidal voltage 114
e and the buoy velocity s to the current i. Moreover, the device 115
mass M and added mass a are represented by the inductance L, 116
the spring stiffness K by the inverse of the capacitance C and, 117
finally, the mechanical damping B by the resistance R. Thus, the 118
buoy, as a whole, is represented by the impedance Z. The force 119
applied by the PTO corresponds to the load voltage uL , whose 120
value is related to the control parameters represented by load 121
resistance RL and load reactance XL , as will be better explained 122
in Section III. 123
C. Model of the WEC for Irregular Waves Tests 124
The time-domain model of the WEC has been built from (1b) 125
and is reported in Fig. 3. The excitation force FE coming from 126
the waves is considered as a system input and its derivation is 127
described in detail in the following section. The control force 128
applied by the PTO FL is a system input as well. 129
The point absorber considered in this paper is the same as 130
that analyzed in [7]. Its hydrodynamic coefficients, damping 131
b(ω) and addedmass a(ω) have been obtained using a boundary- 132
element code (ANSYSAQWA),working on the geometrical and 133
physical properties of the system. For simple standard shapes 134

IEEE
Proof
TEDESCHI et al.: EFFECT OF CONTROL STRATEGIES AND POWER TAKE-OFF EFFICIENCY ON THE POWER CAPTURE FROM SEA WAVES 3
Fig. 3. Time-domain model of the wave energy converter used in irregularwaves analyses.
Fig. 4. RIRF of the considered point absorber.
as the spherical one, those coefficients could be as well found135
tabulated in an adimensional form [20].136
The radiation force FR has been determined as described137
in the following. If we consider the system represented by the138
transfer function −Hrad (ω), whose input is the buoy velocity s139
and the output is the radiation force FR , it can be shown that the140
impulse response of such system −Hrad (t) corresponds to the141
inverse Fourier transform of −Hrad (ω), which in turn is related142
to the hydrodynamics coefficients as follows [17]:143
Hrad(t) = F−1 [Hrad(ω)] = F−1 [b(ω) + jω a(ω) − jω a∞].(2)
Thus, for the considered system, the RIRF showed in Fig. 4 was144
derived by an inverse Fourier transform F−1 , starting from the145
hydrodynamic coefficients. Once the RIRF is available, there146
are several identification methods that can be used to identify147
the system, i.e., in the form of transfer function or of state-space148
model. In our case, the state-space model of the radiation force149
has been derived and its order conveniently reduced by proper150
MATLAB functions to finally obtain a fourth-order state-space151
model of the radiation force (see Fig. 3).152
Fig. 5. (a) Energy spectrum according to Bretschneider model. (b) Exampleof an excitation force profile in irregular waves.
D. Irregular Incident Waves 153
In order to evaluate the real performance of aWEC, the analy- 154
sis of its behavior when subject to irregular waves is mandatory. 155
It is especially meaningful to develop some time-domain stud- 156
ies related to the power extraction. The stochastic character of 157
real waves can be well understood if the superposition of in- 158
finite sinusoidal waves of infinitesimal height, random phase, 159
and different frequencies is considered. Several different mod- 160
els have been developed to provide a suitable description of a 161
real sea. Most of them use few fundamental parameters that 162
are considered representative of a specific sea state to build 163
up the energy spectrum of the sea itself. In the following, the 164
Bretschneider model [21], [22] will be adopted, where the en- 165
ergy spectrum [see Fig. 5(a)] can be obtained as a function of 166
the selected wave period and significant wave height of the sea 167
state. From the energy spectrum, the time-domain expression 168
of incident waves is found. The force coefficients are derived 169
from the corresponding damping coefficients by applying the 170
Haskind relations [17]. Then, the time-domain expression of 171
the excitation force that the buoy receives from the sea can be 172
found [23]; an example of excitation force profile is shown in 173
Fig. 5(b). 174
It is worth noting that, for the purpose of control strategies 175
comparison, the energy period, also known as “true average 176
period,” Te = 6 s and the significant wave height Hs = 1.41m 177
that are used to build the energy spectrum for the following 178
analyses, are selected according to a criterion of “equal energy 179
period, Te” (3a) and “equal energy transport, EN” (3b) between 180
the cases of sinusoidal and irregular waves [22]: 181
Te = T (3a)
ENsin =ρg
2A2
ENirr =ρg
16H2
s
ENsin = ENirr → Hs = 2√
2A. (3b)

IEEE
Proof
4 IEEE TRANSACTIONS ON ENERGY CONVERSION
In (3a) and (3b), ρ is the water density and g the gravitational182
constant.183
E. Model of the PTO184
The PTO is composed by an electrical machine, and con-185
trolled by a bidirectional switching converter. Field-oriented186
control (FOC) is used to control the torque (i.e., the force) ap-187
plied by the PTO. One of the goals of the following power188
performance analysis is to provide information about the sizing189
of the generator and the power converter.190
III. CONTROL OF THEWEC191
A. Linear Control Strategies192
The simplest and most widespread control strategy for heav-193
ing buoys is passive loading, where the force exerted by the PTO194
is proportional to the buoy velocity. Acting this way, only the195
amplitude of the buoy motion can be controlled. On the other196
hand, both the amplitude and the phase of the motion need to197
be controlled in order to extract the absolute maximum average198
power. This is realized by implementing the so-called optimum199
(reactive) control, where the applied force has a component that200
is proportional to the buoy acceleration (reactive component) in201
addition to the one proportional to the velocity (damping com-202
ponent). It is worthwhile to clarify that this “optimum control”203
is typically used in wave energy applications to denote the case204
when, under the assumption of sinusoidal incident wave, the205
load reactance XL cancels the reactance impedance given by206
inductance L and capacitance C shown in Fig. 2, so that the207
impedance seen by voltage generator E is purely resistive. In208
this case, the theoretical condition of resonance between the209
motion of the device and incident waves is achieved; however,210
a bidirectional power flow between the buoy and the PTO must211
be allowed.212
B. Sinusoidal Incident Waves213
The power performance of point absorbers is well known if214
sinusoidal incident waves are considered [17] and it is here re-215
called with reference to the most consolidated control strategies216
for comparison purposes.217
Passive loading application corresponds to have a zero control218
reactive component, i.e., XL = 0.219
To obtain the maximum possible extraction of average power220
under such condition, the resistive component must be221
RL =
√
R2 +
(
ω L −1
ω C
)2
. (4)
On the other hand, application of optimum control implies222
XL = −
(
ω L −1
ω C
)
(5a)
RL = R (5b)
leading to the resonance condition and, thus, to the absolute223
maximum of the average power extraction.224
Fig. 6. (a) Incident wave, (b) instantaneous and average extracted power ap-plying passive loading, and (c) optimum control.
The sinusoidal reference wave used in the following analysis 225
as a design wave has amplitude A = 0.5m and period T = 6 s 226
[see Fig. 6(a)]. 227
IV. ANALYSIS OF POWER PERFORMANCEWITH DIFFERENT 228
CONTROL STRATEGIES 229
A. Impact of Control Strategies on the Converter Rating 230
In order to rationally choose the WEC control strategy, the 231
rating of the electric and power electronics equipment must be 232
taken into account. For such purpose, one interesting parameter 233
is the instantaneous extracted power or equivalently the ratio k 234
between peak and average power. 235
By simple analytical considerations, it can be shown that un- 236
der sinusoidal conditions (T = 6 s and A = 0.5m), if passive 237
loading is applied, the peak power always doubles the average 238
one. In the presented case, the average power that can be ex- 239
tracted is of 23.73 kW [see Fig. 6(b)]. On the other hand, if 240
optimum control is adopted under sinusoidal conditions, k is 241
largely varying depending on the specific device and incoming 242
waves: in the considered example, the adoption of optimum con- 243
trol leads to an average power of 56.22 kW and peak to average 244
power ratio is equal to 4.54 [see Fig. 6(c)]. Thus, under ideal 245
conditions, optimum control enables the extraction of a higher 246
average power compared to passive loading at the expense of 247
significantly higher power electronics rating. 248
It is then interesting to verify if the same trend applies in the 249
case of irregular incident waves. 250
If the system is completely linear, the power performance 251
under irregular waves can be theoretically predicted, once that 252
the energy spectrum of the incident waves is known. With ref- 253
erence to the Bretschneider spectrum of Fig. 5(a), the total av- 254
erage power extraction is derived as the sum of the extractable 255
power at the different frequency components. For the single fre- 256
quency, the system corresponds to the ideal case described in 257
IEEE
Proof
TEDESCHI et al.: EFFECT OF CONTROL STRATEGIES AND POWER TAKE-OFF EFFICIENCY ON THE POWER CAPTURE FROM SEA WAVES 5
Section II-A1. In the considered case, the control coefficientsRL258
and XL /(2pfp ) are selected as the optimal ones for a sinusoidal259
wave whose frequency fp corresponds to the peak of the energy260
spectrum for both passive loading and optimum control [see261
(4a) and (4b)] and they are then kept constant at all frequencies.262
Under such conditions, the average extracted power is ex-263
pected to be 18.71 kW when applying passive loading and264
28.94 kW when applying optimum control.265
B. Power Saturation Effect266
The analysis of the instantaneous trend of the power extracted267
in irregular waves shows that it is extremely fluctuating with268
sporadic very high peaks. If the conflicting need to maximize269
the average extracted power, while limiting excessive overrating270
of electronic equipment is also taken into account, it is useful271
to consider the effect of saturation on the instantaneous power272
on the average power extraction. Such saturation is obtained273
by conveniently reducing the PTO applied force, so that the274
stated power limit is never exceeded. This effect is represented275
in a very simplified way, since more practically a torque lim-276
itation (possibly including some time-dependant overloading277
conditions) and a power converter current limitation are usually278
applied. All these provisions are here aggregated in the PTO279
power saturation.280
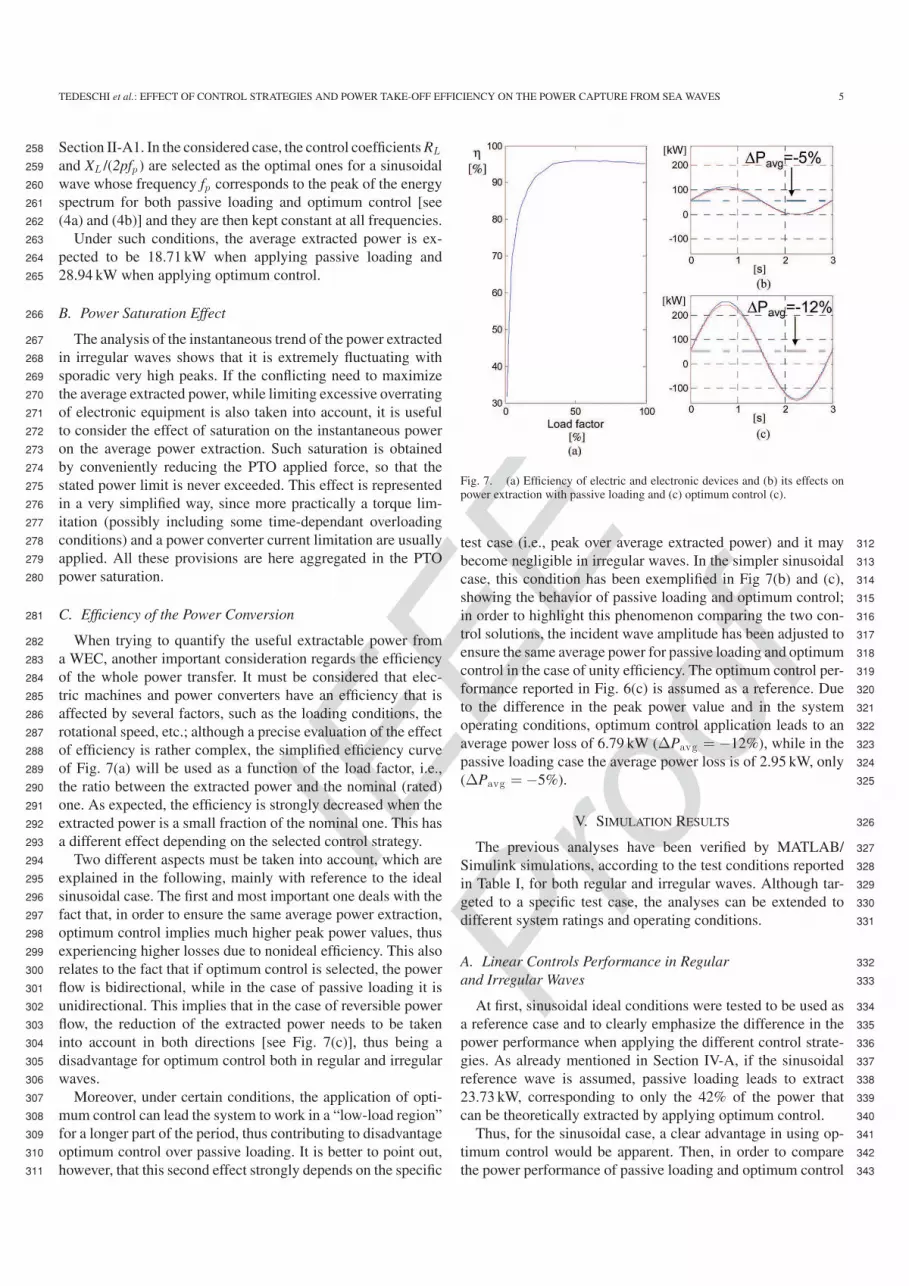
C. Efficiency of the Power Conversion281
When trying to quantify the useful extractable power from282
a WEC, another important consideration regards the efficiency283
of the whole power transfer. It must be considered that elec-284
tric machines and power converters have an efficiency that is285
affected by several factors, such as the loading conditions, the286
rotational speed, etc.; although a precise evaluation of the effect287
of efficiency is rather complex, the simplified efficiency curve288
of Fig. 7(a) will be used as a function of the load factor, i.e.,289
the ratio between the extracted power and the nominal (rated)290
one. As expected, the efficiency is strongly decreased when the291
extracted power is a small fraction of the nominal one. This has292
a different effect depending on the selected control strategy.293
Two different aspects must be taken into account, which are294
explained in the following, mainly with reference to the ideal295
sinusoidal case. The first and most important one deals with the296
fact that, in order to ensure the same average power extraction,297
optimum control implies much higher peak power values, thus298
experiencing higher losses due to nonideal efficiency. This also299
relates to the fact that if optimum control is selected, the power300
flow is bidirectional, while in the case of passive loading it is301
unidirectional. This implies that in the case of reversible power302
flow, the reduction of the extracted power needs to be taken303
into account in both directions [see Fig. 7(c)], thus being a304
disadvantage for optimum control both in regular and irregular305
waves.306
Moreover, under certain conditions, the application of opti-307
mum control can lead the system to work in a “low-load region”308
for a longer part of the period, thus contributing to disadvantage309
optimum control over passive loading. It is better to point out,310
however, that this second effect strongly depends on the specific311
Fig. 7. (a) Efficiency of electric and electronic devices and (b) its effects onpower extraction with passive loading and (c) optimum control (c).
test case (i.e., peak over average extracted power) and it may 312
become negligible in irregular waves. In the simpler sinusoidal 313
case, this condition has been exemplified in Fig 7(b) and (c), 314
showing the behavior of passive loading and optimum control; 315
in order to highlight this phenomenon comparing the two con- 316
trol solutions, the incident wave amplitude has been adjusted to 317
ensure the same average power for passive loading and optimum 318
control in the case of unity efficiency. The optimum control per- 319
formance reported in Fig. 6(c) is assumed as a reference. Due 320
to the difference in the peak power value and in the system 321
operating conditions, optimum control application leads to an 322
average power loss of 6.79 kW (∆Pavg = −12%), while in the 323
passive loading case the average power loss is of 2.95 kW, only 324
(∆Pavg = −5%). 325
V. SIMULATION RESULTS 326
The previous analyses have been verified by MATLAB/ 327
Simulink simulations, according to the test conditions reported 328
in Table I, for both regular and irregular waves. Although tar- 329
geted to a specific test case, the analyses can be extended to 330
different system ratings and operating conditions. 331
A. Linear Controls Performance in Regular 332
and Irregular Waves 333
At first, sinusoidal ideal conditions were tested to be used as 334
a reference case and to clearly emphasize the difference in the 335
power performance when applying the different control strate- 336
gies. As already mentioned in Section IV-A, if the sinusoidal 337
reference wave is assumed, passive loading leads to extract 338
23.73 kW, corresponding to only the 42% of the power that 339
can be theoretically extracted by applying optimum control. 340
Thus, for the sinusoidal case, a clear advantage in using op- 341
timum control would be apparent. Then, in order to compare 342
the power performance of passive loading and optimum control 343

IEEE
Proof
6 IEEE TRANSACTIONS ON ENERGY CONVERSION
Fig. 8. Instantaneous and average power using passive loading.
in irregular waves to the corresponding ones under ideal con-344
ditions, wave’s force time series were created, in the form of345
profiles of 1000 s each (the spectrum discretization frequency346
resolution being ∆f = 0.001Hz).347
While the data about average power extraction are the same348
irrespective of the specific force profile that is applied being349
all of them derived from the same spectrum, the information350
about instantaneous power are related to the specific test case351
since phases at different frequencies are randomly generated.352
Thus, the evaluation of the peak power or the power ratio must353
be performed on a statistical base [18], considering the results354
coming, in our case, from the simulation of 80 different force355
profiles.356
The first test was aimed at the quantification of the power357
performancewhen passive loading is used. A specific simulation358
set showed that the maximum passive loading power extraction359
is achieved when the applied damping is close to the optimal360
one [see (4)] for a perfectly sinusoidal incident wave, whose361
frequency corresponds to the peak of the considered spectrum362
of Fig. 5(a). In this case, the average power can be quantified363
into 18.38 kW (see Fig. 8).When compared to the corresponding364
sinusoidal case, it shows how, due to irregular waves, a reduction365
of almost one-fourth of the average power is to be expected.366
The same kind of test was developed while applying opti-367
mum control. Also in this case, the reactive and damping co-368
efficients are selected as the ones maximizing power absorp-369
tion under regular conditions, with a sinusoidal incident wave,370
whose frequency corresponds to the peak of the spectrum. The371
corresponding power absorption is reported in Fig. 9. The to-372
tal average extracted power is now of 28.38 kW, which is even373
more significantly reduced with respect to the corresponding374
sinusoidal case. The small difference between theoretical and375
simulated values can be due to the approximation introduced376
by the identification process used for the radiation force calcu-377
lation. Then, the statistical analysis on irregular waves shows378
Fig. 9. Instantaneous and average power using optimum control.
that, when passive loading is applied, the peak to average power 379
value is in the range 7.7–17.1 and a power peak of 314 kW 380
can be reached. In the case of optimum control, k is between 381
25.2 and 58.3 and the peak power absorption (over the 80 tested 382
cases) exceeds 1.6MW. 383
Thus, the irregular waves study clearly confirms the need for 384
a consistent overrating of the electric and electronic devices. 385
B. Test on Power Saturation Effect 386
The second part of the analysis is focused on the effects of 387
power saturation, representing the maximum power that can be 388
handled by the electronic equipment and it is performed with 389
reference to a specific force profile. 390
Eight different saturation levels are chosen for both passive 391
loading and optimum control and analyzed with respect to both 392
irregular waves and corresponding sinusoidal waves. Results 393
are reported in Table II. It can be observed that in irregular 394
waves, a saturation of themaximum instantaneous power of 62% 395
(from Psat = 147.04 kW to Psat = 55.14 kW) leads to a loss of 396
average power only of 3% for passive loading, while in the case 397
of optimum control, a corresponding reduction of 67% in the 398
maximum power (from Psat = 1102.8 kW to Psat = 367.6 kW) 399
results in a 19.5% loss of average power, thus meaning that 400
a significant reduction in the power electronics rating can be 401
achieved with limited average power drop. With reference to 402
the optimum control, it is also worth noting that if an even 403
smaller saturation of 43% (from Psat = 255.2 kW to Psat = 404
147.04 kW) is applied under sinusoidal conditions, it leads to 405
an average power loss of 63%, thus meaning that the beneficial 406
effect of a power saturation is specifically related to irregular 407
waves and could be not appreciated if only sinusoidal waves 408
are considered. From the data of passive loading applied in 409
irregular waves, it can be also noted how the adoption of a 410
nonlinear control can lead to the absorption of a higher average 411
power than the corresponding (unconstrained) linear technique, 412
under certain conditions, as already reported in the literature [7]. 413

IEEE
Proof
TEDESCHI et al.: EFFECT OF CONTROL STRATEGIES AND POWER TAKE-OFF EFFICIENCY ON THE POWER CAPTURE FROM SEA WAVES 7
TABLE IIEFFECTS OF INSTANTANEOUS POWER SATURATION
Fig. 10. Average power extraction as a function of the power saturation levelin presence of unity (dashed line) and nonunity (continuous line) efficiency ofthe power conversion, for passive loading and optimum control.
Finally, it is interesting to note the fact that if the same limit for414
peak power is assumed for both passive loading and optimum415
control (e.g., Psat = 73.52 kW), the implementation of passive416
loadingleads to significantly better results than with optimum417
control.418
It is worth noting that the application of saturation tech-419
niques leads to a decreased control over velocity and position420
of the buoy. In the considered case with a saturation threshold421
of 110 kW, the buoy excursion always remains less than +/−422
1m, which is well below the +/−3-m acceptable level for the423
specific device [7]. The adoption of saturation in extreme condi-424
tions is, however, still an open issue and its impact on the buoy425
excursion and generator speed must be carefully evaluated.426
C. Test on Nonideal Efficiency Effect427
The goal of the following set of simulations is to evaluate the428
effect of a nonideal efficiency of electric and electronic devices429
[see Fig. 7(a)] on the power conversion and its specific impact430
on the different control strategies.431
In Fig. 10, the average power extraction as a function of the432
power saturation level is reported for both ideal and nonideal433
Fig. 11. Average power extracted with nonunity efficiency as a function ofthe reactive component, evaluated as a fraction of the value used in optimumcontrol. Resistive component is the one used in passive loading.
conversion efficiency, in the case of passive loading and opti- 434
mum control. 435
The first important thing to underline is that irrespective of 436
the control technique that is applied, the effect of nonideal con- 437
version efficiency is of determining a point of maximum in the 438
average power extraction, corresponding to a specific power 439
saturation level. 440
This means that even if a higher rate of the power electron- 441
ics equipment was allowed, no gain would follow in the final 442
power extraction. The reason is that when the PTO has a con- 443
sistent overrating due to irregular waves, it works mainly in 444
low-load conditions, and consequently, the whole power con- 445
version becomes more and more inefficient. 446
It was already mentioned with reference to Table II that in 447
case of very low saturation level, passive loading leads to higher 448
average power extraction than optimum control. When con- 449
sidering also the effect of nonunity efficiency, the conclusion 450
is even more decisive. When comparing the nonideal curves 451
of Fig. 10 for passive loading and optimum control, it can be 452
clearly seen that the maximum power extraction obtained from 453
passive loading (Pavg = 16.7 kW) is more than the maximum 454
power extraction that can be reached by optimum control even 455

IEEE
Proof
8 IEEE TRANSACTIONS ON ENERGY CONVERSION
Fig. 12. Integrated simulation model, including hydrodynamic and electric model of the WEC.
Fig. 13. Block diagram of the detailed system simulated model, including main control components.
in its most favorable condition (Pavg = 15 kW). Moreover, the456
highest power extraction in the passive loading case can be457
reached at expense of a consistently reduced power electronic458
equipment (Psat = 75 kW), compared to the optimum control459
option (having its maximum at Psat = 500 kW). Thus, in the460
considered test case, optimization of the average power extrac-461
tion can be obtained by designing electric and power electronics462
equipment whose power rating is around 100 kW and by choos-463
ing passive loading as the most convenient control strategy.464
The proven superiority of passive loading over optimum control465
when nonideal efficiency is taken into account, leads to won-466
der if an “intermediate control” solution can ensure a higher467
average power extraction than passive loading under the same468
conditions.469
A specific test was carried out by adopting a saturation level 470
of 110 kW. The resistive component of the control was fixed 471
as in the case of passive loading, while a reactive component 472
being an increasing fraction of the one prescribed by optimum 473
control was added. Average extracted power was then evalu- 474
ated as the mean value of several sets of simulations. As can 475
be seen from Fig. 11, when a reactive component being 50% 476
of the one adopted in optimum control is applied, an average 477
power of 21.8 kW can be obtained, corresponding to a 23% in- 478
crease with respect to pure passive loading. Consequently, an 479
intermediate control solution including a suitable reactive com- 480
ponent is advisable even under nonunity efficiency conditions 481
and must be carefully optimized to improve the whole power 482
performance. 483

IEEE
Proof
TEDESCHI et al.: EFFECT OF CONTROL STRATEGIES AND POWER TAKE-OFF EFFICIENCY ON THE POWER CAPTURE FROM SEA WAVES 9
TABLE IIIPARAMETERS OF THE FULL-SYSTEM SIMULATION
D. Test on Nonideal Efficiency Effect484
Based on the proposed analysis, a detailed simulation model485
has been developed, integrating the wave energy source model486
and the hydrodynamicmodel of theWECpresented in Section II487
with a detailed model of the electric PTO, as can be seen from488
Fig. 12. The electrical model of the system, including the electri-489
cal drive and the grid-interface converter is shown in Fig. 13. For490
this specific example, the electric machine is an asynchronous491
generator with a nominal power of 110 kW and a rated speed492
of 1487 r/min, while other electrical parameters are reported in493
Table III.494
The machine model is implemented in the dq reference frame495
and the FOC has been adopted [25].496
Two-level voltage source inverter (VSI) has been adopted497
both for the electrical drive and for the grid-connected converter498
with fsw = 8 kHz. The second one behaves as an active front499
end (AFE), where an inner dq current control imposes the line500
currents to be in phase with the line voltages and an outer501
control regulates the dc-bus voltage. The control algorithm has502
been implemented in the dq rotating reference frame and the503
angle θ, needed for the transformation, has been generated by a504
phase-locked loop. The control used both for the grid-connected505
VSI and for the electrical drive is based on well-established506
knowledge available in the literature.Main converter parameters507
are also listed in Table III. The PI regulators of the current loops508
of both the electrical drive and the AFE are tuned to achieve509
a bandwidth of 500Hz with a phase margin of 60◦. The PI510
regulating the dc-link voltage is designed for a bandwidth of511
20Hz and a phase margin of 70◦ and a feedforward action is512
added in the dc-bus voltage loop (i.e., a term proportional to the513
generated power p(t) is added at the output of the PI_Vdc) to514
reduce dc-link voltage fluctuation.515
One example of the results obtained with the detailed model516
is reported in Fig. 14. Fig. 14(a) shows the irregular wave pro-517
file, Fig. 14(b) shows the torque applied by the electrical ma-518
chinewhen passive loading is used, and corresponding generator519
speed is shown in Fig. 14(c). It can be observed that the dc volt-520
age [see Fig. 14(d)] reflects the low-frequency oscillations of521
Fig. 14. (a) Sea waves profile, (b) generator torque, (c) generator speed,(d) dc voltage reference and dc actual voltage, and (e) current injected intothe grid in phase a.
Fig. 15. Details of the voltage and current of phase a at the grid section.
sea waves and such fluctuation is present also in the grid current 522
waveform [see Fig. 14(e)]. In this specific example, the dc-link 523
capacitor is not providing any energy smoothing, and the power 524
fluctuation generated by the PTO is directly injected into the 525
grid. 526
From Fig. 15, it can be noted that the current is injected into 527
the grid with a unity power factor, as required. 528
The detailed model confirms the analysis previously reported 529
in Fig. 10. As an example, using a power saturation equal to 530

IEEE
Proof
10 IEEE TRANSACTIONS ON ENERGY CONVERSION
110 kW, the average extracted power using the detailed model531
is 16.4 kW, as marked by the square shown in Fig. 10.532
VI. CONCLUSION533
This paper has considered the effect of irregular waves in the534
control and design of point absorber WECs. The following as-535
pects have been analyzed and proved by computer simulations.536
1) The detrimental effect of irregular waves on the perfor-537
mance of both passive loading and optimum control.538
2) The usefulness of power saturation provisions to reduce539
the rating of power electronics equipment without exces-540
sive drop in the average power extraction.541
3) The impact of nonunity efficiency of the real electric power542
conversion on the selected control techniques.543
REFERENCES544
[1] T. W. Thorpe, “An overview of wave energy technologies: Status, perfor-545
mance and costs,” inWave Power: Moving Towards Commercial Viability.546
London, U.K.: IMechE Seminar, 1999.547
[2] T. K. A. Brekken, A. von Jouanne, and H. Y. Han, “Ocean wave energy548
overview and research at oregon state university,” inProc. Power Electron.549
Mach. Wind Appl., Jun. 24–29, 2009, pp. 1–7.550
[3] M. Leijon, R. Waters, M. Rahm, O. Svensson, C. Bostrom, E. Stromstedt,551
J. Engstrom, S. Tyrberg, A. Savin, H. Gravrakmo, H. Bernhoff, J.552
Sundberg, J. Isberg, O. Agren, O. Danielsson, M. Eriksson, E. Lejerskog,553
B. Bolund, S. Gustafsson, and K. Thorburn, “Catch the wave to electric-554
ity: The conversion of wave motions to electricity using a grid-oriented555
approach,” IEEE Power Energy Mag., vol. 7, no. 1, pp. 50–54, Jan./Feb.556
2009.557
[4] L. Marquis, M. Kramer, and P. Frigaarg, “First power production figures558
from the wave star roshage wave energy converter,” in Proc. 3rd Int. Conf.559
Exhibition Ocean Energy, Bilbao, Spain, Oct. 6–8, 2010, pp. 1–5.560
[5] U. A. Korde, “Control system applications in wave energy conversion,”561
in Proc. MTS/IEEE Oceans Providence, Sep. 2000, pp. 1817–1824.562
[6] J. K. H. Shek, D. E. Macpherson, M. A. Mueller, and J. Xiang, “Reaction563
force control of a linear electrical generator for direct drive wave energy564
conversion,” IET Renew. Power Generation, vol. 1, no. 1, pp. 17–24, Mar.565
2007.566
[7] J. Hals, T. Bjarte-Larsson, and J. Falnes, “Optimum reactive control and567
control by latching of a wave-absorbing semisubmerged heaving sphere,”568
in Proc. 21st Int. Conf. Offshore Mech. Artic Eng., Oslo, Norway, Jun.569
23–28, 2002, pp. 1–9.570
[8] V. Delli Colli, P. Cancelliere, F.Marignetti, R. Di Stefano, andM. Scarano,571
“A tubular-generator drive for wave energy conversion,” IEEE Trans. Ind.572
Electron., vol. 53, no. 4, pp. 1152–1159, Aug. 2006.573
[9] A. Garcıa, D. El Montoya, and A. de la Villa, “Control of hydrodynamic574
parameters of wave energy point absorbers using linear generators and575
VSC-based power converters connected to the grid,” in Proc. Int. Conf.576
Renewable Energies Power Quality, Granada, Spain, Mar. 23–25, 2010,577
pp. 1–6.578
[10] D. Valerio, P. Beirao,M. J. G. C.Mendes, and J. Sa da Costa, “Comparison579
of control strategies performance for a Wave Energy Converter,” in Proc.580
16th Mediterranean Conf. Control Autom., Jun. 25–27, 2008, pp. 773–778.581
[11] E. A. Amon, A. A. Schacher, and T. K. A. Brekken, “A novel maximum582
power point tracking algorithm for ocean wave energy devices,” in Proc.583
IEEE Energy Convers. Congr. Expo., San Jose, CA, Sep. 20–24, 2009,584
pp. 2635–2641.585
[12] M. F. P. Lopes, J. Hals, R. P. F. Gomes, T.Moan, L.M. C. Gato, andA. F. de586
O. Falcao, “Experimental and numerical investigation of non-predictive587
phase-control strategies for a point-absorbing wave energy converter,”588
Ocean Eng., vol. 36, no. 5, pp. 386–402, 2009.589
[13] H. Polinder, M. E. C. Damen, and F. Gardner, “Linear PM Generator590
system for wave energy conversion in the AWS,” IEEE Trans. Energy591
Convers., vol. 19, no. 3, pp. 583–589, Sep. 2004.592
[14] H. Lendenmann, K-C. Stromsem, M. Dai Pre, W. Arshad, A. Leirbukt,593
G. Tjensvoll, and T. Gulli, “Direct generation wave energy converters594
for optimized electrical power production,” in Proc. 7th Eur. Wave Tidal595
Energy Conf., Porto, Portugal, Sep. 11–13, 2007, pp. 1–10.596
[15] M. Ruellan, H. BenAhmed, B. Multon, C. Josset, A. Babarit, and 597
A. Clement, “Design methodology for a SEAREV wave energy con- 598
verter,” IEEE Trans. Energy Convers., vol. 25, no. 3, pp. 760–767, Sep. 599
2010. 600
[16] K. Budal and J. Falnes, “A resonant point absorber of ocean-wave power,” 601
Nature, vol. 256, pp. 478–479, 1975. 602
[17] J. Falnes, Ocean Wave Energy and Oscillating Systems: Linear Interac- 603
tion Including Wave-Energy Extraction, 1st ed. Cambridge, U.K.: Cam- 604
bridge Univ. Press, 2002. 605
[18] P. Ricci, J. B. Saulnier, A. F. de O. Falcao, and M. T. Pontes, “Time- 606
domain models and wave energy converters performance assessment,” in 607
Proc. 27th Int. Conf. Offshore Mech. Artic Eng., Estoril, Portugal, Jun. 608
15–20, 2008, pp. 1–10. 609
[19] W. E. Cummins, “The impulse response function and ship motions,” 610
Schiffstechnik, vol. 9, pp. 101–109, 1962. 611
[20] A. Hulme, “The wave forces acting on a floating hemisphere undergoing 612
forced periodic oscillations,” J. Fluid Mech., vol. 121, pp. 443–463, 1982. 613
[21] W. H. Michel, “Sea spectra revisited,” Marine Technol., vol. 36, no. 4, 614
pp. 211–227, Winter 1999. 615
[22] G. P. Harrison and A. R. Wallace, “Sensitivity of wave energy to climate 616
change,” IEEE Trans. Energy Convers., vol. 20, no. 4, pp. 870–877, Dec. 617
2005. 618
[23] K. A. Ansari and N. U. Khan, “Computation of environmental forces for 619
use in offshore vessel dynamic analysis,” Int. J. Energy Res., vol. 13, 620
pp. 545–553, 1989. 621
[24] R. Krishnan, Electric Motor Drives: Modeling, Analysis, and Control. 622
Englewood Cliffs, NJ: Prentice-Hall, 2001. 623
Elisabetta Tedeschi (M’xx) received the Dr. Ing. de- 624
gree (Hons.) in electrical engineering and the Ph.D. 625
degree in industrial engineering from the Univer- 626
sity of Padova, Padova, Italy, in 2005 and 2009, 627
respectively. Q1628
From 2009 to 2011, she was a Postdoctoral Re- 629
searcher at the Norwegian University of Science and 630
Technology, Trondheim, Norway. In 2010–2011, she 631
was an Abel Grantee Visiting Researcher at the Uni- 632
versity of the Basque Country, Bilbao, Spain. Being 633
received a Marie Curie Fellowship in April 2011 she 634
is currently a Researcher at Tecnalia Research and Innovation, Bilbao. Her re- 635
search interests include design and control of energy conversion systems, with 636
specific focus on wave-energy applications and power-quality issues. 637
638
Matteo Carraro received the M.S. degree in au- 639
tomation engineering from the University of Padova, 640
Padova, Italy, in 2010. Since January 2011, he has 641
been working toward the Ph.D. degree in mechatron- 642
ics engineering and product innovation in the De- 643
partment of Technique andManagement of Industrial 644
Systems, University of Padova, Vicenza, Italy. 645
His main research interests include control and 646
parameter estimation techniques for electrical motor 647
drives. 648
649

IEEE
Proof
TEDESCHI et al.: EFFECT OF CONTROL STRATEGIES AND POWER TAKE-OFF EFFICIENCY ON THE POWER CAPTURE FROM SEA WAVES 11
Marta Molinas (M’94) received the Diploma degree650
in electromechanical engineering from the National651
University ofAsuncion,Asuncion, Paraguay, in 1992,652
the M.Sc. degree from Ryukyu University, Ryukyu,653
Japan, in 1997, and the Dr.Eng. degree from Tokyo654
Institute of Technology, Tokyo, Japan, in 2000.Q2 655
In 1998, she was a Guest Researcher at the Univer-656
sity of Padova, Padova, Italy. From 2004 to 2007, she657
was a Postdoctoral Researcher at the Norwegian Uni-658
versity of Science and Technology (NTNU), Trond-659
heim,Norway,where she became a Professor in 2008.660
From 2008 to 2009, she was a JSPS Research Fellow at the Energy Technology661
Research Institute of Advanced Industrial Science and Technology in Tsukuba,662
Japan. Her research interests include wind/wave energy conversion systems,663
and power electronics and electrical machines in distributed energy systems.664
Dr. Molinas is an active reviewer for the IEEE TRANSACTIONS ON INDUS-665
TRIAL ELECTRONICS and IEEE TRANSACTIONS ON POWER ELECTRONICS. She666
is an AdCom Member of the IEEE Power Electronics Society667
668
Paolo Mattavelli (M’xx) received the Graduate 669
(Hons.) and Ph.D. degrees in electrical engineering 670
from the University of Padova, Padova, Italy, in 1992 671
and 1995, respectively. Q3672
From 1995 to 2001, he was a Researcher at the 673
University of Padova. In 2001, he joined as an Asso- 674
ciate Professor the University of Udine, where he was 675
leading the Power Electronics Laboratory. In 2005, he 676
joined the University of Padova in Vicenza with the 677
same duties and in 2010 Virginia Polytechnic Insti- 678
tute and State University, Blacksburg, as a Professor 679
and member of the Center of Power Electronics Systems. His major research 680
interests include analysis, modeling, and control of power converters, digital 681
control techniques for power electronic circuits, and grid-connected converters 682
for power quality and renewable energy systems. In these research fields, he 683
was leading several industrial and government projects. Q4684
Dr. Mattavelli currently (2010) serves as an Associate Editor for IEEE 685
TRANSACTIONS ON POWER ELECTRONICS, and as an Industrial Power Converter 686
Committee Technical Review Chair for the IEEE TRANSACTIONS ON INDUSTRY 687
APPLICATIONS. For terms 2003–2006 and 2006–2009, he was a member-at- 688
large of the IEEE Power Electronics Society’s Administrative Committee. He 689
received the Prize Paper Award in the IEEE TRANSACTIONS ON POWER ELEC- 690
TRONICS in 2005 and 2006 and a second place in the Prize Paper Award at the 691
IEEE Industry Application Annual Meeting in 2007. 692
693


