Embed Size (px)
Citation preview
Aquaculture Research. 1997. 28,405^17
Effect of dietary lipid level on protein utilization andthe size and proximate composition of bodycompartments of Colossoma macropomum (Cuvier)
M B van der MeerDepartment of Fish Culture and Fisheries. Wageningen Agricultural Universitj'. Wageningen. the Netherlands
) E ZamoraEscuela de Ciencias Biologicas. Unii'ersidad Nacional. Heredia. Co.sta Rica
M C I VerdegemDepartment of Fish Culture and Fisheries. Wageningen Agricultural Universit>'. Wageningen. the Netherlands
Corretipondencc: Dr M B van der Meer. Department of i'ish Culture and Fisheries. Wageningen Agricultural Universitj'. PO Box 338.
6700 AH Wageningen. the Netherlands. E-mail: [email protected]
Abstract
Juvenile Colossoma macropomum were fed ad libitumdiets containing either 30% or 40% protein, whilethe dietary lipid level varied between 5% and 20%.Growth and protein utilization efficiency increasedwith the dietary lipid level. However, the economicfeasibility of the addition of extra dietary lipid toC. macropomum diets is questionable, as for everyextra gram of protein deposition it was necessary toreplace 20-25 g of dietary carbohydrates by lipids.Moreover, increased dietary lipid levels resulted inincreased lipid deposition. In C. macropomum, feeduptake was regulated by the dietary protein leveland unaffected by the dietary lipid level. Dissectionof the body into head, viscera and trunk revealedthat 45-48% of the body lipids were stored in thetrunk, independent of diet composition. A positiverelation between dietary and body protein levelwas confirmed in this experiment. However, thedissection of the body revealed that the body proteinconcentrations in head -I- viscera and trunk are notchanged significantly by the dietary protein level.The higher protein contents offish fed higher-proteindiets are due to an increase in the relative weightof the trunk (muscle) to the total body weight.
Introduction
High growth rates of Colossoyna macropomum (Cuvier)obtained under laboratory' conditions (Gunther &Boza 1993: Van der Meer. Machiehs & Verdegem1995) suggest that this species might be a suitablecandidate for production under intensiveaquaculture conditions. Using fish meal as the maindietarj' protein source, maximal growth ratesrequired a 42-46% protein diet (Van der Meer et al.1995). Van der Meer & Verdegem (1996) suggestedthat several alternative ingredients could besubstituted for most of the fish meal. Experimentaldata confirmed this for soya meal (Van der Meer,Htiisman & Verdegem 1996). However, manyalternative ingredients have lower protein concen-trations than fish meal and soya meal (Van der Meer& Verdegem 1996). Hence, diets with high amountsof alternative ingredients will have lower proteinlevels.
To reduce feeding costs in aquaculture, possibilitiesto reduce dietary protein levels have been studiedextensivel3'. Most studies concentrate on increasingdietary energy levels, or lowering the protein-to-energy ratio (P/E ratio). At low P/E ratios, theuse of dietary protein is limited to growth and
© 1997 Blackwell Science Ltd. 405
Dietary lipid and protein deposition in Colossoma M B van der Meer et al. Aquaculture Research, 1997, 28, 405-417
maintenance of body protein, while at high P/Eratios some protein can be used for energy needs orstored as fat (Winii-ee & Stickney 1981), Hence,increased dietary lipid levels generally increase theefficiency of the conversion of dietary protein intobody protein (net protein utilization, NPU).
This so called 'protein-sparing action' (PSA) ofdietary lipid has not yet. to the best of our knowledge,been studied in C. macropomum. Van der Meer et al.(1995) found that maximal growth rates of C.macropomum required a dietary P/E ratio of 27 mgprotein k j ' ^ However, optimal protein utilization{NPU) was obtained using a diet with a P/E ratioof 15 mg protein kJ"', while at higher P/E ratiosthe NPU decreased. If a PSA effect in C. macropomumexists, improvement of the NPU is expected whenextra energy is added to diets with a P/E ratio above15 mg protein kj"^. However, extra dietary energynormally not only improves the NPU, but alsoincreases the body lipid deposition.
The subject of the present study was therelationship between protein and lipid deposition atdifferent P/E ratios. Our first hypothesis assumedPSA of dietary lipids in C. macropomum diets. Thesecond, alternative hypothesis, assumed that proteinand energy metabolism do not interfere with eachother. This second hypothesis implies that differencesin protein deposition are caused by variations inprotein ration and differences in non-proteindeposition by variations in the non-protein ration.
Material and methods
Experimental units
The experiment was performed in two recirculationunits of 16 45-1 aquaria. Each unit was equippedwith a heating device, an aerator, a sedimentationtank and a biological filter. In both units acontinuous exchange flow of about 0,4 1 min~^ oftap water was maintained.
to 4 fish per aquarium. Average initial weight of thefish ranged between 1,11 and 1.14 g (Table 3.below). The experiment had a duration of 4 weeks.Fish were individually weighed at days 0.14 and 28,
Feeds and feeding
The eight experimental diets differed in protein level(30% and 40%) and lipid level (5%, 10%, 15% and20%), Diets are referred to by two numbers separatedby a '/', the first number being the designed dietaryprotein percentage, the second number the designedlipid percentage (Table 1), The protein source in alldiets was a mix offish meal (15% of the dry matter),blood meal (1%) and soya meal (84%), The lipidsource was a mix of equal amounts of fish oil andsoya oil. Salt (1%). a vitamin/mineral premix (1%)and variable amounts of corn starch were used tocomplete the diets.
Fish were fed to apparent satiation {ad libitum) at8. 12 and 16 h. Each meal lasted at most 1 h.Rations per aquarium were recorded daily. Each diet(treatment) was applied in four aquaria (replicates),two in each recirculation unit.
Chemical analyses
After determination of the final wet weight of thefish, head and viscera were removed. Wet weightand proximate composition of head, viscera and theremaining part of the body (from here on called"trunk") were determined, "Trunks and head +viscera were pooled per aquarium for determinationof proximate composition. Amounts of carbo-hydrates in C. macropomum are low (Van der Meeretal. 1995) and were therefore ignored.Carbohydrates in the diets were calculated,supposing that the part not being protein, lipids.fibre or ash consisted of carbohydrates.
Fish
Juvenile C, macropomum were obtained throughartificial reproduction. One week before the start ofthe experiment. 20 fish were put in each aquarium.The day before the start of the experiment, thefive biggest and the five smallest animals of eachaquarium were removed. A similar procedure wasfollowed at day 14 to reduce fish density from 10
Water quality
Water temperature and dissolved oxygen levels werechecked daily at 0900. 1300 and 1700h, Theaverage temperatures in recirculation units 1 and2 were 28.9°C and 28.8°C. respectively. Oxygenlevels were maintained above 4 p.p.m. Averagedissolved oxygen levels were 5,50 and 6.20 p,p.m.in units 1 and 2. respectively. Nitrite levels werechecked weekly and never exceeded 0.05 p.p.m.
406 O 1997 Biackwell Science Ltd, Aquacultun Research. 28 , 405-117
Aquaculture Research, 1997, 28 . 405-417 Dietary lipid and protein deposition in Colossoma M B van der Meer et al.
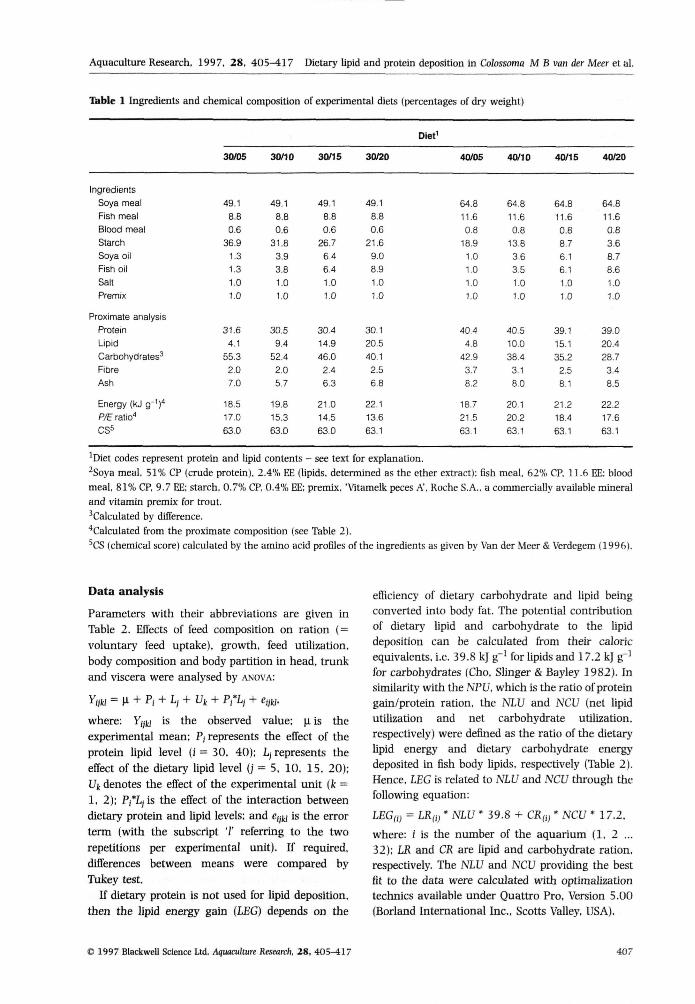
Ibble 1 Ingredients and
IngredientsSoya mealFish meaiBlood mealStarchSoya oilFish oiiSaltPremix
Proximate analysisProtein
LipidCarbohydrates^FibreAsh
Energy (kJ g-i)"P/E ratio''CS^
chemical composition
30/05
49.18.80.6
36.91.31.31.01.0
31.64.1
55.32.07.0
18.517.063.0
30/10
49.18.80.6
31.83.93.81.01.0
30.59.4
52.4
2.05.7
19.815.363.0
of experimental diets
30/15
49.18.80.6
26.76.46.4
1.01.0
30.414.946.02.4
6.3
21.014.563.0
3(V20
49.18.80.6
21.69,08,91.01.0
30.120.540.12.56.8
22.113.663.1
(percentages of dry
Diet^
40/05
64.811,60,8
18,91,01,01,01.0
40.4
4.84293.78.2
18.721.563.1
weight)
40/10
64.811.60.8
13.83.63.51.01.0
40.510.038.43.18.0
20.120.263.1
40/15
64.811.60.88.76.16.11.01.0
39.115.135.22.58.1
21.218.463 1
4(V20
64.811.60.83.68.78.61.01.0
39.020.428.73.48.5
22.217.663.1
'Diet codes represent protein and lipid contents - see text for explanation,
^Soya meal, 51% CP (crude protein), 2,4% EE (lipids, determined as the ether extract); fish meal, 62% CP. 11,6 EE; blood
meal, 81% CP, 9,7 EE; starch, 0,7% CP, 0,4% EE; premix, 'Vitamelk peces A', Roche S,A,, a commercially available mineral
and vitamin premix for trout,
'Calculated by difference,
*Calcuiated from the proximate composition (see Table 2).
'CS (chemical score) calculated by the amino acid profiles of the ingredients as given by Van der Meer & Verdegem (1996),
Data analysis
Parameters with their abbreviations are given inTable 2, Effects of feed composition on ration ( =voluntary feed uptake), growth, feed utilization,body composition and body partition in head, trunkand viscera were analysed by ANOVA;
V«w = H + Pi + L; + Uk + Prii + enkJ,
where; VyH is the observed value; (i is theexperimental mean; P, represents the effect of theprotein lipid level (i = 30, 40); Lj represents theeffect of the dietary lipid level (j = 5, 10, 15. 20);Ut denotes the effect of the experimental unit (fc =1, 2); Pj*L(is the effect of the interaction betweendietary protein and lipid levels; and e^fj is the errorterm (with the subscript '/' referring to the tworepetitions per experimental unit). If required,differences between means were compared byTukey test.
If dietary protein is not used for lipid deposition,then the lipid energy gain (LEG) depends on the
efficiency of dietary carbohydrate and lipid beingconverted into body fat. The potential contributionof dietary' lipid and carbohydrate to the lipiddeposition can be calculated from their caloricequivalents, i,e, 39.8 kJ g"' for lipids and 17.2 kJ g^'for carbohydrates (Cho, Slinger & Bayley 1982), Insimilarity with the NPU, which is the ratio of proteingain/protein ration, the NLU and NCU (net lipidutilization and net carbohydrate utilization,respectively) were defined as the ratio of the dietarylipid energy and dietary' carbohydrate energydeposited in fish body lipids, respectively (Table 2),Hence, LEG is related to NLU and NCU through thefollowing equation;
LEG(i) = LRfi) * NLU * 39,8 + CR,i) * NCU ' 17.2,
where; i is the ntmiber of the aquarium (1. 2 ,,,32); LR and CR are lipid and carbohydrate ration,respectively. The NLU and NCU providing the bestfit to the data were calculated with optimalizationtechnics available under Quattro Pro, Version 5,00(Borland International Inc. Scotts Valley, USA),
1997 BlackweU Science Ltd, Aifuaadmre Research. 28 , 405-417 407
Dietary iipid and protein deposition in Colossoma M B van der Meer et al. Aquaculture Research, 1997, 28, 405-417
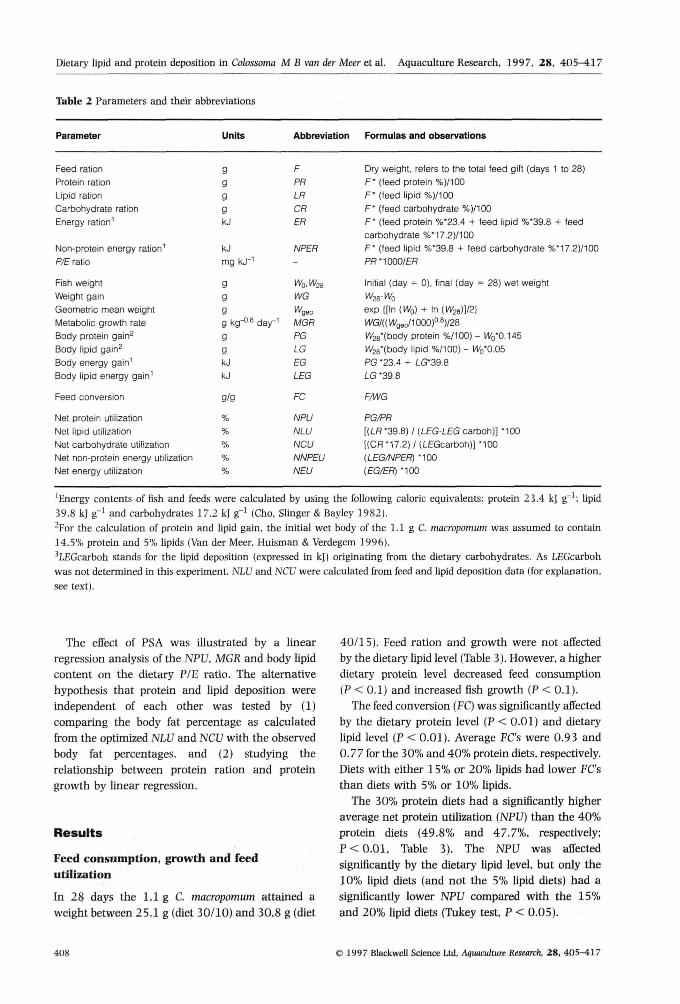
liable 2 Parameters and their
Parameter
Feed rationProtein rationLipid rationCarbohydrate rationEnergy ration'
Non-protein energy ration'P/E ratio
Fish weightWeight gainGeometric mean weightMetabolic growth rateBody protein gain^Body lipid gain^Body energy gain'Body lipid energy gain'
Feed conversion
Net protein utilizationNet lipid utilizationNet carbohydrate utilizationNet non-protein energy utilizationNet energy utilization
abbreviations
Units
g99gkJ
kJmg kJ ' '
9ggg kg-OB day-'
ggkJkJ
g/g
%%%%%
Abbreviation
FPRLRCRER
NPER
-
Wo.W,,WG
Wgeo
MGRPGLGEGLEG
FC
NPUNLUNCUNNPEUNEU
Formulas and observations
Dry weight, refers to the total feed gift (days 1 to 28)F' (feed protein %)/100F- (feed lipid %)/100F* (feed carbohydrate %)/100F- (feed protein %-23.4 + feed lipid %*39.8 + feedcarbohydrate %*17 2)/100F* (feed lipid %*39.8 + feed carbohydrate %*17.2)/100Pff-1000/ER
Initial (day = 0), finai (day = 28) wet weight
exp |[ln (Wo) + In (1^28)1/2)H/G/((Wgeo/1000)0B)/28
i/V28*(body protein %/100) - W^'OAASW2e*(body lipid %/100) - i%'0.05PG •23.4 + Le-39.8
l.S-39.8
F/WG
PG/PR[{LR-39.8) 1 (LEG-LEG carboh)] *100[(CR'17.2) / (LEGcarboh)] "100(LEG/NPER) MOO(EG/ER) "100
'Energ5' contents of fish and feeds were calculated by using the following caloric equivalents: protein 23.4 kJ g '; lipid39,8 k] g-' and carbohydrates 17.2 kl g"' (Cho, Slinger & Bayley 1982).•̂ For the calculation of protein and lipid gain, the initial wet body of the 1.1 g C. macropomum was assumed to contain14.5% protein and 5% lipids (Van der Meer, Huisman & Verdegem 1996).'LEGcarboh stands for the lipid deposition (expressed in kj| originating from the dietary carbohydrates. As LEGcarbohwas not determined in this experiment. NLV and NCU were calculated from feed and lipid deposition data (for explanation,
see text).
The eilect of PSA was illustrated by a linearregression analysis of the NPU, MGR and body lipidcontent on the dietary P/E ratio. The alternativehypothesis that protein and lipid deposition wereindependent of each other was tested by (1)comparing the body fat percentage as calculatedfrom the optimized NLU and NCU with the obsen'edbody fat percentages, and (2) studying therelationship between protein ration and proteingrowth by linear regression.
Results
Feed consumption, growth and feedutilization '
In 28 days the 1,1 g C. macropomum attained aweight between 25.1 g (diet 30/10) and 30.8 g (diet
40/15). Feed ration and growth were not affectedby the dietary lipid level (Table 3). However, a higherdietarj' protein level decreased feed consumption(P < 0.1) and increased fish growth (P < 0.1).
The feed conversion (FC) was significantly affectedby the dietary protein level (P < 0.01) and dietarylipid level (P < 0.01). Average FC's were 0.93 and0,77 for the 30% and 40% protein diets, respectively.Diets with either 15% or 20% lipids had lower FC'sthan diets with 5% or 10% lipids.
The 30% protein diets had a significantly higheraverage net protein utilization (NPU) than the 40%protein diets (49,8% and 47,7%, respectively;P < 0 , 0 1 , Table 3), The NPU was affectedsignificantly by the dietary lipid level, but only the10% lipid diets (and not the 5% lipid diets) had asignificantly lower NPU compared with the 15%and 20% lipid diets (Tukey test, P < 0,05),
408 O 1997 Blackweli Science Ltd. AquaoAtmt: Research, 2S, 405-117
Aquaculture Research, 1997, 28, 405-417 Dietary lipid and protein deposition in Colossoma M B van der Meer et al.
Ikble 3 Feed ration
Diet
30/05
30/10
30/15
30/20
40/05
40/10
40/15
40/20
Fvaiues
DP(1 d.f.)
DL (3 d.f,)
Unit (1 d.f.)
DfDL (3 d.f.)
Error (23/21 d.f.)^
Total (32/30 d.f.)='
, growth and feed utilization i
Wo
1.1.1.
11
12
11
1.121
1
11
.14
.12
.11
.12
-_.-_
± 0.03
± 0.07
± 0.05
± 0.05
T 0.06
± 0.05
± 0.03
+ 0.05
27.3 ±25.1 ±28.2 ±26.2 ±30.1 i27.9 i-30.8 =:28.5 ±
4.16'1.07
0,880.01
3.9
5.85.6
2.0
2.6
2.3
1.0
2.8
MGR
60.0 i56.4 ±60.9 ±58.2 ±63.3 ±60.6 ±64.9 ±61.3 ±
3.93'1.140.970,02
data
6.1
8.0
6.6
3.8
4.3
4.1
2.0
4.3
(mean
F
24.5 =23.0 ±24.7 ±22.9 :::22.7 =
21.3 ±22.5 ±20.5 *
3.75-
0.91
1.82
0.02
± SD)'
Parameter
3.4
5.1
4.4
1.5
1.2
2.514
1.8
FC
0.937 z
0.964 ±
0.915 ±
0.913 ±
0.787 ±
0.792 ±
0.759 ±
0.750 ±
0.014
0.0220.047
0.022
0.031
0.0220.024
0.009
312.10—
5.69—
2.10
0.25
NPU
48.8 i 1.3
49.5 ± 2.0
50.1 ± 2.0
50.9 - 1.5
47.6 - 0.9
44.5 i 2,1
49.3 ± 2.048.4 ± 2.6
14.16"*
4 .21 "5.44"
2.05
NNPEU
33.8
34.3
39.0
38.8
36.3
40.0
41.2
44.6
28
± 2.5
± 1.1
± 1.4
± 1.0± 1.4
± 2.4
± 2.5
± 3.5
.15—
14.96"-1
1.44
A7
NEU
39.8 ± 1.8
39.7 i 0.8
42,8 r^ 1.642.7 ± 1.1
42.0 ± 0.6
42,2 ± 0,8
44.7 ± 1.6
46.2 ± 1.3
28.74"-
15.39"-
0.02
0.55
^Significance and metfiod of caiculation of the parameters used can be found in Table 2. DP, DL denote leveis of dietaryprotein (30% and 40%, respectively) and iipid (5%, 10%, 1 5% and 20%, respectively); DF'DL is the interaction betweenDP and DL: unit denotes the recirculation unit (1 and 2, respectively), *=P < 0,10: "=P < 0,05; "'=P < 0,01,^One head+viscera sample of treatment 40/05 and one trunk sample of treatment 30/20 were lost after determinationof the dry matter content; therefore the total number of degrees of freedom for the ANOVA of NPU. NNPU and NEU wasonly 30,
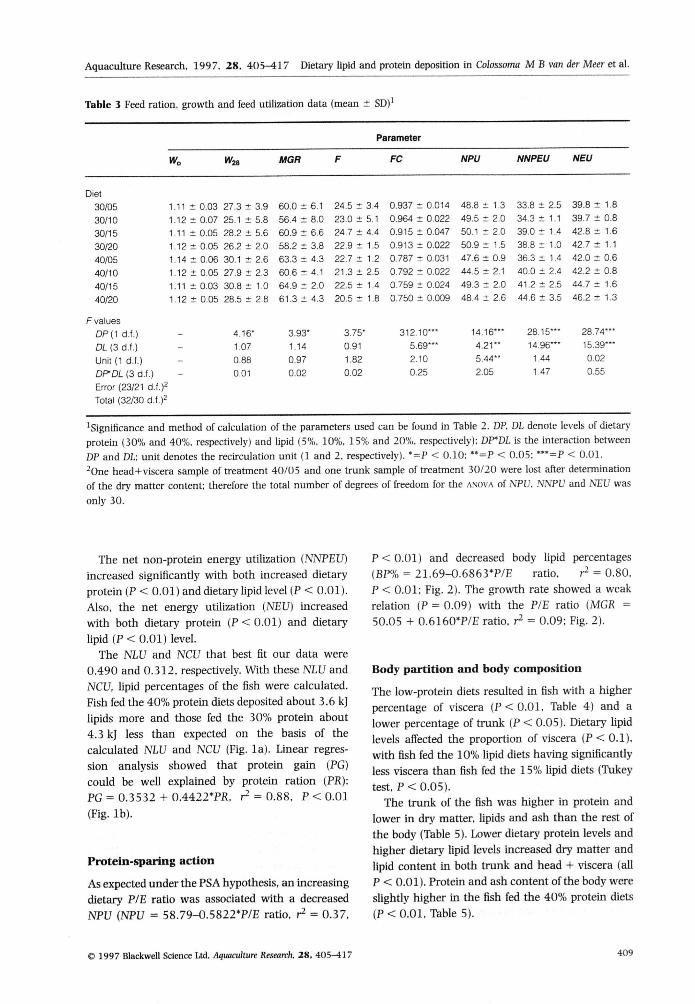
The net non-protein energy utilization (NNPEU)increased significantly with both increased dietaryprotein (P < 0.01) and dietary lipid level (P < 0.01),Also, the net energy utilization (NBU) increasedwith both dietary protein (P < 0,01) and dietarylipid ( P < 0,01) level.
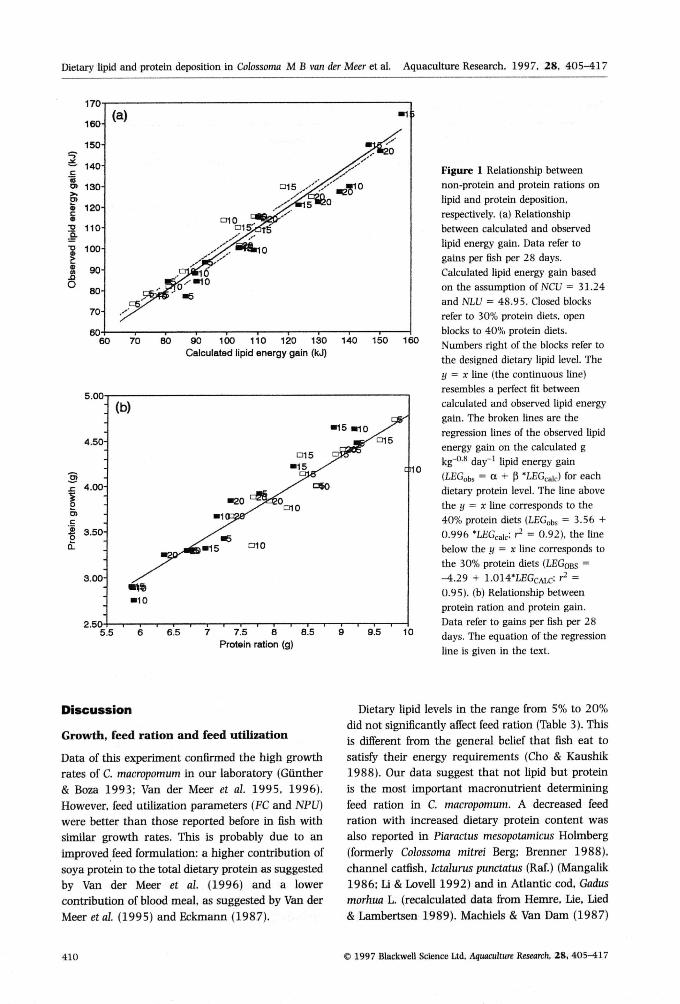
The NLU and NCU that best fit our data were0,490 and 0,312, respectively. With these NLU andNCU, lipid percentages of the fish were calculated.Fish fed the 40% protein diets deposited about 3,6 k]lipids more and those fed the 30% protein about4,3 kJ less than expected on the basis of thecalculated NLU and NCU (Fig, la). Linear regres-sion analysis showed that protein gain {PG)could be well explained by protein ration (PR):PG = 0.3532-F 0,4422*PR, r̂ = 0,88, P < 0.01(Fig, lb).
Protein-sparing action
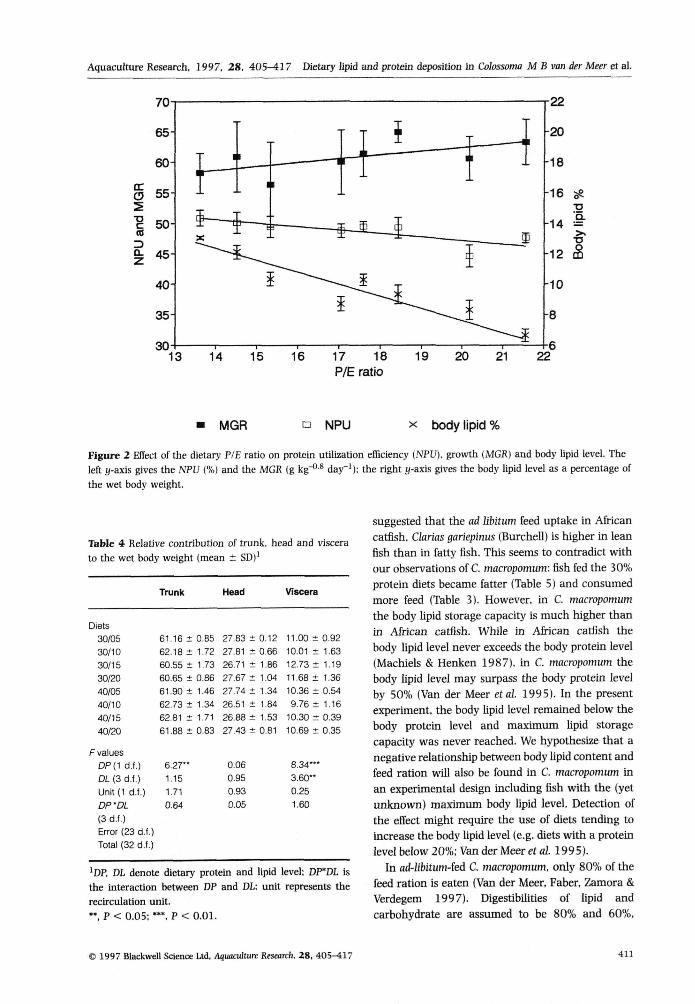
As expected under the PSA hypothesis, an increasingdietary P/E ratio was associated with a decreasedNPU (NPU = 58,79-O,5822*P/E ratio, r^ = 0,37,
P < 0 , 0 1 ) and decreased body lipid percentages(BP% = 21,69-O,6863*P/E ratio, r̂ = 0,80.P < 0,01; Fig. 2), The growth rate showed a weakrelation (P = 0,09) with the P/E ratio (MGR =50,05 + 0,6160*P/E ratio, r̂ = 0,09; Fig, 2),
Body partition and body composition
The low-protein diets resulted in fish with a higherpercentage of viscera ( P < 0 , 0 1 , Table 4) and alower percentage of trunk (P < 0,05), Dietary lipidlevels affected the proportion of viscera (P < 0,1).with fish fed the 10% lipid diets having significantlyless viscera than fish fed the 15% lipid diets (Tukeytest, P < 0,05),
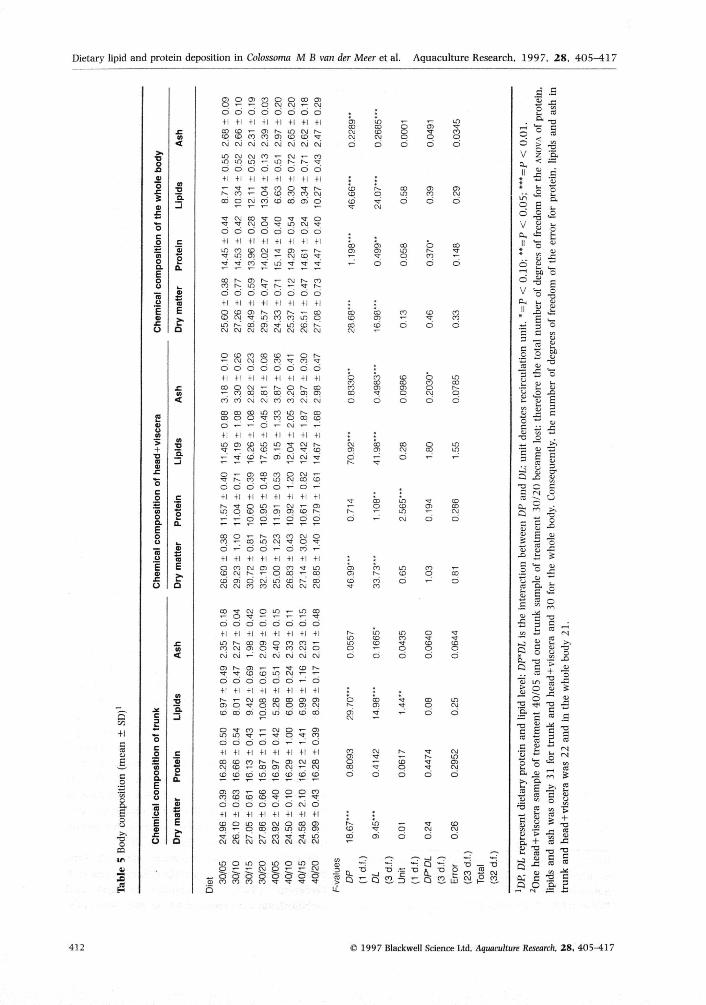
The trunk of the fish was higher in protein andlower in dry matter, lipids and ash than the rest ofthe body (Table 5), Lower dietary protein levels andhigher dietary lipid levels increased dry matter andlipid content in both trunk and head 4- viscera (allP < 0,01), Protein and ash content of the body wereslightly higher in the fish fed the 40% protein diets(P < 0,01, Table 5),
O 1997 Blackwell Science Ltd, Aquaculture Research. 28, 405-417 409
Dietary lipid and protein deposition in Colossoma M B ran der Meer et al. Aquaculture Research. 1997, 28 . 405-417
170
70 80 90 100 110 120 130Calculated lipid energy gain (kJ)
140 150 160
5.00
4.50-
4.00-
c3.50-
3.00
2.505.5 6 7.5 8 8.5
Protein ration (g)9.5 10
Figure 1 Relationship betweennon-protein and protein rations onlipid and protein deposition,respectively, (a) Relationshipbetween calculated and observedlipid energy gain. Data refer togains per fish per 28 days.Calculated lipid energy gain basedon the assumption of NCU = 31.24and KlXi = 48.95. Closed blocksrefer to 30% protein diets, openblocks to 40% protein diets.Numbers right of the blocks refer tothe designed dietary lipid level. They = X line (the continuous line)resembles a perfect fit betweencalculated and observed lipid energygain. The broken lines are theregression lines of the observed lipidenergy gain on the calculated gkg""** day"' lipid energy gain(LEGobs = a -I- P 'tEGcaic) for eachdietary protein level. The line abovethe y = X line corresponds to the40% protein diets ILEGobs = 3.56 +0.996 "LEGcaici r^ = 0.92), the linebelow the y = x line corresponds tothe 30% protein diets (LEGOBS =-4.29 + 1.014'LEGcAu-: i^ =0.95). (b) Relationship betweenprotein ration and protein gain.Data refer to gains per fish per 28days. The equation of the regressionline is given in the text.
Discussion
Growth, feed ration and feed utilization
Data of this experiment confirmed the high growthrates of C. macropomum In our laboratory {Giinther& Boza 1993: Van der Meer et al. 1995, 1996),However, feed utilization parameters (FC and NPU)were better than those reported before in fish withsimilar growth rates. This is probably due to animproved feed formulation: a higher contribution ofsoya protein to the total dietary protein as suggestedby Van der Meer et al. (1996) and a lowercontribution of blood meal, as suggested by Van derMeer etal. (1995) and Eckmann (1987). .
Dietary lipid levels in the range from 5% to 20%did not significantly affect feed ration (Table 3). ThisIs different from the general belief that fish eat tosatisfy their energy requirements (Cho & Kaushik1988). Our data suggest that not lipid but proteinis the most important macronutrient determiningfeed ration in C. macropomum. A decreased feedration with increased dietary protein content wasalso reported in Piaractus mesopotamicus Holmberg(formerly Colossoma mitrei Berg: Brenner 1988),channel catfish, lctalurus punctattis (Raf.) (Mangalik1986: Li & Lovell 1992) and in Atlantic cod, Gadusmorhua L. (recalculated data from Hemre, Lie, Lied& Lambertsen 1989), Machiels & Van Dam (1987)
410 © 1997 Biackweli Science Ltd, Aquaculture Research, 28 , 4 0 5 ^ 1 7
Aquaculture Research. 1997. 28 . 405—417 Dietary lipid and protein deposition in Colossoma M B van der Meer et al.
14 15 16 17 18P/E ratio
19 20 21 22
MGR • NPU X body lipid %
Figure 2 Effect of tbe dietary P/E ratio on protein utilization efficiency (NPU). growth iMGR) and body lipid level. Theleft y-axis gives tbe NFU {%) and the MGR (g kg""** day"'): tbe rigbt y-axis gives tbe body lipid level as a percentage ofthe wet body weight.
Table 4 Relative contribution of trunk, bead and viscerato the wet body weight (mean ± SD)'
Diets30/0530/1030/1530/2040/0540/1040/1540/20
F valuesDP{^ d.f.)DL (3 d.f.)Unit (1 d.f.)DP'DL(3 d.f.)Error (23 d.f.)Total (32 d.f.)
Trunk
61.16 ± 0.8562,18 ± 1.7260.55 ± 1.7360.66 ± 0.8661.90 ± 1.4662.73 ± 1.3462.81 ± 1.7161.88 ± 0.83
6.27"1.151.710.64
Head
27.83 ± 0.1227.81 ± 0.6626.71 ± 1.8627.67 ± 1.0427.74 ± 1.3426.51 ± 1.8426.88 ± 1.5327.43 ± 0.81
0.060.950.930.05
Viscera
11.00 ± 0.9210.01 ± 1.6312.73 ± 1.1911.68 ± 1.3610.36 ± 0.549.76 ± 1.16
10.30 ± 0.3910.69 ± 0.35
8.34"*3.60"0.251.60
' D P , DL denote dietary protein and lipid level: DF'DL isthe interaction between DP and DL; unit represents tberecirculation unit." , P < 0.05: •" , P < 0.01.
suggested that the ad libitum feed uptake In Africancatfish. Clarias gariepinus (Burchell) is higher in leanfish than in fattj' fish. This seems to contradict withour observations of C. macropomum: fish fed the 30%protein diets became fatter (T^ble 5) and consumedmore feed (Table 3). However, in C. macropomumthe body lipid storage capacity is much higher thanin African catfish. While in African catfish thebody lipid level never exceeds the body protein level(Machiels & Henken 1987). in C. macropomum thebody lipid level may surpass the body protein levelby 50% (Van der Meer etal. 1995). In the presentexperiment, the body lipid level remained below thebody protein level and maximum lipid storagecapacity was never reached. We hypothesize that anegative relationship between body lipid content andfeed ration will also be found in C. macropomum inan experimental design including fish with the (yetunknown) maximum body lipid level Detection ofthe effect might require the use of diets tending toincrease the body lipid level (e.g. diets with a proteinlevel below 20%; Van der Meer et al. 1995).
In ad-libitum-fed C. macropomum. only 807o of the
feed ration is eaten (Van der Meer. Faber. Zamora &Verdegem 1997). Digestibilities of lipid andcarbohydrate are assumed to be 80% and 60%,
® 1997 Blackwell Science Ud. Aquaculture Research. 28 , 405-117 411
Dietary lipid and protein deposition in Colossoma M B van der Meer et al, Aquaculture Research, 1997, 28 , 405-417
O l O O C O O O C O O iO ' — • ^ O C M C M i — CM
+1 +1 +1 +1 +1 +1 +1 +1C O C D ' ^ C J l h - l O C M h -C p C p C O C O O ) C D C O ' 3 ;C y C M C M C M O i c M C M O J
0 0 0 0 0 0 0 0
+ 1 +1 +1 +1 +1 +1 +1 4-1
^ p pt x i d c j c o t b c o o i d
dflin
^'
dfl
oCD
dfl
CDin"tf
d+tCD
CM
d+ !CDa>CO
enin
d+ 1
od+ !CMo• ^ '
h-
d+ !r̂LO
d+1
in
d+1COCO
LO
d+ 1OJCM
CM
d+1
CO
CM
d+1,̂(D
d
LO
d+1
CO
d+1COo
C M C M C \ J C M C \ J C M C \ i C M
0 0 0 0 0 0 0 0+ 1 +! +1 +1 +t +1 +1 +1
+1 +1 +1 +! +1 +1 +1
+1 +1 +1 +1 +t +1 +1 +1O C O C M O lc p c v j r
O)dc\iiriC M C O C O C M
CD CO d LO CD tD CO
O ^ C O ' ' ~ C M O ' ' ~ 0 ^
i n i n - c ^ - ^ T r o ' ^ c od d d d d - ' - ' - d+1 +1 +1 +1 +1 +1 +1 +1c o c D c o r ^ N - a > C M c oC V J C D - i - C p O J C M - ^ C J
c b c b c b i n c b c d c D c b
+1 +1 +1 +1 +1 +1 +1 +1
CM
d
CI>
od
in
sd
CO
COCOd+1in
11,
CO
CD
o
+1a>
14,
C\J
,08
r-
fi
16.
CM
,45
ofl
,65
17,
m
nr-'
flin
CO
,05
CM
fl
.04
12,
CM
CO
fl
,42
12,
CVJ
COCD
fl
CD
14.
o
hd
CO
pd
COCM
d
CD
dCO
d
o+1
CM
cn
d+ 1
o+1
CMCM
d+1
o+1
'-
CD
df 1
o+1
,09
CM
COdfl
ofloCM
.^in
dfl
ofl
COCM
CM
d4.1
0
flCOCMCM
CD
fl
0
fl
,01
CM
T —
dfl
05!
0
;
5 gd d
• ^ r ^
in
ci dCM
d
IS
412 I 1997 BlackweU Science Ltd, Aquacultun Research. 28 , 405-4] 7
Aquaculture Research, 1997, 28, 405^17 Dietary lipid and protein deposition in Colossoma M B van der Meer et al.
respectively (Van der Meer & Van Dam, unpublished).The biochemical efficiencies with which fatty acidsand glucose are used for lipid deposition areestimated as 90% and 74% (Black 1995). Thismeans that the NLU could be maximally0.8*0.8*0.9 = 0.57 and the NCU 0.8*0.6*0,74 =0.36. Our estimates of the NIU and NCU (0.49 and0.31, respectively) are below these maxima andleave 15% of the available dietary lipid energy and12% of the available carbohydrate energy for theenergy requirements of the animal. The ratios NLUfNCU (0.49/0.31 = 1.56) and theoretical maximumNLU/theoretical maximum NCU (0.57/0.36 =1.62) were similar. If the routine metabolism offish
uses energy from lipid and carbohydrateproportionally to their respective availabilities, theobserved NLU/NCU ratio is close to the theoreticalexpected value.
Considering the preference for fruits in its naturaldiet, Menton (1989) supposed that C. macropomumcan digest carbohydrates better than most otherfishes. However, the estimated NLU and NCU (49%and 31%, respectively) indicated that also inC. macropomum. lipids are more efficiently used forenergy storage than carbohydrates. A negative effectof increased dietary carbohydrate levels on feeddigestibility has been reported in Atlantic salmon,Salmo salar L. (Hemre, Sandes, Lie, Torissen &Waagbe 1995). As the fixed NLU and NCU wereadequate to explain the variation in NNPEU. anynegative effect of increased dietary carbohydratelevels on carbohydrate and lipid digestibility inC. macropomum must be of minor importance. Anegative effect on protein digestibility cannot beimportant either, as protein utilization is generallybest in high-carbohydrate diets (Van der Meer et al.1996; this study).
Protein-sparing action
PSA of dietary energy is described in several troutspecies: rainbow trout, Oncorhynchus mykiss(Walbaum) (Watanabe, Takeuchi & Ogino 1978;Beamish & Medland 1986). lake trout, Salvelinusnamaycush (Walbaum) Qayaram & Beamish 1992)and brown trout, Salmo trutta L. (Arzel, Lopez,Metailler, Stephan, Viau, Gandemer & Guillaume1994). PSA has also been found in African catfish(Machiels & Henken 1987; Henken, Machiels,Dekker & Hogendoorn 1986) and tilapia (H-Sayed& Garling 1988; Shiau & Peng 1993). However,
findings in warm-water species are not unanimous,as Viola & Arieli (1983) and Hanley (1991) couldnot find any PSA in tilapia. Also, channel catfishdo not show a clear optimum dietary lipid level withregard to PSA (Robinson 1991).
An important effect of PSA for aquaculturepractices is improved protein retention (Kaushik &Cowey 1991). In salmonids the beneficial effect ofPSA induced by dietary lipids is well recognized(Kaushik & Medale 1994). Fortification of the dietwith 100 g of lipids increased protein deposition by3 8 ^ 7 g and 35-49 g, in rainbow trout (Cho etal. 1982) and brown trout (Arzel etal. 1994),respectively. Also in C. macropomum, proteindeposition increased with increasing dietary lipidlevel, but the magnitude of the effect seems to bemuch lower than in trout. The regression line ofthe NPU on the P/E ratio indicates that within onedietary protein level, the addition of 20% instead of5% lipid to the diet increased the NTU by 2 -2.3%. Consequently, the addition of 150 g lipid (inexchange for 150 g carbohydrates) is expected toresult in an extra 6-7 g of protein deposited i>er kgfeed. It seems unlikely that the costs of such achange in diet composition will be sufficientlycompensated by improved feed utilization. Doubtsabout the PSA in other warm-water species, suchas tilapia (Viola & Arieli 1983; Hanley 1991) andchannel catfish (Robinson 1991), suggest that alsoin those species the PSA, if present, is not as effectiveas in trout.
Compared with the 30% protein diets, the 40%protein diets resulted in 7.9 k] of extra lipiddeposition (Fig. la). More protein used for energydeposition at high P/E ratios was also expectedunder the PSA hypothesis. However, as the chemicalscore of all experimental diets was 63 (Table 1),3 7% of all dietary protein was unavailable for proteindeposition (Van der Meer & Verdegem 1996 for fullexplanation). Based on the average ration (23.8 and21.8 g fish"^ per 28 days for the 30% and 40%protein diets, respectively) and average proteincontent (30.7% and 39.8%, respectively), the dietaryprotein not available for protein deposition contained23.8*0.307*0.37*23.4 = 63.3 kj for the average30% protein diet and 21.8*0.398*0.37*23.4 =75.1 kJ for the average 40% protein diet. Thus the40% protein diets contained 75.1-63.3 = 11.8 kJmore protein energy not available for proteindeposition than the 30% protein diets. We assumeda protein digestibility of 80% in C. macropomum (Vander Meer & Van Dam, unpublished), 20% feed losses
© 1997 Blackwell Science Ltd, Aquaculture ResearcK 28 , 4 0 5 ^ 1 7 413
Dietary lipid and protein deposition in Colossoma M B van der Meer et ai. Aquaculture Research. 1997, 28, 405-417
(Van der Meer et al. 1997; Van der Meer, VanHerwaarden & Verdegem 1997) and an energeticefficiency of the transformation of amino acids indeposited lipids of 53% (Black 1995). The diHerencein non-depositable dietary amino acids can thereforeaccount for 0,8*0,8*0,53*11.8 = 4,0 kJ, Thus 4,0/7,9*100 = 51% of the 'extra' lipid deposited withthe 40% protein diets might come from dietaryprotein origin without having any effect on proteindeposition efficiency, Tbe additional 49% of theobserved lipid deposition might have come from theextraction of protein from protein deposition (a PSAefTect). However, if NLU and NCU decrease withcarbohydrate and lipid ration, respectively, the fixedNLU and NCU would underestimate the lipiddeposition of the high (40%) protein diets. In thepresent experiment, a fluctuation of NLU and NCUfrom 90% to 110% of their respective averageswould have been sufficient to explain 49% of theextra lipid deposition with the 40% protein diets.
In pigs a relative independence of protein andenergy metabolism has been noticed. Proteindeposition iticreases linearly with protein intakeuntil the maximum (animal-dependent) proteindeposition rate at that energy intake level isreached. Only if the energy intake fails to supplythe energy required for maintenance and depositionof a minimum amount of lipids, protein depositionwill be reduced when the dietary energy contentdecreases (De Greef & Verstegen 1995). Hence, ifprotein deposition is limited by protein intake,'protein sparing' is not possible (Bikker, Verstegen& Tamminga 1994b). If this is true in fish aswell, improvement of low-protein diets by lipidaddition is virtually impossible, because in practicaldiets tbe non-protein portion consists mainly ofthe energy-carrying carbohydrates and lipids. Thisalso would explain why in this study, with dietaryprotein levels below the 43% required for maximalgrovrth (Van der Meer etal. 1995), no clear PSAwas found. However, a PSA of lipids in C.macropomum with dietary protein concentrationsabove 43% would agree with this concept andmust be considered when developing 'nutrient-dense' diets.
In tbe present study, the major variation ofdietary lipid level from 5% to 20%, and therelatively small variation in dietary protein from30% to 40%, affected the P/E ratio (Table 1) andthe NPU (Table 3) to a comparable extent.Typically, the P/E ratio is more sensitive to thedietary protein content than to the lipid content.
In practical diets, changing the energy content isa gradual process: lipid (39,8 kJg"^) is mostly exchanged by carbohydrates(17,2 kjg"^). In contrast, changing the proteincontent is an "all-or-nothing' process: protein(100% protein) is exchanged by either lipids,carbohydrates or ash (all 0% protein). For example,in a diet containing 45% protein and 10% ash,an increase of the dietary lipid from 1% to 44%decreases the P/E ratio from 24.33 to 15,95 mg kJ"K However, in a 10% ash, 10% lipid diet, tbe P/E ratio varies from 21,92 (45% protein) to 8,03(15% protein). Thus, the P/E ratio decreases to66% of its initial value by putting 44 times morelipid in the diet, while a reduction of the proteincontent by only a factor of 3 decreases the P/Eratio to 37% of its initial value. This shows that,assuming that the NPU is mainly determined bytbe P/E ratio, the most efficient approach to assessthe maximal NPU is by varying the dietaryprotein level.
Body partition and body composition
As demonstrated before in C macropomum (Vander Meer etal. 1995), tbe body lipid level is highlyresponsive to variations in the diet composition.As expected, the body lipid level increased withthe dietary lipid level. However, despite therelatively low variation in dietary protein level(30-40%) compared with the dietary lipid level(5-20%), the negative relationship between dietaryprotein and body lipid level had a highersignificance level (as demonstrated by the F-valuesin Table 5), Accumulation of large amounts ofbody fat in C. macropomum fed low-protein dietshas been demonstrated before (Van der Meer et al.1995). Dietary protein concentrations above therequirement are not likely to cause a significantincrease in the body lipid content, as the conversionof amino acids in deposited lipids has an energeticefficiency of only 53% (Black 1995). Fattiness isundesirable in fish cultured for food (Lovell 1989),Increasing the dietary protein level seems to be asecure strategy to produce a lean product.
Castelo, Amaya & Strong (1980) mention visceraand head as the major lipid stores in adultC. macropomum. In the present study, lipidconcentrations were between 70% (30% proteindiets) and 80% (40% protein diets) higher in thehead + viscera than in the trunk. However, the
414 © 1997 Blackweli Science Ltd, Aquaculturt Research. 28, 405-417
Aquaculture Research, 1997, 28, 405-417 Dietary lipid and protein deposition in Colossoma M B van der Meer et al.
distribution of body lipid over trunk andhead -I- viscera did not change with increasinglipid levels: in all treatments, between 45% and48% of the body lipid was stored in the meat.Thus, a fatty flsh yields fatty fillets.
Van der Meer etal (1995) reported that thewhole-body protein content of C. macropomumincreased when dietary protein levels increasedfrom 20% to 60%. In the present experiment,average protein levels in both trunk andhead + viscera were higher in the fish fed the40% protein diets than in those fed the 30%protein diets (Table 5). However, those differenceswere not significant. In contrast, the proportionof the protein-rich trunk was significantly higherin fish fed the 40% protein diets ( P < 0 . 0 1 )and the portion of the protein-poor viscera wassignificantly lower (P < 0.01; liable 4). It seemsthat the main effect of an increased dietary proteinlevel is an increase of the trunk/viscera ratio,while an increased protein concentration in thedifferent organs is a minor effect. A similar trendmight exist in Atlantic salmon (Hillestad & Johnson1994) and channel catfish (Li & Lovell 1992),where increased dietary protein levels wereassociated with increased dress-out percentages.
In pigs, protein ration was positively correlatedwith the body protein and body muscle content(Bikker, Verstegen, Campbell & Kemp 1994a).However, viscera were the part of the body mostresponsive to changes in diet composition. Weightof viscera] organs increased with increasing proteinration, energy ration or both (Bikker et al. 1994b).In pigs, the weight adjustment of metabolicallyactive organs to changes in feed ration or feedcomposition was the main cause of changesin body composition. In sunshine bass, Moronechrysops X M. saxatilis, substitution of dietaryprotein by carbohydrates resulted in fish withmore abdominal fat, a higher hepatosomatic indexand a lower dress-out percentage (Webster, Tlu,Hdwell, Van Wyk & Howerton 1995). Also inrainbow trout (Lee & Putnam 1973) and cod(Hemre et al. 1989), the exchange of protein bycarbohydrates (starch) resulted in an increasedhepatosomatic index. Considering the F-values ofTable 5, in C. macropomum, as in pigs, the effectof diet composition on body composition might bemainly through its effect on the weight of theviscera. Possibly, an increased weight of the visceracaused by the substitution of dietary protein
by carbohydrate can be confirmed in futureexperiments.
Conclusions
In C. macropomum, the most typical PSA effectwas found: addition of dietary energy increases netprotein utilization. However, this process was notvery efficient and resulted in high lipid contents ofthe meat.
An effective PSA assumes that protein and lipiddeposition interfere with each other. However, inthe present experiment, protein deposition could bewell described by protein ration alone. Equally, lipiddeposition could be well described by assuming thesame lipid and carbohydrate utilization efficienciesin all diets. Half of the 'extra' lipid deposition withthe higher-protein diets could be explained by energysupply from dietary protein not containing therequired amino acid profile for protein deposition.The effect of PSA in C. macropomum might be smallbecause a considerable part of the dietary proteincan be used for energj' purposes without harmingprotein deposition efficiency. Possibilities to increaseprotein deposition by lipid addition might be limitedto high-protein diets.
Dietary lipid energy was deposited more efficientlythan carbohydrate energy. In formulating diets, onefaces the problem that increasing the dietary lipidlevel can improve feed utilization, but might beeconomically unattractive owing to higher feed costs(carbohydrate substituted with lipid) and a lowermeat quality (higher meat lipid content). On theother hand, increased carbohydrate levels at thecost of the dietary lipid level result in leaner fish,but also in a reduced energy retention efficiency.
Feed ration depended on the dietarj' proteincontent rather than dietary energy content. Higherprotein rations resulted in fish with more meat. Thisis the main reason why dietary protein and bodyprotein contents in C. macropomum are correlated.
Acknowledgments
This study was financed by the 'Programa UNA-LUW Acuacultura', a cooperative project betweenthe Escuela de Ciencias Biologicas, UniversidadNacional, Heredia, Costa Rica, and the Departmentof Fishculture and Fisheries of the WageningenAgricultural University, Wageningen, the
C 1997 Biackweil Science Ltd. Aquaculture Research. 28, 405-417 415
Dietary Upid and protein deposition in Colossoma M B van der Meer et al, Aquaculture Research, 1997, 28, 405—il7
Netherlands, Professor Dr Ir, M,W,A, Verstegen isthanked for his valuable comments and suggestions.
ReferencesArzel J,, Lopez F,X,M,, Metailler R,, Stephan G,, Viau M,,
Gandemer G, & Guillaume ], (1994) Effect of dietarylipid on growth performance and body composition ofbrown trout (Salmo trutta) reared in seawater,Aquaculture 123, 361-375,
Beamish F,\V,H, & Medland T,E, (1986) Protein sparing inlarge rainbow trout, Sahno gairdneri. Aquaculture 55,35-42,
Bikker R, Verstegen M,W,A,, Campbell R,G, & Kemp B,(1994a) Digestible lysine requirements of gilts with highgenetic potential for lean gain, in relation to the level ofenergy intake, lournal of Animal Science 72, 1744—1753,
Bikker P,, Verstegen M,W,A, & Tamminga S, (1994b)Partitioning of dietary nitrogen between bodycomponents and waste in young growing pigs,Netherlands Journal of Agricultural Science 42, 37-45,
Black J,L, (1995) Modelling energy metabolism in the pig -critical evaluation of a simple reference model. In:
Modelling Growth in the Pig (ed, by P,J, Moughan, M,W,A,Verstegen & M,I, Visser-Reyneveld), pp, 87-103,European Association for Animal Production,Wageningen Pers, Wageningen, the Netherlands,
Brenner M, (1988) Determination of the proteinrequirement of pacu (Colossoma mitrei Berg, 1895), MScthesis, Vigosa, UFV (In Portuguese), Cited in: CastagnolllN, (1991) Brazilian Finfish, tambaqui, pacu, andmatrinxa, pp. 31-4, In: Handbook of NutrientRequirements of Finfish (ed, by R,P, Wilson), CRC Press,Boca Raton, FL, USA,
Castelo F,P,, Amaya D,R, & Strong F,C, iii (1980) Use andcharacterization of the body cavity fat of the tambaqui,C, macropomum Cuvier 1818 (in Portuguese:Aproveitamento e caracteristicas da gordura cavitariado tambaqui, Colossoma macropomum Cuvier 1818), ActaAmazoniea 10, 557-576,
Cho C,y, & Kaushik S,J, (1988) Effects of protein intake onmetabolizable and net energy values of fish diets. In;Nutrition and Feeding in Fish (ed, by C,B, Cowey, A,M,Mackie& J,G, Bell), pp, 95-115, Academic Press, London,
Cho C,Y,, Slinger S,J, & Bayley H,S, (1982) Bioenergeticsof salmonid fishes, energy intake, expenditure andproductivity. Comparative Biochemistry & Physiology73B, 25 -^1 ,
De Greef K,H, & Verstegen M,W,A, (1995) Evaluation of aconcept on energy partitioning in growing pigs. In:Modelling Growth in the Pig (ed, by P,J, Moughan, M,W,A,Verstegen & M,l, Visser-Reyneveld), pp, 137-149,European Association for Animal Production,Wageningen Pers, Wageningen, the Netherlands,
Eckmann R, (1987) Growth and body composition of
juvenile Colossoma macropomum Cuvier 1818(Characoidei) feeding on artificial diets, Aquaculture 64,293-303,
El-Sayed A,M, & Garling D,L, Jr (1988) Carbohydrate-to-lipid ratios in diets for Tilapia zillii tingerlings, Aquaculture73, 157-163,
Gtinther Nonell J, & Boza Abarca J, (1993) Growthperformance of Colossoma macropomum (Cuvier 1818)juveniles at different feed rations, Aquaculture andFisheries Management 23, 81-93,
Hanley F, (1991) Effects of feeding supplementary dietscontaining varying levels of lipid on growth, foodconversion, and body composition of Nile tilapia,Oreochromis niloticus (L,), Aquaculture 93, 323-334,
Hemre G,-I,, Lie 0,, Lied E, & Lambertsen G, (1989) Starchas an energy source in feed for cod (Gadus morhua):digestibility and retention, Aquaculture 80, 261-270,
Hemre G,-I,, Sandes K,, Lie 0,, Torissen 0, & Waagbo R,(1995) Carbohydrate nutrition in Atlantic salmon, Salmosalar L,: growth and feed utilization, Aquaculture Research26, 149-154,
Henken A,M,, Machiels M,A,M,, Dekker W, & HogendoomH, (1986) The effect of dietary protein and energycontent on growth rate and feed utilization of the Africancatfish Clarias gariepinus (Burchell 1822), Aquaculture58, 55-74,
Hillestad M, & Johnson F, (1994) High energy/low proteindiets for Atlantic salmon: effects on growth, nutrientretention and slaughter quality, Aquacukure 124,109-116.
Jayaram M,G, & Beamish F,W,H, (1992) Influence ofdietary protein and energy losses in lake trout, Salvelinusnamaycush. Canadian lournal of Fisheries and AquaticSciences 49, 2267-2272,
Kaushik S,J, & Cowey C,B, (1991) Dietary factors affectingnitrogen excretion by fish. In: Nutritional Strategy andAquaculture Waste. Proceedings of the First InternationalSymposium on Nutritional Strategies in Management ofAquaculture Waste (ed, by C,B, Cowey and C,Y, Cho), pp,3-19, University of Guelph, Guelph, Ontario, Canada,
Kaushik S,J, & Medale F. (1994) Review, Energyrequirements, utilization and dietary supply tosaimonids, Aquaculture 124, 81-97,
Lee D,], & Putnam G.B, (1973) The response of rainbowtrout to varying protein/energy ratios in a test diet.Journal of Nutrition 103, 916-922,
Li M, & Lovell R,T, (1992) Comparison of satiate feedingand restricted feeding of channel catflsh with variousconcentrations of dietary protein in production ponds,Aquaculture 103, 165-175,
Lovell T, (1989) Nutrition and Feeding of Fish. Van NostrandReinold, New York,
Machiels M,A,M, & Henken A,M, (1987) A dynamicsimulation model for growth of the African catfish,Clarias gariepinus (Burchell 1822), II Effect of feedcomposition on growth and energy metabolism,Aquaculture 60, 33-53,
416 © 1997 BlackweU Science Ltd, Aquacuiture Research. 28, 405-417
Aquaculture Research, 1997. 28. 405-417 Dietary lipid and protein deposition in Colossoma M B van der Meer et al.
Machiels. M.A.M. & Van Dam A.A. (1987) A dynamicsimulation model for growth of the African catfish.Clarias gariepinus (Burchell 1822). III. The effect of bodycomposition on growth and feed intake. Aquaculture 60.55-71.
Mangalik A. (1986) Dietary energy requirements of channelcatfish. PhD dissertation. Auburn University. Auburn.AL, 126 pp. (cited by U & LoveU 1992).
Menton D.J. (1989) Research considerations into thenutrition oi Colossoma and Piaractus in relation to cultureconditions. In: Cultivo de Colossoma. pp. 75-84. RedRegional de Entidades y Centros de Acuicultura deAmerica Latina. Editora Guadalupe Ltda. Bogota.Colombia.
Robinson E.H. (1991) A practical guide to nutrition, feedsand feeding of catfish. MAFES Bulletin 979, Departmentof Information Services. Division of Agriculture, Forestryand Veterinary Medicine, Mississippi State University,18 pp.
Shiau S.y. & Peng C.Y. 1993 Protein-sparing effect bycarbohydrates in diets for tilapia. Oreochromisniloticus X 0. aureus. Aquaculture 117. 327-334.
Van der Meer M.B. & Verdegem M.C.J. (1996) Comparisonof amino acid profiles of feeds and fish as a quickmethod for selection of feed ingredients: a case study forColossoma macropomum (Cuvier). Aquaculture Research27. 4 8 7 ^ 9 5 .
Van der Meer M.B.. Machiels M.A.M. & Verdegem M.C.J.(1995) The effect of dietary protein level on growth,protein utilization and body composition of Colossomamacropomum (Cuvier). Aquaculture Researcii 26. 9 0 1 -909.
Van der Meer M.B.. Huisman E.A. & Verdegem M.C.J.
(1996) Feed consumption, growth and protein utilizationof Colossoma macropomum (Cuvier) at different dietarj'soya meal/lish meal ratios. Aquaculture Research 27.531-538.
Van der Meer M.B.. Faber R.. Zamora J.E. & VerdegemM.C.J. (1997) Effect of feeding level on feed losses andfeed utilization of soya and fish meal diets in Colossomamacropomum (Cuvier). Aquaculture Research 28 . 3 9 1 -403.
Van der Meer M.B.. Van Herwaarden H. & Verdegem M.C.J.(1997) Effect of number of meals and frequency offeeding on voluntary' feed intake of Colossomamacropomum (Cuvier). Aquaculture Research 28. 419-432.
Viola S. & Arieli Y. (1983) Nutrition studies with tilapia{Sarotherodon). 1. Replacement of fishmeal by soybeanmeal in feeds for intensive tilapia culture. Bamidgeh 35.44-52.
Watanabe T.. Takeuchi T. & Ogino Ch. (1978) Studies onthe sparing effect of lipids on dietarj' protein in rainbowtrout (Salmo gairdneri). In: Proceedings of tiie WorldSymposium on Finfish Nutrition and Fishfeed Technology.Hamburg (ed. by J.E. Halver and K. 'Rews). Vol. I, pp.113-125. Heenemarm. Berlin. Germany.
Webster CD.. Tiu L.G.. Tidwell J.H.. Van Wyk P. & HowertonR.D. (1995) Effects of dietary protein and lipid levels ongrowth and body composition of sunshine bass {Moronechrysops x M. saxatilis) reared in cages. Aquaculture 131.291-301.
Winfree R.A. & Stickney R.R. (1981) Effects of dietaryprotein and energy on growth, feed conversion and bodycomposition of Tilapia aurea. Journal of Nutrition 111.
1001-1012.
O 1997 Blackwell Science Ltd. Aquaculture Research. 28, 405^17 417