Embed Size (px)
Citation preview
Effect of dual and single inoculation of rhizobia and arbuscular
mycorrhizal fungi on soybean (Glycine max (L.) Merr.) and tomato
(Solanum lycopersicum L.) under various soil zinc conditions
各種亜鉛条件下におけるダイズ (Glycine max (L.) Merr.) とトマ
ト (Solanum lycopersicum L.) に及ぼす根粒菌とアーバスキュラ
ー菌根菌の二重接種および単独接種の影響
August 2018
IBIANG, YOUNG BASSEY
Graduate School of Horticulture
CHIBA UNIVERSITY
i
(千葉大学審査学位論文)
Effect of dual and single inoculation of rhizobia and arbuscular
mycorrhizal fungi on soybean (Glycine max (L.) Merr.) and tomato
(Solanum lycopersicum L.) under various soil zinc conditions
各種亜鉛条件下におけるダイズ (Glycine max (L.) Merr.) とトマ
ト (Solanum lycopersicum L.) に及ぼす根粒菌とアーバスキュラ
ー菌根菌の二重接種および単独接種の影響
August 2018
A thesis submitted to Graduate School of Horticulture,
Chiba University, in partial fulfillment of the requirements for the
degree of Doctor of Philosophy (Ph. D.)
IBIANG, YOUNG BASSEY
Laboratory of Plant Nutrition
Graduate School of Horticulture
CHIBA UNIVERSITY
ii
APPROVAL
Effect of dual and single inoculation of rhizobia and arbuscular
mycorrhizal fungi on soybean (Glycine max (L.) Merr.) and tomato
(Solanum lycopersicum L.) under various soil zinc conditions
各種亜鉛条件下におけるダイズ (Glycine max (L.) Merr.) とトマ
ト (Solanum lycopersicum L.) に及ぼす根粒菌とアーバスキュラ
ー菌根菌の二重接種および単独接種の影響
August 2018
IBIANG, Young Bassey
(15HD2201)
Approved by:
Prof. Kazunori SAKAMOTO (Ph. D.) (Supervisor) ………………………..
Prof. Kazuyuki INUBUSHI (Ph. D.) (Reviewer) .………………………….
Prof. Akihiro ISODA (Ph. D.) (Reviewer) . ………………………………..
Prof. TANG Changyuan (Ph. D.) (Reviewer) ..…………………………….
iii
LIST OF CONTENTS Page
Title Page……………………………………………………….…………………………..i
Approval ……………………………………………………….……………….………….ii
List of Contents……………………………………………….…………………...............iii
List of Figures………………………………………………….………………………….viii
List of Tables…………………………………………………….…………………...........x
List of Plates………………………………………………….………………………..….xii
Abstract (English)………………………………………………………………………....xiii
Abstract (Japanese) .………………………………………….………………..………….xv
CHAPTER ONE: GENERAL INTRODUCTION
1.1 Background of study…………………………………………………………..…………1
1.2 Trace elements in soil and plant………..………………………………………..………3
1.3 Arbuscular mycorrhizal symbiosis…………………………………………….…..…….5
1.4 Rhizobial symbiosis…………….………………………………………………. ………7
1.5 Justification of study……………………………………………………………..............9
1.6 Aim of study……………………………………………………………………………11
CHAPTER TWO: Bradyrhizobia and arbuscular mycorrhizal fungi modulate manganese,
iron, phosphorus, and polyphenols in soybean (Glycine max (L.) Merr.) under excess zinc
2.1 Introduction…………………………………………………………………………….13
2.2 Materials and methods…………………………………………………………………16
iv
2.2.1 Soil……………………………………………………………………………………16
2.2.2 Zinc addition…………………………………………………………………………16
2.2.3 Seeds…………………………………………………………………………….…...18
2.2.4 Symbiont inoculations……………………………………………………………….18
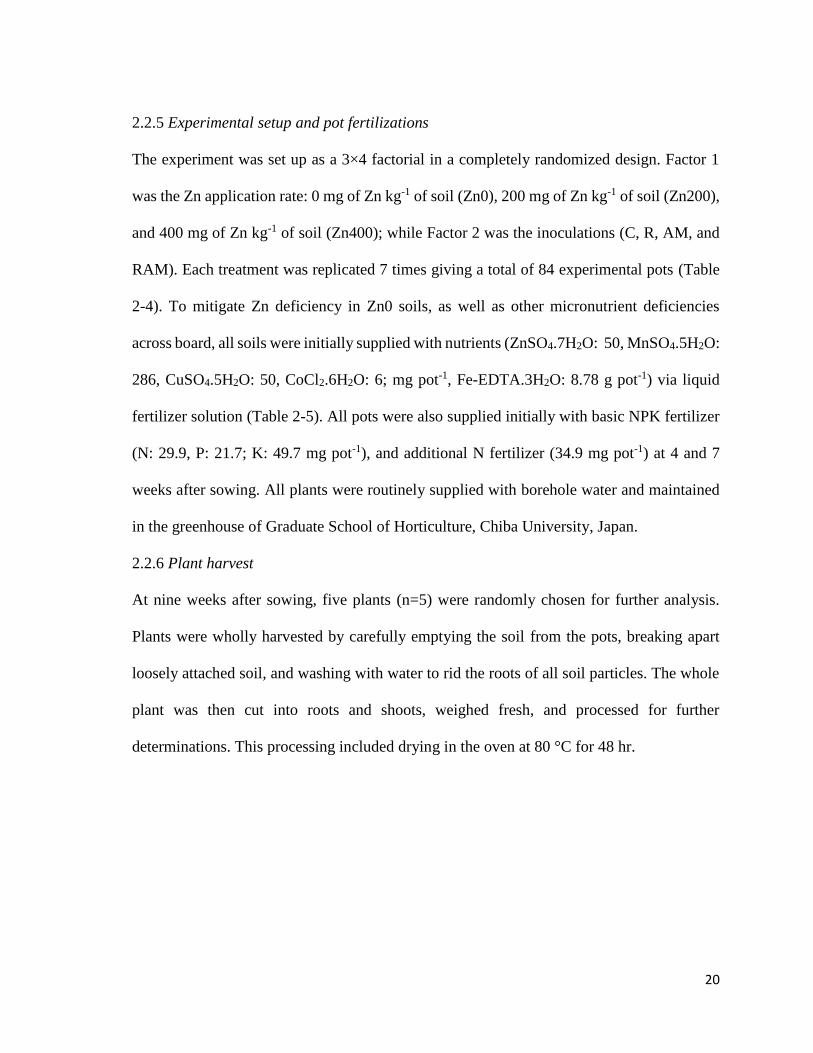
2.2.5 Experimental setup and pot fertilizations…………………………………................20
2.2.6 Plant harvest……………………………………………………………………….....20
2.2.7 Plant growth parameters…………………………………………………..……….…22
2.2.8 Zn, Fe and Mn in plant…………………………………………….............................22
2.2.9 Phosphorus concentration……………………………………………………………22
2.2.10 Polyphenols content………………………………………………….………….…..25
2.2.11 H2O2 estimation ……………………………………………………………….……25
2.2.12 Symbiont colonization……………………………………………………….……..25
2.2.13 Statistical analysis………………………………………………………….….........28
2.3 Results…………………………………………………………………..…….………..30
2.3.1 Plant growth indices…………………………………….…..…………..….………...30
2.3.2 Leaf greenness (SPAD)…………………………………………………..………..…33
2.3.3 H2O2 content (DAB staining intensity)…………………………………..……….…33
2.3.4 Polyphenols content………………………………………………………..…….….33
2.3.5 Mycorrhizal and nodule indices……………………………………………..............35
2.3.6 Element concentration in plant………………………………………………………35
2.4 Discussion……………………………………………………………………………..45
2.5 Conclusion…………………………………………………………………………….54
v
CHAPTER THREE: Synergic effect of arbuscular mycorrhizal fungi and bradyrhizobia on
biomass response, element partitioning and metallothionein gene expression of soybean-host
under excess soil zinc
3.1 Introduction……………………………………………………………………………55
3.2 Materials and methods…………………………………………………..……………..57
3.2.1 Soil……………………………………………………………………..…………….57
3.2.2 Seeds……………………………………………………………………..…………..57
3.2.3 Experimental setup………………………………………………………..…………57
3.2.4 Symbiont inoculations…………………………………………………………..........58
3.2.5 Plant harvest………………………………………………………………………….58
3.2.6 Plant bioproduction and response to inoculants………………………………..……59
3.2.7 Rhizobial nodule and mycorrhizal colonization……………………………………..59
3.2.8 RNA extraction, cDNA synthesis and Real-Time RT-PCR………………………….59
3.2.9 Polyphenols content………………………………………………………………….60
3.2.10 H2O2 estimation …………..………………………………………………………..64
3.2.11 Element analysis in plant tissues……………………………………………………64
3.2.12 pH and available element in soil……………………………………………………64
3.2.13 Statistical analysis………………………………………………………………….65
3.3 Results…………………………………………………………………………………69
3.3.1 Plant bioproduction and biomass response…………………………………….……69
3.3.2 Nodulation and AM fungal colonization……………………………………………73
3.3.3 DAB intensity, root polyphenols and GmMT1 relative expression…………………77
vi
3.3.4 Trace elements in plant………………………………………………………………78
3.3.5 Leaf indices………………………………………………………………………….83
3.3.6 pH and available soil element……………………………………………………….83
3.4 Discussion……………………………………………………………………………..87
3.5 Conclusion…………………………………………………………………………….93
CHAPTER FOUR: Effect of excess zinc and arbuscular mycorrhizal fungus on
bioproduction and trace element nutrition of tomato (Solanum lycopersicum L.)
4.1 Introduction…………………………………………………………………………….94
4.2 Materials and methods…………………………………………………………………95
4.2.1 Soil…………………………………………………………………..……………….95
4.2.2 Plant………………………………………………………………………..…..…….96
4.2.3 AM fungal inoculation………………………………………………………….……96
4.2.4 Experimental setup and pot fertilizations……………………………….……………96
4.2.5 Plant harvest…………………………………………………………….…….………97
4.2.6 Plant biomass and response to AM fungus…………………………………….…….97
4.2.7 Zn, Fe, Mn and Cu in plant………………………………………….……………….99
4.2.8 Available trace element in soil……………………..………………….……….…….99
4.2.9 Phosphorus in plant………………………….…………….……………….….……..99
4.2.10 Mycorrhizal element response in tissues……..………………….…………………103
4.2.11 Polyphenols in fruits…………………………….…………………………………103
4.2.12 AM fungal colonization…………………………….………………………….…..103
vii
4.2.13 Statistical analysis……………………………………………..…….…………..104
4.3 Results……………………………………………………………….…….……….105
4.3.1 Plant biomass, phosphorus and polyphenols………………………….…….……105
4.3.2 Mycorrhizal colonization and biomass response………………………….……...105
4.3.3 Zn in soil and plant……………………………………………………..………...109
4.3.4 Fe in soil and plant………………………………………………………….…....109
4.3.5 Mn in soil and plant………………………………….……………………..……113
4.3.6 Cu in soil and plant…………………………………………………….………...113
4.3.7 Mycorrhizal element response in tissues…………………………….…………..116
4.3.8 Biomass correlation with trace element ratios……………………….……….…118
4.4 Discussion…………………………………………………………….…………...118
4.5 Conclusion………………………………………………………………….……...124
CHAPTER FIVE: GENERAL DISCUSSION AND CONCLUSION
5.1 General discussion………………………………………………………………….125
5.2 General conclusion………………………………………………………….…..….131
ACKNOWLEDGEMENTS……………………………………………………………..134
REFERENCES………………………………………………………………………….135
APPENDIX………………………………………………………………………..151 - 153
viii
LIST OF FIGURES
Figure Page
1-1. Plant-AM fungal-rhizobial symbioses ………………………………….....…...….…12
2-1. Standard absorption curves for determination of Zn concentration…………..…...…23
2-2. Standard absorption curves for determination of Mn concentration……….……....…23
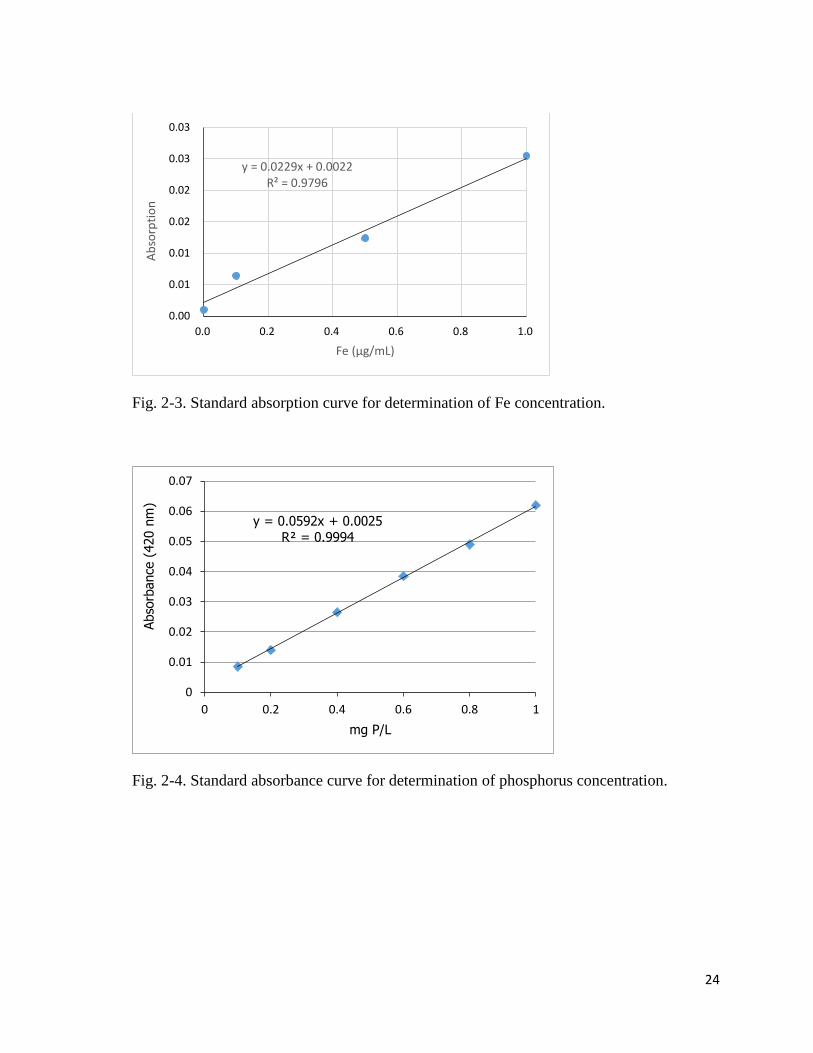
2-3. Standard absorption curves for determination of Fe concentration…………………..24
2-4. Standard absorbance curves for phosphorus concentration……………….………….24
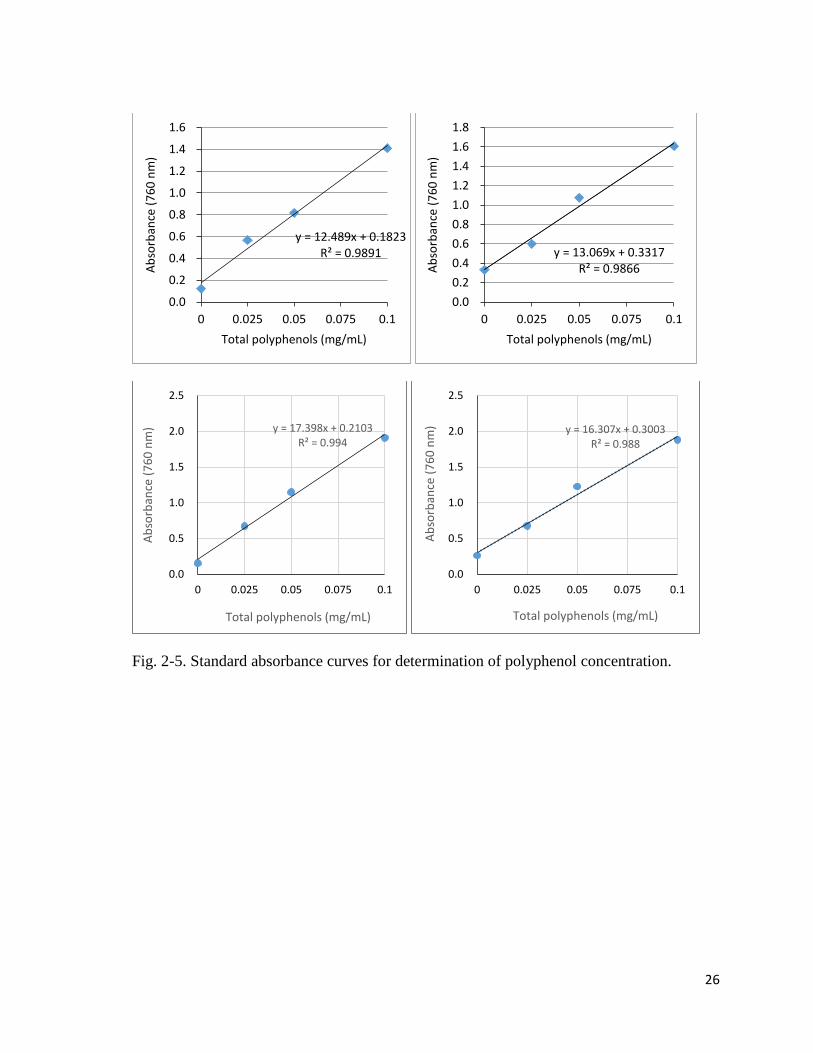
2-5. Standard absorbance curves for polyphenols concentration…………….……………26
2-6. Growth indices of soybean in Zn-treated soil….……………………………………..32
2-7. DAB intensity and total polyphenols…………..……………………………………..34
2-8. Symbiont colonization indices …………..…….……………………………………..36
2-9. Zn in plant…………………………………….………………………………………38
2-10. Fe in plant…………………………………………………………………….……..40
2-11. Mn in plant………………………………………………………………………….42
2-12. P in plant…………………………………………………………………………….44
3-1. Relative amount of GmEF1 cDNA…………………………………………..............61
3-2. Relative amount of GmMT1 cDNA……………………………………….…………62
3-3. Standard absorbance curves for polyphenols concentration…………………….…...63
3-4. Standard absorption curves for plant element concentration……………….…..........67
3-5. Standard absorption curves for available soil Zn and Mn……………………….…..68
3-6. Plant growth indices………………………………………………………………….71
ix
3-7. Host biomass response to inoculants…………………………………………………74
3-8. Root colonization, DAB intensity, GmMT1 relative expression and
polyphenols……………………………………………………………………………......75
3-9. Zn in plant…………………………………………………..………………….…….79
3-10. Mn in plant……………………………………………………..……………….......82
3-11. Fe in plant…………………………………………………………………………...84
3-12. Leaf indices……………………………………………………….…………….......85
4-1. Standard absorption curves for plant element concentration…………..……..……..100
4-2. Standard absorption curves for available soil element………………………………101
4-3. Standard absorbance curve for phosphorus concentration…………………..….…..102
4-4. Standard absorbance curve for polyphenols concentration…………………….…....102
4-5. Plant biomass, phosphorus, polyphenols, root colonization and
Mycorrhizal response…………………………………………………………….............108
4-6. Zn in soil and plant……………………………………………………….…………..110
4-7. Fe in soil and plant………………………………………………………….….…....111
4-8. Mn in soil and plant…………………………………………………….…………....114
4-9. Cu in soil and plant…………………………………………………….…….………115
5-1. Effect of rhizobia and AM fungi on host-plants under various soil Zn conditions …132
x
LIST OF TABLES
Table Page
2-1. ZnSO4·7H2O addition to soil………….…………..……………………………….….17
2-2. YMA for rhizobium pre-incubation…………………….…………….……………....19
2-3. YMB for second rhizobium culture………………………….……….……………....19
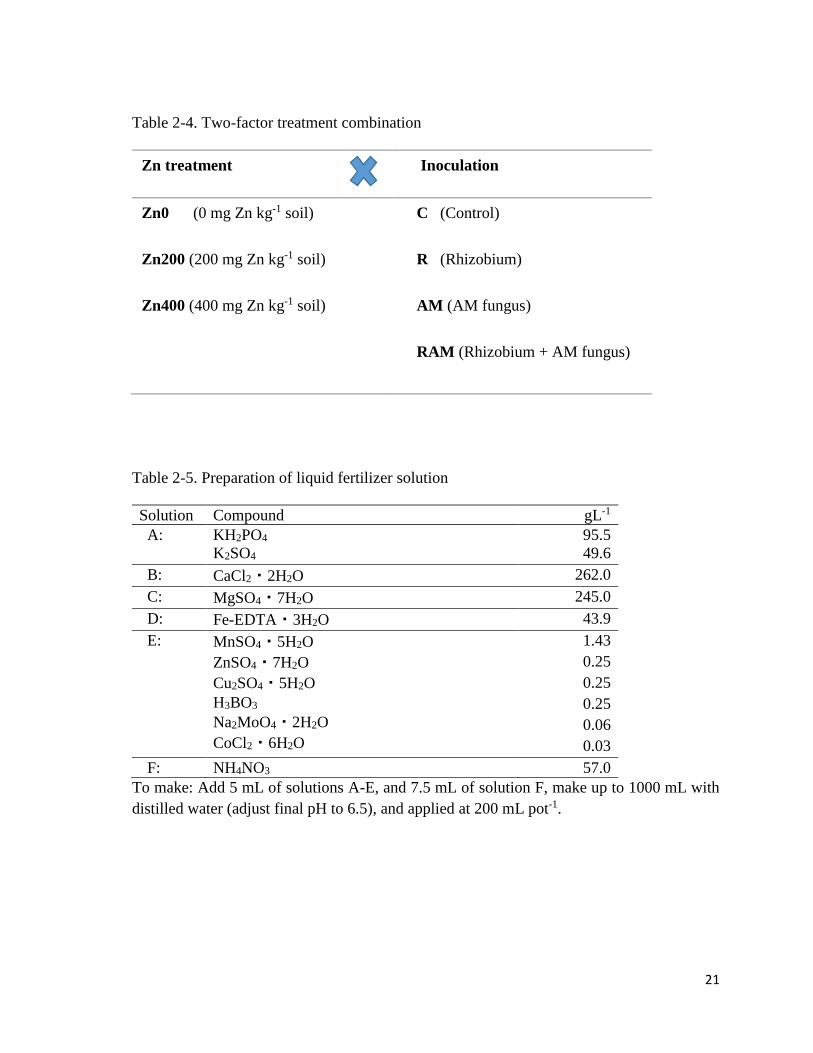
2-4. Two-factor treatment combination………………………………….….………….…21
2-5. Preparation of liquid fertilizer solution………………………………….….…….….21
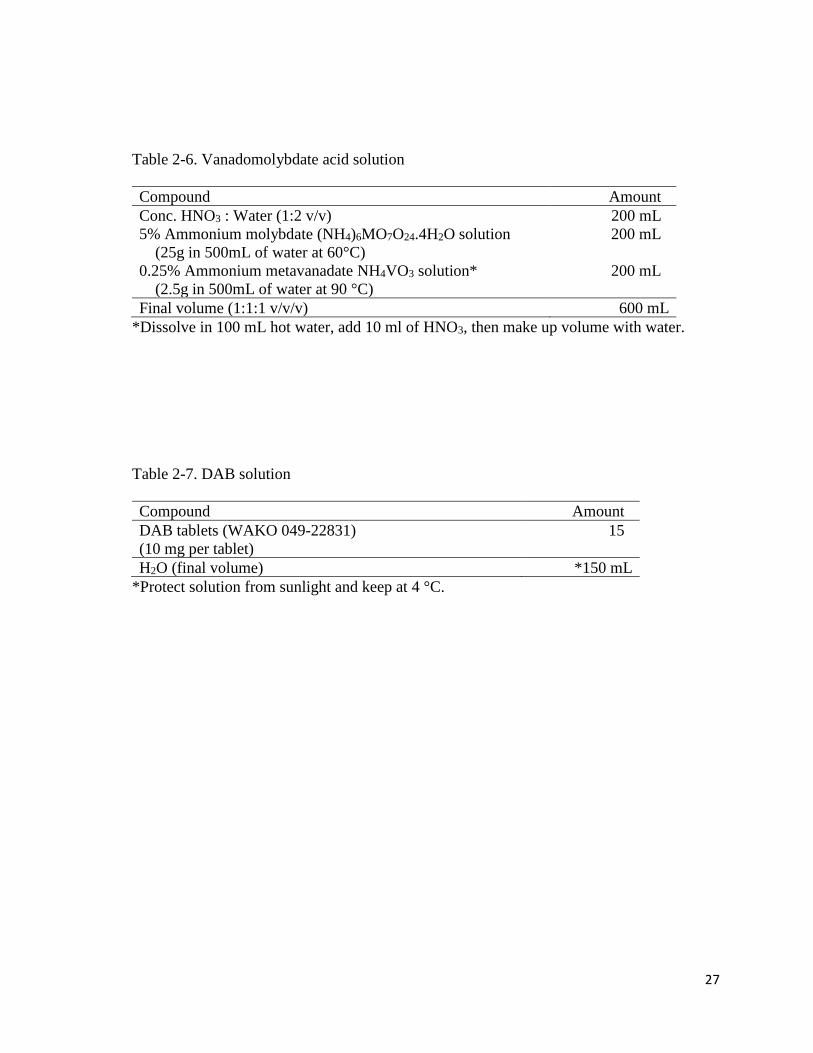
2-6. Vanadomolybdate acid solution………………………………………….……….….27
2-7. DAB solution…………………………………………………………….…………...27
2-8. FAA solution…………………………………………………………….……….......29
2-9. 1% Trypan blue reagent solution………………………………………….………....29
2-10. Lactose-glycerol solution………………………………………………….……......29
2-11. Significance of experimental treatments on plant growth indices, H2O2
and polyphenols…………………………………………………………..…....................31
2-12. Significance of experimental treatments on root colonization………………..……37
2-13. Significance of experimental treatments on Zn, Fe, Mn and P………………..……37
3-1. DTPA solution for soil extraction to determine available TE…………………..……66
3-2. Significance of experimental treatments on soybean growth indices……………..…72
3-3. Significance of experimental treatments on root colonization……………………….76
3-4. Significance of experimental treatments on DAB intensity, GmMT1
relative expression and root polyphenols………………………………………………….76
xi
3-5. Significance of experimental treatments on trace elements and soil pH…….………..80
3-6. Available element and pH in potted soils after soybean growth………………………86
4-1. Modified Hoagland nutrient solution used for tomato cultivation……………………98
4-2. Significance of experimental sources of variation on biomass, phosphorus
and polyphenols of tomato at ten weeks………………………………………………….107
4-3. Significance of experimental sources of variation on available Zn, Fe, Mn
and Cu in soil…………………………………………………………………….……….107
4-4. Significance of experimental sources of variation on Zn, Fe, Mn and Cu
in tomato at ten weeks……………………………………………………………………112
4-5. Mycorrhizal element response in tomato tissues at ten weeks……………………….117
4-6. Pearson correlation coefficients (r) between biomass and element
concentration ratios in tomato shoots at ten weeks…………………………………….…117
xii
LIST OF PLATES
Plate Page
3-1. Soybean in labelled pots representing the different treatments....…………..................70
4-1. Tomato plants cultivated in pots in the growth chamber………………….…….…...106
xiii
ABSTRACT (English)
Microsymbiont inoculation can enhance plant growth and tolerance to excess trace elements
(TE). This study investigated the effect of dual and single inoculation of rhizobia (R) and
arbuscular mycorrhizal (AM) fungi on soybean (Glycine max) and tomato (Solanum
lycopersicum) under various soil zinc (Zn) conditions. In experiment one, the effect of R
(Bradyrhizobium diazoefficiens) and AM (Gigaspora rosea) on biomass production, element
nutrition and polyphenols was investigated in soybean. In a randomized factorial design, Zn
(at 0, 200 and 400 mg Zn kg-1 soil) and inoculation (uninoculated control, R, AM and RAM
dual inoculation) treatments were set up in the greenhouse for nine weeks. Zinc treatment
decreased root manganese (Mn), polyphenols and iron (Fe) translocation, but increased the
frequency of mycorrhization and root phosphorus (P) concentrations. In 400 mg Zn kg-1 soils,
R and AM increased shoot Mn concentrations and synergized to boost root-to-shoot Mn
translocation in the dually inoculated plants – ameliorating the antagonistic effect of excess
Zn on Mn accumulation in the shoots. Dual inoculation also reduced the cumulative number
of fallen leaves, and increased root polyphenols, shoot P and leaf SPAD index to give higher
shoot dry weights under all soil Zn treatments. In experiment two, a different AM fungus
(Claroideoglomus etunicatum) was utilized with Bradyrhizobium diazoefficiens, under
similar soil Zn treatments. Here, symbionts colonization and effectiveness were decreased in
400 mg Zn kg-1 soils, but dual inoculation induced significantly higher biomass production
under all soil Zn treatments. The biomass response indicated that AM modulated stem and
root bioproduction in favor of leaf and pod, while rhizobium favored root production and
potentiated AM effect in dual inoculation. Root colonization and H2O2 level within root
xiv
nodules was also higher in dual inoculation. Compared with control, AM and RAM
treatments lowered leaf and pod Zn concentrations under excess Zn. While Zn treatment
increased leaf and pod Mn in control plants, symbionts countered this by regulating root-to-
stem Mn translocation, especially in RAM. Type 1 metallothionein gene expression in roots
was highest in RAM and lowest in control plants, but Zn effects were not dose-dependent.
From both soybean experiments, synergic effects of R and AM on the number and SPAD
index of leaves, nodule H2O2 content, shoot phosphorus, TE translocation from roots to tops,
polyphenols biosynthesis and metallothionein gene expression are indicated as important
mechanisms underlying improved biomass production in dual inoculation. In experiment
three, the effect of excess Zn and AM fungus on bioproduction and TE nutrition was
investigated in tomato. In a randomized factorial design, Zn (at 0 and 300 mg Zn kg-1 soil)
and AM inoculation (non-AM and Rhizophagus irregularis) treatments were set up in a
growth chamber for ten weeks. Generally, AM effects on the available Zn, Mn, Cu and Fe in
the rhizosphere soil were in tandem with the effects in host tissues. In uncontaminated soil,
AM enhanced Cu availability in the rhizosphere, optimized the Cu:Zn balance in shoots, and
significantly increased the host biomass production. In Zn-treated soils, AM decreased the
Zn concentrations in soil and plant tissues but mycorrhizal colonization and the total plant
biomass in AM and non-AM plants were reduced. Although the Zn concentration in fruit was
within the safety threshold, Mn deficient fruits were observed under excess Zn in both AM
and non-AM plants. In conclusion, partnerships between AM and R inoculants optimize
bioproduction and mitigate excess Zn-induced TE imbalance in soybean tissues. However,
minimizing the toxicity of Zn to AM inoculant infectivity would benefit host responses in
tomato, as well as soybean.
xv
ABSTRACT (Japanese)
共生微生物の接種によって植物の生育や過剰な微量元素に対する耐性を向上させ
ることができる。本研究では各種亜鉛(Zn)条件下におけるダイズ(Glycine max)
とトマト(Solanum lycopersicum)に対する根粒菌とアーバスキュラー菌根菌(AM
菌)の二重接種および単独接種の影響について調べた。
実験1では、ダイズの生育、栄養元素およびポリフェノールに対する根粒菌
(Bradyrhizobium diazoefficiens)と AM菌(Gigaspora rosea)の影響について調べ
た。Znの添加(0, 200 および 400mgZn kg-1乾土)と共生菌の接種(非接種、根粒
菌単独接種、AM 菌単独接種および二重接種)を組み合わせた試験区を設け、温室
内で 9 週間のポット栽培を行った。その結果、Zn の添加は根のマンガン(Mn)と
ポリフェノールの含有率および鉄(Fe)の根から地上部への移行割合を低下させ
たが、菌根形成頻度と根部のリン含量を増大させた。400mgZn kg-1 乾土の Zn 添加
において、根粒菌単独接種と AM菌単独接種は地上部の Mn含有率を増大させた。ま
た二重接種は根から地上部への Mn の移行割合を増大させ、共生菌接種によって地
上部の Mn 含有率に対して過剰な Zn が示す拮抗作用が緩和されることが示唆され
た。全ての Zn 添加処理において、二重接種によって落葉数の低下、根のポリフェ
ノール含量率、地上部のリン含量率および葉の SPAD 値の増大が認められ、ダイズ
の地上部乾物重は最も大となった。
実験 2 では、実験1と同様の実験を異なった種類の AM 菌(Claroideoglomus
etunicatum)を用いて行った。その結果、共生菌の定着とその接種効果は 400mgZn
kg-1乾土の Zn 添加によって低下するが、二重接種は全ての Zn 添加処理においてダ
イズの生育を顕著に向上させることが認められた。AM 菌単独接種は茎と根の生育
を調節し葉と莢の生育を向上させた。一方、根粒菌は根の生育を増大させ、二重
接種における AM 菌の接種効果を支援した。根粒の着生と H2O2含量は二重接種によ
って増大した。AM 菌単独接種と二重接種は非接種のダイズと比べ、Zn 過剰下にお
ける葉と莢の Zn 含有率を低下させた。一方、Zn 添加は非接種のダイズの葉と莢の
Mn 含有率を増大させた。共生菌の接種、とりわけ二重接種は根から地上部の Mn の
移行割合を調節し、葉と莢における Mn 含有率を低下させた。根における Type1 メ
タロチオネイン遺伝子の発現量は二重接種が最も大となり、非接種が最も小とな
xvi
ったが、Zn 添加の影響はその添加量とは関係がなかった。ダイズに関する二つの
実験結果から、葉の SPAD 値、根粒の H2O2 含量、地上部リン含有率、根から地上部
への微量栄養元素の移行割合、ポリフェノール含有率およびメタロチオネイン遺
伝子発現量が二重接種によってダイズの生育が向上する重要な要因であることが
示唆された。
実験 3では、トマトの生育と微量栄養元素に及ぼす過剰 Znと AM菌接種の影響に
ついて調べた。Zn添加(0または 300 mgZn kg-1乾土)と AM菌の接種(非接種また
は Rhizophagus irregularis接種)を組み合わせた試験区を設け、グロースチャン
バー内で 10 週間のポット栽培を行った。その結果、AM 菌の接種はトマトの植物体
に及ぼす影響と同様の効果を培土中の可給態 Zn、Mn、銅(Cu)および Fe に及ぼす
ことが認められた。Zn無添加の場合、AM菌の接種は培土の可給態 Cu含量を増大さ
せ、トマト地上部の Cu:Znの比率を最適化し、宿主の生育を顕著に増大させた。Zn
添加によって菌根形成とトマトの生育は減少したが、AM 菌の接種は培土と植物体
の Zn濃度を低下させた。AM菌の接種の有無に関わらず、Zn添加によってトマト果
実の Mn含有率は減少した。また Zn含有率は増大したが、それは規制値の範囲内で
あった。
以上の研究から、ダイズにおける根粒菌と AM 菌の二重接種は植物体の生育を向
上させ、過剰 Zn がもたらす微量栄養元素のアンバランスを是正することが明らか
となった。またトマトにおいても AM菌の接種は Znの有害性を是正する効果を示す
ことが認められた。
1
CHAPTER ONE
GENERAL INTRODUCTION
1.1 Background of study
Agricultural production and environmental quality have a strong relationship. Both clearly
have a huge impact on human well-being in terms of food security and overall ecosystem
health. As a result, the chemical state of soils, sediments and water are an important
consideration in plant production and bioenvironmental sciences. More specifically, trace
elements (TE) condition of soils can be a serious problem affecting crop production
(Nicholson et al. 2003). While deficient or excessive soil TE conditions are problematic for
plant production in general, their persistence, potential toxicity and accumulation in food
chain are major concerns when levels are elevated in agricultural soils (Gall et al. 2015). Due
to their undesirable effects on living organisms when in excess, environmental regulations
exist for Maximum Allowable Concentration (MAC) of TE in agricultural soils in different
countries. In Japan, for instance, the zinc (Zn) regulatory level in the soil is 120 mg Zn kg-1,
while 200 mg Zn kg-1 was reported in the European Union (EU) (Ogiyama et al. 2005, Tóth
et al. 2016). However, elevated levels up to 400 mg Zn kg-1 has been reported in some farm
soils (ATSDR 2005), although the MAC of Zn in agricultural soils varies from 100 - 300 mg
Zn kg-1 in most countries (Kabata-Pendias 2011).
Excess soil Zn conditions may be due to natural or anthropogenic factors. For instance,
some agricultural soils are known to contain moderately elevated Zn levels due to their
volcanic origins (Okamoto et al. 2002; Ogiyama et al. 2005). Zn is also of interest as a
prevalent contaminant in phosphate fertilizers applied on farms, as reported by Lopez-
2
Camelo et al. (1997) and Benson et al. (2014) in Argentina and Nigeria, respectively. As one
of the most widespread TE in organic soil conditioners (Pinamonti et al. 1997), it may
accumulate in farm soils due to long-term application of pig farm-yard manure (Ogiyama et
al. 2010). High anthropogenic pollution of soils by Zn has also been reported, such as in
highly polluted topsoils with up to 2900 mg Zn kg-1, according to Geochemical Atlas of
Europe Part 1 (http://weppi.gtk.fi/publ/foregsatlas/maps/Topsoil/t_xrf_zn_edit.pdf). In
Nigeria, an important source of TE pollution of soils is run-off from municipal waste
dumpsites rich in heavy metals such as Zn, lead (Pb), cobalt (Co), nickel (Ni), and cadmium
(Cd), with potential adverse effects on human and ecosystem health (Oketola and Akpotu
2014). According to a recent study of several dumpsites, the order of soil and plant heavy
metal contents was given as Zn>chromium(Cr)>Pb, and element concentrations were
significantly higher than EU and Canadian permissible limits for agricultural soils and
vegetation (Nwaogu et al. 2017). Although an essential TE, excess Zn levels in the soil could
negatively affect plant growth and overall performance (Rout and Das 2003). Therefore,
improving plant performance under excess Zn conditions in agricultural soils is valuable, and
the utilization of eco-friendly biotechnologies such as microbe inoculation in this regard has
received attention (Christie et al. 2004; Al-Garni 2006). Exploiting bioinoculants to mitigate
the impact of excess Zn on the acquisition and distribution of TE is also beneficial for food
safety and quality in edible plants.
Plants have established mutually beneficial associations with specific
microorganisms in the environment, such as arbuscular mycorrhizal (AM) fungi and rhizobia
(R) which colonize the roots of host-plants and maintain symbiosis with them. The AM
symbiosis improves especially phosphorus (P) nutrition, while rhizobial nodule symbiosis is
3
concerned with dinitrogen (N2) fixation, in hosts (Polacco and Todd 2011). Their utilization
as biofertilizers and bioprotectants is an important biotechnological approach at enhancing
plant production while minimizing the use of chemical fertilizers. Aside the economic and
environmental benefits that would accrue due to a reduction in the volume and costs of
fertilizer application due to this technology, the utility of sub-optimal soils - such as those
with excess TE - could be enhanced by improving crop tolerance and soil characteristics
(Faria et al. 2011). However, while improvement in plant bioproduction is an important
desirable outcome expected of their utilization in plant production systems, one of the
problems with the deployment of bioinoculants is that the biomass response of the host may
be positive, negative, or nil (Nogueira and Cardoso 2003; Grace et al. 2009). Host-plant
response is a complex issue involving the plant-microbe-environment interaction (Smith and
Smith 2011) and is of huge significance as it defines the effectiveness of inoculated
symbionts. Other factors that are important in bioinoculation technology includes; the
production of sufficient amounts of disease-free inoculum, selection of inoculum type,
amount, and method of application, inoculant fitness and infectivity under the prevailing soil
conditions, amongst others (Miransari 2014; Berruti et al. 2015). In general, scientific
research shedding more light on these issues are necessary to advance our understanding of
host response in plant-microbe symbioses for the overall benefit of plant performance under
various soil conditions (Kogel et al. 2006; Ahemad and Kibret 2014).
1.2 Trace elements in soil and plant
According to Kabata-Pendias (2011) there is yet to be a widely recognized definition of the
term “trace elements” across the geochemical and biochemical sciences. But the
4
understanding has been that it refers to chemical elements (metals and metalloids) in the
Earth crust in amounts less than 0.1% (1000 mg/kg), or at similar levels in biological systems.
Across scientific literature, it can be observed that “trace elements” are sometimes referred
to as “heavy metals”, “transition metals”, “trace metals”, or “metals”. “Heavy metals” have
been very widely used in relation to chemical toxicity. But other commonly encountered
terms such as “essential elements”, “micronutrients” and “trace nutrients” are largely
descriptive of their physiological functions in biosystems, and may not readily be applied to
geochemical systems such as soils or sediments (Kabata-Pendias 2011). While the term
“trace elements” has been mostly adopted in this thesis, no special meaning is implied when
other common terms (as stated above) are used.
Plant roots take up nutrients from the soil for distribution to other parts of the plant.
Elements in soil solution move into root by bulk flow and by diffusion, but active transport
aided by metal chelators and transporters also play a part in element nutrition (Taiz and
Zeiger 2010; Kabata-Pendias 2011). Upon uptake into the root, the loading of ions exiting
the symplast into the conducting cells of the xylem (referred to as xylem loading) is a very
highly regulated process. At the plasma membrane of xylem parenchyma cells, proton pumps
(e.g. H+-ATPases) and a variety of ion channels and specialized carriers mediate the
movement of ions into the xylem tracheary elements for onward distribution to the tops of
plants (Taiz and Zeiger 2010). Within biological systems, essential TE such as Zn, iron (Fe),
manganese (Mn), and copper (Cu) are important for enzyme function and proper growth
(Lippard and Berg 1994). Non-essential TE such as Cd have no clearly known biological
function but are renown for their toxicity (Garg and Bhandari 2014). Low concentrations of
essential TE in plant tissues may result from inadequate root uptake due to deficient levels
5
in soil and diminish plant growth (Taiz and Zeiger 2010). When in excess, TE may disrupt
plant homeostasis and enzyme functions due to antagonistic interactions with other TE that
activate enzymes (Van Assche and Clijsters 1990; Kabata-Pendias 2011).
As an essential metal nutrient in biological systems, Zn functions as a cofactor in over
300 proteins (giving it a prominent role in enzyme activity) and is a structural component of
many proteins (Palmgren et al. 2008). Zn contamination affects both farm and non-farm soils
and may reach levels potentially toxic for some plants and animals (Lado et al. 2008). In
farms soils, Zn contamination may be extensive even when not generally highly excessive
(Holmgren et al. 1993; Tóth et al. 2016). While some soils may contain moderately elevated
Zn levels due to their volcanic origins, emissions from mines and smelters may leave sites
and affected topsoils highly polluted (Kabata-Pendias 2011). Excess Zn may affect plant
growth by inducing ROS (reactive oxygen species) imbalance and inhibiting chlorophyll
biosynthesis and Fe utilization in leaves (Chaney 1993; Petrov et al. 2015). It is capable of
displacing divalent cations like iron (Fe2+) and manganese (Mn2+) at binding sites, when in
excess (Van Assche and Clijsters 1990). Consequently, the situation of these elements in the
plant tissues are an important consideration for crop quality and human nutrition, under
excess soil Zn.
1.3 Arbuscular mycorrhizal symbiosis
Arbuscular mycorrhizal symbiosis refers to an ancient (about 450 million years)
widespread symbiosis between the arbuscular mycorrhizal fungi (Phylum - Glomeromycota)
and about 80% of plants. It is believed to have aided the colonization of land by the early
plants and considerably modifies the host-plant nutrition, growth and tolerance to stresses
6
(Smith and Read 2008). The fungi colonize the roots of plants, developing structures inside
(between and within the cells of the cortex), at the surface, and outside of the roots. The
identifiable fungal structures include arbuscules (the main sites of nutrients exchange
between AM and host-plant), vesicles, appressoria, hyphae/mycelia, coils, and spores (Smith
and Read 2008). In response to the exudation of signalling compounds such as flavonoids
and stringolactones (“branching factor”) by the root, hyphal germination and branching
occurs from an AM spore or adjacent colonized root fragment, meets a plant root and forms
an appresorium at the point of contact. The fungus releases “Myc factors” which are chemical
signals perceived by the host roots which enables proper appressoria formation. Appressoria
(also called hyphopodia) are the fungal structures that serve as precise entry points through
which the external fungal hyphae (collectively called extraradical mycelium, ERM) penetrate
the root of the host-plant (Harrison 1998). There is localized secretion of epidermal cell wall
degrading hydrolytic enzymes which allows the pressurized channel hyphae to penetrate the
root and begin formation of intraradical mycelia (IRM) (Bonfante and Perotto 1995).
Immune to the induced host defense response during the infection process, the IRM extends
through the root system forming other specialized fungal structures.
The AM fungus improve mostly P supply to plants, and possibly other plant nutrients
like Cu, Zn and ammonium (NH4+) (Smith and Read 2008; Bijl et al. 2011). P is a major
nutrient required by plants for healthy growth and the second most important one after
nitrogen. Due to its low solubility and mobility in soil, only a small fraction of total soil P is
available to plants, thus making the plant-AM symbiosis to be of immense value for plant
growth especially during P deficiency (Smith et al. 2011; Rai et al. 2013). In nutrient deficient
soil, AM fungi by its ERM spread out over a larger surface area than the host roots, mine
7
more nutrients for the plant (Miransari 2010). And in soils with excess nutrients, plant-AM
symbiosis can enhance the plant tolerance and minimize negative effects of excess TE
(González-Guerrero et al. 2016). Although not completely understood, the mycorrhizal
mechanisms for this includes increased plant growth occasioned by a higher P supply
(Nogueira et al. 2004; Shen et al. 2006; Zhang et al. 2015), reduced root uptake and changes
in plant nutrition such as depressing root-to-shoot metal translocation via metal
immobilization in roots (Christie et al. 2004), enhanced production of antioxidants to
alleviate oxidative stress (Ruiz-Lozano 2003), and increased expression of metallothionein
genes to improve metal homeostasis and tolerance (Rivera-Becerril et al. 2005).
Reports of AM-induced depressions of host-plant growth (Johnson et al. 1997; Ryan
et al. 2005) had cast the plant-AM symbioses as spanning the mutualism – parasitism
continuum (Taiz and Zeiger 2010). While it may be conceived that sufficient nutrient
availability in rhizosphere minimizes the host dependency on mycorrhizae, the inhibition of
host growth by AM may not easily be attributed to extent of root colonization, P uptake or P
transporter gene expression (Grace et al. 2009). And host response may vary due to plant
species and stage of development, aside the levels of P fertilization (Li et al. 2005).
1.4 Rhizobial symbiosis
In plants, the major form of nitrogen nutrient taken up by the roots is nitrates (NO3-), and to
a lesser extent, NH4+. Via the sequential action of nitrate reductase (NR) and nitrite reductase
(NiR), nitrates are reduced in planta to NH4+ which is the final form of inorganic nitrogen
prior to the incorporation of nitrogen (assimilation) into organic compounds (Hodges 2002).
However, except for dinitrogen-fixing bacteria such as rhizobia which can inhabit the root
8
nodules of leguminous plants, and other prokaryotes such as Clostridium, Anabeana, and
Frankia, diatomic nitrogen (N2) which is the major form of atmospheric nitrogen can hardly
be utilized by most living organisms (Raven et al. 2005). The rod-shaped Gram-negative
rhizobia which inhabit the root nodules of legumes and carry out biological N2 fixation, are
the most popular PGPR (plant growth promoting rhizobacteria). Immensely important in the
cycling of nitrogen from the atmosphere to the biosphere, they include several genera such
as; Rhizobium with at least 34 species, Bradyrhizobium with 9 species, Mesorhizobium with
20 species, Phyllobacterium with 8 species, Azorhizobium with 2 species, and Sinorhizobium
(currently named Ensifer) with 12 species (http://www.bacterio.cict.fr; Mateos et al. 2011).
In biological N2 fixation during plant-rhizobium symbioses, the bacteria reduce N2 to
ammonia (NH3) via the catalytic action of nitrogenase enzyme complex in the nodules, while
the host provides a low oxygen abode and source of carbohydrates to the bacteroids.
N2 + 8e- +16 MgATP +8H+ → 2NH3 +H2 + 16 MgADP + Pi ……………………... (1).
Root nodule symbiosis is regarded to have evolved from an ancient AM symbiosis
due to the similarities between them in infection process and genetic and hormonal regulation
(Mukherjee and Ané 2011). In soybean, rhizobial infection is typically via the root hairs, as
bacteria trapped in root hair curls penetrate the host-plant tissue by local hydrolysis of cell
wall and invagination of the exposed cell membrane (Mateos et al. 2011). It is believed to be
initiated when rhizobia in the soil sense phytochemicals like flavonoids released by the
legume roots, which induces the expression of rhizobial nod genes and leads to the production
of proteins required for the synthesis and export of rhizobial “Nod factors” (NF) to the plant
root hairs. The NF is a lipooligosaccharide (β-1,4-linked N-acetyl-d-glucosamine backbone)
believed to be responsible for initiation of the cascade of events that characterize the early
9
nodulation process, such as root hair invagination, membrane depolarization, intracellular
calcium fluxes, and the root cortex cell division which establishes a nodule primordium
(Abd-Alla et al. 2014). ROS signaling is in play and there is a plant oxidative burst response
(like in a pathogen attack), but the microsymbiont is uninhibited and colonizes the roots
anyway. The entire unit consisting of individual bacterium and surrounding endocytic
membrane is called the symbiosome (Brewin 2004). In the symbiosis between
Bradyrhizobium diazoefficiens (formerly B. japonicum) and soybean, spherical (referred to
as determinate) nodules are formed which are mostly at the same developmental stage. Both
infected and non-infected plant cells are found in the nodule. Infected cells occupy the central
of nodule and each may contain up to 20,000 bacteroids in groups of 10-20 within each
symbiosome; although bacteroids are not in direct contact with the host cell cytoplasm
(Mateos et al. 2011). And leghemoglobin helps to maintain low O2 conditions favourable to
bacteroids metabolism. Although more popular in terms of N2 fixation, rhizobia are also
believed to play a role in plant TE homeostasis (González-Guerrero et al. 2016).
1.5 Justification of study
As the continued increase in the global human population necessitates improvements
in crop production, minimizing the financial and environmental costs of chemical fertilizer
application, as well as protecting plants in metal-contaminated soils, will become more
valuable in the decades ahead. Since many factors may contribute to the biomass response of
host-plants to inoculants, elucidating these factors underlying symbionts effectiveness is
crucial under normal and excess soil TE. Several reports indicate that due to synergic effects,
dual inoculation with AM fungi (AMF) and R improved host performance more than single
10
symbiont inoculations (Antunes et al. 2006; Chalk et al. 2006). But this is not always the case
in a dual inoculation (Brown and Bethlenfalvay 1987; Ray and Valsalakumar 2010). The
underlying synergistic responses during tripartite symbioses generally relate to microbe
identity, physiology, and fitness under the prevailing soil conditions, cultivar, plant nutrition,
gene expression, etc. (Miransari 2014). As these effects could be case-by-case (Gamalero et
al. 2009), the elucidation of synergisms in AMF-rhizobial partnerships help clarify the
mechanisms that underlie improved host bioproduction in an efficient dual inoculation.
Excess Zn may antagonize other essential TE and induce TE imbalance in plant
tissues (Van Assche and Clijsters 1990). The exploitation of bioinoculants to minimize Zn
accumulation in shoots in contaminated soils, as well as mitigate the impact of excess Zn on
the acquisition and distribution of other essential TE, is valuable for food quality and safety.
Compared to phosphorus and nitrogen, the understanding of the TE responses that underpin
host bioproduction in response to AM and R, is less clear (Chalk et al. 2006; Rai et al. 2013).
For although AM fungal effect on one TE may have specific consequences for the acquisition
and internal cycling of others, this has received little attention (Watts-Williams and
Cavagnaro 2014), as many study reports in contaminated soils have focused only on the
pollutant element. Zn, Fe, Mn and Cu are regarded as priority TE in terms of human and
animal dietary requirements (Lehman and Rillig 2015). Therefore, symbiont effects on the
acquisition and distribution of these elements in food crops is of interest in the study of soil-
plant-microbe interaction (Gamalero et al. 2009; Rengel 2015).
Legumes such as soybean (Glycine max (L.) Merr.) are an important source of protein
in the diet of millions of people across the globe. Soybean is a high-value crop with many
industrial applications in addition to its food and feed value (Raghuvanshi and Bisht 2010),
11
and is colonized by AM and R. On the other hand, tomato (Solanum lycopersicum L.) is a
widely-consumed vegetable colonized by AM. Produced in open fields as well as in
commercial greenhouses, its exposure to moderately elevated TE levels in soils and irrigation
water could be prevalent in certain areas (Gharaibeh et al. 2016). Both crops are therefore
attractive for elucidating dual and single inoculant effects that enhance plant performance
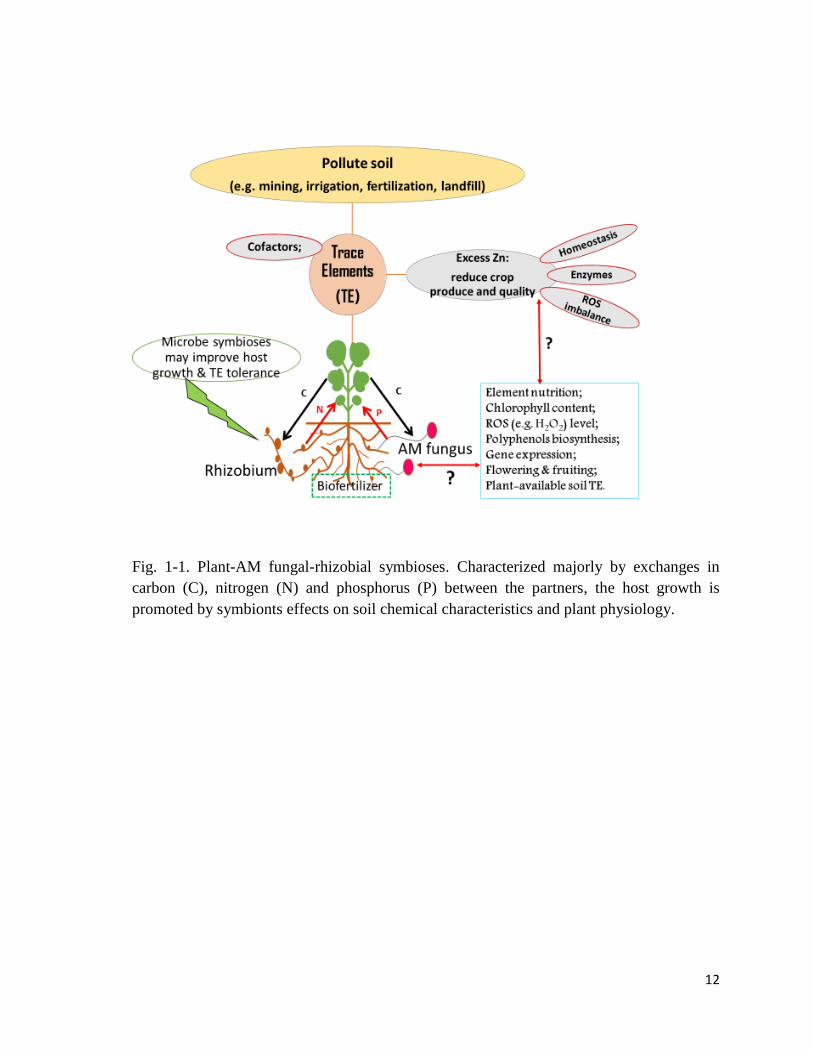
under normal and excess Zn conditions (Fig. 1-1).
1.6 Aim of study
To evaluate the effect of dual and single inoculation of rhizobia and AM fungi on soybean
and tomato under various soil zinc conditions. The scope of this study covers the following:
a. Plant growth and biomass production.
b. Symbionts colonization and effectiveness.
c. TE nutrition in soil and host tissues.
d. ROS (H2O2) levels and polyphenols production.
e. Type 1 metallothionein gene expression.
f. Synergisms between R and AM fungi in dual inoculation.
12
Fig. 1-1. Plant-AM fungal-rhizobial symbioses. Characterized majorly by exchanges in
carbon (C), nitrogen (N) and phosphorus (P) between the partners, the host growth is
promoted by symbionts effects on soil chemical characteristics and plant physiology.
13
CHAPTER TWO
Bradyrhizobia and arbuscular mycorrhizal fungi modulate manganese, iron,
phosphorus, and polyphenols in soybean (Glycine max (L.) Merr.) under excess
zinc
2.1 Introduction
Environmental entities such as heavy metals could be increased in parts of the ecosystem,
including agricultural soils utilized for farming activities (Nicholson et al. 2003). Metal
contamination of soils can occur naturally, or as a result of agricultural and industrial
activities (Christie et al. 2004; Gall et al. 2015). This situation has necessitated studies on
plant growth in such contaminated soils, generally considering aspects of crop physiology,
bioproduction, plant-microbe interactions, phytoremediation, etc. (Luo et al. 2016). Within
biosystems, metals are important for enzyme activity. Improved plant metal nutrient uptake
from the soil and distribution to seeds has therefore been considered a way of combating
nutrient deficiency in the diet (Grotz and Guerinot 2006; Vasconcelos et al. 2014). Despite
their biological significance, however, metals have been implicated in environmental toxicity
and could bear implications for food safety (Gall et al. 2015; Tόth et al. 2016). They could
also limit crop productivity due to their stressful effects on plants when at elevated levels in
the soil (Rout and Das 2003). The above stated facts contribute to make the metal content of
soils utilized in crop production generally an issue of interest.
Zinc (Zn) is an essential metal nutrient. Functioning as a cofactor in over 300 proteins,
it plays a prominent role in enzyme activity, and is a structural component of many proteins
14
(Palmgren et al. 2008). It is also important in the production of auxin in plants. Soil Zn is
mostly mobile and available to plants in the form of soluble free and complex ions such as
Zn2+, ZnHCO3+, Zn(OH)3
-, etc. (Kabata-Pendias and Sadurski 2004). Hydrated Zn and Zn2+
have being pointed out to be the predominant forms of Zn taken up by the roots (Kabata-
Pendias 2011), while Zn fractions associated with Fe and Mn oxides are likely to be the most
available to plants (Norrish 1975; cited by Kabata-Pendias 2011, p280). Zn contamination
was reported as reaching levels potentially toxic for plants and animals in some soils (Lado
et al. 2008). Being one of the most widespread metals in organic soil conditioners (Pinamonti
et al. 1997), it could become elevated in agricultural soils. In farm soils, for instance, it
accumulates due to long term application of pig farmyard manure (Ogiyama et al. 2005;
Ogiyama et al. 2010). While Zn deficiency reduces plant growth due to lowered auxin
production, excess Zn in the soil induces stress in plants; causing reduced root and shoot
growth, curling of young leaves, death of leaf tips, leaf chlorosis, reduced photosynthesis,
etc. (Rout and Das 2003; Shi et al. 2015).
Soybean (Glycine max (L.) Merr.) is involved in tripartite symbioses with dinitrogen
(N2) fixing bacteria and arbuscular mycorrhizal fungi. The symbioses which is under
autoregulation, is thought possible to improve plant growth, pathogen defense, as well as
heavy metal tolerance (Al-Garni et al. 2006; Sakamoto et al. 2013a). While rhizobial N2
fixation improves nitrogen (N) nutrition, AM fungi improve the phosphorus supply to the
plant, while obtaining plant photosynthates in exchange (Farzaneh et al. 2009; Smith and
Read 2008). In legumes, dual inoculation with AMF and rhizobia could improve plant
performance more than single AMF inoculation, due to AMF-rhizobia synergism (Antunes
et al. 2006; Bhattacharjee and Sharma 2012; Chalk et al. 2006; de Varennes and Goss 2007;
15
Guo et al. 2010). While some symbiont strategies such as improvement of antioxidants (Kang
et al. 2015), excess Zn metal immobilization (Christie et al. 2004), and improvement of P
and N supply to the host plant have been widely reported (Gamalero et al. 2009; Zhang et al.
2015), a more complete understanding of the mechanisms involved in the soil-plant-microbe
interaction is yet needed (Chalk et al. 2006; Gamalero et al. 2009; Rengel 2015). In this
regard, an outlook on symbiont ionome responses could be insightful (Ramos et al. 2011), in
case by case, as well as general. In soils moderately polluted with Zn, AMF may improve the
balance of mineral nutrition of trace elements in plants (Christie et al. 2004). However,
clarifications between single and dual symbionts modulation of Zn, Fe, and Mn homeostasis,
in response to excess Zn, is not widely reported within the context of AMF-rhizobia
synergism. The mechanisms of Zn toxicity include ROS imbalance (Petrov et al. 2015; Shi
et al. 2015), as well as disruptions in metal homeostasis in the plant ionome - such as the
inhibition of Fe translocation in soybean due to excess Zn (Ambler et al. 1970; Silva et al.
2014). While Fe homeostasis has been related to the varied Zn tolerance of Arabidopsis
halleri (Zn hyperaccumulator) and Arabidopsis thaliana (non hyperaccumulator)
(Shanmugam et al. 2011), Zn2+ was earlier reported capable of displacing other divalent
cations such as iron (Fe2+) and manganese (Mn2+) within plants, when in excess (Van Assche
and Clijsters 1990). This study focused on the effects of single and dual AM fungal and
rhizobial symbiont(s) on Zn, Fe, Mn, P and polyphenols in soybean under normal and excess
soil Zn.
16
2.2 Materials and methods
2.2.1 Soil
The soil utilized for the study was a mix of river sand and loam soil in the ratio of 2:1
respectively. Bulk river sand was sieved using a lab mesh (2mm) prior to mixing.
Characteristics of the soil mix were determined to be: pH (6.13 ± 0.87); Electrical
conductivity (3.25 ± 0.57 mS m-1); Fe (8.87 ± 1.35 µg g-1); Cu (0.007 ± 0.04 µg g-1); Zn (not
determined); Mn (3.75 ± 1.52 µg g-1). The above stated baseline plant-available element
determinations were done on unpolluted, unfertilized, unplanted soil mix using
diethylenetriamine pentaacetic acid (DTPA) extracts according to Lindsay and Norvell
(1978). 10 g of soil was extracted using 20 mL of 0.005 mol L-1 DTPA solution (pH 7.3) in
Erlenmeyer flasks placed upright in a shaker (TAITEC NR-3, Japan) at 180 rpm for 2 hrs.
2.2.2 Zinc addition
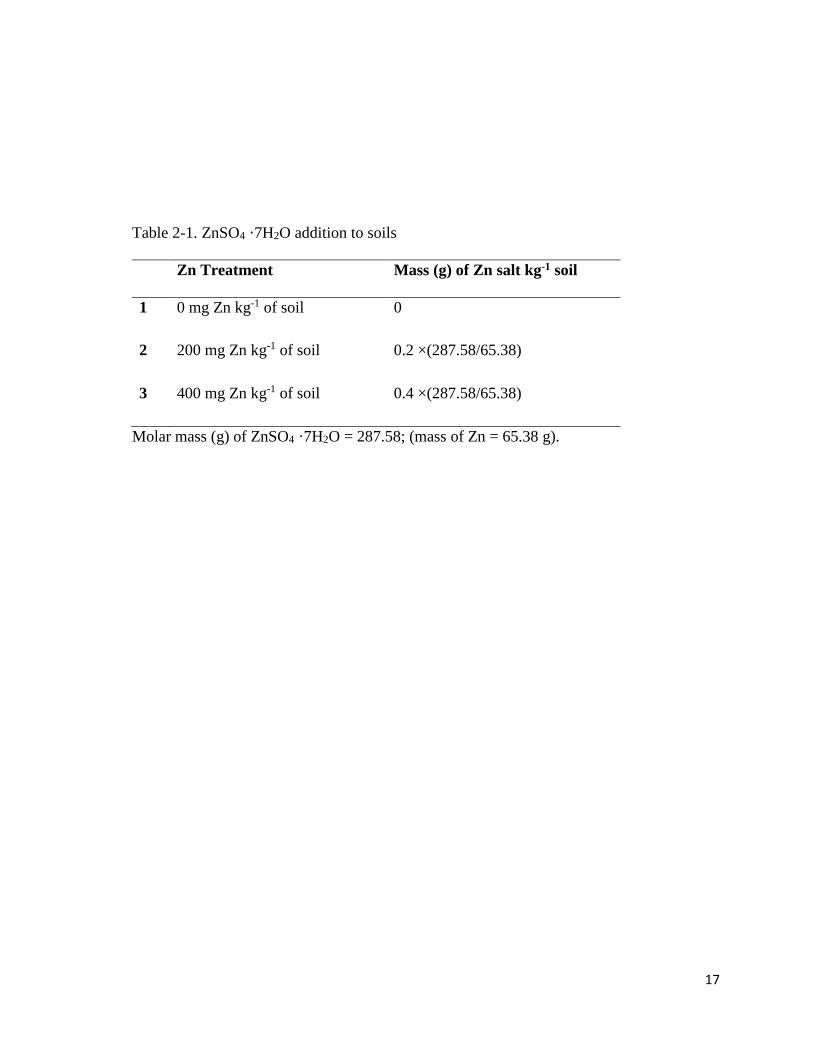
ZnSO4 ·7H2O was artificially applied to the soil at the rate of 0 mg Zn kg-1 of soil, 200 mg
Zn kg-1 of soil (EU Zn threshold), and 400 mg Zn kg-1 of soil (excess) (Table 2-1). Zn salt
was first dissolved in distilled water then applied with mixing to the soil. All soils after
mixing were bulked and autoclaved to kill off indigent microbes. According to Yanai et al.
(2011) aging effect on Zn in soil is almost negligible (<3%) from 4 weeks after contamination.
Therefore, the Zn contaminated soils were stored in non-transparent bags for a month in the
lab. Soils were amended with dolomite (Ca: 278.7, Mg: 96.5 mg pot-1) after which they were
placed in labelled plastic buckets in green house for seed sowing.
17
Table 2-1. ZnSO4 ·7H2O addition to soils
Zn Treatment Mass (g) of Zn salt kg-1 soil
1 0 mg Zn kg-1 of soil 0
2 200 mg Zn kg-1 of soil 0.2 ×(287.58/65.38)
3 400 mg Zn kg-1 of soil 0.4 ×(287.58/65.38)
Molar mass (g) of ZnSO4 ·7H2O = 287.58; (mass of Zn = 65.38 g).
18
2.2.3 Seeds
The soybean, Glycine max (L.) Merr. (cv. Enrei), was used in this study. Seeds were sterilized
in 70% ethanol and 10% H2O2 solution and rinsed in distilled water. Any floating seeds were
discarded. The seeds were germinated on wet filter paper in petri dishes for 72 hr. Seeds with
protruding radicles were then randomly selected and sowed in the soil (four seeds pot-1, later
thinned to one) and kept in the greenhouse, while non-germinated seeds were discarded.
2.2.4 Symbiont inoculations
The bioinoculants used were; arbuscular mycorrhizal (AM) fungi, Gigaspora rosea Nicolson
and Schenck, MAFF520062 (Ministry of Agriculture, Forestry and Fisheries of Japan), and,
rhizobium bacteria, Bradyrhizobium diazoefficiens USDA 110 (USDA Rhizobium culture
collection). The bioinoculants were used singly - rhizobium alone (R); AM fungus alone
(AM); and in combination – rhizobium + AM fungus (RAM). A group of uninoculated
control (C) was maintained. AMF inoculum consisted of soil bearing spores of Gigaspora
rosea applied manually in the middle of soil in bucket, just prior to seed sowing. 10.2 g of
inoculum (with average spore number of 200) was applied per pot. For rhizobium,
Bradyrhizobium diazoefficiens obtained from a pure stock was first preincubated (28 °C) for
1 week using yeast maltose agar (YMA) (Table 2-2), then sub-cultured subsequently in yeast
maltose broth (YMB) (Table 2-3) in a slanted position in a bioshaker (TAITEC BR-23FP,
Japan) (160 rpm, 30°C) for 1 week. The volume of broth was adjusted with sterile distilled
water as needed to obtain average rhizobial cell concentration of 2.5 × 10⁷ cells mL-1. This
was then used for rhizobial inoculation at the rate of 1 mL seed-1 at time of sowing.
19
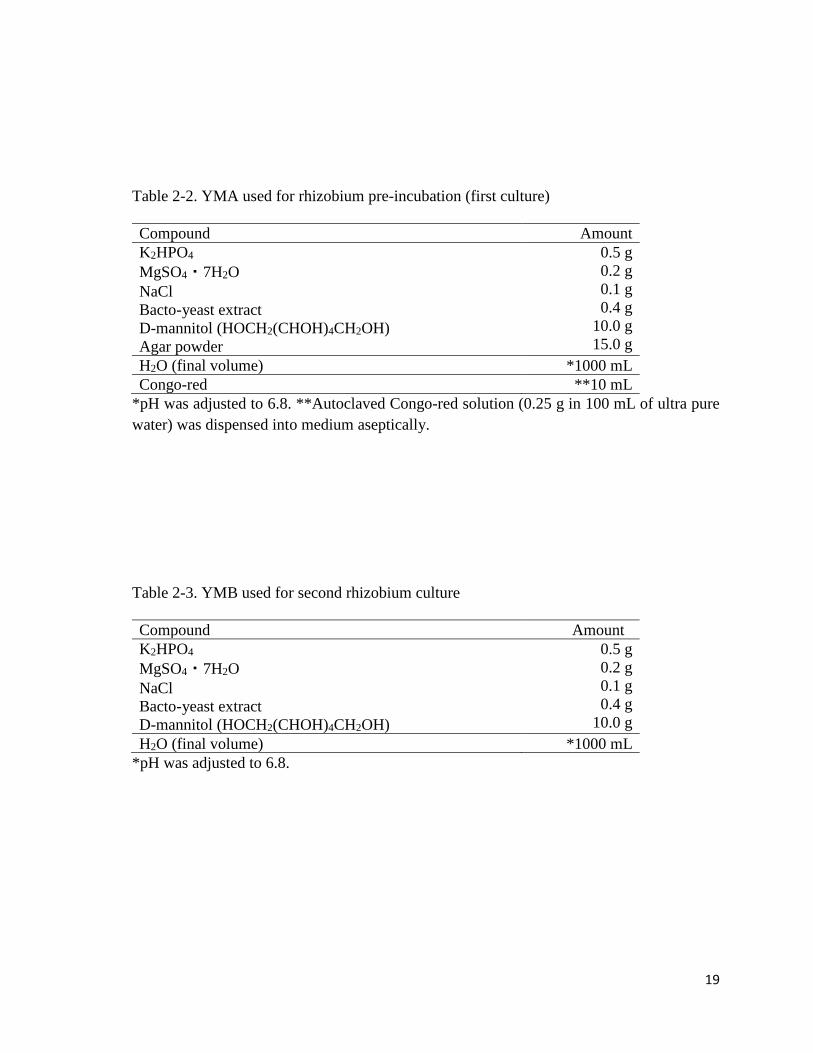
Table 2-2. YMA used for rhizobium pre-incubation (first culture)
Compound Amount
K2HPO4
MgSO4・7H2O
NaCl
Bacto-yeast extract
D-mannitol (HOCH2(CHOH)4CH2OH)
Agar powder
0.5 g
0.2 g
0.1 g
0.4 g
10.0 g
15.0 g
H2O (final volume) *1000 mL
Congo-red **10 mL
*pH was adjusted to 6.8. **Autoclaved Congo-red solution (0.25 g in 100 mL of ultra pure
water) was dispensed into medium aseptically.
Table 2-3. YMB used for second rhizobium culture
Compound Amount
K2HPO4
MgSO4・7H2O
NaCl
Bacto-yeast extract
D-mannitol (HOCH2(CHOH)4CH2OH)
0.5 g
0.2 g
0.1 g
0.4 g
10.0 g
H2O (final volume) *1000 mL
*pH was adjusted to 6.8.
20
2.2.5 Experimental setup and pot fertilizations
The experiment was set up as a 3×4 factorial in a completely randomized design. Factor 1
was the Zn application rate: 0 mg of Zn kg-1 of soil (Zn0), 200 mg of Zn kg-1 of soil (Zn200),
and 400 mg of Zn kg-1 of soil (Zn400); while Factor 2 was the inoculations (C, R, AM, and
RAM). Each treatment was replicated 7 times giving a total of 84 experimental pots (Table
2-4). To mitigate Zn deficiency in Zn0 soils, as well as other micronutrient deficiencies
across board, all soils were initially supplied with nutrients (ZnSO4.7H2O: 50, MnSO4.5H2O:
286, CuSO4.5H2O: 50, CoCl2.6H2O: 6; mg pot-1, Fe-EDTA.3H2O: 8.78 g pot-1) via liquid
fertilizer solution (Table 2-5). All pots were also supplied initially with basic NPK fertilizer
(N: 29.9, P: 21.7; K: 49.7 mg pot-1), and additional N fertilizer (34.9 mg pot-1) at 4 and 7
weeks after sowing. All plants were routinely supplied with borehole water and maintained
in the greenhouse of Graduate School of Horticulture, Chiba University, Japan.
2.2.6 Plant harvest
At nine weeks after sowing, five plants (n=5) were randomly chosen for further analysis.
Plants were wholly harvested by carefully emptying the soil from the pots, breaking apart
loosely attached soil, and washing with water to rid the roots of all soil particles. The whole
plant was then cut into roots and shoots, weighed fresh, and processed for further
determinations. This processing included drying in the oven at 80 °C for 48 hr.
21
Table 2-4. Two-factor treatment combination
Zn treatment Inoculation
Zn0 (0 mg Zn kg-1 soil) C (Control)
Zn200 (200 mg Zn kg-1 soil) R (Rhizobium)
Zn400 (400 mg Zn kg-1 soil) AM (AM fungus)
RAM (Rhizobium + AM fungus)
Table 2-5. Preparation of liquid fertilizer solution
Solution Compound gL-1
A:
KH2PO4
K2SO4
95.5
49.6
B: CaCl2・2H2O 262.0
C: MgSO4・7H2O 245.0
D: Fe-EDTA・3H2O 43.9
E: MnSO4・5H2O
ZnSO4・7H2O
Cu2SO4・5H2O
H3BO3
Na2MoO4・2H2O
CoCl2・6H2O
1.43
0.25
0.25
0.25
0.06
0.03
F: NH4NO3 57.0
To make: Add 5 mL of solutions A-E, and 7.5 mL of solution F, make up to 1000 mL with
distilled water (adjust final pH to 6.5), and applied at 200 mL pot-1.
22
2.2.7 Plant growth parameters
Plant height and biomass, days to flowering, days to fruiting, cumulative number of fallen
leaves, and leaf greenness (SPAD values) (SPAD 502 Plus Chlorophyll Meter, Konica
Minolta, Japan) were determined.
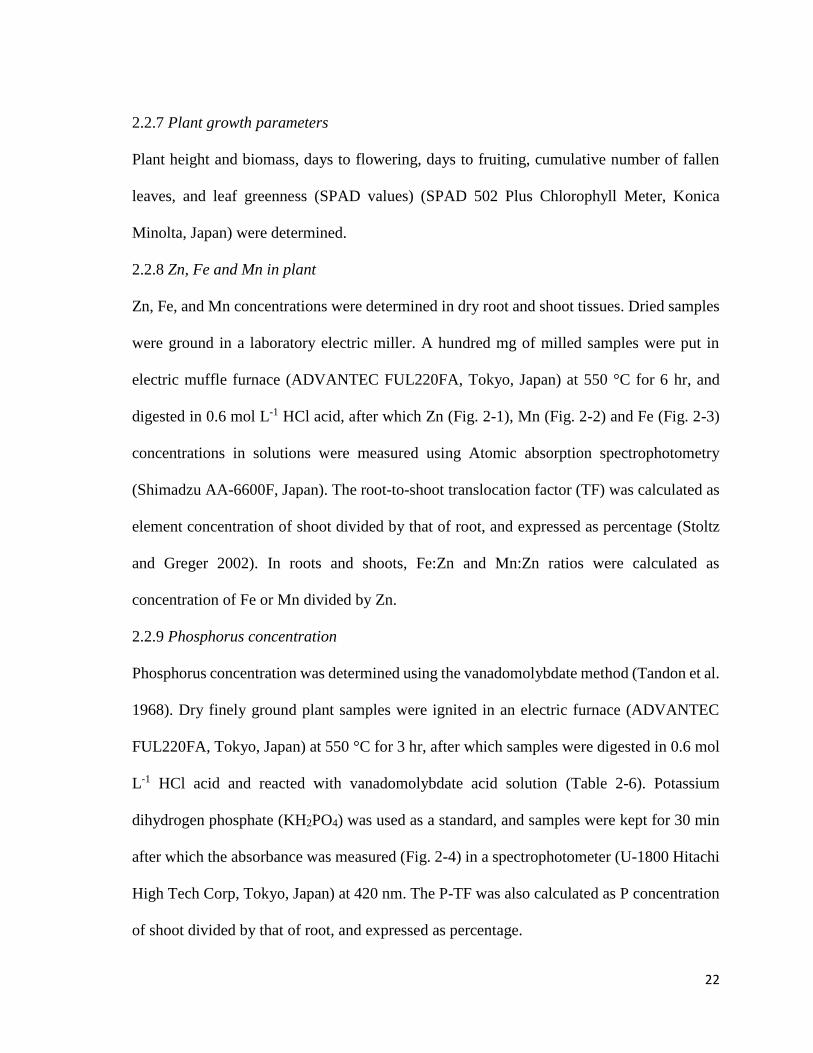
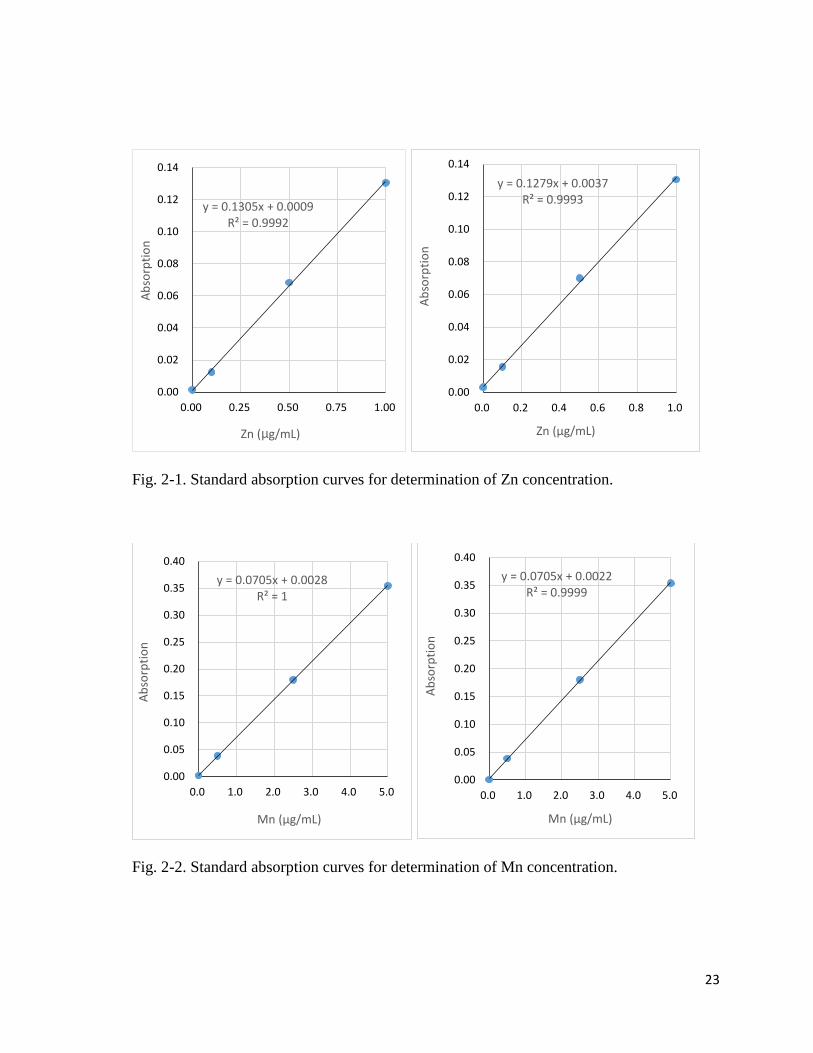
2.2.8 Zn, Fe and Mn in plant
Zn, Fe, and Mn concentrations were determined in dry root and shoot tissues. Dried samples
were ground in a laboratory electric miller. A hundred mg of milled samples were put in
electric muffle furnace (ADVANTEC FUL220FA, Tokyo, Japan) at 550 °C for 6 hr, and
digested in 0.6 mol L-1 HCl acid, after which Zn (Fig. 2-1), Mn (Fig. 2-2) and Fe (Fig. 2-3)
concentrations in solutions were measured using Atomic absorption spectrophotometry
(Shimadzu AA-6600F, Japan). The root-to-shoot translocation factor (TF) was calculated as
element concentration of shoot divided by that of root, and expressed as percentage (Stoltz
and Greger 2002). In roots and shoots, Fe:Zn and Mn:Zn ratios were calculated as
concentration of Fe or Mn divided by Zn.
2.2.9 Phosphorus concentration
Phosphorus concentration was determined using the vanadomolybdate method (Tandon et al.
1968). Dry finely ground plant samples were ignited in an electric furnace (ADVANTEC
FUL220FA, Tokyo, Japan) at 550 °C for 3 hr, after which samples were digested in 0.6 mol
L-1 HCl acid and reacted with vanadomolybdate acid solution (Table 2-6). Potassium
dihydrogen phosphate (KH2PO4) was used as a standard, and samples were kept for 30 min
after which the absorbance was measured (Fig. 2-4) in a spectrophotometer (U-1800 Hitachi
High Tech Corp, Tokyo, Japan) at 420 nm. The P-TF was also calculated as P concentration
of shoot divided by that of root, and expressed as percentage.
23
Fig. 2-1. Standard absorption curves for determination of Zn concentration.
Fig. 2-2. Standard absorption curves for determination of Mn concentration.
y = 0.1305x + 0.0009R² = 0.9992
0.00
0.02
0.04
0.06
0.08
0.10
0.12
0.14
0.00 0.25 0.50 0.75 1.00
Ab
sorp
tio
n
Zn (µg/mL)
y = 0.1279x + 0.0037R² = 0.9993
0.00
0.02
0.04
0.06
0.08
0.10
0.12
0.14
0.0 0.2 0.4 0.6 0.8 1.0
Ab
sorp
tio
nZn (µg/mL)
y = 0.0705x + 0.0028R² = 1
0.00
0.05
0.10
0.15
0.20
0.25
0.30
0.35
0.40
0.0 1.0 2.0 3.0 4.0 5.0
Ab
sorp
tio
n
Mn (µg/mL)
y = 0.0705x + 0.0022R² = 0.9999
0.00
0.05
0.10
0.15
0.20
0.25
0.30
0.35
0.40
0.0 1.0 2.0 3.0 4.0 5.0
Ab
sorp
tio
n
Mn (µg/mL)
24
Fig. 2-3. Standard absorption curve for determination of Fe concentration.
Fig. 2-4. Standard absorbance curve for determination of phosphorus concentration.
y = 0.0229x + 0.0022R² = 0.9796
0.00
0.01
0.01
0.02
0.02
0.03
0.03
0.0 0.2 0.4 0.6 0.8 1.0
Ab
sorp
tio
n
Fe (µg/mL)
y = 0.0592x + 0.0025
R² = 0.9994
0
0.01
0.02
0.03
0.04
0.05
0.06
0.07
0 0.2 0.4 0.6 0.8 1
Abso
rbance
(420 n
m)
mg P/L
25
2.2.10 Polyphenol content
Total polyphenols in root samples was determined via the Folin-Ciocalteu method (Amerine
and Ough 1980). Fresh root samples wrapped in foil were ground in liquid nitrogen using a
mortar and pestle, and then extracted in 70 % acetone. Chlorogenic acid was used as the
standard. 2.5mL of 10-fold diluted Folin-Ciocalteu solution was added to the solutions, and
after 2 mins, 2.0mL of NaCO3 solution (75 gL-1) was added. Absorbance was measured (Fig.
2-3) in a spectrophotometer at 760 nm.
2.2.11 H2O2 estimation
Root H2O2 was determined using the 3, 3’-diaminobenzidine (DAB) staining procedure
described by Fester and Hause (2005). Sections of fresh roots were immersed in DAB
solution (Table 2-7) for 1 hr at room temperature, and transferred to 10% lactic acid solution
in petri dishes. Photos of five sections per sample were captured in a light microscope (Nikon
ECLIPSE 50i, Nikon, Japan), and DAB staining intensity quantified using ImageJ software
(Royo et al. 2015).
2.2.12 Symbiont colonization
Symbiont colonization parameters were assessed in all plants. However, roots of C plants
had neither mycorrhization nor nodules. R and AM plants were devoid of AM fungal
colonization, and nodules, respectively. Root nodules (R and RAM) were removed from
roots, counted and weighed. Mycorrhizal colonization was determined in roots using the
trypan blue staining technique previously described by Rajapakse and Miller (1994).
26
Fig. 2-5. Standard absorbance curves for determination of polyphenol concentration.
y = 12.489x + 0.1823R² = 0.9891
0.0
0.2
0.4
0.6
0.8
1.0
1.2
1.4
1.6
0 0.025 0.05 0.075 0.1
Ab
sorb
ance
(7
60
nm
)
Total polyphenols (mg/mL)
y = 13.069x + 0.3317R² = 0.9866
0.0
0.2
0.4
0.6
0.8
1.0
1.2
1.4
1.6
1.8
0 0.025 0.05 0.075 0.1
Ab
sorb
ance
(7
60
nm
)
Total polyphenols (mg/mL)
y = 17.398x + 0.2103R² = 0.994
0.0
0.5
1.0
1.5
2.0
2.5
0 0.025 0.05 0.075 0.1
Ab
sorb
ance
(7
60
nm
)
Total polyphenols (mg/mL)
y = 16.307x + 0.3003R² = 0.988
0.0
0.5
1.0
1.5
2.0
2.5
0 0.025 0.05 0.075 0.1
Ab
sorb
ance
(7
60
nm
)
Total polyphenols (mg/mL)
27
Table 2-6. Vanadomolybdate acid solution
Compound Amount
Conc. HNO3 : Water (1:2 v/v)
5% Ammonium molybdate (NH4)6MO7O24.4H2O solution
(25g in 500mL of water at 60°C)
0.25% Ammonium metavanadate NH4VO3 solution*
(2.5g in 500mL of water at 90 °C)
200 mL
200 mL
200 mL
Final volume (1:1:1 v/v/v) 600 mL
*Dissolve in 100 mL hot water, add 10 ml of HNO3, then make up volume with water.
Table 2-7. DAB solution
Compound Amount
DAB tablets (WAKO 049-22831)
(10 mg per tablet)
15
H2O (final volume) *150 mL
*Protect solution from sunlight and keep at 4 °C.
28
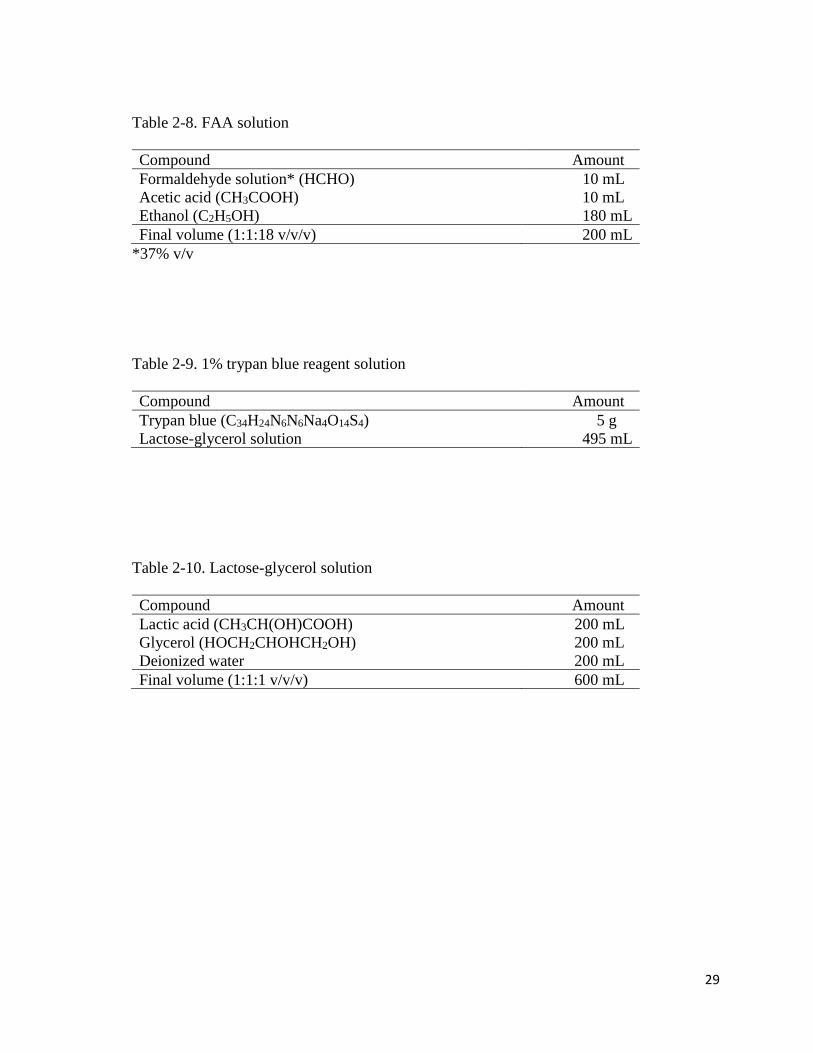
Root sections for estimation of mycorrhization were first put in FAA (formaldehyde/glacial
acetic acid/alcohol) solution (Table 2-8) for 1 week, then rinsed in distilled water and
transferred into a supersonic wave bath (AS ONE, China) for 15 mins at 25 °C. Roots were
then heated (180 °C) in 10 % potassium hydroxide solution for 60 mins, allowed to cool,
and heated (180 °C) in 1 % trypan blue solution (Table 2-9) for 15 mins, then finally stored
(immersed) in lactose-glycerol solution (Table 2-10) for 1 week. Roots sections of
approximately 1 cm (n=30) were mounted on a microscope slide and observed under ×10
lens. Scoring for degree of mycorrhization was according to Trouvelot et al. (1986), and
mycorrhizal indices were determined using “Mycocalc.exe” software.
2.2.13 Statistical analysis
Data collected were processed statistically by two-way analysis of variance (ANOVA).
Significance levels (P values) were taken at P<0.05, and differences between treatment group
means judged on the basis of Tukey-Kramer Tests.
29
Table 2-8. FAA solution
Compound Amount
Formaldehyde solution* (HCHO)
Acetic acid (CH3COOH)
Ethanol (C2H5OH)
10 mL
10 mL
180 mL
Final volume (1:1:18 v/v/v) 200 mL
*37% v/v
Table 2-9. 1% trypan blue reagent solution
Compound Amount
Trypan blue (C34H24N6N6Na4O14S4)
Lactose-glycerol solution
5 g
495 mL
Table 2-10. Lactose-glycerol solution
Compound Amount
Lactic acid (CH3CH(OH)COOH)
Glycerol (HOCH2CHOHCH2OH)
Deionized water
200 mL
200 mL
200 mL
Final volume (1:1:1 v/v/v) 600 mL
30
2.3 Results
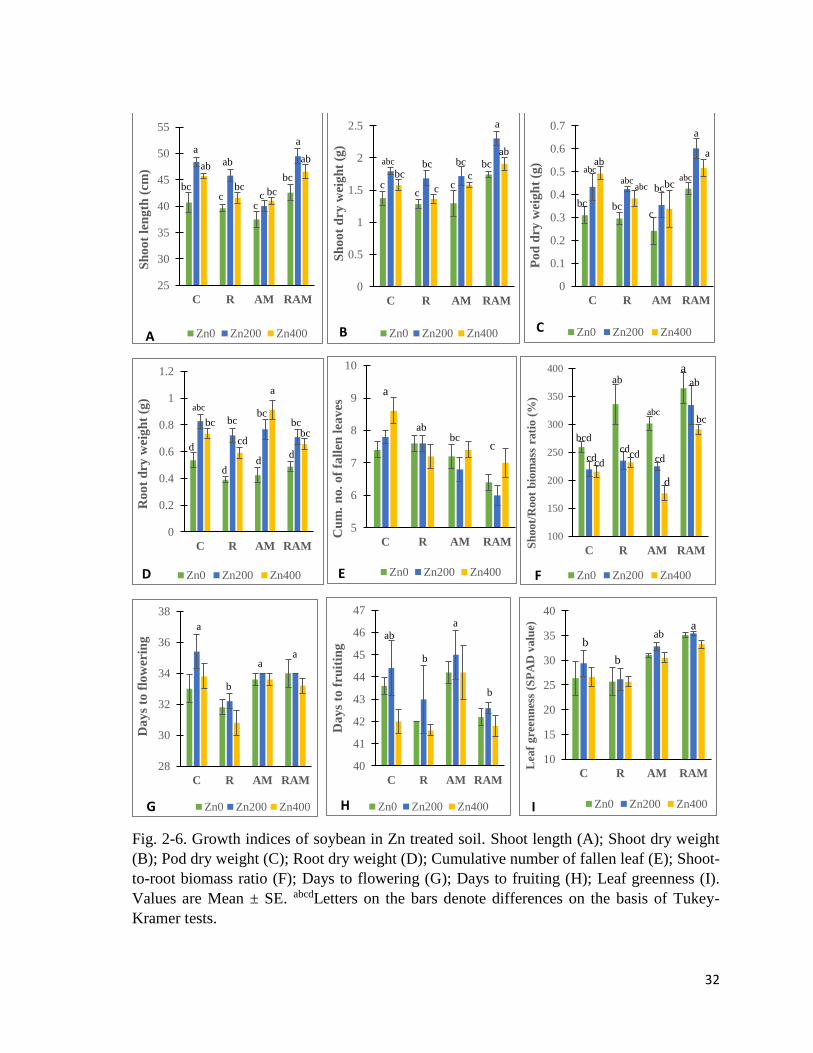
2.3.1 Plant growth indices
Shoot length
Significant differences due to experimental treatments (Table 2-11) were observed in shoot
length (Fig. 2-6 A). Generally, AM plants had the shortest shoots, while Zn200 plants had
the tallest – except in AM series where Zn400 plants were taller than Zn0 and Zn200.
Dry weights
Shoot (Fig. 2-6B), pod (Fig. 2-6C), and root (Fig. 2-6D) dry weights showed significant
differences due to experimental treatments. RAM plants had higher shoot and pod dry weight
than others, especially in RAM-Zn200. Roots dry weight was highest in AM-Zn400 plants,
and lowest in R-Zn0 plants. Overall, dry weights were generally higher in Zn200 plants.
Cumulative number of fallen leaves
Cumulative number of fallen leaves (Fig. 2-6E) showed significant differences due to the
inoculation treatment (Table 2-11). RAM plants had the lowest cumulative number of fallen
leaves, especially in RAM-Zn200, while C plants (especially C-Zn400), had the highest
cumulative number of fallen leaves.
Shoot-to-root biomass ratio
Shoot-to-root biomass ratio (Fig. 2-6F) showed significant differences between the
experimental treatments. RAM plants had higher shoot-to-root biomass ratio than other
inoculation groups, while Zn treatment reduced shoot-to-root biomass ratio.
31
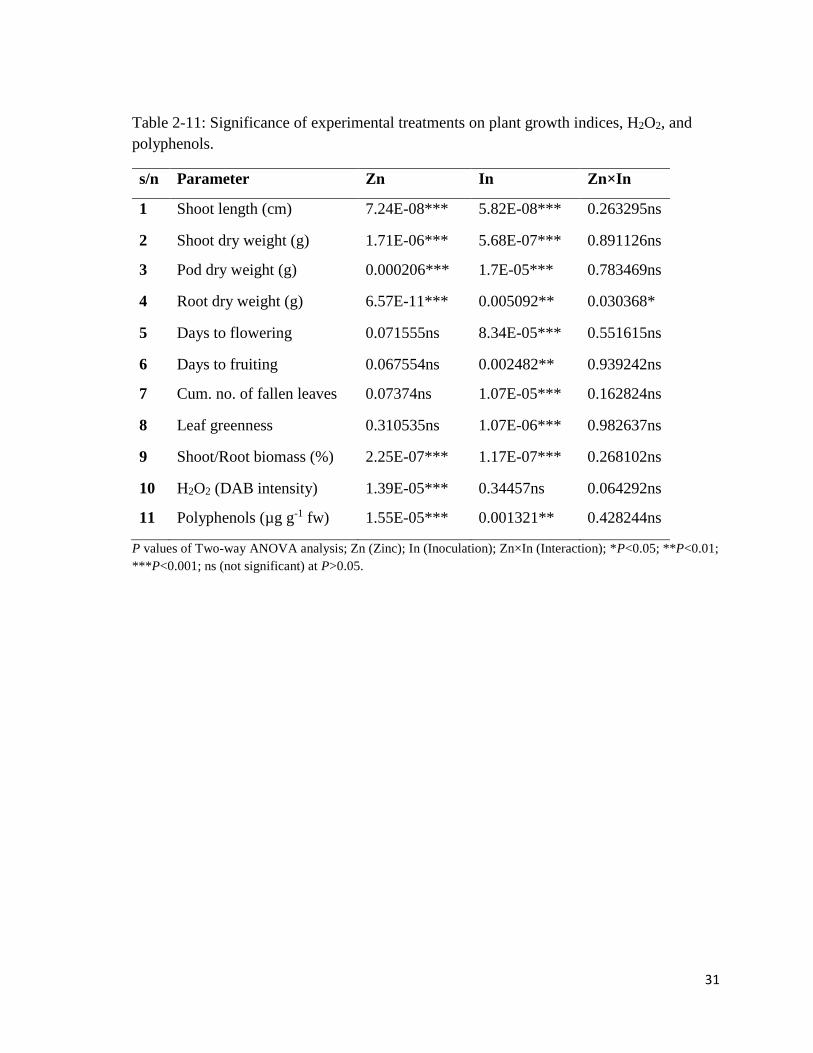
Table 2-11: Significance of experimental treatments on plant growth indices, H2O2, and
polyphenols.
s/n Parameter Zn In Zn×In
1 Shoot length (cm) 7.24E-08*** 5.82E-08*** 0.263295ns
2 Shoot dry weight (g) 1.71E-06*** 5.68E-07*** 0.891126ns
3 Pod dry weight (g) 0.000206*** 1.7E-05*** 0.783469ns
4 Root dry weight (g) 6.57E-11*** 0.005092** 0.030368*
5 Days to flowering 0.071555ns 8.34E-05*** 0.551615ns
6 Days to fruiting 0.067554ns 0.002482** 0.939242ns
7 Cum. no. of fallen leaves 0.07374ns 1.07E-05*** 0.162824ns
8 Leaf greenness 0.310535ns 1.07E-06*** 0.982637ns
9 Shoot/Root biomass (%) 2.25E-07*** 1.17E-07*** 0.268102ns
10 H2O2 (DAB intensity) 1.39E-05*** 0.34457ns 0.064292ns
11 Polyphenols (µg g-1 fw) 1.55E-05*** 0.001321** 0.428244ns
P values of Two-way ANOVA analysis; Zn (Zinc); In (Inoculation); Zn×In (Interaction); *P<0.05; **P<0.01;
***P<0.001; ns (not significant) at P>0.05.
32
Fig. 2-6. Growth indices of soybean in Zn treated soil. Shoot length (A); Shoot dry weight
(B); Pod dry weight (C); Root dry weight (D); Cumulative number of fallen leaf (E); Shoot-
to-root biomass ratio (F); Days to flowering (G); Days to fruiting (H); Leaf greenness (I).
Values are Mean ± SE. abcdLetters on the bars denote differences on the basis of Tukey-
Kramer tests.
25
30
35
40
45
50
55
C R AM RAM
Sh
oo
t le
ng
th (
cm)
Zn0 Zn200 Zn400A
bc
a
ab
c
ab
bcc
c
bc
bc
a
ab
0
0.5
1
1.5
2
2.5
C R AM RAM
Sh
oo
t d
ry w
eig
ht
(g)
Zn0 Zn200 Zn400B
abc
bcc cc
bc
c
bc
cbc
a
ab
0
0.1
0.2
0.3
0.4
0.5
0.6
0.7
C R AM RAM
Po
d d
ry w
eig
ht
(g)
Zn0 Zn200 Zn400C
a
a
abc
ababc
bc bc
abcabc
c
bcbc
0
0.2
0.4
0.6
0.8
1
1.2
C R AM RAM
Ro
ot
dry
wei
gh
t (g
)
Zn0 Zn200 Zn400D
dd
d
d
abc
bc bc
cd
bc
a
bcbc
5
6
7
8
9
10
C R AM RAM
Cu
m.
no
. o
f fa
llen
lea
ves
Zn0 Zn200 Zn400E
a
abbc
c
100
150
200
250
300
350
400
C R AM RAM
Sh
oot/
Root
bio
mass
rati
o (
%)
Zn0 Zn200 Zn400F
a
abab
bcabc
bcd
cdcdcd
cdcd
d
28
30
32
34
36
38
C R AM RAM
Da
ys
to f
low
erin
g
Zn0 Zn200 Zn400G
aa
a
b
40
41
42
43
44
45
46
47
C R AM RAM
Da
ys
to f
ruit
ing
Zn0 Zn200 Zn400H
a
b
b
ab
10
15
20
25
30
35
40
C R AM RAM
Lea
f g
reen
nes
s (S
PA
D v
alu
e)
Zn0 Zn200 Zn400I
aab
b
b
33
Days to flowering and fruiting
Days to flowering (Fig. 2-6G), and days to fruiting (Fig. 2-6H) showed significant differences
due to inoculation treatment (Table 2-11). R plants had the shortest days to flowering, while
C, AM and RAM were not different. AM and RAM plants had similar days to flowering. R
and RAM plants had the shortest days to fruiting, while AM plants had longest days to
fruiting.
2.3.2 Leaf greenness (SPAD)
Leaf greenness (Fig. 2-6I) showed significant differences between the inoculation treatments
(Table 2-11). RAM plants had higher SPAD values than R and C plants. AM plants had
insignificantly lower values than RAM.
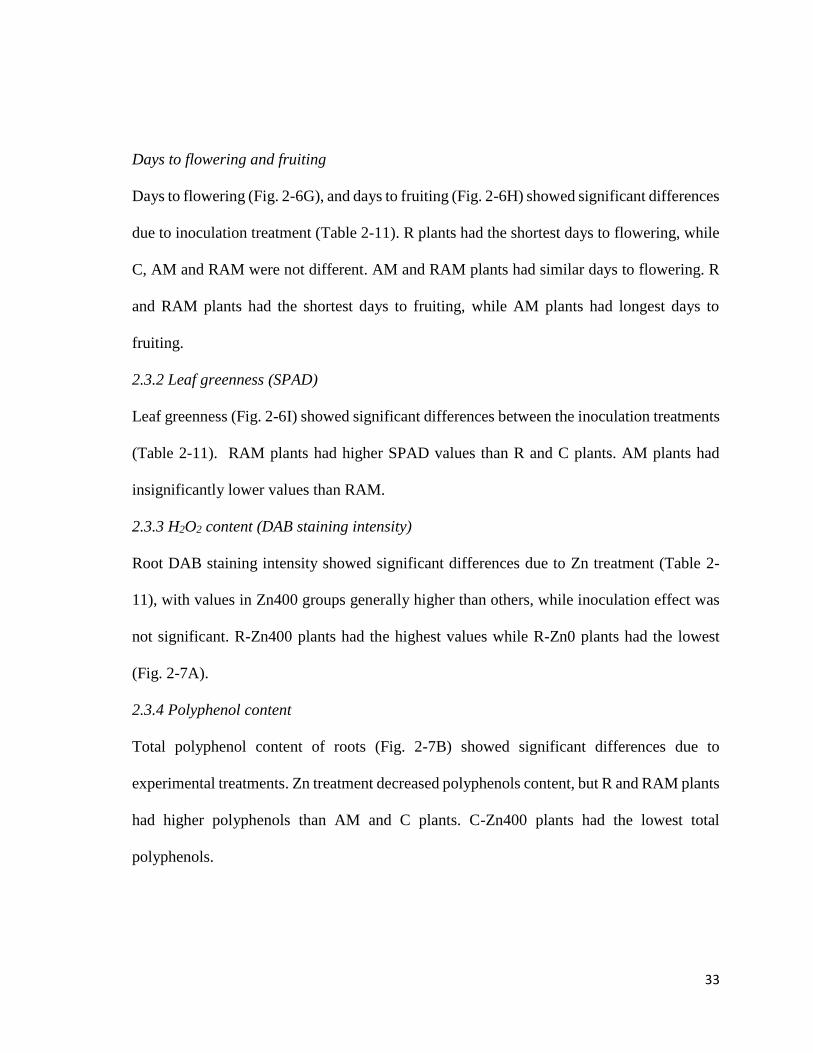
2.3.3 H2O2 content (DAB staining intensity)
Root DAB staining intensity showed significant differences due to Zn treatment (Table 2-
11), with values in Zn400 groups generally higher than others, while inoculation effect was
not significant. R-Zn400 plants had the highest values while R-Zn0 plants had the lowest
(Fig. 2-7A).
2.3.4 Polyphenol content
Total polyphenol content of roots (Fig. 2-7B) showed significant differences due to
experimental treatments. Zn treatment decreased polyphenols content, but R and RAM plants
had higher polyphenols than AM and C plants. C-Zn400 plants had the lowest total
polyphenols.
34
Fig. 2-7. DAB staining intensity of root (A); Total polyphenols in root (B) of soybean. Values
are Mean ± SE. C (uninoculated control); R (Rhizobium only); AM (AM fungus only); RAM
(Rhizobium + AM fungus). abcLetters on the bars denote differences on the basis of Tukey-
Kramer tests.
80
90
100
110
120
130
140
150
C R AM RAM
DA
B i
nte
nsi
ty
Zn0 Zn200 Zn400A
b
abab
b
b
a
bab
abab
ab
a
0
0.5
1
1.5
2
2.5
3
3.5
C R AM RAM
Tota
l p
oly
ph
enols
(µ
g g
-1fr
esh
wt)
Zn0 Zn200 Zn400B
a
a
ab
abc
abc
abc
bcbcbc
abcabc
c
35
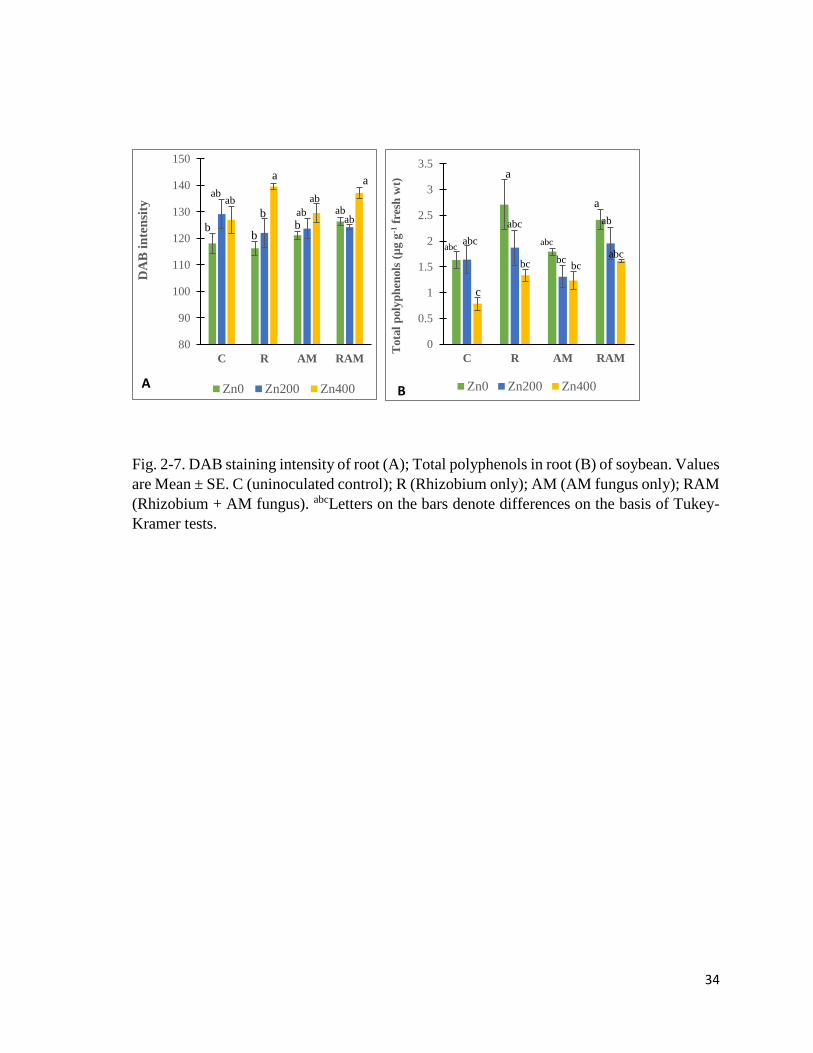
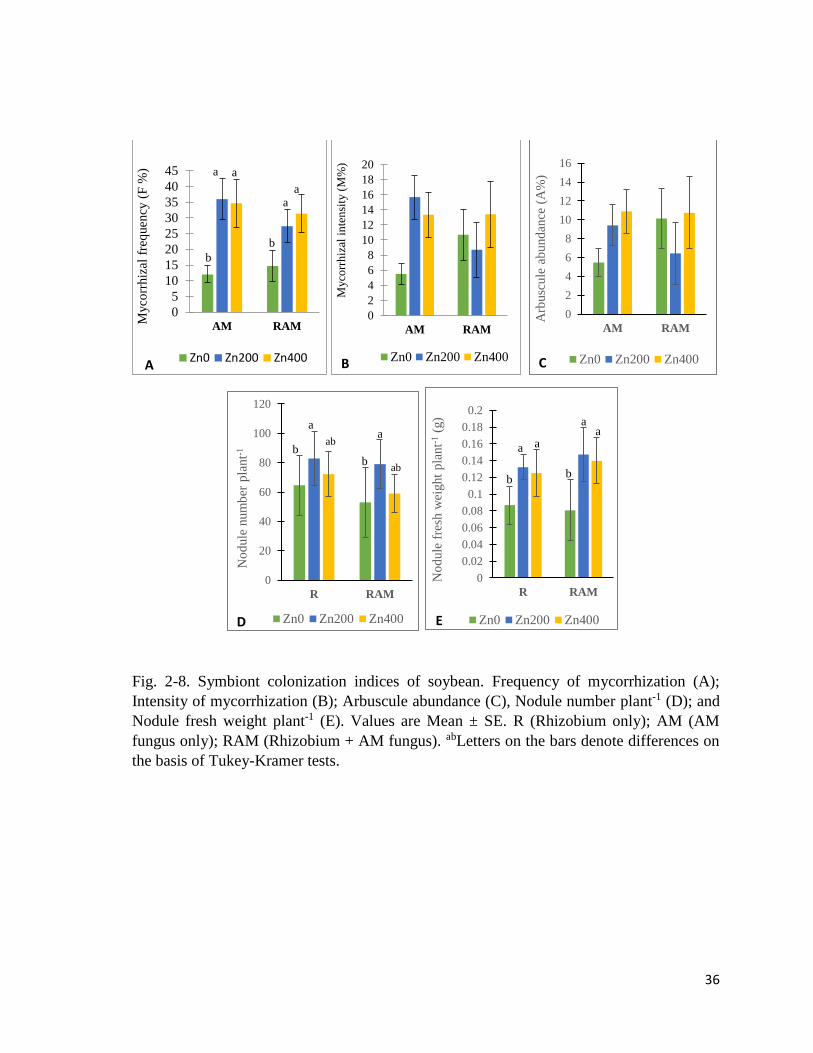
2.3.5 Mycorrhizal and nodule indices
Mycorrhization parameters
Frequency of mycorrhization (F%) (Fig. 2-8A) was significantly affected by Zn treatment,
while intensity of mycorrhization (M%) (Fig. 2-8B) and arbuscule abundance (A%) (Fig. 2-
8C) were not (Table 2-12). F% was significantly higher in roots of plants in Zn200 and Zn400
soils, than plants in Zn0 soils. In roots of AM plants, M% and A% were elevated due to Zn
treatment, but this was not exactly the case in roots of dual inoculated (RAM) plants. C and
R plants were devoid of mycorrhization.
Nodule parameters
Nodule number per plant (Fig. 2-8D) was significantly higher in Zn200 groups, in both R
and RAM plants (Table 2-12). Nodule fresh weight per plant (Fig. 2-8E) differed
significantly due to Zn treatment, being higher in plants in Zn200 and Zn400 soils. C and
AM plants were devoid of nodules.
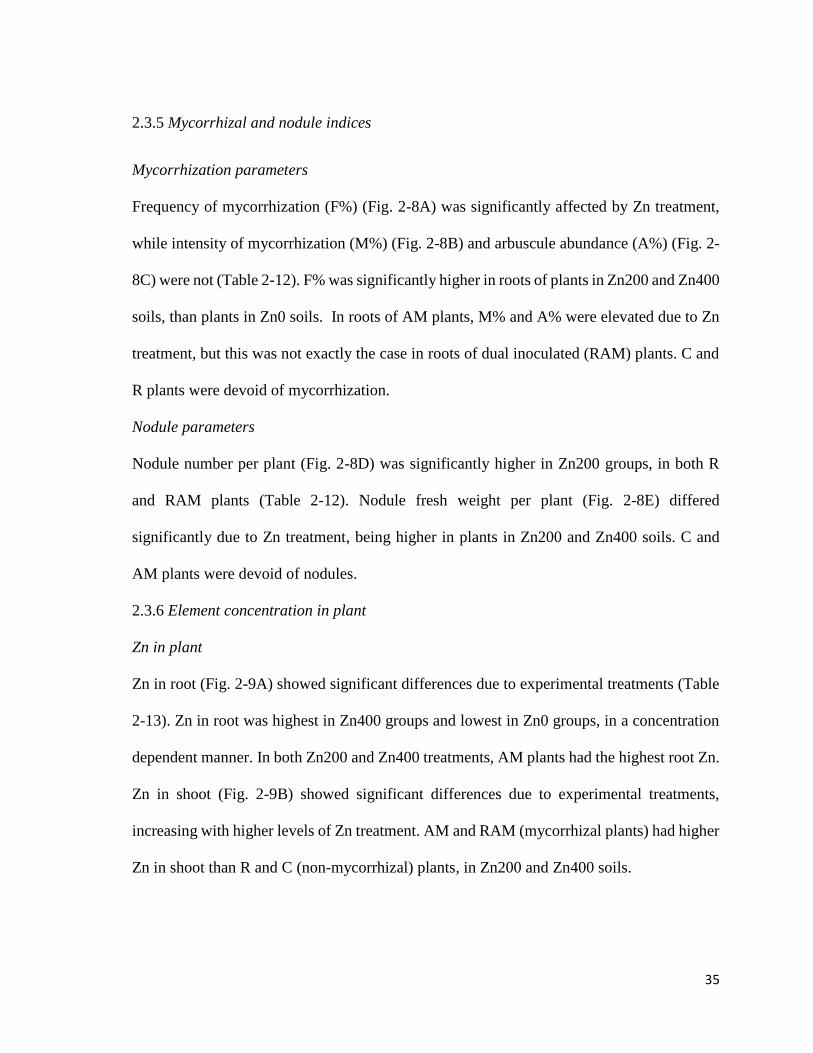
2.3.6 Element concentration in plant
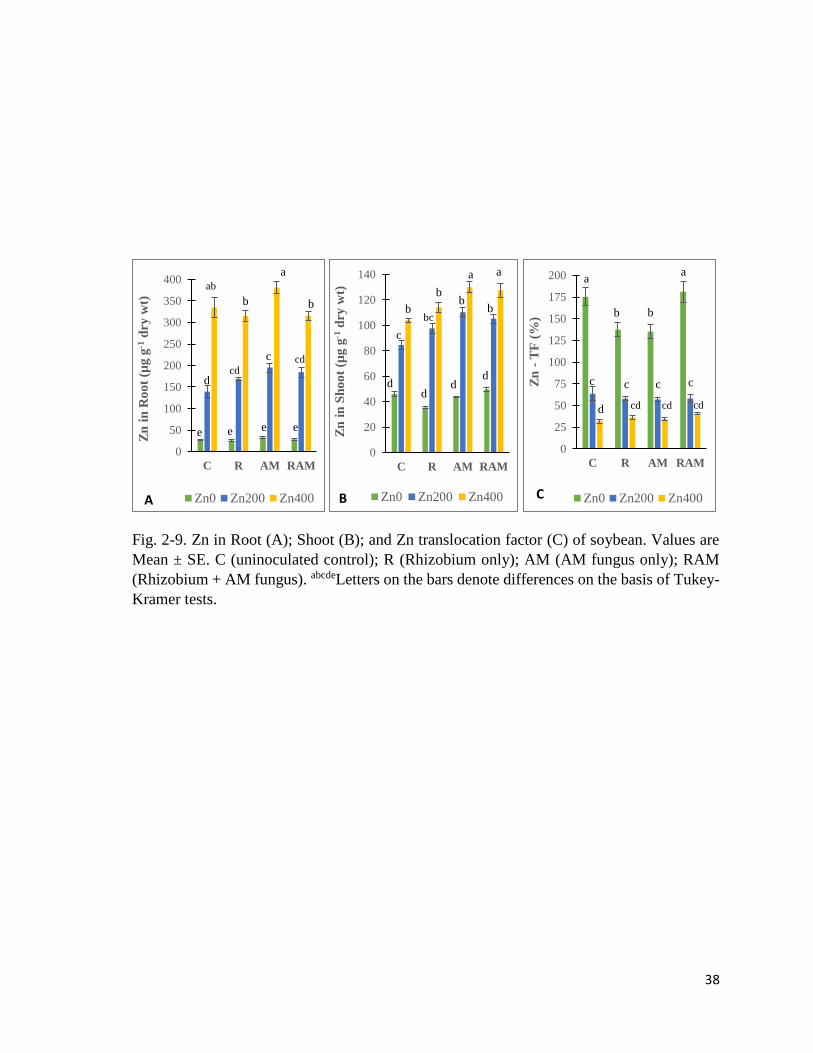
Zn in plant
Zn in root (Fig. 2-9A) showed significant differences due to experimental treatments (Table
2-13). Zn in root was highest in Zn400 groups and lowest in Zn0 groups, in a concentration
dependent manner. In both Zn200 and Zn400 treatments, AM plants had the highest root Zn.
Zn in shoot (Fig. 2-9B) showed significant differences due to experimental treatments,
increasing with higher levels of Zn treatment. AM and RAM (mycorrhizal plants) had higher
Zn in shoot than R and C (non-mycorrhizal) plants, in Zn200 and Zn400 soils.
36
Fig. 2-8. Symbiont colonization indices of soybean. Frequency of mycorrhization (A);
Intensity of mycorrhization (B); Arbuscule abundance (C), Nodule number plant-1 (D); and
Nodule fresh weight plant-1 (E). Values are Mean ± SE. R (Rhizobium only); AM (AM
fungus only); RAM (Rhizobium + AM fungus). abLetters on the bars denote differences on
the basis of Tukey-Kramer tests.
0
5
10
15
20
25
30
35
40
45
AM RAM
Myco
rrhiz
al f
req
uen
cy (
F %
)
Zn0 Zn200 Zn400A
a a
aa
b
b
0
2
4
6
8
10
12
14
16
18
20
AM RAMM
yco
rrh
izal
in
ten
sity
(M
%)
Zn0 Zn200 Zn400B
0
2
4
6
8
10
12
14
16
AM RAM
Arb
usc
ule
ab
und
ance
(A
%)
Zn0 Zn200 Zn400C
0
20
40
60
80
100
120
R RAM
No
dule
num
ber
pla
nt-1
Zn0 Zn200 Zn400D
aa
bb
ab
ab
0
0.02
0.04
0.06
0.08
0.1
0.12
0.14
0.16
0.18
0.2
R RAM
No
dule
fre
sh w
eight
pla
nt-1
(g)
Zn0 Zn200 Zn400E
aa
aa
bb
37
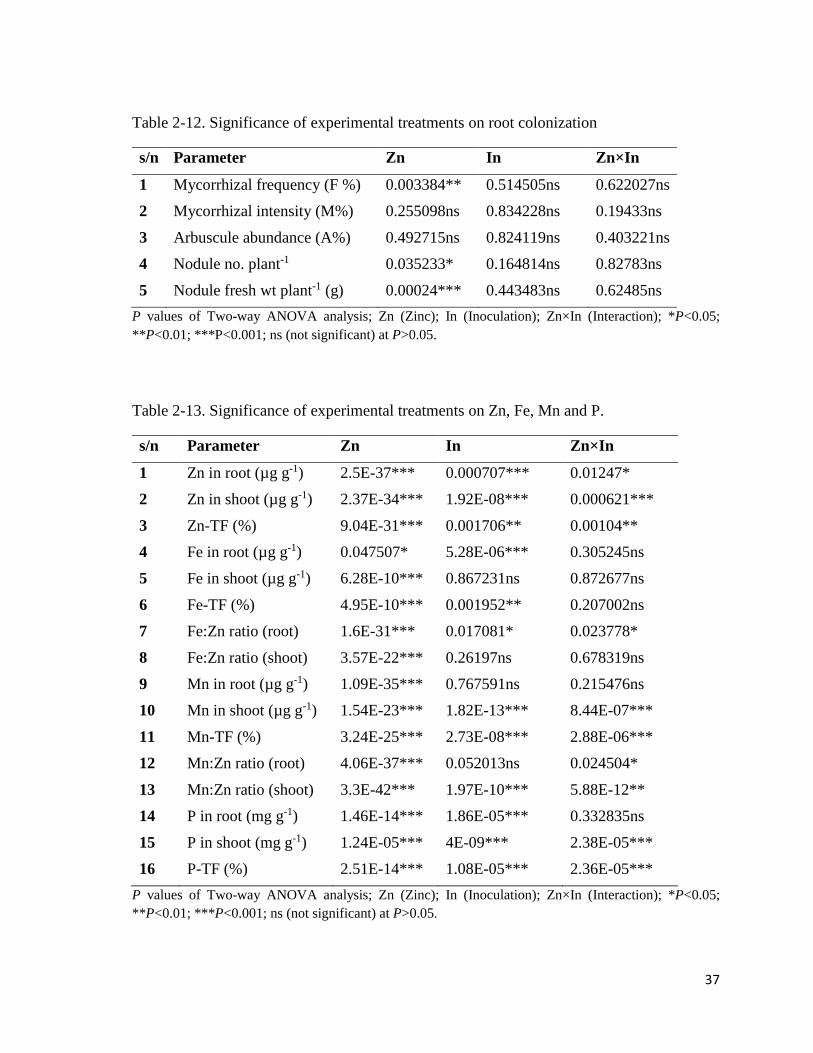
Table 2-12. Significance of experimental treatments on root colonization
s/n Parameter Zn In Zn×In
1 Mycorrhizal frequency (F %) 0.003384** 0.514505ns 0.622027ns
2 Mycorrhizal intensity (M%) 0.255098ns 0.834228ns 0.19433ns
3 Arbuscule abundance (A%) 0.492715ns 0.824119ns 0.403221ns
4 Nodule no. plant-1 0.035233* 0.164814ns 0.82783ns
5 Nodule fresh wt plant-1 (g) 0.00024*** 0.443483ns 0.62485ns
P values of Two-way ANOVA analysis; Zn (Zinc); In (Inoculation); Zn×In (Interaction); *P<0.05;
**P<0.01; ***P<0.001; ns (not significant) at P>0.05.
Table 2-13. Significance of experimental treatments on Zn, Fe, Mn and P.
s/n Parameter Zn In Zn×In
1 Zn in root (µg g-1) 2.5E-37*** 0.000707*** 0.01247*
2 Zn in shoot (µg g-1) 2.37E-34*** 1.92E-08*** 0.000621***
3 Zn-TF (%) 9.04E-31*** 0.001706** 0.00104**
4 Fe in root (µg g-1) 0.047507* 5.28E-06*** 0.305245ns
5 Fe in shoot (µg g-1) 6.28E-10*** 0.867231ns 0.872677ns
6 Fe-TF (%) 4.95E-10*** 0.001952** 0.207002ns
7 Fe:Zn ratio (root) 1.6E-31*** 0.017081* 0.023778*
8 Fe:Zn ratio (shoot) 3.57E-22*** 0.26197ns 0.678319ns
9 Mn in root (µg g-1) 1.09E-35*** 0.767591ns 0.215476ns
10 Mn in shoot (µg g-1) 1.54E-23*** 1.82E-13*** 8.44E-07***
11 Mn-TF (%) 3.24E-25*** 2.73E-08*** 2.88E-06***
12 Mn:Zn ratio (root) 4.06E-37*** 0.052013ns 0.024504*
13 Mn:Zn ratio (shoot) 3.3E-42*** 1.97E-10*** 5.88E-12**
14 P in root (mg g-1) 1.46E-14*** 1.86E-05*** 0.332835ns
15 P in shoot (mg g-1) 1.24E-05*** 4E-09*** 2.38E-05***
16 P-TF (%) 2.51E-14*** 1.08E-05*** 2.36E-05***
P values of Two-way ANOVA analysis; Zn (Zinc); In (Inoculation); Zn×In (Interaction); *P<0.05;
**P<0.01; ***P<0.001; ns (not significant) at P>0.05.
38
Fig. 2-9. Zn in Root (A); Shoot (B); and Zn translocation factor (C) of soybean. Values are
Mean ± SE. C (uninoculated control); R (Rhizobium only); AM (AM fungus only); RAM
(Rhizobium + AM fungus). abcdeLetters on the bars denote differences on the basis of Tukey-
Kramer tests.
0
50
100
150
200
250
300
350
400
C R AM RAM
Zn
in
Ro
ot
(µg
g-1
dry
wt)
Zn0 Zn200 Zn400A
d
c
b
a
b
e e e e
ab
cdcd
0
20
40
60
80
100
120
140
C R AM RAM
Zn
in
Sh
oo
t (µ
g g
-1d
ry w
t)
Zn0 Zn200 Zn400B
b
c
d
b
dd
b
a a
b
d
bc
0
25
50
75
100
125
150
175
200
C R AM RAM
Zn
-T
F (
%)
Zn0 Zn200 Zn400C
aa
b b
c
d
c
cd
c c
cd cd
39
The root-to-shoot translocation factor of Zn (Zn-TF) (Fig. 2-9C) showed significant
differences due to experimental treatments. Zn-TF was highest in Zn0 and lowest in Zn400
groups, in a concentration dependent manner. In Zn0 soils, R and AM plants had lower Zn-
TF than C and RAM plants. In Zn200 and Zn400 soils, mycorrhizal plants (AM, RAM) did
not show differences in Zn-TF from non-mycorrhizal (C, R) ones.
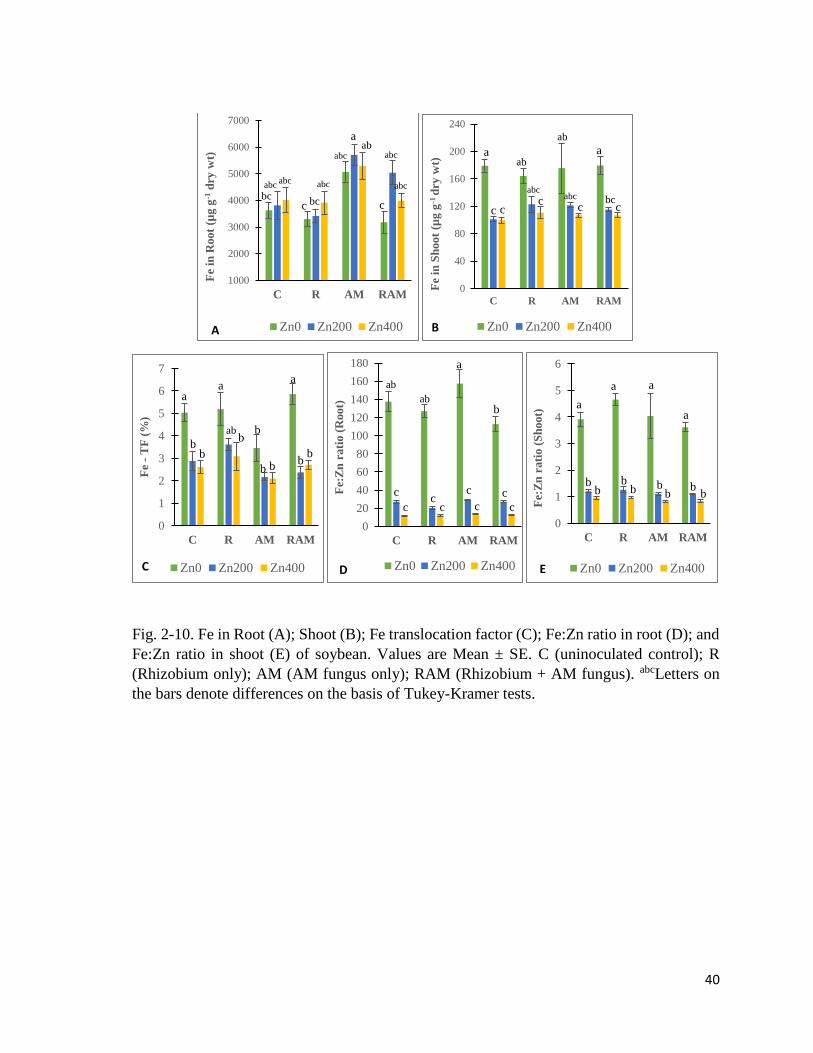
Fe in plant
Fe in root (Fig. 2-10A) showed significant differences due to experimental treatments (Table
2-13). Plants in Zn200 and Zn400 groups had higher Fe in roots than plants in Zn0 soils. AM
plants had higher Fe in root than others. Fe in shoot (Fig. 2-10B) showed significant
differences due to the Zn treatments. Plants in Zn200 and Zn400 groups had lower Fe in
shoots than Zn0 plants. This contrasts with the effect of Zn treatment on Fe in the roots where
there was an increase in root Fe concentration due to increasing Zn level. It was noted that
although there is higher Fe in soybean roots in Zn200 and Zn400 than in Zn0 soils, there is a
reduced Fe in shoots in Zn200 and Zn400 groups, implying an inhibitory impact of Zn on
shoot Fe content. Although inoculation treatment was not significant, Fe in shoot of R, AM,
and RAM plants, in Zn200 soils, were higher than shoot Fe in C-Zn200. This pointed to
insignificant improvement of shoot Fe in Zn200 soils, due to the symbionts. Translocation
factor of Fe (Fe-TF) (Fig. 2-10C) showed significant differences due to experimental
treatments, with Zn treatment reducing Fe-TF. In general, AM plants had lower Fe-TF than
others, indicating AMF root Fe retention tendency. Fe:Zn ratio in root (Fig. 2-10D) showed
40
Fig. 2-10. Fe in Root (A); Shoot (B); Fe translocation factor (C); Fe:Zn ratio in root (D); and
Fe:Zn ratio in shoot (E) of soybean. Values are Mean ± SE. C (uninoculated control); R
(Rhizobium only); AM (AM fungus only); RAM (Rhizobium + AM fungus). abcLetters on
the bars denote differences on the basis of Tukey-Kramer tests.
1000
2000
3000
4000
5000
6000
7000
C R AM RAM
Fe
in R
oot
(µg
g-1
dry
wt)
Zn0 Zn200 Zn400A
bcabc
abc
c bc
abc
abc
aab
c
abc
abc
0
40
80
120
160
200
240
C R AM RAM
Fe
in S
hoot
(µg
g-1
dry
wt)
Zn0 Zn200 Zn400B
cc
aab
abc
c
ab
abc
cbc
c
a
0
1
2
3
4
5
6
7
C R AM RAM
Fe
-T
F (
%)
Zn0 Zn200 Zn400C
a
bb
a
abb
bb
b
bb
a
0
20
40
60
80
100
120
140
160
180
C R AM RAM
Fe:
Zn
rati
o (
Root)
Zn0 Zn200 Zn400D
a
ab
ab
b
c
cc
c
cc
c
c
0
1
2
3
4
5
6
C R AM RAMF
e:Z
n r
ati
o (
Sh
oot)
Zn0 Zn200 Zn400E
a
aa
a
bb
bbb
bb
b
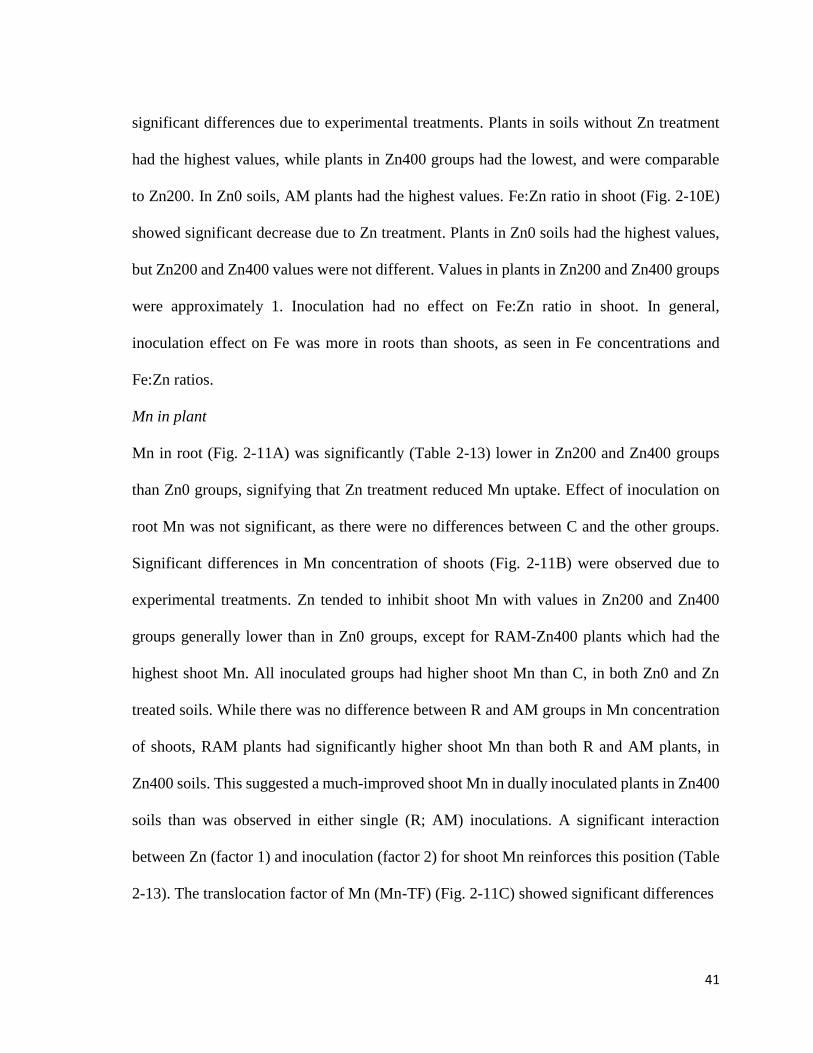
41
significant differences due to experimental treatments. Plants in soils without Zn treatment
had the highest values, while plants in Zn400 groups had the lowest, and were comparable
to Zn200. In Zn0 soils, AM plants had the highest values. Fe:Zn ratio in shoot (Fig. 2-10E)
showed significant decrease due to Zn treatment. Plants in Zn0 soils had the highest values,
but Zn200 and Zn400 values were not different. Values in plants in Zn200 and Zn400 groups
were approximately 1. Inoculation had no effect on Fe:Zn ratio in shoot. In general,
inoculation effect on Fe was more in roots than shoots, as seen in Fe concentrations and
Fe:Zn ratios.
Mn in plant
Mn in root (Fig. 2-11A) was significantly (Table 2-13) lower in Zn200 and Zn400 groups
than Zn0 groups, signifying that Zn treatment reduced Mn uptake. Effect of inoculation on
root Mn was not significant, as there were no differences between C and the other groups.
Significant differences in Mn concentration of shoots (Fig. 2-11B) were observed due to
experimental treatments. Zn tended to inhibit shoot Mn with values in Zn200 and Zn400
groups generally lower than in Zn0 groups, except for RAM-Zn400 plants which had the
highest shoot Mn. All inoculated groups had higher shoot Mn than C, in both Zn0 and Zn
treated soils. While there was no difference between R and AM groups in Mn concentration
of shoots, RAM plants had significantly higher shoot Mn than both R and AM plants, in
Zn400 soils. This suggested a much-improved shoot Mn in dually inoculated plants in Zn400
soils than was observed in either single (R; AM) inoculations. A significant interaction
between Zn (factor 1) and inoculation (factor 2) for shoot Mn reinforces this position (Table
2-13). The translocation factor of Mn (Mn-TF) (Fig. 2-11C) showed significant differences
42
Fig. 2-11. Mn in Root (A); Shoot (B); Mn translocation factor (C); Mn:Zn ratio in root (D);
and Mn:Zn ratio in shoot (E) of soybean. Values are Mean ± SE. C (uninoculated control);
R (Rhizobium only); AM (AM fungus only); RAM (Rhizobium + AM fungus). abcdeletters
on the bars denote differences on the basis of Tukey-Kramer tests.
0
200
400
600
800
1000
1200
1400
1600
C R AM RAM
Mn
in
ro
ot
(µg
g-1
dry
wt)
Zn0 Zn200 Zn400A
a a
b
aa
bb b b b
bb
0
20
40
60
80
100
120
140
160
180
200
C R AM RAM
Mn
in
sh
oo
t (µ
g g
-1d
ry w
t)Zn0 Zn200 Zn400B
b
dd
d dcd
ab
bc
a
b
aa
0
5
10
15
20
25
30
35
40
45
50
55
60
C R AM RAM
Mn
-T
F (
%)
Zn0 Zn200 Zn400C
ddd
d
c cc
cbc
bb
a
0
5
10
15
20
25
30
35
40
45
50
55
60
C R AM RAM
Mn:Z
n r
atio
(R
oo
t)
Zn0 Zn200 Zn400D
c cc cc ccc
aab
ab
b
0
0.5
1
1.5
2
2.5
3
3.5
4
4.5
5
C R AM RAM
Mn:Z
n r
atio
(S
ho
ot)
Zn0 Zn200 Zn400E
c
a
b
bc
d
ee
ee
eee
43
due to experimental treatments. Zn treatment increased Mn-TF (contrasts with its effect on
Fe-TF). All inoculated groups had higher Mn-TF than C, in Zn400 soils. While R and AM
plants were not significantly different in Mn-TF, RAM plants had significantly higher Mn-
TF than both, in Zn400 groups. A significant interaction between Zn and inoculation was
observed for Mn-TF (Table 2-13). Mn:Zn ratio in root (Fig. 2-11D) showed significant
differences due to experimental treatments. Plants in Zn0 groups had the highest values. This
confirms that a higher Zn in the plant root lowered Mn. In Zn0 soils, however, AM plants
had lower values than C. Mn:Zn ratio in shoot (Fig 2-11E) showed significant differences
due to experimental treatments. Plants in Zn0 groups had the highest values, while values in
Zn200 and Zn400 plants were approximately 1. Value in RAM-Zn400 was higher than others
in Zn treated soils. In Zn0 soils, inoculated plants had higher Mn:Zn values than C,
suggesting the inoculants capacity to boost shoot Mn in uncontaminated soils, with respect
to shoot Zn concentrations. In general, inoculation effect on Mn was more in shoots than
roots, as seen in Mn concentrations and Mn:Zn ratios.
P in plant
P in the root (Fig. 2-12A) showed significant differences due to experimental treatments
(Table 2-13). Plants in Zn200 and Zn400 groups had higher root P than Zn0 plants. AM and
RAM plants generally had higher root P than C and R. P in the shoot (Fig. 2-12B) showed
significant differences due to experimental treatments. Shoot P appeared similar between C
and R plants. AM and RAM plants had higher shoot P due to Zn treatment, but RAM plants
had the highest shoot P in Zn200 and Zn400 soils. The translocation factor of P (P-TF) (Fig.
2-12C) showed significant differences due to the experimental treatments. Zn treatment
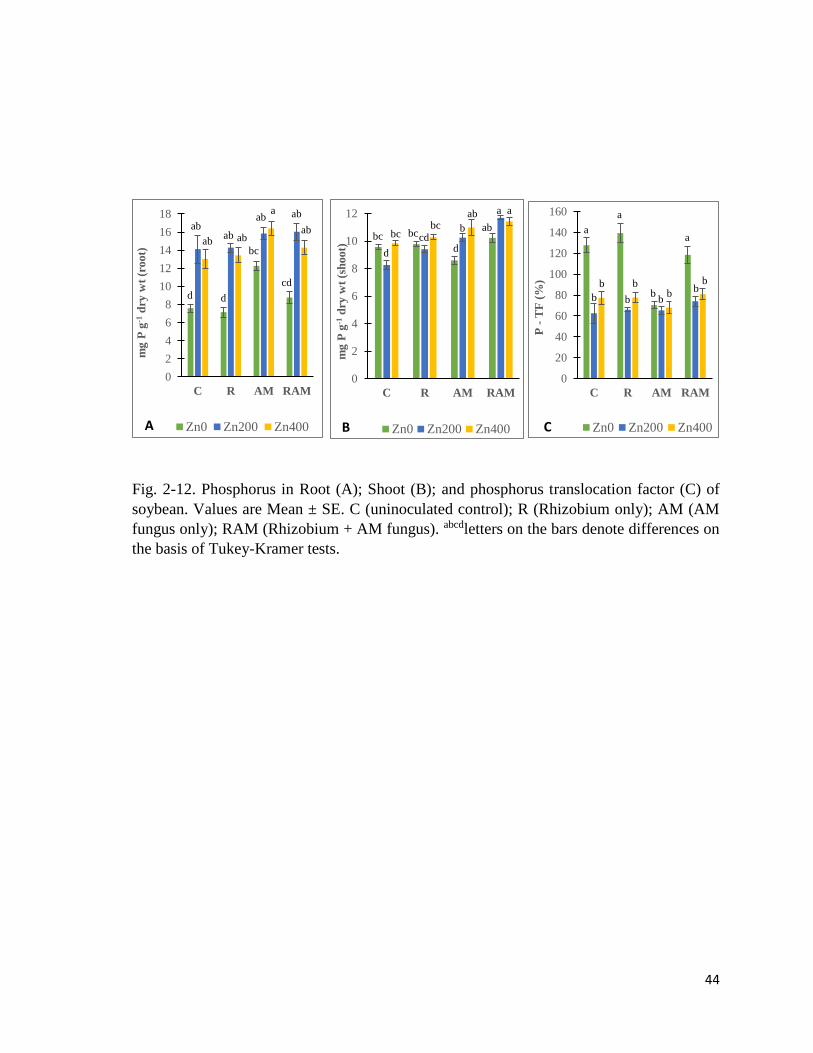
44
Fig. 2-12. Phosphorus in Root (A); Shoot (B); and phosphorus translocation factor (C) of
soybean. Values are Mean ± SE. C (uninoculated control); R (Rhizobium only); AM (AM
fungus only); RAM (Rhizobium + AM fungus). abcdletters on the bars denote differences on
the basis of Tukey-Kramer tests.
0
2
4
6
8
10
12
14
16
18
C R AM RAM
mg
P g
-1d
ry w
t (r
oot)
Zn0 Zn200 Zn400A
dd
cd
bc
a
ab
abab
ababab
ab
0
2
4
6
8
10
12
C R AM RAM
mg
P g
-1d
ry w
t (s
hoot)
Zn0 Zn200 Zn400B
a aab
abb
d
bccd
bcbc
d
bc
0
20
40
60
80
100
120
140
160
C R AM RAM
P -
TF
(%
)
Zn0 Zn200 Zn400C
a
a
a
bb
bb
bb
b
b
b
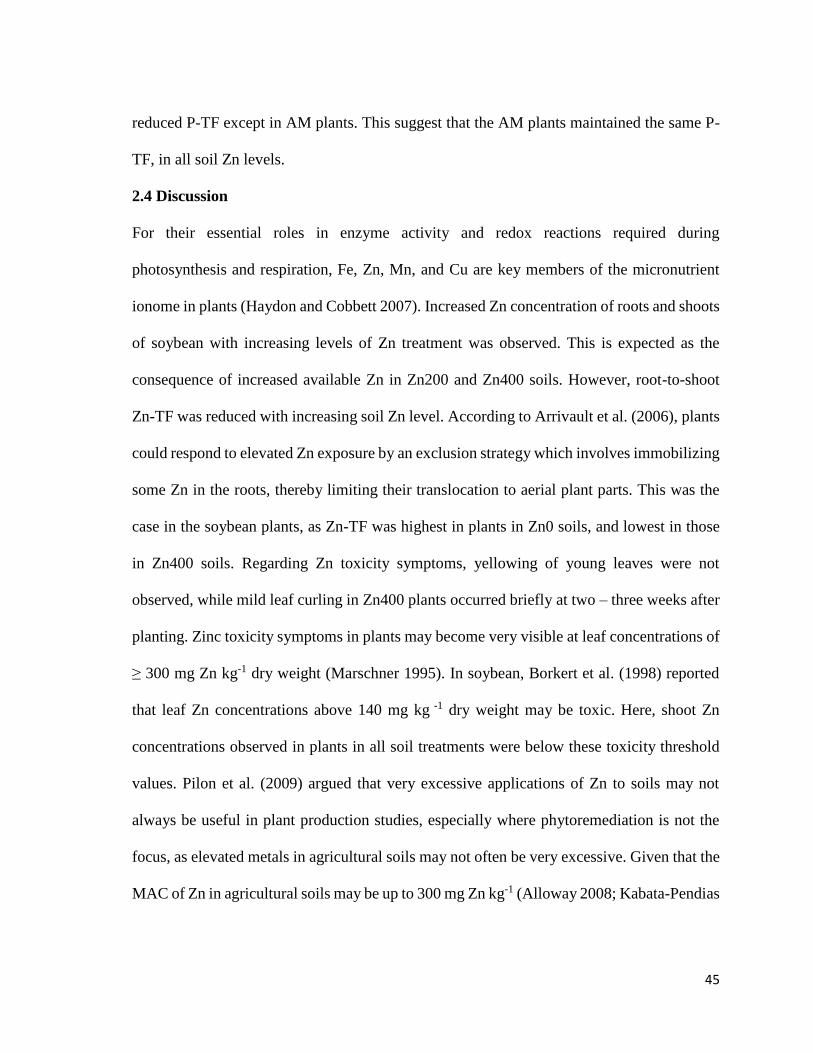
45
reduced P-TF except in AM plants. This suggest that the AM plants maintained the same P-
TF, in all soil Zn levels.
2.4 Discussion
For their essential roles in enzyme activity and redox reactions required during
photosynthesis and respiration, Fe, Zn, Mn, and Cu are key members of the micronutrient
ionome in plants (Haydon and Cobbett 2007). Increased Zn concentration of roots and shoots
of soybean with increasing levels of Zn treatment was observed. This is expected as the
consequence of increased available Zn in Zn200 and Zn400 soils. However, root-to-shoot
Zn-TF was reduced with increasing soil Zn level. According to Arrivault et al. (2006), plants
could respond to elevated Zn exposure by an exclusion strategy which involves immobilizing
some Zn in the roots, thereby limiting their translocation to aerial plant parts. This was the
case in the soybean plants, as Zn-TF was highest in plants in Zn0 soils, and lowest in those
in Zn400 soils. Regarding Zn toxicity symptoms, yellowing of young leaves were not
observed, while mild leaf curling in Zn400 plants occurred briefly at two – three weeks after
planting. Zinc toxicity symptoms in plants may become very visible at leaf concentrations of
≥ 300 mg Zn kg-1 dry weight (Marschner 1995). In soybean, Borkert et al. (1998) reported
that leaf Zn concentrations above 140 mg kg -1 dry weight may be toxic. Here, shoot Zn
concentrations observed in plants in all soil treatments were below these toxicity threshold
values. Pilon et al. (2009) argued that very excessive applications of Zn to soils may not
always be useful in plant production studies, especially where phytoremediation is not the
focus, as elevated metals in agricultural soils may not often be very excessive. Given that the
MAC of Zn in agricultural soils may be up to 300 mg Zn kg-1 (Alloway 2008; Kabata-Pendias
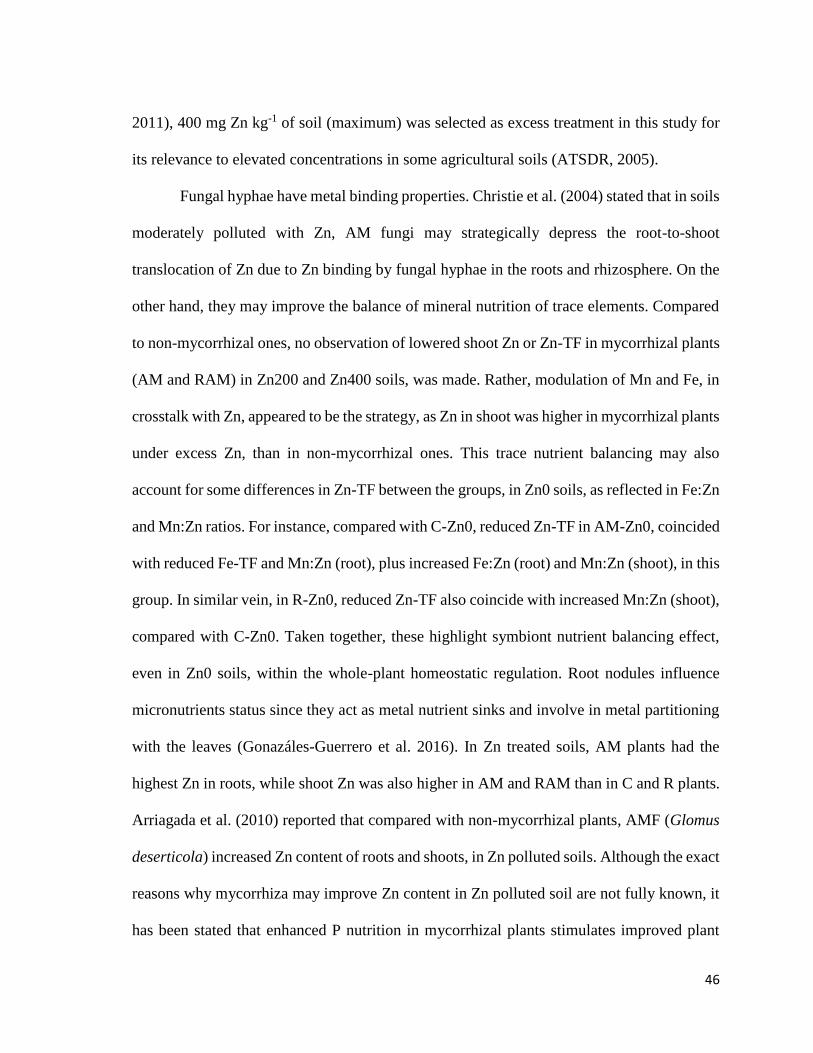
46
2011), 400 mg Zn kg-1 of soil (maximum) was selected as excess treatment in this study for
its relevance to elevated concentrations in some agricultural soils (ATSDR, 2005).
Fungal hyphae have metal binding properties. Christie et al. (2004) stated that in soils
moderately polluted with Zn, AM fungi may strategically depress the root-to-shoot
translocation of Zn due to Zn binding by fungal hyphae in the roots and rhizosphere. On the
other hand, they may improve the balance of mineral nutrition of trace elements. Compared
to non-mycorrhizal ones, no observation of lowered shoot Zn or Zn-TF in mycorrhizal plants
(AM and RAM) in Zn200 and Zn400 soils, was made. Rather, modulation of Mn and Fe, in
crosstalk with Zn, appeared to be the strategy, as Zn in shoot was higher in mycorrhizal plants
under excess Zn, than in non-mycorrhizal ones. This trace nutrient balancing may also
account for some differences in Zn-TF between the groups, in Zn0 soils, as reflected in Fe:Zn
and Mn:Zn ratios. For instance, compared with C-Zn0, reduced Zn-TF in AM-Zn0, coincided
with reduced Fe-TF and Mn:Zn (root), plus increased Fe:Zn (root) and Mn:Zn (shoot), in this
group. In similar vein, in R-Zn0, reduced Zn-TF also coincide with increased Mn:Zn (shoot),
compared with C-Zn0. Taken together, these highlight symbiont nutrient balancing effect,
even in Zn0 soils, within the whole-plant homeostatic regulation. Root nodules influence
micronutrients status since they act as metal nutrient sinks and involve in metal partitioning
with the leaves (Gonazáles-Guerrero et al. 2016). In Zn treated soils, AM plants had the
highest Zn in roots, while shoot Zn was also higher in AM and RAM than in C and R plants.
Arriagada et al. (2010) reported that compared with non-mycorrhizal plants, AMF (Glomus
deserticola) increased Zn content of roots and shoots, in Zn polluted soils. Although the exact
reasons why mycorrhiza may improve Zn content in Zn polluted soil are not fully known, it
has been stated that enhanced P nutrition in mycorrhizal plants stimulates improved plant
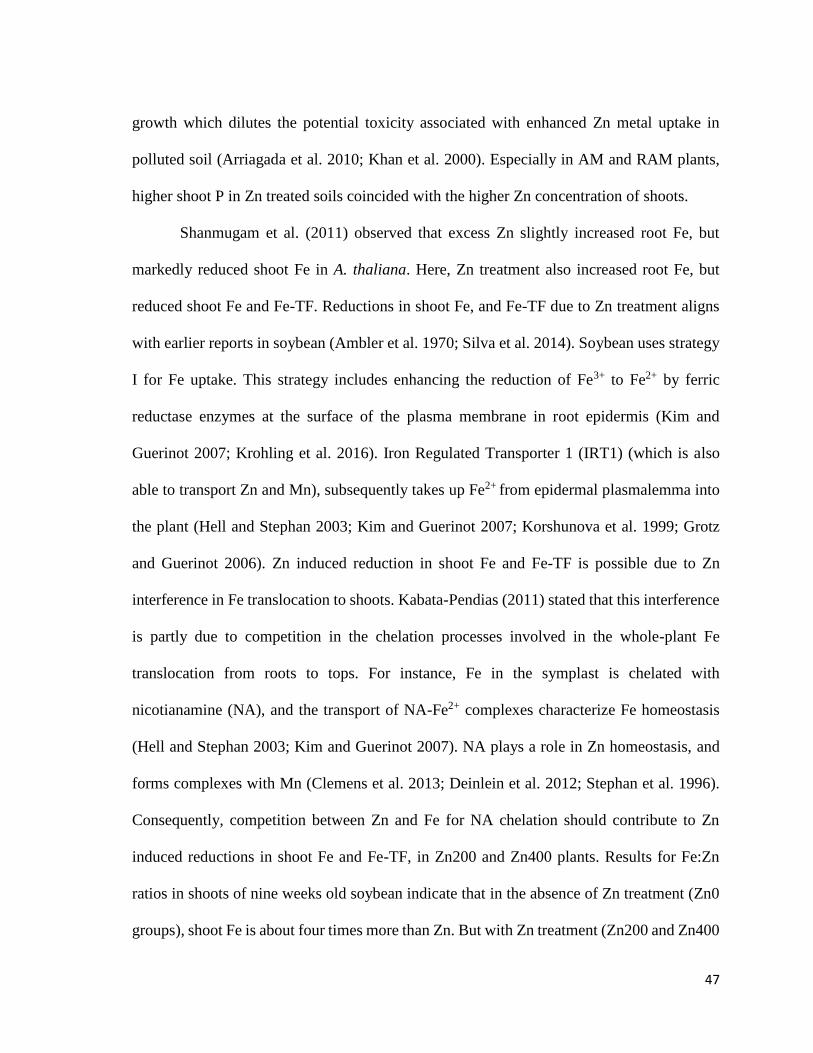
47
growth which dilutes the potential toxicity associated with enhanced Zn metal uptake in
polluted soil (Arriagada et al. 2010; Khan et al. 2000). Especially in AM and RAM plants,
higher shoot P in Zn treated soils coincided with the higher Zn concentration of shoots.
Shanmugam et al. (2011) observed that excess Zn slightly increased root Fe, but
markedly reduced shoot Fe in A. thaliana. Here, Zn treatment also increased root Fe, but
reduced shoot Fe and Fe-TF. Reductions in shoot Fe, and Fe-TF due to Zn treatment aligns
with earlier reports in soybean (Ambler et al. 1970; Silva et al. 2014). Soybean uses strategy
I for Fe uptake. This strategy includes enhancing the reduction of Fe3+ to Fe2+ by ferric
reductase enzymes at the surface of the plasma membrane in root epidermis (Kim and
Guerinot 2007; Krohling et al. 2016). Iron Regulated Transporter 1 (IRT1) (which is also
able to transport Zn and Mn), subsequently takes up Fe2+ from epidermal plasmalemma into
the plant (Hell and Stephan 2003; Kim and Guerinot 2007; Korshunova et al. 1999; Grotz
and Guerinot 2006). Zn induced reduction in shoot Fe and Fe-TF is possible due to Zn
interference in Fe translocation to shoots. Kabata-Pendias (2011) stated that this interference
is partly due to competition in the chelation processes involved in the whole-plant Fe
translocation from roots to tops. For instance, Fe in the symplast is chelated with
nicotianamine (NA), and the transport of NA-Fe2+ complexes characterize Fe homeostasis
(Hell and Stephan 2003; Kim and Guerinot 2007). NA plays a role in Zn homeostasis, and
forms complexes with Mn (Clemens et al. 2013; Deinlein et al. 2012; Stephan et al. 1996).
Consequently, competition between Zn and Fe for NA chelation should contribute to Zn
induced reductions in shoot Fe and Fe-TF, in Zn200 and Zn400 plants. Results for Fe:Zn
ratios in shoots of nine weeks old soybean indicate that in the absence of Zn treatment (Zn0
groups), shoot Fe is about four times more than Zn. But with Zn treatment (Zn200 and Zn400
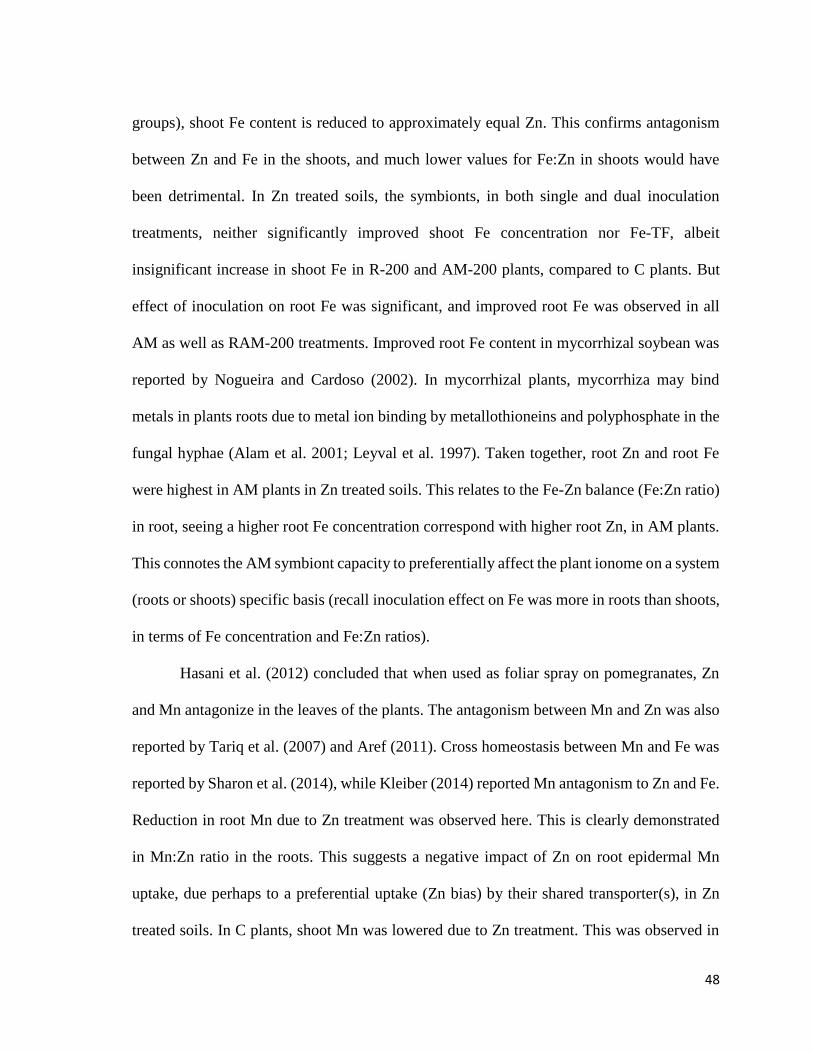
48
groups), shoot Fe content is reduced to approximately equal Zn. This confirms antagonism
between Zn and Fe in the shoots, and much lower values for Fe:Zn in shoots would have
been detrimental. In Zn treated soils, the symbionts, in both single and dual inoculation
treatments, neither significantly improved shoot Fe concentration nor Fe-TF, albeit
insignificant increase in shoot Fe in R-200 and AM-200 plants, compared to C plants. But
effect of inoculation on root Fe was significant, and improved root Fe was observed in all
AM as well as RAM-200 treatments. Improved root Fe content in mycorrhizal soybean was
reported by Nogueira and Cardoso (2002). In mycorrhizal plants, mycorrhiza may bind
metals in plants roots due to metal ion binding by metallothioneins and polyphosphate in the
fungal hyphae (Alam et al. 2001; Leyval et al. 1997). Taken together, root Zn and root Fe
were highest in AM plants in Zn treated soils. This relates to the Fe-Zn balance (Fe:Zn ratio)
in root, seeing a higher root Fe concentration correspond with higher root Zn, in AM plants.
This connotes the AM symbiont capacity to preferentially affect the plant ionome on a system
(roots or shoots) specific basis (recall inoculation effect on Fe was more in roots than shoots,
in terms of Fe concentration and Fe:Zn ratios).
Hasani et al. (2012) concluded that when used as foliar spray on pomegranates, Zn
and Mn antagonize in the leaves of the plants. The antagonism between Mn and Zn was also
reported by Tariq et al. (2007) and Aref (2011). Cross homeostasis between Mn and Fe was
reported by Sharon et al. (2014), while Kleiber (2014) reported Mn antagonism to Zn and Fe.
Reduction in root Mn due to Zn treatment was observed here. This is clearly demonstrated
in Mn:Zn ratio in the roots. This suggests a negative impact of Zn on root epidermal Mn
uptake, due perhaps to a preferential uptake (Zn bias) by their shared transporter(s), in Zn
treated soils. In C plants, shoot Mn was lowered due to Zn treatment. This was observed in
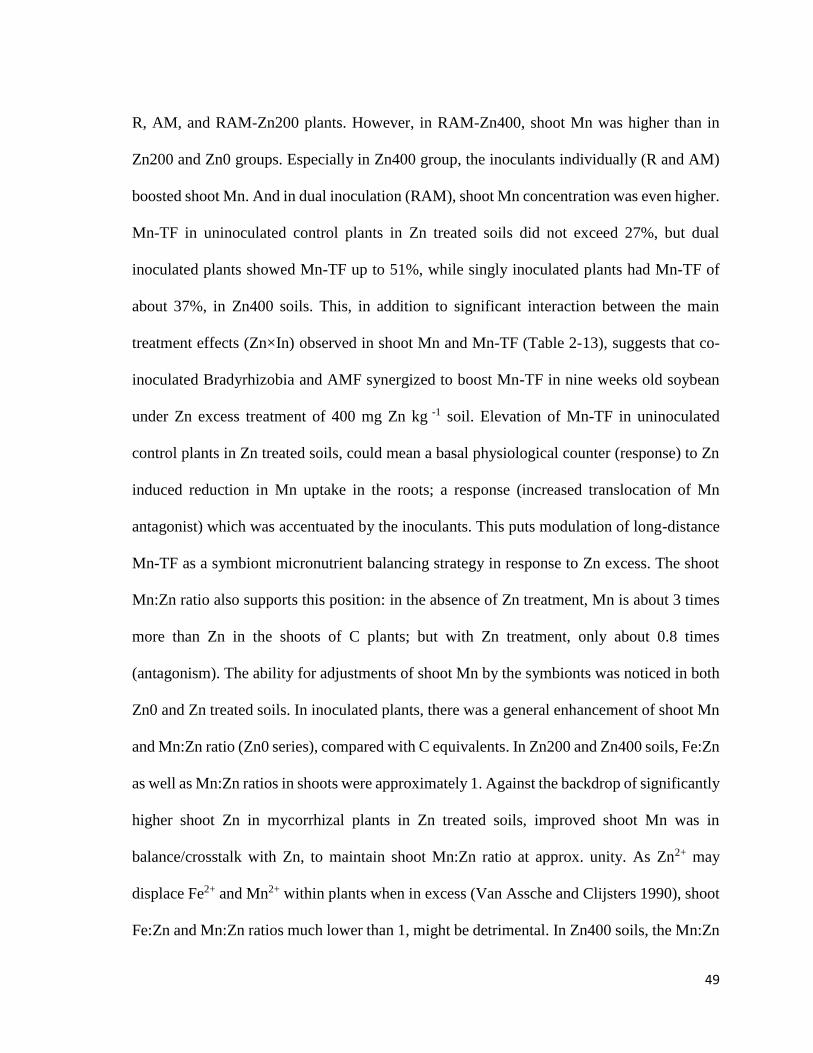
49
R, AM, and RAM-Zn200 plants. However, in RAM-Zn400, shoot Mn was higher than in
Zn200 and Zn0 groups. Especially in Zn400 group, the inoculants individually (R and AM)
boosted shoot Mn. And in dual inoculation (RAM), shoot Mn concentration was even higher.
Mn-TF in uninoculated control plants in Zn treated soils did not exceed 27%, but dual
inoculated plants showed Mn-TF up to 51%, while singly inoculated plants had Mn-TF of
about 37%, in Zn400 soils. This, in addition to significant interaction between the main
treatment effects (Zn×In) observed in shoot Mn and Mn-TF (Table 2-13), suggests that co-
inoculated Bradyrhizobia and AMF synergized to boost Mn-TF in nine weeks old soybean
under Zn excess treatment of 400 mg Zn kg -1 soil. Elevation of Mn-TF in uninoculated
control plants in Zn treated soils, could mean a basal physiological counter (response) to Zn
induced reduction in Mn uptake in the roots; a response (increased translocation of Mn
antagonist) which was accentuated by the inoculants. This puts modulation of long-distance
Mn-TF as a symbiont micronutrient balancing strategy in response to Zn excess. The shoot
Mn:Zn ratio also supports this position: in the absence of Zn treatment, Mn is about 3 times
more than Zn in the shoots of C plants; but with Zn treatment, only about 0.8 times
(antagonism). The ability for adjustments of shoot Mn by the symbionts was noticed in both
Zn0 and Zn treated soils. In inoculated plants, there was a general enhancement of shoot Mn
and Mn:Zn ratio (Zn0 series), compared with C equivalents. In Zn200 and Zn400 soils, Fe:Zn
as well as Mn:Zn ratios in shoots were approximately 1. Against the backdrop of significantly
higher shoot Zn in mycorrhizal plants in Zn treated soils, improved shoot Mn was in
balance/crosstalk with Zn, to maintain shoot Mn:Zn ratio at approx. unity. As Zn2+ may
displace Fe2+ and Mn2+ within plants when in excess (Van Assche and Clijsters 1990), shoot
Fe:Zn and Mn:Zn ratios much lower than 1, might be detrimental. In Zn400 soils, the Mn:Zn
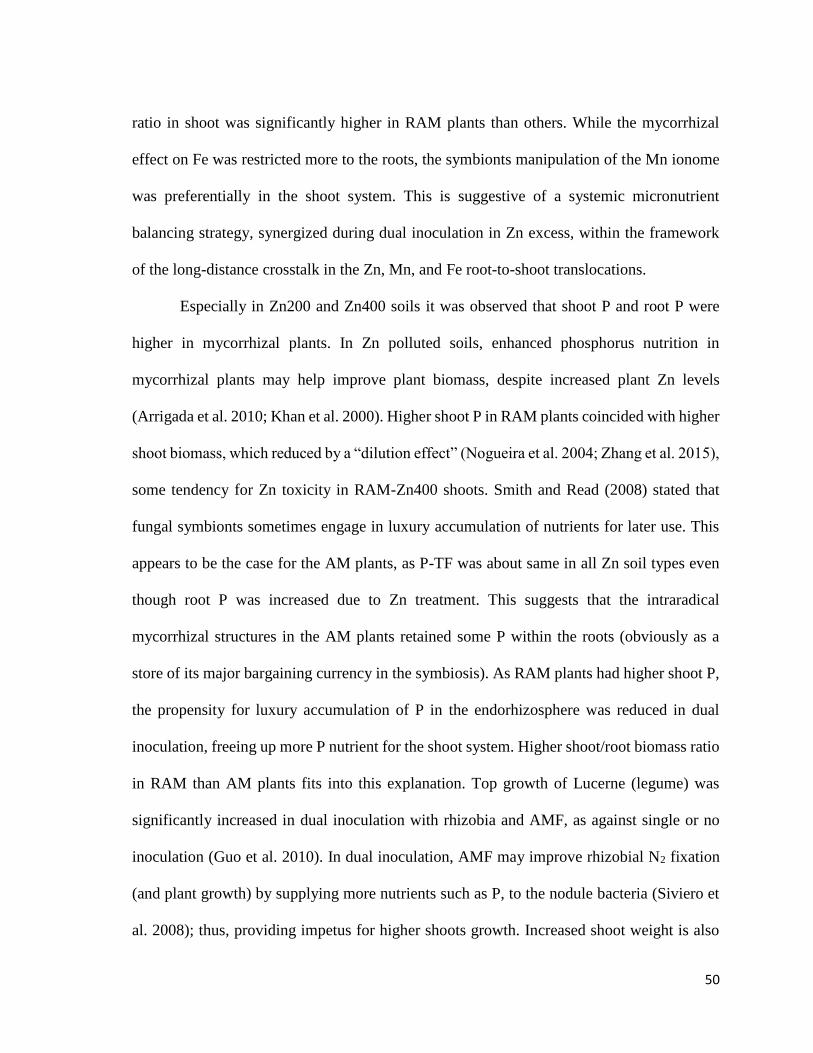
50
ratio in shoot was significantly higher in RAM plants than others. While the mycorrhizal
effect on Fe was restricted more to the roots, the symbionts manipulation of the Mn ionome
was preferentially in the shoot system. This is suggestive of a systemic micronutrient
balancing strategy, synergized during dual inoculation in Zn excess, within the framework
of the long-distance crosstalk in the Zn, Mn, and Fe root-to-shoot translocations.
Especially in Zn200 and Zn400 soils it was observed that shoot P and root P were
higher in mycorrhizal plants. In Zn polluted soils, enhanced phosphorus nutrition in
mycorrhizal plants may help improve plant biomass, despite increased plant Zn levels
(Arrigada et al. 2010; Khan et al. 2000). Higher shoot P in RAM plants coincided with higher
shoot biomass, which reduced by a “dilution effect” (Nogueira et al. 2004; Zhang et al. 2015),
some tendency for Zn toxicity in RAM-Zn400 shoots. Smith and Read (2008) stated that
fungal symbionts sometimes engage in luxury accumulation of nutrients for later use. This
appears to be the case for the AM plants, as P-TF was about same in all Zn soil types even
though root P was increased due to Zn treatment. This suggests that the intraradical
mycorrhizal structures in the AM plants retained some P within the roots (obviously as a
store of its major bargaining currency in the symbiosis). As RAM plants had higher shoot P,
the propensity for luxury accumulation of P in the endorhizosphere was reduced in dual
inoculation, freeing up more P nutrient for the shoot system. Higher shoot/root biomass ratio
in RAM than AM plants fits into this explanation. Top growth of Lucerne (legume) was
significantly increased in dual inoculation with rhizobia and AMF, as against single or no
inoculation (Guo et al. 2010). In dual inoculation, AMF may improve rhizobial N2 fixation
(and plant growth) by supplying more nutrients such as P, to the nodule bacteria (Siviero et
al. 2008); thus, providing impetus for higher shoots growth. Increased shoot weight is also
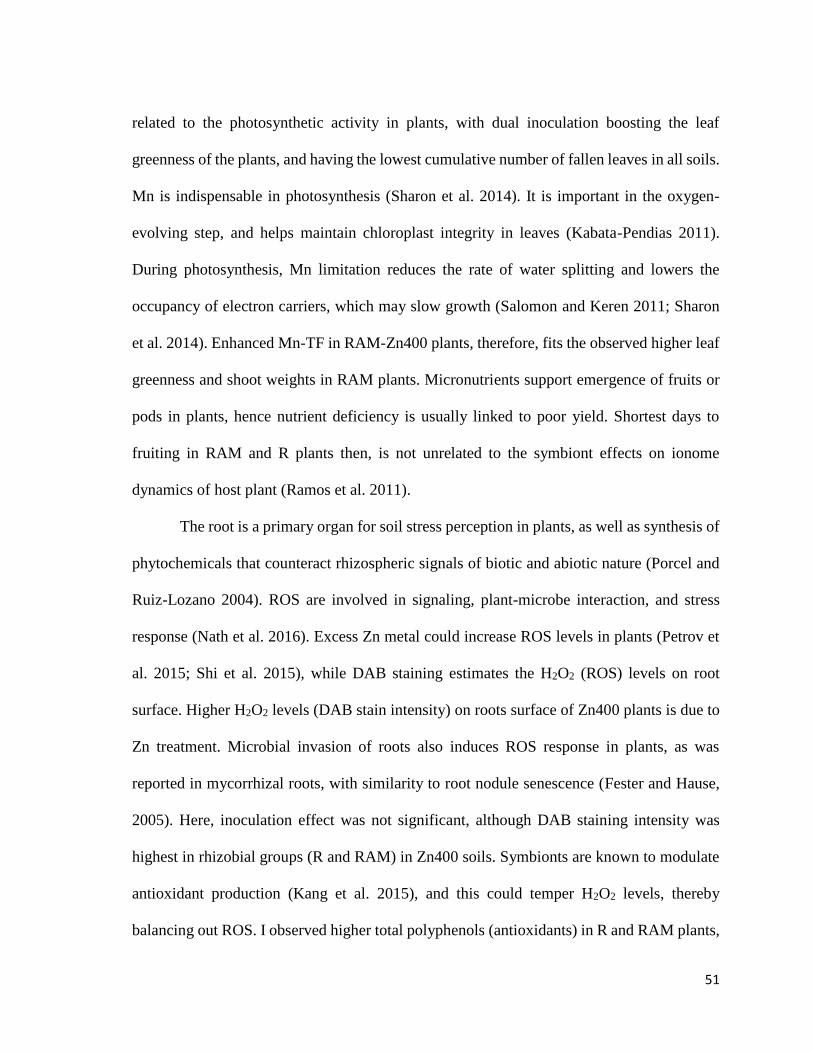
51
related to the photosynthetic activity in plants, with dual inoculation boosting the leaf
greenness of the plants, and having the lowest cumulative number of fallen leaves in all soils.
Mn is indispensable in photosynthesis (Sharon et al. 2014). It is important in the oxygen-
evolving step, and helps maintain chloroplast integrity in leaves (Kabata-Pendias 2011).
During photosynthesis, Mn limitation reduces the rate of water splitting and lowers the
occupancy of electron carriers, which may slow growth (Salomon and Keren 2011; Sharon
et al. 2014). Enhanced Mn-TF in RAM-Zn400 plants, therefore, fits the observed higher leaf
greenness and shoot weights in RAM plants. Micronutrients support emergence of fruits or
pods in plants, hence nutrient deficiency is usually linked to poor yield. Shortest days to
fruiting in RAM and R plants then, is not unrelated to the symbiont effects on ionome
dynamics of host plant (Ramos et al. 2011).
The root is a primary organ for soil stress perception in plants, as well as synthesis of
phytochemicals that counteract rhizospheric signals of biotic and abiotic nature (Porcel and
Ruiz-Lozano 2004). ROS are involved in signaling, plant-microbe interaction, and stress
response (Nath et al. 2016). Excess Zn metal could increase ROS levels in plants (Petrov et
al. 2015; Shi et al. 2015), while DAB staining estimates the H2O2 (ROS) levels on root
surface. Higher H2O2 levels (DAB stain intensity) on roots surface of Zn400 plants is due to
Zn treatment. Microbial invasion of roots also induces ROS response in plants, as was
reported in mycorrhizal roots, with similarity to root nodule senescence (Fester and Hause,
2005). Here, inoculation effect was not significant, although DAB staining intensity was
highest in rhizobial groups (R and RAM) in Zn400 soils. Symbionts are known to modulate
antioxidant production (Kang et al. 2015), and this could temper H2O2 levels, thereby
balancing out ROS. I observed higher total polyphenols (antioxidants) in R and RAM plants,
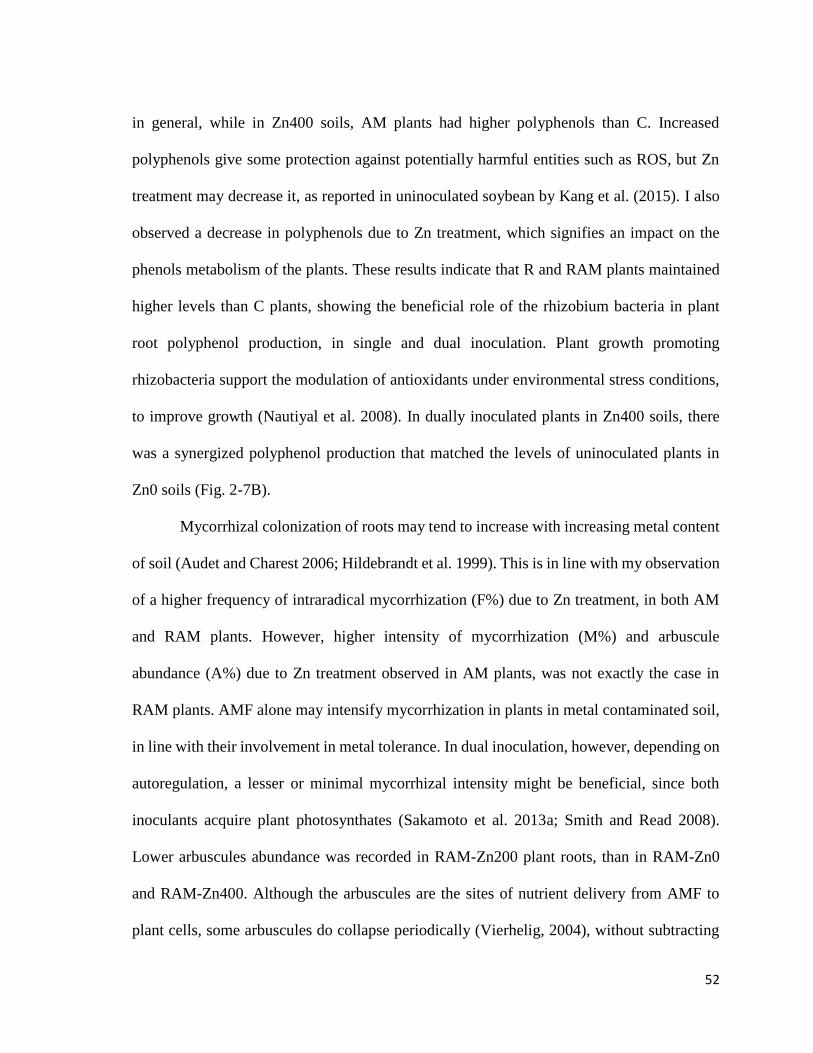
52
in general, while in Zn400 soils, AM plants had higher polyphenols than C. Increased
polyphenols give some protection against potentially harmful entities such as ROS, but Zn
treatment may decrease it, as reported in uninoculated soybean by Kang et al. (2015). I also
observed a decrease in polyphenols due to Zn treatment, which signifies an impact on the
phenols metabolism of the plants. These results indicate that R and RAM plants maintained
higher levels than C plants, showing the beneficial role of the rhizobium bacteria in plant
root polyphenol production, in single and dual inoculation. Plant growth promoting
rhizobacteria support the modulation of antioxidants under environmental stress conditions,
to improve growth (Nautiyal et al. 2008). In dually inoculated plants in Zn400 soils, there
was a synergized polyphenol production that matched the levels of uninoculated plants in
Zn0 soils (Fig. 2-7B).
Mycorrhizal colonization of roots may tend to increase with increasing metal content
of soil (Audet and Charest 2006; Hildebrandt et al. 1999). This is in line with my observation
of a higher frequency of intraradical mycorrhization (F%) due to Zn treatment, in both AM
and RAM plants. However, higher intensity of mycorrhization (M%) and arbuscule
abundance (A%) due to Zn treatment observed in AM plants, was not exactly the case in
RAM plants. AMF alone may intensify mycorrhization in plants in metal contaminated soil,
in line with their involvement in metal tolerance. In dual inoculation, however, depending on
autoregulation, a lesser or minimal mycorrhizal intensity might be beneficial, since both
inoculants acquire plant photosynthates (Sakamoto et al. 2013a; Smith and Read 2008).
Lower arbuscules abundance was recorded in RAM-Zn200 plant roots, than in RAM-Zn0
and RAM-Zn400. Although the arbuscules are the sites of nutrient delivery from AMF to
plant cells, some arbuscules do collapse periodically (Vierhelig, 2004), without subtracting
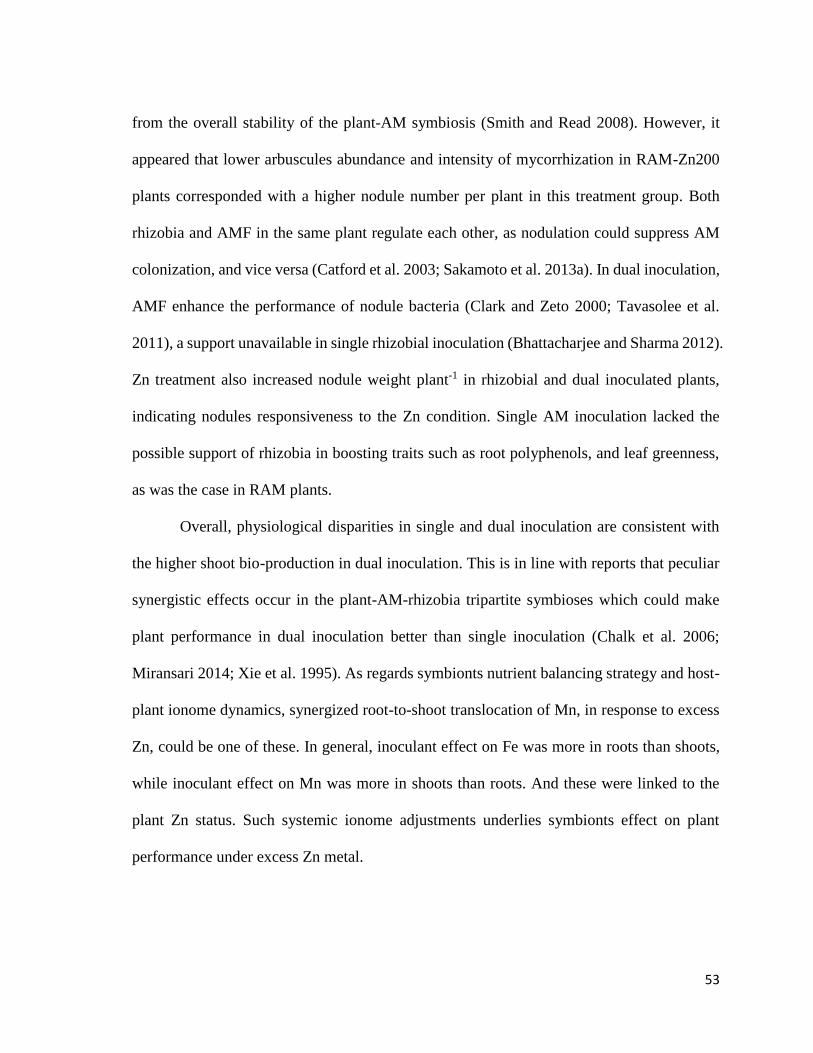
53
from the overall stability of the plant-AM symbiosis (Smith and Read 2008). However, it
appeared that lower arbuscules abundance and intensity of mycorrhization in RAM-Zn200
plants corresponded with a higher nodule number per plant in this treatment group. Both
rhizobia and AMF in the same plant regulate each other, as nodulation could suppress AM
colonization, and vice versa (Catford et al. 2003; Sakamoto et al. 2013a). In dual inoculation,
AMF enhance the performance of nodule bacteria (Clark and Zeto 2000; Tavasolee et al.
2011), a support unavailable in single rhizobial inoculation (Bhattacharjee and Sharma 2012).
Zn treatment also increased nodule weight plant-1 in rhizobial and dual inoculated plants,
indicating nodules responsiveness to the Zn condition. Single AM inoculation lacked the
possible support of rhizobia in boosting traits such as root polyphenols, and leaf greenness,
as was the case in RAM plants.
Overall, physiological disparities in single and dual inoculation are consistent with
the higher shoot bio-production in dual inoculation. This is in line with reports that peculiar
synergistic effects occur in the plant-AM-rhizobia tripartite symbioses which could make
plant performance in dual inoculation better than single inoculation (Chalk et al. 2006;
Miransari 2014; Xie et al. 1995). As regards symbionts nutrient balancing strategy and host-
plant ionome dynamics, synergized root-to-shoot translocation of Mn, in response to excess
Zn, could be one of these. In general, inoculant effect on Fe was more in roots than shoots,
while inoculant effect on Mn was more in shoots than roots. And these were linked to the
plant Zn status. Such systemic ionome adjustments underlies symbionts effect on plant
performance under excess Zn metal.
54
2.5 Conclusion
A greater number of studies on plant element homeostasis have considered metals separately
or individually, even where several metals were measured (Briat et al. 2015). By jointly
considering their concentration, long-distance translocation, and ratios with excess metal in
root and shoot systems, a systemic micronutrient balancing strategy of symbionts was
demonstrated. Compared with non-mycorrhizal ones, no observation of lowered shoot Zn or
Zn-TF in mycorrhizal plants (AM and RAM) in Zn excess soil, was made. Rather, Gigaspora
rosea and Bradyrhizobium diazoefficiens improved shoot Zn and systemically modulated Mn
and Fe in the host plant ionome. In dual inoculation, synergy between co-inoculated AM and
rhizobia for much enhanced Mn-TF was indicated in 400 mg Zn kg-1 treatment. This strategy,
which is supported with improvements in shoot P, root polyphenols, leaf greenness, and
reduction in cumulative number of shed leaves, resulted in higher shoot production, in dual
inoculation.
55
CHAPTER THREE
Synergic effect of arbuscular mycorrhizal fungi and bradyrhizobia on biomass
response, element partitioning and metallothionein gene expression of soybean-
host under excess soil zinc
3.1 Introduction
In chapter two, it was observed that plants dually inoculated with Bradyrhizobium
diazoefficiens and Gigaspora rosea had higher shoot bioproduction, compared with singly
inoculated and/or uninoculated plants. A systemic micronutrient balancing strategy of the
rhizobial and AM fungal symbionts was also demonstrated in soybean-host under excess Zn.
It was earlier observed that while excess Zn antagonized Mn in roots and shoots, symbionts
mitigated this by improving shoot Mn concentrations, with synergy between AM and R on
root-to-shoot Mn translocation, alongside improvements in leaf greenness, shoot P, and root
polyphenols, in the dually inoculated plants. However, the possibility of achieving different
results with a different AM fungal inoculum needed to be considered due to the case-by-case
nature of effects (Gamalero et al. 2009). In this chapter, I considered the synergic responses
underlying symbionts effectiveness in the dual inoculation partnership between
Bradyrhizobium diazoefficiens and Claroideoglomus etunicatum.
As a possible consideration in the utilization of microbial resources, synergic effects
of inoculants in AM-rhizobial partnerships for optimized host response is valuable under
various soil TE conditions. While obtaining a positive biomass response of the host-plant
remains a central objective for inoculum deployment in plant production, it has been argued
56
that aside insufficient time for the “maturity” of plant-AM symbiosis during short-term
studies (Smith and Smith 2011), evaluating inoculant effectiveness using only total biomass
(as is commonly observed in literature) may mask biomass allocations between plant parts,
and obscure a precise microsymbiont effect on host bioproduction (Jayne and Quigley 2014).
Consequently, to evaluate the biomass partitioning effects of symbionts, the biomass
response calculation for distinct parts of host-plant had been suggested (Poorter and Nagel
2000; Veresoglou et al. 2012). Zn and manganese (Mn) nutrition in soybean has been
implicated in the biomass response to symbionts (Nogueira and Cardoso 2003; Ibiang et al.
2017). Both elements have similar ionic potential (charge/size ratio), may bioaccumulate
together or antagonize one another, and share some metal transporters (Korshunova et al.
1999; Bravo et al. 2017). Therefore, symbiont effects on the partitioning of Zn and Mn may
underlie host biomass response under elevated soil Zn conditions, despite a change in AM
fungal species.
Metallothioneins (MTs) are a group (types 1 - 4) of cysteine-rich metal-binding
proteins that are involved in metal homeostasis and ROS response, but their roles are not
fully known in plants (Hassinen et al. 2011). While MT1 is strongly expressed in roots (Guo
et al. 2003), its role in host response to symbionts requires further elucidation within the
context of AMF-rhizobia synergism. Here, the effect of B. diazoefficiens and C. etunicatum
on bioproduction, organ-level partitioning of Zn and Mn, and type 1 metallothionein gene
(GmMT1) expression in soybean-host, under normal and moderately elevated soil Zn
conditions, was examined. The soil pH and available soil TE in pots after plant harvest was
also examined.
57
3.2 Materials and methods
3.2.1 Soil
The soil utilized for this study was a mix of river sand and loam soil (sieved using a 2mm
mesh prior to mixing) in the ratio of 3:2 respectively. Characteristics of the unpolluted,
unfertilized, unplanted soil-mix was determined to be: pH (6.27 ± 0.09), EC (3.99 ± 0.42 mS
m-1), available Zn (0.12 ± 0.04 µg g-1), Fe (9.42 ± 0.44 µg g-1), Mn (8.59 ± 0.23 µg g-1) and
Cu (0.18 ± 0.02 µg g-1). Bulk soils in plastic bags were autoclaved (121°C for 60 min) twice
(at 24 h intervals), after which ZnSO4.7H2O was dissolved in sterile distilled water and
applied with mixing to the soils at 0 mg Zn kg-1 soil (Zn0), 200 mg Zn kg-1 soil (Zn200) and
400 mg Zn kg-1 (Zn400), and stored (25°C) for one week before use. Zn treatments at Zn200
and Zn400 were chosen for their relevance to elevated Zn conditions in agricultural soils
rather than to assuredly elicit metal toxicity (Pilon et al. 2009). On seeding day, soils were
initially amended with dolomite (Ca: 278.7, Mg: 96.5 mg pot-1), NPK fertilizer (N:30, P:44;
K:83 mg pot-1) and nutrient solution (ZnSO4.7H2O: 50, MnSO4.5H2O: 286, CuSO4.5H2O:
50, CoCl2.6H2O: 6; mg pot-1, Fe-EDTA.3H2O: 8.78 g pot-1). Additional N fertilizer (35 mg
pot-1) was later applied at 4 and at 7 weeks after seeding.
3.2.2 Seeds
The soybean, Glycine max (L.) Merr. (cv. Enrei) was used in this study. Seeds were sterilized
in 70% ethanol for 12 min, immersed in 10% H2O2 for 3 min, then rinsed in distilled water
before sowing in pots containing soils (three seeds pot-1, later thinned to one).
3.2.3 Experimental setup
The experiment was set up as a 3×4 factorial in a completely randomized design. Factor 1
was the Zn application (Zn0, Zn200, and Zn400), while factor 2 was the inoculation -
58
rhizobium alone (R), AM fungus alone (AM), rhizobium + AM fungus (RAM), and
uninoculated control (C). Each treatment was replicated 7 times giving a total of 84
experimental pots. All plants were routinely supplied with borehole water and pots were
rotated weekly in the glasshouse for nine weeks.
3.2.4 Symbiont inoculations
The AMF used was Claroideoglomus etunicatum (supplied by Kyowa Hakko Kogyo Co. Ltd,
now Kyowa Hakko Kirin Co. Ltd, Japan), while R was Bradyrhizobium diazoefficiens USDA
110 (USDA Rhizobium culture collection). AM fungal inoculum (soil bearing approx. 400
AM spores) was applied in the middle of soil in the pot, just prior to seeding. Bradyrhizobium
diazoefficiens obtained from pure stock was maintained in YMB, and volume of broth was
adjusted with sterile water as needed to obtain an average rhizobial cell concentration of 5.0
× 107 cells mL-1. This diluted broth was used for rhizobial inoculation at the rate of 1 mL
seed-1 at time of seeding.
3.2.5 Plant harvest
At nine weeks after seeding, leaf greenness (SPAD 502 Plus Chlorophyll Meter, Konica
Minolta, Japan, INC.) were determined and five plants (n=5) were randomly chosen for
further analysis. Plants were wholly harvested by carefully emptying the soil from the plastic
pots into labeled polythene bags, breaking apart soil mass loosely attached to roots in a bucket
of water, washing in running tap water and rinsing in distilled water. The whole plant was
then cut into the roots, stem, leaves, and pods. A portion of roots was subtracted for total
RNA extraction (frozen in liquid nitrogen then stored at -80°C) and determination of
mycorrhizal colonization before drying all fresh biomass in the oven at 80°C for 48 hr.
59
3.2.6 Plant bioproduction and response to inoculants
Total dry weight, as well as root, stem, leaf, and pod dry weights, were determined. Symbiont
effectiveness was determined as total biomass response (Nogueira and Cardoso 2003), while
root biomass response (RBR), stem biomass response (SBR), leaf biomass response (LBR)
and pod biomass response (PBR) were calculated separately (Watts-Williams and Cavagnaro
2012) for each soil condition using the dry weights of inoculated plants (DWsym.) and
uninoculated control (DWcontrol) as shown below:
Biomass response (%) = (DW(sym.) – mean DW(control))/mean DW(control) (×100) ……. (2).
3.2.7 Rhizobial nodule and mycorrhizal colonization
Symbiont colonization parameters were assessed in all the plants. Root nodules (R and RAM)
were removed from roots, counted and weighed. Mycorrhizal colonization (AM and RAM)
was determined in roots using the trypan blue staining technique previously described by
Rajapakse and Miller (1994). Observation and scoring in a light microscope for
mycorrhization indices was according to Trouvelot et al. (1986).
3.2.8 RNA extraction, cDNA synthesis and Real-Time RT-PCR
Total RNA extraction of root sample was carried out using FavorPrep™ kits (FAVORGEN
BIOTECH CORP) according to manufacturer recommendations, including DNA elimination
step using DNase I. The concentration of extracted RNA was confirmed using NanoDrop
Lite Spectrophotometer (Thermo Scientific, USA) and samples with less than 20 ng µL-1
RNA concentration were repeated using a fresh tissue sub-sample. cDNA synthesis
(BIORAD T100™ Thermal Cycler) was then performed using total RNA volume equivalent
to 200 ng in 20 µL total volume mix containing 10 mM dNTPs (Takara, Japan), 5X RT buffer
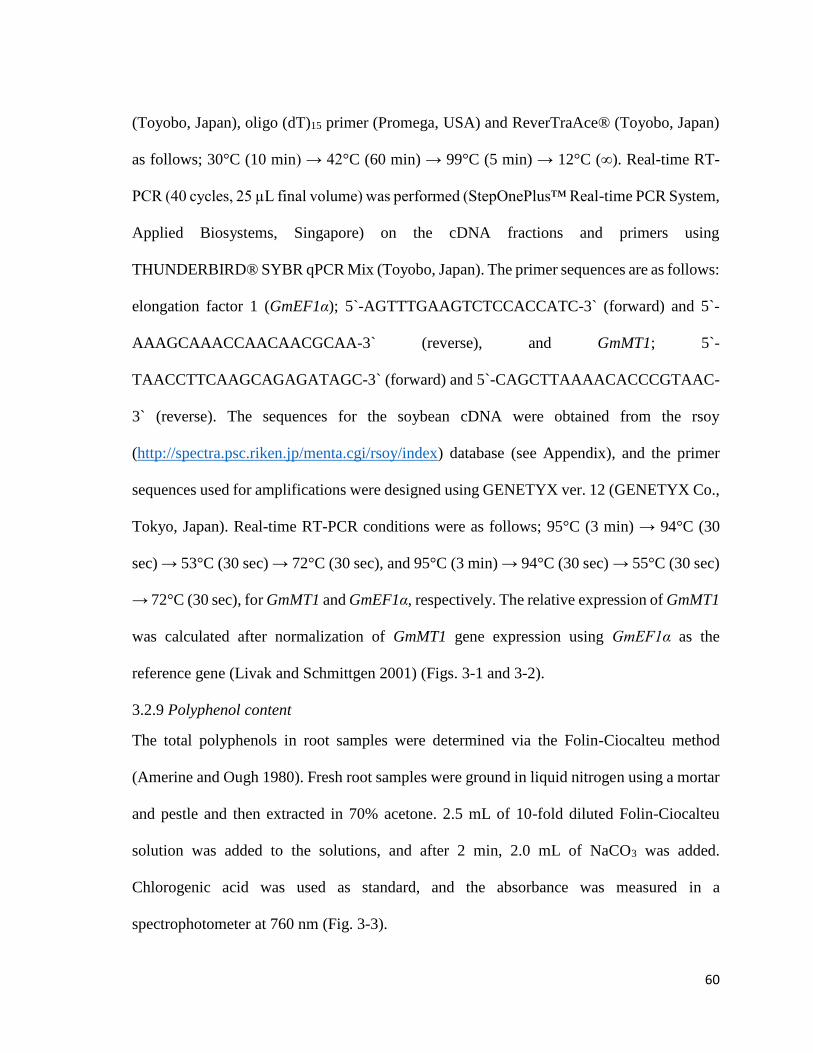
60
(Toyobo, Japan), oligo (dT)15 primer (Promega, USA) and ReverTraAce® (Toyobo, Japan)
as follows; 30°C (10 min) → 42°C (60 min) → 99°C (5 min) → 12°C (∞). Real-time RT-
PCR (40 cycles, 25 µL final volume) was performed (StepOnePlus™ Real-time PCR System,
Applied Biosystems, Singapore) on the cDNA fractions and primers using
THUNDERBIRD® SYBR qPCR Mix (Toyobo, Japan). The primer sequences are as follows:
elongation factor 1 (GmEF1α); 5`-AGTTTGAAGTCTCCACCATC-3` (forward) and 5`-
AAAGCAAACCAACAACGCAA-3` (reverse), and GmMT1; 5`-
TAACCTTCAAGCAGAGATAGC-3` (forward) and 5`-CAGCTTAAAACACCCGTAAC-
3` (reverse). The sequences for the soybean cDNA were obtained from the rsoy
(http://spectra.psc.riken.jp/menta.cgi/rsoy/index) database (see Appendix), and the primer
sequences used for amplifications were designed using GENETYX ver. 12 (GENETYX Co.,
Tokyo, Japan). Real-time RT-PCR conditions were as follows; 95°C (3 min) → 94°C (30
sec) → 53°C (30 sec) → 72°C (30 sec), and 95°C (3 min) → 94°C (30 sec) → 55°C (30 sec)
→ 72°C (30 sec), for GmMT1 and GmEF1α, respectively. The relative expression of GmMT1
was calculated after normalization of GmMT1 gene expression using GmEF1α as the
reference gene (Livak and Schmittgen 2001) (Figs. 3-1 and 3-2).
3.2.9 Polyphenol content
The total polyphenols in root samples were determined via the Folin-Ciocalteu method
(Amerine and Ough 1980). Fresh root samples were ground in liquid nitrogen using a mortar
and pestle and then extracted in 70% acetone. 2.5 mL of 10-fold diluted Folin-Ciocalteu
solution was added to the solutions, and after 2 min, 2.0 mL of NaCO3 was added.
Chlorogenic acid was used as standard, and the absorbance was measured in a
spectrophotometer at 760 nm (Fig. 3-3).
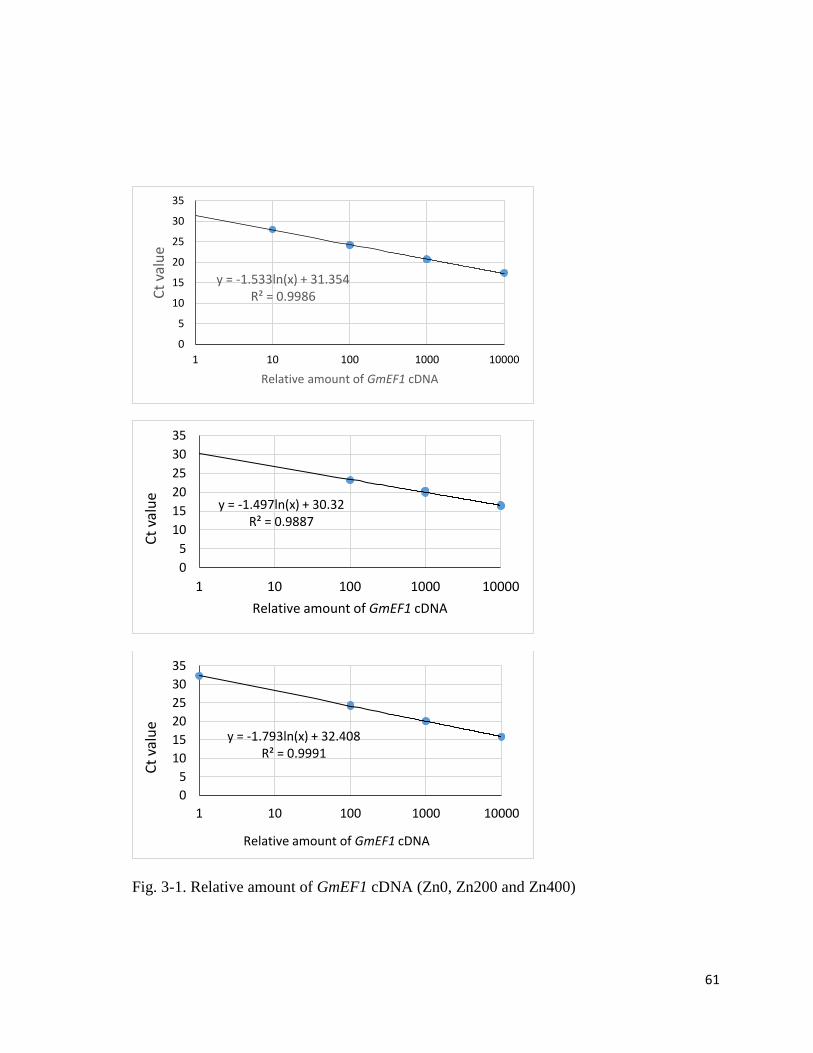
61
Fig. 3-1. Relative amount of GmEF1 cDNA (Zn0, Zn200 and Zn400)
y = -1.533ln(x) + 31.354R² = 0.9986
0
5
10
15
20
25
30
35
1 10 100 1000 10000
Ct
valu
e
Relative amount of GmEF1 cDNA
y = -1.497ln(x) + 30.32R² = 0.9887
0
5
10
15
20
25
30
35
1 10 100 1000 10000
Ct
valu
e
Relative amount of GmEF1 cDNA
y = -1.793ln(x) + 32.408R² = 0.9991
0
5
10
15
20
25
30
35
1 10 100 1000 10000
Ct
valu
e
Relative amount of GmEF1 cDNA
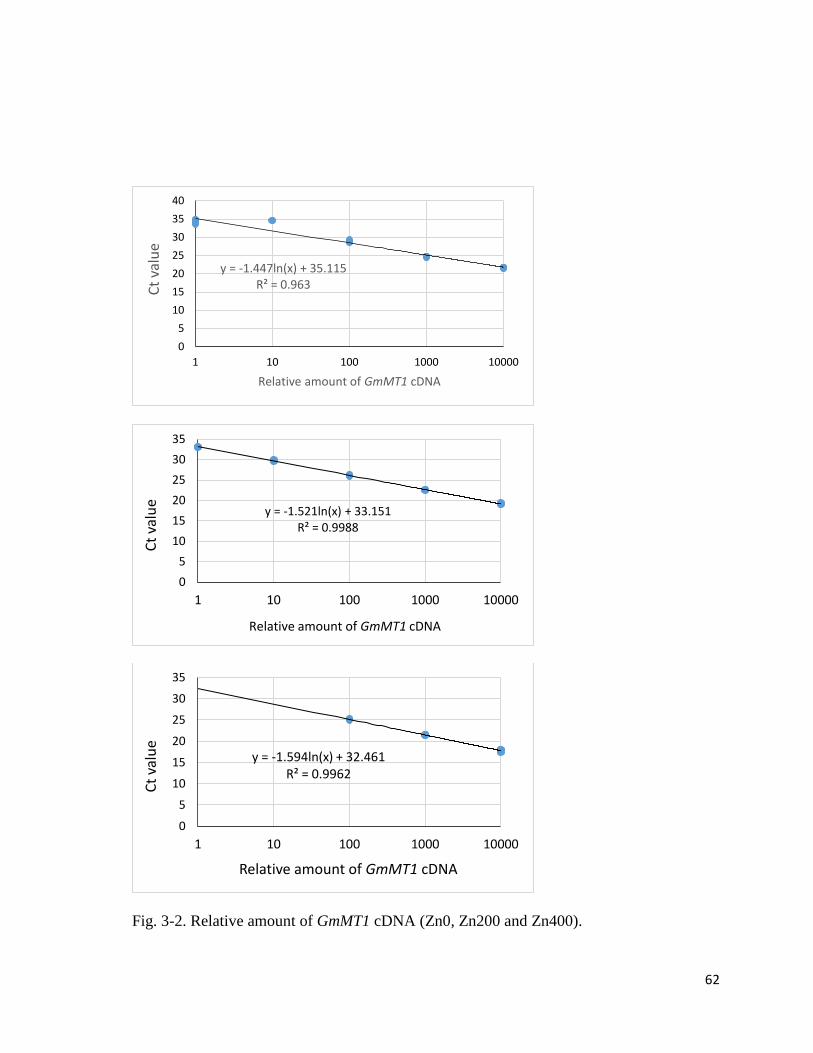
62
Fig. 3-2. Relative amount of GmMT1 cDNA (Zn0, Zn200 and Zn400).
y = -1.447ln(x) + 35.115R² = 0.963
0
5
10
15
20
25
30
35
40
1 10 100 1000 10000
Ct
valu
e
Relative amount of GmMT1 cDNA
y = -1.521ln(x) + 33.151R² = 0.9988
0
5
10
15
20
25
30
35
1 10 100 1000 10000
Ct
valu
e
Relative amount of GmMT1 cDNA
y = -1.594ln(x) + 32.461R² = 0.9962
0
5
10
15
20
25
30
35
1 10 100 1000 10000
Ct
valu
e
Relative amount of GmMT1 cDNA
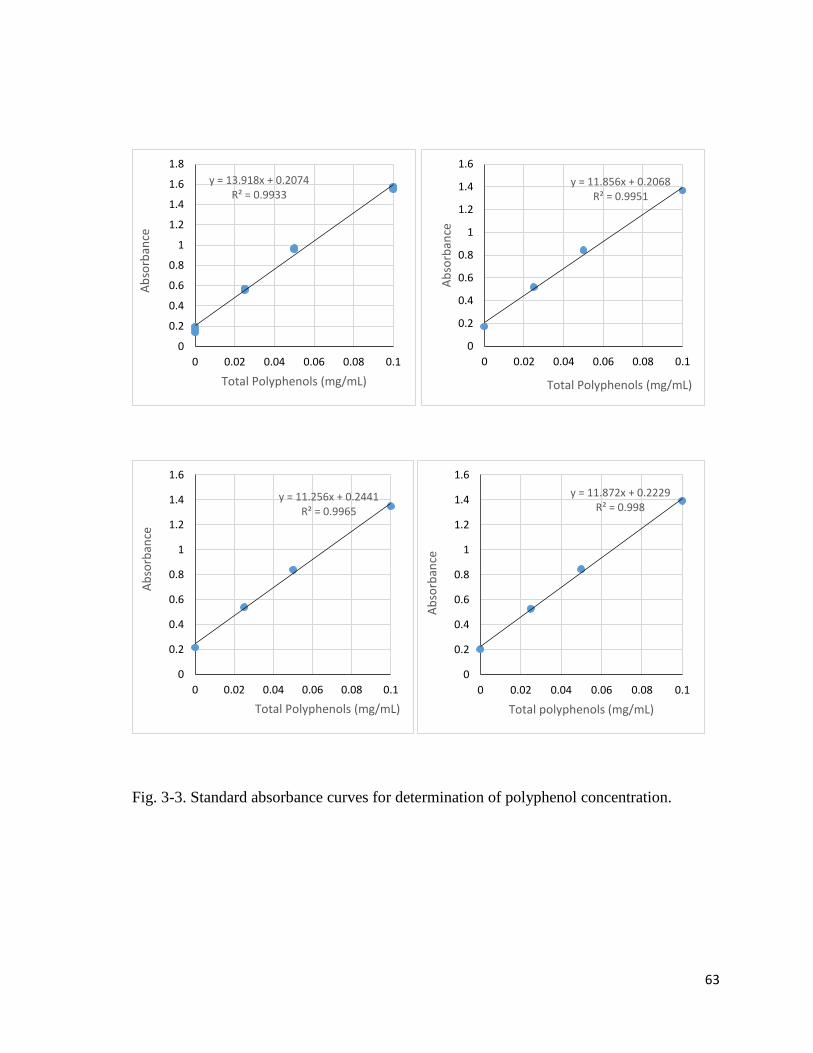
63
Fig. 3-3. Standard absorbance curves for determination of polyphenol concentration.
y = 13.918x + 0.2074R² = 0.9933
0
0.2
0.4
0.6
0.8
1
1.2
1.4
1.6
1.8
0 0.02 0.04 0.06 0.08 0.1
Ab
sorb
ance
Total Polyphenols (mg/mL)
y = 11.856x + 0.2068R² = 0.9951
0
0.2
0.4
0.6
0.8
1
1.2
1.4
1.6
0 0.02 0.04 0.06 0.08 0.1
Ab
sorb
ance
Total Polyphenols (mg/mL)
y = 11.256x + 0.2441R² = 0.9965
0
0.2
0.4
0.6
0.8
1
1.2
1.4
1.6
0 0.02 0.04 0.06 0.08 0.1
Ab
sorb
ance
Total Polyphenols (mg/mL)
y = 11.872x + 0.2229R² = 0.998
0
0.2
0.4
0.6
0.8
1
1.2
1.4
1.6
0 0.02 0.04 0.06 0.08 0.1
Ab
sorb
ance
Total polyphenols (mg/mL)
64
3.2.10 H2O2 estimation
As an indicator of ROS production, H2O2 levels were determined on root and nodule using
the 3, 3’-diaminobenzidine (DAB) staining procedure described by Fester and Hause (2005).
Sections of fresh roots and razor-split nodules were immersed in DAB solution for 1 h at
room temperature, and transferred to 10% lactic acid solution in Petri dishes. Photos of
randomly chosen tissue sections were captured in a light microscope (Nikon ECLIPSE 50i,
Nikon, Japan) and DAB staining intensity was quantified using ImageJ software
(http://imagej.nih.gov/ij/)(Royo et al. 2015).
3.2.11 Element analysis in plant tissues
Element concentrations were determined using milled dry tissue samples. 100 mg of tissue
was ignited in an electric muffle furnace (ADVANTEC FUL220FA, Tokyo, Japan) at 550°C
for 6 h, and digested in 0.6 mol L-1 HCl, after which element concentrations (Fig. 3-4) in
solutions were measured using Atomic absorption spectrophotometry (Shimadzu AA-6600F,
Japan). Element translocation factor (TF) from root to stem and from stem to leaf was
calculated as metal concentrations (µg g-1) in stem divided by that in root, and concentration
in leaf divided by that in stem, respectively (Gharaibeh et al. 2016). To examine the balance
in element concentrations in leaves, Mn:Zn, and Fe:Zn ratios were calculated using leaf Zn,
Mn, and Fe concentrations.
3.2.12 pH and available element in soil
Soils from each pot were recovered in a bag at harvest and bulked. 10 g of soil was mixed
with 50 mL of ultrapure water, then vortexed at maximum speed (R.K.I Test tube mixer 60-
042, IKEMOTO, Japan) twice for 30 secs, allowed to stand for 1 h, and vortexed again before
measuring the pH (Horiba pH Meter D-51). Available soil element was determined using
65
diethylenetriamine pentaacetic acid (DTPA) solution. 10 g of soil was extracted using 20 mL
of 0.005 mol L-1 DTPA (pH 7.3) according to Lindsay and Norvell (1978) (Table 3-1). The
concentration of available Zn and Mn in the soil extracts were measured using Atomic
absorption spectrophotometry (Fig. 3-5). The moisture content of a portion of soils was also
determined after drying in the oven at 105ºC for >24 h to enable subsequent calculation of
dry soil weights.
3.2.13 Statistical analysis
Data collected were processed statistically by two-way analysis of variance (ANOVA), with
significance level set at P<0.05. Differences between treatment group means were based on
Tukey-Kramer Tests.
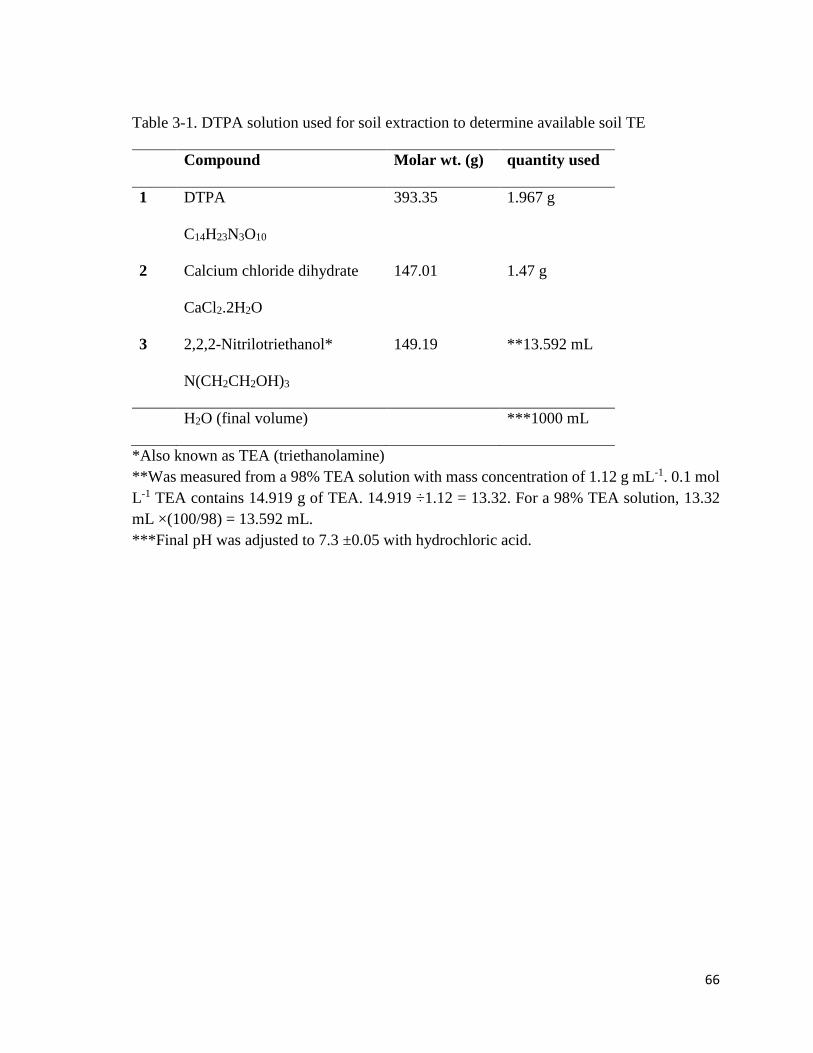
66
Table 3-1. DTPA solution used for soil extraction to determine available soil TE
Compound Molar wt. (g) quantity used
1 DTPA
C14H23N3O10
393.35 1.967 g
2 Calcium chloride dihydrate
CaCl2.2H2O
147.01 1.47 g
3 2,2,2-Nitrilotriethanol*
N(CH2CH2OH)3
149.19 **13.592 mL
H2O (final volume) ***1000 mL
*Also known as TEA (triethanolamine)
**Was measured from a 98% TEA solution with mass concentration of 1.12 g mL-1. 0.1 mol
L-1 TEA contains 14.919 g of TEA. 14.919 ÷1.12 = 13.32. For a 98% TEA solution, 13.32
mL ×(100/98) = 13.592 mL.
***Final pH was adjusted to 7.3 ±0.05 with hydrochloric acid.
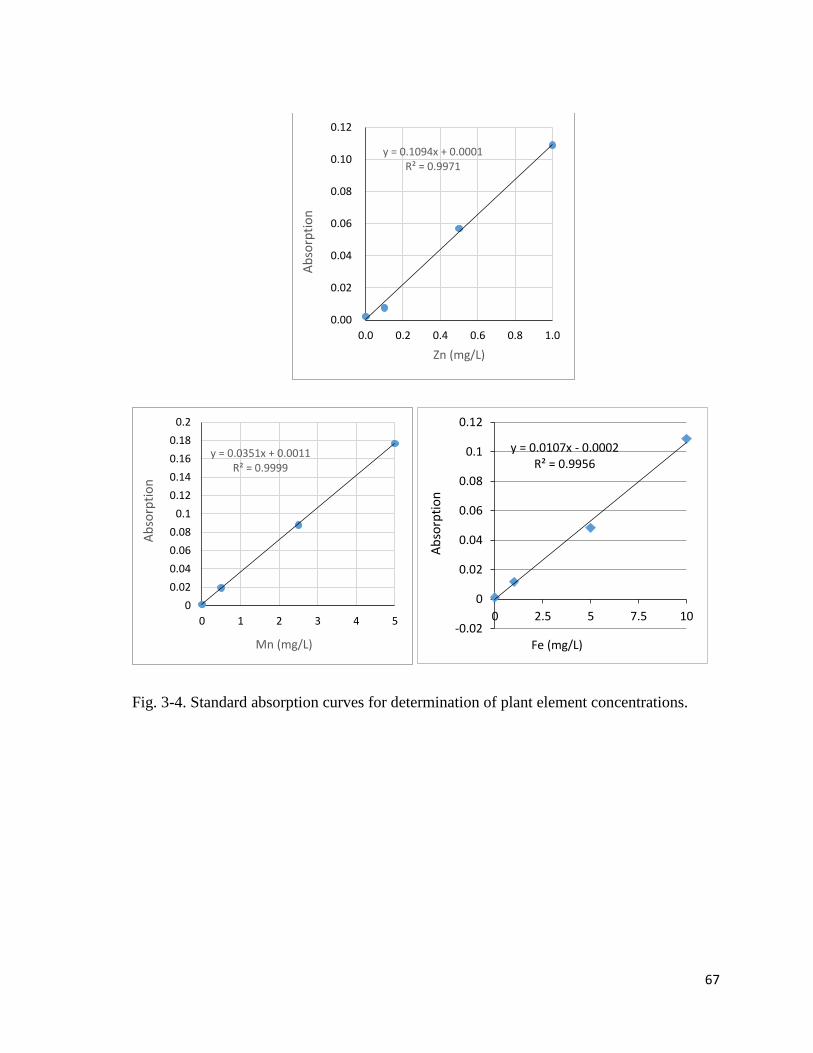
67
Fig. 3-4. Standard absorption curves for determination of plant element concentrations.
y = 0.1094x + 0.0001R² = 0.9971
0.00
0.02
0.04
0.06
0.08
0.10
0.12
0.0 0.2 0.4 0.6 0.8 1.0
Ab
sorp
tio
n
Zn (mg/L)
y = 0.0351x + 0.0011R² = 0.9999
0
0.02
0.04
0.06
0.08
0.1
0.12
0.14
0.16
0.18
0.2
0 1 2 3 4 5
Ab
sorp
tio
n
Mn (mg/L)
y = 0.0107x - 0.0002R² = 0.9956
-0.02
0
0.02
0.04
0.06
0.08
0.1
0.12
0 2.5 5 7.5 10
Ab
sorp
tio
n
Fe (mg/L)
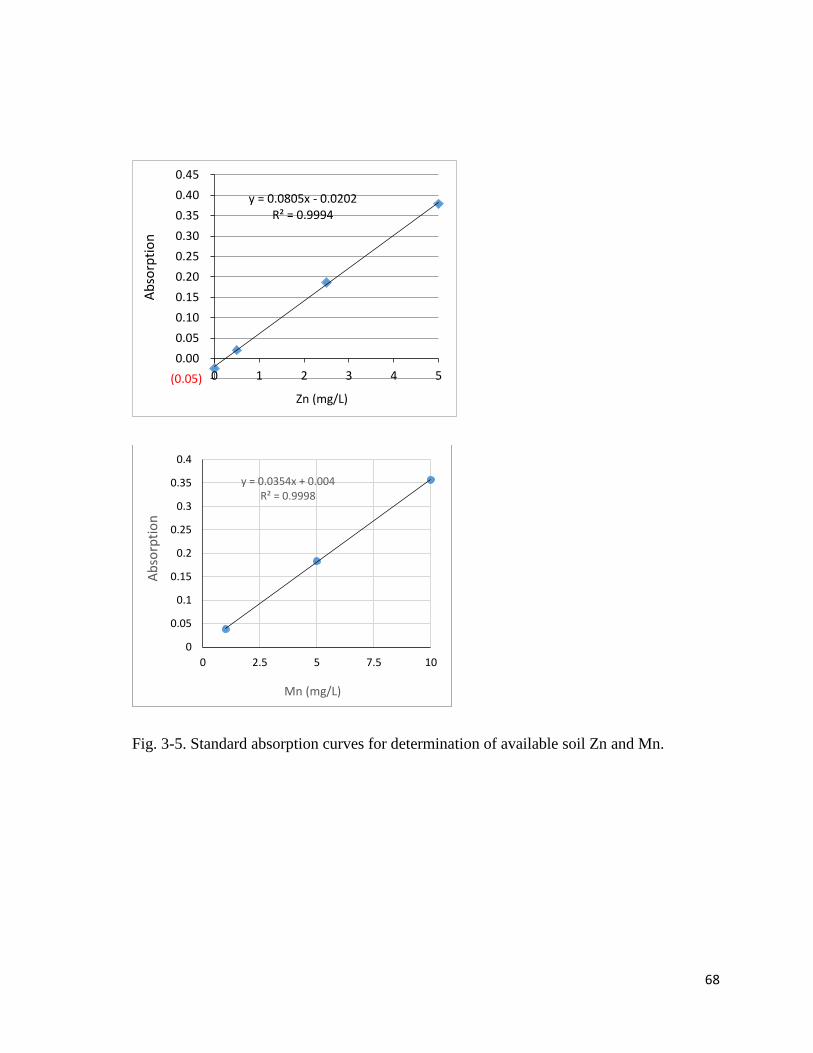
68
Fig. 3-5. Standard absorption curves for determination of available soil Zn and Mn.
y = 0.0805x - 0.0202R² = 0.9994
(0.05)
0.00
0.05
0.10
0.15
0.20
0.25
0.30
0.35
0.40
0.45
0 1 2 3 4 5
Ab
sorp
tio
n
Zn (mg/L)
y = 0.0354x + 0.004R² = 0.9998
0
0.05
0.1
0.15
0.2
0.25
0.3
0.35
0.4
0 2.5 5 7.5 10
Ab
sorp
tio
n
Mn (mg/L)
69
3.3 Results
3.3.1 Plant bioproduction and biomass response
While RAM plants were generally taller (Plate 3-1), the excess Zn treatments induced smaller
mildly curled leaves but no chlorosis was observed. Total dry weight (Fig. 3-6A) showed
significant differences (Table 3-2) between the groups, with RAM plants having the highest
values in all soil Zn treatments. In Zn0 and Zn200 soils, AM and RAM groups had
significantly higher values than C and R, while in Zn400 soil, C, R, and AM groups were not
different. Excess Zn was generally tolerated, but it significantly lowered total dry weight in
AM and RAM, compared to their values in Zn0. Compared to C, R generally favored root
bioproduction, and root dry weight (Fig. 3-6B) was generally highest in RAM groups. In Zn0
and Zn200 soils, respectively, AM had significantly and insignificantly higher root
production than C, but in Zn400 soil, AM had insignificantly reduced root biomass compared
to C. Stem dry weight (Fig. 3-6C) was increased in AM and RAM groups in Zn0 and Zn200
soils. In Zn400 soils, stem dry weights were not significantly different between control and
symbiont groups. Leaf dry weight (Fig. 3-6D) was significantly higher in RAM groups in all
soils but was decreased by excess Zn in AM and RAM. AM plants in Zn0 and Zn200 soils
had higher values than C and R. Pod dry weights (Fig. 3-6E) were not significantly affected
by excess Zn treatment but values were significantly higher in AM and RAM groups, while
C and R were not different. Days to flowering (Fig. 3-6F) was significantly affected by
inoculation treatment, while Zn had no effect, as RAM plants generally had shorter days to
flowering than C and R. Overall, while no differences in total dry weight were observed
between R and C, R appeared to potentiate AM effect in dually inoculated groups.
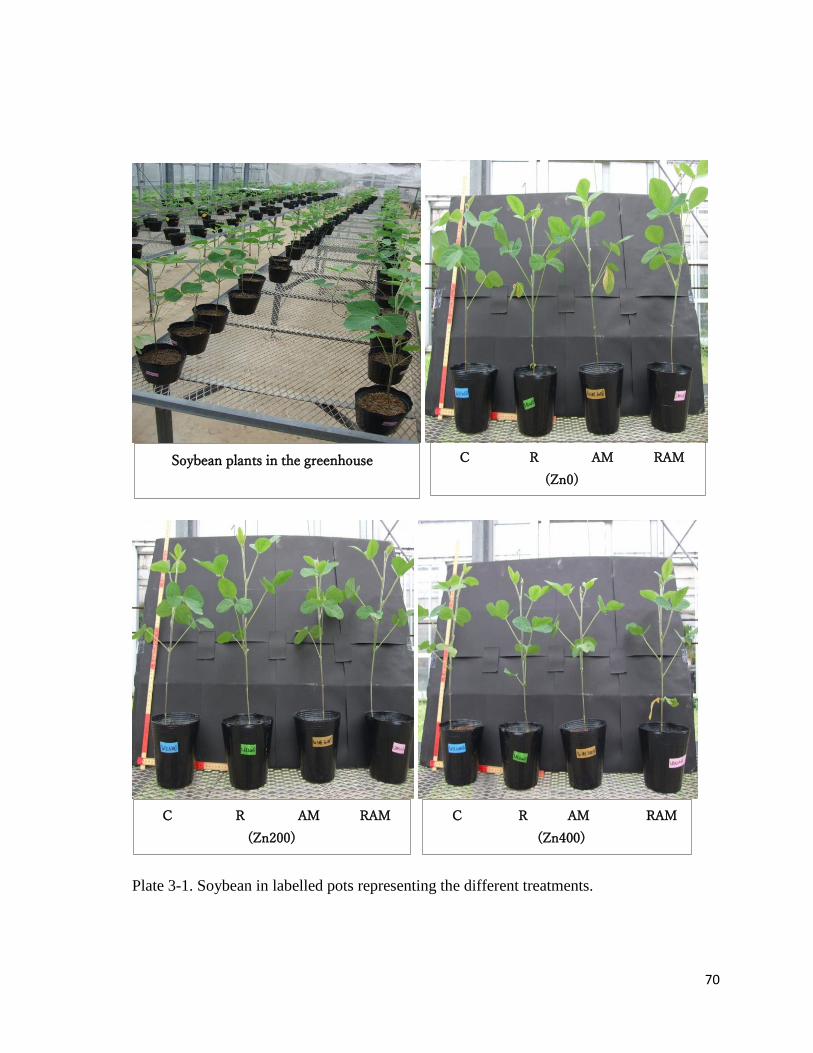
70
Plate 3-1. Soybean in labelled pots representing the different treatments.
C R AM RAM
(Zn0)
C R AM RAM
(Zn200)
C R AM RAM
(Zn400)
Soybean plants in the greenhouse
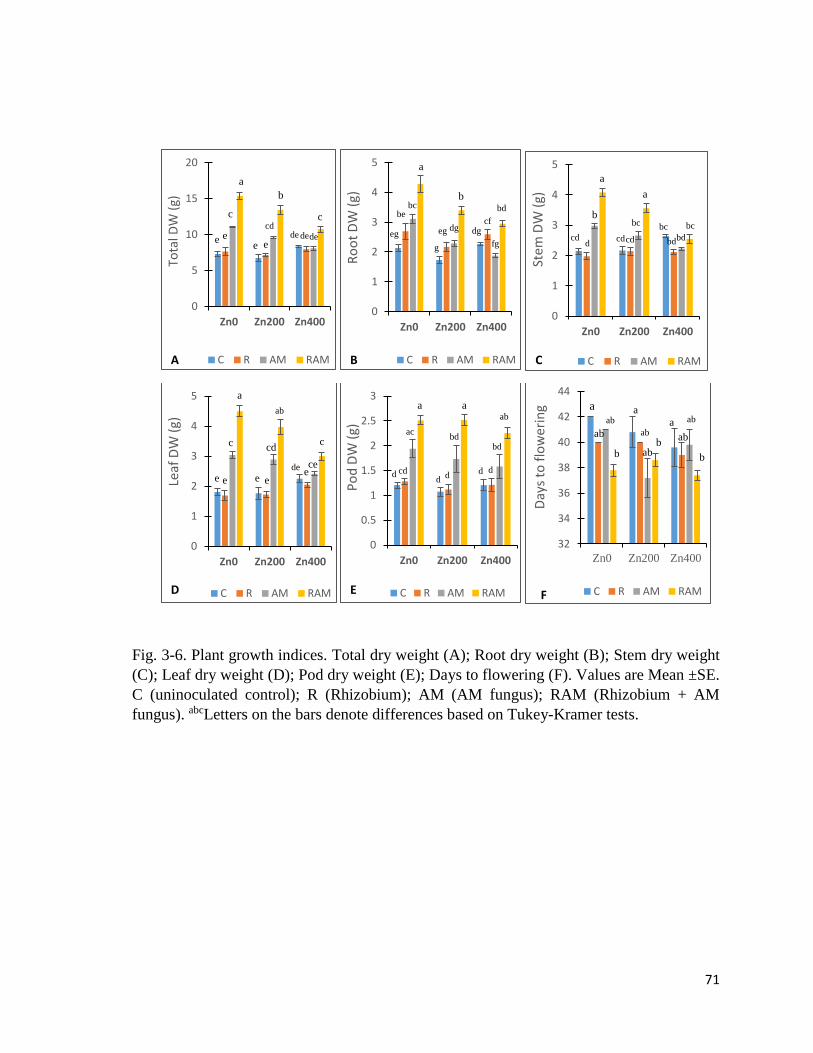
71
Fig. 3-6. Plant growth indices. Total dry weight (A); Root dry weight (B); Stem dry weight
(C); Leaf dry weight (D); Pod dry weight (E); Days to flowering (F). Values are Mean ±SE.
C (uninoculated control); R (Rhizobium); AM (AM fungus); RAM (Rhizobium + AM
fungus). abcLetters on the bars denote differences based on Tukey-Kramer tests.
0
5
10
15
20
Zn0 Zn200 Zn400
Tota
l DW
(g)
C R AM RAM
e e
c
a
e e
cd
b
de dede
c
A
0
1
2
3
4
5
Zn0 Zn200 Zn400
Ro
ot
DW
(g)
C R AM RAM
eg
bebc
a
g
eg dg
b
dgcf
fg
bd
B
0
1
2
3
4
5
Zn0 Zn200 Zn400
Stem
DW
(g)
C R AM RAM
cdd
b
a
cdcd
bc
a
bc
bdbd
bc
C
0
1
2
3
4
5
Zn0 Zn200 Zn400
Leaf
DW
(g)
C R AM RAM
e e
c
a
e e
cd
ab
deece
c
D
0
0.5
1
1.5
2
2.5
3
Zn0 Zn200 Zn400
Po
d D
W (
g)
C R AM RAM
a aab
d cd
ac
dd
bd
d d
bd
E
32
34
36
38
40
42
44
Zn0 Zn200 Zn400
Day
s to
flo
we
rin
g
C R AM RAM
a
ab
ab
b
a
ab
abb
a ab
ab
b
F
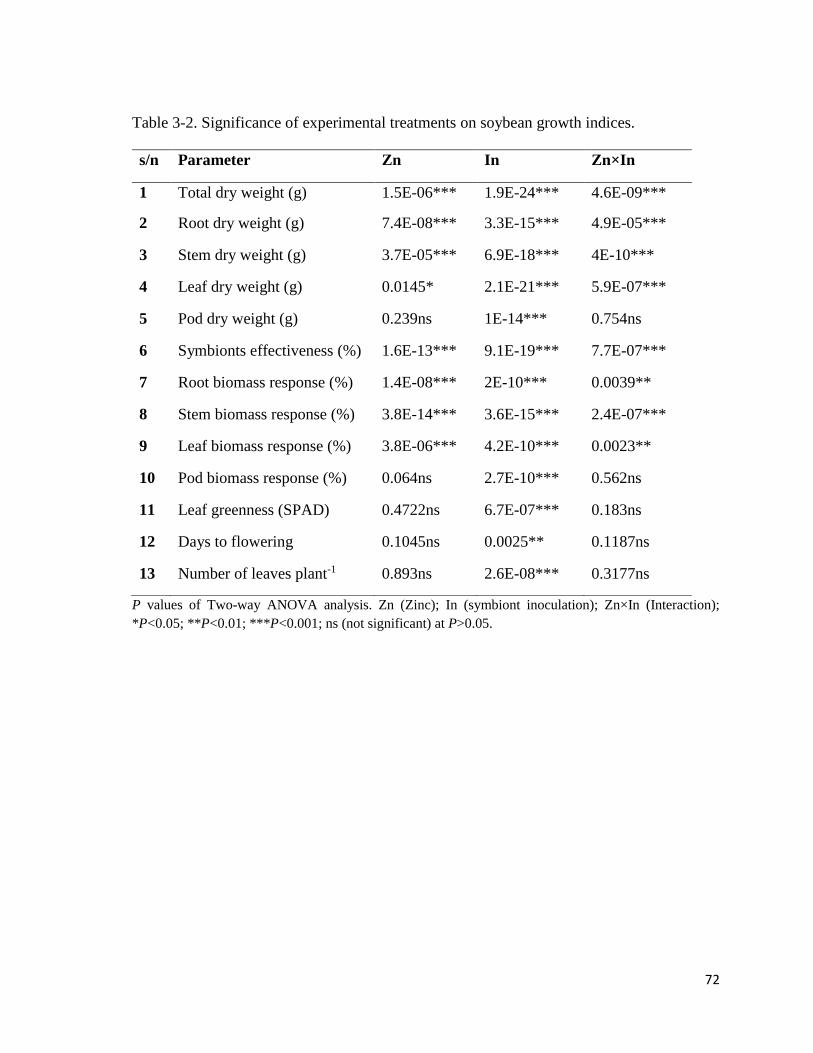
72
Table 3-2. Significance of experimental treatments on soybean growth indices.
P values of Two-way ANOVA analysis. Zn (Zinc); In (symbiont inoculation); Zn×In (Interaction);
*P<0.05; **P<0.01; ***P<0.001; ns (not significant) at P>0.05.
s/n Parameter Zn In Zn×In
1 Total dry weight (g) 1.5E-06*** 1.9E-24*** 4.6E-09***
2 Root dry weight (g) 7.4E-08*** 3.3E-15*** 4.9E-05***
3 Stem dry weight (g) 3.7E-05*** 6.9E-18*** 4E-10***
4 Leaf dry weight (g) 0.0145* 2.1E-21*** 5.9E-07***
5 Pod dry weight (g) 0.239ns 1E-14*** 0.754ns
6 Symbionts effectiveness (%) 1.6E-13*** 9.1E-19*** 7.7E-07***
7 Root biomass response (%) 1.4E-08*** 2E-10*** 0.0039**
8 Stem biomass response (%) 3.8E-14*** 3.6E-15*** 2.4E-07***
9 Leaf biomass response (%) 3.8E-06*** 4.2E-10*** 0.0023**
10 Pod biomass response (%) 0.064ns 2.7E-10*** 0.562ns
11 Leaf greenness (SPAD) 0.4722ns 6.7E-07*** 0.183ns
12 Days to flowering 0.1045ns 0.0025** 0.1187ns
13 Number of leaves plant-1 0.893ns 2.6E-08*** 0.3177ns
73
Symbiont effectiveness (total biomass response) (Fig. 3-7A) showed significant
differences (Table 3-2) with the highest values in RAM, and the lowest in R. In Zn0 and
Zn200 soils, approx. a hundred percent increase in total bioproduction was achieved by RAM
treatment, indicating a highly effective partnership between both symbionts. However,
symbiont effectiveness was significantly lower in Zn400 soil, with approx. twenty eight
percent increase in total bioproduction in RAM, while values in R and AM were approx. nil.
RBR (Fig. 3-7B) was highest in RAM and in Zn0 and Zn200 groups. In Zn400 soils, rhizobial
groups were not different, and both had significantly higher root response values than AM.
SBR (Fig. 3-7C) was highest in RAM groups in Zn0 and Zn200 soils, but was generally
negative or close to zero, in R. In Zn400 soils, all values were negative and not significantly
different between the inoculations. LBR (Fig. 3-7D) was highest in RAM plants, with values
in R generally negative or close to zero. Leaf response in mycorrhizal groups was
significantly reduced in Zn400 soils, compared with values in Zn0 and Zn200. PBR (Fig. 3-
7E) was highest in RAM plants and lowest in R. Excess Zn had an insignificant effect on pod
response, but AM benefitted pod production by approx. thirty one percent in Zn400 soils
despite an approx. nil total biomass response.
3.3.2 Nodulation and AM fungal colonization
The frequency of mycorrhizal colonization (Fig. 3-8A) showed significant differences (Table
3-3), being generally higher in RAM than in AM plants, and lower in Zn400 soils. The
intensity of mycorrhizal colonization (Fig. 3-8B) was generally higher in RAM than in AM
plants with the lowest values seen in AM groups in Zn400 soil. The arbuscule abundance
(Fig. 3-8C) was also significantly reduced in Zn400 soils, with the highest values observed
in RAM groups in Zn0 soils. C and R plants were devoid of mycorrhizal colonization. Nodule
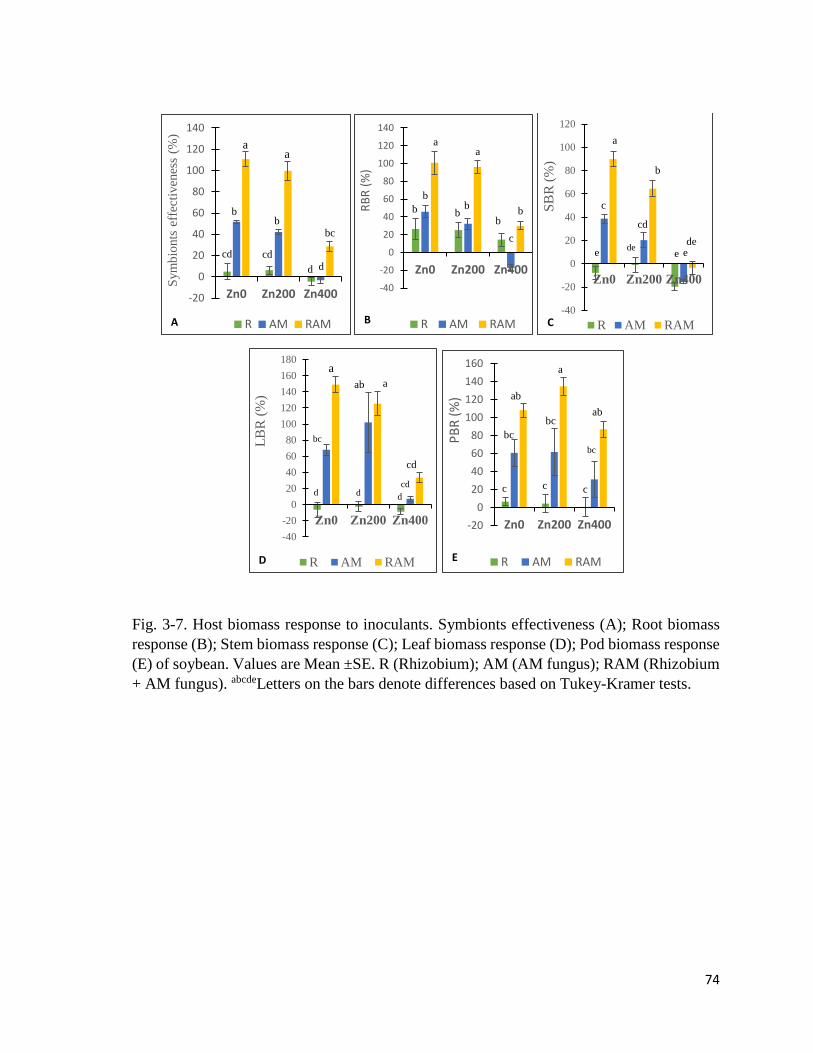
74
Fig. 3-7. Host biomass response to inoculants. Symbionts effectiveness (A); Root biomass
response (B); Stem biomass response (C); Leaf biomass response (D); Pod biomass response
(E) of soybean. Values are Mean ±SE. R (Rhizobium); AM (AM fungus); RAM (Rhizobium
+ AM fungus). abcdeLetters on the bars denote differences based on Tukey-Kramer tests.
-20
0
20
40
60
80
100
120
140
Zn0 Zn200 Zn400
Sym
bio
nts
eff
ecti
ven
ess
(%)
R AM RAM
aa
bc
bb
cd cd
dd
A
-40
-20
0
20
40
60
80
100
120
140
Zn0 Zn200 Zn400
RB
R (
%)
R AM RAM
aa
b
b
b bb
b
c
B-40
-20
0
20
40
60
80
100
120
Zn0 Zn200 Zn400
SB
R (
%)
R AM RAM
e
c
a
de
cd
b
e ede
C
-40
-20
0
20
40
60
80
100
120
140
160
180
Zn0 Zn200 Zn400
LB
R (
%)
R AM RAM
d
bc
a
d
ab a
d
cd
cd
D
-20
0
20
40
60
80
100
120
140
160
Zn0 Zn200 Zn400
PB
R (
%)
R AM RAM
a
c c c
bc
ab
bc
bc
ab
E
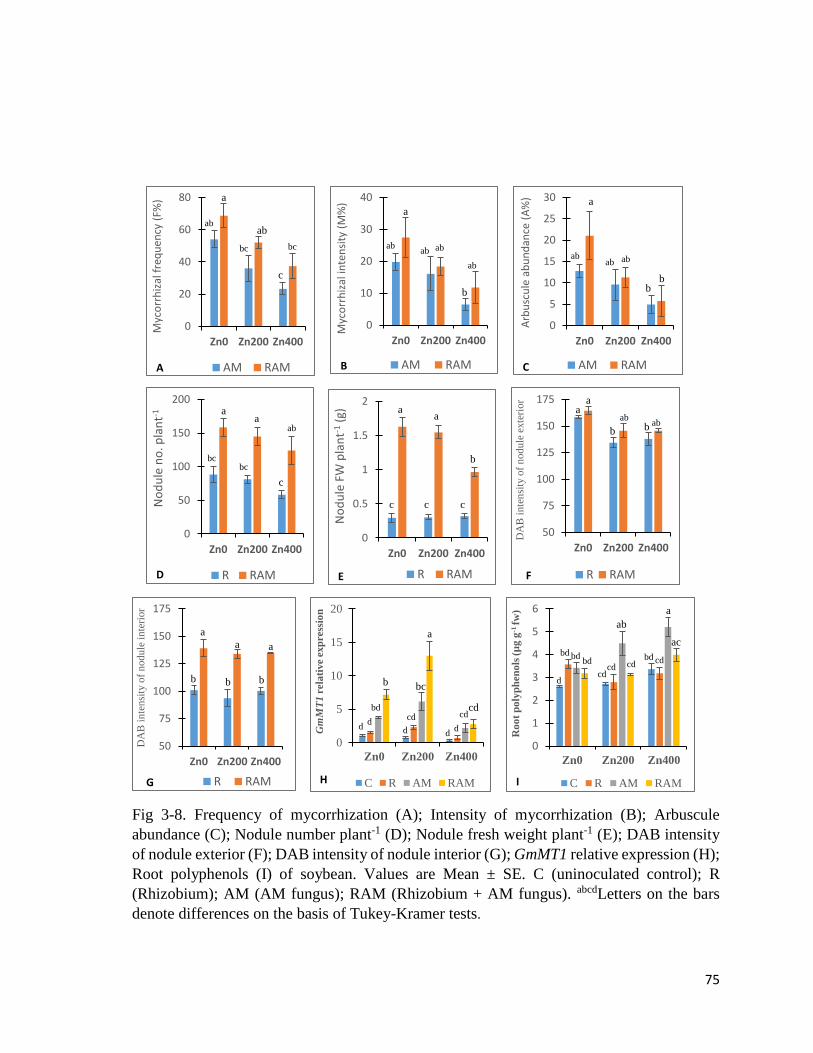
75
Fig 3-8. Frequency of mycorrhization (A); Intensity of mycorrhization (B); Arbuscule
abundance (C); Nodule number plant-1 (D); Nodule fresh weight plant-1 (E); DAB intensity
of nodule exterior (F); DAB intensity of nodule interior (G); GmMT1 relative expression (H);
Root polyphenols (I) of soybean. Values are Mean ± SE. C (uninoculated control); R
(Rhizobium); AM (AM fungus); RAM (Rhizobium + AM fungus). abcdLetters on the bars
denote differences on the basis of Tukey-Kramer tests.
0
20
40
60
80
Zn0 Zn200 Zn400
Myc
orr
hiz
al f
req
uen
cy (
F%)
AM RAM
ab
a
ab
bc bc
c
A
0
10
20
30
40
Zn0 Zn200 Zn400M
yco
rrh
izal
inte
nsi
ty (
M%
)
AM RAMB
a
abab ab
ab
b
0
5
10
15
20
25
30
Zn0 Zn200 Zn400
Arb
usc
ule
ab
un
dan
ce (
A%
)
AM RAM
a
abab ab
bb
C
0
50
100
150
200
Zn0 Zn200 Zn400
No
du
le n
o. p
lan
t-1
R RAM
aa
ab
bcbc
c
D
0
0.5
1
1.5
2
Zn0 Zn200 Zn400
No
du
le F
W p
lan
t-1(g
)
R RAM
aa
b
c c c
E
50
75
100
125
150
175
Zn0 Zn200 Zn400
DA
B i
nte
nsi
ty o
f n
od
ule
exte
rior
R RAMF
aa
b
abb ab
50
75
100
125
150
175
Zn0 Zn200 Zn400
DA
B i
nte
nsi
ty o
f n
od
ule
in
teri
or
R RAM
a
a a
b b b
G
0
5
10
15
20
Zn0 Zn200 Zn400
Gm
MT
1rela
tive e
xp
ress
ion
C R AM RAM
b
dd
bd
d
cd
bc
a
dd
cdcd
H
0
1
2
3
4
5
6
Zn0 Zn200 Zn400
Ro
ot
po
lyp
hen
ols
(µ
g g
-1 fw
)
C R AM RAM
d
bd bdbd
cdcd
ab
cdbd cd
a
ac
I
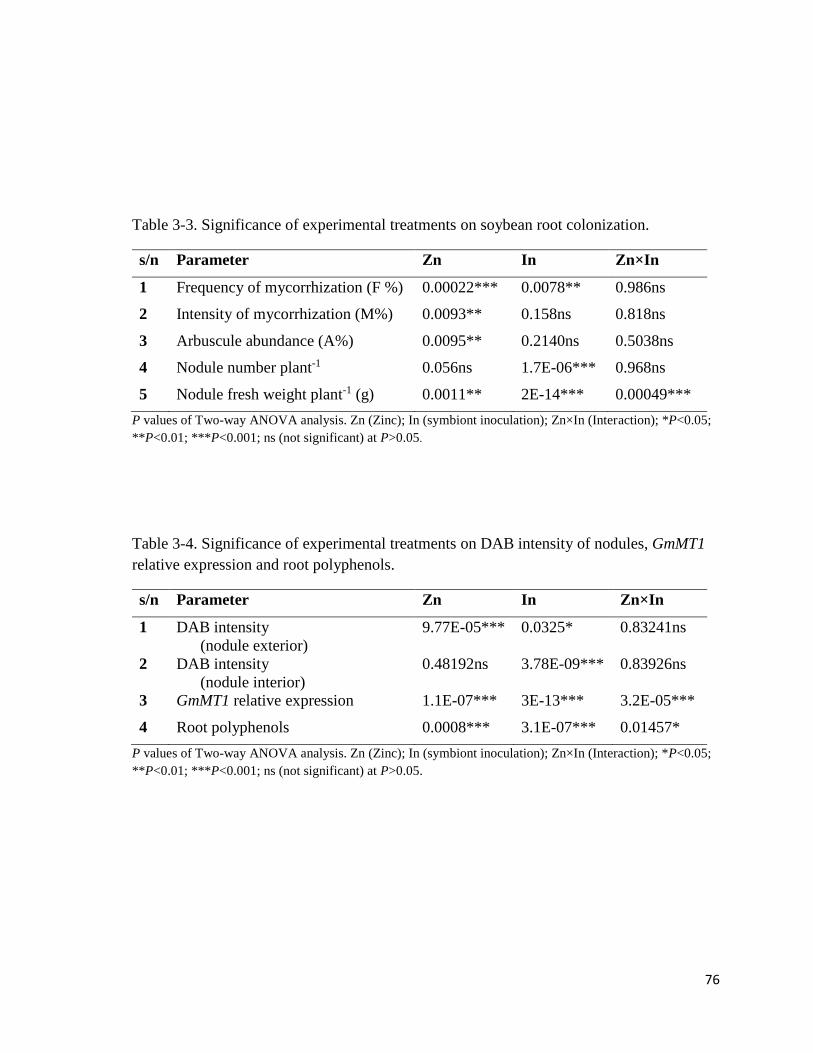
76
Table 3-3. Significance of experimental treatments on soybean root colonization.
s/n Parameter Zn In Zn×In
1 Frequency of mycorrhization (F %) 0.00022*** 0.0078** 0.986ns
2 Intensity of mycorrhization (M%) 0.0093** 0.158ns 0.818ns
3 Arbuscule abundance (A%) 0.0095** 0.2140ns 0.5038ns
4 Nodule number plant-1 0.056ns 1.7E-06*** 0.968ns
5 Nodule fresh weight plant-1 (g) 0.0011** 2E-14*** 0.00049***
P values of Two-way ANOVA analysis. Zn (Zinc); In (symbiont inoculation); Zn×In (Interaction); *P<0.05;
**P<0.01; ***P<0.001; ns (not significant) at P>0.05.
Table 3-4. Significance of experimental treatments on DAB intensity of nodules, GmMT1
relative expression and root polyphenols.
s/n Parameter Zn In Zn×In
1 DAB intensity
(nodule exterior)
9.77E-05*** 0.0325* 0.83241ns
2 DAB intensity
(nodule interior)
0.48192ns 3.78E-09*** 0.83926ns
3 GmMT1 relative expression 1.1E-07*** 3E-13*** 3.2E-05***
4 Root polyphenols 0.0008*** 3.1E-07*** 0.01457*
P values of Two-way ANOVA analysis. Zn (Zinc); In (symbiont inoculation); Zn×In (Interaction); *P<0.05;
**P<0.01; ***P<0.001; ns (not significant) at P>0.05.
77
number plant-1 (Fig. 3-8D) was significantly higher in RAM than in R and was insignificantly
reduced by excess Zn. Nodule fresh weight plant-1 (Fig. 3-8E) was significantly higher in
RAM than in R, but values were reduced in RAM plants in Zn400 soils. C and AM plants
were devoid of nodules.
3.3.3 DAB intensity, root polyphenols, and GmMT1 relative expression
DAB staining intensity of nodule exterior (Fig. 3-8F) was significantly (Table 3-4) lower in
Zn treated groups, and generally higher in RAM than in R. DAB staining intensity of nodule
interior (Fig. 3-8G) was significantly higher in RAM groups than in R, while the effect of Zn
was not significant. GmMT1 relative expression (Fig. 3-8H) showed significant differences
between the experimental groups. Generally, GmMT1 expression in response to mycorrhizal
and dual symbioses is strongly indicated, with RAM plants having the highest values in all
soil Zn treatments, and C having the lowest. The response of GmMT1 to Zn treatment was
also indicated in Zn200 groups, but a lower relative expression in Zn400 soils implied the
absence of a dose-dependent effect. Total polyphenols in the root (Fig. 3-8I) showed
significant differences due to treatments, with the lowest values in C plants in Zn0 soils, and
the highest values in mycorrhizal plants in Zn400 soils. Generally, C, AM, and RAM had
higher values in Zn400 soils than in Zn0. There were no significant effects of experimental
treatments on the DAB staining intensity of roots (not shown).
78
3.3.4 Trace element in plant
Zn in plant
Root Zn concentrations (Fig. 3-9A) showed significant differences (Table 3-5) due to
experimental treatments. In Zn0 soils, there were no significant differences in root Zn
concentrations between control and inoculated groups. In Zn treated soils, AM generally had
lower root Zn concentrations than other groups, while in Zn400 soils, RAM plants had
significantly higher values than AM. Stem Zn concentrations (Fig. 3-9B) showed significant
differences between the groups. In Zn0 soils, values were not different between control and
inoculated groups, but in Zn treated soils, stem Zn concentrations were lower in RAM plants.
Leaf Zn concentrations (Fig. 3-9C) in Zn0 soils were not significantly different between
control and inoculated groups. Under excess Zn, mycorrhizal groups had significantly lower
leaf Zn concentrations, with RAM having the lowest values. Pod Zn concentrations (Fig. 3-
9D) in Zn0 soils were not significantly different between control and inoculated groups. In
Zn treated soils, values were significantly lower in RAM. Root-to-stem Zn-TF (Fig. 3-9E)
was significantly decreased due to excess Zn. In Zn200 and Zn400 soils, AM plants had the
highest values while RAM plants had the lowest. In Zn0 soils, RAM plants also had the
lowest root-to-stem Zn translocation. R groups generally had lower values than C and AM,
in all soils. Stem-to-leaf Zn-TF (Fig. 3-9F) showed significant differences between the
groups. In Zn0 soils, RAM had the lowest values while C had the highest. In Zn200 and
Zn400 soils, AM had the lowest values and differed significantly from R and RAM. In AM
groups, the stem-to-leaf Zn translocation was identical in all soil Zn treatments, suggesting
that AM restricted Zn distribution from stem to leaf, under excess Zn. Compared to AM,
higher values in RAM (and R) suggests an earlier point of control (root-to-stem translocation)
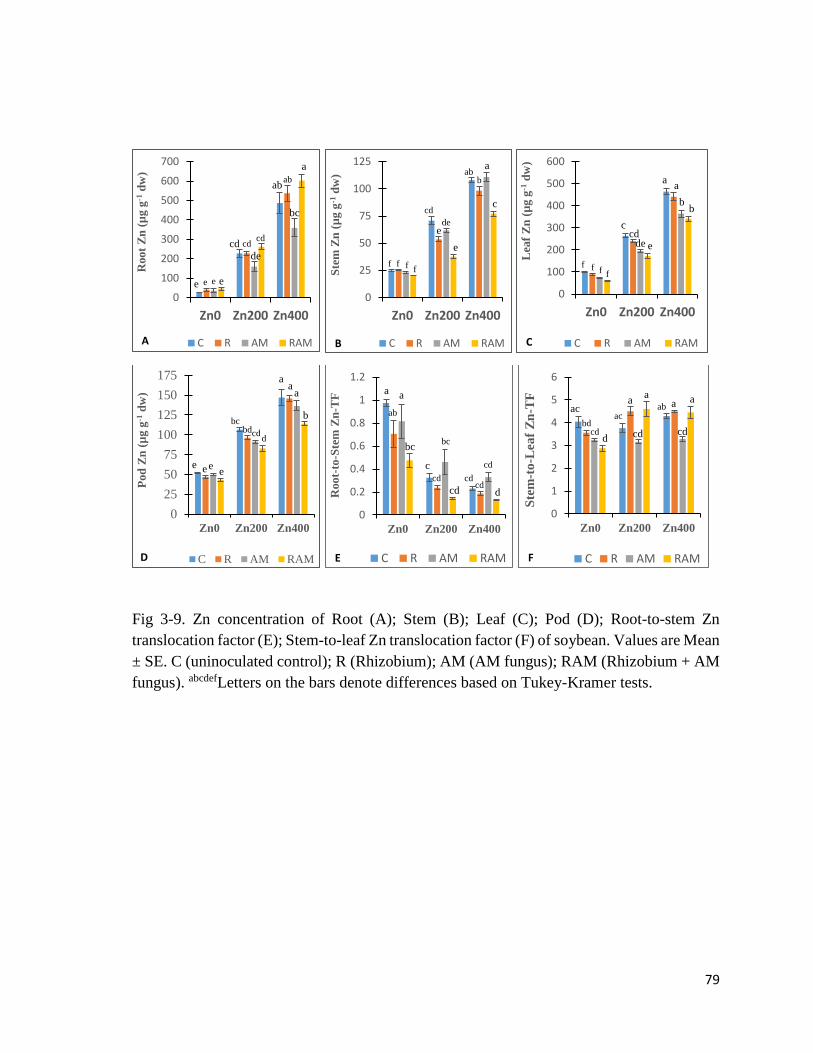
79
Fig 3-9. Zn concentration of Root (A); Stem (B); Leaf (C); Pod (D); Root-to-stem Zn
translocation factor (E); Stem-to-leaf Zn translocation factor (F) of soybean. Values are Mean
± SE. C (uninoculated control); R (Rhizobium); AM (AM fungus); RAM (Rhizobium + AM
fungus). abcdefLetters on the bars denote differences based on Tukey-Kramer tests.
0
100
200
300
400
500
600
700
Zn0 Zn200 Zn400
Root
Zn
(µ
g g
-1d
w)
C R AM RAM
e e e e
cd cd
de
cd
abab
bc
a
A
0
25
50
75
100
125
Zn0 Zn200 Zn400
Ste
m Z
n (
µg
g-1
dw
)C R AM RAM
f f f f
cd
ede
e
abb
a
c
B
0
100
200
300
400
500
600
Zn0 Zn200 Zn400
Lea
f Z
n (
µg
g-1
dw
)
C R AM RAM
aa
bb
ccd
de e
f f f f
C
0
25
50
75
100
125
150
175
Zn0 Zn200 Zn400
Pod
Zn
(µ
g g
-1d
w)
C R AM RAM
eeee
bcbdcd
d
aa
a
b
D
0
0.2
0.4
0.6
0.8
1
1.2
Zn0 Zn200 Zn400
Root-
to-S
tem
Zn
-TF
C R AM RAME
a
ab
a
bc
c
cd
bc
cd
cdcd
cd
d
0
1
2
3
4
5
6
Zn0 Zn200 Zn400S
tem
-to
-Lea
f Z
n-T
F
C R AM RAM
ac
bdcd
d
ac
a
cd
aab a
cd
a
F
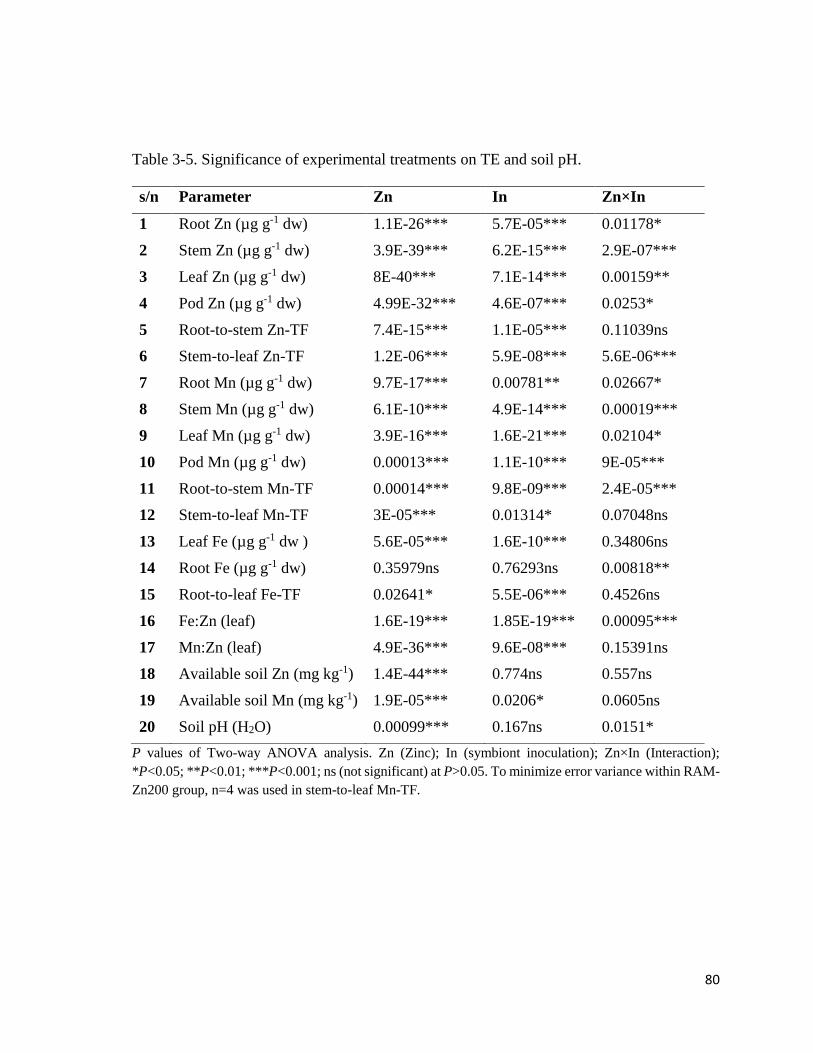
80
Table 3-5. Significance of experimental treatments on TE and soil pH.
P values of Two-way ANOVA analysis. Zn (Zinc); In (symbiont inoculation); Zn×In (Interaction);
*P<0.05; **P<0.01; ***P<0.001; ns (not significant) at P>0.05. To minimize error variance within RAM-
Zn200 group, n=4 was used in stem-to-leaf Mn-TF.
s/n Parameter Zn In Zn×In
1 Root Zn (µg g-1 dw) 1.1E-26*** 5.7E-05*** 0.01178*
2 Stem Zn (µg g-1 dw) 3.9E-39*** 6.2E-15*** 2.9E-07***
3 Leaf Zn (µg g-1 dw) 8E-40*** 7.1E-14*** 0.00159**
4 Pod Zn (µg g-1 dw) 4.99E-32*** 4.6E-07*** 0.0253*
5 Root-to-stem Zn-TF 7.4E-15*** 1.1E-05*** 0.11039ns
6 Stem-to-leaf Zn-TF 1.2E-06*** 5.9E-08*** 5.6E-06***
7 Root Mn (µg g-1 dw) 9.7E-17*** 0.00781** 0.02667*
8 Stem Mn (µg g-1 dw) 6.1E-10*** 4.9E-14*** 0.00019***
9 Leaf Mn (µg g-1 dw) 3.9E-16*** 1.6E-21*** 0.02104*
10 Pod Mn (µg g-1 dw) 0.00013*** 1.1E-10*** 9E-05***
11 Root-to-stem Mn-TF 0.00014*** 9.8E-09*** 2.4E-05***
12 Stem-to-leaf Mn-TF 3E-05*** 0.01314* 0.07048ns
13 Leaf Fe (µg g-1 dw ) 5.6E-05*** 1.6E-10*** 0.34806ns
14 Root Fe (µg g-1 dw) 0.35979ns 0.76293ns 0.00818**
15 Root-to-leaf Fe-TF 0.02641* 5.5E-06*** 0.4526ns
16 Fe:Zn (leaf) 1.6E-19*** 1.85E-19*** 0.00095***
17 Mn:Zn (leaf) 4.9E-36*** 9.6E-08*** 0.15391ns
18 Available soil Zn (mg kg-1) 1.4E-44*** 0.774ns 0.557ns
19 Available soil Mn (mg kg-1) 1.9E-05*** 0.0206* 0.0605ns
20 Soil pH (H2O) 0.00099*** 0.167ns 0.0151*
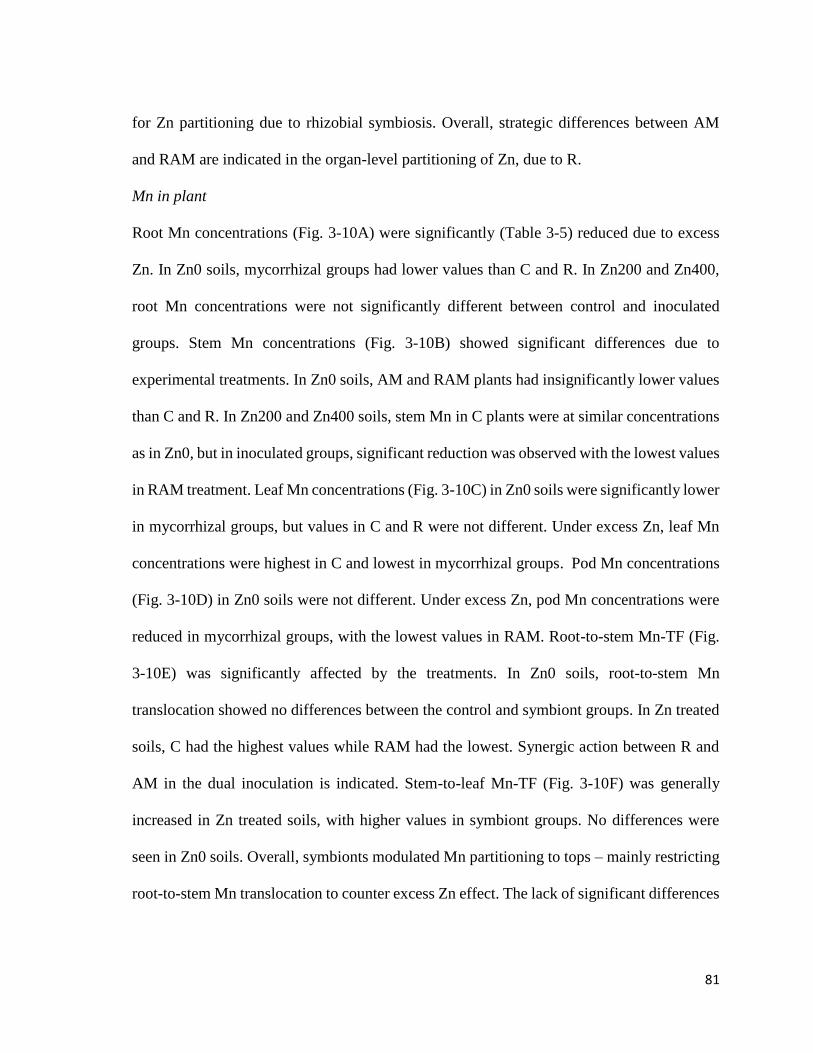
81
for Zn partitioning due to rhizobial symbiosis. Overall, strategic differences between AM
and RAM are indicated in the organ-level partitioning of Zn, due to R.
Mn in plant
Root Mn concentrations (Fig. 3-10A) were significantly (Table 3-5) reduced due to excess
Zn. In Zn0 soils, mycorrhizal groups had lower values than C and R. In Zn200 and Zn400,
root Mn concentrations were not significantly different between control and inoculated
groups. Stem Mn concentrations (Fig. 3-10B) showed significant differences due to
experimental treatments. In Zn0 soils, AM and RAM plants had insignificantly lower values
than C and R. In Zn200 and Zn400 soils, stem Mn in C plants were at similar concentrations
as in Zn0, but in inoculated groups, significant reduction was observed with the lowest values
in RAM treatment. Leaf Mn concentrations (Fig. 3-10C) in Zn0 soils were significantly lower
in mycorrhizal groups, but values in C and R were not different. Under excess Zn, leaf Mn
concentrations were highest in C and lowest in mycorrhizal groups. Pod Mn concentrations
(Fig. 3-10D) in Zn0 soils were not different. Under excess Zn, pod Mn concentrations were
reduced in mycorrhizal groups, with the lowest values in RAM. Root-to-stem Mn-TF (Fig.
3-10E) was significantly affected by the treatments. In Zn0 soils, root-to-stem Mn
translocation showed no differences between the control and symbiont groups. In Zn treated
soils, C had the highest values while RAM had the lowest. Synergic action between R and
AM in the dual inoculation is indicated. Stem-to-leaf Mn-TF (Fig. 3-10F) was generally
increased in Zn treated soils, with higher values in symbiont groups. No differences were
seen in Zn0 soils. Overall, symbionts modulated Mn partitioning to tops – mainly restricting
root-to-stem Mn translocation to counter excess Zn effect. The lack of significant differences
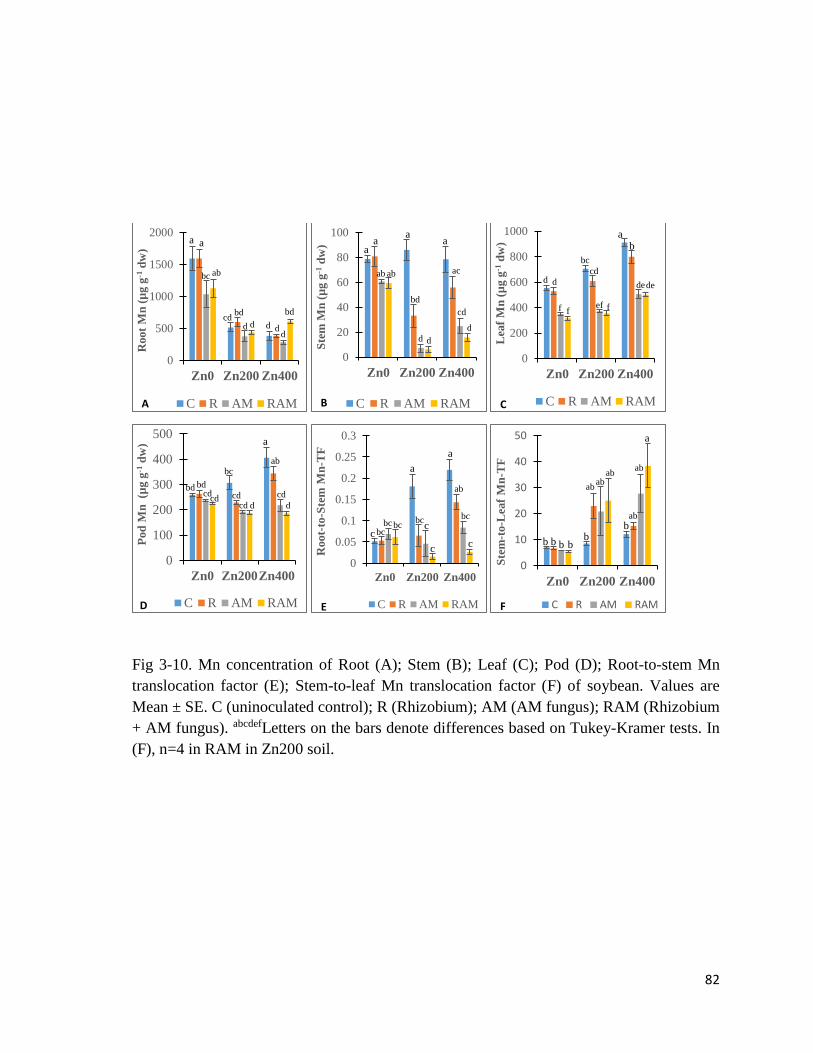
82
Fig 3-10. Mn concentration of Root (A); Stem (B); Leaf (C); Pod (D); Root-to-stem Mn
translocation factor (E); Stem-to-leaf Mn translocation factor (F) of soybean. Values are
Mean ± SE. C (uninoculated control); R (Rhizobium); AM (AM fungus); RAM (Rhizobium
+ AM fungus). abcdefLetters on the bars denote differences based on Tukey-Kramer tests. In
(F), n=4 in RAM in Zn200 soil.
0
500
1000
1500
2000
Zn0 Zn200 Zn400
Root
Mn
(µg
g-1
dw
)
C R AM RAM
a a
bc ab
cdbd
d d d dd
bd
A
0
20
40
60
80
100
Zn0 Zn200 Zn400
Ste
m M
n (
µg
g-1
dw
)
C R AM RAM
aa
ab ab
aa
bd
d d
ac
cd
d
B
0
200
400
600
800
1000
Zn0 Zn200 Zn400
Lea
f M
n (
µg
g-1
dw
)
C R AM RAM
d d
f f
bc
cd
ef f
ab
dede
C
0
100
200
300
400
500
Zn0 Zn200Zn400
Pod
Mn
(µ
g g
-1d
w)
C R AM RAM
bd bdcd
cd
bc
cdcd d
a
ab
cd
d
D
0
0.05
0.1
0.15
0.2
0.25
0.3
Zn0 Zn200 Zn400
Root-
to-S
tem
Mn
-TF
C R AM RAME
c bcbc bc
a
bcc
c
a
ab
bc
c
0
10
20
30
40
50
Zn0 Zn200 Zn400
Ste
m-t
o-L
eaf
Mn
-TF
C R AM RAMF
b b b bb
abab
ab
bab
ab
a
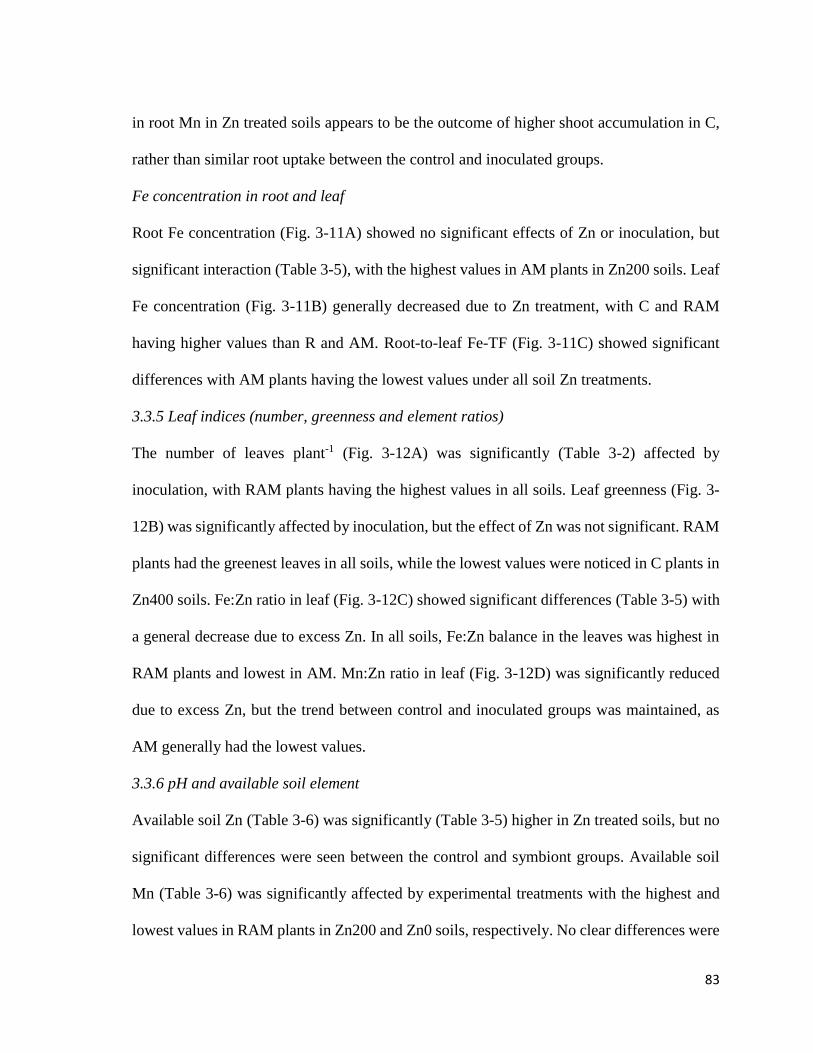
83
in root Mn in Zn treated soils appears to be the outcome of higher shoot accumulation in C,
rather than similar root uptake between the control and inoculated groups.
Fe concentration in root and leaf
Root Fe concentration (Fig. 3-11A) showed no significant effects of Zn or inoculation, but
significant interaction (Table 3-5), with the highest values in AM plants in Zn200 soils. Leaf
Fe concentration (Fig. 3-11B) generally decreased due to Zn treatment, with C and RAM
having higher values than R and AM. Root-to-leaf Fe-TF (Fig. 3-11C) showed significant
differences with AM plants having the lowest values under all soil Zn treatments.
3.3.5 Leaf indices (number, greenness and element ratios)
The number of leaves plant-1 (Fig. 3-12A) was significantly (Table 3-2) affected by
inoculation, with RAM plants having the highest values in all soils. Leaf greenness (Fig. 3-
12B) was significantly affected by inoculation, but the effect of Zn was not significant. RAM
plants had the greenest leaves in all soils, while the lowest values were noticed in C plants in
Zn400 soils. Fe:Zn ratio in leaf (Fig. 3-12C) showed significant differences (Table 3-5) with
a general decrease due to excess Zn. In all soils, Fe:Zn balance in the leaves was highest in
RAM plants and lowest in AM. Mn:Zn ratio in leaf (Fig. 3-12D) was significantly reduced
due to excess Zn, but the trend between control and inoculated groups was maintained, as
AM generally had the lowest values.
3.3.6 pH and available soil element
Available soil Zn (Table 3-6) was significantly (Table 3-5) higher in Zn treated soils, but no
significant differences were seen between the control and symbiont groups. Available soil
Mn (Table 3-6) was significantly affected by experimental treatments with the highest and
lowest values in RAM plants in Zn200 and Zn0 soils, respectively. No clear differences were
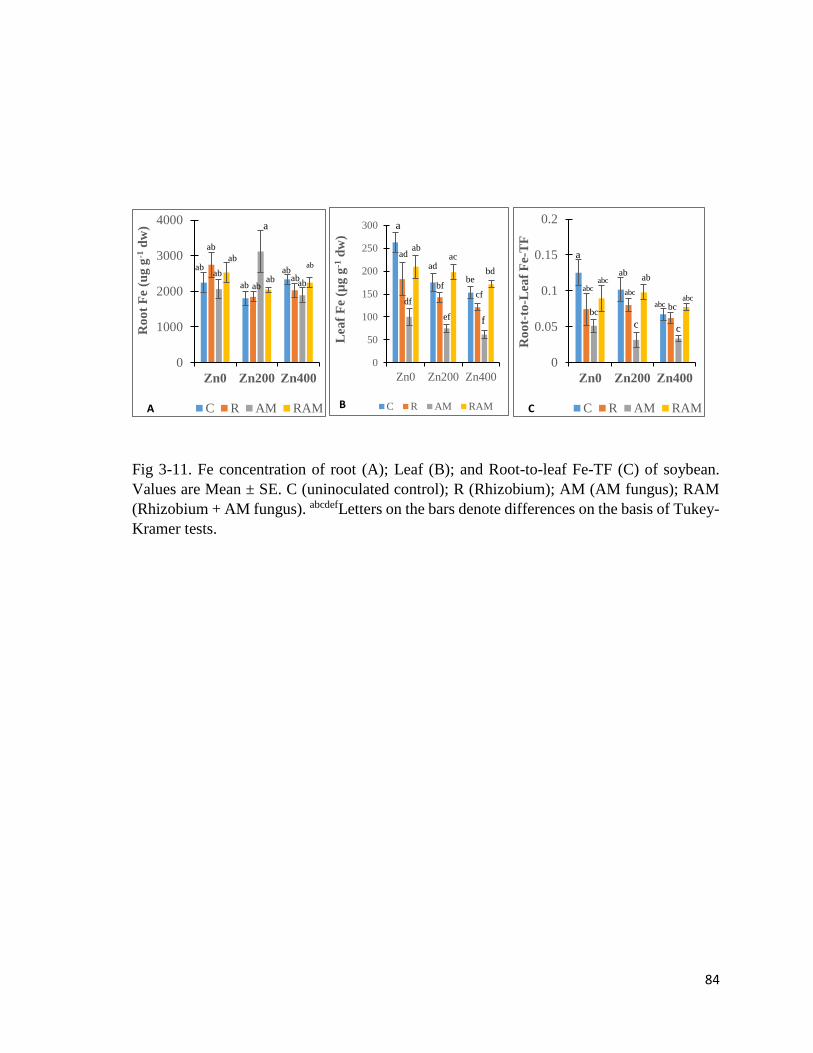
84
Fig 3-11. Fe concentration of root (A); Leaf (B); and Root-to-leaf Fe-TF (C) of soybean.
Values are Mean ± SE. C (uninoculated control); R (Rhizobium); AM (AM fungus); RAM
(Rhizobium + AM fungus). abcdefLetters on the bars denote differences on the basis of Tukey-
Kramer tests.
0
1000
2000
3000
4000
Zn0 Zn200 Zn400
Ro
ot
Fe
(ug
g-1
dw
)
C R AM RAMA
ab
a
abab
ab abab
abab
abab
ab
0
50
100
150
200
250
300
Zn0 Zn200 Zn400
Lea
f F
e (µ
g g
-1d
w)
C R AM RAM
a
ad
df
ab
ad
bf
ef
ac
be
cf
bd
f
B
0
0.05
0.1
0.15
0.2
Zn0 Zn200 Zn400
Ro
ot-
to-L
eaf
Fe-T
F
C R AM RAMC
abc
a
abcabc
abc
abcbc
abab
c c
bc
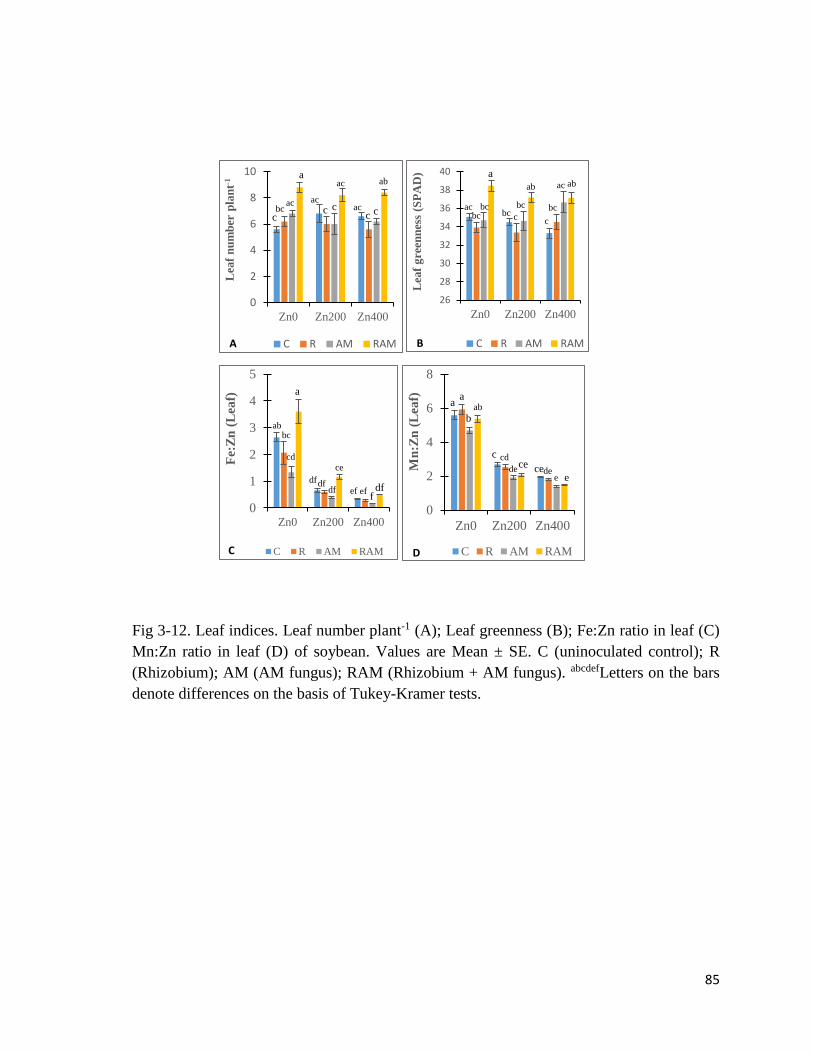
85
Fig 3-12. Leaf indices. Leaf number plant-1 (A); Leaf greenness (B); Fe:Zn ratio in leaf (C)
Mn:Zn ratio in leaf (D) of soybean. Values are Mean ± SE. C (uninoculated control); R
(Rhizobium); AM (AM fungus); RAM (Rhizobium + AM fungus). abcdefLetters on the bars
denote differences on the basis of Tukey-Kramer tests.
0
2
4
6
8
10
Zn0 Zn200 Zn400
Lea
f n
um
ber
pla
nt-1
C R AM RAMA
a
cbc
ac ac
c c
ac
acc c
ab
26
28
30
32
34
36
38
40
Zn0 Zn200 Zn400
Lea
f g
reen
nes
s (S
PA
D)
C R AM RAM
a
ab abac
acbc
bcbc c
bc
c
bc
B
0
1
2
3
4
5
Zn0 Zn200 Zn400
Fe:
Zn
(L
eaf)
C R AM RAM
abbc
cd
a
dfdfdf
ce
ef effdf
C
0
2
4
6
8
Zn0 Zn200 Zn400
Mn
:Zn
(L
eaf)
C R AM RAM
aa
bab
c cd
dece cede
e e
D
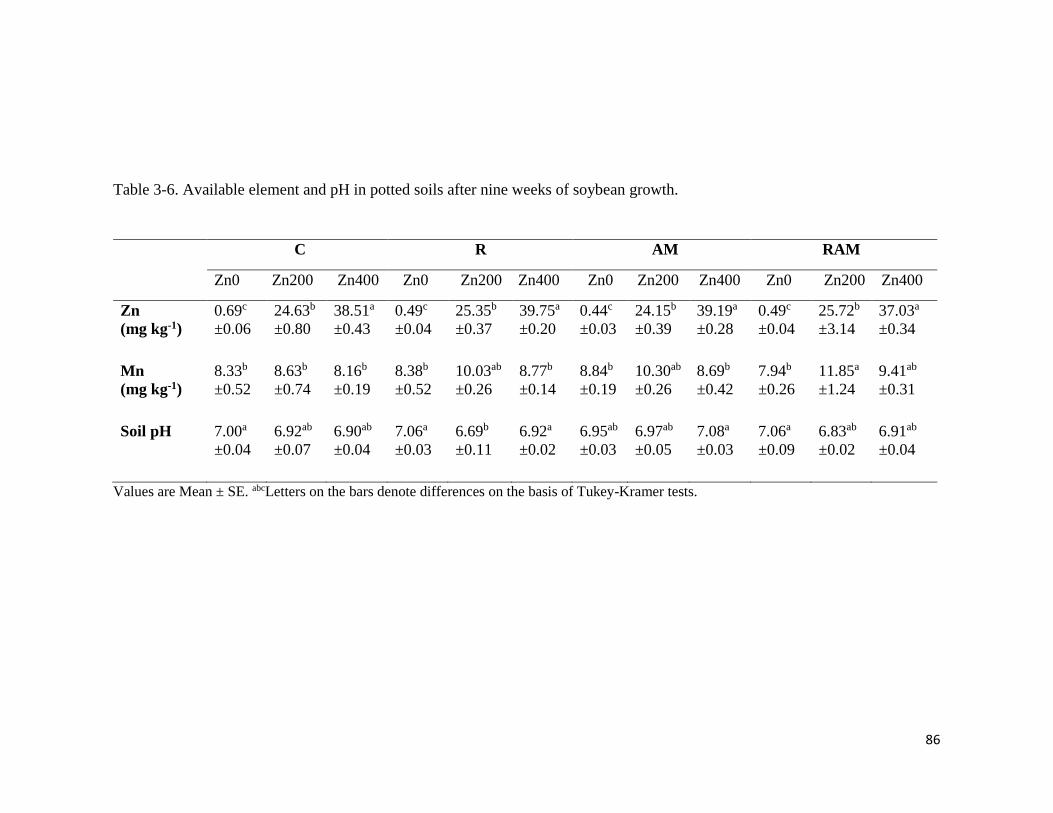
86
Table 3-6. Available element and pH in potted soils after nine weeks of soybean growth.
C R AM RAM
Zn0 Zn200 Zn400 Zn0 Zn200 Zn400 Zn0 Zn200 Zn400 Zn0 Zn200 Zn400
Zn
(mg kg-1)
0.69c
±0.06
24.63b
±0.80
38.51a
±0.43
0.49c
±0.04
25.35b
±0.37
39.75a
±0.20
0.44c
±0.03
24.15b
±0.39
39.19a
±0.28
0.49c
±0.04
25.72b
±3.14
37.03a
±0.34
Mn
(mg kg-1)
8.33b
±0.52
8.63b
±0.74
8.16b
±0.19
8.38b
±0.52
10.03ab
±0.26
8.77b
±0.14
8.84b
±0.19
10.30ab
±0.26
8.69b
±0.42
7.94b
±0.26
11.85a
±1.24
9.41ab
±0.31
Soil pH 7.00a
±0.04
6.92ab
±0.07
6.90ab
±0.04
7.06a
±0.03
6.69b
±0.11
6.92a
±0.02
6.95ab
±0.03
6.97ab
±0.05
7.08a
±0.03
7.06a
±0.09
6.83ab
±0.02
6.91ab
±0.04
Values are Mean ± SE. abcLetters on the bars denote differences on the basis of Tukey-Kramer tests.
87
observed between the inoculation groups. Soil pH (Table 3-6) was significantly affected by
the treatments. In C groups, the highest values where observed in Zn0 soils and the lowest in
Zn400. An opposite trend was observed in AM groups where the lowest pH was observed in
Zn0 soils and the highest in Zn400, while rhizobial groups (R and RAM) show a similar trend
in soil pH with the highest values in Zn0 soils and the lowest in Zn200.
3.4 Discussion
Bioproduction and symbionts colonization
As reflected in symbionts effectiveness, the clear differences in total dry weights between
RAM and other groups indicate that interaction between the rhizobial and AM fungal
inoculants stimulated improved host bioproduction. Compared with control, R consistently
favored root production in line with the position of Brown and Bethlenfalvay (1987), but
contributed little benefit to total plant bioproduction on its own, since no significant
differences in total dry biomass between C and R were observed. This is in line with my
general experience (personal observations) with the additional N fertilizations at 4 and 7
weeks minimizing rhizobial-nitrogen supply effects and permitting comparable performance
between C and R (Ibiang et al. 2017). By minimizing the major benefit of one inoculant (R)
against the control plants, and thus ensuring AM treatments also had this benefit, a scrutiny
of the dual symbioses itself could be had when comparing RAM performance versus AM,
and C-R. In the dual inoculation, synergic effects of both symbionts on bioproduction were
indicated as R appeared to potentiate AM effect across the board. Fe in the leaves of plant is
important in chlorophyll biosynthesis and function but is often antagonized by excess Zn.
The higher leaf number, SPAD values (an indicator of chlorophyll and nitrogen status of
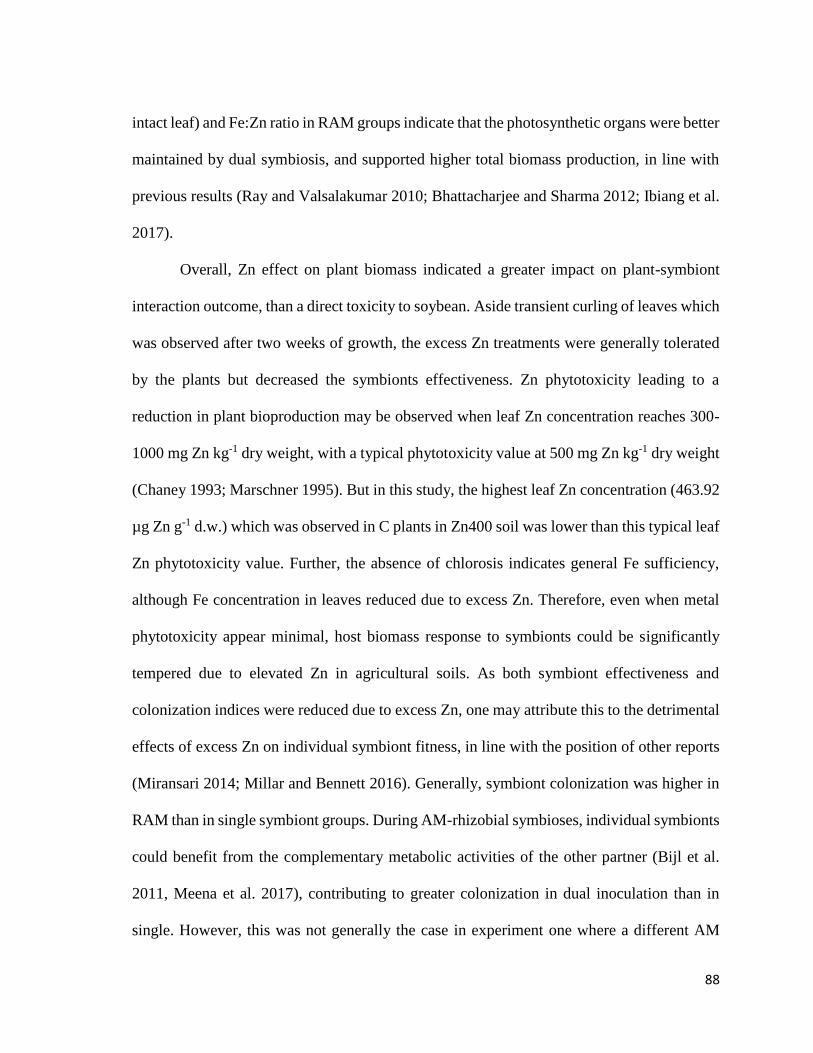
88
intact leaf) and Fe:Zn ratio in RAM groups indicate that the photosynthetic organs were better
maintained by dual symbiosis, and supported higher total biomass production, in line with
previous results (Ray and Valsalakumar 2010; Bhattacharjee and Sharma 2012; Ibiang et al.
2017).
Overall, Zn effect on plant biomass indicated a greater impact on plant-symbiont
interaction outcome, than a direct toxicity to soybean. Aside transient curling of leaves which
was observed after two weeks of growth, the excess Zn treatments were generally tolerated
by the plants but decreased the symbionts effectiveness. Zn phytotoxicity leading to a
reduction in plant bioproduction may be observed when leaf Zn concentration reaches 300-
1000 mg Zn kg-1 dry weight, with a typical phytotoxicity value at 500 mg Zn kg-1 dry weight
(Chaney 1993; Marschner 1995). But in this study, the highest leaf Zn concentration (463.92
µg Zn g-1 d.w.) which was observed in C plants in Zn400 soil was lower than this typical leaf
Zn phytotoxicity value. Further, the absence of chlorosis indicates general Fe sufficiency,
although Fe concentration in leaves reduced due to excess Zn. Therefore, even when metal
phytotoxicity appear minimal, host biomass response to symbionts could be significantly
tempered due to elevated Zn in agricultural soils. As both symbiont effectiveness and
colonization indices were reduced due to excess Zn, one may attribute this to the detrimental
effects of excess Zn on individual symbiont fitness, in line with the position of other reports
(Miransari 2014; Millar and Bennett 2016). Generally, symbiont colonization was higher in
RAM than in single symbiont groups. During AM-rhizobial symbioses, individual symbionts
could benefit from the complementary metabolic activities of the other partner (Bijl et al.
2011, Meena et al. 2017), contributing to greater colonization in dual inoculation than in
single. However, this was not generally the case in experiment one where a different AM
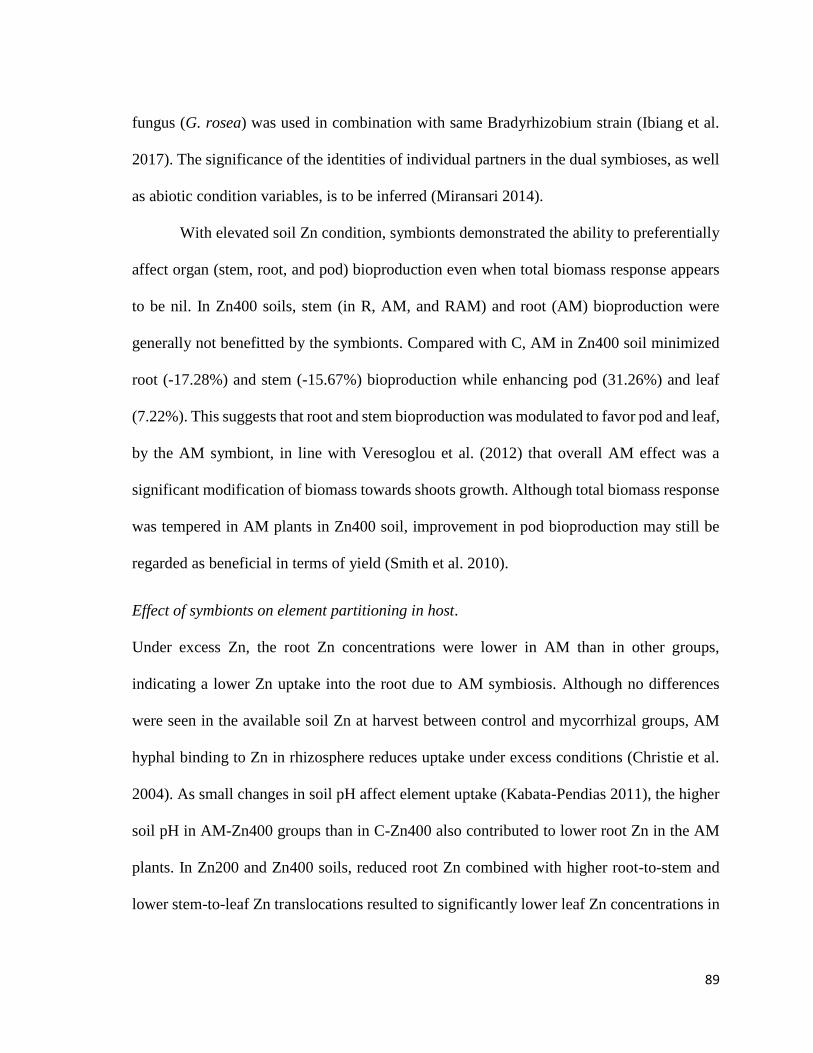
89
fungus (G. rosea) was used in combination with same Bradyrhizobium strain (Ibiang et al.
2017). The significance of the identities of individual partners in the dual symbioses, as well
as abiotic condition variables, is to be inferred (Miransari 2014).
With elevated soil Zn condition, symbionts demonstrated the ability to preferentially
affect organ (stem, root, and pod) bioproduction even when total biomass response appears
to be nil. In Zn400 soils, stem (in R, AM, and RAM) and root (AM) bioproduction were
generally not benefitted by the symbionts. Compared with C, AM in Zn400 soil minimized
root (-17.28%) and stem (-15.67%) bioproduction while enhancing pod (31.26%) and leaf
(7.22%). This suggests that root and stem bioproduction was modulated to favor pod and leaf,
by the AM symbiont, in line with Veresoglou et al. (2012) that overall AM effect was a
significant modification of biomass towards shoots growth. Although total biomass response
was tempered in AM plants in Zn400 soil, improvement in pod bioproduction may still be
regarded as beneficial in terms of yield (Smith et al. 2010).
Effect of symbionts on element partitioning in host.
Under excess Zn, the root Zn concentrations were lower in AM than in other groups,
indicating a lower Zn uptake into the root due to AM symbiosis. Although no differences
were seen in the available soil Zn at harvest between control and mycorrhizal groups, AM
hyphal binding to Zn in rhizosphere reduces uptake under excess conditions (Christie et al.
2004). As small changes in soil pH affect element uptake (Kabata-Pendias 2011), the higher
soil pH in AM-Zn400 groups than in C-Zn400 also contributed to lower root Zn in the AM
plants. In Zn200 and Zn400 soils, reduced root Zn combined with higher root-to-stem and
lower stem-to-leaf Zn translocations resulted to significantly lower leaf Zn concentrations in
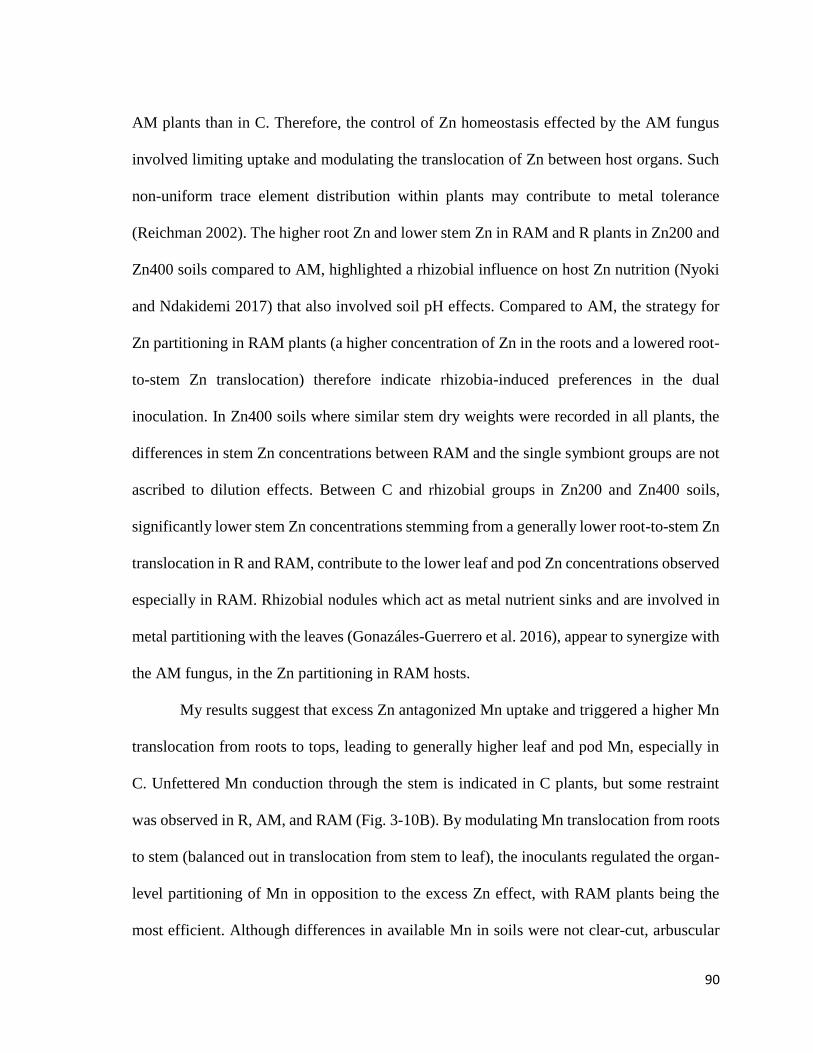
90
AM plants than in C. Therefore, the control of Zn homeostasis effected by the AM fungus
involved limiting uptake and modulating the translocation of Zn between host organs. Such
non-uniform trace element distribution within plants may contribute to metal tolerance
(Reichman 2002). The higher root Zn and lower stem Zn in RAM and R plants in Zn200 and
Zn400 soils compared to AM, highlighted a rhizobial influence on host Zn nutrition (Nyoki
and Ndakidemi 2017) that also involved soil pH effects. Compared to AM, the strategy for
Zn partitioning in RAM plants (a higher concentration of Zn in the roots and a lowered root-
to-stem Zn translocation) therefore indicate rhizobia-induced preferences in the dual
inoculation. In Zn400 soils where similar stem dry weights were recorded in all plants, the
differences in stem Zn concentrations between RAM and the single symbiont groups are not
ascribed to dilution effects. Between C and rhizobial groups in Zn200 and Zn400 soils,
significantly lower stem Zn concentrations stemming from a generally lower root-to-stem Zn
translocation in R and RAM, contribute to the lower leaf and pod Zn concentrations observed
especially in RAM. Rhizobial nodules which act as metal nutrient sinks and are involved in
metal partitioning with the leaves (Gonazáles-Guerrero et al. 2016), appear to synergize with
the AM fungus, in the Zn partitioning in RAM hosts.
My results suggest that excess Zn antagonized Mn uptake and triggered a higher Mn
translocation from roots to tops, leading to generally higher leaf and pod Mn, especially in
C. Unfettered Mn conduction through the stem is indicated in C plants, but some restraint
was observed in R, AM, and RAM (Fig. 3-10B). By modulating Mn translocation from roots
to stem (balanced out in translocation from stem to leaf), the inoculants regulated the organ-
level partitioning of Mn in opposition to the excess Zn effect, with RAM plants being the
most efficient. Although differences in available Mn in soils were not clear-cut, arbuscular
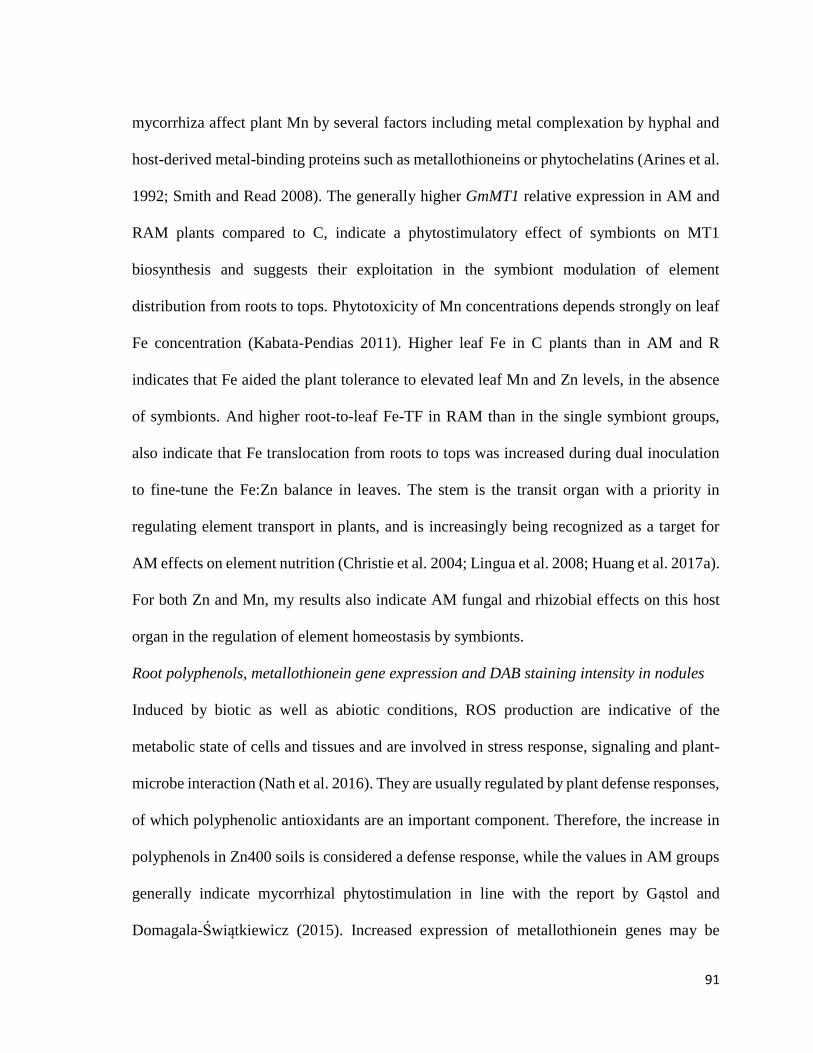
91
mycorrhiza affect plant Mn by several factors including metal complexation by hyphal and
host-derived metal-binding proteins such as metallothioneins or phytochelatins (Arines et al.
1992; Smith and Read 2008). The generally higher GmMT1 relative expression in AM and
RAM plants compared to C, indicate a phytostimulatory effect of symbionts on MT1
biosynthesis and suggests their exploitation in the symbiont modulation of element
distribution from roots to tops. Phytotoxicity of Mn concentrations depends strongly on leaf
Fe concentration (Kabata-Pendias 2011). Higher leaf Fe in C plants than in AM and R
indicates that Fe aided the plant tolerance to elevated leaf Mn and Zn levels, in the absence
of symbionts. And higher root-to-leaf Fe-TF in RAM than in the single symbiont groups,
also indicate that Fe translocation from roots to tops was increased during dual inoculation
to fine-tune the Fe:Zn balance in leaves. The stem is the transit organ with a priority in
regulating element transport in plants, and is increasingly being recognized as a target for
AM effects on element nutrition (Christie et al. 2004; Lingua et al. 2008; Huang et al. 2017a).
For both Zn and Mn, my results also indicate AM fungal and rhizobial effects on this host
organ in the regulation of element homeostasis by symbionts.
Root polyphenols, metallothionein gene expression and DAB staining intensity in nodules
Induced by biotic as well as abiotic conditions, ROS production are indicative of the
metabolic state of cells and tissues and are involved in stress response, signaling and plant-
microbe interaction (Nath et al. 2016). They are usually regulated by plant defense responses,
of which polyphenolic antioxidants are an important component. Therefore, the increase in
polyphenols in Zn400 soils is considered a defense response, while the values in AM groups
generally indicate mycorrhizal phytostimulation in line with the report by Gąstol and
Domagala-Świątkiewicz (2015). Increased expression of metallothionein genes may be
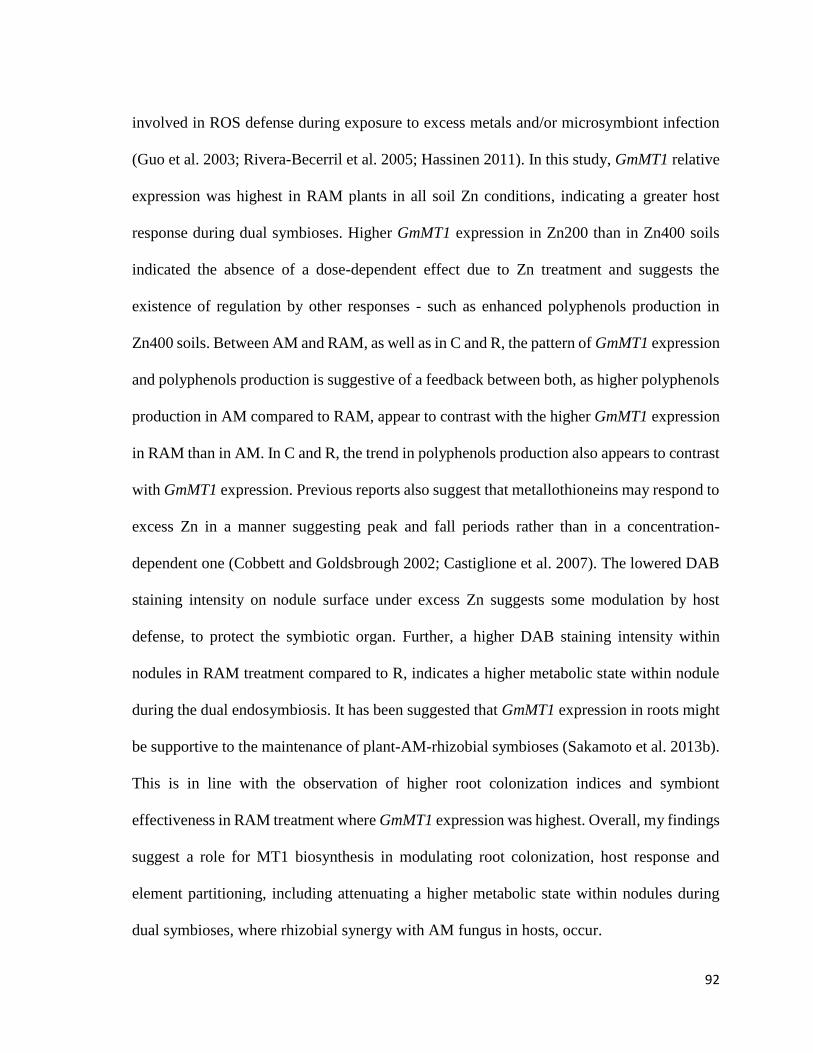
92
involved in ROS defense during exposure to excess metals and/or microsymbiont infection
(Guo et al. 2003; Rivera-Becerril et al. 2005; Hassinen 2011). In this study, GmMT1 relative
expression was highest in RAM plants in all soil Zn conditions, indicating a greater host
response during dual symbioses. Higher GmMT1 expression in Zn200 than in Zn400 soils
indicated the absence of a dose-dependent effect due to Zn treatment and suggests the
existence of regulation by other responses - such as enhanced polyphenols production in
Zn400 soils. Between AM and RAM, as well as in C and R, the pattern of GmMT1 expression
and polyphenols production is suggestive of a feedback between both, as higher polyphenols
production in AM compared to RAM, appear to contrast with the higher GmMT1 expression
in RAM than in AM. In C and R, the trend in polyphenols production also appears to contrast
with GmMT1 expression. Previous reports also suggest that metallothioneins may respond to
excess Zn in a manner suggesting peak and fall periods rather than in a concentration-
dependent one (Cobbett and Goldsbrough 2002; Castiglione et al. 2007). The lowered DAB
staining intensity on nodule surface under excess Zn suggests some modulation by host
defense, to protect the symbiotic organ. Further, a higher DAB staining intensity within
nodules in RAM treatment compared to R, indicates a higher metabolic state within nodule
during the dual endosymbiosis. It has been suggested that GmMT1 expression in roots might
be supportive to the maintenance of plant-AM-rhizobial symbioses (Sakamoto et al. 2013b).
This is in line with the observation of higher root colonization indices and symbiont
effectiveness in RAM treatment where GmMT1 expression was highest. Overall, my findings
suggest a role for MT1 biosynthesis in modulating root colonization, host response and
element partitioning, including attenuating a higher metabolic state within nodules during
dual symbioses, where rhizobial synergy with AM fungus in hosts, occur.
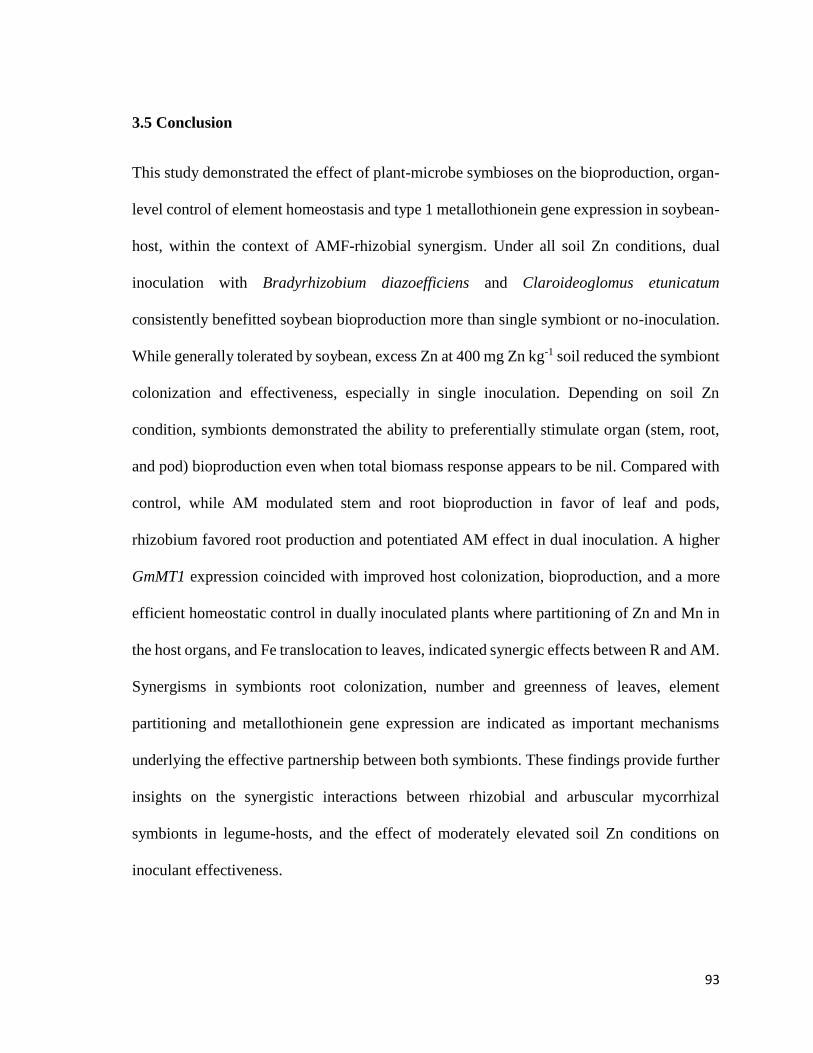
93
3.5 Conclusion
This study demonstrated the effect of plant-microbe symbioses on the bioproduction, organ-
level control of element homeostasis and type 1 metallothionein gene expression in soybean-
host, within the context of AMF-rhizobial synergism. Under all soil Zn conditions, dual
inoculation with Bradyrhizobium diazoefficiens and Claroideoglomus etunicatum
consistently benefitted soybean bioproduction more than single symbiont or no-inoculation.
While generally tolerated by soybean, excess Zn at 400 mg Zn kg-1 soil reduced the symbiont
colonization and effectiveness, especially in single inoculation. Depending on soil Zn
condition, symbionts demonstrated the ability to preferentially stimulate organ (stem, root,
and pod) bioproduction even when total biomass response appears to be nil. Compared with
control, while AM modulated stem and root bioproduction in favor of leaf and pods,
rhizobium favored root production and potentiated AM effect in dual inoculation. A higher
GmMT1 expression coincided with improved host colonization, bioproduction, and a more
efficient homeostatic control in dually inoculated plants where partitioning of Zn and Mn in
the host organs, and Fe translocation to leaves, indicated synergic effects between R and AM.
Synergisms in symbionts root colonization, number and greenness of leaves, element
partitioning and metallothionein gene expression are indicated as important mechanisms
underlying the effective partnership between both symbionts. These findings provide further
insights on the synergistic interactions between rhizobial and arbuscular mycorrhizal
symbionts in legume-hosts, and the effect of moderately elevated soil Zn conditions on
inoculant effectiveness.
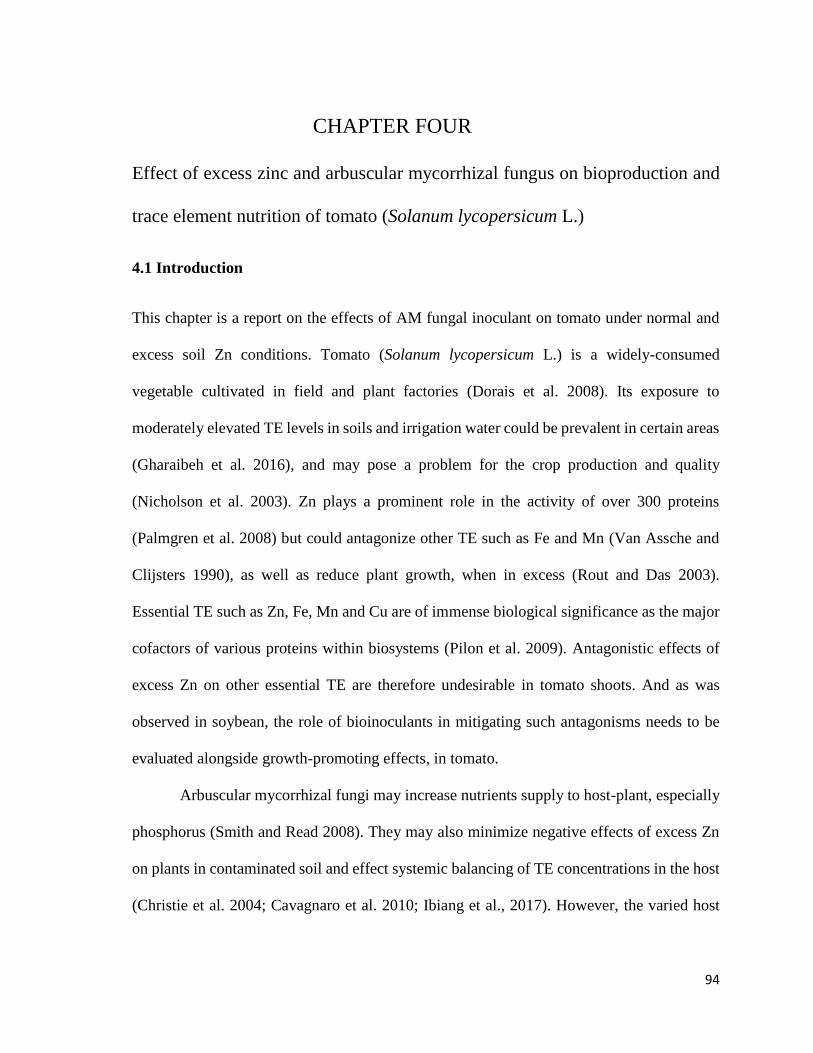
94
CHAPTER FOUR
Effect of excess zinc and arbuscular mycorrhizal fungus on bioproduction and
trace element nutrition of tomato (Solanum lycopersicum L.)
4.1 Introduction
This chapter is a report on the effects of AM fungal inoculant on tomato under normal and
excess soil Zn conditions. Tomato (Solanum lycopersicum L.) is a widely-consumed
vegetable cultivated in field and plant factories (Dorais et al. 2008). Its exposure to
moderately elevated TE levels in soils and irrigation water could be prevalent in certain areas
(Gharaibeh et al. 2016), and may pose a problem for the crop production and quality
(Nicholson et al. 2003). Zn plays a prominent role in the activity of over 300 proteins
(Palmgren et al. 2008) but could antagonize other TE such as Fe and Mn (Van Assche and
Clijsters 1990), as well as reduce plant growth, when in excess (Rout and Das 2003).
Essential TE such as Zn, Fe, Mn and Cu are of immense biological significance as the major
cofactors of various proteins within biosystems (Pilon et al. 2009). Antagonistic effects of
excess Zn on other essential TE are therefore undesirable in tomato shoots. And as was
observed in soybean, the role of bioinoculants in mitigating such antagonisms needs to be
evaluated alongside growth-promoting effects, in tomato.
Arbuscular mycorrhizal fungi may increase nutrients supply to host-plant, especially
phosphorus (Smith and Read 2008). They may also minimize negative effects of excess Zn
on plants in contaminated soil and effect systemic balancing of TE concentrations in the host
(Christie et al. 2004; Cavagnaro et al. 2010; Ibiang et al., 2017). However, the varied host
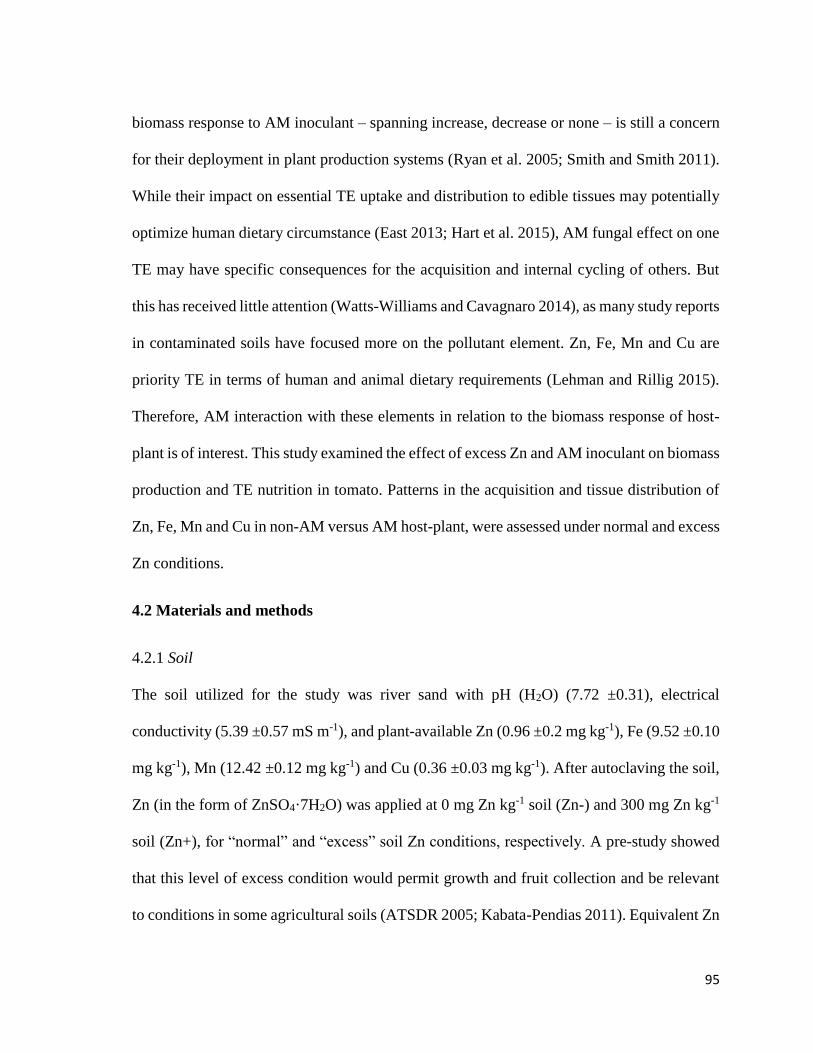
95
biomass response to AM inoculant – spanning increase, decrease or none – is still a concern
for their deployment in plant production systems (Ryan et al. 2005; Smith and Smith 2011).
While their impact on essential TE uptake and distribution to edible tissues may potentially
optimize human dietary circumstance (East 2013; Hart et al. 2015), AM fungal effect on one
TE may have specific consequences for the acquisition and internal cycling of others. But
this has received little attention (Watts-Williams and Cavagnaro 2014), as many study reports
in contaminated soils have focused more on the pollutant element. Zn, Fe, Mn and Cu are
priority TE in terms of human and animal dietary requirements (Lehman and Rillig 2015).
Therefore, AM interaction with these elements in relation to the biomass response of host-
plant is of interest. This study examined the effect of excess Zn and AM inoculant on biomass
production and TE nutrition in tomato. Patterns in the acquisition and tissue distribution of
Zn, Fe, Mn and Cu in non-AM versus AM host-plant, were assessed under normal and excess
Zn conditions.
4.2 Materials and methods
4.2.1 Soil
The soil utilized for the study was river sand with pH (H2O) (7.72 ±0.31), electrical
conductivity (5.39 ±0.57 mS m-1), and plant-available Zn (0.96 ±0.2 mg kg-1), Fe (9.52 ±0.10
mg kg-1), Mn (12.42 ±0.12 mg kg-1) and Cu (0.36 ±0.03 mg kg-1). After autoclaving the soil,
Zn (in the form of ZnSO4·7H2O) was applied at 0 mg Zn kg-1 soil (Zn-) and 300 mg Zn kg-1
soil (Zn+), for “normal” and “excess” soil Zn conditions, respectively. A pre-study showed
that this level of excess condition would permit growth and fruit collection and be relevant
to conditions in some agricultural soils (ATSDR 2005; Kabata-Pendias 2011). Equivalent Zn
96
salt was first dissolved in sterile water then applied to the autoclaved soil. All soils were
bulked after mixing and stored (25°C) in non-transparent bags for seven days before use in
plastic pots. The available TE in soils were determined using diethylenetriamine pentaacetic
acid (DTPA) extracts (Lindsay and Norvell 1978).
4.2.2 Plant
The dwarf tomato, Solanum lycopersicum (L.) (cv. Micro-Tom) was used in this study. It is
convenient to raise in growth chambers and can yield fruits as early as 70 days (Meissner et
al. 1997). Seeds were sterilized in 70% ethanol for 5 min and 3.33% sodium hypochlorite
solution for 15 min then rinsed in sterile distilled water. The seedlings were raised for 10
days on vermiculite moistened with half strength Hoagland solution from the bottom, then
transplanted to potted soils and maintained in the growth chamber (light; 25 °C, 14 h, and
dark; 18 °C, 10 h) for a maximum of 10 weeks.
4.2.3 AM fungal inoculation
AM fungal inoculation was performed at seedling transplant from vermiculite to soils. The
AM fungal inoculant used in this study was Rhizophagus irregularis DAOM197198
(Mycorise, Premier Tech, Rivière-du-Loup, Canada). A control group with no inoculation
(non-AM) was maintained. AM fungal inoculum consisted of soil bearing AM fungal
propagules (mix of spores, hyphae, and mycorrhizal root fragments) applied (10 g pot-1)
manually in the middle of soil in 180 mL pots, just prior to seedling transplant (Merlos et al.
2016).
4.2.4 Experimental setup and pot fertilizations
The experiment was set up for two factors in a completely randomized design with 40 pots.
Factor 1 was the soil Zn conditions (Zn- and Zn+) while Factor 2 was AM inoculation (non-
97
AM and AM). There were ten pots for each treatment combination and five pots each (n=5)
were harvested at flowering (5 weeks) and fruiting (10 weeks). All pots were equally
fertilized with 1/4 phosphate strength Hoagland solution (Zn:0.012, Fe:0.559, Mn:0.123,
Cu:0.005; mg L-1) given every three days until the week of harvest (Table 4-1). Cumulative
TE fertilization from start to final harvest were; 0.014 mg Zn pot-1, 0.615 mg Fe pot-1, 0.135
mg Mn pot-1 and 0.006 mg Cu pot-1.
4.2.5 Plant harvest
Plants were wholly harvested by carefully emptying the soil from the pots, breaking apart
loosely attached soil and washing with distilled water to rid the roots of all soil particles.
Total fresh weights (TFW) were measured then the whole plant was cut into roots, shoots
(stem+leaves) and fruits. To ensure rhizosphere soil collection, soils in closer contact with
roots (from 2 cm round about) were separately removed and extracted immediately using
DTPA to determine available TE. At sampling, a portion of root was first subtracted for
evaluation of AM fungal colonization before plant tissues were dried in the oven at 80°C
until constant weight.
4.2.6 Plant biomass and response to AM fungus
Total dry weight (TDW), root dry weight (RDW), shoot dry weight (SDW) and fruit dry
weight (FDW) were determined at 10 weeks. For mycorrhizal responses, total biomass
response (TBR) and fruit biomass response (FBR) estimated using TDW and FDW
respectively, were calculated (Watts-Williams and Cavagnaro 2012) for each soil condition
as shown below:
Biomass response (%) = (DW(AM) – mean DW(non-AM))/mean DW(non-AM) (×100)…….(3).
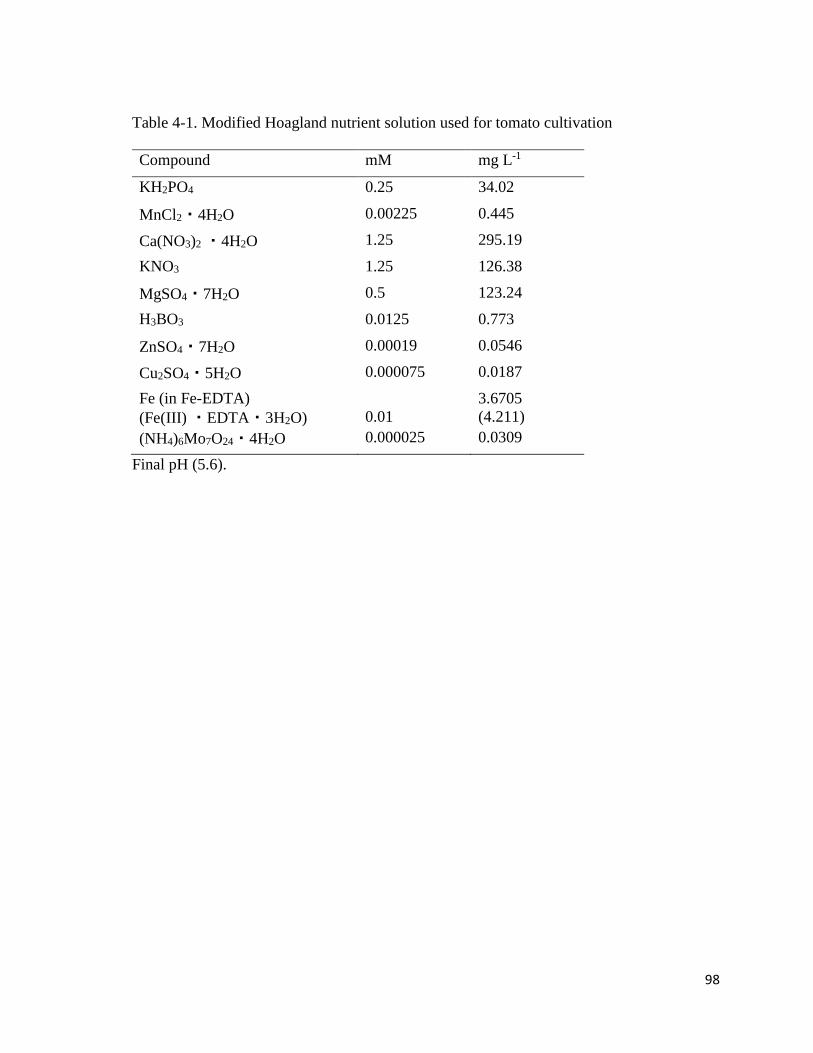
98
Table 4-1. Modified Hoagland nutrient solution used for tomato cultivation
Compound mM mg L-1
KH2PO4 0.25 34.02
MnCl2・4H2O 0.00225 0.445
Ca(NO3)2 ・4H2O 1.25 295.19
KNO3 1.25 126.38
MgSO4・7H2O 0.5 123.24
H3BO3 0.0125 0.773
ZnSO4・7H2O 0.00019 0.0546
Cu2SO4・5H2O 0.000075 0.0187
Fe (in Fe-EDTA)
(Fe(III) ・EDTA・3H2O)
0.01
3.6705
(4.211)
(NH4)6Mo7O24・4H2O 0.000025 0.0309
Final pH (5.6).
99
4.2.7 Zn, Fe, Mn and Cu in plant
The levels of Zn, Fe, Mn and Cu were determined in the dry root, shoot and fruit tissues.
Milled dried samples were combusted in an electric muffle furnace (ADVANTEC
FUL220FA, Tokyo, Japan) at 550°C for 6 h and the ash was digested in 0.6 mol L-1 HCl.
Element concentrations in solutions were measured (Figs. 4-1) using Atomic absorption
spectrophotometry (Shimadzu AA-6600F, Japan). TE root-to-fruit translocation ratio (TR)
was calculated as element concentration (µg g-1) of fruit divided by that of the root
(Gharaibeh et al. 2016). To examine the balance (or imbalance) in TE concentrations in
shoots, Fe:Zn, Mn:Zn and Cu:Zn ratios were calculated as Fe, Mn or Cu concentration
divided by Zn concentration for individual plants.
4.2.8 Available trace element in soil
At planting, flowering and fruiting, TE in moist soils were extracted using 0.005 mol L-1
DTPA (pH 7.3) according to Lindsay and Norvell (1978) and element concentrations in
solutions were measured (Figs. 4-2) using Atomic absorption spectrophotometry. The
moisture content of a portion of soils was also determined after drying in the oven at 105ºC
for >24 h to enable subsequent calculation of dry soil weights.
4.2.9 Phosphorus in plant
P concentration in shoots was determined using the vanadomolybdate method (Tandon et al.
1968). Dry finely ground shoot samples were ignited in an electric furnace at 550°C for 3 h,
then the ash was digested in HCl solution (5 mol L-1) and reacted with vanadomolybdate acid
solution. The samples were kept for 30 min before measuring the absorbance in a
spectrophotometer at 420 nm (Fig. 4-3).
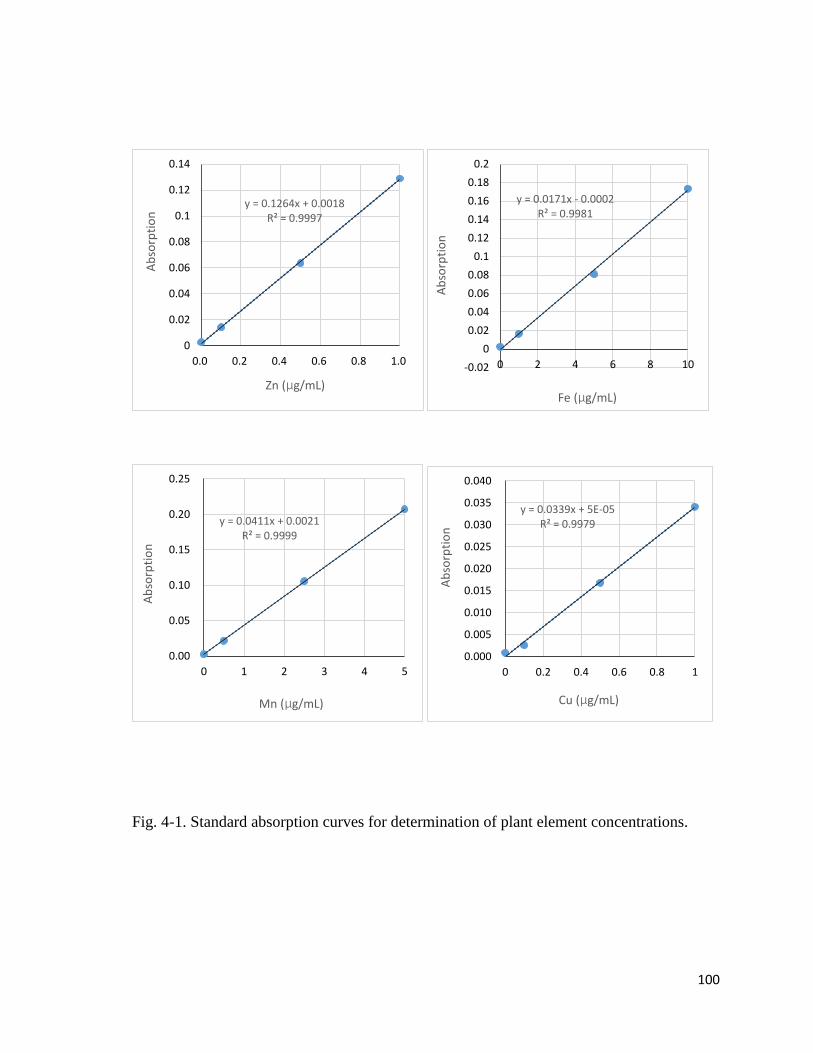
100
Fig. 4-1. Standard absorption curves for determination of plant element concentrations.
y = 0.1264x + 0.0018R² = 0.9997
0
0.02
0.04
0.06
0.08
0.1
0.12
0.14
0.0 0.2 0.4 0.6 0.8 1.0
Ab
sorp
tio
n
Zn (µg/mL)
y = 0.0171x - 0.0002R² = 0.9981
-0.02
0
0.02
0.04
0.06
0.08
0.1
0.12
0.14
0.16
0.18
0.2
0 2 4 6 8 10
Ab
sorp
tio
n
Fe (µg/mL)
y = 0.0411x + 0.0021R² = 0.9999
0.00
0.05
0.10
0.15
0.20
0.25
0 1 2 3 4 5
Ab
sorp
tio
n
Mn (µg/mL)
y = 0.0339x + 5E-05R² = 0.9979
0.000
0.005
0.010
0.015
0.020
0.025
0.030
0.035
0.040
0 0.2 0.4 0.6 0.8 1
Ab
sorp
tio
n
Cu (µg/mL)
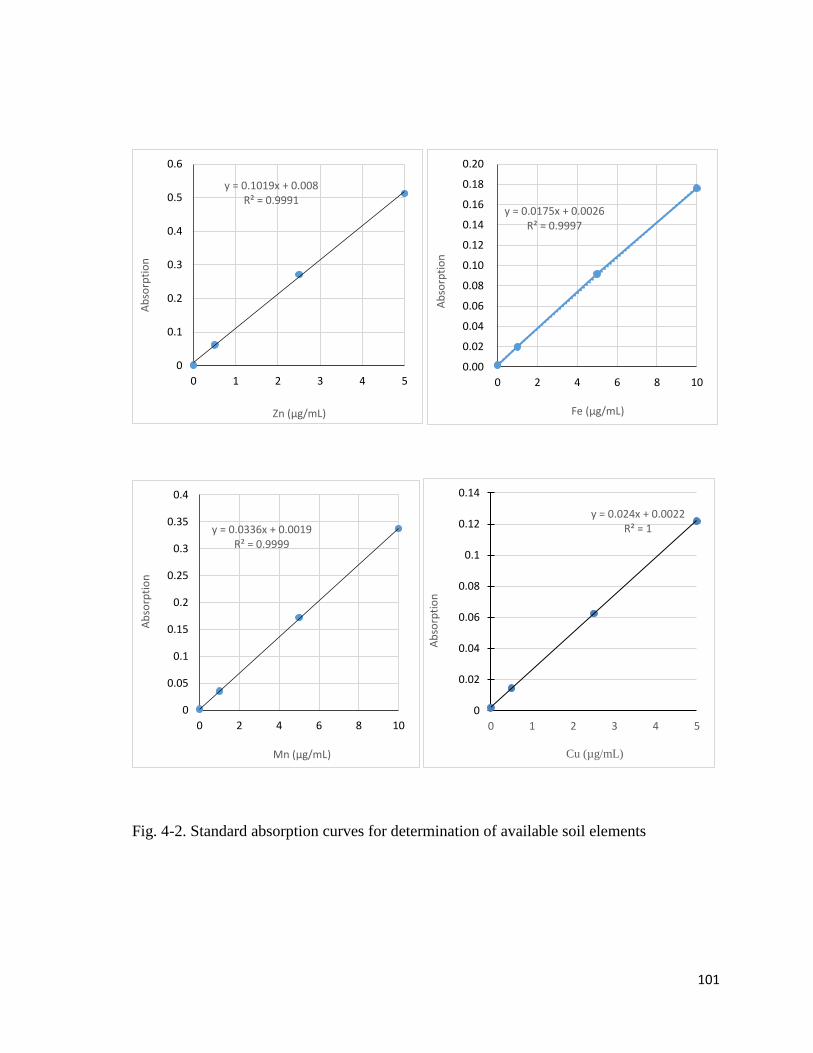
101
Fig. 4-2. Standard absorption curves for determination of available soil elements
y = 0.1019x + 0.008R² = 0.9991
0
0.1
0.2
0.3
0.4
0.5
0.6
0 1 2 3 4 5
Ab
sorp
tio
n
Zn (µg/mL)
y = 0.0175x + 0.0026R² = 0.9997
0.00
0.02
0.04
0.06
0.08
0.10
0.12
0.14
0.16
0.18
0.20
0 2 4 6 8 10
Ab
sorp
tio
n
Fe (µg/mL)
y = 0.0336x + 0.0019R² = 0.9999
0
0.05
0.1
0.15
0.2
0.25
0.3
0.35
0.4
0 2 4 6 8 10
Ab
sorp
tio
n
Mn (µg/mL)
y = 0.024x + 0.0022R² = 1
0
0.02
0.04
0.06
0.08
0.1
0.12
0.14
0 1 2 3 4 5
Ab
sorp
tio
n
Cu (µg/mL)
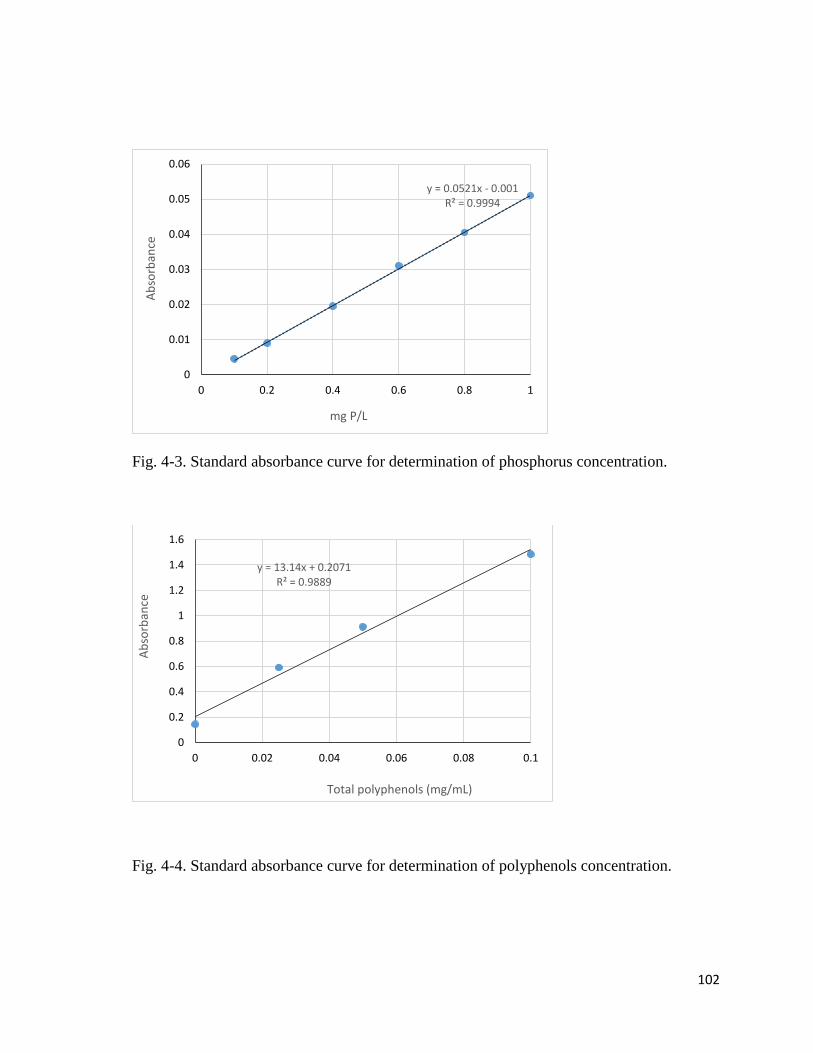
102
Fig. 4-3. Standard absorbance curve for determination of phosphorus concentration.
Fig. 4-4. Standard absorbance curve for determination of polyphenols concentration.
y = 0.0521x - 0.001R² = 0.9994
0
0.01
0.02
0.03
0.04
0.05
0.06
0 0.2 0.4 0.6 0.8 1
Ab
sorb
ance
mg P/L
y = 13.14x + 0.2071R² = 0.9889
0
0.2
0.4
0.6
0.8
1
1.2
1.4
1.6
0 0.02 0.04 0.06 0.08 0.1
Ab
sorb
ance
Total polyphenols (mg/mL)
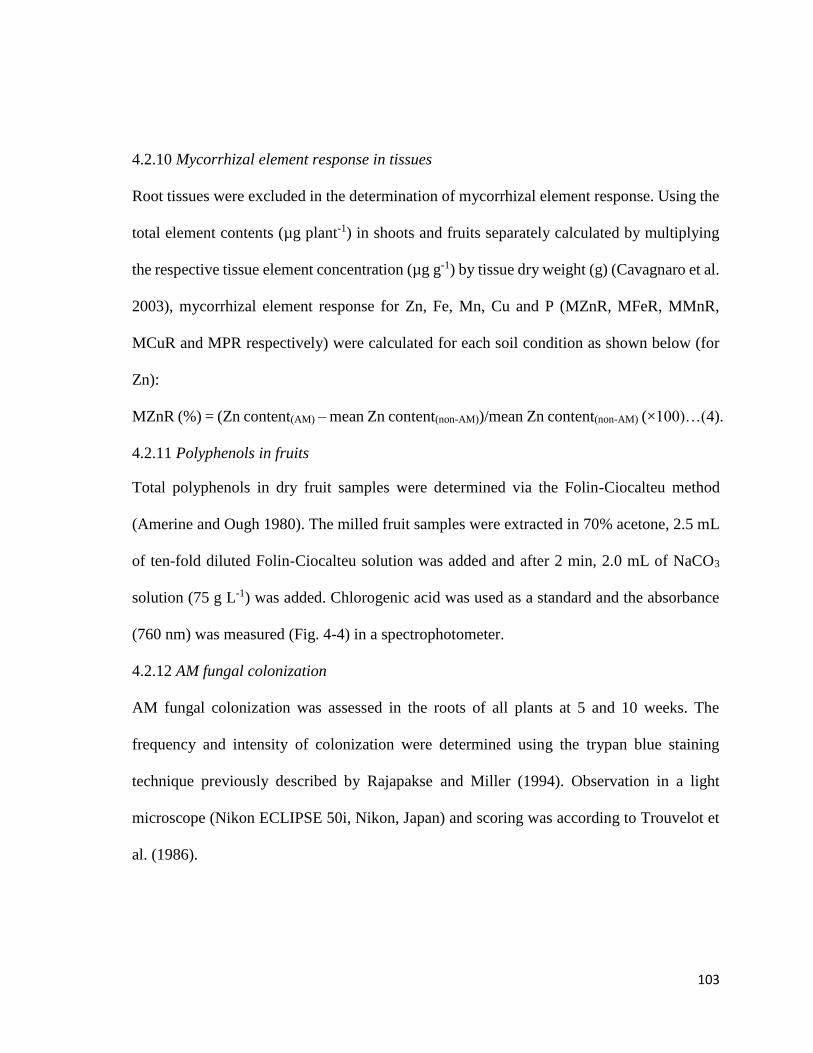
103
4.2.10 Mycorrhizal element response in tissues
Root tissues were excluded in the determination of mycorrhizal element response. Using the
total element contents (µg plant-1) in shoots and fruits separately calculated by multiplying
the respective tissue element concentration (µg g-1) by tissue dry weight (g) (Cavagnaro et al.
2003), mycorrhizal element response for Zn, Fe, Mn, Cu and P (MZnR, MFeR, MMnR,
MCuR and MPR respectively) were calculated for each soil condition as shown below (for
Zn):
MZnR (%) = (Zn content(AM) – mean Zn content(non-AM))/mean Zn content(non-AM) (×100)…(4).
4.2.11 Polyphenols in fruits
Total polyphenols in dry fruit samples were determined via the Folin-Ciocalteu method
(Amerine and Ough 1980). The milled fruit samples were extracted in 70% acetone, 2.5 mL
of ten-fold diluted Folin-Ciocalteu solution was added and after 2 min, 2.0 mL of NaCO3
solution (75 g L-1) was added. Chlorogenic acid was used as a standard and the absorbance
(760 nm) was measured (Fig. 4-4) in a spectrophotometer.
4.2.12 AM fungal colonization
AM fungal colonization was assessed in the roots of all plants at 5 and 10 weeks. The
frequency and intensity of colonization were determined using the trypan blue staining
technique previously described by Rajapakse and Miller (1994). Observation in a light
microscope (Nikon ECLIPSE 50i, Nikon, Japan) and scoring was according to Trouvelot et
al. (1986).
104
4.2.13 Statistical analysis
Data were processed statistically by two-way analysis of variance (ANOVA) with
significance levels (P values) taken at P<0.05. Differences among means were based on
Tukey-Kramer Post Hoc Tests. To quantify effect of main treatments and interaction on fruit
Mn, values below detection were assumed to be zero. Pearson correlation between biomass
indices and shoot TE ratios were determined. Students t-tests were employed (comparing Zn-
and Zn+ groups) for mycorrhizal colonization at 5 and 10 weeks, mycorrhizal responses and
available TE at planting.
105
4.3 Results
4.3.1 Plant biomass, phosphorus, and polyphenols
While days to flowering and number of fruits per plant were not significantly different,
tomato fruits were mostly red or partially ripe in Zn- soil, but mostly green or partially ripe
in the Zn+ soil (Plate 4-1). Zn treatment and AM inoculation had significant effects (Table
4-2) on biomass production at 10 weeks. TDW (Fig. 4-5A) was highest in AM plants in Zn-
soil and lowest in non-AM plants in Zn+. Both non-AM and AM plants had lower TDW in
Zn+ soil than in Zn-, while TDW of non-AM and AM plants in Zn+ soil was not significantly
different (implying an absence of significant AM protective effect against excess Zn). In non-
AM plants, RDW (Fig. 4-5B) was significantly lower in Zn+ soil compared with Zn-. AM
fungus insignificantly improved the SDW in both soils (Fig. 4-5C). FDW (Fig. 4-5D) was
significantly higher in AM plants in Zn- soil, but there was no difference between non-AM
and AM values in the Zn+ soil. Total polyphenols in fruits (Fig. 4-5E) and shoot P (Fig. 4-
5F) were significantly increased due to excess Zn but AM effects were not significant.
4.3.2 Mycorrhizal colonization and biomass response
Both inoculated and un-inoculated plants were evaluated for root mycorrhization but the un-
inoculated plants were devoid of AM fungal colonization. Root colonization indices at 5
weeks were generally lower than at 10, in both soils. The frequency (Fig. 4-5G) and intensity
(Fig. 4-5H) of AM fungal colonization were significantly lower in the Zn+ soil. TBR at 10
weeks was positive in both Zn- (17%) and Zn+ (12%) soils, while FBR was significantly
different in Zn- and Zn+ soils, reaching approximately 40% and 6% respectively (Fig. 4-5I).
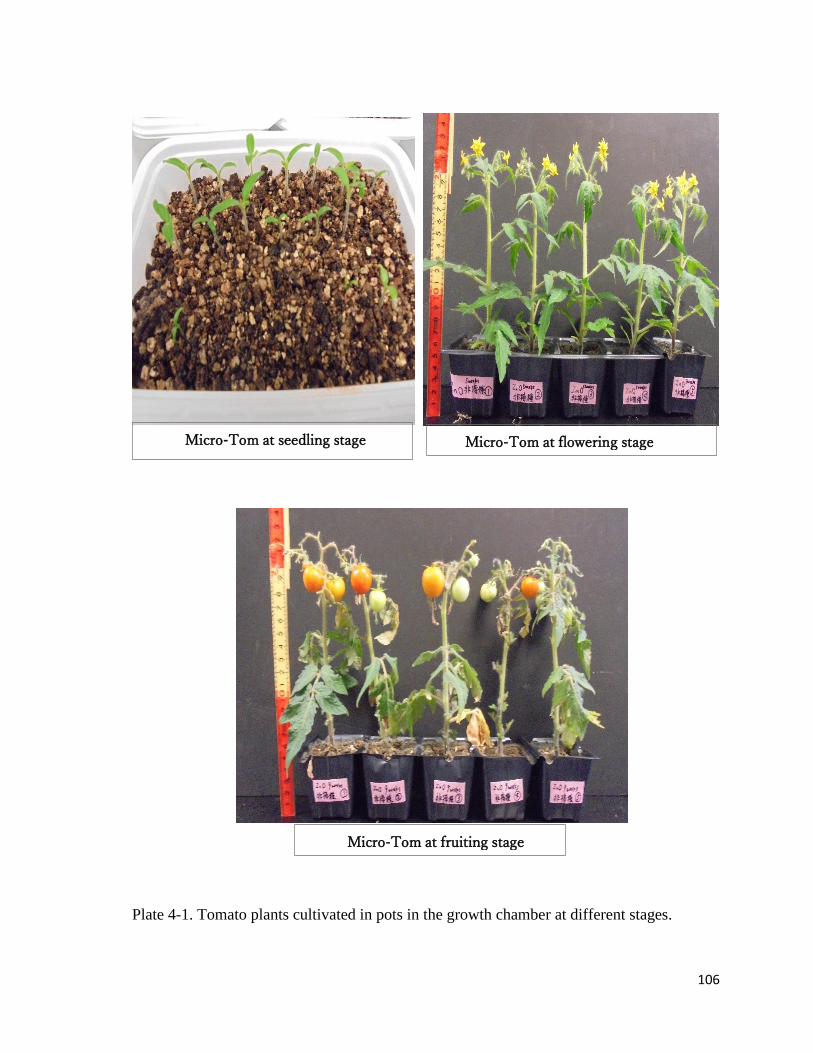
106
Plate 4-1. Tomato plants cultivated in pots in the growth chamber at different stages.
Micro-Tom at seedling stage Micro-Tom at flowering stage
Micro-Tom at fruiting stage
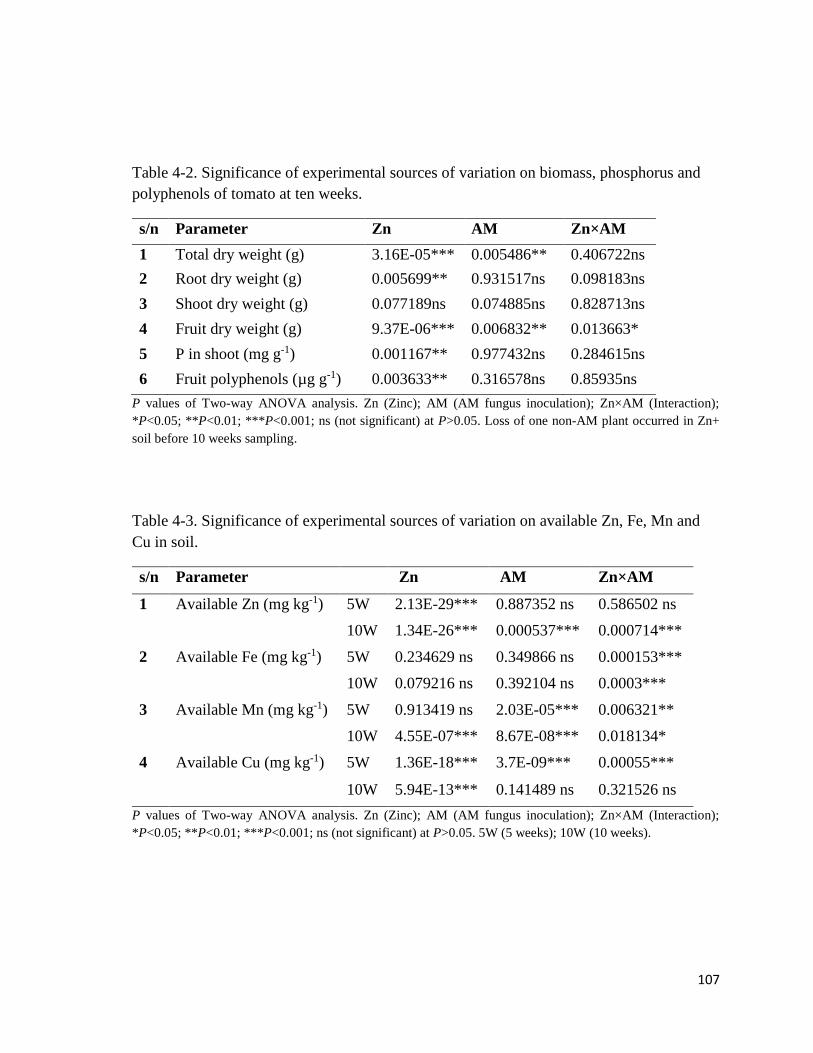
107
Table 4-2. Significance of experimental sources of variation on biomass, phosphorus and
polyphenols of tomato at ten weeks.
s/n Parameter Zn AM Zn×AM
1 Total dry weight (g) 3.16E-05*** 0.005486** 0.406722ns
2 Root dry weight (g) 0.005699** 0.931517ns 0.098183ns
3 Shoot dry weight (g) 0.077189ns 0.074885ns 0.828713ns
4 Fruit dry weight (g) 9.37E-06*** 0.006832** 0.013663*
5 P in shoot (mg g-1) 0.001167** 0.977432ns 0.284615ns
6 Fruit polyphenols (µg g-1) 0.003633** 0.316578ns 0.85935ns
P values of Two-way ANOVA analysis. Zn (Zinc); AM (AM fungus inoculation); Zn×AM (Interaction);
*P<0.05; **P<0.01; ***P<0.001; ns (not significant) at P>0.05. Loss of one non-AM plant occurred in Zn+
soil before 10 weeks sampling.
Table 4-3. Significance of experimental sources of variation on available Zn, Fe, Mn and
Cu in soil.
s/n Parameter Zn AM Zn×AM
1 Available Zn (mg kg-1) 5W 2.13E-29*** 0.887352 ns 0.586502 ns
10W 1.34E-26*** 0.000537*** 0.000714***
2 Available Fe (mg kg-1) 5W 0.234629 ns 0.349866 ns 0.000153***
10W 0.079216 ns 0.392104 ns 0.0003***
3 Available Mn (mg kg-1) 5W 0.913419 ns 2.03E-05*** 0.006321**
10W 4.55E-07*** 8.67E-08*** 0.018134*
4 Available Cu (mg kg-1) 5W 1.36E-18*** 3.7E-09*** 0.00055***
10W 5.94E-13*** 0.141489 ns 0.321526 ns
P values of Two-way ANOVA analysis. Zn (Zinc); AM (AM fungus inoculation); Zn×AM (Interaction);
*P<0.05; **P<0.01; ***P<0.001; ns (not significant) at P>0.05. 5W (5 weeks); 10W (10 weeks).
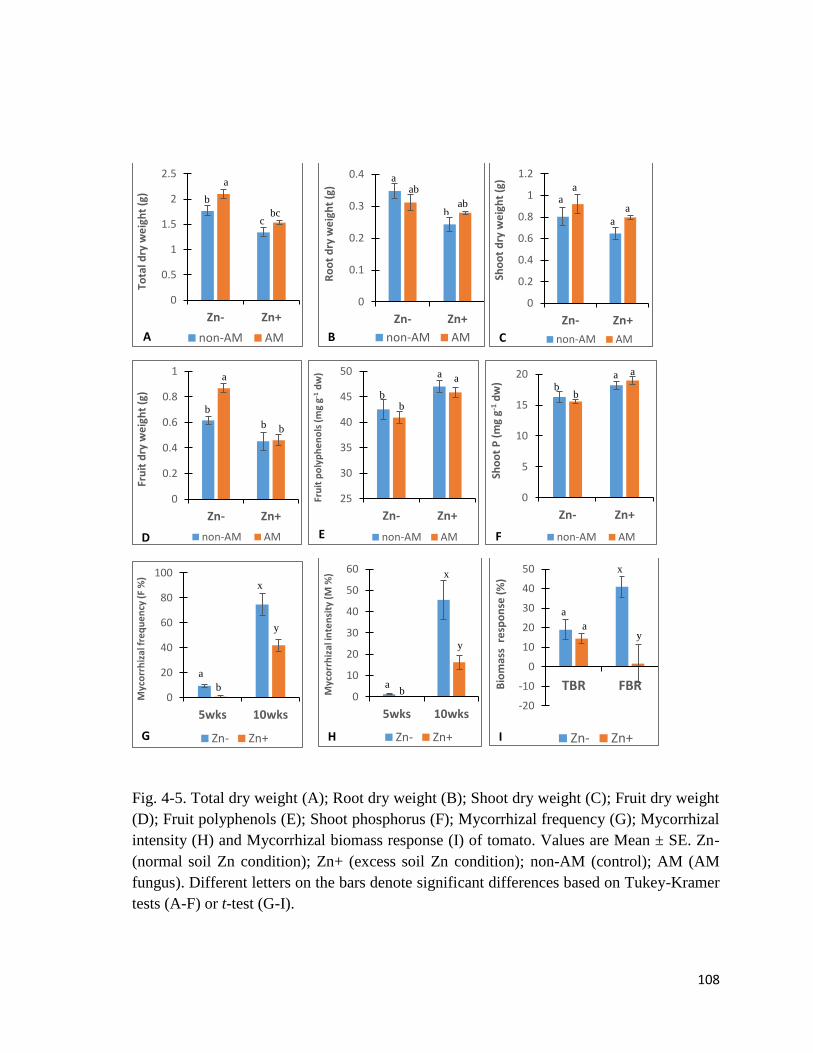
108
Fig. 4-5. Total dry weight (A); Root dry weight (B); Shoot dry weight (C); Fruit dry weight
(D); Fruit polyphenols (E); Shoot phosphorus (F); Mycorrhizal frequency (G); Mycorrhizal
intensity (H) and Mycorrhizal biomass response (I) of tomato. Values are Mean ± SE. Zn-
(normal soil Zn condition); Zn+ (excess soil Zn condition); non-AM (control); AM (AM
fungus). Different letters on the bars denote significant differences based on Tukey-Kramer
tests (A-F) or t-test (G-I).
0
0.5
1
1.5
2
2.5
Zn- Zn+
Tota
l dry
we
igh
t (g
)
non-AM AM
b
a
cbc
A
0
0.1
0.2
0.3
0.4
Zn- Zn+R
oo
t d
ry w
eig
ht
(g)
non-AM AMB
ab
b
a
ab
0
0.2
0.4
0.6
0.8
1
1.2
Zn- Zn+
Sho
ot
dry
we
igh
t (g
)
non-AM AMC
aa
a
a
0
0.2
0.4
0.6
0.8
1
Zn- Zn+
Fru
it d
ry w
eig
ht
(g)
non-AM AMD
a
b
b b
25
30
35
40
45
50
Zn- Zn+
Fru
it p
oly
ph
en
ols
(m
g g-1
dw
)
non-AM AME
b
aa
b
0
5
10
15
20
Zn- Zn+
Sho
ot
P (
mg
g-1d
w)
non-AM AMF
b
a
b
a
0
20
40
60
80
100
5wks 10wks
Myc
orr
hiz
al f
req
ue
ncy
(F
%)
Zn- Zn+
a
b
x
y
G
0
10
20
30
40
50
60
5wks 10wks
Myc
orr
hiz
al in
ten
sity
(M
%)
Zn- Zn+H
ab
x
y
-20
-10
0
10
20
30
40
50
TBR FBRBio
mas
s r
esp
on
se (
%)
Zn- Zn+I
x
y
a
a
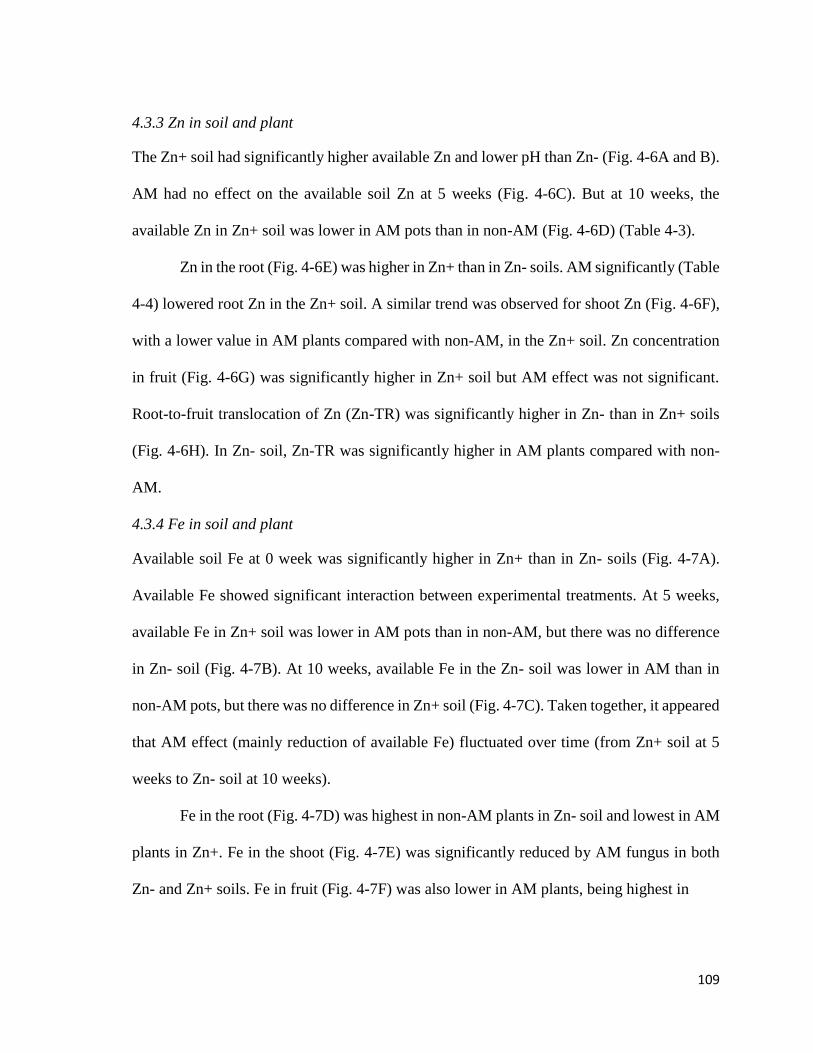
109
4.3.3 Zn in soil and plant
The Zn+ soil had significantly higher available Zn and lower pH than Zn- (Fig. 4-6A and B).
AM had no effect on the available soil Zn at 5 weeks (Fig. 4-6C). But at 10 weeks, the
available Zn in Zn+ soil was lower in AM pots than in non-AM (Fig. 4-6D) (Table 4-3).
Zn in the root (Fig. 4-6E) was higher in Zn+ than in Zn- soils. AM significantly (Table
4-4) lowered root Zn in the Zn+ soil. A similar trend was observed for shoot Zn (Fig. 4-6F),
with a lower value in AM plants compared with non-AM, in the Zn+ soil. Zn concentration
in fruit (Fig. 4-6G) was significantly higher in Zn+ soil but AM effect was not significant.
Root-to-fruit translocation of Zn (Zn-TR) was significantly higher in Zn- than in Zn+ soils
(Fig. 4-6H). In Zn- soil, Zn-TR was significantly higher in AM plants compared with non-
AM.
4.3.4 Fe in soil and plant
Available soil Fe at 0 week was significantly higher in Zn+ than in Zn- soils (Fig. 4-7A).
Available Fe showed significant interaction between experimental treatments. At 5 weeks,
available Fe in Zn+ soil was lower in AM pots than in non-AM, but there was no difference
in Zn- soil (Fig. 4-7B). At 10 weeks, available Fe in the Zn- soil was lower in AM than in
non-AM pots, but there was no difference in Zn+ soil (Fig. 4-7C). Taken together, it appeared
that AM effect (mainly reduction of available Fe) fluctuated over time (from Zn+ soil at 5
weeks to Zn- soil at 10 weeks).
Fe in the root (Fig. 4-7D) was highest in non-AM plants in Zn- soil and lowest in AM
plants in Zn+. Fe in the shoot (Fig. 4-7E) was significantly reduced by AM fungus in both
Zn- and Zn+ soils. Fe in fruit (Fig. 4-7F) was also lower in AM plants, being highest in
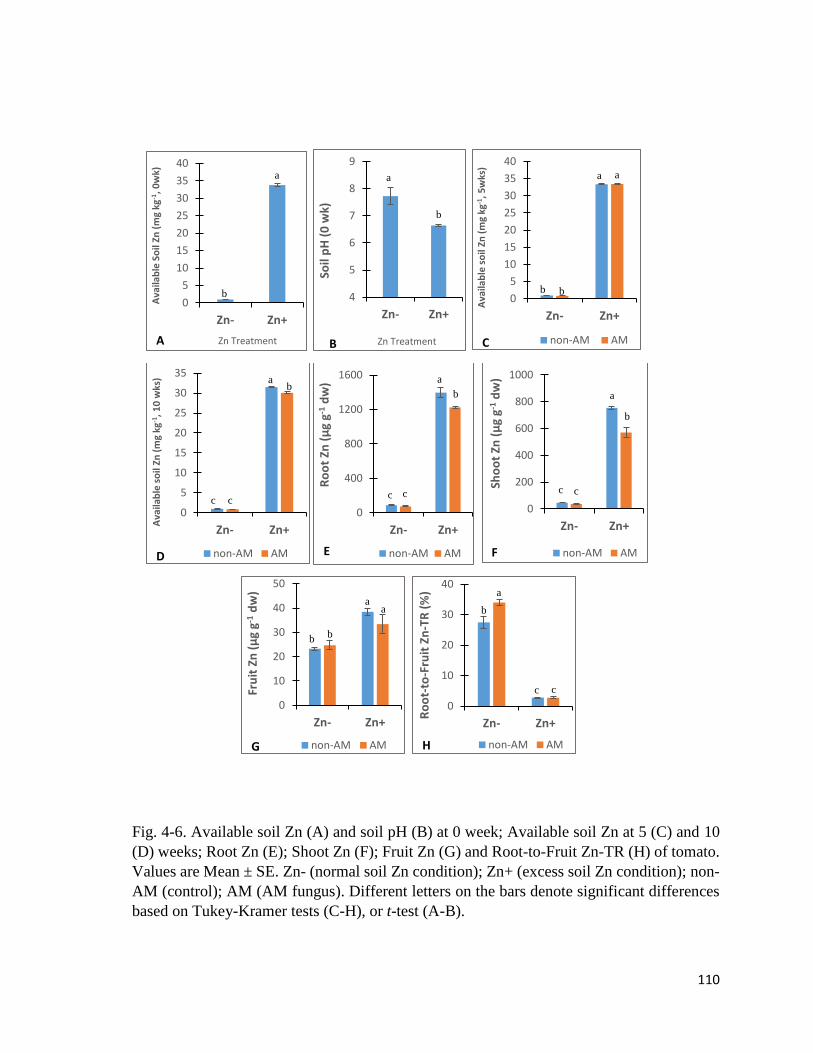
110
Fig. 4-6. Available soil Zn (A) and soil pH (B) at 0 week; Available soil Zn at 5 (C) and 10
(D) weeks; Root Zn (E); Shoot Zn (F); Fruit Zn (G) and Root-to-Fruit Zn-TR (H) of tomato.
Values are Mean ± SE. Zn- (normal soil Zn condition); Zn+ (excess soil Zn condition); non-
AM (control); AM (AM fungus). Different letters on the bars denote significant differences
based on Tukey-Kramer tests (C-H), or t-test (A-B).
0
5
10
15
20
25
30
35
40
Zn- Zn+
Ava
ilab
le S
oil
Zn (
mg
kg-1
, 0w
k)
Zn TreatmentA
a
b 4
5
6
7
8
9
Zn- Zn+So
il p
H (
0 w
k)Zn TreatmentB
b
a
0
5
10
15
20
25
30
35
40
Zn- Zn+
Ava
ilab
le s
oil
Zn (
mg
kg-1
, 5w
ks)
non-AM AM
a
b
C
b
a
0
5
10
15
20
25
30
35
Zn- Zn+
Ava
ilab
le s
oil
Zn (
mg
kg-1
, 10
wks
)
non-AM AMD
ab
cc
0
400
800
1200
1600
Zn- Zn+
Ro
ot
Zn (
µg
g-1d
w)
non-AM AME
c c
a
b
0
200
400
600
800
1000
Zn- Zn+
Sho
ot
Zn (
µg
g-1d
w)
non-AM AM
c c
a
b
F
0
10
20
30
40
50
Zn- Zn+
Fru
it Z
n (
µg
g-1d
w)
non-AM AMG
b
a
b
a
0
10
20
30
40
Zn- Zn+
Ro
ot-
to-F
ruit
Zn
-TR
(%
)
non-AM AM
b
a
cc
H
111
Fig. 4-7. Available soil Fe at 0 (A), 5 (B) and 10 (C) weeks; Root Fe (D); Shoot Fe (E); Fruit
Fe (F); Root-to-Fruit Fe-TR (G) and Fe:Zn ratio (H) of tomato. Values are Mean ± SE. Zn-
(normal soil Zn condition); Zn+ (excess soil Zn condition); non-AM (control); AM (AM
fungus). Different letters on the bars denote significant differences based on Tukey-Kramer
tests (B-H), or t-test (A).
0
2
4
6
8
10
12
14
Zn- Zn+
Ava
ilab
le S
oil
Fe (
mg
kg-1
, 0w
k)
Zn TreatmentA
a
b
0
2
4
6
8
10
12
Zn- Zn+A
vaila
ble
so
il Fe
(m
g kg
-1,
5w
ks)
non-AM AM
b b
ab a
B
0
2
4
6
8
10
12
Zn- Zn+
Ava
ilab
le s
oil
Fe (
mg
kg-1
, 1
0w
ks)
non-AM AMC
a
bb
ab
0
500
1000
1500
2000
2500
Zn- Zn+
Ro
ot
Fe (
µg
g-1d
w)
non-AM AMD
a
b
abab
0
50
100
150
200
250
300
Zn- Zn+
Sho
ot
Fe (
µg
g-1d
w)
non-AM AME
a
a
bb
0
50
100
150
200
Zn- Zn+
Fru
it F
e (
µg
g-1d
w)
non-AM AMF
bb
a
c
0
5
10
15
20
25
Zn- Zn+
Ro
ot-
to-F
ruit
Fe
-TR
(%
)
non-AM AMG
a
b b
a
0
1
2
3
4
5
Zn- Zn+
Fe:Z
n r
atio
(sh
oo
t)
non-AM AMH
a
b
a
b
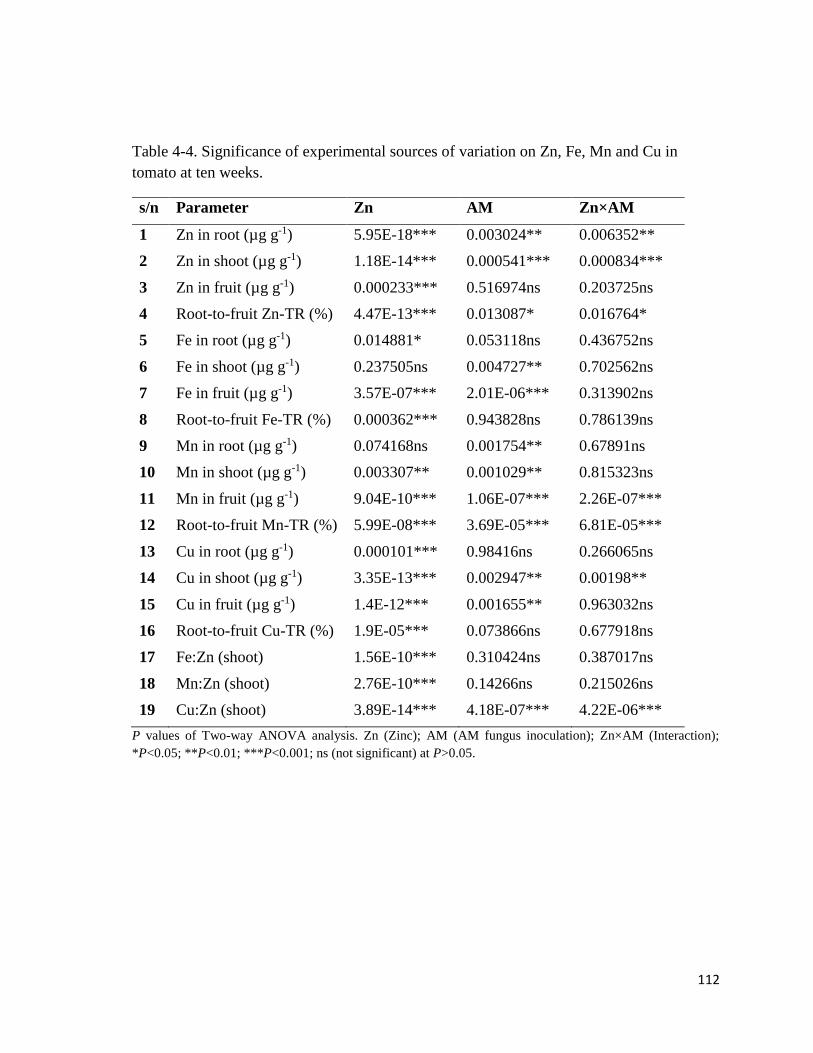
112
Table 4-4. Significance of experimental sources of variation on Zn, Fe, Mn and Cu in
tomato at ten weeks.
s/n Parameter Zn AM Zn×AM
1 Zn in root (µg g-1) 5.95E-18*** 0.003024** 0.006352**
2 Zn in shoot (µg g-1) 1.18E-14*** 0.000541*** 0.000834***
3 Zn in fruit (µg g-1) 0.000233*** 0.516974ns 0.203725ns
4 Root-to-fruit Zn-TR (%) 4.47E-13*** 0.013087* 0.016764*
5 Fe in root (µg g-1) 0.014881* 0.053118ns 0.436752ns
6 Fe in shoot (µg g-1) 0.237505ns 0.004727** 0.702562ns
7 Fe in fruit (µg g-1) 3.57E-07*** 2.01E-06*** 0.313902ns
8 Root-to-fruit Fe-TR (%) 0.000362*** 0.943828ns 0.786139ns
9 Mn in root (µg g-1) 0.074168ns 0.001754** 0.67891ns
10 Mn in shoot (µg g-1) 0.003307** 0.001029** 0.815323ns
11 Mn in fruit (µg g-1) 9.04E-10*** 1.06E-07*** 2.26E-07***
12 Root-to-fruit Mn-TR (%) 5.99E-08*** 3.69E-05*** 6.81E-05***
13 Cu in root (µg g-1) 0.000101*** 0.98416ns 0.266065ns
14 Cu in shoot (µg g-1) 3.35E-13*** 0.002947** 0.00198**
15 Cu in fruit (µg g-1) 1.4E-12*** 0.001655** 0.963032ns
16 Root-to-fruit Cu-TR (%) 1.9E-05*** 0.073866ns 0.677918ns
17 Fe:Zn (shoot) 1.56E-10*** 0.310424ns 0.387017ns
18 Mn:Zn (shoot) 2.76E-10*** 0.14266ns 0.215026ns
19 Cu:Zn (shoot) 3.89E-14*** 4.18E-07*** 4.22E-06***
P values of Two-way ANOVA analysis. Zn (Zinc); AM (AM fungus inoculation); Zn×AM (Interaction);
*P<0.05; **P<0.01; ***P<0.001; ns (not significant) at P>0.05.
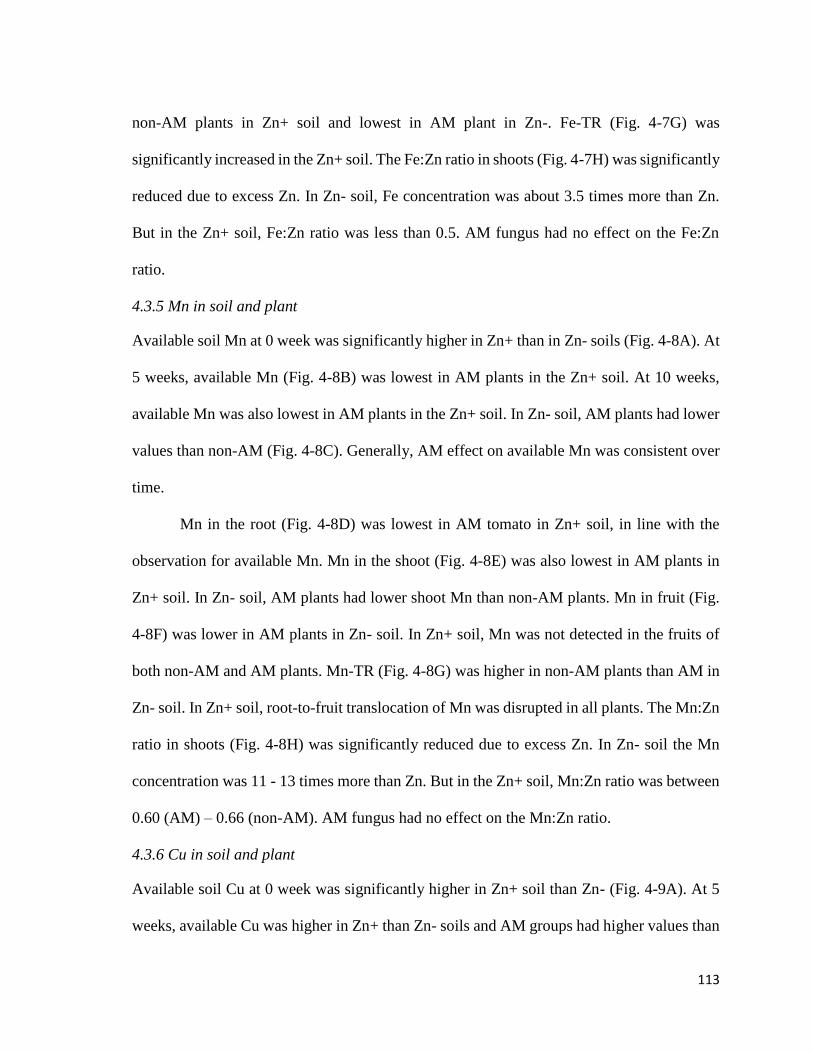
113
non-AM plants in Zn+ soil and lowest in AM plant in Zn-. Fe-TR (Fig. 4-7G) was
significantly increased in the Zn+ soil. The Fe:Zn ratio in shoots (Fig. 4-7H) was significantly
reduced due to excess Zn. In Zn- soil, Fe concentration was about 3.5 times more than Zn.
But in the Zn+ soil, Fe:Zn ratio was less than 0.5. AM fungus had no effect on the Fe:Zn
ratio.
4.3.5 Mn in soil and plant
Available soil Mn at 0 week was significantly higher in Zn+ than in Zn- soils (Fig. 4-8A). At
5 weeks, available Mn (Fig. 4-8B) was lowest in AM plants in the Zn+ soil. At 10 weeks,
available Mn was also lowest in AM plants in the Zn+ soil. In Zn- soil, AM plants had lower
values than non-AM (Fig. 4-8C). Generally, AM effect on available Mn was consistent over
time.
Mn in the root (Fig. 4-8D) was lowest in AM tomato in Zn+ soil, in line with the
observation for available Mn. Mn in the shoot (Fig. 4-8E) was also lowest in AM plants in
Zn+ soil. In Zn- soil, AM plants had lower shoot Mn than non-AM plants. Mn in fruit (Fig.
4-8F) was lower in AM plants in Zn- soil. In Zn+ soil, Mn was not detected in the fruits of
both non-AM and AM plants. Mn-TR (Fig. 4-8G) was higher in non-AM plants than AM in
Zn- soil. In Zn+ soil, root-to-fruit translocation of Mn was disrupted in all plants. The Mn:Zn
ratio in shoots (Fig. 4-8H) was significantly reduced due to excess Zn. In Zn- soil the Mn
concentration was 11 - 13 times more than Zn. But in the Zn+ soil, Mn:Zn ratio was between
0.60 (AM) – 0.66 (non-AM). AM fungus had no effect on the Mn:Zn ratio.
4.3.6 Cu in soil and plant
Available soil Cu at 0 week was significantly higher in Zn+ soil than Zn- (Fig. 4-9A). At 5
weeks, available Cu was higher in Zn+ than Zn- soils and AM groups had higher values than
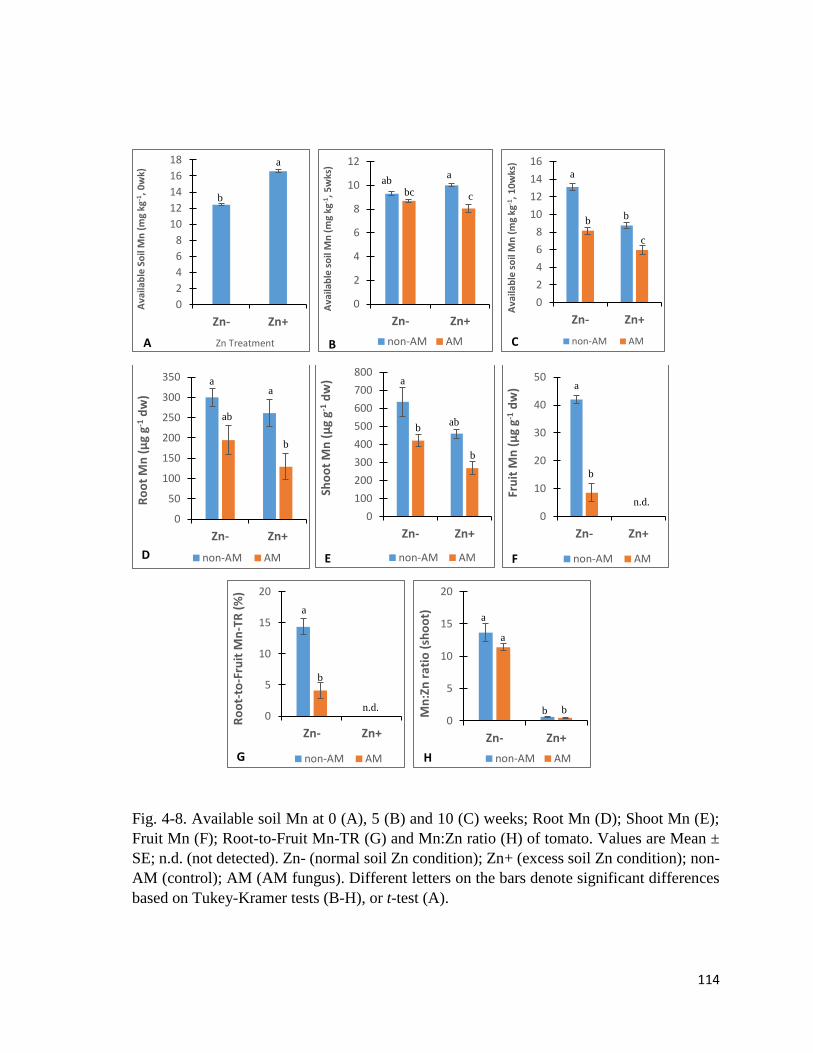
114
Fig. 4-8. Available soil Mn at 0 (A), 5 (B) and 10 (C) weeks; Root Mn (D); Shoot Mn (E);
Fruit Mn (F); Root-to-Fruit Mn-TR (G) and Mn:Zn ratio (H) of tomato. Values are Mean ±
SE; n.d. (not detected). Zn- (normal soil Zn condition); Zn+ (excess soil Zn condition); non-
AM (control); AM (AM fungus). Different letters on the bars denote significant differences
based on Tukey-Kramer tests (B-H), or t-test (A).
0
2
4
6
8
10
12
14
16
18
Zn- Zn+
Ava
ilab
le S
oil
Mn
(m
g kg
-1, 0
wk)
Zn Treatment
a
b
A
0
2
4
6
8
10
12
Zn- Zn+A
vaila
ble
so
il M
n (
mg
kg-1
, 5w
ks)
non-AM AM
aab
bc c
B
0
2
4
6
8
10
12
14
16
Zn- Zn+
Ava
ilab
le s
oil
Mn
(m
g kg
-1, 1
0w
ks)
non-AM AMC
a
bb
c
0
50
100
150
200
250
300
350
Zn- Zn+
Ro
ot
Mn
(µ
g g-1
dw
)
non-AM AMD
aa
ab
b
0
100
200
300
400
500
600
700
800
Zn- Zn+
Sho
ot
Mn
(µ
g g-1
dw
)
non-AM AME
abb
b
a
0
10
20
30
40
50
Zn- Zn+
Fru
it M
n (
µg
g-1d
w)
non-AM AM
a
b
n.d.
F
0
5
10
15
20
Zn- Zn+
Ro
ot-
to-F
ruit
Mn
-TR
(%
)
non-AM AMG
n.d.
a
b
0
5
10
15
20
Zn- Zn+
Mn
:Zn
rat
io (
sho
ot)
non-AM AMH
a
b
a
b
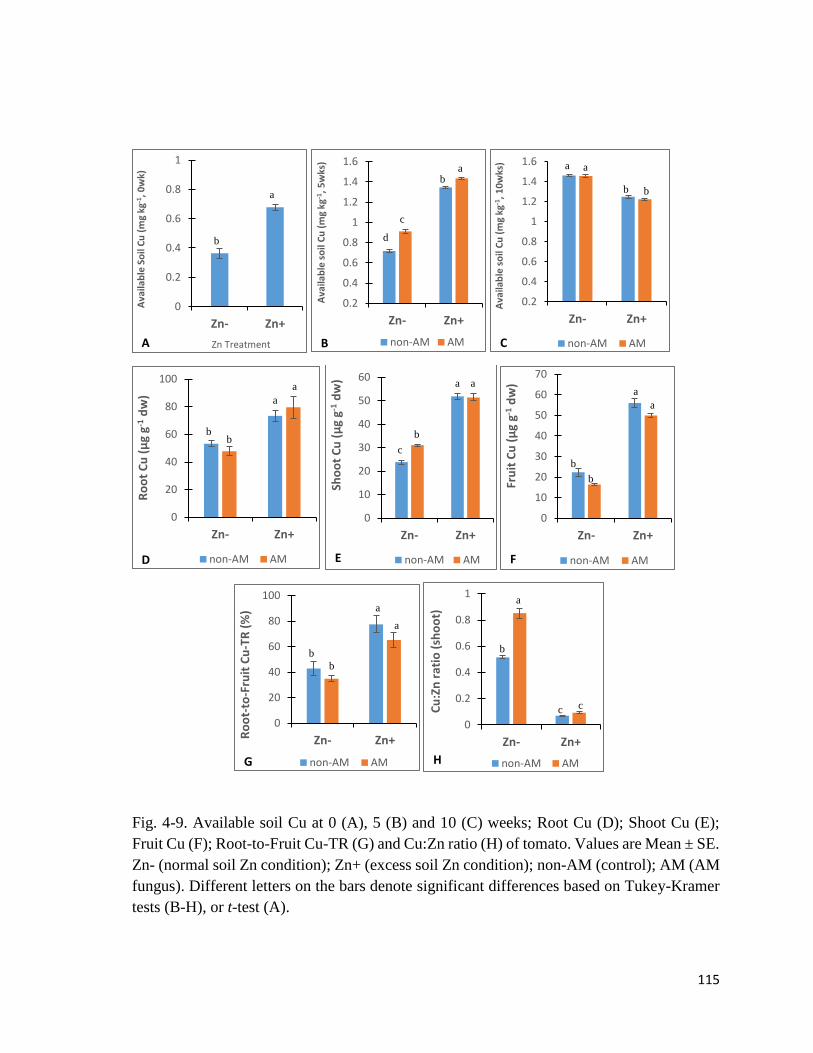
115
Fig. 4-9. Available soil Cu at 0 (A), 5 (B) and 10 (C) weeks; Root Cu (D); Shoot Cu (E);
Fruit Cu (F); Root-to-Fruit Cu-TR (G) and Cu:Zn ratio (H) of tomato. Values are Mean ± SE.
Zn- (normal soil Zn condition); Zn+ (excess soil Zn condition); non-AM (control); AM (AM
fungus). Different letters on the bars denote significant differences based on Tukey-Kramer
tests (B-H), or t-test (A).
0
0.2
0.4
0.6
0.8
1
Zn- Zn+
Ava
ilab
le S
oil
Cu
(m
g kg
-1, 0
wk)
Zn TreatmentA
b
a
0.2
0.4
0.6
0.8
1
1.2
1.4
1.6
Zn- Zn+A
vaila
ble
so
il C
u (
mg
kg-1
, 5
wks
)
non-AM AM
ab
c
d
B
0.2
0.4
0.6
0.8
1
1.2
1.4
1.6
Zn- Zn+
Ava
ilab
le s
oil
Cu
(m
g kg
-1,
10
wks
)
non-AM AMC
a
b
a
b
0
20
40
60
80
100
Zn- Zn+
Ro
ot
Cu
(µ
g g-1
dw
)
non-AM AMD
b
a
a
b
0
10
20
30
40
50
60
Zn- Zn+
Sho
ot
Cu
(µ
g g-1
dw
)
non-AM AME
c
b
a a
0
10
20
30
40
50
60
70
Zn- Zn+
Fru
it C
u (
µg
g-1d
w)
non-AM AMF
b
b
a
a
0
20
40
60
80
100
Zn- Zn+Ro
ot-
to-F
ruit
Cu
-TR
(%
)
non-AM AMG
b
a
a
b
0
0.2
0.4
0.6
0.8
1
Zn- Zn+
Cu
:Zn
rat
io (
sho
ot)
non-AM AMH
a
b
cc
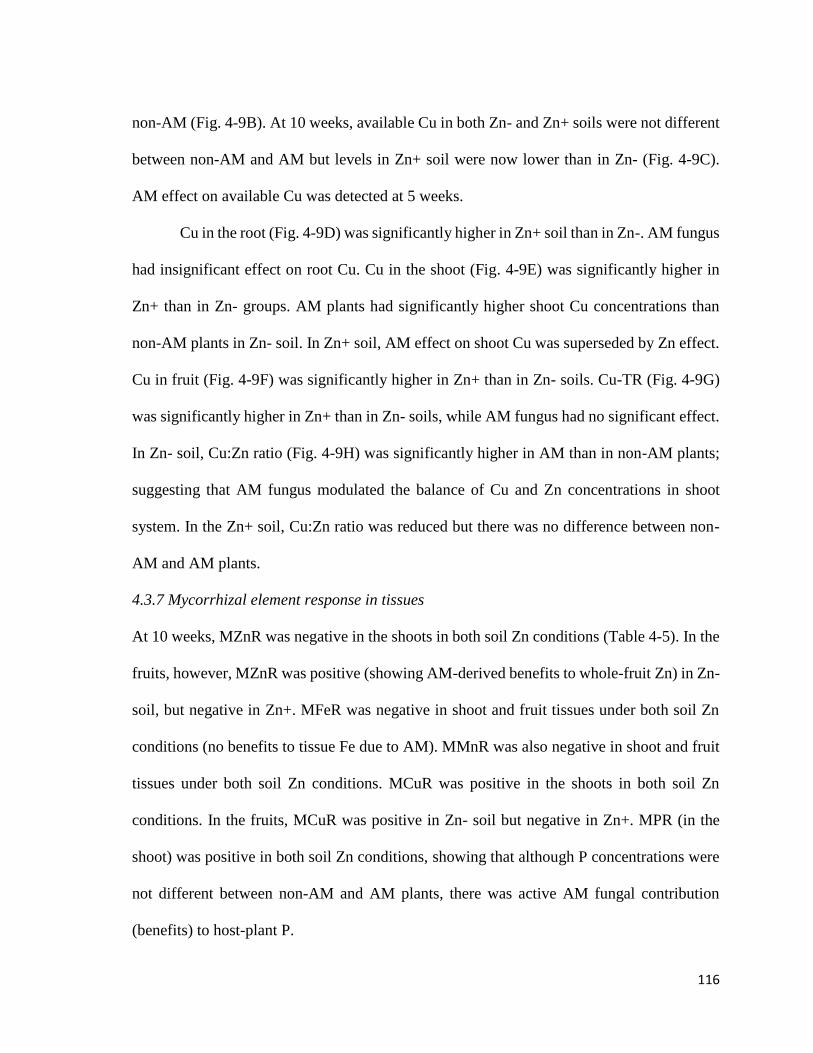
116
non-AM (Fig. 4-9B). At 10 weeks, available Cu in both Zn- and Zn+ soils were not different
between non-AM and AM but levels in Zn+ soil were now lower than in Zn- (Fig. 4-9C).
AM effect on available Cu was detected at 5 weeks.
Cu in the root (Fig. 4-9D) was significantly higher in Zn+ soil than in Zn-. AM fungus
had insignificant effect on root Cu. Cu in the shoot (Fig. 4-9E) was significantly higher in
Zn+ than in Zn- groups. AM plants had significantly higher shoot Cu concentrations than
non-AM plants in Zn- soil. In Zn+ soil, AM effect on shoot Cu was superseded by Zn effect.
Cu in fruit (Fig. 4-9F) was significantly higher in Zn+ than in Zn- soils. Cu-TR (Fig. 4-9G)
was significantly higher in Zn+ than in Zn- soils, while AM fungus had no significant effect.
In Zn- soil, Cu:Zn ratio (Fig. 4-9H) was significantly higher in AM than in non-AM plants;
suggesting that AM fungus modulated the balance of Cu and Zn concentrations in shoot
system. In the Zn+ soil, Cu:Zn ratio was reduced but there was no difference between non-
AM and AM plants.
4.3.7 Mycorrhizal element response in tissues
At 10 weeks, MZnR was negative in the shoots in both soil Zn conditions (Table 4-5). In the
fruits, however, MZnR was positive (showing AM-derived benefits to whole-fruit Zn) in Zn-
soil, but negative in Zn+. MFeR was negative in shoot and fruit tissues under both soil Zn
conditions (no benefits to tissue Fe due to AM). MMnR was also negative in shoot and fruit
tissues under both soil Zn conditions. MCuR was positive in the shoots in both soil Zn
conditions. In the fruits, MCuR was positive in Zn- soil but negative in Zn+. MPR (in the
shoot) was positive in both soil Zn conditions, showing that although P concentrations were
not different between non-AM and AM plants, there was active AM fungal contribution
(benefits) to host-plant P.
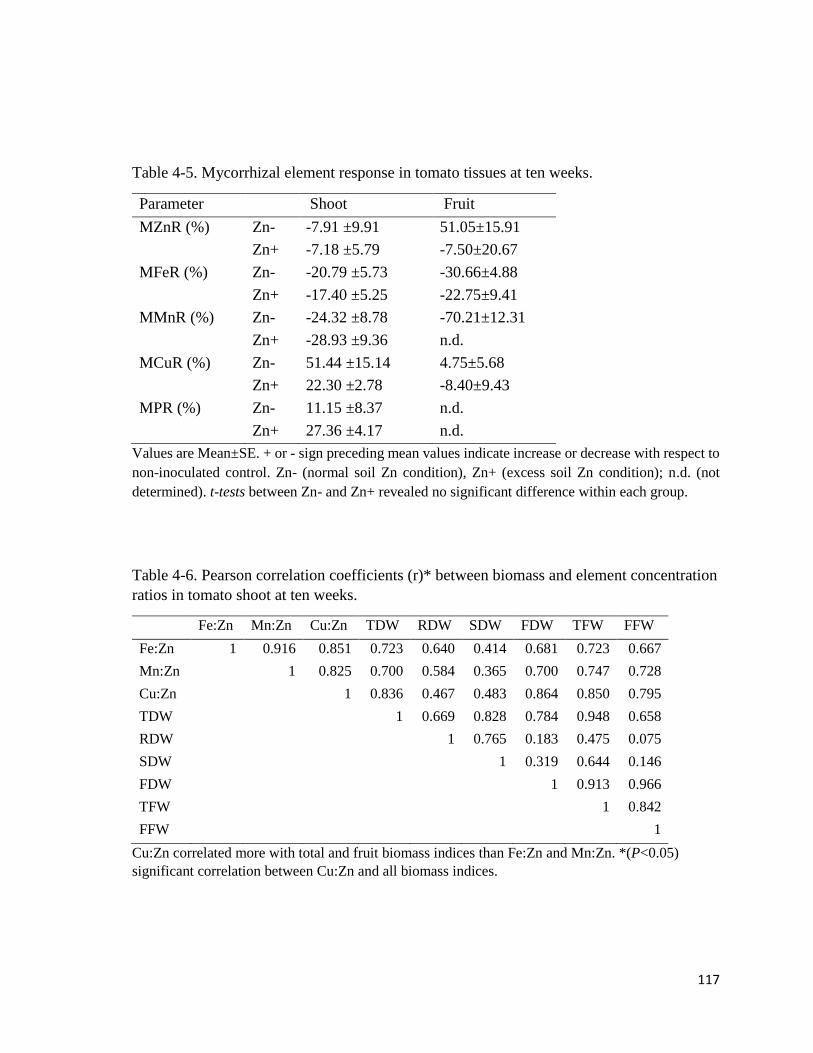
117
Table 4-5. Mycorrhizal element response in tomato tissues at ten weeks.
Parameter Shoot Fruit
MZnR (%) Zn- -7.91 ±9.91 51.05±15.91
Zn+ -7.18 ±5.79 -7.50±20.67
MFeR (%) Zn- -20.79 ±5.73 -30.66±4.88
Zn+ -17.40 ±5.25 -22.75±9.41
MMnR (%) Zn- -24.32 ±8.78 -70.21±12.31
Zn+ -28.93 ±9.36 n.d.
MCuR (%) Zn- 51.44 ±15.14 4.75±5.68
Zn+ 22.30 ±2.78 -8.40±9.43
MPR (%) Zn- 11.15 ±8.37 n.d.
Zn+ 27.36 ±4.17 n.d.
Values are Mean±SE. + or - sign preceding mean values indicate increase or decrease with respect to
non-inoculated control. Zn- (normal soil Zn condition), Zn+ (excess soil Zn condition); n.d. (not
determined). t-tests between Zn- and Zn+ revealed no significant difference within each group.
Table 4-6. Pearson correlation coefficients (r)* between biomass and element concentration
ratios in tomato shoot at ten weeks.
Fe:Zn Mn:Zn Cu:Zn TDW RDW SDW FDW TFW FFW
Fe:Zn 1 0.916 0.851 0.723 0.640 0.414 0.681 0.723 0.667
Mn:Zn 1 0.825 0.700 0.584 0.365 0.700 0.747 0.728
Cu:Zn 1 0.836 0.467 0.483 0.864 0.850 0.795
TDW 1 0.669 0.828 0.784 0.948 0.658
RDW 1 0.765 0.183 0.475 0.075
SDW 1 0.319 0.644 0.146
FDW 1 0.913 0.966
TFW 1 0.842
FFW
1
Cu:Zn correlated more with total and fruit biomass indices than Fe:Zn and Mn:Zn. *(P<0.05)
significant correlation between Cu:Zn and all biomass indices.
118
4.3.8 Biomass correlation with TE ratios
Cu:Zn ratio was significantly affected by AM inoculation while Fe:Zn and Mn:Zn ratios were
not. Pearson correlation coefficients show Cu:Zn ratio correlated more with the total and
above-ground biomass indices; TFW (0.85), TDW (0.83), SDW (0.48), FFW (0.79), FDW
(0.86), than Fe:Zn and Mn:Zn (Table 4-6).
4.4 Discussion
Effects on bioproduction, phosphorus and polyphenols
AM increased TDW and FDW of host-plant in Zn- soil, with a higher FBR and mycorrhizal
colonization. I therefore considered the lack of significant differences in SDW (stem +
leaves) to be due to ripening stage, as the above-ground biomass production at this time is
more in fruit tissue than in leaves. In Zn+ soil, on the other hand, plant dry weights in both
non-AM and AM plants were reduced, showing a diminished host bioproduction under
excess Zn, in line with previous reports (Rout and Das 2003). The lack of significant
difference in dry biomass between mycorrhizal and non-mycorrhizal plants under excess Zn
is in line with Cavagnaro et al. (2010) and Watts-Williams and Cavagnaro (2012), but at
variance with the position of Christie et al. (2004). Excess Zn-induced reductions in the root
colonization by AM (and possibly extraradical hyphal development) may account for this
(Watts-Williams and Cavagnaro 2012), for although mycorrhizal colonization tends to
increase with increasing metal content of soil (Hildebrandt et al. 1999), a reduction in
colonization indices will be seen if the fitness of the AM is negatively affected (Millar and
Bennett 2016). This is in line with the differences observed in FBR between Zn- and Zn+
soils. I observed mild leaf curling in the plants at two – three weeks after planting, increased
119
total polyphenols in fruit and delay in fruit ripening in Zn excess soil. Increased polyphenols
and delayed fruit ripening points to increased levels of antioxidants and homeostatic impacts
on ethylene and abscisic acid, in the exposed plants (Ozga and Reinecke 2003). Although no
differences in shoot P concentrations were observed between non-AM and AM plants, the
positive shoot MPR in both soil Zn conditions show that AM-derived P accrued to host
(Smith and Read 2008). Some unknown quantity of elements (e.g. P and Zn) are usually
bound in the intraradical mycelia of AM within a colonized root. To exclude these elements
(which are “undelivered” to the host ionome) in the estimation of element benefit delivered
to the host by AM, root tissues were avoided (Cavagnaro et al. 2003). As AM plants in Zn-
soil had higher TDW, it was considered that a larger plant size “diluted” tissue P
concentration (dilution effect) thereby masking the mycorrhizal P contribution in those plants
(Smith and Smith 2011; Watts-Williams and Cavagnaro 2012). The increased shoot P
concentration observed in Zn+ soils may be due to decreased dilution effect and Zn-P
interaction effects, and is in line with previous reports (Arriagada et al. 2010; Watts-Williams
and Cavagnaro 2012).
Effects on TE in soil and plant
In Zn- soil, Zn-TR was higher in AM than in non-AM plants, in line with the positive
MZnR in fruit tissue and a negative one in shoot. However, the positive MZnR and MCuR
in fruit was accompanied by negative MFeR and MMnR. AM benefit to fruit tissue in terms
of total Zn content appeared to be at the expense of Fe and Mn. The reduced Fe and Mn
concentrations in tomato fruit I observed due to AM fungus align with the position of Lehman
and Rillig (2015) who concluded that AM symbiosis generally has a positive effect on plant
Cu and mostly negative impact on Mn concentrations. Cavagnaro et al. (2012) also reported
120
that AM colonization increased Cu and decreased Mn in tomato tissues. In their study, while
fruit Zn was insignificantly increased due to AM colonization, the fruit Mn concentrations in
AM (19 μg g-1) compared with non-AM (29 μg g-1) showed a significant decrease. However,
conclusions by Nzanza et al. (2011) (using Glomus mosseae) and Maboko et al. (2013) (using
a mix of Glomus mosseae, Glomus etunicatum, Glomus clarum and Paraglomus occultum)
did not report decreases in Mn concentration in tomato due to AM. Overall, benefits in one
or more TE at the expense of others, as well as differences coinciding with varied AM species
and growth medium are noteworthy in plant biofortification efforts using AM inoculant(s).
The available fractions of TE are more critical in terms of environmental transport
and effects on biota, including plant acquisition (Rieuwerts et al. 1998). Excess Zn treatment
increased the available Zn, as well as Fe, Mn and Cu (derived from their hitherto unavailable
fractions). The pH is regarded as the most influential factor on TE availability in soils
(Rieuwerts et al. 1998). A lowered soil pH (Zn2+ is a weak acid) supported these increases in
the Zn+ soil. Further, excess metal (Zn) addition increase cation competition for adsorption
sites and leads to a saturation of the metal fixation capacity of the soil, causing more elements
to become bioavailable (Banin et al. 1987; Chlopecka 1996; Rieuwerts et al. 1998).
Expectedly, the Zn concentration in tissues was higher in plants in Zn+ soil. But lowered Zn-
TR minimized Zn accumulation in aerial parts (Arrivault et al. 2006), keeping fruit Zn within
the safe European Commission guideline (50 mg kg-1) for Zn in foods (European
Commission Regulation 2006) at 300 mg Zn kg-1 soil. AM lowered available Zn in Zn+ soil
at 10 weeks but not at 5, implying that duration of soil-plant contact (Austruy et al. 2014)
and stage of plant-AM symbiosis (Miransari 2010) vis-a-vis root colonization, were of
importance. This is in line with the significantly reduced root and shoot Zn in AM plants in
121
Zn+ soil, and the general improvement in mycorrhizal frequency and intensity from
flowering to fruiting. Under excess conditions, AM hyphal binding of Zn in the rhizosphere
can promote phytostabilization and reduce the availability and acquisition of the metal (Khan
et al. 2000; Christie et al. 2004). Generally, from planting to flowering to fruiting, changes
in available TE reflects the biotic effects of the tomato root or root+AM fungus, such as
uptake and translocation, sequestration, chelation, stabilization, etc., in the rhizosphere
(Leyval et al. 2002; Miransari 2010). These processes are also influenced by phytochemicals
in plant root exudation (Hage-Ahmed et al. 2013; Rengel 2015). In non-AM groups in the
Zn+ soil for instance, it was observed at 5 weeks that available Mn appeared lower than at 0
and 10 weeks. Spatial and temporal variations in volume and composition of root exudation
over time affect Mn, Fe and Zn availability in the rhizosphere (Rengel 2015). Fluctuating
AM effects on available Fe may reflect modulation in ferrireductase activity in R. irregularis
extraradical mycelia to sustain Fe homeostasis at required levels for the symbiosis (Tamayo
et al. 2014), and finally resulted in reduced Fe levels in host tissues.
Excess Zn distorted Mn:Zn balance and led to Mn deficiency in tomato fruit.
Antagonism between Zn and Mn is known to exist (Van Assche and Clijsters 1990; Hasani
et al. 2012), and I noticed that shoot Mn concentration was roughly double that of root (in
both soils). Observations of Mn preference for shoots or leaves has been reported before
(Page et al. 2006) and could be related to their essential role in photosynthesis (Kabata-
Pendias 2011). I suppose that the fruit “suffered” Mn deprivation for this preference to be
maintained in the face of Mn:Zn imbalance in Zn+ groups. Mn deficiency in fruit may have
contributed to delayed ripening (or vice versa) in the Zn+ soil, but no fruit malformations
were seen. AM neither ameliorated Mn deficiency nor the delay in the ripening of fruits. In
122
terms of probable microsymbiont-assisted amelioration of fruit Mn deficiency, a lower
MMnR than MZnR imply that although AM significantly lowered shoot Zn, it could neither
improve Mn:Zn balance nor ameliorate Mn deficiency, especially as the fungus generally
reduced Mn concentrations in rhizosphere and root tissue. Lower Mn in AM plants might be
due to several factors including metal complexation by hyphal phytochelatins (or similar
metal binding proteins), or by mycorrhizal oxidation of soluble Mn2+ into unavailable Mn3+
or Mn4+ (Arines et al. 1992; Kabata-Pendias, 2011). While Mn-TR was inefficient, Fe-TR
and Cu-TR were increased in Zn+ soil, and fruit Cu exceeded the FAO recommended (40
mg kg-1) safe threshold for Cu in edible vegetables (Codex Alimentarius Commission 2001;
cited by Shaheen et al. 2016). Especially since the Zn level in fruit was safe, I presume that
optimal Mn homeostasis would minimize increases in Cu and Fe translocations to fruits. The
potential optimization of Mn acquisition and in planta cycling by inoculation of additional
microbe(s) may be suggested. According to Ibiang et al. (2017), dual inoculation with AM
fungus and Bradyrhizobium improved Mn translocation and modulated the Mn:Zn ratio in
soybean under excess Zn.
Bioproduction and mycorrhizal TE balance
My results show significant positive correlation between plant biomass and Cu:Zn
ratio, in line with AM modulation of Cu:Zn balance and the enhanced biomass production in
Zn- soil. The reverse situation in Zn+ soil contributed to the observed lower biomass
production; as AM modulation of host Cu:Zn was ineffective - with negative consequences
for the FBR. DTPA available Cu < 0.8 mg kg-1 is low (Juráni et al. 1990, cited by Zbíral
2016), but this was significantly enhanced by AM fungus as detected at 5 weeks. Higher
available Cu at flowering and greater shoot Cu concentrations at fruiting highlight the co-
123
ordination of mycorrhiza-induced soil and tissue effects that underlie such modulation in host
ionome. Cavagnaro et al. (2012) reported an increase in biomass and Cu concentrations in
tomato shoots due to AM colonization. Hart et al. (2015) also reported that R. irregularis
improved Cu levels in tomato. For optimal development, plants do not only require
appropriate amounts of Cu but also a good balance of other elements (Kabata-Pendias 2011).
While several case-by-case studies are needed to infer any range of optimal values in a
cultivar, AM optimization of Cu:Zn in host harps on the physiological benefits of both
elements at the appropriate balance. Zn is important in the function of many proteins and
supports auxin production, while Cu plays a huge role in enabling key biochemical processes
including respiration, photosynthesis, protein and carbohydrate metabolism, and plant
disease resistance (Kabata-Pendias 2011). Although AM contribution to host supply of Zn
and Cu is known (Smith and Read 2008), the precise mechanisms involved including
individual genes and gene networks are not fully understood (Ramos et al. 2011). R.
irregularis is thought to contain zinc-iron permease (ZIP) transporter proteins and cation
diffusion facilitator (CDF) family transporters which have Zn, Fe and Mn as major substrates
(Grotz and Guerinot 2006; Tamayo et al. 2014). Very little is known about individual Cu
transporters in R. irregularis, but the fungus is thought to contain three genes putatively
encoding copper transporter (CTR) family proteins, as well as copper-transporting P-type
ATPases (Tamayo et al. 2014). While the understanding of the gene regulation that underpin
co-ordinated soil and host-tissue AM effects remains unclear, the upregulation of putative
genes involved in mobilization of vacuolar Cu/Zn stores (RiCTR2 and RiZRT3) in AM
intraradical mycelia had been pointed out recently (Tamayo et al. 2014).
124
4.5 Conclusion
Patterns in the acquisition and tissue distribution of Zn, Fe, Mn and Cu in non-AM versus
AM host-plant under normal and excess Zn conditions have been discussed in relation to the
host biomass response. Generally, AM effects on the available Zn, Mn, Cu and Fe in
rhizosphere soil were in tandem with the effects in host tissues. Under normal Zn condition,
R. irregularis enhanced Cu availability in the rhizosphere, optimized the Cu:Zn balance in
shoots and increased host biomass production. However, the AM derived increases to whole-
fruit contents of Zn (+51%) and Cu (+4%) were counterbalanced by decreases in Fe (-30%)
and Mn (-70%). Under excess Zn, the total plant biomass decreased in both AM and non-
AM plants, as did mycorrhizal colonization and fruit biomass response. Although AM
decreased the Zn concentrations in soil and host tissues under excess Zn, the distortions in
Cu:Zn, Fe:Zn and Mn:Zn balance in host tissue were not significantly ameliorated by R.
irregularis. While Zn in fruit was within the safety threshold, excess Zn resulted in Mn
deficiency and elevated Cu and Fe concentrations in fruit. Mycorrhizal reductions in soil and
tissue Mn concentrations was considered a minus in terms of probable symbiont amelioration
of Mn:Zn imbalance in host, under excess Zn. Dual inoculations involving additional
microbe(s) that can optimize Mn and Cu homeostasis might be helpful in tomato under
elevated soil Zn.
125
CHAPTER FIVE
GENERAL DISCUSSION AND CONCLUSION
5.1 General discussion
Rhizobia and AM fungi are arguably the most popular plant-growth promoting
microorganisms, hence, constituted a core focus of this study. While in the soybean
experiments both single and dual inoculations of Bradyrhizobia and AM fungi were tested,
tomato experiments utilized only AM fungal inoculation because, being a non-legume,
rhizobial nodules are not a natural feature of tomato roots. In general, synergic growth-
promoting effects of AM fungi and rhizobia in the rhizosphere of legumes captures a lot of
interest in microbial resource utilization for improving plant production (Meena et al. 2017).
And several recent studies document the beneficial effects of dual inoculations in legumes to
include; improved biomass and grain protein content in chickpea (Oliveira et al. 2017),
improved degradation of polycyclic aromatic hydrocarbons (PAHs) in sesbania pea (Ren et
al. 2017), improved nutrient use efficiency (NUE) in soybean (Ding 2016), increased
nodulation ability and tolerance to Al3+ in alfalfa (Huang et al. 2017b), amongst others. In
tomato, on the other hand, AM fungal inoculation in rhizosphere has been documented to
minimize the incidence and severity of diseases caused by nematodes and root infecting
pathogens such as Phytophthora parasitica (Cordier et al. 1998), due to competition between
AM and pathogen for root colonization, improved plant nutrition, induction of localized and
systemic resistance, etc. (Smith and Read 2008). These benefits add to the overall value of
microsymbiont exploitation in plant production.
126
In experiments one and two on soybean, it was observed that dually inoculated plants
had higher biomass production than singly inoculated or uninoculated control. This is
consistent with the higher leaf SPAD indices, higher number of leaves and lower cumulative
number of fallen leaves in RAM plants, which all indicate that the photosynthetic organs of
the host were better maintained during dual symbiosis. While higher nitrogen and chlorophyll
levels are indicated in greener leaves during dual inoculation, the higher shoot P
concentrations and adjustments in TE balance (Fe:Zn and Mn:Zn ratios) in leaf or shoots also
supported the maintenance of the leaves with their photosynthetic function. In tomato,
positive mycorrhizal phosphorus response as well as mycorrhizal TE balancing are also
indicated as supportive to host bioproduction. A higher number of expressed genes
(Sakamoto et al. 2013b) and relative gene expression levels in dual symbioses than in single,
would be necessary to optimize host metabolism for a higher biomass production. This would
include genes for the biosynthesis and/or activity of enzymes including metal chelators that
influence element homeostasis in hosts, such as metallothioneins. Higher GmMT1 expression
in roots during dual symbioses is therefore in line with the greater homeostatic control and
biomass responses in RAM treatment. Plants may adjust their biomass allocation in response
to the environment, such as favoring root production during nutrient deficiency and shoot
production during excess nutrients (McConnaughay and Coleman 1999). In soybean and
tomato, symbiont modulation of biomass allocation in favor of leaf or fruits is in line with
the plant stage at the time of harvest, as both plants were sampled during their reproductive
stage.
This study demonstrated that rhizobia and AM fungi (G. rosea and C. etunicatum)
synergize to mitigate the antagonistic effect of excess Zn on Mn nutrition in soybean shoots
127
by modulating Mn translocation from roots to tops. Reduction in soybean root Mn
concentrations due to excess Zn triggered a higher translocation of Mn to the shoots in
response. This response was jointly modulated (accentuated or repressed) by both
microsymbionts to optimize the Mn concentrations and Mn:Zn balance in the leaves or shoots.
Mn2+ activates the decarboxylases and dehydrogenases involved in the citric acid (Krebs)
cycle, as well as other enzymes like kinases, oxidases and peroxidases in plant cells. It plays
a role in the electron transport system in mitochondria as a cofactor of Mn2+-dependent
superoxide dismutase (MnSOD) which mops up ROS (Marschner 1995). It also functions in
the oxygen-evolving complex in photosystem II during photosynthesis (Taiz and Zeiger
2010). Higher photosynthesis rates during dual symbioses with AM and R than in single
symbiosis has been reported by Kaschuk et al. (2009), in tandem with the consistently higher
leaf SPAD indices and bioproduction in RAM plants in this study. And AM fungal and
rhizobial effects on photosystem II function have been reported (Tsimilli-Michael et al. 2000).
A higher photosynthetic carbon requirement of host-plant during dual symbioses than in
single symbiosis, may necessitate synergistic effects in the regulation of Mn homeostasis in
shoots or leaves during dual inoculation, to safeguard photosystem II functions from the
impact of Zn-Mn antagonism. Fe is also important in chlorophyll formation (Taiz and Zeiger
2010). Therefore, higher root-to-leaf Fe translocation during dual inoculation than in single
also points to synergic effects of both symbionts geared towards Fe utilization in the leaves.
RAM plants had shorter days to flowering or fruiting, indicating that phenological
responses to physiological effects of RAM treatment, occurred. Phytostimulatory effects of
single and dual symbionts was observed in polyphenols production in colonized soybean
roots, indicating an impact on phenylpropanoid metabolism, that could have affected
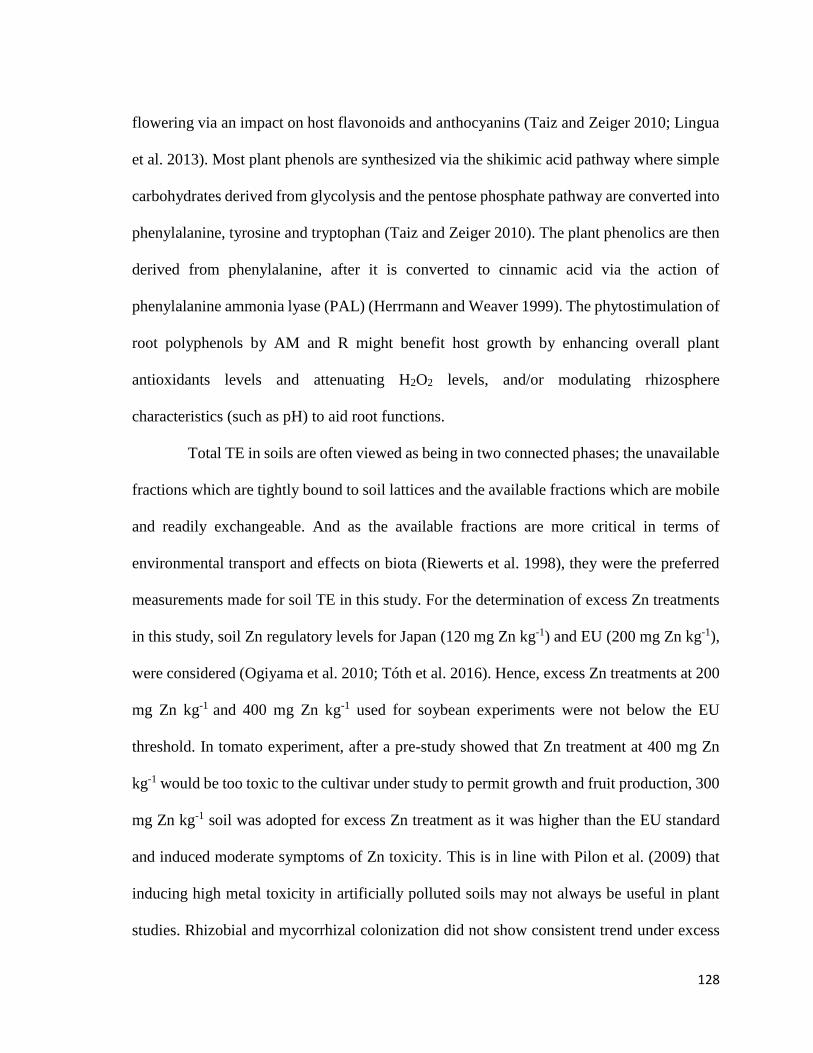
128
flowering via an impact on host flavonoids and anthocyanins (Taiz and Zeiger 2010; Lingua
et al. 2013). Most plant phenols are synthesized via the shikimic acid pathway where simple
carbohydrates derived from glycolysis and the pentose phosphate pathway are converted into
phenylalanine, tyrosine and tryptophan (Taiz and Zeiger 2010). The plant phenolics are then
derived from phenylalanine, after it is converted to cinnamic acid via the action of
phenylalanine ammonia lyase (PAL) (Herrmann and Weaver 1999). The phytostimulation of
root polyphenols by AM and R might benefit host growth by enhancing overall plant
antioxidants levels and attenuating H2O2 levels, and/or modulating rhizosphere
characteristics (such as pH) to aid root functions.
Total TE in soils are often viewed as being in two connected phases; the unavailable
fractions which are tightly bound to soil lattices and the available fractions which are mobile
and readily exchangeable. And as the available fractions are more critical in terms of
environmental transport and effects on biota (Riewerts et al. 1998), they were the preferred
measurements made for soil TE in this study. For the determination of excess Zn treatments
in this study, soil Zn regulatory levels for Japan (120 mg Zn kg-1) and EU (200 mg Zn kg-1),
were considered (Ogiyama et al. 2010; Tóth et al. 2016). Hence, excess Zn treatments at 200
mg Zn kg-1 and 400 mg Zn kg-1 used for soybean experiments were not below the EU
threshold. In tomato experiment, after a pre-study showed that Zn treatment at 400 mg Zn
kg-1 would be too toxic to the cultivar under study to permit growth and fruit production, 300
mg Zn kg-1 soil was adopted for excess Zn treatment as it was higher than the EU standard
and induced moderate symptoms of Zn toxicity. This is in line with Pilon et al. (2009) that
inducing high metal toxicity in artificially polluted soils may not always be useful in plant
studies. Rhizobial and mycorrhizal colonization did not show consistent trend under excess
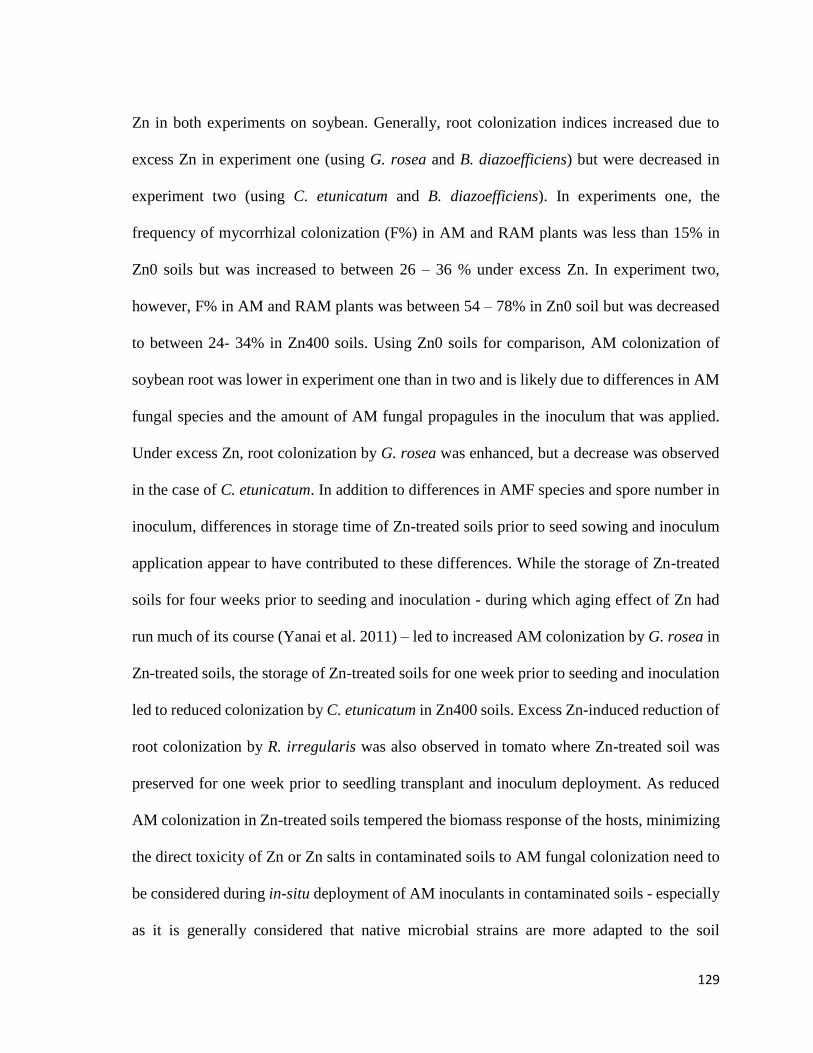
129
Zn in both experiments on soybean. Generally, root colonization indices increased due to
excess Zn in experiment one (using G. rosea and B. diazoefficiens) but were decreased in
experiment two (using C. etunicatum and B. diazoefficiens). In experiments one, the
frequency of mycorrhizal colonization (F%) in AM and RAM plants was less than 15% in
Zn0 soils but was increased to between 26 – 36 % under excess Zn. In experiment two,
however, F% in AM and RAM plants was between 54 – 78% in Zn0 soil but was decreased
to between 24- 34% in Zn400 soils. Using Zn0 soils for comparison, AM colonization of
soybean root was lower in experiment one than in two and is likely due to differences in AM
fungal species and the amount of AM fungal propagules in the inoculum that was applied.
Under excess Zn, root colonization by G. rosea was enhanced, but a decrease was observed
in the case of C. etunicatum. In addition to differences in AMF species and spore number in
inoculum, differences in storage time of Zn-treated soils prior to seed sowing and inoculum
application appear to have contributed to these differences. While the storage of Zn-treated
soils for four weeks prior to seeding and inoculation - during which aging effect of Zn had
run much of its course (Yanai et al. 2011) – led to increased AM colonization by G. rosea in
Zn-treated soils, the storage of Zn-treated soils for one week prior to seeding and inoculation
led to reduced colonization by C. etunicatum in Zn400 soils. Excess Zn-induced reduction of
root colonization by R. irregularis was also observed in tomato where Zn-treated soil was
preserved for one week prior to seedling transplant and inoculum deployment. As reduced
AM colonization in Zn-treated soils tempered the biomass response of the hosts, minimizing
the direct toxicity of Zn or Zn salts in contaminated soils to AM fungal colonization need to
be considered during in-situ deployment of AM inoculants in contaminated soils - especially
as it is generally considered that native microbial strains are more adapted to the soil
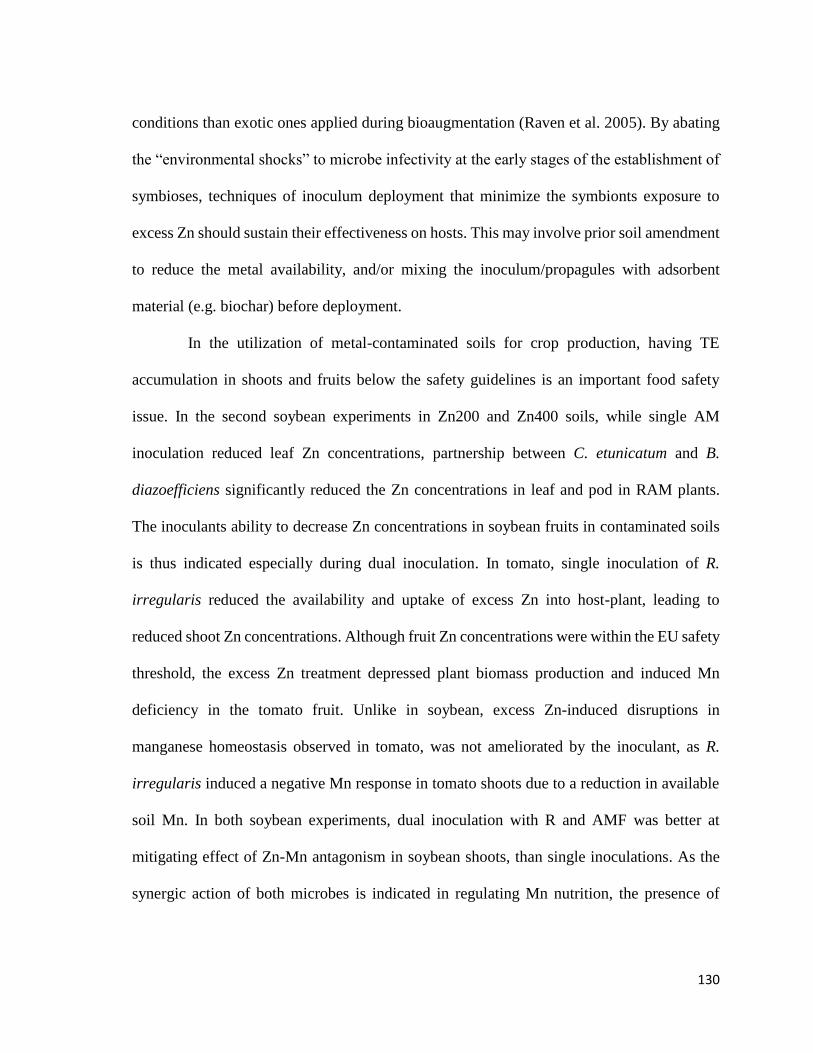
130
conditions than exotic ones applied during bioaugmentation (Raven et al. 2005). By abating
the “environmental shocks” to microbe infectivity at the early stages of the establishment of
symbioses, techniques of inoculum deployment that minimize the symbionts exposure to
excess Zn should sustain their effectiveness on hosts. This may involve prior soil amendment
to reduce the metal availability, and/or mixing the inoculum/propagules with adsorbent
material (e.g. biochar) before deployment.
In the utilization of metal-contaminated soils for crop production, having TE
accumulation in shoots and fruits below the safety guidelines is an important food safety
issue. In the second soybean experiments in Zn200 and Zn400 soils, while single AM
inoculation reduced leaf Zn concentrations, partnership between C. etunicatum and B.
diazoefficiens significantly reduced the Zn concentrations in leaf and pod in RAM plants.
The inoculants ability to decrease Zn concentrations in soybean fruits in contaminated soils
is thus indicated especially during dual inoculation. In tomato, single inoculation of R.
irregularis reduced the availability and uptake of excess Zn into host-plant, leading to
reduced shoot Zn concentrations. Although fruit Zn concentrations were within the EU safety
threshold, the excess Zn treatment depressed plant biomass production and induced Mn
deficiency in the tomato fruit. Unlike in soybean, excess Zn-induced disruptions in
manganese homeostasis observed in tomato, was not ameliorated by the inoculant, as R.
irregularis induced a negative Mn response in tomato shoots due to a reduction in available
soil Mn. In both soybean experiments, dual inoculation with R and AMF was better at
mitigating effect of Zn-Mn antagonism in soybean shoots, than single inoculations. As the
synergic action of both microbes is indicated in regulating Mn nutrition, the presence of
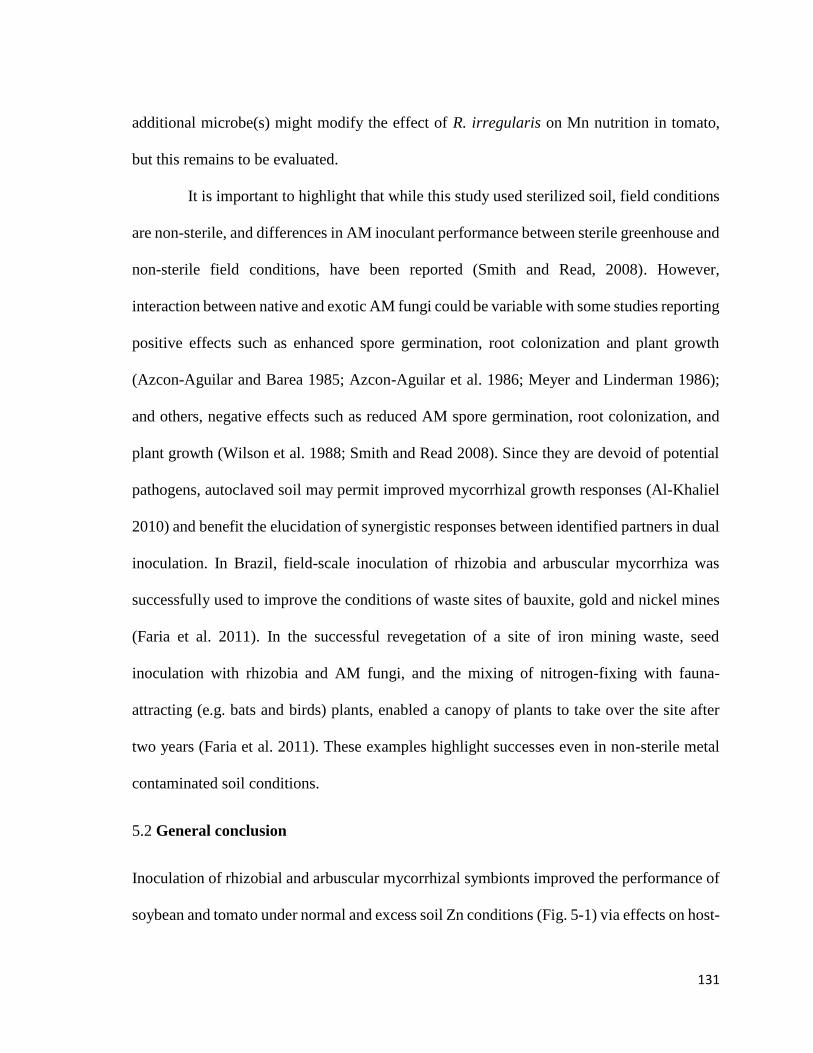
131
additional microbe(s) might modify the effect of R. irregularis on Mn nutrition in tomato,
but this remains to be evaluated.
It is important to highlight that while this study used sterilized soil, field conditions
are non-sterile, and differences in AM inoculant performance between sterile greenhouse and
non-sterile field conditions, have been reported (Smith and Read, 2008). However,
interaction between native and exotic AM fungi could be variable with some studies reporting
positive effects such as enhanced spore germination, root colonization and plant growth
(Azcon-Aguilar and Barea 1985; Azcon-Aguilar et al. 1986; Meyer and Linderman 1986);
and others, negative effects such as reduced AM spore germination, root colonization, and
plant growth (Wilson et al. 1988; Smith and Read 2008). Since they are devoid of potential
pathogens, autoclaved soil may permit improved mycorrhizal growth responses (Al-Khaliel
2010) and benefit the elucidation of synergistic responses between identified partners in dual
inoculation. In Brazil, field-scale inoculation of rhizobia and arbuscular mycorrhiza was
successfully used to improve the conditions of waste sites of bauxite, gold and nickel mines
(Faria et al. 2011). In the successful revegetation of a site of iron mining waste, seed
inoculation with rhizobia and AM fungi, and the mixing of nitrogen-fixing with fauna-
attracting (e.g. bats and birds) plants, enabled a canopy of plants to take over the site after
two years (Faria et al. 2011). These examples highlight successes even in non-sterile metal
contaminated soil conditions.
5.2 General conclusion
Inoculation of rhizobial and arbuscular mycorrhizal symbionts improved the performance of
soybean and tomato under normal and excess soil Zn conditions (Fig. 5-1) via effects on host-
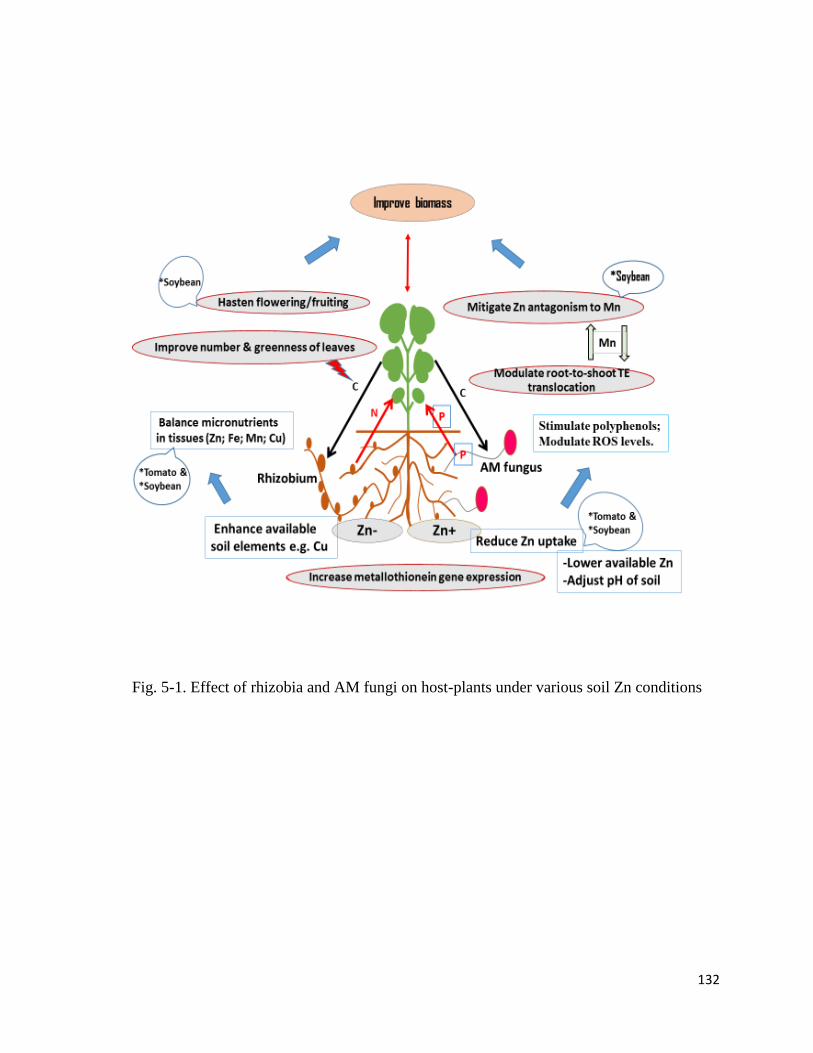
132
Fig. 5-1. Effect of rhizobia and AM fungi on host-plants under various soil Zn conditions
133
plants and soil chemical characteristics. However, the hastening of days to flowering and/or
fruiting and amelioration of Zn-Mn antagonism were exclusive to soybean; and host
responses in both plants were tempered under excess Zn when symbiont colonization was
decreased. The mechanisms underlying symbiont growth-promoting effects include
improvements in the number and greenness of leaves, higher shoot P concentrations,
modulation of TE concentrations in shoots via improvements in element availability in
rhizosphere or adjustments in element translocation from roots to tops, reduced availability
and uptake of excess Zn due to mycorrhization, phytostimulation of polyphenols biosynthesis
and increased metallothionein gene expression (Ibiang et al. 2017; Ibiang et al. 2018; Ibiang
and Sakamoto 2018). While rhizobia potentiated AM effect on host bioproduction, the impact
of excess Zn on host Mn nutrition was countered by synergic effects of both microbes on Mn
translocation. In the dual inoculation partnership between B. diazoefficiens and C. etunicatum,
higher mycorrhization and nodules indices coincided with a higher ROS level within nodules
and improved host bioproduction. While the potential for their exploitation to mitigate
imbalances in element nutrition was indicated in soybean, strategies to minimize Zn toxicity
to symbiont infectivity are recommended to sustain host biomass response under excess Zn,
in both soybean and tomato. As Zn is often a common and/or leading pollutant of dumpsite
leachates, the lowering of available soil Zn, and reduction in plant Zn uptake by the AM
inoculants in this study also suggest their possible exploitation in the remediation of
agricultural soils polluted by dumpsite leachate run-off with high Zn concentrations, as
highlighted by recent studies in Nigeria (Oketola and Akpotu 2014; Nwaogu et al. 2017).

134
ACKNOWLEDGEMENTS
I wish to express my sincere gratitude to my Chief Supervisor, Prof. Sakamoto Kazunori for
his guidance throughout all stages of this research. His deep insights and supportive
disposition are very well appreciated. I also wish to thank my Supervisors Prof. Inubushi
Kazuyuki and Prof. Watanabe Masami for their helpful comments, advice and words of
encouragement, from time to time.
The members of plant nutrition laboratory are very well appreciated for their help throughout
my stay in the Graduate School of Horticulture, especially Koyama-san who was my
Japanese Tutor during my early days in Japan. I couldn’t have completed my experiments on
schedule without the help you all gave, but the best part was the exchange of ideas during
Lab seminars where I learned many new things.
My deep appreciation goes to the Japanese Ministry of Education, Culture, Sports, Science
and Technology (MEXT) for funding my study via the Monbukagakusho scholarship
program. I also wish to thank my friends in Matsudo, especially the Yamauchi family and
members of Matsudo Church for their love and support to me and my family.
Finally, while giving God all the thanks, I must appreciate my wife and kids for their patience
and goodwill during the moments I was away from home attending to my experiments. The
love they continually show, as with the members of my extended family in Nigeria, provided
me with the calmness of thought and peace of mind I needed to focus on my studies.
135
References
Abd-Alla MH, El-Enany AE, Nafady NA, Khalaf DM, Morsy FM (2014) Synergistic
interaction of Rhizobium leguminosarum bv. Viciae and arbuscular mycorrhizal fungi as a
plant growth promoting biofertilizers for faba bean (Vicia faba L.) in alkaline soil.
Microbiological Research, 169: 49-58. https://doi.10.1016/j.micres.2013.07.007
Ahemad M, Kibret M (2014) Mechanisms and applications of plant growth promoting
rhizobacteria: Current perspective. Journal of King Saud University - Science, 26: 1-20.
https://doi.10.1016/j.jksus.2013.05.001
Alam S, Kamei S, Kawai S (2001) Amelioration of manganese toxicity in barley with iron.
J. Plant Nutr., 24: 1421-1433.
Al-Garni SMS (2006) Increased heavy metal tolerance of cowpea plants by dual inoculation
of an arbuscular mycorrhizal fungi and nitrogen-fixer Rhizobium bacterium. Afr. J. Biotech.,
5(2): 133-142.
Al-Khaliel (2010) Effects of arbuscular mycorrhization in sterile and non-sterile soils.
Tropical Life Sciences Research, 21(1): 55-70.
Alloway BJ (2008) Zinc in Soils and Crop Nutrition 2nd edn. IZA and IFA, Brussels/Paris.
Ambler JE, Brown CJ, Gauch HG (1970) Effect of Zinc on Translocation of Iron in Soybean
Plants. Plant Physiol., 46: 320-323.
Amerine MA, Ough CS (1980) Phenolic compounds: Methods of Analysis of musts and
Wines. Wiley, New York.
Antunes PM, de Varennes A, Rajcan I, Goss MJ (2006) Accumulation of specific flavonoids
in soybean (Glycine max (L.) Merr) as a function of the early tripartite symbiosis with
arbuscular mycorrhizal fungi and Bradyrhizobium japonicum (Kirchner) Jordan. Soil Biol.
Biochem., 38: 1234-1242.
Aref F (2011) Influence of zinc and boron nutrition on copper, manganese, and iron
concentrations in maize leaf. Aust. J. Basic and Appl. Sci., 5(7): 52-62.
Arines J, Porto ME, Vilariño A (1992) Effect of manganese on vesicular-arbuscular
mycorrhizal development in red clover plants and on soil Mn-oxidizing bacteria. Mycorrhiza,
1: 127-131. https://doi.org/10.1007/BF00203260
Arriagada C, Pereira G, García-Romera I, Ocampo JA (2010) Improved zinc tolerance in
Eucalyptus globulus inoculated with Glomus deserticola and Trametes versicolor or
Coriolopsis rigida. Soil Biol. Biochem., 42: 118-124.
136
Arrivault S, Senger T, Krämer U (2006) The Arabidopsis metal tolerance protein AtMTP3
maintains metal homeostasis by mediating Zn exclusion from the root under Fe deficiency
and Zn oversupply. Plant J., 46: 861-879.
ATSDR (Agency for Toxic Substances and Disease Registry) (2005)
https://www.atsdr.cdc.gov/toxprofiles/tp60-c6.pdf. pp 141. Accessed 21st January 2017.
Audet P, Charest C (2006) Effects of AM colonization on “wild tobacco” plants grown in
zinc-contaminated soil. Mycorrhiza, 16: 277-283.
Austruy A, Shahid M, Xiong T, Castrec M, Payre V, Niazi NK, Sabir M, Dumat C (2014)
Mechanisms of metal-phosphates formation in the rhizosphere soils of pea and tomato:
environmental and sanitary consequences. J. Soils Sediments, 14: 666-678.
Azcon-Aguilar C, Barea JM (1985) Effect of soil microorganisms on formation of vesicular-
arbuscular mycorrhizas. Transactions of the British Mycological Society, 83: 536-537.
Azcon-Aguilar C, Diaz-Rodriguez RM, Barea JM (1986) Effect of soil microorganisms on
spore germination and growth of vesicular-arbuscular mycorrhizal fungus, Glomus mosseae.
Transactions of the British Mycological Society, 86: 337-340.
Banin A, Navrot J, Perl A (1987) Thin-horizon sampling reveals highly localized
concentrations of atmophile heavy metals in a forest soil. The Science of the Total
Environment, 61: 145-152.
Benson NU, Anake WU, Etesin UM (2014) Trace metals levels in fertilizers commercially
available in Nigeria. J. Sci. Res. Rep., 3(4): 610-620.
Berruti A, Lumini E, Raffaella B, Valeria B (2015) Arbuscular mycorrhizal fungi as natural
biofertilizers: Lets benefit from past successes. Front. Microbiol., 6: 1559.
Bhattacharjee S, Sharma GD (2012) Effect of dual inoculation of arbuscular mycorrhiza and
rhizobium on the chlorophyll, nitrogen and phosphorus contents of Pigeon pea (Cajanus
cajan L.). Adv. Microbiol., 2: 561-564.
Bijl G, De Mita S, Geurts R (2011) Plant associations with mycorrhizae and rhizobium-
evolutionary origins and divergence of strategies in recruiting soil microbes. In: Polacco JC
and Todd CD (eds.) Ecological Aspects of Nitrogen Metabolism in Plants. John Wiley and
Sons, West Sussex, pp 19-51.
Bonfante P, Perotto S (1995) Strategies of arbuscular mycorrhizal fungi infecting host plants.
New Phytol., 130: 3–21.
Borkert CM, Cox FR, Tucker MR (1998) Zinc and copper toxicity in peanut, soybean, rice,
and corn in soil mixtures. Comm. Soil Sci. Plant Anal., 29: 2991-3005.
137
Bravo S, Amorós JA, Pérez-de-los-Reyes C, García FJ, Moreno MM, Sánchez-Ormeño M,
Higueras P (2017) Influence of the soil pH in the uptake and bioaccumulation of heavy metals
(Fe, Zn, Cu, Pb and Mn) and other elements (Ca, K, Al, Sr and Ba) in vine leaves, Castilla-
La Mancha (Spain). Journal of Geochemical Exploration, 174: 79-83.
Brewin NJ (2004) Plant cell wall remodelling in the Rhizobium-legume symbiosis. Critical
Reviews in Plant Sciences, 23: 293-316.
Briat JF, Rouached H, Tissot N, Gaymard F, Dubos C (2015) Integration of P, S, Fe, and Zn
nutrition signals in Arabidopsis thaliana: potential involvement of PHOSPHATE
STARVATION RESPONSE 1 (PHR1). Front. Plant Sci., 6: 290.
Brown MS, Bethlenfalvay GL (1987) Glycine-Glomus-Rhizobium Symbiosis. VI.
Photosynthesis in nodulated, mycorrhizal or N-and P-fertilized soybean plants. Plant Physiol.
85: 120-123.
Castiglione S, Franchin C, Fossati T, Lingua G, Torrigiani P, Biondi S (2007) High zinc
concentrations reduce rooting capacity and alter metallothionein gene expression in white
poplar (Populus alba L. cv. Villafranca). Chemosphere, 67: 117-1126.
https://doi.10.1016/j.chemosphere.2006.11.039
Catford J-G, Staehelin C, Lerat S, Piche Y, Vierheilig H (2003) Suppression of arbuscular
mycorrhizal colonization and nodulation in split-root systems of alfalfa after pre-inoculation
and treatment with Nod factors. J. Exp. Bot., 54(386): 1481-1487.
Cavagnaro TR, Barrios-Masias FH, Jackson LE (2012) Arbuscular mycorrhizas and their
role in plant growth, nitrogen interception and soil gas efflux in an organ production system.
Plant Soil., 353: 181-194.
Cavagnaro TR, Dickson S, Smith FA (2010) Arbuscular mycorrhizas modify plant responses
to soil zinc addition. Plant Soil., 329: 307-313.
Cavagnaro TR, Smith FA, Ayling SM, Smith SE (2003) Growth and phosphorus nutrition of
a paris-type arbuscular mycorrhizal symbiosis. New Phytol., 157: 127-134.
Chalk PM, Souza RD, Urquiaga S, Alves BJR, Boddey RM (2006) The role of arbuscular
mycorrhiza in legume symbiotic performance. Soil Biol. Biochem., 38: 2944-2951.
Chaney RL (1993) Zinc phytotoxicity. In: Robson AD (ed) Zinc in soils and plants.
Developments in Plant and Soil Sciences vol. 55. Springer, Dordrecht.
https://doi.org/10.1007/978-94-011-0878-2_10
Chlopecka A (1996) Assessment of form of Cd, Zn and Pb in contaminated calcareous and
gleyed soils in Southwest Poland. The Science of the Total Environment, 188: 253-262.
138
Christie P, Li X, Chen B (2004) Arbuscular mycorrhiza can depress translocation of zinc to
shoots of host plants in soils moderately polluted with zinc. Plant Soil., 261: 209-217.
Clark RB, Zeto SK (2000) Mineral acquisition by AM plants. J. Plant Nutr., 23: 867-902.
Clemens S, Deinlein U, Ahmadi H, Höreth S, Uraguchi S (2013) Nicotianamine is a major
player in plant Zn homeostasis. Biometals, 26: 623-632.
Cobbett C, Goldsbrough P (2002) Phytochelatins and metallothioneins: roles in heavy metal
detoxification and homeostasis. Ann. Rev. Plant Biol., 53: 159-182.
Codex Alimentarius Commission [FAO/WHO] (2001) Food Additives and Contaminants.
Joint FAO/WHO Food Standards Program. ALINORM 01/12A, pp. 1-289.
ftp://ftp.fao.org/Codex/Reports/Alinorm01/al01_27e.pdf.
Cordier C, Pozo MJ, Barea JM, Gianinazzi S, Gianinazzi-Pearson V (1998). Cell defense
responses associated with localized and systemic resistance to Phytophthora parasitica
induced in tomato by an arbuscular mycorrhizal fungus. Molecular Plant-Microbe
Interactions, 11: 1017-1028.
de Varennes A, Goss MJ (2007) The tripartite symbiosis between legumes, rhizobia and
indigenous mycorrhizal fungi is more efficient in undisturbed soil. Soil Biol. Biochem., 39:
2603-2607.
Deinlein U, Weber M, Schmidt H, Rensch S, Trampczynska A, Hansen TH, Husted S,
Schjoerring JK, Talke IN, Kräemer U, Clemens S (2012) Elevated Nicotianamine Levels in
Arabidopsis halleri Roots Play a Key Role in Zinc Hyperaccumulation. Plant Cell, 24: 708-
723.
Ding X, Zhang S, Wang R, Li S, Liao X (2016). AM fungi and rhizobium regulate nodule
growth, phosphorus (P) uptake, and soluble sugar concentration of soybeans experiencing P
deficiency. J. Plant Nutr., 39(13): 1915 – 1925.
Dorais M, Ehret DL, Papadopoulos AP (2008) Tomato (Solanum lycopersicum) health
components: from the seed to the consumer. Phytochem Rev., 7: 231-250.
East R (2013) Microbiome: soil science comes to life. Nature, 501: S18-S19.
https://doi.10.1038/501S18a
European Commission Regulation (EC) No. 1881/2006 (2006) Setting maximum levels for
certain contaminants in foodstuffs. Off. J. Eur. Union Legis., 364: 5– 24.
139
Faria SM de, Resende AS, Saggin Júnior OJ, Boddey RM (2011) Exploiting mycorrhizae
and rhizobium symbioses to recover seriously degraded soils. In: Polacco JC and Todd CD
(eds.) Ecological Aspects of Nitrogen Metabolism in Plants, 1st edn. John Wiley and Sons
Inc., West Sussex, pp. 195 – 214.
Farzaneh M, Wichman S, Vierheilig H, Kaul HP (2009) The effects of arbuscular mycorrhiza
and nitrogen nutrition on growth of chickpea and barley. Pflanzenbauwissenschaften,
13(1).S.15-22.
Fester T, Hause G (2005) Accumulation of reactive oxygen species in arbuscular mycorrhizal
roots. Mycorrhiza, 15: 373-379.
Gall JE, Boyd RS, Rajakaruna N (2015) Transfer of metals through terrestrial food webs: a
review. Environ. Monit. Assess., 187: 201. http://dx.doi.org/10.1007/s10661-015-4436-3
Gamalero E, Lingua G, Berta G, Glick BR (2009) Beneficial role of plant growth promoting
bacteria and arbuscular mycorrhizal fungi on plant responses to heavy metal stress. Can. J.
Microbiol., 55: 501-514.
Garg N, Bhandari P (2014) Cadmium toxicity in crop plants and its alleviation by arbuscular
mycorrhizal (AM) fungi: An overview. Plant Biosystems, 148 (4): 609-621.
https://doi.10.1080/11263504.2013.788096
Gąstol M, Domagala-Świątkiewicz I (2015) Mycorrhizal inoculation of apple in replant soils
– enhanced tree growth and mineral nutrient status. Acta Sci Pol Hortorum Cultus, 14: 17-
37.
Geochemical Atlas of Europe Part 1 (Salminen R (ed)
(http://weppi.gtk.fi/publ/foregsatlas/maps/Topsoil/t_xrf_zn_edit.pdf. September 2016).
Gharaibeh MA, Albalasmeh AA, Marschner B, Saleem Y (2016) Cadmium uptake and
translocation of tomato in response to simulated irrigation water containing elevated
concentrations of cadmium and zinc in clayey soil. Water Air Soil Pollution, 227: 133.
https://doi.org/10.1007/s11270-016-2829-8
González-Guerrero M, Escudero V, Saéz Á, Tejada-Jiménez M (2016) Transition Metal
Transport in Plants and Associated Endosymbionts: Arbuscular Mycorrhizal Fungi and
Rhizobia. Front Plant Sci., 7:1088. https://doi.org/10.3389/fpls.2016.01088
Grace EJ, Cotsaftis O, Tester M, Smith FA, Smith SE (2009) Arbuscular mycorrhizal
inhibition of growth in barley cannot be attributed to extent of colonization, fungal
phosphorus uptake or effects on expression of plant phosphate transporter genes. New Phytol.,
181: 938-949.
Grotz N, Guerinot ML (2006) Molecular aspects of Cu, Fe and Zn homeostasis in plants.
Biochim. Biophys. Acta., 1763: 595-608.
140
Guo WJ, Bundithya W, Goldsbrough PB (2003) Characterization of the Arabidopsis
metallothionein gene family: tissue-specific expression and induction during senescence and
in response to copper. New Phytol., 159: 369-381.
Guo Y, Ni Y, Huang J (2010) Effects of rhizobium, arbuscular mycorrhiza and lime on
nodulation, growth, and nutrient uptake of Lucerne in acid purplish soil in China. Tropical
Grasslands, 44: 109-114.
Hage-Ahmed K, Moyses A, Voglgruber A, Hadacek F, Steinkellner S (2013) Alterations in
root exudation of intercropped tomato mediated by the arbuscular mycorrhizal fungus
Glomus mosseae and the soilborne pathogen Fusarium oxysporum f.sp. lycopersici. J.
Phytopathol., 161: 763-773.
Harrison MJ (1998) Development of the arbuscular mycorrhizal symbiosis. Current Opinion
in Plant Biology, 1:360–365
Hart M, Ehret DL, Krumbein A, Leung C, Murch S, Turi C, Franken P (2015) Inoculation
with arbuscular mycorrhizal fungi improves the nutritional value of tomatoes. Mycorrhiza,
25: 359-376.
Hasani M, Zamani Z, Savaghebi G, Fatahi R (2012) Effects of zinc and manganese as foliar
sprays on the pomegranate yield, fruit quality, and leaf minerals. J. Soil Sci. Plant Nutr.,
12(3): 471-480. http://dx.doi.org/10.4067/S0718-95162012005000009
Hassinen VH, Tervahauta AI, Schat H, Kärenlampi SO (2011) Plant metallothioneins – metal
chelators with ROS scavenging activity? Plant Biology, 13: 225-232.
Haydon MJ, Cobbett CS (2007) Transporters of ligands for essential metal ions in plants.
New Phytol., 174: 499-506.
Hell R, Stephan UW (2003) Iron uptake, trafficking and homeostasis in plants. Planta, 216:
541-551.
Herrmann KM, Weaver LM (1999) the shikimate pathway. Annu. Rev. Plant Physiol. Plant
Mol. Biol., 50: 473-503.
Hildebrandt U, Kaldorf M, Bothe H (1999) The zinc violet and its colonization by arbuscular
mycorrhizal fungi. J. Plant Physiol., 154, 709-711.
Hodges M. (2002) Enzyme redundancy and the importance of 2-oxoglutarate in plant
ammonium assimilation. Journal of Experimental Botany, 53 (370): 905-916.
Holmgren GGS, Meyer MW, Chaney RL, Daniels RB (1993) Cadmium, lead, zinc, copper
and nickel in agricultural soils of the United States of America. J. Environ. Qual., 22: 335-
348.
141
http://imagej.nih.gov/ij
http://spectra.psc.riken.jp/menta.cgi/rsoy/index
http://www.bacterio.cict.fr
Huang X, Ho S-H, Zhu S, Ma F, Wu J, Yang J, Wang L (2017a) Adaptive response of
arbuscular mycorrhizal symbiosis to accumulation of elements and translocation in
Phragmites australis affected by cadmium stress. J. Env. Mgt., 197: 448-455.
Huang L, He Y, Guo Y (2017b) The efficiency of arbuscular mycorrhizal fungi in promoting
alfalfa growth in acid soils. Journal of Agricultural Science, 9(4): 186-204.
Ibiang YB, Mitsumoto H, Sakamoto K (2017) Bradyrhizobia and arbuscular mycorrhizal
fungi modulate manganese, iron, phosphorus, and polyphenols in soybean (Glycine max (L.)
Merr.) under excess zinc. Environ. Exp. Bot., 137: 1-13.
Ibiang YB, Innami H, Sakamoto K (2018) Effect of excess zinc and arbuscular mycorrhizal
fungus on bioproduction and trace element nutrition of tomato (Solanum lycopersicum L. cv.
Micro-Tom). Soil Science and Plant Nutrition, 64: 342-351.
Ibiang YB, Sakamoto K (2018) Synergic effect of arbuscular mycorrhizal fungi and
bradyrhizobia on biomass response, element partitioning and metallothionein gene
expression of soybean-host under excess soil zinc. Rhizosphere, 6: 56-66.
Jayne B, Quigley M (2014) Influence of arbuscular mycorrhiza on growth and reproductive
response of plants under water deficit: a meta-analysis. Mycorrhiza, 24: 109-119.
Johnson NC, Graham JH, Smith FA (1997) Functioning of mycorrhizal associations along
the mutualism-parasitism continuum. New Phytol., 135: 575-586.
Juráni B, et al. (1990) A Complex Method for Plant Nutrition. Chapter 10: Micronutrient
Fertilization. Institute for Scientific and Technical information in Agriculture, Prague, 137.
(In Czech).
Kabata-Pendias A (2011) Trace Elements in Soils and Plants 4th edn. CRC press, Boca Raton.
Kabata-Pendias A, Sadurski W (2004) Trace elements and compounds in soil. In: Merian E,
Anke M, Ihnat M, and Stoeppler M (eds.) Elements and Their Compounds in the Environment,
2nd ed., Wiley-VCH, Weinheim, pp. 79-99.
Kang SM, Radhakrishnan R, You YH, Khan AL, Lee KE, Lee JD, Lee IJ (2015) Enterobacter
asburiae KE17 association regulates physiological changes and mitigates the toxic effects of
heavy metals in soybean. Plant Biol., 17: 1013-1022.
142
Kaschuk G, Kuyper TW, Leffelaar PA, Hungria M, Giller KE (2009) Are the rates of
photosynthesis stimulated by the carbon sink strength of rhizobial and arbuscular
mycorrhizal symbioses? Soil Biol. Biochem., 41: 1233-1244.
Khan G, Kuek C, Chaudhry TM, Khoo CS, Hayes WJ (2000) Role of plants, mycorrhizae
and phytochelators in heavy metal contaminated land remediation. Chemosphere, 41: 197-
207.
Kim SA, Guerinot ML (2007) Mining iron: iron uptake and transport in plants. FEBS Lett.,
581: 2273-2280.
Kleiber T (2014) Effect of Mn nutrition on content of nutrient and yield of lettuce (Lactuca
sativa L.) in hydroponic. Ecol. Chem. Eng. S., 21(3): 529-537.
Kogel KH, Franken P, Huckelhoven R (2006) Endophyte or parasite-what decides? Curr.
Opin. Plant Biol., 9: 358-363. https://doi.10.1016/j.pbi.2006.05.01
Korshunova YO, Eide D, Clark WG, Guerinot ML, Pakrasi HB (1999) The IRT1 protein
from Arabidopsis thaliana is a metal transporter with a broad specificity. Plant Mol. Bio.,
40: 37-44.
Krohling CA, Eutrópio FJ, Bertolazi AA, Dobbss LB, Campostrini E, Dias T, Ramos AC
(2016) Ecophysiology of iron homeostasis in plants. Soil Sci. Plant Nutr., 62(1): 39-47.
Lado LR, Hengl T, Reuter HI (2008) Heavy metals in European soils: a geostatistical analysis
of the FOREGS Geochemical database. Geoderma, 148: 189-199.
Lehman A, Rillig MC (2015) Arbuscular mycorrhizal contribution to copper, manganese and
iron nutrient concentrations in crops - A meta-analysis. Soil Biol. Biochem., 81: 147-158.
Leyval C, Joner EJ, del Val C, Haselwandter K (2002) Potential of arbuscular mycorrhizal
fungi for bioremediation. In: Gianinazzi S, Schuepp JM, Barea JM, Haselwandter K (eds)
Mycorrhizal Technology in Agriculture, from Genes to Bioproducts. Birkhauser Verlag,
Basel, pp 175-186.
Leyval C, Turnau K, Haselwandter K (1997) Effect of heavy metal pollution on mycorrhizal
colonization and function: physiological, ecological and applied aspects. Mycorrhiza, 7: 139-
153.
Li HY, Zhu YG, Marschner P, Smith FA, Smith SE (2005) Wheat responses to arbuscular
mycorrhizal fungi in a highly calcareous soil differ from those of clover, and change with
plant development and P supply. Plant Soil., 277: 221-232.
Lindsay WL, Norvell WA (1978) Development of a DTPA soil test for zinc, iron, manganese,
and copper. Soil Sci. Soc. Am. J., 42: 421-428.
143
Lingua G, Bona E, Manassero P, Marsano F, Todeschini V, Cantamessa S, Copetta A,
D’Agostino G, Gamalero E, Berta G (2013) Arbuscular mycorrhizal fungi and plant growth-
promoting pseudomonads increases anthocyanin concentration in strawberry fruits (Fragaria
×ananassa var. Selva) in conditions of reduced fertilization. Int. J. Mol. Sci., 14(8): 16207 –
16225.
Lingua G, Franchin C, Todeschini V, Castiglione S, Biondi S, et al. (2008) Arbuscular
mycorrhizal fungi differentially affect the response to high zinc concentrations of two
registered poplar clones. Environ Pollut., 153: 137-147.
Lippard SJ, Berg JM (eds) (1994) Principles of Bioinorganic Chemistry. University Science
Books, Mill Valley, California.
Livak KJ, Schmittgen TD (2001) Analysis of relative gene expression data using real-time
quantitative PCR and the 2-▵▵CT method. Methods 25: 402-408.
Lopez-Camelo LG, de Miguez SR, Marbán L (1997) Heavy metals input with phosphate
fertilizers used in Argentina. Sci. Tot. Environ., 204, 245-250.
Luo ZB, He J, Polle A, Rennenberg H (2016) Heavy metal accumulation and signal
transduction in herbaceous and woody plants: Paving the way for enhancing
phytoremediation efficiency. Biotechnol. Adv., 34: 1131-1148.
Maboko MM, Bertling I, Du Plooy CP (2013) Effect of arbuscular mycorrhiza and
temperature control on plant growth, yield, and mineral content of tomato plants grown
hydroponically. HortScience, 48:1470-1477.
Marschner H (1995) Mineral nutrition of higher plants. Academic Press, London.
Mateos PF, Rivas R, Robledo M, Veláquez E, Martinez-Molina E, and Emerich DW (2011)
The path of rhizobia: From a free-living soil bacterium to root nodulation. In: (Polacco JC
and Todd CD (eds.) Ecological Aspects of Nitrogen Metabolism in Plants, 1st Edn. John
Wiley and Sons Inc., West Sussex, pp 167 - 194.
McConnaughay KDM, Coleman JS (1999) Biomass allocation in plant: ontogeny or
optimality? A test along three resource gradients. Ecology, 80: 2581-2593.
Meena RS, Vijayakumar V, Yadar GS, Mitran T (2017) Response and interaction of
Bradyrhizobium japonicum and arbuscular mycorrhizal fungi in the soybean rhizosphere: A
review. Plant Growth Regulation https://doi.org/10.1007/s10725-017-0334-8
Meissner R, Jacobson Y, Melamed S, Levyatuv S, Shalev G, Ashri A, Elkind Y, Levy A
(1997) A new model system for tomato genetics. Plant J., 12: 1465–1472.
144
Merlos MA, Zitka O, Vojtech A, Azcon-Aguilar C (2016) The arbuscular mycorrhizal fungus
Rhizophagus irregularis differentially regulates the copper response of two maize cultivars
differing in copper tolerance. Plant Sci., 253: 68-76.
Meyer JR, Linderman RG (1986) Response of subterranean clover to dual inoculation with
vesicular-arbuscular mycorrhizal fungi and a plant growth bacterium, Pseudomonas putida.
Soil Biol. Biochem., 18: 185-190.
Millar NS, Bennett AE (2016) Stressed out symbiotes: hypothesis for the influence of abiotic
stress on arbuscular mycorrhizal fungi. Oecologia, https://doi.org/10.1007/s00442-016-
3673-7
Miransari M (2010) Contribution of arbuscular mycorrhizal symbiosis to plant growth under
different types of soil stress. Plant Biology, 12: 563-569. https://doi.10.1111/j.1438-
8677.2009.00308.x
Miransari M (2014) The Interactions of Soil Microbes, Arbuscular Mycorrhizal Fungi and
N-Fixing Rhizobium Bacteria Under Different Conditions Including Stress. In: Miransari M
(ed.) Use of Microbes for the Alleviation of Soil Stresses. Springer, New York, pp. 1-21,
http://dx.doi.org/10.1067/978-1-4939-0721-2_1.
Mukherjee A, Ané J-M (2011) Plant hormones and initiation of legume nodulation and
arbuscular mycorrhization. In: Polacco JC and Todd CD (eds.) Ecological Aspects of
Nitrogen Metabolism in Plants, 1st Edn. John Wiley and Sons Inc., West Sussex, pp. 354 –
396.
Nath M, Bhatt D, Prasad R, Gill SS, Anjum NA, Tuteja N (2016) Reactive Oxygen Species
Generation-Scavenging and Signaling during Plant-Arbuscular Mycorrhizal and Piriformosa
indica Interaction under Stress Condition. Front Plant Sci., 7: 1574.
Nautiyal CS, Govindarajan R, Lavania M, Pushpangadan P (2008) Novel mechanism of
modulating natural antioxidants in functional foods: involvement of plant growth-promoting
rhizobacteria NRRL B-30488. J. Agric. Food Chem., 56: 4474-4481.
Nicholson FA, Smith SR, Alloway BJ, Carlton-Smith C, Chambers BJ (2003) An inventory
of heavy metal inputs to agricultural soils in England and Wales. Sci. Tot. Environ., 311:
205-291.
Nogueira MA, Cardoso EJBN (2002) Microbial interactions on manganese availability and
uptake by soybean [Intracoes microbianas na disponibilidade e absorcao de manganes por
soja]. Pesq. Agropec. Bras., 37(11): 1605-1612.
Nogueira MA, Cardoso EJBN (2003) Mycorrhizal effectiveness and manganese toxicity in
soybean as affected by soil type and endophyte. Scientia Agricola, 60: 329-335.
145
Nogueira MA, Magalhães GC, Cardoso EJBN (2004) Manganese toxicity in mycorrhizal and
phosphorus fertilized soybean plants. J. Plant Nutr., 27: 141-156.
Norrish K (1975) The geochemistry and mineralogy of trace elements, In: Nicholas DJD and
Egan AR (eds.) Trace elements in Soil-Plant-Animal Systems. Academic Press, New York,
p.55.
Nwaogu C, Ogbuagu HD, Abrakasa S, Olawoyin MA (2017) Assessment of the impacts of
municipal solid waste dumps on soils and plants. Chemistry and Ecology, 33(7): 589-606.
Nyoki D, Ndakidemi PA (2017) Rhizobium inoculation reduces P and K fertilization
requirement in corn-soybean intercropping. Rhizosphere, 5:
https://doi.org/10/1016/j.rhisph.2017.12.002
Nzanza B, Marais D, Soundy P (2011) Tomato (Solanum lycopersicum L.) seedling growth
and development as influenced by Trichoderma harzianum and arbuscular mycorrhizal fungi.
Afr. J. Microbiol. Res., 5, 425-431.
Ogiyama S, Sakamoto K, Suzuki H, Ushio S, Anzai T, Inubushi K (2005) Accumulation of
zinc and copper in an arable field after animal manure applications. Soil Sci. Plant Nutr., 51:
801-808.
Ogiyama S, Suzuki H, Sakamoto K, Inubushi K (2010) Absorption of zinc and copper by
maize and sweet potato in an arable field after pig farmyard manure application –
contribution of arbuscular mycorrhizal fungi and effects of wood charcoal application.
HortResearch., 64: 9-18.
Okamoto T, Wachi K, Matuzaki T (2002) Background level of zinc in the farm soils of
kanagawa prefecture. Jpn. J. Soil Sci. Plant Nutr., 73: 175-179 (in Japanese).
Oketola AA, Akpotu SO (2014) Assessment of solid waste and dumpsite leachate and topsoil.
Chemistry and Ecology, 31(2): 134-146.
Oliveira RS, Carvalho P, Marques G, Ferreira L, Nunes M, Rocha I, Ma Y, Vosátka M,
Freitas H (2017) Increased protein content of chickpea (Cicer arietinum L.) inoculated with
arbuscular mycorrhizal fungi and nitrogen-fixing bacteria under water deficit conditions.
Journal of the Science of Food and Agriculture, 97(13): 4379-4385.
Ozga JA, Reinecke DM (2003) Hormonal Interactions in Fruit Development. Journal of
Plant Growth Regulation, 22: 73-81.
Page V, Weisskopf L, Feller U (2006) Heavy metals in white lupin: uptake, root-to-shoot
transfer and redistribution within the plant. New Phytol., 171:329-341.
146
Palmgren MG, Clemens S, Williams LE, Kramer U, Borg S, Schjorring JK, Sanders D (2008)
Zinc biofortification of cereals: problems and solutions. Trends Plant Sci., 13: 464-473.
Petrov V, Hille J, Mueller-Roeber B, Gechev TS (2015) ROS-mediated abiotic stress-
induced programmed cell death in plants. Front. Plant Sci.,
http://dx.doi.org/10.3389/fpls.2015.00069
Pilon M, Cohu CM, Ravet K, Abdel-Ghany SE, Gaymard F (2009) Essential transition metal
homeostasis in plants. Curr. Opin. Plant Biol., 12: 347-357.
Pinamonti F, Stringari G, Gasperi F, Zorzi G (1997) The use of compost: its effects on heavy
metals levels in soils and plants. Resour. Conserv. Recy., 21: 129-143.
Polacco JC, Todd CD (eds.) (2011) Ecological Aspects of Nitrogen Metabolism in Plants.
John Wiley and Sons, West Sussex.
Poorter H, Nagel O (2000) The role of biomass allocation in the growth response of plants
to different levels of light, CO2, nutrients and water: a quantitative view. Aust. J. Plant
Physiol., 27: 595-607.
Porcel R, Ruiz-Lozano JM (2004) Arbuscular mycorrhizal influence on leaf water potential,
solute accumulation, and oxidative stress in soybean plants subjected to drought stress. J.
Exp. Bot., 55(403): 1743-1750.
Raghuvanshi RS, Bisht K (2010) The Soybean: Botany, Production and Uses (ed. Singh G),
pp 404-412. CAB International, Oxfordshire.
Rai A, Rai S, Rakshit A (2013) Mycorrhiza-mediated phosphorus use efficiency in plants.
Environmental and Experimental Biology, 11: 107-117.
Rajapakse S, Miller JC (1994) Methods for studying vesicular arbuscular mycorrhizal root
colonization and related root physical properties. In: Norris JR, Read D, Varma AK (eds.)
Techniques for mycorrhizal research. Academic Press, London, pp. 761-776.
Ramos AC, Facanha AR, Palma LM, Okorokov LA, Cruz ZMA, Silva AG, et al., (2011) An
outlook on ion signaling and ionome of mycorrhizal symbiosis. Braz. J. Plant Physiol., 23:
79-89.
Raven PH, Johnson GB, Losos JB, Singer SR (2005) BIOLOGY 7th edn. New York,
McGraw-Hill.
Ray JG, Valsalakumar N (2010) Arbuscular mycorrhizal fungi and piriformospora indica
individually and in combination with rhizobium on green gram. J. Plant Nutr., 33: 285-298.
Reichman SM (2002) The responses of plants to metal toxicity: A review focusing on copper,
manganese and zinc. Australian Minerals & Energy Environment Foundation, Melbourne
p28.
147
Ren C-G, Kong C-C, Bian B, Liu W, Li Y, Luo Y-M, Xie Z-H (2017) Enhanced
phytoremediation of soils contaminated with PAHs by arbuscular mycorrhiza and rhizobium.
Int. J. Phytorem., 19(9): 789-797.
Rengel Z (2015) Availability of Mn, Zn and Fe in the rhizosphere. J. Soil Sci. Plant Nutr.,
15: 397-409.
Rieuwerts JS, Thornton I, Farago ME, Ashmore MR (1998) Factors influencing metal
bioavailability in soils: preliminary investigations for the development of a critical loads
approach for metals. Chemical Speciation & Bioavailability, 10(2): 61-75.
https://doi.10.3184/095422998782775835
Rivera-Becerril F, van Tuinen D, Martin-Laurent F, Metwally A, Dietz KJ, Gianinazzi S,
Gianinazzi-Pearson V (2005) Molecular changes in Pisum sativum L. roots during arbuscular
mycorrhiza buffering of cadmium stress. Mycorrhiza, 16: 51-60.
Rout GR, Das P (2003) Effect of metal toxicity on plant growth and metabolism: I. Zinc.
Agronomie, 23: 3-11.
Royo B, Moran JF, Ratcliffe RG, Gupta KJ (2015) Nitric oxide induces the alternative
oxidase pathway in Arabidopsis seedlings deprived of inorganic phosphate. J. Exp. Bot., 66:
6273-6280.
Ruiz-Lozano JM (2003) Arbuscular mycorrhizal symbiosis and alleviation of osmotic stress.
New perspectives for molecular studies. Mycorrhiza, 13: 309-307.
Ryan MH, van Herwaarden AF, Angus JF, Kirkegaard JA (2005) Reduced growth of
autumn-sown wheat in a low-P soil is associated with high colonization of arbuscular
mycorrhizal fungi. Plant Soil, 270: 275-286.
Sakamoto K, Ogiwara N, Kaji T (2013a) Involvement of autoregulation in the interaction
between rhizobial nodulation and AM fungal colonization in soybean roots. Biol. Fert. Soil.,
49: 1141-1152.
Sakamoto K, Ogiwara N, Kaji T, Seki M, Matsui A, Ishida J, Tanaka M (2013b)
Transcription profiles of host plant genes induced by rhizobial, AM fungal and dual
inoculations in soybean root. Book of Abstracts of the 18th International Congress on
Nitrogen Fixation, Miyazaki, Japan. p205.
Salomon E, Keren N (2011) Manganese limitation induces changes in the activity and in the
organization of photosynthetic complexes in the cyanobacterium Synechocystis sp. Strain
PCC 6803. Plant Physiol., 155: 571-579.
148
Shaheen N, Irfan NM, Khan IN, Islam S, Islam MS, Ahmed MK (2016) Presence of heavy
metals in fruits and vegetables: Health risk implications in Bangladesh. Chemosphere, 152:
431-438. http://dx.doi.org/10.1016/j.chemosphere.2016.02.060
Shanmugam V, Lo JC, Wu CL, Wang SL, Lai CC, Connolly EL, Huang JL, Yeh KC (2011)
Differential expression and regulation of iron-regulated metal transporters in Arabidopsis
halleri and Arabidopsis thaliana – the role in zinc tolerance. New Phytol., 190: 125-137.
Sharon S, Salomon E, Kranzler C, Lis H, Lehmann R, Georg J, Zer H, Hess WR, Keren N
(2014) The hierarchy of transition metal homeostasis: Iron controls manganese accumulation
in a unicellular cyanobacterium. Biochim. Biophys. Acta., 1837: 1990-1997.
Shen H, Christie P, Li X (2006) Uptake of zinc, cadmium and phosphorus by arbuscular
mycorrhizal maize (Zea mays L.) from a low available phosphorus calcareous soil spiked
with zinc and cadmium. Environ. Geochem. Health., 28: 111-119.
https://doi.10.1007/s10653-005-9020-2
Shi WG, Li H, Liu TX, Polle A, Peng CH, Luo ZB (2015) Exogenous abscisic acid alleviates
zinc uptake and accumulation in Populus × canescens exposed to excess zinc. Plant Cell
Environ., 38: 207-223.
Silva ML, Vitti GC, Trevizam, AR (2014) Heavy metal toxicity in rice and soybean plants
cultivated in contaminated soil. Revista Ceres., 61: 248-254.
Siviero MA, Motta AM, Lima DS, Birolli RR, Huh SY, Santinoni IA, Murate LS, Castro
CMA, Miyauchi MYH, Zangaro W, Nogueira MA, Andrade G (2008) Interaction among N-
fixing bacteria and AM fungi in Amazonian legume tree (Schizolobium amazonicum) in field
conditions. App. Soil Ecol., 39: 144-152.
Smith FA, Smith SE (2011) What is the significance of the arbuscular mycorrhizal
colonization of many economically important crop plants? Plant Soil., 348: 63-79.
Smith SE, Facelli E, Pope S, Smith FA (2010) Plant performance in stressful environments:
interpreting new and established knowledge of the roles of arbuscular mycorrhizas. Plant
Soil., 326: 3-20.
Smith SE, Jakobsen I, Grønlund M, Smith FA (2011) Roles of arbuscular mycorrhizas in
plant phosphorus (P) nutrition: interactions between pathways of P uptake in arbuscular
mycorrhizal (AM) roots have important implications for understanding and manipulating
plant P acquisition. Plant Physiol., https://doi.10.1104/pp.111.174581
Smith SE, Read DJ (2008) Mycorrhizal Symbiosis 3rd edn. Academic Press, San Diego.
Stephan UW, Schmidke I, Stephan VW, Scholz G (1996) The nicotianamine molecule is
made-to-measure for complexation of metal micronutrients in plants. Biometals, 9: 84-90.
149
Stoltz E, Greger M (2002) Accumulation properties of As, Cd, Cu, Pb, and Zn by four
wetland plant species growing on submerged mine tailings. Environ. Exp. Bot., 47: 271-280.
Taiz L, Zeiger E (2010) Plant Physiology 5th edn. Sinauer Associates, Sunderland M.A.
Tamayo E, Gómez-Gallego T, Azćon-Aguilar C, Ferrol N (2014) Genome-wide analysis of
copper, iron and zinc transporters in the arbuscular mycorrhizal fungus Rhizophagus
irregularis. Front. Plant Sci., https://doi.10.3389/fpls.2014.00547
Tandon HLS, Cescas MP, Tyner EH (1968) An acid free vanadate-molydate reagent for the
determination of total phosphorus in soils. Soil Sci. Soc. Am. Prod., 32: 48-51.
Tariq M, Sharif M, Shah Z, Khan R (2007) Effect of foliar application of micronutrients on
the yield and quality of sweet orange (Citrus sinensis L.). Pak. J. Biol. Sci., 10: 1823-1828.
Tavasolee A, Aliasgharzad N, Salehijouzani G, Mardi M (2011) Interactive effects of
Arbuscular mycorrhizal fungi and rhizobial strains on chickpea growth and nutrient content
in plant. Afr. J. Microbiol., 10: 7585-7591
Tόth G, Hermann T, Da Silva MR, Montanarella L (2016) Heavy metals in agricultural soils
of the European Union with implications for food safety. Environ Int., 88: 299–309.
Trouvelot A, Kough JL, Gianinazzi-Pearson V (1986) Mesure du taux de mycorrhization VA
dˋun systéme radiculaire. Recherche de méthodes dˋestimation ayant une signification
fonctionnelle. In: Gianinazzi-Pearson V, Gianinazzi S (eds.) Physiological and genetical
aspects of mycorrhizae. INRA, Paris, pp. 217-221.
Tsimilli-Michael M, Eggenberg P, Biro B, Köves-Pechy K, Vörös I, Strasser RJ (2000)
Synergistic and antagonistic effects of arbuscular mycorrhizal fungi and Azospirillum and
Rhizobium nitrogen-fixers on the photosynthetic activity of alfalfa, probed by the polyphasic
chlorophyll a fluorescence transient O-J-I-P. App. Soil. Ecol., 15(2): 169-182.
Van Assche F, Clijsters H (1990) Effects of metals on enzyme activity in plants. Plant Cell
Environ., 13: 195-206.
Vasconcelos MW, Clemente TE, Grusak MA (2014) Evaluation of constitutive iron
reductase (AtFRO2) expression on mineral accumulation and distribution in soybean
(Glycine max. L). Front. Plant Sci., 5: 112.
Veresoglou SD, Menexes G, Rillig MC (2012) Do arbuscular mycorrhizal fungi affect the
allometric partition of host plant biomass to shoots and roots? A meta-analysis of studies
from 1990 to 2010. Mycorrhiza, 22: 227-235. https://doi.org/10.1007/s00572-011-0398-7
Vierheilig H (2004) Regulatory mechanisms during the plant-arbuscular mycorrhizal fungus
interaction. Can. J. Bot., 82: 1166-1176.
150
Watts-Williams SJ, Cavagnaro TR (2012) Arbuscular mycorrhizas modify tomato responses
to soil zinc and phosphorus addition. Biol. Fert. Soils., 48: 285-294.
https://doi.org/10.1007/s00374-011-0621-x
Watts-Williams SJ, Cavagnaro TR (2014) Nutrient interactions and arbuscular mycorrhizas:
a meta-analysis of a mycorrhiza-defective mutant and wild type tomato genotype pair. Plant
Soil., 384: 79-92. https://doi.10.1007/s11104-014-2140-7
Wilson GWT, Daniels BAH, Kitt DG (1988) Suppression of mycorrhizal growth response
of big bluestem by non-sterile soil. Mycologia, 80: 338-343.
Xie ZP, Staehelin C, Vierheilig H, Wiemken A, Jabbouri S, Broughton WJ, Vogellange R,
Boller T (1995) Rhizobial nodulation factors stimulate mycorrhizal colonization of
nodulating and non-nodulating soybeans. Plant Physiol., 108: 1519-1525.
Yanai J, Yamada K, Yamada H, Nagano Y, Kosaki T (2011) Risk assessment of Heavy
Metal-Contaminated Soils with Reference to the Aging Effect. Pedologist, 2011: 278-284.
Zbíral J (2016) Determination of plant-available micronutrients by the Mehlich 3 soil
extractant – a proposal of critical values. Plant Soil Environ., 62: 527-531.
Zhang X, Chen B, Ohtomo R (2015) Mycorrhizal effects on growth, P uptake and Cd
tolerance of the host plant vary among different AM fungal species. Soil Sci. Plant Nutr., 61:
359-368.
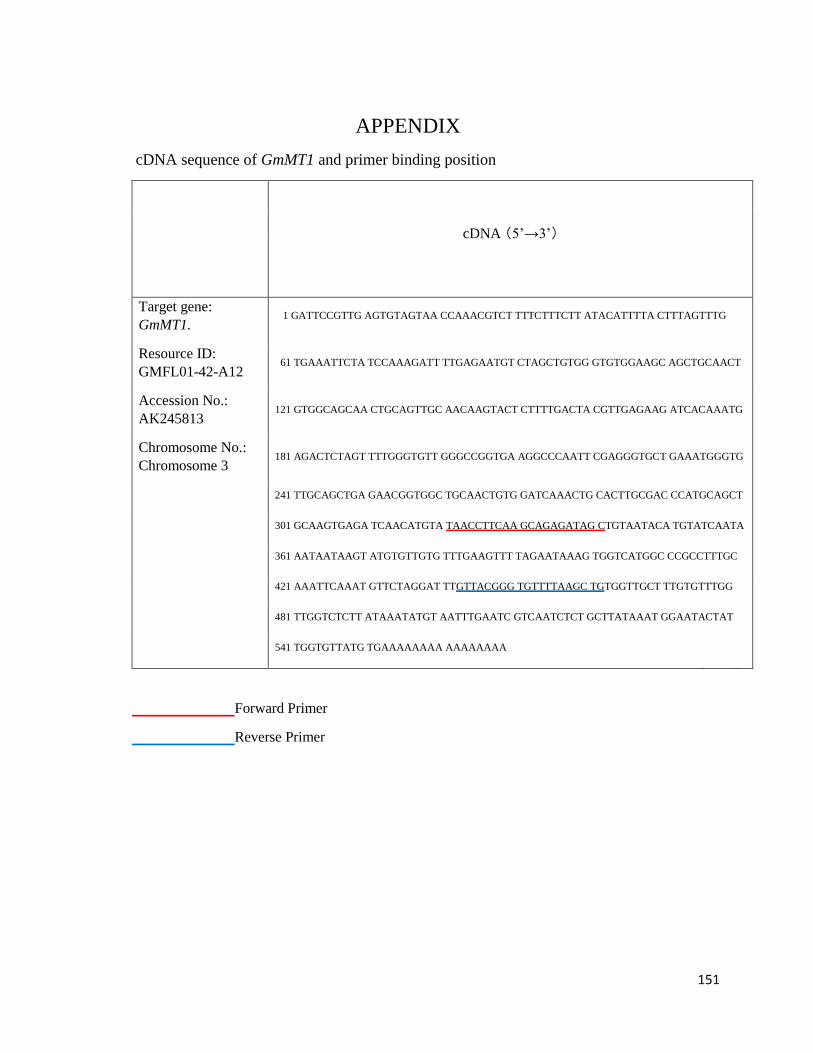
151
APPENDIX
cDNA sequence of GmMT1 and primer binding position
cDNA (5’→3’)
Target gene:
GmMT1. 1 GATTCCGTTG AGTGTAGTAA CCAAACGTCT TTTCTTTCTT ATACATTTTA CTTTAGTTTG
Resource ID:
GMFL01-42-A12 61 TGAAATTCTA TCCAAAGATT TTGAGAATGT CTAGCTGTGG GTGTGGAAGC AGCTGCAACT
Accession No.:
AK245813 121 GTGGCAGCAA CTGCAGTTGC AACAAGTACT CTTTTGACTA CGTTGAGAAG ATCACAAATG
Chromosome No.:
Chromosome 3 181 AGACTCTAGT TTTGGGTGTT GGGCCGGTGA AGGCCCAATT CGAGGGTGCT GAAATGGGTG
241 TTGCAGCTGA GAACGGTGGC TGCAACTGTG GATCAAACTG CACTTGCGAC CCATGCAGCT
301 GCAAGTGAGA TCAACATGTA TAACCTTCAA GCAGAGATAG CTGTAATACA TGTATCAATA
361 AATAATAAGT ATGTGTTGTG TTTGAAGTTT TAGAATAAAG TGGTCATGGC CCGCCTTTGC
421 AAATTCAAAT GTTCTAGGAT TTGTTACGGG TGTTTTAAGC TGTGGTTGCT TTGTGTTTGG
481 TTGGTCTCTT ATAAATATGT AATTTGAATC GTCAATCTCT GCTTATAAAT GGAATACTAT
541 TGGTGTTATG TGAAAAAAAA AAAAAAAA
Forward Primer
Reverse Primer
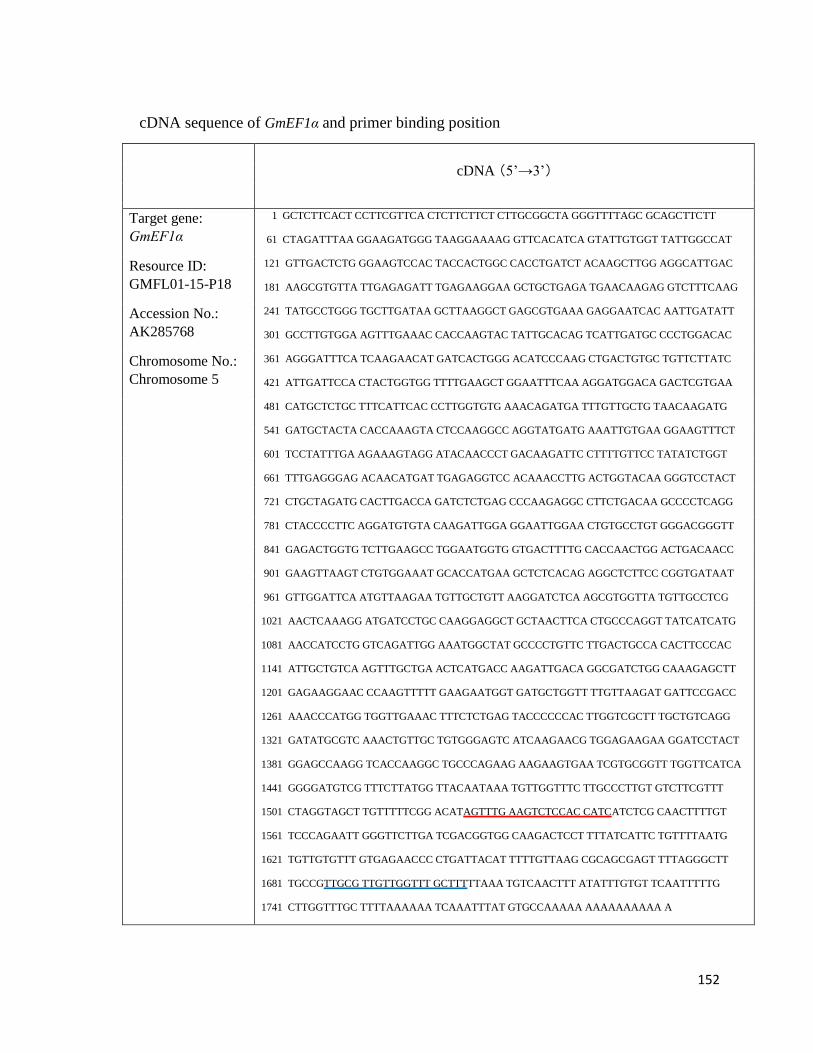
152
cDNA sequence of GmEF1α and primer binding position
cDNA (5’→3’)
Target gene:
GmEF1α
1 GCTCTTCACT CCTTCGTTCA CTCTTCTTCT CTTGCGGCTA GGGTTTTAGC GCAGCTTCTT
61 CTAGATTTAA GGAAGATGGG TAAGGAAAAG GTTCACATCA GTATTGTGGT TATTGGCCAT
121 GTTGACTCTG GGAAGTCCAC TACCACTGGC CACCTGATCT ACAAGCTTGG AGGCATTGAC
181 AAGCGTGTTA TTGAGAGATT TGAGAAGGAA GCTGCTGAGA TGAACAAGAG GTCTTTCAAG
241 TATGCCTGGG TGCTTGATAA GCTTAAGGCT GAGCGTGAAA GAGGAATCAC AATTGATATT
301 GCCTTGTGGA AGTTTGAAAC CACCAAGTAC TATTGCACAG TCATTGATGC CCCTGGACAC
361 AGGGATTTCA TCAAGAACAT GATCACTGGG ACATCCCAAG CTGACTGTGC TGTTCTTATC
421 ATTGATTCCA CTACTGGTGG TTTTGAAGCT GGAATTTCAA AGGATGGACA GACTCGTGAA
481 CATGCTCTGC TTTCATTCAC CCTTGGTGTG AAACAGATGA TTTGTTGCTG TAACAAGATG
541 GATGCTACTA CACCAAAGTA CTCCAAGGCC AGGTATGATG AAATTGTGAA GGAAGTTTCT
601 TCCTATTTGA AGAAAGTAGG ATACAACCCT GACAAGATTC CTTTTGTTCC TATATCTGGT
661 TTTGAGGGAG ACAACATGAT TGAGAGGTCC ACAAACCTTG ACTGGTACAA GGGTCCTACT
721 CTGCTAGATG CACTTGACCA GATCTCTGAG CCCAAGAGGC CTTCTGACAA GCCCCTCAGG
781 CTACCCCTTC AGGATGTGTA CAAGATTGGA GGAATTGGAA CTGTGCCTGT GGGACGGGTT
841 GAGACTGGTG TCTTGAAGCC TGGAATGGTG GTGACTTTTG CACCAACTGG ACTGACAACC
901 GAAGTTAAGT CTGTGGAAAT GCACCATGAA GCTCTCACAG AGGCTCTTCC CGGTGATAAT
961 GTTGGATTCA ATGTTAAGAA TGTTGCTGTT AAGGATCTCA AGCGTGGTTA TGTTGCCTCG
1021 AACTCAAAGG ATGATCCTGC CAAGGAGGCT GCTAACTTCA CTGCCCAGGT TATCATCATG
1081 AACCATCCTG GTCAGATTGG AAATGGCTAT GCCCCTGTTC TTGACTGCCA CACTTCCCAC
1141 ATTGCTGTCA AGTTTGCTGA ACTCATGACC AAGATTGACA GGCGATCTGG CAAAGAGCTT
1201 GAGAAGGAAC CCAAGTTTTT GAAGAATGGT GATGCTGGTT TTGTTAAGAT GATTCCGACC
1261 AAACCCATGG TGGTTGAAAC TTTCTCTGAG TACCCCCCAC TTGGTCGCTT TGCTGTCAGG
1321 GATATGCGTC AAACTGTTGC TGTGGGAGTC ATCAAGAACG TGGAGAAGAA GGATCCTACT
1381 GGAGCCAAGG TCACCAAGGC TGCCCAGAAG AAGAAGTGAA TCGTGCGGTT TGGTTCATCA
1441 GGGGATGTCG TTTCTTATGG TTACAATAAA TGTTGGTTTC TTGCCCTTGT GTCTTCGTTT
1501 CTAGGTAGCT TGTTTTTCGG ACATAGTTTG AAGTCTCCAC CATCATCTCG CAACTTTTGT
1561 TCCCAGAATT GGGTTCTTGA TCGACGGTGG CAAGACTCCT TTTATCATTC TGTTTTAATG
1621 TGTTGTGTTT GTGAGAACCC CTGATTACAT TTTTGTTAAG CGCAGCGAGT TTTAGGGCTT
1681 TGCCGTTGCG TTGTTGGTTT GCTTTTTAAA TGTCAACTTT ATATTTGTGT TCAATTTTTG
1741 CTTGGTTTGC TTTTAAAAAA TCAAATTTAT GTGCCAAAAA AAAAAAAAAA A
Resource ID:
GMFL01-15-P18
Accession No.:
AK285768
Chromosome No.:
Chromosome 5

153
Forward Primer
Reverse Primer


