Embed Size (px)
Citation preview
American Mineralogist, Volume 96, pages 768–780, 2011
0003004X/11/0506–768$05.00/DOI: 10.2138/am.2011.3694 768
Effect of lactate, glycine, and citrate on the kinetics of montmorillonite dissolution
M. ELENA RAMOS,1,* CHIARA CAPPELLI,1 MARISA ROZALÉN,1 SAVERIO FIORE,2 AND F. JAVIER HUERTAS1
1Instituto Andaluz de Ciencias de la Tierra, CSICUniversidad de Granada, Avda Fuentenueva s/n, 18002 Granada, Spain2IMAA–CNR, L.da S. Loja, 85000 Tito Scalo (PZ), Italy
ABSTRACTThe montmorillonite dissolution in saline solutions that mimic synthetic lung fluids (SLF) was
investigated to gain knowledge on the clearance mechanisms of inhaled clay particles. Dissolution rates were measured at pH 4 (macrophages) and 7.5 (interstitial fluids) at 37 !C in flowthrough reactors. The effect of organic acids was investigated through the addition of lactate, citrate, and glycine (0.15, 1.5, and 15 mmol/L). Lactate or glycine does not markedly affect the montmorillonite dissolution rates at pH 4, but at pH 7.5 there exists a slight inhibitory effect of lactate on the dissolution, probably due to a reduction in the number of reactive surface sites caused by lactate adsorption. Citrate enhances the dissolution rate by 0.5 order of magnitude at pH 4 and more than 1 order of magnitude at pH 7.5, thus indicating the prevalence of the ligandpromoted over the protonpromoted dissolution mechanism under these experimental conditions. The kinetic data were used to estimate the reduction in size of an inhaled clay particle. At pH 7.5, a particle 500 nm in diameter could be reduced 25% in the presence of citrate, whereas the reduction in saline solution would only be 10% after 10 years.Ligand adsorption was measured in batch experiments at pH 2–11 and EQ3NR was used to model
the capacity of the ligands to form soluble species of Al. Citrate, glycine, and lactate adsorb onto montmorillonite under acidic conditions, up to 23, 26, and 60 "mol/g, respectively. However, only citrate can complex the released aqueous Al at pH 4 and 7.5, which contributes to enhance dissolution rate and prevents precipitation of gibbsite at pH 7.5.The enhancement of the dissolution rate in acidic citrate solution very likely comes from the for
mation of surface complexes between the ligand and the edge surface of montmorillonite. In neutral conditions the effect may be also due to the decrease of the activity of Al3+ by formation of aqueous Alcitrate complexes.Keywords: Montmorillonite, dissolution rate, organic ligands, adsorption
INTRODUCTIONAfter decades of research, a substantial and growing under
standing of the important role played by geochemical processes on the health effects of biodurable minerals has been gained. Although the precise mechanism to induce disease in an organism has not been fully clarified yet, the initial contact between the organism and the mineral is via the mineral surface in an aqueous medium. The interaction of surface reactive groups (sites with acidbase properties, active sites for cation exchange, surface charge, hydrophilicity or hydrophobicity of the surface, production or adsorption of oxygenfree radicals, etc.) with the biological medium may induce the mineral toxicity (Fubini and Fenoglio 2007). Thus, it is important to see how the surface interaction occurs to understand the pathogenesis of minerals. This understanding requires a mineralogical and geochemical surface characterization. There are very few studies on mineral dissolution in a biologic medium and they are mainly focused on highly toxic asbestos and silica (Scholze and Conradt 1987; Hume and Rimstidt 1992; Werner et al. 1995; Gunter and Wood 2000; Oze and Solt 2010), as well as talc (Jurinski and Rimstidt 2001).
Smectite, kaolin, and illite constitute the main part of the fine and ultrafine fraction in soils and sediments. Therefore, they are the main compounds of suspended dusts formed by mechanical and chemical weathering processes. Human beings are constantly exposed to mineral dust. However, very few studies exist on the toxicity of smectite and clays in general. The World Health Organization indicated the dire need to tackle research on this matter in its report “Environmental Health Criteria on Bentonites and Kaolins” (WHO 2005).Smectite dissolution has not been investigated using similar
physical and chemical conditions to those found in the lung. However, this reaction has been extensively studied under Earth surface conditions for decades (Zysset and Schindler 1996; Bauer and Berger 1998; Cama et al. 2000; Huertas et al. 2001; Amram and Ganor 2005; Metz et al. 2005; Golubev et al. 2006; Rozalén et al. 2008, 2009b). The dissolution reaction is produced in specific active sites on the surface, and is controlled by several factors including temperature, pH, and the presence of organic ligands and inhibitors. Most studies agree that under the same pH conditions the dissolution rate is faster in the presence of organic ligands than that without organic ligand (Zutic and Stumm 1984; Furrer and Stumm 1986; CarrollWebb and * Email: [email protected]
RAMOS ET AL.: DISSOLUTION KINETICS OF MONTMORILLONITE 769
Walther 1988; Chin and Mills 1991; Wieland and Stumm 1992; Ganor and Lasaga 1994; Oelkers and Schott 1998; Stillings et al. 1998), although the precise mechanisms are still being debated. The dissolution process is a sequence of elementary reactions at the mineral/solution interface, where the ions and molecules dissolved in the solution interact with the surface cations, favoring the bonds breaking on the surface. This process is the result of several mechanisms acting simultaneously: protonpromoted dissolution (pH effect) and ligandpromoted dissolution due to the formation of metalligand surface complexes (Zutic and Stumm 1984; Furrer and Stumm 1986; Chin and Mills 1991; Wieland and Stumm 1992; Stillings et al. 1998) or the decrease in the solution saturation with respect to the mineral due to formation of soluble chelates.This study is focused on the effect of lactate, glycine, and
citrate on the rate and mechanism of smectite dissolution under conditions that may be similar to those in the lung. In particular, we investigate the reactions at the montmorillonite/solution interface that contribute to montmorillonite dissolution in synthetic lung fluid (SLF), including surface adsorption of organic ligands (lactate, citrate, and glycine) onto montmorillonite and the modeling of the speciation of released elements in the interstitial solution. Although the experimental conditions do not reproduce exactly the complexity of the human body, they provide a benchmark to evaluate the biological degradation of inhaled clay particles.
MATERIALS AND METHODS
Montmorillonite characterization and pretreatmentThe material used in this study was dioctahedral smectite extracted from the La
Serrata–Cortijo de Archidona bentonite deposit located at Cabo de Gata (Almeria, SE Spain). For a detailed characterization of the sample and methods see Rozalén et al. (2008). This bentonite is ~92% montmorillonite and the rest consists of accessory minerals (quartz, feldspars, micas, calcite, and amphibole) plus volcanic glass. The experiments were performed on the <4 "m fraction saturated with K+. The calculated structural formula of the Ksmectite (based on a halfunit cell) corresponds to an Ferich montmorillonite (Newman and Brown 1987):
K0.44(Al1.27Fe3+0.22Mg0.56)(Si3.95Al0.05)O10(OH)2
The corresponding atomic ratio Al/Si is 0.334. Only 0.38 K+ ions per half formula unit are exchangeable, which indicates the presence of a small proportion of nonswelling layers.
Xray diffraction (XRD) patterns recorded on powder specimens as well as on oriented and glycolated specimens showed that the sample is composed of a dioctahedral smectite with ~10–15% nonswelling layers, in agreement with the presence of nonexchangeable potassium determined by chemical analysis. No accessory phases were detected. The specific surface area after degassing the sample for two days at 110 !C under vacuum measured by BET (Brunauer et al. 1938), using 5point N2 adsorption isotherms, was 111 m2 g#1 with an associated uncertainty of 10%. The edge surface area was estimated to be 6.5 m2 g#1 (Rozalén et al. 2008).
Experimental settingDissolution experiments. Dissolution experiments were performed in
singlepass, stirred, flowthrough cells, which facilitated the measurement of the dissolution rate under fixed saturation state conditions by modifying the flow rate, initial sample mass, and input solution concentrations. The reactors were fully immersed in a thermostatic waterbath held at a constant temperature of 37 ± 1 !C. The flow rate was controlled with a peristaltic pump that injects the input solution into the bottom chamber of the cell (0.02 mL/min) where the solution is homogenized with a magnetic stirrer before reaching the upper chamber. The solid sample is confined within the upper chamber (reaction zone) by using two membrane filters: a 5 "m nylon mesh plus a 1.2 "m Durapore membrane at the
bottom and a 0.45 "m Durapore membrane at the top. The total volume of the cell was 46 mL and the solid mass added to each cell was 0.1 g, to yield a solid solution ratio of ~2 g/L.
The composition of the input solutions mimics the fluids found in the human lung (synthetic lung fluids, SLF), the socalled Gamble’s solution. They were prepared by using the formulation by Jurinski and Rimstidt (2001) with additional modifications. Saline solutions have the same molar composition, but all the salts were potassium salts to keep montmorillonite saturated in K+: KCl 112.3 mmol/L, K2SO4 0.556 mmol/L, and the appropriate amount of HCl or KHCO3 to adjust to the initial pH. Phosphate salts were avoided, because phosphate interferes in the Si analysis. Sodium azide (NaN3, 2 ppm) was added as bactericide. Several runs with ligandfree saline solutions were carried out as control and background experiments covering the pH range between 3 and 8, to have the complete dissolution profile under our experimental conditions.
The effects of three different organic ligands, lactate, citrate, and glycine on the dissolution rate were investigated. Lactate and citrate are contained in interstitial fluids. Glycine was used as a proxy for the amino acids and proteins found in these fluids. The concentration of each organic anion in the interstitial fluid is not well documented. However, lactate has been reported to be the most abundant organic acid in the interstitial fluids, having a concentration of 164 ppm, followed by citrate with 23 ppm (Plumlee and Ziegler 2003).
To assess the ligand effect on the dissolution rate the input solutions were prepared by adding glycine, lactate, or citrate in three different concentrations (0.15, 1.5, and 15 mmol/L for each ligand) to the saline solution. The pH was adjusted with HCl or KHCO3 solutions to ~4 or 7.5. No montmorillonite structural cations (Si, Al, Mg, Fe) were added to the input solutions. The compositions of the input solution in every dissolution experiment are reported in Table 1.
In each run, the flow rate and the input pH were held constant until steadystate conditions were achieved. The steady state was assumed to prevail when the Si output concentration remained fairly constant, differing by <6% between consecutive samples (Rozalén et al. 2008). Reaction times were from 1200 to 1800 h depending on the experimental conditions (pH, temperature, and ligand concentration). At steady state, dissolution is expected to proceed under farfromequilibrium conditions. All the experiments consisted of a single stage; the cell was dismantled after the steady state was achieved.
After sampling every 24 h, the pHs of the output solutions were immediately measured at room temperature by using Crison combination electrodes standardized with pH 4.01 and 7.00 buffer solutions. The reported accuracy was ±0.02 pH units. To evaluate whether any temperature correction between room and experimental temperature was necessary, the pH of input and standard solutions covering a pH range from 4 to 9 was measured both at 20 and 37 !C. The difference in the pH value between both temperatures was less than the accuracy of the measurement, thus no temperature correction was applied. An aliquot of 3 mL was separated for organic ligand analysis. Then the output solutions were acidified to pH 3 with HCl to prevent the precipitation of Al or Febearing phases during storage for Si and Al analyses.
The Si concentration in the samples was determined by colorimetry by using the molybdate blue method (Grasshoff et al. 1983). Total Al concentration in the solutions was determined by atomic adsorption spectroscopy (AAS), inductively coupled plasma mass spectrometry (ICPMS), and fluorimetry using lumogallion as a complexing agent at pH 4.86 (Howard et al. 1986). High salt concentration ($8 gL#1) produced a highmatrix effect with AAS and ICPMS which gives rise to a low reproducibility and a detection limit above the Al concentration in the samples (ppb). The presence of citrate affected the measurement of Al by fluorimetry at its highest concentration (15 mmol/L), since citrate can compete with lumogallion for Al, leading to a negative interference. A correction was carried out by adding the same concentration of ligand to the Al standards. Such an effect was not observed for lactate and glycine.
The concentration of lactate and citrate was measured by ion chromatography using a Metrohm 761 Compact Ion Chromatograph with a Metrosep Organic Acids column. The eluent was prepared with 0.5 mmol/L sulfuric acid/15% acetone. Glycine was analyzed colorimetrically with a UVvisible spectrometer, using the ninhydrin method (Sun et al. 2006). The detection limits are 5 ppb for Si, 0.5 ppb for Al, 0.9 ppm for lactate, 9 ppm for citrate, and 0.7 ppm for glycine. The associated errors were 5% for Si and Al, 3% for lactate and citrate, and 4% for glycine.
Adsorption experiments. Adsorption experiments were performed as a complement to dissolution results to assess whether ligands were adsorbed onto the montmorillonite surface as a function of pH and interpret the dissolution mechanism.
Adsorption experiments of lactate, citrate, and glycine onto montmorillonite were carried out at room temperature. Potassium chloride was added to the solu
RAMOS ET AL.: DISSOLUTION KINETICS OF MONTMORILLONITE770
tions as a background electrolyte. For lactate and glycine, individual suspensions were prepared for every point of the adsorption series. For lactate adsorption, a quantity of 0.023 g of montmorillonite was added to 20 mL of 10 mmol/L KCl in a polyethylene bottle. For glycine experiments the amount of montmorillonite in each suspension was 0.058 g. The suspensions were stirred for 3–4 min and left to equilibrate for 24 h. A volume of lactic acid or glycine stock solution was added to reach a total ligand concentration of 0.15 mmol/L. The pH was adjusted in each sample with an appropriate amount of HCl or KOH solution to cover a pH range from 2 to 10. After 5 h the pH was measured in each bottle and an aliquot of 10 mL was withdrawn and filtered through a 0.22 "m Durapore membrane. The solutions were analyzed for lactate or glycine.
For citrate adsorption 0.58 g of montmorillonite were suspended in 100 mL of 10 mmol/L KCl solution. The suspension was stirred for 3–4 min and equilibrated for 24 h. Then a volume of citrate stock solution was added to reach a total ligand concentration of 0.15 mmol/L and the pH was adjusted to 2 by adding 1 mol/L HCl solution. Every 20 min the pH was measured and a 5 mL aliquot was withdrawn while stirring. The pH was then increased in steps of ~1 unit using an appropriate amount of KOH solution. The 5 mL aliquot was immediately filtered through a 0.22 "m Durapore membrane and the solution was analyzed for citrate.
The anion exclusion volume of the montmorillonite was determined by measuring the concentration of chloride in montmorillonite slurries at increasing ionic strength (Polubesova and Borisover 2009). Chloride concentration in the extract was measured by ion chromatography using a Metrosep A Supp–250 column and a solution of 1.7 mmol/L NaHCO3/1.8 mmol/L Na2CO3 as eluent. Under our experimental conditions (10 mmol/L KCl) the anion exclusion volume was estimated of 0.39 cm3 g#1 of clay.
Kinetic calculationsIn a wellmixed, flowthrough reactor the dissolution rate, Rate (mol g#1 s#1),
can be calculated based on the mass balance of a given mineral component j. Under steadystate conditions this is given by the following equation (e.g., Cama et al. 2000; Rozalén et al. 2008):
Rate mol g sj
j,out j,in
! !( ) = ! !1 1 1
!qMC C( ) (1)
where %j is the stoichiometric coefficient of component j in the dissolution reaction, q stands for the volumetric fluid flow through the system, M is the mass of montmorillonite, and Cj,out and Cj,in correspond to the concentrations of component j in the output and input solutions, respectively. The rate is defined as negative for dissolution and positive for precipitation. The error in the calculated rate is estimated by using the Gaussian error propagation method and is <5% in all cases, which corresponds to ~0.05 logarithmic units. In this study the dissolution rate is calculated from the Si and Al concentrations (RSi and RAl) in the output solutions. All dissolution rates were normalized to the initial mass of montmorillonite (Rozalén et al. 2008).
Montmorillonite dissolves according to the following reaction:
K0.44(Al1.27Fe3+0.22Mg0.56)(Si3.95Al0.05)O10(OH)2 + 6.18 H+ &0.44 K+ + 1.32 Al3+ + 0.22 Fe3+ + 0.56 Mg2+ + 3.95 SiO2 + 4.09 H2O (2)
The estimated equilibrium constant for the Kmontmorillonite dissolution reac
TABLE 1. Experimental conditions and results of flow-through dissolution experiments Run Duration Flow rate Initial mass Ligand pH in pH out C Si,out C Al,out C Mg,out* C Fe,out* Al/Si log R Si log R Al !R Si !R Al (h) (mL/min) (g) (mmol/L) (µmol/L) (µmol/L) (µmol/L) (µmol/L) (mol g–1s–1) (mol g–1s–1) % %
Ligand freeSm-SE-3 1334 0.0239 0.1005 – 3.21 3.06 8.09 3.60 0.89 0.11 0.446 –11.38 –11.26 5.0 5.0Sm-SE-4 1334 0.0221 0.1013 – 4.24 4.10 3.49 1.30 1.26 1.83 0.374 –11.79 –11.74 5.1 5.1Sm-SE-5 1191 0.0226 0.1008 – 5.52 5.19 1.38 0.060 0.81 0.12 0.043 –12.18 –13.07 5.1 5.1Sm-SE-6 1191 0.0227 0.0999 – 6.17 5.83 1.37 0.039 0.81 0.12 0.029 –12.18 –13.24 5.1 5.1Sm-SE-7 1533 0.0230 0.0990 – 6.91 7.02 1.55 0.131 0.54 1.15 0.084 –12.12 –12.71 5.1 5.1Sm-SE-8 1538 0.0229 0.0993 – 7.92 7.58 1.61 0.23 0.56 1.19 0.141 –12.10 –12.47 5.0 5.0
LactateSm-SEL0.15-4 914 0.0198 0.0991 0.15 3.90 3.92 6.17 2.32 2.22 3.24 0.376 –11.58 –11.53 5.0 5.0Sm-SEL0.15-4b 1676 0.0217 0.0998 0.15 3.95 3.93 3.83 1.54 1.38 2.01 0.401 –11.75 –11.66 5.0 5.0Sm-SEL1.5-4 1030 0.0193 0.0994 1.5 4.51 4.52 2.82 1.07 1.02 1.48 0.379 –11.94 –11.88 5.1 5.1Sm-SEL1.5-4b 1555 0.0215 0.0999 1.5 3.96 3.94 3.76 1.87 1.35 1.97 0.424 –11.76 –11.59 5.0 5.0Sm-SEL15-4 1150 0.0193 0.0998 15 4.39 4.30 4.98 1.74 1.79 2.61 0.349 –11.69 –11.67 5.1 5.1Sm-SEL15-4b 979 0.0220 0.1000 15 3.92 3.89 6.68 2.55 2.40 3.51 0.381 –11.50 –11.44 5.0 5.0Sm-SEL0.15-7 1440 0.0223 0.0996 0.15 6.98 7.09 0.894 0.103 0.31 0.66 0.116 –12.37 –12.83 5.1 5.1Sm-SEL0.15-7b 1744 0.0231 0.1001 0.15 7.05 7.50 1.52 0.12 0.53 1.12 0.080 –12.14 –12.77 5.2 5.3Sm-SEL1.5-7 1440 0.0235 0.0997 1.5 7.22 7.28 0.774 0.135 0.27 0.57 0.179 –12.41 –12.69 5.1 5.1Sm-SEL1.5-7b 1747 0.0221 0.0997 1.5 7.12 7.46 1.74 0.18 0.61 1.29 0.102 –12.09 –12.60 5.1 5.1Sm-SEL15-7 1584 0.0229 0.1000 15 7.20 7.79 1.93 0.22 0.68 1.43 0.115 –12.03 –12.50 5.1 5.1Sm-SEL15-7b 1604 0.0220 0.1006 15 7.07 7.46 1.37 0.34 0.48 1.01 0.248 –12.20 –12.33 5.1 5.1
CitrateSm-SEC0.15-4 1119 0.0231 0.0999 0.15 4.00 3.99 7.44 2.87 2.68 3.91 0.386 –11.43 –11.37 5.0 5.0Sm-SEC1.5-4 1119 0.0244 0.0999 1.5 4.14 4.13 8.71 2.98 3.14 4.57 0.344 –11.34 –11.26 5.0 4.3Sm-SEC15-4 1168 0.0227 0.1006 15 4.04 4.03 12.09 4.65 4.35 6.35 0.385 –11.23 –11.17 5.0 5.0Sm-SEC0.15-5a 1071 0.0217 0.1000 0.15 5.56 6.81 2.66 0.60 0.93 1.97 0.222 –11.91 –12.08 5.0 5.0Sm-SEC0.15-5b 1197 0.0204 0.1018 0.15 5.36 5.65 3.93 1.48 2.32 0.35 0.375 –11.77 –11.72 5.0 5.0Sm-SEC1.5-5 1149 0.0204 01.005 1.5 5.57 5.61 5.82 1.94 3.43 0.52 0.333 –11.58 –11.58 4.8 4.8Sm-SEC15-5 1027 0.0210 0.1003 15 5.47 5.50 8.05 2.50 4.75 0.72 0.340 –11.44 –11.27 5.0 3.1Sm-SEC0.15-7 1151 0.0230 0.0999 0.15 7.16 7.34 3.55 0.46 1.24 2.63 0.131 –11.76 –12.16 5.0 5.0Sm-SEC1.5-7 1118 0.0200 0.1001 1.5 6.98 7.19 9.64 1.97 3.37 7.13 0.207 –11.39 –11.59 5.0 5.0Sm-SEC15-7 1094 0.0229 0.1007 15 6.98 7.02 13.24 2.47 4.63 9.80 0.192 –11.20 –11.44 5.1 4.9
GlycineSm-SEG0.15-4 1461 0.0235 0.0992 0.15 4.37 4.44 1.91 0.80 0.69 1.00 0.420 –12.02 –11.92 5.0 5.0Sm-SEG1.5-4 1748 0.0233 0.0995 1.5 4.34 4.37 1.94 0.80 0.70 1.02 0.413 –12.02 –11.93 5.1 5.1Sm-SEG15-4 1604 0.0217 0.1003 15 4.30 4.42 1.80 0.75 0.65 0.95 0.417 –12.09 –11.99 5.1 5.1Sm-SEG15-4b 1917 0.0235 0.1001 15 4.34 4.33 1.74 0.66 0.63 0.91 0.381 –12.06 –12.00 5.0 5.0Sm-SEG0.15-7 1384 0.0224 0.1002 0.15 7.26 7.40 1.57 0.14 0.55 1.16 0.092 –12.13 –12.69 5.0 5.0Sm-SEG1.5-7 1290 0.0235 0.1001 1.5 7.24 7.34 2.31 0.10 0.81 1.71 0.043 –11.94 –12.82 5.1 5.1Sm-SEG15-7 1056 0.0218 0.1000 15 7.32 7.87 1.53 – 0.54 1.13 – –12.19 – 5.5 –Sm-SEG15-7b 1317 0.0243 0.0993 15 7.29 7.49 1.35 0.11 0.47 1.00 0.084 –12.16 –12.75 5.1 5.0Note: Dissolution rates were normalized to mass. * Estimated concentrations (see text for details) to be used exclusively as proxy in EQ3NR calculations (data in italics).
RAMOS ET AL.: DISSOLUTION KINETICS OF MONTMORILLONITE 771
tion at 37 !C was log Keq(K–Sm) = 4.94 (Rozalén et al. 2009b). The saturation state of the solution with respect to solid phases is calculated in terms of the free energy of reaction, 'Gr:
!G RTKr
eq
IAP="
#$
%
&'ln (3)
where IAP and Keq, respectively, stand for the ion activity product and the equilibrium constant for the dissolution reaction. Aqueous activities and chemical affinities are calculated here by using the EQ3NR geochemical code (Wolery 1992).
The IAP was calculated from pH, Si and Al concentration in the output solutions at steadystate conditions. The Mg concentration was estimated according to the Mg/Si ratio observed by Rozalén et al. (2009b) in ligandfree solutions. The same procedure was used to estimate the Fe concentration in ligandfree acidic solutions (pH 2–3). At pH 4–9, the Fe3+ concentration was assumed to be in equilibrium with amorphous Fe(OH)3 (Rozalén et al. 2009b). Such concentrations were used as proxies for the estimation of the solution saturation in K montmorillonite. Additional tests were conducted to assess the variation of montmorillonite saturation with Mg and Fe concentration. The change in 'Gr was negligible when Mg or Fe contents were diluted or concentrated by a factor of 10.
EQ3NR was used to model the capacity of the ligands to form soluble species of Al. To attain this aim, the Lawrence Livermore National Laboratory thermodynamic database (cmp) (Wolery 1992) was modified to include the ligands species and the complexation reactions of aqueous Al (Table 2). Although the dissolution experiments were performed at 37 !C, the most complete set of complexation constant was obtained at 25 !C. Several tests were run to assess the effect of the temperature, concluding that the variation of the species distribution due to the increase in temperature was negligible, if compared with the analytical errors and the scattering of the complexation constant in the literature.
RESULTS
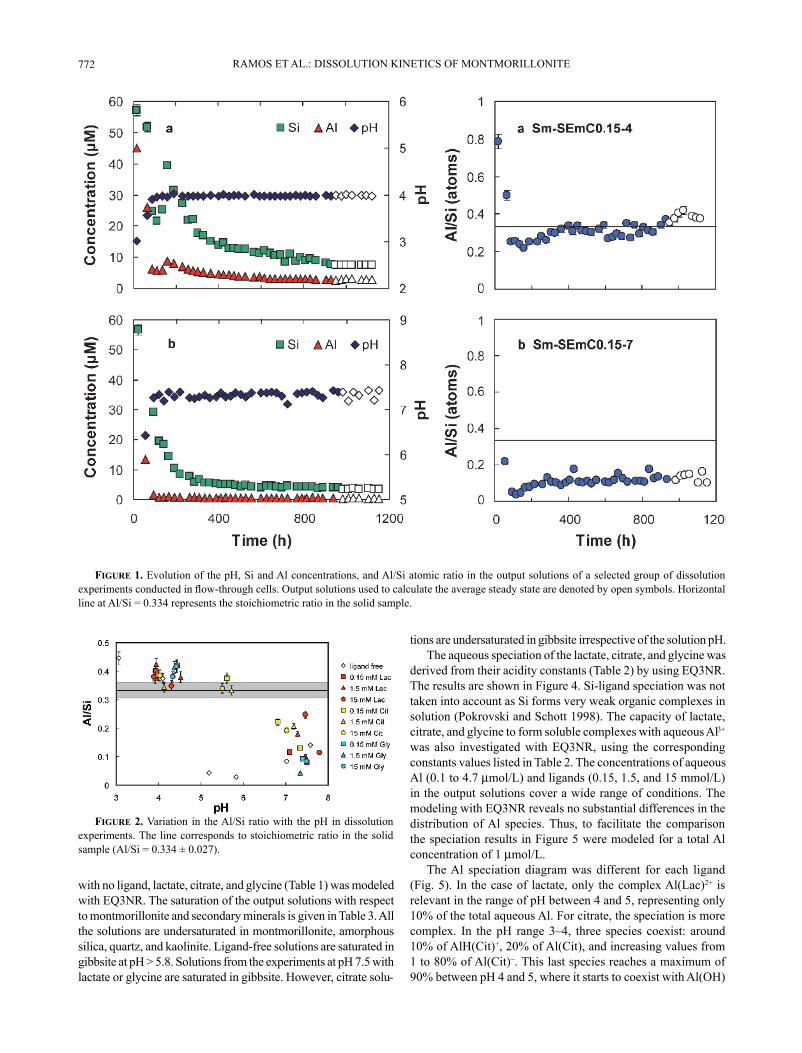
Dissolution experimentsThe variation with time of the output solution composition
of several representative flowthrough experiments is shown in Figure 1. The concentrations of Si and Al and the pH were monitored throughout the duration of all the experiments. The experimental conditions of all the series, the average pH and the concentrations of Si and Al at steady state are reported in Table 1. The nomenclature of the dissolution experiments follows the pattern: SmSEL0.154b, where SmSE is smectite in electrolyte solution that can be followed by L, C, or G that is the ligand used (lactate, citrate, or glycine), with its concentration in mmol/L (0.15, 1.5, or 15). The last number is the initial pH in the experiment (4 or 7.5) and finally, the b corresponds to a replicate.
Experiments without organic ligands. In the experiments without an organic ligand cationrelease rates tend to decrease significantly with elapsed time until steadystate conditions are attained. The solution pH remains constant with elapsed time in all the experiments. High Al and Si concentrations were observed at the onset of most experiments. Afterward, Al and Si concentrations decrease asymptotically until a steady state is approached. The Al/Si release ratio increases up to a constant value at the steady state in all the experiments. Figure 2 shows the Al/Si ratio in solution at steady state as a function of the solution pH. The Al/Si release ratio at pH 4–4.5 is very close to stoichiometric, and the dissolution rates derived from Si and Al concentrations are consistent with each other. In circumneutral pH solutions (pH 4.5–8) the stoichiometric ratio decreases involving a deficit in aqueous aluminum.Experiments with organic ligands. The evolution of pH and
concentrations of Si, Al, and organic ligand with elapsed time in a representative experiment is illustrated in Figure 1. The tendency observed for Si and Al is the same as in experiments without an organic ligand: an initial fast release of montmorillonite structural cations to the solution and an asymptotical decrease until steady state is approached.The pH remained constant in the experiments at pH 4 (Fig.
1). However, it was necessary to readjust the pH in the same series at pH 7, because of a drift to higher values during the first days of reaction.The behavior of the Al/Si ratio with elapsed time is also
similar to that found in organic ligandfree solutions (Fig. 1), which reach a constant value when steady state is approached. At pH 4 and 5.5, montmorillonite dissolution is stoichiometric irrespective of the ligand and its concentration. The dissolution reaction at pH 7–8 is incongruent in solutions with lactate, citrate, or glycine, regardless of their concentrations. Lactate, citrate, and glycine concentrations remain constant with elapsed time in all the experiments.
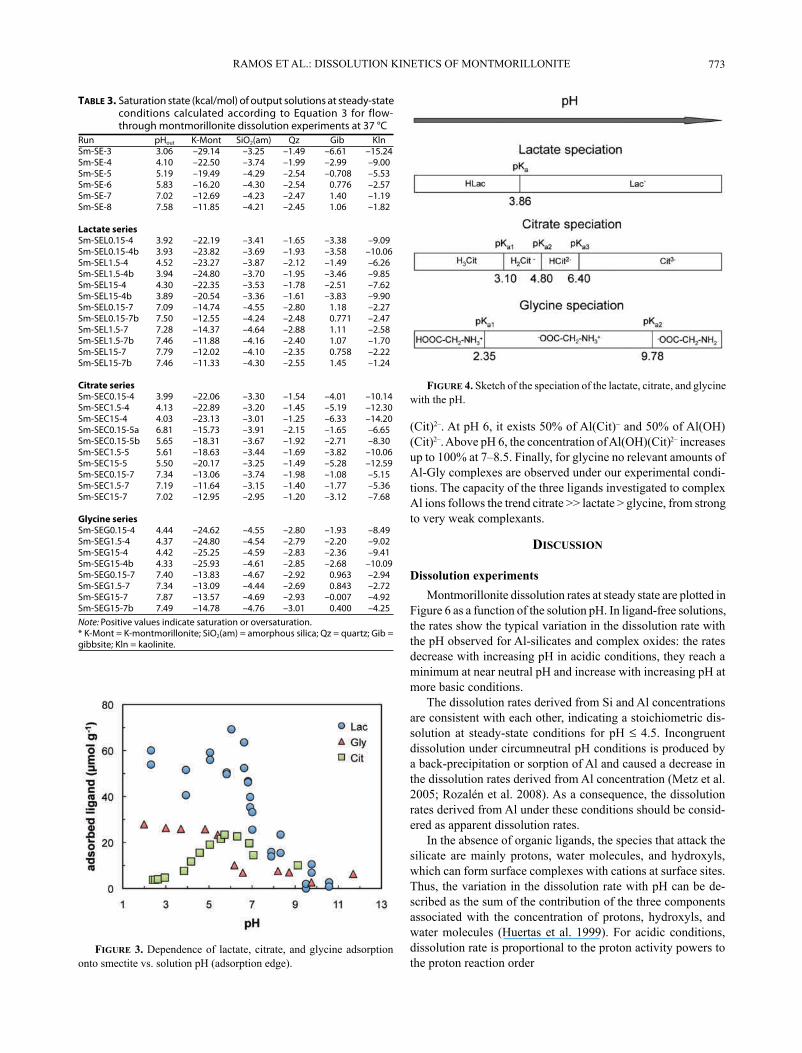
Adsorption experimentsAdsorption experiments were performed as a complement to
dissolution series to assess whether ligands were adsorbed onto the montmorillonite surface as a function of pH and interpret the dissolution mechanism. The pH dependence of the adsorption of lactate, citrate, and glycine onto montmorillonite (adsorption edges) is shown in Figure 3. The amount of ligand adsorbed is small, but all three of these produced different adsorption patterns. In the case of lactate adsorption, three pH intervals exist. Up to pH $6, the amount of adsorbed lactate is approximately constant, with a maximum adsorption of 60 "mol/g at pH 5.5–6. From pH 6 to 9, the adsorbed lactate is progressively lower. Finally, at pH > 9, lactate does not adsorb onto the montmorillonite surface. The glycine adsorption pattern is very similar to that found for lactate, with a maximum of 26 "mol/g, but the decrease in adsorption occurs at pH 5. Citrate adsorption is very close to zero at a low pH, increasing up to a maximum of 23 "mol/g at approximately pH 6 and decreasing over pH 6.
Saturation and aqueous speciationTo assess the contribution of Al speciation, the steadystate
composition of the output solutions of the dissolution experiments
TABLE 2. Stability constants of Al3+ with the organic ligandsReaction Constant ReferenceLactate HLac = Lac– + H+ pKa= 3.86 (1)Al3+ + Lac– = Al(Lac)2+ logK1= 2.36 (2)Al3+ + 2Lac– = Al(Lac)2
+ log"2 = 4.42 (2)Al3+ + 3Lac– = Al(Lac)3 log"3 = 5.79 (2)
Citrate H3Cit = H2Cit– + H+ pKa1= 3.10 (1)H2Cit– = HCit2– + H+ pKa2= 4.80 (1)HCit2– = Cit3– + H+ pKa3= 6.40 (1)Al3+ + Cit3– = Al(Cit) logK1= 7.98 (3)Al(Cit) + H+ = AlH(Cit)+ logK= 2.94 (3)Al(Cit) = AlH–1Cit + H+ logK= –3.31 (3)AlH–1Cit = Al(H–1Cit)(OH) + H+ logK= –6.23 (3)
Glycine HOOC-CH2-NH+ = –OOC-CH2-NH3
+ + H+ pKa1= 2.35 (4)–OOC-CH2-NH+ = –OOC-CH2-NH2 + H+ pKa2= 9.78 (4)Al3+ + 3(–OOC-CH2-NH2) = Al(OOC-CH2-NH2)3 log"3= 19.40 (5)Notes: (1) Filius et al. (1997), (2) Marklund et al. (1986), (3) Martell et al. (1990), (4) Martell and Smith (1974), (5) Yadava et al. (1984).
RAMOS ET AL.: DISSOLUTION KINETICS OF MONTMORILLONITE772
FIGURE 1. Evolution of the pH, Si and Al concentrations, and Al/Si atomic ratio in the output solutions of a selected group of dissolution !"#!$%&!'()*+,'-.+(!-*%'*/,01(2$,.32*+!44)5*6.(#.(*),4.(%,')*.)!-*(,*+74+.47(!*(2!*78!$73!*)(!7-9*)(7(!*7$!*-!',(!-*:9*,#!'*)9&:,4)5*;,$%<,'(74*line at Al/Si = 0.334 represents the stoichiometric ratio in the solid sample.
FIGURE 2. Variation in the Al/Si ratio with the pH in dissolution experiments. The line corresponds to stoichiometric ratio in the solid sample (Al/Si = 0.334 ± 0.027).
tions are undersaturated in gibbsite irrespective of the solution pH.The aqueous speciation of the lactate, citrate, and glycine was
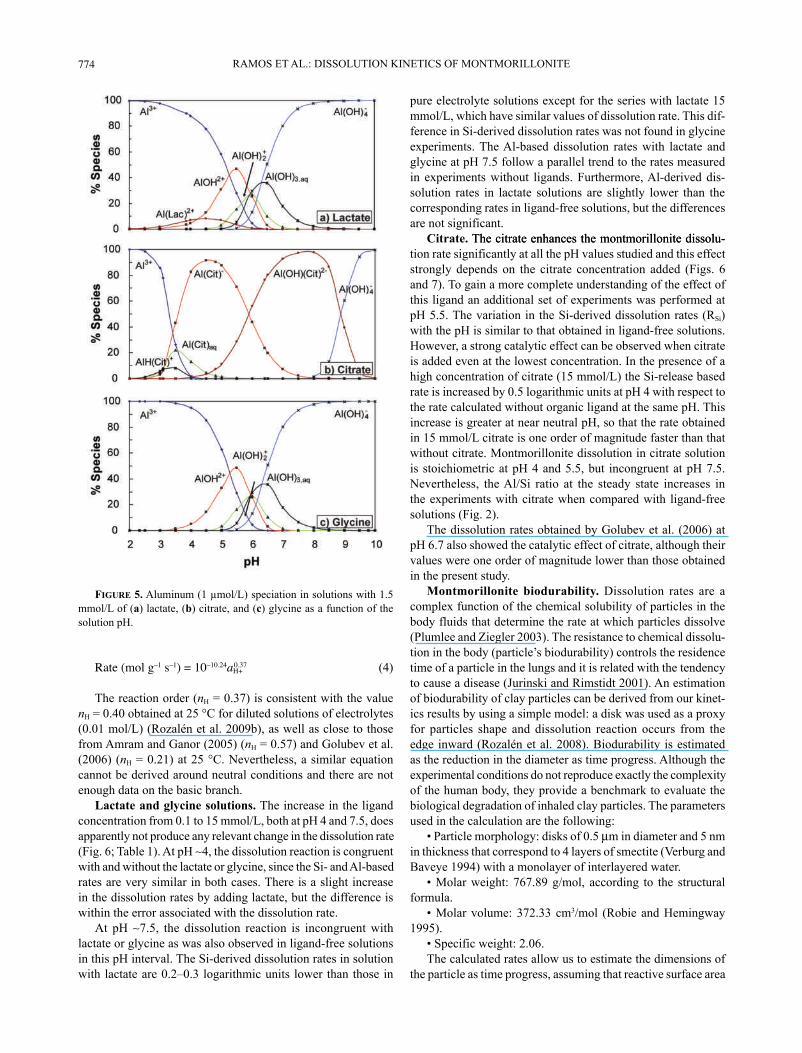
derived from their acidity constants (Table 2) by using EQ3NR. The results are shown in Figure 4. Siligand speciation was not taken into account as Si forms very weak organic complexes in solution (Pokrovski and Schott 1998). The capacity of lactate, citrate, and glycine to form soluble complexes with aqueous Al3+ was also investigated with EQ3NR, using the corresponding constants values listed in Table 2. The concentrations of aqueous Al (0.1 to 4.7 "mol/L) and ligands (0.15, 1.5, and 15 mmol/L) in the output solutions cover a wide range of conditions. The modeling with EQ3NR reveals no substantial differences in the distribution of Al species. Thus, to facilitate the comparison the speciation results in Figure 5 were modeled for a total Al concentration of 1 "mol/L.The Al speciation diagram was different for each ligand
(Fig. 5). In the case of lactate, only the complex Al(Lac)2+ is relevant in the range of pH between 4 and 5, representing only 10% of the total aqueous Al. For citrate, the speciation is more complex. In the pH range 3–4, three species coexist: around 10% of AlH(Cit)+, 20% of Al(Cit), and increasing values from 1 to 80% of Al(Cit)#. This last species reaches a maximum of 90% between pH 4 and 5, where it starts to coexist with Al(OH)
with no ligand, lactate, citrate, and glycine (Table 1) was modeled with EQ3NR. The saturation of the output solutions with respect to montmorillonite and secondary minerals is given in Table 3. All the solutions are undersaturated in montmorillonite, amorphous silica, quartz, and kaolinite. Ligandfree solutions are saturated in gibbsite at pH > 5.8. Solutions from the experiments at pH 7.5 with lactate or glycine are saturated in gibbsite. However, citrate solu
RAMOS ET AL.: DISSOLUTION KINETICS OF MONTMORILLONITE 773
(Cit)2–. At pH 6, it exists 50% of Al(Cit)# and 50% of Al(OH)(Cit)2–. Above pH 6, the concentration of Al(OH)(Cit)2– increases up to 100% at 7–8.5. Finally, for glycine no relevant amounts of AlGly complexes are observed under our experimental conditions. The capacity of the three ligands investigated to complex Al ions follows the trend citrate >> lactate > glycine, from strong to very weak complexants.
DISCUSSION
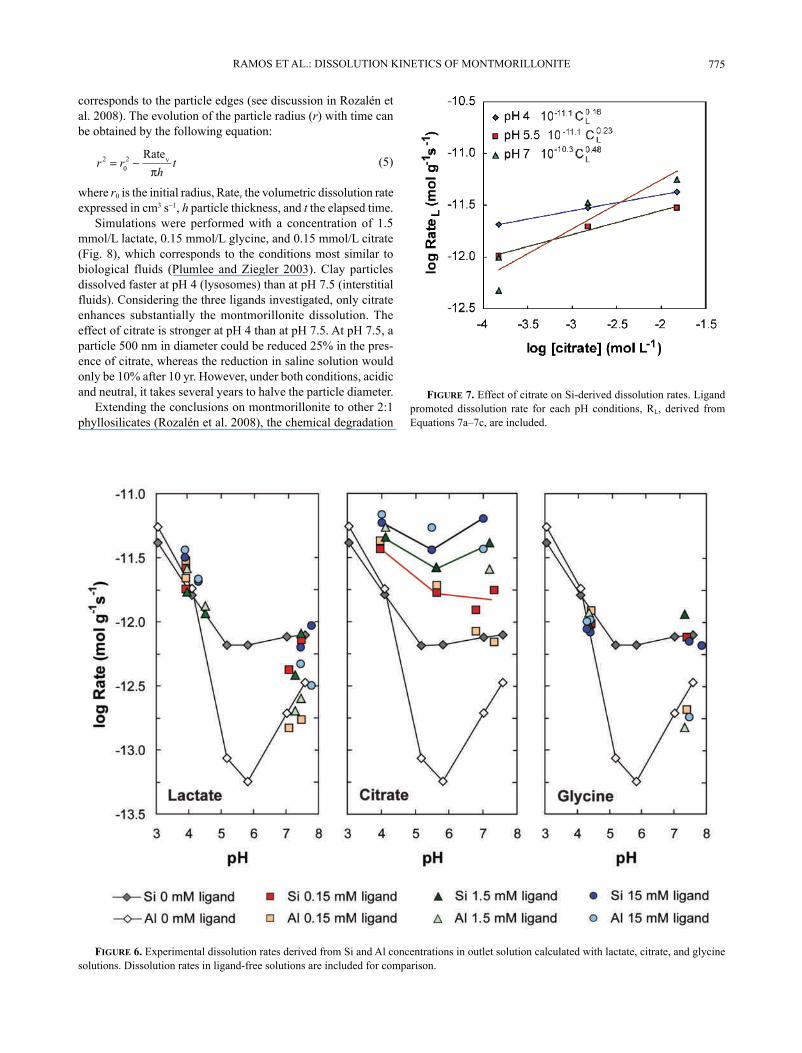
Dissolution experimentsMontmorillonite dissolution rates at steady state are plotted in
Figure 6 as a function of the solution pH. In ligandfree solutions, the rates show the typical variation in the dissolution rate with the pH observed for Alsilicates and complex oxides: the rates decrease with increasing pH in acidic conditions, they reach a minimum at near neutral pH and increase with increasing pH at more basic conditions.The dissolution rates derived from Si and Al concentrations
are consistent with each other, indicating a stoichiometric dissolution at steadystate conditions for pH ( 4.5. Incongruent dissolution under circumneutral pH conditions is produced by a backprecipitation or sorption of Al and caused a decrease in the dissolution rates derived from Al concentration (Metz et al. 2005; Rozalén et al. 2008). As a consequence, the dissolution rates derived from Al under these conditions should be considered as apparent dissolution rates.In the absence of organic ligands, the species that attack the
silicate are mainly protons, water molecules, and hydroxyls, which can form surface complexes with cations at surface sites. Thus, the variation in the dissolution rate with pH can be described as the sum of the contribution of the three components associated with the concentration of protons, hydroxyls, and water molecules (Huertas et al. 1999). For acidic conditions, dissolution rate is proportional to the proton activity powers to the proton reaction order
TABLE 3. Saturation state (kcal/mol) of output solutions at steady-state conditions calculated according to Equation 3 for flow-through montmorillonite dissolution experiments at 37 °C
Run pHout K-Mont SiO2(am) Qz Gib KlnSm-SE-3 3.06 –29.14 –3.25 –1.49 –6.61 –15.24Sm-SE-4 4.10 –22.50 –3.74 –1.99 –2.99 –9.00Sm-SE-5 5.19 –19.49 –4.29 –2.54 –0.708 –5.53Sm-SE-6 5.83 –16.20 –4.30 –2.54 0.776 –2.57Sm-SE-7 7.02 –12.69 –4.23 –2.47 1.40 –1.19Sm-SE-8 7.58 –11.85 –4.21 –2.45 1.06 –1.82
Lactate series Sm-SEL0.15-4 3.92 –22.19 –3.41 –1.65 –3.38 –9.09Sm-SEL0.15-4b 3.93 –23.82 –3.69 –1.93 –3.58 –10.06Sm-SEL1.5-4 4.52 –23.27 –3.87 –2.12 –1.49 –6.26Sm-SEL1.5-4b 3.94 –24.80 –3.70 –1.95 –3.46 –9.85Sm-SEL15-4 4.30 –22.35 –3.53 –1.78 –2.51 –7.62Sm-SEL15-4b 3.89 –20.54 –3.36 –1.61 –3.83 –9.90Sm-SEL0.15-7 7.09 –14.74 –4.55 –2.80 1.18 –2.27Sm-SEL0.15-7b 7.50 –12.55 –4.24 –2.48 0.771 –2.47Sm-SEL1.5-7 7.28 –14.37 –4.64 –2.88 1.11 –2.58Sm-SEL1.5-7b 7.46 –11.88 –4.16 –2.40 1.07 –1.70Sm-SEL15-7 7.79 –12.02 –4.10 –2.35 0.758 –2.22Sm-SEL15-7b 7.46 –11.33 –4.30 –2.55 1.45 –1.24
Citrate series Sm-SEC0.15-4 3.99 –22.06 –3.30 –1.54 –4.01 –10.14Sm-SEC1.5-4 4.13 –22.89 –3.20 –1.45 –5.19 –12.30Sm-SEC15-4 4.03 –23.13 –3.01 –1.25 –6.33 –14.20Sm-SEC0.15-5a 6.81 –15.73 –3.91 –2.15 –1.65 –6.65Sm-SEC0.15-5b 5.65 –18.31 –3.67 –1.92 –2.71 –8.30Sm-SEC1.5-5 5.61 –18.63 –3.44 –1.69 –3.82 –10.06Sm-SEC15-5 5.50 –20.17 –3.25 –1.49 –5.28 –12.59Sm-SEC0.15-7 7.34 –13.06 –3.74 –1.98 –1.08 –5.15Sm-SEC1.5-7 7.19 –11.64 –3.15 –1.40 –1.77 –5.36Sm-SEC15-7 7.02 –12.95 –2.95 –1.20 –3.12 –7.68
Glycine series Sm-SEG0.15-4 4.44 –24.62 –4.55 –2.80 –1.93 –8.49Sm-SEG1.5-4 4.37 –24.80 –4.54 –2.79 –2.20 –9.02Sm-SEG15-4 4.42 –25.25 –4.59 –2.83 –2.36 –9.41Sm-SEG15-4b 4.33 –25.93 –4.61 –2.85 –2.68 –10.09Sm-SEG0.15-7 7.40 –13.83 –4.67 –2.92 0.963 –2.94Sm-SEG1.5-7 7.34 –13.09 –4.44 –2.69 0.843 –2.72Sm-SEG15-7 7.87 –13.57 –4.69 –2.93 –0.007 –4.92Sm-SEG15-7b 7.49 –14.78 –4.76 –3.01 0.400 –4.25Note: Positive values indicate saturation or oversaturation.* K-Mont = K-montmorillonite; SiO2(am) = amorphous silica; Qz = quartz; Gib = gibbsite; Kln = kaolinite.
FIGURE 4. Sketch of the speciation of the lactate, citrate, and glycine with the pH.
FIGURE 3. Dependence of lactate, citrate, and glycine adsorption onto smectite vs. solution pH (adsorption edge).
RAMOS ET AL.: DISSOLUTION KINETICS OF MONTMORILLONITE774
Rate (mol g–1
s–1
) = 10–10.24aH+
0.37 (4)
The reaction order (nH = 0.37) is consistent with the value nH = 0.40 obtained at 25 !C for diluted solutions of electrolytes (0.01 mol/L) (Rozalén et al. 2009b), as well as close to those from Amram and Ganor (2005) (nH = 0.57) and Golubev et al. (2006) (nH = 0.21) at 25 !C. Nevertheless, a similar equation cannot be derived around neutral conditions and there are not enough data on the basic branch.Lactate and glycine solutions. The increase in the ligand
concentration from 0.1 to 15 mmol/L, both at pH 4 and 7.5, does apparently not produce any relevant change in the dissolution rate (Fig. 6; Table 1). At pH $4, the dissolution reaction is congruent with and without the lactate or glycine, since the Si and Albased rates are very similar in both cases. There is a slight increase in the dissolution rates by adding lactate, but the difference is within the error associated with the dissolution rate.At pH $7.5, the dissolution reaction is incongruent with
lactate or glycine as was also observed in ligandfree solutions in this pH interval. The Siderived dissolution rates in solution with lactate are 0.2–0.3 logarithmic units lower than those in
FIGURE 5. Aluminum (1 µmol/L) speciation in solutions with 1.5 mmol/L of (a) lactate, (b) citrate, and (c) glycine as a function of the solution pH.
pure electrolyte solutions except for the series with lactate 15 mmol/L, which have similar values of dissolution rate. This difference in Siderived dissolution rates was not found in glycine experiments. The Albased dissolution rates with lactate and glycine at pH 7.5 follow a parallel trend to the rates measured in experiments without ligands. Furthermore, Alderived dissolution rates in lactate solutions are slightly lower than the corresponding rates in ligandfree solutions, but the differences are not significant.Citrate. The citrate enhances the montmorillonite dissoluThe citrate enhances the montmorillonite dissolu
tion rate significantly at all the pH values studied and this effect strongly depends on the citrate concentration added (Figs. 6 and 7). To gain a more complete understanding of the effect of this ligand an additional set of experiments was performed at pH 5.5. The variation in the Siderived dissolution rates (RSi) with the pH is similar to that obtained in ligandfree solutions. However, a strong catalytic effect can be observed when citrate is added even at the lowest concentration. In the presence of a high concentration of citrate (15 mmol/L) the Sirelease based rate is increased by 0.5 logarithmic units at pH 4 with respect to the rate calculated without organic ligand at the same pH. This increase is greater at near neutral pH, so that the rate obtained in 15 mmol/L citrate is one order of magnitude faster than that without citrate. Montmorillonite dissolution in citrate solution is stoichiometric at pH 4 and 5.5, but incongruent at pH 7.5. Nevertheless, the Al/Si ratio at the steady state increases in the experiments with citrate when compared with ligandfree solutions (Fig. 2).The dissolution rates obtained by Golubev et al. (2006) at
pH 6.7 also showed the catalytic effect of citrate, although their values were one order of magnitude lower than those obtained in the present study.Montmorillonite biodurability. Dissolution rates are a
complex function of the chemical solubility of particles in the body fluids that determine the rate at which particles dissolve (Plumlee and Ziegler 2003). The resistance to chemical dissolution in the body (particle’s biodurability) controls the residence time of a particle in the lungs and it is related with the tendency to cause a disease (Jurinski and Rimstidt 2001). An estimation of biodurability of clay particles can be derived from our kinetics results by using a simple model: a disk was used as a proxy for particles shape and dissolution reaction occurs from the edge inward (Rozalén et al. 2008). Biodurability is estimated as the reduction in the diameter as time progress. Although the experimental conditions do not reproduce exactly the complexity of the human body, they provide a benchmark to evaluate the biological degradation of inhaled clay particles. The parameters used in the calculation are the following:=*>7$(%+4!*&,$#2,4,39?*-%)@)*,A*B5C*"m in diameter and 5 nm
in thickness that correspond to 4 layers of smectite (Verburg and Baveye 1994) with a monolayer of interlayered water.=*D,47$*0!%32(?* EFE5GH*3I&,4J* 7++,$-%'3* (,* (2!* )($.+(.$74*
formula.=*D,47$*8,4.&!?*KEL5KK*+&3/mol (Robie and Hemingway
1995).=*M#!+%A%+*0!%32(?*L5BF5The calculated rates allow us to estimate the dimensions of
the particle as time progress, assuming that reactive surface area
RAMOS ET AL.: DISSOLUTION KINETICS OF MONTMORILLONITE 775
FIGURE 6. Experimental dissolution rates derived from Si and Al concentrations in outlet solution calculated with lactate, citrate, and glycine solutions. Dissolution rates in ligandfree solutions are included for comparison.
FIGURE 7. Effect of citrate on Siderived dissolution rates. Ligand promoted dissolution rate for each pH conditions, RL, derived from Equations 7a–7c, are included.
corresponds to the particle edges (see discussion in Rozalén et al. 2008). The evolution of the particle radius (r) with time can be obtained by the following equation:
r rht2
0
2= !Rate
v
" (5)
where r0 is the initial radius, Ratev the volumetric dissolution rate expressed in cm3 s#1, h particle thickness, and t the elapsed time.Simulations were performed with a concentration of 1.5
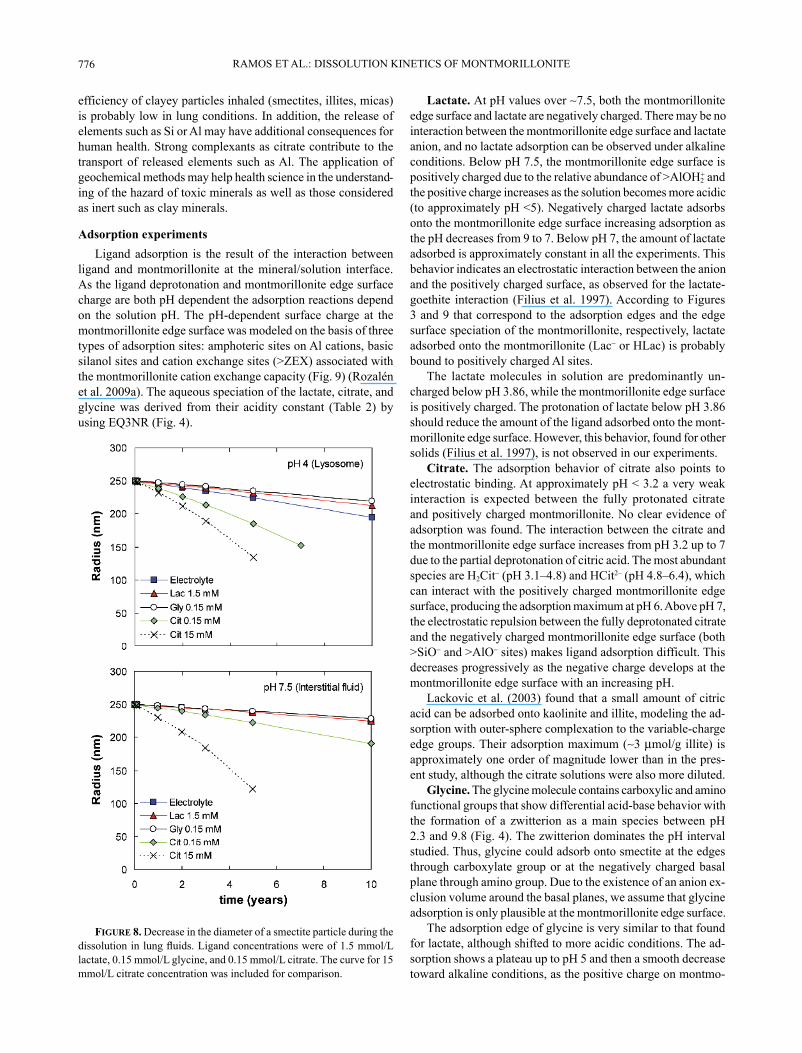
mmol/L lactate, 0.15 mmol/L glycine, and 0.15 mmol/L citrate (Fig. 8), which corresponds to the conditions most similar to biological fluids (Plumlee and Ziegler 2003). Clay particles dissolved faster at pH 4 (lysosomes) than at pH 7.5 (interstitial fluids). Considering the three ligands investigated, only citrate enhances substantially the montmorillonite dissolution. The effect of citrate is stronger at pH 4 than at pH 7.5. At pH 7.5, a particle 500 nm in diameter could be reduced 25% in the presence of citrate, whereas the reduction in saline solution would only be 10% after 10 yr. However, under both conditions, acidic and neutral, it takes several years to halve the particle diameter.Extending the conclusions on montmorillonite to other 2:1
phyllosilicates (Rozalén et al. 2008), the chemical degradation
RAMOS ET AL.: DISSOLUTION KINETICS OF MONTMORILLONITE776
efficiency of clayey particles inhaled (smectites, illites, micas) is probably low in lung conditions. In addition, the release of elements such as Si or Al may have additional consequences for human health. Strong complexants as citrate contribute to the transport of released elements such as Al. The application of geochemical methods may help health science in the understanding of the hazard of toxic minerals as well as those considered as inert such as clay minerals.
Adsorption experimentsLigand adsorption is the result of the interaction between
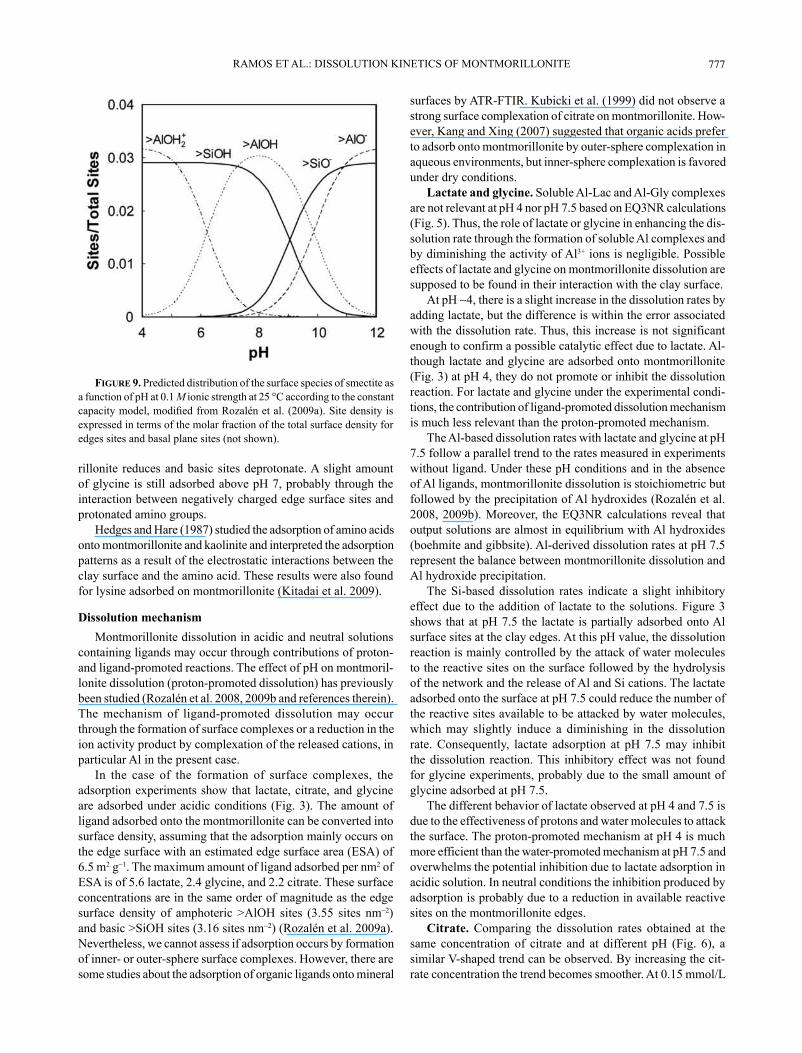
ligand and montmorillonite at the mineral/solution interface. As the ligand deprotonation and montmorillonite edge surface charge are both pH dependent the adsorption reactions depend on the solution pH. The pHdependent surface charge at the montmorillonite edge surface was modeled on the basis of three types of adsorption sites: amphoteric sites on Al cations, basic silanol sites and cation exchange sites (>ZEX) associated with the montmorillonite cation exchange capacity (Fig. 9) (Rozalén et al. 2009a). The aqueous speciation of the lactate, citrate, and glycine was derived from their acidity constant (Table 2) by using EQ3NR (Fig. 4).
Lactate. At pH values over $7.5, both the montmorillonite edge surface and lactate are negatively charged. There may be no interaction between the montmorillonite edge surface and lactate anion, and no lactate adsorption can be observed under alkaline conditions. Below pH 7.5, the montmorillonite edge surface is positively charged due to the relative abundance of >AlOH2+ and the positive charge increases as the solution becomes more acidic (to approximately pH <5). Negatively charged lactate adsorbs onto the montmorillonite edge surface increasing adsorption as the pH decreases from 9 to 7. Below pH 7, the amount of lactate adsorbed is approximately constant in all the experiments. This behavior indicates an electrostatic interaction between the anion and the positively charged surface, as observed for the lactategoethite interaction (Filius et al. 1997). According to Figures 3 and 9 that correspond to the adsorption edges and the edge surface speciation of the montmorillonite, respectively, lactate adsorbed onto the montmorillonite (Lac# or HLac) is probably bound to positively charged Al sites.The lactate molecules in solution are predominantly un
charged below pH 3.86, while the montmorillonite edge surface is positively charged. The protonation of lactate below pH 3.86 should reduce the amount of the ligand adsorbed onto the montmorillonite edge surface. However, this behavior, found for other solids (Filius et al. 1997), is not observed in our experiments.Citrate. The adsorption behavior of citrate also points to
electrostatic binding. At approximately pH < 3.2 a very weak interaction is expected between the fully protonated citrate and positively charged montmorillonite. No clear evidence of adsorption was found. The interaction between the citrate and the montmorillonite edge surface increases from pH 3.2 up to 7 due to the partial deprotonation of citric acid. The most abundant species are H2Cit# (pH 3.1–4.8) and HCit2– (pH 4.8–6.4), which can interact with the positively charged montmorillonite edge surface, producing the adsorption maximum at pH 6. Above pH 7, the electrostatic repulsion between the fully deprotonated citrate and the negatively charged montmorillonite edge surface (both >SiO# and >AlO# sites) makes ligand adsorption difficult. This decreases progressively as the negative charge develops at the montmorillonite edge surface with an increasing pH.Lackovic et al. (2003) found that a small amount of citric
acid can be adsorbed onto kaolinite and illite, modeling the adsorption with outersphere complexation to the variablecharge edge groups. Their adsorption maximum ($3 "mol/g illite) is approximately one order of magnitude lower than in the present study, although the citrate solutions were also more diluted.Glycine. The glycine molecule contains carboxylic and amino
functional groups that show differential acidbase behavior with the formation of a zwitterion as a main species between pH 2.3 and 9.8 (Fig. 4). The zwitterion dominates the pH interval studied. Thus, glycine could adsorb onto smectite at the edges through carboxylate group or at the negatively charged basal plane through amino group. Due to the existence of an anion exclusion volume around the basal planes, we assume that glycine adsorption is only plausible at the montmorillonite edge surface.The adsorption edge of glycine is very similar to that found
for lactate, although shifted to more acidic conditions. The adsorption shows a plateau up to pH 5 and then a smooth decrease toward alkaline conditions, as the positive charge on montmo
FIGURE 8. Decrease in the diameter of a smectite particle during the -%)),4.(%,'*%'*4.'3*/.%-)5*N%37'-*+,'+!'($7(%,')*0!$!*,A*O5C*&&,4IN*lactate, 0.15 mmol/L glycine, and 0.15 mmol/L citrate. The curve for 15 mmol/L citrate concentration was included for comparison.
RAMOS ET AL.: DISSOLUTION KINETICS OF MONTMORILLONITE 777
rillonite reduces and basic sites deprotonate. A slight amount of glycine is still adsorbed above pH 7, probably through the interaction between negatively charged edge surface sites and protonated amino groups.Hedges and Hare (1987) studied the adsorption of amino acids
onto montmorillonite and kaolinite and interpreted the adsorption patterns as a result of the electrostatic interactions between the clay surface and the amino acid. These results were also found for lysine adsorbed on montmorillonite (Kitadai et al. 2009).
Dissolution mechanismMontmorillonite dissolution in acidic and neutral solutions
containing ligands may occur through contributions of proton and ligandpromoted reactions. The effect of pH on montmorillonite dissolution (protonpromoted dissolution) has previously been studied (Rozalén et al. 2008, 2009b and references therein). The mechanism of ligandpromoted dissolution may occur through the formation of surface complexes or a reduction in the ion activity product by complexation of the released cations, in particular Al in the present case.In the case of the formation of surface complexes, the
adsorption experiments show that lactate, citrate, and glycine are adsorbed under acidic conditions (Fig. 3). The amount of ligand adsorbed onto the montmorillonite can be converted into surface density, assuming that the adsorption mainly occurs on the edge surface with an estimated edge surface area (ESA) of 6.5 m2 g#1. The maximum amount of ligand adsorbed per nm2 of ESA is of 5.6 lactate, 2.4 glycine, and 2.2 citrate. These surface concentrations are in the same order of magnitude as the edge surface density of amphoteric >AlOH sites (3.55 sites nm#2) and basic >SiOH sites (3.16 sites nm#2) (Rozalén et al. 2009a). Nevertheless, we cannot assess if adsorption occurs by formation of inner or outersphere surface complexes. However, there are some studies about the adsorption of organic ligands onto mineral
surfaces by ATRFTIR. Kubicki et al. (1999) did not observe a strong surface complexation of citrate on montmorillonite. However, Kang and Xing (2007) suggested that organic acids prefer to adsorb onto montmorillonite by outersphere complexation in aqueous environments, but innersphere complexation is favored under dry conditions.Lactate and glycine. Soluble AlLac and AlGly complexes
are not relevant at pH 4 nor pH 7.5 based on EQ3NR calculations (Fig. 5). Thus, the role of lactate or glycine in enhancing the dissolution rate through the formation of soluble Al complexes and by diminishing the activity of Al3+ ions is negligible. Possible effects of lactate and glycine on montmorillonite dissolution are supposed to be found in their interaction with the clay surface.At pH $4, there is a slight increase in the dissolution rates by
adding lactate, but the difference is within the error associated with the dissolution rate. Thus, this increase is not significant enough to confirm a possible catalytic effect due to lactate. Although lactate and glycine are adsorbed onto montmorillonite (Fig. 3) at pH 4, they do not promote or inhibit the dissolution reaction. For lactate and glycine under the experimental conditions, the contribution of ligandpromoted dissolution mechanism is much less relevant than the protonpromoted mechanism.The Albased dissolution rates with lactate and glycine at pH
7.5 follow a parallel trend to the rates measured in experiments without ligand. Under these pH conditions and in the absence of Al ligands, montmorillonite dissolution is stoichiometric but followed by the precipitation of Al hydroxides (Rozalén et al. 2008, 2009b). Moreover, the EQ3NR calculations reveal that output solutions are almost in equilibrium with Al hydroxides (boehmite and gibbsite). Alderived dissolution rates at pH 7.5 represent the balance between montmorillonite dissolution and Al hydroxide precipitation.The Sibased dissolution rates indicate a slight inhibitory
effect due to the addition of lactate to the solutions. Figure 3 shows that at pH 7.5 the lactate is partially adsorbed onto Al surface sites at the clay edges. At this pH value, the dissolution reaction is mainly controlled by the attack of water molecules to the reactive sites on the surface followed by the hydrolysis of the network and the release of Al and Si cations. The lactate adsorbed onto the surface at pH 7.5 could reduce the number of the reactive sites available to be attacked by water molecules, which may slightly induce a diminishing in the dissolution rate. Consequently, lactate adsorption at pH 7.5 may inhibit the dissolution reaction. This inhibitory effect was not found for glycine experiments, probably due to the small amount of glycine adsorbed at pH 7.5.The different behavior of lactate observed at pH 4 and 7.5 is
due to the effectiveness of protons and water molecules to attack the surface. The protonpromoted mechanism at pH 4 is much more efficient than the waterpromoted mechanism at pH 7.5 and overwhelms the potential inhibition due to lactate adsorption in acidic solution. In neutral conditions the inhibition produced by adsorption is probably due to a reduction in available reactive sites on the montmorillonite edges.Citrate. Comparing the dissolution rates obtained at the
same concentration of citrate and at different pH (Fig. 6), a similar Vshaped trend can be observed. By increasing the citrate concentration the trend becomes smoother. At 0.15 mmol/L
FIGURE 9. Predicted distribution of the surface species of smectite as a function of pH at 0.1 M ionic strength at 25 °C according to the constant +7#7+%(9*&,-!4J*&,-%P!-*A$,&*Q,<74R'*!(*745*SLBBH7T5*M%(!*-!')%(9*%)*expressed in terms of the molar fraction of the total surface density for edges sites and basal plane sites (not shown).
RAMOS ET AL.: DISSOLUTION KINETICS OF MONTMORILLONITE778
citrate, the trend of the dissolution rates is similar to that found for ligandfree experiments with the Sibased dissolution rate higher at pH 4 than that found at pH 7.5 due to the efficiency of the protonpromoted mechanism at acidic pH. As citrate concentration increases up to 1.5 mmol/L the rates at pH 4 approach those at pH 7.5. At 15 mmol/L the effect of the citrate on the dissolution is so high that similar Siderived dissolution rates were obtained for the three pH conditions, which indicates that under these conditions the ligandpromoted dissolution mechanism is much more important than the protonpromoted one. Thus, the effect of citrate is completely different from that of lactate or glycine, although citrate adsorption is more limited when compared with the other two ligands.For a ligand there exists a rough correlation between the
stability constants of aqueous and surface complexes (Kummert and Stumm 1980; Stumm et al. 1980; Sigg and Stumm 1981). Citrate forms stabler aqueous complexes with Al than lactate and glycine (Table 2). Therefore, we may suppose that citrate surface complexes are also stabler than those with lactate and glycine. Strong citrate adsorption would contribute in more extension to the detachment of Al to solution. This behavior enhances dissolution rates in citrate solutions.The overall rate of montmorillonite dissolution can be
expressed as the contribution of proton and ligandpromoted dissolution mechanisms (e.g., Golubev and Pokrovsky 2006; Golubev et al. 2006; Olsen and Rimstidt 2008)
RateTot = RateH + RateLigand = kH∙aH+
nH + kL∙a
nL
L . (6)
The first term in this equation corresponds with the protonpromoted dissolution following Equation 4 and the second term corresponds with the ligandpromoted dissolution. At each specific pH, the ligandpromoted dissolution can be estimated by subtracting the dissolution rate of ligandfree solutions from the overall dissolution rate, RTot – RH (Fig. 7), obtaining these empirical laws:
pH 4 RateL = 10–11.1CL
0.16 (7a)
pH 5.5 RateL = 10–11.1CL0.23 (7b)pH 7 RateL = 10–10.3CL0.48 (7c)
Ligandpromoted dissolution rates increase with increasing citrate concentration. This effect is steeper from pH 4 to 7.5, as reveals the increase in the reaction order nL with the solution pH, from 0.16 to 0.48. This indicates that the effect of citrate is stronger at pH 7.5 that in acidic conditions. The effect of citrate in enhancing dissolution reactions at various pH should be derived from the citrate surface adsorption and formation of aqueous Al complexes.The stoichiometry of the reaction changes with solution pH
and citrate concentration (Fig. 2). At pH 4 and 5.5, the dissolution is stoichiometric irrespective of citrate concentration, but at pH 7.5 the dissolution is incongruent even in 15 mmol/L citrate, although citrate can form stable complexes with aluminum in solution (Venturini and Berthon 1989).Strong chelating ligands such as citrate also inhibit the hy
drolytic reactions of aluminum in solution, thus retarding the crystallization of aluminum hydroxides (Jardine and Zelazny
1996). The effectiveness to hinder the hydrolysis and polymerization of aluminum increases with the affinity of organic ligands for aluminum and the concentrations of these ligands in solution. These effects may contribute to reduce saturation with respect to Albearing phases, including montmorillonite. EQ3NR results revealed that the aluminum in the output solutions should be completely complexed by citrate regardless of pH and citrate concentrations (Fig. 5). That is the case in the experiments with citrate at pH 4 and 5.5. Furthermore, citrate concentration should complex the total aluminum released if dissolution were stoichiometric. It is necessary to answer where the difference between stoichiometric and steadystate Al is, and why so strong a ligand as citrate cannot chelate the total Al released at pH 7 producing a stoichiometric dissolution process.The deficit in Al may be due to precipitation of gibbsite
particles (Nagy et al. 1999) or Alcitrate complexes (Cambier and Sposito 1991). Nagy et al. (1999) demonstrated that gibbsite can grow on phyllosilicate basal planes. Thus, the Al deficit can be converted into surficial gibbsite deposits. For example, the Al deficit in the experiment with 15 mmol/L citrate at pH 7.5 is 1.5 "mol. Assuming for gibbsite deposits a thickness of 4 layers (Nagy et al. 1999), a molar volume of 31.83 cm3 mol#1 (Robie and Hemingway 1995), and c* of 9.75 Å (Gaines et al. 1997), the surface covered by gibbsite is only of 0.01 m2. That value contrasts with the total montmorillonite surface area in the experiment, which can be approximated in the following way
m SAn
g m g m! ! = ! ! =total
10 1 750
1
418 752 2. / .
(8)
where m is the montmorillonite mass, SAtotal stands for the total surface area (Meunier 2003), and n corresponds to the average number of layers in smectite tactoids, which for Kmontmorillonite is 4 (Verburg and Baveye 1994).Alternative explanations consider Al adsorption at Al surface
hydroxyl groups located on the broken edges of the particle surfaces at higher pH values or at permanently charged surface sites by cation exchange up to pH 3 (Charlet et al. 1993). Nevertheless, no decrease in montmorillonite swelling capacity after solvation with ethyleneglycol was observed (Moore and Reynolds 1989). An estimation of the interlayer space occupied by Al hydroxides (0.04 m2) when compared with the total interlayer surface indicates that this effect should be difficult to detect by Xray diffraction.Our experimental results do not allow us to decide if one
mechanism is predominant over the others. All of these could contribute to Al uptake from solution in different proportions. However, how the released Al can escape from complexation with citrate is still unclear.One feasible hypothesis to justify the absence of AlCit
complexation is the presence of an exclusion volume due to the highnegative surface charge of the montmorillonite. The overall surface of montmorillonite is dominated by basal planes with a permanent negative charge that develops an anion exclusion volume of 0.39 cm3 g#1. The thickness of the anion exclusion volume (36 Å) can be obtained by dividing the anion exclusion volume by the external surface area, assuming that the BET surface area may be a proxy of the external surface area. Thus, a layer of solution can be found around clay particles, where
RAMOS ET AL.: DISSOLUTION KINETICS OF MONTMORILLONITE 779
the concentration of citrate is considerably lower than the bulk concentration. Although the results of EQ3NR calculations indicate that the bulk solutions are undersaturated in gibbsite and presumably in aluminum hydroxides due to the complexation with citrate, we may hypothesize that a fraction of the detached Al precipitates or resorbs before diffusing through the exclusion volume and gives rise to the nonstoichiometric reaction.
ACKNOWLEDGMENTSFinancial support was obtained from projects CGL200500618 and CGL2008
01652 (Ministerio de Educación y Ciencia, Spain), P07RNM02772, and Group RNM264 (Junta de Andalucía, Spain), with contribution of FEDER funds. M.E.R. benefited of a FPI grant (Ministerio de Educación y Ciencia), and C.C. of Erasmus (University of Naples Parthenope, Italy) and F.P.U. (Ministerio de Educación y Ciencia) grants. Carlos J. JovéColón helped us to include ligands in the LLNL database for EQ3NR and Ray Ferrell and two anonymous reviewers improved the manuscript with useful comments and suggestions. Paloma Sánchez and José Maceira provided technical assistance. F.J.H. a.m.d.g.
REFERENCES CITEDAmram, K. and Ganor, J. (2005) The combined effect of pH and temperature on
smectite dissolution rate under acidic conditions. Geochimica et Cosmochimica Acta, 69, 2535–2546.
Bauer, A. and Berger, G. (1998) Kaolinite and smectite dissolution rate in high molar KOH solutions at 35 and 80 !C. Applied Geochemistry, 13, 905–916.
Brunauer, S., Emmett, P.H., and Teller, E. (1938) Adsorption of gases in multimolecular layers. Journal of the American Chemical Society, 60, 309–319.
Cama, J., Ganor, J., Ayora, C., and Lasaga, A.C. (2000) Smectite dissolution at 80 !C and pH 8.8. Geochimica et Cosmochimica Acta, 64, 2701–2717.
Cambier, P. and Sposito, G. (1991) Interactions of citric acid and synthetic hydroxyaluminum montmorillonite. Clays and Clay Minerals, 39, 158–166.
CarrollWebb, S.A. and Walther, J.V. (1988) A surface complex reaction model for the pHdependence of corundum and kaolinite dissolution rates. Geochimica et Cosmochimica Acta, 52, 2609–2623.
Charlet, L., Schindler, P.W., Spadini, L., Furrer, G., and Zysset, M. (1993) Cation adsorption on oxides and clays: The aluminum case. Aquatic Sciences, 55, 291–303.
Chin, P.K.F. and Mills, G.L. (1991) Kinetics and mechanism of kaolinite dissolution: effects of organic ligands. Chemical Geology, 90, 307–317.
Filius, J.D., Hiemstra, T., and Van Riemsdijk, W.H. (1997) Adsorption of small weak organic acids on goethite: Modeling of mechanisms. Journal of Colloid and Interface Science, 195, 368–380.
Fubini, B. and Fenoglio, I. (2007) Toxic potential of mineral dusts. Elements, 3, 407–414.
Furrer, G. and Stumm, W. (1986) The coordination chemistry of weathering: I. Dissolution kinetics of Al2O3 and BeO. Geochimica et Cosmochimica Acta, 50, 1847–1860.
Gaines, R.V., Skinner, H.C.W., Foord, E.E., Mason, B., and Rosenzweig, A., Eds. (1997) Dana’s New Mineralogy, 8th edition, 1819 p. Wiley, New York.
Ganor, J. and Lasaga, A.C. (1994) The effects of oxalate acid on kaolinite dissolution rate. Mineral Magazine, 58A, 315.
Golubev, S.V. and Pokrovsky, O.S. (2006) Experimental study of the effect of organic ligands on diopside dissolution kinetics. Chemical Geology, 235, 377–389.
Golubev, S.V., Bauer, A., and Pokrovsky, O.S. (2006) Effect of pH and organic ligands on the kinetics of smectite dissolution at 25 !C. Geochimica et Cosmochimica Acta, 70, 4436–4451.
Grasshoff, K., Ehrhardt, M., and Kremling, K., Eds. (1983) Methods of seawater analysis, 2nd edition. Verlag Chemie.
Gunter, M.E. and Wood, S.A. (2000) Can chrysotile alter to tremolite in the human lung? AGU Spring Meeting 2000, M51A.
Hedges, J.I. and Hare, P.E. (1987) Amino acid adsorption by clay minerals in distilled water. Geochimica et Cosmochimica Acta, 51, 255–259.
Howard, A.G., Coxhead, A.J., Potter, I.A., and Watt, A.P. (1986) Determination of dissolved aluminium by the micelleenhanced fluorescence of its lumogallion complex. Analyst, 111, 1379–1381.
Huertas, F.J., Chou, L., and Wollast, R. (1999) Mechanism of kaolinite dissolution at room temperature and pressure. II. Kinetic study. Geochimica et Cosmochimica Acta, 63, 3261–3275.
Huertas, F.J., Caballero, E., Jiménez de Cisneros, C., Huertas, F., and Linares, J. (2001) Kinetics of montmorillonite dissolution in granitic solutions. Applied Geochemistry, 16, 397–407.
Hume, L.A. and Rimstidt, J.D. (1992) The biodurability of chrysotile asbestos. American Mineralogist, 77, 1125–1128.
Jardine, P.M. and Zelazny, L.W. (1996) Surface reactions of aqueous aluminum
species. In G. Sposito, Ed., The Environmental Chemistry of Aluminum, p. 221–270. Lewis Publishers, Chelsea, Michigan.
Jurinski, J.B. and Rimstidt, J.D. (2001) Biodurability of talc. American Mineralogist, 86, 392–399.
Kang, S. and Xing, B.S. (2007) Adsorption of dicarboxylic acids by clay minerals as examined by in situ ATRFTIR and ex situ DRIFT. Langmuir, 23, 7024–7031.
Kitadai, N., Yokoyama, T., and Nakashima, S. (2009) In situ ATRIR investigation of Llysine adsorption on montmorillonite. Journal of Colloid and Interface Science, 338, 395–401.
Kubicki, J.D., Schroeter, L.M., Itoh, M.J., Nguyen, B.N., and Apitz, S.E. (1999) Attenuated total reflectance Fouriertransform infrared spectroscopy of carboxylic acids adsorbed onto mineral surfaces. Geochimica et Cosmochimica Acta, 63, 2709–2725.
Kummert, R. and Stumm, W. (1980) The surface complexation of organic acid and hydrous )Al2O3. Journal of Colloid and Interface Science, 75, 373–385.
Lackovic, K., Johnson, B.B., Angove, M.J., and Wells, J.D. (2003) Modeling the adsorption of citric acid onto Muloorina illite and related clay minerals. Journal of Colloid and Interface Science, 267, 49–59.
Marklund, E., Sjoberg, S., and Ohman, L.O. (1986) Equilibrium and structural studies of silicon (IV) and aluminum (III) in aqueoussolution. 14. Speciation and equilibria in the aluminum (III)lactic acidOH system. Acta Chemica Scandinavica, A, 40, 367–373.
Martell, A.E. and Smith, R.M. (1974) Critical Stability Constants, Vol 1. Plenum Press, New York.
Martell, A.E., Motekaitis, R.J., and Smith, R.M. (1990) Aluminium complexes of hydroxyaliphatic and hydroxyaromatic ligands in aqueous systems—some problems and solutions. Polyhedron, 9, 171–187.
Metz, V., Amram, K., and Ganor, J. (2005) Stoichiometry of smectite dissolution. Geochimica et Cosmochimica Acta, 69, 1755–1772.
Meunier, A. (2003) Argiles, 434 p. GB Science Publisher, Paris.Moore, D.M. and Reynolds, R.C. (1989) Xray Diffraction and the Identification
and Analysis of Clay Minerals, pp. 340. Oxford University Press, New York.Nagy, K.L., Cygan, R.T., Hanchar, J.M., and Sturchio, N.C. (1999) Gibbsite
growth kinetics on gibbsite, kaolinite, and muscovite substrates: atomic force microscopy evidence for epitaxy and an assessment of reactive surface area. Geochimica et Cosmochimica Acta, 63, 2337–2351.
Newman, A.C.D. and Brown, G. (1987) The chemical constitution of clays. In A.C.D. Newman, Ed., Chemistry of Clays and Clay Minerals, Monograph No. 6, p. 1–128. Mineralogical Society. Wiley, New York.
Oelkers, E.H. and Schott, J. (1998) Does organic acid adsorption affect alkalifeldspar dissolution rates? Chemical Geology, 151, 235–245.
Olsen, A.A. and Rimstidt, J.D. (2008) Oxalatepromoted forsterite dissolution at low pH. Geochimica et Cosmochimica Acta, 72, 1758–1766.
Oze, C. and Solt, K. (2010) Biodurability of chrysotile and tremolite asbestos in simulated lung and gastric fluids. American Mineralogist, 95, 825–831.
Plumlee, G.S. and Ziegler, T.L. (2003) The medical geochemistry of dusts, soils, and other earth materials. In H.D. Holland and K.K. Turekian, Eds., Environmental Geochemistry, vol. 9, p. 263–310. Treatise on Geochemistry, Elsevier, Amsterdam.
Pokrovski, G.S. and Schott, J. (1998) Experimental study of the complexation of silicon and germanium with aqueous organic species: Implications for germanium and silicon transport and Ge/Si ratio in natural waters. Geochimica et Cosmochimica Acta, 62, 3413–3428.
Polubesova, T. and Borisover, M. (2009) Two components of chloride anion exclusion volume in montmorillonitic soils. Colloids and Surfaces A: Physicochemical and Engineering Aspects, 347, 175–179.
Robie, R.A. and Hemingway, B.S. (1995) Thermodynamic properties of minerals and related substances at 298.15 K and 1 Bar (105 Pascals) pressure and at higher temperatures. U.S. Geological Survey, 2131, 461 p.
Rozalén, M.L., Huertas, F.J., Brady, P.V., Cama, J., GarciaPalma, S., and Linares, J. (2008) Experimental study of the effect of pH on the kinetics of montmorillonite dissolution at 25 !C. Geochimica et Cosmochimica Acta, 72, 4224–4253.
Rozalén, M., Brady, P.V., and Huertas, F.J. (2009a) Surface chemistry of Kmontmorillonite: Ionic strength, temperature dependence and dissolution kinetics. Journal of Colloid and Interface Science, 333, 474–484.
Rozalén, M., Huertas, F.J., and Brady, P.V. (2009b) Experimental study of the effect of pH and temperature on the kinetics of montmorillonite dissolution. Geochimica et Cosmochimica Acta, 73, 3752–3766.
Scholze, H. and Conradt, R. (1987) An in vitro study of the chemical durability of siliceous fibres. The Annals of Occupational Hygiene, 31 (4B), 683–692.
Sigg, L. and Stumm, W. (1981) The interactions of anions and weak acids with the hydrous goethite surface. Colloides and Surfaces, 2, 101–117.
Stillings, L.L., Drever, J.I., and Poulson, S.R. (1998) Oxalate adsorption at a plagioclase [An(47)] surface and models for ligandpromoted dissolution. Environmental Science and Technology, 32, 2856–2864.
Stumm, W., Kummert, R., and Sigg, L. (1980) A ligand exchange model for the adsorption of inorganic and organic ligands at hydrous oxide interfaces. Croatica Chemica Acta, 53, 291–312.
RAMOS ET AL.: DISSOLUTION KINETICS OF MONTMORILLONITE780
Sun, S.W., Lin, Y.C., Weng, Y.M., and Chen, M.J. (2006) Efficiency improvements on ninhydrin method for amino acid quantification. Journal of Food Composition Analysis, 19, 112–117.
Venturini, M. and Berthon, G. (1989) Aluminum speciation studies in biological fluids. Part 2. Quantitative investigation of aluminumcitrate complexes and appraisal of their potential significance in vivo. Journal of Inorganic Biochemistry, 37, 69–90.
Verburg, K. and Baveye, P. (1994) Hysteresis in binary exchange of cations on 2:1 clay minerals: A critical review. Clays and Clay Minerals, 42, 207–220.
Werner, A.J., Hochella, M.F., Guthrie, G.C., Hardy, J.A., Aust, A.E., and Rimstidt, J.D. (1995) Asbestiform riebeckite (crocidolite) dissolution in the presence of Fe chelators; implications for mineralinduced disease. American Mineralogist, 80, 1093–1103.
World Health Organization (WHO) (2005) Bentonite, kaolin and selected minerals. Environmental Health Criteria 231, pp. 1–174.
Wieland, E. and Stumm, W. (1992) Dissolution kinetics of kaolinite in acidic aqueous solutions at 25 !C. Geochimica et Cosmochimica Acta, 56, 3339–3355.
Wolery, T.J. (1992) EQ3NR, a computer program for geochemical aqueous
speciationsolubility calculations: Theoretical manual, user’s guide, and related documentation (Ver. 7). UCRLMA110662 PT III. Lawrence Livermore National Laboratory, Livermore, California.
Yadava, H.L., Singh, S., Prasad, P., Singh, R.K.P., Yadava, P.C., and Yadava, K.L. (1984) Stability constants of glycinate complexes of nickel (II), lead (II), chromium (III), aluminium (III) and thorium (IV) by paper electrophoresis. Bulletin de la Société Chimique de France, 1, 314–316.
Zutic, V. and Stumm, W. (1984) Effect of organic acids and fluoride on the dissolution kinetics of hydrous alumina. Geochimica et Cosmochimica Acta, 48, 1493–1503.
Zysset, M. and Schindler, P.W. (1996) The proton promoted dissolution kinetics of Kmontmorillonite. Geochimica et Cosmochimica Acta, 60, 921–931.
MANUSCRIPT RECEIVED SEPTEMBER 15, 2010MANUSCRIPT ACCEPTED JANUARY 27, 2011MANUSCRIPT HANDLED BY BARRY BICKMORE


