Embed Size (px)
Citation preview
Effect of PCs superplasticizers on the rheological propertiesand hydration process of slag-blended cement pastes
M. Palacios Æ F. Puertas Æ P. Bowen ÆY. F. Houst
Received: 29 December 2008 / Accepted: 17 February 2009 / Published online: 13 March 2009
� Springer Science+Business Media, LLC 2009
Abstract The effect of polycarboxylate (PC) superplast-
icizers with different structure on the rheological properties
and hydration process of slag-blended cement pastes with a
slag content between 0 and 75% has been studied. Fluid-
izing properties of PCs admixtures are significantly higher
in slag-blended cement with respect to non-blended Port-
land cement. Also, it has been observed that the rise of the
fluidity induced by the PCs on the cement pastes increases
with the slag content. This effect is mainly attributed to a
decrease in the amount of C3A available to adsorb and
consume admixture to form an organo-mineral phase.
Consequently, the PC admixtures are absorbed onto the
silicate phases of the clinker and onto the slag particles,
inducing a repulsion and the concomitant reduction in yield
stress despite a reduction in the zeta potential. The rheo-
logical results allow us to conclude that the highest increase
of the fluidity is caused by the admixtures with highest
molecular weight due to the higher steric repulsion induced.
As a consequence of the adsorption of the PCs, a delay of
the hydration process of the pastes has been observed.
Introduction
The use of mineral additions, as a partial substitution of
Portland cement clinker, has become one of the chief ways
of obtaining more eco-efficient cements, whose manufac-
ture entails lower energy demands and lower emission of
greenhouse gas into the atmosphere than ordinary Portland
cement (OPC). Both natural additions such as volcanic ash
or limestone and industrial by-products such as fly ash or
blast furnace slag are appropriate for these purposes.
The advantages of slag-blended cements include not
only the energy savings and lower pollution compared to
clinker production, but also greater mechanical strength at
longer ages [1] and higher durability than non-blended
Portland cement due to their finer pore structure [2]. More
specifically, these cements are highly sulphate- [3] and
alkali-aggregate reaction- [4] resistant, while exhibiting a
lower chloride diffusion rate [2] than OPC. However, slag-
blended cements also show poor early strength and lower
resistance against carbonation than non-blended Portland
cements. Slag cements also have lower heat of hydration
values than OPC and the reaction processes involved in
their hydration are more complex [5, 6]. In these cements,
the Ca(OH)2 released as a result of C3S hydration activates
the slag hydration.
Superplasticizers are nowadays an essential component
of concrete. These admixtures reduce the amount of water
needed in the preparation of concrete, enhancing its
mechanical strength and durability. The use of the latest
generation polycarboxylate (PC)-based superplasticizers,
which induces the highest reduction of water content, has
become imperative in high performance and self-com-
pacting concretes. These PC admixtures are characterized
by a ‘‘comb’’ type structure [7] in which the backbone is a
linear hydrocarbonate chain and carboxylate and ether
groups form the lateral chains. In a process mediated by the
carboxylate groups, these admixtures are adsorbed onto the
cement particles, which are subsequently dispersed due to
the electrosteric repulsion generated [8, 9]. A number of
M. Palacios (&) � F. PuertasEduardo Torroja Institute for Construction Science (CSIC),
Box 19002, 28080 Madrid, Spain
e-mail: [email protected]
P. Bowen � Y. F. HoustLaboratoire de technologie des poudres, Ecole Polytechnique
Federale de Lausanne (EPFL), 1015 Lausanne, Switzerland
123
J Mater Sci (2009) 44:2714–2723
DOI 10.1007/s10853-009-3356-4
papers [10–12] have confirmed that the flowability induced
by PC admixtures depends directly on the structure of these
admixtures (length of the main and lateral chains, density
of lateral ether groups, molecular weight and molecular
weight distribution). As a general rule, the longer and more
numerous the ether ‘‘teeth’’, the greater and longer-lasting
is the flowability induced by the admixture. However, there
is an optimum density of the lateral chains that origins the
highest increase of the fluidity. In addition, the ratio
between the number of carboxylate groups (main chain
constituents) and the number of ether groups (lateral chain
constituents) is a fundamental parameter, increasing the
fluidity slightly when this ratio is low (0.057) [10].
Nonetheless, the dispersive effect of superplasticizers
and specifically of polycarboxyalate-based admixtures also
depends on cement properties. Many authors have con-
cluded that the fluidizing effect of PC admixtures depends
on factors such as C3A content, type and content of calcium
sulphate used as a setting regulator [13], clinker alkali
content [14], specific surface and particle size distribution
[15] and type of mineral addition. Nonetheless, very few
papers have been published on this latter factor, namely the
effect of additions on the fluidizing properties of PC-based
admixtures. According to some reports [10, 16], the effect
of the admixture on CEM II/A-V and CEM II/B-L cement
pastes is similar to the changes induced in addition-free
cement pastes. By contrast, the inclusion of only 0.1% of
PC-based admixtures in CEM III/B cement (with around
72% slag by cement weight) led to cement segregation [10,
16]. Consequently, slag cements obviously require lower
dosages of such admixtures than non-blended Portland
cement to attain similar increases in flowability. The causes
of this differential behaviour have yet to be established,
despite the need for such studies to avoid problems of
incompatibility.
The present paper aims to elucidate the lower superp-
lasticizer demand seen for slag-blended cements. This is
performed by investigating the zeta potential and the rhe-
ological properties of cements with varying percentages of
slag (0–75%). The effect of such admixtures on cement
hydration processes is also discussed.
Experimental
Materials
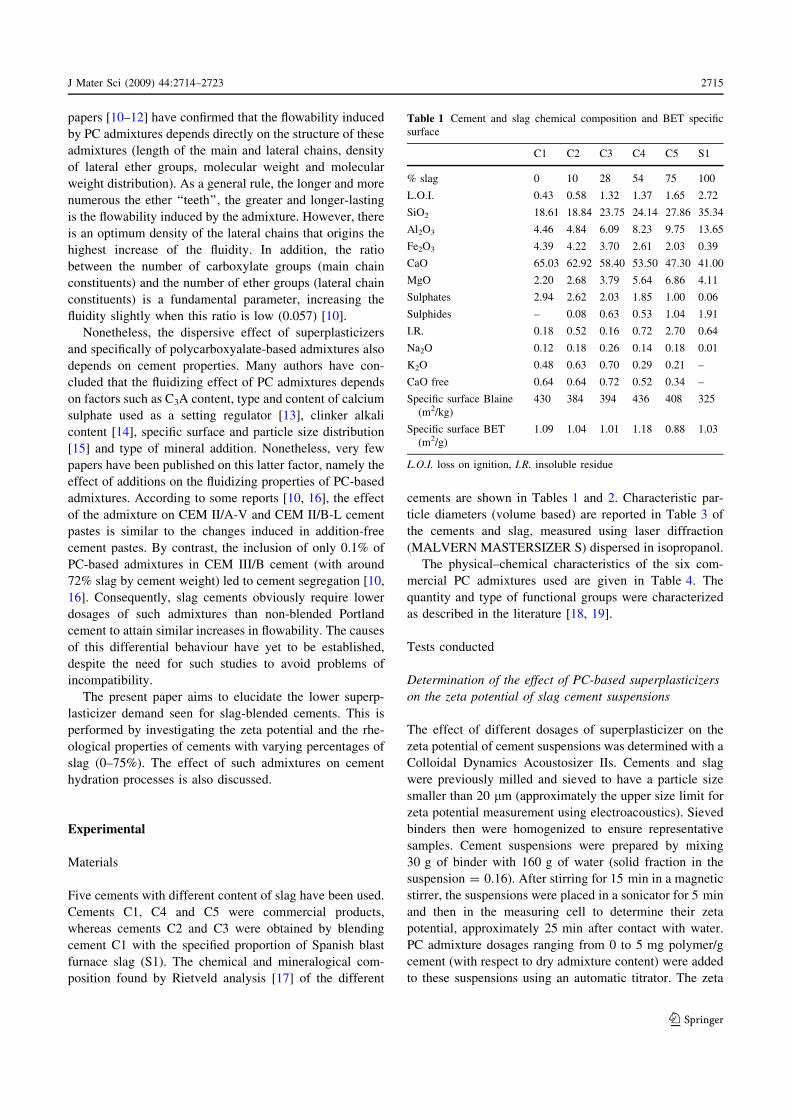
Five cements with different content of slag have been used.
Cements C1, C4 and C5 were commercial products,
whereas cements C2 and C3 were obtained by blending
cement C1 with the specified proportion of Spanish blast
furnace slag (S1). The chemical and mineralogical com-
position found by Rietveld analysis [17] of the different
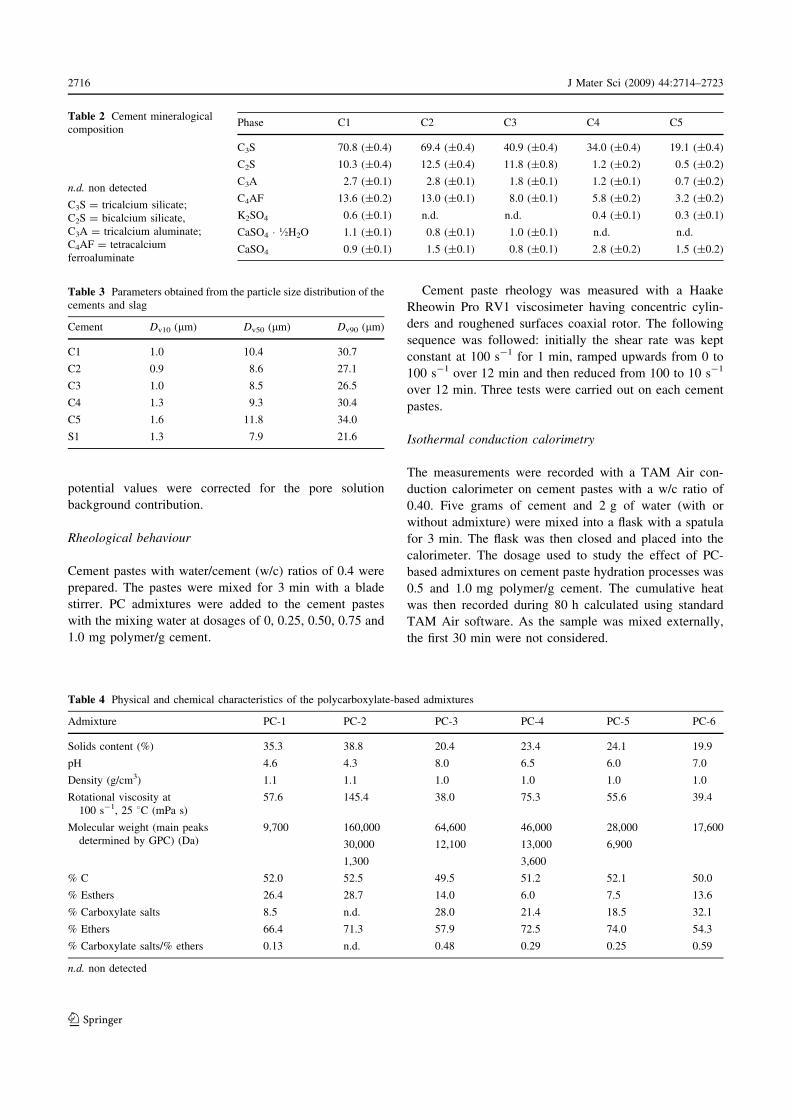
cements are shown in Tables 1 and 2. Characteristic par-
ticle diameters (volume based) are reported in Table 3 of
the cements and slag, measured using laser diffraction
(MALVERN MASTERSIZER S) dispersed in isopropanol.
The physical–chemical characteristics of the six com-
mercial PC admixtures used are given in Table 4. The
quantity and type of functional groups were characterized
as described in the literature [18, 19].
Tests conducted
Determination of the effect of PC-based superplasticizers
on the zeta potential of slag cement suspensions
The effect of different dosages of superplasticizer on the
zeta potential of cement suspensions was determined with a
Colloidal Dynamics Acoustosizer IIs. Cements and slag
were previously milled and sieved to have a particle size
smaller than 20 lm (approximately the upper size limit for
zeta potential measurement using electroacoustics). Sieved
binders then were homogenized to ensure representative
samples. Cement suspensions were prepared by mixing
30 g of binder with 160 g of water (solid fraction in the
suspension = 0.16). After stirring for 15 min in a magnetic
stirrer, the suspensions were placed in a sonicator for 5 min
and then in the measuring cell to determine their zeta
potential, approximately 25 min after contact with water.
PC admixture dosages ranging from 0 to 5 mg polymer/g
cement (with respect to dry admixture content) were added
to these suspensions using an automatic titrator. The zeta
Table 1 Cement and slag chemical composition and BET specific
surface
C1 C2 C3 C4 C5 S1
% slag 0 10 28 54 75 100
L.O.I. 0.43 0.58 1.32 1.37 1.65 2.72
SiO2 18.61 18.84 23.75 24.14 27.86 35.34
Al2O3 4.46 4.84 6.09 8.23 9.75 13.65
Fe2O3 4.39 4.22 3.70 2.61 2.03 0.39
CaO 65.03 62.92 58.40 53.50 47.30 41.00
MgO 2.20 2.68 3.79 5.64 6.86 4.11
Sulphates 2.94 2.62 2.03 1.85 1.00 0.06
Sulphides – 0.08 0.63 0.53 1.04 1.91
I.R. 0.18 0.52 0.16 0.72 2.70 0.64
Na2O 0.12 0.18 0.26 0.14 0.18 0.01
K2O 0.48 0.63 0.70 0.29 0.21 –
CaO free 0.64 0.64 0.72 0.52 0.34 –
Specific surface Blaine
(m2/kg)
430 384 394 436 408 325
Specific surface BET
(m2/g)
1.09 1.04 1.01 1.18 0.88 1.03
L.O.I. loss on ignition, I.R. insoluble residue
J Mater Sci (2009) 44:2714–2723 2715
123
potential values were corrected for the pore solution
background contribution.
Rheological behaviour
Cement pastes with water/cement (w/c) ratios of 0.4 were
prepared. The pastes were mixed for 3 min with a blade
stirrer. PC admixtures were added to the cement pastes
with the mixing water at dosages of 0, 0.25, 0.50, 0.75 and
1.0 mg polymer/g cement.
Cement paste rheology was measured with a Haake
Rheowin Pro RV1 viscosimeter having concentric cylin-
ders and roughened surfaces coaxial rotor. The following
sequence was followed: initially the shear rate was kept
constant at 100 s-1 for 1 min, ramped upwards from 0 to
100 s-1 over 12 min and then reduced from 100 to 10 s-1
over 12 min. Three tests were carried out on each cement
pastes.
Isothermal conduction calorimetry
The measurements were recorded with a TAM Air con-
duction calorimeter on cement pastes with a w/c ratio of
0.40. Five grams of cement and 2 g of water (with or
without admixture) were mixed into a flask with a spatula
for 3 min. The flask was then closed and placed into the
calorimeter. The dosage used to study the effect of PC-
based admixtures on cement paste hydration processes was
0.5 and 1.0 mg polymer/g cement. The cumulative heat
was then recorded during 80 h calculated using standard
TAM Air software. As the sample was mixed externally,
the first 30 min were not considered.
Table 2 Cement mineralogical
composition
n.d. non detected
C3S = tricalcium silicate;
C2S = bicalcium silicate,
C3A = tricalcium aluminate;
C4AF = tetracalcium
ferroaluminate
Phase C1 C2 C3 C4 C5
C3S 70.8 (±0.4) 69.4 (±0.4) 40.9 (±0.4) 34.0 (±0.4) 19.1 (±0.4)
C2S 10.3 (±0.4) 12.5 (±0.4) 11.8 (±0.8) 1.2 (±0.2) 0.5 (±0.2)
C3A 2.7 (±0.1) 2.8 (±0.1) 1.8 (±0.1) 1.2 (±0.1) 0.7 (±0.2)
C4AF 13.6 (±0.2) 13.0 (±0.1) 8.0 (±0.1) 5.8 (±0.2) 3.2 (±0.2)
K2SO4 0.6 (±0.1) n.d. n.d. 0.4 (±0.1) 0.3 (±0.1)
CaSO4 � �H2O 1.1 (±0.1) 0.8 (±0.1) 1.0 (±0.1) n.d. n.d.
CaSO4 0.9 (±0.1) 1.5 (±0.1) 0.8 (±0.1) 2.8 (±0.2) 1.5 (±0.2)
Table 3 Parameters obtained from the particle size distribution of the
cements and slag
Cement Dv10 (lm) Dv50 (lm) Dv90 (lm)
C1 1.0 10.4 30.7
C2 0.9 8.6 27.1
C3 1.0 8.5 26.5
C4 1.3 9.3 30.4
C5 1.6 11.8 34.0
S1 1.3 7.9 21.6
Table 4 Physical and chemical characteristics of the polycarboxylate-based admixtures
Admixture PC-1 PC-2 PC-3 PC-4 PC-5 PC-6
Solids content (%) 35.3 38.8 20.4 23.4 24.1 19.9
pH 4.6 4.3 8.0 6.5 6.0 7.0
Density (g/cm3) 1.1 1.1 1.0 1.0 1.0 1.0
Rotational viscosity at
100 s-1, 25 8C (mPa s)
57.6 145.4 38.0 75.3 55.6 39.4
Molecular weight (main peaks
determined by GPC) (Da)
9,700 160,000 64,600 46,000 28,000 17,600
30,000 12,100 13,000 6,900
1,300 3,600
% C 52.0 52.5 49.5 51.2 52.1 50.0
% Esthers 26.4 28.7 14.0 6.0 7.5 13.6
% Carboxylate salts 8.5 n.d. 28.0 21.4 18.5 32.1
% Ethers 66.4 71.3 57.9 72.5 74.0 54.3
% Carboxylate salts/% ethers 0.13 n.d. 0.48 0.29 0.25 0.59
n.d. non detected
2716 J Mater Sci (2009) 44:2714–2723
123
Results and discussion
Effect of polycarboxylate-based superplasticizers on
the zeta potential of slag cement suspensions
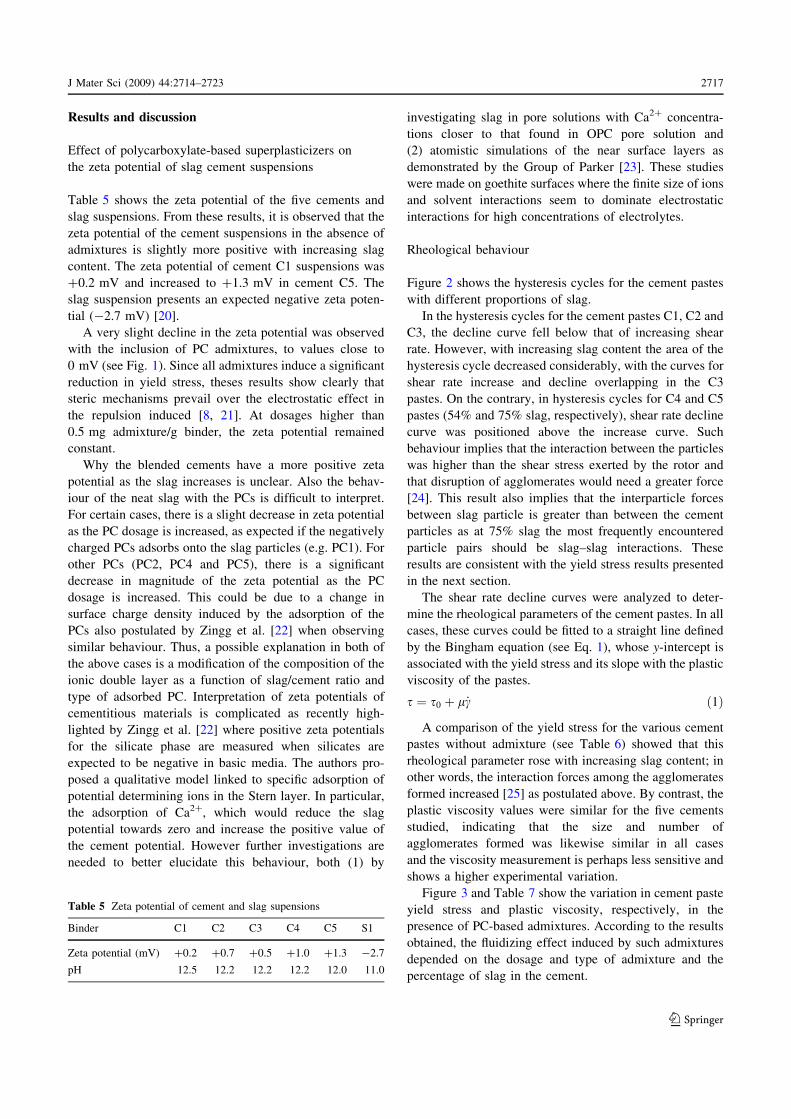
Table 5 shows the zeta potential of the five cements and
slag suspensions. From these results, it is observed that the
zeta potential of the cement suspensions in the absence of
admixtures is slightly more positive with increasing slag
content. The zeta potential of cement C1 suspensions was
?0.2 mV and increased to ?1.3 mV in cement C5. The
slag suspension presents an expected negative zeta poten-
tial (-2.7 mV) [20].
A very slight decline in the zeta potential was observed
with the inclusion of PC admixtures, to values close to
0 mV (see Fig. 1). Since all admixtures induce a significant
reduction in yield stress, theses results show clearly that
steric mechanisms prevail over the electrostatic effect in
the repulsion induced [8, 21]. At dosages higher than
0.5 mg admixture/g binder, the zeta potential remained
constant.
Why the blended cements have a more positive zeta
potential as the slag increases is unclear. Also the behav-
iour of the neat slag with the PCs is difficult to interpret.
For certain cases, there is a slight decrease in zeta potential
as the PC dosage is increased, as expected if the negatively
charged PCs adsorbs onto the slag particles (e.g. PC1). For
other PCs (PC2, PC4 and PC5), there is a significant
decrease in magnitude of the zeta potential as the PC
dosage is increased. This could be due to a change in
surface charge density induced by the adsorption of the
PCs also postulated by Zingg et al. [22] when observing
similar behaviour. Thus, a possible explanation in both of
the above cases is a modification of the composition of the
ionic double layer as a function of slag/cement ratio and
type of adsorbed PC. Interpretation of zeta potentials of
cementitious materials is complicated as recently high-
lighted by Zingg et al. [22] where positive zeta potentials
for the silicate phase are measured when silicates are
expected to be negative in basic media. The authors pro-
posed a qualitative model linked to specific adsorption of
potential determining ions in the Stern layer. In particular,
the adsorption of Ca2?, which would reduce the slag
potential towards zero and increase the positive value of
the cement potential. However further investigations are
needed to better elucidate this behaviour, both (1) by
investigating slag in pore solutions with Ca2? concentra-
tions closer to that found in OPC pore solution and
(2) atomistic simulations of the near surface layers as
demonstrated by the Group of Parker [23]. These studies
were made on goethite surfaces where the finite size of ions
and solvent interactions seem to dominate electrostatic
interactions for high concentrations of electrolytes.
Rheological behaviour
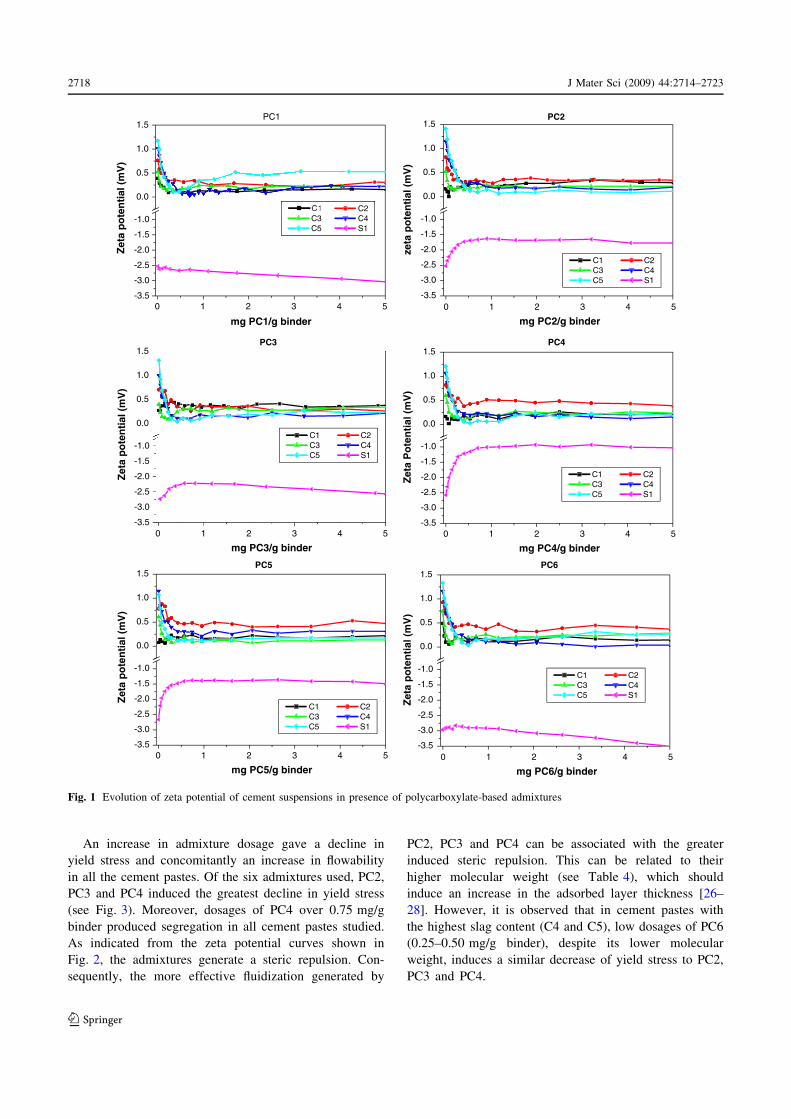
Figure 2 shows the hysteresis cycles for the cement pastes
with different proportions of slag.
In the hysteresis cycles for the cement pastes C1, C2 and
C3, the decline curve fell below that of increasing shear
rate. However, with increasing slag content the area of the
hysteresis cycle decreased considerably, with the curves for
shear rate increase and decline overlapping in the C3
pastes. On the contrary, in hysteresis cycles for C4 and C5
pastes (54% and 75% slag, respectively), shear rate decline
curve was positioned above the increase curve. Such
behaviour implies that the interaction between the particles
was higher than the shear stress exerted by the rotor and
that disruption of agglomerates would need a greater force
[24]. This result also implies that the interparticle forces
between slag particle is greater than between the cement
particles as at 75% slag the most frequently encountered
particle pairs should be slag–slag interactions. These
results are consistent with the yield stress results presented
in the next section.
The shear rate decline curves were analyzed to deter-
mine the rheological parameters of the cement pastes. In all
cases, these curves could be fitted to a straight line defined
by the Bingham equation (see Eq. 1), whose y-intercept is
associated with the yield stress and its slope with the plastic
viscosity of the pastes.
s ¼ s0 þ l _c ð1ÞA comparison of the yield stress for the various cement
pastes without admixture (see Table 6) showed that this
rheological parameter rose with increasing slag content; in
other words, the interaction forces among the agglomerates
formed increased [25] as postulated above. By contrast, the
plastic viscosity values were similar for the five cements
studied, indicating that the size and number of
agglomerates formed was likewise similar in all cases
and the viscosity measurement is perhaps less sensitive and
shows a higher experimental variation.
Figure 3 and Table 7 show the variation in cement paste
yield stress and plastic viscosity, respectively, in the
presence of PC-based admixtures. According to the results
obtained, the fluidizing effect induced by such admixtures
depended on the dosage and type of admixture and the
percentage of slag in the cement.
Table 5 Zeta potential of cement and slag supensions
Binder C1 C2 C3 C4 C5 S1
Zeta potential (mV) ?0.2 ?0.7 ?0.5 ?1.0 ?1.3 -2.7
pH 12.5 12.2 12.2 12.2 12.0 11.0
J Mater Sci (2009) 44:2714–2723 2717
123
An increase in admixture dosage gave a decline in
yield stress and concomitantly an increase in flowability
in all the cement pastes. Of the six admixtures used, PC2,
PC3 and PC4 induced the greatest decline in yield stress
(see Fig. 3). Moreover, dosages of PC4 over 0.75 mg/g
binder produced segregation in all cement pastes studied.
As indicated from the zeta potential curves shown in
Fig. 2, the admixtures generate a steric repulsion. Con-
sequently, the more effective fluidization generated by
PC2, PC3 and PC4 can be associated with the greater
induced steric repulsion. This can be related to their
higher molecular weight (see Table 4), which should
induce an increase in the adsorbed layer thickness [26–
28]. However, it is observed that in cement pastes with
the highest slag content (C4 and C5), low dosages of PC6
(0.25–0.50 mg/g binder), despite its lower molecular
weight, induces a similar decrease of yield stress to PC2,
PC3 and PC4.
-3.5
-3.0
-2.5
-2.0
-1.5
-1.0
0.0
0.5
1.0
1.5PC2
C1 C2 C3 C4 C5 S1
zeta
po
ten
tial
(m
V)
mg PC2/g binder
0 1 2 3 4 5-3.5
-3.0
-2.5
-2.0
-1.5
-1.0
0.0
0.5
1.0
1.5PC1
Zet
a p
ote
nti
al (
mV
)
mg PC1/g binder
C2 C3 C4 C5 S1
-3.5
-3.0
-2.5
-2.0
-1.5
-1.0
0.0
0.5
1.0
1.5PC3
C1 C2 C3 C4 C5 S1
Zet
a p
ote
nti
al (
mV
)
-3.5
-3.0
-2.5
-2.0
-1.5
-1.0
0.0
0.5
1.0
1.5PC4
C1 C2 C3 C4 C5 S1
Zet
a P
ote
nti
al (
mV
)
-3.5
-3.0
-2.5
-2.0
-1.5
-1.0
0.0
0.5
1.0
1.5PC5
C1 C2 C3 C4 C5 S1
Zet
a p
ote
nti
al (
mV
)
-3.5
-3.0
-2.5
-2.0
-1.5
-1.0
0.0
0.5
1.0
1.5PC6
C1 C2 C3 C4 C5 S1
Zet
a p
ote
nti
al (
mV
)
0 1 2 3 4 5
mg PC3/g binder0 1 2 3 4 5
mg PC4/g binder0 1 2 3 4 5
mg PC6/g binder0 1 2 3 4 5
mg PC5/g binder0 1 2 3 4 5
Fig. 1 Evolution of zeta potential of cement suspensions in presence of polycarboxylate-based admixtures
2718 J Mater Sci (2009) 44:2714–2723
123
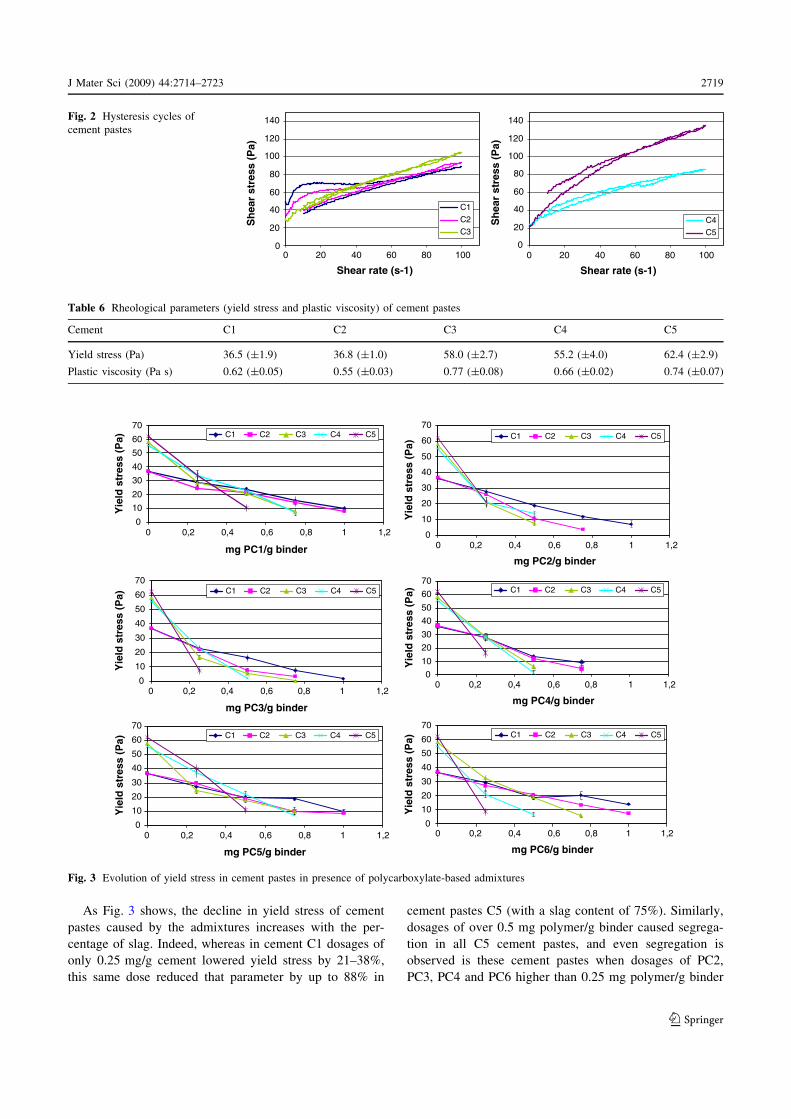
As Fig. 3 shows, the decline in yield stress of cement
pastes caused by the admixtures increases with the per-
centage of slag. Indeed, whereas in cement C1 dosages of
only 0.25 mg/g cement lowered yield stress by 21–38%,
this same dose reduced that parameter by up to 88% in
cement pastes C5 (with a slag content of 75%). Similarly,
dosages of over 0.5 mg polymer/g binder caused segrega-
tion in all C5 cement pastes, and even segregation is
observed is these cement pastes when dosages of PC2,
PC3, PC4 and PC6 higher than 0.25 mg polymer/g binder
0
20
40
60
80
100
120
140
0 20 40 60 80 100
Shear rate (s-1)
0 20 40 60 80 100
Shear rate (s-1)
Sh
ear
stre
ss (
Pa)
C1
C2
C3
0
20
40
60
80
100
120
140
Sh
ear
stre
ss (
Pa)
C4
C5
Fig. 2 Hysteresis cycles of
cement pastes
Table 6 Rheological parameters (yield stress and plastic viscosity) of cement pastes
Cement C1 C2 C3 C4 C5
Yield stress (Pa) 36.5 (±1.9) 36.8 (±1.0) 58.0 (±2.7) 55.2 (±4.0) 62.4 (±2.9)
Plastic viscosity (Pa s) 0.62 (±0.05) 0.55 (±0.03) 0.77 (±0.08) 0.66 (±0.02) 0.74 (±0.07)
0
10
20
30
40
50
60
70
0 0,2 0,4 0,6 0,8 1 1,20 0,2 0,4 0,6 0,8 1 1,2
0 0,2 0,4 0,6 0,8 1 1,2
0 0,2 0,4 0,6 0,8 1 1,2
mg PC1/g binder
Yie
ld s
tres
s (P
a)
0
10
20
30
40
50
60
70
mg PC4/g binder
Yie
ld s
tres
s (P
a)
0
10
20
30
40
50
60
70
mg PC3/g binder
mg PC5/g binder
Yie
ld s
tres
s (P
a)
0
10
20
30
40
50
60
70
mg PC6/g binder
Yie
ld s
tres
s (P
a)
0
10
20
30
40
50
60
70
mg PC2/g binder
Yie
ld s
tres
s (P
a)
0
10
20
30
40
50
60
70
Yie
ld s
tres
s (P
a)
0 0,2 0,4 0,6 0,8 1 1,2
0 0,2 0,4 0,6 0,8 1 1,2
C1 C2 C3 C4 C5
C1 C2 C3 C4 C5
C1 C2 C3 C4 C5
C1 C2 C3 C4 C5
C1 C2 C3 C4 C5
C1 C2 C3 C4 C5
Fig. 3 Evolution of yield stress in cement pastes in presence of polycarboxylate-based admixtures
J Mater Sci (2009) 44:2714–2723 2719
123
are used. Alonso et al. and Puertas et al. [10, 16] reported in
an earlier paper that PC admixtures had a greater dispersive
effect on slag cement than on slag-free Portland cement
pastes.
The main reason for the differential lowering of cement
paste yield stress by the superplastizers can therefore be
linked to the variation in the mineralogical composition of
the cements themselves. In the slag-free cement pastes
(cement C1), the C3A content able to adsorb admixture
[29] and also able to consume it to form an organic-mineral
phase is higher [12, 30]. Consequently, if a high proportion
of PCs is adsorbed and consumed by C3A, there could be
less admixture available in aqueous phase for dispersing
the cement grains by adsorption onto their surface [12, 21].
Since slag contains no C3A, however, with increasing
percentages of the addition and declining cement content,
the amount of the C3A able to interact with the admixture
during these early stages of hydration likewise decreases.
As a consequence, the superplasticizer can be adsorbed
directly by the C3S and C2S phases in the cement, leading
to the dispersive effect observed. The admixture can also
be adsorbed by the slag particles. Prior studies carried out
[20, 31] on slag and alkali-activated slag (AAS) cements
confirm that different types of superplasticizers (naphtha-
lene, melamine and vinyl copolymer based admixtures) can
be adsorbed by the slag particles in high alkaline media
(pH range from 11.7 to 13.6). In particular for naphthalene
superplasticizer, even though the amount of admixture
adsorbed in AAS pastes was three times lower than in
ordinary Portland cement, the decline in yield stress
induced was significantly higher for the slag [20]. Such
behaviour, again linked to the lack of C3A, is consistent
with the findings of the present study, where at small
dosages of admixture flowability was observed to rise with
the slag content. The adsorption isotherms of the PC
admixtures on slag-blended cements will be determined in
future studies to confirm this behaviour.
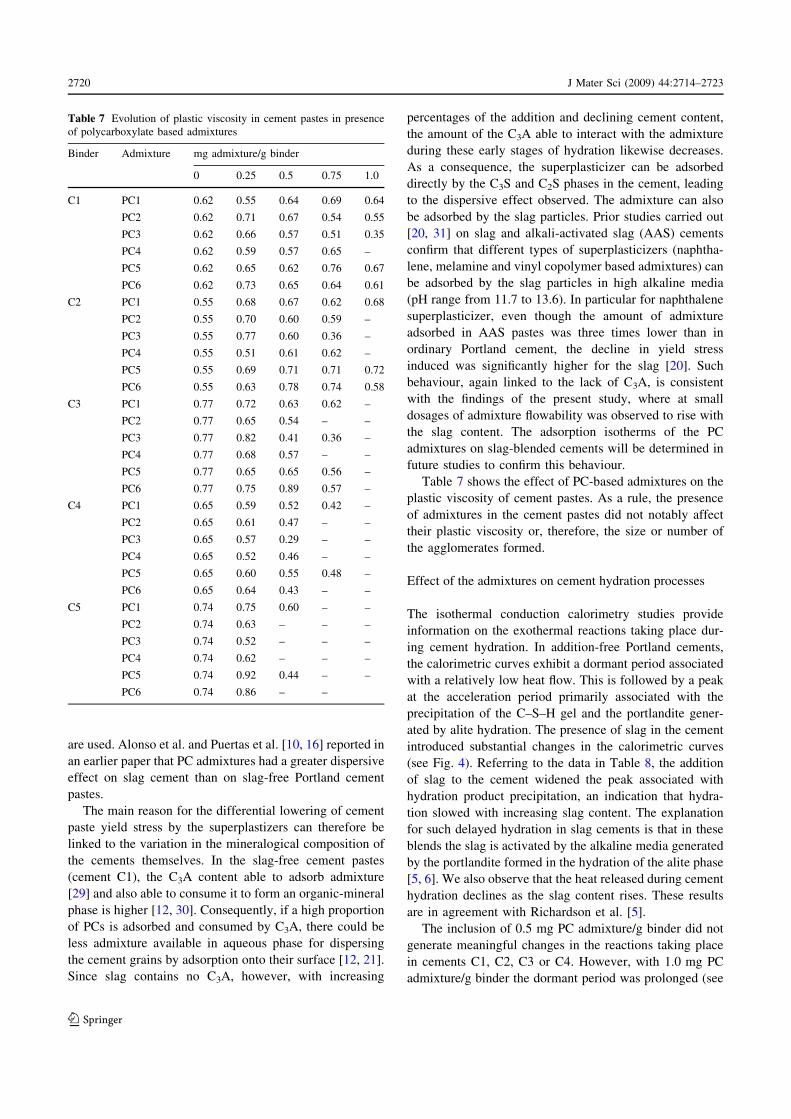
Table 7 shows the effect of PC-based admixtures on the
plastic viscosity of cement pastes. As a rule, the presence
of admixtures in the cement pastes did not notably affect
their plastic viscosity or, therefore, the size or number of
the agglomerates formed.
Effect of the admixtures on cement hydration processes
The isothermal conduction calorimetry studies provide
information on the exothermal reactions taking place dur-
ing cement hydration. In addition-free Portland cements,
the calorimetric curves exhibit a dormant period associated
with a relatively low heat flow. This is followed by a peak
at the acceleration period primarily associated with the
precipitation of the C–S–H gel and the portlandite gener-
ated by alite hydration. The presence of slag in the cement
introduced substantial changes in the calorimetric curves
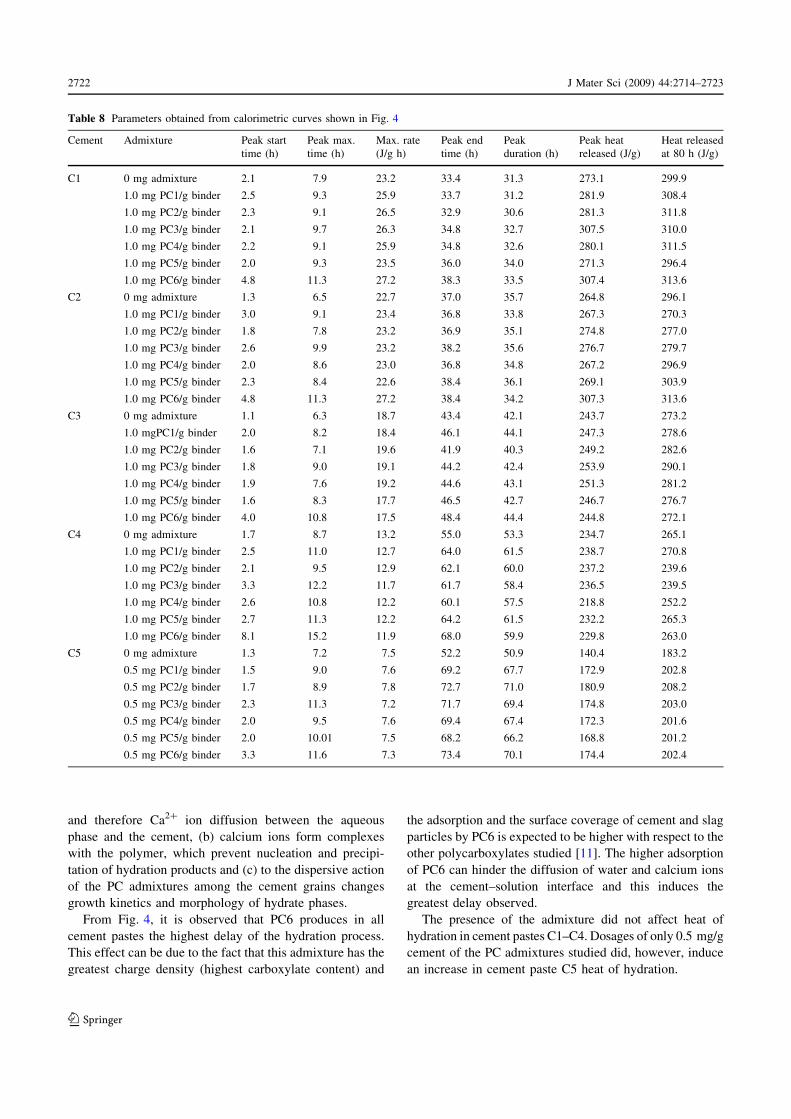
(see Fig. 4). Referring to the data in Table 8, the addition
of slag to the cement widened the peak associated with
hydration product precipitation, an indication that hydra-
tion slowed with increasing slag content. The explanation
for such delayed hydration in slag cements is that in these
blends the slag is activated by the alkaline media generated
by the portlandite formed in the hydration of the alite phase
[5, 6]. We also observe that the heat released during cement
hydration declines as the slag content rises. These results
are in agreement with Richardson et al. [5].
The inclusion of 0.5 mg PC admixture/g binder did not
generate meaningful changes in the reactions taking place
in cements C1, C2, C3 or C4. However, with 1.0 mg PC
admixture/g binder the dormant period was prolonged (see
Table 7 Evolution of plastic viscosity in cement pastes in presence
of polycarboxylate based admixtures
Binder Admixture mg admixture/g binder
0 0.25 0.5 0.75 1.0
C1 PC1 0.62 0.55 0.64 0.69 0.64
PC2 0.62 0.71 0.67 0.54 0.55
PC3 0.62 0.66 0.57 0.51 0.35
PC4 0.62 0.59 0.57 0.65 –
PC5 0.62 0.65 0.62 0.76 0.67
PC6 0.62 0.73 0.65 0.64 0.61
C2 PC1 0.55 0.68 0.67 0.62 0.68
PC2 0.55 0.70 0.60 0.59 –
PC3 0.55 0.77 0.60 0.36 –
PC4 0.55 0.51 0.61 0.62 –
PC5 0.55 0.69 0.71 0.71 0.72
PC6 0.55 0.63 0.78 0.74 0.58
C3 PC1 0.77 0.72 0.63 0.62 –
PC2 0.77 0.65 0.54 – –
PC3 0.77 0.82 0.41 0.36 –
PC4 0.77 0.68 0.57 – –
PC5 0.77 0.65 0.65 0.56 –
PC6 0.77 0.75 0.89 0.57 –
C4 PC1 0.65 0.59 0.52 0.42 –
PC2 0.65 0.61 0.47 – –
PC3 0.65 0.57 0.29 – –
PC4 0.65 0.52 0.46 – –
PC5 0.65 0.60 0.55 0.48 –
PC6 0.65 0.64 0.43 – –
C5 PC1 0.74 0.75 0.60 – –
PC2 0.74 0.63 – – –
PC3 0.74 0.52 – – –
PC4 0.74 0.62 – – –
PC5 0.74 0.92 0.44 – –
PC6 0.74 0.86 – –
2720 J Mater Sci (2009) 44:2714–2723
123
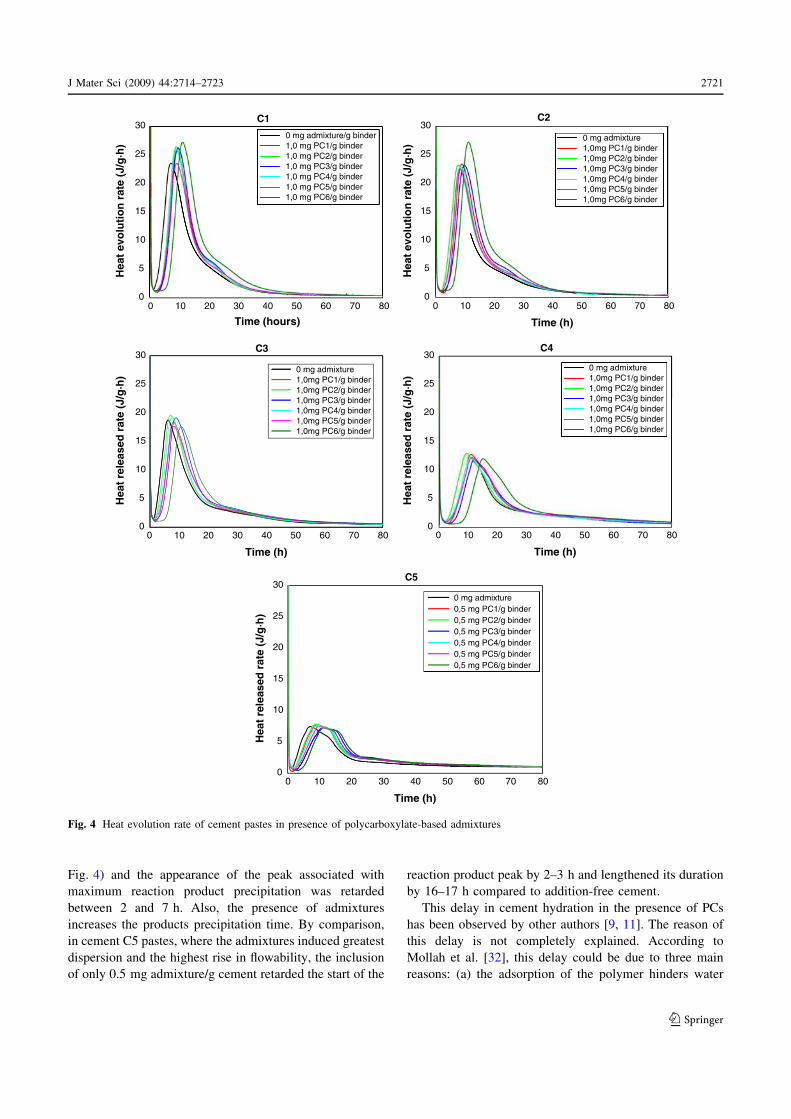
Fig. 4) and the appearance of the peak associated with
maximum reaction product precipitation was retarded
between 2 and 7 h. Also, the presence of admixtures
increases the products precipitation time. By comparison,
in cement C5 pastes, where the admixtures induced greatest
dispersion and the highest rise in flowability, the inclusion
of only 0.5 mg admixture/g cement retarded the start of the
reaction product peak by 2–3 h and lengthened its duration
by 16–17 h compared to addition-free cement.
This delay in cement hydration in the presence of PCs
has been observed by other authors [9, 11]. The reason of
this delay is not completely explained. According to
Mollah et al. [32], this delay could be due to three main
reasons: (a) the adsorption of the polymer hinders water
0 10 20 30 40 50 60 70 80 0 10 20 30 40 50 60 70 800
5
10
15
20
25
30H
eat
evo
luti
on
rat
e (J
/g·h
)
Time (hours)
0 mg admixture/g binder 1,0 mg PC1/g binder 1,0 mg PC2/g binder 1,0 mg PC3/g binder 1,0 mg PC4/g binder 1,0 mg PC5/g binder 1,0 mg PC6/g binder
C1
0
5
10
15
20
25
30
Hea
t ev
olu
tio
n r
ate
(J/g
·h)
Time (h)
0 mg admixture 1,0mg PC1/g binder 1,0mg PC2/g binder 1,0mg PC3/g binder 1,0mg PC4/g binder 1,0mg PC5/g binder 1,0mg PC6/g binder
C2
0
5
10
15
20
25
30
0 mg admixture 1,0mg PC1/g binder 1,0mg PC2/g binder 1,0mg PC3/g binder 1,0mg PC4/g binder 1,0mg PC5/g binder 1,0mg PC6/g binder
Hea
t re
leas
ed r
ate
(J/g
·h)
C3
0
5
10
15
20
25
30 0 mg admixture 1,0mg PC1/g binder 1,0mg PC2/g binder 1,0mg PC3/g binder 1,0mg PC4/g binder 1,0mg PC5/g binder 1,0mg PC6/g binder
Hea
t re
leas
ed r
ate
(J/g
·h)
C4
0
5
10
15
20
25
30 0 mg admixture 0,5 mg PC1/g binder 0,5 mg PC2/g binder 0,5 mg PC3/g binder 0,5 mg PC4/g binder 0,5 mg PC5/g binder 0,5 mg PC6/g binder
Hea
t re
leas
ed r
ate
(J/g
·h)
C5
0 10 20 30 40 50 60 70 80
Time (h)
0 10 20 30 40 50 60 70 80
Time (h)
0 10 20 30 40 50 60 70 80
Time (h)
Fig. 4 Heat evolution rate of cement pastes in presence of polycarboxylate-based admixtures
J Mater Sci (2009) 44:2714–2723 2721
123
and therefore Ca2? ion diffusion between the aqueous
phase and the cement, (b) calcium ions form complexes
with the polymer, which prevent nucleation and precipi-
tation of hydration products and (c) to the dispersive action
of the PC admixtures among the cement grains changes
growth kinetics and morphology of hydrate phases.
From Fig. 4, it is observed that PC6 produces in all
cement pastes the highest delay of the hydration process.
This effect can be due to the fact that this admixture has the
greatest charge density (highest carboxylate content) and
the adsorption and the surface coverage of cement and slag
particles by PC6 is expected to be higher with respect to the
other polycarboxylates studied [11]. The higher adsorption
of PC6 can hinder the diffusion of water and calcium ions
at the cement–solution interface and this induces the
greatest delay observed.
The presence of the admixture did not affect heat of
hydration in cement pastes C1–C4. Dosages of only 0.5 mg/g
cement of the PC admixtures studied did, however, induce
an increase in cement paste C5 heat of hydration.
Table 8 Parameters obtained from calorimetric curves shown in Fig. 4
Cement Admixture Peak start
time (h)
Peak max.
time (h)
Max. rate
(J/g h)
Peak end
time (h)
Peak
duration (h)
Peak heat
released (J/g)
Heat released
at 80 h (J/g)
C1 0 mg admixture 2.1 7.9 23.2 33.4 31.3 273.1 299.9
1.0 mg PC1/g binder 2.5 9.3 25.9 33.7 31.2 281.9 308.4
1.0 mg PC2/g binder 2.3 9.1 26.5 32.9 30.6 281.3 311.8
1.0 mg PC3/g binder 2.1 9.7 26.3 34.8 32.7 307.5 310.0
1.0 mg PC4/g binder 2.2 9.1 25.9 34.8 32.6 280.1 311.5
1.0 mg PC5/g binder 2.0 9.3 23.5 36.0 34.0 271.3 296.4
1.0 mg PC6/g binder 4.8 11.3 27.2 38.3 33.5 307.4 313.6
C2 0 mg admixture 1.3 6.5 22.7 37.0 35.7 264.8 296.1
1.0 mg PC1/g binder 3.0 9.1 23.4 36.8 33.8 267.3 270.3
1.0 mg PC2/g binder 1.8 7.8 23.2 36.9 35.1 274.8 277.0
1.0 mg PC3/g binder 2.6 9.9 23.2 38.2 35.6 276.7 279.7
1.0 mg PC4/g binder 2.0 8.6 23.0 36.8 34.8 267.2 296.9
1.0 mg PC5/g binder 2.3 8.4 22.6 38.4 36.1 269.1 303.9
1.0 mg PC6/g binder 4.8 11.3 27.2 38.4 34.2 307.3 313.6
C3 0 mg admixture 1.1 6.3 18.7 43.4 42.1 243.7 273.2
1.0 mgPC1/g binder 2.0 8.2 18.4 46.1 44.1 247.3 278.6
1.0 mg PC2/g binder 1.6 7.1 19.6 41.9 40.3 249.2 282.6
1.0 mg PC3/g binder 1.8 9.0 19.1 44.2 42.4 253.9 290.1
1.0 mg PC4/g binder 1.9 7.6 19.2 44.6 43.1 251.3 281.2
1.0 mg PC5/g binder 1.6 8.3 17.7 46.5 42.7 246.7 276.7
1.0 mg PC6/g binder 4.0 10.8 17.5 48.4 44.4 244.8 272.1
C4 0 mg admixture 1.7 8.7 13.2 55.0 53.3 234.7 265.1
1.0 mg PC1/g binder 2.5 11.0 12.7 64.0 61.5 238.7 270.8
1.0 mg PC2/g binder 2.1 9.5 12.9 62.1 60.0 237.2 239.6
1.0 mg PC3/g binder 3.3 12.2 11.7 61.7 58.4 236.5 239.5
1.0 mg PC4/g binder 2.6 10.8 12.2 60.1 57.5 218.8 252.2
1.0 mg PC5/g binder 2.7 11.3 12.2 64.2 61.5 232.2 265.3
1.0 mg PC6/g binder 8.1 15.2 11.9 68.0 59.9 229.8 263.0
C5 0 mg admixture 1.3 7.2 7.5 52.2 50.9 140.4 183.2
0.5 mg PC1/g binder 1.5 9.0 7.6 69.2 67.7 172.9 202.8
0.5 mg PC2/g binder 1.7 8.9 7.8 72.7 71.0 180.9 208.2
0.5 mg PC3/g binder 2.3 11.3 7.2 71.7 69.4 174.8 203.0
0.5 mg PC4/g binder 2.0 9.5 7.6 69.4 67.4 172.3 201.6
0.5 mg PC5/g binder 2.0 10.01 7.5 68.2 66.2 168.8 201.2
0.5 mg PC6/g binder 3.3 11.6 7.3 73.4 70.1 174.4 202.4
2722 J Mater Sci (2009) 44:2714–2723
123
Conclusions
1. Polycarboxylate-based admixtures show higher fluid-
izing properties in slag Portland cement with respect to
non-blended Portland cement. The decrease of the
yield stress of cement pastes induced by the PC-based
admixtures increases with the slag content.
This effect is mainly due to in non-blended cement
pastes, part of the admixture is adsorbed on C3A and
also consumed by the C3A phase to form an organic-
mineral phase, leaving less admixture available in
aqueous phase for dispersing the cement grains.
However, with increasing percentages of the addition
and declining cement content, the amount of the C3A
able to interact with the admixture likewise decreases.
Consequently, PCs are adsorbed directly onto C3S and
C2S and slag particles, inducing their dispersion.
2. The admixtures with highest molecular weight produce
the highest reduction of the yield stress of cement
pastes due to the highest steric repulsion induced.
3. Polycarboxylate-based admixtures do not modify sig-
nificantly the plastic viscosity of any of the cement
pastes studied.
4. As a consequence of the adsorption of the PCs, a delay
of the hydration process of the cement pastes has been
observed. The delay is higher in presence of PC6 (with
the highest content of carboxylate groups). Addition-
ally, a highest delay of the hydration process is
produced in pastes with the highest slag content (75%).
Acknowledgements Funding for projects BIA 2007-61380 (pro-
vided by the SpanishMinistry of Science and Technology (MCyT)) and
PMB001389 (CSIC). The authors wish to thank Alice Vieillefosse for
help with rheological experiments and Michaela Barbieri, Julien Froi-
devaux and Matthieu Mottet for help with the zeta potential
measurements. Also the authors thank to Dr. Carmen Peinado and
Mario Luzon for help with the GPC tests. M. Palacios worked under a
postdoctoral contract awarded by the CSIC.
References
1. Sersale R, Marchese B, Frigione G (1980) In: 7th international
congress on the chemistry of cement (edition septima), vol 2.
Paris, p 63
2. Moon HY, Kim HS, Choi DS (2006) Constr Build Mater 20:725
3. Mangat PS, El-Khabit JM (1992) Cem Concr Res 22:1089
4. Smolczyk HG (1974) In: 6th international congress on the
chemistry of cement, vol 3 (supplementary paper). Moscow,
RILEM, Paris, p 57
5. Richardson IG, Wilding CR, Dickson MJ (1989) Adv Cem Res
2(8):147
6. Escalante-Garcıa JI, Sharp JH (2004) Cem Concr Compos 26:967
7. Ohta A, Sugiyama T, Tanaka Y (1997) In: Malhotra VM (ed) 5th
CANMET/ACI superplasticizers and other chemical admixtures.
Concrete (Canada), p 359
8. Uchikawa H, Hanehara S, Sawaki D (1997) Cem Concr Res
27:37
9. Puertas F, Santos H, Palacios M, Martınez-Ramırez S (2005) Adv
Cem Res 17:77
10. Alonso MM, Palacios M, Puertas F, De la Torre AG, Aranda
MAG (2007) Mater Constr 57(286):65
11. Winnefeld F, Becker S, Pakusch J, Gotz T (2007) Cem Concr
Compos 29:251
12. Flatt RJ, Houst Y (2001) Cem Concr Res 31:1169
13. Yamada K, Ogawa S, Hanehara S (2001) Cem Concr Res 31:375
14. Maeder U, Schober I (2003) In: 11th international congress on the
chemistry of cement (Durban). South Africa, p 504
15. Chandra S, Bjornstrom J (2002) Cem Concr Res 32:1605
16. Puertas F, Alonso MM, Vazquez T (2005) Mater Constr
55(277):61
17. Rietveld HM (1969) J Appl Crystallogr 2:65
18. Grzeszcyk S, Sudol M (2003) In: 11th international congress on
the chemistry of cement (Durban). South Africa, p 727
19. Palacios M, Sierra C, Puertas F (2003) Mater Constr 53(269):89
20. Palacios M, Houst YF, Bowen P, Puertas F (2008) Cem Concr
Res (accepted)
21. Perche F (2004) These EPFL No 3041, Lausanne. http://library.
epfl.ch/en/theses/?nr=3041
22. Zingg A, Winnefeld F, Holzer L, Pakusch J, Becker S, Gaukler L
(2008) J Coll Inter Sci 323:301
23. Kerisit S, Cooke DJ, Marmier A, Parker SC (2005) Chem
Commun 24:3027
24. Shaughnessy R, Clark PE (1988) Cem Concr Res 18:327
25. Tattersall GH, Banfill PFG (1983) In: The rheology of fresh
concrete. Pitman Advanced Publishing Program, London, MA
26. Magarotto R, Torresan I, Zeminian N (2003) In: 11th interna-
tional congress on the chemistry of cement (Durban). South
Africa, p 514
27. Houst Y, Bowen P, Siebold A (2002) In: Dhir RK, Hewlett PC,
Csetenvi LJ (eds) Concrete materials and construction. Thomas
Telford, London, p 225
28. Houst YF, Bowen P, Perche F, Kauppi A, Borget P, Galmiche L,
Le Meins J-F, Lafuma F, Flatt RJ, Schober I, Banfill PFG, Swift
DS, Myrvold BO, Petersen BG, Reknes K (2008) Cem Concr Res
38:1198
29. Yoshioka K, Tazawa W, Hawai K, Enohata T (2002) Cem Concr
Res 32:1507
30. Plank J, Dai Z, Zouaoui N, Vlad D (2006) In: 8th CANMET/ACI
superplasticizers and other chemical admixtures in concrete.
Sorrento (Italia), p 201
31. Nagele E, Schneider U (1989) Cem Concr Res 19:811
32. Mollah MYA, Adams WJ, Schennach R, Cocke DL (2000) Adv
Cem Res 12:153
J Mater Sci (2009) 44:2714–2723 2723
123