Embed Size (px)
Citation preview

Effect of Sequence-Dependent Rigidity on Plectoneme Localization in dsDNA
Shlomi Medalion and Yitzhak RabinDepartment of Physics and Institute of Nanotechnology and Advanced Materials, Bar-Ilan University, Ramat-Gan 52900, Israel
(Dated: January 5, 2015)
We use Monte-Carlo simulations to study the effect of variable rigidity on plectoneme formationand localization in supercoiled dsDNA. We show that the presence of soft sequences increases thenumber of plectoneme branches and that the edges of the branches tend to be localized at thesesequences. We propose an experimental approach to test our results in vitro, and discuss the possiblerole played by plectoneme localization in the search process of transcription factors for their targets(promoter regions) on the bacterial genome.
The conformational properties of double-stranded (ds)DNA molecules are usually modeled by treating thesebiopolymers as semi-flexible chains with uniform rigiditythat can be represented by a single persistence length(rigidity is proportional to persistence length), lp '50nm in physiological conditions (1, 2). This is justi-fied when one is interested in large-scale properties of ds-DNA for which one can replace the sequence-dependentdistribution of the elastic rigidity by its average over thechain. When one is interested in small and intermediate-scale phenomena one has to consider the full sequence-dependence of the rigidity. While some studies suggestedthat the rigidity of bare dsDNA varies across a limitedrange 40nm < lp < 75nm (3, 4), experiments on cycliza-tion of short dsDNA fragments (≈ 100bp) reported muchhigher cyclization ratios than expected (5, 6). This led tothe proposal of DNA kinks – pointlike highly flexible do-mains (7) – perhaps due to formation of “DNA bubbles”(8, 9). Such sequence-dependent rigidity is a propertyof bare dsDNA and it has been suggested that the effectcan be utilized for the design of promoter sequences inorder to control the DNA binding affinity of transcrip-tion factors that are sensitive to DNA bendability (10).It may also arise as the consequence of the binding ofproteins to specific DNA sequences; indeed, in vivo DNAis partially covered by proteins that affect its flexibility(3, 11–14) and/or its local curvature (15, 16). For ex-ample, RecA bacterial proteins polymerize along DNAto give an effective persistence length of hundreds of nmto the RecA-dsDNA complex (3, 14). Other positively-charged proteins (e.g., HMGB) and polyamines, increaseDNA’s flexibility significantly (11, 17, 18). Thus, thevariability of DNA rigidity may be even higher in vivothan that of bare DNA in vitro.
In this work we study the interplay between local rigid-ity and plectoneme localization in supercoiled dsDNA.When circular DNA is subjected to sufficiently large tor-sional stress, the minimization of the free energy yieldsstrongly-writhed conformations known as plectonemes(see e.g. Fig. 1). We show that the number of plec-tonemic branches and the locations of the edges (endloops of the branches in Fig. 1) are affected by non-uniform DNA rigidity. This applies not only to circularchains (e.g., bacterial and mitochondrial DNA, and DNA
FIG. 1. (color online) Representative conformation of a su-percoiled chain of length of 5400bp with a pair of low and high
rigidity values (l(l)p , l
(h)p ) = (55nm, 75nm). Here l
(l)p occupies
1/3 of the chain and is divided into 4 equally-spaced domains
of identical size, l(h)p occupies the remaining 2/3 of the chain,
and the superhelical density is σ = −0.05. The red segmentsrepresent the soft domains, while the blue ones correspond tothe stiffer ones. The end loops of the plectonemes tend to belocalized at the soft domains.
plasmids), but to topologically-constrained linear dsDNAmolecules as well, such as eukaryotic chromosomes thatare attached to the nuclear lamina.
We performed Metropolis Monte-Carlo (MC) simula-tions of topology-conserving worm-like rod (WLR) modelthat accounts for bending and twist elasticity of dsDNA.A circular dsDNA molecule was modeled as a closed chainof N segments of length 30bp ' 10nm each. The twistpersistence length of the chain was taken to be ltw =74nm (corresponding to l̃tw = 7.4 in units of segmentlength). The effective diameter of dsDNA was assumedto be 5nm, taking into account the screened electrostaticrepulsion at physiological conditions (19, 20). The degreeof supercoiling of DNA was characterized by the super-helix density σ that is proportional to the amount of tor-sional stress per unit length of the molecule (20, 21). Bac-terial cells have an enzymatic mechanism that keeps thesuperhelix density of the genome at an almost constantvalue, typically in the range −0.03 < σ < −0.09 thatcorresponds to somewhat unwound DNA (21, 22) and,
arX
iv:1
501.
0010
6v1
[co
nd-m
at.s
oft]
31
Dec
201
4

2
0 50 100 1500
0.05
0.1
0.15
0.2
0.25
j (segments along the chain)
Pedges
FIG. 2. (color online) Histogram of the locations of the centersof plectoneme edges (end loops), Pedges, for a circular chainwith σ = −0.06 and 4 soft domains located around the 23rd,68th, 113rd and 158th segments. The rigidities correspond
to the pairs (l(l)p , l
(h)p ) = (40nm, 55nm) (blue), (55nm, 75nm)
(green), and (50nm, 200nm) (red).
unless stated otherwise, we assumed that σ = −0.06.For more details about the energy form used for accept-ing/rejecting the Metropolis MC steps see Sec. S1 in theSI.
In the simulations we used the pivot (or crankshaft)moves described in detail in ref. (5). The angle of rota-tion around the pivot was tuned in order to achieve thedesired acceptance rate of 50%. To make sure that thesimulation was not stuck in a specific plectonemic con-formation, we used the linking number inversion methoddescribed in ref. (24). We ran our simulations for 5400bplong chains with segments of two different rigidities dis-tributed along the chain such that most of the chain had
a higher rigidity (l(h)p ), and a smaller part of the chain
had a lower rigidity (l(l)p ). For each chain conformation
taken into account, we determined the number and thelocations of plectoneme edges (end loops). The algorithmused for this analysis is described in the SI. The chains inthe simulations were unknotted and we made sure thatthis topology was fixed during the simulation by calcu-lating the Alexander polynomials and Vassiliev invariantsafter each move, and rejecting topology-changing moves.
We first considered the effect of non-uniform rigiditydistribution on plectoneme localization in the case whereboth the stiff and the soft domains are relatively large (asfor example in the RecA-DNA complexes). The soft do-main was chosen to occupy 1/3 of the chain and consistedof several domains of identical size, equally-spaced alongthe contour. In order to model sequence-dependent rigid-
ity of bare dsDNA we took (l(l)p , l
(h)p ) = (40nm, 55nm) (as
in ref. (4)) and (55nm, 75nm) (as in ref. (3)). For mod-eling rigidity induced by protein polymerization along
DNA we used (l(l)p , l
(h)p ) = (50nm, 200nm) (even though
polymerization of proteins such as RecA yields rigiditiesin the range of 600nm − 800nm (3, 14), the effect of
l(h)p � l
(l)p on the localization of plectoneme edges is al-
ready clear for l(h)p = 200nm). In Fig. 2 we plotted a his-
togram of the locations of the centers of plectoneme edgesfor a chain with 4 soft domains. Even for the pair withthe smallest difference between rigidities (40nm, 55nm),there is noticeable localization of the edges to the softersegments of the chain. As the difference between rigidi-ties increases, the localization becomes much more pro-
nounced. For (l(l)p , l
(h)p ) = (50nm, 200nm), the edges are
almost exclusively located in the soft domains. Whilehigh superhelix density is a necessary condition for theformation of plectonemes (21), we found that increasingσ beyond the plectoneme formation threshold does nothave a noticeable effect on the localization of the edgesof these branches (see Fig. S5 in the SI).
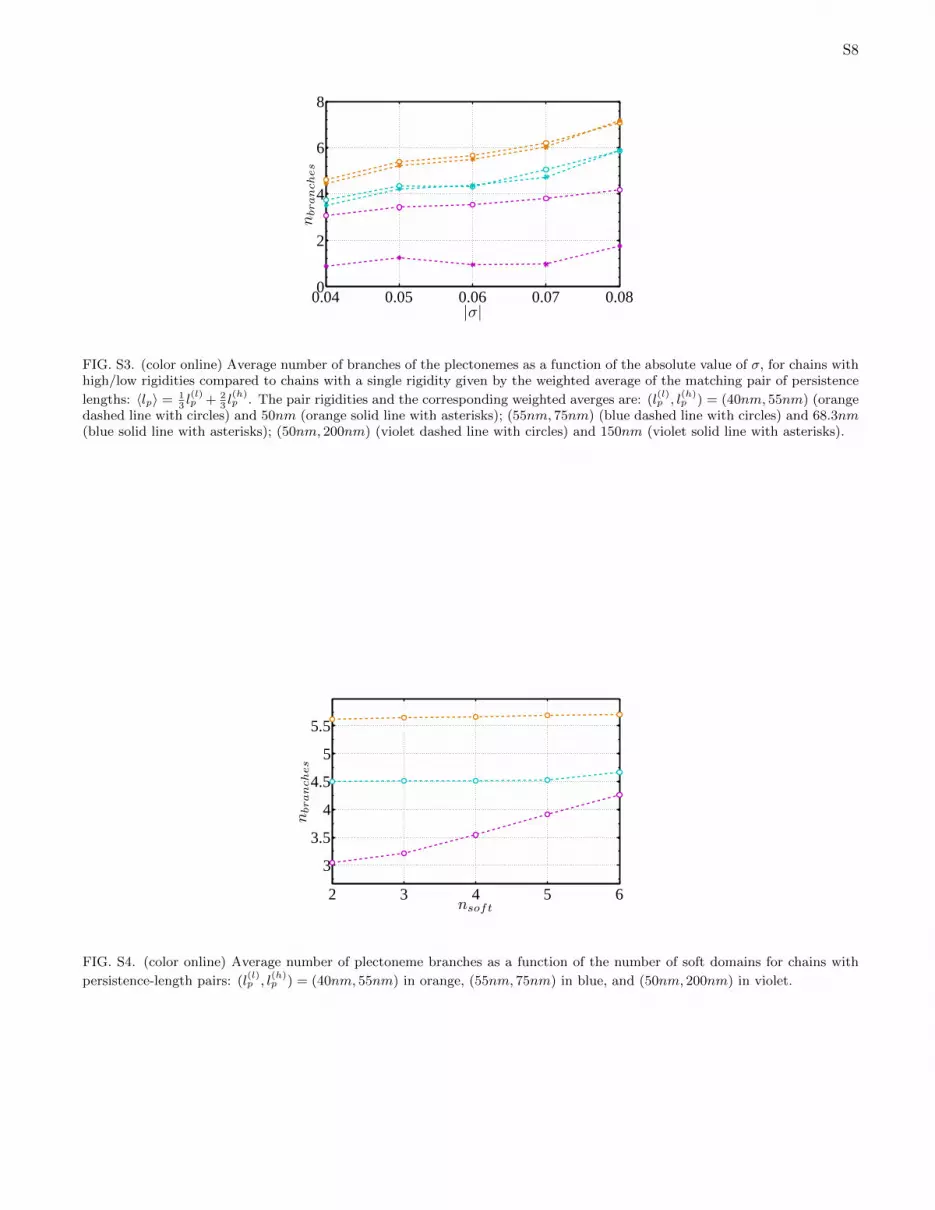
For chains of uniform rigidity the number of plectone-mic branches was shown to increase with σ (5). In orderto understand how the dependence of the number of chainbranches on σ is affected by non-uniform rigidity, we com-pared chains with 4 soft domains with uniform chains of asingle persistence length (weighted average of the pair ofthe corresponding persistence lengths). We observed thatfor the (50nm, 200nm) pair, the presence of soft domainsleads to two-fold enhancement compared to homogeneouschains with an average value of lp = 150nm (the effectis much weaker both for chains with lower rigidities andthose with a smaller difference between higher and lowerrigidities- see Fig. S3 in the SI). The origin of this effect isthat a chain with lp = 150nm has to pay a large bendingenergy penalty in order to create a tight loop/edge and,as a consequence, the number of edges is small. The pres-ence of soft domains with lp = 50nm (even when the stiff-ness of the rest of the chain is increased), allows the edgesto be localized in these domains, thus decreasing thebending energy penalty, and the number of branches in-creases significantly. The number of plectoneme branchesis also affected by the number of soft domains. We calcu-lated the average number of branches as a function of thenumber of soft domains for (40nm, 55nm), (55nm, 75nm)and (50nm, 200nm), where the softer part of the chainwas divided into 2−6 domains of equal length, uniformlydistributed along the chain (Fig. S4 in the SI). As ex-pected, only a minor effect is observed in the first twocases where the difference between rigidities is small butin the case of large rigidity contrast, the number of edgesincreases by nearly 50% as the number of soft domainsincreases from 2 to 6.
Next, we proceeded to characterize the effect of DNAkinks (soft local defects) on the localization and thenumber of plectoneme edges. We simulated 5400bp-longchains with lp = 50nm, and with 2 − 6 kinks at whichthe persistence length dropped to a value of 4nm (abouttwice the rigidity of ssDNA, (9, 25)). As can be seen in

3
0 50 100 1500
0.02
0.04
0.06
0.08
0.1
j
Pedges
FIG. 3. (color online) Histogram of the locations of plectone-mic edges, Pedges, for chains with 4 kinks located at the 23rd,68th, 113rd and 158th dimers, with σ = −0.04 (dark blue),σ = −0.05 (light blue), σ = −0.06 (light green), σ = −0.07(orange) and σ = −0.08 (red).
Fig. 3 for the 4-kink case (and for 2 − 6 kinks in Fig.S6 in the SI), plectoneme edges tend to form at the loca-tions of kinks. Another effect observed in Fig. 3 is thatin the 4-kink case the fraction of edges that contain kinksdecreases monotonicaly with |σ|, presumably because ofthe number of branches increases monotonically with |σ|.In the 6-kink case the decrease in the fraction of kink-containing edges is observed only for |σ| = 0.07 − 0.08(Fig. S9 in the SI). This concurs with the observation(Fig. S8 in the SI) that while in the 6-kink case thenumber of edges is only slightly greater than the numberof kinks in the chain even for the highest value of |σ|, inthe 4-kinks case the number of edges exceeds the numberof kinks already for moderate |σ|s.
In Table I and in Figs. S6-S7 in the SI, we show thatas the number of kinks, nkink, increases, the number ofbranches, nbranch, also grows, but this increment is ac-companied by an even more rapid increase in the frac-
tion of edges that include a kink, P(tot)kink , and in the total
number of edges containing a kink, n∩. Even thoughplectonemes have branches even in the absence of kinks,when supercoiled DNA contains kinks, the edges of thebranches are localized preferentially at the kinks; this re-duces the bending energy penalty for creating edges andpromotes the formation of new branches.
As expected from experience with linear worm-likechains, the presence of a kink affects the local fluctuationsof the chain in which it is imbedded. This effect is clearlyobserved in Fig 4(a) where we compare the distributionof the end-to-end distance d of a short DNA sequence(in a long circular chain) of uniform rigidity, with thatof a DNA sequence of the same length and rigidity butcontaining a kink at its center. Since the length of thesequence is only twice the persistence length of dsDNA,
nkink 〈nbranch〉 P(tot)kink 〈n∩〉
2 5.99 0.332 1.98
3 6.28 0.399 2.50
4 6.41 0.441 2.63
5 6.62 0.510 3.37
6 6.76 0.544 3.67
TABLE I. The number of branches, 〈nbranch〉, the total prob-
ability of an edge to contain a kink, P(tot)kink , and the total
number of edges containing a kink, 〈n∩〉 = 〈nbranch〉 · P (tot)kink
as a function of the number of kinks in the chain, nkink, for5400bp long chains (σ = −0.06).
both distributions are asymmetric, with a peak closerto the fully stretched (100nm) state. The introductionof the kink shifts the maximum of the distribution from80nm to 70nm and results in dramatic enhancement ofthe ends contact probability (d ≤ 10nm), an effect thathas been invoked to explain the anomalously high cycliza-tion probability of short dsDNA molecules(5–7). Thedifference between the distributions becomes much morepronounced in the presence of supercoiling. Since the endloops of plectonemes tend to form around the kinks andthe size of the end loop is of order lp, we expect the endsof the 100nm segment to be preferentially localized inthe stem of the plectoneme and the most probable end-to-end separation will be below 10nm. This expectationis fully confirmed in Fig. 4(b) in which we presented thecorresponding end-to-end distance distributions of super-coiled DNA for σ = −0.06 (the histograms for σ in therange between 0 and −0.07 are shown in Fig. S10 inthe SI). While the distribution for the no-kink case isqualitatively similar to that for σ = 0 (Fig 4(a)), thepeak of the distribution of a kink-containing segment isshifted towards contact. In principle, this prediction canbe tested by FRET experiments by attaching donor andacceptor molecules to the ends of a short (of order lp)sequence in a long circular dsDNA molecule, providedthat one is able to design a sequence that has a highpropensity for forming a kink (26–29). In the absenceof supercoiling, the donor and acceptor will be separatedby tens of nanometers and there will be no FRET signal.As torsional stress is introduced into the chain, e.g., byraising the concentration of intercalators in the solution(30, 31), plectonemes will form with end loops localizedat the kinks and the distance between the donor andacceptor will approach the 6nm limit at which energytransfer will take place and a FRET signal will be ob-served.
This localization effect may also play a significant rolein the search process executed by transcription factors(TFs) that attach to specific sequences in promoter re-gions of DNA. Since bacterial DNA is supercoiled, DNAsegments that reside in the stems of the plectonemes

4
(a)
(b)
FIG. 4. (Color online) Histograms of distances of the endpoints of a 100nm long segment in a 5400bp plasmid contain-ing a kink (light blue) and not containing a kink (orange), for(a) torsionally relaxed (σ = 0) plasmids and (b) torsionallystressed (σ = −0.06) plasmids. Representative DNA confor-mations are shown in the corresponding figures (red), with asequence (light blue) containing a kink (sphere). A sequenceof the same length but without a kink is shown for comparison(orange.)
are pressed against each other and one expects bind-ing of proteins to these segments to be suppresed. Thelooped ends of plectonemes are more accessible and, com-bined with the fact that many bacterial DNA-associatedproteins have a higher binding affinity to bent DNA(16, 32, 33), this suggests that TFs may have a higheraffinity for end loops of plectonemes. Whether natureutilizes such effects to facilitate the search of TFs fortheir DNA binding sites depends on whether promotersites tend to be localized at the edges of plectonemes.Indeed, many bacterial promoters contain TATA-box se-quences that are known for their lower rigidity and highertendency to create DNA bubbles (kinks) (26–29) and, ac-
cording to our results, such sequences will tend to nucle-ate plectonemes and to be positioned at their edges. Fi-nally, we would like to mention that although we are notaware of direct experimental proof of our proposed mech-anism of plectoneme localization to low-rigidity DNA se-quences, there has been a recent experimental study ofthe effects of torsional stress on stretched linear dsDNAin which repeated hopping of plectonemes between spe-cific locations along DNA was reported. (34).
ACKNOWLEDGMENTS
Results obtained in this paper were computed on thebiomed virtual organization of the European Grid In-frastructure (http://www.egi.eu). We thank the Euro-pean Grid Infrastructure and supporting National GridInitiatives (listed here: http://lsgc.org/en/Biomed:home#Supporting National Grid Initiatives) for providingthe technical support, computing and storage facilities.This work was supported by the I-CORE Program of thePlanning and Budgeting committee and the Israel Sci-ence Foundation, and by the US-Israel Binational ScienceFoundation.
(1) P. J. Hagerman, Annual review of biophysics and biophys-ical chemistry 17, 265 (1988).
(2) W. H. Taylor and P. J. Hagerman, Journal of molecularbiology 212, 363 (1990).
(3) J. Leger, J. Robert, L. Bourdieu, D. Chatenay, andJ. Marko, Proceedings of the National Academy of Sci-ences 95, 12295 (1998).
(4) S. Geggier and A. Vologodskii, Proceedings of the Na-tional Academy of Sciences 107, 15421 (2010).
(5) T. E. Cloutier and J. Widom, Molecular cell 14, 355(2004).
(6) T. Cloutier and J. Widom, Proceedings of the NationalAcademy of Sciences of the United States of America 102,3645 (2005).
(7) P. A. Wiggins, R. Phillips, and P. C. Nelson, PhysicalReview E 71, 021909 (2005).
(8) J. Yan, R. Kawamura, and J. F. Marko, Physical ReviewE 71, 061905 (2005).
(9) C. Yuan, E. Rhoades, X. W. Lou, and L. A. Archer,Nucleic acids research 34, 4554 (2006).
(10) M. Levo and E. Segal, Nature Reviews Genetics 15, 453(2014).
(11) M. C. Williams and L. J. Maher III,Biophysics of DNA-protein interactions (Springer,2010).
(12) S. M. Rappaport and Y. Rabin, Physical review letters101, 038101 (2008).
(13) R. Amit, A. B. Oppenheim, and J. Stavans, Biophysicaljournal 84, 2467 (2003).
(14) E. H. Egelman and A. Stasiak, Journal of molecular bi-ology 191, 677 (1986).

S5
(15) S. Jones, P. van Heyningen, H. M. Berman, and J. M.Thornton, Journal of molecular biology 287, 877 (1999).
(16) J. Stavans and A. Oppenheim, Physical biology 3, R1(2006).
(17) A. Podesta, M. Indrieri, D. Brogioli, G. S. Manning,P. Milani, R. Guerra, L. Finzi, and D. Dunlap, Biophys-ical journal 89, 2558 (2005).
(18) R. S. Hegde, Annual review of biophysics and biomolec-ular structure 31, 343 (2002).
(19) V. V. Rybenkov, A. V. Vologodskii, and N. R. Coz-zarelli, Nucleic acids research 25, 1412 (1997).
(20) A. Vologodskii and V. V. Rybenkov, Physical ChemistryChemical Physics 11, 10543 (2009).
(21) A. V. Vologodskii and N. R. Cozzarelli, Annual reviewof biophysics and biomolecular structure 23, 609 (1994).
(22) W. R. Bauer, Annual review of biophysics and bioengi-neering 7, 287 (1978).
(5) A. V. Vologodskii, S. D. Levene, K. V. Klenin, M. Frank-Kamenetskii, and N. R. Cozzarelli, Journal of molecularbiology 227, 1224 (1992).
(24) S. Medalion and Y. Rabin, The Journal of ChemicalPhysics 140, 205101 (2014).
(25) M. Murphy, I. Rasnik, W. Cheng, T. M. Lohman, andT. Ha, Biophysical Journal 86, 2530 (2004).
(26) P. T. McNamara, A. Bolshoy, E. N. Trifonov, and R. E.Harrington, Journal of Biomolecular Structure and Dy-namics 8, 529 (1990).
(27) J. L. Kim, D. B. Nikolov, and S. K. Burley, Nature 365,520 (1993).
(28) M. Peyrard, S. Cuesta-Lopez, and D. Angelov, Journalof Physics: Condensed Matter 21, 034103 (2009).
(29) S. Cuesta-Lopez, D. Angelov, and M. Peyrard, EPL(Europhysics Letters) 87, 48009 (2009).
(30) W. Bauer and J. Vinograd, Journal of molecular biology33, 141 (1968).
(31) T. Steck, G. Pruss, S. Manes, L. Burg, and K. Drlica,Journal of bacteriology 158, 397 (1984).
(32) J. Kim, C. Zwieb, C. Wu, and S. Adhya, Gene 85, 15(1989).
(33) S. Medalion and Y. Rabin, The Journal of chemicalphysics 136, 025102 (2012).
(34) M. Van Loenhout, M. de Grunt, and C. Dekker, Science338, 94 (2012).
(1) F. B. Fuller, Proceedings of the National Academy of Sci-ences 68, 815 (1971).
(2) J. H. White, American Journal of Mathematics , 693(1969).
(3) S. Medalion, S. M. Rappaport, and Y. Rabin, The Jour-nal of chemical physics 132, 045101 (2010).
(4) K. Klenin and J. Langowski, Biopolymers 54, 307 (2000).
SUPPORTING INFORMATION
The Energy Form for the MC Process
In a discrete worm-like rod (WLR) model that accounts for both the bending diversity and twisting elasticity ofthe DNA, the energy of a chain (in units of kBT ) with N segments is given by:
EWLR
kBT=
N∑n=1
[l̃p,n2
(κ̃n)2 +l̃tw2
(δω̃tw,n)2
], (S1)
where l̃p,n is the dimensionless bending persistence length corresponding to the (n, n+1) dimer of segments, l̃tw is thedimensionless twist persistence length (both measured in units of the segment’s length ∆s), and κ̃n = 2[1−cos(θn,n+1)]
is the dimensionless curvature between the nth and the (n+1)th segments. δω̃tw,n = ω̃tw,n−ω̃(0)tw defines the difference
between the nth twist angle, ω̃tw,n, and its spontaneous value, ω̃(0)tw . The twist angle is the sum of the first and the
third rotation angles (ω̃tw,n = ϕ + ψ) of the Euler transformation that rotates the nth segment to the (n + 1)thsegment, while the bending angle, θn,n+1, is the second Euler rotation angle.
Topologically, supercoiled dsDNA could be described as a closed chain made of two strands infinitesimally closedto each other. This kind of a chain obeys two topological constraints, i.e., the closure of each of its strands. Anotherdescription for these topological constraints is given in terms of the closure of the center-line of the chain, and theclosure of the cross-sectional plane. These two constraints are fully accounted by the Fuller-White relation (1–3):
Lk = Wr + Tw. (S2)
where the writhe Wr is a measure of the deviation of the center-line from planarity, and the twist Tw is proportionalto the the sum (in the discrete description) over all the twist angles along the chain. The continuum expressions forTw and Wr are given e.g., in (3). In their discrete version they take the forms:
Tw =1
2π
∑n
ω̃tw,n, (S3)
and:
Wr =1
4π
∑n,m
Wn,m, (S4)

S6
where Wn,m is the discrete pair-of-segments contribution to the Wr, calculated e.g., in (4) (Wr depends only on thecoordinates of the center-line of the chain).
For a circular chain, Lk is a topological invariant (an integer) that does not change as long as the topology of thechain is maintained. A supercoiled dsDNA is overwound or unwound depending whether its Lk is higher or lower
than the preferred value of overall twist, Tw(0) = 1/2π∑
n ω̃(0)tw = Nω̃
(0)tw /2π. When the value of this difference,
∆Lk ≡ Lk − Tw(0) differs from zero, the chain becomes torsionally stressed and attempts to minimize its total freeenergy by transforming some of its twist energy into bending energy and, when a critical value of torsional stress isreached, plectonemes appear in the chain.
Since the twist angles of different segments are independent, one may average the twist along the chain by calculating〈δω̃tw,n〉 ' 2πTw/N = 2π(Lk−Wr)/N , where Lk is a pre-determined topological constant, and the Wr is calculated
using the center-line coordinates of the chain. The resulting twist energy, using ∆Tw ≡ Tw − Tw(0) = ∆Lk −Wr,is then given by:
ET '2π2 l̃twN
∆Tw2 =2π2 l̃twN
(∆Lk −Wr)2. (S5)
Thus, the twist energy in our simulations is obtained by using only the coordinates of the center-line of the chain forcalculating Wr, and plugging this value of Wr (and the constant ∆Lk) into Eq. S5 to calculate ET .
Methods for Identifying Plectoneme Edge Location
The number and locations of plectoneme edges (end loops) were determined by two methods. In the first analysiswe used the method of calculation of local writhe, Wr(loc) described in ref (5). Although Wr of a chain is strictlydefined only for closed chains, one may calculate the Gauss double integral along shorter linear segments of length lalong the chain to obtain the local writhe associated with the jth monomer, Wr(loc)(j). As shown in Fig. S1, thefunction Wr(loc)(j) has maxima at end loops (edges) of the plectoneme, and when the value of such a maximumexceeds a threshold, Wr(threshold) (the horizontal black dashed line in the figure), this monomer is marked as an edgeof the plectoneme (a sphere on the chain in the figure). The height of the peaks of Wr(loc) depends both on thelength l of the segments for which we calculate the local writhe and on the superhelix density σ, since higher |σ|syield tighter loops resulting in higher local writhe values. Since we want the same threshold value, Wr(threshold), todistinguish between edges to other segments for different σs, l must compensate for the σ-dependence of the heightsof the peaks. While in ref (5) the authors flattened the conformations to nearly planar ones before calculating thenumber of edges, we wanted to analyze the three dimensional structures of the plectonemes, and hence, we used adifferent function for l(σ) and a different value of Wr(threshold). In our simulations the choice l = 18lp/(1 + 80|σ|)yielded about the same average heights for the peaks when varying σ, and Wr(threshold) = 0.75 was found to be anappropriate value to identify the edges from other segments.
For our second analysis we started from the jth segment, and measured the distance Dj(1) between the (j + 1)thand (j − 1)th segments, the distance Dj(2) between (j + 2)th and (j − 2)th segments, and in general, the distanceDj(m) between (j+m)th and (j−m)th segments. Plotting D for different js along the chain for a specific realizationone gets curves such as in Fig. S2. If j is a segment somewhere on the stem of the plectoneme, D will increase almostlinearly with m as demonstrated, e.g., by the violet curve in Fig. S2, whereas j corresponding to a segment in thecenter of an end loop will behave differently, i.e., it will slightly increase and then will oscillate with a minimal valuevery close to the (excluded) diameter of the chain, d. Running along specific plectonemic conformation (j = 1, 2...), weidentified the segments that yield local minimum of the sum of distances
∑mcut
m=1 Dj(m) (for mcut = 12 and accepted
only minima under a threshold value of 20 in units of ∆s) as the segments in the center of a loop. An advantage ofthis analysis is that by examining the shape of Dj(m) for the center points of an edge, one may determine the lengthsof the branches as well, since when the two chain parts depart from each other (for some m), there is an abrupt changein the slope of Dj(m). However, for our purposes the two methods of analysis agreed in more than 95% of the cases.
(1) F. B. Fuller, Proceedings of the National Academy of Sciences 68, 815 (1971).(2) J. H. White, American Journal of Mathematics , 693 (1969).(3) S. Medalion, S. M. Rappaport, and Y. Rabin, The Journal of chemical physics 132, 045101 (2010).(4) K. Klenin and J. Langowski, Biopolymers 54, 307 (2000).

S7
FIG. S1. (Color online) Wr(loc) along the chain, for the specific realization plotted in the figure. The spheres at the edges
correspond to the locations of the peaks of Wr(loc).
0 5 10 15 200
5
10
15
20
m (segments)
Dj(m
)
FIG. S2. (Color online) Typical realization of Dj(m) starting from different js along the chain: center of an edge (orange),middle of a branch body (violet), and a point somewhere in between (light blue).
(5) A. V. Vologodskii, S. D. Levene, K. V. Klenin, M. Frank-Kamenetskii, and N. R. Cozzarelli, Journal of molecular biology227, 1224 (1992).
S8
0.04 0.05 0.06 0.07 0.080
2
4
6
8
|σ|nbranches
FIG. S3. (color online) Average number of branches of the plectonemes as a function of the absolute value of σ, for chains withhigh/low rigidities compared to chains with a single rigidity given by the weighted average of the matching pair of persistence
lengths: 〈lp〉 = 13l(l)p + 2
3l(h)p . The pair rigidities and the corresponding weighted averges are: (l
(l)p , l
(h)p ) = (40nm, 55nm) (orange
dashed line with circles) and 50nm (orange solid line with asterisks); (55nm, 75nm) (blue dashed line with circles) and 68.3nm(blue solid line with asterisks); (50nm, 200nm) (violet dashed line with circles) and 150nm (violet solid line with asterisks).
2 3 4 5 6
3
3.5
4
4.5
5
5.5
nsoft
nbranches
FIG. S4. (color online) Average number of plectoneme branches as a function of the number of soft domains for chains with
persistence-length pairs: (l(l)p , l
(h)p ) = (40nm, 55nm) in orange, (55nm, 75nm) in blue, and (50nm, 200nm) in violet.

S9
0 50 100 1500
0.05
0.1
j (segments along the chain)
Pedges
(a)
0 50 100 1500
0.05
0.1
0.15
0.2
0.25
j (segments along the chain)
Pedges
(b)
FIG. S5. (Color online) Histograms of the locations of the centers of the plectonemic edges (loops), Pedges, for a circular chainwith 4 soft regions located around the 23rd, 68th, 113rd and 158th segments for: σ = −0.04 (dark blue), σ = −0.05 (light
blue), σ = −0.06 (light green), σ = −0.07 (orange) and σ = −0.08 (red). (a) (l(l)p , l
(h)p ) = (40nm, 55nm), (b) (l
(l)p , l
(h)p ) =
(50nm, 200nm). Note that the probability of localization of the edges to the kinks doesn’t change significantly with σ.

S10
15 45 75 105 135 1650
0.05
0.1
0.15
0.2
j (segments along the chain)
Pedge(seg)
(a)
10 30 50 70 90 110 130 150 1700
0.05
0.1
j (segments along the chain)
Pedge(seg)
(b)
0 50 100 1500
0.02
0.04
0.06
0.08
0.1
j (segments along the chain)
Pedge(seg)
(c)
0 50 100 1500
0.02
0.04
0.06
0.08
0.1
j (segments along the chain)
Pedge(seg)
(d)
0 50 100 1500
0.02
0.04
0.06
0.08
0.1
j (segments along the chain)
Pedge(seg)
(e)
2 3 4 5 6
0.35
0.4
0.45
0.5
0.55
P(tot)
kinks
nkinks
(f)
FIG. S6. (Color online) Histograms of the locations of the centers of the plectoneme edges, Pedges, for a circular chain ofL ' 5400bp ' 180seg with point-like kinks with lp = 4nm where the rest of the chain has lp = 50nm. (a) two kinks located atj = 45 and j = 135 (b) three kinks located at j = 31, j = 91 and j = 151 (c) four kinks located at j = 23, j = 68, j = 113 andj = 158 (d) five kinks located at j = 19, j = 55, j = 91, j = 127 and j = 163 (e) six kinks located at j = 16, j = 46, j = 76,j = 106, j = 136 and j = 166 (f) the overall probability for an edge to contain a kink as a function of the number of kinks.The existence of higher number of kinks effectively “sucks” the probability from the other parts of the chain, and as can beseen in (a)-(e) the difference between the probabilities of kink-containing and kink-free edges increases.

S11
2 3 4 5 66
6.2
6.4
6.6
6.8
nbranch
nkinks
FIG. S7. (color online) The mean number of plectoneme branches as a function of the number of kinks for 5400bp-long chainswith lp = 50nm for the chain and lp = 4nm for the kinks.
0.04 0.05 0.06 0.07 0.085
6
7
8
|σ|
nbranches
FIG. S8. (color online) The number of branches of the chain, nbranch, as a function of |σ| for 4-kinks (orange) and 6-kinks (lightblue). While for 6-kinks the number of branches is comparable with the number of kinks, for 4-kinks the number of branchesexceeds the number of kinks.
0 50 100 1500
0.02
0.04
0.06
0.08
0.1
j
Pedges
(a)
0 50 100 1500
0.02
0.04
0.06
0.08
0.1
j
Pedges
(b)
FIG. S9. (Color online) Histograms of the locations of the plectoneme edges, Pedges, for σ = −0.04 (dark blue), σ = −0.05(light blue), σ = −0.06 (light green), σ = −0.07 (orange) and σ = −0.08 (red). (a) 4 kinks located at the 22nd, 62nd, 112ndand 152nd dimers and (b) 6 kinks located at j = 16, j = 46, j = 76, j = 106, j = 136 and j = 166.

S12
0 20 40 60 80 1000
0.02
0.04
0.06
0.08
d (nm)
P(d)
(a)
0 20 40 60 80 1000
0.02
0.04
0.06
0.08
d (nm)
P(d)
(b)
0 20 40 60 80 1000
0.02
0.04
0.06
0.08
d (nm)
P(d)
(c)
0 20 40 60 80 1000
0.02
0.04
0.06
0.08
d (nm)
P(d)
(d)
0 20 40 60 80 1000
0.02
0.04
0.06
0.08
d (nm)
P(d)
(e)
0 20 40 60 80 1000
0.02
0.04
0.06
0.08
d (nm)
P(d)
(f)
0 20 40 60 80 1000
0.02
0.04
0.06
0.08
d (nm)
P(d)
(g)
0 20 40 60 80 1000
0.02
0.04
0.06
0.08
d (nm)
P(d)
(h)
FIG. S10. (Color online) Histograms of distances of the end points of a 100nm long segment in a 5400bp plasmid containing akink (light blue) and not containing a kink (orange), for (a) σ = 0 (b) σ = −0.01 (c) σ = −0.02 (d) σ = −0.03 (e) σ = −0.04(f) σ = −0.05 (g) σ = −0.06 (h) σ = −0.07. The shift of the maximal probability to short distances, and the significantenhancement of probability for the shortest distances are clearly observed for segments containing a kink.


