Embed Size (px)
Citation preview
Effect of Voltage & Operation temperature onperformance of self-humidified PEM
fuel cell stack
Vrushali M.Umap1 Dr. R.P.Ugwekar2 Waheed Deshmukh3
Mangesh Waghmare3
1. M.Tech, Ph.D. Scholar, PIT, Nagpur2 Associate professor LIT Nagpur
3. Lecturer, PIET [email protected]
Abstract
The Proton Exchange Membrane Fuel Cell(PEMFC) is a promising candidate as zero-emission alternative power source fortransport & stationary application due to itshigh efficiency ,low temperatureoperation ,high power density ,quick start –upand system robustness.
In this paper, under the condition of steadystate and flow in cell is considered to belaminar, the performance of 300w &100wPEMFC stack has been studied.300w fuel cell iscompact &100w fuel cell is openable. This cellis self-humidified. Series of polarisation curveswith different loading of voltage have beenstudied. various values of voltage, currentdensity, power density &related temperaturehave been recorded using lab VIEW software.For this class of fuel cell, optimal operatingtemperature is found to be 75 0 c at 0.3vloading.the results obtained would lead toimprovements in the design of fuel cell.
Keywords: PEMFC, power density, laminarflow, optimal temperature.
1. Introduction
Proton exchange membrane (PEM)fuel cells are electrochemicaldevices that directly convert theenergy from the chemical reactioninto electricity. Useful featuressuch as high power density,simple, safe construction and faststart-up make those particularlysuitable for home appliance,vehicles and transportation tools[1] Generally, A PEMFC has aworking temperature from 60 to 100°C and an efficiency of about 50%, such that the remaining 50 % iswaste heat. The waste heat must bedischarged efficiently from thefuel cell to protect the protonexchange membrane [2].
It is well known that theoperating temperature has asignificant influence on PEM fuelcell performance. The increase inthe operating temperature isbeneficial to fuel cellperformance since it increasesreaction rate and higher masstransfer rate but usually lowers
1
cell ohmic resistance arising fromthe higher ionic conductivity ofthe electrolyte membrane [1].Useful mathematical models canprovide powerful tools for theanalysis and optimization of fuelcell performance [3].
In the early 1990s, thepioneering work on PEM fuel cellmodel development was done byBernardi et al. [4], and Springeret al. [5] who formulated one-dimensional and isothermal modelsfor the gas-diffusion layer,active catalyst layer and ion-exchange membrane.
Fuel cells in the range of 1 W-100 kW sizes are being consideredfor near term service in severalremote and mobile applicationswhere they provide quietoperation, high reliability,potentially high energy densityand ultra-low emissions. In recentyears, research and development infuel cells and fuel cell systemshave accelerated, and althoughsignificant improvements inpolymer electrolyte membrane fuelcell technology has been achievedover the past decade, theperformance, stability, andreliability for today’s fuel celltechnology is not sufficient toreplace internal combustionengines. On the other hand, thecost of fuel cell systems is stilltoo high for them to become viablecommercial products. A number offundamental problems must beovercome to improve theirperformance and reduce their cost[1-8].
Fuel cell is an electrochemicaldevice that generates electricity,similar to batteries, but whichcan be continuously fuelled. Undercertain pressure, hydrogen (H2) is
supplied into a porous conductiveelectrode (the anode). H2 spreadsthrough the electrode until itreaches the catalytic layer of theanode, where it reacts, separatingprotons and electrons. The H+protons flow through theelectrolyte (a solid membrane),and the electrons pass through anexternal electrical circuit,producing electrical energy. Onthe other side of the fuel cell,oxygen (O2) spreads through thecathode and reaches its catalyticlayer. On this layer, O2, H+protons, and electrons produceliquid water and residual heat assub-products. [15]
The polarization behaviour of afuel cell exhibit similarvoltage/current relationships andit’s the result of three types ofphenomena: electrode kinetics,ohmic losses, and transportlimitations. The activationpolarization loss is dominant atlow current densities and ispresent when the rate of theelectrochemical reaction at theelectrode surface is controlled bysluggish electrode kinetics. Theprocesses involving adsorption ofreactant species, transfer ofelectrons across the double layer,desorption of product species, thenumber and distribution of activesites, and the nature of theelectrode surface can allcontribute to activationpolarization. Ohmic losses varydirectly with current, increasingover the entire range of currentdensity. These are due to theresistance to the flow of protonsin the electrolyte membrane andresistance to flow of electronsthrough the stack materials,electrode materials, electrode
2
backing, interconnects currentcollector plates and constantresistance between variousinterfaces. The ohmic losses canbe reduced by using thinnerelectrolyte membranes with properhumidification, betterconductivity cell stack materials,design of the flow field andcurrent collection plates and byreducing contact resistances atvarious interfaces. Theconcentration polarization lossesoccur due to the mass transportlimitation to reactants/productsto or from the electro activesites. These voltage losses occurover the entire range of currentdensity, but become prominentespecially at high currents, whenit is difficult to provide enoughreactant flow to the reactionsites. The mass transport voltagelosses can be reduced by makingthe gas distribution over theelectrode surfaces more uniform,higher porosity of the backinglayer without losing conductivity,or a right combination of thehydrophobic and hydrophilicproperties of materials used toconstruct electrode layer forefficient water removal [3, 12-22]. Water management representsone of the main critical anddesign issues of PEM fuel cellsbecause the membrane hydration ina PEM fuel cell determines itsperformance and its durability. Ifthe membrane is not properlyhydrated, it exhibits higher ionicresistance and can even beirreversibly damaged in extremecases.[23]
In this work, the effect ofvarious voltages loading on theperformance of 300w &100w fuelcell stack is studied. Data has
been collected & polarizationcurves have been obtained. Thiscell is self-humidified so it’seffect on the performance has notbeen studied. Purge is alsoattached at the end of the cell.In this work, the voltages of theindividual cells have beenmonitored in order to detectpossible voltage drops, as if onlythe stack voltage is monitored,the breakdown of a single cell ina large stack is difficult todetect.[11]
2. EXPERIMENTAL SET UP
In the modelling of the fuelcell the following assumptionswere made: the cell operates understeady-state condition, isothermalboundary conditions were used forexternal walls, flow in the cellis considered to be assumed to beideal gas mixtures, and theelectrode is assumed to be anisotropic and homogenous porousmedium. It was assumed that thefuel was hydrogen at the anodeside, diffuses through the porousgas diffusion layers and come incontact with the catalyst layer.At this layer, it forms hydrogenions and electrons. The hydrogenions diffuse through the polymerelectrolyte membrane at the centrewhile the electrons flow throughthe gas diffusion layer to thecurrent collectors and into theelectric load attached.
The electrochemical reactionsare:
At the anode:2H2→4H+ + 4e- (HOR)
At the cathode: O2+4H+ + 4e- → 2H2O (ORR)
3
Total Cell Reaction: 2H2 +O2→ 2H2O + Heat +Electricity
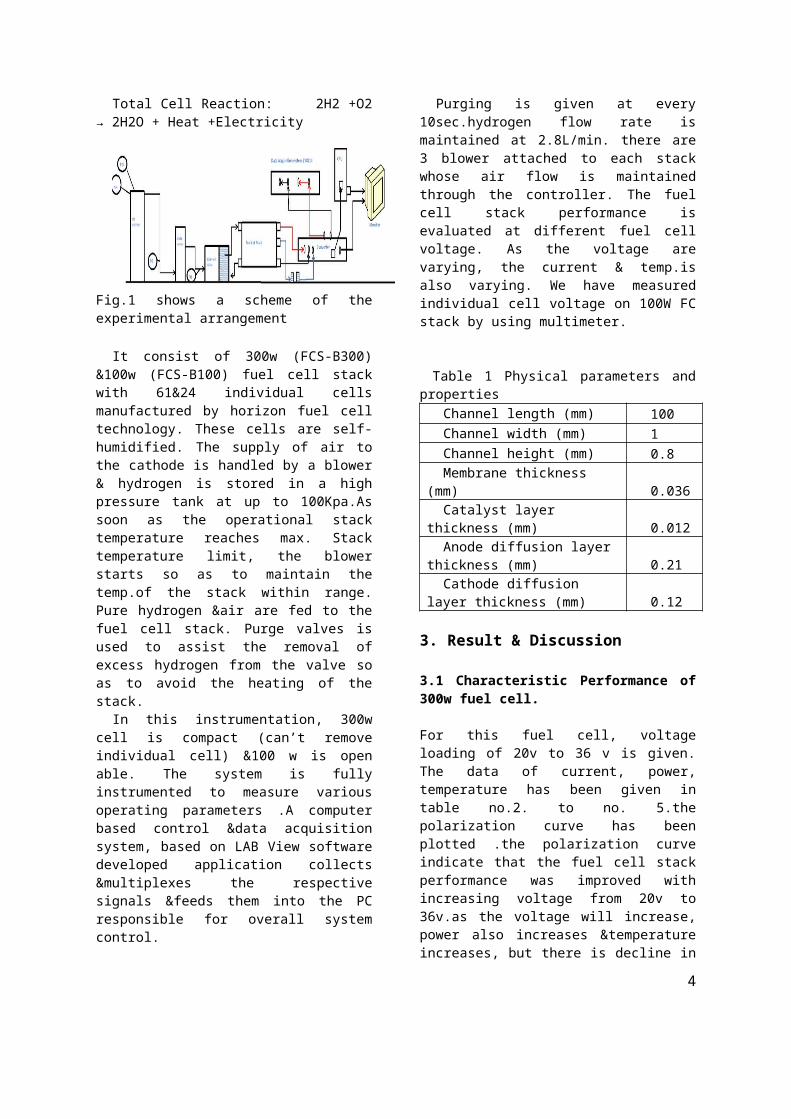
Fig.1 shows a scheme of theexperimental arrangement
It consist of 300w (FCS-B300)
&100w (FCS-B100) fuel cell stackwith 61&24 individual cellsmanufactured by horizon fuel celltechnology. These cells are self-humidified. The supply of air tothe cathode is handled by a blower& hydrogen is stored in a highpressure tank at up to 100Kpa.Assoon as the operational stacktemperature reaches max. Stacktemperature limit, the blowerstarts so as to maintain thetemp.of the stack within range.Pure hydrogen &air are fed to thefuel cell stack. Purge valves isused to assist the removal ofexcess hydrogen from the valve soas to avoid the heating of thestack.
In this instrumentation, 300wcell is compact (can’t removeindividual cell) &100 w is openable. The system is fullyinstrumented to measure variousoperating parameters .A computerbased control &data acquisitionsystem, based on LAB View softwaredeveloped application collects&multiplexes the respectivesignals &feeds them into the PCresponsible for overall systemcontrol.
Purging is given at every10sec.hydrogen flow rate ismaintained at 2.8L/min. there are3 blower attached to each stackwhose air flow is maintainedthrough the controller. The fuelcell stack performance isevaluated at different fuel cellvoltage. As the voltage arevarying, the current & temp.isalso varying. We have measuredindividual cell voltage on 100W FCstack by using multimeter.
Table 1 Physical parameters andproperties
Channel length (mm) 100Channel width (mm) 1Channel height (mm) 0.8Membrane thickness
(mm) 0.036Catalyst layer
thickness (mm) 0.012Anode diffusion layer
thickness (mm) 0.21Cathode diffusion
layer thickness (mm) 0.12
3. Result & Discussion
3.1 Characteristic Performance of300w fuel cell.
For this fuel cell, voltageloading of 20v to 36 v is given.The data of current, power,temperature has been given intable no.2. to no. 5.thepolarization curve has beenplotted .the polarization curveindicate that the fuel cell stackperformance was improved withincreasing voltage from 20v to36v.as the voltage will increase,power also increases &temperatureincreases, but there is decline in
4
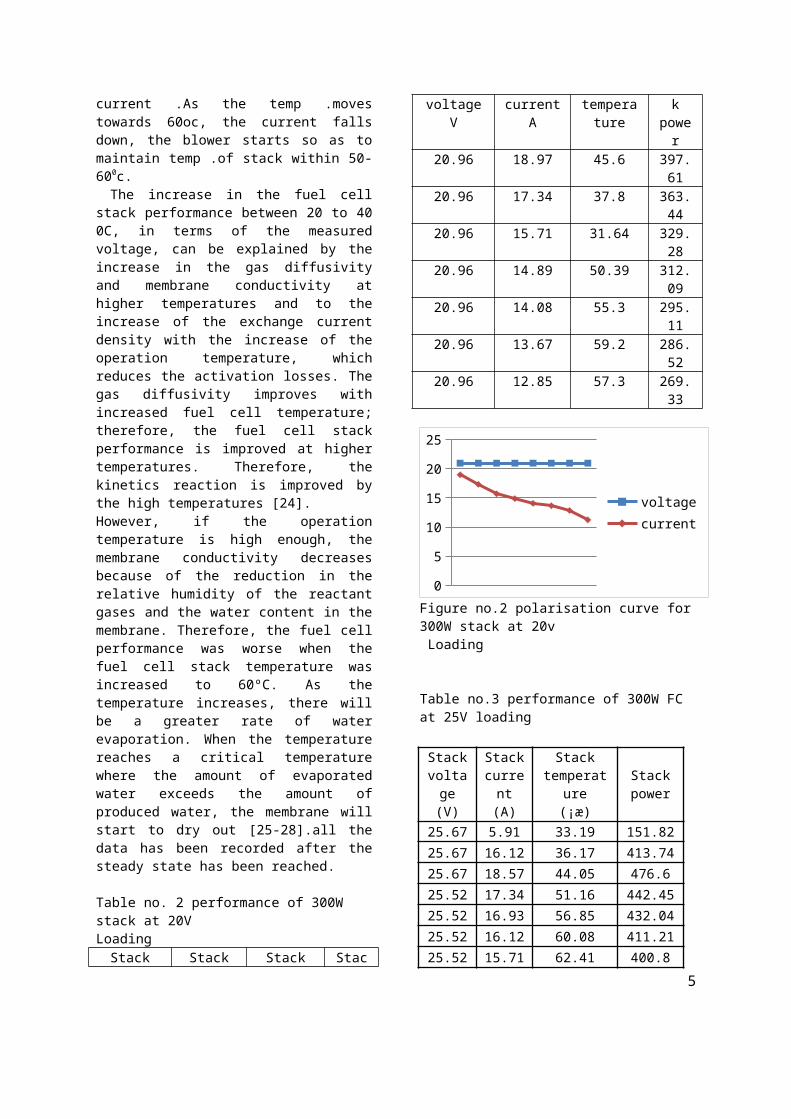
current .As the temp .movestowards 60oc, the current fallsdown, the blower starts so as tomaintain temp .of stack within 50-600c. The increase in the fuel cellstack performance between 20 to 400C, in terms of the measuredvoltage, can be explained by theincrease in the gas diffusivityand membrane conductivity athigher temperatures and to theincrease of the exchange currentdensity with the increase of theoperation temperature, whichreduces the activation losses. Thegas diffusivity improves withincreased fuel cell temperature;therefore, the fuel cell stackperformance is improved at highertemperatures. Therefore, thekinetics reaction is improved bythe high temperatures [24].However, if the operationtemperature is high enough, themembrane conductivity decreasesbecause of the reduction in therelative humidity of the reactantgases and the water content in themembrane. Therefore, the fuel cellperformance was worse when thefuel cell stack temperature wasincreased to 60ºC. As thetemperature increases, there willbe a greater rate of waterevaporation. When the temperaturereaches a critical temperaturewhere the amount of evaporatedwater exceeds the amount ofproduced water, the membrane willstart to dry out [25-28].all thedata has been recorded after thesteady state has been reached.
Table no. 2 performance of 300W stack at 20V LoadingStack Stack Stack Stac
voltageV
currentA
temperature
kpower
20.96 18.97 45.6 397.61
20.96 17.34 37.8 363.44
20.96 15.71 31.64 329.28
20.96 14.89 50.39 312.09
20.96 14.08 55.3 295.11
20.96 13.67 59.2 286.52
20.96 12.85 57.3 269.33
0
5
10
15
20
25
voltagecurrent
Figure no.2 polarisation curve for300W stack at 20v Loading
Table no.3 performance of 300W FC at 25V loading
Stackvoltage(V)
Stackcurrent(A)
Stacktemperat
ure(¡æ)
Stackpower
25.67 5.91 33.19 151.8225.67 16.12 36.17 413.7425.67 18.57 44.05 476.625.52 17.34 51.16 442.4525.52 16.93 56.85 432.0425.52 16.12 60.08 411.2125.52 15.71 62.41 400.8
5
25.52 15.3 63.7 390.3925.52 14.89 64.34 379.98
051015202530
voltagecurrent
Figure no.3 polarisation curve for300W stack at 25v loading
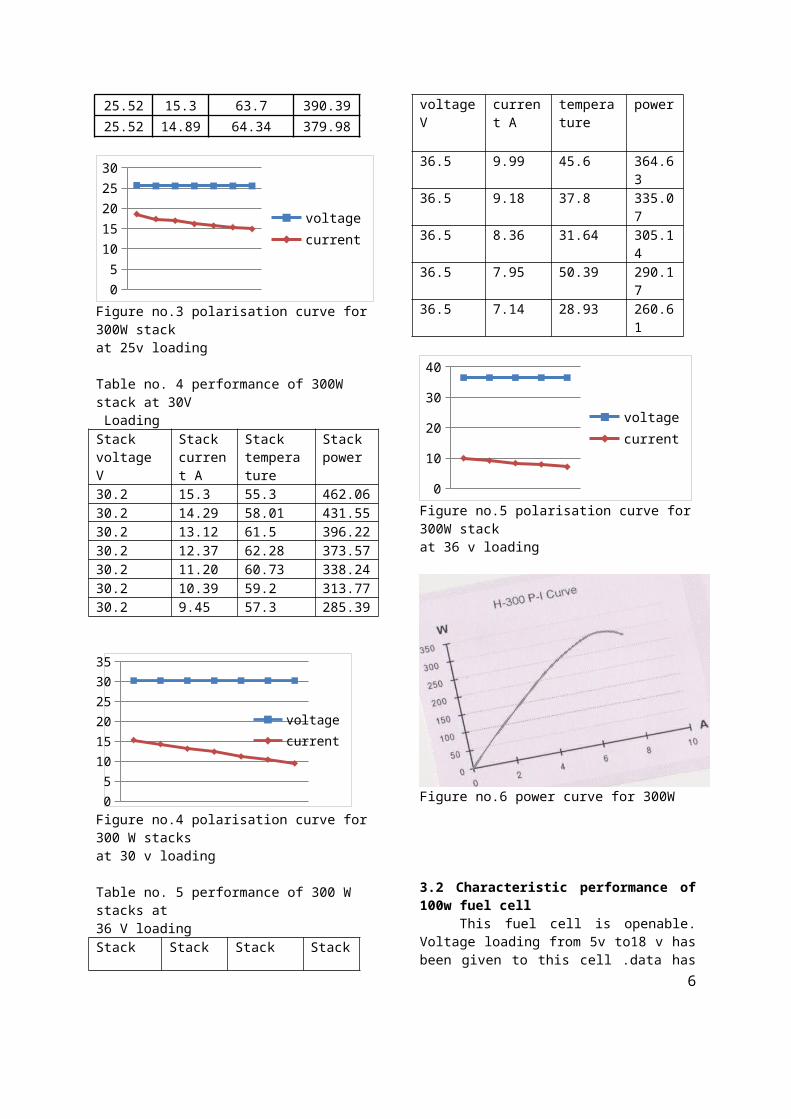
Table no. 4 performance of 300W stack at 30V LoadingStackvoltageV
Stackcurrent A
Stacktemperature
Stackpower
30.2 15.3 55.3 462.0630.2 14.29 58.01 431.5530.2 13.12 61.5 396.2230.2 12.37 62.28 373.5730.2 11.20 60.73 338.2430.2 10.39 59.2 313.7730.2 9.45 57.3 285.39
05101520253035
voltagecurrent
Figure no.4 polarisation curve for300 W stacks at 30 v loading
Table no. 5 performance of 300 W stacks at 36 V loadingStack Stack Stack Stack
voltageV
current A
temperature
power
36.5 9.99 45.6 364.63
36.5 9.18 37.8 335.07
36.5 8.36 31.64 305.14
36.5 7.95 50.39 290.17
36.5 7.14 28.93 260.61
0
10
20
30
40
voltagecurrent
Figure no.5 polarisation curve for300W stack at 36 v loading
Figure no.6 power curve for 300W
3.2 Characteristic performance of100w fuel cell This fuel cell is openable.Voltage loading from 5v to18 v hasbeen given to this cell .data has
6
been recorded & polarisation curvehas been obtained.as this stack isopenable, it takes time to producepower of 100w. Data of performance of 100w isgiven below.
Table no. 6 performance of 100W stack at 6V LoadingStackvoltageV
Stackcurrent A
Stacktemperature
Stackpower
6.52 16.52 50 107.776.52 15.71 42.24 102.456.52 15.3 39.4 99.796.52 14.89 28.28 94.796.52 14.48 27.89 89.926.52 13.10 30.22 85.41
0
5
10
15
20
voltagecurrent
Figure no.7 polarisation curve for100W stack at 6V loading
Table no. 7 performance of 100 W stacks at 11 V loadingStackvoltage v
Stackcurrent
Stacktemperature
Stackpower
11.07 9.59 47.54 106.1711.07 9.18 46.77 101.6511.07 8.77 46.25 97.1311.07 8.36 49.87 92.6111.07 7.95 50.51 88.0911.07 6.73 45.99 74.53
024681012
voltagecurrent
Figure no.8 polarisation curve for100W stack at 11V loading
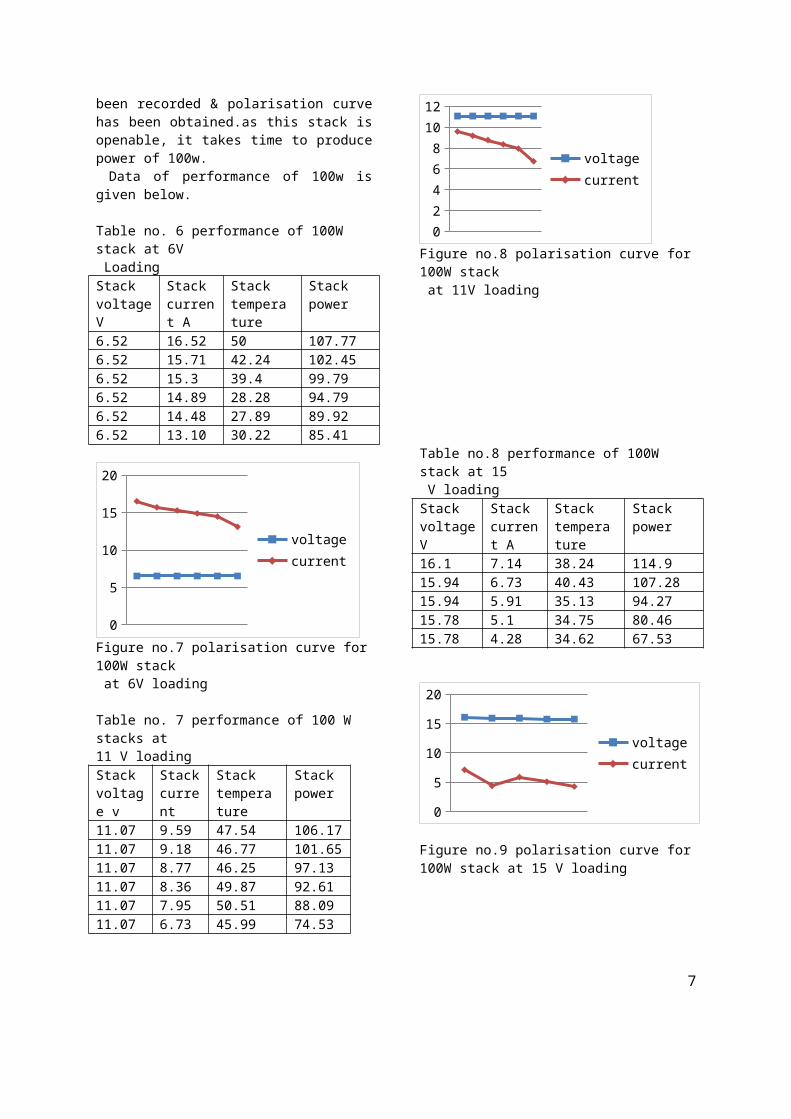
Table no.8 performance of 100W stack at 15 V loading StackvoltageV
Stack current A
Stacktemperature
Stack power
16.1 7.14 38.24 114.915.94 6.73 40.43 107.2815.94 5.91 35.13 94.2715.78 5.1 34.75 80.4615.78 4.28 34.62 67.53
0
5
10
15
20
voltagecurrent
Figure no.9 polarisation curve for100W stack at 15 V loading
7
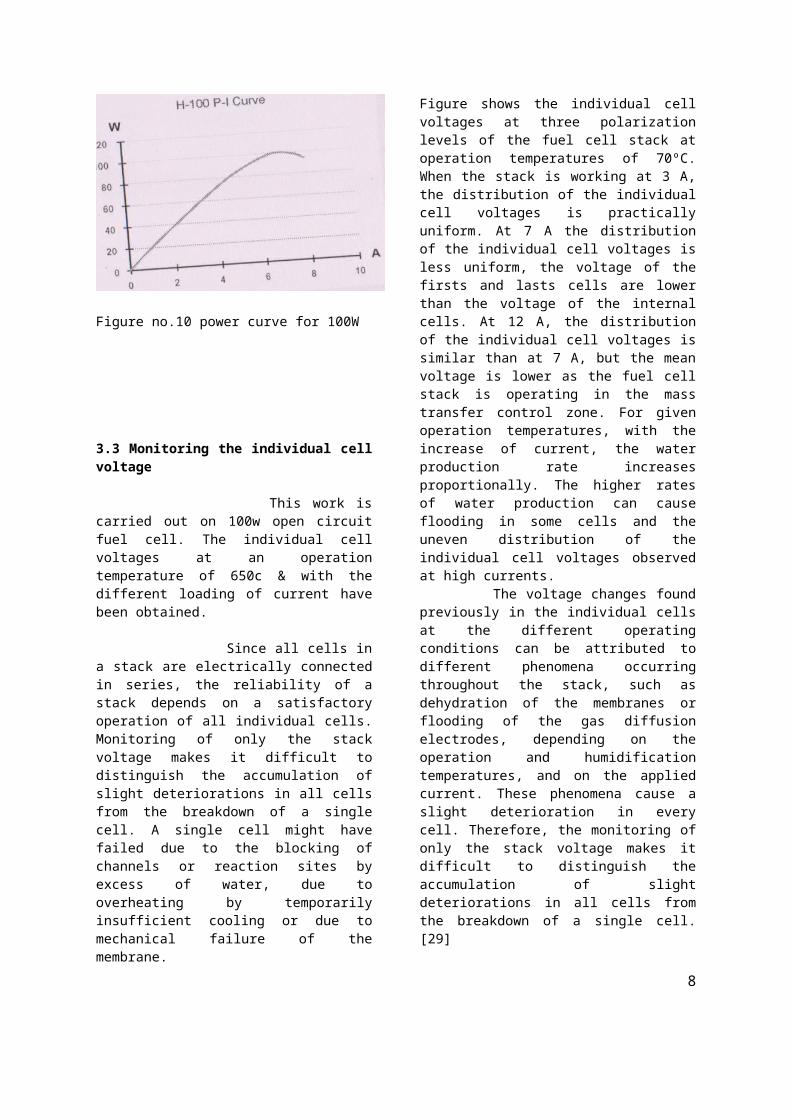
Figure no.10 power curve for 100W
3.3 Monitoring the individual cellvoltage
This work iscarried out on 100w open circuitfuel cell. The individual cellvoltages at an operationtemperature of 650c & with thedifferent loading of current havebeen obtained.
Since all cells ina stack are electrically connectedin series, the reliability of astack depends on a satisfactoryoperation of all individual cells.Monitoring of only the stackvoltage makes it difficult todistinguish the accumulation ofslight deteriorations in all cellsfrom the breakdown of a singlecell. A single cell might havefailed due to the blocking ofchannels or reaction sites byexcess of water, due tooverheating by temporarilyinsufficient cooling or due tomechanical failure of themembrane.
Figure shows the individual cellvoltages at three polarizationlevels of the fuel cell stack atoperation temperatures of 70ºC.When the stack is working at 3 A,the distribution of the individualcell voltages is practicallyuniform. At 7 A the distributionof the individual cell voltages isless uniform, the voltage of thefirsts and lasts cells are lowerthan the voltage of the internalcells. At 12 A, the distributionof the individual cell voltages issimilar than at 7 A, but the meanvoltage is lower as the fuel cellstack is operating in the masstransfer control zone. For givenoperation temperatures, with theincrease of current, the waterproduction rate increasesproportionally. The higher ratesof water production can causeflooding in some cells and theuneven distribution of theindividual cell voltages observedat high currents. The voltage changes foundpreviously in the individual cellsat the different operatingconditions can be attributed todifferent phenomena occurringthroughout the stack, such asdehydration of the membranes orflooding of the gas diffusionelectrodes, depending on theoperation and humidificationtemperatures, and on the appliedcurrent. These phenomena cause aslight deterioration in everycell. Therefore, the monitoring ofonly the stack voltage makes itdifficult to distinguish theaccumulation of slightdeteriorations in all cells fromthe breakdown of a single cell.[29]
8
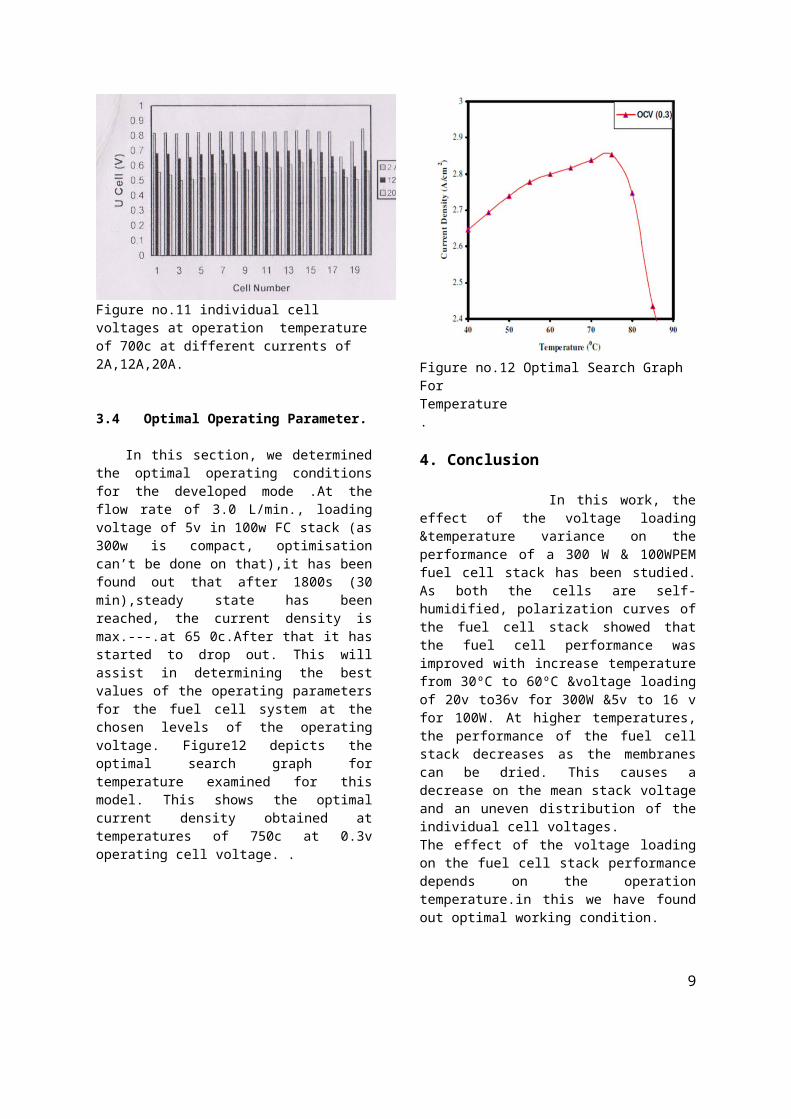
Figure no.11 individual cell voltages at operation temperatureof 700c at different currents of 2A,12A,20A.
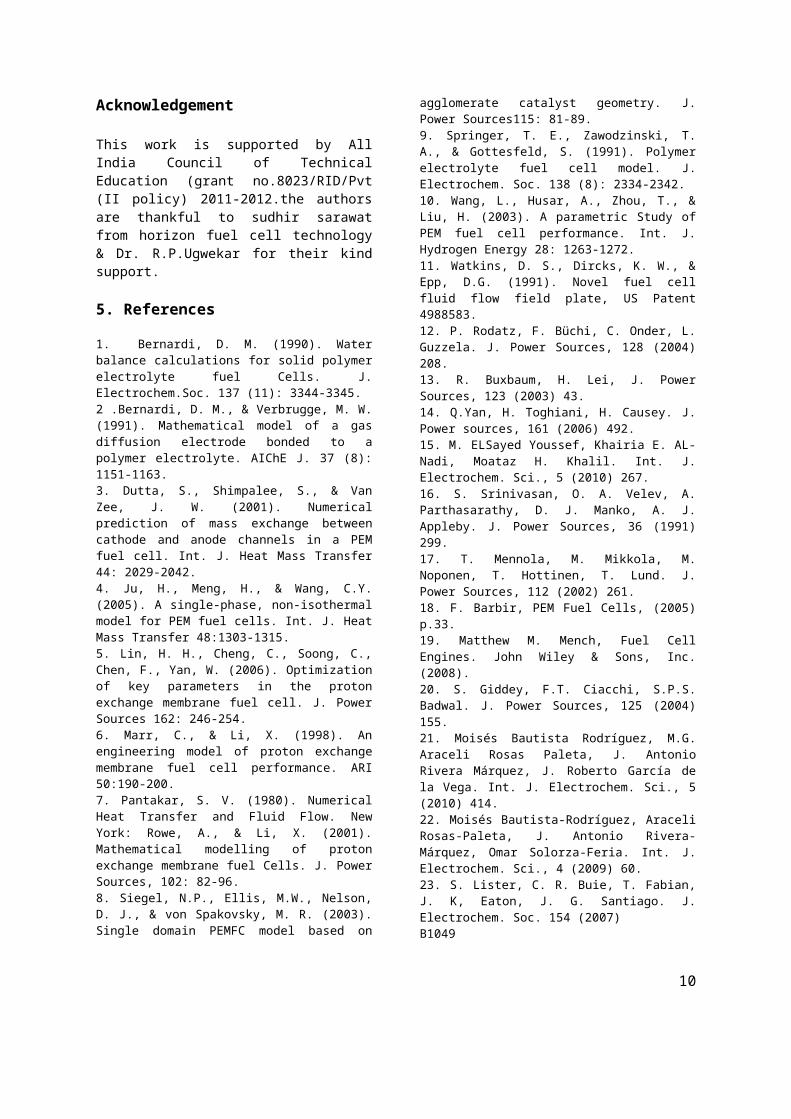
3.4 Optimal Operating Parameter.
In this section, we determinedthe optimal operating conditionsfor the developed mode .At theflow rate of 3.0 L/min., loadingvoltage of 5v in 100w FC stack (as300w is compact, optimisationcan’t be done on that),it has beenfound out that after 1800s (30min),steady state has beenreached, the current density ismax.---.at 65 0c.After that it hasstarted to drop out. This willassist in determining the bestvalues of the operating parametersfor the fuel cell system at thechosen levels of the operatingvoltage. Figure12 depicts theoptimal search graph fortemperature examined for thismodel. This shows the optimalcurrent density obtained attemperatures of 750c at 0.3voperating cell voltage. .
Figure no.12 Optimal Search Graph ForTemperature.
4. Conclusion
In this work, theeffect of the voltage loading&temperature variance on theperformance of a 300 W & 100WPEMfuel cell stack has been studied.As both the cells are self-humidified, polarization curves ofthe fuel cell stack showed thatthe fuel cell performance wasimproved with increase temperaturefrom 30ºC to 60ºC &voltage loadingof 20v to36v for 300W &5v to 16 vfor 100W. At higher temperatures,the performance of the fuel cellstack decreases as the membranescan be dried. This causes adecrease on the mean stack voltageand an uneven distribution of theindividual cell voltages. The effect of the voltage loadingon the fuel cell stack performancedepends on the operationtemperature.in this we have foundout optimal working condition.
9
Acknowledgement This work is supported by AllIndia Council of TechnicalEducation (grant no.8023/RID/Pvt(II policy) 2011-2012.the authorsare thankful to sudhir sarawatfrom horizon fuel cell technology& Dr. R.P.Ugwekar for their kindsupport.
5. References
1. Bernardi, D. M. (1990). Waterbalance calculations for solid polymerelectrolyte fuel Cells. J.Electrochem.Soc. 137 (11): 3344-3345.2 .Bernardi, D. M., & Verbrugge, M. W.(1991). Mathematical model of a gasdiffusion electrode bonded to apolymer electrolyte. AIChE J. 37 (8):1151-1163.3. Dutta, S., Shimpalee, S., & VanZee, J. W. (2001). Numericalprediction of mass exchange betweencathode and anode channels in a PEMfuel cell. Int. J. Heat Mass Transfer44: 2029-2042.4. Ju, H., Meng, H., & Wang, C.Y.(2005). A single-phase, non-isothermalmodel for PEM fuel cells. Int. J. HeatMass Transfer 48:1303-1315.5. Lin, H. H., Cheng, C., Soong, C.,Chen, F., Yan, W. (2006). Optimizationof key parameters in the protonexchange membrane fuel cell. J. PowerSources 162: 246-254.6. Marr, C., & Li, X. (1998). Anengineering model of proton exchangemembrane fuel cell performance. ARI50:190-200.7. Pantakar, S. V. (1980). NumericalHeat Transfer and Fluid Flow. NewYork: Rowe, A., & Li, X. (2001).Mathematical modelling of protonexchange membrane fuel Cells. J. PowerSources, 102: 82-96.8. Siegel, N.P., Ellis, M.W., Nelson,D. J., & von Spakovsky, M. R. (2003).Single domain PEMFC model based on
agglomerate catalyst geometry. J.Power Sources115: 81-89.9. Springer, T. E., Zawodzinski, T.A., & Gottesfeld, S. (1991). Polymerelectrolyte fuel cell model. J.Electrochem. Soc. 138 (8): 2334-2342.10. Wang, L., Husar, A., Zhou, T., &Liu, H. (2003). A parametric Study ofPEM fuel cell performance. Int. J.Hydrogen Energy 28: 1263-1272.11. Watkins, D. S., Dircks, K. W., &Epp, D.G. (1991). Novel fuel cellfluid flow field plate, US Patent4988583.12. P. Rodatz, F. Büchi, C. Onder, L.Guzzela. J. Power Sources, 128 (2004)208. 13. R. Buxbaum, H. Lei, J. PowerSources, 123 (2003) 43. 14. Q.Yan, H. Toghiani, H. Causey. J.Power sources, 161 (2006) 492. 15. M. ELSayed Youssef, Khairia E. AL-Nadi, Moataz H. Khalil. Int. J.Electrochem. Sci., 5 (2010) 267. 16. S. Srinivasan, O. A. Velev, A.Parthasarathy, D. J. Manko, A. J.Appleby. J. Power Sources, 36 (1991)299. 17. T. Mennola, M. Mikkola, M.Noponen, T. Hottinen, T. Lund. J.Power Sources, 112 (2002) 261. 18. F. Barbir, PEM Fuel Cells, (2005)p.33. 19. Matthew M. Mench, Fuel CellEngines. John Wiley & Sons, Inc.(2008). 20. S. Giddey, F.T. Ciacchi, S.P.S.Badwal. J. Power Sources, 125 (2004)155. 21. Moisés Bautista Rodríguez, M.G.Araceli Rosas Paleta, J. AntonioRivera Márquez, J. Roberto García dela Vega. Int. J. Electrochem. Sci., 5(2010) 414. 22. Moisés Bautista-Rodríguez, AraceliRosas-Paleta, J. Antonio Rivera-Márquez, Omar Solorza-Feria. Int. J.Electrochem. Sci., 4 (2009) 60. 23. S. Lister, C. R. Buie, T. Fabian,J. K, Eaton, J. G. Santiago. J.Electrochem. Soc. 154 (2007) B1049
10

24. P. Berg, K. Promislow, J St.Pierre, J. Stumper, B. Wetton. J.Electrochem. Soc. 151 (2004) A341. 25. J. Zhang, Y. Tang, C. Song, X.Cheng, J. Zhang, H. Wnag.Electrochimica Acta, 52 (2007) 5095.26. N. Büchi, S. Srinivasan. J.Electrochem. Soc. 144 (1997) 8. 27. Q. Yan, H. Toghiani, J. Wu. J.Power Sources, 158 (2006) 316.
28. M.M. Saleh, T. Okajima, M. Hayase,F. Kitamura, T. Ohsaka. J.PowerSources, 164 (2007) 503. 29. L.Wang, A. Husar, T. Zhou, H. Liu.International Journal of HydrogenEnergy, 28 (2003) 1263 30. M.Perez-Page, V.Perez-Herranz(2011) Effect of the operation&humidification temperatures on theperformance of Pem Fuel Cell stacks ondead –end mode.Int.J.Electrochem.sci., 6(2011)492-505.
11