Embed Size (px)
Citation preview
University of Windsor University of Windsor
Scholarship at UWindsor Scholarship at UWindsor
Electronic Theses and Dissertations Theses, Dissertations, and Major Papers
2018
Effective Ignition Control in Advanced Combustion Engines Effective Ignition Control in Advanced Combustion Engines
Kelvin Xie University of Windsor
Follow this and additional works at: https://scholar.uwindsor.ca/etd
Part of the Engineering Commons
Recommended Citation Recommended Citation Xie, Kelvin, "Effective Ignition Control in Advanced Combustion Engines" (2018). Electronic Theses and Dissertations. 7486. https://scholar.uwindsor.ca/etd/7486
This online database contains the full-text of PhD dissertations and Masters’ theses of University of Windsor students from 1954 forward. These documents are made available for personal study and research purposes only, in accordance with the Canadian Copyright Act and the Creative Commons license—CC BY-NC-ND (Attribution, Non-Commercial, No Derivative Works). Under this license, works must always be attributed to the copyright holder (original author), cannot be used for any commercial purposes, and may not be altered. Any other use would require the permission of the copyright holder. Students may inquire about withdrawing their dissertation and/or thesis from this database. For additional inquiries, please contact the repository administrator via email ([email protected]) or by telephone at 519-253-3000ext. 3208.
Effective Ignition Control in Advanced Combustion Engines
by
Kelvin Xie
A Dissertation
Submitted to the Faculty of Graduate Studies
through the Department of Mechanical, Automotive and Materials Engineering
in Partial Fulfillment of the Requirements for
the Degree of Doctor of Philosophy at the
University of Windsor
Windsor, Ontario, Canada
2018
© 2018 Kelvin Xie
EFFECTIVE IGNITION CONTROL IN ADVANCED COMBUSTION ENGINES
by
Kelvin Xie
APPROVED BY:
______________________________________________
S. Habibi, External Examiner
McMaster University
______________________________________________
X. Chen
Department of Electrical and Computer Engineering
______________________________________________
J. Tjong
Department of Mechanical, Automotive and Materials Engineering
______________________________________________
G.T. Reader
Department of Mechanical, Automotive and Materials Engineering
______________________________________________
M. Zheng, Advisor
Department of Mechanical, Automotive and Materials Engineering
May 29, 2018
iii
DECLARATION OF ORIGINALITY
I hereby certify that I am the sole author of this thesis and that no part of this thesis has
been published or submitted for publication.
I certify that, to the best of my knowledge, my thesis does not infringe upon anyone’s
copyright nor violate any proprietary rights and that any ideas, techniques, quotations, or
any other material from the work of other people included in my thesis, published or
otherwise, are fully acknowledged in accordance with the standard referencing practices.
Furthermore, to the extent that I have included copyrighted material that surpasses the
bounds of fair dealing within the meaning of the Canada Copyright Act, I certify that I
have obtained a written permission from the copyright owner(s) to include such
material(s) in my thesis and have included copies of such copyright clearances to my
appendix.
I declare that this is a true copy of my thesis, including any final revisions, as approved
by my thesis committee and the Graduate Studies office, and that this thesis has not been
submitted for a higher degree to any other University or Institution.
iv
ABSTRACT
The primary objective of the research was to study the limitations of the
conventional spark ignition architecture with respect to ultra-lean and dilute combustion
and develop ignition technologies and strategies that can facilitate such combustion
strategies. A range of strategies using conventional and modified ignition coil systems
were used in combustion chamber and engine tests to understand the effectiveness of the
energy delivery mechanisms and different energy profiles. At operating conditions where
the conventional ignition strategies had difficulties in achieving adequate ignition
stability, the use of enhanced energy levels with different energy profiles for the
achievement of effective ignition under high dilution ratio engine operating conditions
was found to be necessary. A novel multiple-site ignition system was developed. It has
been demonstrated to effectively deliver of ignition energy and achieved higher tolerance
for lean combustion and high-dilution modes of combustion.
A radio-frequency non-thermal plasma ignition system was developed to
investigate its ability to address some of the deficiencies of the spark ignition architecture.
Compared to the conventional spark ignition architecture, the ignition volume induced by
the corona discharge was greater in size and its growth was less impeded with the
absence of a close ground electrode. The rapid energization and discharge characteristics
additionally offered a more flexible control path. The formation of multiple ignition sites
was possible, although implementation of the system in the engine environment has
proven to be a continuing challenge.

v
DEDICATION
This work is dedicated to my mom and dad.
vi
ACKNOWLEDGEMENTS
The work presented in this manuscript was made possible through the combined
contributions of many current and former research associates. I would like to thank Dr.
Raj Kumar, Dr. Clarence Mulenga, Dr. Usman Asad, Dr. Xiaoye Han, and Yuyu Tan for
their previous work on setting up the engine test cells. I would like to thank all my
colleagues, Dr. Meiping Wang, Dr. Shui Yu, Dr. Marko Jeftic, Dr. Tongyang Gao, Dr.
Prasad Divekar, Dr. Xiao Yu, Shouvik Dev, Qingyuan Tan, and Zhenyi Yang for the
many things they have taught me though our insightful discussions.
I am immensely grateful for the guidance of my primary advisor, Dr. Ming Zheng,
and his influence on my intellectual and professional development. In addition, I am
thankful to Dr. Xiang Chen, Dr. Jimi Tjong, Dr. Graham T. Reader, and Dr. Saeid Habibi
for their advisory roles to this work.
vii
TABLE OF CONTENTS
DECLARATION OF ORIGINALITY .......................................................................... iii
ABSTRACT ...................................................................................................................... iv
DEDICATION....................................................................................................................v
ACKNOWLEDGEMENTS ............................................................................................ vi
LIST OF TABLES .............................................................................................................x
LIST OF FIGURES ......................................................................................................... xi
NOMENCLATURE .........................................................................................................xv
1. CHAPTER I INTRODUCTION ...............................................................................1
1.1 The Engine Cycle ..................................................................................................2
1.2 Dilute Combustion for Spark Ignition Engines .....................................................7
1.3 Spark Ignition ......................................................................................................10
1.4 Diesel Low-Temperature Combustion ................................................................14
1.5 Trends of Advanced Combustion Engines ..........................................................16
2. CHAPTER II OBJECTIVES ..................................................................................19
2.1 Research Objective ..............................................................................................19
2.2 Research Motivation ...........................................................................................19
3. CHAPTER III LITERATURE REVIEW ..............................................................24
3.1 Advanced Ignition Systems .................................................................................24
3.2 Electrical Breakdown ..........................................................................................28
3.3 Transient Plasma Ignition....................................................................................30
3.4 Radio-Frequency Plasma.....................................................................................30
4. CHAPTER IV METHODOLOGY .........................................................................32
4.1 Combustion Vessels ............................................................................................32
4.2 Optical Imaging ...................................................................................................36
viii
4.3 Spark Control and Diagnostics ............................................................................38
4.4 Spark Ignition Components .................................................................................38
4.5 Corona Ignition System .......................................................................................42
4.6 Single-Cylinder Test Engine ...............................................................................43
5. CHAPTER V EFFECT OF ENERGY AND ENERGY PROFILE ON SPARK
IGNITION ........................................................................................................................50
5.1 Effect of Discharge Energy .................................................................................50
5.1.1 Quiescent Conditions ...................................................................................50
5.1.2 Flow Conditions ...........................................................................................56
5.1.3 Engine Conditions ........................................................................................59
5.2 Energy Profile Strategies .....................................................................................67
5.2.1 Multi-coil Ignition ........................................................................................67
5.2.2 Capacitor Discharge .....................................................................................73
5.2.3 Pre-chamber Igniter .....................................................................................83
6. CHAPTER VI MULTIPLE SITE SPARK IGNITION ........................................88
6.1 Multi-pole Ignition ..............................................................................................88
6.2 Extension of Dilution Limit ................................................................................92
6.2.1 Lean Combustion .........................................................................................93
6.2.2 EGR Dilution Combustion ...........................................................................96
7. CHAPTER VII VOLUME IGNITION WITH NON-THERMAL PLASMA
DISCHARGE .................................................................................................................101
7.1 Non-thermal Plasma Discharge .........................................................................101
7.1.1 Electrical Power Control Characteristics ...................................................101
7.1.2 Physical Discharge Characteristics ............................................................106
7.2 Control of Discharge in Air ...............................................................................113
7.2.1 Discharge Voltage Control ........................................................................113
ix
7.2.2 Discharge Duration Control .......................................................................116
7.3 Non-thermal Plasma Ignition ............................................................................117
7.3.1 Flame Kernel Formation Process ...............................................................117
7.3.2 Effect of Discharge Voltage.......................................................................120
7.3.3 Effect of Discharge Duration .....................................................................122
7.3.4 Minimum Discharge Durations for Ignition ..............................................125
7.4 Plasma and Flame Interactions ..........................................................................128
7.4.1 Post-Ignition Flame Kernel Acceleration ..................................................128
8. CHAPTER VIII CONCLUSIONS AND RECOMMENDATIONS ..................132
8.1 Effect of Spark Ignition Energy and Energy Profile .........................................132
8.2 Multiple-Site Spark Ignition .............................................................................132
8.3 Non-thermal Plasma Ignition ............................................................................133
8.4 Application to Ultra-lean or High Dilution Ignition .........................................134
8.5 Recommendations for Future Work ..................................................................134
REFERENCES ...............................................................................................................136
APPENDIX A: GASOLINE HCCI COMBUSTION .................................................146
APPENDIX B: NUMERICAL SIMULATION OF DIESEL AUTO-IGNITION ...153
B.1 Chemical Description of Ignition ......................................................................153
B.2 Sensitivity of Ignition to Physical Parameters ..................................................155
APPENDIX C: NUMERICAL SIMULATION OF LAMINAR FLAME SPEED ..161
APPENDIX D: NOX GENERATION UNDER ELECTRICAL DISCHARGE......163
APPENDIX E: EFFECT OF SPARK GAP SIZE ON KERNEL FORMATION ...166
VITA AUCTORIS .........................................................................................................170
LIST OF PUBLICATIONS ..........................................................................................171
x
LIST OF TABLES
Table 1-1: Specific Heat Ratios of Select Gas Species ....................................................... 9
Table 4-1: Engine Specifications ...................................................................................... 45
Table 4-2: Gas Analyzer Model and Measurement Range ............................................... 49
xi
LIST OF FIGURES
Figure 1-1: The Piston-Crank Mechanism and Engine Cycle ............................................ 3
Figure 1-2: Effect of Compression and Specific Heat Ratios on Ideal Cycle Efficiency ... 5
Figure 1-3: P-V Diagram of an Engine Cycle .................................................................... 6
Figure 1-4: Heat-Release Analysis of Combustion ............................................................ 7
Figure 1-5: Reducing Pumping Work with EGR ................................................................ 8
Figure 1-6: Simplified Spark Ignition Circuit ................................................................... 10
Figure 1-7: Primary Coil Charging Characteristics .......................................................... 12
Figure 1-8: Sample Voltage and Current Profiles for Conventional Spark Ignition ........ 13
Figure 1-9: Discharge and Power Profiles for Conventional Spark Ignition .................... 14
Figure 2-1: Fundamental Aspects of Combustion and Available Controls ...................... 20
Figure 2-2: Impact of Dilution of Spark Timing and Flame Development ...................... 22
Figure 2-3: Comparison of Cycle-to-Cycle Variations ..................................................... 23
Figure 3-1: Potential for Brake Thermal Efficiency Gains [4] ......................................... 26
Figure 3-2: Paschen Curve for Air, adapted from [44] ..................................................... 29
Figure 4-1: CV1 Small Optical Combustion Vessel ......................................................... 33
Figure 4-2: CV2 Intermediate Combustion Vessel ........................................................... 33
Figure 4-3: CV3 Large Optical Combustion Vessel ......................................................... 34
Figure 4-4: Schematic Diagram of Gas Preparation Systems ........................................... 36
Figure 4-5: Z-type Shadowgraph Optical Setup ............................................................... 37
Figure 4-6: Photos of Spark Plugs .................................................................................... 39
Figure 4-7: Later Generation Manufacturing Prototype Multi-pole Spark Plug .............. 40
Figure 4-8: Earlier Generation Lab Prototype Multi-pole Spark Plug ............................. 41
Figure 4-9: Simplified Schematic of Corona Ignition System.......................................... 43
Figure 4-10: Corona Igniter .............................................................................................. 43
Figure 4-11: Engine Igniter Adaption and Combustion Chamber Shape ......................... 44
Figure 4-12: Photo of Engine Setup.................................................................................. 45
Figure 4-13: Engine Test Cell Setup ................................................................................. 47
Figure 5-1: Discharge Characteristics in Conventional System at Different Energies ..... 51
Figure 5-2: Discharge Energy Effect under Stoichiometric Conditions ........................... 52
Figure 5-3: Discharge Energy Effect under Lean Conditions .......................................... 53
xii
Figure 5-4: Flame Kernel Growth under Stoichiometric Case ......................................... 54
Figure 5-5: Flame Kernel Growth under Lean Ignition Cases ......................................... 55
Figure 5-6: Effect of Energy on Ignition Success Rate under Quiescent Conditions ....... 56
Figure 5-7: Effect of Cross-flow Velocity on Discharge Characteristics ......................... 57
Figure 5-8: Restrike Behavior Under Air Flow ................................................................ 58
Figure 5-9: Spark Breakdown Voltage at Various Spark Timings ................................... 61
Figure 5-10: Spark Breakdown Voltage as a Function of Gas Density ............................ 62
Figure 5-11: Calculated In-Cylinder Temperature and Laminar Flame Speed ................ 63
Figure 5-12: Effect of Spark Energy on Engine Operation .............................................. 64
Figure 5-13: Comparison of Spark Energy ....................................................................... 64
Figure 5-14: Effect of Spark Energy at Lean Conditions ................................................. 66
Figure 5-15: Comparison of Spark Energy at Lean Conditions ....................................... 66
Figure 5-16: Effect of Spark Energy up to Lean Limit ..................................................... 67
Figure 5-17: Current Enhancement with Multi-coil Discharge ........................................ 68
Figure 5-18: Discharge Parameters of Multi-coil Strategy ............................................... 69
Figure 5-19: Multi-coil Ignition Effect ............................................................................. 70
Figure 5-20: Single Coil vs Multi-coil Ignition ................................................................ 71
Figure 5-21: Combustion Phasing Stability Scatter Plot .................................................. 72
Figure 5-22: Load Stability Scatter Plot ........................................................................... 72
Figure 5-23: High Energy Capacitor Discharge Configuration ........................................ 74
Figure 5-24: High Power Capacitor Discharge Configuration ......................................... 74
Figure 5-25: Comparison of Capacitor Discharge Power ................................................. 75
Figure 5-26: Capacitor Discharge Effect on Combustion Parameters .............................. 76
Figure 5-27: Capacitive Discharge Effect on Pressure ..................................................... 77
Figure 5-28: Combustion Phasing Stability Scatter Plot at Lambda 1.2 .......................... 78
Figure 5-29: Load Stability Scatter Plot at Lambda 1.2 ................................................... 78
Figure 5-30: Capacitive Discharge Effect on Combustion Parameters ............................ 79
Figure 5-31: Combustion Phasing Stability Scatter Plot at Lambda 1.7 .......................... 81
Figure 5-32: Load Stability Scatter Plot at Lambda 1.7 ................................................... 82
Figure 5-33: Adjacent-cycle Impacts on IMEP ................................................................ 83
Figure 5-34: Images of Pre-chamber Flame Jet in Combustion Vessel............................ 84
xiii
Figure 5-35: Pre-chamber Combustion Comparison ........................................................ 85
Figure 5-36: Pre-chamber Igniter Pressure Trace ............................................................. 85
Figure 5-37: Difference in Spark Timing for Pre-chamber Igniter ................................... 86
Figure 5-38: Comparison of Pre-chamber Igniter Test Engine Load and Emissions ....... 87
Figure 6-1: Location and Orientation of Spark Poles in Multi-pole Configuration ......... 89
Figure 6-2: Comparison between Single Pole and Multi-pole Ignition ............................ 90
Figure 6-3: Combustion Phasing Stability Scatter Plot at Lambda 1.4 ............................ 91
Figure 6-4: Load Stability Scatter Plot at Lambda 1.4 ..................................................... 91
Figure 6-5: Multi-pole Ignition Effect .............................................................................. 92
Figure 6-6: Lean Extension Using Multi-pole Ignition .................................................... 94
Figure 6-7: Efficiency and Emissions of Lean Combustion ............................................. 95
Figure 6-8: EGR Dilution Limit Extension Using Multi-pole Ignition ............................ 97
Figure 6-9: Efficiency and Emissions of EGR Combustion ............................................. 98
Figure 6-10: Lean and EGR Dilution Comparison ......................................................... 100
Figure 7-1: Voltage Buildup Profile in Corona Igniter ................................................... 102
Figure 7-2: Effect of Primary Voltage on Discharge Voltage and Power ...................... 104
Figure 7-3: Corona Discharge Power Curve ................................................................... 105
Figure 7-4: Discharge Voltage as a Function of Frequency ........................................... 106
Figure 7-5: Image Field and Recording Parameters ....................................................... 107
Figure 7-6: High-speed Image Sequence of Corona Discharge...................................... 109
Figure 7-7: High-speed Image Sequence of Corona Transition to Arcing ..................... 110
Figure 7-8: Formation of Corona Streamer at Higher Pressure ...................................... 111
Figure 7-9: Corona Wind Effect in Air and Combusting Mixture.................................. 113
Figure 7-10: Image Field and Recording Parameters ..................................................... 114
Figure 7-11: Pressure and Voltage Effect on Corona Discharge .................................... 115
Figure 7-12: Examples of Arcing Conditions ................................................................. 116
Figure 7-13: Pressure and Duration Effect on Corona Discharge .................................. 117
Figure 7-14: Image Field and Recording Parameters ..................................................... 118
Figure 7-15: Direct Image Overlaid with Shadowgraph of Corona Ignition Event ....... 119
Figure 7-16: Shadowgraph Images of Corona Voltage Effect on Ignition ..................... 121
Figure 7-17: Shadowgraph Area of Corona under Different Voltage Conditions .......... 122
xiv
Figure 7-18: Shadowgraph Images of Corona Duration Effect on Ignition ................... 124
Figure 7-19: Shadowgraph Area of Corona under Different Discharge Durations ........ 125
Figure 7-20: Effect of Corona Voltage on Minimum Ignition Energy ........................... 126
Figure 7-21: Effect of Lambda on Corona Ignition Energy ........................................... 127
Figure 7-22: Influence of Corona Duration on Ignition Success Rate of Lean Mixtures 128
Figure 7-23: Discharge Profile of Post-Ignition Corona Pulse Strategy......................... 129
Figure 7-24: Shadowgraph Images of Post-Ignition Pulse Effect .................................. 130
Figure 7-25: Shadowgraph Area of Post-Ignition Corona Pulses ................................... 131
xv
NOMENCLATURE
γ Isentropic ratio
λ Excess air ratio
θ Engine crank position
abs Absolute
ATDC After top dead centre
BDC Bottom dead centre
BMEP Brake mean effective pressure
CA5 Crank angle of 5% heat release
CA50 Crank angle of 50% heat release
CAD Crank angle degree
CR Compression ratio
CRP Common-rail pressure
CV Combustion vessel
CVC Constant volume chamber
DSO Digital storage oscilloscope
E Energy
EGR Exhaust gas recirculation
EVO Exhaust valve opening
FOV Field of view
FID Flame ionization detector
FSN Filter smoke number
xvi
FTIR Fourier transform infrared
g/kW∙h Unit of quantity normalized by engine work output
HC Hydrocarbon
i Current
IGBT Insulated-gate bipolar transistor
IMEP Indicated mean effective pressure
IVO Intake valve opening
ISFC Indicated specific fuel consumption
L Inductance
LNV Least numerical value
m mass
MAF Mass air flow
η Indicated thermal efficiency
NOx Nitrogen oxides
p Pressure
ppb Parts per billion
ppm Parts per million
Q Heat energy
R 1) Resistance 2) ideal gas constant
RPM Revolutions per minute
T Temperature
t Time
TDC Top dead centre

xvii
THC Total hydrocarbon
V 1) Volume 2) voltage
Vd Displacement volume
WOT Wide open throttle
1
1. CHAPTER I
INTRODUCTION
The continuing need to improve the efficiency and emissions of the internal
combustion engines, which currently power the vast majority of the more than twenty
two million light-duty vehicles and one million heavy-duty vehicles in Canada, is an
important part of the public policy to address the issues of climate change and urban air
quality [1]. Regulations that have been enacted over the last four decades have driven
very significant innovations. Technologies such as variable valve actuation, direct fuel
injection, downsized and turbocharged engines, are being increasingly deployed into
vehicles [2]. The latest fuel economy standards, announced in 2011 by the United States
Environmental Protection Agency, have set annual improvement targets of approximately
5% per year, from the 2016 baseline of 225 g/mile of carbon dioxide emissions to 143
g/mile for 2025 passenger cars [3]. A wide array of technologies, such as improved
aerodynamics, hybridization and electrification, lightweight materials, and more
advanced transmissions will contribute to the targeted goal. The majority of the
improvements, however, are expected to come from internal combustion engines. In
order to achieve the long-term targets, major improvements are necessary in the
combustion systems. For spark-ignition engines, achieving dilute combustion with
cooled exhaust gas recirculation or lean burn combustion is seen as a key pathway to the
enhancement of efficiency [4]. For diesel compression-ignition engines, minimizing
nitrogen oxide and particulate matter emissions without sacrificing thermal efficiency is
the challenge.
2
1.1 The Engine Cycle
The combustion volume of a modern engine is formed by the cylinder head on the
top, the piston on the bottom, and the cylinder bore in the radial direction. The piston,
linked to the engine crank-shaft by a connecting rod and crank-arm, sweeps up and down
the cylinder bore as the engine crankshaft rotates. A schematic of the piston and crank
mechanism is shown in Figure 1-1. The cylinder volume with respect to the engine
crank-arm angular position, θ, follows the relation:
𝑉(𝜃) = 𝑉𝑑 ×
(
1
𝐶𝑅 − 1+ 0.5 ×
(
1 +
𝑙
𝑎− cos(𝜃) − ((
𝑙
𝑎)2
− 𝑠𝑖𝑛2(𝜃))
12
)
)
(1.1)
where 𝑙 is the connecting rod length, 𝑎 is half the engine stroke length, 𝐶𝑅 is the engine
compression ratio, and 𝑉𝑑 is the cylinder displacement volume. The cylinder
displacement volume is the product of the bore area and the stroke length. The
compression ratio is the ratio of the maximum to minimum cylinder volume.
Conventionally, θ is referenced from the axis formed by the crank-shaft and the piston.
At a θ of zero crank angle degree (CAD), the piston is at its top-most position and the
cylinder volume is at a minimum. This position is known as the piston top-dead centre
(TDC) position. As θ increases to 180° CAD, the piston moves to its bottom-most
position and the cylinder volume is at its maximum. The relevant engine cycle is defined
by four of such strokes over two revolutions of the crank. In the intake stroke, an intake
valve is opened to draw in fresh air charge into the cylinder as the piston moves
downward (θ from 0 to 180° CAD). In the compression stroke (θ from 180 to 360°
CAD), the intake valve closes and the charge is compressed. The charge is expanded in
3
the expansion stroke (θ from 360 to 540° CAD). Finally, the charge is expelled from the
cylinder by holding open an exhaust valve while the piston moves upward (θ from 540 to
720° CAD).
Figure 1-1: The Piston-Crank Mechanism and Engine Cycle
The compression and expansion of the in-cylinder working fluid, in the absence
of combustion, approximates the relation:
𝑝𝑉𝛾 = 𝑐𝑜𝑛𝑠𝑡𝑎𝑛𝑡
(1.2)
where 𝑝 is the pressure in the cylinder, 𝑉 is cylinder volume, and 𝛾 is the ratio of the heat
capacities 𝐶𝑝
𝐶𝑣. The conditions of one point of an adiabatic process can be used to define
subsequent points by the relation:
𝑝0𝑉0𝛾= 𝑝1𝑉1
𝛾
(1.3)
0
10
20
0 180 360 540 720
Pre
ss
ure
(b
ar)
Combustion
MotoringSpark
TDCBDCTDC TDCBDC
0.0
0.5
1.0
0 180 360 540 720
Vo
lum
e (
L)
Crank Angle Degree
Compression Expansion ExhaustIntake
IVC IVOEVOEVC
θ
4
The mean gas temperature in the cylinder is approximated by the ideal gas law:
𝑝𝑉 = 𝑚𝑅𝑇
(1.4)
In diesel engines, the compression ratios typically range from 16:1 to 19:1,
resulting in peak compression temperatures of 850 K – 1000 K. This high temperature is
utilized to vaporize and ignite the liquid diesel fuel. In spark-ignition engines lower
compression ratios, typically from 9:1 to 13:1, are used. The compression temperatures
are significantly lower and below the typical ignition temperatures of the fuel. Instead, a
spark discharge initiates a flame front that propagates through the cylinder volume. In
both cases, the heat released by the combustion of the fuel raises the pressure and
temperature of the working fluid. Expansion of the working fluid converts a part of the
combustion thermal energy into work, which is transferred to the engine crank-shaft. The
limit to the thermodynamic efficiency of this process is dependent on the degree of
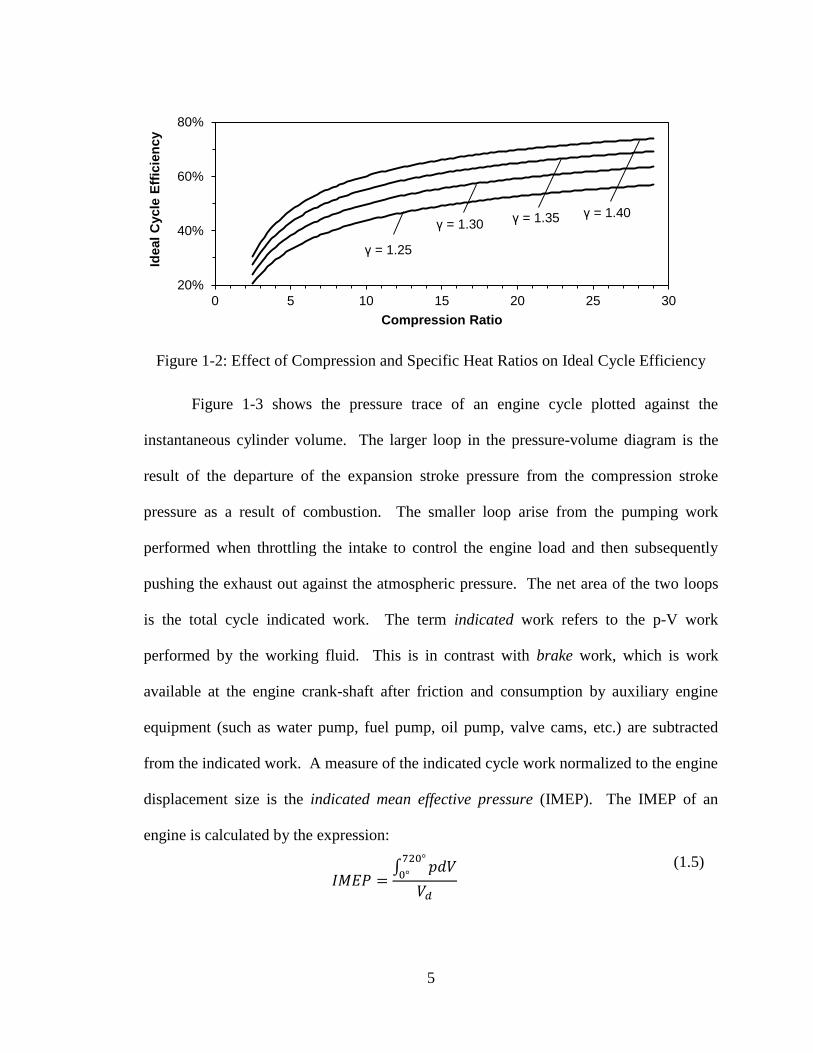
expansion possible, aside from the inevitable energy losses [5]. Figure 1-2 plots this
efficiency limit for a range of compression ratios and specific heat ratios. In engine
designs that have symmetrical compression and expansion ratios, gains in cycle
efficiency by increasing the expansion ratio have a consequence of higher cylinder
pressures and temperatures. The high in-cylinder pressures may require stronger
mechanical designs, which translate into higher masses and larger bearing surfaces, at the
cost of weight and friction. For diesel engines, the high temperatures shorten the ignition
delay and potentially lead to higher NOx production and smoke production [6-7]. For
spark-ignition engines, the higher pressures and temperatures constrain the engine
operation range by the onset of engine knock [8].
5
Figure 1-2: Effect of Compression and Specific Heat Ratios on Ideal Cycle Efficiency
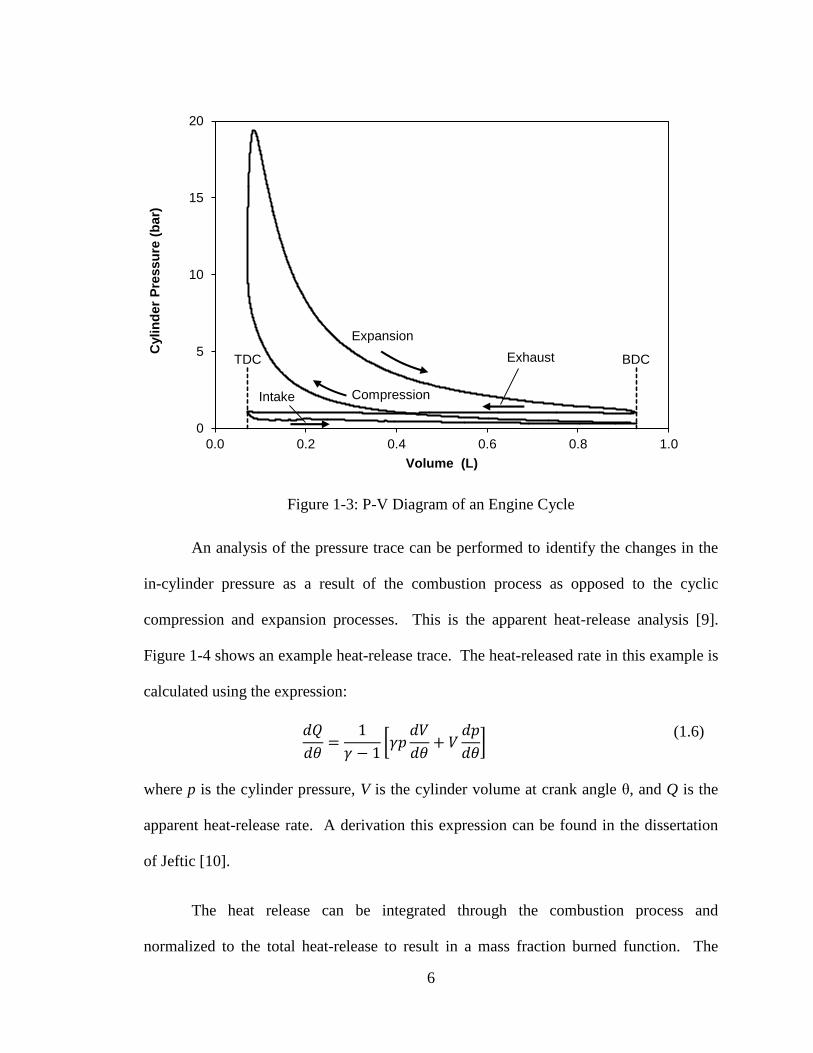
Figure 1-3 shows the pressure trace of an engine cycle plotted against the
instantaneous cylinder volume. The larger loop in the pressure-volume diagram is the
result of the departure of the expansion stroke pressure from the compression stroke
pressure as a result of combustion. The smaller loop arise from the pumping work
performed when throttling the intake to control the engine load and then subsequently
pushing the exhaust out against the atmospheric pressure. The net area of the two loops
is the total cycle indicated work. The term indicated work refers to the p-V work
performed by the working fluid. This is in contrast with brake work, which is work
available at the engine crank-shaft after friction and consumption by auxiliary engine
equipment (such as water pump, fuel pump, oil pump, valve cams, etc.) are subtracted
from the indicated work. A measure of the indicated cycle work normalized to the engine
displacement size is the indicated mean effective pressure (IMEP). The IMEP of an
engine is calculated by the expression:
𝐼𝑀𝐸𝑃 =∫ 𝑝𝑑𝑉720°
0°
𝑉𝑑
(1.5)
20%
40%
60%
80%
0 5 10 15 20 25 30
Ideal
Cycle
Eff
icie
ncy
Compression Ratio
γ = 1.40
γ = 1.25
γ = 1.30γ = 1.35
6
Figure 1-3: P-V Diagram of an Engine Cycle
An analysis of the pressure trace can be performed to identify the changes in the
in-cylinder pressure as a result of the combustion process as opposed to the cyclic
compression and expansion processes. This is the apparent heat-release analysis [9].
Figure 1-4 shows an example heat-release trace. The heat-released rate in this example is
calculated using the expression:
𝑑𝑄
𝑑𝜃=
1
𝛾 − 1[𝛾𝑝
𝑑𝑉
𝑑𝜃+ 𝑉
𝑑𝑝
𝑑𝜃]
(1.6)
where p is the cylinder pressure, V is the cylinder volume at crank angle θ, and Q is the
apparent heat-release rate. A derivation this expression can be found in the dissertation
of Jeftic [10].
The heat release can be integrated through the combustion process and
normalized to the total heat-release to result in a mass fraction burned function. The
0
5
10
15
20
0.0 0.2 0.4 0.6 0.8 1.0
Cyli
nd
er
Pre
ss
ure
(b
ar)
Volume (L)
Expansion
CompressionIntake
ExhaustTDC BDC
7
parameters of CA5, CA50, and CA95 are computed from the heat release to indicate the
crank angles of 5%, 50%, and 95% total heat-release. These parameters serve as
practical quantifiers of the timings of the start of combustion, the midpoint of combustion,
and the end of combustion.
Figure 1-4: Heat-Release Analysis of Combustion
1.2 Dilute Combustion for Spark Ignition Engines
The conventional spark ignition engine utilizes air-fuel ratio control near the
stoichiometric ratio throughout most of its operation range (at high-load operation, fuel
0
5
10
15
0
10
20
30
300 330 360 390 420 450
Eff
ecti
ve E
xp
an
sio
n R
ati
o
Heat-
rele
ase R
ate
(J
/CA
D)
Crank Angle Degree
Heat-release
rate
Effective expansion
ratio
Spark
timing
Coil
charging
0.0
0.5
1.0
0.0
0.5
1.0
300 330 360 390 420 450
Mass F
racti
on
B
urn
ed
Mass fraction
burned
CA5CA50
CA95
8
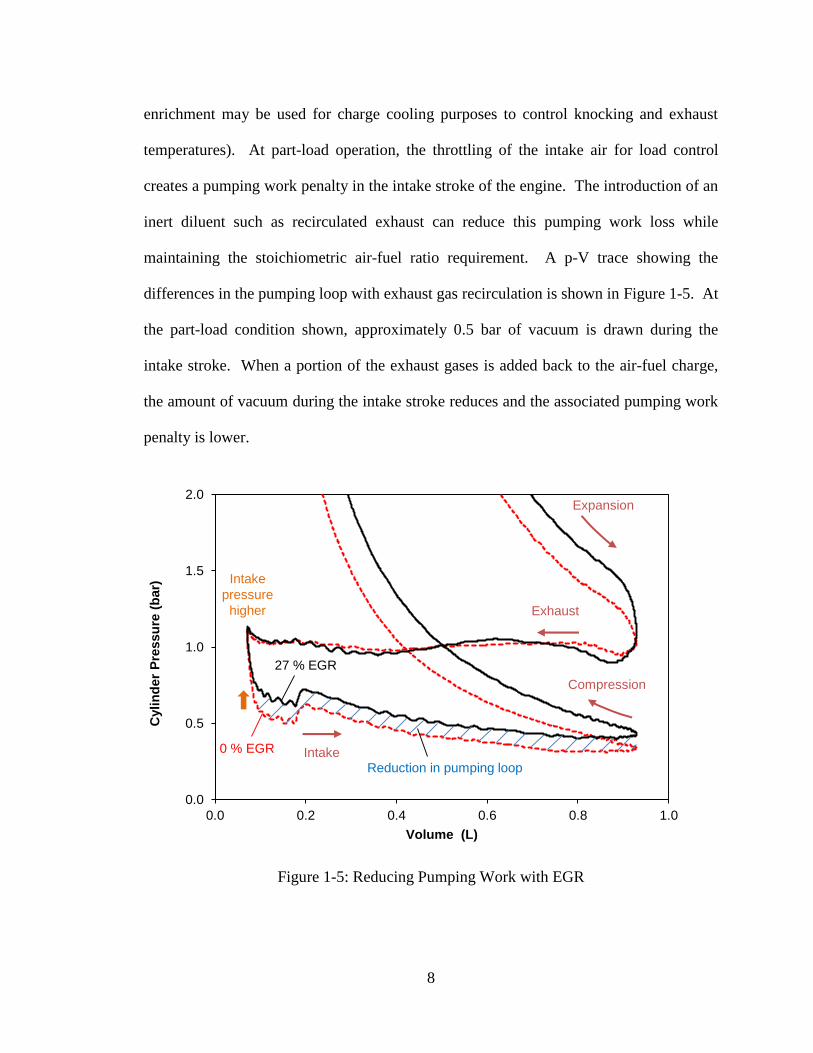
enrichment may be used for charge cooling purposes to control knocking and exhaust
temperatures). At part-load operation, the throttling of the intake air for load control
creates a pumping work penalty in the intake stroke of the engine. The introduction of an
inert diluent such as recirculated exhaust can reduce this pumping work loss while
maintaining the stoichiometric air-fuel ratio requirement. A p-V trace showing the
differences in the pumping loop with exhaust gas recirculation is shown in Figure 1-5. At
the part-load condition shown, approximately 0.5 bar of vacuum is drawn during the
intake stroke. When a portion of the exhaust gases is added back to the air-fuel charge,
the amount of vacuum during the intake stroke reduces and the associated pumping work
penalty is lower.
Figure 1-5: Reducing Pumping Work with EGR
0.0
0.5
1.0
1.5
2.0
0.0 0.2 0.4 0.6 0.8 1.0
Cyli
nd
er
Pre
ss
ure
(b
ar)
Volume (L)
Expansion
Compression
Intake
Exhaust
0 % EGR
27 % EGR
Reduction in pumping loop
Intake
pressure
higher
9
If the requirement of stoichiometric operation is relaxed, additional fresh air can
be used as the diluent. The amount of dilution that can be applied in lean combustion
typically exceeds the amount possible with exhaust gas recirculation. In addition to the
reduction of throttling losses, lower combustion temperatures as a result of the heat sink
action diluent gases result in lower heat-transfer losses to the combustion chamber
surfaces.
It was previously shown in Figure 1-2 that the ideal cycle efficiency is a function
of the specific heat ratio γ. The value γ of air is 1.40 at ambient temperature and
decreases at higher temperatures (for example, 1.34 at 1000 K) [11]. The values of γ for
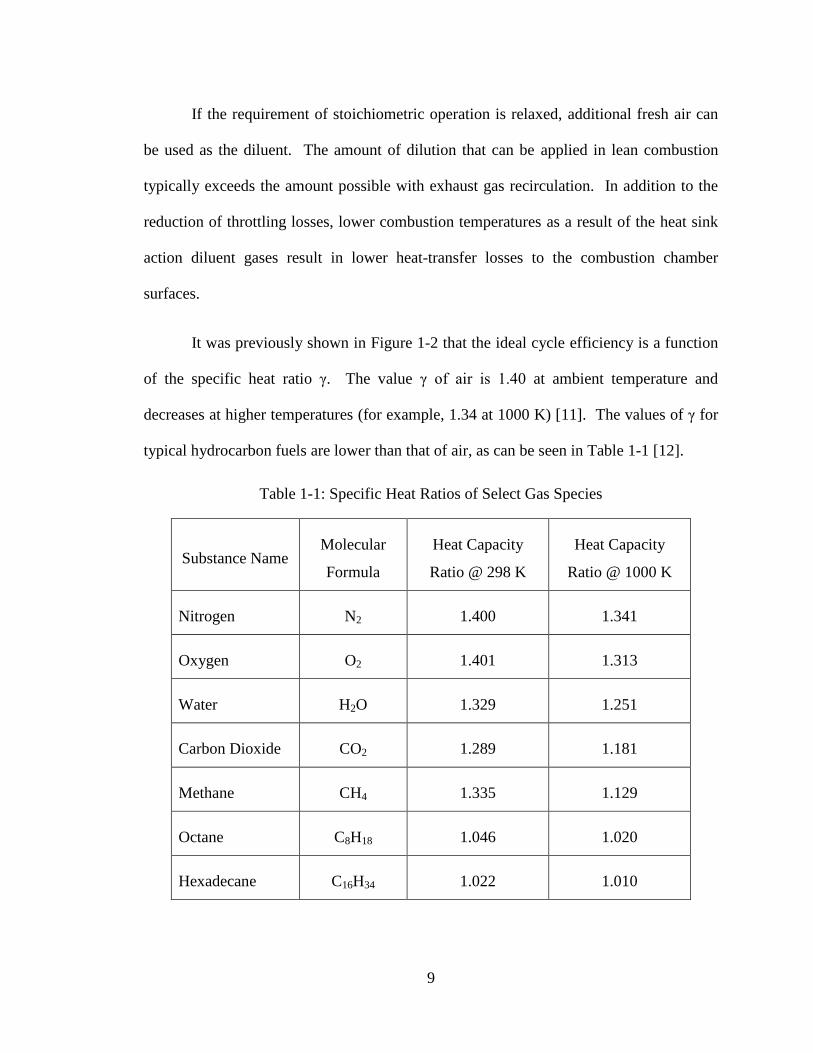
typical hydrocarbon fuels are lower than that of air, as can be seen in Table 1-1 [12].
Table 1-1: Specific Heat Ratios of Select Gas Species
Substance Name Molecular
Formula
Heat Capacity
Ratio @ 298 K
Heat Capacity
Ratio @ 1000 K
Nitrogen N2 1.400 1.341
Oxygen O2 1.401 1.313
Water H2O 1.329 1.251
Carbon Dioxide CO2 1.289 1.181
Methane CH4 1.335 1.129
Octane C8H18 1.046 1.020
Hexadecane C16H34 1.022 1.010
10
Mixtures of fuel and air have a specific heat ratio intermediate of air and the pure
fuel. A higher mixture average γ is achieved with a larger portion of air, which
directionally indicates the leanest possible combustion as being desirable. This effect is
also present with exhaust gas dilution, but the carbon dioxide constituent has a notably
lower specific heat ratio (γ = 1.29) than air.
1.3 Spark Ignition
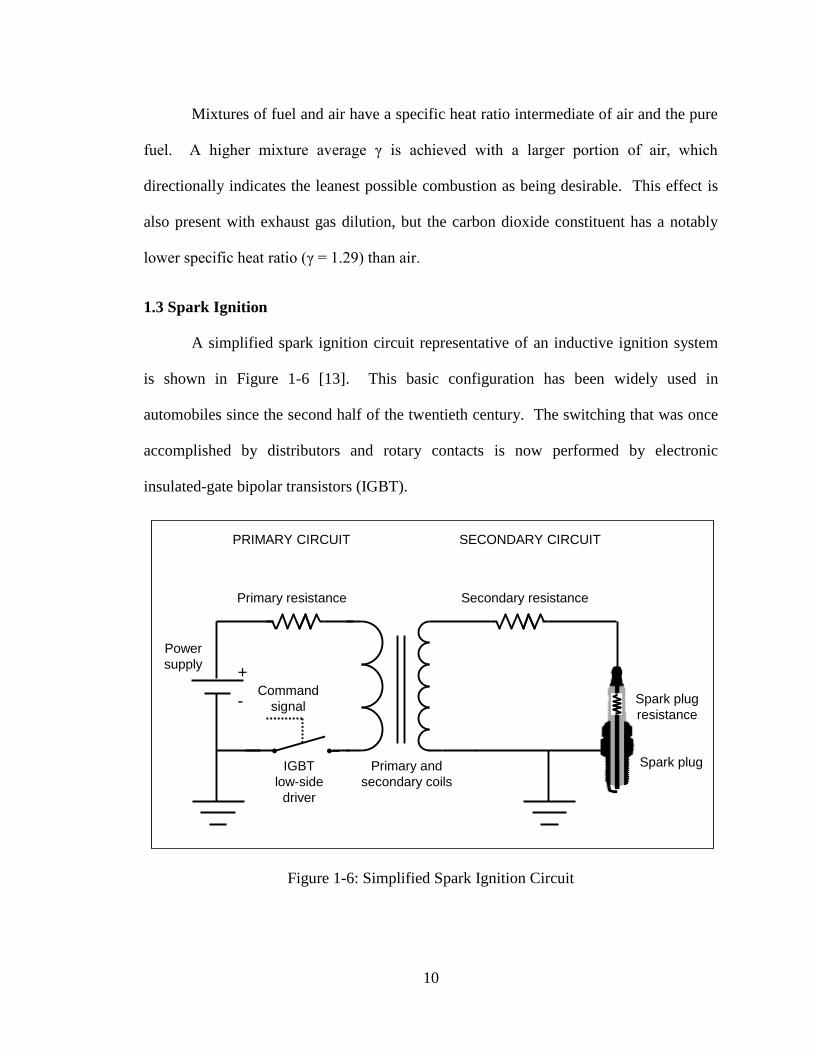
A simplified spark ignition circuit representative of an inductive ignition system
is shown in Figure 1-6 [13]. This basic configuration has been widely used in
automobiles since the second half of the twentieth century. The switching that was once
accomplished by distributors and rotary contacts is now performed by electronic
insulated-gate bipolar transistors (IGBT).
Figure 1-6: Simplified Spark Ignition Circuit
+
-Command
signal
IGBT
low-side
driver
Primary and
secondary coils
Spark plug
Power
supply
Primary resistance Secondary resistance
Spark plug
resistance
PRIMARY CIRCUIT SECONDARY CIRCUIT
11
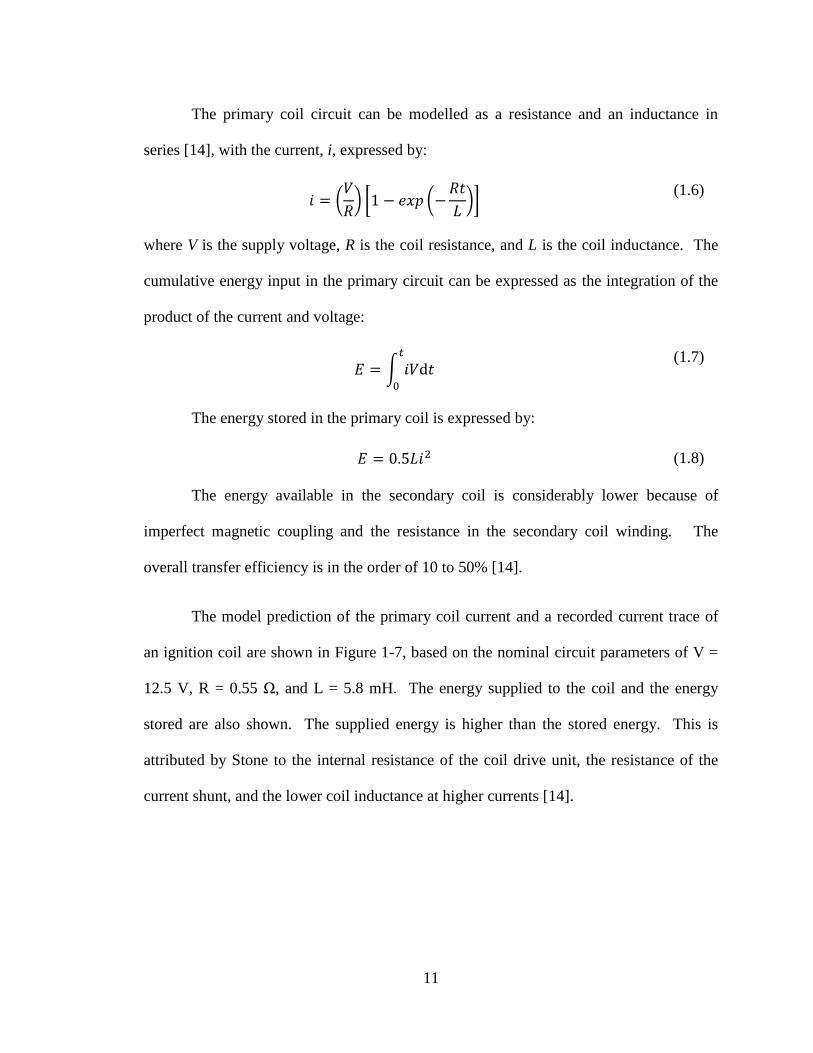
The primary coil circuit can be modelled as a resistance and an inductance in
series [14], with the current, i, expressed by:
𝑖 = (𝑉
𝑅) [1 − 𝑒𝑥𝑝 (−
𝑅𝑡
𝐿)]
(1.6)
where V is the supply voltage, R is the coil resistance, and L is the coil inductance. The
cumulative energy input in the primary circuit can be expressed as the integration of the
product of the current and voltage:
𝐸 = ∫ 𝑖𝑉d𝑡𝑡
0
(1.7)
The energy stored in the primary coil is expressed by:
𝐸 = 0.5𝐿𝑖2 (1.8)
The energy available in the secondary coil is considerably lower because of
imperfect magnetic coupling and the resistance in the secondary coil winding. The
overall transfer efficiency is in the order of 10 to 50% [14].
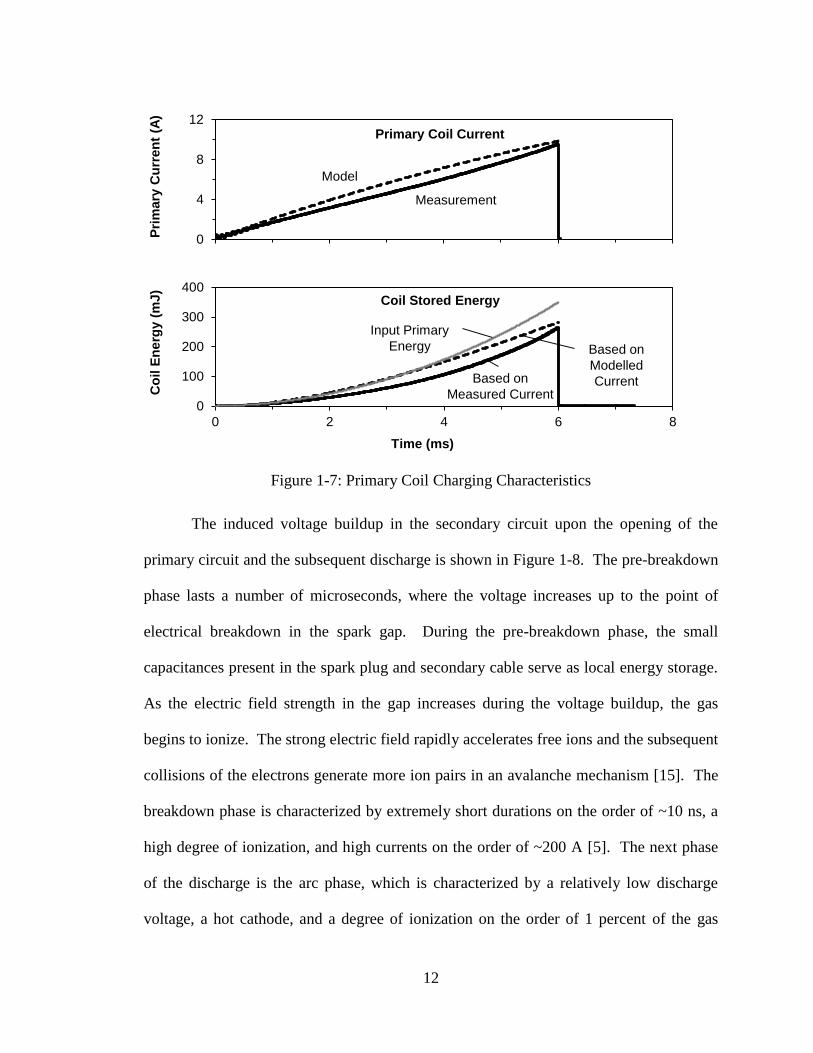
The model prediction of the primary coil current and a recorded current trace of
an ignition coil are shown in Figure 1-7, based on the nominal circuit parameters of V =
12.5 V, R = 0.55 Ω, and L = 5.8 mH. The energy supplied to the coil and the energy
stored are also shown. The supplied energy is higher than the stored energy. This is
attributed by Stone to the internal resistance of the coil drive unit, the resistance of the
current shunt, and the lower coil inductance at higher currents [14].
12
Figure 1-7: Primary Coil Charging Characteristics
The induced voltage buildup in the secondary circuit upon the opening of the
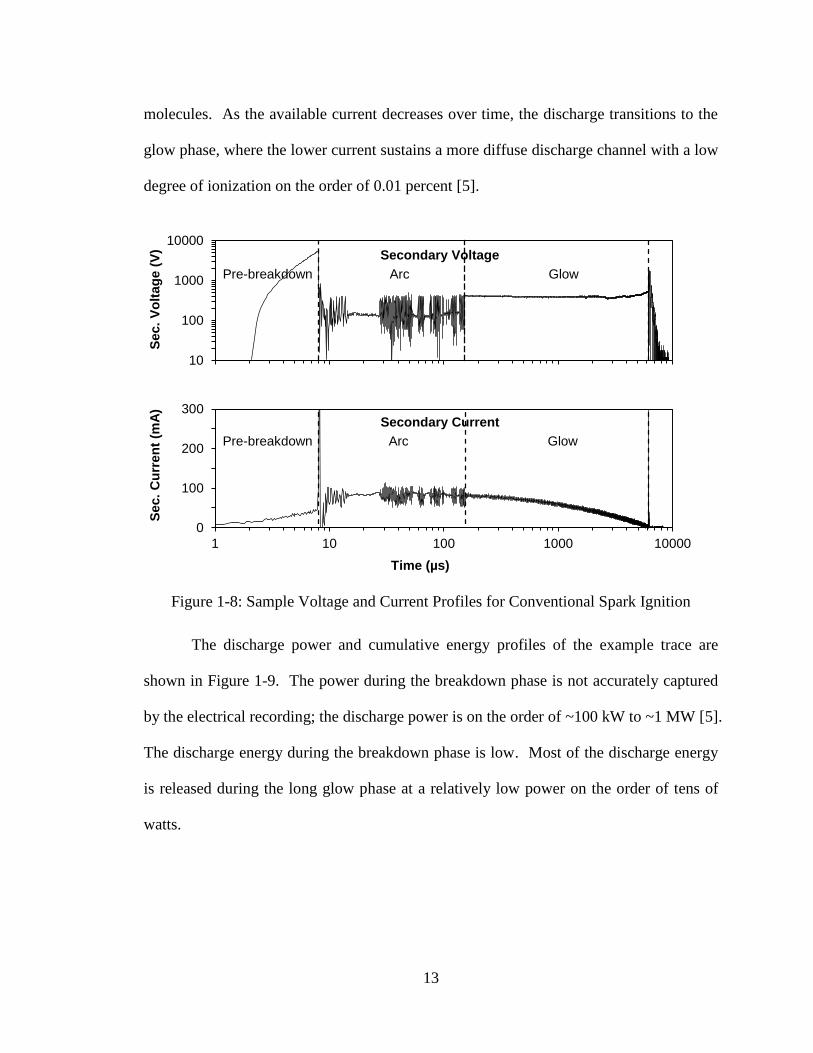
primary circuit and the subsequent discharge is shown in Figure 1-8. The pre-breakdown
phase lasts a number of microseconds, where the voltage increases up to the point of
electrical breakdown in the spark gap. During the pre-breakdown phase, the small
capacitances present in the spark plug and secondary cable serve as local energy storage.
As the electric field strength in the gap increases during the voltage buildup, the gas
begins to ionize. The strong electric field rapidly accelerates free ions and the subsequent
collisions of the electrons generate more ion pairs in an avalanche mechanism [15]. The
breakdown phase is characterized by extremely short durations on the order of ~10 ns, a
high degree of ionization, and high currents on the order of ~200 A [5]. The next phase
of the discharge is the arc phase, which is characterized by a relatively low discharge
voltage, a hot cathode, and a degree of ionization on the order of 1 percent of the gas
0
4
8
12
0 2 4 6 8
Pri
mary
Cu
rren
t (A
)
Primary Coil Current
Measurement
Model
0
100
200
300
400
0 2 4 6 8
Co
il E
nerg
y (
mJ)
Time (ms)
Coil Stored Energy
Based on
Modelled
CurrentBased on
Measured Current
Input Primary
Energy
13
molecules. As the available current decreases over time, the discharge transitions to the
glow phase, where the lower current sustains a more diffuse discharge channel with a low
degree of ionization on the order of 0.01 percent [5].
Figure 1-8: Sample Voltage and Current Profiles for Conventional Spark Ignition
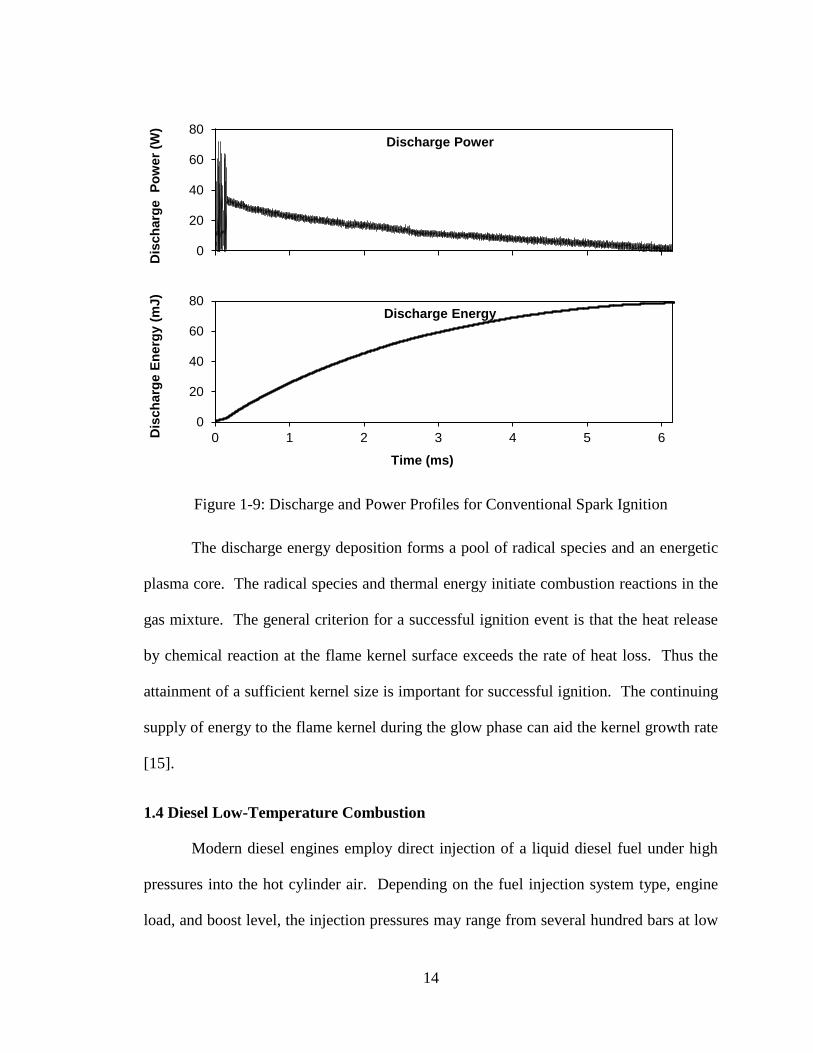
The discharge power and cumulative energy profiles of the example trace are
shown in Figure 1-9. The power during the breakdown phase is not accurately captured
by the electrical recording; the discharge power is on the order of ~100 kW to ~1 MW [5].
The discharge energy during the breakdown phase is low. Most of the discharge energy
is released during the long glow phase at a relatively low power on the order of tens of
watts.
10
100
1000
10000
1 10 100 1000 10000
Se
c.
Vo
lta
ge
(V
) Secondary Voltage
GlowPre-breakdown Arc
0
100
200
300
1 10 100 1000 10000
Sec.
Cu
rre
nt
(mA
)
Time (µs)
Secondary Current
GlowPre-breakdown Arc
14
Figure 1-9: Discharge and Power Profiles for Conventional Spark Ignition
The discharge energy deposition forms a pool of radical species and an energetic
plasma core. The radical species and thermal energy initiate combustion reactions in the
gas mixture. The general criterion for a successful ignition event is that the heat release
by chemical reaction at the flame kernel surface exceeds the rate of heat loss. Thus the
attainment of a sufficient kernel size is important for successful ignition. The continuing
supply of energy to the flame kernel during the glow phase can aid the kernel growth rate
[15].
1.4 Diesel Low-Temperature Combustion
Modern diesel engines employ direct injection of a liquid diesel fuel under high
pressures into the hot cylinder air. Depending on the fuel injection system type, engine
load, and boost level, the injection pressures may range from several hundred bars at low
0
20
40
60
80
0 1 2 3 4 5 6Dis
ch
arg
e E
ne
rgy (
mJ
)
Time (ms)
Discharge Energy
0
20
40
60
80
0 1 2 3 4 5 6
Dis
ch
arg
e
Po
we
r (W
)Discharge Power
15
load to approximately 2,000 bars at high load for common-rail systems. Higher pressures
in the range of 3,000 bars can be achieved for unit injectors and hydraulically intensified
injection systems. The fuel is delivered through a series of nozzles 0.1 to 0.2 mm in
diameter arranged radially around the injector tip, which protrudes into the combustion
chamber. The spray is shattered by shear forces during the high-pressure injection
process, forming a dense cloud of fuel droplets [16]. The droplets undergo evaporation
under the compression temperatures as heat is transferred from the surrounding gas to the
liquid. The evaporated fuel is in part carried away from the droplet surface by diffusion
and convection, forming mixtures of decreasing richness radiating from the droplet
surface [17]. The fuel vapour when mixed with air undergoes the reaction chemistry
described in more detail in Appendix B. The ignition tends to initiate in zones where the
mixture is near stoichiometric. If ignition starts prior to complete evaporation of the fuel,
a stable flame zone may develop where fuel vapour is continuously transported into the
flame zone from the droplet surface and air is transported into the flame zone from the
surrounding gas mixture. This is referred to as a diffusion or non-premixed flame.
Under these conditions, the local stoichiometry may approach λ = 1 even though the
global stoichiometry may be significantly lean. The impact of near stoichiometric
burning is high flame temperatures leading to high NOx production. For example, while
the mean gas temperature of an engine cycle may not exceed 1500 K and is insufficient
for NOx formation, flame temperatures where λ = 1 are calculated to exceed 2600 K.
Dilution of the flame to λ = 2 reduces the flame temperature to under 2000 K, closer to a
low-NOx condition. Thus delaying the ignition to allow more time for evaporation of the
fuel and mixing with air or recirculated exhaust is a necessary measure to control NOx
production in diesel engines.
16
1.5 Trends of Advanced Combustion Engines
In comparison to compression ignition engines, spark ignited engines have lower
efficiencies at both low and high loads. The requirement to operate at stoichiometric
conditions to enable the three-way catalyst to treat exhaust emissions is a limitation to the
achievable efficiency [5]. If the requirement of stoichiometric operation is relaxed,
excess air can be used as the diluent and this would increase efficiency at low and
medium engine loads. The lean limit of conventional gasoline spark ignition and
combustion would however limit the practical dilution level. Alternative combustion
strategies such as homogeneous charge compression ignition or stratified charge
combustion address some aspects of this, however not without their own challenges for
implementation.
One strategy currently being adopted is to reduce the engine displacement and use
a turbocharger to maintain the engine power output. This leads to a shift in the engine
operating range to a higher level of specific power, thereby reducing the effects of the
pumping and frictional losses. A complementary technology is to employ variable valve-
train configurations, such as cam phasing, variable valve lift, or variable valve duration.
Knock is the term given to the noise associated with the auto-ignition of a portion
of the fuel-air mixture ahead of the propagating flame front [8]. In practice knock limits
raising the compression ratio to improve thermal efficiency because sustained auto-
ignition of the end-gas, when forceful enough, can lead to damage to the engine. The
knock tendency can be even more pronounced in turbocharged applications, where the
temperature and pressure of the initial charge is higher than in normally aspirated engines.
The use of cooled exhaust gas recirculation is a potential source of efficiency and
17
emission improvement in this application. Knock reduction using exhaust gas
recirculation can have advantages over the use of fuel enrichment (fuel economy penalty,
high hydrocarbon and carbon monoxide emissions) or delayed combustion phasing (fuel
economy penalty, high exhaust temperatures) [18].
A trend that is occurring in the field of internal combustion engines is the coming
together or merging of what were conventionally two different combustion systems, the
diesel compression ignition system and the spark ignition system [19]. The spark ignition
gasoline engine designs are adopting what were traditionally aspects of diesel engines,
namely turbocharging, direct fuel injection, and diluted combustion. The diesel engines,
on the other hand, are moving toward more moderate compression ratios and
homogeneous combustion to control NOx and smoke emissions.
This trend of engine technology assimilation is exemplified by the Mazda
Skyactiv-X generation of engines, announced in 2017 [20]. This engine uses a high base
compression ratio of 15:1, cam phasing to control valve timing, cooled exhaust gas
recirculation, and a clutched supercharger to boost the air charge. At higher engine loads,
the combustion strategy is conventional spark ignition and flame propagation. At lower
engine loads, the combustion strategy is what Mazda termed spark-controlled
compression ignition. It is a stratified combustion strategy where the bulk cylinder
charge is lean and a core charge near the spark plug is enriched to enable reliable ignition
and a sufficient combustion rate [21-22]. The bulk cylinder charge is sufficiently close to
auto-ignition that the temperature and pressure increase caused by the core charge
combustion initiates the compression ignition. In this fashion, a suitably rapid lean
combustion is achieved in a significant fraction of the cylinder charge, which combined
18
the high base compression ratio, result in a higher degree of efficiency than a
conventional gasoline engine. A key aspect of the technology is the proper matching of
the air flow, fuel injection, and spark to achieve the proper stratification and reliable
ignition. The use of in-cylinder pressure sensors to control the combustion phasing and
the engine mode switching is also critical.
19
2. CHAPTER II
OBJECTIVES
2.1 Research Objective
The main objective of the research was to demonstrate strategies for the effective
delivery of ignition energy for combustion in advanced lean combustion and high-
dilution engines. A range of strategies using conventional and modified ignition coil
systems were used. The aim was to understand the effectiveness of the energy delivery
mechanisms and different energy profiles. The ignition strategies were applied in engine
tests to assess their ability to extend the lean and exhaust gas diluted gasoline combustion
limits with the aim of fuel efficiency improvement.
2.2 Research Motivation
Chapter 1 has highlighted the increasingly strict standards for fuel economy that
the vehicle manufacturers much achieve across their fleet of vehicles. Advances in
engine technology will be required to meet the new requirements. Engine combustion
systems that operate substantially under lean combustion or high dilution are one
proposed solution to achieve higher engine efficiencies. In this case the performance of
the ignition system becomes crucial. A robust ignition process allows stable initiation of
the combustion with small cyclic variations. Advanced ignition systems can also be
advantageous in potentially reducing knock risk at high loads.
Key fundamental aspects that affect the ignition and flame development and the
controls available to influence them are shown as a schematic in Figure 2-1. The
fundamental flame speed is primarily a function of the temperature, stoichiometry, and
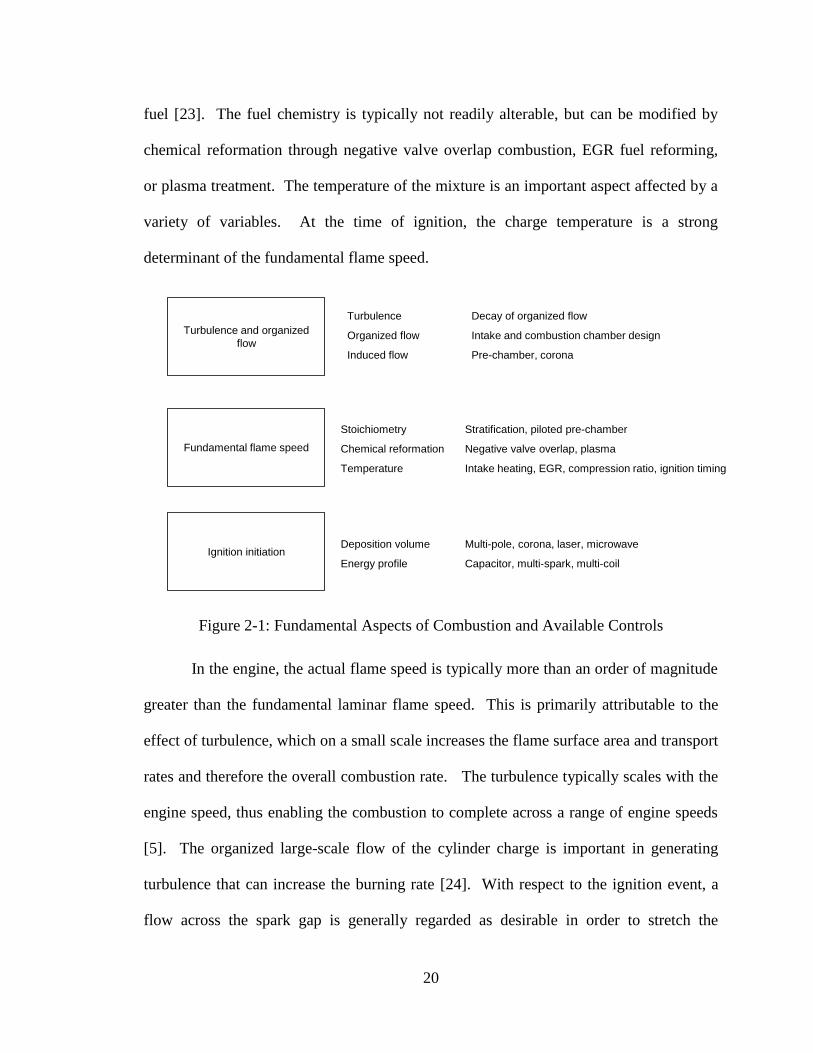
20
fuel [23]. The fuel chemistry is typically not readily alterable, but can be modified by
chemical reformation through negative valve overlap combustion, EGR fuel reforming,
or plasma treatment. The temperature of the mixture is an important aspect affected by a
variety of variables. At the time of ignition, the charge temperature is a strong
determinant of the fundamental flame speed.
Figure 2-1: Fundamental Aspects of Combustion and Available Controls
In the engine, the actual flame speed is typically more than an order of magnitude
greater than the fundamental laminar flame speed. This is primarily attributable to the
effect of turbulence, which on a small scale increases the flame surface area and transport
rates and therefore the overall combustion rate. The turbulence typically scales with the
engine speed, thus enabling the combustion to complete across a range of engine speeds
[5]. The organized large-scale flow of the cylinder charge is important in generating
turbulence that can increase the burning rate [24]. With respect to the ignition event, a
flow across the spark gap is generally regarded as desirable in order to stretch the
Turbulence and organized
flow
Fundamental flame speed
Ignition initiation
Stoichiometry Stratification, piloted pre-chamber
Chemical reformation Negative valve overlap, plasma
Temperature Intake heating, EGR, compression ratio, ignition timing
Turbulence Decay of organized flow
Organized flow Intake and combustion chamber design
Deposition volume Multi-pole, corona, laser, microwave
Energy profile Capacitor, multi-spark, multi-coil
Induced flow Pre-chamber, corona
21
discharge channel and expose more of the charge volume to the discharge. However,
excessively high flow velocities can cause the discharge channel to blowout and reform
prior to the establishment of a stable flame kernel [25]. At conventional levels of energy,
motion of the charge induced by the discharge itself is typically small. There are ignition
systems such as the pre-chamber igniter which locates the ignition in a partially shrouded
volume and uses the ejection of the flame into the main chamber to generate turbulence
and increase the combustion rate [5].
The ignition initiation is traditionally achieved through a spark, although
advanced systems of such as microwave enhancement, corona discharge, or laser ignition
are in development. These systems can alter the energy deposition location, profile, and
quantity. The multi-pole ignition strategy uses multiple sites of closely located spark
ignited volumes.
In order to address the ignition issue under ultra-lean combustion or high dilution
combustion, it is necessary to combine the various controls available to produce an
effective combustion system. An example of deficiencies of the conventional ignition
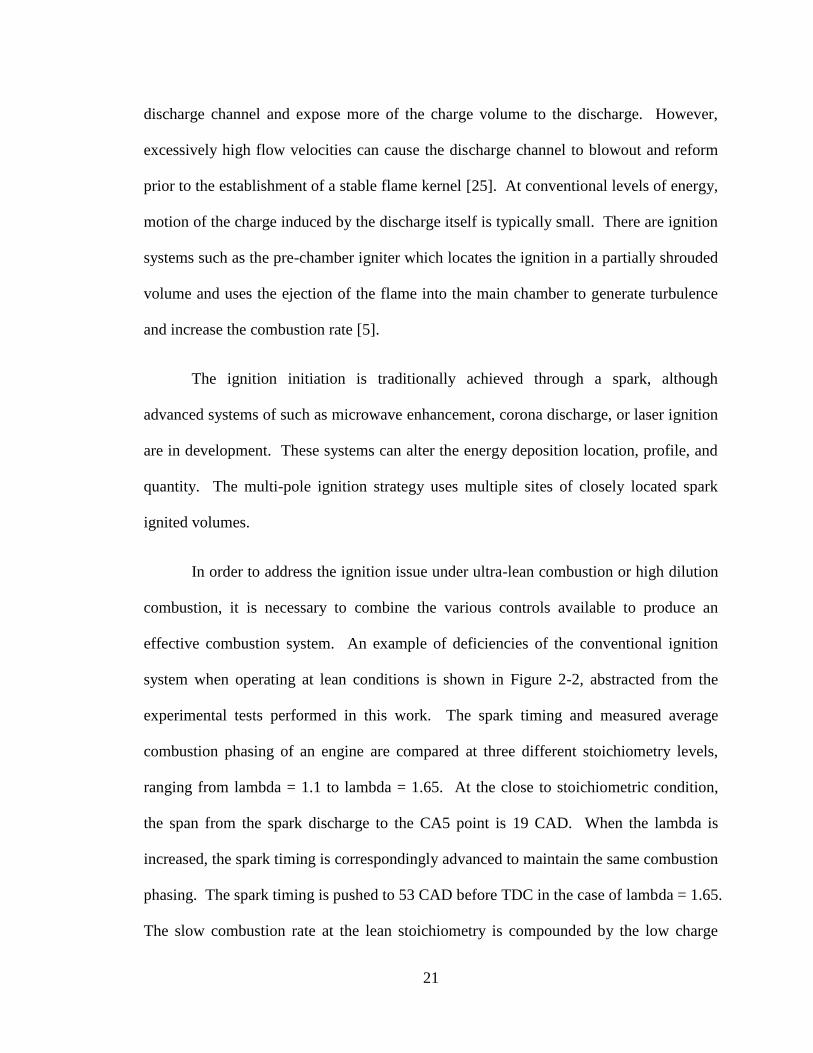
system when operating at lean conditions is shown in Figure 2-2, abstracted from the
experimental tests performed in this work. The spark timing and measured average
combustion phasing of an engine are compared at three different stoichiometry levels,
ranging from lambda = 1.1 to lambda = 1.65. At the close to stoichiometric condition,
the span from the spark discharge to the CA5 point is 19 CAD. When the lambda is
increased, the spark timing is correspondingly advanced to maintain the same combustion
phasing. The spark timing is pushed to 53 CAD before TDC in the case of lambda = 1.65.
The slow combustion rate at the lean stoichiometry is compounded by the low charge
22
temperature at the time of ignition with the highly advanced ignition timing. This results
in a substantially long period from the spark to the CA5 point of 48 CAD.
Figure 2-2: Impact of Dilution of Spark Timing and Flame Development
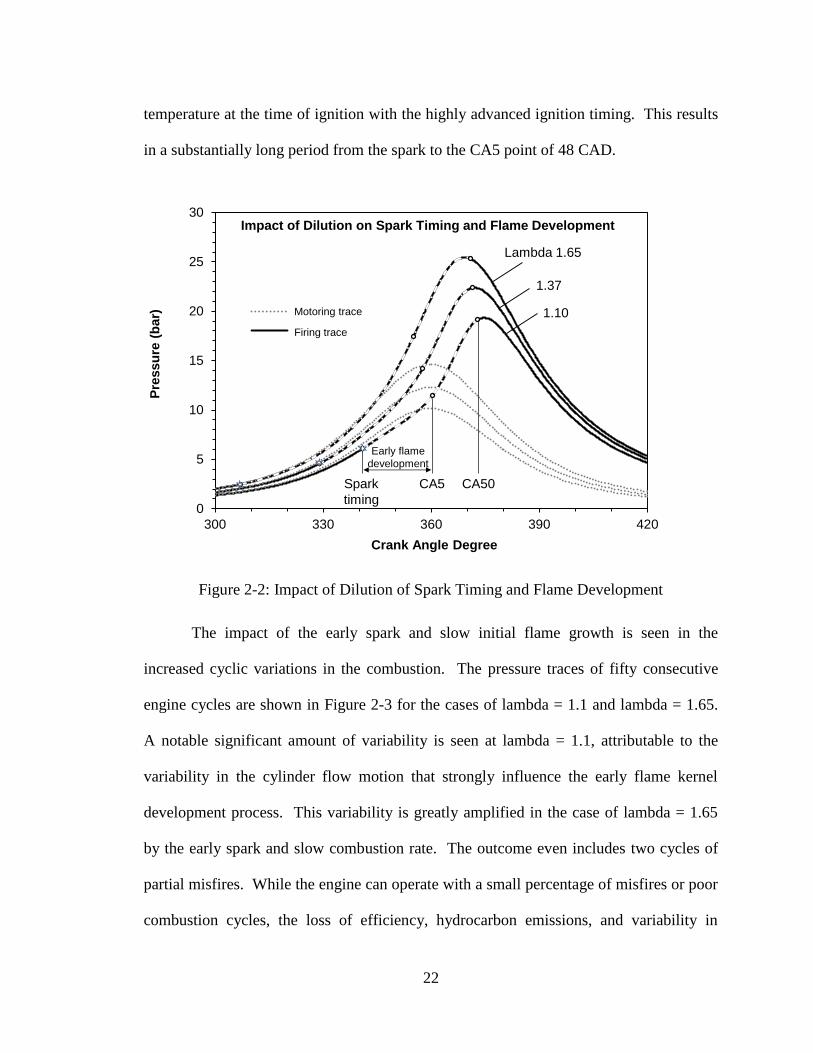
The impact of the early spark and slow initial flame growth is seen in the
increased cyclic variations in the combustion. The pressure traces of fifty consecutive
engine cycles are shown in Figure 2-3 for the cases of lambda = 1.1 and lambda = 1.65.
A notable significant amount of variability is seen at lambda = 1.1, attributable to the
variability in the cylinder flow motion that strongly influence the early flame kernel
development process. This variability is greatly amplified in the case of lambda = 1.65
by the early spark and slow combustion rate. The outcome even includes two cycles of
partial misfires. While the engine can operate with a small percentage of misfires or poor
combustion cycles, the loss of efficiency, hydrocarbon emissions, and variability in
0
5
10
15
20
25
30
300 330 360 390 420
Pre
ss
ure
(b
ar)
Crank Angle Degree
Impact of Dilution on Spark Timing and Flame Development
Spark
timing
Lambda 1.65
1.37
1.10
CA5 CA50
Early flame
development
Firing trace
Motoring trace
23
torque are undesirable. Thus even though the average engine cycle is apparently
controllable by the ignition system, the individual cycle is subject to substantial
variability. A more direct and effective control of the ignition process would improve the
engine stability, extend the operating limits, and potentially improve the efficiency.
Figure 2-3: Comparison of Cycle-to-Cycle Variations
0
5
10
15
20
25
30
300 330 360 390 420
Pre
ss
ure
(b
ar)
Crank Angle Degree
50 Engine Cycles
λ = 1.10
5
10
15
20
25
30
300 330 360 390 420
Crank Angle Degree
50 Engine Cycles
λ = 1.65
24
3. CHAPTER III
LITERATURE REVIEW
3.1 Advanced Ignition Systems
There are a number of ignition and control architectures that can provide benefits
in efficiency and emissions compared to conventional stoichiometric spark-ignition
engines. However, they are typically constrained in engine operating load and have
control challenges. Homogeneous charge compression ignition (HCCI) is a form of low
temperature combustion where a premixed or homogeneous fuel-air mixture is
compressed to the point of auto-ignition in a process predominately controlled by
chemical kinetics [26]. Compared to spark ignition, HCCI combustion is faster and can
be operated with leaner mixtures at higher compression ratios. As HCCI lacks a direct
ignition trigger, the control of the combustion over a wide range of conditions is a severe
challenge [27]. The implementation of HCCI on diesel engine platforms are typically
achieved with the selection of a fuel with suitable volatility and reactivity, combined with
mixing, engine boost, and exhaust gas recirculation control. In spark ignition engine
platforms, the temperatures required to achieve auto-ignition typically cannot be achieved
with compression alone. The temperature of the charge is instead typically raised
through mixing with hot residual gases, for example by exhaust re-breathing during the
intake stroke or trapping of the exhaust with negative valve overlap [28]. A discussion of
a set of gasoline HCCI tests conducted on a diesel engine platform is presented in
Appendix A.2.
25
A complement to the HCCI strategy is the spark-assisted compression ignition
combustion in which spark-ignition is used to directly initiate bulk auto-ignition and
HCCI combustion [28-31]. The spark assist functions by initiating a flame kernel that
propagates through a portion of the charge. The release of this combustion energy serves
to increase the temperature and pressure of the remaining charge to initiate the auto-
ignition. Experimental studies found the use of the spark can alter the phasing of the
auto-ignition effect and improve the cycle to cycle combustion stability [31]. The
application was most effective under moderate to high loads where the flame speed was
adequate to effect significant flame propagation. At the low load limit, however, the
spark-assisted combustion was not seen to be effective because of the excessively slow
flame speeds.
In both of the above combustion system configurations, the charge may be diluted
with excess air or exhaust gas to increase the efficiency, to lower the reactivity, and
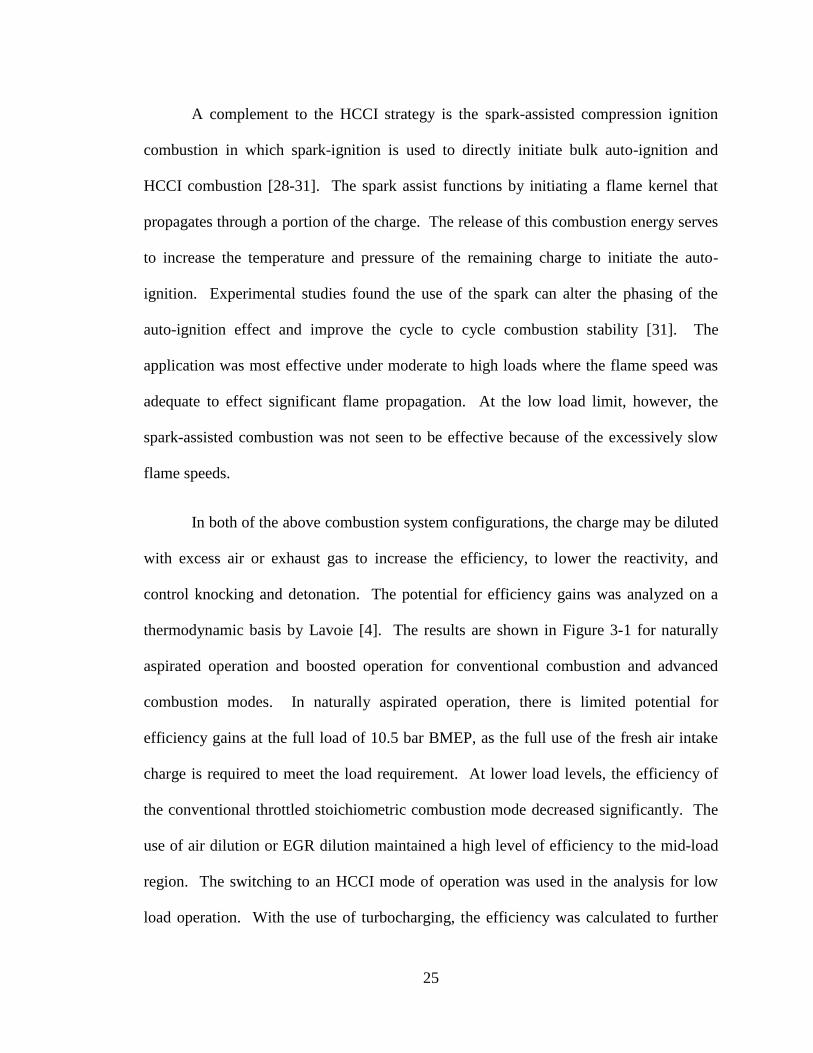
control knocking and detonation. The potential for efficiency gains was analyzed on a
thermodynamic basis by Lavoie [4]. The results are shown in Figure 3-1 for naturally
aspirated operation and boosted operation for conventional combustion and advanced
combustion modes. In naturally aspirated operation, there is limited potential for
efficiency gains at the full load of 10.5 bar BMEP, as the full use of the fresh air intake
charge is required to meet the load requirement. At lower load levels, the efficiency of
the conventional throttled stoichiometric combustion mode decreased significantly. The
use of air dilution or EGR dilution maintained a high level of efficiency to the mid-load
region. The switching to an HCCI mode of operation was used in the analysis for low
load operation. With the use of turbocharging, the efficiency was calculated to further
26
increase from the baseline naturally aspirated air full dilution case starting at about 5 bar
BMEP.
Figure 3-1: Potential for Brake Thermal Efficiency Gains [4]
The thermodynamic analysis by Lavoie gives guidance to the magnitude of gains
that may be achievable from advanced combustion modes. The analysis does not,
however, address the practical challenges of ignition and combustion at those conditions.
As the reactivity and fundamental flame propagation speeds are lowered by dilution, the
combustion rate may have to be maintained through the use of enhanced charge motion.
Ignition under lean burn, EGR, and high flow conditions can be considerably more
challenging. Non-conventional technologies such as laser ignition, microwave generated
plasma, and corona aim to broaden the ignition limit and enhance the rate of combustion
[32-35]. Compared to conventional inductive system spark plugs, the potential
advantages include the ability to deposit higher amounts of energy, the reduction in heat
loss to the electrodes, and the reduced blockage by the electrodes.
27
The principal mechanism of ignition through lasers is electrical breakdown
through multi-photon ionization and the inverse bremsstrahlung process (electrons gain
energy by absorption of laser radiation) [36]. Multi-photon ionization generates electrons
which are further accelerated by photon collision. The accelerated electrons then collide
with neutral molecules and ionize them, creating a plasma kernel. The high plasma
temperatures and pressures generate a shockwave observable in Schileren images. The
plasma then ignites the combustible mixture through conventional chemical and thermal
pathways. The breakdown process is enhanced by pressure due to increased collision
frequencies [37]. The laser energy is typically deposited in a few nanoseconds, with the
lower bound of pulse energies on the order of 5 – 10 mJ. To date, laser ignition systems
have been proven in demonstration combustion systems, for example 100 hours in a
stationary natural gas engine running at lambda = 1.8 ignited by a full-sized external Nd-
YAG laser [38]. A solid-state laser in the form factor of a spark plug, coupled to an
external pumping laser via fiber optics, was realized by Tauer [32]. The high costs of the
laser ignition systems are a current limitation to commercial utilization.
There is still much research activity using conventional or modifications of the
inductive coil and spark plug system hardware. The use of twin ignitions coils
discharging in an offset fashion to generate a continuous discharge without the typical
decay in the current intensity showed increased tolerance to exhaust gas recirculation,
which normally slowed combustion progress and reduced engine stability [39]. The
continuous nature of the discharge was observed to be better than repetitive restriking at
the same spark energy level.
28
The coupling of a number of ignition coils to discharge simultaneously on one
spark plug can increase the discharge energy, with the discharge duration remaining
comparable. Work by Yu coupled four coils to enhance the discharge current [40-41].
The multiple coils were also used to generate high frequency discharges up to 20 kHz
when the primary coil voltages were raised to decrease the required charging duration.
The coupling of ten ignition coils increased the energy by a factor of five, from 50
mJ to 250 mJ, in work by Jung [42]. The multi-coil system was seen to increase the
stability at leaner conditions. The best results were seen when the leaner operation was
matched with enhanced in-cylinder turbulence. It was also found that when examining
the distribution of the spark energies delivered, the actual energy did not strongly
correlate with the cycle combustion characteristics. This indicated that a significant
portion of cycle to cycle variations were not directly relatable to the spark energy, but
other parameters such as flow conditions, fuel concentration, and temperature. A more
powerful spark system using repetitive short discharges (12 ns duration) coupled with a
semi-open cavity that generates turbulent jet-like early flame has been used to
demonstrate the ability to enhance lean-burn operation limits to achieve fuel economy
and NOx benefits [43].
3.2 Electrical Breakdown
The process of electrical breakdown is caused by the various processes of
ionization. Under moderate electrical strength fields, a free electron may be generated by
collisions with background cosmic radiation. Under high strength fields, the ionization
may occur as a result of random collisions [44]. The liberated electron and positive ion
are accelerated under the electrical field and cause further ionization in subsequent
29
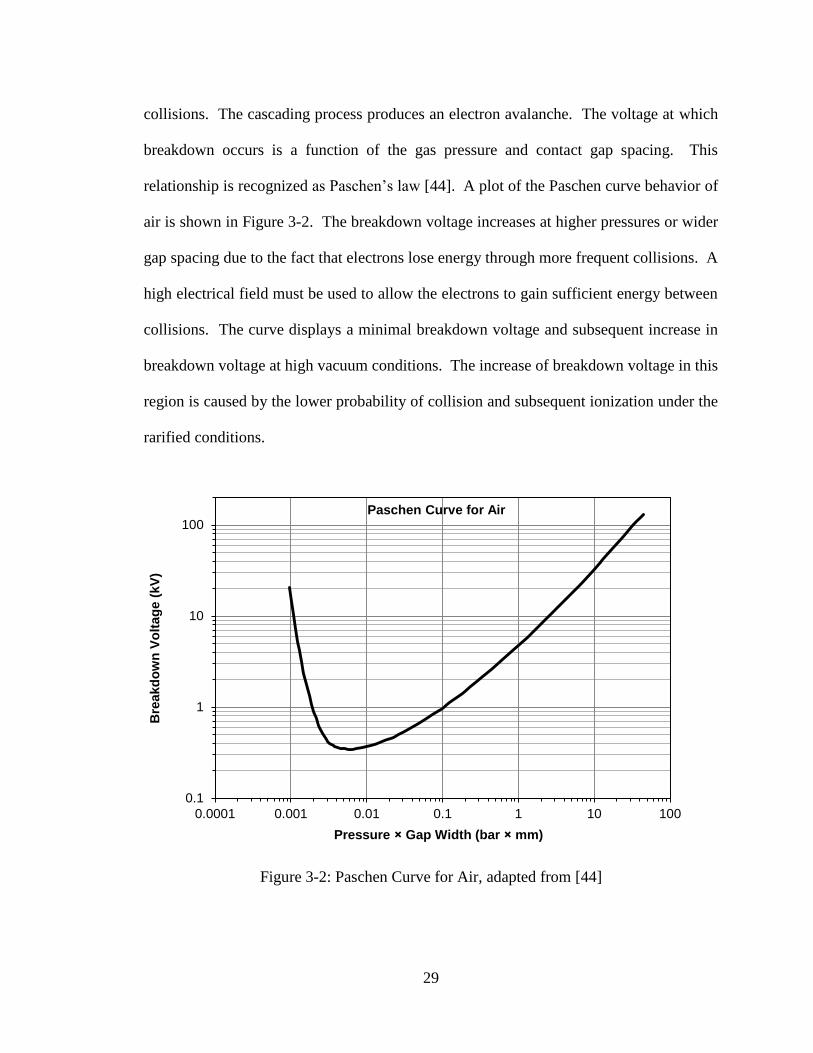
collisions. The cascading process produces an electron avalanche. The voltage at which
breakdown occurs is a function of the gas pressure and contact gap spacing. This
relationship is recognized as Paschen’s law [44]. A plot of the Paschen curve behavior of
air is shown in Figure 3-2. The breakdown voltage increases at higher pressures or wider
gap spacing due to the fact that electrons lose energy through more frequent collisions. A
high electrical field must be used to allow the electrons to gain sufficient energy between
collisions. The curve displays a minimal breakdown voltage and subsequent increase in
breakdown voltage at high vacuum conditions. The increase of breakdown voltage in this
region is caused by the lower probability of collision and subsequent ionization under the
rarified conditions.
Figure 3-2: Paschen Curve for Air, adapted from [44]
0.1
1
10
100
0.0001 0.001 0.01 0.1 1 10 100
Bre
akd
ow
n V
olt
ag
e (
kV
)
Pressure Gap Width (bar mm)
Paschen Curve for Air
30
3.3 Transient Plasma Ignition
A highly transient form of plasma discharge is generated by single or repeated
nanosecond high voltage pulses. The discharge can provide effective electron impact
dissociation at relatively higher pressures for engine applications [45]. The pulse
durations typically are 1 to 10 ns in length and generated by high voltage DC generators
at 20 to 100 kV. The total energy delivery per pulse is also modest at the short durations.
The individual pulses can be coupled together to increase the energy delivered. However,
the repeat pulses increase the likelihood of breakdown discharge that result in the high
current electrode wear associated with thermal plasma sparks [46].
3.4 Radio-Frequency Plasma
Discharges of a more sustained, continuous can be generated by electric fields
with alternate wave frequencies on the order of 1 MHz [47]. The non-equilibrium plasma
from the discharge is also a viable ignition method. Starikovskiy attributes the five
mechanisms through which a plasma discharge initiates and interacts with the flame
kernel. There are two thermal mechanisms: 1) gas heating from the energy deposition, 2)
inhomogeneous gas heating leading to perturbations and mixing, and three non-thermal
mechanisms: 3) the effect of ionic wind 4) the ion and electron drift in the electric field,
and 5) excitation, dissociation, and ionization of the gas by electron impact [48]. An
advantage of the radio-frequency plasma is the ability to continuously supplement the
ignition energy and affect the flame kernel. One of the key challenges of radio-frequency
corona ignition is to ensure the discharge occurs while avoiding breakdown discharge.
This is the challenge especially under high density conditions when higher voltages are
required for initiate a discharge.
31
Development of the radio-frequency corona ignition technology toward
commercialization has been undertaken by a number of automotive technology
companies, the most notable being Federal-Mogul’s Advanced Corona Ignition System
and Borg Warner’s Ecoflash system [49-50]. Published results on research engines with
the Advanced Corona Ignition System have shown a larger initial ignition volume, faster
times to 5% mass burn fraction, and reduced cycle-to-cycle variations compared to
conventional spark ignition [47]. A more systematic follow-up study of the corona
ignition voltage and duration effects was also performed [51]. It was found that the
discharge parameters influenced the early phases of combustion up to the point of 5%
mass fraction burned, beyond which the flame propagation was independent of any action
by the igniter. This corresponded to about 300 µs at lambda = 1 and 500 µs at lambda =
1.4. The use of the highest discharge voltage below the arcing threshold was found to be
the most effective. When arcing occurred, the discharge was isolated to one arc path
instead of the normally four ignition zones generated by the four-pointed igniter. At
lower voltages or corona durations, ignition sometimes did not occur at all the igniter
points, decreasing the overall combustion stability and speed.
32
4. CHAPTER IV
METHODOLOGY
This chapter provides a description of the research platforms used in is dissertation.
The tests are in general of two categories. The first used a combustion vessel to provide a
background gas mixture of controlled pressure and composition to study the electrical
discharge, ignition, and flame propagation. The second used a single-cylinder test engine
to study the processes in actual engine applications.
4.1 Combustion Vessels
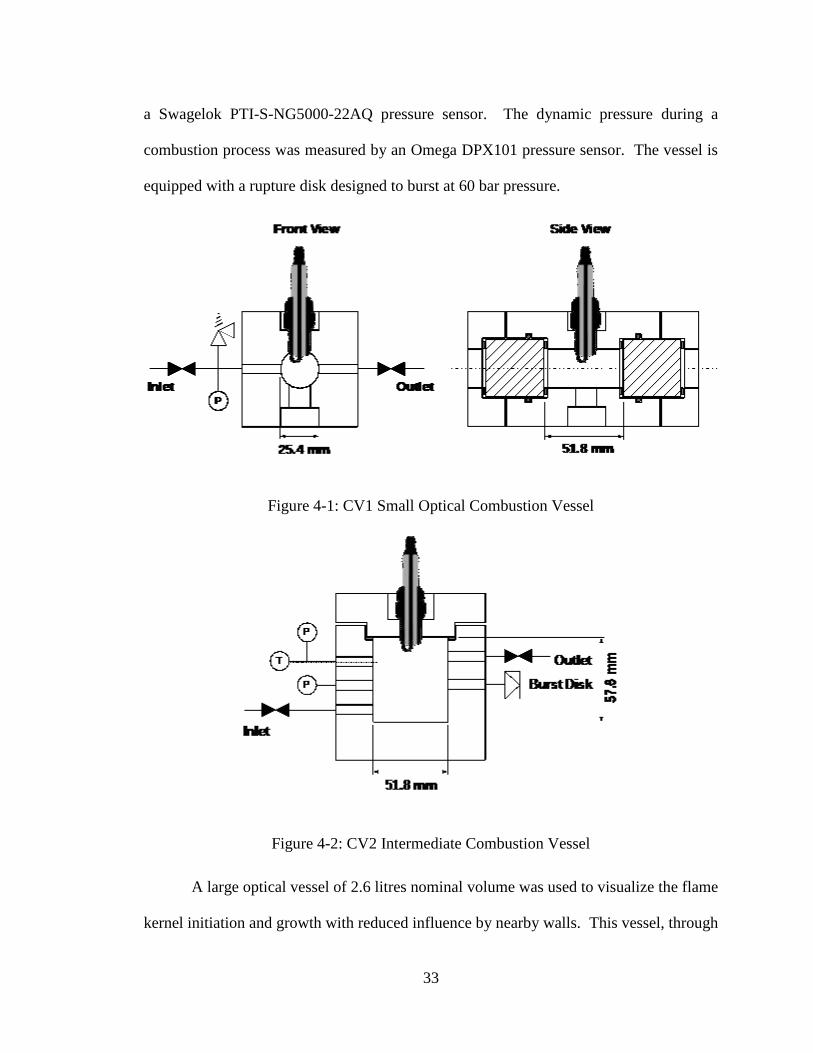
Combustion vessels of three different sizes and functions were used. A small 26
cm3 optical vessel was used for the majority of tests. This vessel was used for inert and
combustible charges up to 8 bar pressure. The layout of this CV1 vessel is shown in
Figure 4-1. The vessel has a cylindrical inner volume of 25.4 mm diameter and 51.8 mm
length. Two quartz windows provide an optical path through the vessel in the axis of the
cylindrical volume. The working fluid of the vessel is filled and discharged through two
1/4 inch ports. The vessel pressure is measured by a Kistler 4075A10 piezoresistive
absolute pressure sensor. The vessel is equipped with a pressure relief valve set at 8.3 bar.
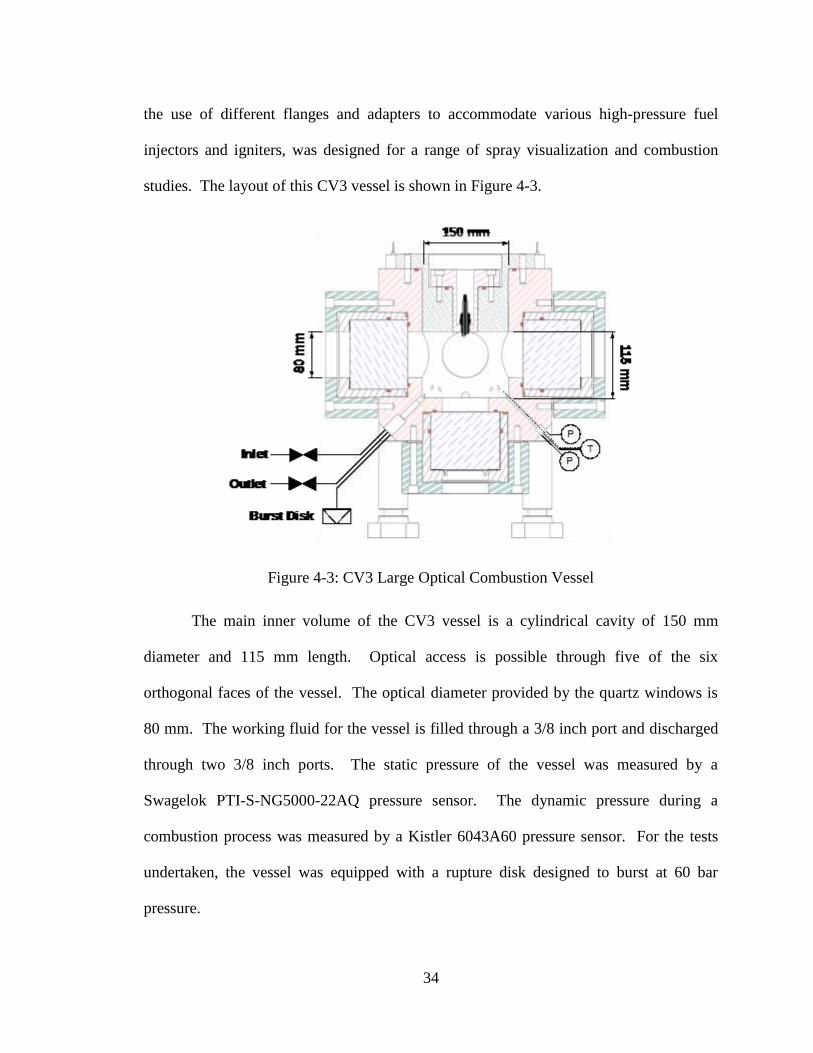
An intermediate sized non-optical vessel of 113 cm3 was used for inert and
combustible charges up to 60 bar. This vessel was not instrumented with any optical
ports to reduce the design complexity and increase the margin of safety. The layout of
this CV2 vessel is shown in Figure 4-2. The vessel cavity is a cylindrical volume of 50.0
mm diameter and 57.6 mm length. The working fluid of the vessel is filled and
discharged through two 1/4 inch ports. The static pressure of the vessel was measured by
33
a Swagelok PTI-S-NG5000-22AQ pressure sensor. The dynamic pressure during a
combustion process was measured by an Omega DPX101 pressure sensor. The vessel is
equipped with a rupture disk designed to burst at 60 bar pressure.
Figure 4-1: CV1 Small Optical Combustion Vessel
Figure 4-2: CV2 Intermediate Combustion Vessel
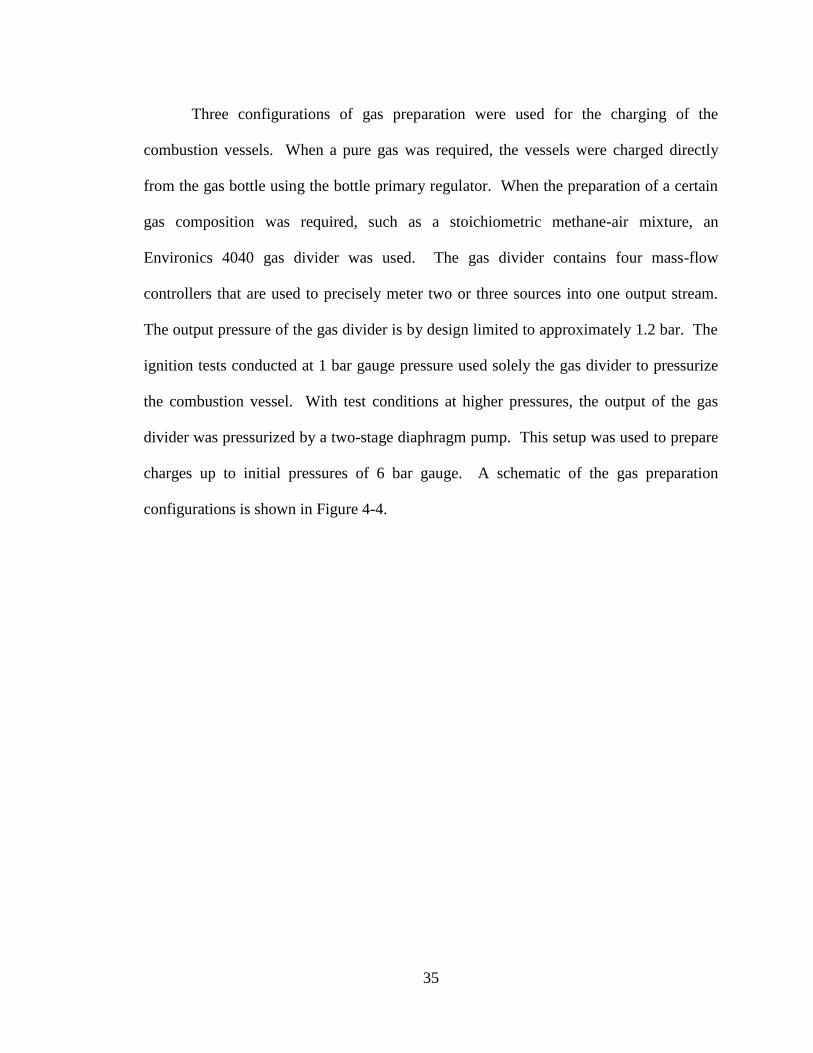
A large optical vessel of 2.6 litres nominal volume was used to visualize the flame
kernel initiation and growth with reduced influence by nearby walls. This vessel, through
34
the use of different flanges and adapters to accommodate various high-pressure fuel
injectors and igniters, was designed for a range of spray visualization and combustion
studies. The layout of this CV3 vessel is shown in Figure 4-3.
Figure 4-3: CV3 Large Optical Combustion Vessel
The main inner volume of the CV3 vessel is a cylindrical cavity of 150 mm
diameter and 115 mm length. Optical access is possible through five of the six
orthogonal faces of the vessel. The optical diameter provided by the quartz windows is
80 mm. The working fluid for the vessel is filled through a 3/8 inch port and discharged
through two 3/8 inch ports. The static pressure of the vessel was measured by a
Swagelok PTI-S-NG5000-22AQ pressure sensor. The dynamic pressure during a
combustion process was measured by a Kistler 6043A60 pressure sensor. For the tests
undertaken, the vessel was equipped with a rupture disk designed to burst at 60 bar
pressure.
35
Three configurations of gas preparation were used for the charging of the
combustion vessels. When a pure gas was required, the vessels were charged directly
from the gas bottle using the bottle primary regulator. When the preparation of a certain
gas composition was required, such as a stoichiometric methane-air mixture, an
Environics 4040 gas divider was used. The gas divider contains four mass-flow
controllers that are used to precisely meter two or three sources into one output stream.
The output pressure of the gas divider is by design limited to approximately 1.2 bar. The
ignition tests conducted at 1 bar gauge pressure used solely the gas divider to pressurize
the combustion vessel. With test conditions at higher pressures, the output of the gas
divider was pressurized by a two-stage diaphragm pump. This setup was used to prepare
charges up to initial pressures of 6 bar gauge. A schematic of the gas preparation
configurations is shown in Figure 4-4.
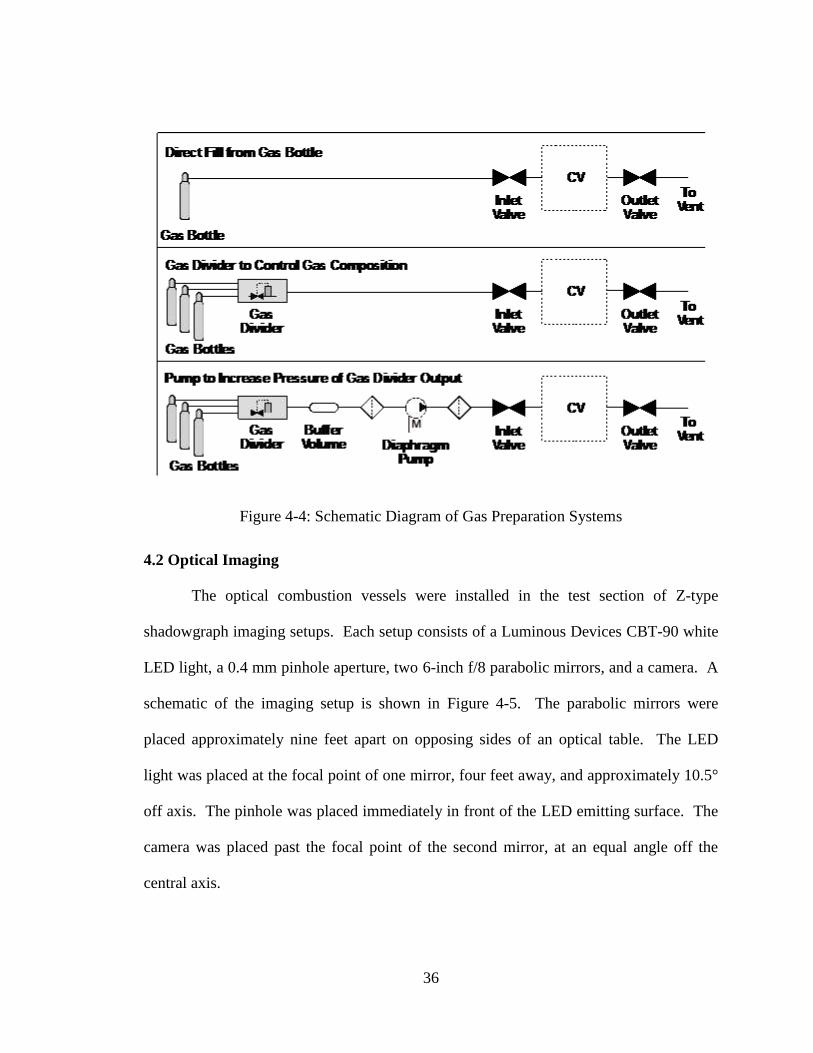
36
Figure 4-4: Schematic Diagram of Gas Preparation Systems
4.2 Optical Imaging
The optical combustion vessels were installed in the test section of Z-type
shadowgraph imaging setups. Each setup consists of a Luminous Devices CBT-90 white
LED light, a 0.4 mm pinhole aperture, two 6-inch f/8 parabolic mirrors, and a camera. A
schematic of the imaging setup is shown in Figure 4-5. The parabolic mirrors were
placed approximately nine feet apart on opposing sides of an optical table. The LED
light was placed at the focal point of one mirror, four feet away, and approximately 10.5°
off axis. The pinhole was placed immediately in front of the LED emitting surface. The
camera was placed past the focal point of the second mirror, at an equal angle off the
central axis.
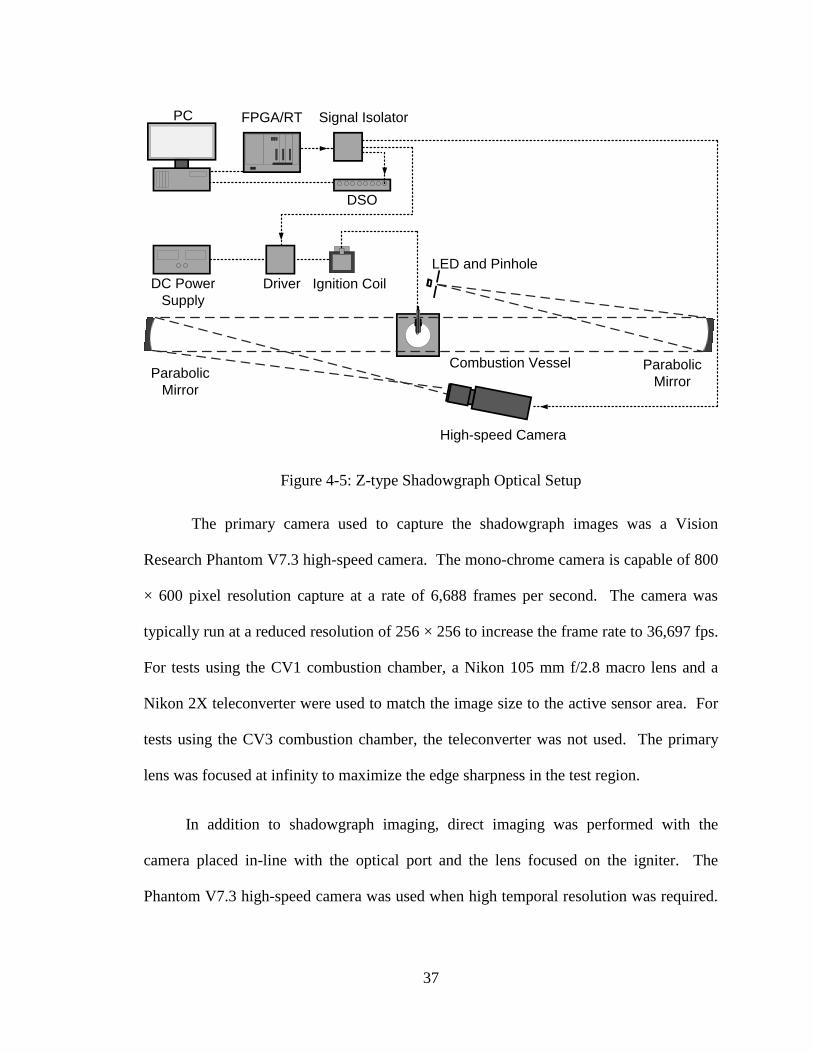
37
Figure 4-5: Z-type Shadowgraph Optical Setup
The primary camera used to capture the shadowgraph images was a Vision
Research Phantom V7.3 high-speed camera. The mono-chrome camera is capable of 800
× 600 pixel resolution capture at a rate of 6,688 frames per second. The camera was
typically run at a reduced resolution of 256 × 256 to increase the frame rate to 36,697 fps.
For tests using the CV1 combustion chamber, a Nikon 105 mm f/2.8 macro lens and a
Nikon 2X teleconverter were used to match the image size to the active sensor area. For
tests using the CV3 combustion chamber, the teleconverter was not used. The primary
lens was focused at infinity to maximize the edge sharpness in the test region.
In addition to shadowgraph imaging, direct imaging was performed with the
camera placed in-line with the optical port and the lens focused on the igniter. The
Phantom V7.3 high-speed camera was used when high temporal resolution was required.
Combustion Vessel
DSO
High-speed Camera
LED and Pinhole
DC Power
Supply
Driver Ignition Coil
Signal IsolatorFPGA/RT
Parabolic
Mirror
PC
Parabolic
Mirror
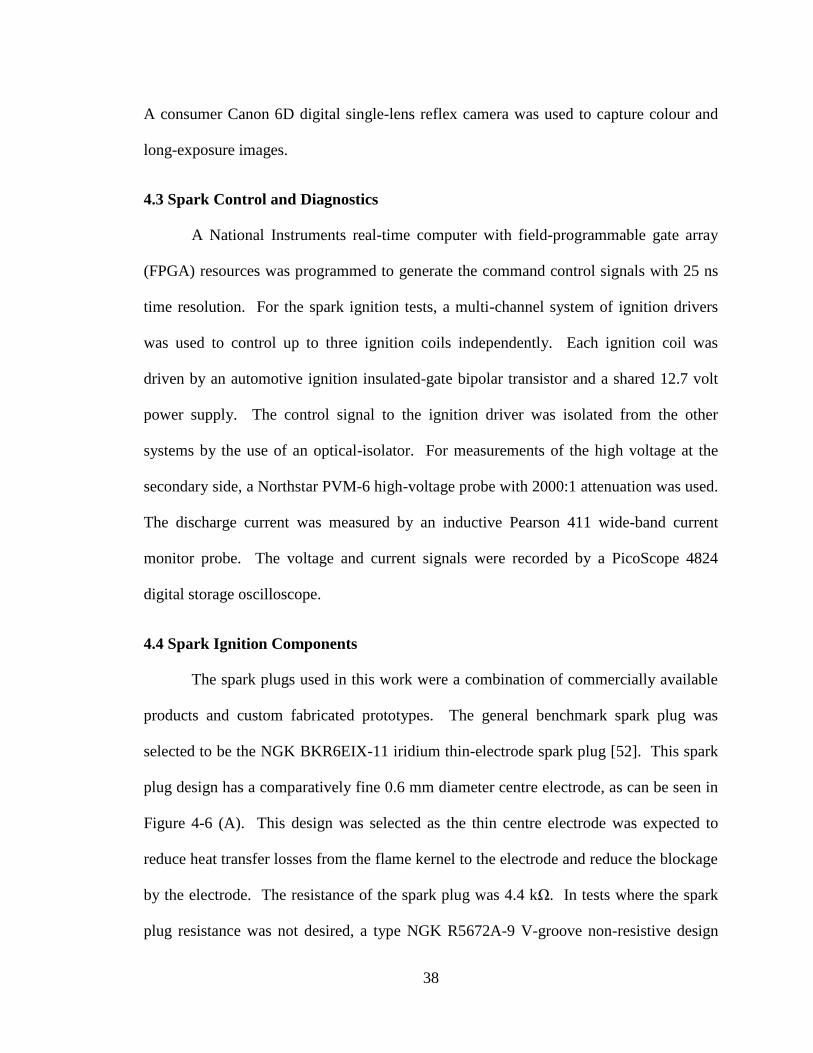
38
A consumer Canon 6D digital single-lens reflex camera was used to capture colour and
long-exposure images.
4.3 Spark Control and Diagnostics
A National Instruments real-time computer with field-programmable gate array
(FPGA) resources was programmed to generate the command control signals with 25 ns
time resolution. For the spark ignition tests, a multi-channel system of ignition drivers
was used to control up to three ignition coils independently. Each ignition coil was
driven by an automotive ignition insulated-gate bipolar transistor and a shared 12.7 volt
power supply. The control signal to the ignition driver was isolated from the other
systems by the use of an optical-isolator. For measurements of the high voltage at the
secondary side, a Northstar PVM-6 high-voltage probe with 2000:1 attenuation was used.
The discharge current was measured by an inductive Pearson 411 wide-band current
monitor probe. The voltage and current signals were recorded by a PicoScope 4824
digital storage oscilloscope.
4.4 Spark Ignition Components
The spark plugs used in this work were a combination of commercially available
products and custom fabricated prototypes. The general benchmark spark plug was
selected to be the NGK BKR6EIX-11 iridium thin-electrode spark plug [52]. This spark
plug design has a comparatively fine 0.6 mm diameter centre electrode, as can be seen in
Figure 4-6 (A). This design was selected as the thin centre electrode was expected to
reduce heat transfer losses from the flame kernel to the electrode and reduce the blockage
by the electrode. The resistance of the spark plug was 4.4 kΩ. In tests where the spark
plug resistance was not desired, a type NGK R5672A-9 V-groove non-resistive design
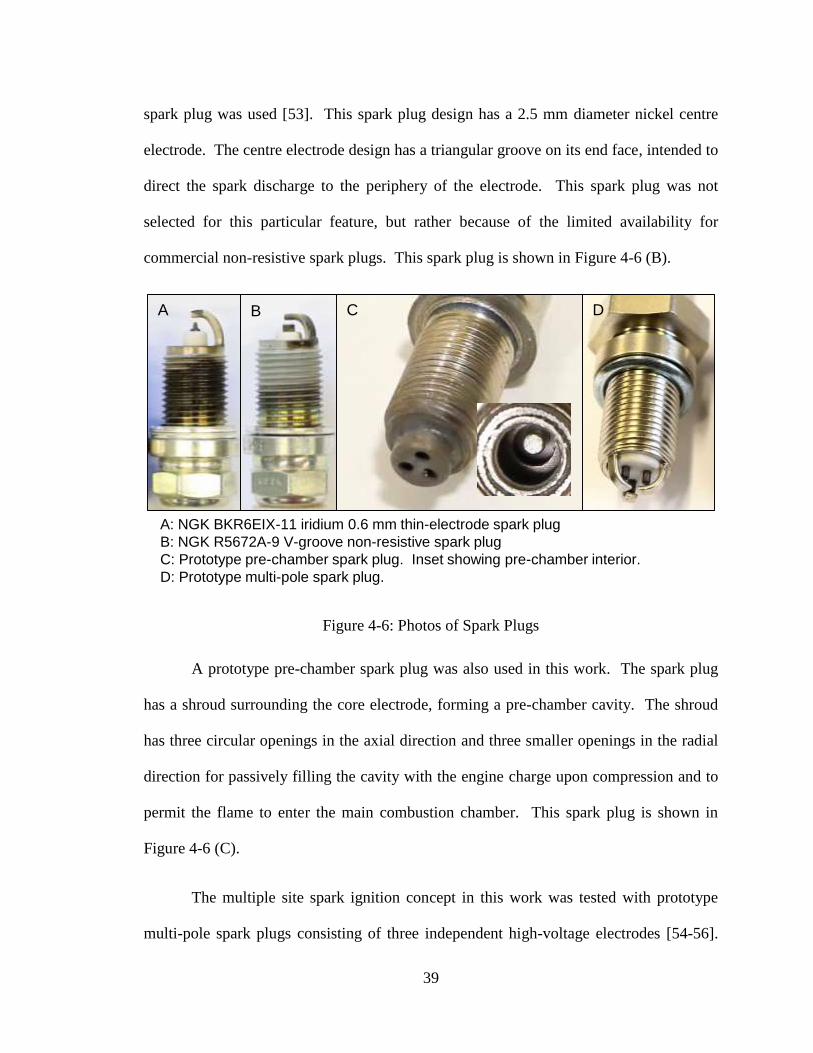
39
spark plug was used [53]. This spark plug design has a 2.5 mm diameter nickel centre
electrode. The centre electrode design has a triangular groove on its end face, intended to
direct the spark discharge to the periphery of the electrode. This spark plug was not
selected for this particular feature, but rather because of the limited availability for
commercial non-resistive spark plugs. This spark plug is shown in Figure 4-6 (B).
Figure 4-6: Photos of Spark Plugs
A prototype pre-chamber spark plug was also used in this work. The spark plug
has a shroud surrounding the core electrode, forming a pre-chamber cavity. The shroud
has three circular openings in the axial direction and three smaller openings in the radial
direction for passively filling the cavity with the engine charge upon compression and to
permit the flame to enter the main combustion chamber. This spark plug is shown in
Figure 4-6 (C).
The multiple site spark ignition concept in this work was tested with prototype
multi-pole spark plugs consisting of three independent high-voltage electrodes [54-56].
A B C D
A: NGK BKR6EIX-11 iridium 0.6 mm thin-electrode spark plug
B: NGK R5672A-9 V-groove non-resistive spark plug
C: Prototype pre-chamber spark plug. Inset showing pre-chamber interior.
D: Prototype multi-pole spark plug.
40
The number of electrodes was selected to be three for the practicality of fabrication, to
ensure adequate ceramic thickness for electrical isolation, and to limit the blockage effect
of the core and ground electrodes on the flame kernel development. The reported work in
this thesis was performed on a manufacturing prototype design made in production-level
processes with conventional sintered aluminum oxide processing methods and steel shell
fabrication. This spark plug design is shown in Figure 4-6 (D). The M-14 size plug
contained three electrically independent 1.5 mm core electrodes arranged in a triangular
pattern with a circumradius of 2.3 mm. The conductor used to connect each of the core
electrodes to spark wires consisted of 20 American wire gauge high-voltage cable with
silicone insulation material. The conductor cable joints were potted with electrical epoxy
to insulate the conductors from each other. These spark plugs were not manufactured
with any internal resistor.
Figure 4-7: Later Generation Manufacturing Prototype Multi-pole Spark Plug
A B
A: Manufacturing prototype multi-pole spark plug
B: Spark discharge in air
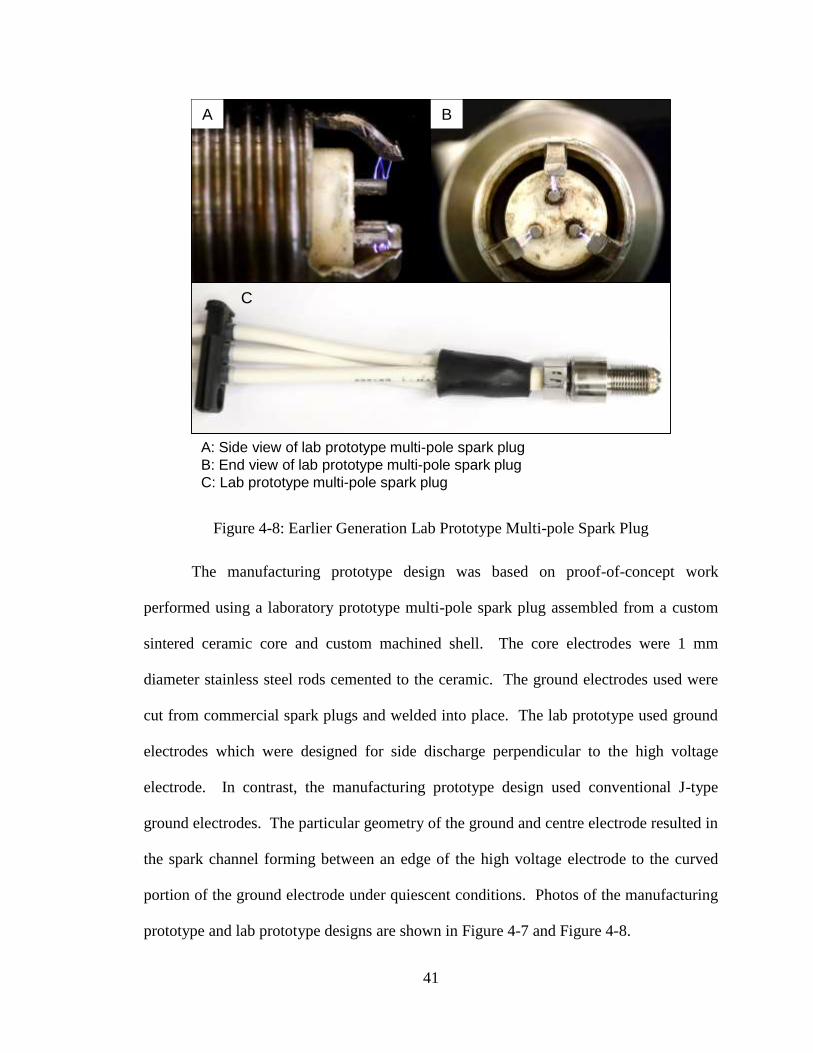
41
Figure 4-8: Earlier Generation Lab Prototype Multi-pole Spark Plug
The manufacturing prototype design was based on proof-of-concept work
performed using a laboratory prototype multi-pole spark plug assembled from a custom
sintered ceramic core and custom machined shell. The core electrodes were 1 mm
diameter stainless steel rods cemented to the ceramic. The ground electrodes used were
cut from commercial spark plugs and welded into place. The lab prototype used ground
electrodes which were designed for side discharge perpendicular to the high voltage
electrode. In contrast, the manufacturing prototype design used conventional J-type
ground electrodes. The particular geometry of the ground and centre electrode resulted in
the spark channel forming between an edge of the high voltage electrode to the curved
portion of the ground electrode under quiescent conditions. Photos of the manufacturing
prototype and lab prototype designs are shown in Figure 4-7 and Figure 4-8.
C
A B
A: Side view of lab prototype multi-pole spark plug
B: End view of lab prototype multi-pole spark plug
C: Lab prototype multi-pole spark plug
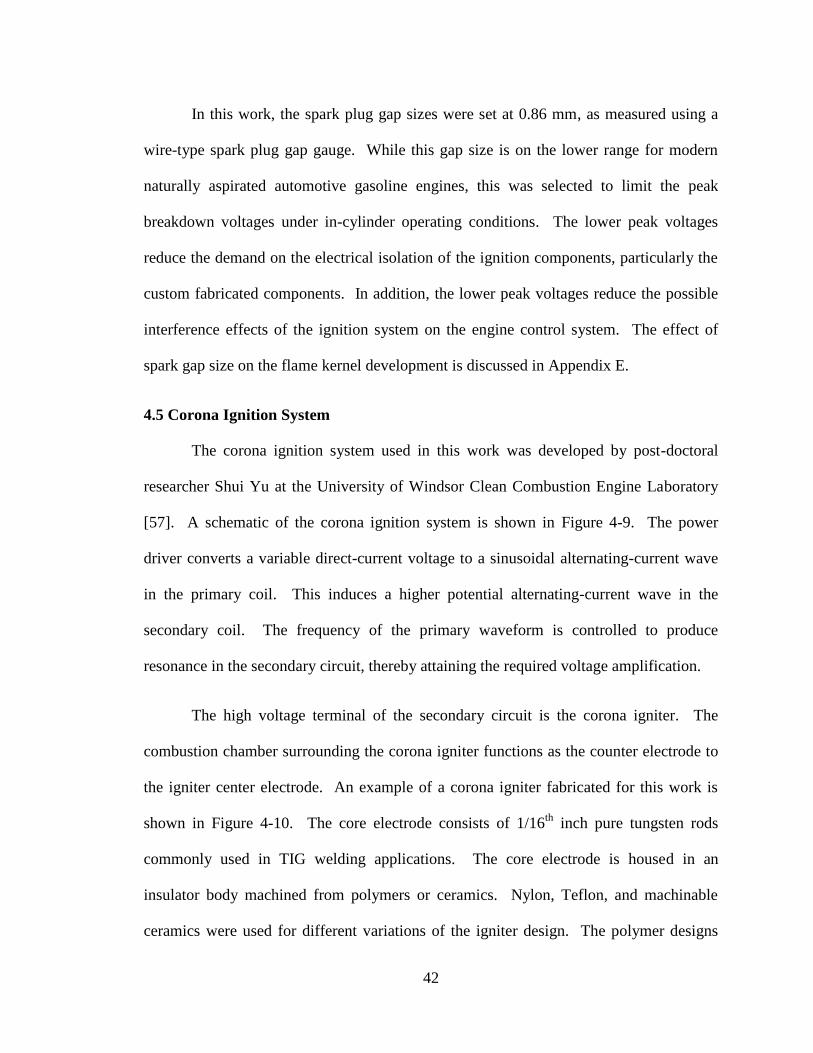
42
In this work, the spark plug gap sizes were set at 0.86 mm, as measured using a
wire-type spark plug gap gauge. While this gap size is on the lower range for modern
naturally aspirated automotive gasoline engines, this was selected to limit the peak
breakdown voltages under in-cylinder operating conditions. The lower peak voltages
reduce the demand on the electrical isolation of the ignition components, particularly the
custom fabricated components. In addition, the lower peak voltages reduce the possible
interference effects of the ignition system on the engine control system. The effect of
spark gap size on the flame kernel development is discussed in Appendix E.
4.5 Corona Ignition System
The corona ignition system used in this work was developed by post-doctoral
researcher Shui Yu at the University of Windsor Clean Combustion Engine Laboratory
[57]. A schematic of the corona ignition system is shown in Figure 4-9. The power
driver converts a variable direct-current voltage to a sinusoidal alternating-current wave
in the primary coil. This induces a higher potential alternating-current wave in the
secondary coil. The frequency of the primary waveform is controlled to produce
resonance in the secondary circuit, thereby attaining the required voltage amplification.
The high voltage terminal of the secondary circuit is the corona igniter. The
combustion chamber surrounding the corona igniter functions as the counter electrode to
the igniter center electrode. An example of a corona igniter fabricated for this work is
shown in Figure 4-10. The core electrode consists of 1/16th
inch pure tungsten rods
commonly used in TIG welding applications. The core electrode is housed in an
insulator body machined from polymers or ceramics. Nylon, Teflon, and machinable
ceramics were used for different variations of the igniter design. The polymer designs
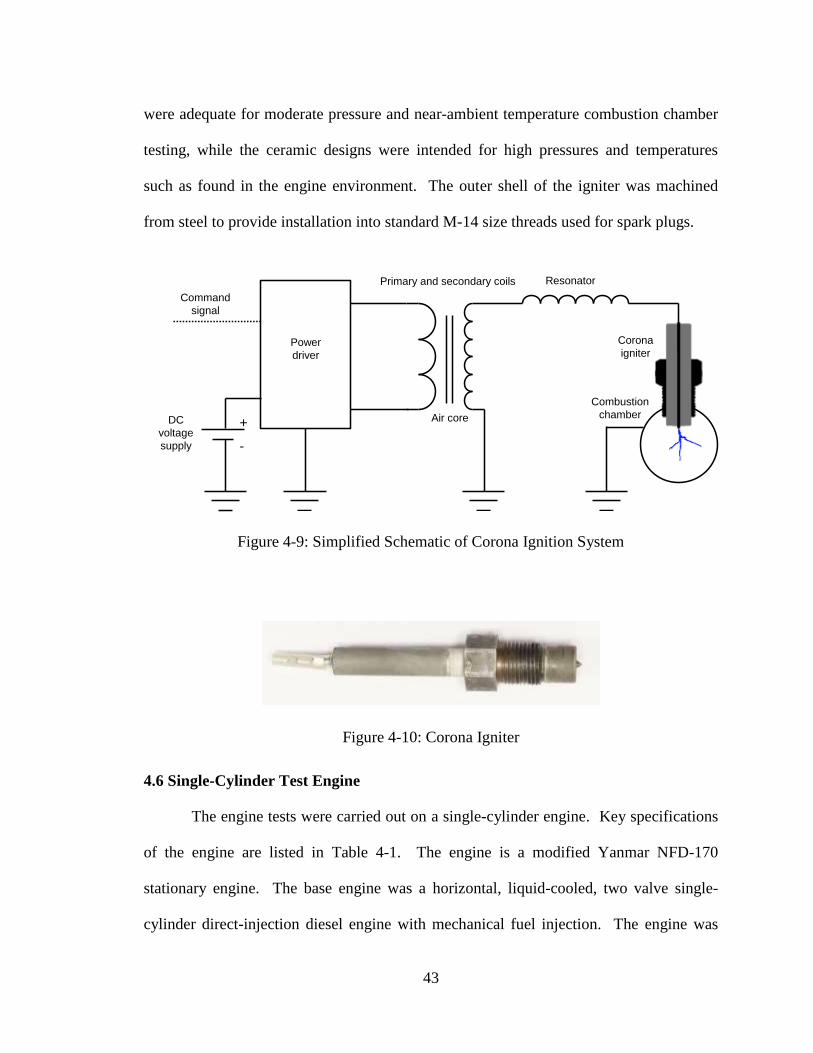
43
were adequate for moderate pressure and near-ambient temperature combustion chamber
testing, while the ceramic designs were intended for high pressures and temperatures
such as found in the engine environment. The outer shell of the igniter was machined
from steel to provide installation into standard M-14 size threads used for spark plugs.
Figure 4-9: Simplified Schematic of Corona Ignition System
Figure 4-10: Corona Igniter
4.6 Single-Cylinder Test Engine
The engine tests were carried out on a single-cylinder engine. Key specifications
of the engine are listed in Table 4-1. The engine is a modified Yanmar NFD-170
stationary engine. The base engine was a horizontal, liquid-cooled, two valve single-
cylinder direct-injection diesel engine with mechanical fuel injection. The engine was
Power
driver
DC
voltage
supply
Corona
igniter
Primary and secondary coils Resonator
+
-
Command
signal
Combustion
chamberAir core
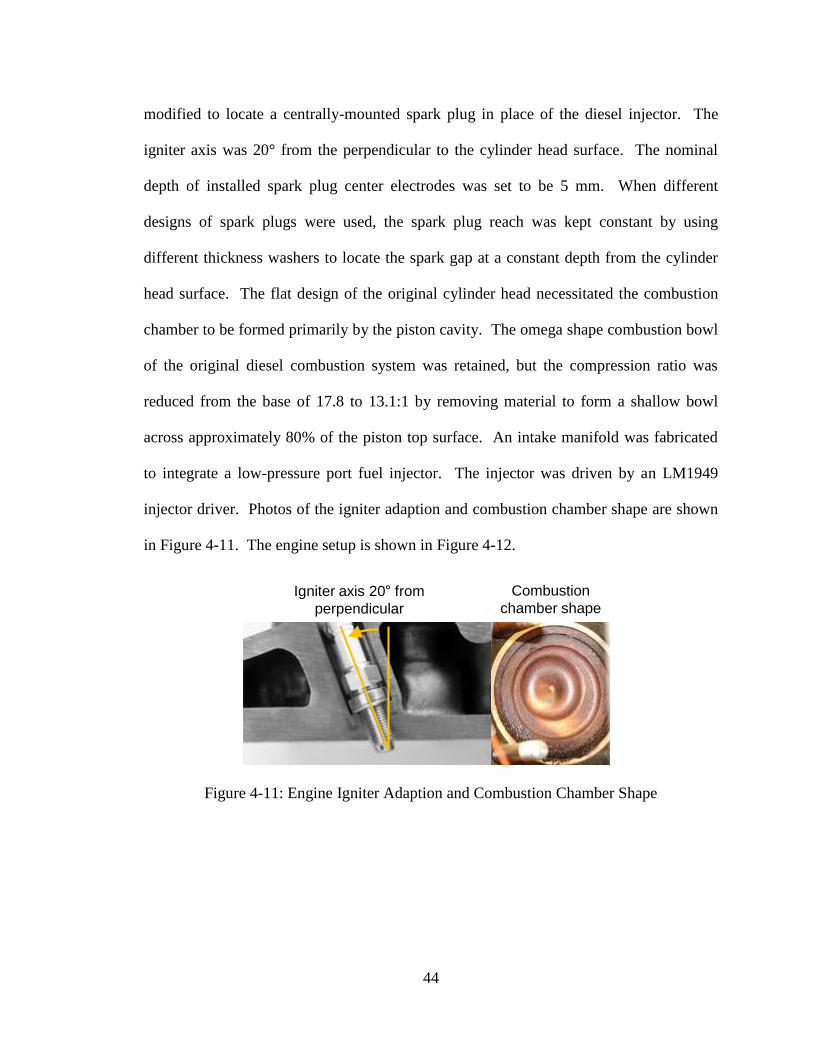
44
modified to locate a centrally-mounted spark plug in place of the diesel injector. The
igniter axis was 20° from the perpendicular to the cylinder head surface. The nominal
depth of installed spark plug center electrodes was set to be 5 mm. When different
designs of spark plugs were used, the spark plug reach was kept constant by using
different thickness washers to locate the spark gap at a constant depth from the cylinder
head surface. The flat design of the original cylinder head necessitated the combustion
chamber to be formed primarily by the piston cavity. The omega shape combustion bowl
of the original diesel combustion system was retained, but the compression ratio was
reduced from the base of 17.8 to 13.1:1 by removing material to form a shallow bowl
across approximately 80% of the piston top surface. An intake manifold was fabricated
to integrate a low-pressure port fuel injector. The injector was driven by an LM1949
injector driver. Photos of the igniter adaption and combustion chamber shape are shown
in Figure 4-11. The engine setup is shown in Figure 4-12.
Figure 4-11: Engine Igniter Adaption and Combustion Chamber Shape
Igniter axis 20 from
perpendicular
Combustion
chamber shape
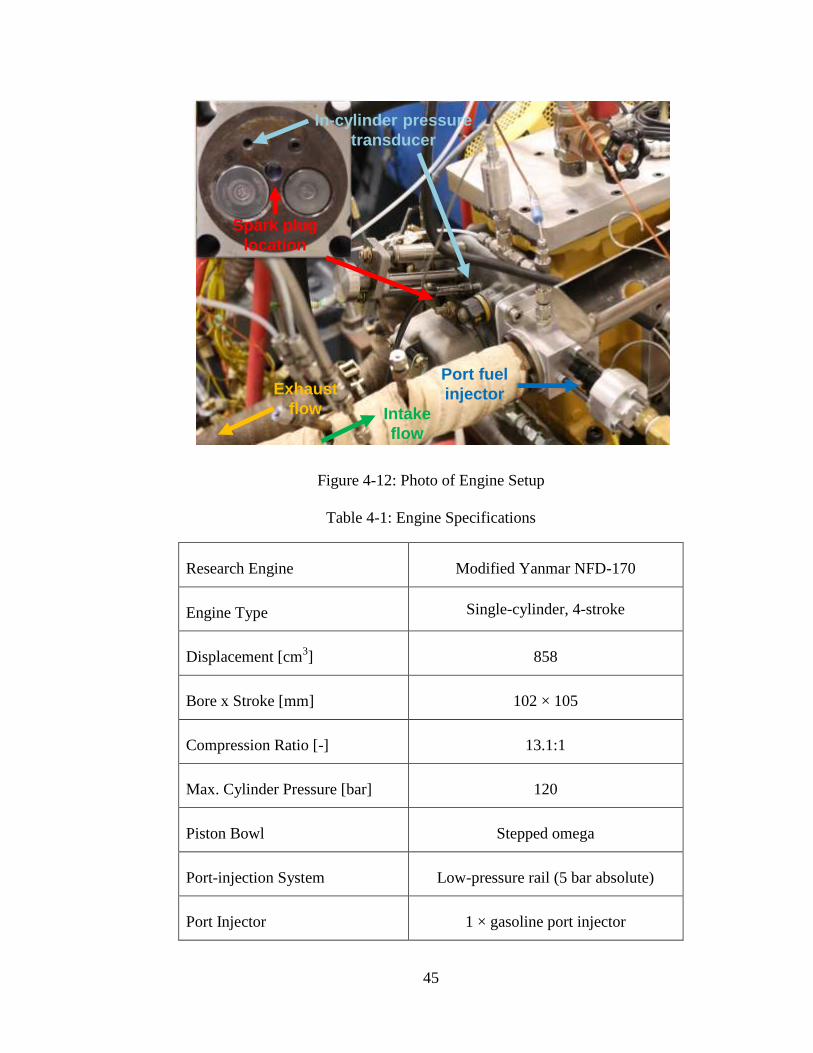
45
Figure 4-12: Photo of Engine Setup
Table 4-1: Engine Specifications
Research Engine Modified Yanmar NFD-170
Engine Type Single-cylinder, 4-stroke
Displacement [cm3] 858
Bore x Stroke [mm] 102 × 105
Compression Ratio [-] 13.1:1
Max. Cylinder Pressure [bar] 120
Piston Bowl Stepped omega
Port-injection System Low-pressure rail (5 bar absolute)
Port Injector 1 × gasoline port injector
Spark plug
location
Port fuel
injector
Intake
flow
In-cylinder pressure
transducer
Exhaust
flow
46
The test engine was located in a test cell equipped with a double-ended GE 26-G-
215 direct-current dynamometer. A DyneSystems Dyn-Loc IV controller was utilized to
control the dynamometer in speed mode. A dedicated coolant condition unit was used to
control the coolant temperature throughout the experiments. Similarly, a dedicated
lubricant system was used to control the engine oil temperature and pressure.
The primary high-speed control of the engine, namely the fuel injection
scheduling and spark commands, was performed by a National Instruments real-time
computer with field-programmable gate array resources. A desktop personal computer
was used for boost and EGR control. A series of additional computers were used for the
monitoring and recording of key engine parameters: temperatures, air and fuel flow rates,
emissions, and the cylinder pressure. The engine crank angle position was indicated by a
crank-shaft aligned rotary incremental encoder (Gurley Precision Instruments
9124S03600H5L01) at 0.1° resolution. The in-cylinder pressure was acquired in
synchronization with the encoder. The Yanmar engine used a water-cooled Kistler
6043A60 transducer mounted into engine cylinder head. The transducer was coupled to a
Kistler 5010B charge amplifier. The manifold pressure was acquired with a Kistler
4075A10 piezo-resistive absolute pressure transducer. Data recording of the pressures at
each condition consisted of 200 consecutive engine cycles.
The intake air for the engine was provided by an off-engine compressor when
operating under boosted conditions. The fresh intake flow rate was measured by a Roots
rotary-type positive displacement air flow meter. An intake surge tank was installed
downstream of the air flow meter to reduce the effects of the intermittent intake valve
action on the accuracy of air-flow measurements. The Yanmar engine was primarily
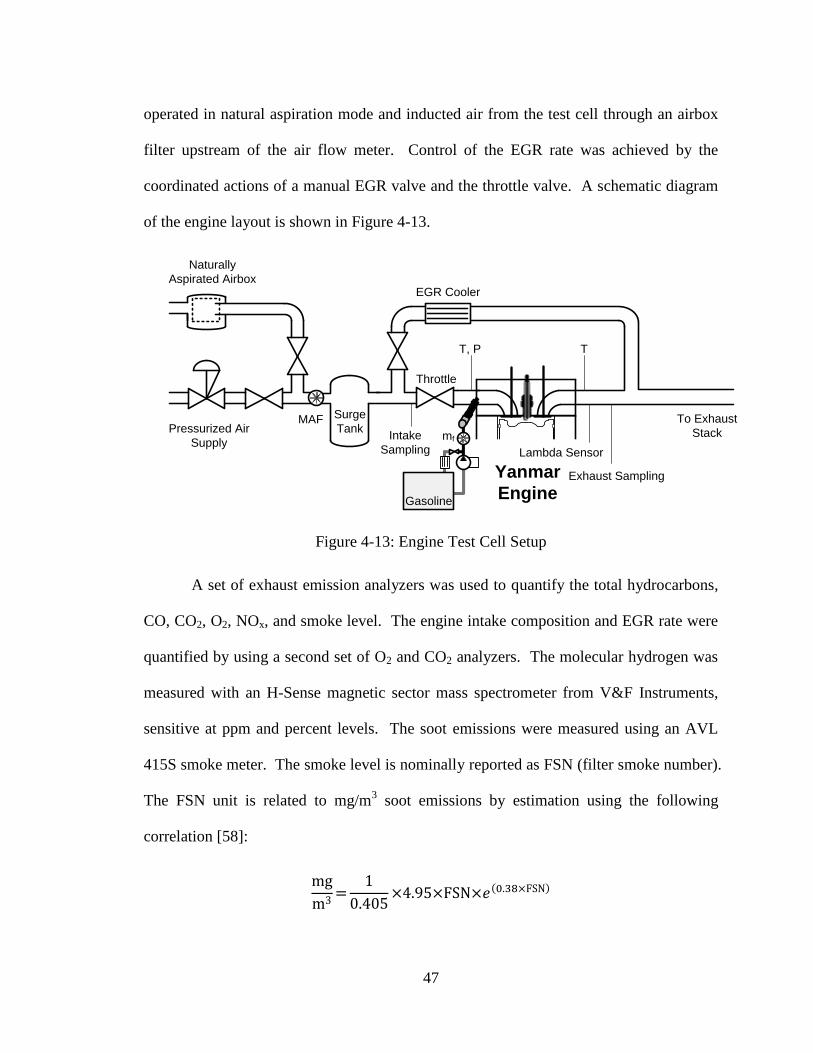
47
operated in natural aspiration mode and inducted air from the test cell through an airbox
filter upstream of the air flow meter. Control of the EGR rate was achieved by the
coordinated actions of a manual EGR valve and the throttle valve. A schematic diagram
of the engine layout is shown in Figure 4-13.
Figure 4-13: Engine Test Cell Setup
A set of exhaust emission analyzers was used to quantify the total hydrocarbons,
CO, CO2, O2, NOx, and smoke level. The engine intake composition and EGR rate were
quantified by using a second set of O2 and CO2 analyzers. The molecular hydrogen was
measured with an H-Sense magnetic sector mass spectrometer from V&F Instruments,
sensitive at ppm and percent levels. The soot emissions were measured using an AVL
415S smoke meter. The smoke level is nominally reported as FSN (filter smoke number).
The FSN unit is related to mg/m3 soot emissions by estimation using the following
correlation [58]:
mg
m3=
1
0.405×4.95×FSN×𝑒(0.38×FSN)
Surge
TankMAF
Pressurized Air
Supply
T, P
Throttle
T
Exhaust Sampling
Lambda Sensor
mf
Naturally
Aspirated Airbox
Gasoline
EGR Cooler
Intake
Sampling
To Exhaust
Stack
Yanmar
Engine
48
A Fourier transform infrared spectrometer was used to allow speciation of the
exhaust. Fourier-transform infrared spectroscopy (FTIR) uses interferometry to obtain a
scan of infrared absorbencies of the sample gas. The absorption of infrared radiation at
specific wavelengths is a property of the molecular composition and structure of each
species. The FTIR instrument used was a MKS model 2030HS with a 5.11 metre
pathlength gas cell and liquid-nitrogen cooled MCT infrared detector. The gas cell, inlet,
and sample line were heated to 191° C. The scan range was configured from 600 to 3500
cm-1
at 0.5 cm-1
resolution and five scans per second. Averages of five scans were
recorded at one sample per second.
The full equipment suite used is listed in Table 4-2. The instrument range is
shown in the right-hand column where applicable. In instances where the calibrated
range differed substantially from the instrument full range, the calibrated range is also
listed.
The engine tests were conducted at an engine speed of 1300 RPM. The coolant
and engine oil temperatures were set at 80 °C. In general, for each ignition strategy and
dilution ratio condition, spark timing sweeps were conducted. This allowed comparisons
of different strategies at the same ignition timing as well as comparisons of optimized
points of the different strategies.
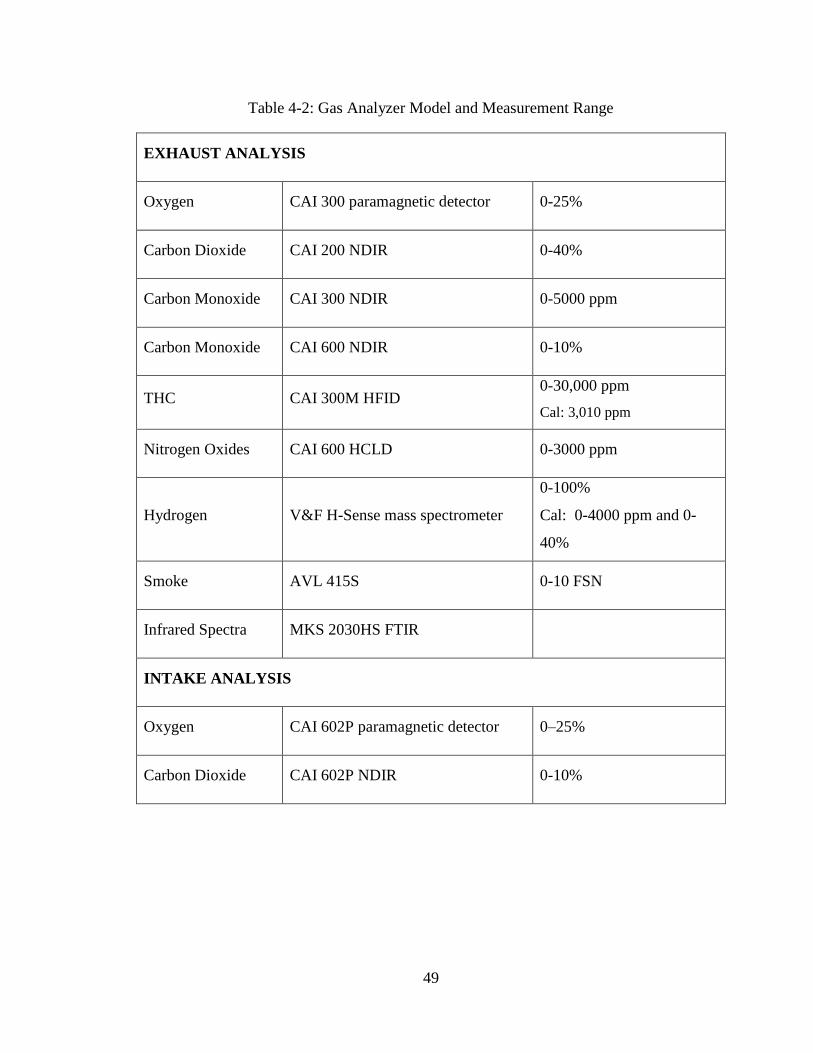
49
Table 4-2: Gas Analyzer Model and Measurement Range
EXHAUST ANALYSIS
Oxygen CAI 300 paramagnetic detector 0-25%
Carbon Dioxide CAI 200 NDIR 0-40%
Carbon Monoxide CAI 300 NDIR 0-5000 ppm
Carbon Monoxide CAI 600 NDIR 0-10%
THC CAI 300M HFID 0-30,000 ppm
Cal: 3,010 ppm
Nitrogen Oxides CAI 600 HCLD 0-3000 ppm
Hydrogen V&F H-Sense mass spectrometer
0-100%
Cal: 0-4000 ppm and 0-
40%
Smoke AVL 415S 0-10 FSN
Infrared Spectra MKS 2030HS FTIR
INTAKE ANALYSIS
Oxygen CAI 602P paramagnetic detector 0–25%
Carbon Dioxide CAI 602P NDIR 0-10%
50
5. CHAPTER V
EFFECT OF ENERGY AND ENERGY PROFILE ON SPARK IGNITION
This chapter presents the results tests on the energy characterization and ignition
effectiveness evaluation the conventional ignition coil system. The tests were performed
both under quiescent conditions in a combustion vessel and under engine conditions. The
conventional energy profiles were then modified to identify the relative impact of energy
addition at different phases of the discharge process.
5.1 Effect of Discharge Energy
5.1.1 Quiescent Conditions
A set of test was carried out in the CV1 optical combustion chamber to compare
the effect of discharge energy in a conventional spark ignition system as specified
previously. The discharge energy was varied by changing the coil charging duration,
ranging from 0.5 ms to 8 ms. The effects of the coil charging duration on the discharge
energy, peak secondary current, discharge duration, and overall current profile are shown
in Figure 5-1. The energy delivered to the spark plug increased as the charging duration
was increased, up to a measured value of 160 mJ at 8 ms. The rate of energy increase
declined at this duration as the primary coil approached current saturation. The measured
energy delivered to the spark gap, however, can be significantly lower because of the
losses in the spark plug resistor. This fraction of energy consumed by the resistor was
less than 15% at low total energy levels, and increased to 67% at the highest energy
levels.
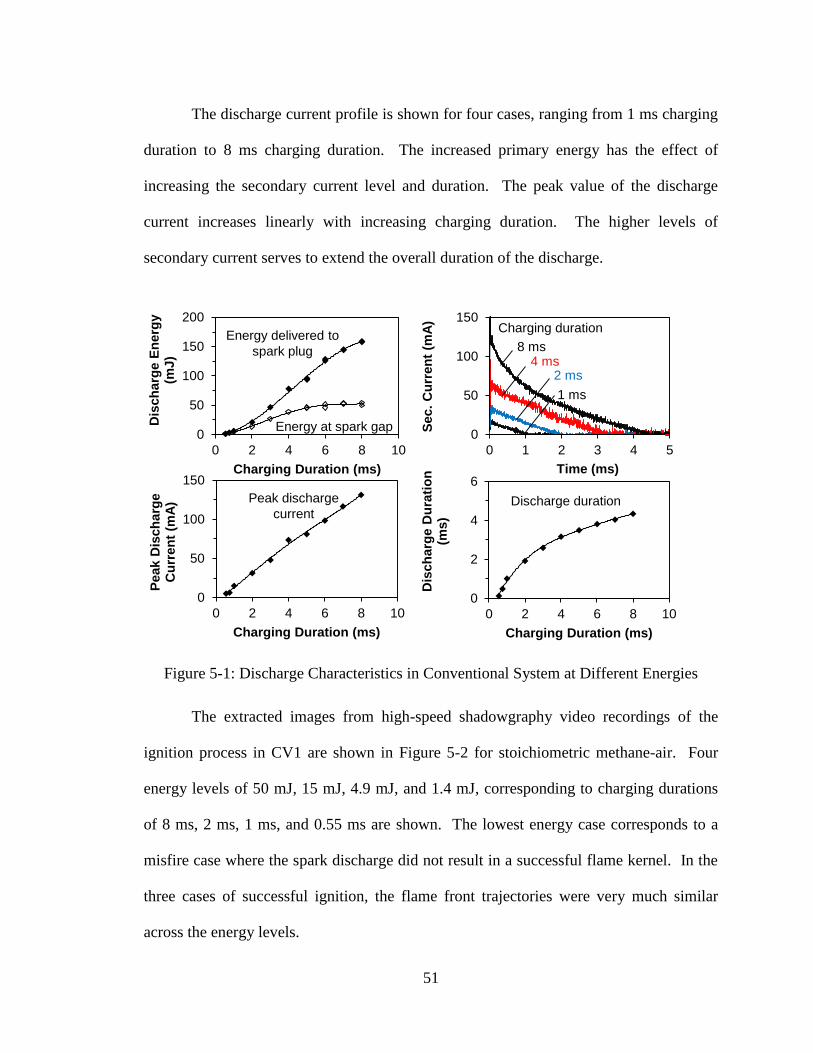
51
The discharge current profile is shown for four cases, ranging from 1 ms charging
duration to 8 ms charging duration. The increased primary energy has the effect of
increasing the secondary current level and duration. The peak value of the discharge
current increases linearly with increasing charging duration. The higher levels of
secondary current serves to extend the overall duration of the discharge.
Figure 5-1: Discharge Characteristics in Conventional System at Different Energies
The extracted images from high-speed shadowgraphy video recordings of the
ignition process in CV1 are shown in Figure 5-2 for stoichiometric methane-air. Four
energy levels of 50 mJ, 15 mJ, 4.9 mJ, and 1.4 mJ, corresponding to charging durations
of 8 ms, 2 ms, 1 ms, and 0.55 ms are shown. The lowest energy case corresponds to a
misfire case where the spark discharge did not result in a successful flame kernel. In the
three cases of successful ignition, the flame front trajectories were very much similar
across the energy levels.
0
2
4
6
0 2 4 6 8 10
Dis
ch
arg
e D
ura
tio
n
(ms)
Charging Duration (ms)
Discharge duration
0
50
100
150
0 2 4 6 8 10
Peak D
isch
arg
e
Cu
rren
t (m
A)
Charging Duration (ms)
Peak discharge
current
0
50
100
150
0 1 2 3 4 5
Sec.
Cu
rren
t (m
A)
Time (ms)
8 ms4 ms
2 ms
1 ms
Charging duration
0
50
100
150
200
0 2 4 6 8 10
Dis
ch
arg
e E
nerg
y
(mJ)
Charging Duration (ms)
Energy delivered to
spark plug
Energy at spark gap
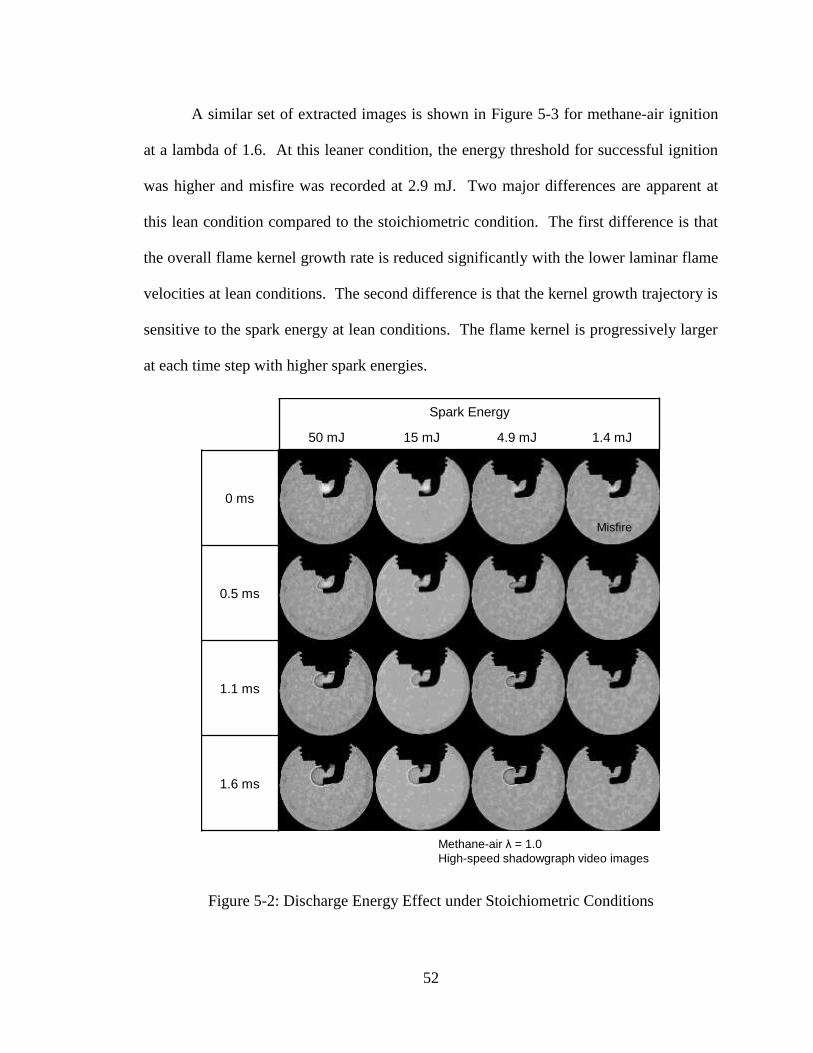
52
A similar set of extracted images is shown in Figure 5-3 for methane-air ignition
at a lambda of 1.6. At this leaner condition, the energy threshold for successful ignition
was higher and misfire was recorded at 2.9 mJ. Two major differences are apparent at
this lean condition compared to the stoichiometric condition. The first difference is that
the overall flame kernel growth rate is reduced significantly with the lower laminar flame
velocities at lean conditions. The second difference is that the kernel growth trajectory is
sensitive to the spark energy at lean conditions. The flame kernel is progressively larger
at each time step with higher spark energies.
Figure 5-2: Discharge Energy Effect under Stoichiometric Conditions
0 ms
0.5 ms
1.1 ms
1.6 ms
Methane-air λ = 1.0
High-speed shadowgraph video images
Spark Energy
50 mJ 15 mJ 4.9 mJ 1.4 mJ
Misfire
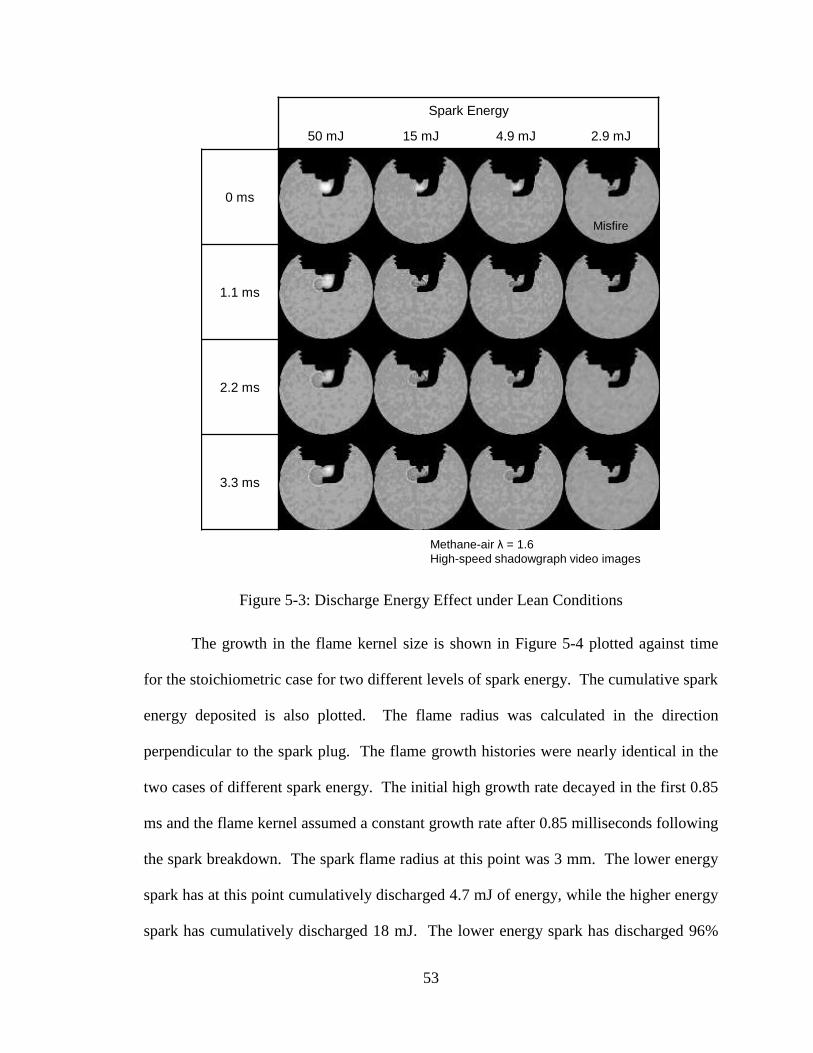
53
Figure 5-3: Discharge Energy Effect under Lean Conditions
The growth in the flame kernel size is shown in Figure 5-4 plotted against time
for the stoichiometric case for two different levels of spark energy. The cumulative spark
energy deposited is also plotted. The flame radius was calculated in the direction
perpendicular to the spark plug. The flame growth histories were nearly identical in the
two cases of different spark energy. The initial high growth rate decayed in the first 0.85
ms and the flame kernel assumed a constant growth rate after 0.85 milliseconds following
the spark breakdown. The spark flame radius at this point was 3 mm. The lower energy
spark has at this point cumulatively discharged 4.7 mJ of energy, while the higher energy
spark has cumulatively discharged 18 mJ. The lower energy spark has discharged 96%
0 ms
1.1 ms
2.2 ms
3.3 ms
Methane-air λ = 1.6
High-speed shadowgraph video images
Spark Energy
50 mJ 15 mJ 4.9 mJ 2.9 mJ
Misfire
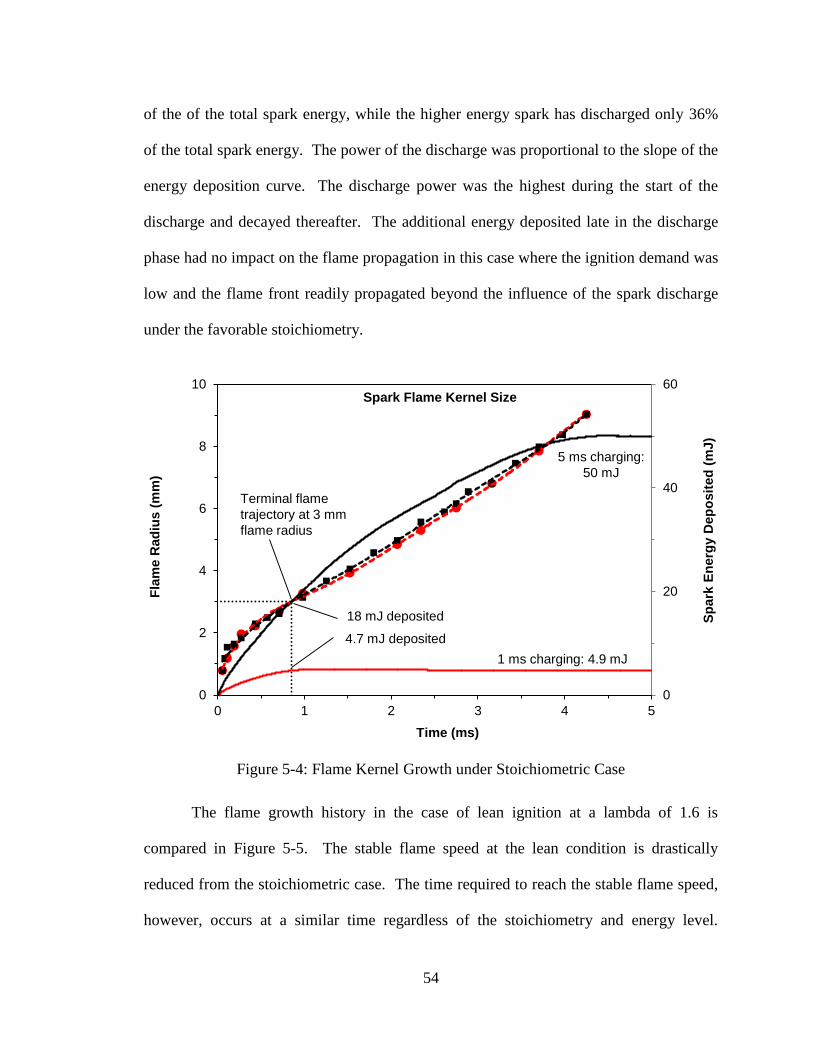
54
of the of the total spark energy, while the higher energy spark has discharged only 36%
of the total spark energy. The power of the discharge was proportional to the slope of the
energy deposition curve. The discharge power was the highest during the start of the
discharge and decayed thereafter. The additional energy deposited late in the discharge
phase had no impact on the flame propagation in this case where the ignition demand was
low and the flame front readily propagated beyond the influence of the spark discharge
under the favorable stoichiometry.
Figure 5-4: Flame Kernel Growth under Stoichiometric Case
The flame growth history in the case of lean ignition at a lambda of 1.6 is
compared in Figure 5-5. The stable flame speed at the lean condition is drastically
reduced from the stoichiometric case. The time required to reach the stable flame speed,
however, occurs at a similar time regardless of the stoichiometry and energy level.
0
20
40
60
0
2
4
6
8
10
0 1 2 3 4 5S
pa
rk E
ne
rgy D
ep
os
ite
d (
mJ
)
Fla
me
Ra
diu
s (
mm
)
Time (ms)
Spark Flame Kernel Size
4.7 mJ deposited
1 ms charging: 4.9 mJ
5 ms charging:
50 mJ
18 mJ deposited
Terminal flame
trajectory at 3 mm
flame radius
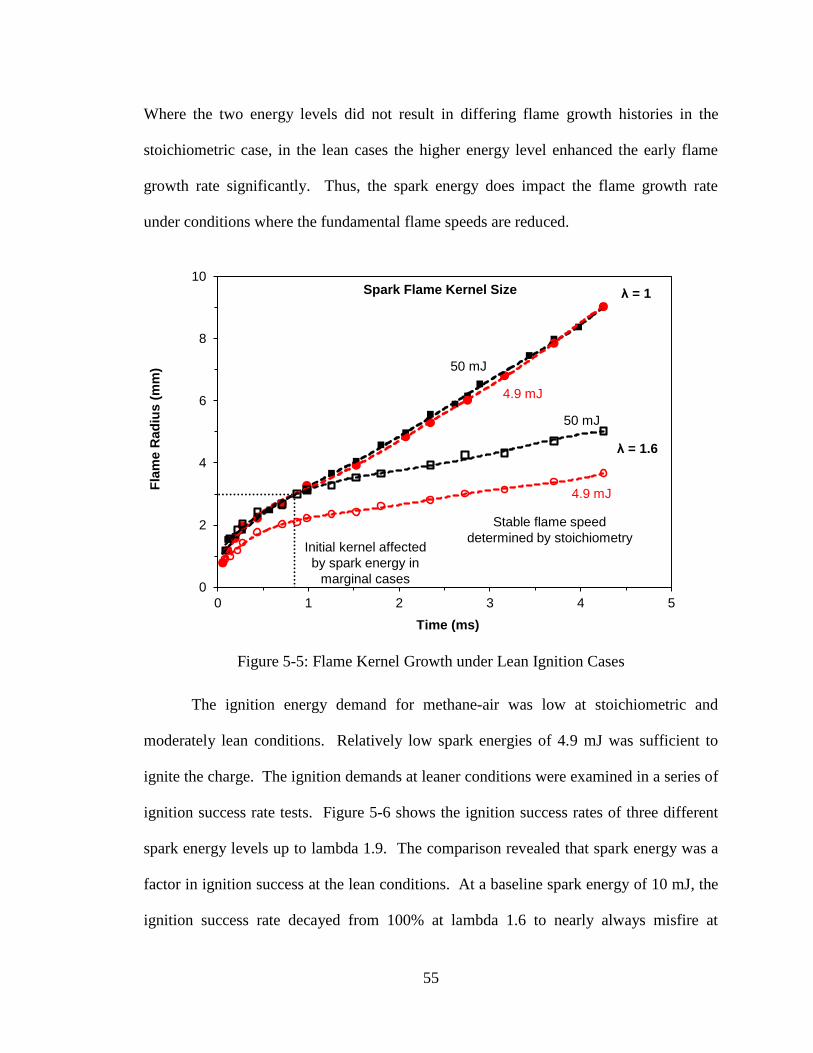
55
Where the two energy levels did not result in differing flame growth histories in the
stoichiometric case, in the lean cases the higher energy level enhanced the early flame
growth rate significantly. Thus, the spark energy does impact the flame growth rate
under conditions where the fundamental flame speeds are reduced.
Figure 5-5: Flame Kernel Growth under Lean Ignition Cases
The ignition energy demand for methane-air was low at stoichiometric and
moderately lean conditions. Relatively low spark energies of 4.9 mJ was sufficient to
ignite the charge. The ignition demands at leaner conditions were examined in a series of
ignition success rate tests. Figure 5-6 shows the ignition success rates of three different
spark energy levels up to lambda 1.9. The comparison revealed that spark energy was a
factor in ignition success at the lean conditions. At a baseline spark energy of 10 mJ, the
ignition success rate decayed from 100% at lambda 1.6 to nearly always misfire at
0
2
4
6
8
10
0 1 2 3 4 5
Fla
me
Ra
diu
s (
mm
)
Time (ms)
Spark Flame Kernel Size λ = 1
Stable flame speed
determined by stoichiometry
λ = 1.6
Initial kernel affected
by spark energy in
marginal cases
50 mJ
4.9 mJ
50 mJ
4.9 mJ
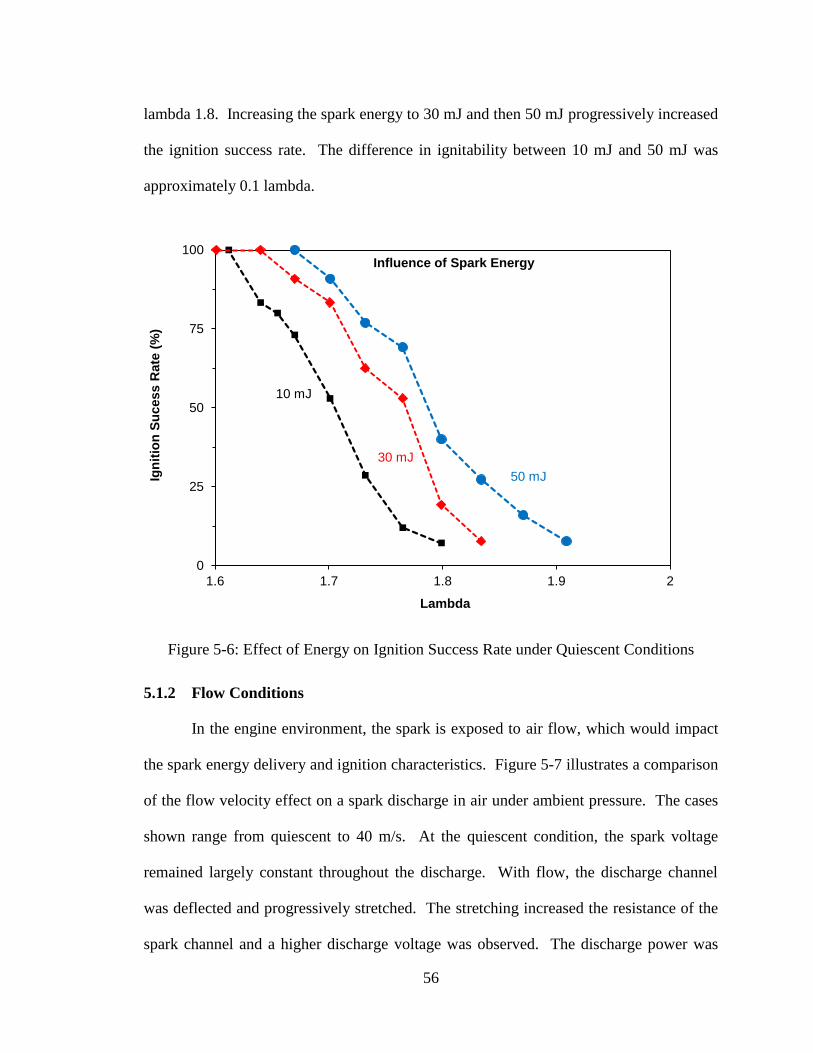
56
lambda 1.8. Increasing the spark energy to 30 mJ and then 50 mJ progressively increased
the ignition success rate. The difference in ignitability between 10 mJ and 50 mJ was
approximately 0.1 lambda.
Figure 5-6: Effect of Energy on Ignition Success Rate under Quiescent Conditions
5.1.2 Flow Conditions
In the engine environment, the spark is exposed to air flow, which would impact
the spark energy delivery and ignition characteristics. Figure 5-7 illustrates a comparison
of the flow velocity effect on a spark discharge in air under ambient pressure. The cases
shown range from quiescent to 40 m/s. At the quiescent condition, the spark voltage
remained largely constant throughout the discharge. With flow, the discharge channel
was deflected and progressively stretched. The stretching increased the resistance of the
spark channel and a higher discharge voltage was observed. The discharge power was
0
25
50
75
100
1.6 1.7 1.8 1.9 2
Ign
itio
n S
ucess R
ate
(%
)
Lambda
Influence of Spark Energy
10 mJ
30 mJ
50 mJ
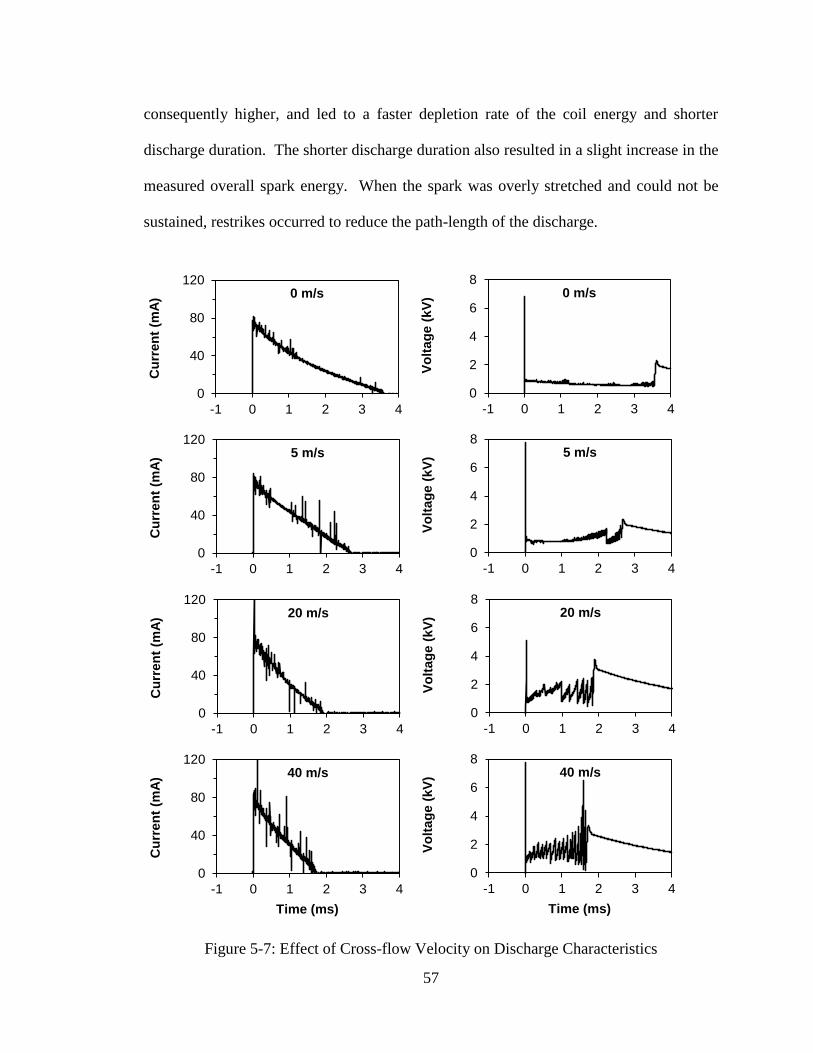
57
consequently higher, and led to a faster depletion rate of the coil energy and shorter
discharge duration. The shorter discharge duration also resulted in a slight increase in the
measured overall spark energy. When the spark was overly stretched and could not be
sustained, restrikes occurred to reduce the path-length of the discharge.
Figure 5-7: Effect of Cross-flow Velocity on Discharge Characteristics
0
40
80
120
-1 0 1 2 3 4
Cu
rren
t (m
A) 0 m/s
0
2
4
6
8
-1 0 1 2 3 4
Vo
ltag
e (
kV
) 0 m/s
0
40
80
120
-1 0 1 2 3 4
Cu
rren
t (m
A) 5 m/s
0
2
4
6
8
-1 0 1 2 3 4
Vo
ltag
e (
kV
) 5 m/s
0
40
80
120
-1 0 1 2 3 4
Cu
rren
t (m
A) 20 m/s
0
2
4
6
8
-1 0 1 2 3 4
Vo
ltag
e (
kV
) 20 m/s
0
40
80
120
-1 0 1 2 3 4
Cu
rren
t (m
A)
Time (ms)
40 m/s
0
2
4
6
8
-1 0 1 2 3 4
Vo
ltag
e (
kV
)
Time (ms)
40 m/s
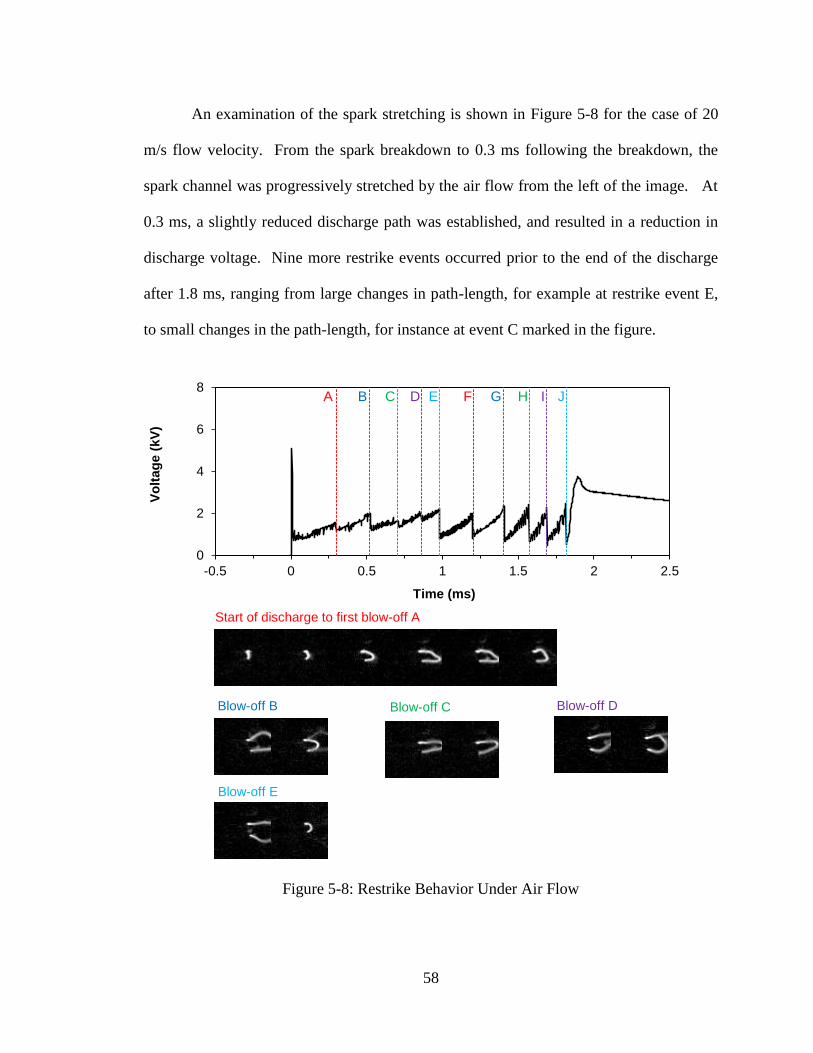
58
An examination of the spark stretching is shown in Figure 5-8 for the case of 20
m/s flow velocity. From the spark breakdown to 0.3 ms following the breakdown, the
spark channel was progressively stretched by the air flow from the left of the image. At
0.3 ms, a slightly reduced discharge path was established, and resulted in a reduction in
discharge voltage. Nine more restrike events occurred prior to the end of the discharge
after 1.8 ms, ranging from large changes in path-length, for example at restrike event E,
to small changes in the path-length, for instance at event C marked in the figure.
Figure 5-8: Restrike Behavior Under Air Flow
Start of discharge to first blow-off A
Blow-off B Blow-off C Blow-off D
Blow-off E
0
2
4
6
8
-0.5 0 0.5 1 1.5 2 2.5
Vo
ltag
e (
kV
)
Time (ms)
A B C D E F G H I J
59
The maximum spark channel length prior to a restrike was not observed to be
sensitive to flow velocity, but was sensitive to the discharge current level. With a coil
charging duration of 5 ms, the average maximum stretched spark channel length was 8.1
times the geometric minimum gap length. When the coil charging duration was reduced
to 3 ms, the average maximum stretched spark channel length was 6.8 times the
geometric minimum gap length. The increased energy available with higher charging
durations was potentially beneficial when the spark gap was under flow conditions in
order to maintain longer spark holding periods and larger stretched gap sizes.
The flow and restrike events impact the ignition process in several ways. Flow
can transport the flame kernel away from the vicinity of the spark plug and reduce the
heat-loss of the flame kernel to the spark plug electrodes. Stretching of the spark channel
increases the volume of the gas in contact with the discharge and can lead to a larger
flame kernel. However, the stretching is limited by the ability to sustain the elongated
discharge path. When the flow velocity is excessively high and the restrikes occur with
high frequency, the individual restrikes may not lead to any successful ignition events.
5.1.3 Engine Conditions
Several tests were conducted to characterize the effect of spark energy on the
ignition behavior in fired engine tests. The tests were performed on the Yanmar engine
described in Chapter 4. The tests were conducted at 1300 RPM engine speed and low
engine load. The effect of engine intake charge dilution was additionally examined by
testing at different lambda values.
The engine environment is significantly different from the quiescent chamber
conditions in several ways. Besides the effect of charge motion, the temperature and
60
pressure conditions at the time of ignition influence the spark discharge and the flame
propagation processes. The measured average spark gap breakdown voltage is shown in
Figure 5-9 for examples of typical throttled and unthrottled operation of the Yanmar
engine. During the compression stroke, the pressure and temperature of the in-cylinder
charge increases significantly. Thus the breakdown voltage is influenced by the charge
thermodynamic conditions in addition to the spark gap size and geometry. Under the
testing conditions, the spark timing for optimal efficiency at stoichiometric condition for
the throttled case is in the 340 – 345 CAD range and the spark breakdown voltage is in
the 8 kV range. Advancing the spark timing results in decreased breakdown voltage as a
result of the lower in-cylinder pressure at the time of breakdown. When the throttling
restriction on the engine is reduced to the wide-open-throttle (WOT) condition, the
breakdown voltage is consequently significantly higher. Thus in diluted charge
combustion, increasing dilution typically requires more advanced spark timing, which
lowers the breakdown voltage. The increased in-cylinder pressure from the dilution will
partially compensate this effect by increasing the breakdown voltage demand.
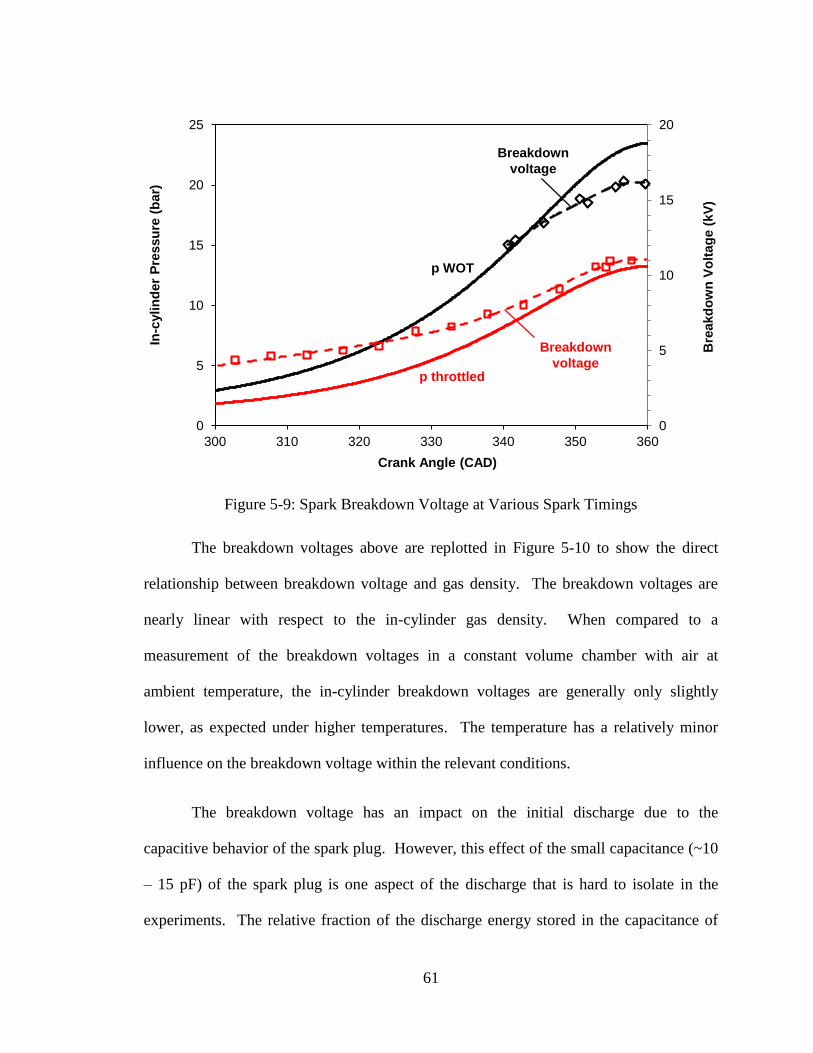
61
Figure 5-9: Spark Breakdown Voltage at Various Spark Timings
The breakdown voltages above are replotted in Figure 5-10 to show the direct
relationship between breakdown voltage and gas density. The breakdown voltages are
nearly linear with respect to the in-cylinder gas density. When compared to a
measurement of the breakdown voltages in a constant volume chamber with air at
ambient temperature, the in-cylinder breakdown voltages are generally only slightly
lower, as expected under higher temperatures. The temperature has a relatively minor
influence on the breakdown voltage within the relevant conditions.
The breakdown voltage has an impact on the initial discharge due to the
capacitive behavior of the spark plug. However, this effect of the small capacitance (~10
– 15 pF) of the spark plug is one aspect of the discharge that is hard to isolate in the
experiments. The relative fraction of the discharge energy stored in the capacitance of
0
5
10
15
20
0
5
10
15
20
25
300 310 320 330 340 350 360
Bre
akd
ow
n V
olt
ag
e (
kV
)
In-c
ylin
der
Pre
ssu
re (
bar)
Crank Angle (CAD)
p throttled
p WOT
Breakdown
voltage
Breakdown
voltage
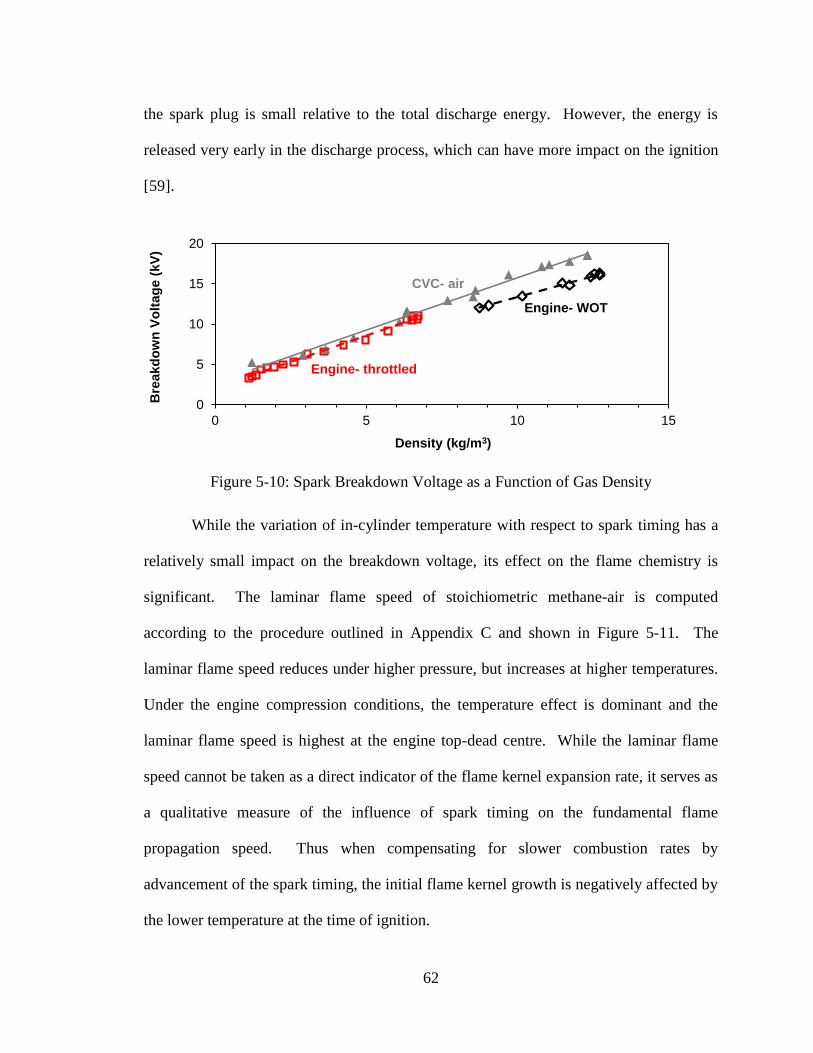
62
the spark plug is small relative to the total discharge energy. However, the energy is
released very early in the discharge process, which can have more impact on the ignition
[59].
Figure 5-10: Spark Breakdown Voltage as a Function of Gas Density
While the variation of in-cylinder temperature with respect to spark timing has a
relatively small impact on the breakdown voltage, its effect on the flame chemistry is
significant. The laminar flame speed of stoichiometric methane-air is computed
according to the procedure outlined in Appendix C and shown in Figure 5-11. The
laminar flame speed reduces under higher pressure, but increases at higher temperatures.
Under the engine compression conditions, the temperature effect is dominant and the
laminar flame speed is highest at the engine top-dead centre. While the laminar flame
speed cannot be taken as a direct indicator of the flame kernel expansion rate, it serves as
a qualitative measure of the influence of spark timing on the fundamental flame
propagation speed. Thus when compensating for slower combustion rates by
advancement of the spark timing, the initial flame kernel growth is negatively affected by
the lower temperature at the time of ignition.
0
5
10
15
20
0 5 10 15
Bre
akd
ow
n V
olt
ag
e (
kV
)
Density (kg/m3)
Engine- throttled
Engine- WOT
CVC- air
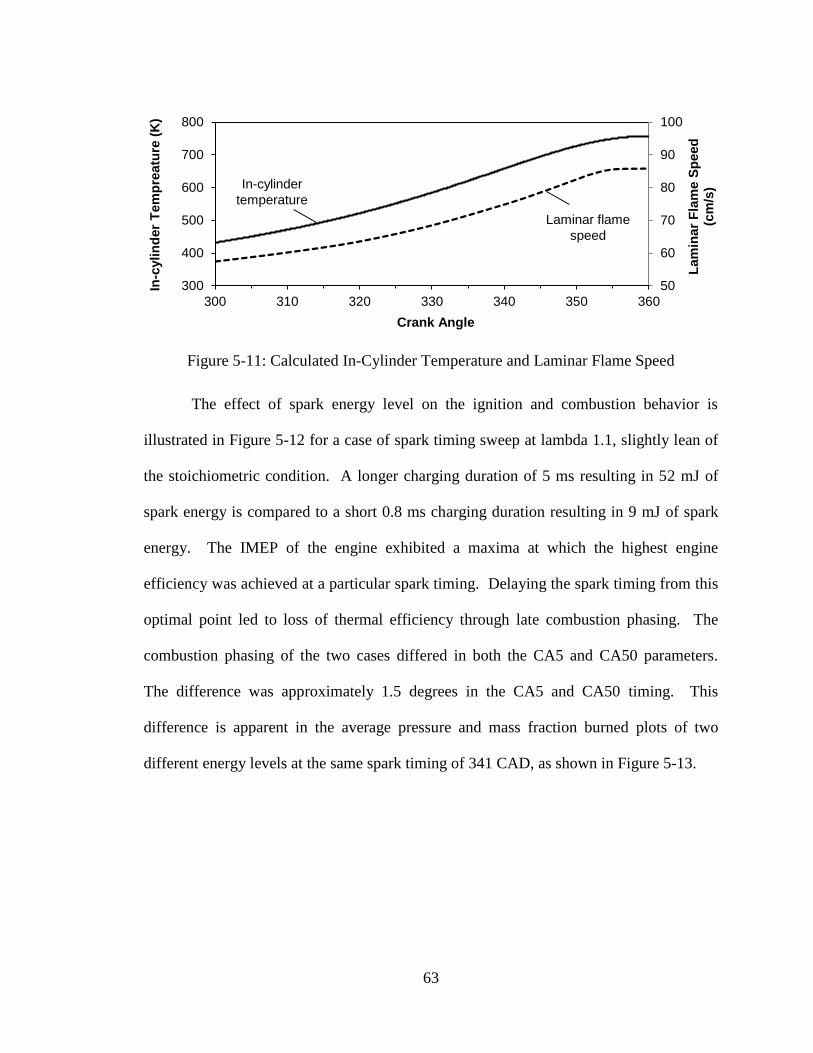
63
Figure 5-11: Calculated In-Cylinder Temperature and Laminar Flame Speed
The effect of spark energy level on the ignition and combustion behavior is
illustrated in Figure 5-12 for a case of spark timing sweep at lambda 1.1, slightly lean of
the stoichiometric condition. A longer charging duration of 5 ms resulting in 52 mJ of
spark energy is compared to a short 0.8 ms charging duration resulting in 9 mJ of spark
energy. The IMEP of the engine exhibited a maxima at which the highest engine
efficiency was achieved at a particular spark timing. Delaying the spark timing from this
optimal point led to loss of thermal efficiency through late combustion phasing. The
combustion phasing of the two cases differed in both the CA5 and CA50 parameters.
The difference was approximately 1.5 degrees in the CA5 and CA50 timing. This
difference is apparent in the average pressure and mass fraction burned plots of two
different energy levels at the same spark timing of 341 CAD, as shown in Figure 5-13.
50
60
70
80
90
100
300
400
500
600
700
800
300 310 320 330 340 350 360
Lam
inar
Fla
me S
peed
(c
m/s
)
In-c
ylin
der
Tem
pre
atu
re (
K)
Crank Angle
In-cylinder
temperature
Laminar flame
speed
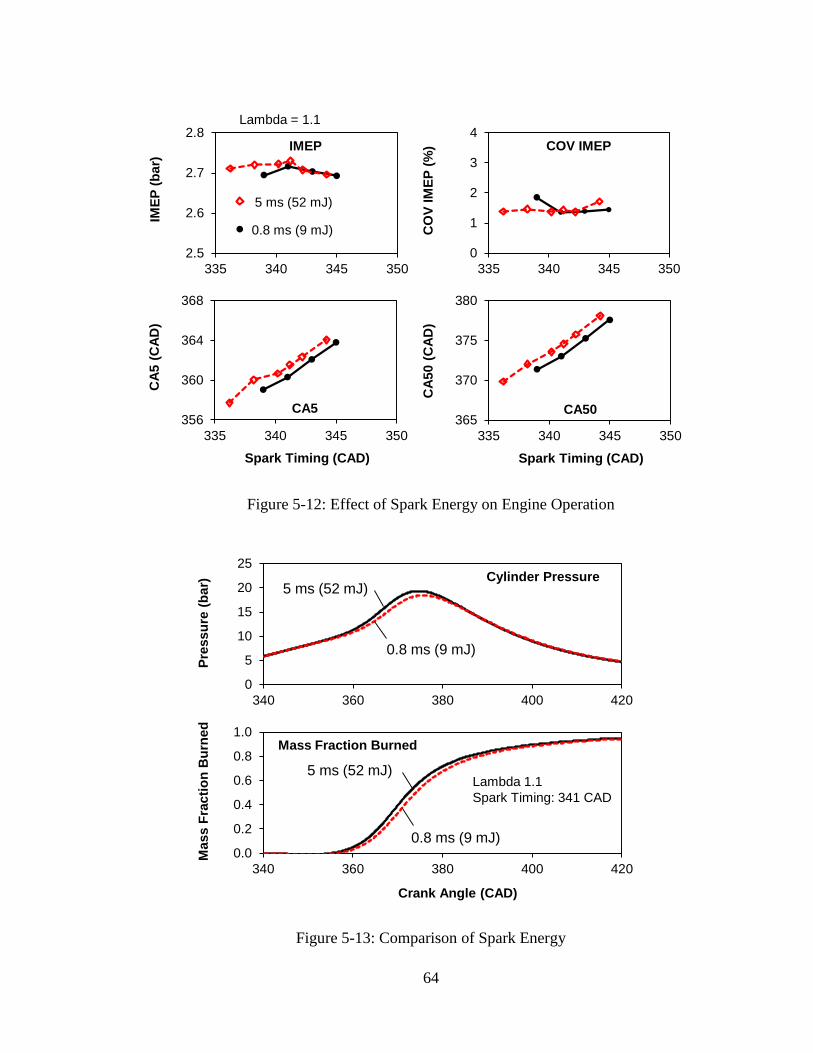
64
Figure 5-12: Effect of Spark Energy on Engine Operation
Figure 5-13: Comparison of Spark Energy
Lambda = 1.1
2.5
2.6
2.7
2.8
335 340 345 350
IME
P (
ba
r)IMEP
5 ms (52 mJ)
0.8 ms (9 mJ)
0
1
2
3
4
335 340 345 350
CO
V I
ME
P (
%) COV IMEP
356
360
364
368
335 340 345 350
CA
5 (
CA
D)
Spark Timing (CAD)
CA5365
370
375
380
335 340 345 350C
A5
0 (
CA
D)
Spark Timing (CAD)
CA50
0
5
10
15
20
25
340 360 380 400 420
Pre
ss
ure
(b
ar)
Cylinder Pressure5 ms (52 mJ)
0.8 ms (9 mJ)
0.0
0.2
0.4
0.6
0.8
1.0
340 360 380 400 420
Ma
ss
Fra
cti
on
Bu
rne
d
Crank Angle (CAD)
Mass Fraction Burned
5 ms (52 mJ)
0.8 ms (9 mJ)
Lambda 1.1
Spark Timing: 341 CAD
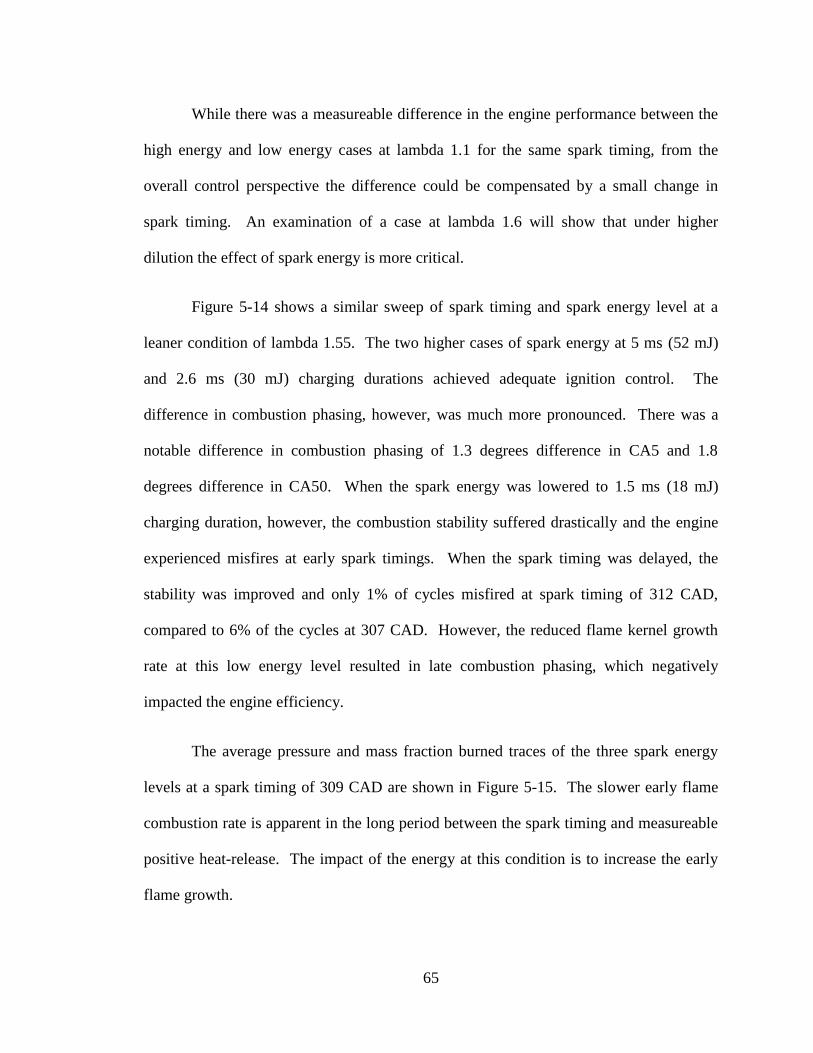
65
While there was a measureable difference in the engine performance between the
high energy and low energy cases at lambda 1.1 for the same spark timing, from the
overall control perspective the difference could be compensated by a small change in
spark timing. An examination of a case at lambda 1.6 will show that under higher
dilution the effect of spark energy is more critical.
Figure 5-14 shows a similar sweep of spark timing and spark energy level at a
leaner condition of lambda 1.55. The two higher cases of spark energy at 5 ms (52 mJ)
and 2.6 ms (30 mJ) charging durations achieved adequate ignition control. The
difference in combustion phasing, however, was much more pronounced. There was a
notable difference in combustion phasing of 1.3 degrees difference in CA5 and 1.8
degrees difference in CA50. When the spark energy was lowered to 1.5 ms (18 mJ)
charging duration, however, the combustion stability suffered drastically and the engine
experienced misfires at early spark timings. When the spark timing was delayed, the
stability was improved and only 1% of cycles misfired at spark timing of 312 CAD,
compared to 6% of the cycles at 307 CAD. However, the reduced flame kernel growth
rate at this low energy level resulted in late combustion phasing, which negatively
impacted the engine efficiency.
The average pressure and mass fraction burned traces of the three spark energy
levels at a spark timing of 309 CAD are shown in Figure 5-15. The slower early flame
combustion rate is apparent in the long period between the spark timing and measureable
positive heat-release. The impact of the energy at this condition is to increase the early
flame growth.
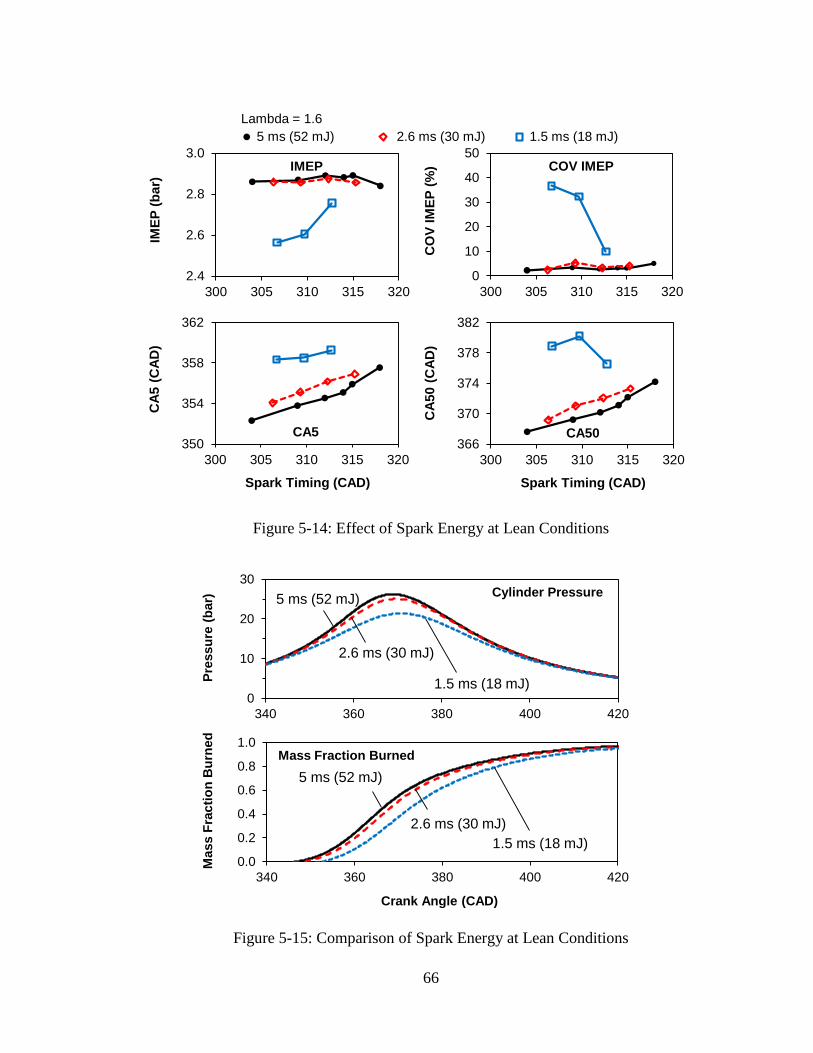
66
Figure 5-14: Effect of Spark Energy at Lean Conditions
Figure 5-15: Comparison of Spark Energy at Lean Conditions
2.4
2.6
2.8
3.0
300 305 310 315 320
IME
P (
bar)
IMEP
0
10
20
30
40
50
300 305 310 315 320
CO
V I
ME
P (
%) COV IMEP
350
354
358
362
300 305 310 315 320
CA
5 (
CA
D)
Spark Timing (CAD)
CA5366
370
374
378
382
300 305 310 315 320
CA
50 (
CA
D)
Spark Timing (CAD)
CA50
5 ms (52 mJ) 1.5 ms (18 mJ)2.6 ms (30 mJ)
Lambda = 1.6
0
10
20
30
340 360 380 400 420
Pre
ssu
re (
bar)
Cylinder Pressure5 ms (52 mJ)
2.6 ms (30 mJ)
1.5 ms (18 mJ)
0.0
0.2
0.4
0.6
0.8
1.0
340 360 380 400 420
Mass F
racti
on
Bu
rned
Crank Angle (CAD)
Mass Fraction Burned
5 ms (52 mJ)
2.6 ms (30 mJ)
1.5 ms (18 mJ)
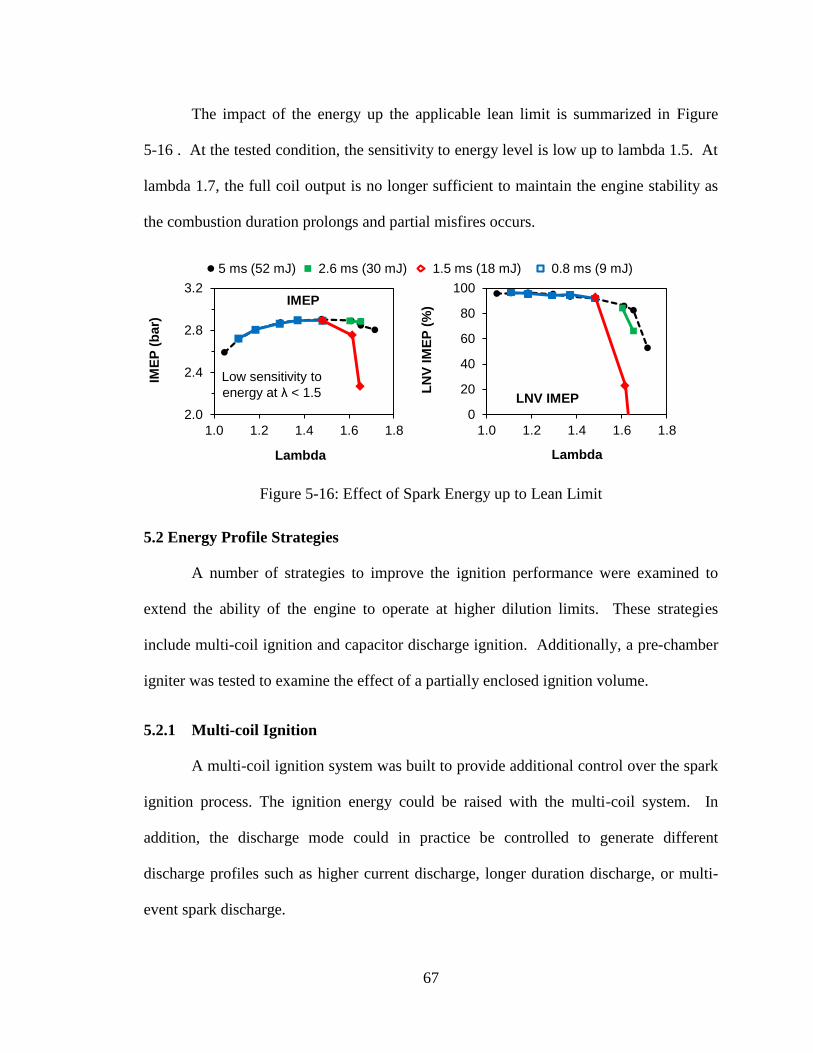
67
The impact of the energy up the applicable lean limit is summarized in Figure
5-16 . At the tested condition, the sensitivity to energy level is low up to lambda 1.5. At
lambda 1.7, the full coil output is no longer sufficient to maintain the engine stability as
the combustion duration prolongs and partial misfires occurs.
Figure 5-16: Effect of Spark Energy up to Lean Limit
5.2 Energy Profile Strategies
A number of strategies to improve the ignition performance were examined to
extend the ability of the engine to operate at higher dilution limits. These strategies
include multi-coil ignition and capacitor discharge ignition. Additionally, a pre-chamber
igniter was tested to examine the effect of a partially enclosed ignition volume.
5.2.1 Multi-coil Ignition
A multi-coil ignition system was built to provide additional control over the spark
ignition process. The ignition energy could be raised with the multi-coil system. In
addition, the discharge mode could in practice be controlled to generate different
discharge profiles such as higher current discharge, longer duration discharge, or multi-
event spark discharge.
2.0
2.4
2.8
3.2
1.0 1.2 1.4 1.6 1.8
IME
P (
bar)
Lambda
IMEP
0
20
40
60
80
100
1.0 1.2 1.4 1.6 1.8L
NV
IM
EP
(%
)
Lambda
LNV IMEP
5 ms (52 mJ) 0.8 ms (9 mJ)1.5 ms (18 mJ)2.6 ms (30 mJ)
Low sensitivity to
energy at λ < 1.5
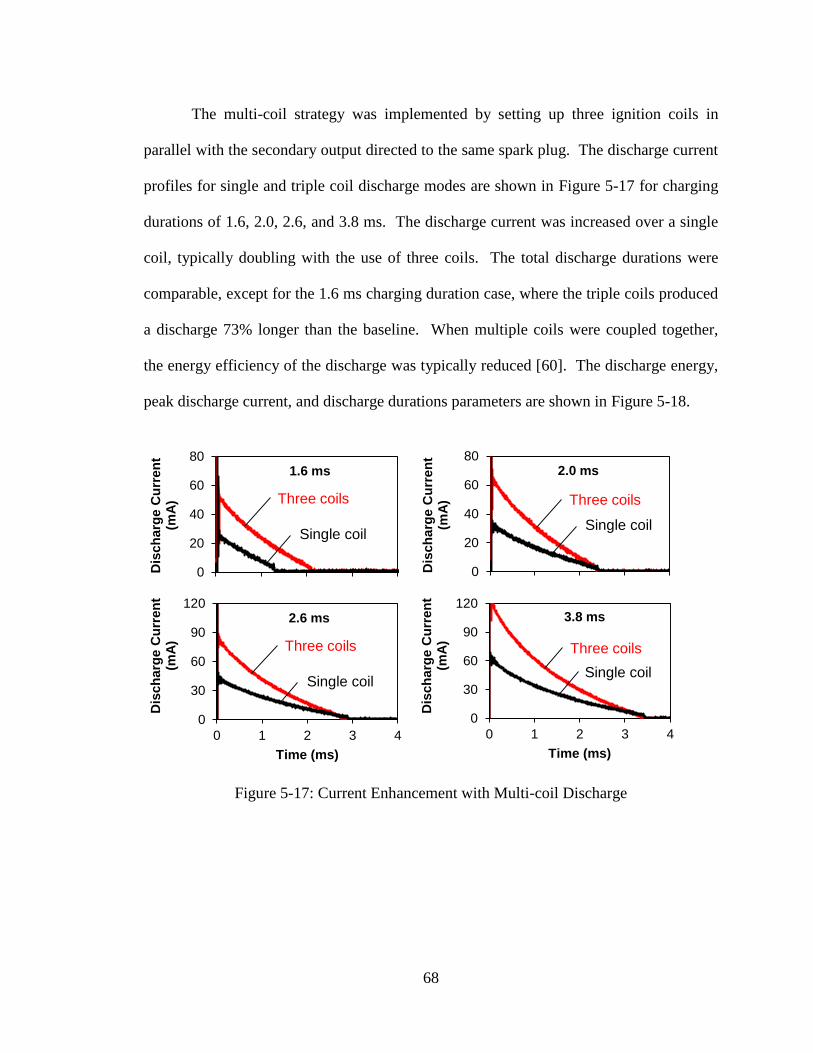
68
The multi-coil strategy was implemented by setting up three ignition coils in
parallel with the secondary output directed to the same spark plug. The discharge current
profiles for single and triple coil discharge modes are shown in Figure 5-17 for charging
durations of 1.6, 2.0, 2.6, and 3.8 ms. The discharge current was increased over a single
coil, typically doubling with the use of three coils. The total discharge durations were
comparable, except for the 1.6 ms charging duration case, where the triple coils produced
a discharge 73% longer than the baseline. When multiple coils were coupled together,
the energy efficiency of the discharge was typically reduced [60]. The discharge energy,
peak discharge current, and discharge durations parameters are shown in Figure 5-18.
Figure 5-17: Current Enhancement with Multi-coil Discharge
0
20
40
60
80
0 1 2 3 4
Dis
ch
arg
e C
urr
en
t (m
A)
1.6 ms
Single coil
Three coils
0
20
40
60
80
0 1 2 3 4
Dis
ch
arg
e C
urr
en
t (m
A)
2.0 ms
Single coil
Three coils
0
30
60
90
120
0 1 2 3 4
Dis
ch
arg
e C
urr
en
t (m
A)
Time (ms)
2.6 ms
Single coil
Three coils
0
30
60
90
120
0 1 2 3 4
Dis
ch
arg
e C
urr
en
t (m
A)
Time (ms)
3.8 ms
Single coil
Three coils
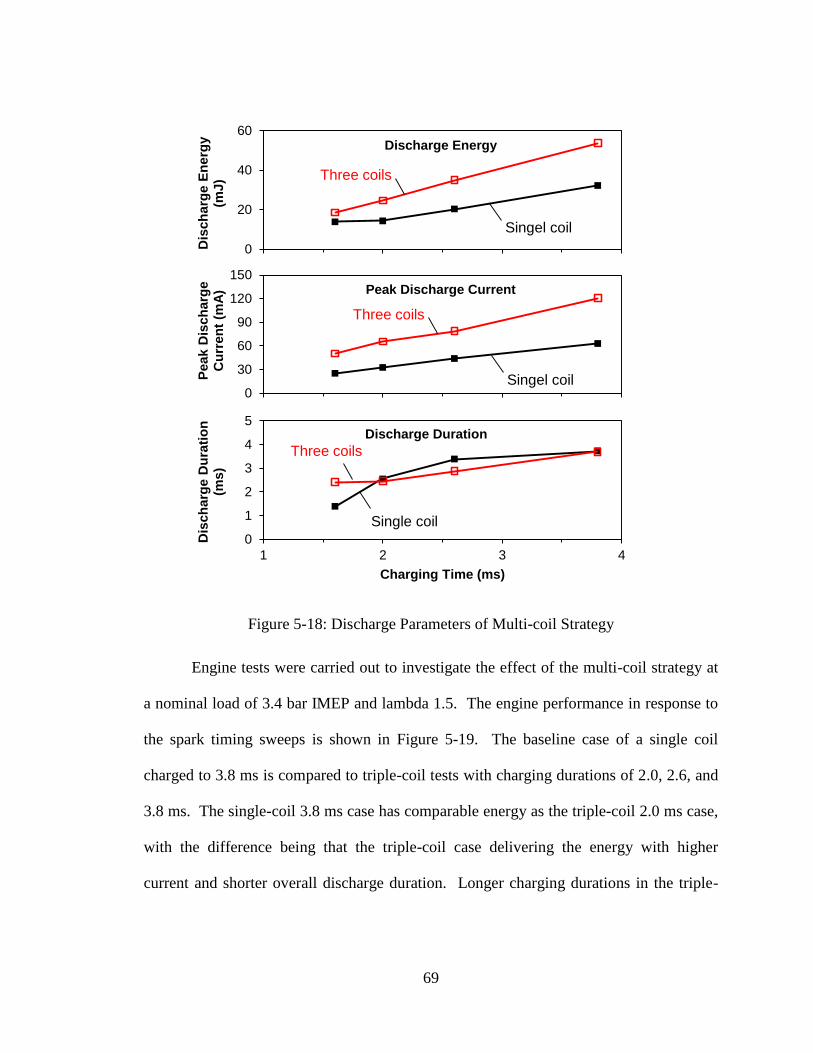
69
Figure 5-18: Discharge Parameters of Multi-coil Strategy
Engine tests were carried out to investigate the effect of the multi-coil strategy at
a nominal load of 3.4 bar IMEP and lambda 1.5. The engine performance in response to
the spark timing sweeps is shown in Figure 5-19. The baseline case of a single coil
charged to 3.8 ms is compared to triple-coil tests with charging durations of 2.0, 2.6, and
3.8 ms. The single-coil 3.8 ms case has comparable energy as the triple-coil 2.0 ms case,
with the difference being that the triple-coil case delivering the energy with higher
current and shorter overall discharge duration. Longer charging durations in the triple-
0
20
40
60
1 2 3 4
Dis
ch
arg
e E
ne
rgy
(mJ
)
Discharge Energy
Singel coil
Three coils
0
30
60
90
120
150
1 2 3 4
Pe
ak
Dis
ch
arg
e
Cu
rre
nt
(mA
) Peak Discharge Current
Singel coil
Three coils
0
1
2
3
4
5
1 2 3 4
Dis
ch
arg
e D
ura
tio
n
(ms
)
Charging Time (ms)
Discharge Duration
Single coil
Three coils
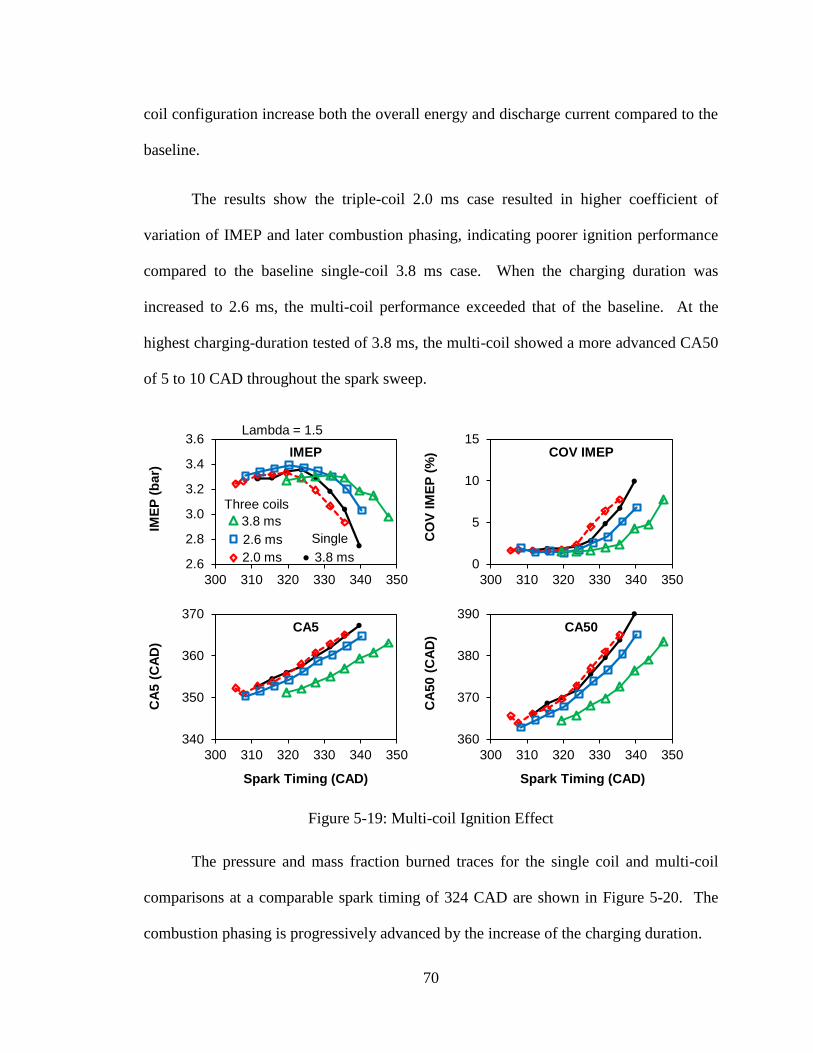
70
coil configuration increase both the overall energy and discharge current compared to the
baseline.
The results show the triple-coil 2.0 ms case resulted in higher coefficient of
variation of IMEP and later combustion phasing, indicating poorer ignition performance
compared to the baseline single-coil 3.8 ms case. When the charging duration was
increased to 2.6 ms, the multi-coil performance exceeded that of the baseline. At the
highest charging-duration tested of 3.8 ms, the multi-coil showed a more advanced CA50
of 5 to 10 CAD throughout the spark sweep.
Figure 5-19: Multi-coil Ignition Effect
The pressure and mass fraction burned traces for the single coil and multi-coil
comparisons at a comparable spark timing of 324 CAD are shown in Figure 5-20. The
combustion phasing is progressively advanced by the increase of the charging duration.
2.6
2.8
3.0
3.2
3.4
3.6
300 310 320 330 340 350
IME
P (
bar)
IMEP
3.8 ms
2.6 ms
3.8 ms2.0 ms
Three coils
Single
Lambda = 1.5
0
5
10
15
300 310 320 330 340 350
CO
V I
ME
P (
%) COV IMEP
340
350
360
370
300 310 320 330 340 350
CA
5 (
CA
D)
Spark Timing (CAD)
CA5
360
370
380
390
300 310 320 330 340 350
CA
50 (
CA
D)
Spark Timing (CAD)
CA50
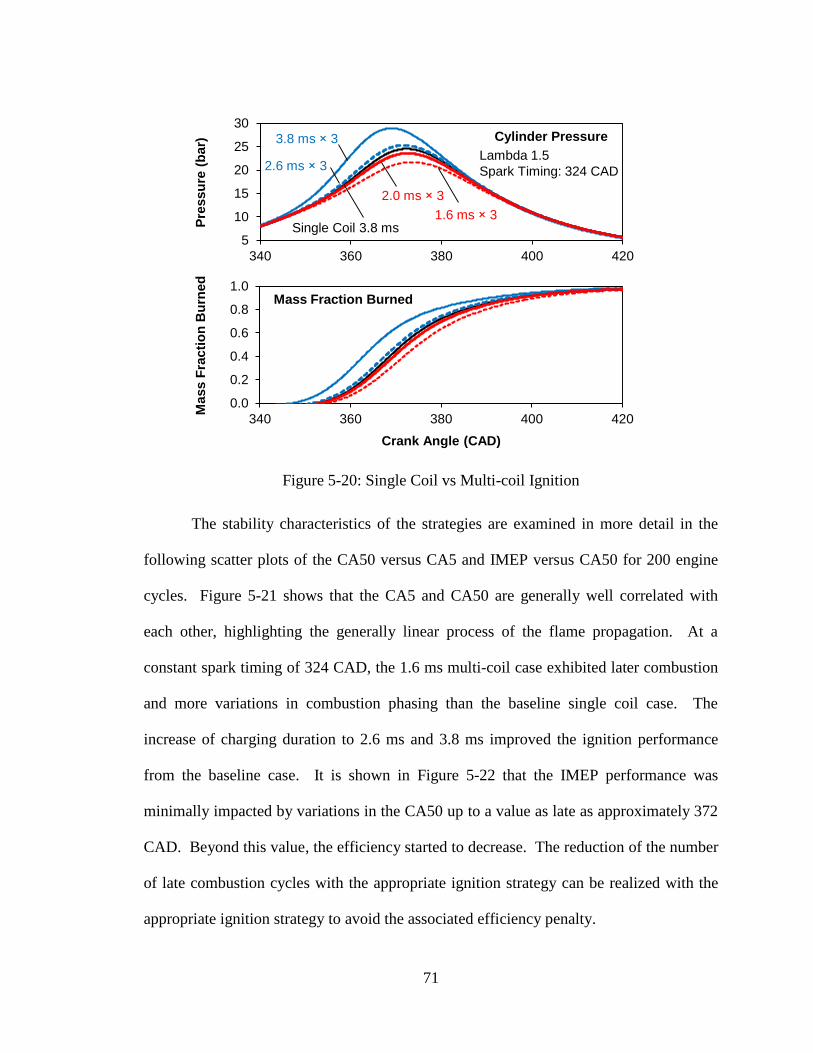
71
Figure 5-20: Single Coil vs Multi-coil Ignition
The stability characteristics of the strategies are examined in more detail in the
following scatter plots of the CA50 versus CA5 and IMEP versus CA50 for 200 engine
cycles. Figure 5-21 shows that the CA5 and CA50 are generally well correlated with
each other, highlighting the generally linear process of the flame propagation. At a
constant spark timing of 324 CAD, the 1.6 ms multi-coil case exhibited later combustion
and more variations in combustion phasing than the baseline single coil case. The
increase of charging duration to 2.6 ms and 3.8 ms improved the ignition performance
from the baseline case. It is shown in Figure 5-22 that the IMEP performance was
minimally impacted by variations in the CA50 up to a value as late as approximately 372
CAD. Beyond this value, the efficiency started to decrease. The reduction of the number
of late combustion cycles with the appropriate ignition strategy can be realized with the
appropriate ignition strategy to avoid the associated efficiency penalty.
5
10
15
20
25
30
340 360 380 400 420
Pre
ss
ure
(b
ar) Cylinder Pressure
2.6 ms 3
1.6 ms 3Single Coil 3.8 ms
2.0 ms 3
3.8 ms 3
Lambda 1.5
Spark Timing: 324 CAD
0.0
0.2
0.4
0.6
0.8
1.0
340 360 380 400 420
Ma
ss
Fra
cti
on
Bu
rne
d
Crank Angle (CAD)
Mass Fraction Burned
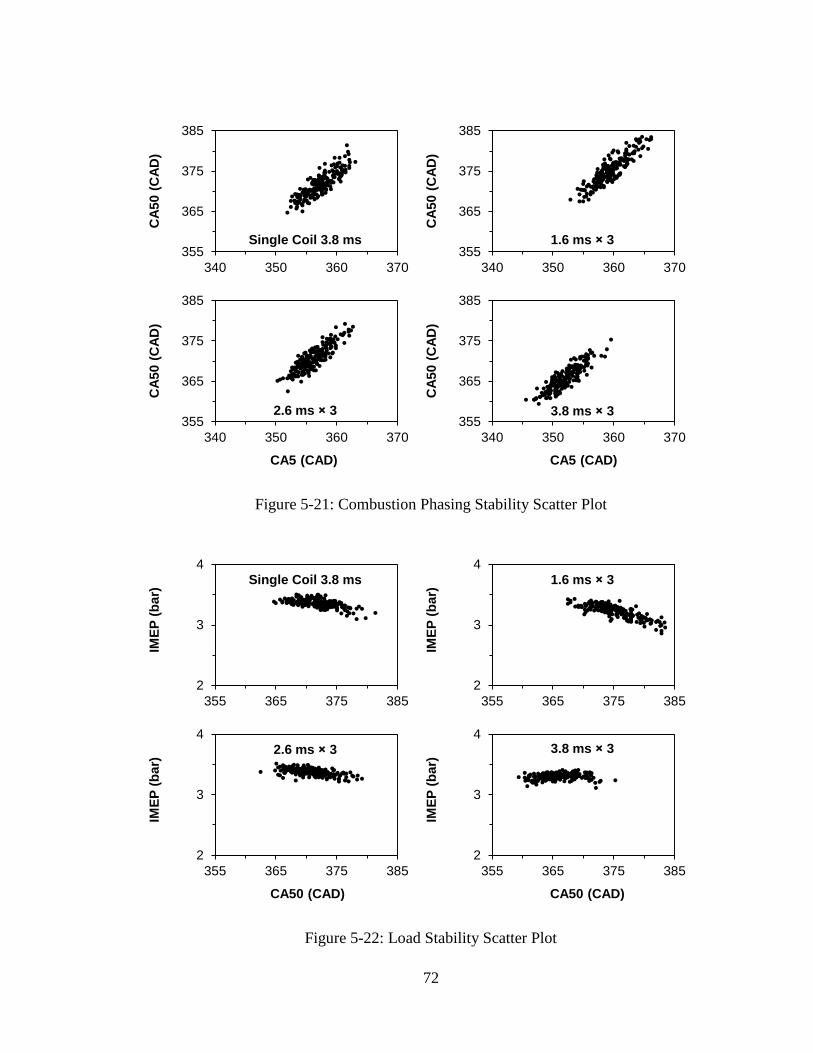
72
Figure 5-21: Combustion Phasing Stability Scatter Plot
Figure 5-22: Load Stability Scatter Plot
355
365
375
385
340 350 360 370
CA
50 (
CA
D)
CA5 (CAD)
2.6 ms 3355
365
375
385
340 350 360 370C
A5
0 (
CA
D)
CA5 (CAD)
3.8 ms 3
355
365
375
385
340 350 360 370
CA
50 (
CA
D)
1.6 ms 3355
365
375
385
340 350 360 370
CA
50 (
CA
D)
Single Coil 3.8 ms
2
3
4
355 365 375 385
IME
P (
ba
r)
CA50 (CAD)
2.6 ms 3
2
3
4
355 365 375 385
IME
P (
ba
r)
CA50 (CAD)
3.8 ms 3
2
3
4
355 365 375 385
IME
P (
ba
r)
Single Coil 3.8 ms
2
3
4
355 365 375 385
IME
P (
ba
r)
1.6 ms 3
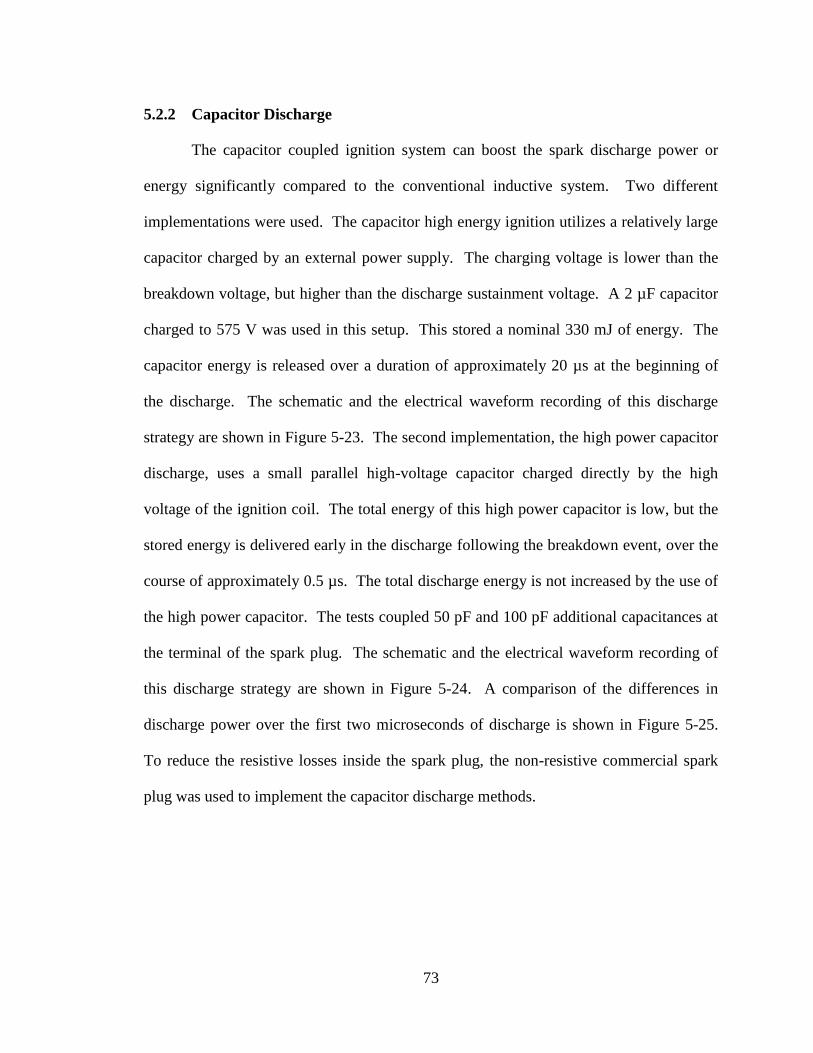
73
5.2.2 Capacitor Discharge
The capacitor coupled ignition system can boost the spark discharge power or
energy significantly compared to the conventional inductive system. Two different
implementations were used. The capacitor high energy ignition utilizes a relatively large
capacitor charged by an external power supply. The charging voltage is lower than the
breakdown voltage, but higher than the discharge sustainment voltage. A 2 µF capacitor
charged to 575 V was used in this setup. This stored a nominal 330 mJ of energy. The
capacitor energy is released over a duration of approximately 20 µs at the beginning of
the discharge. The schematic and the electrical waveform recording of this discharge
strategy are shown in Figure 5-23. The second implementation, the high power capacitor
discharge, uses a small parallel high-voltage capacitor charged directly by the high
voltage of the ignition coil. The total energy of this high power capacitor is low, but the
stored energy is delivered early in the discharge following the breakdown event, over the
course of approximately 0.5 µs. The total discharge energy is not increased by the use of
the high power capacitor. The tests coupled 50 pF and 100 pF additional capacitances at
the terminal of the spark plug. The schematic and the electrical waveform recording of
this discharge strategy are shown in Figure 5-24. A comparison of the differences in
discharge power over the first two microseconds of discharge is shown in Figure 5-25.
To reduce the resistive losses inside the spark plug, the non-resistive commercial spark
plug was used to implement the capacitor discharge methods.
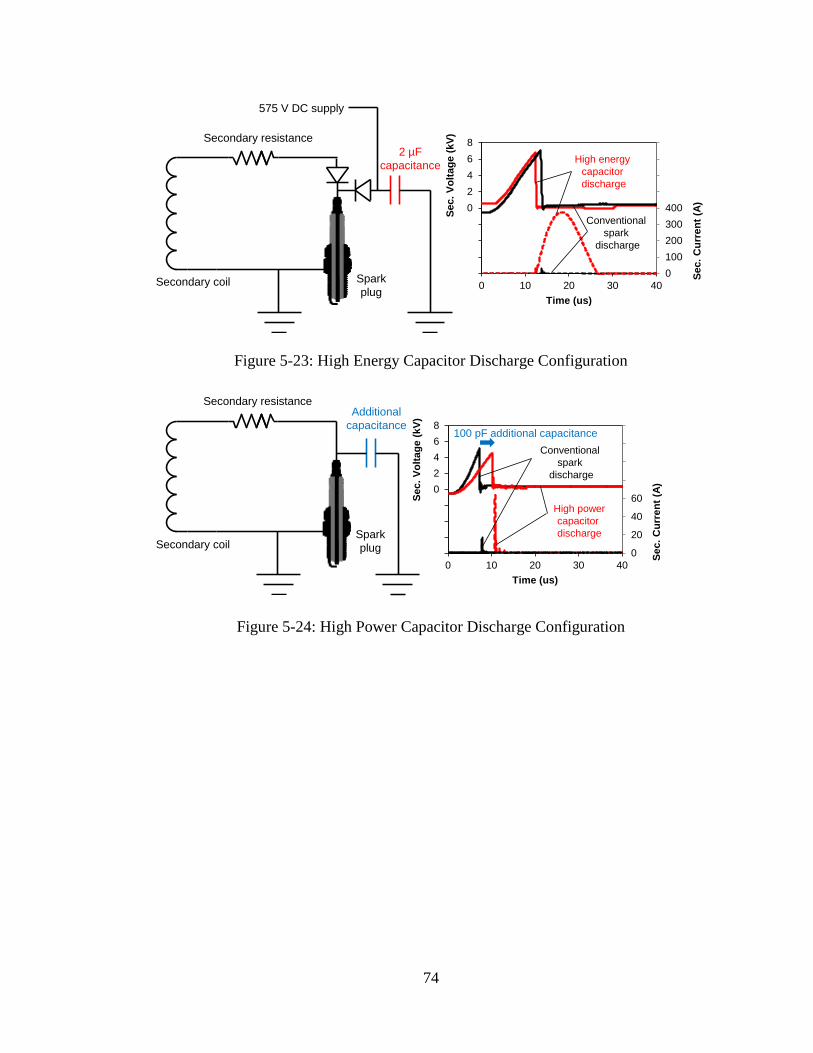
74
Figure 5-23: High Energy Capacitor Discharge Configuration
Figure 5-24: High Power Capacitor Discharge Configuration
Secondary coil Spark
plug
Secondary resistance
2 µF
capacitance
575 V DC supply
0
100
200
300
400
500
600
700
800
-8
-6
-4
-2
0
2
4
6
8
0 10 20 30 40
Sec.
Cu
rren
t (A
)
Sec.
Vo
ltag
e (
kV
)
Time (us)
High energy
capacitor
discharge
Conventional
spark
discharge
Secondary coilSpark
plug
Secondary resistanceAdditional
capacitance
0
20
40
60
80
100
120
140
-8
-6
-4
-2
0
2
4
6
8
0 10 20 30 40
Se
c.
Cu
rre
nt
(A)
Se
c.
Vo
lta
ge
(k
V)
Time (us)
High power
capacitor
discharge
Conventional
spark
discharge
100 pF additional capacitance
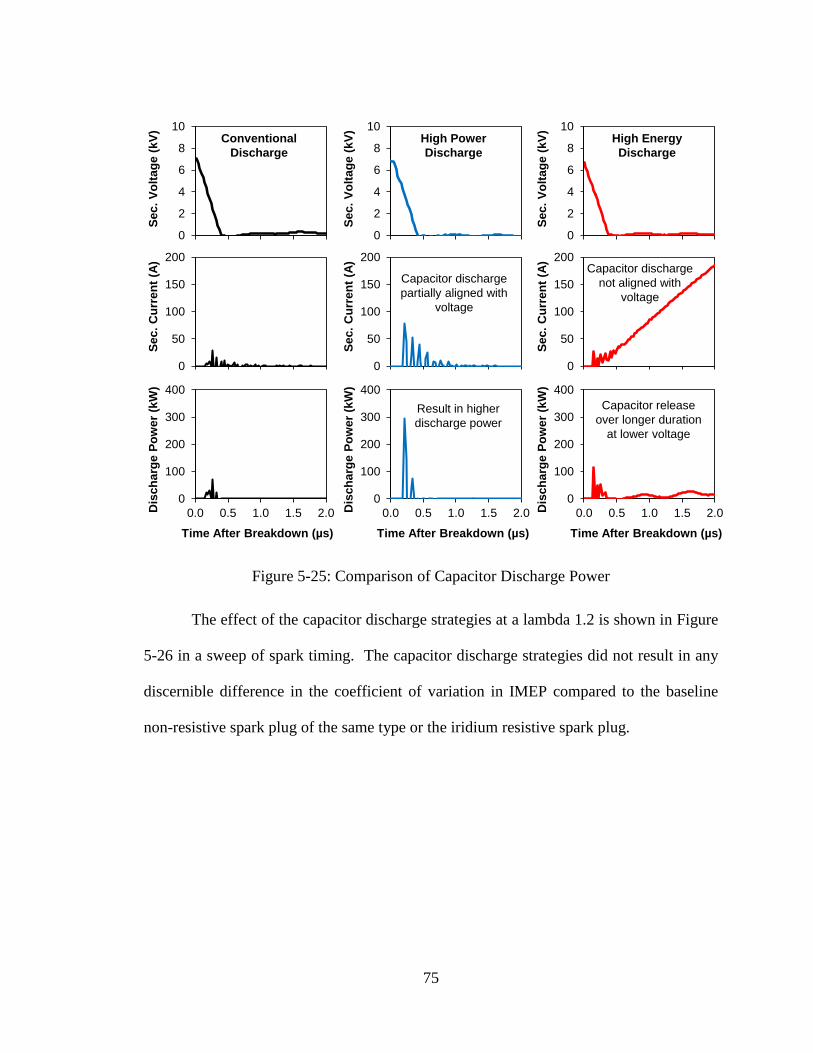
75
Figure 5-25: Comparison of Capacitor Discharge Power
The effect of the capacitor discharge strategies at a lambda 1.2 is shown in Figure
5-26 in a sweep of spark timing. The capacitor discharge strategies did not result in any
discernible difference in the coefficient of variation in IMEP compared to the baseline
non-resistive spark plug of the same type or the iridium resistive spark plug.
0
2
4
6
8
10
0.0 0.5 1.0 1.5 2.0
Sec.
Vo
ltag
e (
kV
)
Conventional
Discharge
0
2
4
6
8
10
0.0 0.5 1.0 1.5 2.0
Sec.
Vo
ltag
e (
kV
)
High Power
Discharge
0
2
4
6
8
10
0.0 0.5 1.0 1.5 2.0
Sec.
Vo
ltag
e (
kV
)
High Energy
Discharge
0
50
100
150
200
0.0 0.5 1.0 1.5 2.0
Sec.
Cu
rren
t (A
)
0
50
100
150
200
0.0 0.5 1.0 1.5 2.0
Sec.
Cu
rren
t (A
)
Capacitor discharge
partially aligned with
voltage
0
50
100
150
200
0.0 0.5 1.0 1.5 2.0
Sec.
Cu
rren
t (A
)
Capacitor discharge
not aligned with
voltage
0
100
200
300
400
0.0 0.5 1.0 1.5 2.0Dis
ch
arg
e P
ow
er
(kW
)
Time After Breakdown (µs)
0
100
200
300
400
0.0 0.5 1.0 1.5 2.0Dis
ch
arg
e P
ow
er
(kW
)
Time After Breakdown (µs)
Result in higher
discharge power
0
100
200
300
400
0.0 0.5 1.0 1.5 2.0Dis
ch
arg
e P
ow
er
(kW
)Time After Breakdown (µs)
Capacitor release
over longer duration
at lower voltage
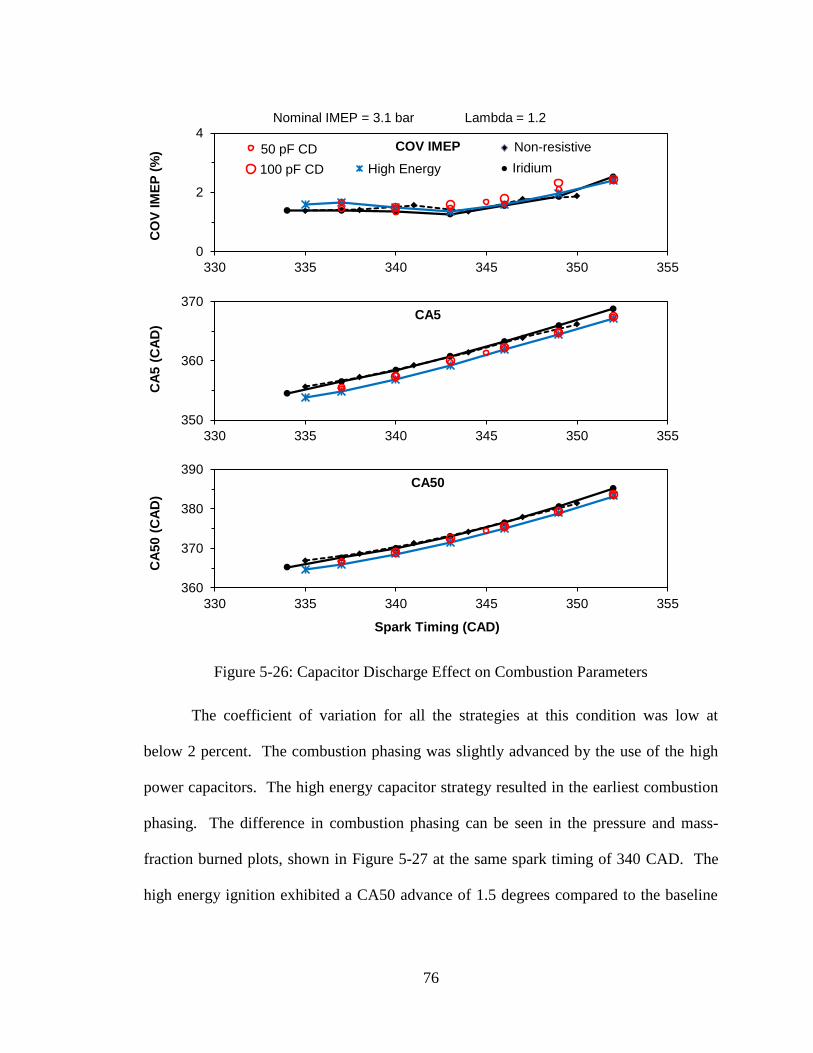
76
Figure 5-26: Capacitor Discharge Effect on Combustion Parameters
The coefficient of variation for all the strategies at this condition was low at
below 2 percent. The combustion phasing was slightly advanced by the use of the high
power capacitors. The high energy capacitor strategy resulted in the earliest combustion
phasing. The difference in combustion phasing can be seen in the pressure and mass-
fraction burned plots, shown in Figure 5-27 at the same spark timing of 340 CAD. The
high energy ignition exhibited a CA50 advance of 1.5 degrees compared to the baseline
0
2
4
330 335 340 345 350 355
CO
V I
ME
P (
%) COV IMEP50 pF CD
100 pF CD High Energy
Non-resistive
Iridium
350
360
370
330 335 340 345 350 355
CA
5 (
CA
D)
CA5
360
370
380
390
330 335 340 345 350 355
CA
50 (
CA
D)
Spark Timing (CAD)
CA50
Nominal IMEP = 3.1 bar Lambda = 1.2
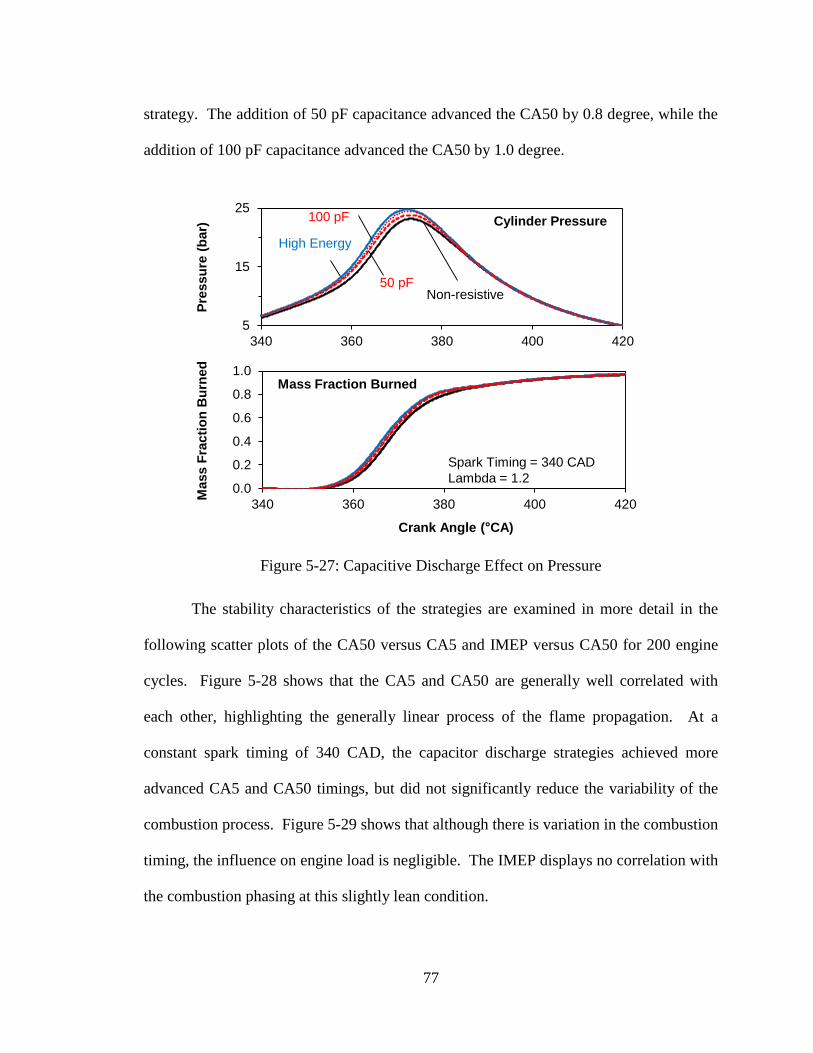
77
strategy. The addition of 50 pF capacitance advanced the CA50 by 0.8 degree, while the
addition of 100 pF capacitance advanced the CA50 by 1.0 degree.
Figure 5-27: Capacitive Discharge Effect on Pressure
The stability characteristics of the strategies are examined in more detail in the
following scatter plots of the CA50 versus CA5 and IMEP versus CA50 for 200 engine
cycles. Figure 5-28 shows that the CA5 and CA50 are generally well correlated with
each other, highlighting the generally linear process of the flame propagation. At a
constant spark timing of 340 CAD, the capacitor discharge strategies achieved more
advanced CA5 and CA50 timings, but did not significantly reduce the variability of the
combustion process. Figure 5-29 shows that although there is variation in the combustion
timing, the influence on engine load is negligible. The IMEP displays no correlation with
the combustion phasing at this slightly lean condition.
5
15
25
340 360 380 400 420
Pre
ssu
re (
bar)
Cylinder Pressure
High Energy
50 pFNon-resistive
100 pF
0.0
0.2
0.4
0.6
0.8
1.0
340 360 380 400 420
Mass F
racti
on
Bu
rned
Crank Angle ( CA)
Mass Fraction Burned
Spark Timing = 340 CAD
Lambda = 1.2
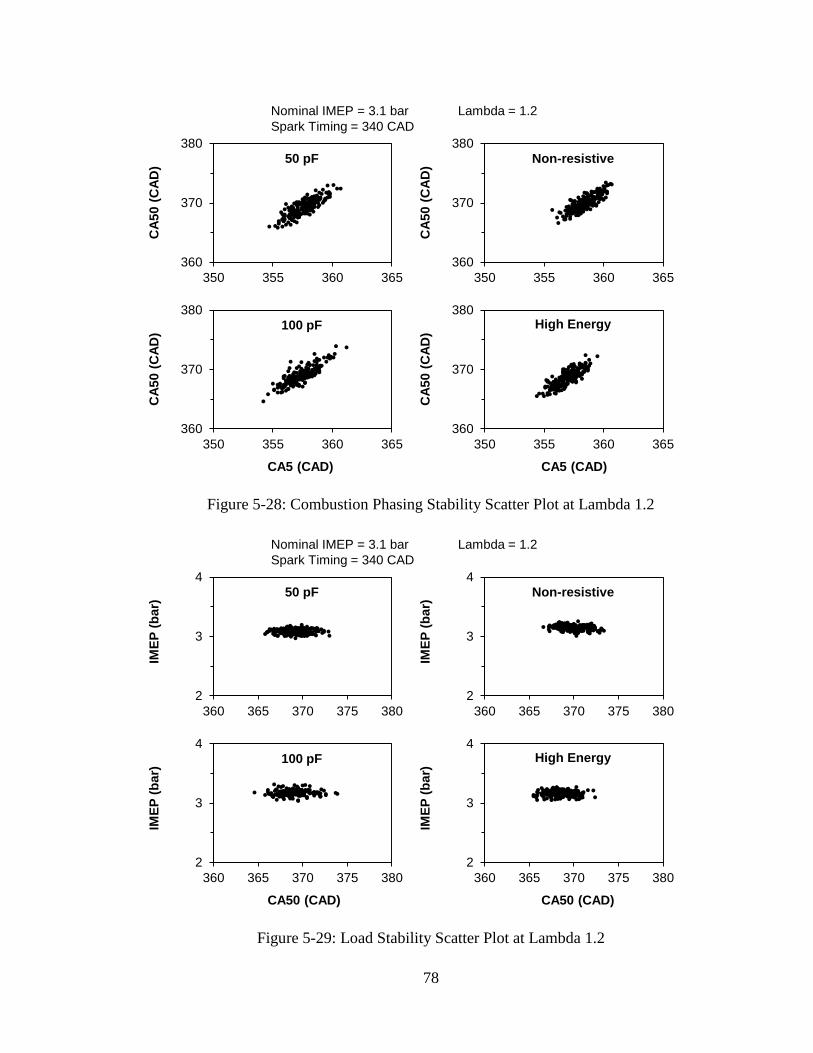
78
Figure 5-28: Combustion Phasing Stability Scatter Plot at Lambda 1.2
Figure 5-29: Load Stability Scatter Plot at Lambda 1.2
360
370
380
350 355 360 365
CA
50 (
CA
D)
CA5 (CAD)
100 pF
360
370
380
350 355 360 365
CA
50 (
CA
D)
CA5 (CAD)
High Energy
360
370
380
350 355 360 365
CA
50 (
CA
D)
Non-resistive
360
370
380
350 355 360 365
CA
50 (
CA
D)
50 pF
Nominal IMEP = 3.1 bar Lambda = 1.2
Spark Timing = 340 CAD
2
3
4
360 365 370 375 380
IME
P (
bar)
CA50 (CAD)
100 pF
2
3
4
360 365 370 375 380
IME
P (
bar)
CA50 (CAD)
High Energy
2
3
4
360 365 370 375 380
IME
P (
bar)
50 pF
2
3
4
360 365 370 375 380
IME
P (
bar)
Non-resistive
Nominal IMEP = 3.1 bar Lambda = 1.2
Spark Timing = 340 CAD
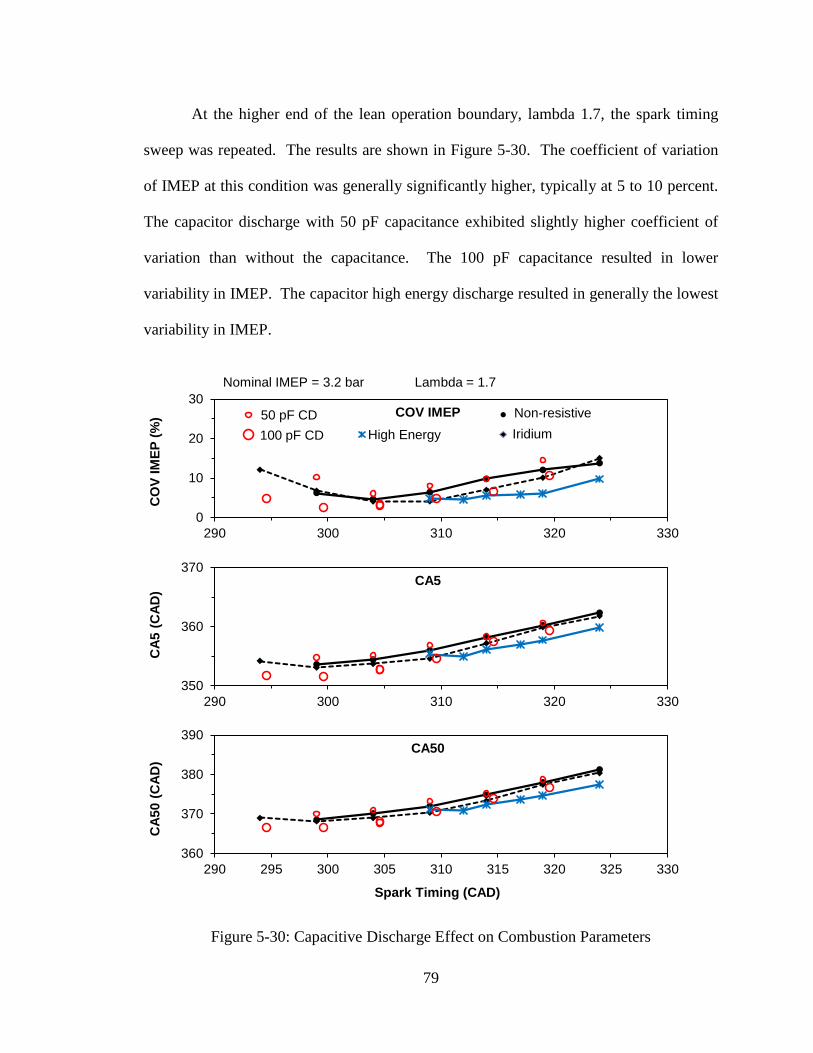
79
At the higher end of the lean operation boundary, lambda 1.7, the spark timing
sweep was repeated. The results are shown in Figure 5-30. The coefficient of variation
of IMEP at this condition was generally significantly higher, typically at 5 to 10 percent.
The capacitor discharge with 50 pF capacitance exhibited slightly higher coefficient of
variation than without the capacitance. The 100 pF capacitance resulted in lower
variability in IMEP. The capacitor high energy discharge resulted in generally the lowest
variability in IMEP.
Figure 5-30: Capacitive Discharge Effect on Combustion Parameters
0
10
20
30
290 300 310 320 330
CO
V I
ME
P (
%) COV IMEP50 pF CD
100 pF CD High Energy
Non-resistive
Iridium
350
360
370
290 300 310 320 330
CA
5 (
CA
D)
CA5
360
370
380
390
290 295 300 305 310 315 320 325 330
CA
50 (
CA
D)
Spark Timing (CAD)
CA50
Nominal IMEP = 3.2 bar Lambda = 1.7
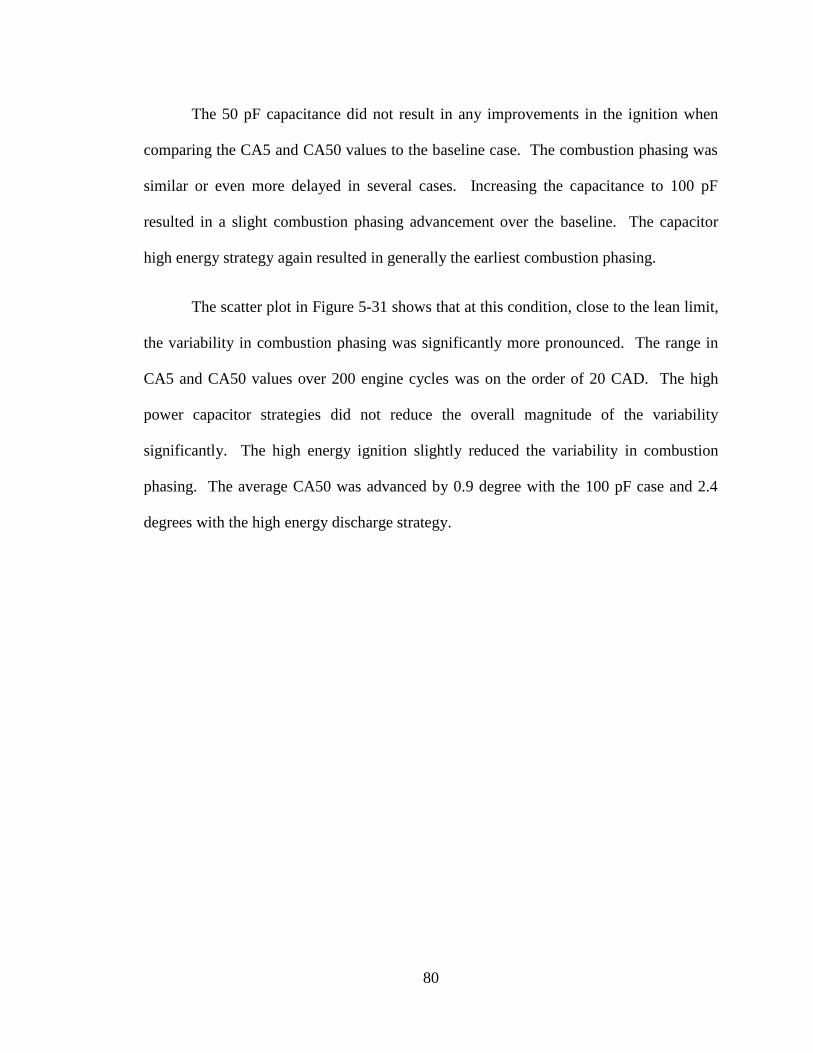
80
The 50 pF capacitance did not result in any improvements in the ignition when
comparing the CA5 and CA50 values to the baseline case. The combustion phasing was
similar or even more delayed in several cases. Increasing the capacitance to 100 pF
resulted in a slight combustion phasing advancement over the baseline. The capacitor
high energy strategy again resulted in generally the earliest combustion phasing.
The scatter plot in Figure 5-31 shows that at this condition, close to the lean limit,
the variability in combustion phasing was significantly more pronounced. The range in
CA5 and CA50 values over 200 engine cycles was on the order of 20 CAD. The high
power capacitor strategies did not reduce the overall magnitude of the variability
significantly. The high energy ignition slightly reduced the variability in combustion
phasing. The average CA50 was advanced by 0.9 degree with the 100 pF case and 2.4
degrees with the high energy discharge strategy.
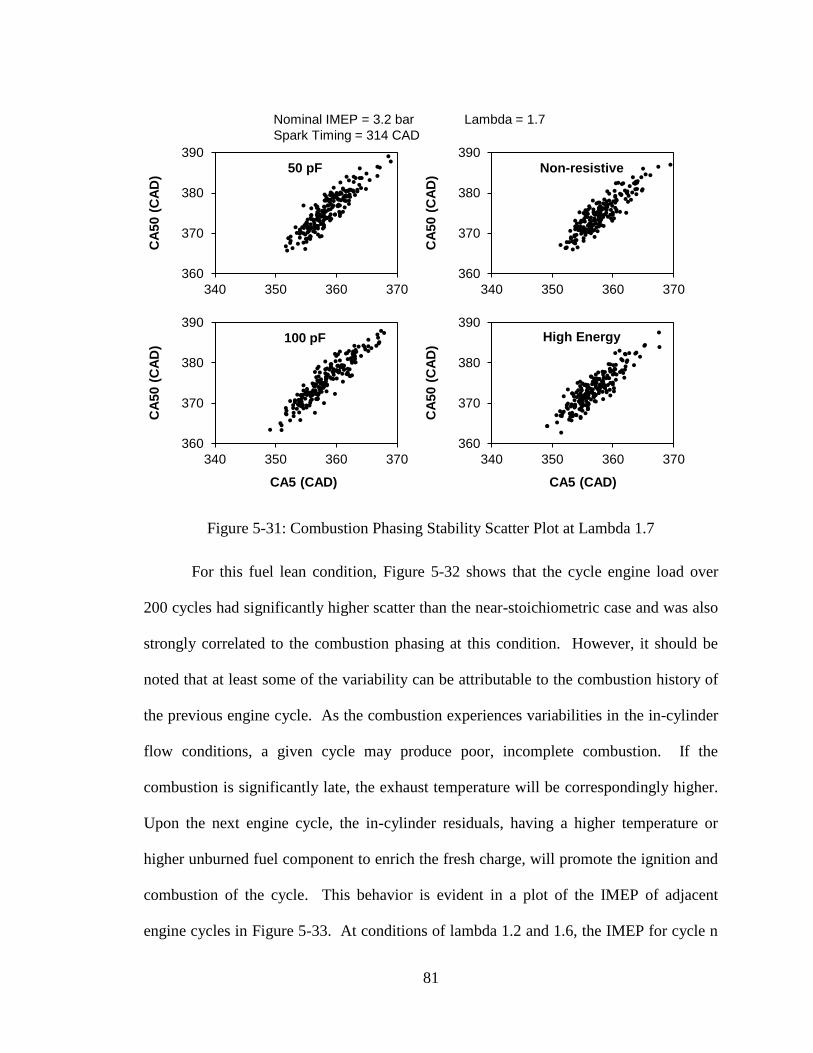
81
Figure 5-31: Combustion Phasing Stability Scatter Plot at Lambda 1.7
For this fuel lean condition, Figure 5-32 shows that the cycle engine load over
200 cycles had significantly higher scatter than the near-stoichiometric case and was also
strongly correlated to the combustion phasing at this condition. However, it should be
noted that at least some of the variability can be attributable to the combustion history of
the previous engine cycle. As the combustion experiences variabilities in the in-cylinder
flow conditions, a given cycle may produce poor, incomplete combustion. If the
combustion is significantly late, the exhaust temperature will be correspondingly higher.
Upon the next engine cycle, the in-cylinder residuals, having a higher temperature or
higher unburned fuel component to enrich the fresh charge, will promote the ignition and
combustion of the cycle. This behavior is evident in a plot of the IMEP of adjacent
engine cycles in Figure 5-33. At conditions of lambda 1.2 and 1.6, the IMEP for cycle n
360
370
380
390
340 350 360 370
CA
50 (
CA
D)
CA5 (CAD)
100 pF
360
370
380
390
340 350 360 370
CA
50 (
CA
D)
CA5 (CAD)
High Energy
360
370
380
390
340 350 360 370
CA
50 (
CA
D)
Non-resistive
360
370
380
390
340 350 360 370
CA
50 (
CA
D)
50 pF
Nominal IMEP = 3.2 bar Lambda = 1.7
Spark Timing = 314 CAD
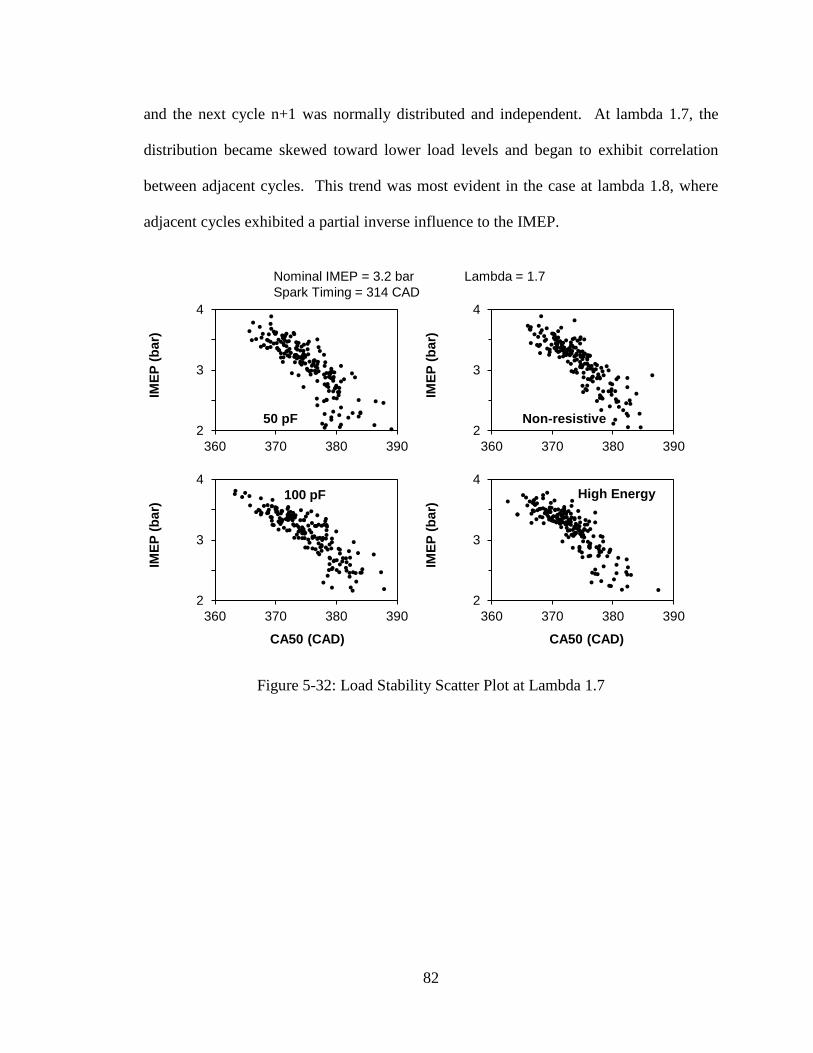
82
and the next cycle n+1 was normally distributed and independent. At lambda 1.7, the
distribution became skewed toward lower load levels and began to exhibit correlation
between adjacent cycles. This trend was most evident in the case at lambda 1.8, where
adjacent cycles exhibited a partial inverse influence to the IMEP.
Figure 5-32: Load Stability Scatter Plot at Lambda 1.7
2
3
4
360 370 380 390
IME
P (
ba
r)
CA50 (CAD)
100 pF
2
3
4
360 370 380 390
IME
P (
ba
r)
CA50 (CAD)
High Energy
2
3
4
360 370 380 390
IME
P (
ba
r)
50 pF2
3
4
360 370 380 390
IME
P (
ba
r)Non-resistive
Nominal IMEP = 3.2 bar Lambda = 1.7
Spark Timing = 314 CAD
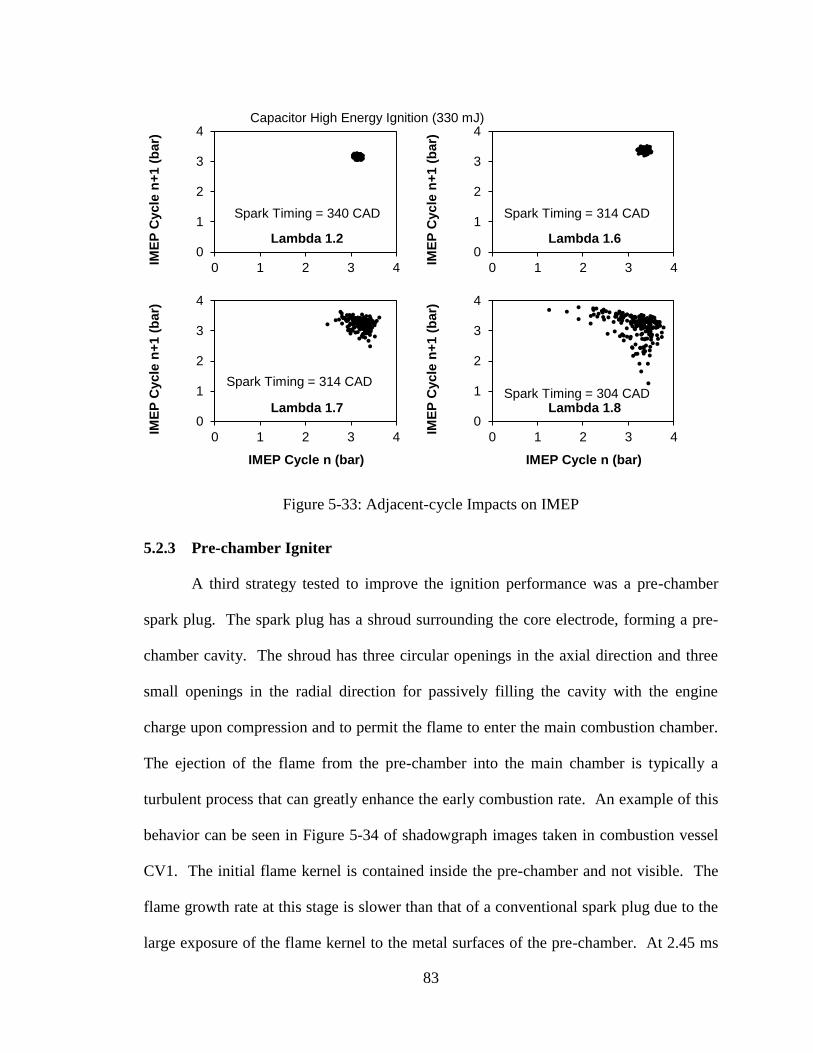
83
Figure 5-33: Adjacent-cycle Impacts on IMEP
5.2.3 Pre-chamber Igniter
A third strategy tested to improve the ignition performance was a pre-chamber
spark plug. The spark plug has a shroud surrounding the core electrode, forming a pre-
chamber cavity. The shroud has three circular openings in the axial direction and three
small openings in the radial direction for passively filling the cavity with the engine
charge upon compression and to permit the flame to enter the main combustion chamber.
The ejection of the flame from the pre-chamber into the main chamber is typically a
turbulent process that can greatly enhance the early combustion rate. An example of this
behavior can be seen in Figure 5-34 of shadowgraph images taken in combustion vessel
CV1. The initial flame kernel is contained inside the pre-chamber and not visible. The
flame growth rate at this stage is slower than that of a conventional spark plug due to the
large exposure of the flame kernel to the metal surfaces of the pre-chamber. At 2.45 ms
0
1
2
3
4
0 1 2 3 4IM
EP
Cycle
n+
1 (
bar)
IMEP Cycle n (bar)
Lambda 1.8
0
1
2
3
4
0 1 2 3 4
IME
P C
ycle
n+
1 (
bar)
Lambda 1.6
0
1
2
3
4
0 1 2 3 4
IME
P C
yc
le n
+1
(b
ar)
IMEP Cycle n (bar)
Lambda 1.7
0
1
2
3
4
0 1 2 3 4
IME
P C
yc
le n
+1
(b
ar)
Lambda 1.2
Spark Timing = 304 CADSpark Timing = 314 CAD
Spark Timing = 314 CADSpark Timing = 340 CAD
Capacitor High Energy Ignition (330 mJ)
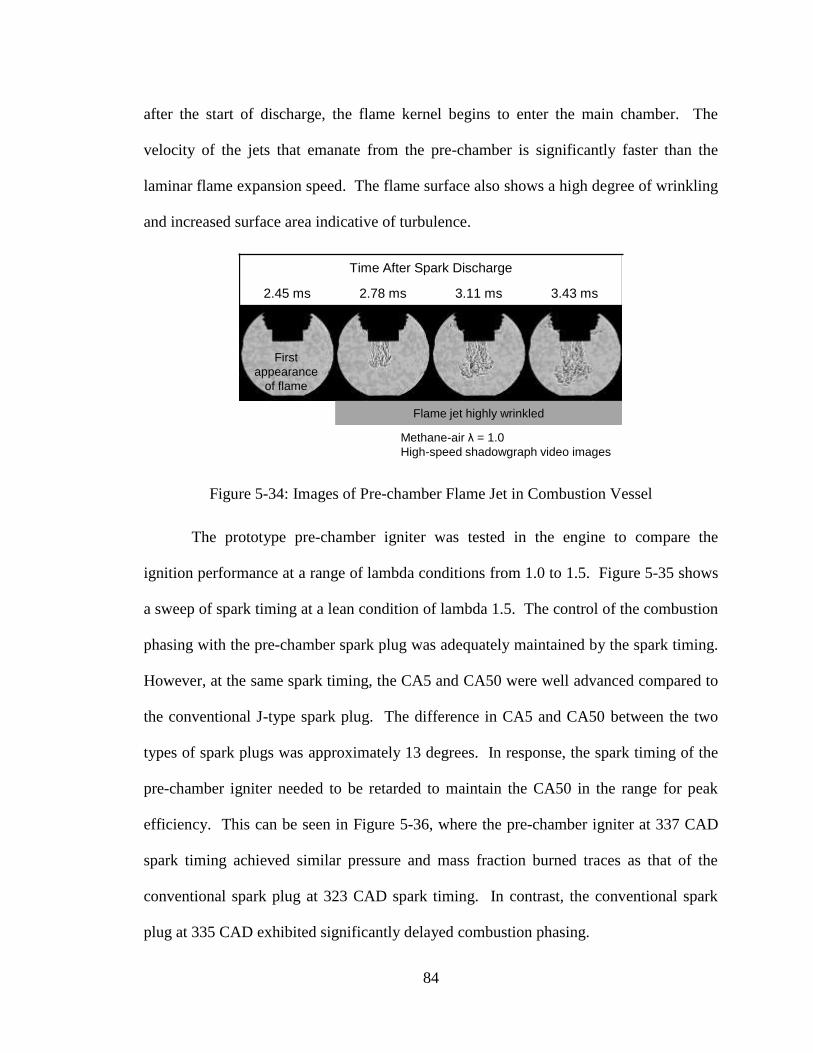
84
after the start of discharge, the flame kernel begins to enter the main chamber. The
velocity of the jets that emanate from the pre-chamber is significantly faster than the
laminar flame expansion speed. The flame surface also shows a high degree of wrinkling
and increased surface area indicative of turbulence.
Figure 5-34: Images of Pre-chamber Flame Jet in Combustion Vessel
The prototype pre-chamber igniter was tested in the engine to compare the
ignition performance at a range of lambda conditions from 1.0 to 1.5. Figure 5-35 shows
a sweep of spark timing at a lean condition of lambda 1.5. The control of the combustion
phasing with the pre-chamber spark plug was adequately maintained by the spark timing.
However, at the same spark timing, the CA5 and CA50 were well advanced compared to
the conventional J-type spark plug. The difference in CA5 and CA50 between the two
types of spark plugs was approximately 13 degrees. In response, the spark timing of the
pre-chamber igniter needed to be retarded to maintain the CA50 in the range for peak
efficiency. This can be seen in Figure 5-36, where the pre-chamber igniter at 337 CAD
spark timing achieved similar pressure and mass fraction burned traces as that of the
conventional spark plug at 323 CAD spark timing. In contrast, the conventional spark
plug at 335 CAD exhibited significantly delayed combustion phasing.
Time After Spark Discharge
2.45 ms 2.78 ms 3.11 ms 3.43 ms
Methane-air λ = 1.0
High-speed shadowgraph video images
First
appearance
of flame
Flame jet highly wrinkled
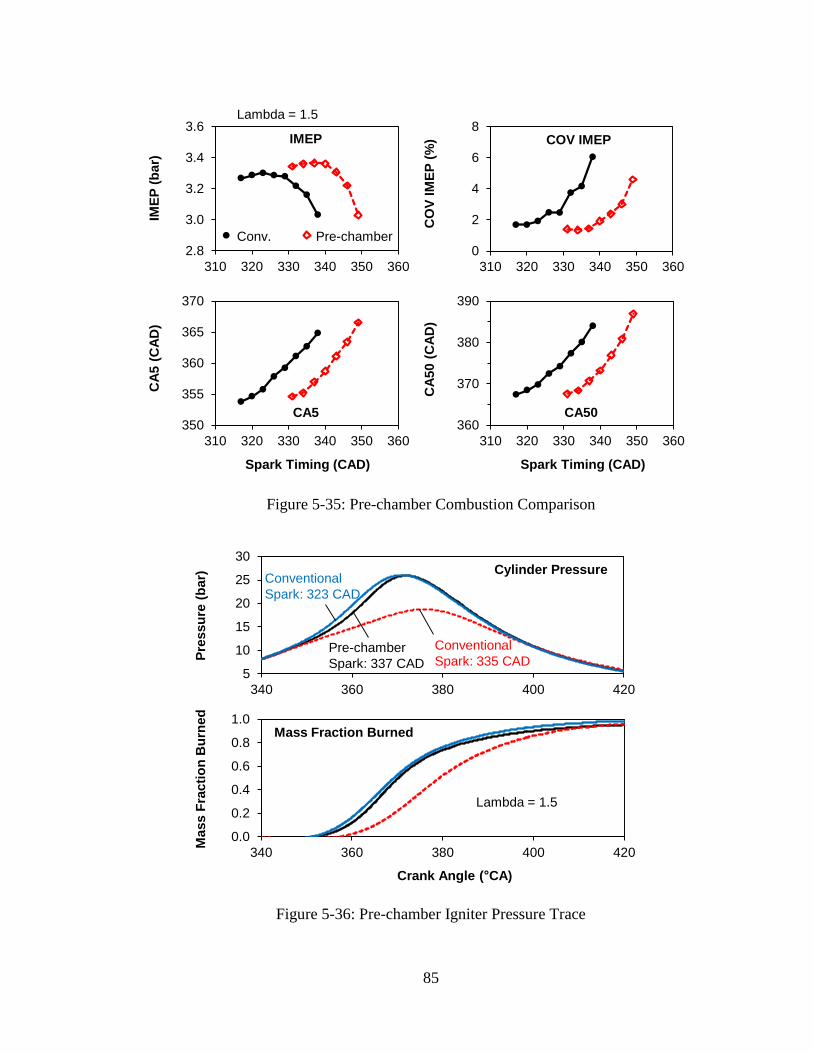
85
Figure 5-35: Pre-chamber Combustion Comparison
Figure 5-36: Pre-chamber Igniter Pressure Trace
350
355
360
365
370
310 320 330 340 350 360
CA
5 (
CA
D)
Spark Timing (CAD)
CA5360
370
380
390
310 320 330 340 350 360C
A5
0 (
CA
D)
Spark Timing (CAD)
CA50
2.8
3.0
3.2
3.4
3.6
310 320 330 340 350 360
IME
P (
ba
r)IMEP
Conv. Pre-chamber0
2
4
6
8
310 320 330 340 350 360
CO
V I
ME
P (
%) COV IMEP
Lambda = 1.5
5
10
15
20
25
30
340 360 380 400 420
Pre
ssu
re (
bar)
Cylinder PressureConventional
Spark: 323 CAD
Conventional
Spark: 335 CADPre-chamber
Spark: 337 CAD
0.0
0.2
0.4
0.6
0.8
1.0
340 360 380 400 420
Mass F
racti
on
Bu
rned
Crank Angle ( CA)
Mass Fraction Burned
Lambda = 1.5
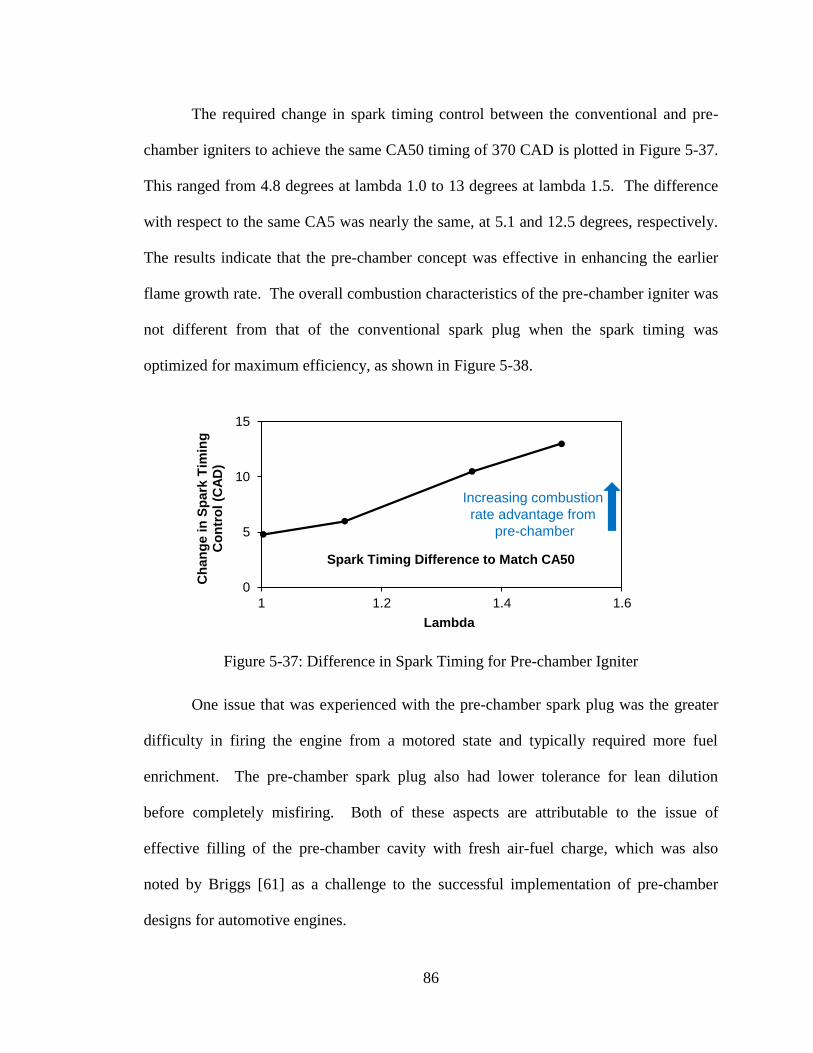
86
The required change in spark timing control between the conventional and pre-
chamber igniters to achieve the same CA50 timing of 370 CAD is plotted in Figure 5-37.
This ranged from 4.8 degrees at lambda 1.0 to 13 degrees at lambda 1.5. The difference
with respect to the same CA5 was nearly the same, at 5.1 and 12.5 degrees, respectively.
The results indicate that the pre-chamber concept was effective in enhancing the earlier
flame growth rate. The overall combustion characteristics of the pre-chamber igniter was
not different from that of the conventional spark plug when the spark timing was
optimized for maximum efficiency, as shown in Figure 5-38.
Figure 5-37: Difference in Spark Timing for Pre-chamber Igniter
One issue that was experienced with the pre-chamber spark plug was the greater
difficulty in firing the engine from a motored state and typically required more fuel
enrichment. The pre-chamber spark plug also had lower tolerance for lean dilution
before completely misfiring. Both of these aspects are attributable to the issue of
effective filling of the pre-chamber cavity with fresh air-fuel charge, which was also
noted by Briggs [61] as a challenge to the successful implementation of pre-chamber
designs for automotive engines.
0
5
10
15
1 1.2 1.4 1.6
Ch
an
ge i
n S
park
Tim
ing
C
on
tro
l (C
AD
)
Lambda
Spark Timing Difference to Match CA50
Increasing combustion
rate advantage from
pre-chamber
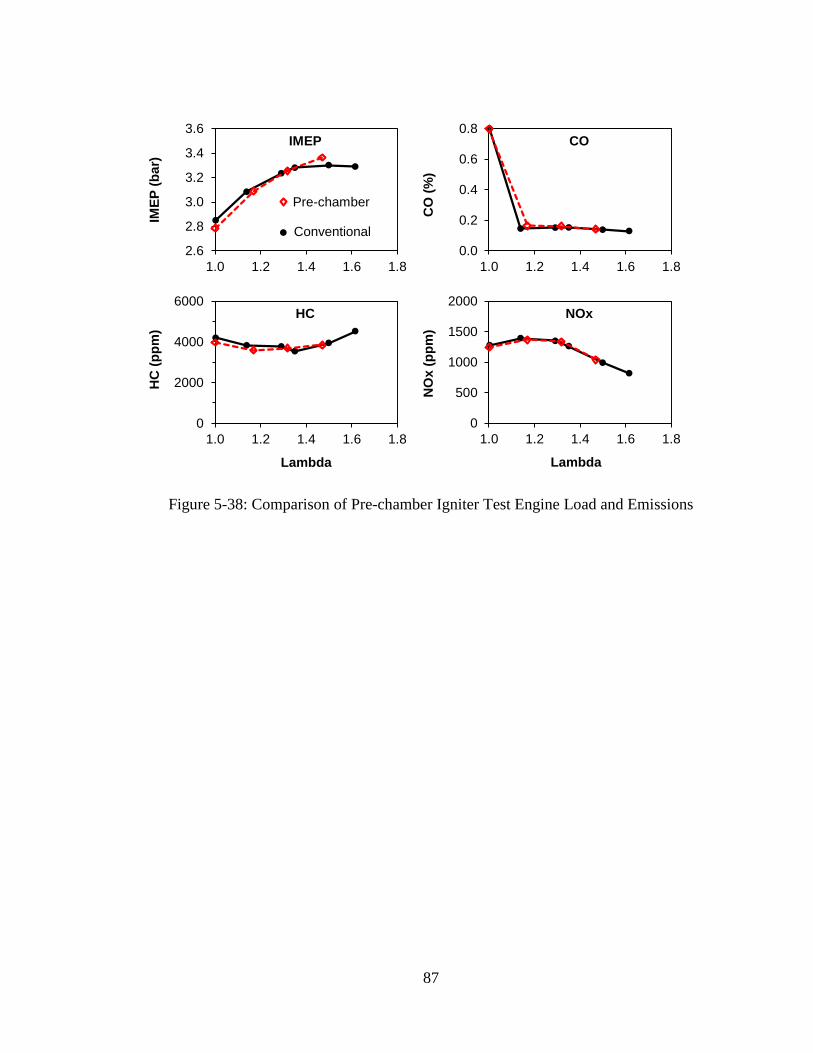
87
Figure 5-38: Comparison of Pre-chamber Igniter Test Engine Load and Emissions
2.6
2.8
3.0
3.2
3.4
3.6
1.0 1.2 1.4 1.6 1.8
IME
P (
bar)
IMEP
Conventional
Pre-chamber
0.0
0.2
0.4
0.6
0.8
1.0 1.2 1.4 1.6 1.8
CO
(%
)
CO
0
500
1000
1500
2000
1.0 1.2 1.4 1.6 1.8N
Ox (
pp
m)
Lambda
NOx
0
2000
4000
6000
1.0 1.2 1.4 1.6 1.8
HC
(p
pm
)
Lambda
HC
88
6. CHAPTER VI
MULTIPLE SITE SPARK IGNITION
This chapter presents the engine test results of a prototype spark plug designed to
achieve ignition at multiple sites. This is done using three independent high voltage
electrodes, each driven by an ignition coil. The impact on flame development in engine
tests is demonstrated. The multipole site ignition strategy is then applied to extend the
engine dilution limit.
6.1 Multi-pole Ignition
The multi-pole ignition concept was explored to study the effect of placing
multiple independent ignition sites in close proximity, with the same overall packing size
as a conventional spark plug. The first test explored the effect of the pole orientation in
the three pole design. In conventional spark plugs, the orientation of the ground electrode
when installed in the engine can influence the kernel formation because of the interaction
of the in-cylinder flows. Similarly, in the installation of the prototype multi-pole spark
plug into the engine, the performance of the individual poles can be expected to be
affected by the prevalent engine flow patterns, as well as manufacturing variances, and
the closeness of the electrode to the center of the combustion chamber. In the present
engine tests, the spark plug was installed with the three poles as shown in Figure 6-1.
Pole 2 and pole 3 were closer to the center of the cylinder, and with pole 2 closer to the
intake valve and pole 3 closer to the exhaust valve. Pole 1 was farther away from the
center of the cylinder. As a result of the angled installation of the spark plug, the
protrusion depth of the spark poles also varied. Pole 1 protruded approximately 2 mm
deeper into the combustion chamber than poles 2 and 3.
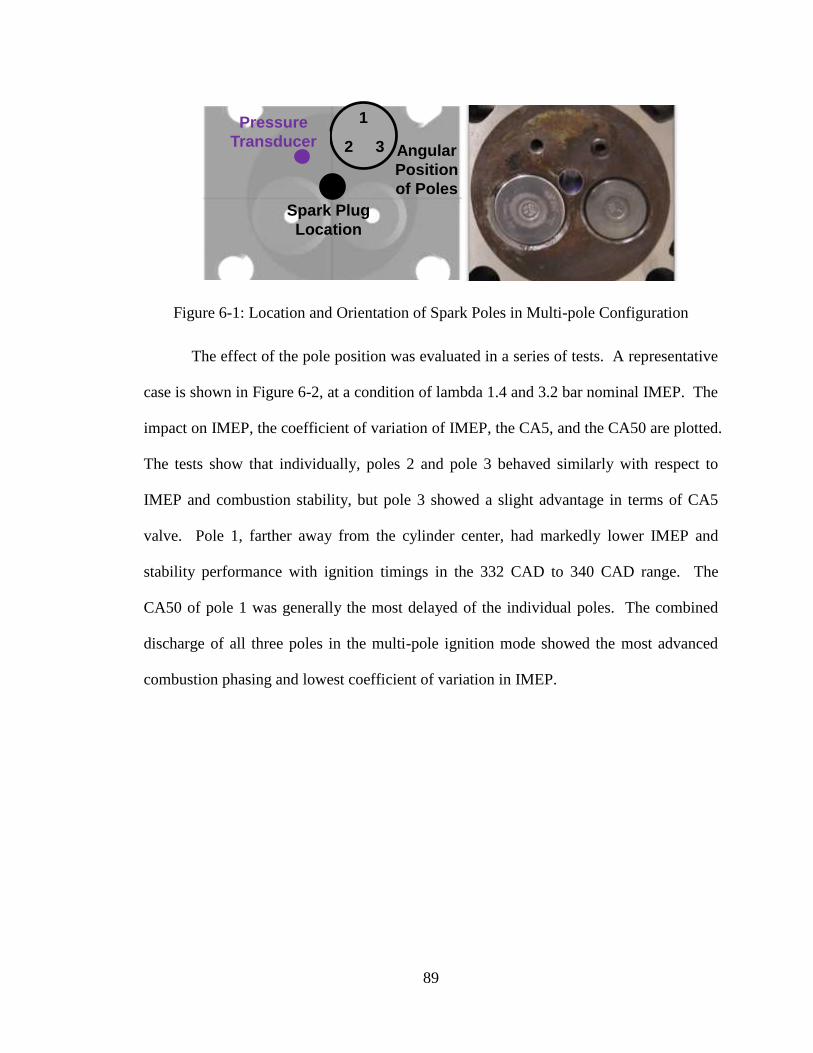
89
Figure 6-1: Location and Orientation of Spark Poles in Multi-pole Configuration
The effect of the pole position was evaluated in a series of tests. A representative
case is shown in Figure 6-2, at a condition of lambda 1.4 and 3.2 bar nominal IMEP. The
impact on IMEP, the coefficient of variation of IMEP, the CA5, and the CA50 are plotted.
The tests show that individually, poles 2 and pole 3 behaved similarly with respect to
IMEP and combustion stability, but pole 3 showed a slight advantage in terms of CA5
valve. Pole 1, farther away from the cylinder center, had markedly lower IMEP and
stability performance with ignition timings in the 332 CAD to 340 CAD range. The
CA50 of pole 1 was generally the most delayed of the individual poles. The combined
discharge of all three poles in the multi-pole ignition mode showed the most advanced
combustion phasing and lowest coefficient of variation in IMEP.
Spark Plug
Location
1
2 3 Angular
Position
of Poles
Pressure
Transducer
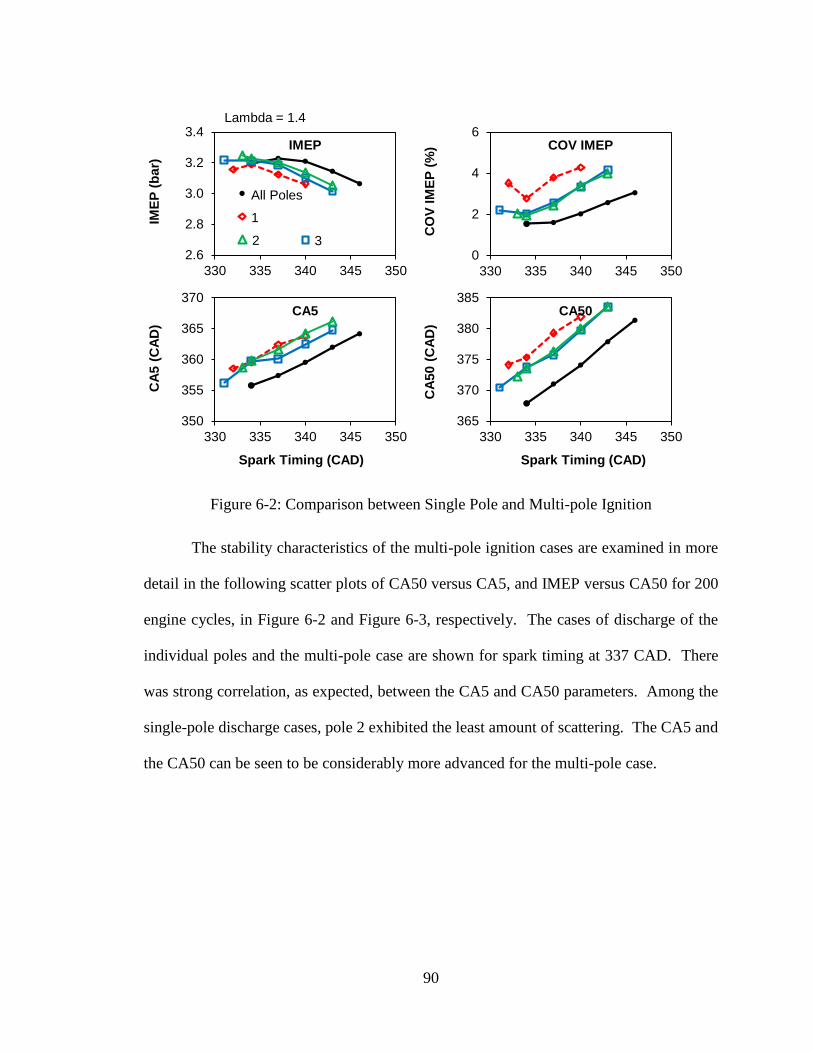
90
Figure 6-2: Comparison between Single Pole and Multi-pole Ignition
The stability characteristics of the multi-pole ignition cases are examined in more
detail in the following scatter plots of CA50 versus CA5, and IMEP versus CA50 for 200
engine cycles, in Figure 6-2 and Figure 6-3, respectively. The cases of discharge of the
individual poles and the multi-pole case are shown for spark timing at 337 CAD. There
was strong correlation, as expected, between the CA5 and CA50 parameters. Among the
single-pole discharge cases, pole 2 exhibited the least amount of scattering. The CA5 and
the CA50 can be seen to be considerably more advanced for the multi-pole case.
2.6
2.8
3.0
3.2
3.4
330 335 340 345 350
IME
P (
ba
r)IMEP
All Poles
1
32
Lambda = 1.4
0
2
4
6
330 335 340 345 350
CO
V I
ME
P (
%) COV IMEP
350
355
360
365
370
330 335 340 345 350
CA
5 (
CA
D)
Spark Timing (CAD)
CA5
365
370
375
380
385
330 335 340 345 350C
A5
0 (
CA
D)
Spark Timing (CAD)
CA50
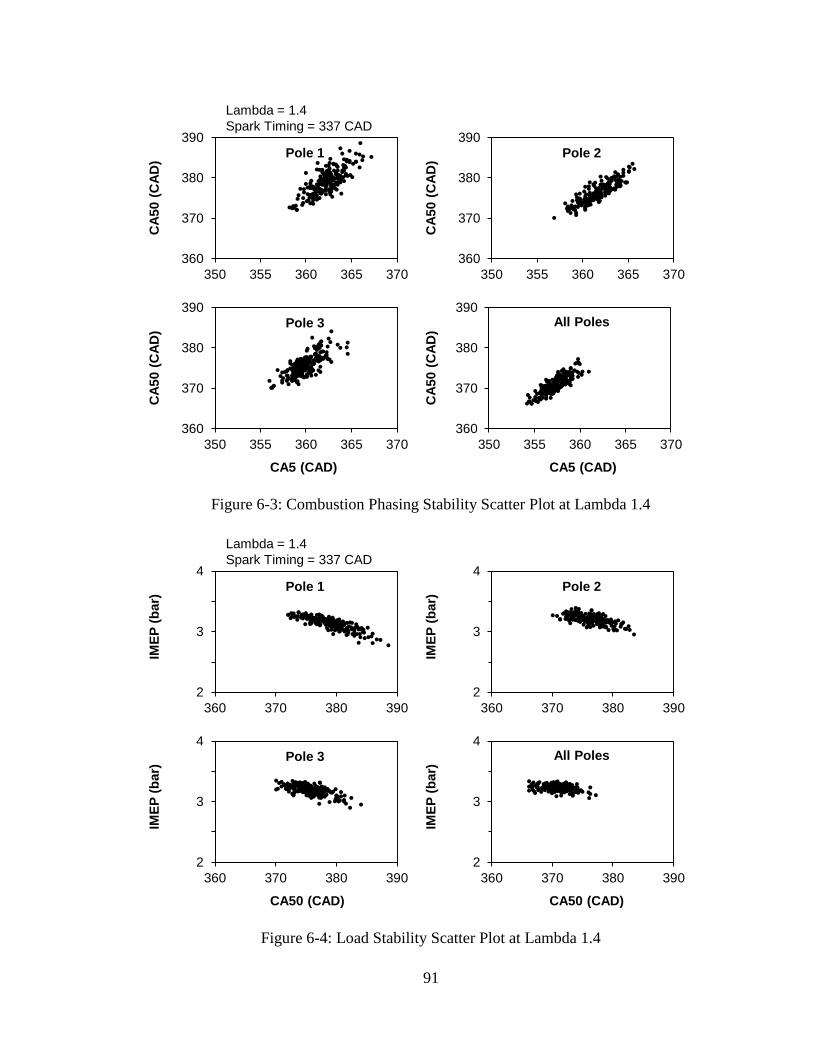
91
Figure 6-3: Combustion Phasing Stability Scatter Plot at Lambda 1.4
Figure 6-4: Load Stability Scatter Plot at Lambda 1.4
360
370
380
390
350 355 360 365 370
CA
50 (
CA
D)
CA5 (CAD)
Pole 3
360
370
380
390
350 355 360 365 370C
A5
0 (
CA
D)
CA5 (CAD)
All Poles
360
370
380
390
350 355 360 365 370
CA
50 (
CA
D)
Pole 2
360
370
380
390
350 355 360 365 370
CA
50 (
CA
D)
Pole 1
Lambda = 1.4
Spark Timing = 337 CAD
2
3
4
360 370 380 390
IME
P (
ba
r)
CA50 (CAD)
Pole 3
2
3
4
360 370 380 390
IME
P (
ba
r)
Pole 1
2
3
4
360 370 380 390
IME
P (
ba
r)
CA50 (CAD)
All Poles
2
3
4
360 370 380 390
IME
P (
ba
r)
Pole 2
Lambda = 1.4
Spark Timing = 337 CAD
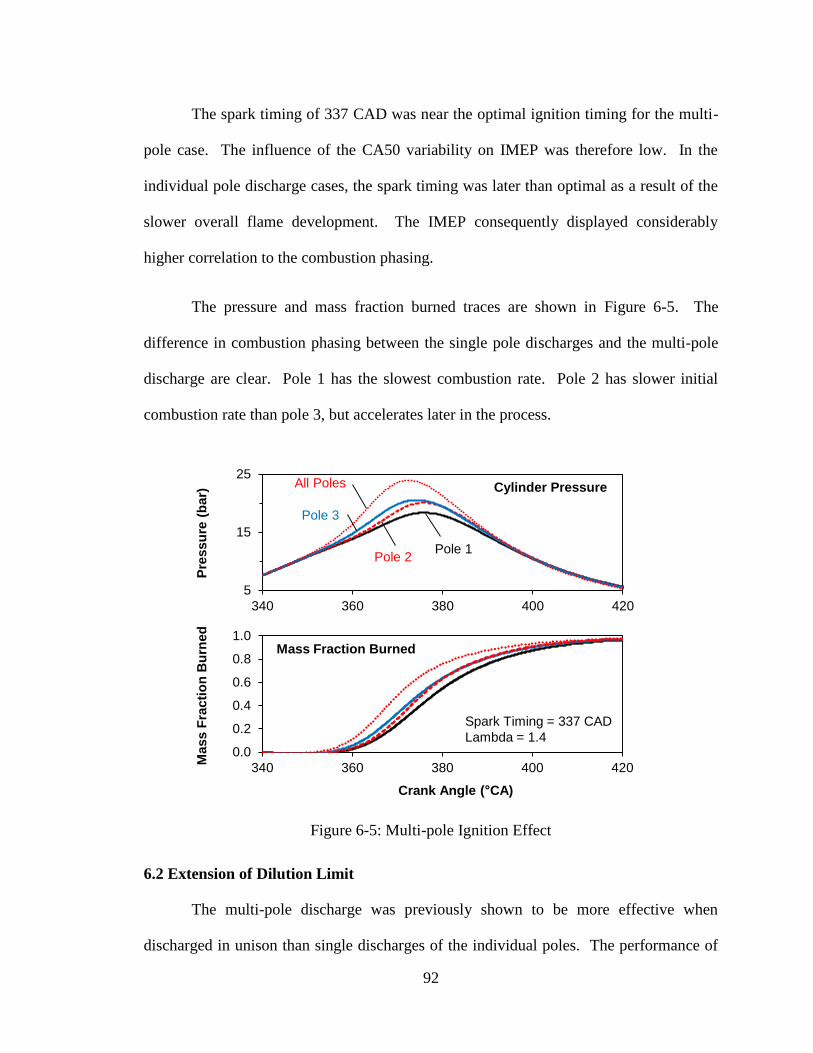
92
The spark timing of 337 CAD was near the optimal ignition timing for the multi-
pole case. The influence of the CA50 variability on IMEP was therefore low. In the
individual pole discharge cases, the spark timing was later than optimal as a result of the
slower overall flame development. The IMEP consequently displayed considerably
higher correlation to the combustion phasing.
The pressure and mass fraction burned traces are shown in Figure 6-5. The
difference in combustion phasing between the single pole discharges and the multi-pole
discharge are clear. Pole 1 has the slowest combustion rate. Pole 2 has slower initial
combustion rate than pole 3, but accelerates later in the process.
Figure 6-5: Multi-pole Ignition Effect
6.2 Extension of Dilution Limit
The multi-pole discharge was previously shown to be more effective when
discharged in unison than single discharges of the individual poles. The performance of
5
15
25
340 360 380 400 420
Pre
ssu
re (
bar) Cylinder Pressure
Pole 3
Pole 2Pole 1
All Poles
0.0
0.2
0.4
0.6
0.8
1.0
340 360 380 400 420
Mass F
racti
on
Bu
rned
Crank Angle ( CA)
Mass Fraction Burned
Spark Timing = 337 CAD
Lambda = 1.4
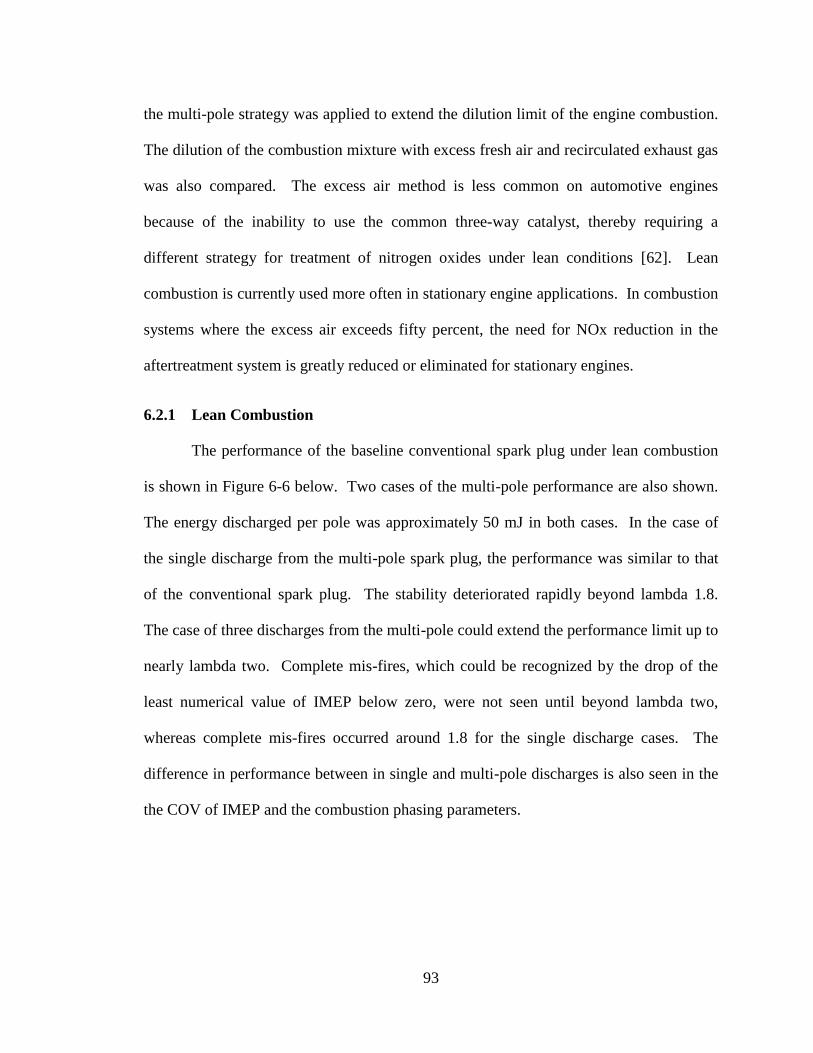
93
the multi-pole strategy was applied to extend the dilution limit of the engine combustion.
The dilution of the combustion mixture with excess fresh air and recirculated exhaust gas
was also compared. The excess air method is less common on automotive engines
because of the inability to use the common three-way catalyst, thereby requiring a
different strategy for treatment of nitrogen oxides under lean conditions [62]. Lean
combustion is currently used more often in stationary engine applications. In combustion
systems where the excess air exceeds fifty percent, the need for NOx reduction in the
aftertreatment system is greatly reduced or eliminated for stationary engines.
6.2.1 Lean Combustion
The performance of the baseline conventional spark plug under lean combustion
is shown in Figure 6-6 below. Two cases of the multi-pole performance are also shown.
The energy discharged per pole was approximately 50 mJ in both cases. In the case of
the single discharge from the multi-pole spark plug, the performance was similar to that
of the conventional spark plug. The stability deteriorated rapidly beyond lambda 1.8.
The case of three discharges from the multi-pole could extend the performance limit up to
nearly lambda two. Complete mis-fires, which could be recognized by the drop of the
least numerical value of IMEP below zero, were not seen until beyond lambda two,
whereas complete mis-fires occurred around 1.8 for the single discharge cases. The
difference in performance between in single and multi-pole discharges is also seen in the
the COV of IMEP and the combustion phasing parameters.
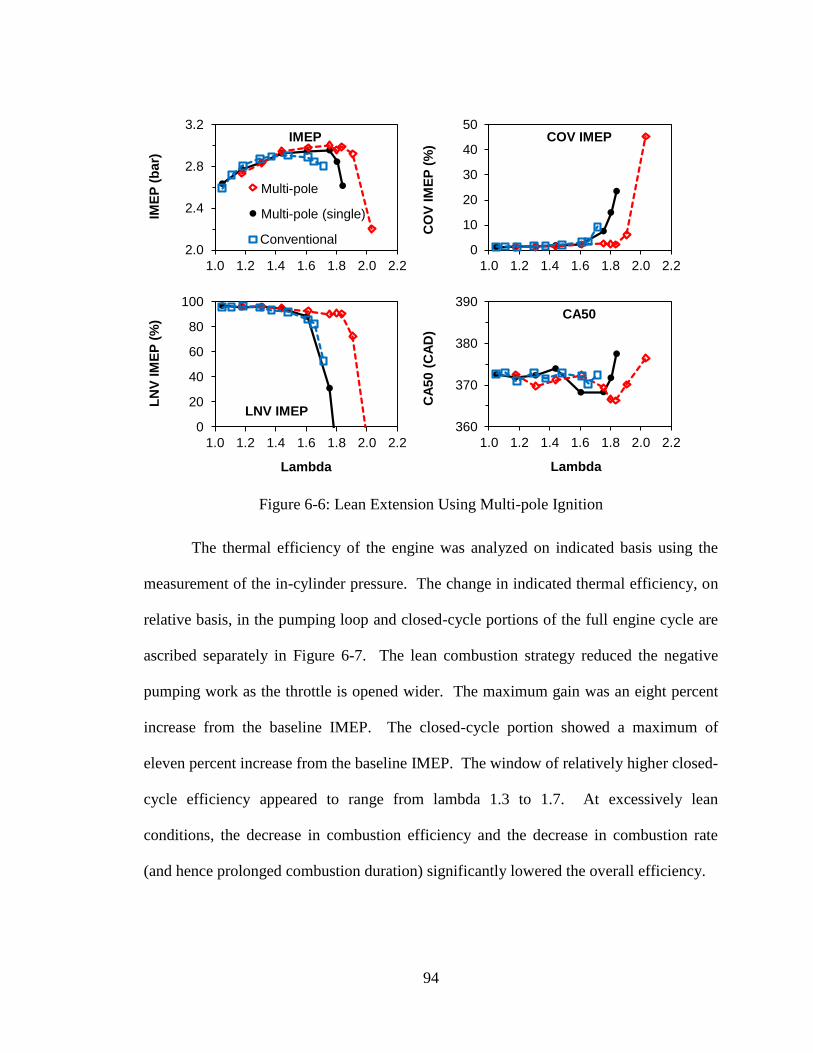
94
Figure 6-6: Lean Extension Using Multi-pole Ignition
The thermal efficiency of the engine was analyzed on indicated basis using the
measurement of the in-cylinder pressure. The change in indicated thermal efficiency, on
relative basis, in the pumping loop and closed-cycle portions of the full engine cycle are
ascribed separately in Figure 6-7. The lean combustion strategy reduced the negative
pumping work as the throttle is opened wider. The maximum gain was an eight percent
increase from the baseline IMEP. The closed-cycle portion showed a maximum of
eleven percent increase from the baseline IMEP. The window of relatively higher closed-
cycle efficiency appeared to range from lambda 1.3 to 1.7. At excessively lean
conditions, the decrease in combustion efficiency and the decrease in combustion rate
(and hence prolonged combustion duration) significantly lowered the overall efficiency.
2.0
2.4
2.8
3.2
1.0 1.2 1.4 1.6 1.8 2.0 2.2
IME
P (
ba
r)
IMEP
Multi-pole (single)
Multi-pole
Conventional0
10
20
30
40
50
1.0 1.2 1.4 1.6 1.8 2.0 2.2
CO
V I
ME
P (
%)
COV IMEP
0
20
40
60
80
100
1.0 1.2 1.4 1.6 1.8 2.0 2.2
LN
V I
ME
P (
%)
Lambda
LNV IMEP
360
370
380
390
1.0 1.2 1.4 1.6 1.8 2.0 2.2C
A5
0 (
CA
D)
Lambda
CA50
95
Figure 6-7: Efficiency and Emissions of Lean Combustion
The engine NOx emissions typically decreased on ppm basis from the peak value
at lambda 1.3. This was partially offset, however, by the increase in exhaust flow from
the use of excess air. The net effect was that significant NOx reduction on an indicated
power basis was not achieved until around lambda 1.7. It would take operation
approaching lambda two to achieve the lowest levels of NOx, at which point the closed-
cycle efficiency would also be compromised.
0
300
600
900
1200
1500
1.0 1.2 1.4 1.6 1.8 2.0 2.2
NO
x (
pp
m)
Lambda
NOx Emissions
0
40
80
120
1.0 1.2 1.4 1.6 1.8 2.0 2.2
NO
x (
g/k
Wh
r)
Lambda
Indicated NOx
0
5
10
15
1.0 1.2 1.4 1.6 1.8 2.0 2.2
IME
P G
ain
(%
)Pumping Loop Gain
Multi-pole (single)
Multi-pole
Conventional
0
5
10
15
1.0 1.2 1.4 1.6 1.8 2.0 2.2
IME
P G
ain
(%
)
Closed-Cycle Gain
0
5
10
15
20
1.0 1.2 1.4 1.6 1.8 2.0 2.2
IME
P G
ain
(%
) Total Relative Gain
240
280
320
360
1.0 1.2 1.4 1.6 1.8 2.0 2.2
ISF
C (
g/k
Wh
r)
ISFC
96
6.2.2 EGR Dilution Combustion
The performance of the multi-pole spark plug under EGR combustion is
compared to the baseline conventional spark plug in Figure 6-8. The engine
stoichiometry was maintained within a range of lambda 1.03 to 1.05 in the EGR tests.
The energy discharged per pole was 50 mJ in all cases. The black trace shows the case
when one pole is discharged. The baseline conventional spark plug case is shown in the
blue trace. The red trace shows the case when all three poles were discharged at the same
energy level per pole. The single discharge cases from the conventional spark plug and
multi-pole spark plug resulted in similar performance. The multiple discharge cases
extended the stability curve to higher EGR rates. Misfires were recorded at 32% EGR
with the multi-pole case, compared to 26% EGR with the conventional spark plug. Even
at low and moderate EGR rates the multiple discharge cases typically also exhibited
higher LNV IMEP values.
97
Figure 6-8: EGR Dilution Limit Extension Using Multi-pole Ignition
The rationale for using EGR dilution was in part to increase the part-load thermal
efficiency and lower NOx emissions. The thermal efficiency of the single-cylinder
engine tests was analyzed on indicated basis using the measurement of the in-cylinder
pressure. The effect on indicated thermal efficiency, on relative basis, in the pumping
loop and closed-cycle portions of the full engine cycle is shown in Figure 6-9. The
negative work associated with the pumping loop reduced with higher EGR rates as the
throttle was opened wider. The closed-cycle efficiency was mainly affected by the
combustion efficiency, heat-transfer losses, and effective expansion ratio (i.e. combustion
phasing). The net effect from these changes shows an increase in the closed-cycle
efficiency with moderate levels of EGR. At the highest levels of EGR, the efficiency in
the closed-cycle portion reduced. Thus the highest increase in the pumping loop and
1.0
1.5
2.0
2.5
3.0
3.5
4.0
0 10 20 30 40
IME
P (
bar)
IMEP
Multi-pole (single)
Multi-pole
Conventional0
2
4
6
8
10
0 10 20 30 40
CO
V I
ME
P (
%)
COV IMEP
0
20
40
60
80
100
0 10 20 30 40
LN
V I
ME
P (
%)
EGR (%)
LNV IMEP360
370
380
390
0 10 20 30 40C
A50 (
CA
D)
EGR (%)
CA50
98
closed-cycle processes occurred at approximately 30% EGR. This range of optimal EGR
from the efficiency perspective is supported by other repeat tests for this engine condition.
Figure 6-9: Efficiency and Emissions of EGR Combustion
The NOx emissions decreased monotonically with the increase of EGR, mainly
attributable to the reduction of peak flame temperatures. Even though the three-way
catalyst system can effectively treat NOx emissions, reductions in the engine-out
emission levels can still lead to a net efficiency benefit from reducing need to
0
400
800
1200
1600
0 10 20 30 40
NO
x (
pp
m)
EGR (%)
NOx Emissions
0
40
80
120
0 10 20 30 40
NO
x (
g/k
Wh
r)
EGR (%)
Indicated NOx
0
2
4
6
8
10
0 10 20 30 40
IME
P G
ain
(%
)
Pumping Loop Gain
Multi-pole (single)
Multi-pole
Conventional
0
2
4
6
8
10
0 10 20 30 40
IME
P G
ain
(%
)
Closed-Cycle Gain
0
5
10
15
20
0 10 20 30 40
IME
P G
ain
(%
) Total Relative Gain
250
270
290
310
0 10 20 30 40
ISF
C (
g/k
Wh
r)
ISFC
99
periodically cycle the engine stoichiometry to rich combustion in order to provide
reductants for the catalyst system.
The data from the two different methods of intake mixture dilution are shown on a
common basis of dilution ratio in Figure 6-10, using the best cases of the multi-pole
discharge strategy. The dilution ratio characterizes the portion of the intake mixture that
is either recirculated exhaust or excess air. It the case of EGR, the possible dilution rate
was significantly lower than that of excess air, in part because of the strong effects of
carbon dioxide in the exhaust. The achievable gains in efficiency from the use of excess
air dilution slightly exceed that from exhaust gas recirculation.
The reduction of NOx emissions, however, was significantly more effective when
using EGR. The use of EGR would also allow the use of a three-way catalyst to
effectively reduce all criterion pollutants. This aspect is more challenging in lean
combustion systems.
100
Figure 6-10: Lean and EGR Dilution Comparison
2.0
2.5
3.0
3.5
0 20 40 60
IME
P (
bar)
IMEP
EGR DilutionLean Dilution
0
40
80
120
0 20 40 60
NO
x (
g/k
Wh
r)
Dilution Ratio (%)
Indicated NOx
EGR Dilution
Lean Dilution
0
5
10
15
0 20 40 60
CO
V I
ME
P (
%) COV IMEP
EGR Dilution
Lean
Dilution
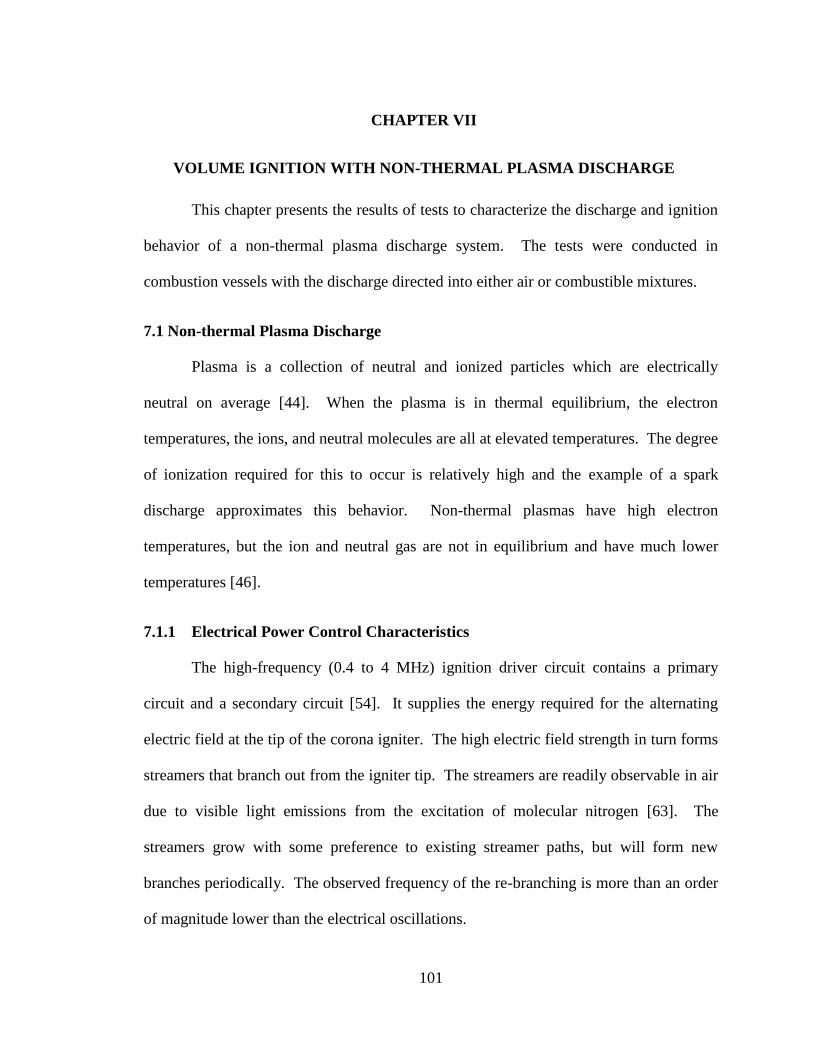
101
7. CHAPTER VII
VOLUME IGNITION WITH NON-THERMAL PLASMA DISCHARGE
This chapter presents the results of tests to characterize the discharge and ignition
behavior of a non-thermal plasma discharge system. The tests were conducted in
combustion vessels with the discharge directed into either air or combustible mixtures.
7.1 Non-thermal Plasma Discharge
Plasma is a collection of neutral and ionized particles which are electrically
neutral on average [44]. When the plasma is in thermal equilibrium, the electron
temperatures, the ions, and neutral molecules are all at elevated temperatures. The degree
of ionization required for this to occur is relatively high and the example of a spark
discharge approximates this behavior. Non-thermal plasmas have high electron
temperatures, but the ion and neutral gas are not in equilibrium and have much lower
temperatures [46].
7.1.1 Electrical Power Control Characteristics
The high-frequency (0.4 to 4 MHz) ignition driver circuit contains a primary
circuit and a secondary circuit [54]. It supplies the energy required for the alternating
electric field at the tip of the corona igniter. The high electric field strength in turn forms
streamers that branch out from the igniter tip. The streamers are readily observable in air
due to visible light emissions from the excitation of molecular nitrogen [63]. The
streamers grow with some preference to existing streamer paths, but will form new
branches periodically. The observed frequency of the re-branching is more than an order
of magnitude lower than the electrical oscillations.
102
A sample of the oscilloscope recording of the command signal, secondary current,
and secondary voltage acquired from the corona system at 1 bar gauge pressure is shown
in Figure 7-1. The command signal to drive the corona circuit turns on and off the power
driver at 434.8 kHz and induces resonant voltage amplification in the secondary circuit.
The buildup takes several tens of microseconds to reach the threshold of visible discharge.
Upon termination of the command signal, the secondary voltage begins to decay within
one cycle.
Figure 7-1: Voltage Buildup Profile in Corona Igniter
The effective power of the corona discharge was primarily controlled through the
primary voltage. The effect of different primary voltages in the range of 32 V through 56
-1.0
-0.5
0.0
0.5
1.0
0 0.2 0.4 0.6 0.8 1 1.2
Se
c.
Cu
rre
nt
(A)
Time (ms)
Secondary Current
0 0.2 0.4 0.6 0.8 1 1.2
Co
mm
an
d S
ign
al Command Signal
1 ms discharge command
-20
-10
0
10
20
0 0.2 0.4 0.6 0.8 1 1.2
Se
c.
Vo
lta
ge
(k
V) Secondary Voltage
90 95 100
Time (µs)
CurrentVoltage
Command
Oscillation frequency:
434.8 kHz
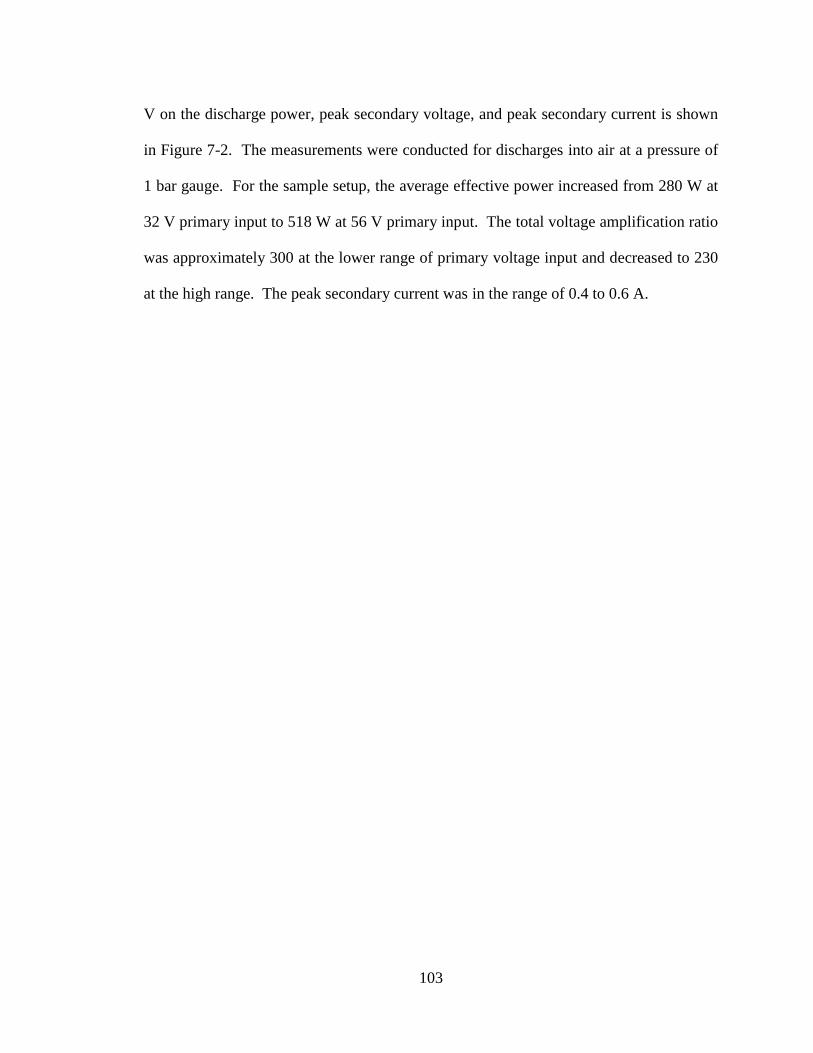
103
V on the discharge power, peak secondary voltage, and peak secondary current is shown
in Figure 7-2. The measurements were conducted for discharges into air at a pressure of
1 bar gauge. For the sample setup, the average effective power increased from 280 W at
32 V primary input to 518 W at 56 V primary input. The total voltage amplification ratio
was approximately 300 at the lower range of primary voltage input and decreased to 230
at the high range. The peak secondary current was in the range of 0.4 to 0.6 A.
104
Figure 7-2: Effect of Primary Voltage on Discharge Voltage and Power
The discharge energy profile of a case at 56 V primary voltage is shown in Figure
7-3. The measured electrical discharge power increased over the course of approximately
35 µs as the secondary resonance built up. The average peak power of the discharge was
557 W.
0
200
400
600
30 35 40 45 50 55 60
Dis
ch
arg
e P
ow
er
(W)
Corona Discharge Power
Discharge in air
p = 1 bar gauge
8
10
12
14
16
30 35 40 45 50 55 60
Pe
ak
Se
c.
Vo
lta
ge
(k
V) Corona Peak Secondary Voltage
0.2
0.4
0.6
0.8
30 35 40 45 50 55 60
Pe
ak
Se
c.
Cu
rre
nt
(A)
Primary Voltage (V)
Corona Peak Secondary Current
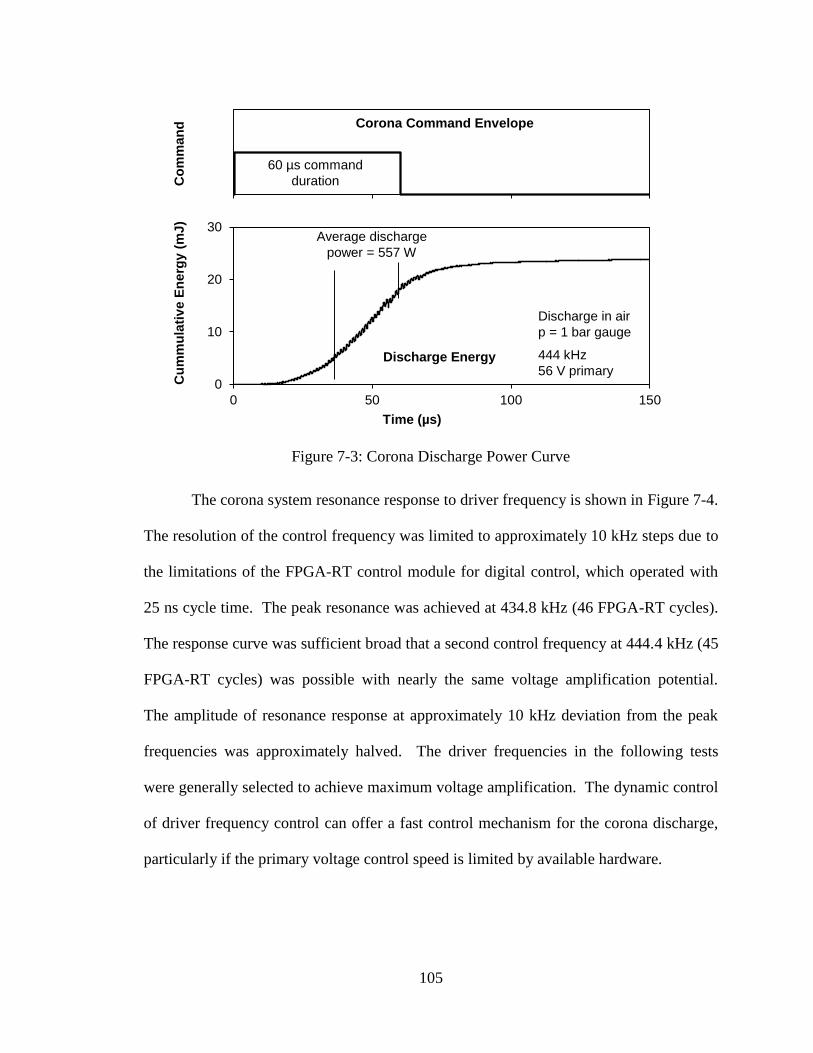
105
Figure 7-3: Corona Discharge Power Curve
The corona system resonance response to driver frequency is shown in Figure 7-4.
The resolution of the control frequency was limited to approximately 10 kHz steps due to
the limitations of the FPGA-RT control module for digital control, which operated with
25 ns cycle time. The peak resonance was achieved at 434.8 kHz (46 FPGA-RT cycles).
The response curve was sufficient broad that a second control frequency at 444.4 kHz (45
FPGA-RT cycles) was possible with nearly the same voltage amplification potential.
The amplitude of resonance response at approximately 10 kHz deviation from the peak
frequencies was approximately halved. The driver frequencies in the following tests
were generally selected to achieve maximum voltage amplification. The dynamic control
of driver frequency control can offer a fast control mechanism for the corona discharge,
particularly if the primary voltage control speed is limited by available hardware.
0
10
20
30
0 50 100 150
Cu
mm
ula
tiv
e E
ne
rgy (
mJ
)
Time (µs)
Discharge Energy
Average discharge
power = 557 W
444 kHz
56 V primary
Discharge in air
p = 1 bar gauge
0 50 100 150
Co
mm
an
d Corona Command Envelope
60 µs command
duration
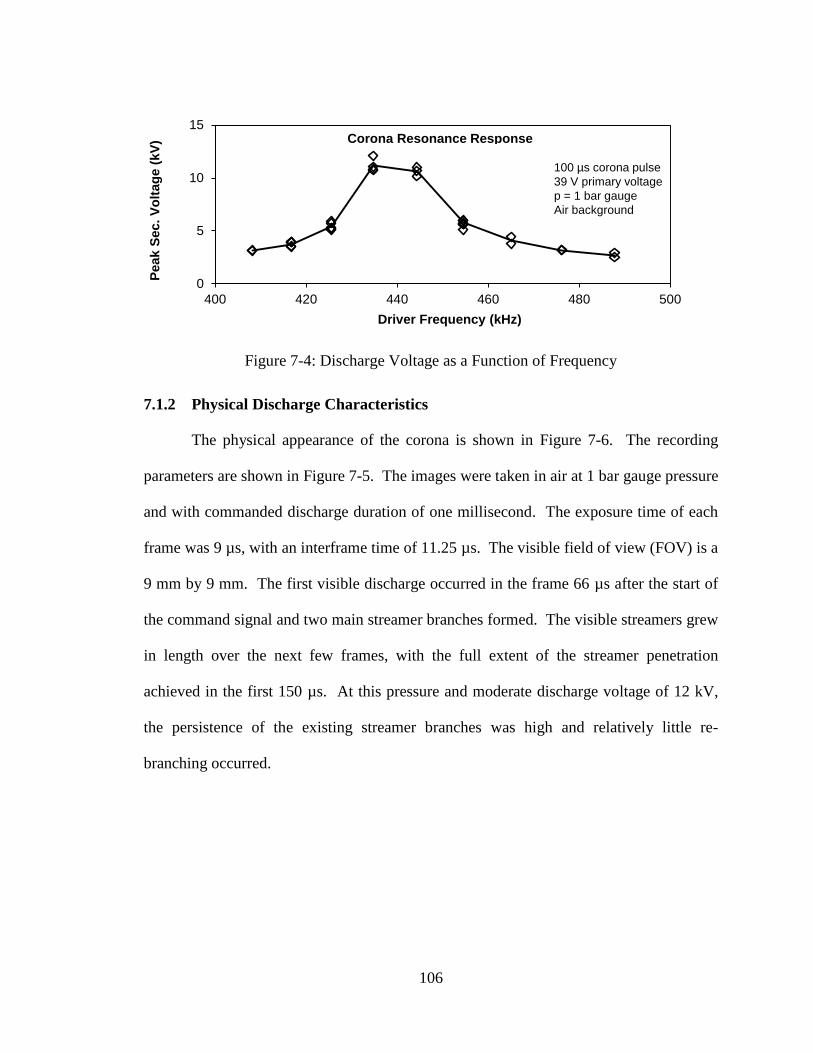
106
Figure 7-4: Discharge Voltage as a Function of Frequency
7.1.2 Physical Discharge Characteristics
The physical appearance of the corona is shown in Figure 7-6. The recording
parameters are shown in Figure 7-5. The images were taken in air at 1 bar gauge pressure
and with commanded discharge duration of one millisecond. The exposure time of each
frame was 9 µs, with an interframe time of 11.25 µs. The visible field of view (FOV) is a
9 mm by 9 mm. The first visible discharge occurred in the frame 66 µs after the start of
the command signal and two main streamer branches formed. The visible streamers grew
in length over the next few frames, with the full extent of the streamer penetration
achieved in the first 150 µs. At this pressure and moderate discharge voltage of 12 kV,
the persistence of the existing streamer branches was high and relatively little re-
branching occurred.
0
5
10
15
400 420 440 460 480 500
Peak S
ec.
Vo
ltag
e (
kV
)
Driver Frequency (kHz)
Corona Resonance Response
100 µs corona pulse
39 V primary voltage
p = 1 bar gauge
Air background
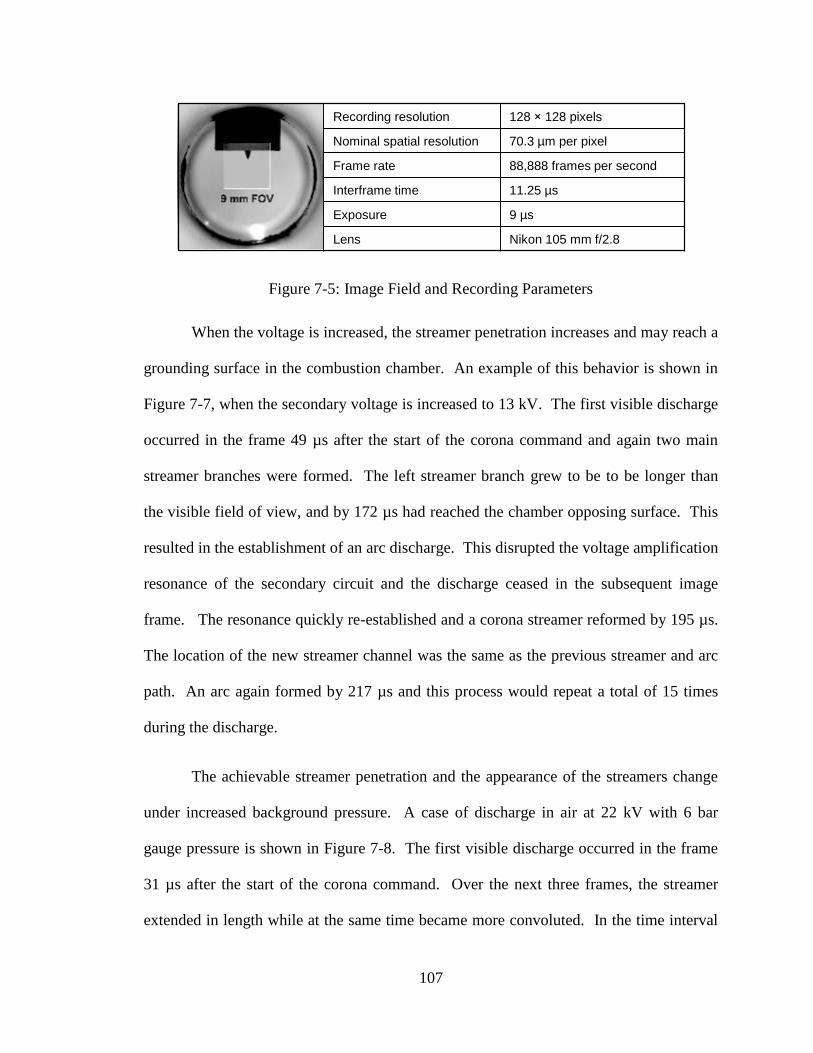
107
Figure 7-5: Image Field and Recording Parameters
When the voltage is increased, the streamer penetration increases and may reach a
grounding surface in the combustion chamber. An example of this behavior is shown in
Figure 7-7, when the secondary voltage is increased to 13 kV. The first visible discharge
occurred in the frame 49 µs after the start of the corona command and again two main
streamer branches were formed. The left streamer branch grew to be to be longer than
the visible field of view, and by 172 µs had reached the chamber opposing surface. This
resulted in the establishment of an arc discharge. This disrupted the voltage amplification
resonance of the secondary circuit and the discharge ceased in the subsequent image
frame. The resonance quickly re-established and a corona streamer reformed by 195 µs.
The location of the new streamer channel was the same as the previous streamer and arc
path. An arc again formed by 217 µs and this process would repeat a total of 15 times
during the discharge.
The achievable streamer penetration and the appearance of the streamers change
under increased background pressure. A case of discharge in air at 22 kV with 6 bar
gauge pressure is shown in Figure 7-8. The first visible discharge occurred in the frame
31 µs after the start of the corona command. Over the next three frames, the streamer
extended in length while at the same time became more convoluted. In the time interval
Recording resolution 128 128 pixels
Nominal spatial resolution 70.3 µm per pixel
Frame rate 88,888 frames per second
Interframe time 11.25 µs
Exposure 9 µs
Lens Nikon 105 mm f/2.8
108
of 76 – 144 µs, the reach of the streamer began to reduce in length. The discharge
thereafter established a new streamer branch and repeated the growth and recession steps.
At the time instance of 223 µs, branched streamer profile was observed. Following the
cessation of the corona driver input after 1 ms, the streamer gradually reduced and
disappeared within 42 µs.
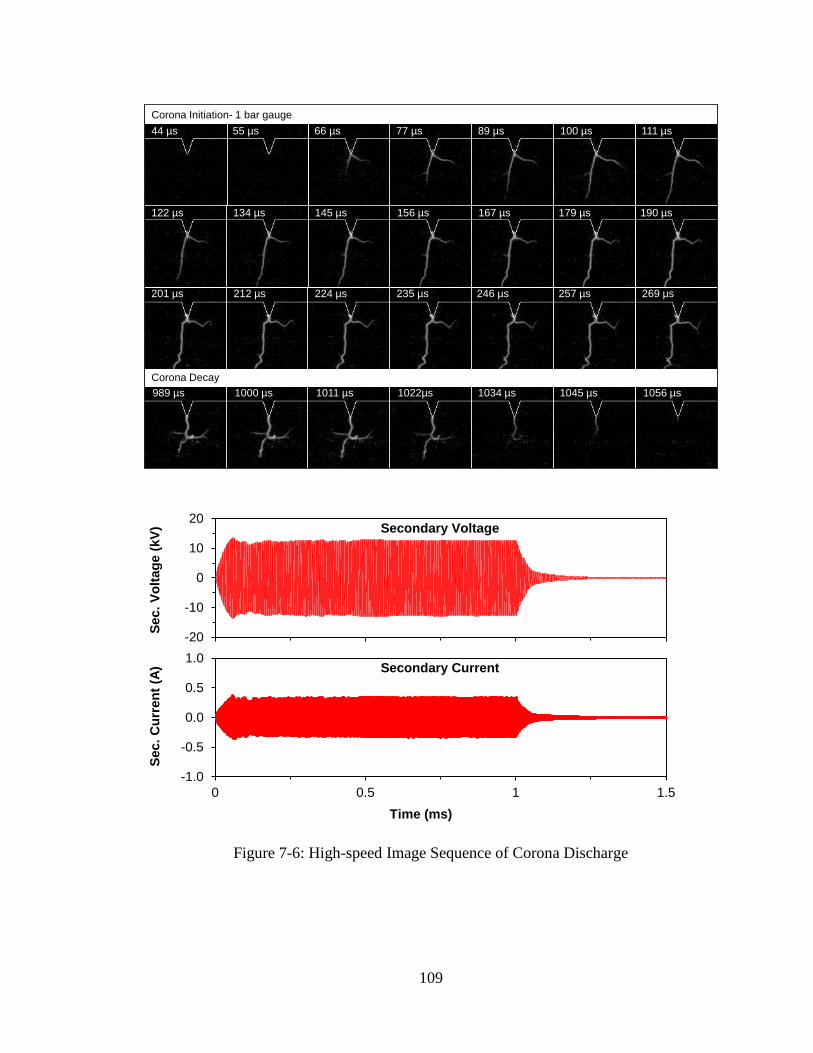
109
Figure 7-6: High-speed Image Sequence of Corona Discharge
44 µs 55 µs 66 µs 77 µs 89 µs 100 µs 111 µs
122 µs 134 µs 145 µs 156 µs 167 µs 179 µs 190 µs
201 µs 212 µs 224 µs 235 µs 246 µs 257 µs 269 µs
989 µs 1000 µs 1011 µs 1022µs 1034 µs 1045 µs 1056 µs
Corona Decay
Corona Initiation- 1 bar gauge
-20
-10
0
10
20
0 0.5 1 1.5
Se
c.
Vo
lta
ge
(k
V) Secondary Voltage
-1.0
-0.5
0.0
0.5
1.0
0 0.5 1 1.5
Se
c.
Cu
rre
nt
(A)
Time (ms)
Secondary Current
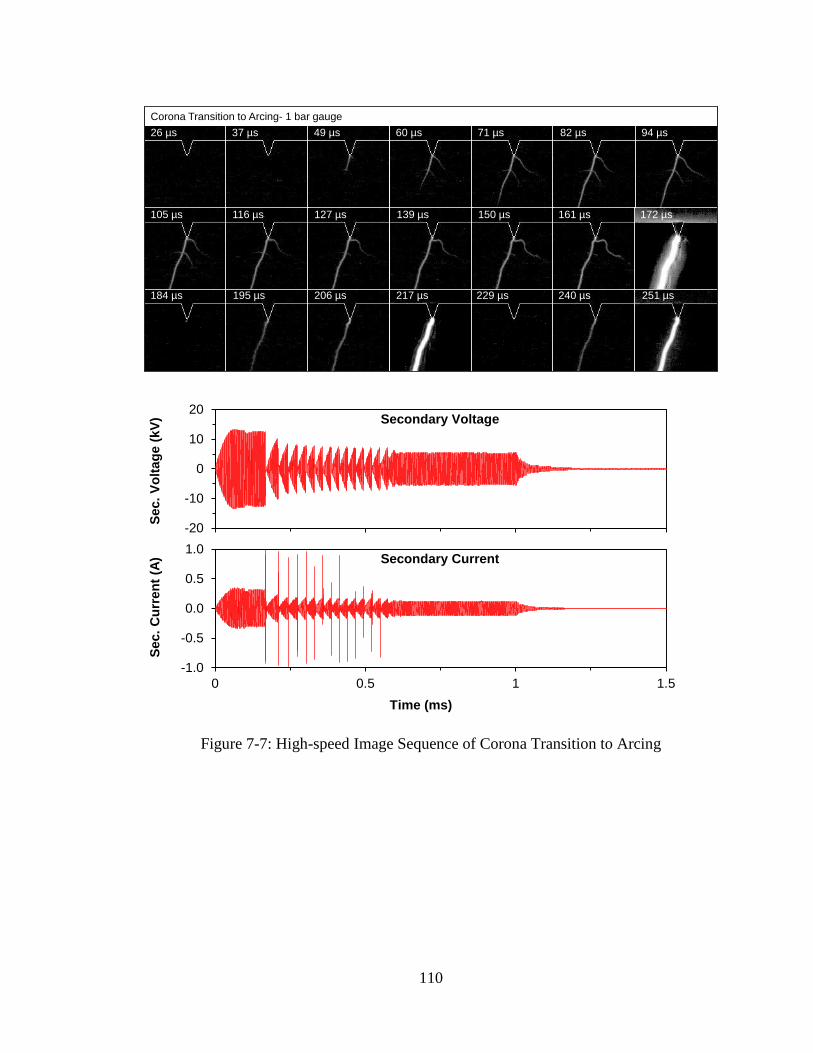
110
Figure 7-7: High-speed Image Sequence of Corona Transition to Arcing
26 µs 37 µs 49 µs 60 µs 71 µs 82 µs 94 µs
105 µs 116 µs 127 µs 139 µs 150 µs 161 µs 172 µs
184 µs 195 µs 206 µs 217 µs 229 µs 240 µs 251 µs
Corona Transition to Arcing- 1 bar gauge
-20
-10
0
10
20
0 0.5 1 1.5
Se
c.
Vo
lta
ge
(k
V) Secondary Voltage
-1.0
-0.5
0.0
0.5
1.0
0 0.5 1 1.5
Se
c.
Cu
rre
nt
(A)
Time (ms)
Secondary Current
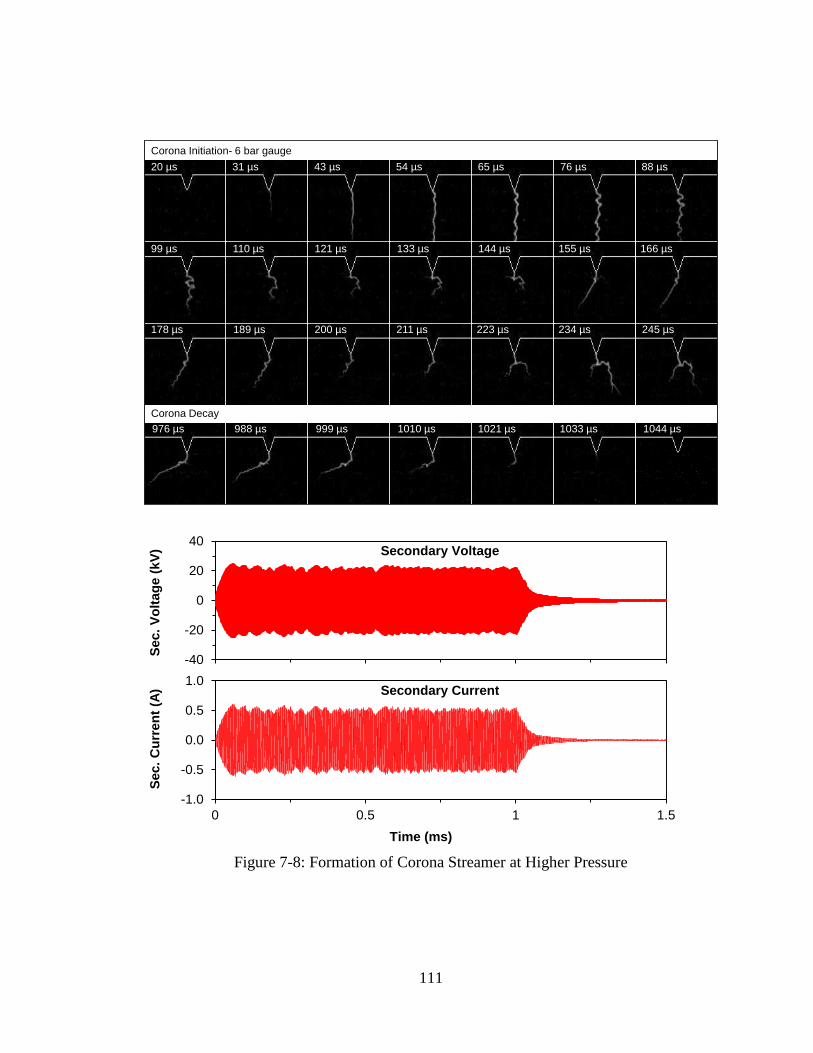
111
Figure 7-8: Formation of Corona Streamer at Higher Pressure
20 µs 31 µs 43 µs 54 µs 65 µs 76 µs 88 µs
99 µs 110 µs 121 µs 133 µs 144 µs 155 µs 166 µs
178 µs 189 µs 200 µs 211 µs 223 µs 234 µs 245 µs
976 µs 988 µs 999 µs 1010 µs 1021 µs 1033 µs 1044 µs
Corona Decay
Corona Initiation- 6 bar gauge
-40
-20
0
20
40
0 0.5 1 1.5
Se
c.
Vo
lta
ge
(k
V) Secondary Voltage
-1.0
-0.5
0.0
0.5
1.0
0 0.5 1 1.5
Se
c.
Cu
rre
nt
(A)
Time (ms)
Secondary Current
112
The visible streamer diameter was typically observed to be on an order of 0.1 –
0.2 mm. The transfer of thermal energy by the streamer to the gas media was observable
in shadowgraph imaging. The visible emissions of the streamers were typically not
strong enough to appear on the shadowgraph recording, so the captured image was
exclusively of the density graduation caused by the heating of the gas media. The size of
the thermally influenced zone was significantly larger in diameter than the visible
emissions. Under continuous corona discharge, the shadowgraph image had the
appearance of a fluid stream emanating from the electrode tip. An example of this effect
in pure air is shown in the top strip in Figure 7-9. The phenomenon of corona discharge
generated gas flow is called the corona wind [47]. This is cause by the net motion of a
flow of ions under the electrical field. This can positively influence the initial flame
kernel development by generating a flow field, increasing the turbulence and mixing.
The effect can be dramatic under quiescent conditions at longer discharge durations. The
presence of the induced flow is shown positively in the bottom strip of Figure 7-9 in its
interaction against a laminar flame front. A spark-ignited flame front was initiated
opposite of the corona igniter, in a stoichiometric charge of methane-air. A corona
discharge of 10 ms duration was used to induce the corona wind. The corona discharge
voltage was selected to be below the threshold for ignition. The flow disturbance on the
laminar flame front was readily visible in the recorded images. Here the corona wind
flow direction acted against the laminar flame propagation. In the case of ignition
initiated by the corona, the corona wind effect would have the effect of expanding the
flame reaction zone.
113
Figure 7-9: Corona Wind Effect in Air and Combusting Mixture
7.2 Control of Discharge in Air
7.2.1 Discharge Voltage Control
The strength of the streamer discharge is strongly influenced by the background
pressure. At a constant voltage, the streamer penetration is shorter under higher pressures.
Under higher pressures, electrons and ions lose energy to more frequent collisions and
have a reduced likelihood of attaining sufficient kinetic energy for further ionization [44].
This can be partially overcome by increasing the electrical field strength through higher
voltage under a fixed oscillation frequency. This can maintain the penetration of the
discharge, as shown in Figure 7-11, where the images of the discharge in air at ambient
pressure, 1 bar gauge, and 6 barge gauge pressures are compared. The image recording
parameters are shown in Figure 7-10. The corona discharge durations were 1 ms in all
cases. The primary voltage ranged from 25 V to 63 V. In cases where the streamer
10 kV Continuous Discharge in Air
0.1 ms 2 ms 4 ms 6 ms 8 ms 10 ms
8 kV Continuous Discharge in Stoichiometric Methane-Air Against Spark Ignited Flame Front
0.1 ms 2 ms 4 ms 6 ms 8 ms 10 ms
114
growth rate was high enough that the ground electrode was reached, an arc was formed.
A case of arcing discharge is shown for each pressure in Figure 7-12.
Figure 7-10: Image Field and Recording Parameters
Recording resolution 5472 3648 pixels
Nominal spatial resolution 22.7 µm per pixel
Frame rate Single frame
Exposure 167 µs
Lens Nikon 105 mm f/2.8
18 mm FOV
115
Figure 7-11: Pressure and Voltage Effect on Corona Discharge
Primary
Voltage
25 V
32 V
35 V
42 V
49 V
56 V
63 V
Gauge Pressure
0 bar 1 bar 6 bar
116
Figure 7-12: Examples of Arcing Conditions
7.2.2 Discharge Duration Control
In addition to the increase of voltage to achieve greater corona discharge effect,
an increase of duration is also a viable way to overcome the effects of pressure and to
increase the discharge energy.
Figure 7-13 illustrates the corona discharge at 1 bar and at 6 bar gauge pressure
for discharge durations ranging from 0.1 ms to 4 ms. At a discharge duration of 0.1 ms,
the discharge was established briefly and only faintly visible. At a discharge duration of
0.25 ms, the full extent of the discharge penetration distance at the pressure and voltage
condition was reached. Increasing the duration further resulted in a greater number of
sequential streamers and spatial coverage, but not the penetration. The cases at 2 ms and
4 ms discharge duration, at a background of 1 bar pressure, also exhibited some discharge
along the bottom surface of the ceramic. This discharge was suppressed at the higher
pressure condition.
Gauge Pressure and Primary Voltage
0 bar 1 bar 6 bar
35 V 42 V 63 V
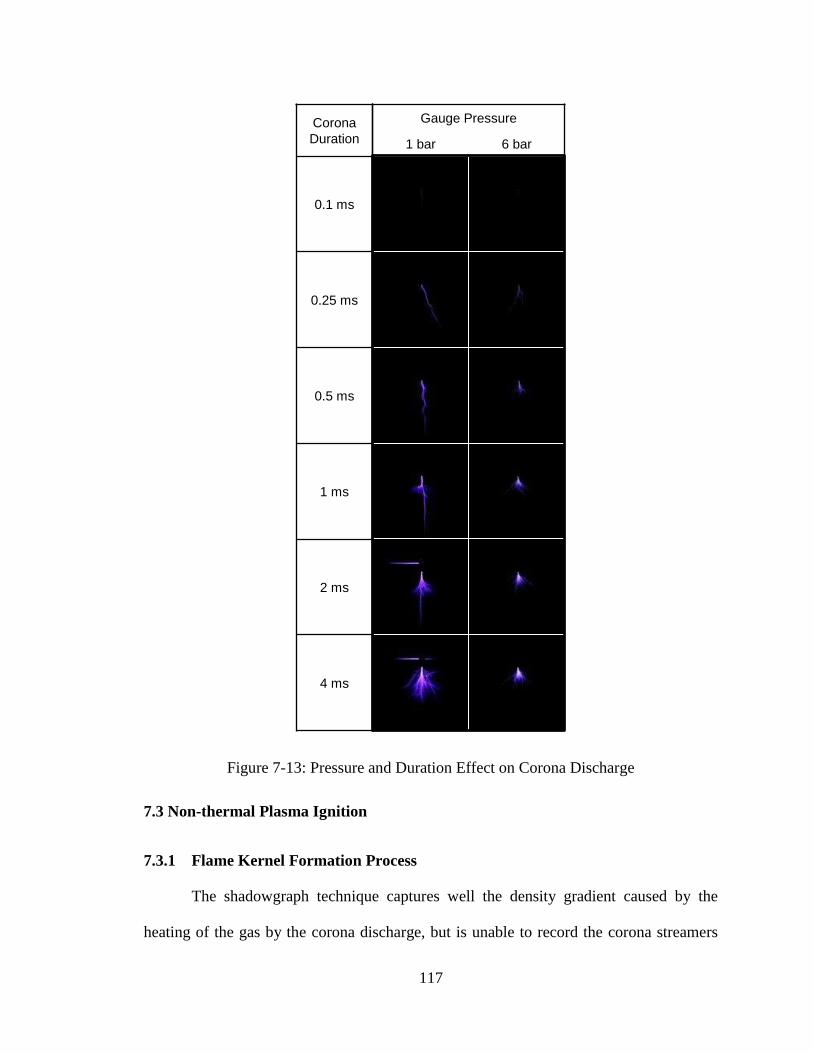
117
Figure 7-13: Pressure and Duration Effect on Corona Discharge
7.3 Non-thermal Plasma Ignition
7.3.1 Flame Kernel Formation Process
The shadowgraph technique captures well the density gradient caused by the
heating of the gas by the corona discharge, but is unable to record the corona streamers
Corona
Duration
0.1 ms
0.25 ms
0.5 ms
1 ms
2 ms
4 ms
Gauge Pressure
1 bar 6 bar
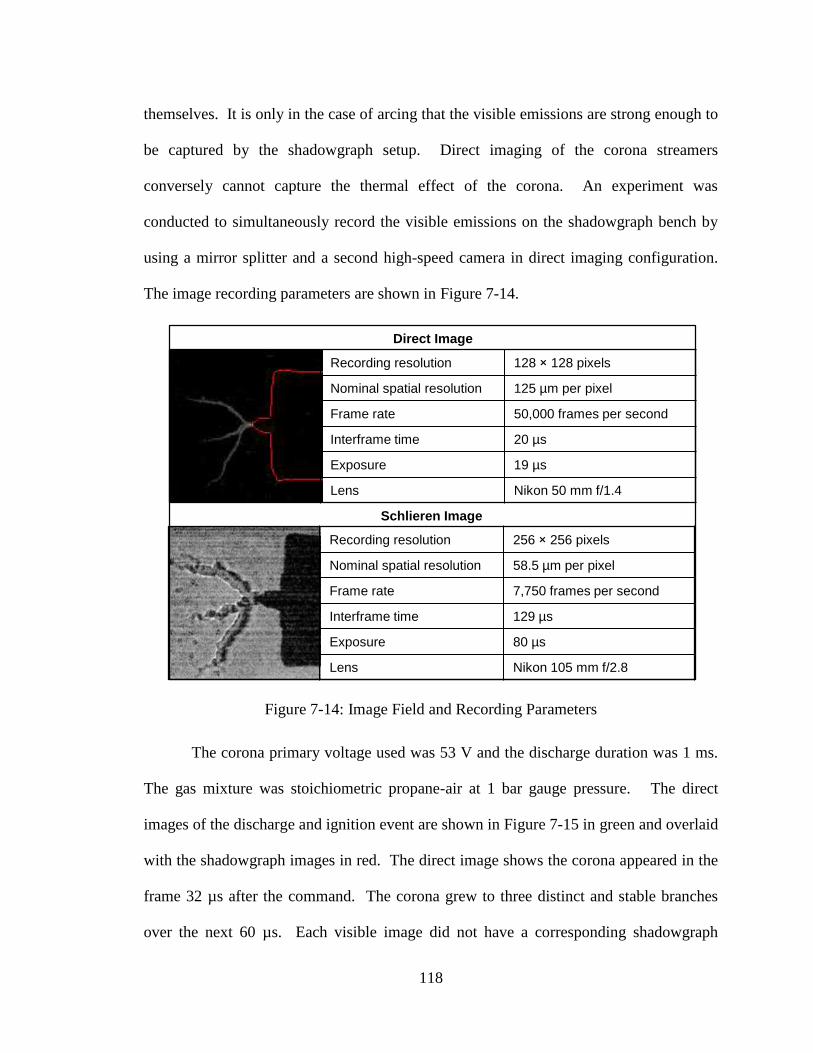
118
themselves. It is only in the case of arcing that the visible emissions are strong enough to
be captured by the shadowgraph setup. Direct imaging of the corona streamers
conversely cannot capture the thermal effect of the corona. An experiment was
conducted to simultaneously record the visible emissions on the shadowgraph bench by
using a mirror splitter and a second high-speed camera in direct imaging configuration.
The image recording parameters are shown in Figure 7-14.
Figure 7-14: Image Field and Recording Parameters
The corona primary voltage used was 53 V and the discharge duration was 1 ms.
The gas mixture was stoichiometric propane-air at 1 bar gauge pressure. The direct
images of the discharge and ignition event are shown in Figure 7-15 in green and overlaid
with the shadowgraph images in red. The direct image shows the corona appeared in the
frame 32 µs after the command. The corona grew to three distinct and stable branches
over the next 60 µs. Each visible image did not have a corresponding shadowgraph
Recording resolution 128 128 pixels
Nominal spatial resolution 125 µm per pixel
Frame rate 50,000 frames per second
Interframe time 20 µs
Exposure 19 µs
Lens Nikon 50 mm f/1.4
Recording resolution 256 256 pixels
Nominal spatial resolution 58.5 µm per pixel
Frame rate 7,750 frames per second
Interframe time 129 µs
Exposure 80 µs
Lens Nikon 105 mm f/2.8
Schlieren Image
Direct Image
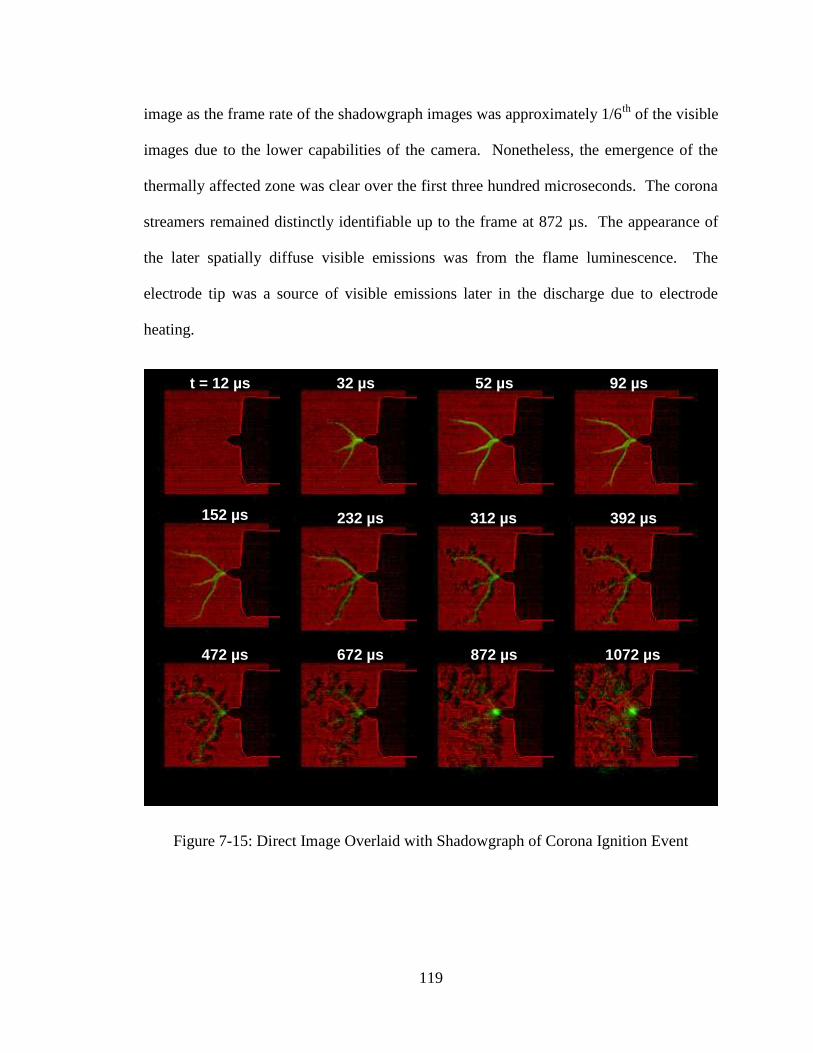
119
image as the frame rate of the shadowgraph images was approximately 1/6th
of the visible
images due to the lower capabilities of the camera. Nonetheless, the emergence of the
thermally affected zone was clear over the first three hundred microseconds. The corona
streamers remained distinctly identifiable up to the frame at 872 µs. The appearance of
the later spatially diffuse visible emissions was from the flame luminescence. The
electrode tip was a source of visible emissions later in the discharge due to electrode
heating.
Figure 7-15: Direct Image Overlaid with Shadowgraph of Corona Ignition Event
File:
Location: F:\Research
Presentations\2014 03
21.pptx
t = 12 µs 32 µs
152 µs 232 µs 312 µs 392 µs
472 µs 672 µs 872 µs 1072 µs
92 µs52 µs
120
7.3.2 Effect of Discharge Voltage
The effect of the corona control parameters of primary voltage and discharge
duration on the ignition event were examined in a series of tests. The corona voltage has
an impact on the corona penetration, electrical power, and to a certain extent the degree
of streamer branching. The discharge and subsequent flame propagation from a short 80
µs corona pulse at primary voltages ranging from 35 V to 53 V are shown in Figure 7-16.
A case of conventional spark ignition is shown for comparison. At the lowest primary
voltage, three corona streamer branches were formed in the image sequence recorded.
However, only one site of ignition occurred, in the main trunk of two streamer branches
near the electrode tip. The sustainable flame kernel was formed near the electrode tip
because of the higher plasma intensity near the tip. The initial density gradients created
in the other branches dissipated after approximately 1 ms as ignition failed. The
successfully formed kernel expanded in a smooth, spherical fashion.
When the primary voltage was increased to 45 V and 49 V, ignition was observed
to originate from two distinct streamer branches. Furthermore, the flame kernels were
elongated in cylindrical fashion along the streamer path. The combined flame expansion
from the multiple sites occurred at a significantly faster rate from the increased flame
surface area. When the primary voltage was increased to 53 V, the discharge reached the
surface of the combustion vessel and an arc discharge occurred. The result was a fully
cylindrical flame kernel.
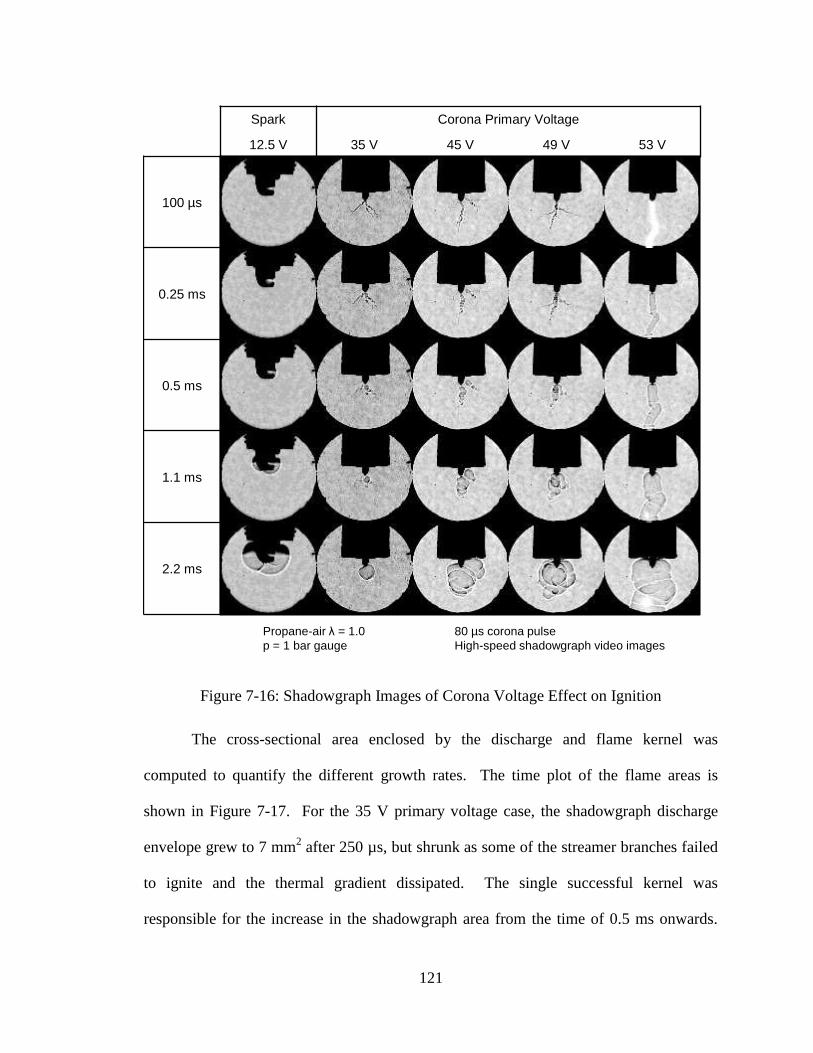
121
Figure 7-16: Shadowgraph Images of Corona Voltage Effect on Ignition
The cross-sectional area enclosed by the discharge and flame kernel was
computed to quantify the different growth rates. The time plot of the flame areas is
shown in Figure 7-17. For the 35 V primary voltage case, the shadowgraph discharge
envelope grew to 7 mm2 after 250 µs, but shrunk as some of the streamer branches failed
to ignite and the thermal gradient dissipated. The single successful kernel was
responsible for the increase in the shadowgraph area from the time of 0.5 ms onwards.
100 µs
0.25 ms
0.5 ms
1.1 ms
2.2 ms
Spark Corona Primary Voltage
12.5 V 35 V 45 V 49 V 53 V
Propane-air λ = 1.0 80 µs corona pulse
p = 1 bar gauge High-speed shadowgraph video images
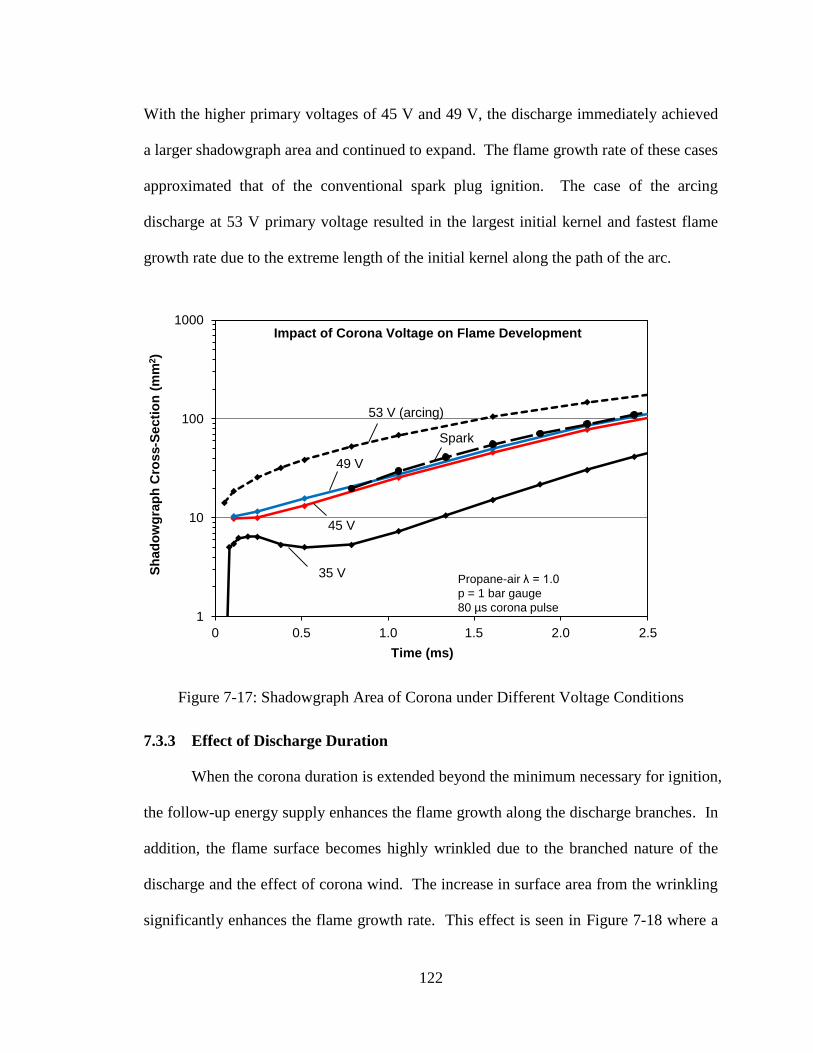
122
With the higher primary voltages of 45 V and 49 V, the discharge immediately achieved
a larger shadowgraph area and continued to expand. The flame growth rate of these cases
approximated that of the conventional spark plug ignition. The case of the arcing
discharge at 53 V primary voltage resulted in the largest initial kernel and fastest flame
growth rate due to the extreme length of the initial kernel along the path of the arc.
Figure 7-17: Shadowgraph Area of Corona under Different Voltage Conditions
7.3.3 Effect of Discharge Duration
When the corona duration is extended beyond the minimum necessary for ignition,
the follow-up energy supply enhances the flame growth along the discharge branches. In
addition, the flame surface becomes highly wrinkled due to the branched nature of the
discharge and the effect of corona wind. The increase in surface area from the wrinkling
significantly enhances the flame growth rate. This effect is seen in Figure 7-18 where a
1
10
100
1000
0 500 1000 1500 2000 2500
Sh
ad
ow
gra
ph
Cro
ss-S
ec
tio
n (
mm
2)
Time (ms)
Impact of Corona Voltage on Flame Development
0
35 VPropane-air λ = 1.0
p = 1 bar gauge
80 µs corona pulse
45 V
49 V
53 V (arcing)
0.5 1.0 1.5 2.0 2.5
Spark
123
range of discharge durations are compared, from the minimum necessary 80 µs for
ignition at this condition to 1 ms duration. When the discharge duration was increased to
100 µs, the initial flame kernel was bigger in size, but still largely smooth and spherical,
propagating from one initial site. At durations of 150 µs and 250 µs, the flame kernel
formed consisted of the entire streamer length. The flame surface showed more wrinkles
and was somewhat cellular in nature. At 1 ms duration, the continued corona discharged
caused the flame to be highly convoluted, with the flame wrinkling at small scales.
The computed cross-sectional areas enclosed by the discharge and flame kernel
are shown in Figure 7-19. In the previous set of tests at 80 µs duration, increasing the
primary voltage increased the flame growth rate of the corona igniter, but only the arcing
case exceed the flame growth rate of the conventional spark. When the duration was
increased, it was seen that the performance of the corona igniter exceeded that of the
spark discharge at discharge durations as short as 150 µs. When the duration was
increased to 250 µs, the flame growth rate achieved was comparable to that of the arc.
Further increase of the discharge duration up to 1 ms increased the flame growth rate
even more. However, discharge durations beyond 1 ms produced no significant increases
in flame growth rate, as the flame growth exceeded the spatial reach of the corona
discharge.
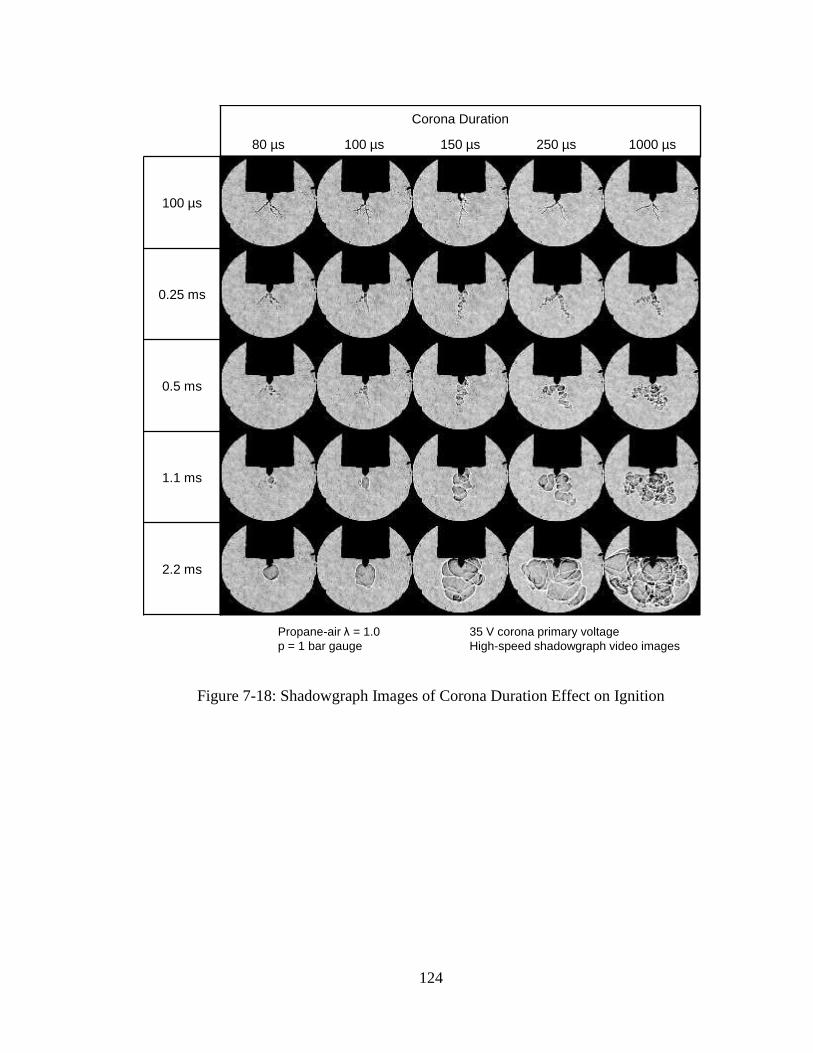
124
Figure 7-18: Shadowgraph Images of Corona Duration Effect on Ignition
100 µs
0.25 ms
0.5 ms
1.1 ms
2.2 ms
Corona Duration
80 µs 100 µs 150 µs 250 µs 1000 µs
Propane-air λ = 1.0 35 V corona primary voltage
p = 1 bar gauge High-speed shadowgraph video images
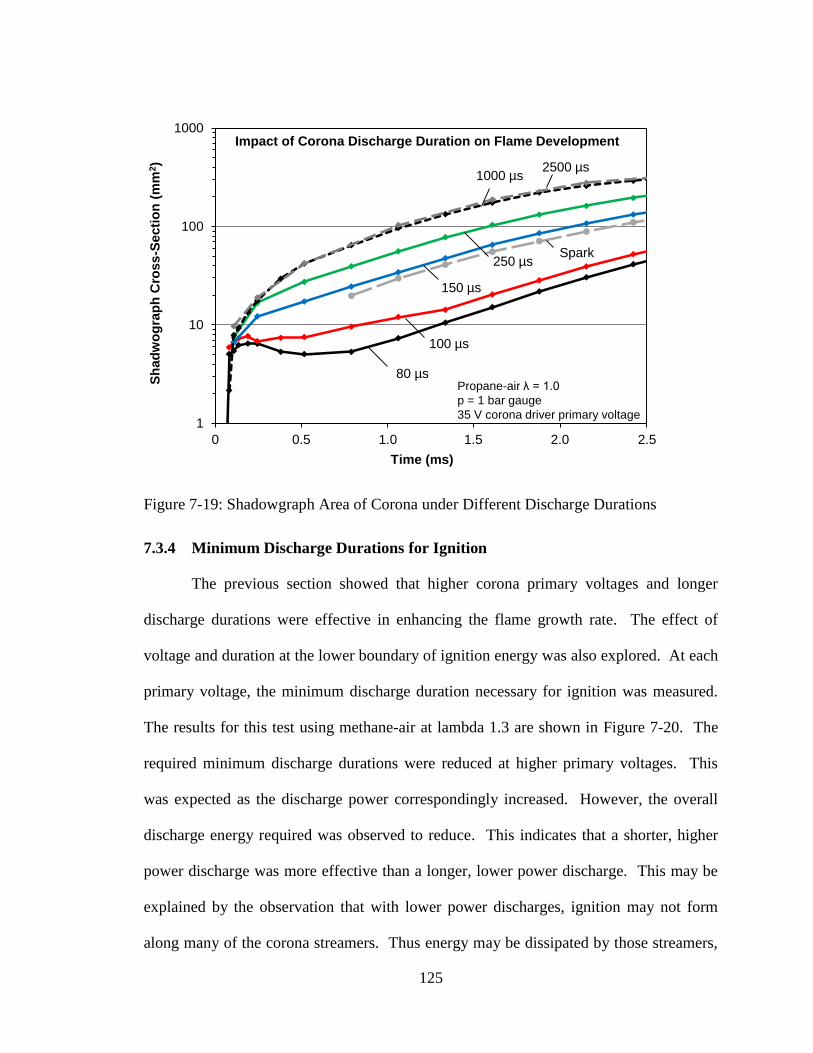
125
Figure 7-19: Shadowgraph Area of Corona under Different Discharge Durations
7.3.4 Minimum Discharge Durations for Ignition
The previous section showed that higher corona primary voltages and longer
discharge durations were effective in enhancing the flame growth rate. The effect of
voltage and duration at the lower boundary of ignition energy was also explored. At each
primary voltage, the minimum discharge duration necessary for ignition was measured.
The results for this test using methane-air at lambda 1.3 are shown in Figure 7-20. The
required minimum discharge durations were reduced at higher primary voltages. This
was expected as the discharge power correspondingly increased. However, the overall
discharge energy required was observed to reduce. This indicates that a shorter, higher
power discharge was more effective than a longer, lower power discharge. This may be
explained by the observation that with lower power discharges, ignition may not form
along many of the corona streamers. Thus energy may be dissipated by those streamers,
1
10
100
1000
0 500 1000 1500 2000 2500
Sh
ad
wo
gra
ph
Cro
ss
-Se
cti
on
(m
m2)
Time (ms)
Impact of Corona Discharge Duration on Flame Development
0
80 µsPropane-air λ = 1.0
p = 1 bar gauge
35 V corona driver primary voltage
100 µs
150 µs
2500 µs
250 µs
0.5 1.0 1.5 2.0 2.5
Spark
1000 µs
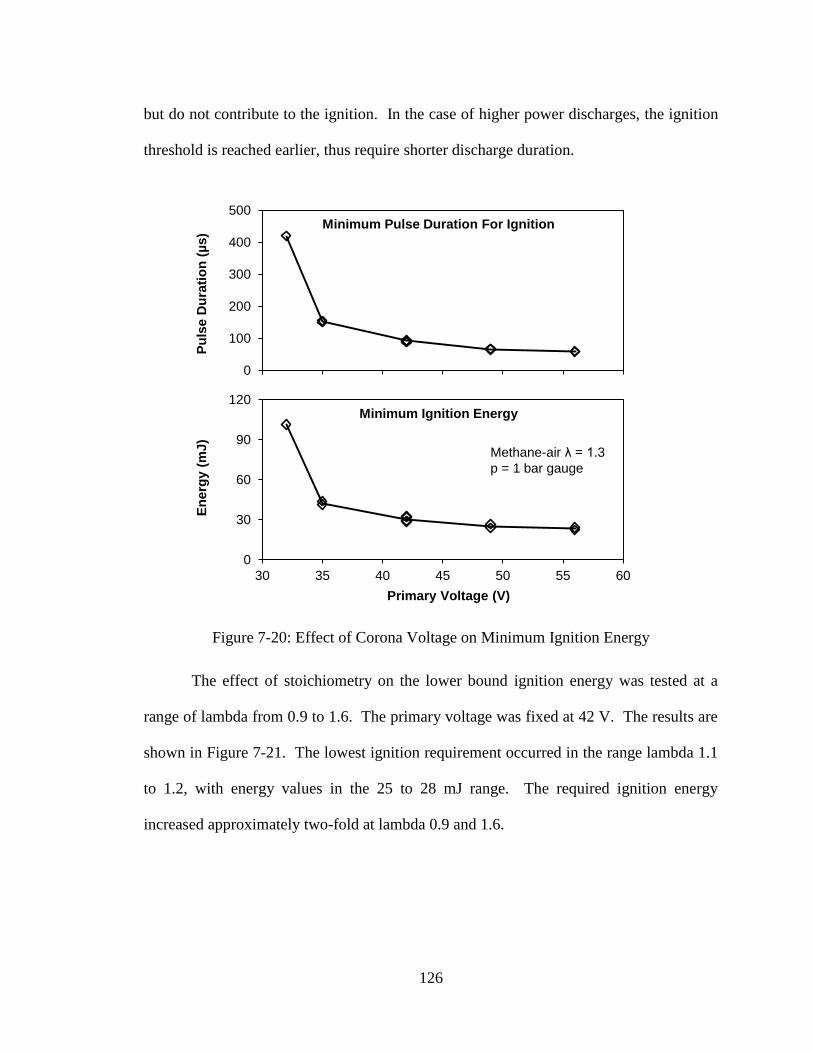
126
but do not contribute to the ignition. In the case of higher power discharges, the ignition
threshold is reached earlier, thus require shorter discharge duration.
Figure 7-20: Effect of Corona Voltage on Minimum Ignition Energy
The effect of stoichiometry on the lower bound ignition energy was tested at a
range of lambda from 0.9 to 1.6. The primary voltage was fixed at 42 V. The results are
shown in Figure 7-21. The lowest ignition requirement occurred in the range lambda 1.1
to 1.2, with energy values in the 25 to 28 mJ range. The required ignition energy
increased approximately two-fold at lambda 0.9 and 1.6.
0
30
60
90
120
30 35 40 45 50 55 60
En
erg
y (
mJ
)
Primary Voltage (V)
Minimum Ignition Energy
Methane-air λ = 1.3
p = 1 bar gauge
0
100
200
300
400
500
30 35 40 45 50 55 60
Pu
lse D
ura
tio
n (
µs
)
Minimum Pulse Duration For Ignition
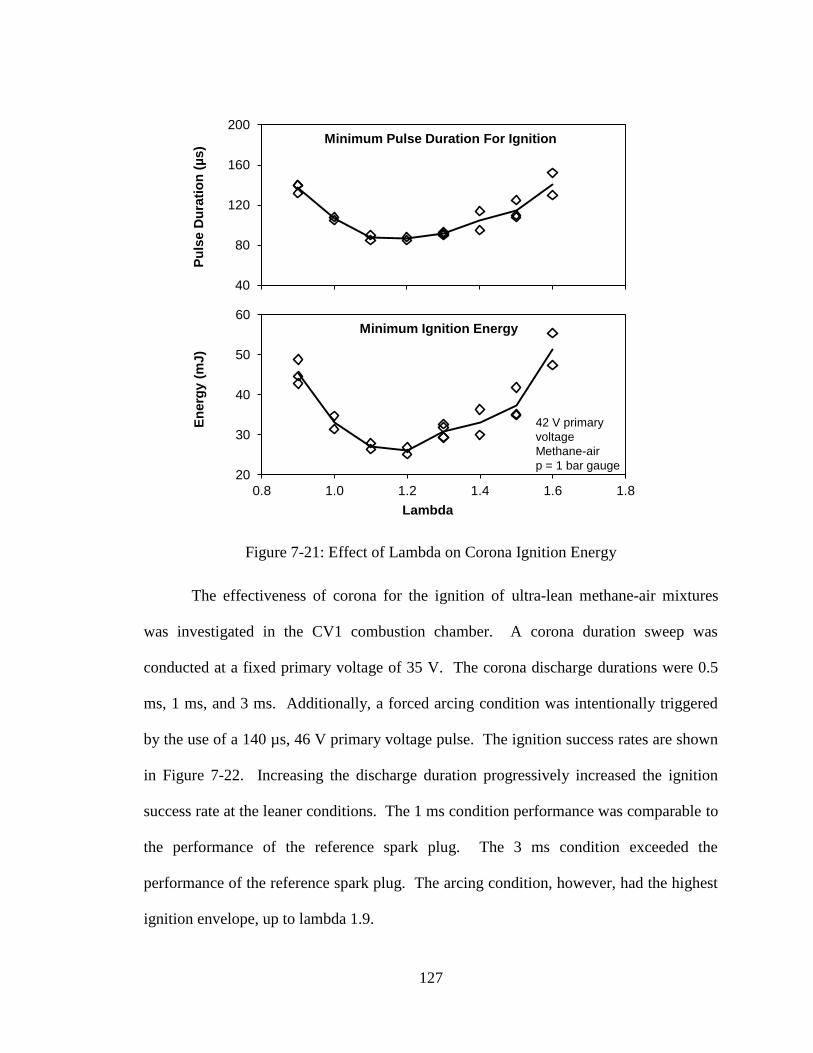
127
Figure 7-21: Effect of Lambda on Corona Ignition Energy
The effectiveness of corona for the ignition of ultra-lean methane-air mixtures
was investigated in the CV1 combustion chamber. A corona duration sweep was
conducted at a fixed primary voltage of 35 V. The corona discharge durations were 0.5
ms, 1 ms, and 3 ms. Additionally, a forced arcing condition was intentionally triggered
by the use of a 140 µs, 46 V primary voltage pulse. The ignition success rates are shown
in Figure 7-22. Increasing the discharge duration progressively increased the ignition
success rate at the leaner conditions. The 1 ms condition performance was comparable to
the performance of the reference spark plug. The 3 ms condition exceeded the
performance of the reference spark plug. The arcing condition, however, had the highest
ignition envelope, up to lambda 1.9.
20
30
40
50
60
0.8 1.0 1.2 1.4 1.6 1.8
En
erg
y (
mJ
)
Lambda
Minimum Ignition Energy
42 V primary
voltage
Methane-air
p = 1 bar gauge
40
80
120
160
200
0.8 1.0 1.2 1.4 1.6 1.8
Pu
lse D
ura
tio
n (
µs
)
Minimum Pulse Duration For Ignition
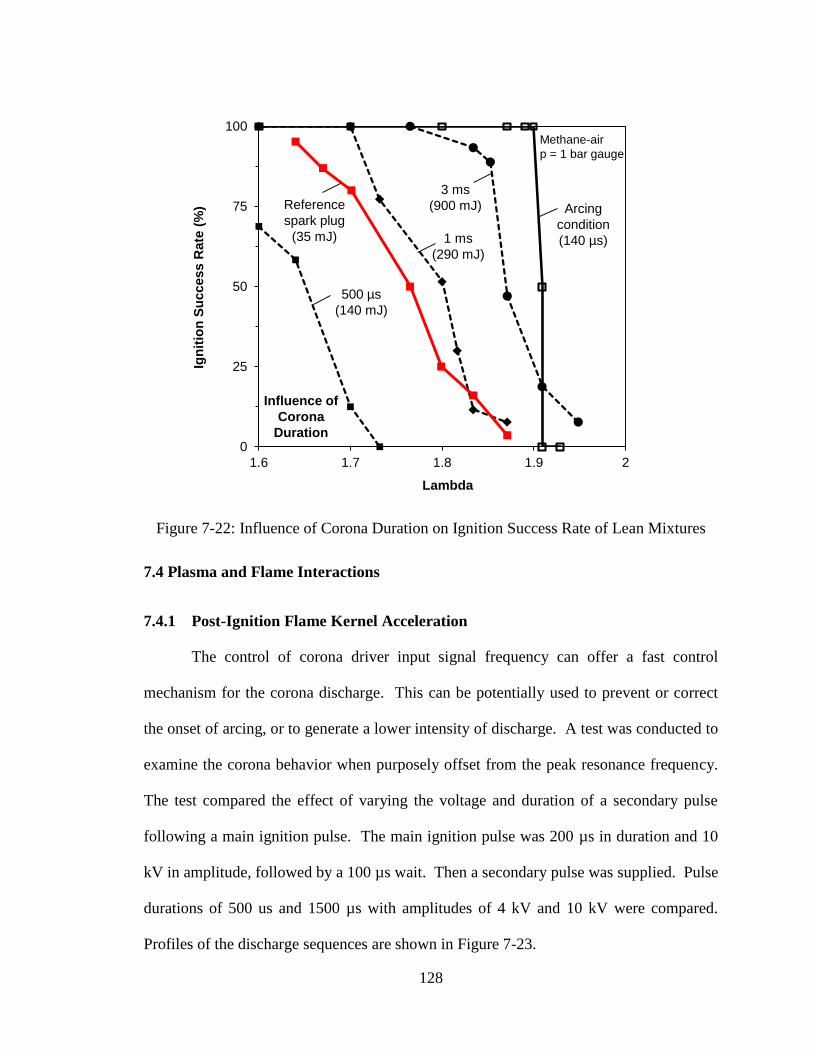
128
Figure 7-22: Influence of Corona Duration on Ignition Success Rate of Lean Mixtures
7.4 Plasma and Flame Interactions
7.4.1 Post-Ignition Flame Kernel Acceleration
The control of corona driver input signal frequency can offer a fast control
mechanism for the corona discharge. This can be potentially used to prevent or correct
the onset of arcing, or to generate a lower intensity of discharge. A test was conducted to
examine the corona behavior when purposely offset from the peak resonance frequency.
The test compared the effect of varying the voltage and duration of a secondary pulse
following a main ignition pulse. The main ignition pulse was 200 µs in duration and 10
kV in amplitude, followed by a 100 µs wait. Then a secondary pulse was supplied. Pulse
durations of 500 us and 1500 µs with amplitudes of 4 kV and 10 kV were compared.
Profiles of the discharge sequences are shown in Figure 7-23.
0
25
50
75
100
1.6 1.7 1.8 1.9 2
Ign
itio
n S
uccess
Rate
(%
)
Lambda
Influence of
Corona
Duration
500 µs
(140 mJ)
1 ms
(290 mJ)
3 ms
(900 mJ)
Methane-air
p = 1 bar gauge
Arcing
condition
(140 µs)
Reference
spark plug
(35 mJ)
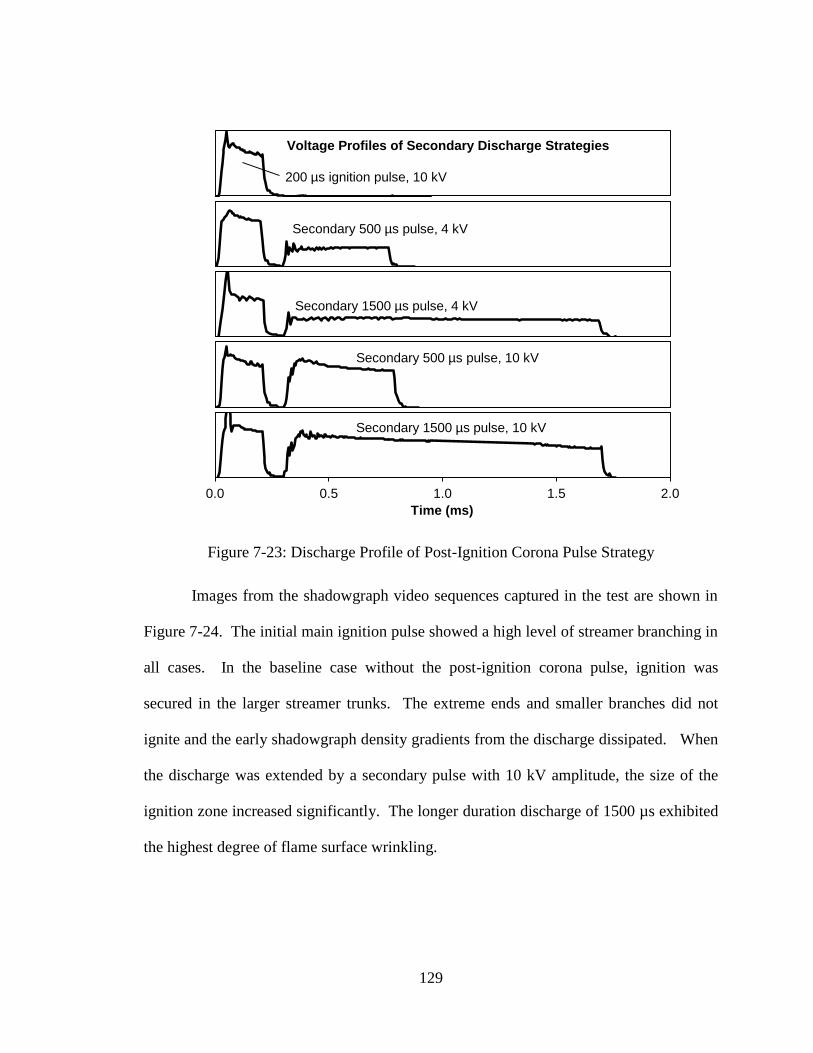
129
Figure 7-23: Discharge Profile of Post-Ignition Corona Pulse Strategy
Images from the shadowgraph video sequences captured in the test are shown in
Figure 7-24. The initial main ignition pulse showed a high level of streamer branching in
all cases. In the baseline case without the post-ignition corona pulse, ignition was
secured in the larger streamer trunks. The extreme ends and smaller branches did not
ignite and the early shadowgraph density gradients from the discharge dissipated. When
the discharge was extended by a secondary pulse with 10 kV amplitude, the size of the
ignition zone increased significantly. The longer duration discharge of 1500 µs exhibited
the highest degree of flame surface wrinkling.
200 µs ignition pulse, 10 kV
Voltage Profiles of Secondary Discharge Strategies
Secondary 500 µs pulse, 4 kV
Secondary 1500 µs pulse, 4 kV
Secondary 500 µs pulse, 10 kV
0.0 0.5 1.0 1.5 2.0
Time (ms)
Secondary 1500 µs pulse, 10 kV
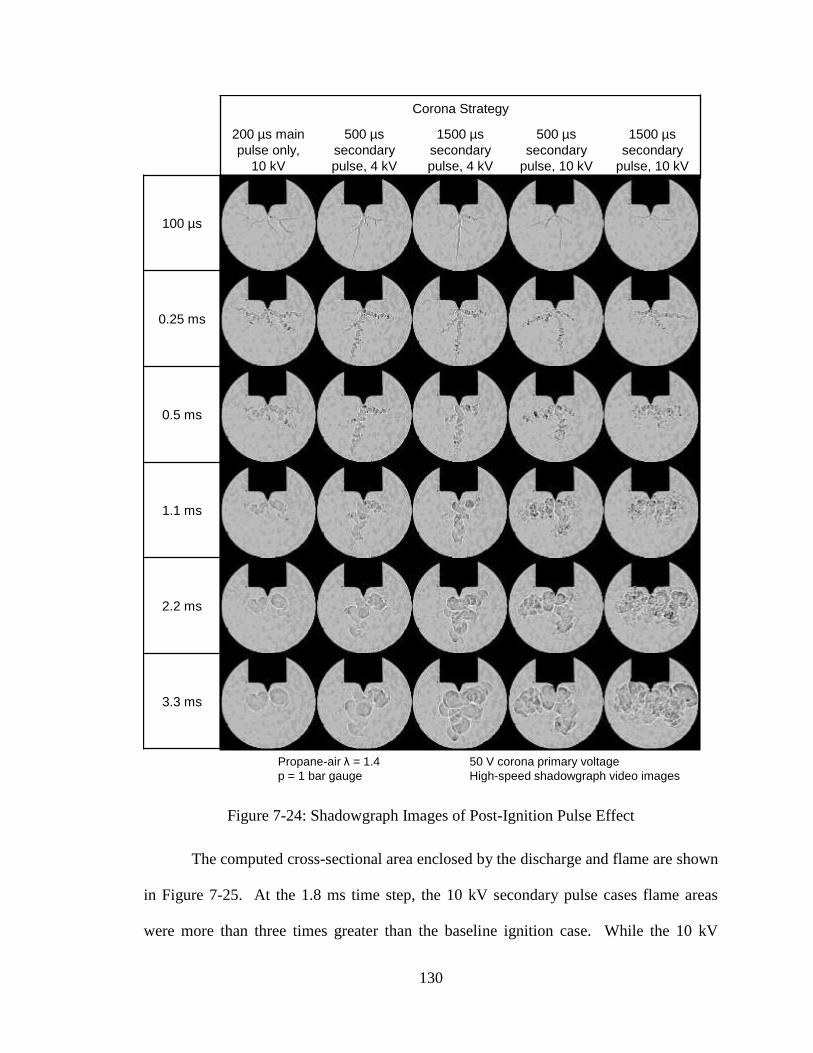
130
Figure 7-24: Shadowgraph Images of Post-Ignition Pulse Effect
The computed cross-sectional area enclosed by the discharge and flame are shown
in Figure 7-25. At the 1.8 ms time step, the 10 kV secondary pulse cases flame areas
were more than three times greater than the baseline ignition case. While the 10 kV
100 µs
0.25 ms
0.5 ms
1.1 ms
2.2 ms
3.3 ms
Corona Strategy
200 µs main
pulse only,
10 kV
500 µs
secondary
pulse, 4 kV
1500 µs
secondary
pulse, 4 kV
500 µs
secondary
pulse, 10 kV
1500 µs
secondary
pulse, 10 kV
Propane-air λ = 1.4 50 V corona primary voltage
p = 1 bar gauge High-speed shadowgraph video images
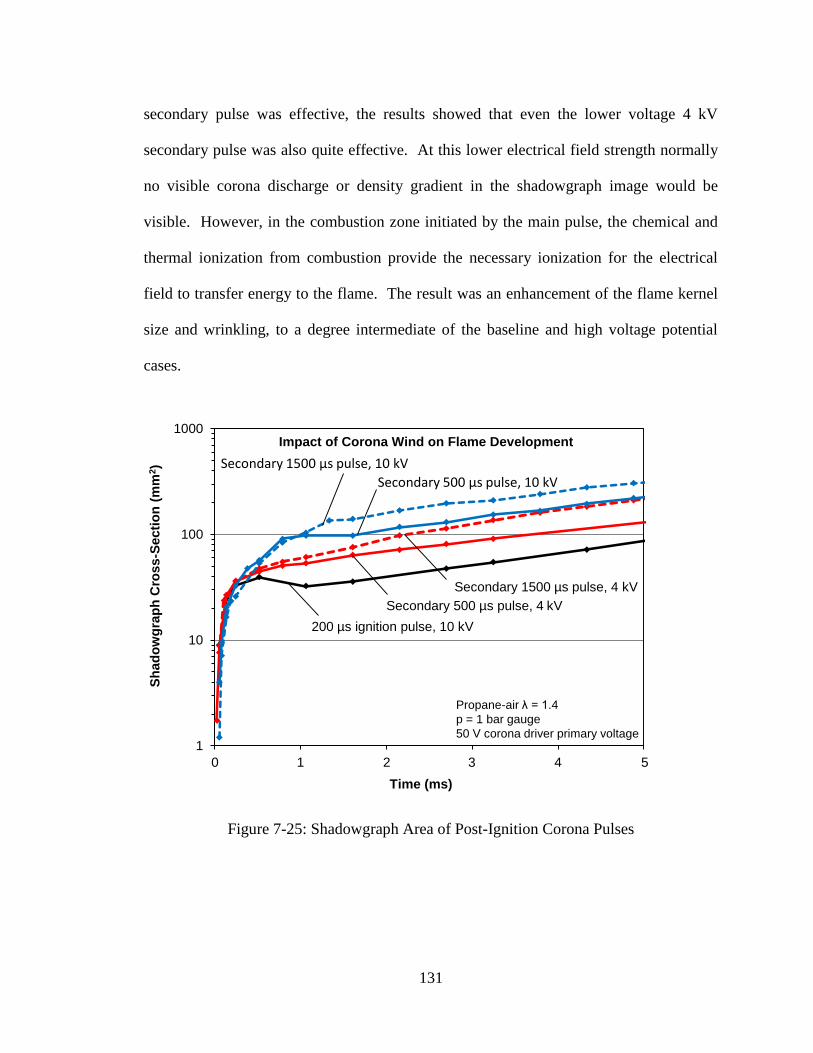
131
secondary pulse was effective, the results showed that even the lower voltage 4 kV
secondary pulse was also quite effective. At this lower electrical field strength normally
no visible corona discharge or density gradient in the shadowgraph image would be
visible. However, in the combustion zone initiated by the main pulse, the chemical and
thermal ionization from combustion provide the necessary ionization for the electrical
field to transfer energy to the flame. The result was an enhancement of the flame kernel
size and wrinkling, to a degree intermediate of the baseline and high voltage potential
cases.
Figure 7-25: Shadowgraph Area of Post-Ignition Corona Pulses
1
10
100
1000
0 1000 2000 3000 4000 5000
Sh
ad
ow
gra
ph
Cro
ss
-Secti
on
(m
m2)
Time (ms)
Impact of Corona Wind on Flame Development
0
200 µs ignition pulse, 10 kV
Propane-air λ = 1.4
p = 1 bar gauge
50 V corona driver primary voltage
Secondary 500 µs pulse, 4 kV
Secondary 1500 µs pulse, 10 kV
1 2 3 4 5
Secondary 1500 µs pulse, 4 kV
Secondary 500 µs pulse, 10 kV
132
8. CHAPTER VIII
CONCLUSIONS AND RECOMMENDATIONS
This chapter provides a summary of the main research results and the conclusions
from the work performed. Recommendations for future research are also provided.
8.1 Effect of Spark Ignition Energy and Energy Profile
The effects of energy level in conventional inductive spark ignition systems were
tested in quiescent combustion vessels. The energy level effects on the flame
development by creating a larger initial flame kernel. The ultimate flame growth rate,
however, is limited by the stoichiometry of the mixture. In the engine environment,
where turbulence and organized flow greatly increase the speed of flame propagation, the
effect of the energy level, at conventional quantities, was still measurable. The
combustion phasing control afforded by increased energy could in most cases be
achieved by the conventional timing control available. In ultra-lean or dilute conditions,
however, scheduling the spark discharge very early to compensate for the slow
combustion rate led to combustion instabilities and ultimately unreliable ignition.
Enhancement of the peak discharge power via capacitor discharge and early spark energy
with the high energy capacitor discharge had limited benefit. The multi-coil energy
enhancement was more effective, indicating that the delivery of energy over a sufficiently
long duration was as key aspect of effective ignition in engines.
8.2 Multiple-Site Spark Ignition
A prototype design of multi-pole spark plugs with three independent high voltage
electrodes was tested in engine operation. The engine was tested with EGR and lean
133
dilution to identify the potential of the multi-pole spark plug to extend the engine
operation limits beyond that of a conventional spark plug. The engine test results showed
that when a single pole of the multi-pole spark plug was discharged, its performance was
comparable to a conventional spark plug. When the three poles of multi-pole spark plug
were commanded to discharge simultaneously, the combustion phasing was notably
advanced. In addition, the performance boundaries exceeded those of the conventional
spark plug. This enhancement was not entirely caused by the overall increase of total
spark energy, as the effect was seen also at reduced spark energies. The result was the
ability to operate at higher EGR rates or higher excess air ratios. The cyclic variations of
the engine load and combustion phasing were also reduced. This resulted in an increase
in thermal efficiency and a decrease in indicated NOx emissions in the case of lean
dilution. Operation at high EGR rates did not achieve as high a gain in thermal efficiency
as excess air dilution, but did result in lower NOx emissions.
8.3 Non-thermal Plasma Ignition
A radio frequency non-thermal plasma ignition system developed in-house [54]
was tested and its ability to address some of the shortcomings of the conventional ignition
system investigated. The ignition volume created by the corona discharge was greater in
size and its growth was impeded less because of the absence of a close ground electrode.
The rapid energization and continuous discharge characteristic additionally offer a more
flexible control path of ignition energy release. In tests under quiescent conditions in
combustion chambers, the adjustments of the discharge voltage and duration afforded a
high degree of control over the flame kernel initiation and growth. A short duration
discharge can provide an ignition kernel that expands in a smooth, spherical fashion.
134
Longer discharges that continue to supply energy after the initial kernel formation greatly
accelerate the flame expansion and create wrinkled flames with larger surface area and
burn rates. The degree of streamer branching was found to be a function of the discharge
voltage. The formation of multiple ignition sites was most favorable under higher
discharge voltages.
8.4 Application to Ultra-lean or High Dilution Ignition
The multiple-site spark ignition method was most promising for operation at
ultra-lean or high dilution ratios. In the comparison of EGR dilution versus excess air
dilution, higher thermal efficiencies were possible with lean combustion, in part because
of the higher dilution ratios achievable prior to the onset of combustion instability. At
similar equivalent dilution ratios, the intake composition in the lean combustion case was
more favorable in achieving thermal efficiency gains. However, the increase in fresh air
flow and oxygen quantity resulted in little or no improvements to NOx emissions until
high dilution levels were reached. In contrast, the use of exhaust dilution gas, with the
presence of carbon dioxide in particular, was very effective in reducing the NOx
emissions.
8.5 Recommendations for Future Work
The present study compared a number of production and new ignition systems for
their performance in igniting well-mixed mixtures under high dilution conditions. Both
constant volume combustion vessel and engine tests were conducted. There is further
research work to be performed to identify the potential of ignition systems for future
advanced combustion engines. In particular, the ignition phenomenon for high

135
turbulence, stratified mixtures are of great importance for future high efficiency engine
developments. Future work needs to continue to address those challenging issues.
136
REFERENCES
1. Homes, Keith. “A Century of Environmental Technologies for Light-Duty
Vehicles,” SAE International Journal of Engines, 10(2), 2017. doi:10.4271/2017-
01-0119.
2. “Light-Duty Automotive Technology, Carbon Dioxide Emissions, and Fuel
Economy Trends: 1975 Through 2017,” The United States Environmental
Protection Agency, EPA-420-S-18-001, 2018.
3. “EPA and NHTSA Set Standards to Reduce Greenhouse Gases and Improve Fuel
Economy for Model Years 2017-2025 Cars and Light Trucks,” The United States
Environmental Protection Agency, EPA-420-F-12-051, 2012.
4. Lavoie, G., Ortiz-Soto, E., Babajimopoulos, A., Martz, J. B., and Assanis, D. N.
“Thermodynamic Sweet Spot for High-Efficiency, Dilute, Boosted Gasoline
Engines,” International Journal of Engine Research, 14(3), 260-278, 2012.
doi:10.1177/1468087412455372.
5. Heywood, John B. Internal Combustion Engine Fundamentals. McGraw-Hill
Books, 1988. ISBN 0-07-100499-8.
6. Asad, U., Zheng, M., Han, X., Reader, G.T., Wang, M. “Fuel Injection Strategies
to Improve Emissions and Efficiency of High Compression Ratio Diesel Engines,”
SAE International Journal of Engines, Vol 1, 1220-1233, 2008.
7. Dec, John. “Advanced Compression-Ignition Engines- Understanding the In-
cylinder Process,” Proceedings of the Combustion Institute, Vol 32, 2727-2742,
2009. doi:10.1016/j.proci.2008.08.008.
137
8. Wang, Z., Liu, H., Reitz, R. “Knocking Combustion in Spark-Ignition Engines,”
Progress in Energy and Combustion Science, Vol 61, 78-112, 2017.
doi:10.1016/j.pecs.2017.03.004.
9. Krieger, R.B., and Borman, G.L. “The Computation of Apparent Heat Release
for Internal Combustion Engines,” ASME, 66-WA/DGP-4, 1966.
10. Jeftic, Marko. Strategies for Enchanced After-Treatment Performance: Post
Injection Characterization and Long Breathing with Low NOx Combustion.
Doctoral thesis. University of Windsor, 2016.
11. Klein, Marcus. A Specific Heat Ratio Model and Compression Ratio Estimation.
Doctoral thesis. Linkoping University, 2004. ISBN 978-91-628-7578-7.
12. Yaws, Carl. Yaw’s Critical Property Data for Chemical Engineers and Chemical
Engineers and Chemists. Knovel, 2012.
13. Robert Bosch GmbH. Bosch Automotive Electrics and Automotive Electronics.
ISBN 978-3-658-01783-5. Springer Vieweg, 2007.
14. Stone, C. R., Steele, A. B. “Measurement and Modelling of Ignition System
Energy and Its Effect on Engine Performance,” Proceedings of the Institution of
Mechanical Engineers, Vol 203, 277-286, 1989.
15. Van Basshuysen, R., and Schafer, F. Internal Combustion Engine Handbook:
Basics, Components, Systems, and Perspectives. SAE, 2016. ISBN 978-0-7680-
8024-7.
16. Warnatz, Jurgen. Combustion. Berlin: Springer, 2006. ISBN 3-540-67751-8.
17. Law, Cheng K. Combustion Physics. Cambridge: Cambridge University Press,
2006. ISBN 978-0-521-87052-8.
138
18. Nakata, K., et al. "Engine Technologies for Achieving 45% Thermal Efficiency
of S.I. Engine," SAE International Journal of Engines, Vol 9, 2016.
doi:10.4271/2015-01-1896.
19. Lerner, Louise. “Combining Gas and Diesel Engines Could Yield Best of Both
Worlds,” Argonne National Laboratory, May 4, 2011.
20. Tracy, David. “Mazda’s Holy Grail of Gasoline Engines is Completely
Fascinating.” Jalopnik, September 7, 2017. https://jalopnik.com/mazda-s-holy-
grail-of-gasoline-engines-is-completely-1801820285.
21. Adcock, Ian. “The Petro Engine That Thinks It’s a Diesel: How Mazda’s
Compression-Ignition Skyactiv-X Engine Works,” Car Magazine, September 6,
2017. http://www.carmagazine.co.uk/car-news/tech/the-petrol-engine-that-thinks-
its-a-diesel-how-mazdas-compression-ignition-skyactiv-x-engine-works/.
22. Stoklosa, Alexander. “Driving Mazda’s Next Mazda 3 with Its Skyactiv-X
Compression-Ignition Gas Engine.” Car and Driver, September 14, 2017.
https://www.yahoo.com/news/driving-mazda-apos-next-mazda-171500129.html.
23. Kuo, Kenneth. Principles of Combustion. John Wiley & Sons, 2005. ISBN 0-
471-04689-2.
24. Lee, K., Bae, C., Kang, K. “The Effects of Tumble and Swirl Flows on Flame
Propagation in a Four-Valve S.I. Engine,” Applied Thermal Engineering, Vol 27,
2122-2130, 2007. doi:10.1016/j.applthermaleng.2006.011.
25. Schneider, A., Raindl, M., Dumser, F. “Analysis of the Flame Kernel Formation
in a SI Engine with Diluted Charge Using Optical Measurement Techniques,”
Ignition Systems for Gasoline Engines, 3rd International Conference. November
3-4, 2016, Berlin, Germany.
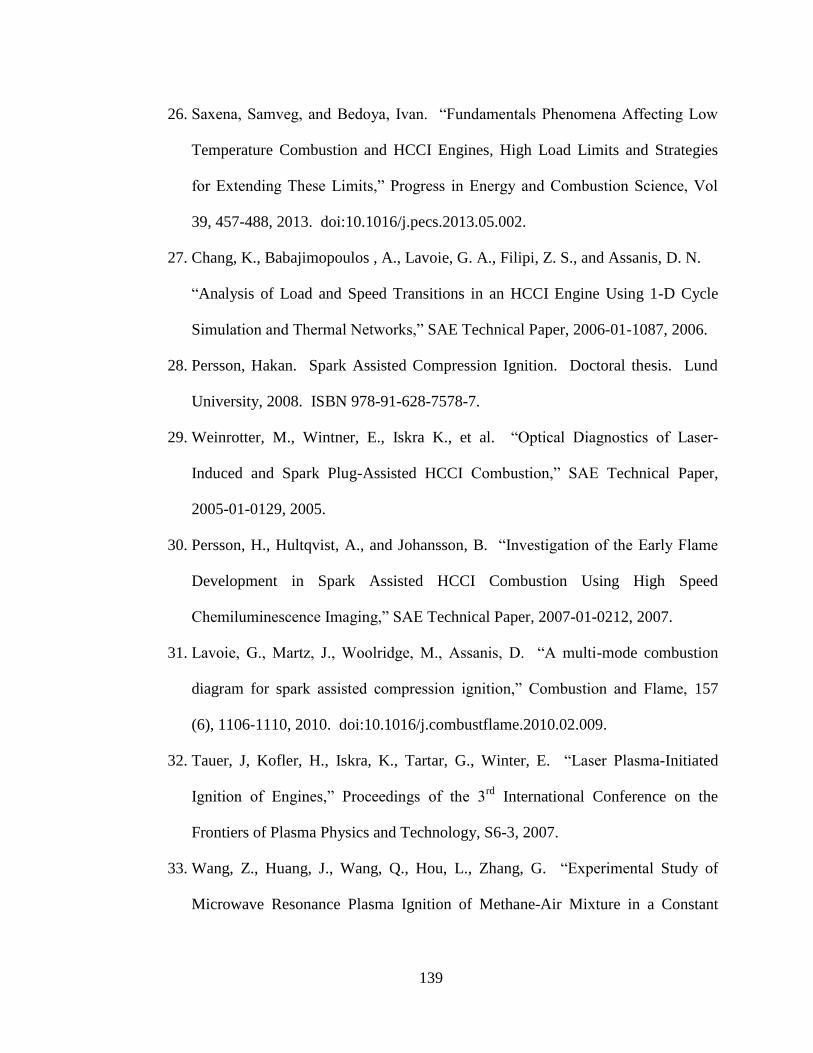
139
26. Saxena, Samveg, and Bedoya, Ivan. “Fundamentals Phenomena Affecting Low
Temperature Combustion and HCCI Engines, High Load Limits and Strategies
for Extending These Limits,” Progress in Energy and Combustion Science, Vol
39, 457-488, 2013. doi:10.1016/j.pecs.2013.05.002.
27. Chang, K., Babajimopoulos , A., Lavoie, G. A., Filipi, Z. S., and Assanis, D. N.
“Analysis of Load and Speed Transitions in an HCCI Engine Using 1-D Cycle
Simulation and Thermal Networks,” SAE Technical Paper, 2006-01-1087, 2006.
28. Persson, Hakan. Spark Assisted Compression Ignition. Doctoral thesis. Lund
University, 2008. ISBN 978-91-628-7578-7.
29. Weinrotter, M., Wintner, E., Iskra K., et al. “Optical Diagnostics of Laser-
Induced and Spark Plug-Assisted HCCI Combustion,” SAE Technical Paper,
2005-01-0129, 2005.
30. Persson, H., Hultqvist, A., and Johansson, B. “Investigation of the Early Flame
Development in Spark Assisted HCCI Combustion Using High Speed
Chemiluminescence Imaging,” SAE Technical Paper, 2007-01-0212, 2007.
31. Lavoie, G., Martz, J., Woolridge, M., Assanis, D. “A multi-mode combustion
diagram for spark assisted compression ignition,” Combustion and Flame, 157
(6), 1106-1110, 2010. doi:10.1016/j.combustflame.2010.02.009.
32. Tauer, J, Kofler, H., Iskra, K., Tartar, G., Winter, E. “Laser Plasma-Initiated
Ignition of Engines,” Proceedings of the 3rd
International Conference on the
Frontiers of Plasma Physics and Technology, S6-3, 2007.
33. Wang, Z., Huang, J., Wang, Q., Hou, L., Zhang, G. “Experimental Study of
Microwave Resonance Plasma Ignition of Methane-Air Mixture in a Constant
140
Volume Cylinder,” Combustion and Flame, 162(6), 2561-2568, 2015.
doi:10.1016/j.combustflame.2015.03.004.
34. Nishiyama, A., Moon, A., Ikeda, Y., Hayashi, J., and Akamatsu, F. “Ignition
Characteristics of Methane/Air Premixed Mixture by Microwave-Enhanced
Laser-Induced Breakdown Plasma,” Optics Express, 21(6), A1094-101, 2013.
doi:10.1364/oe.21.0a1094.
35. Schenk, A., Rixecker, G., Bohne, S., Becker, M., Budde, M. “The Corona
Ignition System EcoFlash®: New Results with CNG Engines and Effects of
Engine-Specific Boundary Conditions,” 2nd International Conference on Ignition
Systems for Gasoline Engines, November 24–25, 2014, Berlin, Germany.
36. Bradley, D., et al. “Fundamentals of High-Energy Spark Ignition with Lasers,”
Combustion and Flame, Vol 138, 55-77, 2004.
37. Schwarz, E., Muri, I., Tauer, J., Kofler, H., Winter, E. “Laser-Induced Ignition by
Optical Breakdown,” Laser Physics, Vol 20 (6), 1543-1553, 2010.
38. Kopecek, H., et al. “Laser Ignition of Methane-Air Mixtures at High Pressures
and Diagnostics,” Journal of Engineering for Gas Turbines and Power, Vol 127,
213-219, 2005.
39. Alger, T., Gingrich, J., Mangold, B., and Roberts, C. “A Continuous Discharge
Ignition System for EGR Limit Extension in SI Engines,” SAE International
Journal of Engines, 4(1), 677-692, 2011. doi:10.4271/2011-01-0661.
40. US Patent 9441604 (Application number 13/917,054, Provisional Patent filing US
61/702,469). "Multi-coil Spark Ignition System." Inventors: Ming Zheng, Shui
Yu, and Kelvin Xie. Priority date: September 25, 2012. Issue date: September 13
141
2016. US application # US 13/917,054. US divisional Patent 15/238,886, file
date Aug 17, 2016.
41. Yu, S., et al. “Multi-Coil High Frequency Spark Ignition to Extend Diluted
Combustion Limits,” Proceedings of the FISITA 2012 World Automotive
Congress. Lecture Notes in Electrical Engineering, Vol 189. Springer-Verlag,
2003. doi:10.1007/978-3-642-33841-0_17.
42. Jung, D., Sasaki, K., and Iida, N. “Effects of Increased Spark Discharge Energy
and Enhanced In-Cylinder Turbulence Level on Lean Limits and Cycle-to-Cycle
Variations of Combustion for SI Engine Operation,” Applied Energy, 2017.
doi:10.1016/j.apenergy.2017.08.043.
43. Sjöberg, M., Zeng, W., Singleton, D., Sanders, J. et al. "Combined Effects of
Multi-Pulse Transient Plasma Ignition and Intake Heating on Lean Limits of
Well-Mixed E85 DISI Engine Operation," SAE International Journal of Engines,
7(4), 2014. doi:10.4271/2014-01-2615.
44. Slade, Paul G. Electrical Contacts: Principles and Applications, Second Edition.
2013, CRC Press. ISBN 9781439881309.
45. Ju, Yiguang, and Sun, Wenting. “Plasma Assisted Combustion: Dynamics and
Chemistry,” Progress in Energy and Combustion Science, Vol 48, 21-83, 2015.
doi:10.1016/j.pecs.2014.12.002.
46. Wolk, B. and Ekoto, I. "Calorimetry and Imaging of Plasma Produced by a
Pulsed Nanosecond Discharge Igniter in EGR Gases at Engine-Relevant
Densities," SAE International Journal of Engines, 10(3), 2017. doi:10.4271/2017-
01-0674.
142
47. Cimarello, A., Grimaldi, C., Mariani, F., Battistoni, M. et al. "Analysis of RF
Corona Ignition in Lean Operating Conditions Using an Optical Access Engine,"
SAE Technical Paper 2017-01-0673, 2017. doi:10.4271/2017-01-0673.
48. Starikovskiy, A., and Aleksandrov, N. “Plasma-Assisted Ignition and
Combustion,” Aeronautics and Astronautics. Intech, 2011. ISBN 978-953-307-
473-3.
49. ACIS- Advanced Corona Ignition System. Federal-Mogul. Accessed December
4, 2017, from http://www.federalmogul.com/en-US/OE/Products/Pages/Product-
Details.aspx?CategoryId=15&SubCategoryId=21&ProductId=224.
50. Ignition Technologies. BorgWarner. Accessed December 5, 2017, from
https://www.borgwarner.com/technologies/ignition-technologies.
51. Cimarello, A., Cruccolini, V., Discepoli, G., Battistoni, M. et al. “Combustion
Behavior of an RF Corona Ignition System with Different Control Strategies,”
SAE Technical Paper, 2018-01-1132, 2018. doi:10.4271/2018-01-1132.
52. NGK 3764 BKR6EIX-11 IX Iridium Plug. NGK.com (retailer not associated
with manufacturer NGK Spark Plugs). Accessed October 12, 2017 from
https://www.ngk.com/product.aspx?zpid=9331.
53. NGK 7405 R5672A-9 Racing Plug. NGK.com (retailer not associated with
manufacturer NGK Spark Plugs). Accessed October 12, 2017 from
https://www.ngk.com/product.aspx?zpid=10048.
54. Yu, S., Xie, K., Yu, X., Wang, M. et al. "High Energy Ignition Strategies for
Diluted Mixtures via a Three-Pole Igniter," SAE Technical Paper, 2016-01-2175,
2016. doi:10.4271/2016-01-2175.
143
55. Xie, K, Yu, S., Gao, T., Yu, X., Zheng, M, Li, L. “Investigation of Multi-pole
Spark Ignition on Flame Kernel Development and in Engine Operation,”
Proceedings of the ASME 2016 Internal Combustion Engine Division Fall
Technical Conference, ASME ICEF2016-9474, October 11, 2016, Greenville,
South Carolina, USA.
56. Xie, K., Yu, S., Yu, X., Bryden, G. et al. "Investigation of Multi-Pole Spark
Ignition Under Lean Conditions and with EGR," SAE Technical Paper, 2017-01-
0679, 2017. doi:10.4271/2017-01-0679.
57. US Patent 9,484,719 (Application 14/329,628). “Active Control Resonant
Ignition System.” Inventors: Ming Zheng, Shui Yu, Meiping Wang. File date
July 3 2014. Issue date Nov 01 2016. US Patent Application 15/286,128
Divisional patent filed Oct 5 2016.
58. Christian, V.R., Knopf, F., Jaschek, A., Schindler, W. “Eine neue Messmethodik
der Bosch-Zalh mit erhohter Empfindlichkeit,” Motortechnische Zeitschrift, 54,
16-22, 1993.
59. Maly, Rudolf, and Vogel, Manfred. “Initiation and Propagation of Flame Fronts
in Lean CH4-Air Mixtures by the Three Modes of Spark Ignition,” International
Symposium on Combustion, Vol 17(1), 821-831, 1979.
60. Yu, X., Yu, S., Yang, Z., et al. "Improvement on Energy Efficiency of the Spark
Ignition System," SAE Technical Paper, 2017-01-0678, 2017. doi:10.4271/2017-
01-0678.
61. Briggs, T., Alger, T., and Mangold, B. "Advanced Ignition Systems Evaluations
for High-Dilution SI Engines," SAE International Journal of Engines, 7(4), 1802-
1807, 2014. doi:10.4271/2014-01-2625.
144
62. Pihl, J., Lewis, J., Topps, T., Parks, J. “Lean NOx Trap Chemistry Under Lean-
Gasoline Exhaust Conditions: Impact of High NOx Concentrations and High
Temperature,” Topics in Catalysis, 26, 89-93, 2013. doi:10.1007/s11244-013-
9934-3.
63. Starikovskii, A. “Plasma Supported Combustion,” Proceedings of the
Combustion Institute, 30, 2405-2417, 2005. doi:10.1016/j.prosci.2004.08.272.
64. Hu, E., Li, X., Meng, X., Chen, Y., Xie, Y., Huang, Z. “Laminar Flame Speeds
and Ignition Delay Times of Methane-Air Mixtures at Elevated Temperatures and
Pressures,” Fuel, 158, 1-10, 2015. doi:10.1016/j.fuel.2015.05.010.
65. Park, O., Veloo, P., Liu, N., Egolfopoulos, F. “Combustion Characteristics of
Alternative Gaseous Fuels,” Proceedings of the Combustion Institute, 33, 887-894,
2011.
66. Gu, X.J., Haq, M.Z., Lawes, M., Woolley, R. “Laminar Burning Velocity and
Markstein Lengths of Methane–Air Mixtures,” Combustion and Flame, 121, 41-
58, 2000.
67. Rozenchan, G., Zhu, D.L., Law, C.K., Tse, S.D. “Outward Propagation, Burning
Velocities, and Chemical Effects of Methane Flames up to 60 ATM,” Proceedings
of the Combustion Institute, 29, 1461-1470, 2002.
68. Alger, T., Gingrich, J., Mangold, B., and Roberts, C. "A Continuous Discharge
Ignition System for EGR Limit Extension in SI Engines," SAE International
Journal of Engines, 4(1), 677-692, 2011. doi:10.4271/2011-01-0661.
69. Badawy, T., Bao, X., Xu, H. “Impact of Spark Plug Gap on Flame Kernel
Propagation and Engine Performance,” Applied Energy, 191, 311-327, 2017. doi:
10.1016/j.apenergy.2017.01.059.
145
70. Abe, Y., Sugiura, A., Doi, K., Shibata, M. et al. “Study of Ignition System for
Demand Voltage Reduction,” SAE Technical Paper, 2015-01-0777, 2015.
doi:10.4271/2015-01-0777.
71. Seiser, R, Pitsch, H., and Seshadri, K. “n-Heptane, Reduced Mechanism.”
Lawrence Livermore National Laboratory. Available at:
https://combustion.llnl.gov/archived-mechanisms/alkanes/heptane-reduced-
mechanism
72. Goodwin, Dave, et al. “Cantera: An Object-Oriented Software Toolkit for
Chemical Kinetics, Thermodynamics, and Transport Processes.” Version 2.1a1,
available at https://code.google.com/p/cantera/
73. Musculus, M. Miles, P., Pickett, L. “Conceptual Models for Partially Premixed
Low-Temperature Diesel Combustion,” Progress in Energy and Combustion
Science, 39, 246-283, 2013. doi:10.1016/j.pecs.2012.09.001.
74. Smith, Gregory P., et al. GRI-MECH 3.0. Available at:
http://www.me.berkeley.edu/gri_mech/.
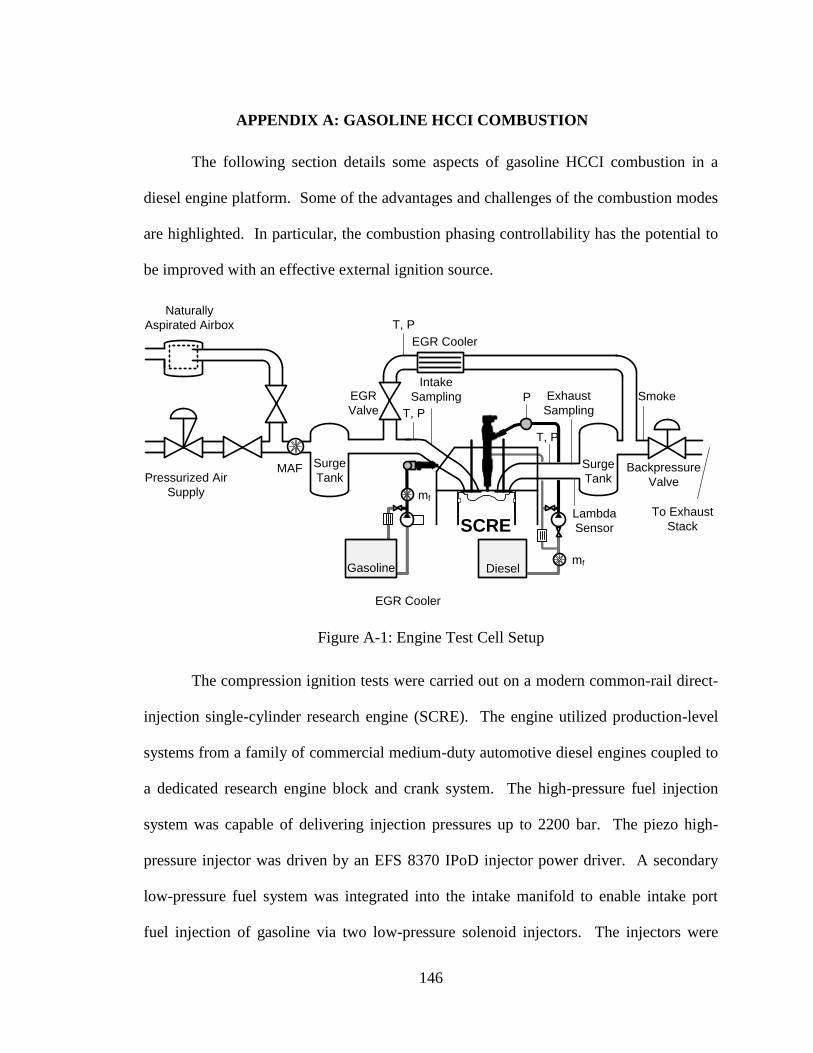
146
APPENDIX A: GASOLINE HCCI COMBUSTION
The following section details some aspects of gasoline HCCI combustion in a
diesel engine platform. Some of the advantages and challenges of the combustion modes
are highlighted. In particular, the combustion phasing controllability has the potential to
be improved with an effective external ignition source.
Figure A-1: Engine Test Cell Setup
The compression ignition tests were carried out on a modern common-rail direct-
injection single-cylinder research engine (SCRE). The engine utilized production-level
systems from a family of commercial medium-duty automotive diesel engines coupled to
a dedicated research engine block and crank system. The high-pressure fuel injection
system was capable of delivering injection pressures up to 2200 bar. The piezo high-
pressure injector was driven by an EFS 8370 IPoD injector power driver. A secondary
low-pressure fuel system was integrated into the intake manifold to enable intake port
fuel injection of gasoline via two low-pressure solenoid injectors. The injectors were
Gasoline Diesel
Surge
TankSurge
Tank
T, P
Intake
SamplingEGR
Valve
MAF Backpressure
Valve
Exhaust
SamplingSmoke
Lambda
Sensor
P
T, P
T, P
mf
EGR Cooler
mf
Pressurized Air
Supply
Naturally
Aspirated Airbox
EGR Cooler
To Exhaust
StackSCRE
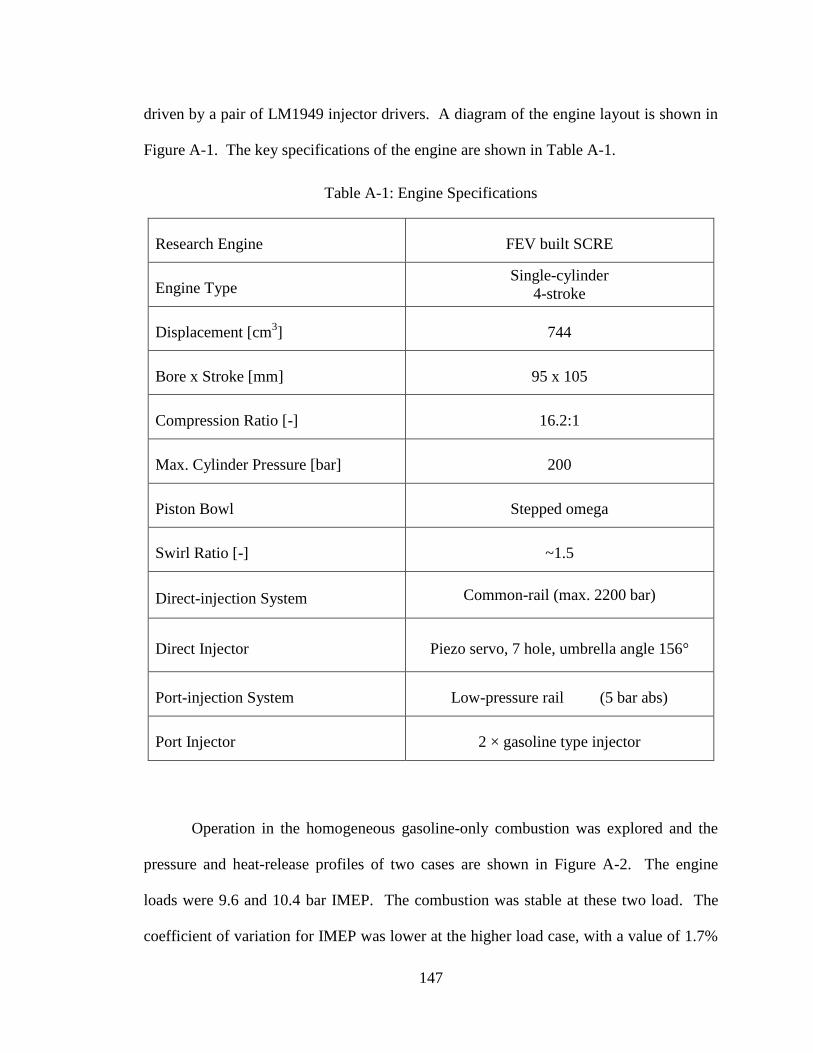
147
driven by a pair of LM1949 injector drivers. A diagram of the engine layout is shown in
Figure A-1. The key specifications of the engine are shown in Table A-1.
Table A-1: Engine Specifications
Research Engine FEV built SCRE
Engine Type Single-cylinder
4-stroke
Displacement [cm3] 744
Bore x Stroke [mm] 95 x 105
Compression Ratio [-] 16.2:1
Max. Cylinder Pressure [bar] 200
Piston Bowl Stepped omega
Swirl Ratio [-] ~1.5
Direct-injection System Common-rail (max. 2200 bar)
Direct Injector Piezo servo, 7 hole, umbrella angle 156°
Port-injection System Low-pressure rail (5 bar abs)
Port Injector 2 × gasoline type injector
Operation in the homogeneous gasoline-only combustion was explored and the
pressure and heat-release profiles of two cases are shown in Figure A-2. The engine
loads were 9.6 and 10.4 bar IMEP. The combustion was stable at these two load. The
coefficient of variation for IMEP was lower at the higher load case, with a value of 1.7%
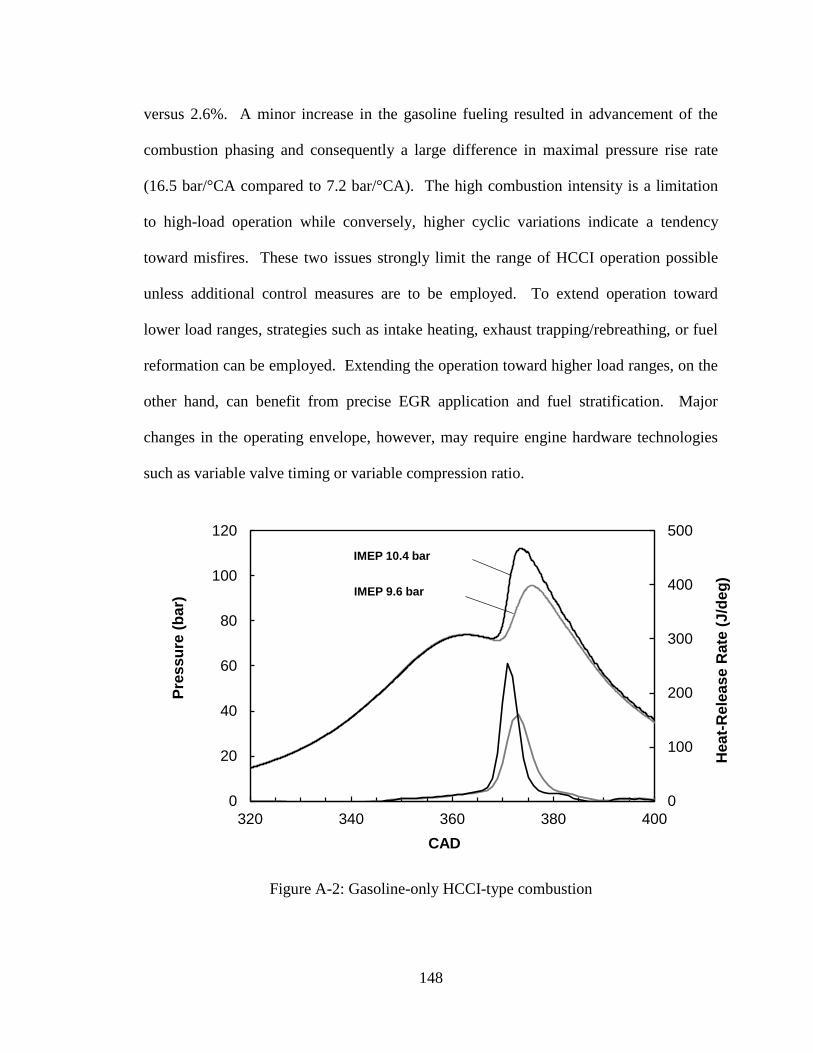
148
versus 2.6%. A minor increase in the gasoline fueling resulted in advancement of the
combustion phasing and consequently a large difference in maximal pressure rise rate
(16.5 bar/°CA compared to 7.2 bar/°CA). The high combustion intensity is a limitation
to high-load operation while conversely, higher cyclic variations indicate a tendency
toward misfires. These two issues strongly limit the range of HCCI operation possible
unless additional control measures are to be employed. To extend operation toward
lower load ranges, strategies such as intake heating, exhaust trapping/rebreathing, or fuel
reformation can be employed. Extending the operation toward higher load ranges, on the
other hand, can benefit from precise EGR application and fuel stratification. Major
changes in the operating envelope, however, may require engine hardware technologies
such as variable valve timing or variable compression ratio.
Figure A-2: Gasoline-only HCCI-type combustion
0
100
200
300
400
500
0
20
40
60
80
100
120
320 340 360 380 400
Heat-
Rele
ase R
ate
(J/d
eg
)
Pre
ssu
re (
bar)
CAD
IMEP 10.4 bar
IMEP 9.6 bar
149
Figure A-3 shows the effect of such a compression ratio increase to 18.2 on the
HCCI combustion of gasoline. The higher compression ratio allowed the operation at
much lower load levels, down to 2 bar IMEP. The negative effect is significantly higher
peak pressure rise rates, even at relatively mild loads of 6 bar IMEP. A significant
contributor to the severe peak pressure rise rates is the combustion phasing in advance of
TDC. This early combustion can be moderated using EGR as will be shown in Figure A-
9.
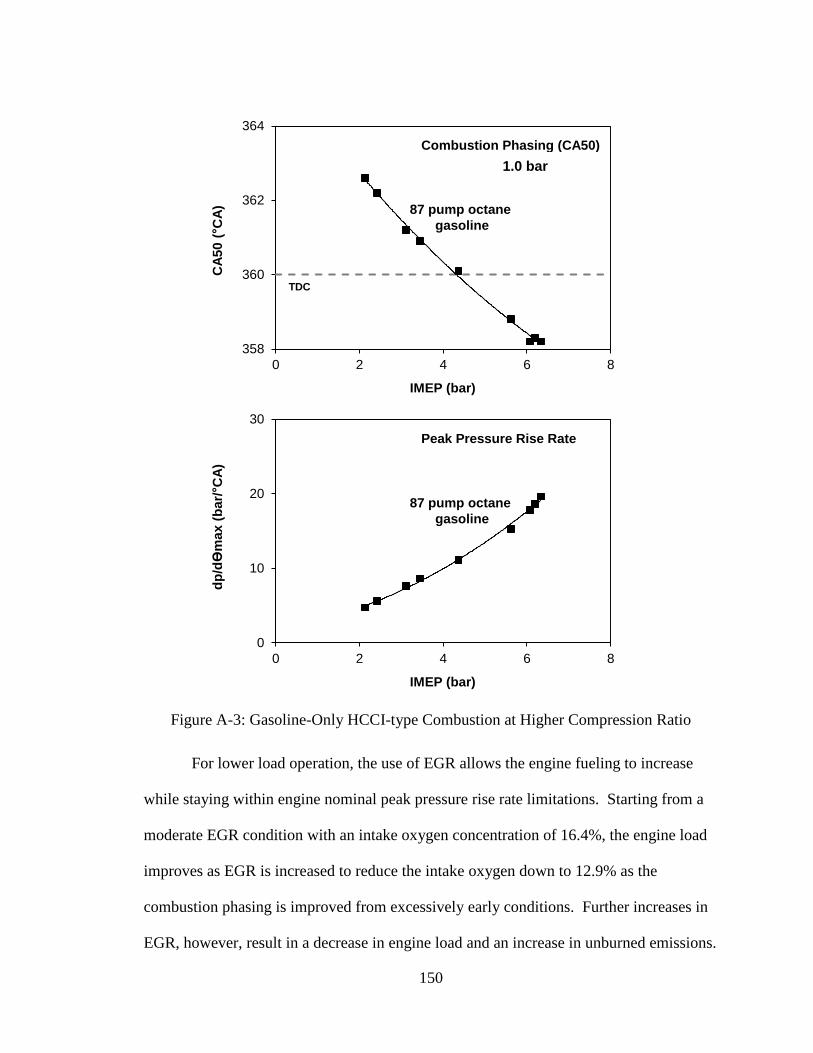
150
Figure A-3: Gasoline-Only HCCI-type Combustion at Higher Compression Ratio
For lower load operation, the use of EGR allows the engine fueling to increase
while staying within engine nominal peak pressure rise rate limitations. Starting from a
moderate EGR condition with an intake oxygen concentration of 16.4%, the engine load
improves as EGR is increased to reduce the intake oxygen down to 12.9% as the
combustion phasing is improved from excessively early conditions. Further increases in
EGR, however, result in a decrease in engine load and an increase in unburned emissions.
358
360
362
364
0 2 4 6 8
CA
50 ( C
A)
IMEP (bar)
Combustion Phasing (CA50)
TDC
1.0 bar
87 pump octane
gasoline
0
10
20
30
0 2 4 6 8
dp
/dϴ
ma
x (
ba
r/ C
A)
IMEP (bar)
Peak Pressure Rise Rate
87 pump octane
gasoline
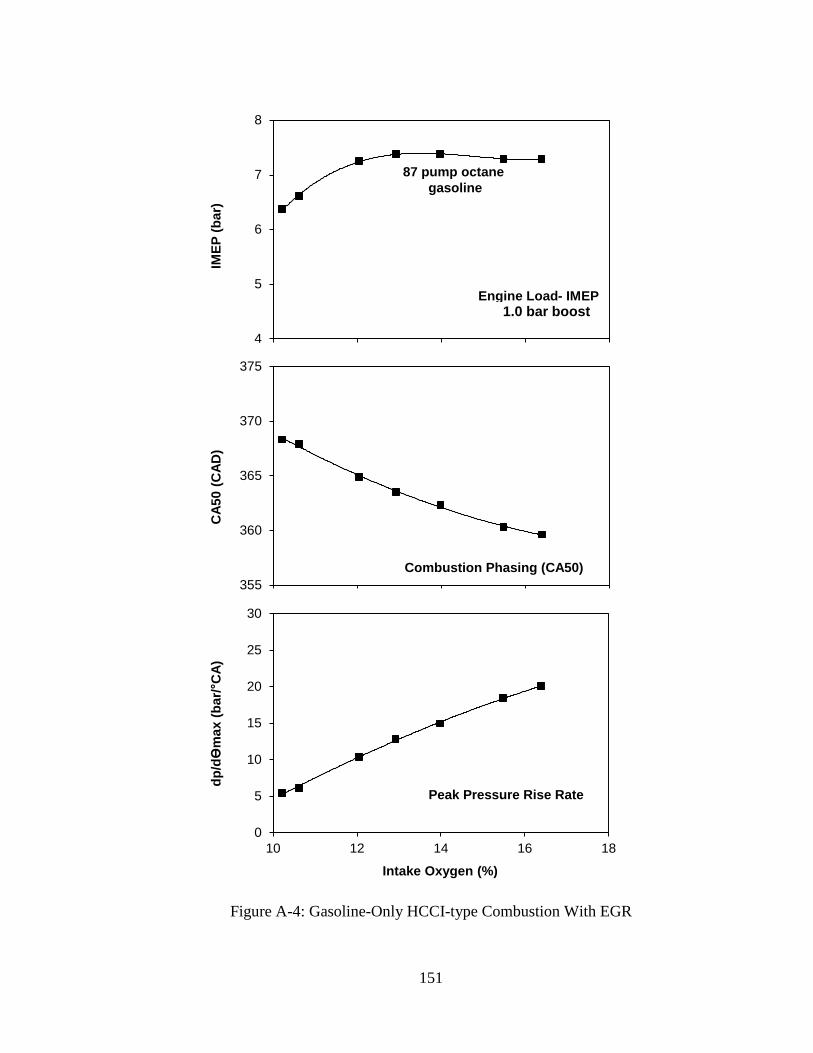
151
Figure A-4: Gasoline-Only HCCI-type Combustion With EGR
355
360
365
370
375
10 12 14 16 18
CA
50 (
CA
D)
Combustion Phasing (CA50)
0
5
10
15
20
25
30
10 12 14 16 18
dp
/dϴ
max (
bar/ C
A)
Intake Oxygen (%)
Peak Pressure Rise Rate
4
5
6
7
8
10 12 14 16 18
IME
P (
bar)
Engine Load- IMEP
1.0 bar boost
87 pump octane
gasoline

152
153
APPENDIX B: NUMERICAL SIMULATION OF DIESEL AUTO-IGNITION
Zero-dimensional kinetic simulations of n-heptane ignition under constant-
pressure conditions were performed to gain insight into the chemistry of the ignition
process. The kinetics mechanism used was the n-heptane reduced mechanism from [71]
computed using the Cantera solver running on the Python platform [72].
B.1 Chemical Description of Ignition
The temporal evolutions of the temperature and bulk species are shown in Figure
B-1 below. Figure B-2 shows the evolution of key chemical species. The initial
conditions of the simulation were the same used in the kinetic analysis by Musculus [73].
The simulation conditions are initialized at a temperature of 787 K, pressure of 50 bar,
and oxygen molar concentration of 12.7%. The balance gas is nitrogen. The n-heptane
concentration is stoichiometric with respect to the available oxygen. The results show
that the earlier reactions consists hydrogen abstraction of the n-heptane fuel by O2
molecules. The buildup of radicals continues with HO2 and OH participation. A key
class of species, ketohydroperoxide (KHP) species, form as a result of alkyl peroxy
radical undergoing a second O2 addition, subsequent isomerization, and then
decomposition. The KHP species are relatively stable and continue to build up to 0.9 ms
after the start of the simulation. This process is truncated when the KHP decomposes at
approximately 850 K, resulting in a rapid surge of radicals. This causes an increase in the
heat release and reaction rates that constitute the first stage of ignition. After the KHP
pool depletes, the heat release rate decrease dramatically. Some CO is generated during
and after the first stage of ignition. Most CO, however, is generated prior to and during
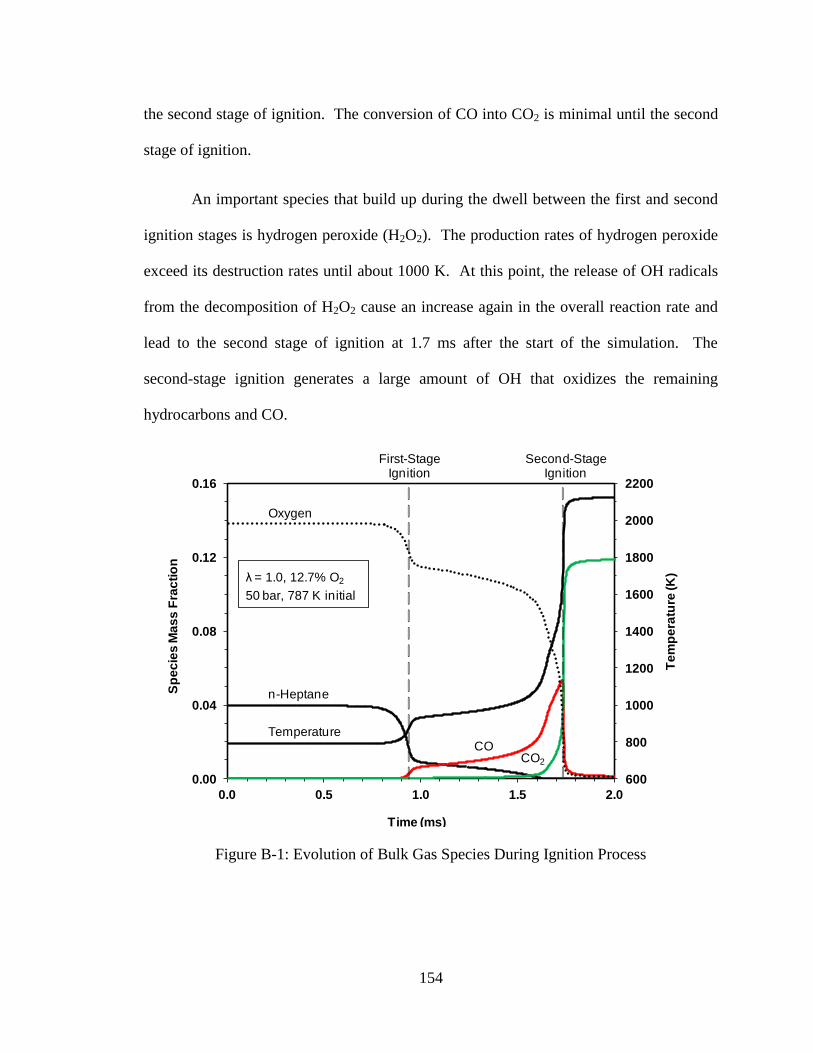
154
the second stage of ignition. The conversion of CO into CO2 is minimal until the second
stage of ignition.
An important species that build up during the dwell between the first and second
ignition stages is hydrogen peroxide (H2O2). The production rates of hydrogen peroxide
exceed its destruction rates until about 1000 K. At this point, the release of OH radicals
from the decomposition of H2O2 cause an increase again in the overall reaction rate and
lead to the second stage of ignition at 1.7 ms after the start of the simulation. The
second-stage ignition generates a large amount of OH that oxidizes the remaining
hydrocarbons and CO.
Figure B-1: Evolution of Bulk Gas Species During Ignition Process
600
800
1000
1200
1400
1600
1800
2000
2200
0.00
0.04
0.08
0.12
0.16
0.0 0.5 1.0 1.5 2.0
Te
mp
era
ture
(K
)
Sp
ec
ies
Ma
ss
Fra
cti
on
Time (ms)
λ = 1.0, 12.7% O2
50 bar, 787 K initial
Temperature
Oxygen
n-Heptane
COCO2
First-StageIgnition
Second-StageIgnition
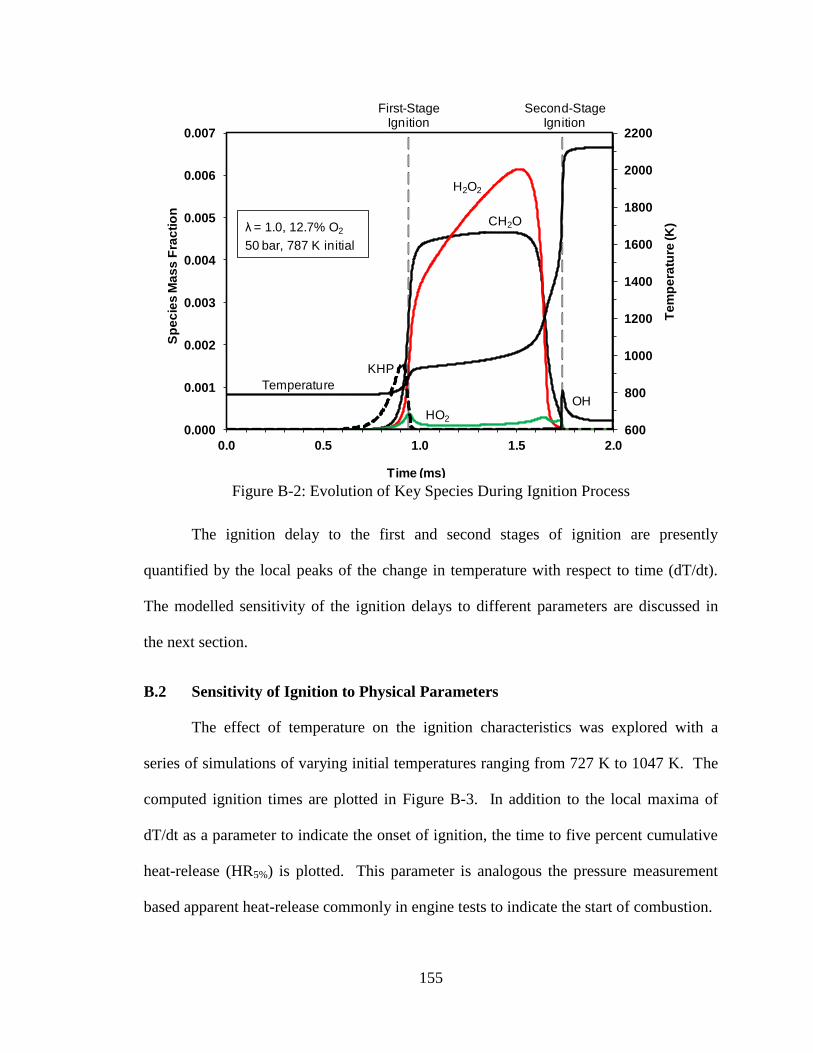
155
Figure B-2: Evolution of Key Species During Ignition Process
The ignition delay to the first and second stages of ignition are presently
quantified by the local peaks of the change in temperature with respect to time (dT/dt).
The modelled sensitivity of the ignition delays to different parameters are discussed in
the next section.
B.2 Sensitivity of Ignition to Physical Parameters
The effect of temperature on the ignition characteristics was explored with a
series of simulations of varying initial temperatures ranging from 727 K to 1047 K. The
computed ignition times are plotted in Figure B-3. In addition to the local maxima of
dT/dt as a parameter to indicate the onset of ignition, the time to five percent cumulative
heat-release (HR5%) is plotted. This parameter is analogous the pressure measurement
based apparent heat-release commonly in engine tests to indicate the start of combustion.
600
800
1000
1200
1400
1600
1800
2000
2200
0.000
0.001
0.002
0.003
0.004
0.005
0.006
0.007
0.0 0.5 1.0 1.5 2.0
Te
mp
era
ture
(K
)
Sp
ec
ies
Ma
ss
Fra
cti
on
Time (ms)
λ = 1.0, 12.7% O2
50 bar, 787 K initial
Temperature
CH2O
HO2
H2O2
First-StageIgnition
Second-StageIgnition
OH
KHP
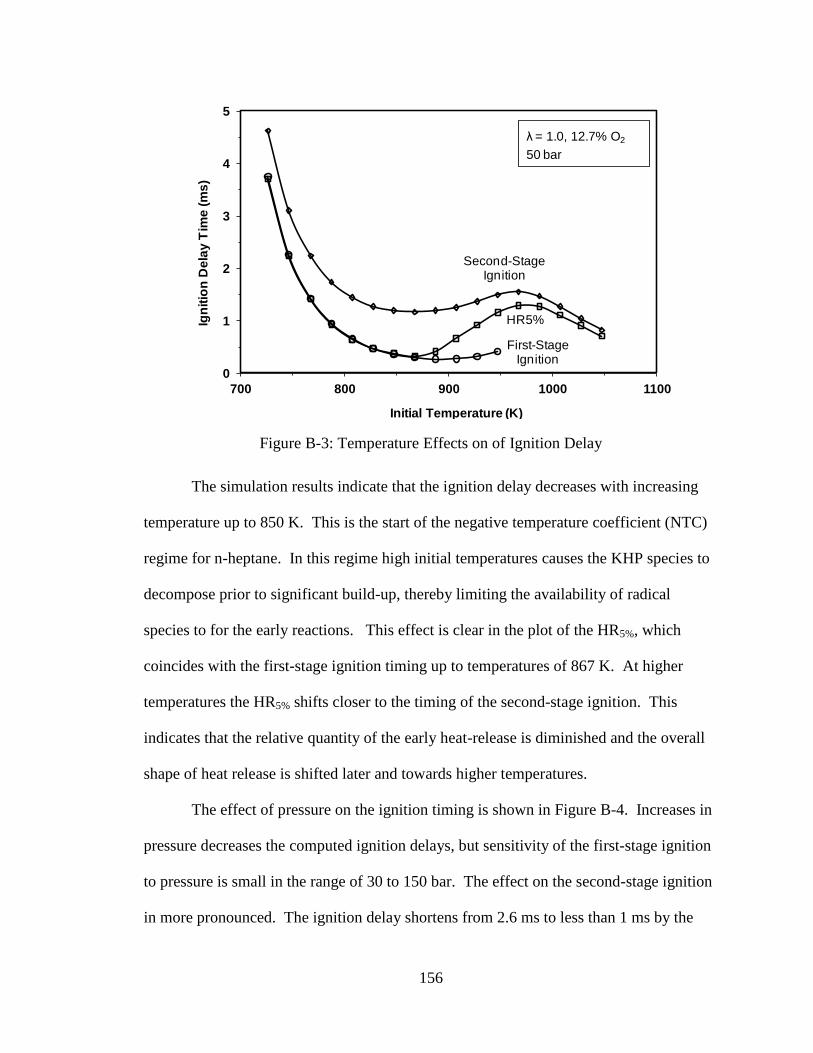
156
Figure B-3: Temperature Effects on of Ignition Delay
The simulation results indicate that the ignition delay decreases with increasing
temperature up to 850 K. This is the start of the negative temperature coefficient (NTC)
regime for n-heptane. In this regime high initial temperatures causes the KHP species to
decompose prior to significant build-up, thereby limiting the availability of radical
species to for the early reactions. This effect is clear in the plot of the HR5%, which
coincides with the first-stage ignition timing up to temperatures of 867 K. At higher
temperatures the HR5% shifts closer to the timing of the second-stage ignition. This
indicates that the relative quantity of the early heat-release is diminished and the overall
shape of heat release is shifted later and towards higher temperatures.
The effect of pressure on the ignition timing is shown in Figure B-4. Increases in
pressure decreases the computed ignition delays, but sensitivity of the first-stage ignition
to pressure is small in the range of 30 to 150 bar. The effect on the second-stage ignition
in more pronounced. The ignition delay shortens from 2.6 ms to less than 1 ms by the
0
1
2
3
4
5
700 800 900 1000 1100
Ign
itio
n D
ela
y T
ime
(m
s)
Initial Temperature (K)
λ = 1.0, 12.7% O2
50 bar
HR5%
First-StageIgnition
Second-StageIgnition
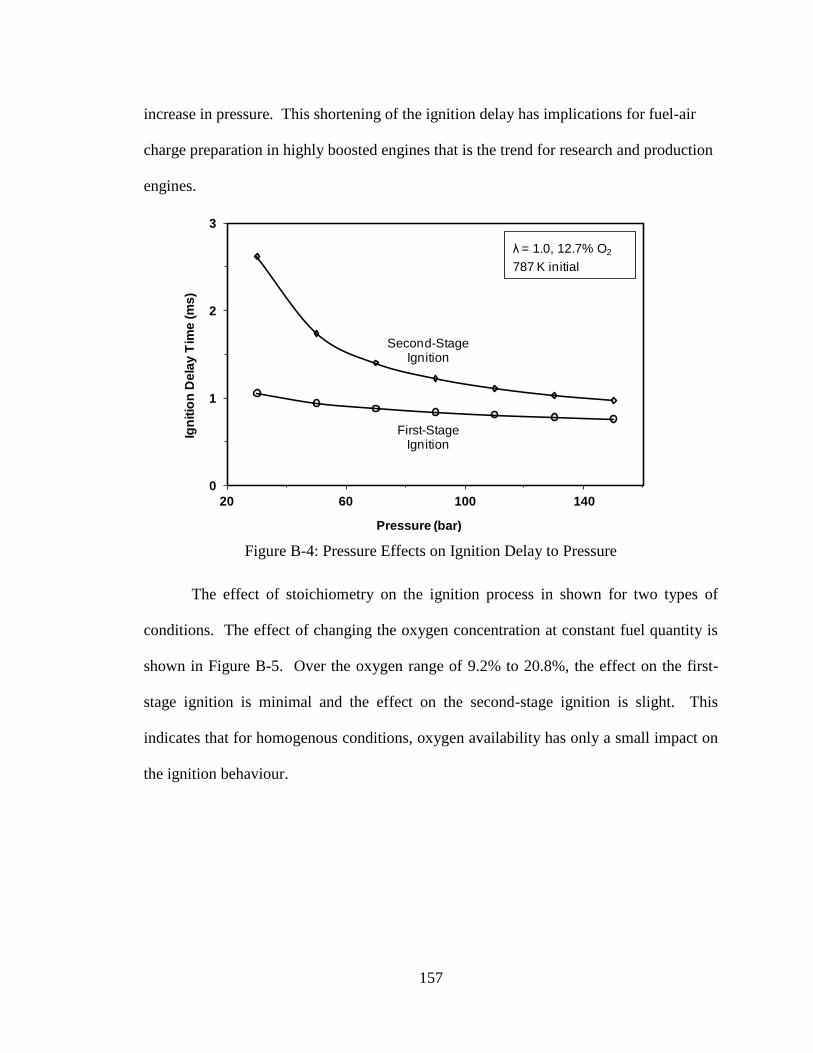
157
increase in pressure. This shortening of the ignition delay has implications for fuel-air
charge preparation in highly boosted engines that is the trend for research and production
engines.
Figure B-4: Pressure Effects on Ignition Delay to Pressure
The effect of stoichiometry on the ignition process in shown for two types of
conditions. The effect of changing the oxygen concentration at constant fuel quantity is
shown in Figure B-5. Over the oxygen range of 9.2% to 20.8%, the effect on the first-
stage ignition is minimal and the effect on the second-stage ignition is slight. This
indicates that for homogenous conditions, oxygen availability has only a small impact on
the ignition behaviour.
0
1
2
3
20 60 100 140
Ign
itio
n D
ela
y T
ime
(m
s)
Pressure (bar)
λ = 1.0, 12.7% O2
787 K initial
First-StageIgnition
Second-StageIgnition
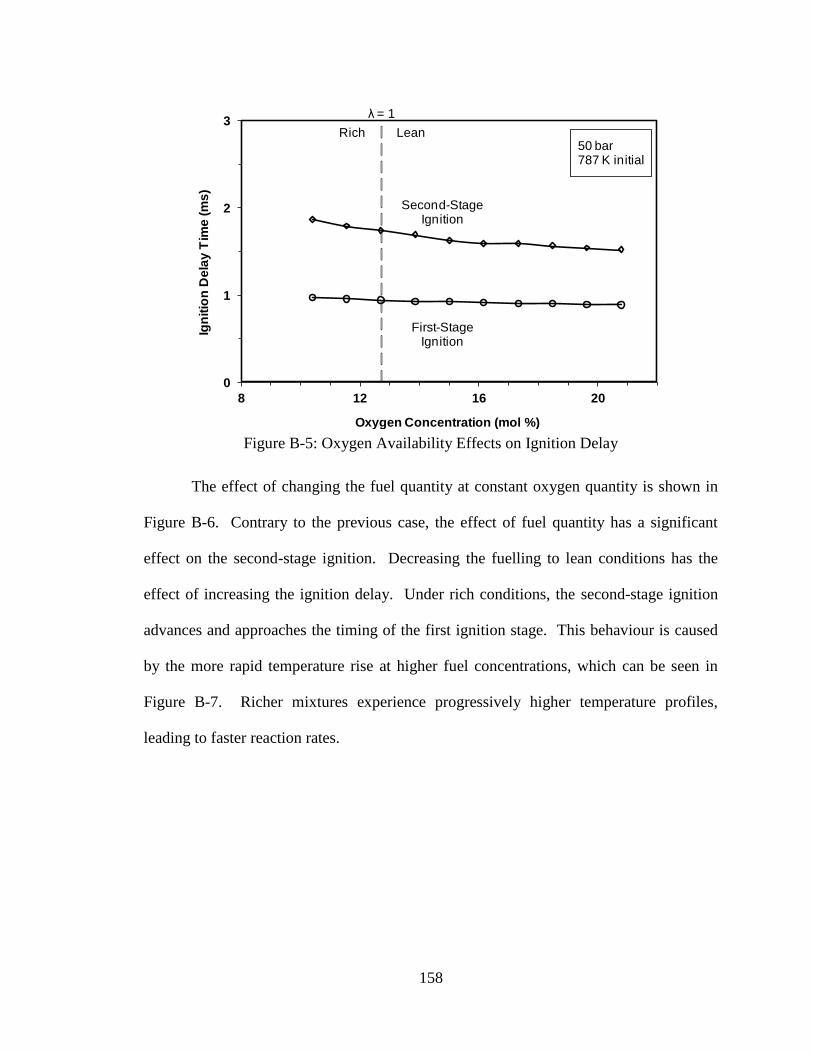
158
Figure B-5: Oxygen Availability Effects on Ignition Delay
The effect of changing the fuel quantity at constant oxygen quantity is shown in
Figure B-6. Contrary to the previous case, the effect of fuel quantity has a significant
effect on the second-stage ignition. Decreasing the fuelling to lean conditions has the
effect of increasing the ignition delay. Under rich conditions, the second-stage ignition
advances and approaches the timing of the first ignition stage. This behaviour is caused
by the more rapid temperature rise at higher fuel concentrations, which can be seen in
Figure B-7. Richer mixtures experience progressively higher temperature profiles,
leading to faster reaction rates.
0
1
2
3
8 12 16 20
Ign
itio
n D
ela
y T
ime
(m
s)
Oxygen Concentration (mol %)
50 bar787 K initial
First-StageIgnition
Second-StageIgnition
λ = 1
Rich Lean
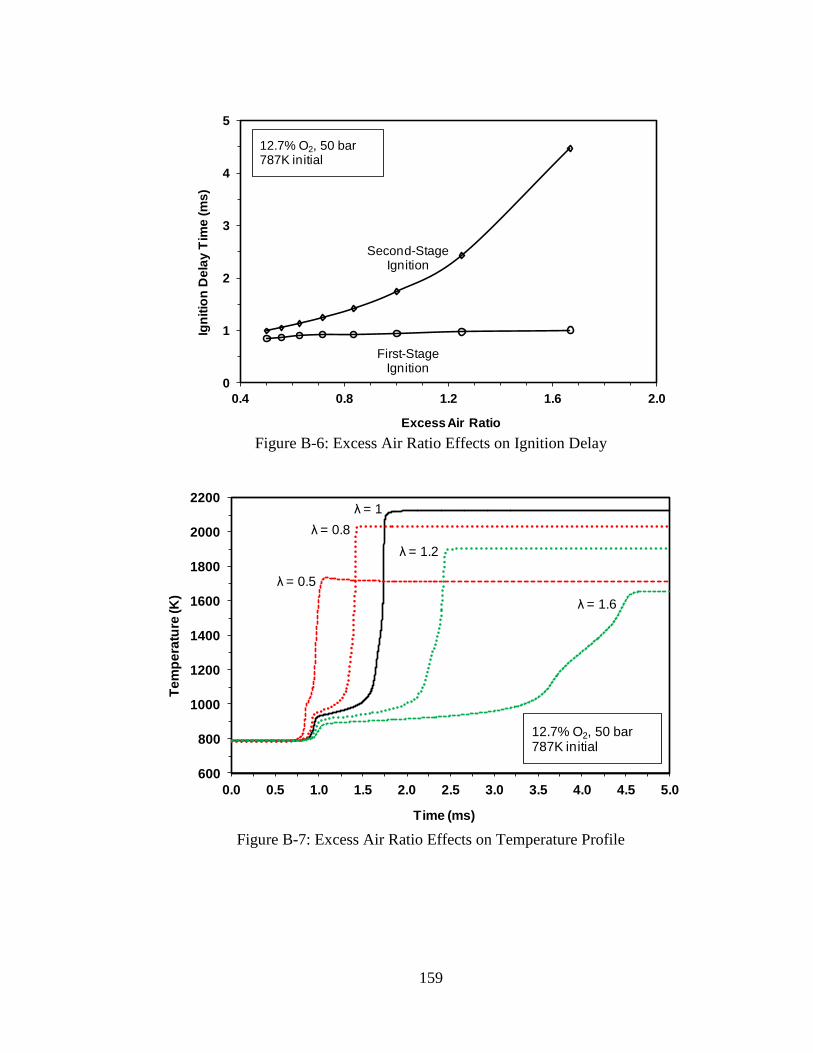
159
Figure B-6: Excess Air Ratio Effects on Ignition Delay
Figure B-7: Excess Air Ratio Effects on Temperature Profile
0
1
2
3
4
5
0.4 0.8 1.2 1.6 2.0
Ign
itio
n D
ela
y T
ime
(m
s)
Excess Air Ratio
12.7% O2, 50 bar 787K initial
First-StageIgnition
Second-StageIgnition
600
800
1000
1200
1400
1600
1800
2000
2200
0.0 0.5 1.0 1.5 2.0 2.5 3.0 3.5 4.0 4.5 5.0
Te
mp
era
ture
(K
)
Time (ms)
12.7% O2, 50 bar 787K initial
λ = 1.6
λ = 1.2
λ = 1
λ = 0.5
λ = 0.8
160
In summary, the simulations show that the temperature is the most important
parameter governing the ignition process. The pressure and fuel quantity are secondary
parameters that influence the ignition behaviour. The availability of oxygen, in the range
that is of practical concern for combustion engines, has limited influence on the ignition
event.
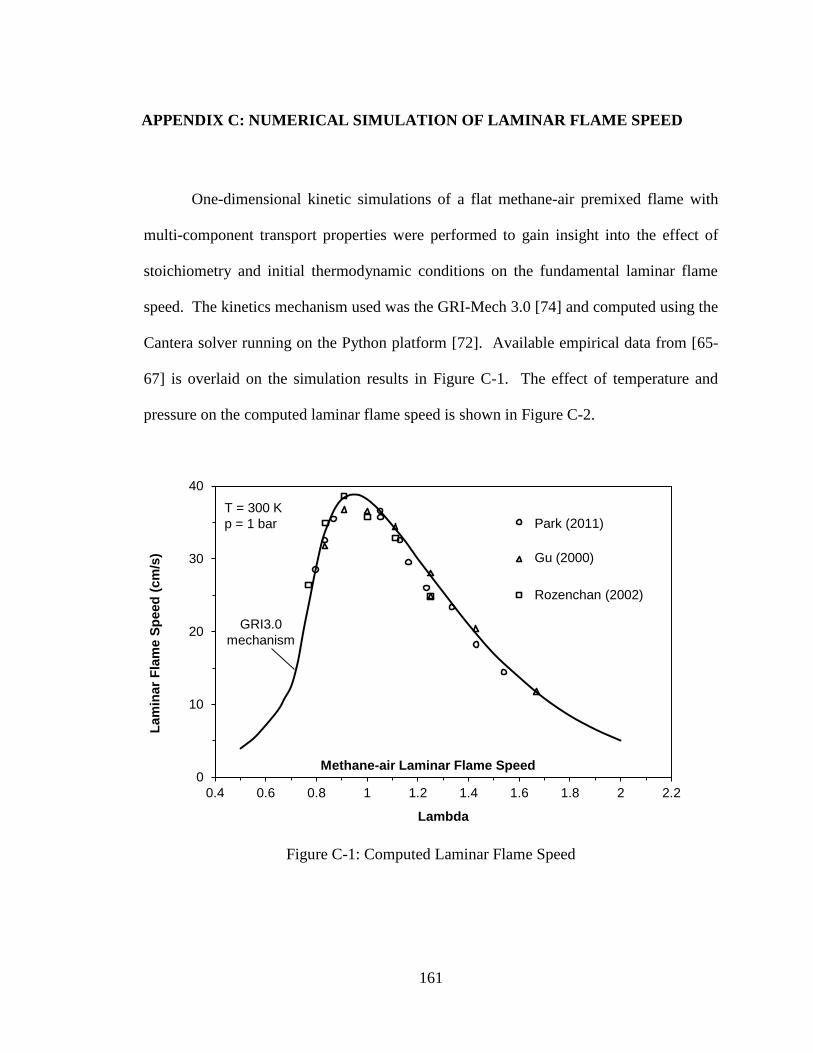
161
APPENDIX C: NUMERICAL SIMULATION OF LAMINAR FLAME SPEED
One-dimensional kinetic simulations of a flat methane-air premixed flame with
multi-component transport properties were performed to gain insight into the effect of
stoichiometry and initial thermodynamic conditions on the fundamental laminar flame
speed. The kinetics mechanism used was the GRI-Mech 3.0 [74] and computed using the
Cantera solver running on the Python platform [72]. Available empirical data from [65-
67] is overlaid on the simulation results in Figure C-1. The effect of temperature and
pressure on the computed laminar flame speed is shown in Figure C-2.
Figure C-1: Computed Laminar Flame Speed
0
10
20
30
40
0.4 0.6 0.8 1 1.2 1.4 1.6 1.8 2 2.2
Lam
inar
Fla
me S
peed
(cm
/s)
Lambda
Methane-air Laminar Flame Speed
Gu (2000)
GRI3.0
mechanism
Park (2011)
Rozenchan (2002)
T = 300 K
p = 1 bar
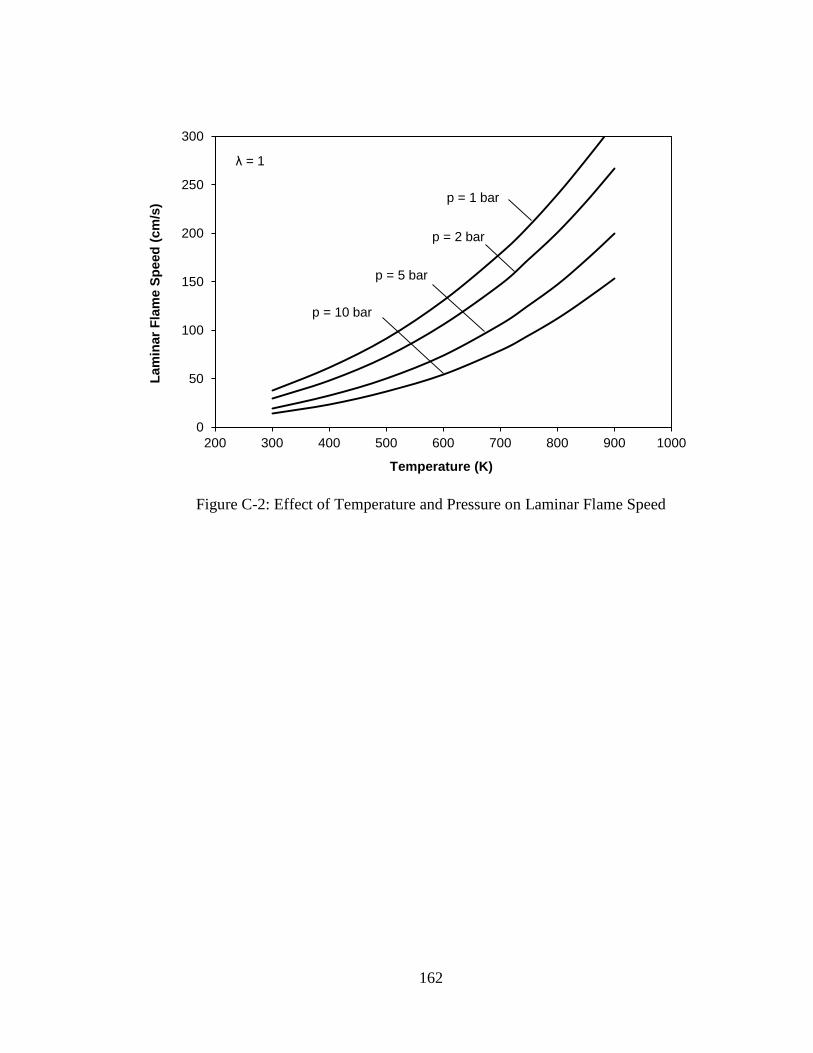
162
Figure C-2: Effect of Temperature and Pressure on Laminar Flame Speed
0
50
100
150
200
250
300
200 300 400 500 600 700 800 900 1000
La
min
ar
Fla
me S
pe
ed
(cm
/s)
Temperature (K)
p = 5 bar
p = 2 bar
p = 10 bar
p = 1 bar
λ = 1
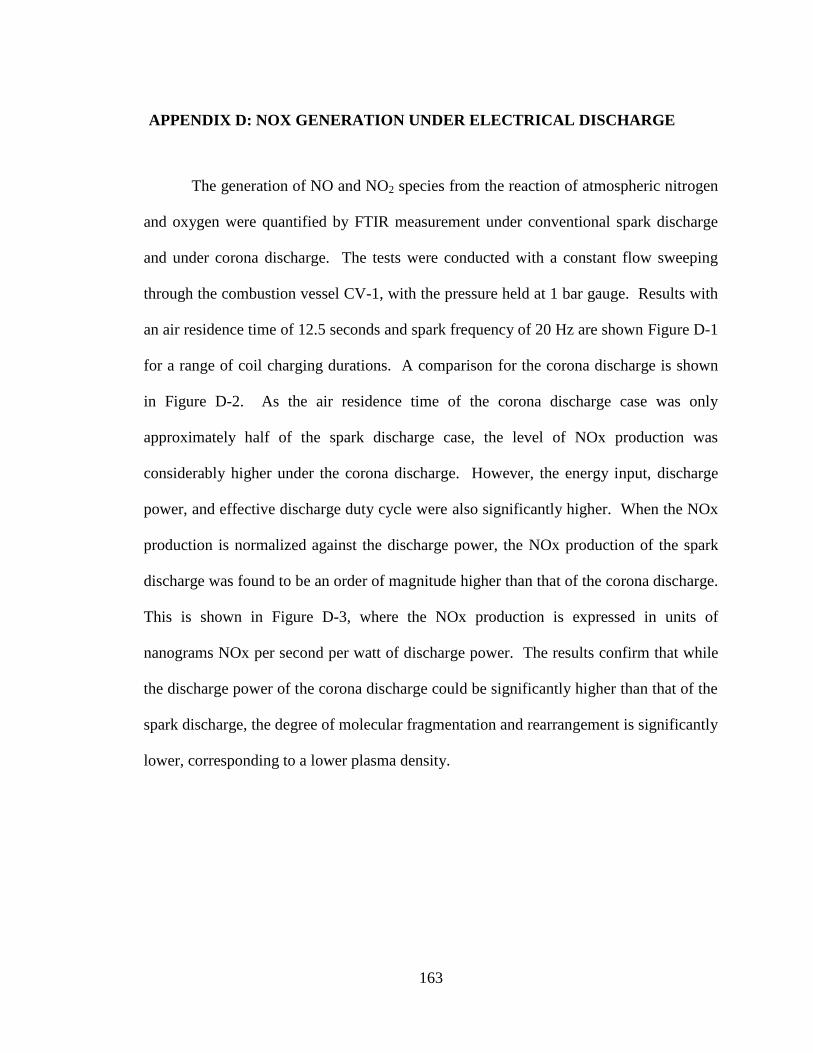
163
APPENDIX D: NOX GENERATION UNDER ELECTRICAL DISCHARGE
The generation of NO and NO2 species from the reaction of atmospheric nitrogen
and oxygen were quantified by FTIR measurement under conventional spark discharge
and under corona discharge. The tests were conducted with a constant flow sweeping
through the combustion vessel CV-1, with the pressure held at 1 bar gauge. Results with
an air residence time of 12.5 seconds and spark frequency of 20 Hz are shown Figure D-1
for a range of coil charging durations. A comparison for the corona discharge is shown
in Figure D-2. As the air residence time of the corona discharge case was only
approximately half of the spark discharge case, the level of NOx production was
considerably higher under the corona discharge. However, the energy input, discharge
power, and effective discharge duty cycle were also significantly higher. When the NOx
production is normalized against the discharge power, the NOx production of the spark
discharge was found to be an order of magnitude higher than that of the corona discharge.
This is shown in Figure D-3, where the NOx production is expressed in units of
nanograms NOx per second per watt of discharge power. The results confirm that while
the discharge power of the corona discharge could be significantly higher than that of the
spark discharge, the degree of molecular fragmentation and rearrangement is significantly
lower, corresponding to a lower plasma density.
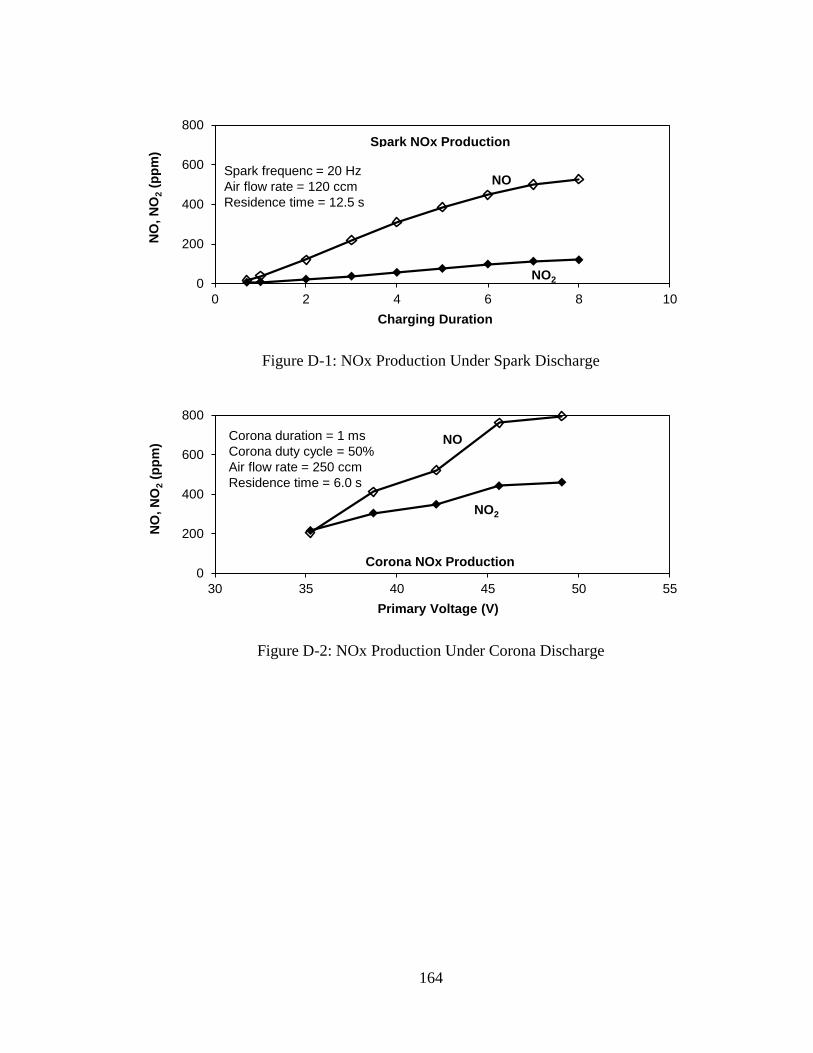
164
Figure D-1: NOx Production Under Spark Discharge
Figure D-2: NOx Production Under Corona Discharge
0
200
400
600
800
0 2 4 6 8 10
NO
, N
O2
(pp
m)
Charging Duration
Spark NOx Production
Spark frequenc = 20 Hz
Air flow rate = 120 ccm
Residence time = 12.5 s
NO
NO2
0
200
400
600
800
30 35 40 45 50 55
NO
, N
O2
(pp
m)
Primary Voltage (V)
Corona NOx Production
Corona duration = 1 ms
Corona duty cycle = 50%
Air flow rate = 250 ccm
Residence time = 6.0 s
NO
NO2
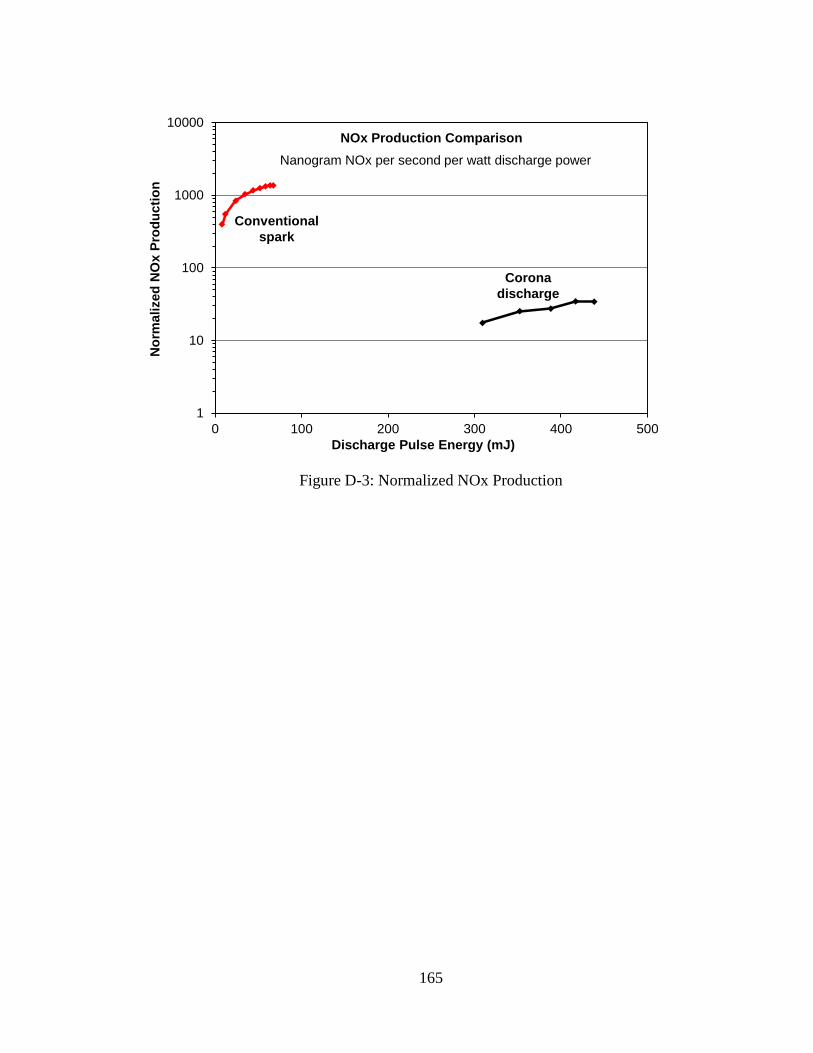
165
Figure D-3: Normalized NOx Production
1
10
100
1000
10000
0 100 200 300 400 500
No
rma
lize
d N
Ox
Pro
du
cti
on
Discharge Pulse Energy (mJ)
NOx Production Comparison
Corona
discharge
Nanogram NOx per second per watt discharge power
Conventional
spark
166
APPENDIX E: EFFECT OF SPARK GAP SIZE ON KERNEL FORMATION
A series of spark ignition tests were performed to evaluate the effect of the spark
gap size on flame kernel formation. These experiments were performed in the constant-
volume combustion chamber CV-1 under laminar conditions using methane-air mixtures
at 1 bar gauge initial pressure and ambient temperature. The spark plug used was a NGK
R5672A-9 V-groove non-resistive spark plug. Figure E-1 shows the flame kernel growth
at lambda 1.3 for five different spark plug gap sizes of 0.5, 0.8, 1.1, 1.4, and 2.0 mm.
The initial kernel expansion is obscured by the electrodes, but the later growth rate
beyond approximately 5 mm in width could be accurately tracked.
A continuous increase in the flame kernel size was observed as the gap size
increased from 0.5 mm up to 2.0 mm. A quantitative comparison of the flame kernel
areas as a function of time after the spark is shown in Figure E-2. The result of a similar
test at lambda 1.0 is shown in Figure E-3, with the same trend of faster early flame kernel
development with larger gap sizes. The results concur with work by Badawy using
gasoline-air mixtures at 1 bar and 90 °C [69]. They extended the combustion vessel work
to an optical engine and observed larger gap sizes increased the turbulent flame speed and
mass fraction burn rate. The engine IMEP increased and cyclic variations decreased
when the spark plug gap size was increased from 1.0 mm to 1.4 mm. The increase in
performance was attributed to decreased heat loss to the electrodes and increased
discharge power at larger gap sizes. This increase in discharge power was also observed
under flow across the spark gap as reported in Chapter 5.1.2.
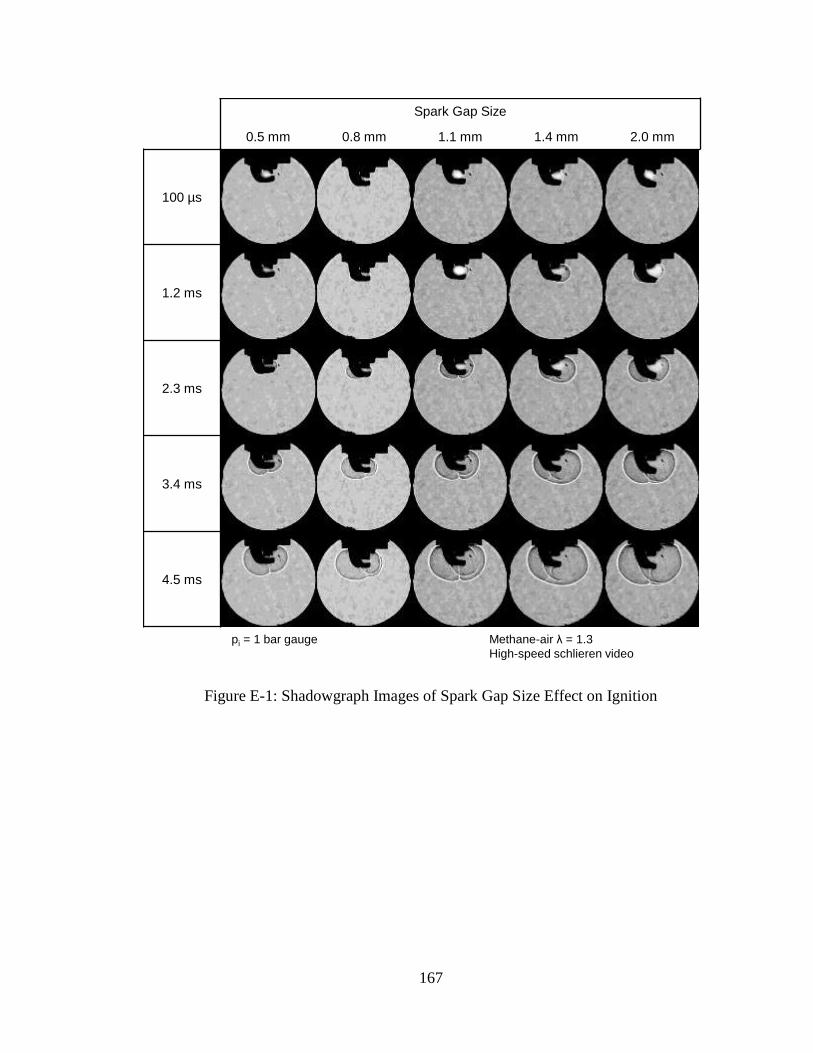
167
Figure E-1: Shadowgraph Images of Spark Gap Size Effect on Ignition
100 µs
1.2 ms
2.3 ms
3.4 ms
4.5 ms
Spark Gap Size
0.5 mm 0.8 mm 1.1 mm 1.4 mm 2.0 mm
Methane-air λ = 1.3
High-speed schlieren video
pi = 1 bar gauge
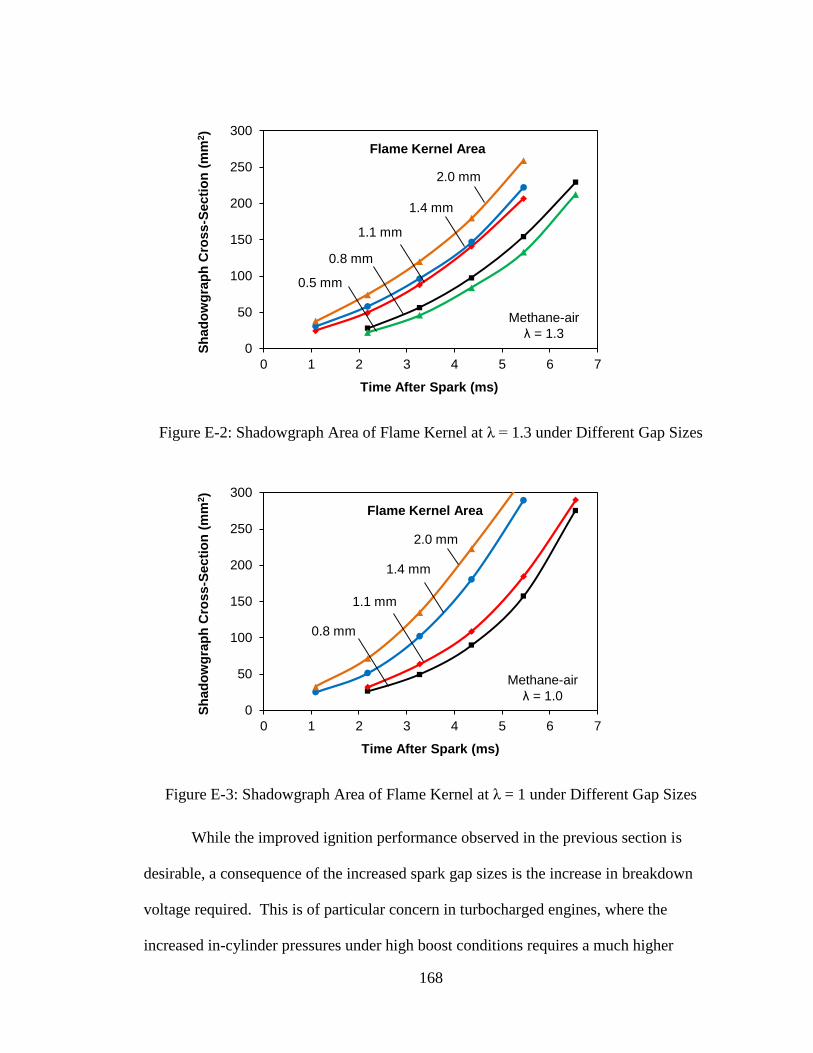
168
Figure E-2: Shadowgraph Area of Flame Kernel at λ = 1.3 under Different Gap Sizes
Figure E-3: Shadowgraph Area of Flame Kernel at λ = 1 under Different Gap Sizes
While the improved ignition performance observed in the previous section is
desirable, a consequence of the increased spark gap sizes is the increase in breakdown
voltage required. This is of particular concern in turbocharged engines, where the
increased in-cylinder pressures under high boost conditions requires a much higher
0
50
100
150
200
250
300
0 1 2 3 4 5 6 7
Sh
ad
ow
gra
ph
Cro
ss
-Secti
on
(m
m2)
Time After Spark (ms)
Flame Kernel Area
0.8 mm
2.0 mm
1.1 mm
1.4 mm
0.5 mm
Methane-air
λ = 1.3
0
50
100
150
200
250
300
0 1 2 3 4 5 6 7
Sh
ad
ow
gra
ph
Cro
ss
-Secti
on
(m
m2)
Time After Spark (ms)
Flame Kernel Area
0.8 mm
2.0 mm
1.1 mm
1.4 mm
Methane-air
λ = 1.0
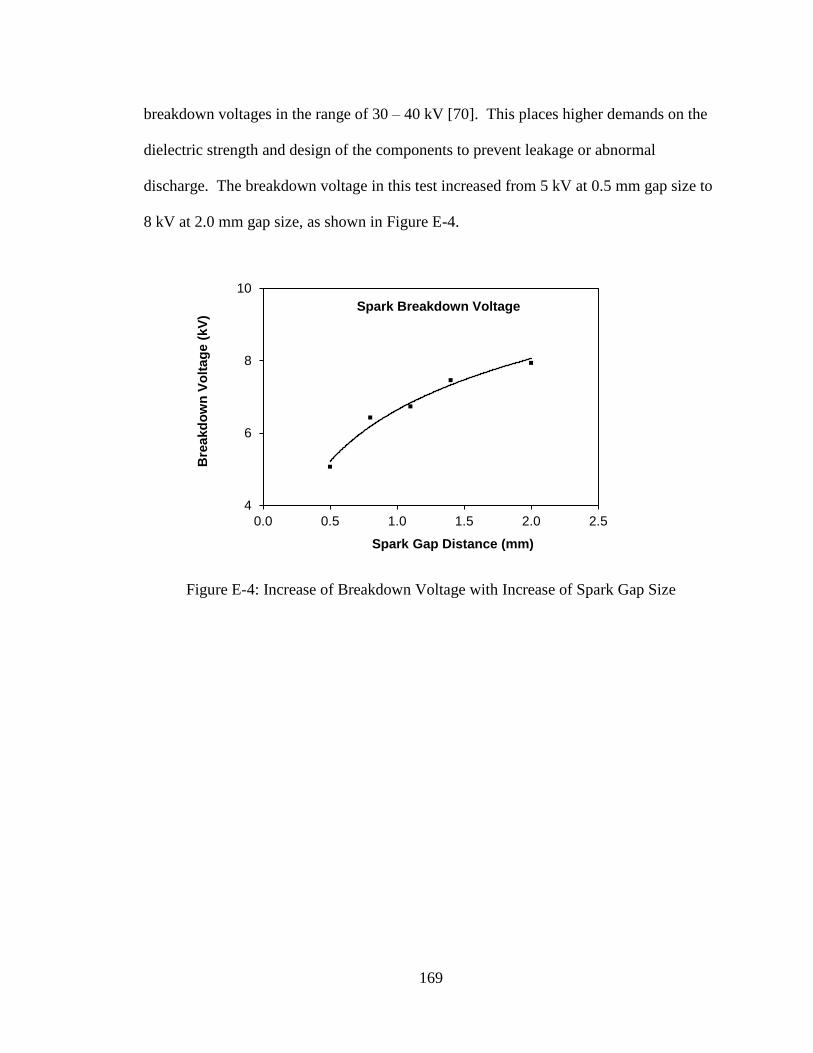
169
breakdown voltages in the range of 30 – 40 kV [70]. This places higher demands on the
dielectric strength and design of the components to prevent leakage or abnormal
discharge. The breakdown voltage in this test increased from 5 kV at 0.5 mm gap size to
8 kV at 2.0 mm gap size, as shown in Figure E-4.
Figure E-4: Increase of Breakdown Voltage with Increase of Spark Gap Size
4
6
8
10
0.0 0.5 1.0 1.5 2.0 2.5
Bre
akd
ow
n V
olt
ag
e (
kV
)
Spark Gap Distance (mm)
Spark Breakdown Voltage
170
VITA AUCTORIS
NAME: Kelvin Xie
PLACE OF BIRTH:
Beijing, China
YEAR OF BIRTH:
1986
EDUCATION:
University of Toronto, B.A.Sc., Toronto, ON 2009
University of Windsor, M.Sc., Windsor, ON, 2012
University of Windsor, Ph.D., Windsor, ON, 2018
171
LIST OF PUBLICATIONS
Refereed Journals:
1. Xiaoye Han, Kelvin Xie, Jimi Tjong, and Ming Zheng. “Empirical Study of
Simultaneously Low NOx and Soot Combustion With Diesel and Ethanol Fuels in Diesel
Engine,” J. Eng. Gas Turbines Power 134, 112802 (2012).
2. Shouvik Dev, Prasad Divekar, Kelvin Xie, Xiaoye Han, Xiang Chen, and Ming Zheng.
“A Study of Combustion Inefficiency in Diesel LTC and Gasoline-Diesel RCCI Via
Detailed Emission Measurement,” J. Eng. Gas Turbines Power 137 (12), 121501 (2015).
Refereed Conference Proceedings:
1. Kelvin Xie, Xiaoye Han, Graham T. Reader, Meiping Wang, and Ming Zheng. “Light
Hydrocarbon Emissions from Diesel Low Temperature Combustion,” Proceedings of the
ASME 2010 International Mechanical Engineering Congress & Exposition, ASME
IMECE2010-39191, November 16, 2010, Vancouver, British Columbia, Canada.
2. Kelvin Xie, Xiaoye Han, Usman Asad, Graham T. Reader, and Ming Zheng. “Empirical
Study of Energy in Diesel Combustion Emissions with EGR Application,” 2011 JSAE
Powertrain, Fuels, and Lubricants Conference, JSAE 20119354, SAE 2011-01-1817,
August 31, 2011, Kyoto, Japan.
3. Marko Jeftic, Usman Asad, Xiaoye Han, Kelvin Xie, Shui Yu, Meiping Wang, and Ming
Zheng. “An Analysis of the Production of Hydrogen and Hydrocarbon Species by Diesel
Post Injection Combustion,” Proceedings of the ASME 2011 Internal Combustion Engine
Division Fall Technical Conference, ASME ICEF2011-60135, October 3, 2011,
Morgantown, West Virginia, USA.
4. Usman Asad, Arturo Mendoza, Kelvin Xie, Marko Jeftic, Meiping Wang, and Ming
Zheng. “Speciation Analysis of Light Hydrocarbon and Hydrogen Production During
Diesel Low Temperature Combustion,” ASME ICEF2011-60130, October 3, 2011,
Morgantown, West Virginia, USA.
172
5. Shui Yu, Kelvin Xie, Xiaoye Han, Marko Jeftic, Tongyang Gao, and Ming Zheng.
“Preliminary Study of the Spark Characteristics for Unconventional Cylinder Charge
with Strong Air Movement,” ASME ICEF2011-60132, October 4, 2011, Morgantown,
West Virginia, USA.
6. William de Ojeda, Yu, Zhang, Kelvin Xie, Xiaoye Han, Meiping Wang, and Ming Zheng.
"Exhaust Hydrocarbon Speciation from a Single-Cylinder Compression Ignition Engine
Operating with In-Cylinder Blending of Gasoline and Diesel Fuels," 2012 SAE World
Congress & Exhibition, SAE 2012-01-0683, April 24, 2012, Detroit, Michigan, USA.
7. Xiaoye Han, Kelvin Xie, Graham T. Reader, Xiang Chen, Jimi Tjong, Meiping Wang,
and Ming Zheng. “The Impact of Fuels and Fuelling Strategy on Enabling of Clean
Combustion in a Diesel Engine,” The Eight International Conference on Modeling and
Diagnostics for Advanced Engine Systems, COMODIA 2012 FL2-1, July 24, 2012,
Fukuoka, Japan.
8. Xiaoye Han, Kelvin Xie, Ming Zheng, and William de Ojeda. “Ignition Control of
Gasoline-Diesel Dual Fuel Combustion,” 2012 SAE Commercial Vehicles Conference,
SAE 2012-01-1972, October 2, 2012, Chicago, Illinois, USA.
9. Shui Yu, Xiaoye Han, Kelvin Xie, Meiping Wang, Liguang Li, Jimi Tjong, and Ming
Zheng. “Multi-coil High Frequency Spark Ignition to Extend Diluted Combustion
Limits,” FISITA F2012-A01-040, November 27, 2012, Beijing, China.
10. Shouvik Dev, Prasad Divekar, Kelvin Xie, Xiaoye Han, Xiang Chen, and Ming Zheng.
“A Study of Combustion Inefficiency in Diesel LTC and Gasoline-Diesel RCCI Via
Detailed Emission Measurement,” Proceedings of the ASME 2014 Internal Combustion
Engine Division Fall Technical Conference, ASME ICEF2014-5656, October 21, 2014,
Columbus, Indiana, USA.
11. Tongyang Gao, Kelvin Xie, Shui Yu, Xiaoye Han, Meiping Wang, and Ming Zheng.
“Characterization of n-Butanol High Pressure Injection from Modern Common Rail
Injection System,” Proceedings of the ASME 2015 Internal Combustion Engine Division
Fall Technical Conference, ASME ICEF2016-1129, November 10, 2015, Houston,
Texas, USA.
173
12. Kelvin Xie, Tadanori Yanai, Zhengyi Yang, Graham Reader, and Ming Zheng. Emission
Analysis of HCCI Combustion in a Diesel Engine Fueled by Butanol,” 2016 SAE World
Congress, SAE Technical Paper 2016-01-0749, April 13, 2016, Detroit, Michigan, USA.
13. Shui Yu, Kelvin Xie, Xiao Yu, Meiping Wang, Ming Zheng, Xiaoye Han, and Jimi
Tjong. “The Effect of High-Power Capacitive Spark Discharge on the Ignition and
Flame Propagation in a Lean and Diluted Cylinder Charge,” 2016 SAE World Congress,
SAE Technical Paper 2016-01-0707, April 12, 2016, Detroit, Michigan, USA.
14. Kelvin Xie, Shui Yu, Tongyang Gao, Xiao Yu, Ming Zheng, and Liguang Li.
“Investigation of Multi-pole Spark Ignition on Flame Kernel Development and in Engine
Operation,” Proceedings of the ASME 2016 Internal Combustion Engine Division Fall
Technical Conference, ASME ICEF2016-9474, October 11, 2016, Greenville, South
Carolina, USA.
15. Shui Yu, Kelvin Xie, Xiao Yu, Meiping Wang, Ming Zheng, Xiaoye Han, and Jimi
Tjong. “High Energy Ignition Strategies for Diluted Mixtures via a Three-Pole Igniter,”
2016 SAE International Powertrains, Fuels & Lubricants Meeting, SAE Technical Paper
2016-01-2175, October 24, 2016, Baltimore, Maryland, USA.
16. Kelvin Xie, Shui Yu, Xiao Yu, Geraint Bryden, Ming Zheng, and Mengzhu Liu.
“Investigation of Multi-Pole Spark Ignition Under Lean Conditions and with EGR,” 2017
SAE World Congress, SAE Technical Paper 2017-01-0679, April 5, 2017, Detroit,
Michigan, USA.


