Embed Size (px)
Citation preview

1 23
Mitigation and Adaptation Strategiesfor Global ChangeAn International Journal Devoted toScientific, Engineering, Socio-Economicand Policy Responses to EnvironmentalChange ISSN 1381-2386Volume 20Number 1 Mitig Adapt Strateg Glob Change (2015)20:121-133DOI 10.1007/s11027-013-9482-y
Effectiveness of strategies at reducingsand temperature to mitigate potentialimpacts from changes in environmentaltemperature on sea turtle reproductiveoutputJ. Jourdan & M. M. P. B. Fuentes

1 23
Your article is protected by copyright and all
rights are held exclusively by Springer Science
+Business Media Dordrecht. This e-offprint
is for personal use only and shall not be self-
archived in electronic repositories. If you wish
to self-archive your article, please use the
accepted manuscript version for posting on
your own website. You may further deposit
the accepted manuscript version in any
repository, provided it is only made publicly
available 12 months after official publication
or later and provided acknowledgement is
given to the original source of publication
and a link is inserted to the published article
on Springer's website. The link must be
accompanied by the following text: "The final
publication is available at link.springer.com”.

ORIGINAL ARTICLE
Effectiveness of strategies at reducing sand temperatureto mitigate potential impacts from changesin environmental temperature on sea turtlereproductive output
J. Jourdan & M. M. P. B. Fuentes
Received: 14 March 2013 /Accepted: 5 June 2013 /Published online: 6 July 2013# Springer Science+Business Media Dordrecht 2013
Abstract Sea turtle reproduction is heavily influenced by environmental temperature. Thus,projected changes in global temperatures are predicted to alter their reproductive output (e.g.hatchling sex ratio and success). Management strategies to mitigate potential threats havebeen identified, but little is known about their effectiveness. We tested how effectivesprinkling nests with water and shading is at reducing sand temperature. We compared sandtemperature at average green turtle (Chelonia mydas) nest depth in a controlled environmentwith 5 different treatments: (1) shade (S), (2) shade with sprinkling during the day (SD) and(3) at night (SN), and (4) sprinkling during the day (ED) and (5) at night (EN) both exposedto sunlight. Not all strategies reduced the sand temperature; treatments with sprinklingduring the day and shading on rainy days had warmer temperatures (0.83±1.20 °C and0.96±0.41 °C respectively) than control treatments. Sprinkling during the night at anexposed and shaded setting were most effective at reducing sand temperature (with sandtemperature on average 2.23±0.66 °C and 1.43±0.94 °C lower than control, respectively).These strategies could potentially be effective in counteracting increases in temperature atnesting grounds used by the northern Great Barrier Reef green turtle by 2030, wherepredictions are for an increase of 0.2–1.8±0.01–0.37 °C. The effectiveness of strategies willlikely vary regionally depending on the beach environment and setting used for the strategy.
Keywords Climate change .Effectiveness . In situ conservation strategies . Sand temperature .
Sea turtles . Temperature-dependent sex determination
Mitig Adapt Strateg Glob Change (2015) 20:121–133DOI 10.1007/s11027-013-9482-y
J. JourdanUniversité de Montpellier 2, Place Eugene Bataillon, 34095 Montpellier, France
J. Jourdan :M. M. P. B. Fuentes (*)Australian Research Council Centre of Excellence for Coral Reef Studies, James Cook University,Townsville 4811 Queensland, Australiae-mail: [email protected]
Author's personal copy

1 Introduction
Sea turtles are thought to be particularly vulnerable to projected changes in environmentaltemperature (Hawkes et al. 2007, 2009). Sea turtle’s life history, physiology and behavioraltraits are influenced by environmental temperature, thus their distribution, reproduction andforaging ecology will likely be affected by projected increases in temperature (Janzen 1994;Davenport 1997). The most detectable impacts of climate change on sea turtles will likely beon their terrestrial reproductive phase as projected increases in temperature could alter theirnesting phenology, offspring sex and incubation success and duration (Standora and Spotila1985; Mazaris et al. 2008). Successful incubation of sea turtle eggs occurs within a narrowthermal range of 25 °C to 33 °C (Yntema and Mrosovsky 1982). Prolonged exposure of eggsto temperatures near the upper thermal threshold (~33 °C) increases the probability ofmorphological abnormalities, and reduces hatching success and hatchling survival(Matsuzawa et al. 2002; Segura and Cajade 2010). Additionally, sea turtles exhibittemperature-dependent sex determination (TSD), whereby the incubation temperature de-termines the sex of hatchlings and warmer temperatures produce higher proportions offemales (Standora and Spotila 1985). The transitional range of temperature (TRT) is therange of temperature in the nest whereby sex ratio shifts from all males to all females and thepivotal temperature is where a 50:50 male to female sex ratio is produced (Yntema andMrosovsky 1980). The upper and lower limits of TRT can vary between sea turtle speciesand populations. Previous studies suggest general ranges for the lower limits (~ 26 to28.75 °C) and upper limits (~ 29.75 to 32 °C) of TRTs, and they provide a general rangeof widths for TRTs (~1 to 3 °C) (Wibbels 2003). The full transitional range (TRT) for thenGBR green turtle population is assumed to be 3 °C wide centered around the pivotaltemperature (Mrosovsky 1994).
Projected increases in temperature could result in highly female-biased populations of seaturtles (see Hays et al. 2003; Hawkes et al. 2007, 2009; Fuentes et al. 2009, 2010a;Poloczanska et al. 2009; Hamann et al. 2013). High degree of feminization of turtlepopulations could alter reproductive factors (e.g. intra- and intersexual competition, spermcompetition, and multiple paternity) (Wibbels 2003) and lead to rates of fertilization and lossof genetic variation, thereby jeopardizing the ability of turtle populations to adapt to climatechange (Hamann et al. 2010).
Concerns about the potential impact of increased environmental temperature on sea turtleshave prompted the identification of management strategies to mitigate potential threats on theirterrestrial reproductive phase (see Fuentes et al. 2012). Strategies include identifying and legallyprotecting extant and future suitable nesting beaches (e.g. male-producing beaches) and activeintervention such as relocation of threatened nests to hatcheries or artificial incubators, and insitu manipulation of incubation temperatures using shade, water sprinklers, native vegetation,and the addition of sediment with different color and grain sizes (Naro-Maciel et al. 1999; vande Merwe et al. 2005; Kamel and Mrosovsky 2006; Fuentes and Cinner 2010; Fuentes et al.2012; Patino-Martinez et al. 2012). However, little is known about how effective thesestrategies are in reducing sand temperature and therefore mitigating potential impacts of climatechange on sea turtle’s reproductive output (Fuentes et al. 2012). For example, the impacts ofclimate change on the terrestrial reproductive phase of sea turtles has been most studied for thenorthern Great Barrier Reef (nGBR) green turtle (Chelonia mydas) population (see Fuentes etal. 2009, 2010a, b, 2011), which is the largest green turtle population in the world (Limpus et al.2003). Although strategies have been suggested to mitigate impacts to this population (seeFuentes and Cinner 2010; Fuentes et al. 2010a) knowledge of their effectiveness is underrepresented in the studies.
122 Mitig Adapt Strateg Glob Change (2015) 20:121–133
Author's personal copy

The aim of the present study is to examine the effectiveness of two identified manage-ment strategies, sprinkling and shading, to reduce sand temperature at sea turtle nestinggrounds. Specifically, we explore whether these strategies would sufficiently reduce the sandtemperature to counteract predicted increases in temperature at nesting grounds used by thenGBR green turtle population. To direct future research in this area we discuss the logisticalconstraints inherent in implementing these strategies.
2 Materials and methods
2.1 Sampling design
The effect of water sprinklers and shade on the thermal profile of sand was explored in anexperimental setting at the Marine Aquaculture and Research Facilities Unit, James CookUniversity (Townsville, Australia). The experiment was conducted over 2 months from the25th December 2011, to coincide with peak nesting season for the northern Great BarrierReef (nGBR) green turtle population. Our experimental design consisted of four 1,000 Lcontainers (IBC1000LRECON, www.peopleinplastic.com, 1,200×1,000×1,160 mm), filledwith sand comparable to that from a typical nesting beach in the region, and located aboveground. Five treatments were tested : (1) shade (S), (2) shade with sprinkling during the day(SD) and at (3) night (SN), and (4) sprinkling of unshaded sand during the day (ED) and at(5) night (EN). Two containers were placed under a shade structure composed of a white,semi-transparent solar weave fabric (50 % of light reduction) and two containers were placedin an exposed area with 100 % exposure to the sun. One container in the shade and one in theexposed area were sprinkled with freshwater. The sprinkling regimes were trialed over12 days for each of the sprinkling treatments: (1) sprinkling daily from 11:00 to 13:00(06th to 17th January 2012), and (2) sprinkling daily from 23:00 to 03:00 (24th January to05th February 2012). The amount of water used was estimated to be 30 l per hour / per tank.Water was at approximately 34±2 °C during the day and 25±2 °C at night and sprinkled viaunburied pipes. The remaining two tanks, one under the shade and the other in the exposedarea, were not sprinkled; the latter was used as control. Sand temperature was recordedhourly with temperature data loggers (VEMCO Minilog-II-T, accuracy ±0.1 °C) at 50 cmdepth to correspond with mean green turtle nest depth (Spotila et al. 1987).
2.2 Data analysis
The mean daily temperature was calculated from hourly sand temperature records for eachtreatment.Mean daily temperature from the treatments were compared to the control using a two-tailed paired-sample t-test. To explore the temporal influence of each sprinkling regime (nightand day) on sand temperature we compared the mean temperature for the hour prior to sprinklingand the hour after sprinkling ceased. We also analyzed the daily range of temperatures at eachtreatment by calculating the difference between the maximum and minimum values recordedeach day. Some rain occurred during the study so rainfall data for the study period was obtainedfrom the Australian Bureau of Meteorology (BOM) weather station in Townsville, (http://www.bom.gov.au/climate/dwo/IDCJDW4128.latest.shtml, [Accessed March 2012]). The effectof rainfall on our treatments was tested using regression analysis. On treatments where rainfallhad a significant effect on temperature we analyzed the mean daily temperature of the treatmentseparately on rainy days (more than 6mmof rain) and on non- rainy days. All reported values aremeans±standard deviations, unless otherwise stated.
Mitig Adapt Strateg Glob Change (2015) 20:121–133 123
Author's personal copy

2.3 Potential of strategies to counteract impacts of increased temperature
To investigate whether shading and sprinkling strategies have the capacity to counteractpredicted increases in temperature on nesting grounds used by the nGBR green turtlepopulation we compared mean temperature change observed during treatment for eachstrategy (as per Table 1) with predicted increases in sand temperature at nesting groundsused by the nGBR green turtle population (as per Fuentes et al. 2009, 2010a). For this, weused published information on the predicted average increase of sand temperature for 7nesting grounds used by the nGBR green turtle population (Fig. 1) for 2,030 and 2,070,under both a ‘conservative’ and an ‘extreme’ scenario of climate change, as per Fuentes et al.(2009, 2010a) and summarized in Appendix Table 2. The selected nesting grounds represent99 % of nesting for the nGBR green turtle population with approximately 90 % of nestingoccurring at Raine Island and Moulter Cay (Limpus et al. 2003). Bramble Cay and DowarIsland are home of the highest densities of nesting green turtles in Torres Strait. Nestingactivity at Sandbank 7 and 8 is considered as minor and trivial at Milman Island (Fuentes etal. 2010a).
3 Results
Temperature at mean sea turtle nest depth in each treatment was significantly different to thecontrol (Table 1).
3.1 Shading
Rainfall influenced sand temperature in the shade (Spearman regression; r2=0.44, p-value<0.00). Consequently, the effectiveness of the “shaded” treatment was analyzed separatelyfor rainy days (Sr) and non-rainy days (Ss). On non-rainy days temperature at the shaded sites(Ss) was 0.68±0.47 °C cooler than the control (Fig. 2). Conversely, temperature was on average0.96±0.41 °C warmer in the shade on rainy days (Sr) compared to the control (Fig. 2).
3.2 Sprinkling
Rainfall was not correlated with sand temperature when sprinkling (day and night)occurred in exposed treatments (Spearman regression; r2: −0.09, p-value=0.77 (ED); r2:0.1268, p-value=0.07 (EN)). Consequently, we did not separate the data for rainy andnon-rainy days for this analysis (see Section 3.1). Sand temperature was on average
Table 1 Comparison of the mean daily temperature between each treatment and the control
Treatments compared with the control Mean T° difference betweenthe control and strategies (°C)±SD
p-Value DF t
Exposed + Day sprinkling −0.83±1.20 0.03 11 −2.41Exposed + Night sprinkling 2.23±0.66 0.00 19 15.07
Shade non rainy days (Ss) 0.68±0.47 2.45e-9 32 8.17
Shade rainy days (Sr) 0.96±0.41 0.00 7 −6.50Shade + Day sprinkling 0.74±1.02 0.01 11 2.13
Shade + Night sprinkling 1.43±0.94 0.00 19 7.24
124 Mitig Adapt Strateg Glob Change (2015) 20:121–133
Author's personal copy

0.83±1.20 °C higher than the control during daytime sprinkling in the exposed treatment(Fig. 3a), with temperature increasing by 3.12±2.41 °C during the sprinkling regime.When sprinkling ceased, sand temperature dropped by 2.85±2.40 °C until sprinklingstarted again the following day (Fig. 4a). Sprinkling the exposed treatment during thenight resulted in cooler temperatures (average 2.23±0.66 °C) than the control (Fig. 3b).During the sprinkling period at night, temperature substantially decreased by 3.02±0.69 °C and increased by 2.96±0.54 °C 7 h after sprinkling stopped until sprinkling
Fig. 1 Map of nesting grounds used by the northern Great Barrier Reef green turtle population and of nestingsites selected for this study. Size of dots indicates importance of each nesting ground: high nesting (+ 1,000turtles nesting a year), moderate nesting (300–1,000 turtles nesting a year), low nesting (50–300 nesting turtlesa year), and trivial nesting (<50 turtles nesting a year)
Mitig Adapt Strateg Glob Change (2015) 20:121–133 125
Author's personal copy

started the following day. The lowest temperature was consistently recorded immediatelyafter the sprinkling stopped (at 4:00 am) (Fig. 4b).
3.3 Combination of shading and sprinkling
Rainfall did not affect the difference between temperature, at average nest depth, in thecontrol and the treatment when shading and sprinkling were combined (regression; r2:0.1034 (SD), 0.1764 (SN)). Consequently, we analyzed the effectiveness of these treatmentswithout distinguishing between rainy and non-rainy days. Temperature was on average 0.74±1.02 °C cooler under the shade while sprinkling during the day than the control (Fig. 3c).Sand temperature increased by 1.94±1.65 °C during the sprinkling period and then de-creased when sprinkling ceased by 1.76±1.67 °C until sprinkling started the following day(Fig. 4a). Similar results were found for sprinkling at night under the shade, with temper-atures in average of 1.43±0.94 °C cooler than the control (Fig. 3d). Sand temperaturedecreased by 2.56±0.75 °C during the sprinkling period and increased by 2.62±0.68 °Cwhen sprinkling stopped (Fig. 4b).
3.4 Comparison among strategies and their potential to mitigate impacts from projectedincreases in environmental temperature
Not all strategies reduced the sand temperature; sprinkling during the day and shading on rainydays increased sand temperature by 0.83±1.20 °C and 0.96±0.41 °C respectively (Fig. 5).Sprinkling during the night at an exposed and shaded setting were most effective at reducingsand temperature ( with sand temperature on average 2.23±0.66 °C and 1.43±0.94 °C respec-tively lower than control) (Fig. 5). These strategies could potentially be effective in counteractingincreases in temperature at nesting grounds used by the northern Great Barrier Reef green turtle
Fig. 2 The effect of rainfall on the difference in daily mean sand temperature between control and shaded (S)treatments
126 Mitig Adapt Strateg Glob Change (2015) 20:121–133
Author's personal copy

by 2,030 (predicted increases in sand temperature for 2,030 ranges from 0.2–1.8±0.01–0.37 °C);however projections are bleaker for 2,070 (predicted increases in sand temperature of 0.9–5.6±0.02–0.37 °C) and strategies may not be able to counteract increases in temperature.
Fig. 3 The effect of rainfall on difference in daily mean sand temperature between control and (a) Exposed +Day sprinkling (ED), (b) Exposed + Night sprinkling (EN), (c) Shade + Day sprinkling (SD), and (d) Shade +Night sprinkling (SN)
Fig. 4 Examples of hourly sand temperature at 50 cm depth for the control and sprinkling regimes: (a) 11:00to 13:00 h, (b) 23:00 to 03:00 h, (EN Exposed + Night sprinkling, SN Shade + Night sprinkling, ED Exposed+ Day sprinkling, SD Shade + Day sprinkling)
Mitig Adapt Strateg Glob Change (2015) 20:121–133 127
Author's personal copy

3.5 Daily range
Sprinkling increased the daily variation in temperature when compared with the control(2.14±0.58 °C). Temperature variation was greatest when sprinkling in the exposed area:variations were of 4.6±1.1 °C (ED); 3.46±0.76 °C (EN) (Fig. 6a) compared to whensprinkling in the shade: variations were of 2.62±0.70 °C (SD); 2.32±0.72 °C (SN) (Fig. 6b).
Fig. 5 Average difference in daily mean sand temperature at 50 cm between each strategy and the controlduring the study period (ED Exposed + Day sprinkling, EN Exposed + Night sprinkling, Ss Shade on non-rainy days, Sr shade on rainy days, SD Shade + Day sprinkling, SN = Shade + Night sprinkling)
Fig. 6 Daily temperature range for each strategy and the control over the study period (a) in the exposed areaand (b) under the shade (ED Exposed + Day sprinkling, EN Exposed + Night sprinkling, S Shade, SD Shade +Day sprinkling, SN Shade + Night sprinkling)
128 Mitig Adapt Strateg Glob Change (2015) 20:121–133
Author's personal copy

4 Discussion
Concern over the potential impacts of predicted increases in temperature on the reproductiveoutput of sea turtle populations has resulted in the identification of an array of potentialmanagement strategies (see Fuentes et al. 2012). However, little is known about theeffectiveness of these strategies in reducing sand temperature and therefore mitigatingimpacts of climate change on sea turtle’s reproductive output. This study indicates that notall suggested strategies may reduce sand temperature.
Sprinkling nests with water, as conducted in this study, will potentially reduce sandtemperature if conducted at night or in shaded areas, as sprinkling water on exposed areasduring the day increased sand temperature. However, Naro-Maciel et al. (1999) reported that2 h of sprinkling on an exposed area of the nesting beach during the hottest period of the dayreduced sand temperature by approximately 1 °C at 60 cm depth, increasing the daily rangeof temperature by about 1 °C. The disparity between these results and ours may be due to adifference in methodology. While the study by Naro-Maciel et al. (1999) was conducted onthe beach and used pumped water from a well transported with buried pipes our study wasconducted in an experimental setting where water was transported by unburied pipes thatcarried water from an exposed container; where ultimately the water was heated by beingexposed. This disparity in results, illustrates the need to carefully consider the equipment andsetup. Clearly, the effectiveness of the sprinkling system may vary and depend on theirrigation design and sprinkling regime. To avoid counterproductive outcomes it is importantto conduct in situ pilot studies prior to fully implementing any sprinkling strategy, whereseveral setups and sprinkling regimes are trialed. Here we sprinkled for 4 h during the hottestpart of the day and at night; future studies should explore the effectiveness of sprinklingduring different times of the day and for different periods using different setups.
Sprinkling not only influenced the sand temperature, it also increased the daily range oftemperature, especially in the exposed area where temperature fluctuations were greater than2.5 °C. Daily temperature fluctuations can have a profound effect on sex determination, withmore females produced when dial fluctuations increase around a mean temperature (Georgeset al. 1994). Considering this, sprinkling strategies should be implemented with care,especially when using unburied pipes on hot days as the result could be counterproductive.Sprinkling should preferentially be implemented in shaded areas where mean temperatureand daily temperature fluctuations are lower. The moisture of the sand should also beconsidered and monitored when using sprinkling systems, as proper moisture conditionsare important for egg development (Bustard and Greenham 1968). Moist environments cantrigger fungal infection (Solomon and Baird 1980), drown the eggs and/or impede gasdiffusion, which may affect the rate of success of embryonic development and cause eggmortality (Ackerman 1997). Excessively wet conditions (i.e. 75 and 100 % humidity) canlower hatching success (Foley et al. 2006; Ozdemir and Turkozan 2006).
Consideration of environmental conditions is also important when designing shadingstructures. While shading has shown to be an effective strategy for reducing sandtemperature (e.g. van de Merwe et al. 2005; Patino-Martinez et al. 2012), the imperme-ability of the fabric prevented natural rainfall from cooling the sand during our study. Asa result, on rainy days, sand in the shaded area had higher temperatures than the control.Shade structures, such as the one used here, that prevents rain from reaching the sand,may also affect hydric conditions in the nest and result in excessively dry sand leading todesiccation of eggs (Mortimer 1990; Ackerman 1997). Natural rainfall plays an important
Mitig Adapt Strateg Glob Change (2015) 20:121–133 129
Author's personal copy

role in cooling sand temperature. Analogous to our study, others have found that heavyrainfall causes a drop in sand temperature by approximately 2 °C (Godfrey et al. 1996;Houghton et al. 2007). Thus, it is important to consider the permeability of the material/fabricwhen considering the shade structure to be used, especially in rainy regions. Highly resistantmaterials, such as mesh fabrics with different mesh size and thickness are readily available inmost countries. A low-cost alternative could be to build a permeable shade structure with leaves,which would allow rain to moist the sand (Higginson and Vasquez 1989). Similarly, shadingthrough coastal re-vegetation programs could help reduce sand temperature and also preventerosion (Kamel and Mrosovsky 2006). Shading through vegetation has been trialed at Junquillalbeach in Costa Rica where sand temperature was reduced by as much as 2.25 °C (Baker-Gallegoset al. 2009). However, care should be takenwhen utilizing re-vegetation programs as invasive rootsmay also present a threat to sea turtle nests (Kornaraki et al. 2006). At places with limitedprecipitation, it may be more relevant to opt for a shading material with a high solar radiation,which has greater potential to reduce sand temperature. Again, there is the need to trial severalshading structures and materials to determine the best set up for a particular location.
Ultimately, the mitigation strategy selected for use at a nesting ground will depend on anumber of factors (Kornaraki et al. 2006; Patino-Martinez et al. 2012), especially thedesired outcome and the required reduction of sand temperature. Thus, for effectiveimplementation of strategies, an understanding of the system being manipulated and thepopulation being managed is essential. An understanding of the thermal profile at differentnesting beaches, the current sex ratio entering the population from each beach and theoperational sex ratio for that population is necessary (Fuentes et al. 2012). Therefore, it isimportant to collect such information at key nesting areas to provide baseline data, whichwill help determine whether strategies are necessary and if so which ones are most likely tobe effective in the future. To ensure that the desirable sex-ratio is produced throughmanipulative strategies such as shading and sprinkling it is important to know the pivotaltemperature (PT) as well as the threshold temperatures for the targeted population (Fuenteset al. 2012). Given the relatively narrow transitional range of temperatures (TRT) in seaturtle species, a temperature change of 3 °C or less can shift a sex ratio from 100 % of onesex to 100 % of the other sex (Wibbels 2003). Consequently, the degree of shading and/orthe amount of water needed will change between nest locations and populations (Hays etal. 1995). Information on PT and TRT should be used, together with baseline thermalprofiles, and information on operational sex ratio to determine which strategy is the mostsuitable to produce the desired sex ratio at a particular nesting site.
Suitability will also depend on the cost and logistical feasibility of implementingstrategies (Fuentes et al. 2009). For example, sprinkling will be unrealistic at remoteand uninhabited islands where water supply is scarce. Acquisition of water may bepossible from the ground, and/or by pumping it from the ocean. However, this couldbe intrusive and expensive to implement at a rookery scale and could increaseosmotic stress in the nest as well. An alternative could be storing rainwater in a tankplaced in a cool area, which could be readily used on hot and sunny days. Anotherpossible method could be the use of a tube buried in the sand able to produce waterfrom air humidity. This inexpensive system could supply up to 40 l of water per day(for more information see http://mb-soft.com/public3/water500.html [Accessed in May2012]). Nevertheless, shading and sprinkling strategies would require frequent main-tenance and monitoring, making them challenging to implement in remote areas. Forexample, even though we found that the majority of the strategies trialed could, in theshort-term, counteract the predicted impacts from climate change on the nGBR greenturtle population, not all strategies will be feasible at all of their nesting grounds.
130 Mitig Adapt Strateg Glob Change (2015) 20:121–133
Author's personal copy
Implementation of strategies at nesting grounds such as Dowar Island, located close tohuman settlement, will be easier than at remote areas such as Bramble Cay and RaineIsland. The effectiveness of strategies will also likely vary across locations due to thecomplex interaction of biological, chemical, and physical factors that influence nesttemperature. Thus, future studies should investigate the spatial and temporal variationin effectiveness of strategies at various nesting beaches rather that at an experimentalsetting to guide future decisions (see Fuentes et al. 2012).
Similarly, further information on the risks associated with implementing strategies should beinvestigated to increase the confidence of implementing strategies as climate change impactsmanifest and active strategies become more necessary (Barker et al. 2007). Some of the risksrelate to further alteration of the natural sex ratio at nesting beaches, impacts to other species,and change to beach dune ecosystems (Hamann et al. 2013). Understanding and mitigatingrisks requires careful case-by-case considerations. In lieu of potential risks and lack of infor-mation on strategies managers should give priority to no regret and reversible strategies whichprotect the nesting environment without posing any risk to turtles and other flora/fauna (Hoegh-Guldberg and Bruno 2010; Fuentes et al. 2012). In the meantime, as strategies are trialed, theireffectiveness and risks should be shared to help reduce any future negative side effectsassociated with them. Obviously the strategies trialed here are band-aid solutions, an effortshould be made to reduce greenhouse gases to reduce future impacts.
Acknowledgements We are grateful to the Marine and Aquaculture Research Facilities Unit (MARFU) staff:S. Wever, B. Lawes and L. Mata who kindly helped set up the experiment. We thank P. Cohen and J. Alvarez-Romero for comments that improved the manuscript. During manuscript preparation MMPB Fuentes wassupported by the Australian Research Council.
Appendix
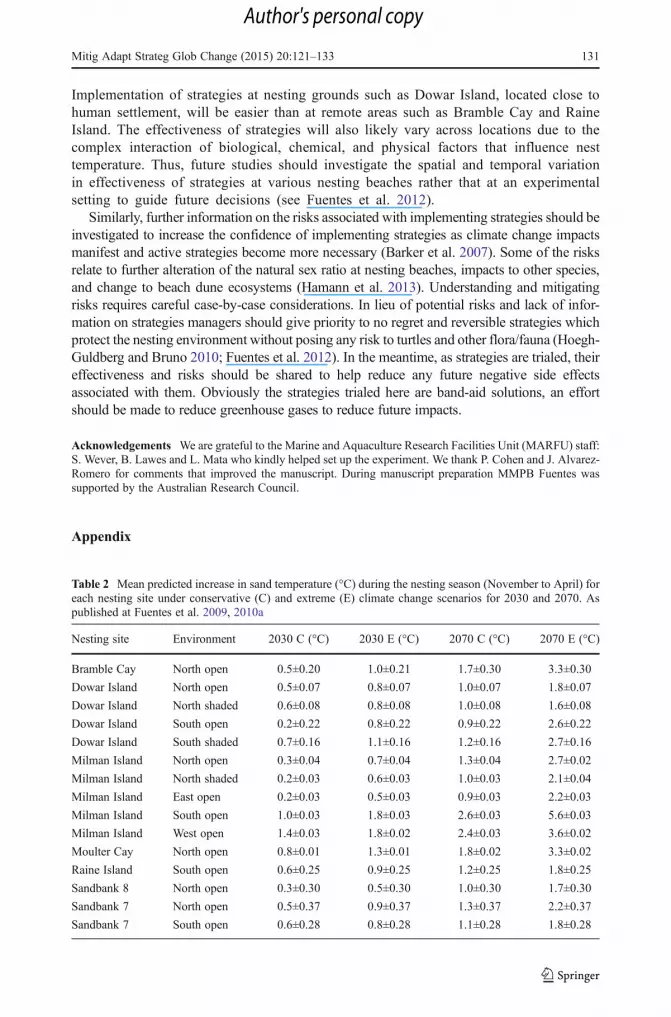
Table 2 Mean predicted increase in sand temperature (°C) during the nesting season (November to April) foreach nesting site under conservative (C) and extreme (E) climate change scenarios for 2030 and 2070. Aspublished at Fuentes et al. 2009, 2010a
Nesting site Environment 2030 C (°C) 2030 E (°C) 2070 C (°C) 2070 E (°C)
Bramble Cay North open 0.5±0.20 1.0±0.21 1.7±0.30 3.3±0.30
Dowar Island North open 0.5±0.07 0.8±0.07 1.0±0.07 1.8±0.07
Dowar Island North shaded 0.6±0.08 0.8±0.08 1.0±0.08 1.6±0.08
Dowar Island South open 0.2±0.22 0.8±0.22 0.9±0.22 2.6±0.22
Dowar Island South shaded 0.7±0.16 1.1±0.16 1.2±0.16 2.7±0.16
Milman Island North open 0.3±0.04 0.7±0.04 1.3±0.04 2.7±0.02
Milman Island North shaded 0.2±0.03 0.6±0.03 1.0±0.03 2.1±0.04
Milman Island East open 0.2±0.03 0.5±0.03 0.9±0.03 2.2±0.03
Milman Island South open 1.0±0.03 1.8±0.03 2.6±0.03 5.6±0.03
Milman Island West open 1.4±0.03 1.8±0.02 2.4±0.03 3.6±0.02
Moulter Cay North open 0.8±0.01 1.3±0.01 1.8±0.02 3.3±0.02
Raine Island South open 0.6±0.25 0.9±0.25 1.2±0.25 1.8±0.25
Sandbank 8 North open 0.3±0.30 0.5±0.30 1.0±0.30 1.7±0.30
Sandbank 7 North open 0.5±0.37 0.9±0.37 1.3±0.37 2.2±0.37
Sandbank 7 South open 0.6±0.28 0.8±0.28 1.1±0.28 1.8±0.28
Mitig Adapt Strateg Glob Change (2015) 20:121–133 131
Author's personal copy

References
Ackerman RA (1997) The nest environment and the embryonic development of sea turtles. In: Lutz P, MusickJA (eds) The biology of Sea turtles. CRC Press, New York, pp 88–106
Baker-Gallegos J, Fish MR, Drews C (2009) Temperature monitoring manual: guidelines for monitoring sandand incubation temperatures on sea turtle nesting beaches. WWF report, San José, p 20
Barker T, Bashmakov I, Bernstein L et al (2007) Technical summary. In: Metz B, Davidson OR, Bosch PR,Dave R, Meyer LA (eds) Climate change 2007: mitigation. Contribution of Working Group III to theFourth Assessment Report of the Intergovernmental Panel on Climate Change, Cambridge UniversityPress, Cambridge, United Kingdom and New York, NY, USA
Bustard HR, Greenham P (1968) Physical and chemical factors affecting hatching in the green sea turtle,Chelonia mydas. Ecology 49:269–276
Davenport J (1997) Temperature and the life-history strategies of sea turtles. J Therm Biol 22:479–488Foley AM, Peck SA, Harman GR (2006) Effects of sand characteristics and inundation on the hatching
success of loggerhead sea turtle (Caretta caretta) clutches on low-relief mangrove islands in southwestFlorida. Chelonian Conserv Bi 5:32–41
Fuentes MMPB, Cinner JE (2010) Using expert opinion to prioritize impacts of climate change on sea turtles’nesting grounds. J Environ Manage 91:2511–2518
Fuentes MMPB, Maynard J, Guinea M et al (2009) Proxy indicators of sand temperature help project impactsof global warming on sea turtles in Northern Australia. Endang Species Res J 9:33–40
Fuentes MMPB, Hamann M, Limpus CJ (2010a) Past, current and future thermal profiles of green turtlesnesting grounds: implications from climate change. J Exp Mar Biol Ecol 383:56–64
Fuentes MMPB, Limpus CJ, Hamann M et al (2010b) Potential impacts of projected sea level rise to sea turtlerookeries. Aquat Conserv Mar Freshwat Ecosyst 20:132–139
Fuentes MMPB, Limpus CJ, Hamann M (2011) Vulnerability of sea turtle nesting grounds to climate change.Global Change Biol 17:140–153
Fuentes MMPB, Fish MR, Maynard JA (2012) Management strategies to mitigate the impacts of climatechange on sea turtle’s terrestrial reproductive phase. Mitig Adapt Strateg Glob Chang 17:51–63
Georges A, Limpus C, Stoutjesdeijk R (1994) Hatchling sex ratio in the marine turtle Caretta caretta isdetermined by proportion of development at a temperature, not daily duration of exposure. J Exp Zool270:432–444
Godfrey MH, Barreto R, Mrosovsky N (1996) Estimating past and present sex ratios of sea turtles inSuriname. Can J Zoolog 74:267–277
Hamann M, Godfrey MH, Seminoff JA et al (2010) Global research priorities for sea turtles: informingmanagement and conservation in the 21st century. Endang Species Res 11:245–269
Hamann M, Fuentes MMPB, Ban N, Mocellin V (2013) Climate change and marine turtles. In: Wyneken J,Lohmann KJ, Musick JA (eds) The biology of sea turtles, vol 3. Taylor & Francis Group, Boca Ranton,pp 353–378
Hawkes LA, Broderick AC, Godfrey MH et al (2007) Investigating the potential impacts of climate change ona marine turtle population. Glob Chang Biol 13:923–932
Hawkes LA, Broderick AC, Godfrey MH et al (2009) Climate change and marine turtles. Endang Species R7:137–154
Hays GC, Adams C, Mortimer J et al (1995) Inter- and intra-beach thermal variation for green turtle nests onAscension Island, South Atlantic. J Mar Biol Assoc UK 75:405–411
Hays GC, Broderick AC, Glen F et al (2003) Climate change and sea turtles: a 150-year reconstruction ofincubation temperatures at a major marine turtle rookery. Glob Chang Biol 9:642–646
Higginson J, Vasquez F (1989) Hatchery design and production of female hatchlings. Unpublished manu-script. Mar Turt Newsl 44:7–12
Hoegh-Guldberg O, Bruno J (2010) The impact of climate change on the World’s marine ecosystems. Science328:1523–1528
Houghton J, Myers A, Lloyd C et al (2007) Protracted rainfall decreases temperature within leatherback turtle(Dermochelys coriacea) clutches in Grenada, West Indies: ecological implications for a speciesdisplaying temperature dependent sex determination. J Exp Mar Biol Ecol 345:71–77
Janzen FJ (1994) Climate change and temperature-dependent sex determination in reptiles. Proc Natl Acad SciUSA 91:7487–7490
Kamel SJ, Mrosovsky N (2006) Deforestation: risk of sex ratio distortion in hawksbill sea turtles. Ecol Appl16:923–931
Kornaraki E, Matossian DA, Mazaris AD, Matsinos YG, Margaritoulis D (2006) Effectiveness of differentconservation measures for loggerhead sea turtle (Caretta caretta) nests at Zakynthos Island, Greece. BiolCons 130:324–330
132 Mitig Adapt Strateg Glob Change (2015) 20:121–133
Author's personal copy

Limpus CJ, Miller J, Parmenter J et al (2003) The green turtle, Chelonia mydas, population of Raine Islandand the Northern Great Barrier Reef 1843–2001. Memoirs Qld Mus 49:349–440
Matsuzawa Y, Sato K, Sakamoto W et al (2002) Seasonal fluctuations in sand temperature: effects on theincubation period and mortality of loggerhead sea turtle (Caretta caretta) pre-emergent hatchlings inMinabe, Japan. Mar Biol 140:639–646
Mazaris AD, Kallimanis AS, Sgardelis SP et al (2008) Do long-term changes in sea surface temperature at thebreeding areas affect the breeding dates and reproduction performance of Mediterranean loggerheadturtles? Implications for climate change. J Exp Mar Biol Ecol 367:219–226
Mortimer JA (1990) The influence of beach sand characteristics on the nesting behavior and clutch survival ofgreen turtles (Chelonia mydas). Copeia 1990:802–817
Mrosovsky N (1994) Sex ratios of sea turtles. J Exp Biol 270:16–27Naro-Maciel E, Mrosovsky N, Marcovaldi MA (1999) Thermal profiles of sea turtle hatcheries and nesting
areas at Praia do Forte, Brazil. Chelonian Conserv Bi 3:407–413Ozdemir B, Turkozan O (2006) Hatching success of original and hatchery nests of the green turtle, Chelonia
mydas, in Northern Cyprus. Turk J Zool 30:377–381Patino-Martinez J, Marco A, Quinones L et al (2012) A potential tool to mitigate the impacts of climate
change to the Caribbean leatherback sea turtle. Glob Chang Biol 18:401–411Poloczanska ES, Limpus C, Hays GC (2009) Vulnerability of marine turtles to climate change. Adv Mar Biol
56:151–211Segura LN, Cajade R (2010) The effects of sand temperature on pre-emergent green sea turtle hatchlings.
Herpetol Conserv Biol 5:196–206Solomon S, Baird T (1980) The effect of fungal penetration on the eggshell of the green turtle. J Electron
Microsc 2:434–435Spotila JR, Standora EA, Morreale SJ et al (1987) Temperature dependent sex determination in the green turtle
(Chelonia mydas): effects on the sex ratio on a natural beach. Herpetologica 43:74–81Standora EA, Spotila JR (1985) Temperature dependent sex determination in sea turtles. Copeia 1985:711–722Van de Merwe J, Ibrahim K, Whittier J (2005) Effects of hatchery shading and nest depth on the development
and quality of Chelonia mydas hatchlings: implications for hatchery management in Peninsular, Malaysia.Aust J Zool 53:205–211
Wibbels T (2003) Critical approaches to sex determination in sea turtles. In: Press C (ed) The Biology of SeaTurtles, Vol 2, p 103–134
Yntema CL, Mrosovsky N (1980) Sexual differentiation in hatchling loggerheads (Caretta caretta) incubatedat different controlled temperatures. Herpetologica 36:33–36
Yntema CL, Mrosovsky N (1982) Critical periods and pivotal temperatures for sexual differentiation in logger-head sea turtles. Can J Zoolog 60:1012–1016
Mitig Adapt Strateg Glob Change (2015) 20:121–133 133
Author's personal copy


