Embed Size (px)
Citation preview

S1
The effects of bioisosteric fluorine in synthetic cannabinoid designer drugs JWH-018, AM-2201, UR-144, XLR-11, PB-22, 5F-PB-22, APICA, and
STS-135
Samuel D. Banister, Jordyn Stuart, Richard C. Kevin, Amelia Edington, Mitchell Longworth, Shane M. Wilkinson, Corinne Beinat, Alexandra S. Buchanan, David E. Hibbs, Michelle Glass,
Mark Connor, Iain S. McGregor, Michael Kassiou
Contents: X-ray crystallographic data: S2–S9. 1H and 13C NMR spectra for XLR-11 (8) and STS-135 (13): S10–S13. Alternative representations of body temperature data: S14–S15. Binding affinities and functional activities of selected cannabinoids: S17. References: S18–S19.

S2
Table S1. Crystal data and structure refinement for UR-144 (7).
Identification code 13sam001 Empirical formula C21H29NO Formula weight 311.45 Temperature/K 150.15 Crystal system monoclinic Space group P21/n a/Å 12.1123(8) b/Å 10.7990(7) c/Å 13.9200(9) α/° 90.00 β/° 93.6870(10) γ/° 90.00 Volume/Å3 1817.0(2) Z 4 ρcalcmg/mm3 1.139 m/mm-1 0.069 F(000) 680.0 Crystal size/mm3 0.15 × 0.15 × 0.1 2Θ range for data collection 4.32 to 56.5° Index ranges -15 ≤ h ≤ 15, -14 ≤ k ≤ 12, -18 ≤ l ≤ 18 Reflections collected 13869 Independent reflections 4170[R(int) = 0.0179] Data/restraints/parameters 4170/0/213 Goodness-of-fit on F2 1.050 Final R indexes [I>=2σ (I)] R1 = 0.0398, wR2 = 0.1019 Final R indexes [all data] R1 = 0.0478, wR2 = 0.1077 Largest diff. peak/hole / e Å-3 0.26/-0.20

S3
Table S2. Fractional Atomic Coordinates (×104) and Equivalent Isotropic Displacement Parameters (Å2×10³) for UR-144 (7). Ueq is defined as 1/3 of of the trace of the orthogonalised UIJ tensor. Atom x y z Ueq C1 11919.5(8) 1638.6(10) 2202.6(8) 23.7(2)
C2 11397.0(8) 2299.5(10) 1453.3(7) 22.7(2)
C3 12215.4(8) 3151.2(10) 1127.1(7) 22.4(2)
C4 13188.4(9) 2957.9(10) 1724.8(7) 22.8(2)
C5 14152.5(9) 3646.4(11) 1637.8(8) 26.2(2)
C6 14131.6(9) 4538.8(11) 927.6(8) 28.9(2)
C7 13181.9(10) 4735.9(11) 314.8(8) 29.7(3)
C8 12224.0(9) 4056(1) 402.3(8) 26.5(2)
C9 10242.0(9) 2202.4(10) 1073.1(8) 24.2(2)
C10 9547.6(8) 1249.8(10) 1517.4(8) 23.7(2)
C11 8620.4(8) 515.2(10) 959.5(8) 25.3(2)
C12 8318.1(8) 1442.5(11) 1706.8(8) 25.4(2)
C13 8361.6(10) 779.1(13) -100.5(8) 34.5(3)
C14 8560.5(10) -862.5(11) 1166.9(10) 33.0(3)
C15 7739.9(10) 2632.3(12) 1396.0(9) 33.4(3)
C16 7986.8(10) 1007.4(12) 2684.7(9) 33.0(3)
C17 13790.9(9) 1480.2(11) 3079.5(8) 28.3(2)
C18 14695.4(9) 744.0(11) 2618.3(9) 31.0(3)
C19 14273.7(10) -156.0(11) 1838.3(9) 30.8(3)
C20 15187.5(11) -962.6(13) 1475.6(10) 41.2(3)
C21 14809.3(14) -1804.2(15) 646.8(12) 53.1(4)
N1 12982.9(7) 2027.3(9) 2374.1(6) 23.9(2)
O1 9888.8(7) 2895.1(8) 422.0(6) 34.0(2)

S4
Table S3. Bond lengths [Å] for UR-144 (7).
Atom Atom Length/Å C1 C2 1.3830(15)
C1 N1 1.3611(13)
C2 C3 1.4465(14)
C2 C9 1.4674(14)
C3 C4 1.4138(15)
C3 C8 1.4051(15)
C4 C5 1.3962(15)
C4 N1 1.3848(14)
C5 C6 1.3797(16)
C6 C7 1.4036(17)
C7 C8 1.3849(16)
C9 C10 1.4882(15)
C9 O1 1.2306(13)
C10 C11 1.5432(14)
C10 C12 1.5430(14)
C11 C12 1.5059(15)
C11 C13 1.5157(16)
C11 C14 1.5181(16)
C12 C15 1.5131(16)
C12 C16 1.5183(16)
C17 C18 1.5281(16)
C17 N1 1.4654(13)
C18 C19 1.5209(17)
C19 C20 1.5200(17)
C20 C21 1.516(2)

S5
Table S4. Bond angles [deg] for UR-144 (7).
Atom Atom Atom Angle/˚ N1 C1 C2 110.80(9)
C1 C2 C3 105.98(9)
C1 C2 C9 127.92(10)
C3 C2 C9 126.08(10)
C4 C3 C2 106.47(9)
C8 C3 C2 134.79(10)
C8 C3 C4 118.74(10)
C5 C4 C3 122.72(10)
N1 C4 C3 108.25(9)
N1 C4 C5 129.02(10)
C6 C5 C4 117.21(10)
C5 C6 C7 121.19(10)
C8 C7 C6 121.65(10)
C7 C8 C3 118.47(10)
C2 C9 C10 116.79(9)
O1 C9 C2 120.03(10)
O1 C9 C10 123.18(10)
C9 C10 C11 123.97(9)
C9 C10 C12 123.72(9)
C12 C10 C11 58.41(7)
C12 C11 C10 60.79(7)
C12 C11 C13 120.21(10)
C12 C11 C14 120.24(10)
C13 C11 C10 119.44(9)
C13 C11 C14 111.10(10)
C14 C11 C10 116.76(9)
C11 C12 C10 60.80(7)
C11 C12 C15 119.72(10)
C11 C12 C16 120.23(10)
C15 C12 C10 119.98(10)
C15 C12 C16 112.02(10)
C16 C12 C10 115.16(9)
N1 C17 C18 113.22(9)
C19 C18 C17 114.55(9)
C20 C19 C18 112.64(10)
C21 C20 C19 113.92(12)
C1 N1 C4 108.49(9)
C1 N1 C17 125.23(9)
C4 N1 C17 126.12(9)

S6
Table S5. Anisotropic Displacement Parameters (Å2×10³) for UR-144 (7). The Anisotropic displacement factor exponent takes the form: -2π2[h2a*2U11+...+2hka×b×U12]
Atom U11 U22 U33 U23 U13 U12 C1 21.2(5) 23.5(5) 26.7(5) -0.5(4) 3.3(4) -2.4(4)
C2 22.3(5) 21.3(5) 24.6(5) -0.8(4) 3.1(4) -0.9(4)
C3 22.8(5) 20.9(5) 23.7(5) -3.4(4) 3.9(4) -0.4(4)
C4 23.6(5) 21.9(5) 23.4(5) -1.9(4) 4.9(4) -0.4(4)
C5 23.1(5) 28.1(6) 27.7(5) -3.9(4) 3.5(4) -3.7(4)
C6 28.3(6) 27.4(6) 32.0(6) -3.3(4) 9.9(4) -6.9(4)
C7 35.1(6) 26.1(6) 28.9(6) 2.7(4) 9.9(4) -2.0(5)
C8 28.4(5) 25.6(6) 25.7(5) 0.3(4) 3.8(4) 1.4(4)
C9 22.7(5) 24.4(5) 25.6(5) -0.8(4) 1.9(4) 0.4(4)
C10 18.4(5) 25.5(5) 27.0(5) 2.4(4) -0.9(4) 0.1(4)
C11 18.9(5) 27.2(6) 29.6(5) -2.3(4) 0.6(4) -0.5(4)
C12 18.4(5) 28.5(6) 29.0(5) -1.9(4) 0.6(4) -0.6(4)
C13 33.0(6) 40.9(7) 29.2(6) -3.8(5) -1.2(5) -4.9(5)
C14 26.2(6) 28.2(6) 44.7(7) -2.5(5) 2.1(5) -3.1(5)
C15 26.4(6) 31.8(6) 41.9(7) -3.1(5) 0.5(5) 6.2(5)
C16 26.9(6) 40.9(7) 31.6(6) -1.8(5) 5.6(4) -4.7(5)
C17 25.1(5) 33.9(6) 25.2(5) 2.8(4) -3.6(4) -1.1(5)
C18 24.2(5) 33.8(6) 34.2(6) 1.8(5) -4.3(4) 1.9(5)
C19 28.6(6) 29.1(6) 34.1(6) 2.4(5) -2.5(4) 2.0(5)
C20 40.3(7) 39.7(7) 42.9(7) -1.6(6) -3.7(5) 13.2(6)
C21 62.4(10) 43.9(9) 52.5(9) -10.3(7) 0.4(7) 11.6(7)
N1 20.7(4) 25.6(5) 25.4(4) 1.5(4) 1.3(3) -1.5(3)
O1 28.5(4) 36.6(5) 36.2(4) 11.6(4) -3.1(3) -1.8(3)

S7
Table S6. Hydrogen Atom Coordinates (Å×104) and Isotropic Displacement Parameters (Å2×10³) for UR-144 (7). Atom x y z U(eq) H1 11582 1000 2550 28
H5 14796 3506 2050 31
H6 14772 5029 852 35
H7 13196 5351 -172 36
H8 11587 4198 -18 32
H10 9961 752 2028 28
H13A 8391 1674 -213 52
H13B 7619 471 -295 52
H13C 8906 363 -479 52
H14A 9105 -1301 802 50
H14B 7817 -1169 975 50
H14C 8721 -1007 1857 50
H15A 7850 3252 1908 50
H15B 6947 2474 1271 50
H15C 8049 2941 808 50
H16A 8453 306 2900 49
H16B 7209 750 2635 49
H16C 8085 1686 3150 49
H17A 13399 926 3511 34
H17B 14140 2150 3479 34
H18A 15211 1333 2337 37
H18B 15120 274 3128 37
H19A 13701 -694 2097 37
H19B 13923 318 1291 37
H20A 15786 -421 1267 49
H20B 15500 -1478 2015 49
H21A 14517 -1302 102 80
H21B 14229 -2359 851 80
H21C 15437 -2296 452 80

S8
Table S7. Torsion angles [deg] for UR-144 (7).
A B C D Angle/˚ C1 C2 C3 C4 -1.06(11)
C1 C2 C3 C8 179.50(12)
C1 C2 C9 C10 -2.38(16)
C1 C2 C9 O1 177.17(11)
C2 C1 N1 C4 -0.60(12)
C2 C1 N1 C17 -176.30(10)
C2 C3 C4 C5 -178.22(10)
C2 C3 C4 N1 0.73(11)
C2 C3 C8 C7 178.30(11)
C2 C9 C10 C11 -145.83(10)
C2 C9 C10 C12 142.21(10)
C3 C2 C9 C10 179.69(10)
C3 C2 C9 O1 -0.75(17)
C3 C4 C5 C6 -0.51(16)
C3 C4 N1 C1 -0.11(12)
C3 C4 N1 C17 175.54(10)
C4 C3 C8 C7 -1.08(15)
C4 C5 C6 C7 -0.51(16)
C5 C4 N1 C1 178.75(11)
C5 C4 N1 C17 -5.60(18)
C5 C6 C7 C8 0.73(17)
C6 C7 C8 C3 0.10(17)
C8 C3 C4 C5 1.33(16)
C8 C3 C4 N1 -179.73(9)
C9 C2 C3 C4 177.24(10)
C9 C2 C3 C8 -2.20(19)
C9 C10 C11 C12 -111.81(11)
C9 C10 C11 C13 -1.54(16)
C9 C10 C11 C14 136.82(11)
C9 C10 C12 C11 112.22(11)
C9 C10 C12 C15 2.74(16)
C9 C10 C12 C16 -135.77(11)
C10 C11 C12 C15 109.88(11)
C10 C11 C12 C16 -103.77(11)
C11 C10 C12 C15 -109.47(11)
C11 C10 C12 C16 112.01(11)
C12 C10 C11 C13 110.27(12)
C12 C10 C11 C14 -111.37(11)
C13 C11 C12 C10 -109.03(11)
C13 C11 C12 C15 0.86(15)
C13 C11 C12 C16 147.21(11)
C14 C11 C12 C10 105.73(11)

S9
C14 C11 C12 C15 -144.39(11)
C14 C11 C12 C16 1.97(15)
C17 C18 C19 C20 -173.93(10)
C18 C17 N1 C1 108.19(12)
C18 C17 N1 C4 -66.76(14)
C18 C19 C20 C21 -175.75(12)
N1 C1 C2 C3 1.04(12)
N1 C1 C2 C9 -177.22(10)
N1 C4 C5 C6 -179.22(10)
N1 C17 C18 C19 -47.60(14)
O1 C9 C10 C11 34.63(16)
O1 C9 C10 C12 -37.32(16)
S10
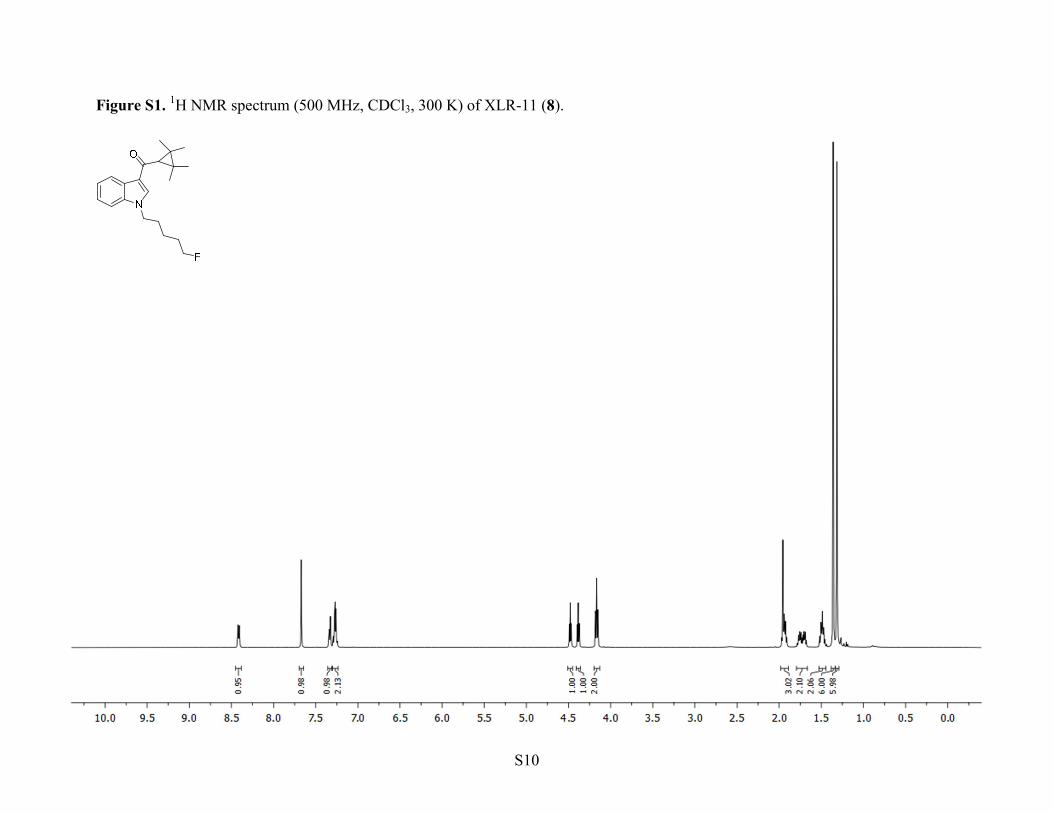
Figure S1. 1H NMR spectrum (500 MHz, CDCl3, 300 K) of XLR-11 (8).

S11
Figure S2. 13C NMR spectrum (125 MHz, CDCl3, 300 K) of XLR-11 (8).

S12
Figure S3. 1H NMR spectrum (500 MHz, CDCl3, 300 K) of STS-135 (13).

S13
Figure S4. 13C NMR spectrum (125 MHz, CDCl3, 300 K) of STS-135 (13).

S14
Figure S5. Mean maximal decrease in body temperature (+/- SEM) for all compounds tested in vivo
The body temperature data for individual rats during the 6 h post-drug was examined to determine the lowest body temperature datapoint recorded. The body temperature recorded during vehicle treatment at that same time point was then used to calculate body temperature change. This was averaged across all the rats receiving the same drug and dose to produce Figure 5. In this Figure compounds are presented in pairs, with the non-fluorinated compound extending upwards and the fluorinated compound downwards.
The data obtained for maximal body temperature change were compared between each drug pair using two-way mixed model ANOVAs, with drug-treatment as the between-subjects factor, and dose as the within-subjects factor. There was a significant main effect of dose for every drug pair (all p < .05). However there was no main effect of drug-treatment for any drug pair (all p > .05). Bonferroni contrasts comparing each dose for each pair (e.g. JWH-018 0.3 mg/kg – AM-2201 0.3 mg/kg) revealed no significant difference for any drug pair at any dose (all p > .05).

S15
Figure S6. Mean area under the curve (AUC +/- SEM) for body temperature for each compound and dose tested, expressed as a percentage of that obtained with PB-22.
The mean area under each drug-treatment curve, relative to baseline under vehicle treatment, was calculated and normalized relative to the highest observed AUC (obtained with 3 mg/kg PB-22). Compounds are presented in pairs, with the fluorinated compound extending downwards.
These areas were calculated via the trapezoidal method. Briefly, for any time point, the area between baseline data points (Bt) and drug-treatment data points (Dt) and the next time points (Bt+1 and Dt+1) forms a trapezoid, the area of which can be calculated via the formula:
���� =��� − �� + ��� � − � ��
2
These areas were summed from the time of injection to 6 hours post-injection.
The mean area for body temperature between baseline and drug-treatment for each drug pair was analysed using two-way mixed model ANOVAs, with drug-treatment as the between subjects factor, and dose as the within subjects factor. Similarly to peak body temperature decrease, there was a significant main effect of dose for every drug pair (all p < .05). However there was no main effect of drug-treatment for any drug pair (all p > .05). Bonferroni contrasts comparing

S16
each dose for each pair revealed no significant difference for any drug pair at any dose (all p > .05).
These results suggest that terminal fluorination has no overall effect on potency as measured by body temperature. However, it remains possible that other measures (e.g. cognitive function, analgesia, appetite) may be differentially affected as a function of fluorination. Further behavioural testing is necessary to clarify this issue.
Ranking the AUCs for all eight compounds at the 3 mg/kg dose gave the following ranking: PB-22 > 5F-PB-22 = JWH-018 > AM-2201 > APICA = STS-135 = XLR-11 > UR-144.

S17
Table S8. Binding affinities and functional activities of selected cannabinoids at CB1 and CB2 receptors.
Compound CB1 EC50
(nM) CB2 EC50
(nM) CB1 Ki (nM) CB2 Ki (nM) Ref
1 (∆9-THC) 250 1157
35.3 3.9 1 39.5 40 2 40.7 36.4 3 53.5 75.3 4 80.3 32.2 5
3 (WIN 55,212-2) 284 62
1.89 0.28 3 4.4 1.2 6
9.94 16.2 1 62.3 3.3 4 123 4.1 7
4 (JWH-018) 102 133 9.00 2.94 8 5 (AM-2201) 38 58 1 2.6 9
7 (UR-144) 421 72 150 1.8 10 29 4.5 11
8 (XLR-11) 98 83 24 2.1 11 9 (5-OH-UR-144) 1959 6.5 680 0.71 10
12 (APICA) 128 29 175a 176a 12 aIC50 (nM)

S18
References 1. Rinaldi-Carmona, M.; Barth, F.; Héaulme, M.; Shire, D.; Calandra, B.; Congy, C.; Martinez,
S.; Maruani, J.; Néliat, G.; Caput, D.; Ferrara, P.; Soubrié, P.; Brelière, J. C.; Le Fur, G. SR141716A, a potent and selective antagonist of the brain cannabinoid receptor. FEBS Letters 1994, 350 (2–3), 240-244.
2. Bayewitch, M.; Rhee, M. H.; Avidor-Reiss, T.; Breuer, A.; Mechoulam, R.; Vogel, Z. (-)-
Delta9-tetrahydrocannabinol antagonizes the peripheral cannabinoid receptor-mediated inhibition of adenylyl cyclase. J. Biol. Chem. 1996, 271 (17), 9902-5.
3. Showalter, V. M.; Compton, D. R.; Martin, B. R.; Abood, M. E. Evaluation of binding in a
transfected cell line expressing a peripheral cannabinoid receptor (CB2): identification of cannabinoid receptor subtype selective ligands. J. Pharmacol. Exp. Ther. 1996, 278 (3), 989-99.
4. Felder, C. C.; Joyce, K. E.; Briley, E. M.; Mansouri, J.; Mackie, K.; Blond, O.; Lai, Y.; Ma,
A. L.; Mitchell, R. L. Comparison of the pharmacology and signal transduction of the human cannabinoid CB1 and CB2 receptors. Mol. Pharmacol. 1995, 48 (3), 443-50.
5. Rhee, M. H.; Vogel, Z.; Barg, J.; Bayewitch, M.; Levy, R.; Hanus, L.; Breuer, A.;
Mechoulam, R. Cannabinol derivatives: binding to cannabinoid receptors and inhibition of adenylylcyclase. J. Med. Chem. 1997, 40 (20), 3228-33.
6. Hillard, C. J.; Manna, S.; Greenberg, M. J.; DiCamelli, R.; Ross, R. A.; Stevenson, L. A.;
Murphy, V.; Pertwee, R. G.; Campbell, W. B. Synthesis and Characterization of Potent and Selective Agonists of the Neuronal Cannabinoid Receptor (CB1). J. Pharmacol. Exp. Ther. 1999, 289 (3), 1427-1433.
7. Shire, D.; Calandra, B.; Rinaldi-Carmona, M.; Oustric, D.; Pessegue, B.; Bonnin-Cabanne,
O.; Le Fur, G.; Caput, D.; Ferrara, P. Molecular cloning, expression and function of the murine CB2 peripheral cannabinoid receptor. Biochim. Biophys. Acta 1996, 1307 (2), 132-6.
8. Aung, M. M.; Griffin, G.; Huffman, J. W.; Wu, M. J.; Keel, C.; Yang, B.; Showalter, V. M.;
Abood, M. E.; Martin, B. R. Influence of the N-1 alkyl chain length of cannabimimetic indoles upon CB1 and CB2 receptor binding. Drug Alcohol Depen. 2000, 60 (2), 133-140.
9. Makriyannis, A.; Deng, H. Preparation of cannabimimetic indole derivatives with
cannabinoid CB1 or CB2 receptor binding affinity. World patent WO 2001/028557, 26 April, 2001.
10. Frost, J. M.; Dart, M. J.; Tietje, K. R.; Garrison, T. R.; Grayson, G. K.; Daza, A. V.; El-
Kouhen, O. F.; Yao, B. B.; Hsieh, G. C.; Pai, M.; Zhu, C. Z.; Chandran, P.; Meyer, M. D. Indol-3-ylcycloalkyl ketones: effects of N1 substituted indole side chain variations on CB(2) cannabinoid receptor activity. J. Med. Chem. 2010, 53 (1), 295-315.

S19
11. Wiley, J. L.; Marusich, J. A.; Lefever, T. W.; Grabenauer, M.; Moore, K. N.; Thomas, B. F. Cannabinoids in disguise: Delta9-tetrahydrocannabinol-like effects of tetramethylcyclopropyl ketone indoles. Neuropharmacology 2013, 75, 145-54.
12. Uchiyama, N.; Kawamura, M.; Kikura-Hanajiri, R.; Goda, Y. URB-754: A new class of
designer drug and 12 synthetic cannabinoids detected in illegal products. Forensic Sci. Int. 2013, 227 (1-3), 21-32.


