Embed Size (px)
Citation preview

Effects of Bone Oscillator Coupling Method, PlacementLocation, and Occlusion on Bone-Conduction Auditory
Steady-State Responses in InfantsSusan A. Small, Jennifer L. Hatton, and David R. Stapells
Objective: The aim of these experiments was toinvestigate procedures used when estimating bone-conduction thresholds in infants. The objectiveswere: (i) to investigate the variability in force ap-plied using two common bone-oscillator couplingmethods and to determine whether coupling methodaffects threshold estimation, (ii) to examine effectsof bone-oscillator placement on bone-conductionASSR thresholds, and (iii) to determine whether theocclusion effect is present in infants by comparingbone-conduction ASSR thresholds for unoccludedand occluded ears.
Design: Experiment 1A: The variability in theamount of force applied to the bone oscillator bytrained assistants (n � 4) for elastic-band and hand-held coupling methods was measured. Experiment1B: Bone-conduction behavioral thresholds in 10adults were compared for two coupling methods.Experiment 1C: ASSR thresholds and amplitudesto multiple bone-conduction stimuli were comparedin 10 infants (mean age: 17 wk) using two couplingmethods. Experiment 2: Bone-conduction ASSRthresholds and amplitudes were compared for tem-poral, mastoid and forehead oscillator placementsin 15 preterm infants (mean age: 35 wk postconcep-tual age (PCA)). Experiment 3: Bone-conductionASSR thresholds, amplitudes and phase delays werecompared in 13 infants (mean age: 15 wk) for anunoccluded and occluded test ear. All infants thatparticipated had passed a hearing screening test.
Results: Experiment 1A: Coupling method did notsignificantly affect the variability in force appliedto the oscillator. Experiment 1B: There were no dif-ferences in adult bone-conduction behaviouralthresholds between coupling methods. Experiment1C: There was no significant difference between oscil-lator coupling method or significant frequency x cou-pling method interaction for ASSR thresholds or am-plitudes in the young infants tested. However, therewas a nonsignificant 9-dB better threshold at 4000 Hzfor the elastic-band method. Experiment 2: Meanbone-conduction ASSR thresholds for the preterminfants were not significantly different for the tempo-ral and mastoid placements. Mean ASSR thresholdsfor the forehead placement were significantly highercompared to the other two placements (12–18 dB
higher on average). Mean ASSR amplitudes were sig-nificantly larger for the temporal and mastoid place-ments compared to the forehead placement. Experi-ment 3: There was no difference in mean ASSRthresholds, amplitudes or phase delays for the unoc-cluded versus occluded conditions.
Conclusions: Trained assistants can apply an appro-priate amount of force to the bone oscillator usingeither the elastic-band or hand-held method. Cou-pling method has no significant effect on estimationof bone-conduction thresholds; therefore, eithermay be used clinically provided assistants are ap-propriately trained. For preterm infants, there areno differences in ASSRs when the oscillator is posi-tioned at the temporal or mastoid placement. How-ever, thresholds are higher and amplitudes aresmaller for the forehead placement, consequently, aforehead placement should be avoided for clinicaltesting. There does not appear to be a significantocclusion effect in young infants; therefore, it maybe possible to do bone-conduction testing with earsunoccluded or occluded without applying a correc-tion factor, although further research is needed toconfirm this finding.
(Ear & Hearing 2007;28;83–98)
It is important to obtain air- and bone-conductionthresholds in infants to distinguish between sensori-neural, conductive, and mixed hearing losses, similarto assessment of adults. It is a relatively straightfor-ward procedure to deliver a calibrated air-conductionstimulus to the infant or adult ear via earphones. Forbone-conduction testing, however, producing a predict-able output of energy at the skull, and ultimately tothe cochlea, is more complicated because of a numberof procedural factors. Important procedural factorsinclude (i) oscillator coupling force and method (steelheadband, elastic-band or hand-held), (ii) oscillatorplacement location on the head (temporal or frontalbone), and (iii) whether the bone-conduction testing isperformed with ears occluded or unoccluded. Proce-dures are relatively standardized for estimating be-havioral thresholds to bone-conducted stimuli inadults and children; the bone oscillator is positioned onthe head of an adult or child using a steel headbandthat applies a constant force to the bone oscillator. Incontrast, there are no standardized methods for bone-conduction testing in infants, only recommended “best
School of Audiology and Speech Sciences, The University ofBritish Columbia, Vancouver, British Columbia, Canada.
0196/0202/07/2801-0083/0 • Ear & Hearing • Copyright © 2007 by Lippincott Williams & Wilkins • Printed in the U.S.A.
83

practices”; many of which are based on assumptionsrather than systematic investigation.
Because the bone oscillator sits on the surface of theskull, a sufficient and constant force is required tocouple it to the head and to produce a calibratedoutput from the transducer. Amount of force andcoupling method are therefore important issues. Also,the bone oscillator can be positioned in different loca-tions on the skull, potentially affecting the intensityof the signal reaching the cochlea (Stuart, Yang &Stenstrom, 1990; Yang, Rupert & Moushegian, 1987).It is also well known, at least for adults, that occludingthe ear canal while estimating bone-conduction thresh-olds significantly improves bone-conduction thresholdsin the low frequencies, a change known as the occlusioneffect (Tonndorf, 1966).
For behavioral testing with bone-conducted stimuli,the oscillator is coupled to the head using a steelheadband to apply a constant force to the bone oscil-lator; the exact amount of force applied (approximately400 to 500 g) will vary, depending on individual headsize. To accommodate the smaller head size for olderchildren, a smaller steel headband is used; the forcegenerated is less than for larger adult heads and willalso vary somewhat with the size of the child’s head(Harrell, 2002; Wilber, 1979). The coupling force usedis limited to some degree by patient comfort; however,behavioral thresholds to bone-conducted stimuli inolder children and adults can usually be obtained inapproximately 10 to 15 minutes with only minor dis-comfort from the steel headband.
Estimation of bone-conduction hearing thresholdsin young sleeping infants using auditory-evokedpotentials poses unique challenges. Infants havesmaller heads than adults, precluding the use of thestandard adult or child steel headband. Also, infantsmust remain asleep during testing; disturbing theinfant as little as possible while positioning theoscillator is critical, as is minimizing the discomfortduring a much longer testing time. One concern forbone-conduction testing is that the amount of forceapplied to the oscillator is consistent. Coupling theoscillator to the infant’s head using an elastic bandis currently the clinical method suggested by manybecause a known force can be applied to the elasticband and the amount of force can be verified using aspring scale (Yang & Stuart, 1990). It is importantto keep in mind, however, that although manyclinical settings use an elastic band to couple theoscillator to the head, the amount of force applied tothe elastic band is not verified for practical reasons(i.e., the clinician does not want to use any “sleeptime” to perform the verification step and does notwant to risk waking the infant in the process ofverifying the force level and re-adjusting the elasticband). Holding the oscillator in place by hand is also
commonly done clinically because it is faster and isfar less likely to wake up the infant than positioningan elastic band (which requires more manipulationof the infant’s head). Another benefit of the hand-held method is that it is more comfortable for theinfant because it can be easily removed and replacedbetween test conditions.
Despite the practical advantages of the hand-heldmethod, its use has been discouraged (Yang & Stuart,2000; Yang, Stuart, Stenstrom, & Hollett, 1991). Thispreference for one coupling method over the other,however, is based on assumptions. The two mainassumptions made are (i) for the hand-held method,there is potential for the applied force to vary duringtesting resulting in an inconsistent output from thetransducer (Yang et al., 1991) and greater variabilityin threshold, and (ii) pressing down on the superiorsurface of the oscillator by hand (i.e., mass loading it)will dampen the response characteristics of the boneoscillator (Wilber, 1979). However, bone-conductionresponses in infants have never been compared usingthe elastic-band and hand-held methods.
There are adult calibration values for bone-conductedstimuli for different bone-oscillator placement locationson the skull (i.e., mastoid and forehead). On average,adult behavioral thresholds measured at the foreheadare higher than at the mastoid by 14, 8.5, 11.5, and 8.0dB at 500, 1000, 2000, and 4000 Hz, respectively(American National Standards Institute [ANSI],1996). Bone-oscillator placement location has alsobeen raised as an issue (Stuart et al., 1990; Yang &Stuart, 2000) when estimating bone-conductionthresholds in sleeping infants because of the potentialfor thresholds to differ, depending on where the oscil-lator is placed on the temporal (mastoid versus upperregion) or frontal bone. When an elastic band is used tocouple the oscillator to the skull, it is typically placedon the infant’s temporal bone, posterior to the upperportion of the pinna; using the hand-held method, avariety of positions are possible.
There are some auditory brain stem response(ABR) data which have been interpreted to suggestthat bone oscillator location does affect the responsein infants (Yang et al., 1987). Yang et al. (1987)investigated the effect of oscillator placement (frontal/forehead, occipital, and temporal) on wave V ABRlatencies to bone-conduction clicks for neonates, 1-yr-old infants and adults. Latency results were found tovary with both age of subject and oscillator placement.The temporal bone yielded significantly shorter laten-cies than either the occipital and frontal placements inthe neonatal group and 1-yr-old group. Based on theselatency differences, they estimated that signal atten-uation in the neonates from the temporal to frontalplacement ranged from 30 to 35 dB. In the 1-yr-oldgroup, signal attenuation between the frontal and
84 EAR & HEARING / FEBRUARY 2007

temporal placements was estimated to be between 20to 25 dB. Attenuation from occipital to temporal was15 to 20 dB for both infant groups. In contrast, thelatency differences in adults were not significant, andthe attenuation between oscillator placement wasjudged to be no more than 5 to 10 dB. This attenuationestimate in adults is smaller than the ANSI-1996standards for mastoid and forehead placements dis-cussed above, and the changes in signal attenuation asa function of location suggested by Yang et al. must beinterpreted with caution for several reasons. First,they used click stimuli rather than frequency-specificstimuli, so they were unable to separate out anyfrequency-dependent effects of oscillator placement onattenuation. Second, they did not directly estimateABR thresholds for the different placements or reportABR amplitudes, which are more related to thresholdthan latency measures. Third, the attenuation esti-mates were derived using latency-intensity functions;inaccurate attenuation estimates may result becauselatency is not linearly related to intensity (Picton,Stapells, & Campbell, 1981).
Stuart et al. (1990) further investigated the effect ofoscillator placement on wave V latencies in infants bycomparing different areas on the temporal bone (supe-rior, supero-posterior, and posterior placements). Theyconcluded that changing the location of the oscillatoron the temporal bone produced significantly differentwave V latencies in the neonate at both 15 and 30 dBnHL. Specifically, the posterior position (similar to the“mastoid” in the current study) yielded the shortestwave V latency, whereas the superior position yieldedthe longest latency. The supero-posterior position(similar to the “temporal placement” in the currentstudy) yielded intermediate latency values. These la-tency differences were attributed to reflect greatersignal attenuation as a function of distance from thecochlea (Stuart et al., 1990). Specifically, it was sug-gested that signal intensity reduces as the bone oscil-lator is moved farther away from the cochlea. Again,these findings were based solely on click-ABR latencydata and the same limitations that are discussedabove apply. Neither of these two placement studiescompared bone-conduction threshold in infants at dif-ferent oscillator placements on the skull, which is theimportant measure for clinical applications.
Correcting for the occlusion effect when estimatingbone-conduction thresholds with occluded ears is alsowell described in adults (Dirks & Swindeman, 1967;Elpern & Naunton, 1963; Hodgson & Tillman, 1966;Small & Stapells, 2003). For insert earphones, behav-ioral thresholds to brief-tones improve by 3 to 5 dB at500 to 1000 Hz (Small & Stapells, 2003), whereaspure-tone behavioral thresholds in the low frequencies(250 to 1000 Hz) improve by as much as 17 dB,depending on the insertion depth (Dean & Martin,
2000). As discussed earlier, any test protocol used toestimate thresholds in sleeping infants must be de-signed to minimize the possibility of waking the infant.Air-conduction thresholds are typically assessed usinginsert earphones, followed by bone-conduction testing(Stapells, 2000). Should the insert earphones be re-moved before assessing bone-conduction thresholds? Itis important to know whether occluding the earsincreases, decreases or has no effect on bone-conduc-tion thresholds in infants. There are no studies thathave investigated the occlusion effect in infants.
The objectives of this study were (i) to investigatethe variability in the amount of force applied using thetwo common bone-oscillator coupling methods used ininfants and to determine whether oscillator couplingmethod affects estimation of bone-conduction thresh-old in infants and adults, (ii) to examine the effects ofbone-oscillator placement location on bone-conductionauditory steady-state responses (ASSR) thresholdsand amplitudes in young infants, and (iii) to determinewhether the occlusion effect is present in infants bycomparing infant bone-conduction ASSR thresholdsfor unoccluded and occluded ears.
GENERAL METHODS
The current study was divided into three mainexperiments that investigated the effects of (1) bone-oscillator coupling method on the variability in theamount of force applied to the oscillator and its impacton estimation of bone-conduction thresholds in infantsand adults, (2) bone oscillator placement location onASSR amplitudes and thresholds in infants, and (3)occluding the ear canal on bone-conduction ASSRamplitudes, phase delays, and thresholds in infants.The General Methods section describes the methodol-ogy common to all experiments including: stimuli,calibration of stimuli, ASSR recording parameters,and ASSR data analyses. The specific details of theparticipants, experimental design, statistical analy-ses, and description of the results for each experimentare reported in separate sections.
Stimuli
All stimuli were bone-conducted tones presentedto a Radioear B-71 bone oscillator that was held byhand or by elastic headband with approximately 400to 450 g of force. The bone oscillator was placed onthe temporal bone (high or low) or on the forehead,depending on the experiment. For the temporal-bone placement location, the left or right side wasselected at random. Bone-conducted stimuli werepresented at intensities 50 to –10 dB HL.
For all ASSR experiments, stimuli were sinusoi-dal bone-conducted tones with the carrier frequen-cies 500, 1000, 2000, and 4000 Hz that were 100%
EAR & HEARING, VOL. 28 NO. 1 85

amplitude and 25% frequency modulated at 77.148,84.961, 92.773, and 100.586 Hz, respectively. Thestimuli were presented simultaneously for all condi-tions tested (i.e., multiple). All ASSR stimuli weregenerated by the Rotman MASTER research system(John & Picton, 2000a), using a digital-to-analog(D/A) rate of 31,250 Hz then attenuated througheither an Interacoustics AC40 clinical audiometer(laboratory) or Tucker-Davis Technologies HB6 andSM3 modules (laboratory) or Med-Associates ANL-918 attenuator [Neonatal Intensive Care Unit(NICU)]. Before the stimuli were attenuated, theywere routed through a Stanford Research SystemsModel SR650 to increase the gain of the stimulus by10 dB. To estimate behavioral thresholds in adultsin Experiment 1B, bone-conduction pure-tones werepresented using an Interacoustics AC40 clinical au-diometer.
Calibration
The bone-conduction stimuli were calibrated in Ref-erence Equivalent Threshold Force Levels (RETFL) indB re:1�N corresponding to 0 dB HL for the mastoid(ANSI S3.6–1996, 1996) by using a Bruel and KjaerModel 2218 sound level meter and Model 4930 artifi-cial mastoid. The oscillator was coupled to the artificialmastoid with 550 g of force.
ASSR Recordings
ASSRs were recorded with the use of the RotmanMASTER system. Three electrodes were used torecord the electrophysiologic responses; the noninvert-ing electrode was placed at the forehead, the invertingelectrode was positioned midline at the nape of theneck, just below the hairline, and an electrode placedat the high forehead acted as ground. All interelec-trode impedances were below 3 kOhm at 10 Hz.
The electroencephalogram (EEG) was filteredwith the use of a 30- to 250-Hz filter (12 dB/oct) andamplified 80,000 times (Nicolet HGA-200A andNic501A). The EEG was further filtered by using a300-Hz low-pass antialiasing filter [NICU: StanfordResearch Systems (115dB/oct); laboratory: WavetekRockland Model 852 (48 dB/oct)]. The EEG was thenprocessed by using a 1250-Hz A/D conversion rate(Small & Stapells, 2004). Each EEG recording sweepwas made up of 16 epochs of 1024 data points each(0.8192 sec per epoch) and lasted a total of 13.107sec. Artifact rejection was set to eliminate epochs ofelectrophysiologic activity that exceeded �40 �V inamplitude to reduce contributions to the EEGcaused by muscle artifact.
ASSRs were averaged in the time domain thenanalyzed online in the frequency domain using aFast Fourier Transform (FFT). Weighted averaging
was used (John, Dimitrijevic & Picton, 2001). TheFFT resolution was 0.093 Hz, over a range of 0 to250 Hz. Amplitudes were measured baseline-to-peak and expressed in nano-Volts (nV). An F ratiowas calculated by MASTER to estimate the proba-bility that the amplitude of the ASSR at the modu-lation frequency for each carrier frequency wassignificantly different from the average amplitude ofthe background noise in adjacent frequencies within�60 bins of the modulation frequency (“noise”) (John& Picton, 2000a). A minimum of seven sweeps wererecorded for each test condition. A response wasconsidered to be present if the F ratio, comparedwith the critical values for F (2, 240), was significantat a level of p � 0.05 for at least two consecutivesweeps. A response was considered to be absent ifp � 0.05 and the mean amplitude of the noise wasless than 11 nV. Alternatively, a response was alsoconsidered to be absent when response amplitudewas �10 nV and the p value was �0.30.
ASSR Data Analyses
Mean amplitude values were averaged acrosssubjects, including ASSR amplitudes for responsesthat were not significant (except for part of the dataanalyses in Experiment 2). The phase values fromMASTER were adjusted by adding 90° to yield theonset phase (John & Picton, 2000a). Onset phasevalues were then converted to phase delay by subtract-ing the onset phase value from 360°. Any phase-delayvalues that differed �180° from an adjacent measurewere “unwrapped” by adding 360° to their value (John& Picton, 2000b). Phase values for ASSRs that werenot significant were excluded from mean phase-delaycalculations. Phase-delay values were averaged acrosssubjects. Results are only reported if at least fivesubjects contributed to the mean.
Statistical Analyses
Comparisons of experimental conditions were madeusing two-way repeated-measures analyses of vari-ance (ANOVA); case-wise deletion was applied whenvalues were missing from the data sets.* The factorsand levels for the ANOVAs performed for each exper-
*For all data sets that had missing values, statistical analysesusing case-wise deletion to handle missing data were compared tostatistical analyses using two different methods for replacing themissing values [mean substitution and imputation based onadjacent values (Little & Rubin, 2002, pp. 3–40)]. The purpose ofthese comparisons was to ensure that case-wise deletion didnot yield different statistical results compared with otherstrategies for handling missing data. No differences in thestatistical results were found for any of the analyses; conse-quently, the statistical analyses that used case-wise deletionwere considered unbiased.
86 EAR & HEARING / FEBRUARY 2007

iment are reported in each section. Huynh-Feldt epsi-lon-adjustments for repeated measures were madewhen appropriate. Newman-Keuls post-hoc compari-sons were performed for significant main effects andinteractions. The criterion for statistical significancewas p � 0.05 for all analyses. The effect sizes for themain effects and interactions between factors werecalculated as the percentage of variance in the scores(PV), where a PV of 0.01, 0.10 and 0.25 correspond tosmall, medium, and large effect sizes (Murphy &Myors, 2004, pp. 22-97).
EXPERIMENT 1: BONE-OSCILLATORCOUPLING METHOD (ELASTIC-BAND VERSUS
HAND-HELD)The purposes of this experiment were to investi-
gate (i) how much the amount of force applied to thebone oscillator varied with coupling method and (ii)to determine whether bone-conduction thresholdsobtained in infants and adults were different be-tween coupling methods. This experiment was di-vided into three subexperiments: 1A, effect of cou-pling method on variability in force level applied tooscillator; 1B, effect of coupling method on adultbehavioral thresholds; and 1C, effect of couplingmethod on infant ASSRs. The participants, proce-dures and a description of the results specific to eachsubexperiment will be presented separately.
Experiment 1A: Effect of Coupling Methodon Variability in Force Level Applied toOscillator
The purpose of Experiment 1A was to measurethe variability in the amount of force applied to theoscillator by four different individuals, using theelastic-band and hand-held coupling methods.MethodsParticipants and Procedure • For this experi-ment, four adults (age range, 23 to 39 yr) were trainedto couple the bone oscillator to the head using theelastic-band and hand-held coupling methods and arereferred to as the assistants. The bone oscillator wasplaced on the temporal bone slightly posterior to theupper part of the pinna. The anterior longitudinal edgeof the oscillator was oriented at an approximately 45°angle to the anterior/posterior plane so that the wireconnecting the oscillator to the attenuator lay in aposterior/inferior direction. Assistants were instructedto apply the same force (425 � 25 g) on the superiorsurface of the bone oscillator on an adult head,whether they used an elastic band or held the oscilla-tor by hand. During a training period, each assistantwas instructed to apply the target force to the oscilla-tor in a group of 10 practice trials. After each practicetrial, the assistant received feedback about the actual
amount of force applied. For the elastic-band method,a spring scale was used to measure the applied force.For the hand-held coupling method, applied force wasmeasured by placing the bone oscillator on a compres-sive spring scale and pressing down on the transducerwith one or two fingers until the desired force wasachieved. Feedback was provided for 10 consecutivepractice trials for each of the coupling methods. Dur-ing the testing period, after completing the training,the assistants applied the target force, without feed-back, for an additional 10 “test” trials for each couplingmethod. For each of these test runs, the actual forcelevels applied were recorded and compared for eachassistant and coupling method.Statistical Analyses • A 2-way repeated measuresANOVA was performed comparing force levels pro-duced across 10 test trials and between the twocoupling conditions (elastic-band and hand-held).Four cases (i.e., the four assistants) were included inthe analysis.Results • As shown in Table 1, there were somedifferences noted in the force levels produced by theassistants. For assistants 1 and 4, the mean forceapplied tended to be more than the target force whenusing the elastic band method but less than the targetforce when using the hand-held method. The meanforces applied by assistants 2 and 3 tended to be moresimilar across coupling method. Using the elastic-band, assistants produced a wider range of forces andlarger standard and mean absolute deviations. Acrossassistants, the mean force produced was essentiallythe same for the elastic-band and hand-held methods.
Figure 1 shows the errors in the force applied tothe oscillator produced by each assistant as a cumu-lative percent of test runs for the two couplingmethods. Using the hand-held method, most of thetest runs (70%) were within 50 g of the target, andall were within 100 g of the target. Using the elasticband, only 60% of the test runs were within 50 g ofthe target and only 88% were within 100 g; 100%
TABLE 1. Range, mean, and mean absolute deviation for forcelevels produced by four assistants trained to use the elastic-band and hand-held bone-oscillator coupling methods
Coupling
EB HH
Assistant Range Mean SD MAD Range Mean SD MAD
1 425–575 483 49 58 360–450 400 32 332 325–490 409 61 54 340–500 436 52 413 350–525 440 54 40 375–550 479 51 644 400–600 490 70 75 360–460 405 35 35All 325–600 455 66 57 340–550 430 52 43
MAD, mean absolute deviation from target; EB, elastic-band; HH, hand-held; SD, 1standard deviation.Target of 425 � 25 g; 10 test trials each.
EAR & HEARING, VOL. 28 NO. 1 87

was only obtained within 175 g of the target. Resultsof an ANOVA comparing force levels across testtrials and coupling method revealed no significantmain effect of coupling method [F (1,3) � 0.577, p �0.503, PV � 0.016] or test trial [F (9,27) � 1.649, p �0.151, PV � 0.406] and no significant interactionbetween test trial and coupling method [F (9,27) �2.016, p � 0.077, PV � 0.496].
Experiment 1B: Effect of Coupling Method onAdult Behavioral Thresholds
The purpose of Experiment 1B was to compareadult behavioral thresholds obtained for 500, 1000,2000, and 4000 Hz, using the elastic-band andhand-held coupling methods.MethodsParticipants and Procedure • Ten adults (agerange, 20 to 39 yr) with normal hearing (pure-toneair-conduction behavioral thresholds �25 dB HL for500 to 4000 Hz) participated. Testing was conducted ina double-walled, sound-attenuated booth in the Hu-man Auditory Physiology Laboratory at the Univer-sity of British Columbia. On average, the noise levelsin the sound-attenuated booth for one-octave-widebands centered at 0.5, 1, 2, and 4 kHz were 12, 10, 10,and 12 dB SPL, respectively.
Behavioral thresholds were obtained using theelastic-band and hand-held coupling methods (assis-tants 1, 2, and 3) with ears unoccluded. The bone-
oscillator placement location was the same as thatused for Experiment 1A. The test order for couplingmethod was randomized. Bone-conducted pure tones(500 to 4000 Hz) were presented in 2-dB steps, usinga bracketing technique. The starting intensity wasrandomly selected as 20, 30, or 40 dB HL. The lowestlevel at which 3/5 stimuli were detected was consid-ered threshold. Behavioral thresholds across fre-quency and coupling methods were compared.Statistical Analyses • A 2-way repeated measuresANOVA was performed comparing behavioralthresholds at 500, 1000, 2000 and 4000 Hz betweencoupling methods (elastic-band and hand-held). Tensubjects were included in the analysis.Results • Adult mean behavioral bone-conductionthresholds for the elastic-band and hand-held couplingmethods are shown in Table 2. Overall, the meanelastic-band minus hand-held threshold differencewas only –1.4 dB. Results of an ANOVA indicated nosignificant main effect of coupling method [F (1,9) �0.432, p � 0.527, PV � 0.010] and no interactionbetween coupling and frequency [F (3,27) � 3.275, p �0.092, PV � 0.170]. The main effect for frequency [F(3,27) � 8.444, p � 0.0004, PV � 0.605] was significantand was explained by slightly poorer thresholds at2000 Hz compared with the other frequencies as indi-cated by post hoc comparisons.
Experiment 1C: Effect of Coupling Method onInfant ASSRs
In Experiment 1C, ASSRs to bone-conductedstimuli were recorded in infants using the elastic-band and hand-held coupling methods to determinewhether coupling method affects estimation of bone-conduction ASSR threshold in young infants.MethodsParticipants and Procedure • Ten normal-hear-ing post-term infants (age range, 0.5 to 38 wk; mean
TABLE 2. Mean behavioral thresholds for 500-, 1000-, 2000- and4000-Hz bone-conduction pure tones using elastic-band andhand-held coupling method in adults with normal hearing (N � 10)
Coupling 500 Hz 1000 Hz 2000 Hz 4000 Hz
Threshold(dB HL)
EBMean 1.7 –0.3 11.5 –1.7SD 3.7 6.6 7.5 5.5N 10 10 10 10
HHMean 1.5 2.3 8.7 0.1SD 4.9 4.1 5.4 5.0N 10 10 10 10
DifferenceMean 0.2 –2.6 2.8 –1.8SD 4.2 3.9 4.5 5.6N 10 10 10. 10
EB, elastic-band; HH, hand-held; Difference, EB minus HH; SD, 1 standard deviation.
Fig. 1. Cumulative percentage of trials that resulted in errorsproduced, for example, 25, 50, 100, 150, and 175 g differ-ences from the target force of 425 � 25 g, for each individualassistant (N � 4; solid and striped bars) and across assistants(cross-hatched bars).
88 EAR & HEARING / FEBRUARY 2007

age, 17 wk) were recruited from the community. Byparent report, all infants were healthy, normal in-fants with no history of middle ear disease. Three ofthe infants were screened with the use of an auto-matic auditory brain stem response (AABR) hearingscreening test at 35 dB nHL. The hearing of theother infants was screened using a distortion-prod-uct otoacoustic emissions (DPOAE) screening test.The pass criterion for the DPOAE screening was asignal-to-noise ratio �5 dB at 2000, 3000 and 4000Hz in both ears. Infants passed the AABR orDPOAE hearing screening in both ears and wereconsidered to be at low risk for significant hearingloss and thus included in the study. Testing wasconducted in the same sound-attenuating booth de-scribed above.
The oscillator was coupled to the infant’s head usingthe elastic-band (assistants 1, 2, 3) and hand-heldcoupling methods (assistants 1 and 2).* The bone-oscillator placement location was the same as thatused for Experiment 1A. The test order for couplingmethod was randomized. Multiple ASSR stimuli (500-to 4000-Hz carrier frequencies) were presented in10-dB steps, using a bracketing technique. The start-ing intensity was randomly selected as 10, 20, 30, or 40dB HL. The lowest level at which a response waspresent was considered threshold. Bone-conductionASSR thresholds were compared across frequency andoscillator coupling method. Bone-conduction ASSRamplitudes at 30 dB HL for 500 and 1000 Hz and at 40dB HL for 2000 and 4000 Hz were compared acrossfrequency and coupling condition. A greater intensitywas selected for 2000 and 4000 Hz than for 500 and1000 Hz to compensate for poorer thresholds (approx-imately 10 dB) at these higher frequencies (Small &Stapells, 2006).Statistical analyses • A 2-way repeated-measuresANOVA was performed comparing ASSR thresholdsfor 10 infants at 500, 1000, 2000 and 4000 Hz betweencoupling methods (elastic-band and hand-held). ASSRamplitudes at 30 dB HL for 500 and 1000 Hz and 40dB HL at 2000 and 4000 Hz were also comparedbetween coupling conditions using a 2-way repeated-measures ANOVA, however, as a result of case-wisedeletion, only five infants were included in the analy-sis. An additional ANOVA comparing ASSR ampli-tudes at 30 dB HL at 500 and 1000 Hz only betweencoupling conditions was also performed; eight infantswere included in the ANOVA as a result of case-wisedeletion.Results • Representative ASSR results to bone-con-ducted stimuli using the elastic-band and hand-heldcoupling methods are shown for a typical infant inFigure 2. For this 8-wk-old infant, there was no con-
sistent effect of coupling method on ASSR thresholds.ASSR threshold was 30 dB poorer at 500 Hz and 10 dBbetter at 2000 Hz for the hand-held compared to theelastic-band coupling condition, and no difference inASSR thresholds was found for the two coupling con-ditions at 1000 and 4000 Hz. Table 3 shows the meanbone-conduction ASSR thresholds for all infants.There was no significant difference between meanASSR thresholds using the two coupling methods[F (1,9) � 0.192, p � 0.67, PV � 0.004]; however, therewas a trend for ASSR thresholds at 4000 Hz to beslightly higher using the hand-held method comparedwith the elastic-band coupling method [couplingmethod x frequency interaction: F (3,27) � 2.791, p �0.06. PV � 0.161].
As shown in Table 4, infant mean ASSR ampli-tudes at 30 db HL (500 and 1000 Hz) and 40 dB HL(2000 and 4000 Hz) were not significantly differentfor the elastic-band and hand-held coupling methods[F (1,4) � 0.027, p � 0.878, PV � 0.001]. However,there was a significant interaction between couplingmethod and frequency [F (3,12) � 3.951, p � 0.036,*Assistant 4 was not available to participate in this study.
Fig. 2. Representative bone-conduction ASSRs for an individ-ual post-term infant (8 wk) for the elastic-band and hand-heldcoupling methods. Shown are amplitude spectra resultingfrom FFT analyses (70 to 101 Hz) of the ASSRs. Filled trianglesindicate responses that differ significantly (p < 0.05) from thebackground noise. Open triangles indicate no response (p >
0.05 and EEG noise <11 nV). Threshold is defined as thelowest intensity that produced a significant response.
EAR & HEARING, VOL. 28 NO. 1 89

PV � 0.497]; post hoc comparisons indicated noelastic-band versus hand-held differences in ASSRamplitudes at the same carrier frequency. MeanASSR amplitudes at 30 dB HL for 500 and 1000 Hzwere not significantly different for coupling method[F (1,7) � 2.231, p � 0.179, PV � 0.04] and there wasno significant interaction between coupling methodand frequency [F (1,) � 0.002, p � 0.967, PV �0.0004].
EXPERIMENT 2: EFFECT OFBONE-OSCILLATOR PLACEMENT LOCATION
ON INFANT ASSRS
The purpose of this experiment was to determine ifdifferent placement locations of the bone oscillator onthe skull affect ASSRs recorded to bone-conductedstimuli in preterm infants. The three oscillator place-
ments investigated in this study included (i) the tem-poral bone slightly posterior to the upper part of thepinna, (ii) the lower portion of the temporal bone whichwill later develop into the mastoid bone, and (iii) themiddle of the forehead. The placements are referred toas temporal, mastoid, and forehead.
Methods
Participants and Procedures • Fifteen preterminfants from a NICU participated. They ranged inage from 32 to 43 wk postconceptional age (PCA),with a mean age of 34.5 wk PCA. All infants weremedically stable at time of test and had a mean (1 SD)Apgar score of 7.4 (2.6) at birth. All of these infantswere screened by using an automatic AABR hearingscreening test at 35 dB nHL. Infants passed the AABRhearing screening in both ears and were considered tobe at low risk for significant hearing loss and thusincluded in the studies.
Testing of preterm infants was performed at thebedside in the NICU. Infants were tested with earsunoccluded. Ambient acoustic noise was likely toaffect the results when recording ASSRs in theNICU. Average ambient noise levels in the NICUmeasured at two different time points using one-third–octave-wide bands were 52, 51, 60, 58, 50, 36,and 47 dB SPL at 0.125, 0.5, 1, 2, 4, and 8 kHz,respectively. The overall A-weighted noise level inthe NICU was 65 dB SPL. To reduce the impact ofhigh ambient noise in the NICU, recording of ASSRswas paused when the background acoustic noise wasexcessively high (e.g., when sink taps were runningnear the infant’s bassinet).
ASSRs were first elicited to bone-conducted stim-uli presented at the temporal bone using the hand-held coupling method at a starting intensity of 40 dBHL (30 dB HL for 2 of 15 infants). ASSRs were thenrecorded, in random order at the mastoid and fore-head, to stimuli presented at 40 dB HL. ASSRthreshold was then determined, always beginningwith the temporal placement, using a bracketingtechnique with a final step size of 10 dB. The orderof threshold search for the mastoid and foreheadplacements was randomized. If a response did notreach significance at the highest intensity (50 dBHL), threshold was arbitrarily assigned a value of 60dB HL.Statistical analyses • Comparison of ASSR thresh-old for 500, 1000, 2000 and 4000 Hz and for the threebone-oscillator placement locations (temporal, mastoidand forehead) was done using a 2-way repeated mea-sures ANOVA. After case-wise deletion, nine preterminfants were included in the analysis of ASSR thresh-old. ASSR amplitudes (all responses) for 500, 1000,2000 and 4000 Hz were compared for three bone-
TABLE 3. Mean ASSR thresholds for 500-, 1000-, 2000- and4000-Hz bone-conduction carrier frequencies using elastic-band and hand-held coupling method in infants with normalhearing (N � 10; age, 2 to 10 mo)
Coupling 500 Hz 1000 Hz 2000 Hz 4000 Hz
Threshold(dB HL)
EBMean 14.0 6.0 26.0 13.0SD 14.3 8.43 9.7 11.6N 10 10 10 10
HHMean 14.0 1.0 25.0 22.0SD 14.3 7.4 7.1 7.9N 10 10 10 10
DifferenceMean 0.0 5.0 1.0 –9.0SD 15.6 5.3 7.4 12.9N 10 10 10 10
EB, elastic-band; HH, hand-held; Difference, EB minus HH; SD, 1 standard deviation.
TABLE 4. Auditory steady-state response mean amplitudeselicited by bone-conduction stimuli presented at 30 dB HL for500- and 1000-Hz and at 40 dB HL for 2000-Hz and 4000-Hzcarrier frequencies using elastic-band and hand-held couplingmethod in infants with normal hearing (N � 6 to 9; age, 2 to 10mo)
Coupling 500 Hz 1000 Hz 2000 Hz 4000 Hz
Amplitude(nV)
EBMean 41.0 59.2 24.5 36.3SD 21.3 19.5 12.6 15.8N 9 9 6 6
HHMean 30.5 54.5 36.9 32.8SD 16.3 18.5 21.6 17.1N 9 9 7 7
DifferenceMean 5.8 5.4 –12.6 9.0SD 15.3 17.1 16.3 11.2N 8 8 5 5
EB, elastic-band; HH, hand-held; Difference, EB minus HH; SD, 1 standard deviation.
90 EAR & HEARING / FEBRUARY 2007

oscillator placement locations for 13 preterm infantsusing a 2-way repeated measures ANOVA. For thesecond analysis of ASSR amplitudes (significant re-sponses only), ASSR amplitudes for 1000 and 4000 Hzand for the three bone-oscillator placement locationswere compared for seven preterm infants.
Results
Representative ASSR results to bone-conductedstimuli at the three bone oscillator placements areshown in Figure 3 for a typical preterm infant (35 wkPCA). ASSR thresholds at the temporal bone andmastoid for this infant were the same at 500 and 1000Hz and only differed by 10 dB at 2000 and 4000 Hz. Incontrast, thresholds at the forehead were 10 to 40 dBHL poorer across frequencies compared to the otherplacements. As shown in Figure 4, there were manyfewer significant responses at the forehead comparedto the temporal and mastoid placements at the maxi-mum intensity tested for 2000 and 4000 Hz. Table 5shows mean bone-conduction ASSR thresholds for thepreterm infants for three bone-oscillator placementconditions. Mean ASSR thresholds for the temporalbone and mastoid placements were similar, whereasthe mean forehead thresholds were elevated comparedwith the other two placements. The results of anANOVA revealed a significant effect of placement[F (2,14) � 11.124, p � 0.005, PV � 0.361] andfrequency [F (3,21) � 12.328, p � 0.0001, PV � 0.587]
but no significant interaction between placement andfrequency [F (6,42) � 0.826, p � 0.556, PV � 0.079].Post hoc comparisons revealed that thresholds for theforehead placement were significantly elevated incomparison to the temporal bone (p � 0.0016) andmastoid (p � 0.003) bone oscillator placements. Nosignificant differences were found for ASSR thresholdbetween the temporal bone and mastoid bone oscilla-tor placements. Consistent with our results reported
Fig. 3. Representative bone-conductionASSRs for an individual preterm infant(35 wk PCA) for three bone oscillatorplacements. Shown are amplitude spec-tra resulting from FFT analyses (70 to 101Hz) of the ASSRs. Filled triangles indicateresponses that differ significantly (p <0.05) from the background noise. Opentriangles indicate no response (p > 0.05and EEG noise <11 nV). Threshold isdefined as the lowest intensity that pro-duced a significant response.
Fig. 4. Cumulative percent occurrence of preterm subjectswith significant responses across frequency for temporal(black bars), mastoid (unfilled bars), and forehead (cross-hatched bars) placements (N � 15).
EAR & HEARING, VOL. 28 NO. 1 91

in a previous study (Small & Stapells, 2006), bone-conduction ASSR thresholds in preterm infants weresignificantly lower (i.e., better) at 500 and 1000 Hzcompared with 2000 and 4000 Hz.
Mean bone-conduction ASSR amplitudes for stim-uli presented at 40 dB HL at the three bone vibratorplacements are shown in Table 6. Mean ASSRamplitudes obtained when the bone oscillator wasplaced at the forehead were smaller compared to theother two placements. Results of an ANOVA com-paring ASSR amplitude at 40 dB HL revealed asignificant effect of placement [F (2,24) � 15.327,p � 0.0001, PV � 0.244]. Post hoc comparisonsindicated that amplitudes for the forehead place-ment were significantly smaller compared with thetemporal and mastoid placements; there was nosignificant difference in mean amplitudes for thetemporal and mastoid placements. The main effectof frequency [F (3,36) � 24.524, p � 0.0001, PV �0.585] was also significant and explained by signif-
icantly larger ASSR amplitudes at 500 and 1000 Hzcompared with 2000 and 4000 Hz. There was nosignificant interaction between placement and fre-quency [F (6,72) � 1.607, p � 0.193, PV � 0.077].
The above analysis included amplitudes for non-significant results because not all of the preterminfants had significant responses at 40 dB HL for allfrequencies, particularly at 2000 Hz. A second anal-ysis of the 40 dB HL ASSR amplitude data was thusdone to include only significant responses (i.e., notbiased to small nonsignificant response amplitudes);ASSR amplitudes for 1000 and 4000 Hz were se-lected to represent the low and high frequencies,respectively. Mean amplitudes for the foreheadplacement (31 nV for 1000 Hz, 14 nV for 4000 Hz)remained smaller compared with the temporal (52nV for 1000 Hz, 22 nV for 4000 Hz) and mastoid (57nV for 1000 Hz, 26 nV for 4000 Hz) placements. Theresults of an ANOVA on this smaller data set alsorevealed a significant effect of placement (p � 0.002,PV � 0.361); post hoc comparisons again indicatedthat this significant difference was explained bysmaller mean ASSR amplitudes for the foreheadcompared with the other two placements which werenot significantly different. There was also no signif-icant interaction between placement and frequency(p � 0.161, PV � 0.071) for this smaller data set.
EXPERIMENT 3: EFFECT OF OCCLUDING THEEAR CANAL ON INFANT ASSRS
The purpose of this experiment was to determinewhether the “occlusion effect,” which results in im-provement in bone-conduction thresholds at 500 and1000 Hz in occluded adult ears, is also present foryoung infants.
Participants and Procedure
Bone-conduction ASSR thresholds were obtainedin 12 post-term infants (age range, 1 to 27 wk; meanage, 15 wk) with the ear canal unoccluded andoccluded. As described in Experiment 1C, all infantswere screened using a DPOAE screening test. Byparent report, all infants were normal, healthy ba-bies with no history of middle ear disease.
The bone-oscillator placement location was thesame as that used for Experiment 1A. For theunoccluded condition, no insert earphones wereplaced in either ear canal. For the occluded condi-tion, a pediatric-size insert earphone foam tip wasinserted into the ear canal that was on the same sideas the bone oscillator. The foam tip was attached tothe ER3A tubing that was plugged at the end distalto the ear (i.e., the end of the tubing normallyattached to the transducer). Unoccluded ASSRthresholds were always obtained before occluded
TABLE 6. Bone-conduction auditory steady-state responsemean amplitudes at 40 dB HL for 500-, 1000-, 2000-, and4000-Hz carrier frequencies for three bone-oscillator place-ments in preterm infants with normal hearing (N � 13 to 15).
Place 500 Hz 1000 Hz 2000 Hz 4000 Hz
Amplitude(nV)
TemporalMean 47.8 58.2 18.5 17.8SD 19.6 24.1 10.2 9.0N 13 13 13 13
MastoidMean 48.9 66.0 15.3 21.8SD 30.1 32.4 9.3 9.9N 15 15 15 15
ForeheadMean 29.9 41.7 8.7 9.7SD 17.6 23.4 4.2 5.6N 13 13 13 13
SD, 1 standard deviation.
TABLE 5. Bone-conduction auditory steady-state responsemean thresholds for 500-, 1000-, 2000-, and 4000-Hz carrierfrequencies for three bone-oscillator placements in preterminfants with normal hearing (N � 9 to 15)
Place 500 Hz 1000 Hz 2000 Hz 4000 Hz
Threshold(db HL)
TemporalMean 16.0 16.7 34.6 33.3SD 11.8 9.0 15.1 15.0N 15 15 13 15
MastoidMean 17.3 14.0 32.3 26.0SD 13.3 9.1 19.6 12.9N 15 15 13 15
ForeheadMean 30.7 26.7 51.1 44.0SD 16.2 13.5 13.6 9.7N 15 15 9 10
SD, 1 standard deviation.
92 EAR & HEARING / FEBRUARY 2007

ASSR thresholds. The oscillator was hand-held forthree of the infants; the elastic-band was used forthe remaining nine infants. Multiple ASSR stimuli(500 to 4000 Hz carrier frequencies) were presentedin 10-dB steps using a bracketing technique. Thestarting intensity varied from 10 to 40 dB HL. Thelowest level at which a response was present wasconsidered threshold. Bone-conduction ASSR thresh-olds were compared across frequency and occlusioncondition.
Statistical Analyses
A 2-way repeated measures ANOVA was per-formed to compare ASSR thresholds at 500, 1000,2000 and 4000 Hz for ears occluded and unoccluded;the same analysis was completed separately forASSR amplitudes and phase delays at 40 dB HLacross frequency and occlusion condition. After case-wise deletion, there were 10, 10 and 7 infantsremaining in the analyses of ASSR threshold, am-plitude and phase delay, respectively.
Results
Representative ASSR results to bone-conductedstimuli for unoccluded and occluded ears are shownfor a typical post-term infant in Figure 5. In thisexample, occluding the ear canal of this 6-wk-oldinfant had no effect on bone-conduction ASSRthresholds for 500, 1000, and 2000 Hz, and only a10-dB increase in ASSR threshold at 4000 Hz. Asindicated by the means shown in Table 7, occludingthe ear canal had no significant effect on meanbone-conduction ASSR thresholds [F (1,8) � 0.075,p � 0.791, PV � 0.001] and there was no significantinteraction between frequency and occlusion condi-tion [F (3,24) � 0.530, p � 0.666, PV � 0.028]. Therewas a significant effect of frequency [F (3,24) �15.770, p � 0.0001, PV � 0.830] as expected (Small& Stapells, 2006). Similarly, as shown in Figure 6,mean ASSR amplitudes were not different for theunoccluded and occluded conditions. Results of anANOVA comparing ASSR amplitudes at 40 dB HLindicated no significant main effect of occlusioncondition [F (1,7) � 2.908, p � 0.132, PV � 0.055]and no significant interaction between occlusioncondition and frequency [F (3,21) � 1.294, p �0.303, PV � 0.043]. There was also no difference inmean ASSR phase delay between occlusion condi-tions, as shown in Figure 7. Results of an ANOVAcomparing ASSR phase delays at 40 dB HL alsorevealed no significant effect of occlusion condi-tion [F (1,6) � 0.016, p � 0.904, PV � 0.0002] andno significant interaction between occlusion con-dition and frequency [F (3,16) � 0.058, p � 0.981,PV � 0.003].
DISCUSSION
Bone Oscillator Coupling Method
For a number of years, it has been assumed thatgood clinical practice requires the use of an elastic
Fig. 5. Representative bone-conduction ASSRs for an individ-ual post-term infant (6 wk) for test ear unoccluded andoccluded. Shown are amplitude spectra resulting from FFTanalyses (70 to 101 Hz) of the ASSRs. Filled triangles indicateresponses that differ significantly (p < 0.05) from the back-ground noise. Open triangles indicate no response (p > 0.05and EEG noise <11 nV). Threshold is defined as the lowestintensity that produced a significant response.
TABLE 7. Mean auditory steady-state response thresholds for500-, 1000-, 2000-, and 4000-Hz bone-conduction carrier fre-quencies for unoccluded and occluded ears in infants withnormal hearing (N � 10 to 13; age, 0 to 6 mo)
500 Hz 1000 Hz 2000 Hz 4000 Hz
Threshold(dB HL)
UnoccludedMean 18.5 3.1 30.0 16.2SD 14.1 8.6 5.8 9.6N 13 13 13 13
OccludedMean 14.6 3.9 30.0 13.6SD 13.9 8.7 13.3 9.2N 13 13 10 11
DifferenceMean 3.9 –0.8 1.0 0.9SD 11.2 10.4 14.5 8.3N 13 13 10 11
Difference, unoccluded minus occluded; SD, 1 standard deviation.
EAR & HEARING, VOL. 28 NO. 1 93
band to couple the bone oscillator to an infant’s headwhen estimating bone-conduction thresholds usingauditory-evoked potentials. That is, it has beensuggested that it is not appropriate to hold theoscillator in place by hand (Cone-Wesson, 1995;Stapells, 2000; Stapells & Oates, 1997; Yang &Stuart, 2000; Yang et al., 1991). This is the firstexperiment that has actually compared the forcelevels applied to the bone oscillator when using theelastic-band and hand-held coupling methods. It isalso the first experiment to compare frequency-specific bone-conduction thresholds in infants andadults, using both of these coupling methods.
The results for Experiment 1 showed no signifi-cant difference in the mean force applied betweencoupling methods, although there is some variabilityin the amount of force applied by individual assis-tants using each of the coupling methods and a
tendency for mean absolute deviations from thetarget force to be slightly larger for the elastic-bandcompared to the hand-held method. Notably, thresh-old variability (i.e., standard deviations) was notgreater for the hand-held method. For bone-conduc-tion testing, the main concern is that a consistentamount of force be applied to the oscillator to pro-duce a predictable output of energy at the skull.Yang et al. (1991) measured wave V latencies andamplitudes for bone-conducted click-ABRs usingforce levels of 225, 325, 425, and 525 g applied usingan elastic band to determine the most efficientamount of force to apply to the oscillator. They foundthat wave V latency decreased significantly whenforce levels increased from 225 to 325 g but did notchange from 325 to 425 g or from 425 to 525 g. Theyalso noted that coupling with a low force level (225 g)caused the oscillator to slip out of the elastic bandand that a high force level (525 g) resulted in theelastic band slipping off of the oscillator. Based ontheir data, Yang et al. concluded that 400 to 450 gwas the most efficient amount of force to apply. Theyfurther suggested that the practice of holding theoscillator by hand not be encouraged because aconstant force could not be applied; they also conjec-tured that the stimulus output could be dampenedusing the hand-held method (see Wilber, 1979).They did not investigate either of these assump-tions. It is also possible that the frequency responseof the bone oscillator could be dampened using anelastic band, although it does seem unlikely thatsuch a dampening effect would be identical for boththe elastic-band and the hand-held methods, whichwould have to be the case as we found no difference inthresholds across frequency for these two methods.
The results of Experiment 1 suggest that individ-uals can be trained to apply a targeted amount offorce to the oscillator by hand to within a reasonableamount of variability (33 g mean absolute deviation)and accuracy (425 � 100 g for 0% errors produced).It is also noteworthy that when a trained assistantcouples the oscillator to the head using an elasticband, without verifying the force level with a springscale, which is in fact most often the case clinically,the force applied is actually more variable (325 to600 g) and the accuracy is poorer (425 � 175 g for 0%errors produced) for the elastic-band coupling com-pared with the hand-held method. The advantage ofthe elastic-band method is that you can directlymeasure the force applied; however, the disadvan-tage of verifying the force is that it takes extra timeand may involve undoing Velcro band several times,which will often wake the baby.
One of the main objectives of this experiment wasto determine whether bone-conduction thresholdsare affected by coupling method. The adult head is a
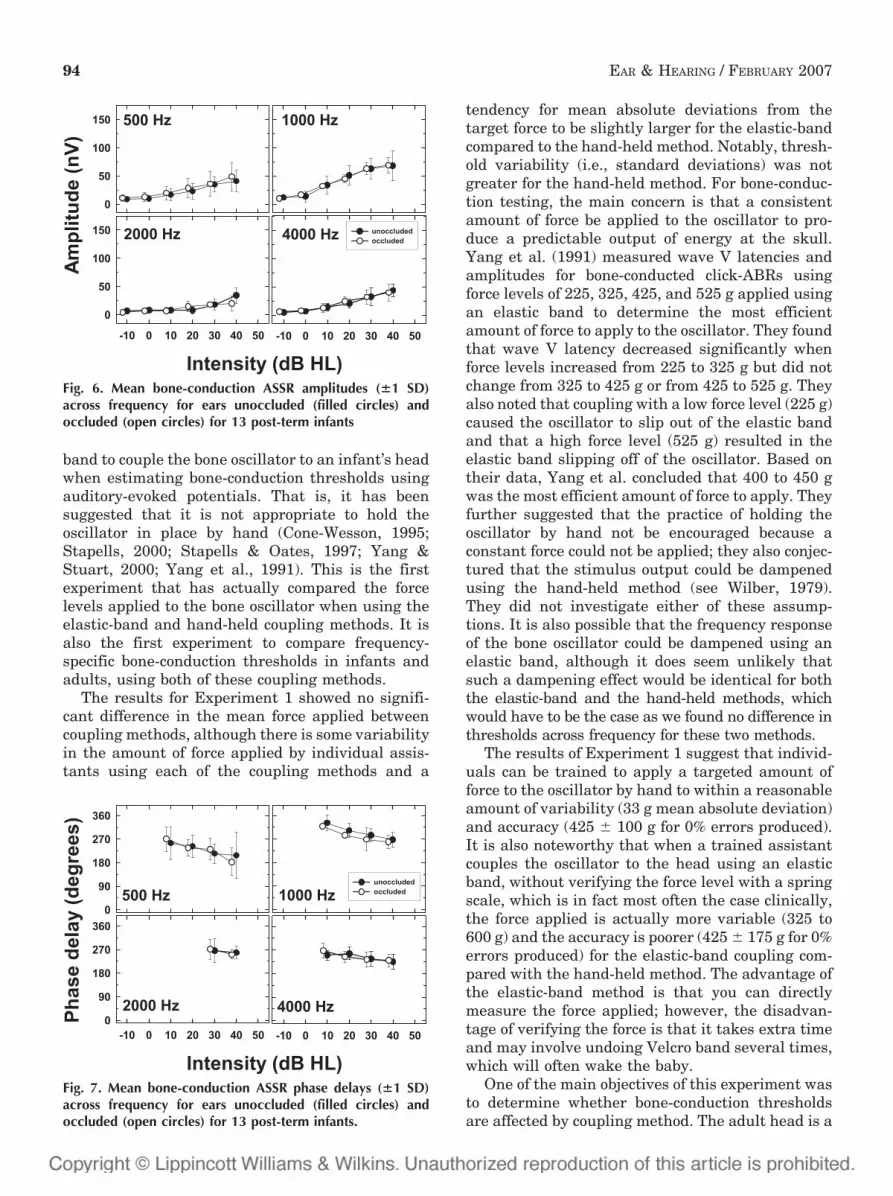
Fig. 6. Mean bone-conduction ASSR amplitudes (�1 SD)across frequency for ears unoccluded (filled circles) andoccluded (open circles) for 13 post-term infants
Fig. 7. Mean bone-conduction ASSR phase delays (�1 SD)across frequency for ears unoccluded (filled circles) andoccluded (open circles) for 13 post-term infants.
94 EAR & HEARING / FEBRUARY 2007

relatively rigid structure with fused sutures so it isassumed that coupling method is the only factorbeing tested when adult behavioral thresholds tobone-conducted stimuli are compared by using theelastic band and hand-held coupling methods. Thebone-conduction behavioral thresholds for adultsobtained in this experiment were not significantlydifferent for the two coupling methods (�3 dB dif-ference across frequencies), suggesting that pressingdown on the oscillator casing by hand, at least withapproximately 425 g of force, does not significantlydampen the response characteristics of the oscillator(Yang et al., 1991). Comparison of bone-conductionASSRs in young infants obtained using the twodifferent coupling methods indicated an elastic-bandversus hand-held mean difference of less than 1 dB.This small difference was not statistically signifi-cant. As noted above, ASSR threshold variabilitywas also not different between the two methods.Similarly, the differences in ASSR amplitudes forthe two coupling conditions were small (�10 nVdifference) and not statistically significant. Thesmall, albeit nonsignificant, elevation in thresholdfor the hand-held condition for 4000 Hz may havesome practical importance. The infant ASSR thresh-old and amplitude results for the elastic-band andhand-held coupling conditions are consistent withthe adult threshold results which also showed littledifference with coupling method.
The only published study that compares bone-conduction thresholds using different coupling meth-ods was conducted in dogs by Munro, Paul & Cox(1997). They compared bone-conduction ABR thresh-olds to click stimuli in two species of dogs that hadsignificantly different head sizes (Dalmations ver-sus Jack Russell terriers), holding the oscillator bothby hand and using a 500-g weight. Similar to ourfindings, these authors found no difference in bone-conduction thresholds using a hand-held couplingmethod compared to a method that applies a con-stant force (i.e., elastic band or 500 g weight).
The clinical implications of these findings arethat bone-conduction thresholds can be obtainedreliably in infants using either an elastic-band orhand-held coupling method, with the caveat that theindividual who is coupling the oscillator to thepatient’s head must have received appropriate train-ing on whichever method is used. There are clinicalsituations in which one method may be preferred.For example, the hand-held method may be a betterchoice if putting the elastic band on the infant’s headis likely to wake the infant. There are also clinicalsettings in which holding the oscillator by hand isnot practical, for example, when the evoked poten-tial equipment is outside the sound booth and anassistant is not available to hold the oscillator.
Bone Oscillator Placement
This was the first infant experiment to directlyassess the effects of changing oscillator placement onfrequency-specific bone-conduction thresholds. Thefindings from the current experiment suggest thatASSR thresholds obtained with bone oscillator place-ment on the forehead are substantially elevated withrespect to thresholds found with either temporal ormastoid oscillator placements. Thresholds obtained atthe temporal and mastoid oscillator placements didnot differ significantly. ASSR thresholds for the NICUinfants averaged across the temporal and mastoidplacements were 17, 15, 34, and 30 dB HL for 500,1000, 2000, and 4000 Hz, respectively. On average,thresholds for the forehead placement were signifi-cantly higher than both the temporal and mastoidplacements by at least 14, 11, 18, and 14 dB at 500,1000, 2000, and 4000 Hz, respectively. These differ-ences may be even greater because absent responsesat the maximum intensity were seen more often withthe forehead placement compared to the other twoplacements. Specifically, absent responses at the high-est intensity (50 dB HL) were seen for the foreheadplacement in 18% of the recordings whereas absentresponses were seen in only 5% of the mastoid andtemporal recordings. This was particularly the case for2000 and 4000 Hz, in which absent responses wereseen for 37% of the forehead placement results com-pared to only 5% of the temporal and mastoid place-ment results. The temporal/mastoid placement shouldtherefore be used to maximize the intensity rangeavailable to assess thresholds in infants.
The findings that infant thresholds differ betweenthe forehead and mastoid are consistent with previousadult behavioral studies (Dirks, 1994). In adults, fore-head thresholds are elevated with respect to mastoidthresholds by an average of 14, 8.5, 11.5, and 8.0 dB for500, 1000, 2000, and 4000 Hz, respectively (ANSI,1996). At 500 Hz, infants and adults have the sameforehead-mastoid threshold differences. The differencein forehead-mastoid threshold for infants, however,increases with increasing frequency: thresholds at1000, 2000, and 4000 Hz were larger than those of theadult by 2.5, 6.5, and 6.0 dB, respectively. Possiblereasons for the larger attenuation differences athigher frequencies exhibited by the infant compared tothe adult may result from the membranous suturessurrounding the temporal bone in the infant (Yang etal., 1987). These membranous sutures have the effectof attenuating the vibratory signal before it reachesthe cochlea. When the forehead oscillator placementlocation is used, the vibratory energy must passthrough two layers of membranous sutures beforereaching the temporal bone to stimulate the cochleaand thus initiate a physiological response (Yang et al.,
EAR & HEARING, VOL. 28 NO. 1 95

1987). Consequently, the effective intensity thatreaches the cochlea decreases as the distance betweenthe bone oscillator and the cochlea increases (Stuart etal., 1990). Thresholds obtained at the forehead should,therefore, be worse (i.e., higher) than those obtained ateither the temporal/mastoid locations which is consis-tent with the current findings. As noted by Yang et al.(1987), the membranous sutures in the infant skullmay act like a low-pass filter, thus allowing low-frequency energy to pass the sutures with minimalattenuation while the high- frequency energy is sub-stantially attenuated. The idea that membranous su-tures act like a low-pass filter in infants may explainwhy infants and adults have the same attenuationbetween placements at 500 Hz, but demonstrate moreattenuation than adults at 1000, 2000, and 4000 Hz.
In contrast to the findings in the current experi-ment, Stuart et al. (1990) concluded that changing theposition of the oscillator on the temporal bone pro-duced significant differences in signal attenuation tothe cochlea. They recorded ABRs to click stimuli atdifferent intensities using different oscillator place-ments on the temporal bone. They reported differencesin ABR latencies for the different temporal placementsand suggested that attenuation within the temporalbone occurs in infants because the temporal boneconsists of several unfused components, thereby caus-ing a reduction in signal transmission when areas ofthe temporal bone farther away from the cochlea areused for oscillator placement. They conjectured thatoscillator placements which are closest to the cochleawill transmit the greatest intensities, whereas oscilla-tor placements on the unfused areas, further away onthe temporal bone, will result in lower intensities(Stuart et al., 1990). Although ABR latency differencesexisted between the various temporal placements, theassumption that attenuation would follow the samepattern appears to be incorrect. Latency is not linearlyrelated to signal attenuation (e.g., Mackersie &Stapells, 1994; Picton, Stapells & Campbell, 1981),consequently, latency-intensity functions cannot beused to accurately estimate threshold changes (Mack-ersie & Stapells, 1994). They also did not report waveV amplitudes, which are better predictors of thresholdthan latency, did not directly estimate threshold at thedifferent placements on the temporal bone, whichwould have been the best measure for assessing atten-uation, and did not use frequency-specific stimuli. Thefindings of Experiment 2 confirmed that latency datado not accurately estimate attenuation.
Although the results of this experiment show ele-vated thresholds at the forehead compared to thetemporal and mastoid oscillator placements, severallimitations exist regarding predicting attenuation ofthe bone-conducted signal across the skull. One limi-tation is that ASSR thresholds obtained in preterm
infants may not reflect the ASSR thresholds for nor-mal full-term infants for the different oscillator place-ments. Another limitation is that threshold was notalways reached at the maximum test intensity foreach placement, particularly at the forehead, resultingin an underestimation of the differences betweenplacements. It is likely that the elevated (i.e., worse)thresholds occur with the forehead location due togreater signal attenuation as a function of distancefrom the cochlea and, furthermore, the greater differ-ences in threshold at the higher frequencies betweenthe forehead and mastoid in infants are likely due tothe low-pass filtering effect imposed by the sutures ofthe infant skull.
Unoccluded Versus Occluded Ears
It is well established that there are significantinfant-adult differences in the transfer of acousticenergy through the outer and middle ear, but thesedifferences are not well understood. We know that theinfant ear canal is narrower and shorter than theadult ear (Keefe et al., 1994); it has also been shownthat the resonant frequency of the ear canal is higherinfants than adults (Keefe et al., 1994; Kruger, 1987;Kruger & Ruben, 1987). We also know that the earcanal wall is thinner and more compliant than inadults up to 2 mo of age (Holte, Margolis & Ca-vanaugh, 1991). Because we do not fully understandthe infant-adult differences in the transfer of acousticenergy in the outer/middle ear, we cannot assume thatphenomena such as the occlusion effect, which hasonly been studied in adults, are necessarily present ininfants or, if present, follow the same pattern. This isthe first experiment to investigate the occlusion effectin infants. The results of this experiment show thatbone-conduction ASSR thresholds in infants youngerthan 6 mo of age do not change at any of the frequen-cies tested when the ear canal was occluded. Compar-ison of unoccluded and occluded bone-conductionmean ASSR thresholds indicated no more than a 4-dBdifference across frequency, in contrast to adultswhose bone-conduction thresholds at 250 to 1000 Hzimprove as much as 17 dB when the ear canal isoccluded using an insert earphone (Dean & Martin,2000). Bone-conduction mean ASSR amplitudes andphase delays were also not significantly affected byoccluding the ear canal in these young infants. Thereare a number of possible explanations for the absenceof an occlusion effect in young infants. In adults, theunoccluded ear acts as a high-pass filter [i.e., low-frequency energy is lost through the open ear canal(Gelfand, 1981, p. 66; Tonndorf, 1966)]; in an occludedear, the improvement in the bone-conduction thresh-olds is due to the enhancement of the low frequencies.In the infant ear canal, it is possible that there is little
96 EAR & HEARING / FEBRUARY 2007

increase in low-frequency energy when the ear canal isoccluded due to its smaller volume or shorter length(Keefe et al., 1994) or that the insert phone takes upmost of the small ear canal volume. Alternatively, ifthere is low-frequency energy trapped in the occludedinfant ear (similar to adults), it may be absorbed by theinfant’s compliant ear canal wall (Keefe et al., 1993,1994), resulting in no net increase in energy passingthrough to stimulate the cochlea.
These preliminary results suggest that there is noeffect of occlusion in infants younger than 6 mo ofage; however, further studies should be conducted ina larger group of infants to confirm these findings.The clinical implications of these occlusion findingsare that it may be possible to do bone-conductiontesting, at least in infants younger than 6 mo of age,with ears occluded without applying a correctionfactor. Also, it is important to investigate whetherthe occlusion effect is present in older infants and todetermine at which age the occlusion effect shouldbe compensated for in clinical testing.
CONCLUSIONS
The results of these experiments have clinicalimplications for bone-conduction testing proceduresused in infants. Our findings support that (i) eitherthe elastic-band or the hand-held method is appro-priate for coupling the bone-oscillator to the head,with the important caveat that adequate traininghas taken place for the method used, (ii) either atemporal or mastoid placement location can be used(forehead placement should be avoided), and (iii)ears may be unoccluded or occluded during bone-conduction testing without significantly affectingthreshold estimation.
ACKNOWLEDGMENTS
Susan Small was supported by a Canadian Institutes of HealthResearch (CIHR) Fellowship and a Michael Smith Foundation forHealth Research Trainee Award. Jennifer Hatton was supportedby a NSERC-Canada Undergraduate Student Research Award.We thank Dan Black from DB Special Instruments for providingequipment for calibration of the bone-conduction stimuli and SueAnne Poh for assistance with data collection. We also thank thestaff and families from the Special Care Nursery NICU at theBritish Columbia’s Children’s and Women’s Hospital for theircooperation. This research was supported by grants from CIHRand the NSERC-Canada to the third author.
Portions of this paper were presented at the 149th Meeting of theAcoustical Society of America (Vancouver, Canada, May 2005)and the XIX Biennial Symposium of the International EvokedResponse Audiometry Study Group (Havana, Cuba, June 2005).Address for correspondence: Dr. David R. Stapells, School ofAudiology and Speech Sciences, The University of British Colum-bia, 5804 Fairview Avenue, Vancouver, BC, Canada V6T 1Z3.E-mail: [email protected].
Received March 21, 2006; accepted August 22, 2006.
REFERENCES
ANSI. (1996). American National Standard Specifications forAudiometers (ANSI S3.6–1996). New York: ANSI.
Cone-Wesson, B. (1995). Bone-conduction ABR tests. AmericanJournal of Audiology, 4, 14–19.
Dean, M. S., Martin, F. N. (2000). Insert earphone and theocclusion effect. American Journal of Audiology, 9, 131–134.
Dirks, D., Swindeman, J. G. (1967). The variability of occludedand unoccluded bone-conduction thresholds. Journal of Speechand Hearing Research, 10, 232–249.
Elpern, B., Naunton, R. F. (1963). The stability of the occlusioneffect. Archives of Otolaryngology, 77, 376–384.
Gelfand, S. A. (1981). Hearing: An introduction to psychological andphysiological acoustics. (pp. 66). New York: Marcel Dekker, Inc.
Harrell, R. W. (2002). Puretone Evaluation. In Katz J (Ed).Handbook of Clinical Audiology, Fifth edition. (pp. 71–87).Philadelphia: Lippincott, Williams & Wilkins.
Hodgson, W. R., Tillman, T. W. (1966). Reliability of bone con-duction occlusion effects in normals. Journal of Auditory Re-search, 6, 141–151.
Holte, L. A., Margolis, R. H., & Cavanaugh R. M., Jr. (1991).Developmental changes in multifrequency tympanometry. Au-diology 30, 1–24.
John, M. S., Dimitrijevic, A., Picton, T. W. (2001). Weightedaveraging of steady-state responses. Clinical Neurophysiology,112, 555–562.
John, M. S., Picton, T. W. (2000a). MASTER: A Windows programfor recording multiple auditory steady-state responses. Com-puting Methods and Programs in Biomedicine, 61, 125–150.
John, M. S., Picton, T. W. (2000b). Human auditory steady-stateresponses to amplitude-modulated tones: phase and latencymeasurements. Hearing Research, 141, 57–79.
Keefe, D., Bulen J., Arehart K., & Burns E. (1993). Ear-canalimpadance and reflection coefficient in human infants andadults. Journal of the Aucostical Society of America 94, 2617–38.
Keefe, D. H., Bulen J. C., Campbell S. L., & Burns E. M. (1994).Pressure transfer function and absorption cross section fromthe diffuse field to the human infant ear canal. Journal of theAcoustic Society of America 95, 355–71.
Kruger, B. (1987). An update on the external ear resonance ininfants and young children. Ear and Hearing 8, 333–6.
Kruger, B., & Ruben R. J. (1987). The acoustic properties of theinfant ear. Acta Otolaryngologica (Stockholm) 103, 578–85.
Little, R. J. A., Rubin, D. B. (2002). Statistical Analysis withMissing Data. 2nd ed. (pp. 3–40). Hoboken: Wiley & Sons Inc.
Mackersie, C. L., Stapells, D. R. (1994). Auditory brainstemresponse wave I prediction of conductive component in infantsand young children. American Journal of Audiology, 3, 52–58.
Munro, K. J., Paul, B., Cox, C. L. (1997). Normative auditorybrainstem response data for bone conduction in the dog. Jour-nal of Small Animal Practice, 38, 353–356.
Murphy, K. R., Myors, B. (2004). Statistical Power Analysis: ASimple and General. Model for Traditional and Modern Hy-pothesis Tests. 2nd ed. (pp. 22–97). Mahwah, NJ: LawrenceErlbaum Associates.
Picton, T. W., Stapells, D. R., Campbell, K. B. (1981). Auditoryevoked potentials from the human cochlea and brainstem.Journal of Otolaryngology, 10, 1–41.
Small, S. A., Stapells, D. R. (2003). Normal brief-tone bone-conduction behavioral thresholds using the B-71 transducer:Three occlusion conditions. Journal of the American Academyof Audiology, 14, 556–562.
Small, S. A., Stapells, D. R. (2004). Artifactual responses whenrecording auditory steady-state responses. Ear and Hearing,25, 611–623.
EAR & HEARING, VOL. 28 NO. 1 97

Small, S. A., Stapells, D. R. (2006). Multiple auditory steady-stateresponse thresholds to bone-conduction stimuli in young in-fants with normal hearing. Ear and Hearing, 27, 219–228.
Stapells, D. R. (2000). Frequency-specific evoked potential audi-ometry in infants. In Seewald R. C. (Ed). A Sound FoundationThrough Early Amplification. (pp. 13–31). Basel, Switzerland:Phonak AG.
Stapells, D. R., Oates, P. (1997). Estimation of the pure-toneaudiogram by the auditory brainstem response: A review.Audiology & NeuroOtology, 2, 257–280.
Stuart, A., Yang, E. Y., Stenstrom, R. (1990). Effect of temporalarea bone vibrator placement on auditory brain stem responsein newborn infants. Ear and Hearing, 11, 363–369.
Tonndorf, J. (1996). Bone Conduction: Studies in experimentalanimals. Acta Otolaryngologica, Supplement 213, 1–132.
Wilber, L. A. (1979). Pure-tone audiometry: Air and bone conduc-
tion. In Rintelmann W. F. (ed). Hearing assessment. (pp.27–42). Baltimore: University Park Press.
Yang, E. Y., Stuart, A. (1990). A method of auditory brainstemresponse testing of infants using bone-conducted clicks. Jour-nal of Speech Language Pathology and Audiology, 14, 69–76.
Yang, E. Y., Stuart, A. (2000). The contribution of the auditorybrainstem responses to bone-conducted stimuli in newbornhearing screening. Journal of Speech-Language Pathology andAudiology, 24, 84–91.
Yang, E. Y., Rupert, A. L., Moushegian, G. (1987). A developmen-tal study of bone conduction auditory brainstem responses ininfants. Ear and Hearing, 8, 244–251.
Yang, E. Y., Stuart, A, Stenstrom, M. A., Hollett, S. (1991). Effectof vibrator to head coupling force on the auditory brain stemresponse to bone-conducted clicks in newborn infants. Ear andHearing, 12, 55–60.
98 EAR & HEARING / FEBRUARY 2007


