Embed Size (px)
Citation preview
David H. Miller,FMedSci
Robert J. Fox, MDJ. Theodore Phillips, MD,
PhDMichael Hutchinson,
FRCPEva Havrdova, MDMariko Kita, MDClaudia A.M. Wheeler-
Kingshott, PhDDaniel J. Tozer, PhDDavid G. MacManus,
MScTarek A. Yousry, Dr Med
HabilMary Goodsell, MScMinhua Yang, MSRay Zhang, PhDVissia Viglietta, MDKatherine T. Dawson,
MDFor the CONFIRM study
investigators
Correspondence toDr. Miller:[email protected]
Supplemental dataat Neurology.org
Effects of delayed-release dimethylfumarate on MRI measures in the phase 3CONFIRM study
ABSTRACT
Objective: To evaluate the effects of oral delayed-release dimethyl fumarate (DMF; also known asgastro-resistant DMF) on MRI lesion activity and load, atrophy, and magnetization transfer ratio(MTR) measures from the Comparator and an Oral Fumarate in Relapsing-Remitting Multiple Scle-rosis (CONFIRM) study.
Methods: CONFIRMwas a 2-year, placebo-controlled study of the efficacy and safety of DMF240mgtwice (BID) or 3 times daily (TID) in 1,417 patients with relapsing-remitting multiple sclerosis (RRMS);subcutaneous glatiramer acetate 20 mg once daily was included as an active reference comparator.The number and volume of T2-hyperintense, T1-hypointense, and gadolinium-enhancing (Gd1) lesions,as well as whole brain volume and MTR, were assessed in 681 patients (MRI cohort).
Results: DMF BID and TID produced significant and consistent reductions vs placebo in the num-ber of new or enlarging T2-hyperintense lesions and new nonenhancing T1-hypointense lesionsafter 1 and 2 years of treatment and in the number of Gd1 lesions at week 24, year 1, and year2. Lesion volumes were also significantly reduced. Reductions in brain atrophy and MTR changeswith DMF relative to placebo did not reach statistical significance.
Conclusions: The robust effects on MRI active lesion counts and total lesion volume in patients withRRMS demonstrate the ability of DMF to exert beneficial effects on inflammatory lesion activity in mul-tiple sclerosis, and support DMF therapy as a valuable new treatment option in RRMS.
Classification of evidence: This study provides Class I evidence of reduction in brain lesion num-ber and volume, as assessed by MRI, over 2 years of delayed-release DMF treatment.Neurology® 2015;84:1145–1152
GLOSSARYANCOVA5 analysis of covariance; BID5 twice daily;CI5 confidence interval;CONFIRM5 Comparator and an Oral Fumarate inRelapsing-Remitting Multiple Sclerosis; DEFINE 5 Determination of the Efficacy and Safety of Oral Fumarate in Relapsing-Remitting Multiple Sclerosis; DMF 5 delayed-release dimethyl fumarate (also known as gastro-resistant dimethyl fumarate);EDSS 5 Expanded Disability Status Scale; GA 5 glatiramer acetate; Gd1 5 gadolinium-enhancing; ITT 5 intent-to-treat; MS 5multiple sclerosis;MTR5magnetization transfer ratio;Nrf25 nuclear factor (erythroid-derived2)–like 2;PBVC5 percentage brainvolume change; RRMS 5 relapsing-remitting multiple sclerosis; SIENA 5 structural image evaluation using normalization of atro-phy; SIENAX 5 structural image evaluation using normalization of atrophy cross-sectional; TID 5 3 times daily.
Multiple sclerosis (MS) is a chronic disease of the CNS, characterized by inflammatory demyelinationand axonal degeneration, producing focal lesions of white and gray matter. Much of the damage inMS is thought to be caused by inflammation and associated oxidative stress; treatments that improvecellular resistance to inflammatory insults may broaden available options in MS therapy.
Oral delayed-release dimethyl fumarate (DMF; also known as gastro-resistant DMF) hasdemonstrated anti-inflammatory and cytoprotective effects mediated via both the nuclear factor(erythroid-derived 2)–like 2 (Nrf2) pathway and Nrf2-independent pathways in preclinical
From the Departments of Neuroinflammation (D.H.M., C.A.M.W.-K., D.J.T., D.G.M.) and Brain Repair and Rehabilitation (T.A.Y.), NMR ResearchUnit, Queen Square Multiple Sclerosis Centre; University College London Institute of Neurology (D.H.M., C.A.M.W.-K., D.J.T., D.G.M., T.A.Y.),UK; Mellen Center for Multiple Sclerosis Treatment and Research (R.J.F.), Cleveland Clinic, OH; Multiple Sclerosis Program (J.T.P.), Baylor Institutefor Immunology Research, Dallas, TX; St. Vincent’s University Hospital (M.H.), Elm Park, Donnybrook, Dublin, Ireland; Department of Neurology(E.H.), First Faculty of Medicine, Charles University, Prague, Czech Republic; Virginia Mason Medical Center (M.K.), Seattle, WA; CircleScience(M.G.), Tytherington, UK; and Biogen Idec Incorporated (M.Y., R.Z., V.V., K.T.D.), Weston, MA.
Coinvestigators are listed on the Neurology® Web site at Neurology.org.
Go to Neurology.org for full disclosures. Funding information and disclosures deemed relevant by the authors, if any, are provided at the end of the article.The Article Processing Charge was paid by Biogen Idec.
This is an open access article distributed under the terms of the Creative Commons Attribution-Noncommercial No Derivative 3.0 License, whichpermits downloading and sharing the work provided it is properly cited. The work cannot be changed in any way or used commercially.
© 2015 American Academy of Neurology 1145
ª 2015 American Academy of Neurology. Unauthorized reproduction of this article is prohibited.
studies.1–4 Two randomized, double-blind, phase3 studies, Determination of the Efficacy andSafety of Oral Fumarate in Relapsing-RemittingMultiple Sclerosis (DEFINE) and Comparatorand an Oral Fumarate in Relapsing-RemittingMultiple Sclerosis (CONFIRM), were con-ducted among patients with relapsing-remittingMS (RRMS).5,6 In both studies, DMF treatmentproduced significant clinical and neuroradiologicbenefits over 2 years, including reductions in re-lapses, new lesion counts, and lesion volumesassessed by MRI, with an acceptable safetyprofile.
DMF is approved in the United States for thetreatment of relapsing forms of MS.7 Here, wereport the effects of DMF on MRI brain lesionsobserved in CONFIRM. Tertiary analyses werealso conducted to assess changes in brain volume(atrophy) and in magnetization transfer ratio(MTR), a quantitative MRI technique used todetect changes in intrinsic tissue structure,including myelin content, in the CNS.8–10
METHODS Standard protocol approvals, registrations, andpatient consents. The CONFIRM study (ClinicalTrials.gov
identifier NCT00451451) was approved by central and local ethics
committees and performed in accordance with The International
Conference on Harmonisation Guidelines on Good Clinical
Practice11 and the ethical principles outlined in the Declaration of
Helsinki.12 Written informed consent was obtained from all patients
before evaluations were performed to determine eligibility.
Study design. CONFIRM was a 2-year, phase 3, randomized,
international, multicenter, parallel-group, placebo-controlled study,
with active reference comparator, that evaluated the safety and
efficacy of DMF in patients with RRMS, as reported previously.6
Patients from 200 sites in 28 countries were randomized 1:1:1:1 to
receive PO placebo, PO DMF 240 mg twice daily (BID), PO DMF
240 mg 3 times daily (TID), or glatiramer acetate (GA) 20 mg once
daily by subcutaneous injection for 96 weeks. DMF and placebo
treatments were double-blind, while GA treatment was rater-blind.
MRI secondary and tertiary outcomes of the study were assessed in
a subset of patients at centers with appropriate imaging facilities. These
included the number of new or enlarging T2-hyperintense, new non-
enhancing T1-hypointense, and gadolinium-enhancing (Gd1) le-
sions; volume of T2-hyperintense, nonenhancing T1-hypointense,
and Gd1 lesions; percentage brain volume change (PBVC); and per-
centage change in whole brain MTR.
Patients. As reported previously,6 patients aged 18–55 years
with a confirmed diagnosis of RRMS according to McDonald
criteria 200513 and an Expanded Disability Status Scale (EDSS)
score of 0–5.0 were enrolled in the MRI portion of the trial at
screening, prior to randomization (figure 1). Additional eligibility
criteria are included in e-Methods on the Neurology® Web site at
Neurology.org.
MRI assessments. MRI scans were obtained at baseline and at
weeks 24, 48, and 96 in patients from a subset of sites with full
MRI capabilities. Approximately 95% of patients at these sites
chose to participate. Original MRI scans from each site were evaluated
in a blinded manner by qualified personnel at a central reading facility
(University College London Institute of Neurology, UK).
Lesion volumes (T2-weighted and nonenhancing T1-weighted)
were assessed at baseline and weeks 48 and 96, and numbers
of new or enlarging T2-weighted lesions and new nonenhancing
T1-weighted lesions were assessed at weeks 48 and 96. Gd1 lesion
count and volume were assessed at baseline and weeks 24, 48, and 96.
Lesion assessment methodology is provided in e-Methods.
Normalized brain volume was assessed at baseline and week 24
using the structural image evaluation using normalization of atrophy
(SIENA) cross-sectional (SIENAX) method, and PBVC was as-
sessed at each post-baseline MRI visit relative to earlier measure-
ments by the SIENA method.14 A more stringent post hoc
quality assessment and analysis of PBVC is also included (metho-
dology described in e-Methods). MTR analysis was conducted
using a purposefully developed pipeline (methodology described
in e-Methods). Median whole brain MTR at baseline, week 48,
and week 96 was reported.
Statistical analyses. The intent-to-treat (ITT) population
comprised all randomized patients who received at least one
dose of study treatment. The MRI cohort comprised ITT
patients who consented to participate in the MRI portion of
the study and had any MRI data.
A negative binomial regression model was used to analyze the
total number of new or enlarging T2-hyperintense lesions and the
number of new T1-hypointense lesions at 2 years (secondary end-
points) and 1 year (tertiary endpoints). The model was adjusted
for region (defined by type of health care system, access to health
care, and geography) and baseline lesion volume (T1-hypointense
or T2-hyperintense). The number of Gd1 lesions at 1 and 2 years
(tertiary endpoints) were analyzed using an ordinal logistic regression
model, adjusted for region and baseline Gd1 lesion number.
Analysis of covariance (ANCOVA) on ranked data was used
to assess the effects of treatment on volume of T1-hypointense,
T2-hyperintense, and Gd1 lesions at 1 and 2 years (tertiary
endpoints). The model included treatment group and adjust-
ments for region and baseline lesion volume (T1-hypointense,
T2-hyperintense, or Gd1).
ANCOVA of ranked data was used to assess the effects of treat-
ment on PBVC at 2 years, relative to baseline and relative to week
24. The model included treatment group and adjustments for region
and brain volume at reference visit (baseline or week 24).
ANCOVA was also used to assess the effects of treatment on
the percentage change from baseline of whole brain MTR at
1 and 2 years. The model included treatment group and adjust-
ments for region and baseline MTR value.
Linear relationships between MRI endpoints and clinical end-
points were calculated using Spearman rank correlation coefficients.
Classification of evidence. This study provides Class I evi-
dence of reduction in brain lesion number and volume, as as-
sessed by MRI, over 2 years of treatment with DMF 240 mg
BID or TID, compared with placebo, in patients with RRMS.
DMF BID and TID reduced the mean number of new or enlarg-
ing T2-hyperintense lesions by 71% and 73%, respectively, the
mean number of new nonenhancing T1-hypointense lesions by
57% and 65%, and Gd1 lesions by 74% and 65% (reductions
in the odds of having more lesions) over 2 years vs placebo (all
p , 0.001). Lesion volumes were also significantly reduced.
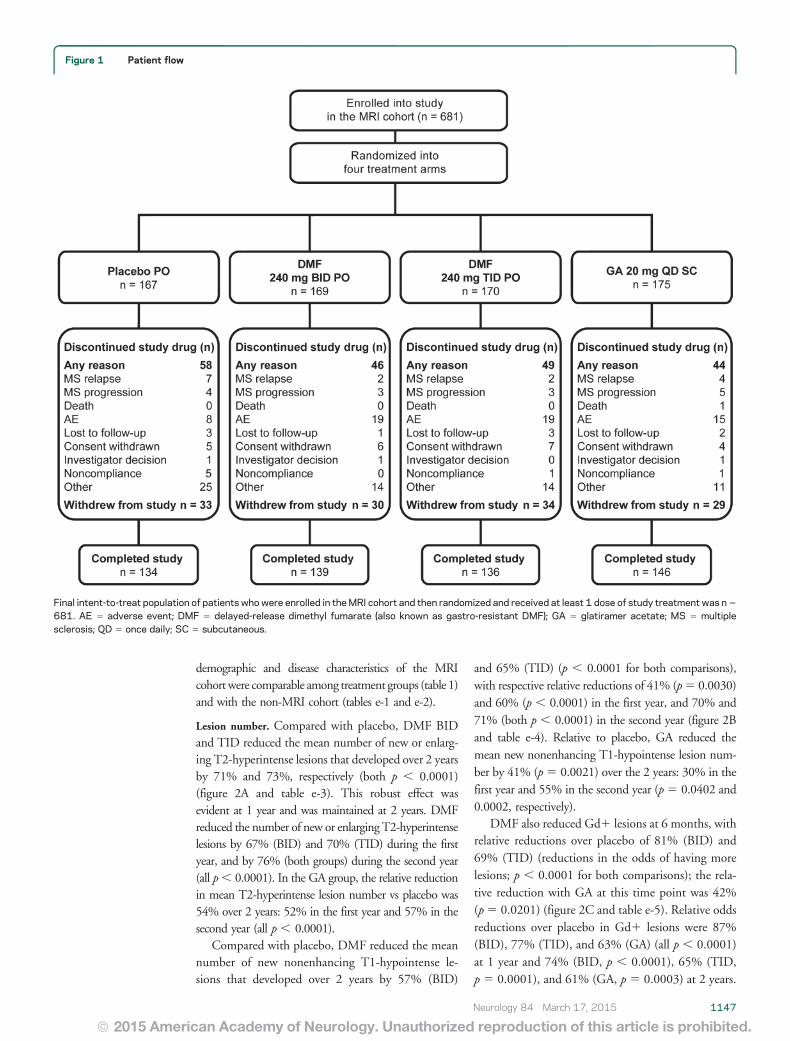
RESULTS Patients. Of the 1,430 patients random-ized, 1,417 were included in the ITT population,and 681 patients in the MRI cohort (figure 1). Baseline
1146 Neurology 84 March 17, 2015
ª 2015 American Academy of Neurology. Unauthorized reproduction of this article is prohibited.
demographic and disease characteristics of the MRIcohortwere comparable among treatment groups (table 1)and with the non-MRI cohort (tables e-1 and e-2).
Lesion number. Compared with placebo, DMF BIDand TID reduced the mean number of new or enlarg-ing T2-hyperintense lesions that developed over 2 yearsby 71% and 73%, respectively (both p , 0.0001)(figure 2A and table e-3). This robust effect wasevident at 1 year and was maintained at 2 years. DMFreduced the number of new or enlarging T2-hyperintenselesions by 67% (BID) and 70% (TID) during the firstyear, and by 76% (both groups) during the second year(all p, 0.0001). In the GA group, the relative reductionin mean T2-hyperintense lesion number vs placebo was54% over 2 years: 52% in the first year and 57% in thesecond year (all p , 0.0001).
Compared with placebo, DMF reduced the meannumber of new nonenhancing T1-hypointense le-sions that developed over 2 years by 57% (BID)
and 65% (TID) (p , 0.0001 for both comparisons),with respective relative reductions of 41% (p5 0.0030)and 60% (p , 0.0001) in the first year, and 70% and71% (both p , 0.0001) in the second year (figure 2Band table e-4). Relative to placebo, GA reduced themean new nonenhancing T1-hypointense lesion num-ber by 41% (p5 0.0021) over the 2 years: 30% in thefirst year and 55% in the second year (p5 0.0402 and0.0002, respectively).
DMF also reduced Gd1 lesions at 6 months, withrelative reductions over placebo of 81% (BID) and69% (TID) (reductions in the odds of having morelesions; p , 0.0001 for both comparisons); the rela-tive reduction with GA at this time point was 42%(p5 0.0201) (figure 2C and table e-5). Relative oddsreductions over placebo in Gd1 lesions were 87%(BID), 77% (TID), and 63% (GA) (all p , 0.0001)at 1 year and 74% (BID, p , 0.0001), 65% (TID,p 5 0.0001), and 61% (GA, p 5 0.0003) at 2 years.
Figure 1 Patient flow
Final intent-to-treat population of patients whowere enrolled in theMRI cohort and then randomized and received at least 1 dose of study treatment was n5
681. AE 5 adverse event; DMF 5 delayed-release dimethyl fumarate (also known as gastro-resistant DMF); GA 5 glatiramer acetate; MS 5 multiplesclerosis; QD 5 once daily; SC 5 subcutaneous.
Neurology 84 March 17, 2015 1147
ª 2015 American Academy of Neurology. Unauthorized reproduction of this article is prohibited.
The robustness of these findings was confirmed bysensitivity analyses based on all observed data, and onobserved data prior to starting alternative MS medica-tion (figure e-1). These sensitivity analyses indicatedthat neither the data imputation method used inthe primary analysis nor the exclusion of data after pa-tients switched to alternative MS medication affectedthe results.
Although this study was not designed to assess supe-riority or noninferiority of DMF over GA, the reduc-tions in lesion numbers over 2 years relative toplacebo were numerically greater in both DMF dosegroups than in the GA group. Direct comparisons (posthoc) of the relative effect of BID and TID vs GA pro-duced rate ratios (95% confidence intervals [CI]) of0.64 (0.46, 0.88) and 0.59 (0.43, 0.82) for new/enlarg-ing T2-hyperintense lesions (nominal p values for thecomparison: p 5 0.0068 and p 5 0.0017), and 0.74(0.52, 1.04) and 0.59 (0.41, 0.84) for new nonenhanc-ing T1-hypointense lesions (nominal p 5 0.0846 andp 5 0.0033), respectively. Odds ratios (95% CI) forGd1 lesions were 0.71 (0.40, 1.25) for BID and 0.87(0.50, 1.52) TID vs GA (not significant).
Lesion volume. A reduction in T2-hyperintense lesionvolume was seen within the first year of DMFtreatment, and was maintained throughout the study.Lesion volume increased in the placebo group, with
mean 6 SD change from baseline to 2 years of744.7 6 3,662.4 mm3, representing a median15% increase from baseline, vs a reduction in T2-hyperintense lesion volume by 1,035.8 6 2,657.2,800.5 6 3,933.3, and 946.0 6 3,766.6 mm3 (medianpercentage change27%,22%, and26%) in the BID,TID, and GA groups, respectively (p , 0.0001 for allcomparisons vs placebo) (figure 2D and table e-3).
Increases in nonenhancing T1-hypointense lesionvolume at 2 years were attenuated with DMF treatmentrelative to placebo, with mean6 SD changes from base-line of 198.1 6 1,380.0 (BID) and 190.7 6 1,204.2(TID), vs 342.4 6 878.5 mm3 with placebo (medianpercentage change 11% and 9% vs 20%; p 5 0.0005and p5 0.0015 vs placebo), respectively (figure 2E andtable e-4). Treatment with GA also attenuated theincrease in T1-hypointense lesion volume at 2 years rel-ative to placebo, with mean6 SD change from baselineof 214.7 6 1,389.0 mm3 (median percentage change9%, p 5 0.0013 vs placebo).
Compared with placebo, DMF reduced Gd1 lesionvolumes, with mean6 SD values at 2 years of 35.96128.5 (BID) and 42.66 149.9 mm3 (TID), comparedwith 141.86 339.1 mm3 for placebo (post hoc analysis;both p , 0.0001 vs placebo) (figure 2F and table e-5).This treatment effect was apparent within 6 months.The mean 6 SD reduction from baseline to 2 yearsin Gd1 lesion volume was 251.8 6 595.6 (BID) and
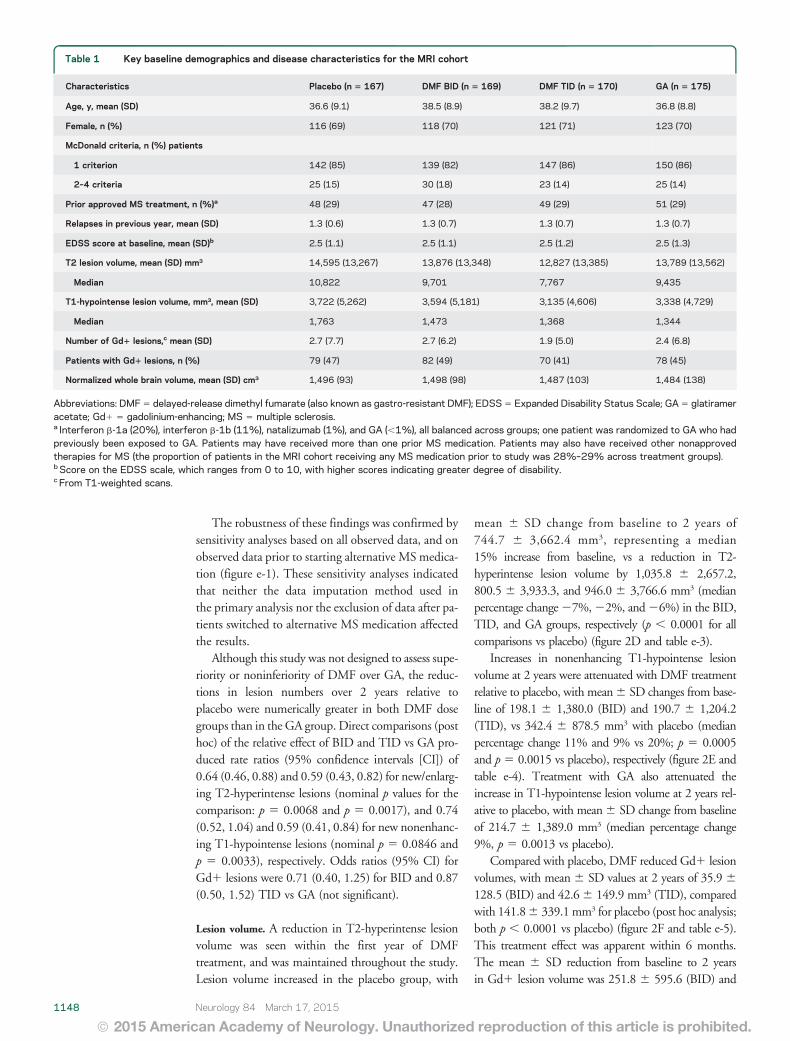
Table 1 Key baseline demographics and disease characteristics for the MRI cohort
Characteristics Placebo (n 5 167) DMF BID (n 5 169) DMF TID (n 5 170) GA (n 5 175)
Age, y, mean (SD) 36.6 (9.1) 38.5 (8.9) 38.2 (9.7) 36.8 (8.8)
Female, n (%) 116 (69) 118 (70) 121 (71) 123 (70)
McDonald criteria, n (%) patients
1 criterion 142 (85) 139 (82) 147 (86) 150 (86)
2–4 criteria 25 (15) 30 (18) 23 (14) 25 (14)
Prior approved MS treatment, n (%)a 48 (29) 47 (28) 49 (29) 51 (29)
Relapses in previous year, mean (SD) 1.3 (0.6) 1.3 (0.7) 1.3 (0.7) 1.3 (0.7)
EDSS score at baseline, mean (SD)b 2.5 (1.1) 2.5 (1.1) 2.5 (1.2) 2.5 (1.3)
T2 lesion volume, mean (SD) mm3 14,595 (13,267) 13,876 (13,348) 12,827 (13,385) 13,789 (13,562)
Median 10,822 9,701 7,767 9,435
T1-hypointense lesion volume, mm3, mean (SD) 3,722 (5,262) 3,594 (5,181) 3,135 (4,606) 3,338 (4,729)
Median 1,763 1,473 1,368 1,344
Number of Gd1 lesions,c mean (SD) 2.7 (7.7) 2.7 (6.2) 1.9 (5.0) 2.4 (6.8)
Patients with Gd1 lesions, n (%) 79 (47) 82 (49) 70 (41) 78 (45)
Normalized whole brain volume, mean (SD) cm3 1,496 (93) 1,498 (98) 1,487 (103) 1,484 (138)
Abbreviations: DMF5 delayed-release dimethyl fumarate (also known as gastro-resistant DMF); EDSS5 Expanded Disability Status Scale; GA5 glatirameracetate; Gd1 5 gadolinium-enhancing; MS 5 multiple sclerosis.a Interferon b-1a (20%), interferon b-1b (11%), natalizumab (1%), and GA (,1%), all balanced across groups; one patient was randomized to GA who hadpreviously been exposed to GA. Patients may have received more than one prior MS medication. Patients may also have received other nonapprovedtherapies for MS (the proportion of patients in the MRI cohort receiving any MS medication prior to study was 28%–29% across treatment groups).b Score on the EDSS scale, which ranges from 0 to 10, with higher scores indicating greater degree of disability.c From T1-weighted scans.
1148 Neurology 84 March 17, 2015
ª 2015 American Academy of Neurology. Unauthorized reproduction of this article is prohibited.
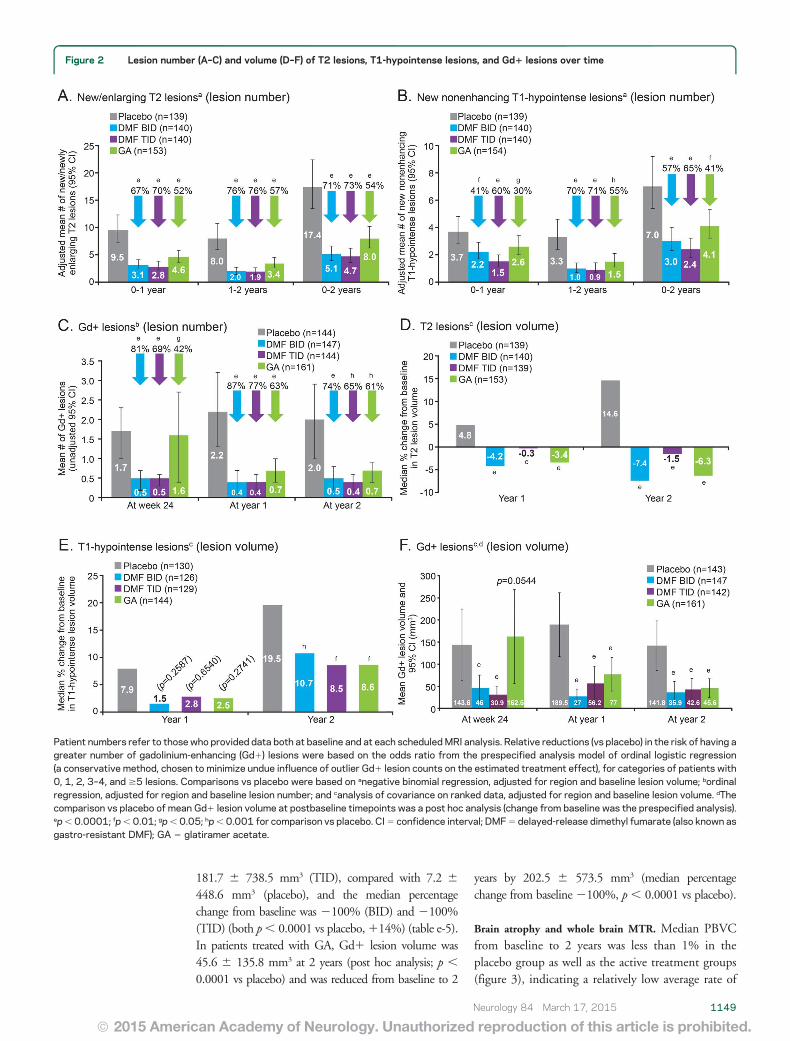
181.7 6 738.5 mm3 (TID), compared with 7.2 6
448.6 mm3 (placebo), and the median percentagechange from baseline was 2100% (BID) and 2100%(TID) (both p, 0.0001 vs placebo,114%) (table e-5).In patients treated with GA, Gd1 lesion volume was45.6 6 135.8 mm3 at 2 years (post hoc analysis; p ,
0.0001 vs placebo) and was reduced from baseline to 2
years by 202.5 6 573.5 mm3 (median percentagechange from baseline2100%, p, 0.0001 vs placebo).
Brain atrophy and whole brain MTR. Median PBVCfrom baseline to 2 years was less than 1% in theplacebo group as well as the active treatment groups(figure 3), indicating a relatively low average rate of
Figure 2 Lesion number (A–C) and volume (D–F) of T2 lesions, T1-hypointense lesions, and Gd1 lesions over time
Patient numbers refer to those who provided data both at baseline and at each scheduledMRI analysis. Relative reductions (vs placebo) in the risk of having agreater number of gadolinium-enhancing (Gd1) lesions were based on the odds ratio from the prespecified analysis model of ordinal logistic regression(a conservative method, chosen to minimize undue influence of outlier Gd1 lesion counts on the estimated treatment effect), for categories of patients with0, 1, 2, 3–4, and $5 lesions. Comparisons vs placebo were based on anegative binomial regression, adjusted for region and baseline lesion volume; bordinalregression, adjusted for region and baseline lesion number; and canalysis of covariance on ranked data, adjusted for region and baseline lesion volume. dThecomparison vs placebo of mean Gd1 lesion volume at postbaseline timepoints was a post hoc analysis (change from baseline was the prespecified analysis).ep, 0.0001; fp, 0.01; gp,0.05; hp,0.001 for comparison vs placebo. CI5 confidence interval; DMF5 delayed-release dimethyl fumarate (also known asgastro-resistant DMF); GA 5 glatiramer acetate.
Neurology 84 March 17, 2015 1149
ª 2015 American Academy of Neurology. Unauthorized reproduction of this article is prohibited.
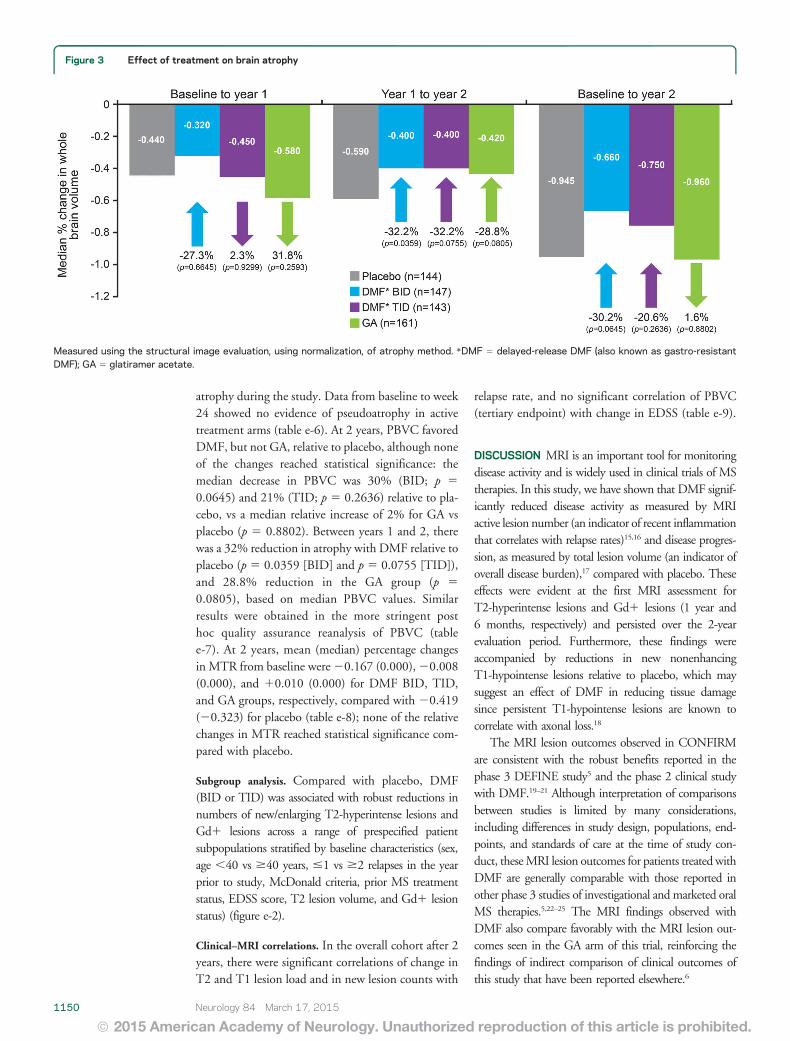
atrophy during the study. Data from baseline to week24 showed no evidence of pseudoatrophy in activetreatment arms (table e-6). At 2 years, PBVC favoredDMF, but not GA, relative to placebo, although noneof the changes reached statistical significance: themedian decrease in PBVC was 30% (BID; p 5
0.0645) and 21% (TID; p 5 0.2636) relative to pla-cebo, vs a median relative increase of 2% for GA vsplacebo (p 5 0.8802). Between years 1 and 2, therewas a 32% reduction in atrophy with DMF relative toplacebo (p 5 0.0359 [BID] and p 5 0.0755 [TID]),and 28.8% reduction in the GA group (p 5
0.0805), based on median PBVC values. Similarresults were obtained in the more stringent posthoc quality assurance reanalysis of PBVC (tablee-7). At 2 years, mean (median) percentage changesin MTR from baseline were20.167 (0.000),20.008(0.000), and 10.010 (0.000) for DMF BID, TID,and GA groups, respectively, compared with 20.419(20.323) for placebo (table e-8); none of the relativechanges in MTR reached statistical significance com-pared with placebo.
Subgroup analysis. Compared with placebo, DMF(BID or TID) was associated with robust reductions innumbers of new/enlarging T2-hyperintense lesions andGd1 lesions across a range of prespecified patientsubpopulations stratified by baseline characteristics (sex,age ,40 vs $40 years, #1 vs $2 relapses in the yearprior to study, McDonald criteria, prior MS treatmentstatus, EDSS score, T2 lesion volume, and Gd1 lesionstatus) (figure e-2).
Clinical–MRI correlations. In the overall cohort after 2years, there were significant correlations of change inT2 and T1 lesion load and in new lesion counts with
relapse rate, and no significant correlation of PBVC(tertiary endpoint) with change in EDSS (table e-9).
DISCUSSION MRI is an important tool for monitoringdisease activity and is widely used in clinical trials of MStherapies. In this study, we have shown that DMF signif-icantly reduced disease activity as measured by MRIactive lesion number (an indicator of recent inflammationthat correlates with relapse rates)15,16 and disease progres-sion, as measured by total lesion volume (an indicator ofoverall disease burden),17 compared with placebo. Theseeffects were evident at the first MRI assessment forT2-hyperintense lesions and Gd1 lesions (1 year and6 months, respectively) and persisted over the 2-yearevaluation period. Furthermore, these findings wereaccompanied by reductions in new nonenhancingT1-hypointense lesions relative to placebo, which maysuggest an effect of DMF in reducing tissue damagesince persistent T1-hypointense lesions are known tocorrelate with axonal loss.18
The MRI lesion outcomes observed in CONFIRMare consistent with the robust benefits reported in thephase 3 DEFINE study5 and the phase 2 clinical studywith DMF.19–21 Although interpretation of comparisonsbetween studies is limited by many considerations,including differences in study design, populations, end-points, and standards of care at the time of study con-duct, theseMRI lesion outcomes for patients treated withDMF are generally comparable with those reported inother phase 3 studies of investigational and marketed oralMS therapies.5,22–25 The MRI findings observed withDMF also compare favorably with the MRI lesion out-comes seen in the GA arm of this trial, reinforcing thefindings of indirect comparison of clinical outcomes ofthis study that have been reported elsewhere.6
Figure 3 Effect of treatment on brain atrophy
Measured using the structural image evaluation, using normalization, of atrophy method. *DMF 5 delayed-release DMF (also known as gastro-resistantDMF); GA 5 glatiramer acetate.
1150 Neurology 84 March 17, 2015
ª 2015 American Academy of Neurology. Unauthorized reproduction of this article is prohibited.
The MRI outcomes in CONFIRM and other clini-cal studies are consistent with preclinical data,2,4,26 sug-gesting that anti-inflammatory properties maycontribute to the efficacy of DMF in RRMS. This isillustrated by the significant reductions in new orenlarging T2-hyperintense, new T1-hypointense,and Gd1 lesion counts, and total lesion volume.The MRI benefits of DMF are observed across patientsubgroups differing in baseline disease activity anddemographic characteristics (despite limited patientnumbers), further supporting the potential value ofthis treatment across a broad spectrum of patientswith RRMS.
MTR has not been explored previously in a largephase 3 study and, therefore, investigation of MTRin the present study and companion phase 3 study,DEFINE, represents a novel approach to obtain explor-atory information and guide future study design. Brainatrophy data were also collected for tertiary analysis. Sta-tistically significant treatment effects of DMF on MTRoutcomes (both doses) and brain atrophy (BID only)were observed in DEFINE.27,28 However, MTR out-comes and brain atrophy results with DMF did notreach statistical significance in CONFIRM. The rateof atrophy in the placebo arm during the CONFIRMstudy was lower in comparison with the placebo arms ofother phase 3 studies of oral MS therapies.22,24 In addi-tion, there was no increase in brain volume loss withDMF during the first 24 weeks, indicating no signifi-cant pseudoatrophy effect due to a decrease in inflam-matory tissue and edema.
Neither of the phase 3 studies was prospectively pow-ered to detect a treatment effect on brain atrophy andMTR. Assessments of these parameters were performedin the MRI cohort that was about half the size of thewhole trial population. The relatively small changes inMTR and atrophy measures in all study arms, includingplacebo, combined with the smaller sample size, mayhave reduced the sensitivity to detect a significant thera-peutic effect over 2 years. A delayed onset of effect mayalso be relevant, as suggested by more evident reductionsin PBVC in the DMF arms during the second year.
Previous trials of GA in clinically isolated syn-dromes29 and RRMS30 revealed 28% less brain atro-phy and no difference in brain volume change after amean follow-up of 3.8 years and 18 months, respec-tively. Although we did not observe less PBVC over 2years in the GA-treated arm vs placebo, there was atrend for less atrophy in the second year.
Overall, the CONFIRM imaging data are consistentwith DMF having robust anti-inflammatory effects. Thepositive imaging findings, when considered alongsideclinical relapse and disability data, as well as the accept-able tolerability and safety profile of this agent,5,6 supportthe use of DMF as a valuable new treatment option inRRMS.
AUTHOR CONTRIBUTIONSD.H.M. assisted in designing the study, supported centralized collection of
the MRI data, overviewed analysis and interpretation of the study data, and
cowrote the manuscript. R.J.F., J.T.P., E.H., and M.K. designed the study,
collected and interpreted the data, and reviewed the manuscript. M.H.
served on the medical advisory board, reviewed drafts, and was involved
in data collection. C.A.M.W.-K., D.J.T., D.G.M., and T.A.Y. collected,
analyzed, and interpreted the data and reviewed the manuscript. M.G. con-
ducted literature searches, wrote an earlier draft of the manuscript, prepared
figures, and edited the manuscript under the direction of the other authors.
M.Y. was involved in the study design, analyzed the data, and reviewed the
manuscript. R.Z. analyzed the data and reviewed the manuscript. V.V. in-
terpreted the data and reviewed the manuscript. K.T.D. designed the study,
interpreted the data, and cowrote the manuscript.
STUDY FUNDINGThe CONFIRM study was funded by Biogen Idec Inc., Weston, MA.
Medical writing and editorial support were provided by CircleScience
(Tytherington, UK) and funded by Biogen Idec Inc. The NMR Research
Unit at the Queen Square MS Centre is supported by the UK MS Soci-
ety and UCLH-UCL Biomedical Research Centre.
DISCLOSURED. Miller has received honoraria through payments to his employer, UCL
Institute of Neurology, for advisory committee and/or consultancy advice
in multiple sclerosis studies from Bayer Schering Pharma, Biogen Idec,
Novartis, Mitsubishi Pharma Europe, Merck, and GlaxoSmithKline;
and research support through payments to his employer, UCL Institute
of Neurology, from Apitope, Biogen Idec, GlaxoSmithKline, Novartis,
and Schering AG. R. Fox reports receiving consulting fees from Allozyne,
Avanir, Biogen Idec, Novartis, Questcor, and Teva; and grant and research
support from Novartis. J. Phillips reports receiving consulting fees from
Acorda, Biogen Idec, Genzyme, Novartis, and Teva; and research support
from Biogen Idec and Roche. M. Hutchinson has received speaker’s hon-
oraria from Bayer Schering, Biogen Idec, and Novartis; editorial fees from
the Multiple Sclerosis Journal; and research grants from the Health
Research Board, Ireland, and Dystonia Ireland. E. Havrdova reports
receiving consulting and lecture fees from Bayer, Biogen Idec, Genzyme,
Novartis, Serono, and Teva; and research support from the Czech Min-
istry of Education (MSM 0021620849, PRVOUK-P26/LF1/4). M. Kita
has received travel support and research grant funding from Biogen Idec
and served on a speaker’s bureau for Genzyme. C. Wheeler-Kingshott
reports receiving consulting fees from Biogen Idec. D. Tozer has a portion
of his salary paid by Biogen Idec and Novartis for work involving analysis
of MRI data in MS trials. D. MacManus has received research grants (held
by University College London) from Apitope, Biogen Idec, GlaxoSmithK-
line, Novartis, Richmond Pharma, and Schering AG for analysis of MRI
data in MS trials. T. Yousry has received honoraria and travel expenses for
advisory committee work from Bayer Schering, Biogen Idec, and Novartis;
and research grants (held by University College London) from Biogen
Idec, GlaxoSmithKline, Novartis, and Schering AG for analysis of data
from MS trials. M. Goodsell was an employee of CircleScience at the time
of writing, which has been contracted by Biogen Idec to provide medical
writing services. M. Yang reports being an employee of and holding stock
in Biogen Idec. R. Zhang reports being an employee of and holding stock
in Biogen Idec. V. Viglietta reports being an employee of and holding
stock in Biogen Idec. K. Dawson reports being an employee of and hold-
ing stock in Biogen Idec. Go to Neurology.org for full disclosures.
Received June 14, 2013. Accepted in final form November 21, 2014.
REFERENCES1. Ghoreschi K, Bruck J, Kellerer C, et al. Fumarates improve
psoriasis and multiple sclerosis by inducing type II den-
dritic cells. J Exp Med 2011;208:2291–2303.
2. Linker RA, Lee DH, Ryan S, et al. Fumaric acid esters
exert neuroprotective effects in neuroinflammation via
activation of the Nrf2 antioxidant pathway. Brain 2011;
134:678–692.
Neurology 84 March 17, 2015 1151
ª 2015 American Academy of Neurology. Unauthorized reproduction of this article is prohibited.
3. Loewe R, Holnthoner W, Groger M, et al. Dimethylfu-
marate inhibits TNF-induced nuclear entry of NF-kappa
B/p65 in human endothelial cells. J Immunol 2002;168:
4781–4787.
4. Scannevin RH, Chollate S, Jung MY, et al. Fumarates pro-
mote cytoprotection of central nervous system cells against
oxidative stress via the Nrf2 pathway. J Pharmacol Exp Ther
2012;341:274–284.
5. Gold R, Kappos L, Arnold DL, et al. Placebo-controlled
phase 3 study of oral BG-12 for relapsing multiple sclero-
sis. N Engl J Med 2012;367:1098–1107.
6. Fox RJ, Miller DH, Phillips JT, et al. Placebo-controlled
phase 3 study of oral BG-12 or glatiramer in multiple
sclerosis. N Engl J Med 2012;367:1087–1097.
7. US Food and Drug Administration. TECFIDERATM
Prescribing Information. Available at: http://www.
accessdata.fda.gov/drugsatfda_docs/label/2013/204063lbl.
pdf. Accessed April 2, 2013.
8. Filippi M, Rocca MA, De Stefano N, et al. Magnetic res-
onance techniques in multiple sclerosis: the present and
the future. Arch Neurol 2011;68:1514–1520.
9. Schmierer K, Scaravilli F, Altmann DR, et al. Magnetiza-
tion transfer ratio and myelin in postmortem multiple
sclerosis brain. Ann Neurol 2004;56:407–415.
10. Chen JT, Easley K, Schneider C, et al. Clinically feasible
MTR is sensitive to cortical demyelination in MS. Neu-
rology 2013;80:246–252.
11. International Conference on Harmonisation of technical
requirements for registration of pharmaceuticals for human
use. ICH harmonised tripartite guideline: Guideline for
Good Clinical Practice. J Postgrad Med 2001;47:45–50.
12. World Medical Association. Declaration of Helsinki: Eth-
ical Principles for Medical Research Involving Human Sub-
jects. Available at: http://www.wma.net/en/30publications/
10policies/b3/. Accessed November 22, 2010.
13. Polman CH, Reingold SC, Edan G, et al. Diagnostic cri-
teria for multiple sclerosis: 2005 revisions to the “McDo-
nald criteria.” Ann Neurol 2005;58:840–846.
14. Smith SM, Zhang Y, Jenkinson M, et al. Accurate, robust,
and automated longitudinal and cross-sectional brain
change analysis. Neuroimage 2002;17:479–489.
15. Kappos L, Moeri D, Radue EW, et al. Predictive value of
gadolinium-enhanced magnetic resonance imaging for
relapse rate and changes in disability or impairment in
multiple sclerosis: a meta-analysis: Gadolinium MRI
Meta-analysis Group. Lancet 1999;353:964–969.
16. Morgan CJ, Ranjan A, Aban IB, et al. The magnetic res-
onance imaging “rule of five”: predicting the occurrence of
relapse. Mult Scler 2013;19:1760–1764.
17. Brex PA, Ciccarelli O, O’Riordan JI, et al. A longitudinal
study of abnormalities on MRI and disability from multi-
ple sclerosis. N Engl J Med 2002;346:158–164.
18. Barkhof F. Assessing treatment effects on axonal loss: evi-
dence from MRI monitored clinical trials. J Neurol 2004;
251(suppl 4):IV6–IV12.
19. Kappos L, Gold R, Miller DH, et al. Efficacy and safety of
oral fumarate in patients with relapsing-remitting multiple
sclerosis: a multicentre, randomised, double-blind, placebo-
controlled phase IIb study. Lancet 2008;372:1463–1472.
20. Kappos L, Gold R, Miller DH, et al. Effect of BG-12 on
contrast-enhancing lesions in patients with relapsing-
remitting multiple sclerosis: subgroup analyses from the
phase 2b study. Mult Scler 2012;18:314–321.
21. Macmanus DG, Miller DH, Kappos L, et al. BG-12 reduces
evolution of new enhancing lesions to T1-hypointense lesions
in patients with multiple sclerosis. J Neurol 2011;258:449–456.
22. Comi G, Jeffery D, Kappos L, et al. Placebo-controlled
trial of oral laquinimod for multiple sclerosis. N Engl J
Med 2012;366:1000–1009.
23. Comi G, Cook SD, Giovannoni G, et al. MRI outcomes
with cladribine tablets for multiple sclerosis in the
CLARITY study. J Neurol 2013;260:1136–1146.
24. Radue EW, O’Connor P, Polman CH, et al. Impact of
fingolimod therapy on magnetic resonance imaging out-
comes in patients with multiple sclerosis. Arch Neurol
2012;69:1259–1269.
25. Wolinsky JS, Narayana PA, Nelson F, et al. Magnetic
resonance imaging outcomes from a phase III trial of teri-
flunomide. Mult Scler 2013;19:1310–1319.
26. Schilling S, Goelz S, Linker R, et al. Fumaric acid esters
are effective in chronic experimental autoimmune enceph-
alomyelitis and suppress macrophage infiltration. Clin Exp
Immunol 2006;145:101–107.
27. Arnold D, Gold R, Kappos L, et al. Effects of BG-12 on
magnetization transfer ratio in whole brain and normal-
appearing brain tissue: findings from the DEFINE study.
Neurology 2012;78:S11.004.
28. Arnold D, Gold R, Kappos L, et al. Effect of BG-12 on
brain atrophy and lesions volume: MRI results from the
DEFINE study during first and second year of treatment.
Neurology 2012;78:S11.003.
29. Comi G, Martinelli V, Rodegher M, et al. Effects of early
treatment with glatiramer acetate in patients with clinically
isolated syndrome. Mult Scler 2013;19:1074–1083.
30. Rovaris M, Comi G, Rocca MA, et al. Short-term brain
volume change in relapsing-remitting multiple sclerosis:
effect of glatiramer acetate and implications. Brain 2001;
124:1803–1812.
1152 Neurology 84 March 17, 2015
ª 2015 American Academy of Neurology. Unauthorized reproduction of this article is prohibited.
DOI 10.1212/WNL.00000000000013602015;84;1145-1152 Published Online before print February 13, 2015Neurology David H. Miller, Robert J. Fox, J. Theodore Phillips, et al.
CONFIRM studyEffects of delayed-release dimethyl fumarate on MRI measures in the phase 3
This information is current as of February 13, 2015
rights reserved. Print ISSN: 0028-3878. Online ISSN: 1526-632X.1951, it is now a weekly with 48 issues per year. Copyright © 2015 American Academy of Neurology. All
® is the official journal of the American Academy of Neurology. Published continuously sinceNeurology
ServicesUpdated Information &
http://n.neurology.org/content/84/11/1145.fullincluding high resolution figures, can be found at:
Supplementary Material
360.DC2http://n.neurology.org/content/suppl/2015/02/13/WNL.0000000000001
360.DC1http://n.neurology.org/content/suppl/2015/02/13/WNL.0000000000001Supplementary material can be found at:
References http://n.neurology.org/content/84/11/1145.full#ref-list-1
This article cites 28 articles, 4 of which you can access for free at:
Subspecialty Collections
http://n.neurology.org/cgi/collection/multiple_sclerosisMultiple sclerosis
http://n.neurology.org/cgi/collection/mriMRI
led_consort_agreementhttp://n.neurology.org/cgi/collection/clinical_trials_randomized_controlClinical trials Randomized controlled (CONSORT agreement)
http://n.neurology.org/cgi/collection/class_1Class I
http://n.neurology.org/cgi/collection/all_imagingAll Imagingfollowing collection(s): This article, along with others on similar topics, appears in the
Permissions & Licensing
http://www.neurology.org/about/about_the_journal#permissionsits entirety can be found online at:Information about reproducing this article in parts (figures,tables) or in
Reprints
http://n.neurology.org/subscribers/advertiseInformation about ordering reprints can be found online:
rights reserved. Print ISSN: 0028-3878. Online ISSN: 1526-632X.1951, it is now a weekly with 48 issues per year. Copyright © 2015 American Academy of Neurology. All
® is the official journal of the American Academy of Neurology. Published continuously sinceNeurology
![Structure–activity relationship of 2,2-dimethyl-2H-chromene based arylsulfonamide analogs of 3,4-dimethoxy-N-[(2,2-dimethyl-2H-chromen-6-yl)methyl]-N-phenylbenzenesulfonamide, a](https://img.pdfslide.net/doc/110x75/6354d65c21a0f893210b38b9/structureactivity-relationship-of-22-dimethyl-2h-chromene-based-arylsulfonamide.jpg)


![2,3-Dimethyl- N -[( E )-(1 H -pyrrol-2-yl)methylidene]aniline](https://img.pdfslide.net/doc/110x75/63559652f4b7d3d11c0cbb34/23-dimethyl-n-e-1-h-pyrrol-2-ylmethylideneaniline.jpg)