Embed Size (px)
Citation preview
RESEARCH ARTICLE Open Access
Effects of gender, activity type, classlocation and class composition on physicalactivity levels experienced during physicaleducation classes in British secondaryschools: a pilot cross-sectional studyAnne Delextrat1* , Patrick Esser1, Nick Beale1, Floris Bozon1, Emma Eldridge1, Hooshang Izadi1,Heidi Johansen-Berg2, Catherine Wheatley2 and Helen Dawes1
Abstract
Background: Pupils in secondary schools do not meet the targets for physical activity levels during physical education(PE) sessions, and there is a lack of data on the vigorous physical activity domain (VPA) in PE known to be positivelyassociated with cardio metabolic health While PE session intensity depends on a variety of factors, the large majority ofstudies investigating these factors have not taken into account the nested structure of this type of data set. Therefore, theaim of this study was to investigate the relationship between various factors (gender, activity type, class location and classcomposition) and various activity levels during PE classes in secondary schools, using a multi-level statistical approach.
Methods: Year eight (12–13 years old) adolescents (201 boys and 106 girls) from six schools were fitted withaccelerometers during one PE session each, to determine the percentage (%) of the PE session time spent in sedentary(SPA), light (LPA), moderate (MPA), vigorous (VPA) and moderate-to-vigorous (MVPA) intensity levels. Two- and three-level(pupils, n = 307; classes, n = 13, schools, n = 6) mixed-effect models were used to assess the relationship betweenaccelerometer-measured physical activity levels (% of class time spent in various activity levels) and gender, activity type,class location and composition.
Results: Participants engaged in MVPA and VPA for 30.7 ± 1.2% and 11.5 ± 0.8% of PE classes, respectively. Overall, nosignificant association between gender or class composition and PA was shown. A significant relationship betweenactivity type and PA was observed, with Artistic classes significantly less active than Fitness classes for VPA (5.4 ± 4.5 vs.12.5 ± 7.1%, p= 0.043, d:1.19). We also found a significant association between class location and PA, with significantly lesstime spent in SPA (24.8 ± 4.8% vs. 30.0 ± 3.4%, p = 0.042, d:0.77) and significantly more time spent in VPA (12.4 ± 3.7% vs.7.6 ± 2.0%, p = 0.022, d:1.93) and MVPA (32.3 ± 6.7% vs.24.8 ± 3.8%, p = 0.024, d:1.33) in outdoors vs. indoors classes.
Conclusions: The results suggest that class location and activity type could be associated with the intensity of PA in PE. Itis essential to take into account the clustered nature of this type of data in similar studies if the sample size allows it.
Keywords: Multilevel statistical model, Vigorous physical activity, MVPA, Accelerometers
© The Author(s). 2020 Open Access This article is licensed under a Creative Commons Attribution 4.0 International License,which permits use, sharing, adaptation, distribution and reproduction in any medium or format, as long as you giveappropriate credit to the original author(s) and the source, provide a link to the Creative Commons licence, and indicate ifchanges were made. The images or other third party material in this article are included in the article's Creative Commonslicence, unless indicated otherwise in a credit line to the material. If material is not included in the article's Creative Commonslicence and your intended use is not permitted by statutory regulation or exceeds the permitted use, you will need to obtainpermission directly from the copyright holder. To view a copy of this licence, visit http://creativecommons.org/licenses/by/4.0/.The Creative Commons Public Domain Dedication waiver (http://creativecommons.org/publicdomain/zero/1.0/) applies to thedata made available in this article, unless otherwise stated in a credit line to the data.
* Correspondence: [email protected] for Movement, Occupational and Rehabilitation Sciences (MOReS),Oxford Brookes University, Headington Campus, Oxford OX3 0BP, UKFull list of author information is available at the end of the article
Delextrat et al. BMC Public Health (2020) 20:1590 https://doi.org/10.1186/s12889-020-09698-y
BackgroundChildren and adolescents who engage in moderate-to-vigorous physical activity (MVPA) are at lower risk ofdeveloping chronic health issues, such as cardiovascular,metabolic or mental health issues [1–3]. In particular,the vigorous PA domain (VPA) has been associated witha more favourable cardiometabolic risk profile in youth[4], and with greater benefits than moderate physical ac-tivity (MPA) on adiposity, bone health, insulin and bloodlipid profiles, and blood pressure [4–6].Despite these positive observations, physical activity
trends globally indicate that only about 20% of adoles-cents meet the recommendation of the World HealthOrganisation (WHO) to participate in 60min of MVPAdaily [7]. Scientific evidence supports that most PA isundertaken as part of the curriculum during school time[8], highlighting the importance of school physical edu-cation (PE) and the need to optimise PA targets withincompulsory PE lessons at school. In the United Kingdom(UK), the Association for Physical Education (afPE) sug-gests that, for young people aged 5–17, “pupils be ac-tively moving for 50-80% of the available learning time”,or at least 50% of PE lesson time should be spent doingMVPA [9]. To our knowledge, no clear recommendationhas been given yet in the UK regarding VPA in PE ses-sions. A recent meta-analysis in seven countries world-wide, including one study in the UK, reported that only35.9% of high school PE classes time (pupils aged 14–18) was spent in MVPA [10]. Other studies on UKschool children and adolescents, indicating the sametrend (between 27 and 47% of PE time spent at MVPAin a review [11]) are more dated, highlighting the needfor more recent data in this country. For VPA, a widerange of data is reported in the literature (from 5.1 to34.8% of the PE class, [12–15]).There is a variety of barriers to optimizing MVPA in PE
sessions, such as institutional (school policies [16]), infra-structural (lack of/small sports halls [16]), pedagogical(class size, teaching approaches [17, 18]) or inter-individual factors (pupils’ motivation [19–21]). Amongstthese factors affecting the amount of MVPA in PE lessons,gender is widely cited in the literature, with boys usuallyengaged in more MVPA than girls [12, 22–25]. This hasbeen reported for VPA, but only by a few studies [12, 26],highlighting the need for additional data on VPA by gen-der during PE. Many reasons could explain this, includingteaching style (more talking and explanations in girls clas-ses, more active teaching style for boys), or psychologicalfactors (girls refusing to sweat). However, it has also beensuggested [12] that the extent of these observed genderdifferences couldbe skewed by the type of activities offeredin PE sessions to boys and girls. Indeed, artistic activities(including gymnastics and dance) characterised by 30% ofclass time in MVPA, are more common in girls-only
classes [27, 28] while ball games (including football, bas-ketball, volleyball, handball and softball), with 48% of classduration spent doing MVPA, are more often found inboys-only classes [29, 30]. To our knowledge, only twostudies reported VPA by activity type, showing a greateramount of VPA in fitness (athletic fitness, circuit, swim-ming) compared to ball games (football, basketball, rugby)and a lower amount of VPA in artistic activities (dance,gymnastics) compared to racket sports (tennis, badmin-ton, table tennis), ball games and fitness [12, 13]. One fac-tor that could be linked to activity type is lesson location.Indeed, more intense PE sessions are usually reported out-doors (41.4–45.7% of the time spent in MVPA) comparedto indoors (33.7–36.1%)) [13, 31, 32], although no data isavailable on VPA. The greater MVPA outdoors has beenattributed to larger spaces and a more favourable temper-aturefor intense exercise [26]. Finally, gender differences inPA levels during PE have also been suggested to vary with-class composition, vizboys or girls only classes vs. mixed-gender (coeducation) classes [13, 26, 33–35]. These studiessuggest that girls generally spend more time in MVPAwhen they are in mixed-gender classes [13, 26, 33, 34], pos-sibly because they are motivated by boys’ greater activitylevels, while no difference linked to class composition hasbeen observed in boys [13, 34, 35]. The same has been ob-served for VPA, but only in one study [26].While the literature is abundant on the association be-
tween various factors and PA levels during PE sessions,there are limitations that need to be addressed. Therehas been limited investigation into different activity do-mains, in addition to MVPA. In particular, VPA wouldbe particularly interesting to examine in light of the sig-nificant health benefits associated with this domain, asdescribed above [4, 6]. Furthermore, the conclusionsdrawn from data in most of the previous studies mightbe biased because they used a single level statistical ana-lysis approach, where the data collected from each childis considered as independent from the others, while inreality it is not (children from the same class are not in-dependent as they share the same teacher, for example).This has major implications for hypothesis testing, be-cause it affects type 1 error and statistical power. In-stead, using a contextual approach, such as multi-levelmodelling, seems more appropriate for this type of hier-archical data because it takes into account the variationin scores at different levels [36]. This statistical approachwas used in very few similar studies on MVPA in PEclasses [37–39].Within this context, the main objective of the present
study was to undertake a pilot study to investigate therelationship between various factors, including gender,activity type, class location and class composition, andthe amount of VPA and MVPA during PE classes in sec-ondary schools, whilst taking into account the influence
Delextrat et al. BMC Public Health (2020) 20:1590 Page 2 of 12
of the specific classes and schools that these children be-long to (i.e. exploring the variance explained by schoolsand classes). Two secondary objectives were to study thesame relationships for other activity domains, includingsedentary (SPA), light (LPA), moderate (MPA) and also toexamine the interactions between these factors (gender*-activity type, gender*location)in all the activity domains.
MethodsParticipantsA convenience sample of 307 year-eight pupils (12–13years old, 201 boys and 106 girls) was recruited from sixschools and 13 classes. Participants and their parents werefully informed about the study procedure, and recruitmentwas performed on a parental opt-out basis, with a 100%response rate from schools and classes (no informationwas obtained about the reason for a pupil’s non-participation in a PE class). Eligibility criteria included be-ing able to take part in PE sessions (i.e. no injury or illnesspreventing participation in physical activity). If a pupilreturned the opt-out slip, they still participated in the PElessons alongside their peers, but were not monitored.Gatekeeper approval was sought pre-study via the headteachers and opt-out consent was provided to both par-ents and children before the start of data collection; thestudy was approved by the Oxford University Central Uni-versity Research Ethics Committee (ref # R48879/RE001).It was part of the ‘Fit-to-Study’ project funded by the Edu-cation Endowment Foundation and the Wellcome Trust(Grant Number 2681).
Design and settingThis study used a cross-sectional design, with measure-ments taken for each participant during one PE class.Data were collected between September and December2015 during a total of 13 PE classes randomly selectedfrom six state schools within Oxfordshire (UK) which in-cluded five in an urban city, and one in a rural town lo-cation (https://onsdigital.github.io/postcode-lookup/).These schools were characterised by Indexes of MultipleDeprivation (IMD) ranging from 3.63 to 18.17, puttingthem in the first (two schools), second (three schools)and third (one school) quintiles. All the PE classes weretaught by specialist PE teachers.
ProcedureThe dependent variables were the active PE session mi-nutes (allocated time minus changing time pre and post)spent in various exercise intensity categories, includingsedentary, moderate, VPA and MVPA. The time spentin the exercise categories was also scaled to minutes perhour, and expressed as a percentage (%) of the active PEsession. The three main independent variables investi-gated are described in Table 1. They include gender,
activity performed: ball games (including basketball,football, handball, netball and rugby) vs. artistic classes(including dance and gymnastics) vs. fitness classes (in-cluding boot camp and fitness) vs. racket sports (bad-minton), and class composition: boys-only, girls-onlyand mixed-gender classes.
Data processingAt the start of the class, each student was fitted with anaccelerometer (Axivity AX3, Axivity Ltd., Melton Park,UK) incorporated in a silicon wristband, on their non-dominant wrist. This device is small (23 × 32.5 × 7.6 mm)and light (11 g) which did not interfere with the activitiesbeing performed whilst recording 3-axis accelerometry.Sampling frequency was set at 50 Hz (with a ± 8 g range)covering the allocated PE class time. Post PE-class, theraw accelerometry data were downloaded via the manu-facturer’s software (version AX-GUI-28), after whichthey were processed, using 1 s epochs, via a bespokeLabView programme (National Instruments, Ireland).Data were selected according to active PE-class time asnoted down via observation of the research team, whichexcluded time spent in changing rooms or awaiting in-structions pre-start. Sample Frequency corrected cut-offlevels, based on gravity subtracted single vector magni-tude, were taken from Phillips et al. [40] from wheresedentary (SPA), light (LPA), moderate (MPA) and vig-orous (VPA) activity levels, expressed in minutes perhour, were derived. In addition, moderate to vigorousactivity (MVPA) was calculated as the sum of moderateand vigorous activity.
Statistical analysesStatistical analyses were performed using R (R CoreTeam) [41], with lme4 [42]. Each dependent variablewas presented as mean and standard deviation (Mean ±SD). A multilevel mixed-effects model with a three-levelstructure accounting for clustering at the school andclass levels was first used (pupils n = 230, classes n = 13,schools n = 6), with a data transformation undertakenfor the dependent variables using the Best Normalizefunction in R (URL https://github.com/petersonR/best-Normalize). This package uses the normalization func-tion that best suits the data provided, amongst severalsuch as Box-Cox transformation, the Yeo-Johnson trans-formation, Lambert WxF transformations, and the or-dered quantile normalization transformation. Its aim isto make the data Gaussian and these transformationsare reversible, so that any analysis performed on the nor-malized data can be interpreted using the original unit.However the model did not converge for schools andtherefore a two-level structure was then adopted, withschools treated as a fixed effect and classes (nestedwithin schools) as a random effect (random intercept).
Delextrat et al. BMC Public Health (2020) 20:1590 Page 3 of 12
Differences between schools were analysed by a one-wayanalysis of variance (ANOVA), followed by a Tukey post-hoc test. At the lowest level of the model,the effect of gen-der, class composition, location and activity type, as well asthe interaction between these factors, on the time spentdoing SPA, MPA, VPA and MVPA during PE sessions wereexamined together in the model as fixed effects. Pairwisecomparisons for the fixed factors (where model estimatesindicated significance), were examined as differences ofLeast Squares (LS) Means adjusted according to Tukey. Forall these analyses, a p value inferior to 0.05 was consideredstatistically significant. The proportion of the variance ineach activity level accounted for by schools and classes wascalculated by dividing the minimum variance quadratic un-biased estimators (MIVQUE) of each variance componentby the sum of MIVQUEs. Effect sizes were calculated asCohen’s d (d) and interpreted as small (0.2), medium (0.5),large (0.8) and very large (1.3) [43].
ResultsOverall, pupils spent 25.8 ± 1.4% of the active PE class inSPA, 19.2 ± 0.7% in MPA and 11.5 ± 0.8% in VPA activ-ities. MVPA accounted for 30.7 ± 1.2% of the PE class. Sig-nificant differences between schools were shown for SPA(school 4 (18.6 ± 7.8 min) greater than 2 (14.4 ± 9.6min)and 6 (13.3 ± 6.7 min), F: 3.358, p = 0.06, d; 0.48 and 0.73,respectively), VPA (schools all significantly different fromeach other, except 1 and 4 (4.4 ± 3.0min and 4.3 ± 1.6min), 2 and 3 (6.5 ± 4.3min and 6.7 ± 4.6min), and 5 and6 (9.7 ± 5.0 and 9.8 ± 3.1 min), F:22.876, p = 0.0001, d: 0.62to 2.23) and MVPA (schools 1 and 4 (15.2 ± 5.0min and16.0 ± 5.4min) significantly lower than 5 and 6 (19.8 ± 8.1min and 22.0 ± 4.4min, d: 0.55 to 1.44).
Statistical modelThe dependent variables were examined at the ‘pupil’level (lowest level of analysis), with the predictor vari-ables being pupil gender, lesson location and lesson
activity. The random effect terms (clustering) allowedfor classes to be treated as random effects, but the modelonly converged when the school was treated as a ‘fixed’effect (Model 1). A fully nested random effects model(with class nested in school) only converged for MVPAand VPA dependent variables (Model 2). In addition, theonly fixed effect interaction that could be examined byboth models was gender*activity (other interactions didnot converge and hence could not be examined). Finally,the class composition variable did not converge for theSPA (Model 1), and thus its effects on the % of PE timespent in sedentary activities could not be analysed.
ClassesClasses accounted for 9.7, 6.1 and 6.0% of the variancein the time spent in MPA, VPA and MVPA intensity do-mains (Model1), respectively.
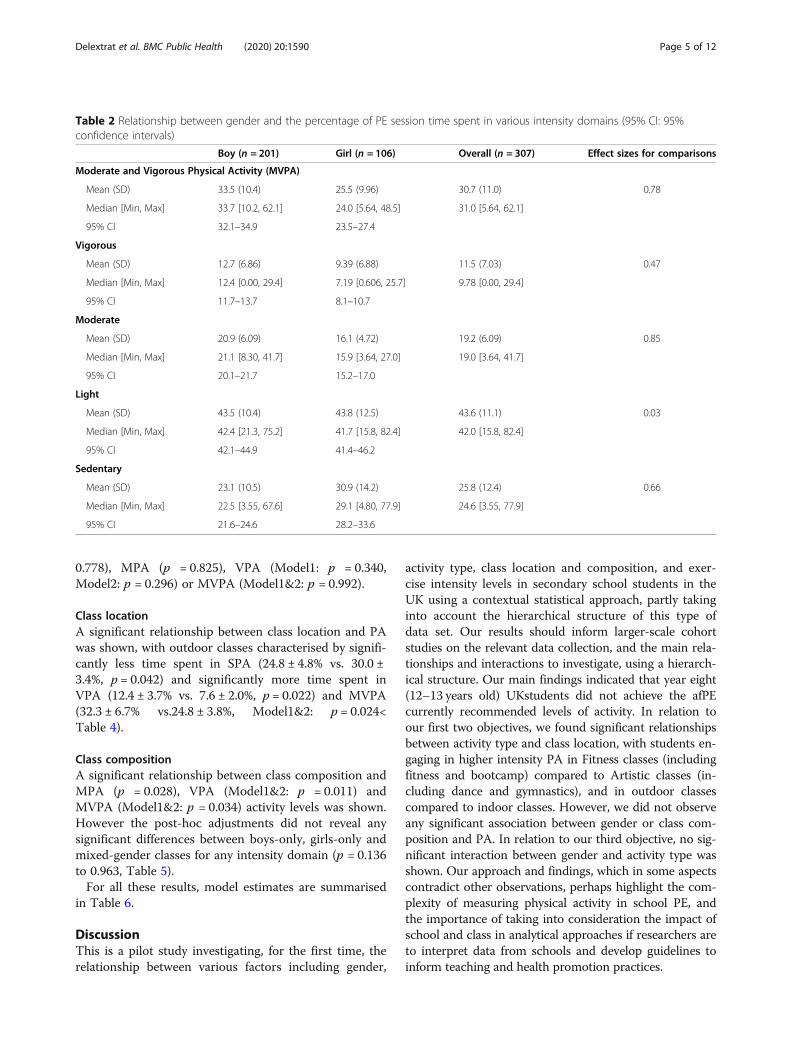
GenderThere was no significant relationship between genderand SPA (p = 0.374), MPA (p = 0.796), VPA (Model1:p = 0.729, Model2: p = 0.773), or MVPA (Model1&2:p = 0.712) levels during PE sessions (Table 2).
Activity typeSignificant associations between activity type and SPAand VPA were observed (Model1&2: p = 0.014 and0.003, respectively), however the post-hoc comparisons(with “Tukey” pairwise adjustment) only showed a sig-nificant difference between Artistic (less time spent) andFitness classes for VPA (p = 0.034); all other activity typeand intensity domain combinations showed no signifi-cance (p = 0.073 to 0.998, Table 3 and Fig. 1).
Interaction between gender and activity typeThe statistical analysis did not show any significantinteraction between gender and activity on SPA (p =
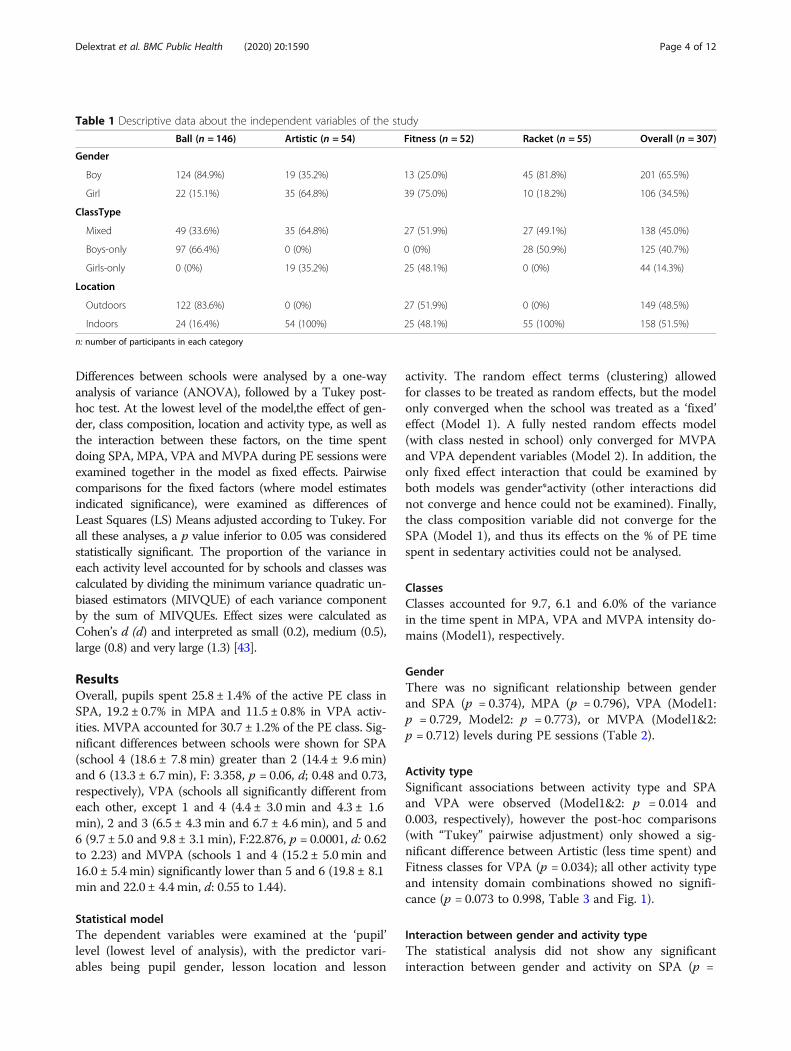
Table 1 Descriptive data about the independent variables of the study
Ball (n = 146) Artistic (n = 54) Fitness (n = 52) Racket (n = 55) Overall (n = 307)
Gender
Boy 124 (84.9%) 19 (35.2%) 13 (25.0%) 45 (81.8%) 201 (65.5%)
Girl 22 (15.1%) 35 (64.8%) 39 (75.0%) 10 (18.2%) 106 (34.5%)
ClassType
Mixed 49 (33.6%) 35 (64.8%) 27 (51.9%) 27 (49.1%) 138 (45.0%)
Boys-only 97 (66.4%) 0 (0%) 0 (0%) 28 (50.9%) 125 (40.7%)
Girls-only 0 (0%) 19 (35.2%) 25 (48.1%) 0 (0%) 44 (14.3%)
Location
Outdoors 122 (83.6%) 0 (0%) 27 (51.9%) 0 (0%) 149 (48.5%)
Indoors 24 (16.4%) 54 (100%) 25 (48.1%) 55 (100%) 158 (51.5%)
n: number of participants in each category
Delextrat et al. BMC Public Health (2020) 20:1590 Page 4 of 12
0.778), MPA (p = 0.825), VPA (Model1: p = 0.340,Model2: p = 0.296) or MVPA (Model1&2: p = 0.992).
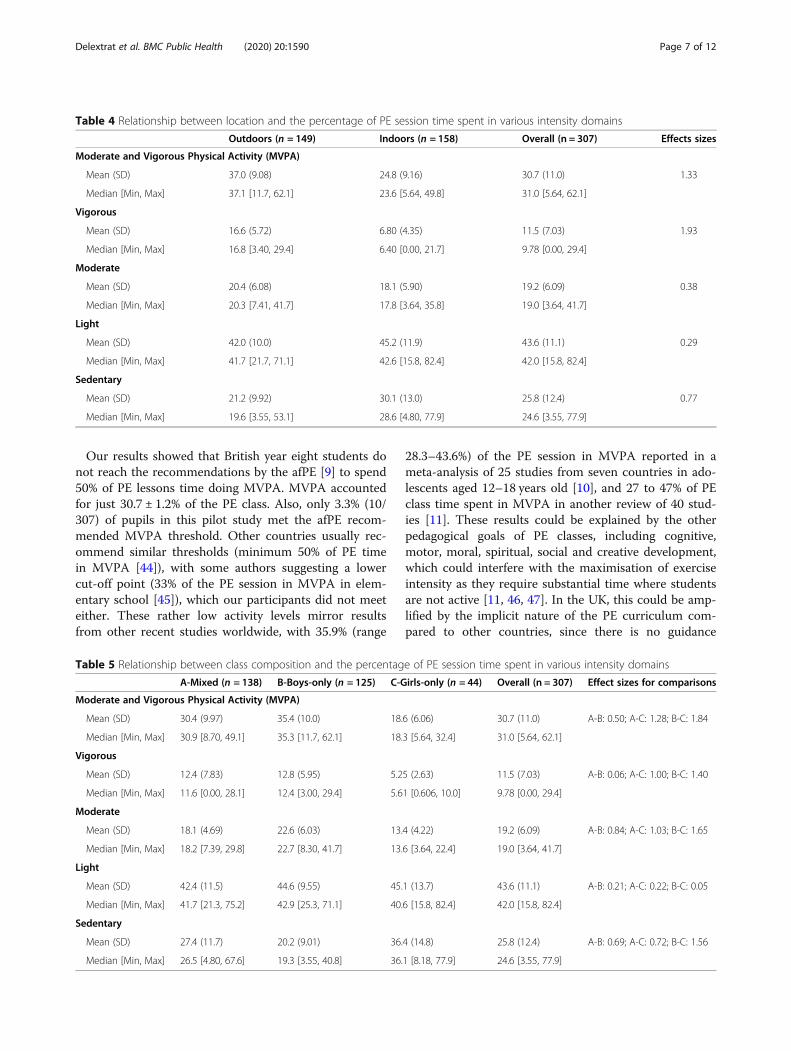
Class locationA significant relationship between class location and PAwas shown, with outdoor classes characterised by signifi-cantly less time spent in SPA (24.8 ± 4.8% vs. 30.0 ±3.4%, p = 0.042) and significantly more time spent inVPA (12.4 ± 3.7% vs. 7.6 ± 2.0%, p = 0.022) and MVPA(32.3 ± 6.7% vs.24.8 ± 3.8%, Model1&2: p = 0.024<Table 4).
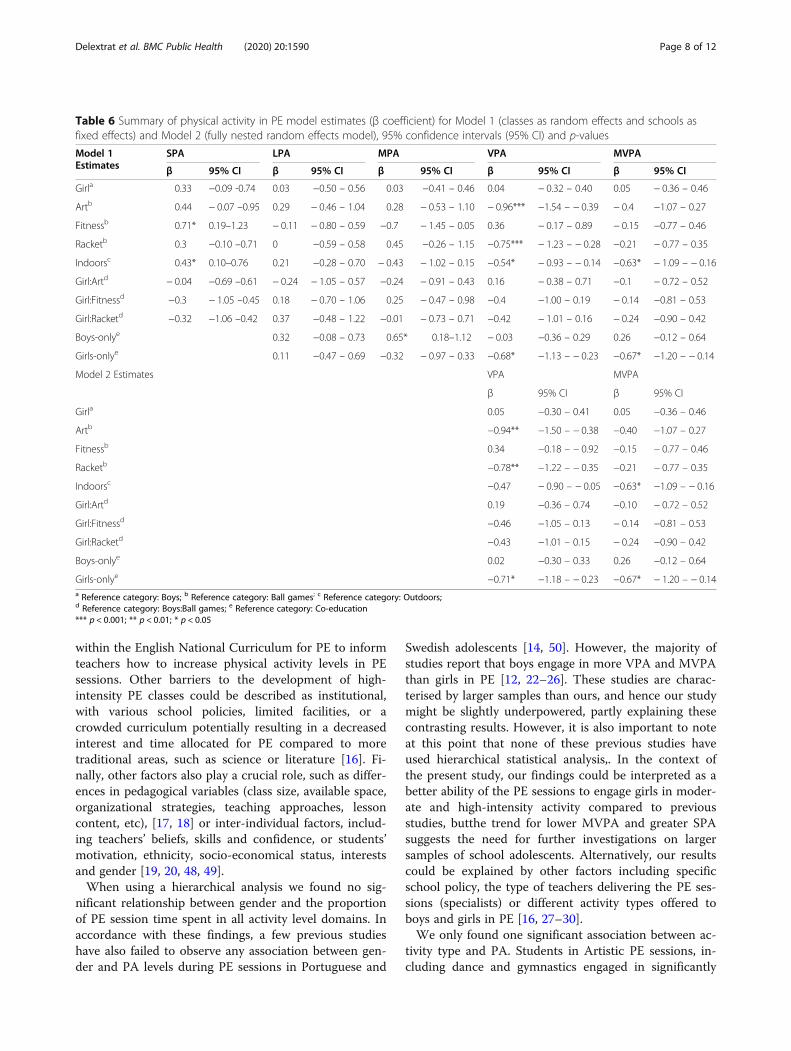
Class compositionA significant relationship between class composition andMPA (p = 0.028), VPA (Model1&2: p = 0.011) andMVPA (Model1&2: p = 0.034) activity levels was shown.However the post-hoc adjustments did not reveal anysignificant differences between boys-only, girls-only andmixed-gender classes for any intensity domain (p = 0.136to 0.963, Table 5).For all these results, model estimates are summarised
in Table 6.
DiscussionThis is a pilot study investigating, for the first time, therelationship between various factors including gender,
activity type, class location and composition, and exer-cise intensity levels in secondary school students in theUK using a contextual statistical approach, partly takinginto account the hierarchical structure of this type ofdata set. Our results should inform larger-scale cohortstudies on the relevant data collection, and the main rela-tionships and interactions to investigate, using a hierarch-ical structure. Our main findings indicated that year eight(12–13 years old) UKstudents did not achieve the afPEcurrently recommended levels of activity. In relation toour first two objectives, we found significant relationshipsbetween activity type and class location, with students en-gaging in higher intensity PA in Fitness classes (includingfitness and bootcamp) compared to Artistic classes (in-cluding dance and gymnastics), and in outdoor classescompared to indoor classes. However, we did not observeany significant association between gender or class com-position and PA. In relation to our third objective, no sig-nificant interaction between gender and activity type wasshown. Our approach and findings, which in some aspectscontradict other observations, perhaps highlight the com-plexity of measuring physical activity in school PE, andthe importance of taking into consideration the impact ofschool and class in analytical approaches if researchers areto interpret data from schools and develop guidelines toinform teaching and health promotion practices.
Table 2 Relationship between gender and the percentage of PE session time spent in various intensity domains (95% CI: 95%confidence intervals)
Boy (n = 201) Girl (n = 106) Overall (n = 307) Effect sizes for comparisons
Moderate and Vigorous Physical Activity (MVPA)
Mean (SD) 33.5 (10.4) 25.5 (9.96) 30.7 (11.0) 0.78
Median [Min, Max] 33.7 [10.2, 62.1] 24.0 [5.64, 48.5] 31.0 [5.64, 62.1]
95% CI 32.1–34.9 23.5–27.4
Vigorous
Mean (SD) 12.7 (6.86) 9.39 (6.88) 11.5 (7.03) 0.47
Median [Min, Max] 12.4 [0.00, 29.4] 7.19 [0.606, 25.7] 9.78 [0.00, 29.4]
95% CI 11.7–13.7 8.1–10.7
Moderate
Mean (SD) 20.9 (6.09) 16.1 (4.72) 19.2 (6.09) 0.85
Median [Min, Max] 21.1 [8.30, 41.7] 15.9 [3.64, 27.0] 19.0 [3.64, 41.7]
95% CI 20.1–21.7 15.2–17.0
Light
Mean (SD) 43.5 (10.4) 43.8 (12.5) 43.6 (11.1) 0.03
Median [Min, Max] 42.4 [21.3, 75.2] 41.7 [15.8, 82.4] 42.0 [15.8, 82.4]
95% CI 42.1–44.9 41.4–46.2
Sedentary
Mean (SD) 23.1 (10.5) 30.9 (14.2) 25.8 (12.4) 0.66
Median [Min, Max] 22.5 [3.55, 67.6] 29.1 [4.80, 77.9] 24.6 [3.55, 77.9]
95% CI 21.6–24.6 28.2–33.6
Delextrat et al. BMC Public Health (2020) 20:1590 Page 5 of 12
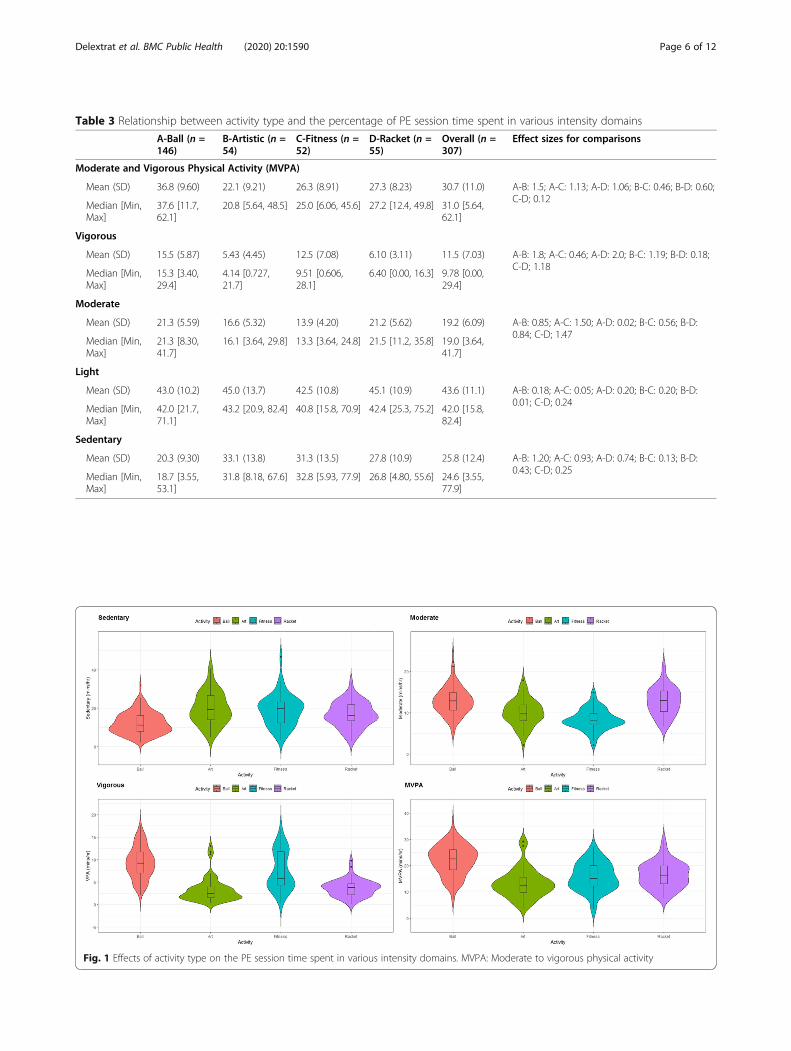
Table 3 Relationship between activity type and the percentage of PE session time spent in various intensity domains
A-Ball (n =146)
B-Artistic (n =54)
C-Fitness (n =52)
D-Racket (n =55)
Overall (n =307)
Effect sizes for comparisons
Moderate and Vigorous Physical Activity (MVPA)
Mean (SD) 36.8 (9.60) 22.1 (9.21) 26.3 (8.91) 27.3 (8.23) 30.7 (11.0) A-B: 1.5; A-C: 1.13; A-D: 1.06; B-C: 0.46; B-D: 0.60;C-D; 0.12
Median [Min,Max]
37.6 [11.7,62.1]
20.8 [5.64, 48.5] 25.0 [6.06, 45.6] 27.2 [12.4, 49.8] 31.0 [5.64,62.1]
Vigorous
Mean (SD) 15.5 (5.87) 5.43 (4.45) 12.5 (7.08) 6.10 (3.11) 11.5 (7.03) A-B: 1.8; A-C: 0.46; A-D: 2.0; B-C: 1.19; B-D: 0.18;C-D; 1.18
Median [Min,Max]
15.3 [3.40,29.4]
4.14 [0.727,21.7]
9.51 [0.606,28.1]
6.40 [0.00, 16.3] 9.78 [0.00,29.4]
Moderate
Mean (SD) 21.3 (5.59) 16.6 (5.32) 13.9 (4.20) 21.2 (5.62) 19.2 (6.09) A-B: 0.85; A-C: 1.50; A-D: 0.02; B-C: 0.56; B-D:0.84; C-D; 1.47
Median [Min,Max]
21.3 [8.30,41.7]
16.1 [3.64, 29.8] 13.3 [3.64, 24.8] 21.5 [11.2, 35.8] 19.0 [3.64,41.7]
Light
Mean (SD) 43.0 (10.2) 45.0 (13.7) 42.5 (10.8) 45.1 (10.9) 43.6 (11.1) A-B: 0.18; A-C: 0.05; A-D: 0.20; B-C: 0.20; B-D:0.01; C-D; 0.24
Median [Min,Max]
42.0 [21.7,71.1]
43.2 [20.9, 82.4] 40.8 [15.8, 70.9] 42.4 [25.3, 75.2] 42.0 [15.8,82.4]
Sedentary
Mean (SD) 20.3 (9.30) 33.1 (13.8) 31.3 (13.5) 27.8 (10.9) 25.8 (12.4) A-B: 1.20; A-C: 0.93; A-D: 0.74; B-C: 0.13; B-D:0.43; C-D; 0.25
Median [Min,Max]
18.7 [3.55,53.1]
31.8 [8.18, 67.6] 32.8 [5.93, 77.9] 26.8 [4.80, 55.6] 24.6 [3.55,77.9]
Fig. 1 Effects of activity type on the PE session time spent in various intensity domains. MVPA: Moderate to vigorous physical activity
Delextrat et al. BMC Public Health (2020) 20:1590 Page 6 of 12
Our results showed that British year eight students donot reach the recommendations by the afPE [9] to spend50% of PE lessons time doing MVPA. MVPA accountedfor just 30.7 ± 1.2% of the PE class. Also, only 3.3% (10/307) of pupils in this pilot study met the afPE recom-mended MVPA threshold. Other countries usually rec-ommend similar thresholds (minimum 50% of PE timein MVPA [44]), with some authors suggesting a lowercut-off point (33% of the PE session in MVPA in elem-entary school [45]), which our participants did not meeteither. These rather low activity levels mirror resultsfrom other recent studies worldwide, with 35.9% (range
28.3–43.6%) of the PE session in MVPA reported in ameta-analysis of 25 studies from seven countries in ado-lescents aged 12–18 years old [10], and 27 to 47% of PEclass time spent in MVPA in another review of 40 stud-ies [11]. These results could be explained by the otherpedagogical goals of PE classes, including cognitive,motor, moral, spiritual, social and creative development,which could interfere with the maximisation of exerciseintensity as they require substantial time where studentsare not active [11, 46, 47]. In the UK, this could be amp-lified by the implicit nature of the PE curriculum com-pared to other countries, since there is no guidance
Table 4 Relationship between location and the percentage of PE session time spent in various intensity domains
Outdoors (n = 149) Indoors (n = 158) Overall (n = 307) Effects sizes
Moderate and Vigorous Physical Activity (MVPA)
Mean (SD) 37.0 (9.08) 24.8 (9.16) 30.7 (11.0) 1.33
Median [Min, Max] 37.1 [11.7, 62.1] 23.6 [5.64, 49.8] 31.0 [5.64, 62.1]
Vigorous
Mean (SD) 16.6 (5.72) 6.80 (4.35) 11.5 (7.03) 1.93
Median [Min, Max] 16.8 [3.40, 29.4] 6.40 [0.00, 21.7] 9.78 [0.00, 29.4]
Moderate
Mean (SD) 20.4 (6.08) 18.1 (5.90) 19.2 (6.09) 0.38
Median [Min, Max] 20.3 [7.41, 41.7] 17.8 [3.64, 35.8] 19.0 [3.64, 41.7]
Light
Mean (SD) 42.0 (10.0) 45.2 (11.9) 43.6 (11.1) 0.29
Median [Min, Max] 41.7 [21.7, 71.1] 42.6 [15.8, 82.4] 42.0 [15.8, 82.4]
Sedentary
Mean (SD) 21.2 (9.92) 30.1 (13.0) 25.8 (12.4) 0.77
Median [Min, Max] 19.6 [3.55, 53.1] 28.6 [4.80, 77.9] 24.6 [3.55, 77.9]
Table 5 Relationship between class composition and the percentage of PE session time spent in various intensity domains
A-Mixed (n = 138) B-Boys-only (n = 125) C-Girls-only (n = 44) Overall (n = 307) Effect sizes for comparisons
Moderate and Vigorous Physical Activity (MVPA)
Mean (SD) 30.4 (9.97) 35.4 (10.0) 18.6 (6.06) 30.7 (11.0) A-B: 0.50; A-C: 1.28; B-C: 1.84
Median [Min, Max] 30.9 [8.70, 49.1] 35.3 [11.7, 62.1] 18.3 [5.64, 32.4] 31.0 [5.64, 62.1]
Vigorous
Mean (SD) 12.4 (7.83) 12.8 (5.95) 5.25 (2.63) 11.5 (7.03) A-B: 0.06; A-C: 1.00; B-C: 1.40
Median [Min, Max] 11.6 [0.00, 28.1] 12.4 [3.00, 29.4] 5.61 [0.606, 10.0] 9.78 [0.00, 29.4]
Moderate
Mean (SD) 18.1 (4.69) 22.6 (6.03) 13.4 (4.22) 19.2 (6.09) A-B: 0.84; A-C: 1.03; B-C: 1.65
Median [Min, Max] 18.2 [7.39, 29.8] 22.7 [8.30, 41.7] 13.6 [3.64, 22.4] 19.0 [3.64, 41.7]
Light
Mean (SD) 42.4 (11.5) 44.6 (9.55) 45.1 (13.7) 43.6 (11.1) A-B: 0.21; A-C: 0.22; B-C: 0.05
Median [Min, Max] 41.7 [21.3, 75.2] 42.9 [25.3, 71.1] 40.6 [15.8, 82.4] 42.0 [15.8, 82.4]
Sedentary
Mean (SD) 27.4 (11.7) 20.2 (9.01) 36.4 (14.8) 25.8 (12.4) A-B: 0.69; A-C: 0.72; B-C: 1.56
Median [Min, Max] 26.5 [4.80, 67.6] 19.3 [3.55, 40.8] 36.1 [8.18, 77.9] 24.6 [3.55, 77.9]
Delextrat et al. BMC Public Health (2020) 20:1590 Page 7 of 12
within the English National Curriculum for PE to informteachers how to increase physical activity levels in PEsessions. Other barriers to the development of high-intensity PE classes could be described as institutional,with various school policies, limited facilities, or acrowded curriculum potentially resulting in a decreasedinterest and time allocated for PE compared to moretraditional areas, such as science or literature [16]. Fi-nally, other factors also play a crucial role, such as differ-ences in pedagogical variables (class size, available space,organizational strategies, teaching approaches, lessoncontent, etc), [17, 18] or inter-individual factors, includ-ing teachers’ beliefs, skills and confidence, or students’motivation, ethnicity, socio-economical status, interestsand gender [19, 20, 48, 49].When using a hierarchical analysis we found no sig-
nificant relationship between gender and the proportionof PE session time spent in all activity level domains. Inaccordance with these findings, a few previous studieshave also failed to observe any association between gen-der and PA levels during PE sessions in Portuguese and
Swedish adolescents [14, 50]. However, the majority ofstudies report that boys engage in more VPA and MVPAthan girls in PE [12, 22–26]. These studies are charac-terised by larger samples than ours, and hence our studymight be slightly underpowered, partly explaining thesecontrasting results. However, it is also important to noteat this point that none of these previous studies haveused hierarchical statistical analysis,. In the context ofthe present study, our findings could be interpreted as abetter ability of the PE sessions to engage girls in moder-ate and high-intensity activity compared to previousstudies, butthe trend for lower MVPA and greater SPAsuggests the need for further investigations on largersamples of school adolescents. Alternatively, our resultscould be explained by other factors including specificschool policy, the type of teachers delivering the PE ses-sions (specialists) or different activity types offered toboys and girls in PE [16, 27–30].We only found one significant association between ac-
tivity type and PA. Students in Artistic PE sessions, in-cluding dance and gymnastics engaged in significantly
Table 6 Summary of physical activity in PE model estimates (β coefficient) for Model 1 (classes as random effects and schools asfixed effects) and Model 2 (fully nested random effects model), 95% confidence intervals (95% CI) and p-values
Model 1Estimates
SPA LPA MPA VPA MVPA
β 95% CI β 95% CI β 95% CI β 95% CI β 95% CI
Girla 0.33 −0.09 -0.74 0.03 −0.50 – 0.56 0.03 −0.41 – 0.46 0.04 − 0.32 – 0.40 0.05 − 0.36 – 0.46
Artb 0.44 − 0.07 –0.95 0.29 − 0.46 – 1.04 0.28 − 0.53 – 1.10 − 0.96*** −1.54 – − 0.39 − 0.4 −1.07 – 0.27
Fitnessb 0.71* 0.19–1.23 − 0.11 − 0.80 – 0.59 −0.7 − 1.45 – 0.05 0.36 − 0.17 – 0.89 − 0.15 −0.77 – 0.46
Racketb 0.3 −0.10 –0.71 0 −0.59 – 0.58 0.45 −0.26 – 1.15 −0.75*** − 1.23 – − 0.28 −0.21 − 0.77 – 0.35
Indoorsc 0.43* 0.10–0.76 0.21 −0.28 – 0.70 − 0.43 − 1.02 – 0.15 −0.54* − 0.93 – − 0.14 −0.63* − 1.09 – − 0.16
Girl:Artd − 0.04 −0.69 –0.61 − 0.24 − 1.05 – 0.57 −0.24 − 0.91 – 0.43 0.16 − 0.38 – 0.71 −0.1 − 0.72 – 0.52
Girl:Fitnessd −0.3 − 1.05 –0.45 0.18 − 0.70 – 1.06 0.25 − 0.47 – 0.98 −0.4 −1.00 – 0.19 − 0.14 −0.81 – 0.53
Girl:Racketd −0.32 −1.06 –0.42 0.37 −0.48 – 1.22 −0.01 − 0.73 – 0.71 −0.42 − 1.01 – 0.16 − 0.24 −0.90 – 0.42
Boys-onlye 0.32 −0.08 – 0.73 0.65* 0.18–1.12 − 0.03 −0.36 – 0.29 0.26 −0.12 – 0.64
Girls-onlye 0.11 −0.47 – 0.69 −0.32 − 0.97 – 0.33 −0.68* −1.13 – − 0.23 −0.67* −1.20 – − 0.14
Model 2 Estimates VPA MVPA
β 95% CI β 95% CI
Girla 0.05 −0.30 – 0.41 0.05 −0.36 – 0.46
Artb −0.94** −1.50 – − 0.38 −0.40 −1.07 – 0.27
Fitnessb 0.34 −0.18 – − 0.92 −0.15 − 0.77 – 0.46
Racketb −0.78** −1.22 – − 0.35 −0.21 − 0.77 – 0.35
Indoorsc −0.47 − 0.90 – − 0.05 −0.63* −1.09 – − 0.16
Girl:Artd 0.19 −0.36 – 0.74 −0.10 − 0.72 – 0.52
Girl:Fitnessd −0.46 −1.05 – 0.13 − 0.14 −0.81 – 0.53
Girl:Racketd −0.43 −1.01 – 0.15 − 0.24 −0.90 – 0.42
Boys-onlye 0.02 −0.30 – 0.33 0.26 −0.12 – 0.64
Girls-onlye −0.71* −1.18 – − 0.23 −0.67* − 1.20 – − 0.14a Reference category: Boys; b Reference category: Ball games; c Reference category: Outdoors;d Reference category: Boys:Ball games; e Reference category: Co-education*** p < 0.001; ** p < 0.01; * p < 0.05
Delextrat et al. BMC Public Health (2020) 20:1590 Page 8 of 12
less VPA than Fitness sessions, including fitness andbootcamp), with a large effect size (d: 1.19). This largeeffect size suggests that these differences are practicallymeaningful, and would translate into around 9min moreVPA in Fitness classes than Artistic classes per week, fora class with 2-h of PE per week. This is in accordancewith two studies [12, 13], however the lack of data onVPA in the literature suggests the need for more studiesin this area. Our results on MVPA are in disagreementwith most past studies [11, 29, 51, 52], showing moretime spent at this intensity when ball games (includingfootball, softball, basketball, netball and handball) werethe focus of the session compared to other activity types.Regarding artistic class (dance and gymnastics), difficultyin reaching higher levels of intensity (VPA) in this typeof activity compared to lower intensity levels (MPA,LPA, SPA) could be a plausible explanation. However, itshould be noted that, again these past studies did nottake into account the nested structure of this type ofdata (participants nested in classes, as weaccounted for,classes nested in schools, that could not be taken intoaccount), and therefore it should be highlighted that pre-vious literature may have been influencedby this ap-proach. As mentioned before, it is difficult to compareVPA with existing literature (only two studies on activitytype and VPA [12, 13]) because most studies only con-sidered MVPA and did not break down activity levelsinto other intensity zones. The inclusion of several cat-egories of physical activity in future studies would be es-sential to allow a better comparison of activity patternsin the literature and thus enhance our understanding ofthe demands of PE sessions. In particular, it has beensuggested the advantages of VPA compared to MVPAthresholds are a greater association with future cardio-vascular health [26], and a better differentiation betweengroups, as it is relatively easy to reach moderate vs vigor-ous levels of physical activity [30].Our results did not reveal any significant interactions
between gender and activity level, which is in agreementwith the findings of Stratton et al. [30] and Kulinna et al.[29]. Conversely, Froberg et al. [50] showed a significantgender by activity type interaction, with boys engaged insignificantly more MVPA than girls in ball games anddance activities. The discrepancy between these resultsand those of the present study could be due to the cut-offs used to define MVPA. Indeed, Froberg et al. [50]showed different results when using two different cut-offs [53, 54]. The absence of interaction reported in ourstudy could be explained by students’ age. When con-trasting results by age, Froberg et al. [50] found no sig-nificant differences between genders on MVPA in grade5 and 8 (12 and 15 years old, respectively), and a signifi-cant gender effect in grade 2 (9 years old). They sug-gested that there was a good opportunity to reach girls
between 12 and 15 years old and motivate them to bemore active during PE sessions.It has been suggested that lesson location influences
the intensity of PE lessons [13, 26, 31]. In accordancewith these studies, we observed that outdoor classes ledto a greater proportion of MVPA and VPA compared toindoor classes, and less time spent in SPA. There weremoderate to large effect sizes associated with these dif-ferences, suggesting the importance of lesson location ina practical context and the potential benefits of usingoutdoor classes in the aim of increasing the intensity ofa PE session. Similarly, in the literature more intense PEsessions are usually reported outdoors (41.4–45.7% ofthe time spent in MVPA) compared to indoors (33.7–36.1% of the time spent in MVPA), [13, 31], although nodata is available in the literature on lesson location andVPA. In addition, Chow et al. [26], used multiple regres-sions and showed that the proportion of PE sessions al-located to MVPA was positively linked to the size of theclass area and negatively associated with air temperature.These factors could explain our results, in particular asour study was undertaken in winter in the UK Whilethese results could point to outdoor PE classes beingprioritised to achieve greater intensity levels, the impli-cation of our findings is limited by several factors. First,‘class’ does not explain a large proportion of the varianceof the time spent in any activity level (up to 9.0%). Sec-ond, the various activity types are not proportionallyrepresented in the outdoors and indoors sessions (forexample 83.6% of ball sports are performed outdoorsand 100% of artistic classes are indoors), which can biasfindings. Indeed, looking at the data in Tables 3 and 4,the amount of time in MVPA and VPA match closelybetween Outdoors and Ball sports (37% vs. 36.8% ofMVPA and 16.6% vs. 15.5% of VPA, respectively forOutdoors and Ball sports), as well as between Indoorsand Racket Sport (24.8% vs. 27.3% of MVPA and 6.8%vs. 6.1% of VPA, respectively for Indoors and Racketsports). While this suggests that knowing that rugby wasplayed outdoors makes it a more intense activity beyondthe fact that rugby was played, larger data sets with abetter representation of activity types are necessary toconfirm these findings.A crucial factor cited in the literature to account for
differences in activity levels during PE classes is classcomposition, with past studies indicating that girls expe-rienced more MVPA [13, 26, 31, 33, 34] and VPA [21]in mixed-gender classes compared to girls-only classes.In these studies, no difference was reported betweenboys-only and mixed gender classes [13, 34, 35]. whereless time was spent giving instructions in boys-only clas-ses, and that instructions were often given while the stu-dents were standing up, while teachers tend to giveinstructions to girls while they are seated [26, 34]. While
Delextrat et al. BMC Public Health (2020) 20:1590 Page 9 of 12
it is difficult to compare our data on girls with the litera-ture due to a limited amount of girls-only classes, ourfindings are in agreement with past studies on boys. It isinteresting to note that the absence of significant relation-ship between class composition in boys previously re-ported remains even after taking into account the nestedstructure of this type of data. However our data, as well asthose from previous studies, could be biased by the differ-ent types of activities used in mixed-gender vs. boys onlyclasses. To our knowledge, no study has previously ad-dressed this issue, and unfortunately we could not statisti-cally account for the interaction between these factors dueto the lack of convergence of the class composition datain our model, suggesting high levels of variability. How-ever if we examine lesson content in our study, as pre-sented in Table 1, we can observe that ball games(football, rugby, basketball, netball, handball) were repre-sented at 33.6% in our data in mixed-gender classes com-pared to 66.4% in the boys-only classes.The main limitations of this study are the relatively
small sample size, which did not enable a fully nested ran-dom structure (school, class) to converge with all fixed-effect terms of interest included. The lack of data on theschools/classes/pupils (ethnicity, information aboutteachers and reasons for pupils non-participation in PEclass) and the fact that we only recorded PA during onePE class per student should also be acknowledged as po-tential confounding factors and the cross-sectional natureof our design does not allow causal conclusions. Our toolto measure PA, accelerometry is also associated with po-tential limitations, such as imprecision tin quantifyingheavy work done isometrically, and the variability in PAlevels presented between studies using different cut-offs[50]. However, it should be pointed out that there is cur-rently no gold standard in PA measurements, and othertools are also characterized by limitations (inter-rater reli-ability issues of the System of Observing Fitness Instruc-tion Time (SOFIT), vulnerability of physiological factors,such as heart rate to parameters other than PA levels,such as stress or emotions). Finally, while the mainstrength of our statistical approach was to account for thehierarchical structure of the data, it was only possible toapply this model for the MPA and VPA intensity domains.It was also not possible to examine all the independentvariables (e.g. class composition in SPA) and/or interac-tions (only one possible was gender*activity type) due to alack of convergence of the data. To address this issue, thedata set should include a better representation of eachsub-type of independent variable in each class/school.However, this cannot be forced if the aim of the study isto examine current practices without intervening. It ispossible that further studies with larger sample sizes willpartly address this issue and provide some insight intothese interactions.
ConclusionsIn conclusion, our results suggest that class location (clas-ses located outdoors lead to the greatest MVPA and VPA)and the choice of activity (for example we found that Art-istic classes such as dance and gymnastics were signifi-cantly less active than Fitness-based classes, such asfitness and bootcamp) may affect the intensity of PA inPE, and it would be important to consider these aspectswhen planning PE sessions. Considering the importanceof school in PA of young people, further studies takinginto account the nested structure of this type of data setare needed on larger samples to address the increasingconcerns of PA levels of adolescents. One such project isthe ‘Fit to Study’ trial (https://doi.org/10.1186/s13063-019-3279-6). This is looking to advance the understandingof the complex relationships between school PE, PA andaerobic fitness, and whether school PE is an effective set-ting to increase the PA and fitness levels of adolescents.
AbbreviationsPE: Physical eduation; PA: Physical activity; SPA: Sedentary physical activity;LPA: Light physical activity; MPA: Moderate physical activity; VPA: Vigorousphysical activity; MVPA: Moderate-to-vigorous physical activity; WHO: WorldHealth Organisation; UK: United Kingdom; afPE: Association for physicaleducation; IMD: Indexes of multiple deprivation; ANOVA: Analysis of variance;LS: Least squares; MIVQUE: Minimum variance quadratic unbiased estimators;d: Cohen’s d; 95% CI: 95% confidence intervals
AcknowledgementsThe authors would like to thank the children and PE teachers who took partin the testing sessions.
Authors’ contributionsAD and NB were involved in analysing the data and writing the manuscript.EE and HI were involved in the statistical analysis. FB, CW and PE wereinvolved in data collection and reviewing the manuscript. HD and HJ-B wereinvolved in the study design and reviewing the manuscript. All authors haveread and approved the manuscript.
Authors’ informationNon applicable.
FundingThe ‘Fit-to-Study’ project was funded by the Education EndowmentFoundation and the Wellcome Trust under their ‘Education andNeuroscience’ Programme (Grant Number 2681). The role of the funder wasonly to pay for resources, they had no involvement in the design of thestudy and collection, analysis, and interpretation of data and in writing themanuscript.
Availability of data and materialsThe datasets used and/or analysed during the current study are availablefrom the corresponding author on reasonable request.
Ethics approval and consent to participateThe study was approved by the Oxford University Central University ResearchEthics Committee (ref # R48879/RE001) and written consent was obtainedfrom participants’ legal guardians.
Consent for publicationNon applicable.
Competing interestsThe authors declare that they have no competing interests.
Delextrat et al. BMC Public Health (2020) 20:1590 Page 10 of 12
Author details1Centre for Movement, Occupational and Rehabilitation Sciences (MOReS),Oxford Brookes University, Headington Campus, Oxford OX3 0BP, UK.2Wellcome Centre for Integrative Neuroscience, FMRIB Centre, NuffieldDepartment of Clinical Neurosciences, University of Oxford, John RadcliffeHospital, Oxford OX3 9DU, UK.
Received: 28 January 2020 Accepted: 14 October 2020
References1. Biddle SJ, Asare M. Physical activity and mental health in children and
adolescents: a review of reviews. Br J Sports Med. 2011;45(11):886–95.2. Janssen I, Leblanc AG. Systematic review of the health benefits of physical
activity and fitness in school-aged children and youth. Int J Behav Nutr PhysAct. 2010;7:40.
3. Nocon M, Hiemann T, Müller-Riemenschneider F, Thalau F, Roll S, Willich SN.Association of physical activity with all-cause and cardiovascular mortality: asystematic review and meta-analysis. Eur J Cardiovasc PrevRehabil. 2008;15(3):239–46.
4. Inchley J et al. eds. Growing up unequal: gender and socioeconomicdifferences in young people’s health and well-being. Health Behaviour inSchool-aged Children (HBSC) study: international report from the 2013/2014survey. Copenhagen: WHO Regional Office for Europe; 2016 (Health Policyfor Children and Adolescents, No. 7).
5. Owens S, Galloway R, Gutin B. The case for vigorous physical activity inyouth. Am J Lifestyle Med. 2016;11(2):96–115.
6. Carson V, Rinaldi RL, Torrance B, Maximova K, Ball GD, Majumdar SR, et al.Vigorous physical activity and longitudinal associations withcardiometabolic risk factors in youth. Int J Obes. 2014;38(1):16–21.
7. World Health Organisation. Global Strategy on Diet, Physical Activty andHealth. In Physical Activity and Young People. 2014.
8. Schneller MB, Duncan S, Schipperijn J, Nielsen G, Mygind E, Bentsen P. Arechildren participating in a quasi-experimental education outside the classroomintervention more physically active? BMC Public Health. 2017;17:523.
9. Association for Physical Education (AfPE). Health Position Paper. 2015. http://www.afpe.org.uk/physicaleducation/wpcontent/uploads/afPE_Health_Position_Paper_Web_Version2015.pdf.
10. Hollis JL, Sutherland R, Williams AJ, Campbell E, Nathan N, Wolfenden L,et al. A systematic review and meta-analysis of moderate-to-vigorousphysical activity levels in secondary school physical education lessons. Int JBehav Nutr Phys Act. 2017;14(1):52.
11. Fairclough SJ, Stratton G. Physical activity levels in middle and high schoolphysical education: a review. Pediatr Exerc Sci. 2005;17:217–36.
12. Fairclough S, Stratton G. 'Physical education makes you fit and healthy’.Physical education's contribution to young people's physical activity levels.Health Educ Res. 2005;20(1):14–23.
13. McKenzie TL, Catellier DJ, Conway T, Lytle LA, Grieser M, Webber LA, et al.Girls’ activity levels and lesson contexts in middle school PE: TAAG baseline.Med Sci Sports Exerc. 2006;38:1229–35.
14. Wang GY, Pereira B, Mota J. Indoor physical education measured by heart ratemonitor: a case study in Portugal. J Sports Med Phys Fitness. 2005;45:171–7.
15. Kremer MM, Reichert FF, Hallal PC. Intensity and duration of physical effortsin physical education classes. Rev Saude Publica. 2012;46(2):320–6.
16. England S. Young people and sport in England 1999. London: SportEngland; 2001.
17. Borys AH. Increasing pupil motor engagement time: case studies of studentteachers. In: Telema R, editor. International Symposium on Research inSchool Physical Education. Jyvaskyla: Foundation for Promotion of PhysicalCulture and Health; 2003. p. 351–8.
18. Stratton G. Children’s heart rates during physical education lessons: areview. Pediatr Exerc Sci. 1996;8:215–33.
19. Morgan PJ, Hansen V. Classroom teachers’ perceptions of the impact ofbarriers to teaching physical education on the quality of physical educationprograms. Res Q Exerc Sport. 2008;79:506–16.
20. Stratton G. Physical activity levels of 12–13 year old schoolchildren duringEuropean handball lessons: gender and ability group differences. Eur PhysEduc Rev. 1996;2:165–73.
21. McKenzie TL, Marshall SJ, Sallis JF, Conway TL. Student activity levels, lessoncontext, and teacher behavior during middle school physical education. ResQ Exerc Sport. 200(71):249–59.
22. Ferreira FS, Mota J, Duarte JA. Patterns of physical activity in Portugueseadolescents. Evaluation during physical education classes throughaccelerometry. Arch Exerc Health Dis. 2014;4:280–5.
23. Jago R, McMurray RG, Bassin S, Pyle L, Bruecker S, Jakicic JM, et al. Modifyingmiddle school physical education: piloting strategies to increase physicalactivity. Pediatr Exerc Sci. 2009;21(2):171–85.
24. Scruggs PW, Mungen JD, Oh Y. Physical activity measurement deviceagreement: pedometer steps/minute and physical activity time. Meas PhysEduc Exerc Sci. 2010;14:151–63.
25. Scruggs PW, Mungen JD, Oh Y. Quantifying moderate to vigorous physicalactivity in high school physical education: a pedometer steps/minutestandard. Meas Phys Educ Exerc Sci. 2010;14:104–15.
26. Chow BC, McKenzie TL, Louie L. Physical activity and environmentalinfluences during secondary school physical education. J Teach Phys Educ.2009;28:21–37.
27. Baquet G, Berthoin S, Van Praagh E. Are intensified physical educationsessions able to elicit heart rate at a sufficient level to promote aerobicfitness in adolescents? Res Q Exerc Sport. 2002;73(3):282–8.
28. Bebcakova V, Brtkova M, Belej M. Load intensity profile of physical educationclasses at secondary grammar school. Acta Kinesiol Univ Tartuensis. 2001;6(Supp l):69–72.
29. Hodges-Kulinna PJ, Lai MQ, Kliber A, Reed B. Student physical activitypatterns: grade, gender, and activity influences. J Teach Phys Educ. 2003;22:298–310.
30. Stratton G. Children’s heart rates during British physical education lessons. JTeach Phys Educ. 1997;16:357–67.
31. Skala KA, Springer AE, Sharma SV, Hoelscher DM, Kelder SH. Environmentalcharacteristics and student physical activity in PE class: findings from twolarge urban areas of Texas. J Phys Act Health. 2012;9(4):481–91.
32. Brusseau TA, Burns RD, Fu Y. Contextual factors related to physical activity duringdaily middle school physical education. J Sci Med Sport. 2016;19(9):733–7.
33. Hannon JC, Ratliffe T, Holt B, Thorn J. Activity levels and female students’views of a high school physical education flag football unit: coeducationaland single gender settings. ICHPER. 2005;41:16–21.
34. Dudley DA, Okely AD, Cotton WG, Pearson P, Caputi P. Physical activitylevels and movement skill instruction in secondary school physicaleducation. J Sci Med Sport. 2012;15:231–7.
35. McKenzie TL, Prochaska JJ, Sallis JF, LaMaster KJ. Coeducational and single-sex physical education in middle schools: impact on physical activity. Res QExerc Sport. 2004;75(4):446–9.
36. Zhu W. A multilevel analysis of school factors associated with health-relatedfitness. Res Q Exerc Sport. 1997;68(2):125–35.
37. Kirkham-King M, Brusseau TA, Hannon JC, Castelli DM, Hilton K, Burns RD.Elementary physical education: a focus on fitness activities and smaller classsizes are associated with higher levels of physical activity. Prev Med Rep.2017;8:135–9.
38. Thompson HR, Duvall J, Padrez R, Rosekrans N, Madsen KA. The impact ofmoderate-to-vigorous intensity physical education class immediately priorto standardized testing on student test-taking behaviors. Ment Health PhysAct. 2016;11:7–11.
39. Thompson HR, Vittinghoff E, Linchey JK, Madsen KA. Public disclosure toimprove physical education in an Urban School district: results from a 2-year quasi-experimental study. J Sch Health. 2015;85(9):604–10.
40. Phillips LR, Parfitt G, Rowlands AV. Calibration of the GENEA accelerometerfor assessment of physical activity intensity in children. J Sci Med Sport.2013;16:124–8.
41. R Core Team (2019). R: a language and environment for statisticalcomputing. R Foundation for statistical computing, Vienna, Austria. URLhttps://www.R-project.org/.
42. Bates D, Maechler M, Bolker B, Walker S. Fitting linear mixed-effects modelsusing lme4. J Stat Sofw. 2015;67(1):1–48.
43. Cohen J. Statistical power analysis for the behavioral sciences, Hillsdale, NJ,L. Erlbaum associates, 1998.21. Welk GJ, going SB, Morrow JR.
44. U.S. Department of Health Human Services. Physical activity guidelines forAmer-icans (Report), Washington, DC, Author, 2008.
45. Scruggs PW, Beveridge SK, Eisenman PA, Watson DL, Shultz BB, Ransdell LB.Quantifying physical activity via pedometry in elementary physicaleducation. Med Sci Sports Exerc. 2003;35(6):1065–71.
46. Simons-Morton B, Taylor WC, Snider SA, Huang IW, Fulton JE. Observedlevels of elementary and middle school children's physical activity duringphysical education classes. Prev Med. 1994;23:437–41.
Delextrat et al. BMC Public Health (2020) 20:1590 Page 11 of 12
47. Department for Education and Employment/Qualifications and CurriculumAuthority. Physical education—the National Curriculum for England.London: DFEE/QCA; 1999.
48. Morgan K, Hallingberg B, Littlecott H, Murphy S, Fletcher A, Roberts C,Moore G. Predictors of physical activity and sedentary behaviours among11-16 year olds: multilevel analysis of the 2013 health behaviour in school-aged children (HBSC) study in Wales. BMC Public Health. 2016;16:569.
49. Zhou Y, Wang L. Correlates of physical activity of students in secondaryschool physical education: a systematic review of literature. Biomed Res Int2019;2019: 4563484.
50. Fröberg A, Raustorp A, Pagels P, Larsson C, Boldemann C. Levels of physicalactivity during physical education lessons in Sweden. Acta Paediatr. 2017;106(1):135–41.
51. Fairclough S. Physical activity levels during key stage 3 physical education.Br J Teaching Phys Ed. 2003;34:40–5.
52. Fairclough S. Physical activity, perceived competence and enjoyment duringhigh school physical education. Eur J Phys Ed. 2003;8:5–18.
53. Evenson KR, Catellier DJ, Gill K, Ondrak KS, McMurray RG. Calibration of twoobjective measures of physical activity for children. J Sports Sci. 2008;26:1557–65.
54. Freedson P, Melanson E, Sirard J. Calibration of the computer science andapplications. Accelerometer Med Sci Sports Exerc. 1998;30:777–81.
Publisher’s NoteSpringer Nature remains neutral with regard to jurisdictional claims inpublished maps and institutional affiliations.
Delextrat et al. BMC Public Health (2020) 20:1590 Page 12 of 12


