Embed Size (px)
Citation preview
UNIVERSITY OF GHANA
COLLEGE OF BASIC AND APPLIED SCIENCES
EFFECTS OF IMMOBILIZATION DEVICES ON SKIN DOSES AND DOSES IN
THE BUILD-UP REGIONS FOR HIGH ENERGY PHOTON BEAMS
BY
BISMARK DJAN
(10598536)
THIS THESIS/DISSERTATION IS SUBMITTED TO THE UNIVERSITY OF
GHANA, LEGON IN PARTIAL FULFILMENT OF THE REQUIREMENT FOR
THE AWARD OF MPHIL MEDICAL PHYSICS DEGREE
JULY, 2018
University of Ghana http://ugspace.ug.edu.gh
ii
DECLARATION
This thesis is the result of a research work undertaken by Bismark Djan in the
Department of Medical Physics, School of Nuclear and Allied Sciences, University of
Ghana – Legon. The research was done under the able supervision of Prof. J. H. Amuasi,
Dr. Francis Hasford, and Mr. George Felix Acquah all from the Department of Medical
Physics.
It is my conviction that, no part of this research work has been presented in part or whole
to any other institution or university for the award of a diploma, or degree at any level.
Accordingly, other works and/or researches done by other researchers cited in this work
have been duly acknowledged under references.
…………………………….. Date …………………… Bismark Djan (Student’s ID: 10598536) …………………………….. Date …………………… Dr. Francis Hasford (Principal Supervisor) …………………………….. Date …………………… Prof. J. H. Amuasi (Co-Supervisor) …………………………….. Date …………………… Mr. George Felix Acquah (Co-Supervisor)
University of Ghana http://ugspace.ug.edu.gh
iii
ABSTRACT
This study presents the significant increase in skin dose caused by the presence of
thermoplastic immobilizing masks used for positioning and immobilization of patients
during cancer treatments in the head and neck region. Made from organic materials,
thermoplastics become soft and pliable when heated and forms a rigid replication of the
patient’s anatomy as it cools down. The use of the mask plays a key role in achieving the
therapeutic aim in head and neck treatments but can as well lead to a rise in surface dose.
The purpose of this research is to examine and analyze the effects of thermoplastic masks
used as immobilization devices on skin and the build-up region doses for a 6 MV Three
Dimensional Conformal Radiotherapy plan. Measurements in the solid water phantom
coupled with an electrometer and a Roos type ionization chamber at the surface (skin),
the dmax (1.6 cm) and a specified depth of 10 cm of the 6 MV photon beam were made
and recorded employing the isocentric technique for known varying field sizes with 100
MU. Measurements with or without the mask were also made on the phantom.
GafChromic films were also used to assess the skin dose and dmax and compared to the
measured values. Surface dose increased significantly due to the presence of the
thermoplastic masks. It was observed that the estimated surface doses with the presence
of the thermoplastic mask were consistently larger than those without the mask. Due to
the presence of the thermoplastic mask during measurements, the dose in the build-up
region increased, subsequently shifting the depth of maximum dose, dmax, to shallower
depths to the skin surface. For a field size of 10 x 10 cm2, an increase in skin dose of
0.21, 0.13 and 0.05 Gy was estimated for the unstretched mask, the 5 cm stretched mask
and the 10 cm stretched mask respectively, which was ascribed to the “bolus” effect of
University of Ghana http://ugspace.ug.edu.gh
iv
the thermoplastic masks. For the various field sizes, the skin dose increased by an
average factor less than 1% for the different mask stretches. However, a variation within
1% was recorded although the skin dose decreased as the mask was extended. The
thermoplastic factor at the skin surface was also found to increase with an increasing
mask thickness and for a particular mask type (unstretched, 5 cm stretched, or 10 cm
stretched) the thermoplastic factor decreased with increasing field size. The discrepancies
obtained using the GafChromic films varied significantly with those obtained using the
ionization chamber which was associated with the heterogeneous composition of the film
arising from the manufacturing process. The skin-sparing effect which is an advantage
for megavoltage beams was not achieved due to the presence of the masks.
University of Ghana http://ugspace.ug.edu.gh

v
DEDICATION
This thesis work is dedicated to God Almighty for love, care, provisions,
encouragements, strength, protection, and blessings He has given me throughout my
education and above all, for the wisdom, He has been granting me since secondary school
till now. Also, I dedicate this work to my irreplaceable family for their love, care,
encouragements, support and prayers throughout my education and most especially to my
sister Mrs. Esther Anokye.
University of Ghana http://ugspace.ug.edu.gh
vi
ACKNOWLEDGMENTS
My first and foremost thanks and appreciation go to God Almighty for protecting and
guiding me, giving me the sound health, wisdom, knowledge and providing me with all
that I needed throughout this research work. May His sovereign name be praised now and
forever more.
I am very much grateful to the International Atomic Energy Agency for making it
possible for me to undertake this Master of Philosophy Degree programme in Medical
Physics here in Ghana.
I sincerely salute my able supervisors, Prof. J.H. Amuasi, Dr. Francis Hasford, and Mr.
George Felix Acquah for their continued pieces of advice, corrections, directions,
comfort, sacrifices and above all the love and commitments they had in helping me
through with my work. No word can express my joy at having you as my team of
supervisors, I truly appreciate your support.
Also, to my parents and siblings, I am very much grateful for all the support, advice,
encouragements and love you gave me during my entire life in school. I pray for Gods
blessings for you all.
Lastly, my special thanks go to my Head of Department, Dr. Francis Hasford who is also
my principal supervisor and all the Lecturers for their continued encouragements and
motivations.
University of Ghana http://ugspace.ug.edu.gh
vii
TABLE OF CONTENTS
DECLARATION............................................................................................................... ii ABSTRACT ...................................................................................................................... iii
DEDICATION....................................................................................................................v
ACKNOWLEDGMENTS ............................................................................................... vi
TABLE OF CONTENTS ............................................................................................... vii LIST OF FIGURES ...........................................................................................................x
LIST OF TABLES .......................................................................................................... xii
LIST OF ABBREVIATIONS ....................................................................................... xiii
CHAPTER ONE ................................................................................................................1
INTRODUCTION..............................................................................................................1
1.1 Background ....................................................................................................... 1
1.2 Problem Statement............................................................................................ 6
1.3 Objectives........................................................................................................... 7
1.4 Relevance and Justification .............................................................................. 8
1.5 Scope and Limitation ........................................................................................ 9
1.6 Organization of Thesis ...................................................................................... 9
CHAPTER TWO .............................................................................................................10
LITERATURE REVIEW ...............................................................................................10
2.1 Introduction ..................................................................................................... 10
2.2 Skin and Buildup Region Doses ..................................................................... 11
2.2.1 Electron Contamination of Photon Beams ............................................. 12
2.2.2 Skin-Sparing Effect as A Function of Photon Energy ........................... 13
2.2.3 Effects of Thermoplastic Immobilizers on Surface Dose. ..................... 15
2.2.4 Effect of Field Size on Skin/Surface Dose ............................................... 18
2.3 Exit Dose .......................................................................................................... 19
2.4 Radiation Dosimeters for Skin Dose Measurements ................................... 20
2.4.1 Ionization Chambers ................................................................................ 20
2.4.2 Electrometers............................................................................................. 21
2.4.3 Radiochromic Film ................................................................................... 22
CHAPTER THREE .........................................................................................................27
MATERIALS AND METHODS ....................................................................................27
University of Ghana http://ugspace.ug.edu.gh
viii
3.1 Materials .......................................................................................................... 27
3.1.1 Medical Linear Accelerator ..................................................................... 27
3.1.2 Ionization Chamber .................................................................................. 29
3.1.3 Electrometer .............................................................................................. 31
3.1.4 Diodes ......................................................................................................... 32
3.1.5 Water Bath ................................................................................................ 33
3.1.5 Thermoplastic Immobilization Mask ...................................................... 33
3.1.6 GafChromic Films .................................................................................... 34
3.1.7 ImageJ Software........................................................................................ 34
3.1.8 Other Materials ......................................................................................... 35
3.2 Experimental Method ..................................................................................... 36
3.2.1 Part 1: ......................................................................................................... 36
3.2.2 Part 2: ......................................................................................................... 40
3.2.3 Part 3: ......................................................................................................... 44
CHAPTER FOUR ............................................................................................................46
RESULTS AND DISCUSSION ......................................................................................46
4.1 Introduction ..................................................................................................... 46
4.2 Dose Determination from Ion chamber ........................................................ 46
4.2.1 Graphical Representations of Absorbed Dose against Depth ............... 50
4.3 Percentage Depth Dose (PDD) Determination ............................................. 52
4.3.1 Variation of Percentage Depth Dose (PDD) with Field Size and Depth. 54
4.4 Determination of Skin Dose from PDD values ............................................. 57
4.4.1 Effect of Field Size on Skin Dose. ............................................................ 60
4.4.2 Verification of Prescribed Dose ............................................................... 60
4.5 Thermoplastic Factors, TF ............................................................................. 61
4.6 Calibration Curve ........................................................................................... 62
4.6.1 Dose Determination for the Irradiated GafChromic EBT3 Films. ...... 65
CHAPTER FIVE .............................................................................................................73
CONCLUSION AND RECOMMENDATIONS ...........................................................73
5.1 Conclusions ...................................................................................................... 73
5.2 Recommendations ........................................................................................... 75
5.3 Further Research ............................................................................................ 75
University of Ghana http://ugspace.ug.edu.gh
ix
REFERENCES .................................................................................................................76
APPENDICES ..................................................................................................................82
APPENDIX 1 ............................................................................................................... 82
APPENDIX 2 ............................................................................................................... 82
APPENDIX 3 ............................................................................................................... 84
APPENDIX 4 ............................................................................................................... 86
APPENDIX 5 ............................................................................................................... 86
APPENDIX 6 ............................................................................................................... 88
APPENDIX 7 ............................................................................................................... 89
APPENDIX 8 ............................................................................................................... 90
APPENDIX 9 ............................................................................................................... 91
APPENDIX 10 ............................................................................................................. 92
APPENDIX 11 ............................................................................................................. 93
University of Ghana http://ugspace.ug.edu.gh
x
LIST OF FIGURES
Figure 1. 1: An illustration of the concept of therapeutic ratio. Image from (“Basics of Radiation Therapy | Clinical Gate,” 2015)...........................................................................2
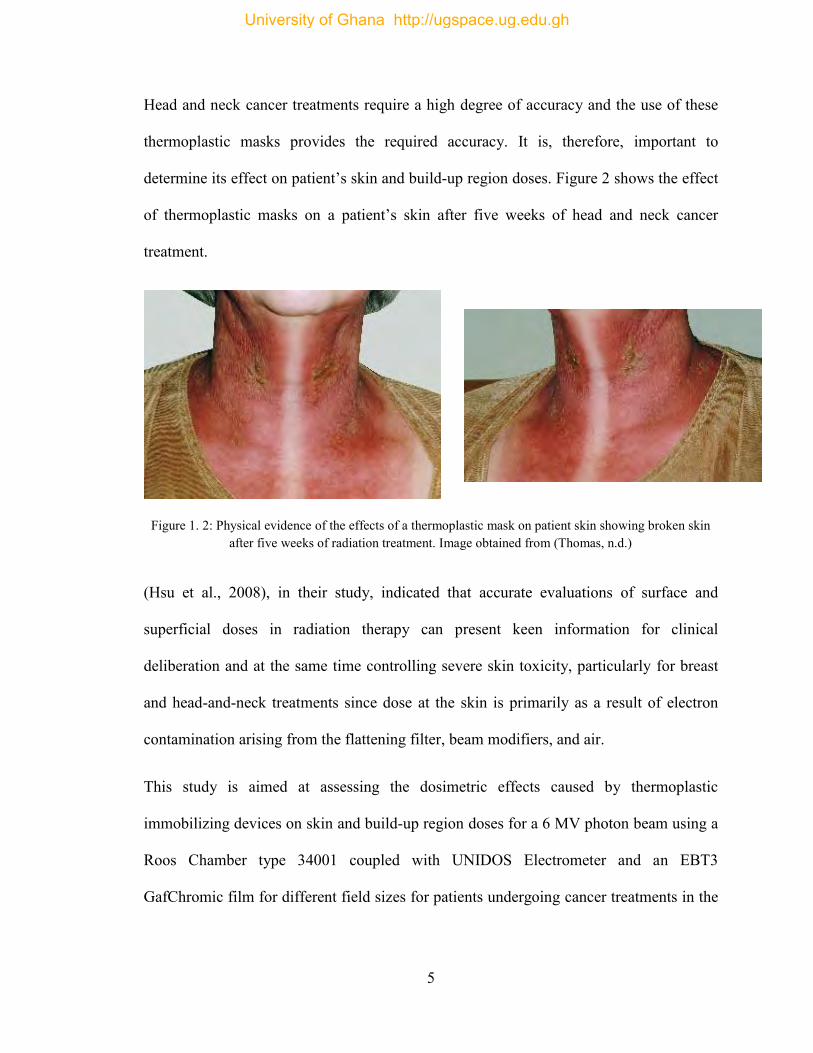
Figure 1. 2: Physical evidence of the effects of a thermoplastic mask on patient skin showing broken skin after five weeks of radiation treatment. Image obtained from (Thomas, n.d.) ......................................................................................................................5
Figure 2. 1: A graph of absorbed dose and kerma as functions of depth ...........................12
Figure 2. 2: An unstretched thermoplastic mask ...............................................................17
Figure 2. 3: A stretched thermoplastic mask to be used on the solid water phantom ........17
Figure 2. 4: A thermoplastic mask fixed to the couch in the treatment room....................17
Figure 2. 5: A moulded thermoplastic mask during simulation.........................................17
Figure 2. 6: The effect of thermoplastic mask on skin dose ..............................................17
Figure 2. 7: Percentage skin dose against field size. (Data from Velkley, et al., 10 MV data are from Khan FM, et al.) ...........................................................................................19
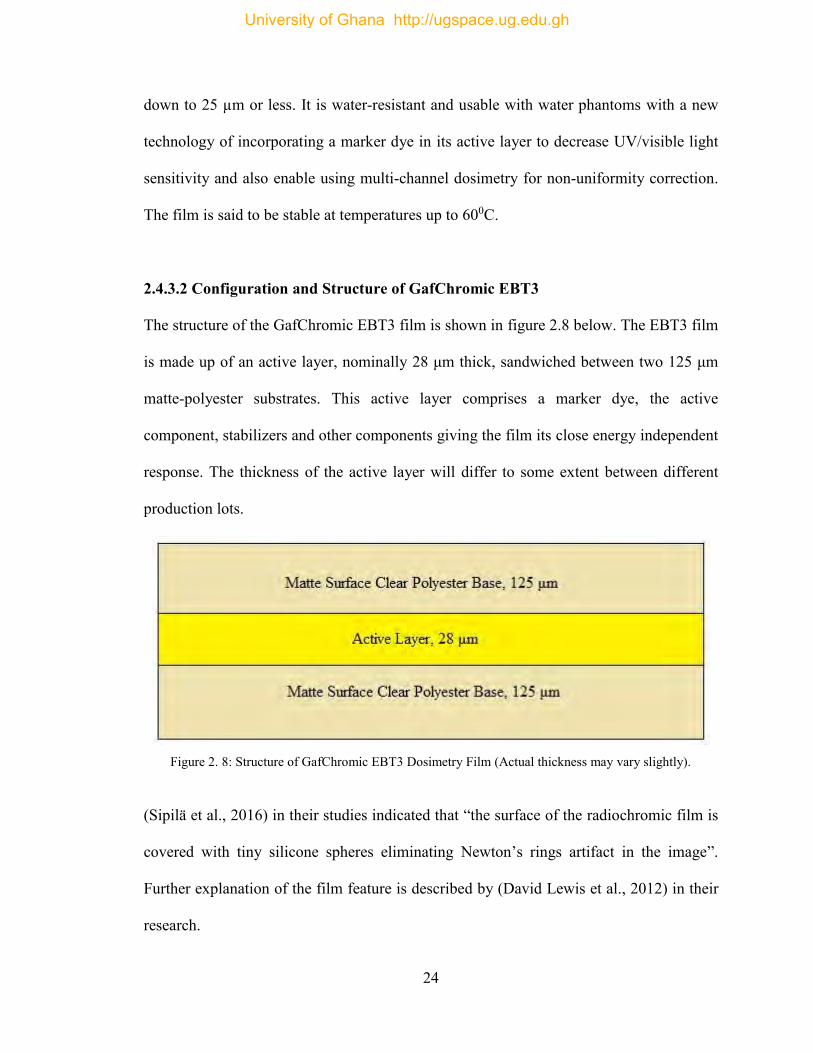
Figure 2. 8: Structure of GafChromic EBT3 Dosimetry Film (Actual thickness may vary slightly). .............................................................................................................................24
Figure 3. 1: Medical Linear Accelerator at Sweden Ghana Medical Centre (SGMC) ......29
Figure 3. 2: Roos Chamber type 34001 .............................................................................30
Figure 3. 3: Inserting/removing the Roos Chamber...........................................................31
Figure 3. 4: Twin plate with inserted Roos chamber .........................................................31
Figure 3. 5: PTW UNIDOS Electrometer ..........................................................................32
Figure 3. 6: Diode ..............................................................................................................32
Figure 3. 7: Water Bath ......................................................................................................33
Figure 3. 8: Image J software interface ..............................................................................35
Figure 3. 9: Barometer .......................................................................................................35
Figure 3. 10: Diode reader .................................................................................................35
Figure 3. 11: Solid water phantom .....................................................................................35
Figure 3. 12: Thermometer ................................................................................................35
Figure 3. 13: Setup without a thermoplastic mask .............................................................37
Figure 3. 14: Setup with an unstretched thermoplastic mask ............................................37
Figure 3. 15: Setup with a 5 cm stretched thermoplastic mask .........................................38
Figure 3. 16: Positioning of the film set A, B, and C at the surface of the phantom, at the dmax of 1.6 cm for the 6 MV photon beam, and at a depth of 10 cm respectively .............41
Figure 3. 17: Film placement on the scanner .....................................................................43
Figure 3. 18: ImageJ software interface with a scanned film image split into the RGB channels..............................................................................................................................44
Figure 3. 19: Treatment planning process for the dose verification ..................................45
Figure 4. 1: A graphical representation of Absorbed dose against Depth for no thermoplastic mask. .........................................................................................................50
University of Ghana http://ugspace.ug.edu.gh
xi
Figure 4. 2: A graphical representation of Absorbed dose against Depth for the unstretched thermoplastic mask. ....................................................................................51
Figure 4. 3: A graphical representation of Absorbed dose against Depth for the 5 cm stretched thermoplastic mask. ........................................................................................51
Figure 4. 4: A graphical representation of Absorbed dose against Depth for the 10 cm stretched thermoplastic mask. ........................................................................................52
Figure 4. 5: A graph of PDD against Depth for a 10x10 field size with an unstretched mask and without a mask. ..................................................................................................53
Figure 4. 6: A graph of PDD against Depth for a 10x10 field size with a 5 cm stretched mask and without a mask. ..................................................................................................53
Figure 4. 7: A graph of PDD against Depth for a 10 x 10 field size with a 10 cm stretched mask and without a mask. ..................................................................................................54
Figure 4. 8: A graph showing the variation of PDD versus depth and field size for measurements without the thermoplastic mask..............................................................55
Figure 4. 9: A graph showing the variation of PDD versus depth and field size for measurements with an unstretched thermoplastic mask. ...............................................56
Figure 4. 10: A graph showing the variation of PDD versus depth and field size for measurements with a 5 cm stretched thermoplastic mask. ............................................56
Figure 4. 11: A graph showing the variation of PDD versus depth and field size for measurements with a 10 cm stretched thermoplastic mask. ..........................................57
Figure 4. 12: A bar chart showing the effect of different mask thickness on PDD at depth 0.0 cm. ................................................................................................................................58
Figure 4. 13: A bar chart showing the effect of different mask thickness on the skin dose at depth 0.0 cm. ..................................................................................................................59
Figure 4. 14: Calibration curve comparing RGB channels for 6 MV photon energy. .......63
Figure 4. 15: A graph of Absorbed Dose against Net Optical Density for the Red channel.64
Figure 4. 16: A graph showing the variation of absorbed dose versus depth and field size for GafChromic measurements without the mask. ..........................................................70
Figure 4. 17: A graph showing the variation of absorbed dose versus depth and field size for GafChromic measurements with the unstretched mask. ............................................71
Figure 4. 18: A graph showing the variation of absorbed dose versus depth and field size for GafChromic measurements with the 5 cm stretched mask. .......................................71
Figure 4. 19: A graph showing the variation of absorbed dose versus depth and field size for GafChromic measurements with the 10 cm stretched mask. .....................................72
University of Ghana http://ugspace.ug.edu.gh
xii
LIST OF TABLES
Table 2. 1: Buildup Dose Distribution in Polystyrene for a 10 × 10 cm2 Field .................14
Table 4. 1: Measured Absorbed dose (Gy) values for various field sizes at different depths without the mask. .................................................................................................47
Table 4. 2: Measured Absorbed dose (Gy) values for various field sizes at different depths with the unstretched mask. ...................................................................................47
Table 4. 3: Measured Absorbed dose (Gy) values for various field sizes at different depths with the 5 cm stretched mask. ..............................................................................48
Table 4. 4: Measured Absorbed dose (Gy) values for various field sizes at different depths with the 10 cm stretched mask .............................................................................49
Table 4. 5: Dose (Gy) differences between the various mask stretches and without the mask ...................................................................................................................................59
Table 4. 6: Skin Doses (Gy) at a depth of 0.0 cm for the various Stretches of the thermoplastic mask. ...........................................................................................................60
Table 4. 7: Thermoplastic factor for the unstretched thermoplastic mask. ...................61
Table 4. 8: Thermoplastic factor for the 5 cm stretched thermoplastic mask. ...............62
Table 4. 9: Thermoplastic factor for the 10 cm stretched thermoplastic mask. .............62
Table 4. 10: Net Optical Densities as a function of absorbed dose for the calibrated GafChromic films ..............................................................................................................63
Table 4. 11: Net Optical Densities (Net OD) obtained for the GafChromic films without the mask. ...........................................................................................................................65
Table 4. 12: Net Optical Densities (Net OD) obtained for the GafChromic films with the unstretched mask. ............................................................................................................65
Table 4. 13: Net Optical Densities (Net OD) obtained for the GafChromic films with the 5 cm stretched mask.........................................................................................................65
Table 4. 14: Net Optical Densities (Net OD) obtained for the GafChromic films with the 10 cm stretched mask.......................................................................................................66
Table 4. 15: Calculated absorbed dose (Gy) values for various field sizes at different depths without the mask. .................................................................................................66
Table 4. 16: Calculated absorbed dose (Gy) values for various field sizes at different depths with the unstretched mask. ...................................................................................67
Table 4. 17: Calculated absorbed dose (Gy) values for various field sizes at different depths with the 5 cm stretched mask. ..............................................................................68
Table 4. 18: Calculated absorbed dose (Gy) values for various field sizes at different depths with the 10 cm stretched mask. ............................................................................69
University of Ghana http://ugspace.ug.edu.gh

xiii
LIST OF ABBREVIATIONS
SGMC Sweden Ghana Medical Centre
MPHIL Master of Philosophy
ICRU International Commission on Radiation Units and Measurements
MU Monitor Units
3DCRT Three-Dimensional Conformal Radiotherapy
TG Task Group
TPS Treatment Planning System
SAD Source to Axis Distance
CT Computed Tomography
SSD Source to Surface Distances
PDD Percentage Depth Dose
IMRT Intensity-Modulated Radiation Therapy
ICRP International Commission on Radiological Protection
MV Mega Voltage
AAPM American Association of Physicist in Medicine
CPE Charge Particle Equilibrium
Dmax Depth of Maximum Dose
LINACs Linear Accelerators
TCP Tumor Control Probability
IEC International Electrotechnical Commission
NTCP Normal Tissue Complication Probability
University of Ghana http://ugspace.ug.edu.gh
xiv
TIFF Tagged Image File Format
TLD Thermoluminescent dosimeter
RGB Red, Green and Blue
EF-IMRT Extended Field Intensity-Modulated Radiotherapy
TMR Tissue Maximum Ratio
OD Optical Density
PMMA Polymethylmethacrylate
UV Ultra Violet
PTV Planning Target Volume
IAEA International Atomic Energy Agency
CRT Conformal Radiation Therapy
Co-60 Cobalt-60 Teletherapy unit
QC Quality Control
TF Thermoplastic Factor
EBTXD EBT-eXtended Dose
University of Ghana http://ugspace.ug.edu.gh
1
CHAPTER ONE
INTRODUCTION
1.1 Background
Ever since Wilhelm Conrad Roentgen begun with the discovery of X-rays on the 8th
November 1895 at the University of Wurzburg and Antoine Henri Becquerel coined the
radioactivity phenomenon in 1896, cancer treatments have been appreciated through the
use of ionizing radiation. (Podgorsak & Rosenberg, 2008) stated that “radiotherapy, also
known as radiation therapy, radiation oncology or therapeutic radiology, is one of the
three major modalities used in the treatment of cancers, where electromagnetic and
particle radiations are used, with the other two being surgery and chemotherapy”.
Radiation therapy subsequently has gained recognition and has tremendously improved
and developed into one of the important specialized medical fields. (Podgorsak &
Rosenberg, 2008) have also stated that “X-rays are mostly used in diagnostic radiology
for diagnosing diseases and in radiation oncology for the treatment of cancerous tumors”.
Radiation therapy is generally characterized by two major forms considering the distance
between the radiation source and the tumor, to be treated. Brachytherapy “is a method of
treatment in which sealed radioactive sources are used to deliver radiation at a short
distance by interstitial, intracavitary, or surface application” as stated by (Khan, 2014). In
this method of therapy, the high radiation dose is delivered locally to the tumor with rapid
dose fall-off in the surrounding normal tissue. The second form of radiation therapy is
known as external beam radiotherapy. (Podgorsak & Rosenberg, 2008) describes this as a
type of radiation therapy which has the radiation source at a distance away from the
patient and the tumor target within the patient is irradiated with an external radiation
University of Ghana http://ugspace.ug.edu.gh
2
beam. Most of the external beam radiation therapy is performed with photon beams,
some with electron beams and a very small fraction with more exotic particles such as
heavy ions, protons or neutrons.
Studies by (Sweeney et al., 1998) have shown that the accurate delivery of a prescribed
radiation dose to a target tumor while sparing surrounding critical and normal tissues, is
the key objective of radiotherapy. The International Commission on Radiation Units and
Measurements (ICRU) recommends that to obtain this accuracy, it is required that the
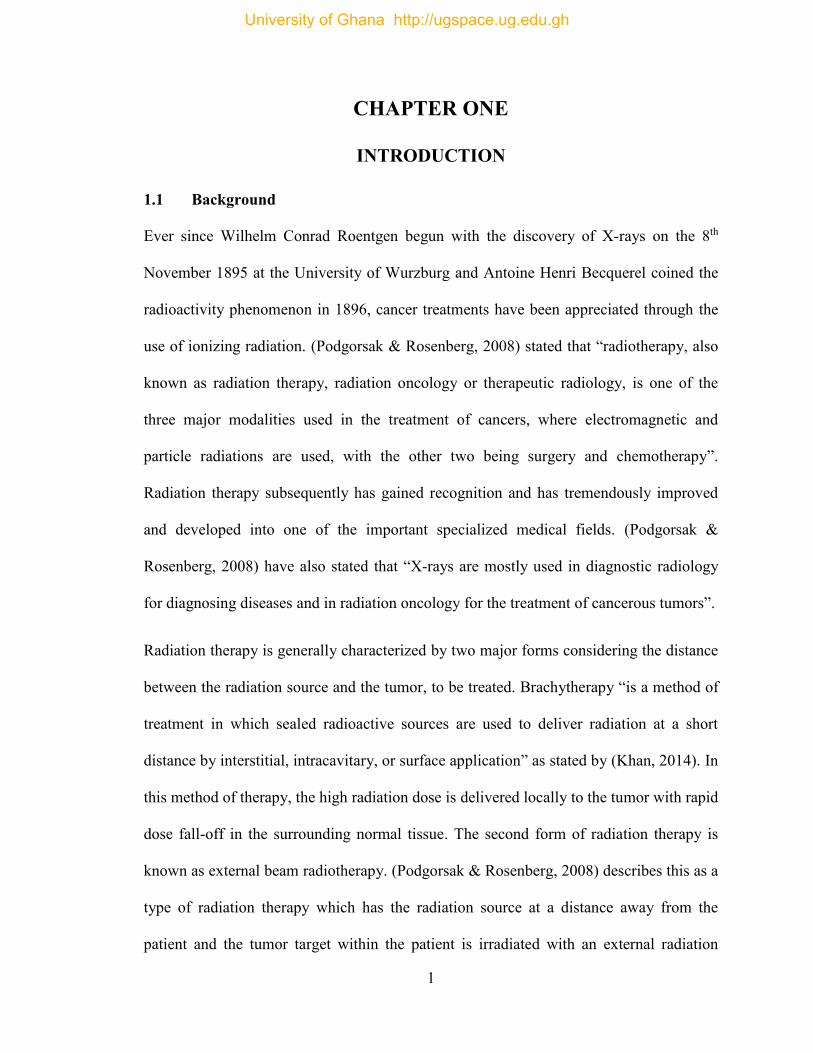
error in total dose be within ±5% (Musolino, 2000). Figure 1 illustrates the concept of
therapeutic ratio explained by (Williams & Thwaites, 2000) as delivering the highest
probable dose to the tumor and thus the maximum probability of complete tumor
regression.
Figure 1. 1: An illustration of the concept of therapeutic ratio. Image from (“Basics of Radiation Therapy |
Clinical Gate,” 2015)
Radiotherapeutic success is most probable when the two curves in Figure 1 are widely
separated (Williams & Thwaites, 2000). The further the normal tissue complication
University of Ghana http://ugspace.ug.edu.gh
3
probability (NTCP) curve is to the right of the tumor control probability curve (TCP), the
greater the therapeutic ratio and the lesser the treatment complications.
The prescribed treatment can either be for curative or palliative intent. In the case of
curative purpose, the side effects are sometimes unavoidable, but they are accepted as an
inevitable part of the cure. On the other hand, (Tabakov et al., 2008) stated that “where
cure from radical treatment is unlikely, palliative treatment can alleviate painful or
distressing symptoms and restore a higher degree of life quality for patients”. A target
dose uniformity within +7% and -5% is recommended by the ICRU Report number 50
for the radiation dose delivered to a precise prescription point within the target (Jones,
1994).
In external beam radiation therapy, medical linear accelerators and Cobalt-60 units are
used for cancer treatments and the procedures of treatment commonly rely on different
conditions such as the;
Shape, size, and position of the cancerous cells.
Location of sensitive or critical organs within the locality of the target volume
(that is, sparing of normal tissues) and
Financial constraints and the quest for optimization of radiation dose to the target
volume.
(Khan, 2014) indicates that “skin-sparing effect is one of the most desired features of
megavoltage beams, and all effort should be focused toward preserving this effect when
irradiating normal skin”. However, this effect may be reduced or even lost if the radiation
beam is extremely contaminated with secondary electrons. Consequently, skin dose
should be negligible during this treatment delivery, but this is never achieved because it
University of Ghana http://ugspace.ug.edu.gh
4
depends on secondary electrons (Yadav et al. 2009). These secondary electrons are
mostly produced by the interaction of photons with some scattering materials such as
collimator jaws, air, patient's skin and beam modifiers. (Nilsson & Brahme, 1986) has
shown in their studies that the air column under block tray has a more substantial
contribution at lower energies.
(Prabhu, 2012) has shown that positioning and immobilization of patients are the most
crucial parts of radiotherapy treatment. Therefore, in order to achieve this therapeutic aim
in the head and neck areas of cancer treatment, patients undertaking radiation therapy
must be well immobilized. Without proper immobilization such as the use of
thermoplastic masks, a patient is probably at risk for wrong or improper treatment and
this can result in unwanted side effects. In his study, (Meyer, 2014) stated that “a skin
condition called radiation dermatitis is one of the most common side effects of radiation
treatment and can range from a mild, red rash (erythema) and itchy, peeling or flaking
skin to a more severe reaction with blisters and wet, peeling skin”.
Thermoplastic is a plastic material (polymer) which turn out to be pliable or mouldable
above a certain temperature and hardens upon cooling. The main goal of a thermoplastic
mask is to provide a dependable method for accurate patient positioning and
immobilization during radiation head and neck treatments as well as patient repositioning
from one treatment to another and improving patient comfort. The thermoplastic mask is
first placed in warm water at a specified temperature to soften it and make it pliable, then
pulled over the patient’s face and moulded to the contours of his/her anatomy. As the
thermoplastic mask cools down, a firm replication of the patient’s anatomy is then
produced, and the thermoplastic mask is then fastened directly to the treatment couch.
University of Ghana http://ugspace.ug.edu.gh
5
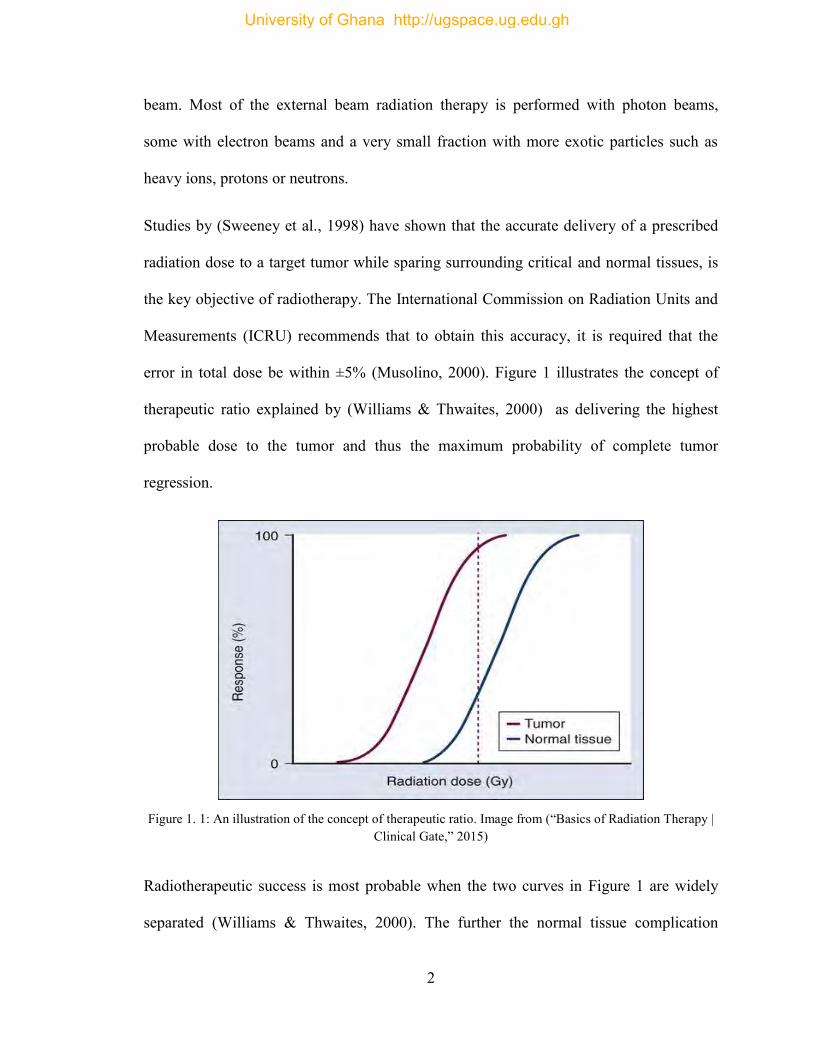
Head and neck cancer treatments require a high degree of accuracy and the use of these
thermoplastic masks provides the required accuracy. It is, therefore, important to
determine its effect on patient’s skin and build-up region doses. Figure 2 shows the effect
of thermoplastic masks on a patient’s skin after five weeks of head and neck cancer
treatment.
Figure 1. 2: Physical evidence of the effects of a thermoplastic mask on patient skin showing broken skin after five weeks of radiation treatment. Image obtained from (Thomas, n.d.)
(Hsu et al., 2008), in their study, indicated that accurate evaluations of surface and
superficial doses in radiation therapy can present keen information for clinical
deliberation and at the same time controlling severe skin toxicity, particularly for breast
and head-and-neck treatments since dose at the skin is primarily as a result of electron
contamination arising from the flattening filter, beam modifiers, and air.
This study is aimed at assessing the dosimetric effects caused by thermoplastic
immobilizing devices on skin and build-up region doses for a 6 MV photon beam using a
Roos Chamber type 34001 coupled with UNIDOS Electrometer and an EBT3
GafChromic film for different field sizes for patients undergoing cancer treatments in the
University of Ghana http://ugspace.ug.edu.gh
6
head and neck using a medical linear accelerator at the Sweden Ghana Medical Center in
Accra.
1.2 Problem Statement
In radiation therapy, there is the possibility of encountering several problems since
tumors in areas like head and neck are in close proximity to healthy tissues/critical organs
and the radiation has to travel through these healthy tissues before reaching the target
volume. Consequently, patients are required to be properly immobilized using
immobilization devices to provide precision/accuracy during treatments, enhance
reproducibility from one treatment fraction to another, to reduce daily setup errors and
also increase patient comfort.
In view of the proximity of the tumor to the surrounding critical organs and normal
tissues with comparatively limited intra-fractional motion in head and neck cancers,
proper immobilization technique will allow smaller treatment margins and reduce the
side effects.
However, recent works have shown that the use of these immobilization devices
(thermoplastic mask) tends to attenuate part of the radiation beam and as a result,
increasing skin toxicity and the dose to the build-up region. From literature, the presence
of the thermoplastic mask tends to have some effects on the dosimetric outcomes (skin or
surface dose, dose at maximum depth, and at a depth of d = 10 cm). Because of the
uneven stretching of the heated thermoplastic mask, one ends up having a mask with
varying holes which also contributes to dosimetric effects on the patient. This can,
University of Ghana http://ugspace.ug.edu.gh
7
however, have an effect on the quality of life of the patients after treatment. Since these
effects are mostly ignored in practice, it is, therefore, important to analyze their impacts
on radiation therapy for head and neck cancer treatments.
This study thus seeks to investigate the operational challenges of using thermoplastic
immobilization mask and find out how its dosimetric effects can be reduced.
1.3 Objectives
The main aim of this study is to examine and analyze the effects of thermoplastic masks
used as immobilizing devices on the skin and the build-up region doses. The study
involves 3D conformal radiotherapy (CRT) plan for patients receiving head and neck
cancer treatments using 6 MV external radiation therapy (medical linear accelerator) with
a flat ionization chamber and EBT3 GafChromic films dosimetry.
The specific objectives are to:
1. Determine the LINAC’s output factors.
2. Determine the thermoplastic percentage depth dose and thermoplastic factor.
3. Determine the skin dose and the dose at maximum depth (Dmax), and also the
effects of the thermoplastic mask on them.
4. Use an anthropomorphic phantom for dose verification.
5. Make appropriate recommendations from the findings.
University of Ghana http://ugspace.ug.edu.gh
8
1.4 Relevance and Justification
Since the primary aim of radiotherapy is to accurately and precisely deliver a prescribed
dose to a target volume while sparing surrounding healthy and critical tissues, the
dosimetric effect of certain treatment parameters must not be overlooked in today’s
radiation therapy.
In radiotherapy, the accurate and precise delivery of radiation doses critically depends on
the day-to-day reproducibility of patient positioning. Now, different immobilization
devices are available to help in providing precise repositioning during radiation
treatments and also increasing patient comfort. Thermoplastic masks are widely used in
head and neck cancer treatments because cancer in the head and neck areas are in close
proximity to critical organs and it is required that patients are properly immobilized in
order to achieve the goals of immobilization devices.
During simulations or treatments, lasers are used in aligning the patient in the room and
these thermoplastic masks provide suitable space for the use of fiducial markers which
eliminates the markings on the skin (face) of the patient. On the contrary, the presence of
these immobilizing devices (thermoplastic masks) have the tendency of attenuating part
of the radiation beam and further increasing skin and build-up region doses which could
change the intended plan. For that reason, understanding how these devices affect skin
and the build-up region doses in a particular treatment form is of great importance. This
would ensure that medical physicists consider their effects and hence make appropriate
setup corrections and other adjustments (that is, firmly stretching the mask to reduce its
thickness) to keep acceptable doses to skin and build-up regions.
University of Ghana http://ugspace.ug.edu.gh
9
1.5 Scope and Limitation
Some works have been done to investigate skin and build-up region doses in radiotherapy
using various methods. However, this study focuses on employing the application of
thermoplastic masks as the immobilization device stretched at three different lengths in
order to obtain different hole diameters (unstretched, 5 cm stretched, and 10 cm
stretched) during head and neck cancer treatments with a 6 MV 3D conformal Plan in
radiation therapy. This was done at the Sweden Ghana Medical Centre using the medical
linear accelerator. The Roos Chamber type 34001 and the GafChromic EBT3 films are
used in this study because they are user-friendly and can easily be used to measure the
surface dose whiles on the other hand, the Farmer type Ion Chamber cannot be used to
measure the surface dose directly but can only be determined from the PDD.
Measurements are made in a solid water phantom at the surface (skin), the build-up
region, the dmax = 1.6 cm and a specified depth of 10 cm for the 6 MV photon beam at
field sizes of 5 x 5, 10 x 10, 15 x 15, and 20 x 20 cm2.
1.6 Organization of Thesis
This study is arranged in a chronological order of five chapters. Chapter One introduces
the research of which comprises; the background of the study, problem statement,
objectives, relevance, and justification, scope and limitation. Chapter Two reviews
existing literature relevant to the research problem. Chapter Three focuses on the
materials and methodologies used for the study. Chapter Four presents the results
obtained and discussions performed. Chapter Five is the conclusion of the study and
recommendations made from the study.
University of Ghana http://ugspace.ug.edu.gh
10
CHAPTER TWO
LITERATURE REVIEW
2.1 Introduction
Surface dose varies quite significantly using megavoltage radiations in clinical
radiotherapy. These differences can be ascribed to variations in electron contamination
and phantom scatter (Alnawaf et al., 2012). Majority of these discrepancies are detected
for fluctuations in some beam parameters such as use of beam modifying devices, field
size and the radiation beam angle of incidence (Hounsell & Wilkinson, 1999; M. J.
Butson et al., 1996) or due to the composition of the material which may be in the direct
or indirect path of the radiation beam in question (Martin J. Butson et al., 2007).
During external beam radiation therapy, the skin is mostly in danger from radiation
effects such as skin shedding, necrosis, and erythema. Epidemiological studies have also
found a link between basal cell carcinoma and radiotherapy (Kry et al., 2012). However,
skin dose is complicated because of the different skin layers with various depths of
thickness that varies between patients and positions on the patient. Besides, the
International Commission on Radiological Protection (ICRP) recommends measuring the
radiation dose to the skin at 0.07 mm (ICRP, 1977; ICRU, 1985) and 1.0 mm (M. Butson
et al., 1997) depth for the basal layer which is taken as the surface dose and dermal layer
respectively. (Court et al., 2008); (Dogan & Glasgow, 2003); (Panettieri et al., 2009)
have indicated that even though the surface dose may be evaluated with the TPS, mostly
within ± 25% accuracy, this method requires computed tomography images and an
estimated treatment plan. (Lamb & Blake, 1998) in their studies proposed a skin dose
estimation technique on the beams central axis as a function of the treatment parameters.
University of Ghana http://ugspace.ug.edu.gh
11
Nevertheless, their model evaluated only 6 MV and 10 MV photon beams and it is
limited to the central axis of the radiation beam.
2.2 Skin and Buildup Region Doses
When a patient is undergoing radiation therapy with a high energy photon, the surface
dose is said to be significantly lower than the radiation dose at the dmax that occurs in the
subcutaneous tissues. Notwithstanding the rise in extreme ionization at or close to the
skin as a result of the lower-energy beams, the megavoltage or high energy photon beams
produce an initial electronic build-up with depth. Consequently, the skin dose is less than
that at dmax which occurs at a depth downstream. Research has shown that the higher the
radiation energy, the deeper the penetration power and the dmax. (F. M. Khan, 2014)
stated that “for a higher energy photon beams, dose in the build-up region results from
the relatively long range of energetic secondary charged particles (positive and negative)
that are first released in the patient by photon interactions and then deposit their kinetic
energy in the patient”. The low skin dose is known as the skin-sparing effect, which is
mostly absent in superficial or orthovoltage beams. This effect, which is a property of
megavoltage beams may be reduced or even lost if the radiation beam is extremely
contaminated with secondary electrons. Orthovoltage and superficial beams do not
demonstration skin-sparing effects given that the maximum dose transpires at the
patient’s skin surface. Immediately under the patient’s skin surface, the condition of
charged particle equilibrium (CPE) ceases to exist and the absorbed radiation dose is thus
much smaller than the collisional kerma. However, with increasing depth in the patient,
the charged particle equilibrium is finally reached at d = dmax where d is nearly equal to
University of Ghana http://ugspace.ug.edu.gh
12
the range of the secondary charged particles and the radiation dose becomes comparable
with the collisional kerma. Beyond d = dmax, both collisional kerma and absorbed dose
decreases due to photon attenuations in the patient that results in transient rather than true
CPE (Podgorsak & Rosenberg, 2005).
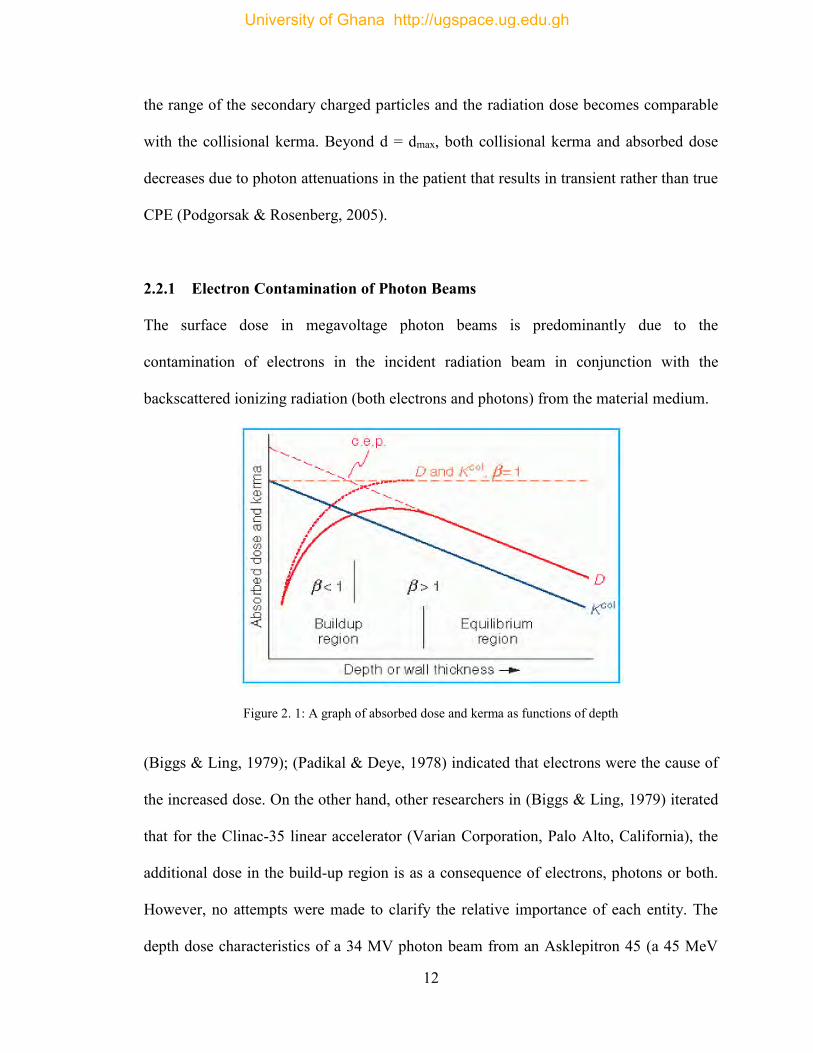
2.2.1 Electron Contamination of Photon Beams
The surface dose in megavoltage photon beams is predominantly due to the
contamination of electrons in the incident radiation beam in conjunction with the
backscattered ionizing radiation (both electrons and photons) from the material medium.
Figure 2. 1: A graph of absorbed dose and kerma as functions of depth
(Biggs & Ling, 1979); (Padikal & Deye, 1978) indicated that electrons were the cause of
the increased dose. On the other hand, other researchers in (Biggs & Ling, 1979) iterated
that for the Clinac-35 linear accelerator (Varian Corporation, Palo Alto, California), the
additional dose in the build-up region is as a consequence of electrons, photons or both.
However, no attempts were made to clarify the relative importance of each entity. The
depth dose characteristics of a 34 MV photon beam from an Asklepitron 45 (a 45 MeV
University of Ghana http://ugspace.ug.edu.gh
13
betatron) was studied by Dawson (Biggs & Ling, 1979) and drew a conclusion that
electrons were the greatest contributor. Also, (Marbach & Almond, 1977) in their
publication postulated that for a 25 MV radiation beam from a Sagittaire, Compton
scattered photons were the cause for the added dose in the build-up region. Studies have
shown that virtually all X-ray and gamma-ray beams employed in radiotherapy mostly
face contamination with secondary electrons (mostly Compton electrons) produced by the
photon interactions with the collimator, air, the flattening filter, and other materials in the
path of the beam such as wedges and shadow tray. Electron contamination also disturbs
the disparity of dose in the build-up region with field size. (Dogan & Glasgow 2003)
described a decreased build-up region dose when comparing IMRT strip fields to open
beam fields and established that any rise in skin toxicity was not inherently due to IMRT
delivery techniques. (Biggs & Ling, 1979); (F. M. Khan, 2014) stated that “as the field
size increases, the depth dose in the build-up region increases, resulting in a shift in the
depth of maximum dose, dmax, to increasingly shallower depths”. Researchers such as
(Biggs & Ling, 1979); (Marbach & Almond, 1977); (Padikal & Deye, 1978) have shown
that this effect is mainly triggered by the secondary electrons.
2.2.2 Skin-Sparing Effect as A Function of Photon Energy
Researchers have indicated that the dose distribution in the build-up region relies on
numerous variables such as SSD, field size, photon beam energy, and configuration of the
secondary blocking trays (F. M. Khan, 1971; Pillai et al., 1973; Velkley et al., 1975).
Certain studies have indicated that there is a reduction in skin dose at higher photon beam
energies (Martin J. Butson et al., 1998; Chiu-Tsao & Chan, 2009; Lin et al., 2001;
University of Ghana http://ugspace.ug.edu.gh
14
Stathakis et al., 2006). However, other studies provide contrary view, particularly for
large field sizes (M. Butson et al., 1997; De Ost et al., 1997; Kim et al., 1998; Klein &
Purdy, 1993; Yu et al., 2003) as demonstrated with lower energies (6-10 MV) and higher
energies (15-18 MV). Nevertheless, Cobalt-60 is said to create a higher skin dose which
further increases with field size and ranged between 20% - 85% of dmax for the open
beam (Kry et al., 2012). Though the skin-sparing effect relies on many conditions, the
outcome, in general, becomes well pronounced as the photon energy increases. (Martin J.
Butson et al., 1998) in their studies on the central axis of the photon beam relative to dmax
for a field size of 10 x 10 cm2 and obtained measured skin doses greater by 22%, 17%,
and 15.5% corresponding to 6, 10, and 18 MV respectively.
Table 2. 1: Buildup Dose Distribution in Polystyrene for a 10 × 10 cm2 Field
Depth (mm) 60Co 80 cma (cGy) 4 MV 80 cma
(cGy) 10 MV 100 cmb
(cGy) 25 MV 100 cma
(cGy)
0 18.0 14.0 12.0 17.0 1 70.5 57.0 30.0 28.0 2 90.0 74.0 46.0 39.5 3 98.0 84.0 55.0 47.0 4 100.0 90.0 63.0 54.5 5 100.0 94.0 72.0 60.5 6 - 96.5 76.0 66.0 8 - 99.5 84.0 73.0
10 - 100.0 91.0 79.0 15 - - 97.0 88.5 20 - - 98.0 95.0 25 - - 100.0 99.0 30 - - - 100.0
aData from Velkley et al., (1975) bData from F. Khan, Moore, & Levitt, (1973)
University of Ghana http://ugspace.ug.edu.gh
15
2.2.3 Effects of Thermoplastic Immobilizers on Surface Dose.
Thermoplastic immobilization devices are mostly used worldwide in head and neck
radiation therapy to substantially improve the precision of treatment delivery. However,
there have been concerns regarding the rise in radiation-induced skin morbidity with the
use of these devices thereby eliminating the skin sparing effect of megavoltage radiation
(Fiorino et al., 1992; Mellenberg, 1995). (Hadley et al., 2004) reported that a rise in
surface dose from 16 to 27% for a 6 MV megavoltage radiation was observed when
thermoplastic masks were used, however, this may increase the skin toxicity and can be
detrimental for the patient’s quality of life. (Mellenberg, 1995) in his studies observed
that, for 6 and 15 MV photon energies, the PDD measured at the surface just behind the
used thermoplastic mask was 35.7% and 24.3% respectively which agrees well with the
PDD measured at 0.6 mm in the beam without the thermoplastic mask (33.8% and
24.5%). In conclusion, he noted that surface dose increases as a gram per square
centimeter relationship for thermoplastic masks. In 2002, research was conducted to
determine the cause of acute skin toxicity in head and neck cancer treatment with
extended-field intensity-modulated radiotherapy by (Lee et al., 2002). They observed that
the estimated surface dose with the thermoplastic mask was constantly larger than those
without the thermoplastic mask. An average rise in dose of approximately 18% was
estimated which was ascribed to the bolus effect of the masks used for IMRT treatment.
Lee et al. later reported that measurements on a phantom presented that the mask had a
“bolus” effect on the surface of the skin and at the same time did not take the skin into
consideration as one of the sensitive structures during treatment planning. They also
added that the use of multiple tangential fields in intensity-modulated radiation therapy
University of Ghana http://ugspace.ug.edu.gh
16
plans contributes to an increase in surface dose by approximately 19% and 27% with and
without the thermoplastic mask, respectively. In conclusion, they suggested the skin
should be taken into consideration as one of the sensitive structures during treatment
planning and to reduce the “bolus” effect of the thermoplastic mask was to stretch hard
on the mask to “thin” it out as shown in figures 2.3 – 2.5. (Higgins et al., 2001) in their
studies measured a rise in skin dose as a result of the carbon fiber tables used and it was
as high as 400%. They reported that the presence of the carbon fiber substantially
reduced the skin-sparing effect by a magnitude which was relatively larger for small
beam sizes. They concluded from their research that, the skin dose was approximately
four times as large when the carbon fiber was added to the 10 x 10 beam and
approximately double for the 40 x 40 beam. Works have been done by Hadley et al.
(2004) to investigate the rise in skin dose triggered by the use of thermoplastic mask and
quantify the change between the mask samples presented. The solid water phantom in
conjunction with the Attix parallel plate chamber was used to determine the change in the
dose build-up by measuring the tissue maximum ratios (TMRs). Using dual energies of 6
and 15 MV, measurements were obtained with and without the thermoplastic mask on top
(surface) of the solid water phantom and the effective thickness of equivalent water was
estimated from the TMR curves. They measured the build-up effect to be equivalent to
0.6 to 2.2 mm for the thermoplastic masks that have been extended at varying hole
diameters. The increase in skin dose was projected to rise from 16% and 12% for 6 MV
and 15 MV respectively to 27% to 61% for 6 MV and 18% to 40% for 15 MV with the
thermoplastic mask samples. Below are sample images of thermoplastic masks with
University of Ghana http://ugspace.ug.edu.gh
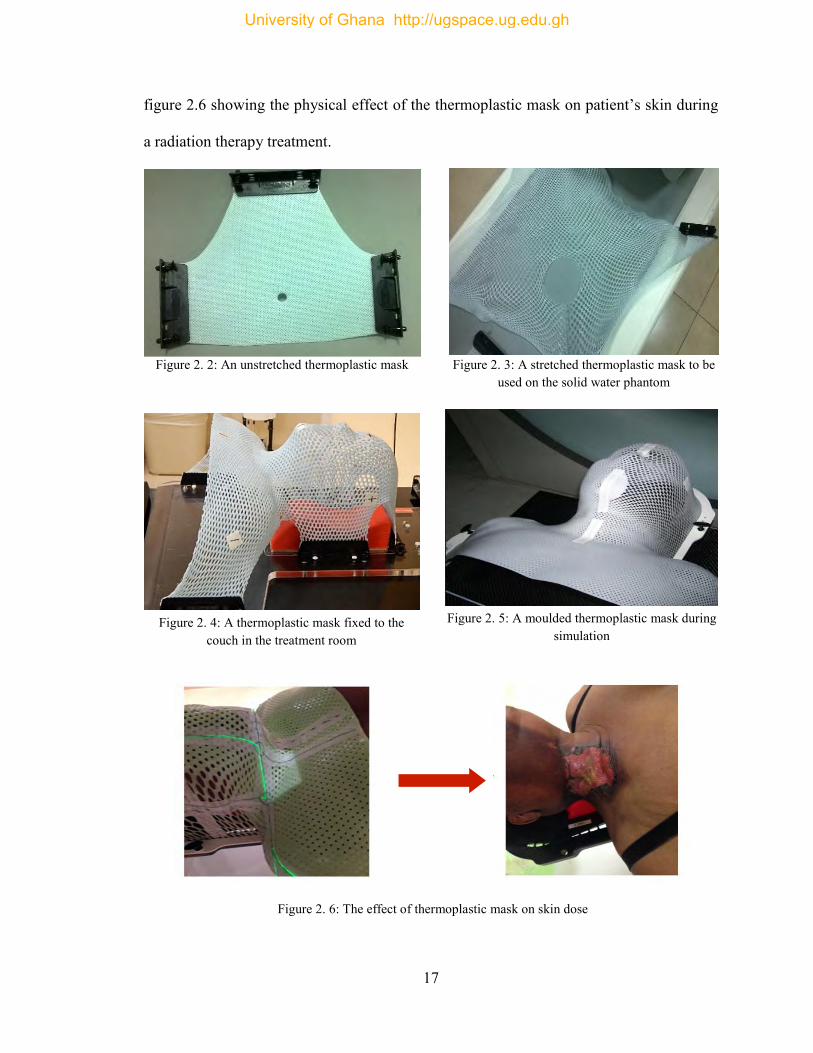
17
figure 2.6 showing the physical effect of the thermoplastic mask on patient’s skin during
a radiation therapy treatment.
Figure 2. 2: An unstretched thermoplastic mask Figure 2. 3: A stretched thermoplastic mask to be used on the solid water phantom
Figure 2. 5: A moulded thermoplastic mask during simulation
Figure 2. 4: A thermoplastic mask fixed to the couch in the treatment room
Figure 2. 6: The effect of thermoplastic mask on skin dose
University of Ghana http://ugspace.ug.edu.gh
18
2.2.4 Effect of Field Size on Skin/Surface Dose
(Yadav et al., 2009) studied surface dose estimations for numerous beam modifiers at
different SSD’s for 6 MV photon beam using an acrylic slab phantom and a Markus
0.055 cc parallel plate ion chamber to measure the skin and build-up region doses. They
undertook measurements for motorized wedges, open fields and acrylic block tray fields
for various field sizes of 3 x 3 cm2 to 30 x 30 cm2. They later concluded from their
research that the skin dose for all the beam modifiers increased with increasing field size.
Considering the block trays, they indicated that electrons were eliminated from the
upstream but generated its own new secondary electrons increasing the number of
electrons generated upstream as compared to the ones removed downstream by the tray,
thereby increasing the surface dose. For the 60o motorized wedge fields, they realized
that, at larger field sizes, the increase in skin dose was higher as compared to that for the
open fields. For the physical wedges, electrons were eliminated from upstream and were
produced by itself; with the number generated being less than the ones eliminated for
smaller field size (Kry et al., 2012; Yadav et al., 2009). Increasing field size generally
comes with increasing surface dose which is as a result of the higher electron emissions
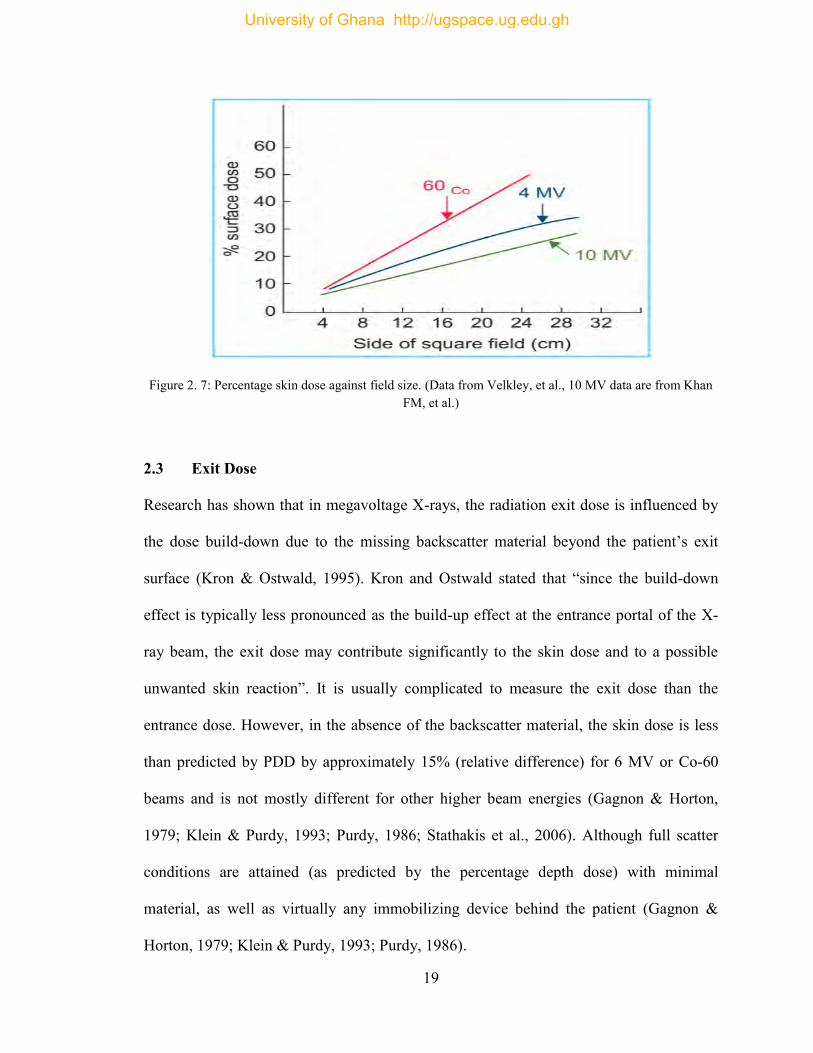
from the collimator and air (F. M. Khan, 2014). Figure 2.7 below is a graph showing
relative skin dose against field size for Co-60, 4 MV, and 10 MV photon beams. These
data indicate that the skin-sparing effect is substantially lowered for the higher field sizes.
University of Ghana http://ugspace.ug.edu.gh
19
Figure 2. 7: Percentage skin dose against field size. (Data from Velkley, et al., 10 MV data are from Khan FM, et al.)
2.3 Exit Dose
Research has shown that in megavoltage X-rays, the radiation exit dose is influenced by
the dose build-down due to the missing backscatter material beyond the patient’s exit
surface (Kron & Ostwald, 1995). Kron and Ostwald stated that “since the build-down
effect is typically less pronounced as the build-up effect at the entrance portal of the X-
ray beam, the exit dose may contribute significantly to the skin dose and to a possible
unwanted skin reaction”. It is usually complicated to measure the exit dose than the
entrance dose. However, in the absence of the backscatter material, the skin dose is less
than predicted by PDD by approximately 15% (relative difference) for 6 MV or Co-60
beams and is not mostly different for other higher beam energies (Gagnon & Horton,
1979; Klein & Purdy, 1993; Purdy, 1986; Stathakis et al., 2006). Although full scatter
conditions are attained (as predicted by the percentage depth dose) with minimal
material, as well as virtually any immobilizing device behind the patient (Gagnon &
Horton, 1979; Klein & Purdy, 1993; Purdy, 1986).
University of Ghana http://ugspace.ug.edu.gh
20
2.4 Radiation Dosimeters for Skin Dose Measurements
A device, tool or a system that is used in measuring or evaluating either indirectly or
directly: absorbed dose, equivalent dose, kerma, exposure or associated quantities of
ionizing radiation is known as a radiation dosimeter. It can provide a measurement that is
a degree of the average absorbed dose deposited in its sensitive volume by the radiation.
It is referred to as a dosimetry system in conjunction with its reader. For a device to work
as a dosimeter, it must have at least one physical characteristic that is dependent on the
measured quantity and that can be used for measuring the radiation with correct
calibration. Nevertheless, to be suitable, the dosimeters must show various required
features. For instance, the dimensions of the dosimeter should be as small as possible
along the incident beam, due to the steep dose gradient in the build-up region. Hence, an
extrapolation chambers is the suitable instruments for such the measurements as indicated
by (Khan, 2014). However, only a few centers have these radiation dosimeters available
and as an alternative, the fixed plane-parallel ion chambers are usually used for this
purpose. In addition to ionization chambers, thin layers (< 0.5 mm) of TLD material
(Rapley, 2006) and radiochromic films such as the GafChromic films are available for
measurements of skin dose. The film is first calibrated within the dose range required
before use (Butson et al., 1999; Khan, 2014). In this study, the choice of the ionization
chamber and GafChromic films were made due to its availability at the facility.
2.4.1 Ionization Chambers
Ionization chambers are types of radiation dosimeters which are employed in both
radiation therapy and diagnostic radiology for the measurement of doses. They come in
University of Ghana http://ugspace.ug.edu.gh
21
numerous sizes and shapes subject to a particular requirement, but usually they possess
these features: It is fundamentally a gas-filled cavity that is enclosed by a conducting
outer layer with a collecting electrode at the center which is separated with a high-quality
insulator in order to decrease the leakage current when a polarizing voltage is applied to
the chamber. Additional chamber leakage is reduced by means of a guard electrode that
cuts off the leakage current and permits it to move to the ground, avoiding the collecting
electrode. Better charge collection due to enhanced field consistency in the
sensitive/active volume of the chamber is another advantage. However, (Podgorsak &
Rosenberg, 2005) stated that temperature and pressure corrections are required during
measurements with open-air ion chambers to help explain the variation in air density in
the chamber volume as a result of a change in ambient temperature and pressure.
Particularly, for skin dose measurements are the fixed plate ionization chambers and the
extrapolation chambers (Andreo et al., 1995; Khan, 2014; Rawlinson et al., 1992). In this
work, a Roos Chamber type 34001, used for dose or dose rate measurement for the
measuring quantity “absorbed dose to water” in solid water phantoms and used for the
determination of relative depth dose curves of megavoltage beams was used in
conjunction with an electrometer. The Roos chamber is said to be waterproof, fully
guarded having a 15 mm width collector and a nominal sensitive volume of 0.35 cm3.
2.4.2 Electrometers
Electrometers are devices used for measuring small currents (approximately ≤ 10-9 A).
When used in combination with an ion chamber, it gives a high gain, negative feedback,
University of Ghana http://ugspace.ug.edu.gh
22
operational amplifier with a standard resistor or a standard capacitor in the feedback path
to determine the ion chamber current or charges collected over a time range.
2.4.3 Radiochromic Film
Several methods and procedures have been developed for the measurement of a patient’s
skin dose using different dosimeters. This research seeks to use a new type of film in
radiotherapy dosimetry known as the radiochromic film. GafChromic films are said to be
the most commonly used films in dosimetry (e.g. HD-810 film, DM-1260, EBT, EBT2,
EBT3, MD-55 and MD-55-2 film with an effective depth of skin dose measurement at
0.17mm ± 0.03mm). They are said to be colourless films with closely tissue equivalent
composition (11.2% nitrogen, 19.2% oxygen, 60.6% carbon, and 9.0% hydrogen) which
changes colour to dark blue upon radiation exposure. The unexposed radiochromic film is
said to be colourless and changes colour to shades of blue due to its composition of a
special dye that polymerizes as a result of its interaction with radiation. After the
absorption of light by the polymer, the light transmission through the radiochromic film
can be measured using an appropriate device known as a densitometer. Radiochromic
film requires no chemical, physical or thermal processing to bring out or stabilize this
colour. Studies have shown that the film’s ability to respond to radiation exposures less
than 50 mGy is not noticeable making the flatbed scanner incapable of picking up the
small changes in film color (Lewis, 2009). Radiochromic films used in dosimetry is said
to have some potentials over radiographic films such as ease of use; eliminates the need
for darkrooms, film cassettes or film processing (chemicals); insensitive to ambient
conditions and improved energy characteristics making it useful at higher doses
University of Ghana http://ugspace.ug.edu.gh
23
(Podgorsak & Rosenberg, 2005). Radiochromic films are relative dosimeters and must be
well calibrated before used for dosimetry, however, with proper calibration and taking
into account the environmental conditions, a precision better than 3% can be archived
(Khan, 2014). The film is also used for field size alignment and shaping of radiation
fields, detecting radiation leakage around the collimator head and positioning of special
radiation fields (Niroomand-Rad et al., 1998). With careful handling and calibration of
the film in accordance with the overall recommendations outlined by the manufacturer’s
specifications as stated in the AAPM TG-55 report by (Niroomand-Rad et al., 1998) it
should be possible to achieve a precision of better than 3% for dosimetric work.
2.4.3.1 Introduction
A GafChromic [International Specialty Products (ISP), Wayne, NJ] EBT3 film which is
specifically developed to address the need of a medical physicist working in the
radiotherapy setting and a type of a radiochromic film was used for this study. The active
range of the film is constructed for greatest operation in the dose range from 0.2 to 10
Gy. This makes it good for various applications in intensity modulated radiotherapy
(IMRT), VMAT and brachytherapy. Like the previous versions, EBT3 is said to be self-
developing, requiring neither developer nor fixer. Some of the main technical features of
the GafChromic EBT3 film include:
It is a near tissue equivalent material which requires no post-exposure treatments since it
develops in real time. It has a dynamic dose range of 0.1 to 20 Gy with 0.2 to 10 Gy
being its optimum dose range although it has a slight response variation from 100 keV
into the MV range. The film has a high spatial resolution, hence, can resolve features
University of Ghana http://ugspace.ug.edu.gh
24
down to 25 µm or less. It is water-resistant and usable with water phantoms with a new
technology of incorporating a marker dye in its active layer to decrease UV/visible light
sensitivity and also enable using multi-channel dosimetry for non-uniformity correction.
The film is said to be stable at temperatures up to 600C.
2.4.3.2 Configuration and Structure of GafChromic EBT3
The structure of the GafChromic EBT3 film is shown in figure 2.8 below. The EBT3 film
is made up of an active layer, nominally 28 μm thick, sandwiched between two 125 μm
matte-polyester substrates. This active layer comprises a marker dye, the active
component, stabilizers and other components giving the film its close energy independent
response. The thickness of the active layer will differ to some extent between different
production lots.
Figure 2. 8: Structure of GafChromic EBT3 Dosimetry Film (Actual thickness may vary slightly).
(Sipilä et al., 2016) in their studies indicated that “the surface of the radiochromic film is
covered with tiny silicone spheres eliminating Newton’s rings artifact in the image”.
Further explanation of the film feature is described by (David Lewis et al., 2012) in their
research.
University of Ghana http://ugspace.ug.edu.gh
25
2.4.3.3 Medical Applications
Radiochromic films are said to be comparatively unresponsive to ionizing radiation
compared to frequently used detectors in medical applications making it ideal for
dosimetry where high radiation doses are applied (Niroomand-Rad et al., 1998). The
application of radiochromic film in the medical fields is vastly extending from high-dose
gamma ray exposures in brachytherapy to low-dose clinical valuation in-vivo such as
conventional radiation therapy of breast cancer patients. Below are three medical
applications of a GafChromic (radiochromic) films (Martin J. B. et al., 1999; Stevens et
al., 1996).
i. Proton Dosimetry
(Nichiporov et al., 1995; Vatnitsky, 1997 and Vatnitsky et al., 1997) indicated that one of
the useful detectors in clinical proton beams for dosimetry measurements is the
radiochromic films. It possesses a fundamental composition equivalent to that of water,
which decreases its sensitivity to photon energy for an application dealing with the
determination of dose delivered to water as is given in TG-55 (Niroomand-Rad et al.,
1998).
ii. Skin and Surface Dosimetry
Due to the low energy reliance of the film, relatively small effective thickness and the
ability to produce a two-dimensional dose map which other skin dosimeters in
radiotherapy is currently lacking, the radiochromic film is a detector for choice. These
applications include in-vivo dosimetry as well as phantom studies for dose calculation at
University of Ghana http://ugspace.ug.edu.gh
26
the skin surface, dermal and basal cell layers as well as the subcutaneous layers as
indicated by (Niroomand-Rad et al., 1998).
iii. Brachytherapy
In brachytherapy, one of the advantages is the sharp or steep dose fall-off outside the
tumor or target volume. From the inverse square law, radiation dose at a point close to the
radiation source can be very high, which becomes a problem with the use of conventional
detectors. The low sensitivity and high resolution of the radiochromic film give it an
advantage over the other detectors which makes it useful for dosimetry near these high
activity sources (Niroomand-Rad et al., 1998).
2.4.3.4 Advantages of GafChromic Films
Below are some of the advantages of using GafChromic films for dosimetry.
The GafChromic film gives permanent absolute values of absorbed dose with a
satisfactory accuracy and precision. It provides a larger area for dosimetry; including
beam profiles. It has a higher spatial resolution and easy to handle and analyze. Non-
uniformity correction is possible when using multi-channel dosimetry. The film is water-
resistant and usable with water phantoms. It needs no darkrooms, film processing
(chemicals) or cassettes due to its real-time developments without post-exposure
treatment. The film is said to be insensitive to visible light.
University of Ghana http://ugspace.ug.edu.gh
27
CHAPTER THREE
MATERIALS AND METHODS
The methodologies adopted to assess the effects of thermoplastic immobilization mask on
patient’s skin and the build-up region doses in the head and neck region for high energy
photon beams using a Roos Chamber type 34001 coupled with PTW Freiburg UNIDOS
Electrometer and EBT3 GafChromic films for different field sizes are presented in this
chapter. Known procedures for the calibration of GafChromic EBT3 films for assessing
skin dose with solid water phantom together with the dose measurements are outlined in
this chapter.
3.1 Materials
The materials used in this study include; a medical linear accelerator unit (figure 3.1),
anthropomorphic phantom, plastic water (PMMA) phantom, PTW Freiburg UNIDOS
electrometer, Roos chamber type 34001, thermoplastic masks, EBT3 GafChromic film,
EPSON STYLUS CX5900 flatbed scanner, water bath, diode, diode reader, digital
thermometer, and barometer. Some specific materials are presented with details below.
3.1.1 Medical Linear Accelerator
This is a device most commonly used for the treatment of cancer with external beam
radiation. The linear accelerator can be used to treat all body parts or organs of a patient
undergoing radiation therapy treatment. The device uses high radio-frequency (RF)
electromagnetic waves to accelerate charged particles (electrons) to interact with a heavy
metal target and because of these collisions, high energy X-rays (photons) are emitted
University of Ghana http://ugspace.ug.edu.gh
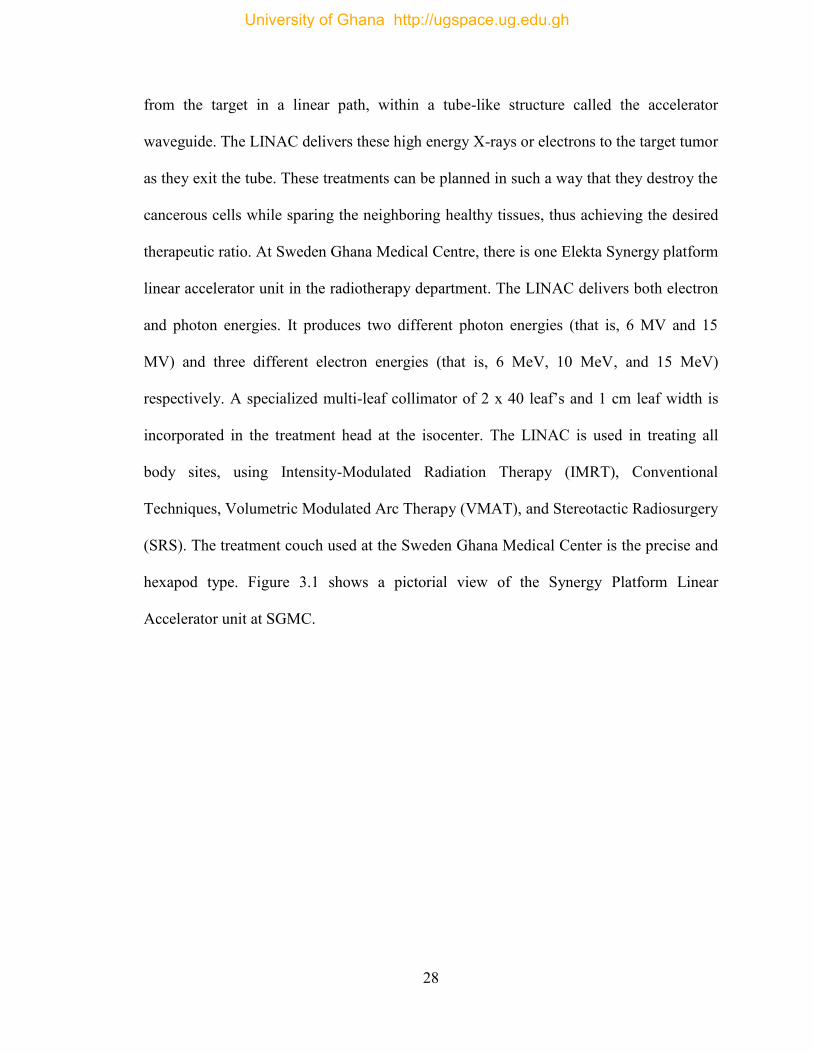
28
from the target in a linear path, within a tube-like structure called the accelerator
waveguide. The LINAC delivers these high energy X-rays or electrons to the target tumor
as they exit the tube. These treatments can be planned in such a way that they destroy the
cancerous cells while sparing the neighboring healthy tissues, thus achieving the desired
therapeutic ratio. At Sweden Ghana Medical Centre, there is one Elekta Synergy platform
linear accelerator unit in the radiotherapy department. The LINAC delivers both electron
and photon energies. It produces two different photon energies (that is, 6 MV and 15
MV) and three different electron energies (that is, 6 MeV, 10 MeV, and 15 MeV)
respectively. A specialized multi-leaf collimator of 2 x 40 leaf’s and 1 cm leaf width is
incorporated in the treatment head at the isocenter. The LINAC is used in treating all
body sites, using Intensity-Modulated Radiation Therapy (IMRT), Conventional
Techniques, Volumetric Modulated Arc Therapy (VMAT), and Stereotactic Radiosurgery
(SRS). The treatment couch used at the Sweden Ghana Medical Center is the precise and
hexapod type. Figure 3.1 shows a pictorial view of the Synergy Platform Linear
Accelerator unit at SGMC.
University of Ghana http://ugspace.ug.edu.gh
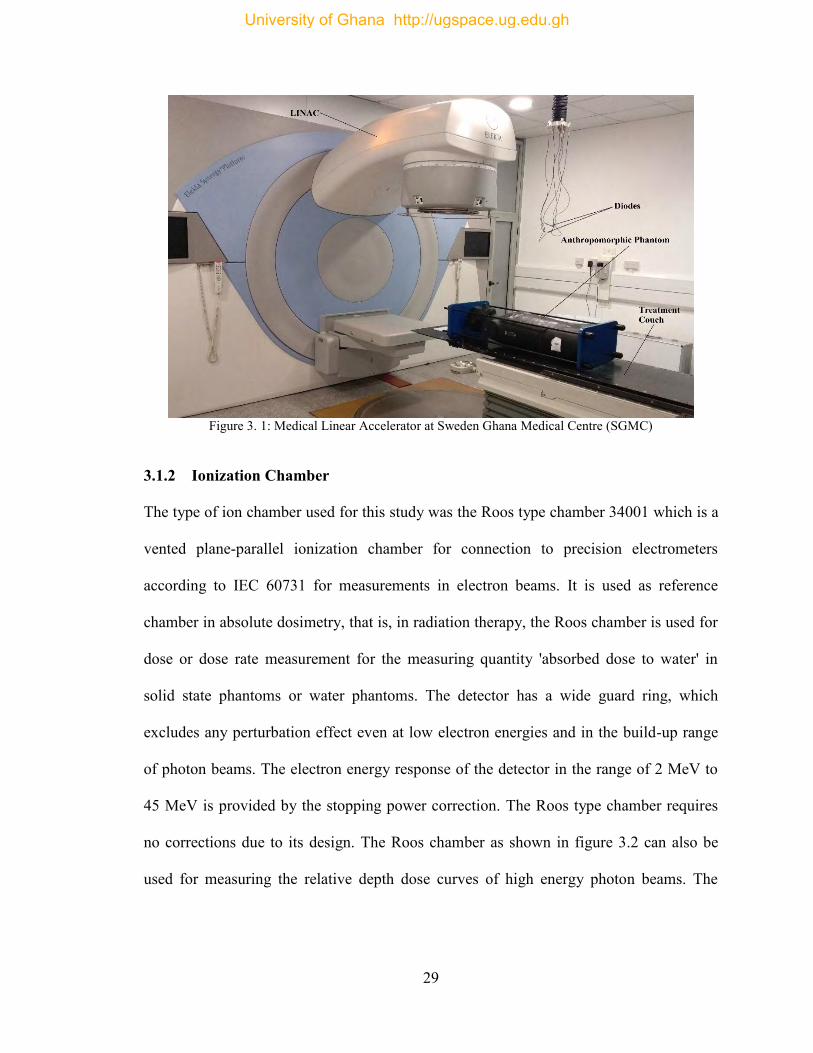
29
Figure 3. 1: Medical Linear Accelerator at Sweden Ghana Medical Centre (SGMC)
3.1.2 Ionization Chamber
The type of ion chamber used for this study was the Roos type chamber 34001 which is a
vented plane-parallel ionization chamber for connection to precision electrometers
according to IEC 60731 for measurements in electron beams. It is used as reference
chamber in absolute dosimetry, that is, in radiation therapy, the Roos chamber is used for
dose or dose rate measurement for the measuring quantity 'absorbed dose to water' in
solid state phantoms or water phantoms. The detector has a wide guard ring, which
excludes any perturbation effect even at low electron energies and in the build-up range
of photon beams. The electron energy response of the detector in the range of 2 MeV to
45 MeV is provided by the stopping power correction. The Roos type chamber requires
no corrections due to its design. The Roos chamber as shown in figure 3.2 can also be
used for measuring the relative depth dose curves of high energy photon beams. The
University of Ghana http://ugspace.ug.edu.gh
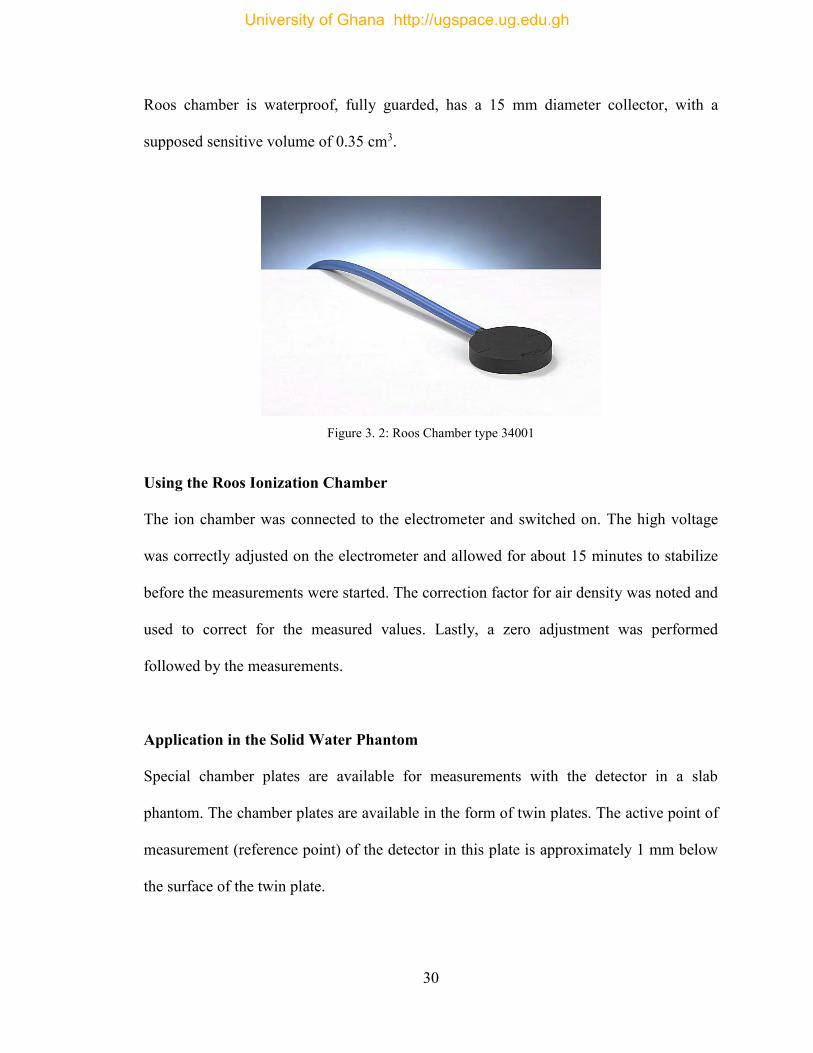
30
Roos chamber is waterproof, fully guarded, has a 15 mm diameter collector, with a
supposed sensitive volume of 0.35 cm3.
Figure 3. 2: Roos Chamber type 34001
Using the Roos Ionization Chamber
The ion chamber was connected to the electrometer and switched on. The high voltage
was correctly adjusted on the electrometer and allowed for about 15 minutes to stabilize
before the measurements were started. The correction factor for air density was noted and
used to correct for the measured values. Lastly, a zero adjustment was performed
followed by the measurements.
Application in the Solid Water Phantom
Special chamber plates are available for measurements with the detector in a slab
phantom. The chamber plates are available in the form of twin plates. The active point of
measurement (reference point) of the detector in this plate is approximately 1 mm below
the surface of the twin plate.
University of Ghana http://ugspace.ug.edu.gh
31
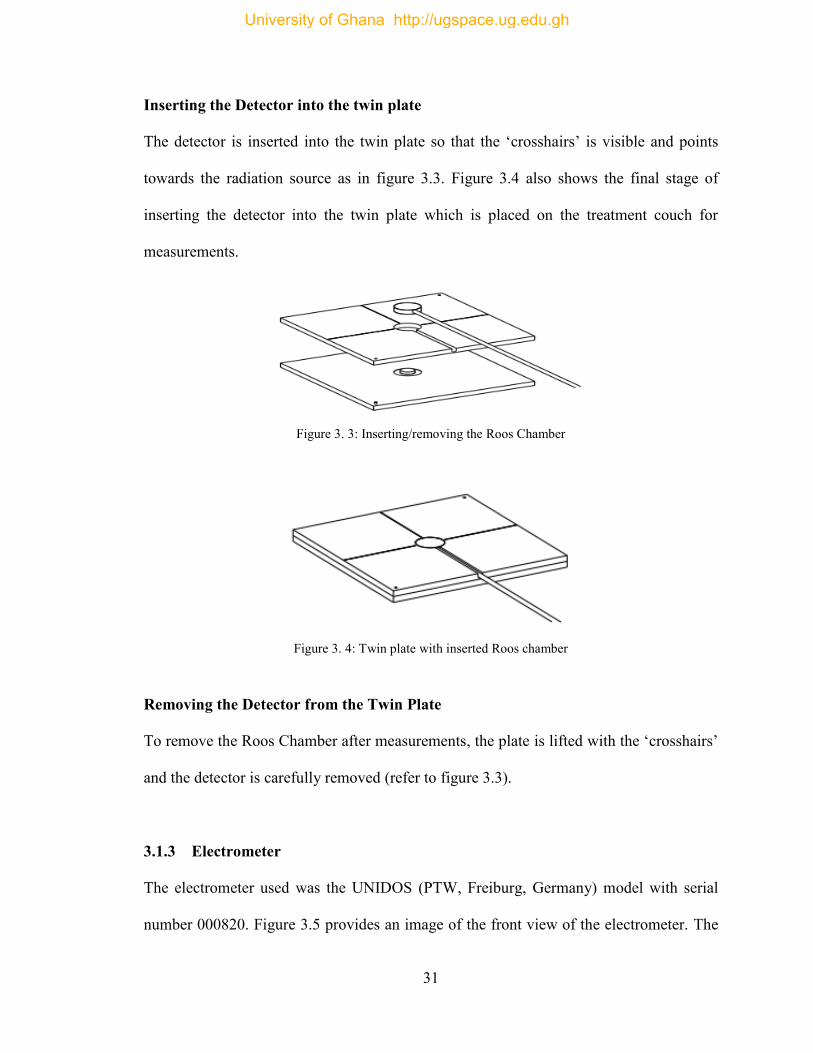
Inserting the Detector into the twin plate
The detector is inserted into the twin plate so that the ‘crosshairs’ is visible and points
towards the radiation source as in figure 3.3. Figure 3.4 also shows the final stage of
inserting the detector into the twin plate which is placed on the treatment couch for
measurements.
Figure 3. 3: Inserting/removing the Roos Chamber
Figure 3. 4: Twin plate with inserted Roos chamber
Removing the Detector from the Twin Plate
To remove the Roos Chamber after measurements, the plate is lifted with the ‘crosshairs’
and the detector is carefully removed (refer to figure 3.3).
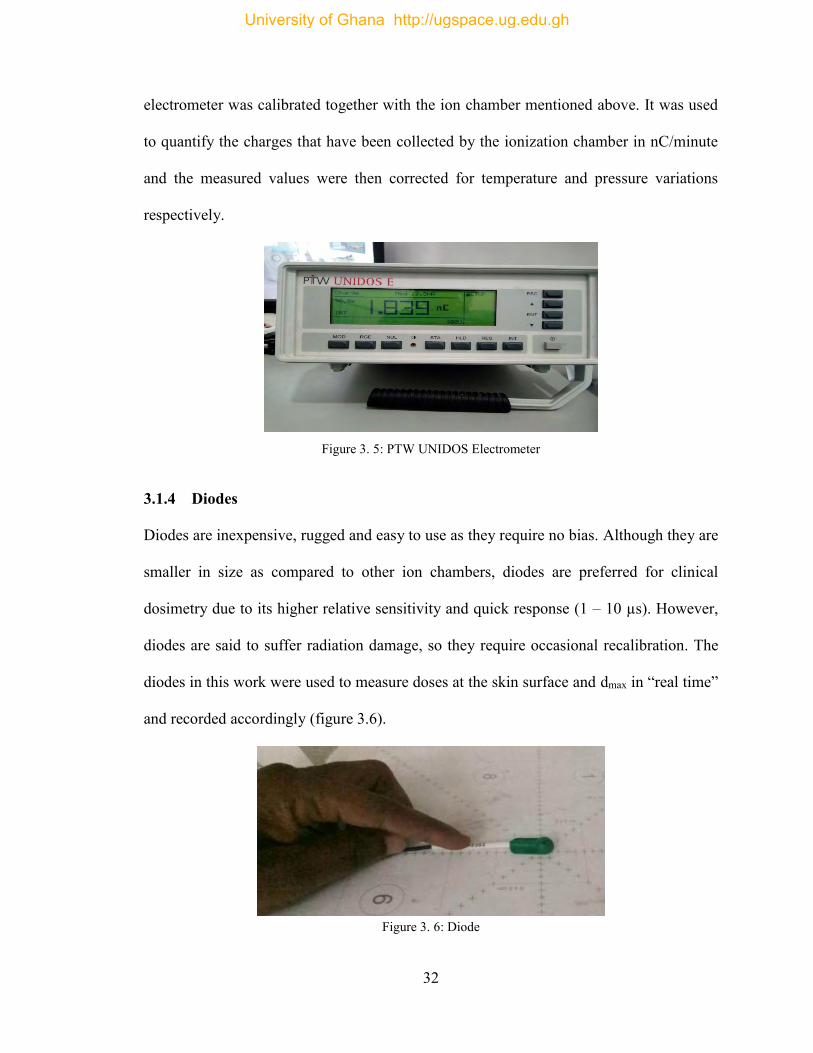
3.1.3 Electrometer
The electrometer used was the UNIDOS (PTW, Freiburg, Germany) model with serial
number 000820. Figure 3.5 provides an image of the front view of the electrometer. The
University of Ghana http://ugspace.ug.edu.gh
32
electrometer was calibrated together with the ion chamber mentioned above. It was used
to quantify the charges that have been collected by the ionization chamber in nC/minute
and the measured values were then corrected for temperature and pressure variations
respectively.
Figure 3. 5: PTW UNIDOS Electrometer
3.1.4 Diodes
Diodes are inexpensive, rugged and easy to use as they require no bias. Although they are
smaller in size as compared to other ion chambers, diodes are preferred for clinical
dosimetry due to its higher relative sensitivity and quick response (1 – 10 µs). However,
diodes are said to suffer radiation damage, so they require occasional recalibration. The
diodes in this work were used to measure doses at the skin surface and dmax in “real time”
and recorded accordingly (figure 3.6).
Figure 3. 6: Diode
University of Ghana http://ugspace.ug.edu.gh
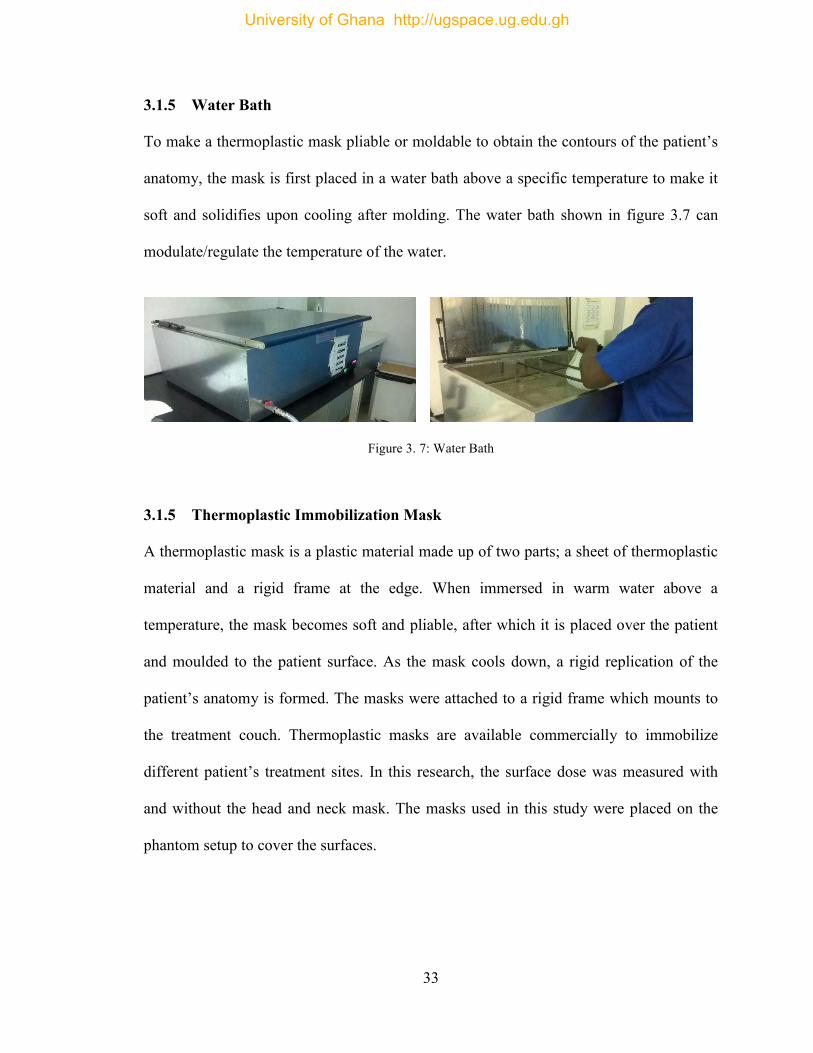
33
3.1.5 Water Bath
To make a thermoplastic mask pliable or moldable to obtain the contours of the patient’s
anatomy, the mask is first placed in a water bath above a specific temperature to make it
soft and solidifies upon cooling after molding. The water bath shown in figure 3.7 can
modulate/regulate the temperature of the water.
Figure 3. 7: Water Bath
3.1.5 Thermoplastic Immobilization Mask
A thermoplastic mask is a plastic material made up of two parts; a sheet of thermoplastic
material and a rigid frame at the edge. When immersed in warm water above a
temperature, the mask becomes soft and pliable, after which it is placed over the patient
and moulded to the patient surface. As the mask cools down, a rigid replication of the
patient’s anatomy is formed. The masks were attached to a rigid frame which mounts to
the treatment couch. Thermoplastic masks are available commercially to immobilize
different patient’s treatment sites. In this research, the surface dose was measured with
and without the head and neck mask. The masks used in this study were placed on the
phantom setup to cover the surfaces.
University of Ghana http://ugspace.ug.edu.gh
34
3.1.6 GafChromic Films
The radiochromic film used here was a GafChromic EBT3 film (lot # 04201601), with
known dimensions of 8” x 10”. In view of the procedures stated in the AAPM TG-55
report by (Niroomand-Rad et al., 1998), the film was handled and used in accordance
with the overall recommendations outlined by the manufacturer’s specifications in order
to preserve its integrity. (Podgorsak & Rosenberg, 2005) described GafChromic film as a
colourless film with nearly tissue equivalent composition that develops a dark blue colour
upon its exposure to radiation and it is intended for the determination of absorbed doses
of ionizing radiation with a dynamic range intended for greatest operation in the dose
range from 0.2 Gy to 10 Gy, making it appropriate for different applications in IMRT,
VMAT, and Brachytherapy. It has the ability of self-developing right after exposure and
requires neither a developer nor a fixer. During the estimation of doses considerably
larger than 10 Gy, EBTXD or MDV3 are chosen while the measurement of still higher
dose uses the HDV2.
3.1.7 ImageJ Software
The ImageJ software is a freely available Java-based image processing and analysis
software developed/established at the National Institutes of Health (NIH). This software
was built with an open architecture that offers extensibility via Java plugins and
recordable macros (Girish, V., Vijayalakshmi, 2004) by using objective physical
characteristics of the imaging system such as spatial resolution, contrast, and noise. The
user-written plugins make it possible to solve almost any image processing and analysis
University of Ghana http://ugspace.ug.edu.gh
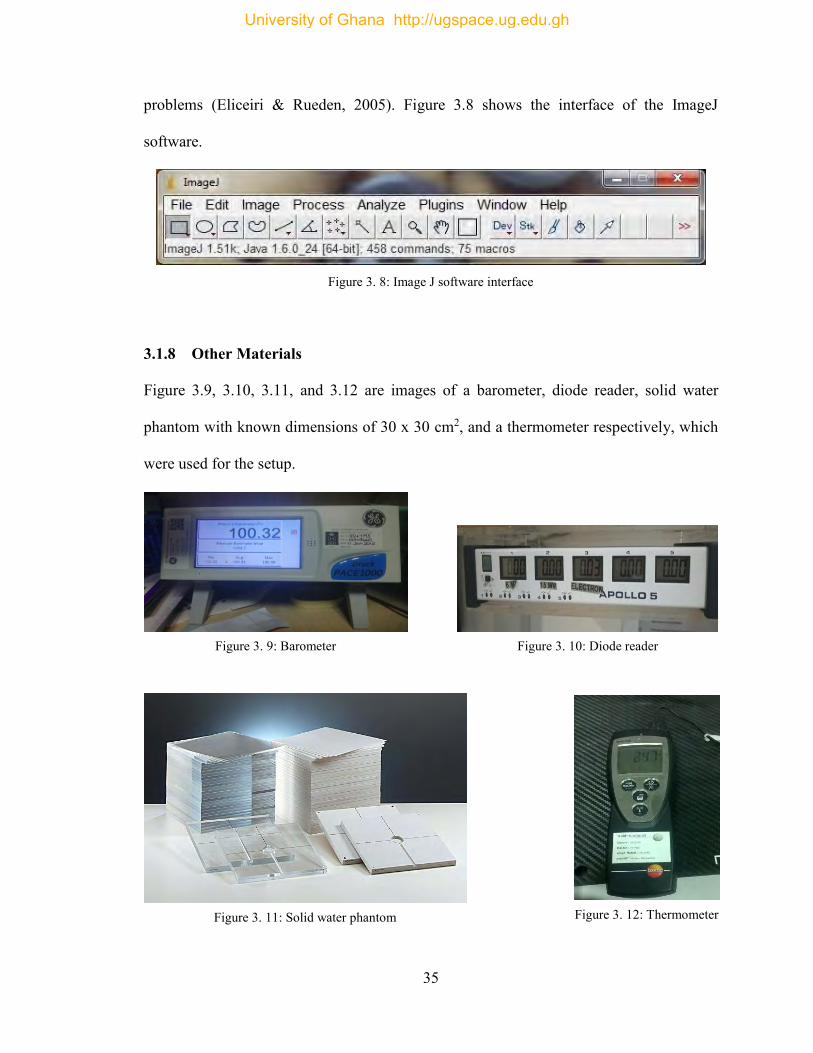
35
problems (Eliceiri & Rueden, 2005). Figure 3.8 shows the interface of the ImageJ
software.
Figure 3. 8: Image J software interface
3.1.8 Other Materials
Figure 3.9, 3.10, 3.11, and 3.12 are images of a barometer, diode reader, solid water
phantom with known dimensions of 30 x 30 cm2, and a thermometer respectively, which
were used for the setup.
Figure 3. 9: Barometer Figure 3. 10: Diode reader
Figure 3. 11: Solid water phantom Figure 3. 12: Thermometer
University of Ghana http://ugspace.ug.edu.gh
36
3.2 Experimental Method
In radiotherapy, before any measurement is clinically done, it is required that thorough
quality control tests are performed. These tests were performed on all equipment before
any measurement was taken, and all the equipment were allowed to acclimatize to the
room’s conditions. The chamber was pre-irradiated for about 5 minutes to remove all
traces of stray charges and checked for stability. The solid water phantom was setup on
the LINAC’s couch, perpendicular to the beams central axis using the isocentric
technique. The Roos chamber was positioned, coupled with the UNIDOS electrometer at
the required depth within the phantom and used to collect and measure the charges
respectively. The initial temperature and pressure were recorded using the thermometer
and the barometer respectively.
3.2.1 Part 1:
3.2.1.1 Measurement Without Thermoplastic Mask
Using a varying field size of 5 x 5, 10 x 10, 15 x 15, and 20 x 20 cm2 without a
thermoplastic mask as illustrated in figure 3.13, the ionization chamber was irradiated
with 100 MU (1 Gy) for the open beam. The charges collected by the ion chamber was
measured and recorded using the electrometer. Three successive measurements were
taken for each field size and their average values estimated and recorded. The final
temperature and pressure were recorded using the thermometer and the barometer
respectively. The experiment was repeated for other depths of 0, 1.6 (dmax), 4, 6, 8, and 10
cm for the open beam. Temperature and pressure correction was performed for all charge
measurements.
University of Ghana http://ugspace.ug.edu.gh
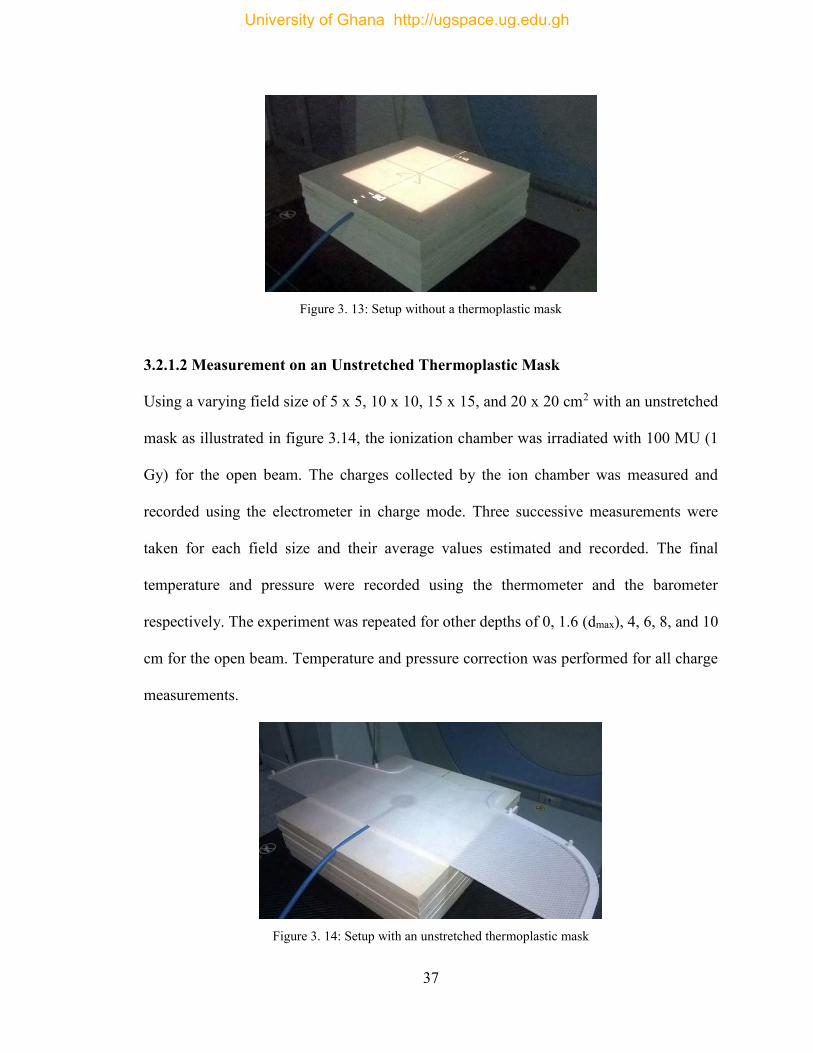
37
Figure 3. 13: Setup without a thermoplastic mask
3.2.1.2 Measurement on an Unstretched Thermoplastic Mask
Using a varying field size of 5 x 5, 10 x 10, 15 x 15, and 20 x 20 cm2 with an unstretched
mask as illustrated in figure 3.14, the ionization chamber was irradiated with 100 MU (1
Gy) for the open beam. The charges collected by the ion chamber was measured and
recorded using the electrometer in charge mode. Three successive measurements were
taken for each field size and their average values estimated and recorded. The final
temperature and pressure were recorded using the thermometer and the barometer
respectively. The experiment was repeated for other depths of 0, 1.6 (dmax), 4, 6, 8, and 10
cm for the open beam. Temperature and pressure correction was performed for all charge
measurements.
Figure 3. 14: Setup with an unstretched thermoplastic mask
University of Ghana http://ugspace.ug.edu.gh
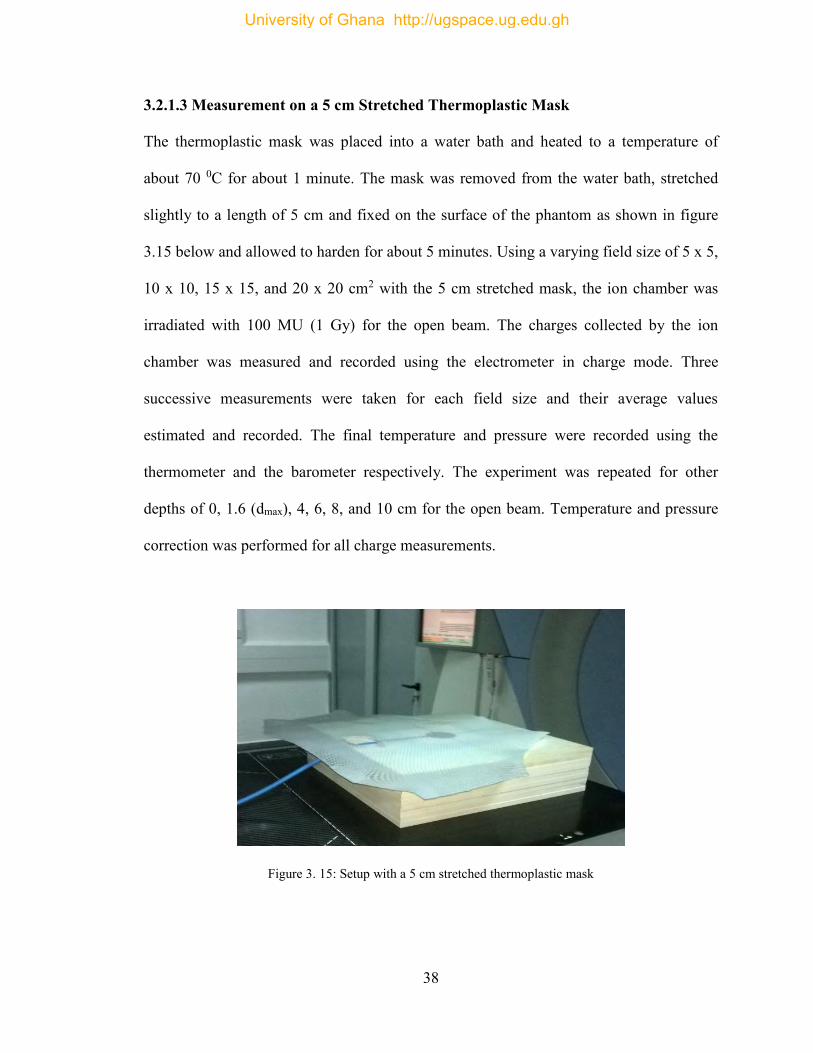
38
3.2.1.3 Measurement on a 5 cm Stretched Thermoplastic Mask
The thermoplastic mask was placed into a water bath and heated to a temperature of
about 70 0C for about 1 minute. The mask was removed from the water bath, stretched
slightly to a length of 5 cm and fixed on the surface of the phantom as shown in figure
3.15 below and allowed to harden for about 5 minutes. Using a varying field size of 5 x 5,
10 x 10, 15 x 15, and 20 x 20 cm2 with the 5 cm stretched mask, the ion chamber was
irradiated with 100 MU (1 Gy) for the open beam. The charges collected by the ion
chamber was measured and recorded using the electrometer in charge mode. Three
successive measurements were taken for each field size and their average values
estimated and recorded. The final temperature and pressure were recorded using the
thermometer and the barometer respectively. The experiment was repeated for other
depths of 0, 1.6 (dmax), 4, 6, 8, and 10 cm for the open beam. Temperature and pressure
correction was performed for all charge measurements.
Figure 3. 15: Setup with a 5 cm stretched thermoplastic mask
University of Ghana http://ugspace.ug.edu.gh
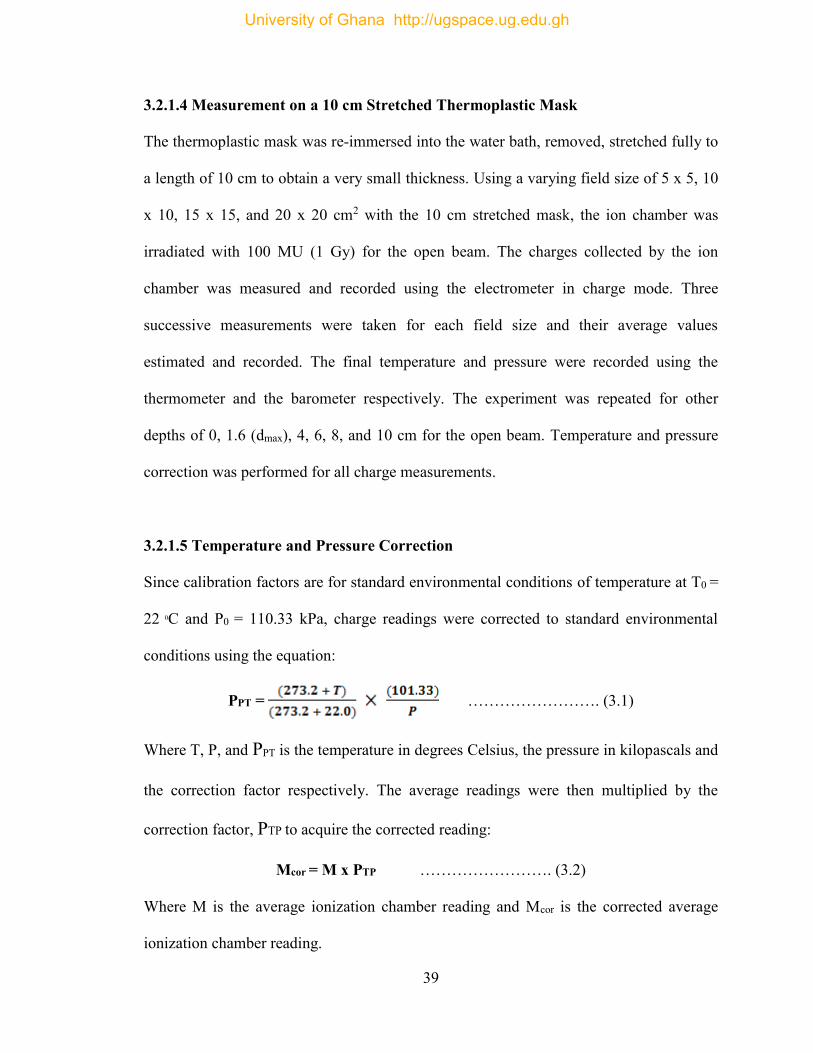
39
3.2.1.4 Measurement on a 10 cm Stretched Thermoplastic Mask
The thermoplastic mask was re-immersed into the water bath, removed, stretched fully to
a length of 10 cm to obtain a very small thickness. Using a varying field size of 5 x 5, 10
x 10, 15 x 15, and 20 x 20 cm2 with the 10 cm stretched mask, the ion chamber was
irradiated with 100 MU (1 Gy) for the open beam. The charges collected by the ion
chamber was measured and recorded using the electrometer in charge mode. Three
successive measurements were taken for each field size and their average values
estimated and recorded. The final temperature and pressure were recorded using the
thermometer and the barometer respectively. The experiment was repeated for other
depths of 0, 1.6 (dmax), 4, 6, 8, and 10 cm for the open beam. Temperature and pressure
correction was performed for all charge measurements.
3.2.1.5 Temperature and Pressure Correction
Since calibration factors are for standard environmental conditions of temperature at T0 =
22 0C and P0 = 110.33 kPa, charge readings were corrected to standard environmental
conditions using the equation:
PPT = ……………………. (3.1)
Where T, P, and PPT is the temperature in degrees Celsius, the pressure in kilopascals and
the correction factor respectively. The average readings were then multiplied by the
correction factor, PTP to acquire the corrected reading:
Mcor = M x PTP ……………………. (3.2)
Where M is the average ionization chamber reading and Mcor is the corrected average
ionization chamber reading.
University of Ghana http://ugspace.ug.edu.gh
40
3.2.1.6 Measurement of The Thermoplastic Mask Factor, TF.
To know and correct for the effects the thermoplastic mask has on the skin dose, the
thermoplastic factor variation with depth and field size were determined. Just like the tray
factor, the thermoplastic mask factor is expressed as a ratio of the corrected ion chamber
readings with mask I1 to that without mask I0. That is,
TF = I1/I0 ………………… (3.3)
3.2.2 Part 2:
3.2.2.1 GafChromic Film Calibration
A solid water phantom (PTW, Freiburg, Germany) of dimensions 30 x 30 cm2 was used
for the calibration with 10 cm of the build-up material above and below the GafChromic
film. The field size of 10 x 10 cm2 was used at the isocenter and SSD was set at 100 cm.
The GafChromic film samples were cut (2 x 3 cm2) and irradiated perpendicularly to the
beams central axis for the 6 MV photon beam. A calibrated ion chamber was introduced
in the water phantom below the film level to determine the LINAC’s output during the
irradiation process and measured the absorbed dose deposited to the film by employing
the IAEA-TRS 398 protocol (Musolino, 2000). To acquire a calibration curve, the films
were irradiated with the LINAC (using 6 MV) of uniform radiation at dose levels of 0,
0.20 Gy, 0.40 Gy, 0.80 Gy, 1.60 Gy, 2.40 Gy, 3.20 Gy, 4.00 Gy, and 5.00 Gy. The cut
films were labeled with respect to the above radiation doses.
University of Ghana http://ugspace.ug.edu.gh
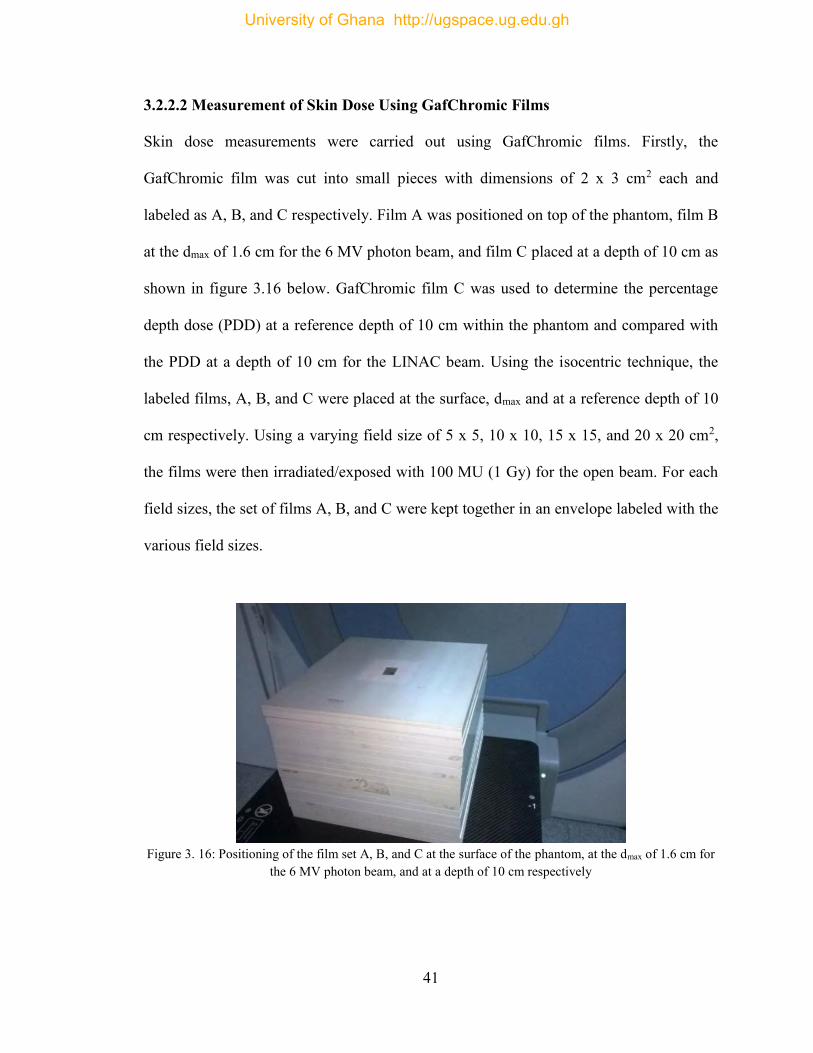
41
3.2.2.2 Measurement of Skin Dose Using GafChromic Films
Skin dose measurements were carried out using GafChromic films. Firstly, the
GafChromic film was cut into small pieces with dimensions of 2 x 3 cm2 each and
labeled as A, B, and C respectively. Film A was positioned on top of the phantom, film B
at the dmax of 1.6 cm for the 6 MV photon beam, and film C placed at a depth of 10 cm as
shown in figure 3.16 below. GafChromic film C was used to determine the percentage
depth dose (PDD) at a reference depth of 10 cm within the phantom and compared with
the PDD at a depth of 10 cm for the LINAC beam. Using the isocentric technique, the
labeled films, A, B, and C were placed at the surface, dmax and at a reference depth of 10
cm respectively. Using a varying field size of 5 x 5, 10 x 10, 15 x 15, and 20 x 20 cm2,
the films were then irradiated/exposed with 100 MU (1 Gy) for the open beam. For each
field sizes, the set of films A, B, and C were kept together in an envelope labeled with the
various field sizes.
Figure 3. 16: Positioning of the film set A, B, and C at the surface of the phantom, at the dmax of 1.6 cm for
the 6 MV photon beam, and at a depth of 10 cm respectively
University of Ghana http://ugspace.ug.edu.gh
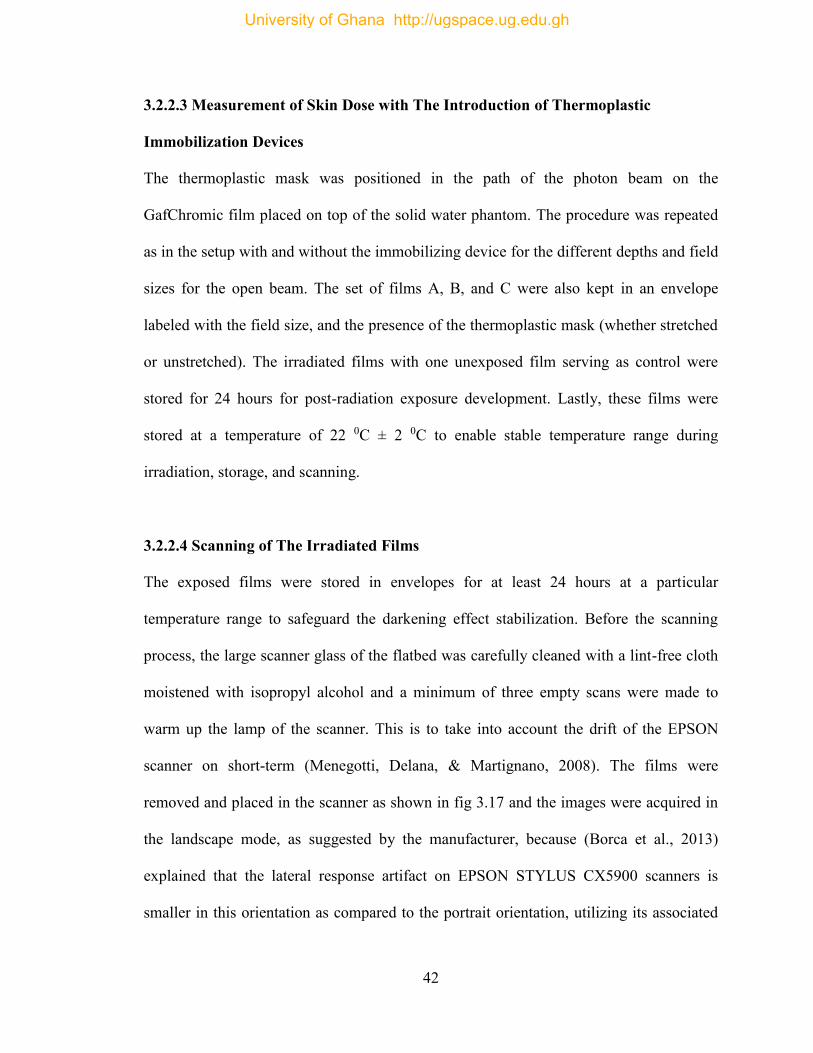
42
3.2.2.3 Measurement of Skin Dose with The Introduction of Thermoplastic
Immobilization Devices
The thermoplastic mask was positioned in the path of the photon beam on the
GafChromic film placed on top of the solid water phantom. The procedure was repeated
as in the setup with and without the immobilizing device for the different depths and field
sizes for the open beam. The set of films A, B, and C were also kept in an envelope
labeled with the field size, and the presence of the thermoplastic mask (whether stretched
or unstretched). The irradiated films with one unexposed film serving as control were
stored for 24 hours for post-radiation exposure development. Lastly, these films were
stored at a temperature of 22 0C ± 2 0C to enable stable temperature range during
irradiation, storage, and scanning.
3.2.2.4 Scanning of The Irradiated Films
The exposed films were stored in envelopes for at least 24 hours at a particular
temperature range to safeguard the darkening effect stabilization. Before the scanning
process, the large scanner glass of the flatbed was carefully cleaned with a lint-free cloth
moistened with isopropyl alcohol and a minimum of three empty scans were made to
warm up the lamp of the scanner. This is to take into account the drift of the EPSON
scanner on short-term (Menegotti, Delana, & Martignano, 2008). The films were
removed and placed in the scanner as shown in fig 3.17 and the images were acquired in
the landscape mode, as suggested by the manufacturer, because (Borca et al., 2013)
explained that the lateral response artifact on EPSON STYLUS CX5900 scanners is
smaller in this orientation as compared to the portrait orientation, utilizing its associated
University of Ghana http://ugspace.ug.edu.gh
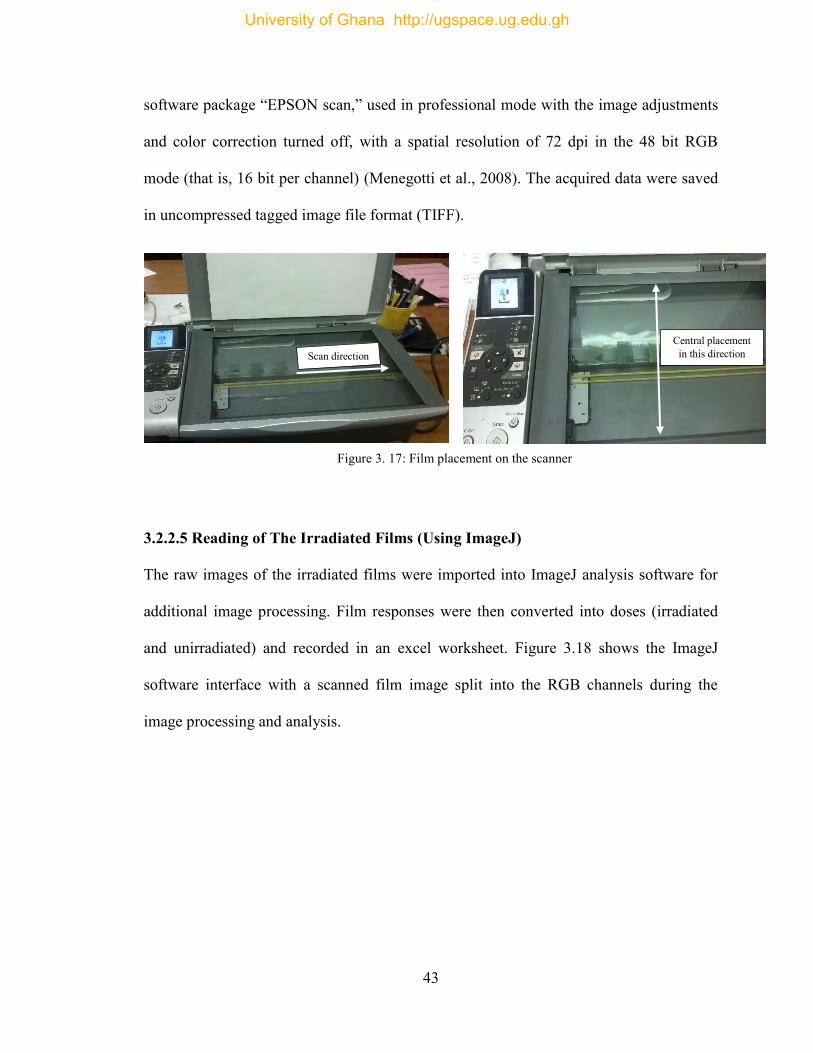
43
software package “EPSON scan,” used in professional mode with the image adjustments
and color correction turned off, with a spatial resolution of 72 dpi in the 48 bit RGB
mode (that is, 16 bit per channel) (Menegotti et al., 2008). The acquired data were saved
in uncompressed tagged image file format (TIFF).
3.2.2.5 Reading of The Irradiated Films (Using ImageJ)
The raw images of the irradiated films were imported into ImageJ analysis software for
additional image processing. Film responses were then converted into doses (irradiated
and unirradiated) and recorded in an excel worksheet. Figure 3.18 shows the ImageJ
software interface with a scanned film image split into the RGB channels during the
image processing and analysis.
Scan direction Central placement
in this direction
Figure 3. 17: Film placement on the scanner
University of Ghana http://ugspace.ug.edu.gh
44
Figure 3. 18: ImageJ software interface with a scanned film image split into the RGB channels
The net optical densities of the data obtained from the mean RGB values were calculated
using the following equation:
3.2.3 Part 3:
3.2.3.4 Dose Verification Using the Anthropomorphic Phantom
Here the anthropomorphic phantom and the diode were used for the dose verification of
the treatment plan. The phantom was first scanned using the Siemens SOMATOM
Emotion 16 CT-scanner at the head and neck region in the head first supine (HFS)
position. The acquired CT images were then imported into the TPS and a plan for the
University of Ghana http://ugspace.ug.edu.gh
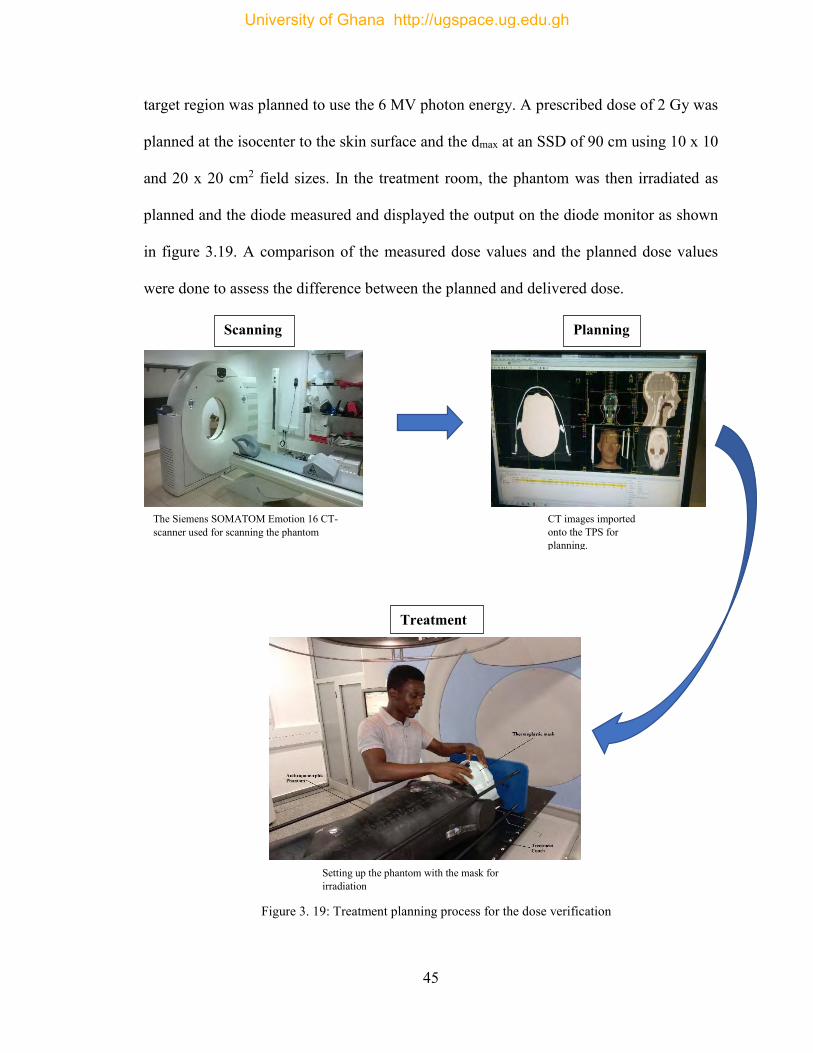
45
target region was planned to use the 6 MV photon energy. A prescribed dose of 2 Gy was
planned at the isocenter to the skin surface and the dmax at an SSD of 90 cm using 10 x 10
and 20 x 20 cm2 field sizes. In the treatment room, the phantom was then irradiated as
planned and the diode measured and displayed the output on the diode monitor as shown
in figure 3.19. A comparison of the measured dose values and the planned dose values
were done to assess the difference between the planned and delivered dose.
The Siemens SOMATOM Emotion 16 CT- scanner used for scanning the phantom
Setting up the phantom with the mask for irradiation
CT images imported onto the TPS for planning.
Scanning Planning
Treatment
Figure 3. 19: Treatment planning process for the dose verification
University of Ghana http://ugspace.ug.edu.gh
46
CHAPTER FOUR
RESULTS AND DISCUSSION
4.1 Introduction
The use of the thermoplastics masks for immobilization during treatment of patients can
be analyzed on the basis of percentage depth dose (PDD) effect, and surface dose effect
on the patient. These skin dose measurements were made using the Roos type ionization
chamber coupled with the UNIDOS electrometer and GafChromic EBT3 films to
compare them with the values obtained from the ionization chamber. This chapter moves
on to the presentation of the findings produced by the original quantitative analysis
conducted as a part of this research. The raw data from all the measurements are
presented in the appendices.
4.2 Dose Determination from Ion chamber
The absorbed dose at varying depths (that is, 0, 1.6, 4, 6, 8, and 10 cm) and field sizes
(that is, 5 x 5, 10 x 10, 15 x 15, and 20 x 20 cm2) of the solid water phantom was
determined and tabulated. Tables 4.1 – 4.4 present the measured absorbed dose values
using the Roos type ionization chamber coupled with the UNIDOS electrometer for
different field sizes at different depths.
University of Ghana http://ugspace.ug.edu.gh
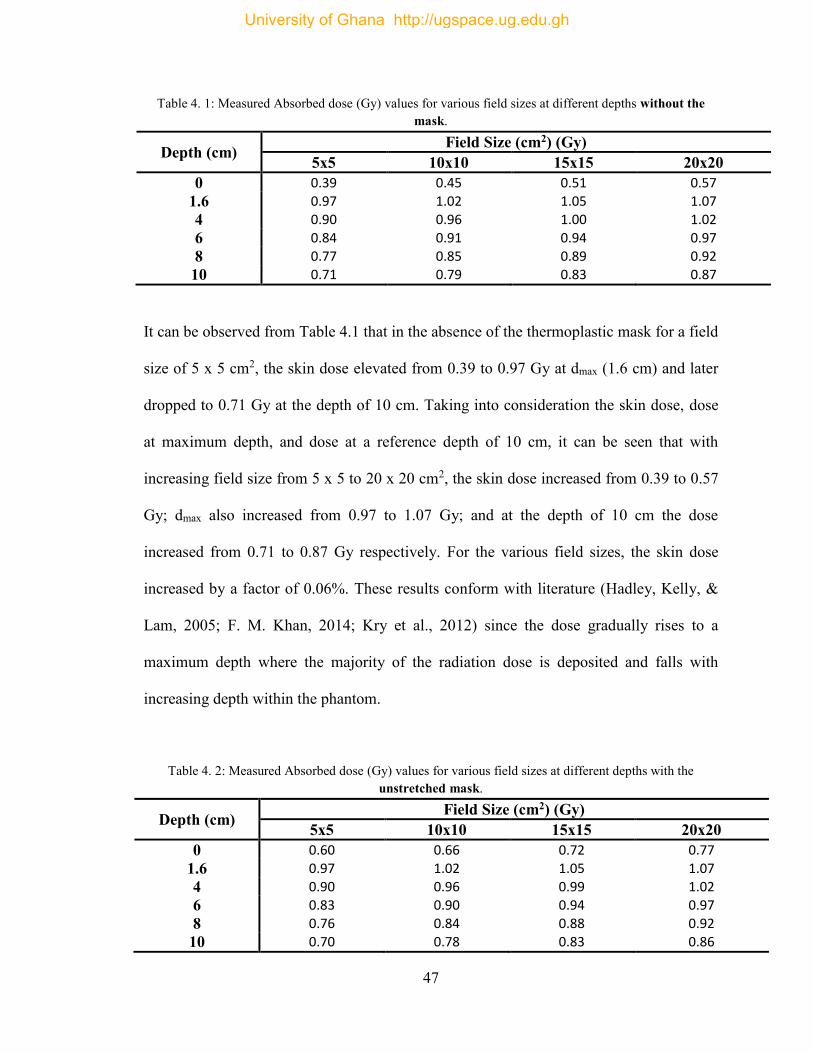
47
Table 4. 1: Measured Absorbed dose (Gy) values for various field sizes at different depths without the mask.
It can be observed from Table 4.1 that in the absence of the thermoplastic mask for a field
size of 5 x 5 cm2, the skin dose elevated from 0.39 to 0.97 Gy at dmax (1.6 cm) and later
dropped to 0.71 Gy at the depth of 10 cm. Taking into consideration the skin dose, dose
at maximum depth, and dose at a reference depth of 10 cm, it can be seen that with
increasing field size from 5 x 5 to 20 x 20 cm2, the skin dose increased from 0.39 to 0.57
Gy; dmax also increased from 0.97 to 1.07 Gy; and at the depth of 10 cm the dose
increased from 0.71 to 0.87 Gy respectively. For the various field sizes, the skin dose
increased by a factor of 0.06%. These results conform with literature (Hadley, Kelly, &
Lam, 2005; F. M. Khan, 2014; Kry et al., 2012) since the dose gradually rises to a
maximum depth where the majority of the radiation dose is deposited and falls with
increasing depth within the phantom.
Table 4. 2: Measured Absorbed dose (Gy) values for various field sizes at different depths with the unstretched mask.
Depth (cm) Field Size (cm2) (Gy) 5x5 10x10 15x15 20x20
0 0.60 0.66 0.72 0.77 1.6 0.97 1.02 1.05 1.07 4 0.90 0.96 0.99 1.02 6 0.83 0.90 0.94 0.97 8 0.76 0.84 0.88 0.92 10 0.70 0.78 0.83 0.86
Depth (cm) Field Size (cm2) (Gy) 5x5 10x10 15x15 20x20
0 0.39 0.45 0.51 0.57 1.6 0.97 1.02 1.05 1.07 4 0.90 0.96 1.00 1.02 6 0.84 0.91 0.94 0.97 8 0.77 0.85 0.89 0.92 10 0.71 0.79 0.83 0.87
University of Ghana http://ugspace.ug.edu.gh
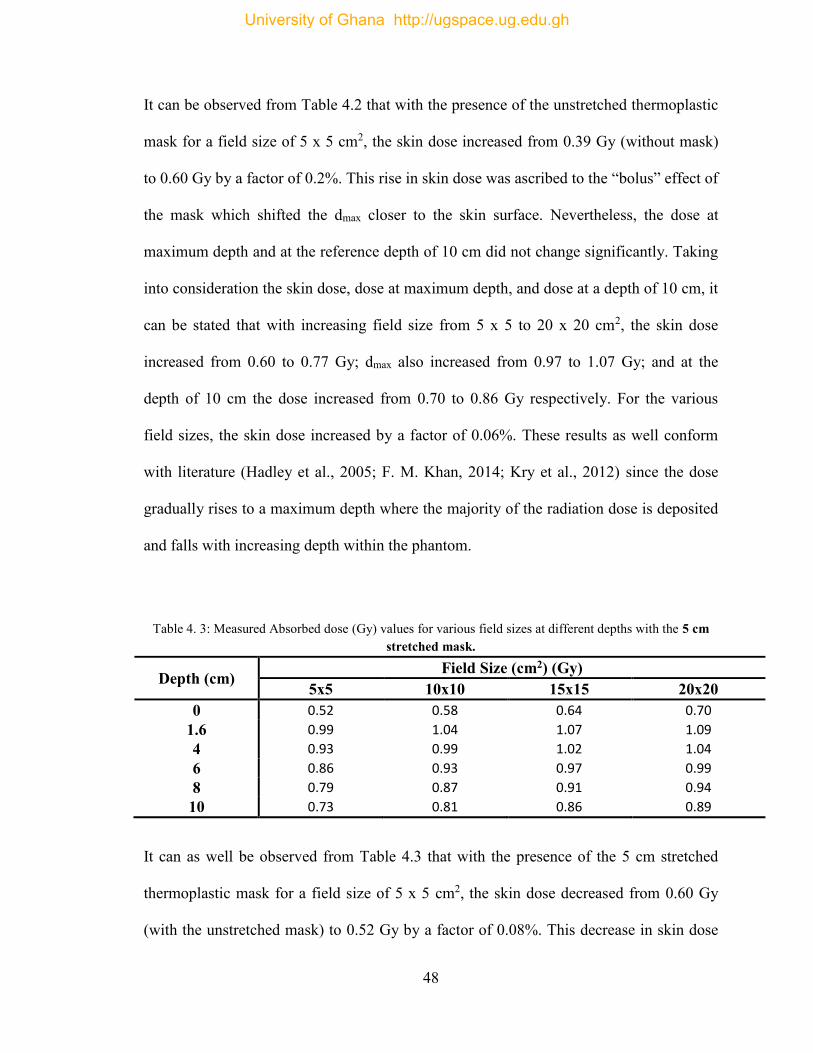
48
It can be observed from Table 4.2 that with the presence of the unstretched thermoplastic
mask for a field size of 5 x 5 cm2, the skin dose increased from 0.39 Gy (without mask)
to 0.60 Gy by a factor of 0.2%. This rise in skin dose was ascribed to the “bolus” effect of
the mask which shifted the dmax closer to the skin surface. Nevertheless, the dose at
maximum depth and at the reference depth of 10 cm did not change significantly. Taking
into consideration the skin dose, dose at maximum depth, and dose at a depth of 10 cm, it
can be stated that with increasing field size from 5 x 5 to 20 x 20 cm2, the skin dose
increased from 0.60 to 0.77 Gy; dmax also increased from 0.97 to 1.07 Gy; and at the
depth of 10 cm the dose increased from 0.70 to 0.86 Gy respectively. For the various
field sizes, the skin dose increased by a factor of 0.06%. These results as well conform
with literature (Hadley et al., 2005; F. M. Khan, 2014; Kry et al., 2012) since the dose
gradually rises to a maximum depth where the majority of the radiation dose is deposited
and falls with increasing depth within the phantom.
Table 4. 3: Measured Absorbed dose (Gy) values for various field sizes at different depths with the 5 cm stretched mask.
Depth (cm) Field Size (cm2) (Gy) 5x5 10x10 15x15 20x20
0 0.52 0.58 0.64 0.70 1.6 0.99 1.04 1.07 1.09 4 0.93 0.99 1.02 1.04 6 0.86 0.93 0.97 0.99 8 0.79 0.87 0.91 0.94 10 0.73 0.81 0.86 0.89
It can as well be observed from Table 4.3 that with the presence of the 5 cm stretched
thermoplastic mask for a field size of 5 x 5 cm2, the skin dose decreased from 0.60 Gy
(with the unstretched mask) to 0.52 Gy by a factor of 0.08%. This decrease in skin dose
University of Ghana http://ugspace.ug.edu.gh
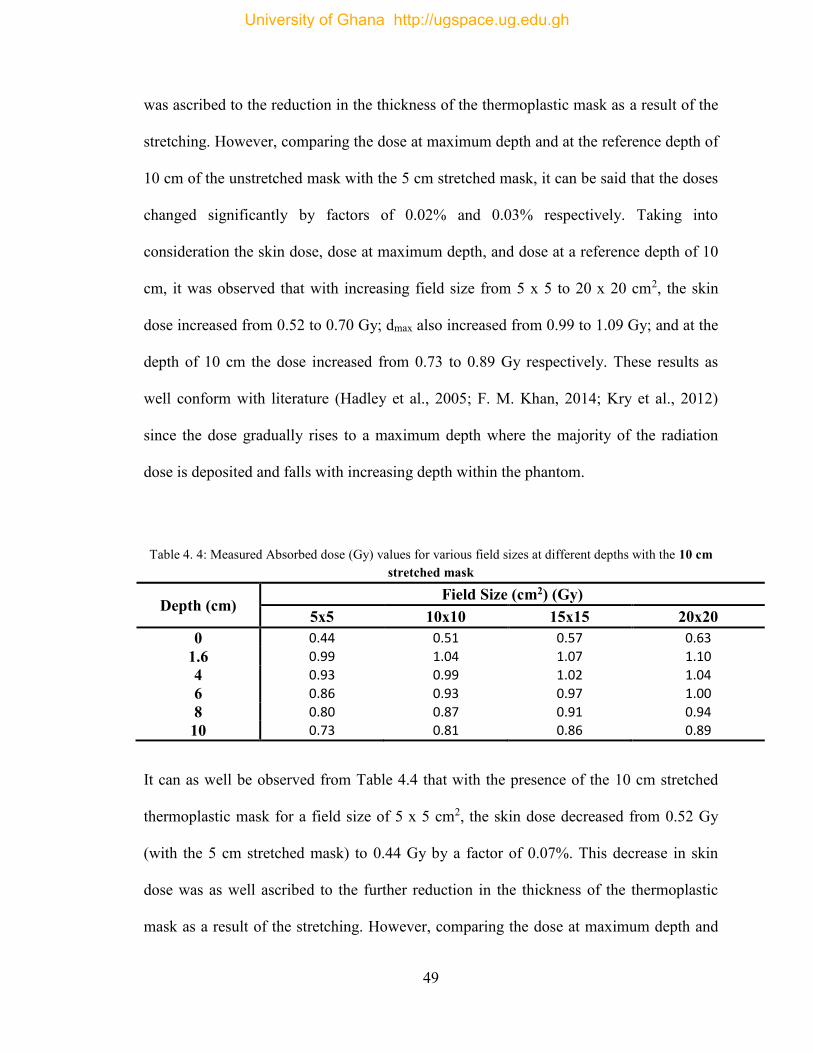
49
was ascribed to the reduction in the thickness of the thermoplastic mask as a result of the
stretching. However, comparing the dose at maximum depth and at the reference depth of
10 cm of the unstretched mask with the 5 cm stretched mask, it can be said that the doses
changed significantly by factors of 0.02% and 0.03% respectively. Taking into
consideration the skin dose, dose at maximum depth, and dose at a reference depth of 10
cm, it was observed that with increasing field size from 5 x 5 to 20 x 20 cm2, the skin
dose increased from 0.52 to 0.70 Gy; dmax also increased from 0.99 to 1.09 Gy; and at the
depth of 10 cm the dose increased from 0.73 to 0.89 Gy respectively. These results as
well conform with literature (Hadley et al., 2005; F. M. Khan, 2014; Kry et al., 2012)
since the dose gradually rises to a maximum depth where the majority of the radiation
dose is deposited and falls with increasing depth within the phantom.
Table 4. 4: Measured Absorbed dose (Gy) values for various field sizes at different depths with the 10 cm stretched mask
Depth (cm) Field Size (cm2) (Gy)
5x5 10x10 15x15 20x20 0 0.44 0.51 0.57 0.63
1.6 0.99 1.04 1.07 1.10 4 0.93 0.99 1.02 1.04 6 0.86 0.93 0.97 1.00 8 0.80 0.87 0.91 0.94 10 0.73 0.81 0.86 0.89
It can as well be observed from Table 4.4 that with the presence of the 10 cm stretched
thermoplastic mask for a field size of 5 x 5 cm2, the skin dose decreased from 0.52 Gy
(with the 5 cm stretched mask) to 0.44 Gy by a factor of 0.07%. This decrease in skin
dose was as well ascribed to the further reduction in the thickness of the thermoplastic
mask as a result of the stretching. However, comparing the dose at maximum depth and
University of Ghana http://ugspace.ug.edu.gh
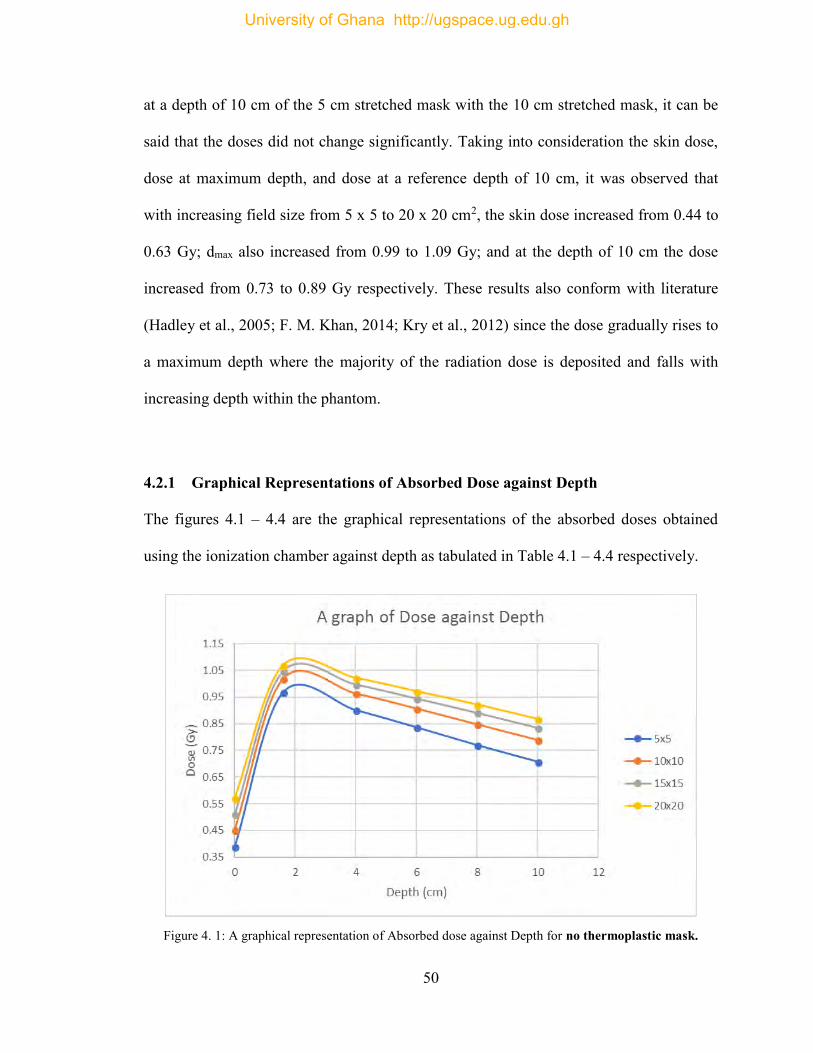
50
at a depth of 10 cm of the 5 cm stretched mask with the 10 cm stretched mask, it can be
said that the doses did not change significantly. Taking into consideration the skin dose,
dose at maximum depth, and dose at a reference depth of 10 cm, it was observed that
with increasing field size from 5 x 5 to 20 x 20 cm2, the skin dose increased from 0.44 to
0.63 Gy; dmax also increased from 0.99 to 1.09 Gy; and at the depth of 10 cm the dose
increased from 0.73 to 0.89 Gy respectively. These results also conform with literature
(Hadley et al., 2005; F. M. Khan, 2014; Kry et al., 2012) since the dose gradually rises to
a maximum depth where the majority of the radiation dose is deposited and falls with
increasing depth within the phantom.
4.2.1 Graphical Representations of Absorbed Dose against Depth
The figures 4.1 – 4.4 are the graphical representations of the absorbed doses obtained
using the ionization chamber against depth as tabulated in Table 4.1 – 4.4 respectively.
Figure 4. 1: A graphical representation of Absorbed dose against Depth for no thermoplastic mask.
University of Ghana http://ugspace.ug.edu.gh
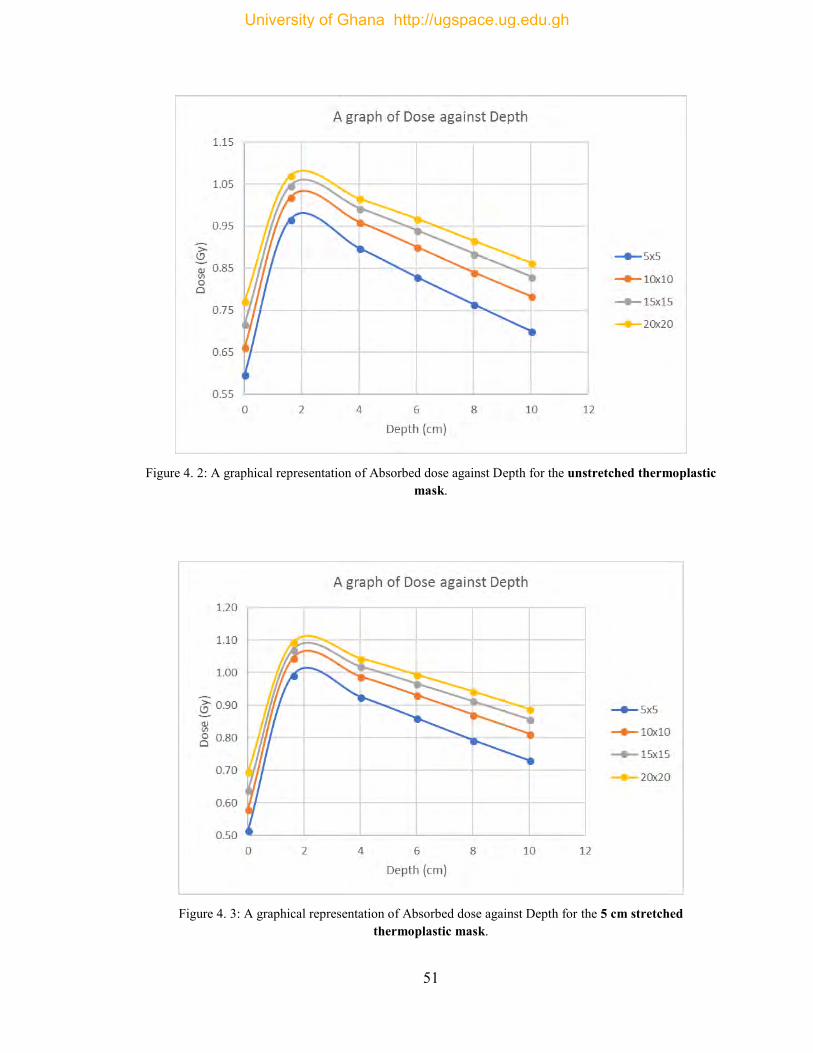
51
Figure 4. 2: A graphical representation of Absorbed dose against Depth for the unstretched thermoplastic
mask.
Figure 4. 3: A graphical representation of Absorbed dose against Depth for the 5 cm stretched
thermoplastic mask.
University of Ghana http://ugspace.ug.edu.gh
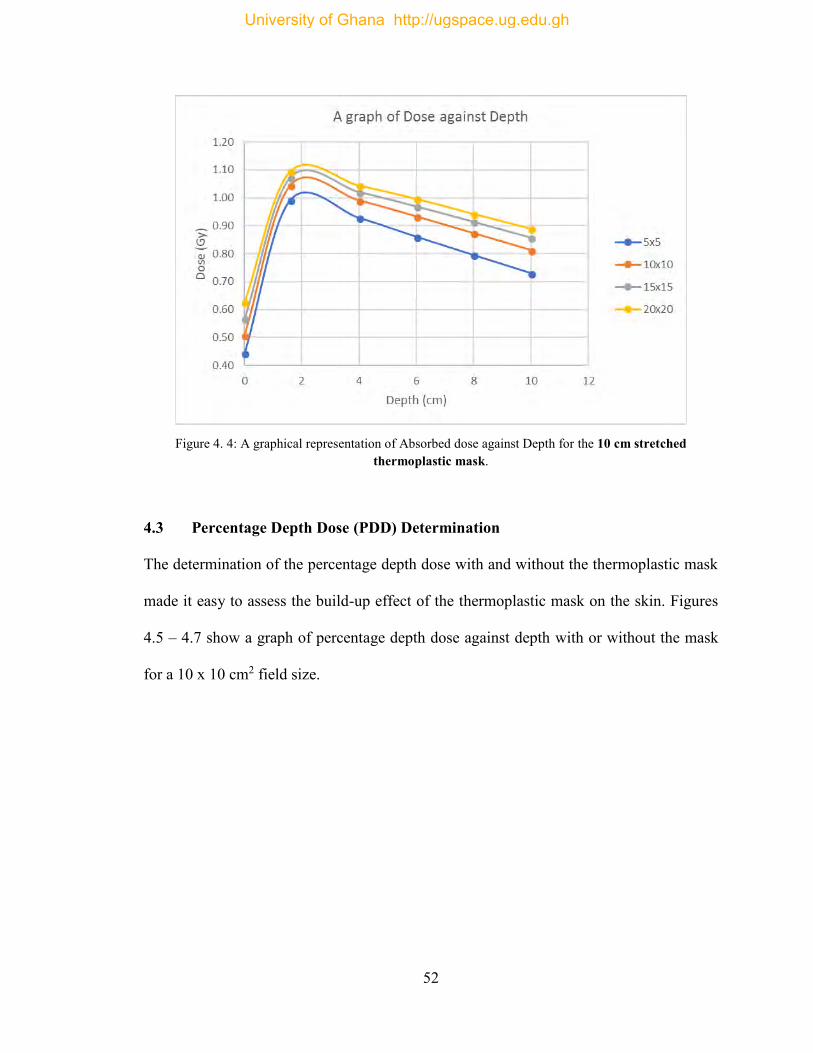
52
Figure 4. 4: A graphical representation of Absorbed dose against Depth for the 10 cm stretched
thermoplastic mask.
4.3 Percentage Depth Dose (PDD) Determination
The determination of the percentage depth dose with and without the thermoplastic mask
made it easy to assess the build-up effect of the thermoplastic mask on the skin. Figures
4.5 – 4.7 show a graph of percentage depth dose against depth with or without the mask
for a 10 x 10 cm2 field size.
University of Ghana http://ugspace.ug.edu.gh
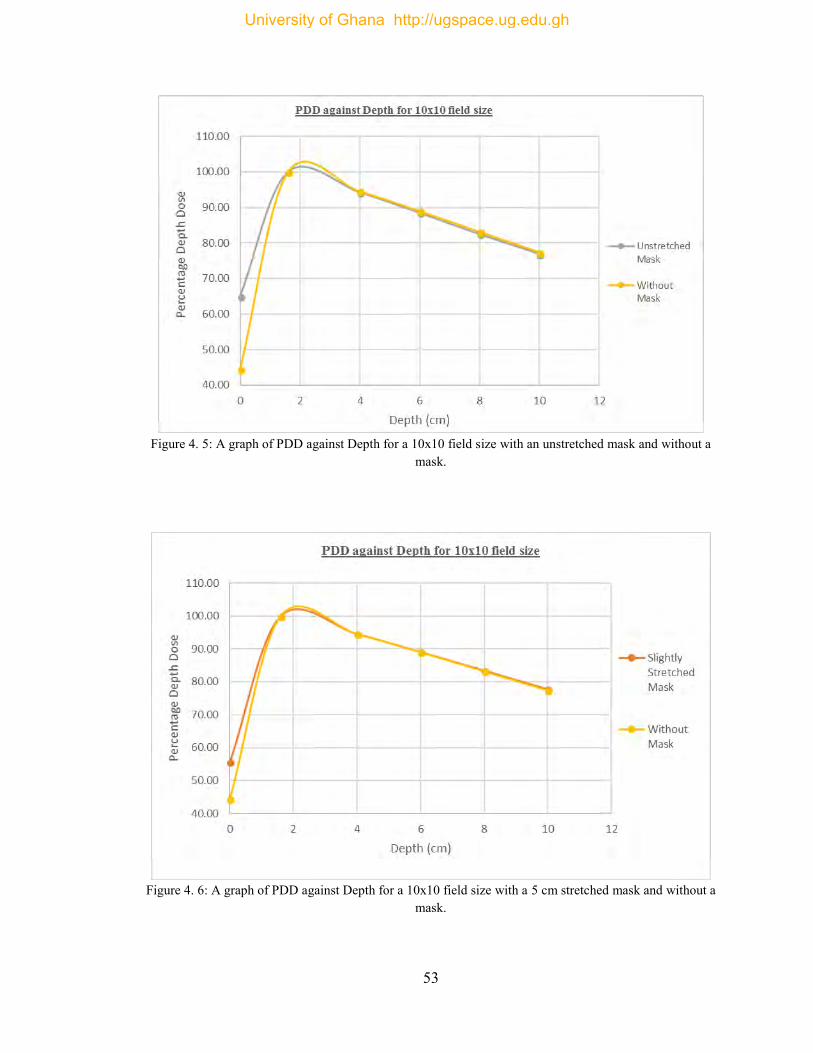
53
Figure 4. 5: A graph of PDD against Depth for a 10x10 field size with an unstretched mask and without a
mask.
Figure 4. 6: A graph of PDD against Depth for a 10x10 field size with a 5 cm stretched mask and without a
mask.
University of Ghana http://ugspace.ug.edu.gh
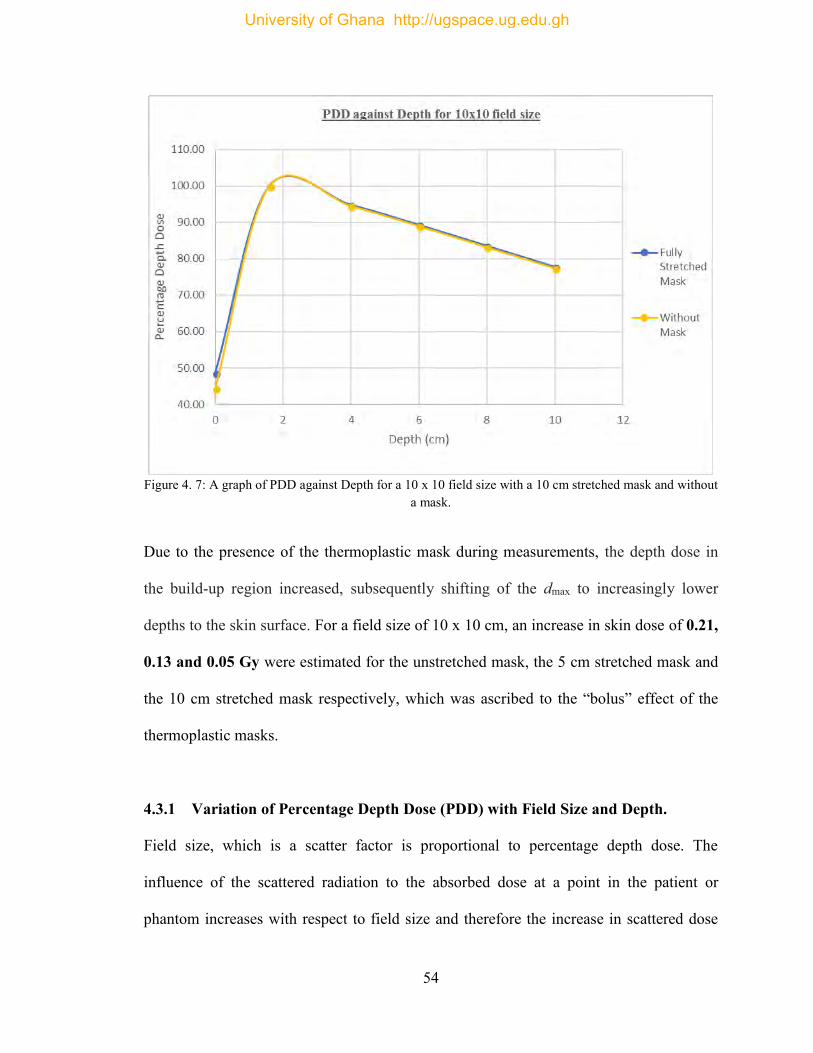
54
Figure 4. 7: A graph of PDD against Depth for a 10 x 10 field size with a 10 cm stretched mask and without
a mask.
Due to the presence of the thermoplastic mask during measurements, the depth dose in
the build-up region increased, subsequently shifting of the dmax to increasingly lower
depths to the skin surface. For a field size of 10 x 10 cm, an increase in skin dose of 0.21,
0.13 and 0.05 Gy were estimated for the unstretched mask, the 5 cm stretched mask and
the 10 cm stretched mask respectively, which was ascribed to the “bolus” effect of the
thermoplastic masks.
4.3.1 Variation of Percentage Depth Dose (PDD) with Field Size and Depth.
Field size, which is a scatter factor is proportional to percentage depth dose. The
influence of the scattered radiation to the absorbed dose at a point in the patient or
phantom increases with respect to field size and therefore the increase in scattered dose
University of Ghana http://ugspace.ug.edu.gh
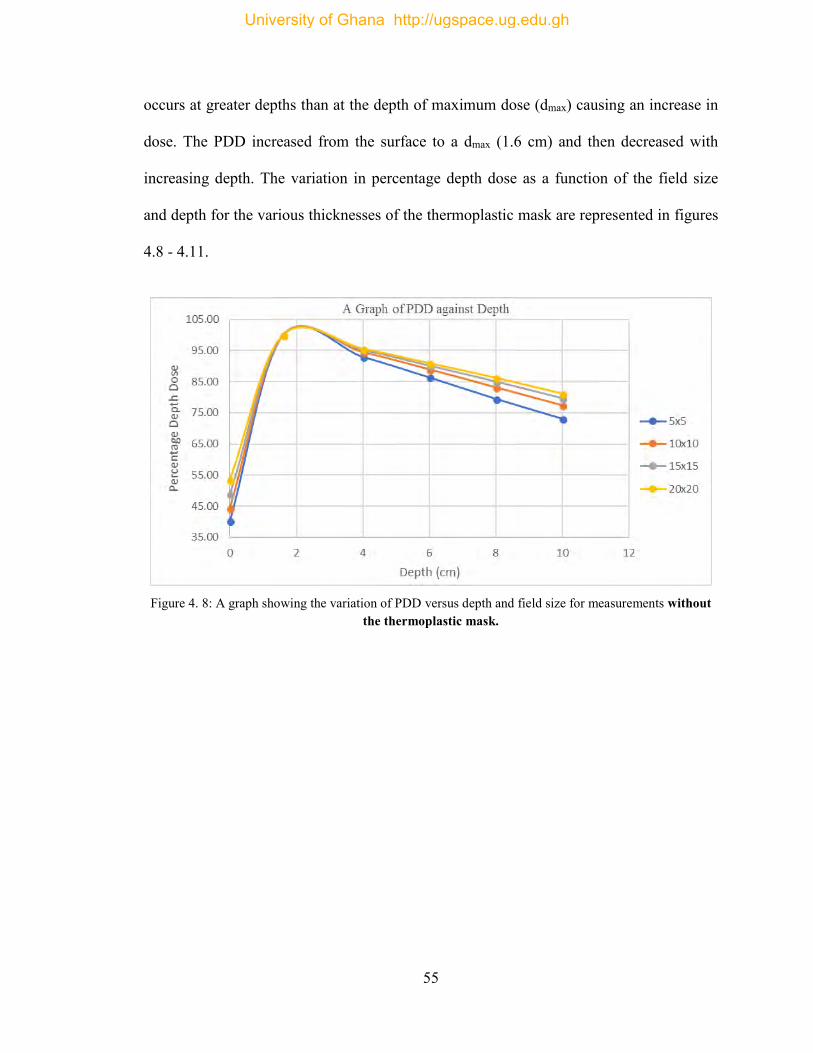
55
occurs at greater depths than at the depth of maximum dose (dmax) causing an increase in
dose. The PDD increased from the surface to a dmax (1.6 cm) and then decreased with
increasing depth. The variation in percentage depth dose as a function of the field size
and depth for the various thicknesses of the thermoplastic mask are represented in figures
4.8 - 4.11.
Figure 4. 8: A graph showing the variation of PDD versus depth and field size for measurements without
the thermoplastic mask.
University of Ghana http://ugspace.ug.edu.gh
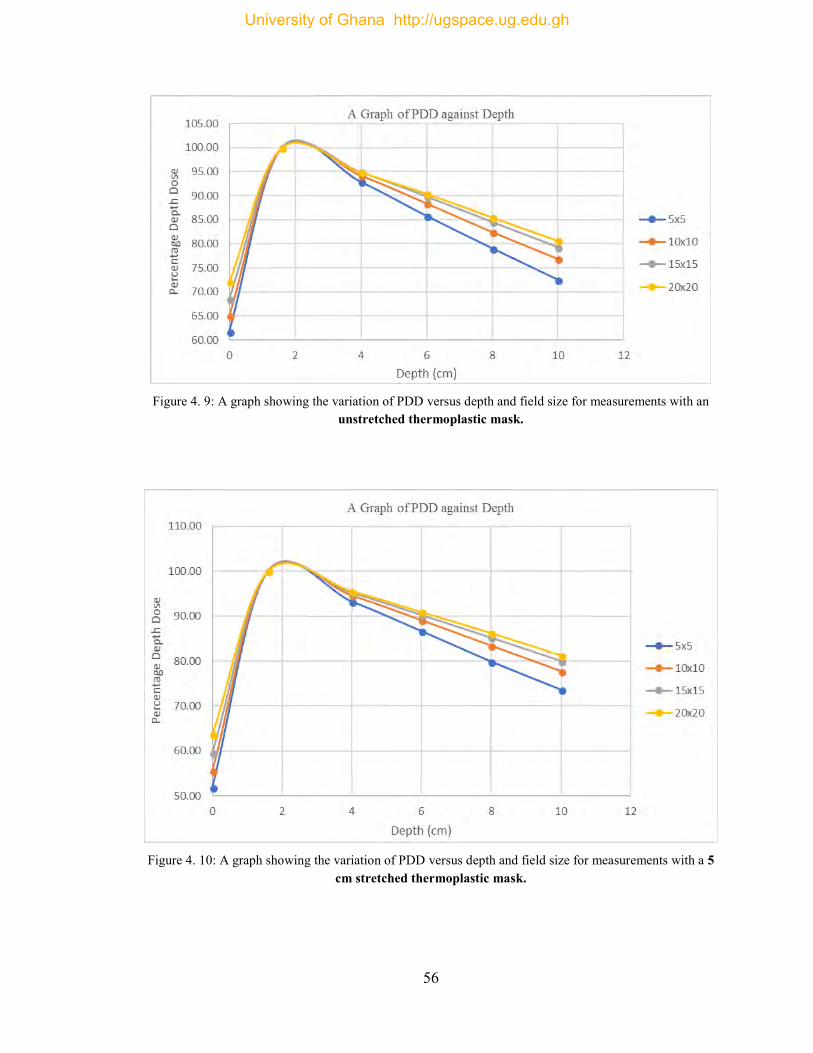
56
Figure 4. 9: A graph showing the variation of PDD versus depth and field size for measurements with an
unstretched thermoplastic mask.
Figure 4. 10: A graph showing the variation of PDD versus depth and field size for measurements with a 5
cm stretched thermoplastic mask.
University of Ghana http://ugspace.ug.edu.gh
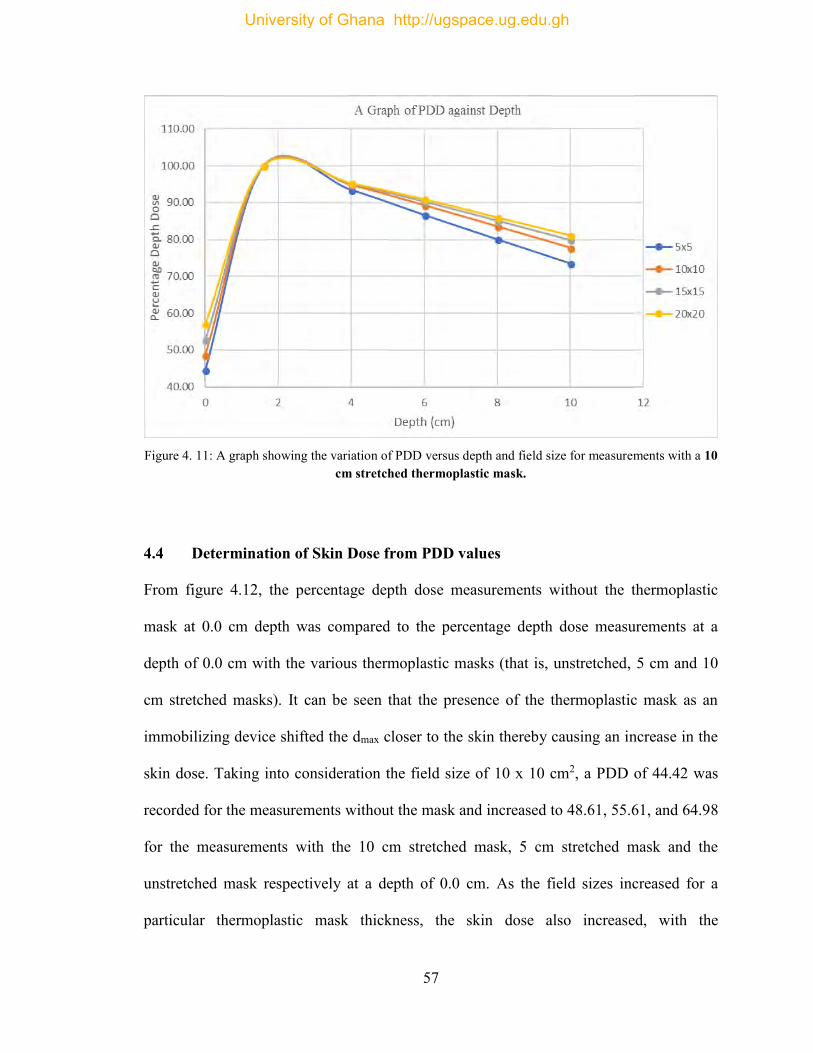
57
Figure 4. 11: A graph showing the variation of PDD versus depth and field size for measurements with a 10
cm stretched thermoplastic mask.
4.4 Determination of Skin Dose from PDD values
From figure 4.12, the percentage depth dose measurements without the thermoplastic
mask at 0.0 cm depth was compared to the percentage depth dose measurements at a
depth of 0.0 cm with the various thermoplastic masks (that is, unstretched, 5 cm and 10
cm stretched masks). It can be seen that the presence of the thermoplastic mask as an
immobilizing device shifted the dmax closer to the skin thereby causing an increase in the
skin dose. Taking into consideration the field size of 10 x 10 cm2, a PDD of 44.42 was
recorded for the measurements without the mask and increased to 48.61, 55.61, and 64.98
for the measurements with the 10 cm stretched mask, 5 cm stretched mask and the
unstretched mask respectively at a depth of 0.0 cm. As the field sizes increased for a
particular thermoplastic mask thickness, the skin dose also increased, with the
University of Ghana http://ugspace.ug.edu.gh
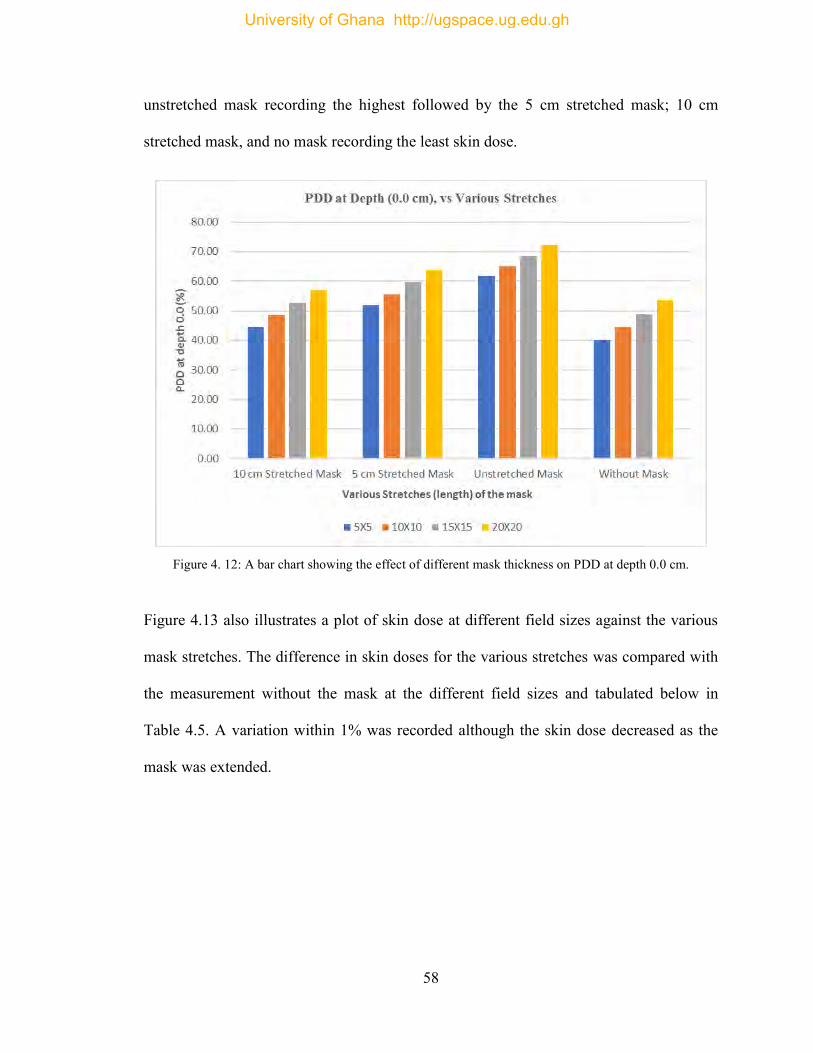
58
unstretched mask recording the highest followed by the 5 cm stretched mask; 10 cm
stretched mask, and no mask recording the least skin dose.
Figure 4. 12: A bar chart showing the effect of different mask thickness on PDD at depth 0.0 cm.
Figure 4.13 also illustrates a plot of skin dose at different field sizes against the various
mask stretches. The difference in skin doses for the various stretches was compared with
the measurement without the mask at the different field sizes and tabulated below in
Table 4.5. A variation within 1% was recorded although the skin dose decreased as the
mask was extended.
University of Ghana http://ugspace.ug.edu.gh
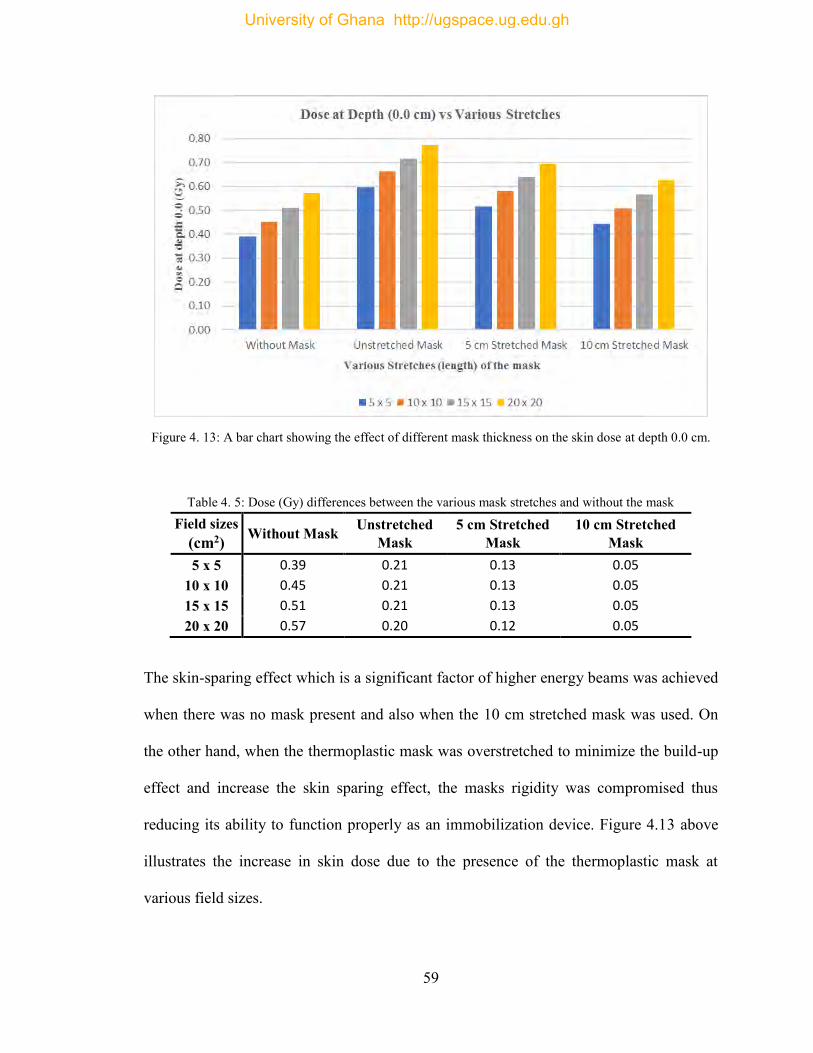
59
Figure 4. 13: A bar chart showing the effect of different mask thickness on the skin dose at depth 0.0 cm.
Table 4. 5: Dose (Gy) differences between the various mask stretches and without the mask
Field sizes (cm2) Without Mask Unstretched
Mask 5 cm Stretched
Mask 10 cm Stretched
Mask 5 x 5 0.39 0.21 0.13 0.05
10 x 10 0.45 0.21 0.13 0.05 15 x 15 0.51 0.21 0.13 0.05 20 x 20 0.57 0.20 0.12 0.05
The skin-sparing effect which is a significant factor of higher energy beams was achieved
when there was no mask present and also when the 10 cm stretched mask was used. On
the other hand, when the thermoplastic mask was overstretched to minimize the build-up
effect and increase the skin sparing effect, the masks rigidity was compromised thus
reducing its ability to function properly as an immobilization device. Figure 4.13 above
illustrates the increase in skin dose due to the presence of the thermoplastic mask at
various field sizes.
University of Ghana http://ugspace.ug.edu.gh
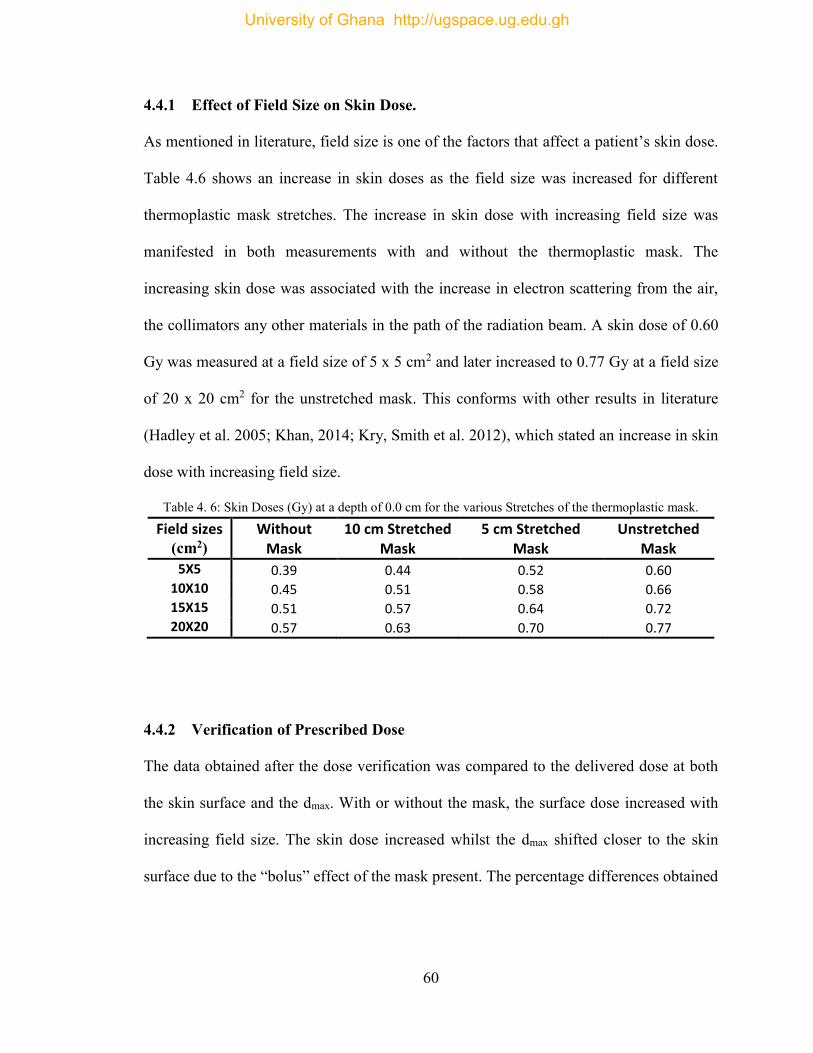
60
4.4.1 Effect of Field Size on Skin Dose.
As mentioned in literature, field size is one of the factors that affect a patient’s skin dose.
Table 4.6 shows an increase in skin doses as the field size was increased for different
thermoplastic mask stretches. The increase in skin dose with increasing field size was
manifested in both measurements with and without the thermoplastic mask. The
increasing skin dose was associated with the increase in electron scattering from the air,
the collimators any other materials in the path of the radiation beam. A skin dose of 0.60
Gy was measured at a field size of 5 x 5 cm2 and later increased to 0.77 Gy at a field size
of 20 x 20 cm2 for the unstretched mask. This conforms with other results in literature
(Hadley et al. 2005; Khan, 2014; Kry, Smith et al. 2012), which stated an increase in skin
dose with increasing field size.
Table 4. 6: Skin Doses (Gy) at a depth of 0.0 cm for the various Stretches of the thermoplastic mask.
Field sizes (cm2)
Without Mask
10 cm Stretched Mask
5 cm Stretched Mask
Unstretched Mask
5X5 0.39 0.44 0.52 0.60 10X10 0.45 0.51 0.58 0.66 15X15 0.51 0.57 0.64 0.72 20X20 0.57 0.63 0.70 0.77
4.4.2 Verification of Prescribed Dose
The data obtained after the dose verification was compared to the delivered dose at both
the skin surface and the dmax. With or without the mask, the surface dose increased with
increasing field size. The skin dose increased whilst the dmax shifted closer to the skin
surface due to the “bolus” effect of the mask present. The percentage differences obtained
University of Ghana http://ugspace.ug.edu.gh
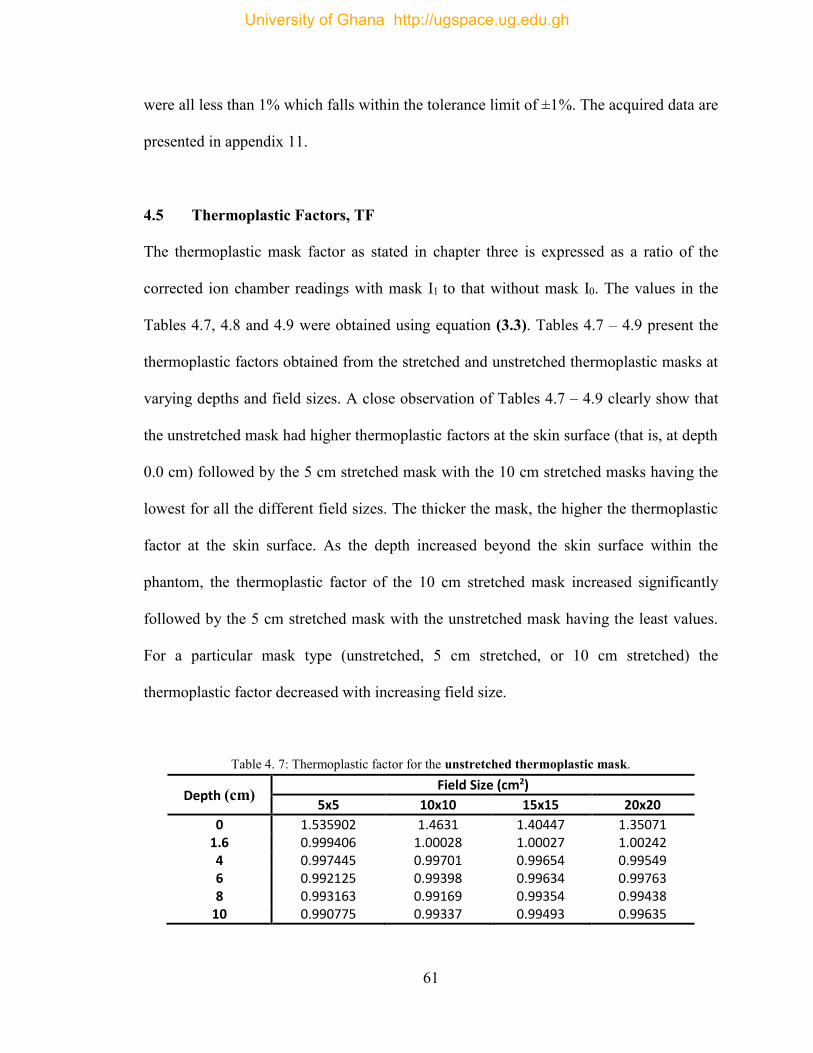
61
were all less than 1% which falls within the tolerance limit of ±1%. The acquired data are
presented in appendix 11.
4.5 Thermoplastic Factors, TF
The thermoplastic mask factor as stated in chapter three is expressed as a ratio of the
corrected ion chamber readings with mask I1 to that without mask I0. The values in the
Tables 4.7, 4.8 and 4.9 were obtained using equation (3.3). Tables 4.7 – 4.9 present the
thermoplastic factors obtained from the stretched and unstretched thermoplastic masks at
varying depths and field sizes. A close observation of Tables 4.7 – 4.9 clearly show that
the unstretched mask had higher thermoplastic factors at the skin surface (that is, at depth
0.0 cm) followed by the 5 cm stretched mask with the 10 cm stretched masks having the
lowest for all the different field sizes. The thicker the mask, the higher the thermoplastic
factor at the skin surface. As the depth increased beyond the skin surface within the
phantom, the thermoplastic factor of the 10 cm stretched mask increased significantly
followed by the 5 cm stretched mask with the unstretched mask having the least values.
For a particular mask type (unstretched, 5 cm stretched, or 10 cm stretched) the
thermoplastic factor decreased with increasing field size.
Table 4. 7: Thermoplastic factor for the unstretched thermoplastic mask.
Depth (cm) Field Size (cm2)
5x5 10x10 15x15 20x20
0 1.535902 1.4631 1.40447 1.35071 1.6 0.999406 1.00028 1.00027 1.00242 4 0.997445 0.99701 0.99654 0.99549 6 0.992125 0.99398 0.99634 0.99763 8 0.993163 0.99169 0.99354 0.99438
10 0.990775 0.99337 0.99493 0.99635
University of Ghana http://ugspace.ug.edu.gh
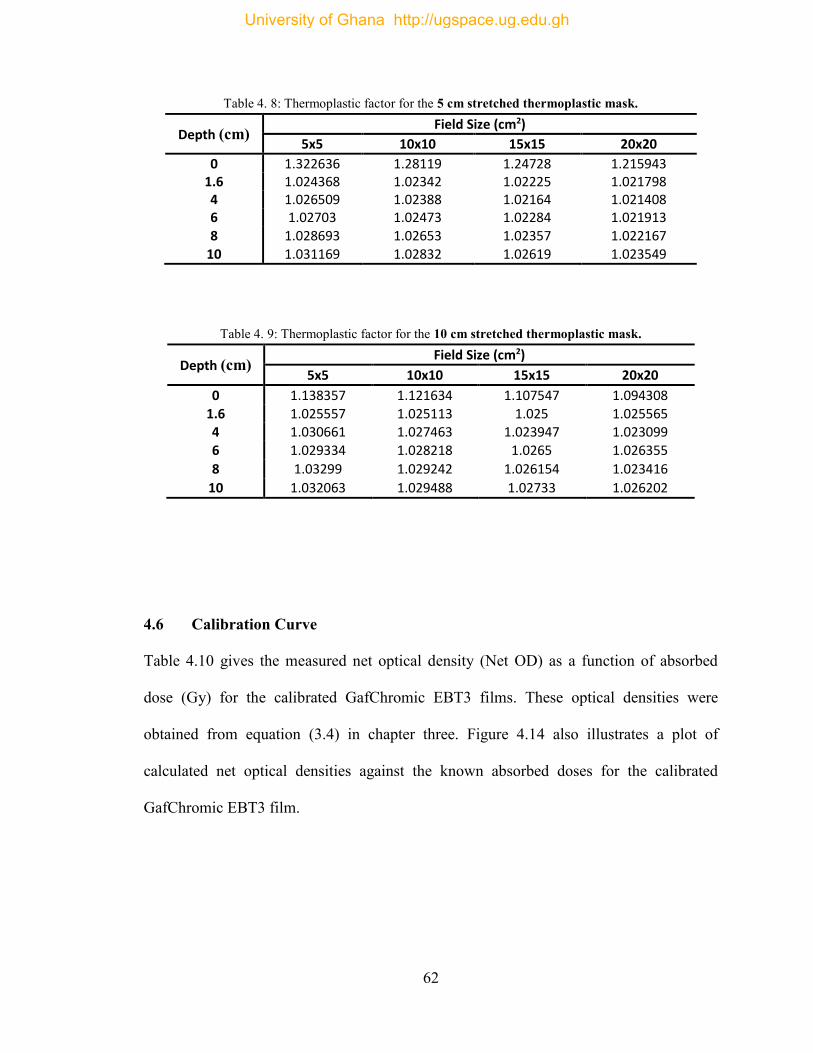
62
Table 4. 8: Thermoplastic factor for the 5 cm stretched thermoplastic mask.
Depth (cm) Field Size (cm2)
5x5 10x10 15x15 20x20
0 1.322636 1.28119 1.24728 1.215943 1.6 1.024368 1.02342 1.02225 1.021798 4 1.026509 1.02388 1.02164 1.021408 6 1.02703 1.02473 1.02284 1.021913 8 1.028693 1.02653 1.02357 1.022167
10 1.031169 1.02832 1.02619 1.023549
Table 4. 9: Thermoplastic factor for the 10 cm stretched thermoplastic mask.
Depth (cm) Field Size (cm2)
5x5 10x10 15x15 20x20
0 1.138357 1.121634 1.107547 1.094308 1.6 1.025557 1.025113 1.025 1.025565 4 1.030661 1.027463 1.023947 1.023099
6 1.029334 1.028218 1.0265 1.026355
8 1.03299 1.029242 1.026154 1.023416
10 1.032063 1.029488 1.02733 1.026202
4.6 Calibration Curve
Table 4.10 gives the measured net optical density (Net OD) as a function of absorbed
dose (Gy) for the calibrated GafChromic EBT3 films. These optical densities were
obtained from equation (3.4) in chapter three. Figure 4.14 also illustrates a plot of
calculated net optical densities against the known absorbed doses for the calibrated
GafChromic EBT3 film.
University of Ghana http://ugspace.ug.edu.gh
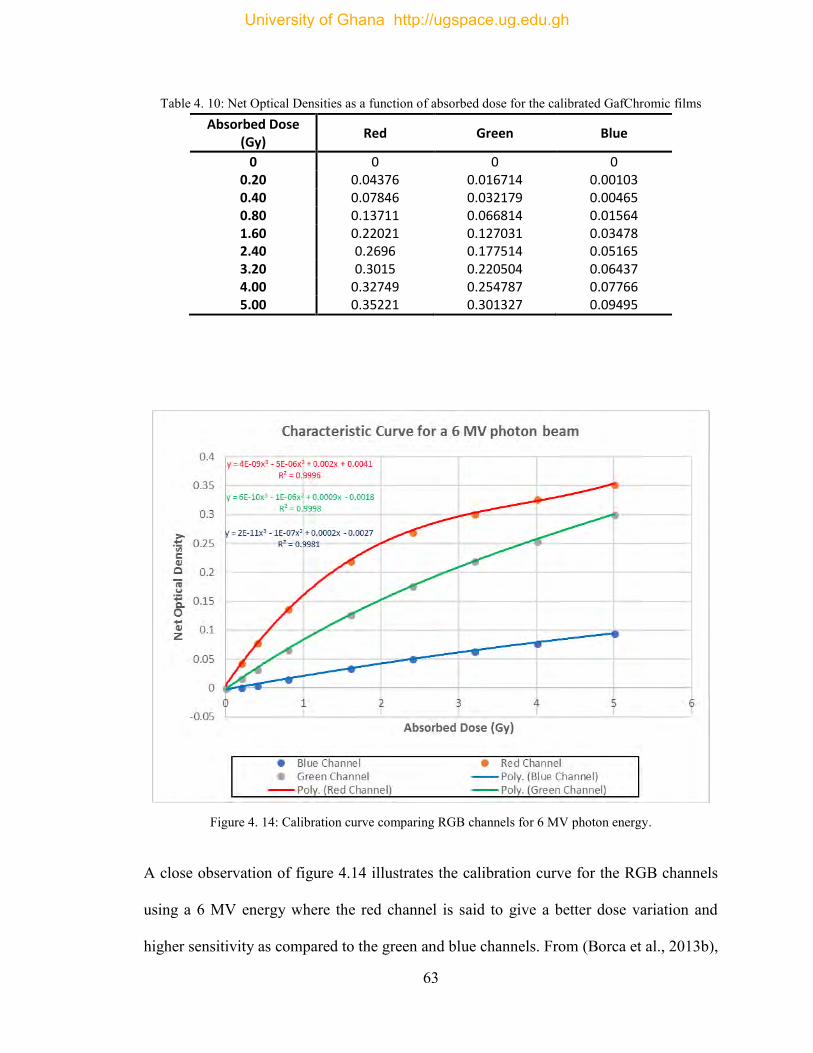
63
Table 4. 10: Net Optical Densities as a function of absorbed dose for the calibrated GafChromic films Absorbed Dose
(Gy) Red Green Blue
0 0 0 0 0.20 0.04376 0.016714 0.00103 0.40 0.07846 0.032179 0.00465 0.80 0.13711 0.066814 0.01564 1.60 0.22021 0.127031 0.03478 2.40 0.2696 0.177514 0.05165 3.20 0.3015 0.220504 0.06437 4.00 0.32749 0.254787 0.07766 5.00 0.35221 0.301327 0.09495
Figure 4. 14: Calibration curve comparing RGB channels for 6 MV photon energy.
A close observation of figure 4.14 illustrates the calibration curve for the RGB channels
using a 6 MV energy where the red channel is said to give a better dose variation and
higher sensitivity as compared to the green and blue channels. From (Borca et al., 2013b),
University of Ghana http://ugspace.ug.edu.gh
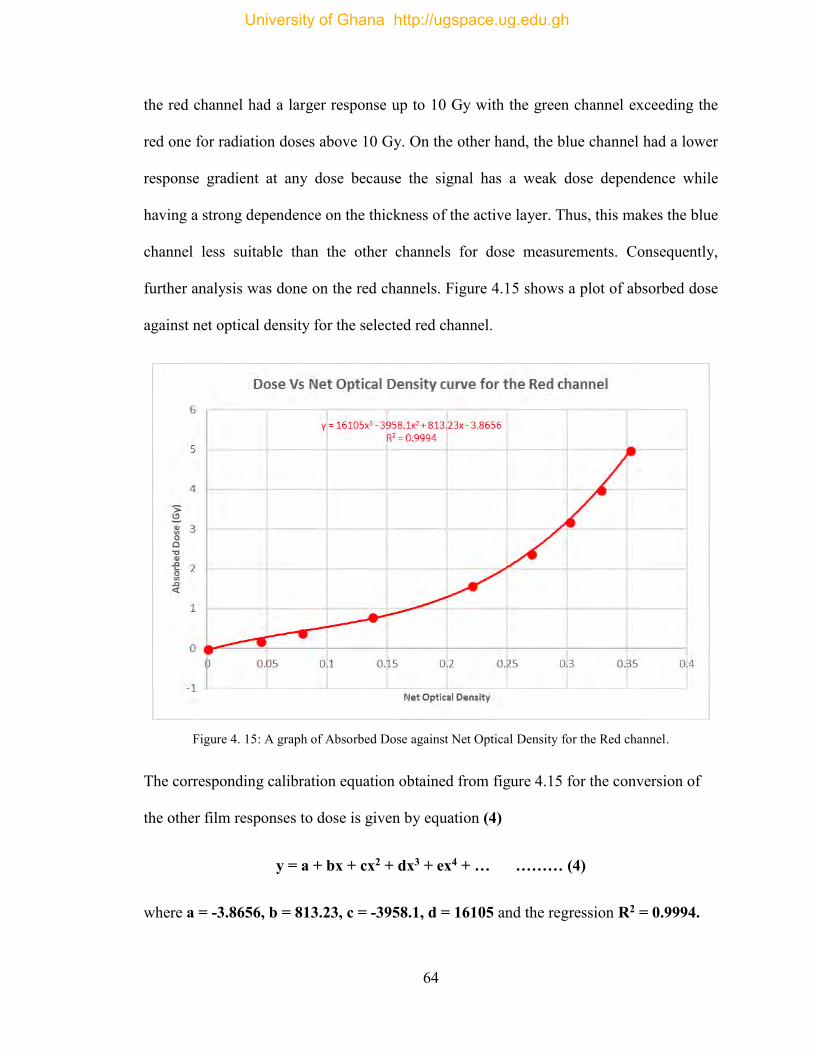
64
the red channel had a larger response up to 10 Gy with the green channel exceeding the
red one for radiation doses above 10 Gy. On the other hand, the blue channel had a lower
response gradient at any dose because the signal has a weak dose dependence while
having a strong dependence on the thickness of the active layer. Thus, this makes the blue
channel less suitable than the other channels for dose measurements. Consequently,
further analysis was done on the red channels. Figure 4.15 shows a plot of absorbed dose
against net optical density for the selected red channel.
Figure 4. 15: A graph of Absorbed Dose against Net Optical Density for the Red channel.
The corresponding calibration equation obtained from figure 4.15 for the conversion of
the other film responses to dose is given by equation (4)
y = a + bx + cx2 + dx3 + ex4 + … ……… (4)
where a = -3.8656, b = 813.23, c = -3958.1, d = 16105 and the regression R2 = 0.9994.
University of Ghana http://ugspace.ug.edu.gh
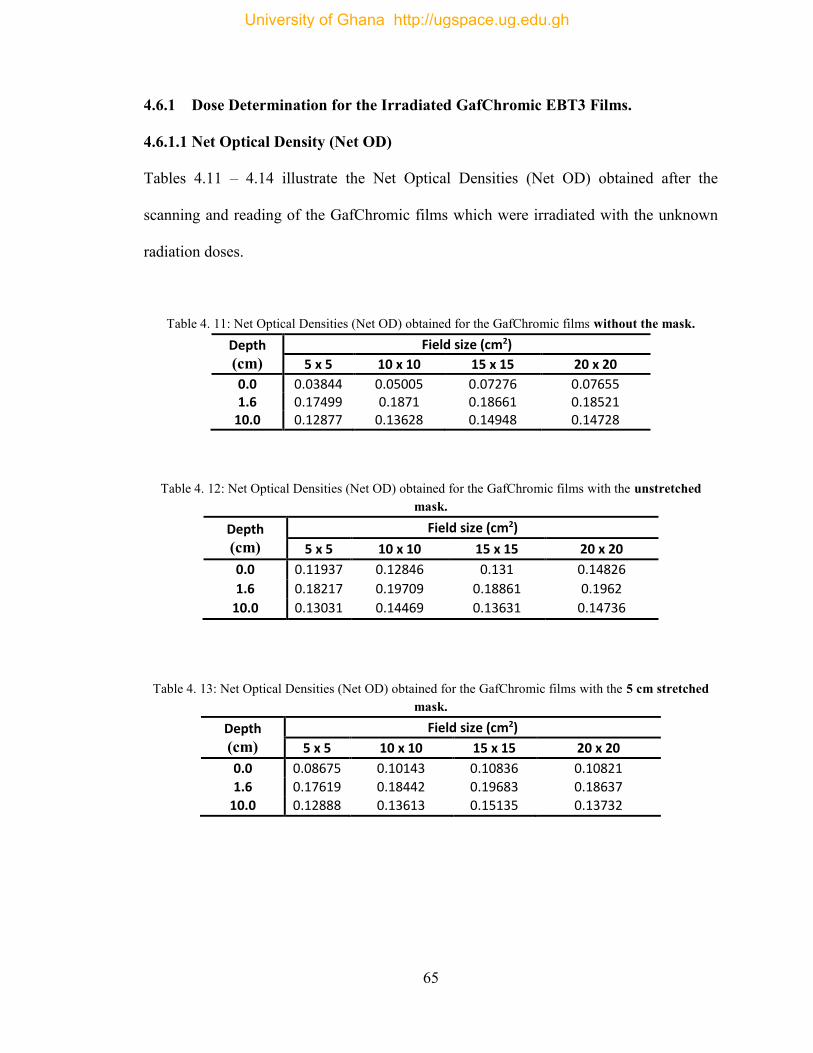
65
4.6.1 Dose Determination for the Irradiated GafChromic EBT3 Films.
4.6.1.1 Net Optical Density (Net OD)
Tables 4.11 – 4.14 illustrate the Net Optical Densities (Net OD) obtained after the
scanning and reading of the GafChromic films which were irradiated with the unknown
radiation doses.
Table 4. 11: Net Optical Densities (Net OD) obtained for the GafChromic films without the mask. Depth
(cm)
Field size (cm2)
5 x 5 10 x 10 15 x 15 20 x 20
0.0 0.03844 0.05005 0.07276 0.07655 1.6 0.17499 0.1871 0.18661 0.18521
10.0 0.12877 0.13628 0.14948 0.14728
Table 4. 12: Net Optical Densities (Net OD) obtained for the GafChromic films with the unstretched mask.
Depth
(cm)
Field size (cm2)
5 x 5 10 x 10 15 x 15 20 x 20
0.0 0.11937 0.12846 0.131 0.14826
1.6 0.18217 0.19709 0.18861 0.1962
10.0 0.13031 0.14469 0.13631 0.14736
Table 4. 13: Net Optical Densities (Net OD) obtained for the GafChromic films with the 5 cm stretched mask.
Depth
(cm)
Field size (cm2)
5 x 5 10 x 10 15 x 15 20 x 20
0.0 0.08675 0.10143 0.10836 0.10821
1.6 0.17619 0.18442 0.19683 0.18637
10.0 0.12888 0.13613 0.15135 0.13732
University of Ghana http://ugspace.ug.edu.gh
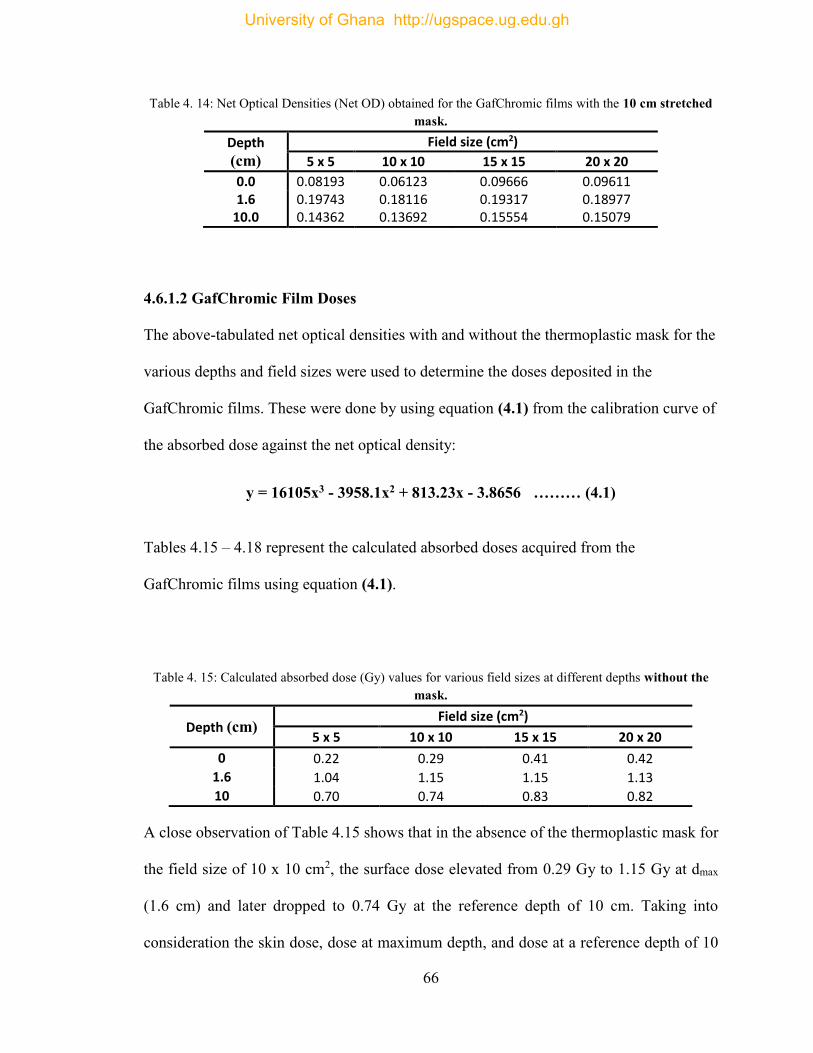
66
Table 4. 14: Net Optical Densities (Net OD) obtained for the GafChromic films with the 10 cm stretched mask.
Depth
(cm)
Field size (cm2)
5 x 5 10 x 10 15 x 15 20 x 20
0.0 0.08193 0.06123 0.09666 0.09611 1.6 0.19743 0.18116 0.19317 0.18977
10.0 0.14362 0.13692 0.15554 0.15079
4.6.1.2 GafChromic Film Doses
The above-tabulated net optical densities with and without the thermoplastic mask for the
various depths and field sizes were used to determine the doses deposited in the
GafChromic films. These were done by using equation (4.1) from the calibration curve of
the absorbed dose against the net optical density:
y = 16105x3 - 3958.1x2 + 813.23x - 3.8656 ……… (4.1)
Tables 4.15 – 4.18 represent the calculated absorbed doses acquired from the
GafChromic films using equation (4.1).
Table 4. 15: Calculated absorbed dose (Gy) values for various field sizes at different depths without the mask.
Depth (cm) Field size (cm2)
5 x 5 10 x 10 15 x 15 20 x 20
0 0.22 0.29 0.41 0.42
1.6 1.04 1.15 1.15 1.13
10 0.70 0.74 0.83 0.82
A close observation of Table 4.15 shows that in the absence of the thermoplastic mask for
the field size of 10 x 10 cm2, the surface dose elevated from 0.29 Gy to 1.15 Gy at dmax
(1.6 cm) and later dropped to 0.74 Gy at the reference depth of 10 cm. Taking into
consideration the skin dose, dose at maximum depth, and dose at a reference depth of 10
University of Ghana http://ugspace.ug.edu.gh
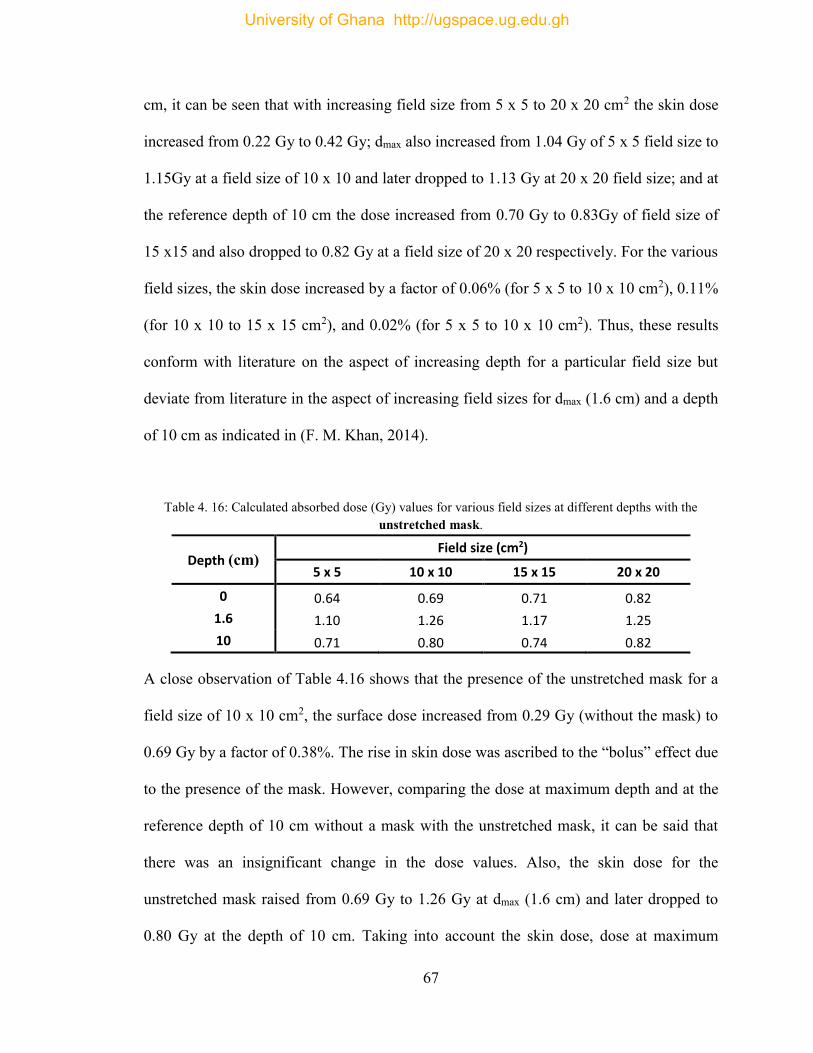
67
cm, it can be seen that with increasing field size from 5 x 5 to 20 x 20 cm2 the skin dose
increased from 0.22 Gy to 0.42 Gy; dmax also increased from 1.04 Gy of 5 x 5 field size to
1.15Gy at a field size of 10 x 10 and later dropped to 1.13 Gy at 20 x 20 field size; and at
the reference depth of 10 cm the dose increased from 0.70 Gy to 0.83Gy of field size of
15 x15 and also dropped to 0.82 Gy at a field size of 20 x 20 respectively. For the various
field sizes, the skin dose increased by a factor of 0.06% (for 5 x 5 to 10 x 10 cm2), 0.11%
(for 10 x 10 to 15 x 15 cm2), and 0.02% (for 5 x 5 to 10 x 10 cm2). Thus, these results
conform with literature on the aspect of increasing depth for a particular field size but
deviate from literature in the aspect of increasing field sizes for dmax (1.6 cm) and a depth
of 10 cm as indicated in (F. M. Khan, 2014).
Table 4. 16: Calculated absorbed dose (Gy) values for various field sizes at different depths with the unstretched mask.
Depth (cm) Field size (cm2)
5 x 5 10 x 10 15 x 15 20 x 20
0 0.64 0.69 0.71 0.82
1.6 1.10 1.26 1.17 1.25
10 0.71 0.80 0.74 0.82
A close observation of Table 4.16 shows that the presence of the unstretched mask for a
field size of 10 x 10 cm2, the surface dose increased from 0.29 Gy (without the mask) to
0.69 Gy by a factor of 0.38%. The rise in skin dose was ascribed to the “bolus” effect due
to the presence of the mask. However, comparing the dose at maximum depth and at the
reference depth of 10 cm without a mask with the unstretched mask, it can be said that
there was an insignificant change in the dose values. Also, the skin dose for the
unstretched mask raised from 0.69 Gy to 1.26 Gy at dmax (1.6 cm) and later dropped to
0.80 Gy at the depth of 10 cm. Taking into account the skin dose, dose at maximum
University of Ghana http://ugspace.ug.edu.gh
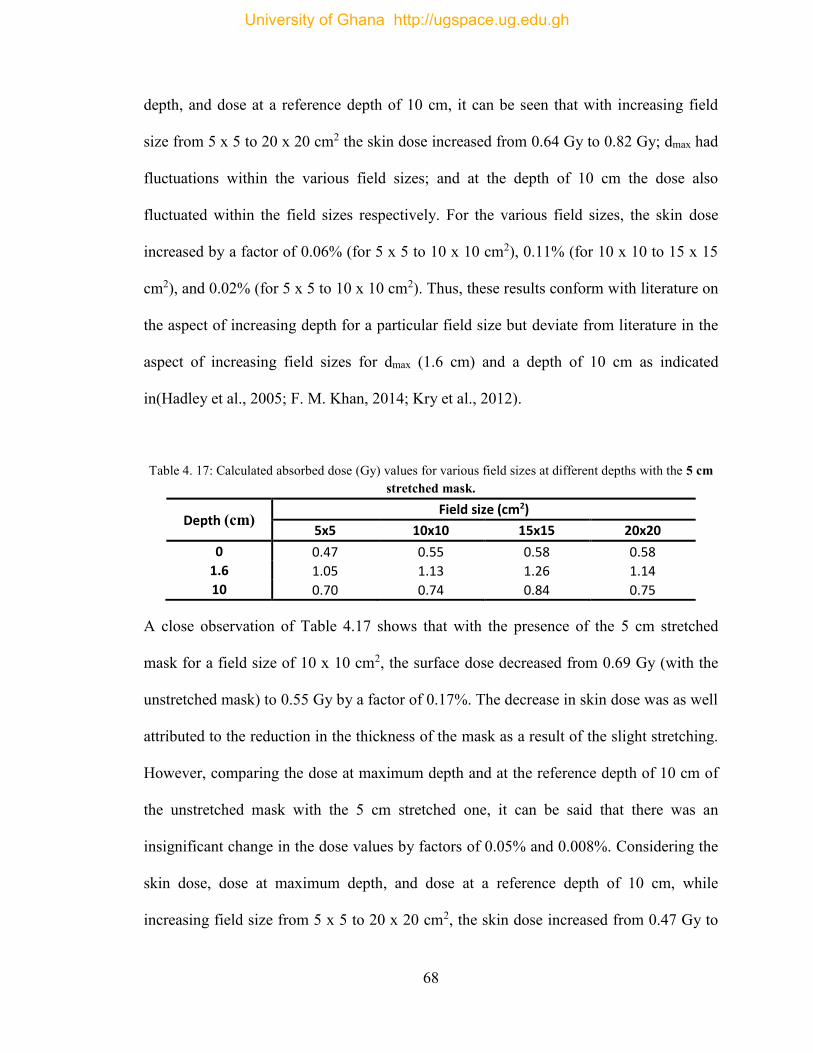
68
depth, and dose at a reference depth of 10 cm, it can be seen that with increasing field
size from 5 x 5 to 20 x 20 cm2 the skin dose increased from 0.64 Gy to 0.82 Gy; dmax had
fluctuations within the various field sizes; and at the depth of 10 cm the dose also
fluctuated within the field sizes respectively. For the various field sizes, the skin dose
increased by a factor of 0.06% (for 5 x 5 to 10 x 10 cm2), 0.11% (for 10 x 10 to 15 x 15
cm2), and 0.02% (for 5 x 5 to 10 x 10 cm2). Thus, these results conform with literature on
the aspect of increasing depth for a particular field size but deviate from literature in the
aspect of increasing field sizes for dmax (1.6 cm) and a depth of 10 cm as indicated
in(Hadley et al., 2005; F. M. Khan, 2014; Kry et al., 2012).
Table 4. 17: Calculated absorbed dose (Gy) values for various field sizes at different depths with the 5 cm stretched mask.
Depth (cm) Field size (cm2)
5x5 10x10 15x15 20x20
0 0.47 0.55 0.58 0.58
1.6 1.05 1.13 1.26 1.14
10 0.70 0.74 0.84 0.75
A close observation of Table 4.17 shows that with the presence of the 5 cm stretched
mask for a field size of 10 x 10 cm2, the surface dose decreased from 0.69 Gy (with the
unstretched mask) to 0.55 Gy by a factor of 0.17%. The decrease in skin dose was as well
attributed to the reduction in the thickness of the mask as a result of the slight stretching.
However, comparing the dose at maximum depth and at the reference depth of 10 cm of
the unstretched mask with the 5 cm stretched one, it can be said that there was an
insignificant change in the dose values by factors of 0.05% and 0.008%. Considering the
skin dose, dose at maximum depth, and dose at a reference depth of 10 cm, while
increasing field size from 5 x 5 to 20 x 20 cm2, the skin dose increased from 0.47 Gy to
University of Ghana http://ugspace.ug.edu.gh
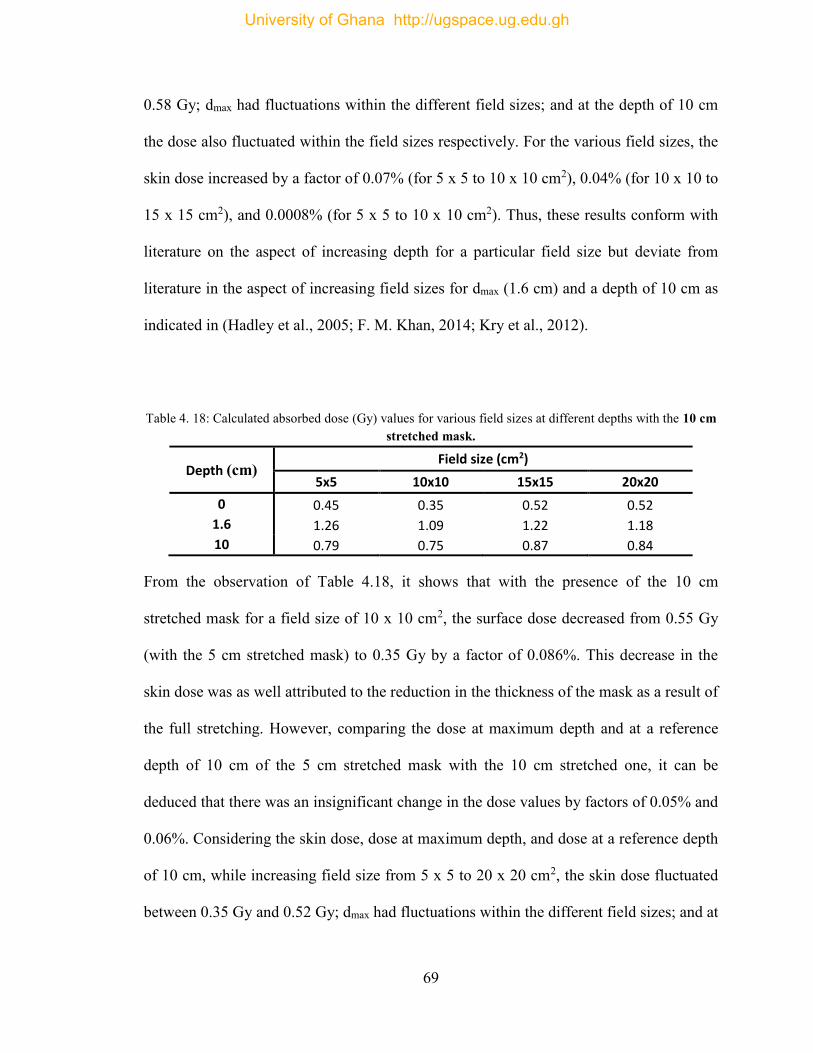
69
0.58 Gy; dmax had fluctuations within the different field sizes; and at the depth of 10 cm
the dose also fluctuated within the field sizes respectively. For the various field sizes, the
skin dose increased by a factor of 0.07% (for 5 x 5 to 10 x 10 cm2), 0.04% (for 10 x 10 to
15 x 15 cm2), and 0.0008% (for 5 x 5 to 10 x 10 cm2). Thus, these results conform with
literature on the aspect of increasing depth for a particular field size but deviate from
literature in the aspect of increasing field sizes for dmax (1.6 cm) and a depth of 10 cm as
indicated in (Hadley et al., 2005; F. M. Khan, 2014; Kry et al., 2012).
Table 4. 18: Calculated absorbed dose (Gy) values for various field sizes at different depths with the 10 cm stretched mask.
Depth (cm) Field size (cm2)
5x5 10x10 15x15 20x20
0 0.45 0.35 0.52 0.52
1.6 1.26 1.09 1.22 1.18
10 0.79 0.75 0.87 0.84
From the observation of Table 4.18, it shows that with the presence of the 10 cm
stretched mask for a field size of 10 x 10 cm2, the surface dose decreased from 0.55 Gy
(with the 5 cm stretched mask) to 0.35 Gy by a factor of 0.086%. This decrease in the
skin dose was as well attributed to the reduction in the thickness of the mask as a result of
the full stretching. However, comparing the dose at maximum depth and at a reference
depth of 10 cm of the 5 cm stretched mask with the 10 cm stretched one, it can be
deduced that there was an insignificant change in the dose values by factors of 0.05% and
0.06%. Considering the skin dose, dose at maximum depth, and dose at a reference depth
of 10 cm, while increasing field size from 5 x 5 to 20 x 20 cm2, the skin dose fluctuated
between 0.35 Gy and 0.52 Gy; dmax had fluctuations within the different field sizes; and at
University of Ghana http://ugspace.ug.edu.gh
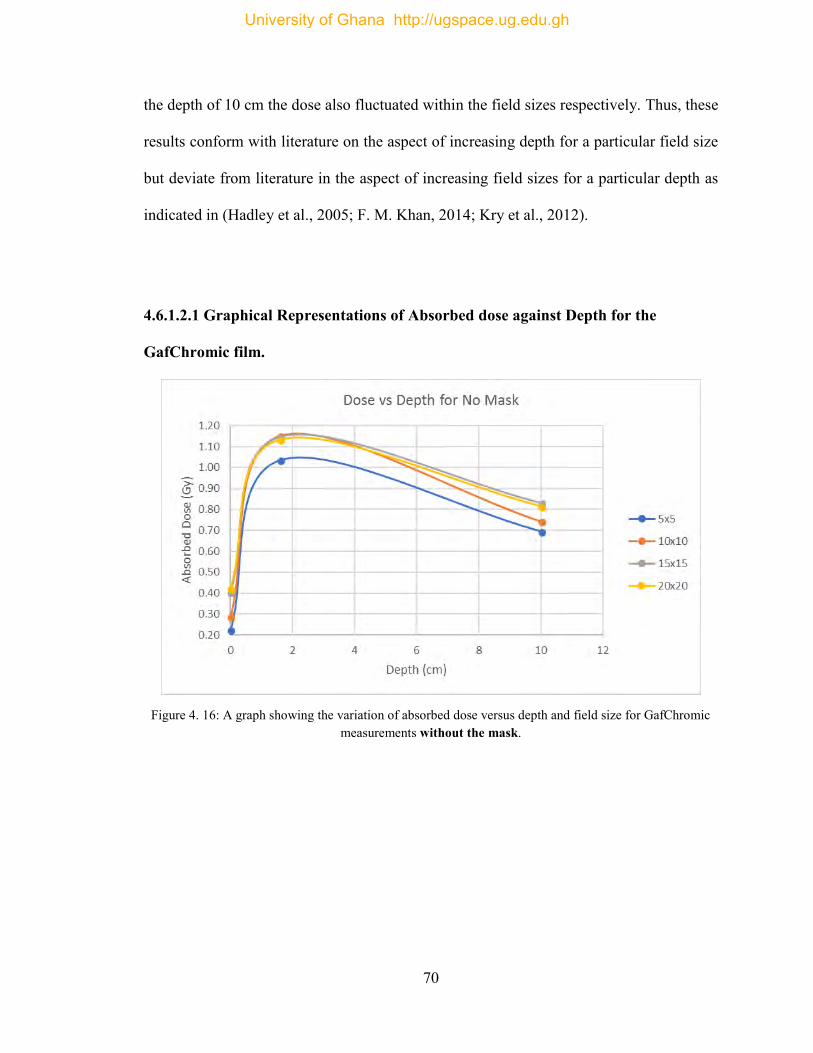
70
the depth of 10 cm the dose also fluctuated within the field sizes respectively. Thus, these
results conform with literature on the aspect of increasing depth for a particular field size
but deviate from literature in the aspect of increasing field sizes for a particular depth as
indicated in (Hadley et al., 2005; F. M. Khan, 2014; Kry et al., 2012).
4.6.1.2.1 Graphical Representations of Absorbed dose against Depth for the
GafChromic film.
Figure 4. 16: A graph showing the variation of absorbed dose versus depth and field size for GafChromic
measurements without the mask.
University of Ghana http://ugspace.ug.edu.gh
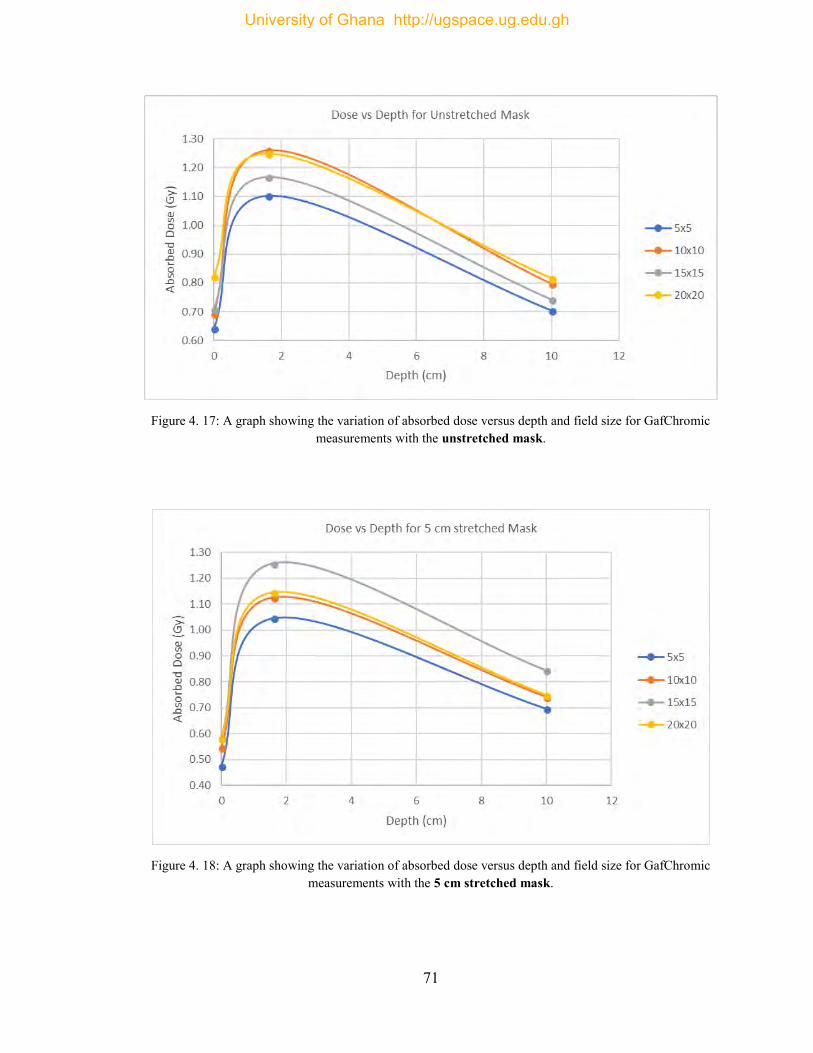
71
Figure 4. 17: A graph showing the variation of absorbed dose versus depth and field size for GafChromic
measurements with the unstretched mask.
Figure 4. 18: A graph showing the variation of absorbed dose versus depth and field size for GafChromic
measurements with the 5 cm stretched mask.
University of Ghana http://ugspace.ug.edu.gh
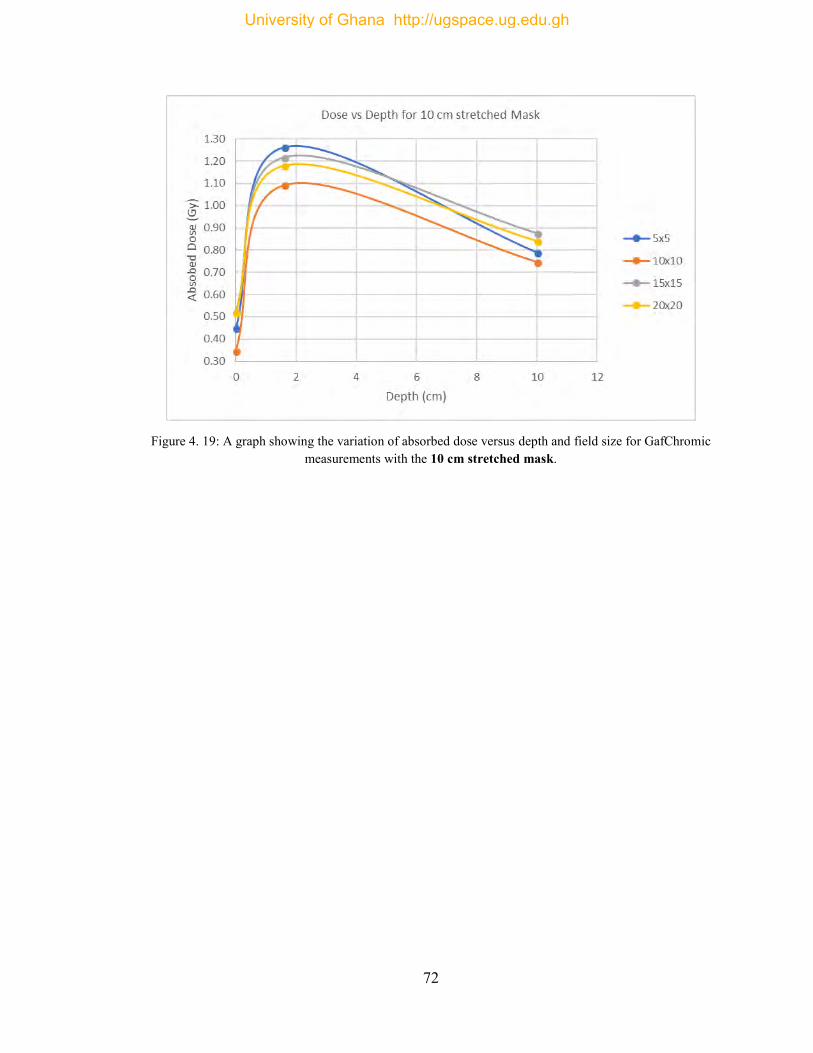
72
Figure 4. 19: A graph showing the variation of absorbed dose versus depth and field size for GafChromic
measurements with the 10 cm stretched mask.
University of Ghana http://ugspace.ug.edu.gh
73
CHAPTER FIVE
CONCLUSION AND RECOMMENDATIONS
5.1 Conclusions
The purpose of this research was to examine and analyze the effects of thermoplastic
masks used as immobilization devices for cancer treatments in the head and neck region
on the skin and the build-up region doses in terms of the thermoplastic percentage depth
dose, thermoplastic factor and the changes in the skin dose and build-up region.
Taking into consideration measurements done with the ionization chamber, the surface
dose, the dose at maximum depth (dmax) and the dose at a reference depth of 10 cm were
found to increase with increasing mask thickness and increasing field size respectively.
Due to the presence of the thermoplastic mask during measurements, the dose in the
build-up region increased, subsequently shifting dmax, to increasingly lower depths to the
skin surface. For a field size of 10 x 10 cm, an increase in skin dose of 0.21, 0.13 and
0.05 Gy was estimated for the unstretched mask, the 5 cm stretched mask and the 10 cm
stretched mask respectively, which was ascribed to the “bolus” effect of the thermoplastic
masks. For the various field sizes, the skin dose increased by an average factor less than
1% for the different mask stretches. However, a variation within 1% was recorded
although the skin dose decreased as the mask was extended.
The thermoplastic factor at the skin surface was also found to increase with an increasing
mask thickness and for a particular mask type (unstretched, 5 cm stretched, or 10 cm
stretched) the thermoplastic factor decreased with increasing field size. With respect to
the doses obtained using the GafChromic EBT3 films, there were lots of discrepancies in
University of Ghana http://ugspace.ug.edu.gh
74
the values which varied significantly with those obtained using the ionization chamber.
The main cause behind the variation between the GafChromic EBT3 film and the
ionization chamber dose values is the inhomogeneous composition of the GafChromic
film emanating from the film’s manufacturing process. Note that the film and the ion
chamber measurements were yielding and comparing absolute dose values, that is, no
normalization was applied.
It can generally be concluded that multiple factors contributed to the observed increase in
skin dose during the measurements and these include, the bolus effect of the
immobilization mask (the thickness of the mask use), the inadvertent inclusion of the skin
as a part of the target volume and field size.
The results obtained from the dose verification using the anthropomorphic phantom and
diodes clearly confirms the fact that the presence of the thermoplastic mask and
increasing field size with or without the mask increases the skin dose. The percentage
differences obtained were all less than 1% which falls within the tolerance limit of ±1%.
A vivid comparison of this work with that performed by (Adu-poku, 2017) a formal
student of the Department of Medical Physics, on the “Dosimetric Effects of
Thermoplastic Immobilizing Devices on Skin Dose” was done. It was found that the skin
dose, the dose at maximum depth and at a reference depth of 10 cm, increased with
increasing mask thickness and also increasing the field sizes respectively. With respect to
the thermoplastic mask factor, both studies found that it increased at the skin surface as
the mask thickness was increased and for a particular mask type (stretched or
unstretched) the thermoplastic mask factor decreased with increasing field size. In both
situations, the rise in dose was associated with the “bolus” effect caused by the presence
University of Ghana http://ugspace.ug.edu.gh
75
of the thermoplastic mask. Although, her work was performed on a Cobalt-60 (energy =
1.25 MeV) machine at Komfo Anokye Teaching Hospital, Kumasi, a variation within 1%
was recorded although the skin dose decreased as the mask was extended for both
studies.
5.2 Recommendations
At the Sweden Ghana Medical Center, when a thermoplastic mask is to be used at
simulation, it should be stretched firmly toward the patient’s skin surface to thin the
polystyrene in the targeted area in order to minimize the bolus effect, the build-up effect
and increase the skin sparing effect, bearing in mind not to compromise the rigidity of the
mask as it will decrease the mask’s capability to function properly as an immobilization
device. Also, taking into account the skin as one of the sensitive structures will be
possible to reduce the skin dose to a tolerable level without compromising the tumor
target coverage during the treatment planning.
Since thermoplastic immobilization masks are said to increase the dose to the skin
significantly, it is recommended that the thermoplastic mask factor should be
incorporated into the treatment planning system, just as in tray factors, in order to account
for the effect of the increase in skin dose.
5.3 Further Research
Additional work should be done using two different beam energies (example 6 MV and
15 MV) to study and compare the effect of the thermoplastic mask used as immobilizing
device on skin dose.
University of Ghana http://ugspace.ug.edu.gh
76
REFERENCES
Adu-poku, O. (2017). Dosimetric effects of thermoplastic immobilizing devices on skin dose. University of Ghana, Legon. https://doi.org/10.1038/253004b0
Alnawaf, H., Butson, M., & Yu, P. K. N. (2012). Measurement and effects of MOSKIN detectors on skin dose during high energy radiotherapy treatment. Australasian Physical & Engineering Sciences in Medicine, 35(3), 321–328. https://doi.org/10.1007/s13246-012-0153-1
Andreo, P., Almond, P. R., Mattsson, O., Nahum, A. E., & Roos, M. (1995). THE USE OF PLANE-PARALLEL IONIZATION CHAMBERS IN HIGH-ENERGY ELECTRON AND PHOTON BEAMS. AN INTERNATIONAL CODE OF PRACTICE FOR DOSIMETRY. IAEA Technical Report Series, TRS-381(December), 1–143.
Basics of Radiation Therapy | Clinical Gate. (2015). Retrieved February 8, 2018, from https://clinicalgate.com/basics-of-radiation-therapy-2/
Biggs, P. J., & Ling, C. C. (1979). Electrons as the cause of the observed dmax shift with field size in high energy photon beams. Medical Physics, 6(4), 291–295. https://doi.org/10.1118/1.594580
Borca, V. C., Pasquino, M., Russo, G., Grosso, P., Cante, D., Sciacero, P., … Tofani, S. (2013a). Dosimetric characterization and use of GAFCHROMIC EBT3 film for IMRT dose verification. Journal of Applied Clinical Medical Physics, 14(2), 158–171. https://doi.org/10.1120/jacmp.v14i2.4111
Borca, V. C., Pasquino, M., Russo, G., Grosso, P., Cante, D., Sciacero, P., … Tofani, S. (2013b). Dosimetric characterization and use of GAFCHROMIC EBT3 film for IMRT dose verification. Journal of Applied Clinical Medical Physics, 14(2), 158–171. https://doi.org/10.1120/jacmp.v14i2.4111
Butson, M. J., Cheung, T., & Yu, P. K. N. (2007). Megavoltage x-ray skin dose variation with an angle using grid carbon fibre couch tops. Physics in Medicine and Biology, 52(20), N485–N492. https://doi.org/10.1088/0031-9155/52/20/N03
Butson, M. J., Perez, M. D., Mathur, J. N., & Metcalfe, P. E. (1996). 6MV x-ray dose in the build up region: empirical model and the incident angle effect. Australasian Physical & Engineering Sciences in Medicine, 19(2), 74–82. Retrieved from http://www.ncbi.nlm.nih.gov/pubmed/8826712
Butson, M. J., Yu, P. K. N., & Metcalfe, P. E. (1998). Measurement of off-axis and peripheral skin dose using radiochromic film. Physics in Medicine and Biology, 43(9), 2647–2650. https://doi.org/10.1088/0031-9155/43/9/015
Butson, M. J., Yu, P. K. N., & Metcalfe, P. E. (1999). Extrapolated surface dose measurements with radiochromic film. Medical Physics, 26(3), 485–488. https://doi.org/10.1118/1.598539
University of Ghana http://ugspace.ug.edu.gh
77
Butson, M., Mathur, J., & Metcalfe, P. (1997). Skin dose from radiotherapy X-ray beams: The influence of energy. Australasian Radiology, 41(2), 148–150.
Chiu-Tsao, S. T., & Chan, M. F. (2009). Photon beam dosimetry in the superficial buildup region using radiochromic EBT film stack. Medical Physics, 36(6), 2074–2083. https://doi.org/10.1118/1.3125134
Court, L. E., Tishler, R., Xiang, H., Allen, A. M., Makrigiorgos, M., & Chin, L. (2008). Experimental evaluation of the accuracy of skin dose calculation for a commercial treatment planning system. Journal of Applied Clinical Medical Physics / American College of Medical Physics, 9(1), 2792.
De Ost, B., Vanregemorter, J., Schaeken, B., & Van Den Weyngaert, D. (1997). The effect of carbon fibre inserts on the build-up and attenuation of high energy photon beams. Radiotherapy and Oncology, 45(3), 275–277. https://doi.org/10.1016/S0167-8140(97)00118-7
Dogan, N., & Glasgow, G. P. (2003). Surface and build-up region dosimetry for obliquely incident intensity modulated radiotherapy 6 MV x rays. Medical Physics, 30(12), 3091–3096. https://doi.org/10.1118/1.1625116
Eliceiri, K. W., & Rueden, C. (2005). Tools for visualizing multidimensional images from living specimens. Photochemistry and Photobiology, 81(5), 1116–1122. https://doi.org/10.1562/2004-11-22-IR-377
Fiorino, C., Cattaneo, G. M., del Vecchio, a, Longobardi, B., Signorotto, P., Calandrino, R., … Volterrani, F. (1992). Skin dose measurements for head and neck radiotherapy. Medical Physics, 19(5), 1263–1266. https://doi.org/10.1118/1.596758
Gagnon, W. F., & Horton, J. L. (1979). Physical factors affecting absorbed dose to the skin from cobalt-60 gamma rays and 25-MV x rays. Medical Physics, 6(4), 285–290. https://doi.org/10.1118/1.594583
Girish, V., Vijayalakshmi, a. (2004). Affordable Image Analysis using NIH Image / ImageJ. Indian Journal of Cancer, 41(1), 47.
Hadley, S. W., Kelly, R., & Lam, K. (2004). Effects of immobilization mask material on surface dose. Journal of Applied Clinical Medical Physics [Electronic Resource] / American College of Medical Physics., 6(1), 1–7. https://doi.org/10.1120/jacmp.2023.25317
Hadley, S. W., Kelly, R., & Lam, K. (2005). Effects of immobilization mask material on surface dose. Journal of Applied Clinical Medical Physics / American College of Medical Physics, 6(1), 1–7. https://doi.org/10.1120/jacmp.v6i1.1957
Higgins, D. M., Whitehurst, P., & Morgan, A. M. (2001). The effect of carbon fiber couch inserts on surface dose with beam size variation. Medical Dosimetry, 26(3), 251–254. https://doi.org/10.1016/S0958-3947(01)00071-1
Hounsell, A. R., & Wilkinson, J. M. (1999). Electron contamination and build-up doses in conformal radiotherapy fields. Physics in Medicine and Biology, 44(1), 43–55. https://doi.org/10.1088/0031-9155/44/1/005
University of Ghana http://ugspace.ug.edu.gh
78
Hsu, S.-H., Roberson, P. L., Chen, Y., Marsh, R. B., Pierce, L. J., & Moran, J. M. (2008). Assessment of skin dose for breast chest wall radiotherapy as a function of bolus material. Physics in Medicine and Biology, 53(10), 2630. https://doi.org/10.1088/0031-9155/53/10/010
ICRP. (1977). Recommendations of the International Commission on Radiological Protection. ICRP Publication 26. Annals of the ICRP, 1(3), 2–3. https://doi.org/10.1017/CBO9781107415324.004
ICRU. (1985). ICRU Report 39: Determination of Dose Equivalents Resulting from External Radiation Sources. Retrieved from papers3://publication/uuid/76C5448B-62FD-4031-A86D-AF520E686CD0
Jones, D. (1994). ICRU Report 50-Prescribing, Recording and Reporting Photon Beam Therapy. Medical Physics, 21(6), 833–834. https://doi.org/10.1118/1.597396
Khan, F. M. (1971). Use of electron filter to reduce skin dose in cobalt teletherapy. American Journal of Roentgenology, 111(1), 80–81.
Khan, F. M. (2014). The Physics of Radiation Therapy (5th Ed). Lippincott Williams & Wilkins.
Khan, F., Moore, V., & Levitt, S. (1973). Effect of various atomic number absorbers on skin dose for 10-MeV x-rays. Radiol-ogy, 109, 209. https://doi.org/10.1148/109.1.209
Kim, S., Liu, C. R., Zhu, T. C., & Palta, J. R. (1998). Photon beam skin dose analyses for different clinical setups. Medical Physics, 25(6), 860–866. https://doi.org/10.1118/1.598261
Klein, E. E., & Purdy, J. A. (1993). Entrance and exit dose regions for a clinac-2100c. International Journal of Radiation Oncology, Biology, Physics, 27(2), 429–435. https://doi.org/10.1016/0360-3016(93)90256-U
Kron, T., & Ostwald, P. (1995). Skin exit dose in megavoltage x-ray beams determined by means of a plane parallel ionization chamber (Attix chamber). Medical Physics, 22(5), 577–578. https://doi.org/10.1118/1.597544
Kry, S. F., Smith, S. A., Weathers, R., & Stovall, M. (2012). Skin dose during radiotherapy: A summary and general estimation technique. Journal of Applied Clinical Medical Physics, 13(3), 20–34. https://doi.org/10.1118/1.3469011
Lamb, A., & Blake, S. (1998). Investigation and modelling of the surface dose from linear accelerator produced 6 and 10 MV photon beams. Physics in Medicine and Biology, 43(5), 1133–1146. https://doi.org/10.1088/0031-9155/43/5/006
Lee, N., Chuang, C., Quivey, J. M., Phillips, T. L., Akazawa, P., Verhey, L. J., & Xia, P. (2002). Skin toxicity due to intensity-modulated radiotherapy for head-and-neck carcinoma. International Journal of Radiation Oncology Biology Physics, 53(3), 630–637. https://doi.org/10.1016/S0360-3016(02)02756-6
Lewis, D. (2009). Gafchromic ® EBT2. Isp, 1–17.
University of Ghana http://ugspace.ug.edu.gh
79
Lewis, D., Micke, A., Yu, X., & Chan, M. F. (2012). An efficient protocol for radiochromic film dosimetry. Medical Physics, 39(10), 6339. https://doi.org/10.1118/1.4754797
Lin, J.-P., Chu, T.-C., Lin, S.-Y., & Liu, M.-T. (2001). Skin dose measurement by using ultra-thin TLDs. Applied Radiation and Isotopes, 55(3), 383–391. https://doi.org/10.1016/S0969-8043(01)00082-3
Marbach, J. R., & Almond, P. R. (1977). Scattered photons as the cause for the observed dmax shift with field size in high-energy photon beams. Medical Physics, 4(4), 310–314. https://doi.org/10.1118/1.594319
Mellenberg, D. E. (1995). Dose behind various immobilization and beam-modifying devices. International Journal of Radiation Oncology, Biology, Physics, 32(4), 1193–1197. https://doi.org/10.1016/0360-3016(94)00371-Q
Menegotti, L., Delana, A., & Martignano, A. (2008). Radiochromic film dosimetry with flatbed scanners: A fast and accurate method for dose calibration and uniformity correction with single film exposure. Medical Physics, 35(7), 3078–3085. https://doi.org/10.1118/1.2936334
Meyer, L. (2014). What to Do When Radiation Causes Skin Damage. Retrieved February 18, 2018, from https://www.curetoday.com/publications/cure/2014/spring2014/what-to-do-when-radiation-causes-skin-damage
Musolino, S. V. (2000). Absorbed Dose Determination in External Beam Radiotherapy: An International Code of Practice for Dosimetry Based on Standards of Absorbed Dose to Water; Technical Reports Series No. 398,. Health Physics (Vol. 81). https://doi.org/10.1097/00004032-200111000-00017
Nichiporov, D., Kostjuchenko, V., Puhl, J. M., Bensen, D. L., Desrosiers, M. F., Dick, C. E., … Zink, S. (1995). Investigation of applicability of alanine and radiochromic detectors to dosimetry of proton clinical beams. Applied Radiation and Isotopes, 46(12), 1355–1362. https://doi.org/10.1016/0969-8043(95)00213-W
Nilsson, B., & Brahme, A. (1986). Electron contamination from photon beam collimators. Radiotherapy and Oncology : Journal of the European Society for Therapeutic Radiology and Oncology, 5(3), 235–244. https://doi.org/10.1016/S0167-8140(86)80053-6
Niroomand-Rad, A., Blackwell, C. R., Coursey, B. M., Gall, K. P., Galvin, J. M., Mclaughlin, W. L., … Soares, C. G. (1998). Radiochromic Film Dosimetry: Recommendation of AAPM Radiation Therapy Committe Task Group 55, 25(11), 2093–2115.
Padikal, T. N., & Deye, J. A. (1978). Electron contamination of a high-energy x-ray beam. Physics in Medicine and Biology, 23(6), 1086–1092. https://doi.org/10.1088/0031-9155/23/6/004
Panettieri, V., Barsoum, P., Westermark, M., Brualla, L., & Lax, I. (2009). AAA and
University of Ghana http://ugspace.ug.edu.gh
80
PBC calculation accuracy in the surface build-up region in tangential beam treatments. Phantom and breast case study with the Monte Carlo code penelope. Radiotherapy and Oncology, 93(1), 94–101. https://doi.org/10.1016/j.radonc.2009.05.010
Pillai, K., Rao, P. S., & Gregg, E. C. (1973). Effect of shadow trays on surface dose and buildup for megavoltage radiation. American Journal of Roentgenology, 117(1), 68–74.
Podgorsak, E. B., & Rosenberg, I. (2005). Radiation Oncology Physics: A Handbook for Teachers and Students. International Atomic Energy Agency. https://doi.org/10.1038/sj.bjc.6604224
Prabhu, L. (2012). Immobilization in radiotherapy. Retrieved from https://www.slideshare.net/prabhurt/immobilization-in-radiotherapy
Purdy, J. A. (1986). Buildup/surface dose and exit dose measurements for a 6-MV linear accelerator. Medical Physics, 13(2), 259–262. https://doi.org/10.1118/1.595908
Rapley, P. (2006). Surface dose measurement using TLD powder extrapolation. Medical Dosimetry, 31(3), 209–215. https://doi.org/10.1016/j.meddos.2006.02.003
Rawlinson, J. A., Arlen, D., & Newcombe, D. (1992). Design of parallel plate ion chambers for buildup measurements in megavoltage photon beams. Medical Physics, 19(3), 641–648. https://doi.org/10.1118/1.596896
Sipilä, P., Ojala, J., Kaijaluoto, S., Jokelainen, I., & Kosunen, A. (2016). Gafchromic EBT3 film dosimetry in electron beams - energy dependence and improved film read-out. Journal of Applied Clinical Medical Physics, 17(1), 360–373. https://doi.org/10.1120/jacmp.v17i1.5970
Stathakis, S., Li, J. S., Paskalev, K., Yang, J., Wang, L., & Ma, C. M. (2006). Ultra-thin TLDs for skin dose determination in high energy photon beams. Physics in Medicine and Biology, 51(14), 3549–3567. https://doi.org/10.1088/0031-9155/51/14/018
Stevens, M. A., Turner, J. R., Hugtenburg, R. P., & Butler, P. H. (1996). High-resolution dosimetry using radiochromic film and a document scanner. Physics in Medicine and Biology, 41(11), 2357–2365. https://doi.org/10.1088/0031-9155/41/11/008
Sweeney, R. (B. S., Bale, R. (M. D., Vogele, M., Nevinny-Stickel, M. (M. D., Bluhm, A. (R. T. T., Auer, T. (B. S., … Lukas, P. (M. D. (1998). Repositioning accuracy: Comparison of a noninvasive head holder with thermoplastic mask for fractionated radiotherapy and a case report. International Journal of Radiation Oncology Biology Physics, 41(2), 475–483. https://doi.org/http://dx.doi.org/10.1016/S0360-3016(98)00064-9
Tabakov, S., Milano, F., Strand, S.-E., Lewis, C., & Sprawls, P. (2008). Encyclopaedia of Medical Physics Volume I and II.
Vatnitsky, S. M. (1997). Radiochromic film dosimetry for clinical proton beams. Applied Radiation and Isotopes, 48(5), 643–651. https://doi.org/10.1016/S0969-8043(97)00342-4
University of Ghana http://ugspace.ug.edu.gh
81
Vatnitsky, S. M., Schulte, R. W. M., Galindo, R., Meinass, H. J., & Miller, D. W. (1997). Radiochromic film dosimetry for verification of dose distributions delivered with proton-beam radiosurgery, 1887(42).
Velkley, D. E., Manson, D. J., Purdy, J. A., & Oliver, G. D. (1975). Build up region of megavoltage photon radiation sources. Medical Physics, 2(1), 14–19. https://doi.org/10.1118/1.594158
Williams, J., & Thwaites, D. (2000). Radiotherapy Physics: in Practice. Oxford University Press (2nd Ed). Oxford University Press.
Yadav, G., Yadav, R. S., & Kumar, A. (2009). Skin dose estimation for various beam modifiers and source-to-surface distances for 6MV photons. Journal of Medical Physics / Association of Medical Physicists of India, 34(2), 87–92. https://doi.org/10.4103/0971-6203.51935
Yu, P. K. N., Cheung, T., & Butson, M. J. (2003). Variations in skin dose using 6MV or 18MV x-ray beams. Australasian Physical & Engineering Sciences in Medicine / Supported by the Australasian College of Physical Scientists in Medicine and the Australasian Association of Physical Sciences in Medicine, 26(2), 79–81. https://doi.org/10.1007/BF03178461
University of Ghana http://ugspace.ug.edu.gh
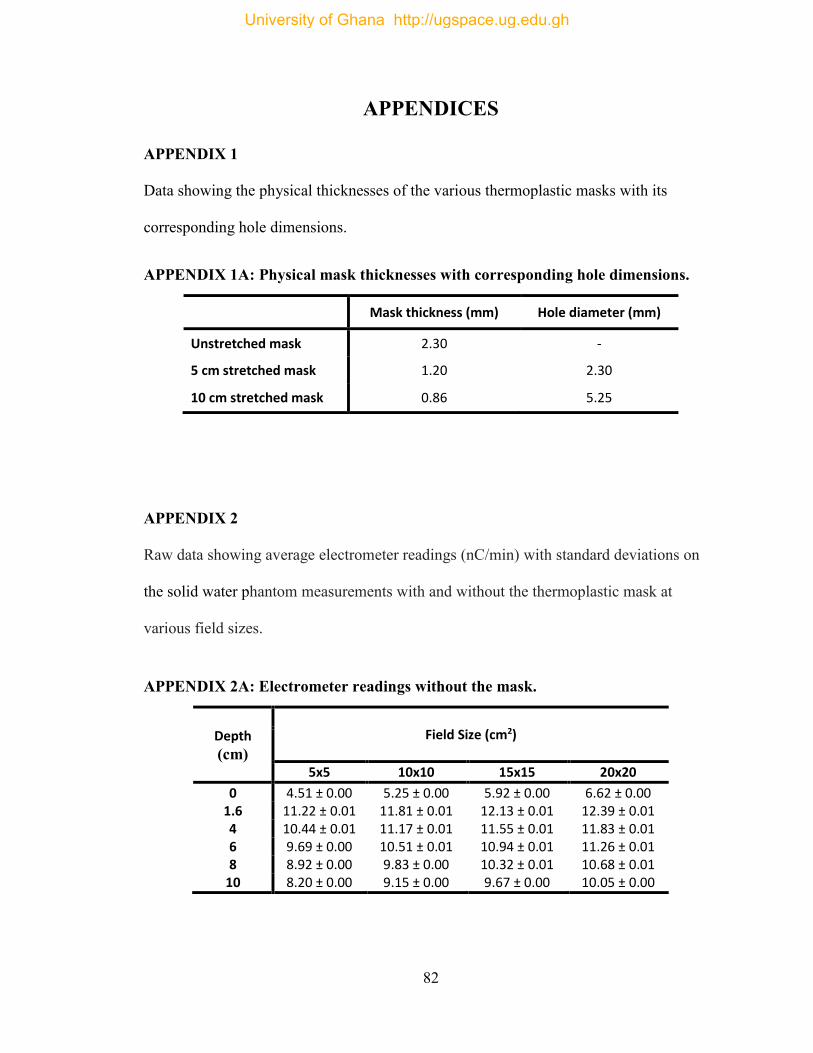
82
APPENDICES
APPENDIX 1
Data showing the physical thicknesses of the various thermoplastic masks with its
corresponding hole dimensions.
APPENDIX 1A: Physical mask thicknesses with corresponding hole dimensions.
Mask thickness (mm) Hole diameter (mm)
Unstretched mask 2.30 -
5 cm stretched mask 1.20 2.30
10 cm stretched mask 0.86 5.25
APPENDIX 2
Raw data showing average electrometer readings (nC/min) with standard deviations on
the solid water phantom measurements with and without the thermoplastic mask at
various field sizes.
APPENDIX 2A: Electrometer readings without the mask.
Depth
(cm)
Field Size (cm2)
5x5 10x10 15x15 20x20
0 4.51 ± 0.00 5.25 ± 0.00 5.92 ± 0.00 6.62 ± 0.00 1.6 11.22 ± 0.01 11.81 ± 0.01 12.13 ± 0.01 12.39 ± 0.01 4 10.44 ± 0.01 11.17 ± 0.01 11.55 ± 0.01 11.83 ± 0.01 6 9.69 ± 0.00 10.51 ± 0.01 10.94 ± 0.01 11.26 ± 0.01 8 8.92 ± 0.00 9.83 ± 0.00 10.32 ± 0.01 10.68 ± 0.01
10 8.20 ± 0.00 9.15 ± 0.00 9.67 ± 0.00 10.05 ± 0.00
University of Ghana http://ugspace.ug.edu.gh
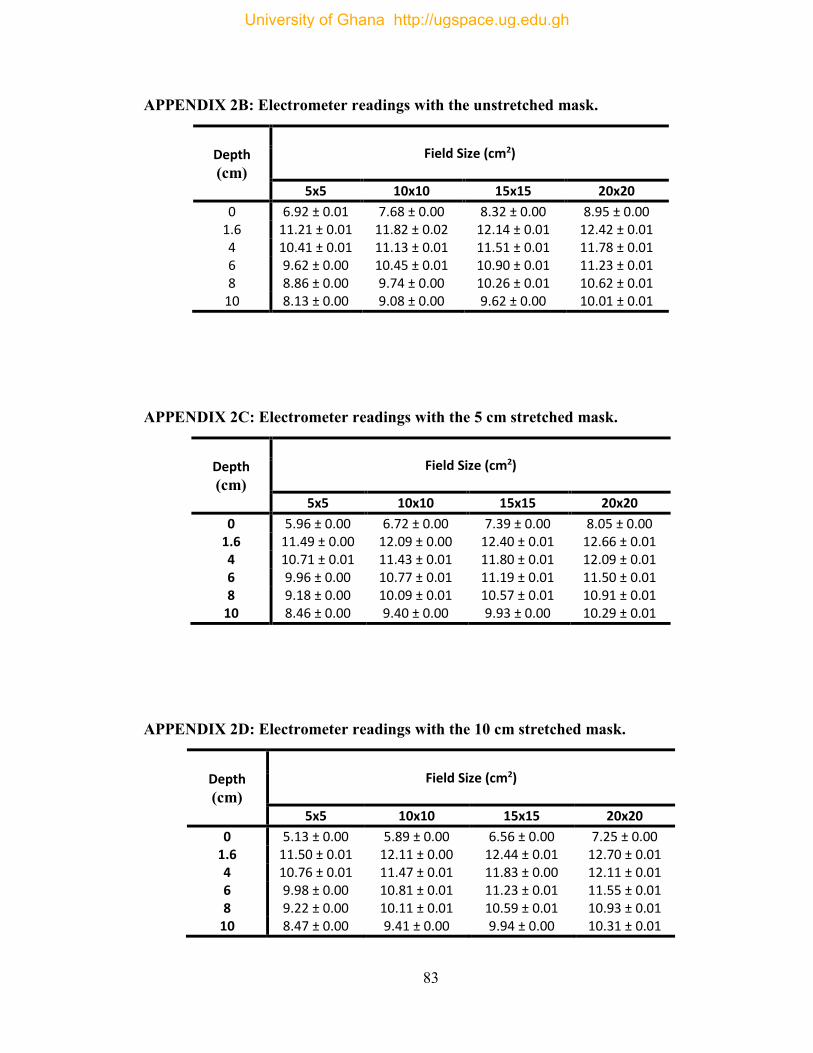
83
APPENDIX 2B: Electrometer readings with the unstretched mask.
Depth
(cm)
Field Size (cm2)
5x5 10x10 15x15 20x20
0 6.92 ± 0.01 7.68 ± 0.00 8.32 ± 0.00 8.95 ± 0.00 1.6 11.21 ± 0.01 11.82 ± 0.02 12.14 ± 0.01 12.42 ± 0.01 4 10.41 ± 0.01 11.13 ± 0.01 11.51 ± 0.01 11.78 ± 0.01 6 9.62 ± 0.00 10.45 ± 0.01 10.90 ± 0.01 11.23 ± 0.01 8 8.86 ± 0.00 9.74 ± 0.00 10.26 ± 0.01 10.62 ± 0.01
10 8.13 ± 0.00 9.08 ± 0.00 9.62 ± 0.00 10.01 ± 0.01
APPENDIX 2C: Electrometer readings with the 5 cm stretched mask.
Depth
(cm)
Field Size (cm2)
5x5 10x10 15x15 20x20
0 5.96 ± 0.00 6.72 ± 0.00 7.39 ± 0.00 8.05 ± 0.00 1.6 11.49 ± 0.00 12.09 ± 0.00 12.40 ± 0.01 12.66 ± 0.01 4 10.71 ± 0.01 11.43 ± 0.01 11.80 ± 0.01 12.09 ± 0.01 6 9.96 ± 0.00 10.77 ± 0.01 11.19 ± 0.01 11.50 ± 0.01 8 9.18 ± 0.00 10.09 ± 0.01 10.57 ± 0.01 10.91 ± 0.01
10 8.46 ± 0.00 9.40 ± 0.00 9.93 ± 0.00 10.29 ± 0.01
APPENDIX 2D: Electrometer readings with the 10 cm stretched mask.
Depth
(cm)
Field Size (cm2)
5x5 10x10 15x15 20x20
0 5.13 ± 0.00 5.89 ± 0.00 6.56 ± 0.00 7.25 ± 0.00 1.6 11.50 ± 0.01 12.11 ± 0.00 12.44 ± 0.01 12.70 ± 0.01 4 10.76 ± 0.01 11.47 ± 0.01 11.83 ± 0.00 12.11 ± 0.01 6 9.98 ± 0.00 10.81 ± 0.01 11.23 ± 0.01 11.55 ± 0.01 8 9.22 ± 0.00 10.11 ± 0.01 10.59 ± 0.01 10.93 ± 0.01
10 8.47 ± 0.00 9.41 ± 0.00 9.94 ± 0.00 10.31 ± 0.01
University of Ghana http://ugspace.ug.edu.gh
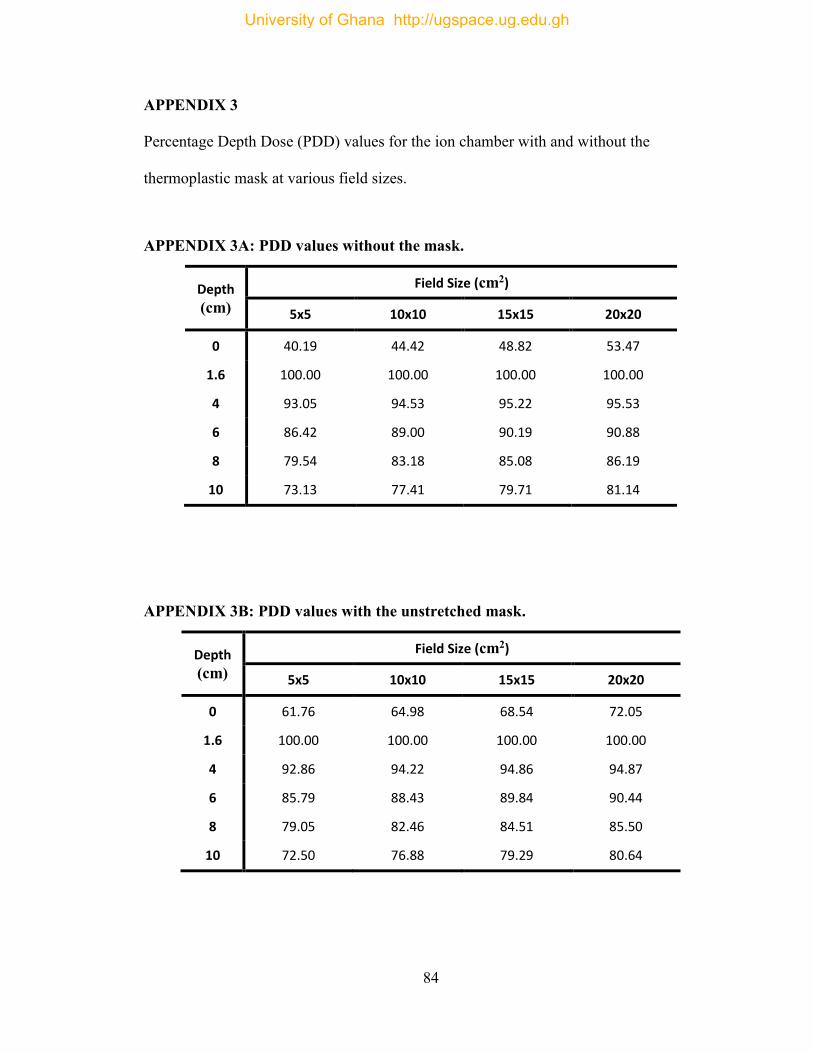
84
APPENDIX 3
Percentage Depth Dose (PDD) values for the ion chamber with and without the
thermoplastic mask at various field sizes.
APPENDIX 3A: PDD values without the mask.
Depth
(cm)
Field Size (cm2)
5x5 10x10 15x15 20x20
0 40.19 44.42 48.82 53.47
1.6 100.00 100.00 100.00 100.00
4 93.05 94.53 95.22 95.53
6 86.42 89.00 90.19 90.88
8 79.54 83.18 85.08 86.19
10 73.13 77.41 79.71 81.14
APPENDIX 3B: PDD values with the unstretched mask.
Depth
(cm)
Field Size (cm2)
5x5 10x10 15x15 20x20
0 61.76 64.98 68.54 72.05
1.6 100.00 100.00 100.00 100.00
4 92.86 94.22 94.86 94.87
6 85.79 88.43 89.84 90.44
8 79.05 82.46 84.51 85.50
10 72.50 76.88 79.29 80.64
University of Ghana http://ugspace.ug.edu.gh
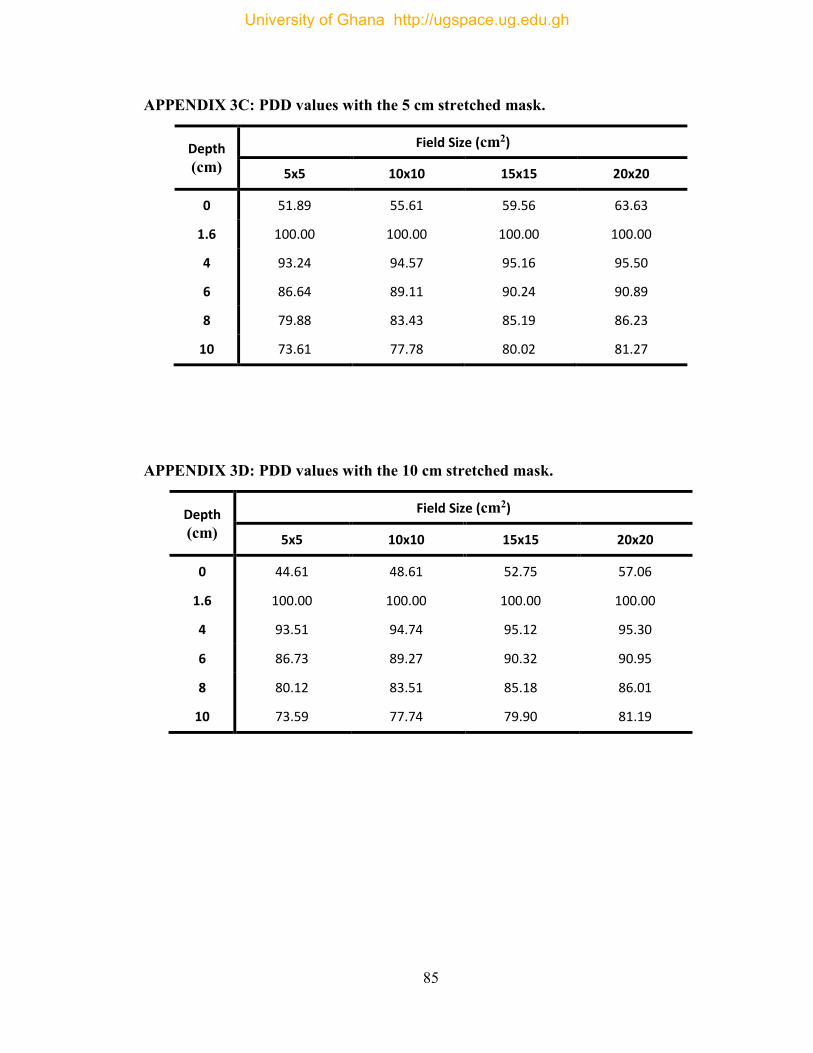
85
APPENDIX 3C: PDD values with the 5 cm stretched mask.
Depth
(cm)
Field Size (cm2)
5x5 10x10 15x15 20x20
0 51.89 55.61 59.56 63.63
1.6 100.00 100.00 100.00 100.00
4 93.24 94.57 95.16 95.50
6 86.64 89.11 90.24 90.89
8 79.88 83.43 85.19 86.23
10 73.61 77.78 80.02 81.27
APPENDIX 3D: PDD values with the 10 cm stretched mask.
Depth
(cm)
Field Size (cm2)
5x5 10x10 15x15 20x20
0 44.61 48.61 52.75 57.06
1.6 100.00 100.00 100.00 100.00
4 93.51 94.74 95.12 95.30
6 86.73 89.27 90.32 90.95
8 80.12 83.51 85.18 86.01
10 73.59 77.74 79.90 81.19
University of Ghana http://ugspace.ug.edu.gh
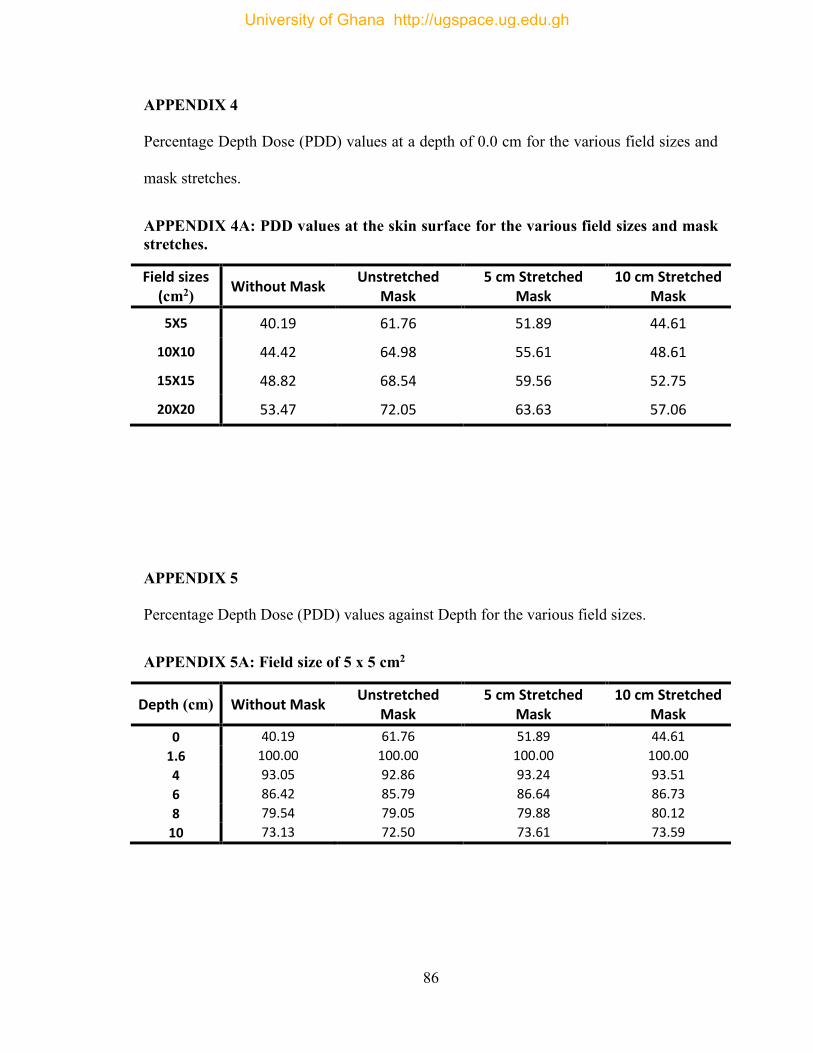
86
APPENDIX 4
Percentage Depth Dose (PDD) values at a depth of 0.0 cm for the various field sizes and
mask stretches.
APPENDIX 4A: PDD values at the skin surface for the various field sizes and mask stretches.
Field sizes (cm2) Without Mask
Unstretched Mask
5 cm Stretched Mask
10 cm Stretched Mask
5X5 40.19 61.76 51.89 44.61
10X10 44.42 64.98 55.61 48.61
15X15 48.82 68.54 59.56 52.75
20X20 53.47 72.05 63.63 57.06
APPENDIX 5
Percentage Depth Dose (PDD) values against Depth for the various field sizes.
APPENDIX 5A: Field size of 5 x 5 cm2
Depth (cm) Without Mask Unstretched
Mask 5 cm Stretched
Mask 10 cm Stretched
Mask
0 40.19 61.76 51.89 44.61
1.6 100.00 100.00 100.00 100.00
4 93.05 92.86 93.24 93.51
6 86.42 85.79 86.64 86.73
8 79.54 79.05 79.88 80.12
10 73.13 72.50 73.61 73.59
University of Ghana http://ugspace.ug.edu.gh
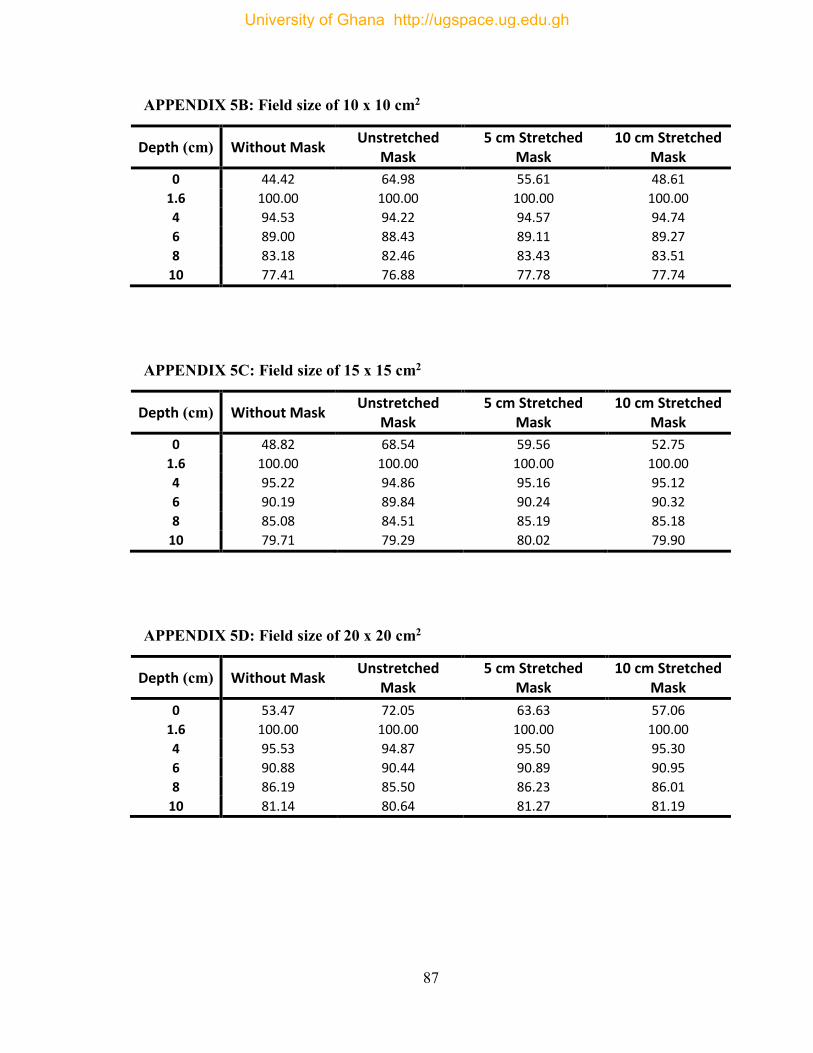
87
APPENDIX 5B: Field size of 10 x 10 cm2
Depth (cm) Without Mask Unstretched
Mask 5 cm Stretched
Mask 10 cm Stretched
Mask
0 44.42 64.98 55.61 48.61
1.6 100.00 100.00 100.00 100.00
4 94.53 94.22 94.57 94.74
6 89.00 88.43 89.11 89.27
8 83.18 82.46 83.43 83.51
10 77.41 76.88 77.78 77.74
APPENDIX 5C: Field size of 15 x 15 cm2
Depth (cm) Without Mask Unstretched
Mask 5 cm Stretched
Mask 10 cm Stretched
Mask
0 48.82 68.54 59.56 52.75
1.6 100.00 100.00 100.00 100.00
4 95.22 94.86 95.16 95.12
6 90.19 89.84 90.24 90.32
8 85.08 84.51 85.19 85.18
10 79.71 79.29 80.02 79.90
APPENDIX 5D: Field size of 20 x 20 cm2
Depth (cm) Without Mask Unstretched
Mask 5 cm Stretched
Mask 10 cm Stretched
Mask
0 53.47 72.05 63.63 57.06
1.6 100.00 100.00 100.00 100.00
4 95.53 94.87 95.50 95.30
6 90.88 90.44 90.89 90.95
8 86.19 85.50 86.23 86.01
10 81.14 80.64 81.27 81.19
University of Ghana http://ugspace.ug.edu.gh
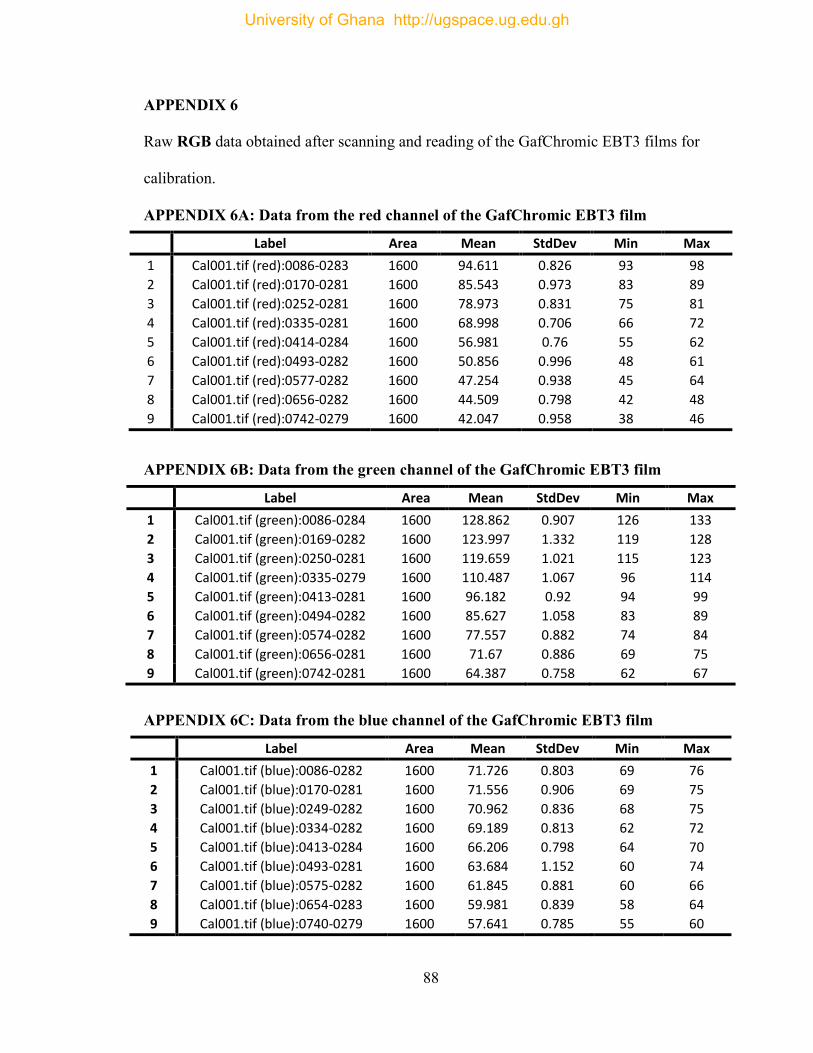
88
APPENDIX 6
Raw RGB data obtained after scanning and reading of the GafChromic EBT3 films for
calibration.
APPENDIX 6A: Data from the red channel of the GafChromic EBT3 film
Label Area Mean StdDev Min Max
1 Cal001.tif (red):0086-0283 1600 94.611 0.826 93 98
2 Cal001.tif (red):0170-0281 1600 85.543 0.973 83 89
3 Cal001.tif (red):0252-0281 1600 78.973 0.831 75 81
4 Cal001.tif (red):0335-0281 1600 68.998 0.706 66 72
5 Cal001.tif (red):0414-0284 1600 56.981 0.76 55 62
6 Cal001.tif (red):0493-0282 1600 50.856 0.996 48 61
7 Cal001.tif (red):0577-0282 1600 47.254 0.938 45 64
8 Cal001.tif (red):0656-0282 1600 44.509 0.798 42 48
9 Cal001.tif (red):0742-0279 1600 42.047 0.958 38 46
APPENDIX 6B: Data from the green channel of the GafChromic EBT3 film
Label Area Mean StdDev Min Max
1 Cal001.tif (green):0086-0284 1600 128.862 0.907 126 133
2 Cal001.tif (green):0169-0282 1600 123.997 1.332 119 128
3 Cal001.tif (green):0250-0281 1600 119.659 1.021 115 123
4 Cal001.tif (green):0335-0279 1600 110.487 1.067 96 114
5 Cal001.tif (green):0413-0281 1600 96.182 0.92 94 99
6 Cal001.tif (green):0494-0282 1600 85.627 1.058 83 89
7 Cal001.tif (green):0574-0282 1600 77.557 0.882 74 84
8 Cal001.tif (green):0656-0281 1600 71.67 0.886 69 75
9 Cal001.tif (green):0742-0281 1600 64.387 0.758 62 67
APPENDIX 6C: Data from the blue channel of the GafChromic EBT3 film
Label Area Mean StdDev Min Max
1 Cal001.tif (blue):0086-0282 1600 71.726 0.803 69 76
2 Cal001.tif (blue):0170-0281 1600 71.556 0.906 69 75
3 Cal001.tif (blue):0249-0282 1600 70.962 0.836 68 75
4 Cal001.tif (blue):0334-0282 1600 69.189 0.813 62 72
5 Cal001.tif (blue):0413-0284 1600 66.206 0.798 64 70
6 Cal001.tif (blue):0493-0281 1600 63.684 1.152 60 74
7 Cal001.tif (blue):0575-0282 1600 61.845 0.881 60 66
8 Cal001.tif (blue):0654-0283 1600 59.981 0.839 58 64
9 Cal001.tif (blue):0740-0279 1600 57.641 0.785 55 60
University of Ghana http://ugspace.ug.edu.gh
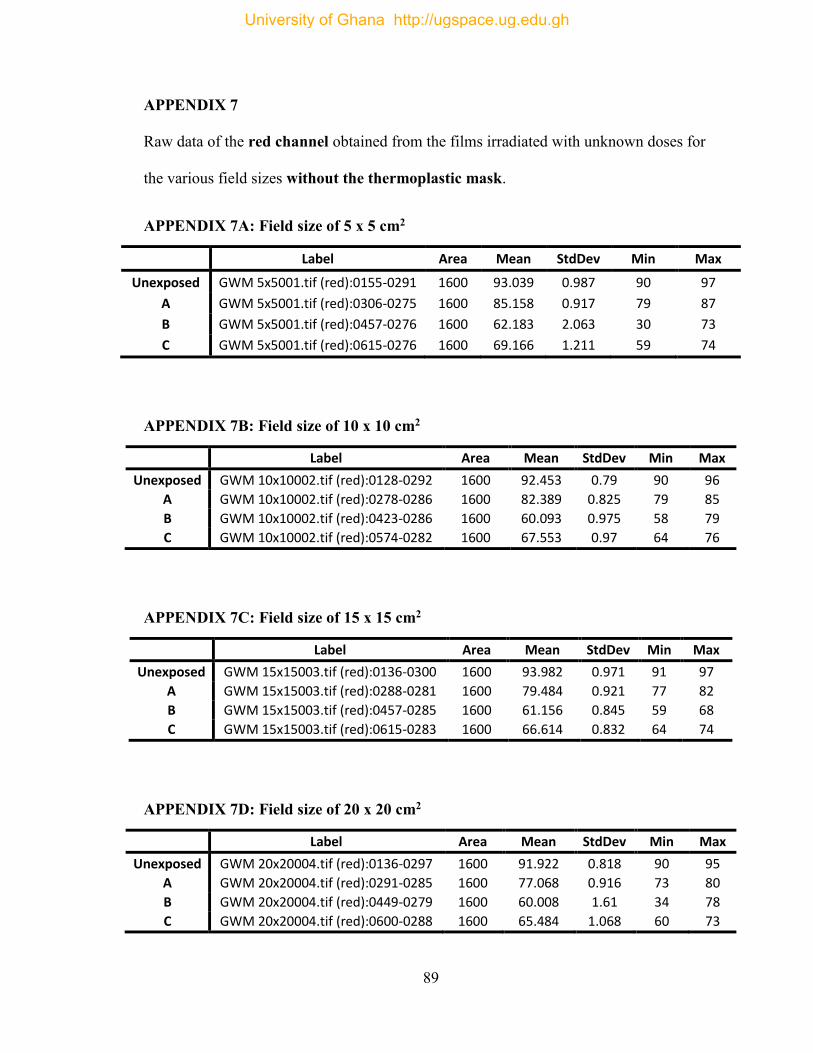
89
APPENDIX 7
Raw data of the red channel obtained from the films irradiated with unknown doses for
the various field sizes without the thermoplastic mask.
APPENDIX 7A: Field size of 5 x 5 cm2
Label Area Mean StdDev Min Max
Unexposed GWM 5x5001.tif (red):0155-0291 1600 93.039 0.987 90 97
A GWM 5x5001.tif (red):0306-0275 1600 85.158 0.917 79 87
B GWM 5x5001.tif (red):0457-0276 1600 62.183 2.063 30 73
C GWM 5x5001.tif (red):0615-0276 1600 69.166 1.211 59 74
APPENDIX 7B: Field size of 10 x 10 cm2
Label Area Mean StdDev Min Max
Unexposed GWM 10x10002.tif (red):0128-0292 1600 92.453 0.79 90 96
A GWM 10x10002.tif (red):0278-0286 1600 82.389 0.825 79 85
B GWM 10x10002.tif (red):0423-0286 1600 60.093 0.975 58 79
C GWM 10x10002.tif (red):0574-0282 1600 67.553 0.97 64 76
APPENDIX 7C: Field size of 15 x 15 cm2
Label Area Mean StdDev Min Max
Unexposed GWM 15x15003.tif (red):0136-0300 1600 93.982 0.971 91 97
A GWM 15x15003.tif (red):0288-0281 1600 79.484 0.921 77 82
B GWM 15x15003.tif (red):0457-0285 1600 61.156 0.845 59 68
C GWM 15x15003.tif (red):0615-0283 1600 66.614 0.832 64 74
APPENDIX 7D: Field size of 20 x 20 cm2
Label Area Mean StdDev Min Max
Unexposed GWM 20x20004.tif (red):0136-0297 1600 91.922 0.818 90 95
A GWM 20x20004.tif (red):0291-0285 1600 77.068 0.916 73 80
B GWM 20x20004.tif (red):0449-0279 1600 60.008 1.61 34 78
C GWM 20x20004.tif (red):0600-0288 1600 65.484 1.068 60 73
University of Ghana http://ugspace.ug.edu.gh
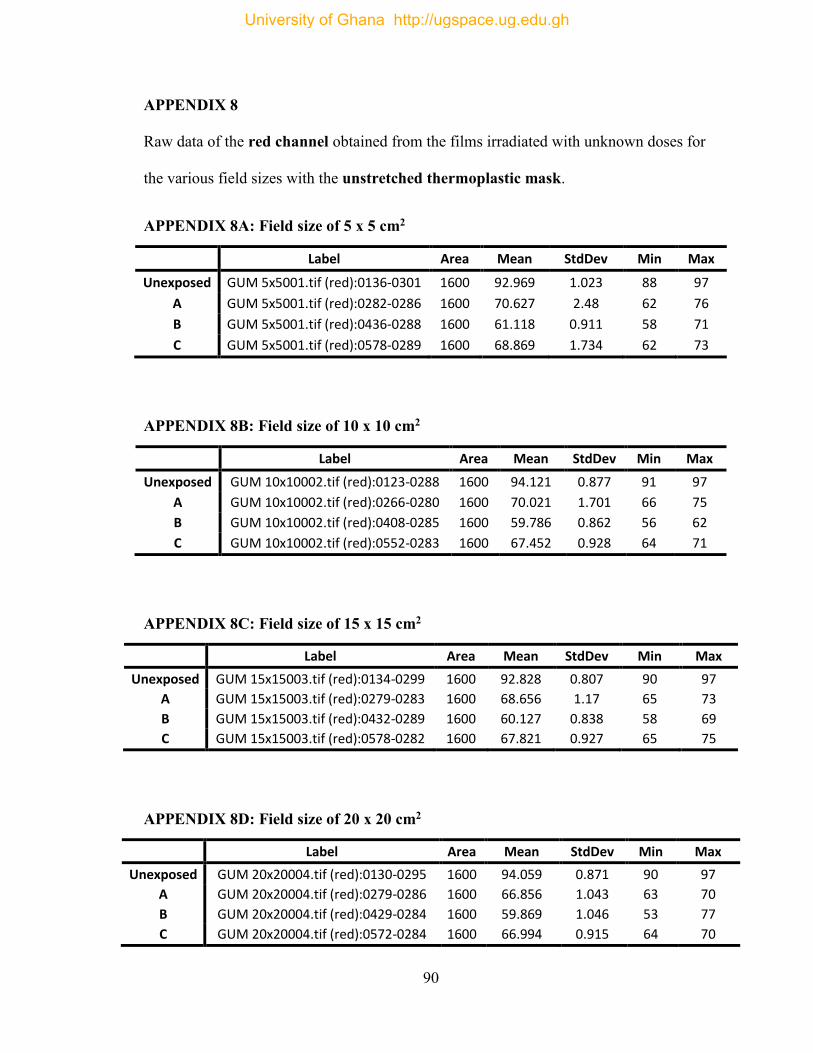
90
APPENDIX 8
Raw data of the red channel obtained from the films irradiated with unknown doses for
the various field sizes with the unstretched thermoplastic mask.
APPENDIX 8A: Field size of 5 x 5 cm2
Label Area Mean StdDev Min Max
Unexposed GUM 5x5001.tif (red):0136-0301 1600 92.969 1.023 88 97
A GUM 5x5001.tif (red):0282-0286 1600 70.627 2.48 62 76
B GUM 5x5001.tif (red):0436-0288 1600 61.118 0.911 58 71
C GUM 5x5001.tif (red):0578-0289 1600 68.869 1.734 62 73
APPENDIX 8B: Field size of 10 x 10 cm2
Label Area Mean StdDev Min Max
Unexposed GUM 10x10002.tif (red):0123-0288 1600 94.121 0.877 91 97
A GUM 10x10002.tif (red):0266-0280 1600 70.021 1.701 66 75
B GUM 10x10002.tif (red):0408-0285 1600 59.786 0.862 56 62
C GUM 10x10002.tif (red):0552-0283 1600 67.452 0.928 64 71
APPENDIX 8C: Field size of 15 x 15 cm2
Label Area Mean StdDev Min Max
Unexposed GUM 15x15003.tif (red):0134-0299 1600 92.828 0.807 90 97
A GUM 15x15003.tif (red):0279-0283 1600 68.656 1.17 65 73
B GUM 15x15003.tif (red):0432-0289 1600 60.127 0.838 58 69
C GUM 15x15003.tif (red):0578-0282 1600 67.821 0.927 65 75
APPENDIX 8D: Field size of 20 x 20 cm2
Label Area Mean StdDev Min Max
Unexposed GUM 20x20004.tif (red):0130-0295 1600 94.059 0.871 90 97
A GUM 20x20004.tif (red):0279-0286 1600 66.856 1.043 63 70
B GUM 20x20004.tif (red):0429-0284 1600 59.869 1.046 53 77
C GUM 20x20004.tif (red):0572-0284 1600 66.994 0.915 64 70
University of Ghana http://ugspace.ug.edu.gh
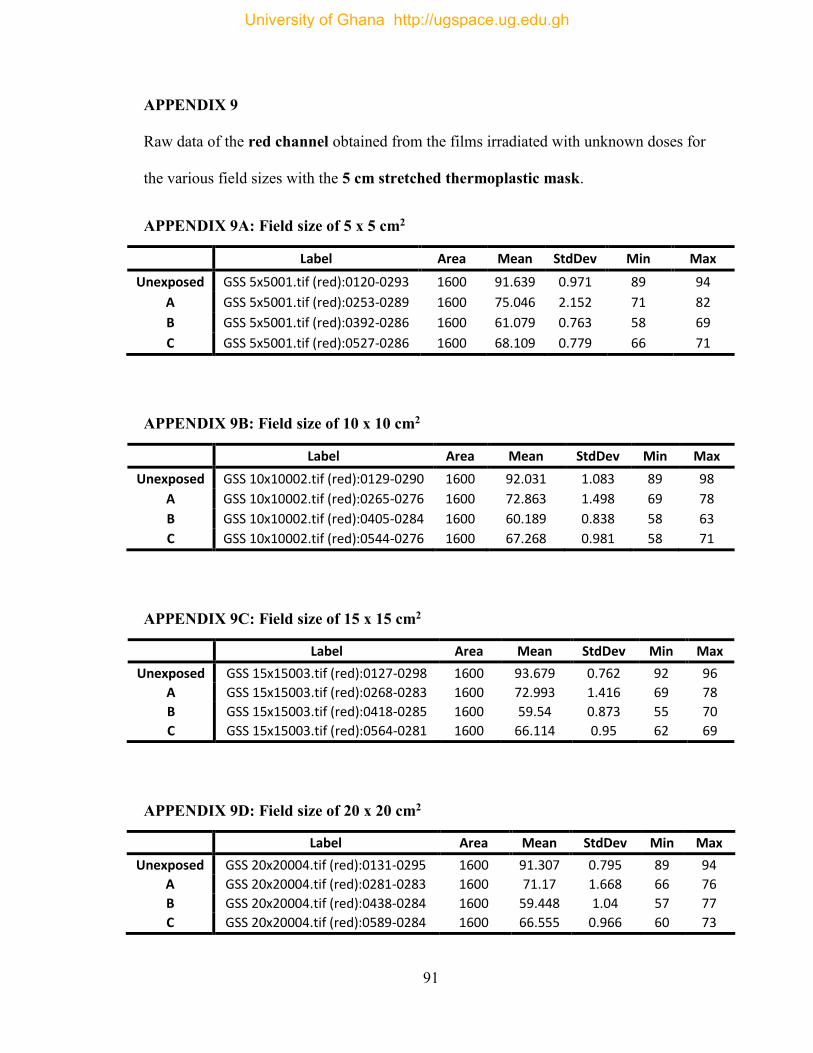
91
APPENDIX 9
Raw data of the red channel obtained from the films irradiated with unknown doses for
the various field sizes with the 5 cm stretched thermoplastic mask.
APPENDIX 9A: Field size of 5 x 5 cm2
Label Area Mean StdDev Min Max
Unexposed GSS 5x5001.tif (red):0120-0293 1600 91.639 0.971 89 94
A GSS 5x5001.tif (red):0253-0289 1600 75.046 2.152 71 82
B GSS 5x5001.tif (red):0392-0286 1600 61.079 0.763 58 69
C GSS 5x5001.tif (red):0527-0286 1600 68.109 0.779 66 71
APPENDIX 9B: Field size of 10 x 10 cm2
Label Area Mean StdDev Min Max
Unexposed GSS 10x10002.tif (red):0129-0290 1600 92.031 1.083 89 98
A GSS 10x10002.tif (red):0265-0276 1600 72.863 1.498 69 78
B GSS 10x10002.tif (red):0405-0284 1600 60.189 0.838 58 63
C GSS 10x10002.tif (red):0544-0276 1600 67.268 0.981 58 71
APPENDIX 9C: Field size of 15 x 15 cm2
Label Area Mean StdDev Min Max
Unexposed GSS 15x15003.tif (red):0127-0298 1600 93.679 0.762 92 96
A GSS 15x15003.tif (red):0268-0283 1600 72.993 1.416 69 78
B GSS 15x15003.tif (red):0418-0285 1600 59.54 0.873 55 70
C GSS 15x15003.tif (red):0564-0281 1600 66.114 0.95 62 69
APPENDIX 9D: Field size of 20 x 20 cm2
Label Area Mean StdDev Min Max
Unexposed GSS 20x20004.tif (red):0131-0295 1600 91.307 0.795 89 94
A GSS 20x20004.tif (red):0281-0283 1600 71.17 1.668 66 76
B GSS 20x20004.tif (red):0438-0284 1600 59.448 1.04 57 77
C GSS 20x20004.tif (red):0589-0284 1600 66.555 0.966 60 73
University of Ghana http://ugspace.ug.edu.gh
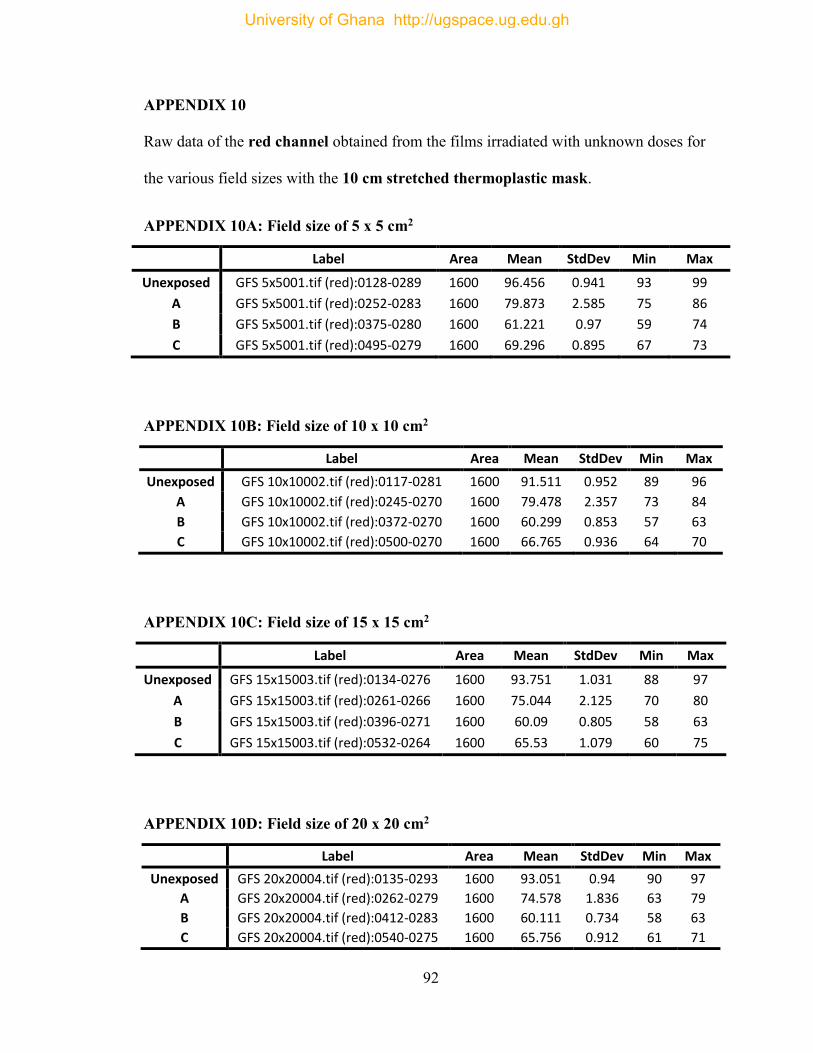
92
APPENDIX 10
Raw data of the red channel obtained from the films irradiated with unknown doses for
the various field sizes with the 10 cm stretched thermoplastic mask.
APPENDIX 10A: Field size of 5 x 5 cm2
Label Area Mean StdDev Min Max
Unexposed GFS 5x5001.tif (red):0128-0289 1600 96.456 0.941 93 99
A GFS 5x5001.tif (red):0252-0283 1600 79.873 2.585 75 86
B GFS 5x5001.tif (red):0375-0280 1600 61.221 0.97 59 74
C GFS 5x5001.tif (red):0495-0279 1600 69.296 0.895 67 73
APPENDIX 10B: Field size of 10 x 10 cm2
Label Area Mean StdDev Min Max
Unexposed GFS 10x10002.tif (red):0117-0281 1600 91.511 0.952 89 96
A GFS 10x10002.tif (red):0245-0270 1600 79.478 2.357 73 84
B GFS 10x10002.tif (red):0372-0270 1600 60.299 0.853 57 63
C GFS 10x10002.tif (red):0500-0270 1600 66.765 0.936 64 70
APPENDIX 10C: Field size of 15 x 15 cm2
Label Area Mean StdDev Min Max
Unexposed GFS 15x15003.tif (red):0134-0276 1600 93.751 1.031 88 97
A GFS 15x15003.tif (red):0261-0266 1600 75.044 2.125 70 80
B GFS 15x15003.tif (red):0396-0271 1600 60.09 0.805 58 63
C GFS 15x15003.tif (red):0532-0264 1600 65.53 1.079 60 75
APPENDIX 10D: Field size of 20 x 20 cm2
Label Area Mean StdDev Min Max
Unexposed GFS 20x20004.tif (red):0135-0293 1600 93.051 0.94 90 97
A GFS 20x20004.tif (red):0262-0279 1600 74.578 1.836 63 79
B GFS 20x20004.tif (red):0412-0283 1600 60.111 0.734 58 63
C GFS 20x20004.tif (red):0540-0275 1600 65.756 0.912 61 71
University of Ghana http://ugspace.ug.edu.gh
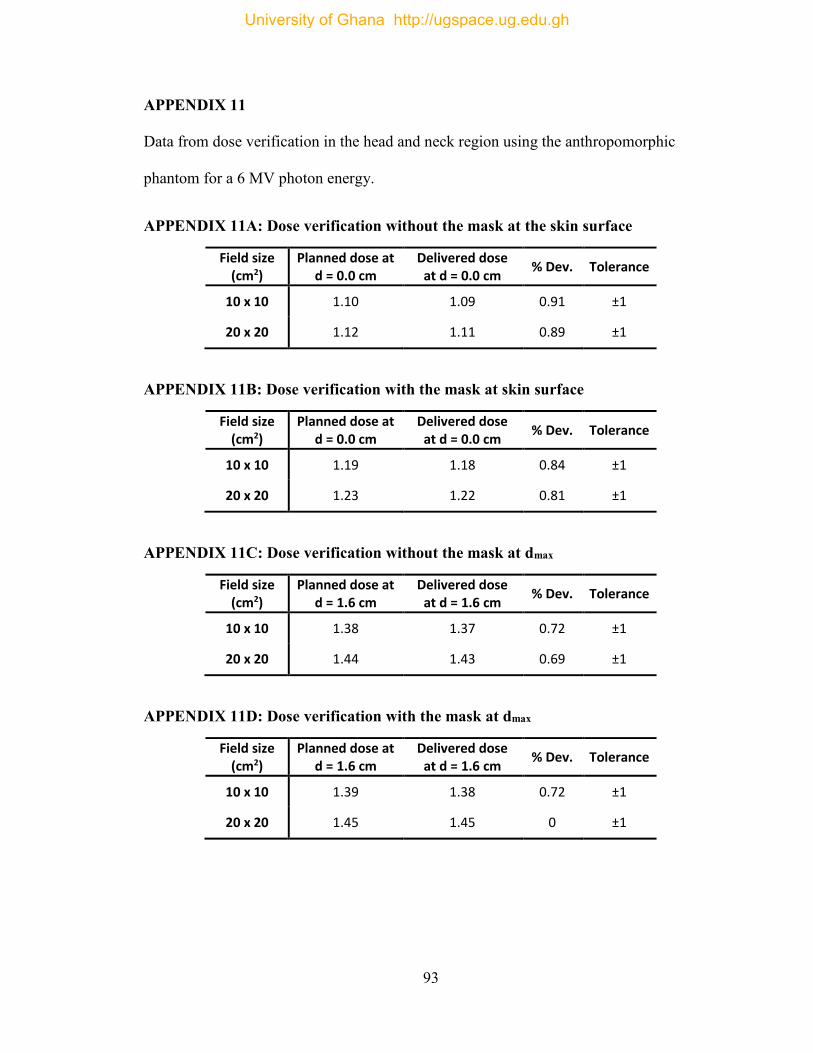
93
APPENDIX 11
Data from dose verification in the head and neck region using the anthropomorphic
phantom for a 6 MV photon energy.
APPENDIX 11A: Dose verification without the mask at the skin surface
Field size (cm2)
Planned dose at d = 0.0 cm
Delivered dose at d = 0.0 cm
% Dev. Tolerance
10 x 10 1.10 1.09 0.91 ±1
20 x 20 1.12 1.11 0.89 ±1
APPENDIX 11B: Dose verification with the mask at skin surface
Field size (cm2)
Planned dose at d = 0.0 cm
Delivered dose at d = 0.0 cm
% Dev. Tolerance
10 x 10 1.19 1.18 0.84 ±1
20 x 20 1.23 1.22 0.81 ±1
APPENDIX 11C: Dose verification without the mask at dmax
Field size (cm2)
Planned dose at d = 1.6 cm
Delivered dose at d = 1.6 cm
% Dev. Tolerance
10 x 10 1.38 1.37 0.72 ±1
20 x 20 1.44 1.43 0.69 ±1
APPENDIX 11D: Dose verification with the mask at dmax
Field size (cm2)
Planned dose at d = 1.6 cm
Delivered dose at d = 1.6 cm
% Dev. Tolerance
10 x 10 1.39 1.38 0.72 ±1
20 x 20 1.45 1.45 0 ±1
University of Ghana http://ugspace.ug.edu.gh


