Embed Size (px)
Citation preview

International Journal of Finance and Accounting 2015, 4(5): 262-280 DOI: 10.5923/j.ijfa.20150405.05
Effects of Investment Incentives on Stock Market Perfomance: Survey of Listed Firms in Kenya
Ondabu Ibrahim Tirimba1,*, Willy Muturi1, Kisaka Erastus Sifunjo2
1Department of Economics, Accounts and Finance, Jomo Kenyatta University of Agriculture and Technology, Nairobi, Kenya 2Department of Finance and Accounting, University of Nairobi, Kenya
Abstract Stock market perfomance has not improved despite investment incentives. Researchers in the field of Finance have not been able to clear the air on the question whether stock market incentives are a gift or a motivator; sometimes stock market perfomance increases when incentives decrease and sometimes even decrease when more incentives are given. The study objectives were to determine the relationship between incentives (tax, liduidity, growth and visibility) and stock market perfomance and to again investigate the moderating effects of investors’ perception on the stock market perfomance. This study adopted a descriptive research design with a study population of 61 listed firms in NSE. A sample of 150 respondents was picked through Stratified random sampling technique. The study used both primary and secondary data sources in gathering data for analysis. Data collection involved self-administration of questionnaires. The findings from this study reveal that investors’ perceptions affects stock market performance more than the stock market incentives. Furthur, Incentives were viewed as gift and not a motivator for investors’ decisions at NSE. An identical study on the effects of incentives on perfomance of stock markets using time series models such the autoregressive conditional heteroscedasticity (ARCH) models, with its extension to generalized autoregressive conditional heteroscedasticity (GARCH) respectively which accommodate the dynamics of conditional heteroscedasticity (the changing variance nature of the data) should be conducted to determine if the results will be identical. Kenya being a developing nation, the findings of this study will be generalized to the state of incentives in the international context of developing nations.
Keywords Investment Incentives, Stock market Performance, Perceptions, Motivator, Gift
1. Introduction The rationale behind granting of tax incentives is to
exploit investments opportunities, where tax system is seen as an obstacle with an aime of promoting stock market perfomance. They are also used to improve social welfare of the community for example, granting incentives related to health, education or savings for future use. On the other hand they can also be used to discourage certain activities like overproduction of agricultural produce resulting to instability in prices [1].
In the Indian stock market, investors use both fundamental and technical analysis while making investment decisions. The most worthy investment strategies in Indian stock market are buying stocks for which some good news is expected, buying stocks which are expected to announce bonus issue, momentum strategy, and size strategy and following investment behavior of Foreign Investment Incentives (FIIs). However, investors’ perceptions influence
* Corresponding author: [email protected] (Ondabu Ibrahim Tirimba) Published online at http://journal.sapub.org/ijfa Copyright © 2015 Scientific & Academic Publishing. All Rights Reserved
stock market performance more than investment incentives [2].
In the Palestine Securities Exchange (PSE), the perceptions of investors regarding availability, adequacy, and timeliness of relevant information about marketable securities are important for both pricing efficiency and market confidence. The investors must be fully informed of relevant facts to make sound judgments about the value of securities. Investors’ perceptions are seen as an important determinant of stock market performance [3].
In Sri Lanka, [5] Identified the factors affecting investment decisions as risk factor, return on investment, liquidity. [4] Found that in Bangladesh, the most influencing factors on investors’ decisions are efficiency of the company, inflation rate, easy and quick transactions, transaction cost, and access to the company and industry information, quality of information and prior knowledge of securities.
In Nigeria, the study by [6] found that the ten most influencing factors on investor’s decision in order of importance are: motivation by people who have attained financial security through share investment, future financial security, recommendations by reputable and trusted stock brokers, management team of the company, awareness of the prospects of investing in shares, composition of the board of

International Journal of Finance and Accounting 2015, 4(5): 262-280 263
directors of companies, recent financial performance of the company, ownership structure of the company, reputable predictions of future increment in share value and bonus payments. Stock market incentives are a gift and not a motivator to invest in the stock market [6].
Fiscal policy incentives have been used in many countries like Kenya and Tanzania. For example, in Kenya, the rate of corporation tax for newly listed companies on the Nairobi stock exchange was reduced from 30% to 25% over a five-year period starting 1st January 2002. There are exemptions from withholding tax on interest and dividends on collective investment schemes for employees and the limit on tax-free contributions to registered retirement benefit scheme was removed. In Tanzania, withholding tax on interest earned on long term debt securities listed in the Dar-es-Salaam stock exchange during the 2002/2003 fiscal years was abolished [7].
The Nairobi Securities Exchange is currently the only stock market in Kenya which has a total of 60 listed companies grouped into Agricultural, commercial, Telecommunication, Automobile, banking sector, Insurance, Investment, Manufacturing, Construction and Energy sector (NSE, 2013). The Nairobi Securities Exchange (NSE) is open for trading from Monday to Friday, and closed on Saturday and during public holidays (Mokua, 2003). Most stock exchange in the world also trade from Monday to Friday [8]. Nairobi Securities Exchange has three types of indices; these are NSE 20 share Index, NSE All Share Index (NASI) and FTSE Share Index. NSE 20 share Index comprises 20 selected companies. In 2008, the NSE All Share Index (NASI) was introduced as an alternative index. It is a measure of overall indicator of market performance. The Index incorporates all the traded shares of the day. Its attention is therefore on the overall market capitalization rather than the price movements of selected companies. The Financial Times Stock Exchange (FTSE) Share index is divided into two: FTSE 25 Index which comprises of the exchange’s 25 most liquid stocks and the 15 Index which is made up of the exchange's 15 largest stocks by market capitalization [9].
Ideally, the policy maker will want to verify if it is necessary to grant tax incentives to an investor, or if the investor would also carry out the investment without such tax incentives. From a perspective of fiscal revenue, granting tax incentives to listed companies that would also list without such tax incentives actually simply constitutes windfall profits for the shareholders. Such is not an effective measure as the fiscal revenue is unnecessarily lost. However, it is in most cases impossible to calculate whether a tax incentive actually “bites” or is needed [1]. Through an estimate, about Kshs 220.8 billion was lost between the years 2003-2009 towards granting of investment incentives [10].
[14] Study revealed that although tax issues will always be taken into account by investors, these are rarely among the most important factors when an investment decision is made. Prospect theory supports this behavioural view to argue further that people evaluate losses and gains using certain
heuristics. There is much evidence that once people have formed an opinion, they cling to it too tightly and for too long [11].
The governments of today still continue granting incentives in order to promote stock market investments. In fact some of the firms listed at NSE have not realized high market capitalization, their market index remains at a desperate state and their market turnover ratio is wanting. The topic on incentives as affecting stock market performance has not been wholistically studied. While many researchers have concentrated their studies on the effects of tax incentives on Foreign Direct Investments’ inflows among listed firms and effects of stock market liquidity on stock performance and even investors’ perceptions as affecting the performance of worldly stock markets; there has been no study that has emerged determining whether stock market incentives are a gift or a motivator to investors in influencing the performance of stock market and in particular the performance of Nairobi Securities Exchange. Also, there has been no study focusing on all the incentives provided by the stock market and how they influence performance thereon. The area still remains grey, the reason that provoked the researcher to fill this gap. The general objective of this study was to investigate the effects of investment incentives on stock market Performance in Kenya.
The governments and policy makers are the vital beneficiaries of this study in determining whether to invest in incentives as a way of encouraging investments, or on whether incentives are a misuse and loss of money, something which should be abolished if the governments of tomorrow are to plan on how to minimize budgetary spill overs towards white elephant projects. This study also benefits new and prospective investors in understanding the key investment aspects they need to take into consideration before making investment decisions. This study will help investment brokers to know the exact factors that current and potential investors take into consideration before making an investment decision. Academicians and researchers who are willing to provide more education and solution to the stock market dilemmas will find this study very useful in feeding them with the bread and butter of actual investment influences that motivate local investors to make their investment decisions. Additionally, the information from the study may also form basis for literature for other researchers and academicians who are willing to carry out studies in the same field in sub-Saharan Africa.
2. Literature Review 2.1. Tax Incentives
From a perspective of fiscal revenue, granting tax incentives to listed companies that would also list without such tax incentives actually simply constitutes windfall profits for the shareholders [10]. Such is not an effective measure as the fiscal revenue is unnecessarily lost. However,
264 Ondabu Ibrahim Tirimba et al.: Effects of Investment Incentives on Stock Market Perfomance: Survey of Listed Firms in Kenya
it is in most cases impossible to calculate whether a tax incentive actually “bites” (is needed). Sometimes developing countries want to compensate with low tax rates for a country’s lack of fundamental production factors such as skilled labor, infrastructure or commodities. However, studies show that in most cases that gap is too wide anyway [14].
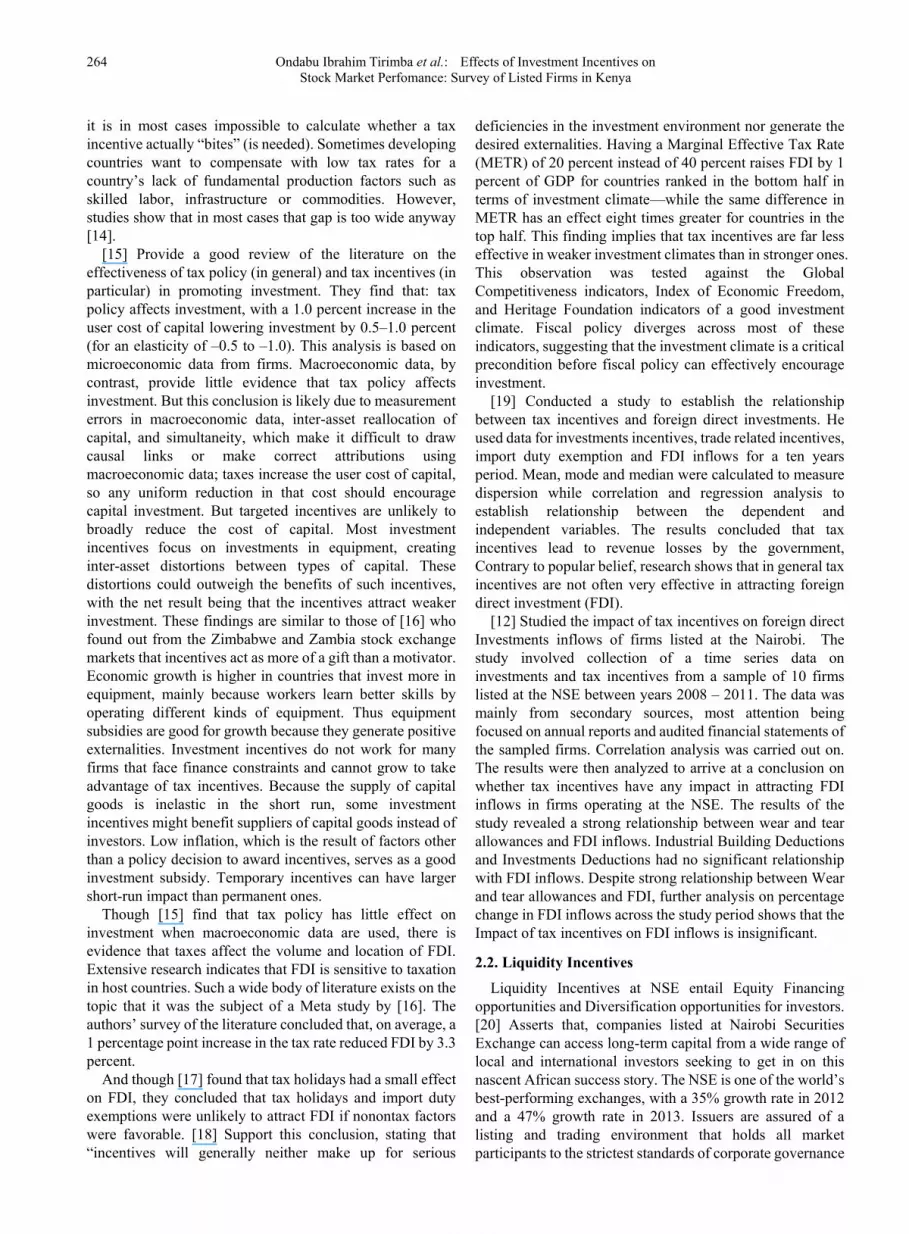
[15] Provide a good review of the literature on the effectiveness of tax policy (in general) and tax incentives (in particular) in promoting investment. They find that: tax policy affects investment, with a 1.0 percent increase in the user cost of capital lowering investment by 0.5–1.0 percent (for an elasticity of –0.5 to –1.0). This analysis is based on microeconomic data from firms. Macroeconomic data, by contrast, provide little evidence that tax policy affects investment. But this conclusion is likely due to measurement errors in macroeconomic data, inter-asset reallocation of capital, and simultaneity, which make it difficult to draw causal links or make correct attributions using macroeconomic data; taxes increase the user cost of capital, so any uniform reduction in that cost should encourage capital investment. But targeted incentives are unlikely to broadly reduce the cost of capital. Most investment incentives focus on investments in equipment, creating inter-asset distortions between types of capital. These distortions could outweigh the benefits of such incentives, with the net result being that the incentives attract weaker investment. These findings are similar to those of [16] who found out from the Zimbabwe and Zambia stock exchange markets that incentives act as more of a gift than a motivator. Economic growth is higher in countries that invest more in equipment, mainly because workers learn better skills by operating different kinds of equipment. Thus equipment subsidies are good for growth because they generate positive externalities. Investment incentives do not work for many firms that face finance constraints and cannot grow to take advantage of tax incentives. Because the supply of capital goods is inelastic in the short run, some investment incentives might benefit suppliers of capital goods instead of investors. Low inflation, which is the result of factors other than a policy decision to award incentives, serves as a good investment subsidy. Temporary incentives can have larger short-run impact than permanent ones.
Though [15] find that tax policy has little effect on investment when macroeconomic data are used, there is evidence that taxes affect the volume and location of FDI. Extensive research indicates that FDI is sensitive to taxation in host countries. Such a wide body of literature exists on the topic that it was the subject of a Meta study by [16]. The authors’ survey of the literature concluded that, on average, a 1 percentage point increase in the tax rate reduced FDI by 3.3 percent.
And though [17] found that tax holidays had a small effect on FDI, they concluded that tax holidays and import duty exemptions were unlikely to attract FDI if nonontax factors were favorable. [18] Support this conclusion, stating that “incentives will generally neither make up for serious
deficiencies in the investment environment nor generate the desired externalities. Having a Marginal Effective Tax Rate (METR) of 20 percent instead of 40 percent raises FDI by 1 percent of GDP for countries ranked in the bottom half in terms of investment climate—while the same difference in METR has an effect eight times greater for countries in the top half. This finding implies that tax incentives are far less effective in weaker investment climates than in stronger ones. This observation was tested against the Global Competitiveness indicators, Index of Economic Freedom, and Heritage Foundation indicators of a good investment climate. Fiscal policy diverges across most of these indicators, suggesting that the investment climate is a critical precondition before fiscal policy can effectively encourage investment.
[19] Conducted a study to establish the relationship between tax incentives and foreign direct investments. He used data for investments incentives, trade related incentives, import duty exemption and FDI inflows for a ten years period. Mean, mode and median were calculated to measure dispersion while correlation and regression analysis to establish relationship between the dependent and independent variables. The results concluded that tax incentives lead to revenue losses by the government, Contrary to popular belief, research shows that in general tax incentives are not often very effective in attracting foreign direct investment (FDI).
[12] Studied the impact of tax incentives on foreign direct Investments inflows of firms listed at the Nairobi. The study involved collection of a time series data on investments and tax incentives from a sample of 10 firms listed at the NSE between years 2008 – 2011. The data was mainly from secondary sources, most attention being focused on annual reports and audited financial statements of the sampled firms. Correlation analysis was carried out on. The results were then analyzed to arrive at a conclusion on whether tax incentives have any impact in attracting FDI inflows in firms operating at the NSE. The results of the study revealed a strong relationship between wear and tear allowances and FDI inflows. Industrial Building Deductions and Investments Deductions had no significant relationship with FDI inflows. Despite strong relationship between Wear and tear allowances and FDI, further analysis on percentage change in FDI inflows across the study period shows that the Impact of tax incentives on FDI inflows is insignificant.
2.2. Liquidity Incentives
Liquidity Incentives at NSE entail Equity Financing opportunities and Diversification opportunities for investors. [20] Asserts that, companies listed at Nairobi Securities Exchange can access long-term capital from a wide range of local and international investors seeking to get in on this nascent African success story. The NSE is one of the world’s best-performing exchanges, with a 35% growth rate in 2012 and a 47% growth rate in 2013. Issuers are assured of a listing and trading environment that holds all market participants to the strictest standards of corporate governance

International Journal of Finance and Accounting 2015, 4(5): 262-280 265
[20]. Stock market liquidity is a slippery and elusive concept
partly because it encompasses a number of transactional properties of the market [33]. [22] Defines liquidity, as the ability to transact quickly and without substantially moving prices, and market depth as the ability to transact at the current market price. [23] Relates the liquidity with information asymmetry and argued that the quality of information possessed by market makers and the traders significantly influence market depth and the size of the bid-ask spread. Thus, higher the information asymmetry, widen the spread, lowering the market depth and market liquidity.
Recent performance and its expected variation influence its liquidity by affecting inventory risk of liquidity providers in financial markets or their funding abilities [24]. Co-variation in price and in volatility should also induce a co-variation in the provision of liquidity. Without liquidity, we see disparities in price to book value, investors cannot get enough stocks to meet their portfolio requirements, and foreign trade is deterred. There is simply no point in having a price, if there is no liquidity in a market. [25] Cited the benefits of reduced risk, higher trading limits, greater credibility in terms of price discovery, and generally better quality capital markets. [26] Highlighted that liquidity enables financial institutions such as banks to offer depth of product, and Ian listed the benefits of visibility, greater investment choices, certainty, and confidence in the processes of the market. Stockholders of public listed companies can sell their shares in the open market. This provides investors or company owners with exit strategy and portfolio diversity.
[27] Carried out a study to determine liquidity of listed shares, using panel data and with a census of CSX shares. The researcher found out that by their nature, listed shares are a very liquid products which can be bought and sold quickly on an exchange platform rather than having to go through the gruelling process of having to look for a transferee, and also through the use of a broker at a relatively low cost to other products, all the work is done for you. Trading on an exchange also allows you to sell part of your share parcels rather than having to redeem the whole lot. [28] Conclude that Low liquidity is portrayed with a significantly high negative relationship between the spread and market depth. [29] Observe that greater transparency in the trading process enhances market liquidity by reducing the opportunities for taking advantage of less informed or non-professional participants. [30] Find market liquidity increasing with information asymmetry, as insiders are able to obtain superior execution for their trades relative to the contemporaneous liquidity traders, concluding that the presence of informed traders to the market does not necessarily reduce market liquidity.
2.3. Growth Incentives
Growth in the stock market can be looked at both by stock equity growth (partial growth) and total assets growth (full
growth). Going public provides your company with equity financing opportunities to grow your business from expansion of operations to acquisitions. The issuance of public shares will expand your investor base, and will help set the stage for secondary equity financings, including private placements. As well, issuers often receive more favorable lending terms when borrowing from financial institutions [31]. As a public company, your shares can be utilized as an acquisition currency to acquire target companies, instead of a direct cash offering. Using shares for an acquisition can be a tax efficient and cost effective vehicle to finance such a transaction. This can also improve your ability to complete mergers and acquisitions in a more timely and cost-effective manner [32].
Moreover [33] argues that liquid stock markets can increase incentives for investors to get information about firms and improve corporate governance. International risk sharing through internationally integrated stock markets improves resource allocation and can accelerate the rate of growth. In connection with takeovers, it may be desirable that the shares of the continuing company are listed on a stock exchange. The continuing company may thus use liquid listed shares as payment, in full or in part, to the shareholders in the ceasing company. Those shareholders will be able to make a more informed assessment of the offer if the values are fixed through a trustworthy marketplace [34].
African stock exchanges are seeing a growing demand for new issues. Opportunities to list are increasing with 23 domestic and 2 regional stock exchanges operating on the Continent. Empirical evidence suggests that over the last three years, valuations achieved by many private equity exits in Africa via a stock listing yielded a higher return thn could have achieved in a private transaction. While private equity firms in the US and in the UK are increasing using IPOs to exit transactions, African Private Firms are still dragging their feet, hence lagging behind their feet, hence lagging behind their developed market peers when it comes to using IPOs to exit investments [22].
2.4. Visibility Incentives
Stock market visibility incentives entail: media coverage, publicly filed documents and industry stories, all of which translate to better image and high visibility of listed firms as opposed to unlisted firms. Presence on the stock exchange improves consumer awareness and confidence and improves company marketability and recognition. Listing on the stock exchange is accompanied by particularly significant attention from the local media, according to experience, in comparison with listing on other exchanges.
Public companies are prominently featured in major newspapers and magazines than a private enterprise. The constant and timely use of company announcements, press releases and industry news stories can increase investor awareness, shareholder value and demand for the shares. A strong marketing strategy and awareness campaign coupled with smart public relations initiatives can potentially

266 Ondabu Ibrahim Tirimba et al.: Effects of Investment Incentives on Stock Market Perfomance: Survey of Listed Firms in Kenya
increase sales and thus increased revenue for companies [31]. Periodic analyst reports and publication of daily share prices contribute to increased publicity which leads to enhanced corporate image. Listed company's stories and news transient across borders and this allows for investors in other countries to become aware of your company. Publicly listed companies are subject to the rules of the Securities Commission and the Stock Exchange's self-regulatory rules that it provides investors with confidence [22].
When companies offer shares in an Initial Public Offer (IPO), it is perceived as a stable entity and often at times, gains prestige by undertaking this form of capital rising. Raising capital through an IPO increases a company's profile, perceived competitiveness and stability. A company's founders and owners and managers gain prestige from being associated with a public company. Prestige can be very helpful in recruiting key and talented employees, marketing products and services to key target markets. Increased and shared ownership of a public entity can enhance the company's reputation and increase its business opportunities. Your company can gain additional exposure and become better known. A listed company is perceived by lenders and suppliers as a safer credit risk; this will enhance the opportunities for favorable financing terms [20].
[25] Carried a study to investigate on whether listed companies attain visibility incentives verses the unlisted companies. The researcher found that a listed company is more visible than an unlisted one. The researcher furthur argued that, the media constantly follows the developments of listed companies. The researcher found that daily price information in printed media serves as constant reminder of developments among listed companies. Whether it’s Zimbabwe or Zambia, institutions will invest, but they need to know there is stability. The regulatory framework can, therefore, be seen as a big barrier – investors may see good opportunities but may not even invest in the first place if they have concerns about legal and structural obstacles that will “prevent them getting their money out.” [16] Posits that a public listed company always receives more publicity and media attention than a private enterprise.
2.4.1. Stock market Perceptions
Experience exerts statistically significant positive effect on overconfidence. With time-tested strategies investors get overconfident and their experience with these strategies always increases their confidence. This psychological aspect was explored through regression analysis on the Jordanian investors. It was shown that the Jordanian investors are overconfident of their trading skills and investment decisions they make through strategic planning as per [35]. In the aftermath of several widespread financial crises, “herd” has again become a pejorative term in the financial lexicon. Investors and fund managers are portrayed as herds that charge into risky ventures without adequate information and appreciations of the risk-reward trade-offs and, at the first sign of trouble, flee to safer havens. Some observers express
concern that herding by market participants exacerbates volatility, destabilizes markets, and increases the fragility of the financial system [36].
Fundamentals-driven spurious herding out of equities could arise if, for example, interest rates suddenly rise and stocks become less attractive investments. Investors under the changed circumstances may want to hold a smaller percentage of stocks in their portfolio [36]. This is not herding according to the definition above because investors are not reversing their decision after observing others. Instead, they are reacting to commonly known public information, which is the rise in interest rates. Spurious herding may also arise if the opportunity sets of different investors differ. [55] Argues that, Intentional herding may be inefficient and is usually characterized by fragility and idiosyncrasy. It can lead to excess volatility and systemic risk. Therefore, it is important to distinguish between true (intentional) and spurious (unintentional) herding. Furthermore, the causes of investor herding are crucial for determining policy responses for mitigating herd behavior. How does one empirically distinguish between informational, reputation-based, and compensation-based herding? One approach would be to examine whether the assumptions underlying some of the theories of herd behavior are satisfied.
[31] Conducted a study to determine the main determinants of risk tolerance of individual investors and collected responses from 1500 respondents. The general objective was aimed at determining the main determinants of risk tolerance of individuals. The researcher used the questionnaire method for which he distributed the questionnaires to a sample size of 1,500 respondents. The main findings from the researcher were that men are less risk averse than women, less educated investors are less likely to take risk and age factor is also important in risk tolerance and also investors are more risk tolerance than the less wealthy investors. This research was similar to the findings of [36] that focused on investment trusts and debated the behavior of individual investors to find out that investment trusts are only the means of managing assets.
2.4.2. Incentives, Investors’ Perceptions and Perfomance
According to [2], Investors use both fundamental as well as technical analysis while investing in Indian stock market. They strongly agree that various company fundamentals significantly influence stock prices in India. The most worthy investment strategies in Indian stock market are buying stocks for which some good news is expected, buying stocks which are expected to announce bonus issue, momentum strategy, and size strategy and following investment behavior of Foreign Indian Investors (FIIs). The widely used investment strategies in Indian equity market are size based strategies, momentum strategies, following FIIs investment behavior, buying stocks on the basis of 30 days moving average and buying stocks on the basis of the relative strength index. It was also noticed that there is a substantial
International Journal of Finance and Accounting 2015, 4(5): 262-280 267
change in investment strategies used by active investors in Indian stock market over the past five years. In a nutshell, there has been a shift from purely technical analysis based strategies on the one which involves both fundamental and technical analysis. Moreover the investment horizon of investors has also reduced due to higher volatility.
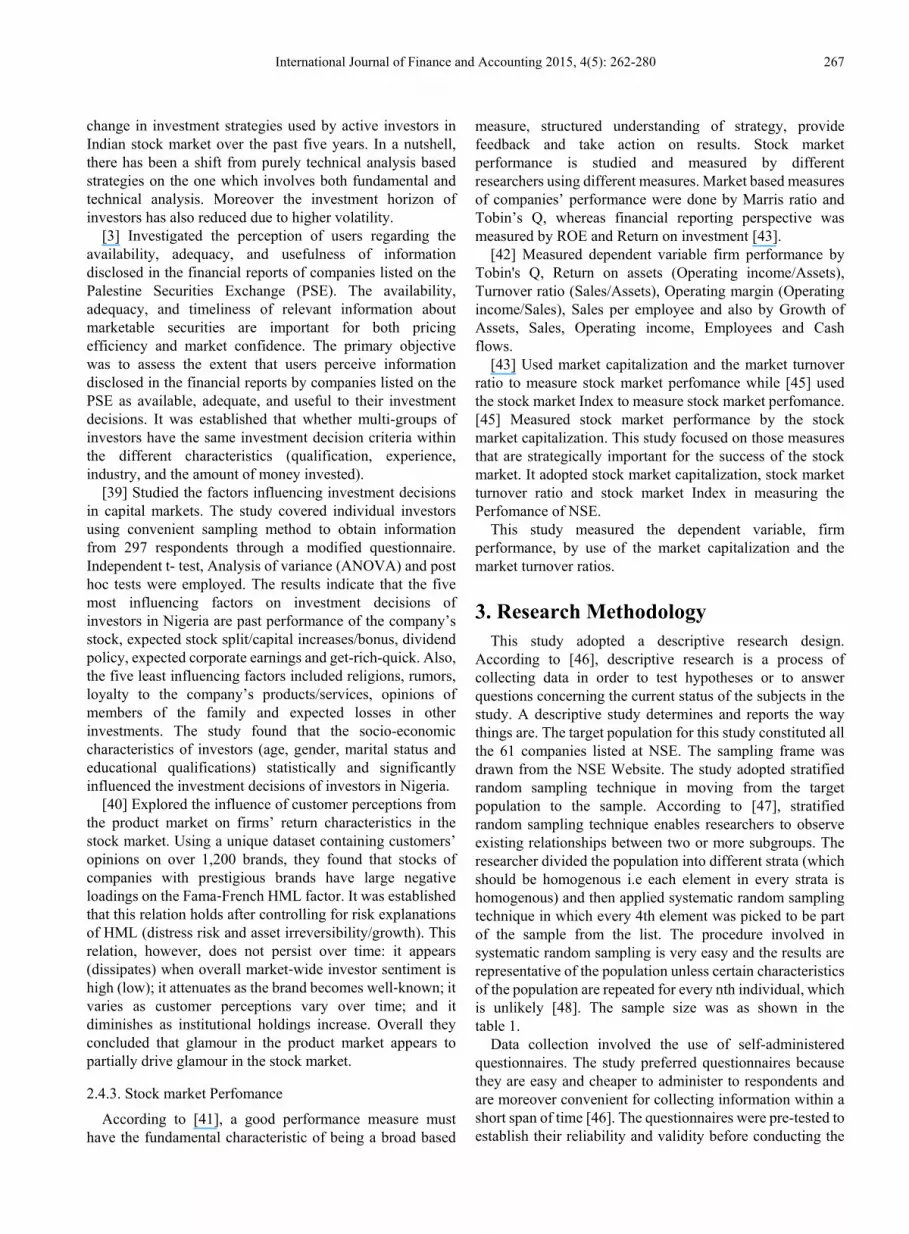
[3] Investigated the perception of users regarding the availability, adequacy, and usefulness of information disclosed in the financial reports of companies listed on the Palestine Securities Exchange (PSE). The availability, adequacy, and timeliness of relevant information about marketable securities are important for both pricing efficiency and market confidence. The primary objective was to assess the extent that users perceive information disclosed in the financial reports by companies listed on the PSE as available, adequate, and useful to their investment decisions. It was established that whether multi-groups of investors have the same investment decision criteria within the different characteristics (qualification, experience, industry, and the amount of money invested).
[39] Studied the factors influencing investment decisions in capital markets. The study covered individual investors using convenient sampling method to obtain information from 297 respondents through a modified questionnaire. Independent t- test, Analysis of variance (ANOVA) and post hoc tests were employed. The results indicate that the five most influencing factors on investment decisions of investors in Nigeria are past performance of the company’s stock, expected stock split/capital increases/bonus, dividend policy, expected corporate earnings and get-rich-quick. Also, the five least influencing factors included religions, rumors, loyalty to the company’s products/services, opinions of members of the family and expected losses in other investments. The study found that the socio-economic characteristics of investors (age, gender, marital status and educational qualifications) statistically and significantly influenced the investment decisions of investors in Nigeria.
[40] Explored the influence of customer perceptions from the product market on firms’ return characteristics in the stock market. Using a unique dataset containing customers’ opinions on over 1,200 brands, they found that stocks of companies with prestigious brands have large negative loadings on the Fama‐French HML factor. It was established that this relation holds after controlling for risk explanations of HML (distress risk and asset irreversibility/growth). This relation, however, does not persist over time: it appears (dissipates) when overall market‐wide investor sentiment is high (low); it attenuates as the brand becomes well‐known; it varies as customer perceptions vary over time; and it diminishes as institutional holdings increase. Overall they concluded that glamour in the product market appears to partially drive glamour in the stock market.
2.4.3. Stock market Perfomance
According to [41], a good performance measure must have the fundamental characteristic of being a broad based
measure, structured understanding of strategy, provide feedback and take action on results. Stock market performance is studied and measured by different researchers using different measures. Market based measures of companies’ performance were done by Marris ratio and Tobin’s Q, whereas financial reporting perspective was measured by ROE and Return on investment [43].
[42] Measured dependent variable firm performance by Tobin's Q, Return on assets (Operating income/Assets), Turnover ratio (Sales/Assets), Operating margin (Operating income/Sales), Sales per employee and also by Growth of Assets, Sales, Operating income, Employees and Cash flows.
[43] Used market capitalization and the market turnover ratio to measure stock market perfomance while [45] used the stock market Index to measure stock market perfomance. [45] Measured stock market performance by the stock market capitalization. This study focused on those measures that are strategically important for the success of the stock market. It adopted stock market capitalization, stock market turnover ratio and stock market Index in measuring the Perfomance of NSE.
This study measured the dependent variable, firm performance, by use of the market capitalization and the market turnover ratios.
3. Research Methodology This study adopted a descriptive research design.
According to [46], descriptive research is a process of collecting data in order to test hypotheses or to answer questions concerning the current status of the subjects in the study. A descriptive study determines and reports the way things are. The target population for this study constituted all the 61 companies listed at NSE. The sampling frame was drawn from the NSE Website. The study adopted stratified random sampling technique in moving from the target population to the sample. According to [47], stratified random sampling technique enables researchers to observe existing relationships between two or more subgroups. The researcher divided the population into different strata (which should be homogenous i.e each element in every strata is homogenous) and then applied systematic random sampling technique in which every 4th element was picked to be part of the sample from the list. The procedure involved in systematic random sampling is very easy and the results are representative of the population unless certain characteristics of the population are repeated for every nth individual, which is unlikely [48]. The sample size was as shown in the table 1.
Data collection involved the use of self-administered questionnaires. The study preferred questionnaires because they are easy and cheaper to administer to respondents and are moreover convenient for collecting information within a short span of time [46]. The questionnaires were pre-tested to establish their reliability and validity before conducting the

268 Ondabu Ibrahim Tirimba et al.: Effects of Investment Incentives on Stock Market Perfomance: Survey of Listed Firms in Kenya
study. The questionnaires were distributed by email to the sample number of respondents through the Human Resource managers in the 30 organizations and they were sent back electronically through mail. The study conducted a pilot study to 1% (2 respondents) of the respondents from two listed firms forming the sample. This was mainly to ascertain the validity and reliability of the instrument. According to [48], validity is the degree by which the sample of test items represents the content the test is designed to measure. Content validity employed by this study is a measure of the degree to which collected data using a particular instrument represents a specific domain or content of a particular concept. [46] Observe that the purpose of the pilot study is to assess the clarity of the instruments and the validity and reliability of each item in the instruments.
The study used the Cronbach (Alpha – α) model to test the reliability of the data. [49] Indicates that Cronbach’s alpha reliability coefficient normally ranges between 0 (if no variance is consistent) and 1 (if all variance is consistent). The closer the coefficient is to 1.0 the greater the internal consistency of the items in the scale. An alpha (α) score of 0.70 or higher is considered satisfactory [49]. Correlation analysis was computed to determine the level of association of two variables [50]. Multiple regression analysis was computed to determine the relationship between one dependent variable and one or more independent variables [51]. This study employed a multiple linear regression analysis using Stock market Index, Normality of the variables was examined using the skewness and kurtosis. The conceptual model and conceptual model were as follows:
3.1. Conceptual Model
Dependent variable for this model is represented as a percentage change in the stock market performance to a function of percentage changes in tax incentives. Equation 3.1: Conceptual model equation
y = f (Φ1, Φ2, Φ3, Φ4, Φ5)
In this model y represents the percentage change in NSE investments, while Φ represents percentage change in stock market incentives. Investments variables is measured using stock market turnover ratio of sampled firms while stock market incentives variables is measured using the percentage changes in the number of investments upon their introduction. Theoretically in a developing country, local investors’ perceptions is triggered by Political stability; good Infrastructure; cost of doing business and investment incentives [2].
3.2. Analytical Model
After tabulating and analyzing data collected, analytical model was estimated. Percentage changes in dependent variable were multiplied by respective correlation coefficients and then summed up together with the error term
and the constant term to arrive at percentage change in stock market investments. The analytical model used in the study is explained below: Equation 3.2: General Analytical model equation
y = β0 + β1Φ1 + β2Φ2 + β3Φ3 + β4Φ4 + ε Where: y = Percentage change in NSE Investments β0 = Constant term β = Correlation coefficients Φ1= Percentage change in stock market tax incentives Φ2= Percentage change in stock market liquidity
incentives Φ1= Percentage change in stock market tax incentives Φ2= Percentage change in stock market liquidity
incentives Φ3= Percentage change in stock market growth incentives Φ4= Percentage change in stock market visibility
incentives ε = Error term
Equation 3.3: Analytical model equation for measuring moderating effect
y = β0 + β1Φ1 + β2Φ2 + β3Φ3 + β4Φ4 + β5 Φ1* Φ2+ β6 Φ1* Φ3+ β7 Φ1* Φ4+ β8 Φ2* Φ3+ β9 Φ2* Φ4+ β10 Φ3* Φ4 + ε
Where: β0 = Constant term β1-4 = Correlation coefficients β5-10 = the parameter estimate for the interaction term Φ1= Percentage change in stock market tax incentives Φ2= Percentage change in stock market liquidity
incentives Φ3= Percentage change in stock market growth incentives Φ4= Percentage change in stock market visibility
incentives ε = Error Term The t-test was computed to test hypothesis that stock
market incentives have little impact on NSE investments, performance and results to revenue losses by the government. In addition to t- test and ANOVA test of hypothesis was also computed. The tests were conducted on NSE Incentives across year 2003 - 2014. This gave a statistical strength on the relationship between stock market incentives and performance. The decision to reject or accept the null hypothesis was made on 95% level of confidence. The data was tabulated and classified accordingly in line with the objectives of the study [52]. The coded, tabulated and classified data was subjected to both quantitative and qualitative analysis. Quantitative data analysis is helpful in data evaluation because it provides quantifiable and easy to understand the result. Quantitative data can be analyzed in a variety of different ways, which can help the researcher to meet his set objectives with much ease [52]. Quantitative data was presented in through statistical techniques such as pie charts, tables and bar charts

International Journal of Finance and Accounting 2015, 4(5): 262-280 269
4. Findings, Conclusions and Recommendations
This study was undertaken to fill the research gap that exists by uncovering the relationship between stock market incentives and perfomance and also to reflect the moderating effects brought about by investors’ perceptions in influencing the perfomance of the NSE. The purpose of this study was to clear the air about the existing dichotomies and paradoxes regarding the big question as to whether investment incentives are a gift or a motivator to investors at NSE.
4.1. Findings
4.1.1. Tax Incentives
The study findings reveal that tax incentives mostly motivates firms to list at NSE; these findings were supported by [1] in the sentiments: ‘the reason for the granting of investment incentives is to promote stock market perfomance through listing.’ Tax reductions and exemptions influence stock market performance. Some firms researched were of the agreement that their firms enjoyed tax incentives before listing at NSE however, 31% of respondents disagreed with this illusion. The findings reveal that tax incentives are an important variable when making listing decisions at NSE. However, predictable, clear tax laws and transparent tax administration are also important than low tax rates when making listing in NSE with 54.2% confirming this. This justifies the study of [13] that although Incentives are provided to motivate investors; for investors, access to domestic markets, a good investment climate, security and stability, skilled labor, and other factors matter mostly. Many respondents asserted that the tax incentives were a gift and not a motivator to invest in NSE. As much as they serve as a point of reference while making listing decisions at NSE, they remain a symbol of donations and grants coming to reward investors for listing at NSE.
4.1.2. Liqudity Incentives
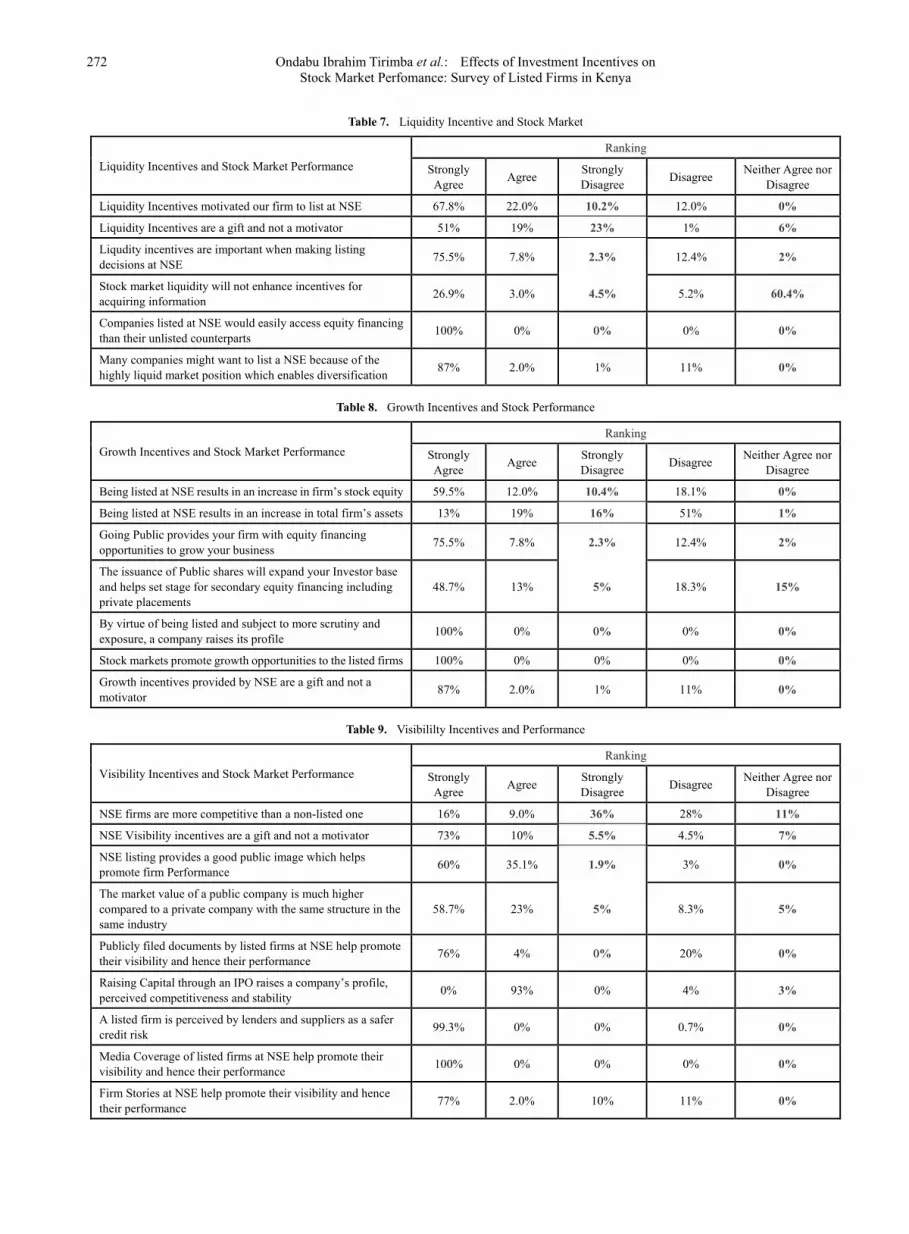
A majority of the respondents agreed that liquidity incentives mostly motivates firms to list at NSE with about 67.8% strongly agreeing and 22% agreeing. These findings concur with those conducted by [5] in Sri Lanka stock markets which also found out that liquidity affects investment decisions. Liqudity incentives were termed as more important when making listing decisions at NSE with support respondents of 75% strongly agreeing. It was not clear from among the respondents on whether stock market liquidity enhances incentives for acquiring information (60.4% neither agreeing nor disagreeing). 100% respondents revealed that the companies listed at NSE would easily access equity funds than those not listed. 87% of respondents’ furthur indicated that, companies will most likely want to be listed at NSE because of liquidity incentives. However, liquidity incentives were highly ranked (51%) as a gift and not a motivator when investing at NSE. These findings were
identical to those of [6] which ranked incentives as a gift and not a motivator.
4.1.3. Growth Incentives
Respondents argued that being listed at NSE results in an increase in firms’ stock equity (59.5% confirmed this). By virtual of being listed and subject to more scrutiny and exposure, a company raises its perfomance (100% respondents strongly agreed). Also, the study found out that stock markets promote growth opportunities on the part of listed firms. This findings are in line with the major findings of [33] which concluded that incentives are a motivator and result in more trading stock, strengthen investor confidence and foster participation. On the contrary, being listed at NSE alone doesn’t result in an increase in total firms’ assets (51% of respondents strongly argued) since the listing thing is not margical, firms must work to grow their assets individually. Growth incentives were concluded to being more of a gift than a motivator when making investment incentives at NSE (87% respondents argue in this manner). The findings of incentives as being a gift and not a motivator were similar to those of [16] whose findings argued that incentives are more of a gift and not a motivator to investors in the stock markets.
4.1.4. Visibility Incentives
It was found that the firms listed at NSE are not more competetitve than those not listed. NSE visibility incentives were ranked as a gift and not a motivator when making investment decisions at NSE. Listing at NSE provides good public image which helps promote firm perfomance. The respondents’ furthur argued that, the market value of public companies is much higher than that of private companies with same structure and in the same industry.
76% of respondents opined that publicly filed documents by listed firms at NSE help promote listed companies’ visibility abd hence their perfomance. These findings were in line with those of [22] who found out that publicly listed companies are subject to rules of securities commission and stock exchanges’ self regulatory rules that provides investors with confidence. The study also found out that raising capital through IPOs raises the companies’ profile, perceived competition and stability; listed firms were perceived by lenders and suppliers as a safer credit risk. These findings were similar to those by [20] who concluded that being listed enhances opportunities for favourable terms both on the part of lenders and the suppliers. Firm stories at NSE were viewed as having helped provide more visibility and hence perfomance as backed by 77% respondents. Finally, media coverage of listed firms at NSE was opined as greatly helping in promotion of companies’ visibility of listed firms. These findings were similar to those of [25] who found out that a publicly listed company always receives more publicity and media attention than a private enterprise.
4.1.5. Investors’ Perceptions
On the perceptions of investors towards stock market

270 Ondabu Ibrahim Tirimba et al.: Effects of Investment Incentives on Stock Market Perfomance: Survey of Listed Firms in Kenya
perfomance, the research found out that a majority of investors use both fundamental and technical analysis while investing at NSE. These study findings were similar to the findings of [2] who found out from the perspective of the Indian stock market that Investors use both fundamental as well as technical analysis while investing. [2]’s respondents strongly agreed that various company fundamentals significantly influence stock prices in India. 41% of the respondents argued that NSE investors are overconfident of their trading and investment decisions. This is similar to the findings of [35] whose study on the Jordanian stock market revealed that with time-tested strategies investors get overconfident and their experience with these strategies always increases their confidence. 78.4% of investors argued that the investors at NSE tend to imitate the trading patterns of previous gainers even without any additional analysis of the market. Investors at NSE were seen to tend towards holding on to losing stocks for too long and selling the winning stocks too soon, 49% of respondents who were the majority revealed this.
This was different to the argument of [55] who on the study of NSE argued that the most logical course of action would be to hold on to winning stocks in order to further gains and to sell losing stocks in order to prevent escalating losses [55]. The sentiment by [55] was a hypothesis of the ideal world and not a real world scenario. It was noted that NSE perfomance is affected more by investors’ perceptions than the individual incentives given. These findings are in line with those of [3] who concluded those investors’ perceptions were more important determinants of stock market perfomance than incentives in the Palestinine stock exchange whose findings who found out that perceptions influence stock market perfomance. However, the findings oppose the [33]’s report which argued from the point of view that incentives are a motivator and result in more trading stock, strengthen investors’ confidence and foster participation.
4.2. Conclusions
In this study, the researchers obtained significant results to
the research objectives and the research questions. The reason for granting incentives at NSE is to implore investors to make more listing aimed at promoting the stock market perfomance of Kenya. The researchers based on these findings concluded that the incentives provided at NSE are a gift and not a motivator to implore investors makes investment decisions at NSE. While the governments believe that incentives strongly influence investment decisions, for investors: access to domestic markets, a good investment climate, security and stability, skilled labor, and other factors ranks much higher than incentives. The governents must therefore be sensitive of these factors which influence investors’ decisions for the decisions made by investors are critical on the performance levels of NSE and the stock markets of developing nations as a whole.
4.3. Recommendations
4.3.1. Recommendations to Policy Makers
The study recommends for the government to put in place predictable, clear tax laws and transparent tax administration that would provide conducive and favourable market opportunities to the investors rather than low tax rates. The good environment for business itself is a motivator and a more important factor than the incentives.
4.3.2. Recommendations for Further Research
Research on incentives and stock market perfomance in developing countries is at its infant stages. In this regard, the researchers recommends an identical study on the effects of incentives on perfomance of stock markets using time series models such the autoregressive conditional heteroscedasticity (ARCH) models, with its extension to generalized autoregressive conditional heteroscedasticity (GARCH) models as introduced by [53, 54] respectively which accommodate the dynamics of conditional heteroscedasticity (the changing variance nature of the data) to determine if the results will be identical.
5. List of Supporting Tables Table 1. Stratified sample size
STRATUM A B C D E F G H I TOTAL
Population Size
8 9 2 4 10 6 4 14 4 61
Systematic size, every 2nd element 4 4 1 2 5 3 2 7 2 30
Respondents (10 managers
per firm) 20 20 5 10 25 15 10 35 10 150
Table 2. Response Rate
Population Frequency Percentage 150 127 84.66%

International Journal of Finance and Accounting 2015, 4(5): 262-280 271
Table 3. Gender among Departments
Gender
Department
Administration Finance IT Sales & Marketing Total
Freq % Freq % Freq % Freq % Freq %
Female 15 56 16 36 3 13 16 55 51 40
Male 12 44 29 64 20 87 13 45 76 60
Total 27 100 45 100 23 100 29 100 127 100
Table 4. Duration in the Current Department
Department Duration
Total 1 year 2 year 3 year 4 year >=5 years
Administration 13 8 13 2 5 42
Finance 9 2 12 2 4 29
IT 3 1 1 1 2 9
Sales & Marketing 6 11 17 4 8 47
Total 31 22 43 10 18 127
Table 5. Duration of Service Current Position
Gender Duration
Total 1 year 2 year 3 year 4 year >=5 years
Female 12 10 13 18 7 51
Male 14 18 14 14 16 76
Total 26 26 27 32 23 127
Table 6. Tax Incentives and Stock Market Perfomance
Tax Incentives and Stock Market Performance
Ranking
Strongly Agree Agree Strongly
Disagree Disagree Neither
Agree nor Disagree
Tax Incentives motivated our firm to list at NSE 52% 19% 15% 8% 6%
Tax incentives are an important variable while making listing decisions at NSE 21% 8% 56% 12% 3%
Tax reductions and exemptions influence stock market performance 100% 0% 0% 0% 0%
Our company enjoyed Tax incentives before listing at NSE 17% 23% 29% 31% 0%
Predictable, clear tax laws and transparent tax administration are important than low tax rates when listing in NSE
54.2% 45.8% 0% 0% 0%
272 Ondabu Ibrahim Tirimba et al.: Effects of Investment Incentives on Stock Market Perfomance: Survey of Listed Firms in Kenya
Table 7. Liquidity Incentive and Stock Market
Liquidity Incentives and Stock Market Performance Ranking
Strongly Agree Agree Strongly
Disagree Disagree Neither Agree nor Disagree
Liquidity Incentives motivated our firm to list at NSE 67.8% 22.0% 10.2% 12.0% 0%
Liquidity Incentives are a gift and not a motivator 51% 19% 23% 1% 6%
Liqudity incentives are important when making listing decisions at NSE 75.5% 7.8% 2.3% 12.4% 2%
Stock market liquidity will not enhance incentives for acquiring information 26.9% 3.0% 4.5% 5.2% 60.4%
Companies listed at NSE would easily access equity financing than their unlisted counterparts 100% 0% 0% 0% 0%
Many companies might want to list a NSE because of the highly liquid market position which enables diversification 87% 2.0% 1% 11% 0%
Table 8. Growth Incentives and Stock Performance
Growth Incentives and Stock Market Performance Ranking
Strongly Agree Agree Strongly
Disagree Disagree Neither Agree nor Disagree
Being listed at NSE results in an increase in firm’s stock equity 59.5% 12.0% 10.4% 18.1% 0%
Being listed at NSE results in an increase in total firm’s assets 13% 19% 16% 51% 1%
Going Public provides your firm with equity financing opportunities to grow your business 75.5% 7.8% 2.3% 12.4% 2%
The issuance of Public shares will expand your Investor base and helps set stage for secondary equity financing including private placements
48.7% 13% 5% 18.3% 15%
By virtue of being listed and subject to more scrutiny and exposure, a company raises its profile 100% 0% 0% 0% 0%
Stock markets promote growth opportunities to the listed firms 100% 0% 0% 0% 0%
Growth incentives provided by NSE are a gift and not a motivator 87% 2.0% 1% 11% 0%
Table 9. Visibililty Incentives and Performance
Visibility Incentives and Stock Market Performance Ranking
Strongly Agree Agree Strongly
Disagree Disagree Neither Agree nor Disagree
NSE firms are more competitive than a non-listed one 16% 9.0% 36% 28% 11%
NSE Visibility incentives are a gift and not a motivator 73% 10% 5.5% 4.5% 7%
NSE listing provides a good public image which helps promote firm Performance 60% 35.1% 1.9% 3% 0%
The market value of a public company is much higher compared to a private company with the same structure in the same industry
58.7% 23% 5% 8.3% 5%
Publicly filed documents by listed firms at NSE help promote their visibility and hence their performance 76% 4% 0% 20% 0%
Raising Capital through an IPO raises a company’s profile, perceived competitiveness and stability 0% 93% 0% 4% 3%
A listed firm is perceived by lenders and suppliers as a safer credit risk 99.3% 0% 0% 0.7% 0%
Media Coverage of listed firms at NSE help promote their visibility and hence their performance 100% 0% 0% 0% 0%
Firm Stories at NSE help promote their visibility and hence their performance 77% 2.0% 10% 11% 0%

International Journal of Finance and Accounting 2015, 4(5): 262-280 273
Table 10. Investors’ Percetions and Stock Perfomance
Investors’ Perceptions and Stock Market Performance Ranking
Strongly Agree Agree Strongly
Disagree Disagree Neither Agree nor Disagree
Majority investors use both fundamental and technical analysis while investing at NSE 59% 17% 0% 21% 3%
NSE Investors are Over Confident of their trading skills and investment decisions 41% 30% 9% 20% 0%
Investors at NSE tend to imitate the trading patterns of previous gainers even without any additional analysis of the market
100% 0% 0% 0% 0%
NSE investors fear the loss more than the gain 78.4% 13% 4% 4.6% 0%
Investors at NSE tend to hold on to losing stocks for too long and sell winning stocks too soon 49% 14% 8% 29% 0%
NSE Performance is affected more by Investors’ Perceptions than the investment Incentives given 100% 0% 0% 0% 0%
Table 11. Percentage Change in Incentives
Year Percentage change in incentives made during the years 2003-2014.
Net capital investment amount Total assets Total stock Equity
2003 8% 12% 13%
2004 14% 10% 17%
2005 21% -8% 2%
2006 10% 25% 7.7%
2007 6.50% 4.7% 1.4%
2008 -11.3% 15% 18.7%
2009 10% 17% 12%
2010 12% 8% -8%
2011 1.35% 8% 9.3%
2012 5.40% 12% 6.1%
2013 8.26% 2% 14%
2014 -4.90% 3.7% 7.9%
Average 6.72% 9.10% 8.42%
Table 12. Descriptive Statistics of Stock Incentives
Variable N Mean Median Minimum Maximum Standard Deviation
Tax incentives 127 0.177 0.140 0.000 0.930 0.153 Liquidity incentives 127 0.295 0.270 0.030 1.290 0.190
growth incentives visibility incentives
127 127
0.472 0.532
0.460 0.421
0.100 0.200
1.290 1.124
0.189 0.173
Table 13. Shapiro-Wilk test on Market capitalization
Kolmongrov-Smirnova Shapiro-Wilk
Statistic Df Sig. Statistic df Sig. Data 0.137 126 0.200a 0.946 20 0.316
Table 14. Cronbach’s Alpha Reliability findings
Variables Cronbach’s
Tax Incentives 0.701 Liquidity Incentives 0.769 Growth Incentives 0. 731
Visibility Incentives 0.720

274 Ondabu Ibrahim Tirimba et al.: Effects of Investment Incentives on Stock Market Perfomance: Survey of Listed Firms in Kenya
Table 15. T-test on NSE Investment and Incentives
T-test for equality of means
DF P-value (2-tailed) Mean Difference Std. Error
Difference
95% Confidence Interval of the Difference
Lower Upper
Equal variances assumed 126 0.001 0.6504 0.5967 0.5507 1.856 Equal variances not assumed 162 0.001 0.6504 0.5967 0.5511 1.852
Table 16. Incentives on Stock Market Index
t-test for Equality of Means
T DF P-value Mean Difference Std. Error Difference
95% Confidence Interval of the Difference
Lower Upper Equal variances assumed 3.558 126 0 0.337 0.6044 1.8796 2.653
Equal variances not assumed 3.558 126 0 0.337 0.6044 1.881 2.655
Table 17. Incentives on Market Capitalization
t-test for Equality of Means
t Df P-value Mean Difference Std. Error Difference
95% Confidence Interval of the Difference
Lower Upper Equal variances assumed 3.757 126 0 2.013 0.5359 0.9345 3.092
Equal variances not assumed 3.757 126 0 2.013 0.5359 0.9345 3.092
Table 18. Correlation Matrix for Stock Incentives
Table 19. Model Summary
Model R R Square Adjusted R Square Std. Error of the Estimate
1 0.525a 0.276 0.219 2.03647
Table 20. Stock Market ANOVA
Model Sum of Squares df Mean Square F Sig.
1
Regression 11.771 3 3.9237 1.2632 0.0110a
Residual 369.530 123 3.110
Total 381.301 126
Stock market Index
Pearson Correlation Stock market Index
Tax incentives Liquidity incentives
Growth incentives
visibility incentives
Pearson Correlation Sig. (1-tailed)
Tax incentives 1 -0.321 0.278 -0.02
Liquidity incentives -0.321 1 0.342 0.151
growth incentives 0.278 0.342 1 0.195
visibility incentives Stock market Index
-0.028 0.151 0.195 1
Sig. (1-tailed) N
Tax incentives . 0.019 0.037 0.108 0.108
Liquidity incentives 0.019 0.013 0.013 0.429 .
growth incentives 0.037 0.17 . 0.17
visibility incentives Stock market Index
0.429

International Journal of Finance and Accounting 2015, 4(5): 262-280 275
Table 21. Coefficients for Stock Market Incentives
Model
Unstandardized Coefficients Standardized Coefficients
T Sig.
B Std. Error Beta
1
(Constant) 3.347 1.733
1.932 0.061 Tax incentives -0.081 0.026 -0.467 -3.168 0.003
Liquidity incentives 0.363 0.121 0.447 3.006 0.005 growth incentives -0.004 0.012 -0.045 -0.319 0.752
visibility incentives 0.373 0.132 0.481 3.104 0.004
Source: Researcher (2015)
Table 22. Market Capitalization Model Summary
Model R R Square Adjusted R Square Std. Error of the Estimate
1 .758a .575 .562 .39768
a. Predictors: (Constant), Tax incentives, Liquidity incentives, growth incentives, visibility incentives b. Dependent Variable: Market capitalization
Table 23. Market Capitalization ANOVA
Model Sum of Squares df Mean Square F Sig.
1
Regression 28.888 4 7.222 46.67 .000a
Residual 19.276 122 .158
Total 48.164 126
Table 24. Market capitalization and Incentives
Coefficientsa
Model
Unstandardized Coefficients Standardized Coefficients
T Sig.
B Std. Error Beta
1
(Constant) -1.215 .454
1.932 .025 Tax incentives -6.561E-02 .070 -.055 -3.168 .348
Liquidity incentives 6.749E-03 .001 .549 3.006 .000 growth incentives 3.374E-03 .000 .456 -0.319 .000
visibility incentives -2.353E-03 .001 -.243 3.104 .001
Table 25. Regression Summary for NSE and Incentives
Statistic Std.Error
Data Mean
18.4719 0.77126
95% Confidence Interval Lower Bound 16.8577
Upper Bound 20.0862
5% Trimmed Mean
18.4986
Median
18.3962
Variance
11.897
Std.Deviation
3.44918
Minimum
12.68
Maximum
23.8
Range
11.14
Interquartile Range
6.8
Skewness
0.07 0.512
Kurtosis
-1.06 0.992

276 Ondabu Ibrahim Tirimba et al.: Effects of Investment Incentives on Stock Market Perfomance: Survey of Listed Firms in Kenya
Table 26. Regression Coefficients for Incentives and NSE
Variable B SE B Beta T Sig T
Constant term 4.530989 0.620501 13.388 0.0000
% change in stock market liquidity incentives 4.377789 0.909829 -0.56376 -4.812 0.0000 % change in stock market tax incentives 0.082682 0.040147 -0.18296 -1.142 0.2594
% change in stock market growth incentives -0.13018 0.057808 0.351942 2.252 0.0291 % change in stock market visibility incentives 0.24313 0.052810 -0.36603 -2.252 0.0423
6. List of Supporting Figures
Source: Researchers (2015)
Figure 1. Gender of the Respondents
Figure 2. Education Levels

International Journal of Finance and Accounting 2015, 4(5): 262-280 277
Figure 3. Age of the Respondents
Figure 4. Tax Investment as a Gift or Motivator
Figure 5. Percentage Change in Incentives

278 Ondabu Ibrahim Tirimba et al.: Effects of Investment Incentives on Stock Market Perfomance: Survey of Listed Firms in Kenya
Figure 6. Average Change in Incentives
Figure 7. NSE Investment Distributions
Figure 8. Regression for Stock Market Incentives

International Journal of Finance and Accounting 2015, 4(5): 262-280 279
Figure 9. NSE Investment and Incentives
REFERENCES [1] Klemm, N. (2009). “Growth Empirics: A Panel Data
Approach.” Quarterly Journal of Economics 110 No. 4 (November, 1995): 1127–70.
[2] Tripathi, D. 2009, ‘On large amplitude oscillations in solar prominences’, Space Science Reviews, Under revision after referee’s comments
[3] Abdikarim, F., Emilio, S., and Gonzalo, Salinas. (2009). The Macroeconomic Impact of Scaled-Up Aid: The Case of Niger, IMF Working Paper
[4] Rashid, M. and Nishat, A., 2009. Disparity of Performance Indicators of Islamic Banks: Study on Bangladesh: International Journal of Business and Management International Journal of Business and Management. 4(8), 52-72 [ERA, ABDC - C]
[5] Cooray, A. 2003. Financial Reform: The Sri Lankan Experience Stamford Lake.
[6] Aregbeyen & Mbadiugha, (2011) Factors influencing investors decisions in shares of quoted companies in Nigeria, Medwell Journals.
[7] A Quarterly Newsletter of Capital Markets Authority (Kenya) Vol. 1, Issue 1 June, 2005.
[8] Jeffrey, J. & Randolph, W. (1985). The Week-End Effect in Common Stock Returns: The International Evidence. The Journal of American Finance Association. Volume 40, Issue 2, pages 433–454, June 1985
[9] Nairobi Stock Exchange, (2013). Handbook, ‘corporate information and financial review of listed equity companies.’
[10] KRA, (2009). Taxation and foreign direct investment a synthesis of empirical research: CPB Discussion Paper. Hague: Mooij R.A. and Ederveen S.
[11] Shafi, H., Akram, M., Hussain, M., Sajjad, S. I., & Rehman, K. (2011). Relationship between risk perception and employee investment behavior. Journal of Economics and
Behavioral Studies, 3(6), 345–351.
[12] Githaiga, I.W., (2009). ‘the impact of tax incentives on Foreign Direct Investments inflows of firms listed at the Nairobi Securities Exchange’, Unpublished MBA Project, University of Nairobi.
[13] Gale, W., (1996). “The Kemp Commission and the Future of Tax Reform.” Tax Notes 70 No. 6 717–29.
[14] OECD Report, (2002). “Tax incentives may enhance the attractiveness of a potential host country, but in many cases the relief provided will be insufficient to offset additional costs incurred when investing there” p. 81.
[15] William M. & R. Hubbard, 2002. "The Effects of Progressive Income Taxation on Job Turnover," NBER Working Papers 9226, National Bureau of Economic Research, Inc.
[16] Noble, G. & White, C. (2012). All the Incentives Were Wrong: Opportunism and the Financial Crisis. University of California.
[17] Rolfe, R., & White, R. (1990). “The Influence of Tax Incentives in Determining the Location of Foreign Direct Investment in Developing Countries,” Working Paper, University of South Carolina College of Business Administration.
[18] Morriset, J., & Pirnia, N. (2001). “How tax policy and Incentives affect foreign direct investment: A review in Allen, N., Morriset, J., Pirnia, N. & Wells, L (2001) ‘Using Tax Incentives to compete for Foreign Direct Investment_ Are they worthy the cost? FLASS occassional Paper 15. Washington D.C.: Foreign Investment Advisory Service.
[19] Musyoka K. (2012). “The relationship between tax incentives and foreign direct investment in Kenya”. Unpublished MBA Project, University of Nairobi.
[20] Mutua, Y. (2011). - Cities, Climate Change and Global Heat: 2007 Habitat Debate, Vol.13, No.4- Healthy Cities, UN-HABITAT, Nairobi.
[21] Kyle, A.S. (1985). Continuous auctions and insider trading. Econometrica, 53(6), 1315-1335.
[22] Glen, M. (1994). The effects of Incentives on organizational Perfomance. Unpublished Masters Dissertation, University of

280 Ondabu Ibrahim Tirimba et al.: Effects of Investment Incentives on Stock Market Perfomance: Survey of Listed Firms in Kenya
Columbia.
[23] Madhavan, A. (1992). Trading mechanisms in securities markets. Journal of Finance, XLVII (2), 607-641.
[24] Chordia, T., R. Roll, & Subrahmanyam, A. (2003). Determinants of daily fluctuations in liquidity and trading activity. Working paper.
[25] Donna, M. (2013). Wellness Incentives: Can the use of Financial Incentives and penalties be effective for motivating participation in wellness programs and sustaining health behavior modification? University of Rhode Island
[26] Chris, A. & David, F. The Incentives for Tax Planning. Journal of Accounting and Economics, Volume 53, Issues 1–2, (Feb–April 2012): 391-411.
[27] Harvey, Campbell R., 1991, The world price of covariance risk, Journal of Finance 46, 111-157.
[28] Ahn, D & Chung, K. (1999). Calibrated Incentive Contracts. Princeton University
[29] Pagano, M and Roell, A, 1996, Transparency and liquidity: A comparison of auction and dealer markets with informed trading, Journal of Finance, pages 579 – 611.
[30] Cornell, B. & Sirri, E.R. (1992). The reaction of investors and stock prices to insider trading. Journal of Finance, 47, 1031-1059. Fama, E.F., Fisher, L., Jensen & Roll, (1969). ‘The Adjustment of stock Price to New Information’, International Economic Review, Vol. 10, No. 1, pp 1-21
[31] Levine, R. (1997). Financial development and growth: Views and agenda. Journal of Economic Literature, 35, 688-726.
[32] Botosan, C. A. (1997). Disclosure level and the cost of equity capital. Accounting Review, 72(3), 232-349.
[33] IOSCO (May 2002). AMERC Survey on Incentive offered in EMC jurisdictions. Author. Johnson, & M. Zanna (Eds.) Handbook of attitudes and behavior.
[34] Boot, A., Gopalan, R. & Thalor, A.V. (2006). The entrepreneur’s choice between private and public ownership. Journal of Finance 61: 803–836.
[35] Al-Rabadi, G.J., Torley, P.J., Williams, B.A., Bryden, W.L., Gidley, M.J. (2011). Effect of extrusion temperature and pre-extrusion particle size on starch digestion kinetics in barley and sorghum grain extrudates. Animal Feed Sci. and Technol. 168:267–279.
[36] Admati, A., & Pfleiderer, P. (1997). “Does it All Add Up? Benchmarks and the Compensation of Active Portfolio Managers,” Journal of Business, Vol. 70, pp. 323–50. [38] A Quarterly Newsletter of Capital Markets Authority (Kenya) Vol. 1, Issue 1 June, 2005.
[37] Ajmi, J. (2008). “Risk Tolerance of Individual Investors in an Emerging Markets”, International Research Journal of Finance and Economics, Issue 17, pp 15-26.
[38] Kaneko, J. (2004). Incentive Schemes on the Horticultural Firms listed in the Stock Market. Research in Agricultural and Applied Economics Journal
[39] Obamuyi, T.M. (2013), Factors influencing investment decisions in capital market: A study of individual investors in Nigeria. Organizations and Markets in Emerging Economies, 4(7), 141-161.
[40] Billett, M.T., Jiang, Z., & Lie, E. (2010). The effects of change-in-control covenant on takeovers: evidence from leveraged buyouts. Journal of Corporate Finance, 16(1), p.1-15.
[41] Bourne, M. & Franco, S. (2003). The impact of performance targets on behaviour: A close look at sales force contexts. Cranfield University.
[42] Bhagat, S. & Bernard, B. (1996). Do independent directors matter? Unpublished manuscript, University of Colorado and Columbia Law School.
[43] Shah, N., Zhou, D. & Peres, Y. (2015). Approval Voting and Incentives in Crowdsourcing. Proceedings of the 32 nd International Conference on Machine Learning, Lille, France, 2015. JMLR: W&CP volume 37. Copyright 2015 by the author(s).
[44] Wright, S. (2011). Share incentives in the economic downturn. www.wrighthassall.co.uk
[45] Matolcsy, Z & Wright, A. (2011). CEO Compensation Structure and Firm Performance. Accounting & Finance, Vol. 51, Issue 3, pp. 745-763, 2011
[46] Mugenda, M. and Mugenda, G. (2003): Research Methods, Quantitative and Qualitative Approaches. Nairobi: African Centre for Technology Studies. [108] Young, K. H., (1988), The effects of taxes and rates of return on foreign direct investment in the United States, National Tax Journal 41, 109-121.
[47] Kothari C.R. (2001). Research Methodology Methods and Techniques. (2nd ed). New Delhi: New Age International Publisher.
[48] Kombo, D. K., & Tromp, D.L. (2006). Proposal and thesis writing: An introduction. Nairobi: Pauline's. Publications Africa.
[49] Gliem, J.A., & Gliem, R.R. (2003). Calculating, interpreting, and reporting Cronbach's alpha reliability coefficient for Likert-type scales. Midwest Research to Practice Conference in Adult, Continuing, and Community Education, The Ohio University, Columbus, OH
[50] Levine R. & Zervos S. (1998). Stock Market, Banks and Economic Growth. American Economic Review, Vol 88, pp. 537-558.
[51] Hair, J F; Anderson, R E; Tatham, R L and Black, W C (2006). Multi-Variate Data Analysis, New Jersey: Prentice Hall International.
[52] Kombo, D. K. and Tromp, D. L. A. (2006)’. Proposal and Thesis Writing: An Introduction. Paulines Publications’ Africa, Nairobi.
[53] Engle, R.F. Autoregressive Conditional Heteroscedasticity with Estimates of the Variance of United Kingdom Inflation. The Econometric Society.
[54] Bollerslev, T. (1986). Generalized autoregressive conditional heteroskedasticity. Journal of Econometrics, 1986, vol. 31, issue 3, pages 307-327.
[55] Mokua, E.M., (2003). ‘Empirical Study of The Weekend Effect on Stocks at NSE’, Unpublished MBA Project, University of Nairobi.


