Embed Size (px)
Citation preview
Composites Science and Technology 47 (1993) 405-418
EFFECTS OF MATERIAL PROPERTIES AND CRUSH CONDITIONS ON THE CRUSH ENERGY ABSORPTION OF
FIBER COMPOSITE RODS
Wess H. Tao, Richard E. Robertson* Department of Materials Science and Engineering, The University of Michigan, Ann Arbor, Michigan 48109-2136, USA
&
Peter H. Thornton Ford Motor Company, Dearborn, Michigan 48121-2053, USA
(Received 15 August 1991; revised version received 25 August 1992; accepted 8 October 1992)
Abstract Crushing along the fiber axis of unidirectional E-glass fiber composite rods was examined to determine the effects of fiber volume fraction, fiber diameter, matrix compressive yield strength, crush rate, fiber surface treatment, and crush plate geometry. The volume specific energy absorption was found to increase with fiber content, fiber diameter, matrix yield strength, and crush rate. The crush load stability was found to be independent of fiber content and fiber diameter but not of matrix yield strength. The crush load became less stable as the yield strength increased. The crush behavior of specimens containing clean fibers was about the same as with sized fibers, but specimens with a release agent on the fiber surface crushed with less energy absorption that decreased even as the fiber content increased, but the crush load was more stable than with sized or clean fibers. The volume specific energy absorption was greater when the rod specimens were crushed against concave surfaces than against a flat plate. A relatively simple model was able to account for the dependence of the energy absorption on fiber volume fraction and matrix yield strength.
Keywords: crash energy, crashworthiness, crush, E- glass fiber composite, fiber composite materials.
1 INTRODUCTION
Polymer fiber composite materials are becoming widely used for structural applications because of their light weight, high strength and corrosion resistance. For automobiles and helicopters, polymer fiber
* To whom correspondence should be addressed.
Composites Science and Technology 0266-3538/93/$06.00 (~) 1993 Elsevier Science Publishers Ltd.
405
composite materials are known also to be efficient energy absorbers. They can absorb large amounts of kinetic energy during crash, a behavior that is important for passenger safety.
Maximum energy is absorbed by progressive crushing which involves extensive microfracture and deformation in a small zone adjacent to the crush plate. 1-3 Although fiber composite materials at their best are capable of absorbing more energy per unit mass than other materials, the crush behavior is often unstable, with erratically rising and falling energy absorption rates. A number of factors influence crush stability. These include the specific specimen geometry 3-7 and fiber lay-up. T M
In most studies of the past ten years, column specimens of square or round tubes with various fiber lay-ups have been crushed with examination only of the macroscopic details. The basic, microscopic crushing processes and their intrinsic stability have not received much attention, except for the recent work on tubes and columns by Hull. 3 In the present work, continuous unidirectional fiber composite material with the fibers aligned with the crush axis was studied. The material was studied as a rod in isolation of fibers and plies in other orientations to better illuminate the effects of several material variables and testing conditions. The material variables studied were fiber diameter, fiber volume fraction, matrix compressive yield strength, and, in a minor way, fiber-matrix bond. The testing conditions were the crush rate and crush plate configuration.
2 MATERIALS AND EXPERIMENTAL METHODS
Fiber composite rod specimens were fabricated in glass tubes 7 mm o.d. and 5 mm i.d. Continuous fibers
406 Wess H. Tao, Richard E. Robertson, Peter H. Thornton
were laid inside the tubes; then resin was injected into the tubes with compressed air and cured. The materials used were continuous E-glass fibers from Owens-Corning Fiberglass Company and vinyl ester resin (Derakane 411C-50) from Dow Chemical Company. Three fiber diameters were used: 23 ~m (Type 30, P366C-X1), 17/~m (Type 30, P366C-X5), and 13/~m (Type 30, P366C-X6). The size on the fibers was described by the manufacturer as being appropriate for vinyl ester resin. The resin was mixed with l%wt benzoyl peroxide catalyst before being injected into the fiber-filled glass tubes and was cured at 90°C. The cured specimens were generally void-free.
After curing, the rods were removed from the glass tubes by smashing the glass shell and were cut into 18 mm long specimens. One end of each specimen was ground to a point for the purpose of initiating crush at that end. The specimens were crushed along the fiber axis in an Instron machine against plates of hardened steel. Three to five specimens were tested for each condition.
The energy absorption was obtained by integrating the area under the instantaneous load versus crushing distance curve, beginning the integration after crush was fully initiated. The average crush load was obtained from the energy absorption by dividing by the crush distance. To describe the energy absorption ability of the fiber composite rods, the volume specific energy absorption, E~c (MJ m-~), obtained by dividing
/ ¢ <
~ 4.96 mm
the average crush load by the cross-sectional area of the rod (the energy absorbed divided by the volume of material crushed, equal to the product of the crush distance and the cross-sectional area), is used.
To compare the energy absorption of the fiber composite rods with the compressive yield strength of polymer rods with the same geometry but without fibers, polymer rod specimens were fabricated using the same method as for composite rods, except that the glass tubes did not contain fibers when the resin was injected. The polymer rod specimens were compressed with flat ends. To vary the compressive strength of the matrix in the polymer and composite rods, the resin was cured at different temperatures for different lengths of time.
For the effect of fiber surface treatment, three different fiber surface treatments were used for continuous E-glass fiber with an average diameter of 13 ~m. The first surface treatment was the as-received condition of the fibers, which gave good adhesion to the vinyl ester matrix. The second was no surface treatment, i.e. continuous E-glass fibers to which no size had ever been applied. The third was the unsized E-glass fibers treated with a release agent. The release agent was Mono-Coat, obtained from Chem-Trend Incorporated. The unsized fibers were wetted by undiluted Mono-Coat, the excess Mono-Coat allowed to drain, and dried. This left a thin layer of a low friction polymer film deposited on the fiber surface that gave poor adhesion between the fiber and matrix.
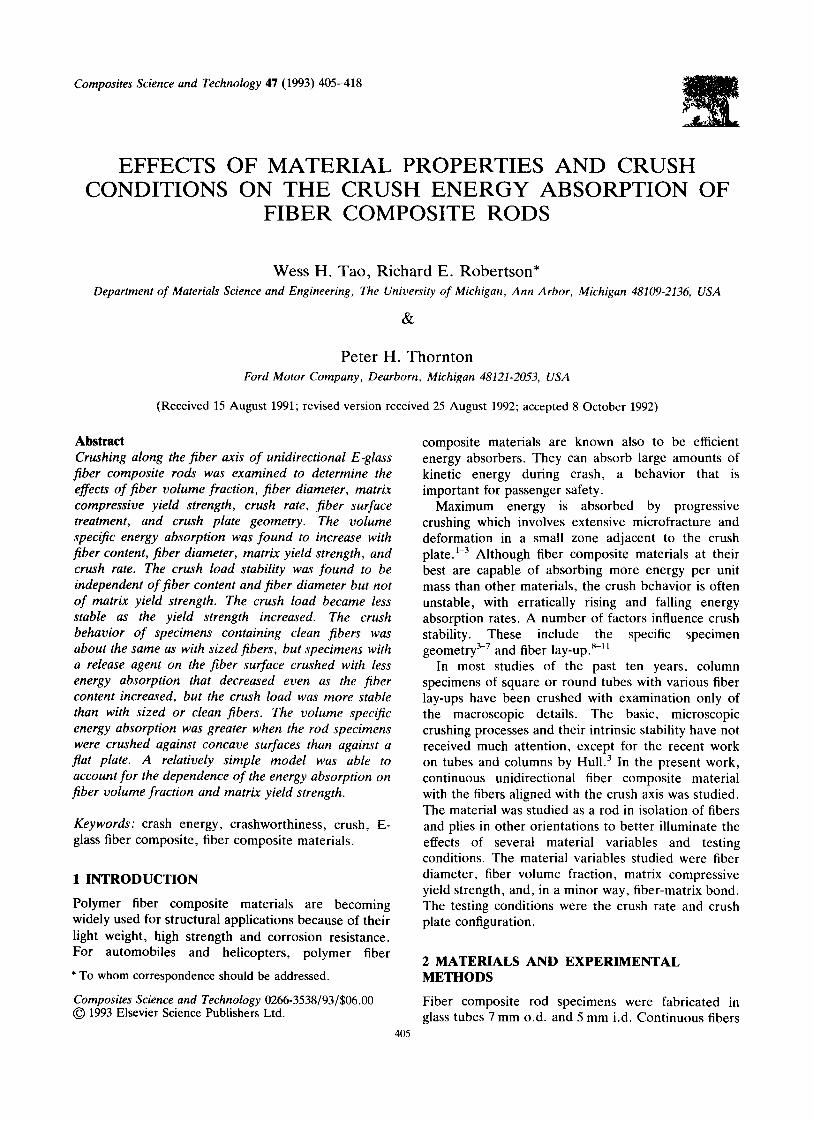
Side view ~_] ~ ~ -~r = 9.5 mm
I I / / ~1 "1 19mm ]"
Side view 5.8mm I J[- _ r = 14.3 mm
0 / Side view .~.._1 Flat plate I
Fig. 1. Configurations of three crush plates.
Crush energy absorption of fiber composite rods 407
The vinyl ester resin for each composite rod was cured at 90°C for 25 minutes.
To study the effect of crush plate geometry, three different crushing plates were used, one that was fiat and two with depressions with radii of curvature 9-5 mm and 14.3 mm, as shown in Fig. 1.
3 RESULTS
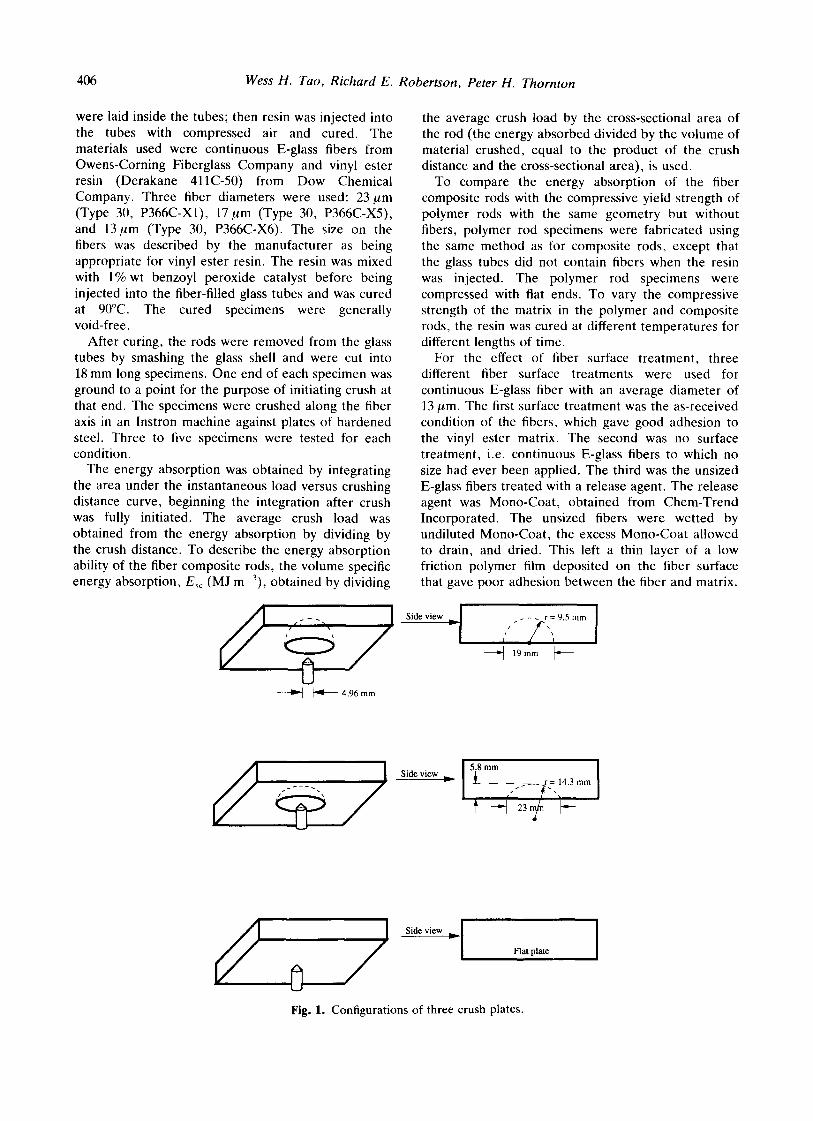
3.1 Effects of fiber volume fraction and fiber diameter A typical load versus crush distance curve for composite rod specimens is shown in Fig. 2. The variation in the instantaneous crush load is very noticeable. But the degree of variation was found to be independent of fiber content and fiber diameter.
For the average volume specific energy absorption, Esc, three to five specimens were tested for each fiber content. The energy absorption was found to increase with increase in fiber content, as shown in Fig. 3. For each of the points of average crush energy shown, the standard deviation was about 5 MJ m -3. Specimens containing the 23/~m diameter fibers generally gave the highest volume specific energy absorption, specimens containing 13/zm diameter fibers gave the lowest, but the differences were small. For the data in Fig. 3, the vinyl ester resin had been cured at 90°C for 25 minutes, which gave a compressive yield strength for the cured matrix of 75 MPa. The specimens had been crushed at a rate of 2 . 5 4 m m m i n -1 at room temperature by a fiat plate. Because of the difficulty of laying fibers inside the glass tube at high fiber content,
50o0 J ' I , I , I , I ,
4 0 0 0
3 0 0 0 -
2 0 0 0 -
1 0 0 0 "
0 I ' I ' I ' I
2 4 6 8 I 0
D e f o r m a t i o n ( r a m )
Fig. 2. Load versus deformation plot for crushing a composite rod specimen containing 75 MPa compressive strength matrix and 34% vol. 23/~m diameter fibers crushed
by a fiat plate.
o = e.-
200
160-
120-
80"
I , I , I , I , I ,
[ ]
[] o ~ O 0 ®
ffl 23 pJn-diameter fiber
® 13 lUn-diameter fiber
i i i i i
0 10 20 30 40 50
F i b e r v o l u m e f r a c t i o n ( % )
60
Fig. 3. Effects of fiber volume fraction and fiber diameter on volume specific energy absorption of unidirectional fiber
composite rods.
the maximum fiber content obtainable was 29% vol. for composite rod specimens with an average fiber diameter of 13/zm, 44% vol. for specimens with an average fiber diameter of 17/zm, and 50% vol. for specimens with an average fiber diameter of 23/zm.
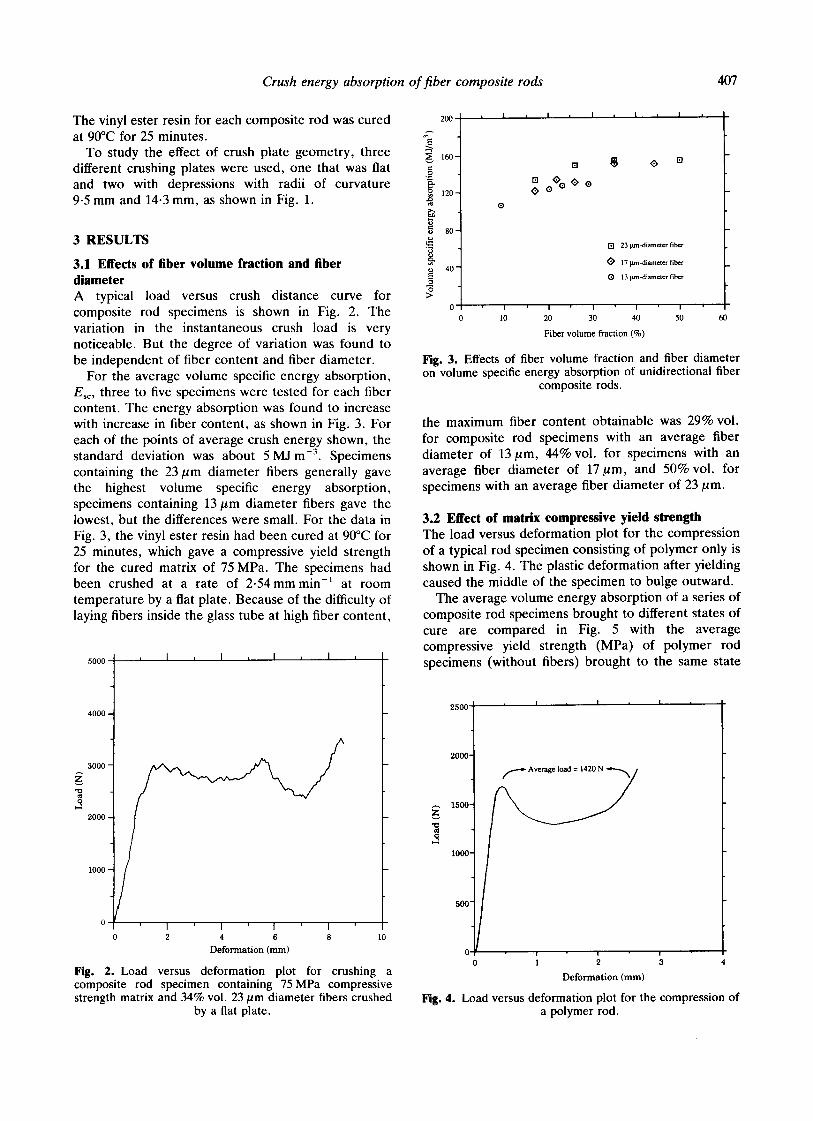
3.2 Effect of matrix compressive yield strength The load versus deformation plot for the compression of a typical rod specimen consisting of polymer only is shown in Fig. 4. The plastic deformation after yielding caused the middle of the specimen to bulge outward.
The average volume energy absorption of a series of composite rod specimens brought to different states of cure are compared in Fig. 5 with the average compressive yield strength (MPa) of polymer rod specimens (without fibers) brought to the same state
25~i , i , l , i ,
I 2000 1
! i ! 0 1 2 3
Deformation (ram)
Fig. 4 . Load versus deformation plot for the compression of a polymer rod.
408 Wess H. Tao, Richard E. Robertson, Peter H. Thornton
2O0
160.
120 -
80"
g 40-
>
- - ~ 34 vol % fibers
-- -- -- [] 17vol%fibers
/ /
[]
7
0 I I I I
0 20 40 60 80 100
Matrix compressive strength (MPa)
Fig. 5. Effect of matrix compressive strength on volume specific energy absorption of fiber composite rods.
of cure. For each curing state, five polymer rod specimens were compressed and five composite rod specimens were crushed. The average standard deviations for each point were 5 M J m -3 for the volume specific energy absorption and 2 MPa for the compressive yield strength. Both sets of specimens were crushed or compressed at room temperature at 2.54mm min -~ with a flat steel plate. The volume specific energy absorption is seen to increase essentially linearly with the matrix compressive yield strength. The two sets of data, from composite rod specimens with 17% vol. and from 34% vol. fibers, were each fitted to a least squares line, but the lines are nearly the same within experimental error. (Since the units MPa and MJ m -3 are the same, the matrix yield strength is equivalent to a volume specific energy absorption. The matrix rod without fibers does not crush, however. When an end of the rod without fibers is sharpened into a point in an attempt to 'trigger' crush and the rod compressed, the point is just flattened.)
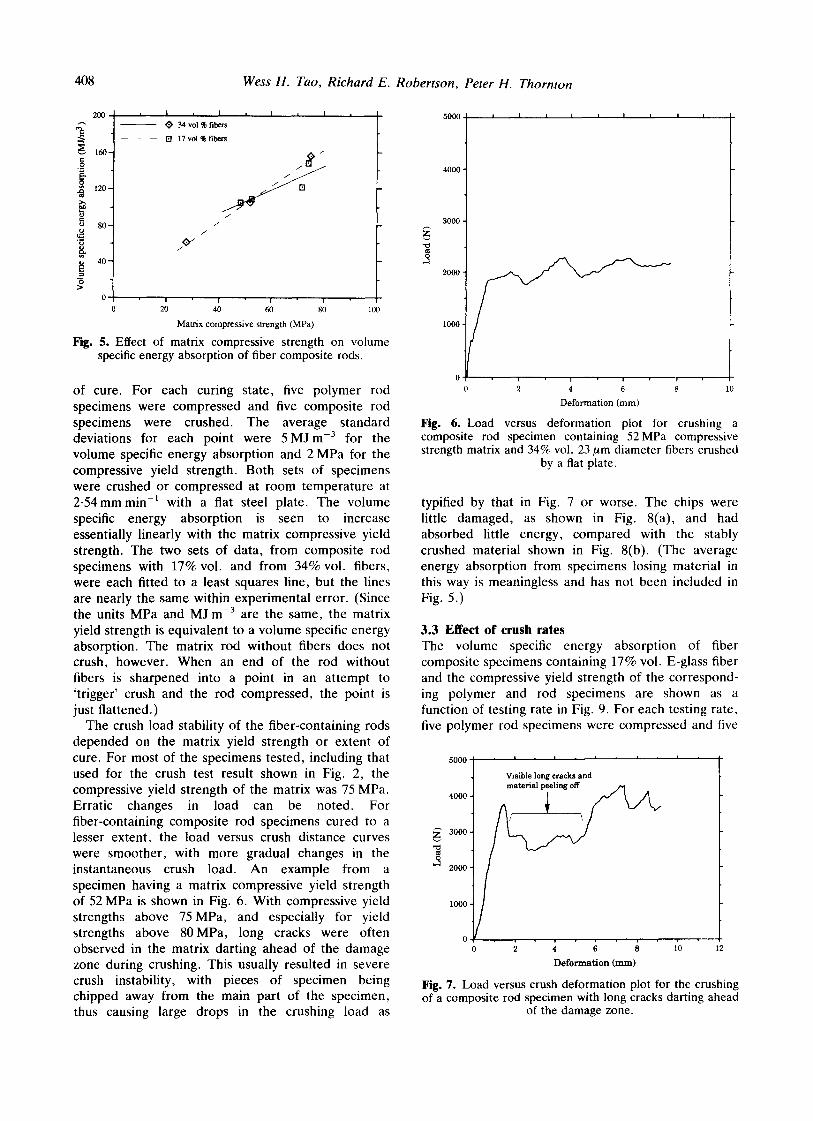
The crush load stability of the fiber-containing rods depended on the matrix yield strength or extent of cure. For most of the specimens tested, including that used for the crush test result shown in Fig. 2, the compressive yield strength of the matrix was 75 MPa. Erratic changes in load can be noted. For fiber-containing composite rod specimens cured to a lesser extent, the load versus crush distance curves were smoother, with more gradual changes in the instantaneous crush load. An example from a specimen having a matrix compressive yield strength of 52 MPa is shown in Fig. 6. With compressive yield strengths above 75MPa, and especially for yield strengths above 80MPa, long cracks were often observed in the matrix darting ahead of the damage zone during crushing. This usually resulted in severe crush instability, with pieces of specimen being chipped away from the main part of the specimen, thus causing large drops in the crushing load as
5000
4000
30OO
2OOO
1000
I I I I I I I I
0 I I I I
0 2 4 6 8 10
Deformation (mm)
Fig. 6. Load versus deformation plot for crushing composite rod specimen containing 52MPa compressive strength matrix and 34% vol. 23/~m diameter fibers crushed
by a fiat plate.
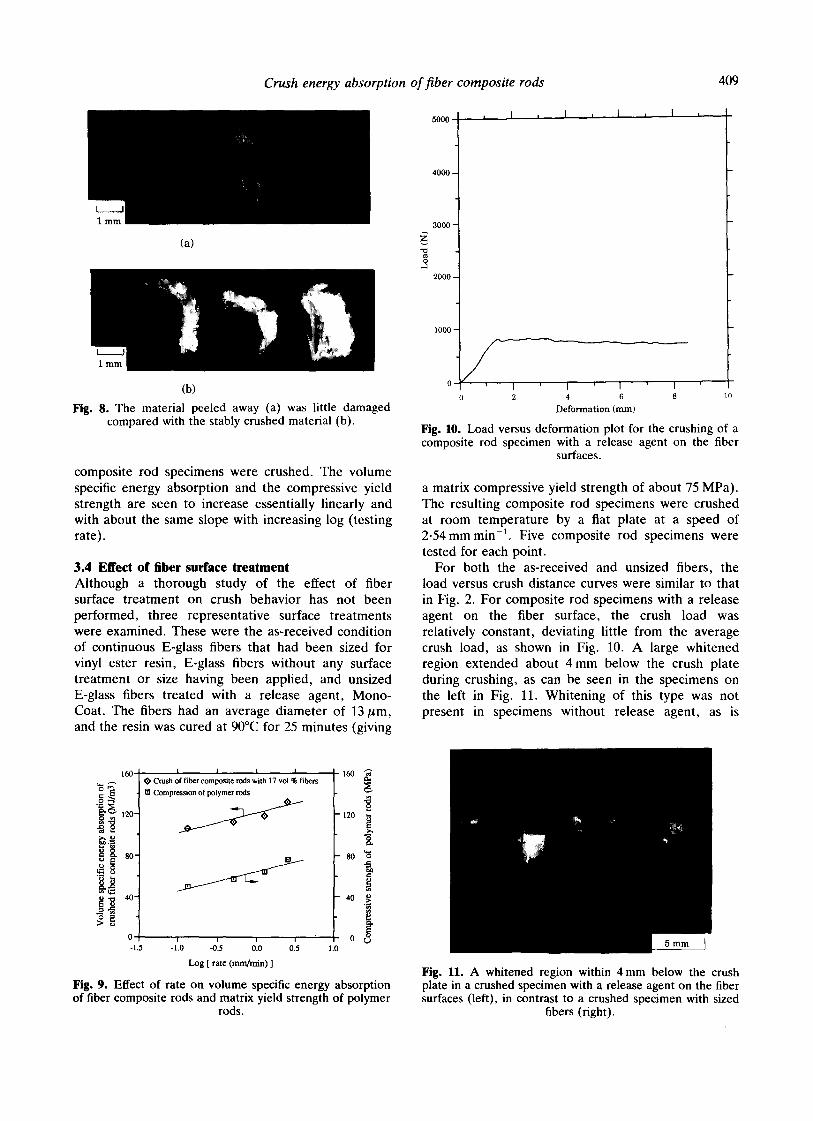
typified by that in Fig. 7 or worse. The chips were little damaged, as shown in Fig. 8(a), and had absorbed little energy, compared with the stably crushed material shown in Fig. 8(b). (The average energy absorption from specimens losing material in this way is meaningless and has not been included in Fig. 5.)
3.3 Effect of crush rates The volume specific energy absorption of fiber composite specimens containing 17% vol. E-glass fiber and the compressive yield strength of the correspond- ing polymer and rod specimens are shown as a function of testing rate in Fig. 9. For each testing rate, five polymer rod specimens were compressed and five
5000
4000
3000
2000
1000
I I I I
Visible long cracks and material pieling °ff / / ~ A
0 2 4 6 8 1'0 12
Defo rma t ion ( ram)
Fig. 7. Load versus crush deformation plot for the crushing of a composite rod specimen with long cracks darting ahead
of the damage zone.
Crush energy absorption of fiber composite rods 409
(a)
(b)
Fig. 8. The material peeled away (a) was little damaged compared with the stably crushed material (b).
composite rod specimens were crushed. The volume specific energy absorption and the compressive yield strength are seen to increase essentially linearly and with about the same slope with increasing log (testing rate).
3 . 4 E l l e c t o f f i b e r s u r f a c e t r e a t m e n t
Although a thorough study of the effect of fiber surface treatment on crush behavior has not been performed, three representative surface treatments were examined. These were the as-received condition of continuous E-glass fibers that had been sized for vinyl ester resin, E-glass fibers without any surface treatment or size having been applied, and unsized E-glass fibers treated with a release agent, Mono- Coat. The fibers had an average diameter of 13/um, and the resin was cured at 90°C for 25 minutes (giving
5000
4000
3000 "
2000-
1000'
, I , I , I ~ I ,
0 , I I I 0 2 4 6 8 10
D e f o r m a t i o n ( m r n )
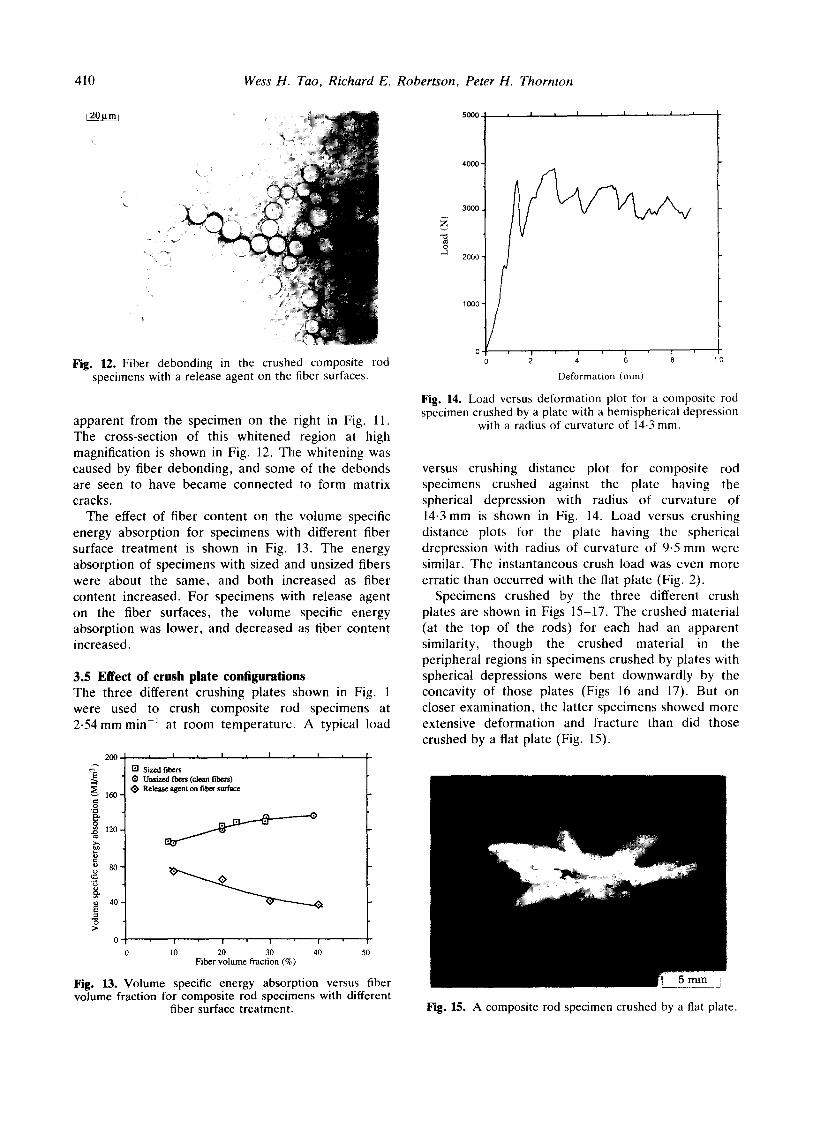
Fig. 10. Load versus deformation plot for the crushing of a composite rod specimen with a release agent on the fiber
surfaces.
a matrix compressive yield strength of about 75 MPa). The resulting composite rod specimens were crushed at room temperature by a fiat plate at a speed of 2 .54mmmin -1. Five composite rod specimens were tested for each point.
For both the as-received and unsized fibers, the load versus crush distance curves were similar to that in Fig. 2. For composite rod specimens with a release agent on the fiber surface, the crush load was relatively constant, deviating little from the average crush load, as shown in Fig. 10. A large whitened region extended about 4 m m below the crush plate during crushing, as can be seen in the specimens on the left in Fig. 11. Whitening of this type was not present in specimens without release agent, as is
160
120'
80'
40'
I I I I Crush of tibet composite rods with 17 vol % fibers
El Compression of polymer rods
Y
0 0 -1.5 -11.0 -01.5 01.0 015 1.0
L o g [ ra te ( ram/ra in) ]
160 gu
12o
80 ~
40 ~
Fig. 9. Effect of rate on volume specific energy absorption of fiber composite rods and matrix yield strength of polymer
rods.
Fig, 11. A whitened region within 4 mm below the crush plate in a crushed specimen with a release agent on the fiber surfaces (left), in contrast to a crushed specimen with sized
fibers (right).
410 Wess H. Tao, Richard E. Robertson, Peter H. Thornton
[ 2 0 p - m l
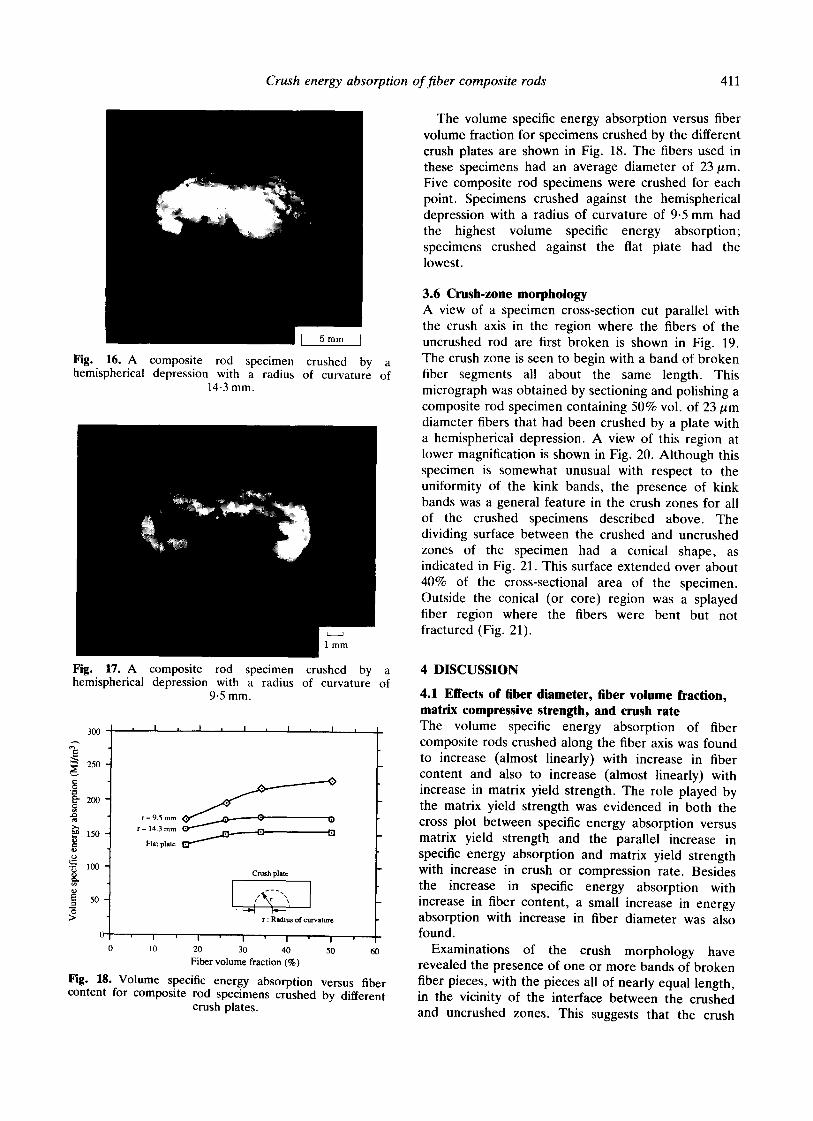
Fig. 12. Fiber debonding in the crushed composite rod specimens with a release agent on the fiber surfaces.
apparent from the specimen on the right in Fig. 11. The cross-section of this whitened region at high magnification is shown in Fig. 12. The whitening was caused by fiber debonding, and some of the debonds are seen to have became connected to form matrix cracks.
The effect of fiber content on the volume specific energy absorption for specimens with different fiber surface treatment is shown in Fig. 13. The energy absorption of specimens with sized and unsized fibers were about the same, and both increased as fiber content increased. For specimens with release agent on the fiber surfaces, the volume specific energy absorption was lower, and decreased as fiber content increased.
3.5 Effect of crush plate configurations The three different crushing plates shown in Fig. 1 were used to crush composite rod specimens at 2-54 mm min -~ at room temperature. A typical load
20O
~--~ 160 ¸
.~ 120
i .
o 80
~ 40
>
0
0
, I ~ I
I r l S i zed f i b e r s
® Unsizcd fbers (clean fibers) Release agent on fiber surface
, I = I J
I I I I
10 20 30 4 0 50 F i b e r v o l u m e f rac t ion (%)
Fig. 13. Volume specific energy absorption versus fiber volume fraction for composite rod specimens with different
fiber surface treatment.
5 0 0 0 = I = I I , I J '
4 0 0 0 •
3ooo.
2 0 0 0 -
1000 ' / 0 i i i 1
0 2 4 6 8 1 0
D e f o r m a t i o n { m m )
Fig. 14. Load versus deformation plot for a composite rod specimen crushed by a plate with a hemispherical depression
with a radius of curvature of 14.3 mm.
versus crushing distance plot for composite rod specimens crushed against the plate having the spherical depression with radius of curvature of 14.3 mm is shown in Fig. 14. Load versus crushing distance plots for the plate having the spherical drepression with radius of curvature of 9.5 mm were similar. The instantaneous crush load was even more erratic than occurred with the flat plate (Fig. 2).
Specimens crushed by the three different crush plates are shown in Figs 15-17. The crushed material (at the top of the rods) for each had an apparent similarity, though the crushed material in the peripheral regions in specimens crushed by plates with spherical depressions were bent downwardly by the concavity of those plates (Figs 16 and 17). But on closer examination, the latter specimens showed more extensive deformation and fracture than did those crushed by a flat plate (Fig. 15).
L J
Fig. 15. A composite rod specimen crushed by a flat plate.
Crush energy absorption of fiber composite rods 411
The volume specific energy absorption versus fiber volume fraction for specimens crushed by the different crush plates are shown in Fig. 18. The fibers used in these specimens had an average diameter of 23/,m. Five composite rod specimens were crushed for each point. Specimens crushed against the hemispherical depression with a radius of curvature of 9.5 mm had the highest volume specific energy absorption; specimens crushed against the flat plate had the lowest.
[ 5 mm I
Fig. 16. A composite rod specimen crushed by a hemispherical depression with a radius of curvature of
14-3 mm.
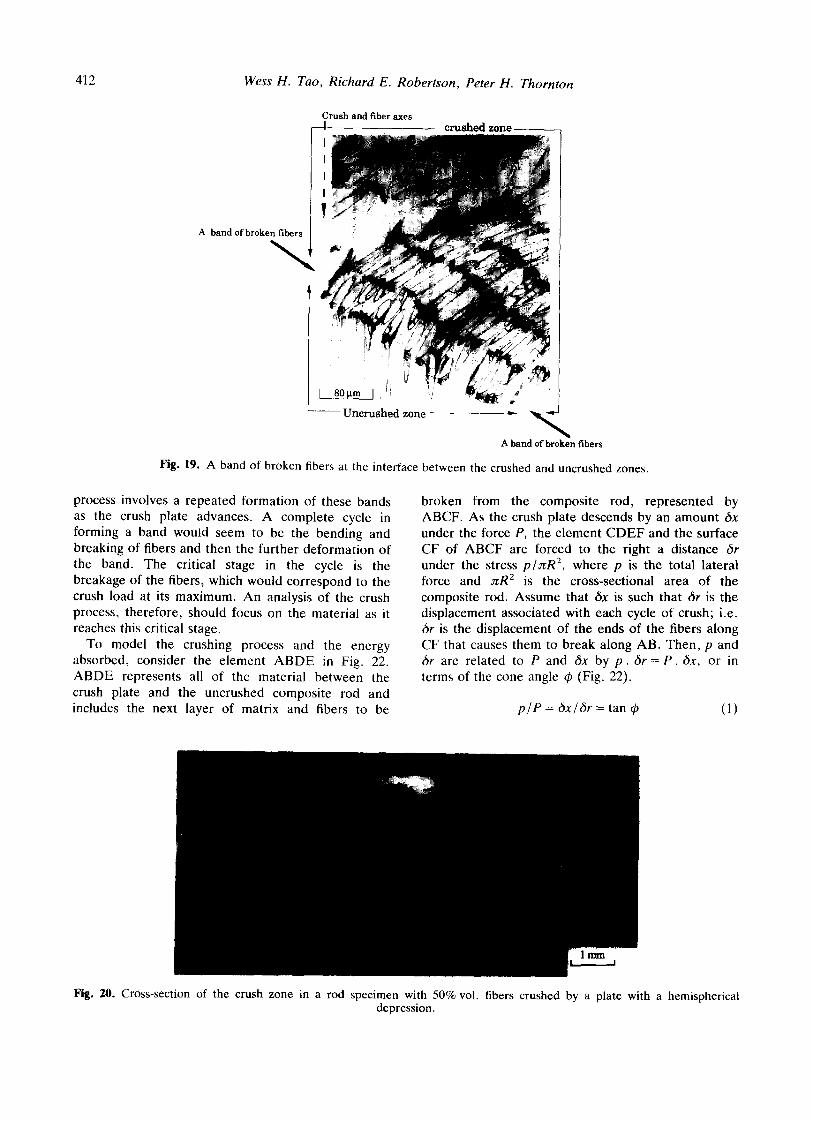
3.6 Crush-zone morphology A view of a specimen cross-section cut parallel with the crush axis in the region where the fibers of the uncrushed rod are first broken is shown in Fig. 19. The crush zone is seen to begin with a band of broken fiber segments all about the same length. This micrograph was obtained by sectioning and polishing a composite rod specimen containing 50% vol. of 23/~m diameter fibers that had been crushed by a plate with a hemispherical depression. A view of this region at lower magnification is shown in Fig. 20. Although this specimen is somewhat unusual with respect to the uniformity of the kink bands, the presence of kink bands was a general feature in the crush zones for all of the crushed specimens described above. The dividing surface between the crushed and uncrushed zones of the specimen had a conical shape, as indicated in Fig. 21. This surface extended over about 40% of the cross-sectional area of the specimen. Outside the conical (or core) region was a splayed fiber region where the fibers were bent but not fractured (Fig. 21).
Fig. 17. A composite rod specimen crushed by a hemispherical depression with a radius of curvature of
9.5 mm.
3 0 0
250
150
~ 100
~ 50
, I u I , I , I , I J
r =9.5 mm
r = 14,3 mm
Flat plata
Crush plat~
r : Radius of curvature
I I I I I
0 10 20 30 40 50
F i b e r v o l u m e f r a c t i o n ( % ) 60
Fig. 18. Volume specific energy absorption versus fiber content for composite rod specimens crushed by different
crush plates.
4 DISCUSSION
4.1 Effects of fiber diameter, fiber volume fraction, matrix compressive strength, and crush rate The volume specific energy absorption of fiber composite rods crushed along the fiber axis was found to increase (almost linearly) with increase in fiber content and also to increase (almost linearly) with increase in matrix yield strength. The role played by the matrix yield strength was evidenced in both the cross plot between specific energy absorption versus matrix yield strength and the parallel increase in specific energy absorption and matrix yield strength with increase in crush or compression rate. Besides the increase in specific energy absorption with increase in fiber content, a small increase in energy absorption with increase in fiber diameter was also found.
Examinations of the crush morphology have revealed the presence of one or more bands of broken fiber pieces, with the pieces all of nearly equal length, in the vicinity of the interface between the crushed and uncrushed zones. This suggests that the crush
412 Wess H. Tao, Richard E. Robertson, Peter H. Thornton
A band of broken fibers
"x,
Crush and fiber axes I c r u s h e d z o n e - -
- - U n c r u s h e d zone
Fig. 19. A band of broken fibers at the interface
A band of broken fibers
between the crushed and uncrushed zones.
process involves a repeated formation of these bands as the crush plate advances. A complete cycle in forming a band would seem to be the bending and breaking of fibers and then the further deformation of the band. The critical stage in the cycle is the breakage of the fibers, which would correspond to the crush load at its maximum. An analysis of the crush process, therefore, should focus on the material as it reaches this critical stage.
To model the crushing process and the energy absorbed, consider the element A B D E in Fig. 22. A B DE represents all of the material between the crush plate and the uncrushed composite rod and includes the next layer of matrix and fibers to be
broken from the composite rod, represented by ABCF. As the crush plate descends by an amount 6x under the force P, the element C D E F and the surface CF of ABCF are forced to the right a distance 6r under the stress p / n R 2, where p is the total lateral force and zR 2 is the cross-sectional area of the composite rod. Assume that 6x is such that 6r is the displacement associated with each cycle of crush; i.e. Or is the displacement of the ends of the fibers along CF that causes them to break along AB. Then, p and 6r are related to P and 6x by p . 6r = P. 6x, or in terms of the cone angle q~ (Fig. 22).
p / P = ?)x/Or = tan q~ (1)
Fig . 20 . Cross-section of the crush zone in a rod specimen with 50% vol. fibers crushed by a plate with a hemispherical depression.
Crush energy absorption of fiber composite rods
Crushed zone
[]~] Uncrushed zone
413
Splay~lfibcrrcgiort ] ~"~-----Conie~regiort ~ S p l a y ~ d f i b c r r e g ~ i o r t I I (or Co~]region) I
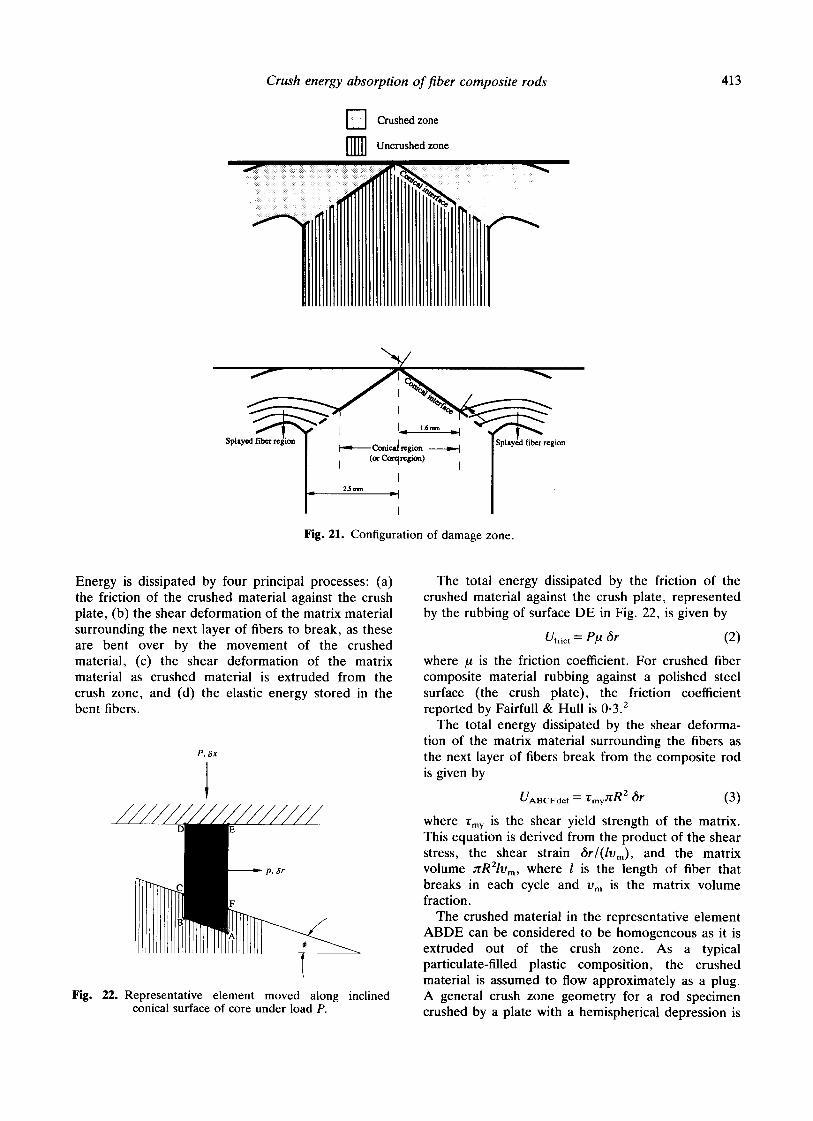
I -E Fig. 21. Configuration of damage zone.
Energy is dissipated by four principal processes: (a) the friction of the crushed material against the crush plate, (b) the shear deformation of the matrix material surrounding the next layer of fibers to break, as these are bent over by the movement of the crushed material, (c) the shear deformation of the matrix material as crushed material is extruded from the crush zone, and (d) the elastic energy stored in the bent fibers.
P, t~x
1
Fig. 22. Representative element moved along inclined conical surface of core under load P.
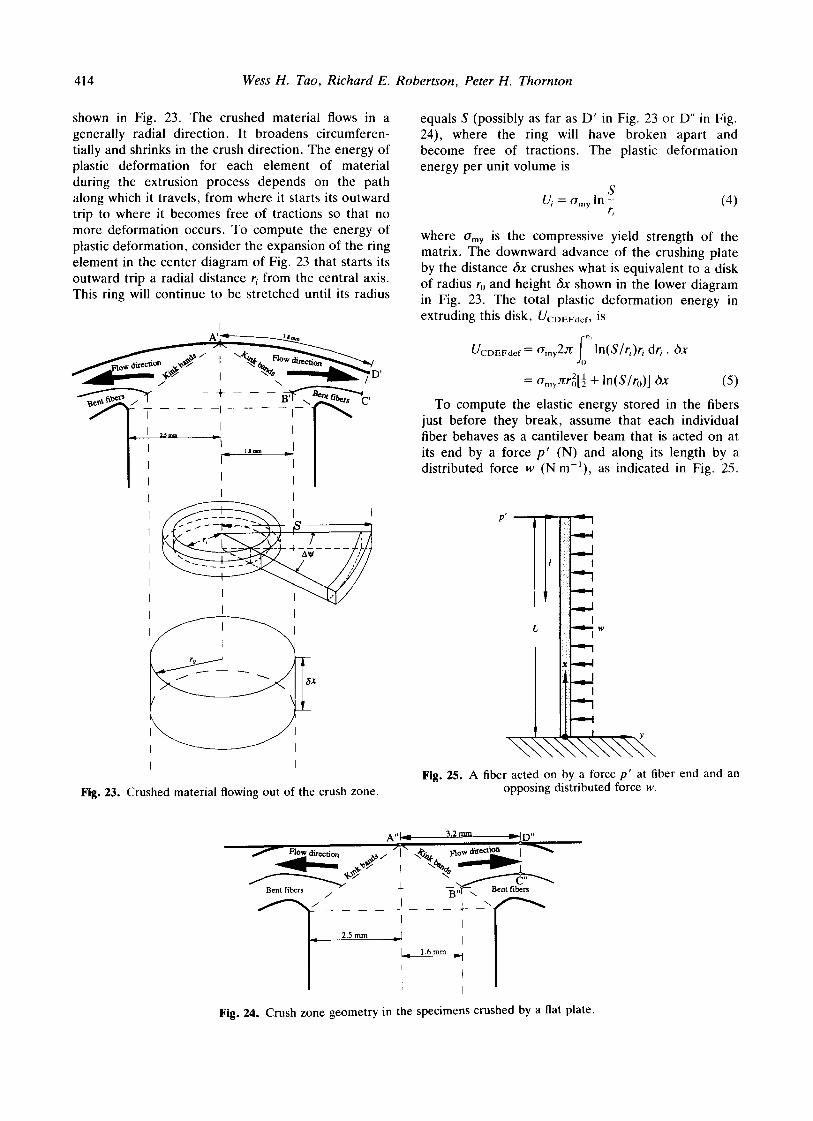
The total energy dissipated by the friction of the crushed material against the crush plate, represented by the rubbing of surface DE in Fig. 22, is given by
Ufrict = PI~ 6r (2)
where /~ is the friction coefficient. For crushed fiber composite material rubbing against a polished steel surface (the crush plate), the friction coefficient reported by Fairfull & Hull is 0-3. 2
The total energy dissipated by the shear deforma- tion of the matrix material surrounding the fibers as the next layer of fibers break from the composite rod is given by
UABCFde f = Tmy~R 2 6r (3)
where "t'my is the shear yield strength of the matrix. This equation is derived from the product of the shear stress, the shear strain &/(lVm), and the matrix volume ~R2/um, where l is the length of fiber that breaks in each cycle and Vm is the matrix volume fraction.
The crushed material in the representative element ABDE can be considered to be homogeneous as it is extruded out of the crush zone. As a typical particulate-filled plastic composition, the crushed material is assumed to flow approximately as a plug. A general crush zone geometry for a rod specimen crushed by a plate with a hemispherical depression is
414 Wess H. Tao, Richard E. Robertson, Peter H. Thornton
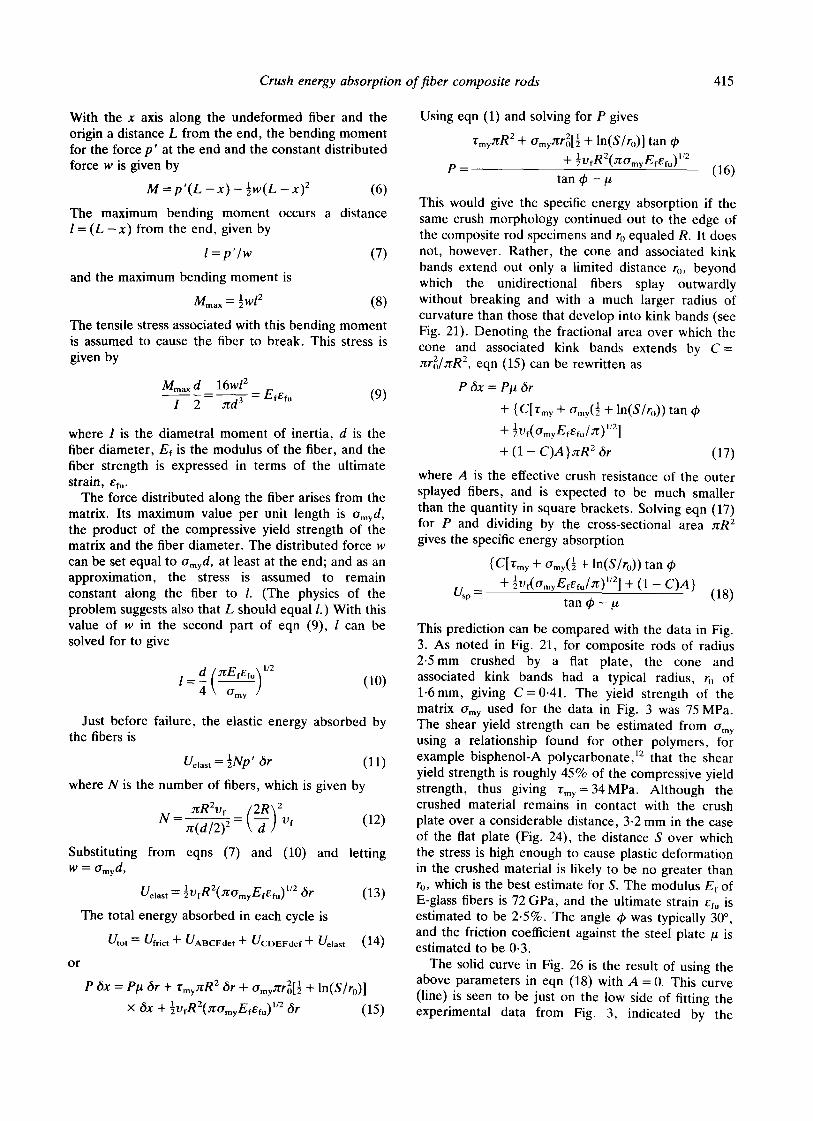
shown in Fig. 23. The crushed material flows in a generally radial direction. It broadens circumferen- tially and shrinks in the crush direction. The energy of plastic deformation for each element of material during the extrusion process depends on the path along which it travels, from where it starts its outward trip to where it becomes free of tractions so that no more deformation occurs. To compute the energy of plastic deformation, consider the expansion of the ring element in the center diagram of Fig. 23 that starts its outward trip a radial distance ri from the central axis. This ring will continue to be stretched until its radius
I
I
, -~. ~ .~ . . . . . ~aoa ~ - - ~ . " W I ~ ' \ ~ - ~ D '
I
I
l~m I
Fig. 23. Crushed material flowing out of the crush zone.
equals S (possibly as far as D' in Fig. 23 or D" in Fig. 24), where the ring will have broken apart and become free of tractions. The plastic deformation energy per unit volume is
S U i = O'my In - (4)
ri
where Omy is the compressive yield strength of the matrix. The downward advance of the crushing plate by the distance 6x crushes what is equivalent to a disk of radius r0 and height 6x shown in the lower diagram in Fig. 23. The total plastic deformation energy in extruding this disk, UCDEFOef, is
UCDEFde f = O'my2.J~ ln(S/ri)ri drs. 6x
2 1 = Omy~r0[g + ln(S/ro)] bx (5)
To compute the elastic energy stored in the fibers just before they break, assume that each individual fiber behaves as a cantilever beam that is acted on at its end by a force p ' (N) and along its length by a distributed force w (N m-l) , as indicated in Fig. 25.
p"
.,5,
i i:i = i
w
Fig. 25. A fiber acted on by a force p' at fiber end and an opposing distributed force w.
I 2.5mm r"
I 4 _ _ ~
I I
I~ 1.6ram
I I
E I
Fig . 24. Crush zone geometry in the specimens crushed by a flat plate.
Crush energy absorption of fiber composite rods 415
With the x axis along the undeformed fiber and the origin a distance L from the end, the bending moment for the force p ' at the end and the constant distributed force w is given by
M = p ' ( L - x) - ½w(L - x) 2 (6)
The maximum bending moment occurs a distance l = (L - x ) from the end, given by
l = p ' / w (7)
and the maximum bending moment is
Mmax = lwl 2 (8)
The tensile stress associated with this bending moment is assumed to cause the fiber to break. This stress is given by
Mmax d 16wl 2 I 2 ~ d 3 Etef~ (9)
where ! is the diametral moment of inertia, d is the fiber diameter, Ef is the modulus of the fiber, and the fiber strength is expressed in terms of the ultimate strain, efu.
The force distributed along the fiber arises from the matrix. Its maximum value per unit length is omyd ,
the product of the compressive yield strength of the matrix and the fiber diameter. The distributed force w can be set equal t o omyd , at least at the end; and as an approximation, the stress is assumed to remain constant along the fiber to I. (The physics of the problem suggests also that L should equal l.) With this value of w in the second part of eqn (9), l can be solved for to give
d (~EfEfu] 1/2 l = ~ \'---~my / (10)
Just before failure, the elastic energy absorbed by the fibers is
Uelas ' = 1Net Or (11)
where N is the number of fibers, which is given by
zR2yf [2R] 2 U = ~(d/2) 2 = ~-~-) vf (12)
Substituting from eqns (7) and (10) and letting W ---- Omyd ,
Uelas t = ½vtR2(~omyEfefu) v2 Or (13)
The total energy absorbed in each cycle is
Uto, = Ueric, + U..BcF~of + UcI~EFdef + U~,.st (14)
o r
P 6x = P# Or + "t'rny.,~R 2 5r + Omy~r2[ 1 + ln(S/ro)] 1 2 1/2 X 6X + 2ufR (~OrmyEfEfu) Or (15)
Using eqn (1) and solving for P gives
"t'my,rrR 2 + Orny.Trr2[ 1 + ln(S/r(,)] tan tp 1 2 I/2 + ~IyfR (~O'myEfefu)
P -- (16) tan q~ - #
This would give the specific energy absorption if the same crush morphology continued out to the edge of the composite rod specimens and r0 equaled R. It does not, however. Rather, the cone and associated kink bands extend out only a limited distance to, beyond which the unidirectional fibers splay outwardly without breaking and with a much larger radius of curvature than those that develop into kink bands (see Fig. 21). Denoting the fractional area over which the cone and associated kink bands extends by C = ~rZ/~R 2, eqn (15) can be rewritten as
P 6x = P# 6r
+ {C[rmy + Omy(½ + ln(S/ro)) tan (p
+ ½Vt(OmyEfe_.fu/~) '/2]
+ (1 - C ) A } x R 2 6r (17)
where A is the effective crush resistance of the outer splayed fibers, and is expected to be much smaller than the quantity in square brackets. Solving eqn (17) for P and dividing by the cross-sectional area zR 2 gives the specific energy absorption
{ C [ r m y "]- O'my( 1 -6- ln(S/ro)) tan tp
Usp = + ½vf(°myEfefu/~r)l/2] + (1 - C)A} (18) tan cp - #
This prediction can be compared with the data in Fig. 3. As noted in Fig. 21, for composite rods of radius 2 .5mm crushed by a fiat plate, the cone and associated kink bands had a typical radius, ro of 1.6mm, giving C=0 .41 . The yield strength of the matrix O'my used for the data in Fig. 3 was 75 MPa. The shear yield strength can be estimated from amy using a relationship found for other polymers, for example bisphenol-A polycarbonate, 12 that the shear yield strength is roughly 45% of the compressive yield strength, thus giving S'my= 34MPa. Although the crushed material remains in contact with the crush plate over a considerable distance, 3.2 mm in the case of the flat plate (Fig. 24), the distance S over which the stress is high enough to cause plastic deformation in the crushed material is likely to be no greater than r0, which is the best estimate for S. The modulus Et of E-glass fibers is 72 GPa, and the ultimate strain et. is estimated to be 2-5%. The angle tp was typically 30 °, and the friction coefficient against the steel plate # is estimated to be 0-3.
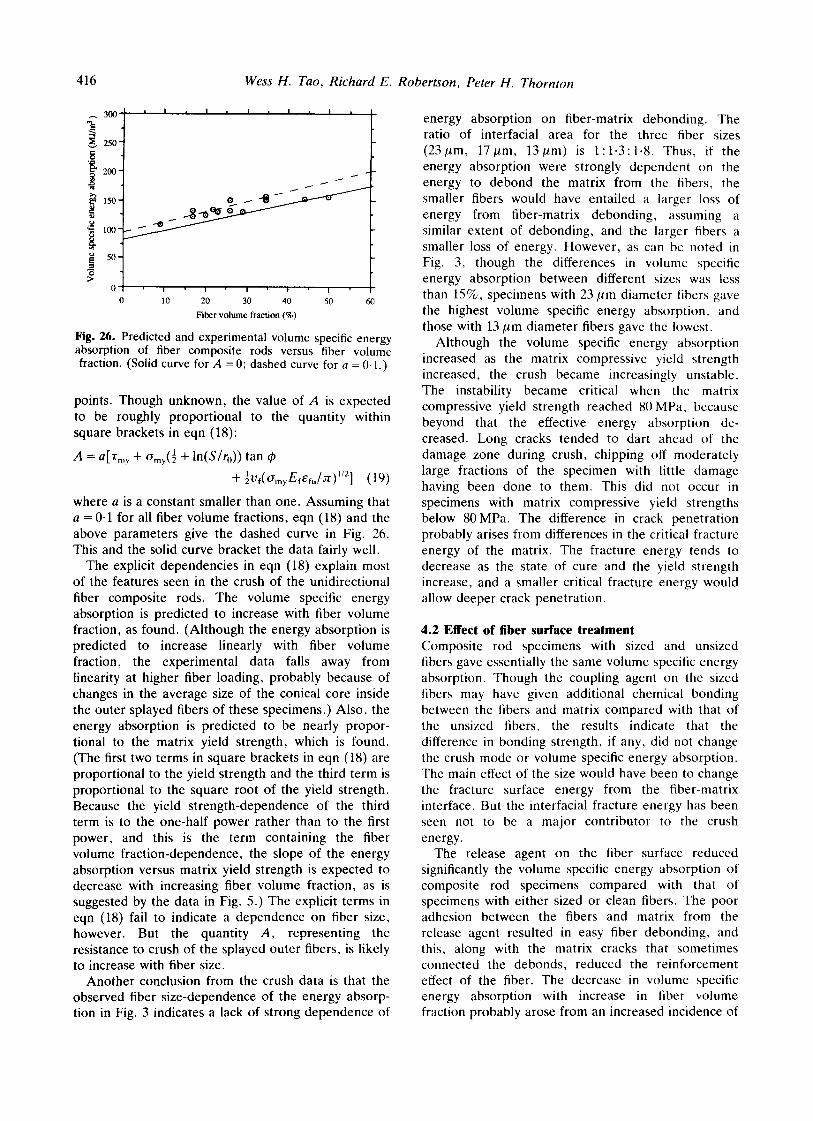
The solid curve in Fig. 26 is the result of using the above parameters in eqn (18) with A = 0. This curve (line) is seen to be just on the low side of fitting the experimental data from Fig. 3, indicated by the
416 Wess H. Tao, Richard E. Robertson, Peter H. Thornton
3 0 0 | i I I I I I I I i I I
50 f ' , ' i ' i • r , , ,
0 10 2 0 30 4 0 50 60
F i b e r v o l u m e f r a c t i o n ( % )
Fig. 26. Predicted and experimental volume specific energy absorption of fiber composite rods versus fiber volume fraction. (Solid curve for A = 0; dashed curve for a = 0-1.)
points. Though unknown, the value of A is expected to be roughly proportional to the quantity within square brackets in eqn (18):
A = a[rmy + Orny( 1 + ln(S/ro)) tan q0
+ Iuf(OmyEfEfu/3"f)l/2] (19)
where a is a constant smaller than one. Assuming that a = 0.1 for all fiber volume fractions, eqn (18) and the above parameters give the dashed curve in Fig. 26. This and the solid curve bracket the data fairly well.
The explicit dependencies in eqn (18) explain most of the features seen in the crush of the unidirectional fiber composite rods. The volume specific energy absorption is predicted to increase with fiber volume fraction, as found. (Although the energy absorption is predicted to increase linearly with fiber volume fraction, the experimental data falls away from linearity at higher fiber loading, probably because of changes in the average size of the conical core inside the outer splayed fibers of these specimens.) Also, the energy absorption is predicted to be nearly propor- tional to the matrix yield strength, which is found. (The first two terms in square brackets in eqn (18) are proportional to the yield strength and the third term is proportional to the square root of the yield strength. Because the yield strength-dependence of the third term is to the one-half power rather than to the first power, and this is the term containing the fiber volume fraction-dependence, the slope of the energy absorption versus matrix yield strength is expected to decrease with increasing fiber volume fraction, as is suggested by the data in Fig. 5.) The explicit terms in eqn (18) fail to indicate a dependence on fiber size, however. But the quantity A, representing the resistance to crush of the splayed outer fibers, is likely to increase with fiber size.
Another conclusion from the crush data is that the observed fiber size-dependence of the energy absorp- tion in Fig. 3 indicates a lack of strong dependence of
energy absorption on fiber-matrix debonding. The ratio of interfacial area for the three fiber sizes (23#m, 17~m, 13#m) is 1:1.3:1.8. Thus, if the energy absorption were strongly dependent on the energy to debond the matrix from the fibers, the smaller fibers would have entailed a larger loss of energy from fiber-matrix debonding, assuming a similar extent of debonding, and the larger fibers a smaller loss of energy. However, as can be noted in Fig. 3, though the differences in volume specific energy absorption between different sizes was less than 15%, specimens with 23 #m diameter fibers gave the highest volume specific energy absorption, and those with 13 #m diameter fibers gave the lowest.
Although the volume specific energy absorption increased as the matrix compressive yield strength increased, the crush became increasingly unstable. The instability became critical when the matrix compressive yield strength reached 81)MPa, because beyond that the effective energy absorption de- creased. Long cracks tended to dart ahead of the damage zone during crush, chipping off moderately large fractions of the specimen with little damage having been done to them. This did not occur in specimens with matrix compressive yield strengths below 80MPa. The difference in crack penetration probably arises from differences in the critical fracture energy of the matrix. The fracture energy tends to decrease as the state of cure and the yield strength increase, and a smaller critical fracture energy would allow deeper crack penetration.
4.2 Effect o f fiber surface treatment Composite rod specimens with sized and unsized fibers gave essentially the same volume specific energy absorption. Though the coupling agent on the sized fibers may have given additional chemical bonding between the fibers and matrix compared with that of the unsized fibers, the results indicate that the difference in bonding strength, if any, did not change the crush mode or volume specific energy absorption. The main effect of the size would have been to change the fracture surface energy from the fiber-matrix interface. But the interfacial fracture energy has been seen not to be a major contributor to the crush energy.
The release agent on the fiber surface reduced significantly the volume specific energy absorption of composite rod specimens compared with that of specimens with either sized or clean fibers. The poor adhesion between the fibers and matrix from the release agent resulted in easy fiber debonding, and this, along with the matrix cracks that sometimes connected the debonds, reduced the reinforcement effect of the fiber. The decrease in volume specific energy absorption with increase in fiber volume fraction probably arose from an increased incidence of
Crush energy absorption of fiber composite rods 417
matrix cracking connecting the debonds. Besides the decreased contribution of the fiber-matrix energy to the total energy absorbed, the release agent and the concomitant increase in fiber-matrix debonds and matrix cracks seem also to have changed the crush mode and the distribution of various energy dissipation processes to result in less overall energy dissipation. Among other things, less matrix deforma- tion is likely to have occurred than occurs with good fiber bonding during the extrusion of the crushed material from the damage zone. With slip allowed between the matrix and fiber pieces, the matrix would not have had to deform as much for the crushed material to conform to the constraints of the flow path.
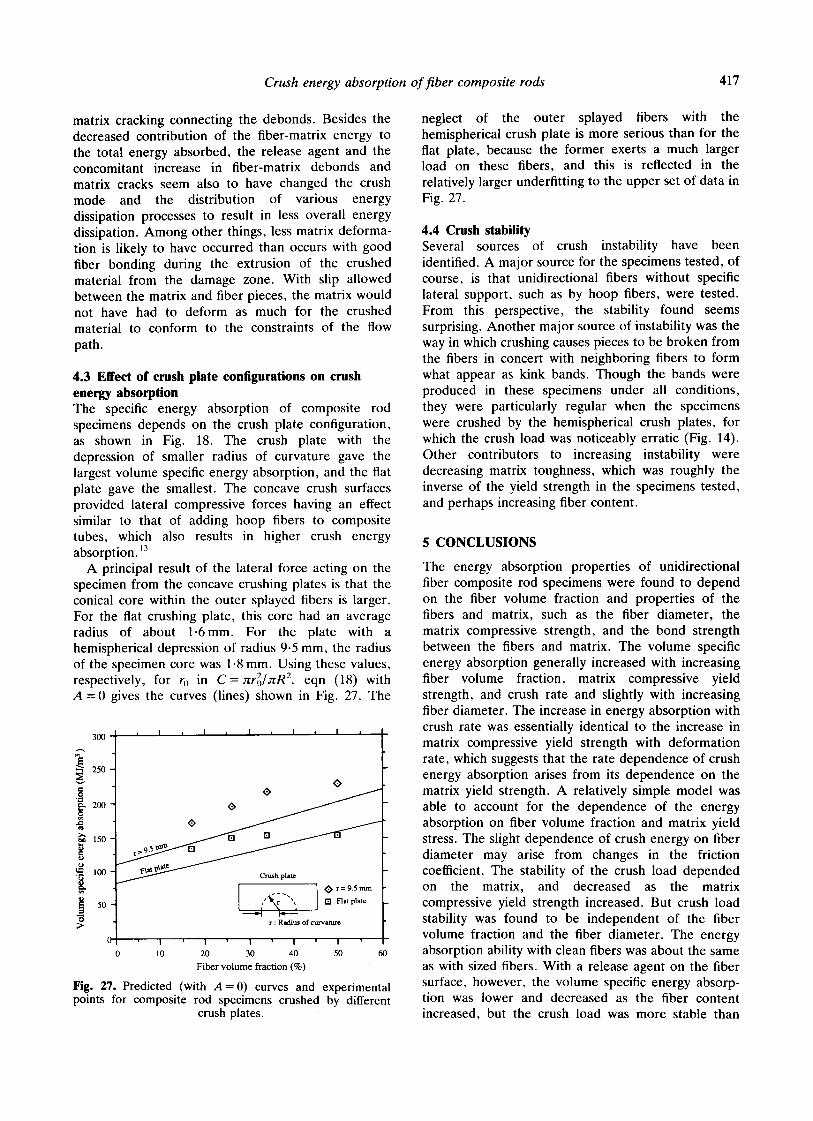
4.3 Effect of crush plate configurations on crush energy absorption The specific energy absorption of composite rod specimens depends on the crush plate configuration, as shown in Fig. 18. The crush plate with the depression of smaller radius of curvature gave the largest volume specific energy absorption, and the flat plate gave the smallest. The concave crush surfaces provided lateral compressive forces having an effect similar to that of adding hoop fibers to composite tubes, which also results in higher crush energy absorption. 13
A principal result of the lateral force acting on the specimen from the concave crushing plates is that the conical core within the outer splayed fibers is larger. For the flat crushing plate, this core had an average radius of about 1-6mm. For the plate with a hemispherical depression of radius 9-5 mm, the radius of the specimen core was 1.8 mm. Using these values, respectively, for r0 in C=Jrr2/~rR 2. eqn (18) with A = 0 gives the curves (lines) shown in Fig. 27. The
300
250
~ 2oo
~ 15o
~ 50 >
J I ~ I , I , I , I
o
Crush plate
• . - - . ~ ] ~r=9.5mm =(; [] Flat plate
r : Radius of ctawature
I I I I I
10 20 30 40 50 Fiber volume fraction (%)
60
Fig. 27. Predicted (with A = 0) curves and experimental points for composite rod specimens crushed by different
crush plates.
neglect of the outer splayed fibers with the hemispherical crush plate is more serious than for the fiat plate, because the former exerts a much larger load on these fibers, and this is reflected in the relatively larger underfitting to the upper set of data in Fig. 27.
4.4 Crush stability Several sources of crush instability have been identified. A major source for the specimens tested, of course, is that unidirectional fibers without specific lateral support, such as by hoop fibers, were tested. From this perspective, the stability found seems surprising. Another major source of instability was the way in which crushing causes pieces to be broken from the fibers in concert with neighboring fibers to form what appear as kink bands. Though the bands were produced in these specimens under all conditions, they were particularly regular when the specimens were crushed by the hemispherical crush plates, for which the crush load was noticeably erratic (Fig. 14). Other contributors to increasing instability were decreasing matrix toughness, which was roughly the inverse of the yield strength in the specimens tested, and perhaps increasing fiber content.
5 CONCLUSIONS
The energy absorption properties of unidirectional fiber composite rod specimens were found to depend on the fiber volume fraction and properties of the fibers and matrix, such as the fiber diameter, the matrix compressive strength, and the bond strength between the fibers and matrix. The volume specific energy absorption generally increased with increasing fiber volume fraction, matrix compressive yield strength, and crush rate and slightly with increasing fiber diameter. The increase in energy absorption with crush rate was essentially identical to the increase in matrix compressive yield strength with deformation rate, which suggests that the rate dependence of crush energy absorption arises from its dependence on the matrix yield strength. A relatively simple model was able to account for the dependence of the energy absorption on fiber volume fraction and matrix yield stress. The slight dependence of crush energy on fiber diameter may arise from changes in the friction coefficient. The stability of the crush load depended on the matrix, and decreased as the matrix compressive yield strength increased. But crush load stability was found to be independent of the fiber volume fraction and the fiber diameter. The energy absorption ability with clean fibers was about the same as with sized fibers. With a release agent on the fiber surface, however, the volume specific energy absorp- tion was lower and decreased as the fiber content increased, but the crush load was more stable than
418 Wess H. Tao, Richard E. Robertson, Peter H. Thornton
with sized or clean fibers. The energy absorption ability of the unidirectional fiber composite rods also depended on the geometry of the crush plate. The volume specific energy absorption and the lateral compressive force increased as the radius of curvature of concave crush plates was decreased from ~ (a flat plate) to 9.5 mm.
ACKNOWLEDGEMENT
This work was supported by a grant from Ford Motor Company.
REFERENCES
1. Tao, W. H., Robertson, R. E. & Thornton, P. H., Energy absorption in crushing fiber composite mate- rials. In How to Apply Advanced Composites Technology. ASM International, Metals Park, OH, 1988, p. 47.
2. Fairfull, A. H. & Hull, D., Energy absorption of polymer matrix composite structures: frictional effects. In Structural Failure, ed. T. Wierzbicki & N. Jones. Wiley and Sons, New York, 1989, pp. 255-79.
3. Hull, D., A unified approach to progressive crushing of fiber-reinforced composite tubes. Compos. Sci. Technol., 40 (1991) 377-421.
4. Thornton, P. H. & Edwards, P. J., Energy absorption in composite tubes. J. Compos. Mater., 16 (1982) 521-45.
5. Price, J. N. & Hull, D., Axial crushing of glass-polyester composite cones. Compos. Sci. Technol., 28 (1987) 211-30.
6. Fairfull, A. H. & Hull, D., Effect of specimen dimensions on the specific energy absorption of fiber composite tubes. ICCM-VI, ed. F. L. Matthews et al. Elsevier Science Publishers, London, 1987, pp. 3.36-45.
7. Farley, G. L. & Jones, R. M., Crushing characteristics of continuous fiber-reinforced composite tubes. J. Compos. Mater., 26 (1992) 37-50.
8. Thornton, P. H., The crush behavior of glass fiber reinforced plastic sections. Compos. Sci. Technol., 27 (1986) 199-223.
9. Farley, G. L., Energy absorption of fiber composite material. J. Compos. Mater., 17 (1983) 267-79.
10. Farley, G. L., Energy absorption in composite materials for crashworthy structures. ICCM-IV/and ECCM 2, ed. F. L. Matthews et al. Pergamon Press, London, 1987, pp. 57-66.
11. Farley, G. L., The effects of crushing speed on the energy-absorption capability of composite tubes. J. Compos. Mater., 25 (1992) 1314-29.
12. Robertson, R. E., On the cold-drawing of plastics. J. Appl. Polym. Sci., 7 (1963) 443-50.
13. Czaplicki, M. J., Masters thesis, The University of Michigan, 1989.