Embed Size (px)
Citation preview
WAiTIì INSTITUTE?--1 . -ja
I.IBR¡ I{Y
A thesis pz,esented, in pattiaL fuLfilmeryt _of the tequirements
for tlæ Oelgree of Mastuï of lgiieiLturaL Seience, FaeuLty of" l,grieuLturaL Seíenâe' t)niuersity of AdeLaide'
EFFECTS OF STOCKING RATE AT{D BOTAI'¡ICAJ. COMPOSITION ON A}IIMAL
PRODUCTION FROM SOI^IN PAST"I]RES IN A MEDITERRAT{EAN-TYPE
EIWIRONMENT.
by
PETER R. GIBSON B.Ag-Se.
SOUTTT AUSTRALIA}I DEPARTIÍENT OF AGRICULTURE AI{D FISHERIES
DEPARIUENT OF AGRONOI'ÍY
I{AIIE AGRICULTT]RAL RESEARCH INSTII"I]TEI]NIVERSITY'OF ADELATDE
AUGUST, T977

Fl-¡
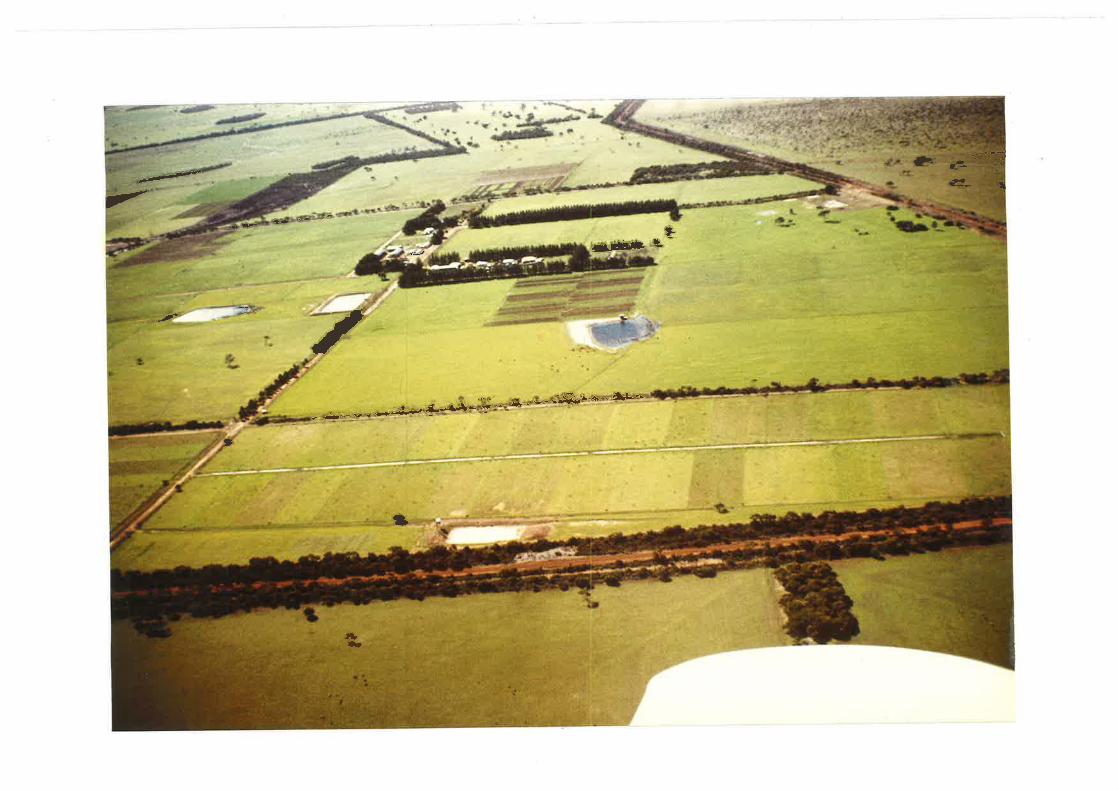
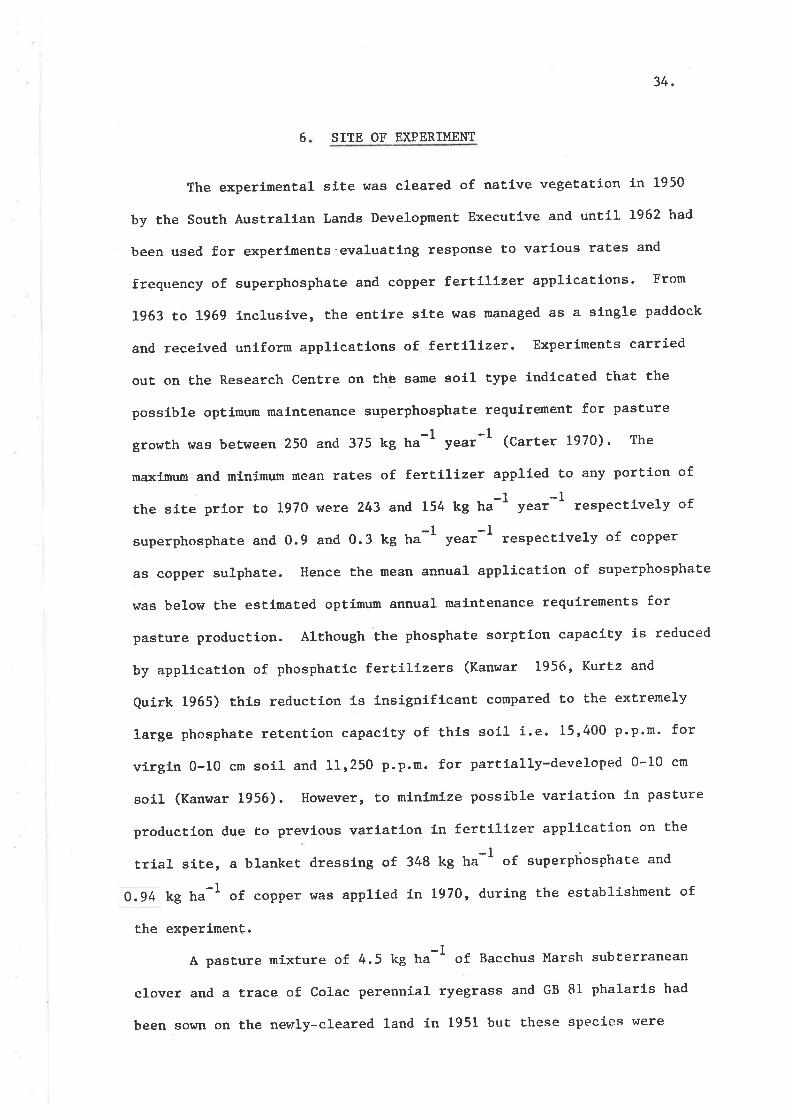
PLATE 1
Aerial photograph taken in September L972, of the Kangaroo Island Research Centre located
on the plateau region of Kangaroo Island. The research centre bullding complex can be
seen ringed by pine trees and the experimental site (15 elongate paddocks on either side of
a central raceway) is clearly delíneated in the foreground.
The natural vegetatlon, dry sclerophyll scrub some of r¡hich can stlll be seen along the
road fn the foreground, was cleared and sown to petilanent pasture 1n 1950/51.
Areas of surface flooding would normally be evident during the winter months due to the
poor drainage of the soll (lateritic podzol overlying an lupervLous clay at 20 to 60 c¡n).
.esC- a-.-' j"
€_r,r"-
-'lGrf] L
*
/
./
j
å-- v .'*'J&*J'--'å- ; ^ + -'--'-'$'i'o''' AL-''
¡ \
ñ¡Þ
ili
TASLE OF CONTENÎS
List of Figures
List of Plates
List of Tables
List of APPendix Tables
Sr:nmary
StatemenÈ
Acknor¿ledgements
1. INTRODUCTION
2. LITERAT'T]RE REVIEIT
2.L The influence of the grazing animal on pasÈure
2.I.L Treadlng
2.L.2 DefoliatLon2.L.3 Seed disPersal
2.I.4 Nutrlent recYling
2.2 The nutritive value of annual pasture plants
2.2.L DigestíbilitY2.2.2 DrY matter content
2.2.3 DrY matter loss
2.2.4 Chemlcal comPosition
2.2.5 Herbage preference and intake
2.2.6 Anímal Performance
2.3 EffecË of botanical composltion on anímalperform¡nce
2.3.I The fmPortance of the legume
2.3.2 Differences beÈween grasses
Interact.ion of stocking rate and botanicalcomposiÈion in the determlnation of anlmalproduction
BACKGROUND TO EXPERIMENTAL PROGRAM
AIM OF EXPERIMENT
ENVIRONMENT
SITE OF EXPERIMENÎ
L^Æ-
vf
vií
víií
ix
xí
xiv
xv
1
4
4
4
6
T4
L6
L7
r7
20
2l2l22
23
24
2.4
24
25
26
28
30
31
34
3
4
5
6
Lv
7
TABLE OF CONTENTS (Contd.)
EXPERIMEMAL METHODS
7.L Site PreParatlon
7.2 Treatments
7.2.I Pasture treatments
7.2.2 Stocklng rates
7.2.3 Layout and allocaÈion of treatments
7.3 Pasture establlshment
7.4 Fertllizer aPPlicatlon
7.5 Selectíon and allocatlon of experimentalanlmals
7.6 GrazLng management of pastures 1n 1970
7.7 Routlne management
7.7.L Pastures
7.7.2 Anl-nals
7.8 Data collectíon Procedures
7.8.f Pasture data 1970
7.8.2 Pasture data 1971-L974
Subterranean clover seed
Sheep live welghts
7.8.5 Annual wool Production7.8.6 Fleece characterlstlcs7.8.7 Seasonal wool Production
7.9 Data analYsis
RESULTS
8.1 Pasture establishment
8.2 Pasture Production 1970
8.3 Botanlcal composltiot L97L-I974
8.3.1 Sown grasses
8.3.2 Subterranean clover
8.3.3 Volunteer annual sPecies
Page
36
36
36
36
38
38
40
40
4L
7.8. 3
7.8.4
42
42
42
43
44
44
44
46
47
47
48
48
49
51
51
51
52
52
59
6L
8
v
TABLE OF CONTENTS (Contd.)
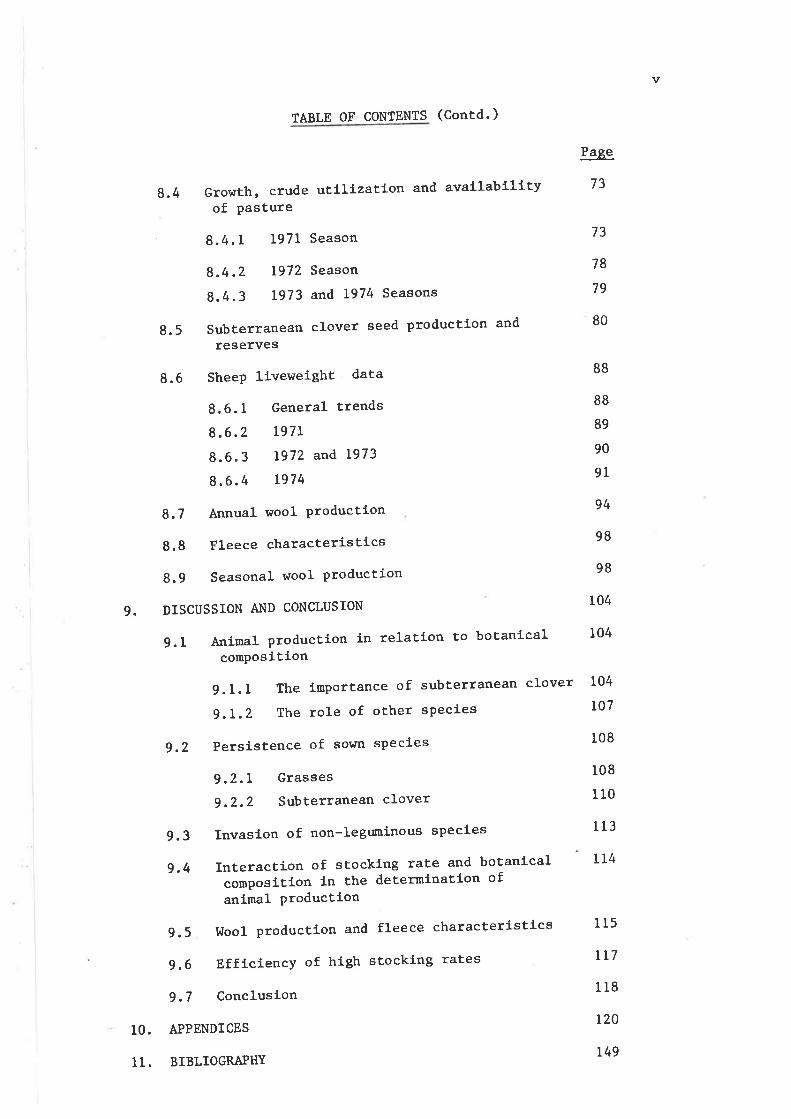
8.4 GrowÈh, crude utlllzation and aval-labilltyof Pasture
' 8.4.1 1971 Season
8.4.2 1972 Season
8.4.3 1973 and 1974 Seasons
8.5 SubÈerranean clover seed production and
reserves
8.6 SheeP lJ-veweight data
8.6.1 General trends
8.6.2 r97L
8.6.3 1972 and L973
8.6.4 1974
8.7 Annual wool Productlon
8.8 Fleece characteristics
8.9 Seasonal wool Production
g. DISCUSSION AI{D CONCLUSION
9.1 Animal production 1n relation to botanlcalcomPosiÈion
9.1.I the ínportance of subterranean clover
g.L.2 The role of oEher sPecies
g.2 Persistence of sown sPecies
9.2.1 Grasses
g.2.2 Subterranean clover
9.3 Invasl-on of non-leguninous specl-es
g.4 Interaction of stocking rate and boÈanicalcompositLon ln the deteminatíon ofanimal Production
9.5 ldool production and fleece characteristics
g.6 EfficÍency of high stocking rates
9.7 Conclusíon
10. APPENDICES
11. BIBLIOGRAPI{Y
Page
73
73
78
79
80
88
88
89
90
9T
94
98
98
104
104
104
ro7
108
108
110
113
114
115
LL7
118
r20
r49
vl
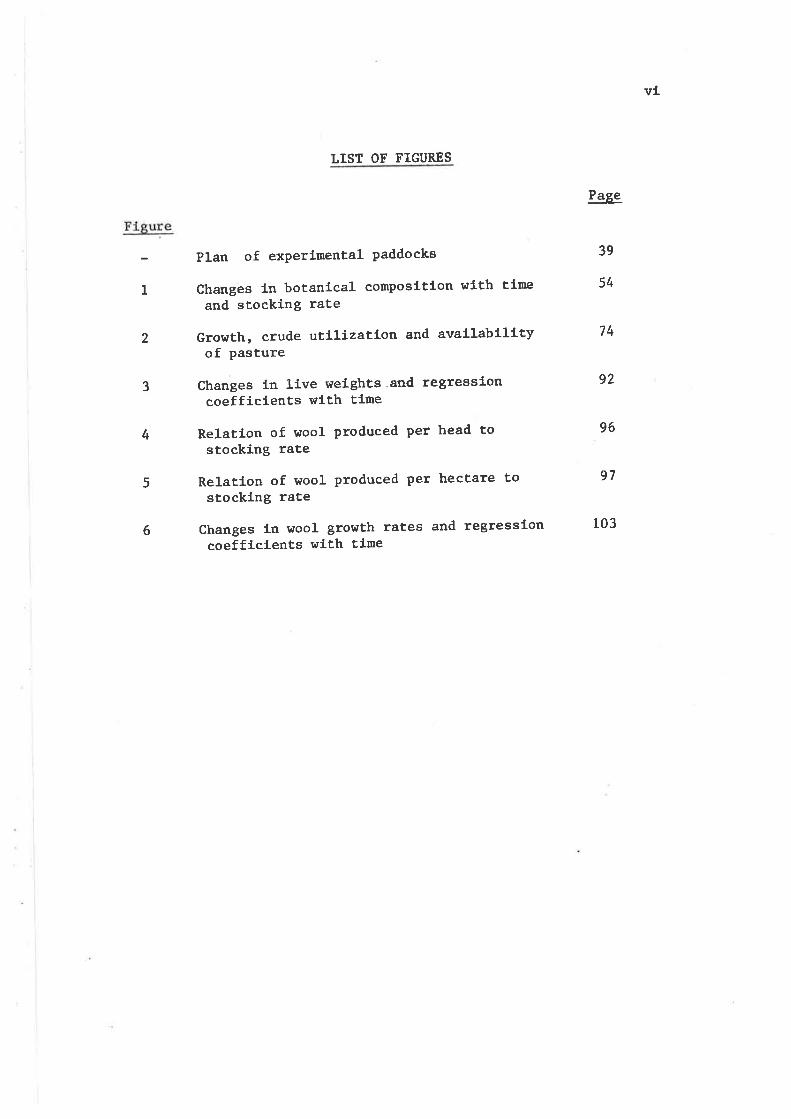
LISÎ OF FIGURES
Plan of exPerimental Paddocks
Changes in botanlcal composltlon wlth tineand stocklng rate
Growth, crude utllfzatLon and avallabl-lityof pasture
Changes Ln Live welghts -and regressloncoefficients $tLth tlme
Relation of wool produced per head tostocking rate
Relation of wool produced per hectare tosÈocklng rate
Changes in wool growth rates and regressloncoefflcients wlth tlme
Paq¿e
39
54
74
92
96
97
103
I
2
3
4
5
6
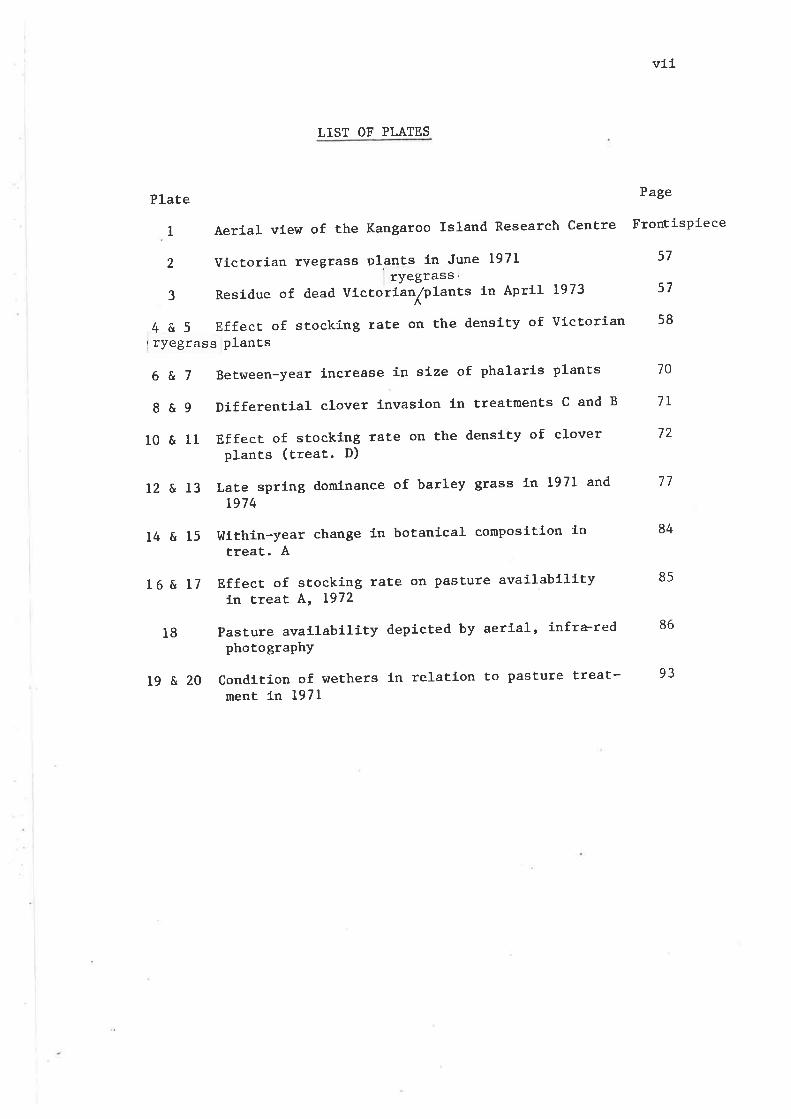
LIST OF PLATES
Plate
lAerialviewoftheKangaroolslandResearchcentre
Victorian rvegrass plants 1n June 197lryegrass
Residue of dead VlcÈorfanlplants in April
4&5EffectofstockingÏateonthedensltyofVictorianI ryegrass plants
6&TBetween-yearincreaseinslzeofphalarlsplants
8&gDifferentialcloverinvasionintreatmentsCandB
10 & 1l Effect of stocking rate on Èhe denslty of cloverplants (treat. D)
12&13LatesprlngdomlnanceofbarleySrasslnl9Tlandr97 4
14 & 15 tlithin-year change in botanical composition lntreat. A
2
3 L973
val-
Page
FrontísPieee
57
57
58
70
7T
72
77
84
86
93
Effect of stocking rate on Pasture availabllíty1n treat A, 1972
Pasture availability depicted by aerial, infræredphotograPhY
Condition of wethers 1n relation to pasture treat-ment in l97l
8516 & 17
18
19&20
vfif
Table
10
ll
t2
13
L4
15
I6
r7
18
r9
20
2T
22
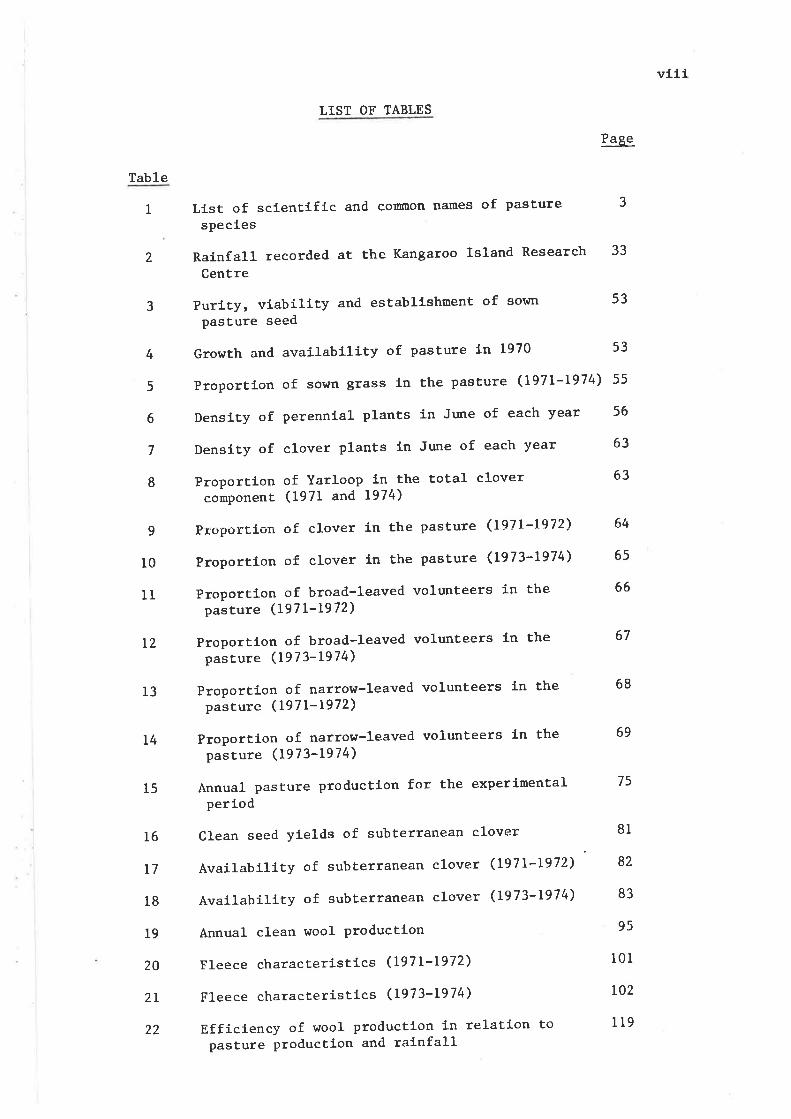
LIST OF TABLES
List of scientLfic and coÍtrtron names of pasturespecies
Rainfall recorded at the Kangaroo Island Research
Centre
Purlty, viability and establlshnent of sown
pasture seed
Growth and availablllty of pasture ln 1970
Proportlon of sown grass ln the Pasture (L97L-L974)
Density of perennlal- plants in June of each year
Density of clover plants in Jr¡ne of each year
Proportion of Yarloop in the total clovercomponeriË (1971 and 1974)
Proportion of clover in the pasture (1971-L972)
Proportfon of clover ln the pasture (1973-1974)
Proportlon of broad-leaved volunteers Ín thepasture (197L-1972)
Proportion of broad-leaved volunteers Ln thepasture (1973-1974>
Proportion of narrow-leaved volunteers in thepasture (I971-1972)
ProporÈíon of narrow-leaved volunteers ln thepasture (I973-1974)
Annual pasture production for the experímentalperiod
Clean seed yields of subterranean clover
Avaílability of subterranean clover (I97L-L972)
Availability of subterranean clover (1973-1974)
Annual clean wool ProducÈlon
Fleece characterisÈfcs (I971-1972)
Fleece characteristics (1973-L974)
Efficiency of wool production 1n relation topasture producÈion and rainfall
Page
33
53
53
55
56
63
63
65
67
68
75
81
82
83
95
101
ro2
r19
3I
2
3
4
5
6
7
8
964
66
69
t_x
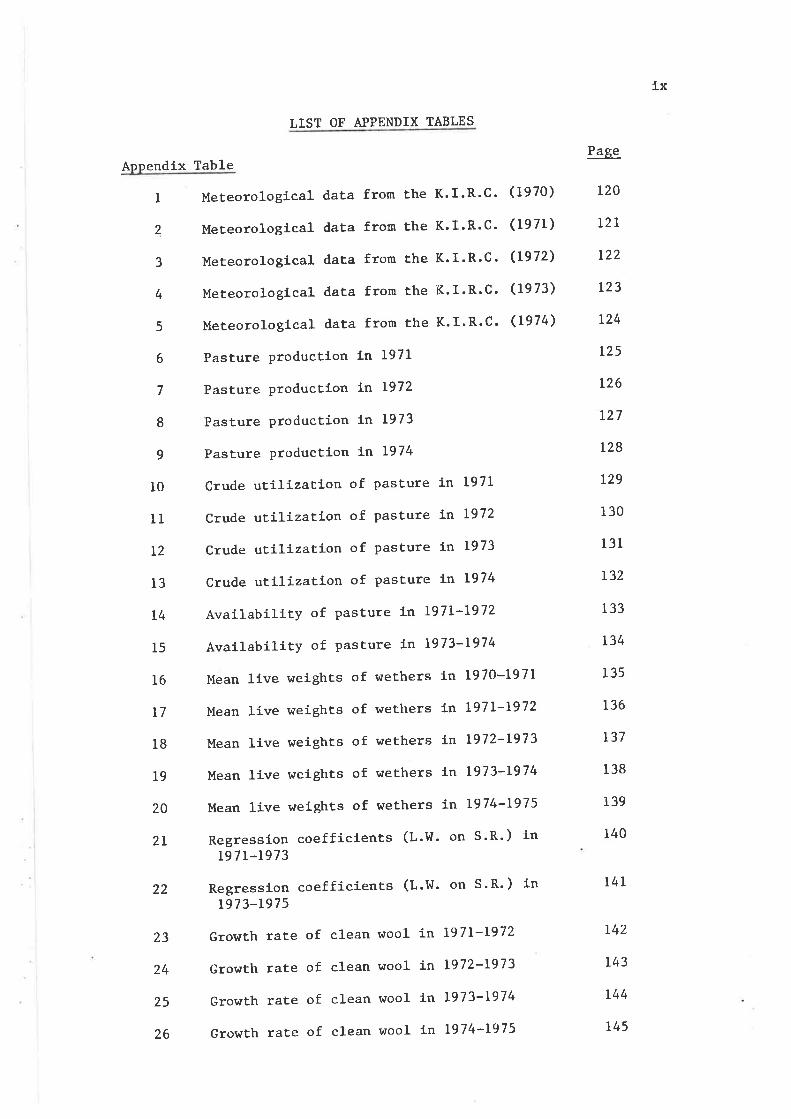
LIST OF APPENDIX TABLES
PageAppendix Table
I
2
3
4
5
6
7
I
9
10
11
L2
13
t4
15
16
t7
I8
19
20
2L
Mereorological data from the K.I.R.C. (1970)
Meteorological data from the K.I'R'C' (1971)
Meteorological data from the K.I'R'C ' (1972)
MeÈeorological data from the K.I'R'C' (1973)
MeÈeorological data from the K'I'R'C' (L974)
Pasture productíon tn I971
Pasture productlort L¡ 1972
Pasture productíon fn 1973
Pasture production ln I974
Crude utilizatlon of pasture in 1971
Crude utll-izatlon of pasÈure In L972
Crude uÈilization of pasture tn 1973
Crude utilÍzation of pasture i¡ 1974
Availability of pasture ín I97L-L972
Avallability of pasÈure ln 1973-1974
Mean live weights of wethers in 1970-L971
Mean live weights of wethers in 197L-L972
Mean live weights of wethers in 1972-1973
Mean live weights of wethers 1n 1973-1974
Mean live weights of wethers ín 1974-I975
Regression coef f íclents (L.I^I. on S ' R' ) inL97L-r973
Regression coefficients (t.W' on S'R') inr97 3-197 5
Growth rate of clean wool in I97L-1972
Growth rate of clean wool in L972-I973
Growth rate of clean wool ln L973-I974
GrowÈh rate of clean wool in L974-1975
120
I2L
r22
t23
t24
t25
126
L27
L28
r29
130
131
t32
133
134
135
r36
r37
138
139
140
22
23
24
25
r4r
t42
L43
r44
t4526

x
LIST OF A?PENDIX TABLES (Contd.)
Appendlx Table
27
28
RegressLon coeffLclents (t'Iool growthrate on S.R.) ln 1971-1973
Regresslon coeffÍcfents (Wool gro!ùthrate on S.R.) tn 1973-L975
Nr:mber and cause of deaths of experimentalwethers
Paq-e
L46
r47
14829
x1
SUMMARY
AstockingraÈeexperimentevaluatíngfivepasturetypeswas
undertaken in a Medlterranean-tyPe cllmate on Èhe Kangaroo Island Research
Centre, Parndana EasÈ, South Australla'
ThehypothesisÈestedwasthattherenovatlonofanexisting
volunteer annual grass - Yarloop subterranean clover (It'ifoLiWn
sþbteruartelnn L. cv. yarloop) pasture by tLllage, seedbed preparation
and sowlng of, a mixture of the best avallable grass species and low
oestrogenic subterranean clovers, would result 1n increased llve weight
and wool production from gxazíng wethers'
Merlnowethersh'erecontinuouslygtazedforfouryearsatsix
rares of stocking (10, 11, 13, L4,15 and 17 sheep t"-1) on each of the
following five pasture Èreatments'
Treatment (A) - An unrenovated, volunteer annual grass-subterranean clover
pasture domtnated by Yarloop subterranean clover and barley grass (Hordewn
Lepoz,ínwn Link. ) .
Treatmen ts B. C. D and E - 1111age, seed bed preparation and sowing of
grass, together with Mt. Barker and woogenellup subterranean clovers'
TreatmenÈ grasses sown rúere as follo¡us: (B) t{lmnera annual ryegrass
(LoLiøn ri,giduin Gaud. cv. Ì,linmera), (C) Vlctorian perennial ryegrass
(LoLi,wn pe4enne L. cv. vlctorlan), (D) Medea perennial ryegrass (LoLiun
pe?enne L. cv. Medea) and (E) Hybrid phalaris (PhaLarLs tubez'osa x
PlnLar|s amtndirneea cv. Siro 1146) '
Large differences between pasture treatments in both pasture and
animal productivlty occurred ln the fl-rst year and' to a lesser extent'
in the second and third years of seÈ stocking and these could be attribuÈed
to dlfferences in botanical compositi'on'
x11
Dominant ryegrass stands in treatments B, C and D following
pasture renovation and ffrst year ¡nanagenent procedures, proved less
+productlv.' ttrtt the more subterranean clover - domlnant Pastures in
treatments A and E. The data presented show clearly that the availabílity
of the subterranean clover comPonent lras the domlnant factor ln the
deternination of animal production throughout the experiment.
Medea ryegrass conslstently failed to demonstrate any degree of
perennf-ality and Victorlan ryegrass plants persisted over no more than
three srrImers.
The ínfluence of increased stocklng rate ln aecelerating
the between-year decline ln density of Victorlan ryegrass plants and
the proportlon of this species fn the Pasture' IAÎas clearly demonstrated'
However, irrespective of stocking rate' the conÈribution of the three
ryegrass species and sovm subterranean clovers had decllned to negligible
proportions by the end of the experiment and thls decline was associated
with a concurrent increase fn the pastures of Yarloop srùterranean clover
and other annual species, malnly of Medlterranean origin. In partíctrlar,
the sowlng of Mt. Barker and t{oogenellup subterranean clovers proved
unsuccessful in malntainlng a low proportion of Yarlc'oP in the overall
legrne coryonent of the sward af ter a perlod of four Èo f ive years '
Ihis was highlighted by the level of hard seed reserves of subterranean
clover measured 1n August 1973 tn the renovated pasture treatments
(rnean of c. 210 kg t r-1) of which c. 90 per cent was Yarloop.
The results demonstrated the excellent adaptatíon of Yarloop
subterranean clover to the laterític podzolic soils of Kangaroo rsland:
particularly f.ts rapid growth during the winter and early spring and its
ability to seÈ copious supplies of seedrirrespective of stocking rate'The large seed reserves ensure a potential for germinaLíon over
a number of years. Hence the volunteer annual grass-subterranean clover
stures ical of t
ift., a.t*s of Pl-ant and animal
xLl-1
environment, seemed to be assured a degree of quantltative and qualitatlve
índependence of stocking rate.
The results clearly demonstrated an interaction between stocking
rate and botanícal compositfon in Èhe deËerminaÈion of anímal production
followÍng Èhe renovation and early management procedures used in this
experiment. However, it was further demonstrated that this was only a
short-term effect, because, as the experiment progressed, there \¡Ias a
trend towards like-botanical composition in all pasture treatDents.
The efficiency of wool production, in relatíon to Pasture
productíon and rainfall, was dependent on stocking rate,and the experiment
highlighted the blological and economical lnefficiency of low stocking
ratesMostímportantly'theexperimentshowedthat,withadequate
subterranean clover, changes ín botanícal composition arisíng from
differerrces from varj-ous stockíng rates had not adversely affected
animal producËíon. None of the sor,ln species and cultivars ínvesti-
gated performed as well as the origínal volunteer annual grass-
subterranean clover (cv. Yarloop) pasture'
x1v
SÎATEMENT
The lnvestigatlons reported hereln ltere calried ouÈ as
part of my duties as a staff member of the south Australi.an
Departnent of Agriculture and Ffsheries and as an external-
student in the Department of Agronomy! !{aíte Agricultural
Research Instltute, Unlverslty of Adelaide'
This thesls contaLns.no maËerial whlch has been accepted
for the award of any other degree or dlplorna 1n any UnLversfty
and, to the best of rny knowledge and bellef, lt contalns no
materlal previously publtshed or wrltten by another Person'
except where due reference fs nade ln the text of the thesis.
Peter R. GLbson
xv
ACKNOIILEDGEI'{ENTS
Iamgratefulforthegui-danceofmySuPervisorsMr.E.D.
carter of the trlaite Agricultural Research InstituÈe' and Messrs'
E.D. Híggs and M.v. smlth of the south Australian Department of
Agriculture and Fisheries throughout the Program. Special thanks
must go to Mr. B. Ninnes and the Kangaroo Island Research Centre
staff for their interest and co-operatíon and I am particularly
grateful for the field asslstance rendered by Messrs. M.R. Lewis,
P.G. lelfer and A.D. Murray which was diligently and thoroughly
performed at all Èimes.
Senior Biometrician Mr. J.V. Eltls gave valuable assistance
with the deslgn of the experiment and Bíometricians Messrs. B'
Glaetzer and P. McCloud of the south Australian Department of
Agriculture and Fisheries performed some of the statistical analyses'
I gratefully acknowledge the assistance of Mrs. P. Anderson
lntypingthethesÍs,andMrs.M.SchubertandMessrs.J.Clarke
and N. Ellison of the Department of Agriculture and Fisheries for
the preparation of fi-gures.
Finally, I wish to thank the Australian llool corpoTation
for financing the project (DAS-16) through the ilool Research
Trust Fr¡rd.
I NTRODUCTI ON
t,r
þ
WAITE iNSTITUTE
LlÛiìÄír.Y
1
1. INTRODUCTION
Since European settlement, extenslve changes have taken place
in the botanical composftlon and productivlty of pastures ín southern
Australia. The use of superphosphate for top-dressing native grass
pastures (Cook 1939) led to a rapld lnvasfon of exoÈie annual species
(includfng many annual legumes) from Ëhe Mediterranean zone. The most
notable legume, TnífoLíwn subterraneum L. (subterranean clover), províded
a substantial lift in sofl fertlllty whích further accelerated the ínvasíon
of many more of these free-seeding and fast-growlng annual grasses and
herbs. These invadlng specLes have been regarded as weedy and lnferior
to cultivars of lmported temperate grasses (Tíver and Crocker 1951) '
Any effort directed towarde exploitfng the naturallsed volunteer
pasture species has been, with few exceptlons, conflned to legumes of
undoubted value such as subterranean clover. For example, by 1970' eleven
naturally-occurring blotypes (cormrercl-al cultl-vars) of this species were
l-n use 1n zones wíth dlstinct climatlc and edaphlc features' Some
conmgn examples are cv. Yarloop - reglons subject to regular flooding:
cv. Mt. Barker for long growfng aeasons: cv. Geraldton for greater speed
of seed maturation' etc. =(Donald-1970) '
only recently has the signlfLcance of the many attrlbutes of
some other coflìmon volunteer annuals been recognl'zed (e.g. Carter 1968a
and b, Snith 1968b). In partlcular, thefr perslstence under lntenslve
grazlng, and their contribution to pasture and hence anlmal productlvlty
under diverse management and seasonal influences ls fast earnlng them
the reputatÍon of valuable pasture specles in many areas of southern
Australia.
There appear to have been no reported experiments carrled out ín
the Medlterranean-type environment of souÈhern Australia comparing
anímal productlon from pastures based on subterranean clover - volunteer
i,
tI
I
r
2
+annual grass and subterranean clover-sown temperate grass.
Thls thesis descrfbes an experlment comparing the lfvewefght
response and wool productLon from wethers grazlng at six dffferent
stocking rates on subterranean clover - volunteer annual grass pesture
wlth and wlthout the introductlon of four tenperate grass - subterranean
clover mixËures. PartLcular emphasis has been placed on determinlng the
extent of re-Lnvasion of the renovated pastures by volunteer epecÍes'
and the persfstence of the introduced Pasture species, as Ínfluenced by
stocking rate. An attempt has been node to elucidate some of the fnter-
relatlonshlps of stockl.ng rate and botanLcal composltion as deËernlnants
of animal productfon fn the lledlterranean-type envlronnent.
The followlng revlew of llterature covers factors affectlng
botanical composftion and productivity of annual Pastures with partlcular
enphasls on the fnfluence and producttviËy of grazLng animals. Sectlon 2'L
revlews the influence of the grazLng anfnal on Pasture, the naLn effects
belng treadlng, defoliatlon, seed dlspersal and nutrient recycling'
SecËfon 2.2 briefly revfews the nuÊritlve value of the commonly-occurring'
volunteer annuals. Sectlo¡ 2.3 revielüa the effect of botanlcal composltion
on anfnal perfotmance and finally sectfon 2.4 dfscusses the interacÈion
of stocking rate and botanlcal conposltlon 1n the deternlnation of ani¡nal
productlon.
+Hor.rr"r, the earlíer experíments of Neal Smith (1942) and Rossiter(1952) have some relevance here even though there Isere no directcomparisons of anímal production between sov¡n temPerate grass plussubterranean clover and volunteer annual grass plus subterraneanclover. In both experiments Èhe lack of perslstence of the sor^m
grass componenË had little effecÈ on plant or anímal productívity'
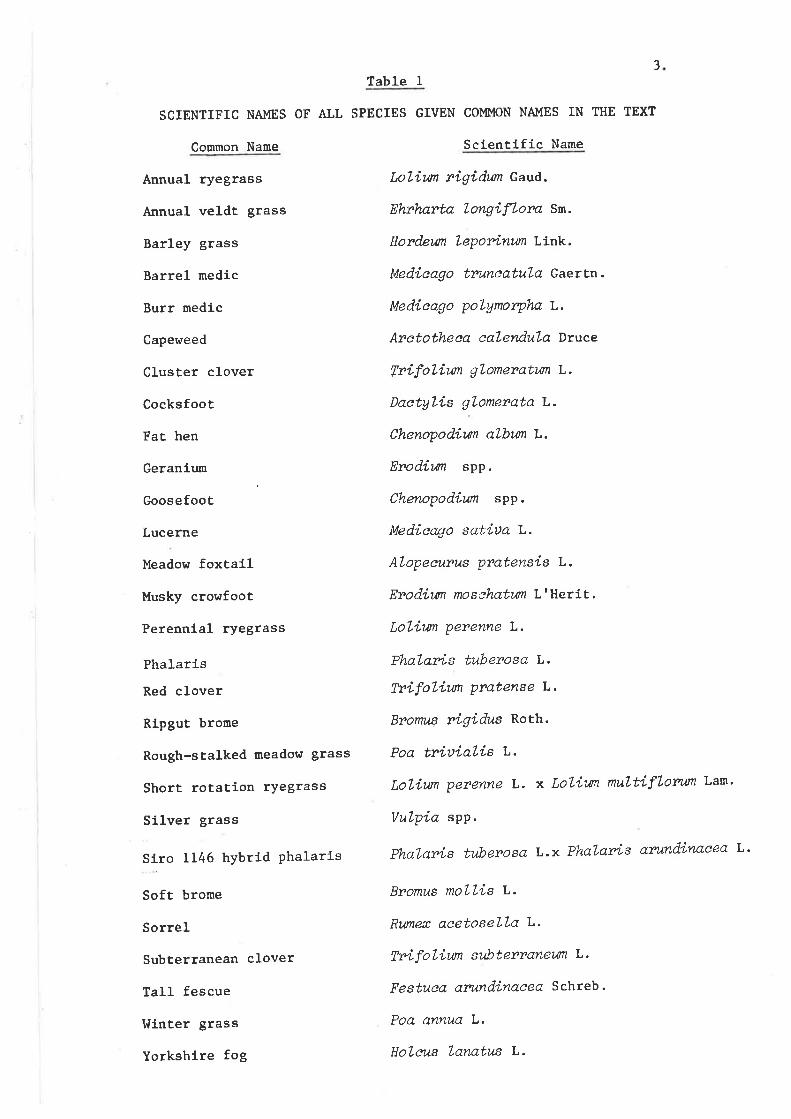
3lable I
SCIENTIFIC NAMES OF ALL SPECIES GIVEN COMMON NAI'ÍES IN THE TEXT
Common Name Scientlfic Name
Annual ryegrass
Annual veldt grass
Barley grass
Barrel rnedic
Burr medic
Capeweed
Cluster clover
Cocksfoot
Fat hen
Geranir¡n
Goosefoot
Lucerne
Meadow foxtail
Musky cror¡foot
Perennial ryegrass
Phalaris
Red clover
Ripgut brome
Rough-sÈalked meadow grass
Short rotation ryegrass
Silver grass
Siro 1146 hYbrid Phalaris
Soft brome
Sorrel
Subterranean clover
1a11 fescue
I{lnter grass
Yorkshire fog
LoLiun nigídun Gaud.
Eht'hanta Longi fLota Sn.
Hord.eum Lepor"inun Link.
Medicago truneatuLa Gaertn.
Medieago polgmotpha t.
Aretothe ca calendula Druce
TrifoLiun gLomenatttn L.
Daetylis glomenata L.
Chenopodiún albwt L.
Erodiwn spp.
Chenopodiun spp.
Medieogo satíua t.
ALopeeutus pratensis L.
Enoditn mosehatwn L I Herít.
Lolittn penenne L.
PhaLaz"Ls tuberosa L.
TrifoLíun pnatense L.
Brorru.g rigidus Roth.
Poa trítsíalis L.
LoLiun perenne L. x LoLim rmútiflorum Lam'
VuLpia spp.
PhaLar"is tuberosa L.x Ph.q'Lav"Ls azwn&Lnaeea L'
Bromus moLLis L.
Rumeæ acetoseLLa L,
Tnifolíun subtenY'anewn L.
Festuea atwn&Lnae¿a Schreb .
Poa annua L.
HoLeus Lanatus L.

LI TTRATIJRE REV I EI^I
4
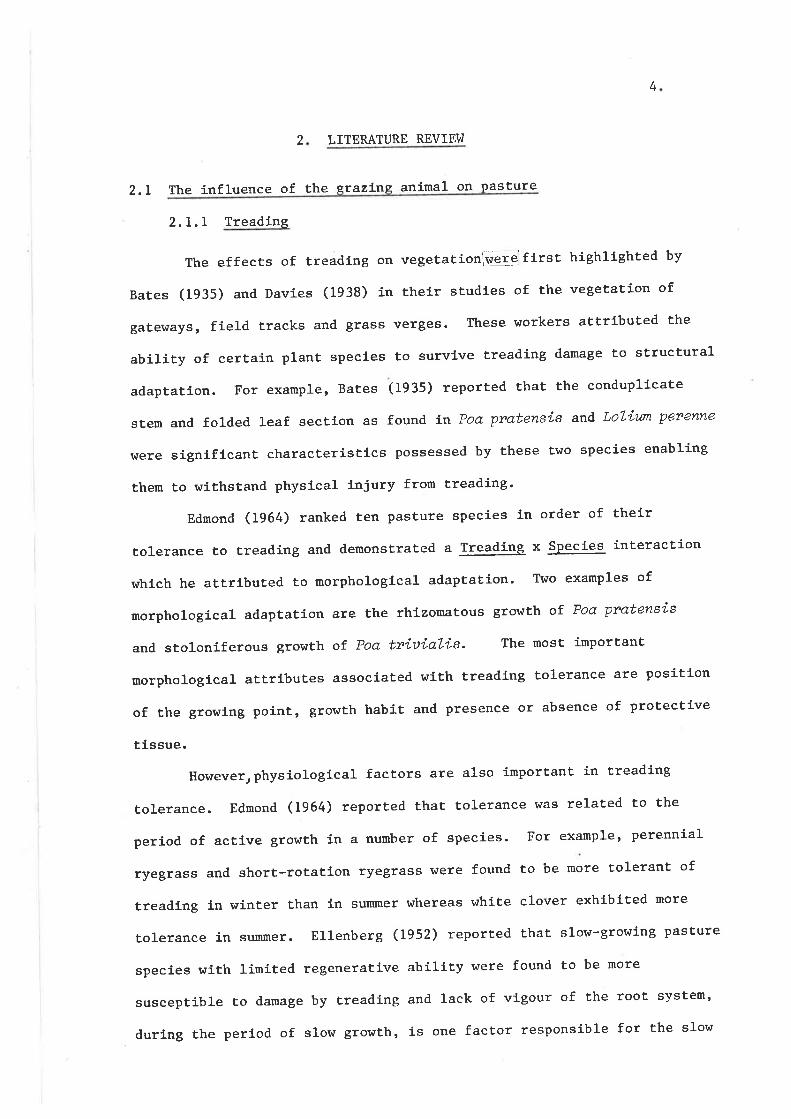
2 LITERATURE REVIEI,T
2.L The ínfluence of the q-tazírLg animal on pasture
2.I.1 Treading
The effects of treading on vegetatíon\irere first highlighted by
Bates (1935) and Davíes (f938) ín theír studies of the vegetation of
gatehrays, field tracks and grass verges. These workers attríbuÈed the
ability of cert.aín plant species to survive Èreadíng damage to strucÈural
adaptatíon. For example, Bates (1935) reported that the conduplicate
sËern and folded leaf sectlon as found ín Poa pz'atensis a¡d LoLí'um pe"enne
were signiflcant characterlstics possessed by these Èwo species enablíng
them to withstand physical injury from treadíng'
Edmond(1964)rankedtenPasturespecíesinorderoftheír
tolerance to treading and demonstrated a Treading x Species ínteraetíon
which he attributed to morphologlcal adaptation. Two examples of
morphologícal adaptaËion are the rhizomatous growth of Poa pratensis
and stoloniferous grordth of Poa ttiuiaLis. The most important
morphological attributes assoclated r,rith treading tolerance are positíon
of the growing poínt, growth habit and presence or absence of protective
tlssue.
However, physiological factors are also importanÈ in treading
tolerance. Ednond (1964) reported that tolerance was related to the
period of active grovrth ln a number of species. For example, perennial
ryegrass and short'rotation ryegrass were found to be more tolerant of
treading in wínter than in summer r^rhereas white clover exhlbited more
tolerance in summer. Ellenberg (1952) reported that slor^r-growíng Pasture
specíes with limited regeneratíve abilíty were found to be rnore
susceptible to damage by treading and l-ack of vigour of the root system'
during the perÍod of slow growth, is one factor responsible for the slow
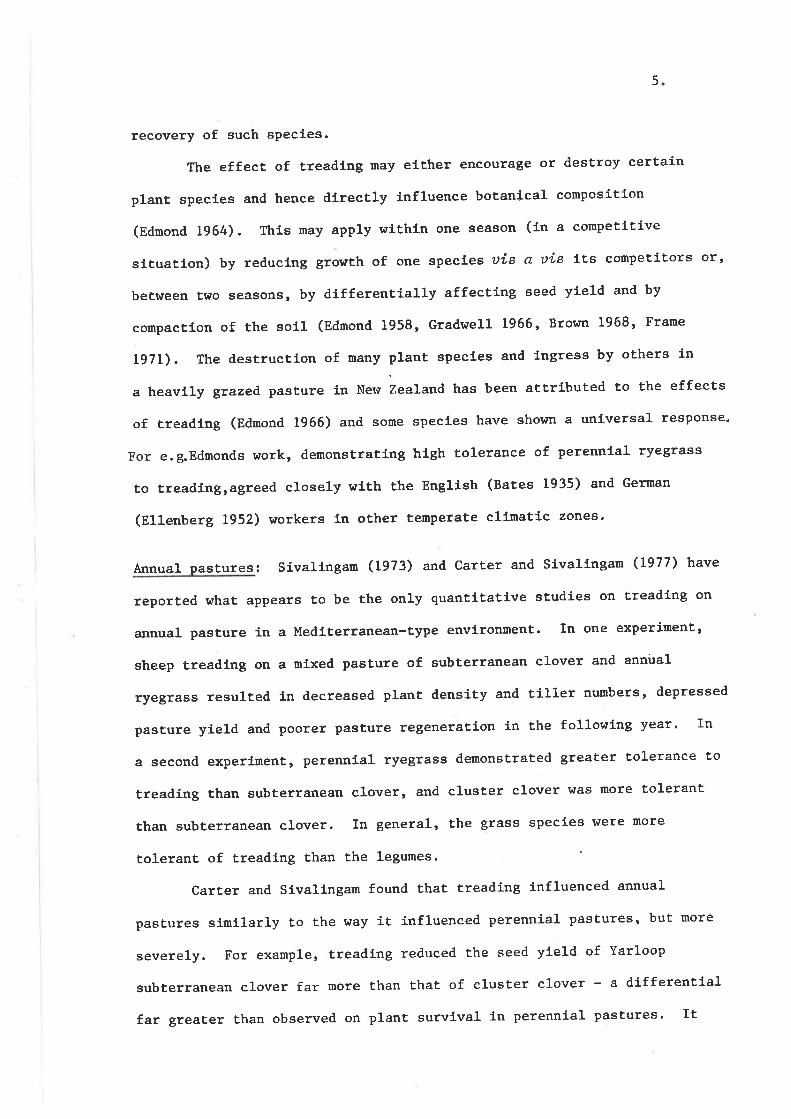
5
recovery of such sPecles.
The effect of treading nay efther encourage or desÈroy certain
plant specles and hence directly lnfluence botanlcal composition
(Edmond 1964). This may apply wlthln one season (1n a compeÈitive
situatlon) by reducing growth of one specles Ðis a Ðis its competítors or'
between trùo seasons, by differentially affectíng seed yíeld and by
compacÈlon of the soil (Edmond 1958, GradwelL L966, Bror^m 1968, Frame
1971). The destruction of many plant specles and ingress by others ln
a heavfly grazed. Pasture in New 7,eaLa¡d has been attributed to the effects
of treading (Ednond 1966) and some species have sho!''n a uníversal response"
For e.g.Edmonds work, demonstratíng high tolerance of perennial ryegrass
to treadÍngragreed closely wlth the Engllsh (Bates 1935) and German
(Ellenberg L952) workers ln other Èemperate cllnatic zones.
Annual pastures: Sivallngan (1973) and Carter and sivallngan (1977) have
reported what appears Ëo be the only quantitattve studies on treading on
annual pasture in a Mediterranean-type environment. In one experinent'
sheep treadlng on a mixed pasture of subterranean clover and anniral
ryegrass resulted in decreased plant density and tiller numbers, depressed
pasture yield and poorer pasture regeneratíon 1n the followíng year. In
a second experiment, perennlal ryegrass demonstrated greaÈer tolerance to
treading than subterranean clover, and cluster clover l^tas more toleranÈ
than subterranean clover. In general , the grass species Í,{ere more
tolerant of treadlng than the legumes.
Carter and Sivallngam found that treading influenced annual
pastures sínílarly to the way it influenced perennial Pastures, but more
severely. For example, treadÍng reduced the seed yield of Yarloop
subterranean clover f.ar more than that of cluster clover - a differential
far greater than observed on plant survival in perennial pastures' It
6
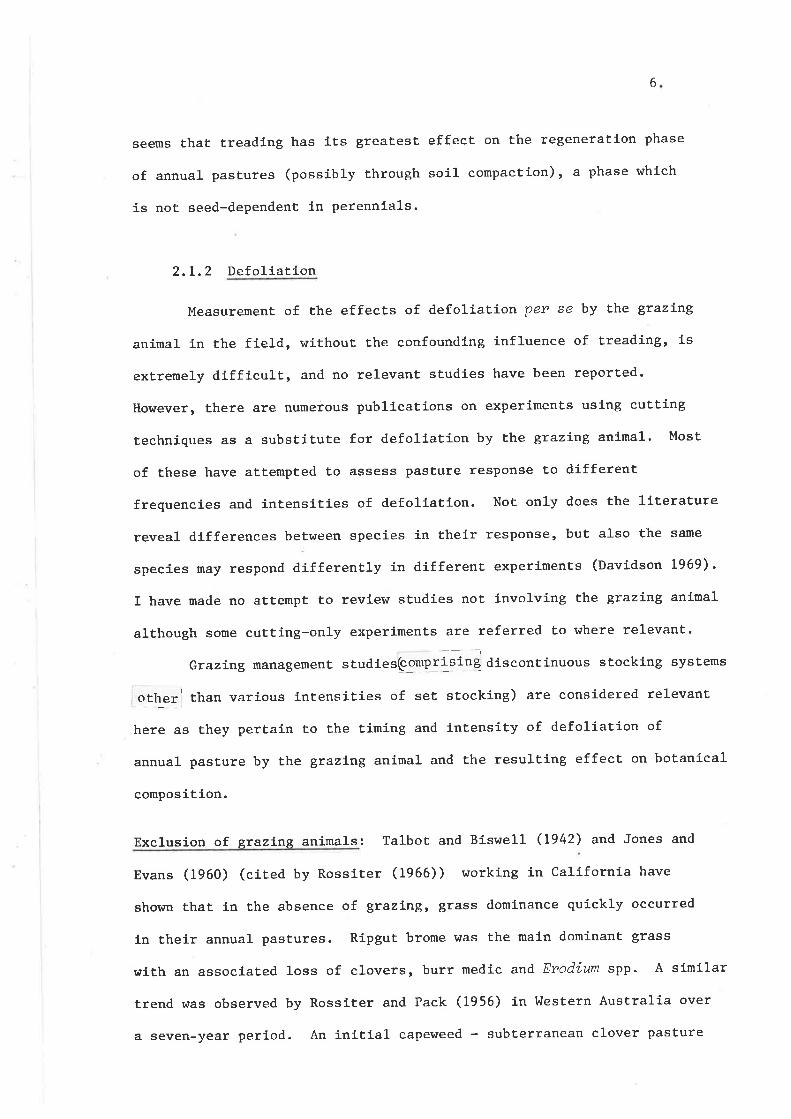
seems thaË treading has its greatest effect on the regeneratíon phase
of annual pastures (possibly through soil cornpaction), a phase whích
is not seed-dependent in perennials.
2.I.2 Defolíatíon
MeasuremenÈ of the effects of defoliatíon per se by the grazing
animal in the fie[d, without the confounding influence of treading, is
extrernely diffícult, and no relevanÈ studies have been reported.
llowever, there are numerous publicatíons on experiments using cutÈing
techniques as a substitute for defolíation by ttre grazing anlmal. Most
of these have attempted to assess pasture response to different
frequencies and intensities of defolíatl-on. Not only does the literature
reveal differences between specíes in theír resPonse' but also the same
species may respond differently ín different exPeriments (Davidson 1969).
I have made no a¡Èempt to revievr studies not involvíng the gtazíng anímal
although some cuttíng-only experiments are referred to where relevant.
Grazíng management studiesþgtp.l-tittg discontinuous stocking systems
other than various intensiÈies of set stocking) are considered relevant
here as they pertaín to the Ëiming and intensity of defoliation of
annual pasture by the gtazíng anímal and the resulting effect on botanical
compositíon.
Exclusíon of grazing animals: Talbot and Bíswell (1942) and Jones and
Evans (1960) (clted by Rossiter (1966)) working in California have
shown that in the absence of grazing, grass dominance quickly occurred
ín their annual pastures. Rípgut brone \ìlas the main dominant grass
with an assoclated loss of clovers, burr medic and Erodilm sPP. A similar
trend was observed by Rossiter and Pack (1956) in l^Iestern Australia over
a seven-year period. An initial capeweed - subterranean clover pasture
7
was dominated bY rlPgut
eventually was rePlaced
However, results
"have doubÈful - lf not
(Rossiter 1966).
brome grass after three to four years but
by annual veldtgrass.
produced ln the absence of the grazlng animal,
frankly misleading - agronomic significance"
RoËationa]- stazlne: The early Callfornian workers placed much emphasls
on rotationaL grazing to promote or inhlbit certain annual pasture
speeies. However, Heady (1961)r'in a revÍew of gxazíng management
sysÈems on the Californian annual-tyPe pasturer concluded that there ldere
no obvlous productlon beneflts from rotatíonaL grazLng systems on these
pastures and that no obvious change 1n boËanlcal compositl-on could be
related to mafiagement system. Rossiter (1966) states that he, and
probably most agronomlsts 1n southern Australla, belleved that set
stocking was the best grazing system on annual-type pasture ín southern
Australia. However, no experiments have been reported comparing roÈational
gtazlrng versus set-stocking nanagement systems over an extended períod
of time on annual PasÈures 1n southern Australía and hence one cannot
be certain Èhet Ëhe results of management experÍments performed ln
callfornla can be extrapolated to southern Australia.
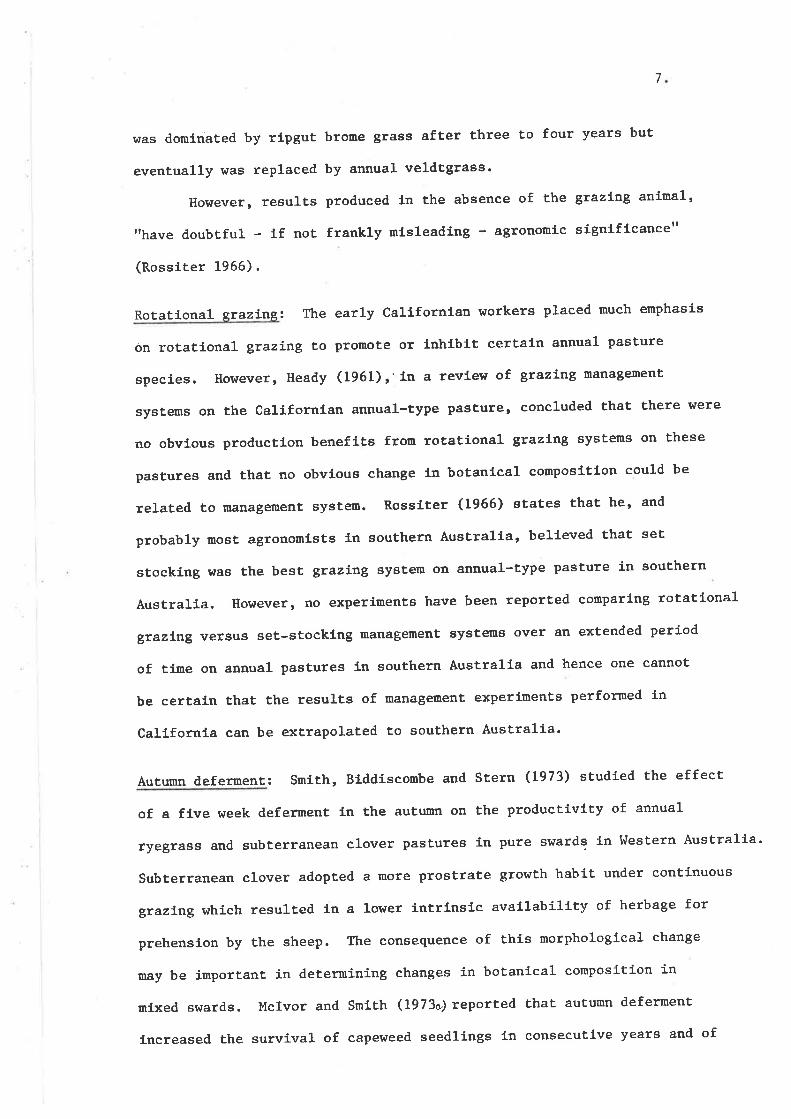
Autumn defernent: SmfÈh, Blddiscombe and Stern (1973) studied the effect
of a fÍve week defer:nent 1n Èhe autumn on the productivtty of annual
ryegrass and subterranean clover pastures in pure swards ín l^Iestern AusÈralla'
Subterranean clover adopted a more prostrate growth habit under contÍnuous
grazíng which resul-Èed in a lower intrfnslc availabílíty of herbage for
prehenslon by the sheep. The consequence of thís morphologícal change
may be important in determining changes in botanlcal composltion in
¡rLxed swards. Mclvor and Smith (1973a) reporÈed that autumn deferment
lncreased the survival of capeweed seedlings in consecutive years and of
I
subterranean clover Ln one year but had 11tt1e effect on the annual
grasses. Despite the lower capeweed plant numbers under continuous
grazlng thfs specfes still rerrained a substantial component of the sward
and by sprlng any changes in botanfcal composition due to deferment
had dlsappeared.
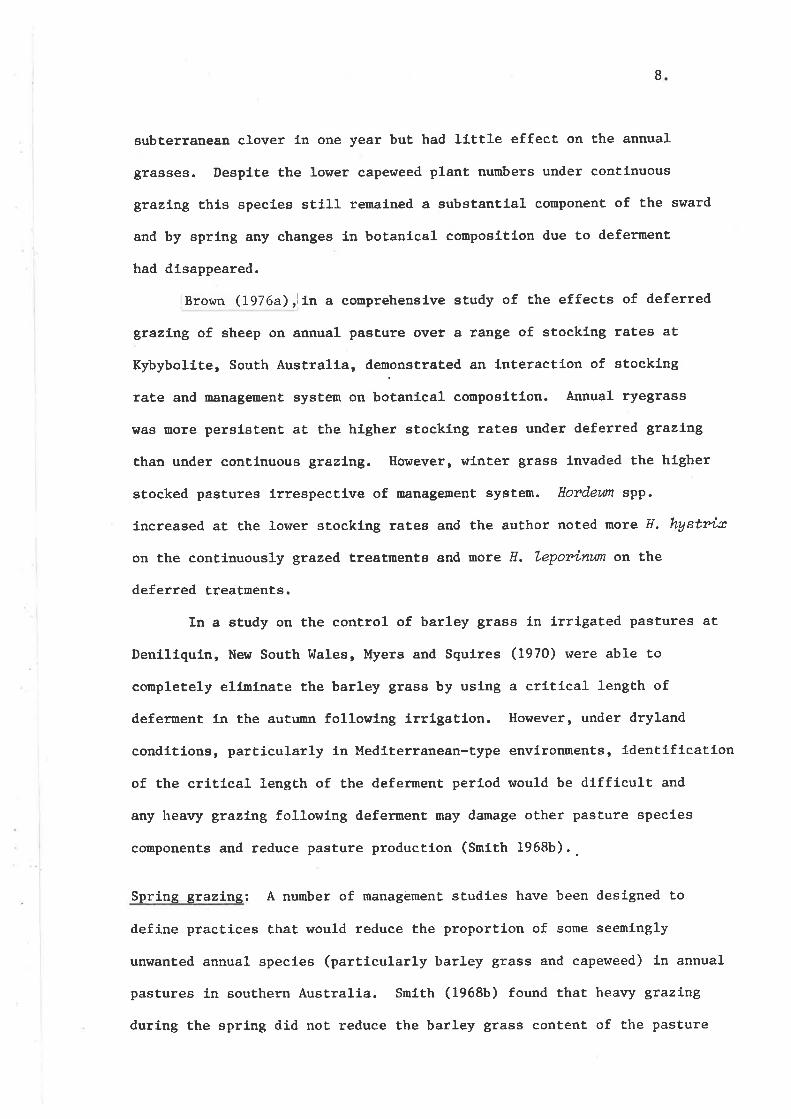
Brown (I976a),11n a conprehenslve study of the effects of deferred
gtazLng of sheep on annual pasture over a range of stocklng rates at
Kybybollte, South AustralÍa, demonstrated an fnteractfon of stockLng
rate and nanagemenÈ system on botanical conpositlon. Annual ryegrass
rùas more persistent at the higher stocking rates under deferred grazíng
than under contlnuous grazÍng. Ilowever, wlnter grass invaded the hlgher
stocked pastures ÍrrespectLve of rûanagement system. Hordeum spp.
increased at the lower stockl-ng ratea and the author noted more f1. hystr"iæ
on the contfnuously grazed treatmente and more fl. Leponinun on the
deferred treatments.
In a study on the control of barley grass in írrlgated pastures at
Denlllqutn, New South l,lales, Myers and SquÍres (1970) ¡¡ere able to
completely ell-ninaÈe the barley grass by uslng a critical length of
defement in the autumn following irrLgatlon. Ilowever, under dryland
conditions, particularly ln MedLterranean-type environnents, identification
of the crltfcal length of the deferment perfod would be difficult and
any lreavy grazLng following deferment may damage other pasture species
components and reduce pasture productfon (Smtth 1968b). -
Spring gtazÍrngz A number of management studies have been designed to
define practices that lrould reduce the proportion of some seemingl-y
un¡¡anted annual specles (particularly barley grass and capeweed) in annual
pastures in southern Australia. S¡nLth (1968b) found that heavy grazíng
during the spring did not reduce the barley grass content of the pasture
9
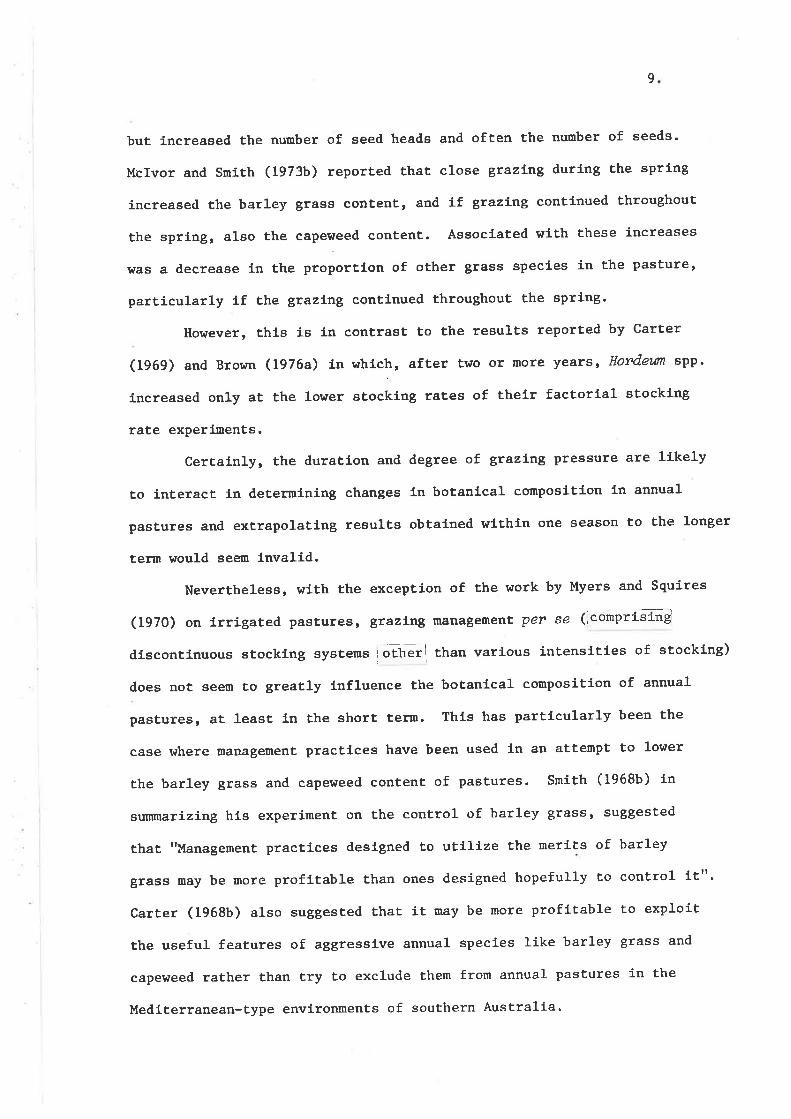
buÈ increased the number of seed heads and often the number of seeds.
Mclvor and Snith (1973b) reported that close grazíng durlng the sprÍng
increased the barley grass content, and lf gtazíng continued throughouÈ
the sprlng, also the capeweed content. Assoclated with these lncreases
nas a decrease in the proportlon of other grass speeies in the Pasturet
particularly íf Ëhe grazLng contlnued throughout the sprlng.
However, Èhis is in contrast to the result.s reported by Carter
(1969) and Bro¡sn (I976a) 1n whlch, after tr,ro or more years, Hordeum spp'
increased only at the lower sËocking rates of thelr factoríal stocking
rate experíments.
Certainly, the duration and degree of grazl-ng pressure are ltkely
to inÈeract in determining changes 1n botanlcal comPosftfon in annual
pastures and exËrapolating results obtained wlthln one season to the longer
ter¡t would seem lnvalid.
Nevertheless, with the exception of the work by Myers and Squires
(1970) on irrigated pastures, grazing management per se (þmprisíng
discontinuous stocklng systerns otheil than varlous íntensities of stockíng)
does not see$ to greatly lnfluence the botanical compositíon of annual
pastures, at least in the short Èerm. Thls has Particularly been the
case where management Practlces have been used in an attemPt to lower
the barley grass and capeweed content of pastures. Smith (1968b) 1n
suumarízing his experiment on the control of barley grass, suggested
that "Management practices designed to utilize the merÍts of barley
grass nay be more profitable than ones designed hopefully to coritrol it".
Carter (1968b) also suggested that 1t uray be more profftable to exploit
the useful features of aggressive annual species like barley grass and
capeweed rather than try to exclude them from annual pastures in the
Mediterranean-tyPe environments of southern Australia.
10.
Stocking rate: as dLstlnct from Èhe other forms of. gtazíng management
referred to above, can have a marked influence on the botanical
composlt,ion of pasture under sustained contínuous gtaztrrg 1n the
Medíterranean-type envíronment of southern Australia.
Drake and Elliott (1963) reported dramatl-c changes in botanical
composition afÈer flve years in a set-stocked, stocking rate exPeriment
at Bengworden, VfcËoría. At the lowest stocking rate the pasÈure was
grass domfnant with a high conponent of Yorkshire fog. At the ínterDediate
stockÍng rate grass and subterranean clover were Present in equal
proportlons buÈ fog grass was elimlnated. At the highest stocking rate
the caperdeed component had increased from two to 17 per cenÈ with a
concurrent decrease in the grass component'
In l,Iestern Australfa iDavíes (1965) and Rosslter (L966) denonstrated
an íncrease in the volunteer capeweed and ErOdiWn species and a decrease
in volunteer annual grass components as stocking rate íncreased' In
the latter study, partitioníng of the annual grasses revealed a reductlon
in the ripgut brome component and an increase ln the silver grass
componenÈ at the hfgher stocklng rate.
YIan¡ et aL. (1966), worklng near Mt. Barker 1n l'lestern Australfa,
reported an interactlon between superphosphate, stocklng rate and
botanl-cal composlt,ion. After t$to years, subterrenean clover was
dominanË at the highest stocking rate, irrespectlve of the rate of
superphosphate applícatlon. At the lowest sÈocking rate, grass doninance
Lncreased with rate of superphosphate application'
In a set-stocked experlment at Kojonup, I.Iestern Australía,
Greenwood, Davies and l,Iatson (1967) recorded a marked invaslon of a
subterranean clover - sofÈ brome pasture by VuLpia sPP., Enodiun sPP',
barley grass, rlpgut brone and capeweed. At the end of the fourth year
the subterranean clover component was higher at the higher stocking rate
11.
but Ëhís difference disappeared in the flfth year. After five years of
set stocklng, the pastures ltere dominated by VuLpia sPP', ripgut brome
and capeweed. The proportlon of each volunteer specíes comPonent hras
independent of stocking rate in each year, with the exception of the
ripgut brome component, whÍch was signiffcantly greaÈer at the lower
stocking rate.
I{hen three stockíng rates were l-mposed on an annual ryegrass -
subterranean clover Pasture at tlerribee, Victoria, Sharkey et aL' (1964>
found that both soI{n specLes dLsapPeared fron the Pasture at the highest
stocking rate with a concurrent Lnvaslon of Vulpia sPP., CrassuLa sPP.,
Lythrun spp. and winter grass. However, aÈ the lowest stocking fate'
an increase ín annual ryegrass and a decrease in subterranean cloVer
plants was recorded. This trend was reversed et the intermedlate stocklng
rate.
Cameron and Cannon (1970) rePorted Lncreased proportions of
subterranean clover and annual volunteer grasses at intermediate sÈocking
rates but a decreased proPortlon at the hlgher stocklng rates, ín an
experlment in north eastern Vlctorla. However, wlnter grass, cluster
clover, Tn'ifoLiwn eûltpest?e and fu'ífoLíun duhium aLL increased in
proportlon to fncreased stockfng rate up to the highest rate. The
broad-leaved component, coftsl-sÈing of capeweed, Rtaneæ dcetoseLLa' Erodium
spp. and Cerastíum Uiseosum, showed no consistenÈ change 1n m¡gnl-tude.
Carter and Day (1970) reported a marked invasion of wínter grass'
cluster clover and, to a lesser extent, geranium at the highest stocking
rate Ín a factorial stocking rate and superphosphate gtazing experiment
at Parndana, South Australía. The authors reported no consistent effect
of sËocking rate on the between-year changes in the proportion of
subterranean clover ln the pasture. The pastures were also ínvaded by
silver grass, ripgut brome, soft brome, barley grass and capeweed,
L2.
írrespectíve of treatment.
At the t{aÍte Instftute, South Australla, Carter (1969) reported
a simllar ínvasion of annual pasture by volunteer annuaL species'
al-though a dlfferentlal- effect of sÈockfng rate on the domÍnance of
barley grass and capeweed was recorded in thls experiment. At the highest
stockÍng rate, cluster clover and winter grass were agaln the maln
invaders and barley grass and capeweed dominance occurred at the Lower
and intermedÍate stocklng rates resPecÈively'
Borh Brown (197&) at Kybybollte, South Australia, and Fitzgerald
(Lg76) at t{agga T{agga, New South l{ales, also reported a more marked
invasion of annual Pasture by barley grass aË the lower stocklng rates'
The former author reported l-ncreased Proportions of cluster clover,
wlnter grass aîd Juneus bufonius, and the laÈter author, increased
proportions of subterranean clover and sllver grass at the highest stocklng
rates.
Although effectlve grazLng Pressures, so1l tyPe, climatic conditions'
micro-envfronment and many other factors would have varied between
experÍmental sltes, the domfnance of certaLn specles at eíther high or
low sÈocking rates is conrmon to most of the experinents referred to
above. In partlcular, the trend towards higher Proportions of cluster
cl-over and winter grass at the híghest stockÍng rates is cornmon to many
of the experlnents.
The reason for certaln Pasture species growing under different
grazítg reglmes is unclear and many factors may be of lmportance' For
sxanple¡ tolerance to treading (see 2.1.L), preference for particular
nutrient levels (although it ls unclear if, and to what extent, stocking
rate affects nutrient levels 1n the soLl - see sectíon 2.1.4)' seed
production and dfspersal (see Sectíon 2.1.3)'
Perhaps the most slgniflcant factor ín the marked persistence of
13.
rùlnter grass and cluster clover at high stocklng rates fs that a htgh
proportfon of the seeds of these two species pass through the allnentary
tract of the gtazl:ng animal and remal-n vfable (Carter 1969), thus
naintainLng a high level of seed reserves for propagatlon of the specíes.
The differential digestibility of seed by the grazing animal l-s further
díscussed in Section 2.L.3.
Persístence of sown perennial species: Few experiments have reported
any real degree of perslstence b¡¡ sown perenníal grasses (with the
possible exception of phalaris) fn the pastures coúnon to Mediterranean-
type regions of southern Australla. Ttre extent to which stocklng rate
fnfluences the persistence of Ëhese sortn perenníal grasses Ls also
uncertaln. In the grazÍng experÍment reported by Caneron and Cannon (1970),
perennlal ryegrass, although lnftially the naJor component, flnally
disappeared at all levels of stocking. However, in the short term
(4 to 5 years), the decline in the perennfal grass component !üas more
rapfd at the hlgher stocking rates.
Carter and Day (1970) reported a rapid between-year decl-fne fn
the perennial ryegrass component in theÍr experíment. In the first year
the perennfal conponent appeared to be depressed at the hígher stocklng
rates, but by the end of the thfrd season, its contribution was so snal1
that no treatment fnfluence was evident. The authors state that t'the
declfne in the perennlal ryegrass component was probably associated
nafnly with dry spring and sunrmer conditions".
ComparLsons of the persistence of different perennial grass species
fn a Medfterranean-type envlronnent are almost Èotally lackíng. Reed
(1974) reported an lnteraction between the persistence of perennial
species and stocklng rate at Glenorníston, Victoría; phalaris proving
slightly more persistent at Ëhe higher stocking rates than perennial
14.
ryegrass.
Differences fn the perslstence of perennial grasses under dlfferent
grazíng pressures have been recorded for other clirnatic regions of
southern Australla. For gxample, Biddiscourbe (1953), in a survey of
grazed natural conrmunitíes at Trangle, New South l.lales, found thaÈ the
perennÍal grass component decLfned and the annual component lncreased as
the grazing pressure lncreased. Ilutchinson (1970) reported an inter-
action between perennfal grass specLes and stocklng rate at Armldale'
New South l{ales, where phalarÍs showed marked perslstence at high and
low stocklng rates, fescue persLsted wel-l- at the lower stocking rates
only, and both perennial ryegrass and cocksfoot plant numbers were
severely reduced at boÈh stocking rates.
2.L.3 Seed Dispersal
The attachment of seed, indívidually or ín burrs and pods, to
the halr or wool coat of the grazing animal is an íroportant means of
seed dfspersal. However, it seems thaÈ no experíments have been reported
assesslng the lmportance of grazing management, partictrlarly stocking
rate, on external seed transfer and the resulting effect on botanical
composÍtion Ln annual pastures. It would seem logical that maxÍmum
movement of stock would enhance seed dístributíon by thÍs means.
However, although higher stockLng rates would probably ensure
greater movement of livestock and therefore provide more'Potential
carríers of seed, seed productíon may in fact be lor+er at the higher
stocking rates wíÈh a resultant decrease in dispersal of seed by the
gtazlrng anímal. In many situations, low stocking rates have encouraged
grass doml-nance and, particularly if barley grass ís presenÈ' resulted
fn íncreased seed fault ín wool (Carter 1969).
The dlfferentÍal digestibility of seed Í-n the allmentary tract of
15.
t]ne gxazing animal clearly ts important in determinlng changes ín
botanical composition in annual pastures. Dore and Rayno¡d (L942)
estimated that 1100 viable seeds of red clover may be distrlbuted
through the alimentary tract of one cow in tt.e grazíng season' However, in
thís experiment no account hras taken of rhardr seeds which were still
ungermínaÈed at the tlme the counts were dlscontlnued. Suckling (L952)
estímated, that under a stocklng rate whe-re all the available pasture of
white clover l{as grazed down 1n one day, four míllíon viabl-e seeds could
be distributed 1n the combíned faeces of the grazíng sheep. This auÈhor,
together with other workers (Bunton and Andrews 1948), advocated the
practice of purposeful dissemination of seed by the movement of sheep
from pasture which is plentiful ín supply of certain seed to nearby
depleted areas.
The proportíon of whole seeds passed in the faeces appears to
be related to seed size, Franklin and Powning Q942) recovered 57 per
cent of uncrushed clusËer clover seeds (wetght of 1000 seeds = 0'4 g)
compared to a three Percent recovery of barrel medíc seeds (weíght of
1000 seeds = 3 .7 Ð reported by vercoe and Pearce (1960).
carter (1969), in a stocking raÈe experlment on annual pasture at
Èhe Waite Institute, South Australia' counted high numbers of víable
seed of cluster clover, wínter grass and capeweed in the faeces of sheep
but recorded very low seed counts of subterranean clover' annual rye-
grass and barley grass. The differences apPeared to be. related to
dífferentíal seed digestibility rather than differential inÈake of seed.
Continuous grazi¡¡g at a high stocklng rate caused rapid changes in
botanical courposítion in his experiurent. After four years of continuous
grazing, the quanÈity of cluster clover seed obtaíned at Èhe híghest
stockíng rate (22.2 sheep t"-1) was 440 kg ha-l compared to 16 kg ha-l
16.
-l -1 ' -i 1 t. -laE L7 sheep ha-I and less than one kg ha-r at 14.8, L2'4 a¡d 7'4 sheep ha ^
These mârked dtfferences in seed production lÀtere refl-ected in botanical
compositlon.
2.1.4 Nutríent recvclíng
The effect of excreta from the grazfng anÍnal on the botanlcal
composition of annual pasture is not clearly undersÈood (Barrow 1969) '
Increased stocking rates w111 l-ncrease the turnover of nutríenÈs and
should lead to lower requlrements, but the large-scale heterogenous
distriburion of faeces and urine by the gxazLng animal- mây result ín the
naJority of pasÈure being depleted 1n nutrlents at high stocking rates'
even though the grazíng pressure may be more unifom (Hildet L964 and 1966)'
the distributíon of faeces and urine nay be partlcularly uneven when
lnvolving camp sites near shelter' ttater on adJacent anímals of like kind'
Canpbell and Beale (1973) concluded from their results of an experíment
with ìlerino wethers grazing natural pasture at Trangíe, New south I'lales,
that dlfferences in stocking rate did not resulÈ in any díscernlble
difference fn soil nitrogen status that níght 1n turn have brought about
the observed change 1n barley grass content ín thelr pasture.
The changes in botanical cornposÍtlon that occur on animal camp
sites ln response to the lncreased source of available nutrients may be
i$portant Ín the ínvaslon of larger areas of pasture. The classical
ínvasion patterns of barley grass and capeweed frequently show a spread
from ínitl-al foci withín such areas of enhanced fertllíty' Avoídance by
the grazing animal of these areas of concentrated excreta can furÈher
accelerate lnvasÍon by vigorous annuals. However, the confoundlng
Lnfluence of altered seed populations caused by dífferentíal dlgestlbility
of seed by the grazbng animal m¡kes the <llrect attributfon of changes
fn botanical composltíon to altered nutríent levels pe? set in these
17.
camp sites, urtterlable (Carter 1969).
I,ltrile further work is required to establ-ish to what extent the
grazl:rrg animal ínfluences the avallability of nutrlents in the soíl
there ís llttl-e doubt that soil ferttlity rnay have a major influence
on the conpetitive growth of some annual Pasture specíes. For exarnple,
Moore (1965) demonsËrated that barley grass was significantly more
competitive than annual ryegrass at high levels of soil nitrogen and
calcÍum. Snlth (1966 and 1968a) has produced evidence correlating
frosÈ resistance in barley grass wlth the nltrogen 1evel of both herbage
and soil. However, Snith (1968a) also suggests that competítion between
annual ryegrass and barley grass in the vegetative sÈage may not be
ímportant because the roots of the two species explore rnainly separate
soll layers. Cocks (L974) reasons, that although barley grass is a
planÈ of fertíle soíls its presence ís probably not due to íts comPetitive
abillty at high nitrogen levels, at least when compared to tr'llmtera annual
ryegrass. He demonstrated that aÈ 1ow niÈrogen levels barley grass
was the successful conpetÍtor but lts competitive ability decreased with
increased plant density. At high nitrogen levels annual ryegrass
became the successful competitor but the competíÈive ability of barley
grass increased with its densitY.
Examples of particular pasture species requÍring either hígh or
low fertílíty regimes are numerous and bey<lnd the scope of thís revíew
ín so nuch as particular fertility regímes cannot be adequately related
to the lnfluence of the gtazÍ:ng animal'.
2.2 The nutritíve value of annual Pasture Plants
2.2.I DígestíbilítY
Growing season: The digestibiltty of pasture is narkedly
lnfluenced by lts chemical composit.íon and, in partícular, by the amount
.i
$',1j
18.
of structural- ce1l rirall naterlal Lt contalns (Arnstrong et aL. L964,
Jones Ig72). The dfgestibillty fs usually hígh for young herbage and
decLínes as the plant,s nature (Mfnson et aL. 1960' Radcllffe and Newbery
1963). For any one species, leaf bl-ades usuaLly have a higher digestibility
than stems, wíth leaf sheaths intermedlate (Raymond 1969).
Rossiter (1966) quotes two early studies on the digestibllity of
annual pasture fn southern Australla. a) For a mixed Pasture under
grazíng at Roseworthy College, South Australia, Hutehinson and Porter
(1958) obtafned a value of c. 75 per cent for D.U.D. (dry matter
digestíbíl-ity) duríng the spring. b) Í'fith a mixed Pasture of annual
ryegrass and subterranean clover under gtazLng, Pearce et aL. (1962) at
werríbee, Victoria, obtaíned a value of c. 80 per cent O.M.D.t (organic
maÈter digestfbl-líty) during the sprlng.
Only slíght differences Ín the O.M.D. of dífferent annual pasture
species, \,ùhen measured at comPerable stages of growth' I^lere found by
FeIs et aL. (1959) and Davie" (tgOS) 'i
However, Mclvor and Snl-th (1973c) have recorded some dífferences
in digestibllity between comPonent Parts of some annual specÍes. For
example, the stems of annual ryegrass and barley grass were rnuch lower
1n digestíb11-íty at maturity than ripgut t¡ronre grass, soft brome grass'
capeweed and musky crowfoot. However, the seed heads of annual- ryegrass
and soft brome grass were of hígher digestibílity than those of barley
grass and rlpgut brome grass
The dfgesttbility of many volunteer annual specíes compares
favourably with that of introduced temperate grass specíes. For example,
Jones et aL. (1971) at Canberra reported that the <ligestibíLíty of whole
plants of capeweed (grazed or ungrazed), rough-leaved goosefoot and sorrel
T
* 0.. cenÈ O.M.D. is usually l to 3 uníts hlgher than per cent D.M.D.
¿l
¡
II
19.
(grazed) and fat hen (ungrazed) conpared favourablV\wftfr equivalently -
managed sown species of cocksfoot, lucerne, ryegrass and phalaris.
A marked decline 1n dlgestibility following the onseÈ of floweríng
has cornmonly been reported in most pasture species. Radcllffe and Newbery
(1968) recorded a decline fn dtgesÈ1ble dry matter of between 0.7 to 0.9
percentage units per day over the- last month of the growing season
(November) 1n five, wlnter grazed, perenníal grass - subterranean clover
pastures in the Adelaíde Hflls of South Australia. This declíne was
hlgher than that recorded by other workers in other environments (i.e.
Mínson et aL. 1960, PrÍtchard et aL. L963, Mowat et aL. 1965). In a
later experiment, Radcliffe and Cochrane (1970) recorded wfde variability
fn the rate of decline of digestibil-ity of pure swards of perennfal and
annual grasses at Northfield, South AustralÍa. In the month fol-lowfng
flowerlng, annual ryegrass lost dlgestibtt-1ty at the rate of 0.9 units
per day r¡hich was similar to the declíne observed ín mixed Pastures
domínated by perennial ryegrass (Radcllffe and Newbery (1968). Lower
values (0.3 to 0.5 unlt decl-fne per day) rirere recorded for phalarls,
brome grass, sÍlver grass, barley grass, subterranean clover and barrel
medic. Wllson and McCarrick (1966) also observed that the rate of
decllne 1n dfgesttbllity of mfxed swards of perennlal ryegrass, rough-
stalked meadow grass and meadow foxtaLl was lower Èhan for pure perennlal
ryegrass. The authors suggested Èhat this was probably due to the
differentÍal rate of physiological development of the rnany species Èhat
comprised the pasture,
Sum¡er oeríod: Dur ing the sunmer period, Fels et aL. (1959) reporËed a
val-ue of 57 per cent O.M.D. for grass and 43 per cent for subterranean
clover. In a subsequent experiment, Fels (unpublÍshed data as quoted by
Rossiter 1966) obÈafned values of 48, 47 and 52 per cent for grass, capeweed
!
)Ìfit
T
,I[l.É
'!
,¡
20
and subterranean clover resPectively. Values of 55 to 60 per cent for
both cape!úeed and burr-free subterrAnean clover, collected at the
beglnnLng of sumner at Perth, were found by Roseiter (1966). In
South Australla, 45 pet cent D.M.D. was the most comnon value for mature
srrmer pasture residue reported by Hutchinson and Porter (1958). More
recently, ALlden (1969) and Pullman and Allden (L97I) reported D.M.D.
values of 45 to 49 per cent and 53 Per cent respectlvel-y for dry sunmer
herbage 1n South Australla.
A drop in digestlbflity oi ary herbage followíng sunner rain has
been reported by several $rorkers ln Callfornia (Gullbert and Mead 1931 t
Hart et aL. Lg32) but surprislngly l1ttle ínformation is available on Èhe
extent ralnfall pe" se affects the digestÍbil1ty of dry herbage in the
Medfterranean-tyPe envlronment of southern Australla.
2,2.2 Dry mattêr content
Herbage intake by the grazLng anlmal can be sÍgnificantly affected
by the dry matter content of the herbage (Arnold L962, Davies L962b),
The latter author recorded a constant lntake of t¡¡et matterr by sheep
when the dry natter content was below 16 per cent. McIvor and Smith
(1973c) recorded values of 10 to 20 Per cent dry matter for a number of
annual plant soec{es prior to flowerfrrgi One noticeable exception was
mostly]caperùeed whfchnva-ied fn dry matter content from 6 to 7 per cent. Davfes
(lg62b)suggests thaÈ the nutrltive value of capeweed nay be inpal-red
during the growing season because of iÈs 1ow dry matter content. However
the dry mâËter content of most herbage plants l-ncreases as the herbage
matures (Parrott and Donald 1970) and at m¡turitY the nuÈríÈive value of
capeweed ís comparable to oËher pasture species (McIvor and Srnith L973c).I
+Dry matter determínations were made on the leaves and not Èhet whole planË.
2r.
2.2.3 Dry matter loss
Following maturiÈy, large logses of dry matter can occur over the
summer period (Ratcllff and Heady L962, Rossiter 1966, Cameron 1966,
Broum 1977). Large differences between species l-n the rate of
disintegration of annual pasture, excLuded f.tom gtazing, have been
recorded in the Californian sull¡ner (Ratcliff and Heady 1962). This
applies to both grasses and legumes; for example, ripgut brome and burr
medic lost c. 80 per cent and 70. per cent of thelr maxímum annual yield
respectively. Under gtazlng, the loss of dry natter over the sutmer
period Ín 1{estern Australla has been estímated by Rossiter (1966) to be
c. 50 per cent of total annual productlon of which al-most half the loss
was due to tramplíng and suumer ralns. Brown (1977) measured the rate of
dfsappearance of the dry resldues of nLne pasture specles over a 139 day
perlod during s1¡mer at Kybybolite, South AustralLa. Clovers and capeweed
disappeared at about two to three times Èhe rate of perennial grasses.
High rates of disappearance were associated r¡ith initially l-ow flbre and
high nltrogen, sulphur, calclum and sodium concentrations.
2.2.4 ChenLcal composftfon
chemical analyses of annual grasses in cal-lfornía showed a
declfne Ln nitrogen concentratfon from 3.5 per cent' in the early
vegeËatlve growth stage, to 0.8 per cent at maturfty. The correspondlng
values for burr medic ltere aPProxfmately 4.5 and 2.4 per cent nitrogen
(Rossiter 1966). Values for subterranean clover have been found to
approximate those of burr medic (Beck 1952, Rosslter 1958).
More recently, Mclvor and Smith (I973c) ranked the nitrogen
concentration of subterranean clover > caperreed > annual ryegrass, based
on several analyses of the leaves of the species sanpled in the field.
22
In each case, the nl-trogen concentratfon decllned sl1ght1-y during the
season. Only slight dffferences 1n nltrogen concentration were found
for plant fractions of annual ryegrass and capeweed at fl-owerlng but
the developlng subterranean clover burrs were hÍgher 1n nitrogen
(3.8 per cent) than the leaves (2,6 per cent).
Rossiter (1966) reported a decllne in the nltrogen concentratlon
of dry herbage and large differences between sites during the sunmer
period. However, Brown (L977) fotrnd nltrogen concentration lncreased
wl-th tfne ln a number of pasture specfes over sutmer and Barrett et aL.
(1973) reported no change ln thelr experLment.
2.2.5 Herbage preference and intake
LitËle work has been reported on specfes preference by sheep or
cattle grazing annual pastures and no clear rankíng of specLes on the
basís of preference 1s possible. Davis (1964) recorded no dfstíncÈ
preference by sheep for elther annual ryegrass or subterranean clover
during the growing season at l,lerrlbee, Vfctoria, but in early sumer
there was a clear prefàrence for grass and 1n late surmer the sheep
preferred the dry clover toPs. At the sâr¡e Locatfon Hodge and Doyle
(1967) laÈer reported no dístfnct preference for annual grass or
subterranean clover by grazíng sheep. Rossíter (1966) quotes a number
of studies 1n California where forage preferences have been demonstrated
for annual-type pastures. I,IeÍr et aL. (1959) concluded'that grasses
(naínly soft brome) and to a lesser extent Erodiwn sPp. were selected
during the winter but, at maturity, medic was preferred. Van Dyne and
Heady (1965) reported preference by sheep for Epodittn seed heads over
the sunrmer period.
Hol¡ever in relation to anínal production, the preference ranking
23
of specles under ad Líb avaLlabilLty of Pasture may not necessariLy
equate wlth a ranklng based on intake when pasture availabilíty límits
Íntake (Arnold Lg64). AccordLngl-y, the effect of forage preference by
the grazlng animal on the botanícal composítlon of Pasture requires
much more elucidatfon.
2.2.6 Anioal performance
Ttre linitatlons of annual, Erass-legume Pasture as a producÈive
feed for young sheep l-n the Mediterranean-tyPe environment have been
docunented by Donald and Allden (1959). Although adequate liveweight
gains can be made during the perLod of acËive pasture growth (autumn to
earLy sumer) the live r"eight usuaLly reaches its zenlth in early surmer
than declines over the suuner-autumn perl-od when the Pasture 1s mature
and dry.
The decline in líve weíght nay contl-nue until well after the autumfi
break of the following year (Caneron and Cannon 1970, Carter and Day
1970, Davls and Sharkey L972, Brown 1976b) '
Thegeneralpatternofwoolgrolrthofsheepgtazíngannual
pastures ís sl-n1lar to the patÈern of llveweight change excePt for an
earlíer and more narked decllne in ¡,¡oo1 production at the end of the
growlng season. This decline in rate of wool- growth is nearly always
assoclated wlth the senescence and dryl.ng of the pasture and the 1íve
weight may not decline for some months later (Hutchlnson and Porter 1958'
Roe et aL. Lgsg, Arnold and McManus 1960' Stewart et aL. 1961)' The
domínant influence of nutrition in determining thls seasonal patÈern of
wool growth is emphasízed by the fact that pot,enËíal wool production Ís
highest in sunmrer when the days are longer and Èhe temperature hígher
(Morris 1961, Hutchlnson and l,Iodzicka-Tamaszewska 1961) .
24.
stocking rate can affect the pattern of livewelght change and
wool productlon partícularly during perlods of low Pasture avaílabilíty'
such as occurs durlng the autumn and wLnter in Medíterranean-tyPe
environments.
Brown (1976b) demonstrated a b1-nodal change in the regresslon
coefficlent (rate of change in live weight or wool growth on stocking rate)
in each of flve years ln whfch an annual Pasture was set stocked at
Kybyboltte, South AusÈral1a.
2.3 EffecÈ of botanical- comooeitlon anfmal- Derformance
2.3.I Ttre impor tance of the legume
The greater nutrftive value of legume Pastures compared to grass
pastures has now been well established over a range of environmenÈs and
under differíng experímenÈal techniques. Examples are as follows: in
set-stocked experiments (Gallagher et aL. L966, Spedding et aL' 1966);
experlnents when herbage was non-linitLng (Mclean et aL. 1962, Rae et aL'
1963 and 1964, Híght and Sínclair 1965); in put-and-take experíments'
(Heinernann and Van Keuren 1958) and in ad Lib. pen-feeding experiments
(SinclaÍr et aL. 1956, Joyce and Newth L967). For further references
the reader ls referred to a recent revlew on the subject by Reed (1972b).
In the Mediterranean-type environment of southern Australíat
Davies and Greenwood ( Ig72) demonstrated an effect of botanícal composition
on the relationship beÈween líveweight gain and dry mâtÈer on offer
durfng the pasture growing season. They showed that, despite Èhe lower
avaílabílity of grass-doninanÈ pasture required for naíntenance' there
was greater liveweighÈ gain and wool production fron sheep gtazíng clover-
dominant pastures due to the higher nutrltive value of the legume component'
Reed ( Lg74) at Glenor"míston, Victoria, also reported thaÈ most differences
25.
recorded Ín fleece weight of wethers grazfng dlfferent pasture tyPes
in a gtazÍng experfment were related to the ProPortlon of subterranean
clover in the pastures.
2.3.2 Differences between qrasses
Neal Smlth (1942) found no signiflcant difference ln live weight
between eI¡Ies grazing annual- ryegrass-subterranean clover pasÈure and
those gxazíng phalaris-subterranean clover pasture over a five-year
períod at Kybybollte, South Australfa l
Reed (197[i]3gt"normiston, Vfctorta, reported smal1, but not
statistícally signlficant, dffferences ln the growth rate of l-ambs
gtazj:ng pastures containing a range of perennlal grasses and mixture
combinatlons, all soqm wlth a mlxture of clovers. The author states
that, rrat Glenormíst.on, anímal- production could not be ímproved by the
lncluslon of a perennial grass fn the pasture!'.
In other envfronments, few experiments have demonstrated large
differences in animal productlon between grass specles. For example,
Hamllton et aL. (1970) found lower llveweight gains by lambs grazing a
pure sward of cocksfoot compared to either phal-aris, Tal1 fescue and
perennial ryegrass. But the dlfference was smalL compared to the large
seasonal differences in growth of lambs grazíng each species. In
New Zealand some experiments have shor¡n higher liveweight gain of sheep
on short rotatlon ryegrass compared to perennlal ryegrass (Rae et aL.
1963, Barton and Ulyatt 1963, Johns 1966). However, i'n two experiments
comparing the same ttrro grass specíes, no dffference in anímal productlon
was recorded (Ewer and Sinclatt 1952, Barclay 1963).
No difference ín fleece weLght rùas recorded by Hutchíngs et aL.
(1963) at Canberra for sheep grazíng phalarís and Ta1l fescue, although
)
26
the fleece wei,ghts were hfgher than those fron sheep graz|ng Bromus
ieoLoratus and Bz,omts inerrrùs. Howeverr' Axelsen and Morley (1968)
' "
also at Canberra, recorded hlgher live weights and fleece weights from
ehres grazing phalarÍs-legume pasture compared to six other perennlal
(and one annual) grass-legume pastures. The results, however' demonstrated
' llttle or no advantage within, or to, the perennÍals apart fron phal-aris.
2.4 Interactlon of stocklns rate and botanlcal composition in
the determinatLon of aninal productÍon
MaJor between'year changes 1n botanfcal composftion, assocíated
wlth increased stockÍng rates, were recorded by Cameron and Cannon (1970)
but there lras no consfsÈent change fn the relatlonshlp between wool
production and stockíng rate. Bror¡n (L976a) reported a depression ín
pasture productlon at hígh stocking rates which was associated with the
doninance ín the pasÈure oÍ Juncus bufoniue and wÍnter grass. The auÈhor
states that I'a hlgh proportion of these two specíes in Pastures may be
a useful indl.cator that the gtazlrng pressure is too high, wíth an
assoclated loss of productiontr.
However, there appears to be no experíment rePorted where the
effect of stocking rate on pasture production has been Ísolated fron
the effect of concomitant changes in botanical composition ln annual
pastures. In a number of experlments, hfgher stocking rates have
resulted in hJ.gher anJmal productíon per head but, 1n most cases, the
change in botanícal composltlon, rather than an effect of stockÍng rate on
increased quantity or qual-ity of available feed, has been reputed to be
the fundamental cause. For example, þIa¡¡ et aL. (L966) reported that
sheep, grazed at the hfghest stocking rate 1n the second and third years
of an experlnent, maíntalned higher liveweíght over the surmer whích the
27.
authors attrfbuted to the greater subterranean clover component in
the pasture at the higher stockfng rate. Carnpbell et aL. (f973)
reported hfgher live weighÈg of sheep grazlng aÈ the highest of three
stocking rates whích they attrÍbuted to less aggravat of the sheep
fn the presence of fewer barl-ey grass plants and lnflorescences et thls
stocking rate.
The dlscussion of stockl-ng rate effects, lndependent of changes
Ln boËanÍcal compositlon, l-s probably of academic i-mportance only unless
a stable pasture composition can be malntaíned over a number of years
lrrespectlve of stockLng rate. This has been shown to be highly unlíke1-y,
even with perennlal speciee, 1n the Medlterranean-type regions of
southern Australía, and the interactlon of stockÍng rate and botanÍcal
composftlon fn deÈermíning the level of animal production is the prlme
consideratíon.

BACKGROUI{D, AIlvl, ENVIRONlulE]\lT AND SITE
OF EXPERI iVIENT
28.
3 BACKGROUND TO EXPERIMENTAL PROGRA},I
The few relevanÈ experlments rePorted prior to 1970 showed the
extreme lack of evidence for the popular bel-Íef that the introductíon
of perennial grass specíes Ínto a,nnual pastures in the l"lediterranean-
type regions of southern Australia, either stabílized pasture composition
for an extended period, or resulted in lncreased anÍmal production However
the realfzatj:oî that. volunteer annual specLes, in conjunctlon with an
adequate legurne componentr ßâY be useful pasture plants htasl not uncorrnonl
Irl
I dur ing the 1950's (RossiÈer 1952). I
In additíon, little evidence was avaílable on the effect of
stocking rate on the rate of fnvaslon of annual volunteer species into
sovJn perenníaL based Pastures or the concomitant declÍne in perennlal
grass componenÈ. The fol-lowing experimental work reporÈed in thís thesis
has attempted to provide evÍdence on some of these fundamental questions
which are of fumediate practical importance to the grazíng índustries'
A further impetus to the experimental program hlas the need to
solve another imporÈant problem which Idas partlcularly relevant to
Kangaroo Is1-and, South Australla. In the period' 1945 to 1970'
100rOO0 hectares of vLrgln scrub r¡ere cleared for development on
Kangaroo Island. The solls are m¡rlnly lateritic podzols comprisíng
sandy loams overlyíng lmpermeable clay at a depth of from 20 to 60 cm
(Northcote and Tucker 1948). The reglon Ís typlcal of the nore humid
Mediterranean-type envíronments of souÈhern Australía wíth precipitatíon
exceeding evaporatíon during May to August and, due to poor draÍnaget
the soil is generally waterlogged durÍng most of this perlod. Early
experíments carried out on the Kangaroo Island Research Centre, Parndana'
demonstrated the outstanding herbage productLon of Yarloop subterranean
clover during the winter (Day 1963) and the use of thls cultívar ín seed
29.
mixtures $ras lüldesPread fron 1957 to 1963. However, thLs has resul-ted
in nany newly-sown pâstures belng dominated by Yarloop subterranean
clover, and by 1963, the occurrence of a general problem of clover-
lnduced lnfertil-lty tn ewes (BenD.etts et aL. 1946) rtas recognfzed on
Kangaroo Island, with Yarloop subterranean clover bel-ng lmpl-lcated as
the main causal species. The fntroductlon of a successful perennial-
grass int,o these pastures could dllute the fntake of oestrogenLeally-
potent legrrme by the grazLng anioal and perhaps stabllfze pasture
compositíon.
30
4 ATM OF EXPERIMENT
Thehypothesístestedinthisexperimentisspecificallythat
the renovation of existing volunteer annual grass - Yarloop subterranean
clover pasture by the tillage, seedbed preparation and sowing of a
mixture of the best available grass species and low oestrogenic subterranean
clovers results ín increased live læíght and wool production f rom gtazíng "
wethers. No attempt has been made to dlvorce the response due to
tillage and/or seedbed preparation from that due to pasture species
pey se in the comparison of renovated and unrenovated treatments '
In essence, the aim of the experíment was to compare the
productivity of tl^ro systems; one being an unrenovated establíshed pasture
cornprising subterranean clover - volunteer annual grass(typifying Èhe
majorj-ty of existing pasÈures on Kangaroo Island and in many other areas
of southern Australia) and the other, a renovated pasture involving
tillage, clover seed and grass seed inputs - a neht sysEem as defined
by the outcome of an established and reconmended renovaÈíon pracÈice'
The experímental comparisons \¡rere specifically designed so that the
results r¿ou1d be relevant to an established agricultural system; the
importance of whích had been stressed by Morley and Spedditg (1968) '
31.
5. ENVIRONMENT
The experíment was located at the Kangaroo Islan<l Research Centre
(lat. 35o 48's., long. l37o2otq., alt. 153 m')"
Clíuratic rlata for the Rese-arch centre are presented i.n Table 2 and
appendlx Tabl-es 1-5.
The vegetation of the experimental site was originally a dry
sclerophyll scrub dominated by an E. bantenú - E. cosnophyLT'a association'
The maln tall shrubs included casunrina sty,ieta (bulloak), Banksía
matgírw,ta (honeysuckle) , Banksia o?nata (broad leaved honeysuckle),
Hakea z,osttata and XAnthot't'hoea tateana (the endemíc yacca) ' Undershrubs
included Dayiesia genistifoLia' D. breuífolia, Adenanthos terTninaLis'
Lhotzkya gLabez,z,ima, PhyLlota pLeurandnoi.des, Pt'tltenaea uiscid;uLa,
Logcmia oüats, spgr,ídtwn thynifoTium" PetrophíLa muLl;ieeeta, Isopogon
eeratophyLLus, Ietratlteea haLmatu?Lna, T" ericífoLia artd Hibbev'tia stz'icta
(Northcote and Tucker 1948).
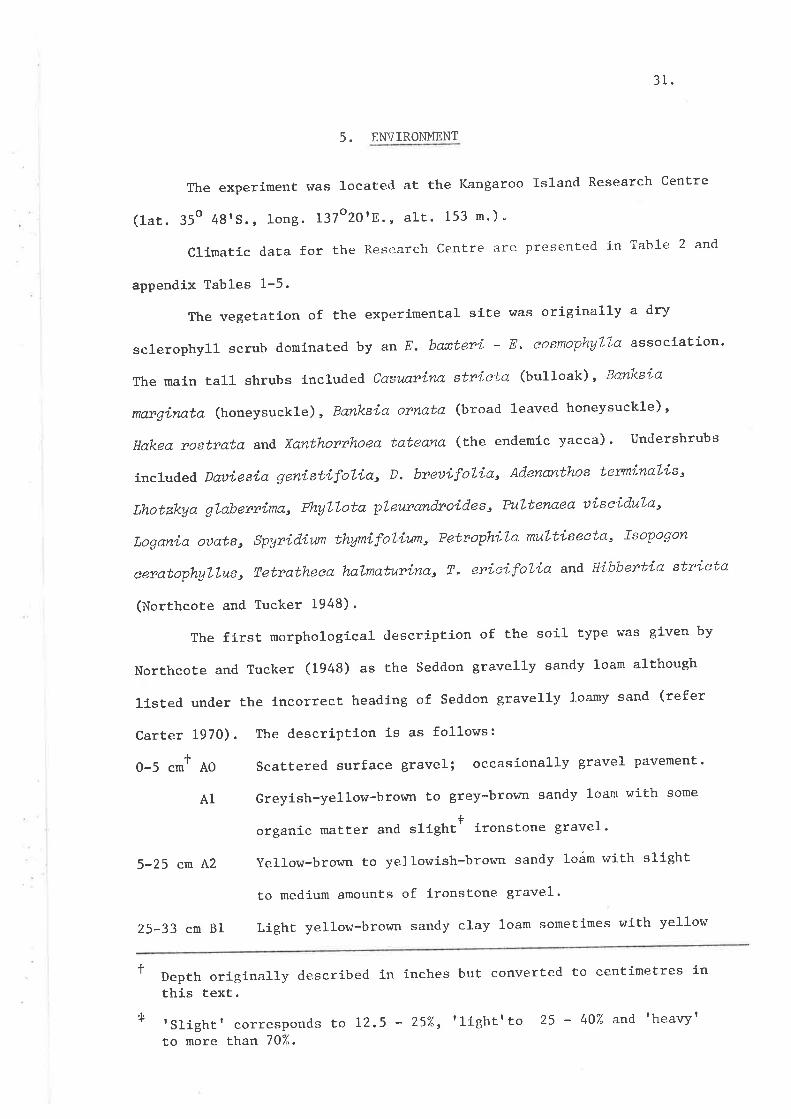
Thefirstmorphologicaldescript'ionofthesoiltypewasgivenby
NorÈhcote and Tucker (1948) as the Seddon gravelly sandy loam although
listed under the íncorrect headlng of Seddon gravelly loamy sand (refer
Carter 1970) . The description i.s as follows:
0-5 cmf Ao ScaÈtered surface gravel; occasional-ly gravel pavement'
AlGreyísh-yellow.browntogrey-brownsandyloamwithsome
organíc matter and s1íght* íronstone gravel'
5-25 em A2 Yel1ow-bror.rn to yellowish-brov¡n sandy loárn with slíght
Èo medíum amounts of ironstone gravel'
25-33 crn Bl Light yellow-brown sandy clay loam sometimes with yellow
f l"pth originally descríbed in inches but converted to centirnetres inEhis text.
+ 'Slight'corresponds Èo I2.5 - 25%r'líghttto 25 - 40% and'heavy'to more- Etran 707".
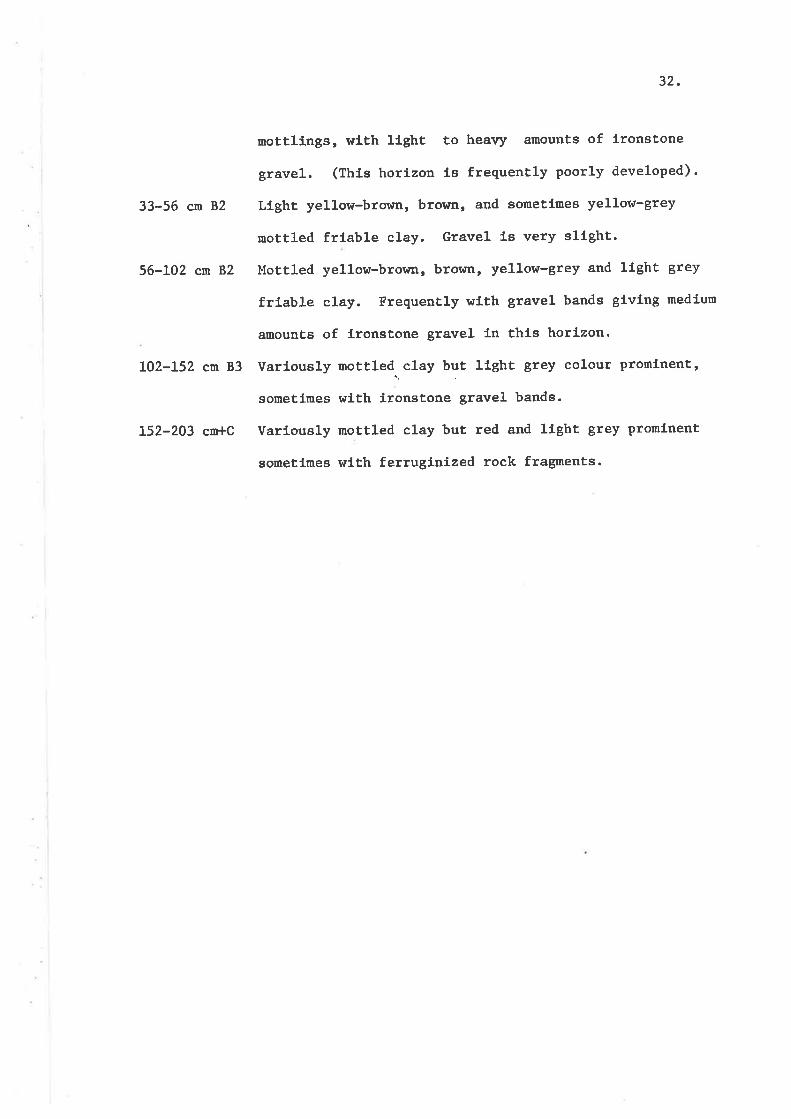
33-56 cn 82
56-L02 cn 82
LO2-L52 cm 83
152-203 cm+C
32.
nottlings, with llght to healry amounts of ironstone
gravel. (Thfs horizon ls freguently poorly developed).
Llght yelLow-brorrn, brom, and sometÍmes yellow-grey
mottled frtable clay. Gravel Ls very sltght.
Mottled yellow-brown, bror^m, yellow-grey and light grey
frLable c1ay. Frequently with gravel bands givlng medium
amounts of fronstone gravel Ln thls horlzon.
Variously nottled. clay but ltght grey colour prominent,
sometlmes wiÈh ironstone gravel bands.
VarLously mottled clay but red and lfght grey Promlnent
sometlmes with ferrugfnized rock fragments.
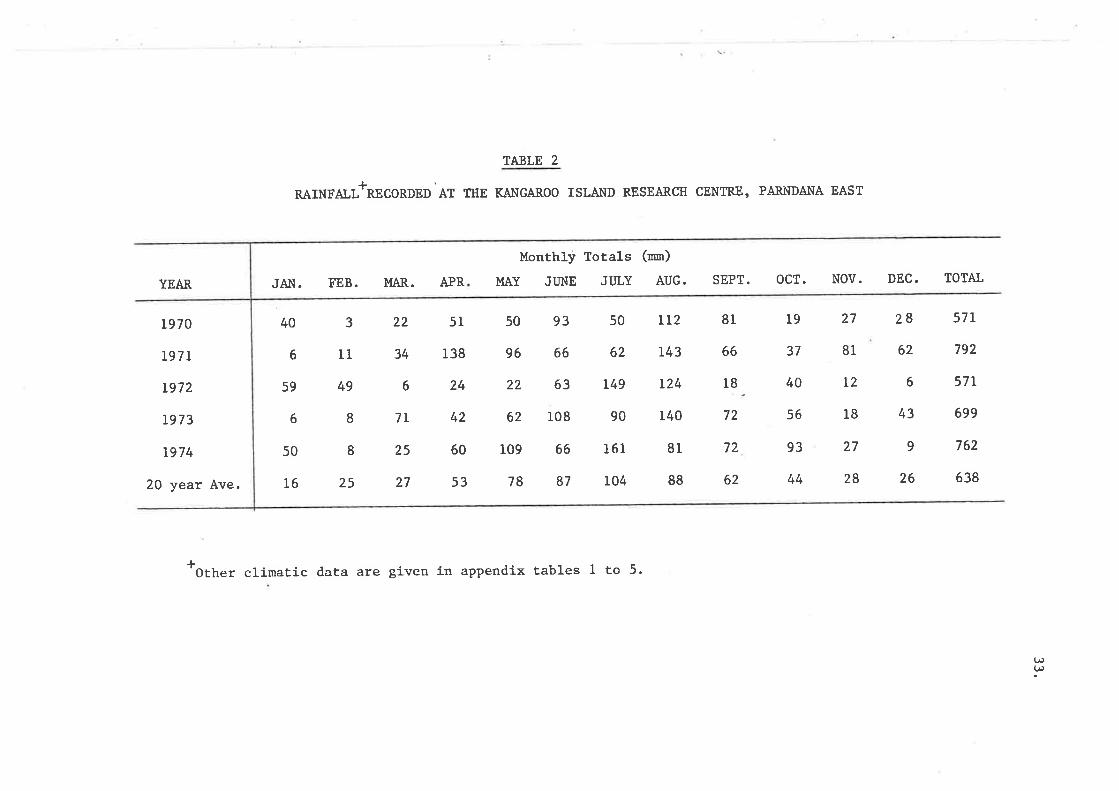
TA3LE 2
l-RAINFALL-RECORDED AT TITE KA}IGAROO ISLAI{D F.ESEARCH CENTRX, PARNDANA EAST
JAN. FEB. MAR. APR
Monthly Totals (mr)
MAY JT]NE JIILY AUG. SEPT. OCT. NOV. DEC. TOTA].YEAR
L970
I97L
L972
L973
r974
20 year Ave.
40
6
59
6
50
16
3
11
49
I
8
25
22
34
6
7I
25
27
5l
138
24
42
60
53
50
96
22
62
109
78
93
66
63
108
66
87
50
62
L49
90
161
104
LT2
143
L24
140
81
88
81
66
18
72
72
62
19
37
40
56
93
44
27
81
I2
18
27
28
28
62
6
43
9
26
57L
792
57r
699
762
638
*Oah". climaËic data are given in appendix tables I to 5.
(,(,
34
6 SITE OF EXPERIMENT
The experimental site was cleared of native vegetation ín 1950
by the South Australian Lands Development Executive and until 1962 }r.ad
been used for experlmenÈs'evaluating response to various rates and
frequency of superphosphate and copper fertllízer applications. From
1963 to 1969 inclusive, the entlre site ¡.tas managed as a single paddock
and received uniform applicatlons of tertíllzer. Experiments carried
out on the Research CenÈre on the same soil type lndicated that the
possíble optfmum maíntenance suPerphosphate requirement for Pasture
gror,rth was between 250 and 375 tg tra-l y.tt-l (Carter 1970). The
maximum and mlnimum mean rates of fertiLízer applled to any Portion of
the sfte prior to 1970 were 243 and 154 kg ha-l y""t-l respectlvely of
superphosphate and 0.9 and 0.3 kg h"-1 y."r-l t."p""tlvely of copper
as copper sulphate. Hence the mean annual application of superphosphate
was below the estimated optimum annual maintenance requirements for
pasture produetion. Although Èhe phosphate sorption capaclty ls reduced
by application of phosphatic fertilizers (Kanwar L956, Kurtz and
euirk 1965) thÍs reductíon ís Lnsigníficant compared to the extrernely
large phosphate retention capaciÈy of thls soíl- i.e. 15,400 p.p.m. for
vírgin 0-10 cn soil an<l 11,250 p.p.trr. for partially-developed 0-10 cm
soil (Kaw¡ar 1956). However, to minlmize possible varíatío¡r in pasture
producÈion due to previous variation Ín fertlLlzer applicatíon on the
trial site, a blanket dressing of 348 kg tra-l of superpÉosphate and
-tlõ.% kg ha-r of copper was applied ln L97O, during the establishment of
the experiment.
A pasture mixture of 4.5 kg ha-l of Bacchus Marsh subÈerranean
clover and a trace of Colac perennial ryegrass and GB 81 phalarís had
been sown on the nerrly-cleared land ín 1951 but these species were
35.
scarce on the sl-te in 1970. In 1960 Ëhe sLte was worked up in the spring'
stumps rlpped and the soil levelled and in 1961 a ¡nixture comprÍsing
perennial ryegrass and Yarloop and MÈ. Barker subterranean clovers soIfll.
By 1969 the pasture !üas domLnated by Yarloop subterranean clover and
barley ass.cultivars or
spec present were Mt. Barker, Drlalganup (although
never sowed on the sfte) and Bacchus Marsh subterranean clovers, sllver
grass, soft brorre, ripgut, broner"geranlum and capeweed.

EXPERIt'lENTAL tvlETl-lODS
¿l
36.
7. EXPERIMENTAL METHODS
7.1 Site preparation
An area of 11.6 hectares of land was prepared ln 1970, wiÈh the
excepËion of certain areas allocated Ëo an unrenovated pasture treatment
(see 7.2.I)r as followsl
Dried pasture residue remainÍng from the 1969 growing season !üas
burnt in March, ploughed 1n early Aprtl, cultivated and harrowed in mid-
April and finally rolled with a äultlpacker in late Apríl.
7.2 Treatments
7.2.I Pasture treatments
Five pasture treatments were lncorporated in the desígn as follows:
TreatnenÈ A: The unrenovated, volunteer annual grass - subterranean
clover pasture thaÈ was present on the experimental site as described in
6. The paddocks comprísing thls treatment $rere untouched ín any way
during the renovation of the remaining four treaÈments and for the
duratlon of the experimenË (except for the topdresssíng of fertilizer).
TreatmenÈs B, C, D and E: Tíllage, seed bed preparation and sowing of
respective treatment grasses together r¿ith Mt. Barker and Woogenellup
subterranean clovers. Treatment grasses ülere as follows:
B: I^Iiurnera annual ryegrass
C: Victorian perennial ryegrass
D: Medea perennial ryegrass
E: Siro 1146 hybrid phalaris
The pasture treatments ¡ti1l hereafter be referred to as A, B, C, D and
E respectively.
hlimmera and Victorian ryegrasses have been and are the rnost
conunonly sor,rn annual and perennial grasses respectively on Kangaroo Island
(the latter r¡Ias frequently recontmended e.g. Carter 1958, Taylor f 961).
r{[TrÌ'i
.ti
i
37.
CutËing experíments carri-ed out on the Kangaroo Island Research Centre
had shown Victorían ryegrass to be the mosË productive perennial
pasture species in this envlronment (Crawford 1956). Tall fescues and
cocksfoots had generally produced only small quantities of dry matter
compared Èo the ryegrasses (Crawford 1956) and great difflculty had been
encountered in adequat.ely establishing varieties of phalaris on the
ironstone soils.
Medea ryegrass !üas a recently released culÈivar developed at the
I,Iaite Institute (Silsbury 1961) by selection of plants collected near
Medea in Algerla (Neal smith 1955). This cultLvar t.tas reputed to be
characterized by a high degree of summer dormancy and persistence
(Barnard 1972> and would have potentlal for widespread use on Kangaroo Island
if its reputation for persistence could be subsÈantiated under grazíng
on thls soil type. Trials in VÍctorla had also shown Medea to produce
more dry matter in late autumn, winter and early spring than Vlctorian
ryegrass but that it was less productive during the rest of the season
(Cade 1969).
Siro 1146 hybrÍd phalarls was developed by the CSIRO by the
hybridizat,ion of PVnLalts tuberosa and the hexaploid race of PhaLa.rís
arundinaeea. Details concernLng the hybridization have been reported
in several publications (Mctlilliam L962, Mcl,Iilllam and Neal Smith 1962,
Anon 1962). The more recent resul-ts concernÍng the characteristics and
performance of this hybrid have been described (Mcllilliam et aL. 1965,
Myers and Squires 1968 ). Prl-or to 1970 thís pasture species had
received little testíng under grazing but ín Èhe few tríals Èhat were
then in progress the hybrid had shorsn an ability Èo establish readily,
to combine well r^rith a variety of legumes and to persÍst under heavy
stocking and through extended dry periods. Although it generally appeared
that maximum benefit from the use of the hybrid would be obtaÍned from
'j
ilìE'\
tI
Ì
38.
regions where s1¡nmer raÍnfall lncidence was hlgh or where irrígatíon
was available, reports of suPeríc¡r ease of establÍshment and persistence
under hraterlogged condÍtions lndfcated that Ëhis specles may have been
useful in the Kangaroo Island environgrent.
+7.2,2 Stockins raÈes
Informatlon deríved from prevlous experiments carried out on the
Kangaroo Island Research Centre (Day 1964' CarËer 1965' Carter and DaY 1970)
indicated thaÈ large-framed, sÈrong-lsool type, South Australían Merino
wethers could be contínuously Brazed wlthout supplementary feeding at
a stocking rate of 13 sheep ha-l without undue stress on the sheep'
This was based on the Pasture containlng a urajor componenÈ of subterranean
clover and supplied with an annual malntenance dressing of superphosphate
at c. 190 kg ha-1
Slx stocking rates chosen for the experinent descríbed in this
thesis were 10, 11, 13, L4,15 and 17 sheep h"-1, gÍving a range'
incorporating an average and maximum, slíghtly higher than the respectíve
13 and 16.5 ha-l used in the grazlng experlment of Carter and Day (1970).
7.2.3 LavouÈ and allocation of treatments
Pasture treatments and stocklng rates were allocated aË random
to the experimental site whÍch courprísed fLfteen elongate paddocks on
each side of a single raceway. The length of each paddôck hTas constant
and the wídth varied to give the required areas for the allocated
stocking rates. Seed bed preparatlon and sowing of pastures I¡Ias completed
prior to the erecÈfon of fences and watering faeílitíes. Once set
stocked, eaeh paddock r¿as continuousLy grazed by five sheep thus
utilizing 150 experímenÈal aninals. There was no replication of treatments:
+In gxazir^g Ëria1s, a number of stockíng raÈes are necessary to
detect treatment dífferences (Conniffe et aL.1970).
.Iil,!
tI
I
!
Plan of experimental paddocks
Pasture treatments and stocking rates were allocated at random Èo the experímental site.The length of each paddock was constant and the width varied to give the required areas
for the allocated stocking rates. Each pasture t.reatment was unreplicated at compaïative
stocking rates.
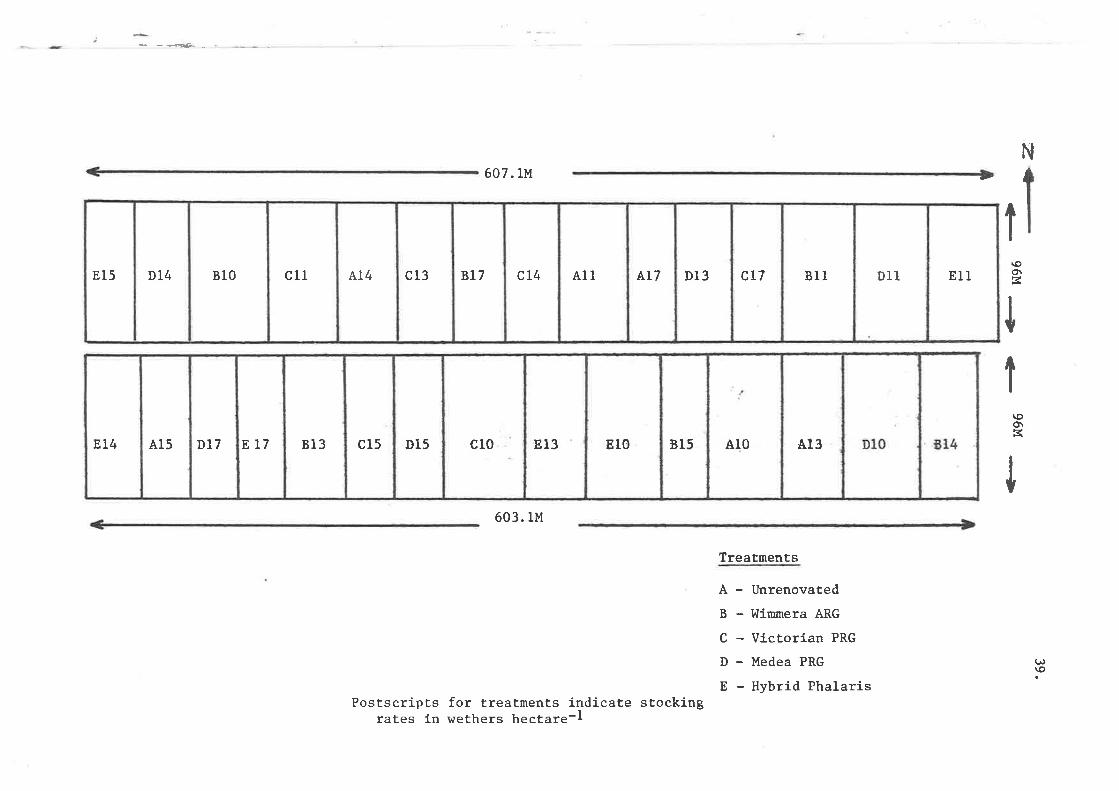
---æ--
607.lMN
Et5 D14 Bt0 cll A14 c13 BL7 cr4 All^r7
Dl3 cL7 811 D11 811
603.lM
I\oc'r
I
I\oo\ß
I
Treatments
A-B-C.D-E-
Unrenovated
I'linmera ARG
Victorian PRG
Medea PRG
Hybrid Phalaris
(,\o
Postscripts for treaÈments indicate stockingrates ín r¿ethers hectare-l
EL4 Al5 Dl7 817 813 c15 DI5 c10 E13 Et0 815 A10 Al3
40
I
í.e. Ëhe 30 paddocks comprised Pastures (5) x Stocking Rates (6) = 30.
7.3 Pasture establishment
Pastures Ìdere sov¡n.on May 11, 12 and 13, L970, as grass-subterranean
clover mlxtures through the seeds box Of a 12 row, E series, Shearer
comblne. All- seed, excePt l,JLnUera ryegrassr lfas certified with a potential
germinatl-on of g)?"t .
The experimental site had. not prerrfously been sor¡n to l^Ioogenellup
subterranean clover: Ëherefore, because of Lts specific rhizobial
requirements, all tloogenellup seed waa fnoculated with comnercial
inoculant príor to sowing. Sowing rAteg used were approxfmately those
currenËly recornnended by the South Australlan Department of Agriculture
and adJusted to a 9O% germination. Actual rates ldere:
Inli-mera ryegrass (Treat. B) f9.4 kg ha-l'
- Victorian ryegrass (lreat- C) 10 kg ha-l'
- Medea ryegrass (Îreat. D) 9.7 kg h.-1.
- Slro 1146 hybríd phalaris (Treat. E) 4.3 kg ha-l'
I,Ioogenellup and 1"1t. Barker subterranean clovers were sown ín the ratio 3:2
at a combined sowing rate of I0.4 kg ht-I.
7.4 FertilLzer application
All paddocks recelved 348 tg ha-l of normal single superphosphate
(g.67" P, 22lZ P205) during pasture establfshment, in t'tay igZO, and applied
as follows:
In treatments B, C, D and E 140 tg ha-l was drilled in with the
seed and in treaËment A 140 kg h"-1 tas topdressed onto the pasture' All
treatments were topdressed again r¿|th 208 kg ha-l of superphosphate
t Tested by the South Australian Department of Agriculture and Fisheries I
seed testíng Laboratory.
4r.
fncluding), o.g4ltg ta-l of copper ana i:oi g ha-l of molybdenum.
7.5 Selection and allocatLon of lmental animals
In Ocrober 1970, a ll.ne of 1000 wether hoggets (South Australian
srrong wool Merinos - Coll-inçville bt ood) f ron Pttlochry I aqtlilel
I Cantarari South Australlar ttere visually examined for any obvious foot,
nouth, plzzLe or wool defects and 370 culled frorn the main flock. The
renainÍng 630 sheep hrere conseCutively numbered and shorn. Total
greasy fleece weight (wetghed to 0.05 kg)r lncluding locks, skírtlngs
and pleces but excluding bet,ly woOl and dagsrwas recorded for each sheep.
The rsethers were then weLghed (to the nearest 0.5 kg) off-shears and
250 which confor:med to the criterla, 40.9 kg < livewelght < 52.2 kg
and 5.3 kg < greasy fleece welght < 6.8 kg, were purchased'
Followl-ng transport Èo the Kangaroo Island Research Centre the
weÈhers were given a cobalt bullet, drenched, Èagge.d with large,
easily-read cattle tags and gtazed as a slngle flock until placed on
their allocated paddocks ón December 22, 1970. The allocation of sheep
to paddocks was performed by graphically plottfng the fleece weight
againstlivewelght for each sheep (as detemined 1n Oetober, 1970) and
stratífyfng the 250 v¡ethers lnto groups. Allocatlon to both pasture
Èreatments and stocking rates rsas made from these groupings at random.
Each of the.30 paddocks comprÍsing the experfment was allocated fíve
sheep with similar mean live weight and mean greasy fl-eece weight at Èhe
start of the experirnent. The 100 ürethers remainlng were run as one
flock of spares ln laneways and spare paddocks around the experimental'
site. The wethers lrere two years o1d at the tíme of placement ín their
paddocks and thereafter they grazed thefr allotted paddocks continuously
unÈil the end of the experiment Ín January L975.
42.
7.6 Gr manaqenent of pastures in 1970
Managenent of the Pastures fn the first year prior to set stocking
with the experlmental anlmals was designed to fulfll the followíng.
criteria.
a)Ensurethatapproxfmatelyequl.valentamountsofpasture$lere
avaLlable on all paddocks prlor to the allocation of experimental anlmals
to thelr paddoeks in December 1970'
b)EnsurethatthetreatFentgrassesweredomlnantín1971
(i.e. allow maximun seed set of treatment grasses in the spring of L970)
r¡lthout undue suppression of the subterranean clover comPonent'
c)GrazetreatmentApaddocksatleastoncefnkeepingwith
normal conrmercial practice.
Treatment A paddocks rùere uniformly grazed for síx weeks (June 18
to July 29) by a large flock of wethers dívíded lnto equivalent numbers
per unit area for each paddock. lreatment B paddocks were símilarly
grazed durlng the early spring (sePterrber 17 to October 7) as pasture
production lras far ín excess of the other renovated treatments and severe
suppresslon of the subterranean clover comPonent ltIas occurring' The
allowance of an adequate groldth perfod following ttle grazíng of treatment
B was consídered essentfal to allow adequate seed set of the tr'lirrmera
ryegrass. Treatments C, D and E remalned ungrazed until seE stocked wíth
the experímental animals ín December 1970'
7.7 Routine management
7.7.L Pastures
Fertíli zex aooLlcaÈion: From 1971 to 1974 inclusíve, all paddocks
were topdressed with 200 kg ha-l of single superphosphate príor to the
opening rains 1n each Year.

43.
-1Insect conttol: All paddocks were misted with 350 g ha (active
ingredient) of tlmidiner five weeks after the opening rains in each year
to control red-legged-earth mlte (HaLotydeus destz'uetor) ' In some years
a second mistJ-ng was performed to control later hatchings.
7.7.2 AnLnals
Flystrike: The r¡ethers lùere crutched once during the spring of
each year and strateglcally jett.ed (conmon treatment to all sheep) wíth
rDiazinonr in the experínental paddocks as required'
Worns: All experímental animals were drenched in the autumn of
each year with rThÍobendazoler to control round ttorms. Additional
drenchfng was carríed out as required'
Lic., Dipplng f^ras carried out off-shears for control of lice
(DønaLina ouis) and ked ØeLophagus ou'Lnusl prlor to selection of the
experÍmental animals and agaln in January 1973'
Pizzle rot: Durlng the experimental períod a number of animals
were lanced to release accumulated fluids'
Suoplemen tarv feedlng: I,lethers grazítg in treatments B, C and D
at the highest stocking rate (17 t.-1) were fed 0.5 kg of oats "h""p-l
d"y-l for one week only, coumencíng 2nd Ju1y 1972' to Prevent death from
undernutrition. No hand feeding or fodder conservation'was carríed out
at any other tÍme during the experimenÈ.
Replacement of animals: Experimental animals that died in their
paddocks were replaced within a few days (usually wíthin 24 hours) from
the reserve flock grazlng near the experimental site. The replacement
sheep Iûere matched as elosely as possible on the basís of live weight and
44
wool cuttíng ability as determfned in the original weighl-ng and shearíng
(October 1970).
Live weights of replacement sheep were not used in the group data
means for at least 12 weeks. Fleece weights and measurements of fleece
characËeristics of replacement anímals \'¡ere not used in the data analysis
in the year of replacement.
Causes of death of experimental wethers other than undernutritiont
included pIzzLe rot, obesíty and flystrike and are lísted ín appendix
TabIe 29.
7.8 Data col lectlon procedures
7.8.1 Pasture data 1970
Establíshed plants of the sowrr Pasture species and Yarloop subterranean
clover lüere counted in each of ten randomly-thrown, 0.04 'n2
qt'"tlttts on
June 17, Lg7O. Pasture productlon ín the sown Ëreatments I^Ias measured
over tqro perÍods i.e. May 11 to September 17 and SepÈember 17 to November
25 using the techniques described for topent cuts in 7 .8.2. In treatment
B both topen and closedr cuts were taken because of the presence of
grazíng sheep as described in 7.6.
Available pasture r¡¡as measured on all paddocks on November 11 to
coincíde wÍth the end of the growing season.
7.8.2 Pasture data 1971-L974
The ropen and cl0sed quadratr method of Mclntyre (L946) was used
to estimate dry matt,er availability, seasonal and total dry matter
production, and crude ut1lízation (amount of pasture dry matter eaten or
otherwise disappearing - refer Carter and Day L970) '
samples r¿ere cut from six areas Protected by tltleldmesht cages
*severrl fat sheep died but the cause was listed as unknor,m ínappendíx Table 29.
45.
(closed quadrats) c. 1.4 n square. [rithin each of these cages a 0'5 rn2
quadrat was cut at ground level wl-th a nobLl-e, motorized sheep-shearing
hand piece with twidet combs and cutÈers. A corresponding sample was
cut from without, but in close proxfunlty to, each cage. Thus the number'
size and shape of the rclosedr cuts fro¡n r¿ithin the cages were the
s¿rme as for the topent quadrats. Following cutting of the protected
quadrat site, the cage was placed at random on a new un-cut site in
the paddock. No pasture measuregtents were made during the characterlstic
4-5 ¡ronth perlod of surnmer drought and the protective cages were shifted
to a new site Just before the opening rains in each season. Three
sanplings were made durlng each growing season to apProximately coincide
with the end of the three calendar seasons' autumn' Idinter and sprlng'
The one exception being in 1971 when an extra sampling was made ín July'
On most occasions, índivÍdual green weights ürere recorded for each of the
six 'opent and six rcl0sedt sanples. These sanples were then bulked into
,open, and rclosedr lots and a rePresentative subsample was taken from
each Iot. The síze of the subsample was usually I07. of the total green
herbage within each lot but varled depending on size and growth stage
of the pasture plants. stríct mixing and subsampling procedures \^Iere
follor.red to ensure representative subsamples'
Each subsample was hand-separated, while fresh, into botanical
components which were then drled separaÈely to constant I'rteight ín a
forced aÍr-drought oven aÈ 85oC.
The comPonents were as follor¡s:
(1) Sown grass (2) Subterranean clover (3) Broad-leaved volunteers
and (4) Narrow-leaved volunteers.
plant densitv: Ten fÍxed sampling siËes marked with yellow-painted
jarrah pegs r4rere selected at random ín each paddock at the start of the
46.
experiment. In June of each year all perennialf pl"r,t" and subterranean
clover plants within a one r-2 qrradrat, placed at each site, were counted.
7.8.3 SubËerranean clover seed
Measurement of subterranean clover seed present in, or on, the soil
was nade on four occaslons durlng the experiment, i.e. August 1973 and
1974 arlð, January L974 anð, L975. The difference in quantity of seed
recorded betr¿een Ehe sprlng and.followLng sutrtrner sampling was used as a
crude esÈimation of seed produced during the season. No aÈtempt was made
to measure loss of seed due to trampling, eaÈíng, or any other cause'
during the intervening period. The sa.npllng during August also estimated
the hard seed reserves presenÈ at that tine.
At the August sampllngs 30 round cores of 10 cm dlameter and 5 cm
depth were taken at rando¡n wl-thin three transects across each paddock'
The 10 cores from each paddock transect r¿ere bulked to give three lots
per paddock which were then dried at 50oC, broken up and sieved through
a 0.5 nm sieve to reduce the sample bulk by separation of fine soil
particles. The sample was then thoroughly stirred ín tGenklener solution
(trichloroethane SG 1.314) to separate the coarse sand, gravel and stones
from the floating sample mass (Carter, Challís and Ridgway L977),
The sample ïras then air dried, threshed in a bel-t thrasher, hand-
sorted into l^rhite seed (Yarloop) and black seed (non-Yarloop) and each
lot weighed to 0.001 g.
At the January samplings, above and below-ground components l^Iere
sanpled separaÈely. The above-ground sanpling was perforrned by cuttingtsix 0.5 m¿ quadrats at ground level in each paddock fn a sÍmilar manner
to that described for pasture availability during the growing season.
The soil surface was then brushed with a ffbre brush and all loose soil
and dry herbage collecÈed, dried at 50oC for 24 hours and hand-plcked to
t plants thaÈ had survived at least one summer'
47.
remove faeces, sticks and large stones. Followíng the removaL of the
above-ground naterial , the soil rÀras carefully hoed to a dePth of 5 cm'
removed and bulked into three sample lots per paddock. Fínal treatment
of the above and below-ground fractlons was sirnllar to that used for the
August samples.
7.8.4 Sheep l1ve weíghts
All sheep (experimental and spares) were hteighed at approximaËely
six-weekly fntervals. Occasionall-y, addltlonal weighlngs were made when
animals were in stress periods. The sheep were weighed in the raceway'
at the entrance to each paddock, usfng mobile scales. Líveweight data
were recorded to the nearest 0.1 kg. Sheep were weighed throughout the
day and no specíal measures were taken to ensure sheep r¿ere of slmilar
gut-f 1l-1.
7. 8.5 Annual üroo1 production
All experímental sheep vrere removed from their paddocks on the day
of, or one day prior to, shearlng and were drlven as a single flock to
the sheartng shed (c. I km). The sheep \rere transported back to theír
paddocks, the same day or early the next day followlng shearing, ín theír
respectLve experimental groups. All sheep were combined into one flock
ín the shearing shed and randomly selected by the shearers. The same
procedure was repeated |n the spring of each year when the sheep were
crutched and only on Èhese two occasíons, durlng any one year, were the
experimental sheep removed from their paddocks.
Total greasy fleece weight in all data presented ís the summatíon
of the lntlividual wefghts of dyeband sample (refer 7.8.7), midside sample
(refer 7.8.6) locks, belly and skirted fleece of each sheep. Bellies,
locks and fleece of each sheep were weighed separately ln each year (tqith
48.
the exceptfon of the January L972+shearlng when the total weight only
I^tas recorded).
7.8.6 Fleece characterLstlcs
A sanple of r¡oo1 was taken from the nidside of each fl-eece as
each sheep was shorn. This sample was then weighed, placed in an alr-
tíght plastic bag wfth an identificatÍon card, and sent to the Gordon
Institute of Technology, Geelongo. Victoria for analysis. The following
fleece measurements rüere made on each midsíde sample: a) Yteld aE L67.
regain b) nean staple length c) mean number of crimps per unit length
of fibre (crimp frequency) and d) mean flbre dlameter.
7.8.7 Seasonal wool producÈion
On most occasions of lfveweight measurement, a dyeband (10-15 cn
long) was applied dorso-ventrally on each sheep ín the approximate position
of the last rib, according to the technlque of Short and Chapnan (1965).
Each year, one day prlor to annual shearing, the dyeband staples
rfere carefully removed by clfpping the wool as close to the skín as
possible using 'Osterr small- anímal clippers. Appllcation of dyebands
and removal of dyeband staples were performed in a sheep-holding cage.
Thís unit contaLned a rotatable síde to which the animal was strapped
and held on its side at a convenient r¿orking height. The wídth of staple
removed was from c. 2-3 cm of skin. Each harvested, dyébanded staple
was weighed, had a length of tissue paPer placed along its length, rolled
and stored fn a bag.
All dyeband sÈaples for all years were measured as follows:
The staples rsere opened so Èhat an even spread of dyebands was obtaíned
on both sides. Five measurements were made on each half of the sample
t shearing was in January each year (refer appen<líx Tables 17-20 for dates) '
49.
(taktng care to measure staples of good length, i.e. away from the be1ly
and back extremities). The staple vras placed in a natural (unstretched)
position and the measurements \.fere made by zetoíng a ruler on the base
of the staple, and Ëhen readj-ng off the lengths at the proximal end of
each dyeband. The length between dyebands, used in conjunction with
Èhe total clean fleece weight, allowed estimates to be rnade of periodic
clean wool growth during each year.
7.9 Data analysÍs
In all statistical analyses, the mean measurement for each paddock
has been used as the basÍc experimenÈal unit (e.g. meanliveweíght of the
fíve sheep on each weighl-ng occaslon, or mean availability of pasture |n
each paddock on each sanpling occasfon). Regresslons of each unit of
DeasuremenÈ on stocking raÈe on each sampling occasion were performed and
Èhe relationship tesËed for línearfty. On nearly all occasíonsrhígher
order polynomial relationshlps could not be Justified sÈatistically due
to insuffícíent levels of the x variate (stocklng rate) ' even though they
may have been biologically posstble or probable. Tests of homogeneity of
regression coefficients (homogeneity of the slopes of the regression of
each unit of measurement, for each pasture treaÈment' on stockíng rate)
were performed to indicate any signifícant lnteraction between pasture
treatment and stocking rate. The mean regression coefficíent for the
fÍve regression relationships (five pasture treatments on stocking rate)
has also been calculated for each unít of measurement'
I{here the heterogeneity of regressíon coefficients üras noÈ
statistÍcally significant (P > 0.05) a test of homogeneity of adjusted
treaÈment means (adjusÈed to x = i where i = *""n of all the x-values
of K treatment "4p1u"+¡ was performed to indicate whether the pasture
as the s¿rme stocking rates $Iere used over each pasture treatment
i = i (mean of stocking rates 10, 11, 13, L4,15 and tZ tra-l)'
+

50.
treatment means (averaged over stockíng rates) were statístically
different and the least significant difference (LSD) between these means
calculated. Angular transformatlon of proportional data (percent) was
performed as required.

SIIllS]U
51.
8. RESULTS
8.1 Pasture esÈab1íshment
tr{ith the exception of the hybríd phalaris, the soI^rn grasses and
legumes established satisfactorily (Table 3), in particular' the
density of perennlal ryegrass plants (treatments C and D) were obviously
higher than the densíty that could be maíntained as Perennial plants Ìn
the following years. The density of established hybrid phalarís plants
was low, although superíor to pràvlously obtaínetl <lensities of phalaris
(cv. Australian) sown at similar rates on this soil type on Kangaroo Island'
The density of hybrid plants was considered sufflcíent Èo allow Ëhis
specíes Èo make a worthwhíle contributlon to pasture production ín the
later years of the experimenË, provided that the individual plants expanded
ín diameter, as is characteristic of thís species'
There hras no significant (P >0.05) dlfference betrseen the densíÈy
of established sorÀtn grass plants wíthin each sown Pasture treatmenÈ over
the range of sËocking rates, or in the case of subterranean clover plants'
over all renovat.ed paddocks. However, the mean density of Yarloop
subterranean cloVer planÈs in treatment A r¿as 580 plants *-2 "otptt"d
to the combined g5 plants ^-2 of. Mt. Barker and l,Ioogenellup and 25 plants
.-2 of Yarloop subterranean clovers established in the renovated paddocks'
A visual inspection of the pastures during the spring showed that,
r,¡ithin the narrow-leaved volunteer component, barley grass and rípgut
brome were the dominant species in Èreatments A and E råspectively'
8.2 Pasture production 1970
The superLor pasture production in treetment B duríng the autumn
and r.rinter is shown in Table 4. There was less dífference between PasÈure
treatments ín pasture production durlng the spring" A different seasonal
52.
gror^r¡h pattern for the tvro perennial ryegrass species (treatments C and
D) ls also evídent in Table 4.
Some variation in levels Of available pasture was present at Èhe
end of the 1970 growing season (Table 4) because of the difficulty of
achieving even grazing. Treatment A contaíned the lowesÈ, and treatment
D the highest, amounts of available pasture at the end of the 1970 growíng
season.
8.3 Botanical composition I97L-L974
8.3.1 Sown grasses
The renovatíon of the original pasture by the sowíng of tr{immera
ryegrass (treatment B), Víctorian ryegrass (Ëreatment C) and Medea
ryegrass (treatment D), togeÈher with Mt. Barker and Woogenellup
subÈerranean clovers resulted ín ryegrass-clominant pastures in Èhe autumn
of 1971 (Table 5).
The majority of Victorlan ryegrass plants díed over Ehe I972/73
sunmer (Table 6) and although some self-sowing of this species occurred
ín the autumn of L973, íts conËríbutíon was negligible by the end of the
1973 season (Table 5). The Medea ryegrass plants died <luring each sunmer
of the experiment e-xcept for a ferv plants which survived tlne L973/74
suntrner at the lov¡er stocking rates (Table 6).
In the first three years of set stockíng there rüas a within-year
decline in the ryegrass component in all three ryegrass treatments during
the autumn and r,rinter and in sorne years the decline continued during the
spríng.
An effect of stocklng rate on the between-year decline in the
proportion of l^Iirmnera and Victorian ryegrasses was evident over the first
t!'ro surmers following seË stocking (L97L/72 and L972/73) Fígure 1.
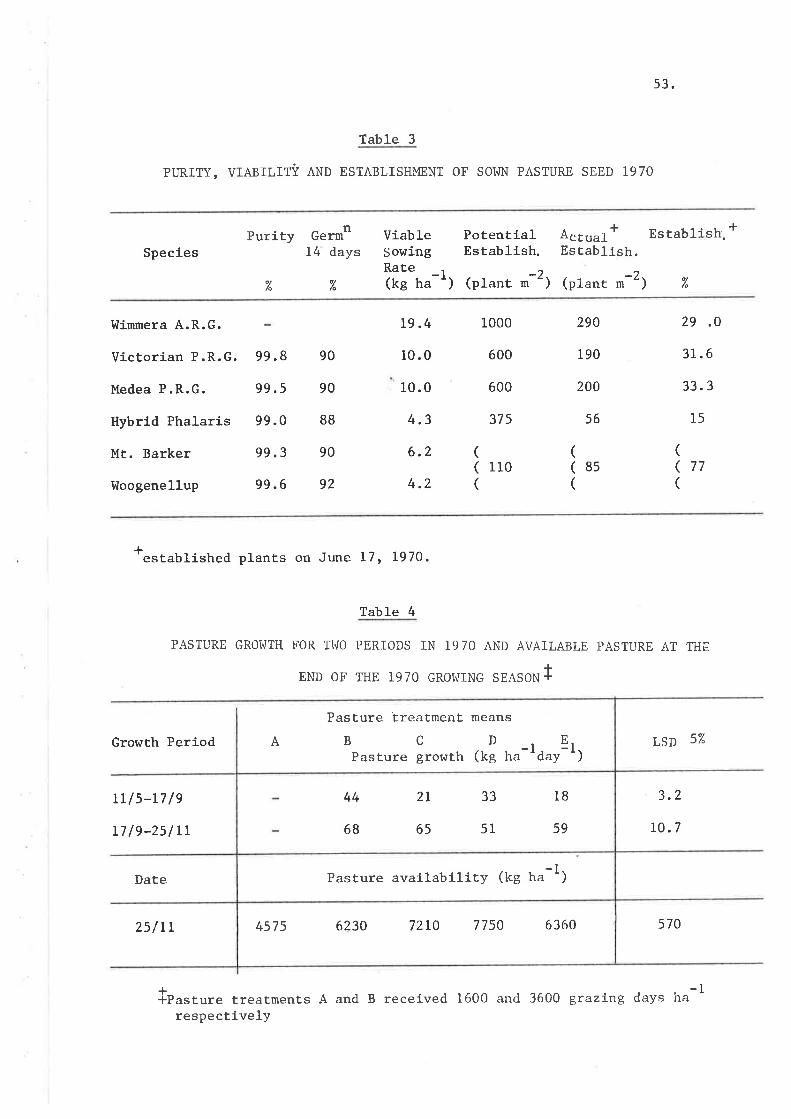
53.
Table 3
PI]RITY, VIABILITY AND ESTABLISHMENT OF SOI^TN PASTURE SEED 1970
SpeciesPurity Germn
14 daysViableSowingRate(kg ha
PotentialEstablish.
A.t,r"lt Establísh. *Establish.
/" 7"-1) (planr m-2) (planr m-2) %
llimmera A.R.G.
VicËorian P.R.G.
Medea P.R.G.
Itybrid Phalaris
Mt. Barker
[,loogenellup
99 .8
99.5
99.0
99 .3
99.6
90
90
88
90
92
((tt(
t9.4
10.0
10.0
4.3
6.2
4.2
1000
600
600
375
290
190
200
56
((8s(
29.0
31 .6
33.3
15
(((
110
*establlshed plants on June 17, lg7},
Table 4
PASTURE GROI{TH FOR TI'IO PERIODS IN I97O AND AVAILABLE PASTURE AT THE
END OF THE I97O GROWING SEASON +
Gror¿th Period
Lr/5-17/e
L7/9-25/rr
DaÈe
2s/Lr
Pasture treaÈment means
BCDPasture gro\^tth (kg ha
A-1 E1
dayLSD 57"
3.2
t0.7
570
)
lPr"arrr" treatments A ancl B receÍved 1600 and 3600 gtazing days harespectively
6230 72L0 77sO 63604575
PasÈure availability (kg ha-1)
5951
1B33
65
2I
68
44
1
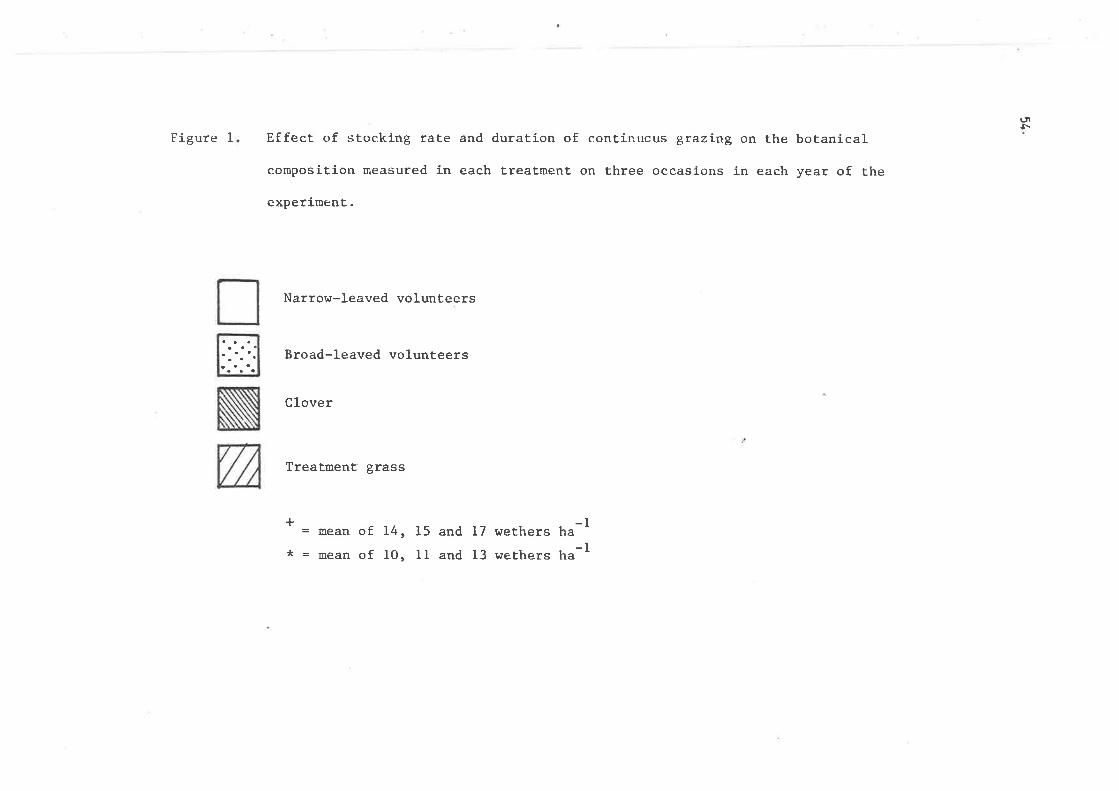
uì¡.Figure I Effect of stocking rate and duration of continucus g,razing on the botanical
composition measured in each treatment on three occasions in each year of the
experimenÈ.
Narrow-leaved volunteers
Broad-leaved volunteers
Clover
Treatment grass
N
* = *a"r, of 14,* = mean of 10,
15 and 17 wether" h"-1lI and 13 wether" h"-I
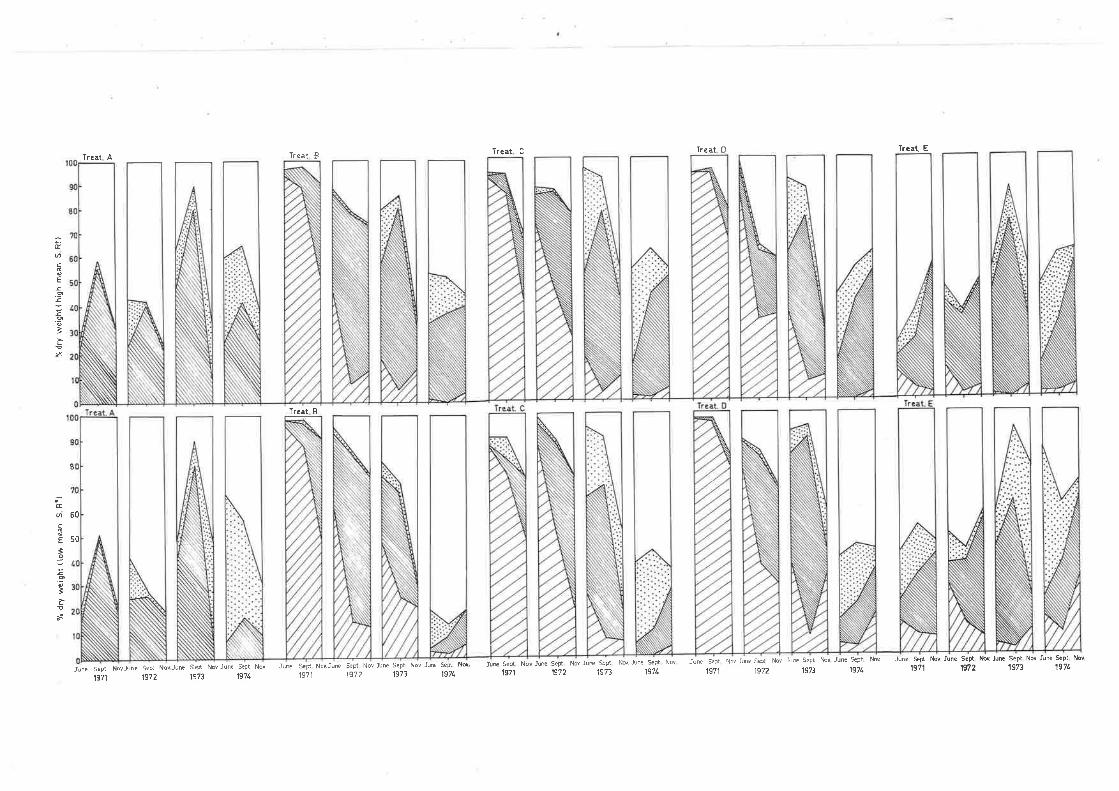
freat D Tr¿at. E
É
ei.9Ê
t.9
ìs
Treat A
June Sept NôvJuñe SePl NovJuÉ Sept Nov June Scpt Nov
Treat B
lrcat B
Treåt C
tuæ Sept Nov Juñe Sept Nov Juæ Sepi Nov Ju¡e SePtJune S.pt NovJune S€pt Nov June Sept No! Juæ Sept Nov June Sçt Nov June Sept Nov Juæ sept lbv
B
50
50
ÉØc
Ê
,='õ3È
s
Junc Scpt l¡ov June Àbv June s.pt ¡,lo{ JuÈ sÊpt Nov June sêpt Nov
1Eì2 1973 19?¿
1971 19?2 1973 197L 1971 197 2 1973 1974 1971 1972 1973 1971 1971 1972 I 973 1974
9pt19?1
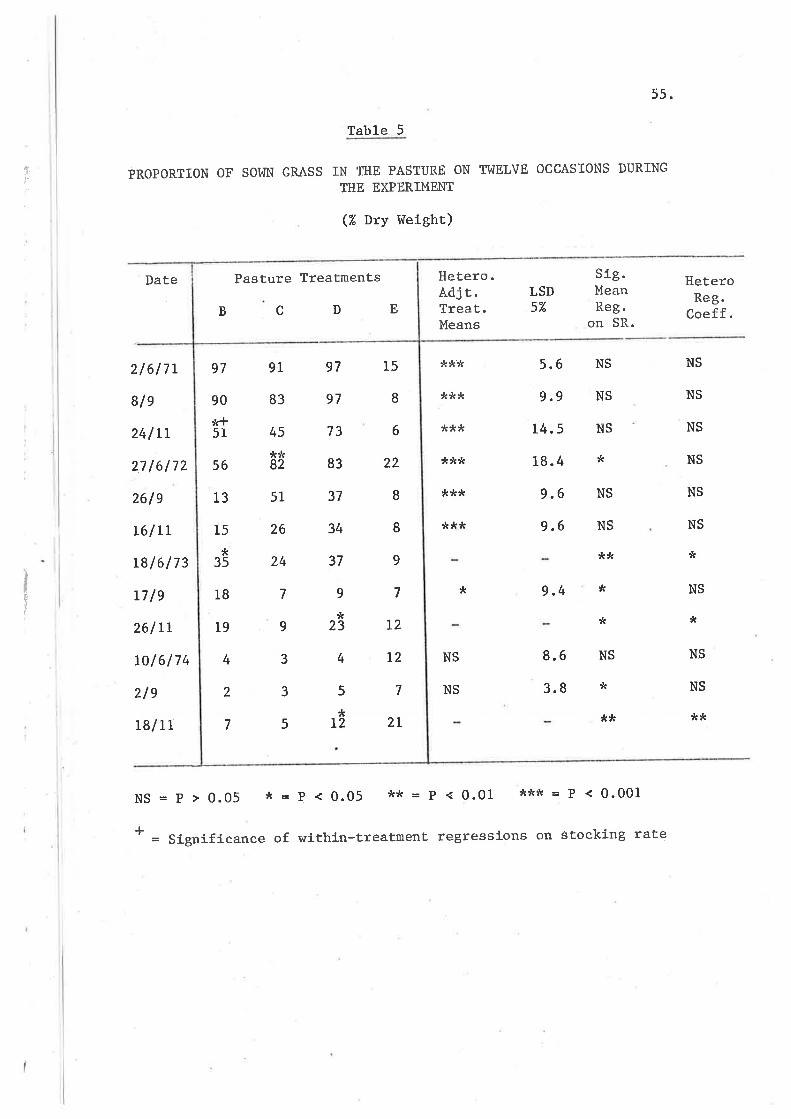
lí,
slJ
5s.
lable 5
pROpORTION OF SOI,üN 6RASS IN TIIE PASTURE ON II^IELVE OCCASIONS DURING
THE EXPERIMENT
(7. nxy l{eÍght)
DaËe Hetero.Adj È.Treat.Means
***
***
***
***
***
***
*
5.6
9.9
14.5
18.4
9.6
9.6
sig.MeanReg.
on SR.
ïIeteroReg.
Coeff.LSD5%
216/7r
8/e
24/ IT
2716172
26le
L6I LT
18l6l73
L7 /9
26/ rr
tol6l74
2le
18/1r
NS
NS
NS
*
NS
NS
**
NS
NS
NS
NS
NS
NS
*
NS
*
9.4
8.6 NS
3.8 *
**
*
*
NS
NS
NS
NS
**
NS = p > 0.05 * = P < 0.05 ** = p < 0.01 *** = p { 0.001
* = Slgnificance of within-treatment regressíons on ètocking rate
56
13
15
*35
1B
19
4
2
7
97
97
73
83
37
34
37
9
*23
4
5
T
l2 2l
22
*+51
15
7
L2
T2
24
26
51
90
97
7
9
3
3
5
I
8
9
7
8
6
**82
91
B3
45
Pasture Treatments
B D Ec
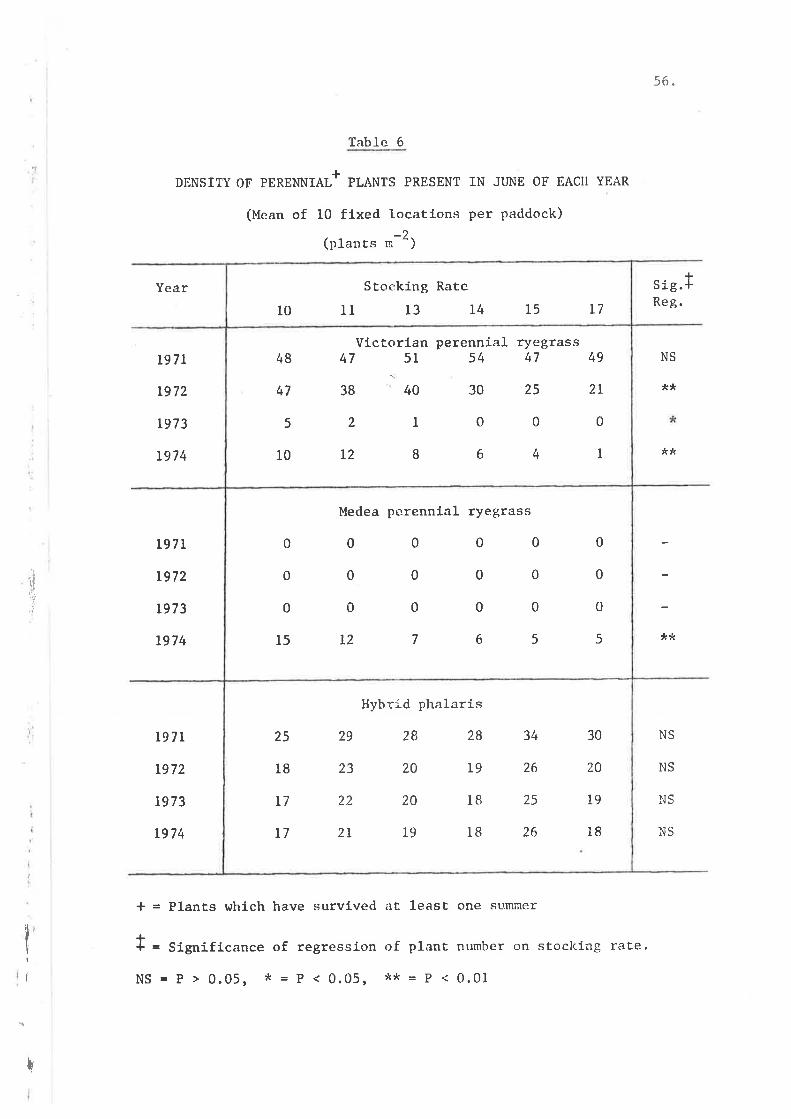
Table 6
+DENSITY OF PERENNIAL PLANTS PRESENT IN JIJNE OF EACH YEAR
(Mcan of 10 ftxed locatlons per paddock)
(plants rn-2¡
Year
19 71
L972
L973
197 4
19 71
r972
r973
L974
L97L
L972
1973
r974
* = Plants which have survi.ved at least one sìummer
+* = Significance of regression of plant number on stoclcing raËe.
NS = P > 0.05, * = P < 0.05, *:k - P < 0.01
56.
s ig.Reg.
NS
**
&¿
**
+
,lil'l
NS
NS
NS
NS
I
!
25
l8
T7
T7
Hybrid phalarÍs
29 28 28
23 ZO L9
22 20 18
2I 19 18
30
20
19
1826
25
26
34
Medea perennial ryegrass
0000
0000
0000
t2765
0
0
0
515
0
0
0
48
47
5
10
Victorlan perenníal ryegrass47 51 54 47 49
T2
2l
8 I
I 02
38 40
0
6
0
4
30 25
Stocking Rate
ll 13 L410 I715
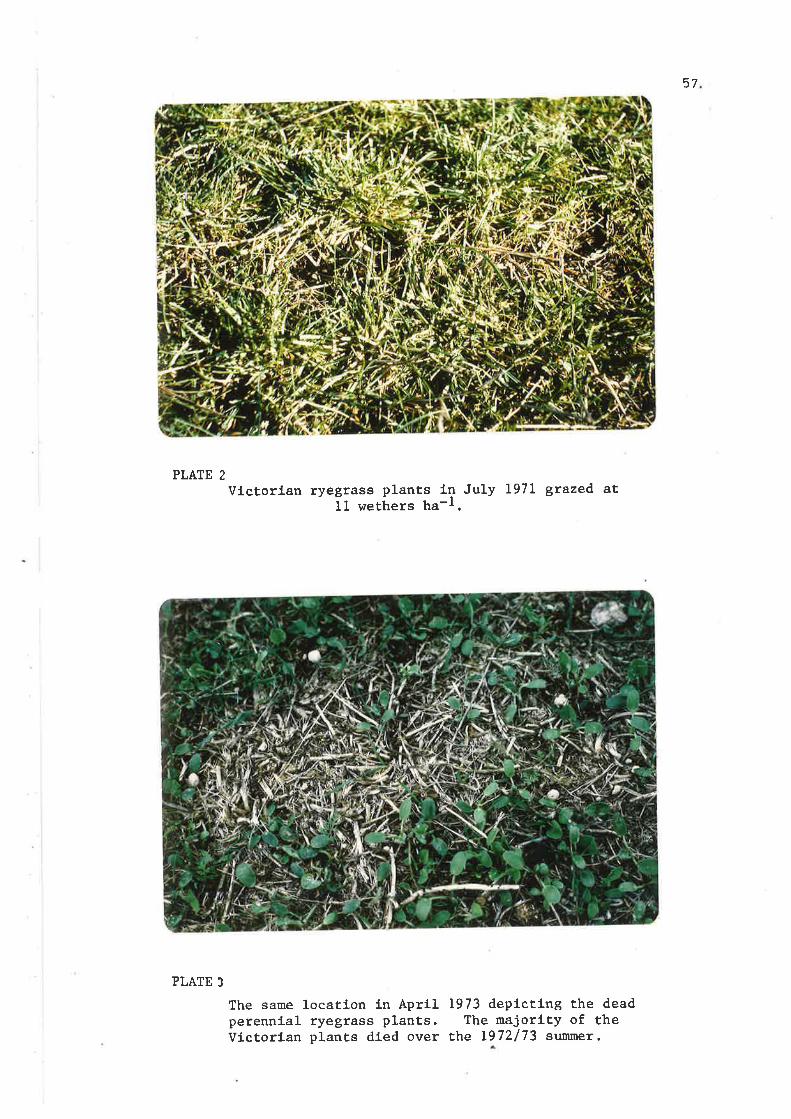
57
PLATE 2
VLctorlan ryegrass plants tr-r July L97L grazed11 wethers ha-r.
at
The same location ln Aprllperennial ryegrass plants.Victorian plants died over
1973 depíctlng the deadthe majority of the
the 1972173 summer.
PLATE ]
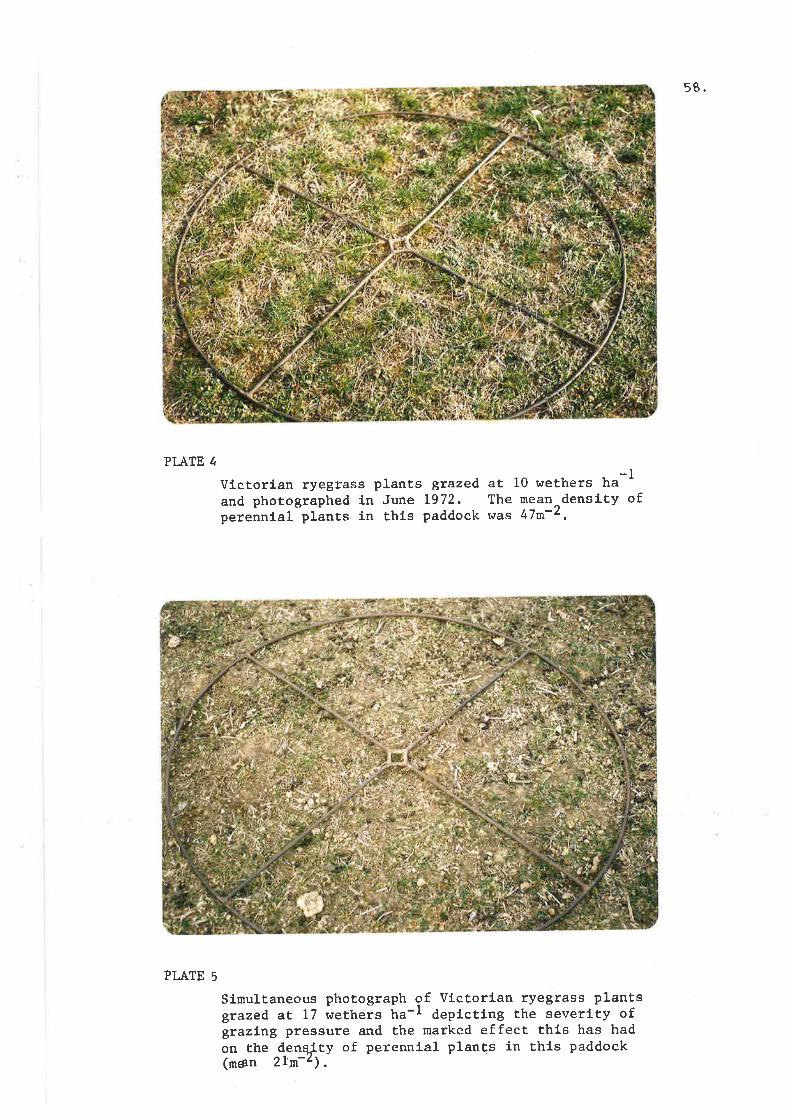
58.
PI,ATE 4-1Vfctorian ryegrass plants grazed, at 10 wethers ha
and photographed in June 1972. The mean^density ofperennial plants in this paddock was 47m-¿,
Slmultaneous photograph of Vlctorlan ryegrass plantsgrazed aE 17 wethers ha-r deplcting the severity ofgtazlng pressure and the marked effect thls has hadon the densJty of perennial plants in thls paddock(men zlntl .
PLATE 5
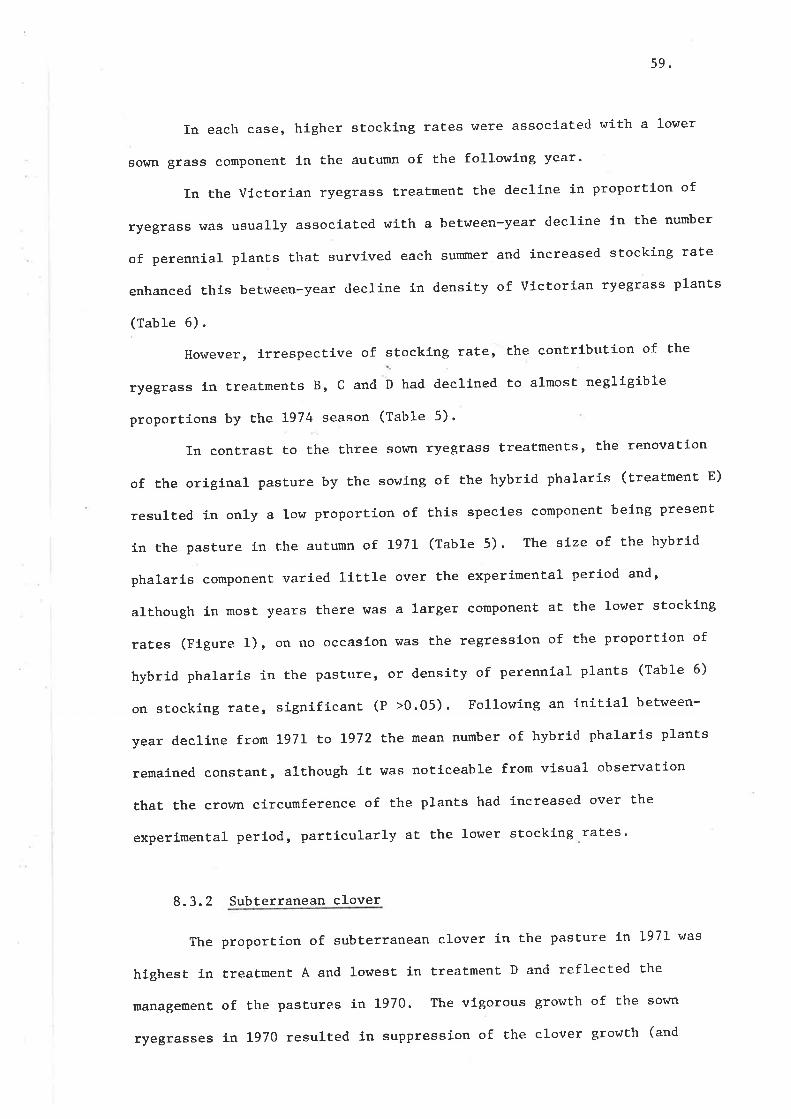
59.
In each case, higher sËocking rates vTere assoclated with a lower
sor{n grass componenÈ in the autumn of the followíng year'
In the victorian ryegrass treatment the decline in proportion of
ryegrass was usually associated with a between-year decline in the number
of perennial plants that survlved each summer and increased stocking rate
enhanced this between-year decline ín densíty of Victorian ryegrass plants
(Table 6).
Ilowever, lrrespectíve of stocklng rate, the contribution of the
ryegrass ín treatments B, C and D had declined to almost negltgíble
proportions by the 1974 season (Table 5).
In contrast to the three sovtn ryegrass treatments, the renovation
of the origlnal pasture by the sowing of the hybrid phalarls (treatment E)
resulted in only a low proportíon of thís species comPonenÈ beíng present
ín the pasture ín the autumn of 1971 (Table 5). The size of the hybrid
phalaris component varíed l-íttle over Èhe experímenËa1 períod and,
alÈhough in most years there was a larger comPonent aÈ the lovrer stockíng
rates (Figure 1), on no occaslon q¡as the regressíon of the proportion of
hybrid phalaris in the pasture, or density of perenníal plants (Table 6)
on sÈocking rate, sígnificant (P >0.05). Following an inítial bet¡'¡een-
year decline from 1971 to L972 t]ne mean number of hybrid phalaris plants
remaíned constant, although it was noticeable from visual observatíon
that the cror¡rn círcumference of the planÈs had increased over the
experimental period, particularly at the lower stocking raÈes.
8.3.2 Subterranean clover
The proportion of subterranean clover in the pasture ín 1971 was
híghest in treatment A and lowest in treatment D and reflected the
managemenÈ of the pasÈures Ín 1970. The vigorous grohtth of the sovm
ryegrasses in 1970 resulted in suppression of the clover growth (and
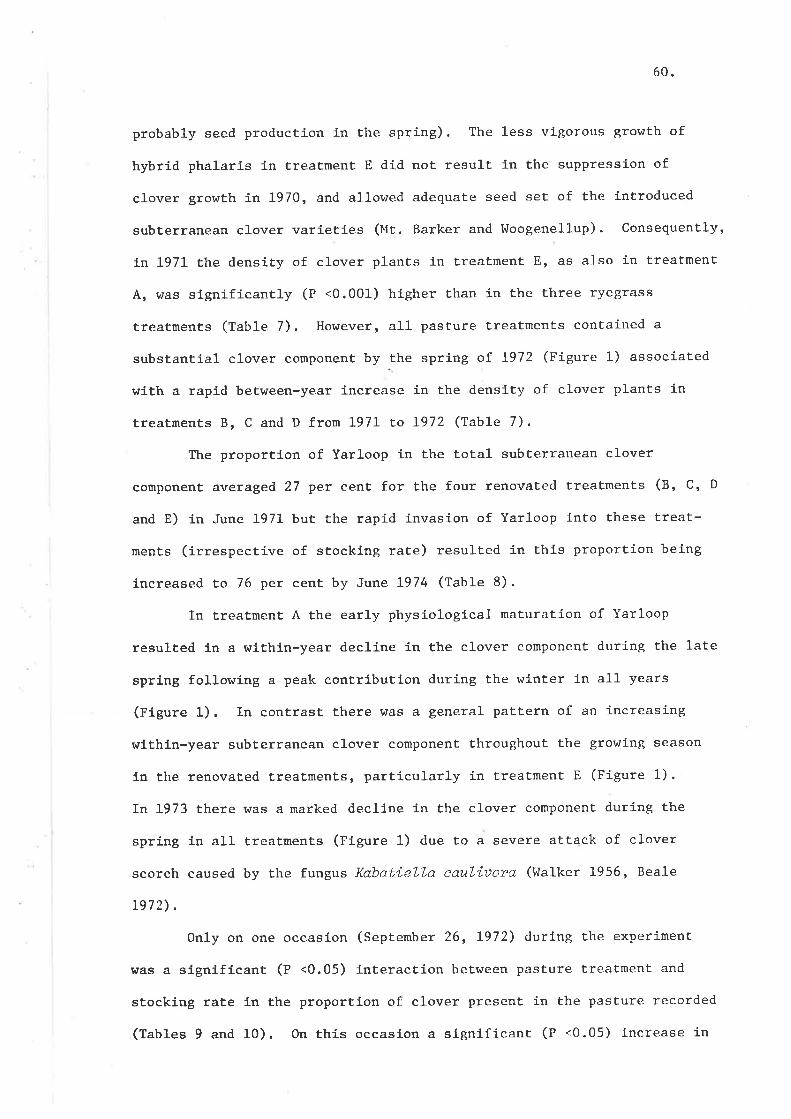
60.
probably seed production in the spring). The less vigorous growth of
hybríd phalaris in Èreatment E did not result in the suppression of
clover grohrth in 1970, and allowed adequate seed set of the introduced
subterranean clover varietíes (Mt. Barker and Inloogenellup). Consequently,
in 1971 the density of clover plants in treatment E, as also ín treatmenE
A, was signífieantly (P <0.001) hígher than in the three ryegrass
treatments (Table 7). However, all pasture treatments contained a
substantía1 clover component by the spring of L972 (Figure 1) associated
wíÈh a rapid beÈween-year increase in the density of clover plants in
treatments B, C and D from L97I Eo 1972 (Table 7).
The proportíon of Yarloop ln the total subterranean clover
component averaged 27 per cenÈ for the four renovated treatments (8, C, D
and E) ín June 1971 but the rapid invasion of Yarloop into these treat-
ments (írrespectíve of stockíng rate) resulted in this proportion being
increased to 76 per cent by June 1974 (Table 8).
In Èreatment A the early physiological maturation of Yarloop
resulted ín a wíthín-year decline in the clover componenÈ during the late
sprlng following a peak contríbutlon duríng the winter in all years
(Figure 1). In contrast there r/as a general pattern of an increasing
withÍn-year subterranean clover component throughout the growing season
ín the renovated treatments, particularly ín treatment E (Figure 1).
In 1973 there r¡ras a marked declíne in the clover component during the
spring ln all treatments (Fígure 1) due to a severe attack of clover
scorch caused by the fungus KabatieLLa eauLiuora (l^Ialker 1956, Beale
1972).
Only on one occasíon (September 26, L972) during the experiment
was a significant (P <0.05) ínteraction belween pasture ÈreaÈment and
stockíng rate in the proportion of clover present in the pasture recorded
(Tables 9 and 10). On this occasion a sígnífícant (P <0.05) increase in
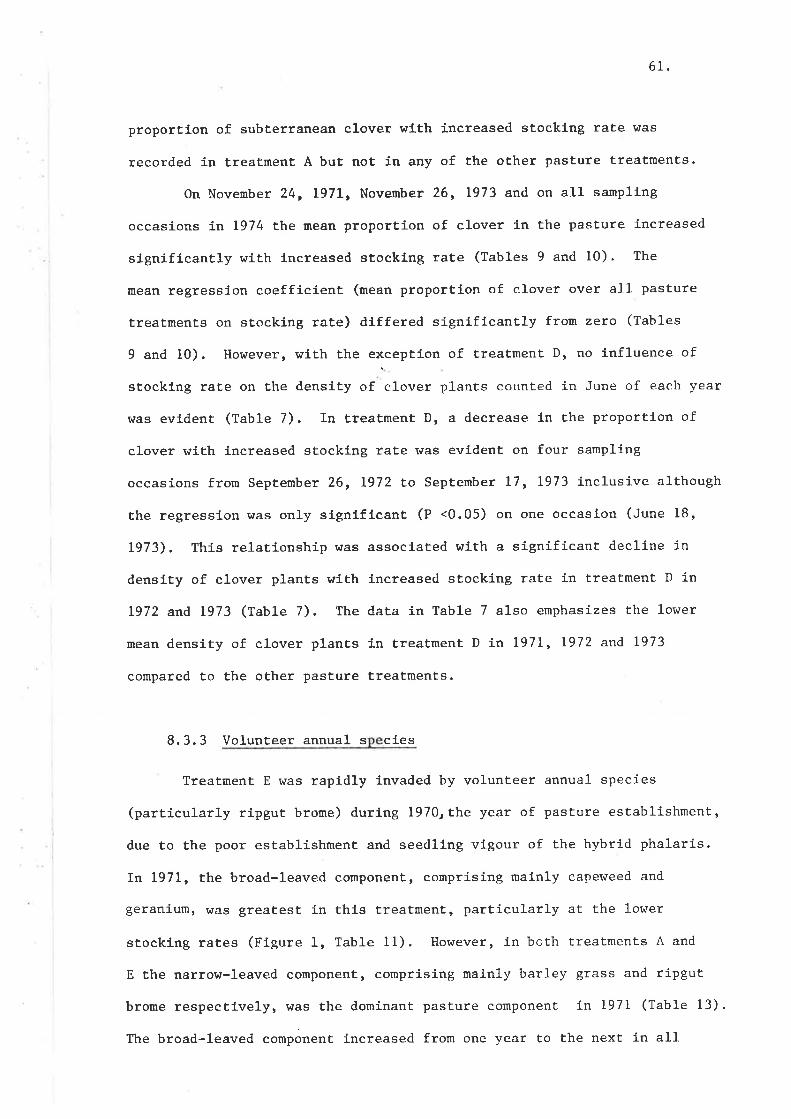
61.
proporÈ1on of subÈerranean clover wlth Íncreased stocking rate r^/as
recorded in treatment A but ûot ín any of the other pasture treatments.
On November 24, I97L, November 26, 1973 and on all sampling
occasions in I974 the mean proportion of clover ln Ëhe pasture increased
signíflcantly with lncreased stocking rate (Tables 9 and 10). The
mean regression coefficient (mean proportíon of clover over all pasture
treatmenËs on stocking rate) differed signiftcanÈly from zero (Tables
9 and I0). However, r¡1th the exception of Èreatment D, no ínfluence of
stocking rate on the density of clover plants counted in Jr¡ne of each year
was evident (Table 7). In treatment D, a decrease ín the proportion of
clover \nrith increased stockÍng rate liras evident on four sanpling
occasions frorn September 26, 1972 to Septernber 17, 1973 inclusive although
the regressíon was only slgniflcant (P .0.05) on one occasion (June 18,
1973). This relationship was associaEed with a significant decline in
density of clover plants wlth increased stockíng rate in treatment D in
1972 a¡d 1973 (Table 7). The data in Table 7 also emphasizes the lower
mean density of clover planËs 1n treatment D in 1971, 1972 and L973
compared to the other pasture treatments.
8.3.3 Volunteer annual s c].es
Treatment E was rapidly ínvaded by volunteer annual species
(particularly ripgut brome) durlng l970rthe year of pasture establíshment,
due to the poor establishment and seedllng vigour of the hybrid phalaris.
In 1971, the broad-leaved component, comprising mainly cape\^leed and
geranium, hras greatest in this EreatmenÈ, particularly at the lower
stocking raÈes (Figure 1, Table 1l). Ho¡vever, in both treatments A and
E the narrow-leaved component, comprising mainly barley grass and rípgut
brome respectively, was the doninant pasture component in 1971 (Table 13).
The broad-leaved component increased from one year to the next ín all
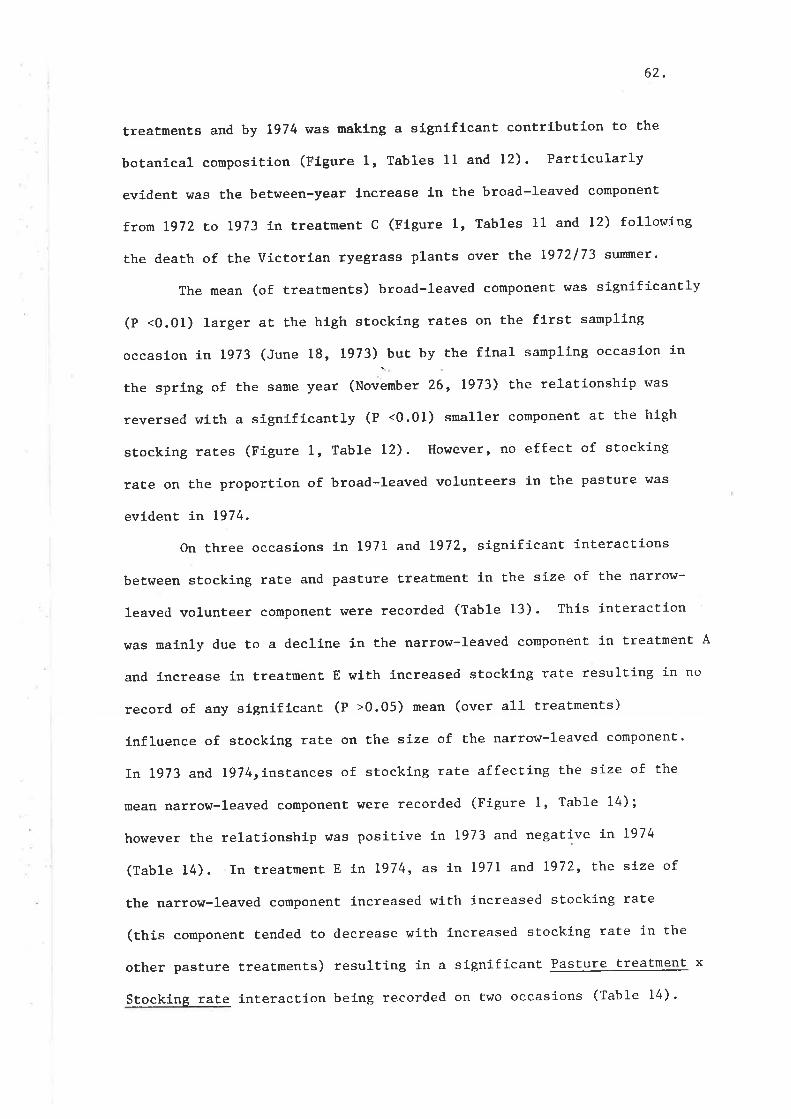
62.
treaÈments and by L974 lüas naking a signiflcant contributíon to the
botanical composition (Figure 1, Tables 1l and 12). Particularly
evídent rüas the between-year increase in the broad-leaved component
from L972 to 1973 in treatment C (Flgure 1, Tables 11 and 12) followíng
the death of the VÍctorian ryegrass pl-anÈs over the 1972/73 sultner'
The mean (of treatnents) broad-l-eaved component was signífícantly
(P <0.01) larger at the hlgh stocking rates on the first saurpling
occasíon ln 1973 (June 18, 1973).but by the final sanpling occasion in
the spring of the same year (November 26, 1973) Èhe relationship was
reversed wiEh a signifícantly (P <0.01) smaller componenÈ at the high
stocking raEes (Figure 1, Table 12). However, no effect of stocking
rate on Ëhe proportion of broad-leaved volunteers ín Èhe Pasture l¡ras
evident i¡ 1974.
On three occasions 1n 1971 and I972, significant inÈeractions
between stocking rate and Pasture treaËment ín the size clf the narrow-
leaved volunteer component slere recorded (Table 13). Thís interaction
was mainly due to a decline in the narrow-leaved component ín treatment A
and increase in treaÈment E wlth increased stocking rate resulting in no
record of any slgniflcant (P >0.05) urean (over all treatments)
influence of sÈockíng rate on the size of Ehe narrow-leaved component.
In 1973 and I9l4¡instances of stocking rate affecting the size of the
mean narrow-leaved component were recorded (Figure l, table 14) ;
however the relationship was positive in 1973 and negative in L974
(Table 14). In treatment E in 1974, as ín l97I and L972' the size of
the narrow-leaved comPonent increased wíth increased stocking rate
(ttris component tended to decrease with increased stocking rate in the
other pasture treatments) resulting in a significant Pasture treatment x
Stockíng raÈe interactíon being recorded on t\^lo occasions (Table 14) '
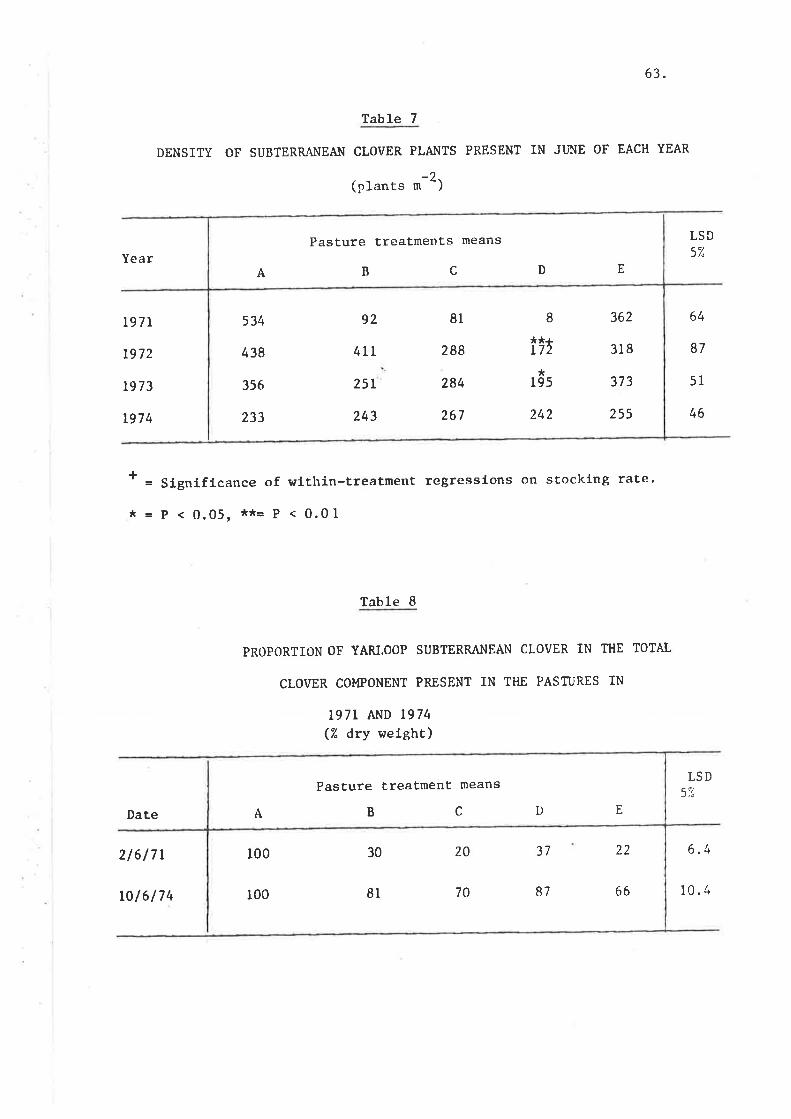
63.
Table 7
DENSITY OF SUBTERRÂNEAN CLOVER PLANTS PRESENT IN JIJNE OF EACH YEAR
(plants m 2)
f = Significance of within-treatment regresslons on stocking rate.
*=P<0.05r**=P<0.01
Table 8
PROPORÎION OF YARLOOP SUBTERRANEAN CLOVER IN T1IE TOTAL
CLOYER COMPONENT PRESENÎ IN THE PASTURES IN
1971 AND 1974(% dry weight)
Year
19 71
t972
r973
1974
Date
2/617 |
Lol6174
37 22
B7
LSD5'/"
64
87
51
46
LSDsi(
6.4
66 10.4
EDA
70
100
100
Pasture Èreatment means
BC
30 20
8l
s34
438
356
233
92
4rr
251
243
81
288
284
267
362
318
373
255242
r95
**¿172
*
8
A D ECB
Pasture ÈreaÈments means
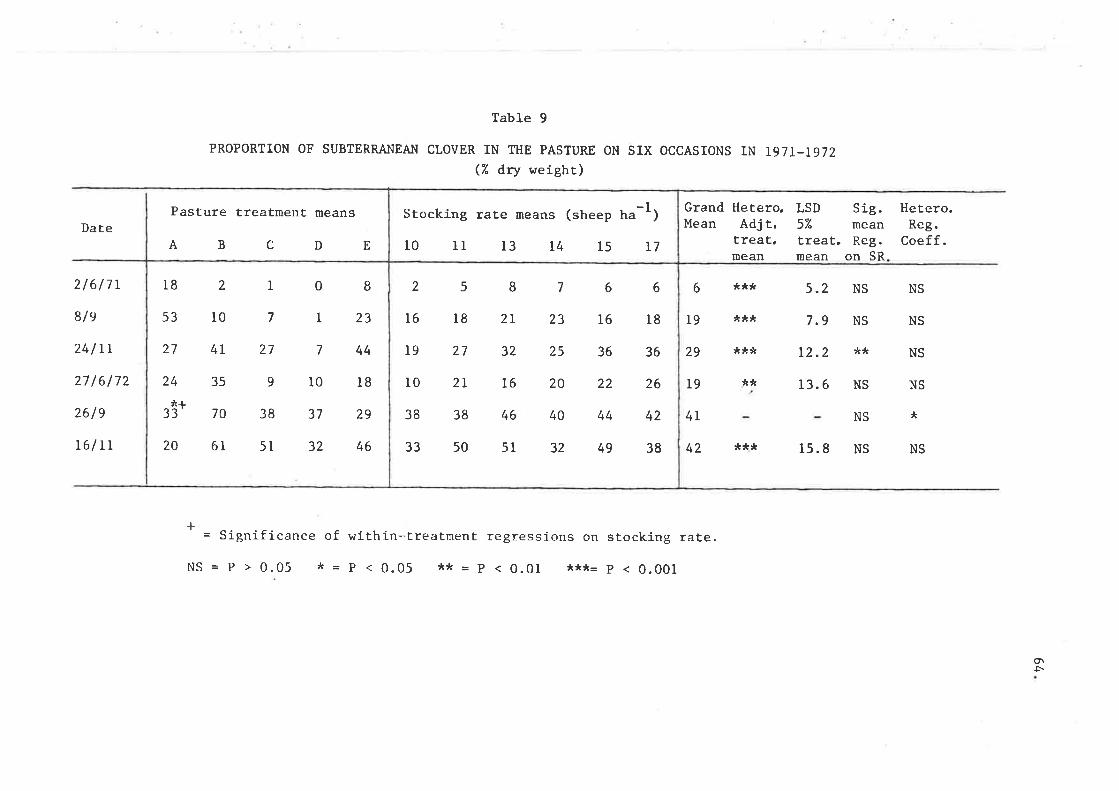
Table 9
PROPORTION OF SUBTERRANEAN CLOVER IN THE PASTURE ON SIX OCCASIONS ÍN I}TI_T972(% dry weight)
Pasture treatment means Grand Hetero,Mean Adjt.
treat.mean
LSD Sig.57" meantreat, Reg.mean on SR
Hetero.Reg.
Coeff.Date
2/6/7r
8/e
24/LL
27 /6/72
26 /e
16/rr
A BCDE
6
19
29
19
4T
42
= Significance of r¿ithin--treatment regressions on stocking rate,
NS = p > 0.05 * = p < 0.05 ** _ p < 0.01 ***= p < 0.001
*** 5.2 NS NS
*** 7.9 NS NS
*** 12.2 ** NS
** 13.6 NS NS
*** 15.8 NS NS
NS *
+
Or5
2
10
4I
35
70
61
8
23
44
l8
29
4620
27
3 ä+
I
7
51 32
38 37
910
0
I
7
18
53
27
24
7
23
25
20
40
32
6
I6
36
22
44
49
6
18
36
26
42
38
19 27 32
16 18 2r
258
33 50 5l
38 38 46
10 2L 16
Stocking rate means (sheep t"-1)
l0 lt 13 t4 15 17
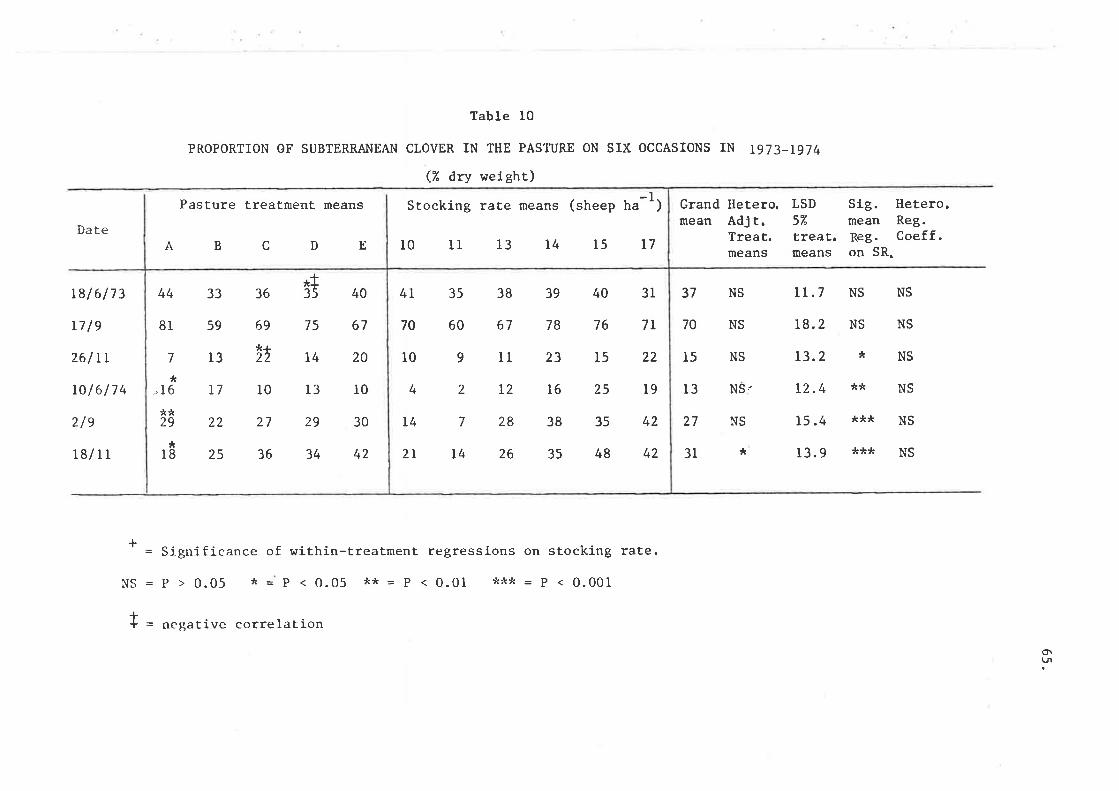
Pasture treatment means
ABCDE
Table l0
PROPORTION OF SUBTERRANEAN CLOVER IN THE PASI]IJRE ON SIX OCCASIONS IN T973_1974
(7. dxy weight)
Stocking rate means (sheep tr-1)
l0 11 13 14 15 L7
Grand Hetero.mean Adjt.
Treat.means
Sig. Hetero.mean Reg.Reg. Coeff.on SR.
LSD5i¿
treat.means
Date
L8l6/73
17 /9
261 tt
rol6/74
2/e
18/11
37 NS
70 NS
15 NS
13 NS'
27 NS
31 *
LL.7
18.2
L3.2
t2.4
15.4
r3. 9
NSNS
NS NS
*NS
** NS
*** NS
*** NS
+ = Significance of within-treatment regressions on stocking rate.
NS=P>0.05 *=P<0.05 **=P<0.01 )k-**=p<0.00 I
Ï = negative correlarion
o\(.fr
36
69
,(¿22
10
27
36
22
25I
JL
29
*I
*
*t35 40
713
81 59
44 33
,t6 r7
29 30
L4 20
75 67
34 42
13 t0
4t 35 38 39 40 31
7L
22
l9
42
42
70 60 67 78 76
109LL23152121625
147283835
2r 14 26 35 48
4
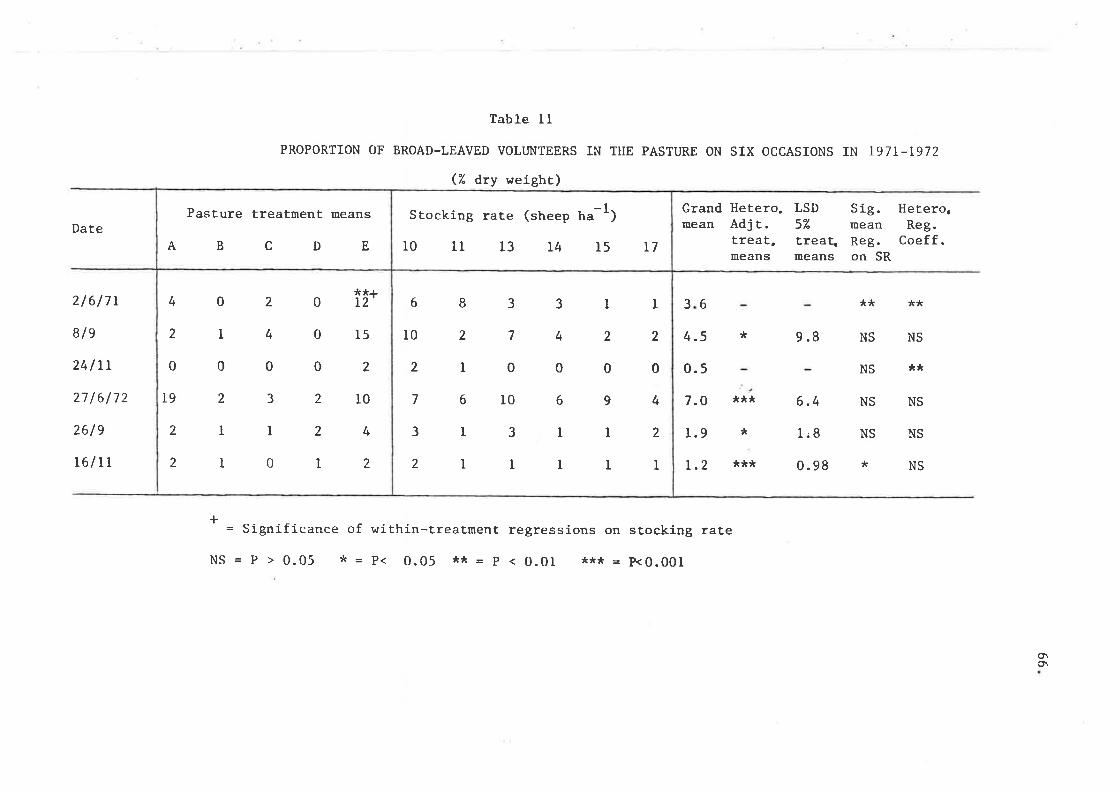
Table lI
PROPORTION OF BROAD-LEAVED VOLIJNTEERS IN THE PASTURE ON SIX OCCASIONS IN I97I-I972
(iA dry weight)
Date
216 /7 r
8le
24ILL
27 /6/72
26/ e
T6ITL
Grand Hetero.mean Adjt.
treat.means
Sig. Hetero.mean Reg.Reg. Coeff.on SR
LSD57"
treatmeans
63 ** *tç
4.5 * 9.8 NS NS
NS **0.5
7.O ***
= Significance of within-treatment regressions on stocking rate
NS=P>0.05 *=P< 0.05 ,c*=p<0.01 *:r:r=p<0.00 I
6.4 NS NS
1.9 * 1.8 NS NS
I.2 *** 0.98 * NS
+
co\
Pasture treatment means
A BC DE
**¿t2'
15
2
l0
4
2
l9 2 3
I
2
0
2
2
000
4
2 140
10
112
o20
Stocking rate (sheep ta-1)
r0 1l 13 L4 15 t7
6833
102
2T
76
3I
2l
0000
r0694
I
7 4
I
I
2
I
2
23l
111
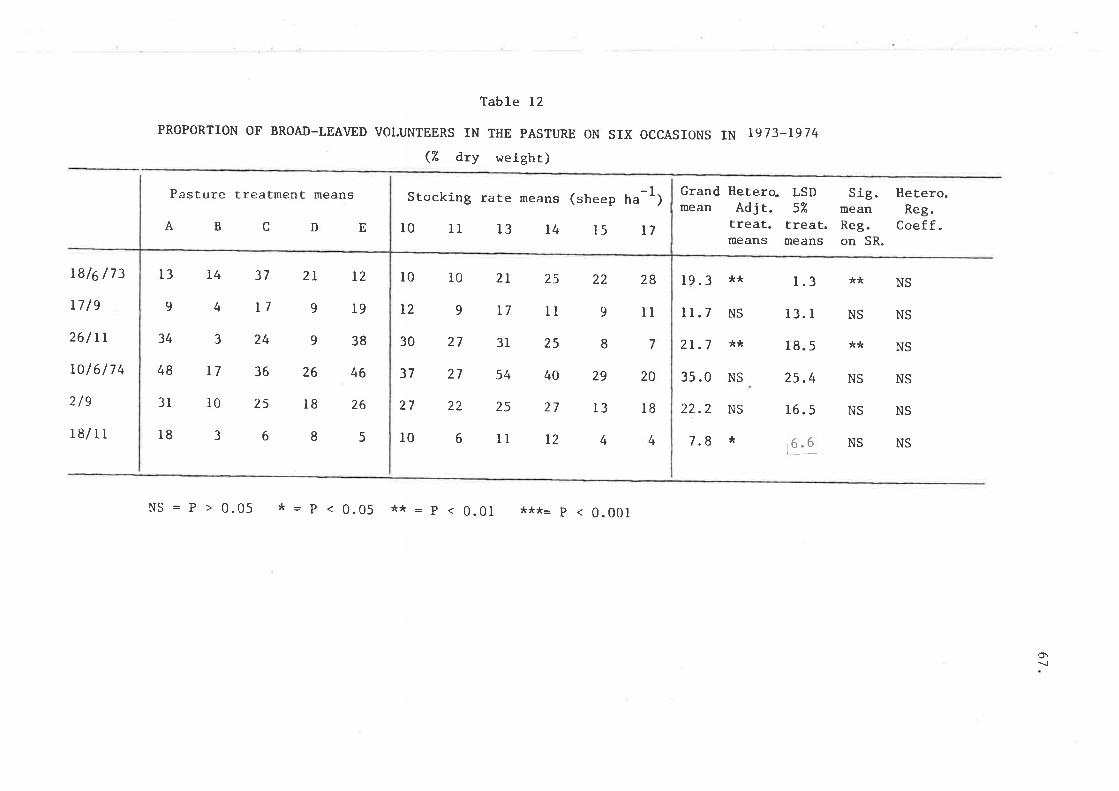
Table 12
PROPORTION OF BROAD-LEAVED VOLUNTEERS IN THE PASTURE ON SIX OCCASIONS IN Lg73_L974
(7" dry weight)
Pasture treatment means Stocking rate means
r0 tr 13 14
Grand Hetero. LSDmean Adjt. 5Z
treat. treat.means means
(sheep ha
l5
-r) sig.neanReg.on SR.
Hetero"Reg.
Coeff.A B CD E
I2
r9
38
46
26
T7
LB/6 /73
L7 le
26/rr
ro/6/74
2le
I8/I1
13 L4 37
9 4 17
32448 17 36
31 l0 25
1836
2L
9
9
26
t8
8
2L
L7
31
54
25
ll
1.3 ** NS
13.1 NS NS
18.5 ** NS
25.4 NS NS
16.5 NS NS
16.6l.---
NS NS
l0
T2
30
37
27
t0
10
27
27
22
25
1t
25
27
t2
22
9
I
29
13
4
28
11
20
18
4
9
19.3 **
II.7 NS
2L.7 **
35.0 NS
22.2 NS
7.8 *
347
40
65
NS = P > 0.05 * = p < 0.05 ** = p < O.0l ,r**= p < 0.001
o\!
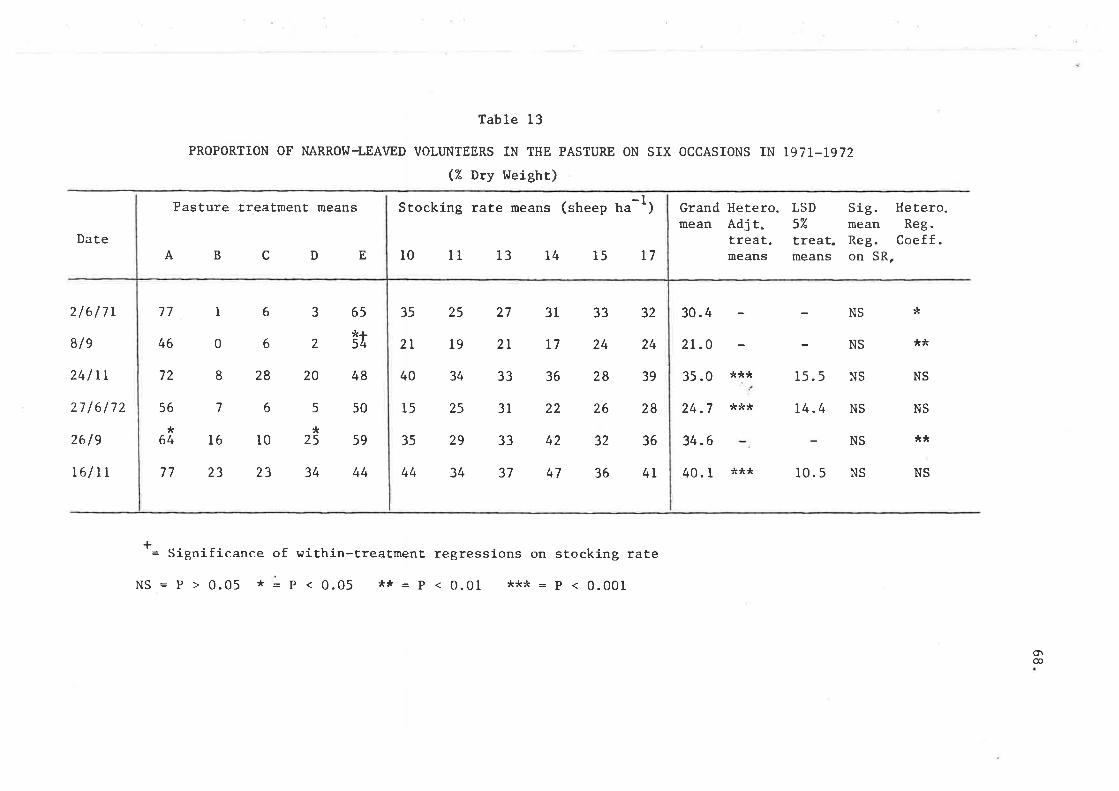
Table 13
PROPORTION OF NARROW-LEAVED VOLUNTEERS IN THE PASTURE ON SIX OCCASIONS IN 197L_I972
(7" Dry l,Ieight)
Pasture treetment means Stocking rate meens (sheep ha-1)
Dat.e
2l6l7 r
8/e
24ITL
27 /6/72
26 /9
L6/ tt
AB C D E
Grand Hetero.mean Adjt.
treat.means
Sig. Hetero.mean Reg.Reg. Coeff.on SR,10 lt 13 L4 15 17
LSD5%
treat.means
35
2L
40
l5
35
44
25
19
34
25
29
34
27
2L
33
3r
33
37
31 33 32 30. 4 J
NS35.0 ***
NS
NS
NS
NS
NS
36 28 39
22 26 28 24.7 ***
42 32 36 34.6
I7 24 24
47 36 4r
2t.o
40. I ***
15.5
r4 .4
10. 5 NS
**
NS
**
NS
+= Significance of within-treatment regressions on stocking rate
NS = P > 0.05 * = P < 0.05 :t:t = p < 0.01 *** = P < 0.001
Or@
77 1 6 3 6s
*¿s4
48
50
59
44
5676s**64 16 l0 25
77 23 23 34
46
72
6 20
8 28 20
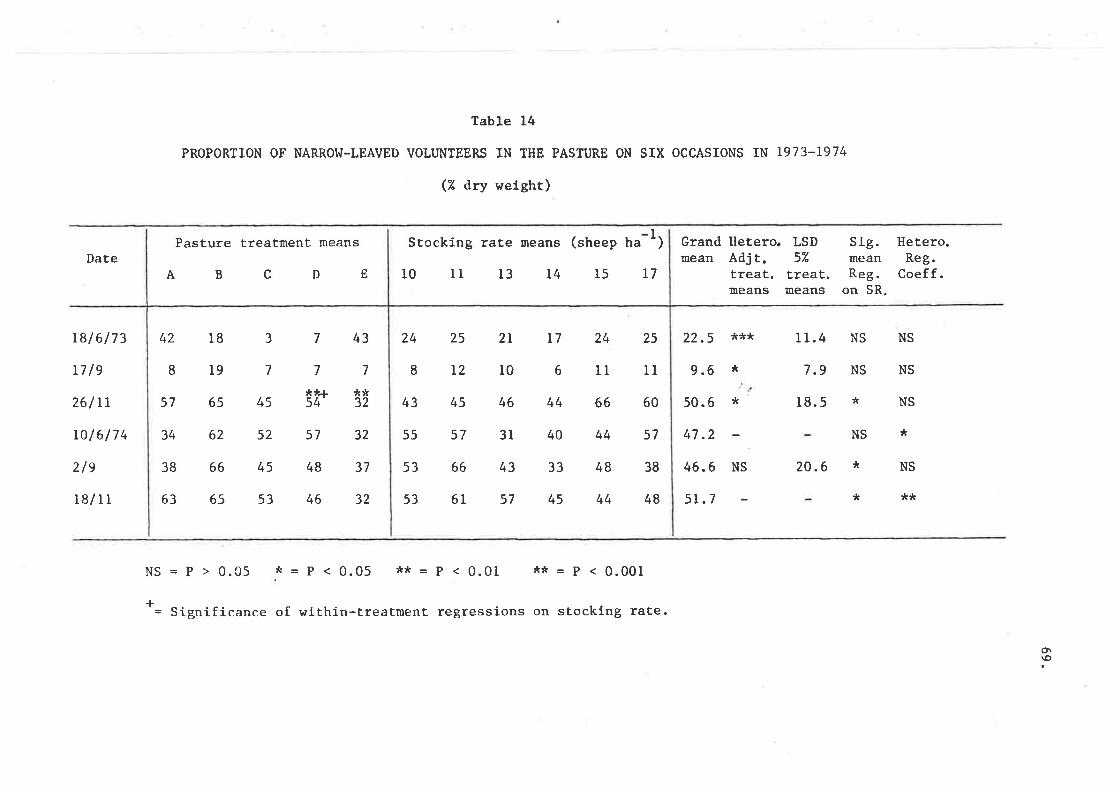
Table 14
PROPORTION OF NARROI^I-LEAVED VOLUNTEERS IN THE PASTURE ON SIX OCCASIONS IN 1973-1974
(% ð,ry wefght)
Date
r8/6/73
17 /9
26/TL
ro/6174
2/e
18/11
ABC
Pasture treatment means Stocking rate means (sheep tr.-1)
10 11 13 t4 15 L7
Grand Hetero. LSDmean Adjt. 57"
treat. treat.means means
Sig. Hetero.mean Reg.R.g. Coeff.
on SR.
42 18 3
DE
743 24 25 2L L7
812r06
43 45 46 44
55 57 31 40
24
1l
66
44
48
44
25
11
60
57
38
48
22.5 *** I1.4 NS NS
9.6 * 7.9 NS NS819 7 7 7
57 6s 4s ËT \i34 62 s2 57 32
38 66 4s 48 37
63 6s 53 46 32
53 66 43 33
s3 61 57 45
50.6 *
47.2
46.6 NS
5r.7
18.5 * NS
20.6 * NS
**
*NS
*
NS = p > 0.c5 * = p < 0.05 ** = p < 0.01 ** = p < 0.00I
+'= Significance of within-treatment regressions on stocking rate.
Or\o
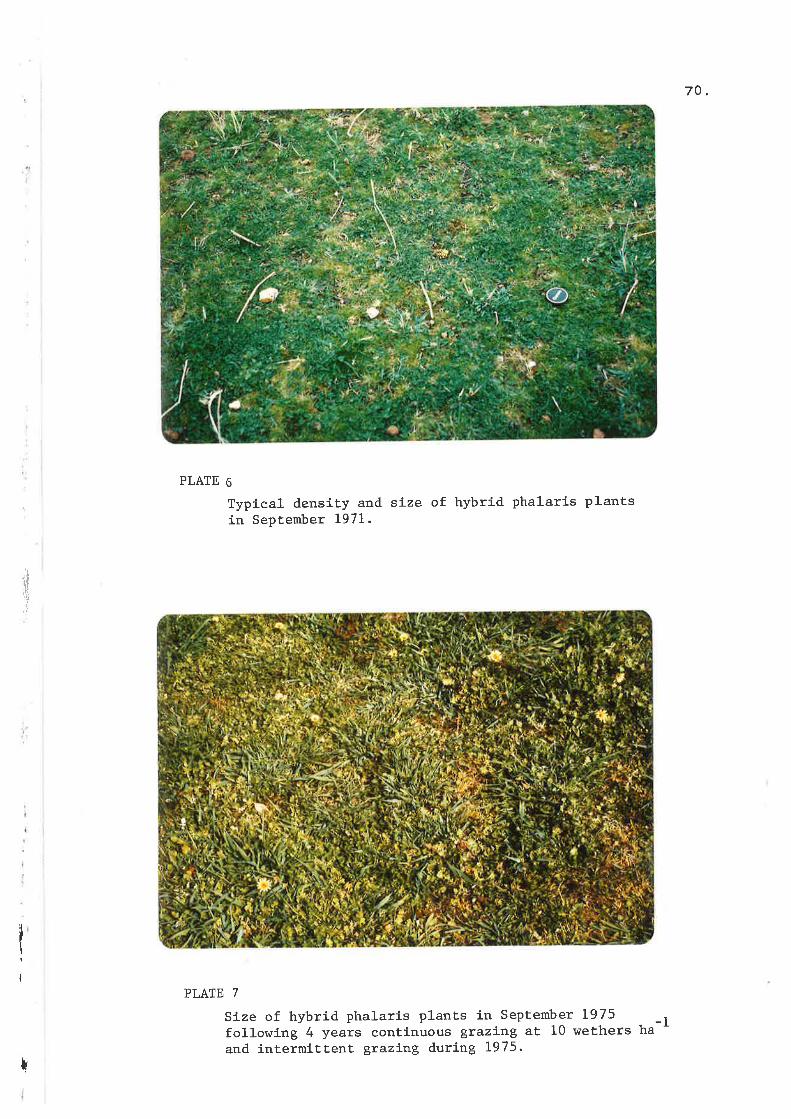
70.
:i
'¡1,1
irj'\
I
PLATE 6
Typical densíty and size of hybrid phalarís plantsín September 1971.
PLATE 7
Size of hybríd phalaris plants ín Septernbex L975following 4 years continuous gtazír.g aÈ 10 wethers ha
and íntermittent grazíng during L975.
!
-1
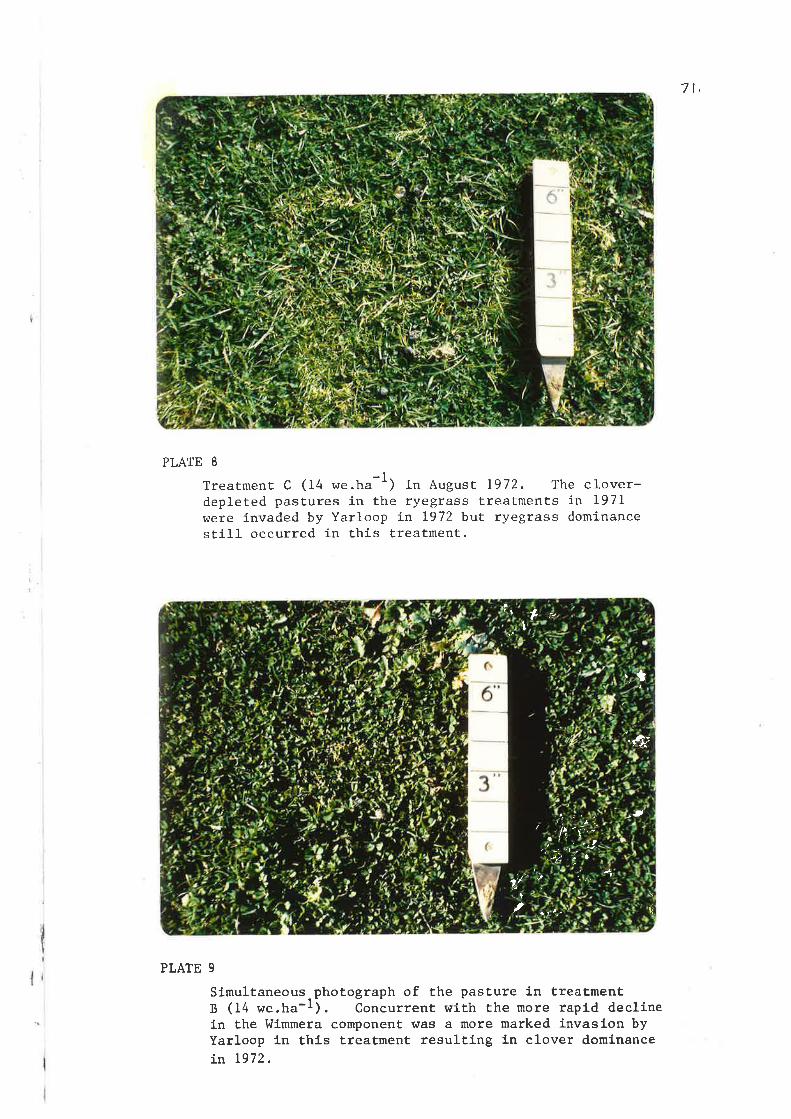
7t.
PLATE 8
Treatment C (14 "..hr-l) in August Ig72, The clover-
depleted pastures in the ryegrass treatments in L97Iwere invaded by Yarloop in 1972 but ryegrass dominancestíll occurred in thís Èreatment.
PLATE 9
Simultaneous-photograph of the pasture in treatmentB (14 we.ha-I). Concurrent r^rith the more rapid declíneÍn the l^Iimmera component htas a more marked invasion byYarloop 1n thls treatment resulting in cl-over domlnancein L972.
-ìt!.t
,t
-fr
//''or t l:-
'r | "'t
", I
r,f
t.ta
"î: :' 'h'I t.
', r- 'l ,t-lt)
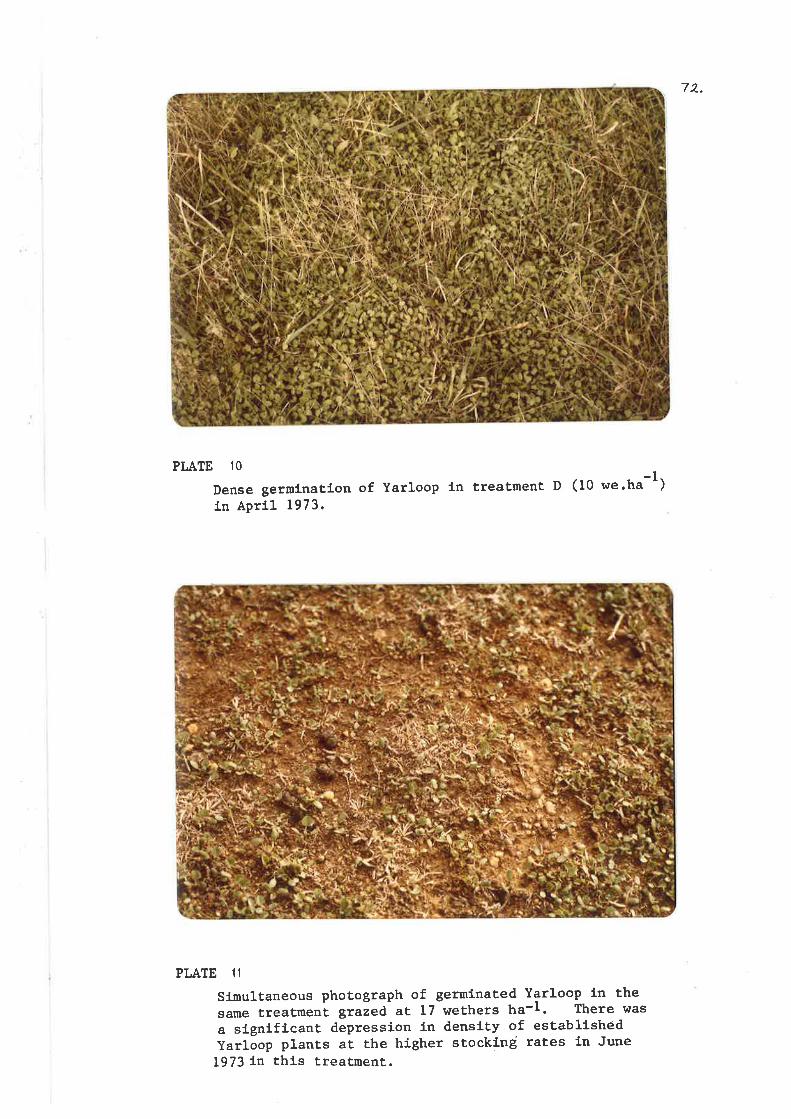
72.
PI,ATE IO
Dense germfnatlon of Yarloop 1n treatment D (10 we.hafn Aprfl L973.
PLATE 11
slnultaneous photograph of gerurinaÈed Yarloop in thesame treatment gtazed at 17 wethers ha-I. There was
a signlflcant depression in density of establishedyarloop plants at the higher stocklng rates ln Jr¡ne
1973 1n thls treatment.
-1)
73.
Although no data were collected on the botanl.cal conpositlon
wlthfn eLther the broad- or narrow-leaved components ft was obvíous from
vlsual observatl-on that the proportfon of barley grass, ripgut brome
and capeweed v¡as greatest at the lor¿er stocklng rates and VuLpia spp.
and Erodiurn spp. aÈ the hfgher stocking ratea. Durlng L974, on no
occasion was the botanical conrposltlon of efther the broad-leaved
componenÈ or the narrow-leaved component obviously dlfferent bethteen
pasture treatments at similar stockÍng rates.
8.4 Growth. crude utillzation and avallabll-lty of pasture
8.4.1 1971 Season
The sígnlfícantly lower pasture productLon Ín treatment B and to
a lesser extent in treatment D durfng the autuwt (Flgure 2) can be
attributed to the poor grorJth rate of tlímera ryegrass and Medea ryegrass
respectlvely, as these components contrlbuted over 90 per cent of total
pasture production fn theÍr respectLve treatments (Table 5). However,
total annual production was lowest ín treatment D (Table 15), associated
wlth thÍs treatment having the snallest clover component during the
spríng period (Ffgure 1). Hlghest annual pasture production was
recorded 1n treatments A and E (Table 15) assocíated with higher winter
productíon from Yarloop subterranean clover in Èreatment A and higher
sprÍng productfon from l{oogenellup and particularly Mt. Barker
subterranean clover"t in treatmenÈ E (Figure 1).
The ranking of treatments based on the crude utiLízation of pasture
was símílar to that based on pasture gror"rth rate in 1971 (Figure 2).
The partítioníng of the subterranean clover component lnto conÈributionsby the Woogenellup and Mt. Barker subterranean cl-over varíeties wasonly assessed by vlsual observation.
f
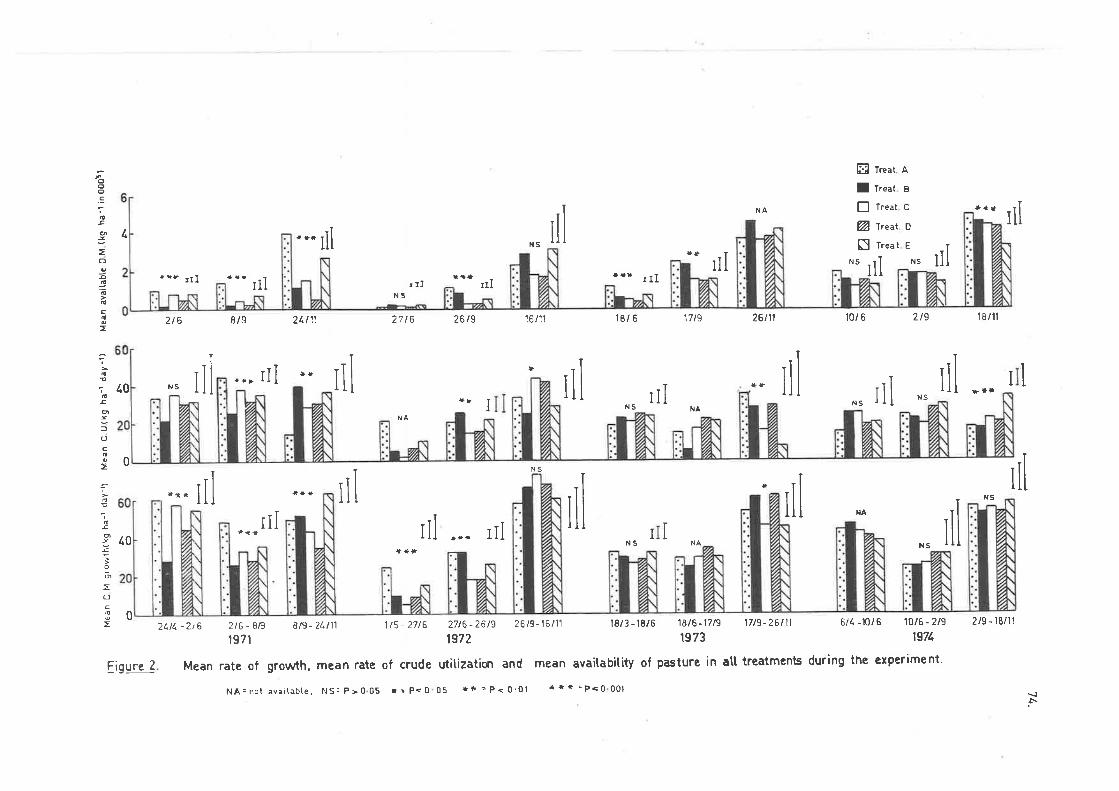
¿0
0
l.O
ooo.=
6EoJ
o0o-õ
õa{
óþd
E
o
lC)
cd
2
ñ!
--ìoo
ocd
ilINA + +*
Iil
S Treat A
I Treat B
! Treat C
Ø T¡e¿t D
S lreat E
l.' -' lll
21.11'.
¡t
t* +
NS
++r ¡rI
18/ 6 17 t9 26t11
**NS NÀ
NS
t8/3-18/6 ',18/6-17/9 l7l9-26/ll
NS
10/ 6 2t9 I 8/11
**lNS
NS
NS
6/¿ -r0/6 '10/6 - 2/9 2/9 - lB/ll
l*
rtl I j N5 ilI**t rIl
2t6 8/9
rrÌNS
***
2/.11, -2t6
III ¡ tIN3
27 t6
NA
++*
1t5- 2716
26/9
{Þ
¡rI
III
16 /11
III
III
IIIIIi
III
l
iII
ilI
rti
ilI
III
irl
rtlI
IIII
II
I
27t6 - 2619
1972
NS
26/9-16/11
I ilNS
IIII iINA
NA
08t9- 2t tl1
1973 1971.
Mean rate of growth. mean rate of crude utitization and mean avaitabitity of pasture in all treatments during the experiment'
NA:notavaiLabte, NS:P>005 r=P<0 05 **--P.OOt ¡r+:P<0001
2lî, - 8ß1971
figure 2
\¡¡\
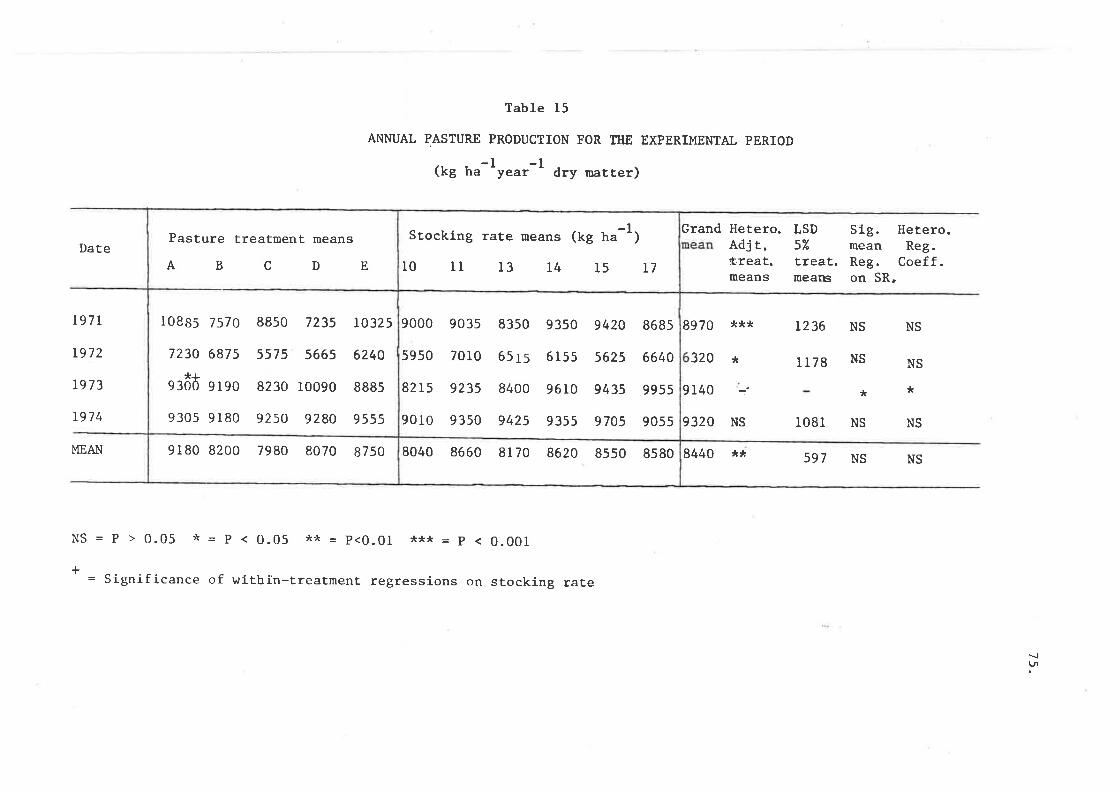
Table 15
ANNUAL PASTURE PRODUCTION FOR ITTE EXPERIMENTAL PERIOD
-l -t(kg ha 'year ' dry rnatter)
DateGrand Hetero.
Adj r.treat.means
Sig. Hetero.mean Reg.Reg. Coeff.on SR,
LSD57"
treat.means
197t
t972
1973
r97 4
8970 *** L236 NS NS
32O * 1178 NS NS
9140 -:9320 NS r08l NS NS
8440 ** 597 NS NS
**
MEAN
NS=P>0.05 *=P<0.05 )t't-p<0.01 ***=p<0.00 I
= Significance of withÍn-treatment regressions on stocking raÈe+
\.1\.Íl
Pasture treatment means
ABCDE
9180 8200 7980 8070 8750
r0885 7570
7230 6875*¡
9300 9190
9305 9180
8850 7235
5575 5665
8230 10090
92sO 9280
10325
6240
8885
9 555
8040 8660 8170 8620 8s50 8580
9000
5950
82r5
9010
9035
7010
9235
9350
8350
65 rs
8400
9425
9350
6 155
96 10
9355
9420
5625
9435
9705
8685
6640
9955
9055
Stoeking rate means (kg tr"-l)
10 1l 13 14 15 17
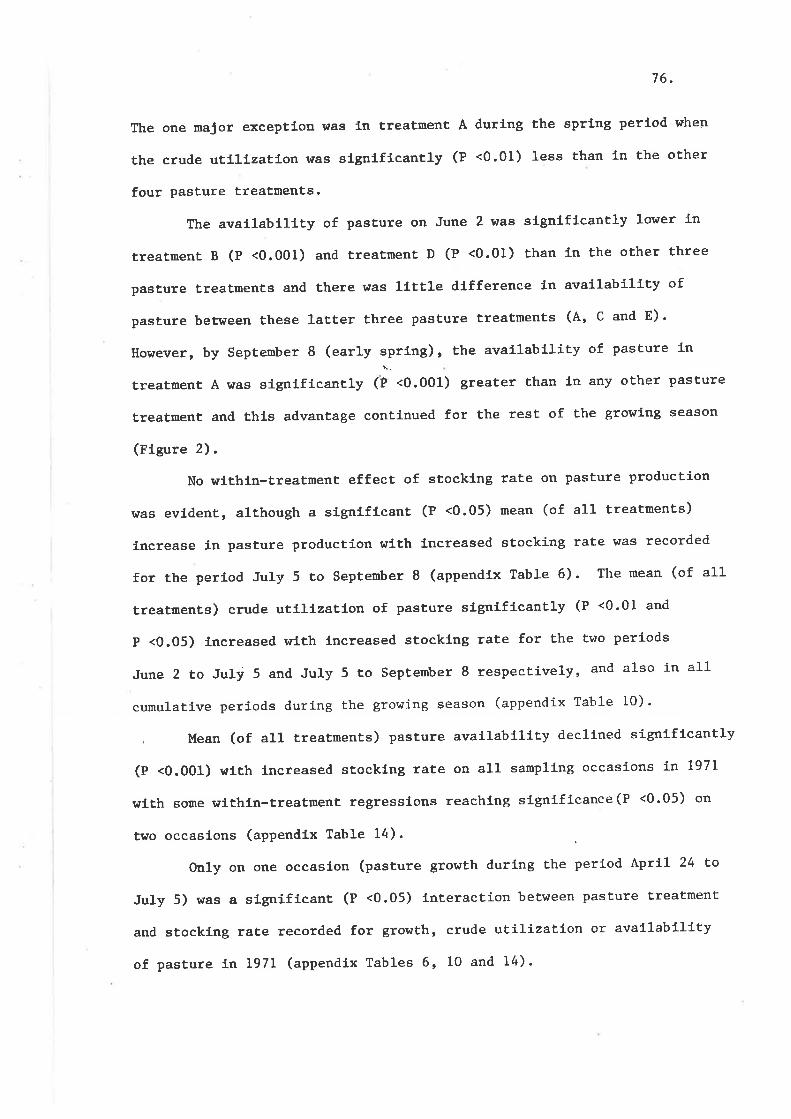
76.
The one naJor exceptlon was fn treatment A durtng the sprfng perLod when
the crude uÈlllzatfon was slgnlficantly (P <0.01) less than in the other
four pasture treatments.
The availabil-ity of pasture on June 2 was signiflcantly lower in
treatment B (P <0.001) and treatment D (P <0.01) than l-n the other three
pasture treatments and there was lLttl-e dl'fference 1n availabillty of
pasture between Ëhese latter Èhree pasture treatments (4, C and E) '
However, by september I (early sprlng), the avaílab11Íty of pasture ín
treatment A was signifícantly (P <0.001) greater than 1n any other Pasture
treatment and this advantage continued for the rest of the growing season
(rigure 2).
No withtn-treatment effect of stocking rate on pasture production
was evÍdent, although a significant (P <0.05) nean (of all treaËments)
fncrease fn pasture productíon with Lncreased stoeking rate was recorded
for the perÍod July 5 to September I (appendLx lable 6). The mean (of all
treatments) crude utllizatfon of Pasture sl'gniflcantly (P <0.01 and
P <0.05) increased wfth lncreased stocklng raËe for the two periods
June 2 to July 5 and July 5 to September 8 respectively, and also in all
cumulatíve periods during the growing season (appendix Table 10).
, Mean (of all treaÈmenÈs) pasture availability declíned sígnificantly
(p <0.001) with lncreased stocking rate on all samplíng occasions ín 1971
with sone lùLthin-treatment regressions reaehíng slgnificance(P <0'05) on
two occaslons (appendix Tab1e 14).
only on one occasion (pasture Srowth during the period Aprll 24 to
July 5) was a signiflcant (P <0.05) lnÈeraction between pasture treatment
and stocking rate recorded for growth, crude utilization or availablllty
of pasture in 1971 (appendix Tables 6, 10 and 14).
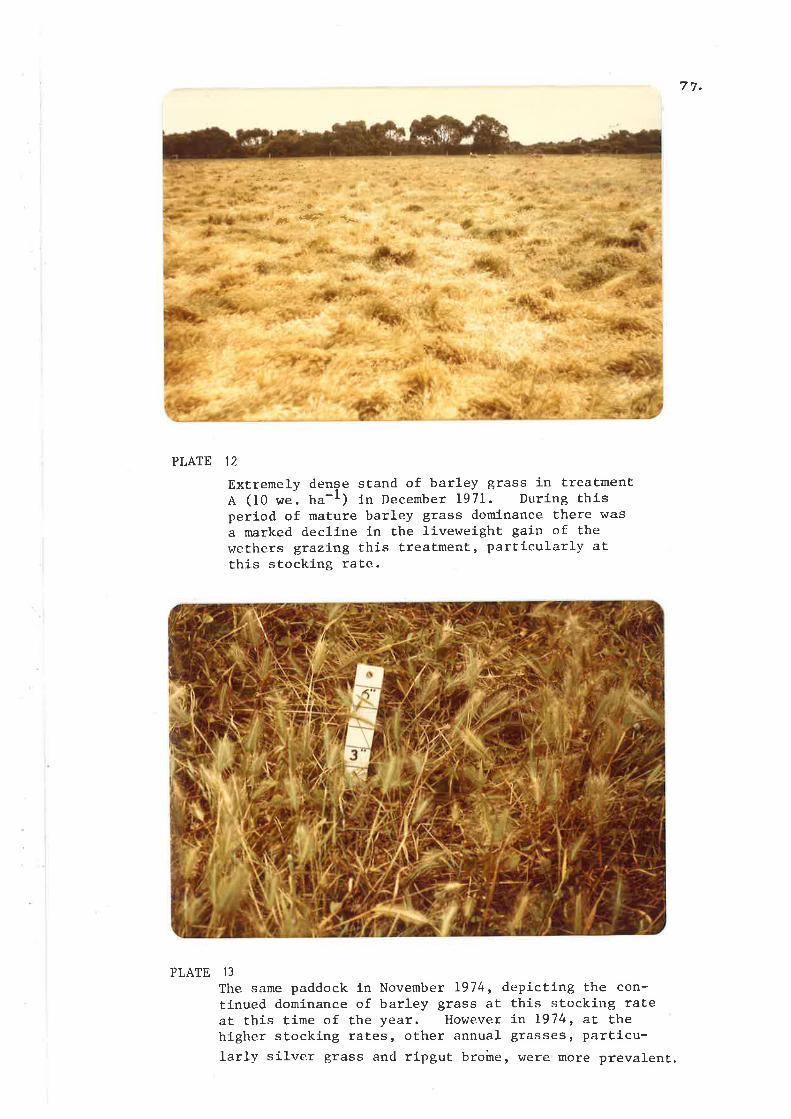
rc.. /Ê
2*.f , nn
PLATE 12
Ext.remely denge stand of barley grass in treatmentA (10 we. ha-r) 1n December 197L. Durlng thísperiod of mature barley grass dominance there wasa marked decline in the líveweíght gain of thewethers grazíng this treatment, partlcularly atthis stockíng rate.
PLATE 13
The same paddock in November 1974, depicting the con-tinued dominance of barley grass at this stocking rateat this time of the year. However in 1974, at thehlgher stocking rates, other annual grasses, parËicu-lar1y silver grass and ripguÈ broine, r^rere more prevalent.
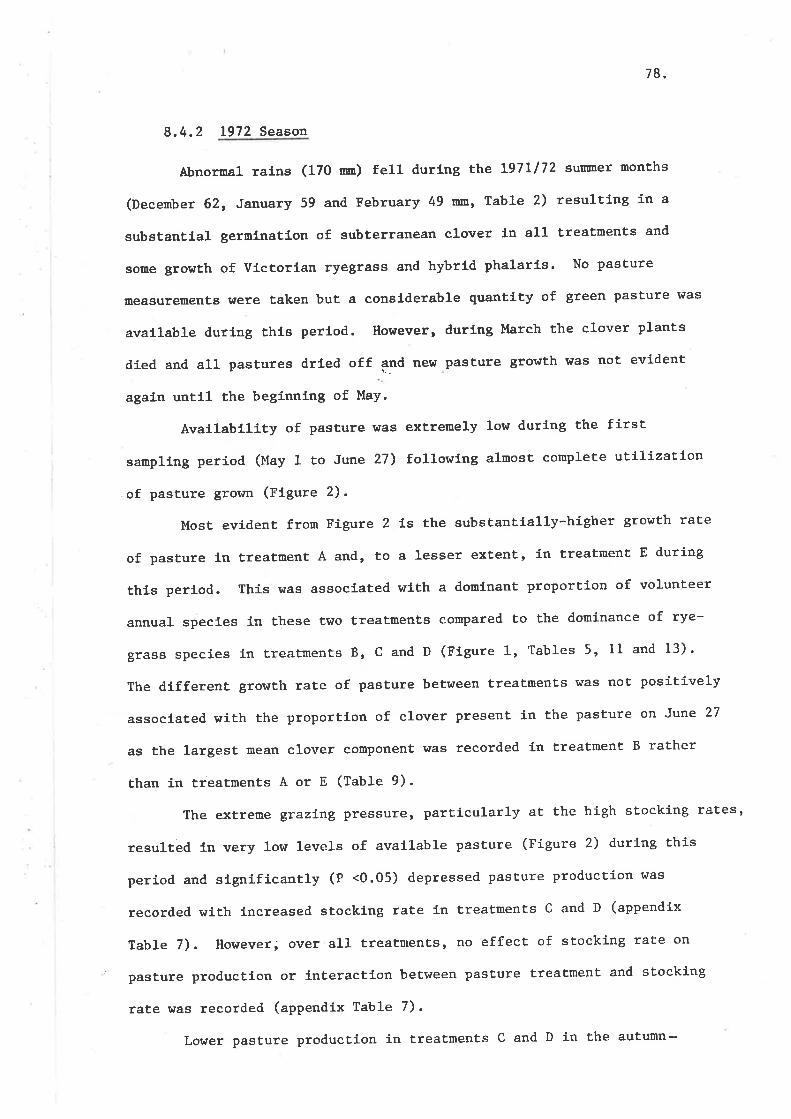
78.
8.4.2 1972 Season
Abnornal rafns (170 m) fell durfng the L97Ll72 surmer months
(December 62, January 59 and February 49 nn, Table 2) resul-ting in a
substantlal germinatlon of subterranean clover ln all treatments and
some growth of victorlan ryegress and hybrtd phalarls. No pasture
measurements were taken but a conslderable quantity of green Pasture üras
avallable during thLs perlod. However, during March the clover plants
dled and all pastures drfed off and new pasture growth !üas not evídent
agaln untll the beginning of MaY.
Avatlability of pasture rüas extremely low durl-ng the first
sarnpling period (May 1 to June 27) followlng almost complete uÈ11ízation
of pasture groÌ,rn (rigure 2).
MosÈ evídent from Figure 2 1s the substantially-higher growth rate
of pasture in treatment A and, to a lesser extent, ln treaÈment E during
this perlod. Thís was associated with a domfnant ProPortion of volunteer
annual species in these t1^to treatments cornpared to the dominance of rye-
grass species in treatments B, C and D (Figure 1, Tables 5, 1l and 13).
The dtfferent groÌ{th rate of pasture between treâtments Ï^tas not positively
associated wlth the proportlon of clover Present 1n the pasture on June 27
as the largest nean clover component l^tas recorded ín treatmenË B rather
Èhan in treatments A or E (Table 9).
The extreme grazlng pressure' perticularly at the high stocking rates'
resulted in very low levels of available pasture (Figure 2) during this
period and sLgnificantly (P <0.05) depressed pasture production lì/as
recorded with increased sÈocking rate in treaËmenÈs C and D (appendix
Table 7). However, over all treatments, no effect of stocking rate on
pasture productfon or lnteraction between Pasture treatment and stoeking
rate was recorded (appendix Table 7).
Lower pasture production in treatments C and D in the autumn-
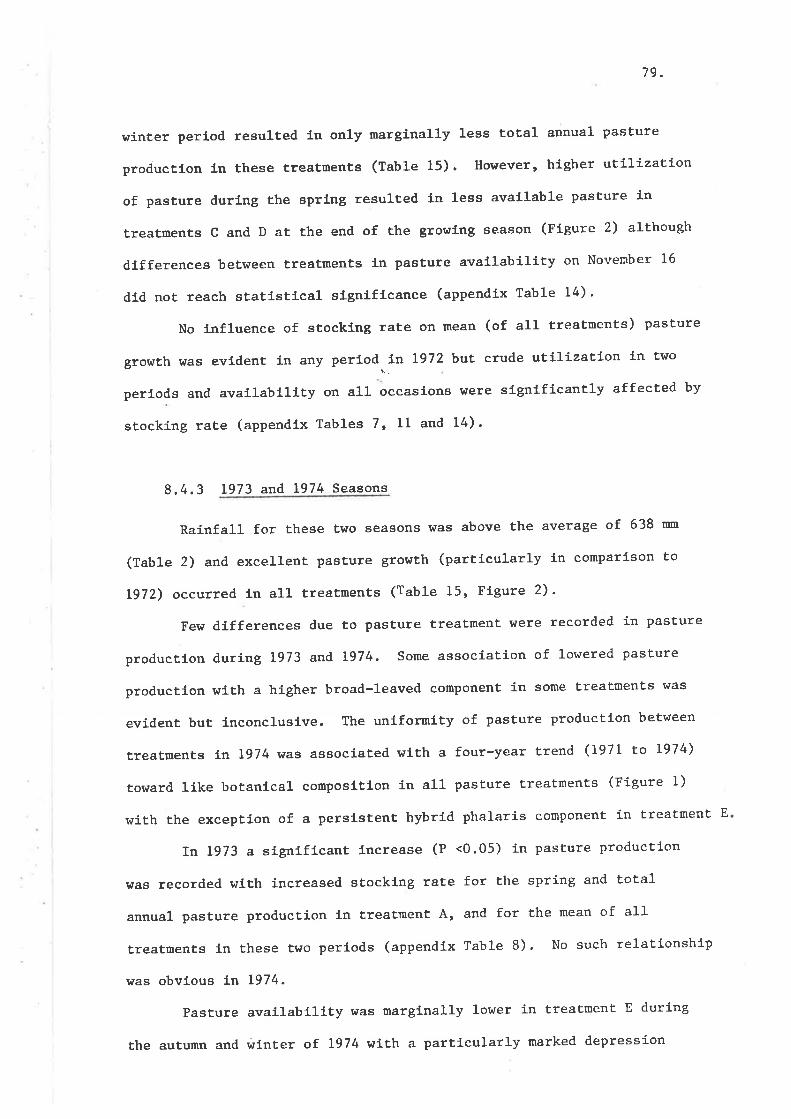
79.
winter perÍod resulted 1n only marginally less total annual pasture
production ln these treatments (Table 15). However, higher utilizatíon
of pasture during the sprl-ng resulted l-n less ava1lable pasture in
treatments C and D at the end of the growlng season (Flgure 2) although
differences between treatments in pasture avatlabillty on November 16
did not reach statlstical- sfgnlfLcance (appendix Table 14).
No l-nfluence of stocking rate on mean (of all treatments) pasture
growth was evldent ín any period,.!n 1972 but crude utilízatíon in two
perlods and availablltty on all occasions were signLfícantly affected by
stocking rate (appendix Tables 7, 11 and 14) '
8.4.3 L973 artd 1974 Seasons
Raínfall for these È!üo seasons hras above the average of 638 tm
(Table 2) and excellent pasture growth (Partícu1arly ln comparíson to
Lg72) occurred 1n all- treatments (Table 15, Flgure 2)'
Few differences due to pasture treatment htere recorded in Pasture
production durlng 1973 and 1974. Some assocl-atíon of lowered pasture
productíon wíth a higher broad-leaved component in some treatments I¡Ias
evÍdenÈ but lnconclusíve. The uniformlty of pasture production between
treaÈments in 1974 was associated with a four-year trend (L97L to 1974)
tor¡ard líke l¡otanLcaL compositlon in all pasture treatments (Figure 1)
¡.rith the excepÈíon of a perslstent hybrid phalaris component in treatment E
In 1973 a signffícant lncrease (P <0.05) in pasture producËíon
was recorded with increased stocking rate for the spríng and total
annual pasture productíon fn treatment A, and for the mean of all
treatments in these Èwo perlods (appendix Table 8). No such relationshíp
was obvíous in L974.
Pasture availabílíty was marginally lower in treatDent E during
the autumn and winter of 1974 wiËh a partícularly rnarked depressíon
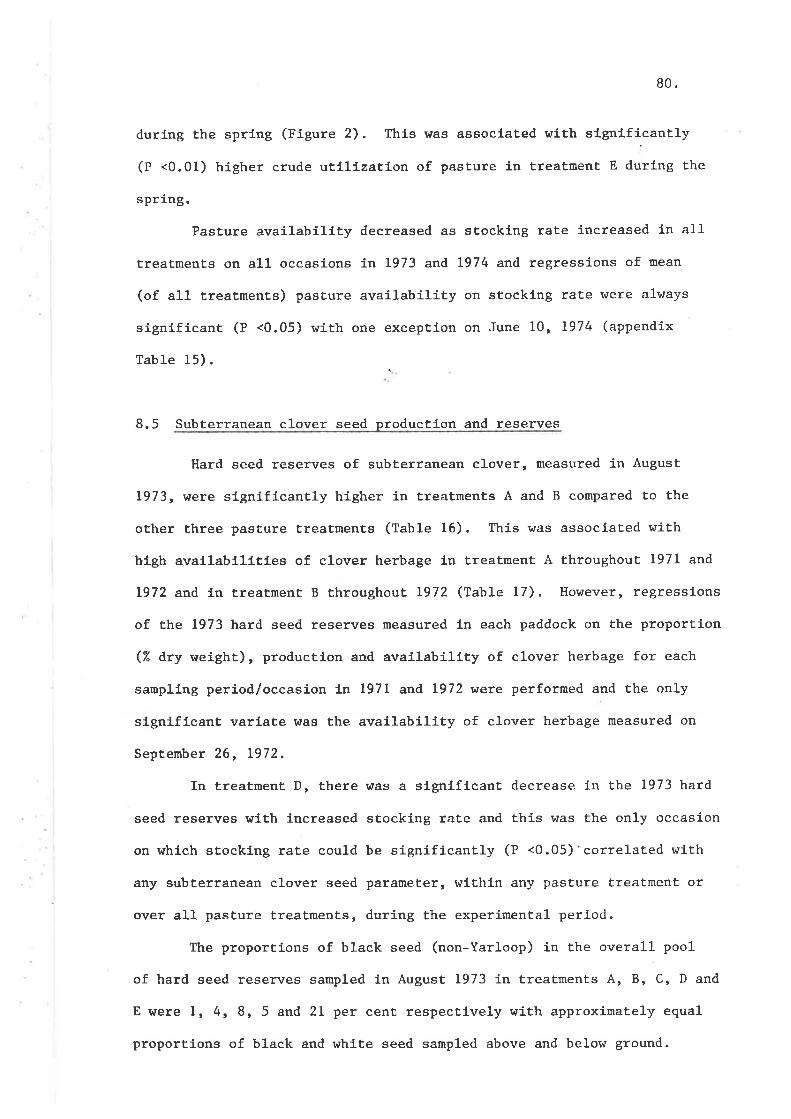
80.
during the sprtng (Figure 2). Thls was assoclated with slgnifi.cantly
(P <0.01) higher crude utilization of pasÈure in treatment E during the
spríng.
Pasture avaílabílity decreased as stocking rate íncreased in all
treatments on all occasions in 1973 and 1974 and regressíons of mean
(of all treatments) pasture avaílabilíty on stocklng rate were always
sfgnlfícant (P <0.05) with one exception on June 10, L974 (appendix
Table 15).
8.5 Subterranean clover seed productlon and reserves
Hard seed reserves of subterranean clover, measured in August
L973, were significantly higher in treatments A and B compared Ëo the
other three pasture treatments (Table 16). Thís was assocíated wiÈh
high avaílabilitíes of clover herbage ln treatment A throughout 1971 and
L972 arrd in treatment B Èhroughout 1972 (Table 17). However, regressions
of the 1973 hard seed reserves measured ln each paddock on the proportíon
(i( dry weight), production and availability of clover herbage for each
sanpling períod/occasion tn L97 1 and L972 vere perforrned and the only
signiflcanÈ variate hras the availabiltty of clover herbage measured on
Septenber 26, 1972.
In treaÈment D, there was a significant decrease in the 1973 hard
seed reserves with increased stockíng rate and this was Èhe only occasíon
on which stocking rate could be signÍficantly (P <0.05)'correlated with
any subterranean clover seed parameter, within any pasture treatment or
over all pasture treatments, during the experimental period.
The proportions of black seed (non-Yarloop) in the overall pool
of hard seed reserves sampled in August 1973 in treatments A, B, C, D and
E were 1, 41 8, 5 and 21 per cent respecËlvely wíth approximately equal
proportions of black and ¡¿hite seed sampled above and below ground.
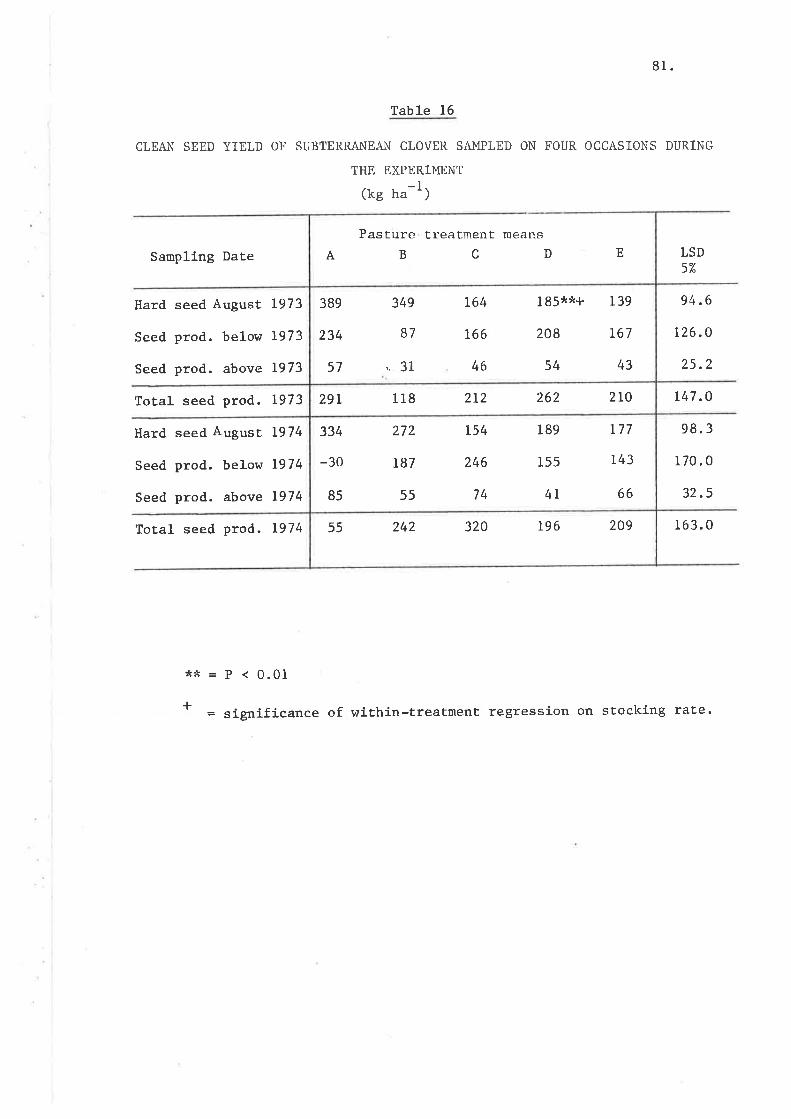
81.
Table 16
CLEAN SEED YIELD OF SUBTERRANE^\N CLOVER SA]"IPLED ON FOUR OCCASIONS DURING
THE EXPERIMENT
-t(ke ha ^)
Samplíng Date LSD5"/"
Hard seed August 1973
Seed prod. below 1973
Seed prod. above 1973
Total seed prod. 1973
Ilard seed August 1974
Seed prod. below 1974
Seed prod. above L974
94.6
126.O
25.2
r47.O
98.3
170.0
32.5
Total seed prod. L974 163.0
*?k=P<0.01
+ = signifÍcance of wLthin-treaÈment regression on stocking rate.
242 20919632055
334
-30
85
L54
246
74
r77
t43
6655 4T
187 155
189272
291 2r2118 2to262
389
234
57
1 85**+
208
54
139
167
43'. 31
r64
46
87
349
t66
Pasture treatm.ent means
BCDA E
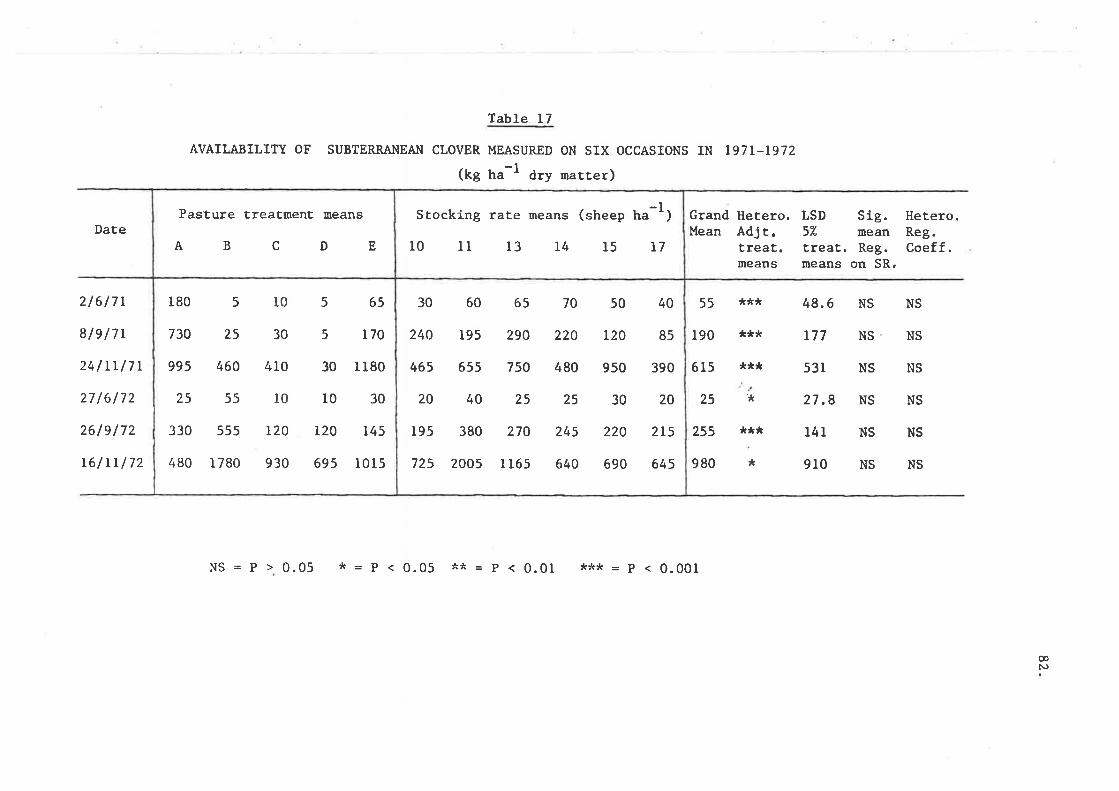
Table 17
AVAILABILITY OF SUBTERRAI{EAIi¡ CLOVER MEASURED ON SIX OCCASIONS IN I97I_L972-t(kg ha ' dry matter)
Grand Hetero.Mean Adjt.
treat.means
LSD Sig. Hetero.57" mean Reg.treat. Reg. Coeff.means on SR,
Date
2l6l7t
8le /7r
24/rrl7r
27 /6172
26/e/72
16/rr/72
55
190
615
25
255
980
***
***
***
*:t*
48.6
t77
53r
27.8
141
910
*
tt
NS
NS
NS
NS
NS
NS
NS
NS
NS
NS
NS
NS
NS = P > 0.05 * = P < 0.05 ** - P < 0.01 **tr = P < 0.001
æ¡\)
Pasture treatment means
AB CDE
180
730
995
25
330
480
5
25
460
55
555
I 780
5
5
30
10
L20
695
65
170
I 180
30
145
10 15930
410
30
t0
r20
l0
Stocking rate means (sheep t"-1)
10 l1 13 14 15 t7
30
240
465
20
195
725
60
195
655
40
380
2005
65
290
750
25
270
r 165
70
220
480
25
245
640
50
120
950
30
220
690
40
85
390
20
2L5
645
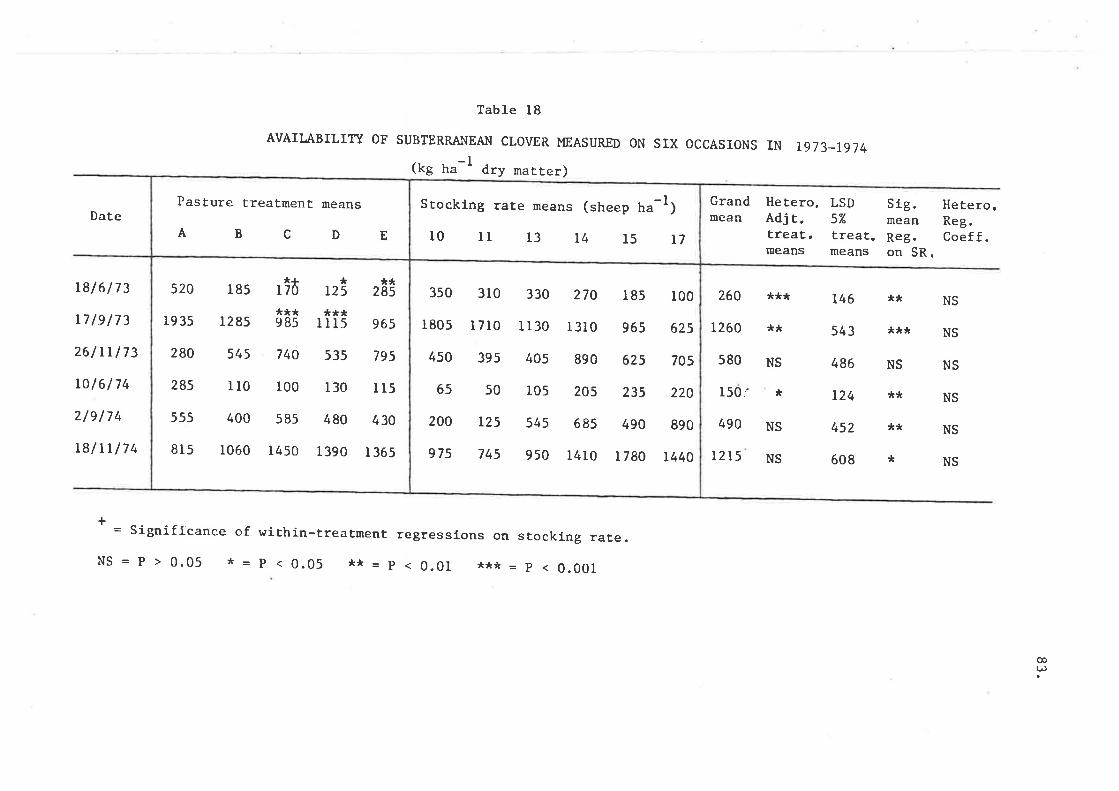
Table 18
AVAII.ABILITY OF SUI}TERRAI.¡EA}¡ CLOVER MEASURED ON SIX oCcASIoNS IN Tg73-1g]4(kg ha-l dry marrer)
Date
r8l6/73
LTls/73
26/Lr/73
Lol6l74
2/e l7 4
L8lrrl74
+
Grandmean
260
1260
580
150:'
490
12t5
Hetero.Adj r.treat.means
LSD57"
treat.means
Sig. Hetero.mean Reg.Reg. Coeff.on SR.
***
**
NS
*
NS
NS
t46
543
486
124
452
608
**
***
NS
**
**
NS
NS
NS
NS
NS
NS*
= Significance of wichin-treatment regressrons on stocking rate.NS = P > 0.05 * = p < 0.05 ** = p < 0.01 :r** = p < 0.001
@(,
520
I9 35
280
285
555
815
r85
l2 85
545
110
400
1060
965
795
tt5
430
I 365
**285
740
100
585
1450
s35
130
480
I 390
*+*170 125
*** ***985 11ts
Pasture treatment means
ABCD E
350
r 805
450
65
200
975
3r0
r 7l0
395
50
125
745
330
1130
405
r05
54s
950
270
I 310
890
205
685
1410
185
965
625
235
490
I 780
100
625
705
220
890
t440
Stocking rate means (sheep t,.-1)
10 l1 13 t4 t5 L7
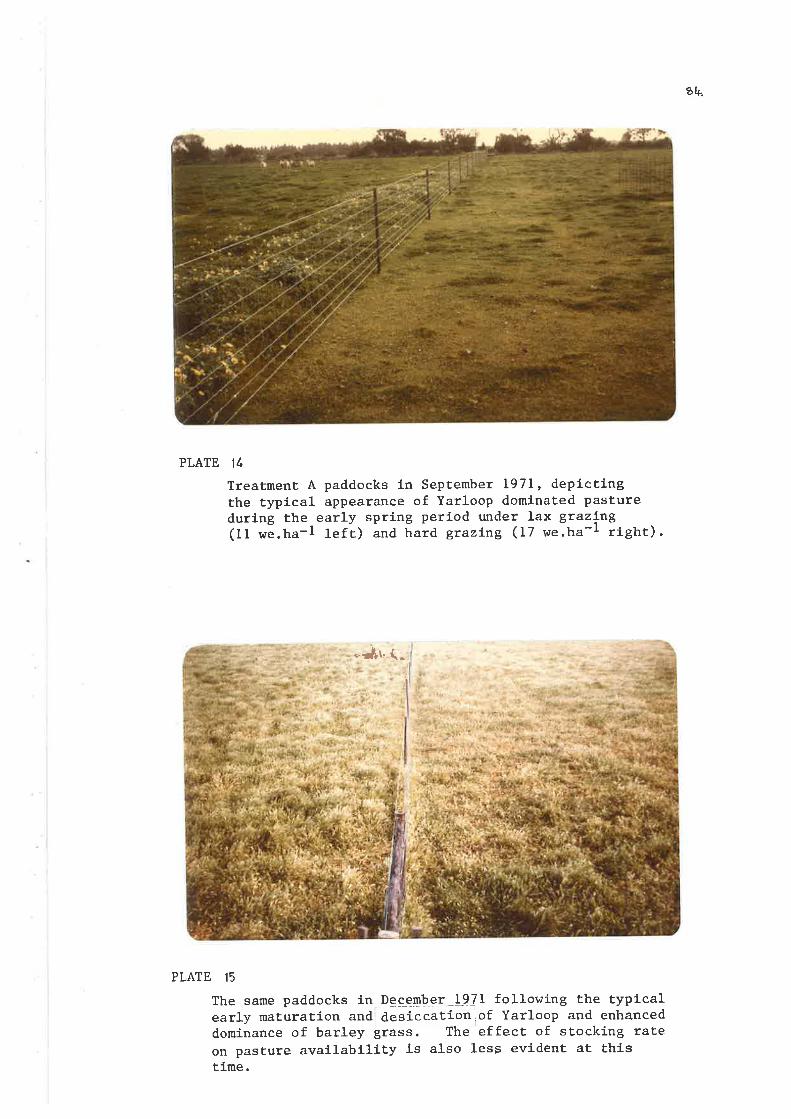
bl+.
PLATE \1,
Treatment A paddocks in September L97I, depictlngthe typical appearance of Yarloop dominated Pastureduring the early spring period under Iax grazing(11 we.ha-l left) and hard grazLng (17 we.ha-r right).
.-¡ff\,.1.
PLATE 15
The same paddocks ín Dçrqe¡¡b9I l-911 follov¡ing the typicalearly maturation and desÍccatíoniof Yarloop and enhanceddominance of barley grass. The effect of stockíng rateon pasture availability is also less evident at thistime.
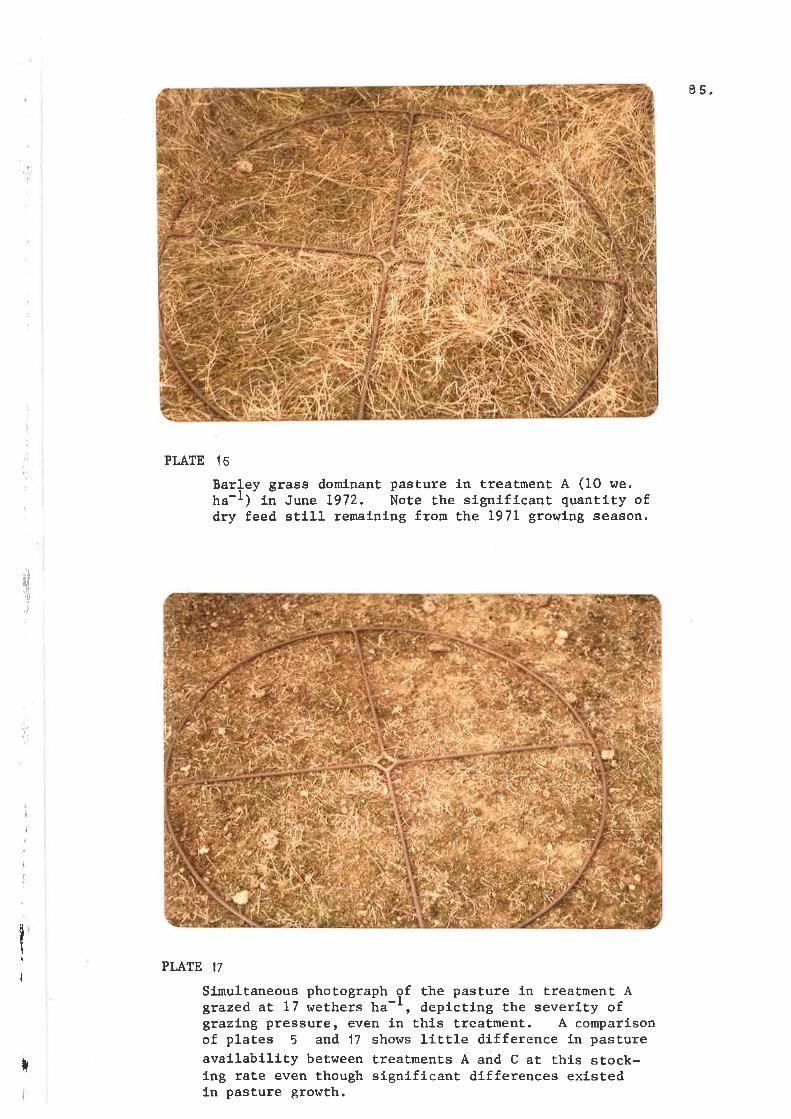
85,
t!
I
._r
el'i
Barley grass domlnant pasture Ín Èreatment A (10 we.tra-r) ln June L972. Note the stgnificant quantity ofdry feed st1ll remaLnlng from the 1971 growlng season.
I
PLATE 16
PLATE 17
r
Sfunultaneous phot,ograph gf the pasture in treatment Agtazed at 17 wethers ha-r, depictlng the severity ofgxazLng pressure, even in this treatment. A comparisonof plates 5 and 17 shows little dlfference 1n pastureavallablllty between treatments A and c at thls stock-ing rate even though sígnificant differences exlstedfn pasture grovrth.
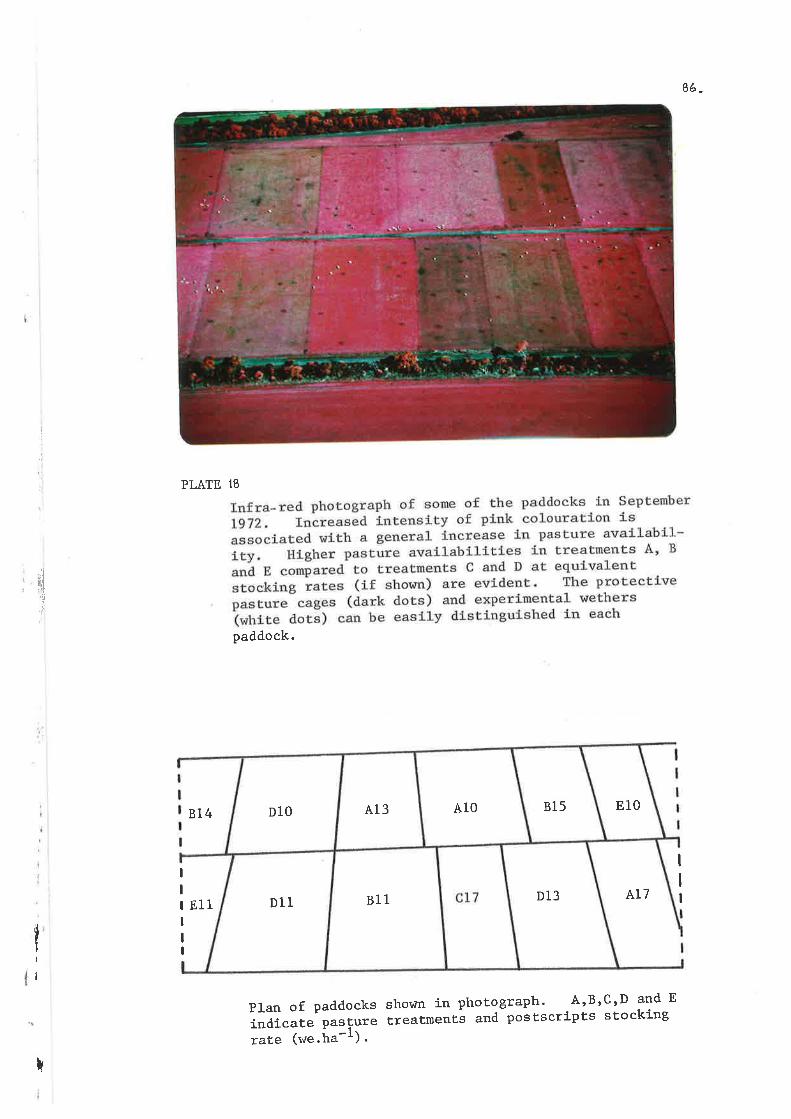
86-
I
,¡
PLATE 18
{¡'l
paddock.
1B 4
I
III
II
I
A17
I
I
I
r
Dl1 811 D13
D10 A13 A10 815 810
811
Plan of paddocks shown in photograph' A'B'c'D and E
índicate pasture treatmentÁ and postscripts stocking
raËe (v/e.tra-r).
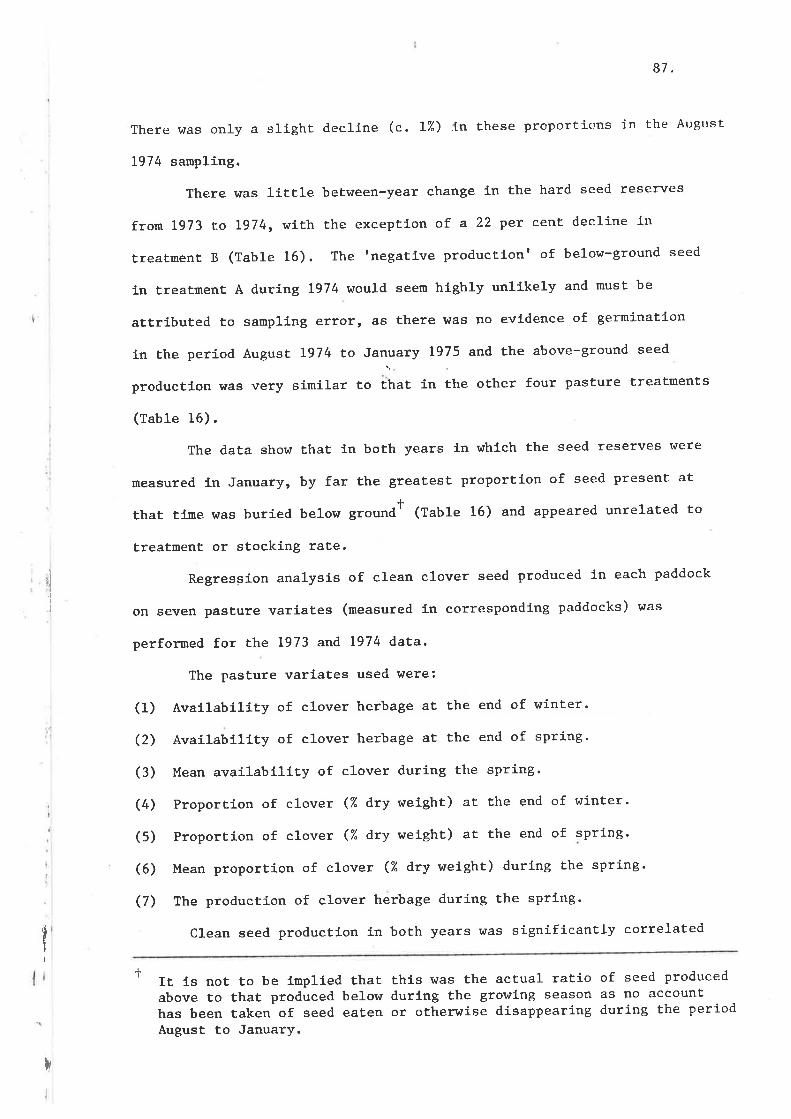
',,]
'ri
l
87,
There was only a slight decline (c. 17") ín these proportions in the Ar:gust
1974 sampl-íng.
There was líttle between-year change ín the hard seed reserves
from 1973 to 1974, with the exception of a 22 per cent decline ín
treatment B (Table 16). The Ineɡative production' of below-ground seed
ín treatment A duríng 1974 would seem hígh1y unlikely and must be
attributed to sampling error, as there I'¡as no evidence of germination
1n the period August 1974 to January 1975 and the above-ground seed
productlon htas very símilar to that in the oÈher four pasture treatments
(Table 16).
The data show thaÈ in boÈh years in which the seed reserves I^Iere
measured l-n January, by far the greatest ProPortion of seed present at
that time was buried below gtot nd+ (Table 16) and appeared unrelated to
Èreatment or stockíng rate.
RegressÍon analysis of clean clover seed produced in each paddock
on seven pasture variates (measured in correspondíng paddocks) was
perforured for the 1973 and L974 data.
The pasture variates used hrere:
(1) Availabilíty of clover herbage at the end of wínter.
(2) Availabílity of clover herbage at the end of spring'
(3) Mean availability of clover during the spring'
(4) Proporrion of clover (7" dry weight) at the end of wínÈer.
(5) Proportion of clover (% dry weíght) at the end of spring.
(6) Mean proportion of clover (7" dry welght) during the sPring.
(7) The production of clover herbage during the spring'
CLean seed production in both years was signífícantly correlated
It ís not to be implied that thls was the actual ratío of seed produced
above to that produced below during the growíng season as no accounthas been taken of seed eaten or otherwise disappearing during the periodAugust to January.
I
+
þ
88.
only with Ëhe avaílability of clover at the end of each respective
spring accordíng to the followfng equations
lg73 y = 63.48 + 0.479x- 0.00024*2, t2 = 0.46, P <0.001
Lg74 y = 24.98 + 0.188x, t2 = O.52, P <0.001
where y = clean clover seed production (kg ha-l) measured ín 1973 and
and I974 respectively
and x = availability of clover ltg tra-l) measured on the last sampling
occasion in 1973 ar.d 1.974 respectively.
It is interesting to note here that, alÈhough there appeared to be
an íncrease in Èhe amount of clover seed produced r¡lth increased avallability
of clover herbage at the end of the 1974 growfng season' there was no
recorded effect of stocking rate on clover seed production in I974. This
was despite the significant (P <0.05) nean (of all treatments) íncrease
in the availability of clover with íncreased stocklng rate recorded on
November 18, L974 (Table 18).
8.6 Sheep liveweight data
The foLlowing points are evident from Figure 3.
8.6.1 General Trends
a) The recorded pattern of liver¡eight change in the sheep is
characteristic for the Mediterranean-type envíronment, wíÈh a
decline in liveweighÈ during the sunmer and autumn (and in 1972'
r¡inter also) and lncrease during the winter and spring.
b) Minimum, and maximum, live weights h¡ere recorded símultaneously in
all treaÈments in all years.
c) In the three years I97L, 1973' and 1974 mlnimumliveweighls vrêrê
recorded during the same fifteen day, calendar period in each year
(April 18 to May 3). In L972, mínimumliveweights \,tere not reached
89
d)
unÈ1l July 12 fol-lowing the late seasonal break.
A dlrninishíng wiÈhin-year magnitude of difference in live weight
between pasture treatments over the experimental period (L97I to L974)
is obvíous. I
8.6.2 r97I
In comparison to the other four pasture treatments the mean live
weight ín treatment B declined more rapidly prfor to the opening rains
ín April, and during May all she.ep díed from undernutrítion aË the
híghesË stockíng rate (l-7 t.-1) ln this treatment (appendix TabLe 29).
lreatmenË B ranked signífícantly (P <0.001) lowest in mean live weight on
all weighlng occasions in 1971 and on the first weighing ín 1972 (January
19) prlor Èo shearing. However, once neI¡r pasture growth occurred in
April, liveweight gaín was greater ín treaÈment B than in treatment D.
Five dístincÈ periods of differential liveweight change between
pasture treatments were recorded :
a) The inittal period from the allocation of the sheep to their
. respectlve paddocks to the fírst paddock weíghing (February 10).
The decline ín the líve welghts ín treatment B was the most significant
aspect ín this períod.
b) May 3 to June 23 - markedly superior liveweight gain was recorded
fn treatment A and, to a lesser extent, in treatments C and E.
c) June 23 to August 24 - superior liveweight gain was only recorded
ín treatments A and E.
d) August 24 to October 5 - subsÈantial liveweíghÈ gain only occurred
Ín treatment A.
e) October 5 to November 11 - lívewelght gain in treatmenÈ A was Èhe
lowest of all- pasture treatments.
A significant effect of stocking rate on the mean (of all treatments)
live weight was flrst recorded on June 23 and an lnteractlon between
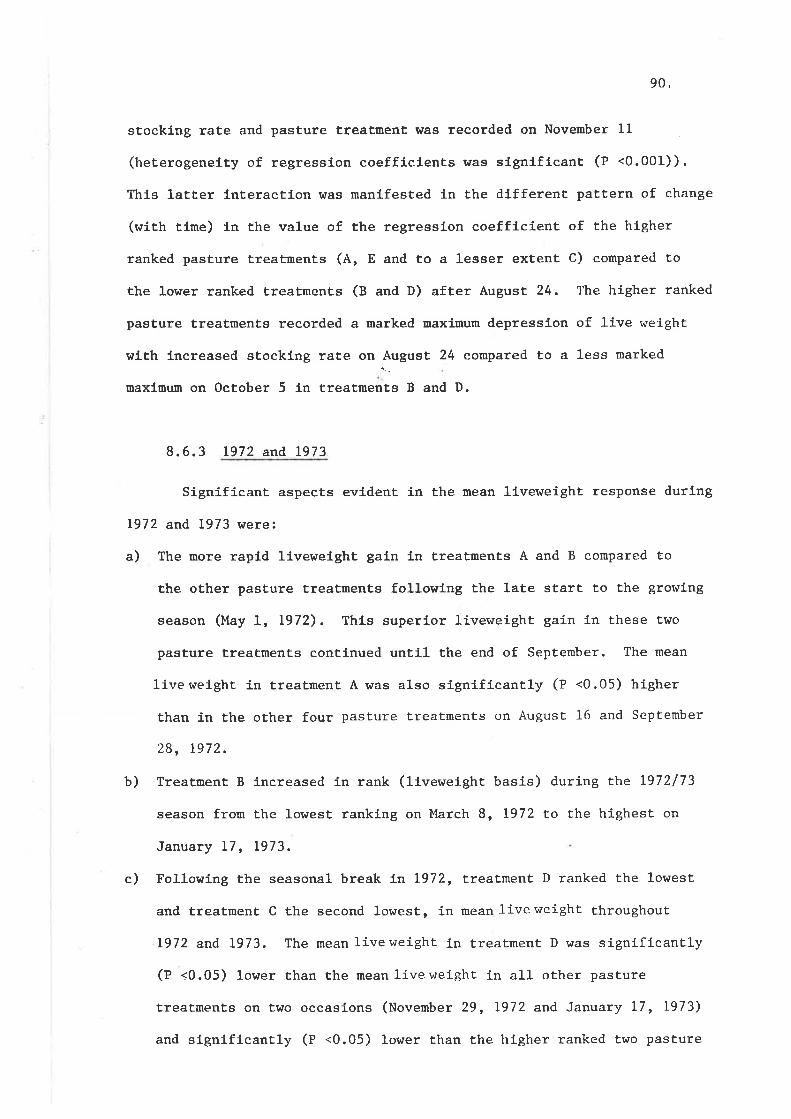
90,
stocking rate and pasture treatment was recorded on November 11
(heÈerogeneity of regression coefficlents was slgnlfícant (P <0.001)).
Thís latter ínteracÈíon was manifested in the dl,fferent pattern of change
(with tlme) fn the value of the regressíon coefficíent of the hígher
ranked pasture treatments (4, E and to a lesser extent C) cornpared to
the lower ranked treatmenÈs (B and D) after August 24. The higher ranked
pasture treatments recorded a marked maximum depression of live weight
with increased stocking rate on August 24 compared to a less marked
maximum on October 5 in treatrnenis B and D.
8.6.3 L972 ar.d 1973
Significant aspects evident ín the mean liveweight response durlng
1972 and 1973 were:
a) The more rapid lf-vewelghÈ galn in Ëreatments A and B compared to
the other pasture treatments followl-ng the late start to the growing
season (May 1, 1972). Thls superíor livewelght gaín ln these two
pasture treatments contlnued until the end of Septenber. The mean
livewelght in treatment A was also signlficantly (P <0.05) higher
than in the oËher four pasture treatments on August 16 and September
28, t972.
b) Treatnent B íncreased in rank (livewelght basis) during tt.e L972/73
season from the lowest ranklng on I'larch 8, 1972 to the highest on
January 17, L973.
c) Followíng the seasonal break In 1972, treatnent D ranked the lowest
and treatment C the second lowest, in meanliveweight throughout
1972 and I973. The mean liveweight ín treatment D was signifícantly
(P <0.05) lower than the mean liveweight ín all other pasture
treatments on Èrüo occasíons (November 29, 1972 and January 17, 1973)
and signifícantly (P <0.05) lower than the hígher ranked tlnlo pasture
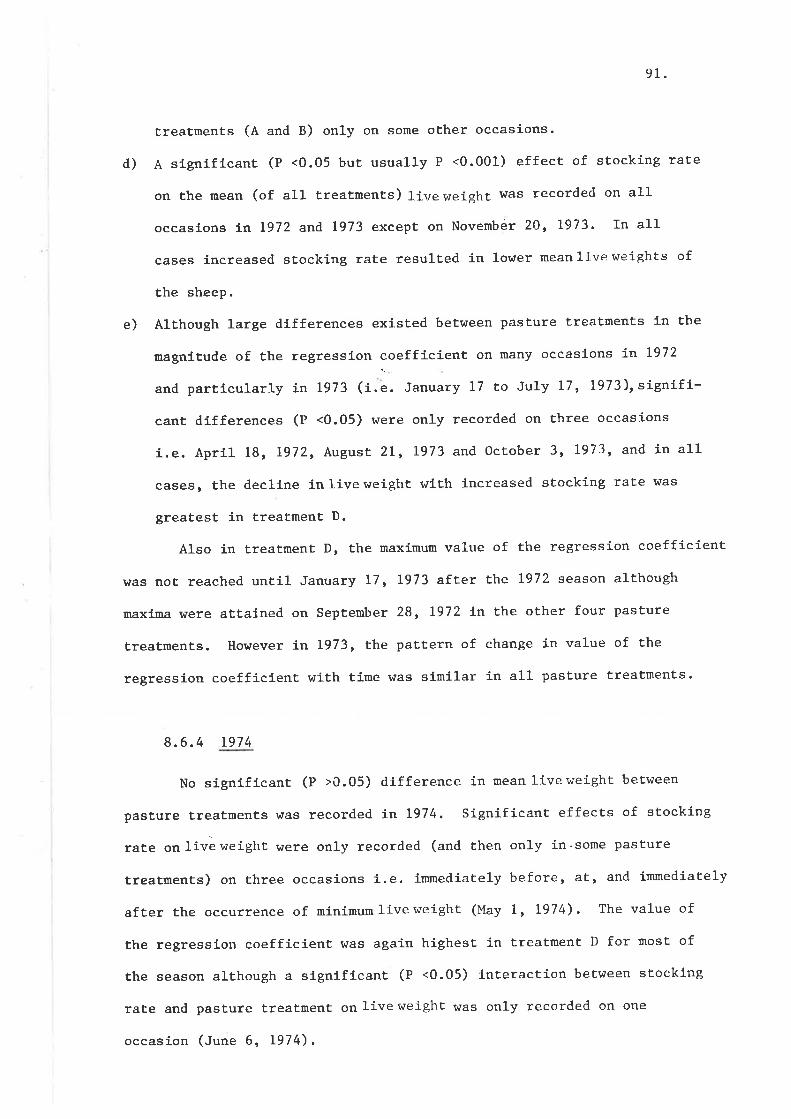
91.
treatmenEs (A and B) only on some other occasions.
d) A signÍflcant (P <0.05 but usually P <0.001) effect of stocking rate
on the mean (of all treatments) lir¡e weighÈ ülas recorded on all
occasions in 1972 and 1973 excepÈ on Novembet 20, L973. In all
cases increased stocking raÈe resulted in lower mean live weights of
the sheep.
e) Although large differences exísted beÈween pasture treatments ín the
magnitude of the regressfon coefficient on many occasíons ín I972
and partieularly in 1973 (í.e. January L7 to July 17, L973), signifi-
cant dífferences (P <0.05) were only recorded on three occasíons
i.e. April 18, 1972, Augusr 21, 1973 and OcÈober 3, L973, and in all
cases, the decline inlíveweight wlth lncreased stockíng rate rntas
greatest in treaËment D.
Also in treatment D, the maximum value of the regression coefficient
was not reached unËil January 17, L973 after the 1972 season although
naxima were attaíned on September 28, L972 ín the other four pasture
treatments. However in 1973, the pattern of change in value of the
regression coefficient rnrith tíne was simÍlar in all pasture treatments.
8.6.4 r974
No sígnificant (P >0.05) difference in meanliveweight between
pasÈure treaÈments \.ras recorded ín I974. Signíficant effects of stocking
rate onlivàweíghL were only recorded (and then only in.some pasture
treatments) on Ëhree occasions í.e. irnmedíately before, ât, and inmediately
after the occurrence of minimumliveweight (May 1, 1974). The value of
the regression coeffÍcient r.ras again highesÈ in treatment D for most of
the season although a signíficant (P <0.05) ínteraction between stockíng
rate and pasture treatment on live weight was only recorded on one
occasion (June 6, 1974).
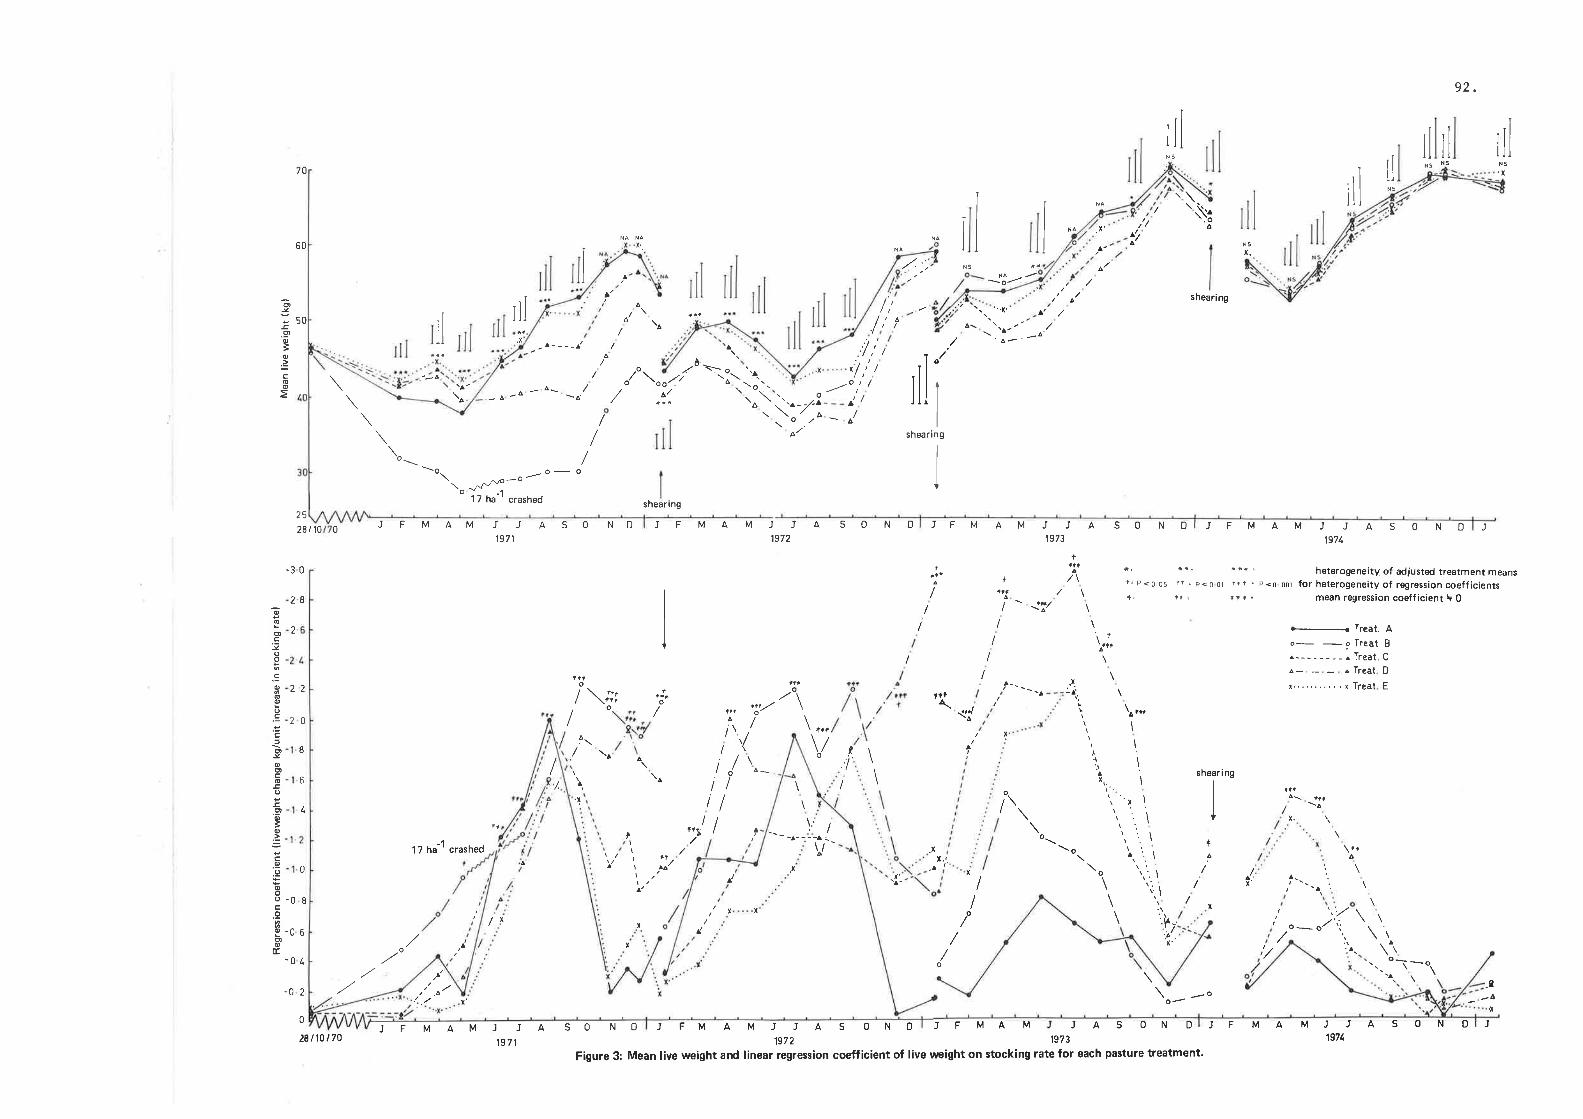
92.
IIiilil ril
N5.x70
60
25
28t10
NS
\
\
'.\i, \
:ì^_
'x'
shearing
ilil
tol
NA
.r. \-^i. \
Ittt to tt'
I+
Io
\:ô
x'.
ô
x'
N5x.
./,'. NS
A \ol'
/ll
50
ov
E.9o3oIcoo
.x
. - ô- /- t -o \À
JJASO19?1
/x
ôo
o/\ oo4/L/
./ \:- o\o\
\o
17 ha-1 crashed
IiI /,, '. ".x.
tX
L'/
ÌI\¡
JFMAM
-o\ -^-o/o- o/
\ ^^^/-""'il n"'1 crashed
JFMAM
a- ^.r^-.-- o.,/' ^¿'
ND
\A
\o'.a.\
^
.,y',,, ,ôA
]II'l-
i/.--ô
- - .t- -,/-L
ìo"ob'/ shear in g
\
shear ing
0JFMAMJJASOND
1972
JJASONOt 973
JFMAM JJASOND197t,
ô
J
-30 I+
'\t
^tr+
a. rt.+.P<O05 1t.p-OOt rr1:+. ît, Itl '
sheari ng
heterogeneity of adjusted treatment meansp <0 00r for heterogeneity of regression coefficients
mean regression coeff icient \ 0
--
lreat. A
o Treat, B
a--------¡Treat.Cô-.- - ¿Treat D
¡.......'...¡ Treat E
-06
o
oc!oo
.;ooo.g.!
IoocoEo
f.9o3oÈ
c.9.9
oooc.9
oootr
28
2
+
I
22
IU
I
6
t,
o
ttJ
o
\A
IIt/
ItL.
tlt\ g,,.\ ^--
ï'
I
t!itil,rr^l I
rlt//o
'(
\.x
/.
\t--^ (\/ -
\r
o
l:.^.ft
,'l
t\\rti\
xr. \
t\ "x \\"\\\'t'.\.a'.\.\ \.o\
\"
\AÀ
A-.-
o
a
¡
ô1
t.\A
I-a
.x
U
-0 8
-0 4
II /,
-oo-
^.x'
,'tx t ',.,/ t,' o=- o./':,
\
-.. "ì-
o
x
JFMAMJT1971
x
ASONO JFMAMJJA1972
SOND JFMAM
A
x'
i7o
-02
0
!..,/-¡
¿ò'x
JASOND JFMAMJJASOND19?t'19732A I 10 170
Figure 3: Mean live weight and linear regression coeff ic¡ent of live vræight on stocking rate for each pasture treatment.
J
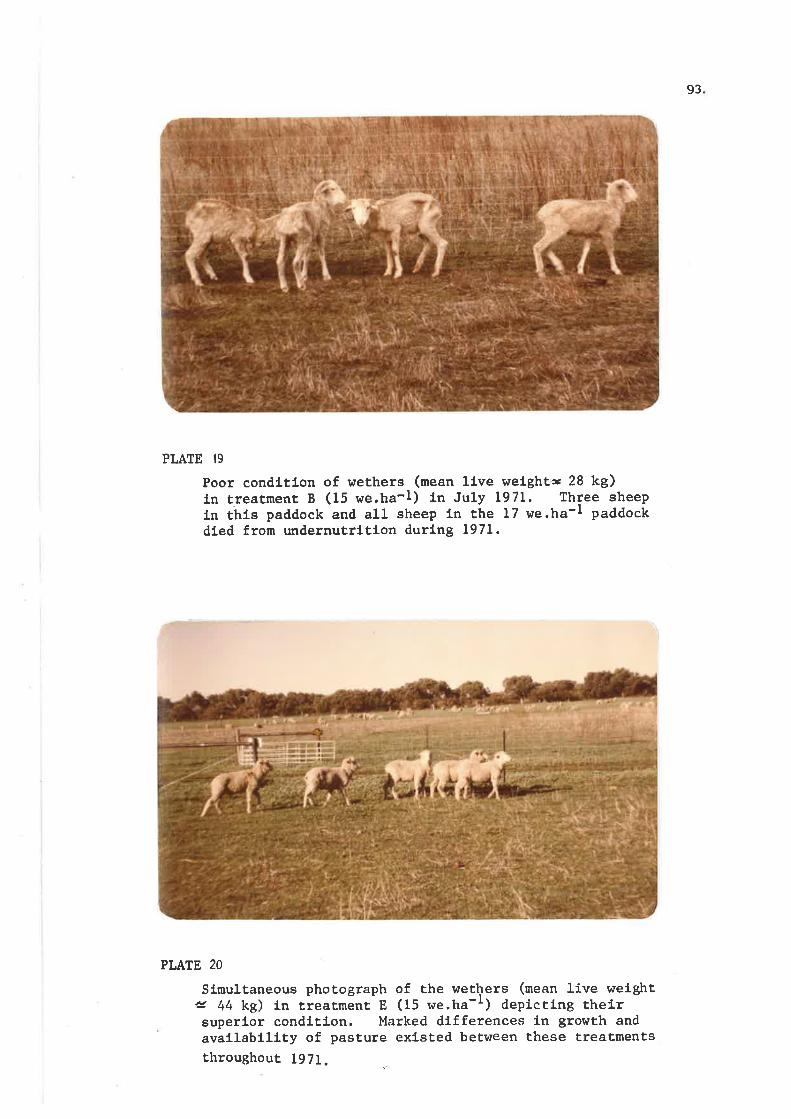
93
PLATE 19
PLATE 20
Poor condftlon of wethers (mean l1ve wefghts 28 kg)Ín treatment B (15 we.tra-l) ln Ju1-y 197L. Three sheepfn thls paddock and all sheep 1n the 17 we.ha-r paddockdfed from undernutrltlon durfng L97L.
'l
Simultaneous photograph of the wethers (mean lÍve weights 44 kg) 1n treatment E (15 we.ha-') depictlng theirsuperlor conditlon. Marked dtfferences in growth andavallablllty of pâsture exlsted between these treatmentsthroughour 1971.
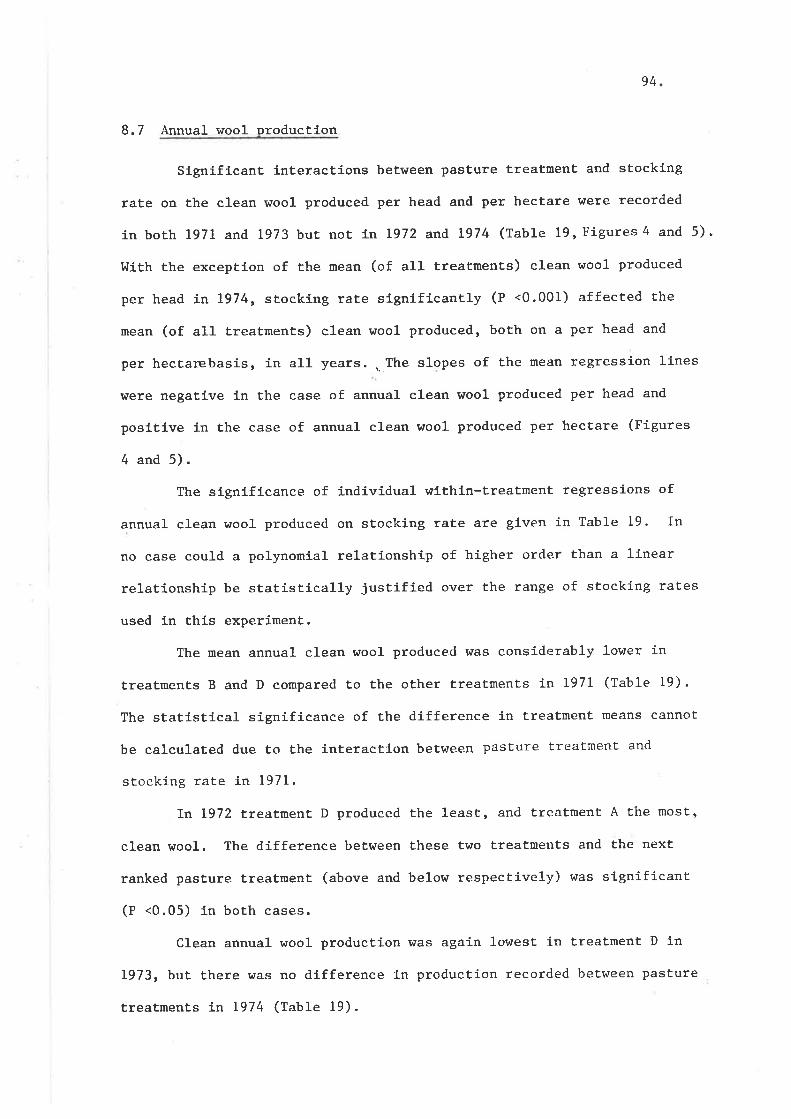
94
8.7 Annual wool production
Signíficant interactions between pasture treatment and sÈocking
rate on the clean wool produced per head and per hectare \¡tere recorded
in borh 1971 and 1973 bur noÈ l-n 1972 and 1974 (Table 19,Figures4 and 5).
I^fíth the exception of the mean (of all treatrnents) clean wool produced
per head ín 1974, stocking rate significanÈly (P <0.001) affected the
urean (of all treatments) clean wool produced, both on a per head and
per hectarebasís, in all years...The slopes of the mean regression lines
were negative in the case of annual clean wool produced per head and
positive i-n the case of annual clean wool produced per hectare (Fígures
4 and 5).
The sígnifícance of indivídual wlthLn-treatment regressions of
annual clean wool produced on stocking rate are given in Table 19. In
no case could a polynomial relationship of higher order than a linear
relationship be statistically justified over the range of stockíng rates
used in this experiment.
The mean annual clean wool produced was consíderably lower ín
treatnents B and D compared to the other treatments in 1971 (Table 19).
The statlstical significance of Èhe difference ín treaÈment means cannot
be calculated due to Èhe ínÈeracËion betweeri pasture treatment and
stockíng rate ín L97I.
In 1972 treatment D produced the least, and treatment A the most'
clean wool. The dífference between these two treatments and the next
ranked pasture treatnent (above and below respectívely) was signifícant.
(P <0.05) ín both cases.
Clean annual wool productíon was again lowest in treatment D in
1973, but there was no dlfference in production recorded between pasture
treatments in 1974 (Table 19).
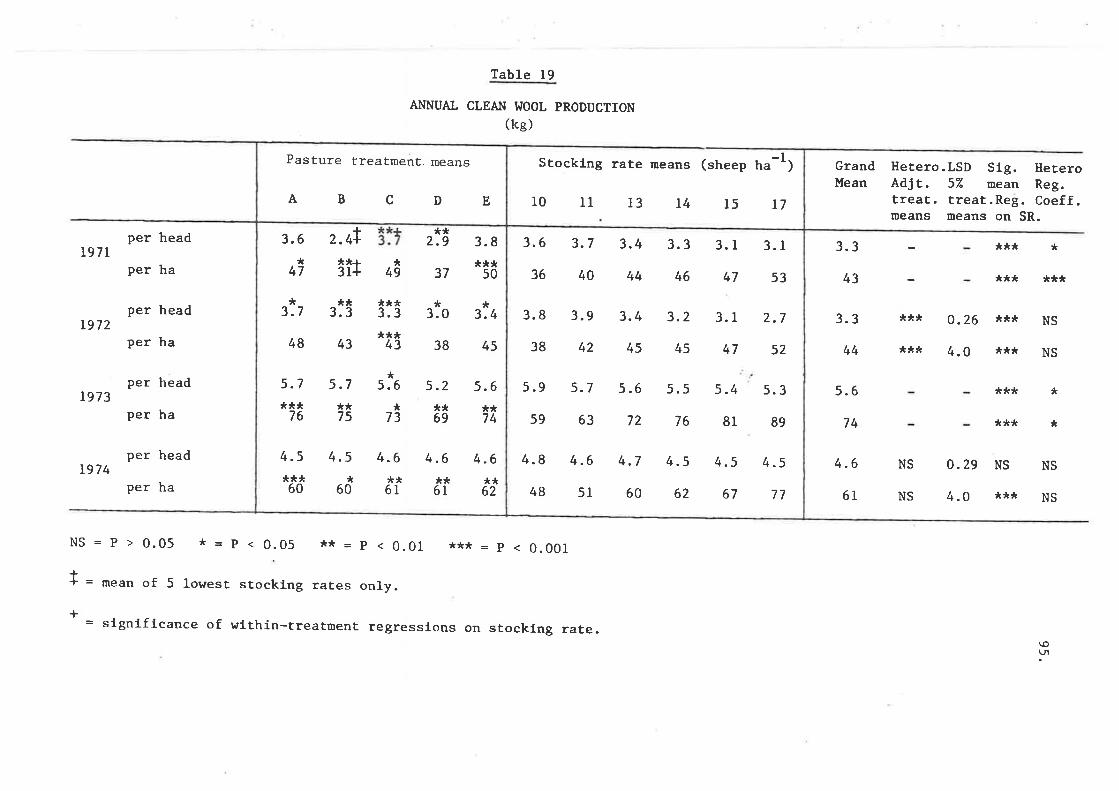
Table 19
ANNUAL CLEAT.¡ }¡OOL PRODUCTION(te)
*3
*
37
*
2
**75
*60
*
**61
*
**
**61
*
**62
48 43
**3.3
.rt|**r3r+
**43 38 4s
*49
**.3
4.64.5***60
3.7
3.6*
47
5.7***
76
4.s
5.7 5.6*
73
4.6
5.2**69
3.0
2.9
4.6
3.4
5.6**74
3.8*:t*
50
Pasture treatment, means
D EABC
3.6 3.7 3.4 3.3 3. r 3.1
36 40 44 46 47 53
3.8 3.9 3.4 3.2 3.1 2.7
38 42 45 45 47 52
5.9 5.7 5.6 5.s 5.4 s.3
59 63 72 76 81 89
4.8 4.6 4.7 4.5 4.5 4.5
48 51 60 62 67 77
Stocking rate means (sheep t"-1)
r0 11 13 L4 15 t7
GrandMean
Hetero.LSD Slg. IleteroAdJt. 5% mean Reg.treat. treat.Reg. Coeff.means means on SR.
l97L
L972
1973
t974
per
Per
per
Per
Per
Per
per
Per
head
ha
head
ha
head
ha
head
ha
3.3 *** *
43 *** ***
3.3 *** 0.26 *** NS
5.6 *** *
74 *** *
4.6 NS 0.29 NS NS
61 NS 4.0 *** NS
**rr 4.O *** NS44
NS = p > 0.05 * = p < 0.05 ** = p < 0.01 *** _ p < 0.001
+ = mean of 5 lowest stocklng rates only.
= slgnfficance of wl,thin-treatment regressfons on stocking rate.+
\o(Jl
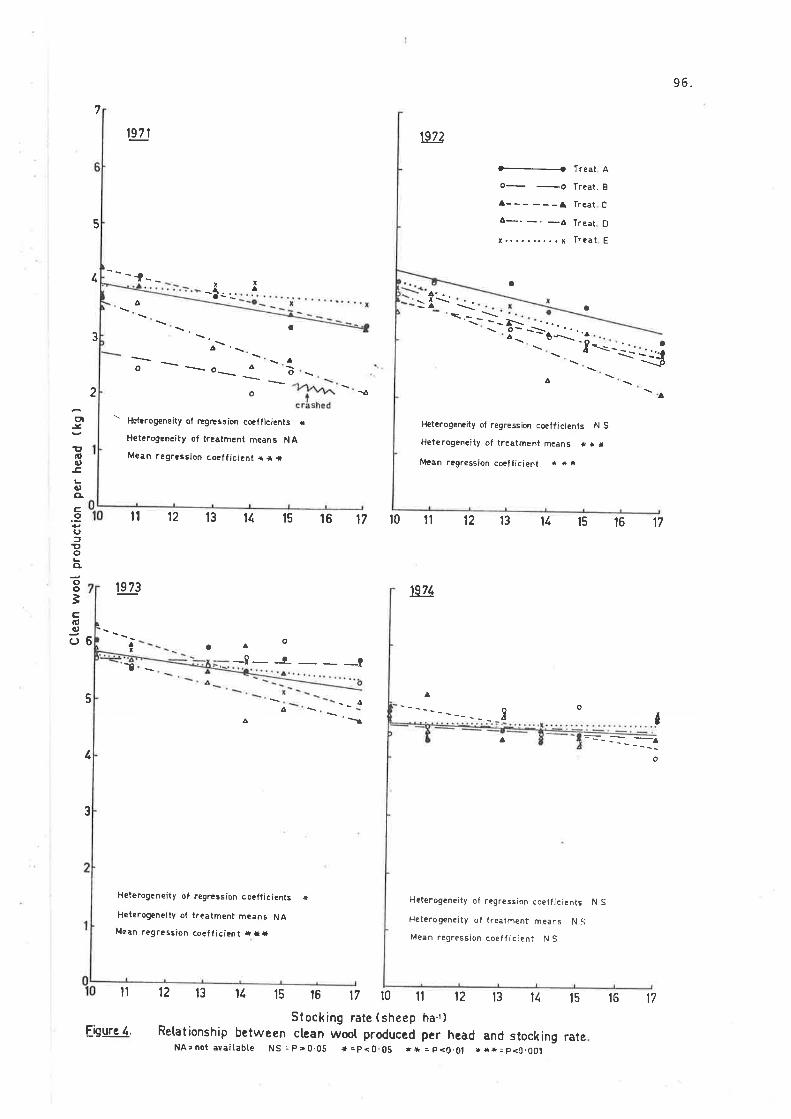
96.
7
t97t 1972
ôx l\
È--<o- _o
^--- ---Aô-, _. _ôI¡......,..X
Â-
Treat A
Treat. B
lreat C
Treat D
Treat E
5
l.
3
-- -t- --å...
x¡
\.ô\'1
O
-^--
a
ô
a
a
"a-ta
=.- --\
\Á¿I\
O-
3
2
--È-:"..-_ -':g-_-\o
o
ÂÁ
Heterogcneity of regression cocffici€nts
Heterogeneity ol treatment means NA
Mean regression coeflicient rI.r
ilt2t314
-ô
Â\ô ô
ctl.f
Ìt.üq,
,Ê,LÂ,CIc.9(,J
!oLooo3ctOCJ
(J
- Hetcrogeneity of rcgæssion coeffic¡ents IHeterogencity of lreatment means NA
Mean regressioo coeff¡c¡?nt * * r
!s 73
^o
_1_ . ___?
Het?rogeneity of regression coefficients N S
Heterogeneity of treatment rneàns r I I
Mcan regression coefficient * ¡ r
197t,
il 12 t3 lt 15 16 1? 10 Ît 12 13 1t, 15 16 17
6
5
t,
aaI
I
^o
.-l ¡- -=_ _:::
I
I
15 16 17 10 lt 12
o
13 1t, 15 16 17
Hcterogeneity of regression coelficients N S
Heterogeneity of treàtment me¿ns N S
Mean regression coeffícient N S
Stocking rate (sheep ha't)Relationship between ctean wool produc¿d per h?ad and stocking rate
NA:not evaitable NS =P>0'05 r=p<O 0S ** =p<0.0t rrr:p<0,00,|fþure 4,
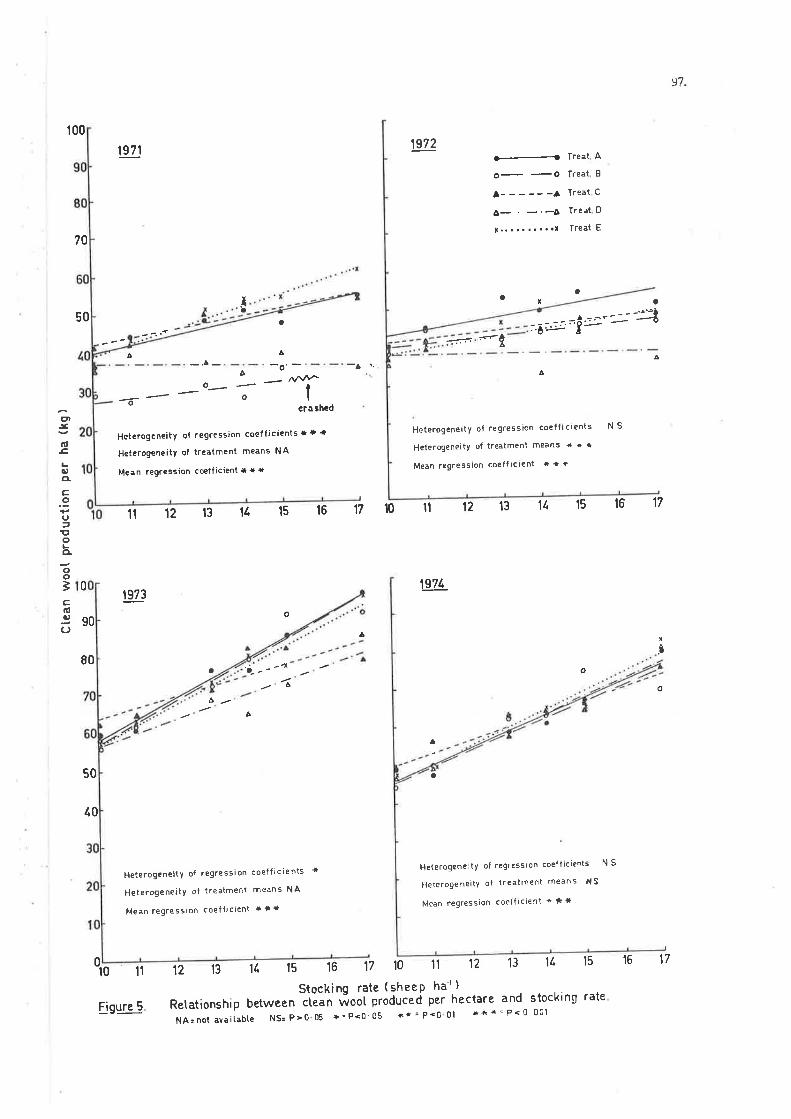
e7
t00
?0
50
19 711972
-
o- -o¡------l
o- -.-ôI .. . . . . . . . .I
freat A
Treàt B
Treat C
Treat D
Treat E
aIa a
a
A
-o' -
ô
:''ò:-Í'-î.--=-=laI
Â
Heterogcne¡ty of regression coeff¡cients t t +
Heterogeneity of treatment means NA
Mean regressìon coetficient r + +
-a:-àÁ
Heterogeneity of regression coefficients
Heierogene¡ty of treatment meens r t I
Mean regression coefficicnt * + +
À
-,Â- ôO-
-Oo
L¿
1crashcd
-a !,A
x
¡
1s7!_
o
0
90
80
Eì5
.ü.c,
Lq,CL
c.9(J)toLcloo3cttta,(J
NS
tl 12 13 14 15 16 17 10 ll 12 13 It, 15 16 17
!s73
ô
a 'í--' 4
12 13 1t, 15 l0 11 12 13
o
1L 15 16
o
Â
a
a50
¿0
Heterogene¡tY ol regression coeff¡c¡ents +
H€terogene¡ty of treatmert me¿ns NA
Mean regression coefllcient { * +
Heterogeneity of regression coefticients N S
lleterogeneity of trealment means t{S
Meàn regression coeffrcient * **
0I011 16 17
stocking rateflgure 5
Stockino rate (sheeP ha-')
Retationship between itãan ñool produced per hectare and
NA:not avaitabte NS=P>0 05 +'P<0 05 ç*'p<0 0l t*r--P< 0 001
17
98.
The mean (of al-L treatments) quantity of clean wool produceC was
very simÍlar in 1971 and 1972 and maxlmum annual- production occurred ín
1973 (Table 19).
8.8 Fleece characterístics
No signífícant interacËlon between past,ure treatment and stocking
rate was recorded for any of the fleece characteristics in any year
(Tables20 and 21). Signlftcant..(P <0.001) differences between pasture
treatmenÈ means rlere recorded for stapl-e length and fíbre diameter and
(P <0.05) for yíeld in 1971 only and not in any of the followÍng three
years (Tables 20 and 2I). Treatments ranked (on a staple length and
ftbre dfameter basis) as follows, wi-th dlffering subscrlpts indícating
a slgniflcant (P <0.05) difference between pasture treatment means.
Staple length - Ea > Ca > Aab > Db > Bc
Fibre díameter - A" t E"b t Cb t D" t B"
Highly signlflcanË (P <0.001) mean (of all treatments) regressions
(negative in slope) of staple 1-ength and fibre diameter on stocking rate
rrere recorded in 1971 and 1972 and wiÈh less signlfícant correlatíon ín
1973. SignificanË negative correlatíons between stocking rate and both
yield ín 1972 and crimp frequency in 1973 were also recorded (Tables 20
and 21).
Fibre diameter íncreased and both crimp frequency and yíe1d
decreased between years frorn 1971 Eo L974 (tables 20 anð, 2L). In each
case, the mean (of all treatments) regression of fleece characterístic
on year was sígnificant (P <0.05).
8.9 Seasonal r¡oo1 production
Season had a far greater l-nfluence on wool growth rate than did
99,
pasture treaËment. This is clearly denonstrated in Figure 6 by the
anplitude of fluctuations in the changing rate of wool growth compared
to the magnitude of between-treatment dífferences in wool growth rate
duríng the experímental period.
During 1971 and 1972 Elne mean wool growth rate varíed in a símilar
pattern to the mean liveweíght change in the sheep (Figures 3 and 6)
with períods of maximum rate of wool growth approximately coínciding
with periods of maxlmum liveweig-ht gaín in the sheep.
In 197I the meanliveweights of the sheep increased throughout
the spring and early sufltrner but the mean wool growth rate declined from
the end of October. However in 1973 and 1974 the mean wool growth rate
decl-ined from the beginning of August and the begínning of July
respectively with a plateau and peak ín mid-November and míd-December
respectively. In both these years (1973 and 1974) thís decline ín wool
growth raÈe during the spring occurred despíte constant líveweight gain
of the sheep during this períod (Figure 3).
with large, seemíngly random, fluctuatíons in the value of the
regressíon coeffícient (wool growth rate change per unit íncrease in
stockíng rate) with time (Figure 6), sígnifícant (P <0.05) StockingLale x
Pasture treatment interactfon in respect of wool growth rate \^ras only
recorded Ín the first three growth periods in 197 I (Fígure 6). In
these Èhree periods, wool growth rate in treatments E and A was less
depressed by the higher stockíng rates than in treatments C, B and D (tne
latter three treatments being ranked on íncreasing absolute value of the
regressíon coefficient). In all other growth periods i¡ 197 I and 1972'
signíficant (P <0.01) and usually P <0.001) differences in the mean wool
growth rate between pasture treatments l^/ere recorded (Figure 6). The
only Èwo exceptional periods r^rere during the rnid-sunmer of l97 l/72 anð
r972/73.
100.
However in 1973 and L974, only in two consecutive growth períods,
r¡ras a significant dlfference ín wool growËh rate betr^teen past.ure treat-
ments recorded (duríng the sprine of 1973).
The ranking of pasture treatments based on mean wool growth rate
hTas consisÈent r¿lth the ranking of treatnents based on mean l1ve weíght
on most occasions in 1971 and L972. This applied in the case of treaÈ-
ments D and B even though, on the basís of liver¿eight gain, the order
was reversed. Treatments E and.B durfng most of 1971 and treatments
A and D ln 1972, ranked highest and lowest respectively in terms of both
wool growth rate and live weíght (Fígures 3 and 6).
In all growth periods in 1971 and 1972 the mean (of all treatments)
depression of wool growth rate with l-ncreased stocking rate Intas
sígnifÍeanr (P <0.05 and usually P <0.001) but ín 1973 and 1974 a
sfmilar relaÈíonship was only recorded significantly (P <0.05) in some
growth perlods during the late wínter and spring (Fígure 6).
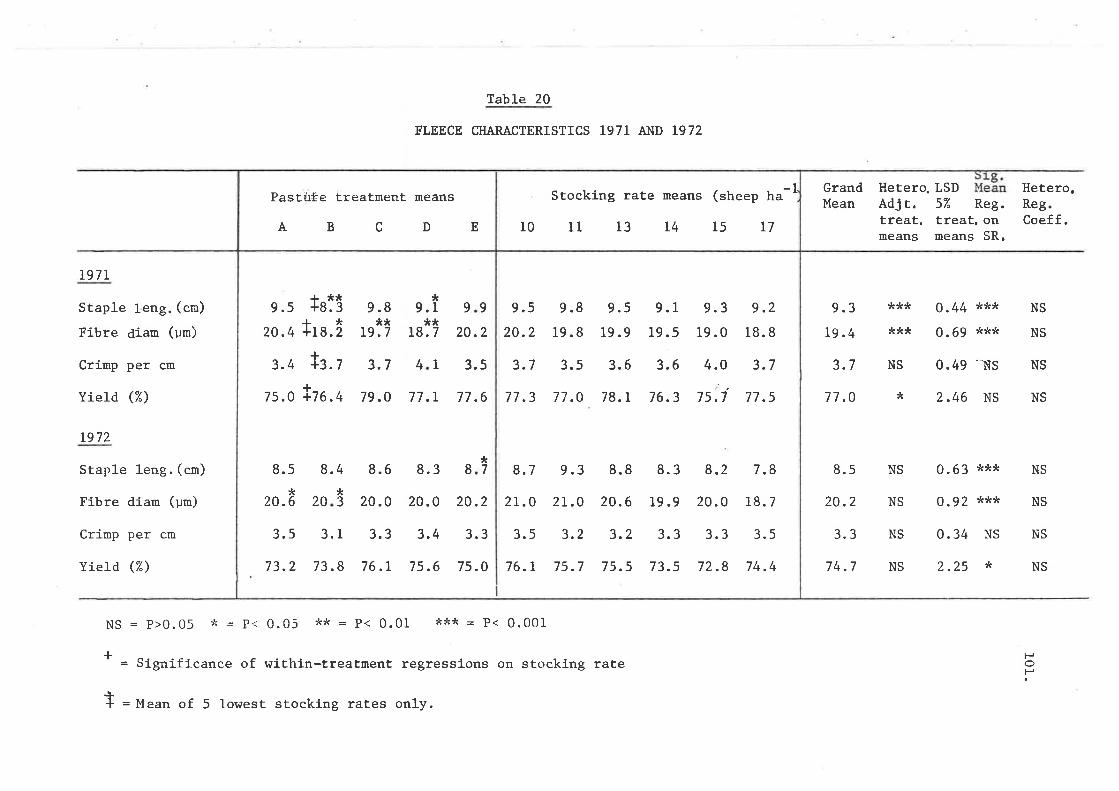
Table 20
FLEECE SHARACTERISTICS 1971 Æ{D 1972
20¿3
**.7
9 9
*7
3.5 3. r
8.5 8. 4
*20.6
3.4 3. 3
8.3 I
20.o 20.2
I 3.5
20.2**
L9.7
3.7
79.O
9.8
8.6
20.0
3.3
76.r
*9.1
73.2 73. 8 75.6 75.O
77.t 77 .6
18
4
+**9.5 +8.3+*
20.4 +r8.2I
3.4 Ig.tJ-
7s .o +76.4
Past&fe treatment means
ABCD E
20.0
3.3
8.2
72.8
9.5
20.2
3.7
77 .3
8.7
21.0
3.5
76.r
9.8
19.8
3.5
77 .O
9.5
19 .9
3.6
78. 1
8.3
19 .9
3.3
73.5
9.1
19 .5
3.6
76.3
9.3
19 .0
4.O
7s.7
9.2
18. I
3.7
77 .5
7.8
18. 7
3.5
74.4
9.3
2L.0
3.2
75.7
8.8
20.6
3.2
75.5
Stocking rate means (sheep ha
11 13 14 15 t710
-1
L97L
Staple 1eng. (cn)
Fibre ¿iarn (um)
Crimp per cm
Yield (%)
1972
Staple leng. (crn)
Fibre díarn (um)
Crirnp per cm
Yield (%)
+
GrandMean
9.3
19.4
3.7
77 .O
8.5
20.2
3.3
74.7
Hetero. LSDAdj r.treat.means
57. Reg.treat. onmeans SR.
Hetero.Reg.Coeff.
******
NS
¡
NS
NS
NS
NS
NS
NS
NS
NS
NS
NS
NS
NS
0.44 ***0.69 ***
0.49 'NS
2.46 NS
0.63 ***
0.92 ***
0.34 NS
2.25 *
NS = p>0.05 * = P< 0.05 ** = P< 0.01 *** = P< 0.001
= Significance of withín-treatment regressions on stocking rate tsots
T = Mean of 5 lowest stocking raÈes only.
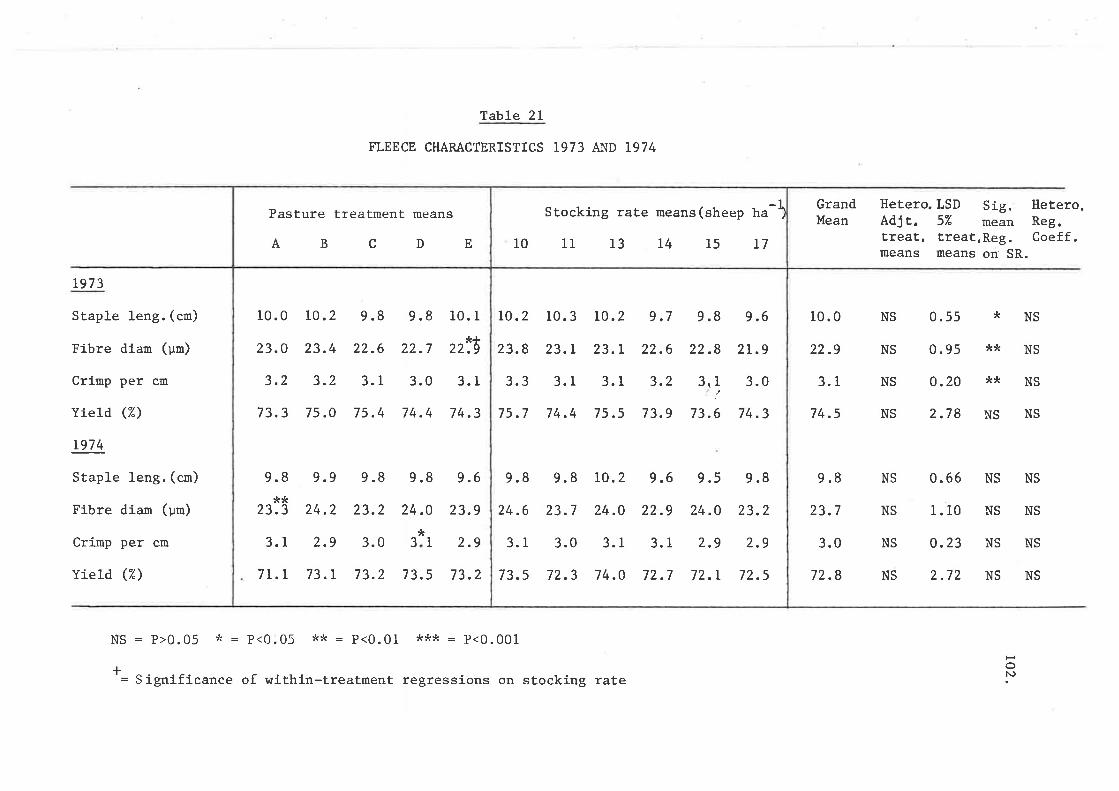
Table 21
FLEECE CHARACTERISTICS 1973 AND 1974
9.9 9.8 9.8 9.6
24.2 23.2 24.0 23.9
3.1 2.9 3.0 3
71.1 73.L 73.2 73.5 73.2
*
**23.3
3.0 3.1
*+22.7 22.9
9.8 10.1
L 2.9
9.8
74.4 74.3
10.0
23.O
3.2
73.3
ro.2
23.4
3.2
75.0
9.8
22.6
3.1
75.4
Pasture treatment means
EAB CD
74.3
3.0
24.0
3.1 2.9 2.9
9.5 9.8
9.8 9.6
74.O
L0.2
1,0.2
23.8
3.3
75.7
10. 3
23.r
3.1
74.4
ro.2
23.L
3.1
75.5
9.6
22.9
3.1
72.7
9.7
22.6
3.2
73.9
3.1
73.6
72.L 72.5
24.0 23.2
22.8 2L.9
9.8
24.6
3.1
73.5
9.8
23.7
3.0
72.3
Stocking rate means(sheep ha
11 13 L4 15 t710
-1 GrandMean
Hetero. LSD Sig. Hetero.AdjÈ. 57" mean Reg.treat, treat.Reg. Coeff.means means oo SR.
L973
Staple leng. (cn)
Fibre diam (un)
Crinp per cm
Yield (%)
r97 4
Staple leng. (cm)
Fíbre diam (urn)
Crimp per cm
Yield (%)
10.0 NS 0.55 * NS
22.9 NS 0.95 ** NS
3.1 NS O.2O ** NS
74.5 NS 2.78 NS NS
9.8
23.7
3.0
72.8
0.66
1. 10
o.23
2.72
NS
NS
NS
NS NS
NS
NS
NS
NS
NS
NS
NS
NS = P>0.05 * = P<0.05 *x = pçQ.Ql rc¡trc = P<0.001HoN)+
= Significance of within-treaÈment regressions on stocking rate
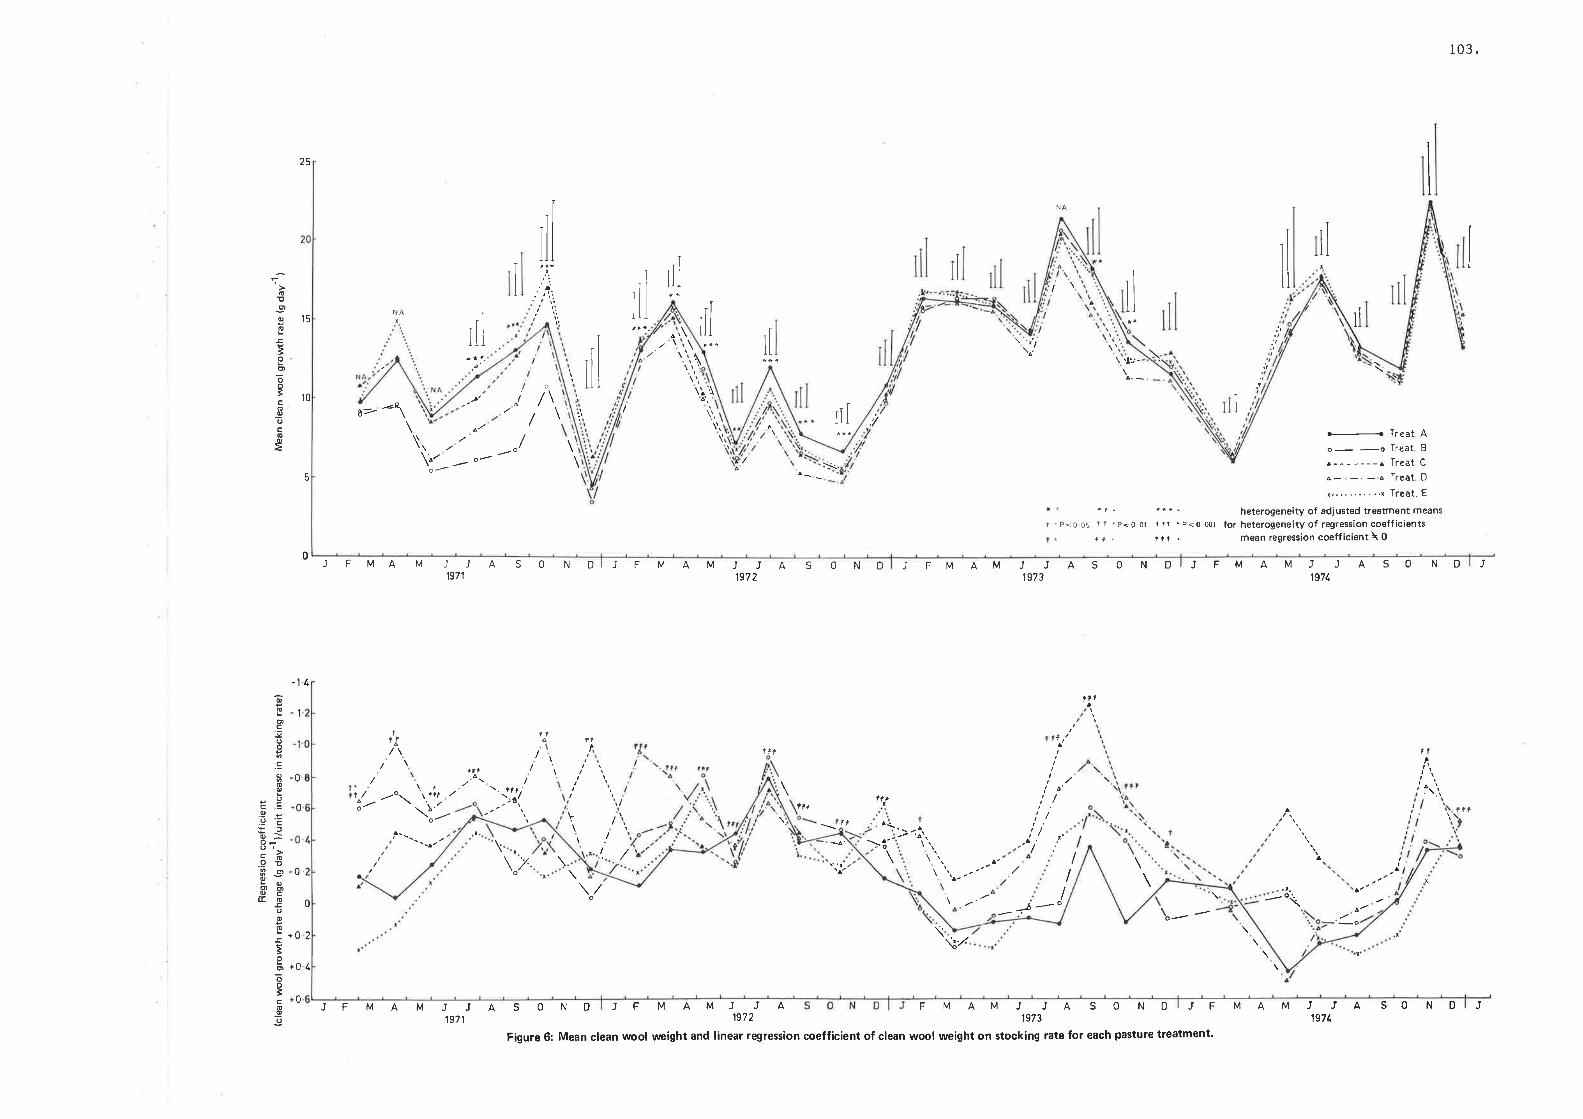
25
15
0
-1 l.
III
T
il1'l'.'.
.r,,ï,,
'i:/
JJ1973
l-
NA
il
103.
+tt
't0
o!Ioo
Ëooõo
cooocoË
[|
ill
il1ilI
ilti
NA
il
\
\ \.I.j- \
:,
\o. -o
I\l'
à-/ -t\)'
\,, ,/
o¿
1¡+
ss{
\
JFMAM
t
-
o
- -o¡-------l
ô- - - À
t.,,.,......1
ASOND
Treat ATreat B
Treat, C
Treat D
Treat. E
heterogeneity of adjusted treatment meansp<o oi r rt 'P<o oot for heterogeneity of regression coefficients
r r r . mean regression coeff icient \ 0
V.,o-
5
1:ps6 ¡5 11
JJASOND1971
JFMA MJJ1972
JFN4AM ASOND JFMAMJJASOND J1971.
oaog!oo
';ooo
c.:,!P eo'=Ffõ>o-o'
Þ€3 -:';'goafEõ
-coo6
ËooõoIooo
rttI
0
0
rj 't
Io
t,\;. .¡
It
iì,rãr
tÈr,'-;â/
\"7..t./
f
o -o\'\ ltl ./\:i tlt
Tttt I
A \i-
o
IIt
a
tL
l- ¡.Èô.
.:.r
\,
JFMAM
¡
0* 'r- ,'
oa.
ò/
x
"\0
1
F¡'4AMJJAS0N0
\o..-
-o\+02 ¡\¡'lt
+0
JFMAM0J1971
JASOND JFMAMJJA J'ASOND19711972 1973
Figure 6: Mean clean wool \'ìre¡ght and linear regress¡on coefficient of clean wool weight on stocking rate for each pasture treatment'
J

DI SCUSS I ON AND COI{CLUS I ON
104.
9 DISCUSSION AND CONCLUSION
9.1 Aninal oroducÈion in relatlon to botanlcal composLtion
It is necessary to first refer to the fact that ÈreatmenÈ A dld
not have the tílLage and seedbed preparationr or the sowing of new species'
I,ltrlle it fs acknowledged that in some resPects this has a confoundíng
Ínfluence, the pasture treatments are best regarded as rminl systemsl
r¡hlch can be validly extrapolated to the farm sltuatLon' In this respect '
the varlous pasture Èreatments it n""arrte systems, with superfnposed
stocking rate treatment$ are quite valíd'
9. 1. 1 The rtance of subter ranean clover
The ouÈstandíng result from this experlnent is that the renovatlon
of the existfng volunteer annual grass - Yarloop subterranean clover
pasture by the tlllage, seedbed Preparation and sowing of the four grass -
subterranean clover mixtures dfd not result 1n eÍther Íncreased live
wetght or wool productlon from the grazing wethers during the set-stocked
experl.mental perlod of four years. In fact, lower Pasture and animal
production occurred in the three ryegrass treatments during the first and'
to a lesser extent, the second and thlrd years of set stocking..L
The differences in productivity'can be attributed to the extensive
differences 1n avallabiliÈy of clover that exLsted between pasture
treatments in 1971 and, to a lesser extent, In 1972 and' 1973, following
the renovation and pasture nanagement procedures carried out 1n 1970'
It is difficult to ascrlbe animal productivity to the quantlty
and qualÍty of particular botanical components of grazeð, pasture and
the quantitative and qualitatLve intake of pasture by the grazing animal
nay be related (conrad 1966). The nost ímportant single determinant of
r-ma 1*ir, a"t*" of plant and AN
105.
rumlnant production at a particular time l-s the quantfty of feed being
harvested by the animal, and this Ls very often the inrmediate linitlng
factor to anlmal productlon. Demonstratlon of qualitative dífferences
can only be accomplíshed when allohtance has been made for differences
in quantfty of feed eaten (Lanbourne 1969).
In the comparison of treatments clted below, quality and quantity
of pasture are confounded because total pasture productlon lüas usually
higher in those treatments with a hÍgher clover component.
Nevertheless, the data ttåù nave been presented, strongly impl-Lcate
the avaÍlabllíty of the subterranean clover component as belng the
doninant factor ín the deterninaËion of aninal production 1n thís
experlnent. It may be argued that the differences ín animal performance
ln any of the treatment comparfsons clted below, may be due to the higher
quality of the non-legume component. However this is unlíkely to be true
as there is little evidence fn the literature for subsËantíally-superior
nutritÍonal value of any of the volunteer or sohtn grass species comprisíng the
pastures fn this experirnenË. For example, Mclvor and Snith (1973c)
reporÈed l{ttle difference in the dry matter content, nitrogen content of
leaves a¡d. ín üitro dígestlbiltty of a number of tenperate annual
pasture species including rlpgut brome, barley gress and annual ryegrass'
Thus during the autumn of. L97I, for example, it ís unlikely that the
superl-or liveweight gain recorded in treaÈment A was due to the higher
nutritional value of the barley grass-dominant pasture compared to the
pasture comprislng dominant rtPgut brome and hybríd phalaris in treatment
E or Victorian ryegrass 1n treatment c, but rather Èo the higher
proportion and availability of subËerranean clover. Certalnly there
was no subsÈantial difference between these pasture treaËments in
pasture productÍon, crude utllLzation or availability of pasture during
thls period. This example quoted is the only one in whích superior
106.
quality pe" se of the clover herbage was clearly demonstrated because
equivalent levels of production,utilLzatlon and avaflabflity of total
pasture !ìtere recorded.
. Further exanples fmplicating the avail-abfl-ity of clover as the
maln deter:minant of anfmal productfon Ín thls experíment are as follows:
(1) The proportion and avallability of clover, together with the
total availabilfty of pasture, lrere sl-gnlficantly greater ín
treatment A during the winter of 1971, and only 1n this treatment
dld Èhe mean lLve weLght toàt.""" substantially durlng this period.
(2) ComparLng the three ryegrass treatments B, c and D during the
growing season of. 1971, the lowest avail-abiliÈy of clover was
recorded in treatment D and thls rüas assocfated with the lowest
llvewelght gain belng recorded Ln this treatment'
(3) DurLng the winter and spring of 1972 the rapid liveweight gain in
treatment B was assocLated with maximum proportLon and availabílity
of clover being recorded fn this treatment. The increased
performance of the sheep fn Èreatment B durJ.ng L972 ls demonstrated
by the change in ranE (lLveweight basis) of this treatment, from
the lowest on March 8, L972 to the highest on January 17, 1973
and thfs rùas associated wlth this treatment havlng the greatest
between-year increase in the sLze of the subterranean clover
component of all the pasture treatments from 197I to 1972'
(4) The lower l-ivewelght gain durl-ng the winter of 1972 in treaÈments C'
D and E was associated wlth lower availabllitles of subÈerranean
clover during thls PerLod.
(5) The decline l-n l1ve weight with increased stocking rate was greatest
in treatment D throughout 1973 artd L974 and only in this treatmenÈ
was a decrease ín the proportlon of clover with lncreased stocking
rate recorded.
107.
9 .1.2 The role of other specÍes
Apart from the role of subterranean clover' no other conslstent
relationshLp between the slze or Presence of a partfcular pasture component
and ânl-rnal performance $tes evident 1n thls exPerl-Dent alÈhough two isolated
insÈances are worthY of note.
(1) The greater LiveweLghÈ loss ín treatment B, prior to the opening
of the season fn 1971, can only be explaÍned by the poor nutrLtional
value of the avail-able feed,.in thls treatment over the sunmer períod'
The avaílab1lity of pasture'at the end of the 1970 growing season
was simllar Ln treatments B and E and even lo¡¡ter 1n treatment A'
Reasons for this poor quality of feed in treatment B are possibly:
a) A lower clover component in the dry sumter residue resultíng
fron suppression of thfs comPonent by the l,Iiumera ryegrass
durÍng the spríng of 1970, eveft though an attempt had been
madetoPreventthtshappenl.ngbythestrategícgrazlngof'
the pasture at that tlme.
b) Lol¡er nutriÈional value of the wir¡nera ryegrass ítself, due to
a lower number of seed heads belng available to the sheep ín
comparison to the previously ungrazed Victorian and Medea
ryegrasses. However, these latter Èwo treatments also had
higher avaflabilitÍes of pasture at the end of the 1970 growíng
season.
In comparison to treatments A and E the tr{lnmera ryegrass nay
have been of lower nuÈrÍtive value than the dominant barley
grass and ripgut brome components that comprlsed treatments A
and E respectively. Radcliffe and Cochrane (1970) reported
that l-n l{Lmnera ryegrass the dlgestlbillty declined at the
rate of 0.9 unl_ts per day in the month followlng flowerlng
compared to an average of 0.3 to 0.5 unlts per day for phalaris'
108.
brome grass, sflver grass, barl-ey grass, Yarloop subterranean
cloverandbarrel-nredlc.Theyalsorecordedalowcrude
proteincontentin!,limreraryegrasslnmid-December.
(2). During 1971 and 1972, the decline in raÈe of liveweíghÈ gain in
treatment A during ml-d to late spring and marked decllne in wool
growthrateduringthespríngoflgTlcomparedtotheotherpasture
Èreatments could be attrfbuted to an excessive production of, and
aggravaÈion y, barley gras,: inflorescences (Canpbell et aL' 1973) '
9.2 Persistenc e of sown specÍes
9.2.L Grasses
The almost total fallure of Medea ryegrass to demonsttate any
perennial characterísÈics under continuous grazíng in this experimenË
was both unexpected and diffícult to explain and repudiaÈes Èhe original
claims of increased individual plant persistence by this cultivar, at
least under the condiÈlons imposed l-n thl-s experiment. certainly, Medea
rye.grass demonstratecl adequate seed productlon and an ability (rnargÍnally
greaÈer than l,Iimrera and Victorian ryegrasses) to regenerate from self-
sown seed following Ëlto sumners in thls environment'
However,ashasfrequentlybeendemonstratedinthepast,the
behavíour of planÈ species under continuous gtazírng nay differ from that
demonstrated under cutting or short, periodic gtazíng regimes (Davidson
1969).
Subsequenttothecompletionofthisexperíment'reportsof
wide variability in the suûtrner dormancy and persistence of Medea ryegrass
have been received in South Australia (Higgs' personal communication) '
An experimenÈ (Gibson, unpubllshed) carried out in l97l and 1972
on Kangaroo Island to define the best first yeat gtazing management
109.
practice for Medea ryegrass demonstrated that this species could exhíbít
a marked degree of perennialiÈy when lntermittenÈly gtazeð, durlng the
spring and surmrer ln thLs environment, but not when under contínuous
grazírng by sheep.
The lack of perslstence of Victorian ryegrass over more than three
suÍrmers in this envíronment agrees closely wfth the findings of Carter
and Day (f970), on Kangaroo Island. These authors attríbuted the decl-ine
in the perennial ryegrass comPonent, in their experlmenÈ' to the dry
spring and sunmer conditions. The death of the Victorian ryegrass plants
in this experíment occurred predominantly over the 1972/73 summer which
also followed the driest spring and sumner encountered during the
experimental period: the total raLnfall duríng ttte 1970171, 7L172,
72173 and. 73174 spring/surmer periods betng 172, 354, 9I and 247 nm
respecÈively.
The influence of lncreased stockíng rate in hasÈening the between-
year declÍne fn density of Victorian ryegrass plants' and Èhe proportion
of this species in the pasture' was clearly demonstrated in thls experiment'
Decreased persistence of perennial ryegrass wlth íncreased stocklng rate
has also been reported by Cameron and Cannon (1970) in Victoria.
In this Kangaroo Island exPeriment the species failed to persíst
even at the lowest stocking rate and 1t seems likely that the dry spring/
sunmer condítions, possibly in combination with contlnuous gtazíng duríng
this perlodrprobably caused the lack of persistence of this species ín
this environnent.
The high degree of persistence of the hybrid phalaris duríng the
experlmenÈal period, irrespective of stocking rate' is in marked contrast
to that of the ryegrass species and demonstrates the ability of this
species to persist under varíable management and environmental influences'
This finding is in accordance wlth that of Hutchinson (1970) at Armidale'
110.
New South [,lales, Ín a dlfferent environment and v¡ith thaÈ of Reed (L974)
in a more siurilar environment at Glenor^mLston, Vfctorfa. Both of these
workers also demonstrated an interactfon between survival of perennial
grass specfes and stockLng rate in theLr experlments.
Although stocking rate did not lnfluence Ëhe density of hybríd
phalarts plants, 1t did influence their size and also the proportion of
thfs species in the pasture, however, statlstical significance could
not be demonstraÈed during the experlmental period. VÍsual appraisal
of the pastures durlng the sprini of 1975 and 1976 (after intermittent
gtazing during these two years) revealed a continuatíon of the between-
year trend tor¿ards increasing plant size and proportion of Èhe hybrid
phalaris in the pasture. In some paddocks the proportion was estlmated
to be between 30 and 40 per cent of the total available pasture. This
highlights the problem of evaluating pasÈure species only over a relatívely
short period (4 years) when the long term (at least 10 years) changes in
boËanícal conposition may be ímportant.
A further grazíng experlment (Gibson, unpublíshed) in which the
same hybrid phalaris has been compared with perennial ryegrass and
Demeter fescue under grazÍrrrg at three stocking rates in a hÍgher rainfall
environment, has sÍnce demonstraÈed hígh pasture production from the
hybrid phalaris at the higher plant densities obtaíned in that experiment.
However there was no advantage over the other pasture species in terms of
animal production.
9.2.2 Subterranean clover
The partial replacement only of Yarloop with Mt. Barker and
I^Ioogenellup subterranean clovers in the renovated treatments in 1970,
proved unsuccessful in maintaining a low proportion of Yarloop subterranean
',i
111 .
clover in the overall clover comPonent after a Perlod of four Èo five
years.
Although, 1n 1970, the growth and seed set of the lntroduced
subterranean clovers I^Ias supPressed Èo some degree by the vígorous growth
of the ryegrass in treaturents B, C and D, thls did not occur in treatment
E, yet Yarloop successfully invaded thls treatment. This is highlighÈed
by the level of hard seed reserves present in August 1973 1n Èreatment E
-1(c. 140 kg h"-t) of which only 2,1 per cenÈ rras non-Yarloop seed. However'
as the level of subterranean clover seed reserves \fas not measured ln
1970, it is uncertaln to what extent any ínitial reserves lilere inportant
l-n enabling the rapf-d invasion of Yarloop inÈo the pastures to take
place in subsequent Years.
Beale (Ig74) found that germinatlon of hard and soft seed of
Yarloop from an initial reserve on Kangaroo Island' contlnued at a very
high level in the second and third years and only began to fall off in
the fourth year. Thís is in contrast to the findtngs of Donald (1959)
and Taylor (1972) who found that the naJoríty of subterranean clover seed
germÍnated in the fírst year after Èhe seed was set and that the level of
regeneration fel1 rapidly in subsequent years. However, these latter
two workers did not include Yarloop ln theír experiments and Beale (1974>
suggests that Yarloop has a greater capacity for continual regeneraËíon
from seed than has been observed in Geraldton, Dwalganup, Bacchus Marsh,
Mt. Barker and Tallarook subterranean clovers
In this thesis experiment the 1eve15 of hard seed reserves Írere
similar in treatments A and B by August 1973 indicating that any decline
in Yarloop seed reserves in treatment B, following the pasture renovation
and management procedures performed in this treatment' \dere only temporary'
Experiments evaluating the possíbilíÈy of replacing Yarloop.with
low-oestrogenic llnes of subterranean clover are presently in Progress on
,'Iil;II
I
LI2.
Kangaroo Island. Parti.cular attentlon ls being paid to minimizlng the
germinable pool of Yarloop seed, prior to the sowing of new cultl-vars.
Various tillage pracÈices, such as mouldboard Ploughing to deep-bury the
seed and/or repeated cul-tivation to ktll successfve gerrninations of
Yarloop are being evaluated (Beale et aL. L976).
The lack of evidence for the lnfluence of stocking rate on the
hard seed reserves and Èhe seed production measured in 1973 and 1974 Ín
this experLment, indicates that adequate levels of Yarloop seed reserves
can be maintained, irrespectf*r"'¡f the levef,of set stocking; at least
over the tine period and range of stocking rates used in this experiment.
The proportíon of clover Ln the pasture on many occasions and
particularly on the final sampling occasion in the spring of each year
(except Ig72), and the availability of pasÈure on nearly all sampling
occasions during the experiment, were respectivel-y positively and
negatively correlated with stockíng rate. Hence the net infl-uence of
stocking rate on the availabílfty of clover herbage is dependent on the
degree to which stocking rate influences both the proportton of clover
in the sward and the total availability of pasture. In 1971 and 1972t
there rüas no evidence of stocking rate influenclng the availabillty of
clover on any occaslon and in 1973 and lgT4tnegative and positive
relatlonships were recorded respecÈively.
In 1973 a¡¡ð. L974ron1y c. 507" of the variability in elover seed
production was accounted for by the avaílability of clover aË the end of
the growing season. This is not surprising consldering the possíble
variabillty in both the seed production and clover availabillty data due
to sa.npling. This latter point is highlfghted by the anomolous result
obtained Ín 1974 when clover seed production htas not influenced by stocklng
raÈe even though Èhe former \ías related to the avallabilíty of clover,
and stocking rate influenced the availabiliËy of clover.
"t'U
I
I
i
)
}I'!
113.
Nevertheless, íÈ is clear from both the pasture productíon data
and the data on clover seed production and reserves that Yarloop is
extremely well adapted to this envl-ronment lüith lts outstanding growth
during Èhe wint,er and early spring and wlth fts ablllty to set copious
supplles of seed when grazed at both high and l-ow stockíng rates.
9.3 Invasion o f non-legumÍnous sPecies
The invasion of the renovated treatments B' C and D by volunÈeer
annual species proceeded concurrently wfth the decline ín the ryegrass
component, and by 1974 obvLous changes in botanical- cornposlÈion due to
stocking rate hrere evldent. The higher proportlon of rlpgut brome,
capeweed and barley grass at the lower stocking rates, and VuLpia and
Enodiwn spp. aË Ëhe higher stocking rates, agrees with the fíndings of
other r¿orkers (Sharkey et aL. 1964,\ Davies 1965,\ Carter 1968b).'t
The occurrence of cluster clover and winter grass aL the highest
stocking rates as reported by Carter (1968b) and Brown (I976a) I^/as not
evident. Hor¿ever, it is possible that the effective grazlng pressure
(in addition to the actual stocking rate) at the hlghest sÈocking rate
in this experíment Ì.ras lower than in the above t$lo experiments where
there was need for regular supplementary feed in Brownfs experiment and
sheep deaths at Èhe highest stocking rate in Carterts experiment' In
this thesis experiment, sheep that died from undernutrition were from
mainly one treatnent (B) and these deaths occurred in only one year (1971) '
The doninance of ripgut brome in the absence of grazing ín
treatment E during 1970 supports the observatÍons of the Californian
workers (Talbot and BisweLI Ig42, Jones and Evans 1960) and also those of
Rossiter and Pack (1956) in t'Jestern Australia.
!
I
114.
9.4 Interaction of s tockine ra te and botanlcal composlÈion l-n
the detemina tíon of anlmal producÈion
It has been clearly demonsÈrated that the differences ín anímal
production recorded in this experlment involving various pasture treaÈments
and sÈockfng rates $/ere usually assoeiated with the qualltatlve and
quantitative presence of subterranean clover in the pasture. The Presence
or absence of other species (whether sown t.emperate, perennial or annual
species, or volunÈeer, broad-leaygd or narrol^I-leaved annual specfes)
could not consistently be assoclated with changes in anímal productivity
in this experiment. The marked invasion of Yarloop ínto the renovated
pasture treatments occurred at all stocking rates and, although the
avallabilíÈy of clover may be influenced by stockíng rate withín any one
season, in the longer term the presence of Yarloop appears independent
of stocking rate. Hence the excellent adaptation of Yarloop in this
environmenÈ, with iÈs rapid growth durLng the winter and early spring and
its ab1l1ty to set copious supplies of seed with potentíal for germination
over a number of years, seems to have guaranteed these pastures a degree
Of quantiËative and qualitative índependence of sÈocking rate. It
therefore is important to state, that 1n the long term, there apPears
to be no obvious interaction of sÈocklng rate and botanícal composition
in the determination of animal production in thís envÍrorrnent ' This is
not to say ÈhaÈ no such interaction occurred in this experiment (as it
obviously dld in 1971) buÈ the difference in botanical eomposition \¡Ias
primarily a result of the pasÈure renovation practice raÈher than as a
direct result of ímposed stocking rates. The obvious effects of the
renovation practíce in terms of botanical composition l^Iere only evidenÈ
in the short term.
The short ter:m interaction of pasture treatment and stocking rate
in determining animal productlon is best seen by conparlng the quanÈity
tI
t
115 .
of clean wool produced per hectare in 1971 ín treatments A and D' The
absence of a slgnificanÈ component of Yarloop ín treatmenÈ D during 1971
and most of 1972 resulted l-n an almosÈ constant quant.ity of clean wool
per hectare being produced over the range of stockíng rates' Only ín
1973 r¡as Èhere a slgníficant increase 1n clean wool produced per hectare
with lncreased stocking rate. In contrasÈ, maximum clean wool per hecÈare
was produced at the highest stocking rate ín Èreatment A in a1l- years
with no índícation (except perhaps Ín the Poorest pasture year of 1972)
:'that the potential maxlmum clean'r¿oo1 per hectare had been attaíned'
However, in I974 there l'tas no difference between Èhese pasture treatments
in the relationshíp of clean wool produced per hectare and stocking rate;
a result of a significant legume component comprising the pastures of
both pasture treatments.
9.5 l,loo1 roduction and fleece charact.eristlcs
clear evidence has been produced for an lnverse relationshlp
between the clean fleece weight and stocking rate of the wethers 1n this
experÍment. Thls result is to be expecÈed in the l1ght of previously
reported experiments r¿ith weÈhers (Arnold and Mcllanus 1960, Cannon 1969 '
Carrer and Day Lg7O, Frowl-TqZ66Jãñd wlth ewes (Darríes I962a, Morley
et aL 1969). The reduction ín fibre dlameter and staple length with
íncreased stockÍng raÈe, as recorded in this experiment, has also been
reporÈed in prevíous experiments (Sharkey et aL' 1962' Cannon 1972'
Langlands and Bennett 1973, Lipson and Bacon-Hall LgT4r hlhite and
ÌfcConchie Lg76, Brown 1976b). However, McManus et aL. (1964) ín the
Canberra environment, found no signíficant effect of stockíng rate on
the fibre diameters, staple lengths and subjective characÈeristics of
Merino fleeces. However these workers díd observe stocking raËe effects
on the seasonal change's in fibre diameter and staple lengÈh during their
li
116.
experiment. Simllar seasonal trends have been recorded by Roe et aL'
(1959) and Sharkey et aL. (L962r.
The observed decrease in staPle crLrnp frequency wiÈh l-ncreased
stockíng rate in Lg73, and the lack of response of thls characteristie
to stocking rate ln other years in thLs experiment, 1s Ín contrast Èo
the posÍtive relationship reported by Ì,lhtte and Mcconchie (1976), Cannon
(1972) and Langlands and Bennett (1973).
cannon (1972) reported both increases and decreases ín yíeLd of
clean wool with increased stockrig rate (depending on Èhe level of
superphosphate applicatíon in his experlment) r¡híle Langlands and
Bennett (1973) and lthlte and McConchie (1976) reported no relatíonship'
However ln this thesLs experimenÈr a negative relatlonship was recorded
ln L972 r¿hich fs ln accordance r¿ith the fíndíngs of Brown (1976b) who
recorded a similar relatlonshtp in four consecutive years.
Although no sígnificant Ínteraction between Pasture treatmenÈ and
stocking rate hras recorded for any of the fleece characteristícs ín any
year, signlfÍcant differences bet¡¿een pasture Èreatments were recorded
ín this experiment ín 1971.
There eppears to be no experiment reporting a slgnificant effect
of pasture type on the fleece chaùacterlstlcs of grazi'ng sheep. In one
study reported from canberra, A.c.T. (McManus et aL, 1964) in which the
fleece characterístícs of Merino wethers grazlng eíther a phalarls-
subterranean clover pasture or an annual pasture comprising subterranean
clover, BnOrmtS spp. and barley €lrass h¡ere compared, no effect of pasture
type on any fleece characteristic was recorded. However, Latge
differences in the proportion and avaílabí1ity of the pasture legume
component did not exist ín that experiment and hence the result is not
in discord with this Kangaroo Island experiment'
In most experiments reported, the fleece characLeristics of the
tL7 .
grazing sheep have been insensitive, not only to botanical composition
buË also to pasture management practices (oÈher than sÈockl-ng rate).
For example, isolated instances only (and then in only one year) have been
reported where the level of superphosphate applicatlon (Cannon L972'
Irrhite and McConchie 1976) or grazlng managemenÈ (Brown 1976b) have
sígnificantly affected any fleece characterlstic.
9.6 Effíciency of high stocking rates
There is no doubt that the use of higher sÈocki-ng rates on the
annual-type pasture typical of the Mediterranean-type cli¡nate in southernusuallY
Australia wíIl¡-esu1t in increased animal production, particularly wool
.Lproductíon'as recorded in this experiment (Lloyd Davies and Humphríes
1965, Carter 1965, Carter and Day I97O, CarËer L973, Brown 1976b).
The efficiency of vrool productlon in relation to pasture production
and rainfall, was clearly dependent on stocking rate (Table 22) and this
experiment híghlights the blologícal and econo¡nic ineffíciency of low
stocking rates. The indíces of total clean wool produetíon, in relation
Èo rainfall, show a close parallel r¿ith that for pasture production, and
enphasize the ímproved effíciency of water use at higher stocking rates.
The percentage crude utilization of green pasture ranged from 57% to 737"
aÈ the lowesË and highest stocklng rates respectively (table 22).
Total annual crude uÈilization of pasture (including the pasÈure utí1ized
or otherwise dísappearing over the summer nonths) would be much hígher.
Carter (1973) reported total annual crude utiltzatíon values of. 96.2% aE
a stocking rate of 22.2 sheep h"-1 in his stocking rate experiment on
annual pasture aÈ the hlaite Inst.itute, South Australía. Those stocking
rates in which a crude utilizatíon value of 822 vras recorded were perfectly
safe resulting in no undue stress on the experimental wethers under the
a'However, increased stoclcing rate often does not increase neat ornilk production.
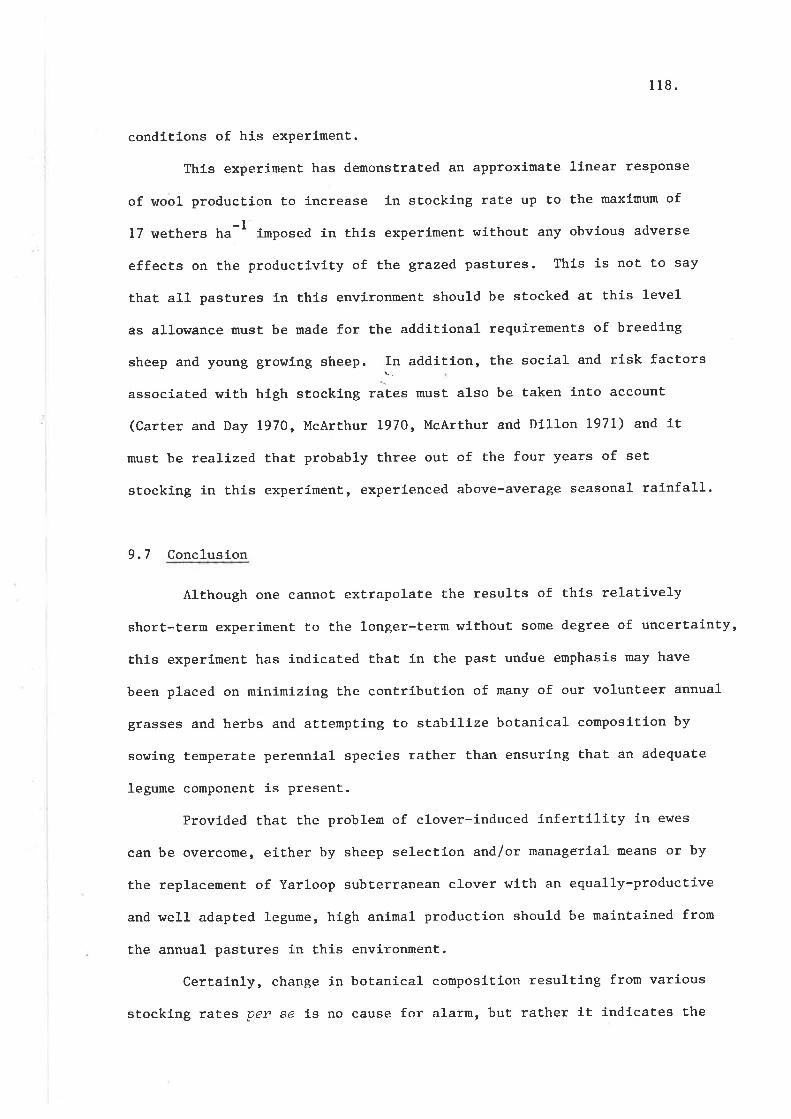
118 .
condiËions of his exPerÍment.
This experimenÈ has demonstrated an approximate linear resPonse
of wool production to increase 1n stocking rate up to the maxf-rnum of
-l17 weÈhers ha-' imposed in this experiment wíthout any obvíous adverse
effecËs on the producÈivity of the grazed pastures. This is not to say
that all pastures in thís envlronmenÈ should be sÈocked at thís level
as allowance must be made for the additional requirements of breeding
sheep and young growing sheep. .fn addition, the social and risk factors
associated wtth high stocklng raÈes must also be Èaken into account
(Carter and Day 1970, McArthur L970, McArthur and Dll-lon 1971) and lt
must be realized that probably three out of the four years of set
stocking in this experiment, experienced above-average seasonal rainfall.
9.7 Conclusíon
Although one cannot extrapolate the results of this relatívely
short-Èerm experíment to the longer-Èerm without some degree of uncertaínty,
Èhis experiment has indicated that in the past undue emphasis may have
been placed on minimizing the contríbution of many of our volunteer annual
grasses and herbs and attempttng to stabilize botanical conposition by
sowíng temperate perennial species rather than ensuring that an adequate
legume component is present.
Provided that the problern of clover-induced infertílity in ewes
can be overcome, either by sheep selection and/or managerial means or by
the replacement of Yarloop subt.erranean clover with an equally-productíve
and r¡ell adapted legume, high anirnal production should be maintained from
the annual pasÈures in thís envlronment.
Certainly, change in botanical composition resulting from varíous
stocking rates pep se is no cause for alarm, but rather lt indlcates the
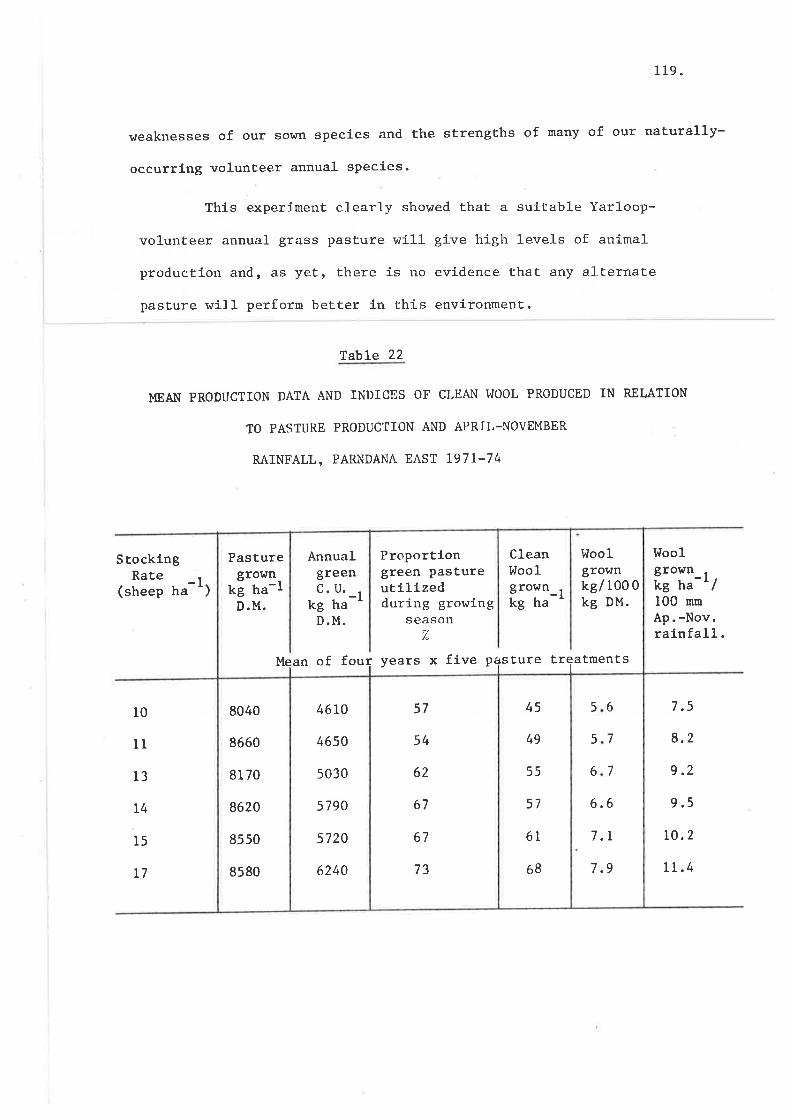
119 .
hreaknesses of our soI^In species and the sËrengths of many of our naturally-
occurríng volunteer annual species.
This experÍment clearly showed that a suítable Yarloop-
volunteer annual grass pasture will give high levels of animal
production and, as yet, there is no evídence that any alternate
pasture will perform better in this environment.
Table 22
MEA}I PRODUCTION DATA AND INDICES OF CLEAN I^IOOL PRODUCED IN RELATION
TO PASTURE PRODUCTION AND APRIL-NOVEMBER
RAINFALL, PARNDANA EAST T971_74
StocklngRate _l
(sheep ha ' )
I{oo1grolfn rkg t.a-L /100 nnAp. -Nov.raÍnfa11.
7.5
8.2
9.2
9.5
10.2
LL.4
10
ll
13
T4
15
r7
8040
8660
8I 70
8620
8550
8580
46 10
4650
5030
5790
5720
6240 73
67
67
62
54
57
7.9
7.L
6.6
6
7
7
5
5
6
45
49
55
57
6l
68
Annualgreenc. u.
-tkgha^D.M.
Proportlongreen pastureutilízedduríng growlng
season(/
of foul years x five plsture trlatments
-1
MeanI
I^Ioolgrownkel 100 0kg DM.
Cleanf,Joolgroe¡nkg ha
Pasturegro!Ùn
kg ha-lD.M.

APPENDICES
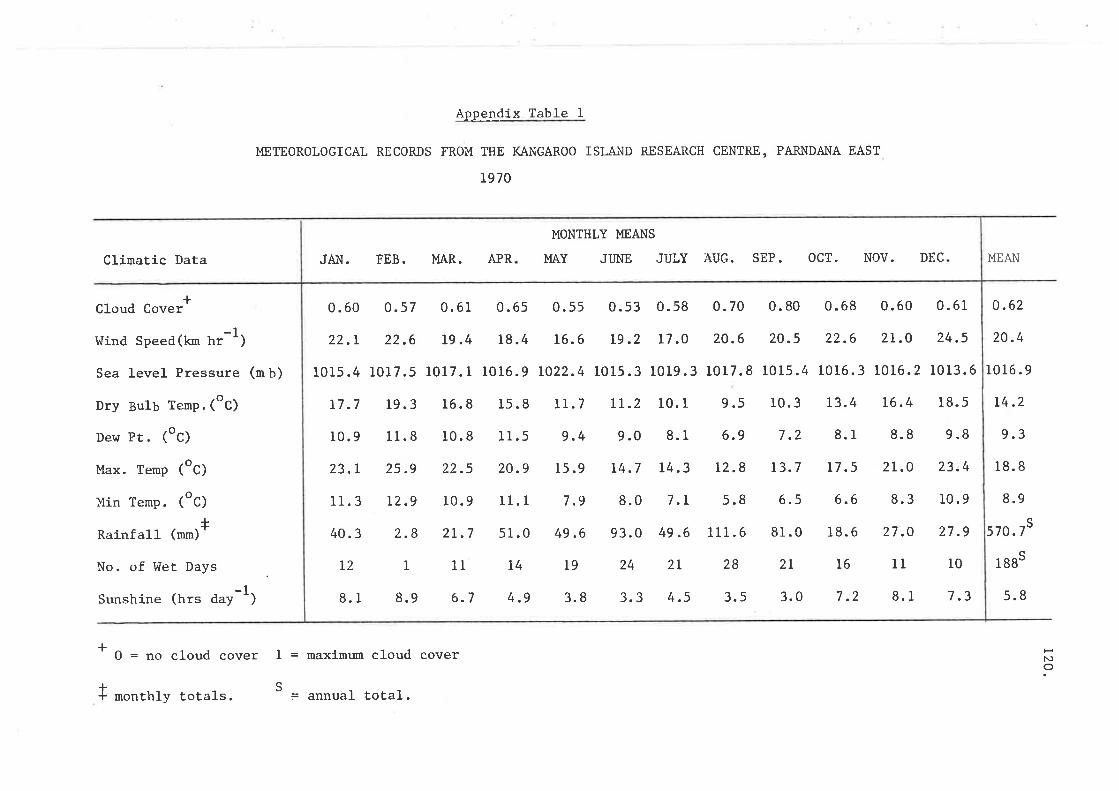
Appçqdi¿ Table I
METEOROLOGICAL RECORDS FROM TITE I(ANGAROO ISLAND RESEARCH CENTRE, PARNDANA EAST
L970
MONTHLY MEANS
MAY JI]NE JULY AUG. SEP. OCT, NOV. DECClimatic Data JAN. FEB. MAR. APR
Cloud Cover+
líind Speea(kur trr-1)
Sea level Pressure (m b)
Dry ¡ulb tenp. (oc)
Der¡ Pt. (oc)
Max. Temp (oc)
Min Temp. (oc)
Rainfall (**)*
No. of l{et Days
Sunshine (trrs aay-l)
* 0 = no cloud cover I = maxímum cloud cover
MEAN
0.62
20.4
1016.9
14.2
9.3
18.8
8.9
570.7s
1 88s
5.8
tsl\)o
0.60 o.57 0.61 0.65 0.55 0.53 0.58 0.70 0.80 0.68 0.60 0.61
22.r 22.6 19.4 18.4 16.6 19.2 17.0 20.6 20.5 22.6 2r.0 24.5
1015.4 LOL7.5 1017.1 1016.9 LO22.4 1015.3 1019.3 1017.8 1015.4 1016.3 1016.2 LOI3.6
17.7 19.3 16.8 Is.8 lr.7 rr.2 10.1 9.5 10.3 r3.4 L6.4 18.5
10.9 11.8 10.8 11.5 9.4 9.0 8.1 6.9 7.2 8.1 8.8 9.8
23.r 25.9 22.5 20.9 15.9 L4.7 L4.3 12.8 r3.7 L7.5 2r.0 23.4
11.3 12.9 10.9 11.1 7.9 8.0 7.r 5.8 6.5 6.6 8.3 10.9
40.3 2.8 2r.7 sl.0 49.6 93.0 49.6 111.6 81.0 18.6 27.O 27.9
121111419242L2821161110
8.1 8.9 6.7 4.9 3.8 3.3 4.s 3.5 3.0 7.2 8.1 7.3
T monthly totals = annual total.
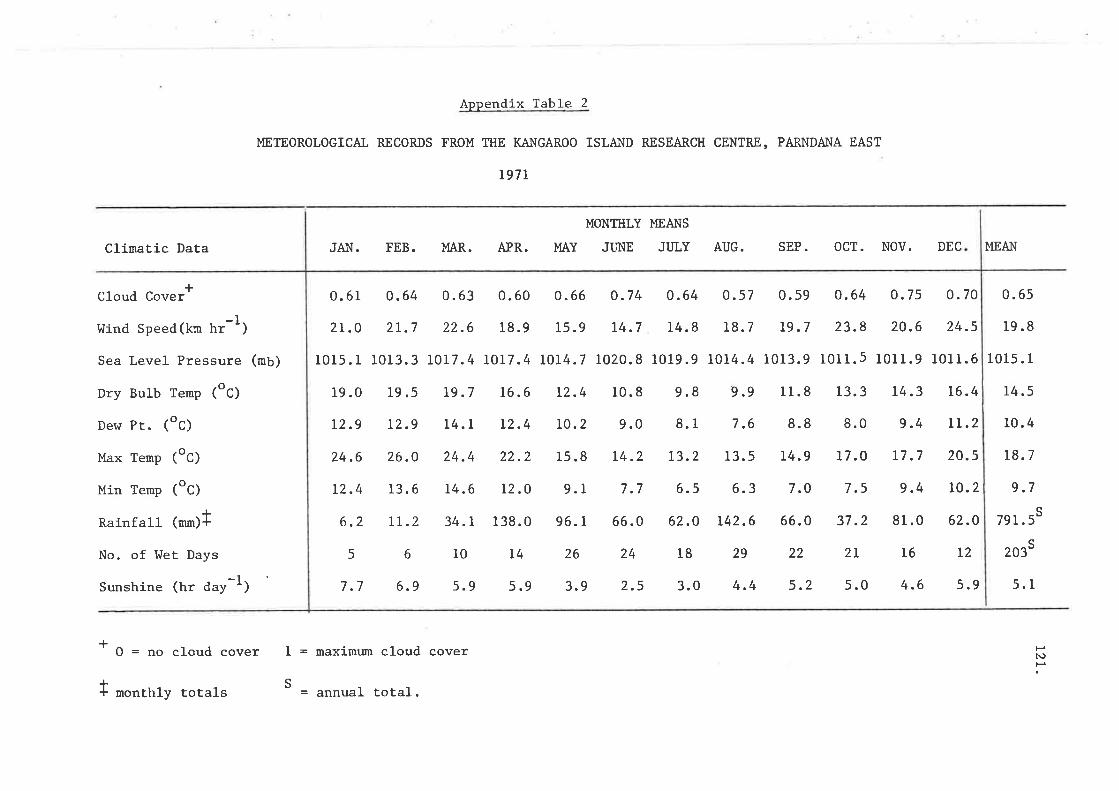
Climatic Data
Cloud Co.rerf
llind Speea(krn frr-1)
Sea Level Pressure (mb)
Dry Bulb Temp ("C)
Der¿ Pt. (oc)
Max Temp (oc)
Min Temp ("c)
Rainfall (*tn)l
No. of l,tret Days
Sunshine (rrr day-l)
+
Append ix TabLe 2
METEoRoLOGICAL RXCORDS FROM THE KANGARoo rSLAr{D RESEARCH CENTRE, PARNDÆ{A EAST
L97L
JAN. FEB. MAR. APR.
MONTIILY MEANS
MAY JI]NE JULY AUG. SEP. OCT. NOV. DEC MEAI{
0.61 0.64 0.63 0.60 0.66 0.74 0.64 0.57 0.59 0.64 0.75 0.70 0.65
2r.o 2L.7 22.6 18.9 15.9 14.7 14.8 18.7 19.7 23.8 20.6 24.5 19 .8
lols.r 1013.3 1017.4 LOL7.4 LOL4.7 1020.8 1019.9 1014.4 1013.9 10I1.5 1011.9 1011.6 101s.1
19.0 19.5 19.7 16.6 r2.4 10.8 9.8 9.9 11.8 13.3 L4.3 16.4 L4.5
24.6 26.O 24.4 22.2 15.8 14.2 13.2 13.5 14.9 17.0 17.7 20.5 18.7
r2.9 L2.9 14.r 12.4 L0.2 9.0 8.1 7.6 8.8 8.0 9.4 LL.z
t2.4 13.6 14.6 12.0 9.1 7.7 6.5 6.3 7.0 7.5 9.4 I0.2
10.4
9.7
S6.2 rr.2 34.1 138.0 96.L 66.0 62.0 142.6 66.0 37.2 81.0 62.0 79L.5
2l 16 T2 203S
5 6 10 L4 26 24 18 29 22
7.7 6.9 s.9 5.9 3.9 2.5 3.0 4.4 s.2 5.0 4.6 5.9 5.1
O = no cloud cover I = maximr:m cloud cover HN)F
f monthly totals S= annual total.
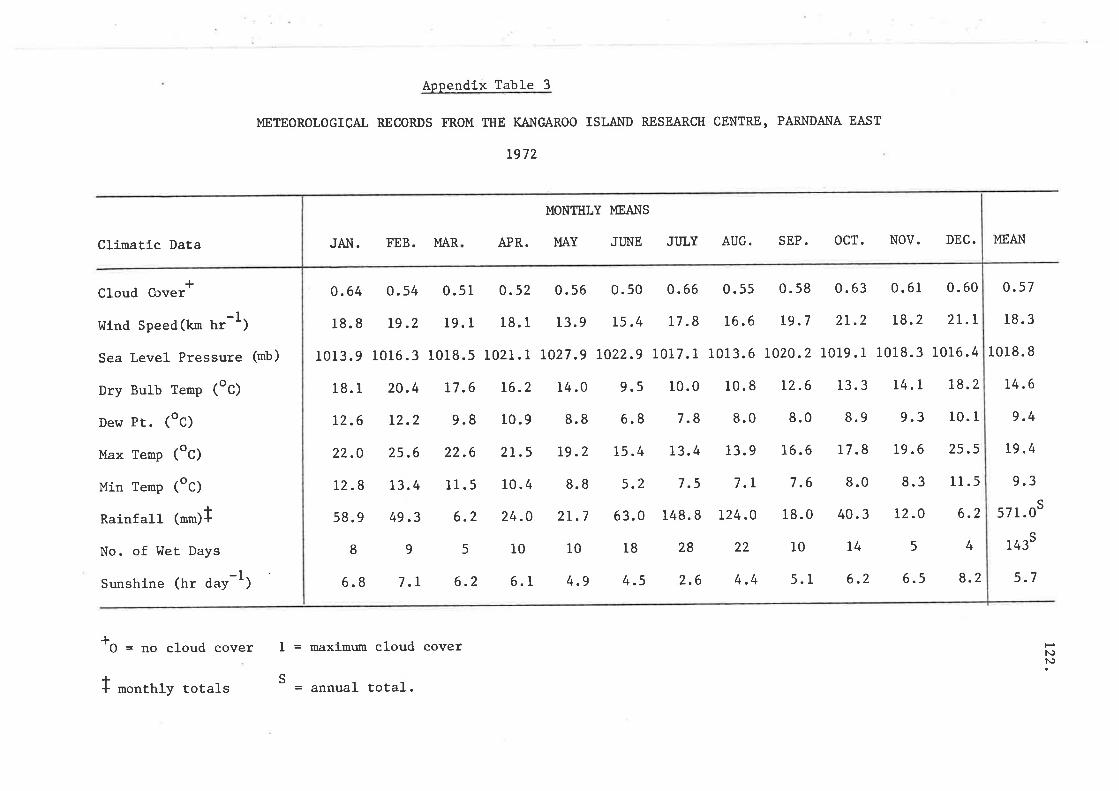
Appeq4l¿-! able 3
METEOROLOGICAL RECORDS FROM TIIE IGI{GAROO ISLÆ.TD RESEARCH CENTRE, PARNDANA EAST
L972
JAI{. TEB. MAR
MONITTLY MEAI.IS
APR. MAY JIJNE JT]LY AUG. SEP. OCT. NOV. DEC. MEANClimatic Data
Cloud Co',r.r*
llind Spee¿(tm trr-1)
Sea Level Pressure (mb)
Dry Bulb Tenp (oC)
Dew Pt. (oc)
Max Temp (oc)
Min Temp (oc)
Rainfall (nm)l
No. of trIet Days
Sunshine (rrr ¿ay-l)
*o = ,ro cloud cover I = maximr¡n cloud cover
0.57
18. 3
1018.8
L4.6
9.4
L9.4
9.3
57 I .0s
143s
5.7
N)N)
0.64 0.54 o.5I 0.52 0.56 0.50 0.66 0.55 0.58 0.63 0.61 0.60
18.8 Ig.2 19.1 18.1 13.9 15.4 17.8 16.6 19.7 21.2 I8.2 zL.l
1013.9 1016.3 1018.5 1021.1, L027.9 t022.9 1017.1 1013.6 LO20.2 IOL9.1 1018.3 1016.4
18.1 20.4 L7.6 16.2 14.0 9.s 10.0 10.8 12.6 13.3 L4.L I8.2
L2.6 12.2 9.8 10.9 8.8 6.8 7.8 8.0 8.0 8.9 9.3 10.1
22.0 25.6 22.6 2L.5 19.2 15.4 L3.4 13.9 L6.6 17.8 t9.6 25.5
L2.8 13.4 11.5 10.4 8.8 5.2 7.5 7.I 7.6 8.0 8.3 11.5
s8.9 49.3 6.2 24.O 2I.7 63.0 148.8 L24.0 18.0 40.3 L2.0 6.2
8951010182822101454
6.8 7.1 6.2 6.1 4.9 4.5 2.6 4.4 5.1 6.2 6-5 8.2
I rnonthly totals S= annual total.
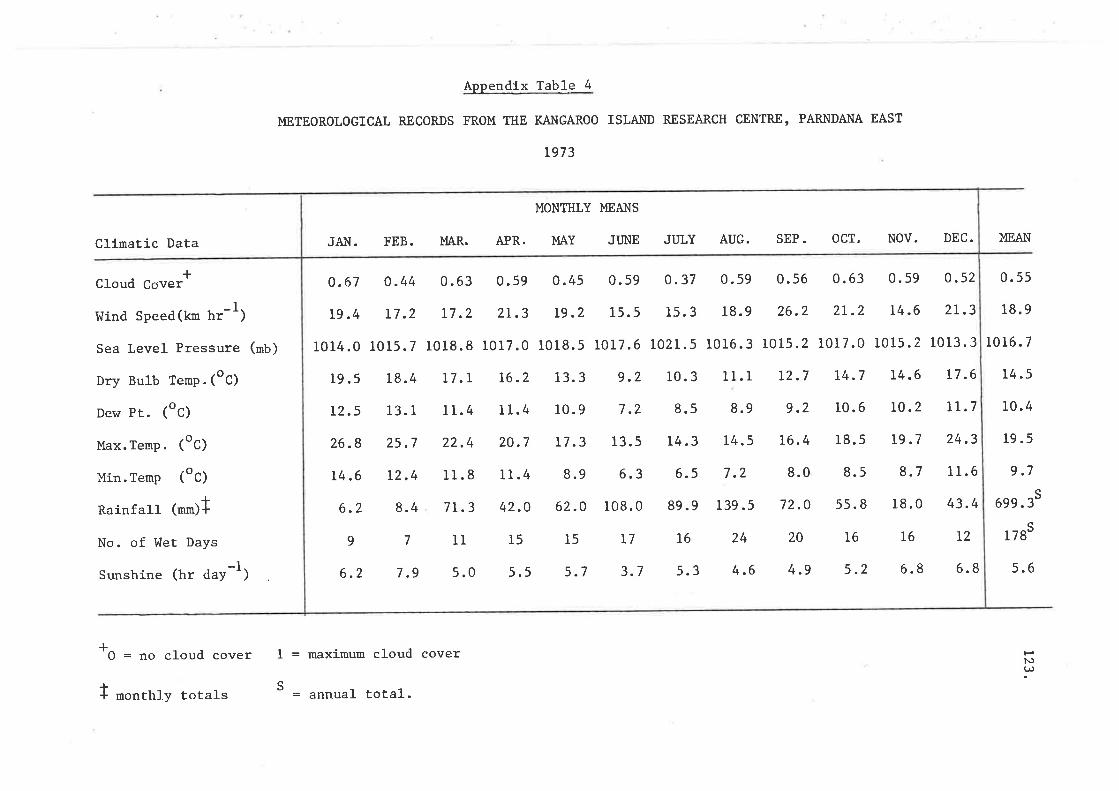
Appendix Table=1!
METEOROLOGICAL RECORDS FROM TIIE KANGAROO ISLA}ID RESEARCH CENTRE, PARNDANA EAST
L973
*o = ,ro cloud cover I = maximum cloud cover
MEANClimatic Data
cloud cover*
llind Spee¿(m frr-1)
Sea Leve1 Pressure (mb)
Dry Bulb temp.(oC)
Dew Pt. (oc)
Max. Ternp . (oc)
Min.Temp (oc)
Rainfall (**)Í
No. of I'let Days
Sunshine (frr day-l)
0.55
18.9
10 16. 7
r4.5
10.4
19 .5
9.7
699 .3s
I 78s
5.6
HN)(,
JAN. FEB. MAR. APR. MAY JI.]NE JULY AUG. SEP. OCT. NOV. DEC.
MONTIILY MEAI{S
0.67 0.44 0.63 0.59 0.45 0.59 0.37 0. s9 0.56 0.63 0.59 0.52
rg.4 L7.2 I7.2 2I.3 L9.2 15.5 15.3 18.9 26.2 21.2 L4.6 2I.3
1014.0 1015.7 1018.8 1017.0 1018.5 1017.6 LO}I.5 1016.3 1015.2 1017.0 1015.2 1013.3
19.5 18.4 L7.r 16.2 13.3 9.2 10.3 11.1 L2.7 14.7 14.6 17.6
t2.5 13.1 11.4 11.4 10.9 7.2 8.5 8.9 9.2 10.6 IO.2 II.7
26.8 25.7 22.4 20.7 t7.3 13.5 14.3 14.5 16.4 18.5 L9.7 24.3
14.6 I2.4 11.8 11.4 8.9 6.3 6.5 7.2 8.0 8.5 8.7 11.6
6.2 8.4 7r.3 42.O 62.O 108.0 89.9 139.5 72.0 55.8 18.0 43.4
g71115IsL7162420161612
6.2 7.9 5.0 5.5 5.7 3.7 5.3 4.6 4.9 5.2 6.8 6.8
I monthly totals S = annual ÈoÈal.
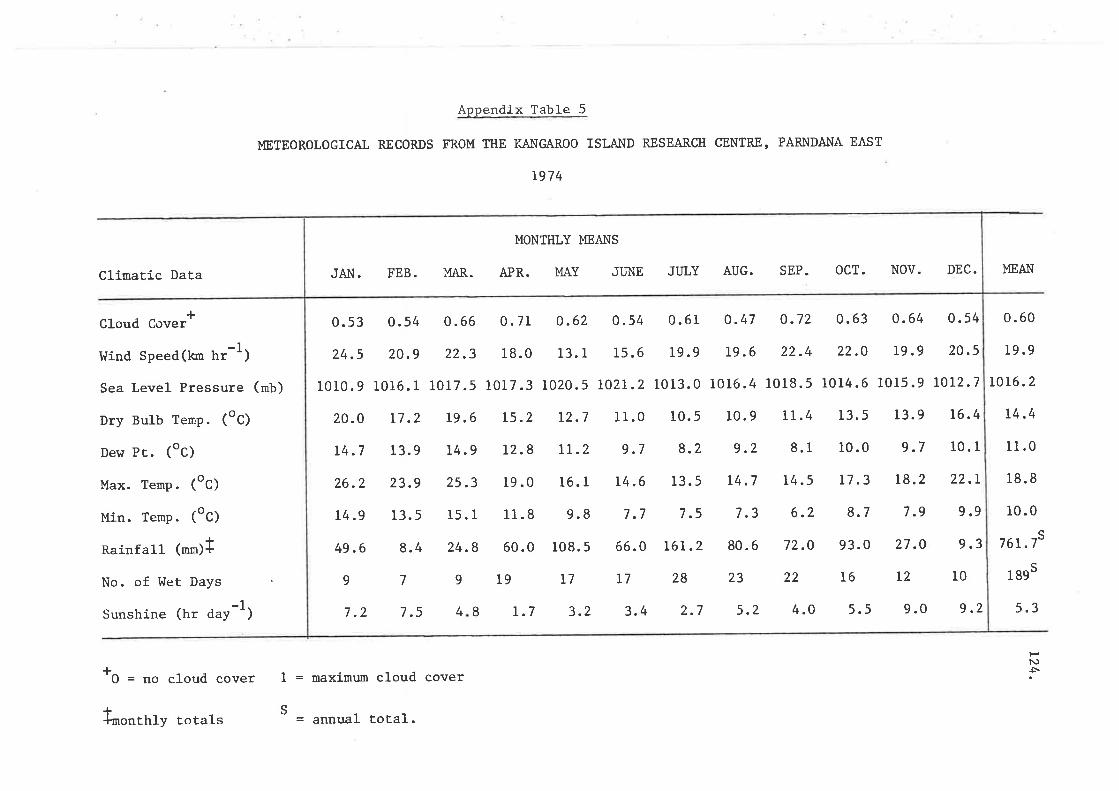
Appen dix Table 5
METEOROLOGICAL RECORDS FROM THE T.ANGAROO ISLÆ{D RESEARCH CENTRE, PARNDANA EASÎ
r97 4
*o = ,l'o cloud cover I = maximum cloud cover
MEAI'TClimatic Data
Cloud Cover*
lfind Speea(Un frr-l)
Sea Level Pressure (mb)
Dry Bulb Temp. (oC)
Dew Pt. (oc)
Max. Temp. (oc)
Min. Ternp . (oc)
Rainfall (*t)l
No. of tlet Days
Sunshine (nr aay-l)
0.60
t9.9
LOl6.2
t4.4
11.0
18.8
10.0
7il.7s
I 89s
5.3
N)r
JAN. FEB. MAR. APR. MAY JI]NE JI]LY AUG. SEP. OCT. NOV. DEC.
MONTHLY MEÆ.IS
0.53 0.54
24.5 20.9
1010. 9 1016. 1
20.0 17.2
L4 .7 13. 9
26.2 23.9
L4 .9 13. 5
49.6 8.4
97
7.2 7.5
0. 71 0.62 0.54 0.61 0.47
18.0 13.1 15.6 19.9 L9.6
1017.3 1020.5 1021.2 r}t3.0 1016.4
L5.2 r2.7 1 1.0 10.5 10.9
L2.8 tr.2 9.7 8.2 9.2
19 .0 16. I 14 .6 13.5 14 .7
11.8 9.8 7.7 7.5 7.3
60.0 108.5 66.0 L6t.2 80.6
19 L7 17 28 23
r.7 3.2 3.4 2.7 5.2
o.72
22.4
1018 . 5
1r.4
8.1
14.5
6.2
72.0
22
4.0
13.5
10.0
17.3
8.7
93.0
16
5.5
0.54
20.5
roL2.7
16.4
10. I
22.L
9.9
2s.3
0.66
I
22.3
14.9
9
4
24.8
9.0 9.2
12 10
9.3
t9.6
1017 . 5
15. I
0.63 0 .64
22.0 19 .9
1014.6 1015.9
13. 9
9.7
18.2
7.9
27 .O
honthly totals S= annual tot.a1 .
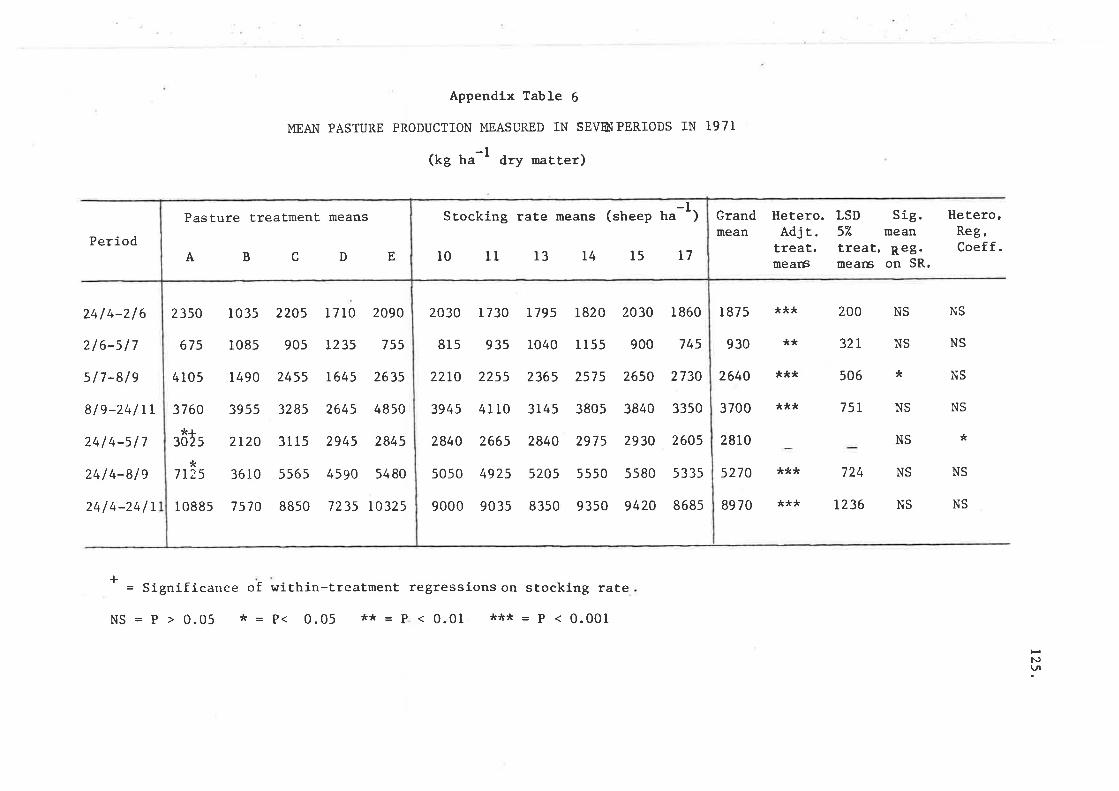
Appendlx Table 6
},IEAN PASTURE PRODUCTION I'IEASURED IN SEVBIPERIODS IN 1971
-1(kg ha ' dry natter)
Period
24 / 4-2/ 6
2/6-s l7
517-8/9
819-24lLr
2414-sl7
24 / 4-81 e
24/4-24/r
+
Grandmean
l 875
930
2640
3700
2810
5270
89 70
Hetero.Adj r.
treat.mearÊ
LSD Sig.57" meantreat, Reg.mears on SR.
Hetero,Reg,Coeff.
**
***
***
***
200
321
506
75r
NS NS
NS NS
*
NS
NS
NS NS
*
*** 724 NS NS
*** 1236 NS NS
= Significance of within-treatment regressions on stocking rate
NS=P>0.05 *=P< 0.05 **-P<0.01 ***-P<0.001
HNJ(,¡l
Pasture treatment means
A B c DE
1035
t085
1490
39 55
2t20
3610
7 570
2205
905
2455
3285
3115
5565
88s0
I7I0 2090
L23s 755
t645 2635
2645 4850
2945 2845
4590 5480
7235 rO325I 088s
*¿30)s
*7 t25
2350
675
4 105
3760
Stocking rate means (sheep ha
10 1l 13 t4 15 L7
-1)
2030
815
22tO
3945
2840
5050
9000
I 730
93s
2255
4I 10
2665
4925
9035
L795
1040
2365
3145
2840
5205
8350
1820
I 155
2575
3805
2975
5 550
9350
2030
900
2650
3840
2930
5580
9420
I 860
74s
2730
3350
2605
5335
8685
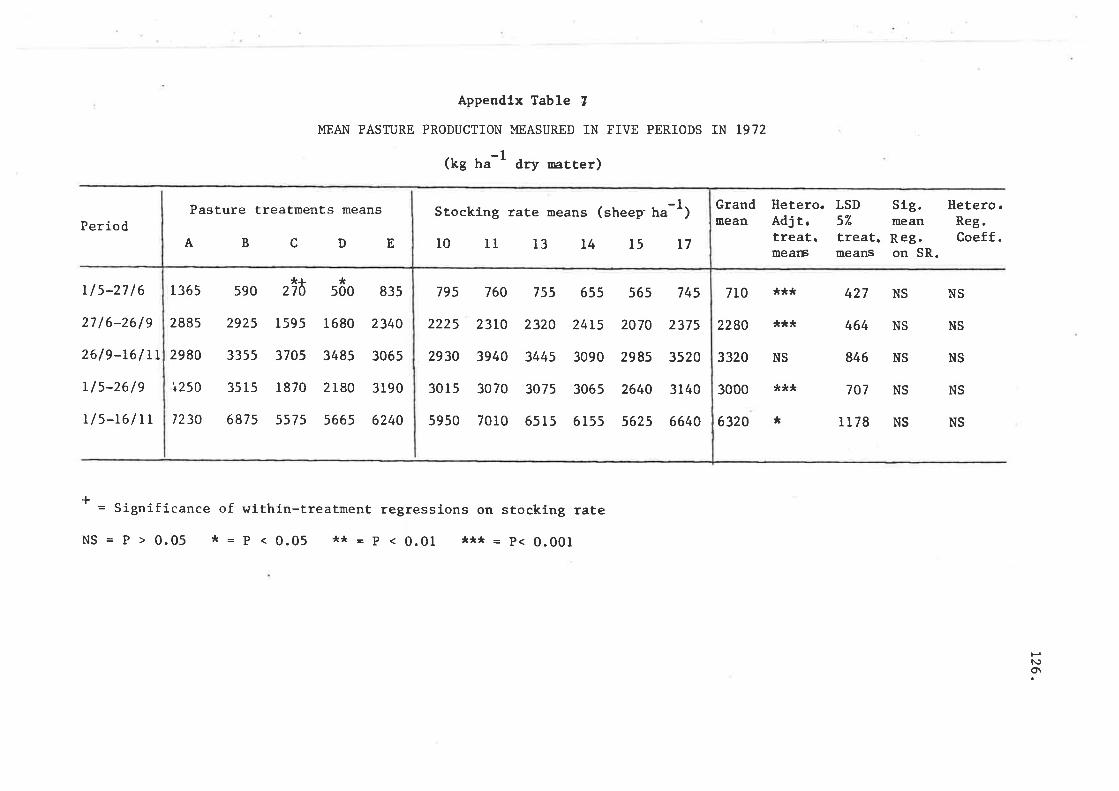
Appendlx Table 7
MEAN PASTURE PRODUCTION MEASURED IN FIVE PERIODS IN 1972
(kg ha-l dry oatter)
Pasture treatments means Stocking rate means (sheep- ha-
10 11 13 L4 15
t) Grandmean
7L0
2280
3320
3000
6320
Hetero.Adj r.treat.meafE
LSD57"
treat.means
S1g. Hetero.mean Reg.Reg. Coeff.on SR.
Períod
r/s-27 /6
27 /6-2619
2619-16/rL
r/s-26/9
rls-r6/Lr
+
BCDA E T7
***
***
***
427
464
846
707
1178
NS NS
NS
NS
NS
NS
NS
NS
NS
NS
NS
*
= Significance of within-treatment regressions on stocking rate
NS = P > 0.05 * = P < 0.05 *:t = p < 0.01 *** = p< 0.00I
HN)o\
1365
2885
2980
'+25O
7230
590
2925
3355
35 15
6875
1595
3705
1870
5575
*500
1680
3485
2 180
5665
835
2340
3065
3190
6240
795
2225
2930
30 r5
5950
760
23LO
3940
3070
7010
755
2320
3445
3075
65 l5
655
24L5
3090
3065
6 155
565
2070
2985
2640
5625
745
2375
3520
3140
6640
*¡27ö
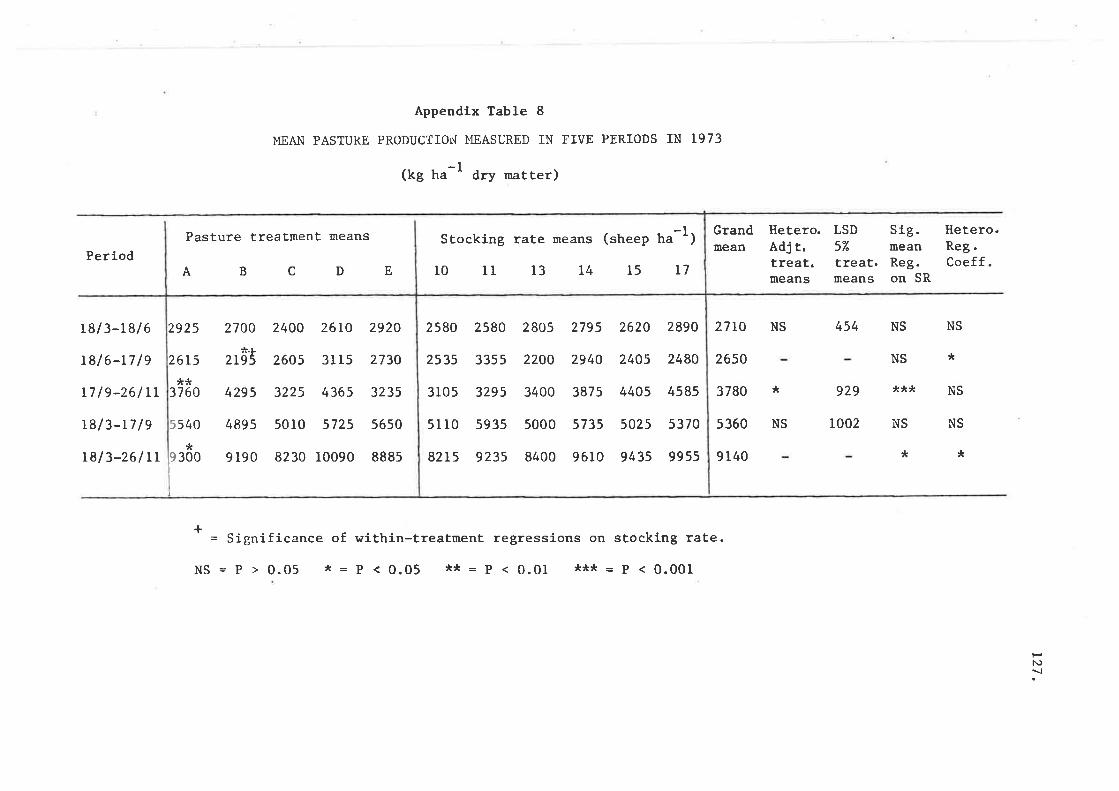
Appendlx Table 8
MEAN PASTURE PRODUCTIOi{ MEASURED IN FIVE PERIODS IN 1973
-t(kg ha ^ dry rnatter)
Pasture treatment means Stocking rate means
10 11 13 L4
-1(sheep ha '
15 L7
)Grandmean
Hetero.Adj r.treat.means
LSD57"
treat.means
sig.meanReg-on SR
Hetero.Reg.Coeff.Period
t8l 3-r8l 6
L8/ 6-17 /9
17l9-26/Lr
18/3-1719
18l 3-26 I rr
A BC D E
27LO
2650
3780
s360
9140
NS 454 NS NS
NS
* 929
1002
* *
*
NS
*** NS
NS NS
+ = Significance of within-treatment regressions on stocking rate.
NS = p > 0.05 * = p < 0.05 ** = p < 0.01 *** = P < 0.00I
l\)!
2400 26tO
2605 3115
3225 4365
50r0 5725
8230 10090
2920
2730
3235
5650
8885
26r5
3760
2r95
300
**
2925 2700
5
4295
4895
9 I90
540
*
2580
2535
3105
51r0
82r5
2580
3355
3295
5935
9235
2805
2200
3400
5000
8400
279s
2940
3875
5735
9 610
2620
2405
4405
5025
9435
2890
2480
4585
5370
9955
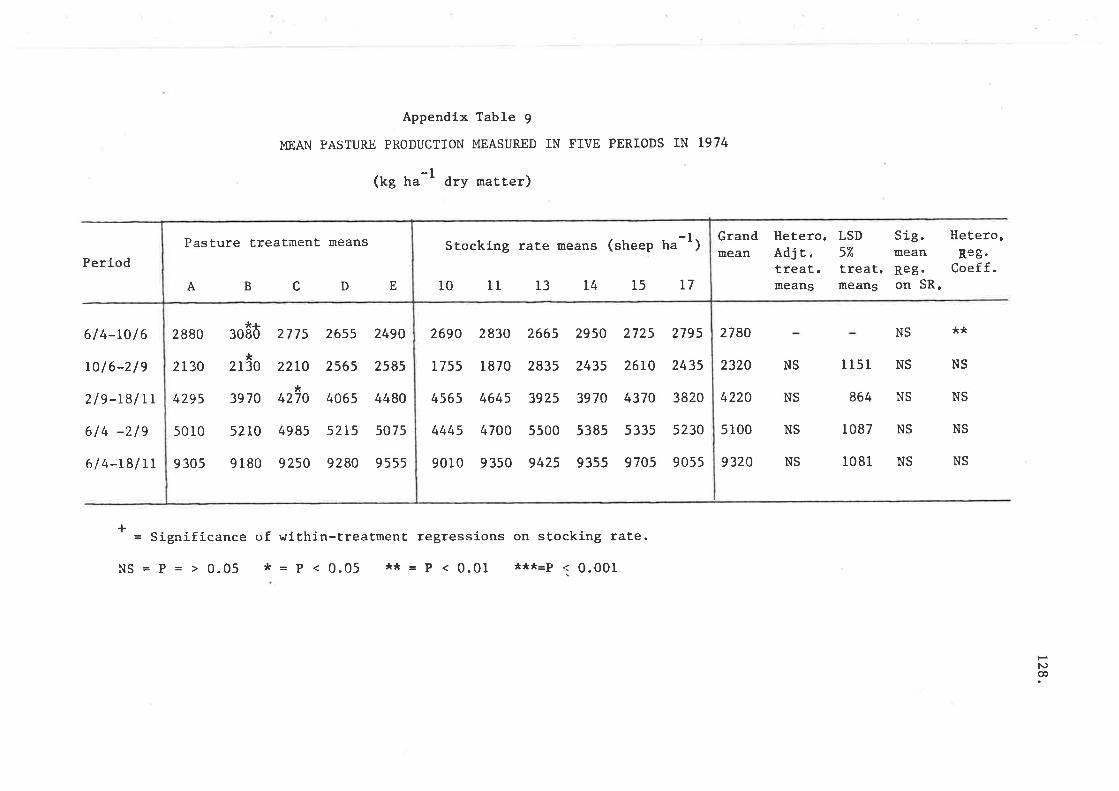
Appendix Table 9
},IEAN PASTURL] PRODUCTION MEASURED IN FIVE PERIODS IN 1974
-1(kg ha dry natter)
Period
614-LOl6
ro/6-2/e
219-r8l rt
6/4 -2/e
6l 4-r8l rr
+
Grandmean
2780
2320
4220
5 100
9320
Hetero.Adjr.treat.means
LSD5"1
treat.IIlêâlls
Síg. Hetero.mean Reg.Reg. Coeff.on SR.
NS
NS
,R*
NS
NS
NS
NS
1151
864
r087
r081
NS
NS NS
NS NS
NS NS
= Significance of within-treatment regressions on stocking rate.
NS = P = > 0.05 * = P < 0.05 :t:t = p < 0.01 ***=P < 0.001
HN@
Pasture treatinent means
A B c D E
2 880
2r30
4295
50 r0
9 305
*.!3080
tc2r30
3970
52 l0
9180
2775
22IO,r
4270
4985
9250
2655
2565
4065
5215
9280
2490
2585
4480
5075
9555
Stocking rate means (sheep ha
l0 1r 13 14 15 L7
-1)
2690
1755
4565
4445
9010
2830
I 870
4645
4700
9 350
2665
2835
3925
5500
9425
2950
2435
3970
5385
93s5
2725
26L0
4370
5335
9705
2795
2435
3820
5230
9055
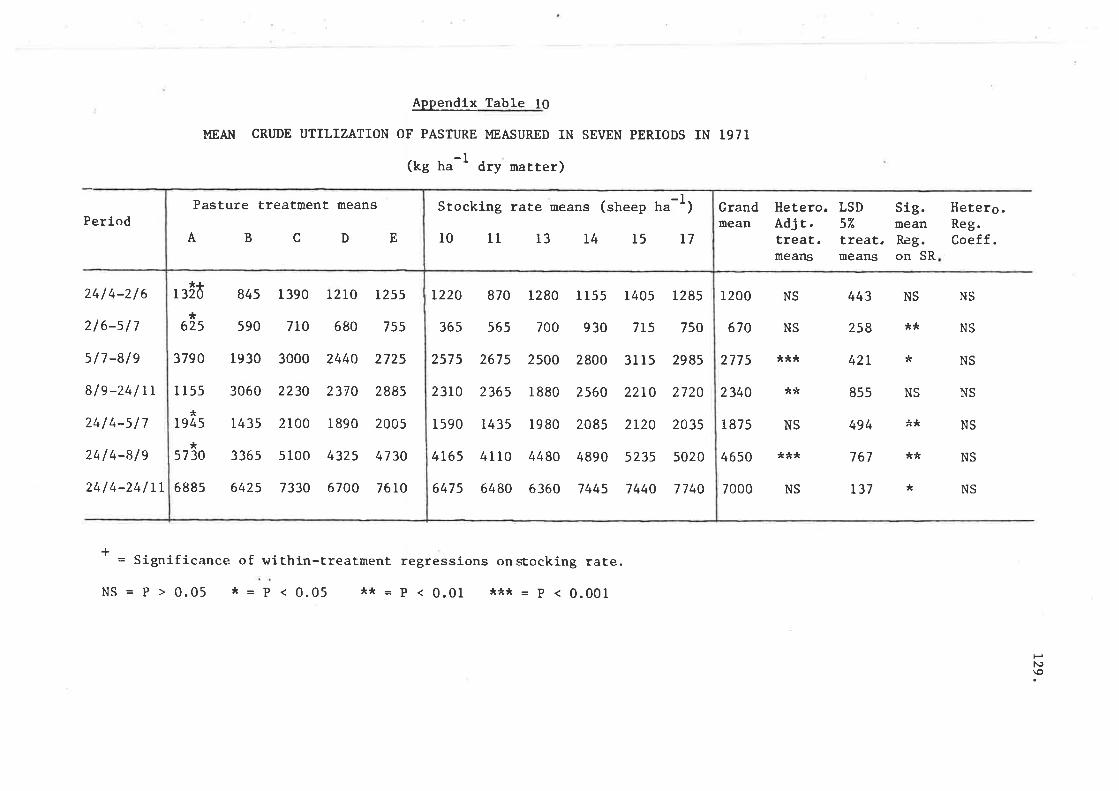
Appendlx Table lO
MEAI{ CRI.]DE UTILIZATION OF PASTURE MEASURED IN SEVEN PERIODS IN 1971
(kg ha-l dry marter)
Perlod
241 4-2/ 6
216-s/7
517 -8/e
8/9-24/rr
24/4-s/7
24 / 4-81 e
24/ 4-24/ rL
Grandmean
I 200
670
2775
2340
I 875
4650
7000
Hetero.Adj r.treat.means
LSD Sig.5% meantreat, Reg.means on SR
Hetere.Reg.Coeff.
NS
NS
***
**
NS
***
NS
443
258
42r
855
494
767
r37
NS NS
,r* NS
*NS
NS NS
** NS
** NS
*NS
+ = Significance of within-treatment regressions onsÈocking rate.
NS = p > 0.05 * = p < 0.05 ** - p < 0.01 *** - p < 0.001
HN)\o
Pasture treatment means
A EBCD
3790
I 155
1945
*s730
688s
845
590
1930
3060
r435
336s
6425
1390
710
3000
2230
2100
5 100
7330
t2LO
680
2440
23V0
1890
4325
6700
1255
755
2725
2885
2005
47 30
7610
*25
*¡2ö13
6
Stocking rate means (sheep ha
r0 11 13 L4 15
-1
T7
)
1220
365
2575
2310
1590
4165
6475
870
565
2675
2365
r435
4110
6480
1280
700
2500
I 880
r9 80
4480
6360
1 155
930
2800
2560
2085
4890
7445
r405
715
3115
22LO
2120
5235
7 440
L285
750
2985
2720
2035
5020
7740
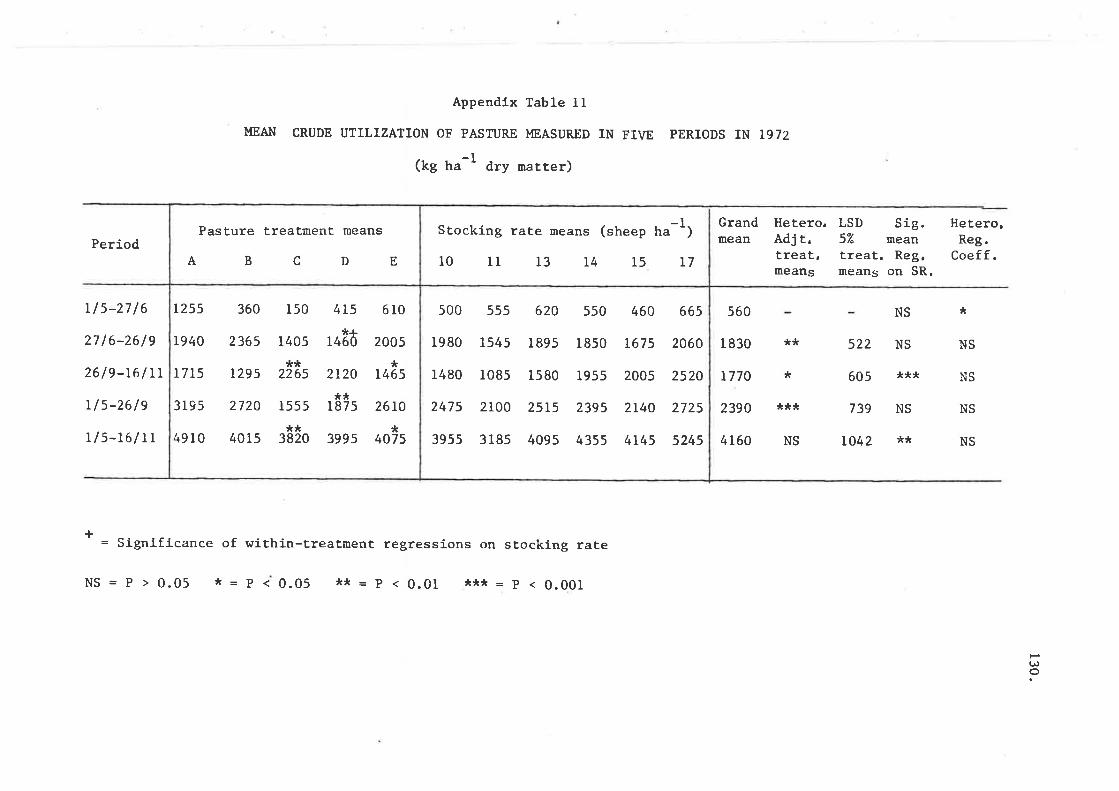
Appendfx Table llMEAN CRUDE UTTLTZATTON OF PASTURE MEASURED IN FIVE PERIODS IN 1972
-l(kg ha ' dry matter)
Period
t/s-2716
2716-26/9
26/9-16/rr
L/s-261e
r/5-t6lrr
+
Grandmean
560
I 830
1770
2390
4r60
Hetero.Adj r.treat,means
LSD Sig.5i¿ meantreat. Reg.means on SR.
Hetero.Reg.
Coeff.
NS
NS
522 NS NS
605 *** NS
739 NS NS
*
**
)c
***
NS lO42 **
= Significance of within-treatEent regressions on stocking rate
NS = p > 0.05 * = p < 0.05 ** - p < 0.01 *** = p < 0.001
U)o
Pasture treatment means
A c EB D
I255
1940
r715
3195
49 10
360
2365
I295
2720
4015
1555
**3820
2265 2t20
*+r46ô
150
1405
**
**r 87s
2005
*1465
26LO
4L5 610
*399s 4075
500
1980
1480
2475
3955
555
1545
1085
2100
3 185
620
1895
1580
2515
4095
550
1 850
1955
2395
4355
460
1675
2005
2140
4145
66s
2060
2520
2725
5245
Stocking rate means (sheep ha
10 lt t3 t4 15
-1
T7
)
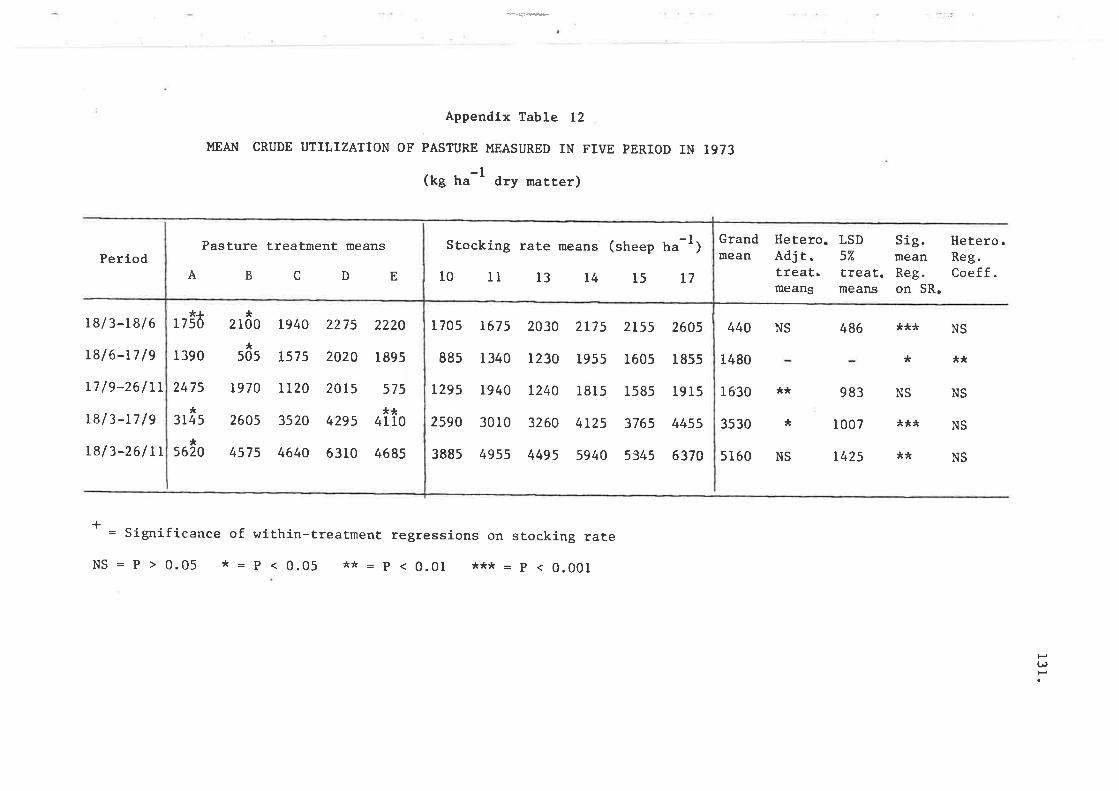
Appendix Table Iz
MEAN CRUDE UTILIZATION OF PASI'T]RE I4EASURED IN FIVE PERIOD IN 1973
(kg ha-1 dry marter)
Pasture treatment means
1940
I575
I 120
3520
4640
2275
2020
20t5
4295
6310
I 705
885
L295
2590
3885
1675
1340
r940
30 l0
4955
2030
1230
1240
3260
4495
2175
1955
1815
4r25
5940
2t55
1605
1585
3765
5 345
2605
1 855
t9 15
4455
6370
Grandmean
440
1480
r630
3530
5160
Stocking rate means (sheep t"-I)
10 11 13 14 15 t7
Hetero. LSDAdjr. 5%
tfeat. treat.means means
sig. Hetero.Reg.Coeff.
Period meanA B
*2 I00
*505
1970
2605
4575
CD E
2220
r 895
575
**4110
SR.Regon
18/ 3-r8l 6
L8/6-17 /9 t 390
L7 /9-26/rL 2475
L8/3-r7 /9*
3145
*5620
+
*!r 7s0 NS 486
983
r007
I425
NS
**
NS
NS
NS
**
*
NS
***
*
NS
¡¿+
**18/ 3-26/ Lr 4685
= significance of within-treaÈment regressions on stocking rate
NS = p > 0.05 * = p < 0.05 ** = p < 0.oI *** = p < 0.00I
ts(,
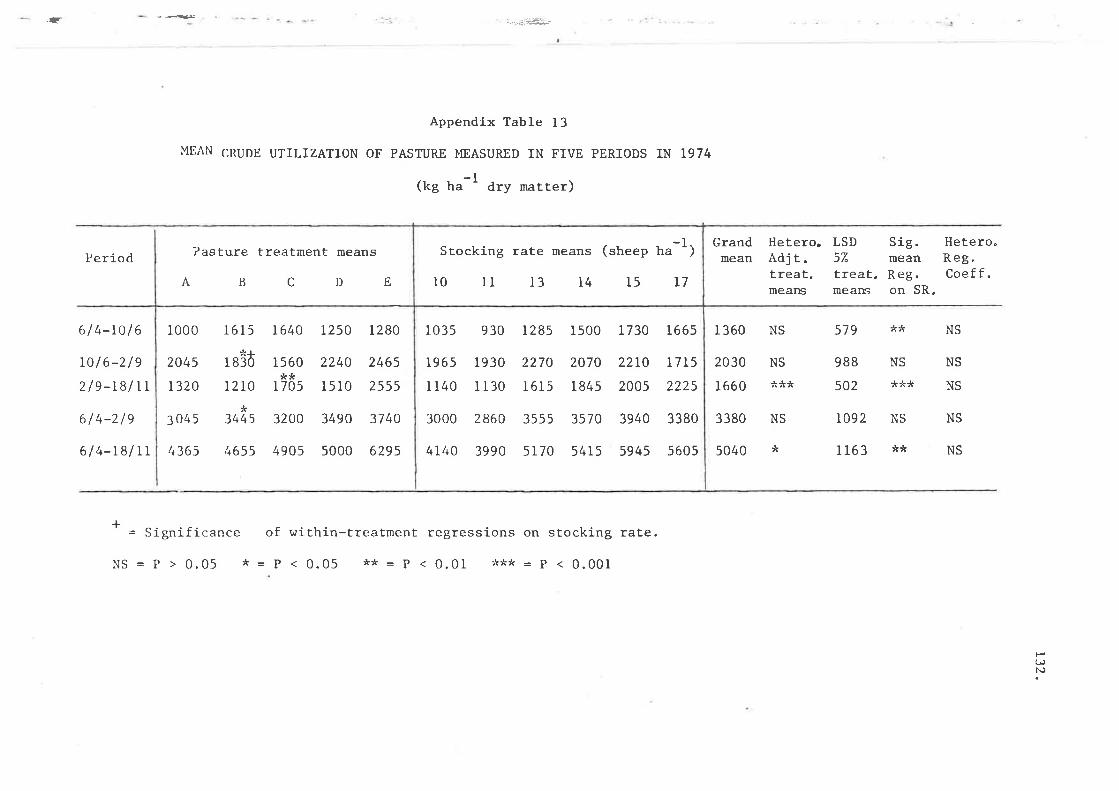
_{
Appendix Table 13
l'lliAN s¡¡pE urrlrzATroN oF pASTURE MEASURED rN FrvE pERroDS rN 1974
(t<g ha-l dry matter)
Period
614-Lo/6
rol6-2le219-r8lrr
614-2le
6 I 4-r8l rr
B c DE
Grandmean
I 360
2030
1660
3380
5040
Hetero.Adj r.treat.means
LSD)/"treat.means
Pasture treatment meansSig. HeÈero,mean Reg.Reg. Coeff.on SR.
A
1000
2045
r320
3045
4365
1615
rÂ+
I 83Ô
L2TO
I640
1560**
1 705
3200
4905
1250
2240
1510
3490
5000
1280
2465
2555
3740
6295
NS
579
988
502
to92
1163
3445
NS
NS
!
NS
NS
!!
NS
NS
NS
NS
NS4655
Significance
NS=P>0.05 *=
+ of within-treatment regressions on stocking rate.
P < 0.05 ** = P < 0.0I rk** = p ç 0.00f
tsUJl\)
Stocking rate means
10 1l 13 t4
-l(sheep ha '
15 L7
)
1035
L965
I 140
3000
4t40
930
1930
1130
2860
3990
12 85
2270
I6t 5
3s 55
5170
r 500
2070
184 5
3570
5415
I 730
22L0
2005
3940
5945
1665
I 715
2225
3380
5605
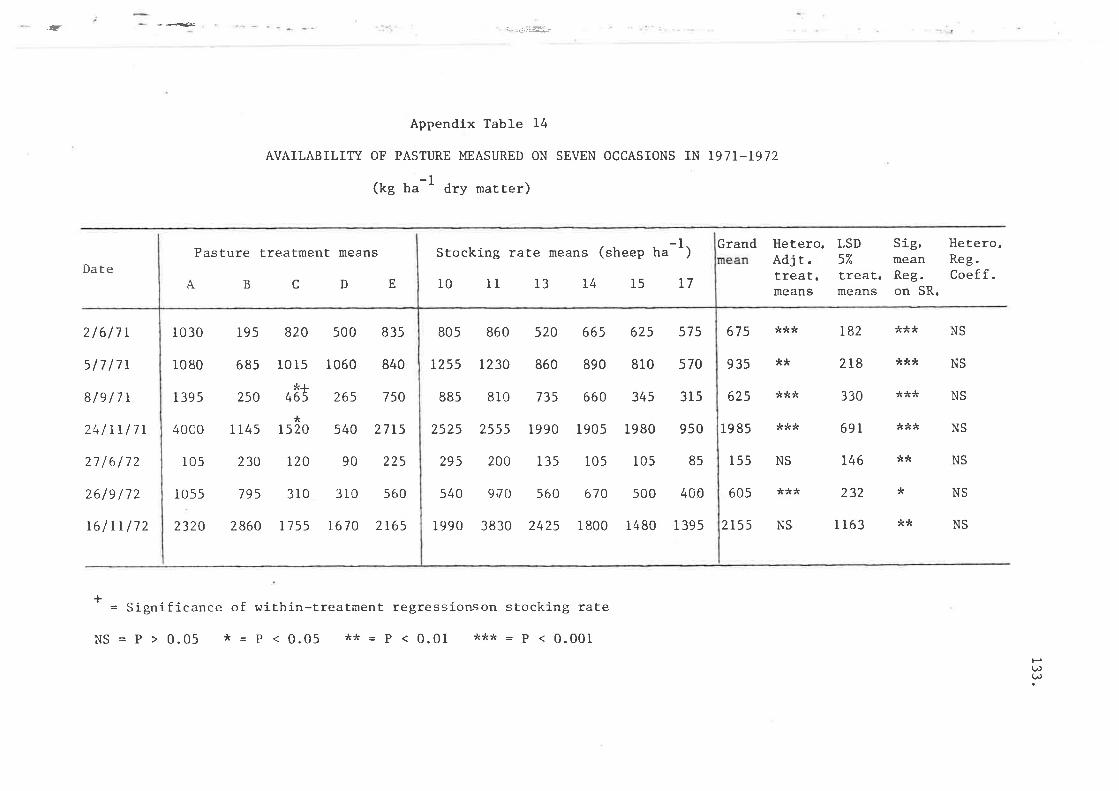
-{
Pasture treatmerit means Stocking rate means (sheep ha
10 11 13 14 15
Appendlx Table 14
AVAILABILITY OF PASTURE MEASURED ON SEVEN OCCASIONS IN 197T_T972
(kg ha-1 dry matter)
Date
2l6l7r
5/7 /7t
8/e /7r
24lrrl7r
2716172
2619 /72
16lrrl72
+
A B CD E L7
-r) Grand
67s
93s
625
19 85
155
605
2t55
Hetero.Adj r.treat.means
LSD5%
treat.means
sig.meanReg.on SR.
Hetero.Reg.Coeff.
**
***
¡¿¿
***
***
r82
218
330
691
146
232
I 163
*Jr* NS
,s** NS
*** NS
*rÁ* NS
¿ NS
** NS
J¿NS NS
NS
= Significance of within-treatment regressionson stocking rate
H(,(,
r0 30
1080
139 5
4000
105
1055
2320
r95
685
250
I 145
230
795
2 860
500
1060
265
540
90
3r0
r670
83s
840
750
27 15
225
560
2r65
4ê,3
820
I0 15
*15 20
t20
310
It 55
805
t255
88s
2525
295
540
I 990
860
I230
810
2555
200
9;70
3830
s20
860
735
19 90
135
560
2425
665
890
660
I 905
105
670
I 800
625
810
345
1980
105
500
1480
575
570
315
950
85
400
I 395
NS = p > 0.05 * = p < 0.05 ** - P < 0.01 *** = P < 0.00I
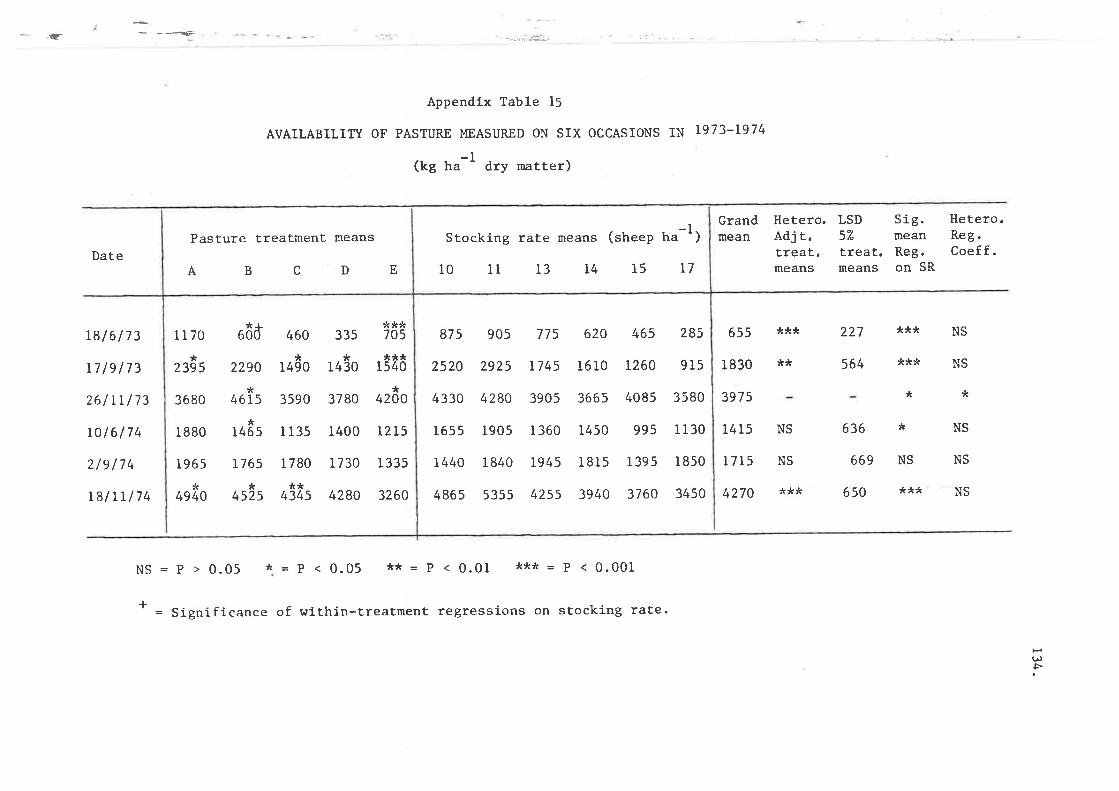
ù _ _=.<=
Appendlx Table 15
AVAILABILIfi OF PASTURE MEASURED ON SIX OCCASIONS IN T973-T974
-t(kg ha ' dry r¡atter)
Date
18 /617 3
17/e173
2.61 rL 173
ro/6174
2le l74
18lrrl74
1170
*2395
3680
I 880
I 965
*4940
***705
*4200
T2L5
I 335
3260
875
2520
4330
165 5
L440
486s
905
2925
4280
1905
I 840
5355
620
16 t0
3665
1450
1 815
3940
465
r260
4085
995
139 5
3760
285
915
3580
1130
I 850
3450
*J-60d
2290
*4615
*t465
460
*1490
3590
I l3s
335
*1430
3780
1400
t730
4280
775
t745
3905
I 360
1945
4255
Grandmean
655
I 830
3975
14r5
1715
4270
Hetero.Adj r.treat.means
LSDs7"
treat.means
sig.meanReg.on SR
Hetero.Reg.Coeff.
***
**
NS
¿¡¿
227 *** NS
564 *** NS
* *
636
669
650
NS
*** NS
,r**1540
NS¡
NS
NS
r76s 1780
***4525 4345
NS = P > 0.05 * = P < 0.05 ** = P < 0.01 *:t* = P < 0.001
+ = Significance of within-treaÈment regressions on stocking rate.
H(¡)Þ
Pasture treatment means
A B CDE
Stocking rate means
10 11 13 14
(sheep ha
15 T7
-1)
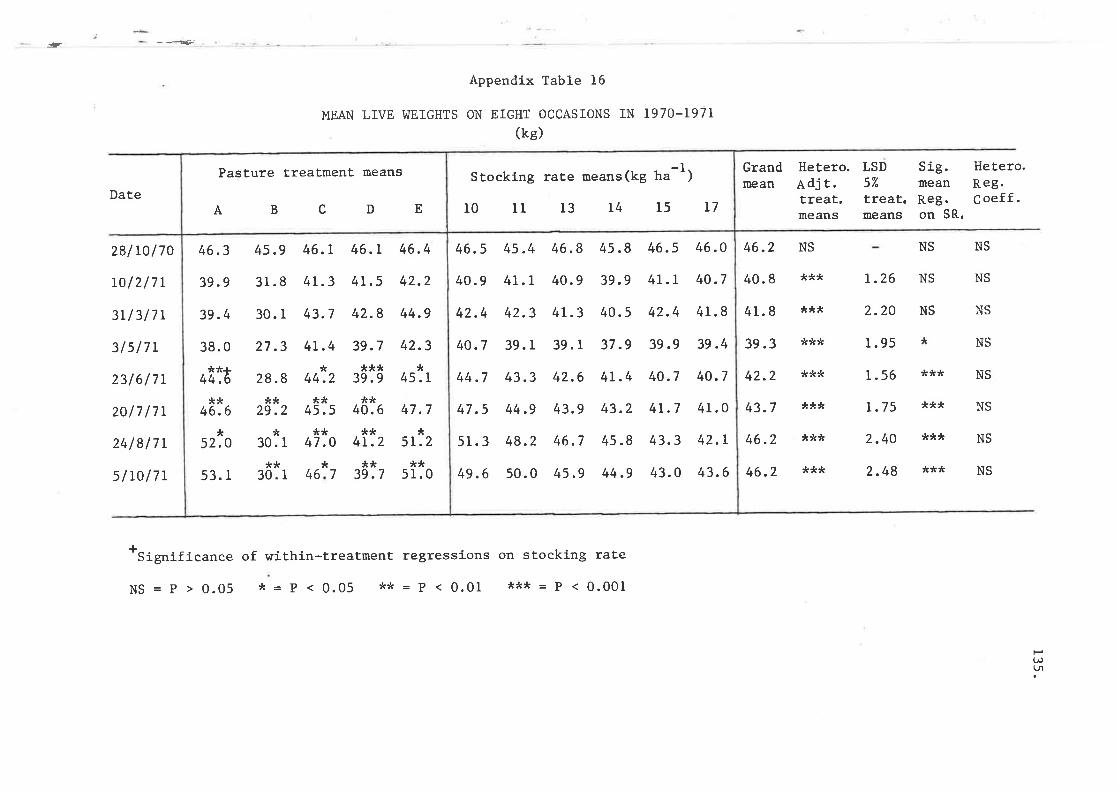
.t
Appendix Table 16
MEAN LIVE I,{EIGHTS ON EIGHT OCCASIONS IN 1970-1971(ke)
Grandnean
46.2
40. I
41. 8
39 .3
42.2
43.7
46.2
46.2
Hetero.Adj t.treaÈ,means
LSD57"
treat.means
Sig. Hetero.mean Reg.Reg. Coeff.on SR.
Date
28/ t0 /70
Lo /217 r
3LI3l7r
3ls /7 r
23/6/7r
20/7 /7L
24 /817 L
s /r0l7L
NS NS NS
NS NS
NS
*
*** NS
*** NS
*** NS
*tr* NS
¿¿¡
¿¿¡
***
***
***
***
***
r.26
2.20
1.95
1. s6
r.75
2.40
2.48
NS
NS
*Sigrrifi"ance of within-treatment regressions on stocking rate
NS = p > o.o5 * = P < 0.05 ** = P < 0.01 *** = P < 0.001
(,L¡l
PasÈure treatmenÈ means
A BC DE
4s.9
31.8
30. 1
27.3
28.8**
29.2,r
30. 1
**30. I
46.6
53. r
s2.o
**r44.6
46.4
42.2
*
**
46*
7
**47 .0
45.5
**51.0
46.3
39.9
39.4
38. 0
46.r
4L.3
43.7
4t.4*
44.2,r**
39.9¿T
40.6**
4L.2**
39.7
46.r
4r.5
42.8
39.7
44.9
42.3*
45. I
47 .7*
5r.2
Stocktng rate means(kg ha
10 11 13 L4 15 L7
1)
46.5
40.9
42.4
40.7
44.7
47 .5
51.3
49.6
42.3
39. 1
43.3
44.9
48.2
50.0
4r.3 40.5 42.4
39. r 37 .9 39 .9
42.6 4r.4 40.7
43.9 43.2 4L.7
46.7 4s .8 43.3
45 .9 44 .9 43. 0
46.O
40.7
41.8
39.4
40.7
41.0
42.1,
43.6
9 39.9
45.4 46.
4t.L 40.
46.s
4r.l
I 45.8
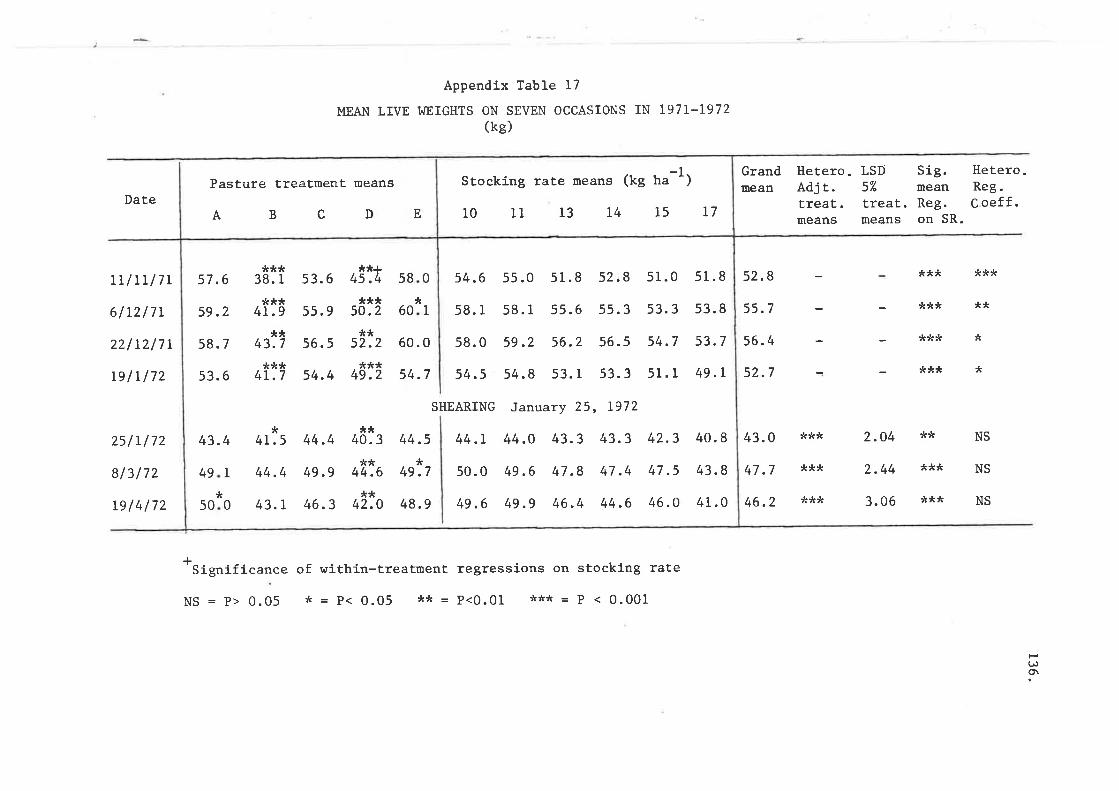
Pasture treatment means
Appendix Table l7
MEAN LIVE T^]EIGHTS ON SEVEN OCCASIONS TN I97L-I972(ke)
Stocking rate means (kg ha
10 11 13 L4 15
-1)
Hetero. LSD Sig. Iletero.Adjt" 5% mean Reg.treat. treat. Reg. Coeff.means means on SR.
GrandInean
Date
LL/LL/77
6/12/71
22/12/71
relL/72
25/t/72
813172
19/4172
A BCD E L7
52.8 *** ***
55.7 *t(* **
56.4 I¿& T
52.7 *** *
43.0 *** 2.04 ** NS
47 .7 *** 2.44 *rr* NS
46.2 *** 3.06 ,r** NS
+Significance of within-treatment regressions on stocking rate
NS = p> 0.05 * = P< 0.05 ** = P<0.01 *** = P < 0.001
HUto\
43.4
* **
*1
0
49
50
r 44.4 4s .s +frio qgl,t
0 43.1 46.3 42.0 48.9
**40.3 44.5
60.0
58
60
50.0
44.L
59.2
54.7
SHEARING
57 .6
59.2
58.7
53.6
s3.6
55.9
56.5
54.4
**+4s.4***
50.2**
52.2***
49.2
s4 .6 55 .0
s8.1 58.1
sl .8
55.6
56.2
52.8
55. 3
56.5
53. 3
January 25, L972
44 .O 43.3 43.3
49.6 47.8 47 .4
51 .0
s3.3
54.7
51. I
42.3
47 .5
46.O
51.8
53. 8
53.7
49.L
40. I
43. 8
41 .0
,,**38. I***
4L.9*rr
43.7**tr
4r.7
*4L.5 44 .4
49.6 49.9 46.4 44.6
s4.8 53.1
58. 0
54.5
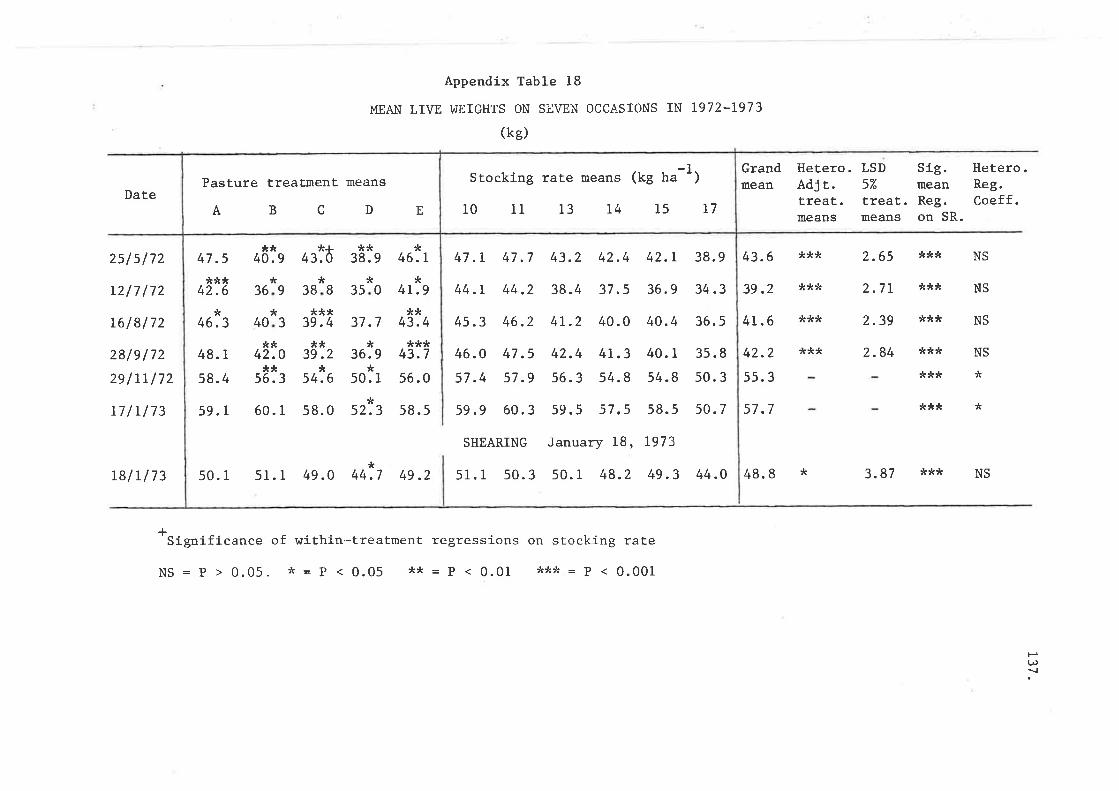
Appendix Table 18
I"IEAN LIVE I,]EIGHTS ON SEVEN OCCASIONS IN 1972_1973
(ke)
Grandmean
43.6
39.2
4t.6
42.2
5s.3
57 .7
Hetero. LSD Síg.Adj t. 57. meantreat. treat. Reg.means means on SR.
Hetero.Reg.Coeff.Date
25/s/72
L2/7 /72
L6/8/72
28/e /72
2e /rr/72
17lrl73
***+***47 .5 40.9 43.0 38.9 46.L
*
37 .7*
36.9
*
42.r
36.9
40.4
40.1
54.8
58.5
r973
49.3
38.9
34.3
36. 5
35.8
50. 3
50.7
***
***
¿¿r
2.65
2.7L
2.39
2.84
¿¿¿
**rß
***
J¿¿
I¿
***
47.r 47.7
44.t 44.2
45.3 46.2
46.O 47.5
57.4 s7.9
59 .9 60. 3
SHEARING
s1.t 50.3
43.2 42.4
38.4 37.s
4r.2 40.0
42.4 41.3
56.3 54.8
59.5 57.5
January 18,
50. r 48.2
NS
NS
NS
NS
***42.6
¡46.3
48.1
s8.4
59. 1
03s8
tc
4
*
&¿9.
38
3
36
40
*4t.9**
43.4
******43.7
+&
42.0
*9
*3
**39.2
*
60.1 58.0
*50. I54.6
**56.3
52.3
56.0
58.5
¿
&
*L8/r/73 50.1 5r.1 49.0 44.7 49.2
l-'Significance of within-treatment regressions on stocking rate
NS = P > 0.05. * = P < 0.05 't* = P < 0.01 *** = P < 0.001
44.O 48. I 's
3.87 *** NS
(,!
Pasture treatment means
ABCD E
Stockíng rate means (kg ha
10 11 13 14 15
-1
L7
)
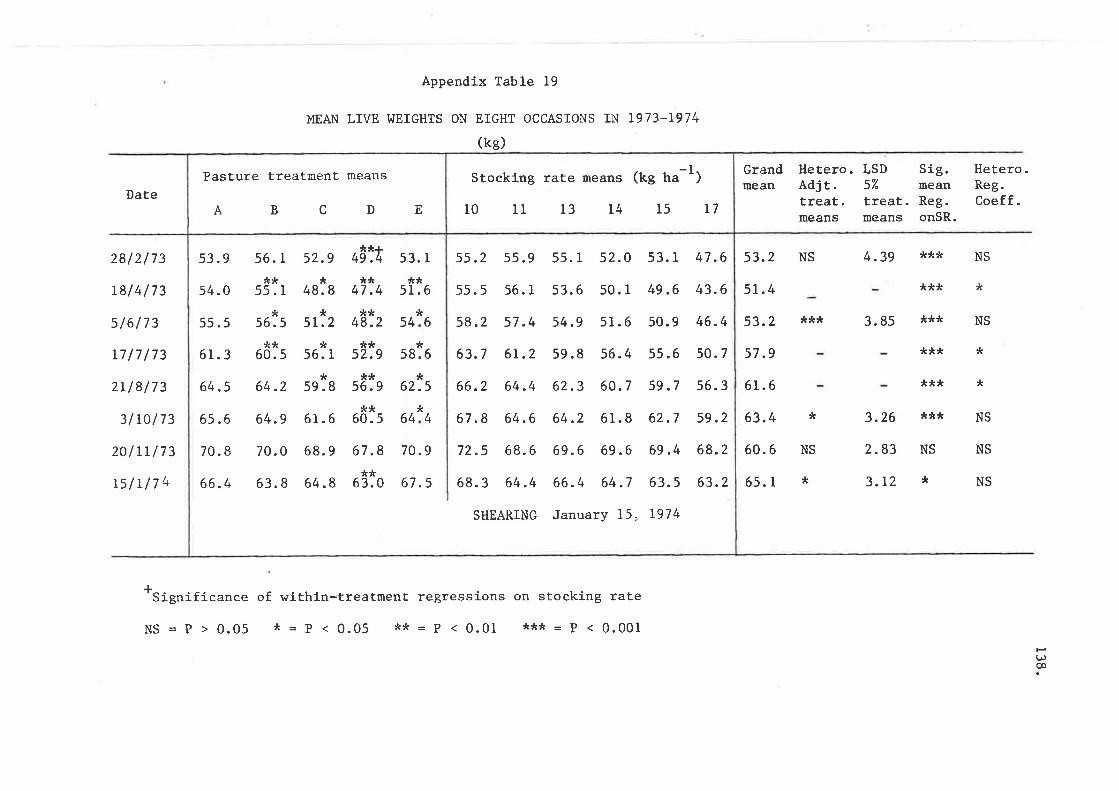
AppendÍx Table 19
MEAN LIVE I^IEIGHTS ON EIGHT OCCASIONS IN 1973-1974
(te)
Date
28/ 2/ 73
18/4173
5 /6/73
L7 /7 /73
2rl8/73
3/tol73
20/rr/73
15/r/74
Grandmean
53.2
5r.4
53.2
57.9
6r.6
63.4
60. 6
6s. I
Hetero.Adj r.freat.means
LSD Slg.57" meantreat. Reg.means onSR.
Hetero.Reg.Coeff.
NS 4.39 *** NS
*** *
*** 3.85 *** NS
*** *
*** *
3.26 ,ß** NS
NS 2.83 NS NS
3.t2 * NS
*
¡
+'Significance of within-treatment regressions on stocking rate
NS = p > 0.05 * = P < 0.05 ** = P < 0.01 *** - P < 0.001tsU)@
Pasture treatment means
BCDEA
Stocking rate means (kg ha
10 11 13 L4 15
-1
I7
)
53.9
54.0
55 .5
61.3
64.5
6s.6
70.8
66.4
56.L**
55.1$
s6. 5**
60. 5
64.2
64.9
70.0
63. 8
s5.2 s5.9
55.5 56.1
58.2 57 .4
63.7 6r.2
66.2 64 .4
67 .8 64.6
72.5 68.6
68. 3 64 .4
SHEARING
55. I
53.6
54.9
59.8
62.3
64.2
69.6
52.O
50. I
5r.6
56.4
60.7
61.8
69.6
52.9**+
49.4 53.1
67 .5
,r
**
54,ß
*
*
4
6
7
4
48. 8
60.5
67 .8 70.9
64
s8.6
**51.6
62.7
,ß
59 .8
6r.6
68.9
64.8
**48.2**
52.9**
56.9*
62.5
53.1
49.6
50.9 46.
s5.6 50.
59.2
68.2
63.2
Jr*47 .4
,c*63.0
59 .7 56. 3
43.6
47.6
*51.2
*56. 1
66.4 64.7 63.s
January 15, 1974
69 .4
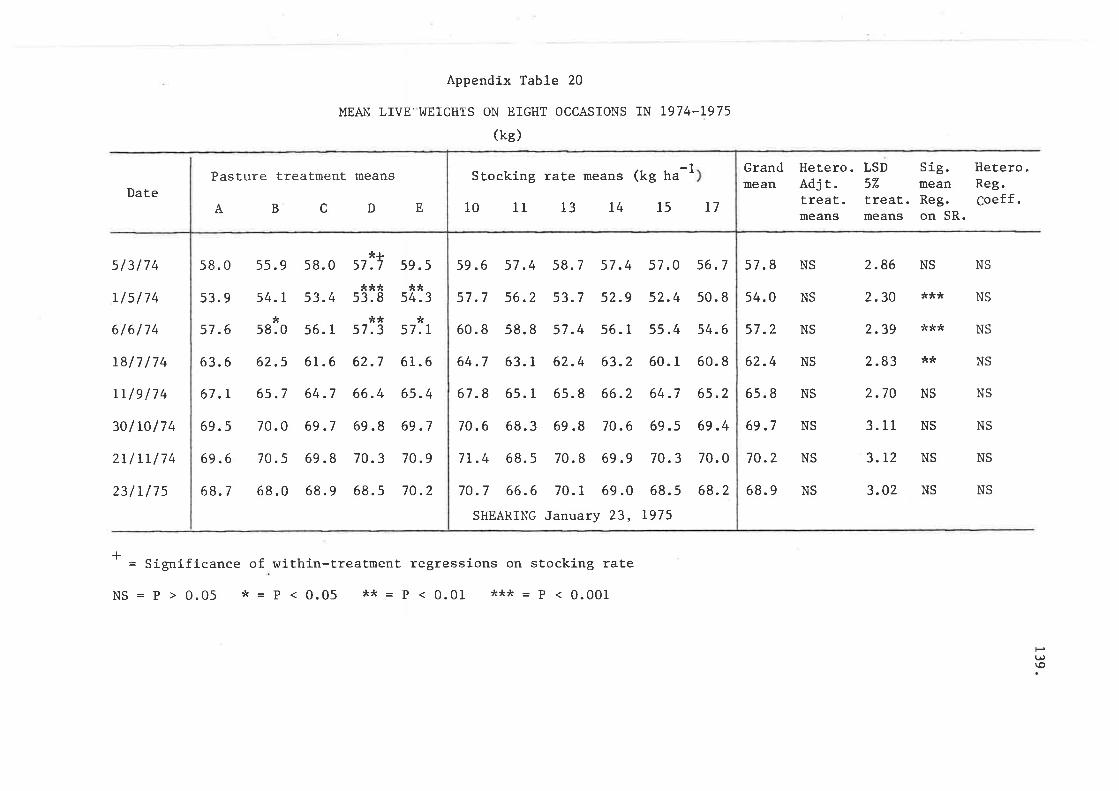
Appendix Table 20
MEAN LIVE'IITEIGHTS oN EIGHT OCCASIONS IN L974-L975
(te)
Pasture treatment means
58.0
53.4
s6. I
6t.6
64.7
69 .7
69 .8
68.9
*¡57 .?
Grandmean
57 .8
54.0
s7 .2
62.4
65. I
69 .7
70.2
68. 9
2.86
2.30
2.39
2.83
2.70
3.tl
3.12
3.02
s5.9
54.1*
58.0
62.5
6s.7
70.0
70.5
68 .0
59.5J¿
54.3
NS
***
***
**
NS
NS
NS
NS
Hetero. LSD Sig. Hetero.Adjt. 57" mean Reg.treat. treat. Reg. Coeff.means means on SR.
Date
s/3/74
r/s/74
6/ 6/ 74
18/7 /74
Lr/9/74
30ltOl74
2r/tL/74
23/r/7s
+
A
58. 0
53. 9
57 .6
63.6
67.L
69.s
69.6
68.7
BC DE
ù¿r
53. I**
57 .3
62.7
66.4
69.8
70.3
68. 5
57.r
6t.6
6s .4
69.7
70.9
70.2
NS
NS
NS
NS
NS
NS
NS
NS
NS
NS
NS
NS
NS
NS
NS
NS
*
= Significance of within-treatment regressions on stocking rate
NS = p > 0.05 * = P < 0.05 ** = P < 0.01 *** = P < 0.001
Hu)\o
Stocking rate means (kg ha
10 lr 13 L4 15
-1
T7
59.6
57.7
60.8
64.7
67.8
70.6
7L.4
57 .4
56.2
58.8
63. t
65. 1
68.3
68.5
58.7
53.7
57 .4
62.4
65. 8
69 .8
70. 8
57 .4
52.9
56. 1
63.2
66.2
70.6
69.9
57.O
52.4
55.4
60. I
64.7
69.5
70. 3
56.7
50. 8
54.6
60. 8
65.2
69.4
70. 0
68.270.7 66.6 70.1 69.0 68.5
SHEARING January 23, 1975
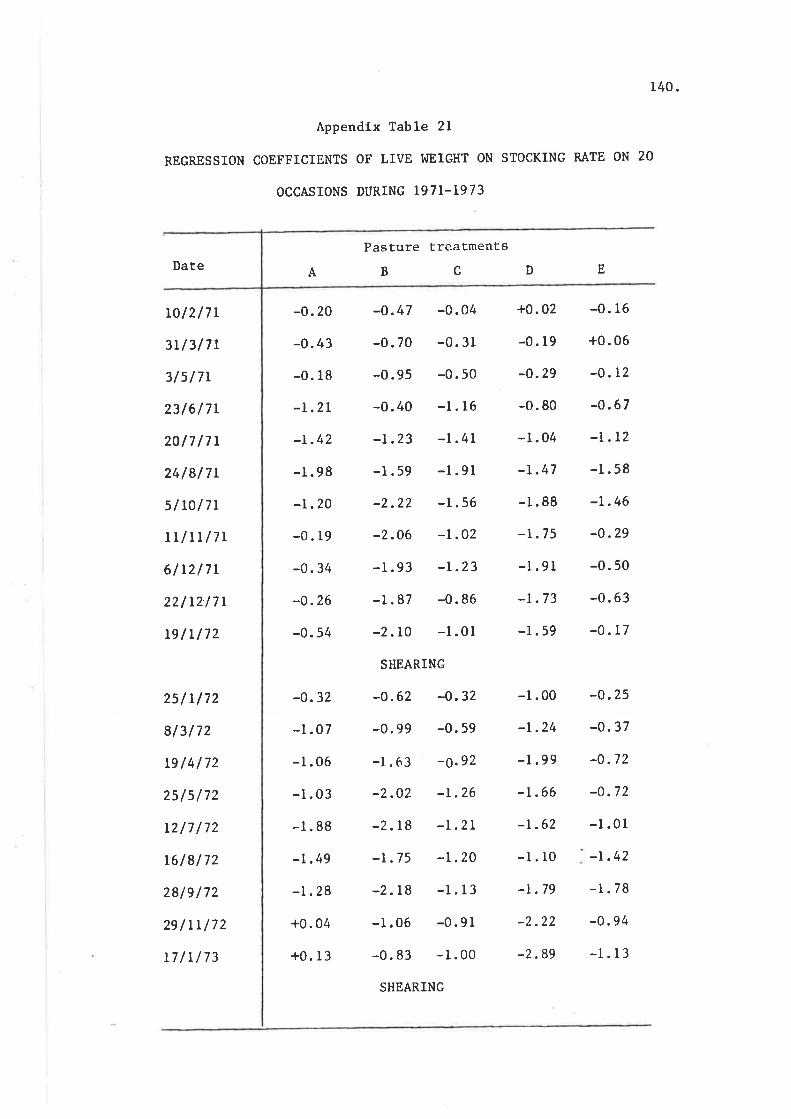
140.
Appendix Table 2l
REGRESSION COEFFICIENTS OF LIVE I^IEIGHT ON STOCKING RATE ON 20
OCCASIONS DURING L97I_L973
DatePasture treatments
BC D E
L0l2/7r
3L /317 t
315l7L
23l6l7L
20l7l7L
24l817r
5/r0l7r
LLlrrlTr
6/12/7r
22l12l7r
t9lL/72
-0. 20
-0.43
-0. 18
-t.21
-r.42
-r.98
-r.20
-0. t9
-0. 34
-0.26
-0. 54
-o.47 -0.04
-0.70 -0.31
-0.95 -0.50
-0.40 -1. 16
-r.23 -1.41
-1.59 -1.91
-2.22 -1.56
-2.06 -1 .02
-r .93 -1.23
-1.87 -0.86
-2. l0 -1.01
SHEARING
-0.62 4.32
-0.99 '0.59
,1 .63 -0.92
-2.02 -r.26
-2. l8 -r.21
-1.75 -1.20
-2. l8 -1. l3
-1 .06 -0.91
-0. 83 -1.00
SHEARING
+0. 02
-0. l9
-o.29
-0. 80
-1.04
-t.47
-1 .88
-r.75
-r.91
-r.73
-1.59
-0. 16
+0.06
-0.12
-0.67
-1.12
-r .58
-1.46
-0.29
-0. 50
-0. 63
-0 .17
251Ll72
81 3/ 72
Le/4172
2s/s/72
12/7172
16/8172
28/9 /72
2e / LL /72
rTlL/73
-0.32
-l .07
-l .06
-1 .03
-1. 88
-L .49
-1. 28
+0. 04
+0. l3
-l .00
-r.24
-1.99
-1.66
-r.62
-1. l0
-r .79
-2.22
-2.89
-0.25
-0. 37
-0.72
-0.72
-t .01
-r.42
-1.78
-0.94
-1.13
A
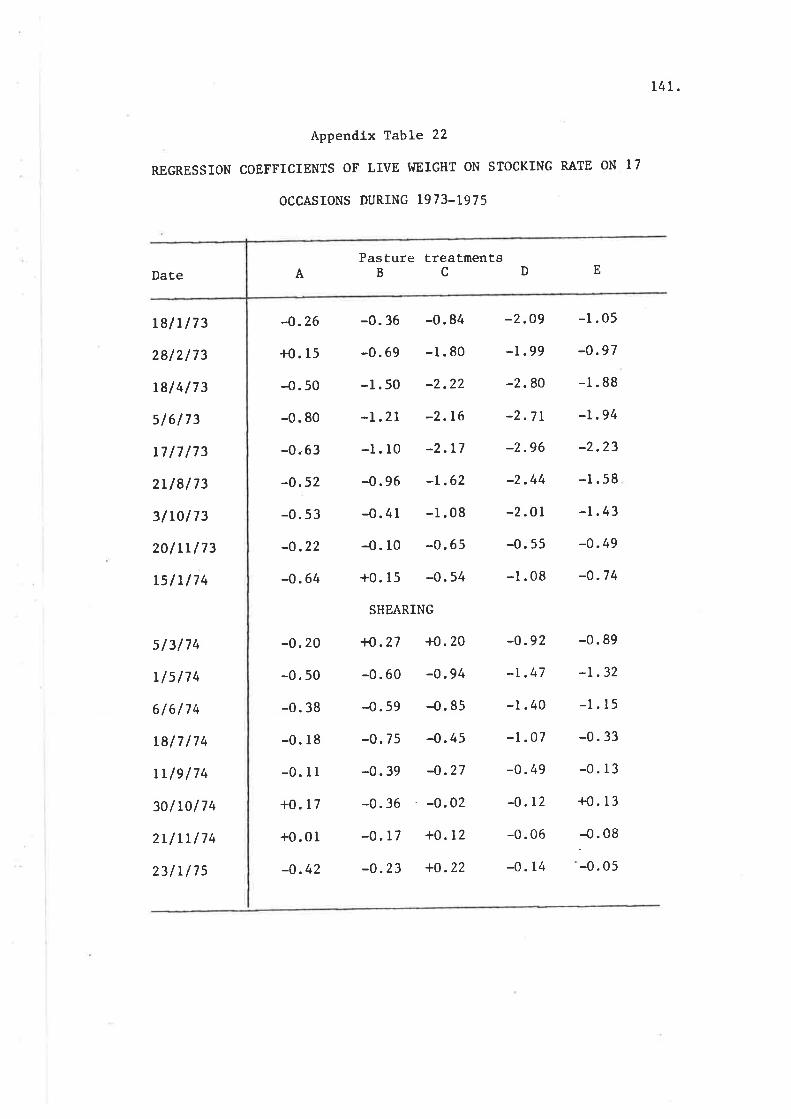
t4L.
Appendlx TabLe 22
REGRESSION COEFFICIENTS OF LIVE I"IEIGHI ON STOCKING RATE ON 17
OCCASIONS DURING I973-I975
Date
Lglrl73
2812173
L8/4173
sl6l73
17l7l73
2Ll8l73
3l ro/ 73
201rL 173
15 /rl7 4
sl 3/ 74
r/sl74
6/6/74
L8l7l74
rrle/74
30/10174
2Llrr/74
23lL/75
-o.26
+0. 15
-o. 50
-0. 80
-0,63
-0.52
-0.53
-0.22
-0. 64
-0.20
-0. 50
-0. 38
-0. r8
-0. 11
+0. 17
+0.01
-0.42
-2.09
-l .99
-2.80
-2.7 L
-2.96
-2.44
-2.O1
-0. 55
-l .08
E
-1 .05
-o.97
-1 .88
-L.94
-2.23
-1 .58
-1.43
-o.49
-o.7 4
-0. 89
-r.32
-1. t5
-0. 33
-0. l3
+0.13
.-o.ot-0.05
APasture treatments
BC
-0. 36 -0.84
-0.69 -1.80
-1.50 -2.22
-r.21 -2.16
-1. l0 -2.r7
-0.96 -L.62
-0.41 -1.08
-o.10 -0.65
+0.15 4.54
SHEARING
+0.27 {{.20
-0.60 -0.94
-0.59 -0.85
-0.75 -0.45
-0.39 -0.27
-0.36 -0.02
-0. l7 +0.12
-o.23 +0.22
D
-0.92
-r .47
-l .40
-1.07
-0.49
-0. t2
-0.06
-0. 14
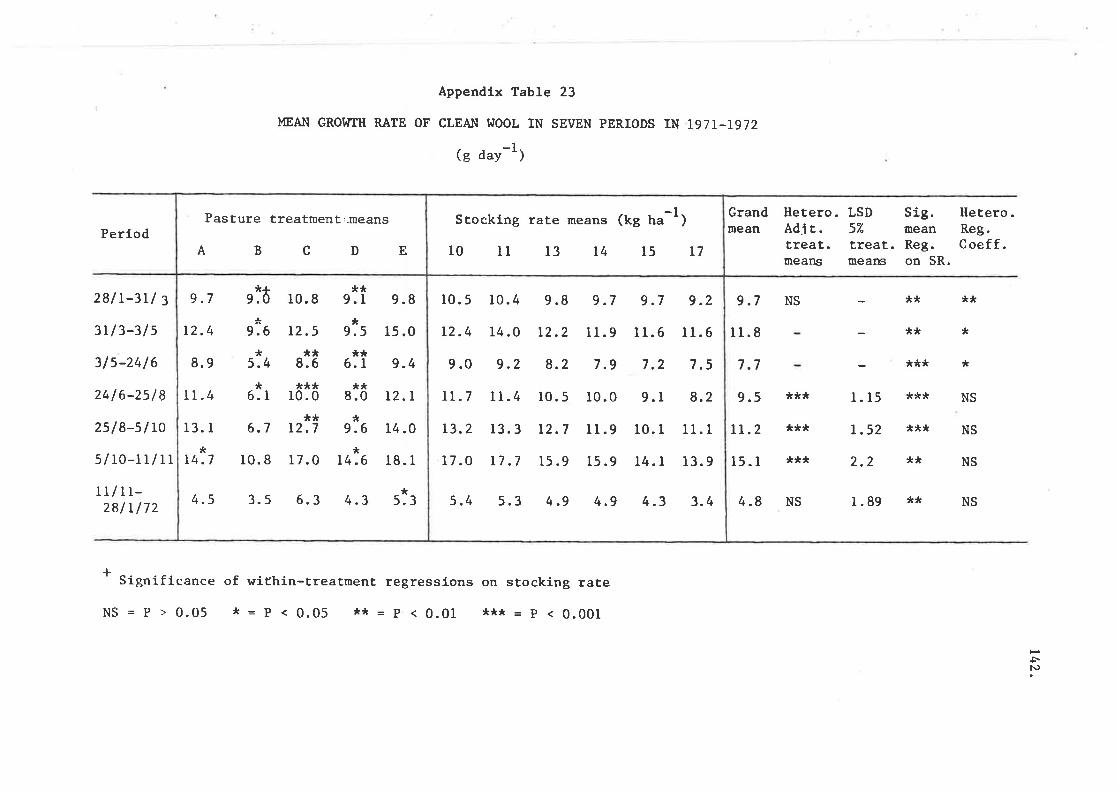
Appendix Table 23
MEAN GROIITH RATE OF CLEÆI T{OOL IN SEVEN PERIODS TN I97T-L972
-1(g day ')
Perlod
z9lI-3r/ z
3r / 3-31 s
3l 5-24 / 6
24/6-2518
2sl8-slrc
s/10-1r/11
r l / 1r-281 L /72
Grandmeen
9.7
11.8
7.7
9.5
TL.2
15. t
4.8
**NS
Hetero. LSD Sig. Hetero.Adi t. 5"4 mean Reg.treat. treat. Reg. Coeff.means means on SR.
*** l. 15
t.52
2.2
1.89
***
***
NS
NS
NS
NS
*
*
**
**
***
tr**
***
**
**NS
+ Significance of wiËhin-treatment regressions on stocking rate
NS = p > 0.05 * = p < 0.05 ** - p < 0.01 *** = p < 0.001
rN)
Pasture treatment j-means
BCDEA
**13.1 6.7 12.7
9.8
15.0
9.4
L2.T
14.0
18.1**14.7 r0.8 r7.0 14.6
4.5 3.s 6.3 4.3
12.4¡
*
*
*
*¿9 .7 9.0
8.9**
8.0ll.4 *6.1
5.4
9.6
10.8
t2.5
**9.1
9.6
**6.1
9.5
*5.3
***10.0
**8.6
Stocking rate means (kg ha
10 rl t3 14 15
-1
t7
)
10. 5
12.4
9.0
IT.7
13.2
17.0
5.4
10.4
14.0
9.2
ll.4
r3. 3
17 .7
5.3
9.8
L2.2
8.2
10. 5
t2.7
l5 .9
4.9
9.7
11.9
7.9
10.0
I r.9
15 .9
4.9
9.7
11.6
7.2
9.I
10.1
l4.l
4.3
9.2
11.6
7.5
8.2
1l.t
13.9
3.4
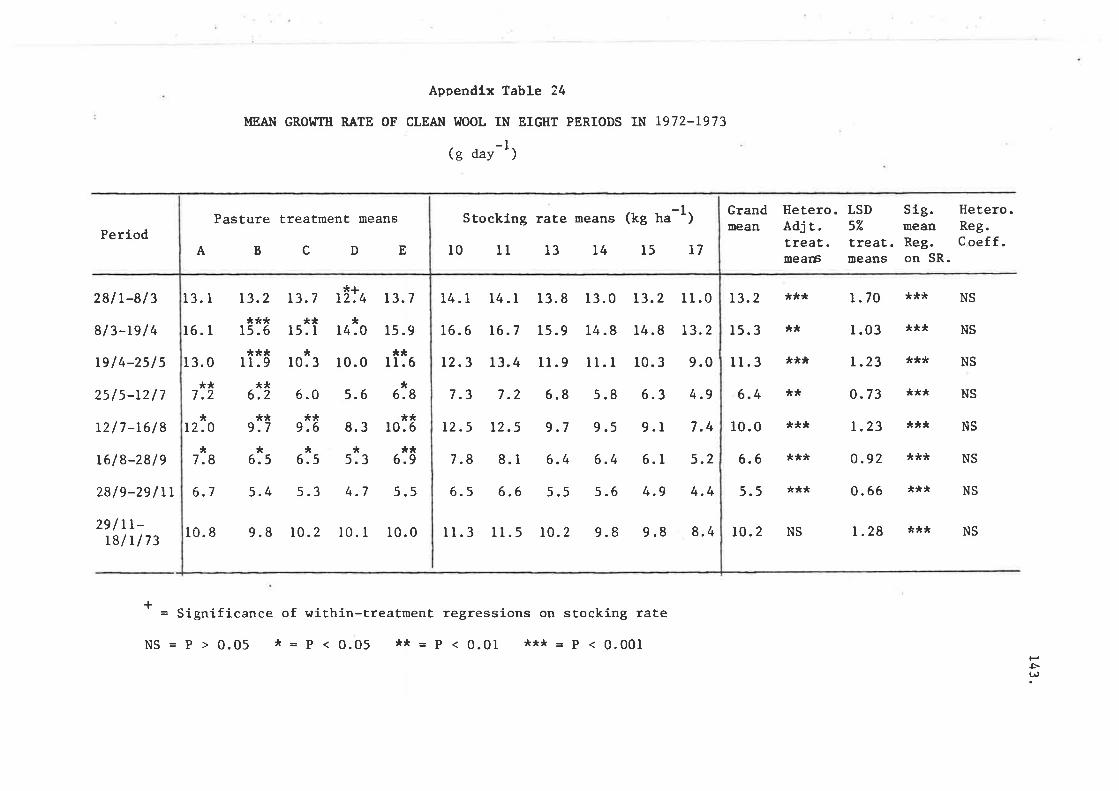
Appendlx TabLe 24
MEAN GROI{TIT RATE OF CLEAN IJOOL IN ETGHT PERIODS TN T972-1973
(e ¿ry-l)
Perlod
281 L-81 3
8l 3-re / 4
19l4-25/5
2sls-1217
t2/7-1618
16l8-28/9
28/9-29lrt
29 / rr-rB/r173
+
Grandmeen
13.2
15.3
1r.3
6.4
10.0
6.6
5.5
10. 2
Hetero.Adj È.treat.tl¡earÊ
LSD57"
treat.means
Sig. Hetero.mean Reg.Reg. Coeff.on SR.
*)c
1*t*1*
***
**
***
***
***
NS
I .70
r .03
L.23
o.73
t,23
o.92
0.66
1.28
*** NS
*** NS
*** NS
*** NS
*** NS
*** NS
*** NS
*** NS
= Significance of within-treatment regressions on stocking rate
5(,
Pasture treatment means
A B CDE
Stocklng rate means (kg ha
l0 11 13 L4 15
't
L7
)
14. I
16. 6
L2.3
7.3
L2.5
7.8
6.5
tl.3
14.1
16.7
L3.4
7.2
12.5
8.1
6.6
1l.s
13.8
15.9
11.9
6.8
9.7
6.4
5.5
10.2
13.0
14 .8
l1.r
5.8
9.5
6.4
5.6
9.8
L3.2
l4 .8
10. 3
6.3
9.1
6.1
4.9
9.8
1r .0
13.2
9.0
4.9
7.4
5.2
4.4
8.4
13.2
* * * * **
6.7 5.4 s.3 4.7 5.s
** **7.2 6.2
9.8 10.2 l0.l 10.0
6.0 5.6** **9.6 8.3 10.6
7.8
*r2.0
13. I
16. I
13.0
**9.7
6.5 6.5 5.3
13.7
r5 .9**Il.6*
6.8
6.9
10.8
**15.
**I1.
*6
*9
13.7
**15. r
*r0. 3
*+12:4
*r4 .0
r0.0
NS = p > 0.05 * = p < 0.05 ** = p < 0.01 *** = p < 0.001
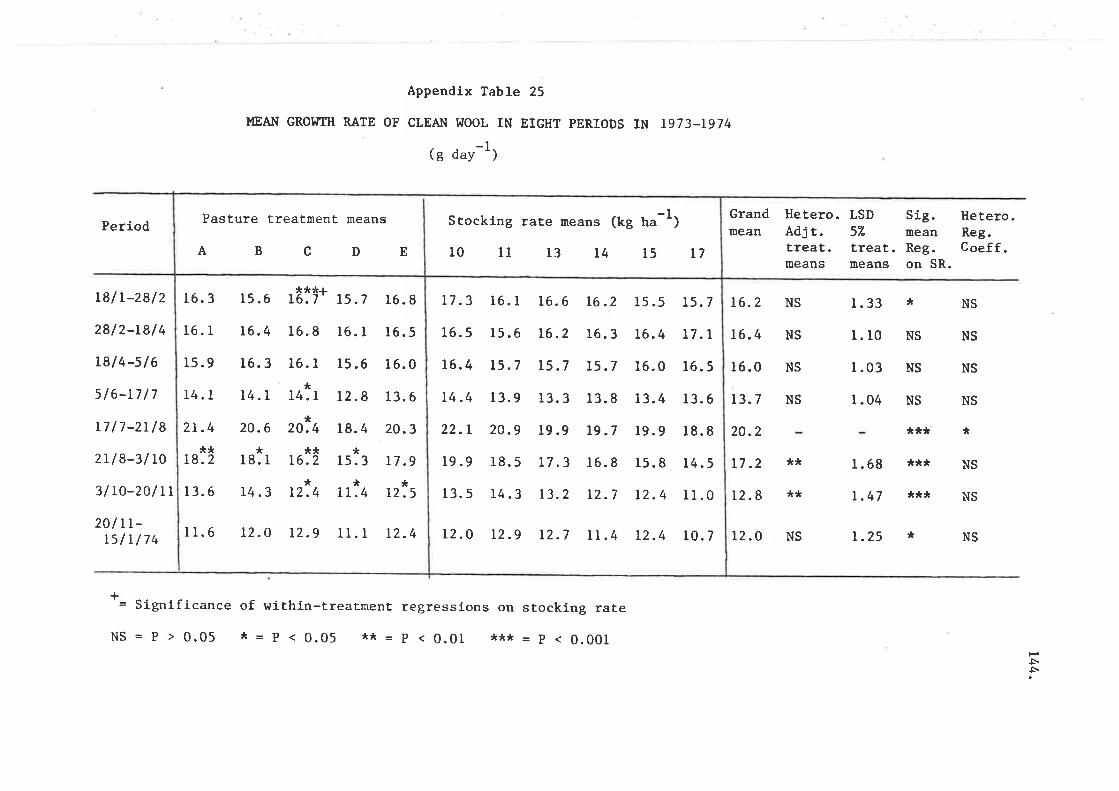
Appendix Table 25
MEÆi¡ GROTfTII RATE OF CLEAI¡ T.¡OOL IN EIGHT PERIODS IN 1973-T974
-l(g day ')
Period
r8l L-28/ 2
28/ 2-18/ 4
L9l 4-s/ 6
sl6-17/7
t7/7-2r/8
2r/8-3/rO
3/ L0-20/ rr
20/ rr-rs/r/74
+
Grandmean
16.2
16.4
16.0
t3.7
20.2
17.2
12.8
12.0
Hetero.Adj r.treat.means
LSD57"
treat.means
Sig. Hetero.mean Reg.Reg. Coeff.on SR.
NS
NS
NS
NS
NS
NS
NS
NS
NS
NS
NS
**
**
NS
1. 33
l. r0
l .03
1.04
r.68
| .47
r.25
*
NS
NS
NS
***
***
***
*
*
= signlficance of within-treatment regressions on stocking rate
ss
L5.7
16. I
r5.6
12.8
18.4*
1s.3*
16. I
16.5
16.0
13.6
20.3
17 .9
13.6 t4.3 12.4 11.4
rl.6 12.0 t2.9 ll.l 12.4
16. I
16.3 t ,r6
*
*
**¿.7',
15.9
*rrt8.2
20.421.4
14. I
l5 .6
16.4
16.3
14. I
20.6
16.8
16. I*
14. r
*18. I
**16.2
*12.5
Stocking rate means (kg ha
10 ll 13 t4 15
-1
t7B
)
A CDE
Pasture treatment means
L7 .3
16.5
16.4
14.4
22.L
19 .9
13.5
t2.o
16. I
r5.6
L5.7
13.9
20.9
18. 5
14.3
12.9
16. 6
t6.2
L5.7
13.3
r9 .9
17 ,3
t3.2
t2.7
L6.2
r6. 3
15.7
r3. 8
19.7
16.8
t2.7
11.4
15.5
16.4
r6.0
r3.4
19.9
15. 8
12.4
12.4
15.7
17.1
r6. 5
13.6
18.8
14.5
1l .0
r0.7
NS = P > 0.05 * = P < 0.05 rr* = p < 0.01 *** = p < 0.001
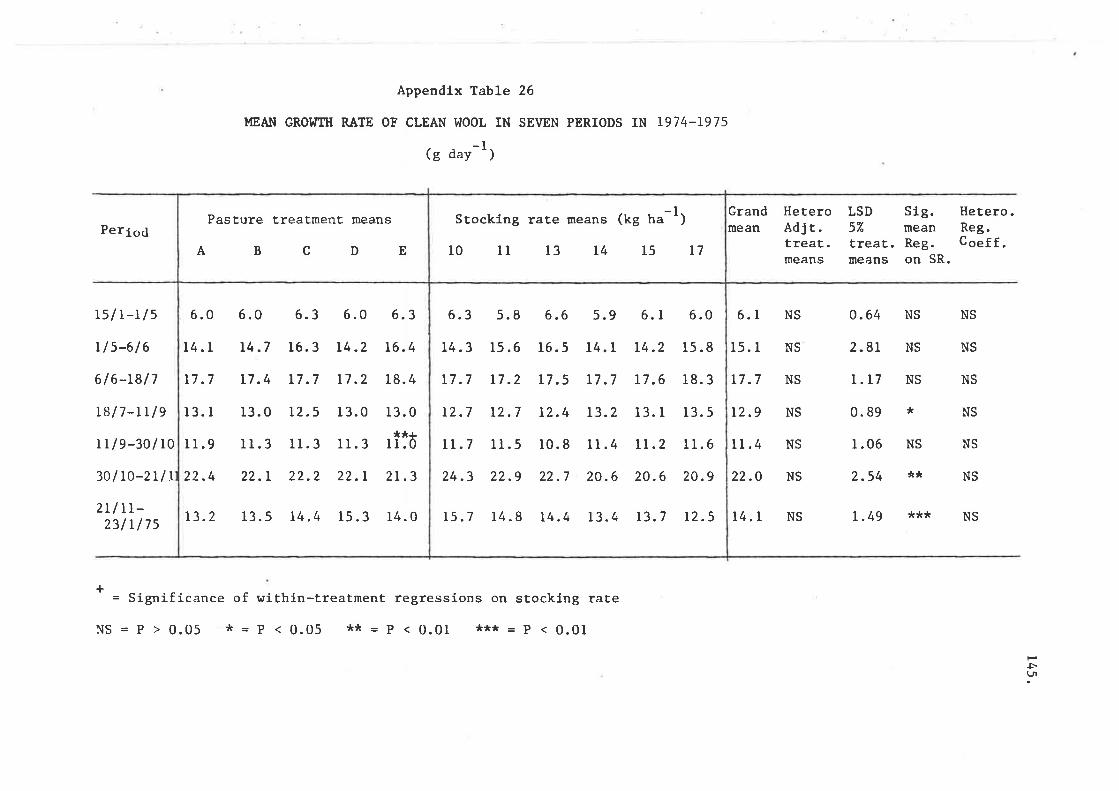
Appendlx Table 26
MEA}¡ GROITTIT RATE OF CLEAN I"IOOL IN SEVEN PERIODS IN T974-T975
(g ðay-1)
Perlo¿
rs/L-Ll5
Lls-6/6
616-18/7
t8l7-rLle
r I /9-30/ r0
30/ro-2rlr
2L I rr-23lrl7s
+
Grandmean
6.1
15. I
L7 .7
12.9
1l .4
22.0
14. I
HeteroAdj r.treat.means
LSD Sig. Hetero.5"/" mean Reg.treat. Reg. Coeff.means on SR.
NS
NS
NS
NS
NS
NS
NS
0.64 NS NS
2.8T NS NS
T.T7 NS NS
0.89 * NS
I.06 NS NS
2.54 ** NS
1.49 *** NS
= Significance of within-treatment regressions on stocklng rate
NS = P > 0.05 * = P < 0.05 ** = p < 0.01 *** = p < 0.01
H5(Jl
Pasture treatment means
A D EB c
6.0
14. I
L7 .7
13. I
11 .9
22.4
t3.2
6.0
L4.7
L7.4
13. 0
rl.3
22.r
13.5
6.3
16. 3
L7 .7
t2.5
11. 3
22.2
14.4
6.0
L4 -2
17.2
13.0
1r. 3
22.L
15 .3 14.0
2r.3
**+1r.0
6.3
L6.4
18.4
r3.0
Stocklng rate means (kg ha
10 l1 13 L4 15
-1
t7
)
6.3
14.3
17 .7
12.7
11.7
24.3
t5.7
5.8
t5 .6
L7.2
12.7
11.5
22.9
14.8
5.9
14. I
17 .7
t3.2
1I.4
20.6
13.4
6.L
L4.2
L7.6
13. t
ll.2
20.6
13.7
6.0
15.8
18.3
13. 5
11.6
20.9
12.5
10. I
14 .4
12.4
16.5
6.6
22.7
17.5
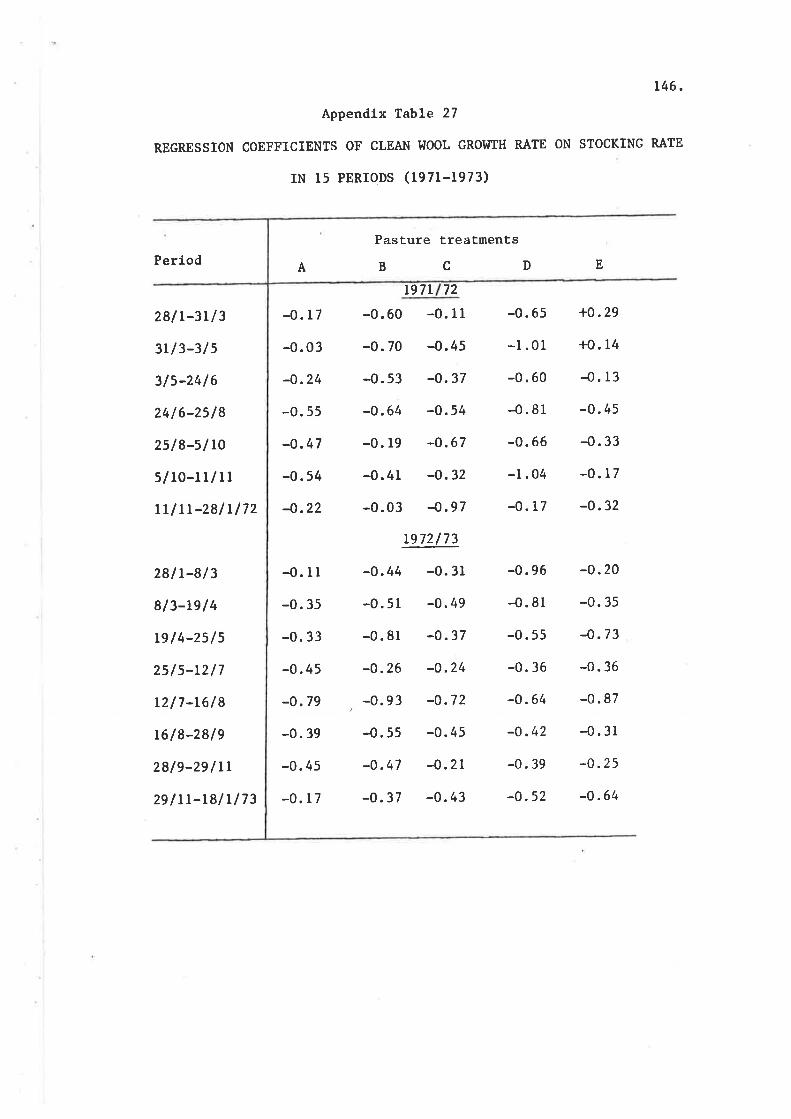
L46.
Appendíx Table 27
REcRESSION COEFFICIENTS OF CLEAN I^IOOL GROI{TH RATE ON STOCKING RATE
rN 15 PERTODS (1971-1973)
PeriodPasture treatments
BCDT97I 72
+o.29
+0.14
-o. 13
-o .45
-o. 33
-0. r7
-o,32
28lL-8/3
81 3-Le I 4
Lel4-2515
25ls-rz/7
tzl 7 -L6l I16 I 8-281 9
28/9-29 /Lr
2e lLr-18/ L/73
-o.11
-0. 35
-0.33
-0.45
-0.79
-0. 39
-0. 4s
-0.17
-0.96
{.81
-0. 55
-0.36
-0.64
-0.42
-0. 39
-0.52
-0. 20
-0.35
4.73
-0. 36
-0.87
-0. 3l
-0.25
-o.64
EA
28lL-31/3
3L /3-3/5
315-2416
24/6-2s18
2518-51L0
s/r0-r1/11
LLItL-281 Ll72
-0.60 -0. I I
-0.70 -0.45
-0.53 -O.37
-0.64 -0.54
-0. 19 -o.67
-0.41 -O.32
-0.03 4.97
LeIL/73
-o.44 -0.31
-0.51 -0.49
-0.8r -0.37
-o.26 -0.24
-0.93 -O.72
-0.55 -0.45
-o.47 -0.21
-0.37 -0.43
-0. 17
-0.03
-o.24
-0. 55
-o.47
-0.54
4.22
-0. 65
-l .01
-0.60
-o.81
-0. 66
-l .04
-0. 17
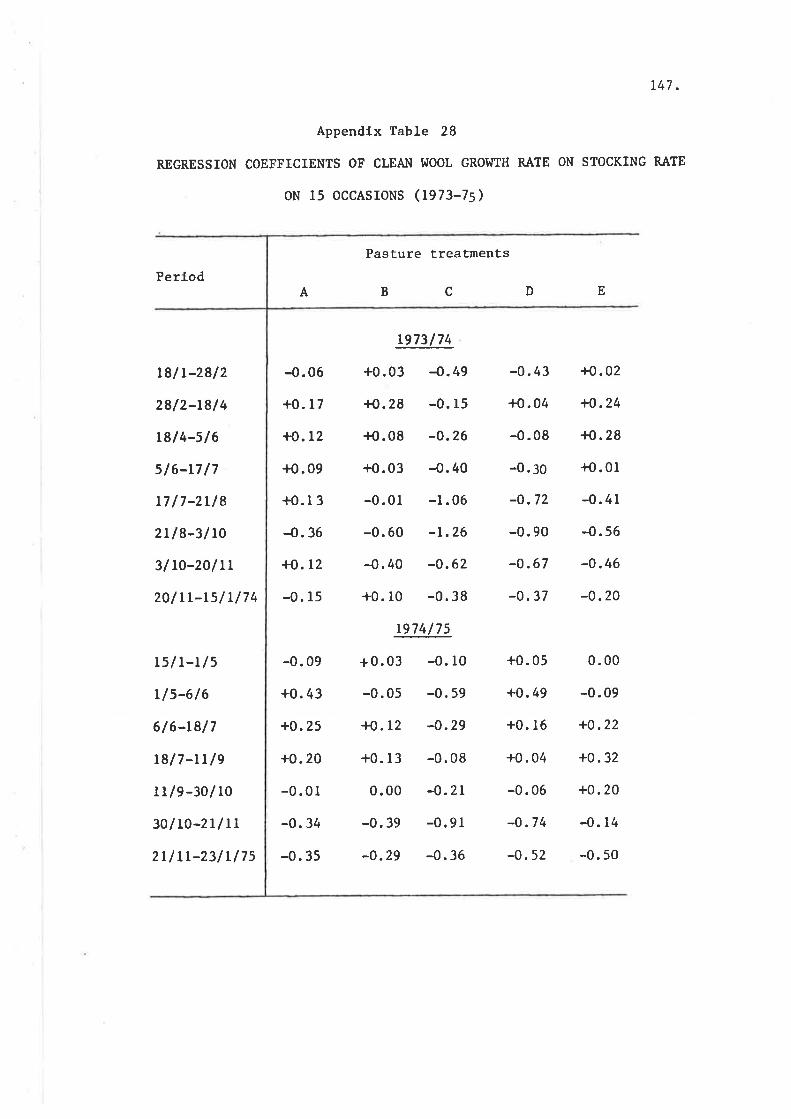
r47 .
Appendlx Table 28
REGRESSION COEFFICIENTS OF CLEAlil WOOL GROI'ITH RATE ON STOCKING RATE
oN 15 oCcAsIoNs (1973-7s)
Pasture treatments
PerlodA B c D E
t8l L-2812
2812-r814
r8l4-5/6
516-1717
L7 l7-2118
2Ll8-3lto
3/ LO-201 LL
201 rL-rs/ L/74
-0.06
+0.17
+0.12
+o.09
+0.1 3
-o.36
+o.I2
-0. l5
19731 74
+0.03 4.49
{{.28 -0. 15
-r{.08 -0.26
+o.03 -0.40
-0.01 -1.06
-0.60 -t.26
-o.40 -o.62
+0. r0 -0.38
r974/75
+0.03 -0. 10
-0.05 -0.59
+0.12 4.29
+0. l3 -0.08
0.00 -o.21
-0.39 -0.91
-o.29 -0.36
-0.43
+0.04
-0.08
-0.30
-0.72
-0. 90
-o.67
-o.37
æ.02
+o.24
14.28
{{.01
-0. 41
-0. 56
-0.46
-o.20
L5lL-r/s
rl5-616
6 / 6-t817
r8l7-tr/e
r l /9-30/ l0
301L0-2LlrL
2rl LL-231 rlTs
-0. 09
+0.43
+o.25
+0.20
-0. 0l
-0. 34
-0. 35
+0.05
+0.49
+0.16
+0.04
-0. 06
-o.74
4.52
0. 00
-0.09
+0.22
+0.32
+0. 20
4.t4
-0. 50
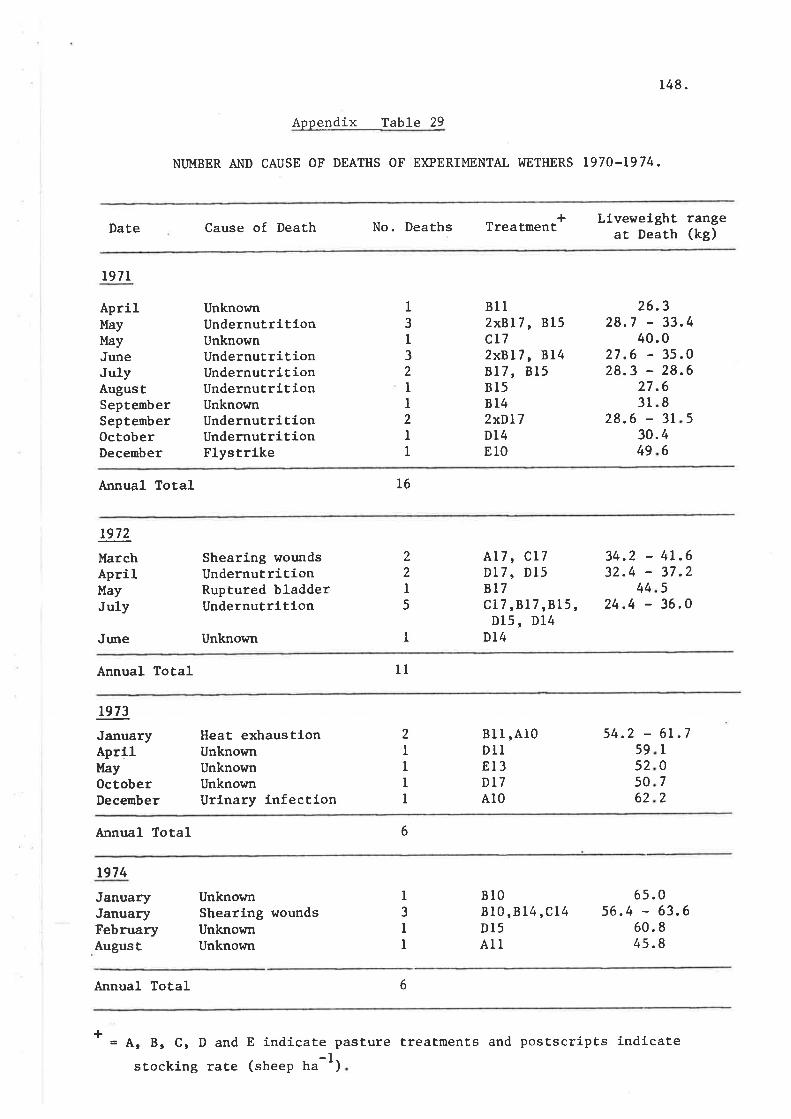
148.
Appendix TabIe 29
NIJMBER AND CAUSE OF DEATHS OF EXPERIMENTAL I^IETHERS L97O-T974.
Date Cause of Death No. Deaths Treatmentt Liveweight rangeat Death (kg)
197r
AprilMayMayJuneJulyAugustSeptemberSeptenrberOctoberDecember
UnknownUndernutritionUnknownUndernutritíonUndernutrltionUndernutritionUnknownUndernutritionUndernutrítionFlystrtke
8112xBI7, Bl5cL72xBL7, BL4Bt7, Bl58158142xDL7Dl4E10
26.328.7 - 33.4
40.27.6 -28.3 -
27.3I.
28.6 -30.
1
3
I32
II2II
03528683r46
.0
.6
5
49
Annual Total L6
1972
MarchAprilMayJuly
Jtme
Shearing woundsUndernutritionRuptured bladderUndernutrition
Unknown
22I5
I
AL7, CL7Dl7, Dl5BL7cl7 ,BL7 , B l5 ,015, D14
D14
34.2 -32.4 -
4424.4 -
4L.637.2536.0
Annual Total tl
r973
JanuaryAprill{ayOctoberDecember
Heat exhaustionUnknownUnknor¡nUnkno¡snUrlnary infection
2
IIII
BII,Al0D11813DL7Al0
54.2 -59525062
61.7I07
2
Annual Total 6
t974
JanuaryJanuaryFebruaryAugust
UnknownShearing woundsUnknownUnknown
Bl0Bl0,B14,Cl4Dl5AlI
65.056.4 - 63.6
60. I45.8
I3
II
Annual Total 6
f = A, B, C, D and E indicate pasture treatments and postscrípts lndicate
)stocking rate (sheep ha-1

B I BLI OGRAPHY
149.
11. BIBLIOGRAPHY
ALLDEN, I.f.G. (1969). - The summer nutrLtion of weaner sheep: Thevoluntary feed intake, body weight change, and woolproducÈíon of sheep grazlng the mature herbage of sownpasture ln relatlon to the lntake of dietary energy undera supplementary feedlng regirne.Aust. J. Agrie. Res. 2Oz 499-5L2.
ANON (1962). - Phalarls hybrids promising.RtpaL Res. CSIR). 4Iz I6-2L.
ARMSTRONG, D.G., BLAXTER, K.L. and !ÍAITE' R. (1964). - The evaluationof artificíally dried grass as a source of energy for sheep.III. The predíction of nutrltlve value from chemical andbÍologícal measurements.J, Agrüe. Sci. 622 4L7-424.
ARNOLD, G.I,I. (L962). - EffecËs of pasture maturlty on the diet ofsheeP.Aust. J. Agrie. Res. 13: 70L-7O6.
ARNOLD, G.I,I. (1964). - Some principles 1n the lnvestigation ofselective gxazLng.Ptoc. Aust. Soe. Anin. Prod. 5: 258-27I.
ARNOLD, G.W. and McMANUS, I^I.R. (1960). - The effect of level ofstocking on Èwo pasture tyPes upon wool production andquality.
, tuoe. Aust. Soc. Anim. tuod. 3: 63-68.
AXELSEN, A. and MORLEY, F. (1968). - Evaluation of eight pastures byanimal productíon.Pz,oe. Aust. Soc. Anín. Pxod. 7z 92-98.
BARCLAY, P.C. (1963). - Ariki, a nelt select,ed perennial tyPe ryegrassvariety.Pz.oc. N.Z. GrassL. Assoe. 25¡ 128-149.
BARNARD, C. (L972). - Reg. Aust. Herb. Pl. cvv. CSIRO. (Aust.), pp. I6-L7.
BARRETT, D.W., CAI{PBELL, N.A. and ARNOLD, G.I^l. (1973). - The effectsof pre-maturity desiccation wlth paraquat and leachlngon the qualíty of dry llimmera ryegrass.Aust. J. Eæp. AgrLe. Anim. Husb. 13: 41L-4L7.
BARRO$I, N.J. (1969). - ftnplications of stocking raÈe experiments -nutrient requirement and fertillzer requirement.Proc. Aust. Grassl. Conf., Perth, 1968. Vol. 2, PP. L69-171.
BARTON, R.A. and IILYATT, M.J. (1963). - Pasture tyPe in relatíon to líve-weight gain, carcass composition, iodine nutrition and sonerumen characteristics of sheep. II. Carcass compositíonand the non-carcass components of liveweight.J. Agrte. Sei. Cønb. 6Lz 191-195.
150.
BATES, G.II. (1935). - The vegetation of footPaÈhs, sidewalks, cart-Èracks and gatewaYs.J. EeoL. 23: 470-487.
BEALE, (L972). - Clover wilt threat to pastures.Dep. Agr"Lc. S. Aust. 752 69-7L.
BEALE, P.E. (Lg74>. - RegeneraËíon of TnífoLitrn subte2?aneum cv.Yarloop from seed reserves in soil on Kangaroo Island.J. Aust. fnst. Agr\e. Sei. 4Oz 78-80'
BEAIE, P.8., CHAMBERLAIN, II.V., NINNES, B.A. and LEI'JIS, M.R. (L976).Trikkala - a replacement for Yarloop'Dep. Agric. Fish. Spec. Bull. No' 2'76'
BECK, A.B. (1952). - The composition of the lhralganuP strain ofsubÈerranean clover.J. Agrie. W. Aust. (3) 1: 257-259.
BENNETTS, H.W., UNDERI^IOOD, E.J. and SIIIER, F.L, (1?46). - A speeificbreeding problem of sheepi on subterraneanclover pasturesl in i,lestern Aiustralj.a ' I
Aust. Vet. J- '¿¿. ¿-rz.
BIDDISCOMBE, E.F. (1953). - A survey of the natural pastures of theTrangiedístricÈrNewSouÈhl^lales,withparticularreference to the gtazlr.g factor'Aust. J. AgtLe. Res. 4z l-28'
BROI.IN, K.R. (1963). - The influence of herbage height at treadingand treading intensity on the yield and botanical composítionof a perennial ryegrass - white clover pasture'N.Z. J. Agtie. Res. LIz 131-137.
BROI^IN, T.It. (L976a). - Effect of deferred autr¡mn grazíng and stockingrate of sheep on pasture production in a Mediterranean-type cli-nate.At+st. J. Eüp. AgrLc. Aním. Husb. 16: 181-188'
BROI^IN, T.H. (1976b). - The effect of sËocking rate and deferred autumn
grazing of pasture on liveweight and wool productíon ofMerino wethers ín a Mediterranean-type climate'Aust. J. Eæp. Agric. Aním- Husb. L6z 189-196.
T.H. (Ig77'). - RaÈe of loss of dry matter and change in chemicalcomposítion of nine pasture species over summer'
Aust. J. Erp. AgrLe. Anin. Husb. I7z 75-79.
G.I^I. and Aì{DREI^IS, J.S. (1948). - Recovery and viabilíty ofseeds of certain Southern Grasses and Lespedeza throughthe bovine digestive tract.J. AgrLe. Res. 762 95-103.
BROI'üN,
CADE, J.W. (f969). - The ryegrasses in Victoria'J. DeP. Agt"Le. Viet. 672 300-305.
P .8.J.
'lltTl|"
BUNÎON,
þ
CAMPBELL' R.J., sAvrLLE, D.G. and ROBARDS, G.E. (1973).- Evatuarionof natural annual pastures at Trangie in c:entral westernNew Sorrth l^Ia,l es . I . Sheep pror|rrcti on.Aust. J. Eæp. Agric. Anirn. Husb. 13: 238_244.
151 .
CAMPBELL, R.J. and BEAIE, J.A. (1973). - Evaluatlon of natural annualpastures at. Trangie in central ty'estern New South I'Iales.2. Botanical composition changes v¡ith partícularreference to Hordettn Leporintnn.Aust. J. Eæp. AgrLe. Anim. Husb.
CAI'{ERON,
CA},IERON,
CANNON,
CANNON,
CARTER,
CARTER,
CARTER,
CARTER,
CARTER,
CARTER,
I.H. (1966). - Dry matter and quality changes duríng and
after naking pasture hay.Aust. J. Erp. AgrLe. Anim. Husb. 6z 394-40L.
I.II. and CANNON, D.J. (1970). - Changes ín the botanicaleonposiÈÍon of pasture in relation Èo rate of stockingr¿ith sheep, and consequenË effecËs on wool productlon.Proc. XI. Int. Grassl. Cong. Qld. Aust. pP. 640-643-
13:662-668.
D.J. (1969). - The wool producÈion and liveweight of wethersin relation to sÈocklng rate and superphosphate applicatlon.Aust. J. Erp. Agrie. Anim. Husb. 9z I72-I8O.
D.J. (1972>. - The lnfluence of rate of stocking and appllcationof superphosphate on the production and quality of wool,and on the gross margin from Merino r,tethers.ATt. J. Erp. Agric. Anim. Husb. l2z 348-354.
E.D. (1958). - Pasture renovaËlon of the SÈringybark Landsof Kangaroo Island.J. Dept. Agric. S. Aust. 6Lz 401-408.
E.D. (1965). - Some relationshíps between superphosphate useand consequent animal production from pasture in SouthAustralia.Proc. IX. Int. Grassl. Cong., Sao Paulo, Brazí-l.. Vol. 2.pp. IO27-LO32.
E.D. (1968a). - The effect of stocking rate on the productionand utilization of annual Pasture and on wool production.Proc. Aust. Grassl. Conf., Perth, 1968. Vol. 1, Sect' la' pp'
E.D. (1968b). - Changes in seed supply of an annual pasturegrazeð continuously by sheep at five stocking rates'ito". Aust. Grassl. Conf., Perth, 1968. Vol. 1, Sect' lb' PP'
E.D. (1969). - Implications of stocking rate for botanicalcomposítion of Pasture.Proc. Aust. Grassl. Conf., Perth, 1968. Vol. 2, PP. I73-I78.
E.D. (1970). l:ÞhosphoruG fertilizer requirements of theSeddon Soil Series on Kangaroo Island, South Australia.M.Ag.Sc. Thesis, Unlversíty of Adelaide, AdelaiderS. AusÈ.
(1973). - Pasture production and utilization.Rep. I'Iaite Agric. Res. Inst. L972-73, PP. 42-43.
9-11.
7-10.
E.D.CARTER,Bi

DAvrEs, H.L. (I965).- studies in nutrítíon and reproduction in sheepin I^lestern Australia.Ph.D. Thesis, Uníversity of Western Australía, perth, lI . Aust:
t52.
CARTER, E.D., CHAILIS, S. and RIDGI^IAY, I.G. (1977). - The use of heavysolvents for separating seed from soil 'Proc. XIII. Int. Grassl. Cong., Leípzig' GDR' (in Press)'
CARTER, E.D. and DAY, H.R. (1970). - InÈerrelatíonships of stocking' rate and superphosphate rate on pasture as detennínants
of anj-mal production. 1. ConËinuous1-Y grazed old ture land. I
Aust. J. AgrLe. Res.
CARTER, E.D. and SIVALINGAM, T. (1977). - Some effects of treadíngby sheep on pastures of the Mediterranean clímate zone ofSouth Australía.Proc. XIII. Int. Grassl. Cong. , Lei-:pzíg, GDR. (ín press) '
COCKS, P.S. (1974). - The influence of density and nitrogen on theoutcome of competitíon between two annual pasture grasses(Hordewn Leporinwn Link and LoLiwn rLgi&n Gaud.).Aust. J. Agt'ic. Res. 252 247-258.
CONNIFFE, D., BRO!,JNE, D. and ÍIALSHE' M.J. (1970). - ExperlmenÈaldesign fox gxazing trials.J. Agr"ie. SaL. Cønb. 742 339'342.
CONRAD, H.R. (1966). - SynPosiu¡n on factors influencíng thevoluntary intake of herbage by ruminants: physíologicaland physical factors limitíng feed intake.J. Anín. Sci. 252 227-235.
COOK, L.J. (1939). - Further results ín "topdressing" poor pasture landswiÈh phosphatic fertllizers.J. Dep. Agric. S. Aust. 42: 791-808 and 851-865.
CRAI.IFORD, E.J. (1956). - Perennial grasses - Kangaroo IslandResearch Centre.Dept. Agric. S. AusË. Pl. Introd. Sect. Ann. Rep. 1965/66,pp. 60-68.
DAVIDSON, J.L. (1969). - Growth of gtazed plants.Proc. Aust. Grassl. Conf., Perth, 1968. Vol. 2, PP. L25-L37.
DAVIES, H.L. (L962a). - SrudieslofrÈime of lambing in relation tostocking rate in southWest.ern Australia.Proe. Aust. Soc. Anim. Prod. 4z 113-120.
DAVIES, H.L. (1962b). - Intake studies in sheep involving highfluid intake.tuoe. Aust. Soe. Aním. Prod. 4: L67-I7I.
H.L. and GREENT^IOOD, E.A.N. (L972). - Liveweight and woolgrowth of sheep in response to the quantity and botanlcalcomposition of annual pasture induced by nítrogenfertilízer and stocking treatments.Aust. J. Agr"Lc. Res. 232 110f-1111.
DAVTES,
DAVIES, H.L. and HUMPHRIES, A.l{. (1965). - Stocking rate and woolproduction at KojonuP. 1. I'Iether sheep.J. Dep. AgrLc. W. Aust. 6= 409-413.
DAVIES, I,l. (1938). - VegeÈation of grass verges and other' excessivelY trodden habitats.
J. EeoL. 26: 38-49.
DAVIS, I.F. (1964). - Díet selecÈed by sheep grazing on annualpasture Ín southern VlcÈorla.Pz,oe. Aust. Soc. Anim. Ptod. 5: 249-250.
153.
F. and sHARKEY, M.J. (L972). - Effect of fertj-Lí-zet nitrogenand feedíng practices on productívíty of Corriedale r¿ethersgrazíng annual Pasture ln southern VicÈoria.Aust. J. Eæp. Agrie. Anin. Husb. L2z 589-595.
(f963). - Sub-clovers for Kangaroo Island.J. Dep. Agríc. S. Aust. 662 288-293.
DAVIS, I
DAY, H.R.
DAY, H.R. (1964). - Sub-clover stralns under graztng.Kangaroo Isl-and Res. Centre Ann. Rep. 1963164, PP. 9-10.
DONALD, C.1,1. (1959). - The producËion and lífe span of subterraneanclover (TrifoLiwn subtevvanewn L.) .
Aust. J. Agric. Res. l0z 77L-787.
DONALD, C.M. (1970). - Temperate pasture species. InrrAustralianGrasslandstt.Ed. R.M. Moore (Aust. Nat,. Uni. PressrCamb. Aust.)pp. 303-320.
DONALD, C.M. and AI,LDEN, I^t.G. (1959). - The sttlnmer nutrltion ofrùeaner sheep: The deficiencies of the mature herbageof sown pasÈure as a feed for young sheep.Aust. J. Agr"Lc. Res. LOz 199-2L8.
DORE, I,I.G. and RAYMOND, L.C. (1942). - Vlable seed in pasture soiland manure.Sei. Agrie. 23(2): 69-79.
DRAKE, F.R. and ELLIOTT' N.M. (1963). - Rates of stockínginvestigated aÈ Bengworden.J. Dep. AgrLe. Viet. 6Lz 553-558.
EDMOND, D.B. (1958). - Some effects of soil physical condltionon ryegrass growth.N.Z. J. Agric. Res. Lz 652'659.
EDMOND, D.B. (1964). - Sone effects of sheep treadíng on the grohtthof 10 PasËure sPecies.N.Z. J. Agri,c. Res. 7z 1-16.
EDMOND, D.B. (1966). - The lnfluence of animal treading on Pasturegrowth.Proc. X. Int. Grassl. Cong., Finland, PP. 452-458.
ELLENBERG, H.IItt.
1s4.
VON (1952) . - I'Landwirtschaftliche PflanzensozíoLogie'Eugen Ulmer, Stuttgart, I{est Germany. p. L32.
EtrfER, T.K. and SINCLAIR, D.P. (1952). - Lamb fattening tríals on
Ëhe CanterburY Plains.N.Z. J. Sci. TechnoL.334(6):1-30.
FELS, H.E., MOIR, R.J. and ROSSITER, R.C. (1959). - Herbage lntakeof grazing sheep ín south-l'Iestern Australia'Aust. J. AgrLc. Res. 10: 237-247.
FITZGERALD, R.D. (1976). - Effect of stocklng rate, lambing timeand pasËure management on wool and l-arnb productlon on
annual subterranean clover Pasture'Aust. J. Agrie. Res. 272 261-275.
FRAME, J. (1971). - Fundamentals of grassland management, Part 10:
The grazing animal.Seot. AgrLe. 502 I-I7.
FRANKLIN, M.C. and PotrlNING, R.F. (1942). - SÈudíes on the chemicalcomposlÈion of pods and seeds of certain specíes ofMedLcago with a note on the apparenÈ dlgestibility ofclusÈer clover (frLfoLiun gLomeratwa t') seed'J. Cotm. Seí. fndustt'. Res. Aust. 15: 191-200'
GALLAGHER, J.R.¡I^IATKIN, B.R. and GRIMES' R.C' (1966) 'of pasture quality with young gtazíng sheep'weight groltth and clean wool production'J. Agz"ie. Sci. 66: 107-111.
GRADI^rELL, M.W. (1966). - So11 moisture deficlencles in puddled PasÈures.N.Z. J. Agrie. Res.9z 127-136.
GREENI^IOOD, E.A.N., DAVIES, H.L. and WATSON' B.R. (1967). - Growth of
"r, "nrrrr"i pasture on virgin land in south-western Australia
Lncluding effects of stocklng rate and nitrogen fertiLizet -
Aust. J. Agrie. Res. L9z 447-459.
GUILBERT, H.R. and MEAD, S.W. (1931). - The digestibÍlity of burrclover as affected by exPosure to sunlight and rain.HiLgar&ia 6z 1-1r.
HAMILTON, 8.4., HUTCHINSON, K.J. and S$IAIN' F'G' (1970) ' - The
growth of Merlno lambs gtazí:ng four temperate grasses.Pnoe. Aust. Soe. Aním- Prod. 9z 455-459'
HART, G.H., GUILBERT, H.R. and GOSS, H. (L932). - Seasonal changes
in the chemical conposition of range forage and theirrelaÈion to nutrítion of animals'Calífornía, Univ. Agric. ExpË. Sta. Bull' No' 543, pp' l-62'
HIADY, H.F. (196r). - continuous vs specÍalízed grazj-ng systems:a review and application to the california annual ÈyPe.
J. Range Managanent L4¿ 182-193'
- An evaluation1. Live-
155.
HEINEMANN, I{.1,I. and vAN K-EUREN, R.W. (1958). - A comparison of grasslegrmre mi_xtures, legunes and grass under irrigatíon, as
pastures for sheeP.Agron. J. 50: LB9-I92.
HIGHT, G.K. and sINCLAIR, D.P. (1965). - The autlfnn growth of hoggetson different Pasture ÈYPes.N.Z. J. Agz"Le. Res.8z 1079-1086.
IIILDER, E.J. (1964). - The distribution of plant nutrients by sheepat Pasture.Proc. Aust. Soc. Anim. Ptod. 5: 24L-248.
HILDER, E.J. (1966). - Dístribution of excreta by sheeP at PasÈure.Proc. X. Int. Grassl. Cong., Helsinki, Finland.PP.977-98L.
HODGE, R.W. and DoYLE, J.J. (1967). - DLet selected by larrbs andyearlíng sheep gxaztng on annual and perennial pasturesín southern Victoria.Aust. J. Erp. Agr"ie. Anín. Husb, 7z L4L-I43.
HUlCHINGS
JOHNS,
JONES,
JONES,
JONES,
tb
R.J., NEALE-SMITH, C.A. and SETON, R. (1963). - The
ehaviour under gtazíng of some introduced perennialgrasses.Fld. Stn. Rec. Div. Pl-. Ind. cSIRo. (Aust.) 2(1) pp.29-38.
- ClimateIIUTGHINSON, J.C.D. and MANIKA I^IODZICKA-TOMASZEI^ISIG (1961) .
physÍologY of sheeP.Anín. BYeed. Abstz'. 292 L-L4.
HUTCHINSON, K.J. (1970). - The persistence of perenníal speciesr:nder intensive grazíng in a cool temperate environmenÈ.Proc. XI. Int. Grassl. Cong., Qld. AusÈ. PP' 6lI-614'
HUTCHINSON, K.J. and PORTER, R.B. (1958). - Growth and woolproduction of Merino hoggets related Eo gtazíng Íntakein a South Australian environment.Proe. Aust. Soe. Anim. Prod. 2z 33-4L.
A.T. (1966). - Pasture content has dramatic effecË on animalnuÈrítion.N.Z. J. Agrie. LL2z 44-47.
D.8., CHRISTIAN, K.R. and SNAYDON, R.I^I. (1971). -'Chenicalcomposition and in uitt'o digestibility of some weed
species during sunmer.Aust. J. Eæp. Agníe. Anín. Husb. 1l: 403-406.
D.I.H. (L972). - The chemistry of grass for anirnal production"OutLook on Agr'íc. 7z 32-38.
M.B. and EVANS, R.A. (1960). - Botanical composition changesin annual grassland as affected by fettíLization andgrazing.Agron. J. 52: 459-46L.
156.
JOYCE, J.P. and NEIITII, R.P. (L967). - Use of comparatlve slaughterÈechnique to estimate the nutritive value of pasture forhoggets.Pnoc. N.z. Soc. Anin. Prod. 272 166-180-
KANI^IAR, J.S. (1956). - Phosphate retention ín some AusÈraliansoils.SoiL Sei. 822 43-50.
KURTZ, L.T. and QUIRK, J.P. (1965). - Phosphate adsorPtion andphosphate fractions ín f ield soils of varylne þþtori9¡_1of phosphate fertÍlization.At¿st. J. Agrïe. Res. 16: 403-4L2.
LAI'ÍBOURNE, L.J. (1969). - Evaluatlon of herbage plants by measure-ment of animal Production.Proc. AusÈ. Grassl. Cong. Perth, I^I. Aust. Pp. 33-46.
LANGI"ANDS, J.P. and BENNETT, I.L. (1973). - Stocking intensity andpasÈoral production. III . I,Ioo1 production, fleececharacteristics, and the utlllzatio¡ of nutrients formaintenance and wool growth by Merlno sheep gxazed atdlfferent stocklng rates.J. AgrLe. Sei. Cønb, 8L¿ 2LL-2L8.
LIPSON, N. and BACON-HALL, R.E. (1974>. - Influence of stockingrate on the manufacturing performance and textil-eproperties of wool.J. Aust. Inst. Agríe. Sei. 402 7L-73.
McARTHUR, I.D. (1970). - Optiurum sheep stocking raÈe.J. Aust. Inst. Agric. Sei. 362 9-L4.
McARTHUR, I.D. and DILLON' J.L. (1971). - Risk, utilÍ-ty andsËocking rate.Aust. J. Agt'ic. Eeon. 15: 20-35.
McINTYR-E, G.A. (1946). - The measurement of pasture yield undergtazj:ng. Appendix Ín ttGrazing mnn¿gsment: continuousand rotatlonal grazlng by Merino sheep".C.S.I.R. Aust. 8u11. No. 201, pp. 70-83.
McIVOR, J.G. and SMITH, D.F. (L973a). - A comparíson of the effectsof autr-mn deferment and continuous grazí-:ng on the groÌrthof an annual pasÈure.Au,st. J. Erp. Agt"ic. Anim. Husb. L3z 669'675.
McIVOR, J.G. and SMITH, D.F. (1973b). - The effect of managementduring spring on the grovrth of a mixed annual Pasturecontaining capeweed (Aretotheea eaLendula) .
Aust. J. Erp. Agrie. Anín. Husb. I3z 398-403.
McIVOR, J.G. and SMITH, D.F. (1973c). - Plant facÈors influencingthe nutritive value of some temperate annual pasture species.Aust. J. Eæp. Agz"ie. Aním. Husb. L3z 4O4'4IO.
157 .
McLEAN, J.W., THOMSON, G.C., TVERSEN, C.E., JAGUSH, K.T. andLAI^ISON, B.M. (L962). - Sheep production and health onpure species pastures.Pz,oc. N.Z. GnassLd. Assoc. 242 57-70. t
McI"IANUS, W.R., ARNOLD, G.tr'I. and PAYNTER, J.R. (1964). - Studiesin the wool producÈion of grazlr.g sheep. 2. Variatíonin wool characterisÈics wlÈh season and stocking rate.Aust. J. Eæp. AgrLe. Anín. Husb. 4z 4O4-4LI.
MeI'IILLIAM, J.R. (1962). - Interspecific hybridizatíon in phalaris;hybrids between PhaLap¿s tutberosa and Èhe hexapl-oid raceof PhaLaz,is ammdinaeea.Au,st. J. Agrie. Res. L3z 585-598.
McI.IILLIAÌ"f, J.R., MACKAY, J.H.E., ROGERS, V.E. and SCHROEDER, H.E.(1965). - CharacËerisËlcs and performance of inÈerspecifichybrids betr¡reen PhnLoyis tuberosa a¡d PhaLati.s am,tndinq,eea..CSIRO. Aust. Div. Pl. Ind. Fld. Stn. Rec.4, PP.34-58.
MeI,IILLIAM, J.R. and NEAL-SMITH, C.A. (L962). - Tetraplold andhexaploid chromosome races of. PhaLaris arundinøcea L.Aust. J. Agrie. Res. l3z 1-9.
MANN, P.P., GORDDARD, 8.J., GLENCROSS, R.N. and FIIZPATRICK, E.N.(1966). - Stockíng rate and rate of superphosphate ina higher rainfall area.J. Dep. Agrie. I'1. Aust. 7: 482-488.
MINSON, D.J., RAYMOND, W.F. and HARRIS, C.E. (1960). - Studies lnthe dÍgestibility of herbage. VIII. The dtgestibilttyof S37 cocksfoot, S23 ryegrass and S24 ryegrass.J. Br.it. GnassL. Soe. 15: 174-180.
MOORE, R.M. (1965). - Ecological effects of. grazing on grasslandsin south-eastern Australia.Proc. IX. Int. Grassl. Cong., Sao Pau1o, ßtazíL. Vol. 1,pp. 429-433.
MoRLEY, F.H.I{., BENNETT, D. and McKINNEY, G.T. (1969). - The effectof intensiÈy of rotationaL grazing r¿íth breeding ewes onphalarÍs-subterranean clover Past,ures.Aust. J. Eæp. Agrie. Aním. Husb. 9z 74-84.
MORLEY, F.H.I,I. and SPEDDING, C.R.W. (1968). - AgrícuLtural systemsand grazing experimentsHerb. Abstr. 38: 279'287.
MORRIS, L.R. (196f). - Photoperiodícity of seasonal rhythm ofwool growth ín sheep.Natute I9Oz 102-103.
D.N., FLILKERSON, R.S., TOSSELL, W.E. and WINCII, J.E. (1965).- The in uítto dry matter dígestibility of severalspecies and varietles and thelr plant parts withadvancing stages of maturity.Proc. IX. Int. Grassl. Cong., Sao Paulo, BxazíL¡ Vol. I,pp. 801-806.
MOI.¡AT,
1s8.
MYERS, L.F. and SQUIRES, V.R. (1968 ). - Comparison under grazí:ngof PhalaT,is tttberosa and an interspecific Pha\aris hybridin irrlgated swards.AusÈ. Grassl. Conf . Perth, I'I. Aust. 1(2b) r pp. 26-27.
MYERS, L.F. and SQUIR.ES, V.R. (1970). - Control of barley grass bygtazing mânagement in irrigated pastures.Aust. J. Eæp. Agr|c. Anim. Husb. 10: 151-155.
NEAL SMITH, C.A. (1942). - The comparative grazing values of top-dressed natural and sown pastures in the middle south-easÈof South Australla.J. Dep. Agr|c. S. At*st. 452 485-496.
NEAI SMITH, C.A. (1955). - Report on herbage plant exploratlon inthe Mediterranean reglon.F.A.O. Rep. No. 4I5 (Rome).
NORTHCOTE, K.H. and TUCKER, B.M. (1948). - A soil survey of theHundred of Seddon and part of the Hundred of MacGillivray,Kangaroo Island, South Australia.C.S.I.R. AusÈ. Bull. No.233.
PARROTT, R.T. and DONAI,D, C.M. (1970). - Growrh and ignirabilityof annual pasÈures in a Mediterranean environment.I. Effect of length of season and of defol_iation onthe growth, water content and desíccatj_on of annualpastures.Aust. J. Erp. Agric. Anim. Husb. 10: 67-75.
PEARCE, G.R., VERCOE, J.E. and FREER, M. (L962). - The esrablish¡nenrof faecal nitrogen-digestibility regressíons for animalsgrazíng irrigated pasture.J. Agr"í,e. Sei. 59: 397-402.
PRITCHARD, G.I., FOLKINS, L.P. and PIGDEN, W.J. (1963). - Theín uitro digestibility of whole grasses and thej_r partsat progressive stages of naturity.Can. J. PTnnt Scí. 432 79-87.
PULLMAN, A.L. and ALLDEN, I^f .G. (1971). - Chemical curing of annualpastures in southern Australia for beef cattle and sheep.Aust. J. Agrùe. Res. 222 4OL-4L3.
RADCLIFFE, J.C. and COCHRAI{E, M.J. (1970). - Digestibility andcrude proÈein changes in ten maturíng pasture species.tuoc. Aust. Soc. Anim. Pnod. 8: 531-536.

RossrrER, R.c. (1952).- The effecr or. grazir'g on a perennial veldtgrass - subterranean clover pasture.Aztst. J. Agtic, Res. S: t4B-159.
1s9.
RADCLIFFE, J.C. and NEI^IBERY, 1.R. (1968). - Dlgestibility, crudeprotein and yíeld changes in maturing grass-legumehay crops.Pz,oc. Aust. Soe. Anim. Prod. ZrþO=10,1
RAE, 4.L., BROUGHAM, R.W. and BARTON' R.A. (1964). - A note on theliveweight gains of sheep gxazíng different ryegrassPastures.N.Z. J. Agrie. Res. 7z 49L-495.
RAE, 4.L., BROUGHAM, R.W., GLENDAY, A.C. and BUTLER, G.I^f. (1963).- Pasture type in relatlon to llvewelght gain' carcasscomposit.ion, iodine nutrltlon and some rumen character-ístics of sheep. 1. Liveweight growth of the sheep.J. Agríe. Sei. Cønb. 6Lz 187-190.
RATCLIFF, R.D. and HEADY, II.F. (L962). - Seasonal changes in herbagewelght in an annual grass communlty.J. Range Management L5z L46-L49.
RAYMOND, lü.F. (1969). - The nuËritive value of forage crops.Adu. Agron. ZLz 1-108.
R.EED, K.F.M. (1970). - Variation in liveweÍght galn with grassspecies in grass-clover Pastures.Proc. XI. Int. Grassl. Cong. Qld. AusL. PP. 877-880.
REED, K.F.M. (1972a). - Some effects of botanÍcal composition ofpasture on growth and wool production of weaner sheep'At*st. J. Erp. Agníe. Anim. Husb. L2: 355-360.
REED, K.F.M. (L972b). - The performance of sheep gxazing dÍfferentpasture types. In trPlants for sheep in Austral-ia"pP. 193.204. A Review of Pasture, browse and foddercrop research 1948-70. Eds. Leigh and Noble. (Angus andRoberÈson, Aust.).
REED, K.F.M. (Ig74). - The productívity of pastures sown with PhaLaristubenosa ox LoLium Pe?enne.1. Pasture growth and composiÈion.Aust. J. Erp. Agn'Le. Anim. Husb. L4:
ROE, R., SOUTHCOTT, W.H. and TURNER, H.N. (1959). - Grazíng managemenÈof pastures in the New England region of New South Wales.1. Pasture and sheep production with special reference tosystems of grazir.g and internal parasites.Attst. J. AgrLe. Res. l0z 530-554.
ROSSITER, R"C. (1958). - UÈillzatíon of annual pastures in aMediÈerranean envíronment w-ith special reference toautumn deferment.Aust. Agrostology Conf., Univ. New England. Vol. 1,pp. 56/I-15.
640-648.
160.
ROSSITER, R.C. (1966). - Ecology of the Medlterranean annual-typepast.ure.A&s. Agron. I8z 1-56.
ROSSITER, R.C. and PACK, R.J. (f956). - The effect of protectíon' from gxazjrng on the botanical- compositlon of an annual-tyPe
subterranean clover PasÈure.J. Aust. Inst. Agrùe. Seí'. 222 7L-73.
SHARKEY, M.J., DAVIS, I.F. and KENNEY, P.A. (L962). - The effectof previous and current nutrltion on r¡oo1 production insouthern Victorla.Aust. J. Erp. Agrie. Aní'm. Husb. 2z 160-169.
SHARKEY, M.J., DAVIS, I.F. and KENNEY, P.A. (L964). - The effect ofrate of stocking wlth sheep on the botanical conposítionof an annual Pasture ln southern Victoria.Aust. J. Erp. Agrùe. Anim. Ht¡sb. 4z 34-38.
sHoRT, B.F. and CIIAPIIAN, R.E. (1965). - Technlques for lnvestigatÍngwool growth. In I'Field InvesÈigations with Sheep - A
Manual of Techniques", Section 13. Ed. G.R. Moule (CSIRO.
Melb.), pp. L-23.
SILSBURY, J.H. (1961). - A study of dormancy,characteristics ín LoLiwn pe?enne L.SouÈh Australia.Aust. J. Agric. Res. LZz 1-9.
survlval, and otherat Adelaide,
SINCLAIR, D.P., CLARK, E.A. and FILMER, D.B. (1956). - A comparisonof hogget ill-thirft on perennial ryegrass and white clover.tuoe. N.Z. Soe. Anin. Prod. L6z 23'28.
SMLINGAM (1973). - Some ef fects of treading by sheep on Pasturesin a Mediterranean environment of South Australia.M.Ag.Sc. Thesis, University of Adelaide, Adelaide.
SMITII, D.F. (1966). - Barley grass in Australían pastures.Ph.D. Thesis, Universíty of Melbourne, Melbourne.
SMITII, D.F. (1968a). - The growth of barley grass (Hordewn Leporinwn)in annual pasture: 2. Growth comparisons with Wirnneraryegrass (LoLim rí.gidwü.Awt. J. Eæp. Agrie. Anim. Husb. 8z 484-490.
SMITII, D.F. (f968b). - The grol^¡th of barley grass (Hordeun LeporLrun)in annual pasture: 4. The effect of some managementpractÍces on barley grass content.Aust. J. Erp. Agrie. Anim. Husb. 8: 7O6'7LL.
SMITII, R.C.G., BIDDISCOMBE' E.F. and STERN, W.R. (L973). - Effectof spelling newlY sor.rn PasÈures.Aust. J. Erp. Agrie. Anín. Husb. L3z 549-555.
SPEDDING, C.R.$I., LARGE, R.V. and KYDD, D.D. (1966). - The evaluatíonof herbage species by grazi;rg animals.Proc. X. Int. Grassl. Cong., Helsinkí, Flnland. Pp, 479-483.
SÎEWART, 4.M., MOIR, R.J. and SCHINCKEL, P.G. (1961). - Seasonalfluctuatlons ln wool growth in south-western Aust.xaLia.Attst. J. Eæp. Agrie. Aním. Husb- 6z 85-91.
sucKLING, F.E.T. (1952). - Díssemlnation of whíte clover by sheep.N.Z. J. Sei. Tech. 33: 64-77.
IAI¡BOT, M.I,I. and BISI,üELL, H.H. (L942). - The forage crop and itsmanagement.Calífornia, Univ. Agric. Expt. Sta. Bu1l' 663: L3-49'
TAYLOR, G.B. (L972). - Time distrlbution of seedlíng emergencefrom síng1e seed croPs of several- annual pasture legr:nes.At*st. J. Erp. AgrLe. Aním. Husb- L2z 628'633'
161 .
R.J. (1961). - Renovation is Èhe ansÌ¡Íer Ëo run-down PasÈures.J. Dep. Agrie. S. Aust. 642 510-5f8.
N.S. and CROCIGR, R.L. (1951) ' - The grasslands of south east
South Australia ín rel-ation to cli¡nãte, soils and developmental
his Èory.J. Brit. GrassL. Soe. 6: 29-80'
TAYLOR,
TrvER,
I.IALKER,
VAN DYNE, G.M. and HEADY, H.F. (1965). - Interrelations of botanicaland chemícal dietary components of animals gtazíng dtyannual range.J. Aním. 5e1,. 24¿ 305-312.
VERCoE, J.E. and PEARCE, G.R. (1960). - DÍgestibility of Medieagofi,ibuLoides (barrel nedic) pods.J. Aust. Inst. Agnie. Sei. 262 67-70.
J. (1956). - The reactlon of subÈerranean clover varíetiesto scorch caused by KabatieLLa cauliuora (Kirchn.) Karak.J. Aust. Inst. Agrie. SeL. 222 288-29L.
!¡EIR, I{.C., MEYER, J.H. and LoFGREEN, G.P. (1959). - SynPosÍum on
forage evaluation: vI. The use of oesophageal fístula'lignÍn and chronogen techniques for studyíng selectivegràzirrg and digestibility of range and pasture by sheep
and cattle.Agron. J. 5Lz 235'237.
I{ttITE, D.H. and McCONCHIE, B.J. (1976). - Effect of stoqking rateon fleece measurements and thelr relationshíps in MerÍnosheeP.Aust" J. Agt"ic. Res. 272 L63-L74.
R.K. and McCARRICK, R.B. (1966). - ApparenÈ dry-matterdigestibility, voluntary food-fntake and yíe1ds ofdry natter of nixed swards, conserved as artificiallydried grass and Ëetrapod hay, at Progressíve stages ofmaturitY.Proc. X. Int. Grassl. Cong., Helsínki, Finland. PP' 371-379'
I^IILSON,


