Embed Size (px)
Citation preview
Efficiency in Islamic and conventional banking: an internationalcomparison
Mariani Abdul-Majid • David S. Saal •
Giuliana Battisti
Published online: 25 December 2009
� Springer Science+Business Media, LLC 2009
Abstract The paper investigates the efficiency of a
sample of Islamic and conventional banks in 10 countries
that operate Islamic banking for the period 1996–2002,
using an output distance function approach. We obtain
measures of efficiency after allowing for environmental
influences such as country macroeconomic conditions,
accessibility of banking services and bank type. While
these factors are assumed to directly influence the shape of
the technology, we assume that country dummies and bank
size directly influence technical inefficiency. The parame-
ter estimates highlight that during the sample period,
Islamic banking appears to be associated with higher input
usage. Furthermore, by allowing for bank size and inter-
national differences in the underlying inefficiency distri-
butions, we are also able to demonstrate statistically
significant differences in inefficiency related to these fac-
tors even after controlling for specific environmental
characteristics and Islamic banking. Thus, for example, our
results suggest that Sudan and Yemen have relatively
higher inefficiency while Bahrain and Bangladesh have
lower estimated inefficiency. Except for Sudan, where
banks exhibits relatively strong returns to scale, most
sample banks exhibit very slight returns to scale, although
Islamic banks are found to have moderately higher returns
to scale than conventional banks. While this suggests that
Islamic banks may benefit from increased scale, we would
emphasize that our results suggest that identifying and
overcoming the factors that cause Islamic banks to have
relatively low potential outputs for given input usage levels
will be the key challenge for Islamic banking in the coming
decades.
Keywords Islamic banking � International efficiency
comparison � Output distance function
JEL Classification G21 � D24 � L1
1 Introduction
The emergence of Islamic banking has been driven by the
increasing number of Muslims who wish to lead their lives
according to the shariah, the legal code of Islam. The
establishment of Nasser Social Bank in Egypt in 1971
(Iqbal and Molyneux 2005), the Dubai Islamic Bank in the
United Arab Emirates and the Islamic Development Bank
(IDB) in 1975 paved the way for the creation of other
Islamic financial institutions all over the world (Central
Bank of Malaysia 1999). Some form of Islamic financial
services is now available in at least 70 countries (Husain
2005).
The salient features of Islamic banking are the prohi-
bition of interest payment in transactions, and the prohi-
bition of undertaking or financing anti-social and unethical
behaviour such as gambling, pornography and alcohol. An
M. Abdul-Majid
School of Economics, Faculty of Economics and Business,
Universiti Kebangsaan Malaysia, 43600 UKM Bangi,
Selangor, Malaysia
e-mail: [email protected]
D. S. Saal (&)
Economics and Strategy Group, Aston Business School,
Aston University, Birmingham B4 7ET, UK
e-mail: [email protected]
G. Battisti
Industrial Economics Division, Nottingham University
Business School, Jubilee Campus, Wollaton Road,
Nottingham NG8 1BB, UK
e-mail: [email protected]
123
J Prod Anal (2010) 34:25–43
DOI 10.1007/s11123-009-0165-3
Islamic bank is governed by shariah, as well as the regu-
lations set in place by the host country. While some Islamic
banks were purposely established to operate within shari-
ah, some Islamic banks were converted from conventional
banks. Thus, in Iran and Sudan, all conventional banks
were converted to Islamic banks in order to conform with
government legislation (Sundararajan and Errico 2002).
However, it is more common for countries with large
Muslim populations to operate Islamic banking systems
alongside conventional banking systems, as is now the case
in Malaysia, Bahrain, Pakistan, Saudi Arabia, and Egypt
(Hassan 2003).
Previous studies using cost and/or profit functions to
compare the efficiency of Islamic and conventional banks,
have found Islamic banks to be similar (Abdul-Majid et al.
2005; Mokhtar et al. 2006) if not better (Alshammari 2003;
Al-Jarrah and Molyneux 2005) than conventional banks.
However, (Abdul-Majid et al. 2008, 2009) demonstrated
that after properly taking into account environmental
variables in either a cost or output distance function,
Malaysian Islamic banks are found to have higher input
requirements. This finding of higher input requirements for
Islamic banks in Malaysia is the main motivation for this
study, as we wish to further investigate how Islamic banks
perform relative to conventional banks internationally.
Moreover, an international study will allow analysis of
how, respectively, Islamic and conventional banks from
various countries perform relative to other countries, and
whether significant differences across countries exist. This
would potentially provide relevant findings for policy
makers in the sample countries who wish to judge the
relative performance of their banking sector.
We also note that the design of this study results from
careful consideration of how to effectively compare the
efficiency of conventional and Islamic banks, while prop-
erly allowing for relative differences between these types
of banks. Thus, following several previous studies that
include both conventional and Islamic banks, we adopt an
intermediation approach. This approach is most suitable
for comparably defining the relationship between bank
outputs and inputs. This is because Islamic banks adopt an
equity participation principle that effectively intermediates
between savers (depositors) and investors (e.g., Al-Jarrah
and Molyneux 2005; El-Gamal and Inanoglu 2005).
However, we also extend this approach by including equity
as an input, because of both its role in Islamic banking and
because we believe this better reflects the fact that banks
can and do employ equity financing as an input which can
be an important component of capital reserves used for
liquidity purposes.
This study also adopts an output distance function
approach to compare Islamic and conventional banks. This
implies the assumption of an output oriented approach, and
therefore measuring efficiency by comparing actual output
relative to potential output, given fixed inputs. This approach
has the advantage of allowing the use of identifiable output
and input quantities such as deposits, total operating
expenses and equity, and therefore allows us to avoid the
possible problem of input price endogeneity (Orea 2002).
Given differences in accounting standards across countries,
as well as differences in conventional and Islamic banking
assets, we also believe that for this international study, the
standard approach of employing accounting information to
define output and/or input prices, is particularly likely to
result in distorted and inaccurate price estimates, and hence
distorted cost or profit efficiency estimates.
In sum, this study aims to measure the efficiency of
banks in countries that have Islamic banking in operation
as well as relative efficiency between countries, and will
particularly focus on the relative performance of Islamic
banks as compared to conventional banks. More specifi-
cally, by deriving estimates of efficiency for banks in dif-
ferent countries after estimating an output distance function
with stochastic frontier techniques, the analysis highlights
the impact of operating characteristics, including Islamic
banking and country-specific environmental characteris-
tics, on the relative outputs of banks. The efficiency esti-
mates highlight that during the sample period, Islamic
banking appears to be associated with higher input usage.
However, as our model specification also allows for both
international differences and differences in bank size in the
underlying inefficiency distributions, our model also sug-
gests the presence of statistically significant differences in
inefficiency related to bank size and across countries.
The rest of the paper is organised as follows. Section 2
provides a brief literature review focused on the relative
performance of banks across countries, and is followed by
a description of the methodology in Sect. 3. Data and the
empirical specification are discussed in Sect. 4. Section 5
reports the results which are comprised of the output dis-
tance function, efficiency, and returns to scale estimates.
Finally, Sect. 6 offers some conclusions.
2 Review of the literature and the modelling
approach
This study contributes to both the existing literature
employing a parametric approach to measure cross-country
bank efficiency as well as the literature considering the
comparative efficiency of Islamic and conventional banks.
As our approach to controlling for differences in operating
environment will have a significant impact on estimated
efficiency, it is necessary to carefully consider the impact
of the chosen operating environment variables on measured
efficiency. Moreover, as the choice of appropriate inputs
26 J Prod Anal (2010) 34:25–43
123
and outputs will significantly influence estimated efficiency,
we also consider previous definitions of the input output set
in order to better model an appropriate common frontier for
Islamic and conventional banks in a cross-country analysis.
It is also necessary to carefully consider the influence of
functional form on the measured efficiency of both con-
ventional and Islamic banks in an international setting.
Finally, we briefly take into account the findings of previous
studies with regard to returns to scale in banking.
We firstly consider the implication of simultaneously
modelling Islamic and conventional banks. As shariah
compliant banking has different objectives and modus
operandi from conventional banking, it may also have
different operational characteristics from conventional
banking, which may influence potential output. Thus, for
example, the prohibition of conventional interest bearing
financial instruments can be considered as an operating
characteristic that limits the use of certain banking ‘‘tech-
nologies’’ and thereby ‘‘reduces’’ potential banking outputs
relative to those feasible for a conventional bank. We
would therefore argue that it is appropriate to control for
Islamic banking as a bank-specific characteristic that
directly influences the estimated frontier, and hence esti-
mated potential output, rather than as a factor that directly
influences estimated inefficiency. Moreover, as Islamic
bank managers are constrained by shariah, this approach
has the dual benefit of measuring their efficiency relative to
an appropriate frontier taking into account operating dif-
ferences between Islamic and conventional banks, while
also simultaneously allowing measurement of differences
in potential output (frontier shift) that can be attributed to
the adoption of Islamic banking practices.
In our opinion, jointly modelling both Islamic and
conventional banks also requires a reconsideration of the
input output set typically employed in banking studies.
Thus, some previous SFA cross-country studies (e.g.,
Maudos et al. 2002; Fries and Taci 2005; Williams and
Nguyen 2005; Kasman and Yildirim 2006) have either
controlled for bank output quality and/or equity in the
frontier estimation. Bank output quality1 (Fries and Taci
2005) or equity capital (Carvallo and Kasman 2005; Bos
and Schmiedel 2007; Fitzpatrick and McQuinn 2008) has
always before been treated as fully exogenous in the
frontier estimation, although some studies have treated
equity (Maudos et al. 2002; Williams and Nguyen 2005;
Kasman and Yildirim 2006) and even both loan quality and
equity (Alshammari 2003) as ‘‘netputs’’.2 However, we
would argue that even conventional banks employ equity
capital as an input in addition to funds from deposits and
inter-bank borrowings to finance their operations (Bonac-
corsi di Patti and Hardy 2005). Moreover, Islamic banks
that apply the equity participation principle also depend
significantly on equity as a source of funds (Metwally
1997). Therefore, while in the previous literature equity has
generally been employed only as an environmental factor
in frontier estimation, we strongly believe that a more
appropriate modelling approach, which not only better
specifies the input relationship for all banks but also allows
a flexible specification that is more appropriate for com-
paring conventional and Islamic banks, is to directly
include equity as an input.
We next consider the specification of an appropriate
model to estimate cross-country bank efficiency. While
some studies do not assume that any environmental con-
ditions influence frontier estimation, and hence location of
the frontier (Allen and Rai 1996; Altunbas et al. 2001;
Maudos et al. 2002); other studies do control for these
factors (Dietsch and Lozano-Vivas 2000; Bonin et al. 2005;
Carvallo and Kasman 2005). These environmental condi-
tions can be categorised into country-specific factors (Fries
and Taci 2005; Williams and Nguyen 2005) and bank-
specific factors. A common frontier without controls for
country-specific factors is likely to be misspecified because
each country may have a different banking technology as
well as different environmental and regulatory conditions,
that influence potential output (Dietsch and Lozano-Vivas
2000), but the frontier would assume the same technology
for all banks (Chaffai et al. 2001). Therefore, by control-
ling for these factors in a common frontier, efficiency
rankings are more persistent (Fries and Taci 2005), effi-
ciency estimates are improved (Dietsch and Lozano-Vivas
2000; Bonin et al. 2005; Carvallo and Kasman 2005;
Kasman 2005), and the estimates of efficiency more
appropriately reflect the impact of less (or more) favour-
able country-specific conditions on estimated relative effi-
ciency (Dietsch and Lozano-Vivas 2000). These country-
specific factors can be broadly generalised into macro-
economic factors such as per capita income, density of
demand, population density, banking concentration (Diet-
sch and Lozano-Vivas 2000; Carvallo and Kasman 2005;
Williams and Nguyen 2005), bank structure and regulation
such as bank branches per capita (Maudos and De Guevara
2007), the intermediation ratio (Dietsch and Lozano-Vivas
2000), as well as accessibility of banking services, as
measured with GDP growth (Kasman and Yildirim 2006)
and density of bank branches (Dietsch and Lozano-Vivas
2000).
In this study, countries involved in the sample range
from low to relatively high income economies and signif-
icant differences exist in many characteristics including
1 If output quality is not controlled for, unmeasured differences in
loan quality that are not captured by banking data may be mistakenly
measured as inefficiency (Berger and Mester 1997).2 ‘‘Netputs’’ are operating characteristic variables that have been
made fully interactive with inputs and outputs in the function.
J Prod Anal (2010) 34:25–43 27
123
those related to politics, economics, social structure, and
geography. Thus, for example Sudan is characterized by a
culture of holding cash to hand, and is plagued by the
effects of civil war, economic sanctions and drought, and
these jointly influence the poorly developed Sudanese
banking sector (Bashir 1999; Hussein 2004). In contrast,
due to its high level of economic development and its
comprehensive regulatory framework, Bahrain has attrac-
ted confidence among investors (Iqbal and Molyneux
2005). These country specific differences in the back-
ground operating environment as well as significant dif-
ferences in bank regulatory frameworks and financial
reporting formats (Karim 2001) strongly suggest that
controlling for country-specific effects appropriately will
have an important impact on estimated efficiency in an
international sample. Irrespective of controlling for coun-
try-specific factors in frontier estimation however, coun-
tries with a bigger sample still show larger difference in
average efficiency scores relative to those with small
samples (Lozano-Vivas et al. 2002) and a wide range of
average inefficiency estimates exists across countries (Abd
Karim 2001; Carvallo and Kasman 2005). Furthermore,
Bonin et al. (2005) found that country effects continue to
play a significant part in explaining differences in effi-
ciency measures even after they have been controlled for in
the frontier estimation.
Focusing specifically on methodological approaches
employed in past SFA based studies, estimated efficiency
scores have been correlated with environmental factors
under investigation using two different methodologies. The
first, which is a ‘‘one step’’ methodology simultaneously
estimates the frontier and the impact of environmental fac-
tors on efficiency by using an inefficiency effects model,
such as that proposed by Battese and Coelli (1995). These
include both studies that assume no direct impact of envi-
ronmental factors on the estimated frontier, and hence
assume that they only influence efficiency (Abd Karim 2001;
Alshammari 2003; Al-Jarrah and Molyneux 2005) and
studies that also control for these factors in estimating the
frontier (Bonin et al. 2005; Williams and Nguyen 2005;
Fitzpatrick and McQuinn 2008). Within the former strand of
literature, bank types dummy variables (Abd Karim 2001;
Alshammari 2003; Al-Jarrah and Molyneux 2005), owner-
ship (Abd Karim 2001), liquidity, bank concentration ratios
(Al-Jarrah and Molyneux 2005) and size (bank assets) (Abd
Karim 2001; Al-Jarrah and Molyneux 2005; Perera et al.
2007) have been assumed to directly influence inefficiency.
In the later group of studies, which assume that environ-
mental conditions do directly influence frontier estimation,
country-specific factors such as governance-related factors
(Williams and Nguyen 2005), market concentration (Perera
et al. 2007) and country dummy variables (Bonin et al. 2005;
Fitzpatrick and McQuinn 2008) have been controlled for.
The second significant methodological approach evident
in the literature employs a ‘‘two step’’ approach. Such
studies have first estimated the frontier, followed by
regression analysis to find correlations between ineffi-
ciency scores and bank-specific factors (Allen and Rai
1996; Altunbas et al. 2001; Maudos et al. 2002). This
category includes both studies that do not assume envi-
ronmental conditions to influence frontier estimation
(Allen and Rai 1996; Altunbas et al. 2001; Maudos et al.
2002) and studies that control for these factors in esti-
mating the frontier (e.g., Dietsch and Lozano-Vivas 2000;
Carvallo and Kasman 2005). Without controlling for any
environmental conditions, the former have subsequently
correlated inefficiency with bank-specific factors such as
ownership (Weill 2002), organisational structure (Boubakri
et al. 2005), bank size (Maudos et al. 2002; Yildirim and
Philippatos 2007), specialisation, profitability, risk and
country-specific factors (Maudos et al. 2002). On the other
hand, studies that control for these factors in estimating the
frontier have subsequently correlated inefficiency with
bank-specific factors such as loan quality, profitability,
equity capital, non-interest income (Carvallo and Kasman
2005) and country-specific factors such as concentration
ratio (Dietsch and Lozano-Vivas 2000). However, this
‘‘two-step’’ procedure is associated with several anomalies
and has been previously criticised as an inappropriate
methodology leading to potentially biased efficiency esti-
mates (Coelli et al. 1998).
Given this discussion, we have chosen to employ a
‘‘one-step’’ procedure similar to Fries and Taci (2005) and
Williams and Nguyen (2005). We will control for country-
specific environmental factors as well as shariah compliant
banking directly in the estimated frontier, thereby allowing
for any differences in technology and/or potential output
that result from differences in operating characteristics.
However, using the Battese and Coelli (1995) model, we
will also allow country dummy variables and bank size to
directly influence the inefficiency specification. As dis-
cussed further below, we believe that this simultaneous
inclusion of country-specific operating characteristics in
the estimated frontier and country dummies in the ineffi-
ciency specification, allows for appropriate differences in
measured potential output between countries, while
simultaneously allowing us to test for systematic differ-
ences in efficiency across countries.
Regarding bank size, we first note that controlling for it
directly in the estimated frontier is an inappropriate
methodology, as bank size is closely correlated with bank
outputs, and this approach would be likely to result in a
biased estimate of the relationship between scale and
potential outputs, and hence biased efficiency estimates.
We believe this argument explains why none of the above
studies has controlled for bank size in the frontier.
28 J Prod Anal (2010) 34:25–43
123
Nevertheless, as our expectation is that Islamic banks are
on average smaller than conventional banks, there is the
potential that any size related heteroskedasticity in the one
sided inefficiency term could be inappropriately accounted
for as group related inefficiency, thereby leading to
potential bias in the estimated inefficiency of Islamic banks
relative to conventional banks.3 Moreover, there is also the
potential that failing to control for size related heteroske-
dasticity may similarly adversely affect the analysis of
economies of scale. We therefore follow the approach of
previous studies (Abd Karim 2001; Al-Jarrah and Moly-
neux 2005; Perera et al. 2007) that have specified bank size
as a determinant of inefficiency. Although Al-Jarrah and
Molyneux (2005) found bank size to be insignificant,
Perera et al. (2007) and Abd Karim (2001) both found that
larger banks are relatively more efficient.
With regard to the chosen functional form, most cross-
country studies of banking efficiency have employed a cost
function approach (Dietsch and Lozano-Vivas 2000; Abd
Karim 2001; Carvallo and Kasman 2005; Fries and Taci
2005; Kasman 2005; Carbo Valverde et al. 2007; Maudos
and De Guevara 2007), or a profit function approach
(Kasman and Yildirim 2006; Fitzpatrick and McQuinn
2008). Moreover, studies have increasingly simultaneously
employed both cost and profit functions (Alshammari
2003; Hassan 2003; Al-Jarrah and Molyneux 2005; Bonin
et al. 2005; Hassan 2005; Kasman and Yildirim 2006; Bos
and Schmiedel 2007). Nevertheless, with international
comparisons of efficiency, one must note that international
differences in accounting information might lead to dis-
torted price estimates, thereby undermining the common
use of both cost and profit functions for measuring bank
efficiency. This study will therefore extend the approach of
Cuesta and Orea (2002) and will measure the efficiency of
banks internationally using an output distance function,
which not only does not require price information, but also
does not require any behavioural assumption such as cost
minimisation or profit maximisation. This study will
therefore join the limited number of studies using an output
distance function approach to judge cross-country banking
efficiency (Chaffai et al. 2001; Olgu 2006), and, to our
knowledge, is the first cross-country study of Islamic and
conventional bank efficiency that has employed an output
distance function approach.
Focussing briefly on returns to scale estimates in the
previous literature, slight economies of scale are found in
every production scale but are more pronounced in small
banks in some studies (Abd Karim 2001; Altunbas et al.
2001; Cavallo and Rossi 2001). However, other studies
also find evidence of diseconomies of scale in large banks
(Allen and Rai 1996; Carvallo and Kasman 2005), small
and medium-sized Islamic banks (Yudistira 2004) and
small banks (Kasman 2005). Irrespective of these differ-
ences in previous findings however, returns to scale esti-
mates are normally near one which indicates that on
average, banks operate at almost constant returns to scale
(e.g., Clark 1996; Cuesta and Orea 2002; Orea 2002;
Carvallo and Kasman 2005). In addition, bank type (e.g.
Islamic, conventional commercial or conventional mer-
chant) is found to have little or no significant impact on
estimated scale economies in Gulf Cooperation Council
(GCC) banks (Alshammari 2003). Given these limited
previous findings, the model below will also investigate
returns to scale of both Islamic and conventional banks
internationally.
In sum, the discussion of the previous literature has
demonstrated the importance of controlling for operating
characteristics, and particularly country-specific environ-
mental conditions, when estimating bank efficiency. In
particular, it highlights that country effects play a signifi-
cant part in explaining estimated efficiency differences
across countries, and must therefore be carefully modelled.
Moreover, in contrast to the previous literature, it has also
been argued that equity should be modelled as an input
because it is a potentially important financial input for
conventional and particularly Islamic banks. In addition,
this section has illustrated the advantage of employing an
output distance function in an international study of banking
efficiency. The model below will therefore employ an
output distance function and control for country-specific
factors and shariah compliant banking directly in the esti-
mated frontier as well as allowing for international differ-
ences and differences related to bank size in the underlying
inefficiency distribution using the Battese and Coelli (1995)
model. Moreover, given the model specification detailed
below, it will be possible to test for statistically significant
differences in the parameters that define each country’s
inefficiency distribution. This study will therefore provide a
useful methodology and expand upon the existing literature
that has analysed cross-country bank efficiency, in addition
to providing a comparison between Islamic and conven-
tional banks. Given this discussion, the following section
further details the methodological approach employed.
3 Methodology
3.1 Output distance function
A production technology can be represented by the tech-
nology set, which is the technically feasible combination of
inputs and outputs (Coelli et al. 1998; Cuesta and Orea
2002). If the vector of K inputs, indexed by k is denoted by
3 We gratefully acknowledge an anonymous referee who highlighted
this issue to us.
J Prod Anal (2010) 34:25–43 29
123
X = (X1, X2,…, XK) and the vector of M outputs, indexed
by m, is denoted by Y = (Y1, Y2,…, YM), the technology
set can be defined by:
T ¼ X;YÞf : X 2 RKþ;Y 2 RM
þ ;X can produce Yg ð1Þ
where RKþ and RM
þ are the sets of non-negative, real K and
M-tuples respectively. For each input vector, X, let P(X) be
the set of producible output vectors, Y, that are obtainable
from the input vector X:
PðXÞ ¼ Y : X;Yð Þ 2 TÞf g: ð2Þ
The output distance function can be defined in terms of the
output set, P(X) as follows:
Do X;Yð Þ ¼ min - [ 0 :Y
-
� �2 PðXÞ
� �: ð3Þ
The output distance function is non-decreasing, positively
linearly homogeneous, increasing in Y, decreasing in X, and
defined as the maximum feasible expansion of the output
vector given the input vector (Fare and Primont 1995). Given
the input vector X, the production possibility set is the area
bounded by the production possibility frontier (PPF), which
defines the maximum feasible output. If the output vector Y
is an element of P(X), Do(X,Y) B 1. However, if firms
produce on the PPF, Do X;Yð Þ- ¼ 1; indicating technical
efficiency. In contrast, for an inefficient firm operating
within the area bounded by the PPF, Do X;Yð Þ ¼ -\1;
thereby indicating the ratio of actual output to potential
output. Farrell’s (1957) output-oriented measure of technical
efficiency, defined as the maximum producible radial
expansion of the output vector, can then be represented as:
OEo ¼ 1=DoðX,Y): ð4Þ
3.2 The econometric specification
Following Fare and Primont (1995) and Cuesta and Orea
(2002), and also allowing for exogenous factors, the gen-
eral form of a stochastic output distance function can be
shown as:
1 ¼ D0 Yn;t;Xn;t;Zn;t; b� �
h en;t
� �ð5Þ
where h en;t
� �¼ exp un;t þ vn;t
� �; Yn,t is a vector of outputs,
Xn,t is an input vector, Zn,t is an exogenous factor vector
and b is a vector of parameters. Inefficiency is accommo-
dated in the specification of h(.), as en,t is a composed error
term comprised of vn,t which represents random uncon-
trollable error that affects the n-th firm at time t, and un,t is
assumed to be attributable to technical inefficiency.
In order to facilitate estimation, we follow the standard
practice of imposing homogeneity of degree one in outputs
on the distance function, which implies that Do Z;X; pYð Þ ¼pDo Z;X;Yð Þ; p [ 0: By arbitrarily choosing the M-th out-
put, we then can define p ¼ 1
YMand write:
Do Zn;t;Xn;t;Yn;t
YM;n;t
� �¼
Do Zn;t;Xn;t;Yn;t
� �YM;n;t
: ð6Þ
which, after assuming Y�n;t ¼ Y1;n;t
�YM;n;t;Y2;n;t
�YM;n;t;
�. . .;YM�1;n;t
�YM;n;tÞ and rearranging terms yields the
general form:
1
YM;n;t¼ Do Y�n;t;Xn;t;Zn;t; b
� h en;t
� �ð7Þ
Finally after assuming a standard translog functional
form4 to represent the technology, the output distance can
be represented as:
� ln YM;n;t ¼ /o þXK
k¼1
ak ln Xk;n;t þXM�1
m¼1
bm ln Y�m;n;t
þ 0:5XK
k¼1
XK
s¼1
ak;s ln Xk;n;t ln Xs;n;t þ1
2
XM�1
m¼1
XM�1
j¼1
bm;j
� ln Y�m;n;t ln Y�j;n;t þXK
k¼1
XM�1
m¼1
hk;m ln Xk;n;t ln Y�m;n;t
þXK
k¼1
sk;t ln Xk;n;tt þXM�1
m¼1
wm;t ln Y�m;n;tt þ k1t þ 0:5k2t2
þXH
h¼1
nhZh;n;t þ vn;t þ un;t ð8Þ
where, Y*m,n,t = Ym,n,t/YM,n,t, k = 1, 2,…, K and s = 1,
2,…, K are indices for input; m = 1, 2,…, M and j = 1,
2,…, M are indices for output; h = 1, 2,…, H is an index
for the total of H environmental Z variables that are
included to account for differences in operating environ-
ment discussed above, and the Greek letters (except v and
u) represent unknown parameters to be estimated. Standard
symmetry is imposed to the second order parameters by
imposing the constraints aks ¼ ask and bmj ¼ bjm:
We specify Battese and Coelli (1995)’s truncated normal
SFA model with the mean of the truncated normal distribu-
tion (Mn,t) made an explicit function of country dummy
variables and size differences across banks. This is illustrated
in Eq. 9, which follows the formulation of the model detailed
in (Coelli 1996). Thus, vn,t is assumed to be normally dis-
tributed with zero mean and variance r2v and independently
distributed of un,t. un,t C 0 is assumed to be drawn from a
truncation (at zero) of the normal distribution with mean,
Mn,t and variance r2u where df and q are parameters to be
estimated, f = 1, 2…, F is an index for countries, C is a
country dummy and S is bank size, as measured by total
assets. The parameters in the translog function as defined
in Eq. 8, the composed error parameters, r2 ¼ r2v þ r2
u and
4 In the literature, the translog function is preferred in estimating a
parametric distance function (Fuentes et al. 2001) because it is
flexible, easy to calculate and permits the imposition of homogeneity.
30 J Prod Anal (2010) 34:25–43
123
c ¼ r2u
�r2
v þ r2u; the country specific inefficiency distribu-
tion parameters (df), and the bank size parameter (q) speci-
fied in Eq. 9 below are estimated simultaneously using
maximum likelihood estimation (MLE) techniques.
EMn;t ¼XF
f¼1
df Cf ;n;t þ qSn;t: ð9Þ
Given the output distance function specification in Eq. 8,
our model controls for country-specific operating character-
istics and Islamic banking by including appropriate Z
variables directly in the estimated frontier. This implies that
the estimated inefficiency scores are net of the impact of
controlled for environmental influences on efficient potential
outputs. The simultaneous estimation of Eqs. 8 and 9
therefore enables one to estimate inefficiency under the
assumption that banks operate in an equivalent environment,
while at the same time modelling how bank inefficiency
differs from one country to another and as bank size varies.
Thus, if q\ 0 ([0) the resulting shift in the truncated normal
inefficiency distribution implies that the probability of
observing higher inefficiency decreases (increases) with
bank size. The sign, magnitude, and statistical significance
of q therefore measure to what extent, ceteris paribus,
inefficiency is related to bank size. Similarly, if dB \ dA the
resulting difference in the truncated normal inefficiency
distributions implies that, ceteris paribus, the probability of
observing higher inefficiencies is lower in Country B than in
Country A. Thus, a finding that dB is statistically significantly
less than dA, implies the presence of higher inefficiency in
country A, after controlling for bank size and differences in
operating environment between countries.
Following from Eq. 5, and given the model assump-
tions, an estimate of output distance can be derived as
Do Yn;t;Xn;t;Zn;t; b� �
¼ expð�lÞ: Equivalently, an esti-
mate of output oriented efficiency is obtainable as:
OEn;t ¼1
Do Yn;t;Xn;t;Zn;t; b� � ¼ exp ln;t
� �: ð10Þ
As OEn,t relies on the unobservable inefficiency, un,t, we
follow the standard approach, as described in Battese and
Coelli (1995) and Frame and Coelli (2001) to estimate un,t,
as the conditional expectation of un,t given the observed
value of the overall composed error term, en,t.
Given the estimated model, returns of scale for the banks in
the sample can also be estimated, using the estimated scale
elasticity. As in Cuesta and Orea (2002), scale elasticity can be
calculated as the negative of the sum of the input elasticities:
SCALEn;t ¼ �XK
k¼1
o ln Do Ym;n;t;Xk;n;t
� �o ln Xk;n;t
: ð11Þ
If SCALEn,t [ 1 a bank is operating at increasing returns to
scale (IRS). If SCALEn,t \ 1, there is decreasing returns to
scale (DRS) and constant returns to scale (CRS) are present
if SCALEn,t = 1.
4 The data and the empirical specifications
Data on 23 Islamic and 88 conventional banks from 10
countries that operate Islamic banking were drawn from the
BankScope database for the period 1996–2002 resulting in
an unbalanced panel of 558 observations, with 95 of these
observations being for Islamic banks. All those Islamic
banks with complete data were selected for inclusion in our
sample, as was a sample of conventional banks from those
countries were Islamic bank data is available. BankScope
did not provide complete data for Islamic banks in several
countries with significant Islamic banking sectors (e.g.
Kuwait, and the UAE), hence those banks and countries
with incomplete information have been dropped from the
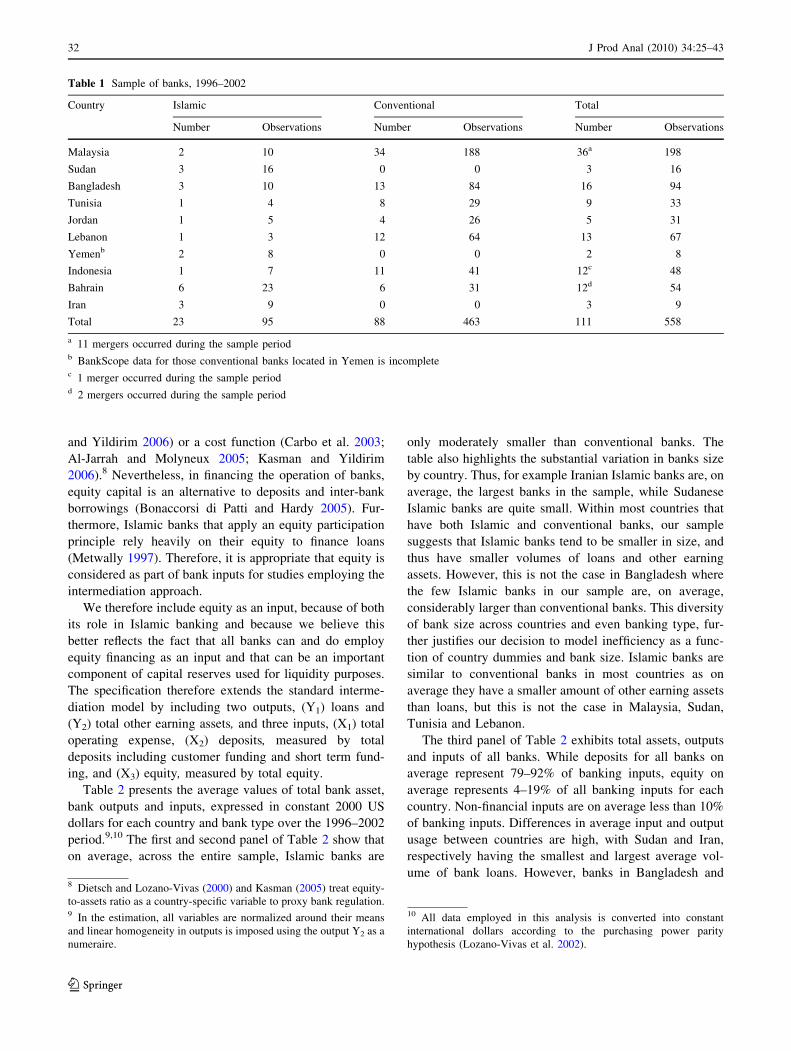
sample. Table 1 describes the sample distribution of banks
by type of bank for each country under study.
The selection of output and input variables follows the
intermediation approach which has been widely employed
in conventional bank studies (e.g., Maudos et al. 2002;
Carbo et al. 2003), Islamic bank studies (e.g., Brown and
Skully 2003; Hassan 2003; Yudistira 2004) and Islamic and
conventional bank studies (e.g., Alshammari 2003; Al-
Jarrah and Molyneux 2005). The intermediation approach
focuses on a bank’s role in intermediating savers and
investors of funds, and is most consistent with the concept
of Islamic banking. This is because Islamic banking relies
on profit-sharing contracts, which involve an equity par-
ticipation principle5 with depositors,6 and banks can
therefore be seen as intermediating savers and investors by
transforming deposits into earning assets, rather than as
producers of services and loans.
Previous studies that employ the intermediation
approach found that equity is significant in defining bank
output but many (e.g., Girardone et al. 2004; Kasman and
Yildirim 2006) include it either as an environmental vari-
able or a netput. However, it has not been previously
employed as an input in single-country studies7 (e.g.,
Mester 1996; e.g., Girardone et al. 2004), and cross-
country studies, nor in those using a profit function (Al-
shammari 2003; Al-Jarrah and Molyneux 2005; Kasman
5 Some current Islamic banks also practice debt-like financing such
as murabaha.6 In some Islamic banks, deposits or equity contributed by depositors
are categorised under shareholders’ funds, but some Islamic banks
group them as deposits from customers, similar to conventional banks
(Karim 2001).7 Some studies have treated equity capital as a netput in the translog
function (Berger and Mester 1997; Hasan and Marton 2003;
Bonaccorsi di Patti and Hardy 2005; Kraft et al. 2006).
J Prod Anal (2010) 34:25–43 31
123
and Yildirim 2006) or a cost function (Carbo et al. 2003;
Al-Jarrah and Molyneux 2005; Kasman and Yildirim
2006).8 Nevertheless, in financing the operation of banks,
equity capital is an alternative to deposits and inter-bank
borrowings (Bonaccorsi di Patti and Hardy 2005). Fur-
thermore, Islamic banks that apply an equity participation
principle rely heavily on their equity to finance loans
(Metwally 1997). Therefore, it is appropriate that equity is
considered as part of bank inputs for studies employing the
intermediation approach.
We therefore include equity as an input, because of both
its role in Islamic banking and because we believe this
better reflects the fact that all banks can and do employ
equity financing as an input and that can be an important
component of capital reserves used for liquidity purposes.
The specification therefore extends the standard interme-
diation model by including two outputs, (Y1) loans and
(Y2) total other earning assets, and three inputs, (X1) total
operating expense, (X2) deposits, measured by total
deposits including customer funding and short term fund-
ing, and (X3) equity, measured by total equity.
Table 2 presents the average values of total bank asset,
bank outputs and inputs, expressed in constant 2000 US
dollars for each country and bank type over the 1996–2002
period.9,10 The first and second panel of Table 2 show that
on average, across the entire sample, Islamic banks are
only moderately smaller than conventional banks. The
table also highlights the substantial variation in banks size
by country. Thus, for example Iranian Islamic banks are, on
average, the largest banks in the sample, while Sudanese
Islamic banks are quite small. Within most countries that
have both Islamic and conventional banks, our sample
suggests that Islamic banks tend to be smaller in size, and
thus have smaller volumes of loans and other earning
assets. However, this is not the case in Bangladesh where
the few Islamic banks in our sample are, on average,
considerably larger than conventional banks. This diversity
of bank size across countries and even banking type, fur-
ther justifies our decision to model inefficiency as a func-
tion of country dummies and bank size. Islamic banks are
similar to conventional banks in most countries as on
average they have a smaller amount of other earning assets
than loans, but this is not the case in Malaysia, Sudan,
Tunisia and Lebanon.
The third panel of Table 2 exhibits total assets, outputs
and inputs of all banks. While deposits for all banks on
average represent 79–92% of banking inputs, equity on
average represents 4–19% of all banking inputs for each
country. Non-financial inputs are on average less than 10%
of banking inputs. Differences in average input and output
usage between countries are high, with Sudan and Iran,
respectively having the smallest and largest average vol-
ume of bank loans. However, banks in Bangladesh and
Table 1 Sample of banks, 1996–2002
Country Islamic Conventional Total
Number Observations Number Observations Number Observations
Malaysia 2 10 34 188 36a 198
Sudan 3 16 0 0 3 16
Bangladesh 3 10 13 84 16 94
Tunisia 1 4 8 29 9 33
Jordan 1 5 4 26 5 31
Lebanon 1 3 12 64 13 67
Yemenb 2 8 0 0 2 8
Indonesia 1 7 11 41 12c 48
Bahrain 6 23 6 31 12d 54
Iran 3 9 0 0 3 9
Total 23 95 88 463 111 558
a 11 mergers occurred during the sample periodb BankScope data for those conventional banks located in Yemen is incompletec 1 merger occurred during the sample periodd 2 mergers occurred during the sample period
8 Dietsch and Lozano-Vivas (2000) and Kasman (2005) treat equity-
to-assets ratio as a country-specific variable to proxy bank regulation.9 In the estimation, all variables are normalized around their means
and linear homogeneity in outputs is imposed using the output Y2 as a
numeraire.
10 All data employed in this analysis is converted into constant
international dollars according to the purchasing power parity
hypothesis (Lozano-Vivas et al. 2002).
32 J Prod Anal (2010) 34:25–43
123
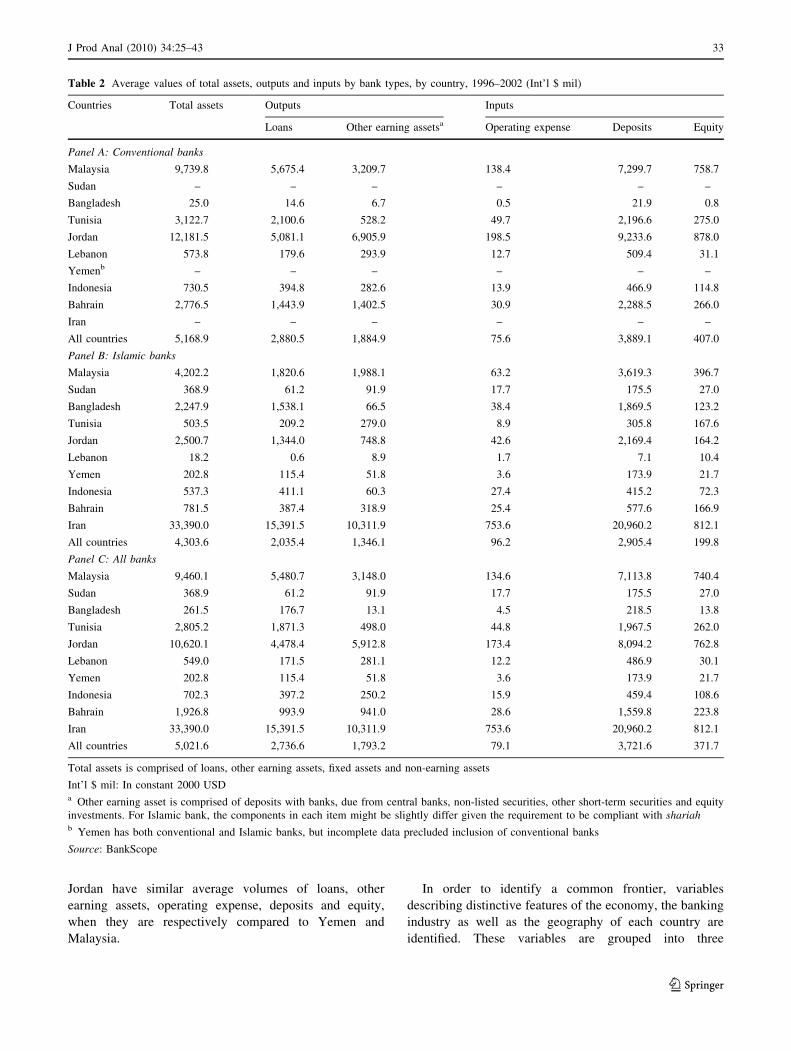
Jordan have similar average volumes of loans, other
earning assets, operating expense, deposits and equity,
when they are respectively compared to Yemen and
Malaysia.
In order to identify a common frontier, variables
describing distinctive features of the economy, the banking
industry as well as the geography of each country are
identified. These variables are grouped into three
Table 2 Average values of total assets, outputs and inputs by bank types, by country, 1996–2002 (Int’l $ mil)
Countries Total assets Outputs Inputs
Loans Other earning assetsa Operating expense Deposits Equity
Panel A: Conventional banks
Malaysia 9,739.8 5,675.4 3,209.7 138.4 7,299.7 758.7
Sudan – – – – – –
Bangladesh 25.0 14.6 6.7 0.5 21.9 0.8
Tunisia 3,122.7 2,100.6 528.2 49.7 2,196.6 275.0
Jordan 12,181.5 5,081.1 6,905.9 198.5 9,233.6 878.0
Lebanon 573.8 179.6 293.9 12.7 509.4 31.1
Yemenb – – – – – –
Indonesia 730.5 394.8 282.6 13.9 466.9 114.8
Bahrain 2,776.5 1,443.9 1,402.5 30.9 2,288.5 266.0
Iran – – – – – –
All countries 5,168.9 2,880.5 1,884.9 75.6 3,889.1 407.0
Panel B: Islamic banks
Malaysia 4,202.2 1,820.6 1,988.1 63.2 3,619.3 396.7
Sudan 368.9 61.2 91.9 17.7 175.5 27.0
Bangladesh 2,247.9 1,538.1 66.5 38.4 1,869.5 123.2
Tunisia 503.5 209.2 279.0 8.9 305.8 167.6
Jordan 2,500.7 1,344.0 748.8 42.6 2,169.4 164.2
Lebanon 18.2 0.6 8.9 1.7 7.1 10.4
Yemen 202.8 115.4 51.8 3.6 173.9 21.7
Indonesia 537.3 411.1 60.3 27.4 415.2 72.3
Bahrain 781.5 387.4 318.9 25.4 577.6 166.9
Iran 33,390.0 15,391.5 10,311.9 753.6 20,960.2 812.1
All countries 4,303.6 2,035.4 1,346.1 96.2 2,905.4 199.8
Panel C: All banks
Malaysia 9,460.1 5,480.7 3,148.0 134.6 7,113.8 740.4
Sudan 368.9 61.2 91.9 17.7 175.5 27.0
Bangladesh 261.5 176.7 13.1 4.5 218.5 13.8
Tunisia 2,805.2 1,871.3 498.0 44.8 1,967.5 262.0
Jordan 10,620.1 4,478.4 5,912.8 173.4 8,094.2 762.8
Lebanon 549.0 171.5 281.1 12.2 486.9 30.1
Yemen 202.8 115.4 51.8 3.6 173.9 21.7
Indonesia 702.3 397.2 250.2 15.9 459.4 108.6
Bahrain 1,926.8 993.9 941.0 28.6 1,559.8 223.8
Iran 33,390.0 15,391.5 10,311.9 753.6 20,960.2 812.1
All countries 5,021.6 2,736.6 1,793.2 79.1 3,721.6 371.7
Total assets is comprised of loans, other earning assets, fixed assets and non-earning assets
Int’l $ mil: In constant 2000 USDa Other earning asset is comprised of deposits with banks, due from central banks, non-listed securities, other short-term securities and equity
investments. For Islamic bank, the components in each item might be slightly differ given the requirement to be compliant with shariahb Yemen has both conventional and Islamic banks, but incomplete data precluded inclusion of conventional banks
Source: BankScope
J Prod Anal (2010) 34:25–43 33
123
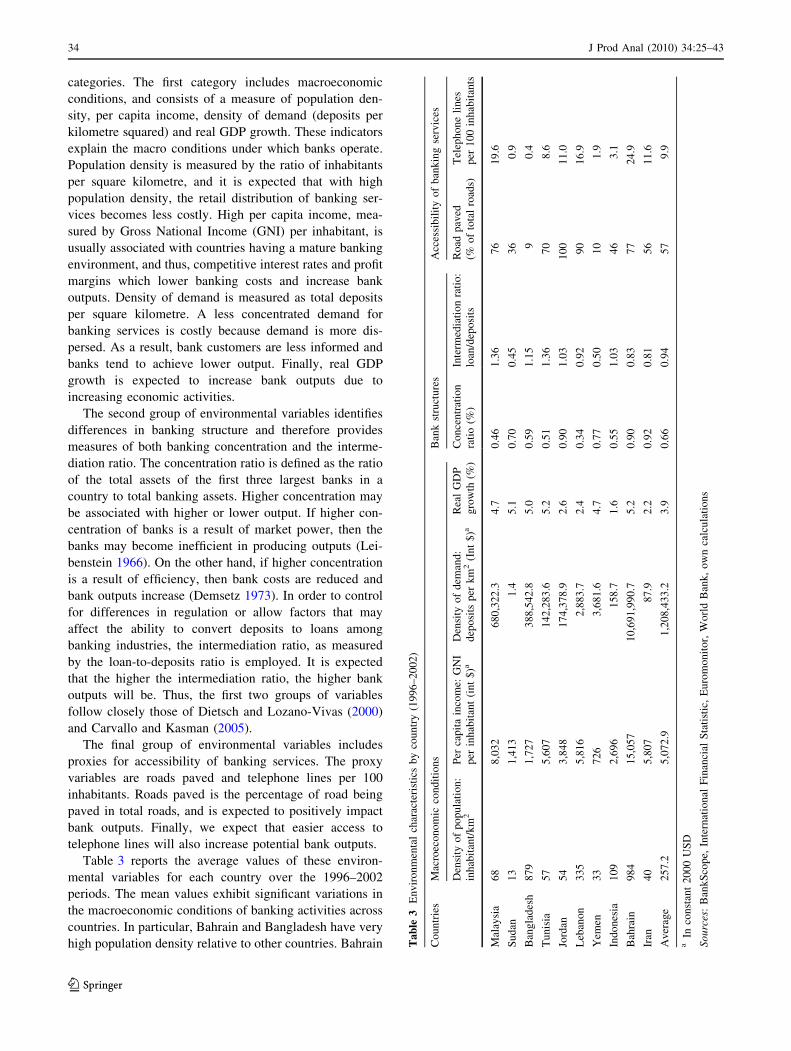
categories. The first category includes macroeconomic
conditions, and consists of a measure of population den-
sity, per capita income, density of demand (deposits per
kilometre squared) and real GDP growth. These indicators
explain the macro conditions under which banks operate.
Population density is measured by the ratio of inhabitants
per square kilometre, and it is expected that with high
population density, the retail distribution of banking ser-
vices becomes less costly. High per capita income, mea-
sured by Gross National Income (GNI) per inhabitant, is
usually associated with countries having a mature banking
environment, and thus, competitive interest rates and profit
margins which lower banking costs and increase bank
outputs. Density of demand is measured as total deposits
per square kilometre. A less concentrated demand for
banking services is costly because demand is more dis-
persed. As a result, bank customers are less informed and
banks tend to achieve lower output. Finally, real GDP
growth is expected to increase bank outputs due to
increasing economic activities.
The second group of environmental variables identifies
differences in banking structure and therefore provides
measures of both banking concentration and the interme-
diation ratio. The concentration ratio is defined as the ratio
of the total assets of the first three largest banks in a
country to total banking assets. Higher concentration may
be associated with higher or lower output. If higher con-
centration of banks is a result of market power, then the
banks may become inefficient in producing outputs (Lei-
benstein 1966). On the other hand, if higher concentration
is a result of efficiency, then bank costs are reduced and
bank outputs increase (Demsetz 1973). In order to control
for differences in regulation or allow factors that may
affect the ability to convert deposits to loans among
banking industries, the intermediation ratio, as measured
by the loan-to-deposits ratio is employed. It is expected
that the higher the intermediation ratio, the higher bank
outputs will be. Thus, the first two groups of variables
follow closely those of Dietsch and Lozano-Vivas (2000)
and Carvallo and Kasman (2005).
The final group of environmental variables includes
proxies for accessibility of banking services. The proxy
variables are roads paved and telephone lines per 100
inhabitants. Roads paved is the percentage of road being
paved in total roads, and is expected to positively impact
bank outputs. Finally, we expect that easier access to
telephone lines will also increase potential bank outputs.
Table 3 reports the average values of these environ-
mental variables for each country over the 1996–2002
periods. The mean values exhibit significant variations in
the macroeconomic conditions of banking activities across
countries. In particular, Bahrain and Bangladesh have very
high population density relative to other countries. Bahrain Ta
ble
3E
nv
iro
nm
enta
lch
arac
teri
stic
sb
yco
un
try
(19
96
–2
00
2)
Co
un
trie
sM
acro
eco
no
mic
con
dit
ion
sB
ank
stru
ctu
res
Acc
essi
bil
ity
of
ban
kin
gse
rvic
es
Den
sity
of
po
pu
lati
on
:
inh
abit
ant/
km
2P
erca
pit
ain
com
e:G
NI
per
inh
abit
ant
(in
t$
)aD
ensi
tyo
fd
eman
d:
dep
osi
tsp
erk
m2
(In
t$
)aR
eal
GD
P
gro
wth
(%)
Co
nce
ntr
atio
n
rati
o(%
)
Inte
rmed
iati
on
rati
o:
loan
/dep
osi
ts
Ro
adp
aved
(%o
fto
tal
road
s)
Tel
eph
on
eli
nes
per
10
0in
hab
itan
ts
Mal
aysi
a6
88
,03
26
80
,32
2.3
4.7
0.4
61
.36
76
19
.6
Su
dan
13
1,4
13
1.4
5.1
0.7
00
.45
36
0.9
Ban
gla
des
h8
79
1,7
27
38
8,5
42
.85
.00
.59
1.1
59
0.4
Tu
nis
ia5
75
,60
71
42
,28
3.6
5.2
0.5
11
.36
70
8.6
Jord
an5
43
,84
81
74
,37
8.9
2.6
0.9
01
.03
10
01
1.0
Leb
ano
n3
35
5,8
16
2,8
83
.72
.40
.34
0.9
29
01
6.9
Yem
en3
37
26
3,6
81
.64
.70
.77
0.5
01
01
.9
Ind
on
esia
10
92
,69
61
58
.71
.60
.55
1.0
34
63
.1
Bah
rain
98
41
5,0
57
10
,69
1,9
90
.75
.20
.90
0.8
37
72
4.9
Iran
40
5,8
07
87
.92
.20
.92
0.8
15
61
1.6
Av
erag
e2
57
.25
,07
2.9
1,2
08
,43
3.2
3.9
0.6
60
.94
57
9.9
aIn
con
stan
t2
00
0U
SD
So
urc
es:
Ban
kS
cop
e,In
tern
atio
nal
Fin
anci
alS
tati
stic
,E
uro
mo
nit
or,
Wo
rld
Ban
k,
ow
nca
lcu
lati
on
s
34 J Prod Anal (2010) 34:25–43
123
also has extremely high per capita income and deposits per
kilometre squared. In contrast, Sudan has very low popu-
lation density and very marginal deposits per kilometre
squared. Furthermore, Bahrain, Iran and Jordan have rela-
tively high concentration ratios. The banks in Sudan and
Yemen stand out as they convert only 50% of their deposits
into loans compared to 94% for the average country. This
is possibly because banks in these countries face difficul-
ties to make investments due to poor socio-economic
conditions (Breitschopf 1999; Hussein 2004). The high
cost of borrowing in Sudan and Sudanese culture of
holding cash (Hussein 2004) as well as Yemeni culture of
relying on micro-enterprise (Breitschopf 1999) may have
contributed to the low loan-to-deposits ratio in banking. In
contrast to Jordan which has all roads paved, Bangladesh
and Yemen have about 10% of roads paved. Finally, as
24.7 telephone lines per 100 inhabitants is the maximum
amount, this reflects the low development of electronic
communications in most countries included in the sample.
In sum, the descriptive statistics suggest that while
Sudan and Yemen have the worst potential operating
environments, Bahrain has the most favourable operating
environment.
The final control variable added to the distance function
specification is a dummy variable indicating whether a
bank is an Islamic bank, as illustrated in Table 1. However,
no a priori assumption is made due to mixed results in the
literature on the direction of the influences of Islamic
banking on the relationship between Islamic banking and
bank outputs (e.g., Al-Jarrah and Molyneux 2005; El-
Gamal and Inanoglu 2005; Mokhtar et al. 2006). We once
again emphasize that this modelling approach maintains
the assumption that adherence to shariah causes a shift in
the level of efficient potential output obtainable from given
inputs, rather than assuming that observed output differ-
ences between conventional and Islamic banks is evidence
of differences in efficiency. As argued in Sect. 2 we have
adopted this approach because we believed that the
restrictions imposed by shariah compliance require Islamic
banks to effectively operate in an environment that is not
equivalent to that of conventional banks. However, we can
now further note that the inclusion of the Islamic dummy
variable in the inefficiency specification in our final model
reported in Table 4, can be rejected as highly statistically
insignificant.11 This therefore provides strong statistical
evidence in favour of our approach to directly controlling
for the impact of Islamic banking on bank outputs in the
distance function, rather than treating Islamic banking as a
determinant of inefficiency. We therefore, turn to our
model results, which provide estimates of the impact of
Islamic banking on the potential output achievable by
banks.
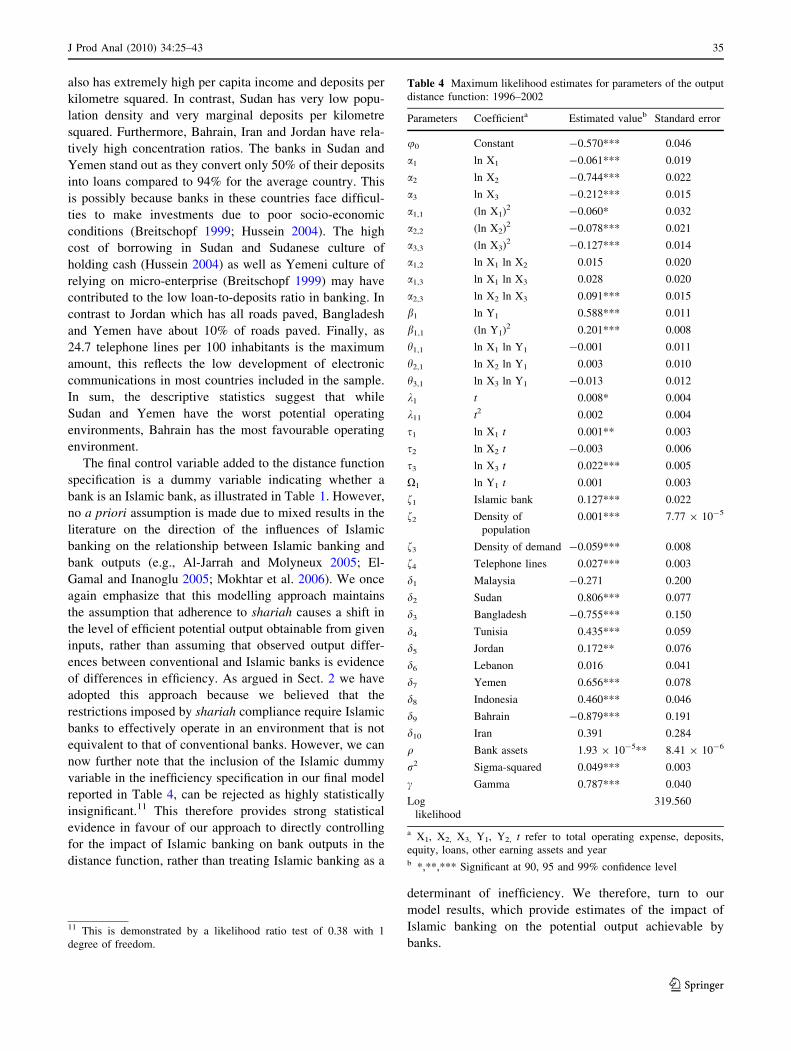
Table 4 Maximum likelihood estimates for parameters of the output
distance function: 1996–2002
Parameters Coefficienta Estimated valueb Standard error
u0 Constant -0.570*** 0.046
a1 ln X1 -0.061*** 0.019
a2 ln X2 -0.744*** 0.022
a3 ln X3 -0.212*** 0.015
a1,1 (ln X1)2 -0.060* 0.032
a2,2 (ln X2)2 -0.078*** 0.021
a3,3 (ln X3)2 -0.127*** 0.014
a1,2 ln X1 ln X2 0.015 0.020
a1,3 ln X1 ln X3 0.028 0.020
a2,3 ln X2 ln X3 0.091*** 0.015
b1 ln Y1 0.588*** 0.011
b1,1 (ln Y1)2 0.201*** 0.008
h1,1 ln X1 ln Y1 -0.001 0.011
h2,1 ln X2 ln Y1 0.003 0.010
h3,1 ln X3 ln Y1 -0.013 0.012
k1 t 0.008* 0.004
k11 t2 0.002 0.004
s1 ln X1 t 0.001** 0.003
s2 ln X2 t -0.003 0.006
s3 ln X3 t 0.022*** 0.005
X1 ln Y1 t 0.001 0.003
f1 Islamic bank 0.127*** 0.022
f2 Density of
population
0.001*** 7.77 9 10-5
f3 Density of demand -0.059*** 0.008
f4 Telephone lines 0.027*** 0.003
d1 Malaysia -0.271 0.200
d2 Sudan 0.806*** 0.077
d3 Bangladesh -0.755*** 0.150
d4 Tunisia 0.435*** 0.059
d5 Jordan 0.172** 0.076
d6 Lebanon 0.016 0.041
d7 Yemen 0.656*** 0.078
d8 Indonesia 0.460*** 0.046
d9 Bahrain -0.879*** 0.191
d10 Iran 0.391 0.284
q Bank assets 1.93 9 10-5** 8.41 9 10-6
r2 Sigma-squared 0.049*** 0.003
c Gamma 0.787*** 0.040
Log
likelihood
319.560
a X1, X2, X3, Y1, Y2, t refer to total operating expense, deposits,
equity, loans, other earning assets and yearb *,**,*** Significant at 90, 95 and 99% confidence level
11 This is demonstrated by a likelihood ratio test of 0.38 with 1
degree of freedom.
J Prod Anal (2010) 34:25–43 35
123
5 Results
5.1 The output distance function estimates
The estimated output distance function parameters are
reported in Table 4.12 Recalling that, c ¼ r2u
�r2
v þ r2u; the
highly significant estimate of 0.787 for this parameter,
suggests that the estimated deviation from the frontier is
mainly due to inefficiency. Besides the statistically sig-
nificant Islamic bank dummy variable, the only significant
country-specific environmental variables are density of
population, density of demand, and telephone lines per 100
inhabitants. Many country-specific environmental variables
become insignificant when country dummy variables are
included in the inefficiency specification, thereby sug-
gesting that these factors serve as proxies for cross country
differences in bank efficiency, rather than legitimate
determinants of potential output.13
The Islamic bank dummy (Z1) has a positive coefficient,
indicating that full-fledged Islamic banks are found to have
potential efficient outputs that ceteris paribus are 12.7%
lower than for other banks. Therefore the results suggest a
systematic reduction in potential output that can be
attributed to Islamic banking, which may result from
constrained opportunities in terms of investments as a
result of shariah compliance. Given our discussion in Sect.
2 and at the end of Sect. 4, this should not be considered as
evidence of managerial inefficiency but should be consid-
ered as evidence of differences in unobserved operating
characteristics and/or applicable technology, which result
in lower potential output for Islamic banks for given input
usage. Moreover, because the estimated model effectively
assumes that the reduced outputs associated with Islamic
banking result from legitimate differences in operating
environment that reduce potential output, the efficiency
scores reported below for Islamic banks must be carefully
interpreted as they net out this impact.
In contrast to expectations, the sign of the coefficient of
the population density variable (Z2) is positive indicating
that, ceteris paribus countries with high population density
have lower bank output.14 A possible explanation for this
finding is that in non-price bank competition, banks may
open branches in large cities, in which real estate and
labour costs are high, for strategic reasons, and thereby
reduce their potential outputs (Dietsch and Lozano-Vivas
2000). As expected, lower density of demand (Z3), tends to
increase expenses thereby, limiting potential output. This
finding of reduced potential output is consistent with
(Dietsch and Lozano-Vivas 2000) and (Carvallo and
Kasman 2005), which found that lower density of demand
raises bank costs, and hence reduces efficiency. Finally, in
contrast to our a priori assumption, the positive sign of
telephone lines per 100 inhabitants’ variable (Z4) indicates
that greater availability of telephone lines decreases bank
outputs. This is possibly because most countries in the
sample are developing economies,15 in which electronic
communications including phone- and internet-banking are
not fully developed. Hence, telephone usage may raise
relative bank costs within the sample of countries.
We next turn to the inefficiency specification. The
positive and statistically significant estimate for q implies
that, ceteris paribus, larger banks have inefficiencies drawn
from distributions where higher estimated inefficiency is
more likely. Thus, our results suggest that inefficiency
increases with bank size.16 Table 4 also demonstrates that
the country dummy variables illustrate systematic and
significant differences in the relative inefficiency of banks
across countries. Thus, for example dMalaysia, dLebanon, dIran
are found to be insignificantly different from zero, thereby
suggesting that inefficiencies for Malaysian, Lebanese and
Iranian banks are drawn from a standard half-normal dis-
tribution. However, banks in Bangladesh and Bahrain17 are
found to have df \ 0 and hence, inefficiency in these
countries is estimated as being drawn from truncated nor-
mal distributions with lower expected inefficiency than in a
half normal distribution. In contrast, Sudan, Tunisia, Jor-
dan, Yemen, and Indonesia all have df [ 0, and hence are
estimated to have higher expected inefficiency than that
drawn from a half-normal distribution, with given variance
r2u: Furthermore, Table 4 suggests that while Bahraini
banks have on average the best efficiency, Sudanese banks
12 We note that a log likelihood ratio test for the joint significance of
the 6 parameters related to equity is 17.98, thus we can reject the null
hypothesis that these parameters are jointly insignificant at the 99%
confidence level.13 Bank-specific loan quality and merger dummy variables were also
found to be statistically insignificant when they were included in the
distance function.14 The finding is consistent with cost function studies in which higher
population density contributes to an increase in banking costs in
France and Spain (Dietsch and Lozano-Vivas 2000), and Latin
American and Caribbean countries (Carvallo and Kasman 2005).
15 All countries in the sample are developing economies except for
Bahrain (World Bank 2007).16 The exclusion of bank size from the inefficiency specification can
be rejected given a likelihood ratio test of 62.90 with 1 degree of
freedom. In the rejected restricted model, Iranian banks are found to
have the lowest estimated inefficiency, which is consistent with
previous international studies that do not control for bank size (e.g.,
Brown 2003; Brown and Skully 2003). This therefore suggests that
our approach of controlling for both asset size and countries in the
inefficiency specification is necessary to better measure cross county
differences in inefficiency.17 Al-Jarrah and Molyneux (2005) also found that Bahraini banks are
relatively efficient when compared to Jordanian banks.
36 J Prod Anal (2010) 34:25–43
123
experience the worst efficiency.18 The df parameters
therefore suggest a clear hierarchy of estimated efficiency
across countries, with higher df values indicating greater
inefficiency.
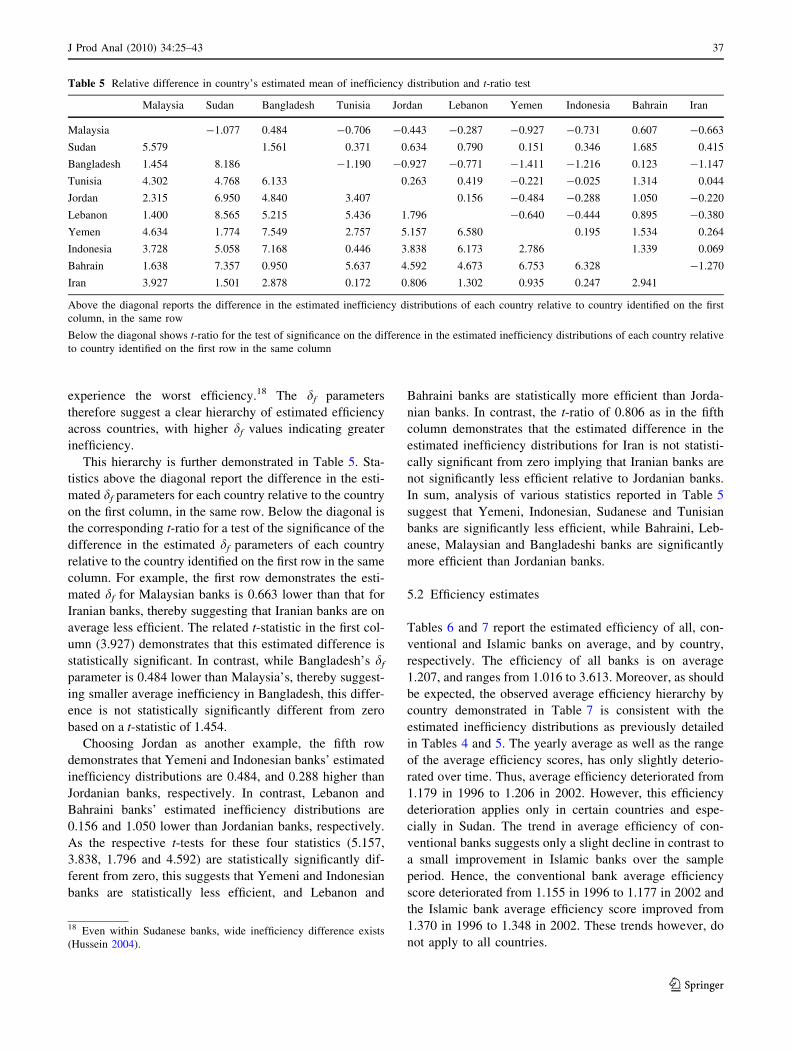
This hierarchy is further demonstrated in Table 5. Sta-
tistics above the diagonal report the difference in the esti-
mated df parameters for each country relative to the country
on the first column, in the same row. Below the diagonal is
the corresponding t-ratio for a test of the significance of the
difference in the estimated df parameters of each country
relative to the country identified on the first row in the same
column. For example, the first row demonstrates the esti-
mated df for Malaysian banks is 0.663 lower than that for
Iranian banks, thereby suggesting that Iranian banks are on
average less efficient. The related t-statistic in the first col-
umn (3.927) demonstrates that this estimated difference is
statistically significant. In contrast, while Bangladesh’s df
parameter is 0.484 lower than Malaysia’s, thereby suggest-
ing smaller average inefficiency in Bangladesh, this differ-
ence is not statistically significantly different from zero
based on a t-statistic of 1.454.
Choosing Jordan as another example, the fifth row
demonstrates that Yemeni and Indonesian banks’ estimated
inefficiency distributions are 0.484, and 0.288 higher than
Jordanian banks, respectively. In contrast, Lebanon and
Bahraini banks’ estimated inefficiency distributions are
0.156 and 1.050 lower than Jordanian banks, respectively.
As the respective t-tests for these four statistics (5.157,
3.838, 1.796 and 4.592) are statistically significantly dif-
ferent from zero, this suggests that Yemeni and Indonesian
banks are statistically less efficient, and Lebanon and
Bahraini banks are statistically more efficient than Jorda-
nian banks. In contrast, the t-ratio of 0.806 as in the fifth
column demonstrates that the estimated difference in the
estimated inefficiency distributions for Iran is not statisti-
cally significant from zero implying that Iranian banks are
not significantly less efficient relative to Jordanian banks.
In sum, analysis of various statistics reported in Table 5
suggest that Yemeni, Indonesian, Sudanese and Tunisian
banks are significantly less efficient, while Bahraini, Leb-
anese, Malaysian and Bangladeshi banks are significantly
more efficient than Jordanian banks.
5.2 Efficiency estimates
Tables 6 and 7 report the estimated efficiency of all, con-
ventional and Islamic banks on average, and by country,
respectively. The efficiency of all banks is on average
1.207, and ranges from 1.016 to 3.613. Moreover, as should
be expected, the observed average efficiency hierarchy by
country demonstrated in Table 7 is consistent with the
estimated inefficiency distributions as previously detailed
in Tables 4 and 5. The yearly average as well as the range
of the average efficiency scores, has only slightly deterio-
rated over time. Thus, average efficiency deteriorated from
1.179 in 1996 to 1.206 in 2002. However, this efficiency
deterioration applies only in certain countries and espe-
cially in Sudan. The trend in average efficiency of con-
ventional banks suggests only a slight decline in contrast to
a small improvement in Islamic banks over the sample
period. Hence, the conventional bank average efficiency
score deteriorated from 1.155 in 1996 to 1.177 in 2002 and
the Islamic bank average efficiency score improved from
1.370 in 1996 to 1.348 in 2002. These trends however, do
not apply to all countries.
Table 5 Relative difference in country’s estimated mean of inefficiency distribution and t-ratio test
Malaysia Sudan Bangladesh Tunisia Jordan Lebanon Yemen Indonesia Bahrain Iran
Malaysia -1.077 0.484 -0.706 -0.443 -0.287 -0.927 -0.731 0.607 -0.663
Sudan 5.579 1.561 0.371 0.634 0.790 0.151 0.346 1.685 0.415
Bangladesh 1.454 8.186 -1.190 -0.927 -0.771 -1.411 -1.216 0.123 -1.147
Tunisia 4.302 4.768 6.133 0.263 0.419 -0.221 -0.025 1.314 0.044
Jordan 2.315 6.950 4.840 3.407 0.156 -0.484 -0.288 1.050 -0.220
Lebanon 1.400 8.565 5.215 5.436 1.796 -0.640 -0.444 0.895 -0.380
Yemen 4.634 1.774 7.549 2.757 5.157 6.580 0.195 1.534 0.264
Indonesia 3.728 5.058 7.168 0.446 3.838 6.173 2.786 1.339 0.069
Bahrain 1.638 7.357 0.950 5.637 4.592 4.673 6.753 6.328 -1.270
Iran 3.927 1.501 2.878 0.172 0.806 1.302 0.935 0.247 2.941
Above the diagonal reports the difference in the estimated inefficiency distributions of each country relative to country identified on the first
column, in the same row
Below the diagonal shows t-ratio for the test of significance on the difference in the estimated inefficiency distributions of each country relative
to country identified on the first row in the same column
18 Even within Sudanese banks, wide inefficiency difference exists
(Hussein 2004).
J Prod Anal (2010) 34:25–43 37
123
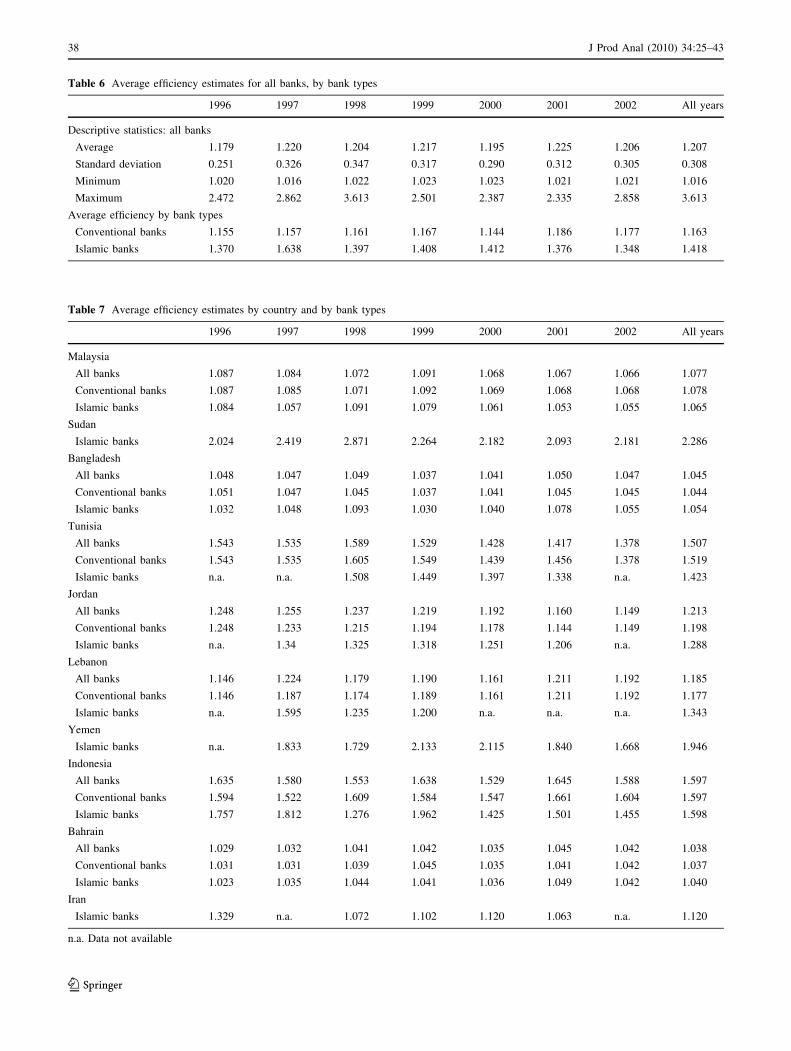
Table 6 Average efficiency estimates for all banks, by bank types
1996 1997 1998 1999 2000 2001 2002 All years
Descriptive statistics: all banks
Average 1.179 1.220 1.204 1.217 1.195 1.225 1.206 1.207
Standard deviation 0.251 0.326 0.347 0.317 0.290 0.312 0.305 0.308
Minimum 1.020 1.016 1.022 1.023 1.023 1.021 1.021 1.016
Maximum 2.472 2.862 3.613 2.501 2.387 2.335 2.858 3.613
Average efficiency by bank types
Conventional banks 1.155 1.157 1.161 1.167 1.144 1.186 1.177 1.163
Islamic banks 1.370 1.638 1.397 1.408 1.412 1.376 1.348 1.418
Table 7 Average efficiency estimates by country and by bank types
1996 1997 1998 1999 2000 2001 2002 All years
Malaysia
All banks 1.087 1.084 1.072 1.091 1.068 1.067 1.066 1.077
Conventional banks 1.087 1.085 1.071 1.092 1.069 1.068 1.068 1.078
Islamic banks 1.084 1.057 1.091 1.079 1.061 1.053 1.055 1.065
Sudan
Islamic banks 2.024 2.419 2.871 2.264 2.182 2.093 2.181 2.286
Bangladesh
All banks 1.048 1.047 1.049 1.037 1.041 1.050 1.047 1.045
Conventional banks 1.051 1.047 1.045 1.037 1.041 1.045 1.045 1.044
Islamic banks 1.032 1.048 1.093 1.030 1.040 1.078 1.055 1.054
Tunisia
All banks 1.543 1.535 1.589 1.529 1.428 1.417 1.378 1.507
Conventional banks 1.543 1.535 1.605 1.549 1.439 1.456 1.378 1.519
Islamic banks n.a. n.a. 1.508 1.449 1.397 1.338 n.a. 1.423
Jordan
All banks 1.248 1.255 1.237 1.219 1.192 1.160 1.149 1.213
Conventional banks 1.248 1.233 1.215 1.194 1.178 1.144 1.149 1.198
Islamic banks n.a. 1.34 1.325 1.318 1.251 1.206 n.a. 1.288
Lebanon
All banks 1.146 1.224 1.179 1.190 1.161 1.211 1.192 1.185
Conventional banks 1.146 1.187 1.174 1.189 1.161 1.211 1.192 1.177
Islamic banks n.a. 1.595 1.235 1.200 n.a. n.a. n.a. 1.343
Yemen
Islamic banks n.a. 1.833 1.729 2.133 2.115 1.840 1.668 1.946
Indonesia
All banks 1.635 1.580 1.553 1.638 1.529 1.645 1.588 1.597
Conventional banks 1.594 1.522 1.609 1.584 1.547 1.661 1.604 1.597
Islamic banks 1.757 1.812 1.276 1.962 1.425 1.501 1.455 1.598
Bahrain
All banks 1.029 1.032 1.041 1.042 1.035 1.045 1.042 1.038
Conventional banks 1.031 1.031 1.039 1.045 1.035 1.041 1.042 1.037
Islamic banks 1.023 1.035 1.044 1.041 1.036 1.049 1.042 1.040
Iran
Islamic banks 1.329 n.a. 1.072 1.102 1.120 1.063 n.a. 1.120
n.a. Data not available
38 J Prod Anal (2010) 34:25–43
123
Across all countries, the average conventional and
Islamic bank efficiency measures are 1.163 and 1.418,
respectively. This suggests that on average, even after
having netted out the 12.7% lower potential output asso-
ciated with Islamic banking, potential output of conven-
tional banks is only 16.3% higher than actual output, while
for Islamic banks this difference is 41.8%. In contrast to
this aggregate result, Table 7 suggests little variation in
estimated efficiency between Islamic and conventional
banks within most countries, although Table 7 does sug-
gests that, on average, Islamic banks in Tunisia have
moderately better efficiency performance than conven-
tional banks, while the reverse is true in Jordan and Leb-
anon. However, it is clear that the substantially lower
cross-country average estimated efficiency for Islamic
banks relative to conventional banks reported in Table 6
can be primarily attributed to country effects. In particular,
Sudan and Yemen, which have only Islamic banks in the
sample, have extremely low average estimated efficiency,
even after netting out the impact of the statistically sig-
nificant environmental characteristics and Islamic banking
dummy variable. Put differently, while the results do
clearly demonstrate a significant 12.7% decrease in
potential output attributable to Islamic banking, the further
particularly poor performance of Islamic banks in Sudan
and Yemen, which drives the overall average for Islamic
banks, must be attributed to relatively poor country specific
banking inefficiency in these countries.
We once again emphasize that because the methodology
assumes that differences in operating environment influ-
ence potential output rather than efficiency, the resulting
efficiency estimates should in principle be interpreted as
allowing for legitimate difference in potential output
associated with compliance with shariah. Therefore, as
argued by (Coelli et al. 1999), as this approach nets out the
impact of operating environments, it provides a measure of
managerial efficiency. Thus, based on this argument, Isla-
mic banks are, on average, more efficient than conventional
banks in Malaysia and Tunisia, but less efficient in all other
countries where both Islamic and conventional banks
operate. However, this interpretation is dependent on the
assumption that all of the reduced output of Islamic banks
is attributable to differences in operating environment and/
or applicable technology relative to conventional banks.
These results can be compared to the previous literature
that does not allow for exogenous variables in either the
frontier or as an influence on inefficiency: Islamic banks are
found to be no different from conventional banks in
Malaysia (Abdul-Majid et al. 2005; Mokhtar et al. 2006),
and equally if not more cost efficient in Turkey (El-Gamal
and Inanoglu 2005). After allowing for bank types including
Islamic, conventional, commercial, and investment banks,
country dummies, assets, liquidity, concentration ratios, and
market shares as direct influences on inefficiency in Arabian
countries, Islamic banks are found to be more cost efficient
(Al-Jarrah and Molyneux 2005). Controlling for loan
quality and capital in the function and modelling for bank
type, country dummy, assets, liquidity, concentration ratio,
and market share to directly influence inefficiency effects in
Arabian countries using a profit function, Islamic banks are
also more efficient (Al-Jarrah and Molyneux 2005). Al-
shammari (2003) also found relatively efficient Islamic
banks in GCC countries when loan quality and capital are
included in the function, and bank type and country dum-
mies are assumed to directly influence inefficiency. The
differences in results may potentially be due to different
environmental variables in the function, different input and
output specifications, and cross-country differences in
Islamic banking that may influence relative efficiency.19
5.3 Returns to scale
Tables 8 and 9 provide firm specific returns to scale esti-
mates for all, conventional and Islamic banks on average,
and by country. Estimated returns to scale averages 1.027
for all banks, ranges between 0.961 and 1.107, and is
consistent with the previous literature (e.g., Abd Karim
2001; Cavallo and Rossi 2001; Carvallo and Kasman
2005). On average, these estimated returns to scale have
declined from 1.040 in 1996 to 1.013 in 2002. The average
estimated returns to scale for conventional banks is lower
(1.024) than for Islamic banks (1.042) and this applies to
all countries except for Malaysia, Tunisia and Jordan. This
suggests that generally a larger scale of operation will be
useful if Islamic banks wish to eliminate any disadvantages
attributable to their relatively small size. However, there is
little evidence of substantial returns to scale to be gained,
nor is there substantial difference in potential returns to
scale between conventional and Islamic banks.20 The trend
for both conventional and Islamic banks also suggests a
decline in average returns to scale over the sample period.
Hence, average returns to scale for conventional banks
declined from 1.038 in 1996 to 1.011 in 2002 and Islamic
bank average returns to scale declined from 1.053 in 1996
to 1.026 in 2002. Compared to other countries, Sudanese
banks exhibits relatively strong returns to scale, which is
consistent with the very small bank size in this country as
demonstrated in Table 2. This is consistent with Kasman
19 For example, Islamic banks in countries other than Malaysia may
have a higher percentage of equity-based financing which has been
controlled for in this study.20 Alshammari (2003) found almost constant returns to scale in banks
(including Islamic banks) in GCC countries and no difference across
bank types. However, Yudistira (2004) found that small and medium-
sized Islamic banks in most countries have diseconomies of scale.
J Prod Anal (2010) 34:25–43 39
123
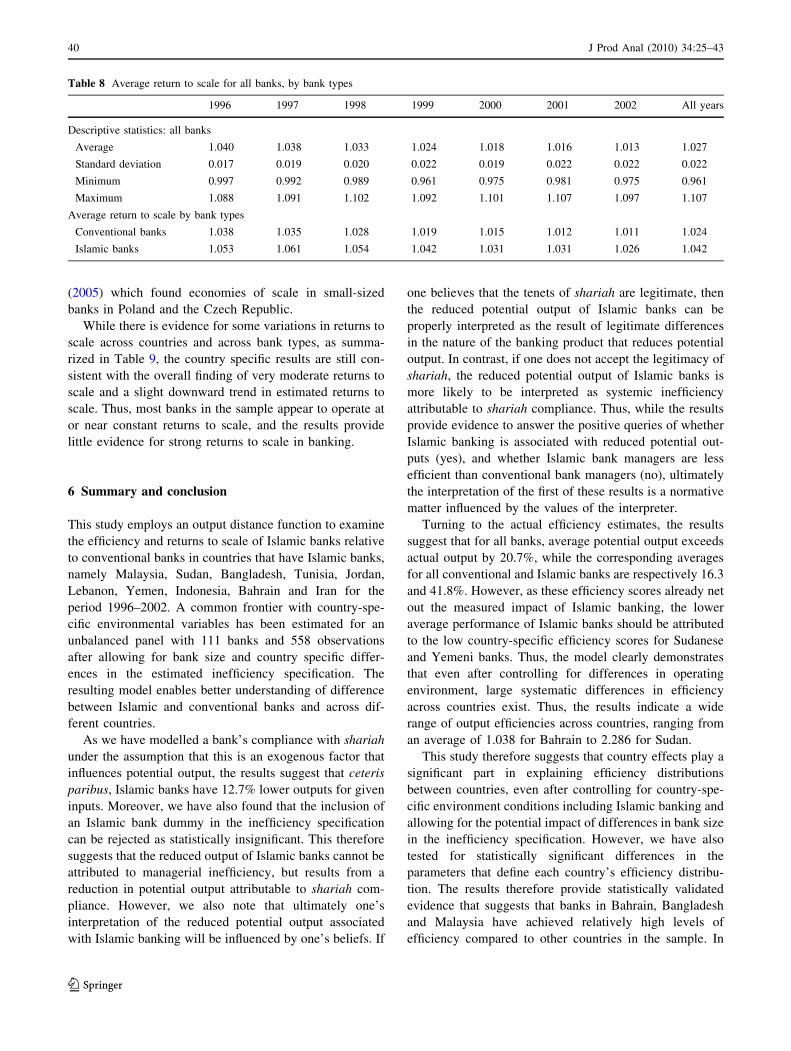
(2005) which found economies of scale in small-sized
banks in Poland and the Czech Republic.
While there is evidence for some variations in returns to
scale across countries and across bank types, as summa-
rized in Table 9, the country specific results are still con-
sistent with the overall finding of very moderate returns to
scale and a slight downward trend in estimated returns to
scale. Thus, most banks in the sample appear to operate at
or near constant returns to scale, and the results provide
little evidence for strong returns to scale in banking.
6 Summary and conclusion
This study employs an output distance function to examine
the efficiency and returns to scale of Islamic banks relative
to conventional banks in countries that have Islamic banks,
namely Malaysia, Sudan, Bangladesh, Tunisia, Jordan,
Lebanon, Yemen, Indonesia, Bahrain and Iran for the
period 1996–2002. A common frontier with country-spe-
cific environmental variables has been estimated for an
unbalanced panel with 111 banks and 558 observations
after allowing for bank size and country specific differ-
ences in the estimated inefficiency specification. The
resulting model enables better understanding of difference
between Islamic and conventional banks and across dif-
ferent countries.
As we have modelled a bank’s compliance with shariah
under the assumption that this is an exogenous factor that
influences potential output, the results suggest that ceteris
paribus, Islamic banks have 12.7% lower outputs for given
inputs. Moreover, we have also found that the inclusion of
an Islamic bank dummy in the inefficiency specification
can be rejected as statistically insignificant. This therefore
suggests that the reduced output of Islamic banks cannot be
attributed to managerial inefficiency, but results from a
reduction in potential output attributable to shariah com-
pliance. However, we also note that ultimately one’s
interpretation of the reduced potential output associated
with Islamic banking will be influenced by one’s beliefs. If
one believes that the tenets of shariah are legitimate, then
the reduced potential output of Islamic banks can be
properly interpreted as the result of legitimate differences
in the nature of the banking product that reduces potential
output. In contrast, if one does not accept the legitimacy of
shariah, the reduced potential output of Islamic banks is
more likely to be interpreted as systemic inefficiency
attributable to shariah compliance. Thus, while the results
provide evidence to answer the positive queries of whether
Islamic banking is associated with reduced potential out-
puts (yes), and whether Islamic bank managers are less
efficient than conventional bank managers (no), ultimately
the interpretation of the first of these results is a normative
matter influenced by the values of the interpreter.
Turning to the actual efficiency estimates, the results
suggest that for all banks, average potential output exceeds
actual output by 20.7%, while the corresponding averages
for all conventional and Islamic banks are respectively 16.3
and 41.8%. However, as these efficiency scores already net
out the measured impact of Islamic banking, the lower
average performance of Islamic banks should be attributed
to the low country-specific efficiency scores for Sudanese
and Yemeni banks. Thus, the model clearly demonstrates
that even after controlling for differences in operating
environment, large systematic differences in efficiency
across countries exist. Thus, the results indicate a wide
range of output efficiencies across countries, ranging from
an average of 1.038 for Bahrain to 2.286 for Sudan.
This study therefore suggests that country effects play a
significant part in explaining efficiency distributions
between countries, even after controlling for country-spe-
cific environment conditions including Islamic banking and
allowing for the potential impact of differences in bank size
in the inefficiency specification. However, we have also
tested for statistically significant differences in the
parameters that define each country’s efficiency distribu-
tion. The results therefore provide statistically validated
evidence that suggests that banks in Bahrain, Bangladesh
and Malaysia have achieved relatively high levels of
efficiency compared to other countries in the sample. In
Table 8 Average return to scale for all banks, by bank types
1996 1997 1998 1999 2000 2001 2002 All years
Descriptive statistics: all banks
Average 1.040 1.038 1.033 1.024 1.018 1.016 1.013 1.027
Standard deviation 0.017 0.019 0.020 0.022 0.019 0.022 0.022 0.022
Minimum 0.997 0.992 0.989 0.961 0.975 0.981 0.975 0.961
Maximum 1.088 1.091 1.102 1.092 1.101 1.107 1.097 1.107
Average return to scale by bank types
Conventional banks 1.038 1.035 1.028 1.019 1.015 1.012 1.011 1.024
Islamic banks 1.053 1.061 1.054 1.042 1.031 1.031 1.026 1.042
40 J Prod Anal (2010) 34:25–43
123
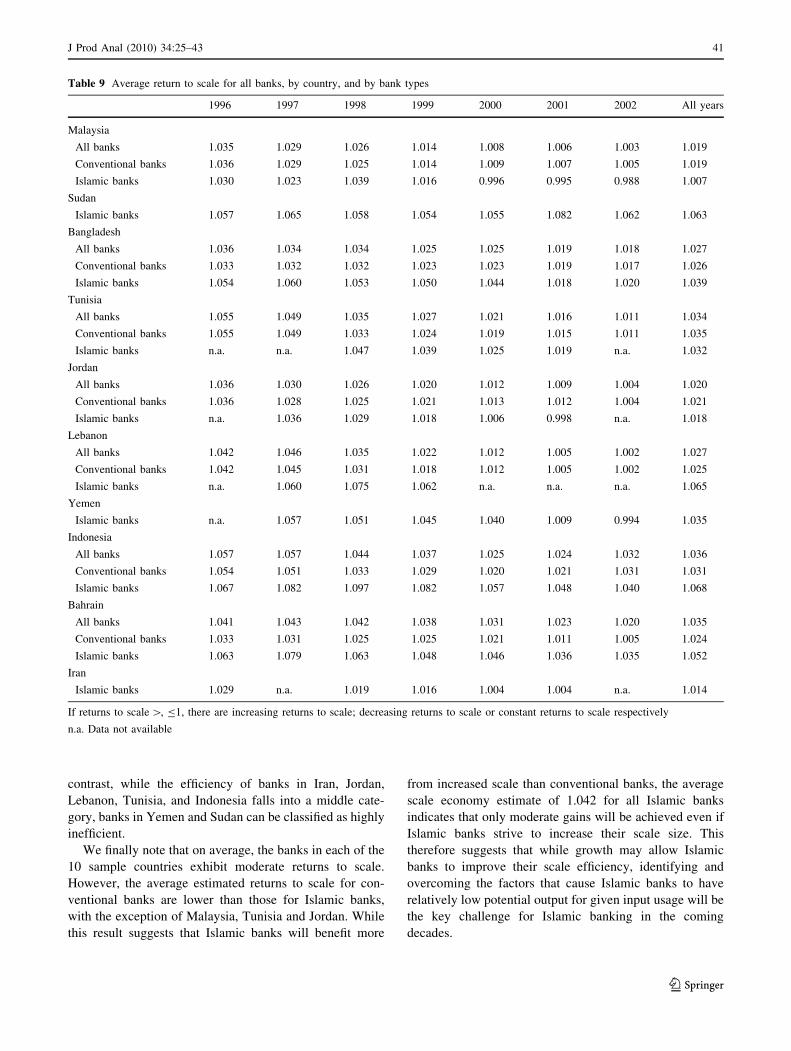
contrast, while the efficiency of banks in Iran, Jordan,
Lebanon, Tunisia, and Indonesia falls into a middle cate-
gory, banks in Yemen and Sudan can be classified as highly
inefficient.
We finally note that on average, the banks in each of the
10 sample countries exhibit moderate returns to scale.
However, the average estimated returns to scale for con-
ventional banks are lower than those for Islamic banks,
with the exception of Malaysia, Tunisia and Jordan. While
this result suggests that Islamic banks will benefit more
from increased scale than conventional banks, the average
scale economy estimate of 1.042 for all Islamic banks
indicates that only moderate gains will be achieved even if
Islamic banks strive to increase their scale size. This
therefore suggests that while growth may allow Islamic
banks to improve their scale efficiency, identifying and
overcoming the factors that cause Islamic banks to have
relatively low potential output for given input usage will be
the key challenge for Islamic banking in the coming
decades.
Table 9 Average return to scale for all banks, by country, and by bank types
1996 1997 1998 1999 2000 2001 2002 All years
Malaysia
All banks 1.035 1.029 1.026 1.014 1.008 1.006 1.003 1.019
Conventional banks 1.036 1.029 1.025 1.014 1.009 1.007 1.005 1.019
Islamic banks 1.030 1.023 1.039 1.016 0.996 0.995 0.988 1.007
Sudan
Islamic banks 1.057 1.065 1.058 1.054 1.055 1.082 1.062 1.063
Bangladesh
All banks 1.036 1.034 1.034 1.025 1.025 1.019 1.018 1.027
Conventional banks 1.033 1.032 1.032 1.023 1.023 1.019 1.017 1.026
Islamic banks 1.054 1.060 1.053 1.050 1.044 1.018 1.020 1.039
Tunisia
All banks 1.055 1.049 1.035 1.027 1.021 1.016 1.011 1.034
Conventional banks 1.055 1.049 1.033 1.024 1.019 1.015 1.011 1.035
Islamic banks n.a. n.a. 1.047 1.039 1.025 1.019 n.a. 1.032
Jordan
All banks 1.036 1.030 1.026 1.020 1.012 1.009 1.004 1.020
Conventional banks 1.036 1.028 1.025 1.021 1.013 1.012 1.004 1.021
Islamic banks n.a. 1.036 1.029 1.018 1.006 0.998 n.a. 1.018
Lebanon
All banks 1.042 1.046 1.035 1.022 1.012 1.005 1.002 1.027
Conventional banks 1.042 1.045 1.031 1.018 1.012 1.005 1.002 1.025
Islamic banks n.a. 1.060 1.075 1.062 n.a. n.a. n.a. 1.065
Yemen
Islamic banks n.a. 1.057 1.051 1.045 1.040 1.009 0.994 1.035
Indonesia
All banks 1.057 1.057 1.044 1.037 1.025 1.024 1.032 1.036
Conventional banks 1.054 1.051 1.033 1.029 1.020 1.021 1.031 1.031
Islamic banks 1.067 1.082 1.097 1.082 1.057 1.048 1.040 1.068
Bahrain
All banks 1.041 1.043 1.042 1.038 1.031 1.023 1.020 1.035
Conventional banks 1.033 1.031 1.025 1.025 1.021 1.011 1.005 1.024
Islamic banks 1.063 1.079 1.063 1.048 1.046 1.036 1.035 1.052
Iran
Islamic banks 1.029 n.a. 1.019 1.016 1.004 1.004 n.a. 1.014
If returns to scale [, B1, there are increasing returns to scale; decreasing returns to scale or constant returns to scale respectively
n.a. Data not available
J Prod Anal (2010) 34:25–43 41
123
References
Abd Karim MZ (2001) Comparative bank efficiency across selected
ASEAN countries. ASEAN Econ Bull 18(3):289–304
Abdul-Majid M, Mohammed Nor NG, Said FF (2005) Efficiency of
Islamic banks in Malaysia. In: Iqbal M, Ahmad A (eds) Islamic
finance and economic development. Palgrave Macmillan, New
York, pp 94–115
Abdul-Majid M, Saal DS, Battisti G (2008) The efficiency and
productivity of malaysian banks 1996–2002: an output distance
function approach. 21st Australasian Finance and Banking
Conference: 2012–49. Australian School of Business, The
University of New South Wales, Sydney
Abdul-Majid M, Saal DS, Battisti G (2009) The impact of Islamic
banking on the cost efficiency and productivity change of
Malaysian commercial banks. Appl Econ 99999:1
Al-Jarrah I, Molyneux P (2005) Efficiency in Arabian banking. In:
Iqbal M, Wilson R (eds) Islamic perspectives on wealth creation.
Edinburgh University Press, Edinburgh, pp 97–117
Allen L, Rai A (1996) Operational efficiency in banking: an
international comparison. J Bank Finance 20(4):655–672
Alshammari SH (2003) Structure-conduct-performance and efficiency
in gulf co-operation council. PhD thesis, University of Wales,
Bangor
Altunbas Y, Gardener EPM, Molyneux P, Moore B (2001) Efficiency
in European banking. Eur Econ Rev 45(10):1931–1955
Bashir A-HM (1999) Risk and profitability measures in Islamic
banks: the case of two sudanese banks. Islam Econ Stud 6(2):
1–24
Battese GE, Coelli TJ (1995) A model for technical inefficiency
effects in a stochastic frontier production function for panel data.
Empir Econ 20(2):325–332
Berger AN, Mester LJ (1997) Inside the black box: what explains
differences in the efficiencies of financial institutions? J Bank
Finance 21:895–947
Bonaccorsi di Patti E, Hardy DC (2005) Financial sector liberaliza-
tion, bank privatization, and efficiency: evidence from Pakistan.
J Bank Finance 29(8–9):2381–2406
Bonin JP, Hasan I, Wachtel P (2005) Bank performance, efficiency
and ownership in transition countries. J Bank Finance 29(1):
31–53
Bos JWB, Schmiedel H (2007) Is there a single frontier in a single
European banking market? J Bank Finance 31(7):2081–2102
Boubakri N, Cosset J-C, Fischer K, Guedhami O (2005) Privatization
and bank performance in developing countries. J Bank Finance
29(8–9):2015–2041
Breitschopf B (1999) Financial sector study: Yemen. Vol 2007.
Deutsche Gesellschaft fur: Eschborn. http://www.gtz.de/de/
dokumente/en_financial_sector_Yemen_Breitschopf.pdf.
Brown K (2003) Islamic banking comparative analysis. Arab Bank
Rev 5(2):43–50
Brown K, Skully M (2003) A comparative analysis of Islamic bank
efficiency. International Banking Conference, Prato, Italy
Carbo Valverde S, Humphrey DB, Lopez del Paso R (2007) Do cross-
country differences in bank efficiency support a policy of
‘‘National champions’’? J Bank Finance 31(7):2173–2188
Carbo S, Gardener EPM, Williams J (2003) A note on technical
change in banking: the case of European savings banks. Appl
Econ 35(6):705–719
Carvallo O, Kasman A (2005) Cost efficiency in the latin American
and caribbean banking systems. J Int Financ Mark Inst Money
15(1):55–72
Cavallo L, Rossi SPS (2001) Scale and scope economies in the
European banking systems. J Multinatl Financ Manag 11(4–5):
515–531
Central Bank of Malaysia (1999) The central bank and the financial
system in Malaysia: a decade of change 1989–1999. Bank
Negara Malaysia, Kuala Lumpur
Chaffai ME, Dietsch M, Lozano-Vivas A (2001) Technological
and environmental differences in the European banking industry.
J Financ Serv Res 19(2, 3):147
Clark JA (1996) Economic cost, scale efficiency, and competitive
viability in banking. J Money Credit Bank 28 part 1(3):342–364
Coelli T (1996) A guide to frontier 4.1: a computer program
for stochastic frontier production and cost function estima-
tion. CEPA Working Paper 96/07, Vol 2003. www.uq.edu.au/
economics/cepa
Coelli T, Rao DSP, Battese GE (1998) An introduction to efficiency
and productivity analysis. Kluwer, London
Coelli T, Perelman S, Romano E (1999) Accounting for environ-
mental influences in stochastic frontier models: with application
to international airlines. J Prod Anal 11(3):251–273
Cuesta RA, Orea L (2002) Mergers and technical efficiency in
Spanish savings banks: a stochastic distance function approach.
J Bank Finance 26(12):2231
Demsetz H (1973) Industry structure, market rivalry, and public
policy. J Law Econ 16:1–9
Dietsch M, Lozano-Vivas A (2000) How the environment determines
banking efficiency: a comparison between French and Spanish
industries. J Bank Finance 24:985–1004
El-Gamal MA, Inanoglu H (2005) Inefficiency and heterogeneity in
Turkish banking: 1990–2000. J Appl Econom 20(5):641–665
Fare R, Primont D (1995) Multi-output production and duality: theory
and applications. Kluwer, London
Farrell MJ (1957) The measurement of productive efficiency. J Roy
Stat Soc 120(Series A Part III):253–281
Fitzpatrick T, McQuinn K (2008) Measuring bank profit efficiency.
Appl Financ Econ 18(1):1–8
Frame WS, Coelli TJ (2001) U.S. financial services consolidation: the
case of corporate credit unions. Rev Ind Organ 18(2):229
Fries S, Taci A (2005) Cost efficiency of banks in transition: evidence
from 289 banks in 15 post-communist countries. J Bank Finance
29(1):55–81
Fuentes HJ, Grifell-Tatje E, Perelman S (2001) Parametric distance
function approach for malmquist productivity index estimation.
J Prod Anal 15(2):79
Girardone C, Molyneux P, Gardener EPM (2004) Analysing the
determinants of bank efficiency: the case of Italian banks. Appl
Econ 36(3):215–227
Hasan I, Marton K (2003) Development and efficiency of the banking
sector in a transitional economy: Hungarian experience. J Bank
Finance 27(12):2249–2271
Hassan MK (2003) Cost, profit and x-efficiency of Islamic banks in
Pakistan, Iran and Sudan. Paper presented at international
conference on Islamic banking: risk management, regulation
and supervision. Jakarta, Indonesia
Hassan MK (2005) The cost, profit and x-efficiency of islamic banks.
12th Annual conference. Economic Research Forum, Cairo
Husain I (2005) Islamic financial services industry: the European
challenges. Keynote address at the Islamic financial services
forum. Islamic Financial Services Board and Central Bank of
Luxembourg, Luxembourg
Hussein KA (2004) Operational efficiency in Islamic banking: the
Sudanese experience. Vol 2004: Research Paper No 65. Islamic
Research and Training Institute, Islamic Development Bank.
www.irti.org/Sudan%20-Banks.pdf Jeddah
Iqbal M, Molyneux P (2005) Thirty years of Islamic banking: history,
performance and prospects. Palgrave Macmillan, New York
Karim RAA (2001) International accounting harmonization, banking
regulation, and Islamic banks. Int J Account 36(2):169–193
42 J Prod Anal (2010) 34:25–43
123
Kasman A (2005) Efficiency and scale economies in transition
economies. Emerg Mark Finance Trade 41(2):60–81
Kasman A, Yildirim C (2006) Cost and profit efficiencies in transition
banking: the case of new e u members. Appl Econ 38(9):1079–
1090
Kraft E, Hofler R, Payne J (2006) Privatization, foreign bank entry
and bank efficiency in croatia: a fourier-flexible function
stochastic cost frontier analysis. Appl Econ 38(17):2075–2088
Leibenstein H (1966) Allocative efficiency vs. ‘‘X-efficiency’’. Am
Econ Rev 56(3):392–415
Lozano-Vivas A, Pastor JT, Pastor JM (2002) An efficiency
comparison of European banking systems operating under
different environmental conditions. J Prod Anal 18(1):59
Maudos J, De Guevara JF (2007) The cost of market power in
banking: social welfare loss vs. cost inefficiency. J Bank Finance
31(7):2103–2125
Maudos J, Pastor JM, Perez F, Quesada J (2002) Cost and profit
efficiency in European banks. J Int Financ Mark Inst Money
12(1):33–58
Mester LJ (1996) A study of bank efficiency taking into account risk-
preferences. J Bank Finance 20:1025–1045
Metwally MM (1997) Differences between the financial characteris-
tics of interest-free banks and conventional banks. Eur Bus Rev
97(2):92
Mokhtar HSA, Abdullah N, Al-Habshi SM (2006) Efficiency of
Islamic banking in Malaysia: a stochastic frontier approach.
J Econ Coop 27(2):37–70
Olgu O (2006) Productivity decomposition in European banking with
accession economies: an application of parametric and nonpara-
metric malmquist techniques, PhD thesis, University of Leices-
ter, Leicester
Orea L (2002) Parametric decomposition of a generalized malmquist
productivity index. J Prod Anal 18(1):5–22
Perera S, Skully M, Wickramanayake J (2007) Cost efficiency in
south Asian banking: the impact of bank size, state ownership
and stock exchange listings. Int Rev Finance 7(1–2):35–60
Sundararajan V, Errico L (2002) Islamic financial institutions and
products in the global financial system: key issues in risk
management and challenges ahead. Vol 2004. IMF. http://www.
imf.org/external/pubs/ft/wp/2002/wp02192.pdf
Weill L (2002) Does restructuring improve banking efficiency in a
transition economy? Appl Econ Lett 9:279–281
Williams J, Nguyen N (2005) Financial liberalisation, crisis, and
restructuring: a comparative study of bank performance and
bank governance in south east Asia. J Bank Finance 29(8–9):
2119–2154
World Bank (2007) Country groups. Vol 2007: grouped by region,
by income, by lending. www.worldbank.org/data/countryclass/
classgroups.htm
Yildirim HS, Philippatos GC (2007) Efficiency of banks: recent
evidence from the transition economies of Europe, 1993–2000.
Eur J Finance 13(2):123–143
Yudistira D (2004) Efficiency in Islamic banking: an empirical
analysis of eighteen banks. Islam Econ Stud 12(1)
J Prod Anal (2010) 34:25–43 43
123
![[2009] 1 MLJ xci Islamic Banking: Perspectives on Recent Case Development ISLAMIC BANKING: PERSPECTIVES ON RECENT CASE DEVELOPMENT](https://img.pdfslide.net/doc/110x75/631600d15cba183dbf084242/2009-1-mlj-xci-islamic-banking-perspectives-on-recent-case-development-islamic.jpg)


