Embed Size (px)
Citation preview
Efficiency vs. multi-photon contributiontest for quantum dots
Ana Predojevic,1,∗ Miroslav Jezek,2 Tobias Huber,1 HarishankarJayakumar,1 Thomas Kauten,1 Glenn S. Solomon,3 Radim Filip,2 and
Gregor Weihs1
1Institute for Experimental Physics, University of Innsbruck, Technikerstrasse 25, 6020Innsbruck, Austria
2Department of Optics, Palacky University, 17. listopadu 12, 77146 Olomouc, Czech Republic3Joint Quantum Institute, National Institute of Standards and Technology and University of
Maryland, Gaithersburg, MD 20849, USA∗[email protected]
Abstract: The development of linear quantum computing within inte-grated circuits demands high quality semiconductor single photon sources.In particular, for a reliable single photon source it is not sufficient to havea low multi-photon component, but also to possess high efficiency. Weinvestigate the photon statistics of the emission from a single quantum dotwith a method that is able to sensitively detect the trade-off between theefficiency and the multi-photon contribution. Our measurements show, thatthe light emitted from the quantum dot when it is resonantly excited possessa very low multi-photon content. Additionally, we demonstrated, for thefirst time, the non-Gaussian nature of the quantum state emitted from asingle quantum dot.
© 2014 Optical Society of America
OCIS codes: (000.1600) Classical and quantum physics; (270.0270) Quantum optics;(270.5290) Photon statistics.
References and links1. P. Grangier, G. Roger, and A. Aspect, “Experimental evidence for a photon anticorrelation effect on a beam
splitter: A new light on single-photon interferences,” Europhys. Lett. 1, 173–179 (1986).2. S. Scheel, “Single-photon sources-an introduction,” J. Mod. Opt. 56, 141–160 (2009).3. E. Knill, R. Laflamme, and G. J. Milburn, “A scheme for efficient quantum computation with linear optics,”
Nature 409, 46–52 (2001).4. J. L. O’Brien, “Optical quantum computing,” Science 318, 1567–1570 (2007).5. M. Varnava, D. E. Browne, and T. Rudolph, “How good must single photon sources and detectors be for efficient
linear optical quantum computation?,” Phys. Rev. Lett. 100, 060502 (2008).6. T. Jennewein, M. Barbieri, and A. White, “Single-photon device requirements for operating linear optics quantum
computing outside the post-selection basis,” J. Mod. Opt. 58, 276–287 (2011).7. U. Leonhardt, Measuring the Quantum State of Light (Cambridge University, 1997).8. R. Glauber, Quantum Theory of Optical Voherence (Wiley-VCH, 2007).9. R. L. Hudson, “When is the Wigner quasi-probability density non-negative?,” Rep. Math. Phys. 6, 249–252
(1974).10. A. I. Lvovsky, H. Hansen, T. Aichele, O. Benson, J. Mlynek, and S. Schiller, “Quantum state reconstruction of
the single-photon Fock state,” Phys. Rev. Lett. 87, 050402 (2001).11. R. Filip and L. Mista, Jr., “Detecting quantum states with a positive Wigner function beyond mixtures of Gaussian
states,” Phys. Rev. Lett. 106, 200401 (2011).12. Z. Y. Ou, S. F. Pereira, and H. J. Kimble, “Quantum noise reduction in optical amplification,” Phys. Rev. Lett.
70, 3239–3242 (1993).
#203994 - $15.00 USD Received 2 Jan 2014; revised 11 Feb 2014; accepted 13 Feb 2014; published 21 Feb 2014(C) 2014 OSA 24 February 2014 | Vol. 22, No. 4 | DOI:10.1364/OE.22.004789 | OPTICS EXPRESS 4789
13. H. Vahlbruch, M. Mehmet, S. Chelkowski, B. Hage, A. Franzen, N. Lastzka, S. Goler, K. Danzmann, and R.Schnabel, “Observation of squeezed light with 10-dB quantum-noise reduction,” Phys. Rev. Lett. 100, 033602(2008).
14. Y. Takeno, M. Yukawa, H. Yonezawa, and A. Furusawa, “Observation of -9 dB quadrature squeezing with im-provement of phase stability in homodyne measurement,” Opt. Express 15, 4321–4327 (2007).
15. H. Jayakumar, A. Predojevic, T. Huber, T. Kauten, G. S. Solomon, and G. Weihs, “Deterministic photon pairsand coherent optical control of a single quantum dot,” Phys. Rev. Lett. 110, 135505 (2013).
16. T. Flissikowski, A. Betke, I. A. Akimov, and F. Henneberger, “Two-photon coherent control of a single quantumdot,” Phys. Rev. Lett. 92, 227401 (2004).
17. M. Jezek, I. Straka, M. Micuda, M. Dusek, J. Fiurasek, and R. Filip, “Experimental test of the quantum non-Gaussian character of a heralded single-photon state,” Phys. Rev. Lett. 107, 213602 (2011).
18. D. F. Walls and G. J. Milburn, Quantum Optics (Springer, 2008).19. C. Santori, D. Fattal, J. Vuckovic, G. S. Solomon, E. Waks, and Y. Yamamoto, “Submicrosecond correlations in
photoluminescence from InAs quantum dots,” Phys. Rev. B 69, 205324 (2004).20. A. Predojevic, S. Grabher, and G. Weihs, “Pulsed Sagnac source of polarization entangled photon pairs,” Opt.
Express 20, 25022–25029 (2012).21. O. Kuzucu and F. N. C. Wong, “Pulsed Sagnac source of narrow-band polarization entangled photons,” Opt.
Express 15, 15377-15386 (2007).22. J. Eisert, S. Scheel, and M. B. Plenio, “Distilling Gaussian states with Gaussian operations is impossible,” Phys.
Rev. Lett. 89, 137903 (2002).23. J. Niset, J. Fiurasek, and N. J. Cerf, “No-Go theorem for Gaussian quantum error correction,” Phys. Rev. Lett.
102, 120501 (2009).24. V. Veitch, C. Ferrie, D. Gross, and J. Emerson, “Negative quasi-probability as a resource for quantum computa-
tion,” New. J. Phys 14, 113011 (2012).25. A. Mari and J. Eisert, “Negative quasi-probability as a resource for quantum computation,” Phys. Rev. Lett. 109,
230503 (2012).26. A. Dousse, J. Suffczynski, A. Beveratos, O. Krebs, A. Lemaıtre, I. Sagnes, J. Bloch, P. Voisin, and P. Senellart,
“Ultrabright source of entangled photon pairs,” Nature 466, 217-220 (2010).27. P. Kok, W. J. Munro, K. Nemoto, T. C. Ralph, J. P. Dowling, and G. J. Milburn, “Linear optical quantum com-
puting with photonic qubits,” Rev. Mod. Phys. 79, 135-174 (2007).
1. Introduction
The ideal single photon state is quantum mechanically represented by the Fock state |1〉, aquantum counterpart of the classical particle. The particle nature of a single photon is tradition-ally verified by observing an anticorrelation effect on a beam splitter [1]. This measurement ofthe intensity autocorrelation is commonly accepted as the way to test a light source for non-classicality [2]. Nonetheless, such a measurement is an intensity-normalized measurement andtherefore completely insensitive to the vacuum contribution, |0〉. In practice, however, vacuumcontribution is significant. For many applications that do not depend on the efficiency of thesingle-photon source the intensity autocorrelation is a sufficient test. On the other hand, appli-cations like linear optical quantum computing [3] crucially depend on the overall source anddetector efficiency [4–6].
Seen from this perspective, the characterization of a quantum state produced by realisticsingle photon sources would strongly benefit from a measurement that is sensitive to the vac-uum contribution as well as the multi-photon component. By measuring the density matrix oneobtains informations on occupation probabilities and coherences of quantum states of a realsingle photon source; regrettably, such a full state tomography is usually quite challenging. Analternative approach is to measure a quantum phase-space description of the state, its so-calledWigner function [7]. It is well known that the single photon state |1〉 has a negative Wigner func-tion [8]. Furthermore, there is a whole class of states that possess negative Wigner functions (socalled non-Gaussian states of light) as shown by Hudson’s theorem [9]. The Wigner functionis usually measured by homodyne tomography. This is a very tedious procedure and in somecases even impossible. However, when it is possible, it can detect the negativity of the state’sWigner function, as was demonstrated for heralded single photon sources [10]. The practicalobstacle for such a measurement is that the negativity crucially depends on the overall source
#203994 - $15.00 USD Received 2 Jan 2014; revised 11 Feb 2014; accepted 13 Feb 2014; published 21 Feb 2014(C) 2014 OSA 24 February 2014 | Vol. 22, No. 4 | DOI:10.1364/OE.22.004789 | OPTICS EXPRESS 4790
and detector efficiency η . Namely, if η < 0.5 the measured Wigner function is positive, eventhough the photon source may give a perfectly antibunched intensity autocorrelation measure-ment. Therefore, the Wigner function has never been reconstructed for solid-state single photonsources, mainly because the collection and detection efficiencies are very unfavourable.
Recently, some of us proposed a novel non-Gaussianity criterion (NG criterion) designedto characterize single photon sources [11]. The NG criterion is based on the measurement ofphoton statistics but, in contrast to the intensity autocorrelation measurement, is sensitive tothe overall source (collection and detection) efficiency. Light characterization by measurementand reconstruction of the Wigner function shares some similarities with the NG criterion. Inparticular: it is sensitive to the losses and is able to distinguish Gaussian from non-Gaussianstates [12–14]. Additionally, this criterion [11] is still applicable in the case of low emissionand detection efficiency in contrast to the direct measurement of the negativity of the Wignerfunction. In other words, this criterion enables an efficiency-sensitive evaluation of real singlephoton sources without the necessity for complete quantum state tomography.
Here, we present measurements performed on the light emitted by a single quantum dot andby a parametric down-conversion heralded single photon source. With these measurements weperformed an advanced study of the statistics of the emission from a single quantum dot. Inparticular, we characterized the efficiency and multi-photon contribution and then tested theobtained results using the NG criterion [11]. Further, we compared the results obtained underdifferent types of quantum dot excitation as detailed below. For reference, we also performedmeasurements using a parametric down-conversion-based heralded single photon source.
2. Quantum dot setup
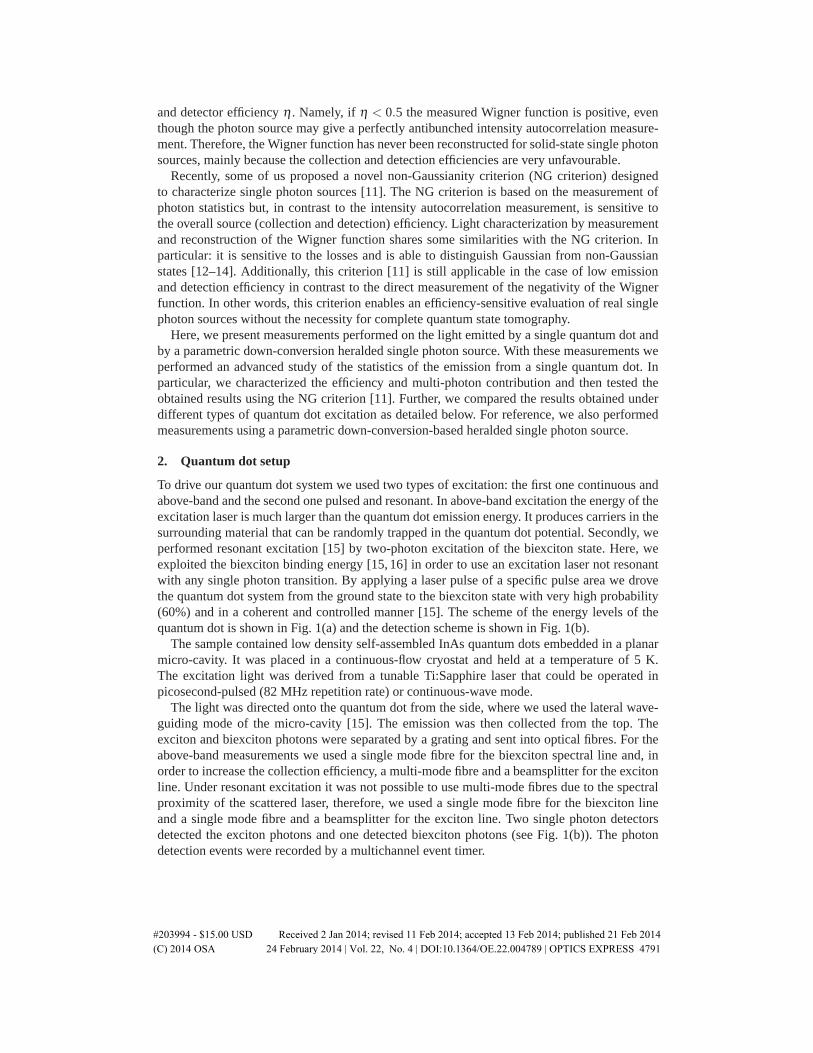
To drive our quantum dot system we used two types of excitation: the first one continuous andabove-band and the second one pulsed and resonant. In above-band excitation the energy of theexcitation laser is much larger than the quantum dot emission energy. It produces carriers in thesurrounding material that can be randomly trapped in the quantum dot potential. Secondly, weperformed resonant excitation [15] by two-photon excitation of the biexciton state. Here, weexploited the biexciton binding energy [15, 16] in order to use an excitation laser not resonantwith any single photon transition. By applying a laser pulse of a specific pulse area we drovethe quantum dot system from the ground state to the biexciton state with very high probability(60%) and in a coherent and controlled manner [15]. The scheme of the energy levels of thequantum dot is shown in Fig. 1(a) and the detection scheme is shown in Fig. 1(b).
The sample contained low density self-assembled InAs quantum dots embedded in a planarmicro-cavity. It was placed in a continuous-flow cryostat and held at a temperature of 5 K.The excitation light was derived from a tunable Ti:Sapphire laser that could be operated inpicosecond-pulsed (82 MHz repetition rate) or continuous-wave mode.
The light was directed onto the quantum dot from the side, where we used the lateral wave-guiding mode of the micro-cavity [15]. The emission was then collected from the top. Theexciton and biexciton photons were separated by a grating and sent into optical fibres. For theabove-band measurements we used a single mode fibre for the biexciton spectral line and, inorder to increase the collection efficiency, a multi-mode fibre and a beamsplitter for the excitonline. Under resonant excitation it was not possible to use multi-mode fibres due to the spectralproximity of the scattered laser, therefore, we used a single mode fibre for the biexciton lineand a single mode fibre and a beamsplitter for the exciton line. Two single photon detectorsdetected the exciton photons and one detected biexciton photons (see Fig. 1(b)). The photondetection events were recorded by a multichannel event timer.
#203994 - $15.00 USD Received 2 Jan 2014; revised 11 Feb 2014; accepted 13 Feb 2014; published 21 Feb 2014(C) 2014 OSA 24 February 2014 | Vol. 22, No. 4 | DOI:10.1364/OE.22.004789 | OPTICS EXPRESS 4791
XX
X
Resonant
Phonondecay
ConductionBand GaAsa)
Above-band
b)
R
exciton biexciton
BS
BA
APD
1B
R1AR2
g
x
b
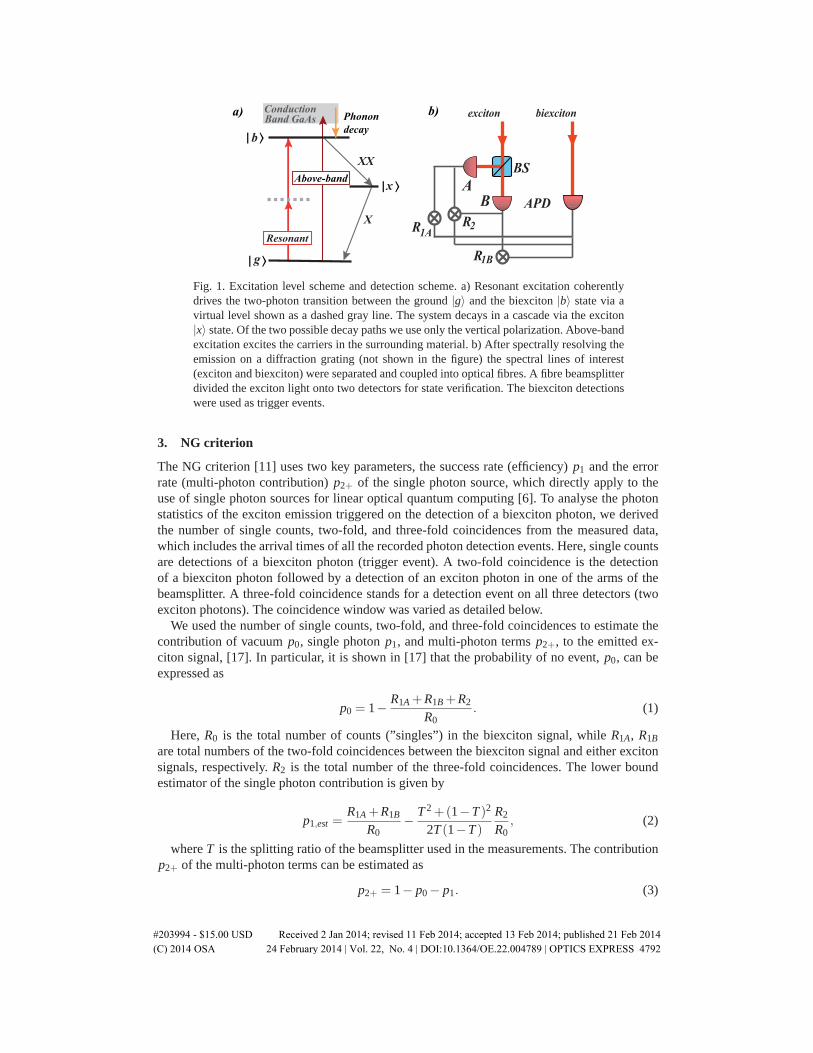
Fig. 1. Excitation level scheme and detection scheme. a) Resonant excitation coherentlydrives the two-photon transition between the ground |g〉 and the biexciton |b〉 state via avirtual level shown as a dashed gray line. The system decays in a cascade via the exciton|x〉 state. Of the two possible decay paths we use only the vertical polarization. Above-bandexcitation excites the carriers in the surrounding material. b) After spectrally resolving theemission on a diffraction grating (not shown in the figure) the spectral lines of interest(exciton and biexciton) were separated and coupled into optical fibres. A fibre beamsplitterdivided the exciton light onto two detectors for state verification. The biexciton detectionswere used as trigger events.
3. NG criterion
The NG criterion [11] uses two key parameters, the success rate (efficiency) p1 and the errorrate (multi-photon contribution) p2+ of the single photon source, which directly apply to theuse of single photon sources for linear optical quantum computing [6]. To analyse the photonstatistics of the exciton emission triggered on the detection of a biexciton photon, we derivedthe number of single counts, two-fold, and three-fold coincidences from the measured data,which includes the arrival times of all the recorded photon detection events. Here, single countsare detections of a biexciton photon (trigger event). A two-fold coincidence is the detectionof a biexciton photon followed by a detection of an exciton photon in one of the arms of thebeamsplitter. A three-fold coincidence stands for a detection event on all three detectors (twoexciton photons). The coincidence window was varied as detailed below.
We used the number of single counts, two-fold, and three-fold coincidences to estimate thecontribution of vacuum p0, single photon p1, and multi-photon terms p2+, to the emitted ex-citon signal, [17]. In particular, it is shown in [17] that the probability of no event, p0, can beexpressed as
p0 = 1− R1A +R1B +R2
R0. (1)
Here, R0 is the total number of counts (”singles”) in the biexciton signal, while R1A, R1B
are total numbers of the two-fold coincidences between the biexciton signal and either excitonsignals, respectively. R2 is the total number of the three-fold coincidences. The lower boundestimator of the single photon contribution is given by
p1,est =R1A +R1B
R0− T 2 +(1−T )2
2T (1−T )R2
R0, (2)
where T is the splitting ratio of the beamsplitter used in the measurements. The contributionp2+ of the multi-photon terms can be estimated as
p2+ = 1− p0 − p1. (3)
#203994 - $15.00 USD Received 2 Jan 2014; revised 11 Feb 2014; accepted 13 Feb 2014; published 21 Feb 2014(C) 2014 OSA 24 February 2014 | Vol. 22, No. 4 | DOI:10.1364/OE.22.004789 | OPTICS EXPRESS 4792
We determine the photon statistics (p0, p1, p2+) using this method because we are inter-ested in calculating p1 as the lower bound estimator, p1,est . The lower bound estimation takesinto account the splitting ratio of the beamsplitter. In this way we avoid that the number ofcoincidences is artificially modified by an unbalanced beamsplitter.
The NG criterion defines a witness, ΔW , that the given state is not a mixture of Gaussianstates ρ /∈G , where G is the set of all mixtures of Gaussian states [17]. It also derives a boundary(NG boundary) between the states that can be described as a mixture of Gaussian states andthose that cannot. This boundary is given as [17]
p0 =e−d2[1−tanh(r)]
cosh(r), p1 =
d2 e−d2[1−tanh(r)]
cosh3(r), (4)
where the squeezing constant r [18] is used to parametrize the curve with the displacementd given by d2 = (e4r −1)/4 [17]. The witness, ΔW is the directed distance between the meas-ured point (p0, p1,est) and the NG boundary. ΔW > 0 indicates that the measured state is non-Gaussian. The results are shown in Fig. 2(b) and Tables 1 and 2.
4. Discussion
Due to the very low collection and detection efficiency ( ≈ 0.3%) the vacuum term p0 prevails.The statistical uncertainties for p0, p1, and p2+ were determined from the Poissonian statisticsof the recorded events. In Tables 1 and 2 the last column gives the value of the witness, ΔW , inunits of the standard deviation. For example, the result given in the first row of Table 2 indicatesa non-Gaussian state, (+), which is situated 2.63 standard deviations away from the boundary.In Fig. 2(b), the states of light in the white area are non-Gaussian and produced by a sourceincompatible with only quadratic non-linear processes.
For the resonantly excited quantum dot our results unambiguously prove that the state cannotbe expressed as a mixture of Gaussian states, because the witness, ΔW , is positive for anycoincidence window that is smaller than the repetition period of the laser pulses. For example,for a coincidence window of 10 ns the measured state exceeds the Gaussian boundary by 2.63standard deviations (green circle in Fig. 2(b)). Extending the coincidence window to 10.24 ns,which includes the beginning of the consecutive pulse, we find the measured state to movetowards the boundary of the Gaussian states. Further extension of the coincidence windowplaces the state in the region where we cannot distinguish it from a coherent mixture of Gaussianstates (shown in Fig. 2(b) in yellow circles).
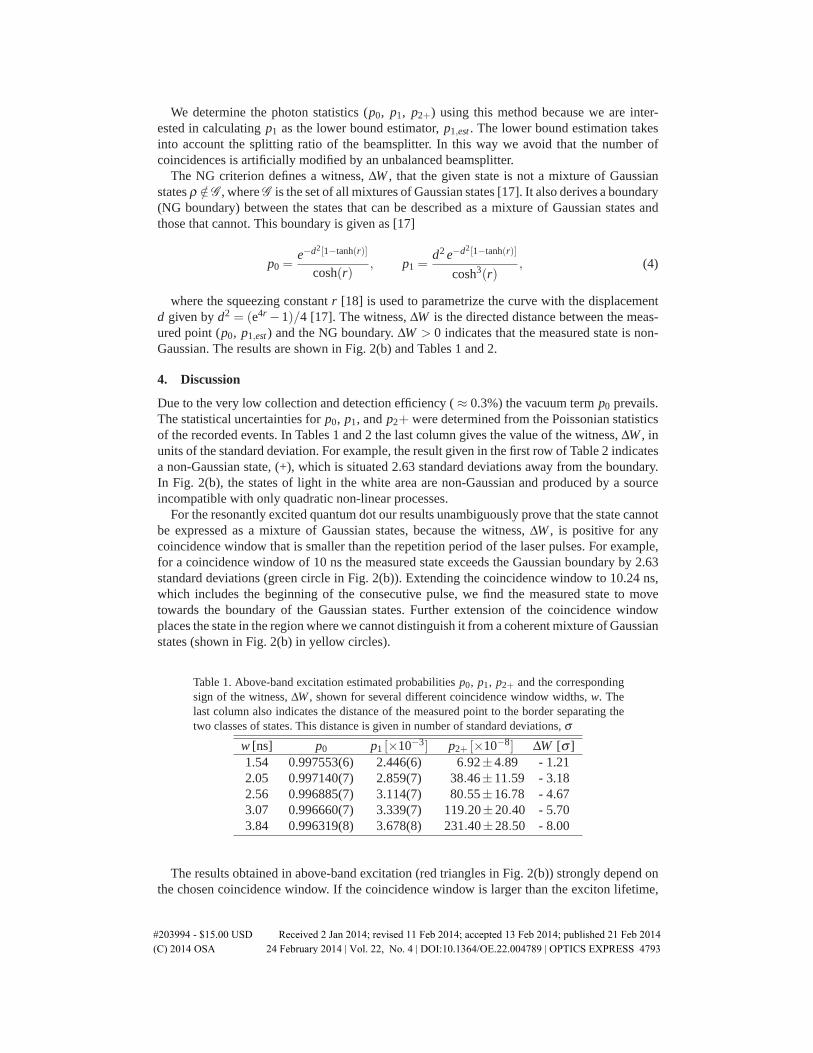
Table 1. Above-band excitation estimated probabilities p0, p1, p2+ and the correspondingsign of the witness, ΔW , shown for several different coincidence window widths, w. Thelast column also indicates the distance of the measured point to the border separating thetwo classes of states. This distance is given in number of standard deviations, σ
w [ns] p0 p1 [×10−3] p2+ [×10−8] ΔW [σ ]1.54 0.997553(6) 2.446(6) 6.92±4.89 - 1.212.05 0.997140(7) 2.859(7) 38.46±11.59 - 3.182.56 0.996885(7) 3.114(7) 80.55±16.78 - 4.673.07 0.996660(7) 3.339(7) 119.20±20.40 - 5.703.84 0.996319(8) 3.678(8) 231.40±28.50 - 8.00
The results obtained in above-band excitation (red triangles in Fig. 2(b)) strongly depend onthe chosen coincidence window. If the coincidence window is larger than the exciton lifetime,
#203994 - $15.00 USD Received 2 Jan 2014; revised 11 Feb 2014; accepted 13 Feb 2014; published 21 Feb 2014(C) 2014 OSA 24 February 2014 | Vol. 22, No. 4 | DOI:10.1364/OE.22.004789 | OPTICS EXPRESS 4793
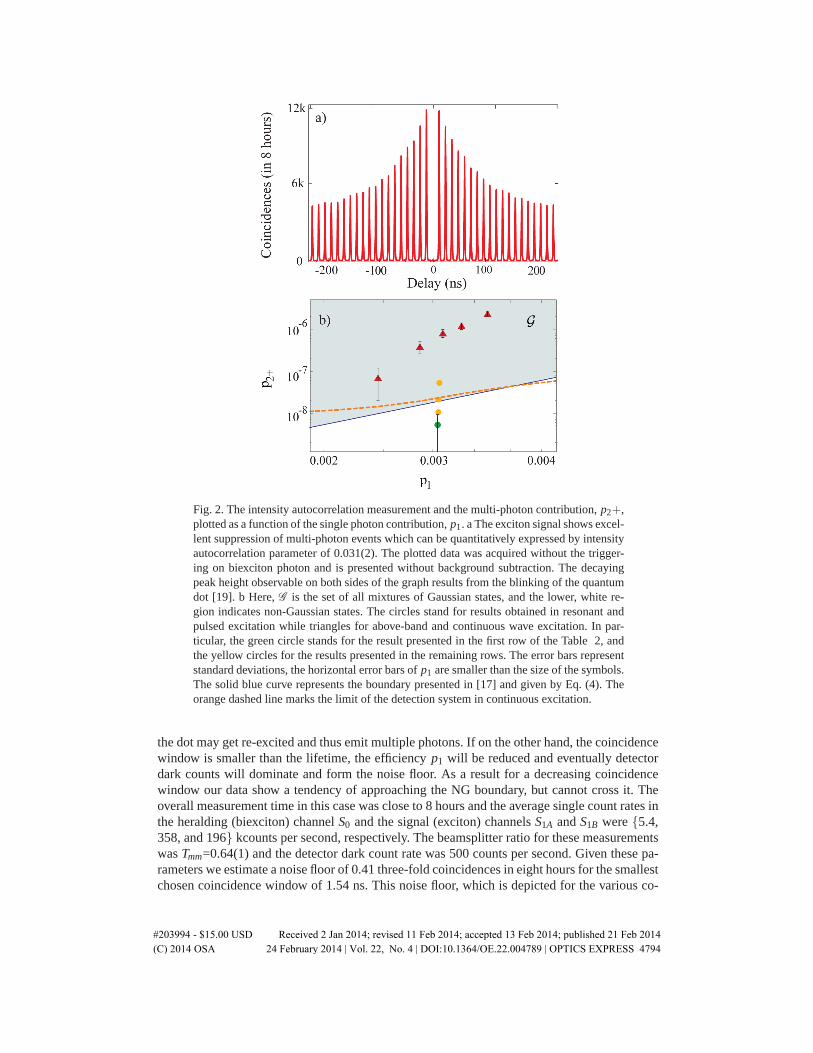
Fig. 2. The intensity autocorrelation measurement and the multi-photon contribution, p2+,plotted as a function of the single photon contribution, p1. a The exciton signal shows excel-lent suppression of multi-photon events which can be quantitatively expressed by intensityautocorrelation parameter of 0.031(2). The plotted data was acquired without the trigger-ing on biexciton photon and is presented without background subtraction. The decayingpeak height observable on both sides of the graph results from the blinking of the quantumdot [19]. b Here, G is the set of all mixtures of Gaussian states, and the lower, white re-gion indicates non-Gaussian states. The circles stand for results obtained in resonant andpulsed excitation while triangles for above-band and continuous wave excitation. In par-ticular, the green circle stands for the result presented in the first row of the Table 2, andthe yellow circles for the results presented in the remaining rows. The error bars representstandard deviations, the horizontal error bars of p1 are smaller than the size of the symbols.The solid blue curve represents the boundary presented in [17] and given by Eq. (4). Theorange dashed line marks the limit of the detection system in continuous excitation.
the dot may get re-excited and thus emit multiple photons. If on the other hand, the coincidencewindow is smaller than the lifetime, the efficiency p1 will be reduced and eventually detectordark counts will dominate and form the noise floor. As a result for a decreasing coincidencewindow our data show a tendency of approaching the NG boundary, but cannot cross it. Theoverall measurement time in this case was close to 8 hours and the average single count rates inthe heralding (biexciton) channel S0 and the signal (exciton) channels S1A and S1B were {5.4,358, and 196} kcounts per second, respectively. The beamsplitter ratio for these measurementswas Tmm=0.64(1) and the detector dark count rate was 500 counts per second. Given these pa-rameters we estimate a noise floor of 0.41 three-fold coincidences in eight hours for the smallestchosen coincidence window of 1.54 ns. This noise floor, which is depicted for the various co-
#203994 - $15.00 USD Received 2 Jan 2014; revised 11 Feb 2014; accepted 13 Feb 2014; published 21 Feb 2014(C) 2014 OSA 24 February 2014 | Vol. 22, No. 4 | DOI:10.1364/OE.22.004789 | OPTICS EXPRESS 4794
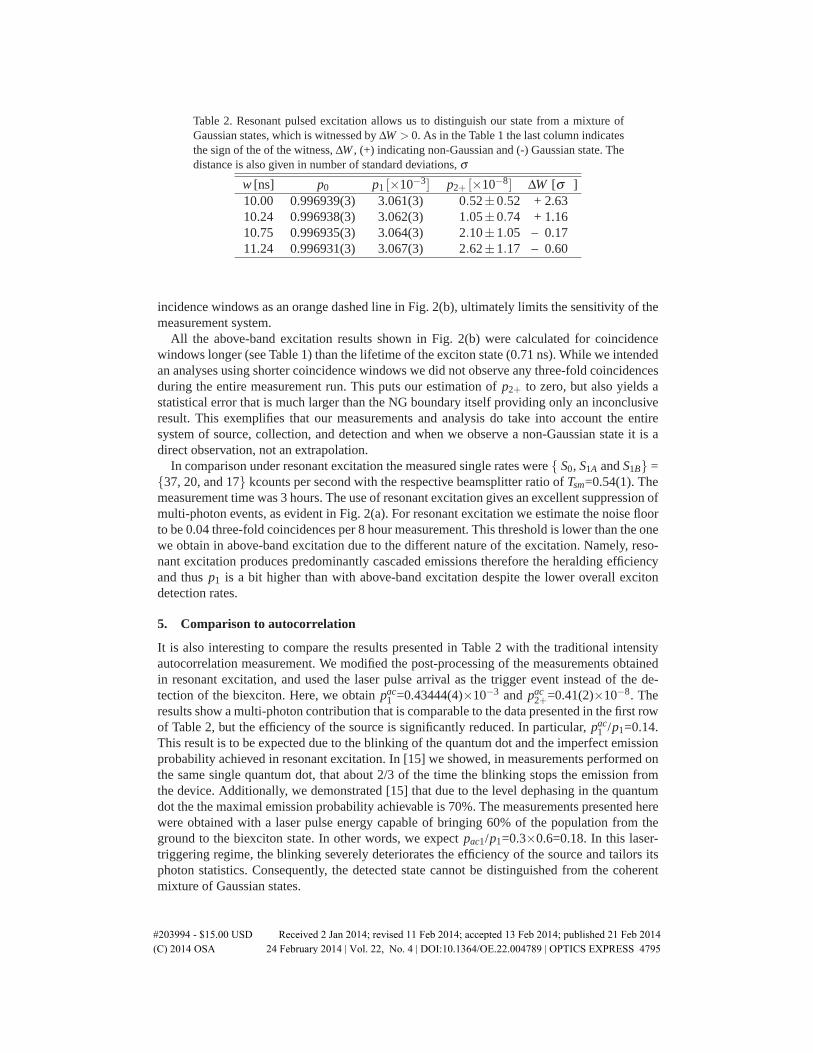
Table 2. Resonant pulsed excitation allows us to distinguish our state from a mixture ofGaussian states, which is witnessed by ΔW > 0. As in the Table 1 the last column indicatesthe sign of the of the witness, ΔW , (+) indicating non-Gaussian and (-) Gaussian state. Thedistance is also given in number of standard deviations, σ
w [ns] p0 p1 [×10−3] p2+ [×10−8] ΔW [σ ]10.00 0.996939(3) 3.061(3) 0.52±0.52 + 2.6310.24 0.996938(3) 3.062(3) 1.05±0.74 + 1.1610.75 0.996935(3) 3.064(3) 2.10±1.05 – 0.1711.24 0.996931(3) 3.067(3) 2.62±1.17 – 0.60
incidence windows as an orange dashed line in Fig. 2(b), ultimately limits the sensitivity of themeasurement system.
All the above-band excitation results shown in Fig. 2(b) were calculated for coincidencewindows longer (see Table 1) than the lifetime of the exciton state (0.71 ns). While we intendedan analyses using shorter coincidence windows we did not observe any three-fold coincidencesduring the entire measurement run. This puts our estimation of p2+ to zero, but also yields astatistical error that is much larger than the NG boundary itself providing only an inconclusiveresult. This exemplifies that our measurements and analysis do take into account the entiresystem of source, collection, and detection and when we observe a non-Gaussian state it is adirect observation, not an extrapolation.
In comparison under resonant excitation the measured single rates were { S0, S1A and S1B} ={37, 20, and 17} kcounts per second with the respective beamsplitter ratio of Tsm=0.54(1). Themeasurement time was 3 hours. The use of resonant excitation gives an excellent suppression ofmulti-photon events, as evident in Fig. 2(a). For resonant excitation we estimate the noise floorto be 0.04 three-fold coincidences per 8 hour measurement. This threshold is lower than the onewe obtain in above-band excitation due to the different nature of the excitation. Namely, reso-nant excitation produces predominantly cascaded emissions therefore the heralding efficiencyand thus p1 is a bit higher than with above-band excitation despite the lower overall excitondetection rates.
5. Comparison to autocorrelation
It is also interesting to compare the results presented in Table 2 with the traditional intensityautocorrelation measurement. We modified the post-processing of the measurements obtainedin resonant excitation, and used the laser pulse arrival as the trigger event instead of the de-tection of the biexciton. Here, we obtain pac
1 =0.43444(4)×10−3 and pac2+=0.41(2)×10−8. The
results show a multi-photon contribution that is comparable to the data presented in the first rowof Table 2, but the efficiency of the source is significantly reduced. In particular, pac
1 /p1=0.14.This result is to be expected due to the blinking of the quantum dot and the imperfect emissionprobability achieved in resonant excitation. In [15] we showed, in measurements performed onthe same single quantum dot, that about 2/3 of the time the blinking stops the emission fromthe device. Additionally, we demonstrated [15] that due to the level dephasing in the quantumdot the the maximal emission probability achievable is 70%. The measurements presented herewere obtained with a laser pulse energy capable of bringing 60% of the population from theground to the biexciton state. In other words, we expect pac1/p1=0.3×0.6=0.18. In this laser-triggering regime, the blinking severely deteriorates the efficiency of the source and tailors itsphoton statistics. Consequently, the detected state cannot be distinguished from the coherentmixture of Gaussian states.
#203994 - $15.00 USD Received 2 Jan 2014; revised 11 Feb 2014; accepted 13 Feb 2014; published 21 Feb 2014(C) 2014 OSA 24 February 2014 | Vol. 22, No. 4 | DOI:10.1364/OE.22.004789 | OPTICS EXPRESS 4795
We can estimate g2(0) as 2×[1-p0-p1]/[2×(1-p0)-p1]2 and the Grangier’s [1] anticorrela-tion parameter α=R0R2/R1AR1B, which is equal to g2(0) for a symmetric beamsplitter. For thebiexciton triggered measurement in resonant excitation we obtain g2(0)=0.0010(10). The samemeasurement triggered on the laser pulse arrival gives g2(0)=0.041(2). The later result is com-parable with the autocorrelation parameter extracted from the traditional intensity autocorrela-tion measurement of 0.031(2). Additionally, it is possible to reconstruct a biexciton triggeredintensity autocorrelation measurement. Such a measurement yields autocorrelation parameter0.0029(29).
As stated above, due to the different nature of the excitation, resonant and above-band, weobtain different noise thresholds. In addition, it is expected that the efficiency of these twoprocesses is different. Only a coherent process such as resonant excitation can bring 100%of the population from the ground to the excited state. To compare the respective efficiencieswe performed biexciton-triggered measurements of p1 in above-band excitation for variousexcitation powers. The results are shown as gray dots in Fig. 3(a). For comparison the dashedline shows the p1 value we obtained in resonant excitation. An interesting feature is that p1
decreases with excitation power, reaching its minimum at the biexciton line saturation. Webelieve that this happens because the biexciton is re-excited directly from the exciton statebefore the system has reached the ground state and thus could not emit an exciton photon.Therefore the ratio of emitted exciton to biexciton photons is reduced. This is ultimately limitshow strongly quantum dot-based pair sources can be driven incoherently.
6. Pulsed down-conversion
To complete the study we also measured the photon statistics from a parametric down-conversion heralded single photon source. For this purpose we used the Sagnac-interferometer-based down-conversion source of entangled photon pairs described in [20]. The pair productionrate was kept at the low value of 0.003 pairs per pulse in order to maintain a high quality ofthe entanglement. In particular, at production rate of 0.003 pairs per pulse we measured H/V,and A/D visibilities to be 99.86(3)% and 98.65(3)%, respectively. The corresponding valueof the tangle was T=0.961(7). It has been shown that entanglement decreases with increasedpump power and photon pair creation probability (number of pairs per pulse) [21]. In particu-lar, in [21] was shown that the probability to obtain double pairs in parametric down-conversionscales with the square of photon pair creation probability. The results are given in Table 3 andFig. 3(b). Here, we used the signal photons to trigger the measurement (corresponding to thebiexciton photons) and the idler photons were sent onto a fibre beamsplitter (corresponding tothe exciton photons).
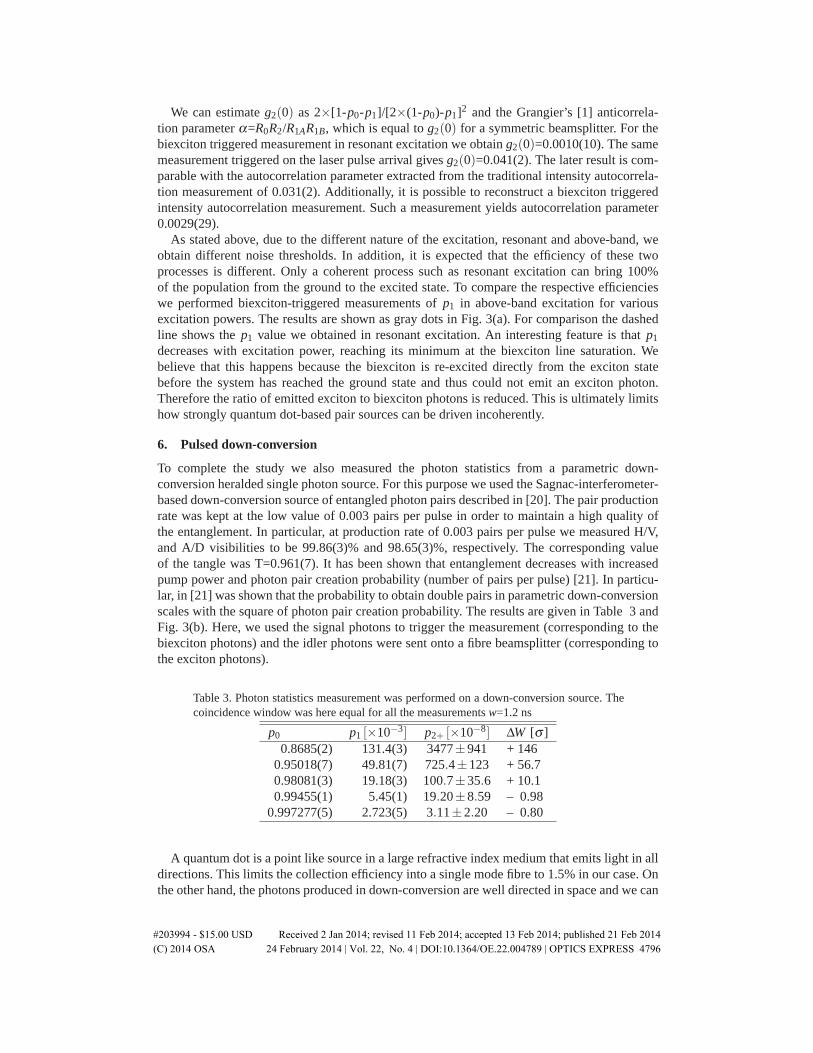
Table 3. Photon statistics measurement was performed on a down-conversion source. Thecoincidence window was here equal for all the measurements w=1.2 ns
p0 p1 [×10−3] p2+ [×10−8] ΔW [σ ]0.8685(2) 131.4(3) 3477±941 + 146
0.95018(7) 49.81(7) 725.4±123 + 56.70.98081(3) 19.18(3) 100.7±35.6 + 10.10.99455(1) 5.45(1) 19.20±8.59 – 0.98
0.997277(5) 2.723(5) 3.11±2.20 – 0.80
A quantum dot is a point like source in a large refractive index medium that emits light in alldirections. This limits the collection efficiency into a single mode fibre to 1.5% in our case. Onthe other hand, the photons produced in down-conversion are well directed in space and we can
#203994 - $15.00 USD Received 2 Jan 2014; revised 11 Feb 2014; accepted 13 Feb 2014; published 21 Feb 2014(C) 2014 OSA 24 February 2014 | Vol. 22, No. 4 | DOI:10.1364/OE.22.004789 | OPTICS EXPRESS 4796
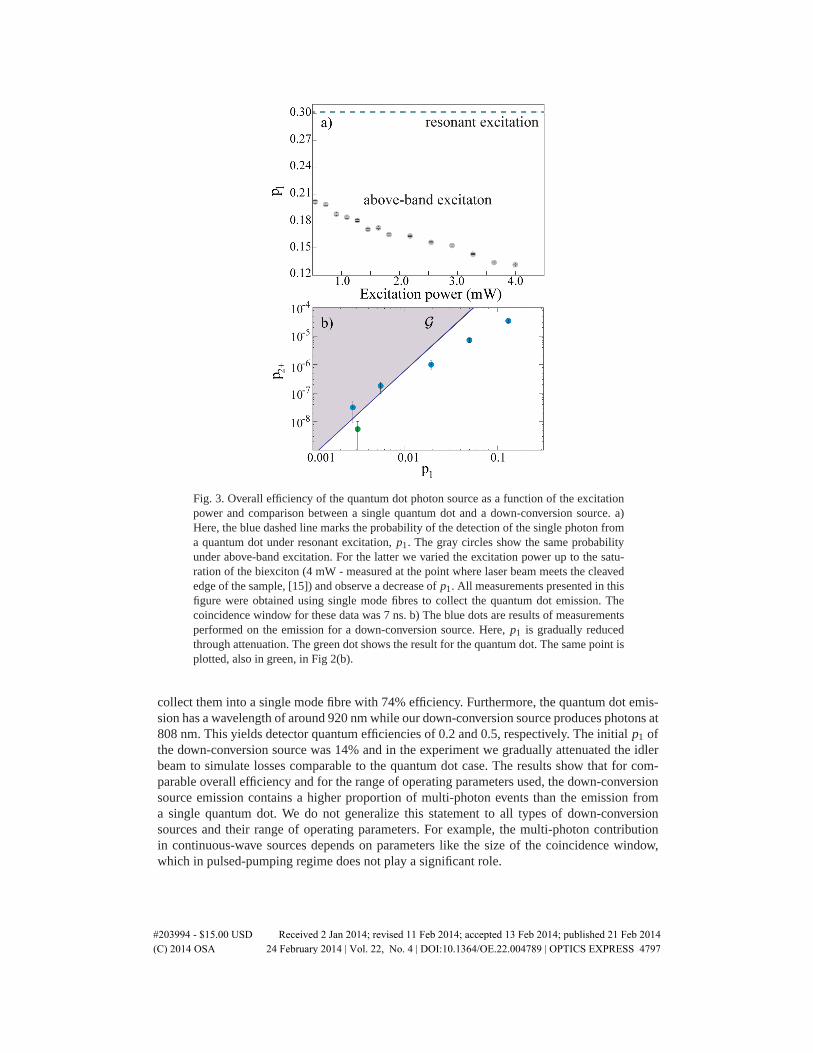
Fig. 3. Overall efficiency of the quantum dot photon source as a function of the excitationpower and comparison between a single quantum dot and a down-conversion source. a)Here, the blue dashed line marks the probability of the detection of the single photon froma quantum dot under resonant excitation, p1. The gray circles show the same probabilityunder above-band excitation. For the latter we varied the excitation power up to the satu-ration of the biexciton (4 mW - measured at the point where laser beam meets the cleavededge of the sample, [15]) and observe a decrease of p1. All measurements presented in thisfigure were obtained using single mode fibres to collect the quantum dot emission. Thecoincidence window for these data was 7 ns. b) The blue dots are results of measurementsperformed on the emission for a down-conversion source. Here, p1 is gradually reducedthrough attenuation. The green dot shows the result for the quantum dot. The same point isplotted, also in green, in Fig 2(b).
collect them into a single mode fibre with 74% efficiency. Furthermore, the quantum dot emis-sion has a wavelength of around 920 nm while our down-conversion source produces photons at808 nm. This yields detector quantum efficiencies of 0.2 and 0.5, respectively. The initial p1 ofthe down-conversion source was 14% and in the experiment we gradually attenuated the idlerbeam to simulate losses comparable to the quantum dot case. The results show that for com-parable overall efficiency and for the range of operating parameters used, the down-conversionsource emission contains a higher proportion of multi-photon events than the emission froma single quantum dot. We do not generalize this statement to all types of down-conversionsources and their range of operating parameters. For example, the multi-photon contributionin continuous-wave sources depends on parameters like the size of the coincidence window,which in pulsed-pumping regime does not play a significant role.
#203994 - $15.00 USD Received 2 Jan 2014; revised 11 Feb 2014; accepted 13 Feb 2014; published 21 Feb 2014(C) 2014 OSA 24 February 2014 | Vol. 22, No. 4 | DOI:10.1364/OE.22.004789 | OPTICS EXPRESS 4797
7. Conclusion
In conclusion, we demonstrated the non-Gaussian nature of the emission of a single quantumdot under resonant excitation. With this we detected a higher order non-classicality than usuallydetected by autocorrelation measurements. Therefore, we gained an intrinsically higher sensi-tivity to possible contributions from other emitters [11]. In particular, we used a pulsed laser toresonantly bring the quantum dot system from the ground to the biexciton state which showedexceptionally pure quantum states of light.
Our measurement is the first demonstration of the non-Gaussian nature of photons producedby a semiconductor device. For completeness, we contrasted our results with the traditionalautocorrelation measurement and with a parametric down-conversion heralded single photonsource. We concluded that for a comparable overall efficiency the quantum dot single photonsource shows a smaller multi-photon contribution.
The non-Gaussian nature of a quantum state is a very important resource for quantum com-munication [22] and quantum computing [23–25]. Furthermore, it is a fundamental property ofthe single photon state [8]. With the increased detection efficiencies available in other devicegeometries [26] the criterion we used becomes an important measure of the quality of the pro-duced light. The combination of resonant excitation, deterministic excitation of the quantumdot, and very pure single photon states is essential for using semiconductor photon sources forintegrated linear optical quantum computing [3, 4, 27].
Acknowledgments
This work was funded by the European Research Council (project EnSeNa) and the CanadianInstitute for Advanced Research through its Quantum Information Processing program. G.S.S.acknowledges partial support through the Physics Frontier Center at the Joint Quantum In-stitute (PFC@JQI). R.F. acknowledges project P205/12/0577 of GACR. M.J. acknowledgesthe support by Palacky University (PrF 2013 008) and the Operational Program Educationfor Competitiveness—Project No. CZ.1.07/2.3.00/20.0060 co-financed by the European SocialFund and Czech Ministry of Education.
#203994 - $15.00 USD Received 2 Jan 2014; revised 11 Feb 2014; accepted 13 Feb 2014; published 21 Feb 2014(C) 2014 OSA 24 February 2014 | Vol. 22, No. 4 | DOI:10.1364/OE.22.004789 | OPTICS EXPRESS 4798