Embed Size (px)
Citation preview
(IJCSIS) International Journal of Computer Science and Information Security,Vol. 7, No. 1, 2010
Efficient Inventory Optimization of Multi Product,Multiple Suppliers with Lead Time using PSO
S.NarmadhaAssistant Professor
Department of Computer Science and EngineeringPark College of Engineering and Tekhnology
Coimbatore – 641659, Tamilnadu, India
Dr.V.SelladuraiProfessor and Head
Department of Mechanical EngineeringCoimbatore Institute of Technology
Coimbatore – 641014, Tamilnadu, India
G.SathishResearch Scholar
Department of Computer Science and EngineeringAnna University – Coimbatore, Tamilnadu, India
Abstract - With information revolution, increased globalization andcompetition, supply chain has become longer and more complicatedthan ever before. These developments bring supply chainmanagement to the forefront of the management’s attention.Inventories are very important in a supply chain. The total investmentin inventories is enormous, and the management of inventory iscrucial to avoid shortages or delivery delays for the customers andserious drain on a company’s financial resources. The supply chaincost increases because of the influence of lead times for supplying thestocks as well as the raw materials. Practically, the lead times will notbe same through out all the periods. Maintaining abundant stocks inorder to avoid the impact of high lead time increases the holding cost.Similarly, maintaining fewer stocks because of ballpark lead timemay lead to shortage of stocks. This also happens in the case of leadtime involved in supplying raw materials. A better optimizationmethodology that utilizes the Particle Swarm Optimization algorithm,one of the best optimization algorithms, is proposed to overcome theimpasse in maintaining the optimal stock levels in each member ofthe supply chain. Taking into account the stock levels thus obtainedfrom the proposed methodology, an appropriate stock levels to bemaintained in the approaching periods that will minimize the supplychain inventory cost can be arrived at.
Keywords: Supply Chain Management, Inventory Optimization,Base Stock, Multiple Suppliers, Lead Time, Particle SwarmOptimization (PSO), Supply Chain Cost
I. INTRODUCTION
Inventory takes many forms, ranging from raw materials tofinished goods. While holding large amounts of inventoryenables a company to be responsive to fluctuations in customerdemand, the associated costs can be excessive. In order tooperate in a lean environment at maximum efficiency levels,companies must minimize all unnecessary expenses, includingthose associated with production and storage of inventories.
Inventory control is typically a key aspect of almost everymanufacturing and/or distribution operation business. Theultimate success of these businesses is often dependent on itsability to provide customers with the right goods, at the rightplace, at the right time. The right goods are those that thecustomer wants; the right place is your “available” inventory,
not the supplier’s warehouse, and in today’s economy the righttime is immediately.
Failure to have the right goods in the right place at theright time often leads to lost sales and profits and, even worse,to lost customers. Today’s reality is that there is very littledifferentiation between commodity products of the same type,and customers will, more often than not, choose to return tobusinesses that meet all three conditions, even choosingrelatively unknown brands over known brands.
The role of inventory management is to coordinate theactions of all business segments, particularly sales, marketingand production, so that the appropriate level of stock ismaintained to satisfy customers’ demands. The goal ofinventory management is to balance supply and demand asclosely as possible in order to keep customers satisfied anddrive profits.
Inventory management is a fundamental requisite to supplychain optimization. The processes and controls of effectiveinventory management are critical to any successful business.Since it is rarely the case that any business has the luxury ofunlimited capital, inventory management involves importantdecisions about what to buy or produce, how much to buy orproduce and when to buy or produce within the capital limits.These are “value decisions.” Excessive inventory investmentscan tie up capital that may be put to better use within otherareas of the business. On the other hand, insufficient inventoryinvestment can lead to inventory shortages and a failure tosatisfy customer demand. A balance must be struck andmaintained.
The aim of inventory management is to reduce inventoryholdings to the lowest point without negatively impactingavailability or customer service levels. This can be done whilestill maximizing the business’ ability to exploit economies ofscale to positively impact profitability.
Inventory optimization takes inventory management to thenext level, enabling businesses to further reduce inventorylevels while improving customer service levels andmaximizing capital investments.
180 http://sites.google.com/site/ijcsis/ ISSN 1947-5500
(IJCSIS) International Journal of Computer Science and Information Security,Vol. 7, No. 1, 2010
Inventory management is an ongoing process that relies oninputs from forecasts and product pricing, and should beexecutable within the cost structure of the business under anoverall plan. Inventory control involves three inventory formsof the flow cycle:
Basic Stock - The exact quantity of an item required tosatisfy a demand forecast.
Seasonal Stock - A quantity buildup in anticipation ofpredictable increases in demand that occur at certain timesin the year.
Safety Stock - A quantity in addition to basic inventorythat serves as a buffer against uncertainty.
The challenge is to weigh the balance in favor of basicstock so that the business holds as little safety stock aspossible and provides ‘just the right amount’ of seasonal stock.However, the predictability of demand has a direct impact onhow much safety stock a business must hold. When demand isunpredictable, higher levels of safety stock must bemaintained. Therefore, the search for the optimal inventorylevels to achieve a lean manufacturing environment becomes akey objective.
A. Benefits of Inventory Optimization
The primary function of an Inventory Optimizationsolution is to allow companies to effectively fulfill demandand identify how to gain additional profits from theirinventories. Improved efficiencies through effective resourcemanagement and optimization lead to an increase in servicelevel, improved performance against customer request datesand improved return on equity. These gains are derived inthree ways: a) System Benefits b) Value-Added Benefits andc) Strategic Benefits.
B. Particle Swarm Optimization
In 1995, Kennedy and Eberhartin, inspired by thechoreography of a bird flock, first proposed the ParticleSwarm Optimization (PSO). In comparison with theevolutionary algorithm, PSO, relatively recently devisedpopulation-based stochastic global optimization algorithm, hasmany similarities and the robust performance of the proposedmethod over a variety of difficult optimization problems hasbeen proved [1]. In accordance with PSO, either the best localor the best global individual affects the behavior of eachindividual in order to help it fly through a hyperspace [2].Simulation of simplified social models has been employed todevelop Particle Swarm Optimization techniques. Thefollowing are the features of the method [3]:
The researches on swarms such as fish schooling and birdflocking are the basis of the method.
The computation time is short and it requires littlememory as it is based on a simple concept.
Nonlinear optimization problems with continuousvariables were the initial focus of this method.Nevertheless, problems with discrete variables can be
treated by easy expansion of the method. Hence, themixed integer nonlinear optimization problems with bothcontinuous and discrete variables can be treated with thismethod.
In addition to PSO, several evolutionary paradigms existwhich include Genetic algorithms (GA), Genetic programming(GP), Evolutionary strategies (ES) and Evolutionaryprogramming (EP). Biological evolution is simulated by theseapproaches which are based on population [4]. Geneticalgorithm and PSO are two widely used types of evolutionarycomputation techniques among the various types ofEvolutionary Computing paradigms [5].
PSO and evolutionary computation techniques such asGenetic Algorithms (GA) have many similarities betweenthem. A population of random solutions is used to initializethe system which updates generations to search for optima.Nevertheless, PSO does not have evolution operators such ascrossover and mutation that are available in GA.
In PSO, the potential solutions, called particles follow thecurrent optimum particles to fly through the problem space.Every particle represents a candidate solution to theoptimization problem. The best position visited by the particleand the position of the best particle in the particle’sneighborhood influences its position.
Particles would retain part of their previous state usingtheir memory. The particles would still remember the bestpositions they ever had even as there are no restrictions forparticles to know the positions of other particles in themultidimensional spaces. An initial random velocity and tworandomly weighted influences: individuality (the tendency toreturn to the particle’s best previous position), and sociality(the tendency to move towards the neighborhood’s bestprevious position) form each particle’s movement [6].
When the neighborhood of a particle is the entire swarm,the global best particle refers to the best position in theneighborhood and in this case, gbest PSO refers the resultingalgorithm. Generally, lbest PSO refers the algorithm in caseswhen smaller neighborhoods are used [5]. A fitness functionthat is to be optimized evaluates the fitness values of all theparticles [6].
PSO uses individual and group experiences to search theoptimal solutions. Nevertheless, previous solutions may notprovide the solution of the optimization problem. The optimalsolution is changed by adjusting certain parameters andputting random variables. The ability of the particles toremember the best position that they have seen is an advantageof PSO [6].
II. RELATED REVIEW
A fresh Genetic Algorithm (GA) approach for theIntegrated Inventory Distribution Problem (IIDP) has beenprojected by Abdelmaguid et al. [7]. They have developed agenetic representation and have utilized a randomized versionof a formerly developed construction heuristic in order toproduce the initial random population.
181 http://sites.google.com/site/ijcsis/ ISSN 1947-5500
(IJCSIS) International Journal of Computer Science and Information Security,Vol. 7, No. 1, 2010
Pongcharoen et al.[8] have put forth an optimization toolthat works on basis of a Multi-matrix Real-coded GenericAlgorithm (MRGA) and aids in reduction of total costsassociated with in supply chain logistics. They haveincorporated procedures that ensure feasible solutions such asthe chromosome initialization procedure, crossover andmutation operations. They have evaluated the algorithm withthe aid of three sizes of benchmarking dataset of logistic chainnetwork that are conventionally faced by most globalmanufacturing companies.
A technique to utilize in supply-chain management thatsupports the decision-making process for purchases of directgoods has been projected by Buffett et al.[9]. RFQs have beenconstructed on basis of the projections for future prices anddemand and the quotes that optimize the level of inventoryeach day besides minimizing the cost have been accepted. Theproblem was represented as a Markov Decision Process(MDP) that allows for the calculation of the utility of actionsto be based on the utilities of substantial future states. Theoptimal quote requests and accepts at each state in the MDPwere determined with the aid of Dynamic programming. Asupply chain management agent comprising of predictive,optimizing and adaptive components called the TacTex-06 hasbeen put forth by Pardoe et al. [10]. TacTex-06 functions bymaking predictions regarding the future of the economy, suchas the prices that will be proffered by component suppliers andthe degree of customer demand and then strategizing its futureactions so as to ensure maximum profit.
Beamon et al.[11] have presented a study on evaluations ofthe performance measures employed in supply chain modelsand have also displayed a framework for the beneficialselection of performance measurement systems formanufacturing supply chains Three kinds of performancemeasures have been recognized as mandatory constituents inany supply chain performance measurement system. Newflexibility measures have also been created for the supplychains. The accomplishment of beam-ACO in supply-chainmanagement has been proposed by Caldeira et al.[12]. Beam-ACO has been used to optimize the supplying and logisticagents of a supply chain. A standard ACO algorithm has aidedin the optimization of the distributed system. The applicationof Beam-ACO has enhanced the local and global results of thesupply chain.
A beneficial industry case applying Genetic Algorithms(GA) has been proposed by Wang et al.[13]. The case hasmade use of GAs for the optimization of the total cost of amultiple sourcing supply chain system. The system has beenexemplified by a multiple sourcing model with stochasticdemand. A mathematical model has been implemented toportray the stochastic inventory with the many to manydemand and transportation parameters as well as priceuncertainty factors. A genetic algorithm which has beenapproved by Lo [14] deals with the production-inventoryproblem with backlog in the real situations, with time-varieddemand and imperfect production due to the defects inproduction disruption with exponential distribution. Besidesoptimizing the number of production cycles to generate a (R,Q) inventory policy, an aggregative production plan can also
be produced to minimize the total inventory cost on the basisof reproduction interval searching in a given time horizon.
Barlas et al.[15] have developed a System Dynamicssimulation model of a typical retail supply chain. The intent oftheir simulation exercise was to build up inventory policiesthat enhance the retailer's revenue and reduce costs at the sameinstant. Besides, the research was also intended towardsstudying the implications of different diversification strategies.A supply chain model functioning under periodic review base-stock inventory system to assist the manufacturing managersat HP to administer material in their supply chains has beenintroduced by Lee et al.[16]. The inventory levels acrosssupply chain members were obtained with the aid of a searchroutine.
The inventory and supply chain managers are mainlyconcerned holding of the excess stock levels and hence theincrease in the holding cost. Meanwhile, there is possibility forthe shortage of products. For the shortage of each productthere will be a shortage cost. Holding excess stock levels aswell as the occurrence of shortage for products lead to theincrease in the supply chain cost. The factory maymanufacture any number of products, each supply chainmember may consume a few or all the products and eachproduct is manufactured using a number of raw materialssourced from many suppliers. All these factors pose additionalholding of the excess stock levels and hence the increase in theholding cost. Meanwhile, there is possibility for the shortageof products. For the shortage of each product there will be ashortage cost. Holding excess stock levels as well as theoccurrence of shortage for products lead to the increase in thesupply chain cost. All these factors pose additional challengein extracting the exact product and the stock levels thatinfluence the supply chain cost heavily.
Many well-known algorithmic advances in optimizationhave been made, but it turns out that most have not had theexpected impact on the decisions for designing and optimizingsupply chain related problems. Some optimization techniquesare of little use because they are not well suited to solvecomplex real logistics problems in the short time needed tomake decisions and also some techniques are highly problem-dependent which need high expertise. This adds difficulties inthe implementations of the decision support systems whichcontradicts the tendency to fast implementation in a rapidlychanging world. IO techniques need to determine a globallyoptimal placement of inventory, considering its cost at eachstage in the supply chain and all the service level targets andreplenishment lead times that constraint each inventorylocation.
III. OBJECTIVES
The supply chain cost increases because of the influence oflead times for supplying the stocks as well as the rawmaterials. Practically, the lead times will not be samethroughout all the periods. Maintaining abundant stocks inorder to avoid the impact of high lead time increases theholding cost. Similarly, maintaining fewer stocks because ofballpark lead time may lead to shortage of stocks. This also
182 http://sites.google.com/site/ijcsis/ ISSN 1947-5500
(IJCSIS) International Journal of Computer Science and Information Security,Vol. 7, No. 1, 2010
happens in the case of lead time involved in supplying rawmaterials. A better optimization methodology would considerall these above mentioned factors in the prediction of theoptimal stock levels to be maintained such that the total supplychain cost can be minimized. Here, an optimizationmethodology that utilizes the Particle Swarm Optimization(PSO) algorithm, one of the best optimization algorithms, isproposed to overcome the impasse in maintaining the optimalstock levels in each member of the supply chain. Taking intoaccount the stock levels thus obtained from the proposedmethodology, an appropriate stock levels to be maintained inthe approaching periods that will minimize the supply chaininventory cost can be arrived at.
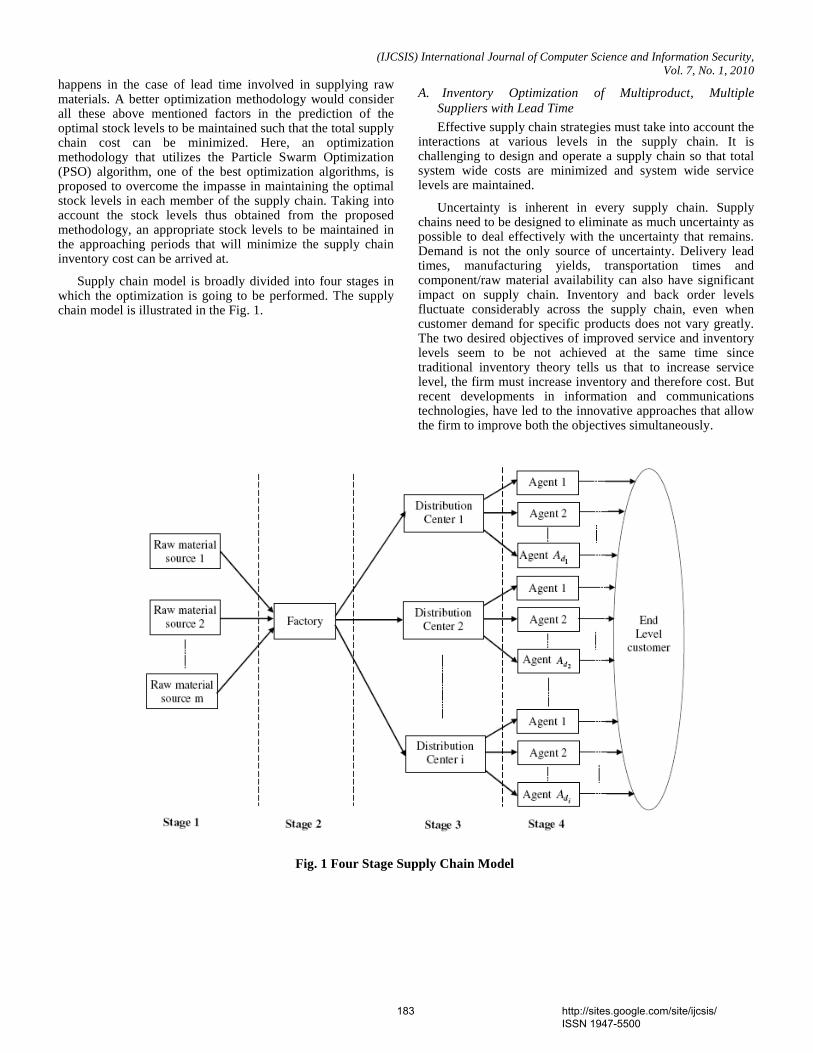
Supply chain model is broadly divided into four stages inwhich the optimization is going to be performed. The supplychain model is illustrated in the Fig. 1.
A. Inventory Optimization of Multiproduct, MultipleSuppliers with Lead Time
Effective supply chain strategies must take into account theinteractions at various levels in the supply chain. It ischallenging to design and operate a supply chain so that totalsystem wide costs are minimized and system wide servicelevels are maintained.
Uncertainty is inherent in every supply chain. Supplychains need to be designed to eliminate as much uncertainty aspossible to deal effectively with the uncertainty that remains.Demand is not the only source of uncertainty. Delivery leadtimes, manufacturing yields, transportation times andcomponent/raw material availability can also have significantimpact on supply chain. Inventory and back order levelsfluctuate considerably across the supply chain, even whencustomer demand for specific products does not vary greatly.The two desired objectives of improved service and inventorylevels seem to be not achieved at the same time sincetraditional inventory theory tells us that to increase servicelevel, the firm must increase inventory and therefore cost. Butrecent developments in information and communicationstechnologies, have led to the innovative approaches that allowthe firm to improve both the objectives simultaneously.
Fig. 1 Four Stage Supply Chain Model
183 http://sites.google.com/site/ijcsis/ ISSN 1947-5500
(IJCSIS) International Journal of Computer Science and Information Security,Vol. 7, No. 1, 2010
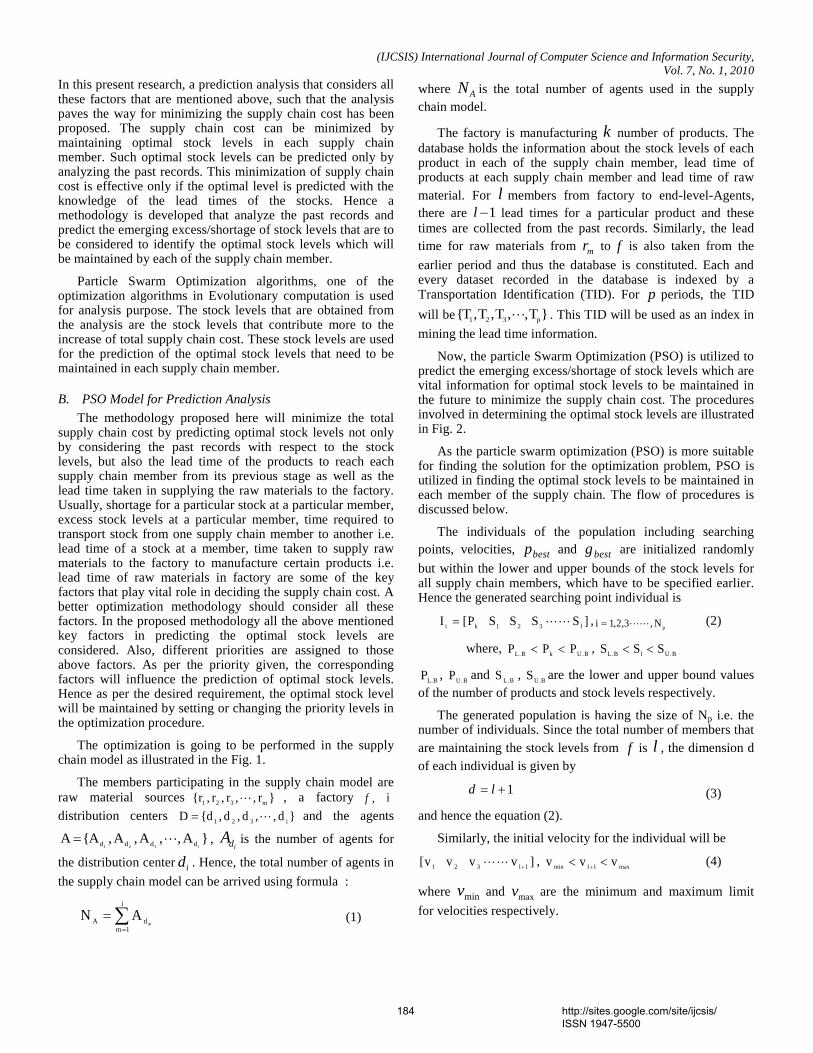
In this present research, a prediction analysis that considers allthese factors that are mentioned above, such that the analysispaves the way for minimizing the supply chain cost has beenproposed. The supply chain cost can be minimized bymaintaining optimal stock levels in each supply chainmember. Such optimal stock levels can be predicted only byanalyzing the past records. This minimization of supply chaincost is effective only if the optimal level is predicted with theknowledge of the lead times of the stocks. Hence amethodology is developed that analyze the past records andpredict the emerging excess/shortage of stock levels that are tobe considered to identify the optimal stock levels which willbe maintained by each of the supply chain member.
Particle Swarm Optimization algorithms, one of theoptimization algorithms in Evolutionary computation is usedfor analysis purpose. The stock levels that are obtained fromthe analysis are the stock levels that contribute more to theincrease of total supply chain cost. These stock levels are usedfor the prediction of the optimal stock levels that need to bemaintained in each supply chain member.
B. PSO Model for Prediction Analysis
The methodology proposed here will minimize the totalsupply chain cost by predicting optimal stock levels not onlyby considering the past records with respect to the stocklevels, but also the lead time of the products to reach eachsupply chain member from its previous stage as well as thelead time taken in supplying the raw materials to the factory.Usually, shortage for a particular stock at a particular member,excess stock levels at a particular member, time required totransport stock from one supply chain member to another i.e.lead time of a stock at a member, time taken to supply rawmaterials to the factory to manufacture certain products i.e.lead time of raw materials in factory are some of the keyfactors that play vital role in deciding the supply chain cost. Abetter optimization methodology should consider all thesefactors. In the proposed methodology all the above mentionedkey factors in predicting the optimal stock levels areconsidered. Also, different priorities are assigned to thoseabove factors. As per the priority given, the correspondingfactors will influence the prediction of optimal stock levels.Hence as per the desired requirement, the optimal stock levelwill be maintained by setting or changing the priority levels inthe optimization procedure.
The optimization is going to be performed in the supplychain model as illustrated in the Fig. 1.
The members participating in the supply chain model areraw material sources }r,,r,r,r{ m321 , a factory ,f i
distribution centers }d,,d,d,d{D i321 and the agents
}A,,A,A,A{Ai321 dddd ,
idA is the number of agents for
the distribution center id . Hence, the total number of agents in
the supply chain model can be arrived using formula :
i
1mdA m
AN (1)
where AN is the total number of agents used in the supplychain model.
The factory is manufacturing k number of products. Thedatabase holds the information about the stock levels of eachproduct in each of the supply chain member, lead time ofproducts at each supply chain member and lead time of rawmaterial. For l members from factory to end-level-Agents,there are 1l lead times for a particular product and thesetimes are collected from the past records. Similarly, the leadtime for raw materials from mr to f is also taken from the
earlier period and thus the database is constituted. Each andevery dataset recorded in the database is indexed by aTransportation Identification (TID). For p periods, the TID
will be }T,,T,T,T{ p321 . This TID will be used as an index in
mining the lead time information.
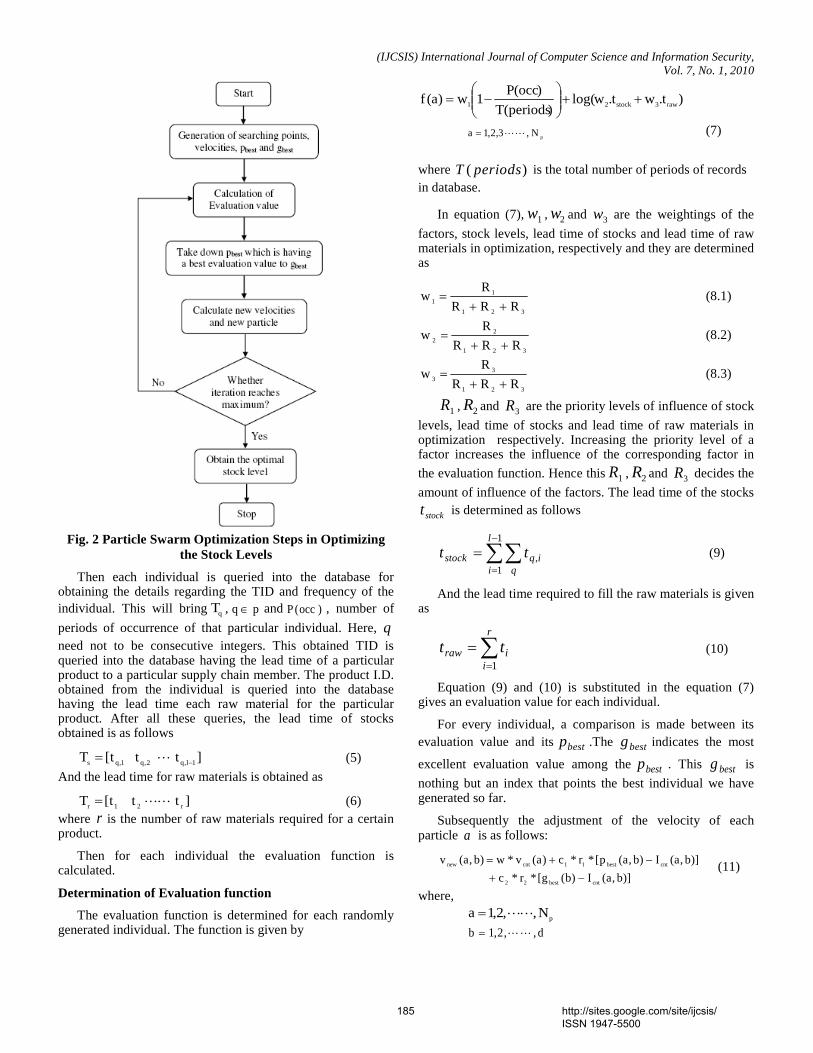
Now, the particle Swarm Optimization (PSO) is utilized topredict the emerging excess/shortage of stock levels which arevital information for optimal stock levels to be maintained inthe future to minimize the supply chain cost. The proceduresinvolved in determining the optimal stock levels are illustratedin Fig. 2.
As the particle swarm optimization (PSO) is more suitablefor finding the solution for the optimization problem, PSO isutilized in finding the optimal stock levels to be maintained ineach member of the supply chain. The flow of procedures isdiscussed below.
The individuals of the population including searchingpoints, velocities, bestp and bestg are initialized randomly
but within the lower and upper bounds of the stock levels forall supply chain members, which have to be specified earlier.Hence the generated searching point individual is
]SSSSP[I l321ki ,pN,3,2,1i (2)
where, B.UkB.L PPP , B.UlB.L SSS
B.LP , B.UP and B.LS , B.US are the lower and upper bound valuesof the number of products and stock levels respectively.
The generated population is having the size of Np i.e. thenumber of individuals. Since the total number of members thatare maintaining the stock levels from f is l , the dimension dof each individual is given by
1 ld (3)
and hence the equation (2).
Similarly, the initial velocity for the individual will be
]vvvv[ 1l321 , max1lmin vvv (4)
where minv and maxv are the minimum and maximum limit
for velocities respectively.
184 http://sites.google.com/site/ijcsis/ ISSN 1947-5500
(IJCSIS) International Journal of Computer Science and Information Security,Vol. 7, No. 1, 2010
Fig. 2 Particle Swarm Optimization Steps in Optimizingthe Stock Levels
Then each individual is queried into the database forobtaining the details regarding the TID and frequency of theindividual. This will bring qT , pq and )occ(P , number of
periods of occurrence of that particular individual. Here, qneed not to be consecutive integers. This obtained TID isqueried into the database having the lead time of a particularproduct to a particular supply chain member. The product I.D.obtained from the individual is queried into the databasehaving the lead time each raw material for the particularproduct. After all these queries, the lead time of stocksobtained is as follows
]ttt[T 1l,q2,q1,qs (5)
And the lead time for raw materials is obtained as
]ttt[T r21r (6)where r is the number of raw materials required for a certainproduct.
Then for each individual the evaluation function iscalculated.
Determination of Evaluation function
The evaluation function is determined for each randomlygenerated individual. The function is given by
)t.wt.wlog()periods(T
)occ(P1w)a(f raw3stock21
pN,3,2,1a (7)
where )( periodsT is the total number of periods of recordsin database.
In equation (7), 1w , 2w and 3w are the weightings of the
factors, stock levels, lead time of stocks and lead time of rawmaterials in optimization, respectively and they are determinedas
321
11 RRR
Rw
(8.1)
321
22 RRR
Rw
(8.2)
321
33 RRR
Rw
(8.3)
1R , 2R and 3R are the priority levels of influence of stock
levels, lead time of stocks and lead time of raw materials inoptimization respectively. Increasing the priority level of afactor increases the influence of the corresponding factor in
the evaluation function. Hence this 1R , 2R and 3R decides the
amount of influence of the factors. The lead time of the stocks
stockt is determined as follows
1
1,
l
i qiqstock tt (9)
And the lead time required to fill the raw materials is givenas
r
iiraw tt
1
(10)
Equation (9) and (10) is substituted in the equation (7)gives an evaluation value for each individual.
For every individual, a comparison is made between itsevaluation value and its bestp .The bestg indicates the most
excellent evaluation value among the bestp . This bestg is
nothing but an index that points the best individual we havegenerated so far.
Subsequently the adjustment of the velocity of eachparticle a is as follows:
)]b,a(I)b(g[*r*c
)]b,a(I)b,a(p[*r*c)a(v*w)b,a(v
cntbest22
cntbest11cntnew
(11)
where,
pN,,2,1a d,,2,1b
185 http://sites.google.com/site/ijcsis/ ISSN 1947-5500
(IJCSIS) International Journal of Computer Science and Information Security,Vol. 7, No. 1, 2010
Here )a(v cnt represents current velocity of the particle,
),( bavnew represents new velocity of a particular parameter
of a particle, 1r and 2r are arbitrary numbers in the interval
]1,0[ , 1c and 2c are acceleration constants (often chosen as
2.0), w is the inertia weight that is given as
iteriter
wwww
max
minmaxmax
(12)
where maxw and minw are the maximum and minimum inertia
weight factors respectively that are chosen randomly in theinterval ]1,0[
maxiter is the maximum number of iterations
iter is the current number of iteration
Such newly obtained particle should not exceed the limits.This would be checked and corrected before proceedingfurther as follows,
If )b(v)b,a(v maxnew , then )b(v)b,a(v maxnew
if )b(v)b,a(v minnew , then )b(v)b,a(v minnew
Then as per the newly obtained velocity, the parameters ofeach particle is changed as follows
)b,a(v)b,a(I)b,a(I newcntnew (13)
Then the parameter of each particle is also verified whetherit is beyond the lower bound and upper bound limits. If theparameter is lower than the corresponding lower bound limitthen replace the new parameter by the lower bound value. Ifthe parameter is higher than the corresponding upper boundvalue, then replace the new parameter by the upper boundvalue. For instance,
If BLk PP . , then .B.Lk PP
Similarly, if BUk PP . , then ..BUk PP
This is to be done for the other parameters also.
This process will be repeated again and again until themaximum number of iterations is reached. Once the maximumnumber of iterations is attained the process is terminated. Thelatest bestg pointing the individual is the best individual which
is having the stock levels that are to be considered and thesestock levels are utilized in taking the necessary steps formaintaining the optimal stock levels at each of the supplychain members.
IV. EXPERIMENTAL RESULTS
The approach suggested for the optimization of inventorylevel and thereby efficient supply chain management has beenimplemented in the MATLAB 7.4. The database consists ofthe records of stock levels held by each member of the supplychain for every period. For implementation purpose, five
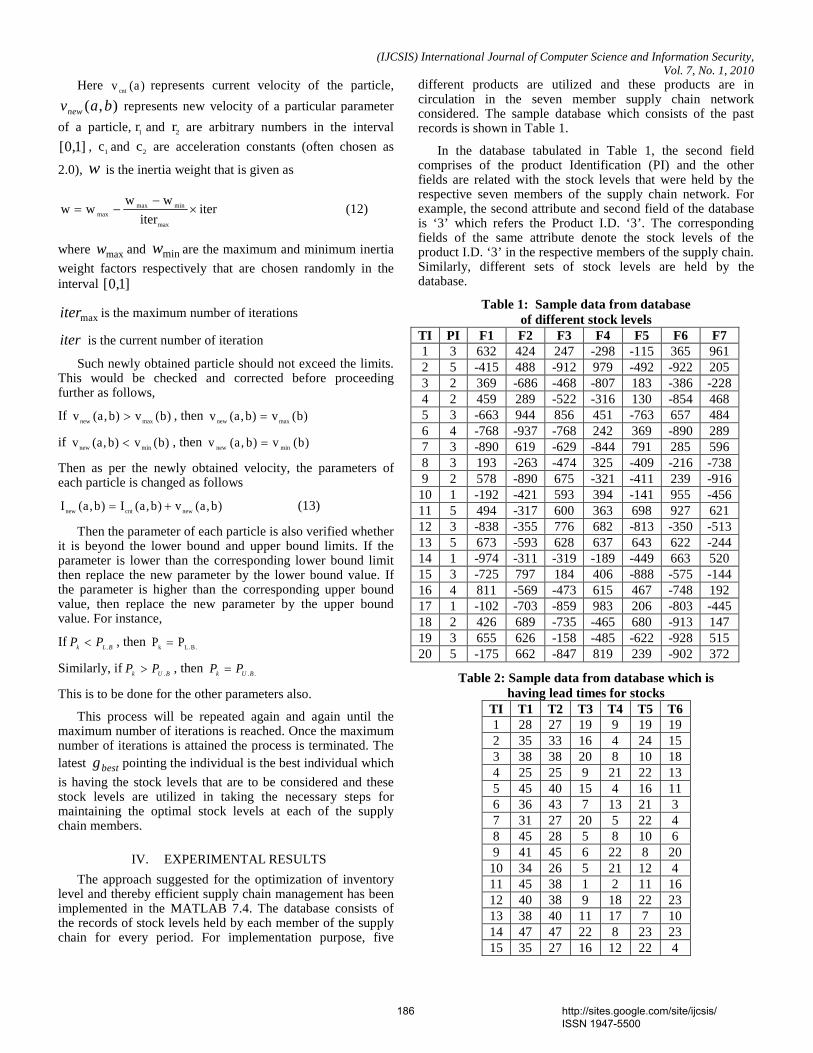
different products are utilized and these products are incirculation in the seven member supply chain networkconsidered. The sample database which consists of the pastrecords is shown in Table 1.
In the database tabulated in Table 1, the second fieldcomprises of the product Identification (PI) and the otherfields are related with the stock levels that were held by therespective seven members of the supply chain network. Forexample, the second attribute and second field of the databaseis ‘3’ which refers the Product I.D. ‘3’. The correspondingfields of the same attribute denote the stock levels of theproduct I.D. ‘3’ in the respective members of the supply chain.Similarly, different sets of stock levels are held by thedatabase.
Table 1: Sample data from databaseof different stock levels
TI PI F1 F2 F3 F4 F5 F6 F71 3 632 424 247 -298 -115 365 9612 5 -415 488 -912 979 -492 -922 2053 2 369 -686 -468 -807 183 -386 -2284 2 459 289 -522 -316 130 -854 4685 3 -663 944 856 451 -763 657 4846 4 -768 -937 -768 242 369 -890 2897 3 -890 619 -629 -844 791 285 5968 3 193 -263 -474 325 -409 -216 -7389 2 578 -890 675 -321 -411 239 -916
10 1 -192 -421 593 394 -141 955 -45611 5 494 -317 600 363 698 927 62112 3 -838 -355 776 682 -813 -350 -51313 5 673 -593 628 637 643 622 -24414 1 -974 -311 -319 -189 -449 663 52015 3 -725 797 184 406 -888 -575 -14416 4 811 -569 -473 615 467 -748 19217 1 -102 -703 -859 983 206 -803 -44518 2 426 689 -735 -465 680 -913 14719 3 655 626 -158 -485 -622 -928 51520 5 -175 662 -847 819 239 -902 372
Table 2: Sample data from database which ishaving lead times for stocks
TI T1 T2 T3 T4 T5 T61 28 27 19 9 19 192 35 33 16 4 24 153 38 38 20 8 10 184 25 25 9 21 22 135 45 40 15 4 16 116 36 43 7 13 21 37 31 27 20 5 22 48 45 28 5 8 10 69 41 45 6 22 8 20
10 34 26 5 21 12 411 45 38 1 2 11 1612 40 38 9 18 22 2313 38 40 11 17 7 1014 47 47 22 8 23 2315 35 27 16 12 22 4
186 http://sites.google.com/site/ijcsis/ ISSN 1947-5500
(IJCSIS) International Journal of Computer Science and Information Security,Vol. 7, No. 1, 2010
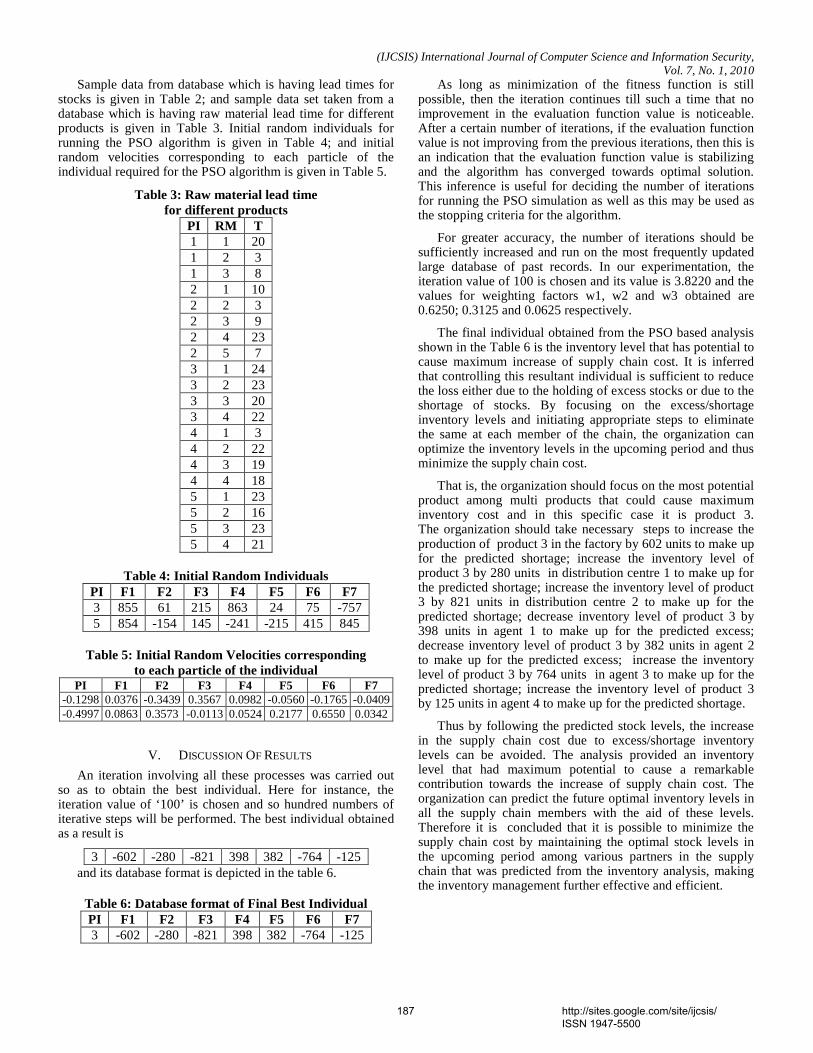
Sample data from database which is having lead times forstocks is given in Table 2; and sample data set taken from adatabase which is having raw material lead time for differentproducts is given in Table 3. Initial random individuals forrunning the PSO algorithm is given in Table 4; and initialrandom velocities corresponding to each particle of theindividual required for the PSO algorithm is given in Table 5.
Table 3: Raw material lead timefor different products
PI RM T1 1 201 2 31 3 82 1 102 2 32 3 92 4 232 5 73 1 243 2 233 3 203 4 224 1 34 2 224 3 194 4 185 1 235 2 165 3 235 4 21
Table 4: Initial Random IndividualsPI F1 F2 F3 F4 F5 F6 F73 855 61 215 863 24 75 -7575 854 -154 145 -241 -215 415 845
Table 5: Initial Random Velocities correspondingto each particle of the individual
PI F1 F2 F3 F4 F5 F6 F7-0.1298 0.0376 -0.3439 0.3567 0.0982 -0.0560 -0.1765 -0.0409-0.4997 0.0863 0.3573 -0.0113 0.0524 0.2177 0.6550 0.0342
V. DISCUSSION OF RESULTS
An iteration involving all these processes was carried outso as to obtain the best individual. Here for instance, theiteration value of ‘100’ is chosen and so hundred numbers ofiterative steps will be performed. The best individual obtainedas a result is
3 -602 -280 -821 398 382 -764 -125and its database format is depicted in the table 6.
Table 6: Database format of Final Best IndividualPI F1 F2 F3 F4 F5 F6 F73 -602 -280 -821 398 382 -764 -125
As long as minimization of the fitness function is stillpossible, then the iteration continues till such a time that noimprovement in the evaluation function value is noticeable.After a certain number of iterations, if the evaluation functionvalue is not improving from the previous iterations, then this isan indication that the evaluation function value is stabilizingand the algorithm has converged towards optimal solution.This inference is useful for deciding the number of iterationsfor running the PSO simulation as well as this may be used asthe stopping criteria for the algorithm.
For greater accuracy, the number of iterations should besufficiently increased and run on the most frequently updatedlarge database of past records. In our experimentation, theiteration value of 100 is chosen and its value is 3.8220 and thevalues for weighting factors w1, w2 and w3 obtained are0.6250; 0.3125 and 0.0625 respectively.
The final individual obtained from the PSO based analysisshown in the Table 6 is the inventory level that has potential tocause maximum increase of supply chain cost. It is inferredthat controlling this resultant individual is sufficient to reducethe loss either due to the holding of excess stocks or due to theshortage of stocks. By focusing on the excess/shortageinventory levels and initiating appropriate steps to eliminatethe same at each member of the chain, the organization canoptimize the inventory levels in the upcoming period and thusminimize the supply chain cost.
That is, the organization should focus on the most potentialproduct among multi products that could cause maximuminventory cost and in this specific case it is product 3.The organization should take necessary steps to increase theproduction of product 3 in the factory by 602 units to make upfor the predicted shortage; increase the inventory level ofproduct 3 by 280 units in distribution centre 1 to make up forthe predicted shortage; increase the inventory level of product3 by 821 units in distribution centre 2 to make up for thepredicted shortage; decrease inventory level of product 3 by398 units in agent 1 to make up for the predicted excess;decrease inventory level of product 3 by 382 units in agent 2to make up for the predicted excess; increase the inventorylevel of product 3 by 764 units in agent 3 to make up for thepredicted shortage; increase the inventory level of product 3by 125 units in agent 4 to make up for the predicted shortage.
Thus by following the predicted stock levels, the increasein the supply chain cost due to excess/shortage inventorylevels can be avoided. The analysis provided an inventorylevel that had maximum potential to cause a remarkablecontribution towards the increase of supply chain cost. Theorganization can predict the future optimal inventory levels inall the supply chain members with the aid of these levels.Therefore it is concluded that it is possible to minimize thesupply chain cost by maintaining the optimal stock levels inthe upcoming period among various partners in the supplychain that was predicted from the inventory analysis, makingthe inventory management further effective and efficient.
187 http://sites.google.com/site/ijcsis/ ISSN 1947-5500
(IJCSIS) International Journal of Computer Science and Information Security,Vol. 7, No. 1, 2010
VI. CONCLUSION
Inventory management is an important component ofsupply chain management. As the lead time plays vital role inthe increase of supply chain cost, the complexity of predictingthe optimal stock levels increases. The novel and proficientapproach based on PSO algorithm, one of the bestoptimization algorithms, is proposed to overcome the impassein maintaining the optimal stock levels in each member of thesupply chain. The proposed methodology reduced the totalsupply chain cost as it undoubtedly established the mostprobable surplus stock level and shortage level along with theconsideration of lead time in supplying the stocks as well asraw materials that are required for inventory optimization.
The organizations can make use of the proposedtechniques in this present research for inventory optimizationby capturing the database in the desired format to suit theirrespective supply chain structure, replacing the simulated dataused in this research with the real data of the organization.For greater accuracy, the number of iterations should besufficiently increased and run on the most frequently updatedlarge database of past records. Also the organization canmention the maximum possible lower limit and upper limit forthe shortage and excess inventory levels respectively, withinwhich the inventory is expected to fluctuate among the variousmembers of the supply chain to make the convergence fastertowards optimal solution. Further if the organization canevaluate and quantify the cost involved for each shortage aswell as excess of inventory at each member of the supplychain, then the exact savings due to inventory optimization inthe supply chain can be calculated for the organization.
VII. FUTURE SCOPE
Organization can adopt decomposition technique and usethe proposed techniques for inventory optimization ofhigh/medium/low value independent products. In this case, theorganization should apply the technique for the high valueitems separately, medium value products separately and lowvalue products separately for inventory optimization in thesupply chain.
REFERENCES
[1]. H. Lu, 2003, “Dynamic Population Strategy Assisted Particle SwarmOptimization in Multiobjective Evolutionary Algorithm design”, IEEENeural Network Society, IEEE NNS Student Research Grants 2002,Final reports.
[2]. Hirotaka Yoshida Kenichi Kawata and Youshikazu Fukuyama YosukeNakanishi, 1999, “A Particle Swarm Optimization for Reactive Powerand voltage control considering voltage stability”, Proceedings of IEEEInternational Conference on Intelligent System Applications to PowerSystems, pp. 117- 121, April 4- 8.
[3]. Mahamed G.H. Omran, Andries P Engelbrecht, and Ayed Salman, 2005,“Dynamic Clustering using Particle Swarm Optimization withApplication in Unsupervised Image Classification”, Proceedings ofWorld Academy of Science, Engineering and Technology, Vol. 9,pp. 199-204
[4]. S. A. Hamdan, 2008, “Hybrid Particle Swarm Optimiser using multi-neighborhood topologies”, INFOCOMP - Journal of Computer Science,Vol.7, No.1, pp.36-43.
[5]. Ling-Feng Hsieh, Chao-Jung Huang and Chien-Lin Huang, 2007,“Applying Particle Swarm Optimization to Schedule Order Picking
Routes in a Distribution Center”, Asian Journal on Management andHumanity Sciences, Vol. 1, No. 4, pp. 558- 576.
[6]. Alberto Moraglio, Cecilia Di Chio, Julian Togelius and Riccardo Poli,2008, “Geometric Particle Swarm Optimization”, Journal on ArtificialEvolution and Applications, Article ID 143624.
[7]. T.F. Abdelmaguid and M.M. Dessouky, 2006, “A genetic algorithmapproach to the integrated inventory-distribution problem”, InternationalJournal of Production Research., 44: 4445-4464.
[8]. P. Pongcharoen, A. Khadwilard and A. Klakankhai, 2007, “Multi-matrixreal-coded Genetic Algorithm for minimizing total costs in logisticschain network”, Proceedings of World Academy of Science, Engineeringand Technology, Vol. 26, pp. 458-463, 14-16, December.
[9]. S. Buffett and N. Scott, 2004, “An Algorithm for Procurement in SupplyChain Management”, AAMAS-04 Workshop on Trading Agent Designand Analysis, New York.
[10]. D. Pardoe and P. Stone, 2007, An Autonomous Agent for Supply ChainManagement. In: Handbooks in Information Systems Series: BusinessComputing, Adomavicius, G. and A. Gupta (Eds.). Elsevier. Amsterdam.http://www.cs.utexas.edu/~pstone/Papers/bib2html/b2hd-TacTex-Book07.html
[11]. B.M. Beamon, 1998, “Supply chain design and analysis: Models andmethods”, International Journal on Production Economics, 55: 281-294.
[12]. J.L. Caldeira, R.C. Azevedo, C.A. Silva and J.M.C. Sousa, 2007,“Supply-chain management using ACO and beam-ACO algorithms”,Proceedings of the IEEE International Fuzzy Systems Conference, July23-26, London, pp. 1-6.
[13]. K. Wang and Y. Wang, 2008, “Applying Genetic Algorithms toOptimize the Cost of Multiple Sourcing Supply Chain Systems - AnIndustry Case Study”, Studies on Computational Intelligence, Vol. 92,pp. 355-372.
[14]. Chih-Yao Lo, 2008, “Advance of Dynamic Production-InventoryStrategy for Multiple Policies using Genetic Algorithm”, InformationTechnology Journal, Vol. 7, pp. 647-653.
[15]. Y. Barlas and A. Aksogan, 1996, “Product Diversification and QuickResponse Order Strategies in Supply Chain Management”, 14th
International Conference of the System Dynamics Society 1996Cambridge, Massachusetts, USA, pp. 51-56.
[16]. H.L. Lee and C. Billington, 1995. The evolution of supply-chain-management models and practice at Hewlett-Packard. Interface, 25: 42-63.
[17]. K.E. Parsopoulos and M.N. Vrahatis, 2005 “Recent approaches to globalOptimization problems through Particle Swarm Optimization”, NaturalComputing, 1 : 235-306.
[18]. http://swarmintelligence.org
ABOUT AUTHORS
Mrs. S. Narmadha is working as Assistant Professor inthe Department of Computer Science and Engineeringin Park College of Engineering and Technology,Coimbatore. She obtained her Bachelor’s degree inComputer Science and Engineering from TamilnaduCollege of Engineering, Coimbatore under BharathiarUniversity and Master’s degree in Mechatronics fromVellore Institute of Technology, Vellore. She iscurrently pursuing Ph.D. under Anna University,Chennai. She has 8 years of Teaching Experience and 2
years of Industrial experience. She has published 14 papers in InternationalConferences, 2 papers in International journals and a book on ‘Open SourceSystems’. She is life member of ISTE. Her field of interest includes SupplyChain Management, Automation, Database Management Systems, VirtualInstrumentation, Soft Computing Techniques and Image Processing.
188 http://sites.google.com/site/ijcsis/ ISSN 1947-5500
(IJCSIS) International Journal of Computer Science and Information Security,Vol. 7, No. 1, 2010
Dr. V. Selladurai is the Professor and Head, Departmentof Mechanical Engineering and Principal, CoimbatoreInstitute of Technology, Coimbatore, India. He holds aBachelor's degree in Production Engineering, a Master'sdegree in Industrial Engineering specialisation and aPh.D. degree in Mechanical Engineering. He has twoyears of industrial experience and 22 years of teachingexperience. He has published over 90 papers in theproceedings of the leading National and International
Conferences. He has published over 35 papers in international journals and 22papers in national journals. His areas of interest include Operation Research,Artificial Intelligence, Optimization Techniques, Non-TraditionalOptimization Techniques, Production Engineering, Industrial andManufacturing Systems, Industrial Dynamics, System Simulation,CAD/CAM, FMS, CIM, Quality Engineering and Team Engineering.
Mr. G. Sathish is a full time research scholar under AnnaUniversity, Coimbatore. He holds a Bachelor’s degreeand a Master’s degree in Computer Science andEngineering. He has 8 years of industrial experience. Hehas published 10 papers in the proceedings of the leadingInternational Conferences. His field of interest includesSupply Chain Management, Optimization Techniques,Data Mining, Knowledge Discovery, Automation, SoftComputing Techniques and Image Processing.
189 http://sites.google.com/site/ijcsis/ ISSN 1947-5500


