Embed Size (px)
Citation preview
Nigerian Journal of Mathematics and ApplicationsV olume 24, (2015), 137 − 156.c©Nig. J. Math. Appl. http : //www.kwsman.com
On The Strength of Agreement Between Students’ Initial and FinalAcademic Performances In Nigeria University System
1A. W. Banjoko, 1W. B. Yahya∗, 1H. S. Abiodun, 1M. O. Adeleke, 1R.B. Afolayan, 1M. K. Garba, 2K. O. Olorede and 2K. A. Dauda
Abstract
This paper examines the strength of agreement between academic
performances of students after their first and final years in the
University. Academic performances of a total of 886 students that
were admitted into various academic programs in the Faculty
of Science, University of Ilorin, during the 2008/2009 academic
session were followed-up to their year of graduation in 2012.
Information on the grade point average (GPA) of students at
the end of their first year in 2008, their final cumulative grade
point average (CGPA) at the end of their studies in 2012 among
others was collected. Results from this study generally showed
a strong agreement between students initial and final academic
performances in Nigeria University system (p < 0.001). This work
will serve as useful counseling guide to prospective admission
seekers into the Universities and all the stakeholders at enhancing
students academic performances in the University system.
Received September 1, 2015. ∗ Corresponding author.2010 Mathematics Subject Classification. 62-xx, 62A99.Key words and phrases. Cohen Kappa agreement index, Cumulative grade point average,
Chi-square test.1Department of Statistics, University of Ilorin, P.M.B., 1515, Ilorin, Nigeria; e-mail:
[email protected]; [email protected] of Statistics and Mathematical Sciences, Kwara State University, Malete, P.M.B
1530, Ilorin, Nigeria.
137

138 Banjoko et al.
1. Introduction
Education, according to Oghuvbu (2007) is a systematic procedure for thetransfer and transformation of culture, through formal or informal training ofpeople in a society. It is a process that leads to mental, physical, psychologicaland social development of an individual in a given society. The prime objective ofacquiring education all over the world is geared towards manpower developmentthat would in turn foster national growth and development. As an instrument forthe development of man and the society, the process of acquiring formal educa-tion can be compartmentalized into different hierarchical stages beginning fromelementary (kindergarten) to higher (tertiary) levels (Ebong, 1996). This hierar-chical structure of education differs from one country to another. At the moment,there are 114 government approved Universities in Nigeria 40 of which are estab-lished and funded by the Federal Government of Nigeria and 36 were own by theState Governments in Nigeria while 38 were owned by private concerns. Theseuniversities admit many students into their various programs and graduated anumber of them with varying class of degrees annually.Obviously, the employability of graduates from the universities largely dependson the class of degrees they had at the end of their programme, therefore, it isquite in order to examine and evaluate the processes that determine the finalacademic performances of the students while they are still in the Universities.The first year of students in the university is usually characterized by a long listof activities such as orientation programme, students’ union activities, travellingshow, having sideshows, sightseeing and rides, engaging in games of skill andthe like all in a bid to get themselves acclimatize to the new school environmentdifferent from where they came from. While these activities would improve thesocial status of the students in the school, unfortunately they are equally capableof distracting the students from their real academic pursuit for which they wereadmitted into the school.This study is therefore aimed at establishing the possible impacts of the aca-demic performances of the students during their first year in the university ontheir final academic performances at the end of their programme. Results fromthis study would serve as self-counseling mechanisms to the newly admitted stu-dents into the universities that would enable them to effectively prioritize theirsocial engagements vis--vis their academic activities during their first year in theuniversity as build-up steps towards attaining academic excellence at the end oftheir studies in the university.

On The Strength of Agreement Between Students’ Initial and Final Academic... 139
2. MATERIAL AND METHODS
2.1. Data Description. Data on results of academic performances of a total of886 students that were admitted into various academic programs in the old Fac-ulty of Science (which later split into Faculties of Physical and Life Sciences), Uni-versity of Ilorin, Nigeria, during the 2008/2009 academic session were followed-upto their year of graduation in 2012. In this study, these two faculties shall bereferred to as Faculty of Science in subsequent discussions. In addition to gender,information on the Grade Point Average (GPA) obtained by these students at theend of their first year in the University in 2008, the final Cumulative Grade PointAverage (CGPA) they graduated with at the end of their studies in 2012, andtheir modes of entry into the University was collected. Of all the 886 students inthis study, 335 (about 38%) were females while the remaining 551 (about 62%)were males. Also, 73(8%) of these students got admitted through Direct Entry(DE), 307 (35%) through Remedial (REM) and 506 (57%) through the UnifiedTertiary Matriculation Examination (UTME). As of the time of collecting thedata for this study in 2012, there were ten difference courses that were beingoffered by students within the Faculty of Science, University of Ilorin, Nigeria.Table 1 presents the distribution of all the 886 students in this study across theten departments in the faculty according to gender. The academic performancesof a student in various courses offered in a session are recorded in percentagescores with possible marks obtainable by the student ranged between 0% and100%. These percentage scores were converted to weighted grade point (WGP)which were thereafter converted to grade point average (the term used for stu-dent’s academic performance point at the end of their first year in the university)or cumulative grade point average (the term used for student’s academic perfor-mance point at the end of their second year and beyond in the university).In other words, the class of degree of a student at the end of each session isdetermined based on the GPA or CGPA point obtained by the student at theend of that session. The performance of students during the first session of theprogramme is recorded as the GPA which is a function of courses’ credit units andgrade points. For two or more sessions, the performance of student is recordedas the CGPA.

140 Banjoko et al.
Table 1: Table showing the distribution of students by gender across the tenDepartments in the Faculty of Science University of Ilorin.
DEPARTMENTS MALE FEMALE TOTALBiochemistry 67 50 117Chemistry 57 49 106Geology 110 32 142Industrial chemistry 26 30 56Mathematics 37 22 59Microbiology 39 51 90Physics 56 12 68Plant biology 28 33 61Statistics 102 38 140Zoology 29 18 47TOTAL 551(62%) 335 (38%) 886 (100%)
The distribution of the range of CPA or CGPA points obtainable by studentsand their respective classes of degrees as approved by National University Com-mission (NUC), the body saddled with the responsibility of regulating Universityeducation in Nigeria, is presented in Table 2. Any student that earn a GPA orCGPA point between 0.00 and 0.99 would be withdrawn from the programme orbe made to probate (repeat the academic level) depending on whether the stu-dent is in his/her first year or second year and higher of his academic programmerespectively.
Table 2: Table of possible GPAs or CGPAs that are obtainable by studentsat the end of each academic session till graduation and their associated classes ofdegree as approved by NUC for Nigeria University system.
Obtainable GPA or CGPA Class of degree4.50 - 5.00 First class (honours) -1st Class3.50 - 4.49 Second class (honours) upper division - 2nd class upper2.40 - 3.49 Second class (honours) lower division - 2nd class lower1.50 - 2.39 Third class (honours) - 3rd class1.00 - 1.49 Pass0.00 - 0.99 Fail
The following possible states of academic performance are true about the per-formances of students in the first and final years of their study in the university.First, it is possible for some students to maintain the class of degrees they earnedin their first year till graduation (e.g. being 2nd class upper at 100 level to being2nd class upper at 400 level). Another possibility is for students to improve ontheir initial GPA in their first year by the time they graduate (e.g. being a 3rdclass at 100 level to being a 2nd class lower at 400 level). The last possibility

On The Strength of Agreement Between Students’ Initial and Final Academic... 141
refers to students that dropped in academic performances at the end of theirstudies from the class of degrees they have in their first year in the university(e.g. . being a 2nd class upper at 100 level to being a 2nd class lower at 400 level).
2.2. Methodology. The variations in the academic performances of students atthe end of their academic program as measured by their CGPAs are caused by anumber of factors. Given the available data collected for this study, these factorsinclude students’ gender, mode of entry into the university, and the initial GPAsof students at the end of their first year in the university. The influence of thesefactors on the final academic performances of the students at graduation (finalCGPA) in the university was determined by fitting multiple regression model(Chatterjee and Hadi, 2006) of the form
(1) CGPAi = β0i+β1iGender(femalei)+β2iUTMEi+β3REMi+β4GPAi+βi
on the data.In regression model (1), the categorical predictor, gender was coded 0 and 1formale and female students respectively indicating that male group was made thereference category. Two dummy variables were created from students’ mode ofentry into the university with UTME and REM codded 1 while DE was the ref-erence category and coded 0.To establish agreement between the initial classes of degrees of students at theend of their first year in the university measured by their GPAs and their finalclasses of degrees they obtained at the end of their study equally measured bytheir CGPAs, a measure of agreement using the Kappa statistic was employed(Scott, 1995; Banergee et al., 1999; Lawal, 2003; Dou, et al, 2006).The Kappa statistic is a correlation-like coefficient that measures the pairwiseagreement between two raters in order to determine whether the observed agree-ment is just obtained by chance or not (Donner and Eliaziw, 1992). This conceptwas extended by Fleiss et al. (1981) to develop a weighted Kappa statistic toassess the ordinal scale degrees of agreement or disagreement.Generally, two possible uses of kappa are i.) to test raters’ independence, thatis, as a test statistic for testing the null hypothesis that there is no agreementbetween the two raters than might occur by chance given random guessing andii.) to quantify the level of agreement (effect-size measure), which is of moreconcern in this work.For any typical square r × c contingency table (withr = c) as given by Table 3(for r = c = 5), the Kappa statistic ka is defined as:
(2) ka = (π0 − πe)/(1 − πe)
where; π0 =∑r
i=1 πii with πii = niin..
; πe = 1n2..
∑ri=1
∑cj=1 ni.n.j ; n.. =
∑ri=1
∑cj=1 nij .

142 Banjoko et al.
Table 3: A typical 5×5 contingency table used for the computation of Kappa co-efficients for raters agreement between two independent ratters (Initial and Finalclasses of degrees obtained by students).
Classes of Degree Final Class of Degree (j) Total1st 21 22 3rd Pass
Initial 1st n11 n12 n13 n14 n15 n1.Class of 21 n21 n22 n23 n24 n25 n2.
Degree (i) 22 n31 n32 n33 n34 n35 n3.3rd n41 n42 n43 n44 n45 n4.
Pass n51 n52 n53 n54 n55 n5.Total n.1 n.2 n.3 n.4 n.5 n..
Table 4: Table of the interpretation of the estimates of the Kappa Statistic ka.
Interval of Kappa Estimates Strength of agreement< 0.00 Less than chance agreement
0.01 − 0.20 Slight agreement0.21 − 0.40 Fair0.41 − 0.60 Moderate0.61 − 0.80 Substantial agreement0.81 − 1.00 Almost perfect
However, different people have different interpretations as to what is a good levelof agreement using the computed Kappa statistic, ka. Traditionally, values ofka between −1 and +1 are used to interpret the inter-rater reliability agreementbetween two raters (McHugh, 2012). However, interpretations of values of kabetween 0 and 1 has been a popular choice in the literature (Altman,1991; Viera,and Garrett, 2005). To this end, Table 4 presents the interpretations of values ofka as reported by Altman (1991) and Viera and Garrett (2005) for values of kain the range of 0 to 1. With these interpretations, the values of ka = 0.00 and1.00 indicate poor agreement (agreement just by chance) and perfect agreementrespectively.Finally, based on the observed counts in the contingency Table 3, we determinethe proportions of students that
i.) dropped from their initial class of degrees (p1),ii.) maintained their initial classes of degrees (p2) oriii.) improved on their initial classes of degrees they started with (p3) as follows:
(3) p1 =1
n..
4∑i=1
5∑i=1
nij , fori < j, i = 1, 2, 3, 4; j = 1, 2, 3, 4, 5
(4) p2 =1
n..
5∑i=1
5∑j=1
nij , fori = j, i, j = 1, 2, 3, 4, 5
On The Strength of Agreement Between Students’ Initial and Final Academic... 143
(5) p3 =1
n..
5∑i=1
4∑j=1
nij , fori > j, i = 1, 2, 3, 4, 5; j = 1, 2, 3, 4
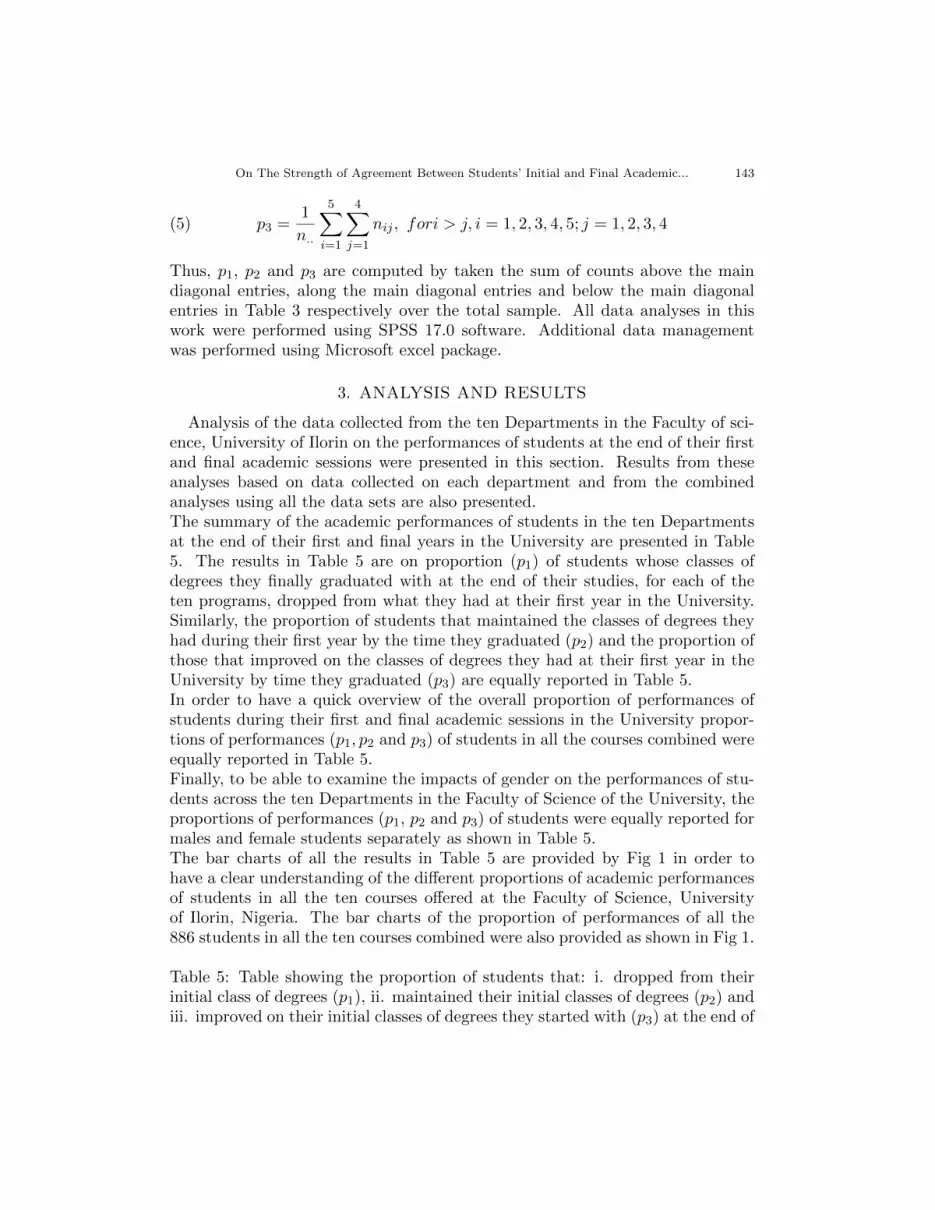
Thus, p1, p2 and p3 are computed by taken the sum of counts above the maindiagonal entries, along the main diagonal entries and below the main diagonalentries in Table 3 respectively over the total sample. All data analyses in thiswork were performed using SPSS 17.0 software. Additional data managementwas performed using Microsoft excel package.
3. ANALYSIS AND RESULTS
Analysis of the data collected from the ten Departments in the Faculty of sci-ence, University of Ilorin on the performances of students at the end of their firstand final academic sessions were presented in this section. Results from theseanalyses based on data collected on each department and from the combinedanalyses using all the data sets are also presented.The summary of the academic performances of students in the ten Departmentsat the end of their first and final years in the University are presented in Table5. The results in Table 5 are on proportion (p1) of students whose classes ofdegrees they finally graduated with at the end of their studies, for each of theten programs, dropped from what they had at their first year in the University.Similarly, the proportion of students that maintained the classes of degrees theyhad during their first year by the time they graduated (p2) and the proportion ofthose that improved on the classes of degrees they had at their first year in theUniversity by time they graduated (p3) are equally reported in Table 5.In order to have a quick overview of the overall proportion of performances ofstudents during their first and final academic sessions in the University propor-tions of performances (p1, p2 and p3) of students in all the courses combined wereequally reported in Table 5.Finally, to be able to examine the impacts of gender on the performances of stu-dents across the ten Departments in the Faculty of Science of the University, theproportions of performances (p1, p2 and p3) of students were equally reported formales and female students separately as shown in Table 5.The bar charts of all the results in Table 5 are provided by Fig 1 in order tohave a clear understanding of the different proportions of academic performancesof students in all the ten courses offered at the Faculty of Science, Universityof Ilorin, Nigeria. The bar charts of the proportion of performances of all the886 students in all the ten courses combined were also provided as shown in Fig 1.
Table 5: Table showing the proportion of students that: i. dropped from theirinitial class of degrees (p1), ii. maintained their initial classes of degrees (p2) andiii. improved on their initial classes of degrees they started with (p3) at the end of

144 Banjoko et al.
their studies across all the ten programs in the Faculty of Science, University ofIlorin, Nigeria for the study periods from 2008 to 2012. These three proportionsas they were observed by gender are equally reported in the table.
Department Gender p1 p2 p3(dropped) (maintained) (improved)
Plant Biology Overall (both male & female) 0.0328 0.4098 0.5574Male - 0.3636 0.6364Female 0.0714 0.4643 0.4643
Statistics Overall (both male & female) 0.2000 0.6571 0.1429Male 0.1961 0.6863 0.1176Female 0.2106 0.5789 0.2105
Geology Overall (both male & female) 0.0505 0.5775 0.3720Male 0.0272 0.6364 0.3364Female 0.0627 0.3750 0.5623
Chemistry Overall (both male & female) 0.0189 0.4245 0.5566Male 0.0350 0.5439 0.4211Female - 0.2857 0.7143
Physics Overall (both male & female) 0.1146 0.4589 0.4265Male 0.1250 0.4821 0.3929Female 0.0834 0.3333 0.5833
Microbiology Overall (both male & female) 0.0223 0.3444 0.6333Male 0.0516 0.4103 0.5381Female - 0.2941 0.7059
Industrial Chemistry Overall (both male & female) - 0.4737 0.5263Male - 0.5185 0.4815Female - 0.4333 0.5667
Biochemistry Overall (both male & female) 0.0256 0.5812 0.3932Male 0.0447 0.5075 0.4478Female - 0.6800 0.3200
Mathematics Overall (both male & female) 0.1186 0.6441 0.2373Male 0.1352 0.7297 0.1351Female 0.0909 0.500 0.4091
Zoology Overall (both male & female) 0.1021 0.5745 0.3234Male 0.0556 0.6111 0.3333Female - 0.5517 0.4483
All courses combined Overall (both male & female) 0.0654 0.5260 0.4086Male 0.0799 0.5771 0.3430Female 0.0418 0.4418 0.5164
For a quick overview of the proportions of performances p1, p2 and p3 presentedin Table 5, we provide the bar charts of these proportions (in %) for each of the

On The Strength of Agreement Between Students’ Initial and Final Academic... 145
ten courses offered by the students in the Faculty of Science, University of Ilorin,Nigeria as well as bar charts of students’ performances for all the 886 students inall the ten courses combined as shown by Fig 1.
Fig 1: Bar charts showing the percentages of number of students that droppedfrom their initial class of degrees (p1), those that maintained their initial classesof degrees (p2) and those that improved on their initial classes of degrees theystarted with (p3) at the end of their studies across all the ten programs in theFaculty of Science, University of Ilorin, Nigeria for the study periods from 2008to 2012. The bar charts of overall performances of all the 886 students in all theten courses in the faculty combined are equally plotted.

146 Banjoko et al.
In term of the observed numbers of students that ended up with differentclasses of degrees in their various disciplines in the Faculty, the confusion matrixin Table 6 presents the distribution of the classes of degrees obtained by the 61students that graduated with B.Sc. Plant Biology cross-classified by their initialclasses of degrees they had at the end of their first year in the University is pre-sented by the confusion matrix in Table 6.
Table 6: The confusion matrix of the distribution of students in B.Sc. PlantBiology program at the University of Ilorin, Nigeria by their initial and finalclasses of degrees they had at the end of their first and final years in the Univer-sity respectively.
Classes of Degree Class of Degree (j) Total1st 21 22 3rd Pass
1st 0 0 0 0 0 0Initial 21 0 4 1 0 0 5
Class of 22 0 8 15 1 0 24Degree (i) 3rd 0 1 23 6 0 30
Pass 0 0 0 2 0 2Total 2 0 13 39 9 0
Table 7: Table of confusion matrices showing the distributions of 140, 142, 106,68 and 90 students in the B.Sc. Statistics, Geology, Chemistry, Physics andMicrobiology programs respectively at the University of Ilorin, Nigeria cross-classified by their initial and final classes of degrees they had at the end of theirfirst and final years in the University respectively.
B.Sc. StatisticsClasses of Degree Final Class of Degree (j) Total
1st 21 22 3rd Pass1st 2 3 0 0 0 5
Initial 21 0 23 10 0 0 33Class of 22 0 4 37 6 0 47
Degree (i) 3rd 0 0 14 28 9 51Pass 0 0 0 2 2 4
Total 2 30 61 36 11 140

On The Strength of Agreement Between Students’ Initial and Final Academic... 147
B.Sc. GeologyClasses of Degree Final Class of Degree (j) Total
1st 21 22 3rd Pass1st 0 0 0 0 0 0
Initial 21 0 2 1 0 0 3Class of 22 0 8 35 2 0 45
Degree (i) 3rd 0 0 30 36 2 68Pass 0 0 0 17 9 26
Total 0 10 66 55 11 142B.Sc. Chemistry
Classes of Degree Final Class of Degree (j) Total
1st 21 22 3rd Pass1st 0 0 0 0 0 0
Initial 21 2 10 0 0 0 12Class of 22 0 22 21 1 0 44
Degree (i) 3rd 0 0 29 13 1 43Pass 0 0 0 6 1 7
Total 2 32 50 20 2 106B.Sc. Physics
Classes of Degree Final Class of Degree (j) Total
1st 21 22 3rd Pass1st 0 0 0 0 0 0
Initial 21 1 4 0 0 0 5Class of 22 0 6 11 2 0 19
Degree (i) 3rd 0 0 17 14 6 37Pass 0 0 2 3 2 7
Total 1 10 30 19 8 68B.Sc. Microbiology
Classes of Degree Final Class of Degree (j) Total
1st 21 22 3rd Pass1st 0 0 0 0 0 0
Initial 21 3 11 2 0 0 16Class of 22 0 25 17 0 0 42
Degree (i) 3rd 0 5 24 3 0 32Pass 0 0 0 0 0 0
Total 3 41 43 3 0 90

148 Banjoko et al.
Table 8: Table of confusion matrices showing the distributions of 56, 117, 59and 47 students in the B.Sc. Industrial Chemistry, Biochemistry, Mathematicsand Zoology programs respectively at the University of Ilorin, Nigeria cross-classified by their initial and final classes of degrees they had at the end of theirfirst and final years in the University respectively. The distribution of all the 886students in all the ten programs in the Faculty of Science cross-classified by theirinitial and final classes of degrees they had at the end of their first and final yearsrespectively is equally reported in the table.
B.Sc. Industrial ChemistryClasses of Degree Final Class of Degree (j) Total
1st 21 22 3rd Pass1st 0 0 0 0 0 0
Initial 21 1 3 0 0 0 4Class of 22 0 10 12 0 0 22
Degree (i) 3rd 0 0 17 11 0 28Pass 0 0 0 1 1 2
Total 1 13 29 12 1 56B.Sc. Biochemistry
Classes of Degree Final Class of Degree (j) Total
1st 21 22 3rd Pass1st 0 0 0 0 0 0
Initial 21 2 40 3 0 0 45Class of 22 0 38 14 0 0 52
Degree (i) 3rd 0 0 5 14 0 19Pass 0 0 0 1 0 1
Total 2 78 22 15 0 117B.Sc. Mathematics
Classes of Degree Final Class of Degree (j) Total
1st 21 22 3rd Pass1st 3 2 0 0 0 5
Initial 21 2 11 2 0 0 15Class of 22 0 5 19 3 0 27
Degree (i) 3rd 0 0 7 5 0 12Pass 0 0 0 0 0 0
Total 5 18 28 8 0 59

On The Strength of Agreement Between Students’ Initial and Final Academic... 149
B.Sc. ZoologyClasses of Degree Final Class of Degree (j) Total
1st 21 22 3rd Pass1st 0 0 0 0 0 0
Initial 21 0 7 0 0 0 7Class of 22 0 10 21 1 0 32
Degree (i) 3rd 0 0 8 0 0 8Pass 0 0 0 0 0 0
Total 0 17 29 1 0 47All The Ten Programs
Classes of Degree Final Class of Degree (j) Total
1st 21 22 3rd Pass1st 5 5 0 0 0 10
Initial 21 11 115 19 0 0 145Class of 22 0 136 201 16 0 353
Degree (i) 3rd 0 6 175 130 18 329Pass 0 0 2 32 15 49
Total 16 262 397 178 33 886
Similarly, the distribution of the classes of degrees obtained by 140, 142, 106,68 and 90 students that graduated with B.Sc. Statistics, Geology, Chemistry,Physics and Microbiology respectively cross-classified by their classes of degreesthey had at the end of their first and final years in the University is presentedby the confusion matrices in Table 7. Also, the cross-classification of academicperformances of 56, 117, 59 and 47 students that graduated with B.Sc. IndustrialChemistry, Biochemistry, Mathematics and Zoology respectively cross-classifiedby their classes of degrees they had at the end of their first year in the Universityis presented by the confusion matrices in Table 8. Finally, the distribution of theclasses of degrees obtained by all the 886 students in the ten academic programsoffered in the Faculty combined at the end of their studies cross-classified bytheir classes of degrees they had at the end of their first year in the University isequally presented by the confusion matrices in Table 8.It can be observed from the data in Table 6 for the 61 graduates of Plant Biologythat a total of 34 (56%) students improved on their initial classes of degrees theystarted with (entries in bold pink colour). Whereas, 25 (41%) students main-tained their initial classes of degrees till graduation (main diagonal entries) andwhile only 2 (3%) students dropped from their classes of degrees they started withat graduation (entries in bold red colour), thus, confirming the results presentedin Table 5. To further examine the association between the initial and final classesof academic performance of students at the end of their first and final years inthe University, the Kappa statistics were computed separately for all the ten pro-grams offered by students in the Faculty of Science, University of Ilorin using the

150 Banjoko et al.
information provided in Tables 6, 7 and 8. The results of the Kappa inter-rateragreement using statistic (2) are presented in Table 9 where reasonable agreementcan be observed between the students’ initial and final classes of degrees they hadat the end of their first and final years of study in the University in verticallyall the courses of study offered. This result was supported by the results of theChi-square test of association in which the p-values for each course of study andall the courses combined were significant (p < 0.05). However, evidence of lackof association was only shown in three of all the cases for gender (Plant-Biology- male, Physics - female and Zoology - female).Finally, in order to measure the impacts of students’ gender, model of entry intothe University and the initial GPAs of students at the end of their first year ontheir final academic performances as measured by their final CGPAs, the linearregression model (1) was fitted to the data using the final CGPAs as responsevariable. The results are presented by Table 10.In fitting the linear regression model (1), a cross validation approach was em-ployed by dividing the entire 886 sample size in the data into 80% (709) trainingset and 20% (177) test set according to scheme adopted elsewhere (Yahya, 2009;Yahya, 2012; Yahya et al., 2014). The regression model was fitted to the trainingset and the fitted model was used to predict the CGPA scores in the test set.This was done to ascertain the stability and efficiency of the fitted model so thatthe final CGPA of any student can be predicted give the information on the pre-dictors (Yahya et al., 2011; Hapfelmeier et al., 2012).The goodness of the fitted model was determined by plotting the box plots of theresiduals of the fitted model using the training and test data sets. The boxplotsof these two residuals are provided by Fig 2. It can be observed from the boxplots that the residual of the test data are relatively more stable (less variable)than that of the training data showing that the fitted model is quite efficient.
Table 9: Table of results of inter-rater agreement measures of Kappa statisticand the Chi-square test of association between the classes of degrees obtained bystudents at the end of their first and final years in the University in ten courses ofstudy in the Faculty of Science, University of Ilorin. These results were reportedfirst irrespective of gender and second by gender. The overall performances ofstudents based on these test measures over the three modes of gaining admissioninto the University were equally reported.

On The Strength of Agreement Between Students’ Initial and Final Academic... 151
Department Category Kappa (ka) Chi-square (χ2) p-valueOverall 0.5149 183.013 ¡ 0.0001
Statistics Female 0.3845 25.505 0.0020Male 0.5587 155.755 ¡ 0.0001
Overall 0.0683 31.213 ¡ 0.0001Plant-Biology Female 0.1053 29.176 ¡ 0.0001
Male 0.1159 7.144 *0.1280Overall 0.3516 104.001 ¡ 0.0001
Geology Female -0.0457 14.640 0.0060Male 0.4496 97.272 ¡ 0.0001
Overall 0.1686 95.432 ¡ 0.0001Chemistry Female -0.0130 50.509 ¡ 0.0001
Male -0.3464 55.572 ¡ 0.0001Overall 0.2247 51.120 ¡ 0.0001
Physics Female 0.1027 1.726 *0.7860Male 0.2563 45.582 ¡ 0.0001
Overall 0.0418 38.893 ¡ 0.0001Microbiology Female 0.0160 17.757 0.0010
Male 0.0800 17.430 0.0080Overall 0.1633 71.403 ¡ 0.0001
Industrial Chemistry Female 0.1583 20.614 ¡ 0.0001Male 0.2515 38.025 ¡ 0.0001
Overall 0.3448 99.557 ¡ 0.0001Biochemistry Female 0.5263 48.631 ¡ 0.0001
Male 0.1698 50.013 ¡ 0.0001Overall -0.3954 52.647 ¡ 0.0001
Mathematics Female 0.2220 30.341 ¡ 0.0001Male 0.6063 44.359 ¡ 0.0001
Overall 0.2075 18.341 ¡ 0.0001Zoology Female 0.0667 4.723 *0.3170
Male 0.2352 12.426 0.0140Overall 0.3192 775.034 ¡ 0.0001
Combined Female 0.1930 532.221 ¡ 0.0001Male 0.3960 525.290 ¡ 0.0001DE 0.4910 73.935 ¡ 0.0001
Mode of entry Remedial 0.3980 272.804 ¡ 0.0001UTME 0.2252 464.456 ¡ 0.0001

152 Banjoko et al.
Table 10: Result of multiple linear regression modeling of students’ final CG-PAs on gender, mode of entry and initial GPAs of students in all the ten academicprograms in the Faculty of Science, University of Ilorin, Nigeria.
Model B Std. Error t-value P-value(Constant) 0.645 0.094 6.864 ¡0.0001Gender (F) 0.251 0.035 7.165 ¡0.0001
UTME 0.160 0.062 2.565 0.011REM -0.131 0.068 -1.929 0.050
FIRST GPA 0.822 0.023 35.282 ¡0.0001
Fig 2: The Box plots of residuals of the fitted regression model for the trainingand test data sets.
4. Discussions
The main objective of this paper is to examine the final academic performancesof students in the University based on certain information regarding their entrybehaviours which include their academic performances at their first year in theUniversity, model of getting admitted into the University and gender. However,emphasis here is more on determining the possible relationship between the ini-tial academic performances of the students at the end of their first year in theUniversity as measured by their GPAs and their final academic performances at

On The Strength of Agreement Between Students’ Initial and Final Academic... 153
the end of their studies as measured by their CGPAs both of which are simplyconverted into possible classes of degrees that are obtainable within the Univer-sity system as provided in Table 2.Data on academic performances of students in ten academic fields of study asoffered in the Faculty of Science, University of Ilorin, Nigeria were collected on886 students. This study can be regarded as a longitudinal study in which theacademic progresses of these 886 students were monitored till graduation.Based on the available information on all the academic performances of 886 stu-dents in all the ten academic programs in the Faculty of Science, University ofIlorin as detained in Tables 8, it is discovered that a total of 362 (≈ 40%) of 886graduates improved on the classes of degrees they had in the first year of theirstudy. Also, 466 (≈ 53%) of the students maintained their classes of degrees theyhad in their first year till graduation while 58 (≈ 7%) of the students droppedfrom the classes of degree they started with in the first year of their study atgraduation.Specifically, out of a total of 145 students that had second class upper (21) atthe end of their first year on their programs, 115 (≈ 79%) of them maintainedthis class of degree till graduation, 11 (≈ 8%) of them improved to first classwhile 19 (≈ 13%) of them dropped to second class lower (22). Surprisingly, ofthe 10 students that started with first class in their first year, only 5 (50%) ofthem maintained this class of degree while the remaining 5 dropped to 21 classat graduation.Also, of 353 students that started with 22 class from their first year in the Uni-versity, 201 (≈ 57%) of them maintained this class of degree till graduation, 136(≈ 39%) of them improved to 21 while only 16 (≈ 5%) of them dropped to thirdclass (3rd) degree status at graduation.Similarly, of the 329 students that had 3rd class degree at their first year, 130(≈ 40%) of them maintained this class of degree till graduation, 181 (≈ 55%)improved (175 had 22 and 6 had 21), while 18 (≈ 5%) students from this groupdropped to pass degree at graduation.Among the 39 students that started with pass degree in their first year, 15(≈ 38%) of them maintained pass degree at graduation while 34 (≈ 87%) ofthem improved to 3rd class (32 students) and 22 class (2 students).In terms of gender, the results in Table 5 showed that about 58% and 44% ofmale and female students maintained the classes of degrees they had at their firstyear at graduation, about 34% and 52% of male and female students improvedon their classes of degree at graduation while about 8% and 4% of male and fe-male students respectively dropped from the classes of degrees they started withat graduation. The summary of this result is that female students do performbetter than their male counterpart in terms of their academic improvement tillgraduation.

154 Banjoko et al.
The above pattern of academic performances of students was replicated acrossthe ten departments covered in this study except in few cases where the perfor-mances moved out of the trend. For instance, more than 40% of the studentsimproved on the classes of degrees they had in their first year at graduation in 6(Plant Biology, Chemistry, Physics, Microbiology, Industrial Chemistry and Bio-chemistry) of the 10 departments examined in this study. Specifically, more than50% of the students in Plant Biology, Chemistry, Microbiology and IndustrialChemistry improved on their initial academic performances at graduation withno student retrogress in their academic performances till graduation in IndustrialChemistry.The departments with the worst cases of performance were Statistics and Mathe-matics. In these two departments, only about 14% (Statistics) and 23% (Mathe-matics) of their students improved their initial academic performances at gradua-tion with above 20% (Statistics) and (12%) dropped from their first year academicperformances at graduation. Academic performances of students of Geology andZoology Departments were apparently similar with about 37% and 32% of thestudents of these Departments respectively improved on their first year academicperformances at graduation.With respect to academic performances of students by gender, it can be ob-served from the Table 5 that female students improved significantly on theiracademic performances better than their mail counterparts in 80% of the cases.For instance, about 70% of female students of Chemistry and Microbiology De-partments improved on their first year academic performances which was sig-nificantly higher than improvements of about 42% and 54% recorded by malestudents from these two Departments respectively (p = 0.014). This is an aver-age of 22% improvement in academic performances by female over male studentsin the University according to the data collected. Departments where improve-ments in the first year academic performances of male students are apparentlybetter than that of the females at graduation were Plant Biology (about 64%)and Biochemistry (about 45%).Results of inter-rater agreement from Kappa statistic as presented in Table 9clearly showed reasonable agreement between the classes of degrees of studentsin their first year as determined from their GPAs and final classes of degrees theyhad at graduation. This result was corroborated by that of the Chi-square test inthe table which again showed the dependency of final classes of degrees obtainedby students at graduation on their first year classes of degree as measured bytheir GPAs.Finally, the impacts of some factors like mode of entry into the University, genderand of course, the initial GPAs of students in their first year on the final academicperformances of students at graduation were determine through the multiple lin-ear regression model fitted the results of which were presented in Table 10. From

On The Strength of Agreement Between Students’ Initial and Final Academic... 155
the results in this table, it can be observed that female students contributed 25%improvement on their final CGPAs more than their male counterparts (p < 0.001)while students that were admitted through UTME would have 16% improvementin their final CGPAs than their counterparts that were admitted through DirectEntry (p = 0.011). On the other hand, students that were admitted through Di-rect Entry would have about 87% improvement in their final CGPAs better thantheir counterparts that were admitted through the Remedial mode (p = 0.05), atany level of significant slightly higher than 5%.More importantly, the results in Table 10 showed that initial GPAs of studentsat the end of their first year contributed about 82% improvement on their finalCGPAs at graduation. These results clearly showed the strong impact of theinitial GPAs of students in their first year on their final CGPAs at graduation.Finally, the results showed that students in the Biological Sciences improvedon their initial (first year) academic performances at graduation more than theircounterparts in the Physical Sciences, especially in Mathematical Science courses.
5. Conclusion
The impact of the performances of students in higher institutions of learning,especially in the University, during their first year on their final academic achieve-ment at graduation is examined in this work. Emphasis is more on determiningthe relationship between the initial GPAs and final CGPAs of students at theirfirst and final years in the University system. This was determined through afollow-up study on the performance of students in the Faculty of Science, Uni-versity of Ilorin, Nigeria between 1998 and 2012.The results from this work showed generally that about 50% of students in theUniversity do maintained the classes of degrees they had in their first year of theirprogram till graduation. Whereas, about 40% of the students improved on theirinitial classes of degrees during their first year at graduation while only about 7%of them had their academic performances dropped from what they had duringtheir first year.Further results indicated that female students do improved progressively on theiracademic program in the University better than their male counterparts.Results from this study have provided vital information that are useful for prospec-tive students of University regarding the need to work very hard during their firstyear on their academic programs since the outcome of such efforts would greatlydetermine their final academic performance on graduation from the University.In addition, the various results from this work would serve as useful counselingresources to stakeholders in the education sector within and outside the Uni-versity system towards improving the academic performances of students in thesystem. This study would equally benefit the parents and guardians to be able
156 Banjoko et al.
to put in place necessary measures that would assist at improving the academicperformances of their children and wards in the University.
References
[1] Altman, D. G. (1991): Practical Statistics for Medical Research. London England: Chap-man and Hall.
[2] Banergee, M., Capozzoli, M., Mcsweeney, L.J and Sinha, D. (1999). Beyond kappa: Areview of inter-rater agreement measure. The Cana, J. of statistics.270,03,23
[3] Chatterjee, S and Hadi, A. S. (2006): Regression Analysis by example. Fourth edition, JohnWiley and sons Inc., Hoboken, New Jersey.
[4] Donner A. and Eliaziw , M.(1992). A goodness of fit approach to inference procedure forthe kappa statistics; confidence interval construction, significance testing and sample sizeestimation-statist. Med. j , 11:1511-1519.
[5] Dou, W., et al. (2006): Fuzzy kappa for the agreement measure of fuzzy classifications,Neuro-computing. doi:10.1016/j.neucom.2006.10.007
[6] Fleiss, J. L., Cohen, J. and Everitt, B. S. (1981). Large sample standard errors of kappaand weighted kappa. Psychological Bulletin, 72(5), 323-327.
[7] Hapfelmeier A., Yahya W. B., Rosenberg R. and Ulm K. (2012): Predictive modelling ofgene Expression data. In: Handbook of Statistics in Clinical Oncology, 3rd ed., Edited byCrowley, J. and A. Hoering. Chapman and Hall/CRC, New York: 463-475.
[8] Lawal, B. H. (2003): Categorical data analysis with SAS and SPSS applications. LawrenceErlbaum Associates Inc. pg 484
[9] McHugh, M. L. (2012): Interrater reliability: the kappa statistic. Biochem Med (Zagreb),22(3): 276-282.
[10] Oghuvbu, E. P.(2007): Education, Poverty and Development in Nigeria: The Way Forwardin the 21st Century. J. Soc. Sci., 14(1): 19-24.
[11] Scott, W. A. (1995). Reliability of content analysis: the case of nominal scale coding. PublicOpinion Quart., 19: 321,325.
[12] Viera, A. J. and Garrett, J. M. (2005): Understanding Inter-observer Agreement: TheKappa Statistic. Family Medicine, 37(5): 360-363.
[13] Yahya W. B. (2009): Sequential dimension reduction and prediction methods withhigh dimensional microarray data. Universittsbibliothek, Ludwig- Maximilians-Universitt,Mnchen, Germany. Ph.D. Thesis. URL: http://edoc.ub.uni-muenchen.de/10254/.
[14] Yahya W. B.(2012): Genes selection and Tumour Classification in Cancer Research: A newapproach. Lambert Academic Publishing, Sbruck, Germany.
[15] Yahya W. B., Rosenberg R. & Ulm K. (2014): Microarray-based Classification ofHistopathologic Responses of Locally Advanced Rectal Carcinomas To Neoadjuvant Ra-diochemotherapy Treatment. Turkiye Klinikleri Journal of Biostatistics, 6(1): 8-23.
[16] Yahya W. B., Ulm K., Ludwig F. and Hapflemeir A. (2011): K-SS: A sequential featureselection and prediction method in microarray study. International Journal of artificialintelligence, Spring, (6) S11:19-47.


