Embed Size (px)
Citation preview

International Journal of Computer Applications (0975 – 888)
Volume 48– No.11, June 2012
32
Effort Estimation Approach for Integrated Medical
Warehouses
Naveen Aggarwal UIET, Panjab University
Chandigarh India
Nupur Prakash Guru Gobind Singh
Indraprastha University Delhi, India.
Sanjeev Sofat PEC University of Technology
Chandigarh India.
ABSTRACT
Medical warehouses are architectural construct of an information system that provides users with current and historical decision support information. But medical warehouse projects suffers from overestimation of resources because of improper estimation approaches which do not suit well on poorly defined architecture of medical warehouses. In this paper, we have first proposed a framework for an
integrated medical warehouse that covers the different aspects of health care management. Then we proposed an effort estimation approach based on this framework which is designed to be used at the very early stage of requirement analysis. The data from the three different set of data warehousing projects are studied and the linear regression approach is used to finalize the model. Final effort is estimated using the project size and the different adjustment
factors. For analytical estimation of project size and its complexity, extended function point analysis is used and identified object are categorized and their complexity weight age is determined. The proposed approach is validated by studying three different set of projects having different level of complexity. First set contains eight business data warehousing projects completed in different domains. Second set contains medical OLAP projects and third set has clinical
data marts. A set of questionnaire is used to estimate the complexity of the project, which has to be filled by the developers after completing the initial requirement analysis. The proposed effort estimation model shows a great improvement as compared to the earlier models used in effort estimation of medical warehousing projects.
General Terms
Data Warehouses, Effort Estimation, Information Processing Systems
Keywords
Medical Warehouses, Effort Estimation, Data Warehousing, Medical support systems, Electronic Medical Records
1. INTRODUCTION Medical Computing systems are gaining popularity day by day. The most of the major health organization have started using the Electronic Medical Record (EMR) [1] and
Computerized Practitioner Order Entry (CPOE) [2] systems. But these systems are used just for manual data entry and not for any automated analysis. When the transition from paper based record maintenance to EMR took place, very less attention was given to the data analysis and linking tasks. Emphasis on the usage of data apart from searching was very less. Even though thousands of patients visits the major hospitals every day and their record is kept using EMR, But
still there is no effective tool available for the automated analysis of the patients’ record. Mostly the records of patients are kept separate in different repository corresponding to
different clinics and there is no way to access these records at one place [1].
The concept of integrating health system data at centralized
place using data warehousing was introduced by Ewen et al [3]. Earlier the main focus was to evaluate the usage of warehouses in healthcare organizations [4] and its impact on the medical thinking and healthcare policy [5]. But it was not clear, how the issues of data warehousing in healthcare systems are different from issues in normal business warehouses. These differences were made clear by Pedersen et al [6] by highlighting the main research issues in clinical
data warehousing. It was found that the integration process in medical warehouses is very complex and time consuming which involves extraction of data from different heterogeneous clinical sources. After extraction, these are transformed into a single consistent format. But in a typical health care management, not only the clinical data, but the billable counter data also need to be integrated [7]. This non-trivial and highly error prone process can be made simpler if
performed using non-systematic approaches based on the metadata such as the descriptions of measured parameters and their higher-level grouping [8] [9]. Nguyen et al [10] use the XML Topic Maps (XTM) [11] to define the meta multi dimensional cubes to represent data in an integrated fashion. Use of XML in representation ensures the uniform way to represent data on multiple platforms using Semantic Web. To further enhance the usability and accessibility of medical
warehouses, different researchers have now started using different data mining functionalities such as concept description, association rule mining, classification, clustering etc. Many recent studies [12] [13] describe the use of association analysis to effectively integrate the information at various granular levels in a medical system. Decision making ability in these systems is further enhanced by using Rule based systems and case based reasoning [14]. Similarly
visualization and analysis of data is enhanced by combining Online Analytical Processing (OLAP) Tool and Geographical Information Tools [15] [16]. So in last few years, numerous medical warehouse architectures are proposed but most of them are confined to one or two domain of healthcare management. Effort estimation based on improper and incomplete approaches may lead to the under or over estimation of resources. Although many medical warehouse implementation projects have suffered because of this, yet
there is no specific estimation model available to address their particular needs.
In this paper, we have proposed an effort estimation approach to effectively predict the effort taken to develop large medical warehouses. Medical warehouse are usually designed by integrating the data taken from different clinical databases and then transforming it into single common format. One such architecture of Medical warehouse is described in detail in
section 2. Effort Estimation model based on this architecture

International Journal of Computer Applications (0975 – 888)
Volume 48– No.11, June 2012
33
and its complexities are discussed in section 3. Section 4 presents the result and the methodology to validate our approach. Finally, section 5 concludes the paper with brief description about the future enhancements.
2. MEDICAL WAREHOUSE
ARCHITECTURE Medical warehouses are blend of technologies and
components and presents an architectural construct of an information system in such a way that user can take the strategic decision based on the current and historical data. Different data sources in a typical healthcare system are distributed across various clinics and administrative units [2]. Some clinics such as radiology have large multimedia data, whereas some clinics use text data [6]. Data in each clinic is
acquired through different medical equipments and is usually stored in different formats. Inconsistency of data formats is the main reason of limited communication among different clinical sources [6]. In large hospitals, these clinical data sources are updated frequently due to large number of
patients, so these collectively are called operational databases and can be categorized as follows:
Text Databases (Medical Observation & Reporting)
Image & Multimedia Databases (DICOM Images, Ultrasound, ECG/EEG etc.)
RDBMS (Administration, Patient Record, Billing & Finance, Personnel Management)
XML databases (Medical Transcriptions, Clinical Reports, Patients Referrals)
Figure 1: Medical Warehouse Architecture
Due to inconsistent nature of data in operational databases these are not considered as part of medical warehouse but are taken as central repository from where the only clean and
processed data can enter the warehouse in an integrated manner [3]. Operational databases usually store information
Laboratory &
Clinical
Databases
Data Pre processing
Extraction Transformation (Standard HL7) & Loading (ETL)
Pharmacy
Databases Patient
Records
Billing &
Finance
Database
Observation&
Reporting
Personnel &
Resource
Management
Multimedia &
DICOM
Databases
Meta data
Repositories Clinical Data
Marts
Multidimensional
Patient Data Cubes
Data Cube & Data Mart Interface
GUI Interface
OLAP &
OLAM
Server
Enterprise Warehouse Server
Query
Reports
Data Visualization Data Mining

International Journal of Computer Applications (0975 – 888)
Volume 48– No.11, June 2012
34
using the various data types and formats, so data needs to be processed into the single consistent format [6].
Over the years, researchers have proposed different framework for medical warehouses. Some researchers [17] focussed on data integration framework. They used multi-
agent technology to configure data warehouse to integrate and archives information from heterogeneous sources of health care unit. But from health care professionals’ perspective, main focus is always on user interface and visualization of multi-modal images [18]. Hence the system should be designed to find suitable strategies to integrate important characteristics of multiple data sets into one image such that better insights can be provided [19]. Parvin Vajirkar et al. [20]
suggested that context aware applications [21] [22] [23] provide better accuracy and precision to the prediction results. They designed a context aware data mining framework for data mining applications for providing accuracy and precision to prediction results based on context aware factors. Similarly, Szirbik et al. [24] used the rational unified process framework in designing the medical warehouse for elderly patient care system. But all these frameworks lack the completeness; they
are either domain specific or focussed on one aspect only. Hence these models cannot be used for generic effort estimation process. For an effective effort estimation model, we have proposed a complete medical warehouse architecture that is flexible enough to be used in different scenario.
The architecture shown in Figure 1 is a four layer architecture where the bottom most layer take the data from the operational databases.
Data is partitioned across multiple servers, each of which resides on individual nodes of the parallel systems and has an ownership of its own disk and thus its own database partition. At this layer, different data pre-processing tools are used to extract clean data and finally transformed to uniform format such as HL7 [25]. We propose to use HL7 data interface as a standard format because it has larger acceptability in many healthcare organizations.
The second layer is basically the metadata layer, here
corresponding to different clinics, Meta data directories are created and the operational data bases are converted into the data marts. We propose that there should be one data mart corresponding to each of the clinical databases which will keep the history of data of the respective clinic in relational format. Apart from the clinic data marts, multi dimensional data bases (data cubes) [26] corresponding to patient and medicinal databases are created. For easy access of historical
administrative data, data cubes having different dimensions are created [27].
Finally the topmost layer is an information access layer. It represents the tools that the end users use daily to extract and analyse the data contained within the data warehouse. It consists of front end tools such as query and reporting tools, analysis tools and other data mining tools. This layer is designed to define the usage of computerized patient record
data for monitoring, charting, compliance and supporting quality initiative [28].
3. EFFORT ESTIMATION Our effort estimation approach is based upon the past data collected from the eight different data warehousing projects
completed in different domains such as health care, financial, education and retail. Among these projects there was no project directly implemented in hospitals, so we refined our model by taking the data collected from the different Medical
OLAP projects which require implementation of one or two data mining functionality on small data marts. Finally we used the data collected by creating special data marts for the different specialized clinics in city. These data marts are especially created for testing our model only. It is assumed
that all the data of eight different project requests studied is correct without any deviation. All the developers who are involved in developing projects are provided with a detailed set of project requirements. All the developers were given a questionnaire, which they have to submit after completing the software requirement specification document. The questionnaire is about the 40 different parameters related to the setup, implementation, design, performance, user
interface, usability, reliability, external interface, and other requirements of the project.
3.1 Object Classification Before estimating the size of the project, its development scope is required to be limited by identifying the boundaries
of the system. The most widely used approach to size estimation is Function Point Analysis (FPA) [29]. Function Points are a measure of the size of computer applications and the projects that build them. So this is not directly suitable for estimating the size of complex data warehouses during the early stages of requirement analysis. So we propose to use the extended FPA [30] approach to measure the size from a components points of view i.e. function points are defined in
terms of object points. It is independent of the computer language, development methodology, technology or capability of the project team used to develop the application.
The Function Points (FP) reflects the countable objectivity provided to the user by the application / tool. The application specific functions should be evaluated in terms of what is being delivered. FP is the total of Function Points for all the functionalities implemented in the Medical Warehouse. In each application, there are two types of requirements, one
which are directly visible through user interface i.e. functional requirements and others which are not directly visible i.e. non-functional requirements. This include only user defined and requested functionalities. Existing functions and non-functional requirements are not included in the final count. We have identified the different objects, which may be part of a medical warehouse and categorized them into as follows:
1. Framework Setup
a. Setting of work area, data and authorities.
b. All the objects that are required to setup the
framework for application development come under
this category. This may include platform setup (if
within scope of application boundary), security
access for users at the application level, user rights,
directory or file setup, configuration settings etc.
c. Network / Hardware / Software set up / Tools
configuration etc.
2. Work Flow Setup
a. Setting up or initializing tasks and defining their
dependencies or impact on each others.
b. Setting up of static or dynamic libraries if required
c. Initializing the privileges for individual tasks.
3. Data Pre-Processing
a. Data Cleaning by filling missing values and
smoothing noise
b. Data transformation to standard normalized form by
removing inconsistencies.
International Journal of Computer Applications (0975 – 888)
Volume 48– No.11, June 2012
35
4. Data Mart Creation
a. Restructuring the historical data.
b. Periodic ETL (Extraction, Transformation &
Loading)
5. Enterprise Warehouse Creation
a. Concept hierarchy Generation
b. Multi dimensional model formation (Defining
dimensions and measures)
c. Business process model
d. Relational or Multi-dimensional server setup
e. Indexing the OLAP data.
6. User Interface
a. Identification of Internal & External components
(ODBC, API, Third party components)
b. Categorize the static and dynamic component
separately
c. Identify all the different containers in the
application such as component containers, data
containers, Media containers, Menus, Tabs, and
Frames etc.
d. Identify all the data components in the system.
These data components may be input components,
output components and display components.
7. Reports Creation
a. It includes all the printed or graphical analysis
reports.
8. Metadata Repositories
a. Identify the schema of databases
b. Identify additions/modifications in the database
c. Identify triggers for any change in data All the objects are characterized by the attributes they possess and their behavior in different environments. It is difficult to capture this at the requirements analysis stage, hence generalized behavior of category they belong is assumed.
3.2 Functional complexity of Objects Each category defined above has certain default behavior and each object in this category inherits this behavior. But this is not the only defining parameter. The complexity of each object also depends upon how it is interlinked with other objects and number of instances it uses. In order to take into
account application specific details, characteristics influencing the system need to be identified. Following are the main characteristics that enhance the complexity of objects:
Interlinking of an object with the other objects, i.e.
degree of coupling of an object.
Number of input sources object is linked with.
Number of validations required by an object.
Number of independent and dependent functions performed by an object.
Out of the above complexity factors, ones having
multiplicative effect are separated out from the ones having additive effect on the complexity. The appropriate weight is assigned to each based on its significance and utility in the application or tool being used.
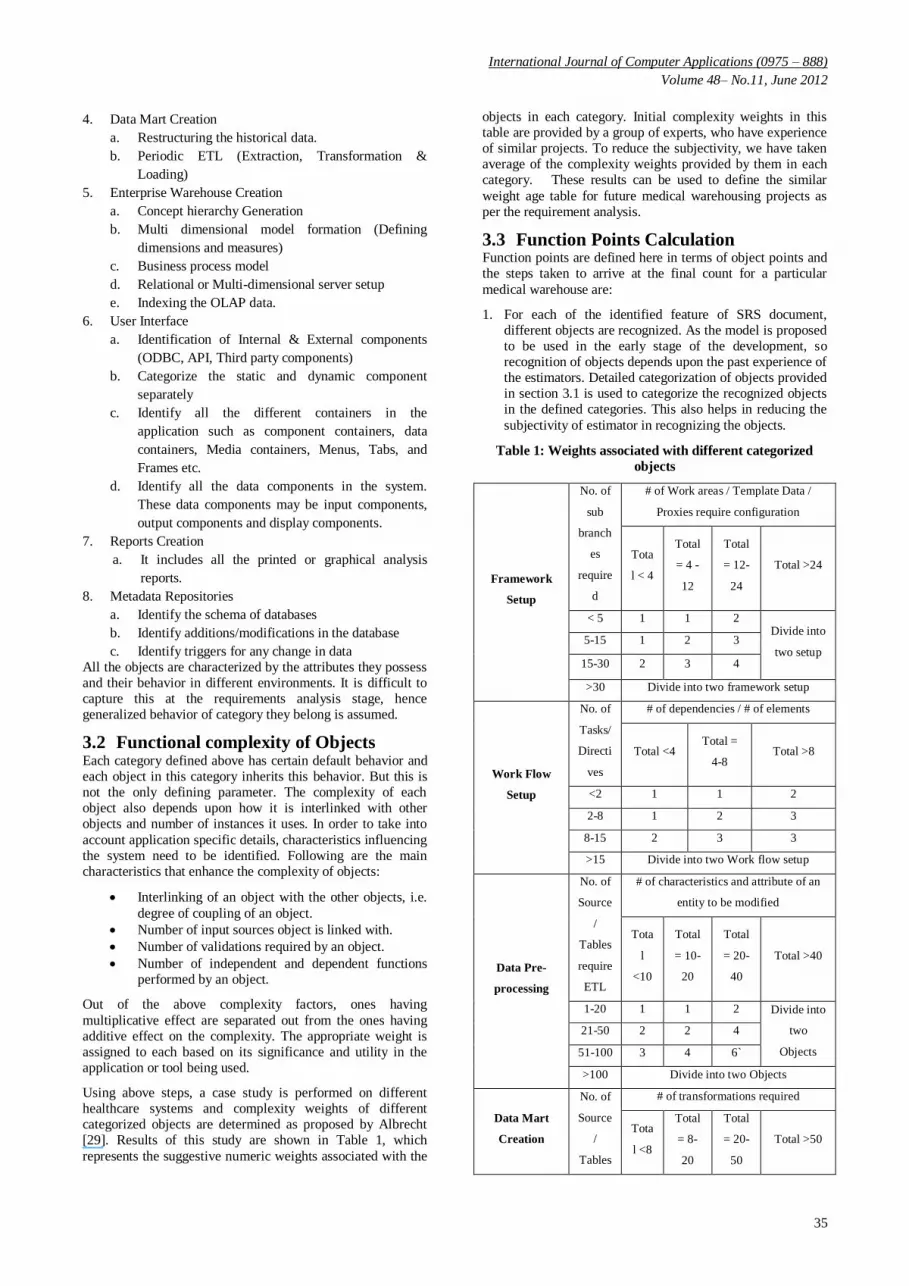
Using above steps, a case study is performed on different healthcare systems and complexity weights of different categorized objects are determined as proposed by Albrecht [29]. Results of this study are shown in Table 1, which
represents the suggestive numeric weights associated with the
objects in each category. Initial complexity weights in this table are provided by a group of experts, who have experience of similar projects. To reduce the subjectivity, we have taken average of the complexity weights provided by them in each category. These results can be used to define the similar
weight age table for future medical warehousing projects as per the requirement analysis.
3.3 Function Points Calculation Function points are defined here in terms of object points and the steps taken to arrive at the final count for a particular
medical warehouse are:
1. For each of the identified feature of SRS document, different objects are recognized. As the model is proposed to be used in the early stage of the development, so recognition of objects depends upon the past experience of the estimators. Detailed categorization of objects provided in section 3.1 is used to categorize the recognized objects in the defined categories. This also helps in reducing the
subjectivity of estimator in recognizing the objects.
Table 1: Weights associated with different categorized
objects
Framework
Setup
No. of
sub
branch
es
require
d
# of Work areas / Template Data /
Proxies require configuration
Tota
l < 4
Total
= 4 -
12
Total
= 12-
24
Total >24
< 5 1 1 2 Divide into
two setup 5-15 1 2 3
15-30 2 3 4
>30 Divide into two framework setup
Work Flow
Setup
No. of
Tasks/
Directi
ves
# of dependencies / # of elements
Total <4 Total =
4-8 Total >8
<2 1 1 2
2-8 1 2 3
8-15 2 3 3
>15 Divide into two Work flow setup
Data Pre-
processing
No. of
Source
/
Tables
require
ETL
# of characteristics and attribute of an
entity to be modified
Tota
l
<10
Total
= 10-
20
Total
= 20-
40
Total >40
1-20 1 1 2 Divide into
two
Objects
21-50 2 2 4
51-100 3 4 6`
>100 Divide into two Objects
Data Mart
Creation
No. of
Source
/
Tables
# of transformations required
Tota
l <8
Total
= 8-
20
Total
= 20-
50
Total >50

International Journal of Computer Applications (0975 – 888)
Volume 48– No.11, June 2012
36
or
hyperli
nks
1-20 1 2 4 Divide into
two
component
s
21-50 2 4 8
51-100 4 6 12
>100 Divide into two components
Enterprise
Warehouse
Creation
No. of
Interna
l /
Extern
al
Object
s
linked
# of dimensions
Tota
l <4
Total
= 4-8
Total
=8-15 Total >15
0-2 3 3 9 Divide into
two
component
s
2-6 3 9 9
6-10 9 18 18
> 10 Divide into two components
User Interface
No. of
Views
contain
ed
# and Source of Data Tables / Style
sheet Classes / Validations
Tota
l <4
Total
= 4-8
Total
=8-15 Total >15
<3 2 2 3 Divide into
two
Screens
3-7 2 3 4
7-12 3 4 4
> 12 Divide into two Screens
Reports
No. of
Sectio
ns
Contai
ned
# and Source of Data Tables
Tota
l <4
Total
= 4-8
Total
=8-15 Total >15
0 or 1 4 4 8 Divide into
two reports 2 or 3 4 8 12
4-10 8 12 12
> 10 Divide into two reports
Metadata
Repositories
Setup
No. of
Tables
/
Views
/
Trigge
rs
# of Attributes changes / Additions /
Deletions
Tota
l <4
Total
= 4-8
Total
=8-15 Total >15
<2 4 6 8 Divide into
two
Database
setup
2-8 5 8 10
8-15 6 9 12
>15 Divide into two Database setup
2. Functional complexity of all the objects is assessed using the Table 1.
3. Further, code reuse is considered as an important parameter which cannot be overlooked while calculating total object points. Although Code reuse parameter vary from application to application and also depends upon the design of an application, but still following factors may
help us to determine this parameter. a. Number of instance of each object b. No. of views of each UI screen c. Different static and dynamic libraries used d. Number of functions enhanced e. Type of work involved with each functions i.e.
enhancement / development. Finally, effect of %age code reuse is taken into account and total number of object point count is modified
accordingly. 4. To find the total function points in a particular feature or
an application, we add up all the objects multiplied by their complexities in it.
5. The final effort in person months is estimated as follows [31], where inputs are the Size of software development, an Adjustment Factor (AF), and a scale factor, B.
PM = AF X (Size) B (1)
The size parameter is total number of object points calculated. AF represents the adjustment factor which depends upon the production and general system characteristics of the systems. It can be determined on the same lines as described by Boehm [33]. The scale (or exponential) factor, B, accounts for the relative economies or diseconomies of scale encountered for software projects of different sizes [32]. The nature of medical warehouse projects is of semidetached type, so initial value of
B can be taken as 1.12 [33]. This value is finally adjusted using simple regression analysis on the feedback data obtained from the project heads after completion of projects.
3.4 Adjustment Factor Calculation Three main factors on which adjustment factor depends are
[31]:
Production System Characteristics (PSC)
General System Characteristics (GSC)
Developer’s Experience and Capability (DEC) [33].
These factors affect the overall features of the projects and not any object in particular. The productivity rate directly depends upon the developer’s experience and capability in a particular tool. It inversely depends upon the Production System
Characteristics (PSC). Main PSC that affects the system can be categorized as follows:
Application Characteristics (Round the Clock Support,
Criticality, Complexity)
Data Characteristics (its Volume, Quality, Change
Dynamics, External Dependency)
Others (Security, Portability, Privacy, Audit ability, User training etc.)
The weighted influence of each of these characteristics is added to get the Adjustment Factor corresponding to the PSC. If a characteristic has strong influence then 3 points are added, for average influence, 2 points are added and for less influence, one point is added. Similarly, the degrees of influence have to be calculated for the system characteristics, which are general to any feature. The following are the main

International Journal of Computer Applications (0975 – 888)
Volume 48– No.11, June 2012
37
system characteristics that are very much significant in designing the medical warehouses.
1. Effective GUI: The complexity of GUI increases with the amount of control provided to user. Data is usually presented in various visual forms such as box plots, 3-D
cubes, charts, curves, surfaces, link graphs etc. DICOM data is usually presented using the multi modal visualization. So designing their GUI is very complex. Further considerable effort is needed to provide the consistent interface with visual, conceptual and linguistic clarity throughout the interface. The warehouses are used from different platforms having different computational power. The designing a GUI that provides immediate
response to user queries and handles all the errors gracefully is very challenging.
2. Distributed Data Processing: In most of the warehouses, data is processed dynamically using the appropriate component of the system. These components may be located at different distributive operational servers at bottom most layer. The processing of multimedia data on these components requires very high transaction rates. The
total number of such components in a particular system defines the complexity of that system. Further the total different types of servers used to store data and different types of network used to connect these, adds the complexity.
3. Installation and Operational Ease: Some databases require user to set up the environment periodically for installation and convert the data into the desired formats.
So, entire burden is on the user. On the other hand, some applications have automated installation and operation without any operator intervention. Hence developing such automated applications is very complex. Similarly, the applications designed for automated recovery from failure or errors have more degree of complexity. The effects of all such general system characteristics are calculated on the same lines as we have calculated the PSC. Finally, the effect of developer’s experience and capability on the
estimated effort can be considered in the similar way as suggested by Boehm et al [33]. It is shown in Table 2. The Final adjustment factor is calculated as follows
Final Adjustment factor (AF) =
((Sum of PSCs & GSCs) * 1/100) + 0.5) / DEC (2)
Table 2: Effect of Developer’s Experience & Capability
Developer’s
Experience
&
Capability
Very
Low Low Nominal High
Very
High
DEC 4 7 13 25 50
3.5 Effort Increment due to Complexity The complexity of each phase may vary for different projects depending upon the features of systems and tools used to develop the system. Hence a complex phase in a particular project may require considerably more effort. Complexity for
certain phases changes considerably with different types of projects, such as Extraction, Transformation, and Loading phase. Complexity variations in other phases can be categorized in three levels viz. simple, medium and complex. In these phases, effort has to be multiplied with 1, 1.5 and 2 respectively for each of the complexity levels. The exact value of multiplier may vary from one project to another project and it also depends upon the tools used.
4. RESULTS & VALIDATION The proposed model is validated using an approach in which
the project heads were asked to estimate the effort of new project using the proposed model and another one of their choice. Then a survey is conducted using a questionnaire to check the confidence level of project manager in using the proposed model. Data is collected from the three different types of projects. First type contains data and other details of eight data warehousing projects completed in different domains. Similarly, second type contains data of 25 different
Medical OLAP projects. Finally, third type contains data collected from 38 different projects in which different data marts are created for special clinics.
All the different types of projects are considered separately. Project heads of each project were asked first to estimate the effort using any model of their choice. Most preferred choice found to be the standard IFPUG model [34]. Then project managers were asked to estimate the effort using the proposed
model as described in section 3. After the completion of each project, mean actual effort is calculated. Mean estimated effort in each category of projects using the proposed model and without using it are compared with the actual calculated effort and the Mean Relative Error (MRE) in each category is calculated. From the Table III, it is very clear that MRE is very less when the effort is predicted using our model. All the effort shown in the table is in person months. Mean of all
MRE (MMRE) using proposed model is 0.16 as compared to MMRE of 0.31 without using the model.
Table 3: Comparison of Mean actual effort of different
projects using the proposed model and without using it
Types of
Projects
No. of
Project
s taken
Mean
Actual
Effort
Using Model of
Project head’s
choice (IFPUG
Model)
Using Proposed
Model
Effort
Estima
tion
MRE
Effort
Estima
tion
MRE
Type 1 8 472 355 0.25 392 0.17
Type 2 25 82 51 0.38 69 0.16
Type 3 38 72 50 0.31 60 0.17
The predictive accuracy of model is compared using the measure PRED [35]. The PRED (X) represents the number of predictions which are within X% of actual effort. This measure is preferred over Bayesian model [36] when the model is based on diversified data. Table IV represents the
predictive accuracy for all sets of projects by using both the models, IFPUG and our proposed model. The PRED (25) by using proposed model is more than 78%, which earlier was about 58% when the proposed model was not used.
Table 4: Prediction Accuracy of the proposed model and
IFPUG Model
Model
used
Predictive
Accuracy
Type of Projects
Type 1 Type 2 Type3
Using
Model of
PRED (20)
55 49 40

International Journal of Computer Applications (0975 – 888)
Volume 48– No.11, June 2012
38
Project
head’s
choice
(IFPUG
Model)
PRED
(25)
63 58 52
PRED
(40)
86 82 78
Proposed
Model
PRED
(20)
72 67 59
PRED
(25)
83 79 73
PRED
(40)
92 85 81
For all these 71 projects, project heads have to answer two separate questionnaires, first one after studying the requirements and then the second one after completing the project. The answers of the first questionnaire are used to predict the effort using the proposed model and of the second questionnaire are used to refine the model. First questionnaire contains six different categories of questions. These categories are Design requirements, Set up requirements,
Implementation requirements, Usability requirements, External interface requirements, Reliability and Performance requirements, Maintainability and Adaptability requirements. Each category contains 8-10 questions about the specific requirements. Hence all the details, which are required by the proposed model, are covered in this questionnaire. Second questionnaire is used after the completion of project. In this first of all, project heads were asked about the increase
in complexity as compared to their first assessment in all the different phases of software development life cycle. Then, they were asked to distribute the total effort in different phases of project. The answers to this questionnaire are considered as a kind of feedback from the project heads and are used to adjust the value of factor B. Table V shows the value of factor B adjusted using the linear regression on the data collected from all the projects [31]. But this may vary as
the project size grows and exhibits more diseconomies of scale. Further, it is found that in the large enterprise warehouses, where maintenance phase is very much significant, it exhibits more diseconomies due to large overhead.
Table 5: Value of B corresponding to different types of
Projects
Type of
Projects
Enterprise
Warehouse
Medical
OLAP
Clinical
Data Marts
Value of B 1.18 1.09 1.03
5. CONCLUSION Medical Warehouses provides a wider knowledge base that can be utilized to provide better decision support services and helps in better management of resources. These systems provide doctors a platform to retrieve analytical information
and interesting patterns in the patients’ historical and current data. It also helps the doctors and clinicians to do better research. In this paper, Medical warehouse effort estimation approach is proposed for the current technologies using which
a piece of work can be estimated more accurately. The model is designed to help project manager to estimate effort at the very early stage of requirement analysis. After the requirement analysis stage, the project size metric is estimated using the object point analysis. A questionnaire is prepared to
help project managers to find out the different objects, their categories and their complexity in the project. Final effort is estimated using the project size and the different adjustment factors. After analysing 8 completed industry projects and 63 different medical OLAP and data mart projects, the model shows very good accuracy as compared to the industry standard estimation approaches such as IFPUG model. Although these results reflects the population of projects from
which model is derived, but the standard models such as IFPUG model generally under estimates or overestimates because of their generic nature. The proposed model is domain specific and is more useful for Medical warehouse projects, but the process used to define the model can be used to define the similar models for other domains as well. Further for better adaptability, model needs to be refined continuously by using machine learning approaches with data of more live
medical warehouse projects.
6. REFERENCES [1] Samuel, J.W., Blackford M, Lisa A.P., & Christiana
G.B., ―A Cost Benefit Analysis of Electronic Medical Records in Primary Care.‖ American Journal of
Medicine 114, no. 5 ,April 2003, pages: 397-403.
[2] Bates, D.W., Leape L.L., and Cullen D.J.. ―Effect Of Computerized Physician Order Entry And A Team Intervention Or Prevention Of Serious Medication Errors.‖ JAMA, 1998, pages: 1311-1316.
[3] Ewen, E.F., Medsker C., Dusterhoft L.E., Levan-Shultz K., Smith J.L., and Gottschall M.A., ―Data Warehousing In Integrated Health System: Building the Business Case.‖ International Workshop on data Warehousing and
OLAP. New York: ACM Press, 1998, pages: 47-53.
[4] Jane R Schubart, Jonathan S Einbinder, ―Evaluation of a data warehouse in an academic health sciences center‖, International Journal of Medical Informatics, Vol. 60, Issue 3, 2000 Pages 319-333.
[5] Mordechai Shani, ―The impact of information on medical thinking and health care policy‖, International Journal of Medical Informatics, Vol. 58, 2000, Pages 3-10,.
[6] Pedersen, T.B., and Jensen C.S., ―Research Issues in Clinical Data Warehousing.‖ International conference on Scientific and Statistical Database Management (SSDBM ). IEEE Computer Society Press, 2001. 43-52.
[7] Szirbik, N.B., Pelletier, C. and Chaussalet, T., ―Integration of Data on Long Term Care from Heterogeneous Sources For Research Purposes.‖ Medicon’04, Ischia, Italy, 2004.
[8] Cynthia A Brandt, Richard Morse, Keri Matthews, Kexin Sun, Aniruddha M Deshpande, Rohit Gadagkar, Dorothy B Cohen, Perry L Miller, Prakash M Nadkarni, ―Metadata-driven creation of data marts from an EAV-modeled clinical research database‖, International Journal of Medical Informatics, Vol. 65, Issue 3, 2002, Pages 225-241.
[9] Valentin Dinu, Prakash Nadkarni, ―Guidelines for the
effective use of entity–attribute–value modeling for

International Journal of Computer Applications (0975 – 888)
Volume 48– No.11, June 2012
39
biomedical databases‖, International Journal of Medical Informatics, Vol. 76, Issue 11, 2007 Pages 769-779.
[10] Nguyen, T.B., Tjoa A.M., and Mangisengi O. ―Metacube XTM: A Multidimensional Metadata Approach For Semantic Web Warehousing Systems.‖ International
conference of data warehousing and knowledge discovery. Berlin: Lecture Notes in computer Science, Springer Verlag, 2003. 76-88.
[11] ―XML Topic Maps (XTM) 1.0.‖ TopicMaps.org Specifications. 6 June 2001. http://www.topicmaps.org/xtm/1.0/xtml-20010806.html.
[12] Laxminarayan, P., Ruiz C, Alvarez SA, and Moonis M. ―Mining Associations over human sleep time series.‖
Symposium Computer based Medical Systems (CBMS `05). IEEE Computer Society, 2005. 323-328.
[13] Banek, Marko, A Min Tjoa, Nevena Stolba, ― Integrating different grain levels in medical data warehouse federation‖, Lecture Notes in computer science, Springer, 2006, ISSN: 0302-9743, 185-194
[14] Delphine Rossille, Jean-François Laurent, Anita Burgun, ―Modelling a decision-support system for oncology using
rule-based and case-based reasoning methodologies‖, International Journal of Medical Informatics, Vol. 74, Issue 2, Pages 299-306, 2005.
[15] Matthew Scotch, Bambang Parmanto, ―Development of SOVAT: A numerical–spatial decision support system for community health assessment research‖, International Journal of Medical Informatics, Vol. 75, Issue 10, 2006, Pages 771-784.
[16] Yvan Bédard, Pierre Gosselin, Sonia Rivest, Marie-Josée Proulx, Martin Nadeau, Germain Lebel, Marie-France Gagnon, ―Integrating GIS components with knowledge discovery technology for environmental health decision support‖, International Journal of Medical Informatics, Vol. 70, Issue 1, 2003, Pages 79-94.
[17] Antonio Abelha, J. Machado, V. Alves, J. Neves, ―Data Warehousing Through Multi-Agent Systems in the Medical Arena‖, in proceedings of First International
conference on knowledge engineering and decision support, Porto, Portugal, 2004.
[18] Isabel H. Manssour, S.S. Furuie, Luciana P. Nedel, CMDS Freitas, ―A Framework to visualize and interact with multimodal medical images‖, in International workshop on volume graphics, New York, IEEE Computer Society, 2001
[19] Song, I.Y., Rowen, W., Medseker, C., and Ewen E.F..
―An analysis of many to many relationships between the fact and dimensions tables in dimensions modelling.‖ International Workshop on Design management of Data Warehouses (DMDW '01). CEUR Workshop Proceedings Ceur WS-org, 2001. 1-13.
[20] Pravin Vajirkar, Sachin Singh, Y Lee, ―Context aware data mining framework for wireless medical applications‖, Lecture Notes in computer science,
Springer, 2003, ISSN: 0302-9743, 381-391
[21] Chen, G., and Kotz D. ―A Survey Of Context-Aware Mobile Computing Research.‖ Technical Report TR2000-381, Dartmouth: Dartmouth Computer science, 2000.
[22] Brown, P.J., Bovey J.D., and Chen X. ―Context-Aware Applications From Laboratory To Market Place.‖ IEEE Personal Communications, 1997: 58-64.
[23] Dey, A.K., and Abowd G.D., ―Towards A Better Understanding Of Context And Context Awareness‖.
GUV Technical Report GITGUV -99-22, Georgia: College of Computing, Georgia Institute of Technology, 1999.
[24] Szirbik, N.B., Pelletier, C. and Chaussalet, T., ―Six Methodological Steps To Build Medical Warehouse For Research.‖ International Journal of Medical informatics, 683-691, 2006.
[25] Huff, S.M., ―Clinical Data Exchange Standards And
Vocabularies For Messages.‖ AIMA Symposiym. 1998. 62-71.
[26] M. Body, M. Miquel, Y. Bedard, and A. Tchounikine, ―Handling Evolutions in Multidimensional Structures‖, ICDE, 2003.
[27] Johann Eder and Christian Koncilia, ―Evolution of Dimension Data in Temporal Data Warehouses‖, DaWaK, 284—293, 2001.
[28] Beverly Collins, Mary Wagner, ―Early experiences in using computerized patient record data for monitoring charting compliance, supporting quality initiatives and assisting with accurate charging at Allina Hospitals & Clinics‖, International Journal of Medical Informatics, Vol. 74, Issue 11, 2005, Pages 917-925.
[29] A.J.Albrecht, J.F. Gaffney, ―Software function, source lines of code and development effort prediction: A
software science validation‖, IEEE Transaction on Software Engineering, Vol SE-9, no. 6, , 1983, pp 639-647.
[30] Vahan Harput, Hermann Kaindl and Stefan Kramer, ―Extending Function Point Analysis of Object-Oriented Requirements Specifications‖, Proceedings of the 11th IEEE International Software Metrics Symposium, 2005.
[31] Boehm, B.W., Clark B, Horrowitz E, Westland C, Nadachy R, and Selby R. ―The COCOMO 2.0 Software
Cost Estimation Model.‖ American Programmer, 1996.
[32] Boehm. B.W., ―Software Engineering Economics‖. Englewood Cliffs NJ: Prentice-Hall, 1981.
[33] Boehm, B.W., ―Anchoring the software processes‖, IEEE Software, Vol 13, No 4, July 1996
[34] Function Point Counting Practice Manual, Release 4.1.1, International Function Point User Group (IFPUG), 2001 available at
http://www.ifpug.org/publications/manual.htm
[35] Coleman, D., Ash, D., Lowther, B., and Oman, P. ―Using Metrics to Evaluate Software System Maintainability‖, IEEE Computer, pp 44-49, 1994.
[36] Chulani, S. Boehm, B. and Steece, B., ―Calibrating Software Cost Models Using Bayesian Analysis‖, IEEE Transactions on Software Engineering, Special Issue on Empirical Methods in Software Engineering, Vol. 25,
No. 4, July/August 1999.


