Embed Size (px)
Citation preview
Page 1 of 28
Technical Support Document (TSD)
for the Final Revised CSAPR Update for the 2008 Ozone NAAQS
Docket ID No. EPA-HQ-OAR-2020-0272
EGU NOX Mitigation Strategies Final Rule TSD
U.S. Environmental Protection Agency
Office of Air and Radiation
March 2021
Page 2 of 28
Introduction:
The analysis presented in this document supports the EPA’s final Revised CSAPR Update for the 2008
Ozone NAAQS. In developing the final Revised CSAPR Update, the EPA considered all NOX control
strategies that are widely in use by EGUs, listed below. This Technical Support Document (TSD)
discusses costs, emission reduction potential, and feasibility related to these EGU NOX emission control
strategies. Specifically, this TSD explores three topics: (1) the appropriate representative cost resulting
from “widespread” implementation of a particular NOX emission control technology; (2) the NOX
emission rates widely achievable by “fully operating” emission control equipment; and (3) the time
required to implement these EGU NOX control strategies (e.g., installing and/or restoring an emission
control system to full operation or shifting generation to reduce NOX emissions). These analyses inform
the EPA’s evaluation of costs and emission reductions in Step 3 of its four step interstate transport
framework. These mitigation technology assessments are also central to EPA’s electricity system impact
estimates, compliance feasibility assessments, and emissions budget determinations for the final Revised
CSAPR Update Rule.
NOX control strategies that are widely available for EGUs include:
• Returning to full operation any existing SCRs that have operated at fractional design capability;
• Restarting inactive SCRs and returning them to full operation;
• Restarting inactive SNCRs and/or returning to full operation any SNCRs that have operated at
fractional design capability;
• Upgrading combustion controls with newer, more advanced technology (e.g., state-of-the-art low
NOX burners);
• Installing new SCR systems;
• Installing new SNCR systems; and
• Shifting generation (i.e., changing dispatch) from high- to low-emitting or zero-emitting units.
To evaluate the cost for some of these EGU NOX reduction strategies, the agency used the capital
expenses, fixed and variable operation and maintenance costs for installing and fully operating emission
controls researched by Sargent & Lundy, a nationally recognized architect/engineering firm with the EGU
sector expertise. From this research, EPA has created a publicly available Excel-based tool called the
Retrofit Cost Analyzer that implements the cost equations.1 Application of the Retrofit Cost Analyzer
equations to the existing coal-fired fleet can be found in the docket.2 EPA also used the Integrated
Planning Model (IPM) to analyze power sector response while accounting for electricity market dynamics
such as generation shifting.
Cost Estimate for Fully Operating Existing SCR that Already Operate to Some Extent
EPA sought to examine costs for full operation of SCR controls. SCR systems are post-combustion
controls that reduce NOx emissions by reacting the NOX with a reagent (typically ammonia or urea). The
SCR technology utilizes a catalyst to increase the conversion efficiency and produces high conversion of
NOX. Over time with use, the catalyst will degrade and require replacement. The ammonia or urea
reagent is also consumed in the NOx conversion process. Fully operating an SCR includes maintenance
1 See https://www.epa.gov/airmarkets/retrofit-cost-analyzer for the location of the Excel tool and for the
documentation of the underlying equations in Attachment 5-3: SCR Cost Methodology (PDF) and Attachment 5-4:
SNCR Cost Methodology (PDF). 2 See the file “SCR_and_SNCR_OS_Rates_and_Costs_Revised_CSAPR_Final.xlsx” for detailed cost estimates
using the Retrofit Cost Analyzer for SCR and SNCR operation and installation.
Page 3 of 28
costs, labor, auxiliary power, catalyst, and reagent cost. The chemical reagent (typically ammonia or
urea) is a significant portion of the operating cost of these controls.
EPA examined the costs to fully operate an SCR that was already being operated to some extent using the
equations within the Retrofit Cost Analyzer. There are variable operations and maintenance (VOM) costs
related to the consumption of reagent and degredation of the catalyst as well as fixed operating and
maintenance (FOM) costs related to maintaining and operating the equipment to be considered.
EPA examined three of the VOM costs illustrated in the Retrofit Cost Analyzer: reagent, catalyst, and
auxiliary power. Depending on circumstances, SCR operators may operate the system while achieving
less than “full” removal efficiency by using less reagent, and/or not replacing degraded catalyst which
allows the SCR to perform at lower reduction capabilities. Consequently, the EPA finds it reasonable to
consider the costs of both additional reagent and catalyst maintenance and replacement in representing the
cost of optimizing existing and operating SCR systems. In contrast, based on the Retrofit Cost Analyzer
equations, the auxiliary power component of VOM is largely indifferent to the NOX removal. That is,
auxiliary power is indifferent to reagent consumption, catalyst degradation, or NOX removal rate.
Therefore, for units where the SCR is operating, but may not be fully operating, the auxiliary power VOM
component has likely been incurred.
In addition, based on the Retrofit Cost Analyzer equations for FOM, units running their SCR systems
have incurred the complete set of FOM costs, regardless of reagent consumption, catalyst degredation, or
NOx removal rate. Thus, as was the case for the auxiliary power VOM cost component, the FOM cost
component is also not included in the cost estimate to achieve “full” operation for units that are already
operating. In conclusion, EPA finds that only the VOM reagent and catalyst replacement costs should be
included in cost estimates for optimization of partially operating SCRs.
In an SCR, the chemical reaction consumes approximately 0.57 tons of ammonia or 1 ton of urea reagent
for every ton of NOX removed. During development of the Clean Air Interstate Rule (CAIR) and the
original CSAPR, the agency identified a marginal cost of $500 per ton of NOX removed (1999$) with
ammonia costing $190 per ton of ammonia, which equated to $108 per ton of NOx removed for the
reagent procurement portion of operations. The remaining balance reflected other operating costs. Over
the years, reagent commodity prices have changed, affecting the operational cost in relation to reagent
procurement. For data on the relationship between reagent price and its associated cost regarding NOX
reduction, see Appendix A: “Historical Anhydrous Ammonia and Urea Costs and their Associated Cost
per NOX ton Removed in a SCR.” These commodities are created in large quantities for use in the
agriculture sector. Demand from the power sector for use in pollution controls is small relative to the
magnitude used in agriculture. Fluctuations in price are expected and are demonstrated in the pricing data
presented in Appendix A. Some of these prices reflect conditions where demand and commodity prices
are high. Consequently, the reagent costs used by EPA in this rule are representative. In the cost estimates
presented here, EPA uses the cost for urea, which is greater than ammonia costs, to arrive at a
conservative estimate. In the CSAPR Update, EPA used the default cost of $310/ton for a 50% weight
solution in Retrofit Cost Analyzer. With the updates to the Retrofit Cost Analyzer, the default costs of the
urea reagent also increased to $350/ton for a 50% weight solution of urea. In this action, EPA
conservatively assumed the cost of $350/ton for a 50% weight solution of urea. Using the Retrofit Cost
Analyzer (multiplying the VOM $/ton cost by the ratio of the VOM cost for urea $/MWh to the total
VOM cost $/MWh) results in a cost of around $500/ton of NOX removed for the reagent cost alone.
EPA also estimated the cost of catalyst replacement and disposal in addition to the costs of reagent. EPA
identified the cost for returning a partially operating SCR to full operation applying the Retrofit Cost
Page 4 of 28
Analyzer equations for all SCR-controlled coal-fired units that operated in 2019 in the United States on a
per ton of NOX removed basis. EPA updated the set of units based on the latest version of the NEEDS
database (December 2020) and commenter data on the proposed rule. Doing so eliminated some units
that, at proposal, EPA had previously characterized as existing coal-fired units with SCR. This final
assessment covered 199 units.3 EPA was able to identify the costs of individual VOM and FOM cost
components, including reagent, catalyst, and auxiliary fans. Some of these expenses, as modeled by the
Retrofit Cost Analyzer, vary depending on factors such as unit size, NOX generated from the combustion
process, and reagent utilized. The EPA performed multiple assessments with this tool’s parameters to
investigate sensitivity relating to cost per ton of NOX removed. Additionally, the agency conservatively
modeled costs with urea, the higher-cost reagent for NOX mitigation (and the reagent included in the
Retrofit Cost Analyzer equations). The key input parameters in the cost equations are the size of the unit,
the uncontrolled, or “input”, NOx rate, the NOx removal efficiency, the type of coal, and the capacity
factor.4
In the analysis, we assumed these units burned bituminous coal at a 47.6% capacity factor.5 We assumed
that the SCRs operate with the NOx removal efficiency needed for them to achieve their third-lowest
ozone season NOx rate over the time-period from 2009-2019.6 In this section, where we are assessing the
cost to return a partially operating SCR to full operation, we examined only the sum of the VOM reagent
and catalyst cost components. In this section and in the next section (where we examine the cost of
returning a unit with an idled SCR to full operation), from the full set of units, we focused on a subset of
132 units that had minimum “input” NOx emission rates of at least 0.2 lb/mmBtu).7 For these units, EPA
ranked the quantified VOM costs for each unit and identified the cost at the 90th percentile level rank,
which rounded to $800 per ton of NOx removed. EPA also identified the average cost which rounded to
$700 per ton of NOx removed. EPA selected the 90th percentile value because a substantial portion of
units had combined reagent and catalyst costs at or less than this $800/ton of NOx removed. Commenters
suggested focusing on a subset of units (i.e., those in the 12-state region) and accounting for coal type in
the analysis. EPA examined each of these alternatives (conservatively assuming all units burn
subbituminous (rather than bituminous) and limiting the geography to 12-states and notes that these
factors do not appear to result in large changes to the costs. When rounded, the 90th percentile cost and
average cost remain at $800/ton and $700/ton, respectively for the bituminous units and decrease slightly
to $700/ton and $600/ton for the subbituminous units. EPA elected to use the proposed methodology that
3 See the file “SCR_and_SNCR_OS_Rates_and_Costs_Revised_CSAPR_Final.xlsx” for detailed cost estimates
using the Retrofit Cost Analyzer for SCR and SNCR operation and installation. 4 For the input NOX rate, each unit’s maximum average ozone season (or non-ozone season) emission rate was
examined from the period 2003-2019 (inclusively) for the purpose of identifying the unit’s maximum emission rate
during time periods when the control was not operating. The long timeframe allowed examination prior to the onset
of annual NOX trading programs (e.g., CAIR and CSAPR). For units where controls have always operated year-
round, this method will underestimate the input NOx rate. 5 EPA evaluated costs of SCR operation utilizing a capacity factor value representing recent unit operation. EPA
identified the 2019 heat input weighted ozone season capacity factor of 47.6% for 193 coal units with SCR on-line
at the start of 2019 and which have nonzero 2019 heat input and are in the CSAPR Update region. 6 The NOX removal efficiency varies by unit and is based on the ozone season or non-ozone season with the highest
NOX rate for the time-period 2003-2019 and is based on the third-lowest ozone season rate from 2009-2019. The
third-lowest ozone season rate from 2009-2019 was selected as the “controlled” rate. This was selected because it
represented a time when the unit was most likely consistently and efficiently operating its SCR over a time period
when the unit would be expected to operate on an annual basis. 7 A NOx emission rate at or above 0.2 lb/mmBtu may be indicative of emissions from units where the SCR is not
operating. See the discussion about state-of-the-art combustion controls for details about why 0.2 lb/mmBtu is an
appropriate emission rate when only combustion controls are being utilized.
Page 5 of 28
relies on a nationwide dataset (while accounting for an updated fleet of units) as described in the
preamble section VI.B.
Thus, EPA concludes that $800 per ton NOx removed represents a reasonable estimate of the cost for
operating these post combustion controls based on current market prices and typical operation. For
purposes of the IPM modeling, the agency assumes that $800 per ton of NOX removed is a broadly
available cost point for units that currently are partially operating SCRs to fully operate their NOX
controls.
Cost Estimates for Restarting Idled Existing SCR
For a unit with an idled, bypassed, or mothballed SCR, all FOM and VOM costs such as auxiliary fan
power, catalyst costs, and additional administrative costs (labor) are realized upon resuming operation
through full potential capability. To understand the costs, the agency applied the Retrofit Cost Analyzer
equations for two “typical” units with varying input NOX rates in a bounding analysis and then did a more
detailed analysis encompassing all coal-fired units with SCR that operated in 2019 in the contiguous
United States. For both analyses, the agency assumed the same input parameters used for the partially-
operating SCR analysis described above, but in keeping with this assessment’s focus on restarting SCRs
that are not already operating, these analyses included the auxiliary fan power VOM component and all of
the FOM components along with the reagent and catalyst VOM components in the total cost estimate.
First, to better understand the effect of input NOX rate on costs, using the Retrofit Cost Analyzer
equations, the EPA performed a bounding analysis to identify reasonable high and low per-ton NOX
control costs from reactivating an existing but idled SCR across a range of potential uncontrolled NOX
rates.8 As was shown at proposal, for a hypothetical 500 MW unit with a relatively high uncontrolled
NOX rate (e.g., 0.4 lb NOX/mmBtu, 80% removal efficiency, 47.6% capacity factor, and 10,000 Btu/kWh
heat rate), VOM and FOM costs were around $1,050/ton of NOX removed. Conversely, a unit with a low
uncontrolled NOX rate (e.g., 0.2 lb NOX/mmBtu and 60% removal) experienced a higher cost range
revealing VOM and FOM costs about $1,840/ton of NOX removed.
Next, using the Retrofit Cost Analyzer cost equations and same input parameters described above for
unit-specific input NOx rate and third best controlled NOx rate, EPA evaluated all of the VOM and FOM
costs for the 132 coal-fired units with SCR in the contiguous United States that were operating in 2019
and had minimum “input” NOx emission rates of at least 0.2 lb/mmBtu.9 EPA updated the set of units
based on the latest version of the NEEDS database (December 2020) and eliminated some units that, at
proposal, EPA had characterized as coal-fired with existing SCR. As was done before at proposal, EPA
ranked the sum of the VOM and FOM costs for each unit and identified the 90th percentile cost. When
rounded, this was $1,600/ton of NOX removed. EPA also identified the average cost, which rounded to
$1,100/ton of NOx removed. Specifically, this assessment found that 120 of the 132 units demonstrated
VOM plus FOM costs lower than $1,600/ton of NOX removed and 125 or the 132 units had costs at or
below $1,800/ton of NOx removed.10 Commenters suggested that EPA should limit the analysis to the 12
8 For these hypothetical cases, the “uncontrolled” NOX rate includes the effects of existing combustion controls
present (i.e., low NOx burners). 9 See the file “SCR_and_SNCR_OS_Rates_and_Costs_Revised_CSAPR_Final.xlsx” for detailed cost estimates
using the Retrofit Cost Analyzer for SCR and SNCR operation and installation. 10 Given the sensitivity of the cost to the input uncontrolled NOx rates, EPA examined the units with higher costs
and observed that some exhibited low, uncontrolled NOX rates suggesting that, perhaps, the SCR may have been
consistently operated year-round over the entire time-period. A low uncontrolled NOX rate would result in a low
Page 6 of 28
state region and should also account for the effects of coal type. EPA examined each of these alternatives
and found that the suggested refinements often did not result in the kinds of changes asserted by the
commenters. For example, focusing on the 12-state region and accounting for coal rank, the cost at the
90th percentile for units that exclusively use bituminous coal was $1,500/ton while the cost for
subbituminous was $1,200 per ton (based on only 4 such units in the region). In regard to a nationwide
coal rank assessment, the 90th percentile costs were $1,600 and 2,000/ton, for bituminous and
subbituminous, respectively. EPA found that even with these different filters and subcategories suggested
by the commenter, these costs continued to be similar to the $1,600 per ton cost level EPA identified
using the illustrative units and a nationwide assessment.
Based on its proposal analysis and subsequent assessment of comments, the EPA concludes that a cost of
$1,600/ton of NOX removed is a representative cost for the point at which restarting and fully operating
idled SCRs becomes widely available to EGUs. EPA notes that the majority of units identified as having
SCR optimization potential in the Revised CSAPR Update Rule are already partially operating and best
reflected by the $800 per ton optimization cost for partially operating units rather than this $1,600 per ton
cost for fully idled units.
NOX Emission Rate Estimates for Full SCR Operation
EPA examined the ozone season average NOX rates for 220 coal-fired units in the contiguous U.S. with
an installed SCR over the time-period 2009-2019, then identified each unit’s lowest, second lowest, and
third-lowest ozone season average NOX rate.11 EPA updated the set of units based on the latest version of
the NEEDS database (December 2020) and eliminated some units based on commenter input that, at
proposal, EPA had characterized as coal-fired with existing SCR. EPA examined ozone season average
NOx rates from 2009 onwards as it constitutes the period since annual NOx programs, rather than just
seasonal programs, became widespread in the eastern US with the start of CAIR in 2009. EPA captured
this dynamic with its baseline choice as this regulatory development could affect SCR operation
(specifically, annual use of SCR means more-frequent change of catalyst and relative difficulty with
scheduling timing when the unit (or just the SCR) is not operating to allow for catalyst replacement and
SCR maintenance). The final CSAPR Update focused on the third-lowest ozone season NOX rates,
reasoning that these emission rates are characteristic of a well-run and well-maintained system and
achievable on a routine basis, while avoiding atypical times such as the start of a new regulatory program
when several catalyst layers may have been simultaneously refreshed or years when the operation of the
unit is not similar to recent or expected operational patterns. In the CSAPR Update, EPA focused on the
third lowest ozone season rate over the 2009-2015 time period to ensure that the rate represents efficient
but routine SCR operation (i.e., the performance of the SCR is not simply the result of being new, or
having a highly aggressive catalyst replacement schedule such as may be found at the onset of new
emission reduction programs, but is the result of being well-maintained and well-run). At that time, 2015
represented the most recent year of full ozone-season data available. In the CSAPR Update, EPA found
that, between 2009 and 2015, EGUs on average achieved a rate of 0.10 lbs NOX/mmBtu for the third-
lowest ozone season rate. In the CSAPR Update, EPA selected 0.10 lbs NOX/mmBtu as a reasonable
representation for full operational capability of an SCR. Here, in the final rule, EPA utilizes the same
rationale and methodology for identifying the rate that it did at proposal and with the CSAPR Update.
EPA maintains that the timeline should include most-recent operational data (i.e., up through 2019) and
continue to extend back to 2009. Considering the emissions data over the full time-period of available
number of tons of NOx removed, and, thus, a high cost on a “per ton of NOX removed” basis when modest fixed and
variable costs are divided by just a few tons of NOX removed. 11 See “ SCR_and_SNCR_OS_Rates_and_Costs_Revised_CSAPR_Final.xlsx” for details.
Page 7 of 28
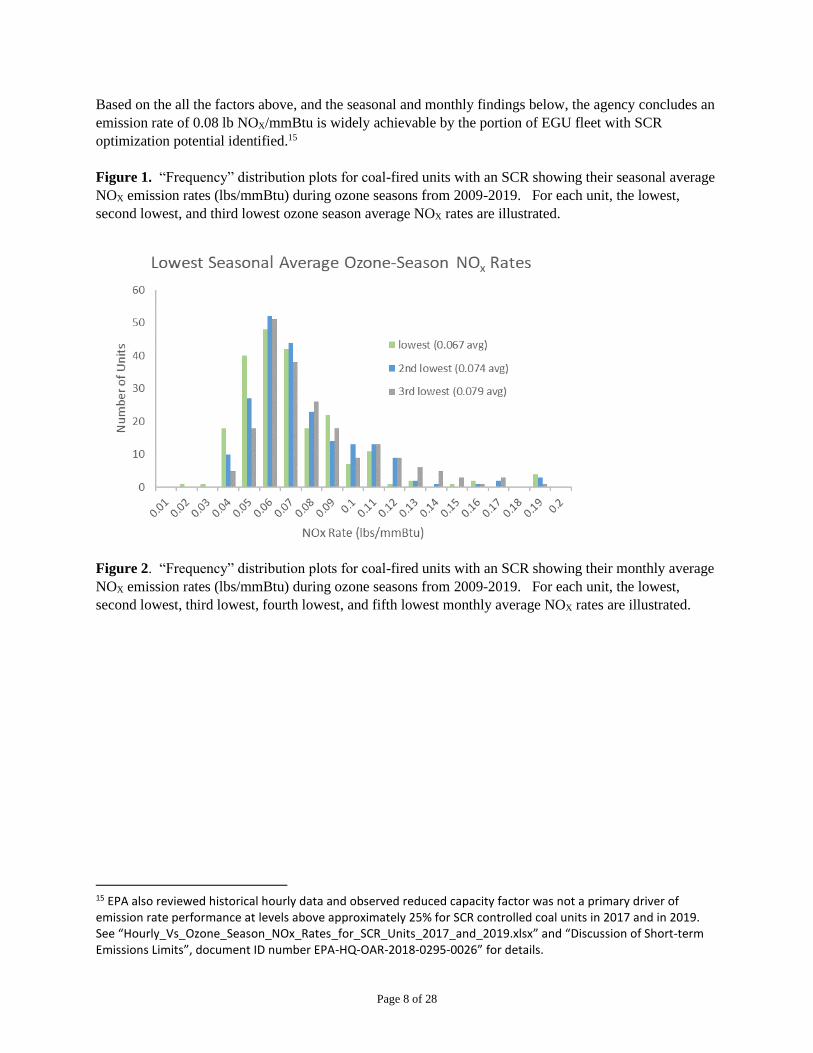
data that includes expected annual operation of SCRs (i.e., 2009-2019) results in a third-best rate of 0.08
lb/mmBtu. EPA notes that half of the EGUs achieved a rate of 0.068 lbs NOX/mmBtu or less over their
third-best entire ozone season (see Figure 1). EPA verified that in years prior to 2019, the majority
(approximately 95%) of these same coal-fired units with identified optimization-based reduction potential
in 2019 data had demonstrated and achieved a NOX emission rate of 0.08 lb/mmBtu or less on a seasonal
and/or monthly basis.12
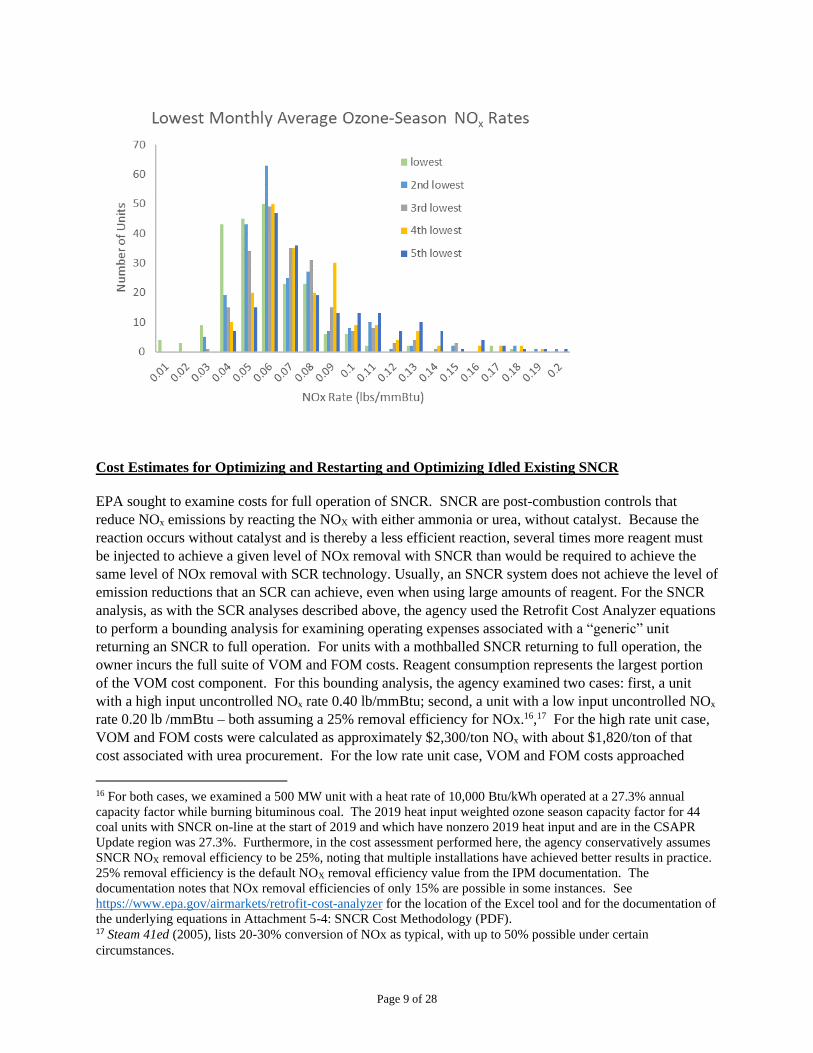
After identifying this approach, the Agency examined each ozone season over the time period from 2009-
2019 and identified the lowest monthly average NOx emission rates for each year. Examining the third-
lowest historical monthly NOx rate, the EPA found that, on average EGUs achieved a rate of 0.068 lbs
NOX/mmBtu. The third-lowest historical monthly NOx rate analysis showed that a large proportion of
units displayed NOx rates below 0.08 lb/mmBtu (see Figure 2).
As was the case with the cost, EPA received comment that the region of analysis should be limited to just
units within the 12-state region and should also be specific to coal rank (among other factors). Examining
the results for the 12-state region, the average rate increased slightly to 0.085 lb/mmBtu. If segmented for
coal rank, the average for bituminous coal units increased to 0.09 lb/mmBtu, while the average rate for
subbituminous units decreased to 0.058 lb/mmBtu. In all scenarios, the 0.08 lb/mmBtu assumption was
revealed to be widely achievable for SCR controlled units regardless of region or coal rank. As noted
above, 95% of the units identified as having SCR optimization potential have demonstrated this level of
performance. Moreover, as some commenters pointed out, the average emission rates used are inherently
conservative as they are driven up by a few units that are not operating their SCRs at all. If EPA removes
these SCRs from the inventory of units used to determine the optimization rate, or, instead focuses on the
median rate, rather than the average, the emission rate is lower than 0.08 lb/mmBtu. EPA’s review of the
historical data at the unit-level compared to the assumed representative rate of .08 lb/mmBtu for SCR-
controlled units not optimized confirmed that the methodology and resulting rate assumption is both
reasonable and viable for SCR-controlled units on average.
Commenters also suggested adjusting the time-period of analysis. Some argued that the time period
should be extended (e.g., starting in the mid to early 2000’s), while other argued it should be shortened
(i.e., starting in 2013). The agency explains the reasons why most of these changes were not adopted in
the preamble section VI.B. EPA examined each of the alternatives suggested by the commenter and
several the resulting estimates are included in the workbook in the docket. EPA did not adopt shortening
the time-period because the Agency believes that operation from the 2009 time-period (when most units
began facing annual operational requirements for their SCR controls) could be representative of current
operation and maximizes the amount of data available. The commenter’s assertion that the fleet
fundamentally altered its operation starting in 2013 with systematic change in capacity factor affecting
performance of unit’s SCRs is not sufficiently supported given the EPA’s analysis suggesting that
operation of SCR is largely unaffected once the SCR is operational (i.e., at greater than about 25% hourly
capacity factors).13,14
12 See “Optimizing SCR Units with Best Historical NOx Rates Final.xlsx” included in the Docket 13 See the “Discussion of Short-term Emissions Limits” document for additional details. 14 See “ SCR_and_SNCR_OS_Rates_and_Costs_Revised_CSAPR_Final.xlsx” for details.
Page 8 of 28
Based on the all the factors above, and the seasonal and monthly findings below, the agency concludes an
emission rate of 0.08 lb NOX/mmBtu is widely achievable by the portion of EGU fleet with SCR
optimization potential identified.15
Figure 1. “Frequency” distribution plots for coal-fired units with an SCR showing their seasonal average
NOX emission rates (lbs/mmBtu) during ozone seasons from 2009-2019. For each unit, the lowest,
second lowest, and third lowest ozone season average NOX rates are illustrated.
Figure 2. “Frequency” distribution plots for coal-fired units with an SCR showing their monthly average
NOX emission rates (lbs/mmBtu) during ozone seasons from 2009-2019. For each unit, the lowest,
second lowest, third lowest, fourth lowest, and fifth lowest monthly average NOX rates are illustrated.
15 EPA also reviewed historical hourly data and observed reduced capacity factor was not a primary driver of emission rate performance at levels above approximately 25% for SCR controlled coal units in 2017 and in 2019. See “Hourly_Vs_Ozone_Season_NOx_Rates_for_SCR_Units_2017_and_2019.xlsx” and “Discussion of Short-term Emissions Limits”, document ID number EPA-HQ-OAR-2018-0295-0026” for details.
Page 9 of 28
Cost Estimates for Optimizing and Restarting and Optimizing Idled Existing SNCR
EPA sought to examine costs for full operation of SNCR. SNCR are post-combustion controls that
reduce NOx emissions by reacting the NOX with either ammonia or urea, without catalyst. Because the
reaction occurs without catalyst and is thereby a less efficient reaction, several times more reagent must
be injected to achieve a given level of NOx removal with SNCR than would be required to achieve the
same level of NOx removal with SCR technology. Usually, an SNCR system does not achieve the level of
emission reductions that an SCR can achieve, even when using large amounts of reagent. For the SNCR
analysis, as with the SCR analyses described above, the agency used the Retrofit Cost Analyzer equations
to perform a bounding analysis for examining operating expenses associated with a “generic” unit
returning an SNCR to full operation. For units with a mothballed SNCR returning to full operation, the
owner incurs the full suite of VOM and FOM costs. Reagent consumption represents the largest portion
of the VOM cost component. For this bounding analysis, the agency examined two cases: first, a unit
with a high input uncontrolled NOx rate 0.40 lb/mmBtu; second, a unit with a low input uncontrolled NOx
rate 0.20 lb /mmBtu – both assuming a 25% removal efficiency for NOx.16,17 For the high rate unit case,
VOM and FOM costs were calculated as approximately $2,300/ton NOx with about $1,820/ton of that
cost associated with urea procurement. For the low rate unit case, VOM and FOM costs approached
16 For both cases, we examined a 500 MW unit with a heat rate of 10,000 Btu/kWh operated at a 27.3% annual
capacity factor while burning bituminous coal. The 2019 heat input weighted ozone season capacity factor for 44
coal units with SNCR on-line at the start of 2019 and which have nonzero 2019 heat input and are in the CSAPR
Update region was 27.3%. Furthermore, in the cost assessment performed here, the agency conservatively assumes
SNCR NOX removal efficiency to be 25%, noting that multiple installations have achieved better results in practice.
25% removal efficiency is the default NOX removal efficiency value from the IPM documentation. The
documentation notes that NOx removal efficiencies of only 15% are possible in some instances. See
https://www.epa.gov/airmarkets/retrofit-cost-analyzer for the location of the Excel tool and for the documentation of
the underlying equations in Attachment 5-4: SNCR Cost Methodology (PDF). 17 Steam 41ed (2005), lists 20-30% conversion of NOx as typical, with up to 50% possible under certain
circumstances.
Page 10 of 28
$3,890/ton NOx with nearly $3,040/ton of that cost associated with urea procurement. Despite equivalent
reduction percentages for each unit, the cost dichotomy results from differences in the input NOx rates for
the units and the type of boiler, resulting in a modeled step-change difference in urea rate (either a 15% or
25% reagent usage factor). EPA also examined SNCR cost sensitivity by varying NOX removal
efficiency while maintaining the uncontrolled NOX emission rate. In these studies, SNCR NOX removal
efficiency was assumed to be 40% for the first cost estimate and 10% for the second cost estimate. For a
high rate unit with an uncontrolled rate of 0.40 lb NOX/mmBtu, the associated costs were $2,210/ton and
$2,600/ton. For a low rate unit with an uncontrolled rate of 0.20 lb NOX/mmBtu, the associated costs
were $3,730/ton and $4,4700/ton. This analysis illustrates that SNCR costs ($/ton) are more sensitive to a
unit’s uncontrolled input NOX rate than the potential NOX removal efficiency of the SNCR itself.
Examining the results across all the simulations, but focusing on the 25% NOx removal efficiency
scenario for the low input uncontrolled NOX rate, which is more representative of typical removal
efficiency, EPA finds that costs for fully operating idled SNCR are substantially higher than for SCR.
We conclude that a cost of $3,900/ton of NOX removed is representative of the cost to restart and fully
operate idled SNCRs.
As described in the preamble, EPA received comment suggesting that EPA had overestimated the cost of
SNCR optimization for units covered in this rule. Commenters noted that many units appeared to be
currently partially or fully operating their SNCRs under the existing CSAPR Update. Using the retrofit
cost analyzer, EPA reexamined the VOM cost components for all existing coal-fired units with SNCR
(and for the units within the 12-state region). EPA assessed the cost of optimizing SNCR at units where
the control is partially operating, similar to how it assessed such cost for partially operating SCRs at units.
EPA focused on the VOM component associated with the urea reagent, since it is the principle cost
associated with NOx removal. The other VOM components, dilution water procurement and heat rate
penalties associated with use of dilution water and auxiliary power requirements, are already partially
incurred because the units are currently operating. EPA concludes (consistent with its data from proposal)
that $1,800/ton is broadly representative of the costs faced by units to fully optimize their SNCRs when
the unit is already partially operating the control.
EPA examined the group of units that have SNCR optimization potential and assessed whether the units
are currently partially operating but not necessarily optimizing their SNCRs. In these cases, the units
would not incur the full VOM and FOM costs of restarting an idled control. Rather, these units could be
expected to incur only the VOM cost of using additional reagent to achieve the additional NOx emission
reductions (thereby only incurring the reagent costs of $1,820/ton, as described above). EPA assessed
whether SNCRs were partially operating by comparing each unit’s 2019 historical rate to its identified
optimization emission rate (identified as mode 2 in the NEEDS file) used in the engineering analytic step
3 efforts. A percent difference less than 25% is an indicator that the SNCR is already partially operating
(as 25% NOx removal is a representative average of what SNCRs may achieve when going from no
operation to full operation). The majority, 23 of the 29, appeared to be partially operating based on this
one indicator alone. For the remainder, EPA compared the historical highest rate for the unit (dating back
to 2009) to its 2019 historical emission rate. If the percent difference between the two was substantial,
this was yet another indicator that the SNCR was partially operating at the unit in 2019 (hence it was
achieving a lower rate in 2019). Between these two indicators, EPA determined that nearly all SNCRs
with optimization potential identified in the 12 states were at least partially operating their controls during
2019. Given the comments and these findings, EPA concluded that a VOM reagent-centric cost of
$1,820/ton was the most reasonable representative cost of additional reductions for units with SNCR
optimization potential (recognizing that unit-specific cost will vary above and below that value).
Page 11 of 28
NOX Emission Rate Estimates for Full SNCR Operation
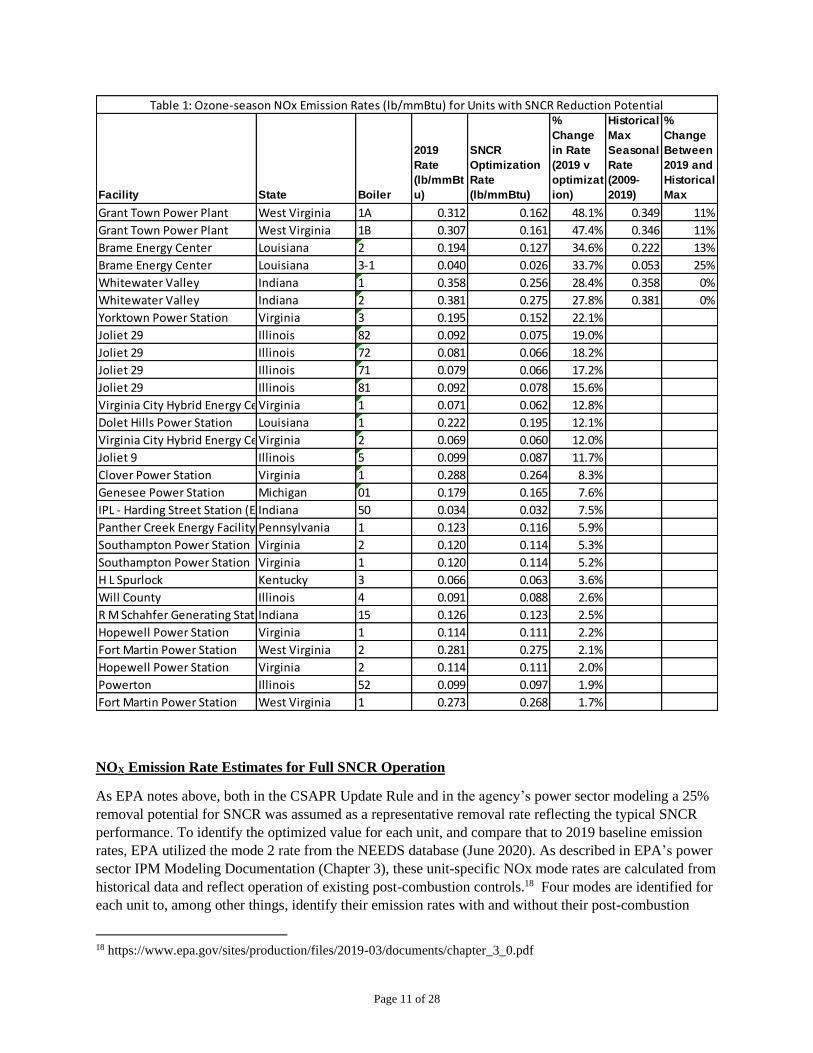
As EPA notes above, both in the CSAPR Update Rule and in the agency’s power sector modeling a 25%
removal potential for SNCR was assumed as a representative removal rate reflecting the typical SNCR
performance. To identify the optimized value for each unit, and compare that to 2019 baseline emission
rates, EPA utilized the mode 2 rate from the NEEDS database (June 2020). As described in EPA’s power
sector IPM Modeling Documentation (Chapter 3), these unit-specific NOx mode rates are calculated from
historical data and reflect operation of existing post-combustion controls.18 Four modes are identified for
each unit to, among other things, identify their emission rates with and without their post-combustion
18 https://www.epa.gov/sites/production/files/2019-03/documents/chapter_3_0.pdf
Facility State Boiler
2019
Rate
(lb/mmBt
u)
SNCR
Optimization
Rate
(lb/mmBtu)
%
Change
in Rate
(2019 v
optimizat
ion)
Historical
Max
Seasonal
Rate
(2009-
2019)
%
Change
Between
2019 and
Historical
Max
Grant Town Power Plant West Virginia 1A 0.312 0.162 48.1% 0.349 11%
Grant Town Power Plant West Virginia 1B 0.307 0.161 47.4% 0.346 11%
Brame Energy Center Louisiana 2 0.194 0.127 34.6% 0.222 13%
Brame Energy Center Louisiana 3-1 0.040 0.026 33.7% 0.053 25%
Whitewater Valley Indiana 1 0.358 0.256 28.4% 0.358 0%
Whitewater Valley Indiana 2 0.381 0.275 27.8% 0.381 0%
Yorktown Power Station Virginia 3 0.195 0.152 22.1%
Joliet 29 Illinois 82 0.092 0.075 19.0%
Joliet 29 Illinois 72 0.081 0.066 18.2%
Joliet 29 Illinois 71 0.079 0.066 17.2%
Joliet 29 Illinois 81 0.092 0.078 15.6%
Virginia City Hybrid Energy CenterVirginia 1 0.071 0.062 12.8%
Dolet Hills Power Station Louisiana 1 0.222 0.195 12.1%
Virginia City Hybrid Energy CenterVirginia 2 0.069 0.060 12.0%
Joliet 9 Illinois 5 0.099 0.087 11.7%
Clover Power Station Virginia 1 0.288 0.264 8.3%
Genesee Power Station Michigan 01 0.179 0.165 7.6%
IPL - Harding Street Station (EW Stout)Indiana 50 0.034 0.032 7.5%
Panther Creek Energy Facility Pennsylvania 1 0.123 0.116 5.9%
Southampton Power Station Virginia 2 0.120 0.114 5.3%
Southampton Power Station Virginia 1 0.120 0.114 5.2%
H L Spurlock Kentucky 3 0.066 0.063 3.6%
Will County Illinois 4 0.091 0.088 2.6%
R M Schahfer Generating StationIndiana 15 0.126 0.123 2.5%
Hopewell Power Station Virginia 1 0.114 0.111 2.2%
Fort Martin Power Station West Virginia 2 0.281 0.275 2.1%
Hopewell Power Station Virginia 2 0.114 0.111 2.0%
Powerton Illinois 52 0.099 0.097 1.9%
Fort Martin Power Station West Virginia 1 0.273 0.268 1.7%
Table 1: Ozone-season NOx Emission Rates (lb/mmBtu) for Units with SNCR Reduction Potential
Page 12 of 28
controls operating. Mode 2 for SNCR-controlled coal units is intended to reflect the operation of that
unit’s post combustion control based on prior years when that unit operated its control. As noted above,
SNCRs are more sensitive to a unit’s uncontrolled input NOX rate than the potential NOX removal
efficiency. Consequently, the “optimized” SNCR emission rate identified through mode 2 has more
variability than the optimized rate assumed for SCR installations (which typically begin to approximate
an emission rate floor due to the 90% reduction). The optimized SNCR emission rates assumed for each
controlled unit are identifiable in the NEEDS file “Mode 2 NOx rate (lb/mmBtu)” column.19 If a unit’s
2019 emission rate was at or lower than its “optimized” SNCR rate, than no additional reductions are
expected from “optimizing” that unit’s post-combustion control. EPA also evaluated its final rule unit-
specific optimization rates for SNCR-controlled units in the 12-state region by comparing the assumed
optimization rate against demonstrated past performance of the unit (in periods prior to 2019). EPA’s
analysis indicated that these rates were not only reasonable, but had been demonstrated as achievable by
each unit in prior periods.20
Cost Estimates for Installing Low NOx Burners and/or Over Fire Air
Combustion control technology has existed for many decades. The technology generally limits NOX
formation during the combustion process by extending the combustion zone. Over time, as the
technology has advanced, combustion controls have become more efficient at achieving lower NOX rates
than those installed years ago. Modern combustion control technologies routinely achieve rates of 0.20 –
0.25 lb NOX/mmBtu and, for some units, depending on unit type and fuel combusted, can achieve rates
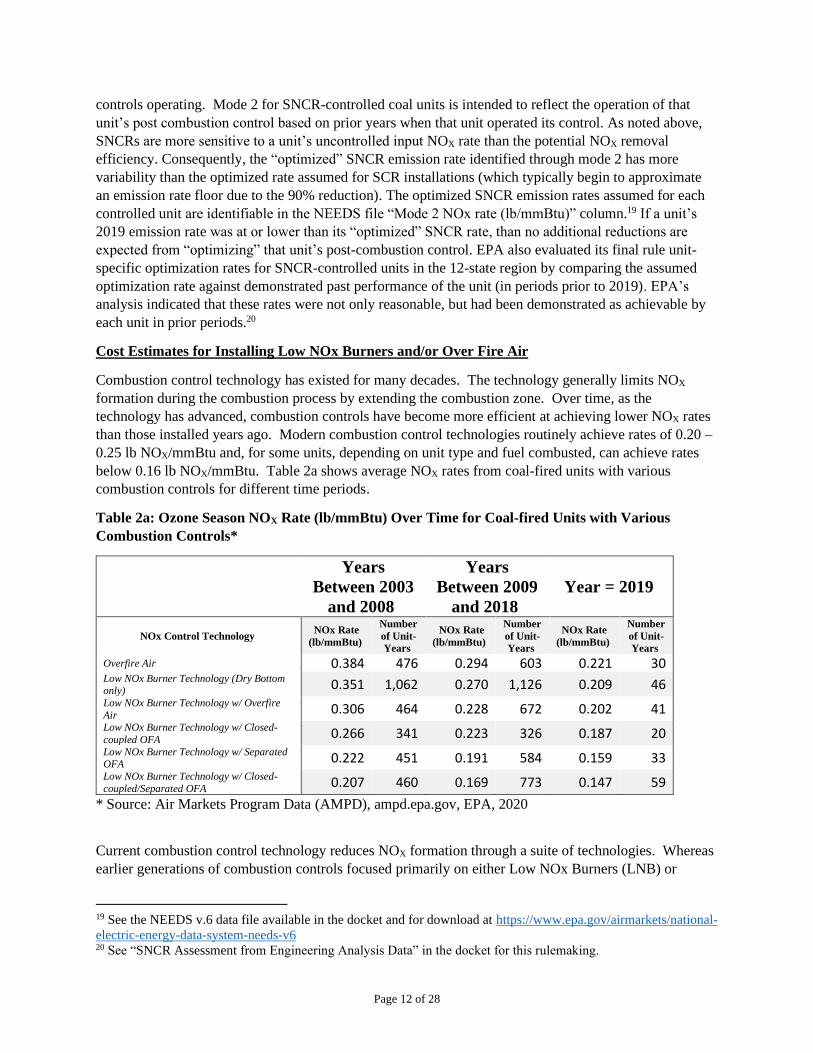
below 0.16 lb NOX/mmBtu. Table 2a shows average NOX rates from coal-fired units with various
combustion controls for different time periods.
Table 2a: Ozone Season NOX Rate (lb/mmBtu) Over Time for Coal-fired Units with Various
Combustion Controls*
Years
Between 2003
and 2008
Years
Between 2009
and 2018
Year = 2019
NOx Control Technology NOx Rate
(lb/mmBtu)
Number
of Unit-
Years
NOx Rate
(lb/mmBtu)
Number
of Unit-
Years
NOx Rate
(lb/mmBtu)
Number
of Unit-
Years
Overfire Air 0.384 476 0.294 603 0.221 30 Low NOx Burner Technology (Dry Bottom only)
0.351 1,062 0.270 1,126 0.209 46
Low NOx Burner Technology w/ Overfire
Air 0.306 464 0.228 672 0.202 41
Low NOx Burner Technology w/ Closed-
coupled OFA 0.266 341 0.223 326 0.187 20
Low NOx Burner Technology w/ Separated OFA
0.222 451 0.191 584 0.159 33
Low NOx Burner Technology w/ Closed-
coupled/Separated OFA 0.207 460 0.169 773 0.147 59
* Source: Air Markets Program Data (AMPD), ampd.epa.gov, EPA, 2020
Current combustion control technology reduces NOX formation through a suite of technologies. Whereas
earlier generations of combustion controls focused primarily on either Low NOx Burners (LNB) or
19 See the NEEDS v.6 data file available in the docket and for download at https://www.epa.gov/airmarkets/national-
electric-energy-data-system-needs-v6 20 See “SNCR Assessment from Engineering Analysis Data” in the docket for this rulemaking.
Page 13 of 28
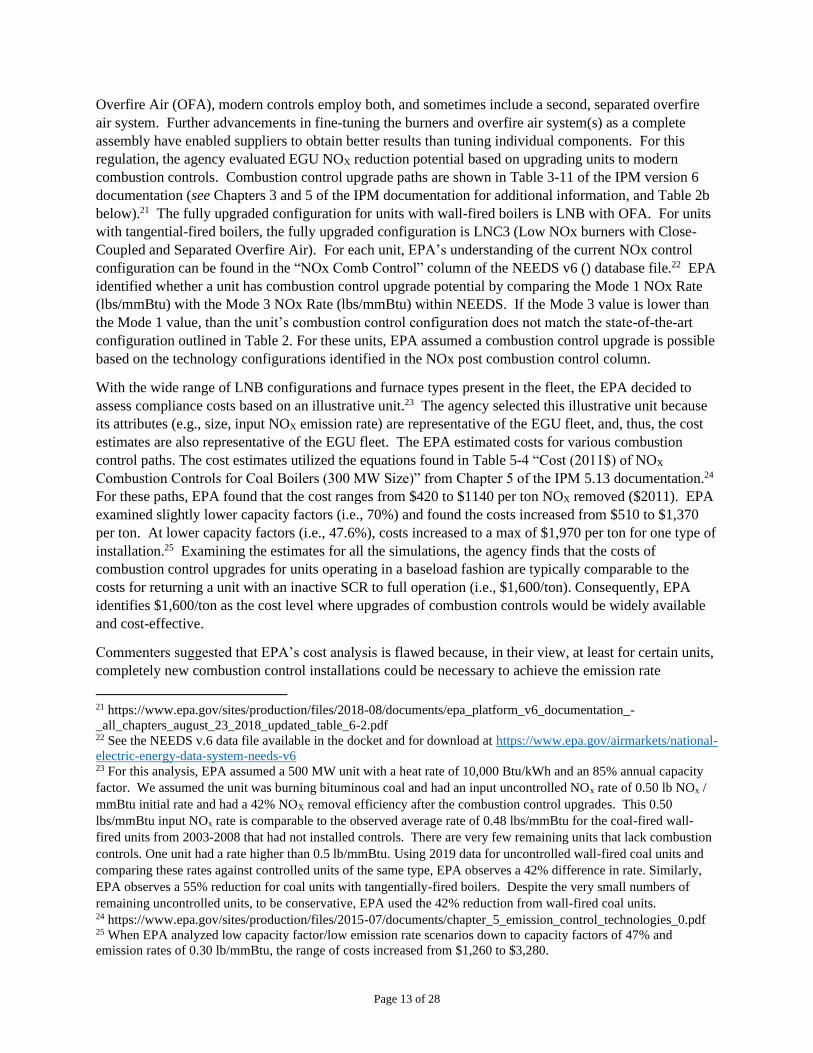
Overfire Air (OFA), modern controls employ both, and sometimes include a second, separated overfire
air system. Further advancements in fine-tuning the burners and overfire air system(s) as a complete
assembly have enabled suppliers to obtain better results than tuning individual components. For this
regulation, the agency evaluated EGU NOX reduction potential based on upgrading units to modern
combustion controls. Combustion control upgrade paths are shown in Table 3-11 of the IPM version 6
documentation (see Chapters 3 and 5 of the IPM documentation for additional information, and Table 2b
below).21 The fully upgraded configuration for units with wall-fired boilers is LNB with OFA. For units
with tangential-fired boilers, the fully upgraded configuration is LNC3 (Low NOx burners with Close-
Coupled and Separated Overfire Air). For each unit, EPA’s understanding of the current NOx control
configuration can be found in the “NOx Comb Control” column of the NEEDS v6 () database file.22 EPA
identified whether a unit has combustion control upgrade potential by comparing the Mode 1 NOx Rate
(lbs/mmBtu) with the Mode 3 NOx Rate (lbs/mmBtu) within NEEDS. If the Mode 3 value is lower than
the Mode 1 value, than the unit’s combustion control configuration does not match the state-of-the-art
configuration outlined in Table 2. For these units, EPA assumed a combustion control upgrade is possible
based on the technology configurations identified in the NOx post combustion control column.
With the wide range of LNB configurations and furnace types present in the fleet, the EPA decided to
assess compliance costs based on an illustrative unit.23 The agency selected this illustrative unit because
its attributes (e.g., size, input NOX emission rate) are representative of the EGU fleet, and, thus, the cost
estimates are also representative of the EGU fleet. The EPA estimated costs for various combustion
control paths. The cost estimates utilized the equations found in Table 5-4 “Cost (2011$) of NOX
Combustion Controls for Coal Boilers (300 MW Size)” from Chapter 5 of the IPM 5.13 documentation.24
For these paths, EPA found that the cost ranges from $420 to $1140 per ton NOX removed ($2011). EPA
examined slightly lower capacity factors (i.e., 70%) and found the costs increased from $510 to $1,370
per ton. At lower capacity factors (i.e., 47.6%), costs increased to a max of $1,970 per ton for one type of
installation.25 Examining the estimates for all the simulations, the agency finds that the costs of
combustion control upgrades for units operating in a baseload fashion are typically comparable to the
costs for returning a unit with an inactive SCR to full operation (i.e., $1,600/ton). Consequently, EPA
identifies $1,600/ton as the cost level where upgrades of combustion controls would be widely available
and cost-effective.
Commenters suggested that EPA’s cost analysis is flawed because, in their view, at least for certain units,
completely new combustion control installations could be necessary to achieve the emission rate
21 https://www.epa.gov/sites/production/files/2018-08/documents/epa_platform_v6_documentation_-
_all_chapters_august_23_2018_updated_table_6-2.pdf 22 See the NEEDS v.6 data file available in the docket and for download at https://www.epa.gov/airmarkets/national-
electric-energy-data-system-needs-v6 23 For this analysis, EPA assumed a 500 MW unit with a heat rate of 10,000 Btu/kWh and an 85% annual capacity
factor. We assumed the unit was burning bituminous coal and had an input uncontrolled NOx rate of 0.50 lb NOx /
mmBtu initial rate and had a 42% NOX removal efficiency after the combustion control upgrades. This 0.50
lbs/mmBtu input NOx rate is comparable to the observed average rate of 0.48 lbs/mmBtu for the coal-fired wall-
fired units from 2003-2008 that had not installed controls. There are very few remaining units that lack combustion
controls. One unit had a rate higher than 0.5 lb/mmBtu. Using 2019 data for uncontrolled wall-fired coal units and
comparing these rates against controlled units of the same type, EPA observes a 42% difference in rate. Similarly,
EPA observes a 55% reduction for coal units with tangentially-fired boilers. Despite the very small numbers of
remaining uncontrolled units, to be conservative, EPA used the 42% reduction from wall-fired coal units. 24 https://www.epa.gov/sites/production/files/2015-07/documents/chapter_5_emission_control_technologies_0.pdf 25 When EPA analyzed low capacity factor/low emission rate scenarios down to capacity factors of 47% and
emission rates of 0.30 lb/mmBtu, the range of costs increased from $1,260 to $3,280.
Page 14 of 28
performance proposed by EPA. As noted below, EPA finalized some adjustments to EPA’s emission rate
performance for combustion controls to better reflect combustion control upgrade potential through
installation of incremental controls. As in the CSAPR Update, EPA’s cost equations consider incremental
improvement and results in a $1,600 per ton being a reasonable representative cost for the technology.
EPA’s analysis indicates some upgrades would likely cost less and some would cost more, but that $1,600
per ton was a reasonable reflection of the cost at which this technology becomes widely available and it is
consistent with both cost assumptions made in the CSAPR Update rule and empirical data observing most
units already having these state-of-the-art controls in place during environments with a lower allowance
price incentive. See EPA’s Response to Comment Document (State Budget Chapter) for further response
to this comment.
NOx Emission Rate Estimates for LNB upgrade
EPA received significant comment on the combustion control upgrade potential and resulting emissions
rate. Commenters specifically identified a need for EPA to update its data year and inventory of sources
to reflect 2019 and units that did not have post-combustion controls. Furthermore, commenters suggested
that EPA ensure its rate assumptions were robust against coal rank for this type of technology.
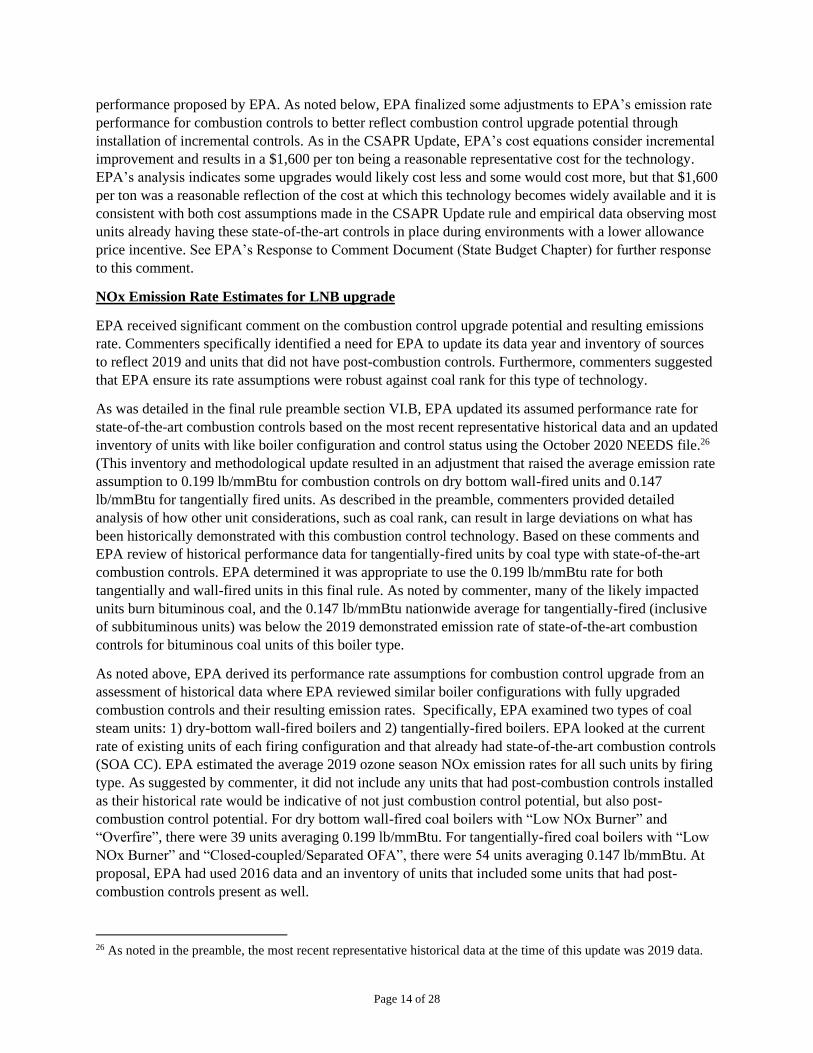
As was detailed in the final rule preamble section VI.B, EPA updated its assumed performance rate for
state-of-the-art combustion controls based on the most recent representative historical data and an updated
inventory of units with like boiler configuration and control status using the October 2020 NEEDS file.26
(This inventory and methodological update resulted in an adjustment that raised the average emission rate
assumption to 0.199 lb/mmBtu for combustion controls on dry bottom wall-fired units and 0.147
lb/mmBtu for tangentially fired units. As described in the preamble, commenters provided detailed
analysis of how other unit considerations, such as coal rank, can result in large deviations on what has
been historically demonstrated with this combustion control technology. Based on these comments and
EPA review of historical performance data for tangentially-fired units by coal type with state-of-the-art
combustion controls. EPA determined it was appropriate to use the 0.199 lb/mmBtu rate for both
tangentially and wall-fired units in this final rule. As noted by commenter, many of the likely impacted
units burn bituminous coal, and the 0.147 lb/mmBtu nationwide average for tangentially-fired (inclusive
of subbituminous units) was below the 2019 demonstrated emission rate of state-of-the-art combustion
controls for bituminous coal units of this boiler type.
As noted above, EPA derived its performance rate assumptions for combustion control upgrade from an
assessment of historical data where EPA reviewed similar boiler configurations with fully upgraded
combustion controls and their resulting emission rates. Specifically, EPA examined two types of coal
steam units: 1) dry-bottom wall-fired boilers and 2) tangentially-fired boilers. EPA looked at the current
rate of existing units of each firing configuration and that already had state-of-the-art combustion controls
(SOA CC). EPA estimated the average 2019 ozone season NOx emission rates for all such units by firing
type. As suggested by commenter, it did not include any units that had post-combustion controls installed
as their historical rate would be indicative of not just combustion control potential, but also post-
combustion control potential. For dry bottom wall-fired coal boilers with “Low NOx Burner” and
“Overfire”, there were 39 units averaging 0.199 lb/mmBtu. For tangentially-fired coal boilers with “Low
NOx Burner” and “Closed-coupled/Separated OFA”, there were 54 units averaging 0.147 lb/mmBtu. At
proposal, EPA had used 2016 data and an inventory of units that included some units that had post-
combustion controls present as well.
26 As noted in the preamble, the most recent representative historical data at the time of this update was 2019 data.
Page 15 of 28
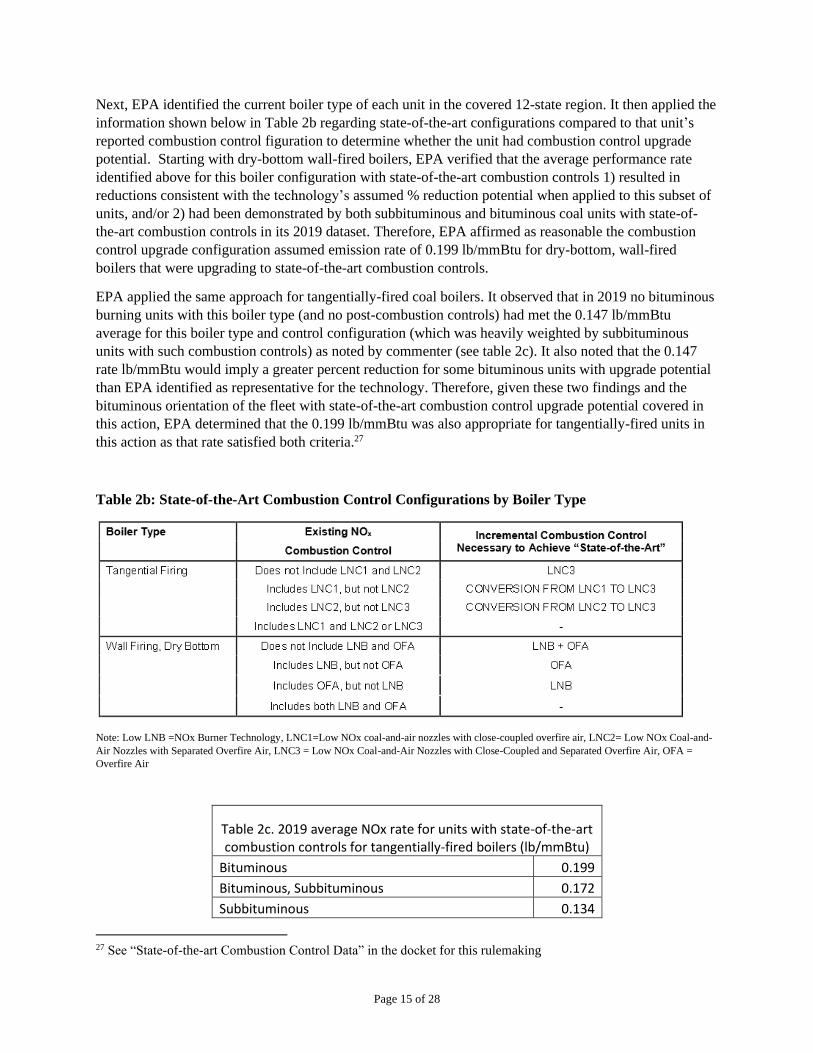
Next, EPA identified the current boiler type of each unit in the covered 12-state region. It then applied the
information shown below in Table 2b regarding state-of-the-art configurations compared to that unit’s
reported combustion control figuration to determine whether the unit had combustion control upgrade
potential. Starting with dry-bottom wall-fired boilers, EPA verified that the average performance rate
identified above for this boiler configuration with state-of-the-art combustion controls 1) resulted in
reductions consistent with the technology’s assumed % reduction potential when applied to this subset of
units, and/or 2) had been demonstrated by both subbituminous and bituminous coal units with state-of-
the-art combustion controls in its 2019 dataset. Therefore, EPA affirmed as reasonable the combustion
control upgrade configuration assumed emission rate of 0.199 lb/mmBtu for dry-bottom, wall-fired
boilers that were upgrading to state-of-the-art combustion controls.
EPA applied the same approach for tangentially-fired coal boilers. It observed that in 2019 no bituminous
burning units with this boiler type (and no post-combustion controls) had met the 0.147 lb/mmBtu
average for this boiler type and control configuration (which was heavily weighted by subbituminous
units with such combustion controls) as noted by commenter (see table 2c). It also noted that the 0.147
rate lb/mmBtu would imply a greater percent reduction for some bituminous units with upgrade potential
than EPA identified as representative for the technology. Therefore, given these two findings and the
bituminous orientation of the fleet with state-of-the-art combustion control upgrade potential covered in
this action, EPA determined that the 0.199 lb/mmBtu was also appropriate for tangentially-fired units in
this action as that rate satisfied both criteria.27
Table 2b: State-of-the-Art Combustion Control Configurations by Boiler Type
Note: Low LNB =NOx Burner Technology, LNC1=Low NOx coal-and-air nozzles with close-coupled overfire air, LNC2= Low NOx Coal-and-
Air Nozzles with Separated Overfire Air, LNC3 = Low NOx Coal-and-Air Nozzles with Close-Coupled and Separated Overfire Air, OFA =
Overfire Air
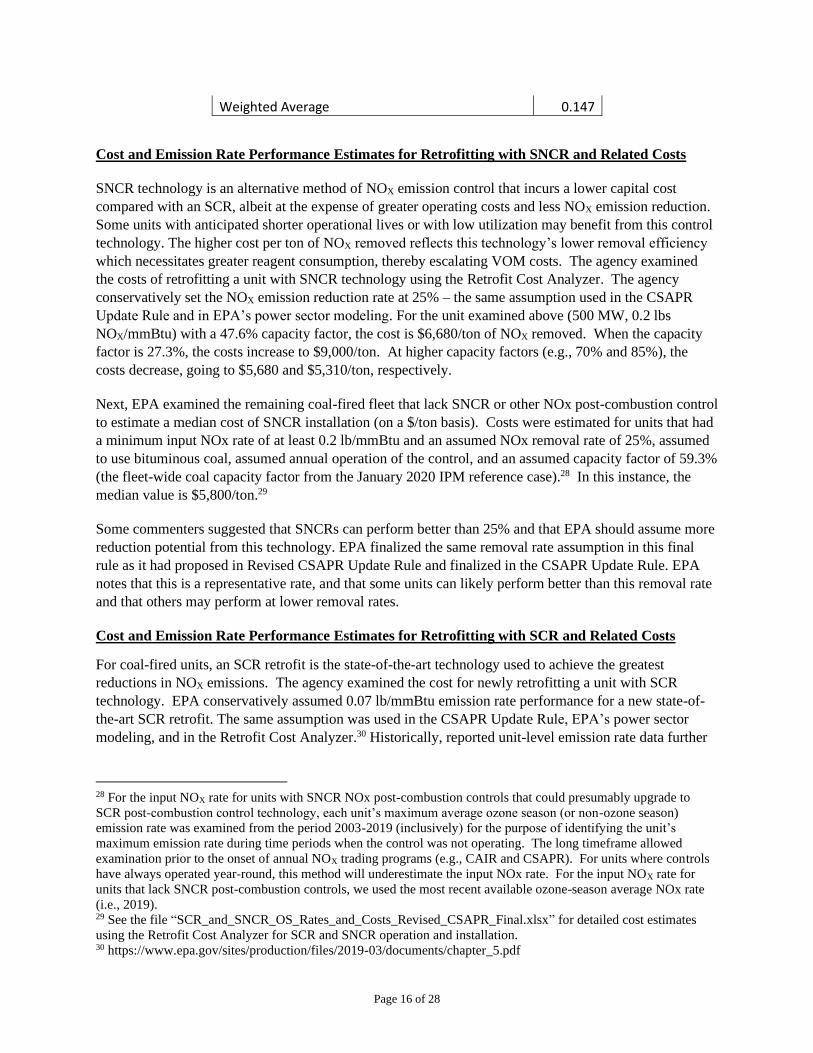
Table 2c. 2019 average NOx rate for units with state-of-the-art combustion controls for tangentially-fired boilers (lb/mmBtu)
Bituminous 0.199
Bituminous, Subbituminous 0.172
Subbituminous 0.134
27 See “State-of-the-art Combustion Control Data” in the docket for this rulemaking
Page 16 of 28
Weighted Average 0.147
Cost and Emission Rate Performance Estimates for Retrofitting with SNCR and Related Costs
SNCR technology is an alternative method of NOX emission control that incurs a lower capital cost
compared with an SCR, albeit at the expense of greater operating costs and less NOX emission reduction.
Some units with anticipated shorter operational lives or with low utilization may benefit from this control
technology. The higher cost per ton of NOX removed reflects this technology’s lower removal efficiency
which necessitates greater reagent consumption, thereby escalating VOM costs. The agency examined
the costs of retrofitting a unit with SNCR technology using the Retrofit Cost Analyzer. The agency
conservatively set the NOX emission reduction rate at 25% – the same assumption used in the CSAPR
Update Rule and in EPA’s power sector modeling. For the unit examined above (500 MW, 0.2 lbs
NOX/mmBtu) with a 47.6% capacity factor, the cost is $6,680/ton of NOX removed. When the capacity
factor is 27.3%, the costs increase to $9,000/ton. At higher capacity factors (e.g., 70% and 85%), the
costs decrease, going to $5,680 and $5,310/ton, respectively.
Next, EPA examined the remaining coal-fired fleet that lack SNCR or other NOx post-combustion control
to estimate a median cost of SNCR installation (on a $/ton basis). Costs were estimated for units that had
a minimum input NOx rate of at least 0.2 lb/mmBtu and an assumed NOx removal rate of 25%, assumed
to use bituminous coal, assumed annual operation of the control, and an assumed capacity factor of 59.3%
(the fleet-wide coal capacity factor from the January 2020 IPM reference case).28 In this instance, the
median value is $5,800/ton.29
Some commenters suggested that SNCRs can perform better than 25% and that EPA should assume more
reduction potential from this technology. EPA finalized the same removal rate assumption in this final
rule as it had proposed in Revised CSAPR Update Rule and finalized in the CSAPR Update Rule. EPA
notes that this is a representative rate, and that some units can likely perform better than this removal rate
and that others may perform at lower removal rates.
Cost and Emission Rate Performance Estimates for Retrofitting with SCR and Related Costs
For coal-fired units, an SCR retrofit is the state-of-the-art technology used to achieve the greatest
reductions in NOX emissions. The agency examined the cost for newly retrofitting a unit with SCR
technology. EPA conservatively assumed 0.07 lb/mmBtu emission rate performance for a new state-of-
the-art SCR retrofit. The same assumption was used in the CSAPR Update Rule, EPA’s power sector
modeling, and in the Retrofit Cost Analyzer.30 Historically, reported unit-level emission rate data further
28 For the input NOX rate for units with SNCR NOx post-combustion controls that could presumably upgrade to
SCR post-combustion control technology, each unit’s maximum average ozone season (or non-ozone season)
emission rate was examined from the period 2003-2019 (inclusively) for the purpose of identifying the unit’s
maximum emission rate during time periods when the control was not operating. The long timeframe allowed
examination prior to the onset of annual NOX trading programs (e.g., CAIR and CSAPR). For units where controls
have always operated year-round, this method will underestimate the input NOx rate. For the input NOX rate for
units that lack SNCR post-combustion controls, we used the most recent available ozone-season average NOx rate
(i.e., 2019). 29 See the file “SCR_and_SNCR_OS_Rates_and_Costs_Revised_CSAPR_Final.xlsx” for detailed cost estimates
using the Retrofit Cost Analyzer for SCR and SNCR operation and installation. 30 https://www.epa.gov/sites/production/files/2019-03/documents/chapter_5.pdf
Page 17 of 28
supports this assumption, as many of the recently installed SCRs achieve this emission rate or lower on a
yearly basis.
First, to better understand the effect of input NOX rate on costs, using the Retrofit Cost Analyzer
equations, the EPA performed a bounding analysis to identify reasonable high and low per-ton NOX
control costs for adding SCR post-combustion controls across a range of potential uncontrolled NOX
rates.31 For a hypothetical unit 500 MW in size with a relatively low uncontrolled NOX rate (e.g., 0.2 lb
NOX/mmBtu, 60% removal efficiency, 47.6% capacity factor, and 10,000 Btu/kWh heat rate), the capital
cost was about $143,000,000. For a similar unit with an input NOx rate of 0.4 lb/mmBtu and 80% NOx
removal efficiency, the total capital cost was $152,000,000. The cost on a per-ton basis varies with the
assumptions concerning the operation of the unit and the book life of the loan (or lifetime of the
equipment). Assuming an annual capital recovery factor of 0.143, NOx rate of 0.2 lb/mmBtu and
removal efficiency of 60% and annual operation, the cost per ton was $18,210/ton ($16,373/ton for the
capital cost, $290/ton for the FOM cost, and $1,546/ton for the VOM cost). For the unit with the NOx
rate of 0.4 and removal efficiency of 80%, the costs were $7,562/ton ($6,515/ton for the capital cost,
$115/ton for the FOM cost, and $932/ton for the VOM cost).
In the CSAPR Update, using a higher capacity factor assumption, EPA used the Retrofit Cost Analyzer to
examine the costs of SCR retrofit for an illustrative unit, a 500 MW unit operating at an 85% capacity
factor with an uncontrolled rate of 0.35 lb NOX / mmBtu, retrofitted with an SCR to a lower emission rate
of 0.07 lb NOX / mmBtu, results in a compliance cost of $5,000 / ton of NOX removed. For this
illustrative unit, as annual capacity factor increased, costs per ton decreased (because the capital cost is
constant, but the number of tons of emissions decreases).
For this final rule, EPA examined the remaining coal-fired fleet that lack SCR to estimate a median cost
of SCR installation (on a $/ton basis). Costs were estimated for units that had uncontrolled NOx rates of
at least 0.2 lb/mmBtu prior to installation of the post-combustion control and decreasing to rates of 0.07
lb/mmBtu following control installation and were assumed to use bituminous coal. 32 Furthermore, we
assumed annual operation of the control and assumed a capacity factor of 59.3% (the capacity factor for
coal units from the January 2020 IPM v.6 reference case). In this instance, these assumptions produce a
median value of $9,600/ton and a 90th percentile value of $13,700/ton. For a baseload coal capacity factor
of 80%, the 90th percentile is less than the $9,600/ton value.33
31 For these hypothetical cases, the “uncontrolled” NOX rate includes the effects of existing combustion controls
present (i.e., low NOx burners). 32 For the input NOX rate for units with SNCR NOx post-combustion controls that could presumably upgrade to
SCR post-combustion control technology, each unit’s maximum average ozone season (or non-ozone season)
emission rate was examined from the period 2003-2019 (inclusively) for the purpose of identifying the unit’s
maximum emission rate during time periods when the control was not operating. The long timeframe allowed
examination prior to the onset of annual NOX trading programs (e.g., CAIR and CSAPR). For units where controls
have always operated year-round, this method will underestimate the input NOx rate. For the input NOX rate for
units that lack SNCR post-combustion controls, we used the most-recent available ozone-season average NOx rate
(i.e., 2019). 33 See the file “SCR_and_SNCR_OS_Rates_and_Costs_Revised_CSAPR_Final.xlsx” for detailed cost estimates
using the Retrofit Cost Analyzer for SCR and SNCR operation and installation.
Page 18 of 28
Feasibility Assessment: Implementation Timing for Each EGU NOX Control Strategy
The agency evaluated the implementation time required for each compliance option to assess the
feasibility of achieving reductions during the 2021 ozone season.
EPA evaluated the feasibility of turning on idled SCRs for the 2021 ozone season. The EGU sector is
very familiar with restarting SCR systems. Based on past practice and the possible effort to restart the
controls (e.g., re-stocking reagent, bringing the system out of protective lay-up, performing inspections),
returning these idled controls to operation is possible within the compliance timeframe of this rule. This
timeframe is informed by many electric utilities’ previous, long-standing practice of utilizing SCRs to
reduce EGU NOX emissions during the ozone season while putting the systems into protective lay-up
during non-ozone season months when the EGUs did not have NOX emission limits that warranted
operation of these controls. For example, this was the long-standing practice of many EGUs that used
SCR systems for compliance with the NOX Budget Trading Program. Based on the seasonality of EGU
NOX emission limits, it was typical for EGUs to turn off their SCRs following the September 30 end of
the ozone season control period. They would then lay-up the pollution control for seven months of non-
use. By May 1 of the following ozone season, the control would be returned to operation. In the 22 state
CSAPR Update region, 2005 EGU NOX emission data suggest that 112 EGUs operated SCR systems in
the summer ozone season, likely for compliance with the NOX Budget Trading program, while idling
these controls for the remaining seven non-ozone season months of the year.34 In order to comply with the
seasonal NOX limits, these SCR controls regularly were taken out of and put back into service within
seven months. Therefore, EPA believes this SCR optimization mitigation strategy is available for the
2021 ozone season.
EPA assessed the number of coal-fired units with SCR that are currently operating with ozone-season
emission rates greater than or equal to 0.2 lb/mmBtu suggesting that their units may not be operating their
NOx post-combustion control equipment. EPA finds that only 14 units in the contiguous United States
(of which eight are in states that are “linked” at or above 1% in this Revised CSAPR Update Rule) fit this
criterion.35 EPA’s assumptions that this mitigation technology is available for the 2021 ozone-season is
further bolstered given that the previous rulemaking (i.e., CSAPR Update) identified turning on and
operating existing SCR as a cost-effective control technology, many sources successfully implemented
that technology requirement, and it appears that only a low number of units in the region may have turned
off these controls.
Full operation of existing SCRs that are already operating to some extent involves increasing reagent (i.e.,
ammonia or urea) flow rate, and maintaining and replacing catalyst to sustain higher NOX removal rate
operations. As with restarting idled SCR systems, EGU data demonstrate that operators have the
capability to fully idle SCR systems during winter months and return these units to operation in the
summer to comply with ozone season NOX limits.34 The EPA believes that this widely demonstrated
behavior also supports our finding that fully operating existing SCR systems currently being operated,
which would necessitate fewer changes to SCR operation relative to restarting idled systems, is also
34 Units with SCR were identified as those with 2005 ozone season average NOX rates that were less than 0.12
lbs/mmBtu and 2005 average non-ozone season NOX emission rates that exceeded 0.2 lb/mmBtu. 35 See the “2019 NOx Rates for 258 Units.xlsx” file in the docket for details. Eight of the units are in states linked at
or above 1%. Three are in Ohio, two each are in Kentucky and New York, and one is in Indiana. Both units in New
York have since permanently retired; Somerset 1 last operated in March 2020 and Cayuga 1 last operated in August
2019. Both units in Kentucky have since permanently retired; Paradise 3 last operated in February 2020 and Elmer
Smith 1 last operated in June 2019.
Page 19 of 28
feasible for the 2021 ozone season. Increasing NOX removal by SCR controls that are already operating
can be implemented by procuring more reagent and/or catalyst. EGUs with SCR routinely procure reagent
and catalyst as part of ongoing operation and maintenance of the SCR system. In many cases, where the
EPA has identified EGUs that are operating their SCR at non-optimized NOX removal efficiencies, EGU
data indicate that these units historically have achieved more efficient NOX removal rates. Therefore, the
EPA finds that optimizing existing and SCR systems currently being operated could generally be done by
reverting to previous operation and maintenance plans. Regarding full operation activities, existing SCRs
that are only operating at partial capacity still provide functioning, maintained systems that may only
require increased chemical reagent feed rate up to their design potential and catalyst maintenance for
mitigating NOX emissions. Units must have adequate inventory of chemical reagent and catalyst
deliveries to sustain operations. Considering that units have procurement programs in place for operating
SCR, this may only require updating the frequency of deliveries. This may be accomplished within a few
weeks. The vast majority of existing units with SCRs covered in this action fall into this category.
Moreover, hourly unit-level data, such as that shown in preamble figure 1 section VI.B, clearly show that
SCR performance can improve within a 2-month time frame. Specifically, when controls are partially
operating (as EPA has demonstrated is the case in nearly all units with optimization potential), the data
shows the hourly emission rate varying significantly (reflective of SCR performance) over hours that
occur well within two months of one another. For instance, the size of the rectangle showing hourly NOx
rates for the unit when the control is partially operating in 2017 and 2018 reflect the 25th-75th percentile
hours. The top left graphic shows emission rates varying between approximately 0.22 b/mmBtu to 0.07
lb/mmBtu in 2017 for instance. This variation, reflective of SCR performance, is occuring within a two-
month time span, indicating the ability for quick improvements in control performance even controlling
for load levels.36
Combustion controls, such as LNB and/or OFA, represent mature technologies requiring a short
installation time – typically, four weeks to install along with a scheduled outage (with order placement,
fabrication, and delivery occurring beforehand and taking a few months). Construction time for installing
combustion controls was examined by the EPA during the original CSAPR development and is discussed
in the TSD for that rulemaking entitled, “Installation Timing for Low NOX Burners (LNB)”, Docket ID
No. EPA-HQ-OAR-2009-0491-0051.37 Industry has demonstrated retrofitting LNB technology controls
on a large unit (800 MW) in under six months (excluding permitting). This TSD is in the docket for the
CSAPR Update and for this rulemaking. EPA is providing until 2022 to implement these controls as the
limited time available between the estimated signature date of this rule and start of the 2021 ozone season
would not be sufficient to install LNBs on a regional level. EPA received significant comment on the
timing assumptions regarding the implementation of state-of-the-art combustion controls such as LNB
and responds to those comments in the final rule preamble section VI.B.
This rule does not consider retrofitting SCR or SNCR technology as a viable compliance option in the
2021 compliance timeframe. The time requirements for a single boiler SCR retrofit exceed 18 months
from contract award through commissioning (not including permitting). SNCR is similar to activated
carbon injection (ACI) and dry sorbent injection (DSI) installation and requires about 12 months from
award through commissioning (not including permitting) at a single boiler. Conceptual design, permitting,
36 Unit-level hourly emission rate data at www.epa.gov/ampd. See also “Miami Fort Hourly Emission Rate at
Capacity Factor of 50%-80%” in the docket for this rulemaking. This file shows the emission rate changes occuring
withing two months of one another. 37 http://www.epa.gov/airmarkets/airtransport/CSAPR/pdfs/TSD_Installation_timing_for_LNBs_07-6-10.pdf
Page 20 of 28
financing, and bid review require additional time. A detailed analysis for a single SCR system can be
found in Exhibit A-3 and an ACI system (equivalent timeline to a SNCR) in Exhibit A-5 in: “Final
Report: Engineering and Economic Factors Affecting the Installation of Control Technologies for
Multipollutant Strategies” located in the Docket for this Rulemaking.38 On a regional scale, the estimate
for installing SCR at multiple boilers on multiple plants is in excess of 39 months. EPA determined these
technologies would not be available at regional scale prior to the start of the of the 2024 ozone season.
See preamble section VI.C for more discussion on post combustion control retrofit timing. EPA received
significant comment on its timing assumptions regarding post-combustion control retrofit options and
responds to those comments in section VI.B and VI.C of the preamble.
This final rule, like prior interstate transport rules, considers the potential for shifting generation among
electric power producers, depending on the price-signal of the allowances in a trading program. Shifting
generation to lower NOX-emitting or zero-emitting EGUs occurs in response to economic factors,
including the costs of pollution control. As the cost of emitting NOX increases, combined with all other
costs of generation, it becomes increasingly cost-effective for units with lower NOX rates to increase
generation, while units with higher NOX rates reduce generation. Because the cost of generation is unit-
specific, this generation shifting occurs incrementally on a continuum. Consequently, there is more
generation shifting at higher cost NOX levels. Because we have identified discrete cost thresholds
resulting from the full operation of particular types of emission controls, it is reasonable to
simultaneously quantify the reduction potential from generation shifting strategy associated with
operating controls at each cost level. Including these reductions is important, ensuring that cost-effective
emission reductions and full operation of controls can be expected to occur.
As described in the preamble, EPA modeled generation shifting to units with lower NOX emission rates
only within the same state as a proxy for estimating the amount of generation that could be shifted in the
near-term (i.e., 2021). We further assume that such generation shifting only occurs within and among
generators that are already in operation and connected to the grid in EPA’s IPM baseline. Under these
circumstances, shifting generation to lower NOX- or zero-emitting EGUs, similar to operating existing
post-combustion controls, uses investments that have already been made, and can significantly reduce
EGU NOX emissions relatively quickly. For example, natural gas combined cycle (NGCC) facilities can
achieve NOX emission rates of 0.0095 lb/mmBtu, compared to existing coal steam facilities, which
emitted at an average rate of 0.12 lb/mmBtu of NOX across the 22 states included in the CSAPR Update
in 2019. Similarly, generation could shift from uncontrolled coal units to SCR-controlled or SNCR
controlled coal units. Shifting generation to lower NOX-emitting EGUs would be a cost-effective, timely,
and readily available approach for EGUs to reduce NOX emissions, and EPA analyzed EGU NOX
reduction potential from this control strategy for the CSAPR Update. EPA considers that the amount of
generation shifting modeled to occur within each particular linked state in response to the selected control
strategy represented by $1800/ton reflects the generation shifting that can occur in the 2021 ozone season
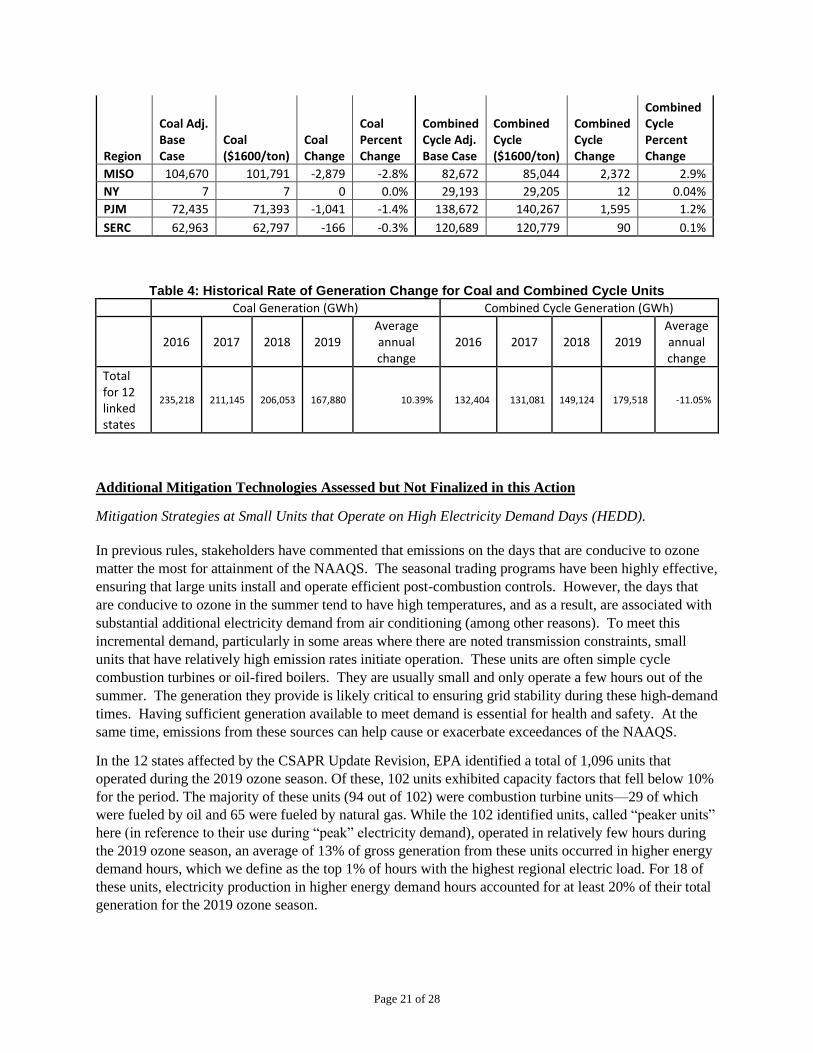
and is thus incorporated into the emission budgets. Table 3 and Table 4 below illustrate the low amount of
generation assumed in EPA’s analysis relative to historical levels.
Table 3: Regional Coal and Gas Summer Generation Changes Base to Cost Threshold Case (2021, GWh)
38 http://nepis.epa.gov/Adobe/PDF/P1001G0O.pdf
Page 21 of 28
Region
Coal Adj. Base Case
Coal ($1600/ton)
Coal Change
Coal Percent Change
Combined Cycle Adj. Base Case
Combined Cycle ($1600/ton)
Combined Cycle Change
Combined Cycle Percent Change
MISO 104,670 101,791 -2,879 -2.8% 82,672 85,044 2,372 2.9%
NY 7 7 0 0.0% 29,193 29,205 12 0.04%
PJM 72,435 71,393 -1,041 -1.4% 138,672 140,267 1,595 1.2%
SERC 62,963 62,797 -166 -0.3% 120,689 120,779 90 0.1%
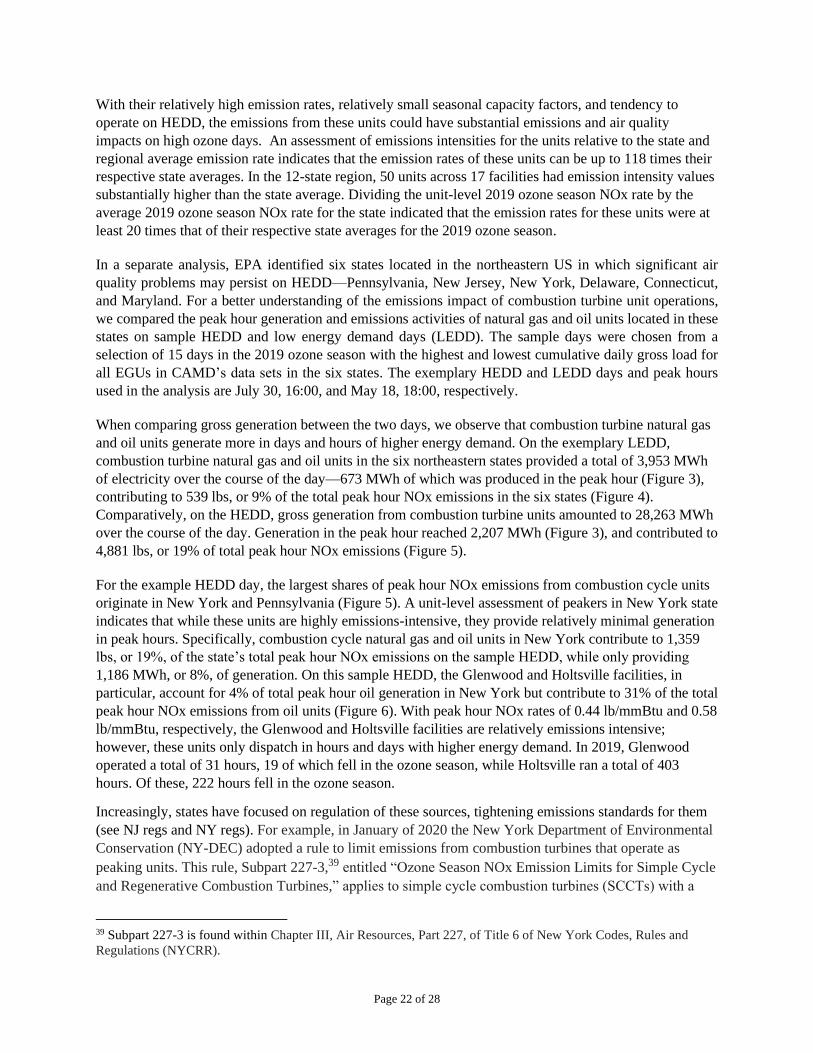
Table 4: Historical Rate of Generation Change for Coal and Combined Cycle Units
Coal Generation (GWh) Combined Cycle Generation (GWh)
2016 2017 2018 2019 Average annual change
2016 2017 2018 2019 Average annual change
Total for 12 linked states
235,218 211,145 206,053 167,880 10.39% 132,404 131,081 149,124 179,518 -11.05%
Additional Mitigation Technologies Assessed but Not Finalized in this Action
Mitigation Strategies at Small Units that Operate on High Electricity Demand Days (HEDD).
In previous rules, stakeholders have commented that emissions on the days that are conducive to ozone
matter the most for attainment of the NAAQS. The seasonal trading programs have been highly effective,
ensuring that large units install and operate efficient post-combustion controls. However, the days that
are conducive to ozone in the summer tend to have high temperatures, and as a result, are associated with
substantial additional electricity demand from air conditioning (among other reasons). To meet this
incremental demand, particularly in some areas where there are noted transmission constraints, small
units that have relatively high emission rates initiate operation. These units are often simple cycle
combustion turbines or oil-fired boilers. They are usually small and only operate a few hours out of the
summer. The generation they provide is likely critical to ensuring grid stability during these high-demand
times. Having sufficient generation available to meet demand is essential for health and safety. At the
same time, emissions from these sources can help cause or exacerbate exceedances of the NAAQS.
In the 12 states affected by the CSAPR Update Revision, EPA identified a total of 1,096 units that
operated during the 2019 ozone season. Of these, 102 units exhibited capacity factors that fell below 10%
for the period. The majority of these units (94 out of 102) were combustion turbine units—29 of which
were fueled by oil and 65 were fueled by natural gas. While the 102 identified units, called “peaker units”
here (in reference to their use during “peak” electricity demand), operated in relatively few hours during
the 2019 ozone season, an average of 13% of gross generation from these units occurred in higher energy
demand hours, which we define as the top 1% of hours with the highest regional electric load. For 18 of
these units, electricity production in higher energy demand hours accounted for at least 20% of their total
generation for the 2019 ozone season.
Page 22 of 28
With their relatively high emission rates, relatively small seasonal capacity factors, and tendency to
operate on HEDD, the emissions from these units could have substantial emissions and air quality
impacts on high ozone days. An assessment of emissions intensities for the units relative to the state and
regional average emission rate indicates that the emission rates of these units can be up to 118 times their
respective state averages. In the 12-state region, 50 units across 17 facilities had emission intensity values
substantially higher than the state average. Dividing the unit-level 2019 ozone season NOx rate by the
average 2019 ozone season NOx rate for the state indicated that the emission rates for these units were at
least 20 times that of their respective state averages for the 2019 ozone season.
In a separate analysis, EPA identified six states located in the northeastern US in which significant air
quality problems may persist on HEDD—Pennsylvania, New Jersey, New York, Delaware, Connecticut,
and Maryland. For a better understanding of the emissions impact of combustion turbine unit operations,
we compared the peak hour generation and emissions activities of natural gas and oil units located in these
states on sample HEDD and low energy demand days (LEDD). The sample days were chosen from a
selection of 15 days in the 2019 ozone season with the highest and lowest cumulative daily gross load for
all EGUs in CAMD’s data sets in the six states. The exemplary HEDD and LEDD days and peak hours
used in the analysis are July 30, 16:00, and May 18, 18:00, respectively.
When comparing gross generation between the two days, we observe that combustion turbine natural gas
and oil units generate more in days and hours of higher energy demand. On the exemplary LEDD,
combustion turbine natural gas and oil units in the six northeastern states provided a total of 3,953 MWh
of electricity over the course of the day—673 MWh of which was produced in the peak hour (Figure 3),
contributing to 539 lbs, or 9% of the total peak hour NOx emissions in the six states (Figure 4).
Comparatively, on the HEDD, gross generation from combustion turbine units amounted to 28,263 MWh
over the course of the day. Generation in the peak hour reached 2,207 MWh (Figure 3), and contributed to
4,881 lbs, or 19% of total peak hour NOx emissions (Figure 5).
For the example HEDD day, the largest shares of peak hour NOx emissions from combustion cycle units
originate in New York and Pennsylvania (Figure 5). A unit-level assessment of peakers in New York state
indicates that while these units are highly emissions-intensive, they provide relatively minimal generation
in peak hours. Specifically, combustion cycle natural gas and oil units in New York contribute to 1,359
lbs, or 19%, of the state’s total peak hour NOx emissions on the sample HEDD, while only providing
1,186 MWh, or 8%, of generation. On this sample HEDD, the Glenwood and Holtsville facilities, in
particular, account for 4% of total peak hour oil generation in New York but contribute to 31% of the total
peak hour NOx emissions from oil units (Figure 6). With peak hour NOx rates of 0.44 lb/mmBtu and 0.58
lb/mmBtu, respectively, the Glenwood and Holtsville facilities are relatively emissions intensive;
however, these units only dispatch in hours and days with higher energy demand. In 2019, Glenwood
operated a total of 31 hours, 19 of which fell in the ozone season, while Holtsville ran a total of 403
hours. Of these, 222 hours fell in the ozone season.
Increasingly, states have focused on regulation of these sources, tightening emissions standards for them
(see NJ regs and NY regs). For example, in January of 2020 the New York Department of Environmental
Conservation (NY-DEC) adopted a rule to limit emissions from combustion turbines that operate as
peaking units. This rule, Subpart 227-3,39 entitled “Ozone Season NOx Emission Limits for Simple Cycle
and Regenerative Combustion Turbines,” applies to simple cycle combustion turbines (SCCTs) with a
39 Subpart 227-3 is found within Chapter III, Air Resources, Part 227, of Title 6 of New York Codes, Rules and
Regulations (NYCRR).
Page 23 of 28
nameplate capacity of 15 MW or greater that supply electricity to the grid. The regulation contains two
compliance dates with increasingly stringent NOx limits, as follows: by May 1, 2023, all SCCTs subject
to the rule must meet a NOx emission limit of 100 ppmvd,40 and; by May 1, 2025, gas-fired SCCTs must
meet a NOx emission limit of 25 ppmvd, and distillate or other liquid-fueled units must a limit of 42
ppmvd. In lieu of meeting these limits directly, New York’s rule offers two alternative compliance
options. The first compliance option allows owners and operators to elect an operating permit condition
that would prohibit the source from operating during the ozone season. The second option allows owners
and operators to adhere to an output-based NOx daily emission rate that includes electric storage and
renewable energy under common control with the SCCTs with which they would be allowed to average.
The EPA previously promulgated NOx emission standards for combustion turbines, which are found in
New Source Performance Standards (NSPS) located at 40 CFR Part 60, Subparts GG and KKKK. Subpart
GG covers turbine engines that commenced constructed after October 3, 1977 and before February 18,
2005. Subpart KKKK covers both the combustion turbine engine and any associated heat recovery steam
generator for units that commenced construction after February 18, 2005.
EPA received comment on potentially including these mitigation technologies in the final Revised
CSAPR Update Rule and addresses those comments in section VI.B. of the preamble.
Figure 3. Hourly gross generation by combustion turbine natural gas and oil units in the six northeastern
states on an exemplary LEDD and HEDD
40 Parts per million on a dry volume basis at 15% oxygen. Using a heat rate of 15,000 BTUs/KWh identified in New
York’s background materials for the rule and the alternative 3 lbs NOx/MWh limit equating to 100 ppmvd, the
equivalent emission rate would be approximately .2 lb/mmBtu and significantly lower for the full implementation of
25 ppmvd. See https://www.dec.ny.gov/docs/air_pdf/siprevision2273.pdf
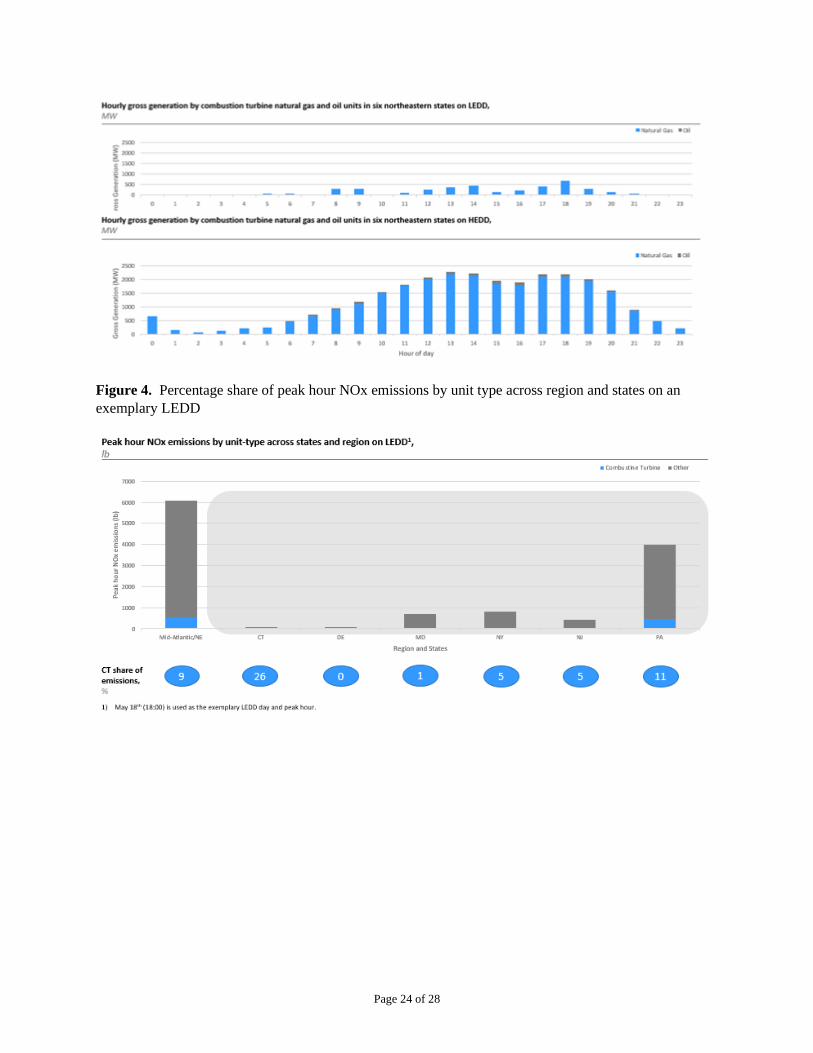
Page 24 of 28
Figure 4. Percentage share of peak hour NOx emissions by unit type across region and states on an
exemplary LEDD
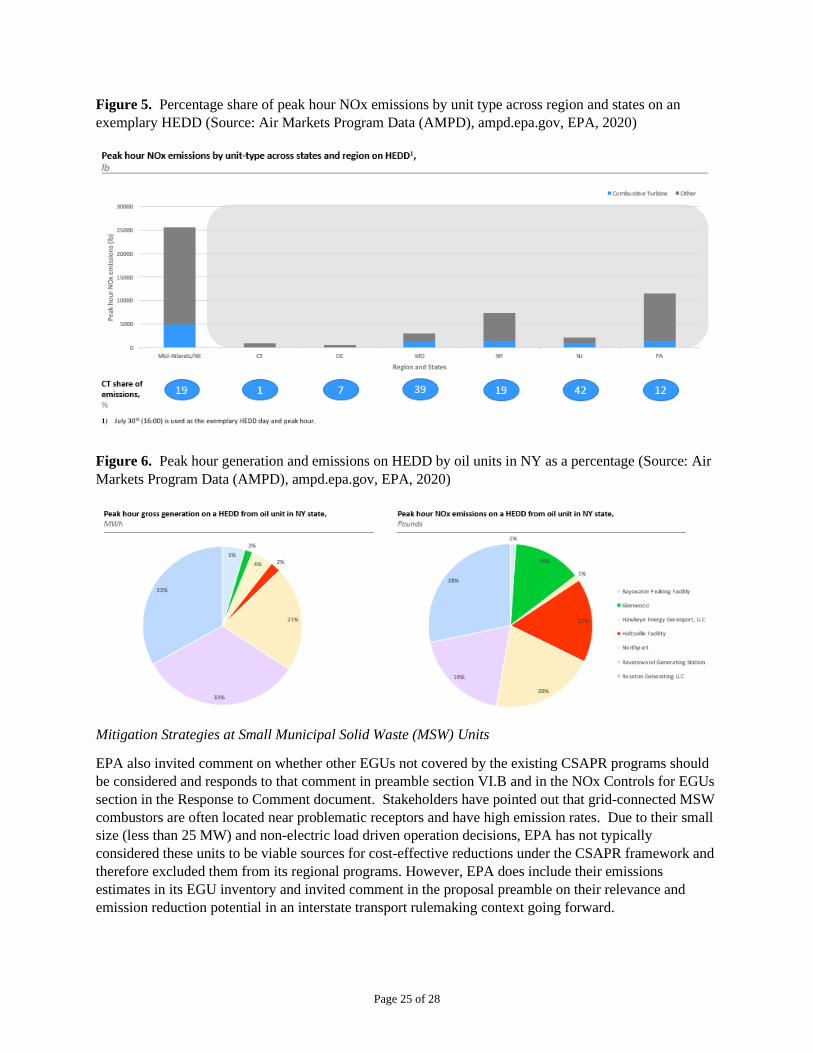
Page 25 of 28
Figure 5. Percentage share of peak hour NOx emissions by unit type across region and states on an
exemplary HEDD (Source: Air Markets Program Data (AMPD), ampd.epa.gov, EPA, 2020)
Figure 6. Peak hour generation and emissions on HEDD by oil units in NY as a percentage (Source: Air
Markets Program Data (AMPD), ampd.epa.gov, EPA, 2020)
Mitigation Strategies at Small Municipal Solid Waste (MSW) Units
EPA also invited comment on whether other EGUs not covered by the existing CSAPR programs should
be considered and responds to that comment in preamble section VI.B and in the NOx Controls for EGUs
section in the Response to Comment document. Stakeholders have pointed out that grid-connected MSW
combustors are often located near problematic receptors and have high emission rates. Due to their small
size (less than 25 MW) and non-electric load driven operation decisions, EPA has not typically
considered these units to be viable sources for cost-effective reductions under the CSAPR framework and
therefore excluded them from its regional programs. However, EPA does include their emissions
estimates in its EGU inventory and invited comment in the proposal preamble on their relevance and
emission reduction potential in an interstate transport rulemaking context going forward.
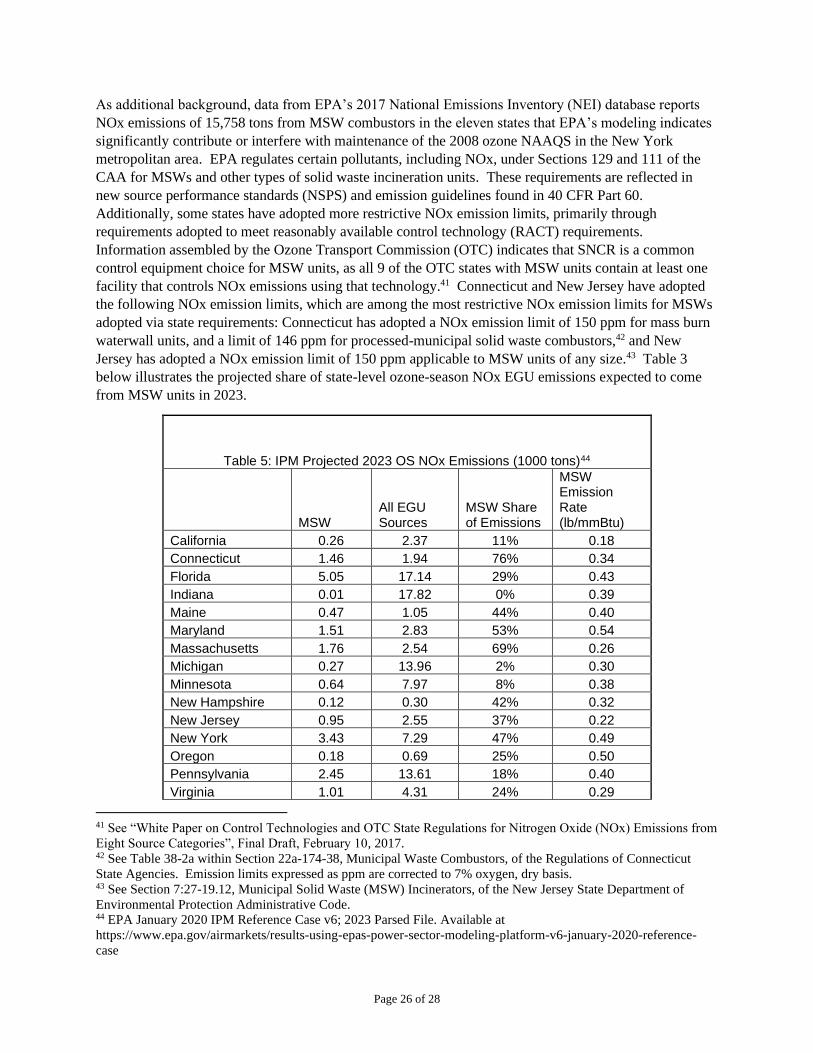
Page 26 of 28
As additional background, data from EPA’s 2017 National Emissions Inventory (NEI) database reports
NOx emissions of 15,758 tons from MSW combustors in the eleven states that EPA’s modeling indicates
significantly contribute or interfere with maintenance of the 2008 ozone NAAQS in the New York
metropolitan area. EPA regulates certain pollutants, including NOx, under Sections 129 and 111 of the
CAA for MSWs and other types of solid waste incineration units. These requirements are reflected in
new source performance standards (NSPS) and emission guidelines found in 40 CFR Part 60.
Additionally, some states have adopted more restrictive NOx emission limits, primarily through
requirements adopted to meet reasonably available control technology (RACT) requirements.
Information assembled by the Ozone Transport Commission (OTC) indicates that SNCR is a common
control equipment choice for MSW units, as all 9 of the OTC states with MSW units contain at least one
facility that controls NOx emissions using that technology.41 Connecticut and New Jersey have adopted
the following NOx emission limits, which are among the most restrictive NOx emission limits for MSWs
adopted via state requirements: Connecticut has adopted a NOx emission limit of 150 ppm for mass burn
waterwall units, and a limit of 146 ppm for processed-municipal solid waste combustors,42 and New
Jersey has adopted a NOx emission limit of 150 ppm applicable to MSW units of any size.43 Table 3
below illustrates the projected share of state-level ozone-season NOx EGU emissions expected to come
from MSW units in 2023.
Table 5: IPM Projected 2023 OS NOx Emissions (1000 tons)44
MSW All EGU Sources
MSW Share of Emissions
MSW Emission Rate (lb/mmBtu)
California 0.26 2.37 11% 0.18
Connecticut 1.46 1.94 76% 0.34
Florida 5.05 17.14 29% 0.43
Indiana 0.01 17.82 0% 0.39
Maine 0.47 1.05 44% 0.40
Maryland 1.51 2.83 53% 0.54
Massachusetts 1.76 2.54 69% 0.26
Michigan 0.27 13.96 2% 0.30
Minnesota 0.64 7.97 8% 0.38
New Hampshire 0.12 0.30 42% 0.32
New Jersey 0.95 2.55 37% 0.22
New York 3.43 7.29 47% 0.49
Oregon 0.18 0.69 25% 0.50
Pennsylvania 2.45 13.61 18% 0.40
Virginia 1.01 4.31 24% 0.29
41 See “White Paper on Control Technologies and OTC State Regulations for Nitrogen Oxide (NOx) Emissions from
Eight Source Categories”, Final Draft, February 10, 2017. 42 See Table 38-2a within Section 22a-174-38, Municipal Waste Combustors, of the Regulations of Connecticut
State Agencies. Emission limits expressed as ppm are corrected to 7% oxygen, dry basis. 43 See Section 7:27-19.12, Municipal Solid Waste (MSW) Incinerators, of the New Jersey State Department of
Environmental Protection Administrative Code. 44 EPA January 2020 IPM Reference Case v6; 2023 Parsed File. Available at
https://www.epa.gov/airmarkets/results-using-epas-power-sector-modeling-platform-v6-january-2020-reference-
case

Page 27 of 28
Washington 0.22 0.51 44% 0.38
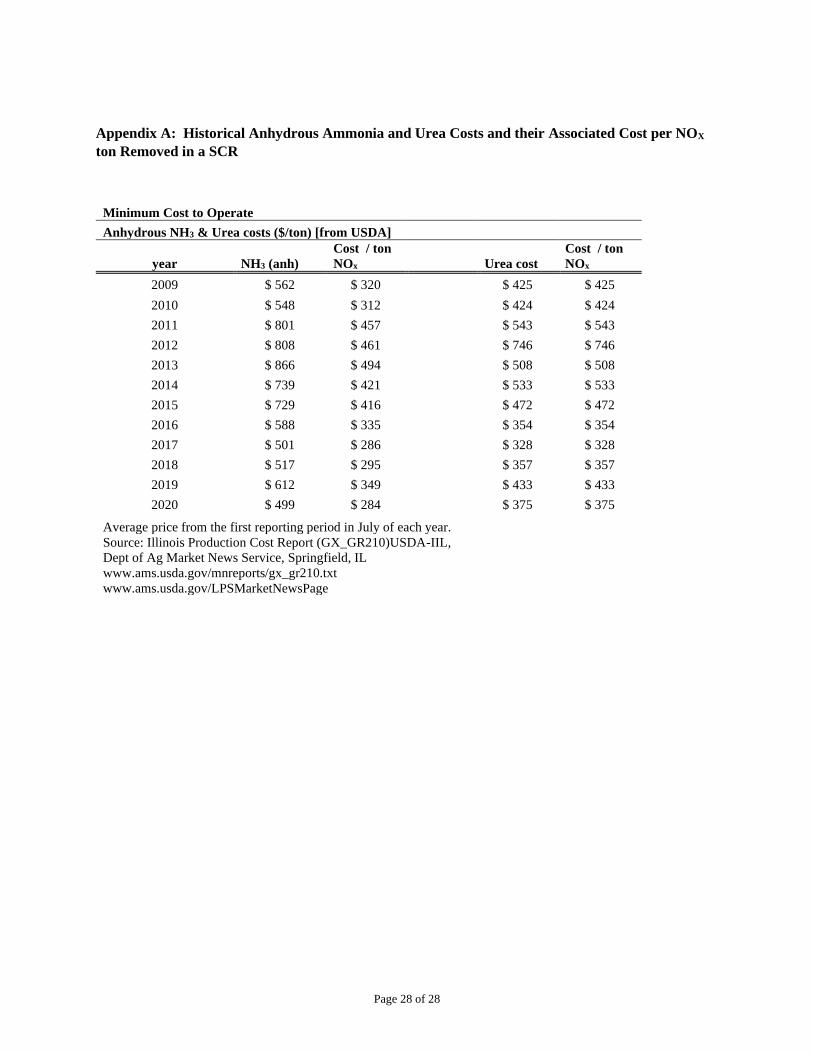
Page 28 of 28
Appendix A: Historical Anhydrous Ammonia and Urea Costs and their Associated Cost per NOX
ton Removed in a SCR
Minimum Cost to Operate
Anhydrous NH3 & Urea costs ($/ton) [from USDA]
year NH3 (anh)
Cost / ton
NOx Urea cost
Cost / ton
NOx
2009 $ 562 $ 320 $ 425 $ 425
2010 $ 548 $ 312 $ 424 $ 424
2011 $ 801 $ 457 $ 543 $ 543
2012 $ 808 $ 461 $ 746 $ 746
2013 $ 866 $ 494 $ 508 $ 508
2014 $ 739 $ 421 $ 533 $ 533
2015 $ 729 $ 416 $ 472 $ 472
2016 $ 588 $ 335 $ 354 $ 354
2017 $ 501 $ 286 $ 328 $ 328
2018 $ 517 $ 295 $ 357 $ 357
2019 $ 612 $ 349 $ 433 $ 433
2020 $ 499 $ 284 $ 375 $ 375
Average price from the first reporting period in July of each year.
Source: Illinois Production Cost Report (GX_GR210)USDA-IIL,
Dept of Ag Market News Service, Springfield, IL
www.ams.usda.gov/mnreports/gx_gr210.txt
www.ams.usda.gov/LPSMarketNewsPage


