Embed Size (px)
Citation preview

UNITED NATIONS ECONOMIC COMMISSION FOR EUROPE
Review of the implementation of OSCE commitments in the economic and environmental dimension
TRANSPORT
Version: 7 May 2010
Eighteenth OSCE Economic and Environmental Forum 24-26 May 2010
Prague, Czech Republic

i
Table of contents Page
List of figures and boxes.................................................................... ii
Conclusions........................................................................................ iv
Acknowledgments ............................................................................. vii
1. Introduction.................................................................................... 1
2. Inland transport in the UNECE region in 2009 ............................. 2
3. Transport infrastructure challenges ............................................... 7
3.1 Roads and highways .................................................................... 7
3.2. Railway infrastructure................................................................. 8
3.3. Inland waterways ........................................................................ 13
3.4. Intermodal transport.................................................................... 18
4. Public-Private Partnerships and financing transport infrastructure .................................................................................. 20
5. Euro-Asian Transport Links .......................................................... 23
6. TEM and TER projects .................................................................. 30
7. Transport and border crossing facilitation..................................... 35
8 Trade facilitation............................................................................. 44
9. Intelligent transport systems .......................................................... 48
10. Landlocked developing countries: Almaty Program of Action.......................................................... 53
11. Refrigerated transport and global food security .......................... 64
12. Green transport ............................................................................ 67
13. Gender and transport.................................................................... 74
14. Road safety .................................................................................. 82
15. Inland transport security .............................................................. 94
Annexes
Project proposals................................................................................ 101
Annex 1. Inland Transport Security Discussion Forum .................... 101
Annex 2. Accession to the European Agreement concerning the International Carriage of Dangerous Goods by Road (ADR)........... 102
Annex 3. A demonstration block train along the North-South Corridor 103
Annex 4: Main international UNECE transport conventions ............ 108

ii
List of figures and boxes
Figure 1: Transportation services index, United States ................................... 4
Box: Hinterland connections............................................................................ 5
Figure 2: High speed railway routes in Europe, 2009..................................... 10
Figure 3 Share of the rail sector in inland transport infrastructure investment, 1995-2007 (per cent) .................................................................... 11
Figure 4: Structure of PPP transport infrastructure investment in UNECE emerging market economies, 1993-2007 (per cent) .......................... 13
Box: The potential of inland water transport ................................................... 14
Figure 5: Classification of E Waterways ......................................................... 15
Figure 6: Container transport on the Main-Danube canal ............................... 16
Figure 7: Freight transport by inland waterways ............................................. 17
Figure 8: Freight transport by inland waterway area in 2008.......................... 18
Figure 9: Intermodal road rail transport in Europe, 1997-2009....................... 19
Figure 10: Transport Sector: Number of Projects by Region and Year of Financial Closure (2005-2008) ........................................................... 20
Figure 11: UNECE-UNESCAP Euro-Asian Links Project RAIL ROUTES .. 25
Figure 12: UNECE-UNESCAP Euro-Asian Links Project ROAD ROUTES 26
Figure13: EATL projects (number of projects and costs in millions of United States dollars)....................................................................................... 28
Box: E-Road Traffic Census............................................................................ 31
Box: E-Rail Traffic Census.............................................................................. 33
Box: The cost of crossing border ..................................................................... 36
Box: Border crossings in numbers................................................................... 37
Box: Example of bribes ................................................................................... 38
Figure 14: Regional variations in rail transport ............................................... 38
Box: Bulgaria and Serbia: Example of best practice ....................................... 39
Figure 15: TIR Carnets issued worldwide in 2001 – 2009 .............................. 42
Figure 16: Geographical distribution of TIR Carnets issued in 2009.............. 42
Box: The International Convention on the Harmonization of Frontier Controls of Goods ........................................................................................ 43
Box: UN/CEFACT’s work in the current multilateral trading context............ 45
Box: Transport of dangerous goods................................................................. 50
Box: Intelligent Transport Systems on Inland Waterways .............................. 51
Box: Transport infrastructure bottlenecks ....................................................... 55

iii
Box: Transport of chilled and frozen perishable foodstuffs: Good practice at border crossings.................................................................... 65
Box: Transport of chilled and frozen perishable foodstuffs: Central Asia ...... 67
Box: Changing patterns of transport-related CO2 emissions .......................... 69
Box: A possible strategy to reduce the transport CO2 emissions.................... 70
Box: International Transport Forum and WP.29 ............................................. 71
Box: The Ministerial Conference on Global Environment and Energy in Transport (MEET) ........................................................................................ 72
Figure 17: Evaluation of emission limits of passenger cars ............................ 73
Figure 18: Emission limits for Heavy transport vehicles................................. 74
Box: Key gender issues in transport ................................................................ 75
Box: Incorporating gender issues in transport ................................................. 79
Box: Global road safety crisis.......................................................................... 83
Figure 19: UNECE Member States Reported Road crash fatalities and rates per million population 2007 .................................................................... 84
Figure 20: Ten year trend in reported fatalities 1997 to 2007 ......................... 85
Box: Digital tachograph – a tool to improve working conditions, road safety and fair competition ...................................................................... 87

iv
Conclusions
Inland transport plays a significant role in today’s world. It is a crucial conduit and intermediary between producers and consumers. It is indispensable for economies to function and populations to be mobile. Inland transport continues to face numerous challenges in the UNECE region: Infrastructure Road and rail networks are not adequate, coherent and integrated. Inland waterways represent a yet to be fully explored market opportunity while intermodal transport could play a greater role. Capacity and quality of road infrastructure, in many UNECE members, is deficient. Proper planning and development of international networks is hindered by the unavailability of data. The rail sector is still not at all inter-operable. Both technical and legal interoperability and compatibility remains to be improved. In the UNECE region, there are fundamentally two different rail market structures: separation of rail infrastructure and service provision has taken place in the EU countries; while in the other UNECE countries vertically integrated railways are in charge of both infrastructure and services. The investment both in rail infrastructure and in rolling stock is inadequate. Inland water transport is safe, reliable, economical and environmentally friendly. This mode of transport offers a large potential. However, insufficient infrastructure development and maintenance prevent competitive and efficient operations on the one hand; and the fragmented market structure makes it hard to effectively integrate it into modern door-to-door transport chains, on the other hand. Transport and border crossing Crossing borders has always been a challenge, but current crossing times in many part of the UNECE region – by truck or train – are too frequently too long. The main barriers are unnecessarily complex control procedures, inadequate infrastructure and low skilled personnel. The difficulties at borders translate into lost time, inefficient us of capital, enhanced security risks, unnecessary inventory costs and higher social costs of transport workers and residents of border regions. The UNECE conventions in the area of border crossing facilitation are aimed at simplification and harmonization of procedures at border crossings. In particular, “The International Convention on the Harmonization of Frontier Controls of Goods” provides the adequate basis to begin to rectify this unsatisfactory and costly situation. Trade facilitation Trade facilitation reduces the transaction costs and complexity of international trade by making the processes more transparent, efficient and cost-effective. There is significant potential for strengthening the exchange of experiences, advisory services and capacity-building between those countries which have successfully addressed trade facilitation problems and those which have been relatively less successful.

v
The environment Transport is a source of air pollution, particularly in urban areas. Noise caused by road and rail transport generates nuisance and health hazards. Introduction of cleaner vehicles and fuels as well as less noisy engines has reduced air pollution and noise in some UNECE countries. Progress is needed in many other UNECE countries. By developing performance requirements for innovative vehicle technologies such as environmentally friendly vehicles as well as conditions for mutual recognition, the UNECE contributes to the rapid introduction of such vehicle technologies into the market. Public-Private Partnerships PPPs are attracting considerable attention as a means to facilitate the development of transport infrastructure. The wider use is constrained by the insufficient knowledge and skills within government administrations. On the other hand, PPPs are not panacea to all transport development issues and particularly cannot replace transport policy reforms. Euro-Asian Transport Links The development potential of Euro-Asian transport connections relies upon EATL countries’ capacity to become effective parts of the integrated supply chain. The EATL countries, particularly landlocked countries, depend on each other. A weak part or a missing link in one country can render the whole route economically unviable. Developing Euro-Asian inland transport links will be a long-term undertaking, requiring effort and perseverance, and enhanced international coordination and cooperation. Intelligent transport systems Intelligent transport systems (ITS) integrate information and communication technology with transport infrastructure, vehicles and users. A growing number of UNECE members are intensively developing and implementing intelligent transport systems in various transport areas. Given that the design and industrial development cycle for ITS systems is shorter than the policy cycle for such technologies, regulatory authorities should speed up efforts to maximise the potential offered by the implementation of ITS. UN Almaty Program of Action Landlocked developing countries in the UNECE region continue to face numerous challenges to decrease “economic distance” to the world market and to improve competitiveness. The UNECE has a number of international legal instruments, standards, norms and recommendations which, if promoted, used and properly implemented, can assist landlocked and transit countries in overcoming their special disadvantages.
Gender and transport Transport can make a significant difference in increasing women’s productivity and in promoting gender equality. In addition to its contribution to economic growth, transport plays a social role by broadening access to health and education services, employment, improving the exchange of information and promoting social cohesion.

vi
Yet, little attention appears to have been paid to women’s needs in transport development projects worldwide. Road safety There are still too many road traffic deaths and injuries in the UNECE region. Many EU-10, SEE and countries in the Eastern Europe, Caucasus and Central Asia region countries are not improving their road safety records. Governments have a primary role in creating safe road traffic conditions by quantifying the road safety problem through reliable national statistics. Research is also essential. Countries without road safety targets should consider introducing the national evidence-based casualty reduction goals. The UNECE transport safety conventions and agreements provide a solid basis for lowering the number of road accidents and fatalities. Effective implementation by contracting parties will improve road safety. Inland transport security It is important to improve the security of domestic and international transport systems by reducing the likelihood of transport being a target or used as a vehicle for terrorism. The security threats should be addressed preventively, but any new initiatives should not lead to excessive obstacles to international transport and trade. This approach requires close cooperation of transport authorities with other authorities such as intelligence, security, customs and border services.

vii
Acknowledgments This report has been prepared by the staff of the Transport Division of the United Nations Economic Commission for Europe under the general direction of Eva Molnar. Robert Nowak wrote Section 1 (Introduction), Section 10 (Landlocked developing countries), Section 15 (Inland transport security), coordinated, edited and assembled the report based upon the individual contributions of Jaromir Cekota (Section 2: Inland transport in the UNECE region; Section 3.2: Railway infrastructure), Virginia Tanase (Section 3.1: Roads and highways and Section 14: Road safety), Viatcheslav Novikov (Section 3.3: Inland waterways), Martin Magold (Section 3.4: Intermodal Transport), Geoffrey Hamilton (Section 4: PPP), Michalis Adamantiadis (Section 5: EATL), Sophie Fouvez (Section 6: TEM/TER), Konstantin Glukhenkiy (Section 7: Transport and border crossing facilitation), Virginia Cram-Martos (Section 8: Trade facilitation), Edoardo Gianotti (Section 9: Intelligent transport systems), Christopher Smith (Section 11: Refrigerated transport and global food security), Romain Hubert (Section 12: Green transport), Miodrag Pesut (Section 13: Gender and transport), Ould Khou Sid’Ahmed provided statistical data while Line Konstad, Maria Mostovets and Dominique Léger provided editorial and secretarial assistance.
The following designations are used in this review: EU-15 (European Union-15): Austria, Belgium, Denmark, Finland, France, Germany, Greece, Ireland, Italy, Luxembourg, Netherlands, Portugal, Spain, Sweden, United Kingdom EU-10 (European Union-10): Cyprus, Czech Republic, Estonia, Hungary, Latvia, Lithuania, Malta, Poland, Slovakia, Slovenia EU-12 (European Union-12): Bulgaria, Cyprus, Czech Republic, Estonia, Hungary, Latvia, Lithuania, Malta, Poland, Romania, Slovakia, Slovenia SEE (South-East Europe): Albania, Bosnia-Herzegovina, Bulgaria, Croatia, Romania, Serbia and Montenegro, The FYR of Macedonia, Turkey OE (Other Europe): Andorra, Iceland, Israel, Liechtenstein, Monaco, Norway, San Marino, Switzerland NA (North America): Canada, United States

1
1. Introduction The United Nations Economic Commission for Europe (UNECE) is one of the five regional commissions of the United Nations. It is the forum where the countries of western, central and eastern Europe, central Asia and North America – 56 countries in all – come together to forge the tools of their economic cooperation. That cooperation concerns economics, statistics, environment, transport, trade, sustainable energy, timber and habitat. The Commission offers a regional framework for the elaboration and harmonization of conventions, norms and standards. The Commission's experts provide technical assistance to the countries of south-east Europe and the Commonwealth of Independent States. This assistance takes the form of advisory services, training seminars and workshops where countries can share their experiences and best practices. The Report of the UN Secretary-General’s High-level Panel on Threats, Challenges and Change has identified economic, social threats and environmental degradation among the six main clusters of threats. The Report has also urged the United Nations to cooperate more closely with regional and sub-regional organizations. It appears that by virtue of the work undertaken together, both the UNECE and OSCE have jointly recognized the importance of economic development and the environment in the context of enhancing security. In fact, in the area of economic and environmental dimension of security, the UNECE and OSCE have developed a close working relationship. There are many reasons for this. First, their respective areas of expertise are complementary. The OSCE provides a political platform and a network of field offices while the UNECE has secretariat capacity and its norms, standards and conventions. Second, both organizations share virtually the same membership and provide to their constituents the same neutral framework discussion. This close relationship is encouraged and supported by member States at the meetings of the UNECE sessions and the participating States at the OSCE Economic and Environmental Sub-Committee. Arguably, the United Nations Economic Commission for Europe occupies a privileged position among all the organizations with which the OSCE has cooperated in the area of economics and the environment. This was partly reflected in the OSCE Strategy Document for the Economic and Environmental Dimension, adopted in 2003, which identified the UNECE as the key partner in its implementation. The Memorandum of Understanding, which both organizations signed at the 2004 Sofia Ministerial meeting provides further supporting evidence. This effective partnership has been fostered through many activities and projects undertaken jointly in the last 15 years or so. Of particular significance are substantive reviews of the performance of OSCE participating States in implementing commitments in the economic and environmental dimension. The commitments stem from declarations since the Helsinki Final Act in 1975, including the Declaration of the Bonn Conference of 1990 and the Istanbul Charter of 1999. These review sessions have become a regular feature of the OSCE annual Economic Forums since 1996. This 2010 review is no exception. The UNECE has prepared this report describing and evaluating issues related to OSCE transport commitments.

2
“We (participating States) encourage the development of transport networks in the OSCE region, which are efficient and integrated, free of avoidable safety and security risks and sensitive to the environment. In this regard, we will give a high priority to the uninterrupted operation of the existing transport corridors and to construction of new ones, where this can be economically justified” This report is not a comprehensive review of transport issues across all UNECE member states. It purposely focuses on some selected issues that relate to the above-noted transport commitment of the OSCE participating States. The report discusses inland transport (road, railway and water) infrastructure in Europe with focus on Euro-Asian links; it presents some key issues concerning border-crossing problems; provides road safety performance indicators across the UNECE region; discusses trade facilitation, a public-private partnership model, intelligent transport systems and, finally, it covers important environmental aspects of transport. Annex 4 provides a list of the main UNECE transport conventions. The OSCE is encouraged to promote them by increasing political visibility of these important international legal instruments. Annexes 1-3 contain descriptions of UNECE project proposals for consideration by the OSCE participating States. It is generally recognized that a low level of economic development and environmental degradation are important sources of insecurity. As UN Secretary-General noted in the report In Larger Freedom, “not only development, security and human rights are imperative; they also reinforce each other”. In this respect, both UNECE and OSCE – fully supported by their members and participating States – have developed close and fruitful relationship in the areas of economic development, security and the environment. In the future, more joint work will be considered, in particular in regions such as South East Europe, the Caucases and Central Asia where closer regional cooperation may positively contribute to prosperity. In sum, both organizations – through joint projects and close cooperation – work to establish and nurture conditions, which seem necessary to secure a safer world. 2. Inland transport in the UNECE region in 2009 The recent economic downturn has impacted all inland transport modes in the UNECE area. Freight transport services declined more than GDP while passenger traffic decreased less. The automotive manufacturing sector was hit hard in Eastern Europe and North America by declining consumer and business demand for motor vehicles. State aid in the form of car scrapping schemes helped to preserve sales and production in Western Europe. Transport infrastructure investment has accelerated in some countries but fell rapidly in the countries that had to pursue fiscal consolidation.
International trade declined by more than 10 per cent in 2009. Trade volumes in economies of Europe and North America stabilized in the second quarter of 2009 at significantly lower levels than a year earlier. Subsequently, trade flows started to

3
recover slowly.1 Since trade and transport flows contracted much more rapidly than GDP during the economic recession and the pace of recovery in major UNECE economies remains slow, a rebound of freight transport volumes to 2008 levels may well be delayed until 2011 or 2012.
The majority of UNECE emerging market economies experienced significant declines in aggregate output and transportation activity. In countries in the Eastern Europe, Caucasus and Central Asia region, GDP fell on average during the first three quarters of 2009 by 9 per cent while cargo transportation volumes plummeted by 19 per cent (year-on-year). Economic performance during this period was uneven throughout the countries in the Eastern Europe, Caucasus and Central Asia Region., ranging from steep output declines in Armenia, Ukraine and the Russian Federation to positive growth in a few smaller economies, including Azerbaijan and Uzbekistan.2 Most countries of Southeast Europe (SEE) experienced an economic downturn in 2009, with GDP declines averaging some 6 per cent. GDP downturn averaged about 3½ per cent in Central Europe and the Baltic States; however, there were large cross-country variations. A fragile recovery is expected to take place in most UNECE emerging market economies in 2010.
In response to a sharp deceleration of industrial production and trade since the last quarter of 2008, freight transport volumes declined rapidly across the UNECE region. The pattern of slowdown differed across markets and transport modes. The latest available data from the United States Bureau of Transportation Statistics show that, following a steep decline, the volumes of both freight and passenger services have stabilized since the middle of 2009 (Figure 1). Available data indicate that a stabilization or fragile recovery of transport services has been taking place in Western Europe and some transition economies since the third quarter of 2009.
1 For details, see OECD, “Trade flows stabilise in second quarter 2009,” 23 October 2009 at http://www.oecd.org/dataoecd/29/42/43935946.pdf.
2 See Interstate Statistical Committee of the CIS, “Main macroeconomic indicators of the countries of the CIS” at http://www.cisstat.com/eng/mac1_ann.htm.

4
Figure 1 Transportation services index, United States (2000 = 100, seasonally adjusted)
Source: Bureau of Transportation Statistics (http://www.bts.gov/press_releases/2009/bts057_09/html/bts057_09.html). Note: The Freight transport Services Index (TSI) measures the output of the for-hire freight transportation industry and consists of data from for-hire trucking, rail, inland waterways, pipelines and air freight. The passenger TSI measures the volume of air, local transit and intercity rail services. Driven by rapidly declining trade flows, road haulage plummeted throughout the UNECE region during the first half of 2009. Given the competitive structure of the road sector (typically of a few major firms and a large number of small contractors), the shock was absorbed by falling haulage rates and rapid layoffs. Some 200,000 contractors lost employment in North America, about 140,000 layoffs took place in the European Union (EU) and 120,000 in the countries in the Eastern Europe, Caucasus and Central Asia region 3.The expected slow recovery of industrial production and trade implies a slow recovery of the road haulage sector. The International Union of Railways (UIC) statistics for the first three quarters of 2009 shows that rail freight traffic, measured by tonne-km, declined in Western Europe (EU + EFTA) by 27 per cent (year-on-year). Freight traffic in Eastern Europe, Turkey and the United States of America also declined noticeably.4 Rail passenger traffic, measured in passenger-km, fell over the same time period in Western Europe and the 3 These estimates were provided by the International Road Transport Union. For details, see http://unece.org/trans/doc/2009/wp5/ECE-TRANS-WP5-2009-22-inf01e.pdf.
4 For details, see http://www.uic.org/spip.php?article1348.

5
United States by 2 and 5 per cent respectively while it increased slightly in Turkey. No significant layoffs were reported to take place in the rail sector where employment levels were typically maintained with part-time work arrangements.5 Port-hinterland flows decreased during the first half of 2009 by some 20 per cent (year-on-year) in Western Europe. Combined (road + rail) traffic volumes in Europe decreased over the same time period by 20 to 25 per cent for unaccompanied and up to 15 per cent for accompanied traffic.
5 For instance, according to the chief executive of Russian Railways (RZD), about 500,000 employees accepted reduced hours and wages in 2009. This has enabled RZD to avoid some 170,000 layoffs and keep its work force at the pre-crisis level of 1.2 million (Reuters, 17 September 2009).
Hinterland connections
Before the financial crisis, the rapid growth of international trade between Asia, Europe and North
America in recent decades was reflected in strongly rising throughput of goods in all major
seaports situated in the UNECE region. This has placed a considerable strain on port hinterland
connections, with consequent economic, environmental and social problems. In particular,
inefficient hinterland links lead to increased supply chain costs that penalize heavily the emerging
market economies in the Caucasus and Central Asia.
A new UNECE report examines the ways in which seaports and their hinterland connections can
help improve supply chain performance, by removing bottlenecks and improving the efficiency
and sustainability of port hinterland links. The study draws on a range of sources, including
published statistics, academic literature and industry reports. In addition, considerable use has
been made of material presented at the UNECE Conference on Hinterland Connections to
Seaports, held in Piraeus, Greece in September 2008, and an original questionnaire survey of port
authorities conducted by UNECE.
There are strong commercial reasons for port authorities to pay attention to their hinterland
connections. Hinterland areas are rarely captive now in Western Europe, but are instead
contestable with two or more ports competing to serve the inland areas. This has led to the
removal of distinct hinterlands and the emergence of overlapping port coverage of inland areas.
Given that logistics chain decision makers are now more likely to be considering the attributes of
entire chains rather than specific legs, and as a result of hinterland connections increasingly
becoming the weakest link of the chain, there is a considerable risk that ports will suffer a loss of
traffic if their connections are inefficient or costly. On the other hand, where port
competitiveness is still limited, the hinterland areas are captive markets of their main ports. This
is the case e.g. for the countries in Central Asia.
There is no agreed standard means of measuring the performance of hinterland connections. Data
availability and consistency issues make international comparison difficult. The lack of consistent,
good quality data hinders a detailed understanding of the effects different factors have on the
performance of hinterland transport. Furthermore, it prevents an evidence-based assessment of
policy priorities for intervention. Essentially, hinterland performance can be considered at the
macro (country) or micro (port or corridor) level. For the former, there is no standard international
comparator of hinterland connections.
Border crossing performance is a major influence on the functioning of hinterland flows that cross
international frontiers en route to/from ports. Obstacles at border crossings have a
disproportionate effect on landlocked countries since they do not have direct access to one or
more seaports without crossing a land frontier, whereas countries with a coastline have the
opportunity to develop direct shipping services.

6
.
International container traffic on the lines operated by Russian Railways (RZD) declined during the first half of 2009 by 31 per cent (year-on-year). Container traffic on the Trans-Siberian route decreased by 59 per cent over the same time period, reflecting the impact of lower trade volumes and extremely low rates on competing maritime routes between East Asia and Europe. The global 2008-09 economic crisis triggered massive public expenditure growth and significant declines in tax receipts, resulting in rapidly growing government deficits and debt levels in all major UNECE economies. Large fiscal stimuli in UNECE economies included some components that are directly relevant to the transportation sector, mainly the public support for infrastructure investment and state aid for the automotive sector but also grants for applied research in the field of mobility, especially for innovations in the field of transport and vehicle technology.6
Infrastructure investment is important for the effective service delivery and long-term growth. In order to support this type of investment, a number of governments with a relatively strong fiscal position provided grants for capital expenditures, accelerated the pace of infrastructure projects and provided state aid for automobile manufacturers. Countries with fragile fiscal positions could not provide any comparable support and experienced a pronounced slowdown of investment.
Most UNECE governments have not provided any targeted short-term fiscal, financial or regulatory support measures for transport operators. This could be explained by the wide geographical dispersion and low visibility of layoffs. Both strategic and shorter-term political economy considerations favored instead state aid for the highly visible car-manufacturing industry. Such aid was used for the assistance with restructuring of
6 For a succinct description of a national fiscal stimulus package, see e.g. the German government’s response to the UNECE questionnaire on the transport situation in 2009 at http://www.unece.org/trans/Welcome.html.
Examples of good practice in enhancing the efficiency and sustainability of hinterland freight movement are
highlighted in the UNECE report mentioned above. These good practice examples could form part of a toolkit of
measures to be adopted in different situations and locations, as appropriate. The examples are grouped into six
themes:
(a) Initiatives to satisfy trade requirements while minimizing transport distance;
(b) Hinterland transport infrastructure provision and use initiatives;
(c) Initiatives to make efficient and sustainable use of transport modes;
(d) Cross-border transport initiatives and the development of partnerships;
(e) Non-transport initiatives to reduce border crossing delays; and
(f) Data availability.
From the analysis carried out by UNECE, a series of recommendations has been made for future consideration by
member States. These include an integration of hinterland connections of seaports into transport development
strategic plans at national and international levels and a systematic collection and processing of harmonized
statistics on annual port-hinterland container and ro-ro ferry traffic flows in UNECE member countries. Such
statistics would help inform policy making for hinterland transport. It is also important to encourage good
practice adoption for border crossings with the aim of improving hinterland efficiency in general terms, but most
particularly for landlocked emerging market economies in the UNECE region.

7
bankrupt American car manufacturers with subsidiaries in Canada and Western Europe and temporary incentives for buyers of new vehicles.
Motor vehicle production in the UNECE region takes place in some 350 plants, including foreign-owned facilities. Almost 300 of them are dispersed across 29 countries in the pan-European region, including a large number of EU countries, Russia, Serbia, Turkey, Ukraine and Uzbekistan. The remaining plants are located in North America, mainly in the United States. Although there seems to be an overcapacity problem on both sides of the Atlantic, plant closures have occurred recently or are scheduled to take place mostly in Canada and the United States.7
Automobile sales declined sharply in 2009 in North America, Eastern Europe and the United Kingdom of Great Britain and Northern Ireland, reflecting to some extent the restricted access to credit.8 In contrast, sales and production were maintained with the aid of temporary incentives in continental Western Europe. In 2010, a reversal of these trends could take place. The problem of excess capacity may well intensify in Western Europe, where sales are expected to decline in the absence of scrapping programs. In the medium term, car sales are likely to stagnate or grow slowly in high-income UNECE countries with saturated markets while increasing rapidly in the “catching-up economies”.
3. Transport infrastructure challenges Efficient transport infrastructure networks contribute to the creation of wealth and employment. A smoothly operating transport system is essential for the proper functioning of the economic system, economic growth and overall national welfare. An uninterrupted flow of goods permits efficient inventories, production and distribution of merchandise. In addition, it provides for the mobility of people as they carry out economic, administrative and social activities. 3.1 Roads and Highways Roads and highways are the dominant mode of inland transport in the majority of ECE member countries. In some countries more than 80 per cent of goods are carried by road; roads and highways also form the backbone of the economy and provide essential links to create effective markets. As discussed above, the worsening macroeconomic climate in many countries and the expectations that recession will be deeper and more prolonged than previously expected, may affect government future spending plans. In some countries new road infrastructure projects that were expected to start in 2010 to boost competitiveness and employment were cancelled because of difficulties to 7 According to the Economist Intelligence Unit, nine GM factories and seven Chrysler factories are expected to be closed in the United States in 2009-10 (EIU Business Eastern Europe, 26 Oct. 2009). According to Canadian sources, two GM plants are to be closed in Canada over the same time period. Two plant closures are expected to take place in Europe in 2010. 8 For details, see the analysis of the automotive sector in chapter 2 of the OECD Economic Outlook, volume 2009/2, No. 86, preliminary edition, November 2009.

8
raise project financing. In some countries, many projects are at risk due to contract disputes over accusations of cost cutting and disputes over contract awards, or even adverse political conditions. 3.2. Railway infrastructure The efficient use of existing railway infrastructure (terminals, tracks and rolling stock) is the major area of policy concern. International rail freight transport has to cope with three basic issues that tend to reduce its ability to compete with other transport modes: (i) technical interoperability, (ii) legal interoperability, and (iii) access to infrastructure. The investment in new infrastructure is a separate policy issue. Technical inter-operability The rail sector is not fully inter-operable across Europe as the loading and track gauges, electric traction voltages, platform lengths at stations and other technical standards often differ from one country to another. This causes costly delays at borders where complex and lengthy technical operations take place. The issue of technical inter-operability has been addressed in directives of the European Commission. Such directives will be implemented by the EU member states over time. However, the implementation will be costly and take many years. Legal inter-operability Two legal systems govern international rail transport in the pan-European region: SMGS and COTIF.9 This legal duality, dating from the Cold War era, increases unnecessarily the cost and time of international railway transport between the SMGS and COTIF countries in general and between the West European and countries in the Eastern Europe, Caucasus and Central Asia Region countries in particular. In order to streamline the border-crossing procedures, a number of bilateral and trilateral intergovernmental agreements have been reached and implemented on specific routes. The common CIM/SMGS consignment note developed by CIT and OSJD has been accepted by the EU and some countries in the Eastern Europe, Caucasus and Central Asia Region, but the document can only be used on designated routes. Access to infrastructure The traditionally integrated railway companies have been separated into infrastructure management, regulatory and operating entities in the EU and some non-EU countries. The setting of appropriate track access charges as well as an efficient regulation of access to important terminals (e.g., in major seaports) present non-trivial challenges to policy makers. Track access charges within the EU are relatively high in the EU-10 countries, in particular for freight trains.10 This reduces cost competitiveness of rail freight services in these countries. The relatively high access charges on freight trains shift a tax burden on the business sector and are likely to deviate from the socially optimal prices.11
9 The SMGS and COTIF systems are administered by the Organization for Cooperation of Railways (OSJD) and the Intergovernmental Organisation for International Carriage by Rail (OTIF).
10 For a detailed analysis of access charges, see L. S. Thompson, Railway Access Charges in the EU: Current Status and Developments since 2004, OECD/ITF, Paris, 2008. 11 Most infrastructure managers in Europe do not have the data needed to estimate accurately changes in infrastructure wear and tear costs associated with marginal variations in traffic volumes.

9
The issue of access to major rail terminals by competing operators is conceptually similar to the ‘last mile’ connectivity in the telecoms sector. In both cases incumbent firms are reluctant to relinquish their dominant positions. Whereas the provision of the final link to connectivity has been addressed by the remedies imposed by competition authorities in the telecommunications sector, comparable interventions have not occurred in the rail sector. This reflects either the availability of alternative modal solutions that neutralize market power or a lack of regulatory independence. Infrastructure investment In the UNECE region, a number of countries continue to face infrastructure investment challenges in the rail sector. In particular, Eastern Europe, Caucasus and Central Asia, South-Eastern Europe and ten EU member States with rail systems appear to be lagging. The rail passenger services gap between Western Europe and the three sub-regions is illustrated by a recent map of high-speed rail routes in Europe (Figure 2).
It can be argued that the railway access charges in Western Europe are below marginal costs, imposing a burden on tax payers. The opposite is the case in new member states where access charges for freight trains probably exceed marginal costs. Actual cost calculations are difficult but feasible. See e.g,. M. Andersson, Empirical Essays on Railway Infrastructure Costs in Sweden, Royal Institute of Technology, Stockholm, 2007.

10
Figure 2 High speed railway routes in Europe, 2009
Source: Wikipedia <http://upload.wikimedia.org/wikipedia/commons/9/9f/High_Speed_Railroad_Map_Europe_2009.gif> In the freight sector the under-maintained rail networks in the EU-10, SEE and parts of countries in the Eastern Europe, Caucasus and Central Asia Region tend to provide lower quality of service (see speed limitations) than well developed and competitive rail systems in North America and Western Europe. Figure 3 shows that between 1995 and 2007 the share of the rail sector in inland transport infrastructure investment increased noticeably in Western Europe, Russian Federation and Turkey while falling in other countries of South-Eastern Europe and Central Europe. In 2007, the railways investment share was highest in the Russian Federation (42 per cent), followed by Western Europe (33 per cent), Central Europe (17 per cent) and Turkey (16 per cent).

11
Figure 3 Share of the rail sector in inland transport infrastructure investment, 1995-2007 (per cent)
0
10
20
30
40
50
60
Wester n Europe CEEC Rus sian Feder ation Turk ey
1995
2000
2007
Source: ITF <http://www.internationaltransportforum.org/statistics/investment/data.htm> In spite of rising rail investment in the EU as a whole, the infrastructure gap between high-income countries and catching-up economies persists. This gap has actually been increasing because the average running, renewal and new rail investment expenditures tend to be much higher in the EU-15 than in the EU-10 countries.12 The current economic crisis has been reflected in a pronounced downturn in transport activity and subdued investment spending throughout the UNECE region. Reduced sales and lower profits have had adverse impacts on the investment financed by retained earnings of railway companies. In most countries of the region, however, the bulk of rail infrastructure investment continues to be financed by the public sector. In a number of countries, governments have initiated fiscal stimulus packages in order to revive consumer and investment spending. Assuming that such packages continue to be implemented in 2010, the public rail infrastructure investment could be sustained in some parts of the UNECE region. However, rail investment is under threat in the transition economies that have been hit hard by the global downturn and confronted with unsustainable fiscal balances.
12 For details, see Towards a Sustainable Railway Network: Annual Report 2008, CER, Brussels.

12
The available information about the structure and implementation of national railway investment programmes is rather limited. In the United States, the American Recovery and Reinvestment Act of 2009 provides for infrastructure investment of $80.9 billion; core rail investments amount to $9.3 billion. Comprehensive data on the actual volume and structure of investment are not available yet. In the EU, a number of governments have adopted fiscal packages with infrastructure spending components. For instance, the economic stimulus package adopted in Germany, the largest EU economy, provides additional funding of €4 billion for federal transport infrastructure in 2009 and 2010. In the Russian Federation and Turkey, the largest emerging market economies in COUNTRIES IN THE EASTERN EUROPE, CAUCASUS AND CENTRAL ASIA REGION and SEE respectively, major rail investment projects have continued with the aid of external funding. In 2009, Russian Railways, a state-owned corporation, placed a large domestic bond issue (90 billion roubles or $2.8 billion) and borrowed $500 million from the European Bank for Reconstruction and Development to finance its extensive investment program. In Turkey, large high-speed railway projects as well as the strategic Marmaray project connecting the Asian and European parts of the country have continued to be financed by the state budget and loans from international financial institutions. The structure and levels of transport infrastructure investment over the medium term depend on the availability of funding. Assuming a slow but steady recovery, one can expect that within a few years the existing backbone network of main international railway lines in the pan-European region will be characterized by increasing traffic levels and bottlenecks that have been identified in recent rail infrastructure master plans.13 Most experts agree that additional sources of finance will be needed for major investment projects that aim to improve the productivity and quality of service on pan-European railway networks. Given the expected fiscal retrenchment during the post-crisis period, the public-private partnership (PPP) financing model is deemed appropriate for such projects.14 However, the availability of private finance for PPP projects in the transport sector has declined, reflecting the massive shift of funds to cash or liquid securities in the aftermath of the global financial crisis. Moreover, even before the recent economic downturn the rail sector accounted for a miniscule proportion of the aggregate value of PPP transport infrastructure projects in UNECE emerging market economies (Figure 4).15 In addition to improving the environment for doing business in order to stimulate private infrastructure investment, new financing models need to be developed for PPP financing of major railway projects.
13 See e.g. UIC (2008), European Rail Infrastructure Masterplan (ERIM) 2007 Report, International Union of Railways, Paris. 14 See e.g. ‘EC and railways promote PPP in rail infrastructure,’ Infrasite News, 2 February 2009 <www.infrasite.net/news/news_article_pda.php?ID_nieuwsberichten=11088&language=en>. 15 In contrast, rail projects account for the bulk of PPP transactions in the United Kingdom.

13
Figure 4 Structure of PPP transport infrastructure investment in UNECE emerging market economies, 1993-2007 (per cent)
Source: PPI database, World Bank. 3.3. Inland waterways Supply chains and logistics are of great importance for competitiveness. They increasingly shape the way goods are supplied, produced and delivered. Driven by consumer demand and the globalization of production and trade, supply and distribution chains are becoming longer and more sophisticated. Just-in-time (JIT) and just-in-sequence (JIS) supply, production and distribution systems increasingly require reliable, flexible, fast and efficient transport systems and are a deciding factor in modal choices made by the industry. The forecasted 30 per cent increase in European freight transport within the next decade will not be possible unless logistics and supply chain systems adapt. As transport infrastructure may not be able to support the anticipated transport increase (for financial and environmental reasons), the existing infrastructure should be utilized more efficiently. In addition, intermodal transport solutions should make optimum use of all transport capacities at all places and at all times. While half of the European population lives close to inland/sea waterways and most industrial centers can be reached by inland navigation, European inland waterways of international importance (E waterways) are relatively short. Their total length is about 28,000 km of which 16 per cent (4,480 km) still has very limited infrastructure and 5 per cent (1,490 km) represents missing links.

14
Twenty-two thousand km of E waterways meet the basic requirements of the European Agreement on Main Inland Waterways of International Importance (AGN) (E-waterways of class IV and higher). Two-thirds of these inland waterways (14,700 km) fulfill the necessary minimum requirements for efficient international container transport as required under the AGTC Protocol on Inland Waterways (Figure 5).
The potential of inland water transport
Inland water transport is a safe, versatile, reliable, economical and environmentally friendly mode of
transport with still untapped capacities and potential for growth. Major pan-European road and rail
transport and port-hinterlands corridors on the other hand, are increasingly overloaded and
congested.
Inland water transport, however, is also facing problems and challenges given its limited speed and
sometimes low and irregular frequency of services. Also, certain shortcomings in reliability due to
weather and hydrological conditions may occur, depending on the geographical location.
Infrastructure development and maintenance are not always at a level that allows for efficient
transport operations and the fragmented nature of the industry means it is often not integrated into
sophisticated door-to-door transport chains and potential high-value markets, such as the transport
of containers and manufactured goods.
While road and rail transport, particularly along major European North-South corridors, are
increasingly congested, inland water transport still offers untapped capacities in the order of 20 to
100 per cent in many UNECE countries, 24 hours a day, 7 days a week. However, adequate capacity
on inland waterways is not sufficient to increase its market share and modal split vis-à-vis road and
rail transport.
If the inland water transport industry is to capture and stay in growth markets and market niches,
such as containers, bulky and heavy goods or waste and recycling materials, it must comply with the
increasingly sophisticated requirements of supply chain and distribution managers and integrate
better into door–to–door transport chains, including efficient transshipment operations and
terminal hauls.
The boom in container traffic on the Rhine shows that inland waterways could play such a role in
the transport of high-value manufactured goods and could thus contribute to reducing congestion
on major European transport corridors. Europe’s network of inland waterways links maritime ports
with virtually all of its economic centers. This should provide ample opportunities for cost-effective
and sustainable transport solutions in global and regional supply chains.
Governments have an important role in making this happen. Logistical processes optimized by the
private sectors do not necessarily constitute optimal social solutions. Apart from planning and
providing adequate infrastructure, governments have to develop and oversee the institutional
framework as well as the rules of the game to ensure a level playing field between all modes of
transport.

15
Figure 5 Classification of E Waterways
Classification of E Waterways suitable for container transport
Source: AGN Agreement and Protocol to the AGTC Agreement. Some 330 inland navigation ports can be considered to be of international importance, 150 of which are located along the Rhine and 45 along the Danube. (The number of containers carried is provided in Figure 6). Almost 100 of these ports operate terminals suitable for intermodal transport.16
16 Detailed data on present and target parameters of all E waterways including information on existing bottlenecks and missing links may be found in the “Inventory of Main Standards and Parameters of the E waterway Network” (Blue book) issued and maintained by UNECE.

16
Figure 6 Container transport on the Main-Danube canal (in TEU)
Source: Water and Inland Navigation Authority Nürnberg (Germany). Container transport on the Rhine (in TEU)
Source: CCNR. Inland waterways obtain a relatively small share of total transport infrastructure investment. Even in the Netherlands and Belgium – the countries with relatively high share of inland waterways transport (IWT) in total freight traffic, inland waterways account for only about 8 per cent of total transport investment, in Germany - 4 per cent and in France – 1.9 per cent. This represents a considerable investment gap. Without the appropriate level of investment, inland waterways will not be able to adapt to the requirements of a modern transport system. About 7 per cent of all goods transported in EU-27 are carried by inland navigation vessels (road and rail transport carry 79 per cent and 15 per cent respectively). The key users of inland waterways are the Netherlands, Germany and Russia (Figure 7). However, countries with efficient navigable waterways and year-round access, particularly along the Rhine corridor, have much higher shares: for example, the Netherlands (44 per cent), Belgium (14 per cent) and Germany (13 per cent). Even in these countries, IWT is loosing its significance. Between 1990-2005 transport demand rose by 41 per cent whereas IWT grew by only 16 per cent. In Central and Eastern European countries the share of IWT is significantly lower. IWT has declined

17
dramatically after the collapse of planned economies. In 2008, in Russia inland navigation carried over 400 million tones less than twenty years before (150 million instead of 580 million tonnes). The market share now stands at 4 per cent in Russia but only 1 per cent in Ukraine. Figure 7 Freight transport by inland waterways (in million t-km)
Freight transport on inland waterways (in 1000 tonnes)
Sources: UNECE Transport Database, International Transport Forum, National Statistical Offices. The two main international inland waterways in Europe are the Rhine and the Danube where approximately 320 and 73 million tonnes of goods were carried in 2008 respectively (Figure 8). On the Rhine, these goods are carried by some 5,500 self-propelled cargo vessels, a thousand tankers and 1,100 pushed barges. On the Danube,

18
about 2,600 dry and around 330 tank barges are in operation together with around 200 self-propelled vessels. On Russia’s extensive inland waterway network under the harsh climate conditions, 150 million tonnes of cargo are carried annually. The total registered fleet comprises more than 28,000 vessels, including more than 1,000 river-sea vessels. Figure 8 Freight transport by inland waterway area in 2008 (in million tones)
Source: National data, Danube Commission, CCNR and Mosel Commission. In 2009, transport performance on European inland waterways declined by 15-25 per cent due to the economic and financial crisis that hit particularly the steel industry which led to a severe reduction in transport demand for coal, iron ore, metal products, but also for port-hinterland transport of containers. 3.4. Intermodal transport Intermodal transport is the transport of containers, swap/bodies or semi-trailers on rail wagons (unaccompanied transport) and of trucks and their drivers in special carriages (accompanied transport or “rolling road”). The majority of intermodal transport operations is confined to Western Europe and is concentrated along a few North-South transport corridors. The largest volumes are transported across the Alps through tunnels linking Italy with France, Germany and the North-European ports in the Netherlands and Belgium. In Eastern Europe and Central Asia, intermodal transport operations are still scarce except for container transport services in Russia, including the Trans-Siberian railway and between Lithuania (Klaipeda) and Ukraine (Odessa/Ilyichevsk) by the combined transport train “Viking”. Figure 9 shows that intermodal road/rail transport has grown considerably in the past 10 years in Europe and reached about 3 million consignments, or 6 million TEUs, in 2008 for International Union of Combined Road/Rail Transport (UIRR) companies (these can be proxies for the total intermodal transport in Western Europe). Unaccompanied transport services have also grown fast and reached 2.57 million
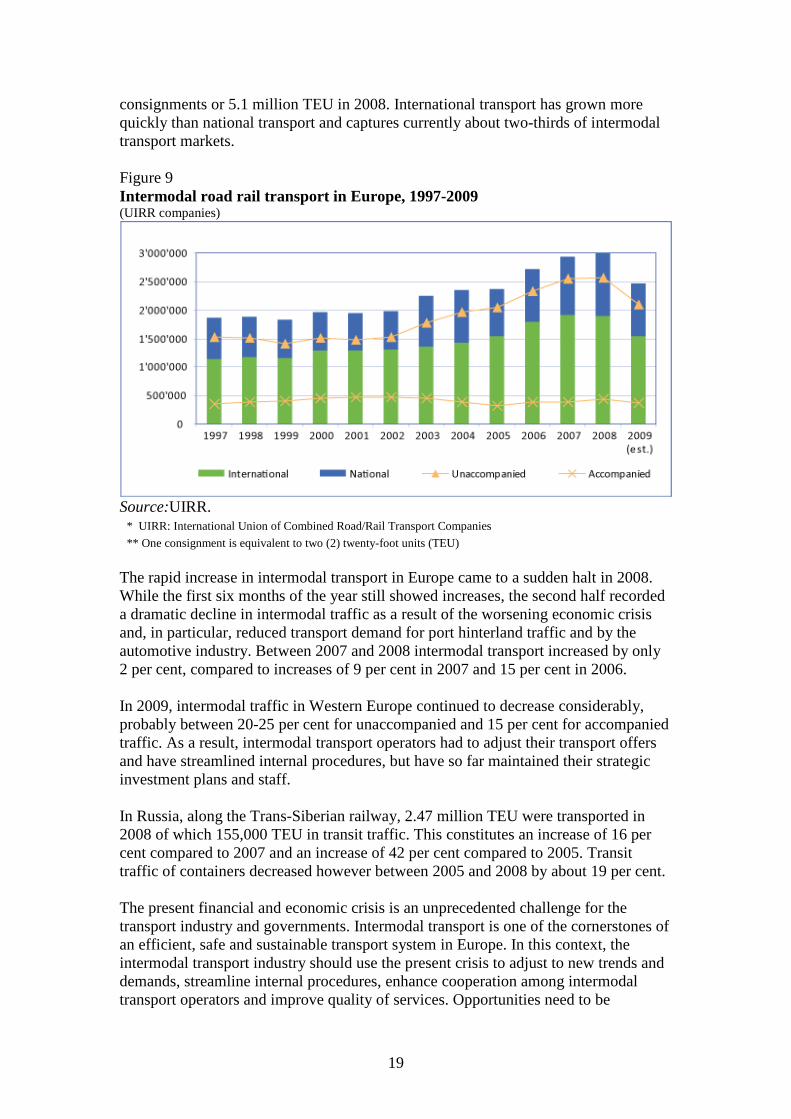
19
consignments or 5.1 million TEU in 2008. International transport has grown more quickly than national transport and captures currently about two-thirds of intermodal transport markets. Figure 9 Intermodal road rail transport in Europe, 1997-2009 (UIRR companies)
Source:UIRR.
* UIRR: International Union of Combined Road/Rail Transport Companies
** One consignment is equivalent to two (2) twenty-foot units (TEU)
The rapid increase in intermodal transport in Europe came to a sudden halt in 2008. While the first six months of the year still showed increases, the second half recorded a dramatic decline in intermodal traffic as a result of the worsening economic crisis and, in particular, reduced transport demand for port hinterland traffic and by the automotive industry. Between 2007 and 2008 intermodal transport increased by only 2 per cent, compared to increases of 9 per cent in 2007 and 15 per cent in 2006. In 2009, intermodal traffic in Western Europe continued to decrease considerably, probably between 20-25 per cent for unaccompanied and 15 per cent for accompanied traffic. As a result, intermodal transport operators had to adjust their transport offers and have streamlined internal procedures, but have so far maintained their strategic investment plans and staff. In Russia, along the Trans-Siberian railway, 2.47 million TEU were transported in 2008 of which 155,000 TEU in transit traffic. This constitutes an increase of 16 per cent compared to 2007 and an increase of 42 per cent compared to 2005. Transit traffic of containers decreased however between 2005 and 2008 by about 19 per cent. The present financial and economic crisis is an unprecedented challenge for the transport industry and governments. Intermodal transport is one of the cornerstones of an efficient, safe and sustainable transport system in Europe. In this context, the intermodal transport industry should use the present crisis to adjust to new trends and demands, streamline internal procedures, enhance cooperation among intermodal transport operators and improve quality of services. Opportunities need to be

20
addressed in the fields of green logistics, improved terminal operations and new markets. Intermodal transport could play an important role for a seamless transport system that constitutes an integral part of regional and global logistics systems and responds to the demands of its customers and policy concerns. 4. Public-Private Partnerships and Financing Transport Infrastructure Public-Private Partnerships (PPPs) offer an important mechanism to develop, maintain and expand various types of transport infrastructure. They also contribute to upgrading management skills and help in raising finance and enhancing efficiency. It needs to be borne in mind however that PPPs are part of the government’s contingent liability as much as the publicly funded investment projects. Therefore, it is important that only feasible projects are concessioned out and that sector reforms (e.g. road pricing) are not delayed. PPPs attract considerable attention as a means to facilitate the development of transport infrastructure, but the wider use is constrained by the insufficient knowledge and skills within government administrations and the current financial crisis (Figure 10). Figure 10
Transport Sector: Number of Projects by Region and Year of Financial Closure (2005-2008)
Financial Closure Year
East Asia and Pacific
Europe and Central Asia
Latin America and the
Caribbean
Middle East and North
Africa South AsiaSub-Saharan
Africa Total
2005 18 8 10 4 15 21 76
2006 24 8 23 3 54 7 119
2007 20 10 24 4 34 2 94
2008 8 9 20 3 13 3 56
Source: PPIAF, PPI Project Database, World Bank.
Experience suggests that the most promising areas where significant private sector participation can be pursued are where there are substantive current or future international transport revenues from partner countries. For this reason, PPPs are more common for port and airport terminals, urban or high density toll roads (often associated with export corridors). PPPs in maintenance and rehabilitation of surface transport assets can be used in rural areas, but generally revenue and affordability issues limit potential use in providing rural transport solutions. Exactly because of this, nationwide road pricing and road financing reforms are warranted before embarking on a PPP scheme. Affordability and governance remain key constraints, particularly in lower income countries. In Central Asia, for example, countries are not densely populated and this means that there are difficulties in generating the revenue that would attract private sector investment. Nevertheless, the scale and nature of the transport infrastructure deficit means that all options need to be systematically and rigorously considered.

21
The PPP governance challenge A key constraint for the wider PPP use is the lack within governments of the relevant knowledge and skills. This gap is reflected in many projects which encounter difficulties. The following illustrates what can and what does go wrong in the road sector. Case Study 1: Czech Republic - D47 PPP Highway Project In the Czech Republic, the first major PPP experience was the construction and maintenance of highway D47 in 2001. This project was under time pressure and no competitive tender was organized in the selection of a private partner. Rather, the partner was chosen through a negotiation between the government and a private consortium. There was no feasibility or preparatory studies made prior to issuing the contract to the company. In addition, a considerable amount of public funds was invested into the project (1.1 per cent of GDP). The contract was cancelled two years later as it had ceased to be beneficial. The Czech Republic terminated the contract and had to pay a penalty for terminating. As a result of the D47 case, many people view PPP with skepticism. Case study 2: Hungary – M1-M5 Motorway The M1-M15 Motorway project was signed in 1993 for tolled motorway from Budapest to the Austrian border (€350 million). It was the first fully privately funded motorway built in Central Europe. However, the traffic forecast was overly optimistic and the toll revenue was not sufficient. Moreover, the presence of an alternative road as well as delays at the border, which more than offset time savings, were additional problem areas. The media made a point that: “the most expensive toll road in Europe charging the highest tolls in one of Europe’s then poorest country”. The automobile club initiated a legal action against the concessionaire to reduce the tolls. Many years of protracted negotiations took place and restructuring plans were elaborated culminating in the re-nationalization of the project in 1999. Case Study 3: Poland – A2 Motorway The concession agreement for the A2 Motorway was signed in October 2000 and defined the terms of financing and construction. The A2 Motorway’s first phase stretches from Nowy Tomyśl to Konin. A consortium of 18 Polish companies forming Autostrada Wielkopolska SA was awarded the contract under a build-operate-transfer arrangement for a concession period of 37 years (until 2037). The development of this motorway was the largest privatized road project. Despite the ambitious goals for the development of this motorway, the issue of high tolls for heavy goods vehicles (HVGs), was an issue. The toll for HVGs was almost ten times the toll for cars. As a result HVGs were diverted onto secondary roads. Consequently, the toll for HVGs was suspended and the concessionaire received large compensation. Case Study 4: Canada – Highway 407 Express Toll Route Highway 407, officially called the 407 Express Toll Route (ETR), is a toll way in the Greater Toronto Area in Canada. The 407 uses a system of cameras and transponders to toll vehicles electronically and automatically. There are no toll booths hence the name "Express Toll Route". In 1999, the project was leased to a private concessionaire, called 407 International Inc, owned by a consortium. The company set the tolls at a very high rate; a charge at the time of Euro 0.12 per km, twice the average rate in other tolls. The concession was for 99 years and there was no

22
government control of the toll prices. After the agreement was signed, the company increased the tolls by 200 percent at peak hours. Attempts to change the contract failed. According to reports at the time, an arbitrator declared that the Ontario highway operator could charge any toll prices. Moreover, the company declared that it could change the toll without first obtaining the government’s approval although the government claimed that in order to increase tolls, the company should have filed a ‘change request’. The cases above suggest four immediate factors contributing to what went wrong in the PPP road projects:
• Lack of due diligence
- In Hungary, the traffic projections were overly optimistic
- In the Czech Republic, the government did not conduct feasibility studies prior to contracting the private consortium
• Risks not properly allocated between the public and private sector
- In Poland, centrality of risk was missing in the PPP project
• Concession agreements did not regulate toll levels
- In Canada, the consortium had the control over the toll rates
• Lack of contingency plans to deal with possible failure or mechanisms to share excessive profits
- All four case studies point at the necessity of incorporating failure mechanisms in PPP road projects.
Overall, there was inadequate capacity within the public sector at both central and sector levels. In the Czech Republic, it appears that the Ministry of Transport was not directly involved in the negotiations. There was either too much political pressure to go ahead with a PPP at any costs or there was not qualified and experienced staff for project preparation and too few staff to supervise ongoing concession agreements. The impact of the financial crisis The current financial crisis has had a major impact on the development of PPPs in the transport sector. The crisis immediately rendered financing and refinancing more difficult. The shrinking capital market, characterized by sluggish bond markets, the collapse of the syndication market and the decline in foreign investment, has further fuelled the problems. Overall, banks became more selective in the projects they financed; required shorter tenures forcing contractors to take refinancing risk; and focused more on domestic and away from international markets. Numerous projects were postponed and cancelled due to the crisis, but many governments introduced stimulus packages that also kept PPP projects going. The financing of PPPs still carried on but with greater state involvement. The Poland A1 Phase II highway project from Gdansk to the Polish–Czech border had financing arrangements that did not include any private debt sources. The project was structured as a PPP but with bilateral and multilateral financial agencies providing the key debt financing. In the USA, a 35-year concession, worth $1.8 billion, on a portion of the highway north of Miami closed in March 2009.

23
The financial crisis has appeared as if the death knell for PPPs had been sounded. But in fact, the crisis, has demonstrated the resilience of the PPP model. The PPP market is picking up again. Moreover, with less finance available, governments’ interest in PPPs is increasing though with a high risk of failure. It needs to be borne in mind that bad projects do not become feasible because they are in a PPP scheme. In addition PPPs are part of the government’s contingent liability. The important imponderable now is whether the banks will re-enter the project finance market to the same extent as before the financial crisis. The longer term effects on regions where PPPs were only starting are troubling. Conclusions PPPs are useful because they bring efficiency into infrastructure development. However, they should not be pursued because of extra-budgetary considerations. Although, the financial crisis has restricted somewhat the PPP use, there are still many opportunities. Arguably, the main challenge is that of governance. Governments with no experience of doing PPP find it very difficult to acquire such expertise. A useful comparison is found in PPP capacity building between Asia and Europe. In India, a number of agencies were supported by the ADB over the last ten years with training and with setting up PPP units around the country. India has now today a successful and flourishing PPP program with tangible and visible benefits in its road sector. In the UNECE region by contrast such support to governments to do PPP is lacking.17 It is important that governments are offered not just more capacity-building in PPP but that they are provided with the right type of capacity-building as well. Ad hoc theory and classroom training will not be sufficient to transfer the necessary knowledge and skills and where possible an emphasis should be placed on practical, hands-on ‘learning by doing’ approaches that result in the implementation of actual demonstration projects that eventually leads to creating the national capability. 5. Euro-Asian Transport Links In 2000 and 2002, the UNECE extended its AGR and AGC (road and rail) infrastructure network agreements to include transport infrastructure in the Caucasus and Central Asia. These international agreements do not set priorities nor do they posit deadlines to catch up to the AGR/AGC standards. In addition, the governments in the region have generally lacked sufficient funds to upgrade and/or maintain transport infrastructure. As a result of these two factors, the Euro-Asian inland transport links, despite the AGR and AGC extensions, remain relatively undeveloped and underutilized. At the same time, to promote the development of Euro-Asian transport links, the UNECE and UNESCAP created and adopted a Common ECE/ESCAP Strategic Vision for Euro-Asian Transport Links. This document took into account the findings of the Second International Euro-Asian Conference on Transport (St. Petersburg,
17 The UNECE is active in the area of capacity-building for PPPs. It has prepared a set of Guidelines
on Good Governance in PPPs and is using this as the basis for the elaboration of a toolkit of training modules.
24
2001) and was the seminal step in triggering the interest to develop Euro-Asian transport links. Euro-Asian Transport Links Project – Phase I In 2003, with funds from a United Nations Development Account Project, the UNECE and UNESCAP secretariats with designated national focal points from eighteen countries began to promote the framework of the Euro-Asian Transport Linkages Project (EATL). The following countries participated: Afghanistan, Armenia, Azerbaijan, Belarus, Bulgaria, China, Georgia, Iran, Kazakhstan, Kyrgyzstan, Moldova, Romania, Russian Federation, Tajikistan, Turkmenistan, Turkey, Ukraine and Uzbekistan. In the four Expert Group Meetings that took place in Almaty (March 2004), Odessa (November 2004), Istanbul (June 2005) and Thessaloniki (November 2006), government representatives identified the main Euro-Asian rail, road and inland waterway routes to be considered for priority development and the main transhipment points along these routes (Figure 11 and 12). Country experts also provided data for the creation of a GIS database and related maps. This included data on technical characteristics and performances of main rail, road and inland water transport infrastructure, borders crossing points, ferryboat links, intermodal terminals and ports along the Euro-Asian routes. This work has been made available to participating countries and constitutes a basic tool for future efforts aimed at developing efficient, safe and secure Euro-Asian transport links.

25
Figure 11

26
Figure 12

27
These government representatives also agreed on a common methodology, similar to that used in the TEM and TER Master Plan, for the evaluation and prioritization of projects along the selected routes. On the basis of this methodology and national proposals submitted by 15 countries, 230 transport investment projects, of an estimated total cost of over $43 billion, were evaluated and prioritized (Figure 13). About one-half of the projects have secured financing and are likely to be implemented in the medium term. Non-physical obstacles, which constitute a major barrier to Euro-Asian transport, were also addressed. Capacity-building national workshops on facilitation of international transport and trade were organized in the framework of the EATL project in six participating countries: Azerbaijan (May 2006), Belarus (May 2007), Georgia (May 2006), Kyrgyzstan (December 2006), Moldova (November 2007) and Ukraine (December 2007). Workshop participants included government officials and business sector representatives from the beneficiary countries. A study, elaborated and published by UNECE and UNESCAP, describes the routes and projects that have been identified and considers the status and problems of international transport along the Euro-Asian land bridge. It shows that a successful development of the EATL network depends on intergovernmental cooperation that is necessary to address technical and operational issues as well as non-physical obstacles to efficient transit and border clearance. The study also presents specific recommendations on infrastructure development, facilitation and policy.18 Government representatives have identified priority areas for future work, including: monitoring of implementation of the identified priority projects; removing non-physical obstacles to transit transport; improving the performance of border- crossing facilities; promoting harmonization of transport legislation; and promoting best practices and sharing of know-how. On 19-21 February 2008 in Geneva, Ministers of Transport and high level officials from countries in the Euro-Asian region, met and signed a Joint Statement on Future Development of the EATL Project. The statement confirmed the need for continued cooperation, endorsed the identified Euro-Asian routes and their priority developments and supported the establishment of a mechanism to continue the development of EATL links. The high level officials also invited governments, international organizations and potential donors to consider providing the needed financial assistance to ensure implementation of the EATL Project Phase II (2008-2011).19
18 The English and Russian versions of the study are available at the UNECE website:
http://www.unece.org/trans/main/eatl/in_house_study.pdf. 19 See http://www.unece.org/trans/MinisterialITC70/index.html.

28
Figure 13
EATL projects (number of projects and costs in millions of United States dollars)
Per type of infrastructure
All types of projects Road Rail Maritime Inl waterway Other
ISO Country
Code No. of
projectsCost of
projectsNo. of
projectsCost of
projects No. of
projects Cost of
projects No. of
projects Cost of
projects No. of
projects Cost of
projects No. of
projects Cost of
projects
ARM 8 121.7 3 56.4 5 65.3 – – – – – –
AZE 10 1 681.5 7 1 079.1 1 600.0 2 2.4 – – – –
BLR 4 28.1 3 27.4 1 0.7 – – – – – –
BGR 24 5 488.9 15 1 532.8 7 3 816.8 1 115.6 1 23.7 – –
CHN 3 4 603.0 1 413.0 – – 2 4 190.0 – – – –
GEO 49 3 312.0 4 108.2 21 2 140.5 24 1 063.3 – – – –
IRN 44 8 428.3 34 3 700.3 10 4 728.0 – – – – – –
KAZ 14 1 902.4 14 1 902.4 – – – – – – – –
KGZ 8 1 555.1 5 218.7 3 1 336.4 – – – – – –
MDA 9 888.9 5 225.5 3 413.4 – – 1 250.0 – –
ROU 12 721.8 – – – – 7 333.3 5 388.5 – –
TJK 7 240.2 4 237.0 1 – – – – – 1 3.1
TUR 19 11 450.0 12 3 124.0 7 8 326.0 – – – – – –
UKR 7 1 226.2 – – 2 292.6 1 1.5 4 932.2 – –
UZB 12 1 774.5 5 100.8 7 1 673.7 – – – – – –
Total 230 43 422.6 112 12 725.7 68 23 393.4 37 5 706.0 11 1 594.3 1 3.1
Note: The table includes only the countries that provided data

29
Euro-Asian Transport links Project - Phase II In 2006, the Inland Transport Committee (ITC) asked the secretariat to present, together with ESCAP, a joint proposal that would ensure the continuation of the project in a new Phase II. In early 2008, the UNECE began establishing an institutional structure to make further EATL work possible. In February 2008, the ITC agreed to establish a Group of Experts on Euro-Asian Transport Links and adopted its terms of reference. The primary objective of the Expert Group is to ensure monitoring and co-ordination of the activities related to developing efficient, safe and secure Euro-Asian inland transport links. Its duration was set for two years with a possibility of further extension. The UNECE invited governments to nominate national focal points who would actively contribute to the work of the EATL Group of Experts and the EATL Phase II. International organizations and IFIs were also invited to take an active role in the work. Three Expert Group meetings have been organized under EATL Phase II. The UNECE hosted two of them in Geneva, in September 2008 and 2009. The third meeting of the Group was held in Istanbul, in November 2009, back-to-back with an inter-regional workshop on developing Euro-Asian transport links, hosted by the Ministry of Transport of Turkey and the Organization of Black Sea Economic Cooperation. A sub-regional workshop was also organized under EATL project in Tehran, in May 2009, together with the Economic Cooperation Organization (ECO). During these meetings national focal points from 26 participating countries created the basis for the development of the EATL Phase II. Government experts agreed on the specific tasks and expected accomplishments of the project; on the strengths, weaknesses, opportunities and threats (SWOT) of the Euro-Asian Transport Links; on the basic data to be collected and processed; and on the basic methodological aspects of the work. They also agreed on the studies to be elaborated with the support of external consultants and country inputs, related to the transport flows and statistics, the comparison of inland transport options with those of existing maritime and on the analysis of non-physical obstacles to international transport along the EATL routes. Questionnaires have been developed for these studies. During the Tehran and Istanbul events experts from participating governments and international organizations discussed the most recent developments in the area of transport infrastructure and facilitation in the ECO and BSEC regions. In addition, they reviewed related national experiences along the Euro-Asian Links and considered the implementation of various tasks. Holding these events in partnership with ECO and BSEC has offered the opportunity to explore greater interaction and synergies. Conclusions Globalization has led to significant increases in trade and transport between Asia and Europe. While most of the traffic has used – increasingly congested - maritime routes, further development of efficient and integrated inland transport routes would provide credible and competitive additional transport options. Once established, these routes could become an effective tool for economic development and integration of the Euro-Asian region, including facilitating greater participation in the globalization process by Central Asia’s landlocked countries.

30
International cooperation under EATL Project - promoted by the UNECE and UNESCAP - has produced tangible results. These results have been considered as a solid basis for the development of Euro-Asian transport linkages. The EATL work is being continued through the activities of a Group of Experts on EATL. The Group is implementing a well focused workplan, including studies and analyses, promoting transport infrastructure and facilitation initiatives and actions, organizing meetings and capacity building events. Notwithstanding the value of the results achieved, there are also many challenges ahead. The work done so far has made it clear that the real development potential of EATL inland transport connections lies upon their capacity to become parts of the main EATL supply chains, focusing on efficiency and reliability and on urgent facilitation and cost/time-reducing transport measures and reforms. It is important to stress that EATL countries, particularly EATL landlocked developing countries, depend on each other. A weak part or missing link in one country can render a whole EATL route economically unviable for international transport. It is, therefore, evident that developing Euro Asian inland transport links would be a long-term undertaking, requiring a great deal of effort and perseverance, and enhanced coordination and cooperation among all EATL countries. 6. TEM and TER projects The UNECE Trans-European Motorways (TEM) Project is an initiative to promote sub-regional cooperation among Central, Eastern and South East European countries. Its main objectives are:
• To facilitate road traffic in Europe • To improve the quality and efficiency of transport operations • To bridge the existing gaps and disparities between motorway networks in
Western, Eastern, Central and South-Eastern Europe • To assist in the integration process of European transport infrastructure
systems
The TEM was established in 1977. The initial financial support was provided by the United Nations Development Programme (UNDP) with the UNECE selected as the executing agency. At present, there are 15 member countries: Armenia, Austria (associate member), Bosnia and Herzegovina, Bulgaria, Croatia, Czech Republic, Georgia, Hungary, Italy, Lithuania, Poland, Romania, Slovakia, Slovenia and Turkey. Four other countries have observer status: Montenegro, Serbia, Sweden and Ukraine. The membership of Azerbaijan is pending.

31
E-Road Traffic Census
Every five years, the E-Road Traffic Census is undertaken to obtain data for improving and
developing the E-Road system, in conformity with the standards set out in Annex II to the
European Agreement on Main International Traffic Arteries (AGR) of 1975 (ECE/TRANS/16 and
Amends.1-9).
The E-Road Traffic Census, carried out under the auspices of UNECE, is the only existing
international framework which provides comparable data on traffic flows on main European roads
on an all-European basis. The Census’ objective is to present detailed data on the E-Road network
traffic to, ultimately, facilitate international passenger and goods traffic.
The benefits of the E-Road Traffic Census data include improved land use management and better
integration of road traffic in planning processes, both nationally and internationally, allowing for
adequate maintenance, renewal and improvement programmes. This information also contributes
to solving problems caused by traffic congestion and facilitates the study of environmental issues,
road safety and energy consumption.
In addition, the Census is used to measure vehicle performance on the road network (expressed in
vehicle-kilometres) as well as the volume of night traffic, holiday traffic and peak-hour traffic.
The main indicator used is the average annual daily traffic flow (AADT). Three methods can be
used to obtain the AADT:
• Continuous counting for the whole year;
• Counting during short periods, ensuring their representation across the year; or
• A combination of the foregoing types of counting. Sampling methods may be integrated into
systems of permanent counts, using so-called “ratio estimates”.
The following countries provided data (totally or partially) for the 2005 E-Road Census: Austria,
Belarus, Belgium, Bulgaria, Croatia, Czech Republic, Denmark, Estonia, Finland, France, Germany,
Hungary, Ireland, Latvia, Lithuania, Luxembourg, Norway, Poland, Portugal, Republic of Moldova,
Romania, Serbia, Slovakia, Slovenia, Spain, Sweden, Switzerland, the former Yugoslav Republic of
Macedonia, Turkey, Ukraine and United Kingdom (see below).

32
The UNECE Trans European Railways (TER) Project is also an initiative to promote sub-regional cooperation among Central, Eastern and South-East European countries. It was established in 1990 and its main objectives are:
• To improve the quality and efficiency of transport operations • To assist in the integration process of European transport infrastructure
systems • To develop a coherent and efficient international railway and combined
transport system in accordance with the UNECE Pan-European infrastructure agreements: European Agreement on Main International Railway Lines (AGC) and European Agreement on Important International Combined Transport Lines and Related Installations (AGTC)
Similarly to the TEM project, the initial financial support for TER was provided by the UNDP with the UNECE nominated as the executing agency. At present, there are 17 member countries: Armenia, Austria, Bosnia and Herzegovina, Bulgaria, Croatia, Czech Republic, Georgia, Greece, Hungary, Italy, Lithuania, Poland, Romania, Russian Federation, Slovakia, Slovenia and Turkey. In addition, a number of observer countries participate in some activities: Belarus, Latvia, Moldova, Montenegro, Serbia, the former Yugoslav Republic of Macedonia and Ukraine. The membership of Azerbaijan is pending.

33
E-Rail Traffic Census
The E-Rail Traffic Census was undertaken for the first time in 2005. It was organized jointly by
UNECE and Eurostat to avoid duplication for EU member States that must participate in a census
on rail transport statistics (based on Regulation No. 91/2003 of 16 December 2002, adopted by
the European Parliament and the Council).
Internationally comparable data on main international railway traffic lines are of major and
increasing importance in Europe, given the growing volume of international and transit traffic.
The data collected include information on the number of trains, train-kilometres and
infrastructure. The rail network considered for the Census consists of:
• Lines that are included in annex 1 of the European Agreement on Main International Railway
Lines (AGC) of 1985 as amended;
• Lines that are included in the European Agreement on Important International Combined
Transport Lines and Related Installations (AGTC) of 1991 as amended; and
• In the European Union countries, lines in the Trans-European rail network (TEN).
For each E-railway line in a country, the annual number of trains should be given per network
segment, by direction and by train category. Governments are also requested to submit
information on the technical characteristics of the rail network (track gauge, length in km, number
of tracks, type of current (AC/DC) and voltage if the segment is electrified).
The following countries provided data (totally or partially) for the 2005 E-Rail Census: Austria,
Belgium, Czech Republic, Denmark, Estonia, Finland, France, Germany, Greece, Hungary, Ireland,
Italy, Latvia, Lithuania, Luxembourg, Netherlands, Norway, Poland, Portugal, Slovakia, Slovenia,
Spain, Sweden, Switzerland, Turkey and United Kingdom (see below).

34
The TEM and TER Projects rest on three pillars: 1. Active participation and support of member countries through the Trust Fund
Agreement, deposited with the UNECE, which nominates the Project's Steering Committee as its highest administrative and political body, formed by delegates from each participating country.
2. The Project Central Office, respectively in Warsaw for TEM and in Bratislava for
TER, hosted by the governments of Poland and Slovakia, with Project office personnel co-ordinating activities.
3. National Project Offices set up or designated in each participating country to liaise
between national activities and those under the Project. These national officers operate under the responsibility of a nominated National Co-ordinator from every member.
The annual and longer term action plans are set by the Steering Committees and the work is done by the Project's personnel, Working Groups, Ad hoc Expert Groups and when required by external consultants in close cooperation with member countries.
35
The main outputs are:
• Development of road and rail infrastructure in TEM and TER countries; bridging the gaps existing between Western, Eastern, Central and South-Eastern Europe; and facilitation of road and rail traffic in Europe.
• Promotion and improvement of cooperation in matters concerning road and rail transport between TEM and TER states enabling greater transport efficiency.
• Support of the integration processes. The TEM is the backbone of the Pan -European Road Corridors in CEE and the TINA initiative.
• Knowledge dissemination and sharing expertise and best practices.
The TEM and TER Master Plan, reflecting the priority transport infrastructure needs of 21 Central, East, and South-East European countries was published in 2006. The Master Plan identified the backbone road and rail networks in these countries and presented a realistic investment strategy to gradually develop these networks. As many as 491 projects with an aggregate estimated cost of €102 billion were evaluated and prioritized. The implementation of this investment plan will contribute to the economic growth and will assist in integrating and harmonizing transport within Europe and beyond.
The Master Plan provides a useful tool and framework for intergovernmental cooperation towards the coordinated development of coherent international transport infrastructure networks in Central, East and South East European countries, and their integration into the pan-European networks. With this Plan, TEM and TER Projects offered a substantial contribution to the extension of TEN-T; the practical implementation of Pan-European Transport Corridors; the promotion of intermodal operations and complementarities of transport modes; and assisted towards the provision of maximum effectiveness of transport infrastructure. The methodology used to elaborate the Master Plan was used in the Europe-Asia Transport Linkages project – Phase I.
The UNECE TEM and TER Projects Steering Committees have decided to revise the Master plan and to elaborate the Terms of Reference (TOR) for that revision. The revision of the TEM and TER Master Plan is scheduled for the end of 2010.
7. Transport and border crossing facilitation Obstacles The amount of time it takes to move goods across borders affects the overall transport time and hence determines both the cost of transport services and of the goods being shipped. Thus, frontiers are an important factor in determining the relative competitiveness of transport modes and of national economies. In Europe, relatively recent major structural changes have created new conditions for crossing borders. For example, many new borders have been created due to the break-up of the Soviet Union and Yugoslavia. The EU enlargement and extending the Schengen Agreement were two major additional institutional changes that have and will continue to have significant impacts. In addition to these major events, security factors related to smuggling, terrorism, illegal trade and immigration are increasingly playing a key role

36
in determining the efficiency of border and transit procedures. For example, the terrorist attacks of September 2001 have resulted in a sharp increase in security measures. Crossing borders has always been a problem in international transport and trade. In spite of many recent improvements, international transport still faces obstacles, costs and difficulties at borders. The costs include time losses, the costs of immobilized equipment, security and theft risks, additional inventory costs, and the human costs for transport workers and the affected border populations. This is aggravated by a high level of unpredictability in both time and costs, which is a major impediment to supply chain efficiency. Some major economic impacts of border delays are illustrated below.
Border crossing problems most severely affect landlocked countries, in particular, in Central Asia, as they seriously impede the access of those countries to the global market. The competitiveness of landlocked countries is undermined by transit fees, including high costs of freight shipping services, road tolls, cumbersome customs and other control procedures, and inadequate or outdated infrastructure and equipment.
The cost of crossing border
Some effects of transport delays on costs and performance
• Border-related costs, when importing goods, may amount to as much as 15 per cent of the
value of the goods being traded;
• Only about 25 per cent of delays is due to poor road or port infrastructure; 75 per cent is due
to non-tariff barriers such as numerous customs procedures, tax procedures, clearances and
cargo inspections;
• On average each additional day that a product is delayed prior to being shipped reduces trade
by at least 1 per cent; The effect is larger on time-sensitive agricultural goods - one day of
delay reduces a country’s relative exports of such products by 7 per cent on average;
• One-day reduction in delays before a cargo sails to its export destination is equivalent to
reducing the distance to trading partners by more than 85 km;
• Increasing global capacity in trade facilitation by half, when compared with the global
average, would increase world trade by US$377 billion, amounting to a 9.7 per cent rise in
global trade.
According to a study by ITF, on some road trips, the waiting time at borders can account for a
third of the total time taken and the road fleet is up to a third bigger than it needs be to carry the
trade. Railway trips still take a very long time, for example, moving goods from Moscow to Berlin
by rail still takes 7 days.
Sources: Trade Facilitation: The Benefits of Simpler, more Transparent Border Procedures; The
OECD Policy Briefs; 2003. Trading on Time; World Bank; Djankov, S.; C. Freund and C. S. Pham,
2006. Facilitating Cross-Border Movement of Goods: A Sustainable Approach, The Global Enabling
Trade Report 2008.

37
Road transport While the EU enlargement has removed border crossing problems in Central Europe, the relocation of the EU's external borders and, in time, the Schengen area has resulted in stricter controls at these borders and hence increased waiting times. The main difficulties are concentrated in Eastern Europe and concern border crossings between the enlarged EU and the Russian Federation, Ukraine and Belarus as well as border crossing between some CIS countries as shown below.
In general, the main obstacles at road border crossings are:
• control procedures, which are without a doubt the main barrier to free-flowing traffic. They are often too complex and sometimes changed without prior notice. There is lack of cooperation between control agencies and, all too often, the lack of joint controls
• bilateral road transport permits
• relatively cumbersome availability of visas to professional drivers
• poor infrastructure and control equipment at some border crossings
• low-skilled, unmotivated personnel, which sometimes features questionable ethical conduct
According to a recent study, unofficial payments at border crossings can be as high as official ones (see below).
Border crossings in numbers
Itinerary Distance Border
crossings
Expected time
(days)
Actual time
(days)
Warsaw – Bishkek 5910 4 7,5 10
Tashkent –
Antwerp 6257 6 8,5 16
Tashkent – Ulm 7758 5 10.5 15
Almaty – Minsk 6081 2 8.5 12
Border Waiting time
Kyrgyzstan – Kazakhstan From 1 to 12 hours
Kyrgyzstan – Uzbekistan From 10 to 96 hours
Uzbekistan – Tajikistan From 3 to 41 hours
Uzbekistan – Kazakhstan From 4 to over 48 hours
Kazakhstan – Russia From 4 to over 60 hours
Belarus – Poland From 4 to 16 hours
Belarus – Lithuania From 5 to 7 hours
Source: International Road Transport Union (IRU)

38
Rail transport Railways share with road some of the border crossing obstacles: delays due to inadequate infrastructure and due to customs or border crossing formalities. At the same time, rail transport faces specific challenges linked to the applicable regulations, notably the compatibility between CIM and SMGS consignment notes and the failure to facilitate rail equipment exchanges between countries. A specific issue concerned the critical need to extend the use of the uniform CIM/SMGS consignment note to more railway routes and corridors. Major advantages for cross border rail traffic could be obtained if the uniform consignment note were also to be accepted as a customs document beyond the CIM area. As noted above, railway equipment (and personnel) is not interoperable, meaning that in almost all cases locomotives and crews have to be changed at borders. Figure 14 Regional variations in rail transport
Ukraine Croatia Serbia Austria Slovakia Slovenia Romania
EU Membership
no negotiated
no yes yes yes yes
Documents Letter of carriage, transfer schedule, carriage statement, train statement, trainload register
Letter of carriage, transfer schedule, carriage statement, train statement, trainload register
Letter of carriage, transfer schedule, carriage statement, train statement, trainload register
Letter of carriage, transfer schedule, carriage statement, train statement, trainload register
Letter of carriage, transfer schedule, carriage statement, train statement, trainload register
Letter of carriage, transfer schedule, carriage statement, train statement, trainload register
Letter of carriage, transfer schedule, carriage statement, train statement, trainload register
Animal and plants medical test
dep. on freight
dep. on freight
dep. on freight
no no no no
Example of bribes
The sums reported to be demanded at a border crossing between Kazakhstan and Uzbekistan:
1) €50 – transport control
2) € 00 – sanitary control
3) €100 – veterinary control
4) €250 – plant control
5) €20 – customs control
6) €65 – passport control
7) €65 – immigration card
8) €65 – x-ray
9) €65 – raising of barrier to enter border crossing point
10) €65 – raising of barrier to exit border crossing point
11) €65 – cab check
Source: International Road Transport Union (IRU)

39
Ukraine Croatia Serbia Austria Slovakia Slovenia Romania
Generally required time of transit
Within 24 hours
Circa 6 hours
1-5 hours
0,25-1,5 hours
1-5 hours
1 hour 2 hour
Technical Factors
Reloading 95%, axle resetting 5%
Change of traction vehicle and staff
Change of traction vehicle and staff
Change of staff at all times, traction vehicle
Change of traction vehicle and staff
Change of traction vehicle and staff
Change of staff at all times, traction vehicle
Source: Hungarian Rail Office.
In fact, many rail systems were often originally built to avoid international transport; thus raising a complex array of infrastructure, electricity supply, signalling, operating and institutional issues that now require intensive efforts to resolve. Lack of cross-border acceptance of railway vehicles, especially locomotives and lack of licenses for railway undertakings to operate on rail infrastructure in another country are also considered an important handicap. Some countries, however, manage to gradually overcome the difficulties (see below).
Bulgaria and Serbia: Example of best practice
Bulgaria and Serbia have concluded an agreement on border controls and procedure for railway
traffic which aims at facilitating border-crossing procedures in international rail transport between
the two countries. The agreement is the result of coordinated activities of border authorities. It
regulates stopping of freight trains subject to border control at the joint border station Dimitrovgrad
(Serbia).
Border control of passenger trains is carried out during their movement between border stations
Dimitrovgrad (Serbia) and Dragoman (Bulgaria). In addition to the opening of the joint border
station, the agreement facilitates joint work of border authorities of both countries at the same
place.
The positive effect of implementing the agreement is shown below.

40
Solutions Effective solutions to border crossing challenges can only be achieved through a holistic approach addressing many complex issues: the reform and modernization of customs and other border agencies, promotion of inter-agency cooperation, liberalization of international transport services, cooperation of the border agencies on both sides of the border, close cooperation between the private and public sectors and dedicated training programs. In the area of customs the following modernization and reforms may be required: - Inter-agency cooperation, particularly coordinated border management within countries (where one of the agencies, possibly customs, is the border manager, being responsible for the overall performance of the border crossing) and across borders
- Management Information Systems (where border agencies are electronically connected to inland terminals and headquarters) and also regional and multisectoral harmonization of IT technology
- Simplification and harmonization of procedures with regard to documentation, means of transport and drivers
- Introduction of selectivity and risk analysis
- Introduction and application of single window and one-stop-shop concepts
- Moving clearance procedures to inland terminals to the extent possible
- Abolishing obligatory escorts
- Access to technical aids and non-intrusive inspection equipment such as X-ray machines
- Training
- Strengthening and/or modernization of infrastructure at border checkpoints, including equipment for non-intrusive inspection (e.g. X-ray scanners)
- Cross country cooperation among customs administrations both at high political level and at working level at border sites Coordinated (integrated) border management (IBM) Border control authorities around the world all face the same dilemma – the increasing volumes of people and goods – without the commensurate increase in resources. Traders and travelers have high expectations for speedy processing and clearance while governments and society expect border authorities to rigorously apply the law in order to protect their interests, safeguard the health and safety of their citizens and ensure national security. An effective border management through an IBM should strike the careful balance between controls and security, on the one hand, and facilitation of cross-border traffic of goods, means of transport and physical persons, on the other hand. Coordinated border management is now recognized as an effective solution for the current challenges with respect to efficient and effective border management. This means balancing trade facilitation and trade security, allowing legitimate goods and travelers to pass through borders without unnecessary hindrances while protecting the international trade supply chain from threats posed by organized crime, smugglers,

41
commercial fraud, terrorists and goods that could endanger people. An essential part of coordinated border management involves dialogue between customs and other agencies at the border as well as between customs and the business community. Effective means to facilitate border crossing: the UNECE conventions The UNECE conventions in the area of border crossing facilitation are aimed at simplification and harmonization of procedures at border crossings, be it customs or other required inspections, with a view to facilitating and developing international transport. The so-called TIR Convention and “Harmonization Convention” are good examples of UNECE’s work in this area. The Customs Convention on the International Transport of Goods under Cover of TIR Carnets (TIR Convention) permits the international carriage of goods by road from one customs office of departure in one country to a customs office of arrival in another country, through as many countries as necessary, without any intermediate frontier check of the goods carried. This, of course, requires a number of precautionary measures, such as customs control and secure sealing or prescriptions for the design of the load compartment or the container, in order to avoid smuggling. To cover duties and taxes at risk throughout the journey, an international guarantee chain has been established under the Convention. Under the Convention, the International Road Transport Union (IRU) has been authorized to distribute the international Customs transit and guarantee document, the so-called TIR Carnets and to manage the international guarantee system. The overall supervision of the TIR Convention and its application in all Contracting States falls within the responsibility of the TIR Administrative Committee, an intergovernmental organ comprising all Contracting Parties and its TIR Executive Board (TIRExB), comprising nine elected members from the Contracting Parties. While the TIR Convention was drawn up originally for European transport only, this system has gradually been extended to other areas in the world, including Central Asia, the Middle East, North Africa and Latin America. The TIR system may also be applied to goods carried in containers, provided that at least a portion of the journey is undertaken by road. Sixty-seven States and the European Union are Contracting Parties to the TIR Convention. More than 40,000 operators are authorized to use the TIR system and more than two millions TIR transports are carried out per year (Figure 15).

42
Figure 15 TIR Carnets issued worldwide in 2001 - 2009
The TIR Convention has contributed significantly to facilitation of international transport and trade in the UNECE region, particularly between EU and non-EU countries as well as among non-EU countries. As demonstrated below (Figures 16), CIS countries, Turkey and EU are the major users of the TIR system. Over the recent years, the share of CIS countries has been steadily increasing and reached 45 per cent in terms of issuance of TIR Carnets and 60 per cent as destination to which the TIR goods have been sent. The existence within the EU of a different transit system has limited the use of TIR Carnets in this region. Figure 16 Geographical distribution of TIR Carnets issued in 2009

43
Countries of destination for TIR transports in 2009
The International Convention on the Harmonization of Frontier Controls of Goods (Harmonization Convention) aims at reducing the requirements for completing formalities, reducing the number and duration of all types of controls, be it for health reasons (medico-sanitary, veterinary, phytosanitary), for reasons of compliance with technical standards or for quality inspections in general, and applies to all goods being imported, exported or in transit. Fifty-three States and the European Union are Contracting Parties. The Harmonization Convention establishes commonly agreed requirements for coordinated border management and reduction of border formalities as well as the number and duration of all types of border controls of goods. In May 2008, a new Annex 8 to the Convention came into force. This is the first time that an annex to the Harmonization Convention deals with a particular mode of transport, i.e. road transport, in recognition of the fact that the road transport industry should be considered as the main beneficiary of the facilitation measures set out in the Convention.
The International Convention on the Harmonization of Frontier Controls of Goods
Of particular importance are the new operational annexes to the Harmonization Convention which
deal with specific modes of transport. In May 2008, Annex 8 on road transport came into force.
Annex 8 covers a wide range of border crossing issues such as:
• Facilitation of visa procedures for professional drivers
• Operational measures to speed-up border crossing procedures for goods, particularly for
urgent consignments, such as live animals and perishable goods
• Harmonized technical provisions relating to faster controls of road vehicles (technical
inspections) and equipment used for transport of goods under controlled temperatures
• Standardized weighing operations and procedures to avoid, to the extent possible,
repetitive weighing procedures at border crossings
• Minimum infrastructure requirements for efficient border crossing points
• Monitoring provisions facilitating appropriate implementation of the Annex in all
Contracting Parties to the Convention
A similar annex (Annex 9) for rail border crossing has been finalized and will soon be considered by
the Contracting Parties.
44
8. Trade facilitation Trade facilitation involves simplification and standardization of international trade processes and procedures and associated information flows. Its primary goal is to reduce the transaction costs and complexity of international trade by making the process more transparent, efficient and cost-effective. Trade facilitation is a diverse and challenging subject with great potential benefits for both business and governments on the national, regional and international levels. It can have a dynamic effect on competitiveness and market integration and cuts across a wide range of areas including: government regulations and controls; business efficiency; transport; and information and communication technologies (ICT). It is at once a political, economic, business, administrative, technical and technological issue, and each of these factors needs to be considered by a country or region when developing a trade facilitation strategy. Business, trade operators and governments generate very large flows of information as part of the processes associated with the movement of goods, transfer of services and related financial flows. Such information flows require special attention in the trade facilitation context because goods cannot move faster than the processes and information that accompanies them. For instance, national regulatory authorities sometimes amend or add to their information requirements without sufficient consideration of the impact such changes may have on the overall trading system. This can easily lead to incompatible, duplicative or inefficient regulations, information requests and controls. The consequence can often be worsened congestion at airports, seaports and inland surface terminals. Landlocked countries, of which more than half are in the UNECE region, are particularly affected by regional deficits in trade facilitation. It has been estimated that, in 2009, the average time for export from landlocked countries was 60 days and for import was 62 days and the average cost to export and import were respectively $2,555 and about $3,020 per container.20 The substantial potential for gains in this area can be gauged by the fact that, in the case of Germany, the average times for both export and import were 7 days and the average cost to export and import were respectively $872 and $937 per container. Trading costs and delays discourage businesses, particularly small and medium-sized enterprises, from engaging in international trade. It has been estimated, for instance, that, on average, a one day delay in product shipment reduces trade by 1 percent for time-insensitive goods and by 7 percent for time-sensitive goods.21 Today, there is a strong need for simpler and more efficient trade procedures in order to help consolidate and strengthen the incipient recovery of the world economy, reduce the burden placed upon the environment by inefficient goods transport and realize benefits from the long-awaited Doha Round agreement (once concluded).
20 World Bank, Doing Business, 2010, www.doingbusiness.org.
21 Djanko s. et al., Trading on Time, World Bank Policy Research Working Paper No. 3909, www.doingbusiness.org/documents/trading_on_time_full_report.pdf.

45
Trade facilitation is a central focus of the work of UNECE’s intergovernmental body, the UN Centre for Trade Facilitation and Electronic Business (UN/CEFACT). The vision of UN/CEFACT is “Simple, Transparent and Effective Processes for Global Commerce”. The mission of the Centre is to improve the ability of business, trade and administrative organizations, from developed, developing and transition economies, to exchange products and relevant services effectively. Its principal focus is on facilitating national and international transactions, through the simplification and harmonization of processes, procedures and information flows, in coordination with other international organizations and key players active in this area and, thus, contributing to the growth of global commerce and of the world economy. UN/CEFACT's principal activities involve the nuts and bolts of international trade, focusing on simplifying, harmonizing and standardizing trade procedures and information flows including in the commercial, transport, regulatory and payment domains. The work of UN/CEFACT supports an open trading and financial system that is rule-based, predictable and non-discriminatory and includes a commitment to good governance, development and poverty reduction – both nationally and internationally, thus also supporting Millennium Goal 8.
The following are some well-known UN/CEFACT instruments dealing with trade facilitation: the United Nations Layout Key for Trade Documents (Recommendation 1), which is the international standard for the layout and content of trade documents; UN/EDIFACT, the international standard for Electronic Data Interchange for Administration, Commerce and Transport; the UN Trade Data Elements Directory
UN/CEFACT’s work in the current multilateral trading context
Although work on trade facilitation has been ongoing for over half a century at UNECE and other
trade related organizations, the inclusion of the issue in the WTO Doha Ministerial Declaration and
the increased international focus on security has brought the subject into sharper political focus.
Trade Facilitation negotiations at the WTO have been underway since 2004 and have focused on
extending Articles V (Freedom of Transit), VIII (Fees and Formalities connected with Importation
and Exportation) and X (Publication and Administration of Trade Regulations) of the General
Agreement on Tariffs and Trade (GATT). These negotiations are quite advanced and a draft
negotiating text, albeit with copious bracketing, is now available.
The WTO trade facilitation negotiations cover a somewhat narrow aspect of the topic - primarily
Customs related – compared to the broader, “total trade transaction” approach of UNECE.
However, the WTO negotiations on trade facilitation have had, and will continue to have a positive
impact on political will and the overall increase in understanding and acceptance of the subject by
governments. This is very positive for the work of UNECE, particularly as several UN/CEFACT trade
facilitation recommendations and standards are explicitly mentioned in the draft text (including
the UN Layout Key for trade documents, the UN/CEFACT Single Window Recommendation 33, and
the UN Trade Data Element Dictionary - UNTDED).
This opens the prospect that UN/CEFACT instruments will play a major role in helping countries to
implement and benefit from the final agreed set of measures. To this end, UN/CEFACT aims to
continue to work closely with members of the Global Facilitation Partnership and other relevant
organizations in the standards-development domain to ensure a harmonized and consistent
approach to trade facilitation work. Thus, for instance, the 16th
session of the UN/CEFACT Forum
(26-30 April 2010) is being organized in Bangkok in cooperation with the United Nations Economic
and Social Commission for Asia and the Pacific (UNESCAP).

46
(UNTDED), containing the standard data elements, and a non-technical description of trade information requirements, for use in paper documents and other means of data communication,; the Recommendation and Guidelines on Establishing a Single Window (Recommendation 33), that allows parties to lodge standardized information and documents at a single entry point in order to fulfill all trade-related regulatory requirements; the Recommendation on Facilitation Measures related to International Trade Procedures (Recommendation 18), outlining international best practices and standards for facilitating and harmonizing trade transactions; as well as other recommendations for the codification of trade information. Continued strong developments in the Single Window area should see a further enhancement of the use of UN/CEFACT standards in data harmonization and data modelling and for the broader implementation of the entire suite of trade facilitation instruments. New challenges have now emerged for companies operating in international trade. These include requests for advance information imposed by security authorities and the increasing complexity and geographic extension of international supply chains. Meeting these challenges requires taking advantage of information and communication technology and UN/CEFACT’s recommendations and standards provide a coherent set of trade facilitation instruments for use in ‘off-the-shelf’ as well as customized software solutions. They make possible a range of efficiency gains encouraging greater involvement in international trade. They also are of direct relevance for new government initiatives in areas such as e-government and on-line taxation. A number of capacity-building activities have been carried out by the UNECE to respond to the trade facilitation needs of UNECE members. In 2008-2009, 14 capacity-building activities and projects were entirely or partially organized by the UNECE, whereby 26 members strengthened their capacity to understand and implement UNECE’s trade facilitation standards and measures, improve trade development and facilitation policies, or participate in regional economic integration. As a result of these capacity building activities:
• Five national projects on the Single Window were launched in SPECA participating countries and, in addition, inter-agency and public-private groups to support the Single Window projects were established.
• Kazakhstan and Uzbekistan used UNECE recommendations to develop Action Plans on Single Window implementation.
• Azerbaijan, Turkmenistan, Uzbekistan, and Mongolia developed trade facilitation activities using information that they received during UNECE capacity-building seminars.
• EurAsEC countries (Belarus, Kazakhstan, Kyrgyzstan, the Russian Federation, and Tajikistan) used the newly acquired capacity from two seminars on the legal aspects of trade facilitation, e-commerce and the Single Window to review and improve their legislation in these areas.
• South Caucasus and neighbouring countries (Armenia, Azerbaijan, Georgia, Turkey and Ukraine) launched a regional initiative on the Single Window and data harmonization.
• Southeast European countries (Albania, Bosnia and Herzegovina, Croatia, the former Yugoslav Republic of Macedonia, Moldova, Montenegro, Serbia,

47
Turkey) and UNMIK/Kosovo strengthened their capacity to implement trade facilitation standards, notably the Single Window and data harmonization.
• The former Yugoslav Republic of Macedonia, collaborating closely with the UNECE-driven initiative on Trade Facilitation, the Single Window, and Data Harmonization in SEE finalized the first stage of a Single Window system, thus becoming the first transition economy to implement such a system.
• Awareness was raised among SPECA countries on trade facilitation at the border and how it could contribute to reducing queues at the border and corruption notably through measures such as: streamlining the physical control of trade documents and distancing this control from the border; combining responsibilities of various control agencies; and simplifying documentation requirements.
• A report has been prepared on the process of border-crossing between Uzbekistan and Tajikistan (at Torsunzade) on the basis of a study visit. The report indicated some specific areas for improvement, notably related to the lack of contacts and co-ordination between reciprocal agencies on the two sides of the border. International experts have already used this report for guidelines on border-crossing.
As can be seen from the above, a major priority of UN/CEFACT is to enhance the implementation of UN/CEFACT instruments in countries with emerging market economies as well as the involvement of experts from these countries in the work of UN/CEFACT. 22 Conclusions It is essential to realize the full potential of trade facilitation in order to enhance the economic performance. Trade facilitation can help reduce the burden of bureaucracy for private sector, improve market access, increase the participation of small and medium enterprises in international trade and reduce corruption. This is a worthy challenge for United Nations organizations, which are, after all, primarily focused on the use of trade as a tool for economic and social development. Strengthened cooperation among the array of international and regional organizations working in the trade facilitation area is essential to avoid duplication and ensure complementarity and synergies. Such collaboration should be agreed upon and implemented on the basis of mandates, ongoing work programmes, core competencies and strengths, including UN/CEFACT’s role with respect to the simplification, harmonization and standardization of the information flows underpinning international trade processes. The aim should be to adopt an approach that encompasses all aspects of trade facilitation. This should include both what is related to the implementation of an eventual World Trade Organization agreement and the regulatory and business aspects that go beyond this agreement. Work should be coordinated among all relevant international organizations, as well as with governments and significant private sector stakeholders. It should also be integrated with other trading system norms and activities that are not directly related to trade facilitation. Activities which
22 UNECE, Recommendations Concerning the United Nations Centre for Trade Facilitation and Electronic Business, ECE/EX/4.

48
could be undertaken include: needs identification; promotion/awareness raising; capacity-building and advisory services; outreach to experts in countries with economies in transition, the organization of international meetings dealing with trade facilitation in the region; the development of national trade facilitation plans and the identification of financial assistance to allow greater participation by experts from transition countries in UN/CEFACT working meetings. While, as suggested, such work should have as one of its aims to support implementation of the final outcome of the eventual Doha Round agreement on trade facilitation – the principal objective should be to improve countries trading environments, so, work can already be started in almost all trade facilitation areas. Concerted action to support trade facilitation would be particularly welcome between UNECE and OSCE. There is significant potential for strengthening the exchange of experiences, advisory services and capacity-building between those countries which have successfully addressed trade facilitation problems and those which have been relatively less successful. This exchange of experience between the more and less successful could be particularly helpful between landlocked countries and between countries with emerging market economies. 9. Intelligent transport systems Intelligent transport systems (ITS) integrate information and communication technology with transport infrastructure, vehicles and users. UNECE has focused on ITS regulations mainly in the World Forum for Harmonization of Vehicle Regulations (WP.29), where significant improvements in road vehicle safety and pollution levels have been achieved with the aid of the progressive technical norms. The improvements in the safety and environmental performance of motor vehicles, particularly with regard to global warming, could be further enhanced. ITS can play a key role in achieving the policy goals for clean and safe roads as well as the Millennium Development Goals. The benefits from ITS deployment include fewer fatalities and injuries, enhanced protection of vulnerable road users, smarter use of infrastructure, better mobility, greater protection of the environment, faster emergency response, increased efficiency of road operators, improved security, safer transport of dangerous goods, increased comfort for road users and better co-modality. With respect to challenges such as global warming and global economic recovery, ITS can play an important role by creating new jobs, promoting innovation, research, technology and stimulating economic growth. Moreover, ITS can provide significant social benefits in emerging market economies that invest in new infrastructure. These systems, as well as their implementation at the global level, appear to be currently under-emphasized. As a result, there is a need for a more harmonized policy approach. Vehicle Regulations UNECE has increased significantly road safety and reduced emission levels of motor vehicles in the World Forum for Harmonization of vehicle Regulations (WP.29) by addressing the issue of ITS implementation in vehicles. The use of information technologies in new motor vehicles contributes to the development of sustainable transport (safety and environmental aspects). Some of these technologies (e.g. navigation systems, cruise control and systems to optimise the braking and the

49
stability of vehicles) are already widely used and have contributed to better fuel consumption and fewer accidents while protecting vulnerable road users. Tire pressure monitoring system (TPMS) and brake assist systems (BAS) are two of the most representative examples. TPMS improves vehicle safety, providing real-time tyre pressure monitoring and helping to reduce CO2 emissions. BAS improves brake efficiency which in turn improves vehicle and pedestrian safety. In 2009, provisions regarding TPMS were adopted and incorporated into vehicle regulations for passenger vehicles. Moreover, the development of provisions of other vehicle based systems (such as lane departure warning systems and braking assistance systems) is at its final stage and should be completed by the end of 2010. In addition to systems confined to vehicles, there are a number of other systems which interact between the road side or infrastructure and the vehicle. Further improvements in safety and environmental performance of transport modes, particularly with regard to global warming could be fostered if ITS applications are streamlined. To this end, the UNECE Transport Division is developing a road map in the different areas of its competencies regarding ITS technologies and their implementation in the future. Transport of Dangerous Goods In the context of developing regulations in the area of inland transport of dangerous goods, UNECE has initiated work to consider how telematics could improve the safety, security and facilitate transport of dangerous goods by using monitoring and tracking systems linking consignors, transport operators, emergency responders, enforcement and control authorities and regulators. A working group has been established to study this issue, particularly from a technical and cost-benefit point of view. The purpose of this work is: • to determine which systems could be standardized for multimodal applications in
the transport of dangerous goods • to propose amendments to the legal instruments administered by the UNECE • to regulate the use of telematics • to require necessary related equipments in transport units used for the carriage of
dangerous goods This work is complemented by projects on electronic transport documentation. Electronic Data Processing and Electronic Data Interchange transmission techniques are included in the regulations of the transport of dangerous goods as an alternative to paper-based documentation. Amendments to these regulations were recently adopted for a better harmonization between modes of transport of the related prescriptions.

50
Transport of dangerous goods
At the Sixteenth OSCE Economic and Environmental Forum in 2008, the UNECE presented a report
with detailed information on the transport of dangerous goods; accidents; regulatory measures to
increase safety and protection of the environment; security and United Nations mechanisms to
develop and harmonize transport of dangerous goods regulations. The report recommended the
following:
- Countries which are not yet parties to the European Agreement concerning the International
Carriage of Dangerous Goods by Road (ADR) and to the European Agreement concerning the
International Carriage of Dangerous Goods by Inland Waterways (ADN) should accede as
appropriate as soon as possible.
Currently, ADR has 46 Contracting Parties. The only UNECE continental countries which are not
yet parties are: Armenia, Georgia, Israel, Kyrgyzstan, Monaco, Uzbekistan, Tajikistan, San Marino
and Turkmenistan. Iceland, Canada and the United States of America are not linked by road to
continental Europe. Iceland is deemed to apply ADR to domestic traffic due to Directive
2008/68/EC. Currently, ADN has 13 Contracting Parties: Austria, Bulgaria, Croatia, France,
Germany, Hungary, Luxembourg, Moldova, Netherlands, Romania, Russian Federation, Slovakia
and Ukraine.
- The transport of dangerous goods regulations contained in the Agreement on International
Transport of Goods by Rail (SMGS, Annex 2) should be fully harmonized with the Regulations
concerning the International Carriage of Dangerous Goods by Rail (known as RID described in
Appendix C to the Convention concerning International Carriage by Rail (COTIF)). Annex 2 of
SMGS remains partly harmonized with RID, but full harmonization is yet to be achieved. The
SMGS Agreement is administered by the Organization for Cooperation of Railways (OSJD).
Among parties to COTIF, 44 countries apply RID to international carriage of dangerous goods by
rail. All countries which are parties to the ADR, ADN and OTIF should apply the requirements of
ADR, RID and ADN to domestic traffic.
- According to Directives 94/55/EC and 96/49/EC (prior to 2008), member States of the European
Union, Iceland, Norway, Liechtenstein and Switzerland had to apply the requirements of ADR and
RID to domestic traffic. These directives have been replaced by a single directive 2008/68/EC
which continues to require application of ADR and RID to domestic traffic, but also requires the
same countries to apply ADN to transport of dangerous goods by inland waterways at least when
they possess inland waterways linked, by inland waterways, to the waterways of other member
States.
Special attention should be paid to accession to ADR, to its application to domestic traffic and to
its effective implementation since transport by road is the most used mode for transport of
dangerous goods and is the essential link between all modes of transport.
In 2008, the UNECE secretariat proposed three projects to strengthen the implementation of ADR
concerning a) monitoring of the implementation of ADR; b) harmonizing the rules applicable to
domestic transport with those of ADR; c) assisting member States of the UNECE which are not yet
parties to ADR to become party.

51
Railways Interoperability of telecommunications in railway operations is important for all countries in Europe. It aims at improving rail infrastructure and thus the efficiency of railway operations. Harmonization efforts have taken place mainly in the European Union (EU) and European Free Trade Association (EFTA) countries. The use of ITS in the railway sector within the EU has been led by the European Commission. The intelligent transport systems adopted by the EU and EFTA countries are not interoperable in the UNECE region as a whole. In other words, the ITS standards for rail operations in non-EU sub-regions (mainly Eastern Europe and North America) are not necessarily compatible with the EU Rail Traffic Management System (ERTMS). The fragmentation of technical standards increases the costs of doing business because potential economies of scale in the manufacturing of rail vehicles and rail operations cannot be fully captured. Recent research has demonstrated that ITS can be used to enhance security of rail transport. This is relevant, given the likelihood of terrorist attacks against 'soft' targets, including railway infrastructure. In the area of container transport, security tends to be uneven across modes. Whereas security measures are usually well developed and integrated in ports, hinterland connections (rail, road and inland waterways) on outer edges of the supply chain are often less protected against security breaches. In the area of passenger transport, railway stations and vehicles are apparently less protected than airports and airplanes.
These projects were not financially supported by OSCE in 2008. The UNECE posits again to assist
countries to accede to ADR. There are a number of countries which are parties to ADR but are not
represented at meetings of the UNECE Working Party on the Transport of Dangerous Goods or
those of the RID/ADR/ADN Joint Meeting. Participation of national authorities in these fora is
particularly important not only for decisions related to the evolution of ADR, but also because of
matters related to the interpretation and effective implementation of ADR, exchange of
experience between Contracting Parties and cooperation and mutual administrative support.
Therefore, OSCE might wish to consider providing assistance to administrations of some
Contracting Parties to ADR which would like to participate more actively in the work but are
prevented to do so due to financial constraints (see Annex 2).
Intelligent Transport Systems on Inland Waterways
River Information Services (RIS) are harmonised information services to support traffic and
transport management in inland navigation, including interfaces to other transport modes. RIS aim
at contributing to a safe and efficient transport process and utilizing inland waterways to their
fullest extent. RIS collect, process, assess and disseminate fairway, traffic and transport
information.
To ensure a harmonized introduction of RIS at the Pan-European level, comprehensive Guidelines
for River Information Services have been established/, describing the principles and general
requirements for planning, implementing and operational use of River Information Services and
related systems. The RIS Guidelines are applicable to the traffic of both cargo and passenger
vessels as well as recreational craft.

52
Infrastructure ITS devices such as variable message signs, speed cameras, electronic vehicle detection, toll charging systems, vehicle positioning and tracking are applied in traffic management and control. Such systems not only eliminate bottlenecks, ensure greater safety and fuel efficiencies, but they are indispensable in assessing traffic loads and patterns, in planning for future infrastructure needs and in greater security of transport. Effective incident management depends mainly on incident detection and verification. The key characteristics required are a high detection rate, a short reaction time and a low false alarm rate. Every ITS service depends on the availability of an enabling Information and Communication Technologies (ICT) infrastructure. Communication equipment underpins practically all ITS services. The costs of ICT are relatively small in comparison to those of the road infrastructure. Mobility Efficient mobility systems are essential for economic development. Mobility is particularly relevant for people with special needs such as disabled and those who live in remote areas. Better mobility improves quality of life and boosts the ability of individuals to contribute to the growth of the economy. ITS include many approaches to enhance the mobility of people and freight in all transport modes. For example, traveller information relieves congestion, promotes a better use of the existing road capacity and improves traffic management. Road Safety Every year 1.2 million people are killed on road and a further 50 million injured. At the end of the 1990s, road traffic was the world's ninth biggest cause of death and
RIS Guidelines are used in conjunction with international standards and recommendations, such
as:
(a) Electronic Chart Display and Information System for Inland Navigation (Inland ECDIS)/;
(b) Standard for Notices to Skippers and for Electronic Ship Reporting in Inland Navigation/;
(c) Guidelines and Criteria for Vessel Traffic Services on Inland Waterways/;
(d) International Standard for Tracking and Tracing on Inland Waterways using the Automatic
Identification System (AIS)/.
RIS is currently being introduced in all UNECE member countries concerned with inland navigation.
For this purpose, inland navigation vessels have to be equipped with VHF radiotelephone stations,
radars, GPS receivers, Inland ECDIS equipment, PC and AIS transponders. Relevant measures
should also be undertaken by competent authorities regarding the establishment of relevant
shore-based infrastructure and services, such as RIS and VTS centres, GPS differential correction
stations, etc.
Full implementation of RIS services allows RIS operators and skippers to see actual and anticipated
traffic situations, undertake voyage planning and optimization through the lock, bridge and
terminal management, receive on-line information on weather and fairway conditions and obtain
navigational support.
The RIS related international standards mentioned above are managed by International Expert
Groups who report to all the intergovernmental bodies concerned, such as EU, UNECE and River
Commissions.

53
disability. Statistics make evident that the human error or inappropriate behaviour is either the first or the co-operating cause nine times out of every 10 accidents. Both the on-board and roadside intelligent transport systems aim at helping by either alerting or informing. The human factor is crucial for road safety and ITS is the tool to provide information, warning, enforcement and assistance services. ITS should be the future instrument preventing accidents that have the human factor as the main or complementary cause. Global warming Exhaust emissions are one of the main negative outcomes of transport. ITS tools could be applied to implement harmonized policies to decrease greenhouse gases. In cities, excessively long and winding bus routes often overlap and congest main roads leading into central areas. Initiatives undertaken by some municipalities to implement a bus rapid transit corridor with intelligent traffic management (i.e., synchronization of traffic lights) effectively curb congestion and provide a more efficient public transport service. For example, in the metropolitan area of Queretaro, Mexico, CO2 emissions were projected to decrease by 85 per cent due to ITS-led design. The future challenges of ITS A growing number of UNECE members are intensively developing and implementing intelligent transport systems in various transport areas. Given that the design and industrial development cycle for ITS systems is shorter than the policy cycle for such technologies, regulatory authorities should speed up efforts to maximise the potential offered by the implementation of ITS. 10. Landlocked developing countries: Almaty Program of Action Location is an important determinant of transport costs as it defines the distance between producers and consumers. While the locations distant from major markets impose additional costs, international transport has the potential to reduce the related economic disadvantages. However, this potential is not always fulfilled as the costs of transport infrastructure may be prohibitive. Moreover, when the existing transport infrastructure is not complemented by the necessary institutional instruments such as efficient customs procedures or secure transit, international transport is unable to compensate for the negative effects associated with unfavourable locations.23 In addition to distance from markets, adverse geographical features such as landlocked locations create additional economic challenges. There are over 40 landlocked countries in the world and more than half of them are located either in Europe or in Asia. The UNECE members have nine “landlocked developing countries” as classified by the Office of High Representative for the Least Developed, Landlocked Developing Countries and Small Island Developing States (OHRLLS). They are: Armenia, Azerbaijan, Kazakhstan, Kyrgyzstan, Republic of Moldova, Tajikistan, The Former Yugoslav Republic of Macedonia, Turkmenistan and Uzbekistan. 23 Good governance is not only required to make transport networks more efficient. Good governance is also needed to encourage private investment in physical infrastructure. As transport infrastructure is immobile, long-lived and requiring large financial outlays, a better than “average” investment climate is needed.

54
In these countries, transport costs, particularly outside of Europe, are excessively high. This is due to a variety of factors that may include isolation, adverse climatic conditions, inhospitable terrain and challenging road and railway conditions. In general, it is estimated that transport costs for goods originating in landlocked locations are, on average, about 50 per cent higher than in the countries with sea access. The general level of development of both landlocked and transit countries – which often determines the quantity and quality of transport infrastructure – is also a factor. Many landlocked countries have low per capita incomes or their economies are stagnant. That gives rise to a vicious circle where infrastructure investment is not viable due to too little demand for transport services and simultaneously less economic activity taking place because of inadequate transport infrastructure. By some estimates transport costs are, on average, 70 per cent higher in developing countries. Although these higher costs are mostly linked to inadequate physical transport infrastructure and inefficient border crossing procedures, extensive documentation requirements are also important sources of avoidable costs. Corruption is another - t is frequently cited by truck operators as prevalent at many road border crossings. In case of railways, corruption is believed to be of lesser concern, but rail border-crossing often take days – not hours - mainly because of non-harmonized technical and operational standards. By some rough estimates, more than half of transit time from Central Asia to Europe is spent while waiting at borders. The export structure of landlocked economies also plays a role. First, landlocked countries typically rely on exports of a few bulky and low value commodities. As transport costs for some of these commodities may account for up to 40 per cent of the final price, the determination to reduce the shipping costs is crucial. Second, landlocked countries often “neighbour” with countries that have similar economic features with, in many cases, comparable poorly developed transport systems. Moreover, their mutual trade tends to be relatively insignificant due to reliance on production and sales of identical natural resources. Third, goods with a high-value-to-weight ratio are cheaper to move and that is why producers of agricultural and mining products or raw materials generally incur higher shipping costs. As noted above, in Central Asia landlocked developing countries natural resources and commodity sales dominate exports.24 In sum, poor physical infrastructure makes transport inefficient and more costly, because it extends the actual shipping time. So do extended amounts of time spent at border crossings. High transport costs, in turn, erode the competitiveness of landlocked countries and reduce the volumes traded. Together these factors reduce the potential economic growth.25 According to the United Nations OHRLLS, the
24 High transport costs also increase the prices for imports: not only for consumer products, but also raw materials and intermediate inputs making the domestic production less competitive.
25 Recent research results, based on an econometric analysis of a sample consisting of 98 countries, indicate that a 10 per cent cut in the length of export procedures increases exports of goods by about 4 per cent. See S. Djankov, C. Freund and C.S. Pham, ‘Trading on Time,’ December 2006 <www.doingbusiness.org/Documents/TradingOnTime_DEC06.pdf>.

55
remoteness and the difficulty to reach world markets are the major reasons why the economies of many landlocked countries (outside Europe) have not grown more rapidly.26 It is often argued that the high transport costs faced by landlocked developing countries are a more restrictive barrier to trade than tariffs.27 “Fundamental transit policy issues” and “Transit transport infrastructure development and maintenance” in the UNECE region Inland transport routes linking Europe and Asia are not as competitive as maritime and air transport modes. This is so because the development of an efficient Euro-Asian inland transport network has been hindered by inadequate infrastructure, inefficient border procedures and by excessive administrative and regulatory burdens. In some cases, the least-cost routes are inaccessible due to protracted military/territorial conflicts. Transport infrastructure in landlocked countries of Central Asia - in general - is still unsatisfactory. Some road networks need to be re-oriented while others renovated to support the current traffic volumes. Roads, in general, have not been adequately maintained. There are still many bottlenecks and missing links. Similarly, railway networks are generally underdeveloped and inadequately maintained. These infrastructure deficiencies are mainly linked to the lack of investment funds.
26 In contrast, landlocked developed countries in Europe are located not far from seaports and are typically surrounded by wealthy countries. This has allowed them to focus on exports of higher value added products mostly to neighbouring or closely located countries.
27 According to UNCTAD estimates, landlocked developing countries spend on average almost two times more of their export earnings for the payment of transport and insurance services than developing countries and three times more than developed economies.
Transport infrastructure bottlenecks
Transport infrastructure in the pan-European region has traditionally been provided by
governments at prices set well below optimal (long-run marginal cost) levels. Therefore, an
administrative process is needed to identify bottlenecks and potential investment. A recent UNECE
report provides a methodology to identify bottlenecks along with options to remove them,
including investment, infrastructure pricing, regulation of access, and so on.
International bottlenecks are likely to have causes and solutions that are different from national
ones. If the bottleneck is between countries or if an internal bottleneck is mostly a problem
because it reduces international traffic flows, the root cause may well be related to rivalry
between states that pursue narrow national interests or the lack of an adequate international
funding mechanism.
Bottlenecks depend on prices. In other words, there will always be a price high enough for the
bottleneck to disappear. In addition to using the price mechanism, bottlenecks can be reduced by
a better management of traffic flows and incidents

56
In principle, a shadow price approach can be applied to assess whether a bottleneck merits
regulation or capacity-increasing investment. This shadow price is the amount that "society"
would pay to have the constraint relaxed or removed, which in turn reflects the degree to which
there are substitutes, more or less adequate, for the bottleneck capacity. This is similar to the
market definition exercise commonly applied in competition law.
Standard economic concepts have been most successfully applied to the identification of
bottlenecks in the case of road transport. The analysis of road bottlenecks uses the concept of
congestion pricing of individual highway links. The efficient price for a highway link is the
monetized value of delay that one vehicle imposes on others using the link. A link should be
expanded when the present discounted value of expected congestion can pay for the capacity
expansion.
In principle, all concepts of capacity are a matter of service degradation as throughput levels rise.
In transportation, it is natural to assume that service degradation can be measured by delay. The
capacities of highways are measured by speed-volume curves that show the drop in speed as
traffic volumes rise for different kinds of highways. The value that users place on service
degradation on one link depends on the availability of alternative routes. This is where market
definitions come into play. If a link is one of several parallel routes, demand on the route will be
highly elastic and thus volumes will quickly balance themselves among different routes when
demand between two endpoints rises.
Would it be possible to measure speed-volume curves and place a value on service loss for
railways, borrowing the highway concepts of bottlenecks? There are numerous issues that would
need to be taken into account if standard economic concepts were to be used to measure shadow
prices of rail bottlenecks.
First, standard traffic theory assumes that there is no scheduler and that the speed falls due to the
decision making of atomistic independent actors on the highway. This assumption obviously fails
in the case of railways. Second, congestion pricing assumes that the goal of transportation policy is
solely to provide service to those users who will pay the maximum amount for the service (net of
the costs of providing the service). In reality, there is a much richer set of motivations than is
assumed by standard congestion theory. In particular, policymakers may not be indifferent
between providing service to their own nationals as opposed to those simply transiting to get to a
different country. Third, for many commodities, reliability is as important as average service
speed, but this is not taken into account in the standard theory of congestion pricing. Fourth,
there may be strategic motivations for a railroad or infrastructure manager in decisions of where
to invest and how to route trains. In this case, technical definitions of bottlenecks may not be
possible based on traffic on particular links.
Due to the obstacles mentioned above, an empirical identification and ranking of railway
bottlenecks by means of shadow prices has not become operational to date. Similarly, the shadow
price approach has not been applied to the identification of bottlenecks on inland waterways. In
practice, separate approaches to bottleneck identification have been used for the three inland
transport modes.
Recent studies have emphasized that border crossings and modal interchanges should be
considered as the equivalent to links in transport networks and identified as bottlenecks on the
basis of empirical analysis. The objective of such analysis should be to construct a list of candidate
investments and/or administrative actions. Competent authorities would then decide how to
alleviate the bottlenecks while bearing in mind environmental concerns and wider socio-political
ambitions reflecting relevant policy directions.

57
Other important, non-physical, obstacles also impede road transport operations in Central Asia. Based on reports of trucking companies operating throughout the region, the most persistent obstacles include the poor implementation of international legal instruments, restrictions on vehicle movements, trans-loading, physical inspections and off-loading of freight at borders, unwarranted inspections of goods en route, differing vehicle standards, inadequate security for drivers and freight and corruption. In the rail sector, the interoperability of the national and international transport laws to improve transport over long distances remains to be addressed. At present, two legal systems define rules for international railway and multimodal transport, including consignment notes and other documentation. The interoperability of national rail transport laws is difficult to achieve but the recent development of a joint CIM/SMGS consignment note demonstrates that non-physical obstacles can be overcome through negotiations.28 Nevertheless, important differences between the two legal regimes continue to exist. For instance, the liability clauses in the CIM and SMGS are almost identical but compensation levels differ significantly.29 The adoption of a unified rail transport law by all countries along the major Euro-Asian corridors would be conducive to the development of competitive inter-regional services. International inland transport along the Europe-Asia axis is vulnerable to safety and security threats, partly due to political instability and weak law enforcement as well as organized crime activities. The most common security risks entail cargo theft, illegal border crossings of persons, drugs and arms, attacks on physical infrastructure and vehicle theft. Governments strive to control illegal transport of goods and persons across national borders by applying higher security standards but these typically increase costs of transport operators. In this context, appropriate security procedures should not be overly disruptive and allow for trade facilitation based on international trade and transport agreements. Finally, in Central Asia container transport remains relatively underdeveloped. However, it may be possible for Central Asian countries to overcome weaknesses by addressing problems at transhipment points (borders, change-of-gauge stations). To this end, the authorities could cooperate with private sector stakeholders such as freight forwarders, transport operators and export/import businesses.
28 The new CIM/SMGS consignment note is comparable to the widely used CMR waybill for the international carriage of goods by road. The rules pertaining to the waybill are specified by the UNECE CMR convention. 29 The CIM rules set the compensation for exceeding the contractual transit period at four times the freight charge. The SMGS rules provide for no more than 30 per cent of the charge.
There is no well-developed methodology for the identification of multimodal traffic bottlenecks.
The UNECE study mentioned above recommends that national administrations for the three
separate inland transport modes should be responsible for identifying multimodal options.
Multimodal possibilities in international transport could be revealed by comparing the national
priorities identified.

58
Armenia30 Armenia has about 7,000 km of paved roads, although a large proportion of these are in need of refurbishment. Much work in rehabilitating the road network — particularly in the capital — has been carried out with the financial support of the IFIs and a private foundation (run by the Armenian diaspora). While ongoing repairs cause traffic bottlenecks, the road sector has been gaining a growing share in modal split. Excluding pipeline transport, road transport accounted for 13 per cent of tonne-km in 2003, but reached 20 per cent in 2008. A major remaining problem was the inadequate quality of rural roads and thus the first leg of transporting agricultural produce. The US Millennium Corporation funding has been launched to address the rural infrastructure shortcomings. The rail sector’s share in freight transport amounted to 79 per cent in 2008 down from 86 per cent five years earlier. The railway infrastructure is, in general, outdated and unreliable, but fully electrified. Similar to roads, rail transport is impacted by bottlenecks caused by ongoing repairs.
Armenia: Freight transport, by mode, in million tonne-km Year 2003 2004 2005 2006 2007 2008
All transport 1741 2007 2301 2368 2875 3015
Railway 529 678 654 668 771 705
Pipelines 1127 1264 1580 1597 1958 2118
Road 79 55 56 91 133 179
Air 6 10 11 12 13 13
Armenia: Rail tracks and roads, length in ‘000 km Year 2003 2004 2005 2006 2007 2008
Railways 0.7 0.7 0.7 0.7 0.7 0.7
of which electrified 0.7 0.7 0.7 0.7 0.7 0.7
Roads 7.6 7.6 7.5 7.5 7.5 7.7
of which paved 7.0 6.9 6.8 6.7 6.7 7.0
Source: Commonwealth of Independent States in 2008, Statistical Yearbook, Moscow, 2009.
The rail border crossing with Georgia and road border crossings with Georgia and Iran operate around the clock. However, the road link to Iran is closed by snow for up to two months per year. Both rail and road border crossings with Azerbaijan and Turkey continue to be closed as a consequence of conflicts in the region. The rail connection to Iran also remains cut-off as it traverses the Nakhichevan region of Azerbaijan.
30 Country reports are partly based on “Joint Study on Developing Euro-Asian Transport Linkages”, United Nations, 2008, pp.176-204.

59
Azerbaijan Azerbaijan has 25,000 km of roads - virtually all are paved. It is estimated, however, that about half of roads in Azerbaijan are in need of urgent repair or even of major reconstruction. Excluding pipeline transport which has become the dominant mode of transport in Azerbaijan, in 2008, the road sector accounted for 38 per cent of transport freight turnover, up from 30 per cent in 2003. The rail sector also accounted for 38 per cent of tonne-km in 2008 (at the same level as in 2003). The sector experienced major disruptions associated with armed conflicts in the region. At present, Azerbaijan has some 2,000 km of railways, of which more than 60 per cent are electrified, but much of the track and rolling stock is in need of repair or replacement. Azerbaijan has direct maritime connections to all other Caspian littoral states. The nation’s capital, Baku, is the largest port on the Caspian Sea. Transit earnings are mostly from the export of Kazakh and Turkmen oil across the Caspian Sea, through Azerbaijan, to the Black Sea oil terminals in Georgia and Russia. Sea transport accounted for 23 per cent of transport freight turnover in 2008, down from 32 per cent in 2003.
Azerbaijan: Freight transport, by mode, in million tonne-km Year 2003 2004 2005 2006 2007 2008
All transport 22292 23283 26534 43294 78007 88607
Railway 7719 7536 9628 11059 10375 10021
Pipelines 1573 1696 1539 15679 52305 62434
Sea 6555 6771 7521 8043 5989 6075
Road 6241 6965 7536 8222 9135 9948
Air 204 315 310 291 205 129
Azerbaijan: Rail tracks and roads, length in ‘000 km Year 2003 2004 2005 2006 2007 2008
Railways 2.1 2.1 2.1 2.1 2.1 2.1
of which electrified 1.3 1.3 1.3 1.3 1.3 1.3
Roads 18.8 18.8 18.8 18.8 18.8 18.9
of which paved 18.6 18.6 18.6 18.6 18.6 18.6
Source: Commonwealth of Independent States in 2008, Statistical Yearbook, Moscow, 2009.
The Baku port has freight, container and oil terminals where the cargoes are loaded on Ro-Ro ferries, dry cargo ships and oil tankers respectively. All terminals operate daily around the clock. There is an ongoing reconstruction of the maritime station in the container terminal.
Major road and rail border crossings are open daily and operate around the clock with the exception of the border crossing with Armenia that is closed and with Iran at Astara that operates from 9 am to 8 pm only. Except for the narrow approach at Astara, there are no physical impediments to traffic. Waiting times are typically short.

60
Kazakhstan
There is substantial need for improving and upgrading the road system. The overall road density in Kazakhstan is about 40km per 1,000 km2 with approximately 90 per cent of paved roads. The overall rail network in Kazakhstan covers about 15 thousand km and has a density of 5 km per 1,000 km2. The railways have consistently accounted for 75-80 per cent of the overall freight traffic turnover with the remainder carried by road.
Kazakhstan: Freight transport, by mode, in million tonne-km Year 2003 2004 2005 2006 2007 2008
All transport 258360 283078 296283 328509 350454 369704
Railway 147672 163454 171855 191233 200785 214950
Pipelines 70364 75563 77099 83326 87761 90329
Inland waterways 72 83 90 40 52 55
Road 40158 43910 47122 53816 61459 63481
Air 94 68 97 70 88 69
Sea - - 20 24 310 820
Kazakhstan: Rail tracks and roads, length in ‘000 km Year 2003 2004 2005 2006 2007 2008
Railways 14.6 15.1 15 15.1 15.1 15.1
of which electrified 3.9 4 4.1 4.1 4.1 4.1
Roads 89 90 90.8 91.6 93.1 93.6
of which paved 83.6 84.1 82.8 83.7 84 84.1
Inland waterways 4 4 4 4.1 4.1 4.1
Source: Commonwealth of Independent States in 2008, Statistical Yearbook, Moscow, 2009.
Kazakhstan is a landlocked country, but with access to the Caspian Sea. It relies to some extent on inland waterways transport, mainly on the Irtysh and Syr Darya rivers. Four major inland waterways covering about 4 thousand km allow for the use of vessels with navigable water level of no less than 2.5 m for river vessels and 4.5 m for “river-sea” vessels respectively. The inland waterways have a limited navigation period averaging 200 days per year. The inland waterways require some infrastructure investment in order to remove the existing bottlenecks. The only major sea port is the Aktau International Commercial Sea Port at the Caspian Sea. Along major roads, Kazakhstan has over 40 international border-crossing points. While the border-crossing points at Khorgos, Dostyk (road and rail), Kegen and Kolzhat have limited opening hours from 9 a.m. to 6 p.m., all others operate daily on a 24 hour basis. Furthermore, 16 rail border-crossing points are operational. At the rail border crossing with the Russia, extensive checks and lengthy processing of documents often cause delays. The Kazakh authorities have planned 17 rehabilitation/reconstruction projects for the road system. The envisaged total project costs amount to $2.7 billion. The projects are

61
implemented in a phased manner with starting dates from 2001 onwards and expected completion dates up to 2012. The funding for all the above projects has been secured. In 2009, a US$ 2.125 billion USD World Bank loan to the Kazakh road sector was agreed on (South-West Roads Project) that will help upgrade the trade route linking China to Russia and Western Europe through Kazakhstan, bringing a helpful economic stimulus to some of Kazakhstan’s provinces. The project will boost Kazakhstan’s competitiveness and bring significant economic benefits both to Kazakhstan and to the broader Central Asia region. The Customs Control Committee is implementing a US $60 million development project with World Bank assistance in order to: (i) promote internationally acceptable practices for expeditious processing of international trade flows, so as to further integrate the country into the world economy and improve the investment climate and competitiveness; (ii) improve taxpayer compliance with the Customs Code and thereby increase revenue. Kyrgyzstan Transport contributes approximately 2-3 per cent to the Kyrgyz GDP, with the country having one of the lowest road densities (0.17 km/km2). Because of the country’s mountainous terrain, more than 97 per cent of goods are transported by truck and 80 per cent of passengers are also transported by road.
Kyrgyzstan: Freight transport, by mode, in million tonne-km Year 2003 2004 2005 2006 2007 2008
All transport 1439 1805 1597 1612 1789 2080
Railway 562 715 662 752 849 946
Pipelines 278 454 314 215 218 212
Inland waterways 7 6 5 6 5 8
Road 586 627 612 638 716 912
Air 6 3 4 2 1 2
Kyrgyzstan: Rail tracks and roads, length in ‘000 km Year 2003 2004 2005 2006 2007 2008
Railways 0.4 0.4 0.4 0.4 0.4 0.4
Inland waterways 0.5 0.5 0.4 0.4 0.4 0.4
Source: Commonwealth of Independent States in 2008, Statistical Yearbook, Moscow, 2009.
Total length of the railroad system in the Kyrgyz Republic is 424.6 km, consisting of two unconnected lines: a “Southern” line - 323.4 km and a “Northern” line - 101.2 km. Kyrgyzstan is a landlocked country, but a small volume of transport on the 500 km of inland waterways occurs on Lake Issyk-Kul (Balykchy port). The Kyrgyz Republic and its four neighbours have 14 border control points, two of which are major rail corridor crossing points. The largest rail control point is in Bishkek (about 40 km from the border with Kazakhstan) whereas the largest road control point is in Akzhol (at the border with Kazakhstan). Osh, another rail border-

62
crossing point covers the traffic through the Ferghana Valley. The border control points process 20,000 rail wagons and about 125,000 trucks annually. With the exception of the new facilities at Akzhol, the main problems are the poor condition of the buildings/offices and inadequate communication and data processing facilities. Moldova There are 9,462 km of roads on the Moldovan territory, but the country continues to be negatively affected by the conflict in Transnistria. Road transport operators have to bypass the Transnistrian part of Moldova to avoid possible difficulties with the self-proclaimed authorities. Nevertheless, the road sector’s performance improved between 2003 and 2008 as its share in the freight turnover almost doubled at the expense of the rail sector. This improvement took place despite the continued deterioration of Moldova’s road network due to the limited investment undertaken in recent years.
Moldova: Freight transport, by mode, in million tonne-km Year 2003 2004 2005 2006 2007 2008
All transport 3918 4346 4349 6519 6403 6314
Railway 3019 3006 3053 3673 3120 2873
Pipelines - - - 1431 1446 1427
Inland waterways 0.4 0.4 0.4 0.6 0.6 0.8
Road 897 1339 1315 1412 1835 2013
Air 0.9 1.0 1.1 1.3 1.3 1.2
Moldova: Rail tracks and roads, length in ‘000 km Year 2003 2004 2005 2006 2007 2008
Railways 1.1 1.1 1.1 1.2 1.2 1.2
Roads 9.5 9.5 9.5 9.5 9.4 9.3
of which paved 8.9 8.9 8.9 8.9 8.8 8.8
Inland waterways 0.6 0.6 0.6 0.6 0.6 0.6
Source: Commonwealth of Independent States in 2008, Statistical Yearbook, Moscow, 2009.
The importance of inland waterways has become negligible since the central government lost control of the major port situated in Transnistria. The government intends to increase the share of inland water in freight turnover with the aid of the new port Giurgiuleşti, which ensures a direct connection of landlocked Moldova to the Black Sea. Tajikistan The Tajik road system covers 27,767 km with a road density of 194 km per 1,000 km2. The railway network covers 951 km and has one of the lowest densities in the Central Asian region. In 2008, the share total freight carried by rail was 49 per cent, down from 67 per cent in 2003 (at the expense of the road sector). A small volume of transport on the 200 km of inland waterways also occurs along the Vakhsh River.

63
Tajikistan: Freight transport, by mode, in million tonne-km Year 2003 2004 2005 2006 2007 2008
All transport 1611 1936 2094 2184 2548 2615
Railway 1086 1118 1066 1220 1274 1282
Road 517 810 1020 958 1269 1329
Air 8 8 8 5 5 5
Source: Commonwealth of Independent States in 2008, Statistical Yearbook, Moscow, 2009.
The Government has adopted an ambitious Program of the Tajik Transport Development by 2015 that focuses on the development of international transport corridors. Turkmenistan The road system in Turkmenistan covers 24,000 km (as of 2001) and represents a road density of 49 km per 1,000 km2:
� One major highway runs westward from Mary, along the Iranian border through
Ashgabat and then to Turkmenbashi on the Caspian Sea � Another one runs north-westward from the Afghan border through
Turkmenabat, along the Uzbek border to Dashhowuz � Major road-building projects – initiated in 2000 – improved sections of the
highway connecting Ashgabat with Turkmenbashi and Mary
The railway network covers 2,503 km and provides a rail density of 5 km per km2. A new 540 km line linking Kypchak (Ashgabat) and Dashoguz was completed in 2006 at a cost of $2 billion, including rolling stock and construction of 17 bridges. Turkmenistan has access to the Caspian Sea with the major port being Turkmenbashi and shipping to Astrakhan in Russia and Baku in Azerbaijan. In addition, smaller Caspian ports are Alaja, Chekelen, and Ekarem. The important inland waterways (1,400 km in length) are the Amu Darya river and the Kara Kum canal. The canal designed mainly for irrigation, is navigable for 450 kilometers from its Caspian terminus, while the Amu Darya is navigable only about 250 kilometers downstream from the Afghan border to Turkmenabat. Uzbekistan The road system in Uzbekistan covers an estimated length of 181,315 km with a road density of 405 km per 1,000 km2. The railway network covers 4,126 km and provides a rail density of 9 km per 1,000 km2. Uzbekistan shares the southern portion of the Aral Sea with a 420 km shoreline. The inland port on the Amu Darya river Uzbekistan operates at Termez. The waterways within the country add up to 1,100 km in length.

64
The former Yugoslav Republic of Macedonia The road system in the Former Yugoslav Republic of Macedonia covers almost 14,000 km with more than half of roads paved. The railway network is 696 km long and has doubled market share since 2004 to 16 per cent.
Freight transport, by mode, in million tonne-km and Rail tracks and roads, length in ‘000 km Year 2004 2005 2006 2007 2008
All transport 5767 6106 8913 6717 4721
Railway 426 530 614 779 743
Road 5341 5576 8299 5938 3978
Railway (km) 696 696 696 696 696
Road (km) 13124 13278 13736 13840 13922
of which paved 6393 7285 7464 7773 7872
Source: Transport and other communications, 2008, Statistical Review: Transport, Tourism and Other Services, Republic of Macedonia State Statistical Office.
In summary, landlocked developing countries in the UNECE region continue to face numerous challenges to decrease their economic distance to the markets and to improve their competitiveness. The UNECE has a number of international legal instruments, standards, norms and recommendations which, if promoted, used and properly implemented, can assist landlocked and transit countries in overcoming their special disadvantages.
11. Refrigerated transport and global food security
Recent spikes in food and fuel prices in Europe and throughout the world, famine in developing countries, adverse climatic events caused by global warming and shortages of water demonstrate the fragility of global food security. Exacerbating the situation is the projected increase in the world's population which is expected to grow from the current 7 billion inhabitants to more than 9 billion by 2050. The World Bank has estimated that 1.4 billion people in developing countries were living in extreme poverty in 2005. The United Nations has established the target, known as Millennium Development Goal No. 1, to cut by half the proportion of people in the developing world living on less than 1 dollar a day by 2015. However, despite successes in Asia, recent increases in the price of food are expected to push an additional 100 million into absolute poverty. While these issues are chiefly problems in the developing world, the UNECE region is not spared. It is estimated by the United Nations Food and Agriculture Organization that in Tajikistan 53 per cent of the population live on less that $1.33 per day and more than two thirds of the population depends on agriculture for its livelihood.

65
Other landlocked countries in Central Asia also face challenges to the optimization of their food supply and ensuring the satisfactory nutrition of their populations. In addition, in an age of globally-sourced production, Europe cannot ignore its responsibilities to the rest of the world. As has been shown, cuts in agricultural production in Europe can lead to worldwide increases in food prices. In light of the projected increase in the world's population, it is clear that there must be a corresponding increase in global agricultural production. In addition to giving over more land to farming, it has been suggested that genetically modified crops may hold the answer to increased production but these are not without their critics. Another means of increasing production is through the reduction of losses at harvest time which average about 25 per cent of food production globally. Drying, salting and canning are traditional means of preserving surplus food supplies but refrigeration offers not only extended preservation but also greater retention of the nutritional and other values of the food. In addition to preservation, refrigeration at the correct temperatures also ensures that bacteria are not allowed to develop and that perishable foodstuffs do not pose a health hazard to the consumer. As with other goods, transport by road offers the advantage for refrigerated foodstuffs of a door-to-door service whereas transport by rail may be more cost effective for longer journeys and bigger cargoes. Refrigerated transport units have stringent technical requirements due in part to the different meteorological conditions that they are required to operate in. Considerations such as the insulation of the transport unit and the capacity of the refrigeration unit therefore assume considerable importance. In some extremely cold countries, heating may be necessary rather than chilling to maintain foodstuffs at the optimum temperature. Frozen foodstuffs are generally transported at maximum temperatures of minus 12°C or minus 18°C and lower temperatures may not have an unduly negative effect on the cargo. However, chilled foods such as fish, meat, poultry, dairy products and milk require stricter temperature controls to ensure that they are kept in the best condition and in general the duration of carriage should not exceed 48 hours. Given the sensitivity of chilled and frozen food cargoes and the fact that excessive variations in temperature can lead to the development of moisture and diminish their quality and even make them dangerous for human consumption, it is essential that train wagons and trucks carrying such goods are allowed to cross borders rapidly and without excessive delay.
Transport of chilled and frozen perishable foodstuffs:
Good practice at border crossings
Given the sensitivity of chilled and frozen food cargoes and the fact that excessive variations in
temperature can lead to the development of moisture, diminish their quality and even make them
dangerous for human consumption, it is essential that railway wagons and lorries carrying such
goods are allowed to cross borders rapidly and without excessive delay. It is recommended
therefore that Customs authorities:

66
It was precisely with these sorts of concerns and the food shortages after the Second World War that the United Nations Economic Commission for Europe first decided to set up a Working Party in 1948 to look into the nature and extent of international traffic in perishable foodstuffs, to ascertain operating difficulties and to study transport requirements for subsequent years. This work developed until in 1970, European Governments adopted the Agreement on the International Transport of Perishable Foodstuffs and on the Special Equipment to be Used for such Transport, or simply the ATP. The ATP applies to the international transport of perishable foodstuffs if the point at which the goods are loaded and unloaded are in two different States and the point at which they are unloaded is situated in the territory of a Contracting Party. Some countries also use the ATP as the basis for their domestic legislation, for example France, Slovakia and Spain. Several others also intend to do this in the future. The ATP lists the products that can be carried under ATP and sets the warmest possible temperature of the load. Fruit and vegetables unless processed are as yet outside the scope of ATP. The ATP lays down common standards for temperature controlled transport equipment such as road vehicles, railway wagons and (for sea journeys under 150km) sea containers and the tests to be done on such equipment to ensure that it meets the standards. The ATP does not cover air transport. The main requirements of the ATP are with respect to the technical details of the transport means (trucks, trailers, containers, wagons/freight cars) and test requirements to check for these standards. For that purpose, the equipment is divided into classes (according to the ATP classification) which specify, for example, whether there is any means of cooling, whether there is a refrigerator or a eutectic plate, whether there is simple or reinforced insulation, and for what temperatures the transport equipment is suitable. Equipment is certified according to test results, and each ATP certificate issued states the classification to which the equipment is
• Minimize waiting times for approved vehicles transporting perishable foodstuffs from the time
of arrival at the frontier until their regulatory, administrative, customs and sanitary controls;
• Ensure that the required controls are carried out as quickly as possible; that the operation of
the necessary refrigerating units of vehicles carrying perishable foodstuffs be allowed during
the time of crossing the border, unless this is impossible as a result of the required control
procedure;
• Cooperate, in particular through advance information exchange, with their counterparts in
other countries in order to accelerate border crossing procedures for perishable foodstuffs in
case these loads are subject to sanitary inspections; and
• Organize separation of traffic for different types of traffic on both sides of the border so as to
give preference to vehicles under the cover of valid international customs transit documents
or carrying live animals or perishable foodstuffs.
These provisions are contained in Annex 8 on “Facilitation of border crossing procedures for
international road transport” of the International Convention on the Harmonization of Frontier
Controls of Goods.

67
approved. Common classifications are: IN (normally insulated equipment), IR (heavily insulated equipment), FNA (class A mechanically refrigerated equipment with normal insulation), and FRC (class C mechanically refrigerated equipment with heavy insulation). The ATP provides for a system of certification for equipment that conforms to the standards and requires all Contracting Parties to the Agreement to recognize certificates issued in accordance with the ATP by the competent authorities of other Contracting Parties. Article 2 of the ATP Agreement, while recognizing the possibility for non-Contracting Parties to issue certificates of conformity with the ATP, does not offer the same guarantee of recognition of those certificates by ATP Contracting Parties. This system of certification is an important facilitation measure and ensures that ATP certified trucks and railway wagons are not subject to lengthy border crossing procedures. Trucks that are not properly certified run the risk of being stopped, turned back and additionally being subject to a substantial fine. A total of 45 countries are parties to the ATP and thereby agree that their international transport of perishable foodstuffs should be subject to the provisions of the ATP. In the last two years Montenegro, Ukraine, Moldova and Andorra have joined the ATP. Two European countries still missing from the members are Turkey and Switzerland. There are two member countries from outside Europe, Morocco and Tunisia. The European Union currently has a project for the Central Asian countries to encourage them to set up ATP testing stations and to join the ATP. Kazakhstan and Uzbekistan are already members and Kyrgyzstan, Tajikistan and Turkmenistan are expected to join shortly.
12. Green transport The UNECE is well-equipped to address environmental policy challenges with its recognized expertise in areas which are crucial for climate change adaptation and mitigation. Specifically, the UNECE World Forum on the Harmonization of Vehicle Regulations (WP.29) develops worldwide harmonized regulations aimed at protecting the environment and promoting the energy efficiency. WP.29 is a unique global forum with significant responsibility for "greening the transport sector". By developing performance requirements for innovative vehicle technologies such as environmentally friendly vehicles as well as conditions for
Transport of chilled and frozen perishable foodstuffs: Central Asia
The two most significant crops grown in the Central Asian countries are wheat and cotton.
However, the region also accounts for a wide variety of fruit and vegetables including barley, corn,
grapes, potatoes, rice, sugar beet, apricots, pears, plums, apples, cherries, pomegranates, melons,
dates, figs, sesame and nuts. In addition, livestock such as cattle, sheep and poultry are raised.
A properly functioning network of testing stations and a larger fleet of refrigerated vehicles
conforming to the ATP could help the Central Asian countries not only to distribute excess
agricultural production more safely within the region but also beyond the region.
One condition, however, would be the extension of the scope of the ATP to cover fresh fruit and
vegetables which is currently under discussion in UNECE’s WP.11 based on proposals made by the
Russian Federation.

68
mutual recognition, the World Forum contributes to the rapid introduction of such vehicle technologies into the market. Fifty-three countries (including the European Union (EU)) are Contracting Parties to at least one of the two United Nations Agreements on vehicle regulations (1958 and 1998 Agreements)31 and apply the vehicle regulations adopted by the World Forum (WP.29). The World Forum and its subsidiary Working Parties consider or have already considered a large number of measures to improve the energy efficiency of the vehicle fleet:
(a) Support of innovative vehicle technologies (Environmentally Friendly Vehicles (EFV), Plug-in Hybrid Electric Vehicles (PHEV), Hydrogen and Fuel Cell Vehicles (HFCV), Electric Vehicles (EV))
(b) Advanced engine management systems (e.g., stop and go function,
gearshift and eco-drive indicators) and engine emission control devices (e.g., on-board diagnostic systems, particle filter, catalytic converter)
(c) Efficient vehicle powertrains (e.g., low friction components, tyres with
low rolling resistance, tyre pressure monitoring systems)
(d) Use of other alternative energy sources such as liquefied petroleum gas (LPG), compressed natural gas (CNG) and sustainable biofuels (liquid and gaseous)
(e) Development of quality specifications for market fuels in relation with
the vehicle emission levels and engine technology type
(f) Installation on vehicles of electric devices with a low energy consumption to reduce the energy consumption (e.g., headlamps with Light Emitting Diode (LED) technologies)
(g) Development of Intelligent Transport Systems (ITS) and intelligent
Information and Communication Technologies (ICT) in order to avoid traffic congestion and driver assisting features
31 The World Forum WP.29 administers the following three Agreements:
The 1958 Agreement concerning the Adoption of Uniform Technical Prescriptions for Wheeled Vehicles, Equipment and Parts which can be fitted and / or be used on Wheeled Vehicles and the Conditions for Reciprocal Recognition of Approvals Granted on the Basis of these Prescriptions, 1958
The 1997 Agreement concerning the Adoption of Uniform Conditions for Periodical Technical Inspections (PTI) of Wheeled Vehicles and the Reciprocal Recognition of Such Inspections, 1997
The 1998 Agreement concerning the Establishing of Global Technical Regulations (gtr) for Wheeled Vehicles, Equipment and Parts which can be fitted and / or be used on Wheeled Vehicles, 1998

69
In general, UNECE addresses road, rail, inland water and intermodal transport at the pan-European and global level through its inter-governmental forum and 57 international conventions. In this respect, intergovernmental bodies in the fields of rail (SC.2), inland water (SC.3) and intermodal transport and logistics (WP.24) work towards the goal of sustainable transport by setting international regulations, standards and targets for more efficient, clean, safe and affordable land transport. This work also includes measures to shift traffic, wherever possible, to railways and inland waterways to free up capacity on roads, to tackle congestion and to arrive at a better carbon foot print of land transport.
For most transport operations, trucks are indispensable to ensure terminal hauls and the final distribution of goods. Therefore, rail and inland waterway transport entails transhipment operations using containers and other intermodal transport units.
Changing patterns of transport-related CO2 emissions
In the short run, the economic crisis has reduced the transport sector’s CO2 emissions but the
medium and long-term evolution remains unclear. The CO2 intensity of transport activity is likely
to keep decreasing as a result of technological progress and integrated transport policies.
However, the continued growth of activity could overwhelm the reduced intensity of transport-
related emissions.
The economic downturn reduced transport-related CO2 emissions in most UNECE countries. The
government stimulus packages could drive the transport emissions in the desirable direction, in
particular during the post-crisis period. A number of countries have targeted energy efficiency
improvements in their recovery plans, aiming not only to stimulate economic activity but also to
improve its sustainability. The “European green cars initiative” is a good example of this
approach.1
A forward-looking alignment of “green recovery” strategies with long-term growth includes
investment in public transport as well as research and development of energy-efficient motor
vehicles and other innovations that would make transportation activity less CO2 intensive and
more sustainable.2 Moreover, national stimulus packages in support of the automotive industry
seem to be designed with a view to replacing rather than expanding national vehicle fleets.
In particular, temporary scrapping schemes have been beneficial for various reasons. First, the car
fuel efficiency has gradually increased over time so that a new car today tends to be much more
fuel efficient than a similar vehicle built 10-15 years ago. Therefore, a substitution of old cars by
new ones is bound to improve the environmental performance of the renewed fleet. Second,
some scrapping schemes have included maximum emission standards for new cars that would be
eligible for government grants. Last but not least, the typical fixed scrapping bonus amounts tend
to favor the purchase of smaller less expensive cars that generally have a comparatively good fuel
efficiency.
1. European Commission, Communication from the Commission to the European council – a European
economic recovery plan. Brussels, April.
http://ec.europa.eu/commission_barroso/president/pdf/Comm_20081126.pdf.2.
2. See OECD, Strategies for aligning stimulus measures with long term growth. Technical report, Paris, 2009
(http://www.oecd.org/dataoecd/12/62/42555546.pdf.2).

70
Efficient and coordinated terminal and transhipment operations are therefore indispensable to ensure the competitiveness of intermodal transport operations vis-à-vis pure road haulages. To make sure that intermodal transport solutions are applicable within supply chains, governments are responsible for establishing the necessary framework conditions for a level playing field among all actors and modes of transport involved. This allows industry to establish and operate seamless intermodal transport operations that are economically viable and ecologically sustainable. Efficient intermodal transport operations are often only feasible beyond distances of 300-500 km. Thus, international cooperation and harmonized transport policies are required. At the pan-European level, UNECE is the only inter-governmental organization that contributes to internationally harmonized solutions in the field of intermodal transport infrastructure, technical minimum standards and service benchmarks. UNECE has negotiated a pan-European network of important road-rail-inland water transport lines (AGTC Agreement and its Protocol) and provides a forum for governments and industry experts to review the latest policy, legal and technical developments in reducing CO2 emissions, to exchange best practices and to prepare policy guidance.
In addition, conferences, workshops and studies undertaken within the framework of the Transport, Health and Environment Pan-European Programme (THE PEP) provide for an exchange of best practices in sustainable transport policies. At the Third High-level Meeting on Transport, Health and Environment in January 2009, governments, adopting the Amsterdam Declaration, renewed political impetus to THE PEP and agreed to reduce emissions of transport-related greenhouse gases, air pollutants and noise. This is to be achieved by supporting a shift in the vehicle fleet towards zero- or low-emission vehicles and fuels based on renewable energy, by promoting a shift towards clean transport modes and by fostering electric mobility as
A possible strategy to reduce the transport CO2 emissions
At its November 2008 session, WP.29 outlined that, with regard to the abatement of global
warming and the reduction of CO2 emissions, a possible strategy for the transport sector could be:
(a) in the short-term, through improved energy efficiency and the use of sustainable
biofuels (2015);
(b) in the medium-term, the development and introduction into the market of plug-in
hybrid vehicles (2020-2025); and
(c) in the long-term, the development and introduction into the market of electric,
hydrogen and fuel cell vehicles (2030-2040).
This strategy would shift the automotive sector from the use of fossil energy to the use of
hydrogen and electric energy. For the effectiveness of that integrated strategy, the energy sector
has to ensure the sustainable and cost-effective generation of electricity and production of
hydrogen.

71
well as eco-driving.32 THE PEP has already supported several measures to reduce CO2 emissions in transport.
The transport of chilled and deep-frozen foodstuffs also has an impact on global warming. First, it depends on containers or refrigerated vehicles which are insulated with foams. These foams were traditionally produced using chlorofluorocarbons (CFCs) and hydrochlorofluorocarbons (HCFCs) which are dangerous for the ozone layer and which have been phased out in accordance with the Montreal Protocol. HCFCs are prohibited in all new equipment and there is a ban on the refilling of equipment (including recycled fluids) with HCFCs after the end of 2014. Now, international negotiations are turning their attention to the phase-out of hydrofluorocarbons. Also, the major refrigerated transport equipment builders are already using green gases as the main fluids for their compression cycles. The refrigerated and chilled transport industry is actively involved in researching new insulating foams and blowing agents that are both safe for the ozone layer and highly effective so that energy can be saved in maintaining the desired temperature. The Working Party on the Transport of Perishable Foodstuffs (WP.11) follows closely developments in this field. A recent addition to the WP.11 ATP Handbook 33 details a procedure for determining the fuel consumption of vehicle-powered refrigeration units, or in other words the increase in diesel engine fuel consumption when the refrigeration unit is running. Energy efficiency is becoming a major concern due to the scarcity of primary sources but also due to harmful CO2. To save energy, it is essential to measure fuel consumption. The influence of aging on the heat transfer coefficient, or the K value, and its interpretation as well as the acceptance of a rule regarding the frequency of renewals of insulating foams are subject of frequent discussions at WP.11.
32 An example of golden rules for eco-driving as well as additional information on this subject can be found on the website http://www.ecodrive.org/.
33 "ATP" means the Agreement on the International Carriage of Perishable Foodstuffs and on the Special Equipment to be Used for such Carriage, done in Geneva on 1 September 1970.
International Transport Forum and WP.29
In May 2008, Transport Ministers met at the International Transport Forum (ITF) held in Leipzig to
discuss energy and climate change challenges for the transport sector. Transport Ministers urged
the World Forum for Harmonization of Vehicle Regulations (WP.29) to accelerate the
development of common methodologies, test cycles and measurement methods for light vehicles,
including CO2 emissions. They addressed the need for CO2 abatement and improved fuel efficiency
in the transport sector, mainly through:
(a) Innovative engine technologies, advanced engine management systems and
efficient vehicle powertrains;
(b) The use of sustainable biofuels of the first generation (i.e. vegetable oil, biodiesel,
bio-alcohols and biogas from sugar plants, crops or animal fats, etc.), of the second
generation (i.e. biofuels from biomass, non-food crops including wood) and the
third generation (i.e. biodegradable fuels from algae);

72
Several conferences have been organized worldwide to discuss the global warming and transport nexus. Among them, the Ministerial Conference on Global Environment and Energy in Transport (MEET) in Tokyo in January 2009 adopted a declaration that, for the purpose of reducing GHG emissions, calls for countries to improve fuel/energy efficiency in the transport sector by the introduction of fuel efficiency or GHG emission standards and by improving motor vehicle components and fuel quality through UNECE/World Forum.
The Ministerial Conference on Global Environment and Energy in Transport (MEET)
It met in Tokyo (January 2009) and adopted a declaration encouraging countries to reduce GHG
emissions by:
(a) Improving fuel/energy efficiency of motor vehicles, railways, and domestic
aircraft and ships, through approaches such as: introducing fuel efficiency or
GHG emission standards and improving vehicle components, noting IEA's energy
efficiency policy recommendations and its development of energy efficiency
indicators; strengthening international cooperation to develop and harmonize
procedures for testing fuel efficiency or measuring GHG emissions through the
UNECE/WP.29 and other regional or international forums; and facilitating, as
appropriate, the introduction of energy-saving equipment and advanced
technologies into ports and other transport facilities;
(b) Using strategic transport policies to reduce emissions, such as coordinating
transport and urban spatial planning to realize, where applicable, more compact
urban forms, transport demand management, enhanced modal integration,
improvement of road and railway networks, and promotion of non-motorized
means of travel; and
(c) Facilitating behavioral changes, including eco-driving, the use of public transport,
and, where applicable, modal shifts, taking the environmental impacts of each
mode into consideration.
(d)
Using strategic transport policies to reduce emissions, such as coordinating Though some
countries have significantly reduced air pollutants such as carbon monoxide (CO), hydrocarbons
(HC), nitrogen oxides (NOx), sulfur oxide (SOx) and particulate matters (PM), MEET agreed on the
need to limit or reduce air pollutant emissions from inland transport also by encouraging countries
to:
(c) Improved transport infrastructure together with Intelligent Transport Systems (ITS)
in order to avoid traffic congestion and to foster the use of intermodal transport
(i.e. road, rail and waterways);
(d) Consumer information (e.g. campaigns for eco-driving, promotion of public
transportation, eco-labelling of vehicles);
Legal instruments (e.g. tax incentives for low carbon products and processes, taxation of CO2
intensive products and processes, differentiated road pricing).

73
In the framework of the 1958 Agreement the World Forum has developed several regulations limiting the maximum admissible level of vehicle emissions for gaseous pollutants (CO, HC, NOx) and particulate matters. The successive amendments of these UNECE regulations have resulted in abatements of almost 100 per cent in the emission limits of CO, HC and NOx for new private passenger cars as compared with the limits established in the 1970s (Figure 17). Similarly, amendments to the relevant UNECE Regulations have reduced emission limits of particulates by over 90 per cent compared with 1990. Figure 17 Evaluation of emission limits of passenger cars
Currently, the World Forum is considering a proposal by the European Commission to further reduce – by September 2011 – the limit values of the above-mentioned pollutants, especially the emissions of particles by more than 80 per cent. These new limit values will not only have to be met, as it is still the case today, by diesel engines but also by petrol engines. The emission limits for heavy duty vehicles have also been abated although with lower percentages and work is under way to reduce them further (Figure 18).
(a) Review and strengthen, as necessary, their regulations on exhaust emissions
from motor vehicles, railway locomotives and ships, both for new and in-use
vehicles; and promote both low sulfur diesel and gasoline accordingly;
(b) Strengthen international cooperation to develop and harmonize procedures
for testing exhaust emissions through the UNECE/WP.29 and other regional or
international forums; and
(c) Work to incentivize the production and use of environmentally friendly
vehicles (EFV) and clean fuels, and to promote public transport.

74
Figure 18 Emission limits for Heavy transport vehicles
Recently, the UNECE Transport Division launched a new website "Global warming and transport" listing a large number of its current activities and measures on climate change mitigation and adaptation, especially with regard to the reduction of CO2 emissions in the transport sector. 13. Gender and transport Transport can make a significant difference in increasing women’s productivity and in promoting gender equality. In addition to its contribution to economic growth, transport plays a social role in by broadening access to health and education services, employment, improving the exchange of information and promoting social cohesion. Yet, little attention appears to have been paid to women’s needs in transport development projects worldwide. Making transport policy more responsive to the needs of women requires developing a structured approach to understanding their needs, identifying instruments to address those needs, analyzing the costs and benefits of those instruments and establishing an appropriate policy framework. It also requires women be represented at each step of the planning and design process of transport investments. Transport is a traditionally male-dominated sector, both from the employment point of view and for the values which are embedded. At same time, it is widely recognized that gender sensitive issues are many and highly relevant. There are, however, certain important differences in approaches to gender sensitive issues in developing and developed countries. In the former, women are frequently constrained in their access

75
to transport and this translates in limited access to labour markets, increases in production costs and reducing the amount of goods which can be taken to market. Poor access to transport also affects girls’ school attendance more than boys’, women’s use of health and other public services and maternal mortality. In developing countries the lack of access to transport services falls more heavily on women since they tend to spend long hours hauling water and fuel and walking to and from farm plots. Head-loading is a major health hazard to women and they may suffer higher accident rates walking on crowded roads with heavy burdens. In some areas where water is scarce half as many girls as boys attend school due to the time-consuming collection of water. Transport is hardly mentioned in the Millennium Development Goals (MDGs) either as a cause of or as a potential solution to poverty. However, transport infrastructure and services have a strong influence on empowerment of vulnerable groups such as women, by reducing time spent on domestic tasks, timely and affordable delivery of basic services such as health, education and water and sanitation. Thus, access to transport services and mobility for women could be considered as critical factors for achieving the MDGs. These considerations, supported by research, case studies and analysis, has led development organizations, international development banks and the aid community to conceptualize new approaches to gender in transport. This conceptualization starts from recognition of women’s transport needs, identification of potential policy analysis and evaluation of the benefits of gender-oriented efforts as well as of their costs. In developed countries, it has been recognized that there are sufficiently significant differences between women’s transport demands and experiences, as opposed to those of men, to justify treating women separately. Within the group “women”, there are highly important distinctions which depend upon income, age, household, employment status, ethnicity, location, class and education. The particular balance among these will vary from country to country and area to area, and it seems essential to gather information locally in line with best gender balancing practice in order to understand the characteristics of women. In addition to understanding travel issues, transport, access and community design, additional specific considerations about injury prevention and ergonomics are also important.
Infrastructure
objectives
NDP Programme
elements
Gender-related issues to consider
Key gender issues in transport
Key gender issues with regard to the Irish National Development Plan (NDP) infrastructure include:
• Domestic responsibilities and lifestyle: men and women have different needs for journey
times and destinations. Public transport services should reflect this;
• Access to transport: fewer women, particularly older women, drive and own cars, and are
therefore more likely than men to rely on public transport;
Employment patterns and participation rates: women are more likely than men to be engaged in
part-time employment, and this has implications for transport needs and patterns.

76
Infrastructure
objectives
NDP Programme
elements
Gender-related issues to consider
National roads
Road Safety
Reduce fatalities
and serious
injuries
Men are more likely than women to be killed in road
accidents as shown by the following fatality rates
from 2000:
Male drivers: 136. Female drivers: 35.
Male passengers: 53. Female passengers: 32.
Male pedestrians: 54. Female pedestrians: 30.
Male cyclists: 8. Female cyclists: 2.
Reliability Removing
bottlenecks
Women are more likely to walk to work; the
inclusion of adequate pavement space and
appropriate crossing points at bottlenecks are
therefore particularly beneficial for women.
Remedying
capacity
deficiencies
Women are the main users of public transport for
journeys to work (NDP Gender Equality Unit (GEU)
databank, 2002) and will therefore particularly
benefit from new roads with sufficient public
transport capacity in terms of dedicated bus lanes
and regular bus stops.
Reducing absolute
journey time and
journey time
variance
Safe and convenient access to buses using these
times and journey time routes is essential.
It is important to consider off-peak as well as peak
time journeys; visits to health and social facilities are
likely to involve off-peak travel
Balanced regional
development
Improve internal
road transport
between and
within regions
Ensure that new roads help to open up employment
opportunities for women as well as men by ensuring
that they give access to public transport facilities
and provide for public transport capacity.
Offsetting negative
effects of
peripherality
Better access to
and from main
ports and airports
Access is important for employees as well as
customers of these facilities. Public transport will
help ensure that women can access jobs in these
locations.
National secondary
roads
Widening and
realignment
Consideration should be given to the provision of
bus stops, cycle paths and pedestrian space, all of
which are significant in terms of relative usage
between men and women.
Light Rail New routes To be useful for everyone, stops need to service
facilities such as schools and shops, as well as places
of work.
For safe and convenient access, carriages need to
have low floors, and have adequate space for
buggies, bags and bicycles.
Traffic
Management
Quality bus
corridors
Park and ride
facilities
Accurate information at bus stops is not only crucial
in terms of ensuring reliability, but also has
implications for women’s safety: for example,
inaccurate information could lead to a passenger
missing the last bus, leaving them in a vulnerable
situation.
Similarly, safe and convenient access from nearby
residential areas is vital, along with adequate
lighting and shelters.
Toilet facilities, good lighting, waiting areas and
phones are desirable.
Need to have car parking spaces available to service

77
Infrastructure
objectives
NDP Programme
elements
Gender-related issues to consider
Cycle network
Improved Traffic
signalling
home-work, home-shopping, home leisure and
home-health journeys.
More men than women use cycles to get to work.
Improved provision for cyclists will therefore
particularly benefit men, and may encourage more
women to cycle to work. The design of cycle
networks should also take account of non-work
journeys and destinations.
To take account of time needed to cross roads by
different groups of people, such as older people and
parents with children.
Mainline Rail
upgrade
infrastructure
rolling stock and
facilities
Railway safety
programme
Needs of both male and female passengers at
stations and the links between stations and other
routes should be taken into account; the provision
of subways, rather than bridges with steps, ensures
greater access for people with prams and wheelchair
users.
Accessibility Renewal and
upgrading
programme
Women and men have different needs in terms of
facilities, such as toilets and baby-changing facilities.
Provision of sufficient and appropriate amenities
should be taken into account prior to the design of
facilities.
Source: National Development Plan, Ireland, 2000-2006 Internationally, gender has begun to feature as a recognized issue in transport policy and planning while transport has begun to feature on the agenda of gender policy. “Gender and transport" is therefore placed on somewhat new professional ground. At present, it is fair to argue that there are no systematic gender inclusion procedures for transport either in terms of training of professionals, the participation of users or the design and planning of systems, services and equipment. As a result, it is easy to overlook gender: no protocols are in place and no sanctions are applied to those who fail to consider the transport needs of over half of the world's population. There is growing support from donor agencies to streamline gender aspects. However, there is less of an acceptance that gender and various aspects of transport, which include regional/national road systems, railways, ports and even aviation, should be gender sensitive. Institutional strengthening, private sector involvement, technical assistance and training in transport also need to consider gender. Key gender issues in transport Seventy per cent of the 1.2 billion people living in poverty worldwide are women. Transport-related issues such as women’s access to jobs, markets and social/educational facilities play an important, but under-appreciated role. There is a considerable amount of information concerning women and their role and importance in the transport chain. This includes: (a) women as users of transport; (b) women as marketers of agricultural and other products; and (c) women as workers in the transport sector. Transport projects and program planning are concerned with operational efficiency, institutional strengthening, increased traffic volumes, private

78
sector participation, adequate services delivery, financial management, safety programs, employment and income generating opportunities, training, and intersectoral linkages. Should these activities take into consideration the needs of women as well as men? Major differences in the mobility needs of women and men are grounded in the gender-based division of labour within the family and community. Men’s stereotypical role in almost all societies is the one of the income-earner, who leaves for work in the morning and comes back in the evening. Women, however, usually perform triple roles as income earners, home-makers and community managers. As a rule, they take shorter, more frequent and more dispersed trips during the day. Women also frequently carry shopping bulky loads and are accompanied by children or elderly relatives. Existing transport systems are not adequately geared towards the needs of women. Rather, most systems are biased towards the travel needs of men. In order to alleviate women’s disproportionate transport burden in society, access to modes of transport, the sitting and routing of facilities and infrastructures and the timing/frequency of services should be addressed. Access to motorized transport is determined not only by economic means but also by cultural roles. In car-owning households, it is often only the men who get to drive. A study from Kenya revealed that while 24 per cent of male heads of households used a car, only 9 per cent of women heads did and a similar study made in Brazil, showed 23 per cent of trips to work made by men were made by car, but only 6 per cent of the women’s. Statistics illustrate that women and men do not access services and facilities to the same extent or in the same way. In Northern Ireland for example, 79 per cent of men have a driver’s licence compared to 61 per cent of women. This difference is most significant in urban areas and means that women are more reliant on public transport than men, so are likely to access it more. In addition 78 per cent of men are in the labour force compared to 65 per cent of women, so women are more likely than men to be travelling to non-work facilities, such as shops, schools, health centres and childcare facilities. Women are also more dependent on public transport than men, especially when they have lower incomes. Frequently, the off-peak and peripheral public transit routes on which many women depend for their travel to shopping or social facilities have much less priority than the corridors going straight to the city centre. Women’s complex household and caretaking responsibilities usually force them to make multiple stops. This also often makes it much more costly for women to get around. Women are also disproportionately affected by the privatization of public transit, because bus companies operating under competitive market conditions are less interested in serving the profitable routes (on which women tend to depend). Personal safety and avoiding harassment are also major concerns for women public transit users. Women are especially vulnerable to violent attacks when transporting heavy goods and accompanying children. This can be a major deterrent for women to use public means of transport. Finally, there are cultural constraints which often prevent women from properly accessing public transport. In some predominately Muslim cities, it is socially difficult for women to share crowded buses with mainly male riders.

79
Overall, women’s access to vehicles and services is often more constrained by socio-cultural conventions than by physical barriers. This is particularly true for bicycles, which represent a particularly attractive transport alternative for shorter trips with multiple stops. Unfortunately, it is culturally unacceptable for women in many societies to ride bicycles. There is a growing understanding that gender analysis needs to be incorporated into all transport planning. Gender analysis challenges the traditional analysis which looks at households and assumes that household behaviour reflects the preferences of all its individuals regardless of the power structures and gender relations. In this sense, gender analysis is part of a general re-orientation of transport planning away from a focus on facilitating the movement of motorized vehicles to a people-centred perspective. A clearer focus on understanding people’s needs as a starting point for developing and delivering transport services is slowly emerging. There is a growing opinion that the way transport is currently designed, built and operated results in transport systems, facilities and operations that women are afraid to use; vehicles designed with seats and seat belts that are not appropriate for a woman’s body mass; transport planning decisions that do not reflect the different work-life balance that many women have such as combining child care with running a home, keeping a full-time job and caring for aging parents; and fare structures and job requirements that work against those who need to work flexibly or on a part-time basis.
Incorporating gender issues in transport
Questions which might be considered and discussed could include the following:
(a) Does the transport sector strategy address gender issues?
(b) Do transport policies and planning procedures explicitly take gender into account?
(c) Are gender gaps and gender specific needs, capacities, constraints and opportunities
identified?
(d) Are safe transport facilities and modes of transport promoted?
(e) Have civil society stakeholders for transport programs (representing women and
men) been consulted or included in teams analyzing policy and strategy or included
in decision-making?
(f) Does investment in the transport sector increase access to schools, markets, health,
financial and other services?
(g) Is privatization of transportation under consideration and what are the implications
for pricing and safety factors that could negatively impact vulnerable sectors of
society?
(h) Is there a system to monitor the implementation of gender components in transport
sector policies and strategies?
(i) Is there a ministry focal point or unit responsible for advocacy and gender inclusion
at the policy and project level?

80
Mobility Women and men travel by different means, at different times, to different patterns of locations over different distances, for different purposes and journeys take on different significances. These differences in travel are not addressed systematically by current transport policies and they may have direct impact on women’s poverty, health consequences and uneven accessibilities to employment, training and healthcare as well as on journeys repressed/suppressed due to personal security concern and poor accessibility. In majority of developed countries, men are much more likely than women to travel as car drivers, while women are more likely to travel as car passengers or on foot. Women are slightly more likely than men to travel by public transport, especially to work, with their greater use of buses outweighing men's slightly greater use of trains. Women and men also travel for different purposes. Men are more likely to do so for commuting and business reasons, whereas women are more likely to do so for shopping or taking children to school. Safety and health Linkages between transport and health touch upon a number of questions: What is the relationship between vehicle design (crashworthiness) and injury patterns for women? How do pedestrian safety issues differ for women? What is known about ergonomic issues related to women’s use of vehicles as a function of their work, especially truck and bus drivers? What variables should be included in models for examining women’s crash and injury risk (transport mode and purpose, types of crashes, types of vehicles driven)? The data from the United States show that the number and rate of driver fatalities are increasing for women but decreasing for men. The number of licensed drivers has been increasing at a faster rate for women than men, so that there are now as many women licensed as men. Mileage is increasing faster for women, but men still drive more. As many as 370 traumatic foetal deaths may occur annually in the United States, of which about 82 per cent are related to motor vehicles. Women are more likely than men to be injured in crashes of the same severity; however, men’s crashes are more likely to be fatal. There are considerable gender differences in personal safety. An important consideration in this context is to what extent does concern for personal safety guide a woman’s decisions regarding transport options? Women are more vulnerable to attack and harassment and their greater concern with personal safety have important implications for transport policy. Many women simply avoid travelling after dark. This concern about personal safety has important implications for a number of issues, including the design of transport interchanges, waiting areas and staffing. The removal of conductors results in reduced personal safety for passengers, especially women. This has important implications for the quality and level of staffing on vehicles and at bus and rail stations.
(j) Is there gender balance in the transport-related ministries’ work force? Is there
gender expertise?
(k) Policy reforms with significant gender impacts (e.g., Increased fuel levies, increased
public transport costs, retrenchment).

81
Vehicle safety issues Vehicle construction and safety may have different ramifications for women’s and men’s safety and health. Frontal airbags reduce driver deaths by 12 per cent for women but only 6 per cent for men. Head protection side airbags reduce the risk of fatality among female and male drivers by 33 per cent and 44 per cent respectively. Torso-only airbags reduce the risk of fatality by 21 per cent for men but do not significantly reduce women’s risk. Policy and planning Introduction of gender considerations may have implications for a range of transport policy areas. For example, one could consider to what extent are women involved in the transport decision-making process, or does involvement by women in transport decision making result in different outcomes? Another set of considerations may include discussions about the implications of women’s trip behaviour for planning practice, implications of women’s transportation issues for policy or the international experiences in planning and policy development based on gender. Further, economic and transport policy-makers could discuss were the supporting roles that transport policies can play in meeting other societal goals important to women. The experience of women’s engagement or participation in the planning and policy-making processes could also be discussed, in particular barriers to and opportunities for women’s participation. Urbanization, community design and modal choice may have important implications for access to transport services, travel patterns and ways women use public transport services. Access to transit, ability to walk and use bicycles and personal security are legitimate issues of concern. To further study these issues the necessary variables would include density, land use mix, network characteristics, aesthetic qualities, regional structure, trip frequency, destination choice, mode choice, and total vehicle kilometres travelled. Qualitative studies focused on women that examine family, health, and safety concerns could enhance the ability to clearly define the issues and seek appropriate solutions in design and policy. Data Availability of data is one of the greatest challenges. The data issues involve quantity, quality, definition and interpretation, and collection methods. Often it is difficult, if not impossible, to distinguish clear gender differences by examining a particular data set either because of the way the data are collected or because of how they are arrayed and managed in the database. Even in cases where significant gender-disaggregated data on mobility at a national level exist, they often do not provide disaggregated data on time of day of travel or the full-nature of multi-purpose complex journey patterns undertaken by women. Time use data may be of significant benefit in highlighting the complexity of mobility patterns and the interaction between people in scheduling mobility and the interaction between mobility and other household activities. Time-use data is only available at a national level in few cases and still have exploratory purpose in influencing transport policy. Gender equality and transport policy Transport remains a significant area of public expenditure and public sector provides significant revenue for its operation and, hence, has leverage over the nature of gender equality in the sector. There are certain tools recommended to engender national

82
budgets: (i) gender-disaggregated policy evaluations of public expenditure to evaluate the policies that underlie budget appropriations in terms of their likely impact on men and women; (ii) gender-disaggregated beneficiary assessments to assess the views of women and men as potential beneficiaries; (iii) gender aware budget statements to indicate the expected implications for gender inequality of the expenditure estimates; (iv) gender-aware medium-term economic policy scenarios to produce a policy framework which recognizes that women and men participate in economic activity in different ways. Gender awareness training and capacity-building If policy-makers and planners in the transport ministries are to work towards gender equality, they need gender awareness training. They are not likely to change attitudes unless they become aware of the transport-related problems women face. The need for understanding and acceptance of gender issues and the commitment to help resolve those issues are crucial. Only then will the appropriate implementation arrangements be made and adequate resources committed. Gender awareness training for all staff, male and female, at all levels of the organization, need to be provided. It should also include some field work doing a survey of women’s (latent) transport needs, including route planning, and services off peak hours and on less travelled routes. Future challenges In spite of progress made, some important questions remain as future challenges:
(a) How can capacity be built to identify the relevance of transport policy to gender equality?
(b) How can culture change within transport sector be created so that indicators are useful tool or generating better performance within public bodies within sector towards developing policy?
(c) How can public bodies in this sector be audited to ensure compliance? (d) How can change be encouraged in the private sector delivering public
services? (e) How does our interaction with communication technologies change
mobility patterns, knowledge creation, employment practices and participation in policy and decision-making?
14. Road safety The United Nations Economic Commission for Europe pioneered road safety activities in the UN system with the establishment of an Ad Hoc Working Group on the prevention of road accidents in March 1950 followed by the Group of Experts on Road Traffic Safety. In addition, at the UNECE several international legal instruments have been drawn up, including the 1949 Convention on Road Traffic and its Protocol on Road Signs and Signals, followed by the two Conventions of 1968 on Road Traffic and on Road Signs and Signals, respectively, and the European Agreements of 1971 which supplemented them. These legal instruments are important points of reference not only for the international harmonization of regulations governing traffic, signs and signals and driving behaviour but also for drawing up national highway codes. The legal instruments were amended in 2006 to prohibit the use of handheld mobile phones while driving, to

83
lower the maximum permissible alcohol limit in the blood and to tighten the conditions for the issuing of driving permits.
To reinforce its legal instruments, Working Party on Road Traffic Safety (WP.1) has also issued two Consolidated Resolutions, on road traffic (R.E.1) and on road signs and signals (R.E.2). While these Resolutions are not legally binding, they provide a catalogue of measures and practices that States could implement on a voluntary basis. Moreover, WP.1 was behind the launch of the Road Safety Week in the UNECE region, of which there have been four since 1990 and the launch of the First Global Road Safety Week in April 2007. Despite these measures, too many people die on roads (Figure 19).
Global road safety crisis
Road traffic fatalities and injuries continue to increase worldwide. Forecasts indicate that, without
substantive improvements in road safety management and leadership:
- By 2015, road injury will be the leading cause of healthy life years lost by children (5-14 years);
- By 2020, the number of deaths from road injury will increase by 80%;
- By 2030, road crash deaths and injuries will be:
- the 4th largest cause of healthy life years lost by the total population
- the 2nd largest cause of healthy life years lost by men
Confronted with the growing challenge of road traffic injury worldwide, the United Nations system
has mobilized to resolve the international road safety crisis. The United Nations General Assembly
considered this question for the first time in 2003 and has since adopted six resolutions on the
issue (57/309, 58/9, 58/289, 60/5, 62/244 and 64/255). While monitoring has shown the scale of
the challenge ahead, these resolutions have given a powerful impetus to road safety work.
The most recent resolution, 64/255, on “Improving global road safety”, was adopted on 2 March
2010. It recognizes the global burden of mortality resulting from road traffic crashes, as well as the
20 to 50 million people who incur each year non-fatal road traffic injuries, many of whom are left
with lifelong disabilities.
The General Assembly noted that this major public health problem has a broad range of social and
economic consequences which, if unaddressed, may affect the sustainable development of
countries and hinder the progress towards the Millennium Development Goals. It invited member
States and the international community to integrate road safety into other international agendas,
such as those on development, environment and urbanization
In resolution 64/255 the United Nations General Assembly proclaimed the period 2011-2020 as the
Decade of Action for Road Safety, with a goal to stabilize and then reduce the forecast level of road
traffic fatalities around the world by increasing activities conducted at the national, regional and
global levels.
The Decade will be launched officially in 2011, expecting the actions recommended by the General
Assembly to be implemented. These actions would build on the commitment of the World Bank
and the six leading multilateral development banks, namely, the African Development Bank, the
Asian Development Bank, the European Bank for Reconstruction and Development, the European
Investment Bank, the Inter-American Development Bank and the Islamic Development Bank, to
cooperate on increasing the road safety component of their infrastructure programmes through
better coordination of their investments and through the application of safety audits and
assessments of road infrastructure projects.

84
In 2007, the fatalities rates ranged from 29 in Malta to 283 in Kazakhstan. Nine countries, all in Western Europe and Israel, had rates up to 60 per million population. Sixteen countries had rates between 60 and 100 per million. This group included five countries in South East or Eastern Europe or Central Asia. There were eighteen countries with rates between 100 and 150 per million, the majority in South East or Eastern Europe and Central Asia, but also including Belgium and the United States. The ten countries with the highest rates were all in Eastern Europe or Central Asia. Figure 19
UNECE Member States Reported Road crash fatalities and rates per million population 2007
Country Fatalities Rate
Albania2 384 120
Andorra N/A N/A
Armenia 371 124
Austria 691 83
Azerbaijan1 1107 131
Belarus 1517 157
Belgium 1067 102
Bosnia and Herzegovina 428 109
Bulgaria 1006 132
Canada* 2889 88
Croatia 619 136
Cyprus 89 104
Czech Rep 1221 120
Denmark 406 74
Estonia 196 147
Finland 380 72
France 4620 75
Georgia4 737 168
Germany 4949 60
Greece 1580 141
Hungary 1232 123
Iceland* 30 100
Ireland 338 78
Israel 398 57
Italy 5131 87
Kazakhstan1 4365 283
Kyrgyzstan5 1252 235
Latvia 419 184
Liechtenstein N/A N/A
Lithuania 739 218
Luxembourg 43 90
Malta 12 29

85
Country Fatalities Rate
Monaco N/A N/A
Montenegro 122 204
Netherlands 709 43
Norway 233 50
Poland 5583 147
Portugal 974 92
Rep of Moldova5 589 155
Romania 2712 127
Russian Fed1 33308 234
San Marino 1 32
Serbia 962 98
Slovakia3 627 116
Slovenia 292 145
Spain 3823 86
Sweden 471 52
Switzerland* 370 49
Tajikistan 464 69
FYR Macedonia* 140 69
Turkey2* 4633 62
Turkmenistan1* 650 131
Ukraine 9921 215
UK 3058 50
US* 42642 139
Uzbekistan2* 2034 74
UNECE total 153,796 122
Source: WHO Global Status Report on Road Safety, UNECE Transport Division and Eurostat. Data for 2007 for deaths within 30 days except where marked: 1. within 7 days, 2. at the scene, 3. within 24 hours, 4. within 20 days, 5. within 1 year. * Data for 2006
Figure 20 shows the ten year trend in fatalities between 1996 and 2006 or 1997 and 2007.
Figure 20 Ten year trend in reported fatalities 1997 to 2007
Country 1997 2007 % change
Albania2 266 384 44
Andorra N/A N/A
Armenia 261 371 42
Austria 1105 691 -38
Azerbaijan1 605 1107 83
Belarus 1726 1517 -12
Belgium 1364 1067 -22

86
Bosnia and Herzegovina 267 428 60
Bulgaria 915 1006 10
Canada* 3091 2889 -7
Croatia 714 619 -13
Cyprus 115 89 -23
Czech Rep 1597 1221 -24
Denmark 489 406 -17
Estonia 280 196 -30
Finland 438 380 -13
France 8445 4620 -45
Georgia4 449 737 64
Germany 8549 4949 -42
Greece 2105 1580 -25
Hungary 1391 1232 -11
Iceland* 10 30 200
Ireland 473 338 -29
Israel 530 398 -25
Italy* 6676 5669 -15
Kazakhstan1 2364 4365 85
Kyrgyzstan5 685 1252 83
Latvia 594 419 -30
Liechtenstein 6 0
Country 1996 or 97 2006 or 07 % change
Lithuania 752 739 -2
Luxembourg 60 43 -29
Malta 18 12 -33
Monaco N/A N/A
Montenegro N/A 122
Netherlands 1163 709 -39
Norway 303 233 -23
Poland 7310 5583 -24
Portugal 2521 974 -61
Rep of Moldova5 569 589 4
Romania 2863 2712 -5
Russian Fed1 27665 33308 20
San Marino N/A 1
Serbia N/A 962
Slovakia3 788 627 -20
Slovenia 357 292 -18
Spain 5604 3823 -32
Sweden 541 471 -13
Switzerland* 616 370 -40
Tajikistan 450 464 3
FYR Macedonia* 154 140 -9
Turkey*2 5428 4633 -15
Turkmenistan*1 404 650 61

87
Ukraine 5988 9921 66
UK 3743 3058 -18
US* 41907 42642 2
Uzbekistan*2 1991 2034 2
UNECE total 153,796
Source: WHO Global Status Report on Road Safety, UNECE Transport Division and Eurostat Data for deaths within 30 days except where marked: 1. within 7 days, 2. at the scene, 3. within 24 hours, 4. within 20 days, 5. within 1 year. * Data for 1996 and 2006
Fatalities declined in 35 countries and rose in 16. For a few countries data were not available for both years. The largest declines were experienced in Portugal, Germany, France, Switzerland, Austria, and the Netherlands, with the largest increases being in Kazakhstan, Kyrgyzstan, Azerbaijan, Ukraine, Georgia and Turkmenistan. The general pattern is one of falling fatalities in EU and other West European countries, and rising fatalities in Eastern Europe and Central Asia.
Digital tachograph – a tool to improve working conditions, road safety and fair competition
A digital tachograph is a standardised recording device which is installed in commercial
vehicles (bus, coach and truck) to control working hours and rest periods of professional drivers
and vehicles’ crew. This device is connected to the gearbox and contains a memory system that
holds data on drivers, their driving activities and resting periods over the period of a preceding
year.
The working hours and rest periods were first recorded manually in a record book, then a
mechanical (analogue) tachograph with paper record sheets was introduced. Since the late 1990s,
the digital tachograph, working with interoperable cards, has gradually replaced the old forms of
recording.
The installation and use of the recording device is regulated at the UNECE level by the
European Agreement Concerning the Work of Crews of Vehicles Engaged in International Road
Transport (AETR), done in Geneva on 1 July 1970, which currently has 49 Contracting Parties from
the UNECE region.
Regulating working hours and rest periods plays an important role in improving road
safety through mitigating effects of drivers’ fatigue, in contributing to fair competition within the
road transport industry, and ensuring harmonized, equitable working conditions for professional
drivers and vehicles’ crew.
For Contracting Parties to AETR that are not members of the European Union, the use of
the digital tachograph will become mandatory on 16 June 2010 for commercial vehicles registered
for the first time after that date (in the EU this was implemented in 2006).

88
Road safety in selected UNECE countries Armenia Road traffic deaths are rising, up by 42 per cent between 1997 and 2007, with a further increase in 2008 to 407 deaths and 3,125 injuries. Thirty-nine per cent of deaths are pedestrians. Cyclists and two-wheel motor vehicle riders account for less than 2 per cent. Many crashes on highways are due to overturning. It is calculated that road crashes cost 1 per cent of national income. The drink-drive limit at 0.08 g/dl is relatively high but deaths involving alcohol account for only 6 per cent of the total. Seat belt and helmet wearing are legal requirements, but enforcement is ineffective. Road safety audits are required for new and existing infrastructure. In August 2009, the Government of Armenia approved the national road safety strategy together with a five-year action plan. There is widespread non-use of seat belts and a key element of the program is its enforcement, including making sure that the police themselves buckle up. There will also be construction of tunnels and pedestrian crossings on the most dangerous sections of national highways. The Ministry of Transport and the police are to work in cooperation with the National Road Safety Council to increase public awareness of road safety. Azerbaijan Traffic fatalities increased by 83 per cent over the 1997-2007 period. Pedestrians accounted for 38 per cent of deaths. There is a road safety strategy and targets. The drink-drive limit is zero and well enforced, with only 3 per cent of deaths involving alcohol. Seat belt and helmet laws are enforced, but no information is available on wearing rates. Road safety audits are required for major new construction projects and existing infrastructure.
The introduction of the digital tachograph requires considerable financial, institutional and
administrative efforts by Contracting Parties. In the last two years, the UNECE secretariat, in
cooperation with the European Commission and other key partners, has explored all possibilities to
assist non-EU Contracting Parties to the AETR in obtaining the necessary know-how to implement it,
by organizing several training seminars and specialized workshops.
All non-EU countries are committed to the full implementation of the digital tachograph by the due
date. However, these countries face certain technical difficulties and some of them may not be ready
to fully implement the device by 16 June 2010. For this reason, UNECE is fully involved with all
stakeholders to find timely and pragmatic solutions to the potential problem this may cause.

89
Belarus Although over the last decade there had been a worsening situation in both the numbers and severity of road crashes, the last two years has seen a decline in casualties. Belarus is the only country in the countries in the Eastern Europe, Caucasus and Central Asia region where traffic deaths decreased between 1997 and 2007 (by 12 per cent). Private automobile ownership has been increasing leading to a need for improvements to the traffic system. Vulnerable road user safety is a problem: pedestrians account for 40 per cent of casualties, cyclists for 9 per cent and two-wheel motor vehicle riders for 4 per cent. The traffic police have responsibility for road safety carrying out awareness raising campaigns and road safety education in schools. Speed and drink-driving are major risk factors and are being targeted. Infrastructure measures to reduce speed and improvements such as safety fences and rumble strips on sides of roads and at pedestrian crossings have been implemented. Road safety audits are required for major new road construction projects and existing infrastructure. Republic of Moldova Road deaths increased by 3 per cent between 1997 and 2007. There is a road safety strategy and targets. The drink-drive limit is 0.05 g/dl, but it is not effectively enforced (17 per cent of deaths are alcohol related). There are seat belt and helmet wearing laws but enforcement is poor for the helmet law. Pedestrians make up 34 per cent of deaths, cyclists 2 per cent and two wheeled motor vehicle riders 4 per cent. Road safety audits are required for major new road construction projects and existing infrastructure. Children are at particular risk. A new road safety plan for 2009 has been launched with new laws on alcohol and drugs, a health test for drivers, and driver tests in line with EU rules. Speed cameras and new alcohol tests are being introduced. Progress is being constrained by halving the numbers of traffic police. Russian Federation Road deaths rose by a fifth between 1997 and 2007. The fatality rate is one of the highest in the region. Thirty-six per cent of deaths are pedestrians. There is a road safety strategy and targets. Laws exist for seat belt and helmet wearing and are well enforced (only one-third of front seat occupants comply). The drink-drive limit of 0.03 g/dl is also well enforced but 10 per cent of deaths are alcohol related. Road safety audits are required for major new road construction projects and existing infrastructure. Tajikistan The fatality rate is one of the lowest in the region but traffic intensity is not high either. Vulnerable road users are at high risk, with pedestrians accounting for 44 per cent, cyclists 6 per cent, but two wheeled motor vehicle riders only 1 per cent. The drink-drive limit of 0.03 g/dl is well enforced (5 per cent of deaths are alcohol related). Enforcement is less effective for seat belt and helmet laws. Road safety audits are required for major new road construction projects and existing infrastructure.

90
Turkmenistan There has been rapid growth in fatalities between 1997 and 2007 (61 per cent). Pedestrians account for 29 per cent of deaths and cyclists 5 per cent. The drink-drive limit of 0.05 is well enforced and alcohol related deaths are 7 per cent. Enforcement of seat belt and helmet wearing is also good. Road safety audits are required for major new road construction projects and existing infrastructure. Ukraine The growth in fatalities between 1997 and 2007 (66 per cent) and the fatality rate of 215 per million population are among the highest in the region. There was a large improvement in 2008 when deaths fell from 9,921 in 2007 to 6,760. Pedestrian deaths are a major problem accounting for 56 per cent of the total. The drink drive limit is zero but there is no information about the alcohol related death rate or enforcement effectiveness. There is no helmet wearing law, and the seat belt law does not apply to all occupants. Audits are required for major new road construction but not for existing roads. Uzbekistan There was a rise of 2 per cent in fatalities between 1996 and 2006. The fatality rate is low. No data are available on fatalities by road user group. There is a road safety strategy and targets. There is a drink-drive law but it is not defined by a BAC limit. Enforcement is judged to be effective but data for alcohol related deaths are unavailable. The situation is similar for seat belt and helmet wearing with good enforcement but no data on wearing rates. Road safety audits are required for major new road construction projects and existing infrastructure. There has been an increase in road safety activity in the last ten years. There are regular monthly traffic safety meetings which address crash reduction measures, particularly focusing on pedestrians and children, driver behaviour and public awareness campaigns. Albania There has been a major increase in the numbers of vehicles and drivers. The increased traffic has led to a rise in road crashes. Road safety is a government priority, but there is neither a road safety strategy nor targets. The fatality rate is one of the highest in the region. Vulnerable road user safety is a problem (40per cent of deaths being amongst pedestrians). The main areas for improvements are in road quality, use of road safety audits, dealing with black spots, road discipline, corrupt issue of driving licences and education. Enforcement of traffic law on speed, drink-drive, helmet and seat belt use is judged to be effective, but only 30 per cent of front seat occupants wear belts. There are road safety audits for major new road construction projects.

91
Bosnia and Herzegovina Although the fatality rate is lower than in several other South East European countries, deaths have been increasing fastest. There is no information on helmet and seat belt wearing rates, but enforcement is judged to be moderately effective. A National Road Safety law was adopted in 2006 to harmonize road safety rules. There is a plan to establish a Road Safety Office in the Ministry of Communication and Transport to coordinate road safety strategy, policy and action programs, statistics, economics and promotion. A National Road Safety Coordination Council will include the Ministries of Transport, Interior, Health and Education to coordinate national strategy development and monitoring. Bulgaria The fatality rate is fairly high, but the growth in deaths has been limited to 10 per cent over the 1997 to 2007 period. Key risk factors and crash circumstances are speeding, non-use of seat belts, new and unlicensed drivers, single vehicle crashes, head-on collisions, old vehicles and poor road infrastructure. Legislative action has been taken on compulsory use of child restraints, licence suspensions and a point system for offenders. A speed control network has been established and a National Strategy for Preservation of Children’s Life and Health has been implemented. More action is needed on speed, seat belt use, raising awareness, drink-driving, local authority action, and working with the media. A National Road Safety Strategy for the next ten years is to be developed. There is no information on helmet and seat belt wearing rates, but enforcement is judged to be moderately effective. There are road safety audits for major new road construction projects and for existing roads. Croatia A National Road Traffic Safety Program began in 1994. The program is continuing and, in the context of negotiations on accession to the European Union, both the directives and the binding guidelines are being implemented. In 2008, deaths were 7 per cent above the 2007 level, but in the previous ten years deaths fell by 13 per cent despite increasing traffic. The aim is to reduce deaths per 100,000 population to 10 from 13.8 by 2010. Deaths involving alcohol are very high at 30 per cent despite enforcement being judged to be quite effective. Seat belt wearing is low (at 45 per cent) and there is no information on helmet use. There are road safety audits for major new road construction projects and for existing roads. Montenegro The fatality rate at 204 per million population is considerably higher than in the other countries of the region. This is attributed to rising traffic, poor infrastructure, poor driver training and behaviour, lack of enforcement and low vehicle standards. Action programs include infrastructure measures, increased enforcement, banning import of sub-standard vehicles and road safety education. A National Road Safety Strategy is being prepared. There is no information about the percentage of alcohol related deaths or seat belt and helmet wearing. Enforcement is judged to be effective. There are road safety audits for major new road construction projects and for existing roads. Romania The fatality rate is quite high at 130 per million population, but deaths have fallen slightly between 1997 and 2007. The proportion of deaths of vulnerable road users is amongst the lowest in the EU. There is a well-enforced drink-drive limit of zero and

92
the proportion of deaths involving alcohol is 2 per cent. Seat belt wearing is high for front seat occupants, but low in the rear. Helmet wearing rates are high, though lower for passengers than for drivers. A major effort has been made to improve emergency response services with integration of the police, fire and ambulance services into a new emergency system. There are road safety audits for major new road construction projects and for existing roads. Serbia There has been a downward trend in road traffic deaths from 1,700 in 1991 to 892 in 2008. The rate per 100,000 population in 2007 was 98, higher than in most West European countries, but lower than in most countries of South East Europe. The key risks are speed which accounts for 58 per cent of deaths, no seat belts, alcohol and road infrastructure deficiencies. There are road safety audits for major new road construction projects and for existing roads. A new model of traffic policing is in place with the use of speed control devices and traffic accident investigation vehicles. New traffic law is being introduced with a coordinating body for traffic safety that includes a Traffic Safety Agency and a penalty point system. There is no national road safety strategy in place. The drink-drive limit is quite well enforced and 6 per cent of deaths involve alcohol. Enforcement of helmet and seat belt wearing is poor. About half of front seat occupants are buckled up but less than 5 per cent in the rear. The Former Yugoslav Republic of Macedonia The fatality rate is one of the lowest in the region. Deaths fell by 9 per cent between 1997 and 2007. Pedestrian deaths account for a third of the total. The national strategy for road safety has a clear vision to reduce fatalities in traffic by 50 per cent to 2014 and to zero for children. The key risk areas are: unsuitable road and road infrastructure maintenance, poor legislation and compliance, improper behaviour of road users, speeding, not giving way, driving under influence of alcohol and other illicit substances, rare use of passive safety equipment. The main aims of national strategy for road safety are to: decrease crashes caused by speeding, not giving way, alcohol and drug use; improve restraint use; protect vulnerable road users; provide safe road environment; improve emergency care; and improve law enforcement. Seat belt and helmet wearing rates are very low. There is little enforcement of helmet laws and only fair enforcement of seat belt wearing. There are road safety audits for major new road construction projects and for existing roads. Turkey Deaths fell by 15 per cent between 1997 and 2007. The drink-drive limit is well enforced and alcohol related deaths are only 2 per cent of the total. The helmet law is less well enforced and only 12 per cent of riders wear helmets. Seat belt wearing is high on rural roads but low in urban areas, despite enforcement being judged to be good. The Turkish police have coordinated a project to strengthen enforcement in coordination with infrastructure, emergency care and education activities. Targets were set for enforcement in the areas of speed, seat belts, drink-drive, helmets, heavy vehicle checks and red light violations. A GIS system allows police information to be mapped digitally which enables focusing law enforcement on hot spots and rehabilitation of black spots. There is a highway upgrading program to carry out road safety audits, reduce black spots and improve maintenance.

93
Setting regional and national road traffic casualty reduction targets The five United Nations Regional Commissions, coordinated by the UNECE, carried out in 2008-2009 a project on “Improving global road safety: setting regional and national road traffic casualty reduction targets”. The project was funded by the United Nations Development Account (UNDA). The project was set up to assist governments in low and middle income countries to develop regional and national road safety targets and to exchange experiences on good practices. There are several reasons why road safety targets deliver benefits: • Setting targets communicates the importance of road safety • Targets motivate stakeholders and increase accountability for achieving results • Targets convey the message that government is serious about reducing road
casualties • Sub-national targets widen the sense of ownership by creating greater
accountability, establishing more partnerships, and generating more action • Targets raise media and public awareness and motivate politicians to support
policy changes and to provide resources Activities under the UNDA project included regional meetings, advisory services, case studies, report on setting and achieving road safety targets and inputs for the Global Ministerial Conference on Road Safety (November 2009, Moscow). The focus of the project was a series of road safety seminars in each of the United Nations Regional Commission areas that provided information on target setting and on good practice interventions that have been successfully employed in countries with good road safety records. Experts involved in road safety who participated and were trained during those events, came from Albania, Armenia, Azerbaijan, Belarus, Bosnia and Herzegovina, Bulgaria, Croatia, Former Yugoslav Republic of Macedonia, Georgia, Greece, Kazakhstan, Kyrgyzstan, Montenegro, Republic of Moldova, Romania, Russian Federation, Serbia, Tajikistan, Turkmenistan, Turkey, Ukraine, Uzbekistan. In the framework of the project, UNECE organized a seminar for countries from the Commonwealth of Independent States (CIS) in Minsk, Belarus, in May 2009, followed by a road safety conference for South East European countries organized in Halkida, Greece, in June 2009. A road safety seminar-cum-study tour for experts from low and middle income countries from UNECE region was organized in Sweden, in November 2009, in cooperation with the Swedish Road Administration, followed by a road safety national seminar in Kyrgyzstan. These events were the starting point for a development process for participating countries to make progress in reducing road traffic casualties. The events brought together countries with similar problems together with a wide range of road safety experts from countries where targets are being or have been successfully used to support road safety policies and/or programmes. Such knowledge sharing is a vital component of action necessary to improve global road safety.

94
The project’s main conclusions are: • Quantifying the road safety problem through good national statistics and research
is an essential first step in establishing campaigns to improve road safety. Countries should therefore adopt/improve methodology for data collection and set-up/improve the existing national computerised databases on road crashes. To this end, UNECE Glossary and database on road traffic accidents would be an appropriate basis.
• Governments have a primary role to play in creating safe road traffic conditions
through legislation, enforcement and education. Reducing the number of road casualties leads to reduced costs for the governments and the society. It is recommended to countries that have not set road safety targets yet, to begin to analyze and model data in order to produce evidence-based casualty reduction targets. In addition, data should be collected in order to have indicators in terms of different road safety problems or groups of road users (for example, separate targets for drinking and driving, use of seatbelts and child restraints and wearing of helmets). When setting targets, effectiveness should prevail on any other consideration, to the maximum extent possible.
• Political will and commitment are key in improving road safety and these are
needed to secure funds and address properly the main priorities in road safety, such as improving the infrastructure, education and enforcement which are high-cost measures.
• International cooperation and knowledge-sharing in road safety should be further
strengthened; to this end, as a first step, a number of advisory missions should be conducted after the seminar upon request of countries in order to assess their road safety problems and help them develop targets in a bilateral setting.
• It is recommended that governments actively participate in the decision-making
process concerning the UN Conventions on Road Traffic and on Road Signs and Signals (1968), which takes place in the Working Party on Road Traffic Safety. This would also provide for an appropriate forum where individual member countries learn from each other’s experience and are able to compare their progress in achieving the targets with other countries in the region.
15. Inland transport security The terrorist attacks in New York City, Madrid, London, Istanbul, Moscow and other cities have shown the capability of a small number of individuals to kill and cause large-scale destruction. These events have also turned the world’s attention to the need to better secure transport systems. There are many reasons why transport is a relatively easy target. Firstly, transport systems have not been designed to cope with security threats. Transport authorities have typically stressed the development of transport networks which facilitate a smooth flow of passengers and cargo while meeting safety - not security - standards. Secondly, transport means and infrastructure are very accessible. Road vehicles are available everywhere and they can be used as weapons or to transport weapons. Infrastructure such as roads, rail

95
lines and inland waterways, including bridges and tunnels, are in the open and largely without surveillance. In transport facilities, large numbers of people often congregate in a predictable manner. Thirdly, transport is complex. Each mode has its own specific infrastructure, vehicles and regulatory requirements. Passengers and/or goods are carried. There are thousands of non-transport companies that interact on a daily basis with the transport sector. International aspects add to this inherent complexity as national regulations and norms typically differ. Harmonizing and aligning national security standards across borders could effectively prevent terrorists from exploiting the weakest links. Given the terrorists’ evident interest in transport, the “transport community” could be expected to demonstrate willingness to reduce or eliminate the underlying security threats. The threats should be addressed preventively. The stakeholders should act at a sufficiently early stage with the full range of existing and, when necessary, new measures. Any new initiatives should not lead to excessive obstacles to international transport and trade. This approach would require close cooperation of transport authorities with other authorities such as intelligence, security, customs and border services. The overall objective would be to improve the security of domestic and international transport systems by reducing the likelihood of transport being a target or used as a vehicle for terrorism. The UNECE and inland transport security: Given this background, in the wake of 11 September 2001, the UNECE Transport Division proposed to create an ad hoc group of experts to consider inland transport security issues. However, the Inland Transport Committee (ITC) – UNECE’s transport governing body – first requested a review of the existing areas of work. Consequently, the UNECE secretariat undertook the review of the existing UNECE transport regulatory instruments. As a result, a number of transport issues were identified in 2001 that could benefit from further security considerations. The following provides a summary. Vehicle Regulations
• Extension of the provisions concerning vehicle alarm and immobilization systems to trucks and buses
• Agreement on provisions for immobilizing vehicles after unauthorized use • Installation of positioning systems in vehicles to facilitate location
Dangerous Goods and Special Cargoes
• Consider developing security recommendations for transport of dangerous goods
• Consider amending the requirements to train drivers and other persons employed in the transport of dangerous goods to include security
96
Road Transport and Road Safety
• Develop regulations to harmonize access to driving profession • Consider developing regulations concerning illegal migration • Review the requirements for the issuance of driving permits
Infrastructure networks
• Consider introducing best security practices for infrastructure network agreements
• Develop best practices in surveillance key infrastructure points • Provide regulations to prevent the use of vessels or trains by
unauthorized persons • Introduce automatic alarm systems in vessels in case of use by an
unauthorized person • Consider security provisions for pipelines
Border Crossing Facilitation
• Introduce modern communications means among Customs authorities • Consider establishing a new Annex to the “Harmonization
Convention” concerning security for international goods transport
An update of the 2001 review was undertaken in the course of 2007. Information below describes the progress made since 2001 and outlines planned UNECE inland transport security initiatives. Working Party on Road Traffic Safety (WP.1) Driving permits New provisions concerning national and international driving permits will become mandatory in March 2011. The validity of the international permit will be recognized only if it is presented together with the corresponding domestic permit on the basis of which it has been issued. Registration of vehicles To counter an unsatisfactory number of vehicles in international traffic using the distinguishing sign of the state of registration, the Vienna Convention on Road Traffic has been modified to allow the possibility of incorporating the distinguishing sign into the registration plate (provisions entered into force in March 2006). Working Party on Road Transport (SC.1) Infrastructure In order to increase safety (in particular tunnel safety), Annex 2 of the AGR has been modified (new provisions entered into force in January 2006). These measures may

97
have indirectly enhanced road transport security (particularly sections IV.5; V.4.1; V.4.2; V.4.4). Professional drivers and heavy vehicles Recommendations may be introduced into the Consolidated Resolution on Road Transport (R.E.4) in the areas of: awareness of professional drivers, security in parking areas (motorways and border crossings) and vehicles (GPS equipment to detect the location of vehicles, electronic anti-theft system). Rail transport (SC.2) SC.2 has adopted (i) the definition of railway safety as “the socially required level of absence of risk of danger in the rail transport system where risk relates to personal accident, injury or material damage; and (ii) the definition of security in railways: “the protection of human beings, transport means and transport infrastructure against unauthorized and unexpected actions of any kind”. In 2004, SC.2 noted that, within its area of competence, it could contribute towards raising awareness of the importance of security in the railways sector. Nevertheless, SC.2 agreed that, at that time, there was no need to develop recommendations for security and safety in rail transport. Working Party on Inland Water Transport (SC.3) A draft Annex IV to the AGN Agreement entitled “Protection of the network from the intentional external influence” was considered by SC.3 in October 2006 as well as by SC.3/WP.3 in June 2007. Delegations abstained from approving the amendment, seeking to ensure that the new annex IV would not contradict in any way the results of the ongoing discussions about inland transport security in the European Union, within River Commissions and elsewhere. Working Party on the Transport of Perishable Foodstuffs (WP.11) WP.11 administers the Agreement on the International Carriage of Perishable Foodstuffs and on the Special Equipment to be used for such Carriage (ATP). WP.11 has not addressed security issues as they pertain to crime or the risk of international terrorist attack during the transport of perishable foodstuffs. It is currently working on securing ATP documents to make it more difficult to falsify documents. Working Party on the Transport of Dangerous Goods (WP.15) For transport of dangerous goods, the UN Recommendations on the Transport of Dangerous Goods, Model Regulations, Chapter 1.4 and section 7.2.4 of Chapter 7.2 are applicable. For international transport by road, rail and inland waterway in Europe (and domestic traffic in the EU), the UN recommendations were considered by WP.15 for ADR, RID, and ADN and the relevant provisions were included, in 2005, in chapter 1.10 of ADR, ADN and RID. The UN security provisions for transport of dangerous goods have also been included, in 2005, in the International Maritime

98
Dangerous Goods Code and in the ICAO Technical Instructions for the Safe Transport of Dangerous Goods by air. Since the UN recommendations are the basis for harmonization of international transport by all modes, WP.15, as a matter of principle, is reluctant to consider possible changes that would not have been previously discussed and agreed by the UN/ECOSOC Committee of Experts. Working Party on Intermodal Transport and Logistics (WP.24) In 2004 and 2005 the Working Party considered the issue of "intermodal transport and security" and decided there was no need to embark on new activities in this field at that time. No new or additional initiatives have since been taken up by the Working Party. World Forum for Harmonization of Vehicle Regulations (WP.29) and Working Party on General Safety Provisions (GRSG)
At its March 2005 session, WP.29 requested the Working Party on General Safety Provisions (GRSG) to advance the development of prescriptions regarding Vehicle Degradation Systems (VDS). The VDS are systems fitted to a vehicle aimed at preventing and restricting the vehicle being driven away during unauthorized use. In the context of transport security, the VDS can prevent the use of stolen vehicles as "car bombs" in explosive attacks. Development of VDS work at the GRSG In April 2004, GRSG agreed to set up an informal VDS group of experts to develop the proposal further. In October 2004, GRSG noted concerns about possible consequences of an external access to the vehicle electronic systems and about the incompatibility of the VDS with the 1968 Vienna Convention. The Vienna Convention establishes that "every driver shall at all times be able to control his vehicle". Experts were requested to reflect on "vehicle tracking systems" that could be considered as an alternative to the VDS. In April 2005, the VDS proposal was withdrawn because a possibility of remote access to vehicle electronic systems was not acceptable. As the VDS cannot be isolated from other vehicle electronic systems, a remote intervention from the outside could facilitate criminal attacks on the vehicle electronics (such as software viruses) and could lead to malfunctions of the vital vehicle safety and emissions systems for example to the engine, steering controls, braking and stability systems. GRSG agreed that the VDS informal group should continue working to elaborate requirements for "Advanced Vehicle Security Systems (AVSS)". Working Party on Customs Questions affecting Transport (WP.30) The TIR Convention contains the following security elements: • Access to the TIR system is granted only to transport operators who have been
authorized by Customs authorities on the basis of strict criteria. The authorization can be withdrawn if these criteria are no longer fulfilled

99
• Vehicles performing TIR transports need to be equipped with Customs secure
loading units and need to fulfill specific sealing requirements • Mutual recognition of Customs controls, aimed at reducing check procedures en
route to a minimum. In particular, goods should be thoroughly checked at departure and put under Customs seal
Multidisciplinary Group of Experts on Inland Transport Security: In February 2007, the Inland Transport Committee reviewed its work in the area of transport security and, stressing the importance of this issue, agreed to establish a multidisciplinary group of experts. The Terms of Reference of the Expert Group pointed at three major areas of transport security: a. Inventory of regulatory initiatives at the national level; b. Inventory of regulatory initiatives at the international level; c. Inventory of standards, initiatives, guidelines, best practices by the private sector. The Terms of Reference stipulated that the Expert Group should be composed of experts in transport security matters appointed by Member States of the UNECE as well as representatives of relevant international governmental and non-governmental organizations. The Group of Experts met four times between 2007 and 2008. Delegates from Belgium, France, Germany, Luxembourg, Russia, Slovenia, Switzerland, Turkey, Ukraine and the United Kingdom participated as members of the Expert Group. In addition, international organizations and NGOs such as the United Nations Conference on Trade and Development (UNCTAD), European Civil Aviation Conference (ECAC), International Atomic Energy Agency (IAEA), International Container Security Organization (ICSO), International Council of Chemical Association (ICCA), Organisation intergouvernementale pour les transports internationaux ferroviaires (OTIF), Organization for Security and Cooperation in Europe (OSCE), International Federation of Freight Forwarders Associations (FIATA), International Maritime Organization (IMO), International Organization for Standardization (ISO), International Road Federation (IRF), International Road Transport Union (IRU) and International Union of Railways (UIC) have participated. The European Commission (EC) has also participated. In the course of its work, the Expert Group took note of information provided by national delegations, international organizations and private sector. By doing so, the Group was able to take stock of current work being undertaken in the area of inland transport security. The Expert Group also created national, international and private sector inventories of inland transport security regulations. The Expert Group also defined security as: “the protection of human beings, transport means and transport infrastructure against unlawful acts of any kind, including crime, vandalism and terrorism”. The focus of the Group’s work, however, was the threat of terrorist attacks, bearing in mind the priority of protecting human beings and political stability. In terms of recommendations, the Group of Experts focused on perceived deficiencies in the area of inland transport security. There is no international body for land transport security, of both goods and passengers, equivalent to IMO and ICAO (which have been instrumental in increasing worldwide maritime and air security). The

100
existence of these two organizations made it possible to have international standards and rules adopted and applied worldwide in the maritime and aviation sectors, including security aspects. The UNECE continues to cooperate with the World Customs Organization and others on the use of sealing devices and on integrity of loading units. In 2006 and 2007, the UNECE Transport Division organized a Round Table on Transport and Security in the UNECE area and a capacity building seminar concerning the approval and control of TIR vehicles. In 2008 and 2009, the UNECE organized and hosted “Inland Transport Security Discussion Forums”. The participants during these events identified the following key transport security issues as those that are most pressing and those that require further discussion/elaboration: • In the area of transport security, the division of responsibilities between the public
and private sectors is unclear (consequently, it is unclear who should pay for increased security)
• an overall, integrated approach to inland transport security is lacking (for example, there are no obvious transport security “centres” or institutions)
• transport security norms, standards, procedures and rules need to be further developed
• knowledge of the existing security norms should be enhanced • risk assessment techniques are not well known and, if sufficiently known, they are
frequently underutilized • there is a need to provide tangible, practical tools to be used by individuals and
firms to enhance transport security • best practice sharing is one the best and most effective ways to enhance transport
security – the UNECE could play a role in providing a forum for exchange • overall, there is insufficient awareness of the need to enhance transport security

101
Annex 1 Project proposal: Inland Transport Security Discussion Forum
Objective: To organize a high level, expert UNECE/OSCE roundtable to promote enhancing inland transport security Background: The UNECE Transport Division has been engaged in promoting additional work in the area of inland transport security. It administered an inland transport security expert group and organized a number of conferences. As a result of its involvement, the UNECE and its member states have concluded that there remains much to be done in the area of inland transport security. The list of activities needed to be explored and worked on is extensive. For example, the division of responsibilities between the public and private sectors is unclear. Consequently, it is unclear who should pay for increased security. An integrated approach to inland transport security is lacking ie., there are no obvious transport security “centres” or institutions. Transport security norms, standards, procedures and rules need to be further developed while the knowledge of the existing security norms should be enhanced. Risk assessment techniques are not well known and, if sufficiently known, they are frequently underutilized. There is a need to provide tangible, practical tools to be used by individuals and firms to enhance transport security. Finally, there is, in general, insufficient awareness of the need to enhance transport security. Good practice sharing is one the best and most effective ways to enhance transport security – both the UNECE and OSCE could play a role in providing a forum for exchange. Expected accomplishments: • A well attended, one day, high level, expert event held in Vienna • Capacity building opportunity for government officials • Awareness raising event to promote enhancing inland transport security • Conference proceedings published in English and Russian Proposed activities: It is proposed to organize a one-day inland transport security roundtable in Vienna. Key experts will be engaged to write papers on assigned inland transport security topics. The papers will be commented on – in writing - by other experts. These key papers and commentaries will make up the core of published proceedings. Following the presentations by keynote speakers and commentaries, national governments will be asked to provide national perspectives concerning inland transport security in their countries. These written contributions will also be published in the roundtable proceedings. Estimated costs: Roundtable papers and travel of keynote speakers 20,000 Roundtable comments and travel of keynote commentators 10,000 Roundtable, interpretation, hospitality, travel of experts 20,000 Editing, translation, publication of proceedings 10,000 Total €60,000

102
Annex 2 Project proposal: Accession to the European Agreement concerning the International
Carriage of Dangerous Goods by Road (ADR) Objective: To assist Member States of the UNECE to become Contracting Parties to ADR Background: The ADR is intended to improve safety during international transport of dangerous goods. Currently, ADR has 46 Contracting Parties. The only UNECE continental countries which are not yet parties are: Armenia, Georgia, Israel, Kyrgyzstan, Monaco, Uzbekistan, Tajikistan, San Marino and Turkmenistan. Iceland, Canada and United States of America are not linked by road to continental Europe. In view of continued development of transport along the Euro-Asia transport axis, it is beneficial for all countries to become parties to the ADR, in order to avoid national regulations being technical barriers to international transport by road. This is of utmost importance for producers of chemical and energy products to facilitate exports to third countries since such exports can only be made if the requirements laid down in international legal instruments based on the UN Recommendations on the Transport of Dangerous Goods are fully met. Expected accomplishments:
(a) Evaluation of the situation (b) Development of an adequate administrative structure for approval of packaging
and transport equipment in accordance with international requirements to improve the safety of the transport of dangerous goods and to facilitate exports to third countries
(c) Accession to ADR to facilitate international transport to, from and through the
country in safe conditions Proposed activities: (1) Development of a questionnaire to assess the situation (2) Analysis of replies and preparation of draft recommendations (3) Organization of a technical workshop with country representatives of, for example,
national administrations, industry, road carriers, customs, emergency responders and controllers to explain the scope and purpose of ADR and to make recommendations for accession
(4) Organize a meeting with country focal points for assessment of follow-up action
and support needed

103
Annex 3 Project proposal: A demonstration block train along the North-South Corridor
Objective: The project aims to demonstrate that the development of regular “block train” services along the North-South Corridor, in particular along the identified Euro-Asian Transport Links (EATL) rail routes, is technically feasible and commercially viable. A block train operates as a closed “highway” - it aims to minimize the time necessary for rail cargo to reach the final destination. The North-South Corridor has the potential to become a major trade lane for the regional and global market. The development of regular block train services on this axis would reduce transport costs thus encouraging international trade and supporting economic growth. Project description: The North–South Corridor connects the Indian Ocean / Arabian Sea and the Persian Gulf to the Caspian region / Central Asia via Iran, and then onwards to Moscow/St. Petersburg and Northern Europe via the Russian Federation and the Baltic States. The North–South Corridor is not a single route. It is an intermodal transport network where several routes and connections already exist and/or can be developed. The main routes in the North-South Corridor are defined as follows: Route 1: The Caucasus Route (west of the Caspian Sea) Route 2: The Central Asia Route (east of the Caspian Sea) Route 3: The Caspian Sea Route (through the Caspian Sea) The existing route (i.e. the Caspian route) involves several trans-loading operations, particularly when the sea meets rail or road; Caspian Sea (two ports), Bandar Abbas (one port) and Mumbai or Karachi (one port). The route east of the Caspian Sea (the Central Asia route) involves several countries and is (considered as a transit route) logistically more complicated that the Caspian Sea route and the planned route west of the Caspian Sea. A direct link from Iran to Russia through Azerbaijan is contingent on the completion of a missing link between Iran and Azerbaijan. This link, as an all-railway connection, is considered to be the most interesting option to study and to develop.

104
Proposed route: Latvia (Riga) – Russian Federation (Saint Petersburg) – Azerbaijan (Baku) – Iran (Bandar Abbas) Country Main Route Latvia Riga
Saint Petersburg Russia Moscow
Azerbaijan Baku Tehran Iran Bandar Abbas
Satellite Routes Russia Murmansk – Saint Petersburg Turkey - Iran Istanbul – Tehran Kazakhstan – Turkmenistan - Iran
Beyneu – Ashgabat - Tehran
Iran – Pakistan - India
Bandar Abbas – Karachi – Mumbai
Support by international organizations: The UNECE, United Nations Economic and Social Commission for Asia and the Pacific (UNESCAP), Economic Cooperation Organization (ECO), International Union of Railways (UIC) and Organization for Cooperation of Railways (OSJD) have frequently expressed interest in assisting in the development of the North-South Corridor by encouraging regular, efficient and competitive rail services along that route. � The International Union of Railways has completed and published a feasibility study
concerning the development of the North-South Corridor. (See “International Corridor Development, The North-South Corridor, The New Caucasus Route, Feasibility Study”, UIC, 3 October 2008).
� In mid-1990s, 13 main Euro-Asian railway corridors were identified by the
Organization for Cooperation of Railways. The OSJD has approved a working programme for the period 2005 – 2010 where development plans for “Corridor 11” are articulated. Corridor 11 shares many similarities with the North-South Corridor.
� The First, Second and Third International Euro-Asian Conference on Transport in St.
Petersburg, in 1998, 2000 and 2003 supported the identification of EATL transport corridors.
� A common UNECE and UNESCAP strategic vision for the development of Euro-
Asian links adopted in 2001 by the Working Party on Transport Trends and Economics supported the development of EATL transport routes (http://www.ECE.org/trans/main/wp5/wp5doc_2001.html).
� Transport Ministers and high level officials from countries across the Euro-Asian
region met in Geneva on 19 February 2008 and endorsed further development of Euro-Asian Transport Links.

105
� The UNECE-UNESCAP joint EATL study includes the North-South Corridor with
the three above-noted branches as parts of EATL rail routes. � The UNESCAP has established an “Expert Group on Operationalization of
International Intermodal Transport Corridors in North-East and Central Asia” to improve the efficiency and performance of transport through the corridors linking North-East and Central Asia. The proposed demonstration run along the North-South corridor is expected to be complementary to the work undertaken by the UNESCAP (see http://www.unescap.org/ttdw/common/TIS/CorridorStudy/Corridor.asp).
� The UNESCAP has received a $1.2 million contribution from the Government of the
Russian Federation. Some of the funds will be used to organize demonstration train runs as parts of the above-noted “Operationalization Expert Group” (see http://www.unescap.org/unis/press/2009/dec/g106.asp).
� The Economic Cooperation Organization has organized a demonstration block train
from Islamabad-Tehran-Istanbul. Currently, the ECO is studying the Urumchi-Almaty-Istanbul route. In general, the ECO has expressed a keen interest in promoting and supporting transport initiatives that would facilitate further economic integration of Central Asia.

106
Proposed work plan: First Steering Committee (Saint Petersburg, Russian Federation): − Develop and agree on the content of a Memorandum of Understanding to be signed by
participating countries in order to proceed with the demonstration train − Distribute a questionnaire concerning commodity structure of trade among participating
countries − Discuss time schedules, tariffs, customs issues and railways operational issues − Discuss strategic implications of the North-South corridor and its future extensions Second Steering Committee (Tehran, Iran): − Agree on the time schedule, tariffs, customs and other operational issues for the
demonstration run of the train − Discuss future operations (corridor mechanism, wagons and personnel scheduling,
marketing and sales, administration) − Set the specific days of the demonstration run of the train (departure days and time) − Decide the consulting team to evaluate demonstration train’s actual operations and
the required facilities to be provided by the rail companies − Cargo to be committed by rail companies to be loaded on the train in order to evaluate
its operations − Discuss inauguration ceremonies Third Steering Committee (Riga, Latvia, immediately preceding the departure of the train): − Final discussion concerning the operations of the demonstration train − Discussions with the consulting team concerning the demonstration run, the forecasted
stopovers and inaugurations, the integrated time schedule − Discussions concerning consulting team’s tasks and expected results − Inauguration of the train and departure − Run of the demonstration train Fourth Steering Committee (Saint Petersburg, Russian Federation): − Discuss and adopt the final report − Review time schedule, tariffs, customs issues and stopovers analysis − Discuss investment needs − Consider a future corridor management mechanism − Discuss future operations issues such as marketing and sales, accounting,
administration, wagons and personnel scheduling Budget proposal: Tasks
Budget
1 1st Steering Committee meeting (Saint Petersburg, Russian Federation) Two representatives from the Russian Federation + one from Latvia + one from Iran + one from Azerbaijan + one UNECE + one consultant (7 in total) x 3 days DSA + airfare “DSA” – UN daily subsistence allowance

107
$8,250 2 2nd Steering Committee meeting (Tehran, Iran)
Seven representatives x 3 days DSA + airfare $10,000
3 3rd Steering Committee meeting (Riga, Latvia) Seven representatives x 3 days DSA + airfare
$8,750
4 4th Steering Committee meeting (Saint Petersburg, Russian Federation) Seven representatives x 3 days DSA + airfare
$8,250
5 Sub-total Steering Committee meetings $35,250 6 Consultant: meetings preparation $4,000 7 Consultant: final report preparation $6,000 8 Consultant: demonstration train run (12-15 days) $20,000 9 Total before UN administration fees $65,250 10 UN administration fee (13 per cent) $9,750 TOTAL $75,000

108
Annex 4 Main international UNECE transport conventions
Con
stru
ctio
n T
raffi
c A
rter
ies,
195
0
E R
oad
Net
wor
k (A
GR
), 1
975
E R
ail N
etw
ork
(AG
C),
198
5
E C
omb.
Tr.
Net
wor
k (A
GT
C),
199
1
Pro
toco
l Inl
. Nav
. to
AG
TC
, 199
7
E In
l. W
ater
Net
wor
k (A
GN
), 1
996
Roa
d T
raffi
c, 1
949
Roa
d T
raffi
c, 1
968
Pro
toca
l on
Roa
d S
igns
& S
igna
ls, 1
949
Roa
d S
igns
& S
igna
ls, 1
968
Sup
pl. 1
968
Con
vent
ion
Roa
d T
raffi
c, 1
971
Sup
pl.1
968
Con
v. R
oad
Sig
ns &
Sig
nals
, 19
71
Wei
ghts
and
Dim
ensi
ons,
195
0
Sup
pl. 1
949
Con
v. a
nd P
roto
col,
1950
Roa
d M
arki
ngs,
195
7
Pro
toco
l Roa
d M
arki
ngs,
197
3
Issu
e an
d V
alid
ity o
f Driv
ing
Per
mits
(A
PC
)
Veh
icle
s R
egul
atio
ns, 1
958
Tec
hn. I
nspe
ct. V
ehic
les,
199
7
Glo
bal V
ehic
les
Reg
ulat
ions
, 19
98
Wor
k of
Cre
ws
Int.
Roa
d T
rans
port
(A
ET
R),
197
0
Tax
atio
n P
riv. R
oad
Veh
ic. ,
195
6
Tax
atio
n R
oad
Pas
seng
er V
ehic
. , 1
956
Tax
atio
n R
oad
Goo
ds. V
ehic
. , 1
956
Con
trac
t Roa
d G
oods
Tra
nspo
rt (
CM
R)
,195
6 P
roto
col t
o C
MR
, 197
8 A
dd'l
Pro
toco
l to
CM
R,
(e-C
MR
) 20
08
Con
trac
t Pas
s. &
Lug
g. R
d. T
rans
p. (
CV
R)
, 197
3 P
roto
col t
o C
VR
, 197
8 E
con.
Reg
ulat
. Roa
d T
rans
p. ,
1954
C
ollis
ion
Inl.
Nav
. , 1
960
Reg
istr
. Inl
. Nav
. Ves
sels
, 196
5 M
easu
rem
ent I
nl. N
av. V
esse
ls, 1
966
Lia
bilit
y V
esse
l Ow
ners
(C
LN),
197
3 P
roto
col t
o C
LN, 1
978
Con
trac
t Inl
. Nav
. Pas
s. &
Lug
g. (
CV
N)
, 197
6 P
roto
col t
o C
VN
, 197
8 T
ourin
g F
acili
ties,
195
4 P
roto
col T
ourin
g F
acili
ties,
195
4 T
emp.
Impo
rt. P
riv. R
oad
Veh
icle
s, 1
954
TIR
Con
vent
ion,
195
9 T
IR C
onve
ntio
n, 1
975
Tem
p. Im
port
.Airc
raft
& B
oats
, 195
6 T
emp.
Impo
rt. C
omm
erc.
Veh
icle
s, 1
956
Cro
ss. F
ront
. Pas
s. B
agg.
Rai
l, 19
52
Cro
ss. F
ront
. Goo
ds R
ail,
1952
S
pare
Par
ts E
urop
Wag
ons,
195
8 C
usto
ms
Con
tain
er C
onve
ntio
n, 1
956
Cus
tom
s C
onta
iner
Con
vent
ion,
197
2 C
usto
ms
Tre
atm
ent
Pal
lets
, 196
0 H
arm
oniz
. Fro
ntie
r C
ontr
ols
Goo
ds, 1
982
Cus
tom
s P
ool C
onta
iner
s, 1
994
Dan
g. G
oods
by
Roa
d (A
DR
) , 1
957
Pro
toco
l to
AD
R, 1
993
Lia
bil.
Dan
g. G
oods
(C
RT
D)
, 198
9
Dan
g. G
oods
by
Inla
nd W
ater
way
s (A
DN
), 2
000
Per
isha
ble
Foo
dstu
ffs (
AT
P),
197
0
Dangerous goods
&
Infrastructure networks
Road traffic and road safety Vehicles Other Legal Instruments
Related to Road Transport
Inland navigation Border crossing facilitation
special cargoes
1 2 3 4 5 6 7 8 9 10 11 12 13 14 15 16 17 18 19 20 21 22 23 24 25 26 27 28 29 30 31 32 33 34 35 36 37 38 39 40 41 42 43 44 45 46 47 48 49 50 51 52 53 54 55 56 57
EU MEMBER STATES
Austria X S X X S S X X X X X X X X X S X X X X X X X X S X X X X X X X X X X X X X X X X X X X
Belgium X X X X X X X X X X X X X X X S X S X X S S S S X X X X X X X X X X X X X X X X X
Bulgaria X X X X X X X X X X X X X X X X X X X X X X X X X X X X X X X X X X
Cyprus X X X S X X X X X X X X X X X X X
Czech Republic X X X X X X X X X X X X X X X S X X X X X X X X X X X X X X X X X X S X
Denmark X X X X X X X X X X X X S X X X X X X S X X X X X X X X X X X S X X X
Estonia X X X X X X X X X X X X X X

109
Con
stru
ctio
n T
raffi
c A
rter
ies,
195
0
E R
oad
Net
wor
k (A
GR
), 1
975
E R
ail N
etw
ork
(AG
C),
198
5
E C
omb.
Tr.
Net
wor
k (A
GT
C),
199
1
Pro
toco
l Inl
. Nav
. to
AG
TC
, 199
7
E In
l. W
ater
Net
wor
k (A
GN
), 1
996
Roa
d T
raffi
c, 1
949
Roa
d T
raffi
c, 1
968
Pro
toca
l on
Roa
d S
igns
& S
igna
ls, 1
949
Roa
d S
igns
& S
igna
ls, 1
968
Sup
pl. 1
968
Con
vent
ion
Roa
d T
raffi
c, 1
971
Sup
pl.1
968
Con
v. R
oad
Sig
ns &
Sig
nals
, 19
71
Wei
ghts
and
Dim
ensi
ons,
195
0
Sup
pl. 1
949
Con
v. a
nd P
roto
col,
1950
Roa
d M
arki
ngs,
195
7
Pro
toco
l Roa
d M
arki
ngs,
197
3
Issu
e an
d V
alid
ity o
f Driv
ing
Per
mits
(A
PC
)
Veh
icle
s R
egul
atio
ns, 1
958
Tec
hn. I
nspe
ct. V
ehic
les,
199
7
Glo
bal V
ehic
les
Reg
ulat
ions
, 19
98
Wor
k of
Cre
ws
Int.
Roa
d T
rans
port
(A
ET
R),
197
0
Tax
atio
n P
riv. R
oad
Veh
ic. ,
195
6
Tax
atio
n R
oad
Pas
seng
er V
ehic
. , 1
956
Tax
atio
n R
oad
Goo
ds. V
ehic
. , 1
956
Con
trac
t Roa
d G
oods
Tra
nspo
rt (
CM
R)
,195
6 P
roto
col t
o C
MR
, 197
8 A
dd'l
Pro
toco
l to
CM
R,
(e-C
MR
) 20
08
Con
trac
t Pas
s. &
Lug
g. R
d. T
rans
p. (
CV
R)
, 197
3 P
roto
col t
o C
VR
, 197
8 E
con.
Reg
ulat
. Roa
d T
rans
p. ,
1954
C
ollis
ion
Inl.
Nav
. , 1
960
Reg
istr
. Inl
. Nav
. Ves
sels
, 196
5 M
easu
rem
ent I
nl. N
av. V
esse
ls, 1
966
Lia
bilit
y V
esse
l Ow
ners
(C
LN),
197
3 P
roto
col t
o C
LN, 1
978
Con
trac
t Inl
. Nav
. Pas
s. &
Lug
g. (
CV
N)
, 197
6 P
roto
col t
o C
VN
, 197
8 T
ourin
g F
acili
ties,
195
4 P
roto
col T
ourin
g F
acili
ties,
195
4 T
emp.
Impo
rt. P
riv. R
oad
Veh
icle
s, 1
954
TIR
Con
vent
ion,
195
9 T
IR C
onve
ntio
n, 1
975
Tem
p. Im
port
.Airc
raft
& B
oats
, 195
6 T
emp.
Impo
rt. C
omm
erc.
Veh
icle
s, 1
956
Cro
ss. F
ront
. Pas
s. B
agg.
Rai
l, 19
52
Cro
ss. F
ront
. Goo
ds R
ail,
1952
S
pare
Par
ts E
urop
Wag
ons,
195
8 C
usto
ms
Con
tain
er C
onve
ntio
n, 1
956
Cus
tom
s C
onta
iner
Con
vent
ion,
197
2 C
usto
ms
Tre
atm
ent
Pal
lets
, 196
0 H
arm
oniz
. Fro
ntie
r C
ontr
ols
Goo
ds, 1
982
Cus
tom
s P
ool C
onta
iner
s, 1
994
Dan
g. G
oods
by
Roa
d (A
DR
) , 1
957
Pro
toco
l to
AD
R, 1
993
Lia
bil.
Dan
g. G
oods
(C
RT
D)
, 198
9
Dan
g. G
oods
by
Inla
nd W
ater
way
s (A
DN
), 2
000
Per
isha
ble
Foo
dstu
ffs (
AT
P),
197
0
Dangerous goods
&
Infrastructure networks
Road traffic and road safety Vehicles Other Legal Instruments
Related to Road Transport
Inland navigation Border crossing facilitation
special cargoes
1 2 3 4 5 6 7 8 9 10 11 12 13 14 15 16 17 18 19 20 21 22 23 24 25 26 27 28 29 30 31 32 33 34 35 36 37 38 39 40 41 42 43 44 45 46 47 48 49 50 51 52 53 54 55 56 57
Finland X X S S X X X X X X X X X X X X X X X X S X X X X X X X X X X X X X X
France X X X X S S X X X X X X X X X S X X X X X X X X X X X X X X X X X X X X X X X X X X
Germany X X X X S S X X X X X X X S X X X X X S S X S X S S X X X X X X X X X X X X X S X X
Greece X X X X S S X X X X X X X X X X S X X X X X X X X X X S X X X X
Hungary X X X X X X X X X X X X X X X X X X X X X X X X X X X X X X X X X X X X X X
Ireland X X X S X X X X X X X X X X X X X X X X X
Italy X X X X S X X X X X X X X X S X X S X X X X X X X X X X X X X X X X X X X X X S X
Latvia X X X X X X X X X X X X X X X X X X X X X
Lithuania X X X X X X X X X X X X X S X X X X X X X X X X X
Luxembourg X X X X X X X X X X X X X X X X X X X X X X X X X S S X X X X X X X X X X X X X X X X X X X
Malta X X X X X X X X X X X X X X

110
Con
stru
ctio
n T
raffi
c A
rter
ies,
195
0
E R
oad
Net
wor
k (A
GR
), 1
975
E R
ail N
etw
ork
(AG
C),
198
5
E C
omb.
Tr.
Net
wor
k (A
GT
C),
199
1
Pro
toco
l Inl
. Nav
. to
AG
TC
, 199
7
E In
l. W
ater
Net
wor
k (A
GN
), 1
996
Roa
d T
raffi
c, 1
949
Roa
d T
raffi
c, 1
968
Pro
toca
l on
Roa
d S
igns
& S
igna
ls, 1
949
Roa
d S
igns
& S
igna
ls, 1
968
Sup
pl. 1
968
Con
vent
ion
Roa
d T
raffi
c, 1
971
Sup
pl.1
968
Con
v. R
oad
Sig
ns &
Sig
nals
, 19
71
Wei
ghts
and
Dim
ensi
ons,
195
0
Sup
pl. 1
949
Con
v. a
nd P
roto
col,
1950
Roa
d M
arki
ngs,
195
7
Pro
toco
l Roa
d M
arki
ngs,
197
3
Issu
e an
d V
alid
ity o
f Driv
ing
Per
mits
(A
PC
)
Veh
icle
s R
egul
atio
ns, 1
958
Tec
hn. I
nspe
ct. V
ehic
les,
199
7
Glo
bal V
ehic
les
Reg
ulat
ions
, 19
98
Wor
k of
Cre
ws
Int.
Roa
d T
rans
port
(A
ET
R),
197
0
Tax
atio
n P
riv. R
oad
Veh
ic. ,
195
6
Tax
atio
n R
oad
Pas
seng
er V
ehic
. , 1
956
Tax
atio
n R
oad
Goo
ds. V
ehic
. , 1
956
Con
trac
t Roa
d G
oods
Tra
nspo
rt (
CM
R)
,195
6 P
roto
col t
o C
MR
, 197
8 A
dd'l
Pro
toco
l to
CM
R,
(e-C
MR
) 20
08
Con
trac
t Pas
s. &
Lug
g. R
d. T
rans
p. (
CV
R)
, 197
3 P
roto
col t
o C
VR
, 197
8 E
con.
Reg
ulat
. Roa
d T
rans
p. ,
1954
C
ollis
ion
Inl.
Nav
. , 1
960
Reg
istr
. Inl
. Nav
. Ves
sels
, 196
5 M
easu
rem
ent I
nl. N
av. V
esse
ls, 1
966
Lia
bilit
y V
esse
l Ow
ners
(C
LN),
197
3 P
roto
col t
o C
LN, 1
978
Con
trac
t Inl
. Nav
. Pas
s. &
Lug
g. (
CV
N)
, 197
6 P
roto
col t
o C
VN
, 197
8 T
ourin
g F
acili
ties,
195
4 P
roto
col T
ourin
g F
acili
ties,
195
4 T
emp.
Impo
rt. P
riv. R
oad
Veh
icle
s, 1
954
TIR
Con
vent
ion,
195
9 T
IR C
onve
ntio
n, 1
975
Tem
p. Im
port
.Airc
raft
& B
oats
, 195
6 T
emp.
Impo
rt. C
omm
erc.
Veh
icle
s, 1
956
Cro
ss. F
ront
. Pas
s. B
agg.
Rai
l, 19
52
Cro
ss. F
ront
. Goo
ds R
ail,
1952
S
pare
Par
ts E
urop
Wag
ons,
195
8 C
usto
ms
Con
tain
er C
onve
ntio
n, 1
956
Cus
tom
s C
onta
iner
Con
vent
ion,
197
2 C
usto
ms
Tre
atm
ent
Pal
lets
, 196
0 H
arm
oniz
. Fro
ntie
r C
ontr
ols
Goo
ds, 1
982
Cus
tom
s P
ool C
onta
iner
s, 1
994
Dan
g. G
oods
by
Roa
d (A
DR
) , 1
957
Pro
toco
l to
AD
R, 1
993
Lia
bil.
Dan
g. G
oods
(C
RT
D)
, 198
9
Dan
g. G
oods
by
Inla
nd W
ater
way
s (A
DN
), 2
000
Per
isha
ble
Foo
dstu
ffs (
AT
P),
197
0
Dangerous goods
&
Infrastructure networks
Road traffic and road safety Vehicles Other Legal Instruments
Related to Road Transport
Inland navigation Border crossing facilitation
special cargoes
1 2 3 4 5 6 7 8 9 10 11 12 13 14 15 16 17 18 19 20 21 22 23 24 25 26 27 28 29 30 31 32 33 34 35 36 37 38 39 40 41 42 43 44 45 46 47 48 49 50 51 52 53 54 55 56 57
Netherlands X X X X X X X X X X X X X S X X X X X X X X X X X S X X X X X X X X X X X X X X X X X X X X
Poland X X X X X X X X X X X X X X X X X X X X X X X X X X X X X X X X X
Portugal X X S X S X S X X X X S X X X X X X X X X X X X X X X X X X
Romania X X X X X X X X X X X X X X X X X X X X X X X X X X X X X X X X X X X X X
Slovakia X X X X S X X X X X X X X X X S X X X X X X X X X X X X X X X X X X X X X
Slovenia X X X X X X X X X X X X X X X X X X X X X
Spain X X S X S X X X S X X X X X X X X X X X X X X X X X X X
Sweden X X X X X X X X X X S X X X X X X X S S X X X X X X X S S X X X X X X X
United Kingdom X S X S X S S S X S X S X X X X X X X S X X X X X X X X X X X X X X
EUROPEAN COMMUNITY X X X X X X X
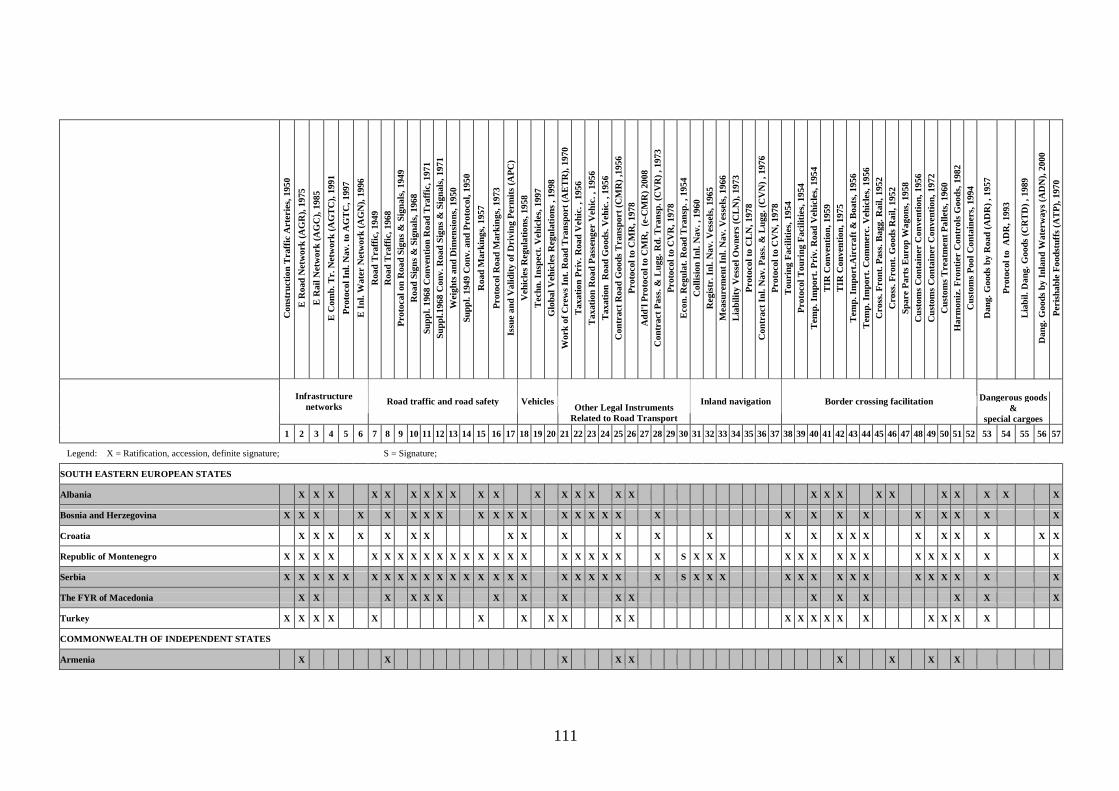
111
Con
stru
ctio
n T
raffi
c A
rter
ies,
195
0
E R
oad
Net
wor
k (A
GR
), 1
975
E R
ail N
etw
ork
(AG
C),
198
5
E C
omb.
Tr.
Net
wor
k (A
GT
C),
199
1
Pro
toco
l Inl
. Nav
. to
AG
TC
, 199
7
E In
l. W
ater
Net
wor
k (A
GN
), 1
996
Roa
d T
raffi
c, 1
949
Roa
d T
raffi
c, 1
968
Pro
toca
l on
Roa
d S
igns
& S
igna
ls, 1
949
Roa
d S
igns
& S
igna
ls, 1
968
Sup
pl. 1
968
Con
vent
ion
Roa
d T
raffi
c, 1
971
Sup
pl.1
968
Con
v. R
oad
Sig
ns &
Sig
nals
, 19
71
Wei
ghts
and
Dim
ensi
ons,
195
0
Sup
pl. 1
949
Con
v. a
nd P
roto
col,
1950
Roa
d M
arki
ngs,
195
7
Pro
toco
l Roa
d M
arki
ngs,
197
3
Issu
e an
d V
alid
ity o
f Driv
ing
Per
mits
(A
PC
)
Veh
icle
s R
egul
atio
ns, 1
958
Tec
hn. I
nspe
ct. V
ehic
les,
199
7
Glo
bal V
ehic
les
Reg
ulat
ions
, 19
98
Wor
k of
Cre
ws
Int.
Roa
d T
rans
port
(A
ET
R),
197
0
Tax
atio
n P
riv. R
oad
Veh
ic. ,
195
6
Tax
atio
n R
oad
Pas
seng
er V
ehic
. , 1
956
Tax
atio
n R
oad
Goo
ds. V
ehic
. , 1
956
Con
trac
t Roa
d G
oods
Tra
nspo
rt (
CM
R)
,195
6 P
roto
col t
o C
MR
, 197
8 A
dd'l
Pro
toco
l to
CM
R,
(e-C
MR
) 20
08
Con
trac
t Pas
s. &
Lug
g. R
d. T
rans
p. (
CV
R)
, 197
3 P
roto
col t
o C
VR
, 197
8 E
con.
Reg
ulat
. Roa
d T
rans
p. ,
1954
C
ollis
ion
Inl.
Nav
. , 1
960
Reg
istr
. Inl
. Nav
. Ves
sels
, 196
5 M
easu
rem
ent I
nl. N
av. V
esse
ls, 1
966
Lia
bilit
y V
esse
l Ow
ners
(C
LN),
197
3 P
roto
col t
o C
LN, 1
978
Con
trac
t Inl
. Nav
. Pas
s. &
Lug
g. (
CV
N)
, 197
6 P
roto
col t
o C
VN
, 197
8 T
ourin
g F
acili
ties,
195
4 P
roto
col T
ourin
g F
acili
ties,
195
4 T
emp.
Impo
rt. P
riv. R
oad
Veh
icle
s, 1
954
TIR
Con
vent
ion,
195
9 T
IR C
onve
ntio
n, 1
975
Tem
p. Im
port
.Airc
raft
& B
oats
, 195
6 T
emp.
Impo
rt. C
omm
erc.
Veh
icle
s, 1
956
Cro
ss. F
ront
. Pas
s. B
agg.
Rai
l, 19
52
Cro
ss. F
ront
. Goo
ds R
ail,
1952
S
pare
Par
ts E
urop
Wag
ons,
195
8 C
usto
ms
Con
tain
er C
onve
ntio
n, 1
956
Cus
tom
s C
onta
iner
Con
vent
ion,
197
2 C
usto
ms
Tre
atm
ent
Pal
lets
, 196
0 H
arm
oniz
. Fro
ntie
r C
ontr
ols
Goo
ds, 1
982
Cus
tom
s P
ool C
onta
iner
s, 1
994
Dan
g. G
oods
by
Roa
d (A
DR
) , 1
957
Pro
toco
l to
AD
R, 1
993
Lia
bil.
Dan
g. G
oods
(C
RT
D)
, 198
9
Dan
g. G
oods
by
Inla
nd W
ater
way
s (A
DN
), 2
000
Per
isha
ble
Foo
dstu
ffs (
AT
P),
197
0
Dangerous goods
&
Infrastructure networks
Road traffic and road safety Vehicles Other Legal Instruments
Related to Road Transport
Inland navigation Border crossing facilitation
special cargoes
1 2 3 4 5 6 7 8 9 10 11 12 13 14 15 16 17 18 19 20 21 22 23 24 25 26 27 28 29 30 31 32 33 34 35 36 37 38 39 40 41 42 43 44 45 46 47 48 49 50 51 52 53 54 55 56 57
Legend: X = Ratification, accession, definite signature; S = Signature;
SOUTH EASTERN EUROPEAN STATES
Albania X X X X X X X X X X X X X X X X X X X X X X X X X X X
Bosnia and Herzegovina X X X X X X X X X X X X X X X X X X X X X X X X X X X
Croatia X X X X X X X X X X X X X X X X X X X X X X X X
Republic of Montenegro X X X X X X X X X X X X X X X X X X X X X X S X X X X X X X X X X X X X X X
Serbia X X X X X X X X X X X X X X X X X X X X X X X S X X X X X X X X X X X X X X X
The FYR of Macedonia X X X X X X X X X X X X X X X X X
Turkey X X X X X X X X X X X X X X X X X X X X X
COMMONWEALTH OF INDEPENDENT STATES
Armenia X X X X X X X X X

112
Con
stru
ctio
n T
raffi
c A
rter
ies,
195
0
E R
oad
Net
wor
k (A
GR
), 1
975
E R
ail N
etw
ork
(AG
C),
198
5
E C
omb.
Tr.
Net
wor
k (A
GT
C),
199
1
Pro
toco
l Inl
. Nav
. to
AG
TC
, 199
7
E In
l. W
ater
Net
wor
k (A
GN
), 1
996
Roa
d T
raffi
c, 1
949
Roa
d T
raffi
c, 1
968
Pro
toca
l on
Roa
d S
igns
& S
igna
ls, 1
949
Roa
d S
igns
& S
igna
ls, 1
968
Sup
pl. 1
968
Con
vent
ion
Roa
d T
raffi
c, 1
971
Sup
pl.1
968
Con
v. R
oad
Sig
ns &
Sig
nals
, 19
71
Wei
ghts
and
Dim
ensi
ons,
195
0
Sup
pl. 1
949
Con
v. a
nd P
roto
col,
1950
Roa
d M
arki
ngs,
195
7
Pro
toco
l Roa
d M
arki
ngs,
197
3
Issu
e an
d V
alid
ity o
f Driv
ing
Per
mits
(A
PC
)
Veh
icle
s R
egul
atio
ns, 1
958
Tec
hn. I
nspe
ct. V
ehic
les,
199
7
Glo
bal V
ehic
les
Reg
ulat
ions
, 19
98
Wor
k of
Cre
ws
Int.
Roa
d T
rans
port
(A
ET
R),
197
0
Tax
atio
n P
riv. R
oad
Veh
ic. ,
195
6
Tax
atio
n R
oad
Pas
seng
er V
ehic
. , 1
956
Tax
atio
n R
oad
Goo
ds. V
ehic
. , 1
956
Con
trac
t Roa
d G
oods
Tra
nspo
rt (
CM
R)
,195
6 P
roto
col t
o C
MR
, 197
8 A
dd'l
Pro
toco
l to
CM
R,
(e-C
MR
) 20
08
Con
trac
t Pas
s. &
Lug
g. R
d. T
rans
p. (
CV
R)
, 197
3 P
roto
col t
o C
VR
, 197
8 E
con.
Reg
ulat
. Roa
d T
rans
p. ,
1954
C
ollis
ion
Inl.
Nav
. , 1
960
Reg
istr
. Inl
. Nav
. Ves
sels
, 196
5 M
easu
rem
ent I
nl. N
av. V
esse
ls, 1
966
Lia
bilit
y V
esse
l Ow
ners
(C
LN),
197
3 P
roto
col t
o C
LN, 1
978
Con
trac
t Inl
. Nav
. Pas
s. &
Lug
g. (
CV
N)
, 197
6 P
roto
col t
o C
VN
, 197
8 T
ourin
g F
acili
ties,
195
4 P
roto
col T
ourin
g F
acili
ties,
195
4 T
emp.
Impo
rt. P
riv. R
oad
Veh
icle
s, 1
954
TIR
Con
vent
ion,
195
9 T
IR C
onve
ntio
n, 1
975
Tem
p. Im
port
.Airc
raft
& B
oats
, 195
6 T
emp.
Impo
rt. C
omm
erc.
Veh
icle
s, 1
956
Cro
ss. F
ront
. Pas
s. B
agg.
Rai
l, 19
52
Cro
ss. F
ront
. Goo
ds R
ail,
1952
S
pare
Par
ts E
urop
Wag
ons,
195
8 C
usto
ms
Con
tain
er C
onve
ntio
n, 1
956
Cus
tom
s C
onta
iner
Con
vent
ion,
197
2 C
usto
ms
Tre
atm
ent
Pal
lets
, 196
0 H
arm
oniz
. Fro
ntie
r C
ontr
ols
Goo
ds, 1
982
Cus
tom
s P
ool C
onta
iner
s, 1
994
Dan
g. G
oods
by
Roa
d (A
DR
) , 1
957
Pro
toco
l to
AD
R, 1
993
Lia
bil.
Dan
g. G
oods
(C
RT
D)
, 198
9
Dan
g. G
oods
by
Inla
nd W
ater
way
s (A
DN
), 2
000
Per
isha
ble
Foo
dstu
ffs (
AT
P),
197
0
Dangerous goods
&
Infrastructure networks
Road traffic and road safety Vehicles Other Legal Instruments
Related to Road Transport
Inland navigation Border crossing facilitation
special cargoes
1 2 3 4 5 6 7 8 9 10 11 12 13 14 15 16 17 18 19 20 21 22 23 24 25 26 27 28 29 30 31 32 33 34 35 36 37 38 39 40 41 42 43 44 45 46 47 48 49 50 51 52 53 54 55 56 57
Azerbaijan X X X X X X X X X X X X
Belarus X X X X X X X X X X X X X X X X X X X X X X
Georgia X X X X X X X S X X X X X X
Kazakhstan X X X X X X X X X X X X
Kyrgyzstan X X X X X X X X X X
Republic of Moldova X X X X X X X X X X X X X X X X X X X
Russian Federation X X X X X X X X X X X X X X X X X X X X X X X X X X X X X X X
Tajikistan X X X X
Turkmenistan X X X X X X
Ukraine X X X X X X X X X X X X X X X X X X X X
Uzbekistan X X X X X X X X X X X X

113
Con
stru
ctio
n T
raffi
c A
rter
ies,
195
0
E R
oad
Net
wor
k (A
GR
), 1
975
E R
ail N
etw
ork
(AG
C),
198
5
E C
omb.
Tr.
Net
wor
k (A
GT
C),
199
1
Pro
toco
l Inl
. Nav
. to
AG
TC
, 199
7
E In
l. W
ater
Net
wor
k (A
GN
), 1
996
Roa
d T
raffi
c, 1
949
Roa
d T
raffi
c, 1
968
Pro
toca
l on
Roa
d S
igns
& S
igna
ls, 1
949
Roa
d S
igns
& S
igna
ls, 1
968
Sup
pl. 1
968
Con
vent
ion
Roa
d T
raffi
c, 1
971
Sup
pl.1
968
Con
v. R
oad
Sig
ns &
Sig
nals
, 19
71
Wei
ghts
and
Dim
ensi
ons,
195
0
Sup
pl. 1
949
Con
v. a
nd P
roto
col,
1950
Roa
d M
arki
ngs,
195
7
Pro
toco
l Roa
d M
arki
ngs,
197
3
Issu
e an
d V
alid
ity o
f Driv
ing
Per
mits
(A
PC
)
Veh
icle
s R
egul
atio
ns, 1
958
Tec
hn. I
nspe
ct. V
ehic
les,
199
7
Glo
bal V
ehic
les
Reg
ulat
ions
, 19
98
Wor
k of
Cre
ws
Int.
Roa
d T
rans
port
(A
ET
R),
197
0
Tax
atio
n P
riv. R
oad
Veh
ic. ,
195
6
Tax
atio
n R
oad
Pas
seng
er V
ehic
. , 1
956
Tax
atio
n R
oad
Goo
ds. V
ehic
. , 1
956
Con
trac
t Roa
d G
oods
Tra
nspo
rt (
CM
R)
,195
6 P
roto
col t
o C
MR
, 197
8 A
dd'l
Pro
toco
l to
CM
R,
(e-C
MR
) 20
08
Con
trac
t Pas
s. &
Lug
g. R
d. T
rans
p. (
CV
R)
, 197
3 P
roto
col t
o C
VR
, 197
8 E
con.
Reg
ulat
. Roa
d T
rans
p. ,
1954
C
ollis
ion
Inl.
Nav
. , 1
960
Reg
istr
. Inl
. Nav
. Ves
sels
, 196
5 M
easu
rem
ent I
nl. N
av. V
esse
ls, 1
966
Lia
bilit
y V
esse
l Ow
ners
(C
LN),
197
3 P
roto
col t
o C
LN, 1
978
Con
trac
t Inl
. Nav
. Pas
s. &
Lug
g. (
CV
N)
, 197
6 P
roto
col t
o C
VN
, 197
8 T
ourin
g F
acili
ties,
195
4 P
roto
col T
ourin
g F
acili
ties,
195
4 T
emp.
Impo
rt. P
riv. R
oad
Veh
icle
s, 1
954
TIR
Con
vent
ion,
195
9 T
IR C
onve
ntio
n, 1
975
Tem
p. Im
port
.Airc
raft
& B
oats
, 195
6 T
emp.
Impo
rt. C
omm
erc.
Veh
icle
s, 1
956
Cro
ss. F
ront
. Pas
s. B
agg.
Rai
l, 19
52
Cro
ss. F
ront
. Goo
ds R
ail,
1952
S
pare
Par
ts E
urop
Wag
ons,
195
8 C
usto
ms
Con
tain
er C
onve
ntio
n, 1
956
Cus
tom
s C
onta
iner
Con
vent
ion,
197
2 C
usto
ms
Tre
atm
ent
Pal
lets
, 196
0 H
arm
oniz
. Fro
ntie
r C
ontr
ols
Goo
ds, 1
982
Cus
tom
s P
ool C
onta
iner
s, 1
994
Dan
g. G
oods
by
Roa
d (A
DR
) , 1
957
Pro
toco
l to
AD
R, 1
993
Lia
bil.
Dan
g. G
oods
(C
RT
D)
, 198
9
Dan
g. G
oods
by
Inla
nd W
ater
way
s (A
DN
), 2
000
Per
isha
ble
Foo
dstu
ffs (
AT
P),
197
0
Dangerous goods
&
Infrastructure networks
Road traffic and road safety Vehicles Other Legal Instruments
Related to Road Transport
Inland navigation Border crossing facilitation
special cargoes
1 2 3 4 5 6 7 8 9 10 11 12 13 14 15 16 17 18 19 20 21 22 23 24 25 26 27 28 29 30 31 32 33 34 35 36 37 38 39 40 41 42 43 44 45 46 47 48 49 50 51 52 53 54 55 56 57
Legend: X = Ratification, accession, definite signature; S = Signature;
OTHER EUROPEAN STATES
Andorra X X X X
Iceland X
Liechtenstein X X X
Monaco X X X X X S S S X
Norway X X X X X S X X X X X X X X X S X X X X X X X X X X X X X X X
San Marino X X X X X
Switzerland X X X X S X S X X X S X X S X X X X S X X X S X X X X X X X X X X X X X X S X X S
NORTH AMERICA

114
Con
stru
ctio
n T
raffi
c A
rter
ies,
195
0
E R
oad
Net
wor
k (A
GR
), 1
975
E R
ail N
etw
ork
(AG
C),
198
5
E C
omb.
Tr.
Net
wor
k (A
GT
C),
199
1
Pro
toco
l Inl
. Nav
. to
AG
TC
, 199
7
E In
l. W
ater
Net
wor
k (A
GN
), 1
996
Roa
d T
raffi
c, 1
949
Roa
d T
raffi
c, 1
968
Pro
toca
l on
Roa
d S
igns
& S
igna
ls, 1
949
Roa
d S
igns
& S
igna
ls, 1
968
Sup
pl. 1
968
Con
vent
ion
Roa
d T
raffi
c, 1
971
Sup
pl.1
968
Con
v. R
oad
Sig
ns &
Sig
nals
, 19
71
Wei
ghts
and
Dim
ensi
ons,
195
0
Sup
pl. 1
949
Con
v. a
nd P
roto
col,
1950
Roa
d M
arki
ngs,
195
7
Pro
toco
l Roa
d M
arki
ngs,
197
3
Issu
e an
d V
alid
ity o
f Driv
ing
Per
mits
(A
PC
)
Veh
icle
s R
egul
atio
ns, 1
958
Tec
hn. I
nspe
ct. V
ehic
les,
199
7
Glo
bal V
ehic
les
Reg
ulat
ions
, 19
98
Wor
k of
Cre
ws
Int.
Roa
d T
rans
port
(A
ET
R),
197
0
Tax
atio
n P
riv. R
oad
Veh
ic. ,
195
6
Tax
atio
n R
oad
Pas
seng
er V
ehic
. , 1
956
Tax
atio
n R
oad
Goo
ds. V
ehic
. , 1
956
Con
trac
t Roa
d G
oods
Tra
nspo
rt (
CM
R)
,195
6 P
roto
col t
o C
MR
, 197
8 A
dd'l
Pro
toco
l to
CM
R,
(e-C
MR
) 20
08
Con
trac
t Pas
s. &
Lug
g. R
d. T
rans
p. (
CV
R)
, 197
3 P
roto
col t
o C
VR
, 197
8 E
con.
Reg
ulat
. Roa
d T
rans
p. ,
1954
C
ollis
ion
Inl.
Nav
. , 1
960
Reg
istr
. Inl
. Nav
. Ves
sels
, 196
5 M
easu
rem
ent I
nl. N
av. V
esse
ls, 1
966
Lia
bilit
y V
esse
l Ow
ners
(C
LN),
197
3 P
roto
col t
o C
LN, 1
978
Con
trac
t Inl
. Nav
. Pas
s. &
Lug
g. (
CV
N)
, 197
6 P
roto
col t
o C
VN
, 197
8 T
ourin
g F
acili
ties,
195
4 P
roto
col T
ourin
g F
acili
ties,
195
4 T
emp.
Impo
rt. P
riv. R
oad
Veh
icle
s, 1
954
TIR
Con
vent
ion,
195
9 T
IR C
onve
ntio
n, 1
975
Tem
p. Im
port
.Airc
raft
& B
oats
, 195
6 T
emp.
Impo
rt. C
omm
erc.
Veh
icle
s, 1
956
Cro
ss. F
ront
. Pas
s. B
agg.
Rai
l, 19
52
Cro
ss. F
ront
. Goo
ds R
ail,
1952
S
pare
Par
ts E
urop
Wag
ons,
195
8 C
usto
ms
Con
tain
er C
onve
ntio
n, 1
956
Cus
tom
s C
onta
iner
Con
vent
ion,
197
2 C
usto
ms
Tre
atm
ent
Pal
lets
, 196
0 H
arm
oniz
. Fro
ntie
r C
ontr
ols
Goo
ds, 1
982
Cus
tom
s P
ool C
onta
iner
s, 1
994
Dan
g. G
oods
by
Roa
d (A
DR
) , 1
957
Pro
toco
l to
AD
R, 1
993
Lia
bil.
Dan
g. G
oods
(C
RT
D)
, 198
9
Dan
g. G
oods
by
Inla
nd W
ater
way
s (A
DN
), 2
000
Per
isha
ble
Foo
dstu
ffs (
AT
P),
197
0
Dangerous goods
&
Infrastructure networks
Road traffic and road safety Vehicles Other Legal Instruments
Related to Road Transport
Inland navigation Border crossing facilitation
special cargoes
1 2 3 4 5 6 7 8 9 10 11 12 13 14 15 16 17 18 19 20 21 22 23 24 25 26 27 28 29 30 31 32 33 34 35 36 37 38 39 40 41 42 43 44 45 46 47 48 49 50 51 52 53 54 55 56 57
Canada X X X X X X X X
United States X X X X X X X X X
OTHER UNECE STATE
Israel X X S X X X X X X
NON-UNECE STATES
Afghanistan X X X
Algeria X X X X X X X X X
Antigua and Barbuda X
Argentina X X X S
Australia X X X X X X X X X X
Bahamas X

115
Con
stru
ctio
n T
raffi
c A
rter
ies,
195
0
E R
oad
Net
wor
k (A
GR
), 1
975
E R
ail N
etw
ork
(AG
C),
198
5
E C
omb.
Tr.
Net
wor
k (A
GT
C),
199
1
Pro
toco
l Inl
. Nav
. to
AG
TC
, 199
7
E In
l. W
ater
Net
wor
k (A
GN
), 1
996
Roa
d T
raffi
c, 1
949
Roa
d T
raffi
c, 1
968
Pro
toca
l on
Roa
d S
igns
& S
igna
ls, 1
949
Roa
d S
igns
& S
igna
ls, 1
968
Sup
pl. 1
968
Con
vent
ion
Roa
d T
raffi
c, 1
971
Sup
pl.1
968
Con
v. R
oad
Sig
ns &
Sig
nals
, 19
71
Wei
ghts
and
Dim
ensi
ons,
195
0
Sup
pl. 1
949
Con
v. a
nd P
roto
col,
1950
Roa
d M
arki
ngs,
195
7
Pro
toco
l Roa
d M
arki
ngs,
197
3
Issu
e an
d V
alid
ity o
f Driv
ing
Per
mits
(A
PC
)
Veh
icle
s R
egul
atio
ns, 1
958
Tec
hn. I
nspe
ct. V
ehic
les,
199
7
Glo
bal V
ehic
les
Reg
ulat
ions
, 19
98
Wor
k of
Cre
ws
Int.
Roa
d T
rans
port
(A
ET
R),
197
0
Tax
atio
n P
riv. R
oad
Veh
ic. ,
195
6
Tax
atio
n R
oad
Pas
seng
er V
ehic
. , 1
956
Tax
atio
n R
oad
Goo
ds. V
ehic
. , 1
956
Con
trac
t Roa
d G
oods
Tra
nspo
rt (
CM
R)
,195
6 P
roto
col t
o C
MR
, 197
8 A
dd'l
Pro
toco
l to
CM
R,
(e-C
MR
) 20
08
Con
trac
t Pas
s. &
Lug
g. R
d. T
rans
p. (
CV
R)
, 197
3 P
roto
col t
o C
VR
, 197
8 E
con.
Reg
ulat
. Roa
d T
rans
p. ,
1954
C
ollis
ion
Inl.
Nav
. , 1
960
Reg
istr
. Inl
. Nav
. Ves
sels
, 196
5 M
easu
rem
ent I
nl. N
av. V
esse
ls, 1
966
Lia
bilit
y V
esse
l Ow
ners
(C
LN),
197
3 P
roto
col t
o C
LN, 1
978
Con
trac
t Inl
. Nav
. Pas
s. &
Lug
g. (
CV
N)
, 197
6 P
roto
col t
o C
VN
, 197
8 T
ourin
g F
acili
ties,
195
4 P
roto
col T
ourin
g F
acili
ties,
195
4 T
emp.
Impo
rt. P
riv. R
oad
Veh
icle
s, 1
954
TIR
Con
vent
ion,
195
9 T
IR C
onve
ntio
n, 1
975
Tem
p. Im
port
.Airc
raft
& B
oats
, 195
6 T
emp.
Impo
rt. C
omm
erc.
Veh
icle
s, 1
956
Cro
ss. F
ront
. Pas
s. B
agg.
Rai
l, 19
52
Cro
ss. F
ront
. Goo
ds R
ail,
1952
S
pare
Par
ts E
urop
Wag
ons,
195
8 C
usto
ms
Con
tain
er C
onve
ntio
n, 1
956
Cus
tom
s C
onta
iner
Con
vent
ion,
197
2 C
usto
ms
Tre
atm
ent
Pal
lets
, 196
0 H
arm
oniz
. Fro
ntie
r C
ontr
ols
Goo
ds, 1
982
Cus
tom
s P
ool C
onta
iner
s, 1
994
Dan
g. G
oods
by
Roa
d (A
DR
) , 1
957
Pro
toco
l to
AD
R, 1
993
Lia
bil.
Dan
g. G
oods
(C
RT
D)
, 198
9
Dan
g. G
oods
by
Inla
nd W
ater
way
s (A
DN
), 2
000
Per
isha
ble
Foo
dstu
ffs (
AT
P),
197
0
Dangerous goods
&
Infrastructure networks
Road traffic and road safety Vehicles Other Legal Instruments
Related to Road Transport
Inland navigation Border crossing facilitation
special cargoes
1 2 3 4 5 6 7 8 9 10 11 12 13 14 15 16 17 18 19 20 21 22 23 24 25 26 27 28 29 30 31 32 33 34 35 36 37 38 39 40 41 42 43 44 45 46 47 48 49 50 51 52 53 54 55 56 57
Bahrain X X
Bangladesh X
Barbados X X X X
Benin X
Legend: X = Ratification, accession, definite signature; S = Signature;
NON-UNECE STATES (cont'd)
Botswana X
Brazil X S
Burkina Faso X X
Burundi X
Cambodia X X X X S S X X

116
Con
stru
ctio
n T
raffi
c A
rter
ies,
195
0
E R
oad
Net
wor
k (A
GR
), 1
975
E R
ail N
etw
ork
(AG
C),
198
5
E C
omb.
Tr.
Net
wor
k (A
GT
C),
199
1
Pro
toco
l Inl
. Nav
. to
AG
TC
, 199
7
E In
l. W
ater
Net
wor
k (A
GN
), 1
996
Roa
d T
raffi
c, 1
949
Roa
d T
raffi
c, 1
968
Pro
toca
l on
Roa
d S
igns
& S
igna
ls, 1
949
Roa
d S
igns
& S
igna
ls, 1
968
Sup
pl. 1
968
Con
vent
ion
Roa
d T
raffi
c, 1
971
Sup
pl.1
968
Con
v. R
oad
Sig
ns &
Sig
nals
, 19
71
Wei
ghts
and
Dim
ensi
ons,
195
0
Sup
pl. 1
949
Con
v. a
nd P
roto
col,
1950
Roa
d M
arki
ngs,
195
7
Pro
toco
l Roa
d M
arki
ngs,
197
3
Issu
e an
d V
alid
ity o
f Driv
ing
Per
mits
(A
PC
)
Veh
icle
s R
egul
atio
ns, 1
958
Tec
hn. I
nspe
ct. V
ehic
les,
199
7
Glo
bal V
ehic
les
Reg
ulat
ions
, 19
98
Wor
k of
Cre
ws
Int.
Roa
d T
rans
port
(A
ET
R),
197
0
Tax
atio
n P
riv. R
oad
Veh
ic. ,
195
6
Tax
atio
n R
oad
Pas
seng
er V
ehic
. , 1
956
Tax
atio
n R
oad
Goo
ds. V
ehic
. , 1
956
Con
trac
t Roa
d G
oods
Tra
nspo
rt (
CM
R)
,195
6 P
roto
col t
o C
MR
, 197
8 A
dd'l
Pro
toco
l to
CM
R,
(e-C
MR
) 20
08
Con
trac
t Pas
s. &
Lug
g. R
d. T
rans
p. (
CV
R)
, 197
3 P
roto
col t
o C
VR
, 197
8 E
con.
Reg
ulat
. Roa
d T
rans
p. ,
1954
C
ollis
ion
Inl.
Nav
. , 1
960
Reg
istr
. Inl
. Nav
. Ves
sels
, 196
5 M
easu
rem
ent I
nl. N
av. V
esse
ls, 1
966
Lia
bilit
y V
esse
l Ow
ners
(C
LN),
197
3 P
roto
col t
o C
LN, 1
978
Con
trac
t Inl
. Nav
. Pas
s. &
Lug
g. (
CV
N)
, 197
6 P
roto
col t
o C
VN
, 197
8 T
ourin
g F
acili
ties,
195
4 P
roto
col T
ourin
g F
acili
ties,
195
4 T
emp.
Impo
rt. P
riv. R
oad
Veh
icle
s, 1
954
TIR
Con
vent
ion,
195
9 T
IR C
onve
ntio
n, 1
975
Tem
p. Im
port
.Airc
raft
& B
oats
, 195
6 T
emp.
Impo
rt. C
omm
erc.
Veh
icle
s, 1
956
Cro
ss. F
ront
. Pas
s. B
agg.
Rai
l, 19
52
Cro
ss. F
ront
. Goo
ds R
ail,
1952
S
pare
Par
ts E
urop
Wag
ons,
195
8 C
usto
ms
Con
tain
er C
onve
ntio
n, 1
956
Cus
tom
s C
onta
iner
Con
vent
ion,
197
2 C
usto
ms
Tre
atm
ent
Pal
lets
, 196
0 H
arm
oniz
. Fro
ntie
r C
ontr
ols
Goo
ds, 1
982
Cus
tom
s P
ool C
onta
iner
s, 1
994
Dan
g. G
oods
by
Roa
d (A
DR
) , 1
957
Pro
toco
l to
AD
R, 1
993
Lia
bil.
Dan
g. G
oods
(C
RT
D)
, 198
9
Dan
g. G
oods
by
Inla
nd W
ater
way
s (A
DN
), 2
000
Per
isha
ble
Foo
dstu
ffs (
AT
P),
197
0
Dangerous goods
&
Infrastructure networks
Road traffic and road safety Vehicles Other Legal Instruments
Related to Road Transport
Inland navigation Border crossing facilitation
special cargoes
1 2 3 4 5 6 7 8 9 10 11 12 13 14 15 16 17 18 19 20 21 22 23 24 25 26 27 28 29 30 31 32 33 34 35 36 37 38 39 40 41 42 43 44 45 46 47 48 49 50 51 52 53 54 55 56 57
Cameroon X
Central African Republic X X X X X X
Chile X S X X X X X
China X1/ S1/ S1/ X X
Congo X
Costa Rica S S X X X
Côte d'Ivoire X X X
Cuba X X X X X X X X X X X X X X X
Democratic Rep. of the Congo X X X
Dominican Republic X X S S
Ecuador X S X S X X X

117
Con
stru
ctio
n T
raffi
c A
rter
ies,
195
0
E R
oad
Net
wor
k (A
GR
), 1
975
E R
ail N
etw
ork
(AG
C),
198
5
E C
omb.
Tr.
Net
wor
k (A
GT
C),
199
1
Pro
toco
l Inl
. Nav
. to
AG
TC
, 199
7
E In
l. W
ater
Net
wor
k (A
GN
), 1
996
Roa
d T
raffi
c, 1
949
Roa
d T
raffi
c, 1
968
Pro
toca
l on
Roa
d S
igns
& S
igna
ls, 1
949
Roa
d S
igns
& S
igna
ls, 1
968
Sup
pl. 1
968
Con
vent
ion
Roa
d T
raffi
c, 1
971
Sup
pl.1
968
Con
v. R
oad
Sig
ns &
Sig
nals
, 19
71
Wei
ghts
and
Dim
ensi
ons,
195
0
Sup
pl. 1
949
Con
v. a
nd P
roto
col,
1950
Roa
d M
arki
ngs,
195
7
Pro
toco
l Roa
d M
arki
ngs,
197
3
Issu
e an
d V
alid
ity o
f Driv
ing
Per
mits
(A
PC
)
Veh
icle
s R
egul
atio
ns, 1
958
Tec
hn. I
nspe
ct. V
ehic
les,
199
7
Glo
bal V
ehic
les
Reg
ulat
ions
, 19
98
Wor
k of
Cre
ws
Int.
Roa
d T
rans
port
(A
ET
R),
197
0
Tax
atio
n P
riv. R
oad
Veh
ic. ,
195
6
Tax
atio
n R
oad
Pas
seng
er V
ehic
. , 1
956
Tax
atio
n R
oad
Goo
ds. V
ehic
. , 1
956
Con
trac
t Roa
d G
oods
Tra
nspo
rt (
CM
R)
,195
6 P
roto
col t
o C
MR
, 197
8 A
dd'l
Pro
toco
l to
CM
R,
(e-C
MR
) 20
08
Con
trac
t Pas
s. &
Lug
g. R
d. T
rans
p. (
CV
R)
, 197
3 P
roto
col t
o C
VR
, 197
8 E
con.
Reg
ulat
. Roa
d T
rans
p. ,
1954
C
ollis
ion
Inl.
Nav
. , 1
960
Reg
istr
. Inl
. Nav
. Ves
sels
, 196
5 M
easu
rem
ent I
nl. N
av. V
esse
ls, 1
966
Lia
bilit
y V
esse
l Ow
ners
(C
LN),
197
3 P
roto
col t
o C
LN, 1
978
Con
trac
t Inl
. Nav
. Pas
s. &
Lug
g. (
CV
N)
, 197
6 P
roto
col t
o C
VN
, 197
8 T
ourin
g F
acili
ties,
195
4 P
roto
col T
ourin
g F
acili
ties,
195
4 T
emp.
Impo
rt. P
riv. R
oad
Veh
icle
s, 1
954
TIR
Con
vent
ion,
195
9 T
IR C
onve
ntio
n, 1
975
Tem
p. Im
port
.Airc
raft
& B
oats
, 195
6 T
emp.
Impo
rt. C
omm
erc.
Veh
icle
s, 1
956
Cro
ss. F
ront
. Pas
s. B
agg.
Rai
l, 19
52
Cro
ss. F
ront
. Goo
ds R
ail,
1952
S
pare
Par
ts E
urop
Wag
ons,
195
8 C
usto
ms
Con
tain
er C
onve
ntio
n, 1
956
Cus
tom
s C
onta
iner
Con
vent
ion,
197
2 C
usto
ms
Tre
atm
ent
Pal
lets
, 196
0 H
arm
oniz
. Fro
ntie
r C
ontr
ols
Goo
ds, 1
982
Cus
tom
s P
ool C
onta
iner
s, 1
994
Dan
g. G
oods
by
Roa
d (A
DR
) , 1
957
Pro
toco
l to
AD
R, 1
993
Lia
bil.
Dan
g. G
oods
(C
RT
D)
, 198
9
Dan
g. G
oods
by
Inla
nd W
ater
way
s (A
DN
), 2
000
Per
isha
ble
Foo
dstu
ffs (
AT
P),
197
0
Dangerous goods
&
Infrastructure networks
Road traffic and road safety Vehicles Other Legal Instruments
Related to Road Transport
Inland navigation Border crossing facilitation
special cargoes
1 2 3 4 5 6 7 8 9 10 11 12 13 14 15 16 17 18 19 20 21 22 23 24 25 26 27 28 29 30 31 32 33 34 35 36 37 38 39 40 41 42 43 44 45 46 47 48 49 50 51 52 53 54 55 56 57
Egypt X X X X X
El Salvador X X X
Fiji X X X X
Ghana X S S X X X X X X X
Guatemala X S S
Guyana X X
Haiti X X X X X
Holy See X S X S X S S S
Honduras S S S
India X S X X X X X
Indonesia S S X X
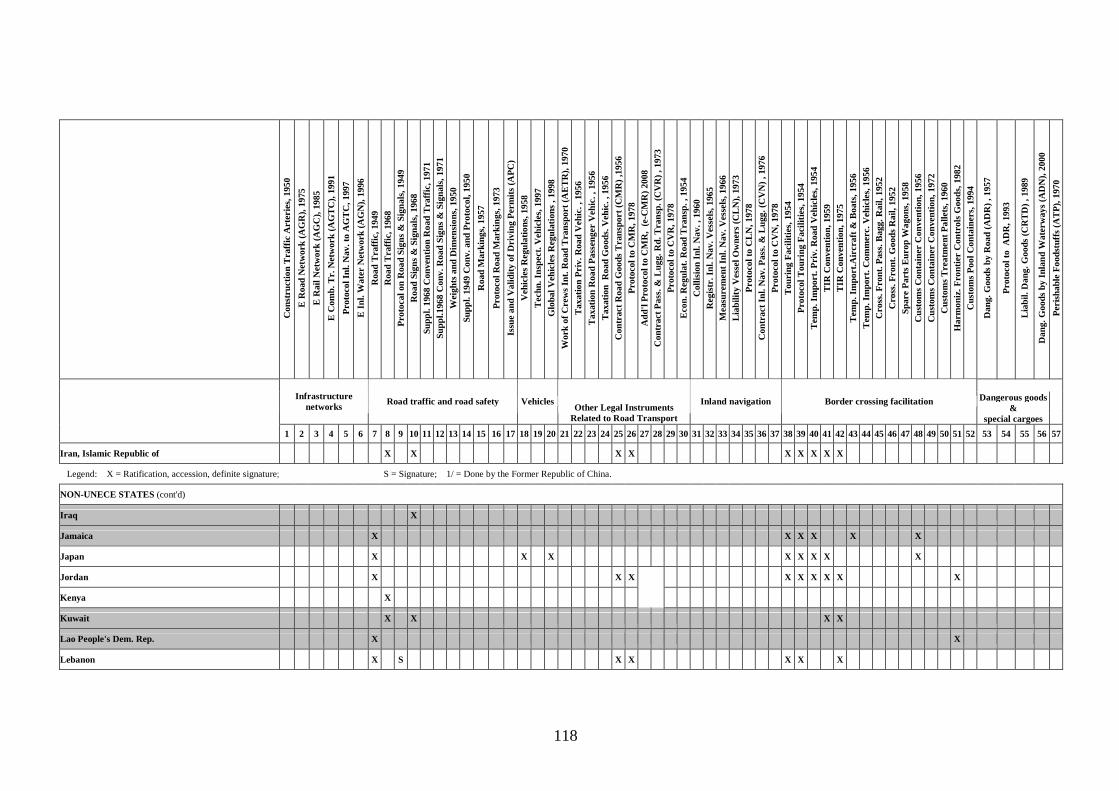
118
Con
stru
ctio
n T
raffi
c A
rter
ies,
195
0
E R
oad
Net
wor
k (A
GR
), 1
975
E R
ail N
etw
ork
(AG
C),
198
5
E C
omb.
Tr.
Net
wor
k (A
GT
C),
199
1
Pro
toco
l Inl
. Nav
. to
AG
TC
, 199
7
E In
l. W
ater
Net
wor
k (A
GN
), 1
996
Roa
d T
raffi
c, 1
949
Roa
d T
raffi
c, 1
968
Pro
toca
l on
Roa
d S
igns
& S
igna
ls, 1
949
Roa
d S
igns
& S
igna
ls, 1
968
Sup
pl. 1
968
Con
vent
ion
Roa
d T
raffi
c, 1
971
Sup
pl.1
968
Con
v. R
oad
Sig
ns &
Sig
nals
, 19
71
Wei
ghts
and
Dim
ensi
ons,
195
0
Sup
pl. 1
949
Con
v. a
nd P
roto
col,
1950
Roa
d M
arki
ngs,
195
7
Pro
toco
l Roa
d M
arki
ngs,
197
3
Issu
e an
d V
alid
ity o
f Driv
ing
Per
mits
(A
PC
)
Veh
icle
s R
egul
atio
ns, 1
958
Tec
hn. I
nspe
ct. V
ehic
les,
199
7
Glo
bal V
ehic
les
Reg
ulat
ions
, 19
98
Wor
k of
Cre
ws
Int.
Roa
d T
rans
port
(A
ET
R),
197
0
Tax
atio
n P
riv. R
oad
Veh
ic. ,
195
6
Tax
atio
n R
oad
Pas
seng
er V
ehic
. , 1
956
Tax
atio
n R
oad
Goo
ds. V
ehic
. , 1
956
Con
trac
t Roa
d G
oods
Tra
nspo
rt (
CM
R)
,195
6 P
roto
col t
o C
MR
, 197
8 A
dd'l
Pro
toco
l to
CM
R,
(e-C
MR
) 20
08
Con
trac
t Pas
s. &
Lug
g. R
d. T
rans
p. (
CV
R)
, 197
3 P
roto
col t
o C
VR
, 197
8 E
con.
Reg
ulat
. Roa
d T
rans
p. ,
1954
C
ollis
ion
Inl.
Nav
. , 1
960
Reg
istr
. Inl
. Nav
. Ves
sels
, 196
5 M
easu
rem
ent I
nl. N
av. V
esse
ls, 1
966
Lia
bilit
y V
esse
l Ow
ners
(C
LN),
197
3 P
roto
col t
o C
LN, 1
978
Con
trac
t Inl
. Nav
. Pas
s. &
Lug
g. (
CV
N)
, 197
6 P
roto
col t
o C
VN
, 197
8 T
ourin
g F
acili
ties,
195
4 P
roto
col T
ourin
g F
acili
ties,
195
4 T
emp.
Impo
rt. P
riv. R
oad
Veh
icle
s, 1
954
TIR
Con
vent
ion,
195
9 T
IR C
onve
ntio
n, 1
975
Tem
p. Im
port
.Airc
raft
& B
oats
, 195
6 T
emp.
Impo
rt. C
omm
erc.
Veh
icle
s, 1
956
Cro
ss. F
ront
. Pas
s. B
agg.
Rai
l, 19
52
Cro
ss. F
ront
. Goo
ds R
ail,
1952
S
pare
Par
ts E
urop
Wag
ons,
195
8 C
usto
ms
Con
tain
er C
onve
ntio
n, 1
956
Cus
tom
s C
onta
iner
Con
vent
ion,
197
2 C
usto
ms
Tre
atm
ent
Pal
lets
, 196
0 H
arm
oniz
. Fro
ntie
r C
ontr
ols
Goo
ds, 1
982
Cus
tom
s P
ool C
onta
iner
s, 1
994
Dan
g. G
oods
by
Roa
d (A
DR
) , 1
957
Pro
toco
l to
AD
R, 1
993
Lia
bil.
Dan
g. G
oods
(C
RT
D)
, 198
9
Dan
g. G
oods
by
Inla
nd W
ater
way
s (A
DN
), 2
000
Per
isha
ble
Foo
dstu
ffs (
AT
P),
197
0
Dangerous goods
&
Infrastructure networks
Road traffic and road safety Vehicles Other Legal Instruments
Related to Road Transport
Inland navigation Border crossing facilitation
special cargoes
1 2 3 4 5 6 7 8 9 10 11 12 13 14 15 16 17 18 19 20 21 22 23 24 25 26 27 28 29 30 31 32 33 34 35 36 37 38 39 40 41 42 43 44 45 46 47 48 49 50 51 52 53 54 55 56 57
Iran, Islamic Republic of X X X X X X X X X
Legend: X = Ratification, accession, definite signature; S = Signature; 1/ = Done by the Former Republic of China.
NON-UNECE STATES (cont'd)
Iraq X
Jamaica X X X X X X
Japan X X X X X X X X
Jordan X X X X X X X X X
Kenya X
Kuwait X X X X
Lao People's Dem. Rep. X X
Lebanon X S X X X X X

119
Con
stru
ctio
n T
raffi
c A
rter
ies,
195
0
E R
oad
Net
wor
k (A
GR
), 1
975
E R
ail N
etw
ork
(AG
C),
198
5
E C
omb.
Tr.
Net
wor
k (A
GT
C),
199
1
Pro
toco
l Inl
. Nav
. to
AG
TC
, 199
7
E In
l. W
ater
Net
wor
k (A
GN
), 1
996
Roa
d T
raffi
c, 1
949
Roa
d T
raffi
c, 1
968
Pro
toca
l on
Roa
d S
igns
& S
igna
ls, 1
949
Roa
d S
igns
& S
igna
ls, 1
968
Sup
pl. 1
968
Con
vent
ion
Roa
d T
raffi
c, 1
971
Sup
pl.1
968
Con
v. R
oad
Sig
ns &
Sig
nals
, 19
71
Wei
ghts
and
Dim
ensi
ons,
195
0
Sup
pl. 1
949
Con
v. a
nd P
roto
col,
1950
Roa
d M
arki
ngs,
195
7
Pro
toco
l Roa
d M
arki
ngs,
197
3
Issu
e an
d V
alid
ity o
f Driv
ing
Per
mits
(A
PC
)
Veh
icle
s R
egul
atio
ns, 1
958
Tec
hn. I
nspe
ct. V
ehic
les,
199
7
Glo
bal V
ehic
les
Reg
ulat
ions
, 19
98
Wor
k of
Cre
ws
Int.
Roa
d T
rans
port
(A
ET
R),
197
0
Tax
atio
n P
riv. R
oad
Veh
ic. ,
195
6
Tax
atio
n R
oad
Pas
seng
er V
ehic
. , 1
956
Tax
atio
n R
oad
Goo
ds. V
ehic
. , 1
956
Con
trac
t Roa
d G
oods
Tra
nspo
rt (
CM
R)
,195
6 P
roto
col t
o C
MR
, 197
8 A
dd'l
Pro
toco
l to
CM
R,
(e-C
MR
) 20
08
Con
trac
t Pas
s. &
Lug
g. R
d. T
rans
p. (
CV
R)
, 197
3 P
roto
col t
o C
VR
, 197
8 E
con.
Reg
ulat
. Roa
d T
rans
p. ,
1954
C
ollis
ion
Inl.
Nav
. , 1
960
Reg
istr
. Inl
. Nav
. Ves
sels
, 196
5 M
easu
rem
ent I
nl. N
av. V
esse
ls, 1
966
Lia
bilit
y V
esse
l Ow
ners
(C
LN),
197
3 P
roto
col t
o C
LN, 1
978
Con
trac
t Inl
. Nav
. Pas
s. &
Lug
g. (
CV
N)
, 197
6 P
roto
col t
o C
VN
, 197
8 T
ourin
g F
acili
ties,
195
4 P
roto
col T
ourin
g F
acili
ties,
195
4 T
emp.
Impo
rt. P
riv. R
oad
Veh
icle
s, 1
954
TIR
Con
vent
ion,
195
9 T
IR C
onve
ntio
n, 1
975
Tem
p. Im
port
.Airc
raft
& B
oats
, 195
6 T
emp.
Impo
rt. C
omm
erc.
Veh
icle
s, 1
956
Cro
ss. F
ront
. Pas
s. B
agg.
Rai
l, 19
52
Cro
ss. F
ront
. Goo
ds R
ail,
1952
S
pare
Par
ts E
urop
Wag
ons,
195
8 C
usto
ms
Con
tain
er C
onve
ntio
n, 1
956
Cus
tom
s C
onta
iner
Con
vent
ion,
197
2 C
usto
ms
Tre
atm
ent
Pal
lets
, 196
0 H
arm
oniz
. Fro
ntie
r C
ontr
ols
Goo
ds, 1
982
Cus
tom
s P
ool C
onta
iner
s, 1
994
Dan
g. G
oods
by
Roa
d (A
DR
) , 1
957
Pro
toco
l to
AD
R, 1
993
Lia
bil.
Dan
g. G
oods
(C
RT
D)
, 198
9
Dan
g. G
oods
by
Inla
nd W
ater
way
s (A
DN
), 2
000
Per
isha
ble
Foo
dstu
ffs (
AT
P),
197
0
Dangerous goods
&
Infrastructure networks
Road traffic and road safety Vehicles Other Legal Instruments
Related to Road Transport
Inland navigation Border crossing facilitation
special cargoes
1 2 3 4 5 6 7 8 9 10 11 12 13 14 15 16 17 18 19 20 21 22 23 24 25 26 27 28 29 30 31 32 33 34 35 36 37 38 39 40 41 42 43 44 45 46 47 48 49 50 51 52 53 54 55 56 57
Lesotho X X
Liberia X X X X X X X X X X
Madagascar X
Malawi X X
Malaysia X X X X X X
Mali X X X X
Mauritius X X X X X
Mexico S S X X X
Mongolia X X X X X
Morocco X X X X X X X X X X X X X S X
Namibia X

120
Con
stru
ctio
n T
raffi
c A
rter
ies,
195
0
E R
oad
Net
wor
k (A
GR
), 1
975
E R
ail N
etw
ork
(AG
C),
198
5
E C
omb.
Tr.
Net
wor
k (A
GT
C),
199
1
Pro
toco
l Inl
. Nav
. to
AG
TC
, 199
7
E In
l. W
ater
Net
wor
k (A
GN
), 1
996
Roa
d T
raffi
c, 1
949
Roa
d T
raffi
c, 1
968
Pro
toca
l on
Roa
d S
igns
& S
igna
ls, 1
949
Roa
d S
igns
& S
igna
ls, 1
968
Sup
pl. 1
968
Con
vent
ion
Roa
d T
raffi
c, 1
971
Sup
pl.1
968
Con
v. R
oad
Sig
ns &
Sig
nals
, 19
71
Wei
ghts
and
Dim
ensi
ons,
195
0
Sup
pl. 1
949
Con
v. a
nd P
roto
col,
1950
Roa
d M
arki
ngs,
195
7
Pro
toco
l Roa
d M
arki
ngs,
197
3
Issu
e an
d V
alid
ity o
f Driv
ing
Per
mits
(A
PC
)
Veh
icle
s R
egul
atio
ns, 1
958
Tec
hn. I
nspe
ct. V
ehic
les,
199
7
Glo
bal V
ehic
les
Reg
ulat
ions
, 19
98
Wor
k of
Cre
ws
Int.
Roa
d T
rans
port
(A
ET
R),
197
0
Tax
atio
n P
riv. R
oad
Veh
ic. ,
195
6
Tax
atio
n R
oad
Pas
seng
er V
ehic
. , 1
956
Tax
atio
n R
oad
Goo
ds. V
ehic
. , 1
956
Con
trac
t Roa
d G
oods
Tra
nspo
rt (
CM
R)
,195
6 P
roto
col t
o C
MR
, 197
8 A
dd'l
Pro
toco
l to
CM
R,
(e-C
MR
) 20
08
Con
trac
t Pas
s. &
Lug
g. R
d. T
rans
p. (
CV
R)
, 197
3 P
roto
col t
o C
VR
, 197
8 E
con.
Reg
ulat
. Roa
d T
rans
p. ,
1954
C
ollis
ion
Inl.
Nav
. , 1
960
Reg
istr
. Inl
. Nav
. Ves
sels
, 196
5 M
easu
rem
ent I
nl. N
av. V
esse
ls, 1
966
Lia
bilit
y V
esse
l Ow
ners
(C
LN),
197
3 P
roto
col t
o C
LN, 1
978
Con
trac
t Inl
. Nav
. Pas
s. &
Lug
g. (
CV
N)
, 197
6 P
roto
col t
o C
VN
, 197
8 T
ourin
g F
acili
ties,
195
4 P
roto
col T
ourin
g F
acili
ties,
195
4 T
emp.
Impo
rt. P
riv. R
oad
Veh
icle
s, 1
954
TIR
Con
vent
ion,
195
9 T
IR C
onve
ntio
n, 1
975
Tem
p. Im
port
.Airc
raft
& B
oats
, 195
6 T
emp.
Impo
rt. C
omm
erc.
Veh
icle
s, 1
956
Cro
ss. F
ront
. Pas
s. B
agg.
Rai
l, 19
52
Cro
ss. F
ront
. Goo
ds R
ail,
1952
S
pare
Par
ts E
urop
Wag
ons,
195
8 C
usto
ms
Con
tain
er C
onve
ntio
n, 1
956
Cus
tom
s C
onta
iner
Con
vent
ion,
197
2 C
usto
ms
Tre
atm
ent
Pal
lets
, 196
0 H
arm
oniz
. Fro
ntie
r C
ontr
ols
Goo
ds, 1
982
Cus
tom
s P
ool C
onta
iner
s, 1
994
Dan
g. G
oods
by
Roa
d (A
DR
) , 1
957
Pro
toco
l to
AD
R, 1
993
Lia
bil.
Dan
g. G
oods
(C
RT
D)
, 198
9
Dan
g. G
oods
by
Inla
nd W
ater
way
s (A
DN
), 2
000
Per
isha
ble
Foo
dstu
ffs (
AT
P),
197
0
Dangerous goods
&
Infrastructure networks
Road traffic and road safety Vehicles Other Legal Instruments
Related to Road Transport
Inland navigation Border crossing facilitation
special cargoes
1 2 3 4 5 6 7 8 9 10 11 12 13 14 15 16 17 18 19 20 21 22 23 24 25 26 27 28 29 30 31 32 33 34 35 36 37 38 39 40 41 42 43 44 45 46 47 48 49 50 51 52 53 54 55 56 57
Nepal X X X
New Zealand X X X X X X X
Niger X X X
Nigeria X X X
Pakistan X X
Panama S S S
Papua New Guinea X
Paraguay X
Peru X X X X X
Philippines X X X X X X
Republic of Korea X S S X X X X

121
Con
stru
ctio
n T
raffi
c A
rter
ies,
195
0
E R
oad
Net
wor
k (A
GR
), 1
975
E R
ail N
etw
ork
(AG
C),
198
5
E C
omb.
Tr.
Net
wor
k (A
GT
C),
199
1
Pro
toco
l Inl
. Nav
. to
AG
TC
, 199
7
E In
l. W
ater
Net
wor
k (A
GN
), 1
996
Roa
d T
raffi
c, 1
949
Roa
d T
raffi
c, 1
968
Pro
toca
l on
Roa
d S
igns
& S
igna
ls, 1
949
Roa
d S
igns
& S
igna
ls, 1
968
Sup
pl. 1
968
Con
vent
ion
Roa
d T
raffi
c, 1
971
Sup
pl.1
968
Con
v. R
oad
Sig
ns &
Sig
nals
, 19
71
Wei
ghts
and
Dim
ensi
ons,
195
0
Sup
pl. 1
949
Con
v. a
nd P
roto
col,
1950
Roa
d M
arki
ngs,
195
7
Pro
toco
l Roa
d M
arki
ngs,
197
3
Issu
e an
d V
alid
ity o
f Driv
ing
Per
mits
(A
PC
)
Veh
icle
s R
egul
atio
ns, 1
958
Tec
hn. I
nspe
ct. V
ehic
les,
199
7
Glo
bal V
ehic
les
Reg
ulat
ions
, 19
98
Wor
k of
Cre
ws
Int.
Roa
d T
rans
port
(A
ET
R),
197
0
Tax
atio
n P
riv. R
oad
Veh
ic. ,
195
6
Tax
atio
n R
oad
Pas
seng
er V
ehic
. , 1
956
Tax
atio
n R
oad
Goo
ds. V
ehic
. , 1
956
Con
trac
t Roa
d G
oods
Tra
nspo
rt (
CM
R)
,195
6 P
roto
col t
o C
MR
, 197
8 A
dd'l
Pro
toco
l to
CM
R,
(e-C
MR
) 20
08
Con
trac
t Pas
s. &
Lug
g. R
d. T
rans
p. (
CV
R)
, 197
3 P
roto
col t
o C
VR
, 197
8 E
con.
Reg
ulat
. Roa
d T
rans
p. ,
1954
C
ollis
ion
Inl.
Nav
. , 1
960
Reg
istr
. Inl
. Nav
. Ves
sels
, 196
5 M
easu
rem
ent I
nl. N
av. V
esse
ls, 1
966
Lia
bilit
y V
esse
l Ow
ners
(C
LN),
197
3 P
roto
col t
o C
LN, 1
978
Con
trac
t Inl
. Nav
. Pas
s. &
Lug
g. (
CV
N)
, 197
6 P
roto
col t
o C
VN
, 197
8 T
ourin
g F
acili
ties,
195
4 P
roto
col T
ourin
g F
acili
ties,
195
4 T
emp.
Impo
rt. P
riv. R
oad
Veh
icle
s, 1
954
TIR
Con
vent
ion,
195
9 T
IR C
onve
ntio
n, 1
975
Tem
p. Im
port
.Airc
raft
& B
oats
, 195
6 T
emp.
Impo
rt. C
omm
erc.
Veh
icle
s, 1
956
Cro
ss. F
ront
. Pas
s. B
agg.
Rai
l, 19
52
Cro
ss. F
ront
. Goo
ds R
ail,
1952
S
pare
Par
ts E
urop
Wag
ons,
195
8 C
usto
ms
Con
tain
er C
onve
ntio
n, 1
956
Cus
tom
s C
onta
iner
Con
vent
ion,
197
2 C
usto
ms
Tre
atm
ent
Pal
lets
, 196
0 H
arm
oniz
. Fro
ntie
r C
ontr
ols
Goo
ds, 1
982
Cus
tom
s P
ool C
onta
iner
s, 1
994
Dan
g. G
oods
by
Roa
d (A
DR
) , 1
957
Pro
toco
l to
AD
R, 1
993
Lia
bil.
Dan
g. G
oods
(C
RT
D)
, 198
9
Dan
g. G
oods
by
Inla
nd W
ater
way
s (A
DN
), 2
000
Per
isha
ble
Foo
dstu
ffs (
AT
P),
197
0
Dangerous goods
&
Infrastructure networks
Road traffic and road safety Vehicles Other Legal Instruments
Related to Road Transport
Inland navigation Border crossing facilitation
special cargoes
1 2 3 4 5 6 7 8 9 10 11 12 13 14 15 16 17 18 19 20 21 22 23 24 25 26 27 28 29 30 31 32 33 34 35 36 37 38 39 40 41 42 43 44 45 46 47 48 49 50 51 52 53 54 55 56 57
Legend: X = Ratification, accession, definite signature; S = Signature;
NON-UNECE STATES (cont'd)
Rwanda X X X X X
Saudi Arabia X X X
Senegal X X X X X X X
Seychelles X X
Sierra Leone X X X X X X X
Singapore X X X X
Solomon Islands X X X X X
South Africa X X X X X
Sudan X

122
Con
stru
ctio
n T
raffi
c A
rter
ies,
195
0
E R
oad
Net
wor
k (A
GR
), 1
975
E R
ail N
etw
ork
(AG
C),
198
5
E C
omb.
Tr.
Net
wor
k (A
GT
C),
199
1
Pro
toco
l Inl
. Nav
. to
AG
TC
, 199
7
E In
l. W
ater
Net
wor
k (A
GN
), 1
996
Roa
d T
raffi
c, 1
949
Roa
d T
raffi
c, 1
968
Pro
toca
l on
Roa
d S
igns
& S
igna
ls, 1
949
Roa
d S
igns
& S
igna
ls, 1
968
Sup
pl. 1
968
Con
vent
ion
Roa
d T
raffi
c, 1
971
Sup
pl.1
968
Con
v. R
oad
Sig
ns &
Sig
nals
, 19
71
Wei
ghts
and
Dim
ensi
ons,
195
0
Sup
pl. 1
949
Con
v. a
nd P
roto
col,
1950
Roa
d M
arki
ngs,
195
7
Pro
toco
l Roa
d M
arki
ngs,
197
3
Issu
e an
d V
alid
ity o
f Driv
ing
Per
mits
(A
PC
)
Veh
icle
s R
egul
atio
ns, 1
958
Tec
hn. I
nspe
ct. V
ehic
les,
199
7
Glo
bal V
ehic
les
Reg
ulat
ions
, 19
98
Wor
k of
Cre
ws
Int.
Roa
d T
rans
port
(A
ET
R),
197
0
Tax
atio
n P
riv. R
oad
Veh
ic. ,
195
6
Tax
atio
n R
oad
Pas
seng
er V
ehic
. , 1
956
Tax
atio
n R
oad
Goo
ds. V
ehic
. , 1
956
Con
trac
t Roa
d G
oods
Tra
nspo
rt (
CM
R)
,195
6 P
roto
col t
o C
MR
, 197
8 A
dd'l
Pro
toco
l to
CM
R,
(e-C
MR
) 20
08
Con
trac
t Pas
s. &
Lug
g. R
d. T
rans
p. (
CV
R)
, 197
3 P
roto
col t
o C
VR
, 197
8 E
con.
Reg
ulat
. Roa
d T
rans
p. ,
1954
C
ollis
ion
Inl.
Nav
. , 1
960
Reg
istr
. Inl
. Nav
. Ves
sels
, 196
5 M
easu
rem
ent I
nl. N
av. V
esse
ls, 1
966
Lia
bilit
y V
esse
l Ow
ners
(C
LN),
197
3 P
roto
col t
o C
LN, 1
978
Con
trac
t Inl
. Nav
. Pas
s. &
Lug
g. (
CV
N)
, 197
6 P
roto
col t
o C
VN
, 197
8 T
ourin
g F
acili
ties,
195
4 P
roto
col T
ourin
g F
acili
ties,
195
4 T
emp.
Impo
rt. P
riv. R
oad
Veh
icle
s, 1
954
TIR
Con
vent
ion,
195
9 T
IR C
onve
ntio
n, 1
975
Tem
p. Im
port
.Airc
raft
& B
oats
, 195
6 T
emp.
Impo
rt. C
omm
erc.
Veh
icle
s, 1
956
Cro
ss. F
ront
. Pas
s. B
agg.
Rai
l, 19
52
Cro
ss. F
ront
. Goo
ds R
ail,
1952
S
pare
Par
ts E
urop
Wag
ons,
195
8 C
usto
ms
Con
tain
er C
onve
ntio
n, 1
956
Cus
tom
s C
onta
iner
Con
vent
ion,
197
2 C
usto
ms
Tre
atm
ent
Pal
lets
, 196
0 H
arm
oniz
. Fro
ntie
r C
ontr
ols
Goo
ds, 1
982
Cus
tom
s P
ool C
onta
iner
s, 1
994
Dan
g. G
oods
by
Roa
d (A
DR
) , 1
957
Pro
toco
l to
AD
R, 1
993
Lia
bil.
Dan
g. G
oods
(C
RT
D)
, 198
9
Dan
g. G
oods
by
Inla
nd W
ater
way
s (A
DN
), 2
000
Per
isha
ble
Foo
dstu
ffs (
AT
P),
197
0
Dangerous goods
&
Infrastructure networks
Road traffic and road safety Vehicles Other Legal Instruments
Related to Road Transport
Inland navigation Border crossing facilitation
special cargoes
1 2 3 4 5 6 7 8 9 10 11 12 13 14 15 16 17 18 19 20 21 22 23 24 25 26 27 28 29 30 31 32 33 34 35 36 37 38 39 40 41 42 43 44 45 46 47 48 49 50 51 52 53 54 55 56 57
Sri Lanka X X X
Syrian Arab Republic X X X X X X
Thailand X S X S X
Togo X
Tonga X X X
Trinidad and Tobago X X X X X X X
Tunisia X X X X X X X X X X X X X X X X
Uganda X X X X X S
United Arab Emirates X X X X X
United Rep. of Tanzania X X X
Uruguay X X S X

123
Con
stru
ctio
n T
raffi
c A
rter
ies,
195
0
E R
oad
Net
wor
k (A
GR
), 1
975
E R
ail N
etw
ork
(AG
C),
198
5
E C
omb.
Tr.
Net
wor
k (A
GT
C),
199
1
Pro
toco
l Inl
. Nav
. to
AG
TC
, 199
7
E In
l. W
ater
Net
wor
k (A
GN
), 1
996
Roa
d T
raffi
c, 1
949
Roa
d T
raffi
c, 1
968
Pro
toca
l on
Roa
d S
igns
& S
igna
ls, 1
949
Roa
d S
igns
& S
igna
ls, 1
968
Sup
pl. 1
968
Con
vent
ion
Roa
d T
raffi
c, 1
971
Sup
pl.1
968
Con
v. R
oad
Sig
ns &
Sig
nals
, 19
71
Wei
ghts
and
Dim
ensi
ons,
195
0
Sup
pl. 1
949
Con
v. a
nd P
roto
col,
1950
Roa
d M
arki
ngs,
195
7
Pro
toco
l Roa
d M
arki
ngs,
197
3
Issu
e an
d V
alid
ity o
f Driv
ing
Per
mits
(A
PC
)
Veh
icle
s R
egul
atio
ns, 1
958
Tec
hn. I
nspe
ct. V
ehic
les,
199
7
Glo
bal V
ehic
les
Reg
ulat
ions
, 19
98
Wor
k of
Cre
ws
Int.
Roa
d T
rans
port
(A
ET
R),
197
0
Tax
atio
n P
riv. R
oad
Veh
ic. ,
195
6
Tax
atio
n R
oad
Pas
seng
er V
ehic
. , 1
956
Tax
atio
n R
oad
Goo
ds. V
ehic
. , 1
956
Con
trac
t Roa
d G
oods
Tra
nspo
rt (
CM
R)
,195
6 P
roto
col t
o C
MR
, 197
8 A
dd'l
Pro
toco
l to
CM
R,
(e-C
MR
) 20
08
Con
trac
t Pas
s. &
Lug
g. R
d. T
rans
p. (
CV
R)
, 197
3 P
roto
col t
o C
VR
, 197
8 E
con.
Reg
ulat
. Roa
d T
rans
p. ,
1954
C
ollis
ion
Inl.
Nav
. , 1
960
Reg
istr
. Inl
. Nav
. Ves
sels
, 196
5 M
easu
rem
ent I
nl. N
av. V
esse
ls, 1
966
Lia
bilit
y V
esse
l Ow
ners
(C
LN),
197
3 P
roto
col t
o C
LN, 1
978
Con
trac
t Inl
. Nav
. Pas
s. &
Lug
g. (
CV
N)
, 197
6 P
roto
col t
o C
VN
, 197
8 T
ourin
g F
acili
ties,
195
4 P
roto
col T
ourin
g F
acili
ties,
195
4 T
emp.
Impo
rt. P
riv. R
oad
Veh
icle
s, 1
954
TIR
Con
vent
ion,
195
9 T
IR C
onve
ntio
n, 1
975
Tem
p. Im
port
.Airc
raft
& B
oats
, 195
6 T
emp.
Impo
rt. C
omm
erc.
Veh
icle
s, 1
956
Cro
ss. F
ront
. Pas
s. B
agg.
Rai
l, 19
52
Cro
ss. F
ront
. Goo
ds R
ail,
1952
S
pare
Par
ts E
urop
Wag
ons,
195
8 C
usto
ms
Con
tain
er C
onve
ntio
n, 1
956
Cus
tom
s C
onta
iner
Con
vent
ion,
197
2 C
usto
ms
Tre
atm
ent
Pal
lets
, 196
0 H
arm
oniz
. Fro
ntie
r C
ontr
ols
Goo
ds, 1
982
Cus
tom
s P
ool C
onta
iner
s, 1
994
Dan
g. G
oods
by
Roa
d (A
DR
) , 1
957
Pro
toco
l to
AD
R, 1
993
Lia
bil.
Dan
g. G
oods
(C
RT
D)
, 198
9
Dan
g. G
oods
by
Inla
nd W
ater
way
s (A
DN
), 2
000
Per
isha
ble
Foo
dstu
ffs (
AT
P),
197
0
Dangerous goods
&
Infrastructure networks
Road traffic and road safety Vehicles Other Legal Instruments
Related to Road Transport
Inland navigation Border crossing facilitation
special cargoes
1 2 3 4 5 6 7 8 9 10 11 12 13 14 15 16 17 18 19 20 21 22 23 24 25 26 27 28 29 30 31 32 33 34 35 36 37 38 39 40 41 42 43 44 45 46 47 48 49 50 51 52 53 54 55 56 57
Venezuela X S S
Zimbabwe X X
Legend: X = Ratification, accession, definite signature; S = Signature;
0 0 0 0 0 0 20 9 5 5 0 0 0 0 0 0 0 4 0 3 0 0 0 0 2 1 0 0 0 0 0 0 0 0 0 0 0 14 13 17 0 5 3 3 0 0 0 3 4 0 2 0 1 0 0 0 1
27 37 27 32 9 16 94 69 39 59 33 30 8 14 18 25 7 48 11 31 49 24 20 20 55 40 3 8 1 4 13 9 16 1 0 1 0 78 73 80 37 68 26 41 10 12 9 44 38 30 54 14 46 33 1 13 45
Total: 1650


