Embed Size (px)
Citation preview
EL SECTOR FORESTAL CHILENO 2011Chilean Forestry Sector 2011
INSTITUTO FORESTAL
I N S T I T U T O F O R E S T A L
Contenido/Content
Evolución del Sector Forestal Chileno 1990-2010/Chilean Forest Sector Evolution1990-2010
- Producto Interno Bruto Forestal/Forestry Gross Domestic Product 2- Superficie Anual de Plantaciones Forestales/Forest Plantation Annual Area 2- Consumo de Madera en Trozos/Roundwood Consumption 3- Consumo de Trozos en la Industria Forestal/Industrial Roundwood Consumption 3 - Producción de Madera Aserrada/Sawnwood Production 4- Producción de Pulpa de Madera/Wood Pulp Production 4- Exportaciones de Productos Forestales/Forest Product Exports 5- Exportaciones Forestales de Principales Productos/ 5 Forest Exports of Main Products- Exportaciones Forestales a Principales Países de Destino/ 6 Forest Exports to Main Markets- Exportaciones Forestales de Principales Compañías/ 6 Forest Exports by Main Companies- Precio de Exportación de Pulpa Blanqueada 7 Pino radiata/Export Price of Radiata Pine Bleached Pulp - Precio Interno de Madera en Trozos/Log Domestic Price 7- Precio Interno de Madera Aserrada de Pino Radiata/ 7 Domestic Price of Radiata Pine Sawnwood
El Sector Forestal Chileno en el Contexto Mundial/ 8Chilean Forestry Sector in the World Context
El Sector Forestal Chileno en la Economía Nacional/ 10Chilean Forestry Sector in the National Economy
Recurso Forestal/ 12Forest Resource
Consumo Industrial de Trozas/ 16Industrial Roundwood Consumption
Producción Industrial/ 18Industrial Production
Ocupación Forestal/ 21Forestry Employment
Comercio Exterior Forestal/ 24 Forestry External Trade
Precio de Productos Forestales/ 33 Forest Product Prices
Chile y sus Regiones/ 35Chilean Regions
PresentaciónEl Instituto Forestal, INFOR, ha trabajado por más de 40 años en la generación, acopio, procesamiento, análisis y transferencia de información sobre los recursos forestales del país, su industria y su comercialización. Como resultado, el sector forestal chileno y todos los actores relacionados con él, tanto en el ámbito nacional como internacional, reconocen a INFOR como la institución responsable de las estadísticas sectoriales. De esta manera, el Instituto contribuye al fortalecimiento de la actividad forestal del país y con ello a su desarrollo, y colabora decididamente con la transparencia y el acceso a los mercados.Este documento resume las estadísticas más relevantes de la actividad forestal de Chile, la mayor parte de ellas actualizadas al año 2010. En las primeras páginas se muestra una selección de los principales indicadores forestales y su evolución en los últimos 20 años. Luego se presenta con mayor detalle la participación del sector forestal a nivel nacional e internacional, la extensión del recurso forestal, consumo de madera trozos, producción industrial, empleo, comercio exterior y precios. Finalmente, se presentan mapas regionales del recurso forestal (plantaciones y bosque nativo) y algunas cifras de interés de la región. PrefaceThe Forest Institute, INFOR, has worked for more than 40 years in the generation, collection, processing, analysis and transfer of information on national forest resources, its industry and its marketing. As a result, the chilean forestry sector and all stakeholders related to him, both at the national and international levels, acknowledge the INFOR as the institution responsible for the sectoral statistics. In this way, the Institute contributes to the strengthening of forestry activity and its development in the country and collaborates actively with transparency and market access.This pocketbook summarises the most relevant statistics of Chilean Forestry Sector, most of them updated to year 2010. The first pages shows a selection of key forestry indicators and how they have evolved over the past 20 years. Then are presented in greater detail the participation of the forestry sector to national and international levels, the extent of forest resources, roundwood consumption, industrial production, employment, foreign trade and prices. Finally, regional maps of the forest resource (plantations and native forest) and some figures of interest are presented.
EL SECTOR FORESTAL CHILENO 2011 1
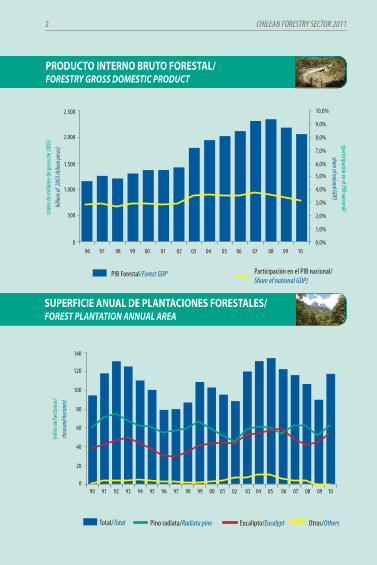
PrODUctO internO BrUtO FOrestaL/fOreSTrY GrOSS DOMeSTIc PrODUcT
2.500
2.000
1.500
1.000
500
0 96 97 98 99 00 01 02 03 04 05 06 07 08 09 10
10,0%
9,0%
8,0%
7,0%
6,0%
5,0%
4,0%
3,0%
2,0%
1,0%
0,0%
(mile
s de m
illone
s de p
esos
de 20
03/
billio
ns of
200
3 chil
ean p
esos
) (participación en el PIB nacional/share of naional GDP)
PIB Forestal/Forest GDP Participación en el PIB nacional/Share of national GDP)
140
120
100
80
60
40
20
0 90 91 92 93 94 95 96 97 98 99 00 01 02 03 04 05 06 07 08 09 10
(mile
s de h
ectá
reas
/th
ousa
nd he
ctares
)
Total/Total Pino radiata/Radiata pine Eucalipto/Eucalypt Otras/Others
sUPerFicie anUaL De PLantaciOnes FOrestaLes/fOreST PLaNTaTION aNNUaL area
CHILEAN FORESTRY SECTOR 20112
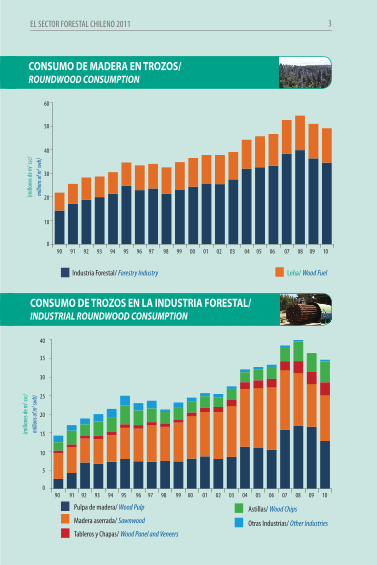
cOnsUMO De MaDera en trOZOs/rOUNDWOOD cONSUMPTION
(millo
nes d
e m3 ss
c/m
illion
s of m
3 swb)
60
50
40
30
20
10
0 90 91 92 93 94 95 96 97 98 99 00 01 02 03 04 05 06 07 08 09 10
Industria Forestal/ Forestry Industry Leña/ Wood Fuel
40
35
30
25
20
15
10
5
0 90 91 92 93 94 95 96 97 98 99 00 01 02 03 04 05 06 07 08 09 10
(millo
nes d
e m3 ss
c/m
illion
s of m
3 swb)
Pulpa de madera/ Wood Pulp
Madera aserrada/ Sawnwood
Tableros y Chapas/ Wood Panel and Veneers
Astillas/ Wood Chips
Otras Industrias/ Other Industries
cOnsUMO De trOZOs en La inDUstria FOrestaL/ INDUSTrIaL rOUNDWOOD cONSUMPTION
EL SECTOR FORESTAL CHILENO 2011 3
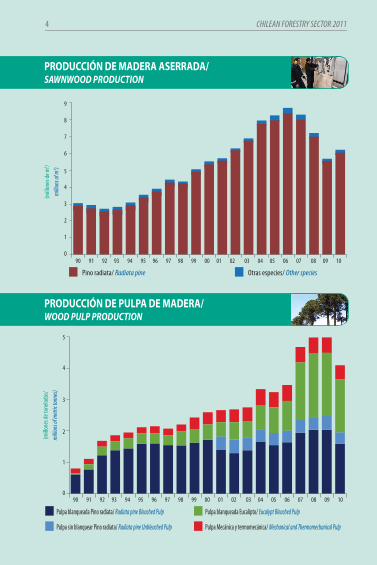
PrODUcción De MaDera aserraDa/SaWNWOOD PrODUcTION
9
8
7
6
5
4
3
2
1
0
(millo
nes d
e m3 /
milli
ons o
f m3 )
90 91 92 93 94 95 96 97 98 99 00 01 02 03 04 05 06 07 08 09 10
Pino radiata/ Radiata pine Otras especies/ Other species
PrODUcción De PULPa De MaDera/WOOD PULP PrODUcTION
(millo
nes d
e ton
elada
s/m
illion
s of m
etric
tonn
es)
90 91 92 93 94 95 96 97 98 99 00 01 02 03 04 05 06 07 08 09 10
5
4
3
2
1
0
Pulpa blanqueada Pino radiata/ Radiata pine Bleached Pulp
Pulpa sin blanquear Pino radiata/ Radiata pine Unbleached Pulp
Pulpa blanqueada Eucalipto/ Eucalypt Bleached Pulp
Pulpa Mecánica y termomecánica/ Mechanical and Thermomechanical Pulp
CHILEAN FORESTRY SECTOR 20114
(US$
millo
nes F
OB/
milli
ons U
SD FO
B)
6.000
5.000
4.000
3.000
2.000
1.000
0 90 91 92 93 94 95 96 97 98 99 00 01 02 03 04 05 06 07 08 09 10
(US$
millo
nes F
OB/
milli
ons U
SD FO
B)
3.000
2.000
1.000
0 90 91 92 93 94 95 96 97 98 99 00 01 02 03 04 05 06 07 08 09 10
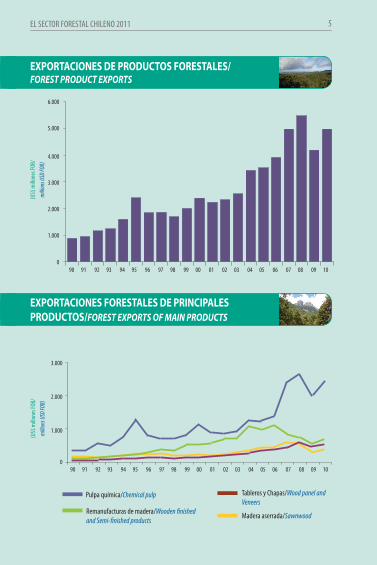
Pulpa química/Chemical pulp
Remanufacturas de madera/Wooden finished and Semi-finished products
Tableros y Chapas/Wood panel and Veneers
Madera aserrada/Sawnwood
eXPOrtaciOnes De PrODUctOs FOrestaLes/fOreST PrODUcT eXPOrTS
eXPOrtaciOnes FOrestaLes De PrinciPaLes PrODUctOs/fOreST eXPOrTS Of MaIN PrODUcTS
EL SECTOR FORESTAL CHILENO 2011 5
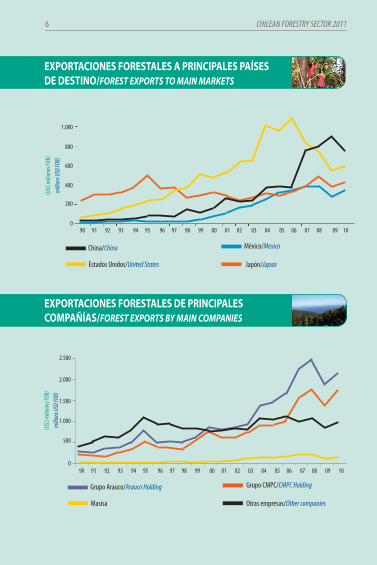
eXPOrtaciOnes FOrestaLes a PrinciPaLes PaÍses De DestinO/fOreST eXPOrTS TO MaIN MarKeTS
(US$
millo
nes F
OB/
milli
ons U
SD FO
B)
1.000
800
600
400
200
0
China/China
Estados Unidos/United States
México/Mexico
Japón/Japan
eXPOrtaciOnes FOrestaLes De PrinciPaLes cOMPaÑÍas/fOreST eXPOrTS BY MaIN cOMPaNIeS
(US$
millo
nes F
OB/
milli
ons U
SD FO
B)
2.500
2.000
1.500
1.000
500
0
Grupo Arauco/Arauco Holding
Masisa
Grupo CMPC/CMPC Holding
Otras empresas/Other companies
90 91 92 93 94 95 96 97 98 99 00 01 02 03 04 05 06 07 08 09 10
90 91 92 93 94 95 96 97 98 99 00 01 02 03 04 05 06 07 08 09 10
CHILEAN FORESTRY SECTOR 20116
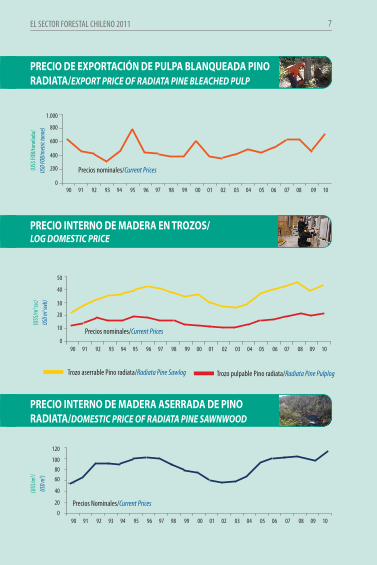
PreciO De eXPOrtación De PULPa BLanQUeaDa PinO raDiata/eXPOrT PrIce Of raDIaTa PINe BLeacHeD PULP
(US$
FOB/
tone
lada/
USD F
OB/m
etric
tonn
e)
1.000
800
600
400
200
0 90 91 92 93 94 95 96 97 98 99 00 01 02 03 04 05 06 07 08 09 10
PreciO internO De MaDera en trOZOs/LOG DOMeSTIc PrIce
90 91 92 93 94 95 96 97 98 99 00 01 02 03 04 05 06 07 08 09 10
(US$
/m3 ssc
/US
D m3 sw
b)
50
40
30
20
10
0
Trozo aserrable Pino radiata/Radiata Pine Sawlog Trozo pulpable Pino radiata/Radiata Pine Pulplog
PreciO internO De MaDera aserraDa De PinO raDiata/DOMeSTIc PrIce Of raDIaTa PINe SaWNWOOD
90 91 92 93 94 95 96 97 98 99 00 01 02 03 04 05 06 07 08 09 10
(US$
/m3 /
USD m
3 )
120
1008060
40
20
0Precios Nominales/Current Prices
Precios nominales/Current Prices
Precios nominales/Current Prices
EL SECTOR FORESTAL CHILENO 2011 7
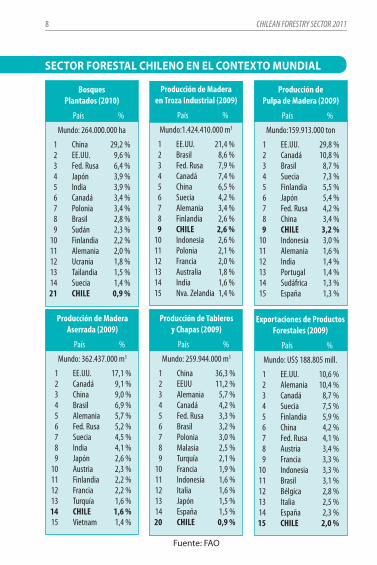
BosquesPlantados (2010)
País %
Mundo: 264.000.000 ha
1 China 29,2 % 2 EE.UU. 9,6 % 3 Fed. Rusa 6,4 % 4 Japón 3,9 % 5 India 3,9 % 6 Canadá 3,4 % 7 Polonia 3,4 % 8 Brasil 2,8 % 9 Sudán 2,3 % 10 Finlandia 2,2 % 11 Alemania 2,0 % 12 Ucrania 1,8 % 13 Tailandia 1,5 % 14 Suecia 1,4 % 21 CHILE 0,9 %
Producción de Maderaen Troza Industrial (2009)
País %
Mundo:1.424.410.000 m3
1 EE.UU. 21,4 % 2 Brasil 8,6 % 3 Fed. Rusa 7,9 % 4 Canadá 7,4 % 5 China 6,5 % 6 Suecia 4,2 % 7 Alemania 3,4 % 8 Finlandia 2,6 % 9 CHILE 2,6 % 10 Indonesia 2,6 % 11 Polonia 2,1 % 12 Francia 2,0 % 13 Australia 1,8 % 14 India 1,6 % 15 Nva. Zelandia 1,4 %
Producción dePulpa de Madera (2009)
País %
Mundo:159.913.000 ton
1 EE.UU. 29,8 % 2 Canadá 10,8 % 3 Brasil 8,7 % 4 Suecia 7,3 % 5 Finlandia 5,5 % 6 Japón 5,4 % 7 Fed. Rusa 4,2 % 8 China 3,4 % 9 CHILE 3,2 % 10 Indonesia 3,0 % 11 Alemania 1,6 % 12 India 1,4 % 13 Portugal 1,4 % 14 Sudáfrica 1,3 % 15 España 1,3 %
Producción de MaderaAserrada (2009)
País %
Mundo: 362.437.000 m3
1 EE.UU. 17,1 % 2 Canadá 9,1 % 3 China 9,0 % 4 Brasil 6,9 % 5 Alemania 5,7 % 6 Fed. Rusa 5,2 % 7 Suecia 4,5 % 8 India 4,1 % 9 Japón 2,6 % 10 Austria 2,3 % 11 Finlandia 2,2 % 12 Francia 2,2 % 13 Turquía 1,6 % 14 CHILE 1,6 % 15 Vietnam 1,4 %
Producción de Tablerosy Chapas (2009)
País %
Mundo: 259.944.000 m3
1 China 36,3 % 2 EEUU 11,2 % 3 Alemania 5,7 % 4 Canadá 4,2 % 5 Fed. Rusa 3,3 % 6 Brasil 3,2 % 7 Polonia 3,0 % 8 Malasia 2,5 % 9 Turquía 2,1 % 10 Francia 1,9 % 11 Indonesia 1,6 % 12 Italia 1,6 % 13 Japón 1,5 % 14 España 1,5 % 20 CHILE 0,9 %
Exportaciones de ProductosForestales (2009)
País %
Mundo: US$ 188.805 mill.
1 EE.UU. 10,6 % 2 Alemania 10,4 % 3 Canadá 8,7 % 4 Suecia 7,5 % 5 Finlandia 5,9 % 6 China 4,2 % 7 Fed. Rusa 4,1 % 8 Austria 3,4 % 9 Francia 3,3 % 10 Indonesia 3,3 % 11 Brasil 3,1 % 12 Bélgica 2,8 % 13 Italia 2,5 % 14 España 2,3 % 15 CHILE 2,0 %
sectOr FOrestaL chiLenO en eL cOnteXtO MUnDiaL
Fuente: FAO
CHILEAN FORESTRY SECTOR 20118
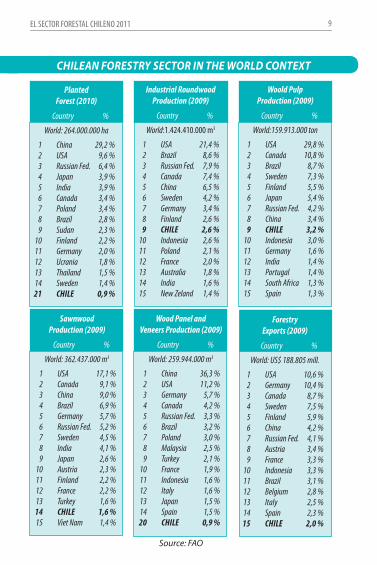
cHILeaN fOreSTrY SecTOr IN THe WOrLD cONTeXT
PlantedForest (2010)
Country %
World: 264.000.000 ha
1 China 29,2 % 2 USA 9,6 % 3 Russian Fed. 6,4 % 4 Japan 3,9 % 5 India 3,9 % 6 Canada 3,4 % 7 Poland 3,4 % 8 Brazil 2,8 % 9 Sudan 2,3 % 10 Finland 2,2 % 11 Germany 2,0 % 12 Ucrania 1,8 % 13 Thailand 1,5 % 14 Sweden 1,4 % 21 CHILE 0,9 %
Industrial RoundwoodProduction (2009)
Country %
World:1.424.410.000 m3
1 USA 21,4 % 2 Brazil 8,6 % 3 Russian Fed. 7,9 % 4 Canada 7,4 % 5 China 6,5 % 6 Sweden 4,2 % 7 Germany 3,4 % 8 Finland 2,6 % 9 CHILE 2,6 % 10 Indonesia 2,6 % 11 Poland 2,1 % 12 France 2,0 % 13 Australia 1,8 % 14 India 1,6 % 15 New Zeland 1,4 %
Woold PulpProduction (2009)
Country %
World:159.913.000 ton
1 USA 29,8 % 2 Canada 10,8 % 3 Brazil 8,7 % 4 Sweden 7,3 % 5 Finland 5,5 % 6 Japan 5,4 % 7 Russian Fed. 4,2 % 8 China 3,4 % 9 CHILE 3,2 % 10 Indonesia 3,0 % 11 Germany 1,6 % 12 India 1,4 % 13 Portugal 1,4 % 14 South Africa 1,3 % 15 Spain 1,3 %
SawnwoodProduction (2009)
Country %
World: 362.437.000 m3
1 USA 17,1 % 2 Canada 9,1 % 3 China 9,0 % 4 Brazil 6,9 % 5 Germany 5,7 % 6 Russian Fed. 5,2 % 7 Sweden 4,5 % 8 India 4,1 % 9 Japan 2,6 % 10 Austria 2,3 % 11 Finland 2,2 % 12 France 2,2 % 13 Turkey 1,6 % 14 CHILE 1,6 % 15 Viet Nam 1,4 %
Wood Panel andVeneers Production (2009)
Country %
World: 259.944.000 m3
1 China 36,3 % 2 USA 11,2 % 3 Germany 5,7 % 4 Canada 4,2 % 5 Russian Fed. 3,3 % 6 Brazil 3,2 % 7 Poland 3,0 % 8 Malaysia 2,5 % 9 Turkey 2,1 % 10 France 1,9 % 11 Indonesia 1,6 % 12 Italy 1,6 % 13 Japan 1,5 % 14 Spain 1,5 % 20 CHILE 0,9 %
Forestry Exports (2009)
Country %
World: US$ 188.805 mill.
1 USA 10,6 % 2 Germany 10,4 % 3 Canada 8,7 % 4 Sweden 7,5 % 5 Finland 5,9 % 6 China 4,2 % 7 Russian Fed. 4,1 % 8 Austria 3,4 % 9 France 3,3 % 10 Indonesia 3,3 % 11 Brazil 3,1 % 12 Belgium 2,8 % 13 Italy 2,5 % 14 Spain 2,3 % 15 CHILE 2,0 %
Source: FAO
EL SECTOR FORESTAL CHILENO 2011 9
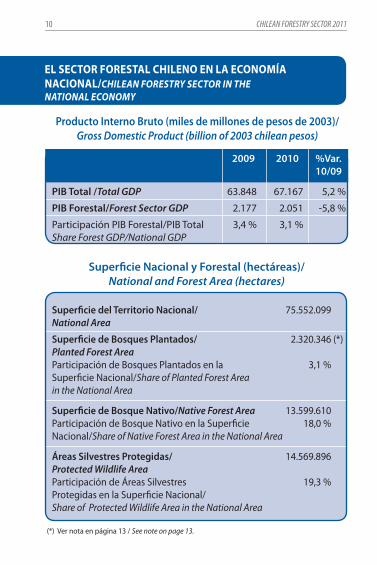
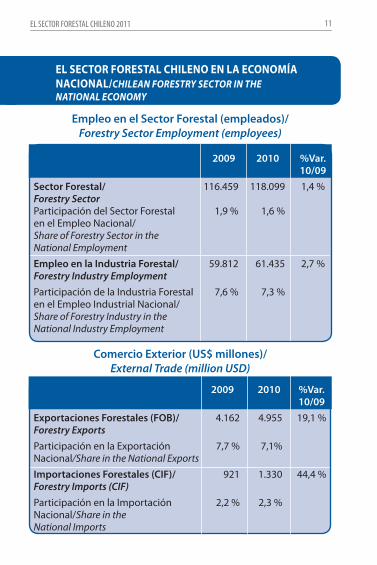
eL sectOr FOrestaL chiLenO en La ecOnOMÍa naciOnaL/cHILeaN fOreSTrY SecTOr IN THe NaTIONaL ecONOMY
Producto Interno Bruto (miles de millones de pesos de 2003)/Gross Domestic Product (billion of 2003 chilean pesos)
2009 2010 %Var. 10/09
PIB Total /Total GDP 63.848 67.167 5,2 %
PIB Forestal/Forest Sector GDP 2.177 2.051 -5,8 %
Participación PIB Forestal/PIB Total 3,4 % 3,1 %Share Forest GDP/National GDP
Superficie Nacional y Forestal (hectáreas)/National and Forest Area (hectares)
Superficie del Territorio Nacional/ 75.552.099 National Area
Superficie de Bosques Plantados/ 2.320.346 (*)Planted Forest AreaParticipación de Bosques Plantados en la 3,1 % Superficie Nacional/Share of Planted Forest Areain the National Area
Superficie de Bosque Nativo/Native Forest Area 13.599.610Participación de Bosque Nativo en la Superficie 18,0 % Nacional/Share of Native Forest Area in the National Area
Áreas Silvestres Protegidas/ 14.569.896Protected Wildlife AreaParticipación de Áreas Silvestres 19,3 % Protegidas en la Superficie Nacional/ Share of Protected Wildlife Area in the National Area
(*) Ver nota en página 13 / See note on page 13.
CHILEAN FORESTRY SECTOR 201110
eL sectOr FOrestaL chiLenO en La ecOnOMÍa naciOnaL/cHILeaN fOreSTrY SecTOr IN THe NaTIONaL ecONOMY
Empleo en el Sector Forestal (empleados)/Forestry Sector Employment (employees)
Comercio Exterior (US$ millones)/External Trade (million USD)
2009 2010 %Var. 10/09Sector Forestal/ 116.459 118.099 1,4 %Forestry Sector Participación del Sector Forestal 1,9 % 1,6 %en el Empleo Nacional/Share of Forestry Sector in theNational Employment
Empleo en la Industria Forestal/ 59.812 61.435 2,7 %Forestry Industry EmploymentParticipación de la Industria Forestal 7,6 % 7,3 %en el Empleo Industrial Nacional/Share of Forestry Industry in the National Industry Employment
2009 2010 %Var. 10/09Exportaciones Forestales (FOB)/ 4.162 4.955 19,1 %Forestry ExportsParticipación en la Exportación 7,7 % 7,1%Nacional/Share in the National Exports
Importaciones Forestales (CIF)/ 921 1.330 44,4 %Forestry Imports (CIF)Participación en la Importación 2,2 % 2,3 % Nacional/Share in the National Imports
EL SECTOR FORESTAL CHILENO 2011 11
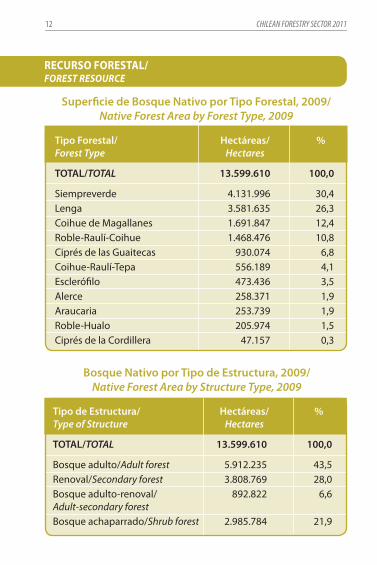
Superficie de Bosque Nativo por Tipo Forestal, 2009/Native Forest Area by Forest Type, 2009
Bosque Nativo por Tipo de Estructura, 2009/Native Forest Area by Structure Type, 2009
recUrsO FOrestaL/fOreST reSOUrce
Tipo Forestal/ Hectáreas/ % Forest Type Hectares
TOTAL/TOTAL 13.599.610 100,0
Siempreverde 4.131.996 30,4Lenga 3.581.635 26,3Coihue de Magallanes 1.691.847 12,4Roble-Raulí-Coihue 1.468.476 10,8Ciprés de las Guaitecas 930.074 6,8Coihue-Raulí-Tepa 556.189 4,1Esclerófilo 473.436 3,5Alerce 258.371 1,9Araucaria 253.739 1,9Roble-Hualo 205.974 1,5Ciprés de la Cordillera 47.157 0,3
Tipo de Estructura/ Hectáreas/ %Type of Structure Hectares
TOTAL/TOTAL 13.599.610 100,0
Bosque adulto/Adult forest 5.912.235 43,5Renoval/Secondary forest 3.808.769 28,0Bosque adulto-renoval/ 892.822 6,6Adult-secondary forestBosque achaparrado/Shrub forest 2.985.784 21,9
CHILEAN FORESTRY SECTOR 201112
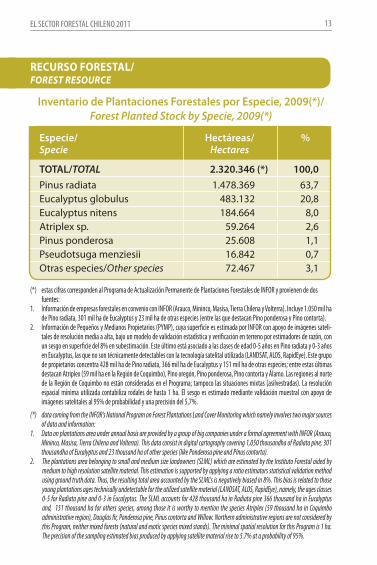
Especie/ Hectáreas/ %Specie Hectares
TOTAL/TOTAL 2.320.346 (*) 100,0Pinus radiata 1.478.369 63,7Eucalyptus globulus 483.132 20,8Eucalyptus nitens 184.664 8,0Atriplex sp. 59.264 2,6Pinus ponderosa 25.608 1,1Pseudotsuga menziesii 16.842 0,7Otras especies/Other species 72.467 3,1
recUrsO FOrestaL/fOreST reSOUrce
Inventario de Plantaciones Forestales por Especie, 2009(*)/Forest Planted Stock by Specie, 2009(*)
(*) estas cifras corresponden al Programa de Actualización Permanente de Plantaciones Forestales de INFOR y provienen de dos fuentes:
1. Información de empresas forestales en convenio con INFOR (Arauco, Mininco, Masisa, Tierra Chilena y Volterra). Incluye 1.050 mil ha de Pino radiata, 301 mil ha de Eucalyptus y 23 mil ha de otras especies (entre las que destacan Pino ponderosa y Pino contorta).
2. Información de Pequeños y Medianos Propietarios (PYMP), cuya superficie es estimada por INFOR con apoyo de imágenes sateli-tales de resolución media a alta, bajo un modelo de validación estadística y verificación en terreno por estimadores de razón, con un sesgo en superficie del 8% en subestimación. Este último está asociado a las clases de edad 0-5 años en Pino radiata y 0-3 años en Eucalyptus, las que no son técnicamente detectables con la tecnología satelital utilizada (LANDSAT, ALOS, RapidEye). Este grupo de propietarios concentra 428 mil ha de Pino radiata, 366 mil ha de Eucalyptus y 151 mil ha de otras especies; entre estas últimas destacan Atriplex (59 mil ha en la Región de Coquimbo), Pino oregón, Pino ponderosa, Pino contorta y Álamo. Las regiones al norte de la Región de Coquimbo no están consideradas en el Programa; tampoco las situaciones mixtas (asilvestradas). La resolución espacial mínima utilizada contabiliza rodales de hasta 1 ha. El sesgo es estimado mediante validación muestral con apoyo de imágenes satelitales al 95% de probabilidad y una precisión del 5,7%.
(*) data coming from the INFOR's National Program on Forest Plantations Land Cover Monitoring which namely involves two major sources of data and information:
1. Data on plantations area under annual basis are provided by a group of big companies under a formal agreement with INFOR (Arauco, Mininco, Masisa, Tierra Chilena and Volterra). This data consist in digital cartography covering 1,050 thousandha of Radiata pine, 301 thousandha of Eucalyptus and 23 thousand ha of other species (like Ponderosa pine and Pinus contorta).
2. The plantations area belonging to small and medium size landowners (SLML) which are estimated by the Instituto Forestal aided by medium to high resolution satellite material. This estimation is supported by applying a ratio estimators statistical validation method using ground truth data. Thus, the resulting total area accounted by the SLML's is negatively biased in 8%. This bias is related to those young plantations ages technically undetectable for the utilized satellite material (LANDSAT, ALOS, RapidEye), namely, the ages classes 0-5 for Radiata pine and 0-3 in Eucalyptus. The SLML accounts for 428 thousand ha in Radiata pine 366 thousand ha in Eucalyptus and, 151 thousand ha for others species, among those it is worthy to mention the species Atriplex (59 thousand ha in Coquimbo administrative region), Douglas fir, Ponderosa pine, Pinus contorta and Willow. Northern administrative regions are not considered by this Program, neither mixed forests (natural and exotic species mixed stands). The minimal spatial resolution for this Program is 1 ha. The precision of the sampling estimated bias produced by applying satellite material rise to 5.7% at a probability of 95%.
EL SECTOR FORESTAL CHILENO 2011 13
recUrsO FOrestaL/fOreST reSOUrce
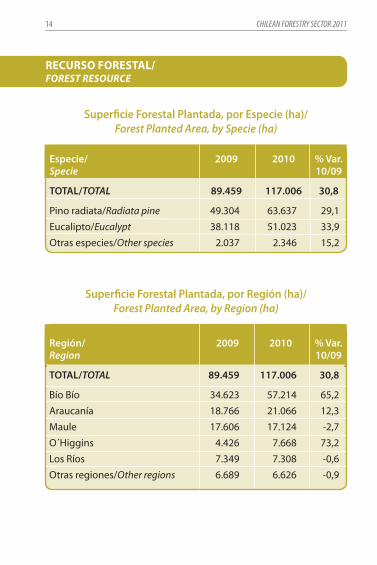
Superficie Forestal Plantada, por Especie (ha)/Forest Planted Area, by Specie (ha)
Superficie Forestal Plantada, por Región (ha)/Forest Planted Area, by Region (ha)
Especie/ 2009 2010 % Var.Specie 10/09
TOTAL/TOTAL 89.459 117.006 30,8
Pino radiata/Radiata pine 49.304 63.637 29,1
Eucalipto/Eucalypt 38.118 51.023 33,9
Otras especies/Other species 2.037 2.346 15,2
Región/ 2009 2010 % Var.Region 10/09
TOTAL/TOTAL 89.459 117.006 30,8
Bío Bío 34.623 57.214 65,2
Araucanía 18.766 21.066 12,3
Maule 17.606 17.124 -2,7
O´Higgins 4.426 7.668 73,2
Los Ríos 7.349 7.308 -0,6
Otras regiones/Other regions 6.689 6.626 -0,9
CHILEAN FORESTRY SECTOR 201114
recUrsO FOrestaL/fOreST reSOUrce
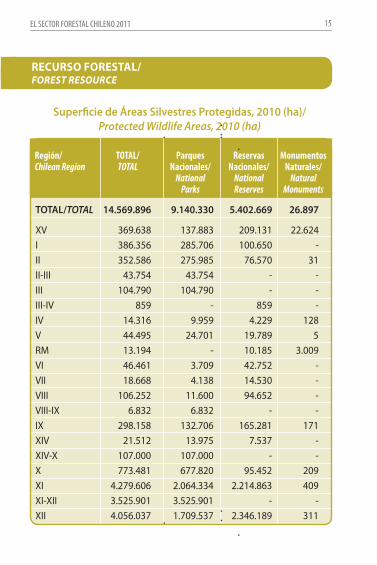
Superficie de Áreas Silvestres Protegidas, 2010 (ha)/Protected Wildlife Areas, 2010 (ha)
TOTAL/TOTAL 14.569.896 9.140.330 5.402.669 26.897
XV 369.638 137.883 209.131 22.624I 386.356 285.706 100.650 -II 352.586 275.985 76.570 31II-III 43.754 43.754 - -III 104.790 104.790 - -III-IV 859 - 859 -IV 14.316 9.959 4.229 128V 44.495 24.701 19.789 5RM 13.194 - 10.185 3.009VI 46.461 3.709 42.752 -VII 18.668 4.138 14.530 -VIII 106.252 11.600 94.652 -VIII-IX 6.832 6.832 - -IX 298.158 132.706 165.281 171XIV 21.512 13.975 7.537 -XIV-X 107.000 107.000 - -X 773.481 677.820 95.452 209XI 4.279.606 2.064.334 2.214.863 409XI-XII 3.525.901 3.525.901 - -XII 4.056.037 1.709.537 2.346.189 311
Región/ TOTAL/ Parques Reservas MonumentosChilean Region TOTAL Nacionales/ Nacionales/ Naturales/ National National Natural Parks Reserves Monuments
EL SECTOR FORESTAL CHILENO 2011 15
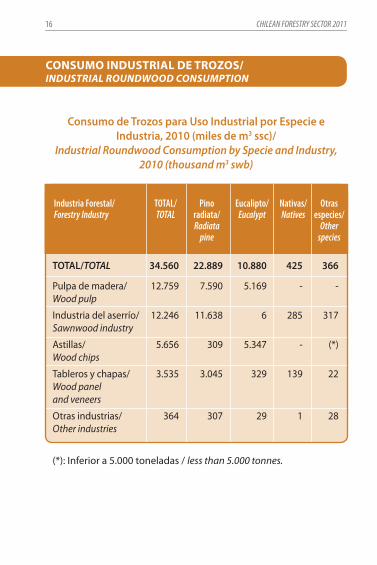
cOnsUMO inDUstriaL De trOZOs/INDUSTrIaL rOUNDWOOD cONSUMPTION
Consumo de Trozos para Uso Industrial por Especie e Industria, 2010 (miles de m3 ssc)/
Industrial Roundwood Consumption by Specie and Industry, 2010 (thousand m3 swb)
TOTAL/TOTAL 34.560 22.889 10.880 425 366
Pulpa de madera/ 12.759 7.590 5.169 - -Wood pulp
Industria del aserrío/ 12.246 11.638 6 285 317Sawnwood industry
Astillas/ 5.656 309 5.347 - (*)Wood chips
Tableros y chapas/ 3.535 3.045 329 139 22Wood panel and veneers
Otras industrias/ 364 307 29 1 28Other industries
(*): Inferior a 5.000 toneladas / less than 5.000 tonnes.
Industria Forestal/ TOTAL/ Pino Eucalipto/ Nativas/ Otras Forestry Industry TOTAL radiata/ Eucalypt Natives especies/ Radiata Other pine species
CHILEAN FORESTRY SECTOR 201116
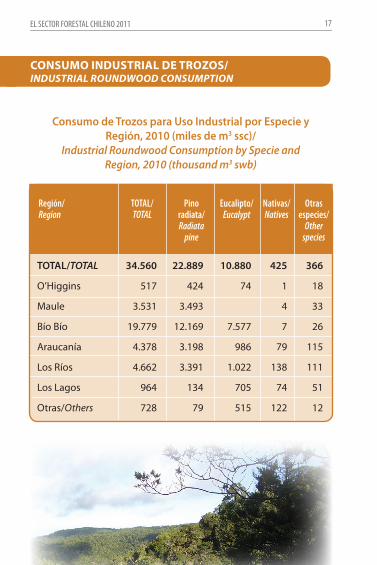
cOnsUMO inDUstriaL De trOZOs/INDUSTrIaL rOUNDWOOD cONSUMPTION
Consumo de Trozos para Uso Industrial por Especie y Región, 2010 (miles de m3 ssc)/
Industrial Roundwood Consumption by Specie and Region, 2010 (thousand m3 swb)
TOTAL/TOTAL 34.560 22.889 10.880 425 366
O’Higgins 517 424 74 1 18
Maule 3.531 3.493 4 33
Bío Bío 19.779 12.169 7.577 7 26
Araucanía 4.378 3.198 986 79 115
Los Ríos 4.662 3.391 1.022 138 111
Los Lagos 964 134 705 74 51
Otras/Others 728 79 515 122 12
Región/ TOTAL/ Pino Eucalipto/ Nativas/ Otras Region TOTAL radiata/ Eucalypt Natives especies/ Radiata Other pine species
EL SECTOR FORESTAL CHILENO 2011 17
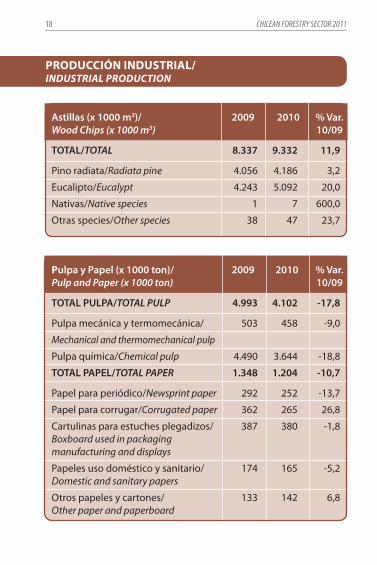
PrODUcción inDUstriaL/INDUSTrIaL PrODUcTION
Astillas (x 1000 m3)/ 2009 2010 % Var.Wood Chips (x 1000 m3) 10/09
TOTAL/TOTAL 8.337 9.332 11,9
Pino radiata/Radiata pine 4.056 4.186 3,2
Eucalipto/Eucalypt 4.243 5.092 20,0
Nativas/Native species 1 7 600,0
Otras species/Other species 38 47 23,7
Pulpa y Papel (x 1000 ton)/ 2009 2010 % Var.Pulp and Paper (x 1000 ton) 10/09
TOTAL PULPA/TOTAL PULP 4.993 4.102 -17,8
Pulpa mecánica y termomecánica/ 503 458 -9,0
Mechanical and thermomechanical pulp
Pulpa química/Chemical pulp 4.490 3.644 -18,8
TOTAL PAPEL/TOTAL PAPER 1.348 1.204 -10,7
Papel para periódico/Newsprint paper 292 252 -13,7
Papel para corrugar/Corrugated paper 362 265 26,8
Cartulinas para estuches plegadizos/ 387 380 -1,8Boxboard used in packaging manufacturing and displays
Papeles uso doméstico y sanitario/ 174 165 -5,2Domestic and sanitary papers
Otros papeles y cartones/ 133 142 6,8Other paper and paperboard
CHILEAN FORESTRY SECTOR 201118
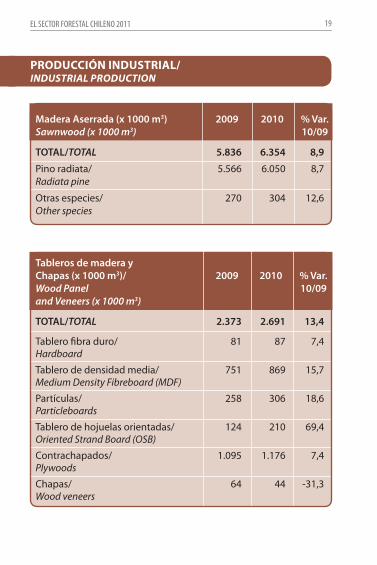
PrODUcción inDUstriaL/INDUSTrIaL PrODUcTION
Tableros de madera yChapas (x 1000 m3)/ 2009 2010 % Var.Wood Panel 10/09and Veneers (x 1000 m3)
TOTAL/TOTAL 2.373 2.691 13,4
Tablero fibra duro/ 81 87 7,4Hardboard
Tablero de densidad media/ 751 869 15,7Medium Density Fibreboard (MDF)
Partículas/ 258 306 18,6Particleboards
Tablero de hojuelas orientadas/ 124 210 69,4Oriented Strand Board (OSB)
Contrachapados/ 1.095 1.176 7,4Plywoods
Chapas/ 64 44 -31,3Wood veneers
Madera Aserrada (x 1000 m3) 2009 2010 % Var. Sawnwood (x 1000 m3) 10/09
TOTAL/TOTAL 5.836 6.354 8,9
Pino radiata/ 5.566 6.050 8,7Radiata pine
Otras especies/ 270 304 12,6Other species
EL SECTOR FORESTAL CHILENO 2011 19
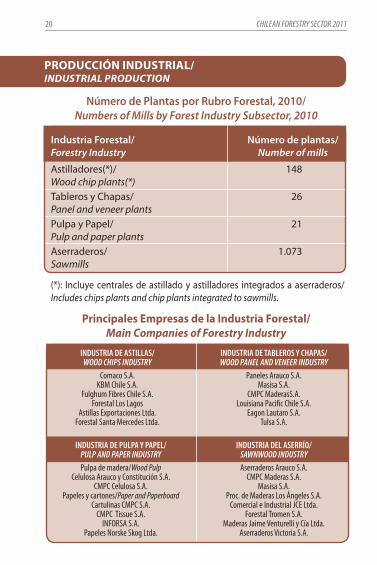
PrODUcción inDUstriaL/INDUSTrIaL PrODUcTION
Número de Plantas por Rubro Forestal, 2010/Numbers of Mills by Forest Industry Subsector, 2010
(*): Incluye centrales de astillado y astilladores integrados a aserraderos/ Includes chips plants and chip plants integrated to sawmills.
Principales empresas de la industria Forestal/Main companies of forestry Industry
Industria Forestal/ Número de plantas/Forestry Industry Number of mills
Astilladores(*)/ 148Wood chip plants(*)Tableros y Chapas/ 26Panel and veneer plantsPulpa y Papel/ 21Pulp and paper plantsAserraderos/ 1.073Sawmills
INDUSTRIA DE ASTILLAS/WOOD CHIPS INDUSTRY
Comaco S.A.KBM Chile S.A.
Fulghum Fibres Chile S.A.Forestal Los Lagos
Astillas Exportaciones Ltda.Forestal Santa Mercedes Ltda.
INDUSTRIA DE TABLEROS Y CHAPAS/WOOD PANEL AND VENEER INDUSTRY
Paneles Arauco S.A.Masisa S.A.
CMPC MaderasS.A.Louisiana Pacific Chile S.A.
Eagon Lautaro S.A.Tulsa S.A.
INDUSTRIA DE PULPA Y PAPEL/PULP AND PAPER INDUSTRYPulpa de madera/Wood Pulp
Celulosa Arauco y Constitución S.A.CMPC Celulosa S.A.
Papeles y cartones/Paper and PaperboardCartulinas CMPC S.A.
CMPC Tissue S.A.INFORSA S.A.
Papeles Norske Skog Ltda.
INDUSTRIA DEL ASERRÍO/SAWNWOOD INDUSTRYAserraderos Arauco S.A.
CMPC Maderas S.A.Masisa S.A.
Proc. de Maderas Los Ángeles S.A.Comercial e Industrial JCE Ltda.
Forestal Tromen S.A.Maderas Jaime Venturelli y Cía Ltda.
Aserraderos Victoria S.A.
CHILEAN FORESTRY SECTOR 201120
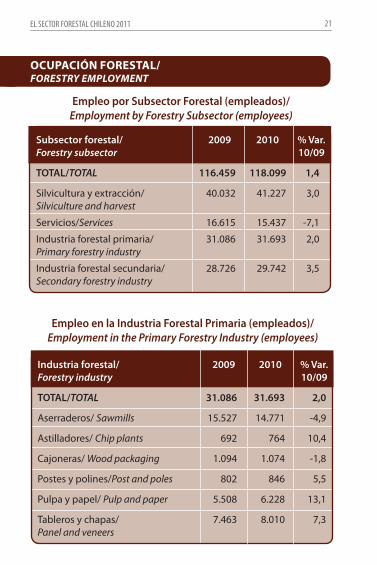
Industria forestal/ 2009 2010 % Var.Forestry industry 10/09
TOTAL/TOTAL 31.086 31.693 2,0
Aserraderos/ Sawmills 15.527 14.771 -4,9
Astilladores/ Chip plants 692 764 10,4
Cajoneras/ Wood packaging 1.094 1.074 -1,8
Postes y polines/Post and poles 802 846 5,5
Pulpa y papel/ Pulp and paper 5.508 6.228 13,1
Tableros y chapas/ 7.463 8.010 7,3Panel and veneers
OcUPación FOrestaL/fOreSTrY eMPLOYMeNT
Empleo por Subsector Forestal (empleados)/Employment by Forestry Subsector (employees)
Empleo en la Industria Forestal Primaria (empleados)/Employment in the Primary Forestry Industry (employees)
Subsector forestal/ 2009 2010 % Var.Forestry subsector 10/09
TOTAL/TOTAL 116.459 118.099 1,4
Silvicultura y extracción/ 40.032 41.227 3,0Silviculture and harvest
Servicios/Services 16.615 15.437 -7,1
Industria forestal primaria/ 31.086 31.693 2,0Primary forestry industry
Industria forestal secundaria/ 28.726 29.742 3,5Secondary forestry industry
EL SECTOR FORESTAL CHILENO 2011 21
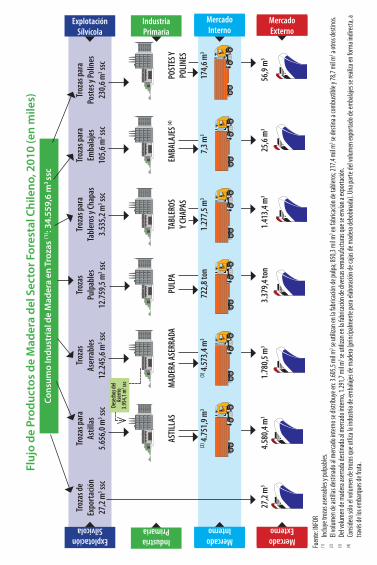
Cons
umo
Indu
stri
al d
e M
ader
a en
Tro
zas
(1) : 3
4.55
9,6
m3
ssc
Tro
zas d
e Tro
zas p
ara
Troza
s Tro
zas
Troza
s par
a Tr
ozas
para
Tr
ozas
para
Ex
porta
ción
Astil
las
Aser
rabl
es
Pulp
able
s Ta
bler
os y
Chap
as
Emba
laje
s Po
stes y
Polin
es
27,2
m3 ss
c 5.
656,
0 m3 ss
c 12
.245
,6 m
3 ssc
12.7
59,5
m3 ss
c 3.
535,
2 m3 ss
c 10
5,6 m
3 ssc
230,
6 m3 ss
c
AS
TILL
AS
MAD
ERA
ASER
RADA
PU
LPA
TABL
EROS
EM
BALA
JES (4
) PO
STES
Y
Y C
HAPA
S
POLIN
ES
(2
) 4.75
1,9 m
3 (3
) 4.57
3,4 m
3 72
2,8 t
on
1.27
7,5 m
3 7,
3 m3
174,
6 m3
27,2
m3
4.58
0,4 m
3 1.
780,
5 m3
3.37
9,4 t
on
1.41
3,4 m
3 25
,6 m
3 56
,9 m
3
MercadoExterno
MercadoInterno
IndustriaPrimaria
ExplotaciónSílvícola
MercadoExterno
MercadoInterno
IndustriaPrimaria
ExplotaciónSílvícola
Fuen
te: IN
FOR
(1)
Incluy
e troz
as as
errab
les y
pulpa
bles.
(2)
El vo
lumen
de as
tillas
desti
nado
al m
ercad
o int
erno s
e dist
ribuy
e en:
3.605
,5 mi
l m3 se
utiliz
an en
la fa
brica
ción d
e pulp
a; 85
0,3 m
il m3 en
fabr
icació
n de t
abler
os; 2
17,4
mil m
3 se de
stina
a co
mbus
tible
y 78,7
mil m
3 a ot
ros de
stino
s.(3
) De
l volu
men d
e mad
era as
errad
a des
tinad
a al m
ercad
o int
erno,
1.291
,7 mi
l m3 se
utiliz
an en
la fa
brica
ción d
e dive
rsas r
eman
ufactu
ras qu
e se e
nvían
a ex
porta
ción.
(4)
Cons
idera
sólo
el vo
lumen
de tr
ozos
que u
tliza l
a ind
ustri
a de e
mbala
jes de
mad
era (p
rincip
almen
te pa
ra ela
borac
ión de
cajas
de m
adera
debo
binad
a). Un
a part
e del
volum
en ex
porta
do de
emba
lajes
se re
aliza
en fo
rma i
ndire
cta, a
tra
vés d
e los
emba
rques
de fru
ta.
Dese
chos
del
Aser
río3.9
54,1
m3 ssc
Fluj
o de
Pro
duct
os d
e M
ader
a de
l Sec
tor F
ores
tal C
hile
no, 2
010
(en
mile
s)
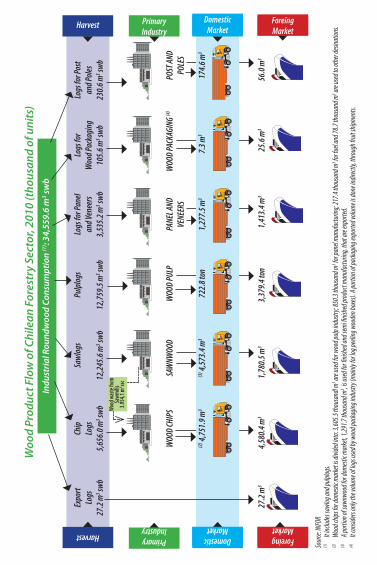
Indu
stria
l Rou
ndw
ood
Cons
umpt
ion
(1) : 3
4,55
9.6
m3 sw
b
Ex
port
Chip
Sa
wlog
s Pu
lplog
s Lo
gs fo
r Pan
el Lo
gs fo
r Lo
gs fo
r Pos
t
Logs
Lo
gs
and V
enee
rs W
ood P
acka
ging
an
d Pole
s
27.2
m3 sw
b 5,
656.
0 m3 sw
b 12
,245
.6 m
3 swb
12,7
59.5
m3 sw
b 3,
535.
2 m3 sw
b 10
5.6 m
3 swb
230.
6 m3 sw
b
W
OOD
CHIP
S SA
WNW
OOD
WOO
D PU
LP
PANE
L AND
W
OOD
PACK
AGIN
G (4)
POST
AND
VENE
ERS
PO
LES
(2
) 4,75
1.9 m
3 (3
) 4,57
3.4 m
3 72
2.8 t
on
1,27
7.5 m
3 7.
3 m3
174.
6 m3
27.
2 m3
4,58
0.4 m
3 1,
780.
5 m3
3,37
9.4 t
on
1,41
3.4 m
3 25
.6 m
3 56
.0 m
3
ForeingMarket
DomesticMarket
PrimaryIndustry
HarvestForeingMarket
DomesticMarket
PrimaryIndustry
Harvest
Sourc
e: IN
FOR
(1)
It inc
ludes
sawl
og an
d pulp
logs.
(2)
Wood
chips
for d
omest
ic mar
ket is
divid
ed in
to: 3,
605.5
thou
sand
l m3 ar
e used
for w
ood p
ulp in
dustr
y; 85
0.3 th
ousa
nd m
3 for p
anel
manu
factu
ring;
217.4
thou
sand
m3 fo
r fuel
and 7
8.7 th
ousa
nd m
3 are u
sed to
othe
r desi
natio
ns.
(3)
A por
tion o
f saw
nwoo
d for
dome
stic m
arke
t, 1,29
1.7 th
ousa
nd m
3 , is us
ed fo
r finis
hed a
nd se
mi fin
ished
prod
uct m
anufa
cturin
g, th
at ar
e exp
orted
.(4
) It c
onsid
ers on
ly th
e volu
me of
logs
used
by w
ood p
acka
ging i
ndus
try (m
ainly
for lo
g pee
ling w
oode
n box
es). A
porti
on of
packa
ging e
xpor
ted vo
lume i
s don
e ind
irectl
y, th
rough
fruit s
hipme
nts.
Wood
was
te fro
mSa
wmills
3.954
,1 m3 ssc
Woo
d Pr
oduc
t Flo
w o
f Chi
lean
For
estr
y Se
ctor
, 201
0 (t
hous
and
of u
nits
)
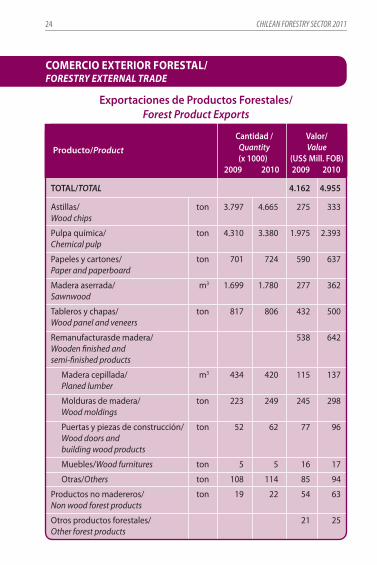
cOMerciO eXteriOr FOrestaL/fOreSTrY eXTerNaL TraDe
Exportaciones de Productos Forestales/Forest Product Exports
TOTAL/TOTAL 4.162 4.955
Astillas/ ton 3.797 4.665 275 333Wood chips
Pulpa química/ ton 4.310 3.380 1.975 2.393Chemical pulp
Papeles y cartones/ ton 701 724 590 637Paper and paperboard
Madera aserrada/ m3 1.699 1.780 277 362 Sawnwood
Tableros y chapas/ ton 817 806 432 500Wood panel and veneers
Remanufacturasde madera/ 538 642Wooden finished and semi-finished products
Madera cepillada/ m3 434 420 115 137Planed lumber
Molduras de madera/ ton 223 249 245 298Wood moldings
Puertas y piezas de construcción/ ton 52 62 77 96Wood doors and building wood products
Muebles/Wood furnitures ton 5 5 16 17
Otras/Others ton 108 114 85 94
Productos no madereros/ ton 19 22 54 63 Non wood forest products
Otros productos forestales/ 21 25Other forest products
Cantidad / Valor/ Quantity Value (x 1000) (US$ Mill. FOB) 2009 2010 2009 2010
Producto/Product
CHILEAN FORESTRY SECTOR 201124
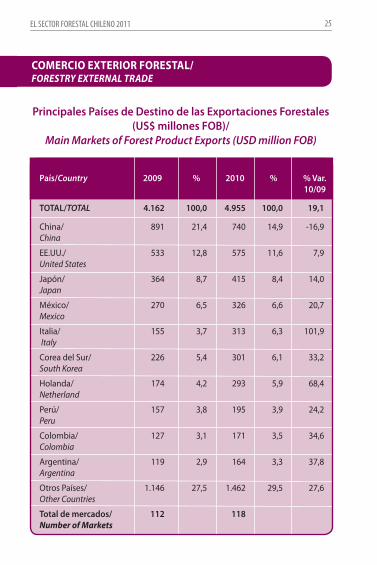
cOMerciO eXteriOr FOrestaL/fOreSTrY eXTerNaL TraDe
Principales Países de Destino de las Exportaciones Forestales (US$ millones FOB)/
Main Markets of Forest Product Exports (USD million FOB)
País/Country 2009 % 2010 % % Var. 10/09
TOTAL/TOTAL 4.162 100,0 4.955 100,0 19,1
China/ 891 21,4 740 14,9 -16,9China
EE.UU./ 533 12,8 575 11,6 7,9United States
Japón/ 364 8,7 415 8,4 14,0Japan
México/ 270 6,5 326 6,6 20,7Mexico
Italia/ 155 3,7 313 6,3 101,9 Italy
Corea del Sur/ 226 5,4 301 6,1 33,2South Korea
Holanda/ 174 4,2 293 5,9 68,4Netherland
Perú/ 157 3,8 195 3,9 24,2 Peru
Colombia/ 127 3,1 171 3,5 34,6Colombia
Argentina/ 119 2,9 164 3,3 37,8Argentina
Otros Países/ 1.146 27,5 1.462 29,5 27,6Other Countries
Total de mercados/ 112 118Number of Markets
EL SECTOR FORESTAL CHILENO 2011 25
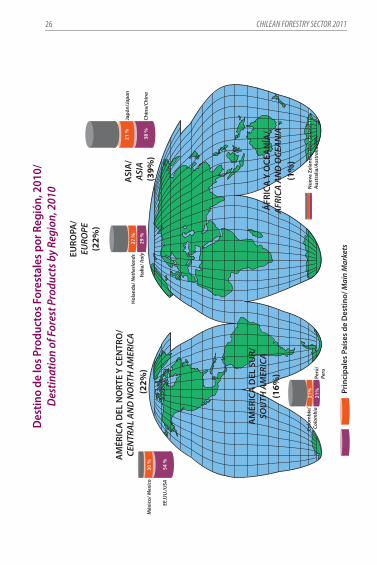
Des
tino
de lo
s Pro
duct
os F
ores
tale
s por
Reg
ión,
201
0/D
estin
atio
n of
For
est P
rodu
cts b
y Re
gion
, 201
0
Prin
cipa
les
País
es d
e D
estin
o/ M
ain
Mar
kets
AM
ÉRIC
A D
EL N
ORT
E Y
CEN
TRO
/CE
NTR
AL A
ND
NO
RTH
AM
ERIC
A(2
2%)
EURO
PA/
EURO
PE(2
2%)
ASI
A/
ASIA
(39%
)
ÁFR
ICA
Y O
CEA
NÍA
/AF
RICA
AN
D O
CEAN
IA(1
%)
Méx
ico/
Mex
ico
30
%
EE.U
U./U
SA
54 %
Hol
anda
/ Net
herla
nds
27
%
Ital
ia/ I
taly
29
%Ch
ina/
Chin
a
Japó
n/Ja
pan
AM
ÉRIC
A D
EL S
UR/
SOU
TH A
MER
ICA
(16%
)
Colo
mbi
a/
Colo
mbi
aPe
rú/
Peru
Nue
va Z
elan
dia/
New
Zel
and
10%
A
ustr
alia
/Aus
tral
ia 7
9%
21%
21%
21 %
38
%
CHILEAN FORESTRY SECTOR 201126
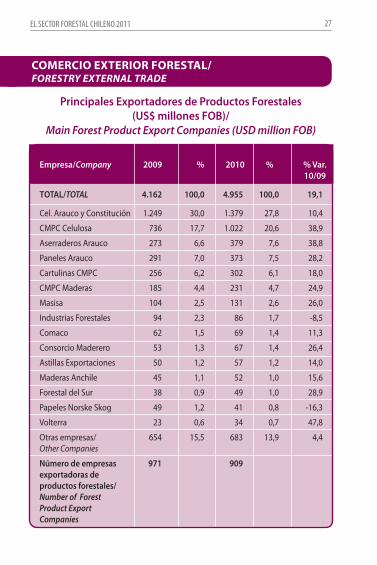
cOMerciO eXteriOr FOrestaL/fOreSTrY eXTerNaL TraDe
Principales Exportadores de Productos Forestales (US$ millones FOB)/
Main Forest Product Export Companies (USD million FOB)
Empresa/Company 2009 % 2010 % % Var. 10/09
TOTAL/TOTAL 4.162 100,0 4.955 100,0 19,1
Cel. Arauco y Constitución 1.249 30,0 1.379 27,8 10,4
CMPC Celulosa 736 17,7 1.022 20,6 38,9
Aserraderos Arauco 273 6,6 379 7,6 38,8
Paneles Arauco 291 7,0 373 7,5 28,2
Cartulinas CMPC 256 6,2 302 6,1 18,0
CMPC Maderas 185 4,4 231 4,7 24,9
Masisa 104 2,5 131 2,6 26,0
Industrias Forestales 94 2,3 86 1,7 -8,5
Comaco 62 1,5 69 1,4 11,3
Consorcio Maderero 53 1,3 67 1,4 26,4
Astillas Exportaciones 50 1,2 57 1,2 14,0
Maderas Anchile 45 1,1 52 1,0 15,6
Forestal del Sur 38 0,9 49 1,0 28,9
Papeles Norske Skog 49 1,2 41 0,8 -16,3
Volterra 23 0,6 34 0,7 47,8
Otras empresas/ 654 15,5 683 13,9 4,4Other Companies
Número de empresas 971 909exportadoras de productos forestales/Number of Forest Product Export Companies
EL SECTOR FORESTAL CHILENO 2011 27
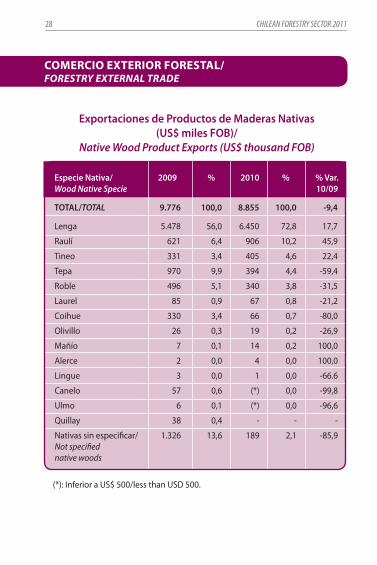
cOMerciO eXteriOr FOrestaL/fOreSTrY eXTerNaL TraDe
Exportaciones de Productos de Maderas Nativas (US$ miles FOB)/
Native Wood Product Exports (US$ thousand FOB)
Especie Nativa/ 2009 % 2010 % % Var.Wood Native Specie 10/09
TOTAL/TOTAL 9.776 100,0 8.855 100,0 -9,4
Lenga 5.478 56,0 6.450 72,8 17,7
Raulí 621 6,4 906 10,2 45,9
Tineo 331 3,4 405 4,6 22,4
Tepa 970 9,9 394 4,4 -59,4
Roble 496 5,1 340 3,8 -31,5
Laurel 85 0,9 67 0,8 -21,2
Coihue 330 3,4 66 0,7 -80,0
Olivillo 26 0,3 19 0,2 -26,9
Mañío 7 0,1 14 0,2 100,0
Alerce 2 0,0 4 0,0 100,0
Lingue 3 0,0 1 0,0 -66.6
Canelo 57 0,6 (*) 0,0 -99,8
Ulmo 6 0,1 (*) 0,0 -96,6
Quillay 38 0,4 - - -
Nativas sin especificar/ 1.326 13,6 189 2,1 -85,9Not specified native woods
(*): Inferior a US$ 500/less than USD 500.
CHILEAN FORESTRY SECTOR 201128
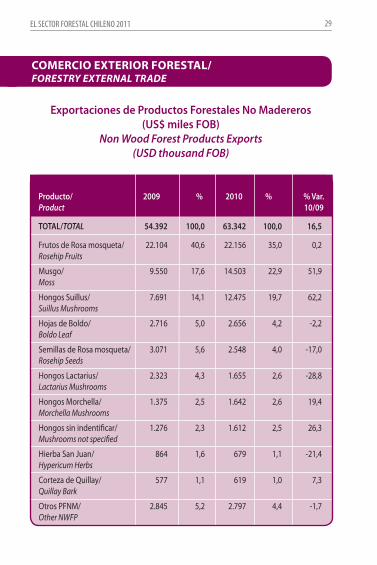
cOMerciO eXteriOr FOrestaL/fOreSTrY eXTerNaL TraDe
Exportaciones de Productos Forestales No Madereros (US$ miles FOB)
Non Wood Forest Products Exports (USD thousand FOB)
Producto/ 2009 % 2010 % % Var.Product 10/09
TOTAL/TOTAL 54.392 100,0 63.342 100,0 16,5
Frutos de Rosa mosqueta/ 22.104 40,6 22.156 35,0 0,2Rosehip Fruits
Musgo/ 9.550 17,6 14.503 22,9 51,9Moss
Hongos Suillus/ 7.691 14,1 12.475 19,7 62,2Suillus Mushrooms
Hojas de Boldo/ 2.716 5,0 2.656 4,2 -2,2Boldo Leaf
Semillas de Rosa mosqueta/ 3.071 5,6 2.548 4,0 -17,0Rosehip Seeds
Hongos Lactarius/ 2.323 4,3 1.655 2,6 -28,8 Lactarius Mushrooms
Hongos Morchella/ 1.375 2,5 1.642 2,6 19,4Morchella Mushrooms
Hongos sin indentificar/ 1.276 2,3 1.612 2,5 26,3Mushrooms not specified
Hierba San Juan/ 864 1,6 679 1,1 -21,4Hypericum Herbs
Corteza de Quillay/ 577 1,1 619 1,0 7,3Quillay Bark
Otros PFNM/ 2.845 5,2 2.797 4,4 -1,7Other NWFP
EL SECTOR FORESTAL CHILENO 2011 29
cOMerciO eXteriOr FOrestaL/fOreSTrY eXTerNaL TraDe
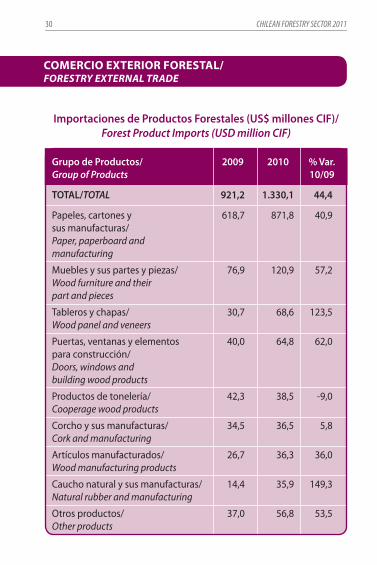
Importaciones de Productos Forestales (US$ millones CIF)/Forest Product Imports (USD million CIF)
Grupo de Productos/ 2009 2010 % Var.Group of Products 10/09
TOTAL/TOTAL 921,2 1.330,1 44,4
Papeles, cartones y 618,7 871,8 40,9sus manufacturas/Paper, paperboard and manufacturing
Muebles y sus partes y piezas/ 76,9 120,9 57,2Wood furniture and their part and pieces
Tableros y chapas/ 30,7 68,6 123,5Wood panel and veneers
Puertas, ventanas y elementos 40,0 64,8 62,0para construcción/Doors, windows and building wood products
Productos de tonelería/ 42,3 38,5 -9,0Cooperage wood products
Corcho y sus manufacturas/ 34,5 36,5 5,8Cork and manufacturing
Artículos manufacturados/ 26,7 36,3 36,0Wood manufacturing products
Caucho natural y sus manufacturas/ 14,4 35,9 149,3Natural rubber and manufacturing
Otros productos/ 37,0 56,8 53,5Other products
CHILEAN FORESTRY SECTOR 201130
cOMerciO eXteriOr FOrestaL/fOreSTrY eXTerNaL TraDe
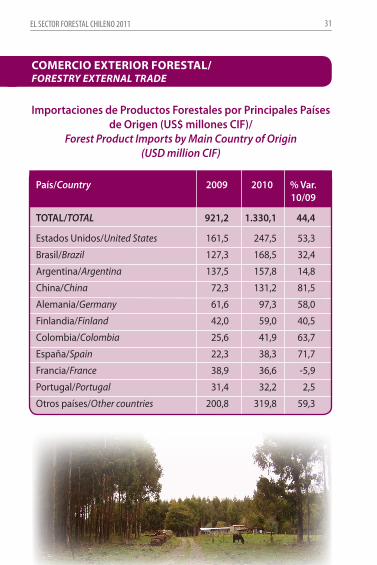
Importaciones de Productos Forestales por Principales Países de Origen (US$ millones CIF)/
Forest Product Imports by Main Country of Origin (USD million CIF)
País/Country 2009 2010 % Var. 10/09
TOTAL/TOTAL 921,2 1.330,1 44,4
Estados Unidos/United States 161,5 247,5 53,3
Brasil/Brazil 127,3 168,5 32,4
Argentina/Argentina 137,5 157,8 14,8
China/China 72,3 131,2 81,5
Alemania/Germany 61,6 97,3 58,0
Finlandia/Finland 42,0 59,0 40,5
Colombia/Colombia 25,6 41,9 63,7
España/Spain 22,3 38,3 71,7
Francia/France 38,9 36,6 -5,9
Portugal/Portugal 31,4 32,2 2,5
Otros países/Other countries 200,8 319,8 59,3
EL SECTOR FORESTAL CHILENO 2011 31
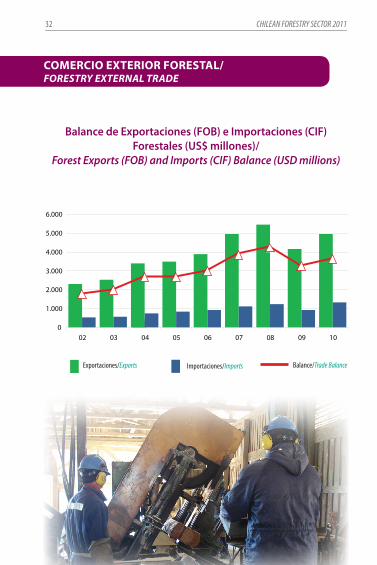
0
1.000
2.000
3.000
4.000
5.000
6.000
02 03 04 05 06 07 08 09 10
cOMerciO eXteriOr FOrestaL/fOreSTrY eXTerNaL TraDe
Balance de Exportaciones (FOB) e Importaciones (CIF) Forestales (US$ millones)/
Forest Exports (FOB) and Imports (CIF) Balance (USD millions)
Exportaciones/Exports Importaciones/Imports Balance/Trade Balance
CHILEAN FORESTRY SECTOR 201132
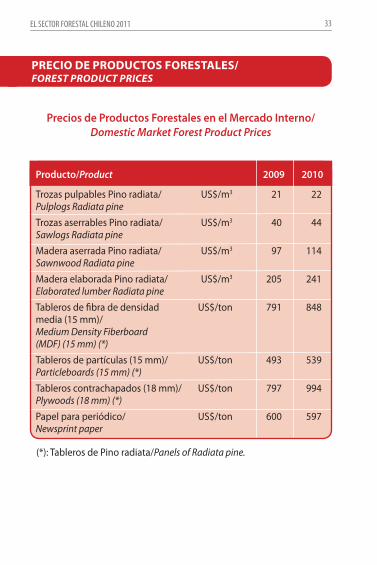
Precios de Productos Forestales en el Mercado Interno/Domestic Market Forest Product Prices
PreciO De PrODUctOs FOrestaLes/fOreST PrODUcT PrIceS
Producto/Product 2009 2010
Trozas pulpables Pino radiata/ US$/m3 21 22Pulplogs Radiata pine
Trozas aserrables Pino radiata/ US$/m3 40 44Sawlogs Radiata pine
Madera aserrada Pino radiata/ US$/m3 97 114Sawnwood Radiata pine
Madera elaborada Pino radiata/ US$/m3 205 241Elaborated lumber Radiata pine
Tableros de fibra de densidad US$/ton 791 848 media (15 mm)/Medium Density Fiberboard (MDF) (15 mm) (*)
Tableros de partículas (15 mm)/ US$/ton 493 539Particleboards (15 mm) (*)
Tableros contrachapados (18 mm)/ US$/ton 797 994Plywoods (18 mm) (*)
Papel para periódico/ US$/ton 600 597Newsprint paper
(*): Tableros de Pino radiata/Panels of Radiata pine.
EL SECTOR FORESTAL CHILENO 2011 33
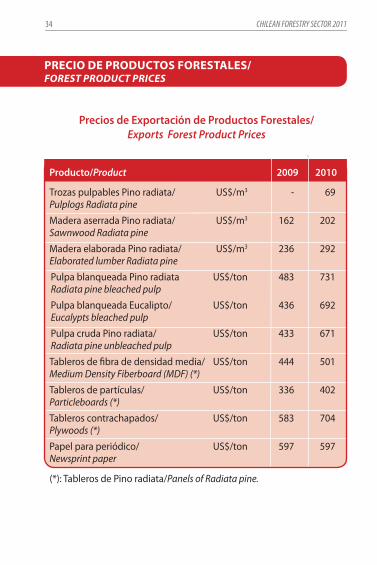
PreciO De PrODUctOs FOrestaLes/fOreST PrODUcT PrIceS
Precios de Exportación de Productos Forestales/Exports Forest Product Prices
Producto/Product 2009 2010
Trozas pulpables Pino radiata/ US$/m3 - 69Pulplogs Radiata pine
Madera aserrada Pino radiata/ US$/m3 162 202Sawnwood Radiata pine
Madera elaborada Pino radiata/ US$/m3 236 292Elaborated lumber Radiata pine
Pulpa blanqueada Pino radiata US$/ton 483 731Radiata pine bleached pulp
Pulpa blanqueada Eucalipto/ US$/ton 436 692Eucalypts bleached pulp
Pulpa cruda Pino radiata/ US$/ton 433 671Radiata pine unbleached pulp
Tableros de fibra de densidad media/ US$/ton 444 501Medium Density Fiberboard (MDF) (*)
Tableros de partículas/ US$/ton 336 402Particleboards (*)
Tableros contrachapados/ US$/ton 583 704Plywoods (*)
Papel para periódico/ US$/ton 597 597Newsprint paper
(*): Tableros de Pino radiata/Panels of Radiata pine.
CHILEAN FORESTRY SECTOR 201134
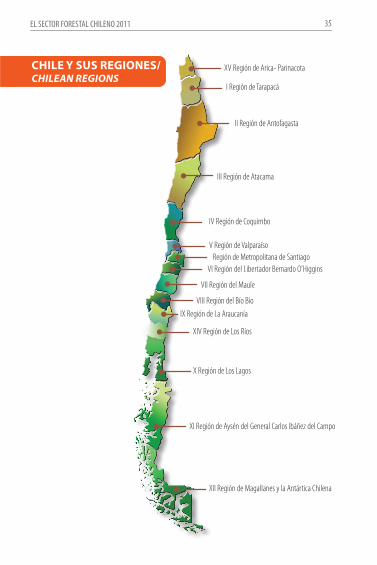
XV Región de Arica- Parinacota
I Región de Tarapacá
II Región de Antofagasta
III Región de Atacama
IV Región de Coquimbo
Región de Metropolitana de SantiagoVI Región del Libertador Bernardo O’Higgins
XII Región de Magallanes y la Antártica Chilena
XI Región de Aysén del General Carlos Ibáñez del Campo
X Región de Los Lagos
IX Región de La Araucanía
XIV Región de Los Ríos
VIII Región del Bío Bío
VII Región del Maule
V Región de Valparaíso
chiLe Y sUs reGiOnes/cHILeaN reGIONS
EL SECTOR FORESTAL CHILENO 2011 35
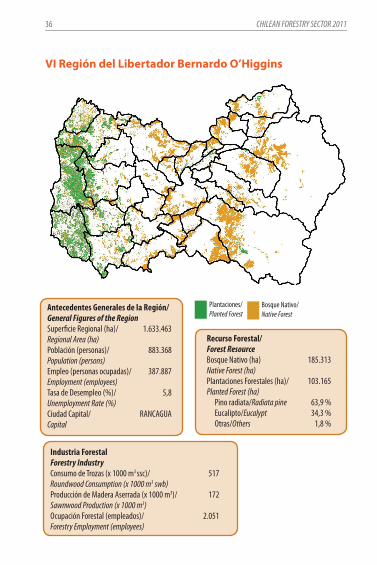
Vi región del Libertador Bernardo O’higgins
Recurso Forestal/Forest ResourceBosque Nativo (ha) 185.313Native Forest (ha) Plantaciones Forestales (ha)/ 103.165Planted Forest (ha)
Pino radiata/Radiata pine 63,9 %Eucalipto/Eucalypt 34,3 %Otras/Others 1,8 %
Antecedentes Generales de la Región/General Figures of the RegionSuperficie Regional (ha)/ 1.633.463Regional Area (ha)Población (personas)/ 883.368Population (persons)Empleo (personas ocupadas)/ 387.887Employment (employees)Tasa de Desempleo (%)/ 5,8Unemployment Rate (%)Ciudad Capital/ RANCAGUACapital
Plantaciones/Planted Forest
Bosque Nativo/Native Forest
Industria ForestalForestry IndustryConsumo de Trozas (x 1000 m3 ssc)/ 517Roundwood Consumption (x 1000 m3 swb)Producción de Madera Aserrada (x 1000 m3)/ 172Sawnwood Production (x 1000 m3)Ocupación Forestal (empleados)/ 2.051Forestry Employment (employees)
CHILEAN FORESTRY SECTOR 201136
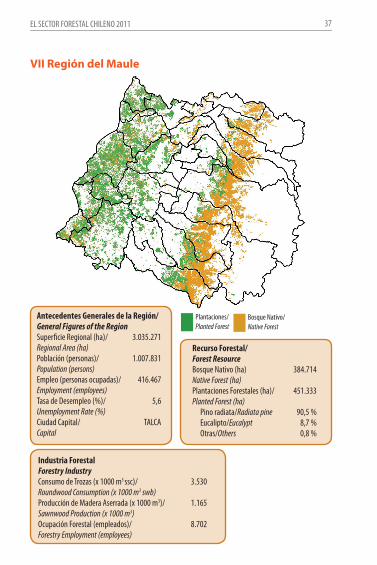
Vii región del Maule
Recurso Forestal/Forest ResourceBosque Nativo (ha) 384.714Native Forest (ha) Plantaciones Forestales (ha)/ 451.333Planted Forest (ha)
Pino radiata/Radiata pine 90,5 %Eucalipto/Eucalypt 8,7 %Otras/Others 0,8 %
Antecedentes Generales de la Región/General Figures of the RegionSuperficie Regional (ha)/ 3.035.271Regional Area (ha)Población (personas)/ 1.007.831Population (persons)Empleo (personas ocupadas)/ 416.467Employment (employees)Tasa de Desempleo (%)/ 5,6Unemployment Rate (%)Ciudad Capital/ TALCACapital
Industria ForestalForestry IndustryConsumo de Trozas (x 1000 m3 ssc)/ 3.530Roundwood Consumption (x 1000 m3 swb)Producción de Madera Aserrada (x 1000 m3)/ 1.165Sawnwood Production (x 1000 m3)Ocupación Forestal (empleados)/ 8.702Forestry Employment (employees)
Plantaciones/Planted Forest
Bosque Nativo/Native Forest
EL SECTOR FORESTAL CHILENO 2011 37
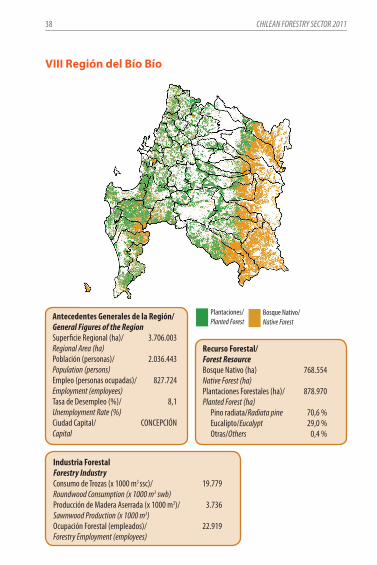
Viii región del Bío Bío
Recurso Forestal/Forest ResourceBosque Nativo (ha) 768.554Native Forest (ha) Plantaciones Forestales (ha)/ 878.970Planted Forest (ha)
Pino radiata/Radiata pine 70,6 %Eucalipto/Eucalypt 29,0 %Otras/Others 0,4 %
Antecedentes Generales de la Región/General Figures of the RegionSuperficie Regional (ha)/ 3.706.003Regional Area (ha)Población (personas)/ 2.036.443Population (persons)Empleo (personas ocupadas)/ 827.724Employment (employees)Tasa de Desempleo (%)/ 8,1Unemployment Rate (%)Ciudad Capital/ CONCEPCIÓNCapital
Industria ForestalForestry IndustryConsumo de Trozas (x 1000 m3 ssc)/ 19.779Roundwood Consumption (x 1000 m3 swb)Producción de Madera Aserrada (x 1000 m3)/ 3.736Sawnwood Production (x 1000 m3)Ocupación Forestal (empleados)/ 22.919Forestry Employment (employees)
Plantaciones/Planted Forest
Bosque Nativo/Native Forest
CHILEAN FORESTRY SECTOR 201138
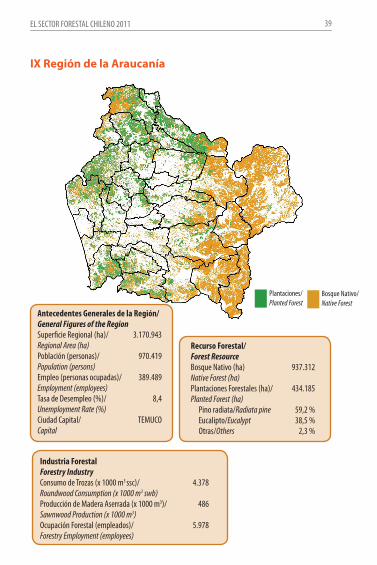
iX región de la araucanía
Recurso Forestal/Forest ResourceBosque Nativo (ha) 937.312Native Forest (ha) Plantaciones Forestales (ha)/ 434.185Planted Forest (ha)
Pino radiata/Radiata pine 59,2 %Eucalipto/Eucalypt 38,5 %Otras/Others 2,3 %
Antecedentes Generales de la Región/General Figures of the RegionSuperficie Regional (ha)/ 3.170.943Regional Area (ha)Población (personas)/ 970.419Population (persons)Empleo (personas ocupadas)/ 389.489Employment (employees)Tasa de Desempleo (%)/ 8,4Unemployment Rate (%)Ciudad Capital/ TEMUCOCapital
Industria ForestalForestry IndustryConsumo de Trozas (x 1000 m3 ssc)/ 4.378Roundwood Consumption (x 1000 m3 swb)Producción de Madera Aserrada (x 1000 m3)/ 486Sawnwood Production (x 1000 m3)Ocupación Forestal (empleados)/ 5.978Forestry Employment (employees)
Plantaciones/Planted Forest
Bosque Nativo/Native Forest
EL SECTOR FORESTAL CHILENO 2011 39
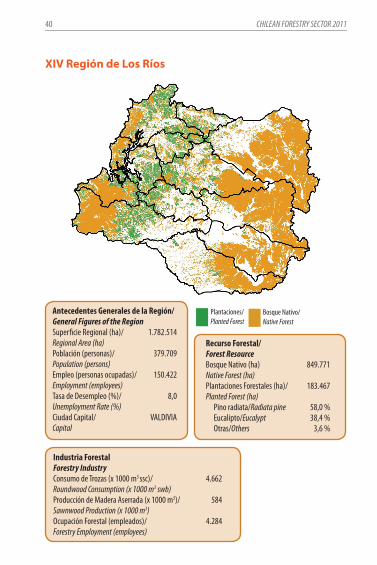
XiV región de Los ríos
Recurso Forestal/Forest ResourceBosque Nativo (ha) 849.771Native Forest (ha) Plantaciones Forestales (ha)/ 183.467Planted Forest (ha)
Pino radiata/Radiata pine 58,0 %Eucalipto/Eucalypt 38,4 %Otras/Others 3,6 %
Antecedentes Generales de la Región/General Figures of the RegionSuperficie Regional (ha)/ 1.782.514Regional Area (ha)Población (personas)/ 379.709Population (persons)Empleo (personas ocupadas)/ 150.422Employment (employees)Tasa de Desempleo (%)/ 8,0Unemployment Rate (%)Ciudad Capital/ VALDIVIACapital
Industria ForestalForestry IndustryConsumo de Trozas (x 1000 m3 ssc)/ 4.662Roundwood Consumption (x 1000 m3 swb)Producción de Madera Aserrada (x 1000 m3)/ 584Sawnwood Production (x 1000 m3)Ocupación Forestal (empleados)/ 4.284Forestry Employment (employees)
Plantaciones/Planted Forest
Bosque Nativo/Native Forest
CHILEAN FORESTRY SECTOR 201140
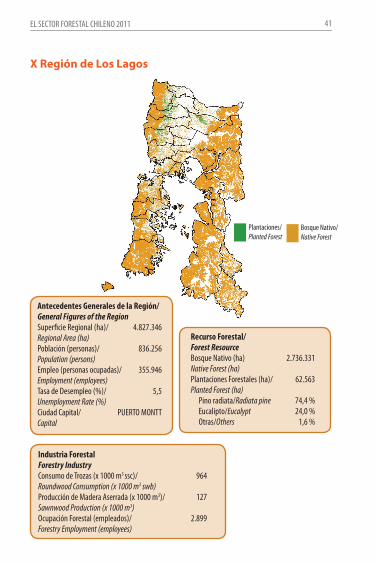
X región de Los Lagos
Recurso Forestal/Forest ResourceBosque Nativo (ha) 2.736.331Native Forest (ha) Plantaciones Forestales (ha)/ 62.563Planted Forest (ha)
Pino radiata/Radiata pine 74,4 %Eucalipto/Eucalypt 24,0 %Otras/Others 1,6 %
Antecedentes Generales de la Región/General Figures of the RegionSuperficie Regional (ha)/ 4.827.346Regional Area (ha)Población (personas)/ 836.256Population (persons)Empleo (personas ocupadas)/ 355.946Employment (employees)Tasa de Desempleo (%)/ 5,5Unemployment Rate (%)Ciudad Capital/ PUERTO MONTTCapital
Industria ForestalForestry IndustryConsumo de Trozas (x 1000 m3 ssc)/ 964Roundwood Consumption (x 1000 m3 swb)Producción de Madera Aserrada (x 1000 m3)/ 127Sawnwood Production (x 1000 m3)Ocupación Forestal (empleados)/ 2.899Forestry Employment (employees)
Plantaciones/Planted Forest
Bosque Nativo/Native Forest
EL SECTOR FORESTAL CHILENO 2011 41
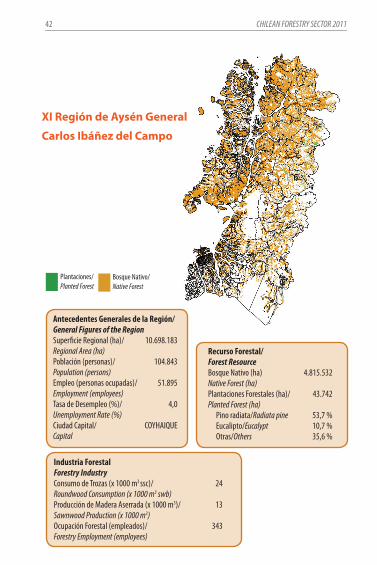
Xi región de aysén General
carlos ibáñez del campo
Recurso Forestal/Forest ResourceBosque Nativo (ha) 4.815.532Native Forest (ha) Plantaciones Forestales (ha)/ 43.742Planted Forest (ha)
Pino radiata/Radiata pine 53,7 %Eucalipto/Eucalypt 10,7 %Otras/Others 35,6 %
Antecedentes Generales de la Región/General Figures of the RegionSuperficie Regional (ha)/ 10.698.183Regional Area (ha)Población (personas)/ 104.843Population (persons)Empleo (personas ocupadas)/ 51.895Employment (employees)Tasa de Desempleo (%)/ 4,0Unemployment Rate (%)Ciudad Capital/ COYHAIQUECapital
Industria ForestalForestry IndustryConsumo de Trozas (x 1000 m3 ssc)/ 24Roundwood Consumption (x 1000 m3 swb)Producción de Madera Aserrada (x 1000 m3)/ 13Sawnwood Production (x 1000 m3)Ocupación Forestal (empleados)/ 343Forestry Employment (employees)
Plantaciones/Planted Forest
Bosque Nativo/Native Forest
CHILEAN FORESTRY SECTOR 201142
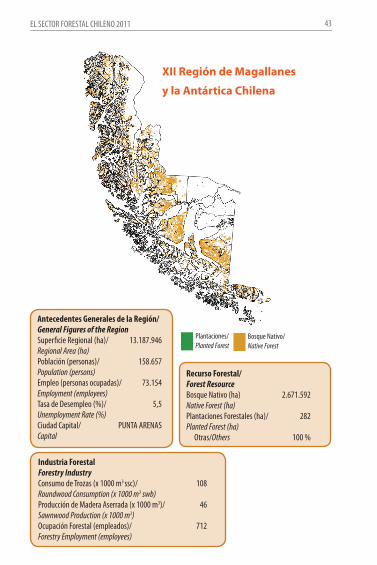
Recurso Forestal/Forest ResourceBosque Nativo (ha) 2.671.592Native Forest (ha) Plantaciones Forestales (ha)/ 282Planted Forest (ha)
Otras/Others 100 %
Xii región de Magallanes
y la antártica chilena
Antecedentes Generales de la Región/General Figures of the RegionSuperficie Regional (ha)/ 13.187.946Regional Area (ha)Población (personas)/ 158.657Population (persons)Empleo (personas ocupadas)/ 73.154Employment (employees)Tasa de Desempleo (%)/ 5,5Unemployment Rate (%)Ciudad Capital/ PUNTA ARENASCapital
Industria ForestalForestry IndustryConsumo de Trozas (x 1000 m3 ssc)/ 108Roundwood Consumption (x 1000 m3 swb)Producción de Madera Aserrada (x 1000 m3)/ 46Sawnwood Production (x 1000 m3)Ocupación Forestal (empleados)/ 712Forestry Employment (employees)
Plantaciones/Planted Forest
Bosque Nativo/Native Forest
EL SECTOR FORESTAL CHILENO 2011 43
• CONAF-CONAMA-BIRF, 1994-1997. Catastro y Evaluación de los Recursos Vegetacionales Nativos de Chile. Santiago, Chile, CONAF; CONAMA. 12v. Incorpora cambios detectados por monitoreo y actualización de catastros, hasta el año 2011.
• INFOR, 2011. Catastro de la Industria Forestal. Base de datos del Área de Información y Mercado, Sede Metropolitana, Instituto Forestal, Chile.
• INFOR, 2010. Anuario Forestal 2010. Boletín Estadístico N°126. Santiago, Chile. 134 p. Instituto Forestal, Chile.
• INFOR, 2011. Exportaciones Forestales Chilenas 2010. Boletín Estadístico N°130. Santiago, Chile.123 p. Instituto Forestal, Chile.
• INFOR, 2011. Importaciones Forestales 2010. Boletín Estadístico N°124. Santiago, Chile. 36 p. Instituto Forestal, Chile.
• INE, 2011. Estadísticas de empleo, demográficas y actividad económica del Instituto Nacional de Estadísticas (INE). En www.ine.cl
• Banco Central, 2011. Producto Interno Bruto 2010. Base de datos estadísticos del Banco Central de Chile. En www.bcentral.cl
• FAO, 2011. Base de datos FAOSTAT. En www.fao.org• FRA, 2010. Evaluación de los Recursos Forestales Mundiales,
Informe Principal. Estudio FAO Montes 163. Disponible en www.fao.org
referencias Bibliográficas/Bibliographic references
Este documento ha sido elaborado por el Área de información Forestal y Análisis Económico de la Sede Metropolitana de INFOR.
This document has bee elaborated by Economic Analysis and Forest Information Area of INFOR.
ISBN: 978-956-318-046-6
Registro de Propiedad Intelectual: 212.403
CHILEAN FORESTRY SECTOR 201144
Publicaciones del Área de Información y Mercado de INFOR/Publication of INFOR Information and Market Area
Dirección Ejecutiva y Sedes Regionales
DIRECCION EJECUTIVASucre 2397, Nuñoa. Fono: (56-2) 3667100
SEDE METROPOLITANASucre 2397, Nuñoa. Casilla: 3085, Santiago.Fono: (56-2) 3667120 Fax: (56-2)3667131
SEDE BIO BIO Camino a Coronel Km. 7,5, Concepción.Casilla: 109 C, Concepción.Fono/Fax: (56-41) 2853260
SEDE VALDIVIAFundo Teja Norte s/n, Valdivia. Casilla: 385, Valdivia.Fono: (56-63) 335200 Fax: (56-63) 218968
OFICINA DIAGUITASKilómetro 5, costado Aeródromo La Florida, La Serena. Fono/Fax: (56-51) 543627
OFICINA PATAGONIARiquelme 147, Coyhaique. Fono: (56-67) 573159
Equipo Directivo
Director EjecutivoHans Grosse Werner
Gerente Técnico NacionalRodrigo Mujica Hoevelmayer
Gerente Regional Sede MetropolitanaGerardo Valdebenito Rebolledo
Gerente Regional Sede Bío BíoÁlvaro Sotomayor Garretón
Gerente Regional Sede ValdiviaJuan Carlos Valencia Baier
Subgerente Regional Oficina DiaguitasEnrique Villalobos Volpi
Subgerente Regional Oficina PatagoniaIván Moya Navarro
INSTITUTO FORESTAL


