Embed Size (px)
Citation preview
T
Ja
b
a
ARRAA
KPVLT
1
TcJcihwn1[ctfbilbcwtH
((a
0h
Electric Power Systems Research 96 (2013) 111– 118
Contents lists available at SciVerse ScienceDirect
Electric Power Systems Research
jou rn al h om epage: www.elsev ier .com/ locate /epsr
esting Low Voltage Ride Through capabilities of solar inverters
. Eloy-Garcia Carrascoa,∗, J.M. Tenab, D. Ugenab, J. Alonso-Martineza, D. Santos-Martina, S. Arnaltesa
Carlos III University, Electrical Engineering Department, C/ Butarque 15, Leganes, Madrid 28911, SpainWind to Power System S.L., Av. Leonardo DaVinci 8-10-12, Getafe, Madrid 28906, Spain
r t i c l e i n f o
rticle history:eceived 20 April 2012eceived in revised form 12 August 2012ccepted 18 October 2012
a b s t r a c t
The increase in the rated power of PV inverters has brought with it new requirements, such as LowVoltage Ride Through and reactive power compensation. Field tests in PV plants are too expensive interms of production losses, and therefore laboratory tests have become a simple, flexible and inexpensivealternative. In this paper, a 500 kW test bench for testing solar inverters has been developed. The test
vailable online 8 December 2012
eywords:V inverteroltage Sagow Voltage Ride Through
bench is based on two inverters connected back-to-back. One of them acts as a controlled voltage sourcewhile the other is the inverter under test. The DC link is fed by a diode rectifier which only compensatesfor the power losses of all the elements in the test bench. With this test bench, Low Voltage Ride Throughperformance of a 500 kW solar inverter can be completely tested at full load. The results presented meetthe requirements of the German BDEW standard.
est bench
. Introduction
Photovoltaic generation of electrical energy is now a reality.housands of photovoltaic plants throughout the world have beenonstructed in the last decade or two. Countries like Germany,apan, the USA, Italy, Spain and China have several GW of installedapacity and targets for 2015 and 2020 are being revised andncreased, as is the case of China, with 21 GW [1]. Most of the plantsave small inverters (less than 100 kW). This usually yields plantsith a lot of inverters. There are cases of small plants with a hugeumbers of inverters, such as two hundred 5 kW inverters for a
MW plant [2] or one thousand 5 kW inverters for a 5 MW plant3]. The consequences are clear for installation, maintenance, effi-iency, monitoring and plant operation issues. Thus, there is a trendowards bigger photovoltaic inverters, 500 kW being one of the pre-erred sizes and, with this increase in size, new requirements muste met, like Low Voltage Ride Through (LVRT) or anti-islanding
ssues [4–11]. The objective of LVRT capability is to avoid a highoss of power in the case of a voltage dip in the grid, usually causedy faults. This was the case for wind farms until recently. The LVRTapability of wind generators could be tested on a single turbine in a
ind farm which typically caused less than 5% power reduction andhus minimized the influence on wind farm performance [12,13].owever, this is not the case in PV plants, which have lower rated
∗ Corresponding author. Tel.: +34 91 624 5993; fax: +34 91 624 9430.E-mail addresses: [email protected] (J.E.-G. Carrasco), [email protected]
J.M. Tena), [email protected] (D. Ugena), [email protected]. Alonso-Martinez), [email protected] (D. Santos-Martin),[email protected] (S. Arnaltes).
378-7796/$ – see front matter © 2012 Elsevier B.V. All rights reserved.ttp://dx.doi.org/10.1016/j.epsr.2012.10.011
© 2012 Elsevier B.V. All rights reserved.
power than wind farms and where the cost of a field test wouldexceed reasonable values, reaching up to 25% power reduction dur-ing tests. In fact, some standards take this matter into account andallow the use of a laboratory test bench to test inverter performance[4,5,7,8].
Most of these standards were developed for wind energy inte-gration and are being adapted for PV plants, mainly dependingon the level of penetration in each country. Studies comparingdifferent grid codes for wind energy were done [14–17] and canbe used as a reference for photovoltaic energy. In Europe, coun-tries like Germany or Spain have adapted their grid codes for PVplants [5,18]. Italy has recently released a new version of the gridcode for distributed generation systems, explicitly including PV [7],including a new requirement for a two-phase sag at the HV levelof the transformer (so called pseudo single-phase sag), but thisdiscussion is out of the scope of the paper. Based on the ENTSOnetwork code [19] and on the European Commission report [20],the next countries to follow the adaptation of their grid codes for PVplants must be France, Czech Republic and United Kingdom, withthe goal to prove that PV is now a mature technology. In NorthAmerica, in the USA, the North American Electric Reliability Cor-poration has recently approved the PRC-024-1 [6], which includesLVRT curves. In Canada, the Hydro-Quebec standard [9] is the ref-erence since 2009. The case of China is slightly different becausethe LVRT requirement for wind turbines was recently approved[11,21,17], but as the growth in PV installed capacity is very high[1], it is probable that the adaptation for PV plants comes soon. In all
cases, the voltage profiles for the sags are all very similar betweendifferent grid codes, with small changes in the remaining voltageand the duration, as is shown below for the case of the BDEW gridcode.
112 J.E.-G. Carrasco et al. / Electric Power Systems Research 96 (2013) 111– 118
pcffa
tetracgMsgpbo
2
l(aaal
4fiisaaroa
it
Fig. 1. One-line circuit of the test bench.
In addition, LVRT field tests usually take a long time to be com-leted because they depend on weather conditions. Tests must bearried out at certain power levels, typically low-, medium- andull-load tests, which for wind energy depend on wind speed andor photovoltaic energy on irradiance and temperature. This implies
waiting time of several hours or even days.These kinds of test benches are usually based on power elec-
ronic devices [22–24] as they provide high flexibility and highfficiency, and are a key element in current renewable energy sys-ems and in the future smart grids [25,26]. As stated in [27], theeason a prototype is built is to demonstrate the functionality of
concept, although it may not have the actual size or power. Thease of LVRT tests is special, because full-load tests are required byrid codes, but these have major drawbacks, as mentioned above.oreover, when a voltage sag is generated in situ at power plants
uch as wind farms or PV plants, a high current is drawn from therid because the sag is in fact a low impedance short circuit at theoint of common connection (PCC) [28]. The proposed LVRT testench allows rated power tests in a laboratory rig while the effectn the inverter under test remains the same.
. Description of the test bench
The topology of the test bench is shown in Fig. 1, where the fol-owing components can be identified: (a) the inverter under testIUT), a solar inverter with LVRT capability; (b) the AC source (volt-ge sag generator, VSG), a 550 kW voltage controlled inverter with
LC output filter, which can generate different voltage sag profilest any load levels; (c) a diode rectifier to compensate for powerosses of the entire test bench.
In this test bench, DC voltage is obtained by rectification of a00 V AC grid voltage by means of a diode rectifier. The diode recti-er was sized to cope with the power losses of all components,
n total less than 40 kW. The voltage sag generator is a voltageource inverter with a LC output filter. It has an open-loop volt-ge control and can generate different sag profiles, both balancednd unbalanced, simulating three-phase and phase-to-phase faultsespectively, as shown in Section 3. The IUT will be controlled inrder to provide rated power at rated AC voltage and also to react
s required by standards in case of voltage sags.Once the DC link has been charged, the voltage sag generators activated to create the necessary three-phase AC voltage. Whenhe IUT detects connection conditions, it starts its synchronization
Fig. 2. Voltage phasors in a three-phase system: normal operation (dotted lines),three-phase sag (dashed lines) and unbalanced sag (bold lines).
process. Then, an active power reference is set to the control of theIUT so that the test can take place with the required power gener-ation, typically full-load and low-load tests. In the case of BDEW,[29] states that tests must be carried out at two active power rangesin accordance with [30], the low-load test being between 10% and30% of rated power and the full-load test at over 90% of rated power.When the system reaches its steady state, a voltage sag command isfed into the control of the voltage sag generator (VSG). A voltage sagappears at the IUT terminals and its LVRT process starts. After thesag, the system returns to its previous state, ready to ride througha new voltage sag.
3. The voltage sag generator
An inverter with a LC output filter has been used in order togenerate voltage sags. This inverter can be considered as a con-trolled voltage source so that, in standard operation, it sets both thedesired voltage amplitude and frequency. Moreover, it can generatebalanced and unbalanced voltage sags.
The voltage phasors of a balanced three-phase system are shownin Fig. 2. Both phase-to-neutral (Va, Vb, Vc) and phase-to-phase vol-tages (Vab, Vbc, Vca) are depicted in dotted lines. In the case of athree-phase sag, all voltages are simultaneously reduced to a valuep times smaller, where p is defined as the per unit remaining volt-age during the sag. Consequently, if V is the phase-to-phase RMSvoltage, the phase-to-phase remaining voltage during the sag willbe pV. In this case, the phase angles do not change, as shown inFig. 2 in dashed lines. Nevertheless, when an unbalanced voltagesag takes place, not only the voltage amplitude but also the phaseangles are affected, as is the case of a phase-to-phase voltage sagbetween phases A and B [31]. In this case, phase-to-neutral voltageVc remains unchanged in both amplitude and phase. As Vab changesto pV, Vbc and Vca change to qV in order to keep neutral point volt-age. Let � be phase-to-phase voltage supplementary angle and �and x the angle and the magnitude of phase-to-neutral voltages Va
and Vb, as depicted in bold lines in Fig. 2. Based on their phasorrelationships and Kirchhoff’s second law and solving for �, � , x andq as a function of p, yields
� = atan
(√3
p
)(1)
� = atan(√
3p) (2)
x = pV
2 sin(
atan(√
3p)) (3)

J.E.-G. Carrasco et al. / Electric Power Systems Research 96 (2013) 111– 118 113
Fig. 3. Block diagram of the voltage sag generator control.
ag pro
q
a
idis[p
TVO
Fig. 4. Profiles in German BDEW standard according to [32]: (a) voltage s
= p
2 cos(
atan(√
3p
)) . (4)
Thus, as voltage depth increases, phase-to-neutral voltages Va
nd Vb approach each other and shrink, as shown in Fig. 2.Based on Eqs. (1)–(4), an open-loop controller was designed and
mplemented in a DSP to control VSG output voltage and generateifferent sag profiles. The block diagram of this controller is shown
n Fig. 3. The inputs to this algorithm, set by the user, are the voltageag type, one among eight different voltage sags defined in Table 129] (see Section 3.1), the fundamental frequency f and the phase tohase RMS voltage V. An additional activation signal SagON is used
able 1oltage sag types in BDEW standard as defined by the German Transmission Systemperators [32].
Type Depth (pu) Length (s) Kind
1 0.03 0.15 Balanced2 0.03 0.15 Unbalanced3 0.2 0.55 Balanced4 0.2 0.55 Unbalanced5 0.45 0.95 Balanced6 0.45 0.95 Unbalanced7 0.75 1.4 Balanced8 0.75 1.4 Unbalanced
file (only borderline 2 applies) and (b) reactive current provision profile.
to trigger the voltage sag, which is active for the time set in Table 1.Frequency and voltage values are used to generate the three-phasevoltage system in normal operating conditions. These values wereadjusted depending on the rated values of the PV inverter undertest.
In normal operation, p = q = 1 and � = 2�/3. Depending on the sagtype, the isbalanced signal indicates whether the voltage sag is bal-anced or not, triggering the switches in Fig. 3. For a three-phasesag, isbalanced = 1 and � = 2�/3 and q = p, equal to the correspond-ing value in Table 1 for the chosen sag type. For unbalancedsags, isbalanced = 0 and � and q are calculated according to Eqs.(1) and (4) respectively. Given V, f, p, � and q, a three-phasevoltage system is created with Va(t) =
√2/3pV sin(2�ft), Vb(t) =√
2/3qV sin(2�ft + � − �) and Vc(t) =√
2/3qV sin(2�ft − � + �).Once the three-phase system was generated, a Clarke trans-
formation was applied to obtain ˛ ̌ components. Inverter outputcurrent Iabc is also measured. This measurement was used to com-pensate for different load levels. This is a simple voltage dropcompensation which considers output filter voltage drops as a func-tion of the current Iabc circulating in the loop, thus taking into
account the reactance of the filter. There is a cross effect causedby the inductive nature of the filter. The compensated voltage v˛ˇis then fed into a Space Vector Modulation (SVM) algorithm, whichproduces the pulses for the inverter switches.
114 J.E.-G. Carrasco et al. / Electric Power Systems Research 96 (2013) 111– 118
sag typ
3
abcr[dscScsdtf
(mro
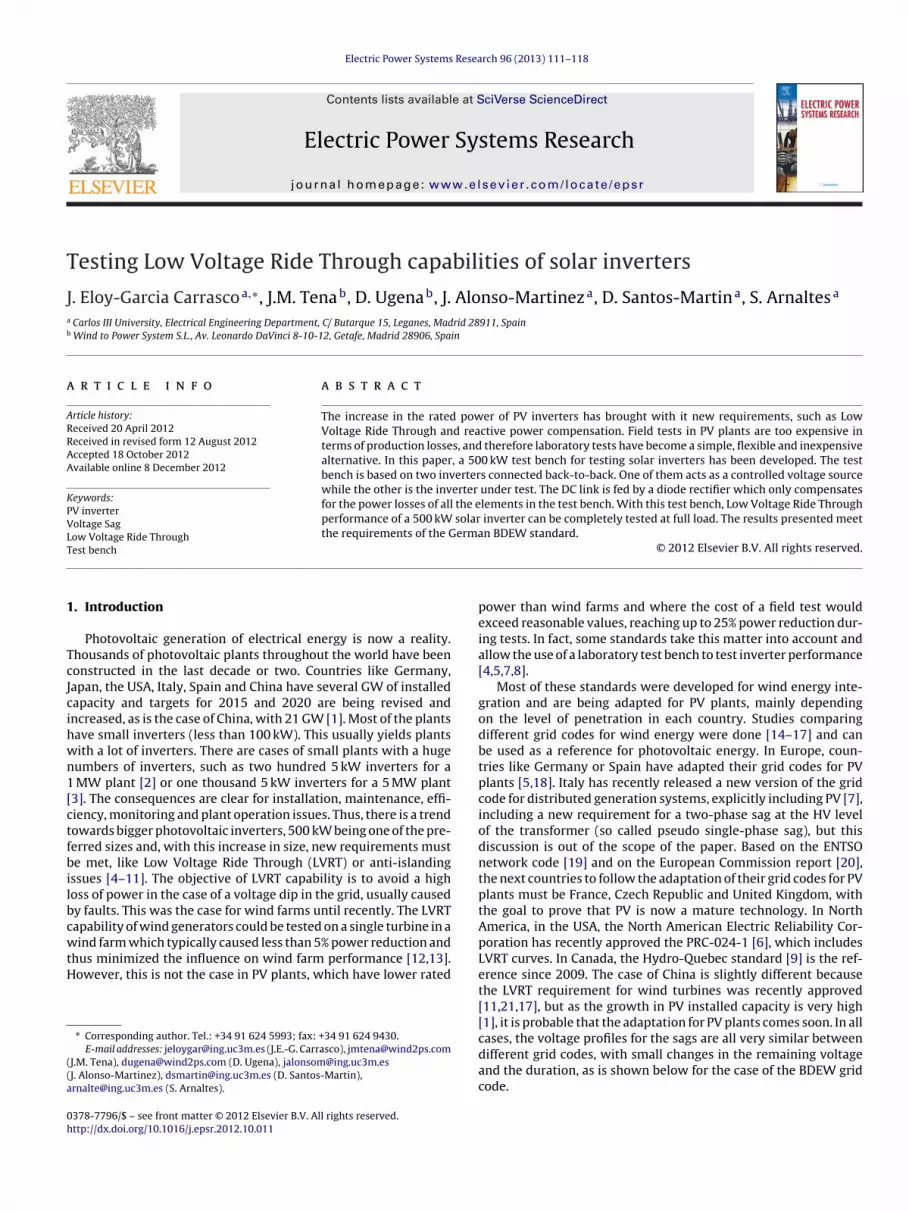
Fig. 5. Scope snapshots of phase-to-neutral voltages for some
.1. The German BDEW standard
The German BDEW standard [5] defines eight voltage sag typesccording to Table 1 [29]. The values of Table 1 are usually agreedetween the Transmission System Operator (TSO) and the certifi-ation company, always according to standard requirements. Theequirements of the BDEW standard are shown in Fig. 4, taken from32]. The voltage sag profile is shown in Fig. 4(a), where only bor-erline 2 applies, as borderline 1 only applies for systems withynchronous generators, according to the definition in the gridode [5]. Fig. 4(b) shows the reactive current provision profile (seeection 4). The voltage profile is approximated by four envelopeurves, which are related to sag types 1, 3, 5 and 7 for balancedags and 2, 4, 6 and 8 for unbalanced sags. Although these curveso not coincide with borderline 2, they follow the requirements ofhe applicable grid code [32] in Table 1 and are more demandingor the inverter than the profile shown in Fig. 4(a).
Fig. 5 shows generated sag types 1 and 5 (balanced) and 2 and 6
unbalanced) for no-load tests. All voltage sag profiles are preciselyatched both in time and amplitude. The certification companyequires these no-load tests prior to the certification process, inrder to verify the sag profiles.
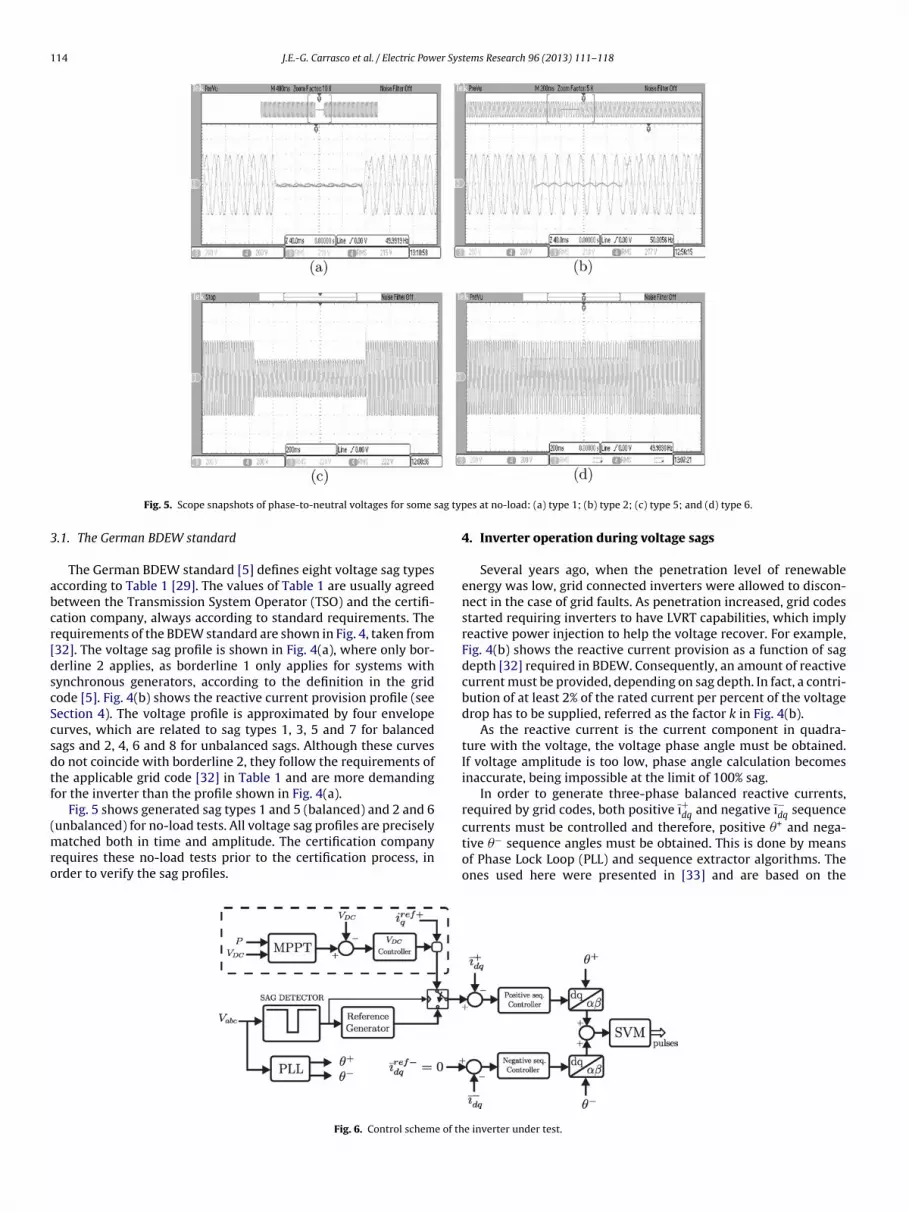
Fig. 6. Control scheme of th
es at no-load: (a) type 1; (b) type 2; (c) type 5; and (d) type 6.
4. Inverter operation during voltage sags
Several years ago, when the penetration level of renewableenergy was low, grid connected inverters were allowed to discon-nect in the case of grid faults. As penetration increased, grid codesstarted requiring inverters to have LVRT capabilities, which implyreactive power injection to help the voltage recover. For example,Fig. 4(b) shows the reactive current provision as a function of sagdepth [32] required in BDEW. Consequently, an amount of reactivecurrent must be provided, depending on sag depth. In fact, a contri-bution of at least 2% of the rated current per percent of the voltagedrop has to be supplied, referred as the factor k in Fig. 4(b).
As the reactive current is the current component in quadra-ture with the voltage, the voltage phase angle must be obtained.If voltage amplitude is too low, phase angle calculation becomesinaccurate, being impossible at the limit of 100% sag.
In order to generate three-phase balanced reactive currents,required by grid codes, both positive ı+dq and negative ı−dq sequence
currents must be controlled and therefore, positive �+ and nega-tive �− sequence angles must be obtained. This is done by meansof Phase Lock Loop (PLL) and sequence extractor algorithms. Theones used here were presented in [33] and are based on thee inverter under test.

J.E.-G. Carrasco et al. / Electric Power Systems Research 96 (2013) 111– 118 115
FAt
ccct
enT
c
+
ig. 7. Graphical example of the performance of the inverter during voltage sags. type 2 voltage sag is depicted together with the space vector diagrams for the
ransition from normal operation to faulty operation and back.
ancellation of positive sequence quadrature component v+q . The
ontrol scheme of the IUT is shown in Fig. 6, where the decoupledontrol of the currents in dq frame is depicted. The transformationso obtain ı+dq and ı−dq are not shown in the diagram for clarity. The ref-
rence for the negative sequence current ı− is always zero, both in
dqormal operation and during the sags, as required by grid codes.he reference for the positive sequence ı+dq in normal operationomes from the DC voltage outer control loop (iref +d
) and the desired
Fig. 9. Phase R current and phase to neutral voltage for type 3 voltage sag (b
Fig. 10. Phase R current and phase to neutral voltage for type 2 voltage sag (u
Fig. 8. Photograph of the test bench.
power factor (indirectly iref +q ). This mode of operation, marked with
a dashed rectangle in Fig. 6, is inhibited during the tests, as Vdc isfixed by the diode rectifier.
During a voltage sag, the reference for ı+dq is calculated taking intoaccount whether the sag is balanced or unbalanced, as calculatedby the sag detector in Fig. 6. For balanced sags, iref +
q is set to 100%
of rated inverter current, while for unbalanced sags, iref +q is set to
60%. As no active power must be generated, iref +d
is always set to0 A. These reactive current values were set in accordance with [29],where it is stated that the reactive current setpoint must not behigher than 100% for three-phase sags (with a tolerance up to 120%)and 40% for two-phase voltage drop tests (with a tolerance up to60%). In the present case, these setpoints were chosen in order tobring the IUT to its limit. The output of the current controllers arethen transformed back to ˛ ̌ axis and added, to obtain the voltage
reference for the modulator. For this inverse transformation, � and�− are again necessary.An example for a type 2 voltage sag is shown in Fig. 7, includingthe space vector diagrams at the beginning and at the end of the sag.
alanced, 20%, 550 ms): (a) beginning of the sag and (b) end of the sag.
nbalanced, 3%, 150 ms): (a) beginning of the sag and (b) end of the sag.

116 J.E.-G. Carrasco et al. / Electric Power Systems Research 96 (2013) 111– 118
61 61.5 62 62.5
−1
0
1
I d, Iq (
kA)
61 61.5 62 62.50
0.5
1
1.5
t (s)
|Vg| (
pu)
(a)
47 47.5 48 48.5 49
−1
0
1
I d, Iq (
kA)
47 47.5 48 48.5 490
0.5
1
1.5
t (s)
|Vg| (
pu)
(b)
218 218.5 219 219.5 220
−1
0
1
I d, Iq (
kA)
218 218.5 219 219.5 2200
0.5
1
1.5
t (s)
|Vg| (
pu)
(c)
132 132.5 133 133.5 134
−1
0
1
I d, Iq (
kA)
132 132.5 133 133.5 1340
0.5
1
1.5
t (s)
|Vg| (
pu)
(d)
1256 1256.5 1257 1257.5
−1
0
1
I d, Iq (
kA)
1256 1256.5 1257 1257.50
0.5
1
1.5
t (s)
|Vg| (
pu)
(e)
198 198.5 199 199.5 200
−1
0
1
I d, Iq (
kA)
198 198.5 199 199.5 2000
0.5
1
1.5
t (s)
|Vg| (
pu)
(f)
1551.5 1552 1552.5 1553
−1
0
1
I d, Iq (
kA)
1551.5 1552 1552.5 15530
0.5
1
1.5
t (s)
|Vg| (
pu)
(g)
268.5 269 269.5 270
−1
0
1
I d, Iq (
kA)
268.5 269 269.5 2700
0.5
1
1.5
t (s)
|Vg| (
pu)
(h)
F grey( d, 20%(
Wsraoaf
ig. 11. Experimental results for all eight types at full load. id marked with dottedunbalanced, 3%, 150 ms), (c) type 3 (balanced, 20%, 550 ms), (d) type 4 (unbalanceg) type 7 (balanced, 75%, 1400 ms) and (h) type 8 (unbalanced, 75%, 1400 ms).
hen the sag is detected, the sag detection signal, output from theag detector block in Fig. 6 is on and the references for active i+
dand
eactive i+q current components change accordingly, as explained
bove. The arrow on the positive part of the d-axis shows the changef the voltage vector amplitude, decreasing when the sag startsnd increasing when the voltage recovers. The 90 degree rotationrom purely active to purely reactive current is also indicated. Whenline, iq marked with bold black line: (a) type 1 (balanced, 3%, 150 ms), (b) type 2, 550 ms), (e) type 5 (balanced, 45%, 950 ms), (f) type 6 (unbalanced, 45%, 950 ms),
the sag ends and the voltage recovery is detected, the sag detectionsignal is off and the references are set back to their pre-sag value.
5. Results of the experiments
The afore mentioned test bench was built in a laboratory witha 400 V 63 A three-phase grid. A picture of the set-up is shown in

er Sys
Fdvt
trcmrbFrtsotrvp2
niatvas(ftoti4oo
6
ahwabtaadbiiftLsbcs
ptm
[
[
[
[
[
[
[
[
[
[
[
[
[
[
[
J.E.-G. Carrasco et al. / Electric Pow
ig. 8. The following figures show results for tests carried out forifferent voltage sags according to Table 1. In the case of unbalancedoltages, currents id and iq refer to positive sequence currents, as, athe moment, grid codes do not allow negative sequence currents.
Fig. 9 shows phase R current and phase-to-neutral voltage for aype 3 sag. The beginning of the sag is shown in Fig. 9(a). A shortesonance transient in voltage is observed. In these tests, the initialurrent reference peak values were id = −500 A (the negative signeans generation) and iq = 0 A. When the sag takes place, current
eferences are changed to id = 0 A and iq = 1460 A. This can be seeny the 90 degree phase displacement between voltage and current.ig. 9(b) shows the end of the sag. In this case, when the voltageecovery is detected, current components are set to zero duringhree cycles to allow a full recovery of the voltage. After this, theystem is sent back to its initial state. A similar response can bebserved for a type 2 sag in Fig. 10(a) and (b). In this case, due tohe unbalance, iq = 900 A during the sag. In all cases, voltage probeatio is 1:100 (V/V) and current probe ratio is 1:500 (V/A), i.e. peakoltage is 230 V, corresponding to a 280 V line voltage, and currenteak value is 1460 A (2.92 V in scope) corresponding to 500 kW at80 V.
Fig. 11(a)–(h) shows direct- and quadrature-current compo-ents in kARMS and grid voltage amplitude in per unit. Before the sag,
d = −1032 A and iq = 0 A, that is to say, the solar inverter is gener-ting rated power at unity power factor with rated voltage. Duringhe sag, id reference is set to zero and, depending on whether theoltage sag is balanced or unbalanced, iq = 1032 A or iq = 636 A, 100%nd 60% of rated current respectively. This means that, during theag, the IUT is only generating positive sequence reactive powerwithout active power at all) as the grid code requires. After theault, the IUT reaches its previous state in approximately 0.5 s. Thisime depends on the IUT configuration and on the requirementsf the grid operator regarding active power gradient and reconnec-ion time after fault, in accordance with [30]. A very stable responses observed in the figures. Current references are reached in about0 ms, which at the same time causes overshoot and small transientscillations, which finally extinguish in less than 150 ms. Maximalvershoot ranges from 27% for type 1 sags to 18% for type 7 sags.
. Conclusions
A 500 kW solar inverter test bench was built to test Low Volt-ge Ride Through (LVRT) capabilities of PV inverters. Due to theigh costs associated with field tests in photovoltaic power plants,here leaving one single inverter out of work could imply losing
considerable amount of PV plant production, this kind of testench would appear to be a highly appropriate alternative solu-ion in terms of time and costs. It also shows a great flexibility indapting to different voltage sag profiles from different grid codesnd countries, as the changes are usually only in sag depth anduration. In addition, the repeatability of the tests is also very high,ecause they do not depend on grid and climate conditions, such as
rradiance and clouds. Its topology, with a loop connection to bothnverters, allows full-load tests while only power losses are drawnrom the grid, increasing security, as there is almost no interac-ion with the grid. This way, the inverter performance regardingVRT can be fully tested before being installed on site. Grid codespecify requirements, such as full-load tests and rated conditions,ut nothing is said regarding tests on site. The certification processan then be carried out after the factory acceptance tests (FAT) andomehow substitute the site acceptance tests (SAT) for LVRT.
A whole set of voltage sag profiles were satisfactorily tested,roving both the ability to generate voltage sags and the ability ofhe IUT to withstand them following the requirements of the Ger-
an BDEW standard. Any other grid code from any other country
[
tems Research 96 (2013) 111– 118 117
like Spain, USA, China, etc., could be also tested by simply modifyingthe values of Table 1 (sag depth and duration) to the requirementsin each grid code.
Acknowledgments
The authors gratefully acknowledge T. Paga, R. Herrero and therest of the team at Wind To Power System for their collaboration inthis work. Without them this work would have never been possible.
References
[1] China is thought to have increased its 2015 target for solar power to21 GW, 2012. http://www.rechargenews.com/energy/solar/article318049.ece(last accessed 19.07.12).
[2] Planta solar fotovoltaica RinconSoto, 1 MW, 2011. www.vinaresol.com/index.php/es/nuestros-proyectos (last accessed 8.03.12).
[3] Planta solar fotovoltaica Villaverde, 5 MW, 2011. www.vinaresol.com/index.php/es/nuestros-proyectos (last accessed 8.03.12).
[4] BOE, P.O. 12.3, Wind farm response requirements during voltage sags, BOE 254(2006) 37017–37019.
[5] BDEW, Technical Guideline: Generating Plants Connected to the Medium-Voltage Network, BDEW Bundesverband der Energie- und Wasserwirtschafte.V., Berlin, Germany, 2008.
[6] NERC Standar PRC-024-1, Generator Performance During Frequencyand Voltage Excursions, 2012. http://www.nerc.com/filez/standards/Generator-Verification-Project-2007-09.html (last accessed 19.07.12).
[7] Regolazione tecnica dei requisiti di sistema della generazione distribuita?Allegato A.70 Codice di Terna, 2012. http://www.allegatoa70.it/?p=22 (lastaccessed 12.08.12).
[8] UL1741, Inverters, Converters, and Controllers for Use in Independent PowerSystems, Underwriters Laboratories Inc., Northbrook, IL, USA, 2001.
[9] Transmission provider technical requirements for the connection of powerplants to the hydro-Quebec transmission system, 2009. http://www.hydroquebec.com/transenergie/fr/commerce/raccordement-transport.html(last accessed 19.07.12).
10] The grid code, issue 4, rev 13, 2012. http://www.nationalgrid.com/uk/Electricity/Codes/gridcode/updates/ (last accessed 19.07.12).
11] National Guidance Catalogue for Renewable Energy Industry Devel-opment (NDRC Energy [2005] No. 2517), 2005. http://www.cwpc.cn/cwpc/en/node/6548 (last accessed 19.07.12).
12] C. Veganzones, J. Sanchez, S. Martinez, C. Platero, F. Blazquez, D. Ramirez, J.Arribas, J. Merino, N. Herrero, F. Gordillo, Voltage dip generator for testing windturbines connected to electrical networks, Renewable Energy 36 (5) (2011)1588–1594.
13] M. Garcia-Gracia, M.P. Comech, J. Sallan, D. Lopez-Andia, O. Alonso, Voltage dipgenerator for wind energy systems up to 5mw, Applied Energy 86 (4) (2009)565–574.
14] M. Tsili, S. Papathanassiou, A review of grid code technical requirements forwind farms, Renewable Power Generation, IET 3 (3) (2009) 308–332.
15] B. Singh, S. Singh, Wind power interconnection into the power system: a reviewof grid code requirements, The Electricity Journal 22 (5) (2009) 54–63.
16] M. Mohseni, S.M. Islam, Review of international grid codes for wind powerintegration: diversity, technology and a case for global standard, Renewableand Sustainable Energy Reviews 16 (6) (2012) 3876–3890.
17] International Grid Code Comparison (IGCC-list), 2012. http://www.gl-group.com/pdf/IGCC Rev 2 36.pdf (last accessed 19.07.12).
18] BOE, P.O. 12.2, Draft: installations connected to the transport system:design, equipment, performance and security, BOE, http://www.aeeolica.es/userfiles/file/procedimientoverificacion/BORRADOR-DE-LA-SEPARATADEL-P.O.12.2.PDF
19] ENTSO-E Network Code for Requirements for Grid Connection Appli-cable to all Generators, 2012. https://www.entsoe.eu/resources/network-codes/requirements-for-generators/ (last accessed 19.07.12).
20] European Commission report. Global market outlook 2016, 2012.http://setis.ec.europa.eu/newsroom-items-folder/european-photovoltaics-at-a-crossroads-says-industry-report (last accessed 19.07.12).
21] Guideline for the Certification of Wind Turbines, Germanischer Lloyd IndustrialServices GmbH, Hamburg, Germany, 2010.
22] D. Ramirez, S. Martinez, C. Carrero, C.A. Platero, Improvements in the grid con-nection of renew. generators with full power converters, Renewable Energy 43(0) (2012) 90–100.
23] F. Ruz, A. Rey, J. Torrelo, A. Nieto, F. Canovas, Real time test benchmark design forphotovoltaic grid-connected control systems, Electric Power Systems Research81 (4) (2011) 907–914.
24] B. Renders, W. Ryckaert, K.D. GussemÃ(c), K. Stockman, L. Vandevelde, Improv-
ing the voltage dip immunity of converter-connected distributed generationunits, Renewable Energy 33 (5) (2008) 1011–1018.25] P. Nema, R. Nema, S. Rangnekar, A current and future state of art developmentof hybrid energy system using wind and pv-solar: a review, Renewable andSustainable Energy Reviews 13 (8) (2009) 2096–2103.

1 er Sys
[
[
[
[
[
[
[
18 J.E.-G. Carrasco et al. / Electric Pow
26] N. Lidula, A. Rajapakse, Microgrids research: a review of experimental micro-grids and test systems, Renewable and Sustainable Energy Reviews 15 (1)(2011) 186–202.
27] P.P. Fasang, Prototyping for ind. applications, IEEE Industrial Electronics andMagnetics 3 (1) (2009) 4–7.
28] A. Sannino, M. Bollen, J. Svensson, Voltage tolerance testing of three-phasevoltage source converters, IEEE Transactions on Power Delivery 20 (2) (2005)
1633–1639.29] FGW, Technical Guidelines for Power Generating Units. Part 3. Determination ofElectrical Characteristics of Power Generating Units Connected to MV, HV andEHV Grids, Fordergesellschaft Windenergie und andere Erneuerbare Energiene.V., Kiel, Germany, 2009, revision 20.
[
tems Research 96 (2013) 111– 118
30] IEC-61400, Wind turbines Part 21: Measurement and Assessment of PowerQuality Characteristics of Grid Connected Wind Turbines, Int. ElectrotechnicalCommission, Geneva, Switzerland, 2008.
31] M.H.J. Bollen, Understanding Power Quality Problems: Voltage Sags and Inter-ruptions, IEEE Press, 445 Hoes Lane, Piscataway, NJ, 1999.
32] H.H. Berndt, M. Hermann, H.D. Kreye, R. Reinisch, U. Scherer, J. Vanzetta, Trans-mission Code 2007: Network and System Rules of the German Transmission
System Operators, Verband der Netzbetreiber - VDN - e.V. beim VDEW, Berlin,Germany, 2007.33] J. Eloy-Garcia, S. Arnaltes, J. Rodriguez-Amenedo, Direct power control of volt-age source inverters with unbalanced grid voltages, Power Electronics, IET 1(3) (2008) 395–407.