Embed Size (px)
Citation preview
www.elsevier.com/locate/apsusc
Applied Surface Science 253 (2006) 2875–2884
Electrochemical impedance spectroscopy and linear polarization
applied to evaluation of porosity of phosphate conversion
coatings on electrogalvanized steels
Vanessa de Freitas Cunha Lins a,*, Geraldo Francisco de Andrade Reis b,1,Carlos Roberto de Araujo a, Tulio Matencio b,1
a Corrosion and Surface Engineering Laboratory, Chemical Engineering Department, Federal University of Minas Gerais,
Rua Espirito Santo 35, 6th floor, Belo Horizonte 30160-030, Brazilb Chemical Department, Federal University of Minas Gerais, AV. Antonio Carlos, 6627-Pampulha, Belo Horizonte 31270-901, Brazil
Received 22 August 2005; received in revised form 3 June 2006; accepted 3 June 2006
Available online 11 July 2006
Abstract
In this work, electrochemical impedance spectroscopy and linear polarization are used in determining porosity of zinc phosphates, and of nickel
and manganese modified zinc phosphates on electrogalvanized steel. The porosity of the phosphate layers ranges from 0.1% for the manganese-
modified hopeite to 8% for hopeite, using the linear polarization and the electrochemical impedance spectroscopy techniques. The porosity values
measured using the two techniques were in agreement. All impedance spectra of coated samples showed two steps, with two capacitive arcs and an
inductive looping.
# 2006 Elsevier B.V. All rights reserved.
Keywords: Phosphate conversion coatings; Electrochemical impedance spectroscopy; Porosity; Linear polarization
1. Introduction
Phosphate conversion coatings are used by industries as a
surface pre-treatment of metals before painting, promoting the
paint adherence and protecting the substrate against corrosion.
Conversion treatments are intended to interpose an inorganic
layer providing both a strong bond to the metal surface and an
adhesive base for the polymeric film and to slow down by long-
term inhibition the destruction of the bonding by general under-
film corrosion due to oxygen diffusing through the coating and
by localized galvanic effects at any flaws in the organic film [1].
The extensive reviews on various aspects of phosphate coatings
are given by Lorin [2], Machu [3], Rausch [4] and Freeman [5].
Thephosphate layeroncarbonsteel shows twophases: hopeite
[Zn3(PO4)2�4H2O] and phosphophillite [Zn2Fe(PO4)2�4H2O]. As
* Corresponding author. Tel.: +55 31 32381773; fax: +55 31 32381789.
E-mail addresses: [email protected] (V. de Freitas Cunha Lins),
[email protected] (T. Matencio).1 Tel.: +55 31 34995758; fax: +55 31 34995700.
0169-4332/$ – see front matter # 2006 Elsevier B.V. All rights reserved.
doi:10.1016/j.apsusc.2006.06.030
the ratio phosphophillite/hopeite increases the adhesion and
corrosion resistance of the phosphate layer increases [6]. The
literature usually deals with phosphate layers on steel [7,8] so the
development of new methods and models for phosphate layers on
zinc is of great interest.
The phosphate coatings on galvanized steels present only
hopeite that has low resistance in alkaline and acid environ-
ments [9]. The addition of cations, such as manganese and
nickel, to the hopeite is an alternative to improve the resistance
of the phosphate coatings in alkaline and acid environments.
There is scarce literature data on physical and chemical
properties of these modified zinc phosphates [9,10].
One problem in the use of phosphate coatings in aggressive
media is the existence of open porosity and pinholes [2,11,12].
These local defects form direct paths between the corrosive
environment and the substrate [12]. As the corrosion reactions
are initiated at the coating–substrate interface, determination of
porosity is important to estimate the overall corrosion
resistance of the coated materials [12]. Notter and Gabe [11]
clearly describe the nature and effect of porosity on the
corrosion resistance of electrodeposited coatings. They point
V. de Freitas Cunha Lins et al. / Applied Surface Science 253 (2006) 2875–28842876
out different methods developed for detecting porosity of
coatings into three main categories: physical methods using
microscopy, chemical methods using different test reagents and
electrochemical methods [11]. The traditional porosity
evaluation techniques are based on active porous observation
and they are generally qualitative [13]. These techniques are not
appropriate to nanometric scale defects evaluation [14]. Typical
porosity tests for phosphate coatings analysis are the
ferrocyanide test and the copper cementation in the pores
[15]; however, electrochemical tests insure better control of the
test conditions [16], such as the capacitance measurements
developed in order to evaluate the free metal fraction [17].
Electrochemical techniques can be used for porosity
measurements and performance evaluation of coating/
substrate systems [8,18,19]. The small potential difference
between the substrate and the coating allows that the substrate
current density be used in the porosity measurement [9].
Application of electrochemical impedance spectroscopy in
the study of substrate/coating system results in a new
information about the material degradation in corrosive media
[20,21].
The objective of this work is to evaluate the porosity, using
electrochemical impedance spectroscopy, Tafel analysis and
linear polarization of the zinc phosphate and the modified zinc
phosphate coatings, with manganese and nickel additions,
deposited on electrogalvanized steels.
2. Methodology
The electrogalvanized steel sheet was produced industrially.
The samples were taken after the hardening rolling, and the
substrate was mild steel (Table 1). The steel used for the
deposition process showed a homogeneous surface in relation
to crystallographic texture [22], carbon residue and roughness.
The carbon residue in the steel surface varied between the
values 2.8 and 4.7 mg m�2, the average value was 3.6 mg m�2.
The average roughness was 0.59 mm.
The main characteristic of this process is the manner in
which high deposition rates are obtained through application of
high current density and high flow electrolyte.
The industrial electroplating line is composed of an
entrance section where the bobbins are welded, and a
chemical process where electrolytic cleaning and pickling
with H2SO4 is used in order to remove oxide layers. The
deposition section contains 20 vertical cells. Each cell has
four boxes containing one insoluble anode. This system
making connections facilitates withdrawing the anode box as
well as making possible to deposit the zinc layer on one or on
both steel faces. The electrolyte that is zinc sulfate flows
Table 1
Chemical composition of the steel
Steel Chemical composition (%, w/w)
C S Mn P Si
Carbon steel 0.060 0.014 0.26 0.020 0.009
from the anode box top and drains away between the anode
and the steel sample. The distance between the steel sample
and the anode is 6.5 mm. The anode is titanium coated with
iridium oxide. The flow rate of the electrolyte in the lower
region reaches 4 m s�1. The electrolyte drains away through
holes in the anode box in order to distribute the pressure.
Gravitational force is used to accelerate the electrolyte in
cells. The application of high current densities
(13,000 A m�2 or higher) is possible because of the high
flow rate. The zinc concentration is maintained through two
dissolution stations, and the zinc electrolyte is fed into the
stations through a by-pass system. The concentration control
is done through the flux control in the dissolution stations.
The electrolyte pH is a control variable and is measured
continuously. The electrolyte temperature was maintained at
55 8C. After the deposition, the samples were immersed in a
sulfuric solution for dissolution of the zinc sulfate that was
deposited in a pure form. The samples were then cleaned and
dried.
The phosphating of the samples was performed at the
laboratory of Henkel Surface Technologies Brasil Ltda., by
immersion in phosphate baths with the compositions presented
in Table 2. The samples were degreased with a 3 wt.% solution
of a commercial product at 60 8C and rinsed with water at room
temperature. The samples were then immerged in a bath
containing 1 g L�1 of a titanium-based refiner for 30 s at the
temperature of 60 8C. The refiner is used to prepare the metallic
surface for the nucleation and growth of the phosphate crystals.
In the next step the samples were immerged in the phosphating
solution for 1 min at the temperature of 60 8C and then rinsed
with running water and dried at 100 8C for 2 min. This
procedure was used for each of the phosphating baths shown in
Table 2.
Accelerator such as nitrate and nitrite was not used.
The mass loss method was used for the determination of
the mass of the phosphate layer. The samples were weighed
at an analytical scale with a precision of 0.1 mg. The
phosphate layer was removed by immerging each sample in a
solution of CrO3 (0.5%, wt./vol. at 70 8C) for 5 min. The
samples were then rinsed with distilled water, dried and
weighed again.
The solution used for the removal of the phosphate coating
on each sample was calibrated and then analyzed by atomic
absorption spectroscopy for the determination of the elements
present in the coating. The equipment used was an Inductive
Coupled Plasma Spectrometer-Spectroflame Modula.
The morphology of the phosphate coating was characterized
by scanning electron microscopy using a Stereoscan 360/
Cambridge microscope.
Alsol Alinsol N O Ni, Cu and Cr
0.052 0.002 0.0027 0.0035 0.055
V. de Freitas Cunha Lins et al. / Applied Surface Science 253 (2006) 2875–2884 2877
Table 3
Mass and chemical composition of the phosphate coating applied on the
electrogalvanized steel
Sample Phosphate coating
Coating weight (g m�2) Chemical composition (wt.%)
Zn P Mn Ni
E-F1 3.2 42.2 9.4 3.9 1.4
E-F2 2.1 54.6 12.7 <0.1 <0.1
E-F3 1.7 37.2 9.6 4.0 <0.1
E-F4 2.9 47.0 8.3 <0.1 1.3
E-F5 2.1 64.8 12.9 <0.1 2.7
Table 2
Chemical composition of phosphatization baths
Samples Phosphate layer Chemical composition (g L�1) Acidness (mL NaOH 0.1 mol L�1)
Zn2+ Mn2+ Ni2+ Free Total
E-F1 Nickel, manganese modified zinc phosphate 1.18 0.73 0.68 0.50 18.0
E-F2 Hopeite 1.23 – – 0.50 17.9
E-F3 Manganese modified zinc phosphate 1.15 0.80 – 0.60 17.9
E-F4 Nickel modified zinc phosphate (low content) 1.16 – 0.43 0.50 17.8
E-F5 Nickel modified zinc phosphate (high content) 1.16 – 0.86 0.60 17.9
The coating porosity can be evaluated using Eq. (1) [12,23].
P ¼ Rps
Rp
� 10�ðDEcorr=baÞ (1)
where P is the coating porosity, Rps the polarization resistance
of substrate, Rp the polarization resistance of coated substrate,
DEcorr the potential difference between the substrate and the
coated substrate and ba is the anodic Tafel coefficient of
substrate.
The electrochemical parameters were obtained by electro-
chemical impedance spectroscopy (EIS), using an Autolab 30
potentiostat, and FRA for Windows v. 2.3, Eco Chemie software,
ZSimpWin Version 2.0, EChem Software and EQUIVCRT
software. The counter electrode was a platinum wire. All the
potentials were measured in relation to a saturated calomel
electrode (SCE) and a three-electrode cell was used in the
experiments. The electrolyte was 0.001 mol L�1 NaCl solution.
The selection of the electrolyte was done in order to minimize the
phosphate dissolution in the alkaline and acid media [9], and in
neutral NaCl solution no passivation takes place on the substrate
[8]. For measuring the porosity of a coating, according to Notter
and Gabe [11] and Weng et al. [8] the linear polarization method
is valid only if the polarization current of the coating is negligible
compared to the substrate and in test solution no passivation
phenomena take place on the substrate. Weng et al. [8] measured
the porosity of zinc and manganese phosphates in 0.5 mol L�1
NaCl. The first electrolyte studied was 0.5 mol L�1 NaCl, but the
dissolution of phosphates occurred, and lower concentrations of
the NaCl solution were tested. The concentration of
0.001 mol L�1 NaCl was selected.
When the corrosion potential remained stable (a variation of
less than 5 mV in 5 min), a sinusoidal ac perturbation of 5 mV
amplitude coupled with the corrosion potential is then applied
to the electrode over the frequency range 5 mHz to 100 kHz.
Linear polarization was also performed to measure the
polarization resistance of the electrogalvanized steel and the
modified zinc phosphate-coated steels. Measurements of
polarization resistance are performed between �10 mV around
the free corrosion potential with a scan rate of 0.167 mV s�1,
after an immersion of 1 h in 0.001 mol L�1 NaCl solution.
Tafel analysis was performed according the ASTM G5
(1994) Standard, using the GPES—General Purpose Electro-
chemical System V. 4.5, Eco Chemie software. The polarization
potential range was �250 mV with respect to the open circuit
potential, and the potential rate was 0.2 mV s�1. The electrolyte
used in the Tafel analysis was 0.001 mol L�1 NaCl.
The working electrodes were electrogalvanized steels and
electrogalvanized steels coated with phosphate layers.
Five measurements of electrochemical parameters using
Tafel analysis, electrochemical impedance spectroscopy and
linear polarization were performed for each sample. The
average value of polarization resistance was registered.
3. Results
3.1. Characterization of zinc and phosphate coating
The zinc coat weight of the electrogalvanized steel was
52.5 g m�2. The result of the zinc coat chemical analysis did
not show the presence of foreign elements in this layer. It was
identified the crystalline phase eta (h—Zn pure) formed by
small randomly oriented hexagonal crystals.
Table 3 shows the mass and chemical composition of the
phosphate coatings from averaging two panels for each
phosphating condition.
The results in Table 3 show that the mass of the phosphate
coating varied according to the composition of the phosphating
bath. Sample E-F1, a tricationic phosphate layer on electro-
galvanized steel, showed the highest phosphate coating mass
while the lowest mass corresponded to the Zn/Mn phosphate
layer on zinc-coated steel. Manganese has a lower molecular
mass than the zinc and nickel, the other elements that constitute
the phosphate layer. This variation was attributed to the
chemical reactivity of each phosphating bath. The increase of
the layer weight with the nickel concentration that was reported
in the literature [24] did not be observed in this work. The
V. de Freitas Cunha Lins et al. / Applied Surface Science 253 (2006) 2875–28842878
structure of inorganic phosphate coatings depends on their film
weight [8]. Normally, light-weight phosphate coatings (0.2–
1.4 g m�2) show an amorphous structure. Middle-weight (1.4–
7.5 g m�2) as well as heavy-weight (7.5–30 g m�2) phosphate
film demonstrates a crystal structure [8]. The phosphate
coatings studied can be classified as middle-weight according
to Table 3.
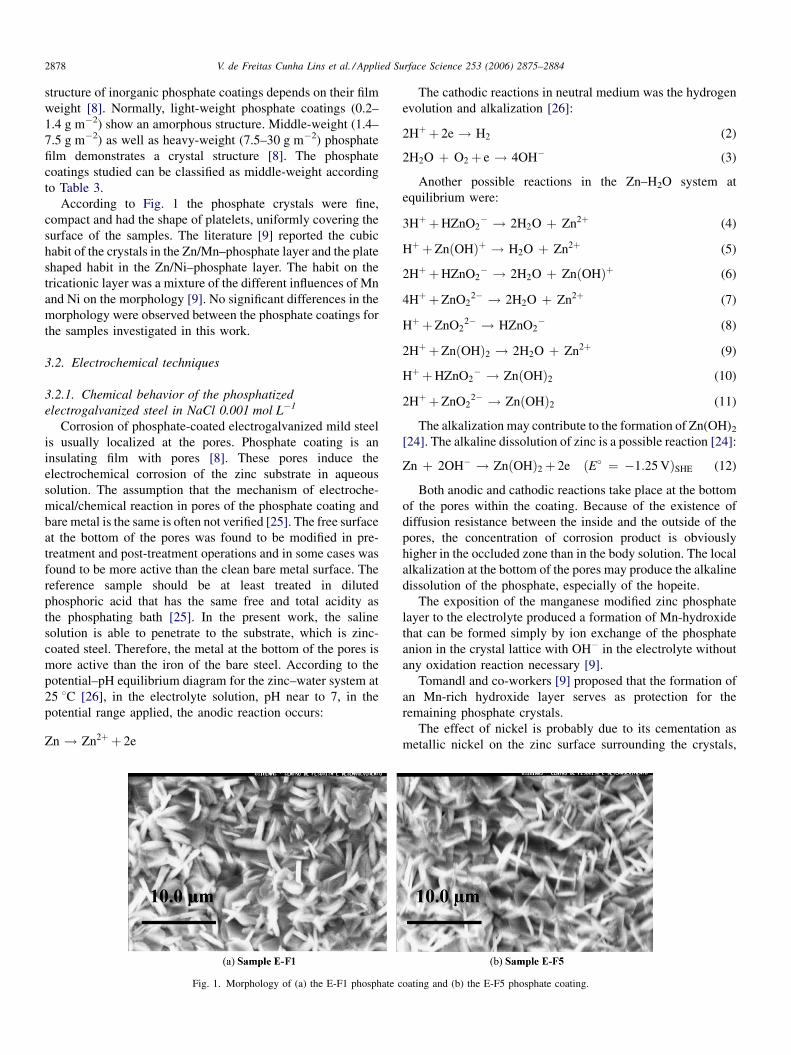
According to Fig. 1 the phosphate crystals were fine,
compact and had the shape of platelets, uniformly covering the
surface of the samples. The literature [9] reported the cubic
habit of the crystals in the Zn/Mn–phosphate layer and the plate
shaped habit in the Zn/Ni–phosphate layer. The habit on the
tricationic layer was a mixture of the different influences of Mn
and Ni on the morphology [9]. No significant differences in the
morphology were observed between the phosphate coatings for
the samples investigated in this work.
3.2. Electrochemical techniques
3.2.1. Chemical behavior of the phosphatized
electrogalvanized steel in NaCl 0.001 mol L�1
Corrosion of phosphate-coated electrogalvanized mild steel
is usually localized at the pores. Phosphate coating is an
insulating film with pores [8]. These pores induce the
electrochemical corrosion of the zinc substrate in aqueous
solution. The assumption that the mechanism of electroche-
mical/chemical reaction in pores of the phosphate coating and
bare metal is the same is often not verified [25]. The free surface
at the bottom of the pores was found to be modified in pre-
treatment and post-treatment operations and in some cases was
found to be more active than the clean bare metal surface. The
reference sample should be at least treated in diluted
phosphoric acid that has the same free and total acidity as
the phosphating bath [25]. In the present work, the saline
solution is able to penetrate to the substrate, which is zinc-
coated steel. Therefore, the metal at the bottom of the pores is
more active than the iron of the bare steel. According to the
potential–pH equilibrium diagram for the zinc–water system at
25 8C [26], in the electrolyte solution, pH near to 7, in the
potential range applied, the anodic reaction occurs:
Zn ! Zn2þ þ 2e
Fig. 1. Morphology of (a) the E-F1 phosphate c
The cathodic reactions in neutral medium was the hydrogen
evolution and alkalization [26]:
2Hþ þ 2e ! H2 (2)
2H2O þ O2þ e ! 4OH� (3)
Another possible reactions in the Zn–H2O system at
equilibrium were:
3Hþ þHZnO2� ! 2H2O þ Zn2þ (4)
Hþ þZnðOHÞþ ! H2O þ Zn2þ (5)
2Hþ þHZnO2� ! 2H2O þ ZnðOHÞþ (6)
4Hþ þZnO22� ! 2H2O þ Zn2þ (7)
Hþ þZnO22� ! HZnO2
� (8)
2Hþ þZnðOHÞ2 ! 2H2O þ Zn2þ (9)
Hþ þHZnO2� ! ZnðOHÞ2 (10)
2Hþ þZnO22� ! ZnðOHÞ2 (11)
The alkalization may contribute to the formation of Zn(OH)2
[24]. The alkaline dissolution of zinc is a possible reaction [24]:
Zn þ 2OH� ! ZnðOHÞ2þ 2e ðE� ¼ �1:25 VÞSHE (12)
Both anodic and cathodic reactions take place at the bottom
of the pores within the coating. Because of the existence of
diffusion resistance between the inside and the outside of the
pores, the concentration of corrosion product is obviously
higher in the occluded zone than in the body solution. The local
alkalization at the bottom of the pores may produce the alkaline
dissolution of the phosphate, especially of the hopeite.
The exposition of the manganese modified zinc phosphate
layer to the electrolyte produced a formation of Mn-hydroxide
that can be formed simply by ion exchange of the phosphate
anion in the crystal lattice with OH� in the electrolyte without
any oxidation reaction necessary [9].
Tomandl and co-workers [9] proposed that the formation of
an Mn-rich hydroxide layer serves as protection for the
remaining phosphate crystals.
The effect of nickel is probably due to its cementation as
metallic nickel on the zinc surface surrounding the crystals,
oating and (b) the E-F5 phosphate coating.
V. de Freitas Cunha Lins et al. / Applied Surface Science 253 (2006) 2875–2884 2879
which remove the zinc surface from contact with the
electrolyte. The dissolution of zinc in the electrolyte occurs
with the hydrogen evolution as the cathodic reaction. In the
potential range studied, there was an increase of the
thermodynamic driving force for cathodic hydrogen evolution,
and there was a potential range of stability of nickel, according
to the potential–pH equilibrium diagram for the nickel–water
system at 25 8C considering the hydrated oxide forms [26]. In
the potential range applied to the sample of zinc/high nickel
phosphate on zinc-coated steel, this reaction could be possible
[24]:
Ni þ 2OH� ! NiðOHÞ2þ 2e ðE� ¼ �0:72 VÞSHE (13)
The metallic nickel present on the zinc surface may support
the cathodic reaction by acting as the cathodic area on the
surface [9]. Zimmermann et al. [24] reported that during the
deposition of the phosphate layer, the cementation of Ni on the
initially corroding Zn gives rise to the formation of surface Ni–
Zn alloys, providing cathodic centers where the reduction of H+
is favored. The electrochemical behavior of Zn/Ni phosphate
layer on zinc-coated steel was less noble than the behavior of
the hopeite layer on zinc-coated steel. These results may be
explained using the literature data [24].
Zimmermann et al. [24] reported that in the absence of
accelerator, the corrosion rate seems not be high enough to get a
sufficient surface Ni enrichment. Because of this, the potential
remains in a value near that of pure zinc.
Tomandl and co-workers [9] also proposed the production of
Zn(OH)2 during the exposition of Zn/Ni phosphate layer on
zinc-coated steel in dilute hydroxide solution.
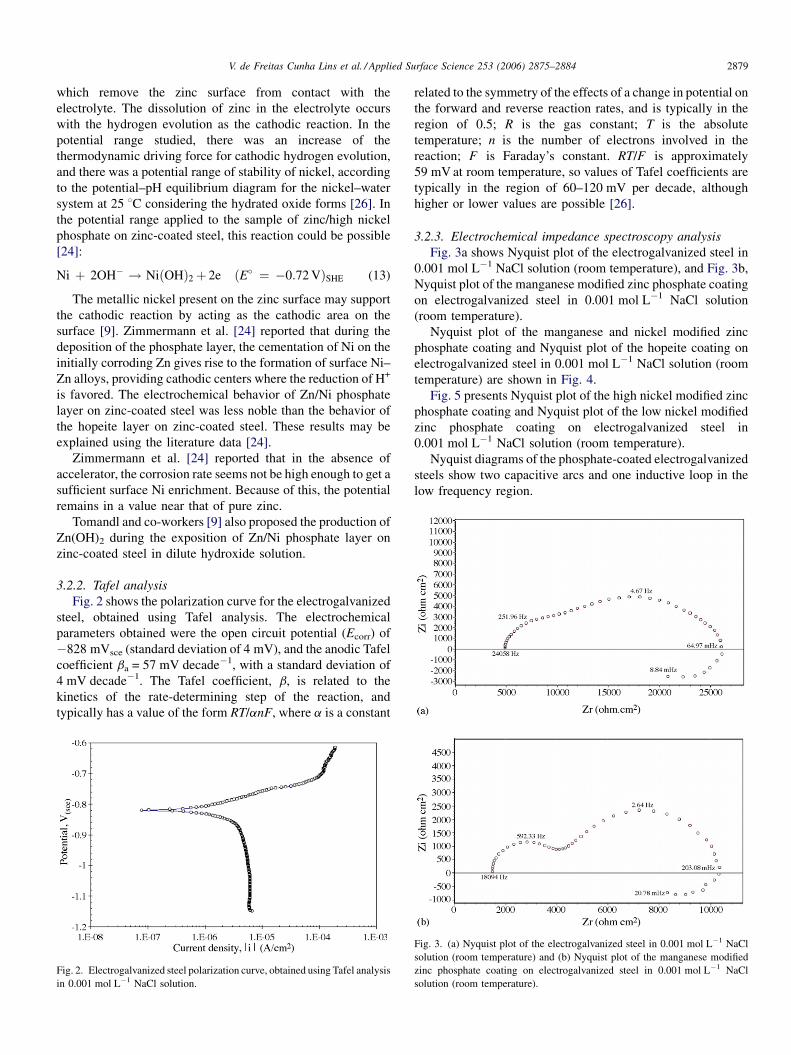
3.2.2. Tafel analysis
Fig. 2 shows the polarization curve for the electrogalvanized
steel, obtained using Tafel analysis. The electrochemical
parameters obtained were the open circuit potential (Ecorr) of
�828 mVsce (standard deviation of 4 mV), and the anodic Tafel
coefficient ba = 57 mV decade�1, with a standard deviation of
4 mV decade�1. The Tafel coefficient, b, is related to the
kinetics of the rate-determining step of the reaction, and
typically has a value of the form RT/anF, where a is a constant
Fig. 2. Electrogalvanized steel polarization curve, obtained using Tafel analysis
in 0.001 mol L�1 NaCl solution.
related to the symmetry of the effects of a change in potential on
the forward and reverse reaction rates, and is typically in the
region of 0.5; R is the gas constant; T is the absolute
temperature; n is the number of electrons involved in the
reaction; F is Faraday’s constant. RT/F is approximately
59 mV at room temperature, so values of Tafel coefficients are
typically in the region of 60–120 mV per decade, although
higher or lower values are possible [26].
3.2.3. Electrochemical impedance spectroscopy analysis
Fig. 3a shows Nyquist plot of the electrogalvanized steel in
0.001 mol L�1 NaCl solution (room temperature), and Fig. 3b,
Nyquist plot of the manganese modified zinc phosphate coating
on electrogalvanized steel in 0.001 mol L�1 NaCl solution
(room temperature).
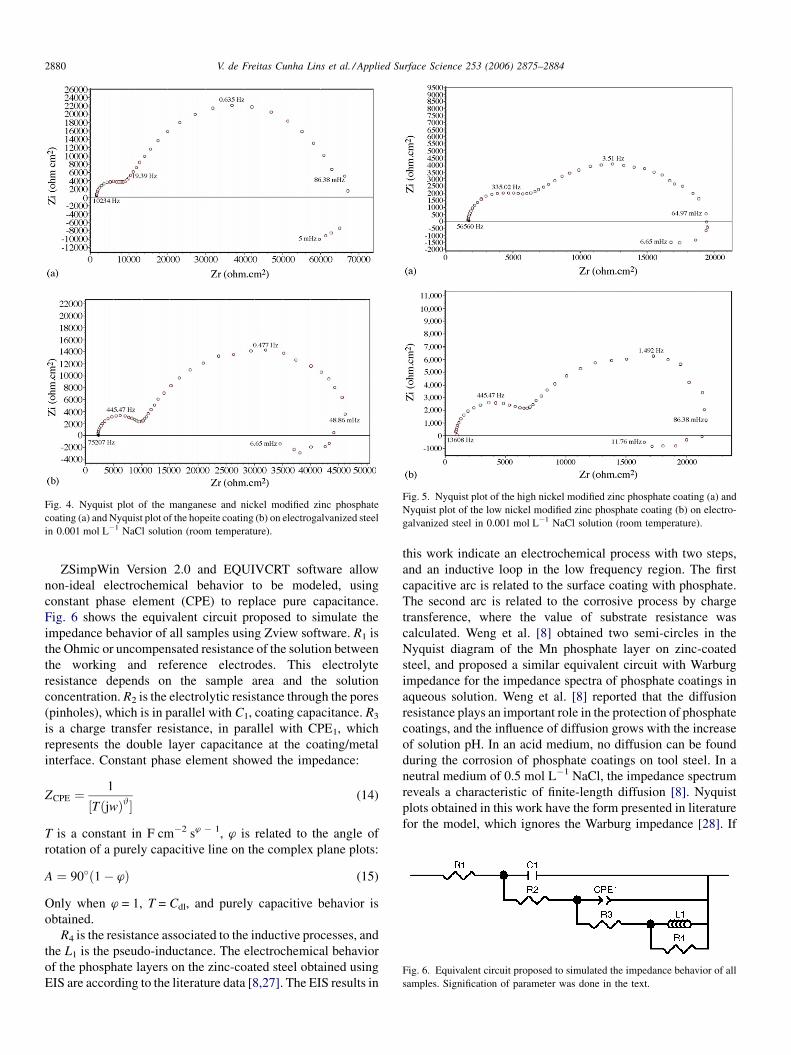
Nyquist plot of the manganese and nickel modified zinc
phosphate coating and Nyquist plot of the hopeite coating on
electrogalvanized steel in 0.001 mol L�1 NaCl solution (room
temperature) are shown in Fig. 4.
Fig. 5 presents Nyquist plot of the high nickel modified zinc
phosphate coating and Nyquist plot of the low nickel modified
zinc phosphate coating on electrogalvanized steel in
0.001 mol L�1 NaCl solution (room temperature).
Nyquist diagrams of the phosphate-coated electrogalvanized
steels show two capacitive arcs and one inductive loop in the
low frequency region.
Fig. 3. (a) Nyquist plot of the electrogalvanized steel in 0.001 mol L�1 NaCl
solution (room temperature) and (b) Nyquist plot of the manganese modified
zinc phosphate coating on electrogalvanized steel in 0.001 mol L�1 NaCl
solution (room temperature).
V. de Freitas Cunha Lins et al. / Applied Surface Science 253 (2006) 2875–28842880
Fig. 4. Nyquist plot of the manganese and nickel modified zinc phosphate
coating (a) and Nyquist plot of the hopeite coating (b) on electrogalvanized steel
in 0.001 mol L�1 NaCl solution (room temperature).
Fig. 5. Nyquist plot of the high nickel modified zinc phosphate coating (a) and
Nyquist plot of the low nickel modified zinc phosphate coating (b) on electro-
galvanized steel in 0.001 mol L�1 NaCl solution (room temperature).
Fig. 6. Equivalent circuit proposed to simulated the impedance behavior of all
samples. Signification of parameter was done in the text.
ZSimpWin Version 2.0 and EQUIVCRT software allow
non-ideal electrochemical behavior to be modeled, using
constant phase element (CPE) to replace pure capacitance.
Fig. 6 shows the equivalent circuit proposed to simulate the
impedance behavior of all samples using Zview software. R1 is
the Ohmic or uncompensated resistance of the solution between
the working and reference electrodes. This electrolyte
resistance depends on the sample area and the solution
concentration. R2 is the electrolytic resistance through the pores
(pinholes), which is in parallel with C1, coating capacitance. R3
is a charge transfer resistance, in parallel with CPE1, which
represents the double layer capacitance at the coating/metal
interface. Constant phase element showed the impedance:
ZCPE ¼1
½TðjwÞ#�(14)
T is a constant in F cm�2 sw � 1, w is related to the angle of
rotation of a purely capacitive line on the complex plane plots:
A ¼ 90�ð1� ’Þ (15)
Only when w = 1, T = Cdl, and purely capacitive behavior is
obtained.
R4 is the resistance associated to the inductive processes, and
the L1 is the pseudo-inductance. The electrochemical behavior
of the phosphate layers on the zinc-coated steel obtained using
EIS are according to the literature data [8,27]. The EIS results in
this work indicate an electrochemical process with two steps,
and an inductive loop in the low frequency region. The first
capacitive arc is related to the surface coating with phosphate.
The second arc is related to the corrosive process by charge
transference, where the value of substrate resistance was
calculated. Weng et al. [8] obtained two semi-circles in the
Nyquist diagram of the Mn phosphate layer on zinc-coated
steel, and proposed a similar equivalent circuit with Warburg
impedance for the impedance spectra of phosphate coatings in
aqueous solution. Weng et al. [8] reported that the diffusion
resistance plays an important role in the protection of phosphate
coatings, and the influence of diffusion grows with the increase
of solution pH. In an acid medium, no diffusion can be found
during the corrosion of phosphate coatings on tool steel. In a
neutral medium of 0.5 mol L�1 NaCl, the impedance spectrum
reveals a characteristic of finite-length diffusion [8]. Nyquist
plots obtained in this work have the form presented in literature
for the model, which ignores the Warburg impedance [28]. If
V. de Freitas Cunha Lins et al. / Applied Surface Science 253 (2006) 2875–2884 2881
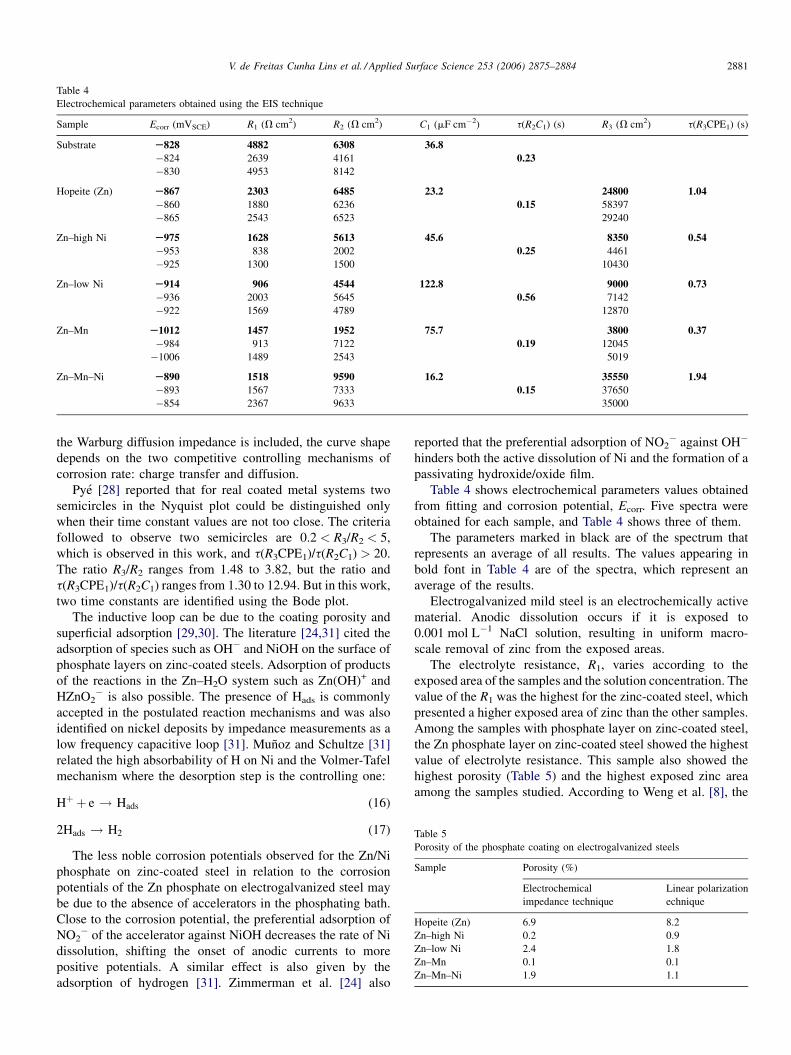
Table 4
Electrochemical parameters obtained using the EIS technique
Sample Ecorr (mVSCE) R1 (V cm2) R2 (V cm2) C1 (mF cm�2) t(R2C1) (s) R3 (V cm2) t(R3CPE1) (s)
Substrate S828 4882 6308 36.8�824 2639 4161 0.23�830 4953 8142
Hopeite (Zn) S867 2303 6485 23.2 24800 1.04�860 1880 6236 0.15 58397
�865 2543 6523 29240
Zn–high Ni S975 1628 5613 45.6 8350 0.54�953 838 2002 0.25 4461
�925 1300 1500 10430
Zn–low Ni S914 906 4544 122.8 9000 0.73�936 2003 5645 0.56 7142
�922 1569 4789 12870
Zn–Mn S1012 1457 1952 75.7 3800 0.37�984 913 7122 0.19 12045
�1006 1489 2543 5019
Zn–Mn–Ni S890 1518 9590 16.2 35550 1.94�893 1567 7333 0.15 37650
�854 2367 9633 35000
Table 5
Porosity of the phosphate coating on electrogalvanized steels
Sample Porosity (%)
Electrochemical
impedance technique
Linear polarization
echnique
Hopeite (Zn) 6.9 8.2
Zn–high Ni 0.2 0.9
Zn–low Ni 2.4 1.8
Zn–Mn 0.1 0.1
Zn–Mn–Ni 1.9 1.1
the Warburg diffusion impedance is included, the curve shape
depends on the two competitive controlling mechanisms of
corrosion rate: charge transfer and diffusion.
Pye [28] reported that for real coated metal systems two
semicircles in the Nyquist plot could be distinguished only
when their time constant values are not too close. The criteria
followed to observe two semicircles are 0.2 < R3/R2 < 5,
which is observed in this work, and t(R3CPE1)/t(R2C1) > 20.
The ratio R3/R2 ranges from 1.48 to 3.82, but the ratio and
t(R3CPE1)/t(R2C1) ranges from 1.30 to 12.94. But in this work,
two time constants are identified using the Bode plot.
The inductive loop can be due to the coating porosity and
superficial adsorption [29,30]. The literature [24,31] cited the
adsorption of species such as OH� and NiOH on the surface of
phosphate layers on zinc-coated steels. Adsorption of products
of the reactions in the Zn–H2O system such as Zn(OH)+ and
HZnO2� is also possible. The presence of Hads is commonly
accepted in the postulated reaction mechanisms and was also
identified on nickel deposits by impedance measurements as a
low frequency capacitive loop [31]. Munoz and Schultze [31]
related the high absorbability of H on Ni and the Volmer-Tafel
mechanism where the desorption step is the controlling one:
Hþ þ e ! Hads (16)
2Hads ! H2 (17)
The less noble corrosion potentials observed for the Zn/Ni
phosphate on zinc-coated steel in relation to the corrosion
potentials of the Zn phosphate on electrogalvanized steel may
be due to the absence of accelerators in the phosphating bath.
Close to the corrosion potential, the preferential adsorption of
NO2� of the accelerator against NiOH decreases the rate of Ni
dissolution, shifting the onset of anodic currents to more
positive potentials. A similar effect is also given by the
adsorption of hydrogen [31]. Zimmerman et al. [24] also
reported that the preferential adsorption of NO2� against OH�
hinders both the active dissolution of Ni and the formation of a
passivating hydroxide/oxide film.
Table 4 shows electrochemical parameters values obtained
from fitting and corrosion potential, Ecorr. Five spectra were
obtained for each sample, and Table 4 shows three of them.
The parameters marked in black are of the spectrum that
represents an average of all results. The values appearing in
bold font in Table 4 are of the spectra, which represent an
average of the results.
Electrogalvanized mild steel is an electrochemically active
material. Anodic dissolution occurs if it is exposed to
0.001 mol L�1 NaCl solution, resulting in uniform macro-
scale removal of zinc from the exposed areas.
The electrolyte resistance, R1, varies according to the
exposed area of the samples and the solution concentration. The
value of the R1 was the highest for the zinc-coated steel, which
presented a higher exposed area of zinc than the other samples.
Among the samples with phosphate layer on zinc-coated steel,
the Zn phosphate layer on zinc-coated steel showed the highest
value of electrolyte resistance. This sample also showed the
highest porosity (Table 5) and the highest exposed zinc area
among the samples studied. According to Weng et al. [8], the
V. de Freitas Cunha Lins et al. / Applied Surface Science 253 (2006) 2875–28842882
porosity is directly responsible for the exposed area of substrate
at the pores within the coating.
The corrosion potential of zinc-coated steel and hopeite
layer on zinc-coated steel (Table 4) was �0.828 V (SCE) and
�0.867 V (SCE). The anodic polarized Zn surface Zn/
Zn2+showed E8 = �0.81 V with [Zn2+] = 0.081 [24]. The
values obtained for the corrosion potentials of zinc-coated
steel and hopeite layer on zinc-coated steel were according to
Zimmermann et al. [24].
The proposed crystal structure of the manganese modified
zinc phosphate on zinc substrate is Mn2Zn(PO4)2�4H2O and
Zn3(PO4)2�4H2O [8]. Manganese occupies both octahedral and
tetrahedral positions in the hopeite crystal lattice [9]. The
exposition of the manganese modified zinc phosphate layer to the
electrolyte produced a formation of Mn-hydroxide that can be
formed simply by ion exchange of the phosphate anion in the
crystal lattice with OH� in the electrolyte without any oxidation
reaction necessary [9]. This ion exchange can have facilitated the
oxidation of zinc, generating the less noble corrosion potential
among the samples. The anodic reaction of zinc oxidation, and
the cathodic reaction of hydrogen evolution probably occurred
[9,26]. The alkalization may produce Zn(OH)2. Table 4 shows
that the values of the electrolytic resistance through the pores, R2,
and the charge transfer resistance, R3, were the lowest values
among the samples studied. The corrosion potential of the Zn/Mn
phosphate layer on zinc-coated steel was the less noble potential,
according to the resistance values.
The Zn/Ni–phosphate layer on zinc-coated steel showed
values of R2, electrolytic resistance through the pores, lower than
the pore resistance of the hopeite (Table 4). The open circuit
potential of the Zn/Ni phosphate layer on galvanized steel was
lower than the Ecorr of the Zn phosphate (Table 4). The less noble
behavior of the Zn–Ni phosphate layer on galvanized steel was
observed. The effect of nickel is probably due to its cementation
as metallic nickel on the zinc surface surrounding the crystals.
The dissolution of zinc in the electrolyte occurs with the
hydrogen evolution as the cathodic reaction. In the potential
range studied, there was an increase of the thermodynamic
driving force for cathodic hydrogen evolution, and there was a
potential range of stability of nickel, according to the potential–
pH equilibrium diagram for the nickel–water system at 25 8Cconsidering the hydrated oxide forms [26]. In the potential range
applied to the sample of zinc/high nickel phosphate on zinc-
coated steel, this reaction could be possible [24]:
Ni þ 2OH� ! NiðOHÞ2þ 2e ðE� ¼ �0:72 VÞ (18)
The metallic nickel present on the zinc surface may support
the cathodic reaction by acting as the cathodic area on the
surface [9]. Zimmermann et al. [24] reported that during the
deposition of the phosphate layer, the cementation of Ni on the
initially corroding Zn gives rise to the formation of surface Ni–
Zn alloys, providing cathodic centers where the reduction of H+
is favored. This hypothesis that nickel metallic on the Zn
surface and Ni–Zn alloys are cathodic centers could explain the
less noble electrochemical behavior of Zn/Ni phosphate layer
on zinc-coated steel in relation to the behavior of the hopeite
layer on zinc-coated steel.
The Zn/Mn/Ni phosphate layer on zinc-coated steel
presented the highest pore resistance (R2) than the samples
studied, and the corrosion potential of the trication phosphate
on zinc-coated steel was higher than the Ecorr of the Zn/Mn and
Zn/Ni phosphate layers on galvanized steel.
The porosity evaluation was done using the Eq. (1) and the
electrochemical parameters obtained using the electrochemical
impedance spectroscopy (Table 4) and the Tafel analysis
(Fig. 2). The Tafel coefficient was ba = 57 mV decade�1. The
polarization resistance values were obtained using the EIS
technique, and are the sum of the pore resistance (R2), the
electrolyte resistance and the charge transfer resistance. Liu
et al. [32] used the same equation for the estimation of porosity
of a PVD ceramic-coated mild steel. In Nyquist diagram, the
interception of the capacitive arc with the real axis in the high
frequency region provides the electrolyte resistance (R1), the
sum of electrolyte resistance and the pore resistance (R1 + R2),
and the interception of the capacitive arc with the real axis in
the low frequency region provides the sum of the electrolyte
resistance, pore resistance and charge transfer resistance
(R1 + R2 + R3) [28]. In the presence of an inductive loop in
the low frequency region, the charge transfer resistance was
calculated according literature [33,34]. The interception
relative to the sum of the electrolyte resistance, pore resistance
and charge transfer resistance is the interception of the loop
inductive with the real axis in the low frequency region.
Table 5 shows the values of porosity of the phosphate
coating on galvanized steels, using electrochemical impedance
spectroscopy. The porosity ranges from 0.1% for the
manganese-modified hopeite to 6.9% for hopeite. According
to the literature data, porosities from 0.2% to 2% are obtained
for zinc phosphates [2]. Weng et al. [8] reported that the mean
porosity of both Zn and Mn phosphates on tool steel was below
1.5%.
Hopeite presented the highest porosity (6.9%) among the
phosphate coatings studied. This result is in agreement with the
corrosion behavior of the hopeite in alkaline and acid
environments, in which it presents low resistance and
dissolution. Tomandl and co-workers [9] reported that the
manganese and nickel addition to the hopeite decreased the rate
of phosphate leaching in proportion to the percent incorporation
of these species. The high porosity of the zinc phosphate
observed in the NaCl solution may be due to the leaching
process. The dissolution of the phosphate layer was observed in
all samples after immersion during 12 h in 3% (w/w) NaCl
solution. The porosity of hopeite could be overestimated
because upon immersion the pore size and number may
increase and lead to overestimating all results, especially the
porosity of hopeite.
One coating used in order to improve the corrosion
resistance of the phosphate coating on galvanized steel is
the tricationic phosphate, which shows an intermediary value
of porosity of 1.9%. A low value of porosity is beneficial to the
corrosion resistance of the coating that acts as a physical
barrier against corrosive agents. In general, a lower porosity
means a smaller corrosion rate of substrate [8]. On the contrary,
considering the adhesion performance, the porosity of a
V. de Freitas Cunha Lins et al. / Applied Surface Science 253 (2006) 2875–2884 2883
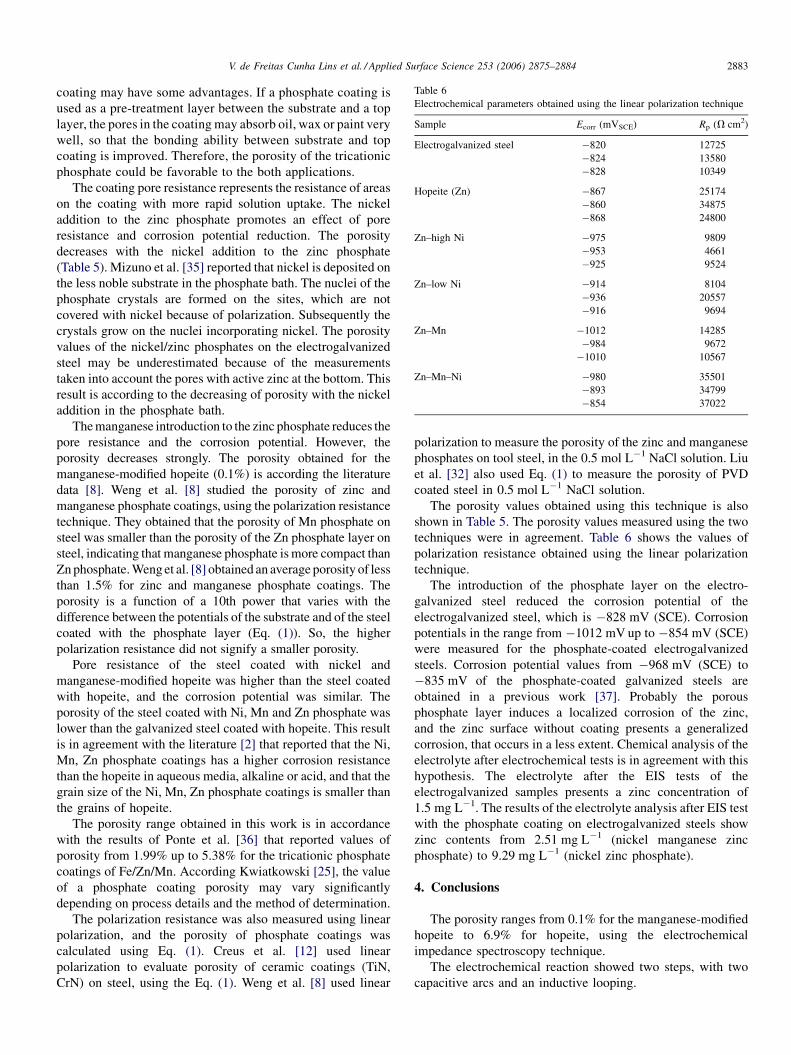
Table 6
Electrochemical parameters obtained using the linear polarization technique
Sample Ecorr (mVSCE) Rp (V cm2)
Electrogalvanized steel �820 12725
�824 13580
�828 10349
Hopeite (Zn) �867 25174
�860 34875
�868 24800
Zn–high Ni �975 9809
�953 4661
�925 9524
Zn–low Ni �914 8104
�936 20557
�916 9694
Zn–Mn �1012 14285
�984 9672
�1010 10567
Zn–Mn–Ni �980 35501
�893 34799
�854 37022
coating may have some advantages. If a phosphate coating is
used as a pre-treatment layer between the substrate and a top
layer, the pores in the coating may absorb oil, wax or paint very
well, so that the bonding ability between substrate and top
coating is improved. Therefore, the porosity of the tricationic
phosphate could be favorable to the both applications.
The coating pore resistance represents the resistance of areas
on the coating with more rapid solution uptake. The nickel
addition to the zinc phosphate promotes an effect of pore
resistance and corrosion potential reduction. The porosity
decreases with the nickel addition to the zinc phosphate
(Table 5). Mizuno et al. [35] reported that nickel is deposited on
the less noble substrate in the phosphate bath. The nuclei of the
phosphate crystals are formed on the sites, which are not
covered with nickel because of polarization. Subsequently the
crystals grow on the nuclei incorporating nickel. The porosity
values of the nickel/zinc phosphates on the electrogalvanized
steel may be underestimated because of the measurements
taken into account the pores with active zinc at the bottom. This
result is according to the decreasing of porosity with the nickel
addition in the phosphate bath.
The manganese introduction to the zinc phosphate reduces the
pore resistance and the corrosion potential. However, the
porosity decreases strongly. The porosity obtained for the
manganese-modified hopeite (0.1%) is according the literature
data [8]. Weng et al. [8] studied the porosity of zinc and
manganese phosphate coatings, using the polarization resistance
technique. They obtained that the porosity of Mn phosphate on
steel was smaller than the porosity of the Zn phosphate layer on
steel, indicating that manganese phosphate is more compact than
Zn phosphate. Weng et al. [8] obtained an average porosity of less
than 1.5% for zinc and manganese phosphate coatings. The
porosity is a function of a 10th power that varies with the
difference between the potentials of the substrate and of the steel
coated with the phosphate layer (Eq. (1)). So, the higher
polarization resistance did not signify a smaller porosity.
Pore resistance of the steel coated with nickel and
manganese-modified hopeite was higher than the steel coated
with hopeite, and the corrosion potential was similar. The
porosity of the steel coated with Ni, Mn and Zn phosphate was
lower than the galvanized steel coated with hopeite. This result
is in agreement with the literature [2] that reported that the Ni,
Mn, Zn phosphate coatings has a higher corrosion resistance
than the hopeite in aqueous media, alkaline or acid, and that the
grain size of the Ni, Mn, Zn phosphate coatings is smaller than
the grains of hopeite.
The porosity range obtained in this work is in accordance
with the results of Ponte et al. [36] that reported values of
porosity from 1.99% up to 5.38% for the tricationic phosphate
coatings of Fe/Zn/Mn. According Kwiatkowski [25], the value
of a phosphate coating porosity may vary significantly
depending on process details and the method of determination.
The polarization resistance was also measured using linear
polarization, and the porosity of phosphate coatings was
calculated using Eq. (1). Creus et al. [12] used linear
polarization to evaluate porosity of ceramic coatings (TiN,
CrN) on steel, using the Eq. (1). Weng et al. [8] used linear
polarization to measure the porosity of the zinc and manganese
phosphates on tool steel, in the 0.5 mol L�1 NaCl solution. Liu
et al. [32] also used Eq. (1) to measure the porosity of PVD
coated steel in 0.5 mol L�1 NaCl solution.
The porosity values obtained using this technique is also
shown in Table 5. The porosity values measured using the two
techniques were in agreement. Table 6 shows the values of
polarization resistance obtained using the linear polarization
technique.
The introduction of the phosphate layer on the electro-
galvanized steel reduced the corrosion potential of the
electrogalvanized steel, which is �828 mV (SCE). Corrosion
potentials in the range from �1012 mV up to �854 mV (SCE)
were measured for the phosphate-coated electrogalvanized
steels. Corrosion potential values from �968 mV (SCE) to
�835 mV of the phosphate-coated galvanized steels are
obtained in a previous work [37]. Probably the porous
phosphate layer induces a localized corrosion of the zinc,
and the zinc surface without coating presents a generalized
corrosion, that occurs in a less extent. Chemical analysis of the
electrolyte after electrochemical tests is in agreement with this
hypothesis. The electrolyte after the EIS tests of the
electrogalvanized samples presents a zinc concentration of
1.5 mg L�1. The results of the electrolyte analysis after EIS test
with the phosphate coating on electrogalvanized steels show
zinc contents from 2.51 mg L�1 (nickel manganese zinc
phosphate) to 9.29 mg L�1 (nickel zinc phosphate).
4. Conclusions
The porosity ranges from 0.1% for the manganese-modified
hopeite to 6.9% for hopeite, using the electrochemical
impedance spectroscopy technique.
The electrochemical reaction showed two steps, with two
capacitive arcs and an inductive looping.
V. de Freitas Cunha Lins et al. / Applied Surface Science 253 (2006) 2875–28842884
The electrogalvanized steel without phosphate coatings
showed a higher corrosion potential than the steel coated with
phosphates.
Hopeite presented the highest porosity among the phosphate
coatings studied. This result is in agreement with the corrosion
behavior of the hopeite in aqueous media, alkaline or acid, in
which it presents low resistance and dissolution.
One coating used in order to improve the corrosion
resistance of the phosphate coating on galvanized steel is the
tricationic phosphate, which shows an intermediary value of
porosity of 1.9%.
As the nickel content decreases from 0.83% (w/w) to 0.43%
(w/w) in the Ni, Zn phosphate, the corrosion potential increase.
However, the porosity also increases. The nickel addition to the
hopeite promotes a decrease of the polarization resistance and
corrosion potential, but again the porosity decreases.
The manganese addition to the hopeite decreases the
corrosion potential and the polarization resistance, decreasing
the corrosion resistance of the material in this medium.
However, the manganese addition to the hopeite decreases
significantly the porosity of the coating.
The addition of manganese and nickel to the hopeite was
beneficial, and increases the polarization resistance and
decreases the phosphate porosity.
Using linear polarization technique, the porosity ranges
from 0.1% for the manganese-modified hopeite to 8.2% for the
hopeite. The porosity values measured using the two
techniques, EIS and linear polarization, were in agreement.
References
[1] G. Bombara, U. Bernabai, Surf. Technol. 11 (1980) 393.
[2] G. Lorin, Phosphating of Metals-Constitution, Finishing Publications
Ltd., Middlesex, 1974.
[3] W. Machu, Die Phosphatierung, Verlag Chemie, 1950.
[4] W. Rausch, The Phosphating of Metals, Finishing Publications Ltd.,
Middlesex, 1990.
[5] D.B. Freeman, Phosphating and Metal Pre-Treatment, Wooghead-Faul-
kner, Cambridge, 1986.
[6] L. Fedrizzi, F. Deflorian, S. Rossi, L. Fambri, P.L. Bonora, Prog. Org.
Coat. 42 (2001) 65.
[7] N. Bretherton, G.E. Thompson, S. Turgoose, Corros. Sci. 35 (1993) 1297–
1303.
[8] D. Weng, P. Jokiel, A. Uebleis, H. Boehni, Surf. Coat. Technol. 88 (1996)
147–156.
[9] K. Ogle, A. Tomandl, N. Meddahi, M. Wolpers, Corros. Sci. 46 (2004)
979.
[10] N. Sato, T. Minami, H. Kono, Surf. Coat. Technol. 37 (1989) 23.
[11] I.M. Notter, D.R. Gabe, Corros. Rev. 5 (1992) 217.
[12] J. Creus, H. Mazille, H. Idrissi, Surf. Coat. Technol. 130 (2000) 224.
[13] E. Julve, Pintura y Acabados (1986) 80.
[14] J.R. Roos, J.P. Celis, F. Chonglun, J. Electrochem. Soc. 137 (04) (1990)
1096.
[15] A. Losch, E. Klusmann, J.W. Schultze, Electrochim. Acta 39 (1994)
1183.
[16] A. Losch, J.W. Schultze, H.D. Speckman, A new electrochemical method
for the determination of the free surface of phosphate layers, in: EURO-
CORR ’91 Proceedings, Budapeste, (1991), pp. 413–418.
[17] A. Losch, J.W. Schultze, J. Electroanal. Chem. 359 (1993) 39.
[18] H. Leidheiser Jr., Corrosion 39 (1983) 189.
[19] B.S. Skerry, D.A. Eden, Prog. Org. Coat. 15 (1987) 269.
[20] F. Deflorian, L. Fedrizzi, A. Locaspi, P.L. Bonora, Electrochim. Acta 38
(1993) 1945.
[21] F. Mansfeld, S.L. Jeanjaquet, M.W. Kendig, Corros. Sci. 26 (1986) 734.
[22] J.F. Silva Filho, V.F.C. Lins, Surf. Coat. Technol. 200 (9) (2006) 2892.
[23] J. Aromaa, Mater. Sci. Eng. A 140 (1991) 722.
[24] D. Zimmermann, A.G. Munoz, J.W. Schultze, Electrochim. Acta 48
(2003) 3267–3277.
[25] L. Kwiatkowski, Surf. Eng. 20 (4) (2004) 292.
[26] P.R. Roberge, Hanbook of Corrosion Engineering, The Mc-Graw-Hill
Companies, New York, 2000, p. 1139.
[27] S. Wolynec, Tecnicas Eletroquımicas em Corrosao, EDUSP—Editora da
Universidade de Sao Paulo, Sao Paulo, 2003, p. 166.
[28] W.A. Pye, Field performance of epoxy-coated reinforcing steel in Virginia
Bridge Decks, Blacksburg—Virginia Polytechnic Institute and State
University, Virginia, 1998, 199 pp., Dissertation (Doctor of Philosophy
in Civil Engineering).
[29] D.C. Silverman, Primer on the AC impedance technique, in: R. Baboian
(Ed.), Electrochemical Techniques for Corrosion Engineering, Houston–
NACE—National Association of Corrosion Engineers, Texas, 1986, p. 73.
[30] A.M.O. Brett, C.M.A. Brett, Electroquımica: Princıpios, metodos e
aplicacoes, Coimbra, Livraria Almedina, Coimbra, 1996, p. 471.
[31] A.G. Munoz, J.W. Schultze, Electrochim. Acta 49 (2004) 293–301.
[32] C. Liu, Q. Bi, A. Leyland, A. Mathews, Corros. Sci. 45 (2003) 1257.
[33] R. Baboian, Electrochemical Techniques for Corrosion Engineering,
National Association of Corrosion Engineers, Texas, 1986, p. 73.
[34] J.R. McDonald, Impedance Spectroscopy: Emphasizing Solid Materials
and Systems, John Wiley and Sons, New York, 1987, p. 346.
[35] K. Mizuno, K. Suzuki, T. Ohtsubo, M. Suzuki, Characterization of
phosphate conversion coatings, in: Proceedings of the International Con-
ference on Zinc and Zinc Alloy Coated Steel Sheet, GALVATECH, Tokyo,
The Iron and Steel Institute, Japan, 1989.
[36] H.A. Ponte, A.M. Maul, E.A. Alvarenga, Mater. Res. 5 (2002) 439.
[37] K.S. Fernandes, V.F.C. Lins, E.A. Alvarenga, M.M.A.M. Schvartzman, in:
Proceedings of the XIV Congresso Brasileiro de Engenharia Quımica,
ABEQ, Natal, 2002.


