Embed Size (px)
Citation preview
Electronic Stethoscope Search: Author Views Views Today Rank Comments
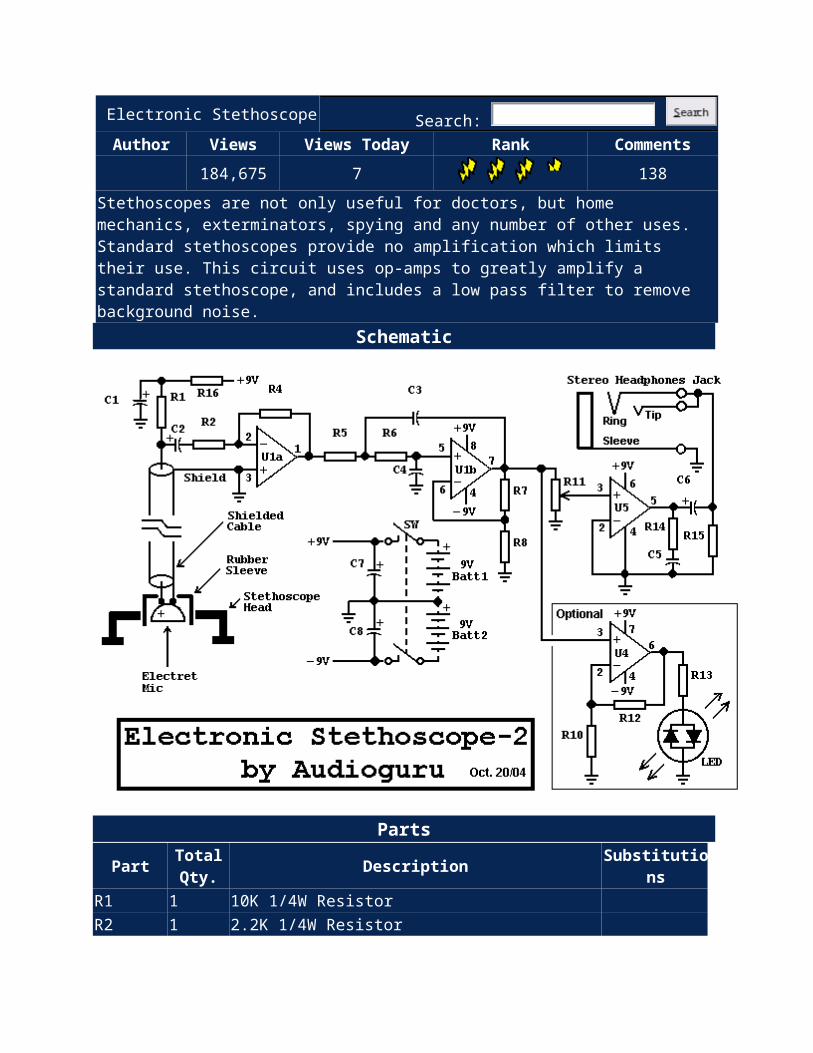
184,675 7 138Stethoscopes are not only useful for doctors, but home mechanics, exterminators, spying and any number of other uses. Standard stethoscopes provide no amplification which limits their use. This circuit uses op-amps to greatly amplify a standard stethoscope, and includes a low pass filter to remove background noise.
Schematic
Parts
Part TotalQty. Description Substitutio
nsR1 1 10K 1/4W ResistorR2 1 2.2K 1/4W Resistor
R4 1 47K 1/4W ResistorR5, R6,R7 3 33K 1/4W Resistor
R8 1 56K 1/4W ResistorR10 1 4.7K 1/4W ResistorR11 1 2.2K to 10K Audio Taper PotR12 1 330K 1/4W ResistorR13, R15, R16
3 1K 1/4W Resistor
R14 1 3.9 Ohm 1/4W ResistorC1, C8 2 470uF 16V Electrolytic CapacitorC2 1 4.7uF 16V Electrolytic Capacitor
C3, C4 2 0.047uF 50V Metalized Plastic Film Capacitor
C5 1 0.1uF 50V Ceramic Disc CapacitorC6, C7 2 1000uF 16V Electrolytic CapacitorU1 1 TL072 Low Noise Dual Op-AmpU4 1 741 Op-AmpU5 1 LM386 Audio Power AmpMIC 1 Two Wire Electret MicrophoneJ1 1 1/8" Stereo Headphone JackBatt1, Batt2 2 9V Alkaline Battery
LED 1 Red/Green Dual Colour Two Wire LEDSW 1 DPST Switch
MISC 1Stethoscope head or jar lid, rubber sleeve for microphone, board, wire, battery clips, knob for R11
Notes1.MIC is an assembly made out of a stethoscope head and
electret mic. Cut the head off the stethoscope and use a small piece of rubber tube to join the nipple on the head to the mic.
2.Be careful with the volume, as excess noise levels may damage your ears.
3.R11 is the volume control.
4.The circuit marked as optional is not required for the main circuit to function. The optional circuit blinks an LED to the heartbeat as it is heard by the microphone. Even if the optional circuit is not included, sound will still be heard via the headphonejack.
5.
6.Thanks to audioguru for correcting and improving thisoriginal schematic. He has essentially redesigned thecircuit as a much improved version. Read about it in this forum topic.
Related Circuits
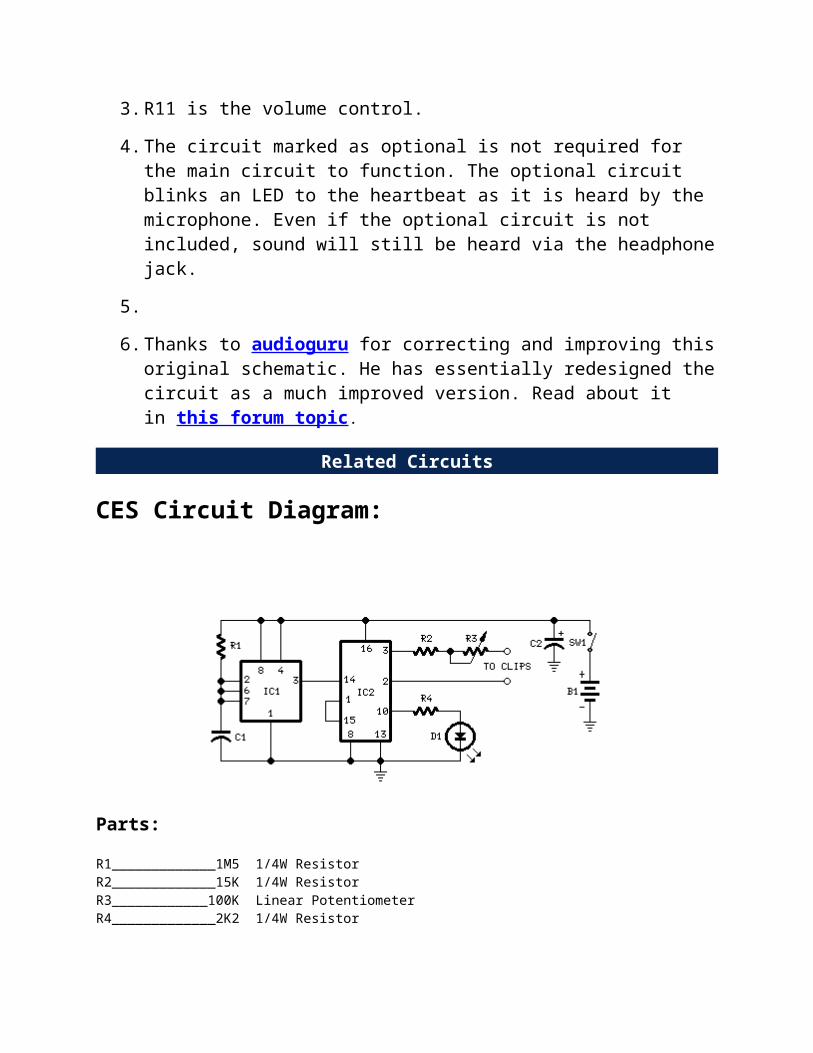
CES Circuit Diagram:
Parts:
R1_____________1M5 1/4W ResistorR2_____________15K 1/4W ResistorR3____________100K Linear PotentiometerR4_____________2K2 1/4W Resistor
C1___________330nF 63V Polyester CapacitorC2___________100µF 25V Electrolytic Capacitor
D1_____________3mm Red LED
IC1___________7555 or TS555CN CMos Timer ICIC2___________4017 Decade counter with 10 decoded outputs IC
SW1___________SPST Slider Switch
B1______________9V PP3 Battery
Clip for PP3 Battery
Two Earclips with wires (see notes)
Device purpose:
Owing to the recent launching in Europe of Cranial ElectrotherapyStimulation (CES) portable sets, we have been "Electronically Stimulated" in designing a similar circuit for the sake of Hobbyists. CES is the most popular technique for electrically boosting brain power, and has long been prescribed by doctors, mainly in the USA, for therapeutic reasons, including the treatment of anxiety, depression, insomnia, and chemical dependency. CES units generate an adjustable current (80 to 600 microAmperes) that flows through clips placed on the earlobes. The waveform of this device is a 400 milliseconds positive pulse followed by a negative one of the same duration, then a pause of 1.2 seconds. The main frequency is 0.5 Hz, i.e. a double pulse every 2 seconds. Some people report that this kind of minute specialized electrical impulses contributes to achieve a relaxed state that leaves the mind alert.
Circuit operation:
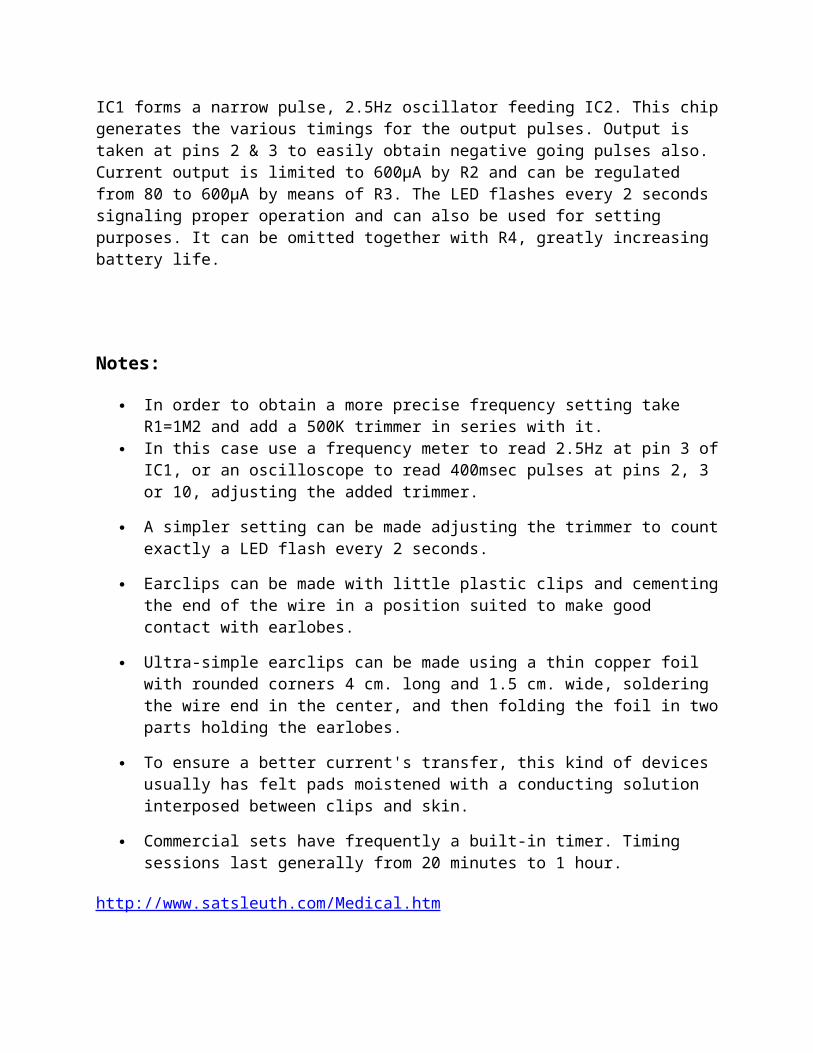
IC1 forms a narrow pulse, 2.5Hz oscillator feeding IC2. This chipgenerates the various timings for the output pulses. Output is taken at pins 2 & 3 to easily obtain negative going pulses also. Current output is limited to 600µA by R2 and can be regulated from 80 to 600µA by means of R3. The LED flashes every 2 seconds signaling proper operation and can also be used for setting purposes. It can be omitted together with R4, greatly increasing battery life.
Notes:
In order to obtain a more precise frequency setting take R1=1M2 and add a 500K trimmer in series with it.
In this case use a frequency meter to read 2.5Hz at pin 3 ofIC1, or an oscilloscope to read 400msec pulses at pins 2, 3 or 10, adjusting the added trimmer.
A simpler setting can be made adjusting the trimmer to countexactly a LED flash every 2 seconds.
Earclips can be made with little plastic clips and cementingthe end of the wire in a position suited to make good contact with earlobes.
Ultra-simple earclips can be made using a thin copper foil with rounded corners 4 cm. long and 1.5 cm. wide, soldering the wire end in the center, and then folding the foil in twoparts holding the earlobes.
To ensure a better current's transfer, this kind of devices usually has felt pads moistened with a conducting solution interposed between clips and skin.
Commercial sets have frequently a built-in timer. Timing sessions last generally from 20 minutes to 1 hour.
http://www.satsleuth.com/Medical.htm
Brain-Wave Machine
(And God said, Let there be light...)
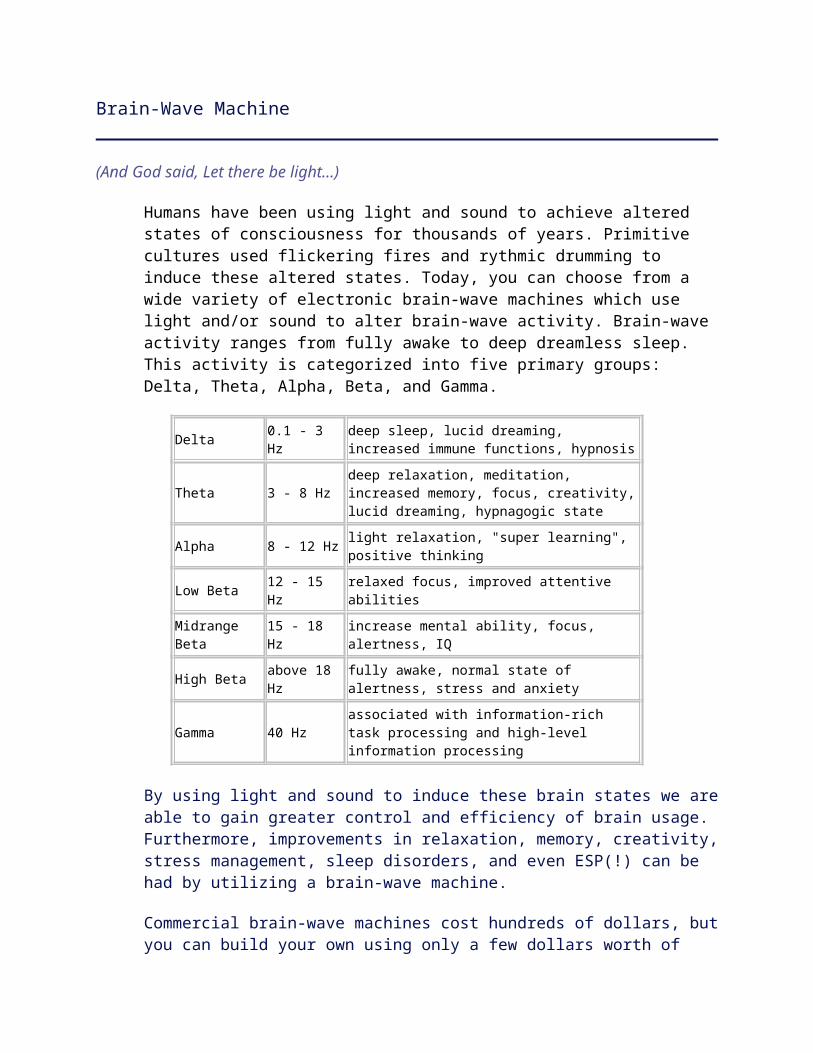
Humans have been using light and sound to achieve altered states of consciousness for thousands of years. Primitive cultures used flickering fires and rythmic drumming to induce these altered states. Today, you can choose from a wide variety of electronic brain-wave machines which use light and/or sound to alter brain-wave activity. Brain-wave activity ranges from fully awake to deep dreamless sleep. This activity is categorized into five primary groups: Delta, Theta, Alpha, Beta, and Gamma.
Delta 0.1 - 3 Hz
deep sleep, lucid dreaming, increased immune functions, hypnosis
Theta 3 - 8 Hzdeep relaxation, meditation, increased memory, focus, creativity,lucid dreaming, hypnagogic state
Alpha 8 - 12 Hz light relaxation, "super learning", positive thinking
Low Beta 12 - 15 Hz
relaxed focus, improved attentive abilities
Midrange Beta
15 - 18 Hz
increase mental ability, focus, alertness, IQ
High Beta above 18 Hz
fully awake, normal state of alertness, stress and anxiety
Gamma 40 Hzassociated with information-rich task processing and high-level information processing
By using light and sound to induce these brain states we areable to gain greater control and efficiency of brain usage. Furthermore, improvements in relaxation, memory, creativity,stress management, sleep disorders, and even ESP(!) can be had by utilizing a brain-wave machine.
Commercial brain-wave machines cost hundreds of dollars, butyou can build your own using only a few dollars worth of
components. In this document I will walk you through hardware construction and software control of an easy to build brain-wave machine.
Disclaimer: I am not an electronics expert or a biofeedback specialist. If you fry your hardware (or your wetware) don'tcome whining (or drooling) to me. I assume no responsibilityfor what you do with this information.
Building the Hardware
(Always yield to the hands-on imperative.)
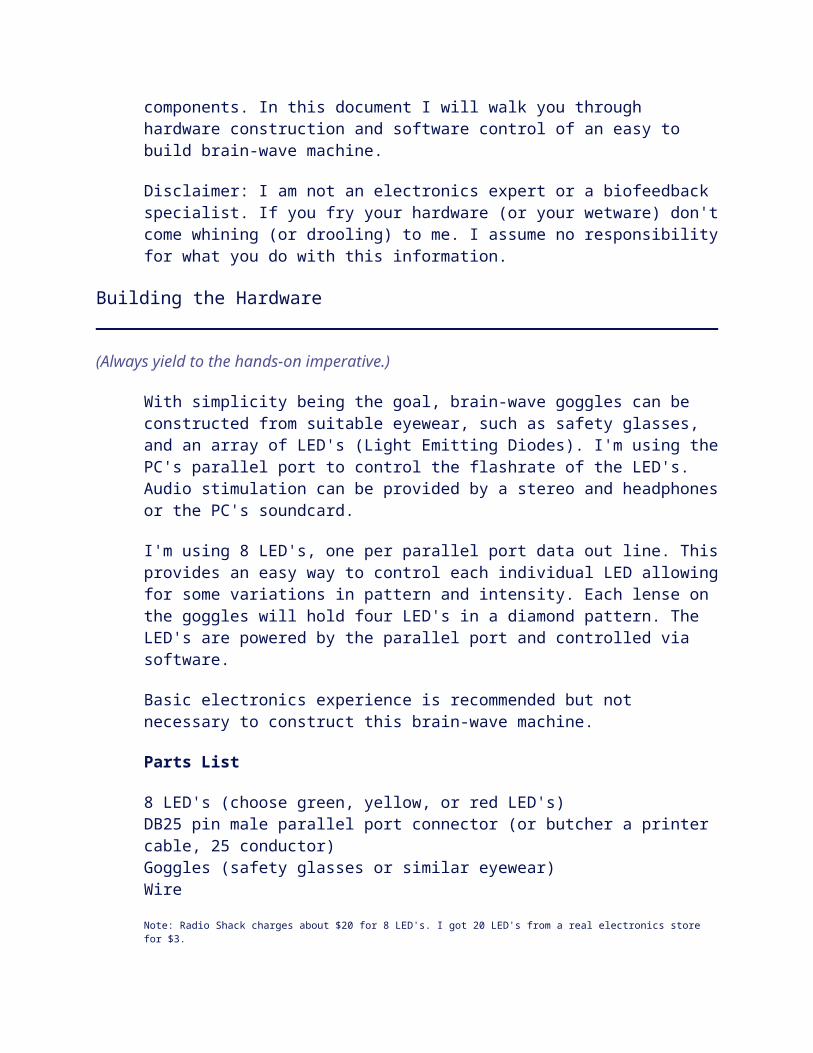
With simplicity being the goal, brain-wave goggles can be constructed from suitable eyewear, such as safety glasses, and an array of LED's (Light Emitting Diodes). I'm using thePC's parallel port to control the flashrate of the LED's. Audio stimulation can be provided by a stereo and headphonesor the PC's soundcard.
I'm using 8 LED's, one per parallel port data out line. Thisprovides an easy way to control each individual LED allowingfor some variations in pattern and intensity. Each lense on the goggles will hold four LED's in a diamond pattern. The LED's are powered by the parallel port and controlled via software.
Basic electronics experience is recommended but not necessary to construct this brain-wave machine.
Parts List
8 LED's (choose green, yellow, or red LED's)DB25 pin male parallel port connector (or butcher a printer cable, 25 conductor)Goggles (safety glasses or similar eyewear)Wire
Note: Radio Shack charges about $20 for 8 LED's. I got 20 LED's from a real electronics store for $3.
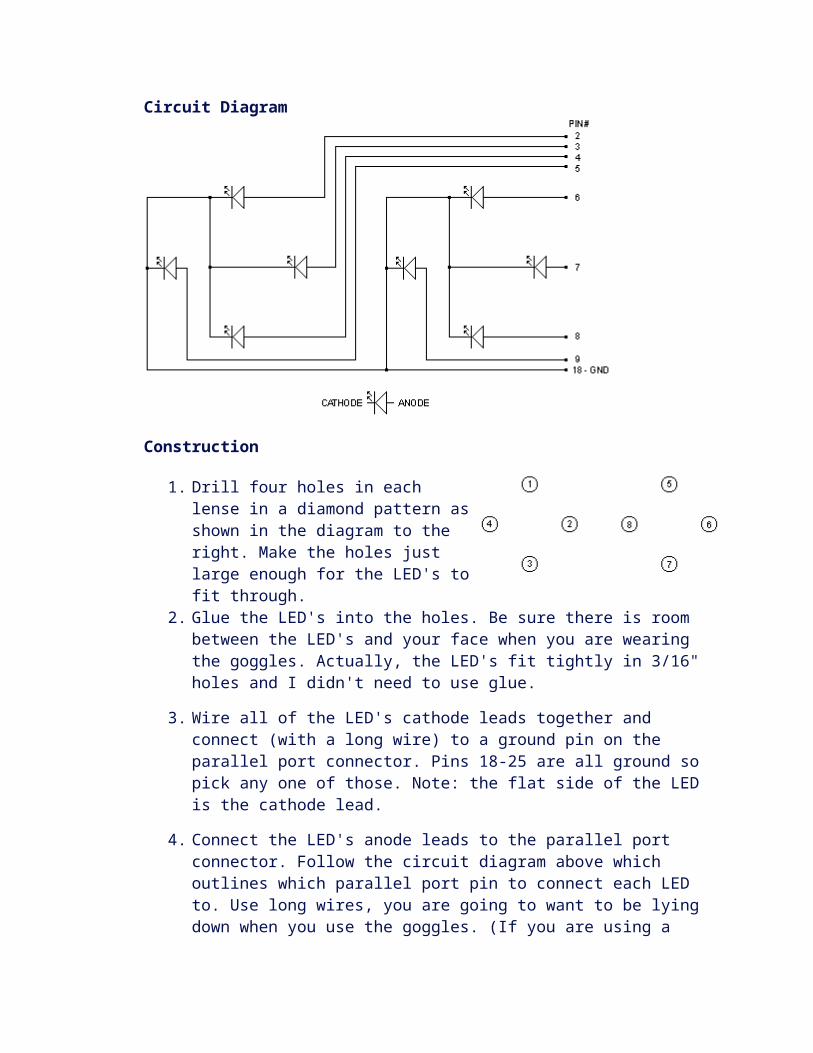
Circuit Diagram
Construction
1. Drill four holes in eachlense in a diamond pattern asshown in the diagram to theright. Make the holes justlarge enough for the LED's tofit through.
2. Glue the LED's into the holes. Be sure there is room between the LED's and your face when you are wearing the goggles. Actually, the LED's fit tightly in 3/16" holes and I didn't need to use glue.
3. Wire all of the LED's cathode leads together and connect (with a long wire) to a ground pin on the parallel port connector. Pins 18-25 are all ground so pick any one of those. Note: the flat side of the LED is the cathode lead.
4. Connect the LED's anode leads to the parallel port connector. Follow the circuit diagram above which outlines which parallel port pin to connect each LED to. Use long wires, you are going to want to be lying down when you use the goggles. (If you are using a
printer cable you can use a battery and a LED to figureout which pin each wire is attached to.)
5. If your parallel port wires aren't already in a bundle tie them together with wire-ties so they don't get tangled. You will also want to provide strain-relief byattaching the wire bundle to the goggles so it doesn't get pulled off.
Hmmm, they look kind of silly. But that's not the point, we're here to explore the phenomenon of biofeedback, not fora fashion show.
Browse the Brain-Wave Machine Image Gallery for pictures of readers goggles as well as modifications and variations.
Programming and Software
(Code is the essence of everything.)
Development of the control software is being carried out primarily in QBasic and C. I've provided a quick introduction to parallel port programming in BASIC so anyonecan experiment with writing their own code. BASIC is also handy for quickly writing little routines to help test the hardware you're building. A few complete BASIC applications are provided to get you started and we've got some reader-submitted C code and a microcontroller implementation too. And finally, I've provided some links to software you can use to create your own brainwave audio sessions in order to greatly enhance your Brain-Wave Machine experience.
BASIC
The PC parallel port has eight data lines out. These data lines can be turned on and off by sending a byte to the portwhere each bit in the byte represents the on or off state ofone of the data lines out. In BASIC you do this with the OUT function. The OUT function accepts two parameters,
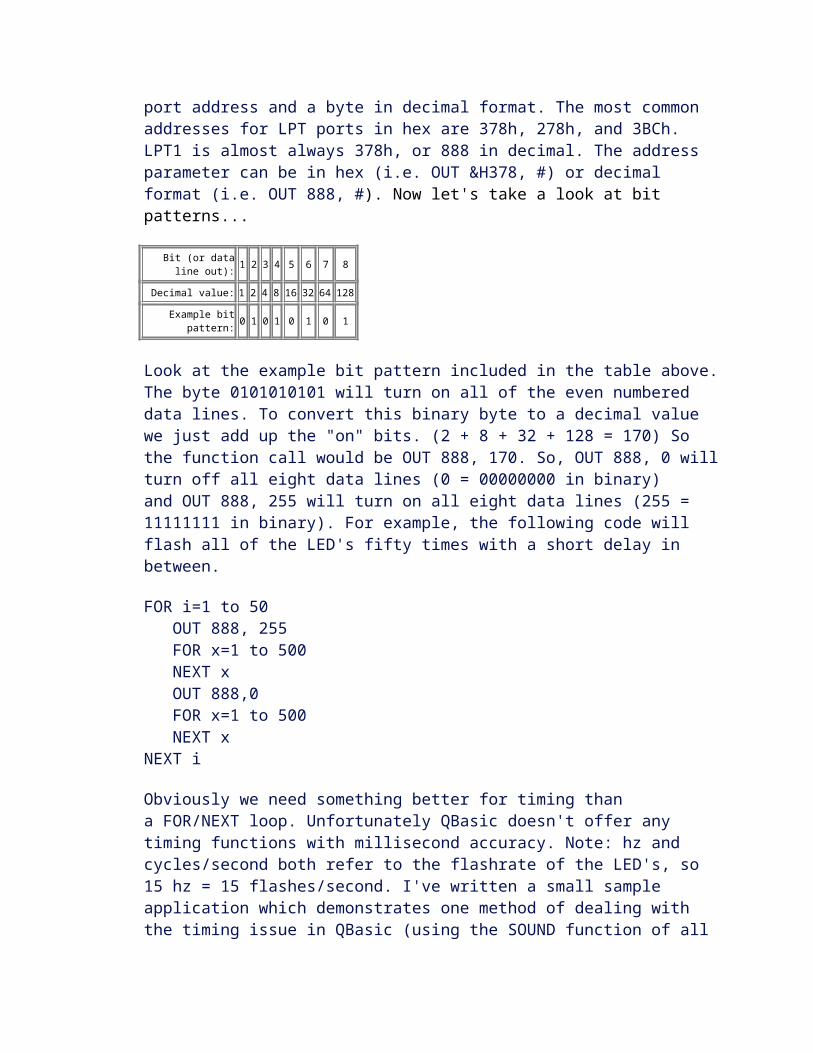
port address and a byte in decimal format. The most common addresses for LPT ports in hex are 378h, 278h, and 3BCh. LPT1 is almost always 378h, or 888 in decimal. The address parameter can be in hex (i.e. OUT &H378, #) or decimal format (i.e. OUT 888, #). Now let's take a look at bit patterns...
Bit (or dataline out): 1 2 3 4 5 6 7 8
Decimal value: 1 2 4 8 16 32 64 128
Example bitpattern: 0 1 0 1 0 1 0 1
Look at the example bit pattern included in the table above.The byte 0101010101 will turn on all of the even numbered data lines. To convert this binary byte to a decimal value we just add up the "on" bits. (2 + 8 + 32 + 128 = 170) So the function call would be OUT 888, 170. So, OUT 888, 0 willturn off all eight data lines (0 = 00000000 in binary) and OUT 888, 255 will turn on all eight data lines (255 = 11111111 in binary). For example, the following code will flash all of the LED's fifty times with a short delay in between.
FOR i=1 to 50 OUT 888, 255 FOR x=1 to 500 NEXT x OUT 888,0 FOR x=1 to 500 NEXT xNEXT i
Obviously we need something better for timing than a FOR/NEXT loop. Unfortunately QBasic doesn't offer any timing functions with millisecond accuracy. Note: hz and cycles/second both refer to the flashrate of the LED's, so 15 hz = 15 flashes/second. I've written a small sample application which demonstrates one method of dealing with the timing issue in QBasic (using the SOUND function of all
things). The program also has timed sessions, selectable frequencies, and three different flash patterns. Feel free to experiment with it.
Sample QBasic App: BWM.BAS.
Brainstar 1: Smoother interface and more features. Edit, save, and load patterns. QBasic source as well as a packagedrun-time version are included. Contributed by Fractal (HardCore Software), May 6, 2000.
Brainstar 2: Now with audio support, graphical session editing, and more. Contributed by Fractal (HardCore Software), October 4, 2000.
Note 1: QBasic can be found on your Windows CD under OTHER/OLDMSDOS or search for olddos.exe on microsoft.com.Note 2: These programs will not work under NT unless a driver such as Direct I/O is utilized.
C / C++
o piX brain-wave controller : Some C source contributed bypiX, September 30, 1999.
o meskalin : Simple brainwave machine app for Linux and FreeBSD. By dodo, December 25, 2002.
o Atmel AVR Microcontroller implementation (AT90LS4433) of the brainwave machine written in AVR C and compiled with avr-gcc: [Schematic] and [Source Code] by slax0r, 2005.
o Brain Wave Machine v1.0 made with NI LabVIEW 6.1 software for Windows 95/98/NT/XP. By Tobio Tezuka, January, 2006.
Audio Tools
o BrainWave Generator shareware for Windows.o SBaGen - Binaural Beat Brain Wave Experimenter's
Lab for Linux, Windows, DOS, and Mac OS X.
Using the Brain-wave Machine
(This is your brain on Theta.)
The key here is to experiment and do what works for you. Lying down in a quiet place where you won't be disturbed is recommended. Close your eyes and relax while the LED's are flashing. Sessions can be from 5-25 minutes or longer. Longer sessions seem to work better.
You can use the brain-wave goggles with or without audio. However, the effects of the brain-wave machine are more powerful when used in conjunction with suitable audio. Many brain-wave stimulation and subliminal CD's and cassettes canbe purchased from new-age bookstores. I highly recommend the"Brainwave Suite" 4 disc box-set by Dr. Jeffrey Thompson. Doctor Thompson has also produced several other brainwave CD's.
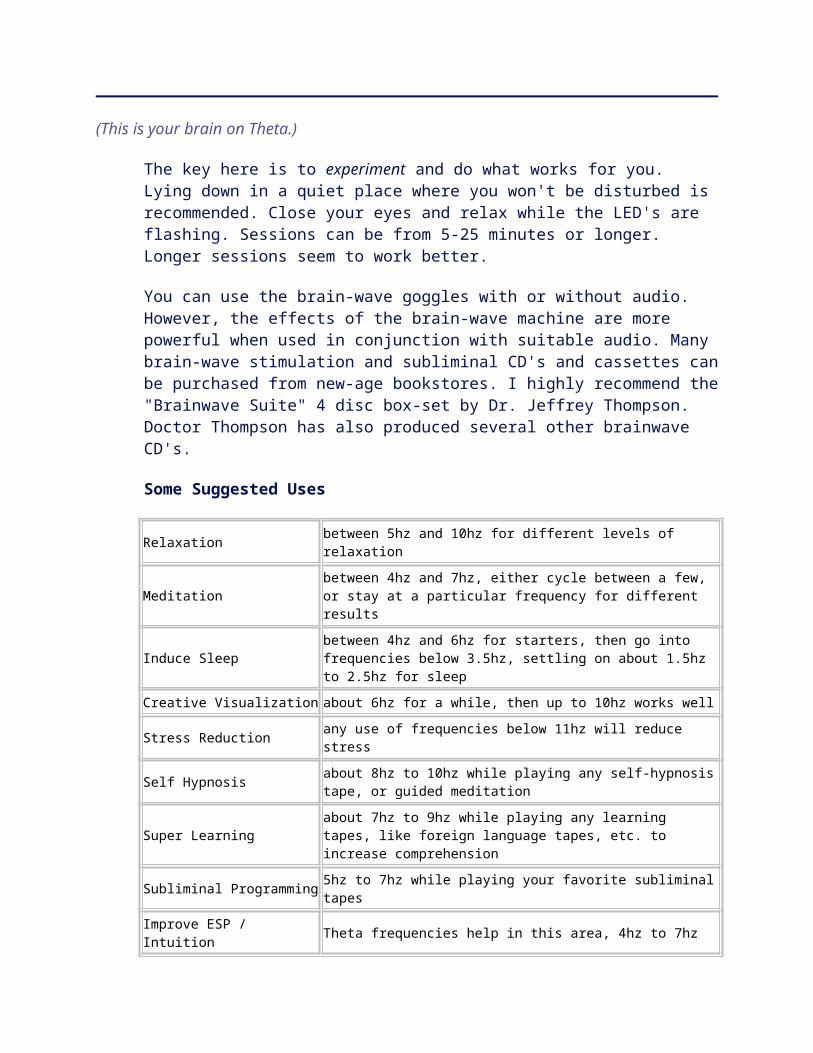
Some Suggested Uses
Relaxation between 5hz and 10hz for different levels of relaxation
Meditationbetween 4hz and 7hz, either cycle between a few, or stay at a particular frequency for different results
Induce Sleepbetween 4hz and 6hz for starters, then go into frequencies below 3.5hz, settling on about 1.5hz to 2.5hz for sleep
Creative Visualization about 6hz for a while, then up to 10hz works well
Stress Reduction any use of frequencies below 11hz will reduce stress
Self Hypnosis about 8hz to 10hz while playing any self-hypnosistape, or guided meditation
Super Learningabout 7hz to 9hz while playing any learning tapes, like foreign language tapes, etc. to increase comprehension
Subliminal Programming 5hz to 7hz while playing your favorite subliminaltapes
Improve ESP / Intuition Theta frequencies help in this area, 4hz to 7hz
Reaching Higher Statesof Consciousness Theta again, with daily half hour sessions
Quick Refresher on long days low Alpha 8hz to 10hz for 15 minutes works well
Optical Heart Rate MonitorPulse Oximetry is a non invasive method of measuring a person's oxygenation level. It
monitors the percentage of haemoglobin (Hb) which is saturated with oxygen. A probe is
attached to the patient's finger or ear lobe comprising LEDs and photodetector. As the
light from the two LEDs (red - 660 nm and infrared - 950 nm) pass through the body tissues
to a photodetector, it is absorbed by blood and soft tissue.
The light absorption rate at the two wavelengths by the hemoglobin is different and depends
on the degree of oxygenation. The light level changes as the blood is pumped by the heart.
As a consequence, the oximeter also measures the heart rate in beats per minute (BPM).
In this application note, we create a heart rate monitor by using one IR LED &
phototransistor pair and observing the waveform at the phototransistor output. This is
intended for illustrating a typical light sensor application and not intended for actual
medical use. The accompanying video also shows the typical low level signals involved in
this type of circuit and how the dynamic range from a 24 bit ADC (EMANT300 USB DAQ) allows
such signals to be observed without further signal conditioning.
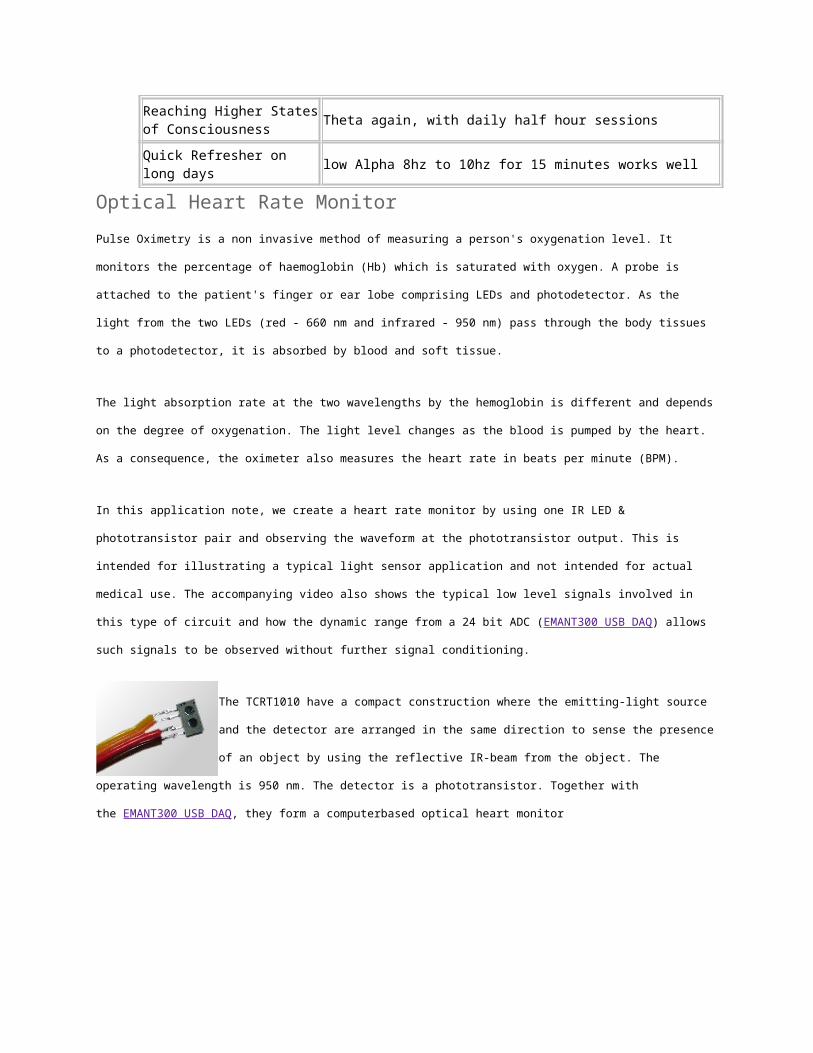
The TCRT1010 have a compact construction where the emitting-light source
and the detector are arranged in the same direction to sense the presence
of an object by using the reflective IR-beam from the object. The
operating wavelength is 950 nm. The detector is a phototransistor. Together with
the EMANT300 USB DAQ, they form a computerbased optical heart monitor
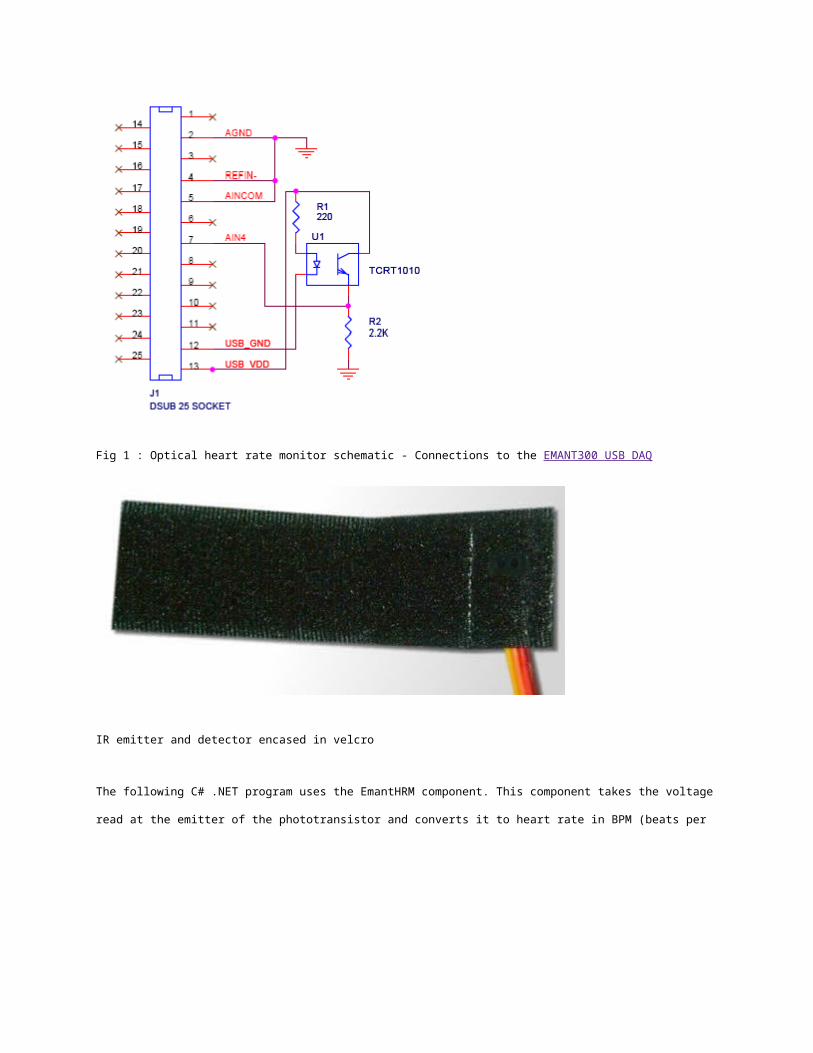
Fig 1 : Optical heart rate monitor schematic - Connections to the EMANT300 USB DAQ
IR emitter and detector encased in velcro
The following C# .NET program uses the EmantHRM component. This component takes the voltage
read at the emitter of the phototransistor and converts it to heart rate in BPM (beats per
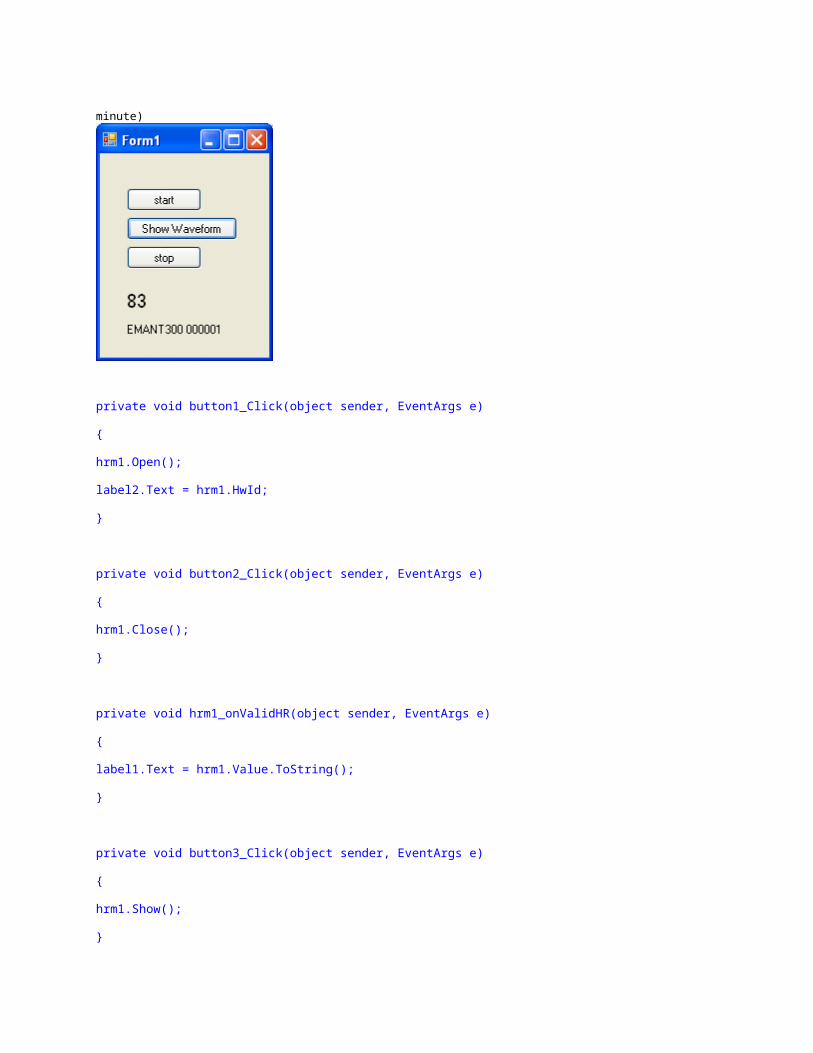
minute)
private void button1_Click(object sender, EventArgs e)
{
hrm1.Open();
label2.Text = hrm1.HwId;
}
private void button2_Click(object sender, EventArgs e)
{
hrm1.Close();
}
private void hrm1_onValidHR(object sender, EventArgs e)
{
label1.Text = hrm1.Value.ToString();
}
private void button3_Click(object sender, EventArgs e)
{
hrm1.Show();
}
When the console program is first run, the user to place his/her
finger on the sensor.
When a finger is placed on the phototransistor, the voltage read
rises above 0.3V. If a good contact is made, a sinusoidal type
signal is observed. As the signal rides on a fluctuating DC signal, a simple differential
signal is created. From maths, we know that when a max or min is reached, its differential
value is zero. After this an autocorrelation function is applied and the peaks extracted to
obtain the heart rate. When the signal is noisy, a wrong BPM will be calculated. Any count
that is obviously wrong is ignored. This is all taken care of by the HRM class. The HRM
class is written in C#. You can improve on it using the Visual C# 2005 Express.
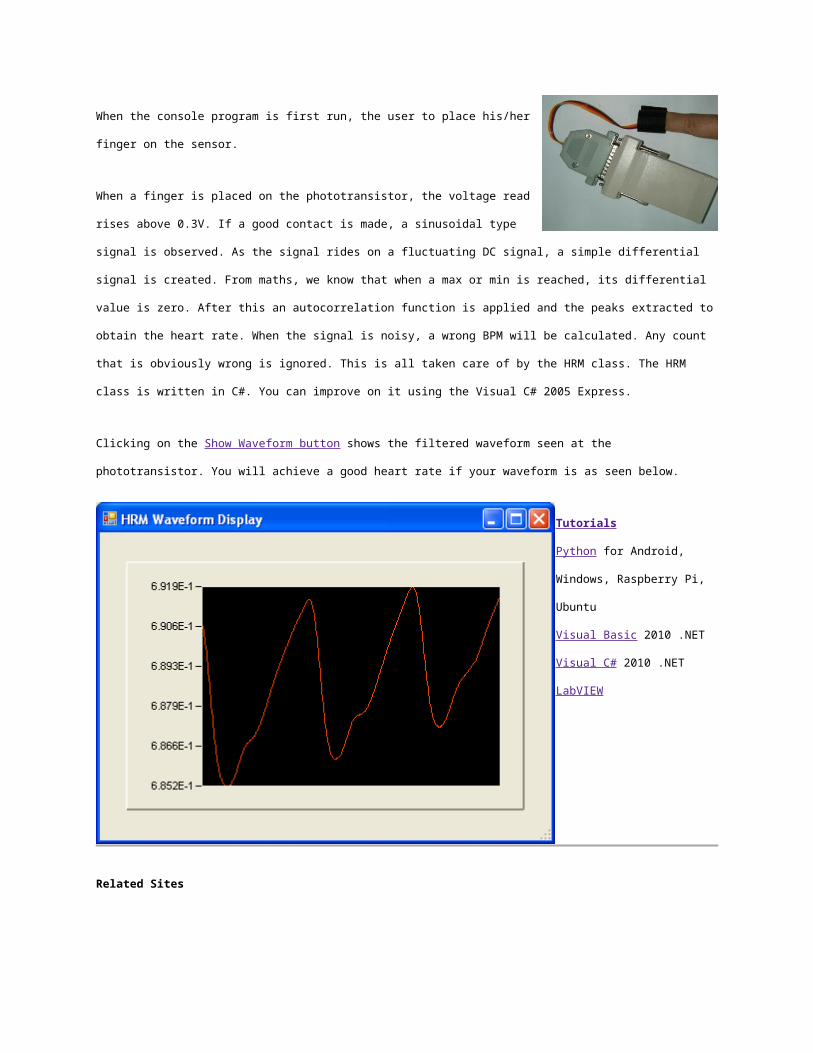
Clicking on the Show Waveform button shows the filtered waveform seen at the
phototransistor. You will achieve a good heart rate if your waveform is as seen below.
Tutorials
Python for Android,
Windows, Raspberry Pi,
Ubuntu
Visual Basic 2010 .NET
Visual C# 2010 .NET
LabVIEW
Related Sites

Sensor Cloud
Smartphone DAQ
Raspberry Pi DAQ
Application Notes
Compare EMANT 300/380
Windows 8
Measure Biopotential
ECG
Measure Strain
Strain Gauge
Center of Pressure
Hand Dynamometer
Pinch Meter
Measure Light
Photodiode
LDR
Heart Rate Monitor
Measure Pressure
Silicon Piezoresistive
Hydrostatic Pressure
Measure Temperature
Thermocouple
Thermistor
Multiple Thermistors
Diodes
Measure Power
Solar Panel Voltage Current
Measure Frequency
Counter
Digital IO
3A 250Vac Switch
DC Fan Speed Control
Stepper Motor Control
Measure Distance
Ultrasonic sensor
Other Applications
PID Temperature Control
Analog Input > 2.5V
10V Analog Output
Use multiple EMANT300
Matlab & EMANT300
C# Strain Logger to Excel
LabVIEW is the trademark of National Instruments. MATLAB is a registered trademark of The MathWorks,
Inc. O
Wireless Electrocardiogram Monitor
BioNB 440
Sean Angeles, John Martin Lee and Nick Liu
[email protected], [email protected], [email protected]
12/08/03
I. Introduction
The electrocardiogram (ECG or EKG) is a noninvasive test used to measure the electrical activity of the heart. An ECG can be used to measure the rate and regularity of
heartbeats, the position of the chambers, the presence ofany damage to the heart and the effects of drugs and devices used to regulate the heart. This procedure is very useful for monitoring people with heart disease or to provide diagnosis when someone has chest pains or palpitations.
Leads are placed on the body in several pre-determined locations, usually the extremities or the front of the chest, to provide information about heart conditions. Forour final project, we implemented a wireless electrocardiogram monitor.
II. High-Level Design
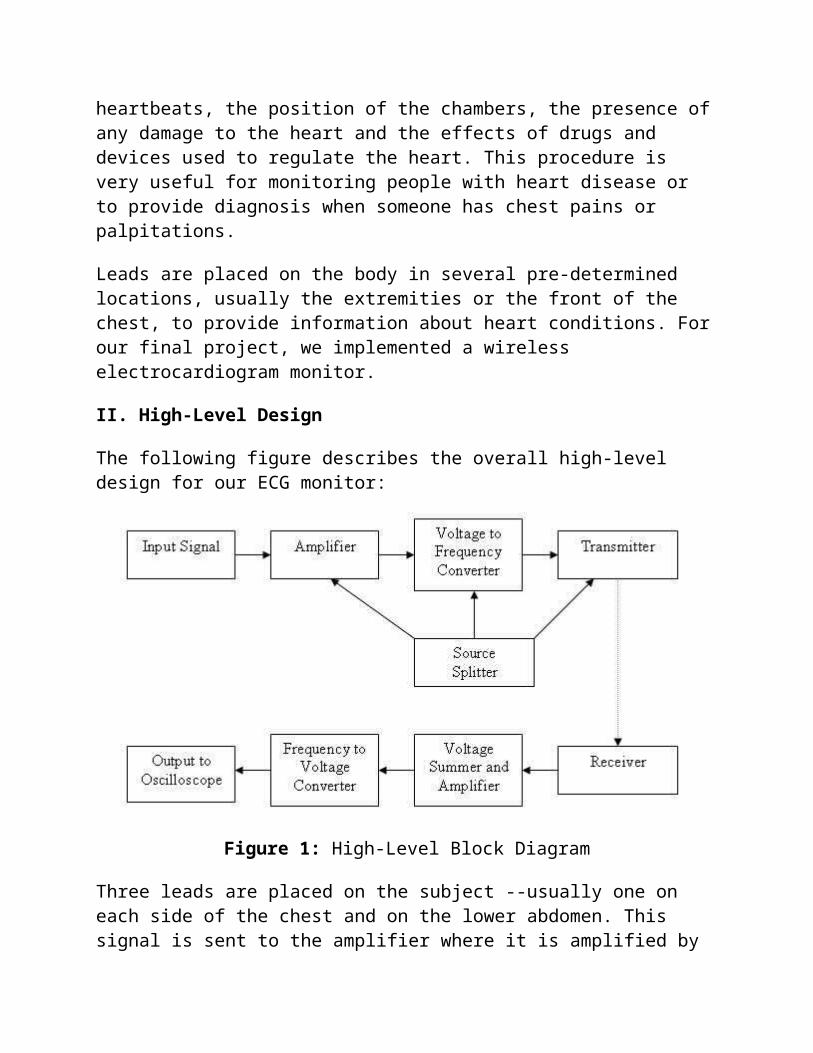
The following figure describes the overall high-level design for our ECG monitor:
Figure 1: High-Level Block Diagram
Three leads are placed on the subject --usually one on each side of the chest and on the lower abdomen. This signal is sent to the amplifier where it is amplified by
a factor of one thousand. The signal is then sent to the voltage to frequency converter (VFC), which converts the signal to a frequency so that it can be transmitted. Since we desired the amplifier, VFC and transmitter to operate using only a single 9 V battery, a separate source splitter circuit was used to provide the proper voltage to each of the components.
Once the signal is received using the radio receiver, a voltage summer is used to add an offset voltage of approximately 800 mV to the signal in order to make the signal entirely positive. This signal is then amplified by a factor of three so that its maximum value exceeds the threshold of the required voltage for the frequency to voltage converter (FVC). After the signal is passed through the FVC, the output signal is displayed on an oscilloscope.
III. Hardware Design
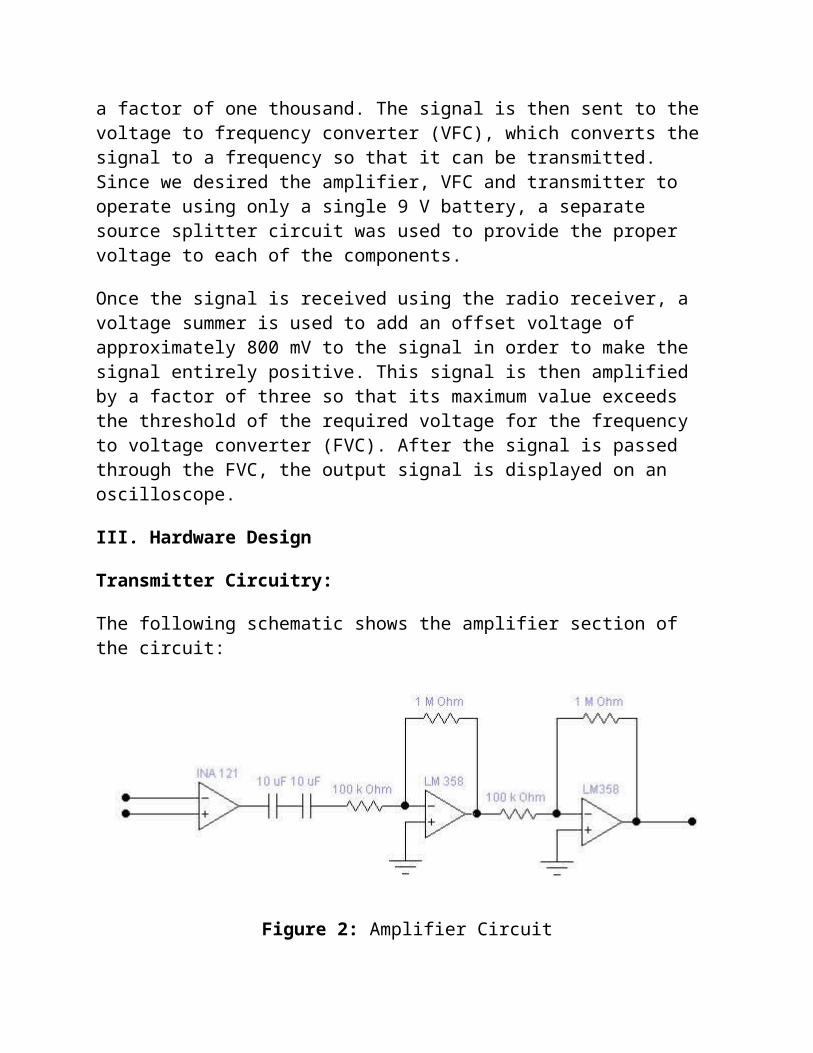
Transmitter Circuitry:
The following schematic shows the amplifier section of the circuit:
Figure 2: Amplifier Circuit
With the reference lead of the the subject placed to ground, each of the input chest leads is sent to an inputof the INA121 instrumentation amplifier. Using a 4.7k resistor, a gain of 11.7 results from this stage. Following the instrumentation amp, the signal is passed through two 10 uF capacitors, placed back to back. The capacitors are used to prevent baseline drift in the ECG signal. Putting two directional capacitors back-to-back forms a bi-directional capacitor. A time constant of 0.5 second was chosen to approximate the frequency of a standard ECG signal (a resistor of 100k can be connected to ground after the capacitor in order to make a time constant of 0.5 sec, but we found that this resistive element is unnecessary). This section is followed by two inverting amplifiers each with a gain of ten. The total gain of this part of the circuit is approximately equal to one thousand.
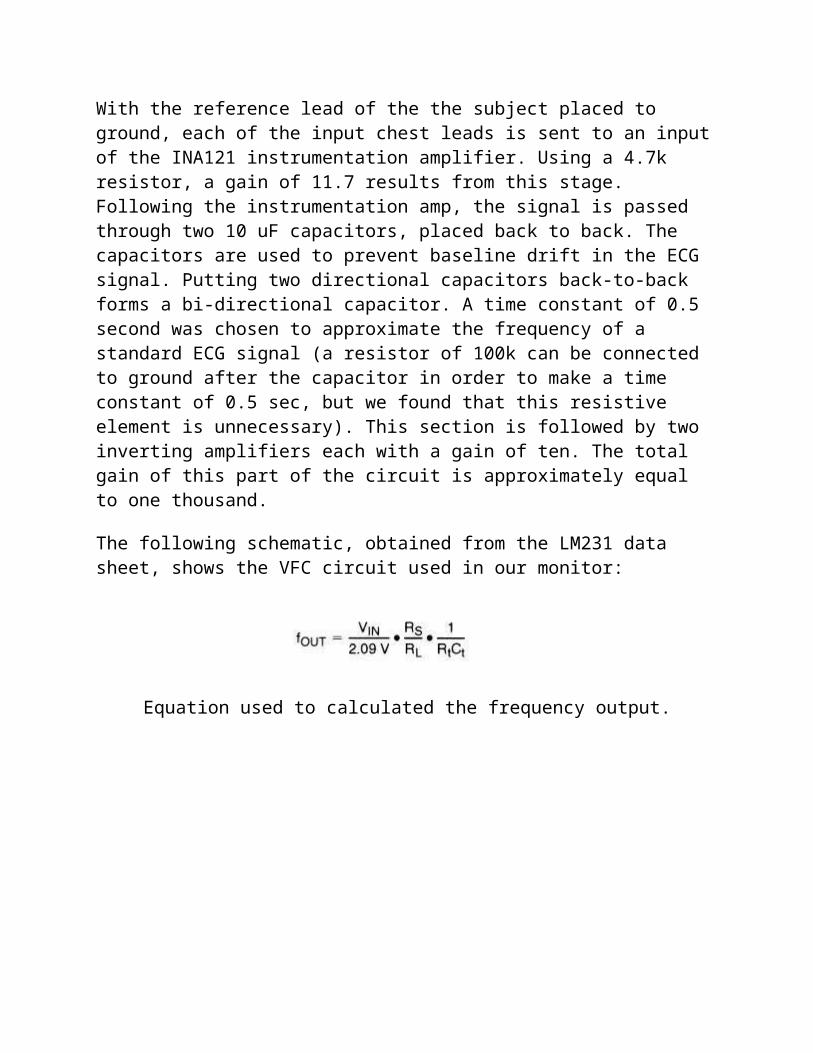
The following schematic, obtained from the LM231 data sheet, shows the VFC circuit used in our monitor:
Equation used to calculated the frequency output.
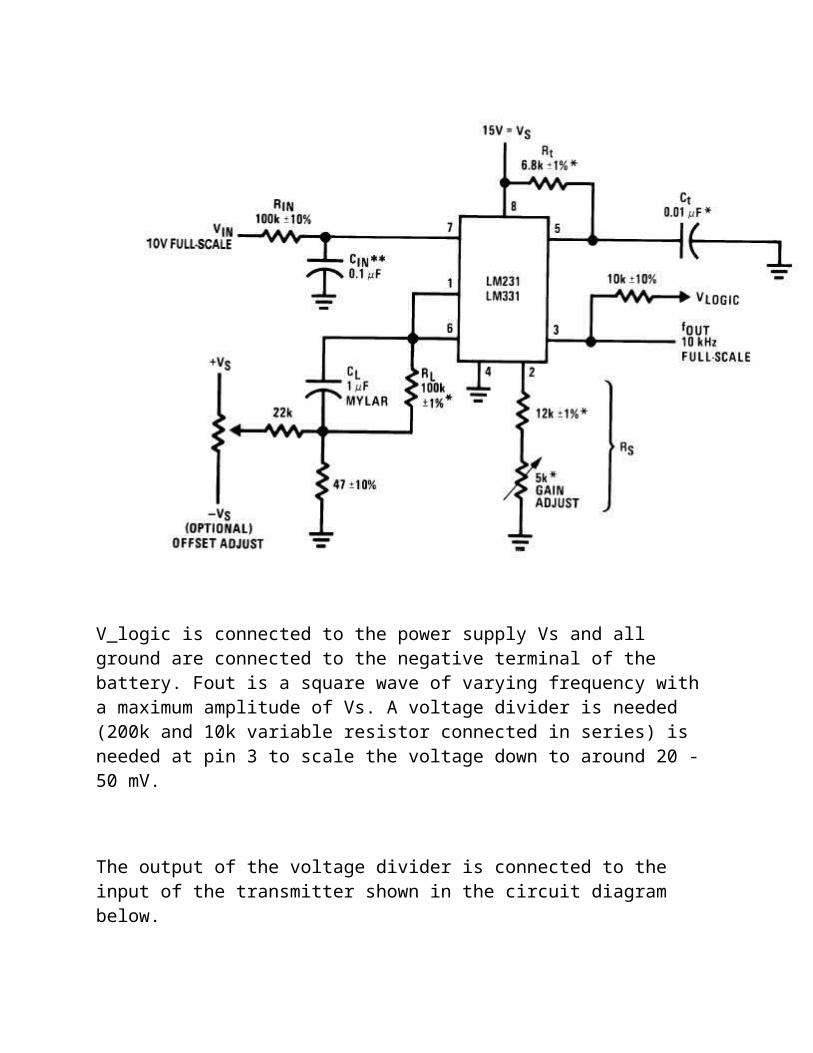
V_logic is connected to the power supply Vs and all ground are connected to the negative terminal of the battery. Fout is a square wave of varying frequency with a maximum amplitude of Vs. A voltage divider is needed (200k and 10k variable resistor connected in series) is needed at pin 3 to scale the voltage down to around 20 -50 mV.
The output of the voltage divider is connected to the input of the transmitter shown in the circuit diagram below.
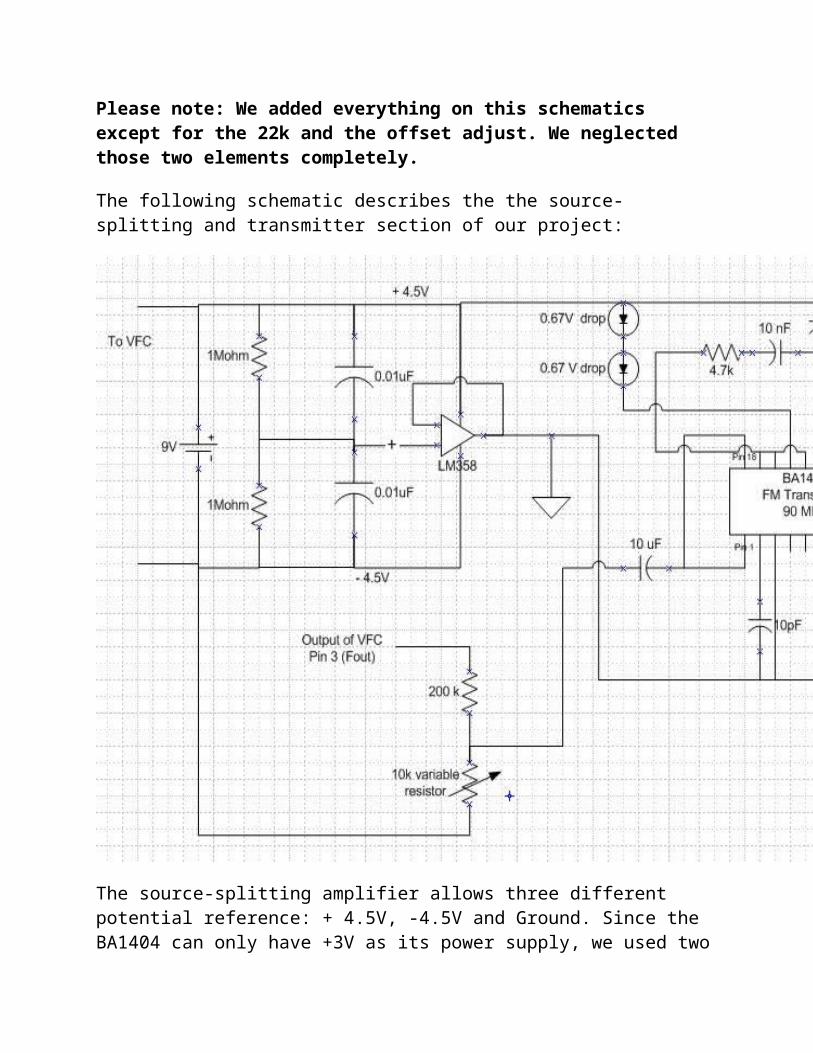
Please note: We added everything on this schematics except for the 22k and the offset adjust. We neglected those two elements completely.
The following schematic describes the the source-splitting and transmitter section of our project:
The source-splitting amplifier allows three different potential reference: + 4.5V, -4.5V and Ground. Since the BA1404 can only have +3V as its power supply, we used two
diodes to create a total drop of 1.4V and this allows thetransmitter to function properly. Another advantage to this setup is that every elements on this circuit can be powered off a signal 9V battery. Although not noted on this schematics, one should know that the input to the transmitter should be on the order of mV (5 - 50mV). Implementing a variable voltage divider to the input is very important. The nice thing about this setup is that one does not need an DC offset circuitry to adjust ECG signal from the output of the amplifier. Since our VFC ispowered between -4.5V and +4.5V, it has a 4.5V offset already. If the ECG signal is centered at 0V with a swingfrom -0.5 to +0.5V, then the VFC sees it as 3.5V to 4.5V swing. It is important to know that VFC cannot have negative voltage as its input. Furthermore, making an inductor at the tunable FM transmitter range is a painstaking process. We found that by turning a wire 4 times around the pen allows the signal to be transmitted at 90 MHz.
Receiver Circuitry:
The following schematic shows the voltage summer and amplifier section of the project:
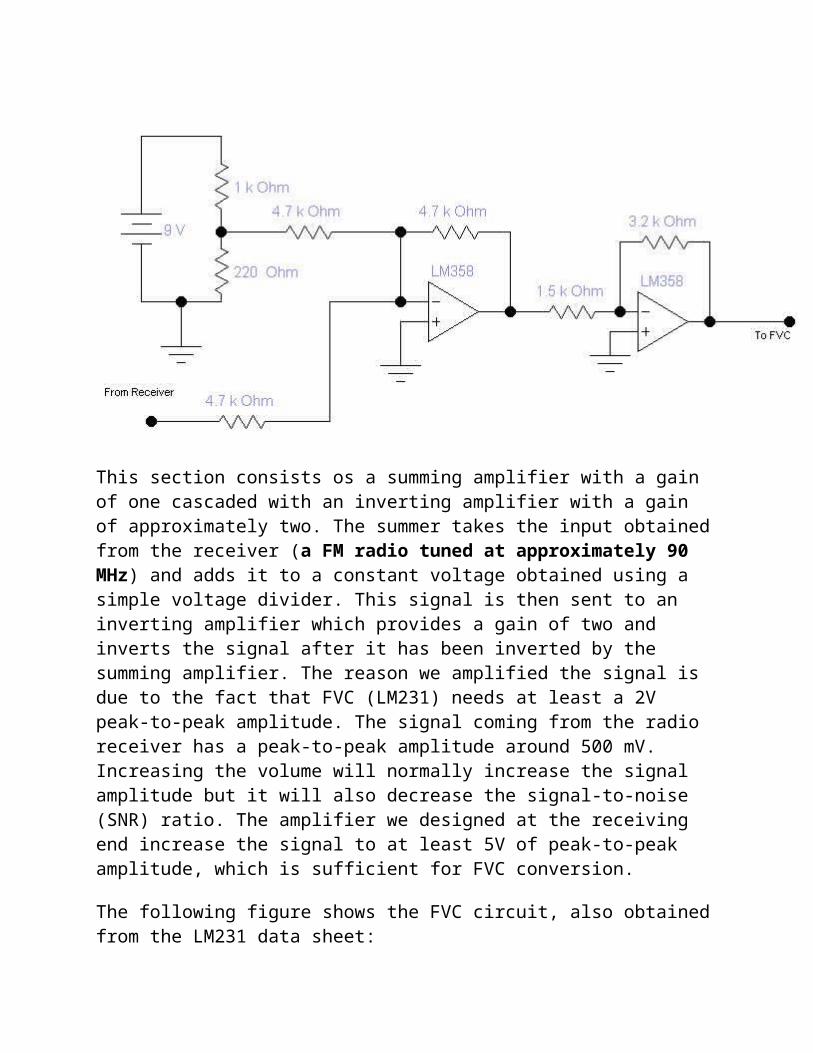
This section consists os a summing amplifier with a gain of one cascaded with an inverting amplifier with a gain of approximately two. The summer takes the input obtainedfrom the receiver (a FM radio tuned at approximately 90 MHz) and adds it to a constant voltage obtained using a simple voltage divider. This signal is then sent to an inverting amplifier which provides a gain of two and inverts the signal after it has been inverted by the summing amplifier. The reason we amplified the signal is due to the fact that FVC (LM231) needs at least a 2V peak-to-peak amplitude. The signal coming from the radio receiver has a peak-to-peak amplitude around 500 mV. Increasing the volume will normally increase the signal amplitude but it will also decrease the signal-to-noise (SNR) ratio. The amplifier we designed at the receiving end increase the signal to at least 5V of peak-to-peak amplitude, which is sufficient for FVC conversion.
The following figure shows the FVC circuit, also obtainedfrom the LM231 data sheet:
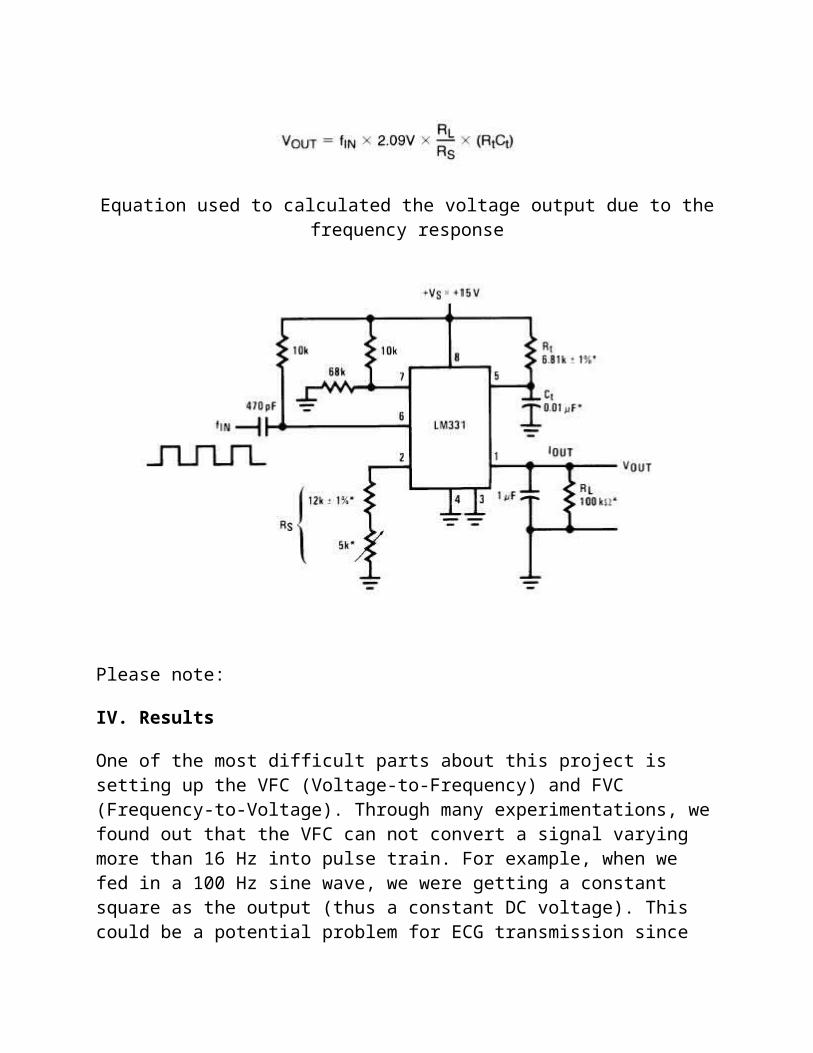
Equation used to calculated the voltage output due to thefrequency response
Please note:
IV. Results
One of the most difficult parts about this project is setting up the VFC (Voltage-to-Frequency) and FVC (Frequency-to-Voltage). Through many experimentations, wefound out that the VFC can not convert a signal varying more than 16 Hz into pulse train. For example, when we fed in a 100 Hz sine wave, we were getting a constant square as the output (thus a constant DC voltage). This could be a potential problem for ECG transmission since
the QRS peak can occur as fast as 20 to 50 Hz. However, when we fed in square waves of varying frequency into theFVC, we could get a varying DC voltage as expected. This is probably the reason why we could not receive a nice-looking ECG waveform on the receiving end. Also, we believe that the signal was attenuated during the transmission process. We had a difficult time receiving anice looking square wave from the FM radio receive. However, we were able to fix that problem by increasing the volume on the radio to create better rising and falling edges for the FVC. Finally, we noticed that our transmission range is about 10 feet, which is not very useful for a wireless ECG. The pictures below demonstrateour final result:
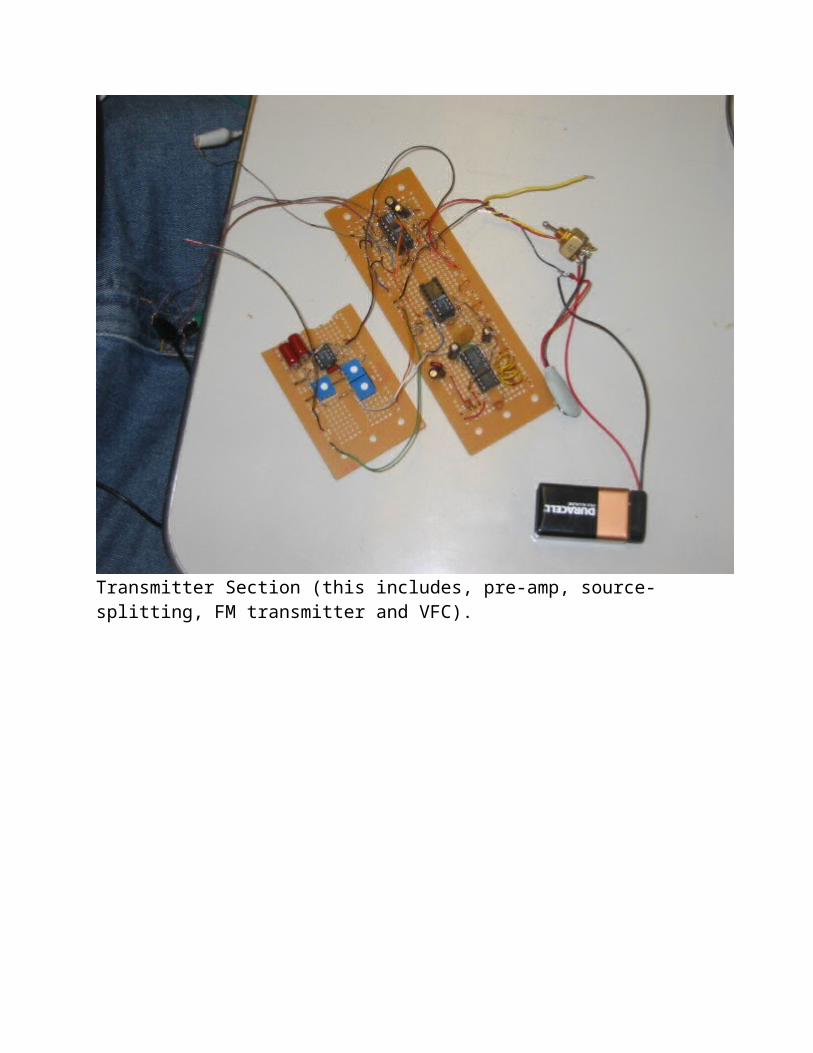
Transmitter Section (this includes, pre-amp, source-splitting, FM transmitter and VFC).
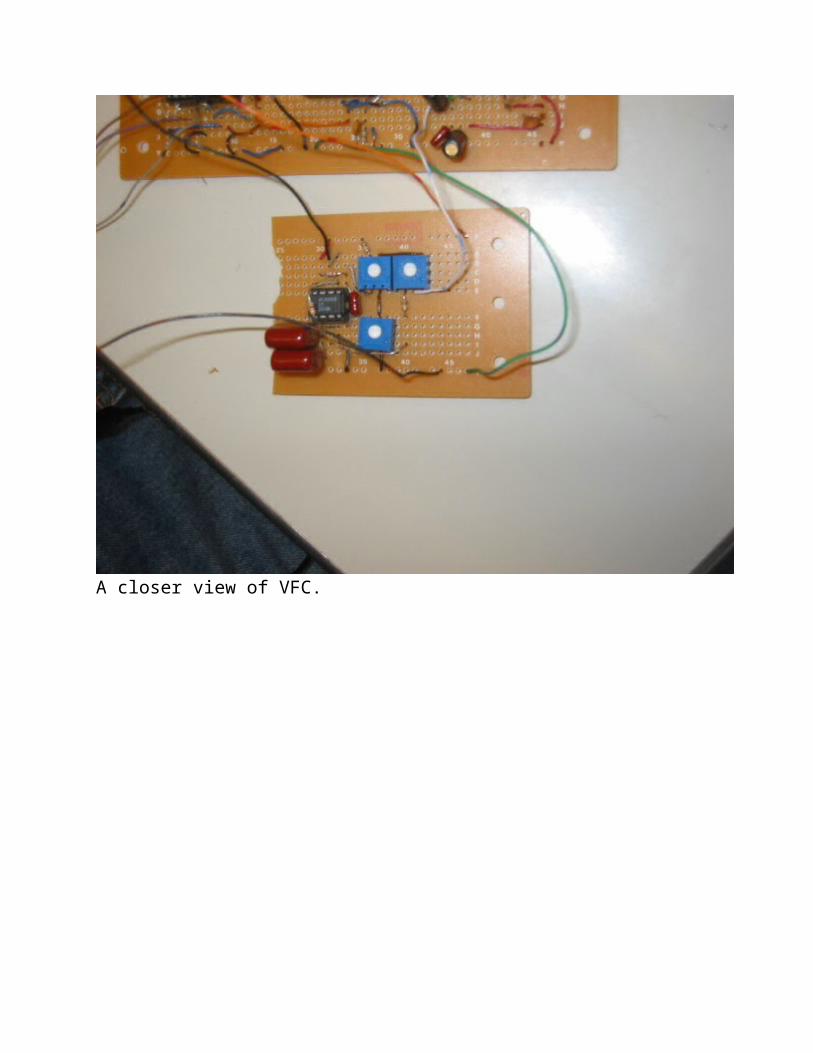
A closer view of VFC.
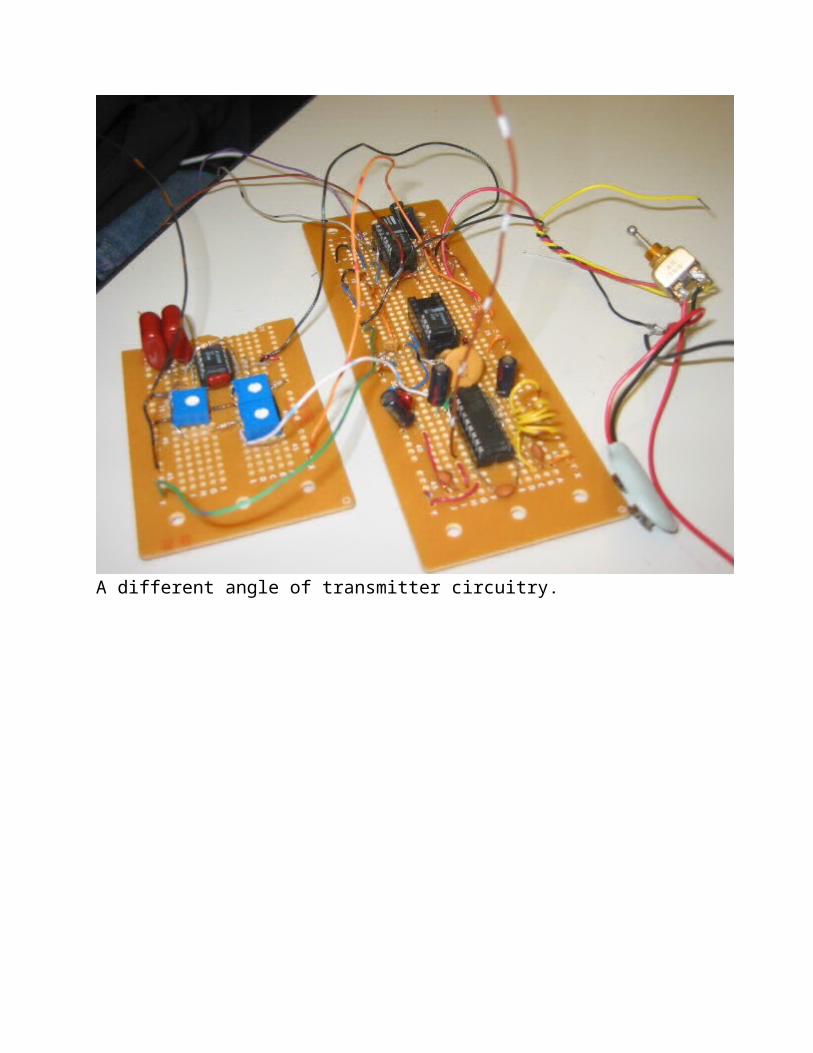
A different angle of transmitter circuitry.
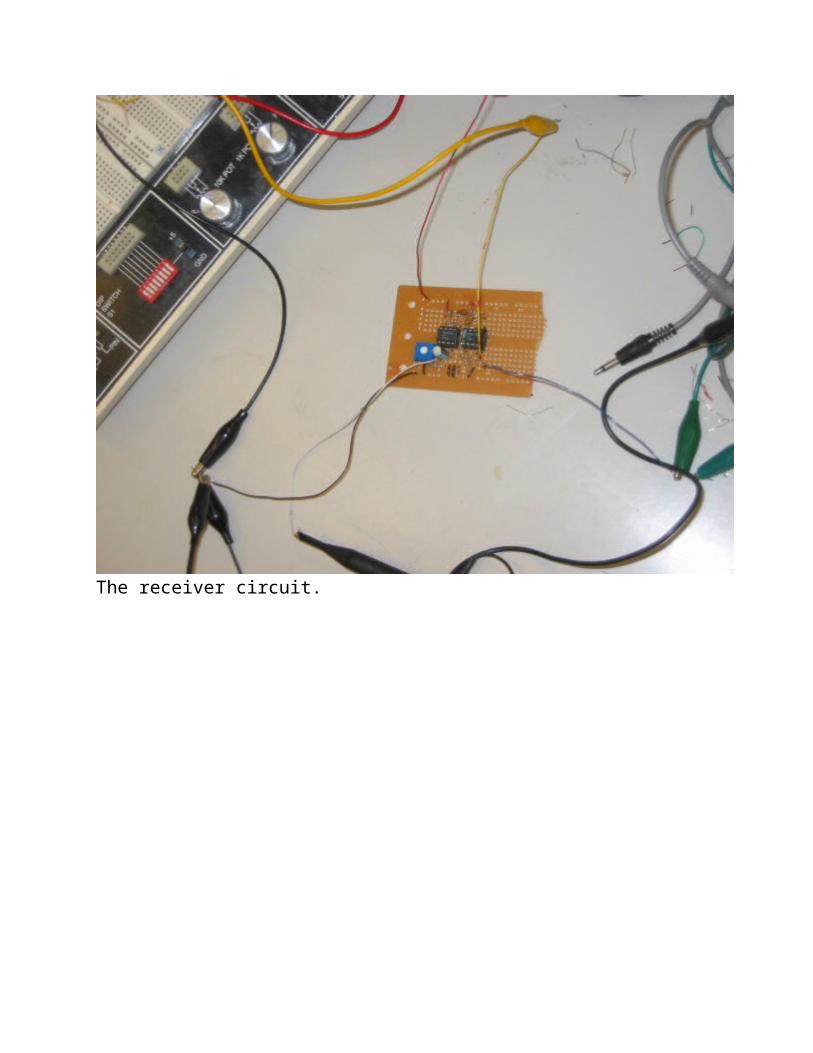
The receiver circuit.
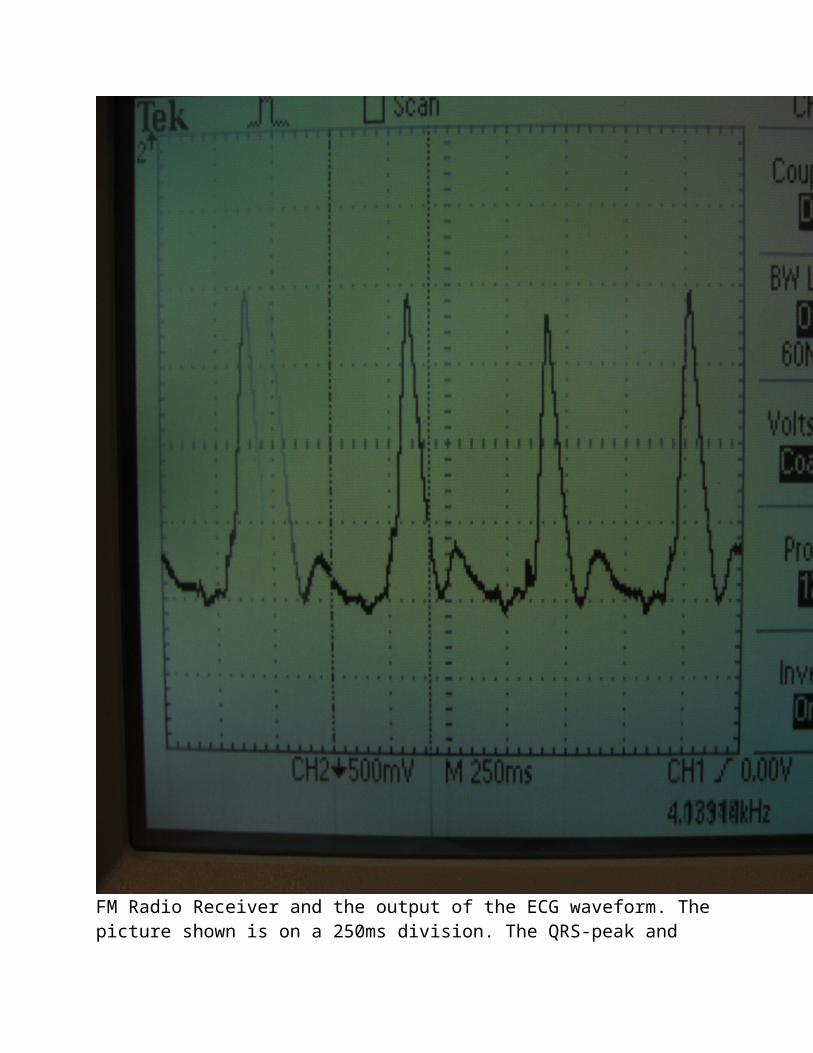
FM Radio Receiver and the output of the ECG waveform. Thepicture shown is on a 250ms division. The QRS-peak and

the T-wave are extremely visible. (we are very pleased with the result. For awhile, we were worried that we might not be able to detect the QRS peak).
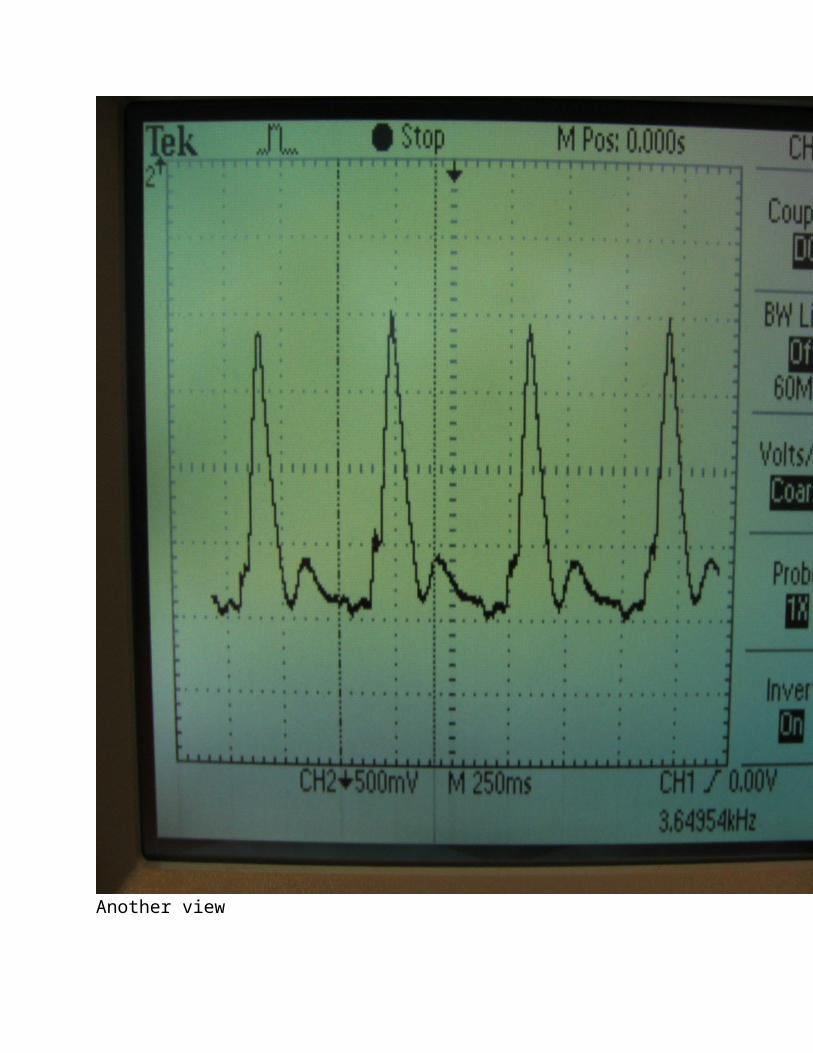
Another view
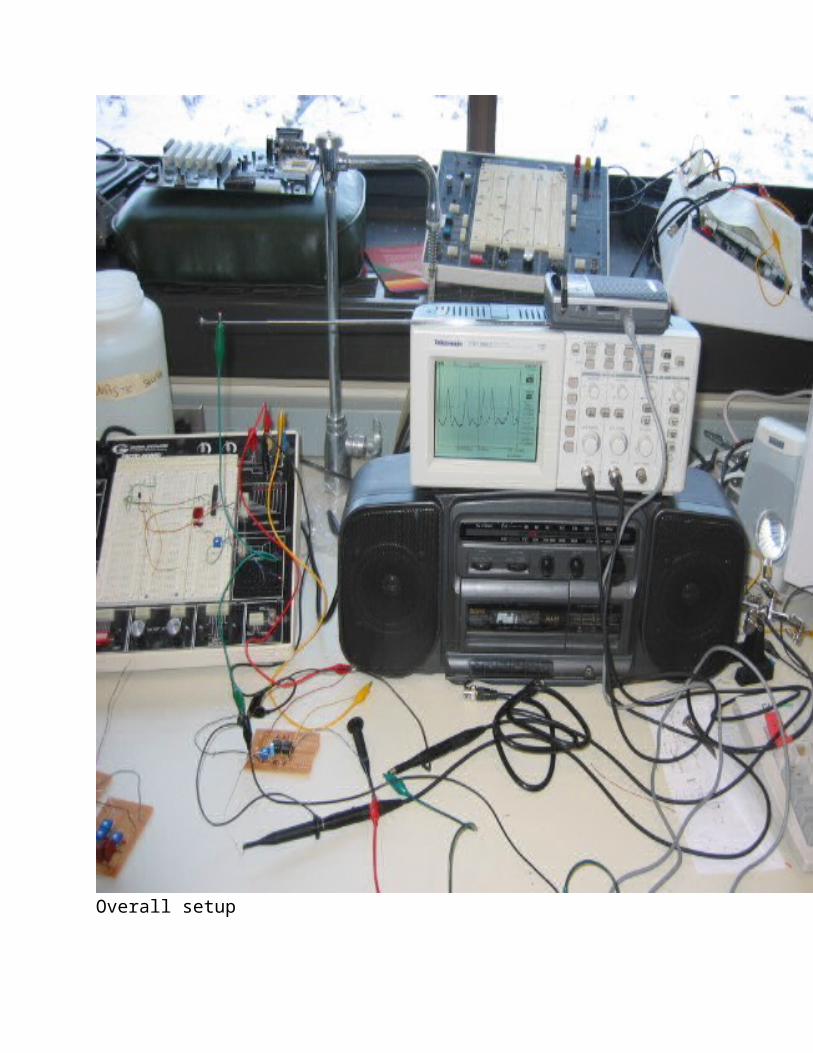
Overall setup
Link to a video that demonstrate its operation
V. Conclusions
Overall, our wireless ECG monitor was able to detect and transmit the basic elements of a ECG waveform, such as the QRS-complex and the T-wave. The two major problems ofthis design are the transmitter and the voltage-to-frequency conversion. To solve the first problem, one could employ a multi-channel digital transmitter, since digital transmitter are often more robust, easy to manipulate, and transmit at a much higher frequency (lessinterruption). Furthermore, transmitting bits are much more reliable than analog voltage data. On the other hand, there are several ways to go about solving the second problem; we could use a one-bit digital-to-analog converter or a sigma-delta converter instead of a VFC. Oftentimes, a sigma-delta converter can convert analog input into digital data at a much higher rate. Finally, if the VFC is somehow desired, one might consider matching the input capacitance (CIn) versus the output load capacitance (CL). One co
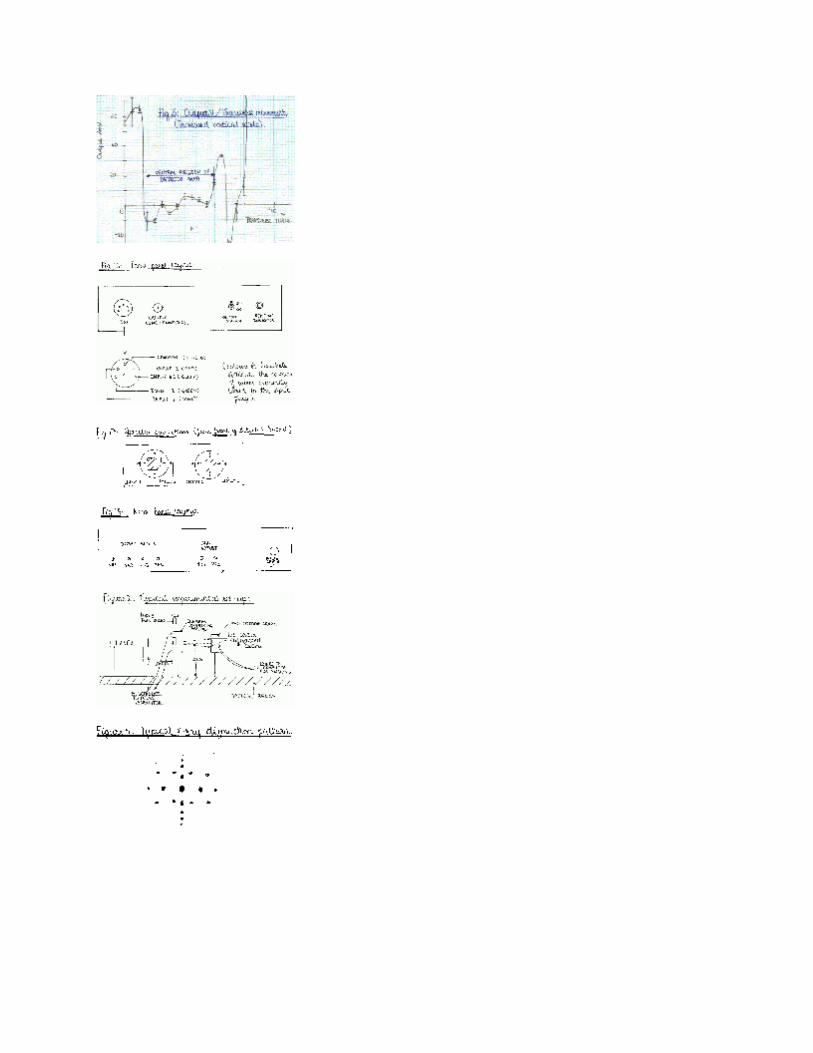
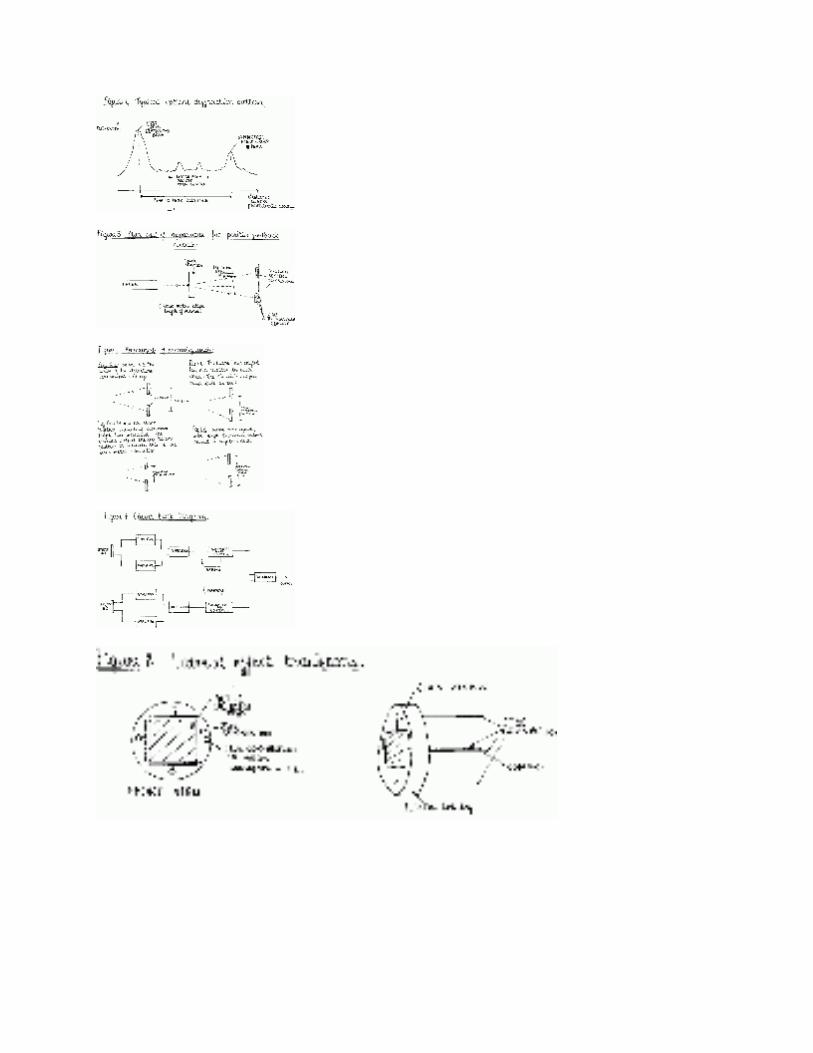
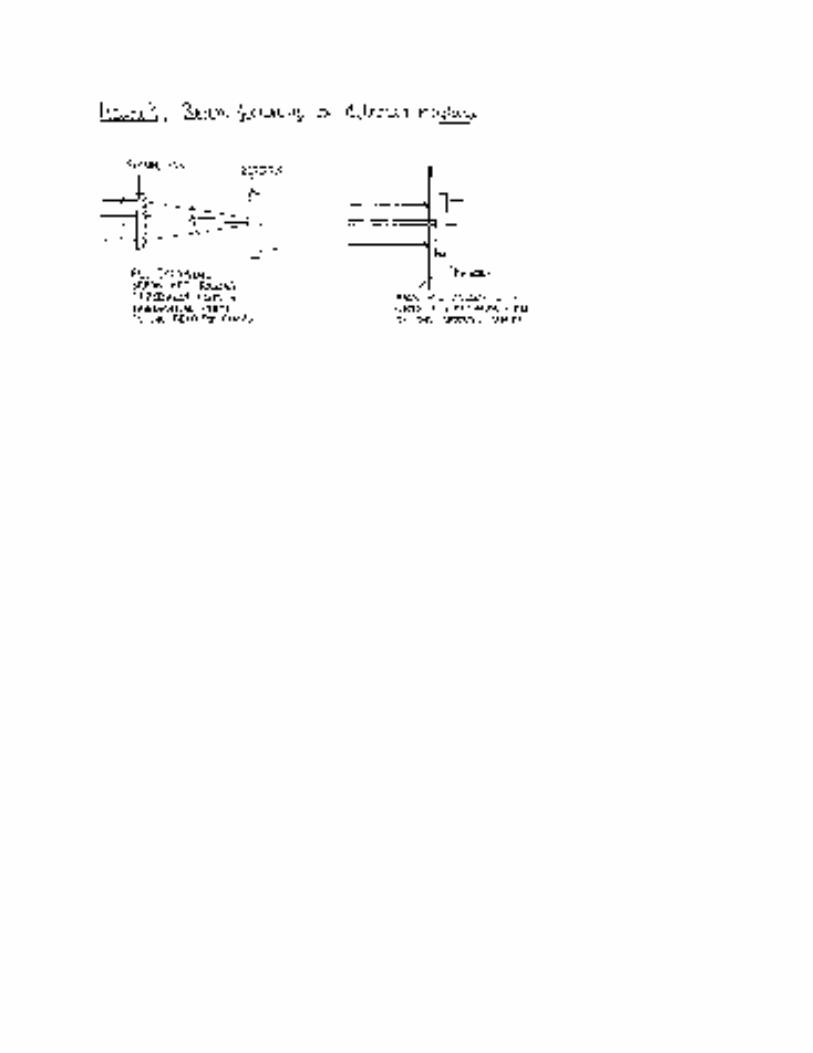
Positive Feedback Circuit for Isometric Muscle Experiments
By Hans Summers, May 1992
Here I present my 2'nd year university physics project, undertaken while at Imperial College, London university. Unlike the 1'st and 3'rd year projects, which were my ownproposals, this one was selected in the more usual way from a list of undergraduate projects provided by the physics department.
Although this is a biophysics project, as usual my main interest was in the electronics. The part of which I am most proud is the innovative Automatic Gain Control (AGC)circuit, without which the project would not have succeeded. This AGC circuit could well be used in many other applications too.
Unfortunately I have no photographs.
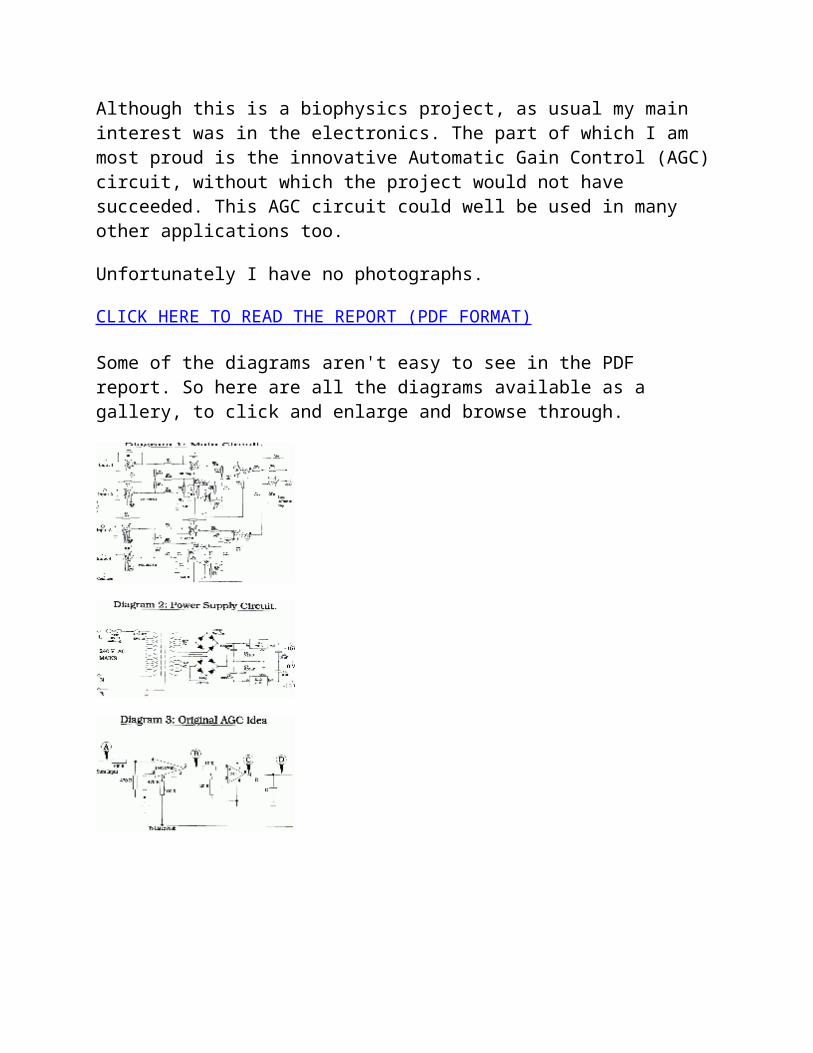
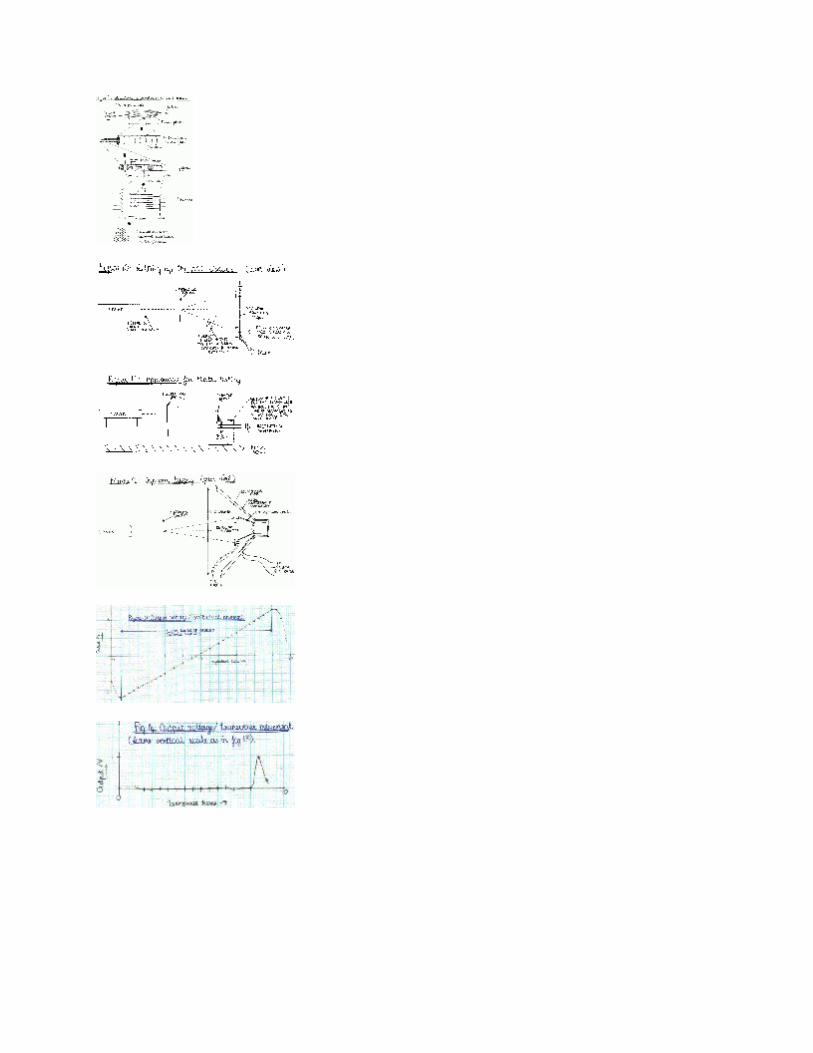
CLICK HERE TO READ THE REPORT (PDF FORMAT)
Some of the diagrams aren't easy to see in the PDF report. So here are all the diagrams available as a gallery, to click and enlarge and browse through.


