Embed Size (px)
Citation preview

January – June 2006 Number 40

journal of the African Elephant, African Rhinoand Asian Rhino Specialist Groups
January – June 2006 No. 40
EditorHelen van Houten
Assistant EditorDali Mwagore
Editorial BoardHolly DublinEsmond MartinLeo NiskanenRobert OlivierNico van StrienLucy Vigne
Design and layoutDamary Odanga
GraphicsPhillip Miyare
Address all correspondence,including enquiries aboutsubscription, to
The Editor, PachydermPO Box 68200 – 00200Nairobi, Kenyatel: +254 20 3876461fax: +254 20 3870385email: [email protected] site: www.iucn.org/afesg
Reproduction of this publicaton foreducational or other non-commercialpurposes is authorized without writtenpermission from the copyright holderprovided the source is fullyacknowledged.
Reproduction of this publication forresale or other commercial purposes isprohibited without written permission ofthe copyright holder.
S P E C I E S
S U R V I V A L
C O M M I S S I O N
The World Conservation Union
IUCN
ISSN 1026 2881
Cover: Elephants from the Noghatsaa area of Chobe cross aroad on a plateau to go down to the Chobe River. Thisphotograph was taken on Ngoma Rd, Kasane, Botswana.Photo by Kelly Landen.
1 Chair reports / Rapports des Présidents
1 African Elephant Specialist Group report /Rapport du Groupe Spécialiste des Eléphantsd’Afrique
Holly T. Dublin
11 African Rhino Specialist Group report / Rapportdu Groupe Spécialiste des Rhinos d’Afrique
Martin Brooks
15 Asian Rhino Specialist Group report / Rapport duGroupe Spécialiste des Rhinos d’Asie
Nico van Strien, Tirtha Maskey
24 Research
24 Effect of artificial water points on the movementand behaviour of desert-dwelling elephants ofnorth-western Namibia
Keith Leggett
35 Distribution des éléphants autour d’une maresahélienne en relation avec le chepteldomestique et la végétation ligneuse
Richard F.W. Barnes, Emmanuel M. Héma,Elmehdi Doumbia
42 Elephant survey in the Bia Conservation Area,western Ghana
Moses Kofi Sam, Emmanuel Danquah, Samuel K.Oppong, Ebenezer Daryl Bosu
52 Food plants of forest elephants and theiravailability in the Kakum Conservation Area,Ghana
Emmanuel Danquah, Samuel K. Oppong
January – June 2006 No. 40
journal of the African Elephant,
African Rhino and
Asian Rhino Specialist Groups
Views expressed in Pachyderm are those of the individual authors and do not necessarily reflect those of IUCN, theSpecies Survival Commission or any of the three Specialist Groups responsible for producing Pachyderm (the AfricanElephant Specialist Group, the African Rhino Specialist Group and the Asian Rhino Specialist Group).
61 Elephant numbers and distribution in the Tsavo–Amboseli ecosystem,south-western Kenya
John Kioko, Moses Okello, Philip Muruthi
69 Caught in the crossfire: the forest elephant and law enforcement in aregion of political instability, eastern Democratic Republic of Congo
Leonard Mubalama and Eulalie Bashige
80 The peaks and troughs of Macau’s ivory trade
Esmond Martin
89 Are we winning the case for ivory substitutes in China?
Esmond Martin
102 History
102 Distribution and extinction of the rhinoceros in China: review ofrecent Chinese publications
Kees Rookmaaker
107 Field note
107 Past population dynamics and individual information on possiblesurviving northern white rhinos in Garamba National Park andsurrounding reserves
Kes Hillman Smith
116 Tribute
116 Thomas John Foose (1945–2006)
Nico van Strien
118 Book review
Ivory markets of Europe, Esmond Martin and Daniel Stiles, drawingsby Andrew Kamiti, review by Kees Rookmaaker
120 IUCN/SSC African Elephant Specialist Group members
123 Guidelines to contributors

Acknowledgements
The production of this issue of Pachyderm was only possible through contributions from a number oforganizations and individuals. In particular, we would like to thank the following:
Ann BisselCurtice GriffinChristopher PowlesFrancesco NardelliElephant Care InternationalEsmond MartinInternational Rhino FoundationJean-Pierre d’HuartJustin Ockenden & Keri Christ (in memory of Michael Curtis)Kes Hillman SmithLucy VigneMaria FinniganMesserli FoundationNico van StrienPaolo Solari-BozziPeter HallRettet die Elefanten Afrikas e.VRichard BlockSave the ElephantsSimon HedgesThe Eric and Virginia Pearson FoundationThe World Association of Zoos and AquariumsThomas de MaarYarrow Robertson
WWF-Malaysia (SOREL Project) Borneo programme
The views expressed herein are those of the authors and can therefore in no way be taken to reflect the officialopinion of the individual donors, donor agencies, the World Conservation Union (IUCN) or any of the threeIUCN/SSC Specialist Groups.

Pachyderm No. 40 January–June 2006 1
African Elephant Specialist Group report
African Elephant Specialist Group reportRapport du Groupe Spécialiste des Eléphants d’Afrique
Holly T. Dublin, Chair/Président
IUCN/SSC African Elephant Specialist Group, PO Box 68200 – 00200 Nairobi, Kenyaemail: [email protected]
This issue of Pachyderm was funded primarily fromindividual donations made through a new onlinefundraising system on the AfESG website. We ex-tend many, many thanks to all those who contributed.
I am also deeply grateful to the UK Departmentfor Environment, Food and Rural Affairs (DEFRA)who have just announced a £75,000 funding packageto support our core activities! We are now hoping thatother supporters will follow suit with similar contri-butions.
Re-appointment of the AfESGmembership
The process for re-appointing the AfESG member-ship for the 2005-2008 quadrennium has now beencompleted. The 38 members (31 re-appointees and 7new members) come from 20 different elephant rangestates. Each member brings a unique set of skills andexperience which will undoubtedly help to maintainthe AfESG on the cutting edge of elephant conser-vation. I would like to give an especially warm wel-come to our new members: Mr. Emmanuel Danquah(Ghana), Dr Keith Leggett (Namibia), Dr. EsmondMartin (Kenya), Mr John Mason (Ghana), Dr BarbaraMcKnight (Kenya), Mr Awo Nandjui (Côte d’Ivoire)and Mr Joseph Tiebou (Cameroon). I look forward toworking with all of you in the coming months. Thefull list of AfESG members can be found at the backof this issue.
Ce numéro de Pachyderm est principalement financépar les donations de particuliers, grâce à un nouveausystème de récolte de fonds en ligne, sur le site duGSEAf. Nous remercions beaucoup, beaucoup, tousceux qui y ont contribué.
Je veux aussi exprimer toute ma reconnaissanceau département britannique de l’Environnement, del’Alimentation et des Affaires rurales (DEFRA), quivient d’annoncer un subside de 75.000 £ pour financernos activités de base ! Nous espérons aujourd’hui qued’autres supporters suivront cet exemple avec descontributions similaires.
Appointement des nouveauxmembres du GSEAf
Le processus de nomination des membres du GSEAfpour les années 2005–2008 est maintenant terminé.Les 38 membres (31 anciens et 7 nouveaux) provien-nent de 20 états différents de l’aire de répartition deséléphants. Chacun d’eux amène un set unique decompétences et d’expériences qui serviront à coup sûrà maintenir le GSEAf à la pointe de la conservationdes éléphants. Je voudrais accueillir très chaleureusementnos nouveaux membres : M. Emmanuel Danquah(Ghana), Dr. Keith Leggett (Namibie), Dr. EsmondMartin (Kenya), M. John Mason (Ghana), Dr. BarbaraMcKnight (Kenya), M. Awo Nandjui (Côte d’Ivoire)et M. Joseph Tiebou (Cameroun). Je me réjouis depouvoir travailler avec vous tous dans les prochains
CHAIR REPORTSRAPPORTS DES PRESIDENTS

2 Pachyderm No. 40 January–June 2006
Dublin
All AfESG members will for the first time be re-quested to input further information about themselvesdirectly onto the new IUCN Commission Online Reg-istration System. This system will enable membersto manage their personal membership profile and tosearch for other members of the six IUCN Commis-sions and their contact details. IUCN Headquarterswill shortly be sending all members an electronic “in-vitation to join”, together with login and passwordinformation to access the system.
The African Elephant Database
With the entry of all new data into the AfricanElephant Database (AED) now completed, JulianBlanc, the AED Manager, has shifted his focus to thepreparation of the African Elephant Status Report2006 (AESR 2006), which is expected to be com-pleted and released later this year. However, a numberof logistical and financial challenges still lie ahead.Although a number of donors have been approached,we still have insufficient funds to print and distributehard copies of the AESR 2006. Plans are underway,however, to hold a final editorial meeting of the DataReview Working Group in early July. To fill remain-ing funding gaps, we are currently exploring variousonline fundraising options, including novel ap-proaches to printing and distributing the AESR, suchas using ‘print-on-demand’ technology, which couldsubstantially reduce the cost of producing the journaland allow a limited number of hard copies.
In view of the uncertain financial situation, andthe potential impact on the continuity of the AED,we are also exploring a number of possible futurescenarios. Among these is the suggestion to join forceswith other SSC Specialist Groups to develop a data-base similar in scope and characteristics to the AED,but geared towards the monitoring of multiple spe-cies for which rich and detailed data are available. Ina related development, we have made some headwaytowards reducing, or altogether eliminating, the highcosts of maintaining GIS software licenses. Enlistingthe help of a community of volunteer programmers,we have started a project to migrate the AED to anopen source platform. The platform of choice isPostgreSQL, a powerful open source database thatprovides capabilities for the storage and analysis ofspatial data. The objective of the project is to developan application that can be used to maintain informa-tion on the distribution and abundance of any species,
mois. La liste complète de tous les membres du GSEAfse trouve au dos de ce numéro.
Tous les membres du Groupe seront priés, pour lapremière fois, de donner de plus amples informationssur eux-mêmes sur le nouveau système d’enregistre-ment en ligne de la Commission de l’UICN. Cesystème permettra aux membres de gérer leur profilpersonnel en tant que membres, et de trouver ce quiconcerne les autres membres des six commissions del’UICN et leurs contacts. Le QG de l’UICN va bientÙtenvoyer à tous les membres une invitationélectronique à rejoindre le système, avec un login etun mot de passe permettant d’y accéder.
Base de données de l’Eléphantafricain
Comme toutes les nouvelles données ont été intégréesdans la Base de données de l’Eléphant africain(BDEA), Julian Blanc, qui en est le gestionnaire, seconsacre désormais à la préparation du Rapport 2006sur le Statut de l’Eléphant africain (RSEA 2006) quidevrait être terminé et diffusé plus tard, cette année.Néanmoins, un certain nombre d’obstacles logistiqueset financiers se dressent encore. Bien que nous ayonscontacté un certain nombre de donateurs, nousmanquons encore de fonds pour imprimer et distribuerdes copies papier du RSEA 2006. Il est prévu d’avoirencore une dernière réunion éditoriale du Groupe detravail pour la Révision des données, début juillet.Pour combler le manque de fonds, nous exploronsactuellement diverses options de récolte de fonds enligne, y compris de nouvelles approches pourl’impression et la distribution, telles que la technologied’impression sur demande, qui pourraient sensible-ment réduire les coûts de production du journal etlimiter le nombre de copies papier.
Vu la situation financière incertaine et son impactpossible sur la continuité de la BDEA, nous exploronsaussi plusieurs scénarios envisageables. Parmi ceux-ci, il y a la possibilité d’unir nos forces avec cellesdes autres Groupes de spécialistes de la CSE, pourdévelopper une base de données de portée et decaractéristiques semblables à celles de la BDEA, maisorientée vers le monitoring de multiples espèces pourlesquelles des données abondantes et détaillées sontdisponibles. Parallèlement, nous avons fait quelquespas vers la réduction, voire l’élimination du prix élevédes licences pour le matériel SIG. En faisant la listede toute une communauté de programmateurs

Pachyderm No. 40 January–June 2006 3
African Elephant Specialist Group report
not just elephants. For more details, please visit theproject site at www.pgfoundry.org/projects/wilddb/where you can sign up to join the project and its mail-ing list.
Updates on conservation andmanagement strategies and actionplans
Sub-regional strategies
CENTRAL AFRICA
The Central African Elephant Conservation Strategy(CAECS) was finalized in late 2005 and the finaldocument has now been disseminated to the wildlifeauthorities of Central African elephant range states,NGOs, donor agencies and other conservation part-ners. It is also available in Portable Document For-mat, in French and in English, at http://iucn.org./afesg/tools.
The CAECS was brought to the attention of therelevant ministers of all seven Central African ele-phant range states at a meeting organized byCOMIFAC (Commission des Forêts d’AfriqueCentrale) in Libreville, Gabon, in March 2006. Wehave recently been informed by the IUCN RegionalOffice for Central Africa that the Executive Secre-tary of COMIFAC will be contacting us soon on thenext steps in getting this strategy integrated into theConvergence Plan of the Yaoundé Heads-of-StateProcess. We hope these efforts will not only increasepolitical backing for the initiative, but also help gen-erate funds for implementation, including the meansto hire a dedicated AfESG Programme Officer to en-sure the necessary technical support and coordina-tion.
WEST AFRICA
A Letter of Agreement has now been finalized be-tween the AfESG and the Convention of MigratorySpecies (CMS) on a detailed workplan for the imple-mentation of the inter-governmental Memorandumof Understanding on conserving elephants in WestAfrica, which was signed into effect by 12 of the 13West African elephant Range States at the meeting ofthe 8th Conference of the Parties to CMS in Novem-ber 2005. The total CMS contribution of US$ 50,000towards the AfESG’s operational budget for West
volontaires prêts à nous aider, nous avons lancé unprojet visant à déplacer la BDEA vers une plate-formeouverte. La plate-forme de choix est PostgreSQL, unepuissante base de données ouverte qui offre lapossibilité de stocker et d’analyser des donnéesspatiales. L’objectif du projet consiste à développerune application qui pourra être utilisée pour conserverles informations sur la distribution et l’abondance detoutes les espèces, et pas seulement les éléphants. Pourde plus amples détails, veuillez visiter le site du projetsur www.pgfoundry.org/projects/wilddb où vouspourrez vous inscrire pour vous joindre au projet etfigurer sur sa mailing list.
Mises à jour des stratégies deconservation et de gestion
Stratégies sous-régionales
AFRIQUE CENTRALE
La Stratégie de Conservation de l’éléphant en AfriqueCentrale (SCEAC) a été finalisée fin 2005, et le docu-ment final a été distribué aux autorités en charge dela faune, aux ONG, aux agences donatrices et auxautres partenaires de la conservation dans les Etatsde l’aire de répartition de l’éléphant en AfriqueCentrale. Il est aussi disponible en format pdf, enfrançais et en anglais, sur http://iucn.org./afesg/tools.
La SCEAC a été portée à l’attention des ministresconcernés de chacun des sept Etats lors d’une réunionorganisée par la COMIFAC (Commission des Forêtsd’Afrique Centrale) à Libreville, au Gabon, en mars2006. Le bureau régional de l’UICN pour l’AfriqueCentrale nous a informés récemment que le Secrétaireexécutif de la COMIFAC nous contacteraitprochainement au sujet des prochaines étapes requisespour intégrer cette stratégie dans le plan de convergencedu Processus des Chefs d’Etat de Yaoundé. Nousespérons que ces efforts augmenteront l’appui politiquede l’initiative et qu’ils aideront à récolter des fonds pourla mettre en œuvre, y compris les moyens pour engagerun responsable de programme dévoué afin d’en assurerle support et la coordination techniques indispensables.
AFRIQUE DE L’OUEST
Une lettre d’agrément est maintenant finalisée entrele GSEAf et la Convention sur les Espèces Migratrices(CEM), avec un plan de travail détaillé pour la mise

4 Pachyderm No. 40 January–June 2006
Dublin
Africa, together with the recent contribution from theFrench Government, ensures that the AfESG shouldbe able to continue providing technical support andcoordination for implementation of the West AfricanElephant Conservation Strategy (WAECS) over thenext few years.
National strategies
The development and implementation of nationalelephant conservation strategies continues in manyRange States. Progress has been particularly impres-sive in West Africa where 11 of the 13 range statesnow have national strategies in various stages of plan-ning or readiness. Some notable recent developmentsinclude the following:• Implementation of Burkina Faso’s and Ghana’s
strategies is fully underway. So far activities havefocused primarily on surveying elephant popula-tions and various transfrontier conservation ini-tiatives.
• Funds are currently being sought for implemen-tation of the national strategy for Togo, which wasfinalized in 2003 with support from the USFWS.
• Strategic planning workshops have been held inBenin, Guinea, Liberia and Niger. All four rangestates are in the process of finalizing their strat-egy documents.
• The AfESG is in the process of assisting Mali andSierra Leone on funding proposals for the devel-opment of their respective national strategies.
• In Kenya, the Kenya Wildlife Service’s specialtechnical advisory committee on the developmentof a national strategy met for the first time in late2005 to discuss procedural matters. In April 2006‘expressions of interest’ were invited from suit-ably qualified consultants, to help consolidate theinputs from planned stakeholder consultations intoa detailed strategy document. A shortlist of suit-able candidates is being prepared.
Transfrontier initiatives
SOUTHERN AFRICA
The potential for range expansion as a managementoption for the elephant ‘overpopulation problem’ wasthe main topic of discussion at the workshop onRationalizing Transboundary Elephant Managementand Human Needs in the Kavango–mid-ZambeziRegion, which took place on 23 and 24 May in
en œuvre d’un protocole d’accord sur la conserva-tion des éléphants en Afrique de l’Ouest. Il a été signépour effet par 12 des 13 Etats de l’aire de répartitionà la Huitième Conférence des Parties à la CEM, ennovembre 2005. La contribution de la CEM au budgetopérationnel du GSEAf en Afrique de l’Ouest s’élèveau total à 50.000 dollars EU et, avec la dernière con-tribution du Gouvernement français, elle garantit quele Groupe pourra continuer à fournir un support tech-nique et à coordonner la réalisation de la Stratégie deConservation de l’éléphant en Afrique de l’Ouestpendant les prochaines années.
Stratégies nationales
Le développement et la réalisation des stratégiesnationales de conservation des éléphants se pour-suivent dans de nombreux états de l’aire de répartition.Les progrès ont été particulièrement impressionnantsen Afrique de l’Ouest où 11 des 13 Etats disposentmaintenant d’une stratégie nationale, à un stade plusou moins avancé. Voici certains développementsrécents remarquables :• Le Burkina Faso et le Ghana sont complètement
impliqués dans la réalisation de leur stratégie.Jusqu’à présent, les activités se sont surtout con-centrées sur des études de population d’éléphantset sur diverses initiatives de conservationtransfrontalière.
• On recherche des fonds pour la mise en place dela stratégie nationale togolaise, qui a été finaliséeen 2003 avec le soutien du Fish and Wildlife Serv-ice américain.
• Il y a eu des ateliers de planning stratégique auBénin, en Guinée, au Liberia et au Niger. Cesquatre Etats de l’aire de répartition sont occupésà finaliser les documents de leur stratégie.
• Le GSEAf aide le Mali et la Sierra Leone àpréparer des propositions de financement pourdévelopper leur stratégie nationale.
• Au Kenya, le comité spécial de conseil techniquedu Kenya Wildlife Service pour le développementd’une stratégie nationale s’est réuni pour lapremière fois fin 2005 pour discuter desprocédures. En avril 2006, on a invité des con-sultants qualifiés à présenter leur « expressiond’intérêt », pour aider à consolider les inputs desconsultations prévues avec les parties prenantesen un document de stratégie détaillé. On prépareune liste restreinte des candidats souhaités.

Pachyderm No. 40 January–June 2006 5
African Elephant Specialist Group report
Gaborone, Botswana. This workshop, organized byConservation International’s Southern Africa Wilder-ness and Transfrontier Conservation Programme, wasattended by representatives from five Southern Africanelephant range States, as well as numerous NGOs, in-dividual elephant researchers, and even a few privatesector partners. The main objective was to help formu-late recommendations for the conservation and estab-lishment of elephant corridors in the proposed 300,000km2 Kavango–Zambezi Transfrontier ConservationArea (KAZA TFCA) straddling the boundaries of An-gola, Botswana, Namibia, Zambia and Zimbabwe. LeoNiskanen, AfESG’s Senior Programme Officer also at-tended, as did AfESG members Tom Milliken (TRAF-FIC East and Southern Africa) and Loki Osborn(Elephant Pepper Development Trust).
The workshop consisted of a series of technical pres-entations and working group sessions addressing themain challenges to, and opportunities for, range expan-sion in the KAZA TFCA. At present, the most promis-ing transboundary corridor leads from northernBotswana through the Caprivi Strip in Namibia intosouth-east Angola. Recent research suggests that el-ephants are already using this corridor, even though apart of it is quite heavily impacted by human activities.The presence of landmines and the lack of infrastruc-ture, resources, and capacity for conservation and man-agement of elephants in Angola are some of thechallenges to the long-term viability of this corridor.
Three other potential elephant corridors were alsoidentified at the workshop. All of these link the Chobeelephant population in northern Botswana to KafueNational Park in Zambia. However, extensive studieswill be needed to determine the feasibility of establish-ing these corridors, especially as they are likely to bringelephants and other wildlife near human settlements,thus increasing the risk of human-wildlife conflict.Generally, it is agreed that the acceptance of the af-fected communities of the planned range expansion isa necessary prerequisite without which the scheme haslittle chance of succeeding. The costs and benefits offree movement of wildlife into areas currently settledby people must therefore be carefully evaluated, andthe communities residing in these areas must be in-volved in the planning from the very beginning.
WEST AFRICA
Since my last Chair’s report, steady progress has beenmade with various transfrontier initiatives. First, a
Initiatives transfrontalières
AFRIQUE AUSTRALE
La possibilité d’étendre l’aire de distribution commeoption pour résoudre le « problème de surpopulation »des éléphants a été le principal sujet de discussion del’atelier « Rationaliser la gestion transfrontalière deséléphants et les besoins humains dans la régionKavango-moyen Zambèze », qui a eu lieu les 23 et 24mai à Gaborone, au Botswana. Organisé par le Pro-gramme de Conservation International « SouthernAfrica Wilderness and Transfrontier Conservation »,cet atelier réunit des représentants de cinq Etats de l’airede répartition des éléphants en Afrique australe, ainsique de nombreuses ONG, des chercheurs indépendants,et même quelques partenaires du secteur privé. Le prin-cipal objectif était d’aider à formuler des recomman-dations pour conserver et établir des corridors pour leséléphants dans les 300.000 km2 de l’Aire de Conser-vation transfrontalière Kavango – Zambezi (KAZATFCA) qui chevauche les frontières de l’Angola, duBotswana, de la Namibie, de la Zambie et du Zimba-bwe. Leo Niskanen, le Responsable de programme duGSEAf y a assisté, ainsi que d’autres membres duGroupe dont Tom Milliken (TRAFFIC Afrique de l’Estet Australe) et Loki Osborn (Elephant Pepper Devel-opment Trust).
L’atelier consistait en une suite de présentationstechniques et de sessions en groupes de travail quiabordaient les principaux obstacles à l’extension del’aire de distribution dans la KAZA TFCA, et aussiles possibilités de la faire. A présent, le corridortransfrontalier le plus prometteur va du nord du Bot-swana au sud-est de l’Angola, via la bande de Caprivi,en Namibie. Des recherches récentes laissent à penserque les éléphants empruntent déjà ce corridor, mêmesi les activités humaines sont parfois intenses surcertains tronçons. La présence de mines et le manqued’infrastructures, de ressources et de capacités pourconserver et gérer les éléphants en Angola sontcertains des problèmes à régler si l’on veut que cecorridor soit viable à long terme.
Trois autres corridors possibles ont aussi étéidentifiés lors de cet atelier. Tous relient la popula-tion d’éléphants de Chobe, au nord du Botswana, auParc National de Kafue, en Zambie. Il faudracependant réaliser des études approfondies pourdéterminer si l’établissement de ces corridors estfaisable, spécialement parce qu’ils sont de nature àamener des éléphants et d’autres animaux près

6 Pachyderm No. 40 January–June 2006
Dublin
consultative workshop to discuss the conservation ofthe Nazinga–Kabore Tambi–Red Volta elephant cor-ridor, which links important elephant populations inBurkina Faso and Ghana, took place in the town ofPô in south-eastern Burkina Faso in late December2005. This workshop was organized by the AfESG’sWest Africa Programme Office and funded by theInstitute of Environmental Sciences in Leiden, theNetherlands, and Centre for Environment and Deve-lopment in Cameroon, under their joint initiative Re-gional Network for the synergy between the UnitedNations Convention on Biological Diversity and theUnited Nations Convention to Combat Desertificationin West and Central Africa. The main output of thisworkshop, which brought together more than 40 par-ticipants from government agencies, NGOs, and lo-cal communities, was the establishment of a localmanagement committee for the elephant corridor. Al-though funding constraints did not allow Ghanaianparticipation at this workshop, the participants firmlyresolved to develop closer cross-border cooperationand build stronger linkages with similar efforts cur-rently underway on the Ghanaian side.
Preparations are currently underway for anotherimportant transfrontier planning exercise to help de-sign an action plan for the Ziama Forest Reserve-North-East National Forest elephant corridor on theborder of Guinea and Liberia. This workshop will befunded by the Keidaren Nature Conservation Fundand Germany’s Kreditanstalt für Wiederaufbau (KfW).The AfESG will compile and synthesize the inputsinto a comprehensive conservation action plan.
Finally, the future viability of an elephant corridorlinking the Sahel area in Burkina Faso with Gourma inMali is currently being investigated as part of a broadertransfrontier conservation programme coordinated bythe IUCN national offices in Burkina Faso and Mali.We are eagerly awaiting the results of an assessment,recently carried out by Dr Richard Barnes, a long-timemember of the AfESG, which is expected to producepreliminary recommendations for the managementactions needed to safeguard the future of this impor-tant transfrontier elephant population.
Human–elephant conflict
The United Nations Development Programme’s Glo-bal Environment Facility has finally given us the go-ahead for a US$ 50,000 Project Development Fundgrant to draft a detailed proposal for designing and test-
d’installations humaines, augmentant ainsi le risquede conflits hommes-faune sauvage. On reconnaîtgénéralement que les communautés touchées devrontaccepter l’extension prévue, sans quoi le projet auraitpeu de chances de réussir. C’est pourquoi il fautsoigneusement évaluer les coûts et bénéfices de laliberté de mouvements de la faune dans les zonesactuellement occupées par des gens, et il faut que lescommunautés qui résident dans ces régions soientimpliquées dans la planification dès le départ.
AFRIQUE DE L’OUEST
Depuis mon dernier rapport de présidente, diversesinitiatives transfrontalières ont connu de grandsprogrès. D’abord, un atelier consultatif pour discuterde la conservation du corridor à éléphants Nazinga –Kabore Tambi – Volta rouge, qui relie d’importantespopulations du Burkina Faso et du Ghana, a eu lieudans la ville de Pô, dans le sud-est de Burkina Faso,fin décembre 2005. Il était organisé par le Bureau duprogramme du GSEAf en Afrique de l’Ouest etfinancé par l’Institut des Sciences environnementalesde Leiden, aux Pays-Bas, et par le Centre pour l’Envi-ronnement et le Développement au Cameroun, dansle cadre de leur réseau conjoint d’initiative régionalepour la synergie entre la Convention des Nations uniespour la diversité biologique et la Convention desNations unies pour la lutte contre la désertificationen Afrique de l’Ouest et Centrale. Le principal résultatde cet atelier, qui avait réuni plus de 40 participantsde diverses agences gouvernementales, d’ONG et decommunautés locales, fut l’établissement d’un comitélocal de gestion du corridor des éléphants. Bien queles contraintes budgétaires aient empêché lesGhanéens d’assister à cet atelier, les participants ontfermement résolu de développer une collaborationtransfrontalière plus étroite et d’établir des liens plussolides avec des efforts similaires, du côté ghanéen.
Les préparatifs sont en cours pour un autreexercice de planification transfrontalier, afin d’aiderà préparer un plan d’action pour le corridor deséléphants entre la Réserve forestière de Ziama et laForêt Nationale du Nord-est, sur la frontière guinéo-libérienne. Cet atelier sera financé par le KeidarenNature Conservation Fund et par le Kreditanstalt fürWiederaufbau (KfW) allemand. Le GSEAf sechargera de la compilation et de la synthèse des in-puts en un plan d’action complet de la conservation.

Pachyderm No. 40 January–June 2006 7
African Elephant Specialist Group report
ing national human–elephant conflict management sys-tems in Burkina Faso and Tanzania. We are discussingthe modalities of disbursing the funds and we hope tobe in a position to hire a consultant in the next fewmonths to develop the final proposal for a Medium-Sized Project (up to US$ 2 million over five years).
In the meantime, with the funding already securedfrom WWF’s African Elephant Programme, AfESG’Sproject coordinators, Dr Richard Hoare and MrFrédéric Marchand, have begun preliminary investi-gations into developing vertically-integrated HECmanagement actions in Tanzania and Burkina Faso,respectively. The main conflict zones and potentialcollaborating agencies have been identified, and back-ground information on key legislation is being gath-ered. In addition, a handful of HEC managers will beselected from both countries for further training inthe latest mitigation practices, using the new AfESG-certified HEC training course currently being devel-oped in collaboration with AfESG member, Dr LokiOsborne’s Elephant Pepper Development Trust.
Local overpopulation guidelines
The AfESG’s Local Overpopulation Task Force hascontinued working on the ‘best practice’ guidelinesfor managing local overpopulation of elephants. Theseare being developed in response to the urgent demandfrom a number of range states, primarily from south-ern Africa, for technical guidance on the various man-agement options available for addressing localoverpopulation problems. A meeting of the Task Forcewill be convened in the near future to put final toucheson the draft document before it is put on the AfESGwebsite for public review.
Update on the CITES MIKEprogramme
As explained in my last report, over the last severalmonths the MIKE programme has been operating ona bridging fund arrangement with very restricted ac-tivities, pending new funding becoming availablefrom the European Commission. In March 2006 themember states of the African, Caribbean, Pacific re-gion (ACP) finally approved the EC ACP/EDF (Eu-ropean Commission’s European Development Fundfor ACP) funding for MIKE activities in Africa andAsia. The immediate focus of these activities will beon site visits to bring data sets up to date and to pre-
La viabilité d’un corridor pour éléphants reliantla région sahélienne du Burkina Faso à Gourma, auMali, est à l’étude, dans le cadre d’un programmeplus vaste de conservation transfrontalière coordonnépar les bureaux nationaux de l’UICN au Burkina Fasoet au Mali. Nous attendons avec impatience lesrésultats d’une évaluation menée récemment par leDr. Richard Barnes, membre de longue date duGSEAf, qui doit fournir les premières reco-mmandations pour les activités de gestion nécessairesafin de sauvegarder l’avenir de cette importante popu-lation transfrontalière d’éléphants.
Conflits hommes – éléphants
Le Fonds pour l’Environnement mondial du Programmedes Nations unies pour le Développement a finalementdonné le feu vert pour que nous recevions un subsidefinancier de 50.000 US$ afin de préparer une proposi-tion détaillée pour concevoir et tester des systèmesnationaux de gestion des conflits hommes – éléphantsau Burkina Faso et en Tanzanie. Nous discutonsactuellement les modalités pour employer les fonds etnous espérons être en mesure d’engager un consultantau cours des prochains mois, pour développer la propo-sition finale pour un projet de taille moyenne (jusqu’à2 millions de dollars sur cinq ans).
Pendant ce temps, grâce aux fonds déjà reçus duProgramme pour l’éléphant africain du WWF, lescoordinateurs de projet, le Dr. Richard Hoare et M.Frédéric Marchand, du GSEAf, ont commencé àétudier les possibilités de développer des activités degestion des CHE verticalement intégrées, le premieren Tanzanie et le second au Burkina Faso. Lesprincipales zones de conflits et les agences quipourraient collaborer ont été identifiées et on est entrain de rassembler toutes les informations nécessairessur les points clés de la législation. De plus, unepoignée de gestionnaires des CHE seront sélectionnésdans les deux pays, pour recevoir une formation auxplus récentes pratiques en matière de mitigation, enemployant le nouveau cours de formation en CHE,certifié GSEAf, qui est actuellement mis au point encollaboration avec le Elephant Pepper DevelopmentTrust du Dr. Loki Osborne, membre du GSEAf.

8 Pachyderm No. 40 January–June 2006
Dublin
pare a report on baseline status at the various sites.In the meantime, a decision has been taken by the
CITES Secretariat to move the MIKE Central Coor-dinating Unit (CCU) from its current location nextdoor to the AfESG Secretariat offices, to the UnitedNations Environment Programme headquarters inNairobi, by 1 August 2006. MIKE CCU staff posi-tions, which have been given UNEP project post sta-tus, will have to be re-advertised, after which standardUNEP recruitment processes will be followed. Thecurrent MIKE Director, Nigel Hunter, has announcedhis decision to step down at the end of July, after help-ing to finalize the transition arrangements. Thischange obviously also has a bearing on the Sub-re-gional Support Officers (SSOs) who have until nowbeen operating on IUCN staff contracts. However,the details pertaining to the future institutional ar-rangements for the SSOs are yet to be finalized bythe CITES Secretariat.
The long-awaited recommended MIKE standardsand guidelines for conducting elephant populationsurveys in forest situations have now been finalizedand will be posted soon on the MIKE website http://www.cites.org/eng/prog/MIKE/index.shtml.
AfESG website
Judging by feedback received from users, as well asour own downloading records, the AfESG websitehttp://iucn.org/afesg continues to serve as a valuabletool for the over 2,000 visitors who access this siteeach day. The most recent addition to the website is areport on the human-elephant conflict situation inAngola. Many thanks to Joe Heffernan of Fauna andFlora International for giving permission to make thisinteresting report available.
The future of Pachyderm
Even though Pachyderm is the journal of three IUCNSSC Specialist Groups, for the past decade raisingfunds to produce and disseminate this journal, as wellas the day-to-day editing and distribution, have beenhandled almost exclusively by the Secretariat of theAfESG. In light of current realities, this situation isclearly no longer viable, and discussions are currentlyunderway with the Chairs of the African and AsianElephant and Rhino Specialist Groups on arrange-ments for greater sharing of the burden. Options un-der consideration include a possible merger with the
Directives en cas de surpopulationlocale
La Force spéciale du Groupe chargée des cas desurpopulation locale poursuit son travail sur les Direc-tives des « meilleurs usages » pour gérer les sur-populations locales d’éléphants. Elles répondent à lademande urgente venant d’un certain nombre d’étatsde l’aire de répartition, principalement d’Afriqueaustrale, pour une guidance technique concernant lesdiverses options de gestion possibles pour traiter lesproblèmes de surpopulation locale. La Force spécialeorganisera très prochainement une réunion pour mettrela touche finale au document avant de le mettre sur lesite Internet du GSEAf pour une révision publique.
Mise à jour du programme MIKE/CITES
Comme je l’expliquais dans mon dernier rapport, leprogramme MIKE fonctionne ces derniers mois surun fond-relais, avec des activités très limitées, enattendant le nouveau financement de la Commissioneuropéenne. En mars 2006, les Etats membres de laRégion ACP (Afrique – Caraïbes – Pacifique) ontfinalement approuvé le financement CE ACP/FED(Fonds européen de développement) pour les activitésde MIKE en Afrique et en Asie. Le point central deces activités consistera en visites de terrain pour mettreà jour les sets de données et préparer un rapport sur lestatut de base des différents sites.
Entre-temps, le Secrétariat CITES a décidé dedéménager l’Unité centrale de coordination (UCC) deMIKE de son emplacement actuel près des bureaux duSecrétariat du GSEAf vers le QG du Programme desNations unies pour l’Environnement (PNUE), à Nai-robi. Le 1er août 2006, les postes du personnel de l’UCCde MIKE, qui ont reçu un statut d’après-projet UE,feront l’objet de nouvelles offres d’emploi suite à quoiles processus standards de recrutement seront suivis.Le directeur actuel de MIKE, Nigel Hunter, a annoncésa décision de se retirer à la fin de juillet après avoiraidé à finaliser les accords de transition. Ce changementa évidemment aussi un impact sur les responsables dusupport sous-régionaux qui travaillaient jusqu’à présentavec des contrats de personnel de l’UICN. Les détailsconcernant leurs futurs accords institutionnels doiventencore être finalisés.
Les standards et les directives de MIKE pourmener des études de population d’éléphants en forêt,

Pachyderm No. 40 January–June 2006 9
African Elephant Specialist Group report
Asian Elephant Specialist Group’s journal Gajah.However, irrespective of the outcome of these dis-cussions, we will make every effort to ensure that thedissemination of information on the conservation andmanagement of African elephants can continuethrough one mechanism or another.
The overall outlook for the future ofthe AfESG Secretariat
Since the beginning of the year, the AfESG Secre-tariat has been on ‘overdrive’ searching for funds tocover its core operating costs. However, despite greatefforts directed at every conceivable source of fund-ing, the kind of long-term resources required to putus on an even keel has simply not materialized. As afinal attempt to drum up support, an “emergency ap-peal” was sent to our main donors and partner agen-cies in March 2006. This was also posted on theAfESG website.
In April 2006, some of our members approachedMr. Valli Moosa, President of IUCN, for assistanceand guidance on our funding predicament. Mr. Moosakindly agreed to contact the Department of Environ-mental Affairs and Tourism of South Africa and torequest the South African government for support. Iam most grateful to Mr. Moosa for his help and toour members for making such a high-level approach.
Although the financial prospects for the immedi-ate future look brighter than they did a few monthsago, the continuing uncertainty over the long-termfunding situation has taken a great toll on the staff ofthe AfESG Secretariat. While the recent contributionfrom DEFRA will help to keep the AfESG Secretariatafloat a little bit longer, maintaining the status quoseems increasingly untenable, and some sort of scal-ing back of activities and staffing in the near futuremay be inevitable.
que l’on attendait depuis longtemps, sont enfinfinalisés et ils seront très bientôt mis sur le site deMIKE : http://www.cites.org/eng/prog/MIKE/index.shtml
Site du GSEAf
A en juger par le feedback des utilisateurs, ainsi quepar l’enregistrement du nombre de déchargements,le site du GSEAf http://iucn.org/afesg est toujours unoutil très utile pour plus de 2000 personnes le visitentchaque jour. La plus récente addition qui y fut faiteest un rapport sur la situation des conflits hommes –éléphants en Angola. Merci beaucoup à Joe Heffernan,de Fauna and Flora International, qui nous a donnél’autorisation de disposer de cet intéressant rapport.
L’avenir de Pachyderm
Même si Pachyderm est le journal de trois Groupesde spécialistes de la CSE/UICN, au cours des 10dernières années, la récolte des fonds destinés à sapublication et à sa diffusion, ainsi que l’édition et ladistribution au jour le jour, ont été presqueexclusivement assurées par le Secrétariat du GSEAf.Face aux réalités du quotidien, cette situation n’estassurément plus viable, et des discussions sont encours avec les Présidents des Groupes spécialistes deséléphants et des rhinos africains et asiatiques pours’accorder sur un meilleur partage des tâches. D’autresoptions sont envisagées, comme la possible fusionavec le journal du Groupe spécialiste des éléphantsd’Asie, Gajah. Quelque soit le résultat de ces discus-sions, nous ferons tous les efforts possibles pourgarantir que les informations sur la conservation et lagestion des éléphants africains soient diffusées parquelque media que ce soit.
Perspectives générales pour l’avenirdu Secrétariat du GSEAf
Depuis le début de l’année, le Secrétariat du GSEAfmet les bouchées doubles car il doit chercher des fondspour financer ses frais de fonctionnementélémentaires. Pourtant, malgré les grands efforts endirection de toutes les sources de financementimaginables, le genre de ressources à long termenécessaires pour stabiliser notre fonctionnement nes’est tout simplement pas matérialisé. Dernier appelpour nous aider, un message urgent a été envoyé à

10 Pachyderm No. 40 January–June 2006
Dublin
nos principaux donateurs et aux agences partenairesen mars 2006. Il fut aussi lancé sur notre site Internet.
En avril 2006, certains de nos membres ontcontacté M. Valli Moosa, Président de l’UICN, pourqu’il nous aide et nous guide dans cette situationfinancière difficile. Il a eu l’amabilité de contacter ledépartement sud-africain des Affairesenvironnementales et du Tourisme pour demanderl’aide du Gouvernement sud-africain. Je lui suis trèsreconnaissante de son aide et je remercie aussi nosmembres pour leurs démarches de haut niveau.
Bien que les perspectives financières semblentplus favorables dans l’avenir immédiat qu’il y aquelques mois, l’incertitude persistante quant aufinancement à long terme pèse lourdement sur lemoral du personnel du Secrétariat. Si la récente con-tribution de DEFRA aidera à le maintenir à flot unpeu plus longtemps, le simple maintien du statu quosemble de plus en plus impossible, et une certaineréduction des activités et du personnel sembleinévitable dans un avenir proche.

Pachyderm No. 40 January–June 2006 11
African Rhino Specialist Group report
African Rhino Specialist Group reportRapport du Groupe Spécialiste des Rhinos d’Afrique
Martin Brooks, Président
59 Silverdale Crescent, Chase Valley, Pietermaritzburg 3201, South Africaemail: [email protected]
Les récentes activités du GSRAf se sont concentréesparticulièrement sur les deux taxons les plus « en dan-ger critique d’extinction » de rhinos africains — lerhino blanc du Nord Ceratotherium simum cottoni etle rhino noir de l’Ouest Diceros bicornis longipes —qui sont tous deux à la limite de l’extinction. Parmid’autres initiatives importantes, nous citerons la nomi-nation des nouveaux membres et la planification dela 8ème réunion du GSRAf, qui se tiendra au Swazilandà la mi-juin 2006. Cette réunion sera l’occasiond’ateliers stratégiques importants sur les nouvellesexigences de la CITES en matière de rapports, sur leslignes directrices pour la réintroduction de rhinos etsur la proposition du Groupe est-africain de gestioncommunautaire des rhinos.
Le rhino blanc du Nord enRépublique Démocratique du Congo
Dans le Pachyderm 39, je rapportais que legouvernement de la République Démocratique duCongo (RDC) avait délocalisé la gestion du ParcNational de la Garamba pour les cinq prochainesannées et l’avait confiée à la African Parks Founda-tion, l’activité prioritaire étant le développement etla mise en œuvre d’un plan de restauration pour cettepopulation de rhinos blancs du Nord qui est la dernièrequi subsiste à l’état sauvage. Point de départ logique,la Fondation a identifié le besoin de préciser le statutde la population et elle a demandé au GSRAf dedéfinir les études aériennes et de terrain appropriéespour déterminer la taille et la distribution de la popu-lation et de réunir le personnel approprié pour fairece travail. Le Responsable scientifique du GSRAf, leDr. Richard Emslie, entreprit cet exercice majeur deplanification et de coordination avec l’aide d’un cer-tain nombre d’experts des rhinos et de la recherche etil fut chargé de compiler le rapport final.
The AfRSG’s recent activities have been particularlyfocused on the two most Critically Endangered Afri-can rhino taxa—the northern white rhino, Ceratothe-rium simum cottoni, and the West African black rhino,Diceros bicornis longipes, both of which are on thevery brink of extinction. Other important initiativeshave included appointing the new membership andplanning the eighth AfRSG meeting, scheduled forSwaziland in mid-2006. This meeting will includeimportant strategic workshops on CITES reportingrequirements, rhino reintroduction guidelines and theproposed East African Community Rhino Manage-ment Group.
Northern white rhino in theDemocratic Republic of Congo
In Pachyderm 39 I reported that the government ofthe Democratic Republic of Congo (DRC) hadoutsourced the management of Garamba NationalPark for the next five years to African Parks Founda-tion, with the priority activity being the developmentand implementation of a recovery plan for this lastremaining wild population of northern white rhino.As a logical point of departure, African Parks Foun-dation identified the need to establish the status ofthe population, and it commissioned AfRSG to de-sign appropriate aerial and ground surveys to deter-mine population size and distribution, and to secureappropriate personnel to undertake the work. AfRSG’sScientific Officer, Dr Richard Emslie, undertook thismajor planning and coordination exercise with assist-ance from a number of rhino and survey experts, andwas tasked with compiling the final report.
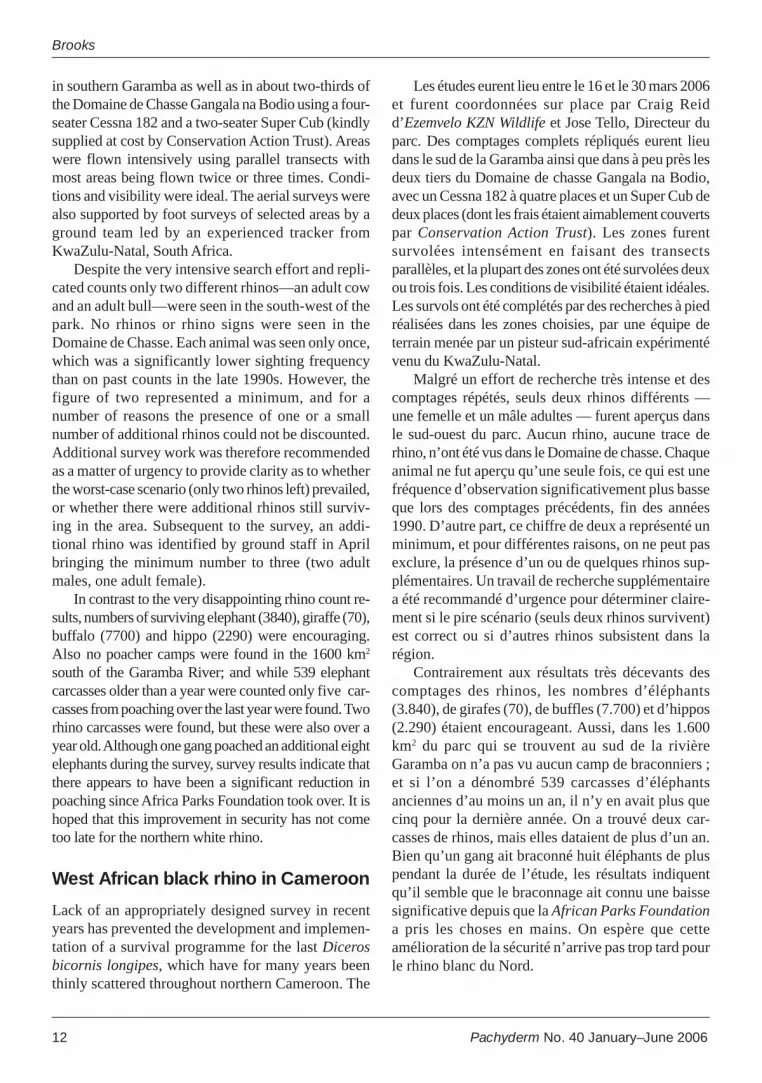
The surveys were undertaken between 16 and 30March 2006 and were coordinated on site by EzemveloKZN Wildlife’s Craig Reid and Park Director JoseTello. Replicated aerial total counts were undertaken
12 Pachyderm No. 40 January–June 2006
Brooks
Les études eurent lieu entre le 16 et le 30 mars 2006et furent coordonnées sur place par Craig Reidd’Ezemvelo KZN Wildlife et Jose Tello, Directeur duparc. Des comptages complets répliqués eurent lieudans le sud de la Garamba ainsi que dans à peu près lesdeux tiers du Domaine de chasse Gangala na Bodio,avec un Cessna 182 à quatre places et un Super Cub dedeux places (dont les frais étaient aimablement couvertspar Conservation Action Trust). Les zones furentsurvolées intensément en faisant des transectsparallèles, et la plupart des zones ont été survolées deuxou trois fois. Les conditions de visibilité étaient idéales.Les survols ont été complétés par des recherches à piedréalisées dans les zones choisies, par une équipe deterrain menée par un pisteur sud-africain expérimentévenu du KwaZulu-Natal.
Malgré un effort de recherche très intense et descomptages répétés, seuls deux rhinos différents —une femelle et un mâle adultes — furent aperçus dansle sud-ouest du parc. Aucun rhino, aucune trace derhino, n’ont été vus dans le Domaine de chasse. Chaqueanimal ne fut aperçu qu’une seule fois, ce qui est unefréquence d’observation significativement plus basseque lors des comptages précédents, fin des années1990. D’autre part, ce chiffre de deux a représenté unminimum, et pour différentes raisons, on ne peut pasexclure, la présence d’un ou de quelques rhinos sup-plémentaires. Un travail de recherche supplémentairea été recommandé d’urgence pour déterminer claire-ment si le pire scénario (seuls deux rhinos survivent)est correct ou si d’autres rhinos subsistent dans larégion.
Contrairement aux résultats très décevants descomptages des rhinos, les nombres d’éléphants(3.840), de girafes (70), de buffles (7.700) et d’hippos(2.290) étaient encourageant. Aussi, dans les 1.600km2 du parc qui se trouvent au sud de la rivièreGaramba on n’a pas vu aucun camp de braconniers ;et si l’on a dénombré 539 carcasses d’éléphantsanciennes d’au moins un an, il n’y en avait plus quecinq pour la dernière année. On a trouvé deux car-casses de rhinos, mais elles dataient de plus d’un an.Bien qu’un gang ait braconné huit éléphants de pluspendant la durée de l’étude, les résultats indiquentqu’il semble que le braconnage ait connu une baissesignificative depuis que la African Parks Foundationa pris les choses en mains. On espère que cetteamélioration de la sécurité n’arrive pas trop tard pourle rhino blanc du Nord.
in southern Garamba as well as in about two-thirds ofthe Domaine de Chasse Gangala na Bodio using a four-seater Cessna 182 and a two-seater Super Cub (kindlysupplied at cost by Conservation Action Trust). Areaswere flown intensively using parallel transects withmost areas being flown twice or three times. Condi-tions and visibility were ideal. The aerial surveys werealso supported by foot surveys of selected areas by aground team led by an experienced tracker fromKwaZulu-Natal, South Africa.
Despite the very intensive search effort and repli-cated counts only two different rhinos—an adult cowand an adult bull—were seen in the south-west of thepark. No rhinos or rhino signs were seen in theDomaine de Chasse. Each animal was seen only once,which was a significantly lower sighting frequencythan on past counts in the late 1990s. However, thefigure of two represented a minimum, and for anumber of reasons the presence of one or a smallnumber of additional rhinos could not be discounted.Additional survey work was therefore recommendedas a matter of urgency to provide clarity as to whetherthe worst-case scenario (only two rhinos left) prevailed,or whether there were additional rhinos still surviv-ing in the area. Subsequent to the survey, an addi-tional rhino was identified by ground staff in Aprilbringing the minimum number to three (two adultmales, one adult female).
In contrast to the very disappointing rhino count re-sults, numbers of surviving elephant (3840), giraffe (70),buffalo (7700) and hippo (2290) were encouraging.Also no poacher camps were found in the 1600 km2
south of the Garamba River; and while 539 elephantcarcasses older than a year were counted only five car-casses from poaching over the last year were found. Tworhino carcasses were found, but these were also over ayear old. Although one gang poached an additional eightelephants during the survey, survey results indicate thatthere appears to have been a significant reduction inpoaching since Africa Parks Foundation took over. It ishoped that this improvement in security has not cometoo late for the northern white rhino.
West African black rhino in Cameroon
Lack of an appropriately designed survey in recentyears has prevented the development and implemen-tation of a survival programme for the last Dicerosbicornis longipes, which have for many years beenthinly scattered throughout northern Cameroon. The

Pachyderm No. 40 January–June 2006 13
African Rhino Specialist Group report
Le rhino noir d’Afrique de l’Ouest auCameroun
Le manque de recherche appropriée au cours desdernières années a empêché le développement et lamise en oeuvre d’un programme de survie pour lesderniers Diceros bicornis longipes, qui sont depuisde nombreuses années disséminés dans le nord duCameroun. Le rôle du GSRAf consistait en grandepartie à encourager la MINEF (l’autorité de la Con-servation au Cameroun), le Comité français del’UICN et diverses initiatives, comme l’AssociationSymbiose, Kilifori et les partisans de l’approche «Black Ghosts » à collaborer et à entreprendre une re-cherche conjointe. Une approche de coopérationcomplète n’a pas abouti, mais le GSRAf a pu fournirun conseil technique pour une étude entreprise parles Dr Isabelle et Jean-François Lagrot qui ontbénéficié de l’expertise de plusieurs de nos membres.Etant donné que la végétation dense et les hautesherbes rendent les observations difficiles dans le norddu Cameroun, l’étude, avec l’aide d’un pisteurspécialisé, Jackson Kamwi, du Zimbabwe, a insistésur l’identification des traces. Au moment de rédigerces lignes, l’étude est encore en cours et les résultatsfinaux viendront plus tard ; mais jusqu’ici, ce n’estpas très encourageant.
Le rhino noir en Zambie
Les efforts se poursuivent pour augmenter la popula-tion de rhinos noirs dans le Parc National de LuangwaNord, en Zambie, pour s’assurer que la populationfondatrice est génétiquement viable. Dans le cadred’une initiative de coopération régionale encouragéepar la SADC (Southern African Development Com-munity), le Programme régional pour la conservationdes rhinos, il semble que les autorités de la conserva-tion en Afrique du Sud vont fournir au moins cinq rhi-nos. D’autres animaux ont été demandés au Zimbabweet en Namibie, par un accord d’échanges, pour garantirqu’il s’agit bien de rhinos de la sous-espèce correcte.
Membres du GSRAf
La nomination des membres pour la période 2005 –2008 est presque complète. Le GSRAf comprend pourle moment un secrétariat avec un Président, unResponsable scientifique et 33 autres membres, ycompris des délégués des états suivants de l’aire de
role of AfRSG has largely been to encourage MINEF(Cameroon’s conservation authority), the FrenchIUCN Committee, and various initiatives such asAssociation Symbiose, Kilifori and proponents of the‘Black Ghosts’ approach, to collaborate and under-take a joint survey. While a fully cooperative approachdid not result, AfRSG has been able to provide tech-nical advice to a survey undertaken by Drs Isabelleand Jean-Francois Lagrot, drawing on the expertiseof a number of our members. Because the dense veg-etation and tall grass make sightings difficult in north-ern Cameroon, the survey, with the help of a specialisttracker, Jackson Kamwi from Zimbabwe, emphasizedspoor identification. At the time of writing, the sur-vey is still in progress and so the final results are notavailable; however, indications are not encouraging.
The black rhino in Zambia
Efforts are continuing to augment the black rhinopopulation in North Luangwa National Park, Zam-bia, to ensure that the founder population is geneti-cally viable. Under a regional cooperation initiativebeing promoted by the SADC (Southern African De-velopment Community) Regional Programme forRhino Conservation, it appears that conservation au-thorities within South Africa will provide at least fiverhinos. Additional animals are being sought from Zim-babwe and Namibia through a swap agreement toensure rhinos of the correct subspecies are used.
AfRSG membership
The appointment of members for the 2005–2008 pe-riod is almost complete. The AfRSG currently com-prises a secretariat of a Chair and Scientific Officerand 33 other members, including representatives fromthe following rhino range states: Botswana, Kenya,Malawi, Namibia, South Africa, Swaziland, Tanza-nia, Zambia and Zimbabwe. Attempts to secure rep-resentation by Cameroon and the DRC have, so far,proved unsuccessful. This membership provides aneffective blend of scientific expertise and field prac-titioners so necessary for effective rhino conserva-tion.
AfRSG meeting in Swaziland
Preparations are well advanced for the eighth AfRSGmeeting scheduled for 27 June–2 July 2006 in

14 Pachyderm No. 40 January–June 2006
Brooks
répartition des rhinos : Afrique du Sud, Botswana,Kenya, Malawi, Namibie, Swaziland, Tanzanie,Zambie et Zimbabwe. Les tentatives pour obtenir unereprésentation du Cameroun et de la RDC sontjusqu’ici restées infructueuses. Tous ces membresapportent un brassage efficace d’expertise scientifiqueet de praticiens de terrains, si nécessaire à la bonneconservation des rhinos.
Réunion du GSRAf au Swaziland
Les préparatifs de la 8ème réunion du GSRAf, prévuedu 27 juin au 2 juillet dans la Mlilwane Game Re-serve, au Swaziland, sont en bonne voie. Nous avonsdéjà le programme complet qui comptera plus de 50présentations sur le statut des rhinos, les programmesde support, les stratégies, les populations focales, lestechniques et la CITES, et cinq ateliers sont aussiprévus. Nous envisageons de poursuivre nos effortsen vue de former un Groupe de gestion des rhinospour la communauté d’Afrique de l’Est (Kenya,Tanzanie, Ouganda), de préparer des directives pourles réintroductions de rhinos africains, de répondreaux décisions prises à la CoP 13 et au meetingsubséquent du Comité permanent de la CITES au sujetdes rhinos, pour nous assurer que le GSRAf et TRAF-FIC apportent une réponse appropriée, de mettre aupoint une stratégie de financement pour le Secrétariatdu Groupe et pour les réunions bisannuelles, etd’explorer plus avant les modèles de conservationcommunautaire des rhinos. Nous devons aussiaccueillir une réunion du Rhino Recovery Group dela SADC. Nous attendons environ 45 membres etobservateurs ; cela dépendra des résultats de nosrecherches pour pouvoir financer la présence d’uncertain nombre de participants clés.
Remerciements
Le GSRAf remercie chaleureusement l’InternationalRhino Foundation, le WWF-Afrique du Sud, le Fishand Wildlife Service américain et Save the Rhino In-ternational pour leur support significatif etappréciable du Secrétariat et de ses activités, sanslequel il n’aurait pas été possible de fonctionnerefficacement.
Mlilwane Game Reserve, Swaziland. A full programof more than 50 presentations on rhino status, sup-port programs, strategies, focal populations, tech-niques and CITES is in place, and in addition fiveworkshops are planned. We plan to further our ef-forts to form a Rhino Management Group for the EastAfrican Community (Kenya, Tanzania and Uganda),draft reintroduction guidelines for African rhinos,address the rhino decisions taken at CITES CoP 13and the subsequent 53rd meeting of the StandingCommittee to ensure appropriate response by AfRSGand TRAFFIC, develop a funding strategy for theAfRSG Secretariat and biennial meetings, and explorecommunity-based rhino conservation models further.We may also host a SADC Rhino Recovery Groupmeeting. Approximately 45 members and observersare expected, depending on our sucess in securingfunding to support the attendance of a number of keyparticipants.
Appreciation
The AfRSG is extremely grateful to the InternationalRhino Foundation, WWF-South Africa, US Fish andWildlife Service, and Save the Rhino Internationalfor their significant and very valuable support of theSecretariat and its activities, without which it wouldnot have been possible to operate effectively.

Pachyderm No. 40 January–June 2006 15
Asian Rhino Specialist Group report
In consultation with key rhino conservationists andscientists, especially from the South Asian region,Tirtha M. Maskey, PhD, was unanimously selectedas the most appropriate choice for the still-vacant po-sition of the South Asia Co-chair of AsRSG. As of2006, Dr Maskey retired as Director General, Depart-ment of National Parks and Wildlife Conservation,Nepal, and he gracefully accepted the invitation ofthe SSC Chair to lead the South Asia section of theAsian Rhino Specialist Group.
Now that the South Asia Co-chair position is filled,the group will be reconstituted and the candidatemembers for the new AsRSG quadrennium will soonbe contacted. Unfortunately, planned meetings to fi-nalize the candidate lists for India and Nepal had tobe postponed because of the recent political unrest inNepal. Now that peace has returned the process ofidentifying candidate members will resume soon.
The office of the South-East Asia Co-chair is sup-ported by the International Rhino Foundation (IRF) andwill be hosted by the Indonesian Rhino Foundations(YMR/YSRS). The South Asia Co-chair is supportedby WWF’s Asian Rhino and Elephant Action Strategy(AREAS) and hosted by WWF-Nepal. Both Co-chairsare in the process of recruiting office assistance.
Two young female Sumatran rhinosat the Sumatran Rhino Sanctuary inWay Kambas National Park,Sumatra
The two young female Sumatran rhinos that were res-cued from unviable, even threatening situations andmoved to the Sumatran Rhino Sanctuary (SRS) inWay Kambas National Park, Sumatra, Indonesia, atthe end of last year have settled in well.
Suite à la consultation de conservationnistes et descientifiques clés des rhinos, spécialement pour larégion de l’Asie du Sud, Tirtha M. Maskey, PhD, était,de l’avis de tous, le choix le plus approprié pour leposte encore vacant de co-président du GSRAs en Asiedu Sud. En 2006, le Dr. Maskey a pris sa retraite duposte de Directeur général du département des ParcsNationaux et de la Conservation de la Faune sauvage,au Népal, et il a aimablement accepté l’invitation duprésident de la CSS de diriger la section d’Asie du Suddu Groupe Spécialiste des Rhinos d’Asie.
Maintenant que ce poste de co-président est pourvu,le groupe va être reconstitué, et les candidats membresdu nouveau GSRAs pour les quatre prochaines annéesseront bientôt contactés. Malheureusement, lesréunions prévues pour finaliser la liste des candidatspour l’Inde et le Népal ont dû être postposées en raisonde l’instabilité civile qui a touché le Népal dernière-ment. La paix étant revenue, le processus d’identi-fication des candidats va bientôt reprendre.
Le bureau du co-président en Asie du Sud-Est estsoutenu par l’International Rhino Foundation (IRF)et il sera accueilli par les Indonesian Rhino Founda-tions (YMR/YSRS). Le co-président pour l’Asie duSud est soutenu par la Asian Rhino and Elephant Ac-tion Strategy (AREAS) du WWF et accueilli par leWWF-Népal. Les deux co-présidents sont occupés àrecruter les assistants pour leur bureau.
Deux jeunes rhinos de Sumatrafemelles au Sanctuaire des Rhinosde Sumatra dans le Parc Nationalde Way Kambas, à Sumatra
Les deux jeunes rhinos de Sumatra femelles qui ontété sauvées de conditions invivables et dangereuses
Asian Rhino Specialist Group reportRapport du Groupe Spécialiste des Rhinos d’Asie
Nico van Strien,1 Co-chair for South-East Asia, and Tirtha Maskey,2 Co-chair for SouthAsia
1 Kondominium Taman Anggrek 3-23B, Jln. Parman. Slipi, Jakarta 11470, Indonesia;email: [email protected] WWF Nepal Program, PO Box 7660, Baluwatar, Kathmandu, Nepal; email: [email protected] [email protected]

16 Pachyderm No. 40 January–June 2006
van Strien and Maskey
Rosa, the young female from Bukit BarisanSelatan National Park, is still being treated for theparasites, intestinal worms and liver fluke that sheapparently contracted from cattle when she venturedinto the fields and villages outside the park. Until allinfection has been cleared she will remain in quaran-tine. The heavy parasite loads that were found aftershe was moved to SRS indicated that the move wastimely and probably life saving.
Ratu, the female rhino that was wandering aroundoutside Way Kambas National Park in September2005, has settled in completely and has recently beenreleased into one of the spacious 10-hectare SRSyards.
Information from villagers provided to the RhinoPatrol Units in Way Kambas indicate that it was therepeated confronting of large groups of people enter-ing the park for fishing that caused Ratu to panic andthat drove her from the safety of the park into un-known territory. Frequent encounters with people,even if they do not intend to harm the rhino, is a seri-ous danger for the animals and may also disturb re-production. This may also be a significant factor inthe poor performance of the Javan rhino populationin Ujung Kulon.
The reproductive cycles of both females are nowbeing regularly monitored, with ultrasonography ex-aminations and hormonal analysis, and it has beenestablished that both are cycling and could breed. Thehealth of the old resident male, Torgamba, in SRS israther unstable, and he has not shown any interest ineither of the females for quite some time. The SRSveterinarian staff is trying to restore his vitality, butso far with limited success. Fortunately help is on itsway.
Sumatran Rhino Global Managementand Propagation Board
The Sumatran Rhino Global Management and Propa-gation Board (GMPB) was established in September2005 to ‘decide on the management of the GlobalSumatran Rhino Captive Population as a truly globalpopulation to maximize the options for reproductionand to improve its vitality and viability’. The boardcomprises representatives of range state authorities,institutions holding Sumatran rhinos, major sponsors,AsRSG, and independent rhino experts.
à la fin de l’année dernière et ont été placées auSanctuaire des rhinos de Sumatra (SRS) se sont bienacclimatées dans le Parc National de Way Kambas, àSumatra, en Indonésie.
Rosa, la jeune femelle du Parc National de BukitBarisan Selatan, est encore en traitement contre lesparasites, vers intestinaux et douves hépatiques qu’ellea apparemment attrapés auprès du bétail lorsqu’elles’est aventurée dans les champs et les villages en de-hors du parc national. Tant qu’elle n’aura pas étéguérie de ses infections, elle restera en quarantaine.L’infestation massive que l’on avait découverte chezelle quand elle a été placée au SRS prouve bien queson placement s’est fait juste à temps et lui aprobablement sauvé la vie.
Ratu, la femelle qui errait autour du Parc Nationalde Way Kambas en septembre 2005, s’est tout à faitadaptée et elle a été relâchée récemment dans un desspacieux parcs de 10 hectares du SRS.
Les informations que les villageois ont fournies àl’Unité de patrouille des rhinos indiquent que ce quia causé la panique chez Ratu, ce sont les confronta-tions répétées avec les grands groupes de gens quipénètrent dans le parc pour pêcher et c’est ce qui l’aéloignée de la sécurité du parc vers un territoireinconnu. Des rencontres fréquentes avec des gens,même s’ils n’ont aucune mauvaise intention, sont unsérieux danger pour les rhinos et peuvent mêmeperturber leur reproduction. C’est peut-être aussi unfacteur significatif expliquant les piètres performancesde la population de rhinocéros de Java à Ujung Kulon.
Les cycles de reproduction des deux femelles sontmaintenant contrôlés régulièrement, avec ultrasono-graphie et analyses hormonales, et il fut établi quetoutes deux avaient des cycles et pouvaient sereproduire. La santé du vieux mâle résidant au SRS,Torgamba, est plutôt instable, et il n’a manifesté aucunintérêt pour aucune des femelles depuis un certaintemps. Le personnel vétérinaire du SRS essaie de luiredonner de la vitalité, avec des succès limités jusqu’àprésent. Heureusement, de l’aide arrive.
Conseil de gestion mondiale de lareproduction assistée et de lapropagation des rhinos de Sumatra
Le Conseil de gestion mondiale de la reproductionassistée et de la propagation des rhinos de Sumatra(GMPB) a été créé en septembre 2005 pour « décider

Pachyderm No. 40 January–June 2006 17
Asian Rhino Specialist Group report
The second GMPB meeting was held in Jakartaon 1 March 2006 to discuss a proposal to enhance thebreeding potential by moving some of the rhinos. Atthe request of the Indonesian authorities the GMPBTechnical Committee developed a proposal involv-ing two of the rhinos. It was recommended that theyoung male Andalas, the first offspring of Emy andIpuh in the Cincinnati zoo, now nearing sexual matu-rity, be moved to the SRS to be paired with the twoyoung females, Ratu and Rosa.
It was recommended that the older female, Bina,be moved from Indonesia to the USA to be pairedwith Ipuh, the only proven breeder in the captivepopulation. Bina has unsuccessfully mated withTorgamba for several years in SRS and current dis-turbance in her oestrous cycle is sign of decliningfertility. She is assessed to be potentially reproduc-tive, but time for her to reproduce is getting short,and therefore pairing with Ipuh is the option judgedto have the highest possibility of success.
The GMPB meeting endorsed these moves andpreparations for transport have started. It is expectedthat first Andalas will move, in October or Novem-ber this year, then Bina several weeks later. This is awonderful development and will benefit both the in-situ programme in Indonesia and the ex-situ pro-gramme in the US, in both the short and the long term.It is hoped that all parties involved will be able toexpedite the movements of these animals as much aspossible.
Update of the Indonesian RhinoConservation Strategy
On 28 and 29 February 2006 a workshop was con-ducted in Jakarta to review and update the Indone-sian Rhino Conservation Strategy of 1993 as well asthe IUCN Asian Rhino Specialist Group’s AsianRhino Conservation Strategy (1997). The workshopwas supported technically and financially by AsRSG,IRF and WWF, with additional financial support fromthe USFWS Rhino and Tiger Conservation Fund.
During the workshop the achievements of the ex-isting Rhino Conservation Strategies were evaluated,long-term targets were formulated, and immediate andattainable priorities for conservation action were iden-tified. Managers of protected areas holding rhinos,the central government’s Forestry ministry, academicinstitutions, and all major international non-govern-mental organizations active in rhino conservation par-
de la gestion des populations de rhinos de Sumatraen captivité partout dans le monde, en les considérantcomme une population vraiment globale, afin demaximiser les options de reproduction et d’améliorersa vitalité et sa viabilité ». Le conseil comprend desreprésentants des autorités des états de l’aire derépartition, des institutions en charge des rhinos deSumatra, des principaux sponsors, du GSRAs, et desexperts indépendants des rhinos.
La deuxième réunion du GMPB s’est tenue àJakarta le 1er mars 2006 pour discuter une proposi-tion de relance du potentiel reproducteur par ledéplacement de certains rhinos. A la demande desautorités indonésiennes, le Comité technique duGMPB a développé une proposition concernant deuxdes rhinos. Il fut recommandé que le jeune mâle adulteAndalas, le premier rejeton d’Emi et d’Ipuh au Zoode Cincinnati, qui a à peu près atteint la maturitésexuelle, soit envoyé au SRS pour s’accoupler avecles deux jeunes femelles Ratu et Rosa.
La femelle plus âgée, Bina, devrait, elle, quitterl’Indonésie pour les USA pour s’accoupler avec Ipuh,le seul reproducteur confirmé de la population encaptivité. Bina s’est accouplée sans succès avecTorgamba pendant plusieurs années au SRS, et lesperturbations constatées maintenant dans son cycleoestral sont des signes du déclin de sa fertilité. Onestime qu’elle pourrait encore se reproduire, mais letemps presse ; c’est pourquoi l’accoupler avec Ipuhsemble l’option qui a le plus de chances de succès.
La réunion du GMPB a approuvé cesdéplacements, et les préparatifs de transports ontcommencé. Normalement, c’est Andalas qui devraitbouger le premier, en octobre ou novembre de cetteannée, suivi par Bina, quelques semaines plus tard.C’est un progrès merveilleux qui va profiter aussi bienau programme in situ en Indonésie qu’au programmeex situ aux USA, à court et à long terme. On espèreque toutes les parties impliquées pourront activer cesdéplacements le plus possible.
Mise à jour de la Stratégieindonésienne de conservation desrhinos
Les 28 et 29 février 2006, un atelier eut lieu à Jakartapour réviser et mettre à jour la Stratégie indonésiennede conservation des rhinos qui date de 1993, ainsique de la Stratégie asiatique de conservation des rhi-

18 Pachyderm No. 40 January–June 2006
van Strien and Maskey
ticipated. A draft report has been produced and is nowbeing refined by a Rhino Task Force, which will alsocatalyse and oversee implementation of the new strat-egy.
Currently Indonesia holds in three main areasabout two-thirds of the world population of Sumatranrhinos, estimated at about 300, and in a single areavirtually all the 50 surviving Javan rhinos. Althoughbetter protection against poaching has resulted in pre-vention of further losses and early recovery in somepopulations, the number of rhinos of both species isfar below the recommended minimum numbers forlong-term survival.
The workshop endorsed the long-term goal of re-storing the populations of each of these species to atleast 1000 animals each in Indonesia. This will re-quire continued strict protection, preservation andsafeguarding of significant areas of suitable habitat,and reintroduction of rhinos in areas where they havebeen exterminated. This is a long-term programmethat will require substantial inputs from all partiesconcerned, but the goals are achievable as is demon-strated by the recovery of the Indian rhino in Indiaand Nepal, and the southern white rhino in SouthAfrica. Both were one time as critically endangeredas the South-East Asian rhinos are now.
Since achieving the goals of viable and securepopulation of both the Sumatran and Javan rhinos willtake a long time, probably as much as a century, theprogramme has tentatively been called ‘Rhino Cen-tury Programme’ and the plan is to have a high-pro-file launching later in the year.
Danum Valley rhino survey, Sabah
In March the summary results of the rhino survey inSabah’s Danum Valley were released. The survey hadbeen conducted several months earlier with 120 peo-ple in 16 teams from the Sabah Wildlife Department,the Sabah Forestry Department, Sabah Parks, the SabahFoundation, WWF-Malaysia, the KinabatanganOrangutan Conservation Project, SOS Rhino, the Uni-versity Malaysia Sabah, and Operation Raleigh.
The survey covered the Greater Danum—the in-terior parts of the huge Yayasan Sabah concession.Rhino signs were found in several locations over alarge area, and the evaluation team concluded thattracks of probably 13 different rhinos were detected.This is a good result, especially as there was heavy
nos du GSRAs/UICN (1997). L’atelier fut soutenufinancièrement par le GSRAs, l’IRF, et le WWF, avecun support financier supplémentaire du Fonds pourla Conservation du Rhino et du Tigre du USFWS.
Pendant cet atelier, on a évalué les progrès desstratégies actuelles de conservation des rhinos, on aformulé les objectifs à long terme et identifié lespriorités immédiates réalisables en matière de con-servation. Les gestionnaires des aires protégées quihébergent des rhinos, le ministère de la Foresterie dugouvernement central, des institutions académiqueset toutes les organisations non gouvernementalesinternationales majeures, actives dans la conserva-tion des rhinos, y ont participé. Un projet de rapporta été rédigé et il est actuellement affiné par une Unitéspéciale Rhino, qui va aussi superviser et catalyser laréalisation de la nouvelle stratégie.
Actuellement, l’Indonésie héberge dans trois airesprincipales près des deux tiers de la populationmondiale de rhinocéros de Sumatra, estimée à 300animaux environ et, au sein d’une seule aire,pratiquement tous les rhinos de Java encore en vie, aunombre de 50. Bien qu’une meilleure protection contrele braconnage ait empêché de nouvelles pertes et permisun début de restauration dans certaines populations, lenombre de rhinos des deux espèces est bien inférieurau minimum recommandé pour une survie à long terme.
L’atelier a adopté comme objectif à long terme unerestauration des populations à 1000 individus au moinspour chaque espèce, en Indonésie. Ceci exigera uneprotection stricte de longue durée, la mise en réserveet la sauvegarde des aires d’habitat propice, et laréintroduction de rhinos dans les zones où ils ont étéexterminés. C’est un programme à long terme quiexigera des inputs substantiels de toutes les partiesconcernées, mais les objectifs sont réalisables commel’ont montré la restauration du rhinocéros unicorne del’Inde, en Inde et au Népal et celle du rhino blanc duSud, en Afrique du Sud. Les deux espèces furent untemps aussi menacées que le sont les rhinos du Sud-Est asiatique aujourd’hui.
Etant donné qu’il faudra très longtemps,probablement un siècle, pour atteindre cet objectif depopulations de rhinos de Java et de Sumatra viables eten sécurité, le programme a été appelé « Programmerhino du siècle » et il est prévu de le lancer de façonspectaculaire plus tard dans l’année.

Pachyderm No. 40 January–June 2006 19
Asian Rhino Specialist Group report
rain during the survey, making it much more difficultto find rhino tracks. Previous surveys indicated at mosthalf of this number.
The tracks found were far apart and no compel-ling evidence of reproduction was found. Therefore,more needs to be done to monitor the rhinos in Danumto verify that it is a viable reproducing populationand not only a number of isolated survivors that haveno chance of meeting and reproducing.
Conservation organizations are currently settingoff a number of patrolling teams to continue the moni-toring and increase the protection of the GreaterDanum rhinos.
In most press coverage it was suggested that the13 rhinos in Danum were the only ones to survive inall of Borneo, ignoring the other known populations,in particular that in Tabin Wildlife Reserve, whichmay have more rhinos than Danum. More precisionin releases to the press is recommended.
Rhino campaigns from Europeanand American zoos
The zoo associations of Europe and North Americahave both launched major campaigns to popularizerhinos and to generate funds for rhino conservation.
The European Association of Zoos and Aquaria(EAZA), together with Save the Rhino International,started their one-year campaign in September 2005.EAZA has 292 members in Europe, who will presentthe Save the Rhinos campaign to their visitors andorganize special rhino events.
The main focus of Save the Rhinos is to raise fundsin support of a minimum of 13 selected rhino conser-vation projects in Africa and Asia, directly support-ing the conservation and survival of rhinos in the wild.The campaign has made a very promising start and itmay well surpass its target of 350,000 euros.
The North American Save the Rhinos campaignwas launched in January 2006 by IRF in partnershipwith the Rhino Advisory Group and Species SurvivalPlans of the American Zoo and Aquarium Associa-tion (AZAA) and Ecko Unlimited.
The campaign will leverage existing pledges toincrease funding from zoos, corporations, foundationsand individuals by raising awareness and increasingcommitments to rhino conservation. Campaign ac-tivities will focus on three critically endangered spe-cies of rhino—black, greater one-horned (Indian) andSumatran.
Etude du rhino dans la Vallée deDanum, à Sabah
En mars, le résumé des résultats de l’étude du rhinodans la vallée de Danum, à Sabah, a été communiqué.Cette étude avait été réalisée plusieurs mois plus tôtpar 120 personnes, composant 16 équipes, venues dudépartement de la Faune sauvage de Sabah, dudépartement des Forêts, des Parcs de Sabah, de laSabah Foundation, du WWF-Malaisie, du Projet deConservation des Orangs-outans de Kinabatangan, deSOS Rhino, de l’University Malaysia Sabah et del’Opération Raleigh.
L’étude a couvert le grand Danum — les partiesintérieures de l’énorme concession de Yayasan Sabah.On a trouvé des signes de rhinos à plusieurs endroitscouvrant une grande superficie, et l’équipe d’évaluationa conclu que les traces correspondaient probablementà 13 rhinos différents. C’est un bon résultat, surtoutlorsque l’on sait qu’il a plu beaucoup pendant l’étude,ce qui a rendu la découverte des traces de rhinosbeaucoup plus difficile. Des études antérieuresindiquaient tout au plus la moitié de ce nombre.
Les traces découvertes étaient éloignées les unesdes autres, et on n’a trouvé aucune preuve d’unequelconque reproduction. C’est pourquoi il faut encoresurveiller davantage les rhinos de Danum pour vérifierqu’il y a une population reproductrice viable et passeulement un certain nombre d’individus isolés quin’ont aucune chance de se rencontrer et de se reproduire.
Les organisations de conservation sont occupéesà organiser un certain nombre d’équipes quipatrouilleront pour poursuivre le monitoring etaugmenter la protection des rhinos du grand Danum.
Dans la plus grande partie de la presse, on a pu lireque les 13 rhinos de Danum étaient les seuls survivantspour toute l’île de Bornéo, ignorant les autrespopulations connues, en particulier celle de la Réservede Faune de Tabin qui pourrait abriter plus de rhinosencore que Danum. On a recommandé de fournir plusde précisions lors des conférences de presse.
Campagnes rhinos dans les zooseuropéens et américains
Les associations des zoos d’Europe et d’Amériquedu Nord ont lancé des campagnes importantes pourrendre les rhinos populaires et pour récolter des fondspour leur conservation.

20 Pachyderm No. 40 January–June 2006
van Strien and Maskey
Both AsRSG and AfRSG have been intensivelyinvolved in setting up the campaigns and in identify-ing the beneficiaries.
Many zoos have contributed significantly to rhinoconservation in the past, and the current campaignsare very much appreciated and will generate muchneeded funds for future rhino conservation pro-grammes. Rhino conservation is very long term, witha century being an appropriate project cycle ratherthan the usual five-year cycle. Therefore we hope andexpect that the support generated through the zoocampaigns will continue with long-term institutionalsupport for rhino conservation in the wild.
Conservation in conflict in Nepal
In the last 30 years, Nepal has set aside over 19% ofits land mass in protected areas ranging from low-land terai in the south to the high Himalayas in thenorth of the country to conserve its endangered wild-life and spectacular landscape and preserve its richculture. Altogether there are 16 protected areas underdifferent management systems. Management styleranges from strict protection to a totally community-based system with revenue sharing, and from conser-vation aimed towards a single species to holisticconservation of the landscape.
Nepal has successfully revived populations ofendangered species like rhino, tiger and wild elephant.For example, the rhino population increased fromfewer than 100 animals in the late 1960s to 612 in2000. Nepal has also initiated a translocation pro-gramme that has led the way in Asia with its proactiveconservation management of rhino populations. Ani-mals that are primarily concentrated in one area aretranslocated to re-establish viable populations—82rhinos have been translocated from Royal ChitwanNational Park to Royal Bardia National Park and theSuklaphanta Wildlife Reserve.
A buffer zone programme has effectively moti-vated and empowered communities by developinglocal institutions, diversifying opportunities to gen-erate income, and reducing dependency on using parkresources for their livelihood. Landscape-level con-servation has dissipated the isolation of the protectedareas, which are considered gene pool repositories.Also, wildlife can now safely roam beyond protectedareas, which will help sustain genetically strongpopulations in days to come.
L’ Association Européenne des Zoos et Aquari-ums (EAZA) et Save the Rhino International, ontlancé leur campagne d’un an en septembre 2005.L’ EAZA compte 292 membres en Europe quiprésenteront la campagne Save the Rhino à leursvisiteurs et organiseront des événements spéciaux.
Le principal objectif de Save the Rhino est de récolterdes fonds pour supporter un minimum de 13 projets deconservation des rhinos en Afrique et en Asie, ensoutenant directement la conservation et la survie desrhinos dans la nature. La campagne a connu un débuttrès prometteur et elle pourrait bien dépasser son objectifqui est de 350.000 euros.
La campagne Save the Rhino en Amérique duNord a été lancée en janvier 2006 par IRF, enpartenariat avec le Rhino Advisory Group, les Plansde Survie des Espèces de l’Association américainedes zoos et aquariums (AZAA) et Ecko Unltd.
La campagne va renforcer les promesses actuellesd’augmenter les fonds provenant des zoos, des cor-porations, des fondations et des particuliers, ensensibilisant davantage et en augmentant les engage-ments envers la conservation des rhinos. Les activitésde la campagne se concentreront sur trois espèces derhinos en danger critique d’extinction – le rhino noir,le rhinocéros unicorne de l’Inde et le rhino deSumatra.
Le GSRAs et le GSRAf se sont beaucoup impliquésdans la préparation de ces campagnes et dansl’identification de leurs bénéficiaires.
De nombreux zoos ont contribué significativementà la conservation des rhinos dans le passé, et lescampagnes actuelles sont très appréciées et rassemble-ront des fonds bien nécessaires pour les futurs pro-grammes de conservation des rhinos. La conservationdes rhinos porte sur le très long terme, une durée d’unsiècle étant plus appropriée pour un cycle de projetque la durée habituelle de cinq ans. C’est pourquoinous espérons que le soutien généré par les campagnesdes zoos va se prolonger par un support institutionnelà long terme de la conservation des rhinos dans lanature.
Conservation en temps de conflit auNépal
Ces trente dernières années, le Népal a mis de côtéplus de 19% de son territoire sous forme d’airesprotégées, allant du terai de basse altitude au sudjusqu’à l’Himalaya au nord du pays, pour conserver

Pachyderm No. 40 January–June 2006 21
Asian Rhino Specialist Group report
But protected area management is facing majornew problems: an upsurge of poaching, rising human–wildlife conflict—and also human–human conflict.The armed insurgency, affecting the entire countryincluding the conservation front, has been going onfor about a decade now. Some of the insurgents’ ac-tions have been very brutal: we lost five staff fromParsa Wildlife Reserve in a landmine blast; 10 peo-ple including staff were killed in another blast inSuklaphanta Wildlife Reserve. These incidents havecreated terror among the staff. Such actions have notonly created physical damage and mental torture butwill also have a long-term effect on managing natu-ral resources. Insurgency has led to illegal and indis-criminate exploitation of rare and valuable medicinalplants. Endangered species like the rhino have be-come more vulnerable to poaching; rhino poachingincreased in 2001 and 2002.
Protected areas require constant surveillancethrough patrolling and stationing staff at different stra-tegic points for effective protection and control.Infrastructural damage has occurred in all protectedareas of the country, much of it to guard posts andoffice buildings.
With the continuance of conflict, the priority ofsecurity personnel deployed in the protected areas haschanged to national security. It has reduced the occu-pancy of the existing guard posts to less than 50%and similarly movement within the protected areashas gone down significantly. Patrolling the interiorof Royal Bardia National Park and Parsa WildlifeReserve has become very risky, and virtually no wild-life monitoring has been done there for a long timebecause these areas are suspected as a transit routefor insurgents. So it is almost impossible to know thecurrent status of wildlife of the area, including that ofthe trans-located rhinos.
Even in such a situation, efforts have been made toincrease surveillance in different protected areas bypatrolling them and by forming community-based anti-poaching groups to gather intelligence. A reward sys-tem has been established to recognize the outstandingconservation work of the staff, army personnel andcommunities. The WWF Nepal Program has strength-ened the communication network in the park by pro-viding Motorola walkie talkie sets and just recentlyWWF–Nepal and Toyota have donated two four-wheel-drive jeeps to Royal Chitwan National Park.
Poaching is under control. We have learned that acommitted and dedicated staff is vital to carry out
sa faune et ses paysages spectaculaires menacés etpour préserver sa riche culture, en harmonie avec sonpeuple. En tout, il y a 16 aires protégées de différentescatégories, avec des régimes de protection différents.L’histoire de la gestion de la conservation montre quel’approche de la gestion s’est faite par adaptation pro-gressive. Par conséquent, le style de gestion des airesprotégées va de la protection stricte à un systèmecomplètement communautaire avec partage desbénéfices, et de la conservation axée sur une seuleespèce à la conservation holistique d’un écosystème.
Le Népal a réalisé avec succès la reprise dequelques espèces en danger, comme le rhino, le tigreet l’éléphant sauvage. Par exemple, la population derhinos est passée de moins de 100 à la fin des années1960 à 612 en 2000. Le Népal a aussi lancé un pro-gramme de translocation qui a montré la voie en Asieavec sa gestion proactive de la conservation despopulations de rhinos. Des animaux qui sont, audépart, concentrés dans une région sont déplacés dansd’autres régions pour y instaurer des populations etles rendre viables – 82 rhinocéros ont été déplacés duParc National Royal de Chitwan vers le Parc NationalRoyal de Bardia et la Réserve de Faune deSuklaphanta.
Un programme de zones tampons a réellementmotivé les populations et les a renforcées, endéveloppant les institutions locales, en diversifiant lespossibilités de générer des revenus et en réduisant ladépendance vis-à-vis des ressources du parc pour lesbesoins quotidiens. La conservation au niveau del’écosystème a levé l’isolement des aires protégées, quisont considérées comme des conservatoires de poolsgénétiques. La faune sauvage peut aussi évoluer ensécurité en dehors des aires protégées, ce qui aidera àl’avenir à maintenir des populations génétiquementsolides.
Mais la gestion d’une aire protégée fait face à denouveaux défis qu’elle doit relever pour rester à lahauteur des succès de la conservation. Les principauxproblèmes sont dus à une hausse du braconnage, quiaugmente les conflits hommes–faune sauvage et aussihommes/hommes. La rébellion armée, qui touche toutle pays, dure depuis près d’une décennie maintenant,et elle a, directement ou indirectement, sérieusementtouché tous les secteurs. Le front de la conservationne fait pas exception. Certaines actions des insurgésont été très brutales. Par exemple, nous avons perducinq hommes de la Réserve de Faune de Parsa dansl’explosion d’une mine. De même, dix personnes,

22 Pachyderm No. 40 January–June 2006
van Strien and Maskey
programmes in a conflict situation. We believe thatsupport and collaborative efforts from conservationpartner organizations is more essential in this diffi-cult situation than in normal times for conserving therhino and managing the natural resources of the coun-try. More and more community empowerment willhelp support the conservation programme.
Preliminary census data for rhinosin Assam, India
Preliminary results of rhino counts in the main rhinoareas in Assam have been announced. The officialfigures, after correction for double or incompletecounting, may give slightly different figures, but it isclear that the numbers are up again.
Kaziranga National Park has once again estab-lished itself as a conservation success story with anincrease of over 300 in the population of the Indianrhinoceros (Rhinoceros unicornis) over the last sevenyears. The park director, N. K. Basu, stated, ‘The rhinocensus has just been concluded and the minimumnumber of rhinos is projected to be 1855.’ The popu-lation figure in the last census in 1999 was 1552. In1966 the population was a mere 366; it jumped up to658 in 1972, 939 in 1978, 946 in 1984, 1129 in 1991and 1164 in 1993. In the same period about 450 rhi-nos died, but death due to poaching has been mini-mized to about five per year now.
The preliminary figures for Pabitora WildlifeSanctuary are 81, and 68 for Orang National Park,bringing the total number of rhinos in Assam to about2000. In 1999 only 46 rhinos were counted in Orang,and 20 rhino were poached since then.
One young rhinoceros that was swept away byfloods in Kaziranga National Park but rescued has beenrelocated to Manas National Park. More rhinos will bemoved later as part of the Vision 2020 programme.
dont des membres du personnel, ont été tuées dansune explosion dans la Réserve de Faune deSuklaphanta. Ces incidents ont semé la terreur parmile personnel, et certains ont été forcés à quitter leurposte régulier. Ces actes n’ont pas seulement causédes dommages physiques et des tortures mentales,mais ils auront en plus un effet à long terme sur lagestion des ressources naturelles. La rébellion est ainsidevenue un des principaux facteurs de l’affaiblisse-ment de la gestion des ressources naturelles. Elle aentraîné l’exploitation illégale et indiscriminée deplantes médicinales rares et précieuses, et des espècesen danger comme le rhinocéros sont plus qu’avantvictimes du braconnage parce que leur mobilité estlimitée et que la fusion des postes de gardes a laissédes espaces moins bien gardés par où il est possibled’accéder aux aires protégées. Pendant la rébellion,le braconnage des rhinos a été enregistré en hausseen 2001 et 2002. Ce braconnage alimente le com-merce illégal de viande de brousse et de plantesaromatiques et médicinales.
Les aires protégées requièrent une surveillanceconstante, la protection et les contrôles efficaces étantassurés par des patrouilles et par du personnel postéà différents points stratégiques. Les infrastructures detoutes les aires protégées du pays ont subi desdommages, la plupart pour garder des postes et desimmeubles.
Une grande partie de ces dommages ont touché lespostes des gardes et les bureaux construits ces trentedernières années dans le cadre du développement dusystème des aires protégées. Il est certain que leur re-construction coûtera beaucoup plus cher.
Avec la poursuite des conflits, la priorité du per-sonnel de sécurité qui était déployé dans les airesprotégées s’est reportée sur la sécurité nationale.L’ occupation des postes de gardes existants s’estréduite de plus de 50% et parallèlement, les déplace-ments au sein des aires protégées ont diminué signifi-cativement. Patrouiller à l’intérieur du Parc NationalRoyal de Bardia et de la Réserve de Faune de Parsaest devenu très dangereux, et on n’y a fait pratiqu-ement plus aucun monitoring de la faune depuislongtemps parce que l’on suspecte que ce sont desvoies de transit des insurgés. Il est donc presque im-possible de connaître le statut actuel de la faune dela région, y compris celui des rhinos réintroduits.
Même dans cette situation, on a fait des effortspour accroître la surveillance dans certaines airesprotégées en y patrouillant et en formant des groupes

Pachyderm No. 40 January–June 2006 23
Asian Rhino Specialist Group report
Les chiffres officiels, après avoir reçu une correctionpour comptages doubles ou incomplets, pourraientêtre légèrement différents mais il est clair qu’ils sontde nouveau en hausse.
Le Parc National de Kaziranga fait de nouveaufigure de « success story », avec une augmentationde la population de plus de 300 rhinos d’Inde (Rhi-noceros unicornis) au cours des sept dernières années.Le Directeur du parc, N. K. Basu a dit : « Lerecensement des rhinos vient de se terminer, et lenombre minimum devrait être de 1855 ». Lerecensement de la population en 1999 avait donné unchiffre de 1552. En 1966, la population ne comptaitque 366 rhinos ; elle atteignait 658 en 1972, 939 en1978, 946 en 1984, 1129 en 1991 et 1164 en 1994.Pendant cette même période, près de 450 rhinos sontmorts, mais les morts dues au braconnage ontmaintenant été ramenées à cinq par an environ.
Les chiffres préliminaires pour le Sanctuaire deFaune de Pabitora sont de 81, et de 68 pour le ParcNational d’Orang, ce qui porte le total des rhinos enAssam à près de 2000. En 1999, on n’avait dénombréque 46 rhinos à Orang, et 20 ont été braconnés depuis.
Un jeune rhino qui avait été emporté par desinondations et puis sauvé dans le Parc national deKaziranga a été placé dans le Parc de Manas. D’autresrhinos seront déplacés cette année dans le cadre duProgramme Vision 2020.
anti-braconnage communautaires pour réunir toutesles informations possibles. On a instauré un systèmede récompenses en reconnaissance du travail de con-servation exceptionnel réalisé par le personnel, lesmilitaires et les communautés. Le Programme WWFau Népal a consolidé le réseau de communication duparc en fournissant des walkies-talkies Motorola et,très récemment, le WWF-Népal et Toyota ont donnédeux jeeps 4X4 au Parc National de Chitwan.
Grâce aux meilleures communications, à desmoyens de transport améliorés et au travail ardu d’unpersonnel dévoué, de l’armée et des communautés quivivent autour de l’habitat des rhinos, le braconnage estsous contrôle. Nous avons appris qu’un personnelengagé et dévoué est indispensable pour réaliser les pro-grammes en cas de conflit. Nous croyons que le sup-port et les efforts de collaboration des organisationspartenaires dans la conservation sont plus essentielsencore dans cette situation difficile qu’en temps nor-mal pour conserver les rhinos et gérer les ressourcesnaturelles du pays. Le pouvoir accru confié auxcommunautés va aider à soutenir le programme de con-servation.
Premières données du recensementdes rhinos en Assam, Inde
Les premiers résultats des comptages dans lesprincipales zones à rhinos d’Assam ont été annoncés.

24 Pachyderm No. 40 January–June 2006
Leggett
Introduction
Providing artificial water points (AWPs) in an arid orsemi-arid area has been regarded as detrimental tothe ‘natural environment’, as it gives permanent ac-cess for people and domestic stock to areas that were
traditionally available only seasonally (Perkins andThomas 1993; Du Toit and Cumming 1999). The con-centration of people and domestic stock around theseAWPs has led to environmental degradation (Reid andEllis 1995) and exclusion of wildlife from these areas(Verlinden et al. 1998). The greatest effect of AWPs
Effect of artificial water points on the movement and behaviourof desert-dwelling elephants of north-western Namibia
Keith Leggett
The Namibian Elephant and Giraffe Trust, PO Box 527, Outjo, Namibia, email: [email protected]
Abstract
In November 2002, two artificial water points (AWPs) were drilled in the Hoanib River, north-western Namibia.This arid area (< 100 mm annual rainfall) seasonally supports a relatively large desert-dwelling elephant popu-lation. The range and the distribution of these elephants are determined by the distance that they need to foragefrom water. Before drilling the AWPs, female family units, hindered by their young, were limited in their move-ment, needing to stay close to natural permanent water sources. Free-ranging adult male elephants had largerranges as they were less constrained in their drinking frequencies. However, the drilling of AWPs allowed familyunits to shift their ranges spatially beyond their normal foraging areas. Free-ranging males did not spatially shifttheir feeding areas but foraged closer to the AWPs. The seasonal movement of one family unit was disrupted bythese AWPs, its members becoming more or less permanent residents along the river. AWPs have also changedthe frequency and manner of drinking behaviour in this elephant population.
Résumé
En novembre 2002, deux points d’eau artificiels (PEA) ont été creusés dans la rivière Hoanib, au nord-ouestde la Namibie. Cette région aride (< 100 mm de chutes de pluie annuelles) accueille de façon saisonnière unepopulation relativement importante d’éléphants du désert. La répartition et la distribution de ces éléphantssont déterminées par la distance qu’ils doivent parcourir entre l’eau et l’endroit où ils mangent. Avant decreuser les PEA, les unités familiales de femelles, ralenties par les jeunes, étaient limitées dans leursdéplacements puisqu’elles devaient rester à portée des points d’eau naturels. Les éléphants mâles adultesavaient une dispersion plus grande parce qu’ils avaient moins de contrainte en ce qui concerne la fréquenceoù ils devaient boire. Cependant, le creusement de PEA a permis aux unités familiales de déplacer leur disper-sion au-delà de leurs aires de nourrissage habituelles. Les mâles n’ont pas changé spatialement leurs aires denourrissage, mais ils se mirent à manger plus près des PEA. Le déplacement saisonnier d’une famille futperturbé par ces PEA, et elle est devenue plus ou moins résidente permanente le long de la rivière. Les PEAont aussi changé la fréquence et la manière de boire de cette population d’éléphants.
RESEARCH

Pachyderm No. 40 January–June 2006 25
Effect of artificial water points on desert-dwelling elephants
had been on vegetation, with dramatic changes in spe-cies composition and productivity occurring near thewater point where intensive grazing forms distinc-tive zones or biospheres (Pickup 1994). Other authorshave referred to the degraded area around AWPs as a‘sacrifice zone’ (Perkins and Thomas 1993). High den-sities of domestic stock have been reported to inducechanges in infiltration rates, soil nutrient levels, andthe resistance and resilience of ecosystems (Legget etal. 2003a). However, the effect on bulk rangeland (morethan a kilometre away from either AWP or humansettlement) was reported to be rare (Leggett et al.2003a,b). Leggett et al. (2003a) reported that wildlifeand domestic stock had a similar effect on veld in anenclosed situation, which was a fenced area in a semi-arid environment.
Elephants vary in their home ranges from being al-most sedentary (Douglas-Hamilton 1971; De Villiersand Kok 1997) to being semi-nomadic or seasonallydispersive (Viljoen 1989a; Lindeque and Lindeque1991; Thouless 1995; Leggett 2006). The timing of sea-sonal movements and differential use of habitats hasbeen linked to rainfall, forage preference and availabil-ity (Western and Lindsay 1984; White 1994; Thouless1995; Babaasa 2000). Several authors (Viljoen 1987,1988, 1989a,b; Lindeque and Lindeque 1991; Leggettet al. 2003c;) have described the movement, behaviourand ecology of elephants in the arid areas of north-west-ern Namibia; however, most of these studies were un-dertaken before AWPs were provided.
The ephemeral rivers of north-western Namibia andtheir associated springs, wetlands and vegetation formlinear oases for wildlife and people in an otherwise bar-ren landscape (Leggett et al. 2003c; 2004). The HoanibRiver catchment, one of the 12 western-flowing ephem-eral rivers of Namibia, has been extensively studied inrecent years. Its geology, vegetation and seasonal dis-tribution of resources have been well documented(Fennessy et al. 2001; Leggett et al. 2003a,b). Wildlifetend to concentrate around water sources during the dryseason within relatively small home ranges and groupsizes. These populations tend to disperse during the wetseason but occasionally form large feeding aggregationsto take advantage of seasonally available vegetation thatis not necessarily located near water points (Leggett etal. 2004). Populations of domestic stock also tend toincrease in the wet season, but they are concentratedaround seasonally available water sources. During thedry season domestic stock is concentrated around per-manent water sources (Leggett et al. 2004).
African elephants are known to dig holes in river-beds to gain access to water during times of seasonalor sustained aridity (Dudley et al. 2001). In arid north-western Namibia, elephants routinely drink year roundfrom shallow holes dug in the ephemeral riverbeds,called ghorras (a local Damara word meaning ‘dugby hand’).
Using a combination of observational and GPSsatellite data of collared adult males and family units,in this paper I report changes in the feeding areas (spa-tial) and seasonal movements within established homeranges in response to the AWPs. In addition, I reportchanges in drinking behaviour that occurred after theAWPs were added.
Study area
The Hoanib River catchment is located in the KuneneRegion of Namibia. The location of the study area,western wetlands, ghorras, rainfall isohyets and AWPsis shown in figure 1.
In arid areas, rainfall is spatially and temporallyvariable. Seasonal rainfall is highly variable and theaverage rainfall of an area does not necessarily serveas a good indicator of the amount of rainfall that canbe expected in any given season (Leggett et al. 2001a).The research reported in this paper was conducted onthe desert-dwelling elephants in a zone with 0–100mm average annual rainfall.
There are three recognizable seasons in north-west-ern Namibia, functionally and broadly defined (afterViljoen 1988): wet season (January–May); cold dryseason (June–September); and hot dry season (Octo-ber–January). In practice these seasons are variable,for example, the 1999/2000 wet season commencedin October 1999, with the last rains falling in May 2000.
In the last 23 years, the number of days of flood-ing (flood is defined as any time there is surface wa-ter flowing in the river) in the Hoanib River variedfrom 4 in 1981 to 52 in 1983, with an average of 17.7days (Leggett et al. 2001a). Before October 2002, theonly water available to elephants in the western sec-tion of the Hoanib River outside of the flood periodswas found in the permanent wetlands at Dubis andthe seasonal wetlands near the dunes in the westernsection of the river. Elephants also drank from ghorras,which varied seasonally in their location but werealways found close to the Dubis wetlands. During thecold dry and hot dry season, most ghorras were dugjust to the west of Dubis.
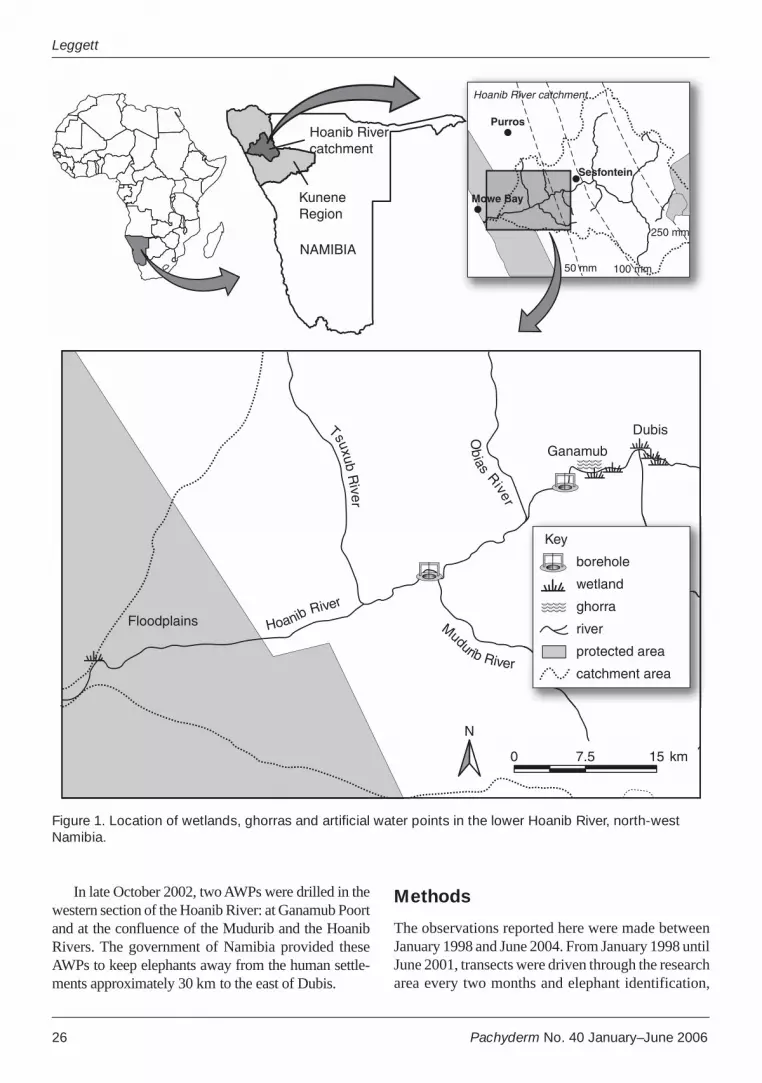
26 Pachyderm No. 40 January–June 2006
Leggett
Figure 1. Location of wetlands, ghorras and artificial water points in the lower Hoanib River, north-westNamibia.
Tsuxub River
Hoanib River
Mudurib River
Floodplains
Ganamub
DubisOb
ias River
Key
borehole
wetland
ghorra
river
protected area
catchment area
Hoanib River catchment
50 mm
Purros
100 mm
250 mm
N
Hoanib River catchment
KuneneRegion
NAMIBIA
0 7.5 15 km
Mowe Bay
Sesfontein
In late October 2002, two AWPs were drilled in thewestern section of the Hoanib River: at Ganamub Poortand at the confluence of the Mudurib and the HoanibRivers. The government of Namibia provided theseAWPs to keep elephants away from the human settle-ments approximately 30 km to the east of Dubis.
Methods
The observations reported here were made betweenJanuary 1998 and June 2004. From January 1998 untilJune 2001, transects were driven through the researcharea every two months and elephant identification,

Pachyderm No. 40 January–June 2006 27
Effect of artificial water points on desert-dwelling elephants
Figure 2. Home ranges of four GPS-collared elephants, north-westNamibia, 2003 and 2004.
0 30 60 km
N
Atlantic Ocean
Key
ephemeral river
catchment area
protected area
WKF-18 home range
WKF-8 home range
WKF-10 home range
WKF-21 home range
Hoarusib River catchment
Hoanib River catchment
Hoarusib
Rive
r
Hoanib River
location (coordinates obtained by GPS), numbers anddrinking behaviour were recorded. (For a detaileddescription of the transect methods see Leggett et al.2003c.) Since June 2001, I have spent a minimum of10 days a month (weather and floods permitting) inthe research area, observing elephants and recordingdetailed information on identification, location num-bers, activities and behaviour.
Elephants were individually identified using acombination of photographs and identification sheets.The photographic techniques used were similar totechniques already described by Douglas-Hamiltonand Douglas-Hamilton (1975)and Moss (1982).
For the purposes of thispaper, a basic family unit isdefined as a mother and off-spring associated with her, aherd as a group of closely as-sociated individuals whocoordinate daily activities,and a clan as individuals whooccupy the same seasonalrange. While the HoanibRiver catchment constitutes asmall section of the total rangeof these elephants, it repre-sents an important core areafor elephants in the KuneneRegion (Leggett 2006).
There are approximately54 elephants in seven familyunits (between 3 and 9 indi-viduals) plus 7 adult males atany one time in the westernsection of the research area.Only two family units and 4free-ranging adult malesmoved between the Hoaniband Hoarusib Rivers. One ofthe family units (WesternKunene Female, WKF-18)and one free-ranging adultmale (Western Kunene Male,WKM-10) were GPS col-lared in September 2002.Douglas-Hamilton (1998),Blake et al. (2001) andLeggett (2006) have previ-ously described the use of
GPS collars for tracking elephants. Two otherelephants were also GPS collared; their home rangesare presented in figure 2. The other family unit (West-ern Kunene Female, WKF-14) was closely observedand its locations recorded during the study period.
Elephant drinking behaviour was recorded forindividual males and for family units over each studyperiod (February 2002; February, May and September2003). Elephants were located daily and followedduring diurnal hours, and their behaviour wasrecorded. AWPs were checked morning and eveningfor spoor to determine whether elephants had drunk

28 Pachyderm No. 40 January–June 2006
Leggett
there during my absence. Only data for elephantswhose locations were known during the study periodare presented.
Data analysis
All GPS readings were converted to a Schwarzek pro-jection using MAPINFO, a geographical informationsystem (GIS) (MapInfo Corporation 1998). Using over-lays of GPS readings of the elephant locations and wa-ter-source information (both artificial and naturallyoccurring), the number and position of elephants withina 1-, 5- or 10-km radius of either the AWPs or thewetlands was determined. The non-parametric Mann-Whitney U-test was used for all statistical analyses.
Results
Observational data on the density of elephants in thelower Hoanib River over the period 1998–2004 are pre-sented schematically in figure 3. The densities of fam-ily units before AWPs were provided (January1998–November 2002) are presented in figure 3a, whilefigure 3b shows the density after AWP (December2002–April 2003). Similarly, figures 3c and 3d showthe density of male elephants before and after AWPswere provided.
Average distance of elephants away from perma-nent natural water sources and AWPs is presented intable 1. Additionally, this table contains the percent-age of elephant observations within radii of 1, 5 and10-km and a radius greater than 10 km of natural andartificial water sources.
Before AWPs were provided, family units wereobserved 22% of the time within a 1-km radius ofwetlands, 61% within a 5-km radius and 13% withina 10-km radius, with only 4% observed more than 10km away from a wetland. The average distance offamily units away from a wetland was 3.65 ± 3.54 km(n = 23). After AWPs were added, however, only 2% offamily unit observations occurred within a 10-kmradius of a permanent natural water source, while 98%of observations located elephants at distances greaterthan 10 km away. The average distance of elephantsaway from permanent natural water sources was 17.90± 5.43 km (n = 41), which is significantly differentfrom the pre-AWP situation (U = 39, p < 0.001).
Free-ranging adult males showed distribution dif-ferent from the family units. Before AWPs 40% offree-ranging adult male elephants were observed
within a 10-km radius of the natural permanent watersources, while 60% of observations were greater than10 km away. The average distance males were ob-served from the wetlands and ghorras was 10.77 ±8.66 km (n = 52). However, after the AWPs were pro-vided, observed free-ranging adult males showed adistribution (U = 1187, p = 0.779) similar to familyunits with 98% of observations being greater than 10km away from the natural permanent water sources.Their average distance was 17.95 ± 6.45 km (n = 60),which was significantly different (U = 839, p < 0.001)from the pre-AWP distance.
Family units and free-ranging adult males showedsimilar distributions around the AWPs with average ob-servation distances of 3.97 ± 3.53 and 4.20 ± 2.92 re-spectively. There was no significant difference (U =791, p = 0.395) between the distribution of family unitsand free-ranging adult males after AWPs were provided.
Collared elephant movement
WKF-18 returned to her seasonal range in the HoanibRiver on 3 October 2002 (fig. 4a). From October toNovember, she and her family unit occupied their tra-ditional range around the wetlands, with occasionalexcursions down past the Obias and Mudurib Rivers.After the construction of AWPs in November 2002,the female and her family unit gradually shifted theirrange until by the end of January, they occupied thearea to the west of the Mudurib River almost exclu-sively (fig. 4b). The herd moved out of the HoanibRiver on 29 January 2002. WKF-18 did not return tothe Hoanib River during the 2003 hot dry season, re-maining at the Hoarusib River instead.
WKM-10 returned to the Hoanib River on 29October 2002 (figs. 4c and 4d). From October untilDecember 2002 he occupied a range approximately10 km to the west of permanent natural water sources.He then occupied a similar range for January, but inFebruary and March 2003 he moved farther west andremained there until he moved out of the Hoanib Riveron 28 March 2003. He returned to the Hoanib Riveron 28 October 2003 and again occupied the westernrange area around the Mudurib AWP before leavingthe river on 12 February 2004.
Seasonal movement
The seasonal movement of WKF-14 and her familyunit, pre- and post- AWPs, is presented in figure 5.

Pachyderm No. 40 January–June 2006 29
Effect of artificial water points on desert-dwelling elephants
Figure 3. Elephant locations in the lower Hoanib River: female family units a) January 1998–November2002, b) December 2002–June 2004; adult male elephants c) January1998–November 2002, d) December2002–June 2004.
Table 1. Average distance from, and the percentage of elephant sightings within 1-, 5-, 10- and > 10-kmradii of water sources in the lower Hoanib River, north-west Namibia
No. Average Elephants Elephants Elephants Elephantsdistance (km) within 1-km within 5-km within 10-km > 10-km
radius (%) radius (%) radius (%) radius (%)
Pre-artificial water points, in wetlands and ghorrasFemales 23 3.65 ± 3.55 22 61 13 4Males 52 10.77 ± 8.66 16 24 12 48
Post-artificial water points, in wetlands and ghorrasFemales 41 17.90 ± 5.43 1 0 1 98Males 60 17.95 ± 6.45 1 1 1 97
Artificial water pointsFemales 35 3.97 ± 3.53 27 52 20 1Males 57 4.20 ± 2.92 15 55 34 1
Key Elephant density
borehole
wetland
ghorra
river
protected area
catchment area
10
5
1
N
0 10 20 km
a b
dc

30 Pachyderm No. 40 January–June 2006
Leggett
Before AWPs were constructed, WKF-14 and herfamily unit moved (over the study period) at the end ofthe hot dry season from the Hoanib to the HoarusibRiver, returning during the cold dry season. However,once AWPs were built in the river, WKF-14 and herfamily unit did not move back to the Hoarusib Riverbut stayed at the Hoanib River for all of 2003 until June2004. There was also a spatial displacement of the lo-cation of this family unit toward the western section ofthe river, centring on the AWP at the Mudurib River.
Neither WKF-18 and her family unit nor WKM-10 disrupted their seasonal movement patterns afterAWPs were added.
Drinking frequency
During drinking studies carried out on two males andone family unit during February 2002, it was estab-lished that males drank every 3–5 days (n = 3) andfemale units every 2–3 days (n = 3). A similar studywas undertaken in February, May and September2003, when drinking frequencies for two males wereobserved to be 2–3 days (n = 9) and 2–3 days for onefamily unit (n = 12).
Flood events and ghorra use
Leggett et al. (2001a,b) and Leggett et al. (2005) de-scribed rainfall, flood events, water chemistry andsediment levels during flood events. The Hoanib Riverflooded twice during the 2003 wet season, with flooddurations of four days and one day. During the 2004wet season the Hoanib River flooded three times withflood durations of seven, three and four days (pers.obs.). Although elephants have been observed drink-ing from ghorras during all seasons, it was most com-mon to observe them drinking during the cold dryand hot dry season (n = 12). After AWPs were con-structed elephants were no longer observed to drinkfrom ghorras during the cold dry and hot dry sea-sons; however, they were observed to do so duringthe wet season (n = 3). The reason for the low numberof observations is because the area becomes inacces-sible when rivers flood or rains occur.
Discussion
Providing AWPs in most areas of Namibia as else-where in Africa has led to permanent occupation bypeople and domestic stock, resulting in environmen-
tal degradation (Du Toit and Cumming 1999). Thishas not occurred in the western areas of the HoanibRiver as local pastoralists have never used them ex-tensively because they were too remote, access routeswere poor and grazing erratic (Leggett et al. 2004).Large wildlife populations around AWPs can have asimilar effect on the environment as domestic stock(Leggett et al. 2003b); however, this effect is partiallymitigated by the nature of the arid areas. Rainfall isnot a certainty and neither is grazing. Grazers thusperiodically migrate into and out of the area, effec-tively reducing pressure on the vegetation aroundAWPs, allowing it to recover.
Historically, large herds of elephants were sea-sonally observed in the western section of the HoanibRiver, particularly in the floodplains at the base ofthe dune field where seasonal water was available(Viljoen 1987). These aggregations were observedduring the study period, with few elephants beingobserved in the western section of the research area.Before AWPs, family units were restricted to areasclose to natural permanent water sources aroundDubis. However, AWPs allowed elephant family unitsto shift their foraging range spatially approximately22 km to the west, into areas they had previously vis-ited only seasonally. They then maintained similarranges around the AWPs, with approximately 80%of sightings made within 10 km of the AWP. The maincause restricting range of the family units was theneed for juvenile elephants to drink more often thanadults (Moss 1982; Viljoen 1988). This concentratesthe family units into areas within a distance from per-manent water sources to which juvenile elephants canwalk in one-and-half to two days. Elephantpopulations tend to stay more permanently in riverineareas, where their potential impact on the vegetation(particularly Faidherbia albida trees) is far greater.However, it is believed that these herds will againstart their regular seasonal movements once the read-ily accessible vegetation has been removed.
Adult male elephants have been reported to havegreater foraging range than family units in the westernsection of the Hoanib River (Viljoen 1988). Viljoen(1988) proposed that this greater foraging range re-sulted from the ability of free-ranging adult males togo for relatively long periods (3–5 days) without wa-ter. Both these observations were supported by thisstudy. With AWPs the free-ranging adult male’s aver-age foraging range decreased to a size similar to thatof family units. In addition, the drinking frequency

Pachyderm No. 40 January–June 2006 31
Effect of artificial water points on desert-dwelling elephants
increased to every second or third day. The spatialmovement of elephants toward the western section ofthe Hoanib River was confirmed by GPS collar datafrom WKF-18 and WKM-10. Both elephants wereobserved to shift their foraging ranges once they dis-covered the western AWP. Verlinden et al. (1998) de-scribed similar spatial movements of domestic stockand wildlife in response to AWPs in the Kalahari Desert.
Providing AWPs has disrupted the seasonal move-ment of at least one family unit (WKF-14). BeforeAWPs, WKF-14 and her family unit would move sea-sonally from Hoanib to Hoarusib Rivers. Throughout
2003 and until June 2004, however, WKF-14 and herfamily unit did not move away from the Hoanib River.The reason the family unit remained there most prob-ably was linked to the easily accessible foraging areasclose to the AWPs. There was simply no need to moveif forage and water both were readily available.
In other areas of Africa, providing AWPs has re-sulted in a rise in reproductive rates of elephants (Weir1971; Dudley et al. 2001). This would be unlikely inthis elephant population as the elephant density isrelatively small and their intercalving period is rela-tively large (Viljoen 1988).
Figure 4. Movement of adult GPS-collared elephants in the Hoanib River: female WKF-18 a) October–November 2002, b) December 2002–January 2003; male WKM-10 c) October–November 2002,d) December 2002–March 2003.
Key
October locations
November locations
December locations
January locations
February locations
March locations
borehole
wetland
ghorra
river
N
0 4 8 km
a b
c d

32 Pachyderm No. 40 January–June 2006
Leggett
0 20 40 km
Key Herd size
Atlantic O
cean
catchment area
ephemeral river
protected area
10
5
1
N
Hoanib River
Hoaru
sib R
iverA
tlantic Ocean
Hoanib River
Hoaru
sib R
iver
a
b
Figure 5. Observed locations of WKF-14 and her family unit in north-west Namibia, a) January 1998–November 2002, b) December 2002–June 2004.

Pachyderm No. 40 January–June 2006 33
Effect of artificial water points on desert-dwelling elephants
In addition to changes in drinking behaviour andforaging ranges, other changes in water-foraging strat-egies have been observed. Before November 2002,the elephants routinely dug ghorras in the riverbedduring all seasons, from which they obtained rela-tively clean water. During the cold dry and hot dryseasons, elephants would continue to dig ghorras toensure good water quality. Digging and drinking ofwater from ghorras was a time-consuming processfor elephants, taking up to one hour for an elephantto be sated (pers. obs.). With the addition of clean,readily available fresh water from AWPs, elephantsabandoned the practice of digging and drinking fromghorras during the cold dry and hot dry seasons. How-ever, this practice continued during the wet seasonand with the arrival of the first floods. Floodwaterquality is generally low, as it contains large amountsof suspended sediment (Leggett et al. 2005). As theghorras filter most of the suspended sediment fromthe water, the quality of ghorra water was probablybetter than that of AWPs during the wet season, dueto a high water table in the rivers. During the colddry and hot dry seasons as the water table falls in therivers, ghorra water becomes more saline (Leggett etal. 2001b) and probably less palatable to elephantsthan the AWP water.
Conclusion
The addition of AWPs to the western section of theHoanib River has allowed spatial movement of ele-phants from their traditional drinking and foraging ar-eas to areas that previously were visited only periodically.Family units in particular have benefited from AWPswith a spatial shift in foraging range from 3.65 ± 3.55km up to 17.90 ± 5.43 km from natural permanent wa-ter sources. Free-ranging adult males have also benefitedby travelling shorter distances to drink. Both free-rang-ing adult males and family units were observed forag-ing within similar ranges around AWPs, 3.97 ± 3.53 kmand 4.20 ± 2.92 km respectively. Potential does exist forelephants to damage the riverine vegetation (particularlyFaidherbia albida trees) in these extended foraging ar-eas; however, it is believed that they will renew theirseasonal movement patterns once the readily availablevegetation has been removed.
AWPs affected the seasonal movement of at leastone family unit that remained in the Hoanib River, inpreference to undertaking its normal seasonal move tothe Hoarusib River. The seasonal movements of other
family units and free-ranging adult males appeared tobe little affected. Free-ranging adult males also ap-peared to increase their drinking frequencies, prefer-ring to drink every 2 to 3 days instead of every 3 to 5days as they had before AWPs were constructed. Drink-ing frequencies of family units remained unchanged.The practice of digging ghorras for water during thecold dry and hot dry seasons also appeared to cease,although elephants still dug ghorras during the wetseason to obtain relatively clean drinking water.
Acknowledgements
The author would like to thank his colleagues at theNamibian Elephant and Giraffe Trust, Messrs JulianFennessy and Todd Maki, for useful discussions andinput into this paper. In addition, Dr Betsy Fox andNicky Knox are thanked for their comments on themanuscript. In addition, the communities of north-western Namibia and the Ministry of Environmentand Tourism are thanked for their permission and sup-port during the study. Finally, the work would nothave been possible without the support of the donors:the Earthwatch Institute, the Denver Zoo and theWildlife Conservation Society. In particular, the au-thor is grateful to Mrs Rebecca Caudle, whose gener-osity made the GPS collaring possible.
References
Babaasa D. 2000. Habitat selection by elephants in BwindiImpenetrable National Park, south-western Uganda.African Journal of Ecology 38:116–122.
Blake S, Douglas-Hamilton I, Karesh WB. 2001. GPStelemetry of forest elephants in Central Africa: resultsof a preliminary study. African Journal of Ecology39:178–186.
De Villiers PA, Kok OB. 1997. Home range, associationand related aspects of elephants in the eastern Trans-vaal lowveld. African Journal of Ecology 35:224–236.
Douglas-Hamilton I. 1971. Radiotracking of elephants. In:Proceedings of a symposium of biotelemetry. Council forScientific and Industrial Research, Pretoria. p 335–342.
Douglas-Hamilton I. 1998. Tracking African elephants witha global positioning system (GPS) radio collar. Pachy-derm 25:81–92.
Douglas-Hamilton I, Douglas-Hamilton O. 1975. Amongthe elephants. Collins and Harvill Press, London.
Dudley JP, Craig GC, Gibson D St. C, Haynes G, KlimowiczJ. 2001. Drought mortality of bush elephants in Hwange
34 Pachyderm No. 40 January–June 2006
Leggett
National Park, Zimbabwe. African Journal of Ecology39:187–194.
Du Toit JT, Cumming DHM. 1999. Functional significanceof ungulate diversity in African savannas and the eco-logical implications of the spread of pastoralism.Biodiversity and Conservation 8:1643–1661.
Fennessy J, Leggett KEA, Schneider S. 2001. Faidherbiaalbida distribution, density and impacts of wildlife inthe Hoanib River catchment, north-western Namibia.DRFN Occasional Paper 17:1–47. Desert ResearchFoundation of Namibia, Windhoek.
Leggett KEA. 2006. Home range and seasonal movementof elephants in the Kunene Region, North-west Na-mibia. African Zoology 41:17–36.
Leggett KEA, Fennessy J, Schneider S. 2001a. Rainfall,water sources and water use in the Hoanib River catch-ment, north-western Namibia. DRFN OccasionalPaper 15:37–75. Desert Research Foundation of Na-mibia, Windhoek.
Leggett KEA, Fennessy J, Schneider S. 2001b. Water chem-istry of selected wetlands and springs in the HoanibRiver catchment, north-western Namibia. DRFNOccasional Paper 15:1–35. Desert Research Founda-tion of Namibia, Windhoek.
Leggett KEA, Fennessy J, Schneider S. 2003a. Seasonalvegetation changes in the Hoanib River catchment,north-western Namibia: a study of a non-equilibriumsystem. Journal of Arid Environments 53:99–113.
Leggett KEA, Fennessy J, Schneider S. 2003b. Does landuse matter in an arid environment? A case study fromthe Hoanib River catchment, north-western Namibia.Journal of Arid Environments 53:529–543.
Leggett KEA, Fennessy J, Schneider S. 2003c. Seasonaldistributions and social dynamics of elephants in theHoanib River catchment, north-western Namibia. Af-rican Zoology 38:305–316.
Leggett KEA, Fennessy J, Schneider S. 2004. A study ofanimal movement in the Hoanib River catchment, north-western Namibia. African Zoology 39:1–11.
Leggett KEA, Fennessy J, Schneider S. 2005. Flood-bornesediment analysis of the Hoanib River, north-westernNamibia. Journal of Arid Environments 62:587–596.
Lindeque M, Lindeque PM. 1991. Satellite tracking of ele-phants in northwest Namibia. African Journal of Ecol-ogy 29:196–206.
MapInfo Corporation. 1998. MapInfo Professional.MapInfo Corporation, New York. 589 p.
Moss CJ. 1982. Portraits in the wild: behavior studies ofeastern African mammals. University of Chicago Press,Chicago, USA. 371 p.
Perkins JS, Thomas DSG. 1993. Environmental responsesand sensitivity to permanent cattle ranching, semi-aridwestern central Botswana. In: Thomas DSG, AllisonR, eds., Landscape sensitivity. Wiley and Sons, Lon-don, p. 273–286.
Pickup G. 1994. Modelling patterns of defoliation by graz-ing animals in rangelands. Journal of Applied Ecology31:231–246.
Reid RS, Ellis JE. 1995. Impacts of pastoralists on wood-lands in south Turkana, Kenya: livestock-mediated treerecruitment. Ecological Applications 5:978–992.
Thouless CR. 1995. Long distance movements of elephantsin northern Kenya. African Journal of Ecology 33:321–334.
Verlinden A, Perkins JS, Murray M, Masunga G. 1998. Howare people affecting the distribution of less migratorywildlife in the southern Kalahari of Botswana? A spa-tial analysis. Journal of Arid Environments 38:129–141.
Viljoen PJ. 1987. Status and past and present distributionof elephants in Kaokoveld, South-West Africa/Namibia.South African Journal of Zoology 22:247–257.
Viljoen PJ. 1988. The ecology of the desert-dwellingelephants, Loxodonta africana (Blumenbach, 1797) ofwestern Damaraland and Kaokoland. PhD thesis, Uni-versity of Pretoria, South Africa. 335 p.
Viljoen PJ. 1989a. Spatial distribution and movements ofelephants (Loxodonta africana) in the northern NamibDesert region of the Kaokoveld, South-West Africa/ Na-mibia. Journal of the Zoological Society of London219:1–19.
Viljoen PJ. 1989b. Habitat selection and preferred foodplants of desert-dwelling elephant population in thenorthern Namib Desert, South-West Africa/Namibia.African Journal of Ecology 27:227–240.
Weir JS. 1971. The effect of creating artificial water sup-plies in a central African national park. Symposium ofthe British Ecological Society 11:367-385.
Western D, Lindsay WK. 1984. Seasonal herd dynamics ofa savanna elephant population. African Journal of Ecol-ogy 22:229–244.
White LJT. 1994. Sacoglottis gabonensis fruiting and theseasonal movement of elephants in the Lopé Reserve,Gabon. Journal of Tropical Ecology 10:121–125.

Pachyderm No. 40 January–June 2006 35
Distribution des éléphants autour d’une mare sahélienne
Introduction
Les derniers éléphants (Loxodonta africana) du Sahelse trouvent dans la région du Gourma au Mali (Blakeet al. 2003). L’écologie et les mouvements annuelsde cette population ont été décrits par Olivier (1983),Jachmann (1991), Pringle and Diakité (1992), Maïga(1999) et Blake et al. (2003). Les mares constituentles principales ressources en eau en saison sèche, quise rétrécissent par évaporation au fur et à mesure quela saison progresse. La plus importante est la mare deBenzéna située au nord ouest de la zone de distribu-tion des éléphants. La mare de Benzéna est uneressource critique pour les éléphants du Gourma pen-dant la période de l’année où ils sont le plussusceptibles au stress. Cependant, la mare et les zonesboisées voisines sont également utilisées par lesgrands troupeaux de bétail, de chèvres et de moutonsainsi que des dromadaires conduits par des pasteurs.Des signes d’intense pâturage autour de la mare ontété mis en évidence depuis des années (Blake et al.
2003). La dessiccation du climat sahélien, lavégétation au cours des trois dernières décennies etl’accroissement de la population humaine ontengendré la crainte d’une exploitation non durablede l’habitat et la compétition entre les éléphants et lecheptel domestique pour le pâturage et l’eau (Maïga1999). Nous avons observé que les éléphantssemblaient éviter les fortes concentrations de chèvreset de boeufs au nord de la mare. D’autre part, leschèvres et éléphants étaient souvent observés en trainde pâturer assez près l’un de l’autre : les chèvresconsomment les gousses et branches tombées au solpar les éléphants.
Pendant que nous prospections les environs de lamare à la recherche des éléphants, nous avonsremarqué leur préférence pour les zones de végétationdense. De plus il nous a semblé que les éléphantsévitaient les bandes de végétation dominées parLeptadenia pyrotechnica, une espèce qui couvre devastes espaces du Gourma et qui s’étendprogressivement autour de Benzéna. L’objectif de cet
Distribution des éléphants autour d’une mare sahélienne enrelation avec le cheptel domestique et la végétation ligneuse
Richard F.W. Barnes,1 Emmanuel M. Héma,2* Elmehdi Doumbia 3
1 Division of Biological Sciences 0116, University of California at San Diego, La Jolla, CA 92093-0116, USA;et Environmental Sciences Research Centre, Anglia Ruskin University, East Road,Cambridge CB1 1PT, UK.; [email protected] c/o Save The Elephants, PO Box 54667, Nairobi ; email: [email protected] ; * auteur avec qui correspondre3 Service de la Conservation de la Nature de Gossi, Gourma Rharous, Mali
Résumé
Un indice du cumul d’occupation des éléphants a été mesuré autour de la mare de Benzéna dans le Gourmamalien, en fin de saison sèche 2004. Un fort gradient d’utilisation d’espace des éléphants à partir de la marea été enregistré. Les éléphants préféraient les endroits à haute diversité spécifique avec abondance de Balan-ites aegyptiaca et Acacia spp., mais évitaient les sols pauvres à Leptadenia pyrotechnica. Aucune évidence decompétition entre les éléphants et le cheptel domestique n’a été constatée.
Abstract
An accumulated count of elephant occupation was measured around Lake Banzena in Gourma in Mali, at the endof the 2004 dry season. There was a steep gradient of elephant use away from the lake. Elephants preferred areaswith high species diversity and with abundant Balanites aegyptiaca and Acacia spp. but avoided poor soils withLeptodenia pyrotechnica. There was no evidence of competition between elephants and livestock.

36 Pachyderm No. 40 January–June 2006
Barnes et al.
inventaire était de décrirel’utilisation de l’espace par leséléphants en saison sècheautour de la mare en relationavec l’eau, l’abondance ducheptel domestique et ladisponibilité du pâturage.
Description de l’aired’étude
Le Gourma est la zonesahélienne située au sud et àl’ouest de la boucle du fleuveNiger, dans le sud-est du Mali.La saison sèche dure plus de huitmois, avec une pluviométrieannuelle moyenne de 300 mm aunord à 600 mm au sud. Les dunescouvrent environ 50% de lasuperficie de la zone, les plaineslatéritiques environ 25% et lesescarpements rocheux 16%(Maïga 1999). La mare deBenzéna (fig. 1) est située dansune dépression et entourées parun anneau de fourrées dominéespar Acacia nilotica. Le nord estconstitué d’un système de duneavec des arbustes clairsemés etdes herbacées annuelles quiavaient disparus au moment de cet inventaire. Au sudexistait d’avantage de dunes mais aussi de vastes plaineslatéritiques dénudées. D’autres reliques de forêts sèchesont également été observées le long des ravins au sudet à l’ouest.
Les éléphants du Gourma suivent un cycle uniquede migration annuelle et se regroupent habituellementà Benzéna de avril à juin puis se dispersent au débutdes pluies (Maïga 1999; Blake et al. 2003). La popu-lation était estimée à 350 par Blake et al. (2003).
Méthodes
Terrain
La température élevée, la brise constante et l’humiditéfaible provoquent l’assèchement rapide des déjectionsdes herbivores ; les déjections déposées au solreprésentent ainsi la distribution accumulée pendant la
saison sèche. De ce fait, nous avons utilisé l’abondancedes déjections animales comme un indice du cumuld’occupation pendant la saison sèche. Pour estimer ladistribution des déjections, nous avons utilisé un modèlede transects systématiques avec un point de départaléatoire. Après avoir sélectionné au hasard un pointsur la berge de la mare, trois lignes parallèles orientéesnord–sud à partir de la mare, ont été matérialisées surla carte (fig. 2). L’intervalle entre les lignes a été fixé à2 km. Sur chaque ligne, nous avons placé sept transectsà des intervalles réguliers de 1 km, avec le premiertransect centré à 500 m de la limite de la mare. Nousn’avons pas tenu compte des transects situés dans laforêt dense (ex : Tabarac-barac) à l’exception d’un seul,à cause du risque de rencontrer les éléphants.
Chaque transect mesurait 200 m de long. Au débutet à la fin de chaque transect les déjections du chepteldomestique étaient comptées dans trois quadrats de 1x 0.5 m, soit six quadrats par transect. La densité
Figure 1. Carte du Gourma montrant la mare de Benzéna.
Bambara-MaoundeIndama 3
Adiora
GuiaTeze
Gossi
Gao
HomboriBoniDouentza
Benzéna Inadiatiafane
0 100 km
N
N
Tombouctou
Gourma-Rharous
Techerit
Mondoro

Pachyderm No. 40 January–June 2006 37
Distribution des éléphants autour d’une mare sahélienne
moyenne de déjection était alors calculée pour chaqueespèces d’animale domestique.
Les déjections d’éléphants ont été recensées enutilisant la méthode des transects en ligne : la dis-tance perpendiculaire était mesurée pour chaquedéjection observée à partir du centre de la ligne detransect (Buckland et al. 1993, 2001). La densité desdéjections des éléphants (D) pour chaque transect aalors été calculée en utilisant la formule :
D = n.f(0) / 2L
où n représente le nombre de déjections observées,f(0) l’inverse de la demi largeur effective de la bandeet L la longueur du transect (Buckland et al. 1993,2001). La valeur de f(0) varie avec le type devégétation, ainsi les données pour tous les transectsde chaque type de végétation ont été regroupées etune valeur globale de f(0) calculée pour chaque typede végétation utilisant DISTANCE 4. La valeur de
f(0) a ensuite été utilisée pour estimer ladensité de déjection pour chaque transectdans chaque type de végétation. Les troistypes de végé-tation étaient la végétationdense boisée adjacente à la mare (6transects), la brousse claire (33 transects)et la forêt (1 transect).
Tous les arbres et arbustes situés dansune bande de 21 m du centre de la ligne detransect soit une largeur effective de 42 m,on été identifiés et recensés. La densité dechaque espèce a été calculée.
Les transects ont été parcourus en finde saison sèche, entre le 27 mai 2004 et le1er juin; les pluies ont commencé le 5 juin2004.
Analyses
Les applications de la loi de ‘Taylor’spower’ (Southwood 1978: p 11) ontsuggéré une transformation logarithmiquepour les densités de déjections deséléphants, boeufs et chèvres, et une trans-formation de racine carrée pour les densitésde déjections de moutons. Les densités devégétation ont aussi subi la transformationlogarithmique ; toutes les transformationslog étaient de la forme ln(1 + X). Ladiversité spécifique des plantes a été
mesurée par l’indice de Schannon-Weiner (Krebs1989):
H = –∑pi.ln(p
i)
Où pi était la proportion de la ième espèce de
l’échantillon.
Résultats
Déjection d’éléphant en relation avec l’eau
Un total de 652 déjections éléphants a été recensé sur40 transects. La végétation boisée du côté de la mareétait plus dense en déjection que la formation végétaleclaire, engendrant une différence significative de dis-tribution de fréquence des distances perpendiculaires(Kolmogorov-Smirnov two-sample test D
max = 0.161,
p < 0.001), donc les transects près de la mare ont ététraités séparément du reste. Les transects des forêts
Figure 2. Carte montrant la position des transects autour dela mare de Benzéna.
Légende
transects
eau
lit de la mare
Foret de Tabarak-barak
1 0 1 km
N

38 Pachyderm No. 40 January–June 2006
Barnes et al.
ont aussi été traités séparément. Pourchaque groupe de transects, lesmodèles semi-normaux se sontrévélés être les estimateurs les plusadéquats pour l’estimation de f(0).
La distance de la mare était lavariable qui expliquait mieux la dis-tribution des déjections d’éléphant(fig. 3).
Déjection d’éléphant enrelation avec la végétation
La densité de Balanites aegyptiacaavait aussi une forte influence sur ladistribution des éléphants (tableau 1et fig. 4), ainsi que la densité detoutes les espèces de Acacia (tableau1 et fig. 5).
Acacia spp. et B. aegyptiacamontraient souvent des signes de broutage important,alors que Boscia senegalensis était rarement touchépar les éléphants. Les éléphants étaient attirés par leszones de forte diversité spécifique (tableau 1 et fig. 6).
Le modèle qui expliquait mieux la distribution desdéjections d’éléphants était :
Ln(1 + E) = 2.61 – 0.41W + 0.60D – 0.20ln(1 + L)+ 0.27ln(1 + A)
radj
2 = 0.596, F = 15.37, p < 0.0001
où E représente la densité de déjections d’éléphantsexprimée en nombre de déjection par ha, W la dis-tance de la mare (km), D l’indice de diversité
Figure 3. La relation entre la densité de déjection des éléphants et ladistance de la mare. Ln(1 + E) = 2.92 – 0.37W, r = –0.647, p < 0.0001.
Tableau 1. Corrélations entre les densités de déjection des herbivores et les variables de végétation. Toutesles densités sont exprimées en nombre de pieds ou de déjections par hectare
Variable de végétation Ln(1+ densité Ln(1 + densité Ln(1 + densité √ Densité dede déjection de déjection de de déjection de déjection ded’éléphant) boeuf) chèvre) mouton
Nombre d’espèces ligneuses 0.195 –0.070 0.126 0.239Diversité spécifique 0.360* –0.062 0.141 0.414*Ln(1 + densité de Leptadenia) 0.025 0.121 0.440** 0.094Ln(1 + densité de toute les espèces ligneuses) 0.168 0.004 0.285 0.131Ln(1 + densité de Acacia spp.) 0.422** -0.160 0.107 0.219Ln(1 + densité de Balanites aegyptiaca) 0.606** 0.045 0.554** 0.488**Ln(1 + densité de Boscia angustifolia) 0.083 0.056 –0.206 –0.246
* p < 0.05; ** p < 0.01
spécifique, L la densité de Leptadenia exprimée ennombre de pieds par ha et A la densité de Acacia spp.exprimée en nombre de pieds par ha.
Cheptel domestique
En contraste avec les éléphants, les déjections desboeufs ne montraient aucune corrélation avec la dis-tance à l’eau (r = –0.134, NS). Il n’y avait aucunerelation entre les boeufs et chacune des variablesvégétales (tableau 1).
Les chèvres étaient fortement corrélées avec Bal-anites et Leptadenia (tableau 1). Tout comme leséléphants, elles étaient plus fréquemment recensées près
0.00 1 2 3 4 5 6 7
1.0
2.0
3.0
4.0
5.0
Distance à l'eau (km)
In (
1 +
den
sité
de
déje
ctio
n de
s él
épha
nts)

Pachyderm No. 40 January–June 2006 39
Distribution des éléphants autour d’une mare sahélienne
faiblement corrélées avec la dis-tance à l’eau (r = –0.221, NS).Les moutons étaient aussicommuns au nord de la mare deBenzéna (t = 2.607, df = 38, p <0.05). Le meilleur modèle pourles déjections de mouton S était:
√S = 0.12 + 0.17ln(1 + B) +0.67D + 0.56N
radj
2 = 0.399, F = 9.65, p < 0.0001où N représente une variableindicatrice décrivant si le transectétait au nord (N = 1) ou au sud(N = 0) de la mare de Benzéna.
Eléphants et chepteldomestique
Le cheptel domestique pourrait-il répondre à toutes les variationsde densité de déjection d’élé-phant non encore expliquées parles quatre variables de l’habitat ?Il y avait une corrélationlégèrement positive avec leschèvres (r = 0.279, NS) et lesmoutons (r = 0.275, NS), maisaucune pour les boeufs (r =0.031, NS). Chaque variable decheptel domestique a été ajoutéepar elle-même à l’équation derégression multiple de la densitéde déjection d’éléphant. Les testspartiels F-tests (Neter et al.1990) ont montré que chaquevariable subit une réductionnégligeable de la variance non
expliquée (tableau 2).
Discussion
La densité de déjection enregistrée à la fin de la saisonsèche représente le cumul d’occupation de chaqueespèce. En effet elle ne peut pas exprimer leschangements d’utilisation de type de végétation quipourraient advenir au fur et à mesure que la saisonprogresse, ni les changements de relations entre lesespèces herbivores.
Figure 4. La relation entre la densité de déjection des éléphants etBalanites aegyptiaca.
Figure 5. La relation entre la densité de déjection des éléphants etAcacia spp.
0.0
0.0 1.0 2.0 3.0 4.0 5.0 6.0
1.0
2.0
3.0
4.0
5.0
Ln(1 + densité de Balanites aegyptiaca)
Ln(1
+ d
ensi
té d
e dé
ject
ion
des
élép
hant
s)
0.0
0.0 0.5 1.0 1.5 2.0 2.5 3.0 3.5 4.0
1.0
2.0
3.0
4.0
5.0
Ln(1 + densité de Acacia sp.)
Ln(1
+ d
ensi
té d
e dé
ject
ion
des
élép
hant
s)
de l’eau (r = –0.415, p < 0.01). Les chèvres étaient pluscommunes au nord de la mare de Benzéna (t = 2.333,df = 38, p < 0.05). Le meilleur modèle pour les déjectionsde chèvre G était :
Ln(1 + G) = 8.79 + 0.41ln(1 + B) + 0.24ln(1 + L)r
adj2 = 0.366, F = 12.27, p < 0.0001
où B était B. aegyptiaca. Les moutons étaient aussifortement corrélés avec B. aegyptiaca et avec ladiversité spécifique (tableau 1) et seulement

40 Pachyderm No. 40 January–June 2006
Barnes et al.
plus petite que l’on ne le pensaitauparavant, compliquantd’avantage les questionsgénérales de la capacité de charge(Macnab 1985).
Les éléphants préféraient leszones de forte diversité spéci-fique, ce qui conforte l’idée selonlaquelle ils ont évolué comme desconsommateurs généraux qui ontbesoin de maintenir une alimen-tation variée (Olivier 1978).Leurs espèces préférées — tellesque B. aegyptiaca et Acacia spp.,et particulièrement Acacia —montraient des signes debroutage intensifs (Blake et al.2003).
Le meilleur modèle pour lesdéjections éléphants montrequ’après que l’on ait pris encompte l’effet de l’eau (W), il yavait une relation négative avecLeptadenia pyrotechnica. C’estune espèce qui colonise les solssecs pauvres en nutriment etsouvent elle couvre de vastes su-perficies du Gourma, parfois enforte densité ; bien que lesdromadaires la consomment etque les chèvres prélèvent plutôt
les fleurs et les fruits, les éléphants ne la consommentpas du tout. La relation négative entre les éléphantset la densité de Leptadenia pourrait signifier que leséléphants évitent les zones de Leptadenia, ou qu’ilsévitent les communautés de plantes sur les solspauvres ; et Leptadenia est un indicateur de tels sols.
Il n’existait aucune évidence de compétition en-tre les éléphants et le cheptel domestique. Commeles éléphants, les chèvres et les moutonssélectionnaient les zones à forte densité de Balanites(tableau 1), mais ils n’étaient pas attirés par les zonesà Acacia que les éléphants préféraient. Contrairementaux éléphants, les chèvres ont montré une fortecorrélation avec Leptadenia. Des différences ont étémises en évidence entre les chèvres et les moutons :les moutons préféraient les zones à haute diversitéspécifique alors que les chèvres montraient unepréférence pour ce type d’habitat, et les moutons nemontraient aucune attraction pour Leptadenia.
Tableau 2. Résultats des tests partiels F-tests pour déterminersi les variables du cheptel domestique contribuent de façonsignificative à l’équation de régression multiple qui expliquel’abondance des éléphants
Espèces F P
Ln(1 + densité de déjection de boeuf) 0.053 NSLn(1 + densité de déjection de chèvre) 0.377 NSDensité de déjection de mouton 0.253 NS
Figure 6. La relation entre la densité de déjection des éléphants etl’indice de diversité spécifique.
0.0
0.0 0.5 1.0 1.5 2.0
1.0
2.0
3.0
4.0
5.0
Indice de diversité spécifique
Ln(1
+ d
ensi
té d
e dé
ject
ion
des
élép
hant
s)
Quatre variables ont décrit la sélection d’habitatdes éléphants autour de Benzéna : la distance à l’eau,la diversité spécifique, et les densités de Leptadeniaet Acacia spp.
Il y avait un fort gradient de densité des éléphantsau fur et à mesure que l’on s’éloigne de la mare (fig.3). Il n’y avait aucun signe de pâturage éléphant audelà de 6 km dans les dunes au nord de la mare.Cependant il existait des axes de déplacementsd’éléphants vers le Sud, avec plus de déjections lelong des axes entre la mare de Benzéna et les forêtstelle que Tabarak-barak où les éléphants s’abritentpendant la journée.
En calculant la capacité de charge écologique duGourma pour les éléphants, Olivier (1983) etJachmann (1991) ont tous les deux, supposé que leséléphants pâturent sur une vaste superficie. Nosrésultats suggèrent que pendant la saison sèche, leséléphants utilisaient une fraction de paysage beaucoup

Pachyderm No. 40 January–June 2006 41
Distribution des éléphants autour d’une mare sahélienne
Contrairement aux moutons et aux chèvres, les boeufsne montraient aucune préférence pour aucun type devégétation.
Remerciements
Nous remercions la Direction Nationale de la Con-servation de la Nature à Bamoko, en particulier leDirecteur adjoint, M. Mamadou Gakou et leCoordonnateur du Projet biodiversité du Gourma, M.Biramou Sissoko, pour leur soutien. Notre gratitudes’adresse aussi au Directeur régional de la Conserva-tion de la Nature à Mopti, M. Timbou, et du Directeurrégional de la Conservation de la Nature àTombouctou, M. Ag Hamati Mohamed, pour leursoutien et leur grand intérêt.
Ce projet a été appliqué par le consortium de TheWild Foundation, The Environment and DevelopmentGroup et Save the Elephants avec des financementsdu Département d’Etat des Etats-Unis à traversl’Ambassade des Etats-Unis à Bamako. L’Ambassadedes Etats Unis a fait don de deux véhicules. Nousremercions l’Ambassadrice de Etats-Unis, Son Ex-cellence Vicki Huddleston, pour son soutien et celuides membres de son équipe, en particulier M. OumarKonipo et M. Matt Miller. Nous remercions lescollègues du Consortium — Dr. Vance Martin, Dr.Keith Lindsay, Dr. Iain Douglas-Hamilton et Dr.Francis Lauginie — pour leur soutien sur le terrain.
Nous remercions les membres de l’équipe de ter-rain, M. Ibrahim Touré, M. Mourtada Diallo Papa,M. Lauka Poudougou et M. Carlton Ward pour leursoutien.
References
Blake S, Bouché P, Rasmussen H, Orlando A, Douglas-Ham-ilton I. 2003. The last Sahelian elephants: ranging behavior,population status and recent history of the desert elephantsof Mali. Save The Elephants, Nairobi. Unpublished.
Buckland ST, Anderson DR, Burnham KP, Laake JL 1993.Distance sampling: estimating abundance of biologi-cal populations. Chapman & Hall, London.
Buckland ST, Anderson DR, Burnham KP, Laake JL,Borchers DL, Thomas L. 2001. Introduction to distancesampling: estimating abundance of biological popula-tions. Oxford University Press, Oxford.
Jachmann H. 1991. Current status of the Gourma elephantsin Mali: a proposal for an integrated resource manage-ment project. IUCN, Unpublished.
Krebs CJ. 1989. Ecological methodology. Harper & Row,New York.
Macnab J. 1985. Carrying capacity and related shibboleths.Wildlife Society Bulletin 13:403–410.
Maïga MH. 1999. Les relations homme–éléphant dans leGourma malien. Le Flamboyant 50:20–26.
Neter J, Wasserman W, Kutner MH. 1990. Applied linearstatistical models, 3rd ed. Richard D. Irwin Inc,Homewood, Illinois.
Olivier RCD. 1978. On the ecology of the Asian elephant.PhD thesis, University of Cambridge.
Olivier RCD. 1983. The Gourma elephants of Mali: a chal-lenge for the integrated management of Sahelianrangeland. UNEP, Nairobi. Unpublished.
Pringle RM, Diakité N. 1992. The last Sahelian elephants.Swara 15:24–26.
Southwood TRE. 1978. Ecological methods. Chapman &Hall, London.

42 Pachyderm No. 40 January–June 2006
Sam et al.
The African Elephant Specialist Group throughits Small Grants Programme funded by the EuropeanUnion supported a preliminary investigation into thepossibilities of linking this population to others in theGuinean rainforests of western Ghana. This paper isabout two of the objectives of the extended study: 1)to determine the distribution and numbers of elephantsin the Bia Conservation Area and 2) to investigatethe relationship between elephant density and differ-ent levels of human activity and ecological factors.
The study also provided an opportunity to test andcompare elephant population size estimates derived
Introduction
Around the turn of the 20th century, elephants werestill widely distributed over the Upper Guinea forestzone and were little affected by human settlement(Roth and Douglas-Hamilton 1991) until the 1950s,when intensive development started. Currently, ele-phants in West Africa are fragmented into 84 sepa-rate populations, many of which are small andthreatened (Blanc et al. 2003). Twelve of these canbe found in Ghana, five of them, including the im-portant Bia population, are forest populations.
Elephant survey in the Bia Conservation Area, western Ghana
Moses Kofi Sam,1 Emmanuel Danquah,2 Samuel K Oppong,2 Ebenezer Daryl Bosu3
1 Resource Management Support Centre, Forestry Commission, PO Box 1457, Kumasi, Ghana;email: [email protected] Faculty of Renewable Natural Resources, College of Agriculture and Natural Resources, Kwame NkrumahUniversity of Science and Technology, Kumasi, Ghana; email: [email protected];[email protected]; [email protected] A Rocha Ghana, PO Box 3480, Kaneshie, Accra, Ghana; email: [email protected]
Abstract
In February 2004, a dry-season elephant survey was conducted in the Bia Conservation Area in WesternRegion of Ghana to determine the distribution and abundance of elephants and the human and ecologicalvariables that affect them. Fifty-two 1-kilometre transects were systematically distributed in three strata (high,medium and low density) based on elephant dung-pile density recorded in an initial reconnaissance. Twoestimation models were used to estimate elephant numbers: a rainfall model gave an estimate of 115 (95% CI= [90, 148]) elephants while a steady-state assumption model provided 146 (95% CI = [107, 185]) elephants.Water availability explained a high proportion of the variance in elephant distribution and illegal activity.Other variables assessed, including raphia stand, secondary vegetation, gap length and fruiting trees, did notaccount significantly for the distribution of elephants.
Résumé
En février 2004, en saison sèche, on a réalisé une étude des éléphants dans l’Aire de Conservation de Bia,dans la Région occidentale du Ghana, pour déterminer la distribution et l’abondance des éléphants ainsi queles variables humaines et écologiques qui les affectent. Cinquante-deux transects d’un km de côté ont étédéterminés systématiquement dans trois strates (haute, moyenne et basse) basées sur la densité de crottesd’éléphant relevée lors d’une reconnaissance préalable. Deux modèles d’estimation ont été utilisés pour évaluerle nombre d’éléphants : un modèle « chute de pluie » qui a donné une évaluation de 115 éléphants (IC 95% =[90, 148]), alors qu’un modèle « stationnaire » donnait 146 éléphants (IC 95% = [107, 185]). La disponibilitéen eau expliquait en grande partie la variance de la distribution des éléphants et les activités illégales. D’autresvariables évaluées, comme la présence de palmier raphia, de végétation secondaire, la longeur de le’space etles arbres en fruits, ne comptent pas significativement dans la distribution des éléphants.

Pachyderm No. 40 January–June 2006 43
Elephant survey in the Bia Conservation Area, western Ghana
from two estimation models, a steady-state assump-tion model (McClanahan 1986), and a rainfall model(Barnes et al. 1997; Barnes and Dunn 2002). Thenumber of elephant dung piles lying on the forest flooris determined by the number of elephants present andthe rainfall in the two preceding months (Barnes andDunn 2002). Hence, the rainfall model uses rainfalldata from previous months to estimate the numbersof dung piles that are likely to be on the ground whena survey is conducted and makes no such assump-tions as steady states or normality. The steady-stateassumption model on the other hand assumes steadystate in the forest, such as a steady rate of dung de-cay. However, because rainfall varies from month tomonth, and in any one month is unevenly distributedacross days, the steady-state assumption is ofteninvalid (Barnes et al. 1997). Because of its appreci-able elephant numbers the Bia Conservation Area(BCA) provides the opportunity to test and comparethe two estimation techniques (Heffernan and Graham1999; Sam 2000).
Study area
Located in western Ghana, the Bia Conservation Area(BCA), comprises Bia National Park (Bia NP) in thenorth and the adjacent Bia Resource Reserve (Bia RR)in the south (fig. 1). Both forests cover an area of 306km2 and were managed as a national park before theirpresent classification. In early 1976, pressure from thetimber industry compelled the government to downgradepart of the park into a resource reserve to allow control-led logging (PADP 2001). Logging was however stoppedin 1997 and both forests classified as the BCA for eco-system protection, research and recreation.
The BCA was originally part of a larger forestecosystem for forest elephants known as the BiaGroup of Forest Reserves, about 1500 km2, most ofwhich are non-existent. The Bia elephant range hascontracted due to clearance for cocoa cultivation andis now an isolated population on an ecological islandof forest with hard boundaries and no transitional zoneto farmland (PADP 2001).
The vegetation comprises mainly Celtis zenkeriand Triplochiton scleroxylon moist semi-deciduousforest, which is transitional towards the more typicalrainforest association of Lophira alata andTriplochiton scleroxylon found in the southern partof Bia RR (Taylor 1960; Hall and Swaine 1976). Rain-fall is bimodal, peaking in June and October.
Methods
Reconnaissance survey
In a reconnaissance exercise undertaken in February2004, the study area was divided into blocks and eachblock thoroughly searched for elephant dung usingmeandering transects in a predetermined compassbearing. The idea was to limit excessive cutting ofvegetation, which would have had to be done hadstraight transects been used. Meandering transectsalso enabled teams to cover much of the forest withina short time.
Based on the dung-density estimates from the re-connaissance survey, the study area was divided intothree strata of population density: high, medium andlow (fig. 1). The southern half of Bia RR was desig-nated high density; the remaining northern half of BiaRR, medium density; and the whole of Bia NP whereno elephant activity was found, low density.
Main survey
The standard line transect method (Barnes 1996a;Buckland et al. 2001) was employed for countingdung piles (Barnes and Jensen 1987) within the studyarea in February–March 2004.
A grid consisting of squares, each one minute oflatitude and longitude, was superimposed on the mapof the study area. An initial square was randomly se-lected and an additional 51 squares were then system-atically selected relative to it within the three strataaccording to the relative dung density found during thereconnaissance (Norton-Griffiths 1978). One-kilome-tre transects were placed in the middle of the selectedgrids and oriented northwards as a rule of thumbbecause of the unavailability of major streams withinBCA. Thus 30 transects were distributed in the high-density stratum, 15 in the medium, and 7 in the low.
The perpendicular distance of the dung piles seenon transects was measured from the transect centreline using a tape measure. The distance along transectswas measured with a hip chain. Age of dung wasgauged using the criteria of Barnes and Jensen (1987).
Two survey teams of four persons each, led by acompass man (team leader) and a line cutter, were main-tained throughout the counts to ensure consistency.

44 Pachyderm No. 40 January–June 2006
Sam et al.
Analysis
STEADY-STATE ASSUMPTION MODEL
Assuming a steady state in the forest, the density ofelephants (E) can be calculated from three variables(McClanahan 1986; Barnes and Jensen 1987):
E = Yr /D (1)
where Y is the density of dung piles, r is the decayrate and D is the defecation rate.
However, each of the variables (Y, r, D) is an esti-mate with its own variance, which will contribute tothe variance of E (Barnes 1993):
var (E) = var (D) x [(Yr)2 / D4] + [var (Yr) / D2] (2)
where
var (Yr) = var (Y) • var (r) + Y2 • var (r) + r2 • var (Y)(3)
The value of the decay rate, r, of elephant dung inthe dry season was obtained from Barnes et al. (1994).
Figure 1. Bia Conservation Area showing transect distribution in the various strata.
KeyGhana–Côte d’Ivoire boundary
Bia River
W 3˚10’
N 6˚20’
N 6˚25’
N 6˚30’
N 6˚35’
N 6˚40’
W 3˚05’ W 3˚00’ W 2˚95’
Ghana
transects
boundaries of strata
Low-density stratum (Bia NP)(area = 77.7 km2)
Medium-density stratum (Bia RR)(area = 114.4 km2)
High-density stratum (Bia RR)(area = 113.5 km2)
0 5 10 km
N
RR resource reserve NP national park

Pachyderm No. 40 January–June 2006 45
Elephant survey in the Bia Conservation Area, western Ghana
No estimate of defecation rate has been done in BCA;therefore Tchamba’s (1992) defecation-rate estimatefrom Cameroon (D) was used. The value of dung-pile density, Y, was calculated using the DISTANCEprogram (Laake et al. 1993).
RAINFALL MODEL
Data on rainfall two months prior to the main line-transect dung survey was collected from four raingauges mounted around BCA and the mean total rain-fall value was calculated for each month. A modelthat relates dung density (Y
t) to rainfall two months
preceding the survey was used to estimate density(Barnes et al. 1997). Thus,
Yt = 1020.24 – 0.79RAIN
t–1 – 0.46RAIN
t–2(4)
where Yt is dung density if there is one elephant per
square kilometre and RAINt–1
is the total rainfall (mm)in the first month preceding the month of the surveyand RAIN
t–2 rainfall preceding the second (Barnes and
Dunn 2002).Elephant density (E) is represented by
E = Y /Yt
(5)
where Y is dung density from the survey.The above analyses were done separately for each
stratum, after which the separate estimates weremerged (Norton-Griffiths 1978).
Factors affecting elephant distribution
On all transects, 10 sampling points were noted, eachat every 100-m mark. When the observer arrived atthe designated sample point, a GPS fix of the pointwas taken. The vegetation type (including secondaryforest, raphia palm stand, riparian vegetation and othervegetation types, which would then be specified) wasnoted. Also the canopy condition (presence of gaps
in the canopy, length of gaps traversed by transect)was recorded.
Any human-built infrastructure or illegal humansigns such as wire snares, empty cartridge cases,poaching camps, cane and wood cuttings encounteredon the transects were also recorded. Other human in-fluence such as the construction of trails or pointsassociated with loading or hauling timber productswas recorded as logging roads. All fruiting trees andwater sources such as streams, rivers, ponds andswamps without raphia palm (may be dry as surveywas conducted in the dry season) were also noted.
Regression analyses were used to investigate re-lationships between dung density and all human andgeographical or other natural variables.
Results
Estimate of elephant numbers in the studyarea
A total of 210 dung piles was spotted: 183 in the highdensity (6.1 piles per km), 27 in the medium density(1.8 piles per km) and none in the low-density strata.Dung density was significantly higher in the high-density than in the medium-density strata (Mann-Whitney U test: U = 41.5, p < 0.05). The high-densitystratum had a higher density of dung piles, and asexpected gave a higher variance (suggesting a highlyclumped elephant distribution) than the medium-den-sity stratum (table 1). Using the rainfall model, theestimated number of elephants was 115 (90, 148 at95% confidence level); with the steady-state assump-tion model the estimate was 146 (107, 185 at 95%confidence level). The rainfall model gives asym-metrical confidence limits (CLs).
Factors affecting elephant distribution
Most elephant activities were concentrated at thesouth and south-eastern sections of Bia RR and thinly
Table 1. Estimates of dung density per stratum in the Bia Conservation Area
Stratum Area (km2) Dung-pile Variance* Number ofdensity (Y)* transects
Low-density 77.7 0 0 7Medium-density 114.4 305.28 7650 15High-density 113.5 758.61 10562 30
* Hazard rate model

46 Pachyderm No. 40 January–June 2006
Sam et al.
spread northwards through the central por-tions with no elephant activity in Bia NP.
Figure 2 indicates that elephant distri-bution was clumped and significantly in-fluenced (r2 = 0.759, p < 0.05) by the numberof water sources (ponds and dams).
Elephants were reported hunted but theteam could not ascertain the intensity. AtAdjuofia, a community in north-eastern BiaNP, for instance, an elephant was report-edly killed less than three months into thestudy. Yet there was no direct correlationbetween illegal activity and elephant dis-tribution (r2 = 0.413, NS).
However, there is a threshold dung-piledensity (approximately 5 dung piles perkm) that affects illegal activity; no illegalactivity was found beyond this threshold(fig. 3).
Similarly, no illegal activity was re-corded on transects with more than ap-proximately five water sources perkilometre (fig. 4).
Other variables assessed: raphia stand(r2 = 0.005), secondary vegetation (r2 =0.249), gap length (r2 = 0.079), and fruit-ing trees per kilometre (r2 = 0.009) didnot account significantly to the distribu-tion of elephants.
Discussion
Estimate of elephant numbers inthe study area
Dung counts relate elephant numbers toa count of dung piles detected along linetransects, corrected for variables such asrainfall in the two months before thecount, rate of deposition of dung piles, and rate ofdung decay (Barnes et al. 1997; Barnes and Dunn2002). The last factor is usually the most problem-atic (Laing et al. 2003), and many elephant surveyorshave relied on data from other sites. A new alterna-tive approach, referred to as the retrospective model(Laing et al. 2003), employs a more advantageousapproach by estimating the mean time to decay ofdung piles already present at the time of the survey.We could not use this method because it requires anadded dung decay rate experiment, which is not fea-
sible for relatively short-duration investigations likeours. Incidentally, the rainfall model also employs aretrospective approach—that is, it uses the rainfalldata from previous months to estimate the numbersof dung piles that are likely to be on the ground whena survey is conducted while making no such assump-tions as the steady states or normality. It is more ac-curate than the steady-state method, which employs a‘prospective’ decay rate for analysing data on dungcount and hence does not estimate the mean time todecay of dung piles that are present at the time of the
–0.5
0
0.5
1.0
1.5
2.0
2.5
3.0
–.5 0 .5 1 1.5 2 2.5 3
ln [(water sources per km)+1]Y = .661 + 1.021 * X - .114 * X^2; R^2 = .759
ln [(
dung
pile
s pe
r km
)+1]
Figure 2. Relationship between water sources and dung-piledensity.
–0.5
0
0.5
1.0
1.5
2.0
2.5
3.0
3.5
4.0
4.5
–2 0 2 4 6 8 10 12 14
Dung piles per km
Illeg
al a
ctiv
ity p
er k
m
Figure 3. Scatterplot of illegal activity against dung piles perkilometre.

Pachyderm No. 40 January–June 2006 47
Elephant survey in the Bia Conservation Area, western Ghana
survey (Laing et al. 2003). Also, rainfall varies frommonth to month, and in any one month it is unevenlydistributed across days. Thus the steady-state assump-tion is often invalid (Barnes et al. 1997). This is sup-ported by the fact that the estimate provided by thesteady-state assumption model was not conservativebut rather higher (21%) than that given by the rain-fall model. Conservative estimates of population sizesmay be better than overestimates, especially if man-agers are faced with potentially damaging decisions,such as whether or not they should reduce the size ofa population through culling (Eggert et al. 2003). Wethus estimate the average density of elephants at BCAat 0.38 per km2, based on the rainfall model.
In an earlier study based on track identification,Sikes (1975) estimated 52 to 82 elephants in BCA,giving a density of 0.25 per km2. Martin (1982) fol-lowed with an estimate of between 200 to 250 for theBia forest area, which was previously 1500 km2 andincluded BCA, but currently is totally degraded leav-ing only BCA intact and with elephants. Based on hiselephant densities, he provided an estimate of between89 and 113 elephants (0.29–0.37 per km2) for BCA.This compared well with an estimated density of 0.33per sq km (40 to 135 elephants) by Short (1983). Morerecently, Heffernan and Graham (1999) estimated 138elephants, comparable to the estimate of 127 elephantsprovided by Sam (2000) with densities of 0.45 and0.42 per km2, respectively. Our present 2004 estimateof 115 elephants (0.38 ele-phants per km2) also lieswell within the CLs of the preceding two estimates,
suggesting no evidence for any signifi-cant change between the years 2000 and2004. The estimates up to 2000 suggestan increasing elephant density withinBCA over the last quarter century. At thesame time, the Bia elephant range hasshrunk to about one-fourth of its originalsize (from 1500 km2 to 366 km2), partlyas a result of the Sukusuku Forest Re-serve and the Bia Tawya Forest Reserveboth being illegally and completely con-verted to farmland (Martin 1982). Hencethe increasing elephant density may re-flect the same number of elephants in asmaller area.
Factors affecting elephantdistribution
Formerly elephants were found in both Bia NP andBia RR (Short 1981; Martin 1982). Favourable con-ditions created by logging activities in Bia RR dur-ing the early 1980s (de Leede 1994), however, havecaused elephants to migrate permanently into itssouthern portions (Short 1981; Martin 1982). BothBarnes (1996b and de Leede (1994), have also ob-served this pattern of distribution. However, in thecurrent study, elephants were found to be more wide-spread than formerly observed. Indeed, there is a me-dium elephant-density stratum that extends above themore southern high density to the limits of Bia NP,suggesting that after the ban on logging in Bia RR in1998 elephants have gradually been dispersing to-wards Bia NP.
Analysis of dung-pile distribution indicated that wa-ter sources accounted for a large proportion of this vari-ation in BCA; elephants were spending more timearound water sources. Barnes (1996b and Sam (2000)also reported a positive correlation between elephantabundance and number of water sources per kilome-tre. These pools or water sources, which were moreabundant in the south and south-eastern sections of thereserve, were created as part of the logging activitiesof Mim Timber Company. Their construction of wideand extensive logging and hauling roads (PADP 1998)have blocked many streams, forming several pools anddams along the sides of sections of the roads. Apartfrom their swampy nature, the areas around these poolswere surrounded by thick thorny vegetation, which isdifficult to traverse and hence likely to be avoided by
–0.5
0
0.5
1.0
1.5
2.0
2.5
3.0
3.5
4.0
4.5
–2 0 2 4 6 8 10 12 14 16Water sources per km
Illeg
al a
ctiv
ity p
er k
m
Figure 4. Scatterplot of illegal activity in relation to water sourcesper kilometre.

48 Pachyderm No. 40 January–June 2006
Sam et al.
hunters (Sam 2000). Therefore, while the pools pro-vided water for the elephants, the vegetation at theirbanks also gave them protection. Barnes (1996b) fur-ther reported significant correlation between dung den-sity and fruiting trees and Sam (2000) between dungdensity and illegal activity. This study found no suchcorrelation.
Sam (2000) stresses that water availability in thereserve is not a problem because of many artificial poolsin the reserve. However, elephants may be avoidingBia NP due to lack of water in most elephant pools,especially in the dry season, when the present surveywas conducted. Besides, the national park was lastlogged in the 1970s; that is, it has not been recentlylogged. Consequently, elephant movement and dis-tribution in the dry season may be restricted by wateravailability more than any other single factor. Adeeper understanding into this current movement to-wards the national park after a long period of absenceis worth obtaining.
Mean illegal activity in BCA (0.74 activities perkm) was comparable to other Ghanaian forests like theKakum (0.67) and Ankassa (0.97) Conservation Areas(EBMP 2000; 2001). Similarly, illegal hunting for al-most all species of animals occurs there includingseveral killings of elephant (Sam 2000). Althoughelephants are fully protected in Ghana, the Bia ele-phant population, like others in the country, is stillthreatened. The last illegal elephant killing was justthree months before this current study. It may be thatas many elephants as are recruited are lost annually.Our information suggests that elephants may be killedfor ivory rather than out of human–elephant conflict,although the resulting free meat is usually not wasted.
Different levels of illegal human activity withinthe park did not influence elephant density. The useof wire snares dominated the signs of illegal activity,although hunting with guns poses the greater threatto elephant populations. Poachers may be avoidingwatering points, possibly because these areas had thehighest concentration of elephants and they may fearencountering herds. These observations suggest thatmost of the illegal activities seen on the transects maybe targeted at small game rather than elephants.
Importance of the Bia population forelephant conservation in West Africa
West African elephants may have diverted from therest of Africa’s elephants more than two million years
ago (Eggert et al. 2003) and may constitute a sepa-rate taxon. If this becomes confirmed through moreextensive genetic sampling, the implications willmake securing the long-term survival of the small andfragmented remaining populations of West Africanelephants challenging indeed (Blanc et al. 2003).
Such a possibility provides a basis for seriouslyconsidering the importance of the Bia elephant rangefor elephant conservation in the subregion. The rela-tively high elephant density estimate in the presentstudy ranks it high in importance for elephant conser-vation and for ensuring its long-term survival in thesubregion; BCA has the third highest forest elephantdensity and a relatively well-protected range (Sam2004). Within Ghana, its importance cannot be over-emphasized, especially taking into consideration thenumber of forest populations available. Such a highconcentration of elephants in a relatively small areaalso has management implications for tourism. Fur-thermore, the Bia population far exceeds the mean sizeof 40 elephants set as priority forest populations in WestAfrica (AfESG 1999). A population of just over 100elephants is fairly large for today’s fragmented forestsbut still is small, and is less than the viable populationsize estimated by Sukumar (1993). Hence, argumentsfor the possibilities of linking this population with theother elephant populations, especially the Goaso popu-lation and those in eastern Côte d’Ivoire, is crucial inensuring the long-term survival of Ghana’s elephantpopulation and that of West Africa.
Acknowledgements
We wish to thank the African Elephant Specialist Group(AfESG) through its EU-funded Small Grants Pro-gramme and A Rocha Ghana for financing this study.We also wish to acknowledge the contributions of BrightKumordzi, Frank Tetteh Kumah and other members ofthe BP 2002 Award Winning Team from KwameNkrumah University of Science and Technology fortheir untiring support of the project. Lastly, we are thank-ful to the entire staff of the Bia Conservation Area, es-pecially Mr Enoch Amasa Ashie (Senior WildlifeOfficer in Charge), Mr Boamah (Senior Wildlife Pro-tection Officer) and Prince Charles Asante (Ranger) forproviding staff and other facilities.

Pachyderm No. 40 January–June 2006 49
Elephant survey in the Bia Conservation Area, western Ghana
References
[AfESG] African Elephant Specialist Group. 1999. Strat-egy for the conservation of West African elephants.Proceedings of a workshop held in Abidjan, 22–26 Feb-ruary 1999. AfESG, Ouagadougu. Unpublished.
Barnes RFW. 1993. Indirect method for counting elephantsin forest. Pachyderm 16:24–30.
Barnes RFW. 1996a. Estimating forest elephant abundanceby dung counts. In: Kangwana K, ed., Studying ele-phants. AWF Handbook No.7. African Wildlife Foun-dation, Nairobi.
Barnes RFW. 1996b. Training course in elephant biologyfor Ghanaian wildlife officers. Report to US Fish &Wildlife Service. 16 + 10 p. Unpublished.
Barnes RFW, Asamoah-Boateng B, Naada Majam J,Agyei-Ohemeng J. 1997. Rainfall and the populationdynamics of elephant dung piles in the forests of south-ern Ghana. African Journal of Ecology 35:39–52.
Barnes RFW, Asamoah-Boateng B, Naada Majam J,Agyei-Ohemeng J, Tchamba MN, Ekobo A, NchanjiA. 1994. Improving the accuracy of forest elephant cen-sus methods: studies of dung decay rates in Ghana andCameroun. In: African Elephant Conservation Pro-gramme final report, vol. 5. Environment and Devel-opment Group, Oxford.
Barnes RFW, Dunn A. 2002. Estimating forest elephantdensity in Sapo National Park (Liberia) with a rainfallmodel. African Journal of Ecology 40:159–163.
Barnes RFW, Jensen KL. 1987. How to count elephants inforests. IUCN African Elephant Specialist Group Tech-nical Bulletin 1:1–6.
Blanc JJ, Thouless CR, Hart JA, Dublin HT, Douglas-Ham-ilton I, Craig CG, Barnes RFW. 2003. African elephantstatus report 2002: an update from the African ElephantDatabase. IUCN/SSC African Elephant SpecialistGroup. IUCN, Gland, Switzerland, and Cambridge, UK.vi + 302 p.
Buckland ST, Anderson DR, Burnham KP, Laake JL,Borchers DL, Thomas L. 2001. Introduction to distancesampling: estimating abundance of biological popu-lations. Oxford University Press, Oxford.
de Leede BM. 1994. Feasibility study on the establishmentof corridors for forest elephants (Loxodonta africanacyclotis Matschie) between forest reserves in westernGhana and eastern Côte d’Ivoire. Ghana Wildlife De-partment, Accra. 39 p.
[EBMP] Elephant Biology and Management Project. 2000.Dry season elephant census of Kakum Conservation
Area. Africa Program, Conservation International,USA. Unpublished.
[EBMP] Elephant Biology and Management Project. 2001.Dry season elephant census of Ankasa ConservationArea. Africa Program, Conservation International,USA. Unpublished.
Eggert LS, Eggert JA, Woodruff DS. 2003. Estimatingpopulation sizes for elusive animals: the forest elephantsof Kakum National Park, Ghana. Molecular Ecology12:1389–1402.
Hall JB, Swaine MD. 1976. Classification and ecology ofclosed canopy forest in Ghana. Journal of Ecology64:913–951.
Heffernan PJ, Graham NAJ. 1999. University of Newcas-tle Bia elephant census, Ghana. Report 1. Dept. of Ag-riculture and Environmental Sciences, University ofNewcastle, UK.
Laake JL, Buckland ST, Anderson DR, Burnham KP. 1993.DISTANCE user’s guide V2.0. Colorado CooperativeFish and Wildlife Research Unit, Colorado State Uni-versity, Fort Collins, CO.
Laing SE, Buckland ST, Burns RW, Lambie D, AmphlettA. 2003. Methodological insights—dung and nest sur-veys: estimating decay rates. Journal of Applied Ecol-ogy 40:1102–1111.
Martin C. 1982. Management plan for the Bia WildlifeConservation Areas. General part 1 and final report.IUCN/WWF project 1251.
McClanahan TR. 1986. Quick population survey methodusing faecal droppings and a steady state assumption.Africa Journal of Ecology 24:37–39.
Norton-Griffiths M. 1978. Counting animals. African Wild-life Foundation, Nairobi.
[PADP] Protected Area Development Project. 1998. Smallmammals survey of Bia and Ankasa. PADP, GhanaWildlife Division, Accra.
[PADP] Protected Area Development Project. 2001. BiaConservation Area Management Plan. Ghana WildlifeDivision, Forestry Commission, Accra.
Roth HH, Douglas-Hamilton I. 1991. Distribution and sta-tus of elephants in West Africa (1). Mammalia 55(4):489–527.
Sam MK. 2000. The distribution of elephants in relation tocrop damage around Bia Conservation Area during the1999 rainy season. Report for IUCN (World Conserva-tion Union), Gland, Switzerland.
Sam MK. 2004. A preliminary investigation into thepossiblities of creating elephant corridors in Guineanforests of western Ghana. Report for IUCN/SSC Afri-can Elephant Specialist Goup, Nairobi, Kenya.

50 Pachyderm No. 40 January–June 2006
Sam et al.
Short J. 1981. Diet and feeding of forest elephants, BiaNational Park. Mammalia 45:177–186.
Short JC. 1983. Density and seasonal movements of theforest elephant (Loxodonta africana cyclotis Matschie)in the Bia National Park, Ghana. African Journal ofEcology 21:175–184.
Sikes SK. 1975. Report on preliminary elephant popula-tion survey in Bia National Park. Ghana Wildlife De-partment. Unublished.
Sukumar R. 1993. Minimum viable populations for elephantconservation. Gajah 11:48–51.
Taylor GJ. 1960. The vegetation zones of Gold Coast. Bul-letin of the Gold Coast Forestry Department 4:1–12.
Tchamba MN. 1992. Defecation by the African forest ele-phant (Loxodonta africana cyclotis) in the SantchouReserve, Cameroon. Mammalia 56:155–158.

52 Pachyderm No. 40 January–June 2006
Danquah and Oppong
Introduction
Few studies have been conducted on the diet of for-est elephants in Ghana (Short 1981; Martin 1982;Liebermann et al. 1987; all in Bia National Park,Ghana) or elsewhere in West Africa (Alexandre 1978in Tai National Park, Côte d’Ivoire; Merz 1981;Theuerkauf et al. 2000 in Bossematie Forest Reserve,Côte d’Ivoire).
It has been suggested that West African elephantsare a separate species from other African elephants(Eggert et al. 2003) hence more information is neededon their foraging ecology to properly developmanagement strategies for their conservation. Moreresearch on the dependence of these elephants onseasonal fruit resources is also important for their
long-term conservation (Dudley et al. 1992). This isespecially true since their protection is high on theconservation agenda in the subregion (AfESG 1999)and particularly in Ghana (Ghana WD 2000).
Study area
The Kakum Conservation Area (KCA) is made up ofKakum National Park and the adjacent AssinAttandanso Resource Reserve (fig. 1). It encompassesan irregular block of forest measuring 366 km2, con-sisting mainly of Celtis zenkeri and Triplochitonscleroxylon moist semideciduous vegetation, whichis transitional to the more typical rainforest Lophiraalata–Triplochiton scleroxylon association in thesouthern part of Kakum Reserve (Dudley et al. 1992).
Food plants of forest elephants and their availability in theKakum Conservation Area, Ghana
Emmanuel Danquah, Samuel K Oppong*
Faculty of Renewable Natural Resources, College of Agriculture and Natural ResourcesKwame Nkrumah University of Science and Technology, Kumasi, Ghanaemail: [email protected]; [email protected]; * corresponding author
Abstract
The diet of elephants in the Kakum Conservation Area, Ghana, was studied from July 2001 to June 2002.Elephants ate fruits and other components of 34 plant species. An examination of elephant dung piles yieldedfruit fragments representing 29 species, while data on fresh feeding signs showed an extra 5 plant species,either browsed upon or barked. The quantity and diversity of fruits eaten showed seasonal differences. Fruitavailability in the park correlated to forest fruits consumed but was inversely correlated to cultivated cropsconsumed. Fruit was most available in October, least available in June. Barking activities were high in closed-canopy areas and browsing in open-canopy areas.
Résumé
Le régime alimentaire des éléphants de l’Aire de Conservation de Kakum, au Ghana, a été étudié de juillet2001 à juin 2002. Les éléphants mangent des fruits et d’autres parties de 34 espèces végétales. L’examen descrottes a permis de récolter des morceaux de fruits de 29 espèces tandis que les données sur les signes d’alimentsfrais désignaient cinq espèces végétales supplémentaires, soit broutées soit écorcées. La quantité et la diversitédes fruits consommés présentaient des différences saisonnières. La disponibilité des fruits dans le parc étaiten corrélation avec les fruits de forêt consommés et inversement proportionnelle aux plantes cultivéesconsommées. Les fruits étaient surtout abondants en octobre, et moins abondants en juin. L’écorçage étaitfréquent dans les endroits où la canopée est fermée et le broutage plutôt là où la canopée est ouverte.

Pachyderm No. 40 January–June 2006 53
Food plants of forest elephants and their availability, Ghana
The rainfall pattern is bimodal: two rainfallseasons separated by a short dry spell in August. Themajor season is between March and July with a peakin June, and the minor season between Septemberand November with a peak in October. There is alsoa main dry season from December to February orMarch, when many water-courses dry up.
Materials andmethods
To equalize sampling effort,KCA was classified into 10blocks approximately 36 km2
each: Adiembra, Aboabo,Ahomaho, Afiaso, Asomdwee,Antwikwaa, Briscoe I, BriscoeII, Mfuom and Park Headquar-ters (fig. 1).
Dung examination
In each block, elephant trailswere followed to locate undis-turbed and relatively new ele-phant dung piles in categoriesA to B (Barnes and Jensen 1987).Distance between selected dungpiles was more than 5 m to en-sure that samples taken were in-dependent deposits (Yumotoand Maruhashi 1995).
Dung piles were examinedin situ; 30 dung piles per month,3 per block, were meticulouslyexamined by carefully siftingthe piles and recording thenumber and type of seeds, fruitand leaf fragments, and seed-lings (Short 1981; White et al.1993; Muoria et al. 2001; Blake2002). The frequency of occur-rence of forest fruits and culti-vated crop fragments in dungpiles was also estimated foreach month. Unidentifiedseeds, seedlings, fruit and leaffragments were sent to the Uni-versity of Cape Coast Her-barium for identification.
Dung components werebroadly classified as seeds, fibre, leaf fragments andunidentified remains. Their abundance was quantifiedon a 4-point scale of relative abundance: up to 25%abundance of a particular component was considered‘rare’ and given 1 point; 25–50%, ‘few’, 2 points; 50–75%, ‘common’, 3 points; more than 75%, ‘abundant’,a full 4 points (White et al. 1993). Monthly averages
Figure 1. The Kakum Conservation Area showing the 10 classified blocks.
Adiembra
Ahomaho
Briscoe I
Briscoe II
Aboabo
Afiaso
*
Antwikwaa*
Mfuom * * Asomdwee
Park HQ *
0 5 km1˚30’ W
5˚15’ N
5˚20’ N
5˚25’ N
5˚30’ N
5˚35’ N
5˚40’ N
1˚25’ W 1˚20’ W 1˚15’ W
Legend
wildlife anti-poaching camps block demarcations
Ghana
1
2
3
4
6 7
8 9
10
5
KakumNationalPark
Assin AttandansoResource Reserve
N

54 Pachyderm No. 40 January–June 2006
Danquah and Oppong
(nearest whole number) per dung component werecomputed by dividing the total points per componentby number of dung piles each month.
An existing record (Nyame 1999) on the averageseed content per fruit of each species was used to es-timate fruit consumption per dung pile. Data werecompiled for a large sample of fruits of the species (>50 fruits), noting the average number of seeds perfruit per species.
Examination of feeding signs
Four blocks—Park Headquarters, Antwikwaa, BriscoeII and Ahomaho—were randomly selected out of the10, based on a numbered system, and a strip transectfor viewing elephant feeding signs was constructed ineach. To increase the likelihood of observing elephantfeeding signs and minimize vegetation damage whencutting new transects, viewing transects were con-structed by linking up elephant trails. Thus were es-tablished four non-linear strip transects approximately3.4 km long and 10 m wide.
Fresh feeding signs that could be attributed withcertainty to elephants (directly by sight or indirectly byassociation with footprints or dung) were inspectedmonthly on transects, and species and parts consumednoted (White et al. 1993; Blake 2002). Vegetation typewas classified as open or closed forest canopy based onthe presence or absence of canopy gaps (> 5 m) withina 5-m radius from where the feeding activity was ob-served. Feeding was classified as leaf stripping, remov-ing terminal twigs, or barking (Short 1981).
Fruit availability
Trees with diameter at breast height (dbh) greater than0.01 m whose fruits are important elephant foodsources (Merz 1981; Short 1981; White et al. 1993;Theuerkauf et al. 2000) were marked as encounteredalong and within 5 m of each side of the strip transects.
Fruit availability of marked species was monitoredevery two weeks by counting and recording thenumber of fresh fallen fruits within and along the striptransects (White et al. 1993; Chapman et al. 1994).Fruit availability was expressed as number of fruitsper square kilometre.
Results
Dung examination
Three hundred and sixty elephant dung piles wereexamined yielding seeds and seedlings, fruits, and leaffragments representing 29 species of which 26 wereforest fruit trees (table 1) and three cultivated crops(Carica, Dioscorea and Citrus species)
There was a distinct seasonal difference in thequantity (Kruskal-Wallis one-way analysis of vari-ance H = 8.344, df = 3, p < 0.05) and number of spe-cies (H = 8.698, df = 3, p < 0.05) that elephantsconsumed. The highest quantity (1688) and numberof species (21) consumed occurred in the minor wetseason, while these variables were least (quantity 60;number of fruit species 8) during the short dry periodin August. Similarly, fruit density per dung pile washighest (18.8) in the minor wet season and least (2.0)during the short dry period (table 1). Panda was themost abundantly eaten species. Desplatsia and Strych-nos species were eaten throughout the year while spe-cies of Aningeria, Antiaris, Ficus, Milicia, Strombosiaand Treculia were eaten seasonally.
Elephant food contained more fibre during themajor wet season (March to July) and a high propor-tion of seeds from minor wet season to early dry sea-son (September to January). There were unidentifieddung components in June (table 2).
Feeding signs
Thirteen species of plants were recorded eitherbrowsed or barked with eight previously registeredduring dung examination (table 3). Thus only fivenew species were added. Leaf and twig stripping(browsing) accounted for 58% of the feeding signswhereas barking formed 42%.
Apart from Antrocaryon micraster, all browsed treespecies were saplings (dbh < 0.03 m). However, withthe exception of Musanga cecropioides, barking activi-ties occurred on bigger trees (dbh > 3 m). The stem ofCombretum oyemense, a liana, was frequently chewedentirely. Elephants selectively browsed (95%) in opencanopy forests (G-test of independence G = 12.566, df= 1, p < 0.05) and barked (87%) in closed canopy for-ests (G = 8.014, df = 1, p < 0.05). To sum up, elephantsate fruits and other components of 34 plant species in-cluding Carica, Dioscorea and Citrus species. Treesrepresented 85%, climbers 9%, and shrubs 6%.

Pachyderm No. 40 January–June 2006 55
Food plants of forest elephants and their availability, Ghana
Fruit availability
Overall fruit availability showed a highly significantrelationship with fruit consumption (r2 = 0.711, p < 0.05)(fig. 2). Individually, Panda (n = 7, r = 0.921, p < 0.005),Parinari (n = 4, r = 0.991, p < 0.01) and Tieghemella (n= 4, r = 0.984, p < 0.05) species displayed significantcorrelations with the remaining fruit species beinginsignificant.
The forest fruits or cultivated crop species thatelephants ate varied with fruit availability across
months (fig. 3). The highest fruit availability levelsof the late minor wet season to the early dry season(October to January) resulted in the highest intakeof forest fruits and reduced the consumption ofcultivated crops. In contrast, in the major wet season(peak in June) consumption of cultivated crop specieswas highest and availability and consumption of fruitthe least. Fruit availability correlated (r = 0.908, p <0.01) to the presence of forest fruits in the dung pilesbut was inversely correlated (r = –0.583, p < 0.05)to the consumption of cultivated crops.
Table 1. Type and quantity of forest fruit species (mean number of fruits per dung pile) found in dung piles ineach season. Scientific names following Hutchison and Dalziel (1954–1972)
Season
Family Fruit species Long wet Short dry Short wet Major dry(Mar–Jul) (August) (Sep–Nov) (Dec–Feb)
Anacardiaceae Antrocaryon micraster 0 0 94 (1.0) 24 (0.3) 118 (3.7)Chrysobalanaceae Parinari excelsa 0 0 20 (0.2) 122 (1.4) 142 (4.5)Euphorbiaceae Ricinodendron heudelotii 20 (0.1) 19 (0.6) 230 (2.6) 0 269 (8.4)Euphorbiaceae Uapaca guineensis 6 (0.04) 4 (0.1) 32 (0.4) 19 (0.2) 61 (1.9)Guttiferae Mammea africana 0 0 59 (0.7) 16 (0.2) 75 (2.4)Irvingiaceae Irvingia gabonensis 0 0 21 (0.2) 26 (0.3) 47 (1.5)Irvingiaceae Klainedoxa gabonensis 0 0 153 (1.7) 40 (0.4) 193 (6.1)Loganiaceae Strychnos aculeata 100 (0.7) 6 (0.2) 48 (0.5) 15 (0.2) 169 (5.3)Mimosoideae Tetrapleura tetraptera 7 (0.05) 4 (0.1) 41 (0.5) 39 (0.4) 91 (2.9)Moraceae Aningeria robusta 0 0 43 (0.5) 0 43 (1.3)Moraceae Antiaris africana 0 0 0 41 (0.5) 41 (1.3)Moraceae Ficus capensis 123 (0.8) 0 0 0 123 (3.9)Moraceae Microdesmis puberula 0 0 36 (0.4) 62 (0.7) 98 (3.1)Moraceae Milicia excelsa 186 (1.2) 0 0 0 186 (5.8)Moraceae Musanga cecropioides 8 (0.05) 0 4 (0.04) 0 12 (0.4)Moraceae Myrianthus arboreus 0 0 100 (1.1) 16 (0.2) 116 (3.6)Moraceae Treculia africana 25 (0.2) 0 0 0 25 (1.0)Myristicaceae Pycnanthus angolensis 4 (0.03) 2 (0.1) 34 (0.4 12 (0.1) 52 (1.6)Ochnaceae Strombosia glaucescens 0 0 40 (0.4) 0 40 (1.3)Olacaceae Ongokea gore 0 0 203 (2.3) 64 (0.7) 267 (8.4)Palmae Raphia sp. 89 (0.6) 13 (0.4) 50 (0.6) 24 (0.3) 176 (5.5)Pandaceae Panda oleosa 62 (0.4) 0 269 (3.0) 57 (0.6) 388(12.2)Sapotaceae Omphalocarpum ahia 22 (0.1) 2 (0.1) 2 (0.02) 3(0.03) 29 (1.0)Sapotaceae Tieghemella heckelii 0 0 47 (0.5) 114 (1.3) 161 (5.0)Tiliaceae Desplatsia dewevrei 47 (0.3) 10 (0.3) 162 (1.8) 11 (0.1) 230 (7.2)Zygophyllaceae Balanites wilsoniana 26 (0.2) 0 0 11 (0.1) 37 (1.2)
Total 725 (4.8) 60 (2.0) 1688 (18.8) 716 (8.0) (100)
Total fruitconsumed/
(percentage)
Table 2. Average abundance of seeds of forest fruit species, fibre, leaf fragments and unidentified remains inelephant dung piles in each month
Dung component Month Total OverallJul Aug Sep Oct Nov Dec Jan Feb Mar Apr May Jun points percentage
Seeds 1 1 2 3 3 3 3 2 1 1 1 1 22 32Fibre 4 4 3 1 2 2 2 3 3 3 4 4 35 52Leaf fragments 1 1 0 0 0 0 1 1 1 1 2 2 10 15Unidentified remains 0 0 0 0 0 0 0 0 0 0 0 1 1 1

56 Pachyderm No. 40 January–June 2006
Danquah and Oppong
species and quantities eatencame from fruits, leaves, twigsand bark. Trees represented 85%of the species that elephants fedon in KCA. Similarly, White etal. (1993) reported that treeswere 73.5% of consumption inLopé Reserve, Gabon. Oursample of 360 dung piles inKCA is similar to the 311 dungpiles that White et al. (1993)inspected at Lopé Reserve.However, soil and fungi, whichelephants in Lopé Reserve werereported to have eaten, were notobserved in the diet of elephantsin KCA.
Differences in digestibilitymake difficult any detailed dis-cussion of the relative quanti-ties of plant parts that wereingested. However, the pres-ence of seeds in all dung piles
shows the importance of fruits in elephant diet (Wingand Buss 1970; Short 1981; White et al. 1993 (in 82%of dung piles); White 1994; Muoria et al. 2001 (in64.5% of dung piles)) and their significance as seed-dispersal agents (Alexandre 1978; Short 1981;Lieberman et al. 1987; White et al. 1993; Muoria et al.
Table 3. Plant species browsed or barked by elephants. Fruits of species marked with asterisk (*) are alsoeaten. Scientific names following Hutchison and Dalziel (1954–1972)
Family Tree species Life form Mean Forest Activity observed
Dbh Feeding type Browsing Barking(m) height (m)
Anacardiaceae Antrocaryon micraster* tree 3.200 2.4 closed 1 2Combretaceae Combretum oyemense liana 0.021 1.2 closed – 6Euphorbiaceae Uapaca guineensis* shrub 0.009 1.0 open 2 –Loganiaceae Strychnos aculeata* liana 0.025 1.0 open 2 –Meliaceae Entandophragma angolense tree 3.200 3.0 closed – 2Meliaceae Trichilia prieureana shrub 0.022 1.0 open 1 –Mimosoideae Albizia zygia tree 0.021 1.0 open 1 –Moraceae Aningeria robusta* tree 0.026 1.5 open 3 –Moraceae Ficus capensis* tree 0.022 1.2 open 2 –Moraceae Musanga cecropioides* tree 0.028 1.5 open 5 2Moraceae Myrianthus arboreus* tree 0.012 2.0 open 2 –Papilionoideae Baphia afzelia shrub 0.019 1.0 open 2 –Sapotaceae Tieghemella heckelii* tree 3.600 2.6 closed – 3
Figure 2. Relationship between fruit availability and elephant fruitconsumption in the Kakum Conservation Area.
0
2.5
5.0
7.5
10.0
12.5
15.0
17.5
20.0
22.5
0 5 10 15 20 25 30 35 40
No. of fruits per sq km (’000)
No.
of f
ruits
con
sum
ed
Y = 4.533 - 3.46E-4 * X + 2.025E-8 * X^2; R^2 = .711n = 12, r2 = 0.711, p < 0.05
Discussion
Dung examination and fruit availability
The study enumerated 34 plant species in the diet ofelephants at KCA. The bulk of the diet in number of

Pachyderm No. 40 January–June 2006 57
Food plants of forest elephants and their availability, Ghana
2001; Waithaka 2001; Blake 2002). In KCA elephantsdisseminated seeds of at least 29 species of forest treesin their dung piles. Other animal groups like birds,rodents, monkeys, duikers and antelopes also dispersemany of these species; hence it may be that only afew tree species really depend directly on elephantsfor their survival (Hawthorne and Parren 2000). Pos-sibly large mammals such as elephants may better dis-perse seeds by conveying them over a wider area thanother animals (Yumoto and Maruhashi 1995). Also,plants with large seeds such as Tieghemella sp., Pandasp. and Parinari sp., which usually would not be swal-lowed by other animal groups, stand a better chanceof avoiding ‘seed shadow’ by being dispersed at suit-able places by elephants. Hawthorne and Parren(2000) also reported improved regeneration rates ofPanda and Balanites species with passage throughelephant gut.
Generally, elephants are known to feed on a widevariety of plant species (Barnes 1982; Yumoto andMaruhashi 1995; Dudley 1999). Research on forestelephant feeding ecology in Nouabalé-Ndoki NationalPark in northern Congo has shown that elephants havea general diet comprising more than 350 species(Blake 2002). At Lopé, the diet of elephants was alsodiverse and constituted 230 plant species with 73.5%from trees (White et al. 1993). Furthermore, the Lopéelephants barked trees from a wide range of 87 plantspecies (White et al. 1993). At KCA, however, elephants
had a rather narrow diet of 34 plant species with 85%from trees; they barked only 4 tree species. This mayseem unusual considering the extent of plant diver-sity that occurs in tropical forests. However, el-ephants may be restricted in the range of foods theyconsume in KCA because the number of preferredspecies is limited (Short 1981).
There is a distinct difference in the quantity andnumber of fruit species (diversity) eaten seasonally(White et al. 1993). In KCA, the threshold fruit density(approximately 15,000 fruits/km2) influences elephantfeeding behaviour. As fruit density increases beyondthe threshold (from minor wet to early dry season),elephants consume the available fruits with increas-ing rapidity. During this period, they are probably lessattracted to other sources of food and hence the ab-sence of cultivated crops in their diet. Large quanti-ties of seeds are present in the dung piles, which arelow in fibre and leaf fragments. When fruit densityfalls below the threshold, elephants possibly use adifferent feeding strategy to compensate for the lackof fruit and tend to depend much more on supple-mentary food, including foliage and bark. Reducedconsumption of fruits and increased consumption ofsupplementary foods is responsible for the decreasedseed content but increased fibre and leaf fragmentcontent of dung piles for the period. An increased levelof cultivated crop fragments (suggesting an increasein crop-raiding activity) and the presence of uniden-
Figure 3. Frequency per dung pile of forest fruits and cultivated crop fragments in relation to fruitavailability each month.
0
5
10
15
20
25
30
35
40
Month
Jul Aug Sep Oct Nov Dec Jan Feb Mar Apr May Jun0
5
10
15
20
25
30
35
fruits per sq km forest fruits cultivated crops
Frui
ts p
er s
q km
(’0
00)
For
est f
ruits
/ cu
ltiva
ted
crop
s

58 Pachyderm No. 40 January–June 2006
Danquah and Oppong
tified components in elephant dung piles all indicatea shift in elephant feeding behaviour (Danquah 2003).
Dudley et al. (1992) speculated that a reductionin the number of fruiting trees (due to logging) inKCA, has stimulated elephants to sometimes go out-side the forest to raid crops, but they provided noevidence. Barnes et al. (1995) suggested that if thehypothesis were true, it would mean that yesterday’sloggers are partly responsible for today’s crop-raid-ing problems in KCA. Recently Danquah (2003) re-ported that due to logging there has been a significantreduction in tree densities of large timber specieswhose fruits elephants eat. Hence fewer trees thanpreviously are likely to result in poor fruit availabil-ity, especially in minor fruiting seasons. There is aninverse correlation between fruit availability in theforest and consumption of cultivated crops, whichprovides the evidence to support Dudley et al. (1992).Elephants ate fewer cultivated crops outside the for-est when fruit availability in the forest was high, andelephant crop-raiding activity increased during themajor wet season with reduced fruit availability. It islikely that other factors act together with insufficientquantity of fruit to encourage elephants to raid farmcrops. Seasonal migration of forest elephants (Short1983) and changes in their use of habitat (Blake 2002)in response to fruit availability have been intimatedas reasons for crop raiding.
Dudley et al. (1992) did not record elephants eat-ing citrus, yet this study found citrus seeds in elephantdung piles. Recently established citrus plantationsclose to the south-eastern edge of KCA might haveinfluenced this elephant adaptation. Barnes et al.(2003) reported strong correlation between distancefrom the boundary of KCA to maize farms and fre-quency of elephant crop raids, yet this study did notrecord maize seeds in dung, possibly due to their highdigestibility. Farmers also complained of emergingcases of elephants eating cocoa fruits, but no cocoaseeds were found in the dung sampled. It is also pos-sible that elephants involved in this act are few andthat the study missed their dung piles. Nonetheless,the large-scale expansion of cocoa farms around al-most all sides of the park suggests the potential ofelephants adapting to cocoa fruits growing in closeproximity to the park. This is a serious signal to parkmanagement to discourage farming and destructionof forest close to the conservation area to avert theproblem of elephants adapting to new sources of foodoutside protected areas.
Seeds of Strychnos aculeata and Desplatsiadewevrei were found regularly in dung piles through-out the study period. Short (1981) also found Strych-nos aculeata in dung throughout the year. Apart fromlonger fruiting periods, these fruits possess extra hardouter coats and are able to persist on the forest floorfor a long time without decaying. Such characteris-tics enable them to serve as a source of fruit for along time, even when their fruiting season is long past.Nevertheless, elephants relied heaviest on Pandaoleosa, Parinari excelsa and Tieghemella heckelli.Such species fruit for only short periods and deterio-rate rapidly and thus are available only briefly. There-fore, consumers with relatively small home rangessuch as small primates may experience reduced fruitresources, unlike elephants, which have large homeranges and will move within them to find these fruits.
Feeding signs
Entandophragma and Tieghemella species foundbarked by Short (1981) in Bia National Park, Ghana,were also barked in KCA. Antrocaryon micraster,which occurs in both locations, was barked only inKCA. Barking of trees is likely to have a very severeeffect on tree species that occur in low densities sincebarking formed a significant proportion of feeding ac-tivity. This aspect of elephant feeding behaviour, whichis targeted at bigger trees, should be of great concernto park management. Short (1981) reported thatGuibourlia ehia became vulnerable to termite attackafter being barked. Struhsaker et al. (1996) observedthat elephant damage to larger trees in the form of barkdamage exposes the wood to attack by beetles andfungi. Elephants, however, browsed much more onsaplings than on bigger trees (Struhsaker et al. 1996).Barnes (1982) argued that the anatomy of the elephant’sdigestive system makes it more sensitive than a rumi-nant to toxic secondary plant compounds; hence,elephants avoid eating larger, more mature plants. El-ephants perpetuate clearings and secondary forests bycontinuously browsing and trampling on immatureplant communities (Struhsaker et al. 1996).
Generally it is accepted that forest elephants prefersecondary forests that follow logging to primary partsof rainforests (Barnes et al. 1991; Struhsaker et al. 1996)because of the abundance of palatable browse species.Barnes et al. (1991) also found elephants in Gabonabundant in secondary forests if there was no hunting.Theuerkauf et al. (2000), however, argued that the
Pachyderm No. 40 January–June 2006 59
Food plants of forest elephants and their availability, Ghana
assumption that forest elephants prefer secondary for-est might not be valid under certain habitat conditions.According to Theuerkauf et al. (2001), in heavily ex-ploited forests that were too degraded to offer optimalconditions for elephants, such as in the BossematieForest Reserve, elephants rather preferred parts of theforest with high canopy cover, obtaining fruits fromthe remaining mature trees. Dudley et al. (1992) alsostated that the fruiting trees on which forest elephantsdepend for both fruits and bark are more abundant inprimary forest and therefore elephants prefer such habi-tats. However, this study found no evidence to rejecteither claim. Our results indicate that elephants tendto bark more trees and browse plants in closed-canopyprimary forests than in open-canopy secondary for-ests (Short 1981). Similarly, White et al. (1993) andMerz (1981) indicated that resources in secondary for-ests combined with resources of the primary forest offerthe forest elephant the best possible living conditions.Barnes (1982) noted that because elephants lack a ru-men they do not benefit from the synthesis of aminoacids and vitamins by rumen bacteria. Hence one canassume that in KCA, elephants eat both vegetationtypes to provide the necessary range of nutrients andachieve good nutrition.
Acknowledgements
Conservation International, the Centre for AppliedBiodiversity Science, the United States Fish & Wild-life Service (African Elephant Conservation Fund),the Smart Family Foundation, and the Betlach Fam-ily Foundation financed this study. The Ghana Wild-life Division provided staff and facilities. We alsowish to acknowledge the contributions of Dr BrentBailey for his untiring support of the Elephant Biol-ogy and Management Project and of Dr RichardBarnes and Dr William Oduro for their invaluableassistance at some stages of the study. Mr Agyarkwaidentified plant specimens.
References
[AfESG] African Elephant Specialist Group. 1999. Strat-egy for the conservation of West African elephants.AfESG, Ouagadougou.
Alexandre DY. 1978. Le role disseminateur des éléphantsen forêt de Tai, Côte d’Ivoire. La Terre et la Vie 32:47–72.
Barnes RFW. 1982. Elephant feeding behaviour in RuahaNational Park, Tanzania. African Journal of Ecology20:123–136.
Barnes RFW, Azika S, Asamoah-Boateng B. 1995. Timber,cocoa and crop-raiding elephants: a preliminary studyfrom southern Ghana. Pachyderm 19:33–38.
Barnes RFW, Barnes KL, Alers MPT, Blom A. 1991. Mandetermines the distribution of elephants in the rainfor-ests of north-eastern Gabon. African Journal of Ecol-ogy 29:54–63.
Barnes RFW, Boafo Y, Nandjui A, Dubiure UF, Hema EM,Danquah E, Manford M. 2003. An overview of crop raid-ing by elephants around the Kakum Conservation Area.Parts 1 and 2. Elephant Biology and ManagementProject, Africa Program, Conservation International.USA. Unpublished.
Barnes RFW, Jensen KL. 1987. How to count elephants inforests. IUCN African Elephant Specialist Group Tech-nical Bulletin 1:1–6.
Blake S. 2002. The ecology of forest elephant distributionand its implications for conservation. PhD dissertation,University of Edinburgh, Edinburgh.
Chapman CA, Wrangham R, Chapman LJ. 1994. Indicesof habitat wide fruit abundance in tropical forests.Biotropica 26:160–177.
Danquah E. 2003. Feeding behaviour of the forest elephantand logging impact on fruit production in the KakumConservation Area. MPhil dissertation, KwameNkrumah University of Science and Technology,Kumasi, Ghana. Unpublished.
Dudley JP, Mensah-Ntiamoah AY, Kpelle DG. 1992. For-est elephants in a rainforest fragment: preliminary find-ings from a wildlife conservation project in southernGhana. African Journal of Ecology 30:116–126.
Dudley JP. 1999. Seed dispersal of Acacia erioloba by Af-rican bush elephant in Hwange National Park, Zimba-bwe. African Journal of Ecology 37:375–385.
Eggert LS, Eggert JA, Woodruff DS. 2003. Estimating popu-lation sizes for elusive animals: the forest elephants ofKakum National Park, Ghana. Molecular Ecology12:1389–1402.
Ghana. Wildlife Division. 2000. Strategy for the conserva-tion of elephants in Ghana. Wildlife Division, ForestryCommission, Accra.
Hawthorne DN, Parren MPE. 2000. How important are for-est elephants to the survival of woody plant species inthe Upper Guinea forests? Journal of Tropical Ecology16:33–150.
Hutchison J, Dalziel JM. 1954–1972. Flora of tropical WestAfrica. Crown Agents, London.

60 Pachyderm No. 40 January–June 2006
Danquah and Oppong
Lieberman D, Lieberman M, Martin C. 1987. Notes on seedsin elephant dung from Bia National Park, Ghana.Biotropica 19:365–369.
Martin C. 1982. Management plan for the Bia conservationareas. IUCN/WWF Project 1251. Wildlife Division, For-estry Commission, Accra, Ghana, Unpublished.
Merz G. 1981. Recherches sur la biologie de nutrition et leshabitats prèfers de l’éléphant de fôret Loxodonta africanacyclotis Matschie, 1900. Mammalia 45:299–312.
Muoria PK, Gordon I, Oguge NO. 2001. Elephants as seeddispersal agents in Arabuko-Sokoke Forest, Kenya.Pachyderm 30:75–80.
Nyame J. 1999. Field notes: types of trees and fruits in theKakum Conservation Area. Kakum Ecological Centre,Kakum, Cape Coast, Ghana. Unpublished.
Short J. 1981. Diet and feeding of forest elephants, BiaNational Park. Mammalia 45:177–186.
Struhsaker TT, Lwanga JS, Kasenene JM. 1996. Elephants,selective logging and forest regeneration in the KibaleForest, Uganda. Journal of Tropical Ecology 12:45–64.
Theuerkauf J, Ellenberg H, Waitkuwait WE, MuhlenbergM. 2001. Forest elephant distribution and habitat use
in the Bossematie Forest Reserve, Ivory Coast. Pachy-derm 30:37–43.
Theuerkauf J, Waitkuwait WE, Guiro Y, Ellenberg H,Porembski S. 2000. Diet of forest elephants and theirrole in seed dispersal in the Bossematie Forest Reserve,Ivory Coast. Mammalia 64:447–460.
Waithaka J. 2001. Elephants as seed dispersal agents inAberdare and Tsavo National Parks, Kenya. Pachyderm30:70–74.
White LJT. 1994. Sacoglottis gabonensis fruiting and theseasonal movements of elephants in the Lope Reserve,Gabon. Journal of Tropical Ecology 10:121–125.
White LJT, Tutin CEG, Fernandez M. 1993. Group com-position and diet of forest elephants, Loxodonta africanacyclotis Matschie, 1900, in the Lopé Reserve, Gabon.African Journal of Ecology 31:181–199.
Wing LD, Buss IO. 1970. Elephants and forests. WildlifeMonograph 19. Wildlife Society, Washington, DC. 92 p.
Yumoto T, Maruhashi T. 1995. Seed dispersal by elephantsin a tropical rainforest in Kahuzi-Biega National Park,Zaire. Biotropica 27(4):526–530.
Pachyderm No. 40 January–June 2006 61
Elephant numbers and distribution in the Tsavo–Amboseli ecosystem, Kenya
Introduction
Two Maasai group ranches, Kimana and Kuku, strad-dling Amboseli, Tsavo West and Chyulu Hills National
Parks (NP) are used by elephants from these protectedareas. Studies in parts of the Tsavo–Amboseli ecosys-tem indicate that forage quality (Western and Lindsay1984) and water distribution (Western 1975; Western
Elephant numbers and distribution in the Tsavo–Amboseliecosystem, south-western Kenya
John Kioko,1 Moses Okello,1 Philip Muruthi2
1School for Field Studies, Centre for Wildlife Management Studies, PO Box 27743, Nairobi, Kenya;email: [email protected] Wildlife Foundation, PO Box 48177, Nairobi, Kenya
Abstract
We assessed how elephants use two Maasai group ranches—Kimana and Kuku—that straddle Tsavo West, ChyuluHills and Amboseli National Parks in south-western Kenya, and investigated their relative distribution, numbersand ranging patterns. Elephant sightings, fresh elephant dung counts and questionnaire interviews with localpeople revealed that elephants were widely distributed. Kimana Community Wildlife Sanctuary was reported asthe place elephants were most likely to be found within the two communal areas. Acacia xanthophloea riverinewoodland and Acacia tortilis woodlands were the habitats highly associated with elephants during the dry season.Bull elephant groups were dominant in the wet and dry seasons. Elephant movement from Kuku Group Ranchinto Kimana Group Ranch was restricted by an electric fence and other human activity into two narrow strips,1.66 km and 0.45 km wide, to the north and south of Kimana fence. We believe that the future of Kuku andKimana Group Ranches as an elephant dispersal area depends on how fast initiatives are made to halt the continu-ing loss and fragmentation of the critical elephant habitat in the area. Immediate interventions need to exploreoptions that enlist landowners’ support in conserving these habitats within the ecosystem.
Additional key words: elephant movement, dispersal areas
Résumé
Nous avons évalué comment les éléphants utilisent deux groupes de ranches masaï (GR) – Kimana et Kuku –qui se trouvent dans les Parcs Nationaux de Tsavo-ouest, Chyulu Hills et Amboseli, au sud-ouest du Kenya, etétudié leur distribution relative, leur nombre et les patterns de répartition. Les observations d’éléphants, lescomptages de crottes fraîches et l’interview de la population locale ont révélé que les éléphants sont largementdistribués. Le sanctuaire communautaire de la Faune de Kimana s’avéra être, des deux sites étudiés, l’endroitoù il était le plus probable de trouver des éléphants. La forêt riveraine à Acacia xanthophloea et les zonesboisées à Acacia tortilis étaient des habitats fortement associés à la présence d’éléphants pendant la saisonsèche. Les groupes de mâles étaient dominants pendant la saison des pluies et la saison sèche. Les déplacementsdes éléphants du Groupe de ranches de Kuku vers le Groupe de ranches de Kimana étaient limités à deuxbandes étroites de 1,66 km et 0,45 km de large, au nord et au sud de la clôture de Kimana, par des clôturesélectriques et par d’autres activités humaines. Nous croyons que l’avenir des deux groupes de ranches, Kukuet Kimana, en tant qu’aires de dispersion des éléphants, dépendra de la rapidité des initiatives qui mettront finà la perte et à la fragmentation continuelles de l’habitat critique pour les éléphants dans la région. Lors d’uneintervention qui doit être immédiate, il faudra explorer les options qui font le compte des propriétaires quis’engagent à supporter la conservation de ces habitats, au sein de l’écosystème.
Mots clés supplémentaires : déplacements d’éléphants, aires de dispersion
62 Pachyderm No. 40 January–June 2006
Kioko et al.
and Lindsay 1984), human settlement and actual pres-ence of humans (Kangwana 1993) influence elephantuse of the ecosystem. Elephants select habitats withabundant forage and their mean group size varied withinhabitats (Western and Lindsay 1984).
The Amboseli elephants known to frequently useAmboseli NP are a discrete population that probablyoverlaps with elephants from Tsavo West and ChyuluHills NPs in the Kimana Community Wildlife Sanc-tuary (Kimana Sanctuary) (Moss 2001). Elephantsfrom Amboseli NP also use the lower Kilimanjaroslopes (Poole and Reuling 1997). The demographicsand behavioural aspects of the Amboseli elephantpopulation have been documented through long-termstudies by the Amboseli Elephant Research Pro-gramme (AERP). There were 1087 elephants in 1999comprising 52 families and 183 adult males (Moss2001). Their population today is estimated to be 1300elephants (S. Sayialel, pers. comm. 2005).
Elephant dung count is the most common indirectmethod of counting elephants (Barnes 1996). Thismethod was used to determine elephant occupancylevels on Maasai settlements in the Amboseli area(Kangwana 1993) and in different habitats in the Athi–Kapiti plains (Gichohi 1996). Recently, periodical aerialelephant counts that covered Kuku and Kimana GroupRanches (GR) were undertaken (Omondi et al. 2002).The counts do not adequately show the fluid natureof elephant use of the Kuku–Kimana area as can becaptured by regularly recording elephant signs suchas dung and tracks. Elephant distribution within com-munity land can be evaluated through existing localknowledge. For instance, the Maasai people, ances-tral inhabitants of this area, have historically inter-acted with elephants on a daily basis and possess awealth of knowledge on elephant use of the area.
Further understanding of how elephants use theprivate land among the Amboseli, Chyulu and TsavoWest NPs is critical considering the evolving changesin land use and a growing human population that maynegatively affect elephant use of the area. The Maasaihave, for instance, shifted their lifestyle from pasto-ralism to a much more diverse and sedentary economythat includes crop farming (Kioko 2005). This cou-pled with increased crop farming by immigrants fromTanzania and other parts of Kenya has led to acceler-ated encroachment into the wetlands and subsequentdisplacement of elephants (Kioko 2005). We give thescope of elephant use of Kuku and Kimana GR, themost important range for dispersal of Amboseli
elephant into the Tsavo–Amboseli ecosystem, and in-vestigate their relative distribution, numbers and rang-ing patterns.
Study area
Kuku (1310 km2) and Kimana (251 km2) GroupRanches are in Oloitokitok Division in Kajiado Dis-trict, south-western Kenya. The two, together withneighbouring group ranches (Olgulului, Imbirikaniand Rombo) and individually owned land on the lowerslopes of Mt Kilimanjaro, are a dispersal area forelephants and other wildlife (fig. 1). The semi-pasto-ral Maasai are the predominant inhabitants althoughin the recent past there has been an influx of immi-grant farming communities from other parts of Kenyaand Tanzania (Berger 1993). In 1996, Kimana Sanc-tuary, a 30-km2 block in Kimana GR, was establishedto generate wildlife-based tourism income for itsmembers (Kioko 2005). Group ranches, introducedin 1968 under the Group Ranch Act, were a way tosettle the Maasai (Graham 1989). In 1981 group ranchmembers preferred to own individual parcels of landso subdivided the ranches among themselves. In 2004Kimana GR was subdivided among the 843 regis-tered members. Kuku GR remains communallyowned; the swamps have, however, been allocated tothe group ranch members who either farm or leasethem.
Mt Kilimanjaro, 5895 m high, and the ChyuluHills Range, 2300 m high, have a dominant influ-ence on the climate and water distribution in theAmboseli ecosystem. Rainfall is highly variable andpoorly distributed. It occurs in two seasons (Pratt andGwynne 1978) and ranges from 300 mm within thegroup ranches to 900 mm on the eastern slopes of MtKilimanjaro (Berger 1993). The ‘short’ rains occurbetween November and December and ‘long’ rainsfrom March to May. The short rains are more criticalwith most droughts associated with their failure(Musembi 1986).The permeable nature of volcanicrocks forms regionally distributed aquifers from MtKilimanjaro that are important sources of water(Omenge and Okello 1992) in an area that has onlytwo permanent rivers (fig. 1). Dominant species arethe yellow fever tree (Acacia xanthophloea), riverineand umbrella thorn (Acacia tortilis) woodland, wait-a-bit thorn (Acacia mellifera) and mixed Commiphorabushland (Kioko 2005). The area is famous for itswildlife and abundance of bird species (Berger 1993).

Pachyderm No. 40 January–June 2006 63
Elephant numbers and distribution in the Tsavo–Amboseli ecosystem, Kenya
Figure 1. Location of Kuku and Kimana Group Ranches in relation to Amboseli, Chyulu Hills and TsavoNational Parks.
Oloitokitokfarms N
oolto
resh
Riv
er
Tanzania
Rombo GameReserve
Kilimanjaro area
OlgululuiGame
Reserve
KimanaGame
Reserve
KimanaSanctuary
OlgululuiGame
ReserveImbirikani
Game Reserve
Kuku GameReserve
(2)
(1)
AmboseliNational
Park
Chyulu HillsNational
Park
TsavoWest
NationalPark
0 30 km
Key
permanent springs
permanent rivers
Kimana (1) and Namelok (2) fence
Kimana Wildlife Sanctuary
protected areas
transect lines
cultivated areas
seasonal rivers
game reserve boundary
Kikarankot River

64 Pachyderm No. 40 January–June 2006
Kioko et al.
Methods
Elephant numbers and relative distribution
To determine elephant distribution in different habi-tats, data on fresh elephant dung and elephantsightings were collected along predetermined tran-sects. Transects of 0.5 km to 2 km were establishedin the different vegetation types. In each transect, anassistant walked and counted fresh elephant dung pilessighted within 10 m on each side of their walkingline. In the springs, fresh elephant dung was sampledat a 100-m radius from the middle of the spring. Whenelephants were sighted, information on the season,number, group type, habitat type and GPS locationof the group was recorded. An elephant group wasdefined, following McKnight (2004), as ‘membersfeeding, resting or moving as a coordinated unit’ andclassified as either bulls or mixed groups (bull andfemale with offspring). The sampling was carried outin the dry (July–October) and wet seasons (Novem-ber–January) at intervals of one month.
In Kimana Sanctuary, a focal point of this study,elephants were counted twice each month. It is rela-tively easy to conduct vehicle counts in the sanctuaryas there are established roads and the area is rela-tively open. Considering that the Maasai people havehistorically interacted with elephants in the area(Kangwana 1993), we interviewed the local Maasaiusing a structured questionnaire to gather informa-tion on elephant movement patterns within the groupranches and adjacent areas. The reported movementwas verified by walking the identified routes and tak-ing GPS points along the trails.
Elephant herd dynamics
Elephant monitoring sites were established in differ-ent habitats in Kuku and Kimana GR. In each site, aresearch assistant trained to recognize elephant groupsmonitored elephants daily during both wet and drymonths. Once an elephant group or individual wassighted, information on group size and members wasrecorded. AERP personnel were occasionally con-sulted to help identify elephant groups and individu-als to determine if they belonged to the Amboseli orthe Tsavo elephant population. AERP has kept long-term records of Amboseli elephants and individualelephants can be identified from photographs.
Data analysis
Analysis of variance (Ritchie et al. 2000) was used tocompare the mean elephant fresh dung-pile densitiesfor different habitat types in each season. If there wereany significant differences in dung-pile densities (p< 0.05), the Turkey test (Ritchie et al. 2000) was usedto establish which means differed. Elephant habitat re-lationships in the wet and dry season were establishedusing the chi-square goodness of fit. A correlation co-efficient was computed to illustrate the magnitude ofthe spatial relationship between fresh elephant dung-pile densities and increasing distance from water points.An independent t-test was used to compare means forelephant group sizes and mean distances from waterpoints for wet and dry season. ArcView-based GIS(geographic information system) maps were made toshow spatially the reported elephant movement pat-terns, trails and main access points.
Table 1. Number of elephants sighted and mean elephant group size in Kimana and Kuku Group Ranches, January 2003–February 2004
Location Area (km2) Number of Elephant densityelephants ± SE (no/km2)
Kimana and Kuku Group Ranches area 1561 390 0.25 ± 0.1Kimana Sanctuary 30 59 1.95 ± 0.96Kimana Group Ranch (excluding Kimana Sanctuary) 251 45 0.18 ± 0.08Kuku Group Ranch 1310 39 0.03 ± 0.014
Location Group type Dry season Wet season
Kimana and Kuku Group Ranches (excluding Kimana Sanctuary) mixed 4.47 ± 0.71 9.30 ± 1.55Kimana Community Wildlife Sanctuary mixed 17.75 ± 3.83 5.05 ± 0.81Kimana Community Wildlife Sanctuary bull 3.36 ± 0.42 3.27 ± 0.37Kimana and Kuku Group Ranches (excluding Kimana Sanctuary) bull 3.53 ± 1.20 4.96 ± 0.56

Pachyderm No. 40 January–June 2006 65
Elephant numbers and distribution in the Tsavo–Amboseli ecosystem, Kenya
Results
Elephant numbers andrelative distribution
Elephant density was significantlyhigher in Kimana Sanctuary com-pared with other parts of the groupranches (table 1). The monthly meannumber of elephants in the sanctuarywas 34 ± 6.49 SE for the period Janu-ary 2003–February 2004. Elephantnumbers in the sanctuary increasedduring the dry season and at timesthere were no elephants there duringthe rainy season (fig. 2). The totalnumber of elephants observed in dif-ferent habitats varied between wet
Figure 2. The relationship between rainfall (mm) and mean monthlyelephant numbers in Kimana Community Wildlife Sanctuary.
Figure 3. Elephant movement within Kuku and Kimana Group Ranches in relation to Amboseli, Chyulu Hillsand Tsavo West National Parks.
0
10
20
30
40
50
Ele
phan
t num
bers
Monthly rainfall (mm)
y = –0.5465x + 50.593r 2 = 0.2913p = 0.038
0 10 20 30 40 50 60 70 80 90 100
60
70
80
90
100
Kilimanjaro area
Oloitokitokfarms
AmboseliNational
Park (2)
(1)
Esambu
Olbili
Olorika
Oloile
Isiruai
Itlal
Chyulu HillsNational
Park
TsavoWest
NationalPark
elephant trails
Key
reported elephant movementKimana Sanctuary
seasonal river
permanent rivers
protected are
cultivated areas
permanent springs Kimana (1) and Namelok (2) fence 0 10 20 km
Lemongo
χ

66 Pachyderm No. 40 January–June 2006
Kioko et al.
and dry seasons (χ2 = 26.50, df = 5, p < 0.01). Acaciaxanthophloea riverine woodlands had the highest ele-phant numbers: 97 (74.04%) during the wet seasonand 461 (80.17%) during the dry.
In the entire area (Kuku and Kimana GR), freshdung-pile densities varied in the different habitats(Kruskal-Wallis H = 8.79, df = 3, p = 0.02). In the dryseason, Acacia xanthophloea woodland had the high-est density of 98 ± 32 SE, while Acacia melliferabushland had the lowest: 17.20 ± 9.40 SE. In the wetseason, the highest density of fresh elephant dung piles(12.1 ± 5.70 SE) was in Acacia mellifera bushland;Acacia xanthophloea woodland had 12.1 ± 5.7 SEand Acacia tortilis woodland 10.80 ± 9.7 SE dungpiles. When each habitat type was compared in thewet and dry seasons (fig. 3), only Acacia tortilis wood-land (t = 3.54, p < 0.001) and Acacia xanthophloeawoodland (t = 3.14, p < 0.001) had significant differ-ences in mean fresh dung-pile densities.
Elephant relative use of wetlands
There was significant difference in fresh elephantdung-pile densities in the wet and dry seasons withinwetlands (t = 3.26, p = 0.0015): 10.73 ± 30.2 SE freshelephant dung piles in the dry season and 7.70 ± 4.11SE in the wet. Elephants were close to wetlands inthe dry season (t = 2.45, p =0.016). The mean distance (inkilometres) was 4.79 ± 0.88 SEfrom the springs and 8.2 ± 1.11SE from permanent rivers. In thewet season, there was no signifi-cant difference in the mean dis-tance elephants were sighted fromwetlands (t = 0.50, p = 0.61). Themean distance from springs was6.9 ± 13 SE and 7.8 ± 1.1 SE fromrivers.
In the dry season there was aweak and insignificant positive re-lationship between fresh dung-piledensity and increasing distancefrom permanent rivers (r2 = –0.021,p = 0.884), and an insignificantnegative relationship between freshdung-pile density and increasingdistance from springs (r2 = 0.054,p = 0.059). In the wet season, therewas a weak positive relationship
between fresh dung-pile density and increasing distancefrom springs (r2 = 0.015, p = 0.166) and from perma-nent rivers (r2 = 0.019, p = 0.113).
Elephant herd dynamics
Table 1 shows mean elephants sighted within Kukuand Kimana GR. When data for Kimana Sanctuarywere not considered, there was no significant differ-ence in mean elephant group size for the wet season(t = 0.2281, p = 0.820). In the dry season meanelephant group size was higher in the sanctuary com-pared with other parts of the group ranches (t = 2.89,p = 0.004). In the wet period, elephant group sizewas higher outside the sanctuary (t = 2.46, p = 0.01).
The mean bull group size was not significantlydifferent in wet or dry season in Kimana Sanctuary (t= 0.143, p = 0.88); however, bull group size differedsignificantly between the sanctuary and other areasin Kuku and Kimana GR in the wet season (t = 2.19,p = 0.03). The number of bull groups (n = 84, 73.68%)in the sanctuary was higher than in mixed groups (χ2
= 25.57, p < 0.001).In the dry season, the number of bull groups (n =
19, 57.57%) was not significantly different from thenumber of mixed groups (χ2 = 0.758, p = 0.384) inthe sanctuary. In the wet season, the number of bull
Figure 4. Mean fresh elephant dung piles for different habitat types inthe Kuku–Kimana area in wet and dry seasons.
0Mixed
Commiphorabushland
Fres
h el
epha
nt d
ung
pile
den
sity
(no
./km
2 )
Habitat types
Acaciamelliferabushland
Acaciatortilis
woodland
Acaciaxanthophloea
woodland
Swampsand
springs
20
40
60
80
100
120
dry season wet season
140

Pachyderm No. 40 January–June 2006 67
Elephant numbers and distribution in the Tsavo–Amboseli ecosystem, Kenya
groups (n = 65, 81.3%) in the sanctuary was higherthan mixed groups (χ2 = 31.25, p < 0.001). Therewere more bull groups (n = 51, 81%) than mixedgroups (n = 12, 17%) in the wet season (χ2 = 24.14, p= 0.001) and more bull groups (n = 60, 80.0%) thanmixed groups (n = 15, 20%) during the dry seasonoutside the sanctuary (χ2 = 27, p < 0.001).
Elephant movement
Elephant trails were clearly defined in the dry seasonand led into and out of the wetlands (fig. 4). Elephantmovement between Kimana and Kuku GR was con-stricted into two access points. Elephants fromKimana GR entered the neighbouring Kuku GRthrough a 1.66-km strip in Isinet and a 0.45-km stripin Impiron. The Impiron point is between Kimanafence and Impiron farmlands on the southern end ofKimana fence. The Isinet access point is to the north-ern end of Kuku and Kimana GR and falls betweenKimana fence and Isinet farms.
Elephants were widely reported within the groupranches; only 7.8% (n = 61) of the residents did notsee elephants in their home area. Most of the inhabi-tants (n = 255, 78.5%) knew in which areas elephantswere ‘commonly’ found within the group ranches. InKimana GR, Kimana Sanctuary (n = 174, 46.63%),Oloile (n = 39, 10.46%) and Lemongo (n = 25, 6.7%)were reported as the areas in which one was mostlikely to see elephants. In Kuku GR, Itlal (n = 54,25.96%), Isiruai (n = 18, 8.65%) and Olorika (n = 17,8.17%) were reported as the most likely places. Mostof the places reported in Kuku GR were in the areaadjacent to Tsavo West NP and in the area north-westof Chyulu Hills NP. Mbirikani GR, neighbour to KukuGR, Kimana swamp (n = 60, 25.32%), Olbili (n = 47,19.83%) and Esambu (n = 21, 8.86%) were reportedas the areas where elephants were most likely seen.
Discussion and conclusions
Elephants widely use Kuku and Kimana GR. The usepattern is characterized by peak concentration in thewetlands in the dry season. Kimana Sanctuary, par-tially a wetland, is an important elephant range in thetwo group ranches. The flood plain on the edges ofthe sanctuary and a wetland-associated riverine habi-tat in the sanctuary produce forage that sustainselephants and other wildlife during the dry season.The sanctuary may have become increasingly impor-
tant after loss and fragmentation of wetlands in thegroup ranches by crop cultivation and human settle-ment.
While elephants relatively associated with perma-nent water points in the dry season, the weak rela-tionship suggests that a multitude of factors influenceelephant use of Kuku and Kimana GR. Elephants usewater points at night to avoid conflict with peoplefetching water or watering their livestock. Increasedhuman activity within the group ranches is likely tolimit elephant use of them. This will negatively af-fect the eco-tourism enterprises that depend on biggame species such as elephants.
The lack of seasonal change in the mean groupsize for both male and mixed groups in Kimana Sanc-tuary and other parts of the group ranch may implythat specific individuals and groups use the area sea-sonally. The area is mainly associated with maleelephants. Males move further from water points inthe dry season than groups with young (Stokke andDu Toit 2002). The presence of lactating calves maylimit how far the group can move from water, qualityforage and shade. The groups with young in KimanaSanctuary remained in the riverine Acacia xantho-phloea woodland during the day; they were observedto leave the sanctuary in the afternoon and return earlymorning.
While there existed defined elephant cluster areas,their daily movement pattern was triggered by theneed to have access to water and a wider feeding area.There was a sudden shift in elephant movement withinwetlands, with elephants suddenly leaving areas oncethe temporary source of water dried. Mpanduji et al.(2003) observed that permanent river systems influ-enced elephant movement in the Selous–Niassa wild-life corridor in Tanzania. In the group ranches, theriverine-associated Acacia xanthophloea woodlandwas the habitat most likely to have reliable shade,forage, escape cover, and a nearby drinking and wal-lowing site for elephants.
Elephants avoided human disturbance by staying incore areas such as Kimana Sanctuary during the dayand moving out at night. At night they are able to ex-ploit a wider range with potentially diverse food re-sources and with little disturbance from humans. Thecontinuing disappearance of elephant corridors inKimana and Kuku GR is a major threat to elephant dis-persion into the wider Amboseli–Tsavo ecosystem.Movement of Amboseli elephants from Kimana GR intoKimana Sanctuary and Kuku GR has been confined by

68 Pachyderm No. 40 January–June 2006
Kioko et al.
farming and human settlement into two narrow stripson both extremes of Kimana fence, and even these stripsare increasingly becoming fragmented.
The distribution of elephants across landscapes isinfluenced by rainfall, presence of permanent waterpoints, human presence and habitat characteristics.It is likely that destruction of elephant range throughfarming and human settlement led to the high con-centration of elephants in areas such as Kimana Sanc-tuary in the dry season. Such an elephant nucleus facesisolation and its future is at stake. Since theseelephants are a focus for community-based tourism,a key economic base for the local people is likely tobe lost. We urge that measures be put in place ur-gently to safeguard elephant pathways into the widerAmboseli ecosystem. This will require an elephantmanagement strategy that seeks to solicit landown-ers’ support through initiating elephant conservationeducation programs and implementing economic in-centives to landowners that are viable, within criticialelephant habitats such as corridors and wetlands. Inthe long term an integrated land-use policy is essen-tial to make it possible for both humans and wildlifeto use the Amboseli ecosystem.
Acknowledgements
This research was funded by the Elephant ResearchFund, Kenya Wildlife Service. Logistical and techni-cal support was provided by the School for Field Stud-ies, Centre for Wildlife Management Studies, Kenya.
References
Barnes R. 1996. Estimating forest elephant abundance bydung counts. In: Kangwana KF, ed., Studying elephants.African Wildlife Foundation Handbook Series No. 7.African Wildlife Foundation, Nairobi.
Berger DJ. 1993. Wildlife exension: participatory conser-vation by the Maasai of Kenya. African Centre for Tech-nology Studies, Nairobi, Kenya.
Gichohi HW. 1996. The ecology of a truncated ecosystem:the Athi–Kapiti plains. PhD thesis, University of Leices-ter.
Graham O. 1989. A land divided: the impact of ranchingon pastoral society. Ecologist 19(5):184–185.
Kangwana FK. 1993. Elephants and Maasai: conflict andconservation in Amboseli, Kenya. PhD thesis. Univer-sity of Cambridge, UK. Unpublished.
Kioko J. 2005. Spatial-temporal distribution of Africanelephants (Loxodonta africana africana, Blumenbach)and their interactions with humans in Kuku–Kimanaarea of Tsavo–Amboseli ecosystem, Kenya. MSc the-sis, University of Greenwich, UK. Unpublished.
McKnight BL. 2004. Elephant numbers, group structureand movements on privately owned land adjacent toTsavo East National Park. Pachyderm 36:44–51.
Moss CJ. 2001. The demography of an African elephant(Loxodonta africana) population in Amboseli. Journalof Zoology of London 255:145–156.
Mpanduji DG, Hofer H, Hilderbrandt TB, Goeritz F, EastML. 2003. Movement of elephants in the Selous–Niassawildlife corridor, southern Tanzania. Pachyderm 33:18–31.
Musembi DK. 1986. The seasonal climate of rangelands.In: Hansen RM, Woie BM, Child RD, eds., Range de-velopment and research in Kenya. Proceedings of aconference, Agricultural Resource Centre, Egerton Col-lege, Njoro, Kenya, 1–5 April 1986. Winrock Interna-tional Institute for Agriculture Development, Morrilton,AR, USA.
Omenge MJ, Okello ER. 1992. Geology of the Chyulu–Oloitokitok area. Mine and Geology Department, Min-istry of Environment and Natural Resources, Kenya.
Omondi P, Muruthi P, Bitok E. 2002. Total aerial count ofelephants in Amboseli–Longido ecosystem. KenyaWildlife Service, Nairobi. Unpublished.
Poole JH, Reuling M. 1997. A survey of elephant and otherwildlife of the West Kilimanjaro Basin Tanzania. Afri-can Elephant Specialist Group, Nairobi. Unpublished.
Pratt DJ, Gwynne MD. 1978. Rangeland management andecology in East Africa. Hodder and Stoughton, UK.
Ritchie MJ, Rogness TN, Stephenson BAP, Stephenson LP.2000. SPSS for Windows manual for Moore’s. The ba-sic practice of statistics. WH Freeman & Company,New York, USA.
Stokke S, du Toit JT. 2002. Sexual segregation in habitatuse by elephants in Chobe National Park, Botswana.African Journal of Ecology 40:360–371.
Western D. 1975. Water availability and its influence onthe structure and dynamics of a savannah large mam-mal community. East African Wildlife Journal 13:265–286.
Western D, Lindsay KW. 1984. Season herd dynamics of asavannah elephant population. African Journal of Ecol-ogy 22:229–244.

Pachyderm No. 40 January–June 2006 69
Caught in the crossfire: the forest elephant and law enforcement
Introduction
Ivory poaching has been a serious problem for Afri-can forest elephant (Loxodonta africana cyclotis)populations. Reliable records of elephants killed andivory harvested within range states are generally una-vailable, particularly where parks have been run on ahand-to-mouth basis. In the Democratic Republic ofCongo (DRC), unreliable data on resources allocatedfor law enforcement and on levels of illegal activityoften result in limited information to guide law-
enforcement operations. This is particularly the casein Kahuzi-Biega National Park (KBNP).
Although much research has been conducted onelephants, information on law enforcement and ille-gal killing has not yet been systematically collectedover sufficient time in most areas of Africa (Dublinand Jachmann 1992; Barnes et al. 1999; MIKE 1999).Attempts are now under way under the auspices ofthe Monitoring of Illegal Killing of Elephants (MIKE)programme to address this gap by training law-en-forcement personnel at selected sites across Africa in
Caught in the crossfire: the forest elephant and law enforcementin a region of political instability, eastern Democratic Republic ofCongo
Leonard Mubalama,1 Eulalie Bashigg 2
1 Monitoring the Illegal Killing of Elephants (CITES/MIKE) Programme, Eastern Democratic Republic ofCongo, PO Box 852, Bukavu, and Système de Gestion d’Information pour les Aires protégées, RépubliqueDémocratique du Congo; email: [email protected] Institut Congolais pour la Conservation de la Nature, BP 868, Kinshasa-Gombe, RépubliqueDémocratique du Congo; email: [email protected]
Abstract
Although much research has been conducted that has generated a wealth of information on basic elephant biology,information on law enforcement and illegal killing has not yet been systematically collected over sufficient timein most areas of Africa, including in Kahuzi-Biega National Park. Attempts are now under way under the auspicesof the Monitoring of Illegal Killing of Elephants (MIKE) programme to address this gap by training law-enforce-ment personnel in how to better collect data at selected sites across Africa and accordingly by gathering andconsolidating law-enforcement data. This paper reports on law-enforcement efforts in Kahuzi-Biega NationalPark and its adjacent hinterlands and provides current information on an endangered elephant population. It alsosuggests possible conservation strategies to protect the species from further slaughter.
Résumé
Bon nombre de travaux ont déjà été effectués sur la biologie de l’éléphant alors que la collecte systématiquede l’information sur le monitoring de l’application de la loi et sur les activités illégales fait encore défaut dansla plupart d’Afrique, y compris le Parc National de Kahuzi-Biega. Sous les auspices du programme MIKE(Monitoring of Illegal Killing of Elephants), quelques initiatives sont présentement en cours à dessein deformer le personnel dans la collecte et la consolidation des données en rapport avec le monitoring de l’applicationde la loi. Ce document livre l’information sur l’effort de protection versus les activités humaines au ParcNational de Kahuzi-Biega et dans son hinterland en période de conflits armés, ainsi que sur la populationd’éléphant en danger. Bien plus, il suggère une stratégique de conservation de l’éléphant pour mieux protégerl’espèce.

70 Pachyderm No. 40 January–June 2006
Mubalama and Bashige
how to collect data. Indeed, given that around 90%of the staff of African wildlife authorities are em-ployed in the field as law-enforcement staff, particu-larly to protect large and economically importantspecies like the elephant (Cumming et al. 1984), wild-life managers must place high priority on monitoringthem. This paper reports on law-enforcement effortsin KBNP and its adjacent hinterlands. It provides cur-rent information on an endangered elephant popula-tion, and suggests possible conservation strategies toprotect it.
Study area
Kahuzi-Biega National Park was gazetted in 1970 toconserve the eastern lowland gorilla (Gorilla beringeigraueri). It covers an area of 6000 km2 and protects amountain forest in the heavily populated Kivu region(fig. 1). Open cultivated areas dominated by banana(Musa parasidiaca or Musa sapientum) plantations,bean, irish potato and cabbage surround the easternside of the park. The area is predominantly montaneforest with a low canopy and abundant herbaceousvegetation with large areas of bamboo (Arundinariaalpina) forest, primary forest, secondary forest,Cyperus latifolius swamps, and mountain transitionforest (Steinhauer-Burkhart et al. 1995). The uplandsector has two dry seasons (January–February andJune–August) and two wet seasons (March–May andSeptember–December) (Bultot and Griffiths 1972).The annual precipitation at Tshivanga, the park head-quarters, is 1200 ± 1300 mm; however, precipitationincreases with altitude, reaching a peak of 3000 mm(Bultot and Griffiths 1972).
KBNP lies between 1°36’–2°37’ S and 27°33’–28°46’ E. Two extinct volcanoes, Kahuzi (3308 m)and Biega (2790 m), have given the national park itsname. The ecosystem is divided into two zones thatare connected by a narrow corridor (ICCN/PNKB2000). On one side is mountain forest covering 600km2 with altitudes between 1800 m and 3308 m andon the other side covering 5400 km2 is tropical forestwith altitudes between 600 m and 1200 m. The richbiodiversity of this region situated in the AlbertineRift makes it a hotspot of the biological and geo-graphical history of eastern DRC, a natural crossroadwhere a dense human population and wildlife havelived in harmony for years, making it one of the mostimportant tropical moist forest areas within theAlbertine Rift region and a centre of endemism in
Africa (Mittermeier et al. 1998). Much of the regionsupports densities of over 300 inhabitants per squarekilometre (Hall et al. 1998), and overall it experienceda 4% rate of growth between 1950 and 1984 (Wils etal. 1976; Institut National de la Statistique 1984).
It is indeed because of its extraordinary naturalbeauty that this park was declared a UNESCO WorldHeritage Site in 1980. Unfortunately, however, esca-lating wars have laid waste to it, and it with others inthe eastern part of the country are now World Herit-age Sites in Danger.
Methods
The two main elements of law enforcement are pa-trols and investigations. Scouts supported by carrierscarried out the patrols; investigations were carried outprimarily in Bukavu town and in villages outside theconservation area (fig. 1), following up informationconcerning illegal activity back to its source. By theirnature, investigations are non-standard and unpredict-able, which makes them easier to quantify than pa-trols.
An initial one-week training session on law-en-forcement monitoring (LEM), both theoretical andin the field, sponsored by a United Nations Founda-tion/UNESCO fund in 2002 was held at park head-quarters in Tshivanga. This course was reinforced withan additional week of actual fieldwork and debrief-ing exercises in plenary sessions. Field trials withcompass, tape measure and GPS (global positioningsystem) were undertaken to equip the guards to han-dle the fieldwork later at different patrol posts. Theprinciple applied throughout this programme was totrain trainers—supervisors would train team leaders—who in turn would train rangers, guides and trackers.This training was further enhanced with a WildlifeConservation Society/PNKB programme in collect-ing and managing data using GPS, compass and maps.
A patrol was usually issued with a bulletin de serv-ice, patrol forms, a map of the area to be covered, apatrol summary, various ancillary recording sheets,simple instruction guidelines, and a notebook and pen.The basics were recorded on patrol but more detailedrecords were completed from notes on return; theywere verified, corrected or enriched during the de-briefing as necessary. On return from patrol, the patrolleader and the patrol secretary scout who kept recordswere debriefed to ensure that the patrol route wascorrectly defined and that all necessary information

Pachyderm No. 40 January–June 2006 71
Caught in the crossfire: the forest elephant and law enforcement
Figure 1. The study area and elephant home range in Kahuzi-Biega National Park, 2002–2004.
headquarters and patrol post
Key
recently re-opened patrol post
major road
big river
elephant home range 2004
elephant home range 2003
elephant home range 2002
KBNP upland sector
Musenyi
Mugaba
Madirhiri
Kasirusiru
Tshivanga
Kashovu
Tshibati
Lemera
0 30 km
640000 650000 660000 670000 680000 690000 700000 710000 720000
9770000
9760000
9750000
9740000
9730000
9720000
9710000
Kinshasa Democratic Republic of Congo
Kisangani
Kahuzi-Biega National Park
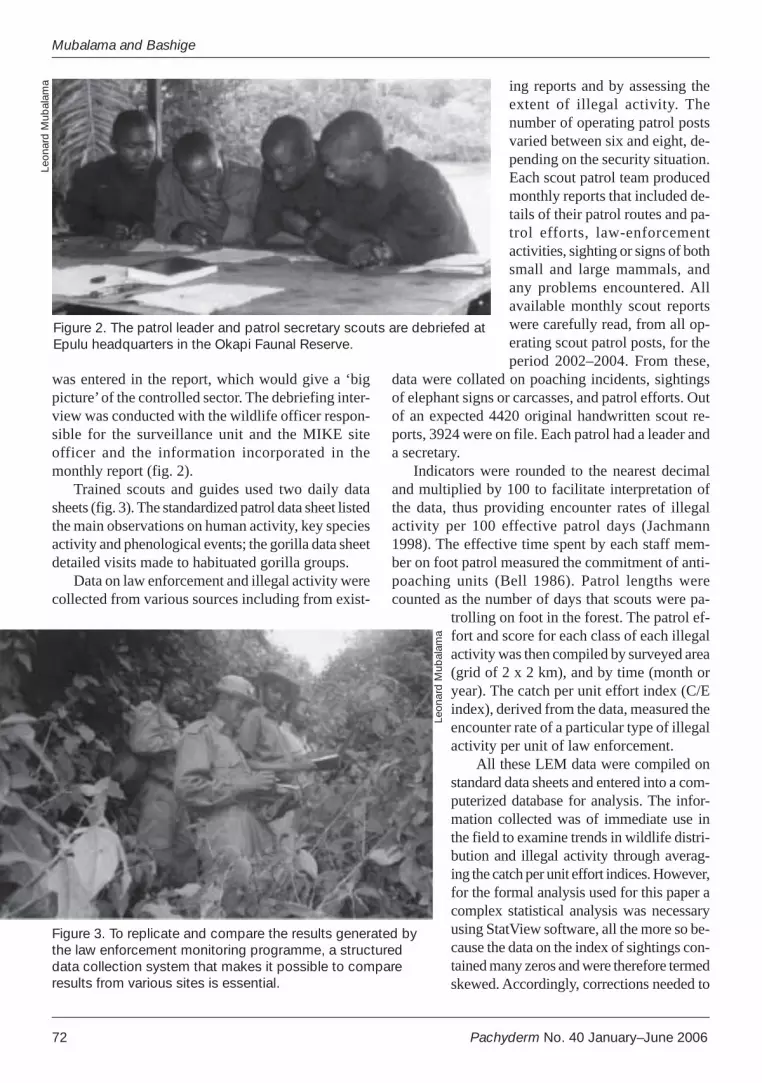
72 Pachyderm No. 40 January–June 2006
Mubalama and Bashige
was entered in the report, which would give a ‘bigpicture’ of the controlled sector. The debriefing inter-view was conducted with the wildlife officer respon-sible for the surveillance unit and the MIKE siteofficer and the information incorporated in themonthly report (fig. 2).
Trained scouts and guides used two daily datasheets (fig. 3). The standardized patrol data sheet listedthe main observations on human activity, key speciesactivity and phenological events; the gorilla data sheetdetailed visits made to habituated gorilla groups.
Data on law enforcement and illegal activity werecollected from various sources including from exist-
ing reports and by assessing theextent of illegal activity. Thenumber of operating patrol postsvaried between six and eight, de-pending on the security situation.Each scout patrol team producedmonthly reports that included de-tails of their patrol routes and pa-trol efforts, law-enforcementactivities, sighting or signs of bothsmall and large mammals, andany problems encountered. Allavailable monthly scout reportswere carefully read, from all op-erating scout patrol posts, for theperiod 2002–2004. From these,
data were collated on poaching incidents, sightingsof elephant signs or carcasses, and patrol efforts. Outof an expected 4420 original handwritten scout re-ports, 3924 were on file. Each patrol had a leader anda secretary.
Indicators were rounded to the nearest decimaland multiplied by 100 to facilitate interpretation ofthe data, thus providing encounter rates of illegalactivity per 100 effective patrol days (Jachmann1998). The effective time spent by each staff mem-ber on foot patrol measured the commitment of anti-poaching units (Bell 1986). Patrol lengths werecounted as the number of days that scouts were pa-
trolling on foot in the forest. The patrol ef-fort and score for each class of each illegalactivity was then compiled by surveyed area(grid of 2 x 2 km), and by time (month oryear). The catch per unit effort index (C/Eindex), derived from the data, measured theencounter rate of a particular type of illegalactivity per unit of law enforcement.
All these LEM data were compiled onstandard data sheets and entered into a com-puterized database for analysis. The infor-mation collected was of immediate use inthe field to examine trends in wildlife distri-bution and illegal activity through averag-ing the catch per unit effort indices. However,for the formal analysis used for this paper acomplex statistical analysis was necessaryusing StatView software, all the more so be-cause the data on the index of sightings con-tained many zeros and were therefore termedskewed. Accordingly, corrections needed to
Figure 2. The patrol leader and patrol secretary scouts are debriefed atEpulu headquarters in the Okapi Faunal Reserve.
Leon
ard
Mub
alam
a
Figure 3. To replicate and compare the results generated bythe law enforcement monitoring programme, a structureddata collection system that makes it possible to compareresults from various sites is essential.
Leon
ard
Mub
alam
a

Pachyderm No. 40 January–June 2006 73
Caught in the crossfire: the forest elephant and law enforcement
be made for patrols of different lengths and in differ-ent seasons (Leader-Williams et al. 1990).
At the monitoring unit office in Bukavu, patroldistances and encounters with illegal activity, togetherwith the grid coordinates, were computerized to visu-alize patrol intensity and illegal wildlife use for eachgrid square in PNKB. The user-friendly ESRIArcView 3.2a was used to better understand spatialrelationship in law-enforcement monitoring datarelated to the distribution of elephant and human ac-tivities, as taken from the sample patrols. Areas ofelephant occurrence and those of high human impactwere modelled using a GIS overlay (figs. 1, 4 and 5).
Results and discussion
Background on population status, trendsand current human threats
Originally considered ‘fairly common to common’over much of their range, the number of KBNPelephants has fluctuated dramatically over the lastdecades, principally as a result of their being huntedfor meat and ivory. These elephants occupied bothlow-altitude and mountainous forests. In 1995, theirmore-or-less straight travel routes could be seen onsteep slopes. As elephants contributed to the rejuve-nation of the forest, they were important landscapearchitects. The gaps they created were usually occu-pied by light-loving plants, which cannot grow in thegloom of the forest. In this way, elephant browsinghelped to increase plant diversity. But beginning in1996, a wave of poaching swept KBNP, and elephantdistribution was determined by the intensity of poach-ing, the distribution of roads and settlements, and thedistribution of secondary forest. Population figuresvaried extensively, from 1350–3600 animals (Hart andHall 1996) to 3720 in 1997 (Hall et al. 1997), and thenwent down to 771 three years later (Inogwabini et al.2000), and further to respectively only 25 and 10elephants in the upland sector (Blanc et al. 2003). Fig-ures in the lowland sector were still estimated to varybetween 1900 elephants (Hall et al. 1997) and 1125(Blanc et al. 2003); recent explorations in 2001showed no elephant sign in the lowland sector (ICCN/PNKB 2002). The report is extremely disturbing andsuggests that both pongid and elephant species are atsevere risk if conservation efforts are not intensified.Density per square kilometer in 1994–1995 was esti-mated at 0.40 in the upland sector and 0.24 in the
hinterland. Given the drastic decrease in elephantnumbers, many donors assumed that under war-torncircumstances it would be impossible for such a largeand vulnerable mammal to survive. The challengenow is to link protection of the remaining elephantswith conservation of the entire park.
Over the past several years, the wildlife popula-tions in eastern DRC (Garamba National Park, KBNP,Okapi Wildlife Reserve) have been severely depletedthrough poaching by refugees, guerillas and armyforces in the ongoing civil war in the region (Plumptreet al. 2000). In December 1997, six elephants werekilled and the poachers arrested. Between April andJune 1999, two infamous poachers alone, both fromKashovu village, killed 17 elephants (ICCN/PNKB1999). A new word, ‘ecocide’, has been added to ourvocabulary to define destruction of the environmentfor military purposes (McNeely 2003).
Assessment of law-enforcement efforts
The objective of law enforcement is to reduce illegalofftake or at least keep it at a low level. In PNKB theacceptable C/E level is set at 0.0012 encounters per100 effective patrol days or 1 encounter per 8.33 ef-fective days (table 1, figs. 6–7). The least amount ofelephant lifetime range (Jewell 1966; Osborn 2004),calculated by ArcView version 3.2a software usingX Tool extension was estimated at 100 km2 to over6000 km2, can explain this given the small portion ofthe vast forest of KBNP that has been patrolled. How-ever, the small elephant lifetime range varied from28 km2 in 2002 up to 24 km2 in 2003 and then 48 km2
during six months in 2004 (fig. 4). This trend towardslarger range should not be explained as an increase inelephant movement but rather as the result of exten-sive deployment of scout teams over a larger area af-ter three patrol posts were reopened: Lemera, Musenyiand Kasirusiru (figs. 1 and 5). Elephant signs wereconcentrated around Musisi Swamp in an elephantlandscape ‘haven’ controlled by Tshivanga, Mugabaand Madirhiri sectors (fig. 4). In fact, the overall rateof decline in numbers of elephants was 99.73% be-tween 1995 and 2000, following rapid increases inhuman pressure and incursions into the park. Thisdecline clearly arose from illegal activity, as is evi-denced by 150 skulls recovered and stored in the aptlynamed Elephant Museum at Tshivanga.
Only a small portion of the vast forest of KBNP hasbeen patrolled (fig. 1) and the LEM data are in too pre-

74 Pachyderm No. 40 January–June 2006
Mubalama and Bashige
liminary a state to be useful in designing an effectiveelephant management programme (table 2). However,from 2000 to 2004 the number of effective man-patroldays markedly increased as park management initiateda major recovery programme of the lowland sector with30 new scouts being recruited and trained. The recov-ered park extension area provides ideal conditions inwhich elephant populations can recover, should their se-curity continue to be guaranteed. Over 15,000 peoplewere estimated to be moving inside the park itself, asso-ciated with over 90 colombo-tantalite (coltan) and gold-mining camps. They were living off the land and no
traces of elephants and very few of other species couldbe found (ICCN/PNKB 2001).
Indicators for arrests on patrol showed a steadydecline from 4.19 encounters per 100 effective man-days in 2000 to 0.76 in 2001 and 0.04 in 2002, a de-cline of 18.13% in 2001 and 1% in 2002. The uplandsector of the park was occupied from June to Decem-ber 2002 by two competing factions—the Rwandan-backed Congolese Rally Gathering for Democracyrebel army, and the Mai Mai militia. It was thereforedifficult for park scouts to control all sectors throughovernight patrols, especially those identified with the
Key
0 40 km
Luyulu
Luguru
Kakuru
LwambaTurionia
Indunga
Ihembe
Budodo
Mudaka
Miti
Kavumu
Katana
KaleheBitale
gold and coltan mining
snares and traps
poacher’s camp
honey collection
footprints
tree cutting
village outside park
village within park
big river
road networkpark limit 2 by 2 km grid
Figure 4. Illegal activity in Kahuzi-Biega National Park, 2004.

Pachyderm No. 40 January–June 2006 75
Caught in the crossfire: the forest elephant and law enforcement
Mushenzi 2004). Following staff shortfall, wildlifeauthorities need to direct manpower into a more ef-fective intelligence network outside protected areas(Bell 1986; Leader-Williams et al. 1990), all the moreso since the likelihood of detection is a better deter-rent than a severe penalty, especially in a region withpoor law enforcement and a declining economy.
Leader-Williams et al. (1990) demonstrated therelative efficiency of investigation operations over con-ventional patrols, in terms of ivory and ammunitionrecovered. For PNKB in 2001, the encounter rates ofivory recovered on investigation operations varied be-tween 1 and 248 times that of patrols, while it variedbetween 1 and 65 times that of patrols for the recoveryof ammunition (figs. 6 and 7). Building upon recordedintelligence data in KBNP and as things stand now,the investigation approach does not seem to be effec-tively operating as it did the previous four years, dueto underfunding and inadequate security. In the future,investigations should be more effective and more effi-cient than is possible with conventional field patrols.
Law enforcement operational budget
The total annual budget allotted to PNKB for the years2000 to 2003 varied substantially from one year to an-other. In 2000, park management used USD 51,028.This means USD 8.50 per km2. The amount in 2002was USD 41,560 with USD 6.93 per km2 and in 2003
USD 55,832 or USD 9.30 perkm2. When considering thatduring the same period the av-erage staff density of guardsper square kilometre was 0.011in 2000 and 2001, 0.013 in2002, and 0.014 in 2003, it be-comes apparent that the severelack of workforce can be linkedto an insufficient operationalbudget. This bud-get for lawenforcement contrasts withUSD 46.50 per km2 a year(Jachmann 1998) allocated toelephant protection for theLuangwa Integrated ResourceDevelopment Project in Zam-bia and is slightly less than theUSD 11 per km2 (YirmedDemeke 2003) for Omo Na-tional Park in Ethiopia.
Table 1. The catch per unit effort (C/E) index of encounter rates of seriousand minor offences per 100 effective patrol days, and serious offencesencountered per 100 effective investigation days, 2001–2004
Event or item 2000 2001 2002 2003 2004
Serious offences (patrol)
Elephants killed < 0.01 0.49 < 0.01 < 0.01 < 0.01Arrests 4.19 0.76 0.04 0.05 < 0.01Poachers encountered < 0.01 0.35 0.05 0.01 0.23Firearms 0.21 < 0.01 0.01 0.01 0.01Ammunitions < 0.01 < 0.01 < 0.01 < 0.01 < 0.01
Serious offences (investigation)
Ivory < 0.01 2.48 < 0.01 < 0.01 < 0.01Other animals confiscated < 0.01 < 0.01 0.04 < 0.01 < 0.01Ammunition < 0.01 0.65 < 0.01 < 0.01 < 0.01
Minor offences (patrol)
Snares recovered 9.23 2.28 1.84 0.09 4.72Camps found < 0.01 < 0.01 0.02 0.01 < 0.01Footprints sited < 0.01 0.98 0.02 0.04 < 0.01
highest rate of illegal incidents. The indicator for con-fiscated snares, firearms recovered and footprints fol-lowed a similar pattern, with a steady decline from9.23 for the snare in 2000 to 0.09 in 2003.
Most staff in anti-poaching units spent about halfof each month patrolling on foot under difficult condi-tions. They covered 376 km2 in 2002, 316 km2 in 2003,and 304 km2 in the first half of 2004 (fig. 1). Signs ofillegal activity, such as poachers’ footprints and camps,snares, and coltan artisanal mining were encounteredthroughout the year. Encounters of illegal activity gen-erally showed consistent trends within different areas,but most trends showed complex changes over time.
Poachers and camps tended to be seen less oftenin more heavily patrolled areas even though these heldthe remaining elephants. The detection of illicit ac-tivities within the upland sector generally increasedas patrol units contained a greater number of staff aswell as spent much more time on the ground (figs. 8and 9). The staff density for KBNP was clearly insuf-ficient to protect a large area (Leader-Williams et al.1990). Indeed, the minimum KBNP number of 0.014guards per square kilometre does not begin to meas-ure up to the IUCN recommendation of 1 guard per40 km2 in an area with human population density ex-ceeding 350 inhabitants per square kilometre (Hall etal. 1998). The average guard density in the centraland eastern sectors of Virunga National Park was oneguard per 10 km2 (Mubalama 2000; Mubalama and

76 Pachyderm No. 40 January–June 2006
Mubalama and Bashige
Figure 5. Protection effort in the upland sector of Kahuzi-Biega National Park.
0 40 km
Key
Luyulu
Luguru
Kakuru
LwambaTurionia
Indunga
Ihembe
Budodo
Mudaka
MitiKavumu
Katana
Kalehe
Lemera
Tshibati
Musenyi
Mugaba
Madirhiri
Nzovu
Tshivanga
Kasirusiru
Itebero
Bitale
headquarters and patrol posts
patrol area 2002–2004
village outside park
village within park
big river
road network
park limit 2 by 2 km grid
Table 2. Law-enforcement effort and illegal activity
Event 2000a 2001a 2002a 2003 2004b
Elephants killed by poachers 0 150 0 0 0Ivory recovered 0 5 0 0 0Ammunition captured 0 197 6 163 0Firearms captured 15 0 6 13 0Effective man-patrol days 18,960 30,090 53,641 198,660 115,584Estimated coverage (km) 11,250 13,210 36,555 41,015 39,772Total patrol days 1,299 1,224 679 2,365 1,376Total arrests 289 76 34 92 42
a Only the original sector of the park under park management controlb From January to June 2004

Pachyderm No. 40 January–June 2006 77
Caught in the crossfire: the forest elephant and law enforcement
We suggest that law-enforcement staff should havebeen deployed at an effective density of at least oneman per 40 km2 of protected area to have preventedthe decline of elephants. If we are to avoid furthermass slaughter of wildlife and a drastic reduction inelephant population in PNKB and surrounding areas,we recommend that an annual operational budget ofUSD 300,000 be allocated for PNKB. This means anaverage of USD 50 per km2.
Conclusion andrecommendations
Elephants in KBNP are facing a severe, un-precedented crisis. We conclude that theavailable workforce for law enforcementwas reasonably effective in capturing mi-nor offences in a very limited protected areabut was too small to provide effective pro-tection to the large populations of elephantsover such a vast and challenging area asKBNP. This situation calls for immediateaction to find and control the causes to savesome of the local wildlife populations fromextinction. Today, the law-enforcementbudget to protect wildlife has plummetedand sophisticated weapons in wrong hands
00.10.20.30.40.50.60.70.80.91.0
2000 2001 2002
Year
ivory
elephants killed
arrests
encountered poachers
firearms
ammunitions
Enc
ount
er n
umbe
r
2003 2004
5
0
2
4
6
8
10
2000 2001 2002
Year
Enc
ount
er n
umbe
r
2003 2004
snares recovered camps found footprints
Figure 6. Encounter rate of illegal activity: serious offencesper 1000 effective patrol days, 2000–2004.
Figure 7. Encounter rate of illegal activity: minor offences per1000 effective patrol days, 2000–2004.
have escalated elephant poaching. Evidence ofsuch poaching was encountered throughout thepatrolled areas, suggesting that smallpopulations of elephant continue to be at se-vere risk of being killed for both ivory and meat.
The future of the African elephant involvesmuch more than maintaining an internationalmoratorium on ivory trade for the foreseeablefuture. We are convinced, however, that anyresumption of legal trade will threaten theelephant throughout its range and the banshould continue to be enforced. Uncoveringand checking new information on the move-ment of poachers and smugglers should bethe highest priority of the anti-poaching in-telligence unit, as receiving advance informa-tion on poacher and smuggler activities isextremely important for apprehending crimi-nals engaging in such nefarious activities. Astrong site-based conservation program isneeded to sustain long-term conservation ef-forts in a region under civil war. Dedicatednational staff should receive regular hands-
on training, developing them professionally to man-age their natural resources. Greater emphasis shouldbe placed on developing methods to ensure properdocumentation of informant sources and the infor-mation they provide.
Enduring peace remains elusive for DRC nationalparks, including KBNP. Racketeers, mercenaries andinterahamwe continue to terrorize the local human

78 Pachyderm No. 40 January–June 2006
Mubalama and Bashige
population and plunder wildlife, minerals and forests.But we can still draw hope for these war-torn pro-tected areas by looking at Uganda. Throughout the1970s and much of the 1980s, the Ugandan govern-ment completely lost control of its parks and wildlifewith highly placed government officials and securityofficers sponsoring elephant and rhino poaching inthe parks. When peace came, much of Uganda’s wild-life and natural environment recovered, and the na-tional government now publicly endorsesconservation and promotes collaborative forest man-agement with local communities.
Acknowledgements
This paper has greatly benefitedfrom insightful comments andideas by many colleagues andfriends as well as by anonymousreviewers. We are grateful to theprotected area management and allpartners who were involved inlong-term conservation throughthe locally based site managementteam called CoCoSi (Comité deCoordination de Site) in a regionspiralling into civil war. Most im-portantly, we would like to thankthe exceptional staff of guards,who continued to conduct dailypatrols for several months, receiv-ing no salaries in a hostile envi-
ronment. Special thanks are extendedto Henri Kayeye, Pascal Basinyizeand Celestin Buroko for their unwa-vering commitment in the day-to-dayLEM data entry exercise.
We take this opportunity to ex-press our sorrow over the deaths ofdedicated staff who died on duty inKBNP, including Méthode Ruboneka,Chimanuka Baganda, MisarhiMastaki, Masumbuko Musharamina,Kasigwa Kaboyi and recently BusasaByanjira. Their sacrifice will not bein vain.
References
Barnes RFW, Craig GC, Dublin HT,Overton G, Simons W, Thouless CR.
1999. African elephant database 1998. IUCN/SSC Af-rican Elephant Specialist Group. IUCN, Gland, Swit-zerland, and Cambridge, UK. 249 p.
Bell RHV. 1986. Monitoring of illegal activity and law en-forcement in African conservation areas. In: Bell RHVand McShane-Caluzi E, eds., Conservation and wild-life management in Africa. Peace Corps, Washington,DC. p 315–317.
Blanc JJ, Thouless CR, Hart JA, Dublin H T, Douglas-Ham-ilton I, Craig CG, Barnes RFW. 2003. African elephantstatus report 200: an update from the African elephantdatabase. IUCN/SSC African Elephant Specialist
Figure 9. Detection of poacher camps related to number of field staffand amount of patrol time, January–June 2004.
Figure 8. Detection of elephant signs related to number of field staffand amount of patrol time, January–June 2004.
0
50
25
75
100
250
January February March
Num
ber
April May June
number of staff
Month
number of elephant signs patrol time
0
10
20
30
40
50
60
70
80
90
January February March
Num
ber
per
patr
ol
April May June
number of staff
Month
number of camps found patrol time

Pachyderm No. 40 January–June 2006 79
Caught in the crossfire: the forest elephant and law enforcement
Group. IUCN, Gland, Switzerland, and Cambridge, UK.vi + 302 p.
Bultot F, Griffiths JF. 1972. The equatorial wet zone. In:Griffiths JF, ed., Climates of Africa. Elsevier Publish-ing Company, Amsterdam.
Cumming DHM, Martin RB, Taylor RH. 1984. Questionnairesurvey on the management and conservation of elephantand rhino. In: Cumming DHM, Jackson P, eds., The sta-tus and conservation of Africa’s elephants and rhinos. In-ternational Union for the Conservation of Nature andNature Resources, Gland, Switzerland. p. 46–62.
Dublin HT, Jachmann H. 1992. The impact of the ivoryban on illegal hunting of elephants in six range statesin Africa. WWF International Research Report. WWF,Gland, Switzerland.
Hall JS, Inogwabini B-I, Williamson EA, Omari I,Sikubwabo C, White LJT. 1997. A survey of elephants(Loxodonta africana) in the Kahuzi-Biega NationalPark lowland sector and adjacent forest in eastern Za-ire. African Journal of Ecology 35(3):213–223.
Hall JS, Saltonstall K, Inogwabini B-I, Ilambo O. 1998.Distribution, abundance and conservation of Grauer’sgorilla. Oryx 32(2):122–130.
Hart JA, Hall JS. 1996. Status of eastern Zaire’s forest parksand reserves. Conservation Biology 10(2):316–327.
[ICCN/PNKB] Institut Congolais pour la Conservation dela Nature / Parc National de Kahuzi-Biega. 1999. Rap-port annuel d’activités, 1999. ICCN/PNKB, Bukavu,DRC.
[ICCN/PNKB] Institut Congolais pour la Conservation dela Nature / Parc National de Kahuzi-Biega. 2000. Rap-port annuel d’activités, 2000. ICCN/PNKB, Bukavu,RDC.
[ICCN/PNKB] Institut Congolais pour la Conservation dela Nature / Parc National de Kahuzi-Biega. 2001. Plande gestion du Parc National de Kahuzi-Biega. PNKB/GTZ, Bukavu, RDC.
Inogwabini B-I, Hall JS, Vedder A, Curran B, Yamagiwa J,Basabose K. 2000. Status of large mammals in themountain sector of the Kahuzi-Biega National Park,Democratic Republic of Congo, in 1996. African Jour-nal of Ecology 38:269–276.
Institut National de la Statistique. 1984. Recensementscientifique de la population 1984: projectionsdémographiques Zaire et regions, 1984–2000. Ministèredu Plan et d’Aménagement du Territoire, Kinshasa.
Jachmann H. 1998. Monitoring illegal wildlife use and lawenforcement in African savanna rangelands. Wildlife Re-source Monitoring Unit, ECZ, Lusaka, Zambia. 124 p.
Jewell PA. 1966. The concept of home range in mammals.Symposium of the Zoological Society of London 18:85–109.
Leader-Williams N, Albon SD, Berry PMS. 1990. Illegalexploitation of black rhinoceros and elephantpopulations: patterns of decline, law enforcement andpatrol effort in the Luangwa Valley, Zambia. Journalof Applied Ecology 27:1055–1087.
McNeely JA. 2003. Conservation forest biodiversity intimes of violent conflict. Oryx 37(2):142–152.
[MIKE] Monitoring the Illegal Killing of Elephants. 1999.Establishing a long-term system for monitoring the il-legal killing of elephants. Geneva, Switzerland.
Mittermeier RA, Myers N, Thomsen JB, Fonseca GAB,Olivieri S. 1998. Biodiversity hotspots and major tropi-cal wilderness areas: approaches to setting conserva-tion priorities. Conservation Biology 12:516–520.
Mubalama L. 2000. Population and distribution of elephants(Loxodonta africana africana) in the central sector ofthe Virunga National Park, eastern DRC. Pachyderm28:44–55.
Mubalama L, Mushenzi N. 2004. Monitoring law enforce-ment and illegal activities in the northern sector of theParc National des Virunga, Democratic Republic ofCongo. Pachyderm 36:16–29.
Osborn FV. 2004. The concept of home range in relation toelephants in Africa. Pachyderm 37:37–44.
Plumptre AJ, Hart T, Vedder A, Robinson J. 2000. Supportfor Congolese conservationists. Science 288:617.
Steinhauer-Burkhart B, Mulhenberg M, Slowik J. 1995.Kahuzi-Biega National Park. GTZ, Würzburg, Ger-many.
Wils W, Carael M, Tondeur G. 1976. Le Kivu montagneux:surpopulation—sous nutrition—érosion du sol. Etudeprospective par simulations mathématiques. CentreScientifique et Médical de l’Université Libre deBruxelles pour ses Activités de Coopération – Institutde Recherche Scientifique (CEMUBAC/IRS), Kin-shasa, Zaire.
Yirmed Demeke. 2003. Law enforcement, illegal activityand elephant status in Mago and Omo National Parksand adjacent areas, Ethiopia. Pachyderm 35:16–30.

80 Pachyderm No. 40 January–June 2006
Martin
guese and Chinese had built 1000 houses in Macau.The main commerce consisted of gold, musk, porce-lain and silk imported from Canton (Guangzhou).These goods were then sent from Macau by ship toJapan. On the return journey, silver was brought backto Macau (Gunn 1996).
In the early 17th century Macau’s ships went alsoto Manila, especially after the collapse of Japanesetrade in 1639. During this time some ivory items,
History of ivory carving in Macau to1970
Macau was an insignificant fishing village on thesouth coast of China until 1557 when the Portuguesewere permitted by the Chinese authorities to residethere permanently (Gunn 1996). The Portugueseneeded a base on the Chinese coast from which totrade. Within only 20 years of settlement, the Portu-
The peaks and troughs of Macau’s ivory trade
Esmond Martin
PO Box 15510 – 00503, Nairobi, Kenya; email: [email protected]
Abstract
Macau, now a small, special administrative region of China, has a long history in dealing in ivory. During theearly centuries of Portuguese rule, ivory items—especially religious sculptures—were traded in Macau, andsome of these items could have been carved there. The boom years for Macau’s ivory industry were in themid-1980s. Astute Chinese Hong Kong businessmen took advantage of a legal loophole. Macau’s officials,unlike those in Hong Kong, did not implement CITES controls on raw ivory until 1986. So these businessmenset up ivory factories in Macau to exploit this loophole with the result that in 1985 almost 100 tonnes of tuskswere imported legally into Macau to be processed into various items, especially beaded necklaces for theHong Kong market. When Macau finally conformed to CITES regulations, the ivory industry declined sig-nificantly. By late 2004 there was not a single ivory factory left and only one full-time carver. In my surveycarried out in late 2004 only 21 retail outlets displaying 1718 ivory items were recorded in Macau. The retailbusiness was slow as the main tourists to Macau, who are mainland Chinese and Hong Kong people, are moreinterested in gambling than buying ivory. Thus Macau is now a minor player in the world’s ivory commerce.
Résumé
Macao, qui est aujourd’hui une petite région administrative spéciale de Chine, a un long passé de commerced’ivoire. Au cours des premiers siècles passés sous la législation portugaise, les objets en ivoire, et spécialementles sculptures religieuses, étaient commercialisés à Macao, et il se pourrait que certains aient même été sculptéslà. Les années glorieuses de l’industrie de l’ivoire à Macao se situent vers le milieu des années 1980. Desbusinessmen chinois de Hong-Kong ont en effet profité d’un vide juridique. Les officiels de Macao,contrairement à ceux de Hong-Kong, n’ont pratiqué aucun contrôle CITES de l’ivoire brut avant 1986. Donc,les businessmen ont installé des fabriques d’objets en ivoire à Macao pour exploiter cette possibilité aveccomme résultat qu’en 1985, près de 100 tonnes d’ivoire ont été importées légalement à Macao pour y êtretransformées en objets divers, spécialement des colliers de perles destinés au marché de Hong-Kong. LorsqueMacao s’est finalement conformé aux réglementations de la CITES, l’industrie de l’ivoire a décliné de façonsignificative. Fin 2004, il ne restait aucune fabrique d’objets en ivoire, et il n’y avait plus qu’un seul sculpteurà temps plein. Dans l’étude que j’ai menée fin 2004 à Macao, je n’ai relevé que 21 points de vente de détail,qui proposaient 1718 objets en ivoire. Le commerce de détail était modeste dans la mesure où les principauxtouristes qui visitent Macao sont des Chinois du continent et de Hong-Kong, qui sont plus intéressés par le jeuque par l’achat d’ivoire. Macao est donc devenu un acteur mineur dans le commerce mondial de l’ivoire.
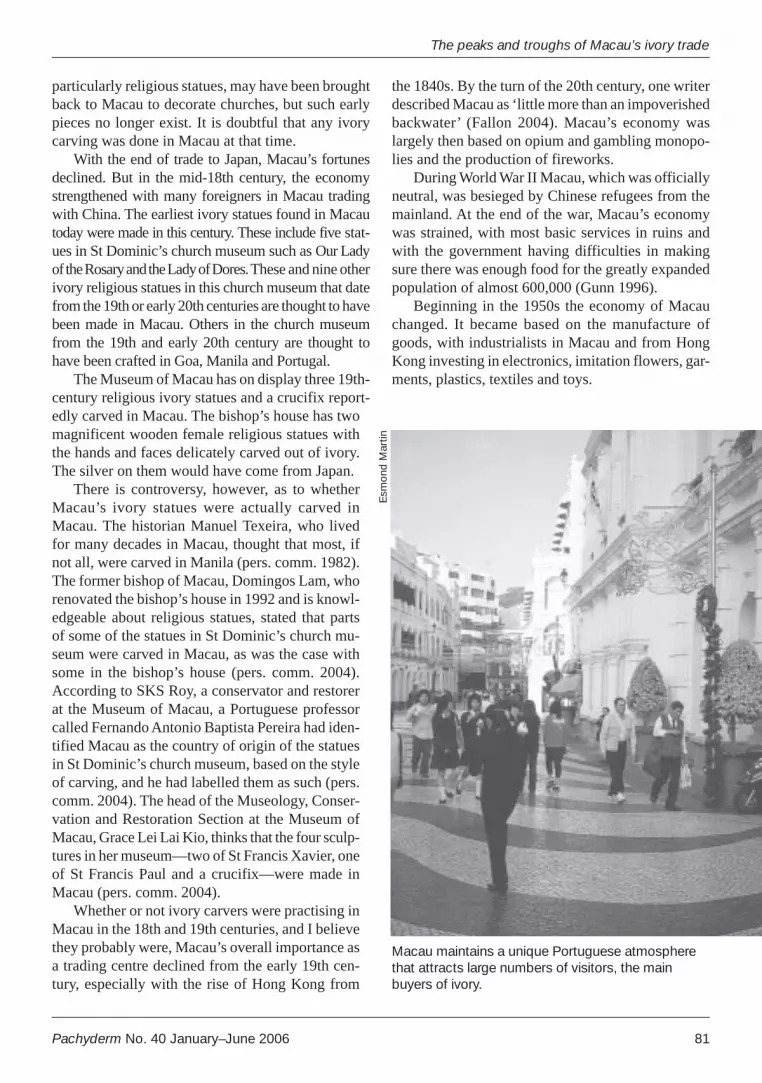
Pachyderm No. 40 January–June 2006 81
The peaks and troughs of Macau’s ivory trade
particularly religious statues, may have been broughtback to Macau to decorate churches, but such earlypieces no longer exist. It is doubtful that any ivorycarving was done in Macau at that time.
With the end of trade to Japan, Macau’s fortunesdeclined. But in the mid-18th century, the economystrengthened with many foreigners in Macau tradingwith China. The earliest ivory statues found in Macautoday were made in this century. These include five stat-ues in St Dominic’s church museum such as Our Ladyof the Rosary and the Lady of Dores. These and nine otherivory religious statues in this church museum that datefrom the 19th or early 20th centuries are thought to havebeen made in Macau. Others in the church museumfrom the 19th and early 20th century are thought tohave been crafted in Goa, Manila and Portugal.
The Museum of Macau has on display three 19th-century religious ivory statues and a crucifix report-edly carved in Macau. The bishop’s house has twomagnificent wooden female religious statues withthe hands and faces delicately carved out of ivory.The silver on them would have come from Japan.
There is controversy, however, as to whetherMacau’s ivory statues were actually carved inMacau. The historian Manuel Texeira, who livedfor many decades in Macau, thought that most, ifnot all, were carved in Manila (pers. comm. 1982).The former bishop of Macau, Domingos Lam, whorenovated the bishop’s house in 1992 and is knowl-edgeable about religious statues, stated that partsof some of the statues in St Dominic’s church mu-seum were carved in Macau, as was the case withsome in the bishop’s house (pers. comm. 2004).According to SKS Roy, a conservator and restorerat the Museum of Macau, a Portuguese professorcalled Fernando Antonio Baptista Pereira had iden-tified Macau as the country of origin of the statuesin St Dominic’s church museum, based on the styleof carving, and he had labelled them as such (pers.comm. 2004). The head of the Museology, Conser-vation and Restoration Section at the Museum ofMacau, Grace Lei Lai Kio, thinks that the four sculp-tures in her museum—two of St Francis Xavier, oneof St Francis Paul and a crucifix—were made inMacau (pers. comm. 2004).
Whether or not ivory carvers were practising inMacau in the 18th and 19th centuries, and I believethey probably were, Macau’s overall importance asa trading centre declined from the early 19th cen-tury, especially with the rise of Hong Kong from
the 1840s. By the turn of the 20th century, one writerdescribed Macau as ‘little more than an impoverishedbackwater’ (Fallon 2004). Macau’s economy waslargely then based on opium and gambling monopo-lies and the production of fireworks.
During World War II Macau, which was officiallyneutral, was besieged by Chinese refugees from themainland. At the end of the war, Macau’s economywas strained, with most basic services in ruins andwith the government having difficulties in makingsure there was enough food for the greatly expandedpopulation of almost 600,000 (Gunn 1996).
Beginning in the 1950s the economy of Macauchanged. It became based on the manufacture ofgoods, with industrialists in Macau and from HongKong investing in electronics, imitation flowers, gar-ments, plastics, textiles and toys.
Macau maintains a unique Portuguese atmospherethat attracts large numbers of visitors, the mainbuyers of ivory.
Esm
ond
Mar
tin

82 Pachyderm No. 40 January–June 2006
Martin
Macau’s ivory industry, 1979 to 1990
Ivory items were made in Macau in the 20th century,but it is not known exactly when Macau’s modern in-dustry started. The owner of the Min Heng Ivory Fac-tory in Macau, who started working there in 1970,claimed that his uncle had started the factory just be-fore World War II. He believed it was the first modernivory factory there (Ho Fook Shing, pers. comm. 1986).
When I first visited Macau in 1979, I went to theMin Heng Ivory Factory. The workers were all bornin Macau, and some had been trained by Hong Kongcraftsmen who came to Macau temporarily and solelyfor that purpose. In 1979 there were seven workersusing electric drills to make a great variety of ivoryobjects, such as animal and human figurines, ban-
gles, chopsticks, jewellery and name seals. None re-ceived a salary but were paid for what they produced.The most successful earned 2000 patacas (USD 385)per month while trainees earned 800 patacas (USD154) per month. In 1982 I returned to this factoryand interviewed another employee, who gave memore details. There were five permanent workers atthat time. One craftsman said he had been craftingivory in Macau since 1952. Workers earned on aver-age 1000 patacas (USD 162) per month and the tusksall came from Hong Kong. The artisans made thesame types of objects as they had in 1979 for tour-ists in Macau, although some items such as nameseals were also exported to Japan and Taiwan. Thefactory sold the leftover chips and powder from theivory carving to local people to cure indigestion (itwas mixed with boiling water and drunk by peoplewho had eaten too much spicy food, especially inthe hot season). Residents did not buy them for ferti-lizer, a practice in Japan, as they disliked the smell.
The ivory business prospered in Macau duringthe 1970s and early 1980s because ivory wholesaleand retail prices were lower than in Hong Kong aslabour and rents were cheaper. The carving was moreoften of lower quality, however, than in Hong Kongand mainland China.
In the early 1980s Hong Kong and other mem-ber states tightened controls on raw ivory trading toconform with the Convention on International Tradein Endangered Species of Wild Fauna and Flora(CITES). Although Portugal became a Party toCITES in 1981 and Macau was a Portuguese colonyuntil 1999, the Portuguese government did not offi-cially require Macau to implement CITES procedures
until February 1986. Therefore, a small group of HongKong ivory traders made use of this loophole. Theylooked for places from where they could import tusksinto Macau, such as non-CITES Parties or exportingcountries with improper documentation, as it was nowillegal to take these dubious tusks into Hong Kong.The tusks were processed in Macau into items suchas jewellery, name seals and figurines. Then the ivorycould be legally taken as worked ivory to Hong Kong.Macau was thus the perfect place as an entrepot forcarving activities because it was close to Hong Kong(one of the largest ivory markets in the world), pos-sessed skilled cheap labour, and most importantly,tusks were cheaper and could be imported withoutCITES documentation, unlike in Hong Kong. Thesecunning Hong Kong ivory traders thus took advan-
This religious statue in the bishop’s house is over ametre tall with ivory hands and face, and silverimported from Japan.
Esm
ond
Mar
tin

Pachyderm No. 40 January–June 2006 83
The peaks and troughs of Macau’s ivory trade
tage of Macau’s laxity in conforming to CITES bynot only importing tusks from dubious sources butby also setting up new ivory factories from about 1983and expanding the existing ones (Woodrow 1988).
As a result, Macau became a huge importer of tusksin the mid-1980s. Imports of tusks rose from only 294kg in 1981 to 23,200 kg in 1983, 42,103 kg in 1984,97,275 kg in 1985 and 71,005 kg in 1986. Most bigconsignments came in from Dubai via Hong Kong (intransit) to Macau (Parker 1989). Of course, many ofthese tusks were from poached elephants, especiallyfrom the Democratic Republic of Congo and Tanza-nia. Often they were shipped from Burundi via Dubaito Macau. Exports of worked ivory from Macau toHong Kong rose considerably from 1981 to 1986. In1981 the export value was only USD 95,035, but by1985 it was USD 664,486. In 1986, the peak year, itrose to USD 1,830,813. Afterwards, with the imple-mentation of CITES in Macau starting in 1986, theofficial export value declined. By 1988 the figure wasdown to USD 827,979 (Milliken and Melville 1989).
During this ivory boom, a new factory, Un HengIvory, was set up in early 1985 by a Hong Kong busi-nessman, Chou Wing Hung. At the time of my visitin January 1986 there were five full-time carvers, allfrom Macau; the manager, Chun Chun Cheong, was
from Hong Kong. Several of the owner’s relativesalso worked part time on carvings in the factory. Ac-cording to the manager, the owner established his fac-tory in Macau because of cheaper tusks—HKD400–550/kg compared with HKD 500–650/kg inHong Kong—and cheaper labour—HKD 50/daycompared with HKD 70/day in Hong Kong for ivorycraftsmen. The exchange rate at the time was HKD7.8 to USD 1. The factory used about 4 tonnes ofivory in 1985 with most being used for making beadsfor necklaces. All these necklaces went to Hong Kong;none were sold locally (Chun Chun Cheong, pers.comm. 1986). The manager admitted that about 10ivory factories (Woodrow 1988), mostly small oneswith perhaps 100 craftsmen, had opened in Macauby the mid-1980s (TH Poon, Tat Hing Ivory WaresFactory, Hong Kong, pers. comm. 1986).
Another new ivory factory, the Song Heng CongNgai, was opened in 1983 by the Poon family, well-known Hong Kong ivory traders. During my January1986 visit, there were 13 artisans making mostly ivorybeads for necklaces. In this factory, the artisans putsmall pieces of ivory into a vice and lowered an elec-tric machine with a rotating head onto the vice to makethe ivory pieces spherical. They then put the roughbeads into a tumbler with ivory powder and water to
Some of Macau’s oldest ivory sculptures are exhibited in St Dominic’s church museum.
Esm
ond
Mar
tin

84 Pachyderm No. 40 January–June 2006
Martin
improve the finish. Next they put wax on a cloth thatwas spun across the beads to make them shiny. If thebeads were brownish, the artisans used hydrogen per-oxide to bleach them. Most beads were made from‘white’ or soft ivory (from the savanna elephant) be-cause it was cheaper than ‘yellow’ or hard ivory (fromthe forest elephant). The craftsmen also made brace-lets and earrings. All the items were exported to HongKong (Ching Cheong, supervisor, Song Heng CongNgai, pers. comm. 1986).
I returned to the Min Heng Ivory Factory in early1986, my third visit to this factory, and business hadpicked up considerably since its earlier slump in 1982.There were now 7 full-time craftsmen, but when busi-ness was good the manager hired up to 20 more arti-sans. Salaries had gone up from 1982 to 1986 by 50%,and the artisans were earning around USD 256 amonth, further illustrating that ivory carving wasbooming in the mid-1980s. They were paid a salaryrather than paid per item as this allowed them to pro-duce higher quality items rather than rush their work.
In January 1986 the largest factory in Macau wasthe Luen Fat Ivory Factory, which had been establishedin 1979 by another Hong Kong businessman. The fac-tory started with 3 or 4 workers, but beginning in themiddle of 1981 business greatly expanded, until by early1986 there were 35 artisans. Men carved netsukes andJapanese-style figurines (90% of the output) whilewomen smoothed and polished the items. They receiveda monthly salary; experienced carvers could get HKD1800 (USD 225) a month. The owner preferred to buy3-kg tusks (USD 45/kg) for making figurines, but hesometimes bought 7–8-kg tusks for bracelets and 12–13-kg tusks for chopsticks (Lo Sun Vo, supervisor, LuenFat Ivory Factory, pers. comm. 1986).
The Van Heng Silverware and Ivory Company wasset up in 1985 in Macau by a man from Hong Kong(where he also was involved in a business called theYan Kee Ivory Company). This company importedtusks for carving and also imported ivory items forretail sale that had been made on the China main-land. The manager stated that they imported tusks intoMacau from African countries that had no CITESpermits, especially from the Democratic Republic ofCongo, and also tusks that had CITES permits fromHong Kong. Tusks with no CITES permits werebought by the company for 10–15% less. The com-pany sold these tusks wholesale for USD 40/kg for1-kg tusks, USD 58/kg for 3–5-kg tusks, and USD100/kg for 10–30-kg tusks. The manager admitted that
business was prospering in Macau now that HongKong could only import tusks with CITES permits.Carvers in Macau were producing many ivory itemsthat Hong Kong businessmen came to Macau to buy.
Government authorities in Macau were fully awareof the activities of the Hong Kong ivory traders thenworking in Macau. But the CITES Secretariat wasunaware of this expansion until it was fully operative.The Secretariat then was extremely concerned. In Oc-tober 1985 the CITES Secretariat reported to the CITESStanding Committee ‘increasingly large volumes of“illegal” trade in rhino horn, musk and ivory were be-ing routed to Hong Kong via Macau’ (Reeve 2002).By 19 December 1985 the Macau government reactedto the criticism and said they would only allow theimport of tusks that had been sanctioned by CITES.On 10 January 1986 four large containers of ivory origi-nally from Tanzania weighing 35,000 kg shipped fromSingapore to Macau were refused entry into Macau(António Pinho, Director, Economic Services, Macaugovernment, pers. comm. 1986).
Macau, however, still had not conformed fullywith CITES, so the Secretariat decided to take actionin January 1986. On 16 January the Secretariat urgedParties to ‘prohibit or prevent trade with or throughMacau and any specimens of species included in theCITES Appendices’. Soon afterwards the Secretariatsent a mission to Macau. The Macau government re-sponded almost immediately by announcing thatCITES was to come into force on 22 February. There-fore, three months later the CITES Secretariat re-scinded its January request to the Parties to ban alltrade in CITES-listed species to and from Macau(Anon. 1986, 1987; Reeve 2002).
In early 1986 the Macau government carried outits first registration of raw ivory in stock in Macau,but only for full tusks (Macau, Government 1986).Twenty-nine companies declared 2374 tusks weigh-ing 22,034 kg. By far the largest quantity was regis-tered under Tat and Company Ltd belonging to thewealthy Poon family: 933 tusks weighing 15,305 kg.The next largest was declared by Lung Fung HongCompany: 83 tusks weighing 386 kg (ArnaldoCorreia, Department of Commerce, Macau govern-ment, pers. comm. 1987).
The implementation of CITES in Macau had dras-tic effects on the local ivory industry. Many workerslost their jobs, and factories went out of business. TheSong Heng Cong Ngai factory, owned by the Poonfamily, closed down in April 1987 and moved to the

Pachyderm No. 40 January–June 2006 85
The peaks and troughs of Macau’s ivory trade
United Arab Emirates with many of its workers; otherivory craftsmen left Macau to work in Dubai. By De-cember 1987 when I was again in Macau, some ofthe workers were returning as they could not copewith Dubai’s heat or food. Finally in late 1989 theUnited Arab Emirates authorities closed down all theivory factories (Martin 1992).
The Luen Fat Ivory Factory in Macau, however,was still in business in December 1987, but there werefewer craftsmen, earning HKD 2000 (USD 250) amonth, and making mostly figurines that went to HongKong or were sold to tourists in Macau. The Un HengIvory Factory was also still in business. I saw sevenworkers, mostly women, semi-processing beads fornecklaces that were sent elsewhere in Macau for fin-ishing. They were also producing name seals and ciga-rette holders. The employees were complaining thatbusiness was not good.
Macau’s Department of Commerce (pers. comm.1987) did not know where these new ivory items weregoing nor who was buying them. They were supposedto provide export licences, but none had been issued.As not enough tourists came to Macau to buy all theivory items produced there, they realized that manyitems were being smuggled, probably into Hong Kongand mainland China. The Hong Kong Department of
Agriculture and Fisheries, responsible for HongKong’s ivory trade controls, agreed with this view(pers. comm. 1987).
On 20 November 1989, as a further step to im-prove controls on the ivory trade, the first detailedregistration was implemented of both raw and workedivory stocks in Macau. This was at a time when manycountries had just brought in national laws prohibit-ing the import and export of ivory. Twenty-five com-panies registered a total of 17,734 kg of ivory—10companies with 773 kg of full tusks, 17 companieswith 13,484 kg of pieces, 12 companies with 1439kg of semi-finished products and 22 companies with2037 kg of worked items (Macau, Government 1989).
In January 1990 the CITES prohibition on com-mercial imports and exports of ivory came into effectfor all CITES member states, including Macau. Thisinternational legislation finally ended Macau’s briefimportance in the world’s ivory trade.
Government controls on the ivorytrade in Macau since 1990
After the CITES ban on international trade in ivoryin 1990, no new ivory was allowed to be importedinto nor exported from Macau in any form. Never-
The Lisboa Hotel displays several magnificent ivory carvings in its public areas.
Esm
ond
Mar
tin

86 Pachyderm No. 40 January–June 2006
Martin
theless, some traders smuggled in ivory. From 2002to 2004 three consignments were confiscated. InMarch 2002 a man from Macau attempted to smug-gle in 61 small pieces of ivory, weighing only 1 kg intotal, overland from mainland China. He was arrestedand fined 2000 patacas (USD 250). In July 2002 an-other person from Macau was arrested in a shop, hav-ing smuggled in 17 pieces of ivory from Hong Kong.He was fined 750 patacas (USD 94). In April 2003 2people from mainland China were intercepted on aship trying to smuggle into Macau 52 pieces of ivoryweighing 175 kg. They were arrested and fined 5000patacas (USD 625). Most wildlife product seizuresare carried out by the Customs Department. The pen-alties for dealing in illegal wildlife commodities arefines from 500 to 5000 patacas (USD 63–625) (LoPui Kei, Acting Head of Division, Macau EconomicServices, Foreign Trade Division, Government of theMacau Special Administrative Region, pers. comm.December 2004).
In most circumstances the personal possession andcommercial sale of raw and worked ivory withinMacau is legal on the basis that most of it predatesthe 1989 ban. There is little evidence of recent im-ported ivory. All shops need business licences fromthe government, but no special one is required forvendors selling ivory, nor for the ivory items them-selves. The government has an inspection team tocheck shops, but it rarely examines antique or giftshops as these are not thought to be a problem. In-stead the inspection team concentrates its efforts onthe very large shops with textiles and foods (JoséOliveria, head of Investigations Department, MacauEconomic Services, pers. comm. December 2004).
Macau’s retail ivory trade in 2004
Towards the late 1990s, wealth grew further in Macau,with tourism steadily increasing along with a boom-ing gambling industry (Macao Special Administra-tive Region 2004a). By 2003, 11,887,876 visitorscame to Macau: 48% from mainland China, 39% fromHong Kong and 9% from Taiwan (Macao SpecialAdministrative Region 2004b). Gambling and shop-ping were, and still are, the main attractions. Thusfrom 2000 to 2005 Macau’s economy expanded phe-nomenally. The per capita income grew 10% in 2002and 15.6% in 2003, one of the highest in the world.By 2003 the per capita income was almost USD18,000, making Macau’s 450,000 inhabitants some
of the richest in Asia. Had tourist and local demandfor ivory items in Macau thus expanded?
In December 2004 I therefore again surveyedMacau’s ivory industry and found that there were noivory factories remaining and only one full-time ivorycarver was still practising. This man, Heong Ka Wa,came to Macau in 1994. Born in Hubei Province inChina in 1938, he learned his profession there andtaught students how to carve very small ivory figu-rines; also he had taught calligraphy. He moved toMacau to join members of his family and continuedthis work. In 2004 he was buying very small piecesof ivory for USD 31/kg to carve his mini-figurines.He also sometimes bought 1-kg pieces for USD 250/kg to make into name seals and sculptures. Duringthe last few years he has used just less than 1 kg ofivory per year. His workshop, where he also sells hisitems, is near the ruins of the 17th-century church ofSt Paul. In December 2004 he had on display 159ivory items, the most numerous being pendants (55),name seals (52) and miniature figurines (34); he alsodisplays his calligraphy work. His ivory miniaturesare usually about 1 cm high and 0.8 cm wide and sellfor USD 38 to people from Japan, Hong Kong, Macau,Singapore and Taiwan. He sells standard size nameseals with carved hallmarks for USD 25 to USD 63to customers from Japan, Macau, South Korea andTaiwan.
I then surveyed the whole of Macau, known asthe Macau Special Administrative Region, for theivory retail trade: the peninsula and the islands ofTaipa and Coloane. I found 21 retail outlets display-ing 1718 ivory items, a fraction of the 37,948 that Icounted in Hong Kong in late 2004. There were 4shops in hotels and 16 more in the main shoppingarea of the peninsula, 7 of which were on Rua de S.Paulo; one in a hotel on Coloane island and none onTaipa island. Of these 21 retail outlets, 11 were giftshops, 9 were antique shops and one was a combinedworkshop and gift shop (Mr Heong’s). Most outletswere small compared with those in Hong Kong, dis-playing only a moderate number of ivory items: 82on average compared with 422 in Hong Kong, sur-veyed also at this time.
All the shops were Chinese-run except for twoIndian ones. One was an antique shop in a hotel thatsold Indian works of art but also Indian ivory itemsmade before 1990. There were 111 miniature paint-ings on thin pieces of ivory illustrating traditionalMogul Indian scenes (dancers, battles, parades and

Pachyderm No. 40 January–June 2006 87
The peaks and troughs of Macau’s ivory trade
gardens) and Renaissance-style paintings. There werealso 46 typical Indian bangles and five sculptures,the largest being a 40-cm-tall elephant with three menin a howdah. One other shop owned by an Indian wasalso selling pre-1990 Indian ivory: 47 bangles and 8necklaces, among other items.
There were at least 289 older objects (made be-fore 1990) going back to three supposedly 18th cen-tury pieces: part of a religious statue, a traditionalChinese musical instrument and a card holder. Ofthese older items 38% were Indian paintings, 32%bangles, 14% figurines and 4% necklaces; 89% weremade in India and 11% were made in Hong Kong,Macau and mainland China.
Of the new and old ivory items in Macau that Ihad time to identify by type, the most common werehuman and animal figurines (33%), bangles (16%),pendants (10%) and rings (10%) (table 1). Most ofthese (86%) were from Hong Kong, Macau and main-land China with the rest from India.
Prices of these ivory items varied hugely depend-ing on the shop and on the quality, age and origin ofthe item. As these items were relatively few andwidely variable it was not possible to produce a mean-ingful average price. For example, name seal pricesranged from USD 10 to USD 188 and 1-cm-thick ban-
Heong Ka Wa, the last full-time ivory carver in Macau, specializes in carving miniature ivory items.
Table 1. Types of ivory seen for retail sale in Macauin December 2004
Item Percentage
Figurine 33Bangle 16Pendant 10Ring 10Painting 7Name seal 7Necklace 5Earring 4Miscellaneous 8Total 100
gles from USD 10 to USD 100. The Indian paintingson ivory varied hugely depending on quality. A 20 x10 cm miniature of the Virgin and Child was USD 25as it was so poorly painted, while a 25 x 15 cm por-trait of a woman wearing a sari inlaid with real pearlsand red stones was USD 4200, both after 35% dis-counts. Figurines carved in the region mostly in the1980s that were 2.5 cm high cost USD 23 while theIndian elephant with a howdah mentioned earlier wasUSD 49,800 after a 20% discount.
The main customers for these ivory items inMacau are Americans, Europeans, Japanese and Tai-
Esm
ond
Mar
tin

88 Pachyderm No. 40 January–June 2006
Martin
wanese. Chinese from the mainland rarely buy ivoryitems in Macau, but instead choose diamonds, goldand watches.
Conclusion
Macau has had a long tradition in ivory, but this maybe coming to an end, despite its booming economy.The flourishing period for ivory carving was in themid-1980s when there were several large ivory fac-tories producing thousands of items a year, mostlyfor the Hong Kong market. With the introduction ofcontrols on the Macau ivory trade in the mid-1980sand the ban on international ivory trade in 1990, allthe large factories had closed down by the early 1990s.In 2004 only one craftsman was active although theremay have been one or two others working part-time.
There is no economic incentive to try to smuggletusks into Macau for domestic use as the one activecarver uses less than a kilo of ivory a year. Theoreti-cally, Macau could become an entrepot for tusksmoving to mainland China, but this is unlikely as theChinese smuggle it in directly and prefer to avoid tran-sit points where there are reasonable controls at theinternational boundaries, as is the case now withMacau.
Retail sales of ivory items in Macau are slow, partlybecause a greater variety of ivory objects for the tour-ist is available in Hong Kong and Guangzhou. Only ifMacau’s gambling sector expands to attract many moreJapanese, Taiwanese, South Koreans and Malaysians,who still like to buy ivory, might the ivory industryrevive for retail sales of the 1700 or so remaining itemson display. The locals are not presently interested inbuying ivory, despite their increase in wealth.
Presently controls on internal sales on ivory itemsare minimal, but adequate, as there is only a smallturnover in ivory; thus additional government paper-work is not required. But if demand were to pick up,another stock-taking of ivory would be helpful to deternewly made items from mainland China being im-ported illegally and sold to tourists in Macau. For now,however, Macau’s ivory market is small and not athreat to elephants in Africa and Asia.
Acknowledgements
I would like to thank the John Aspinall Foundationand the Columbus Zoo and Aquarium ConservationFund for financing my work in Macau. Thanks arealso due to all the people in Macau who kindly as-sisted me, especially Teresa Barreto, Heong Ka Wa,Grace Lei Lai Kio, Domingos Lam, Lo Pui Kei, JoséOliveira and Roy Sit Kai Sin. Particular thanks go tomy wife, Chryssee Martin, for assisting me with allthe fieldwork. I am also grateful to Lucy Vigne forhelping with the production of this article and also toNigel Hunter and Daniel Stiles for their constructivecomments.
References
Anon. 1986. News and notes. TRAFFIC USA 7(1):13.Anon. 1987. News and notes. TRAFFIC USA 7(2–3):34–35.Fallon S. 2004. Hong Kong & Macau, Lonely Planet Pub-
lications, Melbourne.Gunn GC. 1996. Encountering Macau. A Portuguese city-
state on the periphery of China, 1557–1999. WestviewPress, Boulder, Colorado.
Macau, Government. 1986. Marfim registado em Macauno ano de 1986. Unpublished.
Macau, Government. 1989. Boletim oficial de Macau, No. 47.Macau, Government. Special Administrative Region. 2004a.
Macao Economic Bulletin, 4th quarter 2003. Macau.Macau, Government. Special Administrative Region.
2004b. Monthly Bulletin of Statistics, Macau.Martin EB. 1992. Ivory, rhino horn and other wildlife trade
in the United Arab Emirates. Swara 15(4):25–27.Milliken T, Melville D. 1989. The Hong Kong ivory trade.
In: S. Cobb, ed., The ivory trade and future of the Afri-can elephant. Ivory Trade Review Group, Oxford.
Parker ISC. 1989. The raw ivory trade 1979–1987. A con-sultant report for Parties to the Convention on Trade inEndangered Species of Wild Fauna and Flora throughthe Secretary General, Nairobi. Unpublished.
Reeve R. 2002. Policing international trade in endangeredspecies. Royal Institute of International Affairs,Earthscan, London.
Woodrow R. 1988. The ivory crisis. Asiaweek 5 August,14(32):20–39.

Pachyderm No. 40 January–June 2006 89
Are we winning the case for ivory substitutes in China?
Introduction and methodology
For elephant poaching to lessen, not only must ele-phants be well protected and managed in the wild,
but also demand for their tusks must be reduced. Oneof the best ways is to encourage substitutes and winacceptance for materials that can take the place ofelephant ivory.
Are we winning the case for ivory substitutes in China?
Esmond Martin
PO Box 15510 – 00503, Nairobi, Kenya; email: [email protected]
Abstract
The main manufacturers of objects made of ivory, and nowadays ivory substitutes as well, are in mainlandChina. Following the 1990 CITES ban on international trade in elephant ivory, carvers and dealers in China,including Hong Kong and Macau, had to find alternative materials. They tried several animal and vegetableproducts, such as tagua nuts, but they were unpopular and uneconomic so they stopped using them. Objectsmade from buffalo, camel and cow bone, and hippo teeth are still being used. They are inexpensive comparedwith elephant ivory but have been accepted for carving items, especially at the lower end of the market. In themid-1990s businessmen in Hong Kong and south-east China started to import fairly large quantities of mam-moth tusks from Russia. The Hong Kong traders sent them to Guangdong and Fujian Provinces for carving aslabour was much cheaper there than in Hong Kong or Macau. Although there is considerable wastage inmammoth tusks, and they are a harder material than elephant ivory, thousands of items are now being madefrom mammoth ivory both for sculptures on the high end of the market and for curios that are relatively cheap.Customers, especially from the USA and western Europe, are attracted to mammoth ivory because it lookssimilar to elephant ivory and is thousands of years old. The trade in mammoth ivory has continued to expandand should be encouraged, especially for expensive items. It decreases the demand for elephant ivory, whichin turn reduces the pressure to poach elephants.
Résumé
Les principaux fabricants d’objets en ivoire, et aujourd’hui en substituts d’ivoire également, se trouvent enChine continentale. Suite au ban décrété en 1990 par la CITES sur le commerce international d’ivoire d’éléphant,les sculpteurs et les revendeurs qui vivaient en Chine, y compris Hong-Kong et Macao, ont dû trouver unematière alternative. Ils ont essayé plusieurs produits d’origine animale et végétale, comme les noix de tagua,mais elles étaient impopulaires et peu économiques et ils cessèrent donc de les utiliser. Des objets en os debuffle, de chameau ou de vache, et en dent d’hippopotame sont toujours utilisés. Ils ne coûtent pas chercomparé à l’ivoire d’éléphant, mais ils ont été bien acceptés, spécialement au niveau le plus bas du marché.Au milieu des années 1990, les hommes d’affaires de Hong-Kong et du sud-est de la Chine se sont mis àimporter d’assez grandes quantités de défenses de mammouths de Russie. Les commerçants de Hong-Kongles envoyaient dans les Provinces de Guangdong et de Fujian pour les sculpter étant donné que la main-d’œuvre y était beaucoup moins chère qu’à Hong-Kong ou Macao. Bien qu’il y ait beaucoup de déchet dansles défenses de mammouths, et qu’elles soient un matériau plus dur que l’ivoire d’éléphant, des milliersd’objets sont désormais fabriqués en ivoire de mammouth, aussi bien pour des sculptures vendues sur lemarché haut de gamme que pour des curios qui sont relativement bon marché. Les clients, spécialement ceuxdes USA et d’Europe, sont attirés par l’ivoire de mammouth parce qu’il ressemble à celui d’éléphant et qu’ila des milliers d’années. Le commerce d’ivoire de mammouth continue à augmenter et il faudrait l’encourager,spécialement pour les objets de luxe. Cela permet de réduire la demande d’ivoire d’éléphant, ce qui réduit lapression sur le braconnage des éléphants.

90 Pachyderm No. 40 January–June 2006
Martin
The CITES ban on the international trade in ele-phant ivory that came into force in January 1990 causedmany carvers and businessmen to lose their livelihoodsin Europe, Africa and Asia. However, some of the moreenterprising of these people decided to seek alternativeanimal products to craft. The most successful endeav-ours with ivory substitutes have been in south-eastChina, especially in Guangdong and Fujian Provinces.
As no academic study had been carried out on thecraftsmen and businesses using substitute materialsfor elephant ivory in eastern Asia since the 1990 ivoryban, I visited Hong Kong, Macau, Guangzhou (thecapital of Guangdong Province) and Fuzhou (the capi-tal of Fujian Province) in November and December2004. I surveyed shops for ivory and its substitutes,and interviewed craftsmen, sales persons, and own-ers and managers of factories producing items madefrom animal products. I also held discussions withgovernment officers in Hong Kong and Macau.
I limited my research to those substitutes forelephant ivory coming from such animals as cattle, buf-faloes, camels, hippos and, most importantly, mam-moths, avoiding synthetic substances such as plasticsand resins because elephant ivory carvers do not like touse them. Little creative ability is needed for produc-ing items out of synthetic materials. They have beenused for many years but have not found general accept-ance because they look cheap and artificial.
I start here with the status of the elephant ivorybusiness in Hong Kong, Macau, Guangzhou andFuzhou. This is necessary to understand the back-ground of the ivory substitute business. Then I focuson the main substitutes: cow, buffalo and camel bones,hippo teeth, and mammoth tusks.
Results
Elephant ivory
HONG KONG
Hong Kong is still one of the largest elephant ivorymarkets in the world. In June 2004, Hong Kong trad-ers reported to the government that they had stocksamounting to about 260,000 kg of raw and workedivory in their possession. At that time, there were 677registered ivory traders, slightly up from 664 in 2002;822 commercial ivory possession licences had beenissued, again up from 781 in 2002. Under the officialpersonal effects exemption from 2002 to June 2004,only 35 kg of elephant ivory were officially exported,and 51 kg imported (Hong Kong Special Adminis-trative Region, Agriculture, Fisheries and Conserva-tion Department, unpublished statistics, 2004). Inaddition, other ivory, both raw tusks and workeditems, was illegally exported, but statistics do not existon these quantities.
In 2004 it was extremely difficult to obtain theprice for raw elephant tusks as few were sold, althoughtraders said that it remained roughly the same as twoyears earlier when a 5-kg tusk changed hands for USD200/kg and a 10-kg tusk for USD 320/kg.
Elephant ivory items offered for sale in HongKong in December 2004 numbered 37,948 among 80retail outlets (table 1), which are similar figures tothose from a comparable survey made in 2002: 35,884items in 85 retail outlets (Martin and Stiles 2003).There were, however, no full-time carvers workingin elephant ivory, because the cost of labour in HongKong is much higher than on mainland China. Forinstance, if a businessman wished to hire an ivory
Table 1. Economic indicators, 2004
Site Wholesale prices, Retail elephant ivory Wholesale prices, Retail mammothelephant tusks (no.) mammoth tusks ivory (no.)
(USD) (USD)
1–3-kg 10-kg Outlets Items for Grade A Grade B Outlets Items fortusks tusks selling sale selling sale
Hong Kong 200 320 85 35,884 275 225 29 11,282Macau 250 – 21 1,718 – – 4 151Guangzhou – – 72 4,406 – – 17 3,064Fuzhou 316 – 39 737 364 243 2 6
– no data

Pachyderm No. 40 January–June 2006 91
Are we winning the case for ivory substitutes in China?
carver in Hong Kong, he would have to pay him be-tween USD 1000 and 2600 per month, depending onhis skills, whereas on the mainland a carver wouldearn as little as USD 85 a month if he had only re-cently been trained, and up to USD 700 if he were amaster carver. Nevertheless, there are a few crafts-men in Hong Kong, who are occasionally asked torepair ivory items.
Types of items for sale in Hong Kong in 2004included bangles for USD 57 each, 15-cm colouredcabbages for USD 1442, name seals for USD 71,beaded necklaces for USD 70, netsukes for USD 107,5-cm pendants for USD 10, and a 25-cm carved tuskfor USD 1600. There was a range of small sculptures:humans of 5 cm for USD 45 or 12 cm for USD 498,and animals of 2.5 cm for USD 28, or 4 cm for USD31, or 7 cm for USD 114.
MACAU
Macau’s elephant ivory trade is small in comparisonwith Hong Kong’s. There has been only one officialstock-taking of both raw and worked elephant ivory,
which was in November 1989, just before the CITESban. At that time, there were 773 kg of raw tusks,13,484 kg of pieces, 1439 kg of semi-finished ob-jects and 2037 kg of finished objects, totalling 17,734kg. Twenty-five companies registered their stocks(Macau 1989).
Only one full-time ivory craftsman was found inDecember 2004, in a small shop on a street leadingto the ruins of Sao Paulo cathedral. His name is HeongKa Wa and he was born in 1938 in Hubei Province,where he studied painting and calligraphy. He becamea specialist in miniature sculptures and engravingChinese classical literature on tiny pieces of ivory.He moved to Macau in 1994. In 2004 he purchasedvery small pieces of ivory at USD 31/kg for makingminiature sculptures and 1-kg pieces at USD 250/kgfor making name seals and small sculptures. Over thepast several years, he has used only about a kilogramof ivory in a year. He was probably the only full-timeivory craftsman in Macau at the time, but there couldhave been a couple of other part-time carvers.
In December 2004, there were 21 retail shops of-fering for sale 1718 ivory items. The shop with the
Ornaments made from bone are for sale in large quantities in Hong Kong.
Esm
ond
Mar
tin

92 Pachyderm No. 40 January–June 2006
Martin
most had 557 objects, mostly necklaces, pendants,rings and small sculptures. In USD, there was a ban-gle for 10, cigarette holder for 87, beaded necklacefor 44, netsuke for 186, and a 5-cm pendant for 23.There were small animal sculptures of 2.5 cm at USD20 and 9 cm at USD 75.
GUANGZHOU
Ivory carving is still active in and around Guangzhou.The number of craftsmen could not be establishedbecause many of them work secretly at home in thesuburbs and were illegally doing business. I countedin the government-owned Daxin Ivory Carving Fac-tory in Guangzhou 15 craftsmen carving elephantivory. One master craftsman was making a 50-layerCantonese ball from a 20-kg ivory tusk.
In early 2002 there had been 21 retail outlets car-rying 3855 ivory items in Guangzhou (Martin andStiles 2003). In December 2004 there were 72 retailoutlets displaying 4406 ivory items; 43 of these weresmall so-called antique shops. With the easing of somerestrictions on private enterprises since 2002, morepeople have opened these shops where they are dis-playing ivory items, mostly new pieces. They gener-ally have few old ivory items: an average of fewerthan 10 per shop, totalling 382. Almost all these olditems had been made in China, and the most com-mon were small sculptures (15% of the total), ciga-rette holders (10%), name seals (8%), arrows (6%),bangles (6%), chopsticks (6%), pendants (6%) andrings (4%).
Of the 4406 old and new ivory items seen inGuangzhou at the end of 2004, the most numerouswere pendants (31% of the total), sculptures (27%),other jewellery (10%) and name seals (10%).
Prices were usually less than in Hong Kong. Typesof items for sale in Guangzhou included bangles forUSD 23, chopsticks for USD 139 a pair, a small ciga-rette holder for USD 24, name seals for USD 48,beaded necklaces for USD 39, 5-cm pendants for USD13. There were small animal sculptures of 2.5 cm forUSD 27 and of 7 cm for USD 70.
FUZHOU
The number of ivory craftsmen has fallen in this citysince the 1990 CITES ivory ban. A few craftsmenwere working on ivory sculptures in a large factory,specializing in cow-bone carvings when I was there.
The factory owner bought elephant tusks from gov-ernment stock, ivory that apparently the governmenthad confiscated. In November 2004 he paid USD 316/kg for 115 kg. If he bought from private people, heclaimed he would have had to pay up to USD 485/kgfor a 1-kg tusk and up to USD 728/kg for a 5-kg tusk.
Fuzhou is smaller than Hong Kong or Guangzhouwith a population of 1,600,000; unlike Hong Kong,Macau and Guangzhou, it attracts few foreign tourists,who are the main ivory buyers. The Chinese in thiscity are not interested in buying ivory, and there wereonly 39 shops with 737 ivory items. These objects hadmostly been made in Fuzhou in the last 15 years or so.Name seals were most numerous (45% of the total),followed by sculptures (15%), pendants (12%) andcigarette holders (6%). Most of the items were inex-pensive compared with those in Guangzhou and HongKong. The most expensive item found in Fuzhou wasa pair of recently carved tusks for USD 6553, as op-posed to Hong Kong where a new sculpture can go forUSD 100,000. There were bangles for USD 31, chop-sticks for USD 73, small cigarette holders for USD 26and medium ones for USD 46, name seals for USD25, beaded necklaces for USD 41, and 5-cm pendantsfor USD 6. There were small human sculptures of 5cm for USD 64 and of 12 cm for USD 388.
The main retail buyers of ivory items in Fuzhouare Taiwanese and Japanese, but it is highly unlikelythat a Japanese would risk taking a large new ivorycarving back home.
Cow, buffalo and camel bones
HONG KONG AND MACAU
Cow, buffalo and camel bones have been used forcarving in China for centuries. Since labour is moreexpensive in Hong Kong and Macau today, crafts-men there do not use these materials. Certainly noneof the former ivory craftsmen switched to makingitems from any bones.
Large quantities of bone carvings made elsewherein China are for sale, especially in Hong Kong. Su-perficially they look like ivory, but are cheap. Thequality of their carving is poor because little effort isput into the workmanship since bone is not valuable.Only tourists buy them. Examples of items for sale inHong Kong included a 15-cm coloured cabbage forUSD 128, an 8-cm human figurine for USD 38, and a6-cm animal figurine for USD 8–16. In Macau, 15-

Pachyderm No. 40 January–June 2006 93
Are we winning the case for ivory substitutes in China?
cm human figurines were about USD 20 and 2.5-cmanimal figurines USD 6.
GUANGZHOU
The Guangzhou area is one of the main centres formaking carvings out of bone. A large factory that I vis-ited on the city outskirts had 80 craftsmen, and it alsohad a retail outlet with a small workshop employing10 additional craftsmen in a tourist area. The factorymanager purchased his camel bones from north-westChina, mainly in Xinjiang Province. His cow and buf-falo bones came from various other places. The crafts-men believe there is not much difference between cameland cow bones, but because the latter are more com-mon they make up almost 90% of the total used.
Cantonese do not like working animal bones be-cause they smell and produce a lot of dust when cuton machines. People from poor areas of China arebrought into this factory to work on the bones; theyreceive 1000–2000 yuan (USD 121–242) a month.They make small items since the bones are thin and
hollow. When they need to make a large item, theyglue pieces of carved bone together.
Of the 325 finished bone items for sale in the re-tail outlet mentioned above, 70% were sculptures, 8%pendants and 7% necklaces. Most were bleachedwhite, but some were stained dark (using coffee) orpainted. A painted cabbage 15-cm long cost USD 67,a 7-cm elephant was USD 30, a 12-cm tall humanfigure USD 24, a comb USD 7 and a bracelet USD 3.A more expensive item made from cow bone was a30-cm tusk consisting of many individual pieces, andit was priced at USD 874. An exceptionally large,180-cm tusk made of camel bone, with figures on it,which had taken 10 craftsmen almost a year to make,was priced at USD 14,320.
To illustrate the difference in prices, chopstickshere were USD 182 for those made of elephant ivoryand USD 4–12 for those of cow bone. The managertold me that he has an office in the United States tofacilitate his sales of bone items there, which is hismain market. He also exports them to France, Ger-many and Spain.
Cow bones are small compared with elephant tusks; thus many bones are glued together to produce largeitems.
Esm
ond
Mar
tin
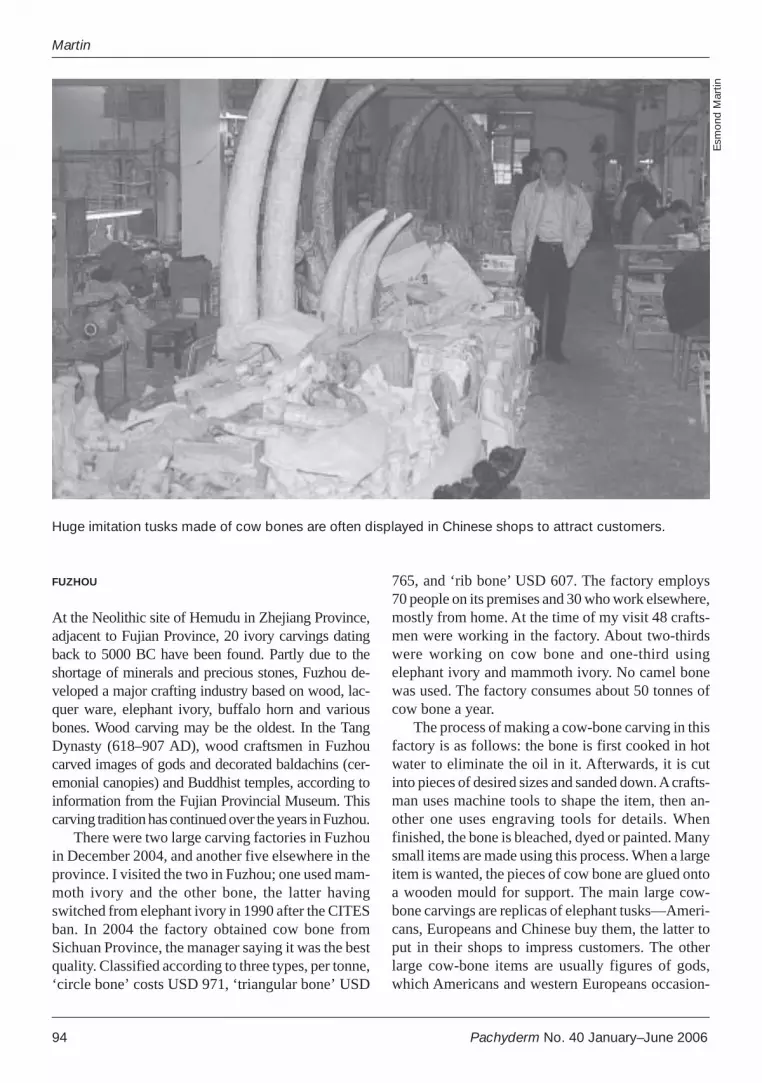
94 Pachyderm No. 40 January–June 2006
Martin
FUZHOU
At the Neolithic site of Hemudu in Zhejiang Province,adjacent to Fujian Province, 20 ivory carvings datingback to 5000 BC have been found. Partly due to theshortage of minerals and precious stones, Fuzhou de-veloped a major crafting industry based on wood, lac-quer ware, elephant ivory, buffalo horn and variousbones. Wood carving may be the oldest. In the TangDynasty (618–907 AD), wood craftsmen in Fuzhoucarved images of gods and decorated baldachins (cer-emonial canopies) and Buddhist temples, according toinformation from the Fujian Provincial Museum. Thiscarving tradition has continued over the years in Fuzhou.
There were two large carving factories in Fuzhouin December 2004, and another five elsewhere in theprovince. I visited the two in Fuzhou; one used mam-moth ivory and the other bone, the latter havingswitched from elephant ivory in 1990 after the CITESban. In 2004 the factory obtained cow bone fromSichuan Province, the manager saying it was the bestquality. Classified according to three types, per tonne,‘circle bone’ costs USD 971, ‘triangular bone’ USD
765, and ‘rib bone’ USD 607. The factory employs70 people on its premises and 30 who work elsewhere,mostly from home. At the time of my visit 48 crafts-men were working in the factory. About two-thirdswere working on cow bone and one-third usingelephant ivory and mammoth ivory. No camel bonewas used. The factory consumes about 50 tonnes ofcow bone a year.
The process of making a cow-bone carving in thisfactory is as follows: the bone is first cooked in hotwater to eliminate the oil in it. Afterwards, it is cutinto pieces of desired sizes and sanded down. A crafts-man uses machine tools to shape the item, then an-other one uses engraving tools for details. Whenfinished, the bone is bleached, dyed or painted. Manysmall items are made using this process. When a largeitem is wanted, the pieces of cow bone are glued ontoa wooden mould for support. The main large cow-bone carvings are replicas of elephant tusks—Ameri-cans, Europeans and Chinese buy them, the latter toput in their shops to impress customers. The otherlarge cow-bone items are usually figures of gods,which Americans and western Europeans occasion-
Huge imitation tusks made of cow bones are often displayed in Chinese shops to attract customers.
Esm
ond
Mar
tin

Pachyderm No. 40 January–June 2006 95
Are we winning the case for ivory substitutes in China?
ally purchase. The factory’s wholesale markets aremainly in the United States (60%), and Europe (30%),with lesser quantities going to Japan, Thailand andMalaysia. Only a small amount is bought by Chinese.
Hippo teeth
HONG KONG
Hippo teeth are not good for carving because theyare too hard and crack easily. To illustrate this, whenIan Parker was culling hippos in Uganda from 1964to 1967 to reduce the population, he removed thelower jaws and put them into the Nile for the flesh torot. He then extracted the teeth and put them on theground in the shade, intending to examine them laterto age the animals. However, within a shortperiod he heard loud noises, similar to pis-tol shots—made by cracking teeth (IanParker, pers. comm. 2005).
Nevertheless, after the CITES ban,Hong Kong businesses imported an annualaverage of 17,063 kg of ‘other ivory ex-cluding mammoth ivory’ between 1992 and2000, according to statistics provided bythe Hong Kong Census and Statistics De-partment (Hong Kong 1993–1997, 1998–2001). Government officers told me thatthis category of ‘ivory’ was almost entirelyhippo teeth, although a few warthog tusksmay have been included (Hong Kong Spe-cial Administrative Region, Agriculture,Fisheries and Conservation Department,pers. comm. 2004). Since the Hong Kongfigures for this category show that Ugandaand Tanzania were the main exporters, andboth these countries had large hippopopulations during this period, this sup-ports the Hong Kong government’s viewthat the ‘ivory’ was hippo teeth.
From 2001 to 2003, the annual quan-tity of hippo teeth and perhaps a fewwarthog tusks imported into Hong Kongdeclined to 10,472 kg, mainly due to thefact that mammoth tusk imports increasedconsiderably because they had been rec-ognized in China as a better material forcarving. The declared import value forthese three years averaged USD 20/kg, andagain the exporting sources were Uganda
and Tanzania (Hong Kong 2002, 2003, 2004). Theaverage wholesale price in Hong Kong for the betterquality teeth was USD 38/kg.
Almost all the hippo teeth were re-exported tomainland China to be made into a great variety ofitems and then sent back to Hong Kong for sale bothlocally and abroad. In late 2004, at least 11 Hong Kongshops had on display a minimum of 1089 hippo-toothobjects. Most of these were netsukes and small sculp-tures. Hippo teeth rarely weigh more than 2 kg each,and when something large is made from them, sev-eral are glued together. I saw a 180-cm-long bargemade from hippo teeth, priced at USD 120,000, butthis was certainly an exceptional work.
Most of the netsukes and small sculptures, around6 cm in size, had a retail price between USD 20 and
Mammoth tusks have their own unusual shape and can beeasily recognized in the raw form from elephant tusks.
Esm
ond
Mar
tin

96 Pachyderm No. 40 January–June 2006
Martin
USD 50. Although not especially well carved, theywere nicely polished, creamy in colour and shiny inappearance. A large hippo tooth, 20-cm long withcarved figures on it was offered for USD 269. A statueof a Chinese emperor, 30-cm tall, made of pieces ofhippo teeth, was priced at USD 5385.
GUANGZHOU
One of the main factories producing carvings inGuangzhou today was started by a businessman fromHong Kong who came to Guangzhou in 1990 to setup a factory. He hired 10 apprentices whom he taughtto carve tagua nuts; he had trouble selling these, sohe then bought wood and cow bone for his appren-tices to use. The items made from these materials werenot profitable either. So he decided to try hippo teethfor the carvings, found it sold better, and continuedwith it until 1997, when he started using mammothtusks, realizing they were far superior. Several otherfactories in Guangdong Province with Hong Kongconnections tried the same alternatives to elephantivory and had similar experience.
FUZHOU
The two large factories I visited in Fuzhou used hippoteeth for carving in the 1990s, but both switched toalternative materials as sales in hippo-tooth items werepoor. One of the factories is still trying to sell its hippo-tooth items and is having difficulty selling the largeones. For example, there was a sculpture entitledQueen of the Gods, 150-cm tall and 90-cm wide,priced at USD 24,272, but the manager said that if ithad been made of mammoth tusk instead, he couldhave easily sold it for twice the price.
Mammoth tusks
HONG KONG
Fewer than 10 craftsmen in Hong Kong were work-ing with mammoth ivory in 2004. They used smallpieces for calligraphic engraving of names, proverbsand poems. However, Hong Kong is the majorentrepot for mammoth tusks and has become theworld’s largest wholesale and retail market for mam-moth ivory carvings. The tusks originate mainly inthe tundra of Russia and Alaska, and especially thosefrom Russia are shipped via Hong Kong to mainland
Mammoth tusks are often larger and heavier than elephant tusks, and the big ones are prominently curved.
Esm
ond
Mar
tin

Pachyderm No. 40 January–June 2006 97
Are we winning the case for ivory substitutes in China?
China for carving. In 2002 Hong Kong traders im-ported 20,022 kg of mammoth tusks, of which 16,696kg came directly from Russia. In 2003 imports to-talled 15,997 kg, and from January to September 2004the amount was 13,995 kg. The declared import valuerose from USD 54.73/kg in 2002 to USD 77.44/kg in2003 and USD 98.61/kg for the first nine months of2004 (Hong Kong Special Administrative Region,2003 and 2004) due to increased demand.
In 2003, the last full year for which statistics areavailable, over 98% of the mammoth tusks were re-exported from Hong Kong to mainland China. Therethey were carved into various items that were in turneither exported wholesale to the USA and Europe anda few other destinations or sent back to Hong Kongfor sale. The wholesale dealers in Hong Kong senttheir items mainly to the USA, but also to France andother western European countries. Some shop own-ers claimed that Americans bought retail as much as70% of their stock. The other purchasers were Euro-peans. In late 2004 there were 29 shops offering forsale a minimum of 11,282 mammoth ivory items. Thegreatest number in any one shop was 3192. The mostcommon items were netsukes and sculptures; littlejewellery was made from mammoth ivory.
Prices were almost the same as for elephant ivory.Small sculptures of mediocre workmanship, 4-cm insize, were priced between USD 32 and 140. The fewnecklaces and brooches varied inprice between USD 50 and 88.Larger, well-carved items in-cluded an 8-cm erotic couple forUSD 120, a 20-cm female nudefor USD 1500 and a 30-cm mon-key for USD 9600.
There were in addition someoutstanding and beautifully carveditems at extremely high prices. Oneshop in Hollywood Road had ahuge mammoth tusk, over 100 kg,covered with intricately carved ani-mals, people and gardens, pricedat USD 115,385. Another shop inWanchi had a 3-m-long mammothtusk with 38 horses carved on it,priced at USD 270,000 after a 15%discount. The most expensivemammoth carving I saw was a150-cm-tall dragon with tourma-line and amber eyes, made in
Guangzhou in 1999, offered for sale at USD 959,000.Several shops had large, uncarved but well-polishedmammoth tusks. Sometimes the outer brown skin isremoved and sometimes it is left intact. Among themost expensive was a pair totalling 195 kg, which hadfairly recently been sold to an Italian for USD 100,000.
MACAU
Macau had only 171,885 visitors from the Americasand Europe in 2003, compared with 1,470,791 to HongKong from the Americas, the UK, Germany, Franceand Italy that year. In Macau, most visit for the daywhereas they spend three or four nights in Hong Kong(Macau Special Administrative Region, 2004; HongKong Special Administrative Region, 2004). Conse-quently, it is not surprising that there were only 151mammoth ivory items, mostly small sculptures, carvedon mainland China (none made in Macau) found injust four retail outlets in Macau. Items such as 5-cmcigarette holders and pendants were USD 23, while a25-cm carved tusk was USD 1250.
GUANGZHOU
The main provinces in China for carving mammothivory are Guangdong and Fujian. There were about fourlarge factories making mammoth ivory items in and
Many mammoth tusks, originating in the Russian tundra, are exportedto Hong Kong, where traders send them to mainland China for carving.
Esm
ond
Mar
tin

98 Pachyderm No. 40 January–June 2006
Martin
around Guangzhou. Some were fullyor part-owned by Hong Kong busi-nessmen. One such mammoth ivory-carving business in December 2004was employing 40 craftsmen. In ad-dition to carvings, they made furni-ture with inlays of mammoth ivory.There was one government factoryusing mammoth ivory, the previ-ously mentioned Daxin Ivory Carv-ing Factory—one of the biggest forelephant ivory (15 craftsmen), and Isaw two craftsmen working mam-moth ivory there in 2004.
Most educated Chinese havenever heard of the mammoth, andeven if they have knowledge of thisextinct animal, they presently preferto buy items made from gold, jadeor other valuable substances. How-ever, foreign visitors do come toGuangzhou in fairly large numbers,especially to attend the Canton TradeFair, held twice a year, and they dopurchase mammoth ivory carvings.In fact, the number of shops and total number of mam-moth ivory items increased significantly from 2002(Martin and Stiles 2003). In December 2004, 17 retailoutlets were offering 3064 mammoth items. The shopwith the most had 1130, 93% of which were small sculp-tures and netsukes. The 1.25-cm animal figurines wereselling for only USD 7.30, but the workmanship wasnot good. In other shops, a beaded necklace was pricedUSD 55, 5-cm animal figurines such as horses and mon-keys were USD 20–34 each, a 5-cm pendant USD 32,and a small cigarette holder USD 8.
FUZHOU
Like Guangzhou, Fuzhou had several factories forcrafting mammoth ivory objects in and around thecity in 2004. The manager of one of the prominentfactories gave me detailed information on the firm’sactivities. He said he purchased mammoth tusks infive grades. Grade A has almost no cracks and hardlyany odour, and in 2004 he paid USD 364/kg for it.Grade B has a few small cracks and cost USD 243/kg. Grade C, with more cracks, was USD 103/kg, andGrade D, with broken outer layers and many cracks,USD 52/kg. Grade E, really poor quality, cost USD
A higher percentage of women carve ivory and bone in China than inany other carving centre.
Craftsmen usually stain mammoth ivory itemsbrown or red, both to hide imperfections andbecause customers like an antique finish.
Esm
ond
Mar
tinE
smon
d M
artin
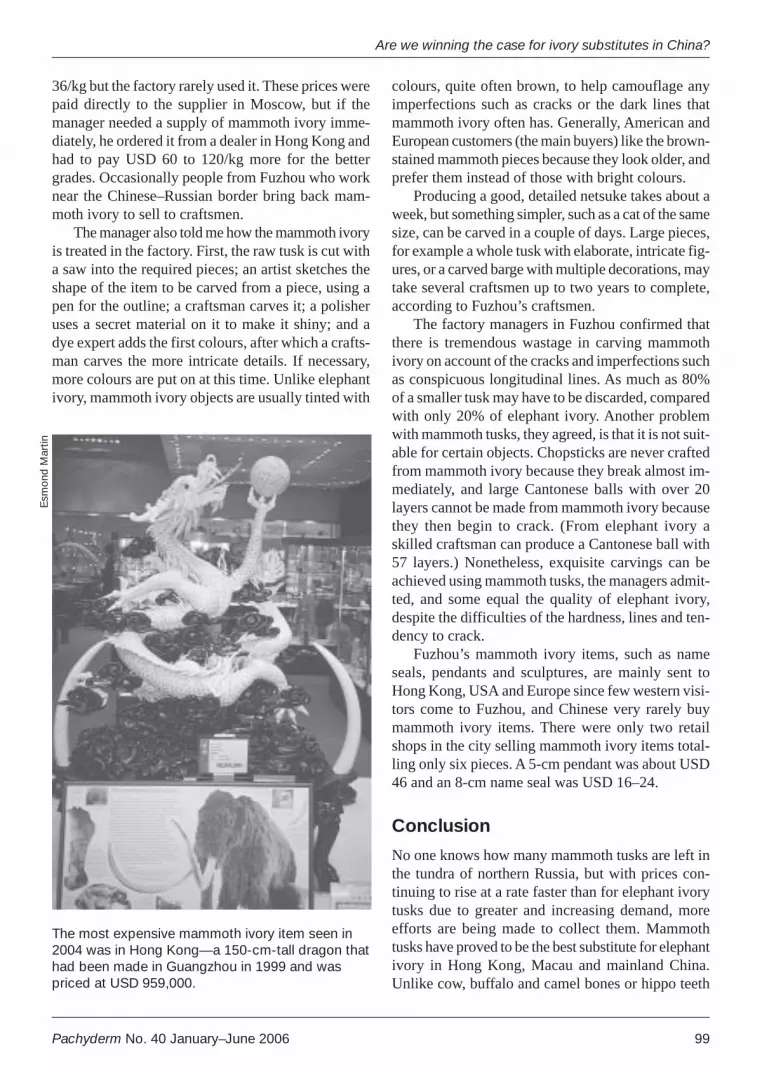
Pachyderm No. 40 January–June 2006 99
Are we winning the case for ivory substitutes in China?
36/kg but the factory rarely used it. These prices werepaid directly to the supplier in Moscow, but if themanager needed a supply of mammoth ivory imme-diately, he ordered it from a dealer in Hong Kong andhad to pay USD 60 to 120/kg more for the bettergrades. Occasionally people from Fuzhou who worknear the Chinese–Russian border bring back mam-moth ivory to sell to craftsmen.
The manager also told me how the mammoth ivoryis treated in the factory. First, the raw tusk is cut witha saw into the required pieces; an artist sketches theshape of the item to be carved from a piece, using apen for the outline; a craftsman carves it; a polisheruses a secret material on it to make it shiny; and adye expert adds the first colours, after which a crafts-man carves the more intricate details. If necessary,more colours are put on at this time. Unlike elephantivory, mammoth ivory objects are usually tinted with
colours, quite often brown, to help camouflage anyimperfections such as cracks or the dark lines thatmammoth ivory often has. Generally, American andEuropean customers (the main buyers) like the brown-stained mammoth pieces because they look older, andprefer them instead of those with bright colours.
Producing a good, detailed netsuke takes about aweek, but something simpler, such as a cat of the samesize, can be carved in a couple of days. Large pieces,for example a whole tusk with elaborate, intricate fig-ures, or a carved barge with multiple decorations, maytake several craftsmen up to two years to complete,according to Fuzhou’s craftsmen.
The factory managers in Fuzhou confirmed thatthere is tremendous wastage in carving mammothivory on account of the cracks and imperfections suchas conspicuous longitudinal lines. As much as 80%of a smaller tusk may have to be discarded, comparedwith only 20% of elephant ivory. Another problemwith mammoth tusks, they agreed, is that it is not suit-able for certain objects. Chopsticks are never craftedfrom mammoth ivory because they break almost im-mediately, and large Cantonese balls with over 20layers cannot be made from mammoth ivory becausethey then begin to crack. (From elephant ivory askilled craftsman can produce a Cantonese ball with57 layers.) Nonetheless, exquisite carvings can beachieved using mammoth tusks, the managers admit-ted, and some equal the quality of elephant ivory,despite the difficulties of the hardness, lines and ten-dency to crack.
Fuzhou’s mammoth ivory items, such as nameseals, pendants and sculptures, are mainly sent toHong Kong, USA and Europe since few western visi-tors come to Fuzhou, and Chinese very rarely buymammoth ivory items. There were only two retailshops in the city selling mammoth ivory items total-ling only six pieces. A 5-cm pendant was about USD46 and an 8-cm name seal was USD 16–24.
Conclusion
No one knows how many mammoth tusks are left inthe tundra of northern Russia, but with prices con-tinuing to rise at a rate faster than for elephant ivorytusks due to greater and increasing demand, moreefforts are being made to collect them. Mammothtusks have proved to be the best substitute for elephantivory in Hong Kong, Macau and mainland China.Unlike cow, buffalo and camel bones or hippo teeth
The most expensive mammoth ivory item seen in2004 was in Hong Kong—a 150-cm-tall dragon thathad been made in Guangzhou in 1999 and waspriced at USD 959,000.
Esm
ond
Mar
tin

100 Pachyderm No. 40 January–June 2006
Martin
that were used for carving even before the CITESivory ban, mammoth ivory carvings were rarely seenin China before the early 1990s. Mammoth ivory be-came important only after elephant ivory could nolonger be legally traded across borders. The accept-ance of mammoth ivory has spurred on a long tradi-tion of fine carving, which was in danger of becominga lost art. It has given more people jobs. Often pro-moted now as an exotic product because mammothshave long been extinct, and also because it has be-come expensive, it has a certain cachet. It is the mostvaluable substitute for elephant ivory.
The optimism for mammoth ivory of former ivorydealers in Hong Kong is obvious: they have openedfactories on the mainland to produce mammoth ivorycarvings, and have started to market these in Europeand the Americas. They do not believe that there isany future for the elephant ivory trade; those who haveold stocks would like to sell them and can legally doso only locally—if they find willing buyers. After the13th Conference of the Parties to CITES, held in 2004,officials of the Agriculture, Fisheries and Conserva-tion Department of Hong Kong invited licensedelephant ivory dealers to a briefing on the outcomeof the conference. But only one showed up, demon-strating the fallen interest in elephant tusks (Chi-sonCheung, Senior Endangered Species Protection Of-ficer, Agriculture, Fisheries and Conservation Depart-ment, Hong Kong, pers. comm. 2004).
To encourage the use of mammoth ivory, govern-ments should continue to allow it. Unfortunately, In-dia has banned its use because the authorities claimthey cannot distinguish it from elephant ivory and soit could create a loophole for the sale of ivory fromIndian elephants. The loophole that the authorities fearin India can be avoided if it is recognized that onlytusks resembling mammoth can be traded. Mammothtusks can be identified from elephant tusks by at leastone of three ways: by often being significantly larger,having a distinguishable brown outer layer, and hav-ing a noticeably different shape. Similarly, sculptureswith streaks can be easily identified as being fromthe mammoth. Then, assuming that the supply of rawmammoth ivory can continue in reasonable quanti-ties over the next 10 or 20 years by being sensiblyharvested, encouragement of its use will decrease thedemand for elephant ivory, thereby helping conser-vation efforts for elephants.
So, too, should the use of the other substitutes, espe-cially bone, continue to be encouraged. Trade in hippo
teeth, however, needs to be carefully controlled to pre-vent overuse. Hippos have been on Appendix II since1995, allowing trade only with a CITES export permit.While bones and teeth do not have as much effect onthe market by reducing the demand for elephant ivoryas mammoth ivory does, they are acceptable at thecheaper end of the market, and if they are better crafted,their role could become more important.
Recommendations
1. The smuggling of elephant ivory into southernChina for the carving industry needs to be stopped.Pressure needs to be put on Chinese authorities toenforce their own laws. Chinese government officialsand international NGOs with knowledge of the Chi-nese ivory industry need to inspect retail shops, fac-tories and small-scale family carving businesses.
2. The quality of the carving of cow, buffalo andcamel bone needs to be improved so that carvingsand trinkets made from these cheaper materials be-come more popular.
3. To encourage people to buy more items madefrom mammoth ivory instead of elephant ivory, trad-ers need to publicize and market mammoth ivory fur-ther. They should display their best carvings at localand international fairs. They should invite journaliststo their factories and showrooms to write about theuse of mammoth ivory as an acceptable, beautifulsubstitute for elephant ivory. Brochures with colourphotographs of mammoth ivory carvings and expla-nations about its suitability for carving intricate worksof art should be available to potential customers.
4. Research is needed to try to determine how muchmammoth ivory is coming out of Russia and Alaska,and the prospects for future supplies. If it appears thatthere will not be enough for bulk manufacture in theforeseeable future, then this material should be recog-nized as rare and valuable, to be used only by mastercraftsmen for expensive carvings. Bones should be usedinstead to replace elephant ivory for trinkets.
5. How to identify mammoth ivory such as by itsstreaks or brown outer coating needs to be made clearto potential buyers through posters and marketing, sothat it can be easily distinguished from elephant ivory.Trinkets should not be made. Not only as they are awaste of a valuable raw material, but also as they couldbe a loophole for elephant ivory as they are often toosmall to have streaks and thus elephant ivory lookstoo similar.

Pachyderm No. 40 January–June 2006 101
Are we winning the case for ivory substitutes in China?
Acknowledgements
I would like to thank the John Aspinall Foundationand the Columbus Zoo and Aquarium ConservationFund for financially supporting my research on thissubject. Chryssee Martin helped me with the researchI carried out in Hong Kong and Macau and workedwith me on this article. Grateful thanks also go toNigel Hunter, Ian Parker, Dan Stiles and Lucy Vignefor their helpful comments and additions.
References
Hong Kong Special Administrative Region. Census and Sta-tistics Department. 2004. Hong Kong digest of statis-tics. Census and Statistics Department, Hong Kong.
Hong Kong. Census and Statistics Department. 1993–1997.Hong Kong trade statistics. Census and Statistics De-partment, Hong Kong.
Hong Kong Special Administrative Region. Census and Sta-tistics Department. 1998–2001. Hong Kong trade sta-tistics. Census and Statistics Department, Hong Kong.
Hong Kong Special Administrative Region. Census and Sta-tistics Department. 2002. Hong Kong trade statistics.Census and Statistics Department, Hong Kong.
Hong Kong Special Administrative Region. Census and Sta-tistics Department. 2003, 2004. Hong Kong trade sta-tistics. Census and Statistics Department, Hong Kong.
Macau, Government. 1989. Existencias declaradas demarfim. Boletim Oficial de Macau, no. 47, 20 Novem-ber, p. 289.
Macau Special Administrative Region. 2004. Monthly bul-letin of statistics. Statistics and Census Service, Macau.
Martin E, Stiles D. 2003. The ivory markets of East Asia.Save the Elephants, Nairobi and London.

102 Pachyderm No. 40 January–June 2006
Rookmaaker
Distribution and extinction of the rhinoceros in China: review ofrecent Chinese publications
Kees Rookmaaker
Rhino Resource Center, c/o IUCN Species Survival Programme, 219c Huntingdon Road,Cambridge CB3 0DL, United Kingdom; email: [email protected]
Introduction
General Western understanding about the distributionof the rhinoceros in China was well stated by Allen(1940: 1279): ‘Although rhinoceroses were once wide-spread over Asia and have left abundant fossil remainsin deposits of no great geological age in China, thereseems to be no evidence that they have occurred evenin southern China within historic times.’ The same im-pression is gained from reading Laufer’s (1914) largebut rambling survey of ancient works by Chinese au-thors, who concluded that the rhinoceros was rarely seenin Chinese territories during the Song Dynasty (960–1279) and had completely disappeared in the follow-ing Yuan Dynasty (1280–1368). Chang (1926) alsolooked at ancient Chinese texts and found that in his-torical times, no elephant or rhinoceros existed in Chinanorth of the Yangtze River. However, rhinos were foundin numerous places in Hunan Province in the south untilthe Song Dynasty. It is, of course, well known that theChinese continued using rhino horn to produce varioustypes of carvings, of which the horn cups are the bestknown (Jenyns 1954; Chapman 1999).
With this background, it is surprising to read inseveral recent papers written by Chinese scientistsabout the existence of the rhinoceros in China as farnorth as the Yellow (Huang He) River and detailedrecords of the animal’s disappearance in the centu-ries that followed. Although only a few of these arti-cles are available to me, and most only through anEnglish summary, I present a brief review here. Be-cause it could well be that some of the data refer tofossil rhinoceros material in relatively recent depos-
its, I have also included a few references summariz-ing the latest findings.
Fossil remains of rhinoceros inChina
As I was primarily interested to learn to what extentthe fossil material can help establish which species ofrhinoceros lived in China, I looked for findings onspecimens from the Late Pleistocene (ca. 120,000 yearsB.P.) and Holocene (ca. 10,000 years B.P.) periods. Thework done in China has been summarized in a numberof articles in English or French by Dr Haowen Tong ofthe Chinese Academy of Sciences in Beijing.
Tong and Moigne (2000) state that for the LatePleistocene, remains of Dicerorhinus mercki,Coelodonta antiquitatis and Rhinoceros sinensis havebeen recognized.
D. mercki and C. antiquitatis were found only innorthern China, while R. sinensis was restricted to theregions south of the Yellow River. Of the currently liv-ing species, R. unicornis was recorded only in the EarlyPleistocene (2 million years B.P.), while both R.sondaicus and Dicerorhinus sumatrensis were foundin Holocene deposits. The Holocene material dated as7000 years B.P. was found in the Hemudu neolithicsite in Zheijang Province (ca. 28º N 129º E, just southof Shanghai) and in Hsia-wang-kang (Xiawanggang)in Hsich’uan County, Honan Province (ca. 30º N 115ºE, south of the Yellow River). Dicerorhinus andCoelodonta were confined to the northern parts ofChina, Rhinoceros to the southern parts.
HISTORY

Pachyderm No. 40 January–June 2006 103
Distribution and extinction of the rhinoceros in China
Tong (2000) provides a review of rhino materialfound in sites associated with human remains. Out of74 palaeolithic sites yielding human remains, 58(78%) also contained rhinoceros material. For theHolocene, Dicerorhinus was found in Hemudu,Xiawanggang and Dongshan (on the eastern shore inFujian Province), while Rhinoceros was found alsoin Hemudu. It is thought that the rapid decline of rhi-noceroses during the later part of the Pleistocene mayhave been due to human activity.
Tong (2001a) lists 17 names of genera and 62names of species or subspecies of rhinoceros reportedfrom China. Out of these, 33 taxa were reported onlyonce, in a single locality and a single horizon,indicating that more work is required to understandthe relationships of the Chinese rhinoceros remains,especially regarding D. mercki and R. sinensis.
Tong (2001b) states that fragmented rhino remainswere found at the Nanjing Homo erectus site (ca. 32ºN 119º E), dated to the late Middle Pleistocene. As all
Mt Table
Beijing
Mt Taihang
Xiawanggang Nanjin
Shanghai
Hemudu
Dongshan
GuangsiProvince
YunnanProvince
China
Vietnam
Nyanm
ar
Laos
Hainan
Yellow River
Yangtze River
Figure 1. Chinese mainland showing localities mentioned in the text.

104 Pachyderm No. 40 January–June 2006
Rookmaaker
these bones were found in caves, it is concluded thatmost probably humans hunted the rhinoceros. Tong(2002) further examines the material from Nanjingand refers the material (6 specimens) excavated fromthe Huludong Cave to D. mercki. Although otherfindings have indicated that this species spread to areassouth of the Yangtze River, only the material fromNanjing is reliable; other remains are poorly preservedand are open to question.
Records of the rhinoceros insouthern China
The paper by Wang Zhentang et al. (1993), publishedin English, contains a number of assertions about thedistribution of the rhinoceros that seem to need moreexplanation than the authors provide. Their aim wasto illustrate a logistic equation expressing therelationship between population numbers and
environmental capacity. They state that the rhinoceroswas widespread in China about 3000 years ago andthat their extinction was due to the human destructionof their environment. They use the rhinoceros as anexample, because ‘the historical documents on thedistribution of Rhinoceros in China are unique anddetailed’. They in fact provide some detail about theearliest records, about 3400 or 3200 years ago, heresummarized. For the Shang Dynasty (2000–1027B.C.), pictographs on bones show places where KingShang captured rhinos (normally 5–6 per trip,sometimes up to 16), at several places north of HuangRiver and south of the Tai Hang mountains. Anancient book of geography written by Shang HaiZhing stated the occurrence of rhinoceros in Mt NuChuang (now Mt Mi Gang), Mt Xun Wu (now MtQuwu) and Mt Zuozi (or Mt Table), all situatedroughly at 37–38º N. This, therefore, was the northernborder of rhinoceros distribution some 3000 years
Shang Dynasty 1400–1200 B.C.
Zhou Dynasty 800–600 B.C.
Zhou Dynasty 400–200 B.C.
Han Dynasty 0–200 A.C.
Tong Dynasty 400–600 A.C.
Song Dynasty 1000 A.C.
Ming Dynasty 600 A.C.
Qing Dynasty 200 A.C.
Yell o
w R
iv
er
Mt
Tabl
e
Mt T
aiha
ng
Mt T
ai
Figure 2. Approximate course of rhinoceros extinction in China (reproduced after Wang Zhentang et al.1993, fig. 2).
Pachyderm No. 40 January–June 2006 105
Distribution and extinction of the rhinoceros in China
ago. The animals belonged to both Rhinoceros (nospecies given) and Dicerorhinus sumatrensis. Thesubsequent history is said to be divided into eighthistorical periods, each lasting some 400 years. Therhinoceros retreated southwards in each of theseperiods, at a higher rate on the eastern coast than inthe mainland, coinciding with the spread of theChinese population. Rhinoceros disappeared fromYunnan in China about 200 years ago.
Although the change of the rhinoceros range from1400 B.C. to the present is illustrated in two maps,there is no explanation of the historical recordsunderpinning the lines or points shown on them. In alater paper, Wang Zhentang et al. (1997) repeat thesame evidence and postulate that the northerndistribution boundary of the rhinoceros shranksouthwards at a speed of 0.5 km per year, essentiallydue to human pressure. It is calculated that 4.0 peopleper square kilometre is the threshold value of humanpopulation pressure under which rhinoceros cansurvive.
Zhou (2003) provides some information on thecontents of the Shan Jing part of the ancient bookSang Hai Jing, considering that the ecologicalmaterial in the book is roughly trustworthy. Itdescribes the environment of the Yangtze River basin,where a rhinoceros identified as Rhinocerossondaicus was found. Lan Yong (1992) discusses thedistribution of the rhinoceros in south-west China,but as this paper has only a very short abstract, it canonly be said that he refers the animals in this regionto R. unicornis.
Lefeuvre (1991) discusses a pictograph found ona Shang oracle bone, which was often translated as‘rhinoceros’. The pictograph was found in aninscription on the head bone of a big animal,excavated on 28 November 1929 in the greatconnective pit, north-east of Xiaotun village, in theland of Zhang Xuexian. After examining all theevidence about this pictograph, it is concluded thatthe animal cannot have been a rhinoceros, rather thatit referred to a wild buffalo.
Finally, Xu (2000) refers to historical records ofthe rhinoceros in the southern province of Yunnan.He estimated that between 79 and 123 rhino hornshad been paid as tribute to the imperial courts fromYunnan since the 13th century. The rhinocerosbecame scarce in the area during the 18th century(latter part of the Qing Dynasty) and the last specimenin southern Yunnan was shot as late as 1957. This
payment of tribute has been an important factor inthe extinction of the rhinoceros in Yunnan. Thepresent eco-environment is suitable for its reintro-duction.
Discussion
It is not easy to judge the value of the records pro-vided by the Chinese authors. The data relating to theShang Dynasty oracle bones used by Wang Zhentangand his coauthors seem to be contradicted by the in-terpretation of the relevant pictograph by Lefeuvre(1991). The records of the ensuing period of the last3000 years, when the rhinoceros was retreating south-wards, need to be further explained in a paper writtenin a Western language. There is also uncertainty aboutwhich species of rhinoceros lived in China. As thedouble-horned Sumatran rhinoceros (Dicerorhinussumatrensis) is known from Myanmar and Thailand,and the single-horned Javan rhinoceros (Rhinocerossondaicus) was found in North Vietnam, one mayexpect that the records pertain to one or both of thesespecies, and it would be interesting to discover if thehistorical records could be separated between thesespecies, or indeed if the Indian rhinoceros (Rhinoc-eros unicornis) existed in China at all. Hopefully oneday the position of the rhinoceros in China will bebetter known to Western scientists.
Acknowledgements
Dr Haowen Tong of Beijing has kindly provided cop-ies of several papers on the rhinoceros in China. Thework of the Rhino Resource Center is supported by theInternational Rhino Foundation (IRF) and SOS Rhino.
References
Allen GM. 1940. The mammals of China and Mongolia.American Museum of Natural History, New York.
Chang HT. 1926. On the question of the existence of ele-phants and rhinoceros in North China in historical times.Bulletin of the Geological Society of China 5:99–105.
Chapman J. 1999. The art of rhinoceros horn carving inChina. Christie’s, London.
Jenyns S. 1954. The Chinese rhinoceros and Chinese carv-ings in rhinoceros horns. Transactions of the OrientalCeramic Society 29:31–62, plates 15–26.
Lan Yong. 1992. Extinguishment of wild Rhinocerosunicornis in southwest China. Journal of the Sichuan

106 Pachyderm No. 40 January–June 2006
Rookmaaker
Teachers College (Natural Science) 13(2). In Chinese,with English summary.
Laufer B. 1914. Chinese clay figures, part 1: Prolegomenaon the history of defensive armor, chapter 1: History ofthe rhinoceros. Publications of the Field Museum ofNatural History 13(2):73–173, figs. 1–24.
Lefeuvre Jean A. 1991. Rhinoceros and wild buffaloes northof the Yellow River at the end of the Shang Dynasty.Monumenta Serica 39:131–157.
Tong Haowen. 2000. Les Rhinocèros des sites à fossileshumains de Chine. L’Anthropologie 104:523–529.
Tong Haowen. 2001a. Rhinocerotids in China—systemat-ics and material analysis. Geobios 34(5):585–591.
Tong Haowen. 2001b. Age profiles of rhino fauna from theMiddle Pleistocene Nanjing Man site, South China:explained by the rhino specimens of living species. In-ternational Journal of Osteoarchaeology 11:231–237.
Tong, Haowen. 2002. Fossil materials of rhinos(Dicerorhinus mercki) from the Middle PleistoceneNanjing Homo erectus site. In: Rukang WU, ed., Homoerectus from Nanjing. Jiangsu Science and TechnologyPublishing House. p. 111–120. In Chinese, with Eng-lish summary.
Tong H, Moigne A-M. 2000. Quaternary rhinoceros ofChina. Acta Anthropologica Sinica, suppl. to vol.19:257–263.
Wang Zhentang, Xu Feng, Sun Gang. 1997. A preliminaryanalysis of the relationship between the extinction ofrhinoceros and human population pressure in China.Acta Ecologica Sinica 17(6).[pages unknown]. In Chi-nese, with English summary.
Wang Zhentang, Zhao Wenjie, Sun Gang, 1993. The eco-environmental model of Rhinoceros extinction in China.Polish Ecological Studies 19(1/2):29–34, figs. 1–3.
Xu Zai-Fu. 2000. The effects of paying tribute to the impe-rial court in the history on rhinoceros’s extinction andelephant’s endangerment in southern Yunnan. ChineseBiodiversity 8(1):112–119. In Chinese, with Englishsummary.
Zhou Hong-wei. 2003. The ecological environment in theYangtze River Basin in the age of writing ‘Shan Jing’.Journal of the Zhuzhou Institute of Technology17(3):12–17. In Chinese, with English summary.

Pachyderm No. 40 January–June 2006 107
Field note
FIELD NOTE
Past population dynamics and individual information on possiblesurviving northern white rhinos in Garamba National Park andsurrounding reserves
Kes Hillman Smith
PO Box 15024 – 00509 Langata, Nairobi, Kenya; email: [email protected]
Since 1983, the Garamba National Park Project(GNPP) in partnership with the Institut Congolaispour la Conservation de la Nature (ICCN) have beenmonitoring the northern white rhinos (Ceratotheriumsimum cottoni) of Garamba National Park, Demo-cratic Republic of Congo (DRC) as part of the con-servation of the park and ecosystem (fig.1). Individualrecognition has been one of the key tools. The cur-rent crisis facing this population has been and is be-ing reported elsewhere.
The objective of this note is to summarize rhinopopulation dynamics based on the individuals andtheir families, to demonstrate the past capacity of thenatural population to increase, to outline what isknown of individual components of the decline ofthe population since mid-2003 with the likelihood ofindividual rhinos that could potentially still exist, andto provide background material for individual identi-fication, population management and conservation atall levels of this now severely reduced population.
Some of this work was done to update the rhinorecognition file and to identify possible survivingindividuals, provide guidance for a survey carried outin March 2006 through the auspices of the IUCN Af-rican Rhino Specialist Group and the African ParksFoundation, and for ongoing monitoring.
Methods
Full rhino monitoring methods are written up in theGaramba National Park Rhino Monitoring Manual(Hillman Smith et al. 1996).
M2 Eleti, an adult male northern white rhino inGaramba National Park, showing nose wrinklesand ear characteristics.

108 Pachyderm No. 40 January–June 2006
Smith
Identification is based on age, sex, horn shapes,ear notches cut on immobilized rhinos, or natural earmarks, tail lengths and hairs, nose wrinkles, associa-tions (such as infant or juvenile with mother). Homeranges and distribution were plotted and observed andonce known were additional guidance.
Age and sex: Basic ageing (infant, juvenile, sub-adult, adult) and sexing formats were provided at aseries of training courses for ICCN park staff and re-searchers over the years. All members of the Moni-toring and Research Unit, patrol leaders andsecretaries of anti-poaching patrol teams, and guardsselected for Equipe Rhino followed the trainingcourse. Therefore there were some guards in everypatrol who could do basic reporting of rhino obser-vations, as well as the specific rhino-monitoringteams. The guidelines and rhino report forms and
maps are carried as part of the patrol data sheets. Thediagram of how to determine age for northern whiterhinos is given in figure 2. Based initially on age de-termination of southern white rhinos (Hillman Smithet al. 1986), classification details have been refinedover 22 years with long-term observations of known-age animals, body and tooth measurements taken fromcasts on immobilized animals.
Physical features: Horn shape, earmarks (natu-ral or with cut notches), tail length, hair variations,nose wrinkles, and scars were maintained on indi-vidual identification cards and later in an Access da-tabase, with drawings and photographs. All rhinoobservers, from the air or on the ground, use a quickreference guide to all extant rhinos, and a further up-dated guide was drawn up that new observers usedon thhhhhe recent surveys.
DEMOCRATIC REPUBLIC OF CONGO
AzandeReserve
Gangala na Bodio
Mondo Missa
GarambaNational
Park
Dungu
Faradje
Aba
Maridi
N
Garamba River
park boundary
international boundary
rhino range
Reserve
0 40 km
SUDAN
Figur 1. Garamba National Park and sorrounding reserves.

Pachyderm No. 40 January–June 2006 109
Field note
Association and nomenclature: Each rhino has aname and ID number. The ID number–letter combina-tion is an indicator of family. At the start of the projectall males were given the code M plus a number and allfemales F plus a number. The offspring of any femalethen take her number plus a successive letter plus F orM depending on sex—for example, F6, Pacque(Easter)’s first known offspring was a daughter, 6aFŒuf de Pacque (Easter Egg). Her most recent one was6g, which had not yet been sexed. 6aF’s first calf was6aaM, Pascal, and the second 6abF, Chocolat. A theme,in this case Easter, often also runs through the naming.When rhinos are very young they clamp their tails downwhen disturbed and are difficult to sex from the air orfrom the ground if the grass is long, and the postfixmay come later. The infants and juveniles are identi-fied by association with the mother at first until otherfeatures are recognizable. The family trees are avail-able for use in conjunction with DNA analyses in fu-ture identification and management of the currentreduced and disrupted population.
Observations: All rhino observations by anyone—researcher, guard or visitor—have been recorded in a
standard format since 1983. They included date, time,location name, and location coordinates on a Uni-versal Transverse Mercator-compatible kilometre-based grid system that was standard for all monitoring,anti-poaching and aerial surveys at Garamba. It there-fore also formed an easy means of communicatingbetween aerial and ground patrols and with the cen-tral radio unit and mapping their positions. The totalnumber in the group are given, with age and sex break-down, habitat and condition based on standardizedclassifications, activity, associated species, individualidentification as far as possible, measurements oftracks and notes. Observations are also classified asoriginal or follow up, by air or ground, and the ob-server’s initials are recorded. On the back of the datasheet are blank outlines of rhino heads for drawinghorn shapes, ear marks and nose wrinkles and roomto complete other identifying features observed. Allobservations are all entered into a computer in aspreadsheet format for analysis.
Survey: Focused monitoring and study of therhinos has been done from ground and air. Aerial workhas included regular surveys of the whole southern
adult
sub-adult
juvenile
infantinfant 1 0–1 months
infant 2 1–3 months
Length of horn relative tolength of ear
Height of a young rhino relative to the height of the mother
juvenile 1 3–6 months
juvenile 2 6–12 months
juvenile 3 12–30 months
sub-adult 1 30–72 monthssub-adult 2 72–120 months
adult
Figure 2. Age determination classification for the northern white rhino.

110 Pachyderm No. 40 January–June 2006
Smith
sector comprising the rhino range and adjacent areas,done as total block counts using individual recogni-tion and other general reconnaissance and radio track-ing when radios were active. All observations ofrhinos, signs of illegal activity and areas of long-grasshabitat are plotted The intensive block counts, usedto guide anti-poaching efforts and to maintain fieldmonitoring, were carried out roughly every twomonths before war started in 1997 but had to be re-duced to one to three times a year during the wars.
Radio telemetry: Between 1993 and 1996, ini-tially with collars and then by pioneering horn trans-mitters with embedded antennae, radio telemetry wasused to treble the rate of observations per time unitover the intensive aerial survey and therefore to makemonitoring and protecting the rhinos more efficient.While rhinos were immobilized for radio telemetry,their ears were also notched, providing easy and cer-tain identification of a selection of animals, particu-larly subadults.
DNA analysis: Material from the notched ears andfrom an earlier programme of biopsy darting and fromrhinos found dead, was analysed to evaluate geneticvariability and subspecific differences and to try toassess paternity to further guide conservation andmanagement of this small, vulnerable population.Analysis was and is being carried out by the molecu-
lar genetics laboratories at the National Museums ofKenya and Cape Town University.
Results
Before 1984 and the start of the Garamba project,97% of the population had been lost in eight yearsdue to heavy commercial poaching. In 1984 the rhinopopulation was only 15 individuals comprising fiveadult females, six adult and one subadult male, andthree juveniles. Over a 22-year period 50 births havebeen recorded. Four died young, one mired in mud,one orphaned and two from unknown causes, but 44were recruited to the population prior to the recentwave of poaching. It is possible that one to three un-detected post-natal losses occurred, considering somelong intercalf intervals in females otherwise regularlyreproducing.
Figure 3 shows annual recorded births with theannual minimum number of the population and thenumber of births per year as a percentage of the popu-lation of the preceding year (because the current year’spopulation includes the new births). Apart from nor-mal annual fluctuations, there has been no significanttrend in rate of reproduction over the 20-year period,with a mean annual rate of reproduction of 9%. Tables1a and b show individual population histories.
0
10
20
30
40
50
1983
1984
1986
1988
1990
1992
1994
1996
1998
2000
2002
2004
1985
1987
1989
1991
1993
1995
1997
1999
2001
2003
2005
minimum rhino numbesrs rhino births
Rhi
no n
umbe
rs
births % of previous year’s population
Figure 3. Rhino births between 1983 and 2005 in Garamba National Park.

Pachyderm No. 40 January–June 2006 111
Field note
Mal
esN
ame
1983
1984
1985
1986
1987
1988
1989
1990
1991
1992
M1
M2
Ele
ti
M3
Kon
do A
kata
ni9.
5.84
M4
Bac
27.8
.84
M5
Baw
esi
27.8
.84
M6
Long
ueco
rne
4.4.
86
M7
Moi
tier
3.3.
86
M9
Not
ch23
.6.8
6
1aM
Mok
e/C
h2?
*b.
83
4aM
Bol
ete
mok
e/H
E?
*b.
83
5aM
Gin
inga
mba
b2.8
5
6bM
Elik
yab6
.88
1bM
Mpi
ko *
*b3
-4.8
9
3aaM
Bon
ne A
nnee
b12.
90
4eS
ifab.
01.9
2
5cM
Mol
ende
b.8.
89
3cM
Sol
ob.
12.8
9
3dM
Mam
ub9
.91
1dM
Alm
eje
6dM
W
illib
adi
4daM
Mbo
lifue
6eM
Con
go
3gM
Laur
ent
4baM
?E
di
1fM
F
rais
e
6fM
Fin
de
Sie
cle
6aaM
Pas
cal
6cbM
Sas
alia
5daM
Mill
eniu
m
Ken
ge m
oke
1993
1994
1995
1996
1997
1998
1999
2000
2001
2002
2003
2004
2005
2006
2.96
4.04
3.97
Out
of t
errit
ory
& d
isap
pear
ed
?N
ot s
een
agai
n, b
ut c
ould
hav
e b
een
Cur
ly H
orn
who
re-
appe
ared
Re-
nam
ed a
s C
urly
Hor
n, b
ut c
ould
hav
e be
en 5
aM
b6.9
3
b.9.
95
b.6.
96
b8.9
7
b12.
97
b2.9
8
b3.9
8
b12.
99
b9.9
9
b12.
99
b2-3
.00
2.93
* 1a
M a
nd 4
aM w
ere
read
ily id
entif
ied
as ju
veni
les
by a
ssoc
iatio
n w
ith m
othe
r, u
ntil
they
bec
ame
inde
pend
ent a
s su
bord
inat
e ad
ults
. Bot
h w
ere
imm
obili
sed
for
radi
o te
lem
etry
and
be
cam
e cl
early
iden
tifie
d as
Cha
nnel
2 a
nd H
airy
Ear
s. W
hat w
as n
ever
cer
tain
was
whi
ch w
as o
rigin
ally
1a
and
whi
ch 4
a.**
Mpi
ko w
as a
lso
iden
tifia
ble
whe
n yo
ung,
but
the
mal
e su
b-ad
ults
dis
pers
e an
d ar
e no
t se
en fo
r pe
riods
of t
ime.
The
you
ng m
ale
know
n as
Cur
ly H
orn
was
sus
pect
ed fr
om h
is a
ge to
pos
sibl
y be
Mpi
ko,
but f
rom
hor
n sh
ape
coul
d ha
ve b
een
from
F5
or F
3 fa
mile
s, i.
e p
oten
tially
Gin
inga
mba
or
Mam
u, b
oth
of w
hom
wer
e su
spec
ted
dead
due
to p
oach
ing
in th
eir
rang
es.
Kno
wn
life
hist
ory
to la
st o
bser
vatio
n or
con
firm
ed id
entif
icat
ion
of d
eath
Con
firm
ed d
eath
by
iden
tific
atio
n of
dea
d rh
ino
with
app
roxi
mat
e da
te
Dat
e at
sta
rt o
f lin
e is
dat
e of
firs
t obs
erva
tion
or b
.plu
s da
te is
app
roxi
mat
e da
te o
f birt
h
Tabl
e 1a
. Gar
amba
Nat
iona
l Par
k: n
orth
ern
whi
te r
hino
his
torie
s (m
ales
)

112 Pachyderm No. 40 January–June 2006
Smith
1993
1994
1995
1996
1997
1998
1999
2000
2001
2002
2003
2004
2005
2006
1dM
1eF
1fM
b 8.
951e
a
b4-5
.02
3eF
3fF
3gM
3h3i
3.96
Pr
b 7.
933e
aF3e
bF3e
c
b11.
99
b11.
01
b10.
04
b9.9
53f
a
b2.0
4
b4.0
0
b8.0
2
4fP
11.9
7
Ken
ge*
4baM
4caF
4cbM
4cc
b9.9
6
1.04
4daM
4dbF
4dc
b2.0
0
b1.0
4
b1.9
4
1.95
5daM
5db
b7.0
3
6dM
6eM
6fM
6g
6aaM
6abF
b2.0
2
6ac
?
b1.0
4
b5.0
4
Fem
ales
and
uns
exed
1983
1984
1985
1986
1987
1988
1989
1990
1991
1992
F1
Mam
a m
oke
1aM
1bM
1cF
1cF
Naw
ango
b 2.
91
1eF
Kas
i
1ea
Kom
bola
ni
F3
Kun
alin
a3a
F3b
F3c
M3d
M
3aF
Kun
i**
3aaM
3bF
Juill
etb
7.85
3eF
E
tum
ba
3eaF
Bob
oto
3ebF
Ste
ps
3ec
Nov
embe
r
3fF
Alig
aru
3fa
Nab
ema
3hZ
igba
3iLi
sung
i
F4
Bol
etin
a4a
M4b
F4c
F4d
F4e
M
4bF
Mai
b5.8
5
4cF
Noe
lb1
0.87
4caF
Kito
4cc
Esp
oir
4dF
Min
zoto
(F
lopE
ar)
b.8.
89
4dbF
San
za
4dc
Eto
ile
4fN
auol
oko
F5
Mam
a G
inin
gam
ba5a
M5b
F5c
M5d
F
5bF
Griz
mek
b10.
87
5dF
Jeng
atu
b7.9
1
5db
Keb
a
F6
Pac
que
6aF
b3.8
6
6bM
3aaM
adop
t
6aF
6abF
6ac
6g
Oeu
f de
Pac
que
Cho
cola
t
Cou
rage
Bun
ny
Key
:
Kno
wn
life
hist
ory
to la
st o
bser
vatio
n or
con
firm
ed id
entif
icat
ion
of d
eath
Con
firm
ed d
ead
by id
entif
icat
ion
of d
ead
rhin
o w
ith a
ppro
xim
ate
date
ID c
odes
with
in th
e lif
e lin
e of
eac
h fe
mal
e in
dica
tes
the
birt
hs o
f cal
ves.
(M
ale
calv
es e
.g 1
aM th
en jo
in th
e M
ale
Tab
le 3
a). F
emal
e ca
lves
e.g
3bF
sta
rt th
eir
life
line
belo
w th
at o
f mot
her,
with
app
roxi
mat
e da
te o
f bi
rth
p.da
te =
con
firm
ed p
oach
ed w
ith d
ate
* K
enge
was
a n
ewbo
rn r
hino
foun
d m
ired
in m
ud. H
is m
othe
r w
as n
ot s
een
for
iden
tific
atio
n, b
ut b
y el
imin
atio
n co
uld
poss
ibly
hav
e be
en 4
bF M
ai**
3aF
Kun
i dis
appe
ared
and
her
cal
f 3aa
M a
ppea
red
to h
ave
been
ado
pted
by
F6
Tabl
e 1b
. Gar
amba
Nat
iona
l Par
k: n
orth
ern
whi
te r
hino
his
torie
s (fe
mal
es)

Pachyderm No. 40 January–June 2006 113
Field note
Intercalf intervals of all females throughout the 20-year period averaged 30 months, with means rangingfrom 24 to 41 months and overall ranges from 21 to 57months (table 2). The mean intercalf interval of youngfemales with their first few calves was 35 months, witha range of 23 to 49 (table 3). It is not clear whether thelonger interval is due to social or physical factors.
When the second generation began reproduction,ages at birth of first calves recorded averaged 8 years3 months, with a variation from 6 years 4 months to13 years 6 months. The rhino population doubled inthe first 8.5 years of the project, with a 9.7% rate ofrecruitment calculated at that time (Smith and Smith1991).
From 1991, increase in the rhino population lev-elled off at around 30 animals, despite continued re-
production (Hillman Smith et al. 1994). This coin-cided with the nearby town of Maridi in Sudan beingcaptured and the war in adjacent Sudan beginning tohave a greater effect on Garamba. With a porous bor-der, easy access to arms and ammunition, 80,000 refu-gees in areas adjoining park’s buffer reserves, andlater the establishment of the Sudanese People’s Lib-eration Army camps on the border, poaching for meatincreased in the north of the park and, despite strongcounter-action, moved down towards the rhino andelephant sector in the south. The first rhinos knownto have been poached were in 1996. The situationwas further exacerbated with the civil wars in Zaire(now DRC) itself, with initial losses of elephants, hip-pos and buffalos, but continued project support anddevelopment of financial and diplomatic support from
the UN Foundation and UNESCO heldrhino and elephant populations stablefrom 1998 to 2003. Since the rate of re-production remained stable there musthave been more rhino deaths than thewar time reduction in ground and aerialmonitoring was able to detect.
The extreme downward trend of thepopulation that started in 2003, shown infigure 3, is reported elsewhere (HillmanSmith et al. 2003; Hillman Smith andNdey 2005). It coincided with the cease-fire in southern Sudan and with changesin the type, distribution and intensity ofpoaching. The trend was detected by bothrhino and law-enforcement monitoring.
Table 3. Age at first calving, northern white rhinos, GarambaNational Park, 1984–2004
Individual no. and name AFC Mean ICI (m.)
1eF Kasi 6 y 8 m3aF Kuni 7 y 3 m3eF Etumba 6 y 4 m 243fF Aligaru 8 y 5 m4bF Mai 7 y 9 m4cF Noel 8 y 11 m 444dF Minzoto 6 y 10 m 445dF Jengatu 8 y 7 m 416aF Oeuf de Pacque 13 y 6 m 26Average 8 y 3 m 35Range 6 y 4 m – 13 y 6 m
AFC – age at first calving; ICI – intercalf interval; y – year and m – month
Table 2. Intercalf interval (in months) of northern white rhino females in Garamba National Park, 1984–2004
Individuals F1 F3 3eF F4 4cF 4dF F5 5dF F6 6aF
23 22 21 32 2729 53 29 22 3226 21 22 23 5731 22 28 23
26 24 39 42 41 28 2927 49 46 48 2223 2428 23
Average indiv. 27 28 24 25 44 44 26 41 36 26Range 23–31 21–53 23–24 21–29 39–9 42–46 22–32 41 23–57 22–29Overall ICI (n = 35) 30Overall range (n = 35) 21–57Young females (n = 10) 35ICI – intercalf interval

114 Pachyderm No. 40 January–June 2006
Smith
The alarm was raised, and major collaborative effortswere made to counter it and conserve the ecosystemand rhinos. But as reported elsewhere, the minimumnumber of rhinos detected in surveys decreased and ninerhino carcasses were found in 2004 and a further two in2005 (Hillman Smith and Ndey 2005) (table 4). Reduc-tion in numbers was due both to deaths and to rhinoscrossing the Dungu River and moving out of the park tothe wooded Gangala na Bodio Reserve to the south.
Since late 2004 it is believed that there are fewerthan 10 northern white rhinos remaining. Successivesurveys have found 4, 4 and 2 plus a possible further2 later as minimum numbers within the park (pers.data; pers. comm. with E. de Merode, IUCN AfRSGand J Tello), but there are almost certainly an addi-tional few within the reserve.
Discussion and conclusions
The initial rate of increase of the population of 9.7%per annum and the overall mean rate of reproductionof 9% over the 22-year period (1983–2004) reportedcompare favourably with rates of increase of 9.5%found by Owen Smith in a well-protected southernwhite rhino (C.s. simum) population (Owen Smith1973). The average intercalf interval of 30 months or
2.5 years was also the same. The rate of reproductionwas maintained throughout despite disruptions fromcivil wars and increased poaching. There was no signof inbreeding depression, and preliminary results ofgenetic analysis indicated a relatively high variabil-ity and a far greater difference between the subspe-cies of white rhinos than that found between any ofthe subspecies of black rhinos. (R. Aman pers. comm.1993; Harley and O’Ryan pers. comm. 1995). Norwas reproduction compromised by low densities, ashome ranges were found to be up to 10 times greaterthan those of southern whites (Smith and Smith 1993).In terms of habitat, behaviour and genetics the northenwhite rhino population was healthy and reproducingwell over the 22-year period and probably has poten-tial to increase again if sufficient animals can be foundeven on a meta-population scale.
The overriding cause of its recent numerical de-cline was illegal offtake in a border region of politi-cal instability, and easy access to weapons bypoachers. Most of the recent illegal exploitation wasof elephants, which share the same range, but withlower numbers the proportional loss of the rhinos hasbeen more serious. Protection by all means possibleis clearly vital to prevent total extinction.
Table 4. Rhinos found dead in Garamba National Park, 2004–05.
Date found. Age/sex Probable ID Region Cause and notes Skull ref.
25 Jan 04 Young adult male 14–20 yr Elikya 6bM Willibadi II Poaching PNG 22
09 Apr 04 Adult male 25–30 yr Notch M9; Willibadi I Wounded by horsemen PNG 23confirmed ID from horns poachers and died; horns
recovered13 Apr 04 Adult Skull not recovered Willibadi I Poaching by horsemen;
seen from air in water07 July 04 Young female adult 7–9 yr Kito 4caF, Kasi 1eF or Dinakpio near Poaching, seen from air PNG 24
Aligaru 3fF Willibadi II and followed up on ground;.lower jaw smashed, hornsgone
01 Aug 04 Adult male c. 28 yr Kondo Akatani M3 Willibadi I Poaching (bullet in head); PNG 25marks of head wound seenbefore death
29 Aug 04 Young adult female 8–9 yr Kito 4caF, Kasi 1eF or Willibadi II Poaching PNG 26Aligaru 3fF
30 Sep 04 Young adult female 8–11 Aligaru Willibadi II Poaching PNG 27yr + infant male +- 4 mo 3fF + 3fa and 28
08 Oct 04 Adult female pregnant Skull not yet recovered Source Nakule Poachingin the triangle
Feb 05 2 adults Patrol report skull not Block 3 near Poachingrecovered confluence
DunguWillibadi II

Pachyderm No. 40 January–June 2006 115
Field note
Results of the monitoring and previous conserva-tion efforts however, provide positive indications forfuture increae if protection is sufficient. In additionto physical identification, the use of DNA analysisfrom dung to help new observers to identify the rhi-nos is also proposed. Individual relationships and theongoing analysis of genetic material is therefore offurther importance.
Adequate protection and informed managementof such a small population should be enhanced byinformation from previous monitoring. Data presentedhere and available in more detail can, we hope, con-tribute to future conservation and management.
Ackowledgements
We of the Garamba Project, are grateful to Interna-tional Rhino Foundation for having supported the con-servation of Garamba National Park and its ecosystemand staff for many years, to the UN Foundation andUNESCO throughout the war, and to WWF, theFrankfurt Zoological Society, and others before that.The support of the Wildlife Conservation Fund bypartnering in the monitoring aircraft has been vital.We are very grateful to the Institut Congolais pour laConservation de la Nature for a long partnership andthe opportunity to have lived and worked in Garambaand done our utmost for its conservation. The IUCNAfrican Rhino Specialist Group and the African ParksFoundation have supported conservation efforts andsome of the analysis. We thank you all.
References
Hillman Smith AKK, Owen Smith N, Anderson JL, HallMartin AJ, Selaladi JP. 1986. Age estimation of thewhite rhinoceros (Ceratotherium simum). Journal ofZoology (London) (A) 210:355–377.
Hillman Smith K, Atalia M, Milledge S. 1994. Pachydermsand threats increasing in Garamba National Park, Za-ire. Species IUCN/SSC.
Hillman Smith K, Atalia M, Milledge S. 1997. Rhino moni-toring manual. Garamba National Park Project report.GNPP/ICCN/WWF.
Hillman Smith K, Smith F, Tshikaya P, Ndey A, Watkin J.2003. Poaching upsurge in Garamba National Park,Democratic Republic of Congo. Pachyderm 35:146–150.
Hillman Smith K, Ndey JA. 2005. Post-war effects on therhinos and elephants of Garamba National Park. Pachy-derm 39:106–110.
Owen Smith N. 1973. The behavioural ecology of the whiterhinoceros. PhD thesis. University of Wisconsin, Madi-son, WI, USA.
Smith K, Smith F. 1993. Conserving northern white rhinosin Garamba National Park. In: O Ryder, ed., Proceed-ings of an interntional conference on Rhinoceros Biol-ogy and Conservation of Rhinos, Publ. Zoo Society,San Diego. p 166–177.

116 Pachyderm No. 40 January–June 2006
Tribute
Thomas John Foose (1945–2006)
Nico van Strien
International Rhino Foundation
Tom Foose, lately program direc-tor for the International RhinoFoundation, unexpectedly passedaway on 17 May 2006 at his homein Waynesboro, Pennsylvania,USA.
Tom was one of my closestfriends. For many years we hadalmost daily we spoke over thephone and exchanged many emailson the rhino programs that wewere both involved with. We metin person several times a year ei-ther in Asia or in the US. Our livesbecame more and more entwinedthrough our common interests andTom became part of my family.His untimely death is a tremen-dous loss for me as for everyonewho knew and worked with him.He was a remarkable person, withquite a few special traits in hischaracter, methods and likings,but he was a true and warm friend,though always cautious with hisemotions and forever somewhatdistant.
Tom was born on 7 March1945 in Waynesboro. He receiveda BA in Biology from PrincetonUniversity in 1969. From 1970 till1980 he held several positions atCornell University and the University of Chicago andat the Philadelphia and Oklahoma City zoos.
His close association with rhinos and rhino con-
servation started with a PhD study at the University ofChicago on feeding strategies for ruminant as opposedto non-ruminant ungulates. His intention was to do the
TRIBUTE
The late Dr Thomas John Foose

Pachyderm No. 40 January–June 2006 117
Thomas John Foose
the research in Kaziranga National Park in Assam, In-dia, but he had to leave Assam after a few months be-cause of security risks in the area. He completed hisstudies at zoos and in 1982 he obtained his doctorate.
From 1981 to 1990 he served as the conservationdirector for the American Zoo and Aquarium Asso-ciation (AZA), and along with Dr Ulie Seal, devel-oped the concept for the species survival plan (SSP)program for endangered species. Such programmesnow are the cornerstone for managing captive spe-cies for all regional zoo associations.
From 1990 to 1992, Tom served as ExecutiveOfficer of the IUCN/SSC Conservation Breeding Spe-cialist Group. He shaped its programmes and focusto include using computer simulation modelling toexamine the risks of species extinction, as well asglobal risk assessments of broad taxonomic groupsincluding making recommendations for species man-agement and research.
In 1991, Tom was one of the founders of the In-ternational Rhino Foundation (IRF), initially calledthe International Black Rhino Foundation. The foun-dation embodies his lifelong passion for rhino con-servation, both in zoos and in nature. Tom was theIRF program director from 1993 and the driving forcebehind its conservation programmes that now spanall rhino species and most range states, focusing onlong-term support for the most endangered rhino typesand areas.
Tom was a program officer of the IUCN/SSCAsian Rhino Specialist Group for as far as memorygoes back and had several other functions in execu-tive, scientific and curatorial capacities. He was in-volved in designing and implementing manyprogrammes, projects, strategies and action plans, in-cluding the IUCN/SSC Global Captive Action Planand Global Animal Survival Plans for all species ofrhino. There are too many to list them all.
After having moved for his jobs to several placesin the US, Tom returned to his home town to take careof his ailing mother. He managed to combine his manyduties with loving care for her until her death. Later,Tom took up part-time teaching at a local high schoolfor several years. He enjoyed the contact with youngpeople and found that it gave extra meaning to his life.He was sad that he had to give up the teaching because
of the demands his other positions made on his time.Tom was always trying new avenues for raising
funds for his programmes and never tired of gettinganother meeting or workshop together. He was a pro-lific writer and a master in formulating concise andprecise summaries and points of agreements. Awordsmith of repute, he would always come up withthe right word.
Throughout his work with many organizations andgroups on conservation and management issues, Tomtouched people around the world and inspired themto set aside their personal, national and institutionalagendas to focus on preventing species extinctions.Over the past 10 years, his primary focus was lead-ing the development and implementation of globaland national conservation strategies and action plansfor rhinos in Asia and Africa.
Most recently, Tom initiated the Sumatran RhinoCaptive Global Management and Propagation Board;he was closely involved with designing the Vision2020 Program for Indian Rhino in Assam and theRhino Century Program to restore the populations ofJavan and Sumatran rhino in Indonesia to viable lev-els. Tom was involved in designing the EuropeanAssociation of Zoos and Aquaria Rhino Campaign.He initiated the North American Save the RhinosCampaign, whose goal was to double the number ofrhinos in critically endangered populations in selectprotected habitats in the wild within 10 years.
He dedicated his life to bridging gaps among peo-ple with diverse interests and perspectives, as well asusing science to foster national and global collabora-tion for threatened species management. We will missTom’s many unforgettable characteristics: his sportysafari attire, his mischievous smile and the twinkle inhis eye whenever a rhino came into view. We willmiss his dry sense of humour, and his love for CocaCola, durians, rendang and coconut ice cream. Memo-ries abound and the many anecdotes about Tom willcontinue to enlighten our lives.
Tom is survived by his children Rebecca FooseNesmith, Thomas John Foose III and their mother,Vi rginia Foose; children Susan Foose and MichaelFoose and their mother, Ellen Foose; and one grand-son, Daniel Nesmith.
118 Pachyderm No. 40 January–June 2006
IUCN/SSC African Elephant Specialist Group memers
BOOK REVIEW
Ivory markets of Europe
Esmond Martin and Daniel Stiles, drawings by Andrew Kamiti
Care for the Wild International, West Sussex, UK, and Save the Elephants, Nairobi and London2005; 104 pages. ISBN 9966 9683 4 2
Review by Kees Rookmaaker
Chief Editor, Rhino Resource Center (sponsored by the International Rhino Foundation and SOS Rhino);Research Assistant, Darwin Online Project, Centre for Research in the Arts, Social Sciences and Humani-ties, University of Cambridge; Researcher, Strickland Archives at the University Museum of Zoology,Cambridge
The African elephant in 1989 was added to Appendix1 of animals governed by the Convention on Interna-tional Trade in Endangered Species of Wild Faunaand Flora (CITES), where the Asian elephants hadbeen listed since 1975. For CITES Parties this meanta ban of all international commercial trade in elephantproducts, which came into effect in January 1990. TheEuropean Union now allows only the import of ivoryantiques, defined as items manufactured before 1 June1947, while raw and worked ivory can be exportedfrom EU countries subject to the destination countryissuing a certificate to authorize the import. Becauseobviously illegal trade in ivory can easily be linkedto poaching wild elephants, Esmond Martin and Dan-iel Stiles have been engaged in a series of surveys tomonitor the extent of ivory trade around the world.
Their latest report, the subject of this review, isthe fourth in a continuing series of surveys to estab-lish baseline figures that can assist in monitoring cur-rent ivory trade. After covering the markets in Africa,South-East Asia and East Asia in three previous books,the authors now for the first time look at the extent ofthe trade in a region where elephants have not oc-curred naturally in the modern epoch. The authorssurveyed the trade in selected cities in Germany, the
United Kingdom, France, Spain and Italy. It is notaltogether clear why these countries were selected,or rather why their neighbours were excluded. Onewould equally expect some trade in Holland or Bel-gium, in Scandinavia, or in some of the countries inthe eastern section of Europe.
Ivory carving has been practised in Germany formany centuries. Erbach on the Rhine has been a centrefor this industry from the middle of the 18th century,and at its peak in the 1870s and 1880s some 200 crafts-men were employed as carvers. Since that time, thetrade has had its ups and downs, based on fashion,economy and the ability to export. In the 1980s, Ger-many imported on average 19.76 tonnes of ivory perannum, less than the domestic consumption in previ-ous decades of 24 tonnes per annum. At the time of thesurvey, there were only 7–10 carvers active in Erbach,producing mostly small figurines and ornaments. InMichelstadt, close to Erbach, where in four shops sur-veyed, 8639 ivory items were offered for sale, all newitems processed from legally acquired stock. Mostproducts are bought by Germans for private use.
In the United Kingdom, ivory has mostly beenworked to produce piano keys, bagpipe mounts, smalljewellery and similar items. In 2004, the survey

Pachyderm No. 40 January–June 2006 119
IUCN/SSC African Elephant Specialist Group members
counted 8325 items in various London outlets, mostlyin stalls in antique markets. Only 166 of these werefound to have been manufactured after the 1989 banon ivory trade. Traders said that Americans boughtmost of the items and in all probability exported themwithout official permits.
There was relatively little ivory for sale in France,Spain or Italy. About 40% of the items were made inAsia. Claims that the figurines and jewellery itemswere imported before 1989 could not be verified.Spain had a commendable record of law enforcementand record keeping on ivory seizures, while the sta-tistics kept by Italy were far from complete.
One of the outcomes of the survey, which possi-bly was least expected, was that the ivory markets inGermany and the UK ranked sixth and ninth fromthe top according to the minimum number of itemsfound for sale during the surveys in Africa, Asia andEurope. Hence the demand in Europe far exceeds thatin China, Japan, Cameroon and Nigeria, which areall viewed as important ivory markets. Most of theEuropean ivory, however, was manufactured pre-1989and is therefore legal, while the African and Asianmarkets use material obtained from freshly poachedelephants. Some raw ivory and small amounts ofworked ivory are still entering the European coun-tries surveyed, mainly from Africa and East Asia.Sizeable quantities of worked ivory are imported fromthe USA. The quantities, however, seem to be dimin-ishing and the demand falling.
Like its predecessors, this is a handsome volume,A4 size, soft cover, well printed. It is illustrated byoriginal drawings prepared by Andrew Kamiti, but Imissed a short biography of this artist in the book.There are maps showing places mentioned in the text,some black-and-white photographs in the text, as wellas eight (unnumbered) pages with colour picturestaken by the authors in the course of their survey. Hadthey been numbered, it would have been easier to re-fer to them in the text, which might have given themsomething more than just decorative value. The bib-liography with 66 references is carefully prepared andproperly presented. There is a list of tables, but nolist of illustrations and no index—which with the
growing number of pages in these reports might besomething to consider in future instalments.
Because the four reports thus far published in thisseries deserve to be kept for future reference, I wascurious how many copies were available in the largerlibraries. I was somewhat surprised to find that asearch of the major depositories in the UK (accessi-ble globally through www.copac.ac.uk) found onlyone copy of one of the reports in one library. A searchthrough European national libraries as well as theLibrary of Congress (accessible throughwww.ubka.uni-karlsruhe.de/hylib/en/kvk.html) didnot show any copies beyond the one mentioned. Thebooks are provided with an ISBN number, but theyare not sold by the large Internet book stores likeAmazon or the Natural History Book Service. I thenhad a look at the websites of the publishers. Care forthe Wild International mentions this latest report (onthe trade in Europe) on their website, but without anyinformation on price or availability. Save the Ele-ephants gives details of the first three reports amongtheir publications, with an email link to request a copy.Possibly the distribution of copies could be improved.
Esmond Martin and Daniel Stiles have again pro-vided valuable baseline statistics to help in monitor-ing the trends in the availability of ivory. The attentionto detail in the report is remarkable, and the text guidesus through the myriad of numbers and trends care-fully and confidently. It should provide a basis forpolicymakers to review the impact of the ivory banon the populations of elephants in the range statesand the use of stockpiles of ivory obtained fromelephants that died naturally. I assume that the cur-rent team will have a chance to continue their effortsto provide more badly needed statistics, maybe bysurveying the markets in the USA and Australia, andpossibly after a while re-visiting the major ivoryhotspots in Africa and Asia. Wherever they go, theywill assemble large amounts of data not available else-where, they will ensure that the results are properlypublished, and they will make every effort to alertthe press to the most important outcome. I recom-mend this report to everybody interested in elephantsor animal trade issues.
Book review

120 Pachyderm No. 40 January–June 2006
IUCN/SSC African Elephant Specialist Group memers
David BalfourSouth African Environmental Observation NetworkNdlovu NodeBox 22Phalaborwa 1390, South Africa
Richard BarnesDivision of Biological Sciences 0016University of California San DiegoLa Jolla, CA 92093-0116, USA
Stephen BlakeForest Elephant Conservation CoordinatorThe Wildlife Conservation Society1700 Connecticut Avenue NW, Suite 403Washington, DC 20009, USA
Blaise Sawadogo BobodoCoordonnateur, President AAPEProgramme National de Gestion des Ecosystème
Naturels (PRONAGEN)Projet de Partenariat pour Amélioration de la
Gestion des Ecosystèmes Naturels (PAGEN)Direction de la Faune et des ChassesMinistere de l’Environnement et de l’Eau01BP 582Ouagadougou 01, Burkina Faso
Colin CraigWildlife Conservation & Management ProgramP Bag 79Maun, Botswana
Emanuel DanquahDepartment of Wildlife and Range ManagementFaculty of Renewable Natural ResourcesKwame Nkrumah University of Science &TechnologyKumasi, Ghana
Iain Douglas-HamiltonChairman, Board of DirectorsSave the ElephantsPO Box 54667Nairobi, Kenya
Holly T DublinChair, IUCN Species Survival Commission (SSC)c/o South African National Biodiversity InstitutePrivate Bag X7, Claremont 7735Cape Town, South Africa
Charles FoleyTarangire Elephant ProjectPO Box 2703Arusha, Tanzania
Marion GaraiChairperson, EMOAChairperson, Space for Elephants FoundationPO Box 98Vaalwater 0530, South Africa
Deborah GibsonWildlife Conservation & Management ProgramP Bag 79Maun, Botswana
John HartSenior Conservation ScientistWCS / Congo ProgramInternational ProgramsWildlife Conservation SocietyBronx, NY 10460, USA
Richard HoarePO Box 707Arusha, Tanzania
IUCN/SSC AFRICAN ELEPHANT SPECIALIST GROUPMEMBERS

Pachyderm No. 40 January–June 2006 121
IUCN/SSC African Elephant Specialist Group members
Nigel HunterDirector, CITES MIKE ProgramPO Box 68200 – 00200Nairobi, Kenya
Okoumassou KotchikpaDirection de la Faune et de ChassesChef, Division de la Protection et Gestion des Parcs
Nationaux.et Reserves de fauneCordonnateur du Programme ElephantBP 355Lomé, Togo
Keith Leggettc/o Namibian Elephant and Giraffe TrustPO Box 527Outjo, Namibia
Moses LitorohResearch ScientistShimba Hills National ReserveKenya Wildlife ServicePO Box 30Kwale, Kenya
Esmond Bradley MartinPO Box 15510, Mbagathi 00503Nairobi, Kenya
John MasonNature Conservation Research CentrePO Box KN 925 KaneshieAccra, Ghana
Barbara McKnightTsavo Elephant ResearchPO Box 14Voi 80300, Kenya
Thomas MillikenDirector, TRAFFIC East and Southern Africac/o WWF-SARPOPO Box CY1409, CausewayHarare, Zimbabwe
Leonard MubalamaNational Elephant OfficerCITES/MIKE – Democratic Republic of Congoc/o GTZ/PNKB Muhuumba Commune Ibanda
Bukavu
PO Box 86Cyangugu, Rwanda
Awo NandjuiCentre Suisse de Recherche ScientifiqueAbidjan Conservation International/Wild
Chimpanzees FoundationBP 2920Abidjan 04, Côte d’Ivoire
Cornelio NtumiDepartment of Biological SciencesUniversity of Eduardo MondlaneMaputo CP 257, Mozambique
Patrick OmondiKenya Wildlife ServicePO Box 40241Nairobi, Kenya
F. V. OsbornElephant Pepper Development Trust24 Luisa Way, Hout Bay 7806Cape Town, South Africa
Conde Cece PapaConservateur Director AdjointCF NzerekreBP 171 NzerekoreBP 624 Conakry, Guinea
Moses Kofi SamWildlife Management SpecialistRMSC, Forestry Regional Office, MinistriesPO Box 1457, KumasiGhana
Noah SitatiProject Coordinator, Mitigating Human Elephant
Conflict in the Mara EcosystemWorld Wide Fund for NaturePO Box 62440Nairobi, Kenya
Russell TaylorProgram DirectorWWF Southern Africa Regional Program OfficePO Box CY, 1409 CausewayHarare. Zimbabwe

122 Pachyderm No. 40 January–June 2006
IUCN/SSC African Elephant Specialist Group memers
Martin TchambaDirector of ConservationWWF Cameroon Program OfficeBP 6776Yaoundé, Cameroon
Aristide C. TehouChercheur des Eaux et ForêtsChef Service écologie du Parc Natinal de la Pendjari
/ CENAGREF02 BP 527Cotonou, Benin
Joseph TiebouOfficier National MIKEDirection de la Faune et des Aires protégéesBP 3099Yaoundé, Cameroun
Chris ThoulessProject CoordinatorNational Museums of KenyaSupport ProgramPO Box 1668 – 00606Nairobi, Kenya
Andrea K. TurkaloWidlife Conservation SocietyBP 1053Bangui, Central African Republic
Ian WhyteKruger National ParkNational Parks BoardPrivate Bag X402Skukuza 1350, South Africa
Yacob YohannesDept. of Regulatory ServicesPO Box 1048Asmara, Eritrea
Yirmed Demeke WorknehZoologist, Institute of Biodiversity Conservation &
ResearchPO Box 32099 (Private)Addis Ababa, Ethiopia

Pachyderm No. 39 June–December 2005 123
Aim and scope
Pachyderm publishes papers and notes concerningall aspects of the African elephant, the African rhinoand the Asian rhino with a focus on the conservationand management of these species in the wild. At thesame time, the journal is a platform for disseminatinginformation concerning the activities of the AfricanElephant, the African Rhino, and the Asian RhinoSpecialist Groups of the IUCN Species SurvivalCommission.
Submission of manuscriptsSubmit manuscripts electronically by email.Alternatively, submit a hard copy and floppy disk orCD by mail.
Email contributions should be sent to:[email protected] copy to: [email protected]
Contributions by post to:The Editor, PachydermIUCN/SSC AfESGPO Box 68200 – 00200Nairobi, Kenyatel: +254 20 3876461; fax: +254 20 3870385
Preparation of manuscriptsManuscripts are accepted in both English and Frenchlanguages. Where possible, the abstract should beprovided in both languages.
Title and authors: The title should contain as manyof the key words as possible but should not be morethan 25 words long. Follow with the name(s) of theauthor(s) with insitutional affiliation and full postaland email address(es). Indicate the correspondingauthor, to whom proofs and editorial comments willbe sent; give post and email addresses for thecorresponding author.
Research papers: Should be not more than 5000words and be structured as follows: 1) Title (as above),2) Abstract of not more than 250 words (informativetype, outlining information from the Introduction,Materials and methods, Results, Discussion, but notdetailed results), 3) additional key words (if any), notappearing in the title, 4) Introduction, 5) Materialsand methods, 6) Results, 7) Discussion, 8) Conclu-sions if appropriate, 9) Acknowledgements (optional,brief), 10) References, 11) Tables, 12) Figure andphoto captions, 13) Figures and photos.
Papers may be reports of original biology research orthey may focus more on the socio-economic aspectsof conservation, including market surveys.
Preferably provide figures and maps in their originalform, for example, Excel files, maps as eps or tif files(17 x 15 cm, 600 dpi), when submitting in electronicform. Indicate clearly the author or source of figures,maps and photographs.
Field notes: The journal welcomes notes from thefield. They may contain figures and tables but shouldbe brief.
Book reviews: Pachyderm invites reviews of newlypublished books, which should be no more than 1500words long.
Letters to the editor: Letters are welcome that com-ment on articles published in Pachyderm or on any otherissue relating to elephant and rhino conservation in thewild.
Journal conventionsNomenclature
Use common names of animals and plants, giving sci-entific names in italics on first mention.Use an ‘s’ for the plural form for animals: rhinos,elephants.
GUIDELINES TO CONTRIBUTORS

124 Pachyderm No. 39 June–December 2005
Spelling
Use British spelling, following the latest edition ofthe Concise Oxford Dictionary or the New OxfordDictionary of English, using ‘z’ instead of ‘s’ in wordslike ‘recognize’, ‘organization’, ‘immobilized’; but‘analyse’, ‘paralyse’.
Numbers
Use SI units for measurement (m, km, g, ha, h) with aspace between the numeral and the unit of measure-ment. Give measurements in figures, for example 12mm, 1 km, 3 ha, except at the beginning of a sentence.
Spell out numbers under 10 if not a unit of measure-ment unless the number is part of a series containingnumbers 10 or over, for example: 14 adult males, 23adult females and 3 juveniles.
In the text, write four-digit numbers without a comma;use a comma as the separator for figures five digitsor more: 1750, 11,750. The separator will be a fullstop in French papers.
ReferencesUse the author-year method of citing and listing ref-erences.
In the text, cite two authors: ‘(X and Y 1999)’ or ‘Xand Y (1999)’; cite more than two authors ‘(X et al.1996)’ or ‘X et al. (1996)’. Note that there is no commabetween the author(s) and the year.
Guidelines
In the reference list, cite publications as in thefollowing examples. List in alphabetical order. Writeout journal titles in full.
Adams JX. 1995b. Seizures and prosecutions. TRAFFICBulletin 15(3):118.
Dobson AP, May RM. 1986. Disease and conservation. In:ME Soulé, ed., Conservation biology: the science ofscarcity and diversity. Sinauer Associates, Sunderland,MA. p. 123–142.
Struhsaker TT, Lwanga JS, Kasenene JM. 1996. Elephants,selective logging and forest regeneration in the KibaleForest, Uganda. Journal of Tropical Ecology 12:45–64.
Sukumar R. 1989. The Asian elephant: ecology and man-agement. Cambridge Studies in Applied Ecology andResource Management. Cambridge University Press,Cambridge.
Cite unpublished material as follows:Tchamba MN. 1996. Elephants and their interactions with
people and vegetation in the Waza–Logone region,Cameroon. PhD thesis, University of Utrecht, The Neth-erlands. 142 p.
Woodford MH. 2001. [Title]. [Journal or publisher]. Forth-coming. [if publication date is known]
Woodford MH. [Title]. [Journal or publisher]. In press. [ifpublication date is not known]
Not accepted as references are papers in preparation or sub-mitted but not yet accepted.
‘Pers. comm.’ accompanied by the date and name of the per-son is cited in the text but not given in the reference list.

ISSN 1026 2881


