Embed Size (px)
Citation preview
ELEVENTH FIVE YEAR PLAN
(July 2013-June 2018)
Zhemgang Dzongkhag
Eleventh Five Year Plan Document © Copyright Gross National Happiness Commission (2013) Published by: Gross National Happiness Commission, Royal Government of Bhutan. ISBN 978-99936-55-01-5
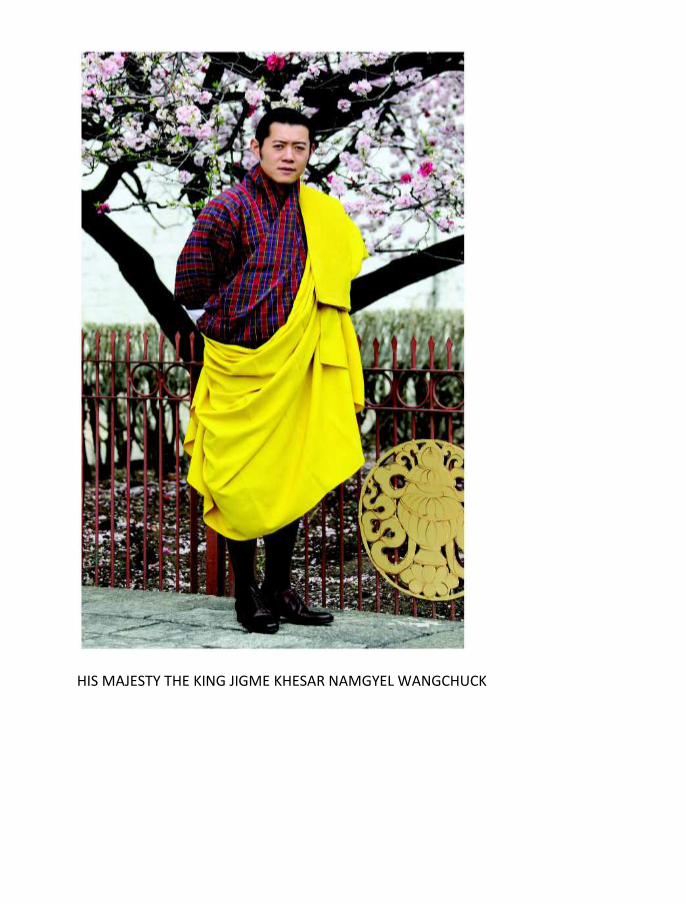
HIS MAJESTY THE KING JIGME KHESAR NAMGYEL WANGCHUCK

Our Nation has seen great socio-economic growth but it is more important that we have growth with equity. We must raise, with all our effort, the less fortunate so that they may, at the earliest, begin to partake in the opportunities brought by modernization and progress.
The government has provided education to our youth. But for the nation to
prosper for all time, a sound education must be succeeded by access to the right
jobs and responsibilities, so that our youth may bloom as individuals and at the
same time serve their Nation well.
The recent Rupee shortage is a serious problem. I feel it is a reminder that, as a
Nation, we must exercise our traditional sense of caution and work even harder
as we address the challenges of the time. For no matter what challenges lie
ahead, it is only the Bhutanese citizen who can protect and safeguard Bhutan.
- His Majesty The King’s address to the nation during the 105th National Day
celebrations, 1 7th December 2012, in Thimphu.
4 Dzongkhag at a Glance
Dzongkhag Bardo Bjoka Goshing Nangkor Ngangla Phangkhar Shingkhar Trong
Population and Land
Population Figure 18636 1997 949 1533 2527 2396 1367 1546 6321
Total number of male 9896 998 437 1374 1247 1163 652 735 3290
Total number of female 9579 1009 512 988 1280 1233 715 811 3031
Total number of
households 2366 337 155 206 336 434 220 325 353
Area (sq. km) 2,421.74 210 196 99.11 494 312 248 309 358
Forest Coverage 89.88 75 87 78 91.42 78 88 77 92
RNR
RNR Center 8 1 1 1 1 1 1 1 1
Number of Farmers’
Groups/Cooperatives 3 0 1 0 0 0 0 0 2
Irrigation schemes
(No.) 51 10 1 0 8 11 5 8 8
Irrigation Schemes
(km) 116.09 30.97 1.14 0 20.02 14.24 12.33 15.29 22.1
Health
Hospital 1 0 0 0 0 0 0 0 1
Basic Health Units 15 2 2 1 2 3 2 1 2
Out Reach Clinics 35 4 2 4 7 6 3 2 7
Subpost 1 0 0 0 0 0 0 1 0
Education
Higher secondary
schools 1 0 0 0 0 0 0 0 1
Middle secondary
schools 3 0 0 0 1 1 0 0 1
Lower secondary
schools 3 0 0 0 0 0 0 0 3
Primary schools 23 4 2 2 5 3 3 3 1
Extended Classrooms 1 0 0 0 0 0 0 0 1
Non-formal Education
Centers 25 2 1 5 5 5 3 3 1
Number of NFE
Learners 281 30 8 70 31 65 36 31 10
Teacher Student Ratio 1:18
Local Governments
Chiwogs 40 5 5 5 5 5 5 5 5
Villages 151 14 5 75 11 19 12 7 8
Number of female DT
members 0 0 0 0 0 0 0 0 0
Number of female GT
members 4 1 0 0 0 0 1 1 1
Number of Community
Centers 3 0 0 0 1 1 0 0 1
Electricity
Number of Households
electrified 1390 0 0 0 316 597 91 50 336
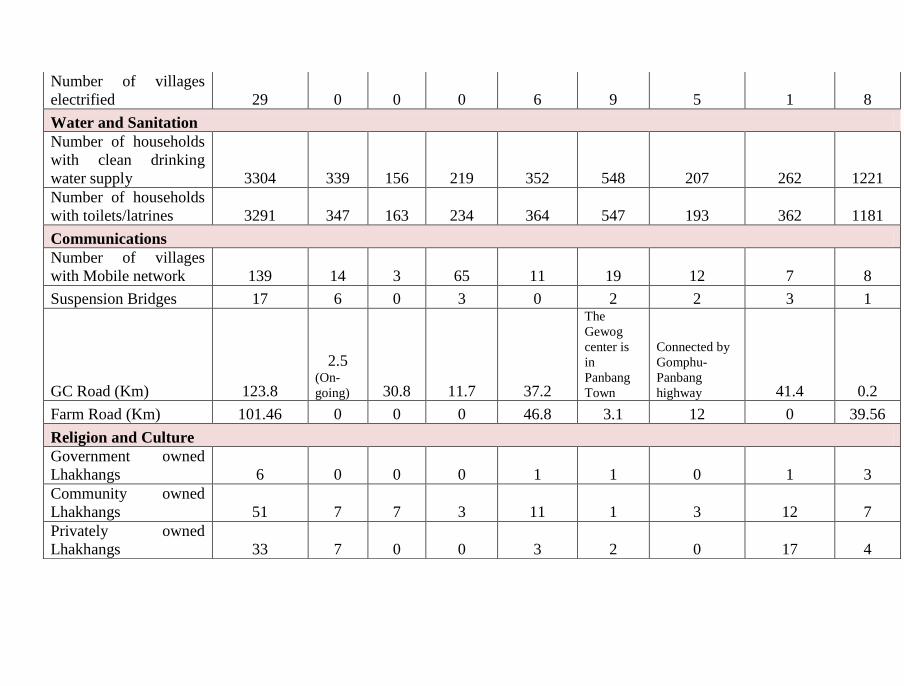
Number of villages
electrified 29 0 0 0 6 9 5 1 8
Water and Sanitation
Number of households
with clean drinking
water supply 3304 339 156 219 352 548 207 262 1221
Number of households
with toilets/latrines 3291 347 163 234 364 547 193 362 1181
Communications
Number of villages
with Mobile network 139 14 3 65 11 19 12 7 8
Suspension Bridges 17 6 0 3 0 2 2 3 1
GC Road (Km) 123.8
2.5 (On-
going) 30.8 11.7 37.2
The
Gewog
center is
in
Panbang
Town
Connected by
Gomphu-
Panbang
highway 41.4 0.2
Farm Road (Km) 101.46 0 0 0 46.8 3.1 12 0 39.56
Religion and Culture
Government owned
Lhakhangs 6 0 0 0 1 1 0 1 3
Community owned
Lhakhangs 51 7 7 3 11 1 3 12 7
Privately owned
Lhakhangs 33 7 0 0 3 2 0 17 4
3 Introduction
The bottom-up Gewog-based planning process, as per the decentralized planning framework, was introduced in the Ninth Plan. Since then, the local governments have been formulating their Five Year Plans based on the development priorities identified by the communities at the Gewog level.
The introduction of the Gewog-based planning process was followed by “fiscal decentralization” in the Tenth Plan. The allocation of annual grants to local governments based on the resource allocation formula that took into account principles of equity, transparency and objectivity was launched. The new system of allocating resources to the local governments provided greater predictability and offered higher flexibility in prioritization and programming of activities. The devolution of authority has enhanced capacities of the local governments in planning, prioritization and fiscal management.
Further, to bring clarity on the roles of various levels of the government in the delivery of public services at the local level and to facilitate the distribution of resources between the centre and the local governments, the division of responsibilities framework was developed in 2012. The division of responsibilities framework1 , clearly delineates responsibilities among the central agencies, Class “A” Thromde, Dzongkhags and Gewogs guided by the ‘principle of subsidiarity’. The ‘principle of subsidiarity’ is that provision of public goods and services should take place at the lowest level of the government and that the centre should be involved only when the lower levels of the government cannot provide the goods and services efficiently. The division of responsibility framework will be reviewed during the Eleventh Plan mainly to assess the capacity of the local governments to shoulder increased responsibilities and to build their capacities accordingly.
In addition to the broad based socio-economic development activities, targeted poverty intervention programmes such as the Rural Economy Advancement Programme (REAP) and the National Rehabilitation Programme (NRP) were initiated in the Tenth Plan to accelerate poverty reduction and address disparities at the local level. Accordingly, 13 poorest villages2 were supported through REAP I and around 109 villages have been identified for implementation under REAP II in the Eleventh Plan.
1 Refer www.gnhc.gov.bt/guidelines-local-government/ 2Thangdokha, Dramekha and Ngatsena - Haa, Sanu Dungtoe - Samtse, Mandokha & Choleykha - Chukha, Lopokha - Wangdue Phodrang, Lauri - Samdrup Jongkhar, Ungar - Lhuentse, Samcholing - Trongsa, Reti - Sarpang, Lamtang - Zhemgang, Pam & Chaibi - Mongar.
Under the NRP, 44 households in Khenadrang, Pemagatshel were rehabilitated. While the rehabilitation at Nye, Lhuentshe (55 households); Bebji, Haa (83 households); Borangmo, Pemagatshel (51 households) and Dawathang, Samdrup Jongkhar (31 households) are ongoing, the planning and feasibility study for Tanzama, Pemagatshel and Serzhong, Tsirang respectively have been initiated under the programme. Efforts are also underway to identify other communities for rehabilitation given that this programme benefits not only the beneficiary communities but also the government through avoidance of the higher costs associated with provision of pubic goods and services for reaching the unreached.
3.1 Planning Process
The local government plans were formulated based on the Local Government Act 2009, the Eleventh Plan preparation guidelines, the Local Development Planning Manual, the Thromde Structural Plans, the Local Area Plans (LAPs) and the indicative five year resource envelope. The process involved close consultations with the communities in order to take stock of the ground realities and assess their needs and aspirations. These were further deliberated and discussed at the Gewog Tshogdes, Dzongkhag Tshogdus, and Thromde Tshogdus before being finalized and approved. The draft LG Eleventh Plan was then submitted to the GNHC for further discussion and coordination at the national level.
While sectoral activities at the local level, as per the division of responsibility framework, are prioritized and planned by the local governments, the planning for education activities is centrally coordinated by the Ministry of Education. This is done given the strategic importance of the education sector for the future of our nation and to ensure that all children across the nation have equal access to quality, adequate, efficient and cost effective education services. The implementation is done by the local governments with resources provided by the Ministry of Education.
3.2 Resource Allocation Formula
Table– Criteria for Resource Allocation Formula
Sl. No. Criteria 10th Plan Formula
Revised New Formula
1. Population 70 % 35 %
2. Poverty 25 % 0 %
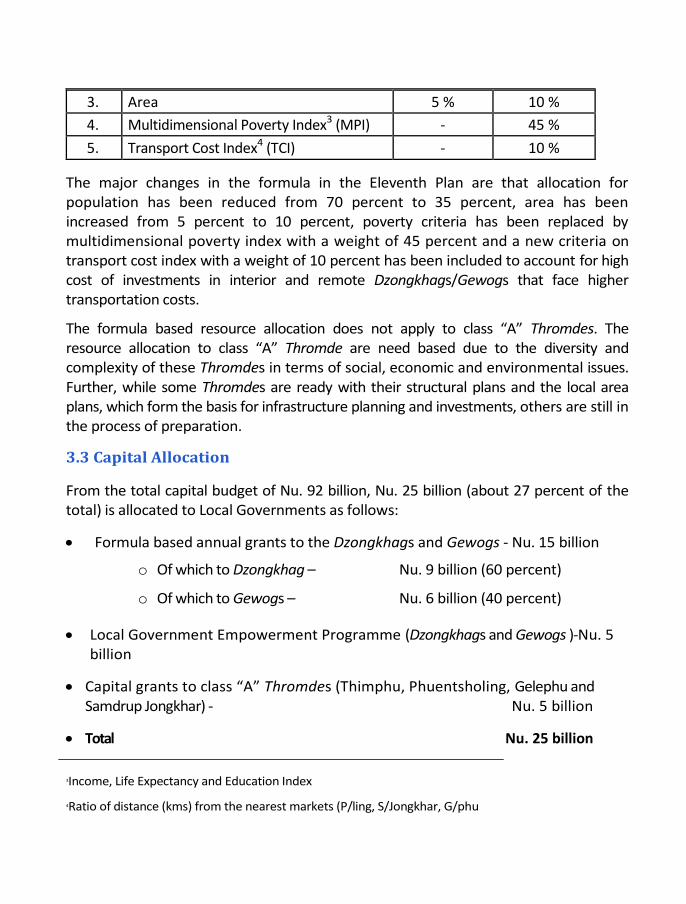
3. Area 5 % 10 %
4. Multidimensional Poverty Index3 (MPI) - 45 %
5. Transport Cost Index4 (TCI) - 10 %
The major changes in the formula in the Eleventh Plan are that allocation for population has been reduced from 70 percent to 35 percent, area has been increased from 5 percent to 10 percent, poverty criteria has been replaced by multidimensional poverty index with a weight of 45 percent and a new criteria on transport cost index with a weight of 10 percent has been included to account for high cost of investments in interior and remote Dzongkhags/Gewogs that face higher transportation costs.
The formula based resource allocation does not apply to class “A” Thromdes. The resource allocation to class “A” Thromde are need based due to the diversity and complexity of these Thromdes in terms of social, economic and environmental issues. Further, while some Thromdes are ready with their structural plans and the local area plans, which form the basis for infrastructure planning and investments, others are still in the process of preparation.
3.3 Capital Allocation
From the total capital budget of Nu. 92 billion, Nu. 25 billion (about 27 percent of the total) is allocated to Local Governments as follows:
Formula based annual grants to the Dzongkhags and Gewogs - Nu. 15 billion
o Of which to Dzongkhag – Nu. 9 billion (60 percent)
o Of which to Gewogs – Nu. 6 billion (40 percent)
Local Government Empowerment Programme (Dzongkhags and Gewogs )-Nu. 5 billion
Capital grants to class “A” Thromdes (Thimphu, Phuentsholing, Gelephu and Samdrup Jongkhar) - Nu. 5 billion
Total Nu. 25 billion
3Income, Life Expectancy and Education Index
4Ratio of distance (kms) from the nearest markets (P/ling, S/Jongkhar, G/phu
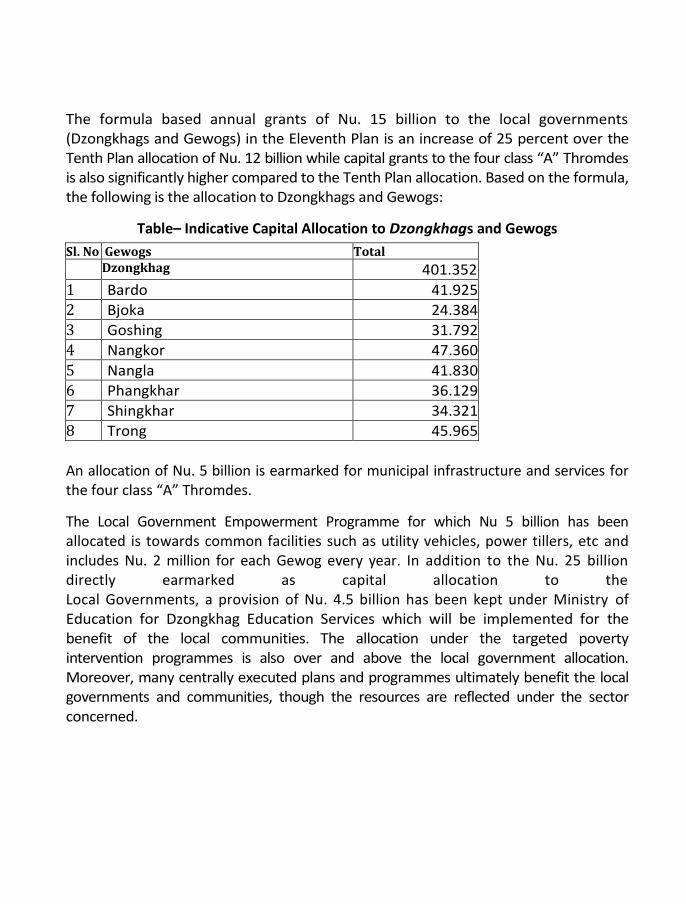
The formula based annual grants of Nu. 15 billion to the local governments (Dzongkhags and Gewogs) in the Eleventh Plan is an increase of 25 percent over the Tenth Plan allocation of Nu. 12 billion while capital grants to the four class “A” Thromdes is also significantly higher compared to the Tenth Plan allocation. Based on the formula, the following is the allocation to Dzongkhags and Gewogs:
Table– Indicative Capital Allocation to Dzongkhags and Gewogs
Sl. No Gewogs Total Dzongkhag 401.352
1 Bardo 41.925
2 Bjoka 24.384
3 Goshing 31.792
4 Nangkor 47.360
5 Nangla 41.830
6 Phangkhar 36.129
7 Shingkhar 34.321
8 Trong 45.965
An allocation of Nu. 5 billion is earmarked for municipal infrastructure and services for the four class “A” Thromdes.
The Local Government Empowerment Programme for which Nu 5 billion has been allocated is towards common facilities such as utility vehicles, power tillers, etc and includes Nu. 2 million for each Gewog every year. In addition to the Nu. 25 billion directly earmarked as capital allocation to the Local Governments, a provision of Nu. 4.5 billion has been kept under Ministry of Education for Dzongkhag Education Services which will be implemented for the benefit of the local communities. The allocation under the targeted poverty intervention programmes is also over and above the local government allocation. Moreover, many centrally executed plans and programmes ultimately benefit the local governments and communities, though the resources are reflected under the sector concerned.
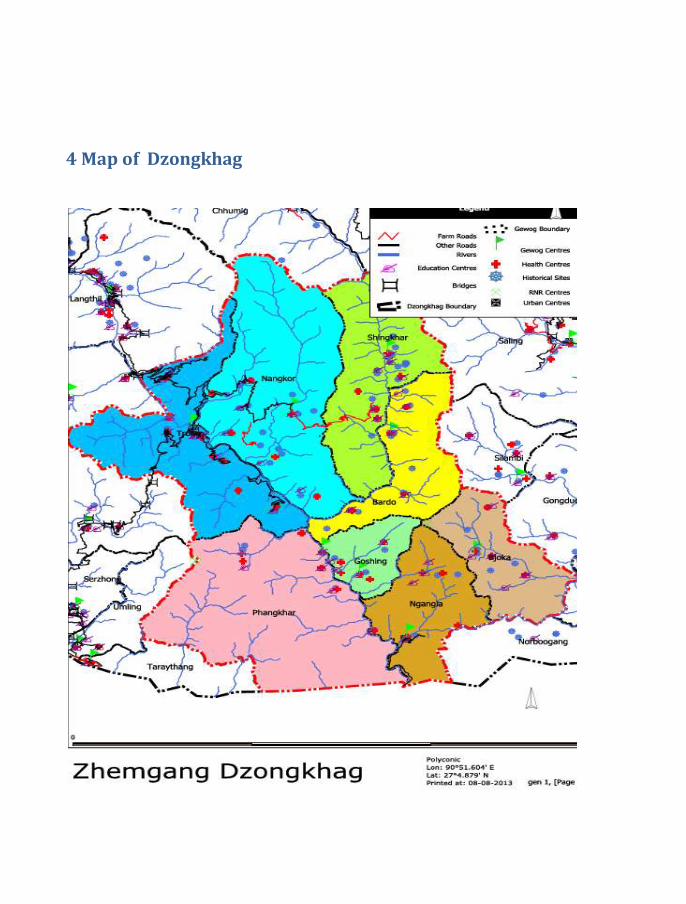
4 Map of Dzongkhag
5 Zhemgang Dzongkhag
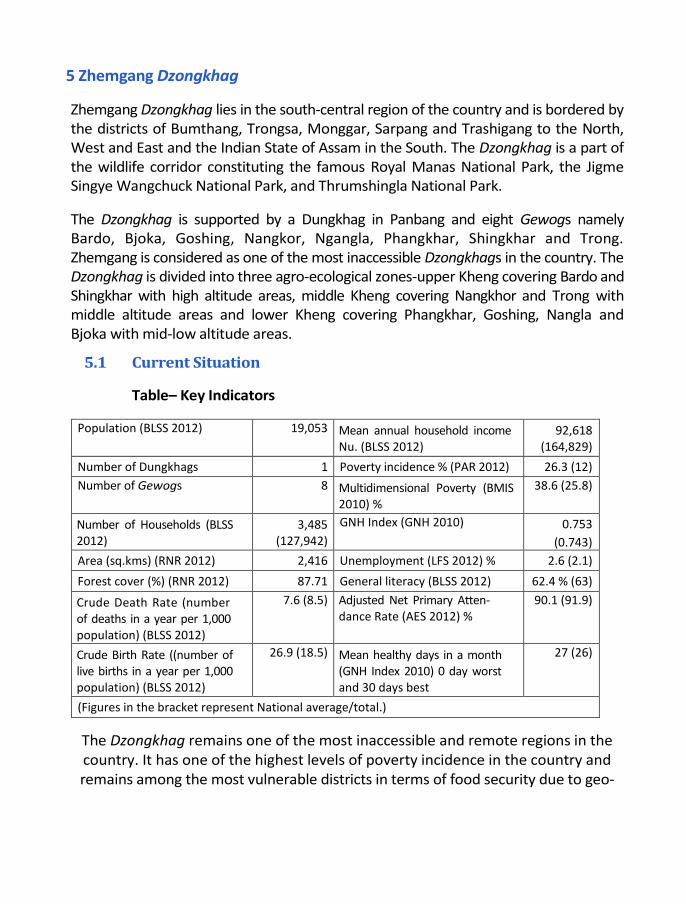
Zhemgang Dzongkhag lies in the south-central region of the country and is bordered by the districts of Bumthang, Trongsa, Monggar, Sarpang and Trashigang to the North, West and East and the Indian State of Assam in the South. The Dzongkhag is a part of the wildlife corridor constituting the famous Royal Manas National Park, the Jigme Singye Wangchuck National Park, and Thrumshingla National Park.
The Dzongkhag is supported by a Dungkhag in Panbang and eight Gewogs namely Bardo, Bjoka, Goshing, Nangkor, Ngangla, Phangkhar, Shingkhar and Trong. Zhemgang is considered as one of the most inaccessible Dzongkhags in the country. The Dzongkhag is divided into three agro-ecological zones-upper Kheng covering Bardo and Shingkhar with high altitude areas, middle Kheng covering Nangkhor and Trong with middle altitude areas and lower Kheng covering Phangkhar, Goshing, Nangla and Bjoka with mid-low altitude areas.
5.1 Current Situation
Table– Key Indicators
Population (BLSS 2012) 19,053 Mean annual household income Nu. (BLSS 2012)
92,618 (164,829)
Number of Dungkhags 1 Poverty incidence % (PAR 2012) 26.3 (12)
Number of Gewogs 8 Multidimensional Poverty (BMIS 2010) %
38.6 (25.8)
Number of Households (BLSS 2012)
3,485 (127,942)
GNH Index (GNH 2010) 0.753
(0.743)
Area (sq.kms) (RNR 2012) 2,416 Unemployment (LFS 2012) % 2.6 (2.1)
Forest cover (%) (RNR 2012) 87.71 General literacy (BLSS 2012) 62.4 % (63)
Crude Death Rate (number of deaths in a year per 1,000 population) (BLSS 2012)
7.6 (8.5) Adjusted Net Primary Atten- dance Rate (AES 2012) %
90.1 (91.9)
Crude Birth Rate ((number of live births in a year per 1,000 population) (BLSS 2012)
26.9 (18.5) Mean healthy days in a month (GNH Index 2010) 0 day worst and 30 days best
27 (26)
(Figures in the bracket represent National average/total.)
The Dzongkhag remains one of the most inaccessible and remote regions in the country. It has one of the highest levels of poverty incidence in the country and remains among the most vulnerable districts in terms of food security due to geo-
physical constraints, poor physical infrastructure and weak road access. However, the district enjoys reasonably moderate levels of human development linked to the acceptable levels of education and health facilities. The 2010 GNH Index reports Zhemgang to be in medium happiness category with a value of 0.753.
Agriculture, horticulture, livestock, weaving and handicrafts, particularly bamboo products, are the main source of livelihood. Paddy, maize, mandarin and vegetables are some of the major crops grown in the Dzongkhag.
Works related to the construction of 56 kms Panbang-Nganglam highway, 44 kms Gomphu – Pan bang highway, 18 kms Manmung – Digala highway and improvement of the Tingtibi- Praling highway are ongoing. Upon completion of these roads in the Eleventh Plan, accessibility and remoteness will be addressed to a large extent.
5.2 Key Opportunities/Challenges
The planned development of 770 MW Chamkharchhu Hydroelectric project during the Eleventh Plan have potential to create new economic opportunities in terms of market for farmers to supply their agricultural and livestock products, local business, employment opportunities etc which will contribute towards improving the livelihood of the people. It gives the Dzongkhag Administration, the project authorities and the concerned central agencies an opportunity to collaborate and facilitate in harnessing new business and income generation opportunities from the mega projects. The enhanced electricity supply reliability will be used to develop small and medium industries in the Dzongkhag, particularly agro based and cane and bamboo products.
Zhemgang also has the potential to become Bhutan’s centre for bird watching and to offer special bird watching treks, e.g. Yebilapcha – Tshangla Dzong – Subrang – Zhurphe - Gongphu road head; 5 days with Rufous necked hornbill, Blythe kingfisher, Green cochooa, Purple cochooa, Chestnut breasted partridge and many other common species found along the route. Other great treks could lead from Zhemgang to Manas (8 days), or from Gonphu via Bjoku back to Gonphu (16 days); both with high bird watching potential as well as potential for a lot of other animals and beautiful waterfalls. There is also good potential for handicraft tourism as people of Kheng Zurphel are skilled artisans who make earthen wares for cooking food and distilling alcohol. Besides, Zhemgang also has high potential for adventure sports such as rafting, fly fishing, trekking, etc. Further, with the completion of the construction of some of the ongoing roads, accessibility will no longer be an issue.
Zhemgang is also well known for production of bamboo and cane handicraft products (approximately 30 items) and many of the rural communities depend on the craft for their livelihood. Therefore, in an effort to facilitate integrated and organized production of bamboo and cane products, the Agency for Promotion of Indigenous Craft (APIC) in collaboration with relevant stakeholders will pilot a cane and bamboo cluster in remote Kheng, Bjokha. This will provide opportunity for upscaling production for possible exports in the future.
With the completion of new roads and highways, access to the Dzongkhag will be improved thereby creating potential for enhancing agriculture, horticulture and livestock. However, issues such as water shortage/irrigation, human wildlife conflict, storage and marketing facilities are some of the challenges that must be addressed.
5.3 Strategies
In keeping with the Plan objective of “Self-reliance and Inclusive Green Socio-economic Development”, the key strategies the Dzongkhag will focus on, are i) targeted poverty intervention programme, ii) development of tourism and small and medium industries, and iii) enhancing agricultural and livestock productivity.
Under the targeted poverty reduction interventions , eight villages namely Dali, Ponchula, Namergang, Bangsikhar, Barpong, Zarkabla, Chapdhempaa and Khushibi will be supported through REAP Phase II. Income generating sustainable livelihood activities, capacity development and establishment of self-help groups/ cooperatives will be some of the interventions at village level and additional support at household levels will be provided to the poorest households within the village. The funds for this programme will be directly provided from the centre.
Given the potential for tourism development in the Dzongkhag, the Dzongkhag Administration in collaboration with the Tourism Council of Bhutan and the communities will accelerate development of new tourism products unique to the Dzongkhag and facilitate establishment of appropriate tourism infrastructure and facilities. Eco and community based tourism, particularly in terms of community lodges, farm houses, camp sites etc, will be encouraged and developed to ensure that the benefits of tourism trickle down to the communities.
The Dzongkhag will work closely with Agency for Promotion of Indigenous Products (APIC) to develop bamboo and cane products on a sustainable basis in the Dzongkhag through training, new product development, quality assurance, raw material availability and exploring markets. The Dzongkhag will also explore possibilities
of establishing small and medium industries based on these products to enhance household income and generate employment.
Enhancing Agriculture and Livestock productivity – with the construction of 770 MW Chamkharchhu Hydroelectric project is scheduled to start during the Eleventh Plan for which, institutional arrangements will be made to facilitate supply of agricultural and livestock products to the project by the local farmers and communities. In collaboration with the Ministry of Agriculture and Forest, the Dzongkhag Administration will address issues of water shortage/irrigation, human wildlife conflict, storage and marketing facilities, to enhance agriculture and livestock production in the Dzongkhag.
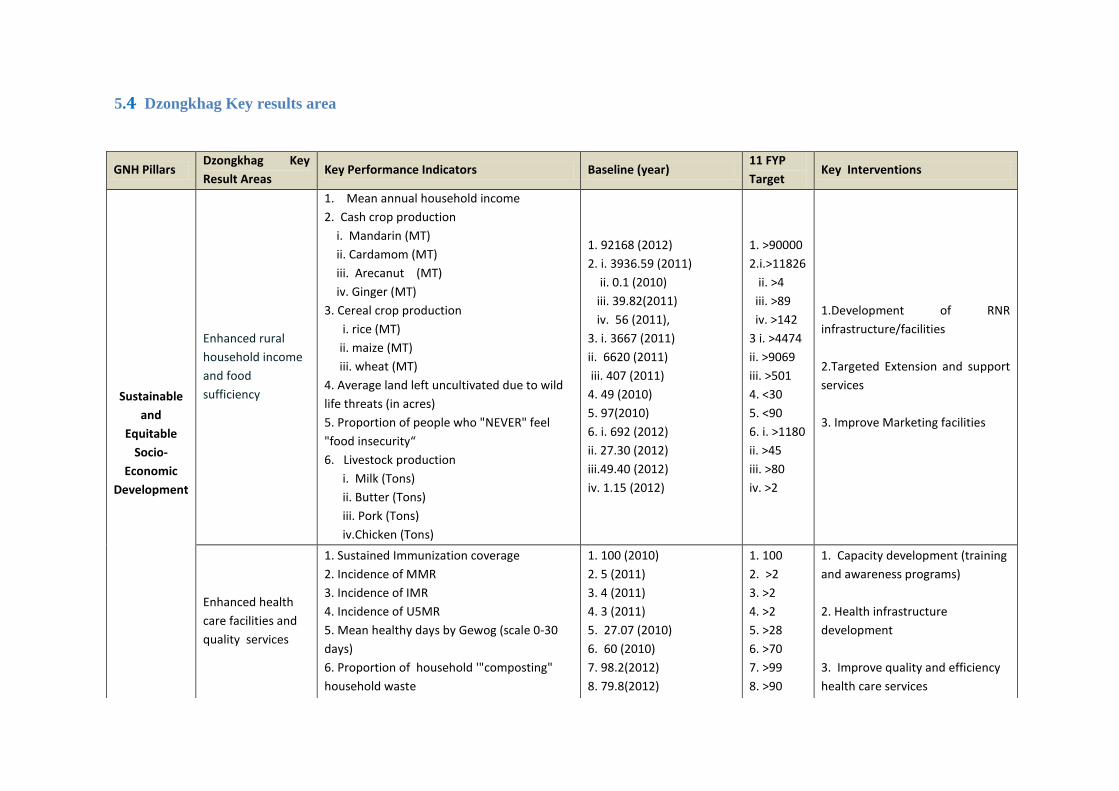
5.4 Dzongkhag Key results area
GNH Pillars Dzongkhag Key
Result Areas Key Performance Indicators Baseline (year)
11 FYP
Target Key Interventions
Sustainable
and
Equitable
Socio-
Economic
Development
Enhanced rural
household income
and food
sufficiency
1. Mean annual household income
2. Cash crop production
i. Mandarin (MT)
ii. Cardamom (MT)
iii. Arecanut (MT)
iv. Ginger (MT)
3. Cereal crop production
i. rice (MT)
ii. maize (MT)
iii. wheat (MT)
4. Average land left uncultivated due to wild
life threats (in acres)
5. Proportion of people who "NEVER" feel
"food insecurity“
6. Livestock production
i. Milk (Tons)
ii. Butter (Tons)
iii. Pork (Tons)
iv.Chicken (Tons)
1. 92168 (2012)
2. i. 3936.59 (2011)
ii. 0.1 (2010)
iii. 39.82(2011)
iv. 56 (2011),
3. i. 3667 (2011)
ii. 6620 (2011)
iii. 407 (2011)
4. 49 (2010)
5. 97(2010)
6. i. 692 (2012)
ii. 27.30 (2012)
iii.49.40 (2012)
iv. 1.15 (2012)
1. >90000
2.i.>11826
ii. >4
iii. >89
iv. >142
3 i. >4474
ii. >9069
iii. >501
4. <30
5. <90
6. i. >1180
ii. >45
iii. >80
iv. >2
1.Development of RNR
infrastructure/facilities
2.Targeted Extension and support
services
3. Improve Marketing facilities
Enhanced health
care facilities and
quality services
1. Sustained Immunization coverage
2. Incidence of MMR
3. Incidence of IMR
4. Incidence of U5MR
5. Mean healthy days by Gewog (scale 0-30
days)
6. Proportion of household '"composting"
household waste
1. 100 (2010)
2. 5 (2011)
3. 4 (2011)
4. 3 (2011)
5. 27.07 (2010)
6. 60 (2010)
7. 98.2(2012)
8. 79.8(2012)
1. 100
2. >2
3. >2
4. >2
5. >28
6. >70
7. >99
8. >90
1. Capacity development (training
and awareness programs)
2. Health infrastructure
development
3. Improve quality and efficiency
health care services
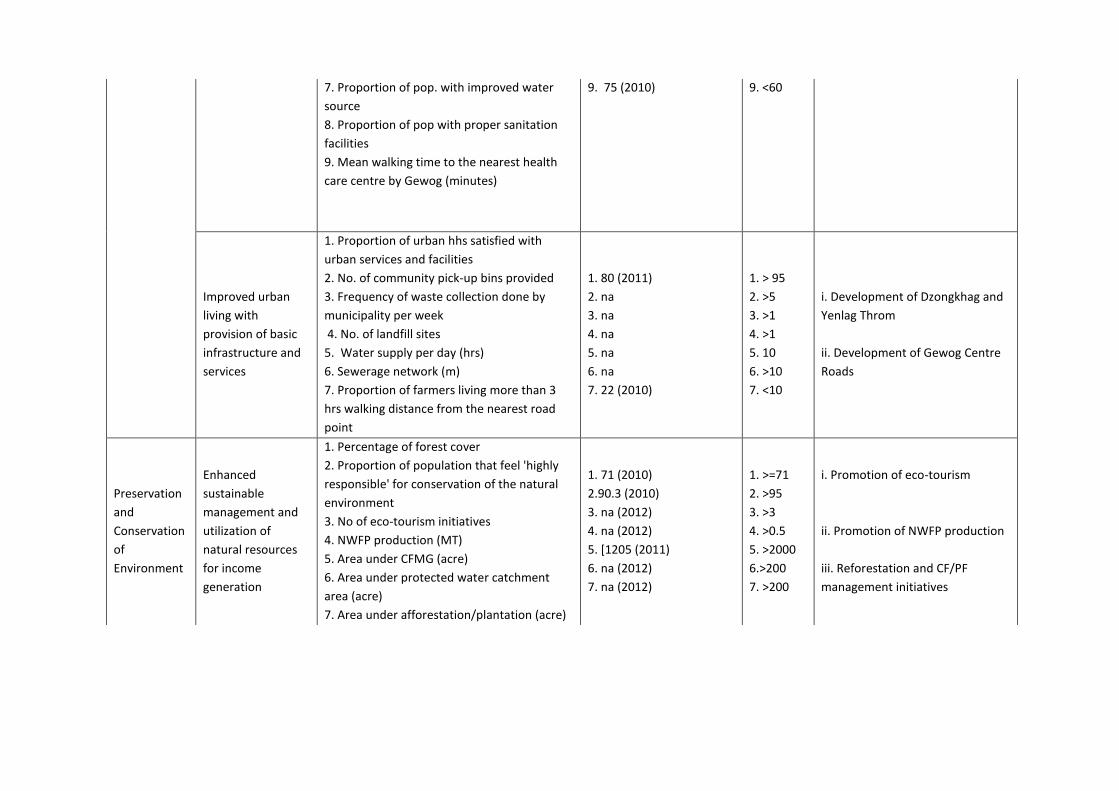
7. Proportion of pop. with improved water
source
8. Proportion of pop with proper sanitation
facilities
9. Mean walking time to the nearest health
care centre by Gewog (minutes)
9. 75 (2010)
9. <60
Improved urban
living with
provision of basic
infrastructure and
services
1. Proportion of urban hhs satisfied with
urban services and facilities
2. No. of community pick-up bins provided
3. Frequency of waste collection done by
municipality per week
4. No. of landfill sites
5. Water supply per day (hrs)
6. Sewerage network (m)
7. Proportion of farmers living more than 3
hrs walking distance from the nearest road
point
1. 80 (2011)
2. na
3. na
4. na
5. na
6. na
7. 22 (2010)
1. > 95
2. >5
3. >1
4. >1
5. 10
6. >10
7. <10
i. Development of Dzongkhag and
Yenlag Throm
ii. Development of Gewog Centre
Roads
Preservation
and
Conservation
of
Environment
Enhanced
sustainable
management and
utilization of
natural resources
for income
generation
1. Percentage of forest cover
2. Proportion of population that feel 'highly
responsible' for conservation of the natural
environment
3. No of eco-tourism initiatives
4. NWFP production (MT)
5. Area under CFMG (acre)
6. Area under protected water catchment
area (acre)
7. Area under afforestation/plantation (acre)
1. 71 (2010)
2.90.3 (2010)
3. na (2012)
4. na (2012)
5. [1205 (2011)
6. na (2012)
7. na (2012)
1. >=71
2. >95
3. >3
4. >0.5
5. >2000
6.>200
7. >200
i. Promotion of eco-tourism
ii. Promotion of NWFP production
iii. Reforestation and CF/PF
management initiatives
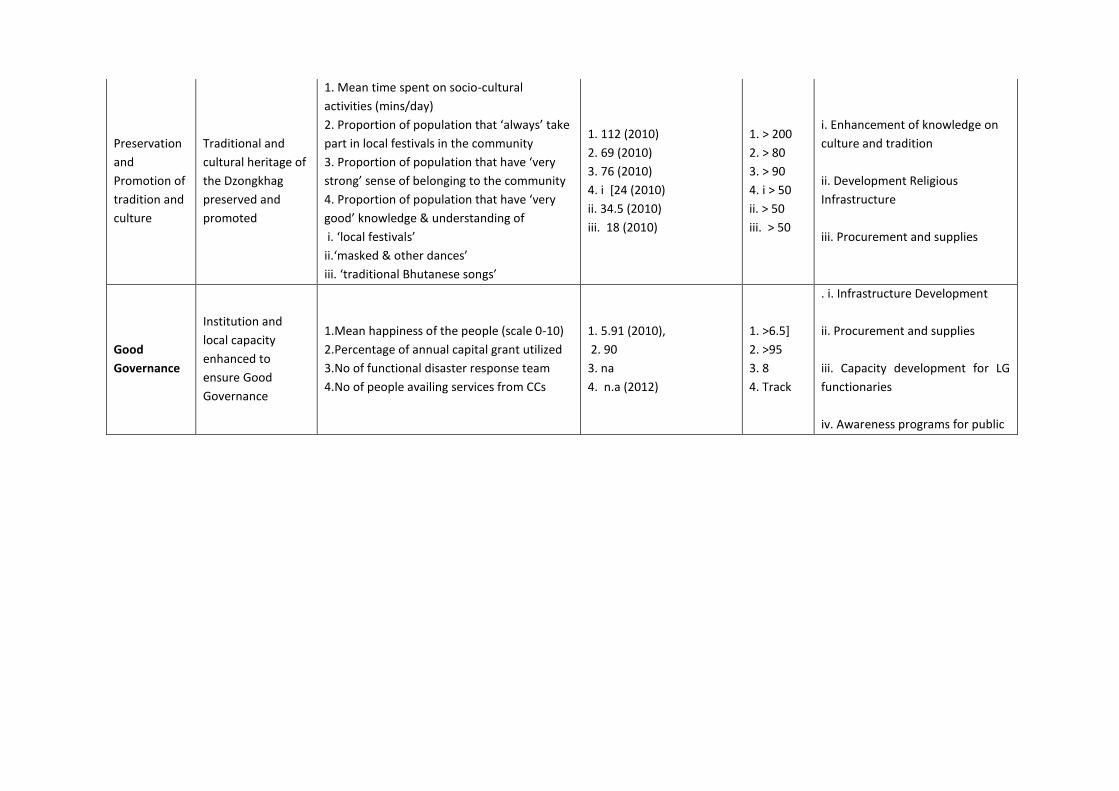
Preservation
and
Promotion of
tradition and
culture
Traditional and
cultural heritage of
the Dzongkhag
preserved and
promoted
1. Mean time spent on socio-cultural
activities (mins/day)
2. Proportion of population that ‘always’ take
part in local festivals in the community
3. Proportion of population that have ‘very
strong’ sense of belonging to the community
4. Proportion of population that have ‘very
good’ knowledge & understanding of
i. ‘local festivals’
ii.‘masked & other dances’
iii. ‘traditional Bhutanese songs’
1. 112 (2010)
2. 69 (2010)
3. 76 (2010)
4. i [24 (2010)
ii. 34.5 (2010)
iii. 18 (2010)
1. > 200
2. > 80
3. > 90
4. i > 50
ii. > 50
iii. > 50
i. Enhancement of knowledge on
culture and tradition
ii. Development Religious
Infrastructure
iii. Procurement and supplies
Good
Governance
Institution and
local capacity
enhanced to
ensure Good
Governance
1.Mean happiness of the people (scale 0-10)
2.Percentage of annual capital grant utilized
3.No of functional disaster response team
4.No of people availing services from CCs
1. 5.91 (2010),
2. 90
3. na
4. n.a (2012)
1. >6.5]
2. >95
3. 8
4. Track
. i. Infrastructure Development
ii. Procurement and supplies
iii. Capacity development for LG
functionaries
iv. Awareness programs for public
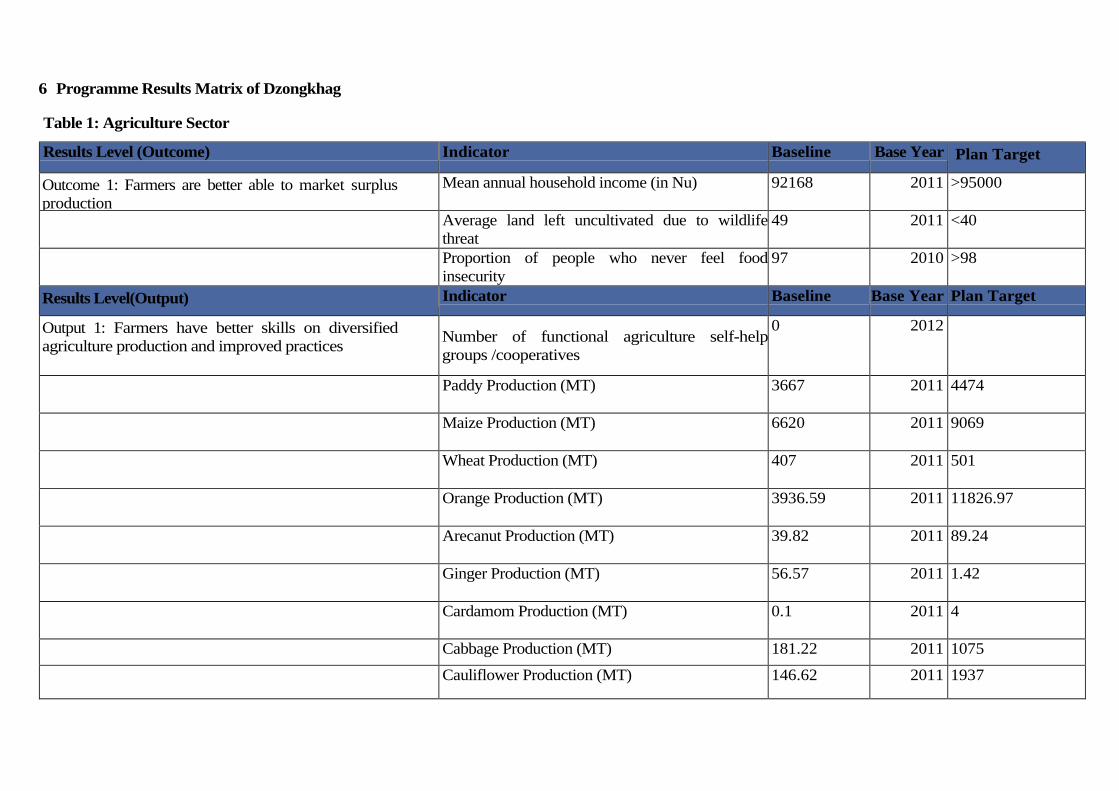
6 Programme Results Matrix of Dzongkhag
Table 1: Agriculture Sector
Results Level (Outcome) Indicator Baseline Base Year Plan Target
Outcome 1: Farmers are better able to market surplus
production
Mean annual household income (in Nu) 92168 2011 >95000
Average land left uncultivated due to wildlife
threat
49 2011 <40
Proportion of people who never feel food
insecurity
97 2010 >98
Results Level(Output) Indicator Baseline Base Year Plan Target
Output 1: Farmers have better skills on diversified
agriculture production and improved practices Number of functional agriculture self-help
groups /cooperatives
0 2012
Paddy Production (MT) 3667 2011 4474
Maize Production (MT) 6620 2011 9069
Wheat Production (MT) 407 2011 501
Orange Production (MT) 3936.59 2011 11826.97
Arecanut Production (MT) 39.82 2011 89.24
Ginger Production (MT) 56.57 2011 1.42
Cardamom Production (MT) 0.1 2011 4
Cabbage Production (MT) 181.22 2011 1075
Cauliflower Production (MT) 146.62 2011 1937
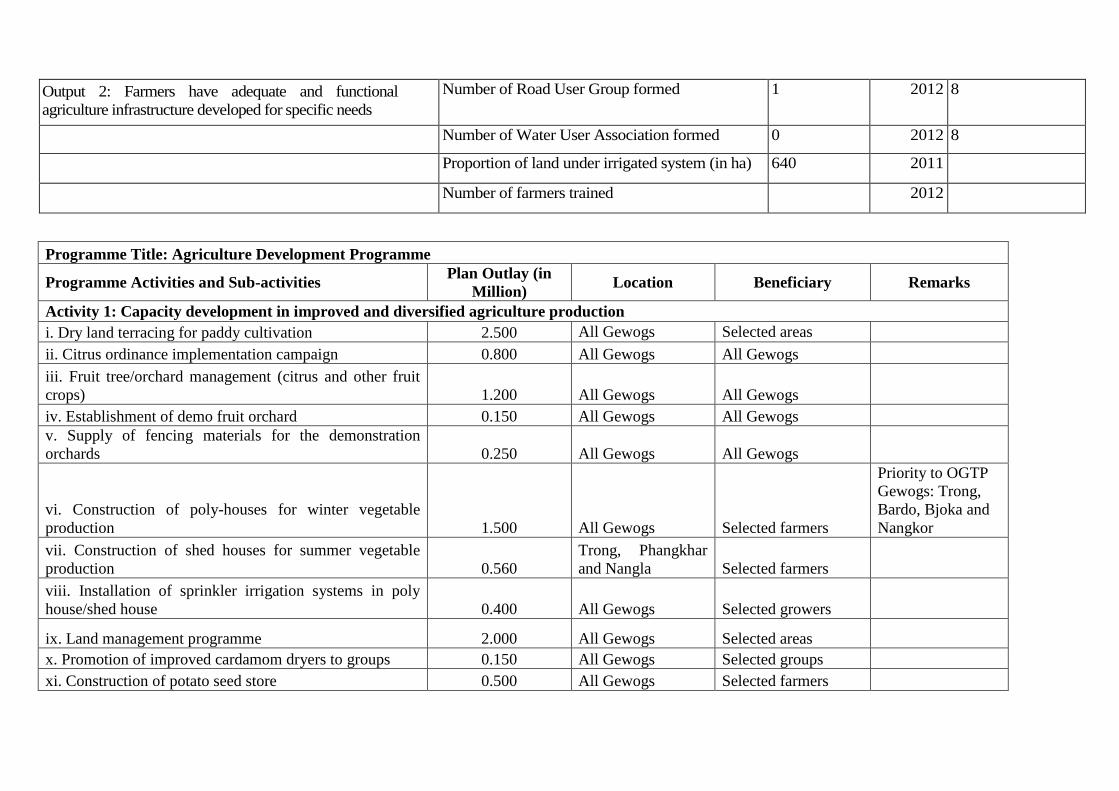
Output 2: Farmers have adequate and functional
agriculture infrastructure developed for specific needs
Number of Road User Group formed 1 2012 8
Number of Water User Association formed 0 2012 8
Proportion of land under irrigated system (in ha) 640 2011
Number of farmers trained 2012
Programme Title: Agriculture Development Programme
Programme Activities and Sub-activities Plan Outlay (in
Million) Location Beneficiary Remarks
Activity 1: Capacity development in improved and diversified agriculture production
i. Dry land terracing for paddy cultivation 2.500 All Gewogs Selected areas
ii. Citrus ordinance implementation campaign 0.800 All Gewogs All Gewogs
iii. Fruit tree/orchard management (citrus and other fruit
crops) 1.200 All Gewogs All Gewogs
iv. Establishment of demo fruit orchard 0.150 All Gewogs All Gewogs
v. Supply of fencing materials for the demonstration
orchards 0.250 All Gewogs All Gewogs
vi. Construction of poly-houses for winter vegetable
production 1.500 All Gewogs Selected farmers
Priority to OGTP
Gewogs: Trong,
Bardo, Bjoka and
Nangkor
vii. Construction of shed houses for summer vegetable
production 0.560
Trong, Phangkhar
and Nangla Selected farmers
viii. Installation of sprinkler irrigation systems in poly
house/shed house 0.400 All Gewogs Selected growers
ix. Land management programme 2.000 All Gewogs Selected areas
x. Promotion of improved cardamom dryers to groups 0.150 All Gewogs Selected groups
xi. Construction of potato seed store 0.500 All Gewogs Selected farmers
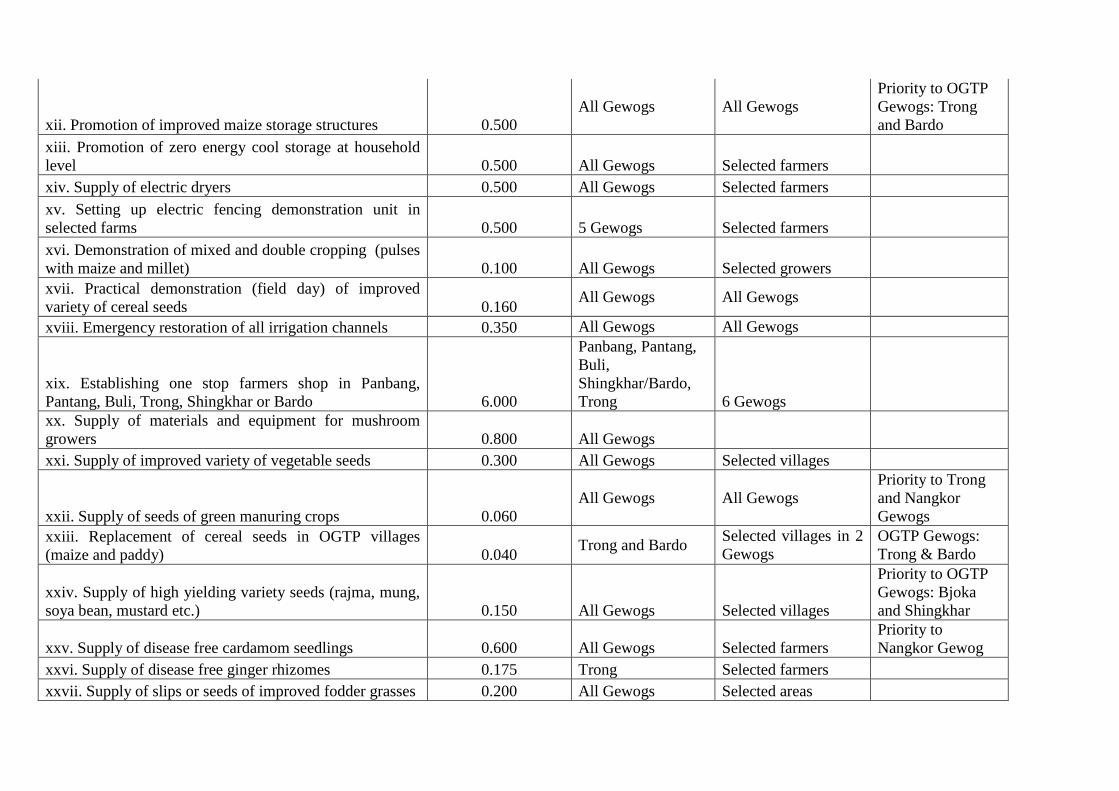
xii. Promotion of improved maize storage structures 0.500
All Gewogs All Gewogs
Priority to OGTP
Gewogs: Trong
and Bardo
xiii. Promotion of zero energy cool storage at household
level 0.500 All Gewogs Selected farmers
xiv. Supply of electric dryers 0.500 All Gewogs Selected farmers
xv. Setting up electric fencing demonstration unit in
selected farms 0.500 5 Gewogs Selected farmers
xvi. Demonstration of mixed and double cropping (pulses
with maize and millet) 0.100 All Gewogs Selected growers
xvii. Practical demonstration (field day) of improved
variety of cereal seeds 0.160 All Gewogs All Gewogs
xviii. Emergency restoration of all irrigation channels 0.350 All Gewogs All Gewogs
xix. Establishing one stop farmers shop in Panbang,
Pantang, Buli, Trong, Shingkhar or Bardo 6.000
Panbang, Pantang,
Buli,
Shingkhar/Bardo,
Trong 6 Gewogs
xx. Supply of materials and equipment for mushroom
growers 0.800 All Gewogs
xxi. Supply of improved variety of vegetable seeds 0.300 All Gewogs Selected villages
xxii. Supply of seeds of green manuring crops 0.060
All Gewogs All Gewogs
Priority to Trong
and Nangkor
Gewogs
xxiii. Replacement of cereal seeds in OGTP villages
(maize and paddy) 0.040 Trong and Bardo
Selected villages in 2
Gewogs
OGTP Gewogs:
Trong & Bardo
xxiv. Supply of high yielding variety seeds (rajma, mung,
soya bean, mustard etc.) 0.150 All Gewogs Selected villages
Priority to OGTP
Gewogs: Bjoka
and Shingkhar
xxv. Supply of disease free cardamom seedlings 0.600 All Gewogs Selected farmers
Priority to
Nangkor Gewog
xxvi. Supply of disease free ginger rhizomes 0.175 Trong Selected farmers
xxvii. Supply of slips or seeds of improved fodder grasses 0.200 All Gewogs Selected areas
xxviii. Supply of improved and disease free planting
materials of mandarin, walnut, avocado, mango, pear,
arecanut, pea can, peach, plum, pineapple, apricot, banana 0.576 All Gewogs All Gewogs
xxix. Supply of seeds and seedlings to schools,
Dratshangs and Shedras 0.200
Priority to
Dratshangs and
Shedras
xxx. Formation of water user associations for all irrigation
schemes 1.000 All Gewogs All Gewogs
xxxi. Formation and training of road construction and
monitoring committee in all Gewogs 0.400 All Gewogs All Gewogs
xxxii.Formation of Road User Groups for all Farm roads 0.560 All Gewogs
xxxiii. Awareness on citrus ordinance and rehabilitation of
citrus orchards 0.250 All Gewogs All Gewogs
xxxiv. Hands-on training on vegetable production in Poly
houses/Shed houses 0.250 All Gewogs Selected farmers
xxxv. Training of all staff on orchard management
techniques (Citrus canopy management and orchard
management) 0.225 All Gewogs All Staff
xxxvi. Training on fruit planting techniques to all Gewogs
(arecanut, apricot, pineapple, plum, walnut, pecan etc.) 0.680 8 Gewogs All Gewogs
xxxvii. Advocacy training on health nutrition and kitchen
gardening in all schools, Dratshangs and Shedras 1.400 All Gewogs
Schools, Dratshangs,
Shedras
xxxviii. Hands on ToT on organic farming to all staff 0.225
Gewogs and Dz.
HQ
xxxix. Hands on training on practical organic farming 0.640 All Gewogs All Gewogs
xxxx. Advocacy training on seed replacement (all crops) 0.400 All Gewogs All Gewogs
xxxxi. Training on the agronomic practices of Bulb
Onion, Broccoli, Tomato, Drolla Chilli etc. 0.400 All Gewogs All Gewogs
Priority to OGTP
Gewogs: Trong,
Nangkor, Bjoka,
Bardo
xxxxii. Training on agronomic practices of cardamom and
ginger 0.280 All Gewogs All Gewogs
xxxxiii. Training and formation of marketing groups for
all farm produce (cereals, vegetables, fruit crops, pulses,
spices etc.) in potential Gewogs 0.080 All Gewogs All Gewogs
xxxxiv. Hands on training to mushroom growers 0.500 All Gewogs All Gewogs
xxxxv. Training on effective nutrient management in
cereals 0.500 All Gewogs All Gewogs
xxxxvi. Awareness on the importance and advantages of
growing pulses 0.450 All Gewogs Selected villages
Sub-total 29.961
Activity 2: Development of production and marketing infrastructure and facilities
i. Construction of permanent works along Shingkhar
Gewog center road (Buli-Therang 25km) 37.500 Shingkhar, Bardo Shingkhar and Bardo
ii. Construction of Therang Zam (160' DDR Bailey
Bridge) 7.040 Shingkhar Shingkhar and Bardo
Taken over by
DoR as per the
directives of the
government
iii. Construction of Rhongdigangchu motorable bridge
(approx.100') 7.500 Shingkhar Shingkhar and Bardo
Taken over by
DoR as per the
directives of the
government
iv. Emergency restoration of all farm roads 0.800 All Gewogs All Gewogs
v. Construction of Farm Road (Shangling-Tshaidang 8.5
Km) 8.552 Nangkor
Nyakhar and
Tshaidang Spillover
vi. Electrification of Agriculture Extension Centres
(AECs) 0.600
Redhijong,
Tshaidang,
Kaktong
vii. Construction of new water supply line at Buli RNR-
EC and Redhijong AEC 2.000 Buli and Redhijong
viii. Construction of Iron Angle post fencing for all AECs 2.000
Tshaidang,
Kaktong,
Redhijong and
Nangkor, Nangla and
Phangkar
langdurbi
ix. Renovation of RNR-EC and AECs 2.500
Redhijong, Tingtibi
and Tshaidang
Phangkar, Trong and
Nangkor
x. Construction of Bjoka RNR Centre with MP Hall and 4
unit staff quarter 11.960 Bjoka Bjoka
xi. Construction of water tank for irrigation purposes in
RNR Technology Parks 0.960
8 RNR-EC & 4
AECs
xii. Installation of sprinkler irrigation systems 0.540
8 RNR-EC & 4
AECs
xiii. Procurement of assorted fruit seedlings for
demonstration 0.084
8 RNR-EC & 4
AECs
xiv. Construction of shed for compost, vermicomposting,
bio-digester etc. in all RNR-ECs and AECs 0.840
8 RNR-EC & 4
AECs All Gewogs
xv. Procurement of vegetable seeds and seedlings for
demonstration 0.108
8 RNR-EC & 4
AECs
xvi. Supply of computer and printers to all staff 0.845
8 RNR-EC & 4
AECs 8 RNR-EC & 4 AECs
xvii. Supply of basic furniture in all extension centres 0.720
8 RNR-EC & 4
AECs 8 RNR-EC & 4 AECs
xviii. Installation of internet facilities to all RNR-EC and
AECs 0.300
8 RNR-EC & 4
AECs 8 RNR-EC & 4 AECs
xix. Renovation of agriculture store in Trong 1.000
Near Dz. Guest
house 8 RNR-EC & 4 AECs
xx. Emergency restoration of all farm roads
xxi. Construction of RNR sale counter in Chamkarchuu
Project area 6.000
Shingkhar/Bardo,
Phangkar, Panbang
and Nangkor
Shingkhar/Bardo,
Phangkar, Panbang
and Nangkor
xxii. Construction of vendor sheds along Panbang-
Gomphu-Tingtibi National Highway 0.500
Nangla, Goshing,
Phangkhar and
Trong
Nangla, Goshing,
Phangkhar and Trong
Sub-total 92.348
Total for Agriculture Sector 122.310
Table 2: Administration and Management Sector
Results Level (Outcome) Indicator Baseline Base Year Plan Target
Outcome 1 : Local Government's service delivery
improved
Track Public Perception on LG
performance (GNH index)
2010
Results Level(Output) Indicator Baseline Base Year Plan Target
Output 1: Functional civil infrastructure and facilities
developed for enabling working environment
Number of functional civil
infrastructure
developed/maintained
2012
Output 2:Local functionaries have better skills to provide
services Number of people trained on disaster
preparedness and responsiveness
10 2012 50
Number of trainings/orientation
conducted 0 2012 1
Disaster response time Track Track
TAT for major services Track Track
Programme Title: Administration and Management Development Programme
Programme activity and sub-activities Plan Outlay (in Million) Location Beneficiary Remarks
Activity 1.1: Development of enabling working environment for Dzongkhag
i. Interior modification and re-electrification of
Dzongkhag Administrative building and offices 6.000 Dzongkhag Dzongkhag
ii. Renovation of plinth protection and walls of
Dzongkhag Administrative building 2.000 Dzongkhag Dzongkhag
iii. Maintenance of Dunmang Tshachu guest house and
other amenities 1.000 Dunmang Dzongkhag
iv. Maintenance of Dzongkhag guest house 1.000 Dzongkhag Dzongkhag
v. Maintenance of staff quarter 2.000 Dzongkhag Dzongkhag
vi. Construction of Dzongkhag store 3.000 Dzongkhag Dzongkhag
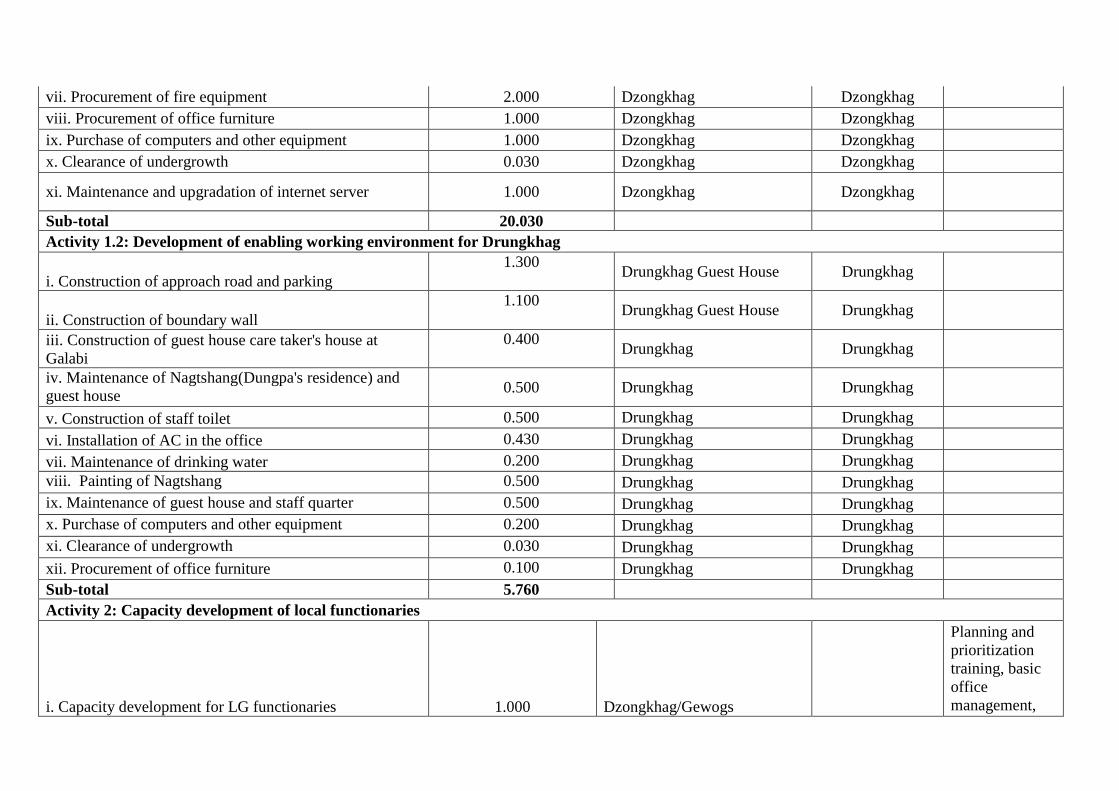
vii. Procurement of fire equipment 2.000 Dzongkhag Dzongkhag
viii. Procurement of office furniture 1.000 Dzongkhag Dzongkhag
ix. Purchase of computers and other equipment 1.000 Dzongkhag Dzongkhag
x. Clearance of undergrowth 0.030 Dzongkhag Dzongkhag
xi. Maintenance and upgradation of internet server 1.000 Dzongkhag Dzongkhag
Sub-total 20.030
Activity 1.2: Development of enabling working environment for Drungkhag
i. Construction of approach road and parking
1.300 Drungkhag Guest House Drungkhag
ii. Construction of boundary wall
1.100 Drungkhag Guest House Drungkhag
iii. Construction of guest house care taker's house at
Galabi
0.400 Drungkhag Drungkhag
iv. Maintenance of Nagtshang(Dungpa's residence) and
guest house 0.500 Drungkhag Drungkhag
v. Construction of staff toilet 0.500 Drungkhag Drungkhag
vi. Installation of AC in the office 0.430 Drungkhag Drungkhag
vii. Maintenance of drinking water 0.200 Drungkhag Drungkhag
viii. Painting of Nagtshang 0.500 Drungkhag Drungkhag
ix. Maintenance of guest house and staff quarter 0.500 Drungkhag Drungkhag
x. Purchase of computers and other equipment 0.200 Drungkhag Drungkhag
xi. Clearance of undergrowth 0.030 Drungkhag Drungkhag
xii. Procurement of office furniture 0.100 Drungkhag Drungkhag
Sub-total 5.760
Activity 2: Capacity development of local functionaries
i. Capacity development for LG functionaries 1.000 Dzongkhag/Gewogs
Planning and
prioritization
training, basic
office
management,
sensitization of
plans and
policies of
various sectors
to LG
functionaries
etc.
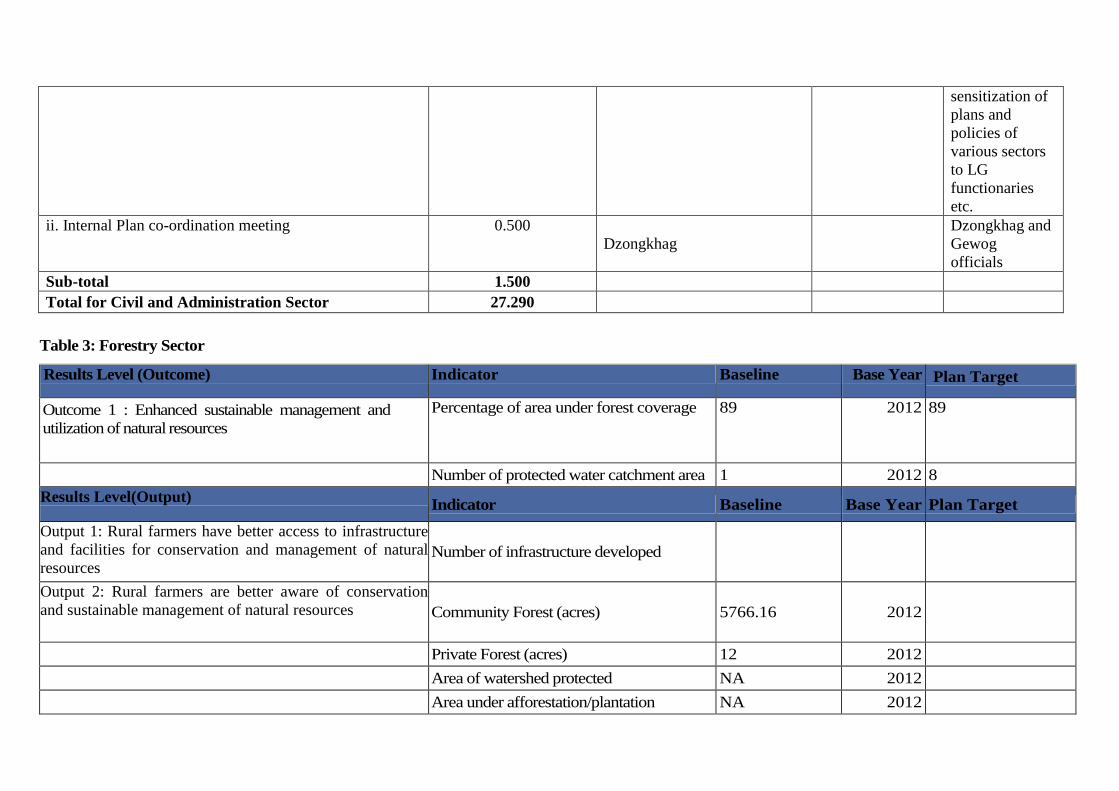
ii. Internal Plan co-ordination meeting 0.500
Dzongkhag
Dzongkhag and
Gewog
officials
Sub-total 1.500
Total for Civil and Administration Sector 27.290
Table 3: Forestry Sector
Results Level (Outcome) Indicator Baseline Base Year Plan Target
Outcome 1 : Enhanced sustainable management and
utilization of natural resources
Percentage of area under forest coverage 89 2012 89
Number of protected water catchment area 1 2012 8
Results Level(Output) Indicator Baseline Base Year Plan Target
Output 1: Rural farmers have better access to infrastructure
and facilities for conservation and management of natural
resources Number of infrastructure developed
Output 2: Rural farmers are better aware of conservation
and sustainable management of natural resources Community Forest (acres) 5766.16 2012
Private Forest (acres) 12 2012
Area of watershed protected NA 2012
Area under afforestation/plantation NA 2012
Track Incidences of forest fire Track Track
NWFP Production (3~5 products) Track Track
Programme Title: Forestry Development Programme
Programme activity and sub-activities Plan Outlay (in
Million) Location Beneficiary Remarks
Activity 1.1: Promotion of Eco-Tourism
i. Formation of eco-tourist management group 0.000
Trong, Nangkor,
Shingkhar, Bjoka,
Goshing, Phangkhar and
Nangla Gewogs
14 Eco-Groups
To be funded by TCB
as these activities are
captured in the
Dzongkhag Tourism
Development Plan
2011-2015.
ii. Identification of eco-trails and management 0.000
Trong, Nangkor,
Shingkhar, Bjoka,
Goshing, Phangkhar and
Nangla Gewogs
Public of the area
iii. Site identification and construction of eco- camps 0.000
Trong, Nangkor,
Shingkhar, Bjoka,
Goshing, Phangkhar and
Nangla Gewogs
Public of the area
iv. Feasibility assessment of home stays 0.000 All Gewogs Individual
household
v. Training of communities for tourist management. 0.000
Trong, Nangkor,
Shingkhar, Bjoka,
Goshing, Phangkhar and
Nagangla Gewogs
Public of the area
vi. Development of Dunmang Tshachu 0.000 Dunmang Tshachu,
Nangkor Gewog
Sub-total 0.000
Activity 1: Development of infrastructure for enabling working environment
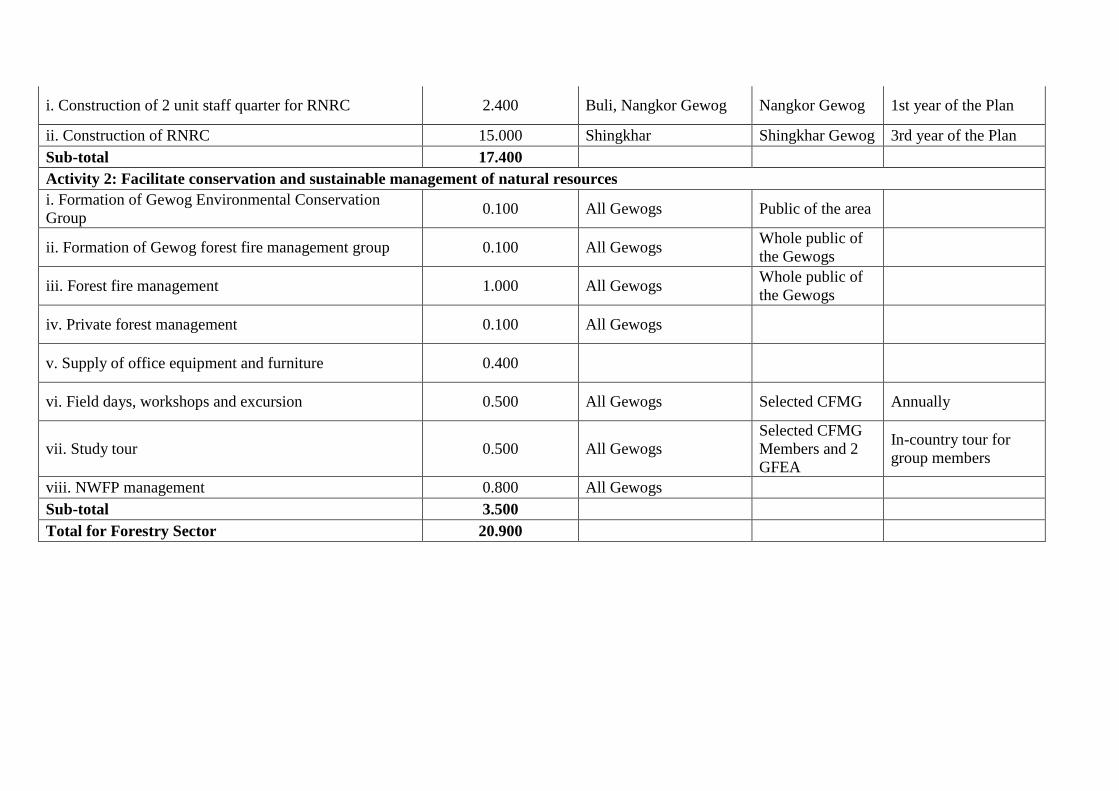
i. Construction of 2 unit staff quarter for RNRC 2.400 Buli, Nangkor Gewog Nangkor Gewog 1st year of the Plan
ii. Construction of RNRC 15.000 Shingkhar Shingkhar Gewog 3rd year of the Plan
Sub-total 17.400
Activity 2: Facilitate conservation and sustainable management of natural resources
i. Formation of Gewog Environmental Conservation
Group 0.100 All Gewogs Public of the area
ii. Formation of Gewog forest fire management group 0.100 All Gewogs Whole public of
the Gewogs
iii. Forest fire management 1.000 All Gewogs Whole public of
the Gewogs
iv. Private forest management 0.100 All Gewogs
v. Supply of office equipment and furniture 0.400
vi. Field days, workshops and excursion 0.500 All Gewogs Selected CFMG Annually
vii. Study tour 0.500 All Gewogs
Selected CFMG
Members and 2
GFEA
In-country tour for
group members
viii. NWFP management 0.800 All Gewogs
Sub-total 3.500
Total for Forestry Sector 20.900
Table 4: Health Sector
Results Level(Outcome) Indicator Baseline Base Year Plan Target
Outcome 1 : Health status of the communities improved Sustained Immunization coverage at 100 percent 100 2012 100
Mean walking time to the nearest health care
center by Gewog (minutes)
75 2010 60
Incidence of maternal mortality 0 2012 0
Incidence of infant mortality 0 2012 0
Incidence of under-five mortality (U5M)
0 2012
Mean healthy days by Gewog (scale 0-30 days) 27.07 2010 28
Proportion of household “composting” household
waste 60.2 2010 70
Results Level(Output) Indicator Baseline Base Year Plan Target
Output 1:Communities have better access to health
infrastructure and facilities
Proportion of households living more than 1 hr
walking from nearest BHU
45 2012
Percentage of institutional delivery 45 2012 >90
Output 2: Communities and health service providers
have better skills and knowledge on health and
hygiene
Proportion of population with adequate
awareness on HIV/AIDS
9
8
2012 10
0
Proportion of population with adequate
awareness on CD and NCD
8
0
2012 10
0
Number of health awareness conducted NA Track
Table 2: Activities and Budget Summary: Health Sector
Programme Activities and Sub-activities Plan Outlay (in Million) Location Beneficiary Remarks
Activity 1.1: Development of Health Infrastructure
i. Construction of 4 unit staff quarter 4.000 Buli BHU Health staff
ii. Construction of 4 unit staff quarter 4.000 Panbang BHU-I Health staff
iii. Construction of dental and X-ray unit 1.000 Panbang BHU-I Lower Kheng
iv. Construction of 2 unit staff quarter 3.500 Shingkhar BHU Health staff
v. Construction of 1 unit staff quarter 1.000 Tashibe Tashibe Chiwog
Present ORC will be
used as OPD room
vi. Construction of 1 unit staff quarter 1.000 Nimshong Nimshong Chiwog Present ORC will be
used as OPD room
vii. Construction of 1 unit staff quarter 1.000 Dungmang Dungmang and
Kamjong
Present ORC will be
used as OPD room
viii. Electrification of all BHUs 1.600
Shingkhar,
Khomsar, Bjoka,
Kaktong and
Tradijong
ix. Construction of staff quarter 2.000 Yebilaptsa hospital Health staff
x. Relocation of BHU with 3 unit staff quarter 12.438 Bjoka BHU
xi. Construction of retaining wall at Namergang BHU II 0.500 Namergang, Bjoka
xii. Construction of approach road to BHU 1.500 Buli BHU
xiii. Construction of water supply 0.500
Namergang BHU,
Bjoka
xiv. Fencing of BHUs 2.000
Zhemgang,
Tradijong and
Namergang BHU
Namergang
xv. Construction of 1 unit staff quarter 1.000 Tradijong BHU
xvi. Construction of 1 unit patient kitchen 1.000 Langdurbi BHU
xvii. Construction of water supply 3.000 Zhemgang BHU-I Zhemgang
xviii. Renovation of water supply 0.300
Langdurbi,
Khomshar and Buli
BHUs
xix. Maintenance of BHUs and staff quarters 2.000
Langdorbi, Goshing,
Kaktong and
Khomsar
xx. Maintenance of BHU fencing 0.600 Kaktong, Khomsar,
Buli and Goshing,
xxi. Major maintenance of BHUs 1.000 Tradijong BHU
Major maintenance will
be carried out and 1
unit staff quarter will
be constructed
Sub-total 44.938
Activity 1.2: Procurement of essential health equipment and office supplies
i. Supply of furniture, equipment and computers 2.000 All BHUs Zhemgang and
Namergang BHUs and
other Health centers
ii. Logistic supply 0.450 All BHUs Supply water boiler and
panel heater for BHUs
Sub-total 2.450
Activity 2: Create awareness and training of health service providers and communities
i. Reproductive health and safe motherhood 0.500 All BHUs All Gewogs
ii. Malaria control programme (awareness and IRS
activity) 0.500
All BHUs
iii. Community development for health and sanitation 0.400
All Gewogs
iv. Nutrition promotion 0.200
v. Carry out risk assessment on disease prevalence 0.700
vi. Advocacy and awareness on health and sanitation 0.200
All Gewogs
vii. Capacity building of health staff 0.750
viii. Training of water caretakers 0.800
All water caretaker
of all Gewogs
ix. Training and study tour for Village Health Workers 0.800
Sub-total 4.850
Total for Health Sector 52.238
Table 5: Livestock Sector
Results Level (Outcome) Indicator Baseline Base Year Plan Target
Outcome 1 : Farmers are better able to market surplus
livestock products
Milk Production (Tons) 692.30 2012 1185
Butter Production (Tons) 27.30 2012 45.20
Cheese Production (Tons) 49.40 2012 85.32
Egg Production (Million) 0.89 2012 5.40
Fish Production (Tons) 1.03 2012 4.90
Pork Production (Tons) 26.71 2012 41.96
Chicken Production (Tons) 1.15 2012 2.00
Results Level (Outcome) Indicator Baseline Base Year Plan Target
Output 1:Farmers have better skills on livestock
production and commercial farming practices
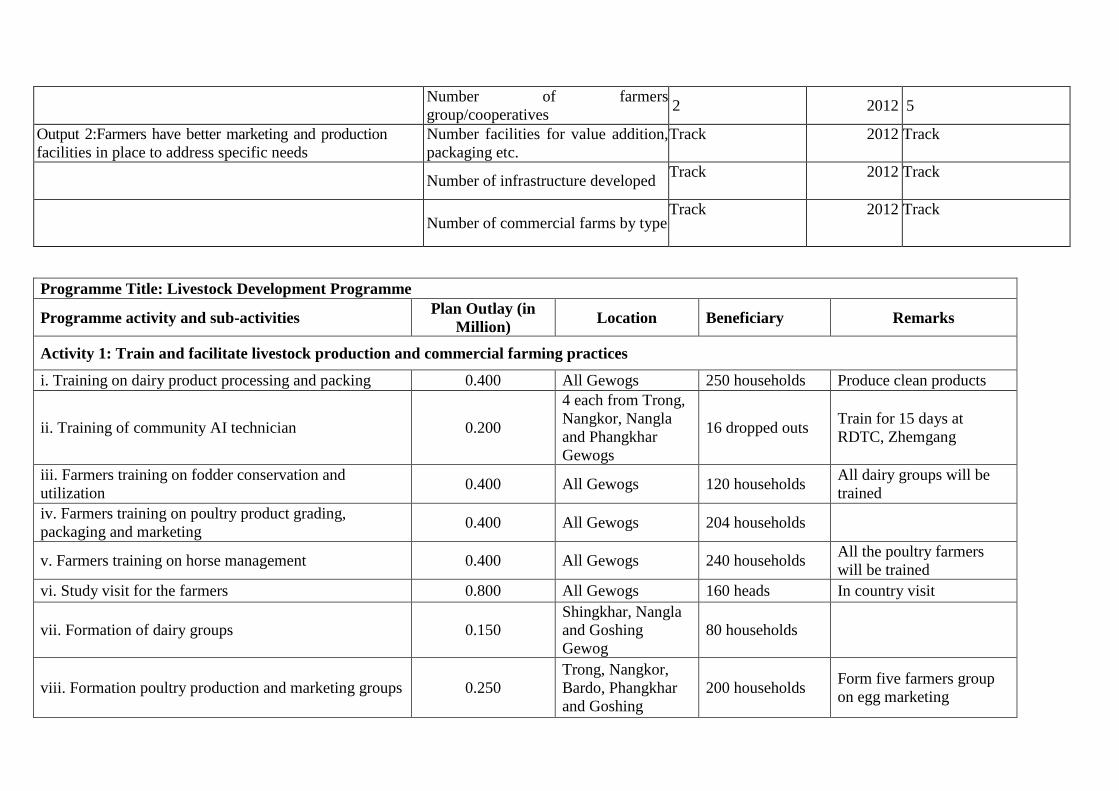
Number of farmers trained Track 2012 Track
Programme Title: Livestock Development Programme
Programme activity and sub-activities Plan Outlay (in
Million) Location Beneficiary Remarks
Activity 1: Train and facilitate livestock production and commercial farming practices
i. Training on dairy product processing and packing 0.400 All Gewogs 250 households Produce clean products
ii. Training of community AI technician 0.200
4 each from Trong,
Nangkor, Nangla
and Phangkhar
Gewogs
16 dropped outs Train for 15 days at
RDTC, Zhemgang
iii. Farmers training on fodder conservation and
utilization 0.400 All Gewogs 120 households
All dairy groups will be
trained
iv. Farmers training on poultry product grading,
packaging and marketing 0.400 All Gewogs 204 households
v. Farmers training on horse management 0.400 All Gewogs 240 households All the poultry farmers
will be trained
vi. Study visit for the farmers 0.800 All Gewogs 160 heads In country visit
vii. Formation of dairy groups 0.150
Shingkhar, Nangla
and Goshing
Gewog
80 households
viii. Formation poultry production and marketing groups 0.250
Trong, Nangkor,
Bardo, Phangkhar
and Goshing
200 households Form five farmers group
on egg marketing
Number of farmers
group/cooperatives 2 2012 5
Output 2:Farmers have better marketing and production
facilities in place to address specific needs
Number facilities for value addition,
packaging etc.
Track 2012 Track
Number of infrastructure developed
Track 2012 Track
Number of commercial farms by type
Track 2012 Track
ix. Awareness campaign on Rabies, Anthrax, FMD and
bird flu 0.400 All Gewogs 800 households
Organize campaign yearly
in all the Gewogs
x. Strengthening the existing farmers group and
formalizing 0.200
Trong, Nangkor
and Nangla
6 Farmers'
Groups
Up-scaling of Livestock
groups
xi. Training livestock staff on dairy product processing
and packaging 0.100 RDTC, Zhemgang 18 staff
xii. Training of staff on high tech poultry production
system and utilization of auto equipment 0.400 NPDC 18 staff
xiii. Training of staff on Feed formulation using locally
available feed resources 0.100 RDTC, Zhemgang 18 staff
xiv. Training of staff on processing, packaging and
marketing of pig product, poultry products fish products
and other niche livestock products 0.500 RDTC, Zhemgang 18 staff
xv. Training of staff on emerging livestock diseases and
its control measures 0.500 RDTC, Zhemgang 18 staff
xvi. Study visit of staff on the emerging livestock
technologies within the country 0.400 In-country 18 staff
Sub total 5.600
Activity 2: Development of production and marketing infrastructure/facilities
i. Construction of RNR Center 2.460 Goshing
All farmers within
the Gewog
ii. Construction of RNR staff quarter 2.690 Goshing
All farmers within
the Gewog
iii. Construction of RNR MP Hall 3.500 Goshing
All farmers within
the Gewog
iv. Fencing of RNR compound 2.000 Goshing
All farmers within
the Gewog
v. Construction of RNR Center 2.460 Bardo
All farmers within
the Gewog
vi. Construction of RNR staff quarter 2.690 Bardo
vii. Construction of RNR MP hall 3.500 Bardo
All farmers within
the Gewog
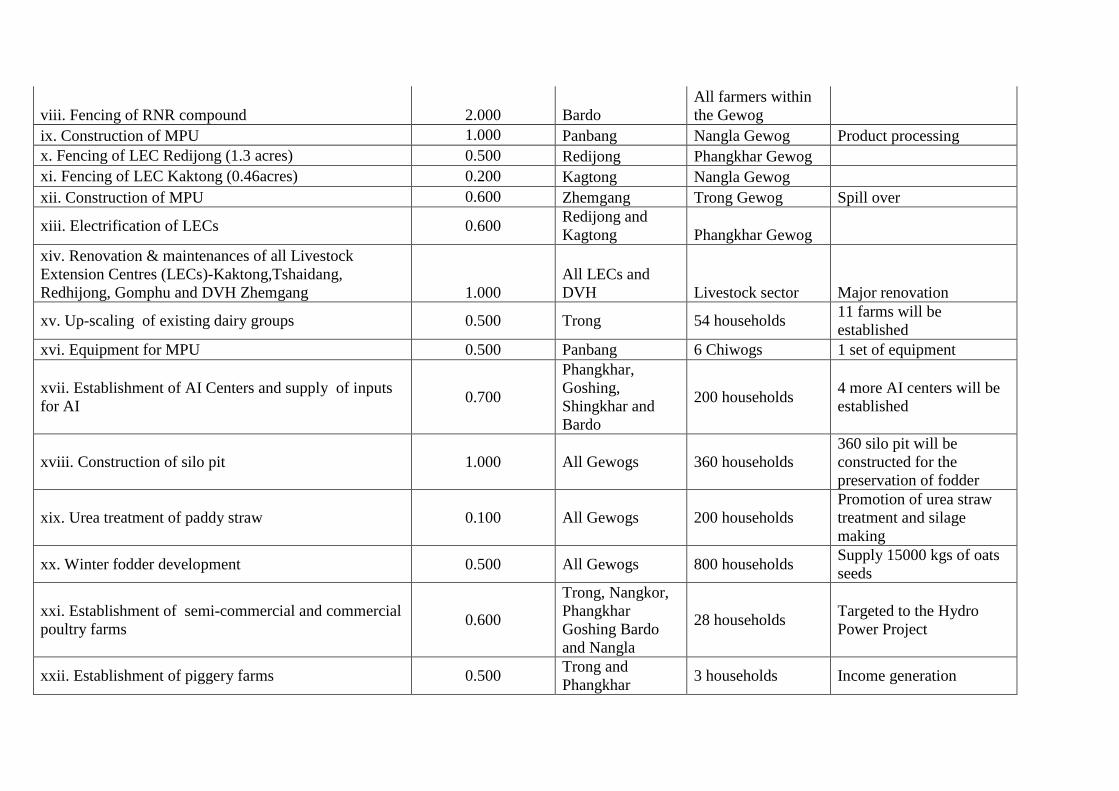
viii. Fencing of RNR compound 2.000 Bardo
All farmers within
the Gewog
ix. Construction of MPU 1.000 Panbang Nangla Gewog Product processing
x. Fencing of LEC Redijong (1.3 acres) 0.500 Redijong Phangkhar Gewog
xi. Fencing of LEC Kaktong (0.46acres) 0.200 Kagtong Nangla Gewog
xii. Construction of MPU 0.600 Zhemgang Trong Gewog Spill over
xiii. Electrification of LECs 0.600 Redijong and
Kagtong Phangkhar Gewog
xiv. Renovation & maintenances of all Livestock
Extension Centres (LECs)-Kaktong,Tshaidang,
Redhijong, Gomphu and DVH Zhemgang 1.000
All LECs and
DVH Livestock sector Major renovation
xv. Up-scaling of existing dairy groups 0.500 Trong 54 households 11 farms will be
established
xvi. Equipment for MPU 0.500 Panbang 6 Chiwogs 1 set of equipment
xvii. Establishment of AI Centers and supply of inputs
for AI 0.700
Phangkhar,
Goshing,
Shingkhar and
Bardo
200 households 4 more AI centers will be
established
xviii. Construction of silo pit 1.000 All Gewogs 360 households
360 silo pit will be
constructed for the
preservation of fodder
xix. Urea treatment of paddy straw 0.100 All Gewogs 200 households
Promotion of urea straw
treatment and silage
making
xx. Winter fodder development 0.500 All Gewogs 800 households Supply 15000 kgs of oats
seeds
xxi. Establishment of semi-commercial and commercial
poultry farms 0.600
Trong, Nangkor,
Phangkhar
Goshing Bardo
and Nangla
28 households Targeted to the Hydro
Power Project
xxii. Establishment of piggery farms 0.500 Trong and
Phangkhar 3 households Income generation
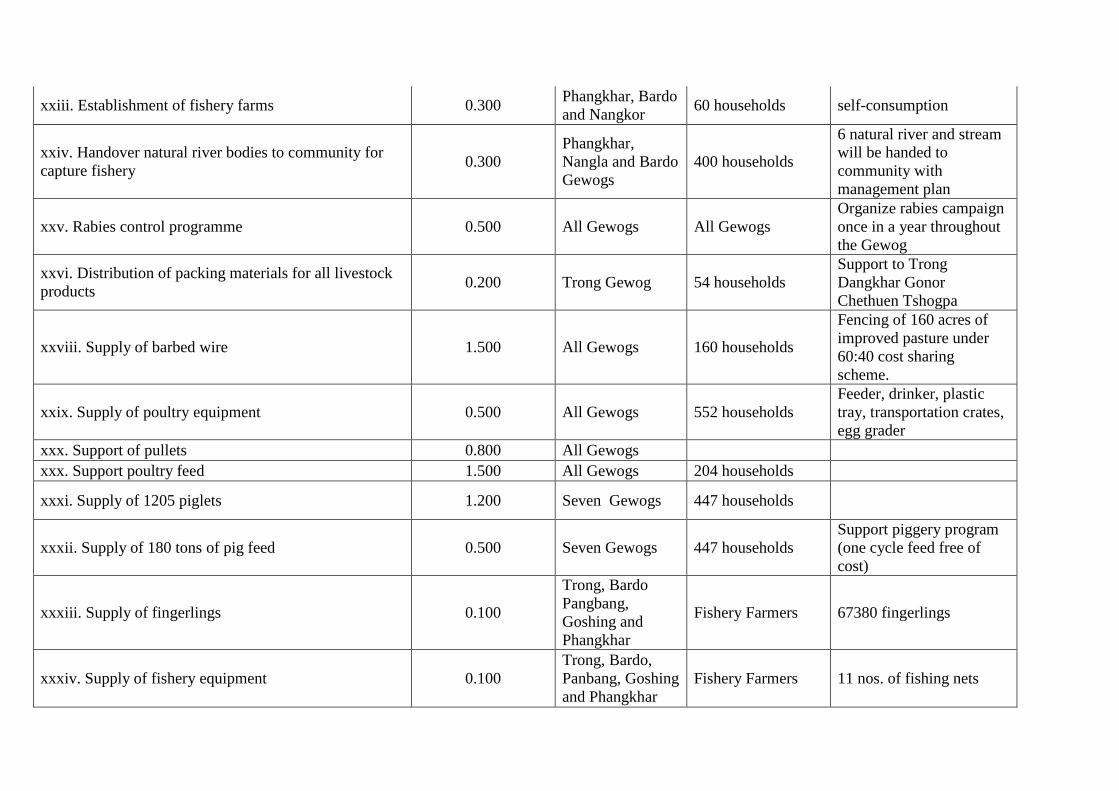
xxiii. Establishment of fishery farms 0.300 Phangkhar, Bardo
and Nangkor 60 households self-consumption
xxiv. Handover natural river bodies to community for
capture fishery 0.300
Phangkhar,
Nangla and Bardo
Gewogs
400 households
6 natural river and stream
will be handed to
community with
management plan
xxv. Rabies control programme 0.500 All Gewogs All Gewogs
Organize rabies campaign
once in a year throughout
the Gewog
xxvi. Distribution of packing materials for all livestock
products 0.200 Trong Gewog 54 households
Support to Trong
Dangkhar Gonor
Chethuen Tshogpa
xxviii. Supply of barbed wire 1.500 All Gewogs 160 households
Fencing of 160 acres of
improved pasture under
60:40 cost sharing
scheme.
xxix. Supply of poultry equipment 0.500 All Gewogs 552 households
Feeder, drinker, plastic
tray, transportation crates,
egg grader
xxx. Support of pullets 0.800 All Gewogs
xxx. Support poultry feed 1.500 All Gewogs 204 households
xxxi. Supply of 1205 piglets 1.200 Seven Gewogs 447 households
xxxii. Supply of 180 tons of pig feed 0.500 Seven Gewogs 447 households
Support piggery program
(one cycle feed free of
cost)
xxxiii. Supply of fingerlings 0.100
Trong, Bardo
Pangbang,
Goshing and
Phangkhar
Fishery Farmers 67380 fingerlings
xxxiv. Supply of fishery equipment 0.100
Trong, Bardo,
Panbang, Goshing
and Phangkhar
Fishery Farmers 11 nos. of fishing nets
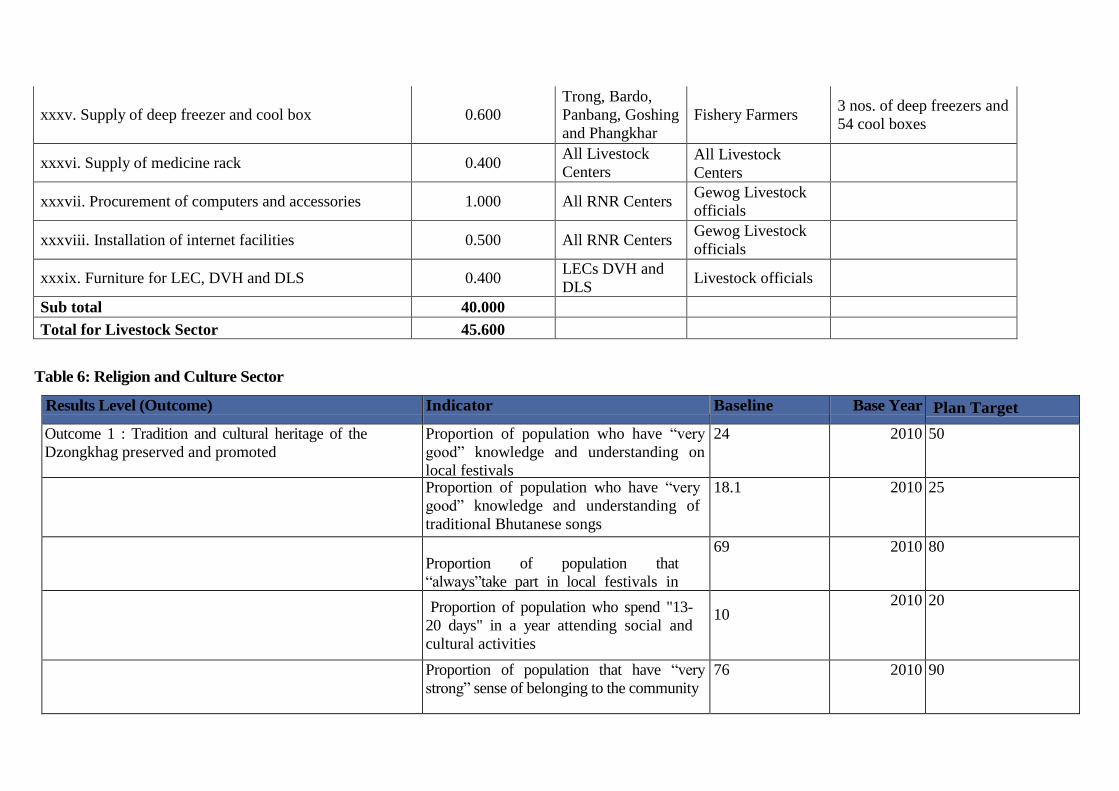
xxxv. Supply of deep freezer and cool box 0.600
Trong, Bardo,
Panbang, Goshing
and Phangkhar
Fishery Farmers 3 nos. of deep freezers and
54 cool boxes
xxxvi. Supply of medicine rack 0.400 All Livestock
Centers All Livestock
Centers
xxxvii. Procurement of computers and accessories 1.000 All RNR Centers Gewog Livestock
officials
xxxviii. Installation of internet facilities 0.500 All RNR Centers Gewog Livestock
officials
xxxix. Furniture for LEC, DVH and DLS 0.400 LECs DVH and
DLS Livestock officials
Sub total 40.000
Total for Livestock Sector 45.600
Table 6: Religion and Culture Sector
Results Level (Outcome) Indicator Baseline Base Year Plan Target
Outcome 1 : Tradition and cultural heritage of the
Dzongkhag preserved and promoted
Proportion of population who have “very
good” knowledge and understanding on
local festivals
24 2010 50
Proportion of population who have “very
good” knowledge and understanding of
traditional Bhutanese songs
18.1 2010 25
Proportion of population that
“always”take part in local festivals in
the community
69 2010 80
Proportion of population who spend "13-
20 days" in a year attending social and
cultural activities
10 2010 20
Proportion of population that have “very
strong” sense of belonging to the community
76 2010 90
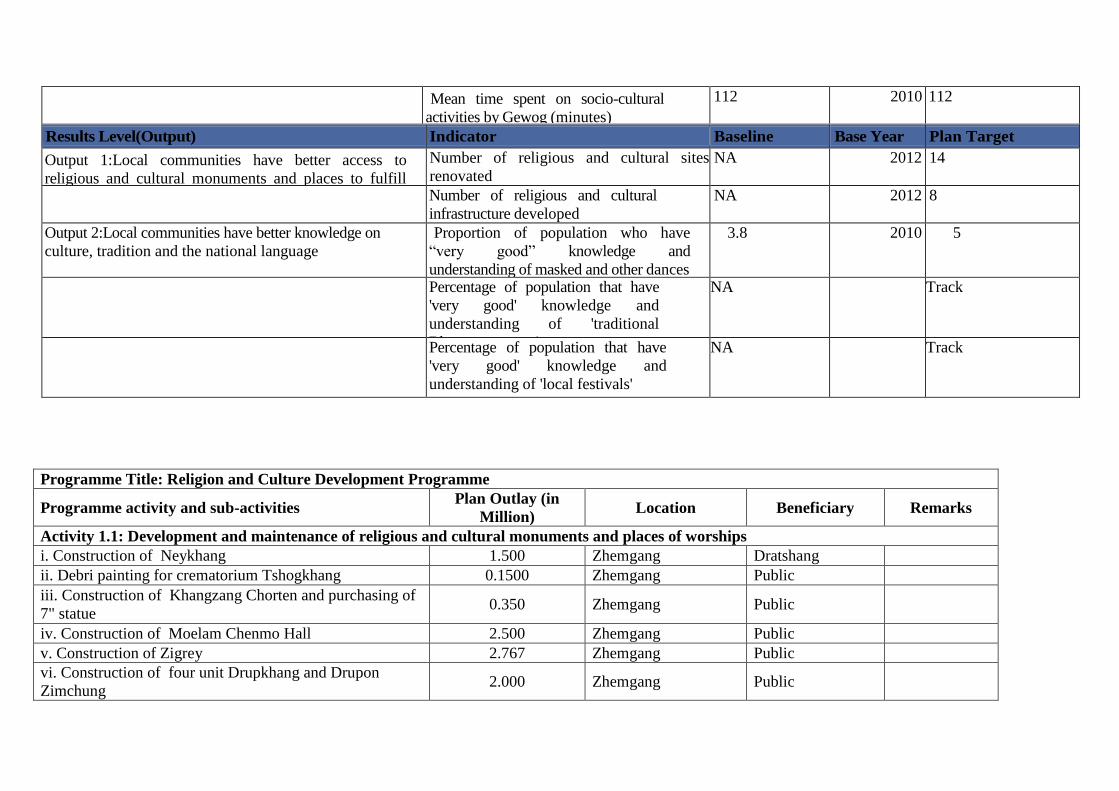
Mean time spent on socio-cultural
activities by Gewog (minutes)
112 2010 112
Results Level(Output) Indicator Baseline Base Year Plan Target
Output 1:Local communities have better access to
religious and cultural monuments and places to fulfill
spiritual needs
Number of religious and cultural sites
renovated
NA 2012 14
Number of religious and cultural
infrastructure developed
NA 2012 8
Output 2:Local communities have better knowledge on
culture, tradition and the national language
Proportion of population who have
“very good” knowledge and
understanding of masked and other dances
3.8 2010 5
Percentage of population that have
'very good' knowledge and
understanding of 'traditional
Bhutanese songs'
NA Track
Percentage of population that have
'very good' knowledge and
understanding of 'local festivals'
NA Track
Programme Title: Religion and Culture Development Programme
Programme activity and sub-activities Plan Outlay (in
Million) Location Beneficiary Remarks
Activity 1.1: Development and maintenance of religious and cultural monuments and places of worships
i. Construction of Neykhang 1.500 Zhemgang Dratshang
ii. Debri painting for crematorium Tshogkhang 0.1500 Zhemgang Public
iii. Construction of Khangzang Chorten and purchasing of
7" statue 0.350 Zhemgang Public
iv. Construction of Moelam Chenmo Hall 2.500 Zhemgang Public
v. Construction of Zigrey 2.767 Zhemgang Public
vi. Construction of four unit Drupkhang and Drupon
Zimchung 2.000 Zhemgang Public
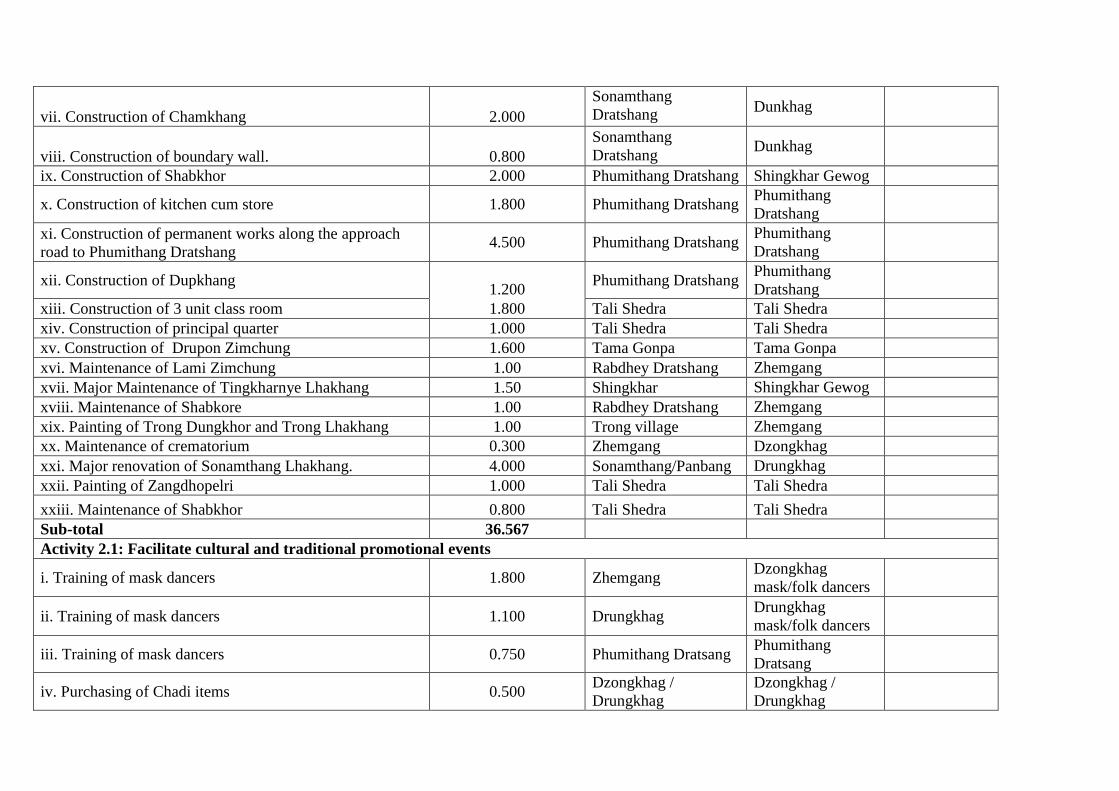
vii. Construction of Chamkhang 2.000
Sonamthang
Dratshang Dunkhag
viii. Construction of boundary wall. 0.800
Sonamthang
Dratshang Dunkhag
ix. Construction of Shabkhor 2.000 Phumithang Dratshang Shingkhar Gewog
x. Construction of kitchen cum store 1.800 Phumithang Dratshang Phumithang
Dratshang
xi. Construction of permanent works along the approach
road to Phumithang Dratshang 4.500 Phumithang Dratshang
Phumithang
Dratshang
xii. Construction of Dupkhang 1.200
Phumithang Dratshang Phumithang
Dratshang
xiii. Construction of 3 unit class room 1.800 Tali Shedra Tali Shedra
xiv. Construction of principal quarter 1.000 Tali Shedra Tali Shedra
xv. Construction of Drupon Zimchung 1.600 Tama Gonpa Tama Gonpa
xvi. Maintenance of Lami Zimchung 1.00 Rabdhey Dratshang Zhemgang
xvii. Major Maintenance of Tingkharnye Lhakhang 1.50 Shingkhar Shingkhar Gewog
xviii. Maintenance of Shabkore 1.00 Rabdhey Dratshang Zhemgang
xix. Painting of Trong Dungkhor and Trong Lhakhang 1.00 Trong village Zhemgang
xx. Maintenance of crematorium 0.300 Zhemgang Dzongkhag
xxi. Major renovation of Sonamthang Lhakhang. 4.000 Sonamthang/Panbang Drungkhag
xxii. Painting of Zangdhopelri 1.000 Tali Shedra Tali Shedra
xxiii. Maintenance of Shabkhor 0.800 Tali Shedra Tali Shedra
Sub-total 36.567
Activity 2.1: Facilitate cultural and traditional promotional events
i. Training of mask dancers 1.800 Zhemgang Dzongkhag
mask/folk dancers
ii. Training of mask dancers 1.100 Drungkhag Drungkhag
mask/folk dancers
iii. Training of mask dancers 0.750 Phumithang Dratsang Phumithang
Dratsang
iv. Purchasing of Chadi items 0.500 Dzongkhag /
Drungkhag
Dzongkhag /
Drungkhag
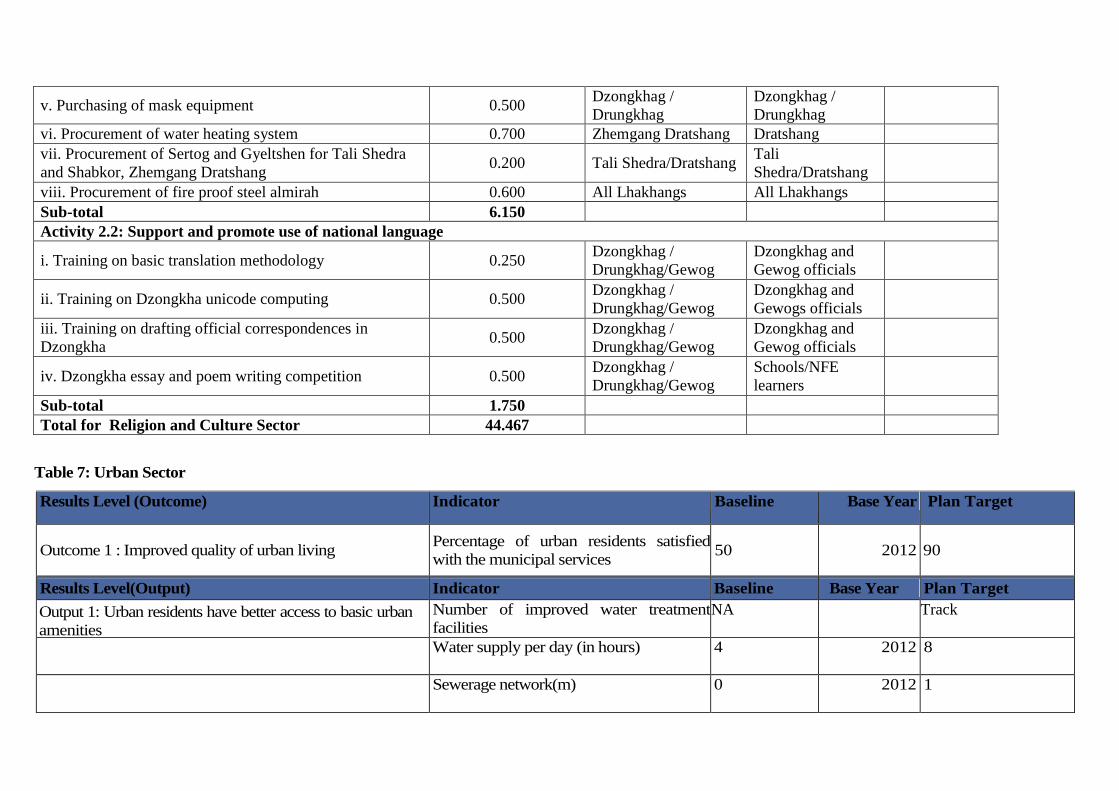
v. Purchasing of mask equipment 0.500 Dzongkhag /
Drungkhag
Dzongkhag /
Drungkhag
vi. Procurement of water heating system 0.700 Zhemgang Dratshang Dratshang
vii. Procurement of Sertog and Gyeltshen for Tali Shedra
and Shabkor, Zhemgang Dratshang 0.200 Tali Shedra/Dratshang
Tali
Shedra/Dratshang
viii. Procurement of fire proof steel almirah 0.600 All Lhakhangs All Lhakhangs
Sub-total 6.150
Activity 2.2: Support and promote use of national language
i. Training on basic translation methodology 0.250 Dzongkhag /
Drungkhag/Gewog
Dzongkhag and
Gewog officials
ii. Training on Dzongkha unicode computing 0.500 Dzongkhag /
Drungkhag/Gewog
Dzongkhag and
Gewogs officials
iii. Training on drafting official correspondences in
Dzongkha 0.500
Dzongkhag /
Drungkhag/Gewog
Dzongkhag and
Gewog officials
iv. Dzongkha essay and poem writing competition 0.500 Dzongkhag /
Drungkhag/Gewog
Schools/NFE
learners
Sub-total 1.750
Total for Religion and Culture Sector 44.467
Table 7: Urban Sector
Results Level (Outcome) Indicator Baseline Base Year Plan Target
Outcome 1 : Improved quality of urban living Percentage of urban residents satisfied
with the municipal services 50 2012 90
Results Level(Output) Indicator Baseline Base Year Plan Target
Output 1: Urban residents have better access to basic urban
amenities
Number of improved water treatment
facilities
NA Track
Water supply per day (in hours) 4 2012 8
Sewerage network(m) 0 2012 1
Number of community pick-up bins
provided.
0 2012
Frequency of waste collection done by
municipality per week.
2 2012 3
Programme Title: Urban Development Programme
Programme activity and sub-activities Plan Outlay (In Million) Location Beneficiary Remarks
Activity 1.1: Development of Dzongkhag Throm Infrastructure
i. Black topping of Wamtakpa road (550m) 3.500 Zhemgang
Town
Public of Zhemgang
Town
ii. Black topping Trong road (750m) 4.500 Zhemgang
Town
Public of Zhemgang
Town
iii. Re-conducting of naked conductor with ABC cable 2.500 Zhemgang
Town
Public of Zhemgsng
Town
iv. Extension of street light within the municipal area 2.000 Zhemgang
Town
Public of Zhemgsng
Town
v. Maintenance of street light 0.500 Zhemgang
Town
Public of Zhemgang
Town
vi. Construction of Multipurpose Hall 15.000 Zhemgang
Town
Public of Zhemgang
Town
vii. Construction of parking space 2.000 Zhemgang
Town
Public of Zhemgang
Town
viii. Maintenance of Municipal office 1.200 Zhemgang
Town Municipal staff
ix. Construction of reservoir for fire hydrant 0.750 Zhemgang
Town
Public of Zhemgang
Town
x. Construction of protective/retaining wall 1.000
Zhemgang
Town
Public of Zhemgang
Town
xi. Construction of wire mesh fencing and covering of
treatment plant 0.500
Zhemgang
Town
Public of Zhemgang
Town
xii. Resurfacing of the road from Dzonglam to ZLSS 2.000
Zhemgang
Town
Public of Zhemgang
Town
xiii. Maintenance of drainage system 4.000
Zhemgang
Town
Public of Zhemgang
Town
xiv. Re-alignment of water distribution system 4.000
Zhemgang
Town
Public of Zhemgang
Town
xv. Maintenance of water supply 1.000
Zhemgang
Town
Public of Zhemgang
Town
xvi. Construction of footpath along the road side 1.500
Zhemgang
Town
Public of Zhemgang
Town
xvii. Survey and demarcation 1.000
Zhemgang
Town
Public of Zhemgang
Town
Sub-total 46.950
Activity 1.2: Development of Yenlag Throm Infrastructure
i. Construction of waste disposal site 1.500 Tingtibi Town Public of Tingtibi
Town
ii. Construction of reservoir for fire hydrant 0.750 Tingtibi Town Public of Tingtibi
Town
iii. Realignment of water supply line 4.000 Tingtibi Town Public of Tingtibi
Town
iv. Maintenance of road network 2.500 Tingtibi Town Public of Tingtibi
Town
v. Construction of retaining walls 1.000 Tingtibi Town Public of Tingtibi
Town
vi. Maintenance of water treatment plant 2.000 Tingtibi Town Public of Tingtibi
Town
vii. Maintenance of street light 1.000 Tingtibi Town Public of Tingtibi
Town
viii. Survey and demarcation/land compensation 1.000 Panbang/
Tunkudenpa
Public of Panbang
Town
ix. Maintenance of water supply at Panbang/Tunkudenpa 1.000 Panbang/
Tunkudenpa
Public of Panbang
Town
x. Construction of waste disposal site 1.000 Panbang/
Tunkudenpa
Public of Panbang
Town
xi. Purchase of computer and furniture 0.750
xii. Purchase of furniture 0.750
Sub-total 15.750
1.3 Capacity Development
i. Training of staff 0.500
Sub-total 0.500
Total for Urban Sector 64.700
6.1: Programme Result Matrix of Bardo Gewog
Table 1: Agriculture Sector
Results Level (Outcome) Indicator Baseline Base Year Plan Target
Outcome 1 : Farmers are better able to market their
surplus agriculture produces
Mean annual household income (in '000
Nu.)
42346 2010 45000
Average land left uncultivated due to
wild life threats (in acres)
125 2010 100
Results Level(Output) Indicator Baseline Base Year Plan Target
Output 1: Farmers in targeted areas have better skills on
diversified agriculture production and improved practices Barley Production (MT) 5 2011 7
Buckwheat Production (MT) 148 2011 195
Millet Production (MT) 57 2011 70
Mustard Production (MT) 26.631 2011 36
Perilla Production (MT) 10.395 2011 13
Soya bean Production (MT) 5.465 2011 8
Paddy Production (MT) 1280 2011 1562
Maize Production (MT) 739 2011 1012
Wheat Production (MT) 191 2011 235
Oranges Production (MT) 62.301 2011 105
Walnut Production (MT) 0.790 2011 1
Chilli Production (MT) 40.046 2011 70
Cabbage Production (MT) 17.068 2011 61
Cauliflower Production (MT) 13.217 2011 93
Carrot Production (MT) 1.535 2011 8
Cardamom Production (MT) 0.050 2011 0.675
Garlic Production (MT) 3.435 2011 6
Ginger Production (MT) 4.336 2011 6
Onion Production (MT) 4.495 2011 11
Output 2: Farmers in targeted areas have adequate and
functional agriculture infrastructure/facilities developed for
production and specific needs
Length of irrigation channel constructed
(km) 30.97 2012 1
Length of farm road constructed (km) 0 2012 8.5
Number of Road User Group formed 0 2012 1
Number of Water User Association formed 0 2012 1
Programme Title: Agriculture Development Programme
Programme activity and sub-activities Plan Outlay( in
Million) Location Beneficiary Remarks
Activity 1: Capacity development on improved agriculture systems and diversified productions
1. Supply of inputs (cereal) 0.200 All Chiwogs 310 households
2. Cash crop production 0.250 All Chiwogs 310 households
3.Vegetable production 0.150 All Chiwogs 310 households
Sub-total 0.600
Activity 2: Development of rural agriculture infrastructure in targeted areas
i. Construction of GC road from Therang-Bardo (16 Kms) 48.000 Bardo 78 households Taken over by DoR
ii. Construction of farm road from Khomshar-Dunglabi-
Phulabi (7.5 km) 22.500 Phulabi 22 households
iii. Construction of farm road from Khomshar-Gonpa
(1km) 3.704 16 households
iv. Extension of irrigation channel (1km) 1.500 Khomshar 121 households
v. Renovation of irrigation channel (2km) 1.000 Khomshar 200 households
vi. Renovation of irrigation channel (1km) 0.500 Bardo
vii. Renovation of irrigation channel (1km) 0.500 Phulabi
Sub-total 77.704
Total for Agriculture Sector 78.304
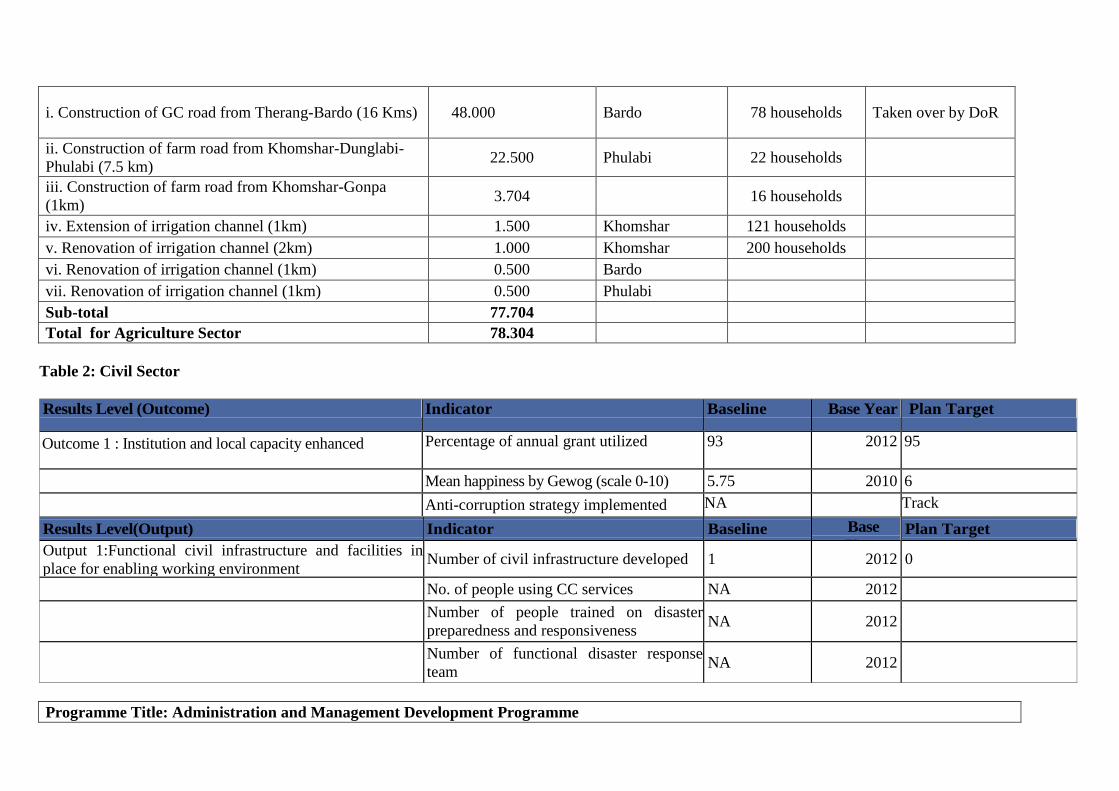
Table 2: Civil Sector
Results Level (Outcome) Indicator Baseline Base Year Plan Target
Outcome 1 : Institution and local capacity enhanced Percentage of annual grant utilized 93 2012 95
Mean happiness by Gewog (scale 0-10) 5.75 2010 6
Anti-corruption strategy implemented NA Track
Results Level(Output) Indicator Baseline Base
Year Plan Target
Output 1:Functional civil infrastructure and facilities in
place for enabling working environment Number of civil infrastructure developed 1 2012 0
No. of people using CC services NA 2012
Number of people trained on disaster
preparedness and responsiveness NA 2012
Number of functional disaster response
team NA 2012
Programme Title: Administration and Management Development Programme
Programme activity and sub-activities Plan Outlay (in Million) Location Beneficiary Remarks
Activity 1: Create enabling working environment for local functionaries and communities
i. Construction of kitchen and store 0.700 Gewog Centre All Chiwogs
ii. Maintenance of the Gewog office 0.500 Gewog Centre All Chiwogs
iii. Maintenance of office equipment 0.100 Gewog Centre Gewog officials
iv. Rehabilitation of water supply 0.100 Gewog Centre Gewog officials
Total for Civil and Ddministration Sector 1.400
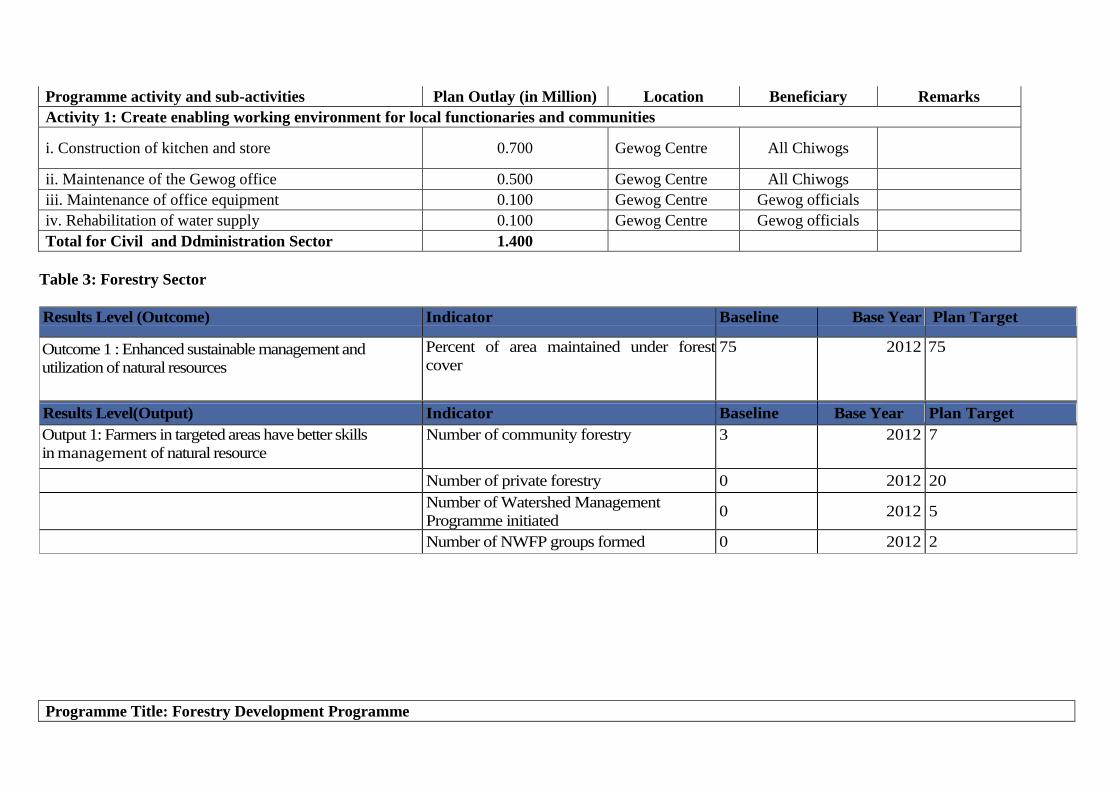
Table 3: Forestry Sector
Results Level (Outcome) Indicator Baseline Base Year Plan Target
Outcome 1 : Enhanced sustainable management and
utilization of natural resources
Percent of area maintained under forest
cover
75 2012 75
Results Level(Output) Indicator Baseline Base Year Plan Target
Output 1: Farmers in targeted areas have better skills
in management of natural resource
Number of community forestry 3 2012 7
Number of private forestry 0 2012 20
Number of Watershed Management
Programme initiated 0 2012 5
Number of NWFP groups formed 0 2012 2
Programme Title: Forestry Development Programme
Programme activity and sub-activities Plan Outlay (in Million) Location Beneficiary Remarks
Activity 1: Farmers skill development on conservation and management of natural resources
i. Establishment of community forest 1.000
Jowoling, Sameth,
Langdurbi and
Khomshar
200 households 4 CFMGs will be formed
ii. Water resource protection and management 0.300 All Chiwogs 310 households 5 water sources will be
protected and managed
Total for Forestry Sector 1.300
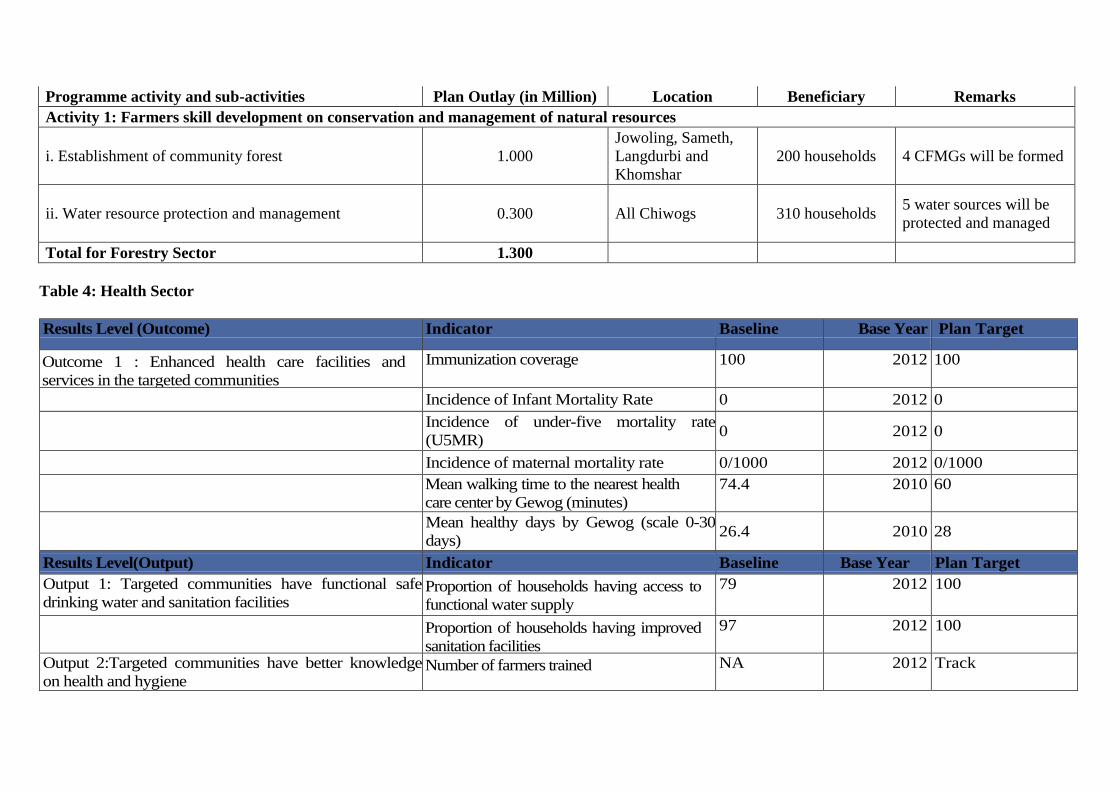
Table 4: Health Sector
Results Level (Outcome) Indicator Baseline Base Year Plan Target
Outcome 1 : Enhanced health care facilities and
services in the targeted communities
Immunization coverage 100 2012 100
Incidence of Infant Mortality Rate 0 2012 0
Incidence of under-five mortality rate
(U5MR) 0 2012 0
Incidence of maternal mortality rate 0/1000 2012 0/1000
Mean walking time to the nearest health
care center by Gewog (minutes)
74.4 2010 60
Mean healthy days by Gewog (scale 0-30
days) 26.4 2010 28
Results Level(Output) Indicator Baseline Base Year Plan Target
Output 1: Targeted communities have functional safe
drinking water and sanitation facilities Proportion of households having access to
functional water supply
79 2012 100
Proportion of households having improved
sanitation facilities
97 2012 100
Output 2:Targeted communities have better knowledge
on health and hygiene Number of farmers trained NA 2012 Track
Number of trainings/awareness programme
initiated
NA 2012 Track
Number of health care providers trained NA 2012 Track
Programme Title: Health Development Programme
Programme activity and sub-activities Plan Outlay (in Million) Location Beneficiary Remarks
Activity 1: Development of safe drinking water and sanitation facilities
i. Construction of toilet 0.400 20 households
ii. Construction of water supply and toilet 0.150 Bardo ORC
iii. Extension of water source 1.080
Khomshar, Digala
and Langdurbi 310 households 3 schemes
iv. Maintenance of water source
1.080
Bardo, Khomshar,
Langdurbi and
Digala
4 schemes
v. Maintenance of ORC 0.250 Digala 38 households
vi. Maintenance of ORC 0.150 Bardo
Total for Health Sector 3.110
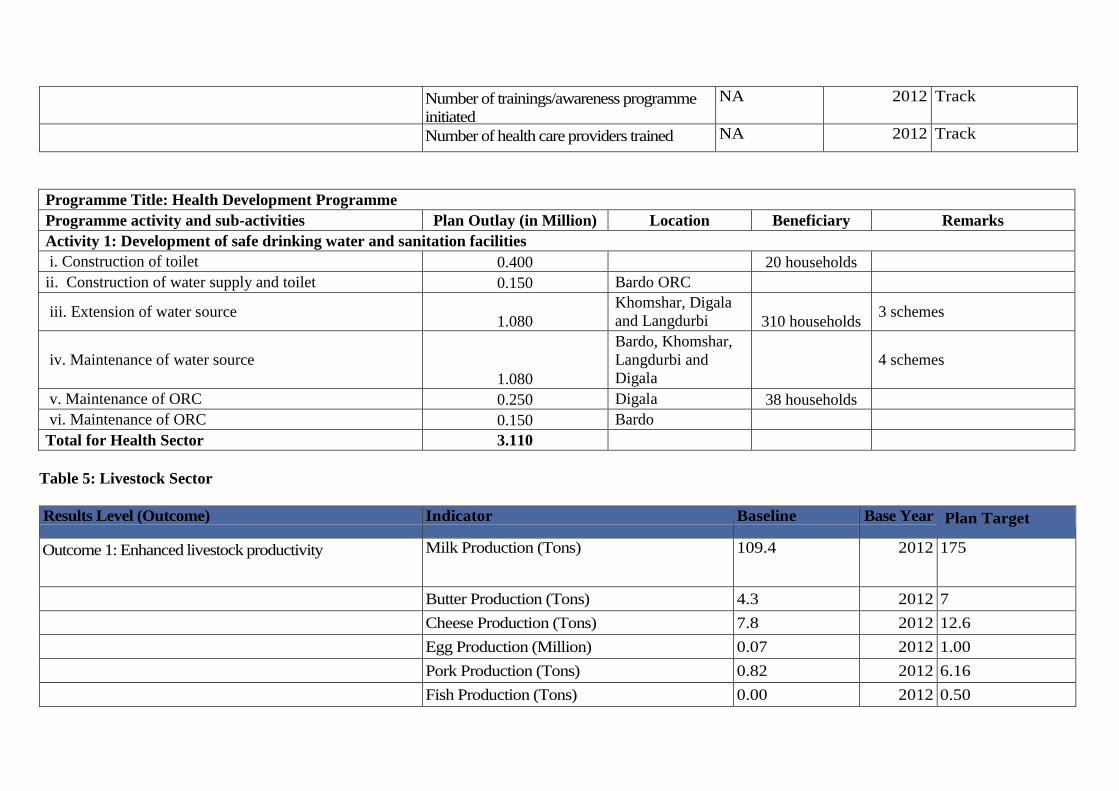
Table 5: Livestock Sector
Results Level (Outcome) Indicator Baseline Base Year Plan Target
Outcome 1: Enhanced livestock productivity Milk Production (Tons) 109.4 2012 175
Butter Production (Tons) 4.3 2012 7
Cheese Production (Tons) 7.8 2012 12.6
Egg Production (Million) 0.07 2012 1.00
Pork Production (Tons) 0.82 2012 6.16
Fish Production (Tons) 0.00 2012 0.50
Quantity of livestock products sold by type NA Track
Programme Title: Livestock Development Programme
Programme activity and sub-activities Plan Outlay Location Beneficiary Remarks
Activity 2: Development of infrastructure and facilities for specific needs of the production
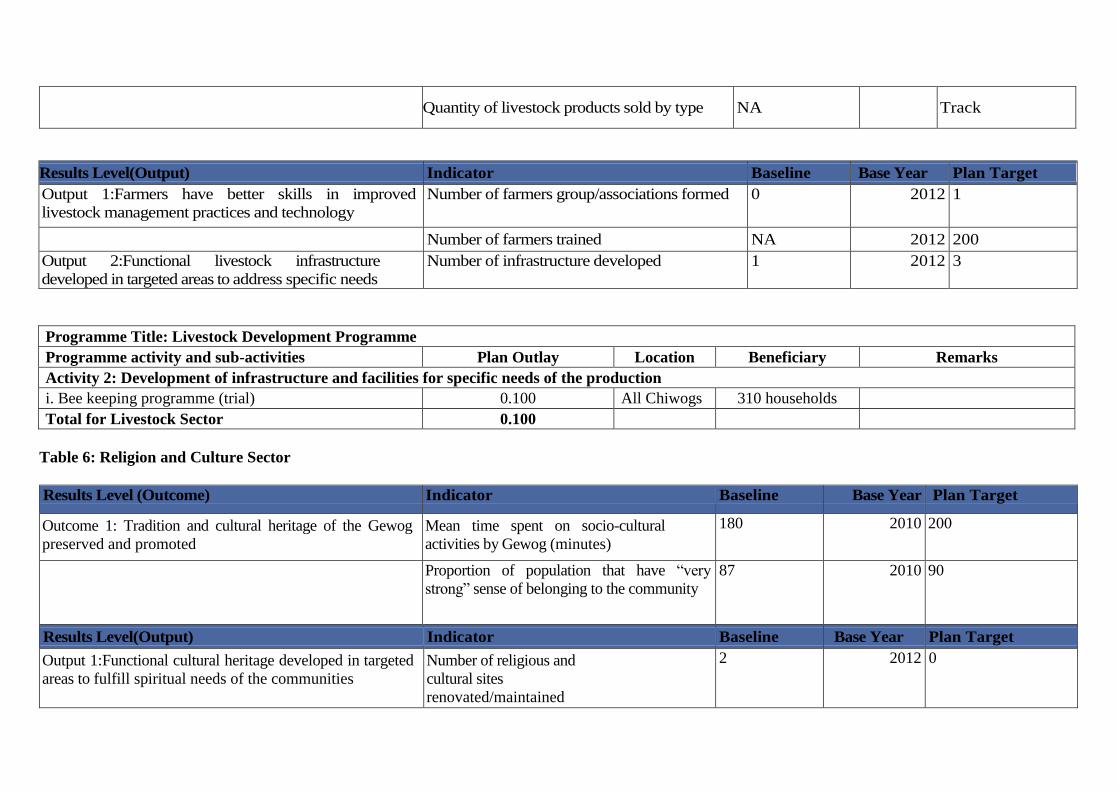
i. Bee keeping programme (trial) 0.100 All Chiwogs 310 households
Total for Livestock Sector 0.100
Table 6: Religion and Culture Sector
Results Level (Outcome) Indicator Baseline Base Year Plan Target
Outcome 1: Tradition and cultural heritage of the Gewog
preserved and promoted
Mean time spent on socio-cultural
activities by Gewog (minutes)
180 2010 200
Proportion of population that have “very
strong” sense of belonging to the community
87 2010 90
Results Level(Output) Indicator Baseline Base Year Plan Target
Output 1:Functional cultural heritage developed in targeted
areas to fulfill spiritual needs of the communities
Number of religious and
cultural sites
renovated/maintained
2 2012 0
Results Level(Output) Indicator Baseline Base Year Plan Target
Output 1:Farmers have better skills in improved
livestock management practices and technology
Number of farmers group/associations formed 0 2012 1
Number of farmers trained NA 2012 200
Output 2:Functional livestock infrastructure
developed in targeted areas to address specific needs
Number of infrastructure developed 1 2012 3
Number of religious and cultural
infrastructure developed
NA 2012 5
Programme Title: Religion and Culture Development Programme
Programme activity and sub-activities Plan Outlay (in Million) Location Beneficiary Remarks
Activity 1: Develop and safeguard cultural/historical places
i. Construction of statue, kitchen and retaining wall for
Digala and Langdurbi lhakhangs 1.000
Langdurbi
and Digala 90 households
ii. Construction of kitchen and relocation of Mani
Dungkhor for Rawathang Lhakhang 0.200 Bardo 78 households
iii. Installation of Sertog for Phulabi Lhakhang 0.060 Phulabi 17 households
iv. Construction of statue, kitchen, ground extension and
installation of Sertog for Umling Lhakhang 0.500 Khomshar 117 households
v. Construction of Statue and hostel, including painting
and installation of Sertog for Goendey Lhakhang 1.000 Khomshar 117 households
Total 2.760
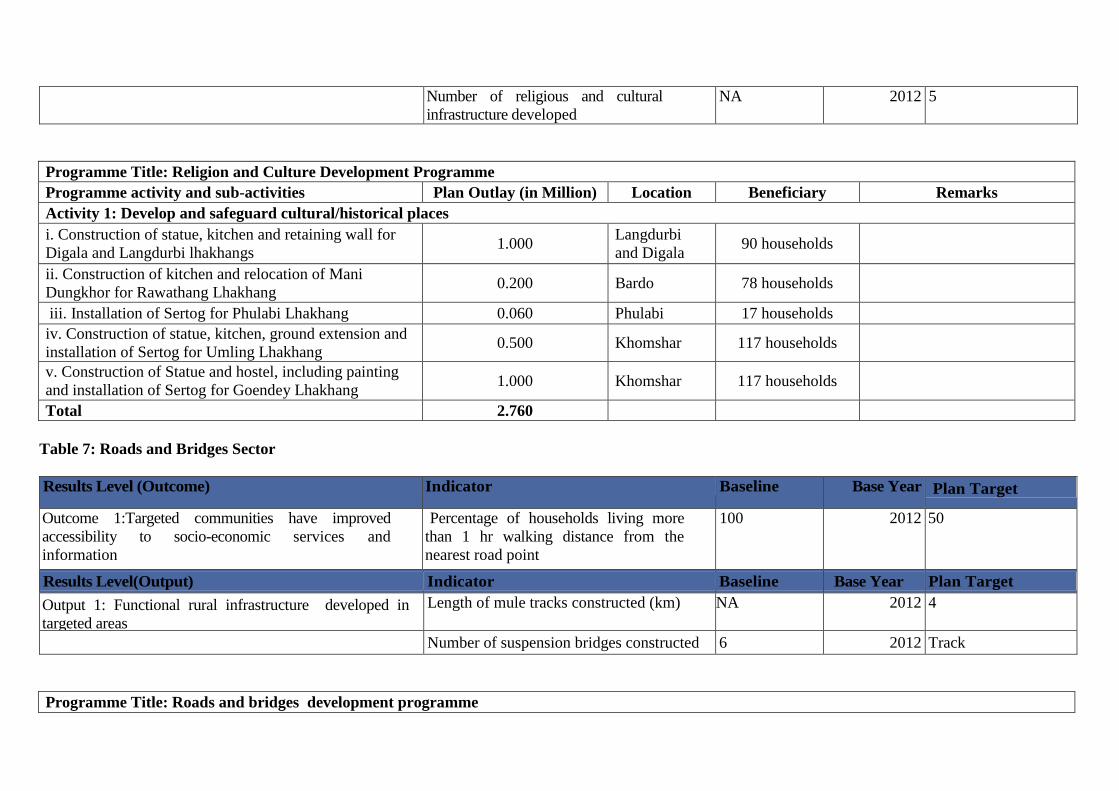
Table 7: Roads and Bridges Sector
Results Level (Outcome) Indicator Baseline Base Year Plan Target
Outcome 1:Targeted communities have improved
accessibility to socio-economic services and
information
Percentage of households living more
than 1 hr walking distance from the
nearest road point
100 2012 50
Results Level(Output) Indicator Baseline Base Year Plan Target
Output 1: Functional rural infrastructure developed in
targeted areas
Length of mule tracks constructed (km) NA 2012 4
Number of suspension bridges constructed 6 2012 Track
Programme Title: Roads and bridges development programme
Programme activity and sub-activities Plan Outlay (in Million) Location Beneficiary Remarks
Activity 1: Development of rural accessibility infrastructure such as mule tracks
1. Maintenance of mule track 0.100 All Chiwogs 310 households
Total 0.100
6.2: Programme Result Matrix of Bjoka Gewog
Table 1: Agriculture Sector
Results Level (Outcome) Indicator Baseline Base Year Plan Target
Outcome 1 : Farmers are better able to market their
surplus agriculture produces
Mean annual household income (in '000
Nu.)
27944 2010 30000
Average land left uncultivated due to
wild life threats (in Acres)
100 2010 50
Results Level(Output) Indicator Baseline Base Year Plan Target
Output 1: Farmers in targeted areas have better skills on
diversified agriculture production and improved practices Buckwheat Production (MT) 15 2011 19
Soya bean Production (MT) 1.80 2011 3
Paddy Production (MT) 5 2011
6
Maize Production (MT) 722 2011 989
Wheat Production (MT) 27 2011 33
Millet Production (MT) 27 2011 33
Mustard Production(MT) 30.375 2011 41
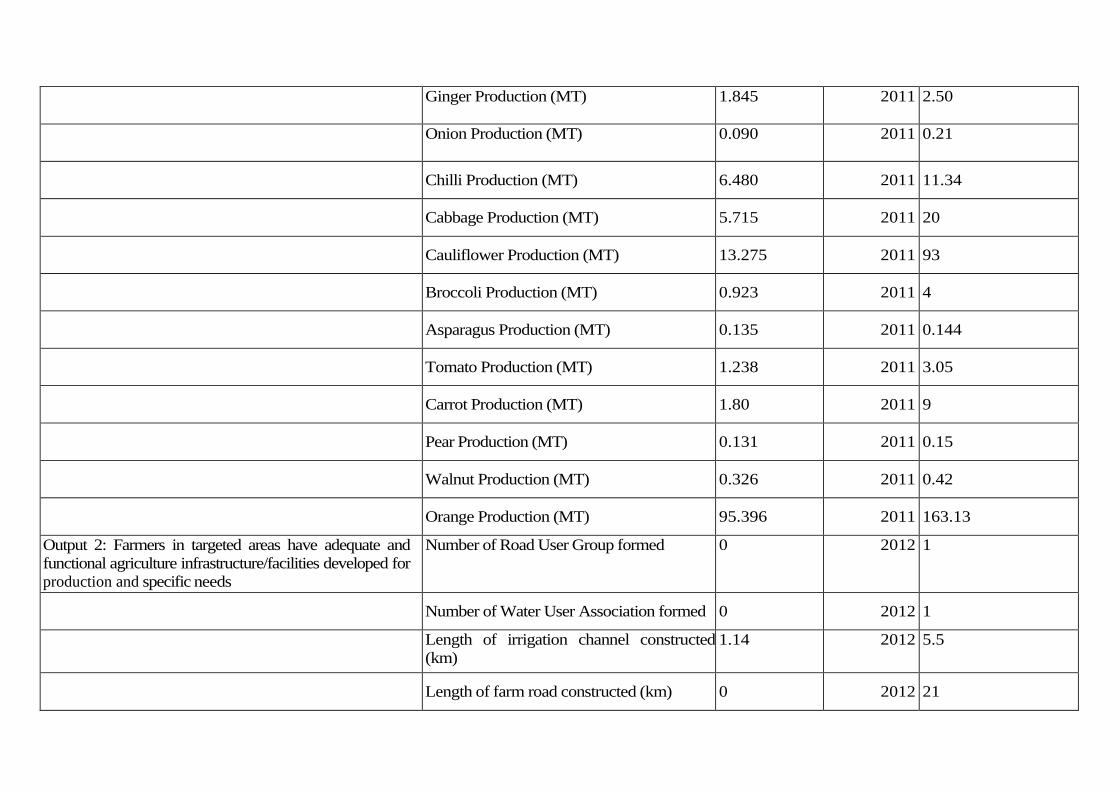
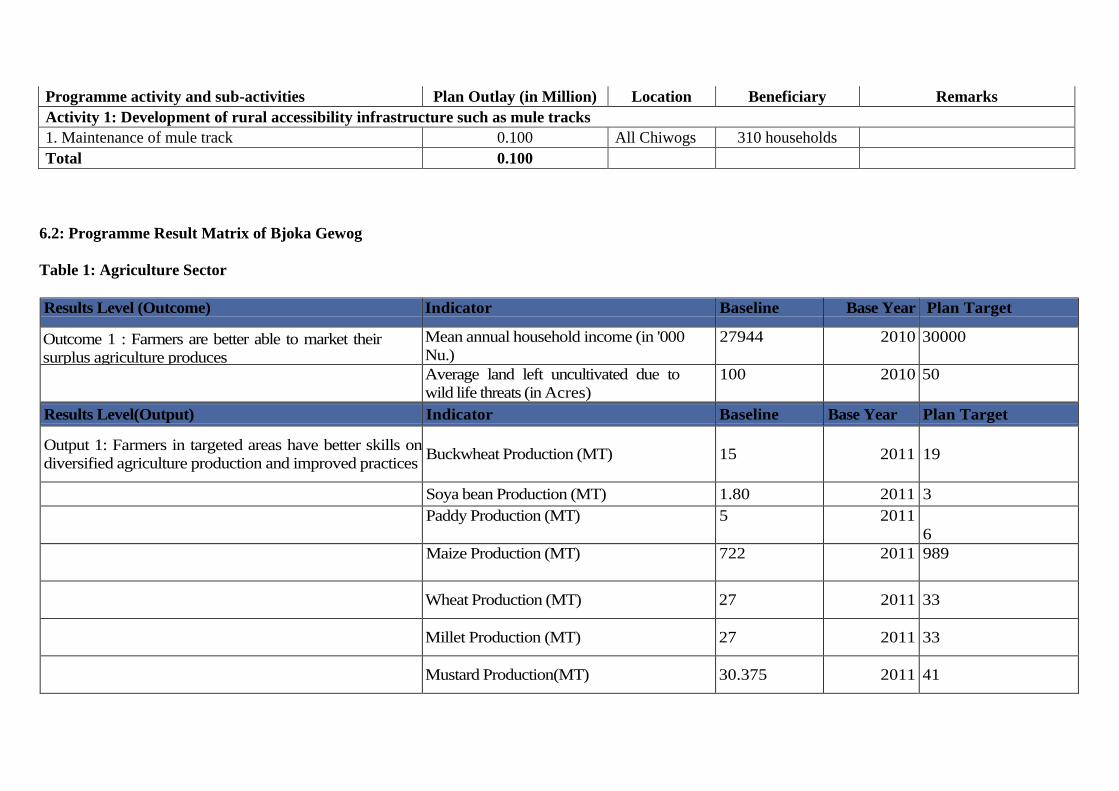
Ginger Production (MT) 1.845 2011 2.50
Onion Production (MT) 0.090 2011 0.21
Chilli Production (MT) 6.480 2011 11.34
Cabbage Production (MT) 5.715 2011 20
Cauliflower Production (MT) 13.275 2011 93
Broccoli Production (MT) 0.923 2011 4
Asparagus Production (MT) 0.135 2011 0.144
Tomato Production (MT) 1.238 2011 3.05
Carrot Production (MT) 1.80 2011 9
Pear Production (MT) 0.131 2011 0.15
Walnut Production (MT) 0.326 2011 0.42
Orange Production (MT) 95.396 2011 163.13
Output 2: Farmers in targeted areas have adequate and
functional agriculture infrastructure/facilities developed for
production and specific needs
Number of Road User Group formed 0 2012 1
Number of Water User Association formed 0 2012 1
Length of irrigation channel constructed
(km)
1.14 2012 5.5
Length of farm road constructed (km) 0 2012 21
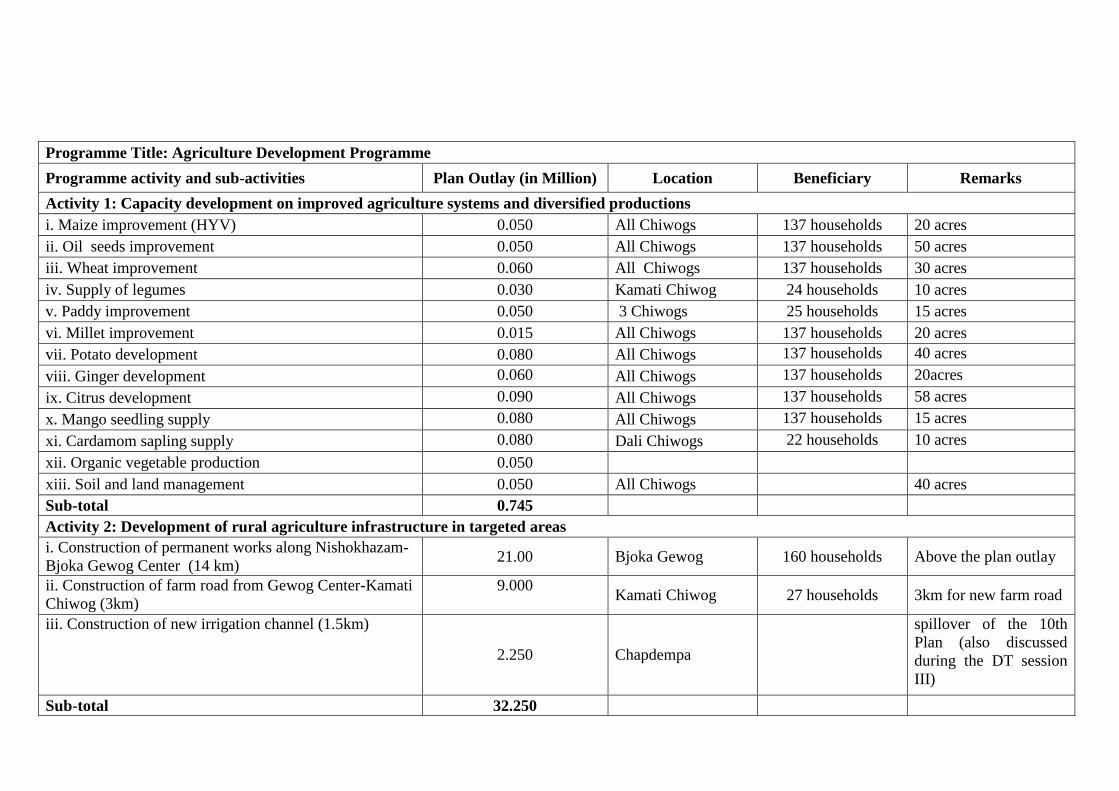
Programme Title: Agriculture Development Programme
Programme activity and sub-activities Plan Outlay (in Million) Location Beneficiary Remarks
Activity 1: Capacity development on improved agriculture systems and diversified productions
i. Maize improvement (HYV) 0.050 All Chiwogs 137 households 20 acres
ii. Oil seeds improvement 0.050 All Chiwogs 137 households 50 acres
iii. Wheat improvement 0.060 All Chiwogs 137 households 30 acres
iv. Supply of legumes 0.030 Kamati Chiwog 24 households 10 acres
v. Paddy improvement 0.050 3 Chiwogs 25 households 15 acres
vi. Millet improvement 0.015 All Chiwogs 137 households 20 acres
vii. Potato development 0.080 All Chiwogs 137 households 40 acres
viii. Ginger development 0.060 All Chiwogs 137 households 20acres
ix. Citrus development 0.090 All Chiwogs 137 households 58 acres
x. Mango seedling supply 0.080 All Chiwogs 137 households 15 acres
xi. Cardamom sapling supply 0.080 Dali Chiwogs 22 households 10 acres
xii. Organic vegetable production 0.050
xiii. Soil and land management 0.050 All Chiwogs 40 acres
Sub-total 0.745
Activity 2: Development of rural agriculture infrastructure in targeted areas
i. Construction of permanent works along Nishokhazam-
Bjoka Gewog Center (14 km) 21.00 Bjoka Gewog 160 households Above the plan outlay
ii. Construction of farm road from Gewog Center-Kamati
Chiwog (3km)
9.000 Kamati Chiwog 27 households 3km for new farm road
iii. Construction of new irrigation channel (1.5km)
2.250 Chapdempa
spillover of the 10th
Plan (also discussed
during the DT session
III)
Sub-total 32.250
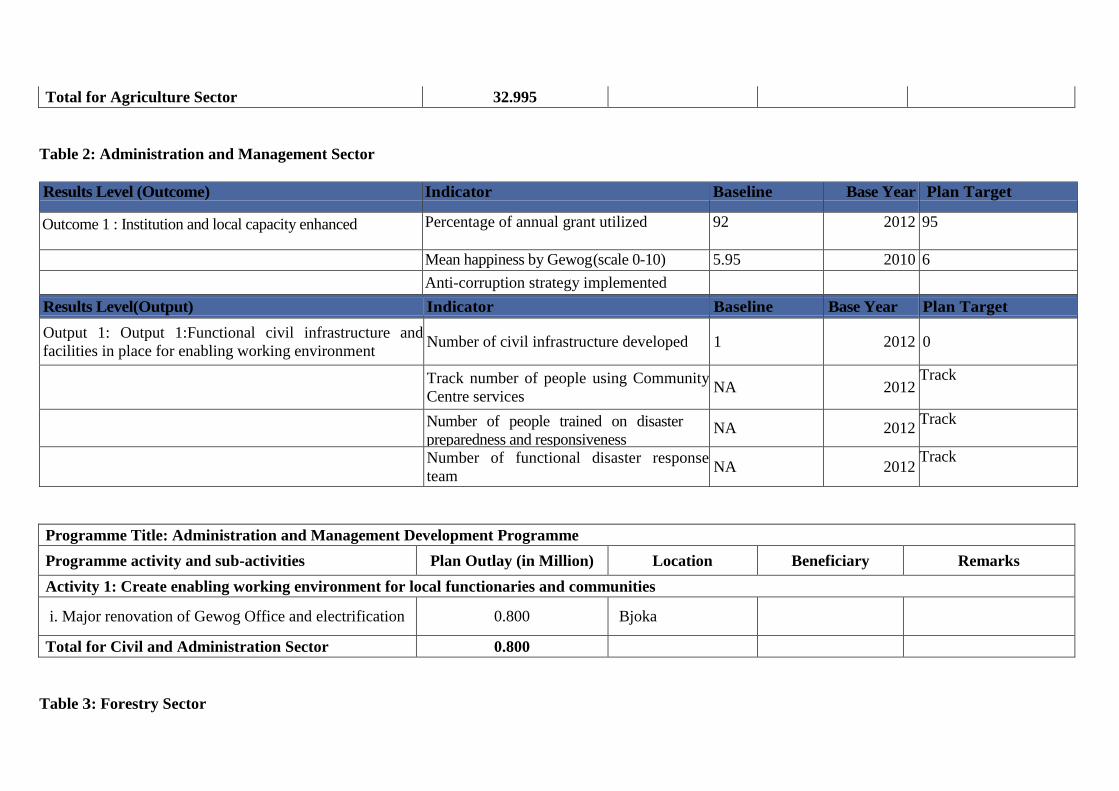
Total for Agriculture Sector 32.995
Table 2: Administration and Management Sector
Results Level (Outcome) Indicator Baseline Base Year Plan Target
Outcome 1 : Institution and local capacity enhanced Percentage of annual grant utilized 92 2012 95
Mean happiness by Gewog (scale 0-10) 5.95 2010 6
Anti-corruption strategy implemented
Results Level(Output) Indicator Baseline Base Year Plan Target
Output 1: Output 1:Functional civil infrastructure and
facilities in place for enabling working environment Number of civil infrastructure developed 1 2012 0
Track number of people using Community
Centre services NA 2012
Track
Number of people trained on disaster
preparedness and responsiveness NA 2012
Track
Number of functional disaster response
team NA 2012
Track
Programme Title: Administration and Management Development Programme
Programme activity and sub-activities Plan Outlay (in Million) Location Beneficiary Remarks
Activity 1: Create enabling working environment for local functionaries and communities
i. Major renovation of Gewog Office and electrification 0.800 Bjoka
Total for Civil and Administration Sector 0.800
Table 3: Forestry Sector
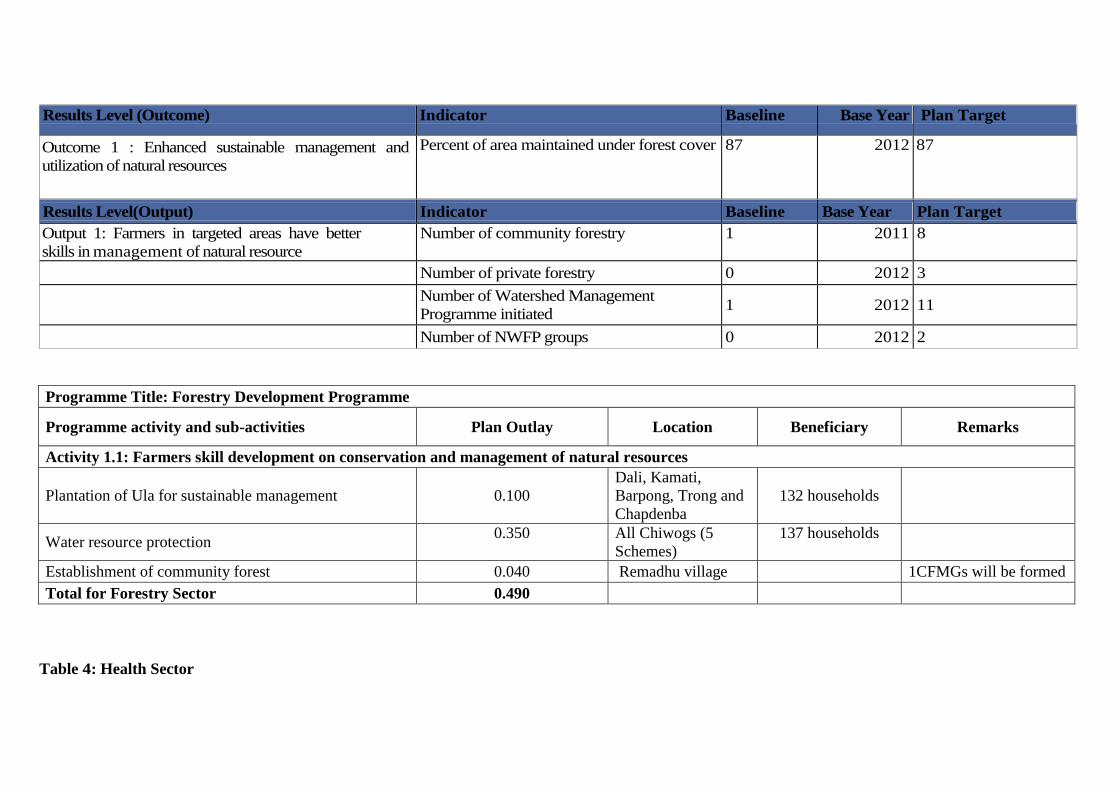
Results Level (Outcome) Indicator Baseline Base Year Plan Target
Outcome 1 : Enhanced sustainable management and
utilization of natural resources
Percent of area maintained under forest cover 87 2012 87
Results Level(Output) Indicator Baseline Base Year Plan Target
Output 1: Farmers in targeted areas have better
skills in management of natural resource
Number of community forestry 1 2011 8
Number of private forestry 0 2012 3
Number of Watershed Management
Programme initiated 1 2012 11
Number of NWFP groups 0 2012 2
Programme Title: Forestry Development Programme
Programme activity and sub-activities Plan Outlay Location Beneficiary Remarks
Activity 1.1: Farmers skill development on conservation and management of natural resources
Plantation of Ula for sustainable management 0.100
Dali, Kamati,
Barpong, Trong and
Chapdenba
132 households
Water resource protection 0.350 All Chiwogs (5
Schemes)
137 households
Establishment of community forest 0.040 Remadhu village 1CFMGs will be formed
Total for Forestry Sector 0.490
Table 4: Health Sector
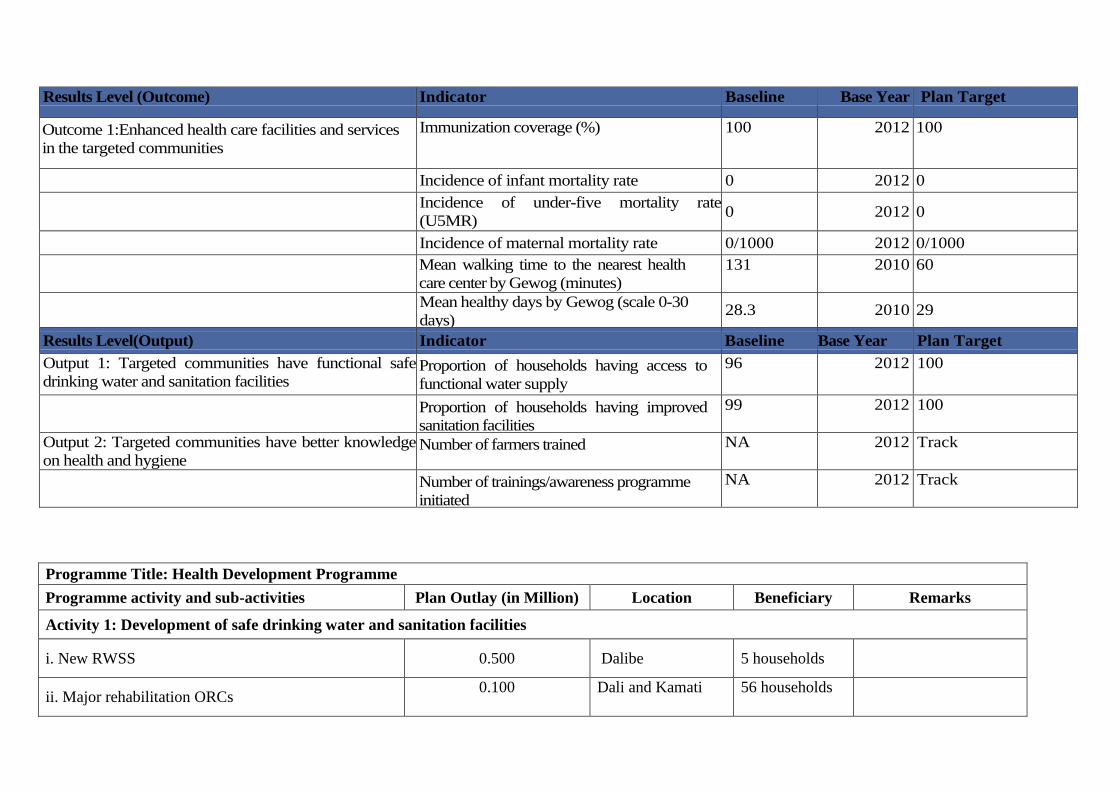
Results Level (Outcome) Indicator Baseline Base Year Plan Target
Outcome 1:Enhanced health care facilities and services
in the targeted communities
Immunization coverage (%) 100 2012 100
Incidence of infant mortality rate 0 2012 0
Incidence of under-five mortality rate
(U5MR) 0 2012 0
Incidence of maternal mortality rate 0/1000 2012 0/1000
Mean walking time to the nearest health
care center by Gewog (minutes)
131 2010 60
Mean healthy days by Gewog (scale 0-30
days) 28.3 2010 29
Results Level(Output) Indicator Baseline Base Year Plan Target
Output 1: Targeted communities have functional safe
drinking water and sanitation facilities Proportion of households having access to
functional water supply
96 2012 100
Proportion of households having improved
sanitation facilities
99 2012 100
Output 2: Targeted communities have better knowledge
on health and hygiene Number of farmers trained NA 2012 Track
Number of trainings/awareness programme
initiated
NA 2012 Track
Programme Title: Health Development Programme
Programme activity and sub-activities Plan Outlay (in Million) Location Beneficiary Remarks
Activity 1: Development of safe drinking water and sanitation facilities
i. New RWSS 0.500 Dalibe 5 households
ii. Major rehabilitation ORCs 0.100 Dali and Kamati 56 households
iii. Rehabilitation of RWSS 0.300 All Chiwogs 137 households
iv. Extension of water source 0.200 Warmphu village 5 households
Total for Health Sector 1.100
Table 5: Livestock Sector
Results Level (Outcome) Indicator Baseline Base Year Plan Target
Outcome 1 : Enhanced livestock productivity Milk Production (Tons) 24.1 2012 50
Butter Production (Tons) 1.0 2012 2.0
Cheese Production (Tons) 1.7 2012 3.6
Egg Production (Million) 0.01 2012 0.10
Pork Production (Tons) 1.6 2012 2.0
Quantity of livestock products sold by type
Results Level(Output) Indicator Baseline Base Year Plan Target
Output 1: Farmers have better skills in improved
livestock management practices and technology
Number of farmers group/associations 0 2012 1
Number of farmers trained NA 2012 150
Output 2: Functional livestock infrastructure
developed in targeted areas to address specific needs
Number of infrastructure developed 1 2012 0
Programme Title: Livestock Development Programme
Activity and Sub-activities Plan Outlay (in Million) Location Beneficiary Remarks
Activity 1: Capacity development on improved livestock management practices and technology
i. Supply of jersey cow 0.150 Kamati Chiwog 5 nos
ii. Supply of jersey bull 0.046 Dali and Kamati 2 nos
iii. Pasture development and feed supply 0.150 All Chiwogs
Sub-total 0.346
Activity 2: Development of infrastructure and facilities for specific needs of the production
i. Establishment of poultry farm 0.100 3 villages
ii. Establishment of piggery farm 0.025 Chapdenba Chiwog
Sub-total 0.125
Total for Livestock Sector 0.471
Table 6: Religion and Culture Sector
Results Level (Outcome) Indicator Baseline Base Year Plan Target
Outcome 1 : Tradition and cultural heritage of the Gewog
preserved and promoted
Mean time spent on socio-cultural activities
by Gewog (minutes)
190 2010 200
Proportion of population that have “very strong”
sense of belonging to the community
78 2010 80
Results Level(Output) Indicator Baseline Base Year Plan Target
Output 1: Functional cultural heritage developed in
targeted areas to fulfill spiritual needs of the
communities
Number of religious and cultural
sites renovated/maintained
NA 2012 6
Number of religious and cultural
infrastructure developed
NA 2012 0
Programme Title: Religion and Culture Development Programme
Programme activity and sub-activities Plan Outlay (in Million) Location Beneficiary Remarks
Activity 1: Develop and safeguard cultural/historical places
i. Debri painting 0.700 Remadhu, Dali and
Kamati Lhakhangs
ii. Renovation of kitchen 0.150 Trong Lhakhang 137 households
iii. Major renovation of Lhakhangs 0.700
Pramaling and
Remadhu
Lhakhangs
12 households
Total for Religion and Culture Sector 1.550
Table 7: Roads and Bridges Sector
Results Level (Outcome) Indicator Baseline Base Year Plan Target
Outcome 1 : Targeted communities have improved
accessibility within and outside Gewog
Percentage of households living more than 1 hr
walking distance from the nearest road point
90 2012 50
Results Level(Output) Indicator Baseline Base Year Plan Target
Output 1: Functional rural infrastructure developed in
targeted areas
Number of suspension bridges constructed 0 2012 1
Length of mule tracks developed (Kms) 2012 16
Programme Title: Roads and Bridges Development Programme
Programme activity and sub-activities Plan Outlay (in Million) Location Beneficiary Remarks
Activity 1: Development of rural accessibility infrastructure such as mule tracks, suspension bridges etc.
i. Construction of suspension bridge at Dangmechu 6.064 Khakari Patong 41 households
The bridge will benefit people
of Barpong and Chapdenba
Chiwogs.
ii. Construction of mule tract from Barpong -Khakari
Patong (12 km) 0.300 Barpong Chiwogs 41 households
iii. Construction of mule track from Langpa Chorten -
Aurongduet (4km) 0.100
Chapdenba
Chiwogs 16 households
iv. Maintenance of mule track from Dali - Rengkola (2
km) 0.020
Total for Roads and Bridges Sector 6.484
6.3: Programme Result Matrix of Goshing Gewog
Table 1: Agriculture Sector
Results Level (Outcome) Indicator Baseline Base Year Plan Target
Outcome 1 : Farmers are better able to market their
surplus agriculture produces
Mean annual household income (in '000 Nu.) 52021 2010 55000
Average land left uncultivated due to wild
life threats (in Acres)
0 2010 0
Results Level(Output) Indicator Baseline Base Year Plan Target
Output 1: Farmers in targeted areas have better skills
on diversified agriculture production and improved
practices
Buckwheat Production (MT) 16 2011 21
Perilla Production (MT) 0.654 2011 1
Paddy Production (MT) 158 2011 193
Maize Production (MT) 888 2011 1217
Millet Production (MT) 72 2011 88
Soya bean Production (MT) 2.660 2011 4
Oranges Production (MT) 994.500 2011 1701
Areca nut Production (MT) 1.102 2011 1.24
Chilli Production (MT) 17.784 2011 31
Cabbage Production (MT) 6.840 2011 24
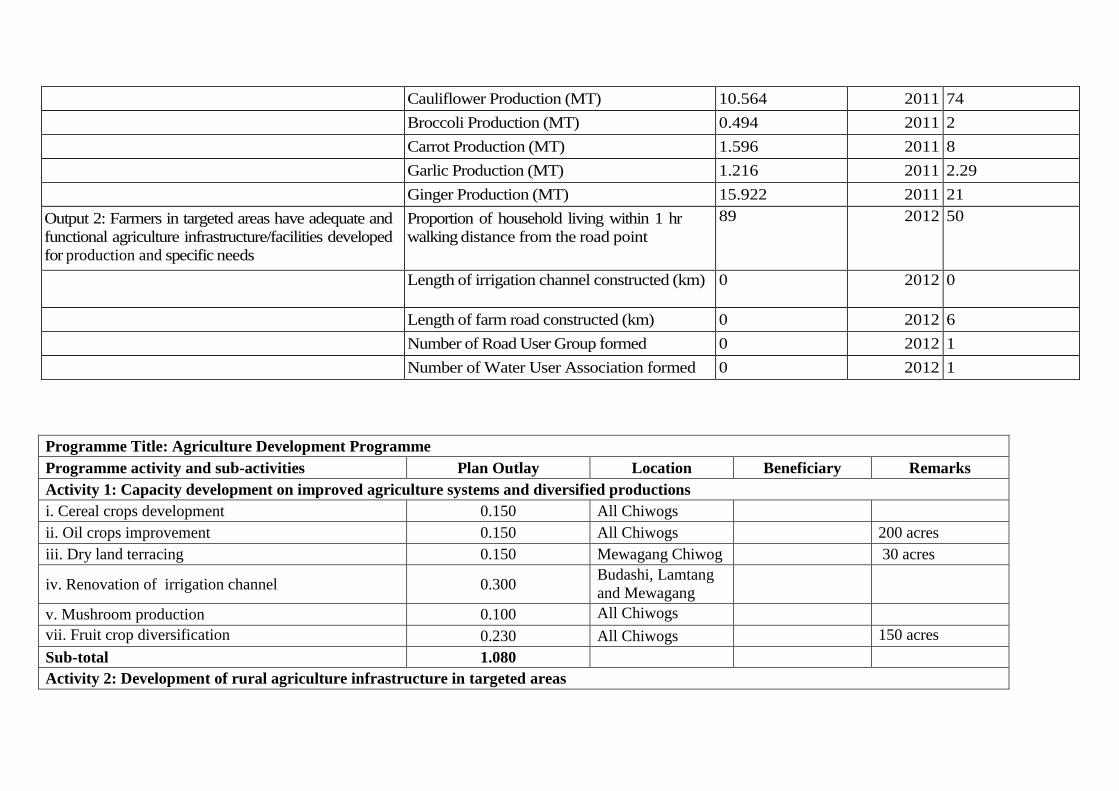
Cauliflower Production (MT) 10.564 2011 74
Broccoli Production (MT) 0.494 2011 2
Carrot Production (MT) 1.596 2011 8
Garlic Production (MT) 1.216 2011 2.29
Ginger Production (MT) 15.922 2011 21
Output 2: Farmers in targeted areas have adequate and
functional agriculture infrastructure/facilities developed
for production and specific needs
Proportion of household living within 1 hr
walking distance from the road point
89 2012 50
Length of irrigation channel constructed (km) 0 2012 0
Length of farm road constructed (km) 0 2012 6
Number of Road User Group formed 0 2012 1
Number of Water User Association formed 0 2012 1
Programme Title: Agriculture Development Programme
Programme activity and sub-activities Plan Outlay Location Beneficiary Remarks
Activity 1: Capacity development on improved agriculture systems and diversified productions
i. Cereal crops development 0.150 All Chiwogs
ii. Oil crops improvement 0.150 All Chiwogs 200 acres
iii. Dry land terracing 0.150 Mewagang Chiwog 30 acres
iv. Renovation of irrigation channel 0.300 Budashi, Lamtang
and Mewagang
v. Mushroom production 0.100 All Chiwogs
vii. Fruit crop diversification 0.230 All Chiwogs 150 acres
Sub-total 1.080
Activity 2: Development of rural agriculture infrastructure in targeted areas
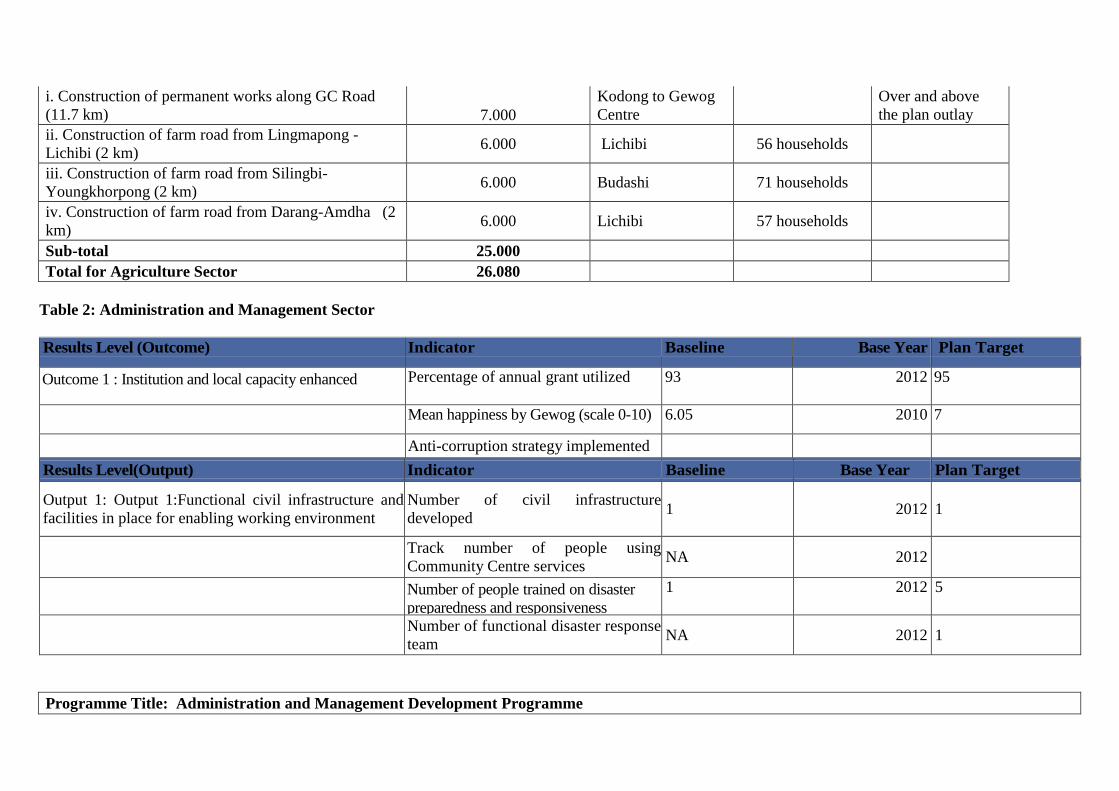
i. Construction of permanent works along GC Road
(11.7 km) 7.000
Kodong to Gewog
Centre
Over and above
the plan outlay
ii. Construction of farm road from Lingmapong -
Lichibi (2 km) 6.000 Lichibi 56 households
iii. Construction of farm road from Silingbi-
Youngkhorpong (2 km) 6.000 Budashi 71 households
iv. Construction of farm road from Darang-Amdha (2
km) 6.000 Lichibi 57 households
Sub-total 25.000
Total for Agriculture Sector 26.080
Table 2: Administration and Management Sector
Results Level (Outcome) Indicator Baseline Base Year Plan Target
Outcome 1 : Institution and local capacity enhanced Percentage of annual grant utilized 93 2012 95
Mean happiness by Gewog (scale 0-10) 6.05 2010 7
Anti-corruption strategy implemented
Results Level(Output) Indicator Baseline Base Year Plan Target
Output 1: Output 1:Functional civil infrastructure and
facilities in place for enabling working environment
Number of civil infrastructure
developed 1 2012 1
Track number of people using
Community Centre services NA 2012
Number of people trained on disaster
preparedness and responsiveness
1 2012 5
Number of functional disaster response
team NA 2012 1
Programme Title: Administration and Management Development Programme
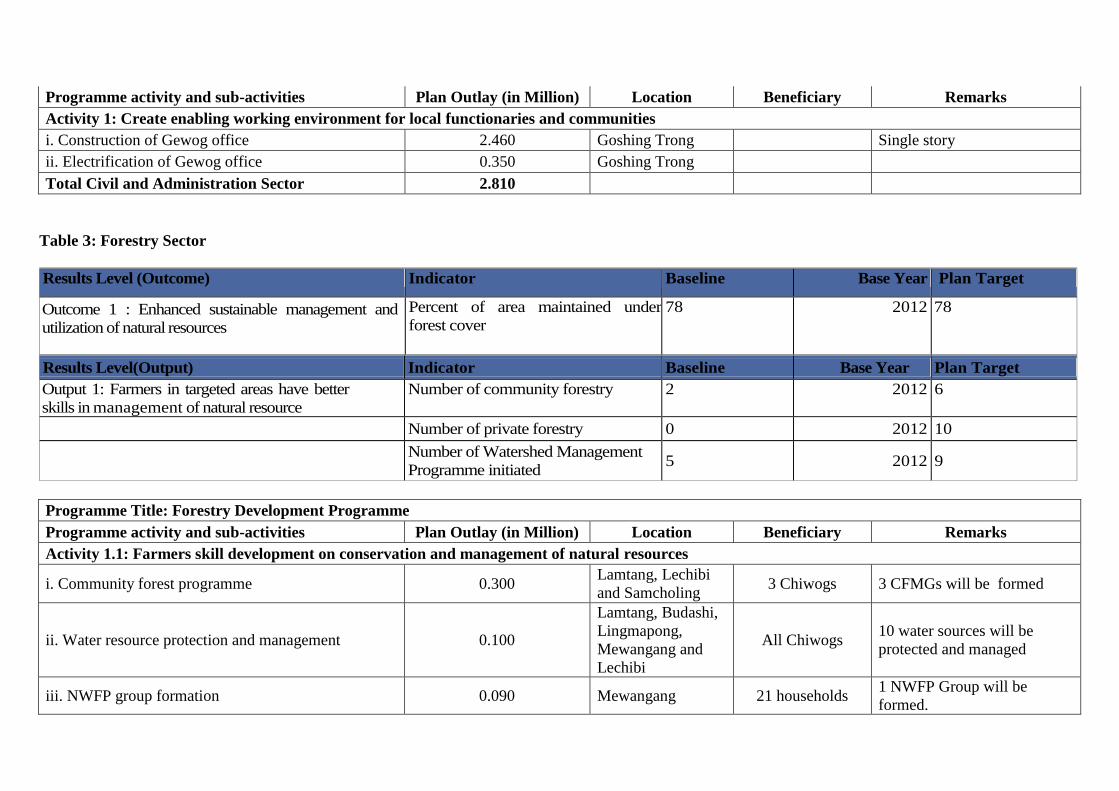
Programme activity and sub-activities Plan Outlay (in Million) Location Beneficiary Remarks
Activity 1: Create enabling working environment for local functionaries and communities
i. Construction of Gewog office 2.460 Goshing Trong Single story
ii. Electrification of Gewog office 0.350 Goshing Trong
Total Civil and Administration Sector 2.810
Table 3: Forestry Sector
Results Level (Outcome) Indicator Baseline Base Year Plan Target
Outcome 1 : Enhanced sustainable management and
utilization of natural resources
Percent of area maintained under
forest cover
78 2012 78
Results Level(Output) Indicator Baseline Base Year Plan Target
Output 1: Farmers in targeted areas have better
skills in management of natural resource
Number of community forestry 2 2012 6
Number of private forestry 0 2012 10
Number of Watershed Management
Programme initiated 5 2012 9
Programme Title: Forestry Development Programme
Programme activity and sub-activities Plan Outlay (in Million) Location Beneficiary Remarks
Activity 1.1: Farmers skill development on conservation and management of natural resources
i. Community forest programme 0.300 Lamtang, Lechibi
and Samcholing 3 Chiwogs 3 CFMGs will be formed
ii. Water resource protection and management 0.100
Lamtang, Budashi,
Lingmapong,
Mewangang and
Lechibi
All Chiwogs 10 water sources will be
protected and managed
iii. NWFP group formation 0.090 Mewangang 21 households 1 NWFP Group will be
formed.
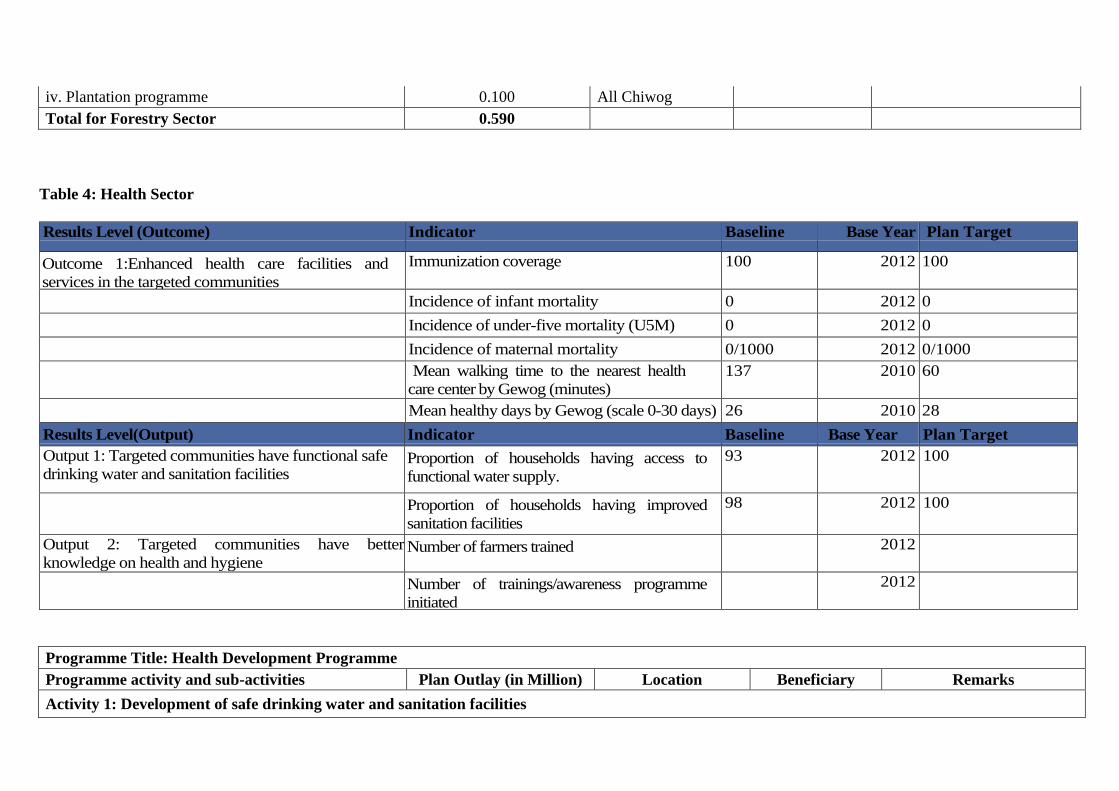
iv. Plantation programme 0.100 All Chiwog
Total for Forestry Sector 0.590
Table 4: Health Sector
Results Level (Outcome) Indicator Baseline Base Year Plan Target
Outcome 1:Enhanced health care facilities and
services in the targeted communities
Immunization coverage 100 2012 100
Incidence of infant mortality 0 2012 0
Incidence of under-five mortality (U5M) 0 2012 0
Incidence of maternal mortality 0/1000 2012 0/1000
Mean walking time to the nearest health
care center by Gewog (minutes)
137 2010 60
Mean healthy days by Gewog (scale 0-30 days) 26 2010 28
Results Level(Output) Indicator Baseline Base Year Plan Target
Output 1: Targeted communities have functional safe
drinking water and sanitation facilities Proportion of households having access to
functional water supply.
93 2012 100
Proportion of households having improved
sanitation facilities
98 2012 100
Output 2: Targeted communities have better
knowledge on health and hygiene Number of farmers trained 2012
Number of trainings/awareness programme
initiated
2012
Programme Title: Health Development Programme
Programme activity and sub-activities Plan Outlay (in Million) Location Beneficiary Remarks
Activity 1: Development of safe drinking water and sanitation facilities
i. Construction of RWSS 0.720
Lechibi and
Samcholing
2 schemes
ii. Renovation of RWSS 1.350 All Chiwogs 5 schemes
iii. Renovation of ORC 0.150
Mewangang,
Lamtang and Lechibi 3 Numbers
iv. Construction of toilet 0.250 Lhakhangs and ORCs 8 Numbers
Total for Health Sector 2.470
Table 5: Livestock Sector
Results Level (Outcome) Indicator Baseline Base Year Plan Target
Outcome 1:Enhanced livestock productivity Milk Production (Tons) 34.20 2012 90
Butter Production (Tons) 1.30 2012 3.60
Cheese Production (Tons) 2.40 2012 6.48
Egg Production (Million) 0.06 2012 0.50
Pork Production (Tons) 3.80 2012 5.40
Fish Production (Tons) 0.00 2012 1.00
Results Level(Output) Indicator Baseline Base Year Plan Target
Output 1: Farmers have better skills in improved
livestock management practices and technology Number of farmers group/associations 0 2012 2
Number of farmers trained NA 2012 150
Output 2:Functional livestock infrastructure developed in
targeted areas to address specific needs Number of infrastructure developed 1 2012 3
Programme Title: Livestock Development Programme
Programme activity and sub-activities Plan Outlay (in Million) Location Beneficiary Remarks
Activity 1: Capacity development on improved livestock management practices and technology
i. Supply of piglet 0.360 All Chiwogs 360 Numbers
ii. Supply of fingerling 0.005 Mewangang and
Budashi
iii. Feed supply 0.640 All Chiwogs 646 bags (50kg)
iv. Supply of pure jersey bull 0.060 All Chiwogs 5 Numbers
Sub-total 1.065
Activity 2: Development of infrastructure and facilities for specific needs of the production
i. Construction of piggery micro-farms 0.316 All Chiwogs 10 Numbers
ii.Establishment of semi-commercial poultry farm 0.215 Budashi/Lingmapong 1 Number
iii. Poultry micro-farms (20 birds) 0.200 All Chiwogs 300 households
iv. Construction of micro-fish farm 0.050 Budashi 1 Number
v. Stream/river stretch capture fishery 0.100
Budashi, Lamtang,
Mewagang and
Lichibi
2 Numbers
vi. Supply of sub-tropical fodder seeds and seedlings 0.120 All Chiwogs 5 acres
vii. Fodder tree plantation 0.020 All Chiwogs 2000 Numbers
Sub-total 1.021
Total for Livestock Sector 2.086
Table 6: Religion and Culture Sector
Results Level (Outcome) Indicator Baseline Base Year Plan Target
Outcome 1: Tradition and cultural heritage of the Gewog
preserved and promoted
Mean time spent on socio-cultural
activities by Gewog (minutes)
96 2010 100
Proportion of population that have “very strong”
sense of belonging to the community
75 2010 90
Results Level(Output) Indicator Baseline Base Year Plan Target
Output 1: Functional cultural heritage developed in
targeted areas to fulfill spiritual needs of the
communities
Number of religious and cultural
sites renovated/maintained
4 2012 1
Number of religious and cultural
infrastructure developed
NA 2012 2
Programme Title: Religion and Culture Development Programme
Programme activity and sub-activities Plan Outlay (in Million) Location Beneficiary Remarks
Activity 1: Develop and safeguard cultural/historical places
i. Painting of Lhakhang 0.070 Mewangang
ii. Construction of crematorium ground 1.000 Samcholing and
Kodong 2nos
iii. Extension of ground 0.500 Goshing Trong
iv. Lhakhang electrification 0.400 Budashi, Lechibi and
Trong 3nos
v. Maintenance of community hall 0.339 Goshing Trong,
Lamtang
Total for Religion and Culture Sector 2.309
Table 7: Roads and Bridges Sector
Results Level (Outcome) Indicator Baseline Base Year Plan Target
Outcome 1 : Targeted communities have improved
accessibility within and outside Gewog
Percentage of households living more than
1 hr walking distance from the nearest road
point
100 2012 50
Results Level(Output) Indicator Baseline Base Year Plan Target
Output 1: Functional rural infrastructure developed in
targeted areas
Number of suspension bridges constructed 3 2012 1
Length of mule tracks developed (Kms) 2012 4
Programme Title: Roads and Bridges Development Programme
Programme activity and sub-activities Plan Outlay (in Million) Location Beneficiary Remarks
Activity 1: Development of rural accessibility infrastructure such as mule tracks, suspension bridges etc.
i. Construction of mule track 0.100 4kms
ii. Renovation of mule track 0.210 All Chiwogs 14kms
iii. Construction of bridge at Gramlang along Gewog
Center Road 3.000 Gramling
Over and above the plan
outlay
Total for Roads and Bridges Sector 3.310
6.4: Programme Result Matrix of Nangkor Gewog
Table 1: Agriculture Sector
Results Level (Outcome) Indicator Baseline Base Year Plan Target
Outcome 1: Farmers are better able to market their
surplus agriculture produces
Mean annual household income (in '000 Nu.) 122373 2010 130000
Average land left uncultivated due to wild
life threats (in Acres)
100 2010 90
Proportion of household having sufficient
food grains 95 2012 100
Results Level(Output) Indicator Baseline Base Year Plan Target
Output 1: Farmers in targeted areas have better skills
on diversified agriculture production and improved
practices
Soya bean Production (MT) 6.743 2011 10.10
Paddy Production (MT) 658 2011 802
Maize Production (MT) 667 2011 913
Barley Production (MT) 5 2011 6.6
Millet Production (MT) 25 2011 30.5
Buckwheat Production (MT) 128 2011 160
Oranges Production (MT) 9.849 2011 16.84
Pear Production (MT) 0.428 2011 0.49
Walnut Production (MT) 1.071 2011 1.39
Chilli Production (MT) 66.445 2011 116.27
Cabbage Production (MT) 27.858 2011 71.595
Cauliflower Production (MT) 10.041 2011 70.487
Broccoli Production (MT) 0.295 2011 1.348
Asparagus Production (MT) 0.295 2011 0.61
Tomato Production (MT) 0.394 2011 0.969
Carrot Production (MT) 0.246 2011 1.279
Ginger Production (MT) 12.305 2011 14.765
Onion Production (MT) 6.940 2011 13.309
Output 2: Farmers in targeted areas have adequate
and functional agriculture infrastructure/facilities
developed for production and specific needs
Number of Road User Group formed 0 2012 1
No. of Water User Association 0 2012 2
Length of irrigation channel constructed (km) 20.20 2012 3
Length of farm road constructed (km) 47.80 2012 16.5
Programme Title: Agriculture Development Programme
Programme activity and sub-activities Plan Outlay Location Beneficiary Remarks
Activity 1: Capacity development on improved agriculture systems and diversified productions
i. Soil and land management (hedge row and stone
bundling) 0.200
Kikhar, Kamjong and
Dunmang 111 households
ii. Supply of seeds and seedlings 0.700 whole Gewog 336 households
Sub-total 0.900
Activity 2: Development of rural agriculture infrastructure in targeted areas
i. Construction of irrigation channel (3 km) 4.500 Badi, Tali, Khamna 57 households
ii. Construction of farm road (8 km) 24.000 Tshaidang - Dunmang 72 households
Tshaidang to Dunmang
will be around 25 km.
However, in the 11th
Plan, only 8 km will be
constructed. ()
iii. Maintenance of farm roads (40 km) 1.040 Shangling - Tshaidang,
Zhobling and Goling
iv. Renovation of irrigation channel (3 km) 1.500
Rumdrang, Bubtang,
Tungkarmo, Silibang,
Okhom and Wangdar
Sub-total 31.040
Total for Agriculture Sector 31.940
Table 2: Administration and Management Sector
Results Level (Outcome) Indicator Baseline Base Year Plan Target
Outcome 1 : Institution and local capacity enhanced Percentage of annual grant utilized 85 2012 90
Mean happiness by Gewog (scale 0-10) 5.98 2010 7
Anti-corruption strategy implemented
Results Level(Output) Indicator Baseline Base Year Plan Target
Output 1: Functional civil infrastructure and facilities in
place for enabling working environment Number of civil infrastructure developed 2 2012 1
Track number of people using Community
Centre services NA 2012
Number of people trained on disaster
preparedness and responsiveness
1 2012 5
Number of functional disaster response team 0 2012 1
Programme Title: Administration and Management Development Programme
Programme activity and sub-activities Plan Outlay (in Million) Location Beneficiary Remarks
Activity 1: Create enabling working environment for local functionaries and communities
i. Construction of Gewog office 2.460 Buli Whole Gewog
ii. Development of Gewog Throm 1.000 Buli 86 households
Total for Civil and Administration Sector 3.460
Table 3: Forestry Sector
Results Level (Outcome) Indicator Baseline Base Year Plan
Target Outcome 1 : Enhanced sustainable management and
utilization of natural resources
Percentage of area maintained under forest
cover
91.42 2012 91.42
Results Level(Output) Indicator Baseline Base Year Plan Target
Output 1: Farmers in targeted areas have better
skills in management of natural resource
Number of community forestry 7 2012 6
Number of private forestry 0 2012 0
Number of Watershed Management
Programme initiated 0 2012 0
Number of NWFP groups 0 2012 2
Programme Title: Forestry Development Programme
Programme activity and sub-activities Plan Outlay (in Million) Location Beneficiary Remarks
Activity 1: Farmers skill development on conservation and management of natural resources
i. Establishment of community forest 0.250 Ngakhar 28 households 1 CFMG will be formed
Total for Forestry Sector 0.250
Table 4: Health Sector
Results Level (Outcome) Indicator Baseline Base Year Plan Target
Outcome 1 :Enhanced health care facilities and
services of the targeted communities
Immunization coverage 95 2012 100
Incidence of infant mortality 0 2012 0
Incidence of under-five mortality (U5M) 0 2012 0
Incidence of maternal mortality 0/1000 2012 0/1000
Mean walking time to the nearest health
care center by Gewog (minutes)
196.2 2010 60
Mean healthy days by Gewog (scale 0-30
days) 27.2 2010 28
Results Level(Output) Indicator Baseline Base Year Plan Target
Output 1: Targeted communities have functional safe
drinking water and sanitation facilities Proportion of households having access to
functional water supply.
90 2012 100
Proportion of households having improved
sanitation facilities
97 2012 100
Output 2: Targeted communities have better
knowledge on health and hygiene Number of farmers trained 2012
Number of trainings/awareness programme
initiated
2012
Programme Title: Health Development Programme
Programme activity and sub-activities Plan Outlay Location Beneficiary Remarks
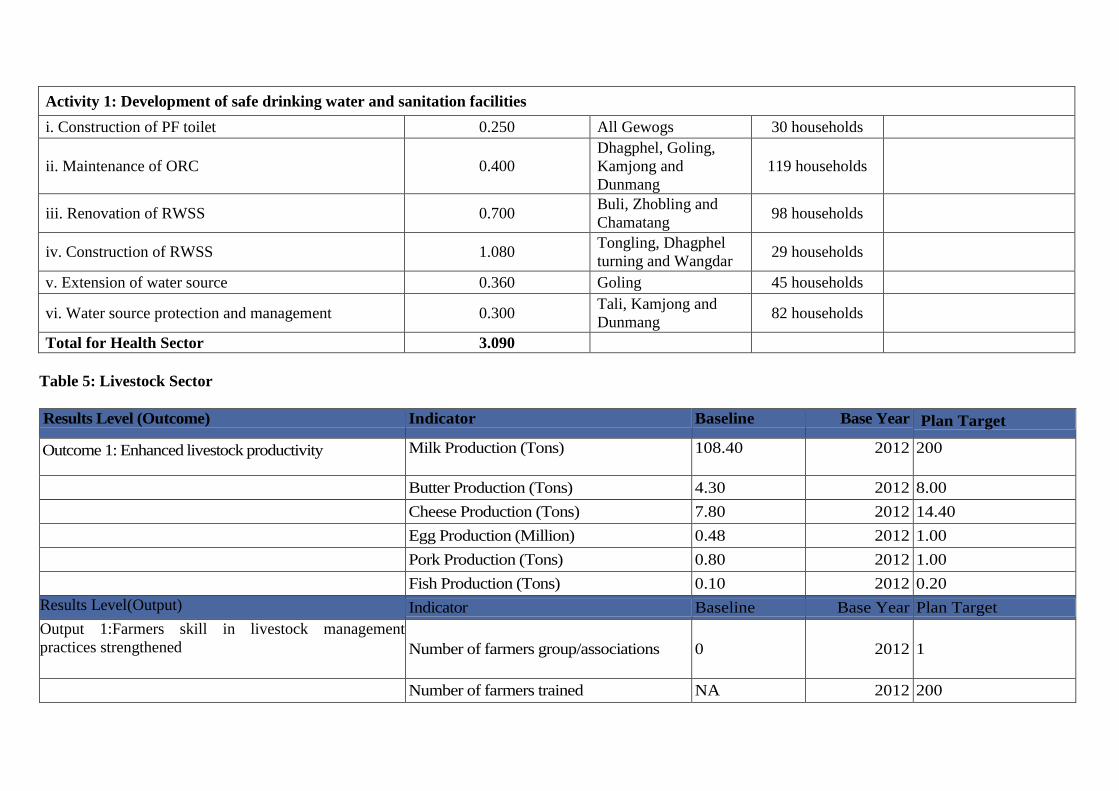
Activity 1: Development of safe drinking water and sanitation facilities
i. Construction of PF toilet 0.250 All Gewogs 30 households
ii. Maintenance of ORC 0.400
Dhagphel, Goling,
Kamjong and
Dunmang
119 households
iii. Renovation of RWSS 0.700 Buli, Zhobling and
Chamatang 98 households
iv. Construction of RWSS 1.080 Tongling, Dhagphel
turning and Wangdar 29 households
v. Extension of water source 0.360 Goling 45 households
vi. Water source protection and management 0.300 Tali, Kamjong and
Dunmang 82 households
Total for Health Sector 3.090
Table 5: Livestock Sector
Results Level (Outcome) Indicator Baseline Base Year Plan Target
Outcome 1: Enhanced livestock productivity Milk Production (Tons) 108.40 2012 200
Butter Production (Tons) 4.30 2012 8.00
Cheese Production (Tons) 7.80 2012 14.40
Egg Production (Million) 0.48 2012 1.00
Pork Production (Tons) 0.80 2012 1.00
Fish Production (Tons) 0.10 2012 0.20
Results Level(Output) Indicator Baseline Base Year Plan Target
Output 1:Farmers skill in livestock management
practices strengthened Number of farmers group/associations 0 2012 1
Number of farmers trained NA 2012 200
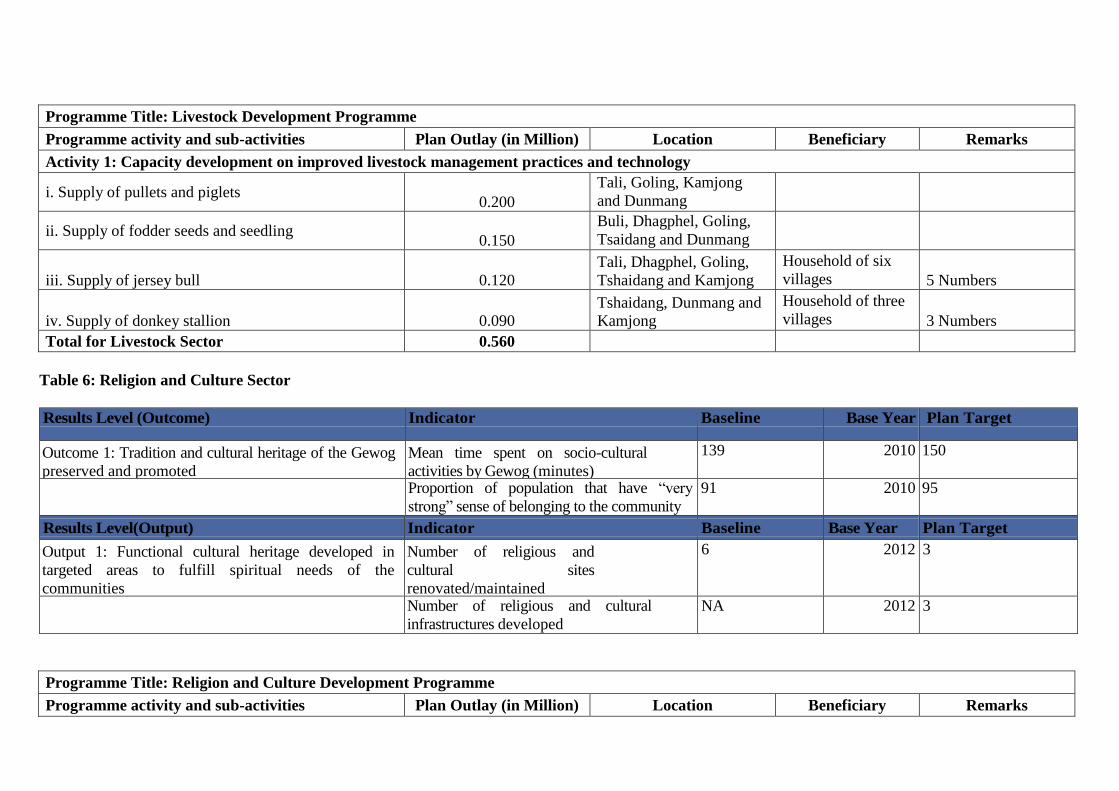
Programme Title: Livestock Development Programme
Programme activity and sub-activities Plan Outlay (in Million) Location Beneficiary Remarks
Activity 1: Capacity development on improved livestock management practices and technology
i. Supply of pullets and piglets 0.200
Tali, Goling, Kamjong
and Dunmang
ii. Supply of fodder seeds and seedling 0.150
Buli, Dhagphel, Goling,
Tsaidang and Dunmang
iii. Supply of jersey bull 0.120
Tali, Dhagphel, Goling,
Tshaidang and Kamjong
Household of six
villages 5 Numbers
iv. Supply of donkey stallion 0.090
Tshaidang, Dunmang and
Kamjong
Household of three
villages 3 Numbers
Total for Livestock Sector 0.560
Table 6: Religion and Culture Sector
Results Level (Outcome) Indicator Baseline Base Year Plan Target
Outcome 1: Tradition and cultural heritage of the Gewog
preserved and promoted
Mean time spent on socio-cultural
activities by Gewog (minutes)
139 2010 150
Proportion of population that have “very
strong” sense of belonging to the community
91 2010 95
Results Level(Output) Indicator Baseline Base Year Plan Target
Output 1: Functional cultural heritage developed in
targeted areas to fulfill spiritual needs of the
communities
Number of religious and
cultural sites
renovated/maintained
6 2012 3
Number of religious and cultural
infrastructures developed
NA 2012 3
Programme Title: Religion and Culture Development Programme
Programme activity and sub-activities Plan Outlay (in Million) Location Beneficiary Remarks
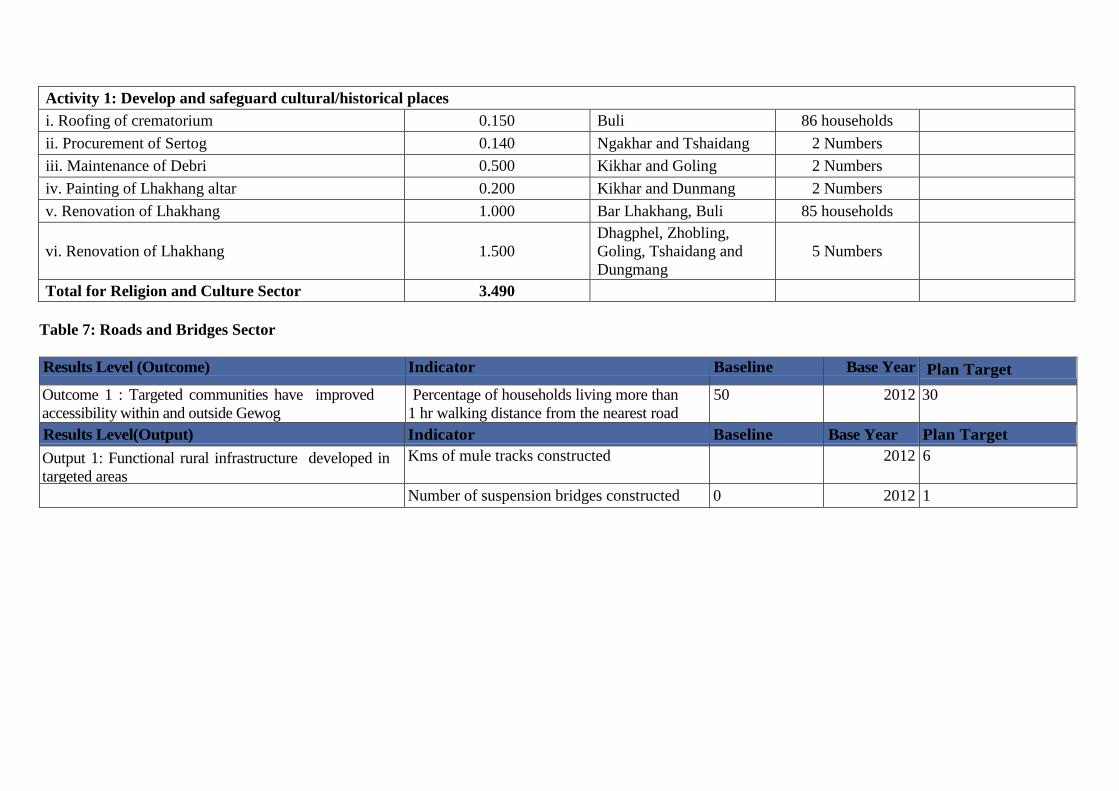
Activity 1: Develop and safeguard cultural/historical places
i. Roofing of crematorium 0.150 Buli 86 households
ii. Procurement of Sertog 0.140 Ngakhar and Tshaidang 2 Numbers
iii. Maintenance of Debri 0.500 Kikhar and Goling 2 Numbers
iv. Painting of Lhakhang altar 0.200 Kikhar and Dunmang 2 Numbers
v. Renovation of Lhakhang 1.000 Bar Lhakhang, Buli 85 households
vi. Renovation of Lhakhang 1.500
Dhagphel, Zhobling,
Goling, Tshaidang and
Dungmang
5 Numbers
Total for Religion and Culture Sector 3.490
Table 7: Roads and Bridges Sector
Results Level (Outcome) Indicator Baseline Base Year Plan Target
Outcome 1 : Targeted communities have improved
accessibility within and outside Gewog
Percentage of households living more than
1 hr walking distance from the nearest road
point
50 2012 30
Results Level(Output) Indicator Baseline Base Year Plan Target
Output 1: Functional rural infrastructure developed in
targeted areas
Kms of mule tracks constructed 2012 6
Number of suspension bridges constructed 0 2012 1
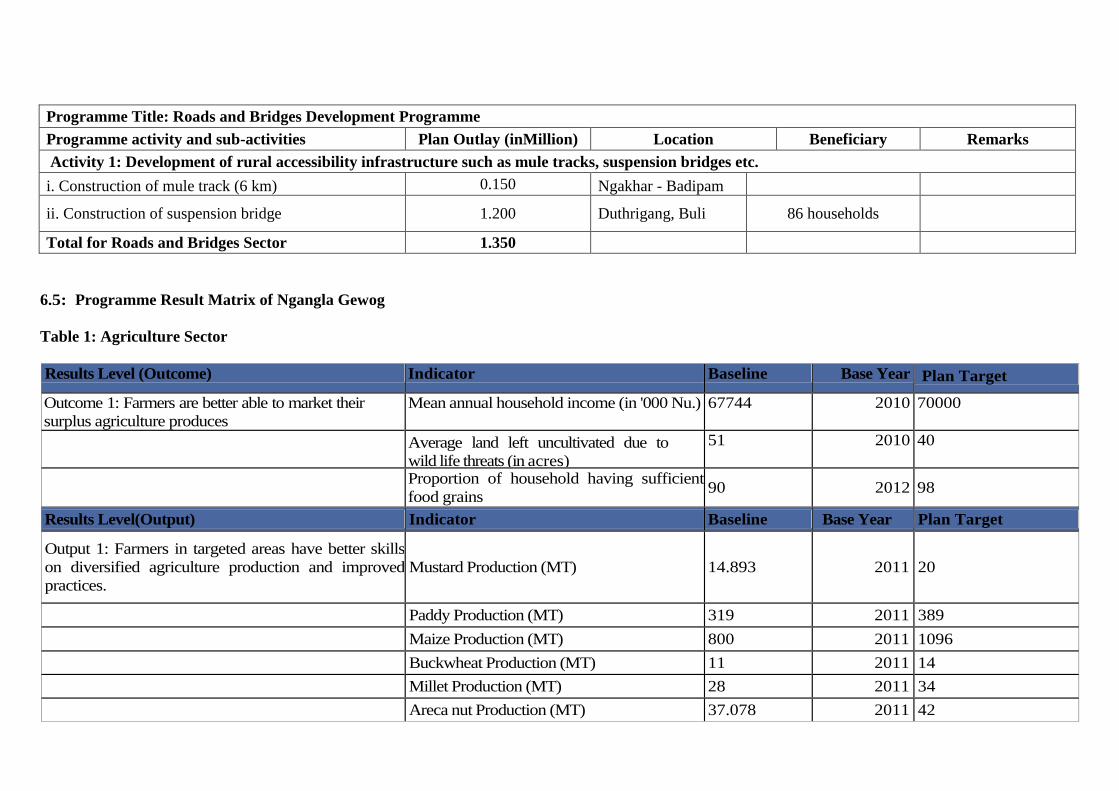
Programme Title: Roads and Bridges Development Programme
Programme activity and sub-activities Plan Outlay (inMillion) Location Beneficiary Remarks
Activity 1: Development of rural accessibility infrastructure such as mule tracks, suspension bridges etc.
i. Construction of mule track (6 km) 0.150 Ngakhar - Badipam
ii. Construction of suspension bridge 1.200 Duthrigang, Buli 86 households
Total for Roads and Bridges Sector 1.350
6.5: Programme Result Matrix of Ngangla Gewog
Table 1: Agriculture Sector
Results Level (Outcome) Indicator Baseline Base Year Plan Target
Outcome 1: Farmers are better able to market their
surplus agriculture produces
Mean annual household income (in '000 Nu.) 67744 2010 70000
Average land left uncultivated due to
wild life threats (in acres)
51 2010 40
Proportion of household having sufficient
food grains 90 2012 98
Results Level(Output) Indicator Baseline Base Year Plan Target
Output 1: Farmers in targeted areas have better skills
on diversified agriculture production and improved
practices.
Mustard Production (MT) 14.893 2011 20
Paddy Production (MT) 319 2011 389
Maize Production (MT) 800 2011 1096
Buckwheat Production (MT) 11 2011 14
Millet Production (MT) 28 2011 34
Areca nut Production (MT) 37.078 2011 42
Pear Production (MT) 1.494 2011 2
Walnut Production (MT) 0.543 2011 1
Chilli Production (MT) 26.695 2011 47
Cabbage Production (MT) 25.196 2011 90
Cauliflower Production (MT) 2.342 2011 16
Broccoli Production (MT) 2.529 2011 12
Tomato Production (MT) 0.656 2011 4.29
Carrot Production (MT) 2.529 2011 13
Garlic Production (MT) 1.030 2011 2
Ginger Production (MT) 5.995 2011 8
Onion Production (MT) 3.091 2011 7
Oranges Production (MT) 1444.003 2011 2469
Output 2: Farmers in targeted areas have adequate and
functional agriculture infrastructure/facilities developed
for production and specific needs Number of Road User Group formed 0 2012 1
Number of Water User Association formed 0 2012 1
Length of irrigation channel constructed (km) 14.24 2012 .800
Length of farm road constructed (km) 3.10 2012 18
Programme Title: Agriculture Development Programme
Programme activity and sub-activities Plan Outlay (in Million) Location Beneficiary Remarks
Activity 1: Capacity development on improved agriculture systems and diversified productions
i. Wetland terracing 1.000 Sonamthang and
Thinleygang 64 households
ii. Supply of citrus seedlings 0.200 Selected Chiwogs 271 households
iii. Fruit crop production (sapling distribution) 0.500 All Chiwogs 271 households
iv. Supply of vegetable seeds 0.150 All Chiwogs 271 households
Sub-total 1.850
Activity 2: Development of rural agriculture infrastructure in targeted areas
i. Construction of farm road from Marangdueth-
Yumdang (6 km) 18.000 Yumdang 25 households Priority ()
ii. Construction of farm road from Nangla Tong-
Kaktong (6km) 0.000 Kaktong 53 households
To be funded by RLP
Phase II
iii. Maintenance of community farm road (1km) 1.500 Upper
Sonamthang 74 households
iv. Construction of irrigation channel (800 m)
1.000
Marangdueth,
Kaktong and
Singlebee 28 households
v. Renovation of irrigation channel (2 km)
1.000
Rebati, Kaktong,
Dochaling,
Tunkudenpa and
Thinleygang
73 households
Sub-total 20.000
Total for Agriculture Sector 21.850
Table 1: Administration and Management Sector
Results Level (Outcome) Indicator Baseline Base Year Plan Target
Outcome 1 : Institution and local capacity enhanced Percentage of annual grant utilized 85 2012 90
Mean happiness by Gewog (scale 0-10) 6.01 2010 7
Anti-corruption strategy implemented
Results Level(Output) Indicator Baseline Base Year Plan Target
Output 1: Functional civil infrastructure and facilities in
place for enabling working environment
Number of civil infrastructure
developed 1 2012 0
Track number of people using
Community Centre services NA 2012
Number of people trained on disaster
preparedness and responsiveness
1 2012 5
Number of functional disaster response
team 0 2012 1
Programme Title: Administration and Management Development Programme
Programme activity and sub-activities Plan Outlay (in Million) Location Beneficiary Remarks
Activity 1: Create enabling working environment for local functionaries and communities
i. Construction of Lhamanpa's house. 1.200 Nangla Trong
ii. Fixing of window frames 0.260 Gewog Office
iii. Construction of wall and fencing 0.900 Gewog Office
iv. Procurement of office equipment and furniture 0.300 Gewog Office
v. Maintenance of office equipment and furniture 0.090 Gewog Office
Total for Civil and Administration Sector 1.760
Table 3: Forestry Sector
Results Level (Outcome) Indicator Baseline Base Year Plan Target
Outcome 1 : Enhanced sustainable management and
utilization of natural resources
Percent of area maintained under forest
cover
78 2012 78
Results Level(Output) Indicator Baseline Base Year Plan Target
Output 1: Farmers in targeted areas have better
skills in management of natural resource
Number of community forestry 3 2012 7
Number of private forestry 0 2012 4
Number of Watershed Management
Programme initiated 0 2012 3
Number of NWFP groups 0 2012 6
Programme Title: Forestry Development Programme
Programme activity and sub-activities Plan Outlay (in Million) Location Beneficiary Remarks
Activity 1: Farmers skill development on conservation and management of natural resources
i. Establishment of community forest 0.150 Tunkudenpa and
Nangla Trong 40 households
ii. Water resource protection and management 0.150
Sonamthang,
Pongchuling, Laling
and Yumdang
128 households
Total for Forestry Sector 0.300
Table 4: Health Sector
Results Level (Outcome) Indicator Baseline Base Year Plan Target
Outcome 1 :Enhanced health care facilities and
services of the targeted communities
Immunization coverage 100 2012 100
Incidence of infant mortality 0 2012 0
Incidence of under-five mortality (U5M) 0 2012 0
Incidence of maternal mortality 0/1000 2012 01000
Mean walking time to the nearest
health care center by Gewog
(minutes)
44.9 2010 30
Mean healthy days by Gewog (scale 0-30
days) 28.4 2010 29
Results Level(Output) Indicator Baseline Base Year Plan Target
Output 1: Targeted communities have functional safe
drinking water and sanitation facilities Proportion of households having access to
functional water supply.
99 2012 100
Proportion of households having
improved sanitation facilities
98 2012 100
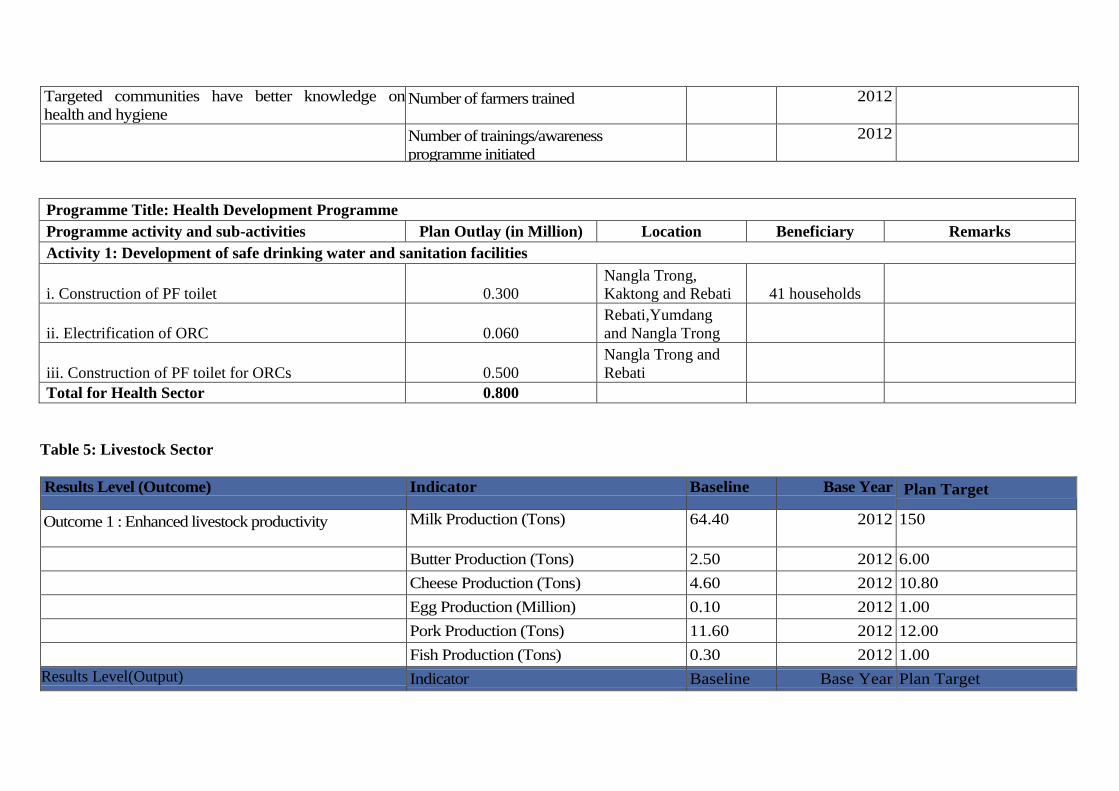
Targeted communities have better knowledge on
health and hygiene Number of farmers trained 2012
Number of trainings/awareness
programme initiated
2012
Programme Title: Health Development Programme
Programme activity and sub-activities Plan Outlay (in Million) Location Beneficiary Remarks
Activity 1: Development of safe drinking water and sanitation facilities
i. Construction of PF toilet 0.300
Nangla Trong,
Kaktong and Rebati 41 households
ii. Electrification of ORC 0.060
Rebati,Yumdang
and Nangla Trong
iii. Construction of PF toilet for ORCs 0.500
Nangla Trong and
Rebati
Total for Health Sector 0.800
Table 5: Livestock Sector
Results Level (Outcome) Indicator Baseline Base Year Plan Target
Outcome 1 : Enhanced livestock productivity Milk Production (Tons) 64.40 2012 150
Butter Production (Tons) 2.50 2012 6.00
Cheese Production (Tons) 4.60 2012 10.80
Egg Production (Million) 0.10 2012 1.00
Pork Production (Tons) 11.60 2012 12.00
Fish Production (Tons) 0.30 2012 1.00
Results Level(Output) Indicator Baseline Base Year Plan Target
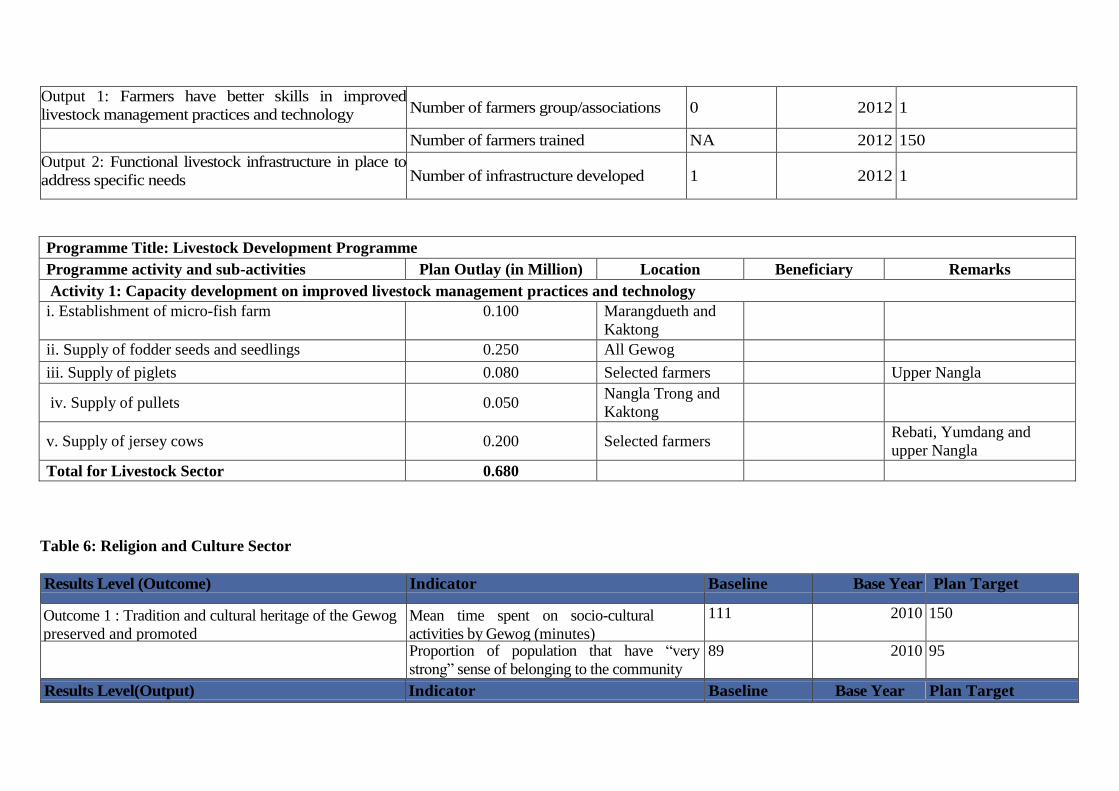
Output 1: Farmers have better skills in improved
livestock management practices and technology Number of farmers group/associations 0 2012 1
Number of farmers trained NA 2012 150
Output 2: Functional livestock infrastructure in place to
address specific needs Number of infrastructure developed 1 2012 1
Programme Title: Livestock Development Programme
Programme activity and sub-activities Plan Outlay (in Million) Location Beneficiary Remarks
Activity 1: Capacity development on improved livestock management practices and technology
i. Establishment of micro-fish farm 0.100 Marangdueth and
Kaktong
ii. Supply of fodder seeds and seedlings 0.250 All Gewog
iii. Supply of piglets 0.080 Selected farmers Upper Nangla
iv. Supply of pullets 0.050 Nangla Trong and
Kaktong
v. Supply of jersey cows 0.200 Selected farmers Rebati, Yumdang and
upper Nangla
Total for Livestock Sector 0.680
Table 6: Religion and Culture Sector
Results Level (Outcome) Indicator Baseline Base Year Plan Target
Outcome 1 : Tradition and cultural heritage of the Gewog
preserved and promoted
Mean time spent on socio-cultural
activities by Gewog (minutes)
111 2010 150
Proportion of population that have “very
strong” sense of belonging to the community
89 2010 95
Results Level(Output) Indicator Baseline Base Year Plan Target
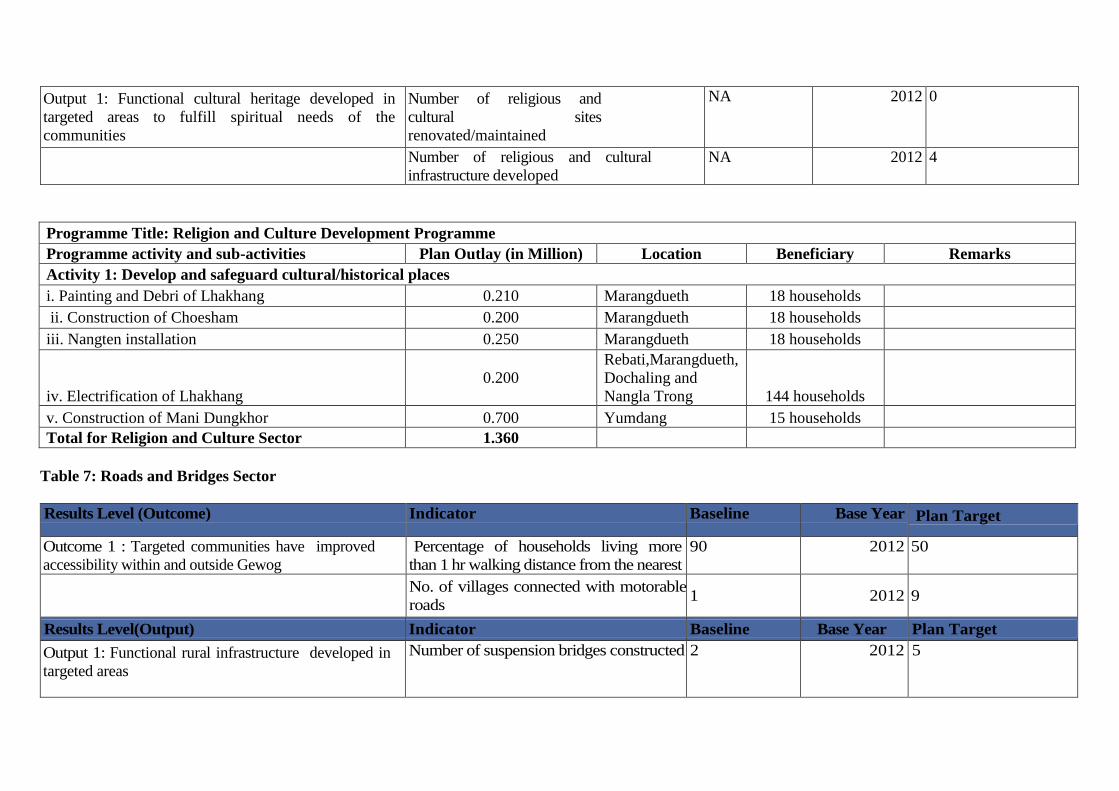
Output 1: Functional cultural heritage developed in
targeted areas to fulfill spiritual needs of the
communities
Number of religious and
cultural sites
renovated/maintained
NA 2012 0
Number of religious and cultural
infrastructure developed
NA 2012 4
Programme Title: Religion and Culture Development Programme
Programme activity and sub-activities Plan Outlay (in Million) Location Beneficiary Remarks
Activity 1: Develop and safeguard cultural/historical places
i. Painting and Debri of Lhakhang 0.210 Marangdueth 18 households
ii. Construction of Choesham 0.200 Marangdueth 18 households
iii. Nangten installation 0.250 Marangdueth 18 households
iv. Electrification of Lhakhang
0.200
Rebati,Marangdueth,
Dochaling and
Nangla Trong 144 households
v. Construction of Mani Dungkhor 0.700 Yumdang 15 households
Total for Religion and Culture Sector 1.360
Table 7: Roads and Bridges Sector
Results Level (Outcome) Indicator Baseline Base Year Plan Target
Outcome 1 : Targeted communities have improved
accessibility within and outside Gewog
Percentage of households living more
than 1 hr walking distance from the nearest
road point
90 2012 50
No. of villages connected with motorable
roads 1 2012 9
Results Level(Output) Indicator Baseline Base Year Plan Target
Output 1: Functional rural infrastructure developed in
targeted areas
Number of suspension bridges constructed 2 2012 5
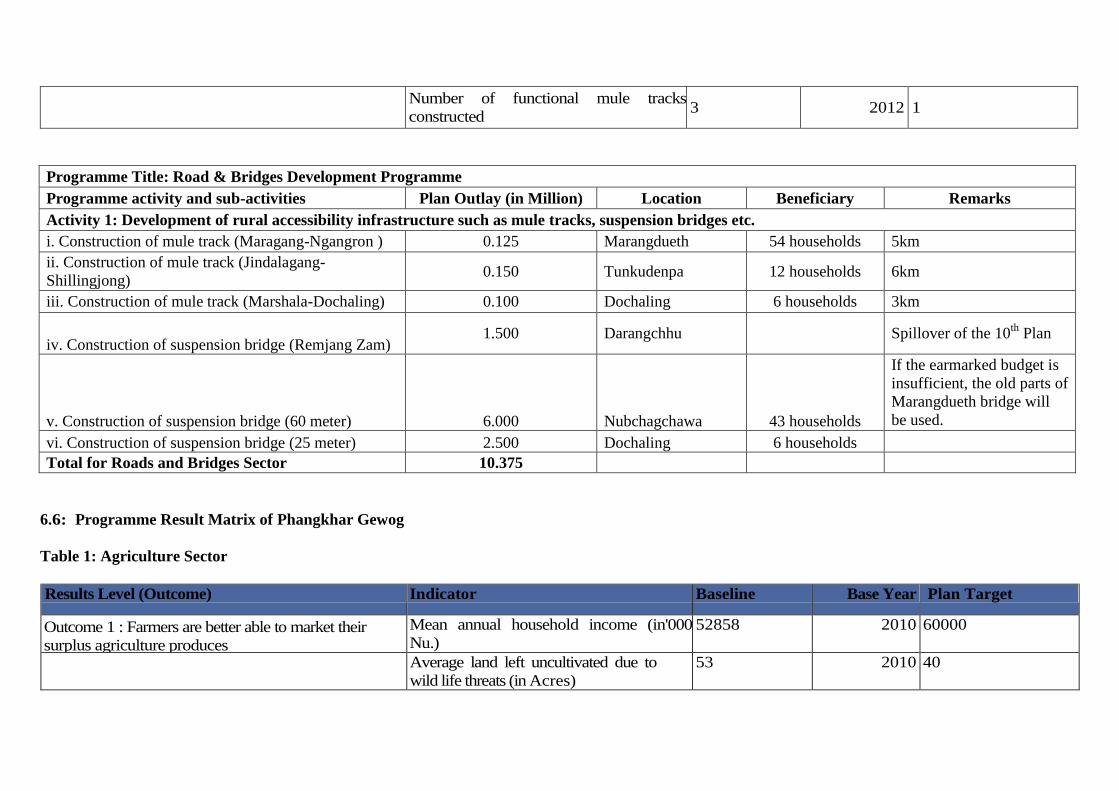
Number of functional mule tracks
constructed 3 2012 1
Programme Title: Road & Bridges Development Programme
Programme activity and sub-activities Plan Outlay (in Million) Location Beneficiary Remarks
Activity 1: Development of rural accessibility infrastructure such as mule tracks, suspension bridges etc.
i. Construction of mule track (Maragang-Ngangron ) 0.125 Marangdueth 54 households 5km
ii. Construction of mule track (Jindalagang-
Shillingjong) 0.150 Tunkudenpa 12 households 6km
iii. Construction of mule track (Marshala-Dochaling) 0.100 Dochaling 6 households 3km
iv. Construction of suspension bridge (Remjang Zam) 1.500 Darangchhu Spillover of the 10
th Plan
v. Construction of suspension bridge (60 meter) 6.000 Nubchagchawa 43 households
If the earmarked budget is
insufficient, the old parts of
Marangdueth bridge will
be used.
vi. Construction of suspension bridge (25 meter) 2.500 Dochaling 6 households
Total for Roads and Bridges Sector 10.375
6.6: Programme Result Matrix of Phangkhar Gewog
Table 1: Agriculture Sector
Results Level (Outcome) Indicator Baseline Base Year Plan Target
Outcome 1 : Farmers are better able to market their
surplus agriculture produces
Mean annual household income (in'000
Nu.)
52858 2010 60000
Average land left uncultivated due to
wild life threats (in Acres)
53 2010 40
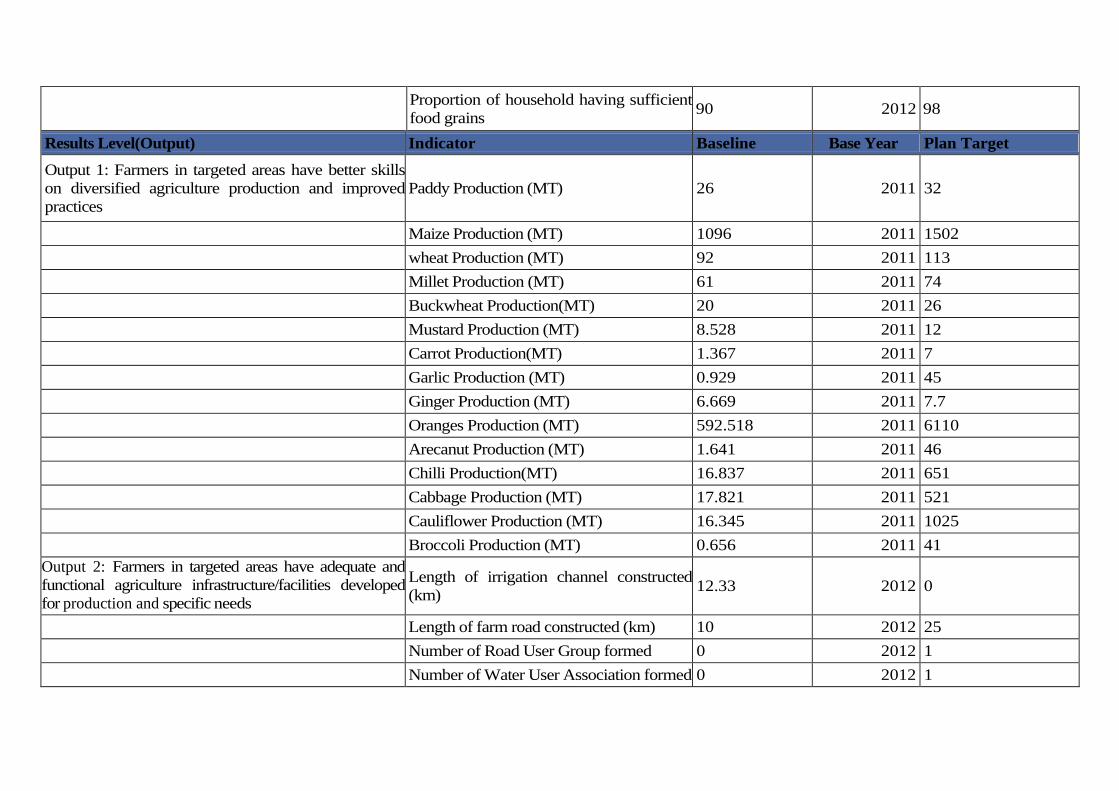
Proportion of household having sufficient
food grains 90 2012 98
Results Level(Output) Indicator Baseline Base Year Plan Target
Output 1: Farmers in targeted areas have better skills
on diversified agriculture production and improved
practices
Paddy Production (MT) 26 2011 32
Maize Production (MT) 1096 2011 1502
wheat Production (MT) 92 2011 113
Millet Production (MT) 61 2011 74
Buckwheat Production(MT) 20 2011 26
Mustard Production (MT) 8.528 2011 12
Carrot Production(MT) 1.367 2011 7
Garlic Production (MT) 0.929 2011 45
Ginger Production (MT) 6.669 2011 7.7
Oranges Production (MT) 592.518 2011 6110
Arecanut Production (MT) 1.641 2011 46
Chilli Production(MT) 16.837 2011 651
Cabbage Production (MT) 17.821 2011 521
Cauliflower Production (MT) 16.345 2011 1025
Broccoli Production (MT) 0.656 2011 41
Output 2: Farmers in targeted areas have adequate and
functional agriculture infrastructure/facilities developed
for production and specific needs
Length of irrigation channel constructed
(km) 12.33 2012 0
Length of farm road constructed (km) 10 2012 25
Number of Road User Group formed 0 2012 1
Number of Water User Association formed 0 2012 1
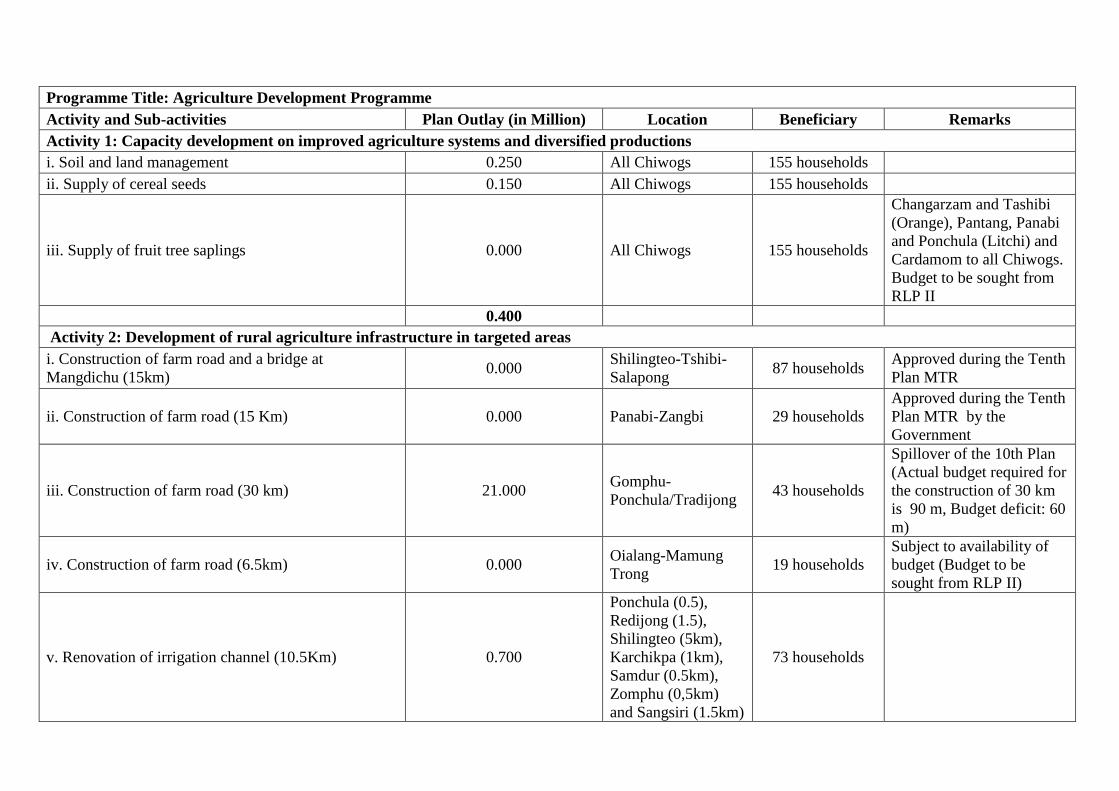
Programme Title: Agriculture Development Programme
Activity and Sub-activities Plan Outlay (in Million) Location Beneficiary Remarks
Activity 1: Capacity development on improved agriculture systems and diversified productions
i. Soil and land management 0.250 All Chiwogs 155 households
ii. Supply of cereal seeds 0.150 All Chiwogs 155 households
iii. Supply of fruit tree saplings 0.000 All Chiwogs 155 households
Changarzam and Tashibi
(Orange), Pantang, Panabi
and Ponchula (Litchi) and
Cardamom to all Chiwogs.
Budget to be sought from
RLP II
0.400
Activity 2: Development of rural agriculture infrastructure in targeted areas
i. Construction of farm road and a bridge at
Mangdichu (15km) 0.000
Shilingteo-Tshibi-
Salapong 87 households
Approved during the Tenth
Plan MTR
ii. Construction of farm road (15 Km) 0.000 Panabi-Zangbi 29 households
Approved during the Tenth
Plan MTR by the
Government
iii. Construction of farm road (30 km) 21.000 Gomphu-
Ponchula/Tradijong 43 households
Spillover of the 10th Plan
(Actual budget required for
the construction of 30 km
is 90 m, Budget deficit: 60
m)
iv. Construction of farm road (6.5km) 0.000 Oialang-Mamung
Trong 19 households
Subject to availability of
budget (Budget to be
sought from RLP II)
v. Renovation of irrigation channel (10.5Km) 0.700
Ponchula (0.5),
Redijong (1.5),
Shilingteo (5km),
Karchikpa (1km),
Samdur (0.5km),
Zomphu (0,5km)
and Sangsiri (1.5km)
73 households
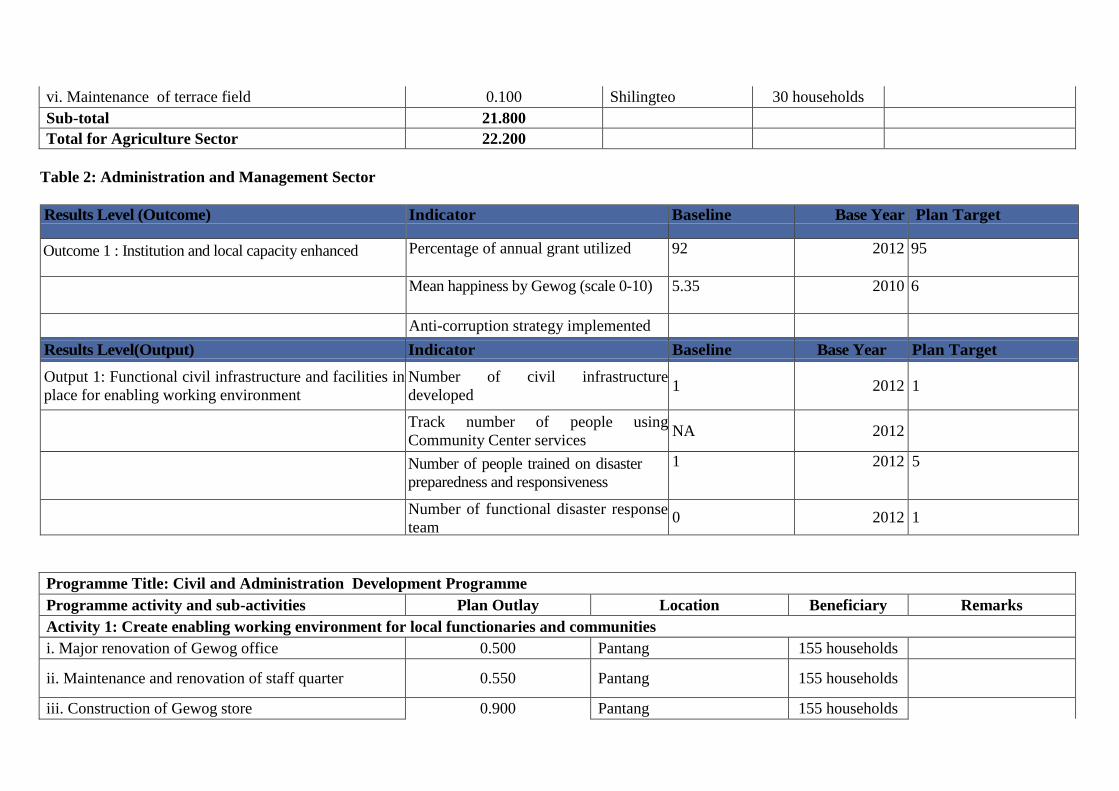
vi. Maintenance of terrace field 0.100 Shilingteo 30 households
Sub-total 21.800
Total for Agriculture Sector 22.200
Table 2: Administration and Management Sector
Results Level (Outcome) Indicator Baseline Base Year Plan Target
Outcome 1 : Institution and local capacity enhanced Percentage of annual grant utilized 92 2012 95
Mean happiness by Gewog (scale 0-10) 5.35 2010 6
Anti-corruption strategy implemented
Results Level(Output) Indicator Baseline Base Year Plan Target
Output 1: Functional civil infrastructure and facilities in
place for enabling working environment
Number of civil infrastructure
developed 1 2012 1
Track number of people using
Community Center services NA 2012
Number of people trained on disaster
preparedness and responsiveness
1 2012 5
Number of functional disaster response
team 0 2012 1
Programme Title: Civil and Administration Development Programme
Programme activity and sub-activities Plan Outlay Location Beneficiary Remarks
Activity 1: Create enabling working environment for local functionaries and communities
i. Major renovation of Gewog office 0.500 Pantang 155 households
ii. Maintenance and renovation of staff quarter 0.550 Pantang 155 households
iii. Construction of Gewog store 0.900 Pantang 155 households
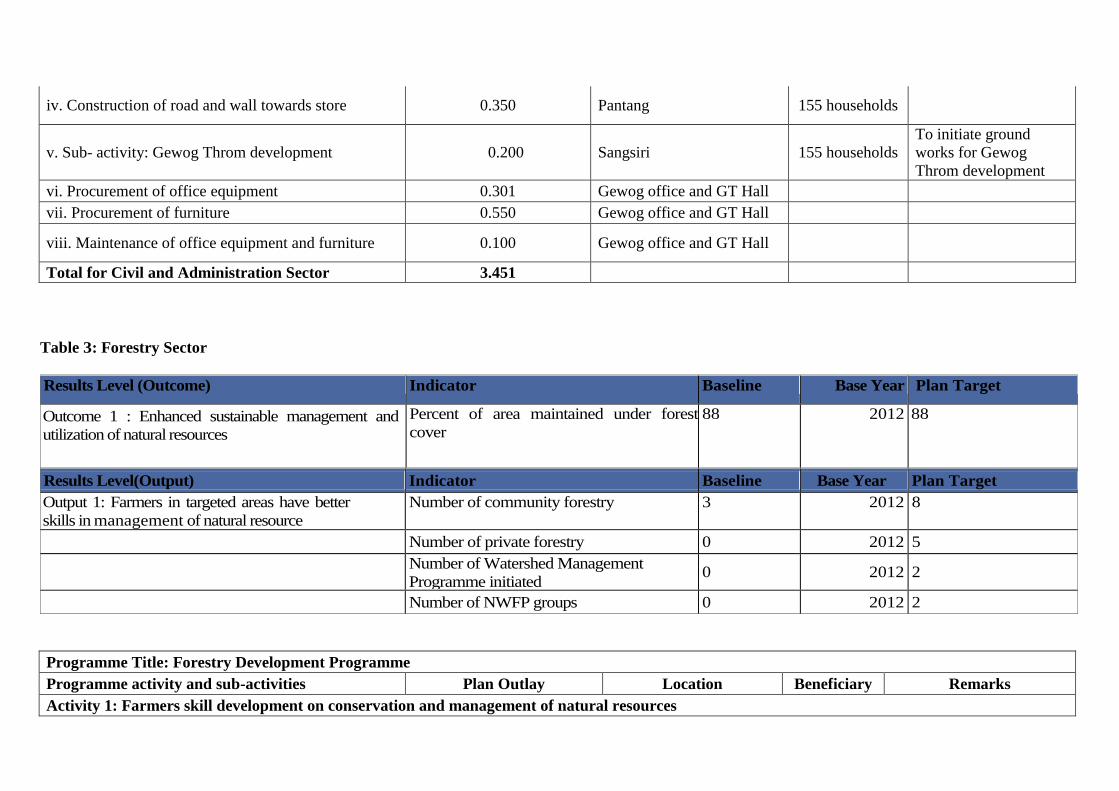
iv. Construction of road and wall towards store 0.350 Pantang 155 households
v. Sub- activity: Gewog Throm development 0.200 Sangsiri 155 households
To initiate ground
works for Gewog
Throm development
vi. Procurement of office equipment 0.301 Gewog office and GT Hall
vii. Procurement of furniture 0.550 Gewog office and GT Hall
viii. Maintenance of office equipment and furniture 0.100 Gewog office and GT Hall
Total for Civil and Administration Sector 3.451
Table 3: Forestry Sector
Results Level (Outcome) Indicator Baseline Base Year Plan Target
Outcome 1 : Enhanced sustainable management and
utilization of natural resources
Percent of area maintained under forest
cover
88 2012 88
Results Level(Output) Indicator Baseline Base Year Plan Target
Output 1: Farmers in targeted areas have better
skills in management of natural resource
Number of community forestry 3 2012 8
Number of private forestry 0 2012 5
Number of Watershed Management
Programme initiated 0 2012 2
Number of NWFP groups 0 2012 2
Programme Title: Forestry Development Programme
Programme activity and sub-activities Plan Outlay Location Beneficiary Remarks
Activity 1: Farmers skill development on conservation and management of natural resources
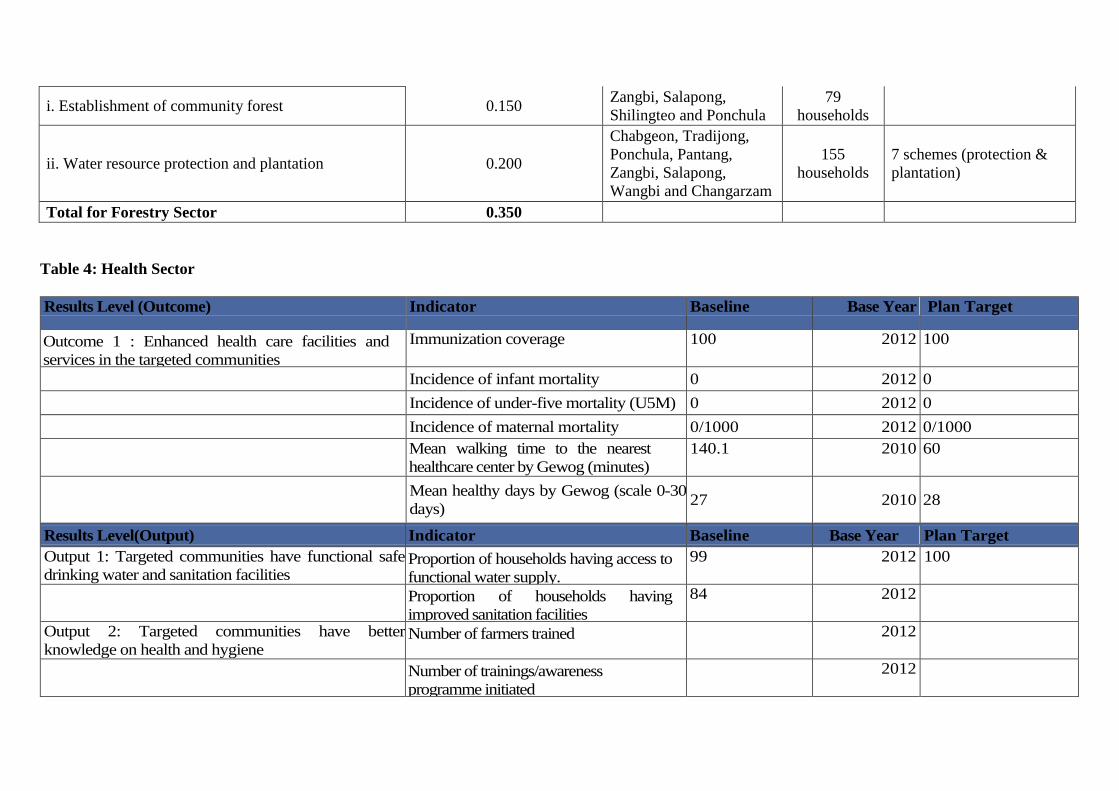
i. Establishment of community forest 0.150 Zangbi, Salapong,
Shilingteo and Ponchula
79
households
ii. Water resource protection and plantation 0.200
Chabgeon, Tradijong,
Ponchula, Pantang,
Zangbi, Salapong,
Wangbi and Changarzam
155
households
7 schemes (protection &
plantation)
Total for Forestry Sector 0.350
Table 4: Health Sector
Results Level (Outcome) Indicator Baseline Base Year Plan Target
Outcome 1 : Enhanced health care facilities and
services in the targeted communities
Immunization coverage 100 2012 100
Incidence of infant mortality 0 2012 0
Incidence of under-five mortality (U5M) 0 2012 0
Incidence of maternal mortality 0/1000 2012 0/1000
Mean walking time to the nearest
healthcare center by Gewog (minutes)
140.1 2010 60
Mean healthy days by Gewog (scale 0-30
days) 27 2010 28
Results Level(Output) Indicator Baseline Base Year Plan Target
Output 1: Targeted communities have functional safe
drinking water and sanitation facilities Proportion of households having access to
functional water supply.
99 2012 100
Proportion of households having
improved sanitation facilities
84 2012
Output 2: Targeted communities have better
knowledge on health and hygiene Number of farmers trained 2012
Number of trainings/awareness
programme initiated
2012
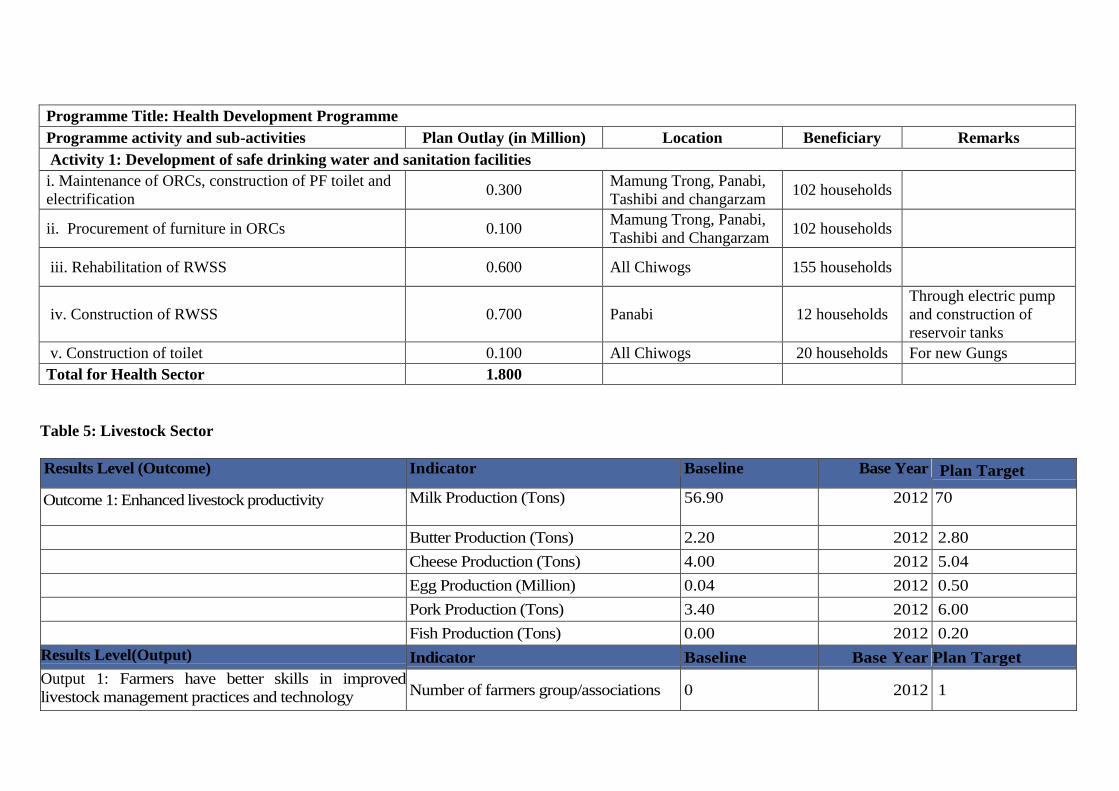
Programme Title: Health Development Programme
Programme activity and sub-activities Plan Outlay (in Million) Location Beneficiary Remarks
Activity 1: Development of safe drinking water and sanitation facilities
i. Maintenance of ORCs, construction of PF toilet and
electrification 0.300
Mamung Trong, Panabi,
Tashibi and changarzam 102 households
ii. Procurement of furniture in ORCs 0.100 Mamung Trong, Panabi,
Tashibi and Changarzam 102 households
iii. Rehabilitation of RWSS 0.600 All Chiwogs 155 households
iv. Construction of RWSS 0.700 Panabi 12 households
Through electric pump
and construction of
reservoir tanks
v. Construction of toilet 0.100 All Chiwogs 20 households For new Gungs
Total for Health Sector 1.800
Table 5: Livestock Sector
Results Level (Outcome) Indicator Baseline Base Year Plan Target
Outcome 1: Enhanced livestock productivity Milk Production (Tons) 56.90 2012 70
Butter Production (Tons) 2.20 2012 2.80
Cheese Production (Tons) 4.00 2012 5.04
Egg Production (Million) 0.04 2012 0.50
Pork Production (Tons) 3.40 2012 6.00
Fish Production (Tons) 0.00 2012 0.20
Results Level(Output) Indicator Baseline Base Year Plan Target
Output 1: Farmers have better skills in improved
livestock management practices and technology Number of farmers group/associations 0 2012 1
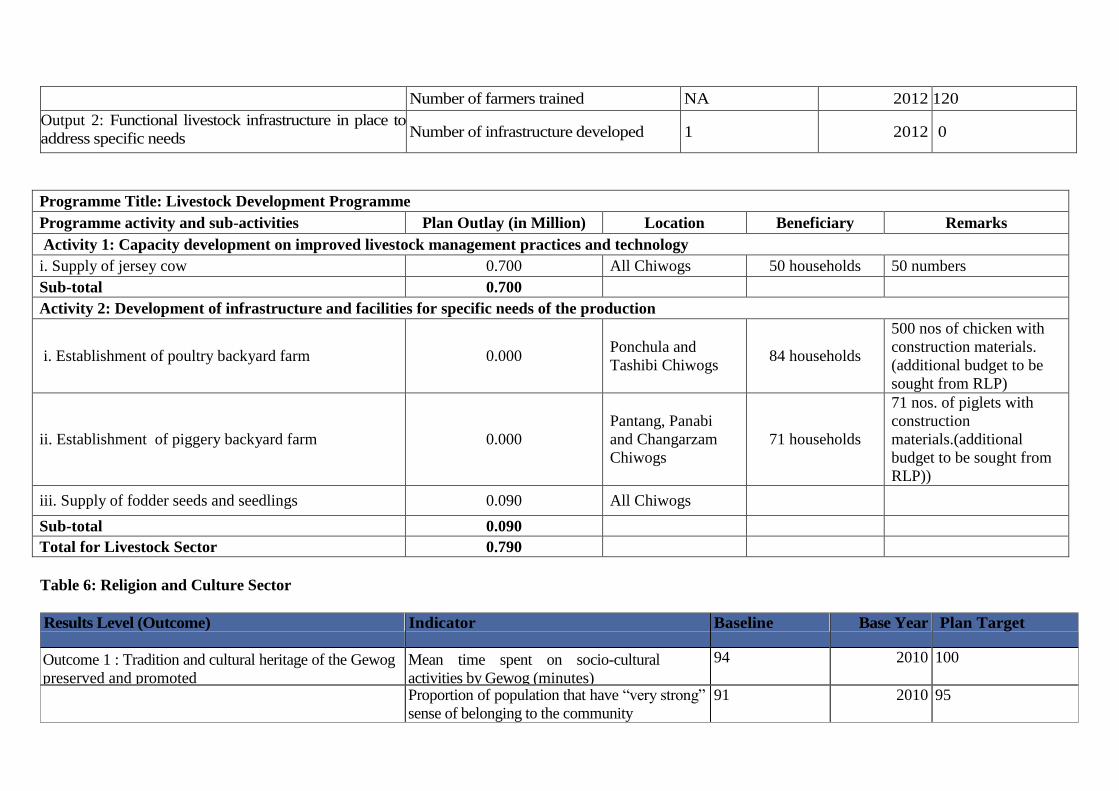
Number of farmers trained NA 2012 120
Output 2: Functional livestock infrastructure in place to
address specific needs Number of infrastructure developed 1 2012 0
Programme Title: Livestock Development Programme
Programme activity and sub-activities Plan Outlay (in Million) Location Beneficiary Remarks
Activity 1: Capacity development on improved livestock management practices and technology
i. Supply of jersey cow 0.700 All Chiwogs 50 households 50 numbers
Sub-total 0.700
Activity 2: Development of infrastructure and facilities for specific needs of the production
i. Establishment of poultry backyard farm 0.000 Ponchula and
Tashibi Chiwogs 84 households
500 nos of chicken with
construction materials.
(additional budget to be
sought from RLP)
ii. Establishment of piggery backyard farm 0.000
Pantang, Panabi
and Changarzam
Chiwogs
71 households
71 nos. of piglets with
construction
materials.(additional
budget to be sought from
RLP))
iii. Supply of fodder seeds and seedlings 0.090 All Chiwogs
Sub-total 0.090
Total for Livestock Sector 0.790
Table 6: Religion and Culture Sector
Results Level (Outcome) Indicator Baseline Base Year Plan Target
Outcome 1 : Tradition and cultural heritage of the Gewog
preserved and promoted
Mean time spent on socio-cultural
activities by Gewog (minutes)
94 2010 100
Proportion of population that have “very strong”
sense of belonging to the community
91 2010 95
Results Level(Output) Indicator Baseline Base Year Plan Target
Output 1: Functional cultural heritage developed in
targeted areas to fulfill spiritual needs of the
communities
Number of religious and cultural
sites renovated/maintained
3 2012 2
Number of religious and cultural
infrastructure developed
NA 2012 4
No. of initiatives taken to promote local
social values and beliefs
3 2012 4
Programme Title: Religion and Culture Development Programme
Programme activity and sub-activities Plan Outlay (in Million) Location Beneficiary Remarks
Activity 1: Develop and safeguard cultural/historical places
i. Debri painting 0.700 Mamung Trong
Lhakhang 17 households
ii. Construction of compound wall 0.400 Pantang and
Ponchula lhakhangs 100 households
iii. Construction of Mani Dungkhor with gate 0.750
Pantang, Ponchula
and Tashibi
Lhakhangs
119 households
iv. Construction of Karmey shed 0.200
Pantang, Ponchula
and Tashibi
Lhakhangs
119 households
v. Construction of Lama Zhimchung 1.200 Pantang lhakhangs
vi. Renovation and Debri painting 0.400 Gujong Lhakhang 155 households
vii. Construction of crematorium 1.000 Ponchula,Tashibi
and Pantang 118 households
viii. Extension of ground 0.150 Tashibi and
Ponchula lhakhangs 85 households
Total for Religion and Culture Sector 4.800
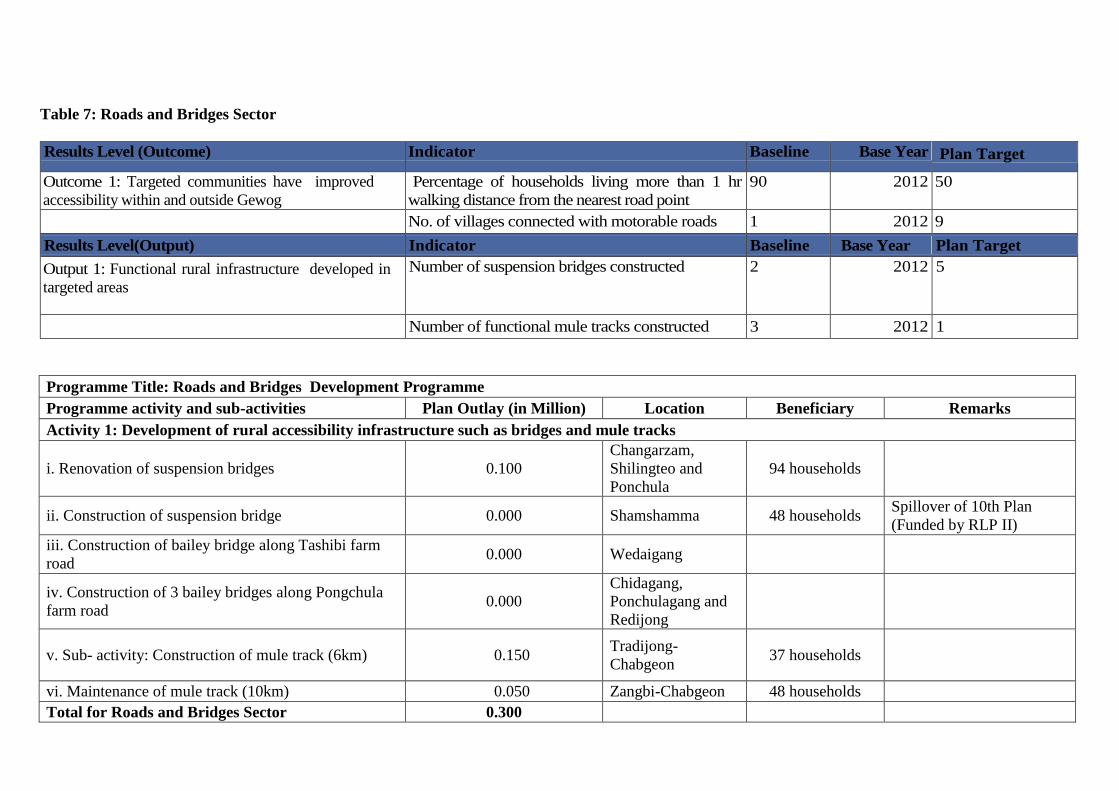
Table 7: Roads and Bridges Sector
Results Level (Outcome) Indicator Baseline Base Year Plan Target
Outcome 1: Targeted communities have improved
accessibility within and outside Gewog
Percentage of households living more than 1 hr
walking distance from the nearest road point
90 2012 50
No. of villages connected with motorable roads 1 2012 9
Results Level(Output) Indicator Baseline Base Year Plan Target
Output 1: Functional rural infrastructure developed in
targeted areas
Number of suspension bridges constructed 2 2012 5
Number of functional mule tracks constructed 3 2012 1
Programme Title: Roads and Bridges Development Programme
Programme activity and sub-activities Plan Outlay (in Million) Location Beneficiary Remarks
Activity 1: Development of rural accessibility infrastructure such as bridges and mule tracks
i. Renovation of suspension bridges 0.100
Changarzam,
Shilingteo and
Ponchula
94 households
ii. Construction of suspension bridge 0.000 Shamshamma 48 households Spillover of 10th Plan
(Funded by RLP II)
iii. Construction of bailey bridge along Tashibi farm
road 0.000 Wedaigang
iv. Construction of 3 bailey bridges along Pongchula
farm road 0.000
Chidagang,
Ponchulagang and
Redijong
v. Sub- activity: Construction of mule track (6km) 0.150 Tradijong-
Chabgeon 37 households
vi. Maintenance of mule track (10km) 0.050 Zangbi-Chabgeon 48 households
Total for Roads and Bridges Sector 0.300
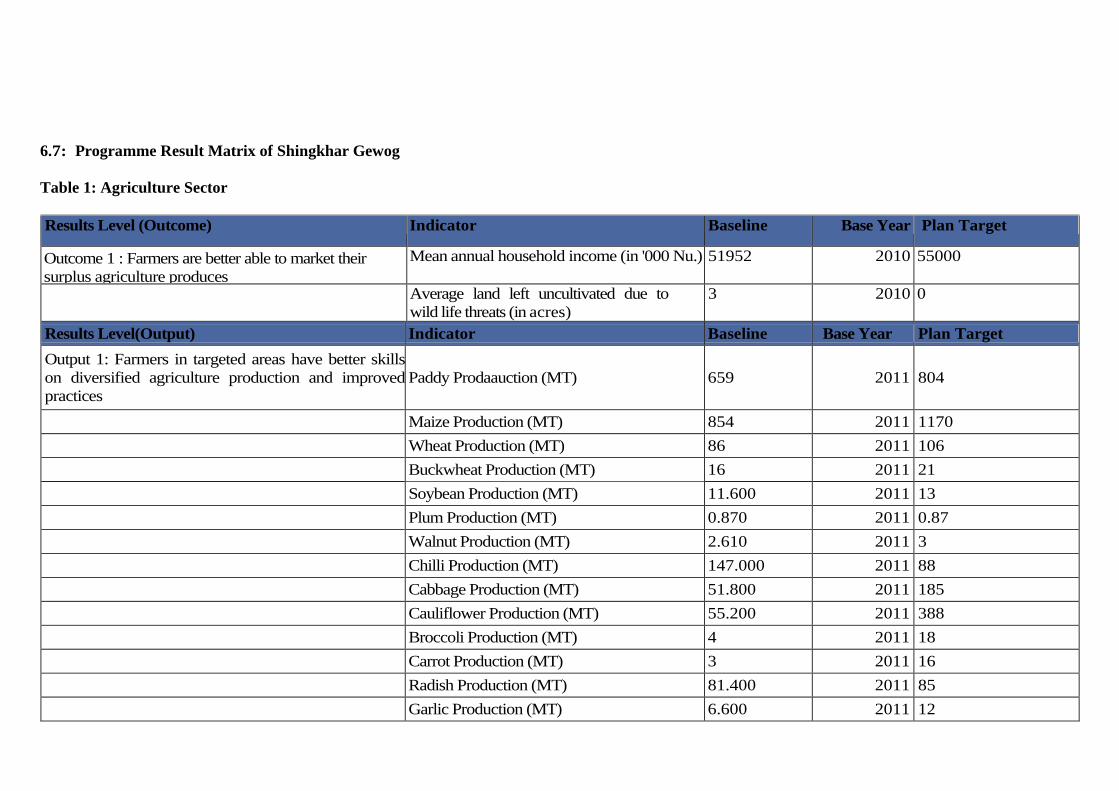
6.7: Programme Result Matrix of Shingkhar Gewog
Table 1: Agriculture Sector
Results Level (Outcome) Indicator Baseline Base Year Plan Target
Outcome 1 : Farmers are better able to market their
surplus agriculture produces
Mean annual household income (in '000 Nu.) 51952 2010 55000
Average land left uncultivated due to
wild life threats (in acres)
3 2010 0
Results Level(Output) Indicator Baseline Base Year Plan Target
Output 1: Farmers in targeted areas have better skills
on diversified agriculture production and improved
practices
Paddy Prodaauction (MT) 659 2011 804
Maize Production (MT) 854 2011 1170
Wheat Production (MT) 86 2011 106
Buckwheat Production (MT) 16 2011 21
Soybean Production (MT) 11.600 2011 13
Plum Production (MT) 0.870 2011 0.87
Walnut Production (MT) 2.610 2011 3
Chilli Production (MT) 147.000 2011 88
Cabbage Production (MT) 51.800 2011 185
Cauliflower Production (MT) 55.200 2011 388
Broccoli Production (MT) 4 2011 18
Carrot Production (MT) 3 2011 16
Radish Production (MT) 81.400 2011 85
Garlic Production (MT) 6.600 2011 12
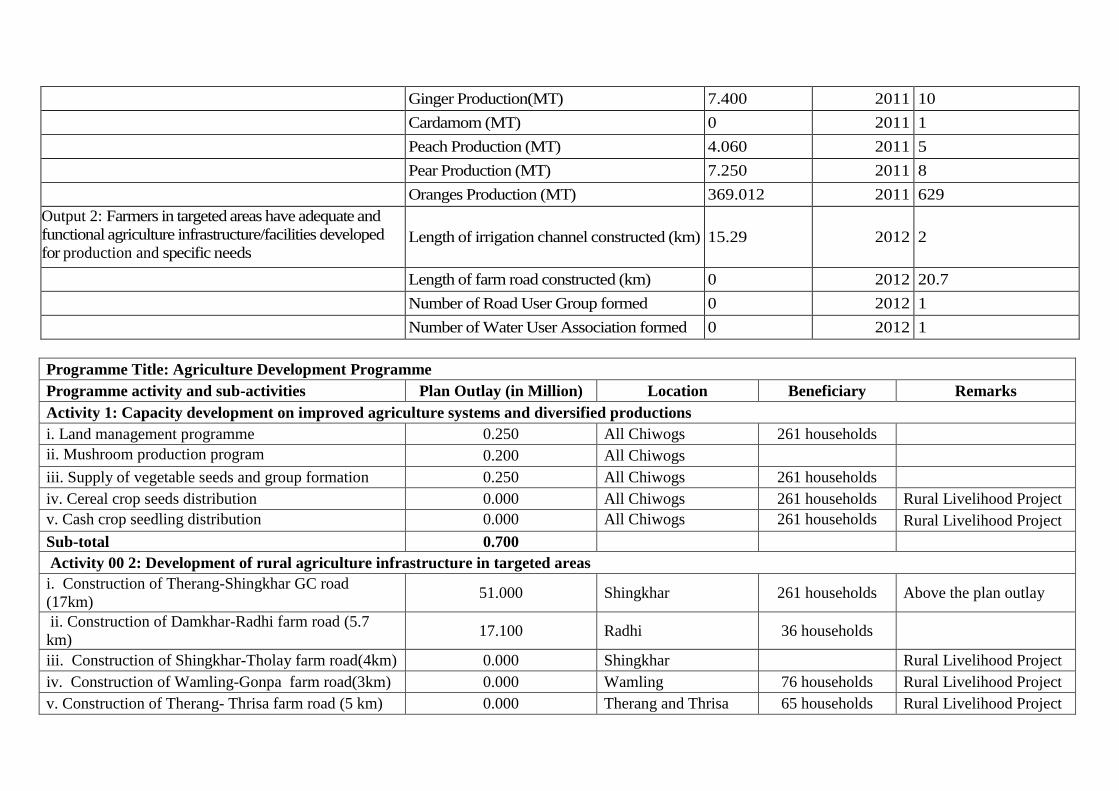
Ginger Production(MT) 7.400 2011 10
Cardamom (MT) 0 2011 1
Peach Production (MT) 4.060 2011 5
Pear Production (MT) 7.250 2011 8
Oranges Production (MT) 369.012 2011 629
Output 2: Farmers in targeted areas have adequate and
functional agriculture infrastructure/facilities developed
for production and specific needs Length of irrigation channel constructed (km) 15.29 2012 2
Length of farm road constructed (km) 0 2012 20.7
Number of Road User Group formed 0 2012 1
Number of Water User Association formed 0 2012 1
Programme Title: Agriculture Development Programme
Programme activity and sub-activities Plan Outlay (in Million) Location Beneficiary Remarks
Activity 1: Capacity development on improved agriculture systems and diversified productions
i. Land management programme 0.250 All Chiwogs 261 households
ii. Mushroom production program 0.200 All Chiwogs
iii. Supply of vegetable seeds and group formation 0.250 All Chiwogs 261 households
iv. Cereal crop seeds distribution 0.000 All Chiwogs 261 households Rural Livelihood Project
v. Cash crop seedling distribution 0.000 All Chiwogs 261 households Rural Livelihood Project
Sub-total 0.700
Activity 00 2: Development of rural agriculture infrastructure in targeted areas
i. Construction of Therang-Shingkhar GC road
(17km) 51.000 Shingkhar 261 households Above the plan outlay
ii. Construction of Damkhar-Radhi farm road (5.7
km) 17.100 Radhi 36 households
iii. Construction of Shingkhar-Tholay farm road(4km) 0.000 Shingkhar Rural Livelihood Project
iv. Construction of Wamling-Gonpa farm road(3km) 0.000 Wamling 76 households Rural Livelihood Project
v. Construction of Therang- Thrisa farm road (5 km) 0.000 Therang and Thrisa 65 households Rural Livelihood Project
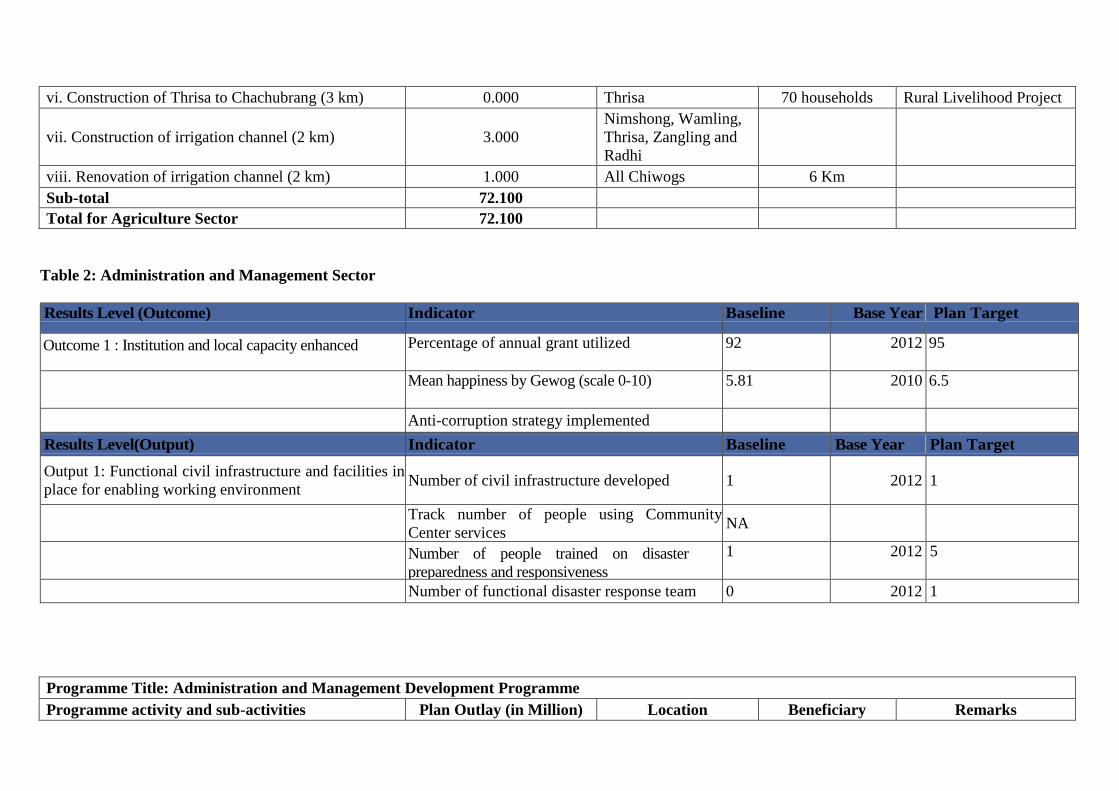
vi. Construction of Thrisa to Chachubrang (3 km) 0.000 Thrisa 70 households Rural Livelihood Project
vii. Construction of irrigation channel (2 km) 3.000
Nimshong, Wamling,
Thrisa, Zangling and
Radhi
viii. Renovation of irrigation channel (2 km) 1.000 All Chiwogs 6 Km
Sub-total 72.100
Total for Agriculture Sector 72.100
Table 2: Administration and Management Sector
Results Level (Outcome) Indicator Baseline Base Year Plan Target
Outcome 1 : Institution and local capacity enhanced Percentage of annual grant utilized 92 2012 95
Mean happiness by Gewog (scale 0-10) 5.81 2010 6.5
Anti-corruption strategy implemented
Results Level(Output) Indicator Baseline Base Year Plan Target
Output 1: Functional civil infrastructure and facilities in
place for enabling working environment Number of civil infrastructure developed 1 2012 1
Track number of people using Community
Center services NA
Number of people trained on disaster
preparedness and responsiveness
1 2012 5
Number of functional disaster response team 0 2012 1
Programme Title: Administration and Management Development Programme
Programme activity and sub-activities Plan Outlay (in Million) Location Beneficiary Remarks
Activity 1: Create enabling working environment for local functionaries and communities
i. Construction of Gewog office 2.460
ii. Supply of office furniture and equipment 0.200
Total for Civil and Administration Sector 2.660
Table 3: Forestry Sector
Results Level (Outcome) Indicator Baseline Base Year Plan Target
Outcome 1: Enhanced sustainable management and
utilization of natural resources
Percent of area maintained under forest cover 77 2012 77
Results Level(Output) Indicator Baseline Base Year Plan Target
Output 1: Farmers in targeted areas have better
skills in management of natural resource
Number of community forestry 2 2012 8
Number of private forestry 0 2012 20
Number of Watershed Management
Programme initiated 0 2012 7
Programme Title: Forestry Development Programme
Programme activity and sub-activities Plan Outlay (in Million) Location Beneficiary Remarks
Activity 1: Farmers skill development on conservation and management of natural resources
i. Establishment of community forestry 0.500
Thrisa, Shingkhar (2
nos) Wamling and
Thajong
194 households 5 CFMG will be formed
ii. Water resource protection and management 0.300 All Chiwogs 261 households 7 water sources
Total for Forestry Sector 0.800
Table 4: Health Sector
Results Level (Outcome) Indicator Baseline Base Year Plan Target
Outcome 1: Enhanced health care facilities and
services of the targeted communities
Immunization coverage 94.6 2012 60
Incidence of infant mortality 0 2012 0
Incidence of under-five mortality (U5M) 0 2012 0
Incidence of maternal mortality 0/1000 2012 0/1000
Mean walking time to the nearest health
care center by Gewog (minutes)
94.6 2010 60
Mean healthy days by Gewog (scale 0-30 days) 24.6 2010 28
Results Level(Output) Indicator Baseline Base Year Plan Target
Output 1: Targeted communities have functional safe
drinking water and sanitation facilities Proportion of households having access to
functional water supply.
90.85 2012 100
Proportion of households having improved
sanitation facilities
98 2012 100
Output 2: Targeted communities have better
knowledge on health and hygiene Number of farmers trained 2012
Number of trainings/awareness programme
initiated
2012
Programme Title: Health Development Programme
Programme activity and sub-activities Plan Outlay (in Million) Location Beneficiary Remarks
Activity 1: Create awareness on health issues
i. Training and awareness on health and sanitation 0.010 7 villages 261 households
Sub-total 0.010
Activity 2: Development of safe drinking water and sanitation facilities
i. Major rehabilitation of Thrisa ORC with toilet and
water
0.500 Thrisa 60 households
ii. Electrification of ORCs 0.500 Thajong, Nimshong,
Radhi and Thrisa
4 numbers
iii. Extension of water source 0.500 All chiwogs 261 households
Sub-total 1.500
Total for Health Sector 1.510
Table 5: Livestock Sector
Results Level (Outcome) Indicator Baseline Base Year Plan Target
Outcome 1 : Enhanced livestock productivity Milk Production (Tons) 96.40 2012 150
Butter Production (Tons) 3.80 2012 6.00
Cheese Production (Tons) 6.90 2012 10.80
Egg Production (Million) 0.01 2012 0.30
Results Level(Output) Indicator Baseline Base Year Plan Target
Output 1:Farmers skill on livestock management
practices strengthened
Number of farmers group/associations 0 2012 1
Number of farmers trained NA 2012 150
Output 2:Functional livestock infrastructure in place to
address specific needs Number of infrastructure developed 1 2012
Programme Title: Livestock Development Programme
Programme activity and sub-activities Plan Outlay (in Million) Location Beneficiary Remarks
Activity 1: Capacity development on improved livestock management practices and technology
i. Supply of Jersey bull 0.050 Shingkhar and
Wamling 120 households
ii. Supply of fodder seeds 0.100 All Chiwogs 261 households
iii. Farmers study tour 0.000 Selected farmers Rural Livelihood Project
iv. Supply of Jersey cow 0.000 All Chiwogs Rural Livelihood Project
Sub-total 0.150
Activity 2: Development of infrastructure and facilities for specific needs of the production
i. Establishment of poultry farm 0.000 7 Villages 7 farms Rural Livelihood Project
Sub-total 0.000
Total for Livestock Sector 0.150
Table 6: Religion and Culture Sector
Results Level (Outcome) Indicator Baseline Base Year Plan Target
Outcome 1 : Tradition and cultural heritage of the Gewog
preserved and promoted
Mean time spent on socio-cultural
activities by Gewog (minutes)
111 2010 120
Proportion of population that have “very strong”
sense of belonging to the community
82 2010 90
Results Level(Output) Indicator Baseline Base Year Plan Target
Output 1: Functional cultural heritage developed in
targeted areas to fulfill spiritual needs of the
communities
Number of religious and cultural
sites renovated/maintained
NA 2012 5
Number of religious and cultural
infrastructure developed
NA 2012 2
Programme Title: Religion and Culture Development Programme
Programme activity and sub-activities Plan Outlay Location Beneficiary Remarks
Activity 1: Develop and safeguard cultural/historical places
i. Construction of crematorium 2.750 All Chiwogs 261 households
ii. Debri Painting for Nimshong Lhakhang 0.200 Nimshong 35 households
iii. Renovation of Wambung Lhakhang (construction
of kitchen, store and ground extension) 0.600 Shingkhar 48 households
iv. Maintenance of kitchen for Radhi Lhakhang 0.053 Radhi 23 households
v. Major renovation and extension of Wamling
Lhakhang 0.500 Wamling 71 households
vi. Renovation of Thrisa Lhakhang (construction of
kitchen, store and ground extension) 0.900 Thrisa 59 households
vii. Maintenance of Choesham 0.100 Zangling Lhakhang
Total for Religion and Culture Sector 5.103
Table 7: Roads and Bridges Sector
Results Level (Outcome) Indicator Baseline Base Year Plan Target
Outcome 1 : Targeted communities have improved
accessibility within and outside Gewog
Percentage of households living more than 1
hr walking distance from the nearest road
point
90 2012 70
Results Level(Output) Indicator Baseline Base Year Plan Target
Output 1: Functional rural infrastructure developed in
targeted areas
Length of mule track constructed (Kms.) 2012 4
Number of functional suspension bridges
constructed 3 2012 3
Programme Title: Roads and Bridges Development Programme
Programme activity and sub-activities Plan Outlay (in Million) Location Beneficiary Remarks
Activity 1: Development of rural accessibility infrastructure such as mule tracks, suspension bridges etc.
i. Construction of Wombugang motorable bridge along
the Gewog Center road (80 ft) 3.520 Thrisa and Wamling 261 households Above the plan outlay
ii. Construction of Yajugang motorable bridge along
the Gewog Center road (100 ft) 4.400
Wamling and
Shingkhar 261 households Above the plan outlay
iii. Construction of Phendeygang motorable bridge
along Damkhar-Radhi farm road 0.000 Damkhar and Radhi 23 households
iv. Construction of mule track (4 km) 0.100 Wamling 71 households
Total for Roads and Bridges Sector 8.020
6.8: Programme Result Matrix of Trong Gewog
Table 1: Agriculture Sector
Results Level (Outcome) Indicator Baseline Base Year Plan Target
Outcome 1 : Farmers are better able to market their
surplus agriculture produces
Mean annual household income (in '000 Nu.) 122373 2010 130000
Average land left uncultivated due to wild
life threats (in Acres)
150 2010 120
Results Level(Output) Indicator Baseline Base Year Plan Target
Output 1: Farmers in targeted areas have better skills
on diversified agriculture production and improved
practices
Buckwheat production (MT) 16 2011 16
Paddy Production (MT) 562 2011 686
Maize Production (MT) 854 2011 1170
Wheat Production (MT) 11 2011 14
Barley Production (MT) 24 2011 32
Mustard Production (MT) 3.989 2011 24
Pear (MT) 1.591 2011 2
Plum (MT) 1.735 2011 2
Walnut (MT) 0.723 2011 1
Chilli (MT) 50.360 2011 88
Cabbage (MT) 28.919 2011 103
Cauliflower (MT) 25.329 2011 178
Garlic (MT) 2.992 2011 6
Ginger (MT) 2.094 2011 3
Cardamom (MT) 0 2011 1
Passion fruit (MT) 0 2011 3
Avocado (MT) 0 2011 3
Turmeric (MT) 0 2011 2
Oranges Production (MT) 369.012 2011 631
Peach production (MT) 0.723 2011 1
Output 2: Farmers in targeted areas have adequate and
functional agriculture infrastructure/facilities developed
for production and specific needs Length of irrigation channel constructed (km) 22.10 2012 5
Length of farm road constructed (km) 39.56 2012 4
Number of Road User Group formed 0 2012 1
Number of Water User Association formed 0 2012 1
Programme Title: Agriculture Development Programme
Programme activity and sub-activities Plan Outlay (in Million) Location Beneficiary Remarks
Activity 1: Capacity development on improved agriculture systems and diversified productions
i. Supply of cereal seeds 0.100 Tama 84 households
ii. Supply of water pump 0.300 Tama 30 households
iii. Supply of vegetable seeds 0.230 Gomphu, Zurphel, Berti
and Dangkhar
iv. Supply of citrus, fruits and cardamom seedlings 0.300 Gomphu, Tshanglajong,
Subrang and Berti
Sub-total 0.930
Activity 2: Development of rural agriculture infrastructure in targeted areas
i. Construction of irrigation channel (5 km) 7.500 Gomphu, Tshanglajong
and Dangkhar
ii. Construction of farm road (4 km) 12.000
Gomphu-Paibang (1km),
Tshanglajong (0.5km),
Tama Gonpa (1km) and
Zurphel Pam (1.5km)
iii. Maintenance of farm road/permanent structure of
farm road (5.9 km) 8.850
Tama, Subrang, Dangkhar
and Trong Pam
iv. Maintenance of irrigation channel (5 km) 2.500 Tshanglajong and
Dangkhar
Sub-total 31.780
Total for Agriculture Sector 32.710
Table 2: Administration and Management Sector
Results Level (Outcome) Indicator Baseline Base Year Plan Target
Outcome 1 : Institution and local capacity enhanced Percentage of annual grant utilized 92 2012 95
Mean happiness by Gewog (scale 0-10) 5.61 2010 6
Anti-corruption strategy implemented
Results Level(Output) Indicator Baseline Base Year Plan Target
Output 1: Functional civil infrastructure and facilities in
place for enabling working environment
Number of civil infrastructure
developed 1 2012 1
Track number of people using
Community Center services NA 2012
Number of people trained on disaster
preparedness and responsiveness
1 2012 5
Number of functional disaster response
team 0 2012 1
Programme Title: Administration and Management Development Programme
Programme activity and sub-activities Plan Outlay (in Million) Location Beneficiary Remarks
Activity 1: Create enabling working environment for local functionaries and communities
i. Construction of public toilet 0.200 Tingtibi
ii. Blacktopping of Gewog approach road 0.500
Tingtibi
iii. Sub- activity: Renovation of Gewog office 0.150 Tingtibi
iv. Construction of Gewog store 1.000 Tingtibi
v. Procurement of office equipment 0.050 Gewog Office
vi. Procurement of furniture 0.050
Total for Civil and Administration Sector 1.850
Table 3: Forestry Sector
Results Level (Outcome) Indicator Baseline Base Year Plan Target
Outcome 1 : Enhanced sustainable management and
utilization of natural resources
Percent of area maintained under forest
cover
92 2012 92
Results Level(Output) Indicator Baseline Base Year Plan Target
Output 1: Farmers in targeted areas have better
skills in management of natural resource
Number of community forestry 3 2012 5
Number of private forestry 12 2012 20
Number of Watershed Management
Programme initiated 0 2012 0
Programme Title: Forestry Development Programme
Programme activity and sub-activities Plan Outlay (in Million) Location Beneficiary Remarks
Activity 001: Farmers skill development on conservation and management of natural resources
i. Establishment of community forest 0.450 Zurphel, Gomphu and
Berti 165 households
5 CFM Groups will
be formed
ii. Initiation and establishment of private forest 0.060 Dangkhar, Gomphu and
Zurphel 69 households
iii. Water resources protection and management 0.270
Zurphel, Dangkhar, Tama,
Gomphu, Tshanglajong
and Berti
6 Chiwogs 9 water sources \
iv. Supply of tree seedlings 0.060 Tama, Berti and Gomphu 69 households
Total for Forestry Sector 0.840
Table 4: Health Sector
Results Level (Outcome) Indicator Baseline Base Year Plan Target
Outcome 1 : Enhanced health care facilities and
services in the targeted communities
Immunization coverage 100 2012 100
Incidence of infant mortality 0 2012 0
Incidence of under-five mortality
(U5M) 0 2012 0
Incidence of maternal mortality 0/1000 2012 0/1000
Mean walking time to the nearest
health care center by Gewog
(minutes)
84.8 2010 60
Mean healthy days by Gewog (scale 0-
30 days) 27.6 2010 28
Results Level(Output) Indicator Baseline Base Year Plan Target
Output 1: Targeted communities have functional safe
drinking water and sanitation facilities Proportion of households having
access to functional water supply.
100 2012 100
Proportion of households having
improved sanitation facilities
97 2012 100
Programme Title: Health Development Programme
Programme activity and sub-activities Plan Outlay (in Million) Location Beneficiary Remarks
Activity 1: Development of safe drinking water and sanitation facilities
i. Construction of waste disposal pit 0.045 Tshanglajong
ii. Construction of RWSS 0.720 Subrang and Dangkhar
iii. Rehabilitation of RWSS 0.270 Zurphel
iv. Extension of water source 1.000
Tama, Tshanglajong,
Zurphel, Dangkhar and
Berti
v. Spring protection 0.060 Tama/Gomphu
Total for Health Sector 2.095
Table 5: Livestock Sector
Results Level (Outcome) Indicator Baseline Base Year Plan Target
Outcome 1 : Enhanced livestock productivity Milk Production (Tons) 198.40 2012 300
Butter Production (Tons) 7.90 2012 12.00
Cheese Production (Tons) 14.20 2012 21.60
Egg Production (Million) 0.20 2012 1.00
Pork Production (Tons) 4.60 2012 9.40
Fish production (Tons) 0.90 2012 2.00
Results Level(Output) Indicator Baseline Base Year Plan Target
Output 1:Farmers skill on livestock management
practices strengthened through formation of self-help
groups and capacity development Number of farmers group/associations 2 2012 1
Number of farmers trained NA 2012 200
Output 2: Functional livestock infrastructure in place to
address specific needs Number of infrastructure developed 1 2012 0
Programme Title: Livestock Development Programme
Programme activity and sub-activities Plan Outlay Location Beneficiary Remarks
Activity 1: Capacity development on improved livestock management practices and technology
i. Supply of jersey bulls and cows 0.217 Berti, Tshanglajong and
Zurphel
ii. Supply of feed and fodder 0.080 Berti and Subrang
iii. Artificial insemination 0.000 Tama and Gomphu
Sub-total 0.297
Activity 2: Development of infrastructure and facilities
i. Establishment of dairy farms 0.800 Tama, Berti, Subrang and
Tshanglajong
Sub-total 0.800
Total for Livestock Sector 1.097
Table 6: Religion and Culture Sector
Results Level (Outcome) Indicator Baseline Base Year Plan Target
Outcome 1: Tradition and cultural heritage of the Gewog
preserved and promoted
Mean time spent on socio-cultural
activities by Gewog (minutes)
61 2010 80
Proportion of population that have “very
strong” sense of belonging to the
community
74 2010 80
Results Level(Output) Indicator Baseline Base Year Plan Target
Output 1: Functional cultural heritage developed in
targeted areas to fulfill spiritual needs of the
communities
Number of religious and
cultural sites
renovated/maintained
NA 2012 3
Number of religious and cultural
infrastructure developed
3 2012 5
Programme Title: Religion and Culture Development Programme
Programme activity and sub-activities Plan Outlay Location Beneficiary Remarks
Activity 1: Develop and safeguard cultural/historical places
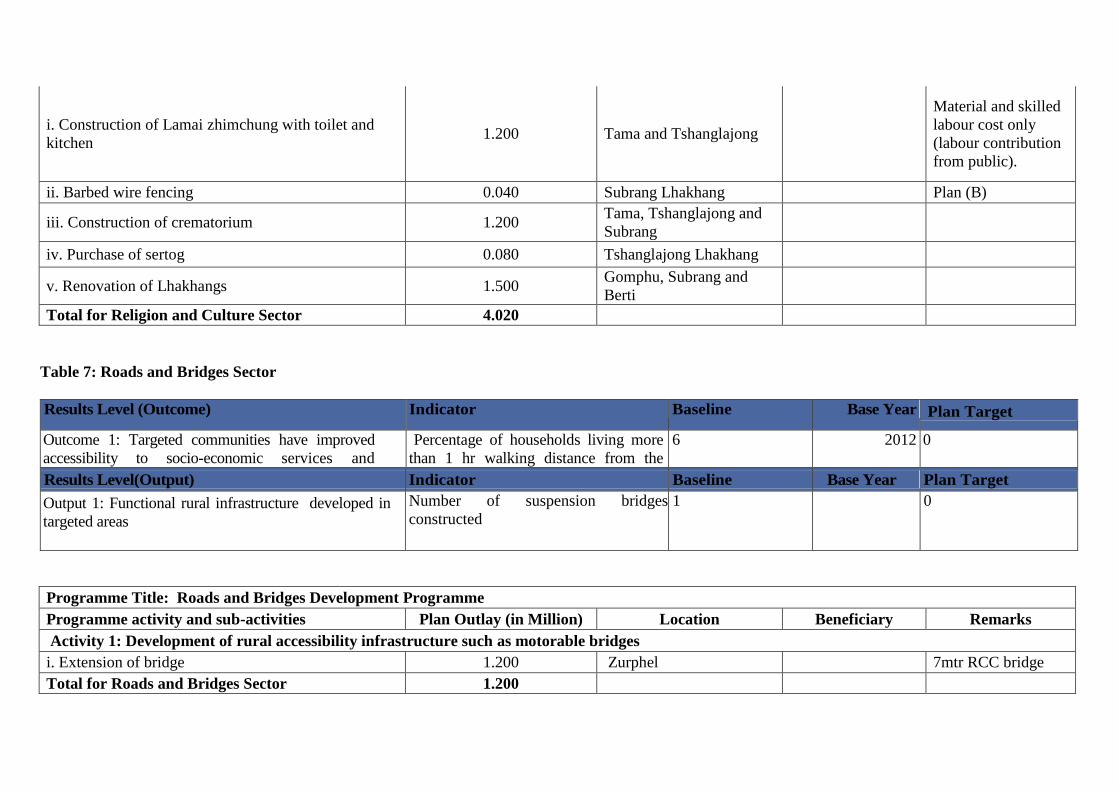
i. Construction of Lamai zhimchung with toilet and
kitchen 1.200 Tama and Tshanglajong
Material and skilled
labour cost only
(labour contribution
from public).
ii. Barbed wire fencing 0.040 Subrang Lhakhang Plan (B)
iii. Construction of crematorium 1.200 Tama, Tshanglajong and
Subrang
iv. Purchase of sertog 0.080 Tshanglajong Lhakhang
v. Renovation of Lhakhangs 1.500 Gomphu, Subrang and
Berti
Total for Religion and Culture Sector 4.020
Table 7: Roads and Bridges Sector
Results Level (Outcome) Indicator Baseline Base Year Plan Target
Outcome 1: Targeted communities have improved
accessibility to socio-economic services and
information
Percentage of households living more
than 1 hr walking distance from the
nearest road point
6 2012 0
Results Level(Output) Indicator Baseline Base Year Plan Target
Output 1: Functional rural infrastructure developed in
targeted areas
Number of suspension bridges
constructed
1 0
Programme Title: Roads and Bridges Development Programme
Programme activity and sub-activities Plan Outlay (in Million) Location Beneficiary Remarks
Activity 1: Development of rural accessibility infrastructure such as motorable bridges
i. Extension of bridge 1.200 Zurphel 7mtr RCC bridge
Total for Roads and Bridges Sector 1.200


