Embed Size (px)
Citation preview
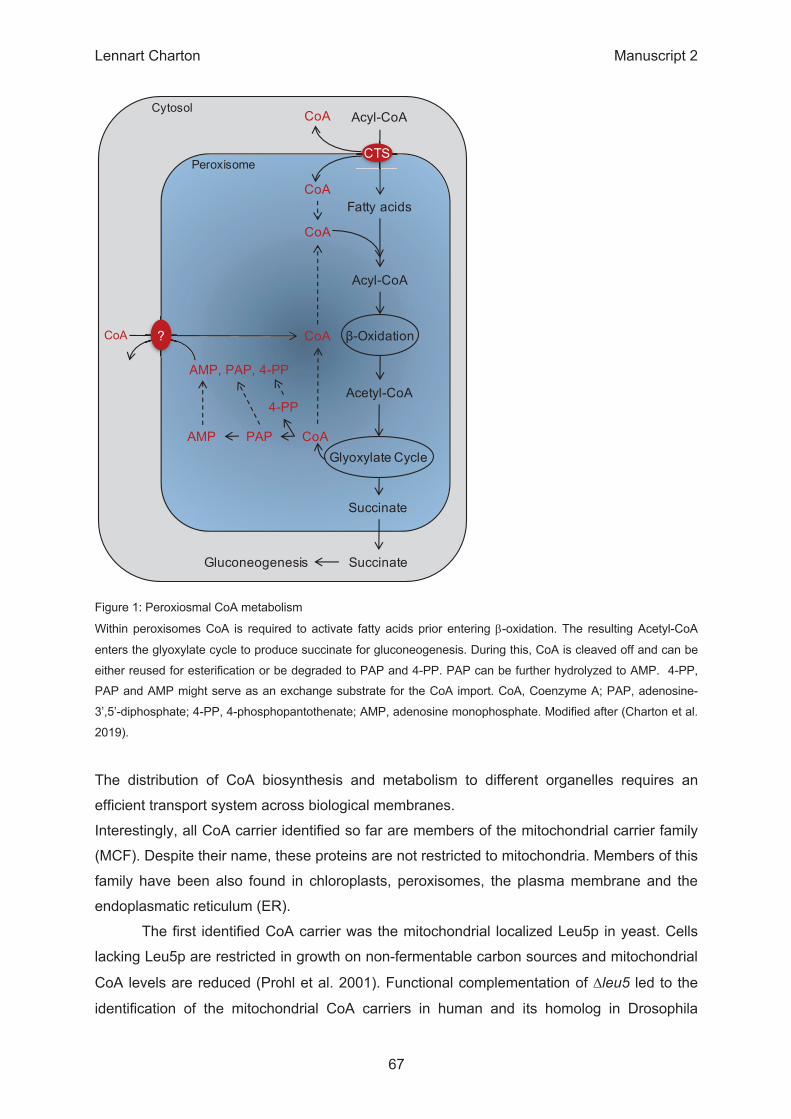
β
β
β
β
β
β
β
β
β
β
β
β
β
β
β
β
α
β
β
β
β
β
β
β
β
β
β
β
α
β
- -
Δ Δ
ε
At1g07030
At2g30160
SAMC1
SAMC2
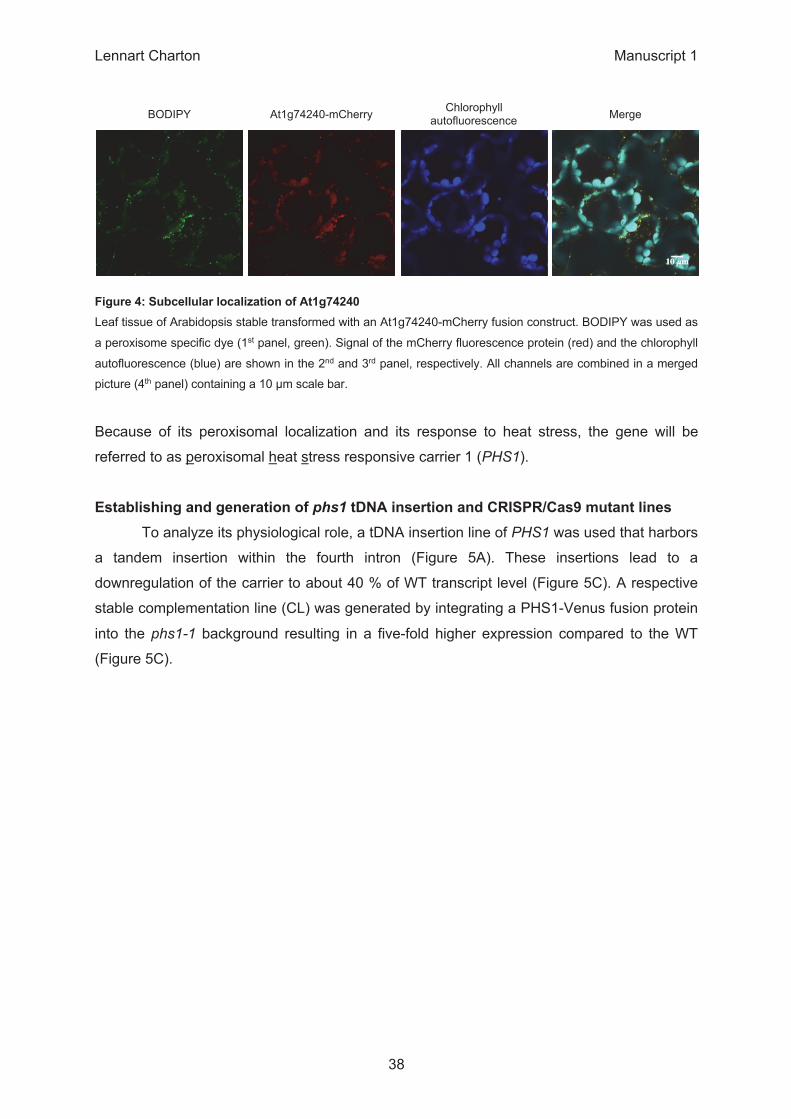
At1g74240
SAMT-like
Ca-SA
MT-like
MFL1
MTM1-lik
e
MTM1
Perc
ent o
f WT
MN
E
0
50
100
150
500
1000
1500
WT phr1-1 CL WT phr1-1 CL 0
20
40
60
80
100
*
Roo
t len
gth
(mm
)
WT C 6-1 C 7 C WT HS 6-1 HS 7 HS0
20
40
60
80
*
heat shockeduntreated
Roo
t len
gth
(mm
)
0.0
0.5
1.0
1.5
2.0
untreatedheat shocked
***
*
mm
ol M
DA
mg
FW-1
1st ATG 2nd ATG0.0
0.5
1.0
1.5
2.0
2.5
ControlHSM
NE
0.0
0.5
1.0
1.5
1 % sucrosew/o sucrose
Roo
t len
gth
(cm
) ** **
0
20
40
60
80
100
0 h 24 h48 h
C20
:1 re
sp. m
g se
eds-1
* **
WT phr1-10
1
2
3
***
405/
488
nm ra
tio
Ratio
none
none
none
ratio ox.
red.
1
2
3
4
5
Ratio
none
none
none
none
none
none
none
ratio ox.
red.
1
2
3
4
5
WT pertl6-10.0
0.1
0.2
0.3
0.4µg
Chl
mg
FW-1
WT cat20.0
0.1
0.2
0.3
0.4
µg C
hl m
g FW
-1
WT x0.0
0.1
0.2
0.3
0.4
µg C
hl m
g FW
-1
WT dwarf 10.0
0.1
0.2
0.3
0.4µg
Chl
mg
FW-1
***
Pyruvate
WT
pertl6
-1ca
t2
pertl6
-1xca
t2dw
arf0
5
10
15
Rel
. Res
p.
Fumarate
WT
pertl6
-1ca
t2
pertl6
-1xca
t2dw
arf0
1000
2000
3000
Rel
. Res
p.
Citrate + Isocitrate
WT
pertl6
-1ca
t2
pertl6
-1xca
t2dw
arf0
100
200
300
400
Rel
. Res
p.
Malate
WT
pertl6
-1ca
t2
pertl6
-1xca
t2dw
arf0
200400600800
1000
Rel
. Res
p.
alpha-Ketoglutarate
WT
pertl6
-1ca
t2
pertl6
-1xca
t2dw
arf02468
10
Rel
. Res
p.
Succinate
WT
pertl6
-1ca
t2
pertl6
-1xca
t2dw
arf0
10
20
30
Rel
. Res
p.
Fructose
WT
pertl6
-1ca
t2
pertl6
-1xca
t2dw
arf0
500
1000
1500
Rel
. Res
p.
Glucose
WT
pertl6
-1ca
t2
pertl6
-1xca
t2dw
arf0
5001000150020002500
Rel
. Res
p.
Maltose
WT
pertl6
-1ca
t2
pertl6
-1xca
t2dw
arf0
10
20
30
40
Rel
. Res
p.
Sucrose
WT
pertl6
-1ca
t2
pertl6
-1xca
t2dw
arf0
1000
2000
3000
4000
Rel
. Res
p.
*
***
*** ***
*
*** **
**
***
***
***
***
***
Δ
β
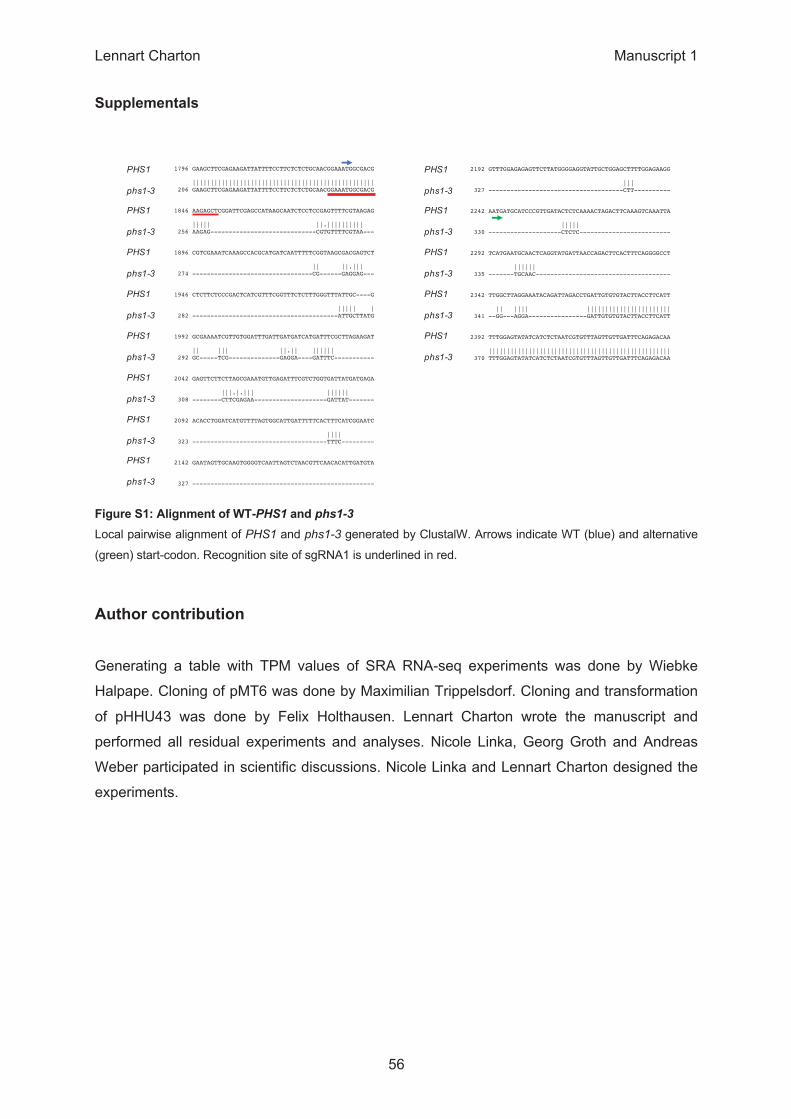
PHS1 1796 GAAGCTTCGAGAAGATTATTTTCCTTCTCTCTGCAACGGAAATGGCGACG 1845 ||||||||||||||||||||||||||||||||||||||||||||||||||phs1-4 206 GAAGCTTCGAGAAGATTATTTTCCTTCTCTCTGCAACGGAAATGGCGACG 255
PHS1 1846 AAGAGCTCGGATTCGAGCCATAAGCAATCTCCTCCGAGTTTTCGTAAGAG 1895 ||||| ||.|||||||||| phs1-4 256 AAGAG-----------------------------CGTGTTTTCGTAA--- 273
PHS1 1896 CGTCGAAATCAAAGCCACGCATGATCAATTTTTCGGTAAGCGACGAGTCT 1945 || ||.||| phs1-4 274 ---------------------------------CG------GAGGAG--- 281
PHS1 1946 CTCTTCTCCCGACTCATCGTTTCGGTTTCTCTTTGGGTTTATTGC----G 1991 ||||| |phs1-4 282 ----------------------------------------ATTGCTTATG 291
PHS1 1992 GCGAAAATCGTTGTGGATTTGATTGATGATCATGATTTCGCTTAGAAGAT 2041 || ||| ||.|| |||||| phs1-4 292 GC-----TCG--------------GAGGA----GATTTC----------- 307
PHS1 2042 GAGTTCTTCTTAGCGAAATGTTGAGATTTCGTCTGGTGATTATGATGAGA 2091 |||.|.||| |||||| phs1-4 308 --------CTTCGAGAA--------------------GATTAT------- 322
PHS1 2092 ACACCTGGATCATGTTTTAGTGGCATTGATTTTTCACTTTCATCGGAATC 2141 |||| phs1-4 323 -------------------------------------TTTC--------- 326
PHS1 2142 GAATAGTTGCAAGTGGGGTCAATTAGTCTAACGTTCAACACATTGATGTA 2191 phs1-4 327 -------------------------------------------------- 326
PHS1 2192 GTTTGGAGAGAGTTCTTATGGGGAGGTATTGCTGGAGCTTTTGGAGAAGG 2241 ||| phs1-4 327 -------------------------------------CTT---------- 329
PHS1 2242 AATGATGCATCCCGTTGATACTCTCAAAACTAGACTTCAAAGTCAAATTA 2291 ||||| phs1-4 330 --------------------CTCTC------------------------- 334
PHS1 2292 TCATGAATGCAACTCAGGTATGATTAACCAGACTTCACTTTCAGGGGCCT 2341 |||||| phs1-4 335 -------TGCAAC------------------------------------- 340
PHS1 2342 TTGGCTTAGGAAATACAGATTAGACCTGATTGTGTGTACTTACCTTCATT 2391 || |||| |||||||||||||||||||||||phs1-4 341 --GG---AGGA----------------GATTGTGTGTACTTACCTTCATT 369
PHS1 2392 TTTGGAGTATATCATCTCTAATCGTGTTTAGTTGTTGATTTCAGAGACAA 2441 ||||||||||||||||||||||||||||||||||||||||||||||||||phs1-4 370 TTTGGAGTATATCATCTCTAATCGTGTTTAGTTGTTGATTTCAGAGACAA 419

β
β
β
β
β
β
Δ
Δ
β
Δ Δ
Δ
- -
At3g55640
At-PXN
H-Slc25a17
At-PNC1
At-PNC2
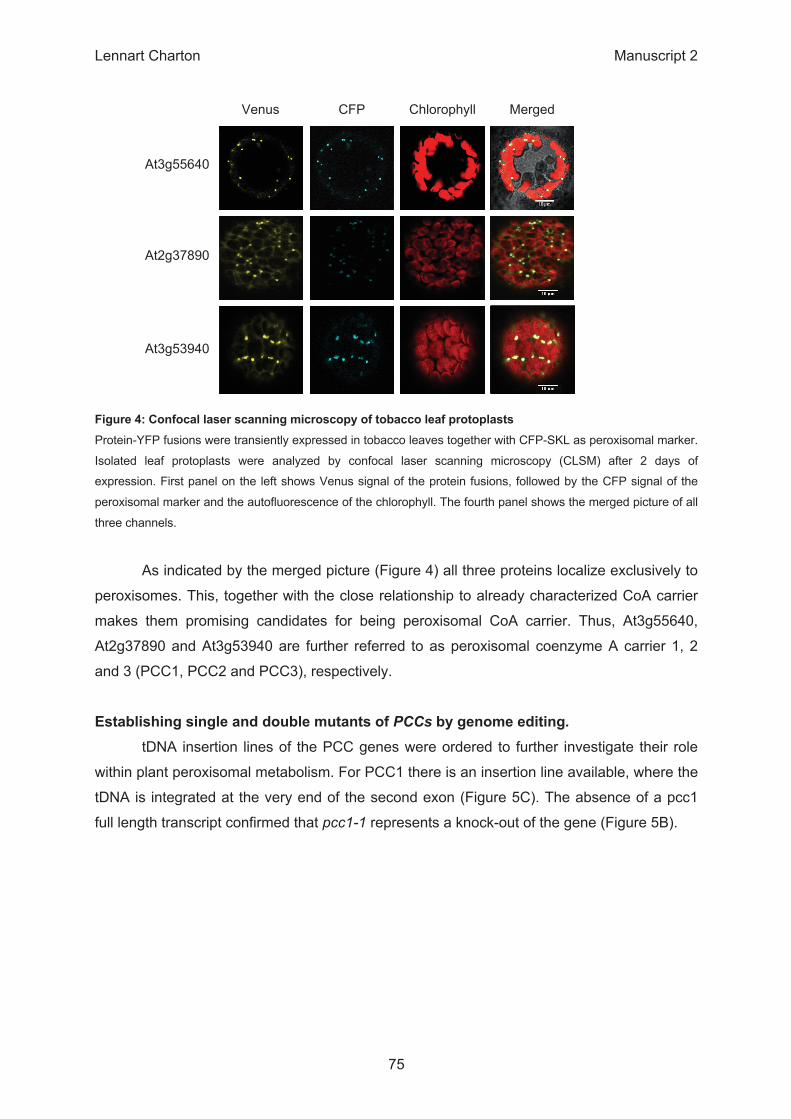
β
β
β
β
β
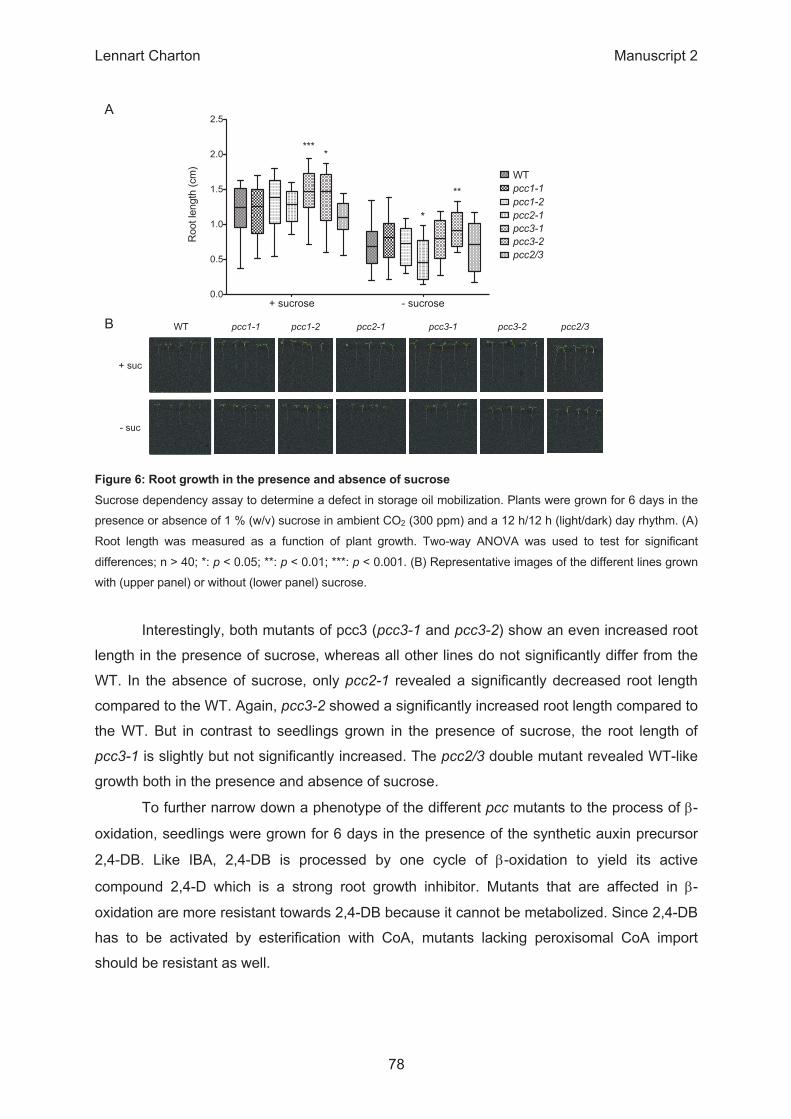
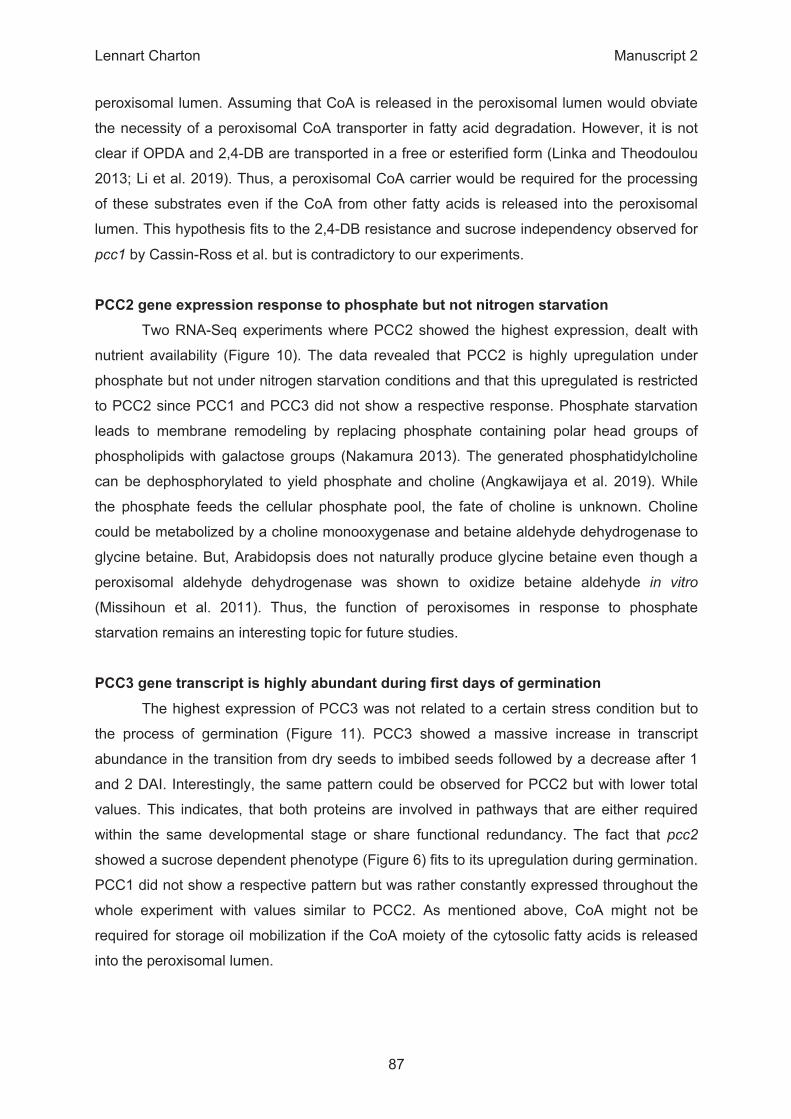
+ sucrose - sucrose0.0
0.5
1.0
1.5
2.0
2.5
WT pcc1-1pcc1-2pcc2-1pcc3-1pcc3-2pcc2/3
Roo
t len
gth
(cm
)
*
****
**
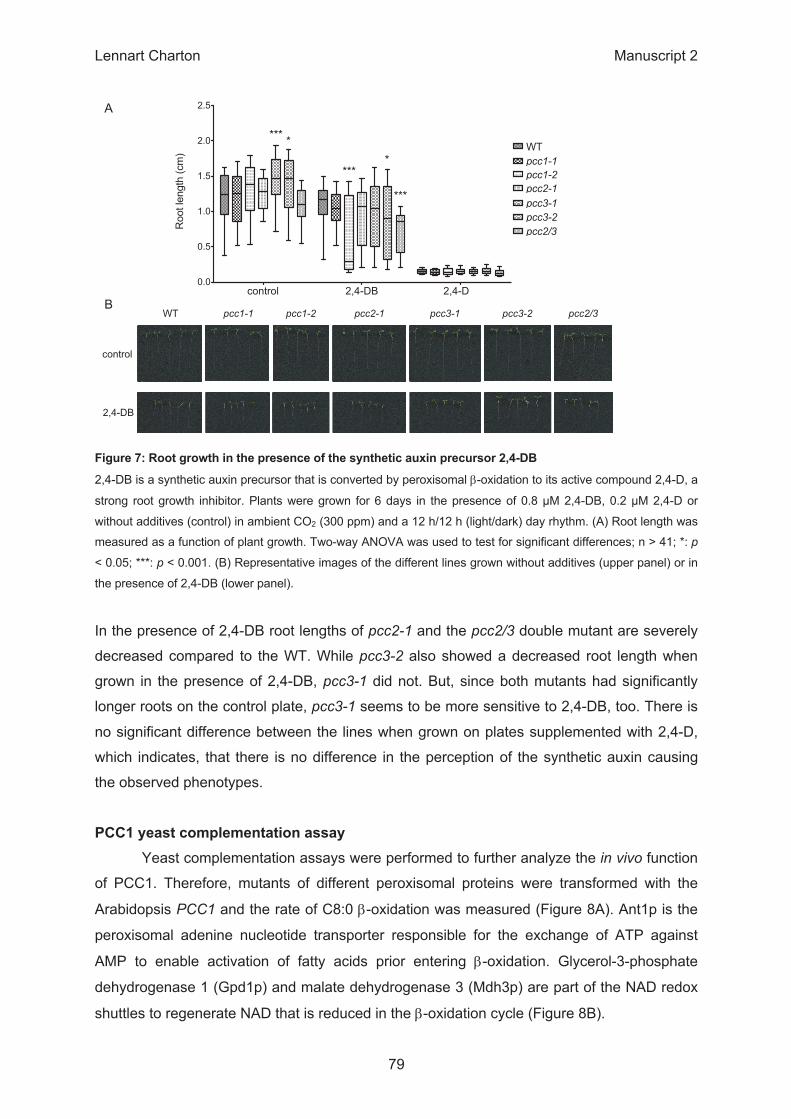
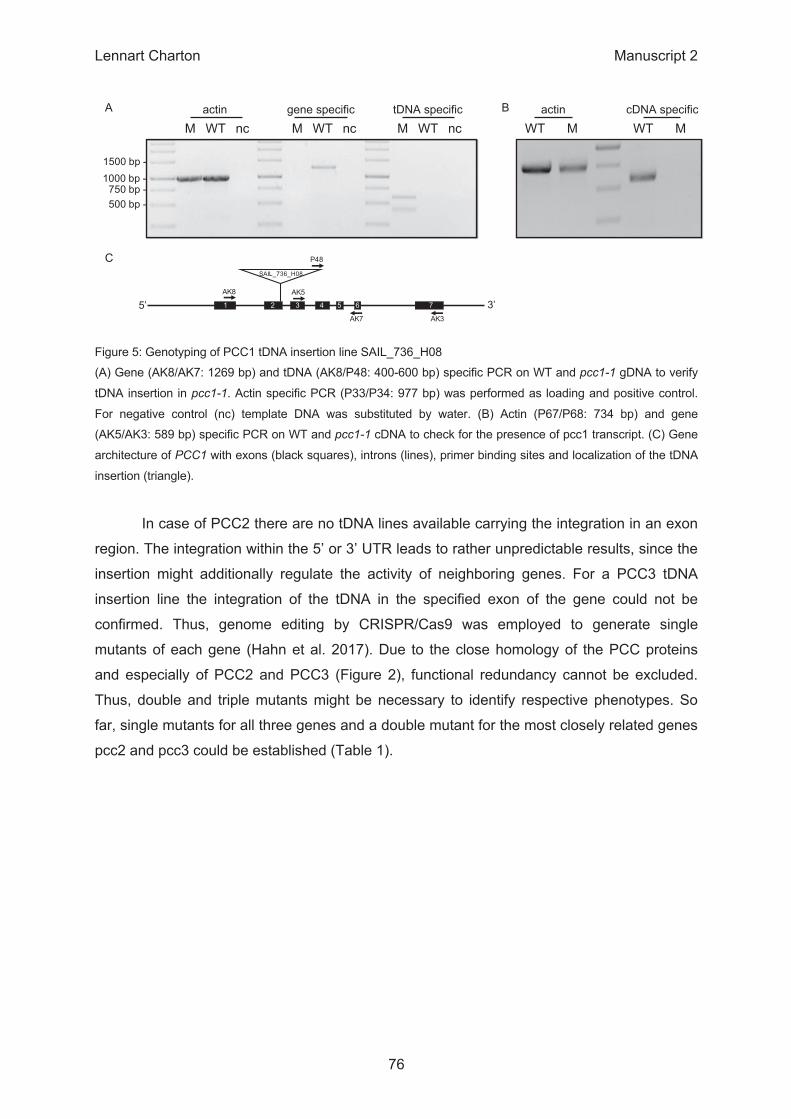
β
β
β
β
control 2,4-DB 2,4-D 0.0
0.5
1.0
1.5
2.0
2.5
WTpcc1-1pcc1-2pcc2-1pcc3-1pcc3-2pcc2/3
***
*** **
***R
oot l
engt
h (c
m)
ββ
β
Δ Δ
Δ
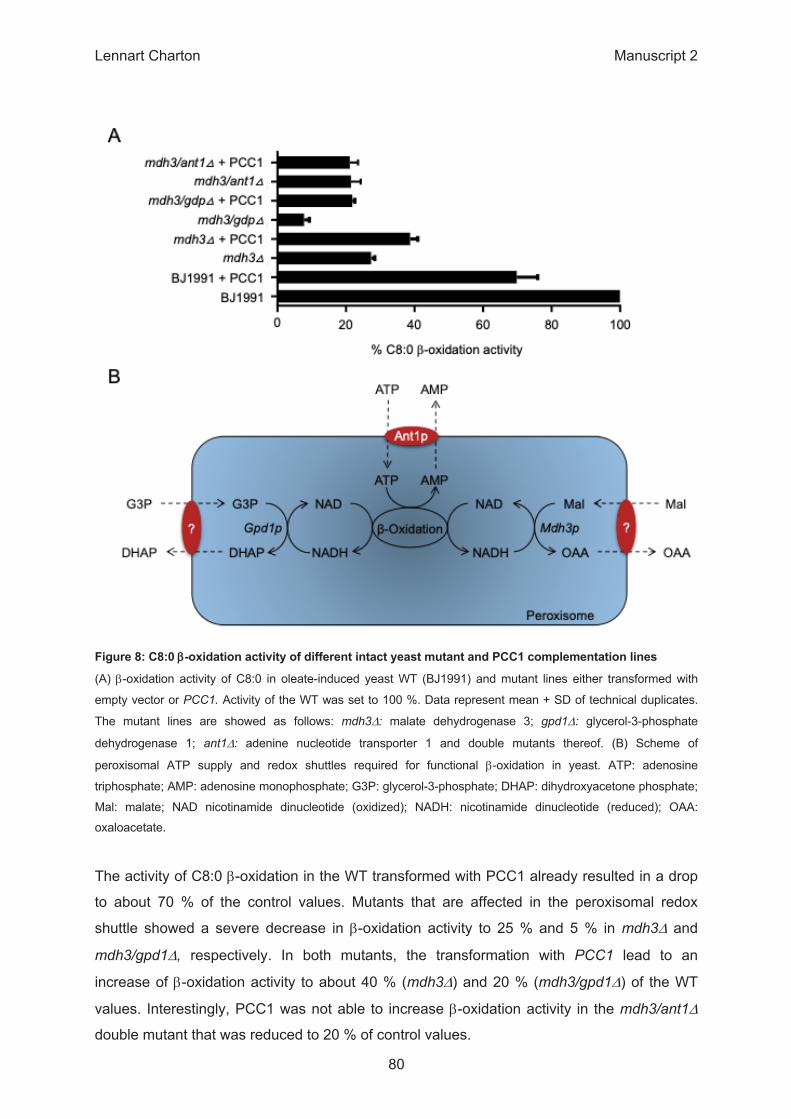
β
β
β Δ
Δ
β Δ Δ
β Δ
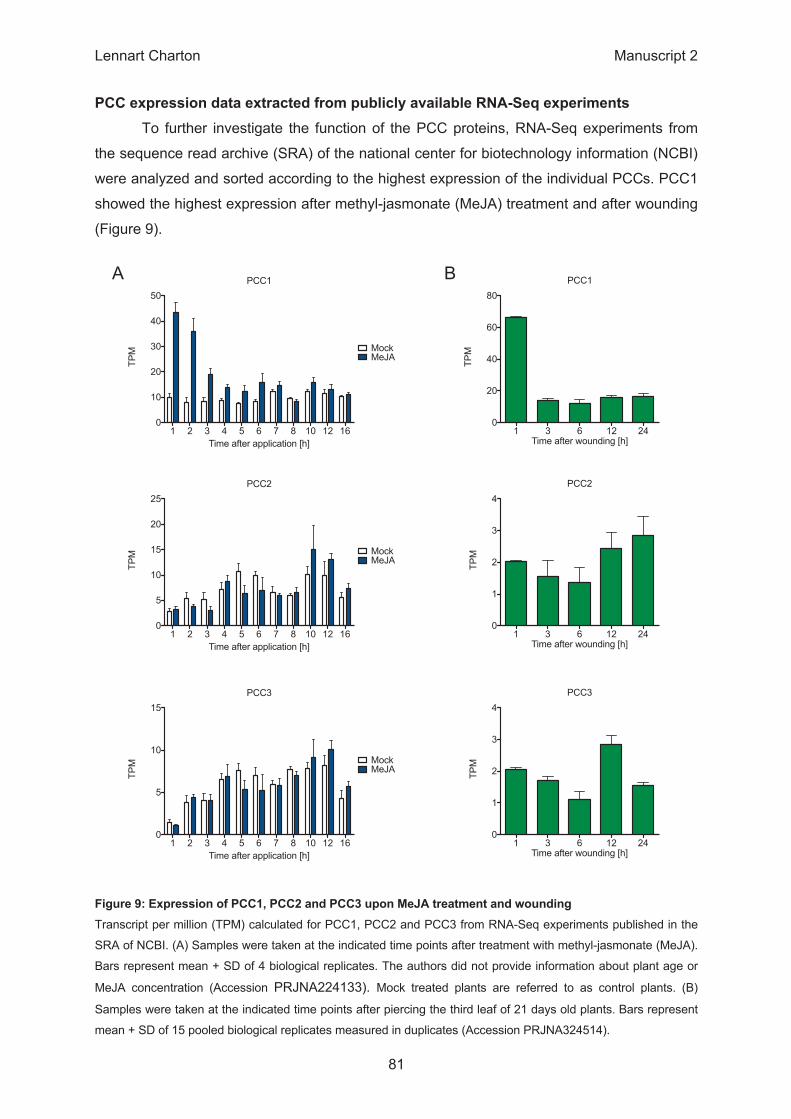
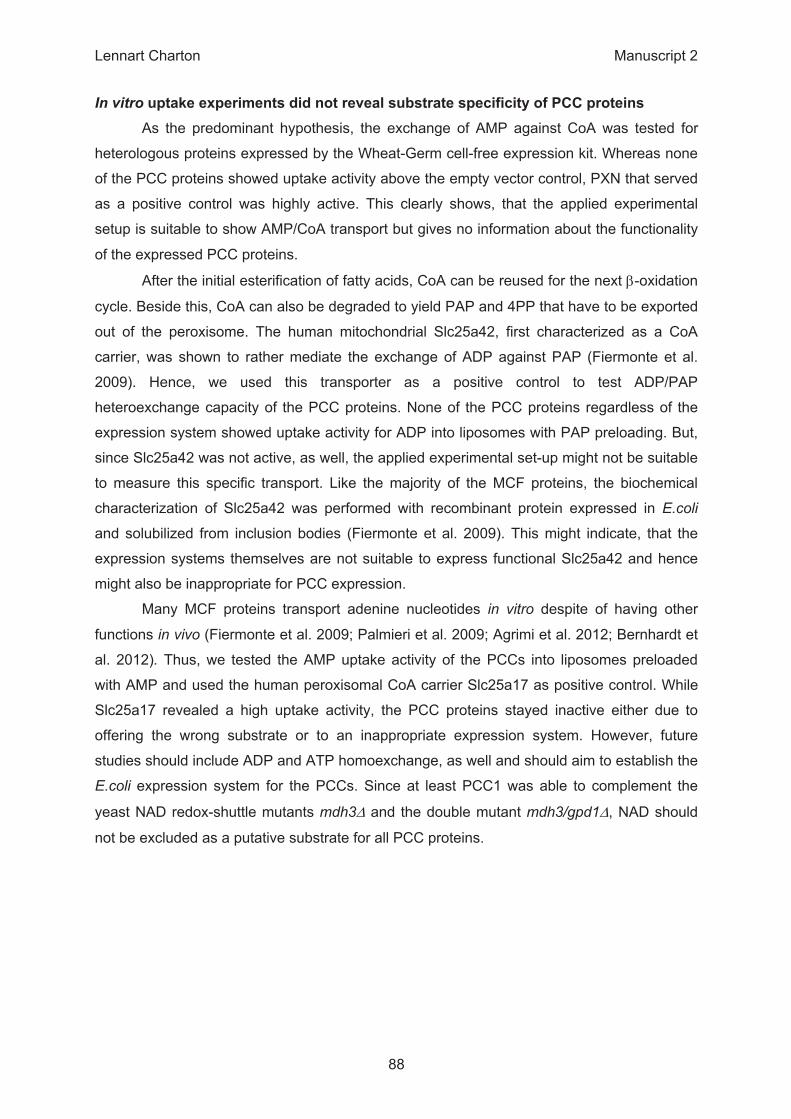
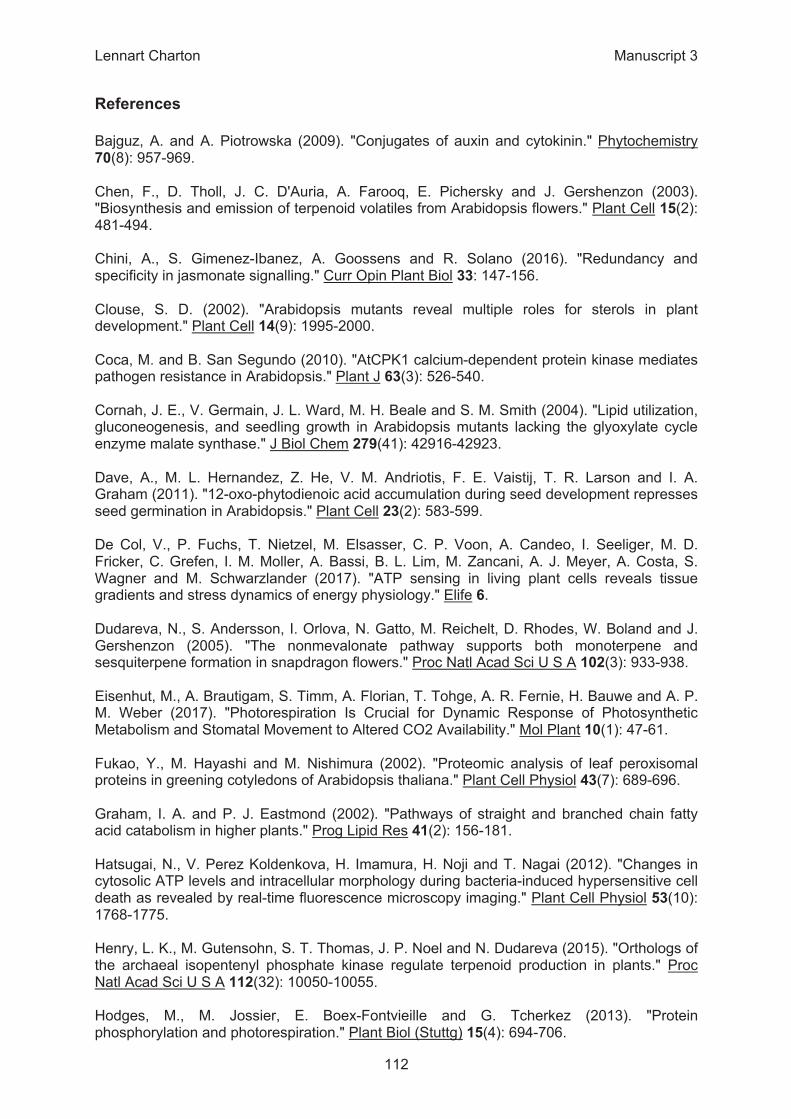
PCC1
1 2 3 4 5 6 7 8 10 12 160
10
20
30
40
50
MockMeJA
Time after application [h]
TPM
PCC2
1 2 3 4 5 6 7 8 10 12 160
5
10
15
20
25
MockMeJA
Time after application [h]
TPM
PCC3
1 2 3 4 5 6 7 8 10 12 160
5
10
15
MockMeJA
Time after application [h]
TPM
PCC1
1 3 6 12 240
20
40
60
80
Time after wounding [h]
TPM
PCC2
1 3 6 12 240
1
2
3
4
Time after wounding [h]
TPM
PCC3
1 3 6 12 240
1
2
3
4
Time after wounding [h]
TPM
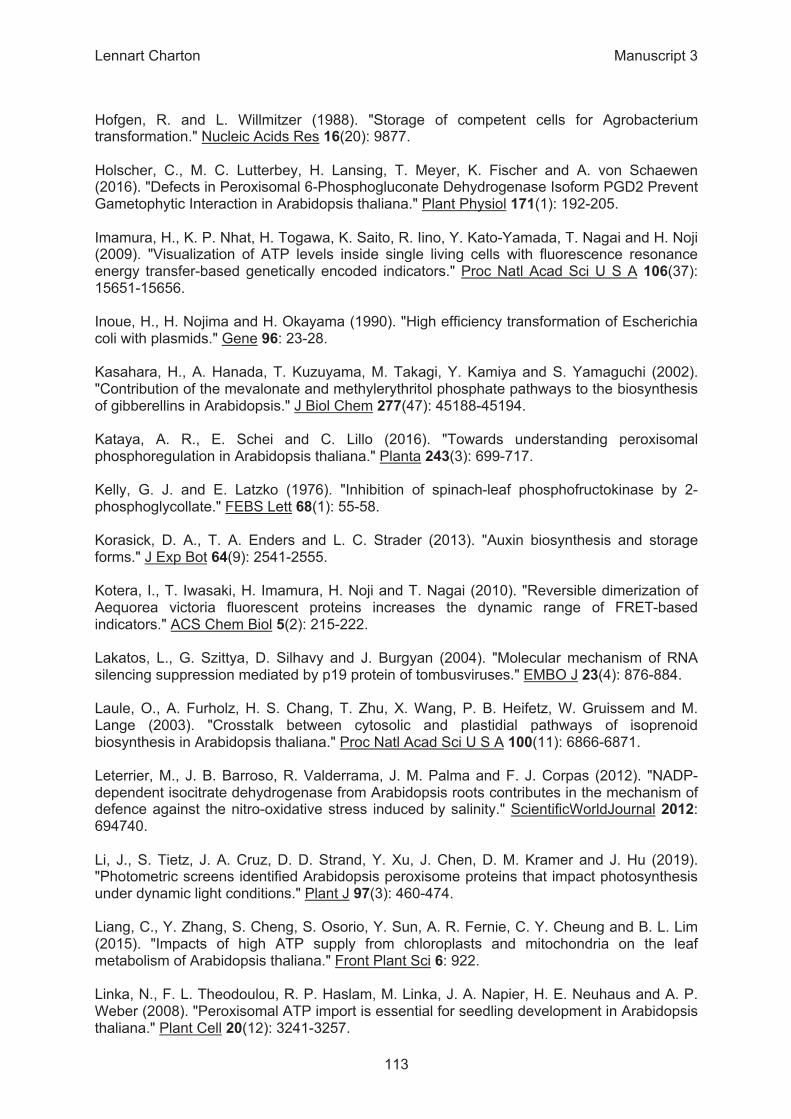
A B
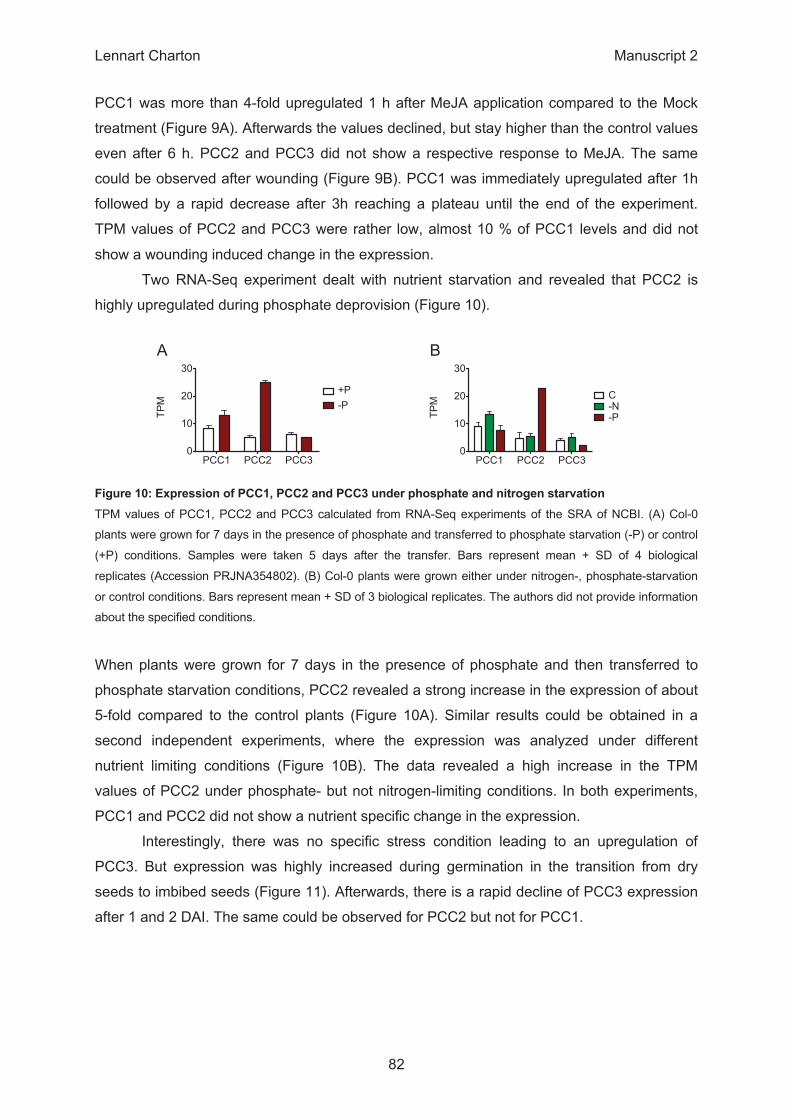
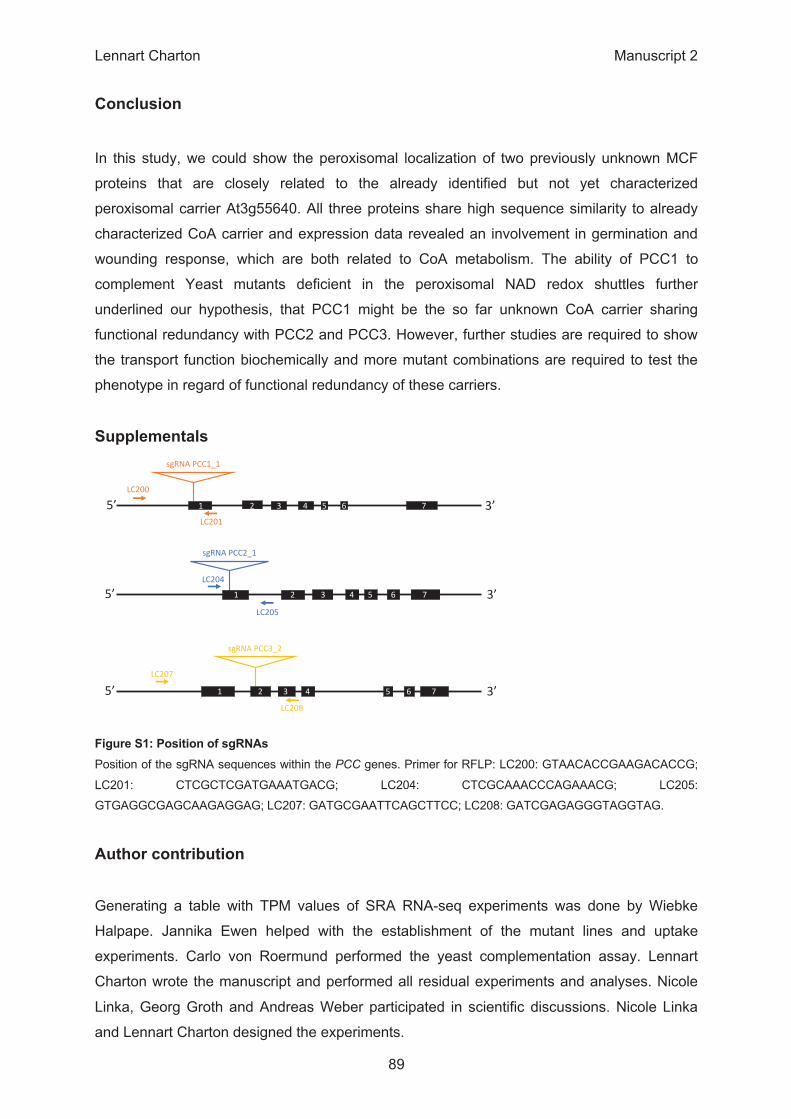
PCC1 PCC2 PCC30
10
20
30
+P -P
TPM
PCC1 PCC2 PCC30
10
20
30
C -N-P TP
M
A B
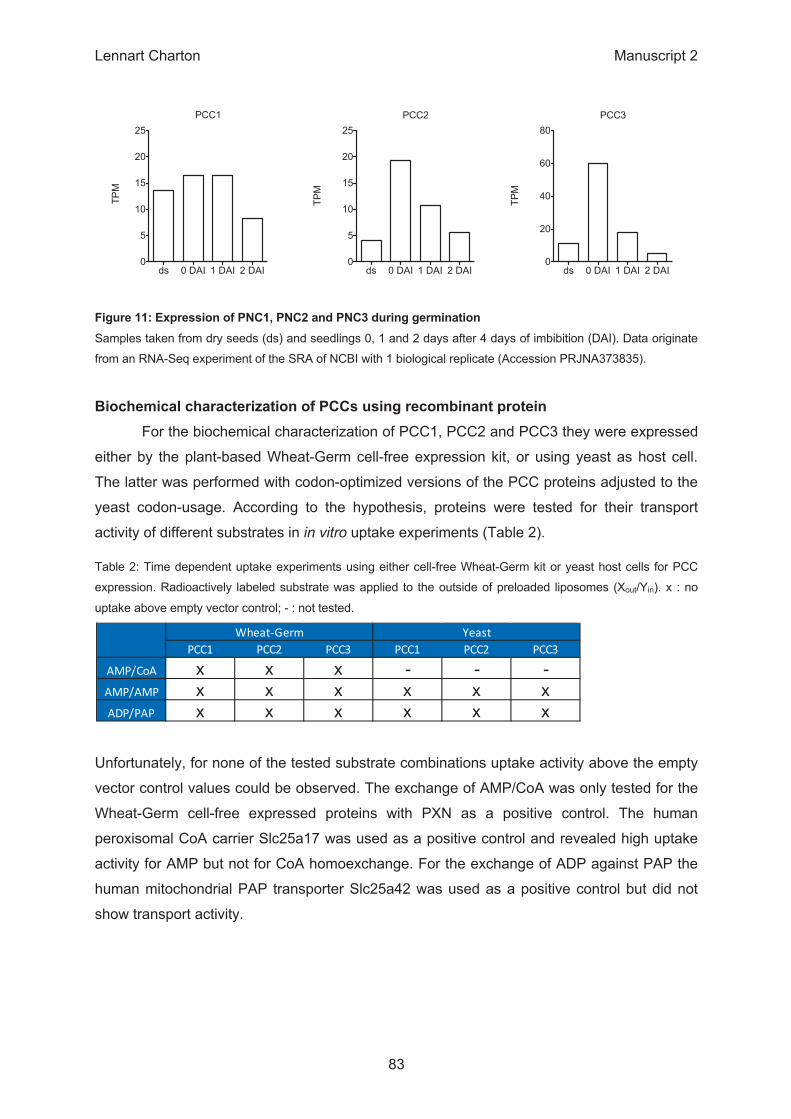
PCC1
ds 0 DAI 1 DAI 2 DAI0
5
10
15
20
25TP
MPCC2
ds 0 DAI 1 DAI 2 DAI0
5
10
15
20
25
TPM
PCC3
ds 0 DAI 1 DAI 2 DAI0
20
40
60
80
TPM
β
β
β
β
β
Δ
β Δ Δ
β
Δ
β
β
Δ Δ
β
β
β
β
β
β
β
β
β
ε
- -
Δ Δ
β
β
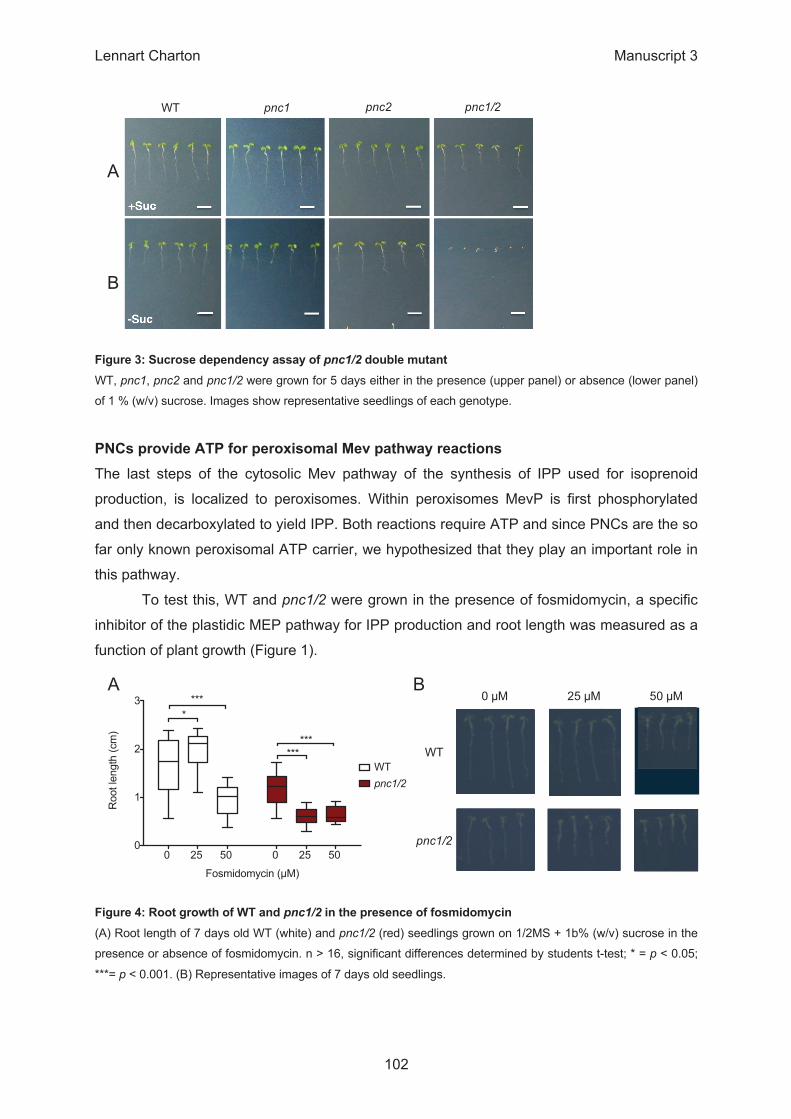
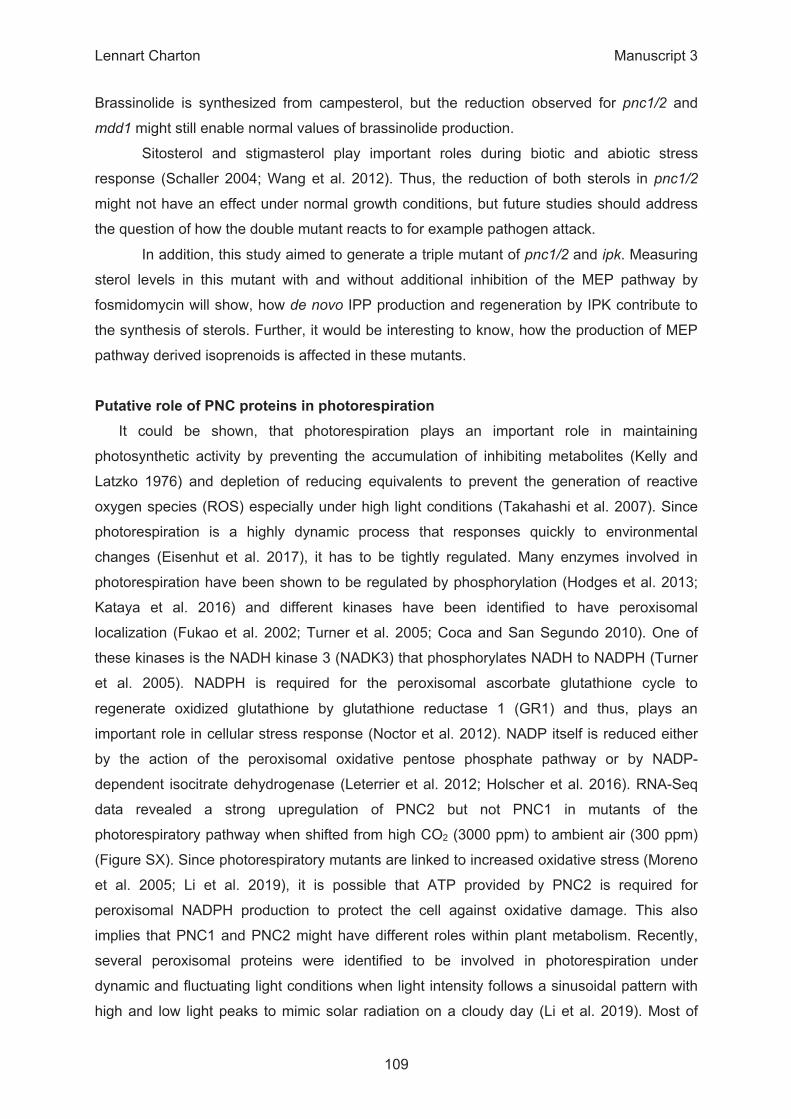
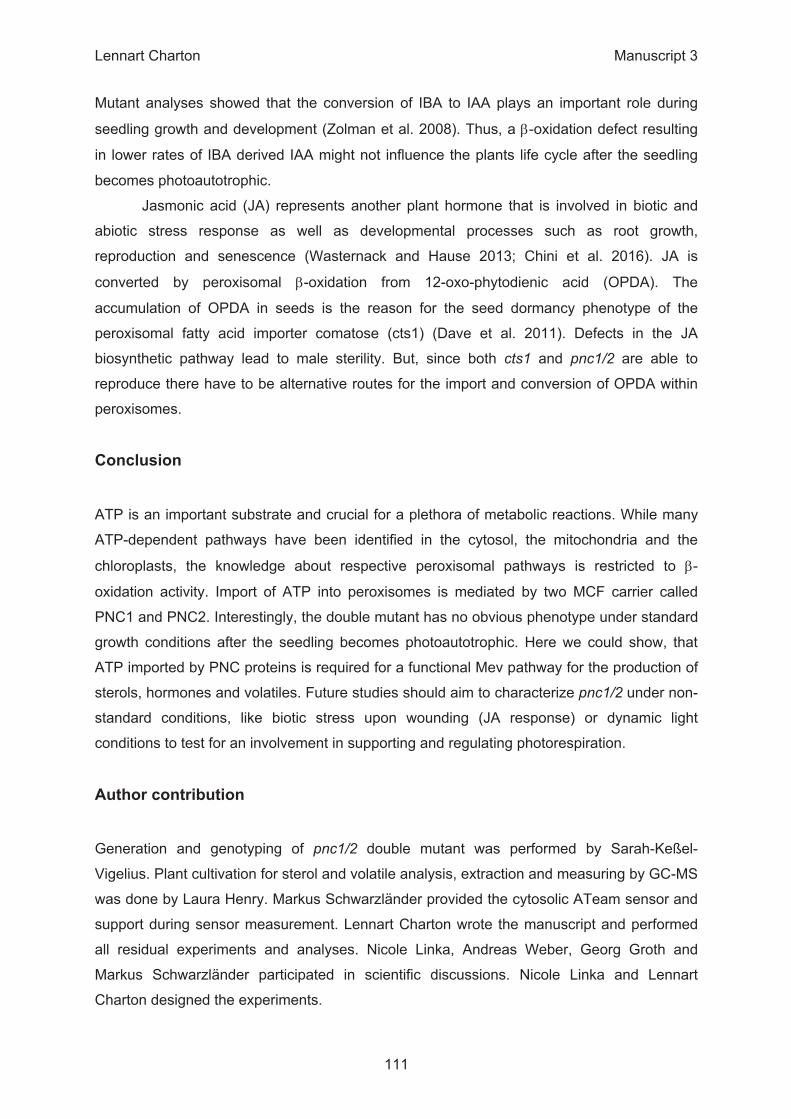
0 25 50 0 25 50 0
1
2
3
WTpnc1/2
Fosmidomycin (µM)
Roo
t len
gth
(cm
)
****
******
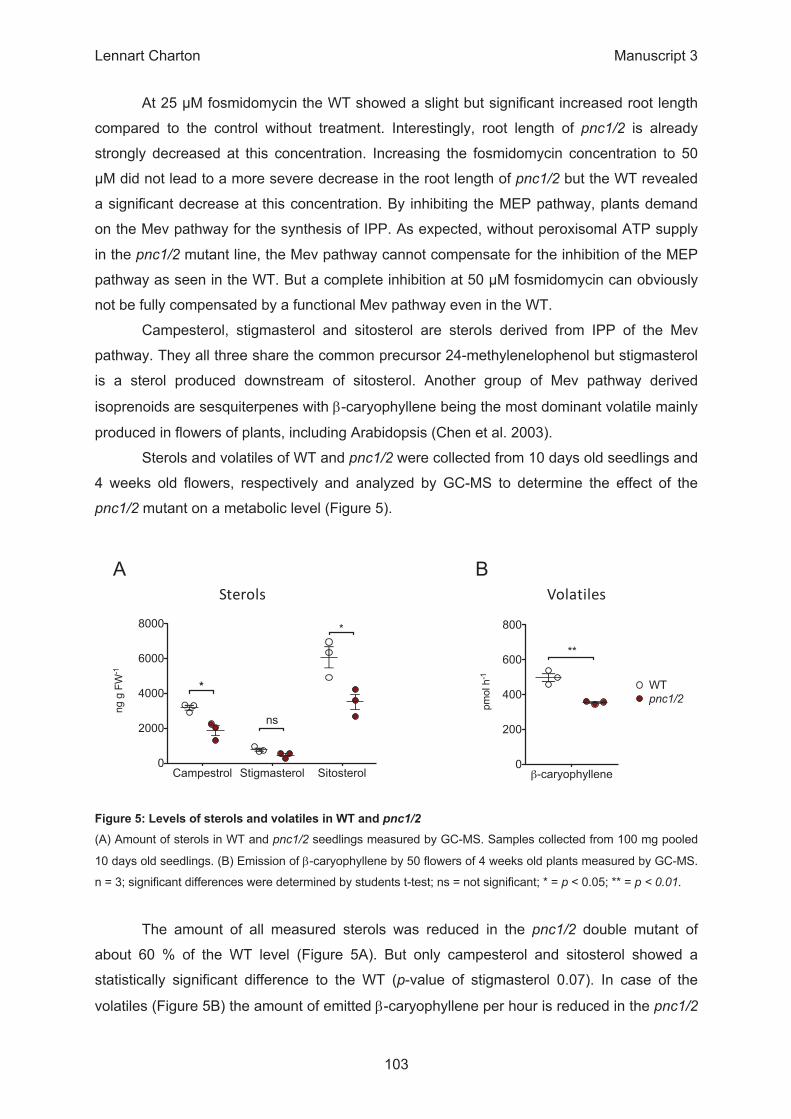
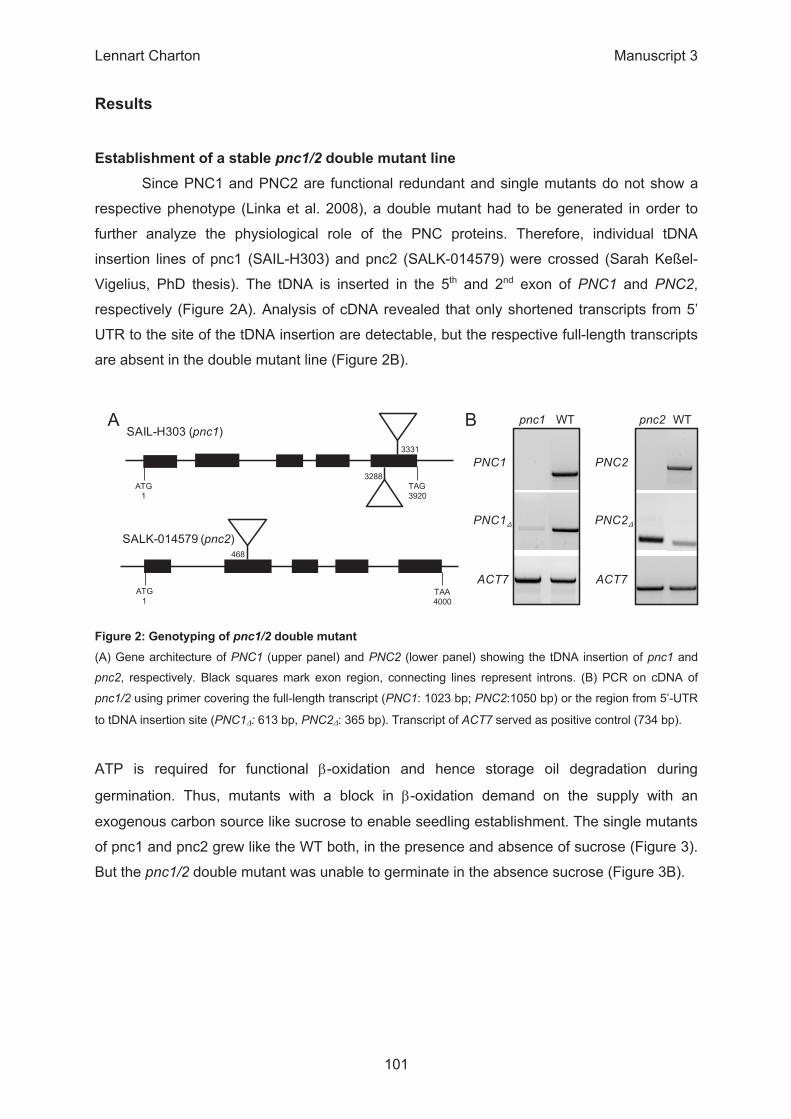
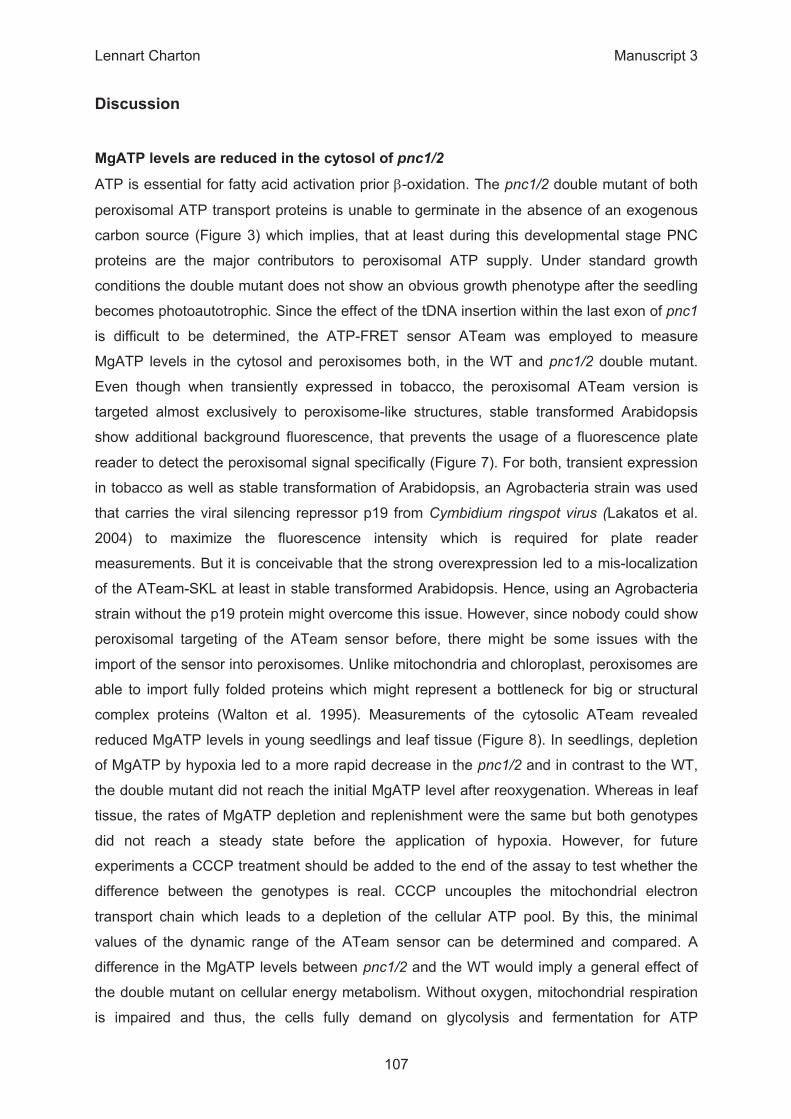
β
β
β
Campestrol Stigmasterol Sitosterol0
2000
4000
6000
8000
*
ns
*
ng g
FW
-1
β-caryophyllene0
200
400
600
800
WTpnc1/2
**
pmol
h-1
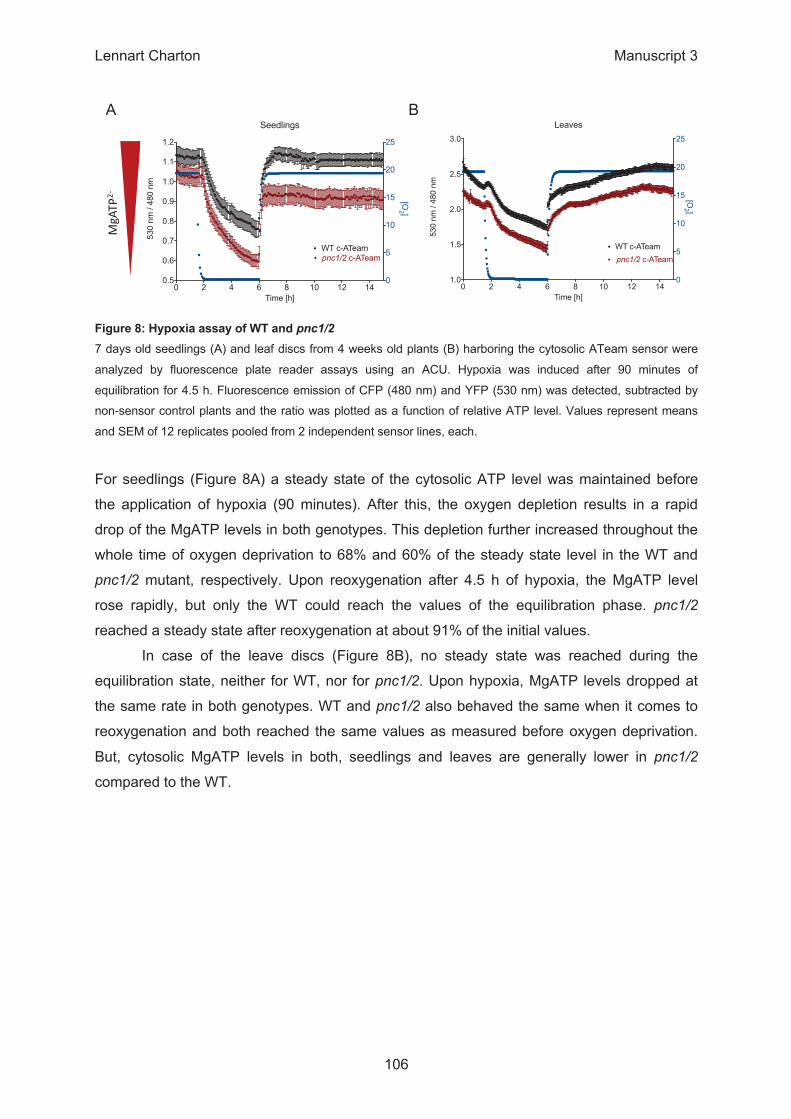
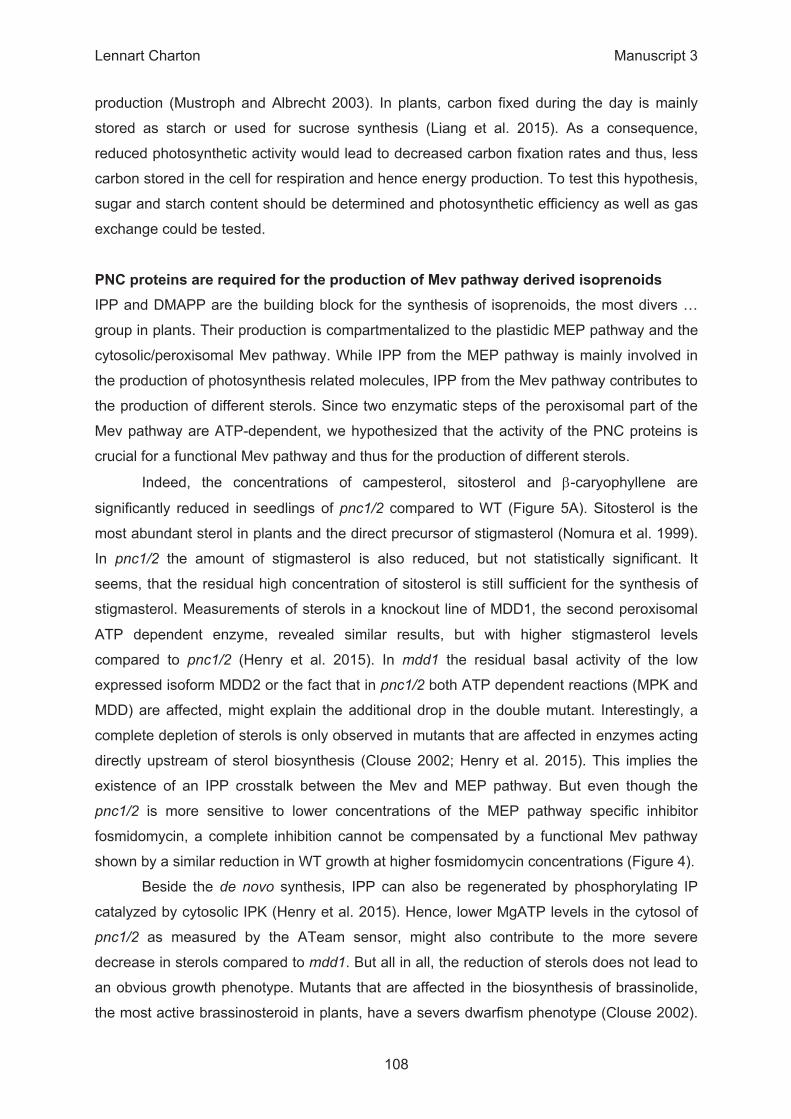
Seedlings
0 2 4 6 8 10 12 140.5
0.6
0.7
0.8
0.9
1.0
1.1
1.2
0
5
10
15
20
25
WT c-ATeampnc1/2 c-ATeam
Time [h]
530
nm /
480
nm
[O2 ]
Leaves
0 2 4 6 8 10 12 141.0
1.5
2.0
2.5
3.0
0
5
10
15
20
25
WT c-ATeampnc1/2 c-ATeam
Time [h]
530
nm /
480
nm
[O2 ]
β
β
β
β
β
β
β
β
β
β
β
β
β
α β
α
α
Δ Δ
α β
Δ Δ
β
Δ
γ
Δ
Δ Δ
±
α
∼
β
Δ
β
Δ
The mitochondrial NAD+ transporter (NDT1) plays importantroles in cellular NAD+ homeostasis in Arabidopsis thaliana
Izabel de Souza Chaves1, Elias Feitosa-Ara�ujo1, Alexandra Florian2, David B. Medeiros1, Paula da Fonseca-Pereira1,
Lennart Charton3, Elmien Heyneke2, Jorge A.C. Apfata1, Marcel V. Pires1, Tabea Mettler-Altmann3, Wagner L. Ara�ujo1,
H. Ekkehard Neuhaus4, Ferdinando Palmieri5, Toshihiro Obata2, Andreas P.M. Weber3, Nicole Linka3, Alisdair R. Fernie2,*
and Adriano Nunes-Nesi1,2,*1Max Planck Partner Group, Departamento de Biologia Vegetal, Universidade Federal de Vic�osa, 36570-900 Vic�osa, Minas
Gerais, Brazil,2Max-Planck-Institute of Molecular Plant Physiology Am M€uhlenberg 1, 14476 Potsdam-Golm, Germany,3Department of Plant Biochemistry, Heinrich Heine University D€usseldorf, 40225 D€usseldorf, Germany,4Department of Plant Physiology, University of Kaiserslautern, D-67663 Kaiserslautern, Germany, and5Department of Biosciences, Biotechnology and Biopharmaceutics, University of Bari, 70125 Bari, Italy
Received 25 August 2017; revised 14 June 2019; accepted 26 June 2019; published online 6 July 2019.
*For correspondence (e-mails [email protected] and [email protected]).
SUMMARY
Nicotinamide adenine dinucleotide (NAD+) is an essential coenzyme required for all living organisms. In
eukaryotic cells, the final step of NAD+ biosynthesis is exclusively cytosolic. Hence, NAD+ must be imported
into organelles to support their metabolic functions. Three NAD+ transporters belonging to the mitochon-
drial carrier family (MCF) have been biochemically characterized in plants. AtNDT1 (At2g47490), focus of the
current study, AtNDT2 (At1g25380), targeted to the inner mitochondrial membrane, and AtPXN (At2g39970),
located in the peroxisomal membrane. Although AtNDT1 was presumed to reside in the chloroplast mem-
brane, subcellular localization experiments with green fluorescent protein (GFP) fusions revealed that
AtNDT1 locates exclusively in the mitochondrial membrane in stably transformed Arabidopsis plants. To
understand the biological function of AtNDT1 in Arabidopsis, three transgenic lines containing an antisense
construct of AtNDT1 under the control of the 35S promoter alongside a T-DNA insertional line were evalu-
ated. Plants with reduced AtNDT1 expression displayed lower pollen viability, silique length, and higher rate
of seed abortion. Furthermore, these plants also exhibited an increased leaf number and leaf area concomi-
tant with higher photosynthetic rates and higher levels of sucrose and starch. Therefore, lower expression
of AtNDT1 was associated with enhanced vegetative growth but severe impairment of the reproductive
stage. These results are discussed in the context of the mitochondrial localization of AtNDT1 and its impor-
tant role in the cellular NAD+ homeostasis for both metabolic and developmental processes in plants.
Keywords: Arabidopsis thaliana, nicotinamide adenine dinucleotide, transporter, pollen viability, starch
metabolism.
INTRODUCTION
Nicotinamide adenine dinucleotide (NAD+) and its phos-
phorylated derivative (NADP+) are central coenzymes impli-
cated in cellular homeostasis. Alteration in the balance of
the anabolism and catabolism of these nucleotides does
not only affect metabolism but also the redox poise of the
entire cell, thereby strongly impacting plant growth and
development (Noctor et al., 2006; Hashida et al., 2009,
2010; Gaki�ere et al., 2018). Along with its derivative forms,
NAD+ participates in several biological reactions in glycolysis,
the tricarboxylic acid (TCA) cycle, glycine decarboxylation,
the Calvin�Benson cycle, and the b-oxidation in peroxisomes
(Bernhardt et al., 2012; Geigenberger and Fernie, 2014).
NAD+ is widely used as coenzyme for reductive/oxidative
processes, playing important roles in the operation of a
range of dehydrogenase activities (Selinski et al., 2014). In
addition, an important role for NAD+ metabolism has been
demonstrated in pollen maturation and germination
(Hashida et al., 2013) and for the energy generation during
pollen germination and tube growth (C�ardenas et al., 2006;
Selinski and Scheibe, 2014). The NADPH generated in
© 2019 The AuthorsThe Plant Journal published by Society for Experimental Biology and John Wiley & Sons LtdThis is an open access article under the terms of the Creative Commons Attribution License,which permits use, distribution and reproduction in any medium, provided the original work is properly cited.
487
The Plant Journal (2019) 100, 487–504 doi: 10.1111/tpj.14452
heterotrophic plastids by the oxidative pentose phosphate
pathway (OPPP) provides the reducing power required for
several pathways, such as fatty acid biosynthesis (Neuhaus
and Emes, 2000), as well as nitrogen assimilation (Bowsher
et al., 2007) and amino acid biosynthesis. Moreover, both
NAD+ and NADP+ play an essential role in signalling path-
ways through their interaction with reactive oxygen spe-
cies (ROS) (Hashida et al., 2010). Consequently, it is
assumed that these two coenzymes are involved in the
acclimation to environmental stresses such as UV radia-
tion, salinity, temperature, and drought (De Block et al.,
2005). Over and above this, it has been proposed that pyri-
dine nucleotide metabolism is important for seed germina-
tion (Hunt et al., 2007), stomatal movement (Hashida et al.,
2010), bolting (Liu et al., 2009), development (Hashida
et al., 2009), senescence (Schippers et al., 2008), and nitro-
gen assimilation (Takahashi et al., 2009).
NAD+ biosynthesis in plants occurs via either the de
novo or the salvage pathway (Noctor et al., 2006; Hashida
et al., 2009). The de novo pathway starts in plastids using
aspartate or tryptophan as precursors, while the salvage
pathway starts with nicotinamide (NAM) or nicotinic acid
(NA). Both metabolic fluxes converge in the formation of
nicotinic acid mononucleotide (NAMN), which in turn gives
rise to NAD+. Furthermore NAD+ kinases can synthetize
NADP+ from NAD+ and ATP in the cytosol (NADK1; Berrin
et al., 2005; Waller et al., 2010) and in the chloroplasts
(NADK2; Chai et al., 2005, 2006). In addition, peroxisomal
NADH kinase, which uses NADH rather than NAD+ as sub-
strate to produce NADPH, has been found in Arabidopsis
thaliana (NADK3; Turner et al., 2005; Waller et al., 2010).
Since the last step of NAD+ synthesis takes place in the
cytosol, NAD+ must be imported into the cell organelles to
allow proper metabolism (Noctor et al., 2006).
In yeast, two carrier proteins called ScNDT1 and ScNDT2
(NDT: NAD+ transporter), which are capable of transporting
NAD+, have been identified (Todisco et al., 2006). The charac-
terization of ScNDT1 protein revealed its location in the inner
mitochondrial membrane and its high NAD+ transport activ-
ity in exchange with ADP and AMP in vitro (Todisco et al.,
2006). The lack of both ScNDT proteins in yeast assigns a
function for supplying NAD+ to the mitochondrial matrix
(Todisco et al., 2006). Three genes encoding proteins cap-
able of NAD+ transport have been identified in Arabidopsis.
AtNDT2 is located in the inner mitochondrial membrane (Pal-
mieri et al., 2009) and AtPXN resides in the peroxisomal
membrane (Agrimi et al., 2012; Bernhardt et al., 2012). More-
over, re-evaluation of the subcellular localization of AtNDT1,
previously reported to encode a protein targeted to the inner
membrane of the chloroplast (Palmieri et al., 2009), revealed
the exclusive mitochondrial localization of this carrier (the
present work). Interestingly, the twomitochondrial NAD+ car-
rier proteins found in Arabidopsis, AtNDT1 and AtNDT2,
have similar substrate specificity, importing NAD+, but not
NADH, nicotinamide, nicotinic acid, NADP+ or NADPH,
against ADP or AMP (Palmieri et al., 2009). In contrast, the
AtPXN transporter has a versatile transport function in vitro,
also using NADH and CoA as substrates (Agrimi et al., 2012;
Bernhardt et al., 2012). Yeast complementation studies
revealed that AtPXN favours the import of NAD+ in exchange
for AMP in intact yeast cells (van Roermund et al., 2016). Fur-
thermore, expression of either AtNDT1 or AtNDT2 is able to
complement the phenotype of S. cerevisiae cells lacking
their NAD+ mitochondrial transporters and increase the mito-
chondrial NAD+ content of the double mutant strain devoid
of their two NAD+ mitochondrial transporters (Palmieri et al.,
2009). In addition, the expression of either AtNDT2 or
ScNDT1 in human cells increases the NAD+ content within
the mitochondria (VanLinden et al., 2015). Together, these
studies provide evidence that AtNDT1, like AtNDT2, catalyzes
the import of NAD+ into the mitochondria under in vivo con-
ditions.
Analysis of Atndt1- and Atndt2-promoter-GUS plants
showed that both genes are strongly expressed in developing
tissues, mainly in highly metabolically active cells, which is in
line with their mitochondrial localization. However, these
transporters have only been characterised at the biochemi-
cal and molecular level, while their physiological function
remains unclear. For this reason, we aimed to investigate
the impact of decreased AtNDT1 expression on plant
development and performance. Given the importance of
NAD+ in plant metabolism, we would expect that the defi-
ciency of AtNDT1 transport would impact the redox bal-
ance of the cells in different plant tissues. This impact on
the redox balance could influence plant growth and devel-
opment under both optimal and stress situations. In addi-
tion, evaluation of the AtNDT1 protein function is critical
for a better understanding of mitochondrial processes and
their regulation. To test this hypothesis, we analysed the
corresponding Arabidopsis mutants showing reduced
expression of AtNDT1 to understand how and at what level
changes in the mitochondrial NAD+ transport can affect
cell metabolism and plant development. We focused our
attention on the impact of reduced AtNDT1 expression in
reproductive tissues and on the importance of this carrier
in illuminated leaves.
RESULTS
AtNDT1 is highly expressed in the pollen grain
The need for NAD+ for multiple essential functions in cellu-
lar organelles is met by specialized NAD+ transport pro-
teins. We therefore expect the presence of these carrier
proteins in various tissues and at several developmental
stages in Arabidopsis. To investigate the AtNDT1 gene
expression, we determined their transcript levels in differ-
ent organs of young and mature Arabidopsis plants by
quantitative real-time PCR (qRT-PCR) analysis (Supporting
© 2019 The AuthorsThe Plant Journal published by Society for Experimental Biology and John Wiley & Sons Ltd,
The Plant Journal, (2019), 100, 487–504
488 Izabel de Souza Chaves et al.
Information Figure S1). In agreement with information in
publicly available gene expression databases (http://bar.
utoronto.ca), but slightly in contrast to that observed in
our previous promotor GUS study (Palmieri et al., 2009),
AtNDT1 was strongly expressed in the pollen grain. It also
displayed considerable expression in seeds, seedlings,
mature leaves and flowers. This suggest that AtNDT1 tran-
script is ubiquitously expressed in Arabidopsis, but mainly
found in pollen grain. This implies a role in sink and source
tissues at any phase of the plant life cycle.
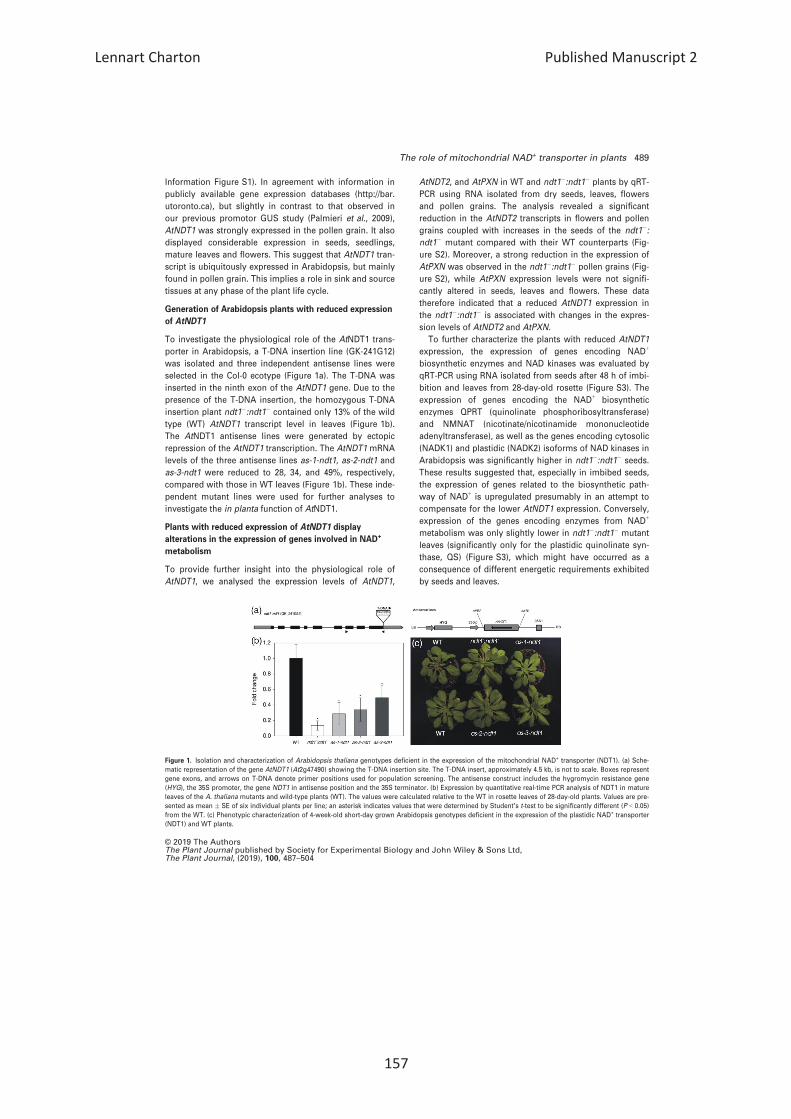
Generation of Arabidopsis plants with reduced expression
of AtNDT1
To investigate the physiological role of the AtNDT1 trans-
porter in Arabidopsis, a T-DNA insertion line (GK-241G12)
was isolated and three independent antisense lines were
selected in the Col-0 ecotype (Figure 1a). The T-DNA was
inserted in the ninth exon of the AtNDT1 gene. Due to the
presence of the T-DNA insertion, the homozygous T-DNA
insertion plant ndt1�:ndt1� contained only 13% of the wild
type (WT) AtNDT1 transcript level in leaves (Figure 1b).
The AtNDT1 antisense lines were generated by ectopic
repression of the AtNDT1 transcription. The AtNDT1 mRNA
levels of the three antisense lines as-1-ndt1, as-2-ndt1 and
as-3-ndt1 were reduced to 28, 34, and 49%, respectively,
compared with those in WT leaves (Figure 1b). These inde-
pendent mutant lines were used for further analyses to
investigate the in planta function of AtNDT1.
Plants with reduced expression of AtNDT1 display
alterations in the expression of genes involved in NAD+
metabolism
To provide further insight into the physiological role of
AtNDT1, we analysed the expression levels of AtNDT1,
AtNDT2, and AtPXN in WT and ndt1�:ndt1� plants by qRT-
PCR using RNA isolated from dry seeds, leaves, flowers
and pollen grains. The analysis revealed a significant
reduction in the AtNDT2 transcripts in flowers and pollen
grains coupled with increases in the seeds of the ndt1�:ndt1� mutant compared with their WT counterparts (Fig-
ure S2). Moreover, a strong reduction in the expression of
AtPXN was observed in the ndt1�:ndt1� pollen grains (Fig-
ure S2), while AtPXN expression levels were not signifi-
cantly altered in seeds, leaves and flowers. These data
therefore indicated that a reduced AtNDT1 expression in
the ndt1�:ndt1� is associated with changes in the expres-
sion levels of AtNDT2 and AtPXN.
To further characterize the plants with reduced AtNDT1
expression, the expression of genes encoding NAD+
biosynthetic enzymes and NAD kinases was evaluated by
qRT-PCR using RNA isolated from seeds after 48 h of imbi-
bition and leaves from 28-day-old rosette (Figure S3). The
expression of genes encoding the NAD+ biosynthetic
enzymes QPRT (quinolinate phosphoribosyltransferase)
and NMNAT (nicotinate/nicotinamide mononucleotide
adenyltransferase), as well as the genes encoding cytosolic
(NADK1) and plastidic (NADK2) isoforms of NAD kinases in
Arabidopsis was significantly higher in ndt1�:ndt1� seeds.
These results suggested that, especially in imbibed seeds,
the expression of genes related to the biosynthetic path-
way of NAD+ is upregulated presumably in an attempt to
compensate for the lower AtNDT1 expression. Conversely,
expression of the genes encoding enzymes from NAD+
metabolism was only slightly lower in ndt1�:ndt1� mutant
leaves (significantly only for the plastidic quinolinate syn-
thase, QS) (Figure S3), which might have occurred as a
consequence of different energetic requirements exhibited
by seeds and leaves.
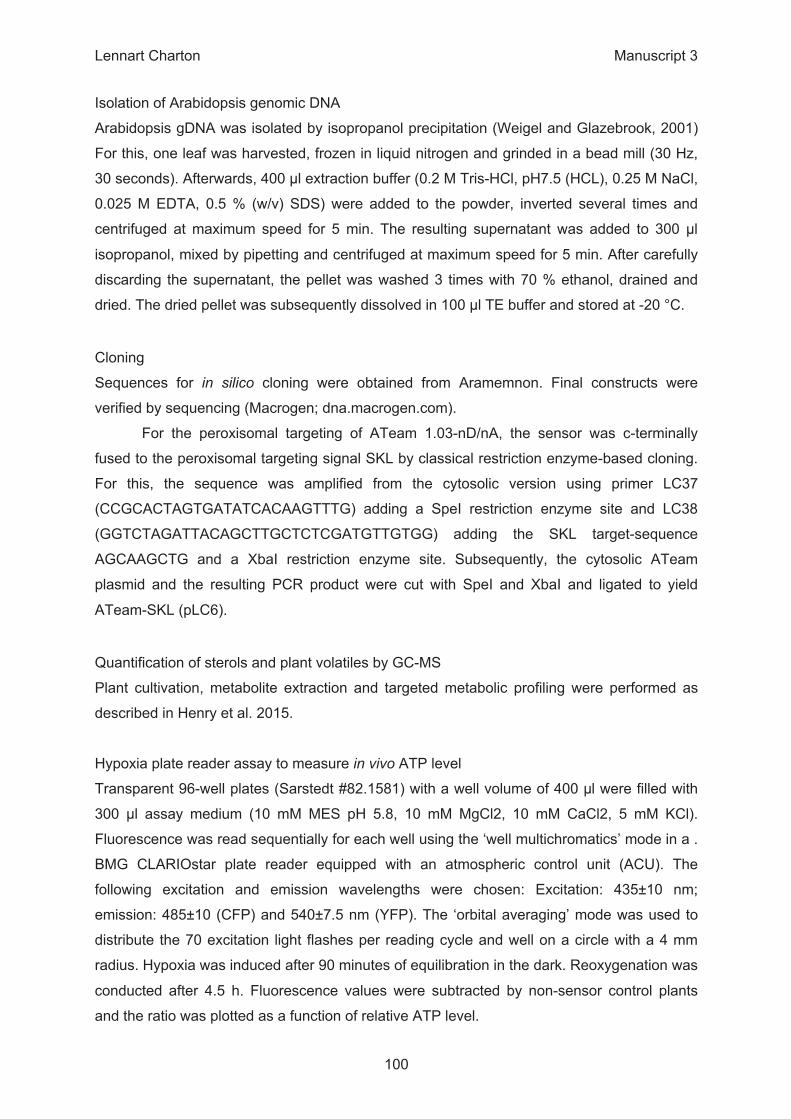
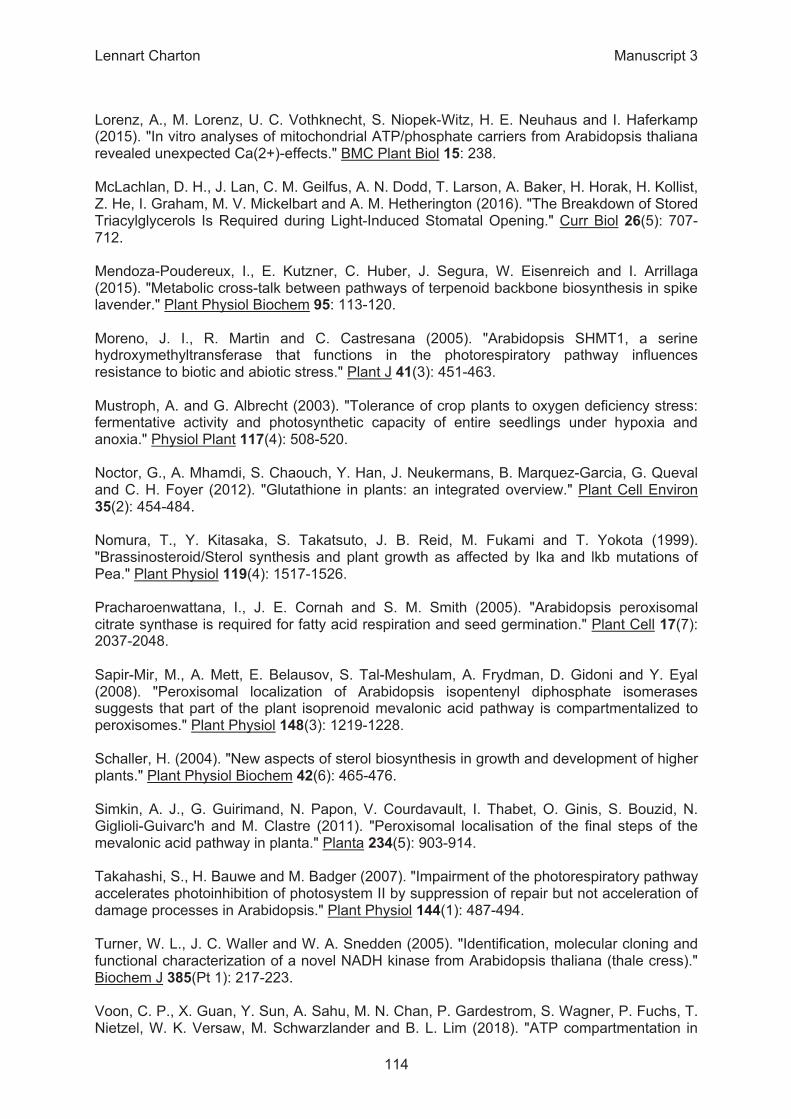
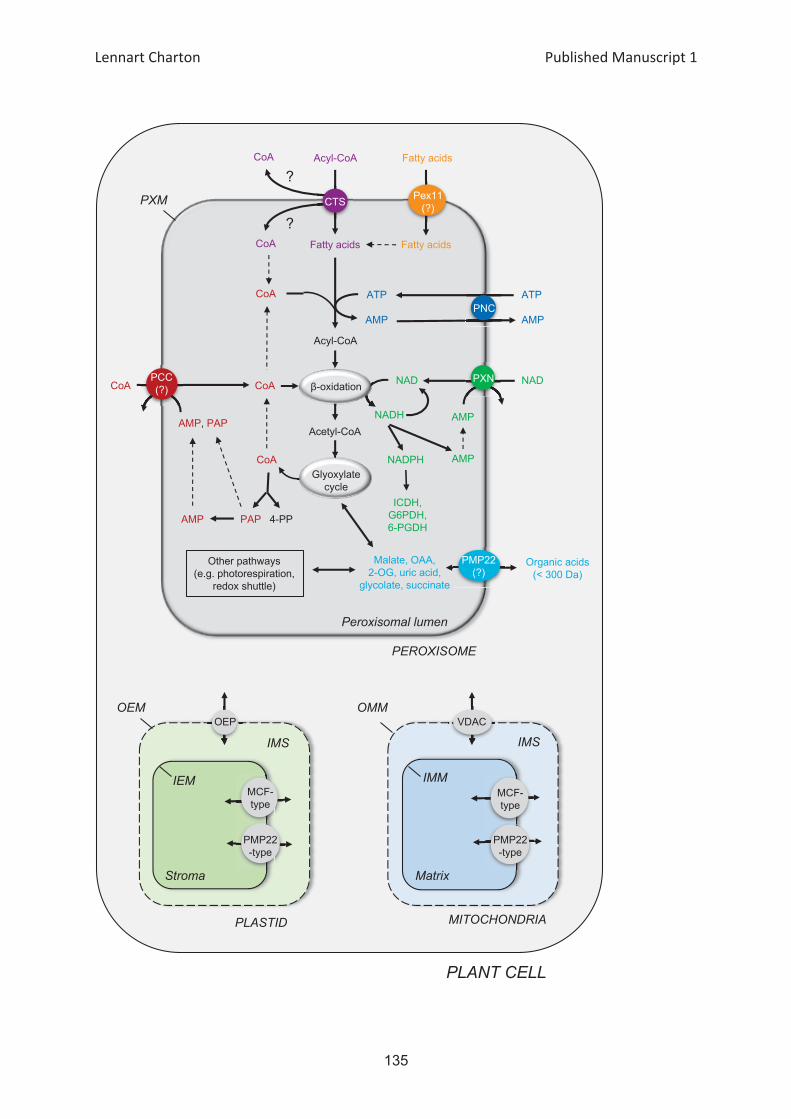
Figure 1. Isolation and characterization of Arabidopsis thaliana genotypes deficient in the expression of the mitochondrial NAD+ transporter (NDT1). (a) Sche-
matic representation of the gene AtNDT1 (At2g47490) showing the T-DNA insertion site. The T-DNA insert, approximately 4.5 kb, is not to scale. Boxes represent
gene exons, and arrows on T-DNA denote primer positions used for population screening. The antisense construct includes the hygromycin resistance gene
(HYG), the 35S promoter, the gene NDT1 in antisense position and the 35S terminator. (b) Expression by quantitative real-time PCR analysis of NDT1 in mature
leaves of the A. thaliana mutants and wild-type plants (WT). The values were calculated relative to the WT in rosette leaves of 28-day-old plants. Values are pre-
sented as mean � SE of six individual plants per line; an asterisk indicates values that were determined by Student’s t-test to be significantly different (P < 0.05)
from the WT. (c) Phenotypic characterization of 4-week-old short-day grown Arabidopsis genotypes deficient in the expression of the plastidic NAD+ transporter
(NDT1) and WT plants.
© 2019 The AuthorsThe Plant Journal published by Society for Experimental Biology and John Wiley & Sons Ltd,The Plant Journal, (2019), 100, 487–504
The role of mitochondrial NAD+ transporter in plants 489
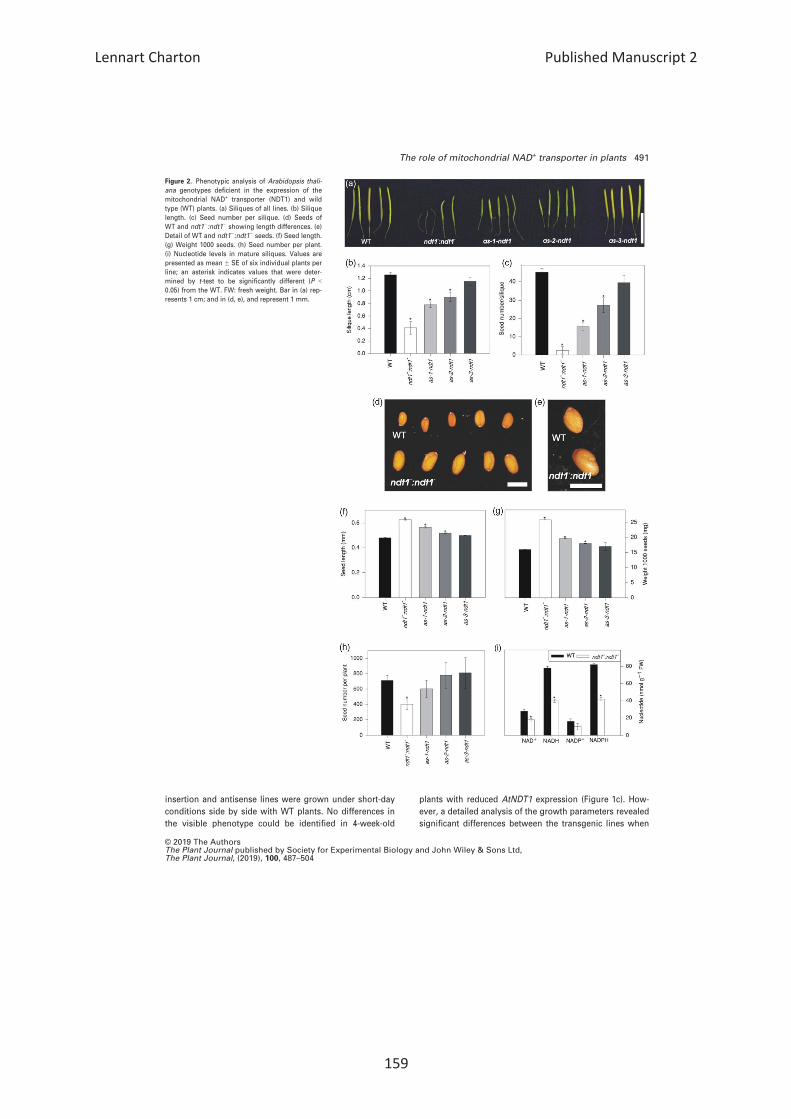
Effects of reduction in AtNDT1 expression on seed
development and seed filling
As AtNDT1 is expressed in seeds and seedlings, we investi-
gated whether AtNDT1 plays a role in seed development
or seed filling. We observed that the silique size (Fig-
ures 2a,b and S4a) and the number of seeds per silique
were lower for ndt1�:ndt1�, as-1-ndt1 and as-2-ndt1 lines
(Figure 2c). Similarly, the total number of seeds per plant
was also decreased in the mutant ndt1�:ndt1� line (Fig-
ure 2h), while seed size increased in these lines compared
with WT (Figures 2d–f, and S4b). Moreover, the weight of
one thousand seeds from these plants was also higher
(Figure 2g), although the total seed weight per plant did
not differ among the lines (Figure S4c).
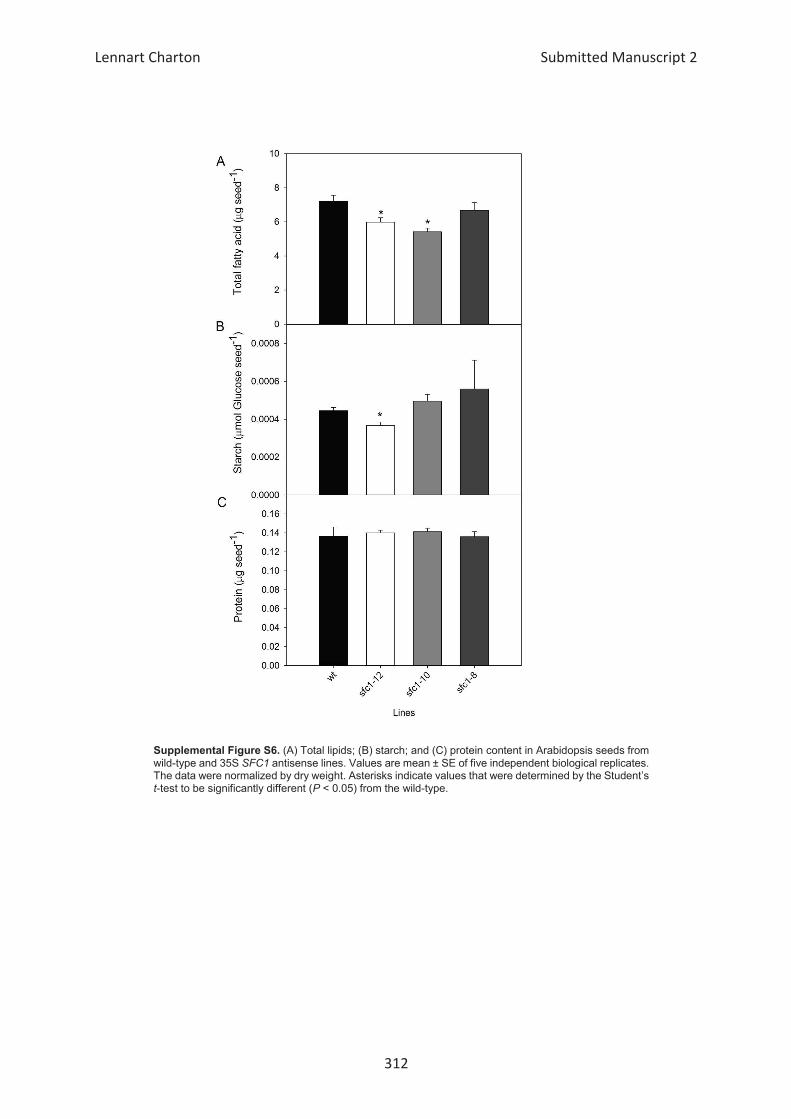
To analyse the accumulation of storage compounds, we
also determined lipid, carbohydrate, and protein contents
in seeds. ndt1�:ndt1� mutant line displayed higher
amounts of lipids in mature seeds (Figure S5a) and, after
imbibition, significantly at 4 days post-imbibition (Fig-
ure S5b). The starch content was also higher in ndt1�:ndt1� mature seeds (Figure S5c), while similar amounts of
proteins (Figure S5d) was observed when compared with
WT seeds.
Given the importance of NAD(P)H as a reducing power
source for fatty acid biosynthesis, we further analysed how
the reduction in the AtNDT1 expression impacts fatty acid
profile in mature seeds (Figure S6). We detected a 2.7-fold
increase of the 14:0 fatty acid in the mutant line compared
with WT (Figure S6a), suggesting that NAD+ import by
AtNDT1 is required for the metabolism of fatty acids in seeds.
Effects of reduction in AtNDT1 expression on seed
germination and seedling establishment
To investigate if the increased levels on the storage
reserves in the ndt1�:ndt1� mature seeds have an effect on
seed germination and seedling establishment, we evalu-
ated the percentage of seed germination and number of
abnormal seedlings. These analyses revealed that germi-
nation as well as the percentage of normal developing
seedlings were reduced in the ndt1�:ndt1� line in compar-
ison with WT (Figure S5g,h). In addition, the germination
speed index (GSI) and emergence speed index (ESI) were
significantly reduced in the ndt1�:ndt1� line (Figure S5e,f),
indicating that AtNDT1 is an important component affect-
ing seed germination and seedling development.
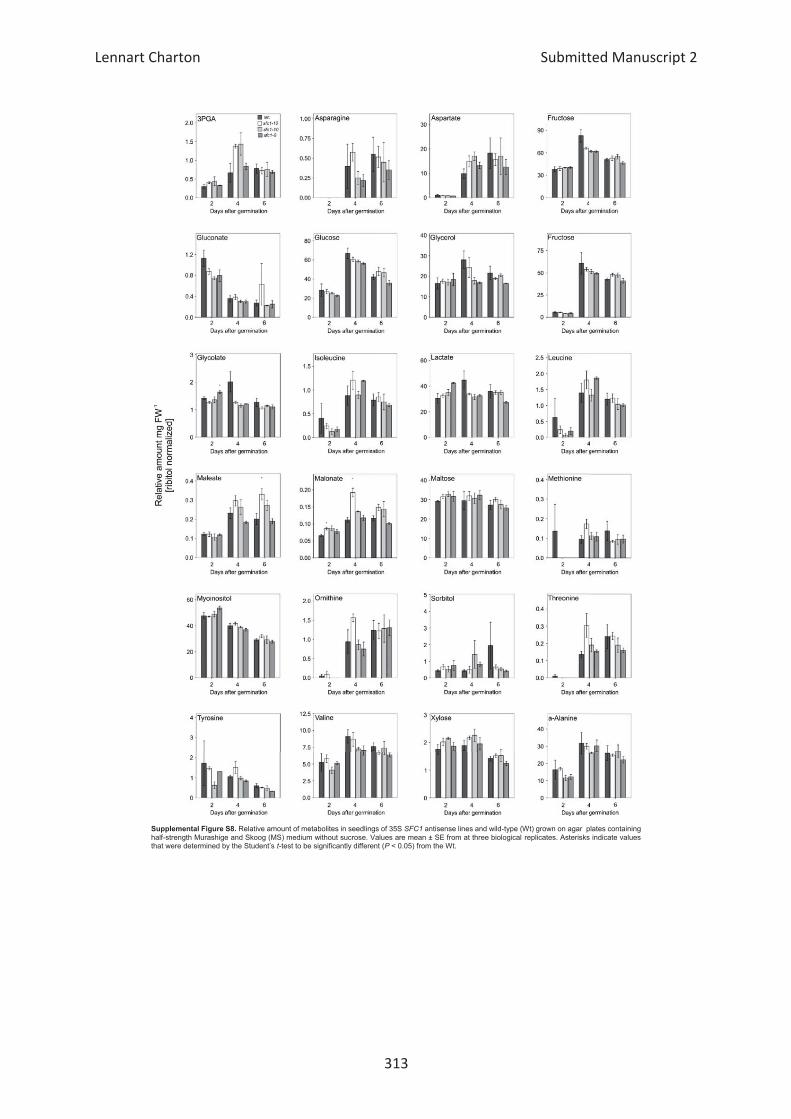
As NAD+ is necessary for the conversion of fatty acids
into carbohydrates during storage lipid mobilization to
drive seedling establishment (Bernhardt et al., 2012), we
further evaluated the fatty acids profile in seedlings at 2, 4,
and 6 days after imbibition. The TAG marker fatty acid in
Arabidopsis is eicosenoic acid C20:1. Interestingly, we
observed elevated C20:1 levels in 2-day-old, 4-day-old and
6-day-old mutant seedlings compared with WT, indicating
that the repression of AtNDT1 led to an impaired storage
oil mobilization during seedling establishment. Our data
also demonstrated that the mutant is able to degrade
C20:1, but the degradation rate is slowed down. The
amounts of 20:2, 24:0, and 24:1 fatty acids were increased
in 2-day-old ndt1�:ndt1� seedlings (Figure S6b). At 4 days
after stratification, the fatty acids 14:0 and 20:1a were
higher in the mutant seedlings (Figure S6c). In 6-day-old
seedlings, higher levels of 14:0, 16:2, 16:3, 18:2, 18:3, 20:2,
and 20:1a were observed for ndt1�:ndt1� line compared
with WT (Figure S6d). These results suggested that the
mobilization of the storage reserves for seed germination
rate and seedling establishment is impaired in the mutant
plants.
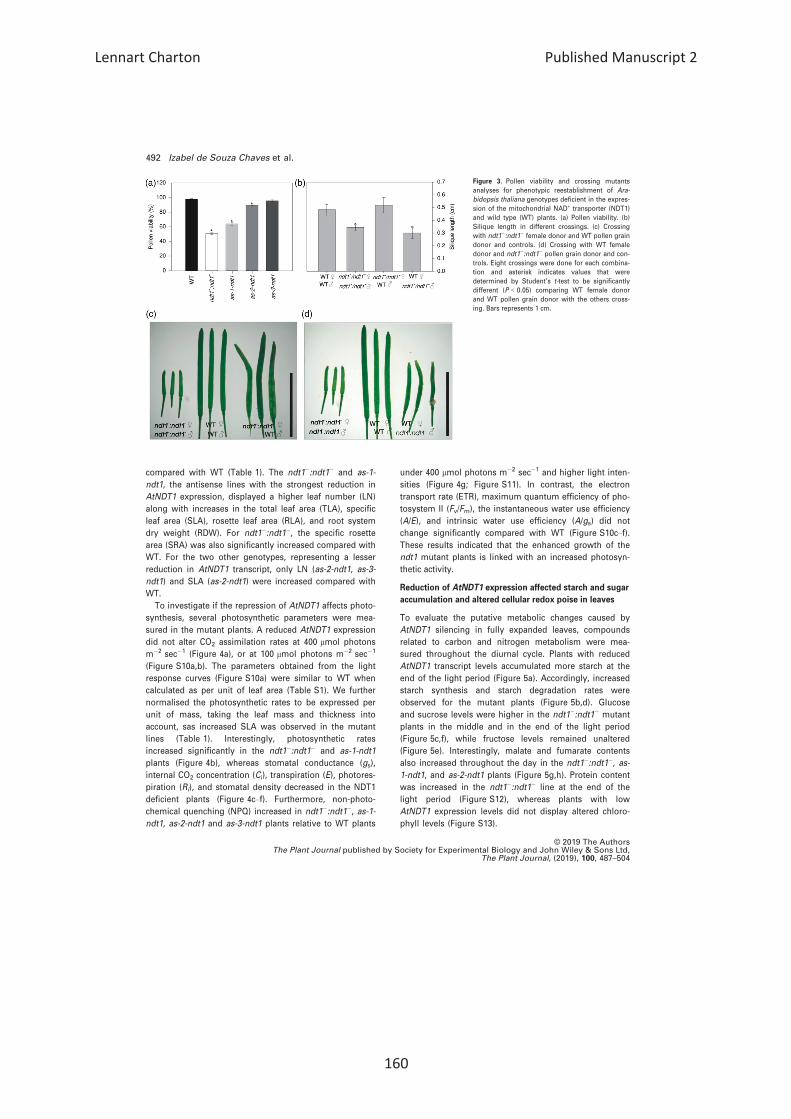
Effects of reduction in AtNDT1 expression in pollen
Considering the observed reduction in seed number per
silique and the higher expression of AtNDT1 in the pollen,
we evaluated if this phenotype could be a consequence of
lower pollen viability, pollen tube growth, effects of lower
expression of AtNDT1 on maternal tissues or impaired
embryo development. Comparing WT, ndt1�:ndt1�, as-1-
ndt1, and as-2-ndt1 pollen grains by stereomicroscopy
revealed lower pollen grain viability in plants with reduced
AtNDT1 expression reaching only 50, 64, and 89% of the
WT values for the ndt1�: ndt1�, as-1-ndt1, and as-2-ndt1
lines, respectively (Figures 3a and S7). Further analysis
revealed that pollen germination and tube growth were
also affected in the ndt1�: ndt1� line (Figure S8). In agree-
ment with these results, in silico analysis of the AtNDT1
gene expression pattern by using the Arabidopsis eFP
Brower (Winter et al., 2007; http://bar.utoronto.ca/efp/cgi-
bin/efpWeb.cgi), indicated that AtNDT1 is highly expressed
in the later stages of pollen development and following
germination (Figure S9a,b).
To better understand the reasons underlying the ndt1�:ndt1� seed phenotype, we pollinated ndt1�:ndt1� mutants
using WT pollen (Figure 3b). Manual pollination of WT (fe-
male donor) with ndt1�:ndt1� pollen (male donor) gave rise
to shorter siliques (Figure 3d), while siliques developing on
plants in which WT pollen served as male donor used to
pollinate ndt1�:ndt1� (female donor) had no discernible dif-
ference in length compared with WT plants (Figure 3c).
Therefore, the complementation of ndt1�:ndt1� stigmas
with WT pollen suggested that male gametophyte and pol-
len development are sensitive to the reduced AtNDT1 trans-
port activity. Collectively, our results supported the
important contribution of AtNDT1 to pollen viability.
AtNDT1 repression enhanced growth and photosynthesis
in Arabidopsis plants
The general impact of the reduced expression of AtNDT1
on vegetative plant growth was studied in detail regarding
leaf morphology and photosynthesis. AtNDT1 T-DNA
© 2019 The AuthorsThe Plant Journal published by Society for Experimental Biology and John Wiley & Sons Ltd,
The Plant Journal, (2019), 100, 487–504
490 Izabel de Souza Chaves et al.
insertion and antisense lines were grown under short-day
conditions side by side with WT plants. No differences in
the visible phenotype could be identified in 4-week-old
plants with reduced AtNDT1 expression (Figure 1c). How-
ever, a detailed analysis of the growth parameters revealed
significant differences between the transgenic lines when
Figure 2. Phenotypic analysis of Arabidopsis thali-
ana genotypes deficient in the expression of the
mitochondrial NAD+ transporter (NDT1) and wild
type (WT) plants. (a) Siliques of all lines. (b) Silique
length. (c) Seed number per silique. (d) Seeds of
WT and ndt1�:ndt1� showing length differences. (e)
Detail of WT and ndt1�:ndt1� seeds. (f) Seed length.
(g) Weight 1000 seeds. (h) Seed number per plant.
(i) Nucleotide levels in mature siliques. Values are
presented as mean � SE of six individual plants per
line; an asterisk indicates values that were deter-
mined by t-test to be significantly different (P <0.05) from the WT. FW: fresh weight. Bar in (a) rep-
resents 1 cm; and in (d, e), and represent 1 mm.
© 2019 The AuthorsThe Plant Journal published by Society for Experimental Biology and John Wiley & Sons Ltd,The Plant Journal, (2019), 100, 487–504
The role of mitochondrial NAD+ transporter in plants 491
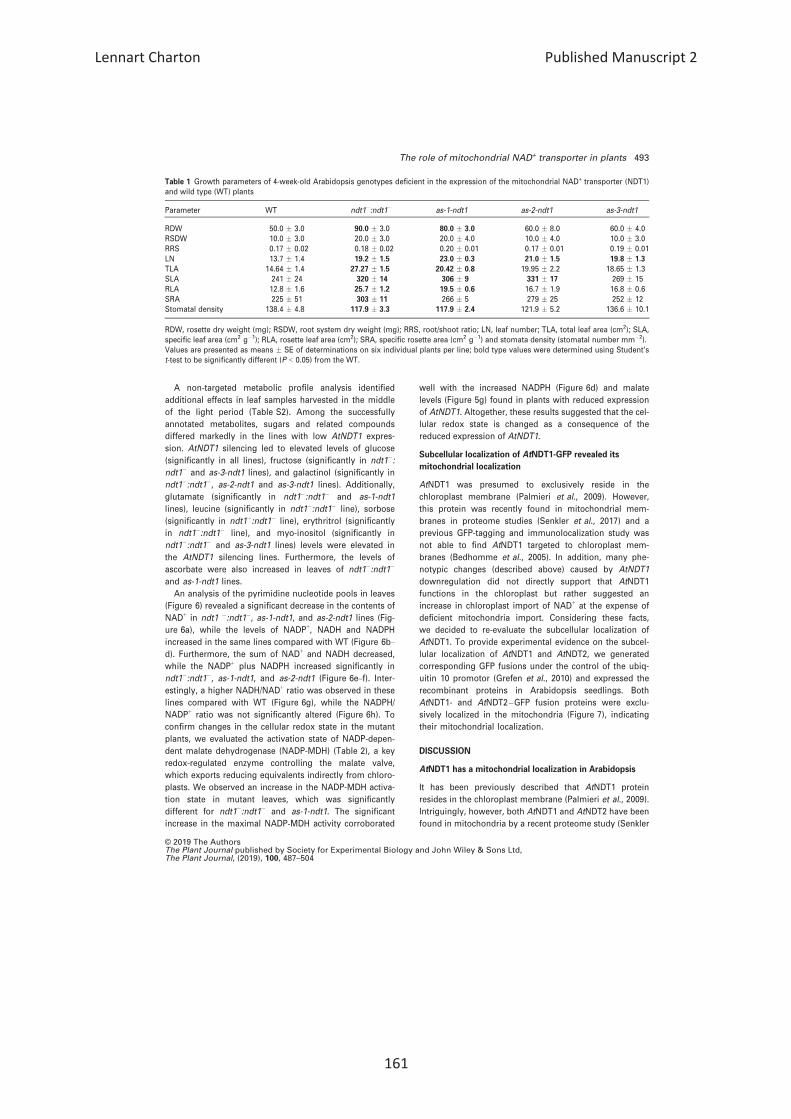
compared with WT (Table 1). The ndt1�:ndt1� and as-1-
ndt1, the antisense lines with the strongest reduction in
AtNDT1 expression, displayed a higher leaf number (LN)
along with increases in the total leaf area (TLA), specific
leaf area (SLA), rosette leaf area (RLA), and root system
dry weight (RDW). For ndt1�:ndt1�, the specific rosette
area (SRA) was also significantly increased compared with
WT. For the two other genotypes, representing a lesser
reduction in AtNDT1 transcript, only LN (as-2-ndt1, as-3-
ndt1) and SLA (as-2-ndt1) were increased compared with
WT.
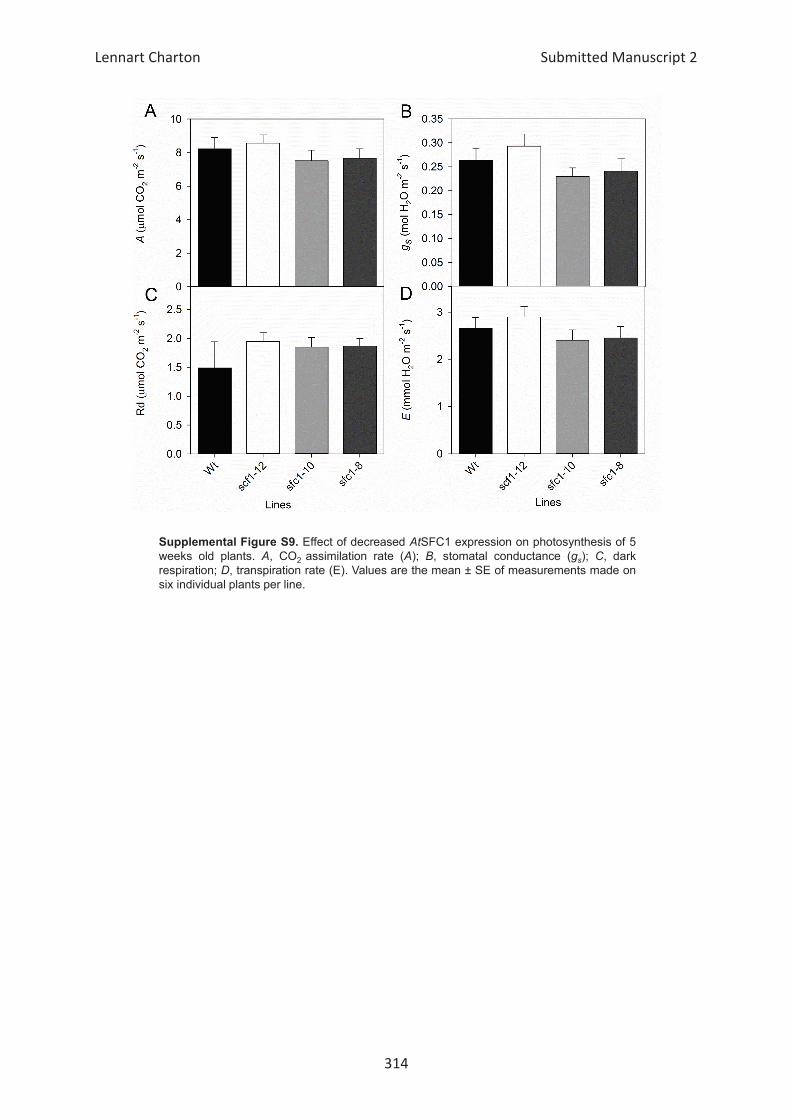
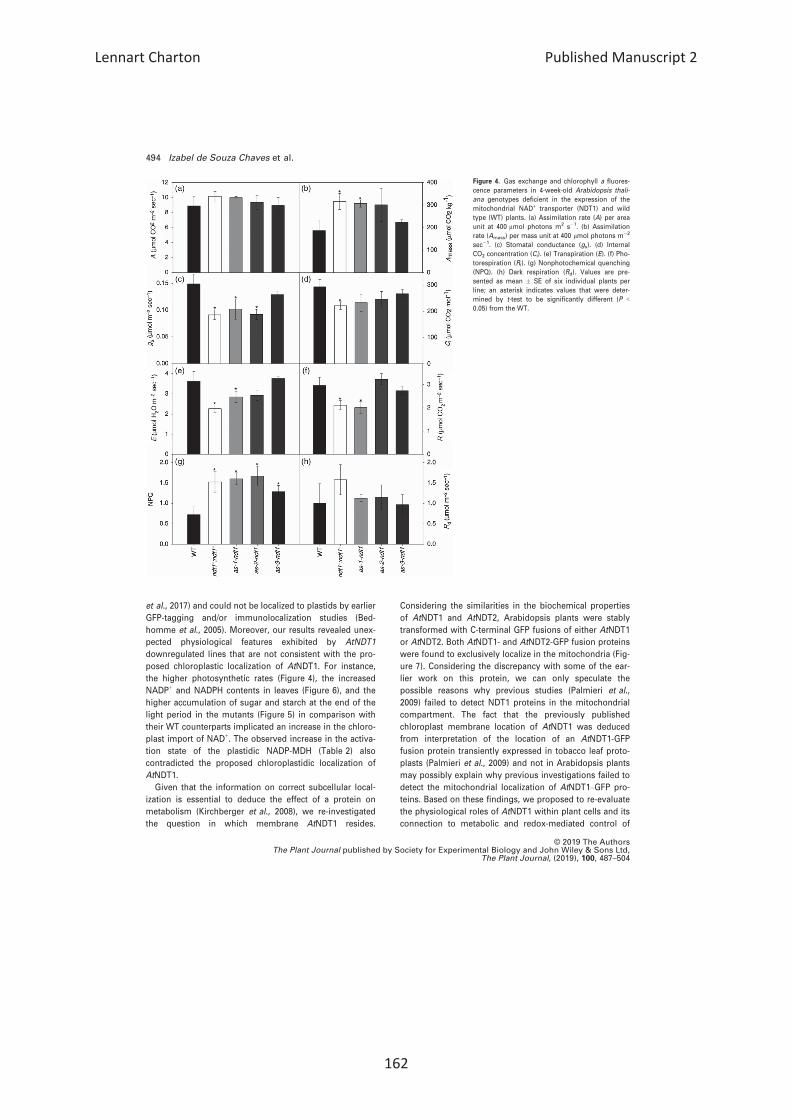
To investigate if the repression of AtNDT1 affects photo-
synthesis, several photosynthetic parameters were mea-
sured in the mutant plants. A reduced AtNDT1 expression
did not alter CO2 assimilation rates at 400 lmol photons
m�2 sec�1 (Figure 4a), or at 100 lmol photons m�2 sec�1
(Figure S10a,b). The parameters obtained from the light
response curves (Figure S10a) were similar to WT when
calculated as per unit of leaf area (Table S1). We further
normalised the photosynthetic rates to be expressed per
unit of mass, taking the leaf mass and thickness into
account, sas increased SLA was observed in the mutant
lines (Table 1). Interestingly, photosynthetic rates
increased significantly in the ndt1�:ndt1� and as-1-ndt1
plants (Figure 4b), whereas stomatal conductance (gs),
internal CO2 concentration (Ci), transpiration (E), photores-
piration (Ri), and stomatal density decreased in the NDT1
deficient plants (Figure 4c–f). Furthermore, non-photo-
chemical quenching (NPQ) increased in ndt1�:ndt1�, as-1-ndt1, as-2-ndt1 and as-3-ndt1 plants relative to WT plants
under 400 lmol photons m�2 sec�1 and higher light inten-
sities (Figure 4g; Figure S11). In contrast, the electron
transport rate (ETR), maximum quantum efficiency of pho-
tosystem II (Fv/Fm), the instantaneous water use efficiency
(A/E), and intrinsic water use efficiency (A/gs) did not
change significantly compared with WT (Figure S10c–f).These results indicated that the enhanced growth of the
ndt1 mutant plants is linked with an increased photosyn-
thetic activity.
Reduction of AtNDT1 expression affected starch and sugar
accumulation and altered cellular redox poise in leaves
To evaluate the putative metabolic changes caused by
AtNDT1 silencing in fully expanded leaves, compounds
related to carbon and nitrogen metabolism were mea-
sured throughout the diurnal cycle. Plants with reduced
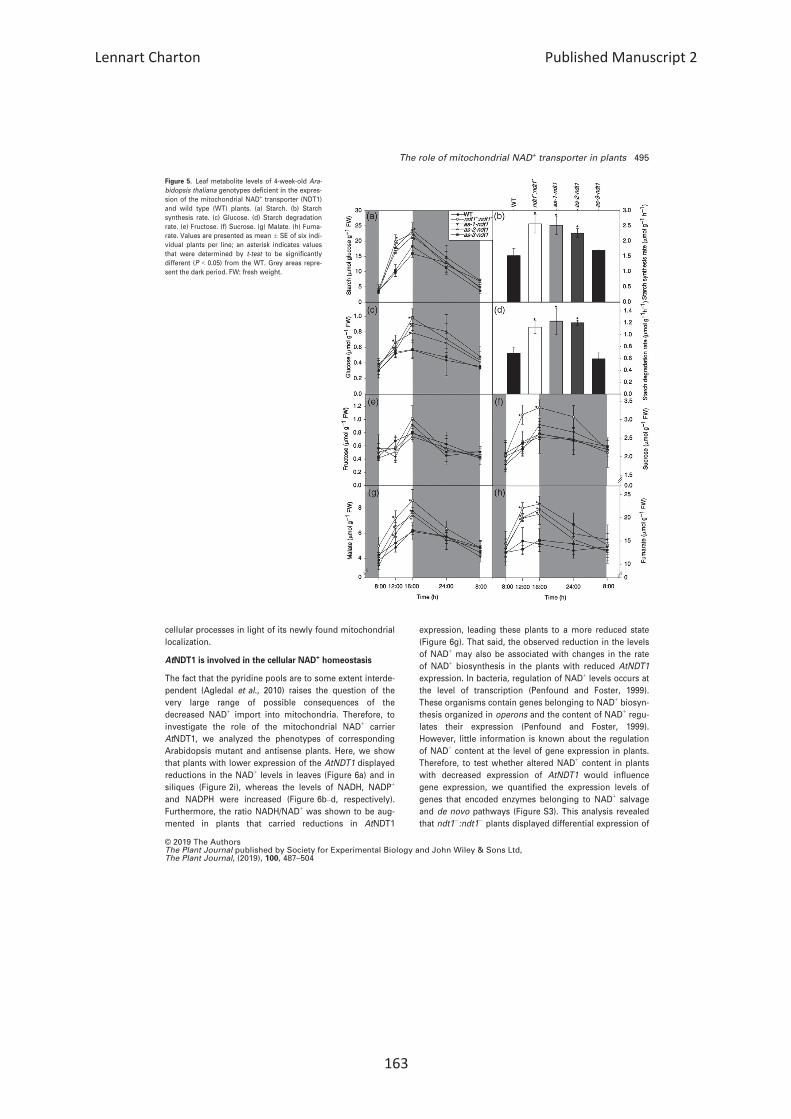
AtNDT1 transcript levels accumulated more starch at the
end of the light period (Figure 5a). Accordingly, increased
starch synthesis and starch degradation rates were
observed for the mutant plants (Figure 5b,d). Glucose
and sucrose levels were higher in the ndt1�:ndt1� mutant
plants in the middle and in the end of the light period
(Figure 5c,f), while fructose levels remained unaltered
(Figure 5e). Interestingly, malate and fumarate contents
also increased throughout the day in the ndt1�:ndt1�, as-1-ndt1, and as-2-ndt1 plants (Figure 5g,h). Protein content
was increased in the ndt1�:ndt1� line at the end of the
light period (Figure S12), whereas plants with low
AtNDT1 expression levels did not display altered chloro-
phyll levels (Figure S13).
Figure 3. Pollen viability and crossing mutants
analyses for phenotypic reestablishment of Ara-
bidopsis thaliana genotypes deficient in the expres-
sion of the mitochondrial NAD+ transporter (NDT1)
and wild type (WT) plants. (a) Pollen viability. (b)
Silique length in different crossings. (c) Crossing
with ndt1�:ndt1� female donor and WT pollen grain
donor and controls. (d) Crossing with WT female
donor and ndt1�:ndt1� pollen grain donor and con-
trols. Eight crossings were done for each combina-
tion and asterisk indicates values that were
determined by Student’s t-test to be significantly
different (P < 0.05) comparing WT female donor
and WT pollen grain donor with the others cross-
ing. Bars represents 1 cm.
© 2019 The AuthorsThe Plant Journal published by Society for Experimental Biology and John Wiley & Sons Ltd,
The Plant Journal, (2019), 100, 487–504
492 Izabel de Souza Chaves et al.
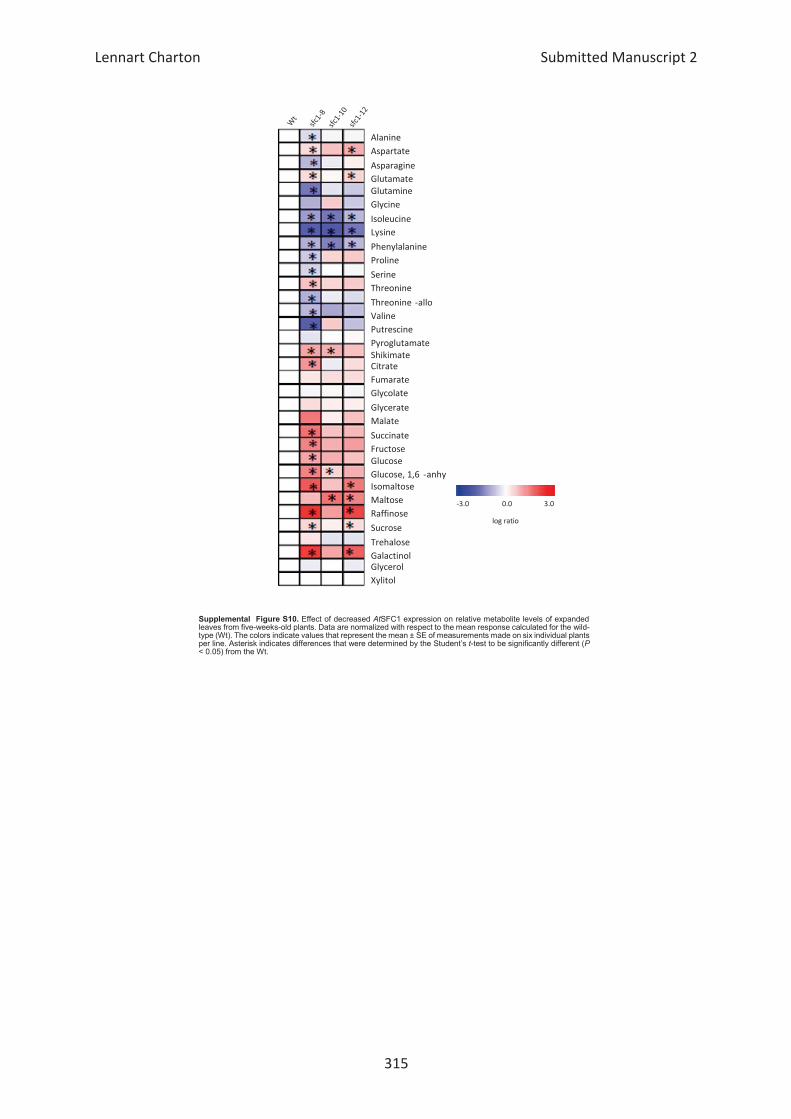
A non-targeted metabolic profile analysis identified
additional effects in leaf samples harvested in the middle
of the light period (Table S2). Among the successfully
annotated metabolites, sugars and related compounds
differed markedly in the lines with low AtNDT1 expres-
sion. AtNDT1 silencing led to elevated levels of glucose
(significantly in all lines), fructose (significantly in ndt1�:ndt1� and as-3-ndt1 lines), and galactinol (significantly in
ndt1�:ndt1�, as-2-ndt1 and as-3-ndt1 lines). Additionally,
glutamate (significantly in ndt1�:ndt1� and as-1-ndt1
lines), leucine (significantly in ndt1�:ndt1� line), sorbose
(significantly in ndt1�:ndt1� line), erythritrol (significantly
in ndt1�:ndt1� line), and myo-inositol (significantly in
ndt1�:ndt1� and as-3-ndt1 lines) levels were elevated in
the AtNDT1 silencing lines. Furthermore, the levels of
ascorbate were also increased in leaves of ndt1�:ndt1�
and as-1-ndt1 lines.
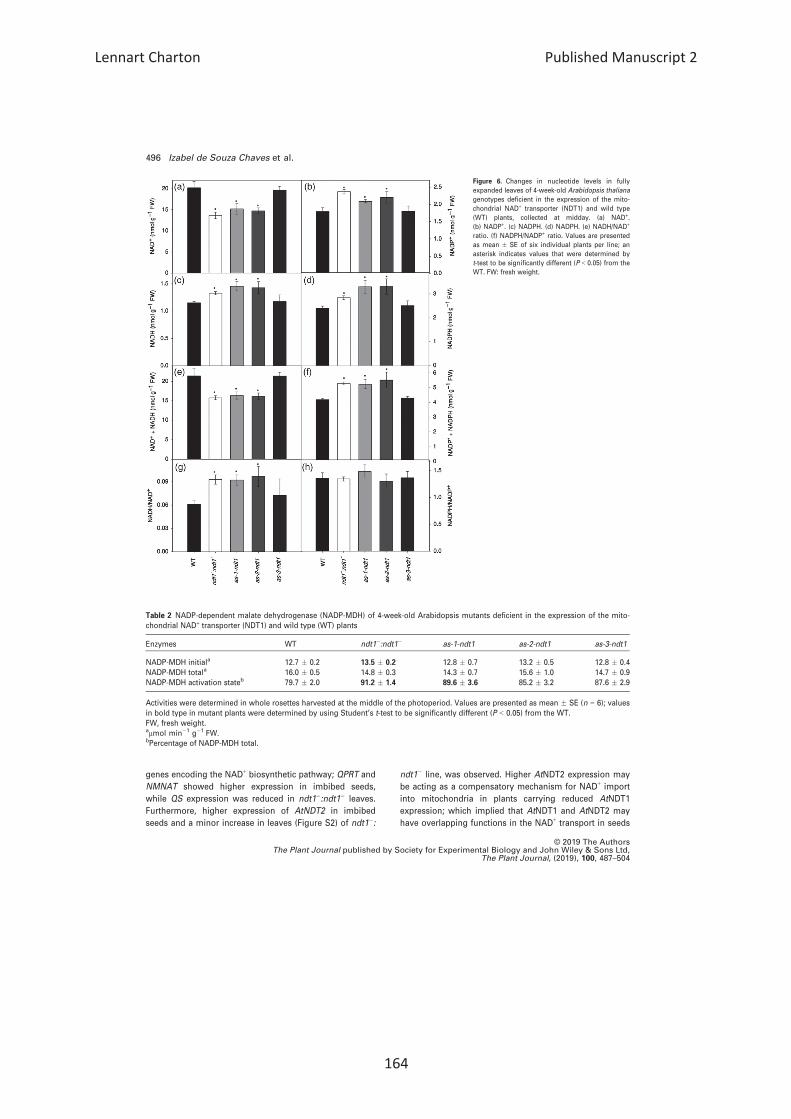
An analysis of the pyrimidine nucleotide pools in leaves
(Figure 6) revealed a significant decrease in the contents of
NAD+ in ndt1 �:ndt1�, as-1-ndt1, and as-2-ndt1 lines (Fig-
ure 6a), while the levels of NADP+, NADH and NADPH
increased in the same lines compared with WT (Figure 6b–d). Furthermore, the sum of NAD+ and NADH decreased,
while the NADP+ plus NADPH increased significantly in
ndt1�:ndt1�, as-1-ndt1, and as-2-ndt1 (Figure 6e–f). Inter-
estingly, a higher NADH/NAD+ ratio was observed in these
lines compared with WT (Figure 6g), while the NADPH/
NADP+ ratio was not significantly altered (Figure 6h). To
confirm changes in the cellular redox state in the mutant
plants, we evaluated the activation state of NADP-depen-
dent malate dehydrogenase (NADP-MDH) (Table 2), a key
redox-regulated enzyme controlling the malate valve,
which exports reducing equivalents indirectly from chloro-
plasts. We observed an increase in the NADP-MDH activa-
tion state in mutant leaves, which was significantly
different for ndt1�:ndt1� and as-1-ndt1. The significant
increase in the maximal NADP-MDH activity corroborated
well with the increased NADPH (Figure 6d) and malate
levels (Figure 5g) found in plants with reduced expression
of AtNDT1. Altogether, these results suggested that the cel-
lular redox state is changed as a consequence of the
reduced expression of AtNDT1.
Subcellular localization of AtNDT1-GFP revealed its
mitochondrial localization
AtNDT1 was presumed to exclusively reside in the
chloroplast membrane (Palmieri et al., 2009). However,
this protein was recently found in mitochondrial mem-
branes in proteome studies (Senkler et al., 2017) and a
previous GFP-tagging and immunolocalization study was
not able to find AtNDT1 targeted to chloroplast mem-
branes (Bedhomme et al., 2005). In addition, many phe-
notypic changes (described above) caused by AtNDT1
downregulation did not directly support that AtNDT1
functions in the chloroplast but rather suggested an
increase in chloroplast import of NAD+ at the expense of
deficient mitochondria import. Considering these facts,
we decided to re-evaluate the subcellular localization of
AtNDT1. To provide experimental evidence on the subcel-
lular localization of AtNDT1 and AtNDT2, we generated
corresponding GFP fusions under the control of the ubiq-
uitin 10 promotor (Grefen et al., 2010) and expressed the
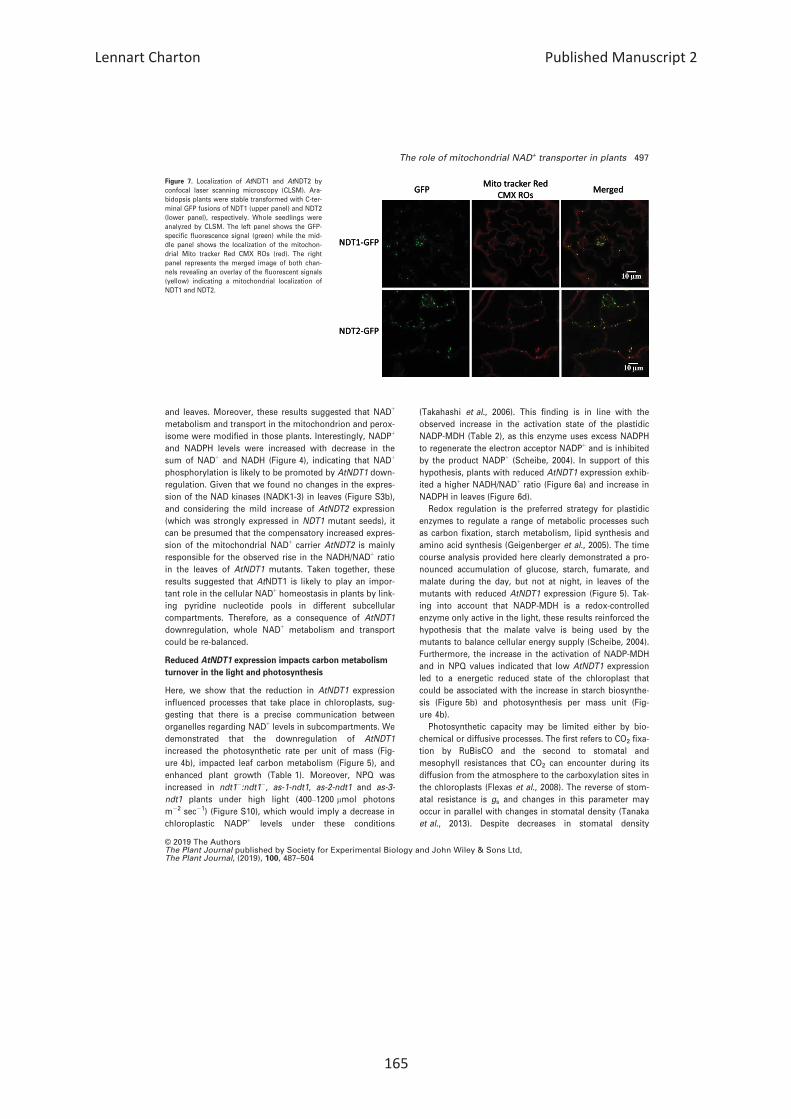
recombinant proteins in Arabidopsis seedlings. Both
AtNDT1- and AtNDT2�GFP fusion proteins were exclu-
sively localized in the mitochondria (Figure 7), indicating
their mitochondrial localization.
DISCUSSION
AtNDT1 has a mitochondrial localization in Arabidopsis
It has been previously described that AtNDT1 protein
resides in the chloroplast membrane (Palmieri et al., 2009).
Intriguingly, however, both AtNDT1 and AtNDT2 have been
found in mitochondria by a recent proteome study (Senkler
Table 1 Growth parameters of 4-week-old Arabidopsis genotypes deficient in the expression of the mitochondrial NAD+ transporter (NDT1)and wild type (WT) plants
Parameter WT ndt1�:ndt1� as-1-ndt1 as-2-ndt1 as-3-ndt1
RDW 50.0 � 3.0 90.0 � 3.0 80.0 � 3.0 60.0 � 8.0 60.0 � 4.0RSDW 10.0 � 3.0 20.0 � 3.0 20.0 � 4.0 10.0 � 4.0 10.0 � 3.0RRS 0.17 � 0.02 0.18 � 0.02 0.20 � 0.01 0.17 � 0.01 0.19 � 0.01LN 13.7 � 1.4 19.2 � 1.5 23.0 � 0.3 21.0 � 1.5 19.8 � 1.3
TLA 14.64 � 1.4 27.27 � 1.5 20.42 � 0.8 19.95 � 2.2 18.65 � 1.3SLA 241 � 24 320 � 14 306 � 9 331 � 17 269 � 15RLA 12.8 � 1.6 25.7 � 1.2 19.5 � 0.6 16.7 � 1.9 16.8 � 0.6SRA 225 � 51 303 � 11 266 � 5 279 � 25 252 � 12Stomatal density 138.4 � 4.8 117.9 � 3.3 117.9 � 2.4 121.9 � 5.2 136.6 � 10.1
RDW, rosette dry weight (mg); RSDW, root system dry weight (mg); RRS, root/shoot ratio; LN, leaf number; TLA, total leaf area (cm2); SLA,specific leaf area (cm2 g�1); RLA, rosette leaf area (cm2); SRA, specific rosette area (cm2 g�1) and stomata density (stomatal number mm�2).Values are presented as means � SE of determinations on six individual plants per line; bold type values were determined using Student’st-test to be significantly different (P < 0.05) from the WT.
© 2019 The AuthorsThe Plant Journal published by Society for Experimental Biology and John Wiley & Sons Ltd,The Plant Journal, (2019), 100, 487–504
The role of mitochondrial NAD+ transporter in plants 493
et al., 2017) and could not be localized to plastids by earlier
GFP-tagging and/or immunolocalization studies (Bed-
homme et al., 2005). Moreover, our results revealed unex-
pected physiological features exhibited by AtNDT1
downregulated lines that are not consistent with the pro-
posed chloroplastic localization of AtNDT1. For instance,
the higher photosynthetic rates (Figure 4), the increased
NADP+ and NADPH contents in leaves (Figure 6), and the
higher accumulation of sugar and starch at the end of the
light period in the mutants (Figure 5) in comparison with
their WT counterparts implicated an increase in the chloro-
plast import of NAD+. The observed increase in the activa-
tion state of the plastidic NADP-MDH (Table 2) also
contradicted the proposed chloroplastidic localization of
AtNDT1.
Given that the information on correct subcellular local-
ization is essential to deduce the effect of a protein on
metabolism (Kirchberger et al., 2008), we re-investigated
the question in which membrane AtNDT1 resides.
Considering the similarities in the biochemical properties
of AtNDT1 and AtNDT2, Arabidopsis plants were stably
transformed with C-terminal GFP fusions of either AtNDT1
or AtNDT2. Both AtNDT1- and AtNDT2-GFP fusion proteins
were found to exclusively localize in the mitochondria (Fig-
ure 7). Considering the discrepancy with some of the ear-
lier work on this protein, we can only speculate the
possible reasons why previous studies (Palmieri et al.,
2009) failed to detect NDT1 proteins in the mitochondrial
compartment. The fact that the previously published
chloroplast membrane location of AtNDT1 was deduced
from interpretation of the location of an AtNDT1-GFP
fusion protein transiently expressed in tobacco leaf proto-
plasts (Palmieri et al., 2009) and not in Arabidopsis plants
may possibly explain why previous investigations failed to
detect the mitochondrial localization of AtNDT1–GFP pro-
teins. Based on these findings, we proposed to re-evaluate
the physiological roles of AtNDT1 within plant cells and its
connection to metabolic and redox-mediated control of
Figure 4. Gas exchange and chlorophyll a fluores-
cence parameters in 4-week-old Arabidopsis thali-
ana genotypes deficient in the expression of the
mitochondrial NAD+ transporter (NDT1) and wild
type (WT) plants. (a) Assimilation rate (A) per area
unit at 400 lmol photons m2 s�1. (b) Assimilation
rate (Amass) per mass unit at 400 lmol photons m�2
sec�1. (c) Stomatal conductance (gs). (d) Internal
CO2 concentration (Ci). (e) Transpiration (E). (f) Pho-
torespiration (Ri). (g) Nonphotochemical quenching
(NPQ). (h) Dark respiration (Rd). Values are pre-
sented as mean � SE of six individual plants per
line; an asterisk indicates values that were deter-
mined by t-test to be significantly different (P <0.05) from the WT.
© 2019 The AuthorsThe Plant Journal published by Society for Experimental Biology and John Wiley & Sons Ltd,
The Plant Journal, (2019), 100, 487–504
494 Izabel de Souza Chaves et al.
cellular processes in light of its newly found mitochondrial
localization.
AtNDT1 is involved in the cellular NAD+ homeostasis
The fact that the pyridine pools are to some extent interde-
pendent (Agledal et al., 2010) raises the question of the
very large range of possible consequences of the
decreased NAD+ import into mitochondria. Therefore, to
investigate the role of the mitochondrial NAD+ carrier
AtNDT1, we analyzed the phenotypes of corresponding
Arabidopsis mutant and antisense plants. Here, we show
that plants with lower expression of the AtNDT1 displayed
reductions in the NAD+ levels in leaves (Figure 6a) and in
siliques (Figure 2i), whereas the levels of NADH, NADP+
and NADPH were increased (Figure 6b–d, respectively).
Furthermore, the ratio NADH/NAD+ was shown to be aug-
mented in plants that carried reductions in AtNDT1
expression, leading these plants to a more reduced state
(Figure 6g). That said, the observed reduction in the levels
of NAD+ may also be associated with changes in the rate
of NAD+ biosynthesis in the plants with reduced AtNDT1
expression. In bacteria, regulation of NAD+ levels occurs at
the level of transcription (Penfound and Foster, 1999).
These organisms contain genes belonging to NAD+ biosyn-
thesis organized in operons and the content of NAD+ regu-
lates their expression (Penfound and Foster, 1999).
However, little information is known about the regulation
of NAD+ content at the level of gene expression in plants.
Therefore, to test whether altered NAD+ content in plants
with decreased expression of AtNDT1 would influence
gene expression, we quantified the expression levels of
genes that encoded enzymes belonging to NAD+ salvage
and de novo pathways (Figure S3). This analysis revealed
that ndt1�:ndt1� plants displayed differential expression of
Figure 5. Leaf metabolite levels of 4-week-old Ara-
bidopsis thaliana genotypes deficient in the expres-
sion of the mitochondrial NAD+ transporter (NDT1)
and wild type (WT) plants. (a) Starch. (b) Starch
synthesis rate. (c) Glucose. (d) Starch degradation
rate. (e) Fructose. (f) Sucrose. (g) Malate. (h) Fuma-
rate. Values are presented as mean � SE of six indi-
vidual plants per line; an asterisk indicates values
that were determined by t-test to be significantly
different (P < 0.05) from the WT. Grey areas repre-
sent the dark period. FW: fresh weight.
© 2019 The AuthorsThe Plant Journal published by Society for Experimental Biology and John Wiley & Sons Ltd,The Plant Journal, (2019), 100, 487–504
The role of mitochondrial NAD+ transporter in plants 495
genes encoding the NAD+ biosynthetic pathway; QPRT and
NMNAT showed higher expression in imbibed seeds,
while QS expression was reduced in ndt1�:ndt1� leaves.
Furthermore, higher expression of AtNDT2 in imbibed
seeds and a minor increase in leaves (Figure S2) of ndt1�:
ndt1� line, was observed. Higher AtNDT2 expression may
be acting as a compensatory mechanism for NAD+ import
into mitochondria in plants carrying reduced AtNDT1
expression; which implied that AtNDT1 and AtNDT2 may
have overlapping functions in the NAD+ transport in seeds
Figure 6. Changes in nucleotide levels in fully
expanded leaves of 4-week-old Arabidopsis thaliana
genotypes deficient in the expression of the mito-
chondrial NAD+ transporter (NDT1) and wild type
(WT) plants, collected at midday. (a) NAD+.
(b) NADP+. (c) NADPH. (d) NADPH. (e) NADH/NAD+
ratio. (f) NADPH/NADP+ ratio. Values are presented
as mean � SE of six individual plants per line; an
asterisk indicates values that were determined by
t-test to be significantly different (P < 0.05) from the
WT. FW: fresh weight.
Table 2 NADP-dependent malate dehydrogenase (NADP-MDH) of 4-week-old Arabidopsis mutants deficient in the expression of the mito-chondrial NAD+ transporter (NDT1) and wild type (WT) plants
Enzymes WT ndt1�:ndt1� as-1-ndt1 as-2-ndt1 as-3-ndt1
NADP-MDH initiala 12.7 � 0.2 13.5 � 0.2 12.8 � 0.7 13.2 � 0.5 12.8 � 0.4NADP-MDH totala 16.0 � 0.5 14.8 � 0.3 14.3 � 0.7 15.6 � 1.0 14.7 � 0.9NADP-MDH activation stateb 79.7 � 2.0 91.2 � 1.4 89.6 � 3.6 85.2 � 3.2 87.6 � 2.9
Activities were determined in whole rosettes harvested at the middle of the photoperiod. Values are presented as mean � SE (n = 6); valuesin bold type in mutant plants were determined by using Student’s t-test to be significantly different (P < 0.05) from the WT.FW, fresh weight.almol min�1 g�1 FW.bPercentage of NADP-MDH total.
© 2019 The AuthorsThe Plant Journal published by Society for Experimental Biology and John Wiley & Sons Ltd,
The Plant Journal, (2019), 100, 487–504
496 Izabel de Souza Chaves et al.
and leaves. Moreover, these results suggested that NAD+
metabolism and transport in the mitochondrion and perox-
isome were modified in those plants. Interestingly, NADP+
and NADPH levels were increased with decrease in the
sum of NAD+ and NADH (Figure 4), indicating that NAD+
phosphorylation is likely to be promoted by AtNDT1 down-
regulation. Given that we found no changes in the expres-
sion of the NAD kinases (NADK1-3) in leaves (Figure S3b),
and considering the mild increase of AtNDT2 expression
(which was strongly expressed in NDT1 mutant seeds), it
can be presumed that the compensatory increased expres-
sion of the mitochondrial NAD+ carrier AtNDT2 is mainly
responsible for the observed rise in the NADH/NAD+ ratio
in the leaves of AtNDT1 mutants. Taken together, these
results suggested that AtNDT1 is likely to play an impor-
tant role in the cellular NAD+ homeostasis in plants by link-
ing pyridine nucleotide pools in different subcellular
compartments. Therefore, as a consequence of AtNDT1
downregulation, whole NAD+ metabolism and transport
could be re-balanced.
Reduced AtNDT1 expression impacts carbon metabolism
turnover in the light and photosynthesis
Here, we show that the reduction in AtNDT1 expression
influenced processes that take place in chloroplasts, sug-
gesting that there is a precise communication between
organelles regarding NAD+ levels in subcompartments. We
demonstrated that the downregulation of AtNDT1
increased the photosynthetic rate per unit of mass (Fig-
ure 4b), impacted leaf carbon metabolism (Figure 5), and
enhanced plant growth (Table 1). Moreover, NPQ was
increased in ndt1�:ndt1�, as-1-ndt1, as-2-ndt1 and as-3-
ndt1 plants under high light (400–1200 lmol photons
m�2 sec�1) (Figure S10), which would imply a decrease in
chloroplastic NADP+ levels under these conditions
(Takahashi et al., 2006). This finding is in line with the
observed increase in the activation state of the plastidic
NADP-MDH (Table 2), as this enzyme uses excess NADPH
to regenerate the electron acceptor NADP+ and is inhibited
by the product NADP+ (Scheibe, 2004). In support of this
hypothesis, plants with reduced AtNDT1 expression exhib-
ited a higher NADH/NAD+ ratio (Figure 6a) and increase in
NADPH in leaves (Figure 6d).
Redox regulation is the preferred strategy for plastidic
enzymes to regulate a range of metabolic processes such
as carbon fixation, starch metabolism, lipid synthesis and
amino acid synthesis (Geigenberger et al., 2005). The time
course analysis provided here clearly demonstrated a pro-
nounced accumulation of glucose, starch, fumarate, and
malate during the day, but not at night, in leaves of the
mutants with reduced AtNDT1 expression (Figure 5). Tak-
ing into account that NADP-MDH is a redox-controlled
enzyme only active in the light, these results reinforced the
hypothesis that the malate valve is being used by the
mutants to balance cellular energy supply (Scheibe, 2004).
Furthermore, the increase in the activation of NADP-MDH
and in NPQ values indicated that low AtNDT1 expression
led to a energetic reduced state of the chloroplast that
could be associated with the increase in starch biosynthe-
sis (Figure 5b) and photosynthesis per mass unit (Fig-
ure 4b).
Photosynthetic capacity may be limited either by bio-
chemical or diffusive processes. The first refers to CO2 fixa-
tion by RuBisCO and the second to stomatal and
mesophyll resistances that CO2 can encounter during its
diffusion from the atmosphere to the carboxylation sites in
the chloroplasts (Flexas et al., 2008). The reverse of stom-
atal resistance is gs and changes in this parameter may
occur in parallel with changes in stomatal density (Tanaka
et al., 2013). Despite decreases in stomatal density
NDT1-GFP
NDT2-GFP
GFP MergedMito tracker Red CMX ROs
NDT1-GFP
NDT2-GFP
GFP MergedMito tracker Red CMX ROs
Figure 7. Localization of AtNDT1 and AtNDT2 by
confocal laser scanning microscopy (CLSM). Ara-
bidopsis plants were stable transformed with C-ter-
minal GFP fusions of NDT1 (upper panel) and NDT2
(lower panel), respectively. Whole seedlings were
analyzed by CLSM. The left panel shows the GFP-
specific fluorescence signal (green) while the mid-
dle panel shows the localization of the mitochon-
drial Mito tracker Red CMX ROs (red). The right
panel represents the merged image of both chan-
nels revealing an overlay of the fluorescent signals
(yellow) indicating a mitochondrial localization of
NDT1 and NDT2.
© 2019 The AuthorsThe Plant Journal published by Society for Experimental Biology and John Wiley & Sons Ltd,The Plant Journal, (2019), 100, 487–504
The role of mitochondrial NAD+ transporter in plants 497
(Table 1) and gs (Figure 4c) in the mutant lines, the
increases in photosynthesis demonstrated that the mutant
plants maintained the synthesis of NADP+ required for
photochemical reactions that might be explained by the
indirect transfer of redox equivalents by redox shuttles
from the cytosol across the chloroplast membrane. Curi-
ously, reduced AtNDT2 expression negatively affected pho-
tosynthetic efficiency as a result of a lowered stomatal
density and conductance (unpublished work). This appar-
ent contradiction can be explained by the fact that AtNDT1
expression is much higher than AtNDT2 in leaves (Fig-
ure S2). Therefore, the entire NAD+ metabolism and trans-
port seems to be reorganized in AtNDT1 downregulated
lines in a more extended way than that in AtNDT2 mutant
lines, in a manner that enables greater transfer of redox
power for photochemical reactions, therefore compensat-
ing lower stomatal conductance and density in leaves of
AtNDT1 downregulated lines.
AtNDT1 was highly expressed in guard cells (Fig-
ure S9c); this finding is in line with the lower stomatal con-
ductance observed in ndt1�:ndt1� plants in our study
(Figure 4c). It has been shown that NAD+ levels are
reduced in response to the generation of ROS induced by
abscisic acid (ABA), which acts as a signal for stomatal clo-
sure (Hashida et al., 2010). Therefore, considering the
association of NAD+ metabolism to stomatal function, the
results presented here suggested that NAD+ is important
not only for stomatal movements, but that NAD+ transport
also acts in regulating guard cell biogenesis.
Repression of AtNDT1 affects pollen viability
It has been demonstrated that pollen maturation and tube
growth are dependent on energy produced by mitochon-
drial respiration and plastid glycolysis (Selinski and Scheibe,
2014). Recently, it has been shown that NADPH provision
via the OPPP in peroxisomes is also needed for gameto-
phytic interaction during pollen tube guidance to ovules
(H€olscher et al., 2016). Therefore, it is clear that energy
metabolism during pollen maturation and tube growth is
highly complex and involves different pathways and cell
compartments and, as NAD+ supply is essential for reduc-
tion related reactions, NAD+ transport is necessary. For
example, deficiency in the plastidic glycolytic glyceralde-
hyde-3-phosphate dehydrogenase, an enzyme that reversi-
bly converts the glyceraldehyde-3-phosphate to 1,3-
bisphosphoglycerate, with the reduction of NAD+ to NADH,
displays male sterility in Arabidopsis, due to a disorganized
tapetum cell layer (Mu~noz-Bertomeu et al., 2010). Further-
more, NAD(P)H accumulation during the growth of the pol-
len tube is directly coupled to ATP generation, which is used
to enable a variety of energy-dependent processes localized
in the pollen tube tip (C�ardenas et al., 2006).
Recent studies using mutants deficient in NAD+ biosynthe-
sis demonstrated a functional importance of NAD+ in
reproductive tissues such as pollen, floral meristem, siliques
and seeds (Hashida et al., 2007, 2013; Hunt et al., 2007; Liu
et al., 2009). Here, we demonstrated that AtNDT1 silencing
promoted a decrease in pollen viability and pollen tube
growth (Figures 3a, S7 and S8). Cumulative evidence sup-
ports the importance of NAD+ metabolism in pollen grain for-
mation and pollen tube growth (Berrin et al., 2005; Chai
et al., 2005, 2006; C�ardenas et al., 2006; Hashida et al., 2009).
In freshly harvested dry pollen, NAD+ is accumulated,
whereas it dramatically decreased immediately after water
contact (Hashida et al., 2013). Furthermore, several metabolic
pathways, which operate during maturation of pollen grains
and pollen tube growth such as the biosynthesis of lipids,
components of cell walls, and amino acids, are highly depen-
dent on NAD+ levels (Hashida et al., 2009). At the same time,
the occurrence of high NAD+ levels can maintain dormant
pollen grains by competitive inhibition of NADH-dependent
redox reactions that are essential for the formation of the pol-
len tube (Hashida et al., 2013). Accordingly, the formation of
non-viable pollen as found in our study and the strong
expression of AtNDT1 in pollen during the later stages of
development and following germination (Figure S9) con-
firmed that AtNDT1 is of fundamental importance for pollen
formation and germination.
In this study, we have shown that decreased AtNDT1
expression also resulted in reduced expression of AtPXN and
AtNDT2 in pollen grains (Figure S2). This result indicated that
reduction in NAD+ import by AtNDT1 may also impact the
NAD+ import by AtNDT2 and AtPXN and this may possibly
disturb the whole cell NAD+ balance in pollen. It deserves
special mention that AtNDT2 expression is dramatically lower
than AtNDT1 in the pollen of WT Arabidopsis (Figure S2),
meaning that emerging phenotypes in pollen could directly
result from AtNDT1 downregulation.
Seed germination and seedling establishment are
impaired due to AtNDT1 repression
The decreased viability of pollen grains observed in plants
with low AtNDT1 expression probably contributed to the
significant reduction in the number of seeds and the result-
ing reduction in siliques filling and lower length and diam-
eter of the siliques (Figures 2 and S4). The production of
shorter siliques can be ascribed to misfunctional male
gametophytes (Hashida et al., 2013). It was recently found
that mutant plants deficient in the expression of nicoti-
namide mononucleotide adenylyltransferase (NMNAT), an
important enzyme in NAD+ biosynthesis, produced non-vi-
able pollen grains, shortened siliques, and smaller num-
bers of seeds per plant (Hashida et al., 2013). These
authors did not comment on the mechanism that led to the
shortening of siliques, although, consistent with our obser-
vations, they showed that it may be a result of pollen ger-
mination and malformation of the pollen tube, due to the
lower concentration of NAD+ found in the mutants.
© 2019 The AuthorsThe Plant Journal published by Society for Experimental Biology and John Wiley & Sons Ltd,
The Plant Journal, (2019), 100, 487–504
498 Izabel de Souza Chaves et al.
The lower number of seeds in ndt1�:ndt1� plants sug-
gested that, in addition to NAD+ metabolism, mitochon-
drial NAD+ transport is also important during embryonic
development. As the concentration of nucleotides
decreased in mature siliques (Figure 2i), we may assume
that resources allocated to the zygote were impaired. As a
result, fewer seeds were generated, however the seeds
produced received a greater amount of carbohydrates,
explaining the larger seed size in ndt1�:ndt1�, as-1-ndt1
and as-2-ndt1 plants (Figures 2 and S4b).
Interestingly, the repression of AtNDT1 expression was
associated with a higher amount of lipids per seed (Fig-
ure S5a). It is well known that Arabidopsis seeds have high
fatty acid content (~35% by weight; Baud et al., 2002),
which serve as a carbon and energy reserve. Accordingly,
the increase in lipid content per seed was followed by a
mild but non-significant increase in starch contents in
ndt1�:ndt1� seeds, without changes in the protein level
(Figure S5c,d). Taken together, these results suggested
that the remaining seeds apparently exerted a higher sink
strength and therefore accumulated a higher amount of
storage compounds when the AtNDT1 expression was
reduced. Additionally, the relative concentration of fatty
acids alongside seedling development was generally
higher in the ndt1�:ndt1� line (Figure S6). As NAD+ is
required for b-oxidation during lipid mobilization and seed-
ling development (Bernhardt et al., 2012), it is suggested
that NDT1 mutant seeds fail to mobilize lipids possibly as a
consequence of an impaired fatty acid b-oxidation. There-fore, the delay in seed germination and impaired fatty acid
degradation (b-oxidation) may also indicate changes in the
peroxisomal NAD+ status in the ndt1�:ndt1� line. Addition-
ally, given that seed dormancy may be regulated by the
relative levels of pyridine nucleotides (Hunt and Gray,
2009), it is possible that the reduced germination rates
observed (Figure S5) are related to alterations in the levels
of NAD(P)(H) in the mutant siliques (Figure 2i).
AtNDT1 and AtNDT2 show varying degrees of redundancy
and specialization
The demonstration that both NDT1 and NDT2 are localized in
the mitochondria of Arabidopsis raises questions about their
exact roles in vivo. Therefore, to ascertain the individual con-
tributions of AtNDT1 and AtNDT2 to metabolism, it is impor-
tant to reconsider previously reported biochemical features
of the two carriers (Palmieri et al., 2009). First, AtNDT1 and
AtNDT2 genes exhibited high structural similarities and their
encoded proteins shared a number of similar transport prop-
erties, with both accepting AMP and ADP as highly efficient
counter-exchange substrates for NAD+. Second, it is assumed
that they derive from a common evolutionary ancestor; this
assumption could explain similarities in their biochemical
properties (Palmieri et al., 2009). Third, in spite of these func-
tional similarities, AtNDT1 and AtNDT2 have different kinetic
constants, with different levels of activity and affinities for
NAD+ (Palmieri et al., 2009). In addition, it should be recalled
that AtNDT1 and AtNDT2 display distinct tissue-specific
expression patterns. For instance, gene expression analysis
of AtNDT1 and AtNDT2 by qRT-PCR (Figure S2) demon-
strated much higher expression of AtNDT1 than AtNDT2 in
seeds, leaves, flowers and pollen, therefore suggesting that
AtNDT1 is the dominant NDT isoform in A. thaliana in these
tissues. In addition, gene expression analysis of AtNDT1 and
AtNDT2 (Figure S2), and depicted by the publicly available
data in Arabidopsis eFP Browser, demonstrated that the high-
est expression of AtNDT1 occurs in pollen grains in compar-
ison with its expression in seeds, leaves and flowers. Another
aspect to be pointed out is that the T-DNA insertion lines for
AtNDT1 and AtNDT2 showed reductions in pollen grain via-
bility of approximately 50% and 13%, respectively, in relation
to the corresponding WT. Altogether, these data suggested
that the formation of non-viable pollen in AtNDT1 downregu-
lated lines is mainly a result of AtNDT1 downregulation.
Moreover, given that decreased AtNDT1 expression also
resulted in lower expression of AtNDT2 in pollen grains (Fig-
ure S2), it seems that, at least in pollen, AtNDT2 does not
compensate for AtNDT1 deficiency. Notwithstanding, the
mutant plants for either AtNDT1 or AtNDT2 exhibited reduc-
tions in pollen viability, seed germination, stomatal density
and conductance, indicating that the activities of both
AtNDT1 and AtNDT2 are important for NAD+ metabolism in
these tissues (unpublished work and the current study). In
spite of these similarities, mutant plants for AtNDT1 and
AtNDT2 displayed opposite phenotypes regarding their pho-
tosynthetic performance, having higher and lower photosyn-
thetic rates, respectively, than the corresponding WT plants.
In conjunction, this information demonstrated that, even
though AtNDT1 and AtNDT2 cooperatively participate in
NAD+ import into mitochondria, both proteins have varying
degrees of specialization which probably took place along-
side their independent cellular evolution and that have
allowed the development of their individual properties such
as the different transport properties and gene expression pat-
terns.
In summary, the present study revealed that AtNDT1 is tar-
geted to the inner mitochondrial membrane and that this
transport protein appears to play an important role in cellular
NAD+ homeostasis in leaves. As a consequence of AtNDT1
downregulation, NAD+ metabolism and transport seems to
be reorganized, leading to metabolic shifts, which results in
increases in photosynthesis, starch accumulation and in the
activation state of the stromal NADP-MDH. In addition,
impaired AtNDT1 transport results in reduced pollen grain
viability, tube growth, and seed filling, demonstrating the
important role of AtNDT1 in reproductive tissues. Further-
more, we demonstrated a possible function for NAD+ trans-
port during seed germination and seedling establishment
that appears to be linked to the need of NAD+ during lipid
© 2019 The AuthorsThe Plant Journal published by Society for Experimental Biology and John Wiley & Sons Ltd,The Plant Journal, (2019), 100, 487–504
The role of mitochondrial NAD+ transporter in plants 499
metabolism and related processes. In the future, we are inter-
ested in identifying to what extent, AtNDT1 and AtNDT2 have
overlapping functions in NAD+ transport in different tissues
and conditions. It will also be interesting to determine
whether specific stress situations characterized by differential
expression patterns of AtNDT1 and AtNDT2 correlated with
the establishment or alteration of the mitochondrial pyridine
nucleotide pool. It seems reasonable to assume that the gen-
eration of multiple mutants for NAD+ transport proteins will
be needed to gain precise mechanistic insight into these phe-
notypes. Moreover, the determination of NAD+ and NADP+
levels at tissue-specific and subcellular levels in these
mutants is likely to enhance our knowledge of the specifici-
ties and redundancies of these different albeit partially com-
plementary transport proteins allowing us to truly
understand the physiological hierarchy under which they
operate.
EXPERIMENTAL PROCEDURES
Plant material
The ndt1�:ndt1� line, previously named GK-241G12, wasobtained from the GABI-KAT collection. This mutant line har-bours a T-DNA insertion in the ninth exon of AtNDT1 (At2g47490)(Figure 1a). The mutant line was selected on medium containingsulfadiazine (https://www.sigmaaldrich.com) and the insertion ofT-DNA and homozygous plants were confirmed by PCR usingspecific primers for the gene that confers resistance to sulfadi-azine (forward 50-GCACGAGGTACAAACCTCTACTCT-30, reverse50-GTCTCTCAAGTTTCAACCCATTCT-30 and T-DNA 50-ATATTGAC-CATCATACTCATTGC-30).
In addition, transgenic plants were generated by insertion of anantisense construct, under the control of the 35S promoter, pro-duced using the Gateway system (Landy, 1989). For this purpose,primers were designed (forward 50-CCACCATGTCCGCTAATTCT-CATCCTC-30 and reverse 50-CTTAAAGTATAGAGCTTTGCTCA-GAAGG-30) from a cDNA library, for amplification of the 939-bpAtNDT1 cDNA fragment. The PCR product was recombined withthe vector donor pDONR207 generating an entry clone in Escheri-chia coli (DH5a strain). A second recombination was performed inpK2WG7 and transformed into E. coli. Subsequently, the selectedcolonies were used to transform A. tumefaciens (strain GV3101),which was then used for insertion in Arabidopsis plants, ecotypeColumbia-0, in which the transgene expression was driven by theconstitutive 35S promoter (Bechtold et al., 1993). The cassettecontained a marker gene, conferring resistance to hygromycin(https://www.thermofisher.com) driven by the nos promoter andnos terminator.
Growth conditions
Seeds were surface sterilized and germinated on half-strengthMurashige and Skoog (½MS) medium (Murashige and Skoog,1962), supplemented with 1% sucrose (w/v) and the selectiveagent corresponding to the genotype used. Seeds were stratifiedfor 4 days at 4°C in the darkness and then kept in a growth cham-ber at 22 � 2°C, 60% relative humidity, irradiance of 150 lmolphotons m�2 sec�1 and a photoperiod of 8 h light and 16 h darkfor 10 days. After, seedlings were transferred to pots containing0.08 dm3 of commercial substrate, Tropstrato HT�, and
maintained under the same conditions. During the 4th week aftertransplanting, physiological assessments and harvesting of sam-ples in liquid nitrogen for biochemical analyses were performed.
For the analyses involving heterotrophic tissues, plates werekept in an air-conditioned growth room at 22 � 2°C, relativehumidity 60%, and an irradiance of 150 lmol photons m�2 sec�1,with a photoperiod of 8 h light and 16 h dark for 10 days. Then, theseedlings were also transferred to commercial substrate and evalu-ated for seed production.
Subcellular localization of NDT1 and NDT2 by confocal
laser scanning microscopy (CLSM)
Arabidopsis plants were stable transformed by Agrobacterium-mediated transformation with NDT1 or NDT2 fused to a C-terminalGFP tag under the control of the ubiquitin 10 promotor (Grefenet al., 2010). Five-day-old transformed seedlings were incubatedin 200 nM Mito tracker Red CMX ROs in ½MS medium for 1 h inthe dark. Afterwards, seedlings were washed with ½MS mediumto remove the Mito tracker solution and analyzed by a CLSM(Zeiss LSM 780) and Zeiss Zen software. Excitation and emissionranges of GFP (488 nm/490–550 nm) and Mito tracker Red CMXROs (561 nm/580–625 nm) were measured in two tracks. Imageprocessing was performed using Fiji as previously described(Schindelin et al., 2012).
Gene expression analysis
Gene expression analysis was performed in leaves, flowers, pol-len, and imbibed seeds using quantitative real-time PCR (qRT-PCR). Total RNA was extracted from leaves and flowers usingTRIzol� reagent (https://www.thermofisher.com) according to themanufacturer’s instructions. Then total RNA was treated withDNase/RNase-free (https://www.thermofisher.com) and quantifiedspectrophotometrically at 260 nm. Approximately 2 lg of isolatedRNA were used to synthesize the complementary strand of DNA(cDNA) using an Improm-IITM Reverse Transcription System (Pro-mega, Madison, WI, USA, https://www.promega.com) and oligo(dT)15, following the manufacturer’s recommendations.
The pollen isolation was made using a liquid pollen collectionmethod as described previously (Hicks et al., 2004), with somemodifications. Briefly, 50 inflorescences were collected into coldpollen growth medium (PGM) 17% sucrose, 2 mM CaCl2, 1.625 mM
boric acid pH adjusted to 7.5 with KOH. The pollen was released byagitating with gloved hands. After removing all green plant mate-rial the PGM was filtered in a nylon membrane (80 lm mesh size).Finally, after centrifugation at 5000 g for 10 min the pellet contain-ing the pollen was immediately frozen until RNA extraction.
Total RNA from pollen and 48 h imbided seeds were both iso-lated using the SV Total RNA Isolation System (Promega, https://www.promega.com) following the manufacturer’s manual. Theintegrity of the RNA was checked on 1% (w/v) agarose gels, andthe concentration was measured using the QIAxpert system (QIA-GEN, https://www.qiagen.com). Subsequently, total RNA wasreverse transcribed into cDNA using the Universal RiboClone�
cDNA Synthesis System (Promega) according the manufacturer’sprotocol.
Quantitative RT-PCRs were performed using a 7300 Real-TimeSystem (Applied Biosystems, Foster City, CA, USA, https://www.thermofisher.com) and Power SYBR� Green PCR Master Mix(https://www.thermofisher.com), following the manufacturer’s rec-ommendations. The relative expression levels were normalizedusing housekeeping genes (Table S3) and calculated using theDDCt method. All primers used for qRT-PCR were designed usingthe QuantPrime software (Messinger et al., 2006) and are listed in
© 2019 The AuthorsThe Plant Journal published by Society for Experimental Biology and John Wiley & Sons Ltd,
The Plant Journal, (2019), 100, 487–504
500 Izabel de Souza Chaves et al.
Table S3. qRT-PCR cycles were set up as follows: 94°C for 10 min,40 cycles of 94°C for 15 sec, 58°C for 15 sec and 72°C for 15 sec.
Gas-exchange and chlorophyll a fluorescence parameters
Gas-exchange and chlorophyll a fluorescence parameters wereevaluated 1 h after the onset of the light period by an infrared gasanalyzer (IRGA) LI 6400XT (LI-COR, Lincoln, NE, USA, https://www.licor.com/) with coupled fluorometer (6400-40 LI-LI-COR Inc.). Lightresponse curves of net CO2 assimilation were obtained using a2 cm2 foliar chamber, 25°C temperature, CO2 concentration (Ca) of400 lmol CO2 mol�1 and irradiances (PPFD) of 0, 10, 25, 50, 100,200, 400, 800, 1000 and 1200 lmol photons m�2 sec�1. The vari-ables derived from the curves A/PPFD, such as compensation irra-diance (Ic), saturation irradiance (Is), light use efficiency (1/ɸ), andCO2 assimilation rate saturated by light (ARFA) were estimatedfrom response curve settings to light by the non-rectangularhyperbolic model (von Caemmerer, 2000).
Gas-exchange parameters were evaluated at saturation, i.e.400 lmol photons m�2 sec�1 (Figure S10). Photosynthesis permass unit was estimated based on SLA and LN.
The photorespiration rate (Ri) was estimated as: Ri = ((1/12) 9 (Jflu � (4 9 (A + Rd)))) where Jflu equivalent to ETR esti-mated by fluorescence parameters (Valentini et al., 1995). Theinstantaneous water use efficiency (A/E) and intrinsic water useefficiency (A/gs), where E stands for transpiration and gs for stom-atal conductance, were also calculated.
Dark respiration (Rd) was determined after 1 h dark acclimationusing the same IRGA system described above. The maximumquantum efficiency of photosystem II (Fv/Fm) was evaluated. After1 h of dark acclimation, an irradiance of 0.03 lmol photonsm�2 sec�1 was applied to determine the initial fluorescence (F0).To obtain maximal fluorescence (Fm), a saturating pulse of6000 lmol photons m�2 sec�1 was applied for 0.8 sec. The Fv/Fmwas then calculated as (Fm � F0)/Fm. Furthermore, NPQ and ETRwere estimated as described by DaMatta et al. (2002) and Limaet al. (2002).
Biometric analysis
Following measurement of gas exchange and fluorescence, thewhole plant was harvested and the following growth parameterswere evaluated: rosette dry weight (RDW), RSDW, root/shoot ratio(RRS), RLA, SRA, LN, TLA, and SLA. RLA and TLA were determinedusing a digital image, in which the leaves were scanned (HewlettPackard Scanjet G2410, Palo Alto, CA, USA) and the obtained imageswere processed with the aid of Rosette Tracker software (De Vylderet al., 2012). SRA and SLA were estimated using the formula: SRA(or SLA) = RLA (or TLA)/RDW.
Stomatal density
The stomatal density was determined using epidermal prints,from the abaxial surface of fully expanded leaves according tovon Groll et al. (2002). Six plants per genotype were printed and,for each epidermal print, 10 different regions were evaluated.
Biochemical analyses
Six whole rosettes of each line were collected from 5-week-oldplants and snap frozen in liquid nitrogen at 8, 12 or 16 h corre-sponding to the beginning, middle and end of the light period and24 h and 8 h representing the middle and end of the dark period,respectively. Subsequently, samples were homogenized, and sub-jected to ethanol extraction as described by Gibon et al. (2004).Chlorophyll, nitrate, glucose, fructose and sucrose contents were
quantified according to Sulpice et al. (2009) and Fernie et al.(2001), soluble amino acids as described by Gibon et al. (2004)and malate and fumarate as detailed by Nunes-Nesi et al. (2007).In the insoluble fraction, the levels of starch and protein weredetermined according to Cross et al. (2006). The rates of starchbiosynthesis ((starch concentration at the end of the light period –starch concentration at the beginning of the light period)/the num-ber of hours of light) and starch degradation ((starch concentra-tion at the end of the light period – concentration starch at the endof the dark period)/number of dark hours) were calculated. In addi-tion, aliquots of approximately 25 mg of leaf samples were col-lected in the middle of the light period for the quantification ofnucleotide NAD+, NADH, NADP+ and NADPH according to the pro-tocol described by Schippers et al. (2008).
The metabolic profile was determined by gas chromatogra-phy time-of-flight mass spectrometry (GC-TOF MS) according tothe protocol described by Lisec et al. (2006). Metabolites weremanually identified using the reference library mass spectraand retention indices from the Golm Metabolome Database(http://gmd.mpimp-golm.mpg.de; Kopka et al., 2005). Metabo-lite profiling data are reported following recommendations(Fernie et al., 2011).
Fatty acids of mature dried seeds and seedlings at 2, 4 or6 days old were extracted and derivatized as described byBrowse et al. (1986), and analyzed as methyl esters (FAMEs). Thefatty acid profile was analyzed by GC-TOF MS. Before derivatisa-tion, fatty acid 17:0 was added as an internal standard to enablequantification. The identification of compounds was based onretention time and comparison of the mass spectra with refer-ence spectra available on the NIST 08 and NIST 08s library data-base (National Institute of Standards and Technology, Babushoket al., 2007). The quantification was performed automatically byintegrating the chromatographic peaks obtained (Bernhardtet al., 2012). The amounts of the 17:0 standard was used for thecorrection of inter-sample variation and absolute quantificationof fatty acids according to Hielscher et al. (2017). The percentageof each fatty acid was calculated relative to the total of all fattyacids for each line per time point.
Morphological analysis
The viability of pollen grain was evaluated as described by Loren-zon and Almeida (1996). For this, dehisced anthers of differentgenotypes were gently dipped onto the surface of the microscopeslide and the pollen grains released were transferred to the dyeand evaluated under a light microscope. Six flowers from sixplants from each line were analyzed, with unstained or deformedpollen grains being considered non-viable. We additionally deter-mined the length and diameter of siliques using a stereomicro-scope. Six siliques from six plants of each line werephotographed and measured and the length, diameter and num-ber of seeds in each silique were determined. In addition, the1000-seed weight was also determined.
Seed germination and seedling development
Seeds of ndt1�:ndt1� and WT plants were surface sterilized andgerminated as described above. After 48 h in the light, the per-centage of germination, GSI, percentage of normal and abnormalseedlings (including albino seedlings) and the ESI was deter-mined. GSI and ESI were calculated by the sum of the number ofgerminated seeds (or normal seedlings) each day, divided by thenumber of days between sowing and germination, according toMaguire (1962). Six replicates of 50 seeds each were used for thisevaluation.
© 2019 The AuthorsThe Plant Journal published by Society for Experimental Biology and John Wiley & Sons Ltd,The Plant Journal, (2019), 100, 487–504
The role of mitochondrial NAD+ transporter in plants 501
Statistical analysis
All the data are expressed as the mean � standard error. Datawere tested for significant differences (P ≤ 0.05) using Student0s ttest. All the statistical analyses were performed using the algo-rithm embedded into Microsoft Excel� (Microsoft, Seattle).
ACCESSION NUMBERS
AtNDT1 (At2g47490); AtNDT2 (At1g25380); AtPXN
(At2g39970); COBL11 (At4g27110); F-box family protein
(At5g15710); AtNADK1 (At3g21070); AtNADK2 (At1G21640);
AtNADK3 (At1G78590); AtACTIN (At2g37620); AtPARP1
(At2g31320); AtPARP2 (At4g02390); AtNUDIX7 (At4g12720);
AtNIC1 (At2G22570); AtNIC4 (At3g16190); AtNAPRT1
(At4g36940); AtNAPRT2 (At2g23420); AtNADS (At1g55090);
AtNMNAT (At5g55810); AtQPT (At2g01350); AtQS
(At5g50210); AtAO (At5g14760).
DATA STATEMENT
All data used for the analyses are available upon request
or as Supporting Information and may be found in the
online version of this article.
ACKNOWLEDGEMENTS
Financial support was provided by Conselho Nacional de Desen-volvimento Cient�ıfico e Tecnol�ogico (CNPq) (Grant 402511/2016-6to WLA), Fundac�~ao de Amparo �a Pesquisa do Estado de MinasGerais (FAPEMIG) [Grant CRA – APQ-01713-13, CBB – APQ-02548-13, CEX – APQ-02985-14 and CRA – RED-00053-16] and Max PlanckSociety to ANN and WLA. HEN and ARF acknowledge the supportof the Deutsche Forschungsgemeinschaft in the framework of thetrans-regional collaborative research centre TRR175. APMWacknowledges funding by the Deutsche Forschungsgemeinschaft(DFG, German Research Foundation) under Germany0s ExcellenceStrategy – EXC-2048/1 – Project ID: 390686111. Research fellow-ships granted by CNPq to ANN and WLA, Coordenac�~ao de Aper-feic�oamento de Pessoal de N�ıvel Superior (CAPES) and FAPEMIGto ISC and DBM are also gratefully acknowledged. The authorswish to thank the NUBIOMOL-UFV for providing the facilities forthe analysis of this work.
CONFLICT OF INTEREST
The authors declare no conflict of interest.
AUTHOR CONTRIBUTIONS
AF and ANN screened and genotyped the mutant line.
MVP performed the cloning and plant transformation
under supervision of TO; ISC screened the transgenic
lines and performed most of the experiments under
supervision of ANN; DBM, PFP, LC, EH and JACA per-
formed complementary experiments and analyses; NL
and TM-A supervised ISC in the lipid analysis and LC in
protein localization analysis; ANN and ISC designed the
experiments and analyzed the data; ARF and ANN con-
ceived the project and wrote the article with contributions
of all the authors; PFP, HEN, FP, WLA, NL and APMW
complemented the writing.
SUPPORTING INFORMATION
Additional Supporting Information may be found in the online ver-sion of this article.Figure S1. Gene expression analysis of the NDT1 gene in differentorgans of Arabidopsis thaliana wild type plants.
Figure S2. Gene expression analysis of genes encoding NAD+ car-riers (NDT1, NDT2 and PXN) in different organs of Arabidopsisthaliana wild type and ndt1�:ndt1� plants.
Figure S3. Gene expression analysis of genes encoding enzymesrelated to NAD+ metabolism in imbibed seeds and leaves of Ara-bidopsis thaliana mutants deficient in the expression of the mito-chondrial NAD+ transporter (NDT1) and wild type (WT) plants.
Figure S4. Phenotypic analysis of Arabidopsis thaliana lines defi-cient in the expression of the mitochondrial NAD+ transporter(NDT1) and wild type (WT) plants.
Figure S5. Seed, seedling, germination and seedling establish-ment characterization of Arabidopsis thaliana mutant line deficientin the expression of the mitochondrial NAD+ transporter (NDT1)and wild type (WT) plants.
Figure S6. Fatty acid composition in seeds and seedling of Ara-bidopsis thaliana mutants deficient in the expression of the mito-chondrial NAD+ transporter (NDT1) and wild type (WT) plants.
Figure S7. Phenotypic analysis of pollen grains stained with aceticcarmine from Arabidopsis thaliana genotypes deficient in theexpression of the mitochondrial NAD+ transporter (NDT1) and wildtype plants.
Figure S8. Germination rate and tube growth of pollen grains fromArabidopsis thaliana genotype deficient in the expression of themitochondrial NAD+ transporter (NDT1) and wild type (WT) plants.
Figure S9. eFP display of transcript accumulation patterns acrossa variety of Arabidopsis organs and treatments.
Figure S10. Gas-exchange and chlorophyll a fluorescence parame-ters in leaves of 4-week-old Arabidopsis thaliana genotypes defi-cient in the expression of the mitochondrial NAD+ transporter(NDT1) and wild type (WT) plants.
Figure S11. Non-photochemical quenching (NPQ) of 4-week-oldArabidopsis thaliana genotypes deficient in the expression of themitochondrial NAD+ transporter (NDT1) and wild type (WT) plantsunder various light intensities.
Figure S12. Changes in the main nitrogen metabolites in leaves of4-week-old Arabidopsis thaliana genotypes deficient in the expres-sion of the mitochondrial NAD+ transporter (NDT1) and wild type(WT) plants.
Figure S13. Changes in chlorophyll content in leaves of 4-week-oldArabidopsis thaliana genotypes deficient in the expression of themitochondrial NAD+ transporter (NDT1) and wild type (WT) plants.
Table S1. Parameters derived from photosynthetic light curveresponse (Figure S4a) of 4-week-old, short-day grown Arabidopsisthaliana genotypes deficient in the expression of the mitochon-drial NAD+ transporter (NDT1).
Table S2. Relative metabolite levels in leaves of 4-week-old, short-day grown, Arabidopsis thaliana genotypes deficient in theexpression of the mitochondrial NAD+ transporter (NDT1) and wildtype (WT) plants.
Table S3. List of primers used in this work to perform qPCR analysis.
REFERENCES
Agledal, L., Niere, M. and Ziegler, M. (2010) The phosphate makes a differ-
ence: cellular functions of NADP. Redox Rep. 15, 2–10. https://doi.org/10.1179/174329210x12650506623122
© 2019 The AuthorsThe Plant Journal published by Society for Experimental Biology and John Wiley & Sons Ltd,
The Plant Journal, (2019), 100, 487–504
502 Izabel de Souza Chaves et al.
Agrimi, G., Russo, A., Pierri, C.L. and Palmieri, F. (2012) The peroxisomal
NAD+ carrier of Arabidopsis thaliana transports coenzyme A and its
derivatives. J. Bioenerg. Biomembr. 44, 333–340. https://doi.org/10.1007/s10863-012-9445-0
Babushok, V.I., Linstrom, P.J., Reed, J.J., Zenkevich, I.G., Brown, R.L., Mal-
lard, W.G. and Stein, S.E. (2007) Development of a database of gas chro-
matographic retention properties of organic compounds. J. Chromatogr.
A, 1157, 414–421. https://doi.org/10.1016/j.chroma.2007.05.044
Baud, S., Boutin, J.P., Miquel, M., Lepiniec, L. and Rochat, C. (2002) An inte-
grated overview of seed development in Arabidopsis thaliana ecotype
WS. Plant Physiol. Biochem. 40, 151–160. https://doi.org/10.1016/s0981-
9428(01)01350-x
Bechtold, N., Ellis, J. and Pelletier, G. (1993) In planta Agrobacterium medi-
ated gene transfer by infiltration of adult Arabidopsis thaliana plants. C.
R. Acad. III, 316, 1194–1199. https://doi.org/10.1007/978-3-642-79247-2_3Bedhomme, M., Hoffmann, M., McCarthy, E.A., Gambonnet, B., Moran, R.G.,
R�ebeill�e, F. and Ravanel, S. (2005) Folate metabolism in plants: an Arabidop-
sis homolog of the mammalian mitochondrial folate transporter mediates
folate import into chloroplasts. J. Biol. Chem. 280, 34823–34831.Bernhardt, K., Wilkinson, S., Weber, A.P.M. and Linka, N. (2012) A peroxiso-
mal carrier delivers NAD+ and contributes to optimal fatty acid degrada-
tion during storage oil mobilization. Plant J. 69, 1–13. https://doi.org/10.1111/j.1365-313x.2011.04775.x
Berrin, J.-G., Pierrugues, O., Brutesco, C., Alonso, B., Montillet, J.-L., Roby,
D. and Kazmaier, M. (2005) Stress induces the expression of AtNADK-1,
a gene encoding a NAD(H) kinase in Arabidopsis thaliana. Mol. Genet.
Genomics, 273, 10–19. https://doi.org/10.1007/s00438-005-1113-1Bowsher, C.G., Lacey, A.E., Hanke, G.T., Clarkson, D.T., Saker, L.R., Stulen,
I. and Emes, M.J. (2007) The effect of Glc6P uptake and its subsequent
oxidation within pea root plastids on nitrite reduction and glutamate syn-
thesis. J. Exp. Bot. 58, 1109–1118. https://doi.org/10.1093/jxb/erl269Browse, J., McCourt, P.J. and Somerville, C.R. (1986) Fatty acid composition
of leaf lipids determined after combined digestion and fatty acid methyl
ester formation from fresh tissue. Anal. Biochem. 152, 141–145. https://doi.org/10.1016/0003-2697(86)90132-6
C�ardenas, L., McKenna, S.T., Kunkel, J.G. and Hepler, P.K. (2006) NAD(P)H
oscillates in pollen tubes and is correlated with tip growth. Plant Physiol.
142, 1460–1468. https://doi.org/10.1104/pp.109.150458Chai, M.F., Chen, Q.J., An, R., Chen, Y.M., Chen, J. and Wang, X.C. (2005)
NADK2, an Arabidopsis chloroplastic NAD kinase, plays a vital role in
both chlorophyll synthesis and chloroplast protection. Plant Mol. Biol.
59, 553–564. https://doi.org/10.1007/s11103-005-6802-yChai, M.F., Wei, P.C., Chen, Q.J., An, R., Chen, J., Yang, S. and Wang, X.C.
(2006) NADK3, a novel cytoplasmic source of NADPH, is required under
conditions of oxidative stress and modulates abscisic acid responses in
Arabidopsis. Plant J. 47, 665–674. https://doi.org/10.1111/j.1365-313x.
2006.02816.x
Cross, J.M., von Korff, M., Altmann, T., Bartzetko, L., Sulpice, R., Gibon, Y.,
Palacios, N. and Stitt, M. (2006) Variation of enzyme activities and
metabolite levels in 24 Arabidopsis accessions growing in carbon-limited
conditions. Plant Physiol. 142, 1574–1588. https://doi.org/10.1104/pp.106.086629
DaMatta, F.M., Loos, R.A., Silva, E.A. and Loureiro, M.E. (2002) Limitations
to photosynthesis in Coffea canephora as a result of nitrogen and water
availability. J. Plant Physiol. 159, 975–981. https://doi.org/10.1078/0176-
1617-00807
De Block, M., Verduyn, C., De Brouwer, D. and Cornelissen, M. (2005) Poly
(ADP-ribose) polymerase in plants affects energy homeostasis, cell death
and stress tolerance. Plant J. 41, 95–106. https://doi.org/10.1111/j.1365-
313x.2004.02277.x
De Vylder, J., Vandenbussche, F., Hu, Y., Philips, W. and Van Der Straeten,
D. (2012) Rosette Tracker: an open source image analysis tool for auto-
matic quantification of genotype effects. Plant Physiol. 160, 1149–1159.https://doi.org/10.1104/pp.112.202762
Fernie, A.R., Roscher, A., Ratcliffe, R.G. and Kruger, N.J. (2001) Fructose 2,6-
bisphosphate activates pyrophosphate: fructose 6 phosphate 1-phospho-
transferase and increases triose phosphate to hexose phosphate cycling
in heterotrophic cells. Planta, 212, 250–263. https://doi.org/10.1007/
s004250000386
Fernie, A.R., Aharoni, A., Willmitzer, L., Stitt, M., Tohge, T., Kopka, J., Car-
roll, A.J., Saito, K., Fraser, P.D. and de Luca, V. (2011) Recommendations
for reporting metabolite data. Plant Cell, 23, 2477–2482. https://doi.org/10.1105/tpc.111.086272
Flexas, J., Ribas-Carb�o, M., Diaz-Espejo, A., Galm�es, J. and Medrano, H.
(2008) Mesophyll conductance to CO2: current knowledge and future pro-
spects. Plant Cell Environ. 31, 602–621. https://doi.org/10.1111/j.1365-
3040.2007.01757.x
Gaki�ere, B., Fernie, A.R. and P�etriacq, P. (2018) More to NAD+ than meets
the eye: A regulator of metabolic pools and gene expression in Ara-
bidopsis. Free Radical Biology and Medicine, 122, 86–95. https://doi.org/10.1016/j.freeradbiomed.2018.01.003
Geigenberger, P. and Fernie, A.R. (2014) Metabolic control of redox and
redox control of metabolism in plants. Antioxid. Redox Signal. 21, 1389–1421. https://doi.org/10.1089/ars.2014.6018
Geigenberger, P., Kolbe, A. and Tiessen, A. (2005) Redox regulation of car-
bon storage and partitioning in response to light and sugars. J. Exp. Bot.
56, 1469–1479. https://doi.org/10.1093/jxb/eri178Gibon, Y., Blaesing, O.E., Hannemann, J., Carillo, P., Hohne, M., Hendriks,
J.H.M., Palacios, N., Cross, J., Selbig, J. and Stitt, M. (2004) A robot-
based platform to measure multiple enzyme activities in Arabidopsis
using a set of cycling assays: comparison of changes of enzyme activi-
ties and transcript levels during diurnal cycles and prolonged darkness.
Plant Cell, 16, 3304–3325. https://doi.org/10.1105/tpc.104.025973Grefen, C., Donald, N., Hashimoto, K., Kudla, J., Schumacher, K. and Blatt,
M.R. (2010) A ubiquitin-10 promoter-based vector set for fluorescent pro-
tein tagging facilitates temporal stability and native protein distribution
in transient and stable expression studies. The Plant Journal, 64(2), 355–365. https://doi.org/10.1111/j.1365-313X.2010.04322.x
Hashida, S.N., Takahashi, H., Kawai-Yamada, M. and Uchimiya, H. (2007)
Arabidopsis thaliana nicotinate/nicotinamide mononucleotide adenyl-
transferase (AtNMNAT) is required for pollen tube growth. Plant J. 49,
694–703. https://doi.org/10.1111/j.1365-313x.2006.02989.xHashida, S.N., Takahashi, H. and Uchimiya, H. (2009) The role of NAD
biosynthesis in plant development and stress responses. Ann. Bot. 103,
819–824. https://doi.org/10.1093/aob/mcp019
Hashida, S.N., Itami, T., Takahashi, H., Takahara, K., Nagano, M., Kawai-
Yamada, M., Shoji, K., Goto, F., Yoshihara, T. and Uchimiya, H. (2010)
Nicotinate/nicotinamide mononucleotide adenyltransferase-mediated
regulation of NAD biosynthesis protects guard cells from reactive oxy-
gen species in ABA-mediated stomatal movement in Arabidopsis. J. Exp.
Bot. 61, 3813–3825. https://doi.org/10.1093/jxb/erq190Hashida, S.N., Takahashi, H., Takahara, K., Kawai-Yamada, M., Kitazaki,
K., Shoji, K., Goto, F., Yoshihara, T. and Uchimiya, H. (2013) NAD+
accumulation during pollen maturation in Arabidopsis regulating onset
of germination. Mol. Plant, 6, 216–225. https://doi.org/10.1093/mp/
sss071
Hicks, G.R., Rojo, E., Hong, S., Carter, D.G. and Raikhel, N.V. (2004) Gemi-
nating pollen has tubular vacuoles, displays highly dynamic vacuole bio-
genesis, and requires VACUOLESS1 for proper function. Plant Physiol.
134, 1227–1239. https://doi.org/10.1104/pp.103.037382Hielscher, B., Charton, L., Mettler-Altmann, T. and Linka, N. (2017) Analysis
of Peroxisomal beta-oxidation during storage oil mobilization in Ara-
bidopsis thaliana seedlings. Methods Mol. Biol. 1595, 291–304. https://doi.org/10.1007/978-1-4939-6937-1_27
H€olscher, C., Lutterbey, M.C., Lansing, H., Meyer, T., Fischer, K. and von
Schaewen, A. (2016) Defects in peroxisomal 6-phosphogluconate dehy-
drogenase isoform PGD2 prevent gametophytic interaction in Arabidop-
sis thaliana. Plant Physiol. 171, 192–205. https://doi.org/10.1104/pp.15.
01301
Hunt, L. and Gray, J.E. (2009) The relationship between pyridine nucleotides
and seed dormancy. New Phytol. 181, 62–70. https://doi.org/10.1111/j.
1469-8137.2008.02641.x
Hunt, L., Holdsworth, M.J. and Gray, J.E. (2007) Nicotinamidase activity is
important for germination. Plant J. 51, 341–351. https://doi.org/10.1111/j.1365-313x.2007.03151.x
Kirchberger, S., Tjaden, J. and Neuhaus, H.E. (2008) Characterization of the
Arabidopsis Brittle1 transport protein and impact of reduced activity on
plant metabolism. Plant J. 56, 51–63. https://doi.org/10.1111/j.1365-313x.2008.03583.x
Kopka, J., Schauer, N., Krueger, S. et al. (2005) [email protected]: the Golm
Metabolome Database. Bioinformatics, 21, 1635–1638. https://doi.org/10.1093/bioinformatics/bti236
© 2019 The AuthorsThe Plant Journal published by Society for Experimental Biology and John Wiley & Sons Ltd,The Plant Journal, (2019), 100, 487–504
The role of mitochondrial NAD+ transporter in plants 503
Landy, A. (1989) Dynamic, structural, and regulatory aspects of Lambda site
specific recombination. Ann. Rev. Biochem. 58, 913–949. https://doi.org/10.1146/annurev.bi.58.070189.004405
Lima, A.L.S., DaMatta, F.M., Pinheiro, H.A., Totola, M.R. and Loureiro, M.E.
(2002) Photochemical responses and oxidative stress in two clones of
Coffea canephora under water deficit conditions. Environ. Exp. Bot. 47,
239–247. https://doi.org/10.1016/s0098-8472(01)00130-7Lisec, J., Schauer, N., Kopka, J., Willmitzer, L. and Fernie, A.R. (2006)
Gas chromatography mass spectrometry-based metabolite profiling
in plants. Nat. Protoc. 1, 387–396. https://doi.org/10.1038/nprot.2006.
59
Liu, Y.-J., Nunes-Nesi, A., Wallstr€om, S.V., Lager, I., Michalecka, A.M., Nor-
berg, F.E.B., Widell, S., Fredlund, K.M., Fernie, A.R. and Rasmusson, A.G.
(2009) A redox-mediated modulation of stem bolting in transgenic nico-
tiana sylvestris differentially expressing the external mitochondrial
NADPH dehydrogenase. Plant Physiol. 150, 1248–1259. https://doi.org/10.1104/pp.109.136242
Lorenzon, M.C.A. and Almeida, E.C. (1996) Viabilidade e germinac�~ao do
p�olen de linhagens parentais de cebola h�ıbrida. Pesqui. Agropec. Bras.
32, 345–349Maguire, J.D. (1962) Speed of germination aid in selection and evaluation
for seedling emergence and vigor. Crop Sci. 2, 176–177. https://doi.org/10.2135/cropsci1962.0011183x000200020033x
Messinger, S.M., Buckley, T.N. and Mott, K.A. (2006) Evidence for involve-
ment of photosynthetic processes in the stomatal response to CO2. Plant
Physiol. 140, 771–778. https://doi.org/10.1104/pp.105.073676Mu~noz-Bertomeu, J., Cascales-Minana, B., Irles-Segura, A., Mateu, I.,
Nunes-Nesi, A., Fernie, A.R., Segura, J. and Ros, R. (2010) The plastidial
glyceraldehyde-3-phosphate dehydrogenase is critical for viable pollen
development in Arabidopsis. Plant Physiol. 152, 1830–1841Murashige, T. and Skoog, F. (1962) A revised medium for rapid growth and
bioassay with tobacco tissue cultures. Physiol. Plant. 15, 473–497.https://doi.org/10.1111/j.1399-3054.1962.tb08052.x
Neuhaus, H.E. and Emes, M.J. (2000) Nonphotosynthetic metabolism in
plastids. Annu. Rev. Plant Physiol. Plant Mol. Biol. 51, 111–140. https://doi.org/10.1146/annurev.arplant.51.1.111
Noctor, G., Queval, G. and Gaki�ere, B. (2006) NAD(P) synthesis and
pyridine nucleotide cycling in plants and their potential importance
in stress conditions. J. Exp. Bot. 57, 1603–1620. https://doi.org/10.
1093/jxb/erj202
Nunes-Nesi, A., Carrari, F., Gibon, Y., Sulpice, R., Lytovchenko, A., Fisahn,
J., Graham, J., Ratcliffe, R.G., Sweetlove, L.J. and Fernie, A.R. (2007)
Deficiency of mitochondrial fumarase activity in tomato plants impairs
photosynthesis via an effect on stomatal function. Plant J. 50, 1093–1106.https://doi.org/10.1111/j.1365-313x.2007.03115.x
Palmieri, F., Rieder, B., Ventrella, A. et al. (2009) Molecular identification
and functional characterization of Arabidopsis thaliana mitochondrial
and chloroplastic NAD+ carrier proteins. J. Biol. Chem. 284, 31249–31259.https://doi.org/10.1074/jbc.m109.041830
Penfound, T. and Foster, J.W. (1999) NAD-dependent DNA-binding activity
of the bifunctional NadR regulator of Salmonella typhimurium. J. Bacte-
riol. 181, 648–655.Scheibe, R. (2004) Malate valves to balance cellular energy supply. Physiol.
Plant. 120, 21–26. https://doi.org/10.1111/j.0031-9317.2004.0222.xSchippers, J.H.M., Nunes-Nesi, A., Apetrei, R., Hille, J., Fernie, A.R. and
Dijkwel, P.P. (2008) The Arabidopsis onset of leaf death5 mutation of
quinolinate synthase nicotinamide adenine dinucleotide biosynthesis
and causes early ageing. Plant Cell, 20, 2909–2925. https://doi.org/10.
1105/tpc.107.056341
Selinski, J. and Scheibe, R. (2014) Pollen tube growth: where does the
energy come from? Plant Signal. Behav. 9, e977200–e977209. https://doi.org/10.4161/15592324.2014.977200
Selinski, J., K€onig, N., Wellmeyer, B., Hanke, G.T., Linke, V., Neuhaus, H.E.
and Scheibe, R. (2014) The plastid-localized NAD-dependent malate
dehydrogenase is crucial for energy homeostasis in developing Ara-
bidopsis thaliana seeds. Mol. Plant, 7, 170–186Senkler, J., Senkler, M., Eubel, H., Hildebrandt, T., Lengwenus, C., Schertl,
P., Schwarzl€ander, M., Wagner, S., Wittig, I. and Braun, H.P. (2017) The
mitochondrial complexome of Arabidopsis thaliana. Plant J. 89, 1079–1092. [Epub 2017 Feb 20]. https://doi.org/10.1111/tpj.13448
Schindelin, J., Arganda-Carreras, I., Frise, E. et al. (2012) Fiji: an open-
source platform for biological-image analysis. Nat. Methods, 9, 676–682Sulpice, R., Pyl, E.T., Ishihara, H. et al. (2009) Starch as a major integrator in
the regulation of plant growth. Proc. Natl Acad. Sci. USA, 106, 10348–10353. https://doi.org/10.1073/pnas.0903478106
Takahashi, H., Takahara, K., Hashida, S., Hirabayashi, T., Fujimori, T.,
Kawai-Yamada, M., Yamaya, T., Yanagisawa, S. and Uchimiya, H. (2009)
Pleiotropic modulation of carbon and nitrogen metabolism in Arabidop-
sis plants overexpressing the NAD kinase2 Gene. Plant Physiol. 151, 100–113. https://doi.org/10.1104/pp.109.140665
Takahashi, H., Watanabe, A., Tanaka, A., Hashida, S., Kawai-yamada, M.,
Sonoike, K. and Uchimiya, H. (2006) Chloroplast NAD Kinase is essential
for energy transduction through the xanthophyll cycle in photosynthesis.
Plant Cell Physiol. 47, 1678–1682Tanaka, Y., Sugano, S.S., Shimada, T. and Hara-Nishimura, I. (2013) Enhance-
ment of leaf photosynthetic capacity through increased stomatal density in
Arabidopsis. New Phytol. 198, 757–764. https://doi.org/10.1111/nph.12186Todisco, S., Agrimi, G., Castegna, A. and Palmieri, F. (2006) Identification of
the mitochondrial NAD1 transporter in Saccharomyces cerevisiae. J. Biol.
Chem. 281, 1524–1531. https://doi.org/10.1074/jbc.m510425200
Turner, W.L., Waller, J.C. and Snedden, W.A. (2005) Identification, molecu-
lar cloning and functional characterization of a novel NADH kinase from
Arabidopsis thaliana (thale cress). Biochem. J. 385, 217–223. https://doi.org/10.1042/bj20040292
Valentini, R., Epron, D., De Angelis, P., Matteucci, G. and Dreyer, E. (1995)
In situ estimation of net CO2 assimilation, photosynthetic electron flow
and photorespiration in Turkey oak (Q. cerris L.) leaves: diurnal cycles
under different levels of water supply. Plant Cell Environ. 18, 631–640.https://doi.org/10.1111/j.1365-3040.1995.tb00564.x
VanLinden, M.R., D€olle, C., Pettersen, I.K. et al. (2015) Subcellular distribu-
tion of NAD+ between cytosol and mitochondria determines the meta-
bolic profile of human cells. J. Biol. Chem. 290, 27644–27659. https://doi.org/10.1074/jbc.m115.654129
van Roermund, C.W., Schroers, M.G., Wiese, J. et al. (2016) The peroxiso-
mal NAD carrier from Arabidopsis imports NAD in exchange with AMP.
Plant Physiol. 171, 2127–2139von, Caemmerer, S. (2000). Biochemical Models of Leaf Photosynthesis. Vic-
toria: CSIRO Publishing.
von Groll, U., Berger, D. and Altmann, T. (2002) The subtilisin-like serine pro-
tease SDD1 mediates cell-to-cell signaling during Arabidopsis stomatal
development. Plant Cell, 14, 1527–1539. https://doi.org/10.1105/tpc.001016Waller, J.C., Dhanoa, P.K., Schumann, U., Mullen, R.T. and Snedden, W.A.
(2010) Subcellular and tissue localization of NAD kinases from Arabidop-
sis: compartmentalization of de novo NADP biosynthesis. Planta, 231,
305–317. https://doi.org/10.1007/s00425-009-1047-7Winter, D., Vinegar, B., Nahal, H., Ammar, R., Wilson, G.V. and Provart, N.J.
(2007) An “Electronic Fluorescent Pictograph” browser for exploring and
analyzing large-scale biological data sets. PLoS ONE, 2, e718
© 2019 The AuthorsThe Plant Journal published by Society for Experimental Biology and John Wiley & Sons Ltd,
The Plant Journal, (2019), 100, 487–504
504 Izabel de Souza Chaves et al.
J Cell Physiol. 2019;1–15. wileyonlinelibrary.com/journal/jcp © 2019 Wiley Periodicals, Inc. | 1
Received: 5 January 2019 | Revised: 23 May 2019 | Accepted: 24 May 2019
DOI: 10.1002/jcp.28954
OR I G I NA L R E S EA RCH ART I C L E
Slc25a17 acts as a peroxisomal coenzyme A transporter andregulates multiorgan development in zebrafish
Yong‐Il Kim1* | In‐Koo Nam1,2* | Dong‐Kyu Lee3 | Sushil Bhandari1 |Lennart Charton4 | SeongAe Kwak5 | Jae‐Young Lim1,2 | KwangHeum Hong1 |Se‐Jin Kim2 | Joon No Lee2 | Sung Won Kwon3 | Hong‐Seob So1 | Nicole Linka4 |Raekil Park2 | Seong‐Kyu Choe1,6
1Department of Microbiology and Center for Metabolic Function Regulation, Wonkwang University School of Medicine, Iksan, South Korea
2Department of Biomedical Science and Engineering, Gwangju Institute of Science and Technology, Gwangju, South Korea
3College of Pharmacy and Research Institute of Pharmaceutical Sciences, Seoul National University, Seoul, South Korea
4Department of Plant Biochemistry, Heinrich‐Heine University Düsseldorf, Düsseldorf, Germany
5Zoonosis Research Center, Wonkwang University School of Medicine, Iksan, South Korea
6Wonkwang Medical Institute, Wonkwang University School of Medicine, Iksan, South Korea
Correspondence
Nicole Linka, Department of Plant
Biochemistry, Heinrich‐Heine University
Düsseldorf, 40225 Düsseldorf, Germany.
Email: [email protected]
Raekil Park, Department of Biomedical
Science and Engineering, Gwangju Institute of
Science and Technology, Gwangju, South
Korea.
Email: [email protected]
Seong‐Kyu Choe, Department of Microbiology
and Center for Metabolic Function Regulation,
Wonkwang University School of Medicine,
Iksan, Jeonbuk 54538, South Korea.
Email: [email protected]
Funding information
Deutsche Forschungsgemeinschaft, Grant/
Award Number: DFG1871/1‐2; National
Research Foundation of Korea, Grant/Award
Numbers: NRF‐2016R1A2B4009129,NRF‐2014M3A9D8034463; Ministry of
Oceans and Fisheries, Grant/Award Number:
MOF‐20180430
Abstract
Slc25a17 is known as a peroxisomal solute carrier, but the in vivo role of the protein
has not been demonstrated. We found that the zebrafish genome contains two
slc25a17 genes that function redundantly, but additively. Notably, peroxisome
function in slc25a17 knockdown embryos is severely compromised, resulting in an
altered lipid composition. Along the defects found in peroxisome‐associatedphenotypic presentations, we highlighted that development of the swim bladder is
also highly dependent on Slc25a17 function. As Slc25a17 showed substrate
specificity towards coenzyme A (CoA), injecting CoA, but not NAD+, rescued the
defective swim bladder induced by slc25a17 knockdown. These results indicated that
Slc25a17 acts as a CoA transporter, involved in the maintenance of functional
peroxisomes that are essential for the development of multiple organs during
zebrafish embryogenesis. Given high homology in protein sequences, the role of
zebrafish Slc25a17 may also be applicable to the mammalian system.
K E YWORD S
coenzyme A transporter, peroxisomes, solute carrier family 25 member 17, swim bladder,
zebrafish
1 | INTRODUCTION
Peroxisomes are subcellular organelles containing various proteins
that perform anabolic and catabolic reactions of fatty acids and decay
of undesirable reactive oxygen species (ROS; Lodhi & Semenkovich,
2014; Wanders, 2014). Therefore, peroxisomal disorders due to
defective single enzyme in peroxisomes, let alone the defective
peroxisome biogenesis, are known to induce developmental abnorm-
alities in humans that manifest a variety of symptoms, including
growth retardation, neurological deficits, hypotonia, and liver
dysfunction (Delille, Bonekamp, & Schrader, 2006; Fujiki, Yagita, &
Matsuzaki, 2012; Vamecq, Cherkaoui‐Malki, Andreoletti, & Latruffe,*Yong‐Il Kim and In‐Koo Nam contributed equally to this study.
2014; Wanders, 2014; Waterham & Wanders, 2012). In particular,
neurological abnormalities due to peroxisome dysfunction originate
likely from aberrant development of neuronal systems, including,
defective neuronal migration, altered axonal integrity, and myelin
formation and maintenance (Berger, Dorninger, Forss‐Petter, &
Kunze, 2016). However, it needs further investigation which factor
is responsible for neuropathology that was differentially observed
between peroxisome‐deficient patients and individuals with defec-
tive in a peroxisome‐resident enzyme (Berger et al., 2016; Islinger,
Voelkl, Fahimi, & Schrader, 2018). Given the known cellular roles of
peroxisomes in regulating lipid metabolism and intracellular ROS
levels, much work is needed to better understand the mechanistic
aspects of peroxisome‐resident proteins in vivo.
Zebrafish has evolved as an important model organism to study
various aspects of biological sciences. In particular, zebrafish may
serve as an ideal animal model to study a gene function in proper and
the associated phenotypes upon its deficiency in vivo, as its
embryonic development entirely relies on its yolk contents for the
first 5 days post fertilization (dpf; Kim et al., 2014; Lieschke & Currie,
2007). Yolk absorption during early zebrafish embryogenesis has
previously been reported in which yolk‐metabolizing processes seem
relatively simple, but may share fundamental similarities to lipid
metabolism in human physiology (Miyares, de Rezende, & Farber,
2014). More recently, yolk absorption has been shown to be closely
related to metabolic profiles of genes involved in metabolic dynamics
(Huang & Linsen, 2015), further suggesting a tight link between yolk
lipid utilization and metabolic organelles. The potential link between
yolk lipid consumption and the roles of metabolic organelles during
vertebrate development is not fully understood.
Members of the solute carrier protein family (SLC) transport
various molecules across membranes, including charged and un-
charged organic molecules, ions, metals, and other metabolites, and
support basal cellular functions (Hediger, Clemencon, Burrier, &
Bruford, 2013; Palmieri, 2013). Among the members of the
mitochondrial SLC25 subfamily, SLC25A17, also known as PMP34,
was originally reported as a peroxisomal membrane protein that
transports adenosine triphosphate (ATP) across the peroxisomal
membrane (Visser, van Roermund, Waterham, & Wanders, 2002).
However, a recent study suggested that human SLC25A17 may act
as a transporter for exchanging not only coenzyme A (CoA), flavin
adenine dinucleotide (FAD), flavin mononucleotide (FMN), or
adenosine monophosphate (AMP) across peroxisomal membranes,
but also nicotinamide adenine dinucleotide (NAD+) or adenosine
diphosphate (ADP; Agrimi, Russo, Scarcia, & Palmieri, 2012). Because
the molecules listed above are necessary for the accomplishment of
β‐oxidation of very long‐chain fatty acids, as well as synthesis of
ether phospholipids in peroxisomes, SLC25A17 has been predicted to
play a critical role in the functions of the peroxisome (Gutierrez‐Aguilar & Baines, 2013; Visser, van Roermund, Ijlst, Waterham, &
Wanders, 2007; Wylin et al., 1998). However, the in vivo role of
SLC25A17 has not been demonstrated till date.
In this study, we report that there are two slc25a17 genes in
zebrafish, presumably due to genome duplication through evolution.
The two Slc25a17 proteins (named as Slc25a17 and Slc25a17‐like[Slc25a17l in short]) are localized to peroxisomes in developing
zebrafish embryos. By analyzing the developmental phenotypes
associated with slc25a17 gene knockdown, we show that Slc25a17
acts as a CoA transporter, which is essentially required for multiple
organ development, including swim bladder, during zebrafish
embryogenesis.
2 | EXPERIMENTAL PROCEDURES
2.1 | Animal care and handling
Adult zebrafish and their embryos were handled and staged
according to standard protocols (Kimmel, Ballard, Kimmel, Ullmann,
& Schilling, 1995). A transgenic line, Tg(lfabp:DsRED) was provided by
the Zebrafish Organogenesis and Mutant Bank in Korea. All
experimental protocols were approved by the Committee for Ethics
in Animal Experiments of the Wonkwang University (WKU15‐127)and carried out according to the Guidelines for Animal Experiments.
2.2 | Constructs
The open reading frames (ORFs) of zebrafish slc25a17 and
slc25a17l were individually amplified from complementary DNAs
(cDNAs); the total RNA was prepared from zebrafish embryos at
1 dpf. Primer sequences used in polymerase chain reactions
(PCRs) are listed in Table 1. The amplified slc25a17 and slc25a17l
ORFs were cloned into pCRII‐TOPO vector (Invitrogen, Carlsbad,
CA). Final constructs were obtained by cloning the slc25a17 and
slc25a17l ORFs into pCS2 + vector or pCS2 + MYC vector using
EcoRI and XhoI restriction enzymes (NEB, Ipswich, MA). The
mdh1aa (malate dehydrogenase 1Aa) ORF was amplified by PCR,
digested with EcoRI and XhoI enzymes and subsequently cloned in
the same sites of pCS2 + MT vector. The peroxisomal targeting
signal 1 (PTS‐1) sequence was inserted by using the primer sets
(listed in the supplemental table) in front of the stop codon. For
heterologous protein expression using wheat‐germ lysate, the
ORFs of slc25a17 and slc25a17l were cloned into pIVEX1.3
expression vector in frame with a C‐terminal His6‐tag using the
primers listed. Both coding sequences were inserted into
pIVEX1.3 by using NcoI and XhoI (for slc25a17) or NdeI and XmaI
(for slc25a17l) restriction enzymes.
2.3 | Microinjections
Morpholinos (MOs) for control, slc25a17, slc25a17l, and CoA
synthase were purchased from Gene Tools, LLC (Philomath, OR).
Morpholino sequences are listed in Table 1. A dosage curve was
built for each MO to determine microinjection concentrations,
and translation MOslc25a17 (5 ng), splicing MOslc25a17 (3 ng),
translation MOslc25a17l (5 ng), splicing MOslc25a17l (5 ng),
translation MOCoA synthase (5 ng), splicing MOCoA synthase
(5 ng), or control MO (5 ng) was microinjected into one‐cell stage
2 | KIM ET AL.
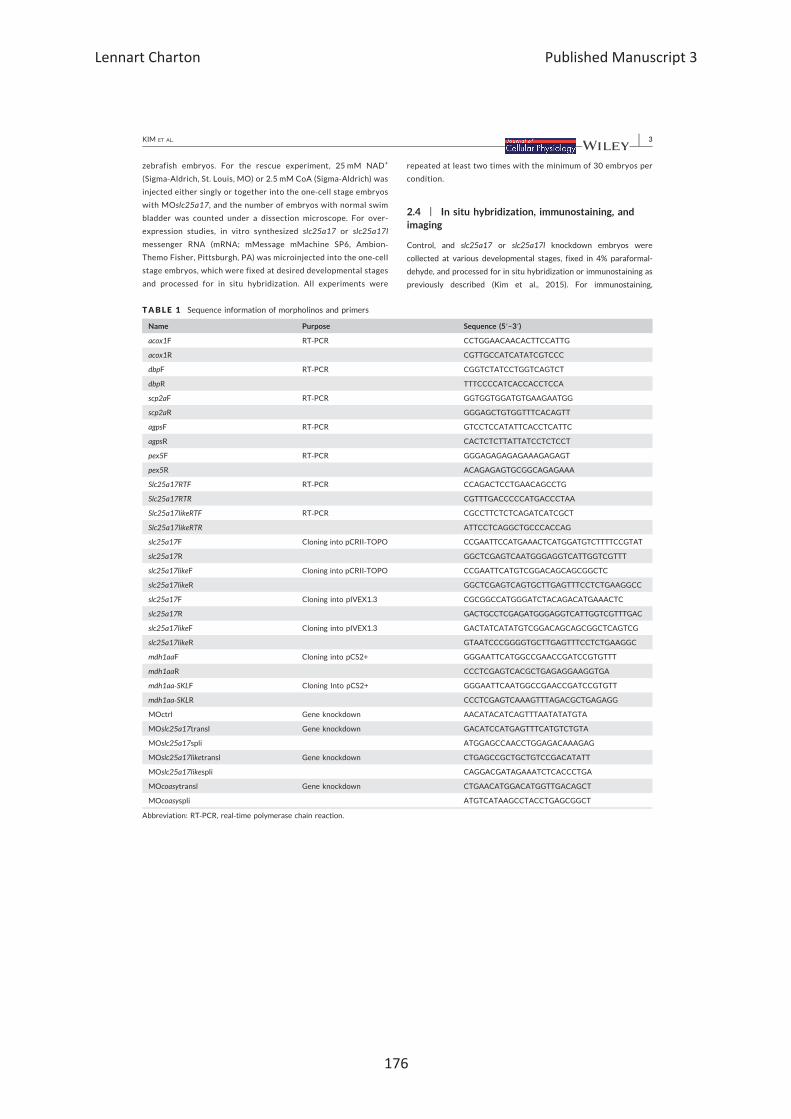
zebrafish embryos. For the rescue experiment, 25 mM NAD+
(Sigma‐Aldrich, St. Louis, MO) or 2.5 mM CoA (Sigma‐Aldrich) was
injected either singly or together into the one‐cell stage embryos
with MOslc25a17, and the number of embryos with normal swim
bladder was counted under a dissection microscope. For over-
expression studies, in vitro synthesized slc25a17 or slc25a17l
messenger RNA (mRNA; mMessage mMachine SP6, Ambion‐Themo Fisher, Pittsburgh, PA) was microinjected into the one‐cellstage embryos, which were fixed at desired developmental stages
and processed for in situ hybridization. All experiments were
repeated at least two times with the minimum of 30 embryos per
condition.
2.4 | In situ hybridization, immunostaining, andimaging
Control, and slc25a17 or slc25a17l knockdown embryos were
collected at various developmental stages, fixed in 4% paraformal-
dehyde, and processed for in situ hybridization or immunostaining as
previously described (Kim et al., 2015). For immunostaining,
TABLE 1 Sequence information of morpholinos and primers
Name Purpose Sequence (5′–3′)
acox1F RT‐PCR CCTGGAACAACACTTCCATTG
acox1R CGTTGCCATCATATCGTCCC
dbpF RT‐PCR CGGTCTATCCTGGTCAGTCT
dbpR TTTCCCCATCACCACCTCCA
scp2aF RT‐PCR GGTGGTGGATGTGAAGAATGG
scp2aR GGGAGCTGTGGTTTCACAGTT
agpsF RT‐PCR GTCCTCCATATTCACCTCATTC
agpsR CACTCTCTTATTATCCTCTCCT
pex5F RT‐PCR GGGAGAGAGAGAAAGAGAGT
pex5R ACAGAGAGTGCGGCAGAGAAA
Slc25a17RTF RT‐PCR CCAGACTCCTGAACAGCCTG
Slc25a17RTR CGTTTGACCCCCATGACCCTAA
Slc25a17likeRTF RT‐PCR CGCCTTCTCTCAGATCATCGCT
Slc25a17likeRTR ATTCCTCAGGCTGCCCACCAG
slc25a17F Cloning into pCRII‐TOPO CCGAATTCCATGAAACTCATGGATGTCTTTTCCGTAT
slc25a17R GGCTCGAGTCAATGGGAGGTCATTGGTCGTTT
slc25a17likeF Cloning into pCRII‐TOPO CCGAATTCATGTCGGACAGCAGCGGCTC
slc25a17likeR GGCTCGAGTCAGTGCTTGAGTTTCCTCTGAAGGCC
slc25a17F Cloning into pIVEX1.3 CGCGGCCATGGGATCTACAGACATGAAACTC
slc25a17R GACTGCCTCGAGATGGGAGGTCATTGGTCGTTTGAC
slc25a17likeF Cloning into pIVEX1.3 GACTATCATATGTCGGACAGCAGCGGCTCAGTCG
slc25a17likeR GTAATCCCGGGGTGCTTGAGTTTCCTCTGAAGGC
mdh1aaF Cloning into pCS2+ GGGAATTCATGGCCGAACCGATCCGTGTTT
mdh1aaR CCCTCGAGTCACGCTGAGAGGAAGGTGA
mdh1aa‐SKLF Cloning Into pCS2+ GGGAATTCAATGGCCGAACCGATCCGTGTT
mdh1aa‐SKLR CCCTCGAGTCAAAGTTTAGACGCTGAGAGG
MOctrl Gene knockdown AACATACATCAGTTTAATATATGTA
MOslc25a17transl Gene knockdown GACATCCATGAGTTTCATGTCTGTA
MOslc25a17spli ATGGAGCCAACCTGGAGACAAAGAG
MOslc25a17liketransl Gene knockdown CTGAGCCGCTGCTGTCCGACATATT
MOslc25a17likespli CAGGACGATAGAAATCTCACCCTGA
MOcoasytransl Gene knockdown CTGAACATGGACATGGTTGACAGCT
MOcoasyspli ATGTCATAAGCCTACCTGAGCGGCT
Abbreviation: RT‐PCR, real‐time polymerase chain reaction.
KIM ET AL. | 3
antibodies to detect acetylated tubulin (antiacetyl tubulin, 1:500,
Sigma‐Aldrich), peroxisomal PMP70 (anti‐PMP70, 1:500, Abcam,
Cambridge, United Kingdom), and secondary Alexa Fluor‐conjugatedantimouse antibodies (1:400, Invitrogen) or antirabbit (1:400,
Invitrogen) antibodies were used. Images were taken using a Leica
M165FC microscope equipped with Leica DFC500, or confocal
microscope (Olympus IX81, Fluoview FV1000). For the observation
of peroxisomes, RFP‐positive embryos obtained from wild type
outcross or from an outcross between wild type and Tg(ef1α:RFP‐SKL)
transgenic zebrafish were microinjected with either control MO or
MOslc25a17 and cryoprocessed to obtain sections for imaging using
confocal microscopy.
2.5 | Cryosectioning
Control or MO‐injected embryos were fixed in AB fix solution
(1:1 ratio of 8% paraformaldehyde and 2X fix solution [8% sucrose,
30 μl 1M CaCl2 in 25ml phosphate‐buffered saline PBS]) overnight.
The samples are washed once with PBS, and then mounted in 5%
sucrose + 1.5% agarose. The blocks were kept in 30% sucrose at 4°C,
overnight. To make frozen blocks, 2‐methylbutane (Junsei Chemical,
Tokyo, Japan) was used, and sectioning of sample blocks was
performed using a cryomicrotome HX525 NX (Thermo Fisher
Scientific, Waltham, MA).
2.6 | Quantitative RT‐PCR
Control or MO‐injected embryos were grown up to 3 dpf (n = 10 per
condition, triplicates) and collected in the Trizol (Ambion‐Themo
Fisher Scientific, Pittsburgh, PA) from which total RNAs were
prepared. First strand cDNA was synthesized as previously described
(Kim et al., 2015). Primer sequences used are listed in Table 1. The
experiment was replicated to confirm data consistency and Student's
t test in Microsoft Excel was used to determine statistical
significance.
2.7 | Oil red‐O staining
Control and MO‐injected embryos were fixed with 4% parafor-
maldehyde overnight, washed three times with PBS, and depig-
mented with a bleaching solution (200 μl 1X saline sodium citrate
[SSC]), 33.8 ml water, 2 ml formamide, and 4 ml hydrogen per-
oxide). The embryos were then washed three times with PBS, and
preincubated in 60% isopropanol for 30 min. For staining, embryos
were incubated in freshly prepared 0.3% oil red‐O (Sigma‐Aldrich)solution in 60% isopropanol for 3 hr, rinsed several times with PBS
and photographed. Microscopic examination was used to quantify
the number of embryos with positive oil red‐O stain in the yolk.
Student's t test in Microsoft Excel was used to determine
statistical significance.
2.8 | Analysis of fatty acids and plasmalogens
Mild methanolysis was applied to simultaneously convert very long‐chain fatty acids (VLCFA) and plasmalogens into methyl ester (ME)
and dimethyl acetal (DMA) forms, respectively, which were subse-
quently volatilized and detected by the GC‐MS system. For the
reaction, 100 zebrafish larvae at the indicated days were collected
and immersed into 1ml of hydrolysis reagent containing methanol:
37% (w/w) hydrochloric acid (4:1) in a 4‐ml glass vial. Methanolic
derivatization was conducted at 100°C for 60min, after which
hydrophobic VLCFA methyl ester and DMA were extracted by
adding 1ml hexane three times for liquid–liquid extraction. The
collected hexane layer was reconstituted into 100 μl hexane. Before
methanolysis, 1 μg of tricosylic acid (C23:0; Sigma‐Aldrich) was added
as an internal standard for elimination any possible variations from
the experimental procedure. Methyl docosanoate (C22:0 ME),
methyl tetracosanoate (C24:0 ME), methyl hexacosanoate (C26:0
ME), 1,1‐dimethoxyhexadecane (C16:0 DMA), 1,1‐dimethoxyoctade-
cane (C18:0 DMA), and 1,1‐dimethoxy‐(9Z)octadecene (C18:1 DMA)
were prepared (fatty acid methyl ester from Sigma‐Aldrich and DMA
from Avanti Polar Lipids, Alabaster, AL) for external standard and
confirmation of the mass spectrum. Derivatized compounds were
separated and detected using GC‐MS (GCMS‐QP2010, Shimadzu,
Kyoto, Japan) system, where 1 μl of reconstituted sample was
injected (split ratio 2:1) and volatilized at 300°C to be introduced
into capillary column (HP‐1, 30m length, 0.32 mm ID, 0.25 μm film
thickness; Agilent Technologies, Santa Clara, CA). Helium gas at a
flow rate of 1 ml/min carried compounds that were separated by
capillary column, with GC temperature program as follows: initial
temperature was 100°C for 2 min, which increased at 10°C/min up to
150°C, at 5°C/min up to 300°C, and was held for 5 min. For mass
spectrometry, the compounds were ionized by the electron impact
ion source at 70 eV at 200°C source temperature. Detection range
was from 50 to 500m/z and detection was processed at 5 scan/s
scan rate. For measuring the quantity, 74m/z; [C3H6O2]+ and 75m/z;
[C3H7O2]+, McLafferty rearrangement ions of each VLCFA methyl
ester and DMA structure, were chosen as a quantification ion.
Extracted ion chromatograms (EIC) of both ions were used to
integrate the peak area of every compound, after which all the areas
were normalized to the response of the internal standard. External
standard calibration was performed with normalized area and
derived linear regression. Limit of detection and limit of quantifica-
tion for the validation and concentration of each compound were
calculated.
2.9 | Heterologous protein expression
Slc25a17 and Slc25a17l were heterologously expressed using the
RTS Wheat Germ CECF kit (biotechrabbit) in the presence of
1% (w/v) L‐α‐phosphatidylcholine vesicles and 0.04% (w/v) Brij‐35 as
described by Bernhardt, Wilkinson, Weber, and Linka (2012). Cell‐free expressed proteins were desalted using Nap‐5 columns
(GE‐Healthcare) and 1ml 10mM Tricine‐KOH, pH 7.2.
4 | KIM ET AL.
2.10 | Reconstitution of liposomes and in vitrouptake assay
Recombinant proteins were reconstituted into liposomes by freeze‐thaw‐sonication procedure (Kasahara & Hinkle, 1976). Therefore, 50 μl
of protein extract was added to 950 μl 3% (w/v) L‐α‐phosphatidylcholineand frozen in liquid nitrogen. The in vitro uptake of 0.2mM (α32P)‐AMP
(6,000Ci/mmol; Hartmann Analytic) was performed as described
previously (Bernhardt et al., 2012). The transport reaction was
terminated by passing through proteoliposomes over Dowex AG1‐X8anion‐exchange columns (acetate form, 100‐200 mesh, Bio‐RAD). Theproteoliposomes were eluted with 150mM sodium acetate (pH 7.2).
The nonincorporated AMP was removed by binding to the anion‐exchange columns. The incorporated radiolabeled AMPwas analyzed by
liquid scintillation counting. Time‐dependent uptake kinetics was fitted
by nonlinear regression, based on one‐phase exponential association
using GraphPad Prism 5.0 software (GraphPad, www.graphpad.com).
Background activities in the absence of recombinant proteins were
subtracted. Calculated kinetic parameters were used to determine
initial velocities using the equation: slope= (Plateau −Y0) x k, where Y0
was set to 0. The values for the plateau and k were determined from the
nonlinear regression analyses using a global fit from three technical
replicates.
3 | RESULTS
3.1 | Slc25a17 is an evolutionarily conservedperoxisomal protein
We identified two slc25a17 genes in zebrafish, slc25a17 and slc25a17l
(Figure 1). Sequence analysis suggested that the two predicted proteins
shared ~65% identical amino acids, and that Slc25a17 was more closely
related to human SLC25A17 (~73% between Slc25a17 and human
SLC25A17 vs. ~67% between Slc25a17l and human SLC25A17).
Furthermore, six predicted transmembrane domains of Slc25a17 were
found to be highly conserved with those of human SLC25A17 (~80% on
average show in the figure by highlighting), suggesting functional
conservation of SLC25A17 between human and zebrafish, and the
transmembrane nature of the proteins. Examination of slc25a17 and
slc25a17l expression by in situ hybridization indicated that both the
genes are maternally deposited and thus ubiquitously expressed until
early segmentation stages (Figure 2a). At 1 dpf, both genes are highly
expressed in tissues that become brain and digestive organs, but also
weakly expressed throughout the embryo body. Although the expres-
sion in the head region seems to decrease at 2 dpf, expression in the
deep tissue layer between the embryo body and the yolk remains at
least until 5 dpf when it is mostly found in the swim bladder.
Previous reports suggested that SLC25A17 is localized in peroxi-
somes (Agrimi et al., 2012; Visser et al., 2002). By performing
immunostaining of embryos injected with MYC‐slc25a17 mRNA together
with GFP‐SKLmRNA at one‐cell stage, we found that bothMYC‐Slc25a17and GFP‐SKL proteins are colocalized, implying Slc25a17 to be localized
in the peroxisome where GFP is targeted by SKL, the C‐terminal
peroxisomal targeting signal sequence (Figure 2b). A similar immunos-
taining confirmed that Slc25a17l is also peroxisomally targeted.
3.2 | Knockdown of slc25a17 alters thecomposition of body lipids metabolized inperoxisomes, and impairs embryonic development
To examine the role of Slc25a17 during animal development, we tried
to generate a slc25a17 gene knockout (KO) animal utilizing both the
TALEN and CRISPR/CAS9 systems but failed to generate a KO allele.
The effect of morpholinos (MOs) in comparison with the use of
knockout animal model has reportedly been discussed; a MO is
considered a valuable tool provided evidence for its specificity and
solid rescue, especially under the condition that no corresponding
gene KO animal is available (Stainier et al., 2017). We utilized MOs
with slc25a17 or slc25a17l to block the step of either mRNA
maturation (splice‐MO) or translation (transl‐MO). We found that a
splice‐MO efficiently blocked mRNA maturation by interfering
presumably with normal splicing event (Figure 3a). Microinjection
of either splice‐MO or transl‐MO generated embryos with indis-
tinguishable, but robust phenotypes, including short body length
compared with control MO‐injected embryos, suggesting that both
MOs may specifically interfere with Slc25a17 function (Figure 3b).
We noticed that slc25a17 knockdown embryos could be recognized
by their voluminous yolks for which we preformed oil red‐O stain to
detect neutral lipids. On or before 3 dpf, oil red‐O stain of control
embryos was largely detected in the yolk and most embryonic
tissues, including brain, heart, and blood vessels (Kim et al., 2014;
Schlegel & Stainier, 2006). However, control embryos at 5 dpf
consumed most of their yolk lipids and thus no or very low level of oil
red‐O staining was visible in the yolks (Figure 3b). At 6 dpf, almost all
control embryos were completely devoid of yolk lipids and the
staining was only detectable in the swim bladder and the head region
(250/260 total embryos from three independent experiments).
However, the pattern of oil red‐O staining changed drastically,
especially in the yolk, when MOslc25a17 was injected. A significant
percent of the slc25a17 knockdown embryos retained yolk lipids that
could be detected at least at 6 dpf or later, indicating that slc25a17
knockdown severely impaired the consumption of yolk lipids (45% in
the total of 226 embryos from three independent experiments;
Figure 3b). We noted that knockdown of slc25a17l generated
phenotypes essentially the same as those with MOslc25a17 injection,
and thus experiments using only MOslc25a17 will hereafter be
described, unless indicated.
Given that Slc25a17 acts as a potential peroxisomal transporter of
essential cofactors such as CoA, FAD, and NAD+, we reasoned that
Slc25a17 might play a crucial role in peroxisome number and function.
We found that the number of peroxisomes had not changed by slc25a17
knockdown, as similar levels of the peroxisome‐targeted RFP signals
between control and MOslc25a17‐injected Tg(ef1α:RFP‐SKL) transgenic
embryos were detected (Figure 3c; Kim et al., 2015). To examine
peroxisome‐dependent functions involved in the oxidation of very long‐chain fatty acids and the synthesis of ether phospholipids (also known
KIM ET AL. | 5
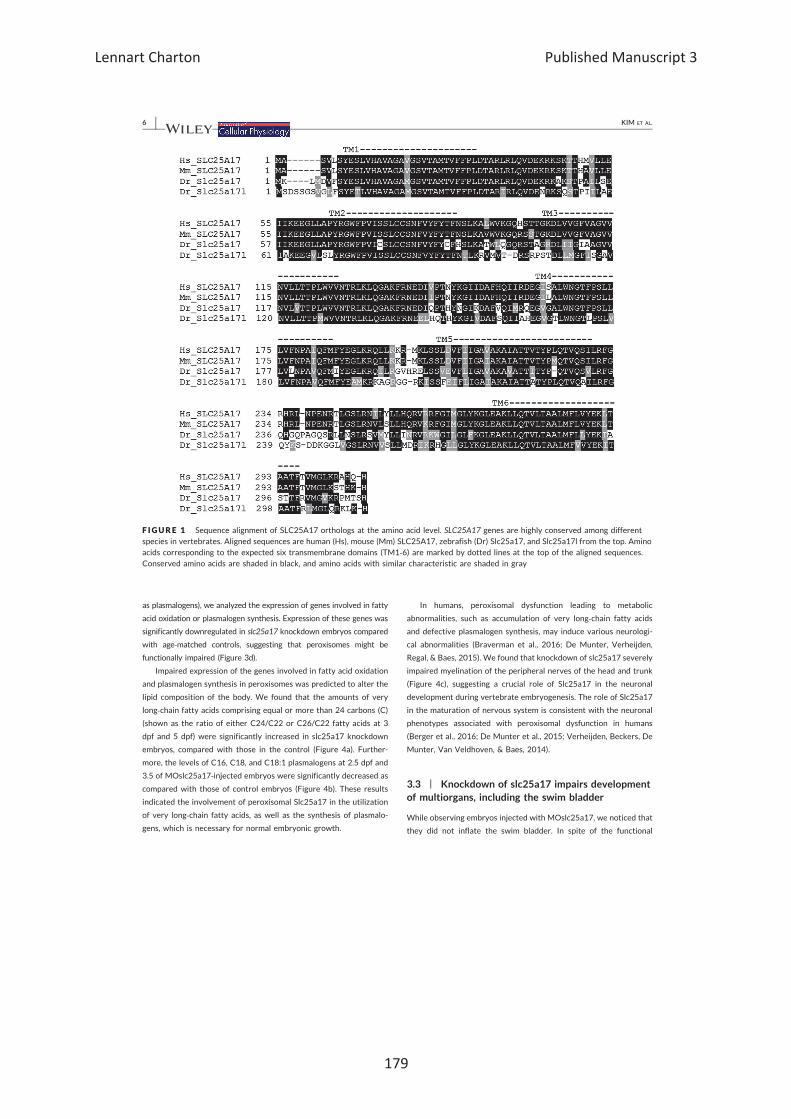
as plasmalogens), we analyzed the expression of genes involved in fatty
acid oxidation or plasmalogen synthesis. Expression of these genes was
significantly downregulated in slc25a17 knockdown embryos compared
with age‐matched controls, suggesting that peroxisomes might be
functionally impaired (Figure 3d).
Impaired expression of the genes involved in fatty acid oxidation
and plasmalogen synthesis in peroxisomes was predicted to alter the
lipid composition of the body. We found that the amounts of very
long‐chain fatty acids comprising equal or more than 24 carbons (C)
(shown as the ratio of either C24/C22 or C26/C22 fatty acids at 3
dpf and 5 dpf) were significantly increased in slc25a17 knockdown
embryos, compared with those in the control (Figure 4a). Further-
more, the levels of C16, C18, and C18:1 plasmalogens at 2.5 dpf and
3.5 of MOslc25a17‐injected embryos were significantly decreased as
compared with those of control embryos (Figure 4b). These results
indicated the involvement of peroxisomal Slc25a17 in the utilization
of very long‐chain fatty acids, as well as the synthesis of plasmalo-
gens, which is necessary for normal embryonic growth.
In humans, peroxisomal dysfunction leading to metabolic
abnormalities, such as accumulation of very long‐chain fatty acids
and defective plasmalogen synthesis, may induce various neurologi-
cal abnormalities (Braverman et al., 2016; De Munter, Verheijden,
Regal, & Baes, 2015). We found that knockdown of slc25a17 severely
impaired myelination of the peripheral nerves of the head and trunk
(Figure 4c), suggesting a crucial role of Slc25a17 in the neuronal
development during vertebrate embryogenesis. The role of Slc25a17
in the maturation of nervous system is consistent with the neuronal
phenotypes associated with peroxisomal dysfunction in humans
(Berger et al., 2016; De Munter et al., 2015; Verheijden, Beckers, De
Munter, Van Veldhoven, & Baes, 2014).
3.3 | Knockdown of slc25a17 impairs developmentof multiorgans, including the swim bladder
While observing embryos injected with MOslc25a17, we noticed that
they did not inflate the swim bladder. In spite of the functional
F IGURE 1 Sequence alignment of SLC25A17 orthologs at the amino acid level. SLC25A17 genes are highly conserved among different
species in vertebrates. Aligned sequences are human (Hs), mouse (Mm) SLC25A17, zebrafish (Dr) Slc25a17, and Slc25a17l from the top. Aminoacids corresponding to the expected six transmembrane domains (TM1‐6) are marked by dotted lines at the top of the aligned sequences.Conserved amino acids are shaded in black, and amino acids with similar characteristic are shaded in gray
6 | KIM ET AL.
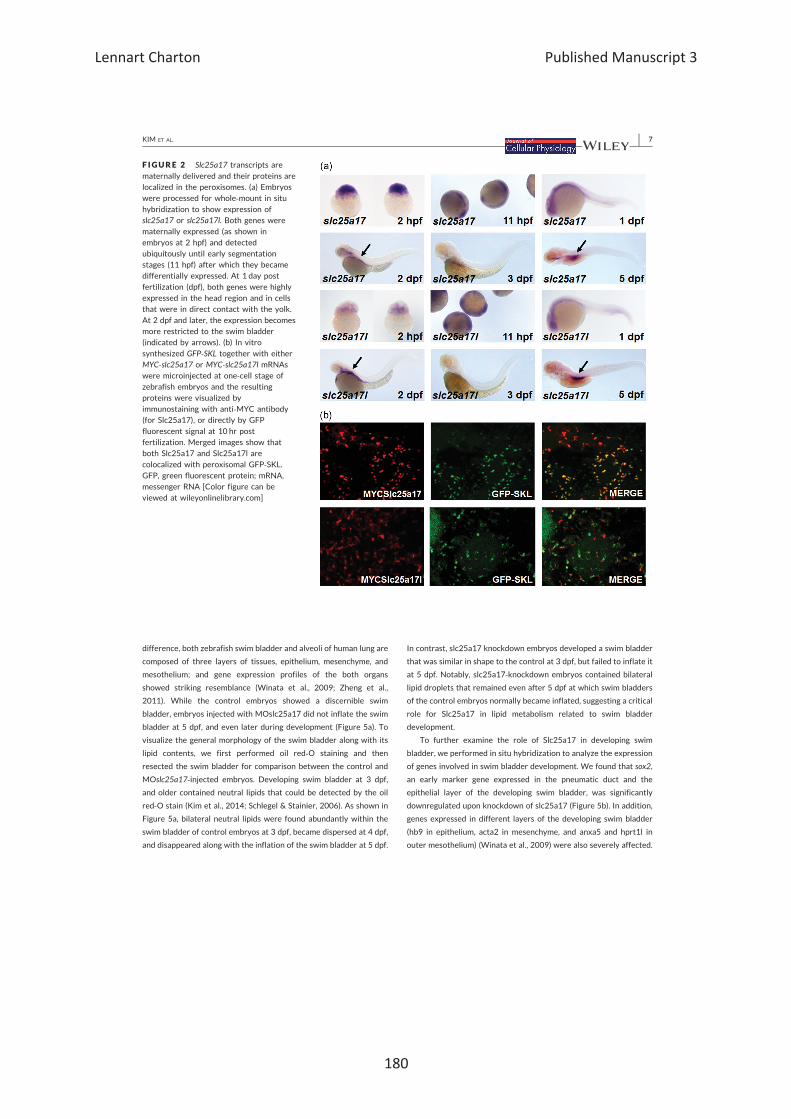
difference, both zebrafish swim bladder and alveoli of human lung are
composed of three layers of tissues, epithelium, mesenchyme, and
mesothelium; and gene expression profiles of the both organs
showed striking resemblance (Winata et al., 2009; Zheng et al.,
2011). While the control embryos showed a discernible swim
bladder, embryos injected with MOslc25a17 did not inflate the swim
bladder at 5 dpf, and even later during development (Figure 5a). To
visualize the general morphology of the swim bladder along with its
lipid contents, we first performed oil red‐O staining and then
resected the swim bladder for comparison between the control and
MOslc25a17‐injected embryos. Developing swim bladder at 3 dpf,
and older contained neutral lipids that could be detected by the oil
red‐O stain (Kim et al., 2014; Schlegel & Stainier, 2006). As shown in
Figure 5a, bilateral neutral lipids were found abundantly within the
swim bladder of control embryos at 3 dpf, became dispersed at 4 dpf,
and disappeared along with the inflation of the swim bladder at 5 dpf.
In contrast, slc25a17 knockdown embryos developed a swim bladder
that was similar in shape to the control at 3 dpf, but failed to inflate it
at 5 dpf. Notably, slc25a17‐knockdown embryos contained bilateral
lipid droplets that remained even after 5 dpf at which swim bladders
of the control embryos normally became inflated, suggesting a critical
role for Slc25a17 in lipid metabolism related to swim bladder
development.
To further examine the role of Slc25a17 in developing swim
bladder, we performed in situ hybridization to analyze the expression
of genes involved in swim bladder development. We found that sox2,
an early marker gene expressed in the pneumatic duct and the
epithelial layer of the developing swim bladder, was significantly
downregulated upon knockdown of slc25a17 (Figure 5b). In addition,
genes expressed in different layers of the developing swim bladder
(hb9 in epithelium, acta2 in mesenchyme, and anxa5 and hprt1l in
outer mesothelium) (Winata et al., 2009) were also severely affected.
F IGURE 2 Slc25a17 transcripts are
maternally delivered and their proteins arelocalized in the peroxisomes. (a) Embryoswere processed for whole‐mount in situ
hybridization to show expression ofslc25a17 or slc25a17l. Both genes werematernally expressed (as shown in
embryos at 2 hpf) and detectedubiquitously until early segmentationstages (11 hpf) after which they becamedifferentially expressed. At 1 day post
fertilization (dpf), both genes were highlyexpressed in the head region and in cellsthat were in direct contact with the yolk.
At 2 dpf and later, the expression becomesmore restricted to the swim bladder(indicated by arrows). (b) In vitro
synthesized GFP‐SKL together with eitherMYC‐slc25a17 or MYC‐slc25a17l mRNAswere microinjected at one‐cell stage ofzebrafish embryos and the resulting
proteins were visualized byimmunostaining with anti‐MYC antibody(for Slc25a17), or directly by GFP
fluorescent signal at 10 hr postfertilization. Merged images show thatboth Slc25a17 and Slc25a17l are
colocalized with peroxisomal GFP‐SKL.GFP, green fluorescent protein; mRNA,messenger RNA [Color figure can be
viewed at wileyonlinelibrary.com]
KIM ET AL. | 7
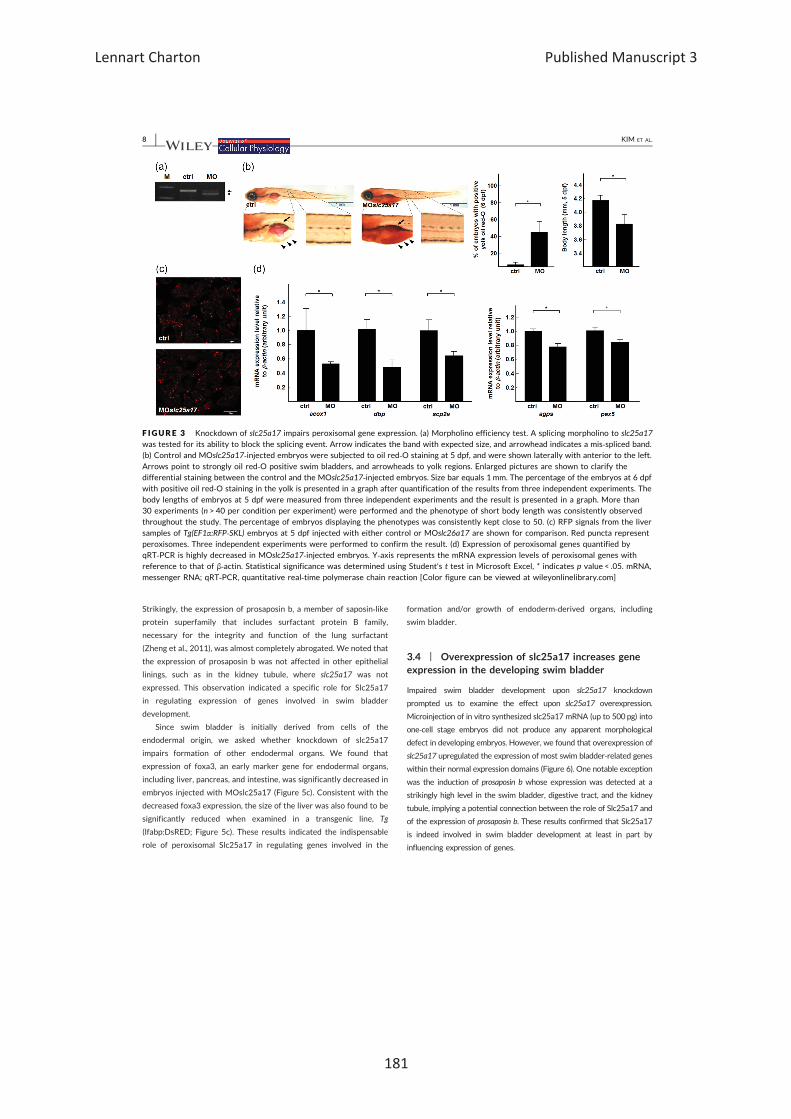
Strikingly, the expression of prosaposin b, a member of saposin‐likeprotein superfamily that includes surfactant protein B family,
necessary for the integrity and function of the lung surfactant
(Zheng et al., 2011), was almost completely abrogated. We noted that
the expression of prosaposin b was not affected in other epithelial
linings, such as in the kidney tubule, where slc25a17 was not
expressed. This observation indicated a specific role for Slc25a17
in regulating expression of genes involved in swim bladder
development.
Since swim bladder is initially derived from cells of the
endodermal origin, we asked whether knockdown of slc25a17
impairs formation of other endodermal organs. We found that
expression of foxa3, an early marker gene for endodermal organs,
including liver, pancreas, and intestine, was significantly decreased in
embryos injected with MOslc25a17 (Figure 5c). Consistent with the
decreased foxa3 expression, the size of the liver was also found to be
significantly reduced when examined in a transgenic line, Tg
(lfabp:DsRED; Figure 5c). These results indicated the indispensable
role of peroxisomal Slc25a17 in regulating genes involved in the
formation and/or growth of endoderm‐derived organs, including
swim bladder.
3.4 | Overexpression of slc25a17 increases geneexpression in the developing swim bladder
Impaired swim bladder development upon slc25a17 knockdown
prompted us to examine the effect upon slc25a17 overexpression.
Microinjection of in vitro synthesized slc25a17 mRNA (up to 500pg) into
one‐cell stage embryos did not produce any apparent morphological
defect in developing embryos. However, we found that overexpression of
slc25a17 upregulated the expression of most swim bladder‐related genes
within their normal expression domains (Figure 6). One notable exception
was the induction of prosaposin b whose expression was detected at a
strikingly high level in the swim bladder, digestive tract, and the kidney
tubule, implying a potential connection between the role of Slc25a17 and
of the expression of prosaposin b. These results confirmed that Slc25a17
is indeed involved in swim bladder development at least in part by
influencing expression of genes.
F IGURE 3 Knockdown of slc25a17 impairs peroxisomal gene expression. (a) Morpholino efficiency test. A splicing morpholino to slc25a17was tested for its ability to block the splicing event. Arrow indicates the band with expected size, and arrowhead indicates a mis‐spliced band.(b) Control and MOslc25a17‐injected embryos were subjected to oil red‐O staining at 5 dpf, and were shown laterally with anterior to the left.
Arrows point to strongly oil red‐O positive swim bladders, and arrowheads to yolk regions. Enlarged pictures are shown to clarify thedifferential staining between the control and the MOslc25a17‐injected embryos. Size bar equals 1 mm. The percentage of the embryos at 6 dpfwith positive oil red‐O staining in the yolk is presented in a graph after quantification of the results from three independent experiments. The
body lengths of embryos at 5 dpf were measured from three independent experiments and the result is presented in a graph. More than30 experiments (n > 40 per condition per experiment) were performed and the phenotype of short body length was consistently observedthroughout the study. The percentage of embryos displaying the phenotypes was consistently kept close to 50. (c) RFP signals from the liver
samples of Tg(EF1α:RFP‐SKL) embryos at 5 dpf injected with either control or MOslc26a17 are shown for comparison. Red puncta representperoxisomes. Three independent experiments were performed to confirm the result. (d) Expression of peroxisomal genes quantified byqRT‐PCR is highly decreased in MOslc25a17‐injected embryos. Y‐axis represents the mRNA expression levels of peroxisomal genes withreference to that of β‐actin. Statistical significance was determined using Student's t test in Microsoft Excel, * indicates p value < .05. mRNA,
messenger RNA; qRT‐PCR, quantitative real‐time polymerase chain reaction [Color figure can be viewed at wileyonlinelibrary.com]
8 | KIM ET AL.
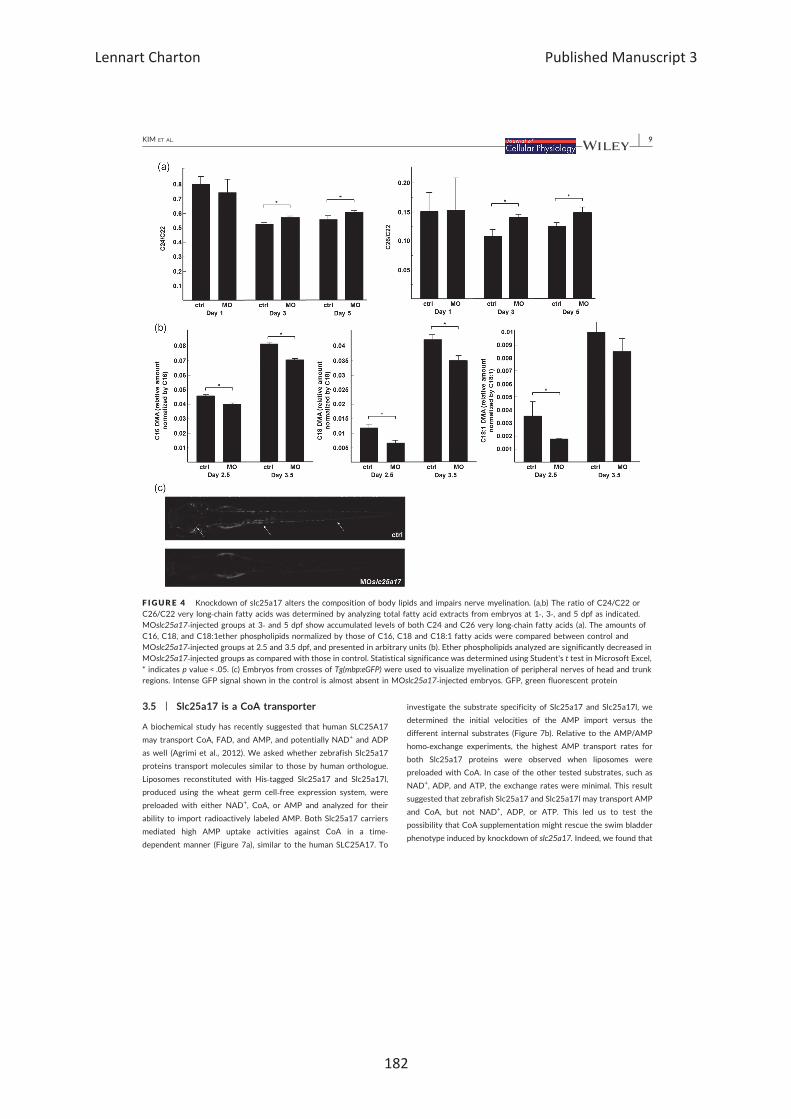
3.5 | Slc25a17 is a CoA transporter
A biochemical study has recently suggested that human SLC25A17
may transport CoA, FAD, and AMP, and potentially NAD+ and ADP
as well (Agrimi et al., 2012). We asked whether zebrafish Slc25a17
proteins transport molecules similar to those by human orthologue.
Liposomes reconstituted with His‐tagged Slc25a17 and Slc25a17l,
produced using the wheat germ cell‐free expression system, were
preloaded with either NAD+, CoA, or AMP and analyzed for their
ability to import radioactively labeled AMP. Both Slc25a17 carriers
mediated high AMP uptake activities against CoA in a time‐dependent manner (Figure 7a), similar to the human SLC25A17. To
investigate the substrate specificity of Slc25a17 and Slc25a17l, we
determined the initial velocities of the AMP import versus the
different internal substrates (Figure 7b). Relative to the AMP/AMP
homo‐exchange experiments, the highest AMP transport rates for
both Slc25a17 proteins were observed when liposomes were
preloaded with CoA. In case of the other tested substrates, such as
NAD+, ADP, and ATP, the exchange rates were minimal. This result
suggested that zebrafish Slc25a17 and Slc25a17l may transport AMP
and CoA, but not NAD+, ADP, or ATP. This led us to test the
possibility that CoA supplementation might rescue the swim bladder
phenotype induced by knockdown of slc25a17. Indeed, we found that
F IGURE 4 Knockdown of slc25a17 alters the composition of body lipids and impairs nerve myelination. (a,b) The ratio of C24/C22 orC26/C22 very long‐chain fatty acids was determined by analyzing total fatty acid extracts from embryos at 1‐, 3‐, and 5 dpf as indicated.MOslc25a17‐injected groups at 3‐ and 5 dpf show accumulated levels of both C24 and C26 very long‐chain fatty acids (a). The amounts of
C16, C18, and C18:1ether phospholipids normalized by those of C16, C18 and C18:1 fatty acids were compared between control andMOslc25a17‐injected groups at 2.5 and 3.5 dpf, and presented in arbitrary units (b). Ether phospholipids analyzed are significantly decreased inMOslc25a17‐injected groups as compared with those in control. Statistical significance was determined using Student's t test in Microsoft Excel,
* indicates p value < .05. (c) Embryos from crosses of Tg(mbp:eGFP) were used to visualize myelination of peripheral nerves of head and trunkregions. Intense GFP signal shown in the control is almost absent in MOslc25a17‐injected embryos. GFP, green fluorescent protein
KIM ET AL. | 9
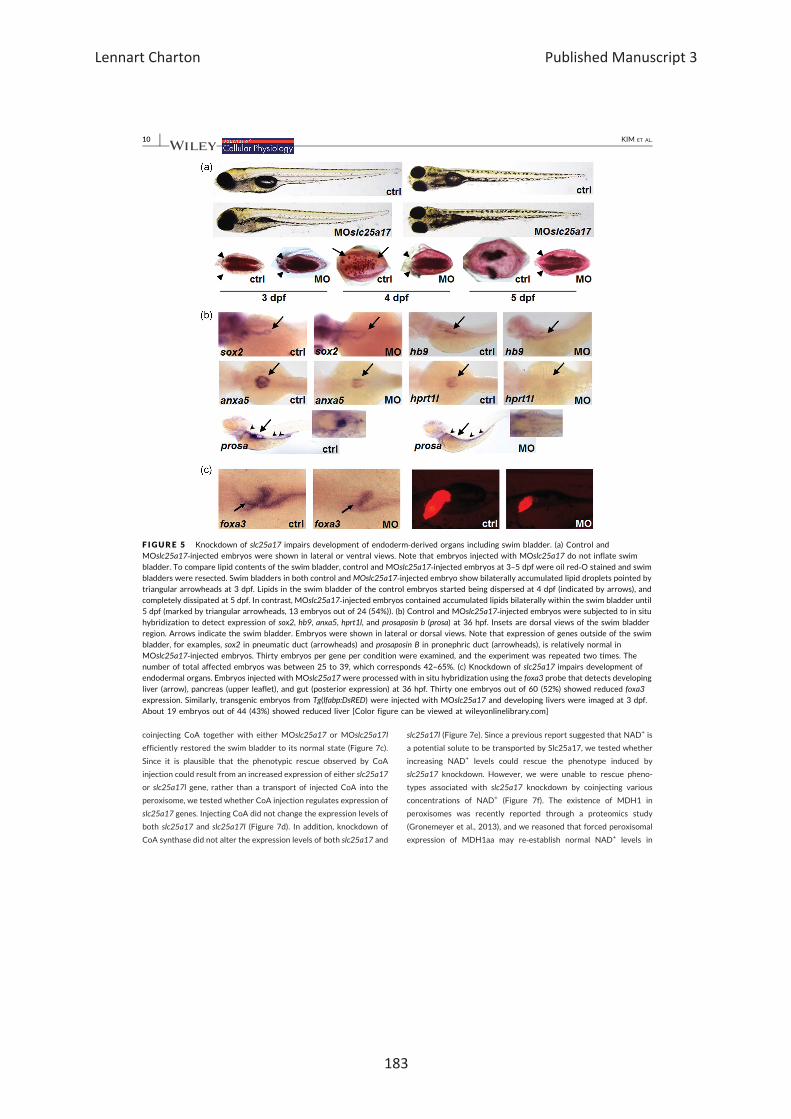
coinjecting CoA together with either MOslc25a17 or MOslc25a17l
efficiently restored the swim bladder to its normal state (Figure 7c).
Since it is plausible that the phenotypic rescue observed by CoA
injection could result from an increased expression of either slc25a17
or slc25a17l gene, rather than a transport of injected CoA into the
peroxisome, we tested whether CoA injection regulates expression of
slc25a17 genes. Injecting CoA did not change the expression levels of
both slc25a17 and slc25a17l (Figure 7d). In addition, knockdown of
CoA synthase did not alter the expression levels of both slc25a17 and
slc25a17l (Figure 7e). Since a previous report suggested that NAD+ is
a potential solute to be transported by Slc25a17, we tested whether
increasing NAD+ levels could rescue the phenotype induced by
slc25a17 knockdown. However, we were unable to rescue pheno-
types associated with slc25a17 knockdown by coinjecting various
concentrations of NAD+ (Figure 7f). The existence of MDH1 in
peroxisomes was recently reported through a proteomics study
(Gronemeyer et al., 2013), and we reasoned that forced peroxisomal
expression of MDH1aa may re‐establish normal NAD+ levels in
F IGURE 5 Knockdown of slc25a17 impairs development of endoderm‐derived organs including swim bladder. (a) Control andMOslc25a17‐injected embryos were shown in lateral or ventral views. Note that embryos injected with MOslc25a17 do not inflate swim
bladder. To compare lipid contents of the swim bladder, control and MOslc25a17‐injected embryos at 3–5 dpf were oil red‐O stained and swimbladders were resected. Swim bladders in both control and MOslc25a17‐injected embryo show bilaterally accumulated lipid droplets pointed bytriangular arrowheads at 3 dpf. Lipids in the swim bladder of the control embryos started being dispersed at 4 dpf (indicated by arrows), and
completely dissipated at 5 dpf. In contrast, MOslc25a17‐injected embryos contained accumulated lipids bilaterally within the swim bladder until5 dpf (marked by triangular arrowheads, 13 embryos out of 24 (54%)). (b) Control and MOslc25a17‐injected embryos were subjected to in situhybridization to detect expression of sox2, hb9, anxa5, hprt1l, and prosaposin b (prosa) at 36 hpf. Insets are dorsal views of the swim bladderregion. Arrows indicate the swim bladder. Embryos were shown in lateral or dorsal views. Note that expression of genes outside of the swim
bladder, for examples, sox2 in pneumatic duct (arrowheads) and prosaposin B in pronephric duct (arrowheads), is relatively normal inMOslc25a17‐injected embryos. Thirty embryos per gene per condition were examined, and the experiment was repeated two times. Thenumber of total affected embryos was between 25 to 39, which corresponds 42–65%. (c) Knockdown of slc25a17 impairs development of
endodermal organs. Embryos injected with MOslc25a17 were processed with in situ hybridization using the foxa3 probe that detects developingliver (arrow), pancreas (upper leaflet), and gut (posterior expression) at 36 hpf. Thirty one embryos out of 60 (52%) showed reduced foxa3expression. Similarly, transgenic embryos from Tg(lfabp:DsRED) were injected with MOslc25a17 and developing livers were imaged at 3 dpf.
About 19 embryos out of 44 (43%) showed reduced liver [Color figure can be viewed at wileyonlinelibrary.com]
10 | KIM ET AL.
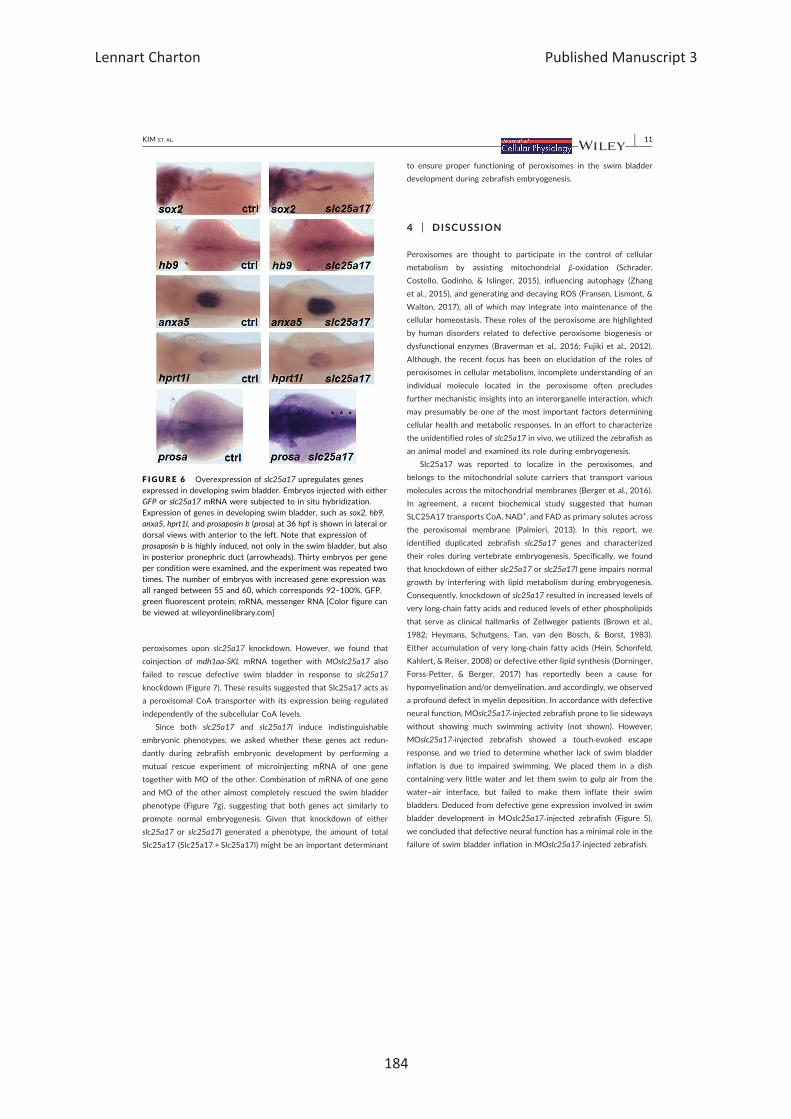
peroxisomes upon slc25a17 knockdown. However, we found that
coinjection of mdh1aa‐SKL mRNA together with MOslc25a17 also
failed to rescue defective swim bladder in response to slc25a17
knockdown (Figure 7). These results suggested that Slc25a17 acts as
a peroxisomal CoA transporter with its expression being regulated
independently of the subcellular CoA levels.
Since both slc25a17 and slc25a17l induce indistinguishable
embryonic phenotypes, we asked whether these genes act redun-
dantly during zebrafish embryonic development by performing a
mutual rescue experiment of microinjecting mRNA of one gene
together with MO of the other. Combination of mRNA of one gene
and MO of the other almost completely rescued the swim bladder
phenotype (Figure 7g), suggesting that both genes act similarly to
promote normal embryogenesis. Given that knockdown of either
slc25a17 or slc25a17l generated a phenotype, the amount of total
Slc25a17 (Slc25a17 + Slc25a17l) might be an important determinant
to ensure proper functioning of peroxisomes in the swim bladder
development during zebrafish embryogenesis.
4 | DISCUSSION
Peroxisomes are thought to participate in the control of cellular
metabolism by assisting mitochondrial β‐oxidation (Schrader,
Costello, Godinho, & Islinger, 2015), influencing autophagy (Zhang
et al., 2015), and generating and decaying ROS (Fransen, Lismont, &
Walton, 2017), all of which may integrate into maintenance of the
cellular homeostasis. These roles of the peroxisome are highlighted
by human disorders related to defective peroxisome biogenesis or
dysfunctional enzymes (Braverman et al., 2016; Fujiki et al., 2012).
Although, the recent focus has been on elucidation of the roles of
peroxisomes in cellular metabolism, incomplete understanding of an
individual molecule located in the peroxisome often precludes
further mechanistic insights into an interorganelle interaction, which
may presumably be one of the most important factors determining
cellular health and metabolic responses. In an effort to characterize
the unidentified roles of slc25a17 in vivo, we utilized the zebrafish as
an animal model and examined its role during embryogenesis.
Slc25a17 was reported to localize in the peroxisomes, and
belongs to the mitochondrial solute carriers that transport various
molecules across the mitochondrial membranes (Berger et al., 2016).
In agreement, a recent biochemical study suggested that human
SLC25A17 transports CoA, NAD+, and FAD as primary solutes across
the peroxisomal membrane (Palmieri, 2013). In this report, we
identified duplicated zebrafish slc25a17 genes and characterized
their roles during vertebrate embryogenesis. Specifically, we found
that knockdown of either slc25a17 or slc25a17l gene impairs normal
growth by interfering with lipid metabolism during embryogenesis.
Consequently, knockdown of slc25a17 resulted in increased levels of
very long‐chain fatty acids and reduced levels of ether phospholipids
that serve as clinical hallmarks of Zellweger patients (Brown et al.,
1982; Heymans, Schutgens, Tan, van den Bosch, & Borst, 1983).
Either accumulation of very long‐chain fatty acids (Hein, Schonfeld,
Kahlert, & Reiser, 2008) or defective ether lipid synthesis (Dorninger,
Forss‐Petter, & Berger, 2017) has reportedly been a cause for
hypomyelination and/or demyelination, and accordingly, we observed
a profound defect in myelin deposition. In accordance with defective
neural function, MOslc25a17‐injected zebrafish prone to lie sideways
without showing much swimming activity (not shown). However,
MOslc25a17‐injected zebrafish showed a touch‐evoked escape
response, and we tried to determine whether lack of swim bladder
inflation is due to impaired swimming. We placed them in a dish
containing very little water and let them swim to gulp air from the
water–air interface, but failed to make them inflate their swim
bladders. Deduced from defective gene expression involved in swim
bladder development in MOslc25a17‐injected zebrafish (Figure 5),
we concluded that defective neural function has a minimal role in the
failure of swim bladder inflation in MOslc25a17‐injected zebrafish.
F IGURE 6 Overexpression of slc25a17 upregulates genes
expressed in developing swim bladder. Embryos injected with eitherGFP or slc25a17 mRNA were subjected to in situ hybridization.Expression of genes in developing swim bladder, such as sox2, hb9,anxa5, hprt1l, and prosaposin b (prosa) at 36 hpf is shown in lateral or
dorsal views with anterior to the left. Note that expression ofprosaposin b is highly induced, not only in the swim bladder, but alsoin posterior pronephric duct (arrowheads). Thirty embryos per gene
per condition were examined, and the experiment was repeated twotimes. The number of embryos with increased gene expression wasall ranged between 55 and 60, which corresponds 92–100%. GFP,
green fluorescent protein; mRNA, messenger RNA [Color figure canbe viewed at wileyonlinelibrary.com]
KIM ET AL. | 11
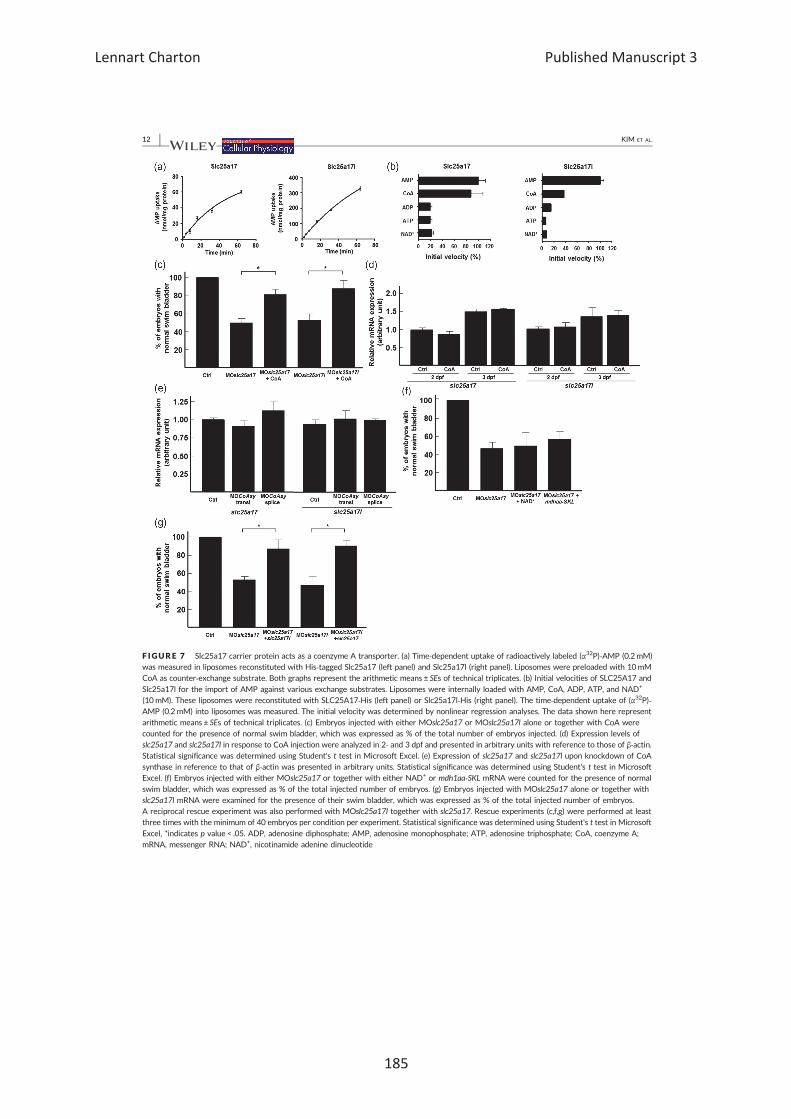
F IGURE 7 Slc25a17 carrier protein acts as a coenzyme A transporter. (a) Time‐dependent uptake of radioactively labeled (α32P)‐AMP (0.2mM)was measured in liposomes reconstituted with His‐tagged Slc25a17 (left panel) and Slc25a17l (right panel). Liposomes were preloaded with 10mMCoA as counter‐exchange substrate. Both graphs represent the arithmetic means ± SEs of technical triplicates. (b) Initial velocities of SLC25A17 and
Slc25a17l for the import of AMP against various exchange substrates. Liposomes were internally loaded with AMP, CoA, ADP, ATP, and NAD+
(10mM). These liposomes were reconstituted with SLC25A17‐His (left panel) or Slc25a17l‐His (right panel). The time‐dependent uptake of (α32P)‐AMP (0.2mM) into liposomes was measured. The initial velocity was determined by nonlinear regression analyses. The data shown here represent
arithmetic means ± SEs of technical triplicates. (c) Embryos injected with either MOslc25a17 or MOslc25a17l alone or together with CoA werecounted for the presence of normal swim bladder, which was expressed as % of the total number of embryos injected. (d) Expression levels ofslc25a17 and slc25a17l in response to CoA injection were analyzed in 2‐ and 3 dpf and presented in arbitrary units with reference to those of β‐actin.Statistical significance was determined using Student's t test in Microsoft Excel. (e) Expression of slc25a17 and slc25a17l upon knockdown of CoAsynthase in reference to that of β‐actin was presented in arbitrary units. Statistical significance was determined using Student's t test in MicrosoftExcel. (f) Embryos injected with either MOslc25a17 or together with either NAD+ or mdh1aa‐SKL mRNA were counted for the presence of normalswim bladder, which was expressed as % of the total injected number of embryos. (g) Embryos injected with MOslc25a17 alone or together with
slc25a17l mRNA were examined for the presence of their swim bladder, which was expressed as % of the total injected number of embryos.A reciprocal rescue experiment was also performed with MOslc25a17l together with slc25a17. Rescue experiments (c,f,g) were performed at leastthree times with the minimum of 40 embryos per condition per experiment. Statistical significance was determined using Student's t test in Microsoft
Excel, *indicates p value < .05. ADP, adenosine diphosphate; AMP, adenosine monophosphate; ATP, adenosine triphosphate; CoA, coenzyme A;mRNA, messenger RNA; NAD+, nicotinamide adenine dinucleotide
12 | KIM ET AL.
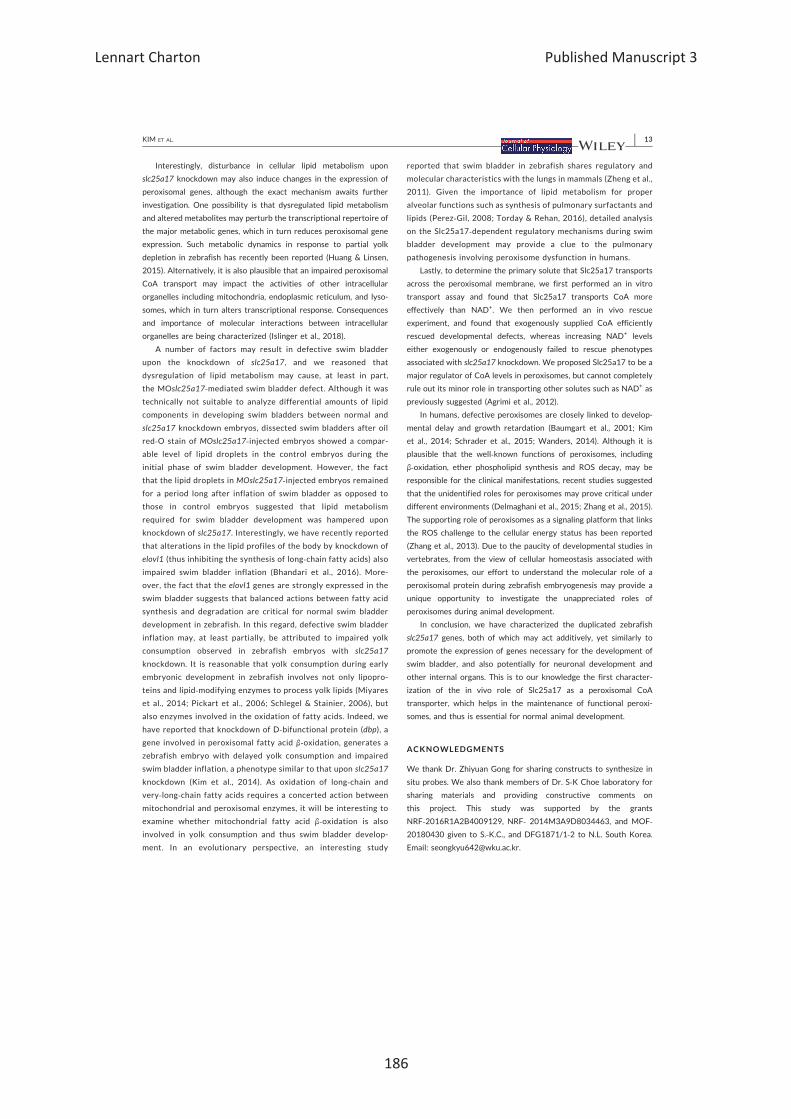
Interestingly, disturbance in cellular lipid metabolism upon
slc25a17 knockdown may also induce changes in the expression of
peroxisomal genes, although the exact mechanism awaits further
investigation. One possibility is that dysregulated lipid metabolism
and altered metabolites may perturb the transcriptional repertoire of
the major metabolic genes, which in turn reduces peroxisomal gene
expression. Such metabolic dynamics in response to partial yolk
depletion in zebrafish has recently been reported (Huang & Linsen,
2015). Alternatively, it is also plausible that an impaired peroxisomal
CoA transport may impact the activities of other intracellular
organelles including mitochondria, endoplasmic reticulum, and lyso-
somes, which in turn alters transcriptional response. Consequences
and importance of molecular interactions between intracellular
organelles are being characterized (Islinger et al., 2018).
A number of factors may result in defective swim bladder
upon the knockdown of slc25a17, and we reasoned that
dysregulation of lipid metabolism may cause, at least in part,
the MOslc25a17‐mediated swim bladder defect. Although it was
technically not suitable to analyze differential amounts of lipid
components in developing swim bladders between normal and
slc25a17 knockdown embryos, dissected swim bladders after oil
red‐O stain of MOslc25a17‐injected embryos showed a compar-
able level of lipid droplets in the control embryos during the
initial phase of swim bladder development. However, the fact
that the lipid droplets in MOslc25a17‐injected embryos remained
for a period long after inflation of swim bladder as opposed to
those in control embryos suggested that lipid metabolism
required for swim bladder development was hampered upon
knockdown of slc25a17. Interestingly, we have recently reported
that alterations in the lipid profiles of the body by knockdown of
elovl1 (thus inhibiting the synthesis of long‐chain fatty acids) also
impaired swim bladder inflation (Bhandari et al., 2016). More-
over, the fact that the elovl1 genes are strongly expressed in the
swim bladder suggests that balanced actions between fatty acid
synthesis and degradation are critical for normal swim bladder
development in zebrafish. In this regard, defective swim bladder
inflation may, at least partially, be attributed to impaired yolk
consumption observed in zebrafish embryos with slc25a17
knockdown. It is reasonable that yolk consumption during early
embryonic development in zebrafish involves not only lipopro-
teins and lipid‐modifying enzymes to process yolk lipids (Miyares
et al., 2014; Pickart et al., 2006; Schlegel & Stainier, 2006), but
also enzymes involved in the oxidation of fatty acids. Indeed, we
have reported that knockdown of D‐bifunctional protein (dbp), a
gene involved in peroxisomal fatty acid β‐oxidation, generates a
zebrafish embryo with delayed yolk consumption and impaired
swim bladder inflation, a phenotype similar to that upon slc25a17
knockdown (Kim et al., 2014). As oxidation of long‐chain and
very‐long‐chain fatty acids requires a concerted action between
mitochondrial and peroxisomal enzymes, it will be interesting to
examine whether mitochondrial fatty acid β‐oxidation is also
involved in yolk consumption and thus swim bladder develop-
ment. In an evolutionary perspective, an interesting study
reported that swim bladder in zebrafish shares regulatory and
molecular characteristics with the lungs in mammals (Zheng et al.,
2011). Given the importance of lipid metabolism for proper
alveolar functions such as synthesis of pulmonary surfactants and
lipids (Perez‐Gil, 2008; Torday & Rehan, 2016), detailed analysis
on the Slc25a17‐dependent regulatory mechanisms during swim
bladder development may provide a clue to the pulmonary
pathogenesis involving peroxisome dysfunction in humans.
Lastly, to determine the primary solute that Slc25a17 transports
across the peroxisomal membrane, we first performed an in vitro
transport assay and found that Slc25a17 transports CoA more
effectively than NAD+. We then performed an in vivo rescue
experiment, and found that exogenously supplied CoA efficiently
rescued developmental defects, whereas increasing NAD+ levels
either exogenously or endogenously failed to rescue phenotypes
associated with slc25a17 knockdown. We proposed Slc25a17 to be a
major regulator of CoA levels in peroxisomes, but cannot completely
rule out its minor role in transporting other solutes such as NAD+ as
previously suggested (Agrimi et al., 2012).
In humans, defective peroxisomes are closely linked to develop-
mental delay and growth retardation (Baumgart et al., 2001; Kim
et al., 2014; Schrader et al., 2015; Wanders, 2014). Although it is
plausible that the well‐known functions of peroxisomes, including
β‐oxidation, ether phospholipid synthesis and ROS decay, may be
responsible for the clinical manifestations, recent studies suggested
that the unidentified roles for peroxisomes may prove critical under
different environments (Delmaghani et al., 2015; Zhang et al., 2015).
The supporting role of peroxisomes as a signaling platform that links
the ROS challenge to the cellular energy status has been reported
(Zhang et al., 2013). Due to the paucity of developmental studies in
vertebrates, from the view of cellular homeostasis associated with
the peroxisomes, our effort to understand the molecular role of a
peroxisomal protein during zebrafish embryogenesis may provide a
unique opportunity to investigate the unappreciated roles of
peroxisomes during animal development.
In conclusion, we have characterized the duplicated zebrafish
slc25a17 genes, both of which may act additively, yet similarly to
promote the expression of genes necessary for the development of
swim bladder, and also potentially for neuronal development and
other internal organs. This is to our knowledge the first character-
ization of the in vivo role of Slc25a17 as a peroxisomal CoA
transporter, which helps in the maintenance of functional peroxi-
somes, and thus is essential for normal animal development.
ACKNOWLEDGMENTS
We thank Dr. Zhiyuan Gong for sharing constructs to synthesize in
situ probes. We also thank members of Dr. S‐K Choe laboratory for
sharing materials and providing constructive comments on
this project. This study was supported by the grants
NRF‐2016R1A2B4009129, NRF‐ 2014M3A9D8034463, and MOF‐20180430 given to S.‐K.C., and DFG1871/1‐2 to N.L. South Korea.
Email: [email protected].
KIM ET AL. | 13
CONFLICTS OF INTEREST
The authors declare that they have no conflict of interests.
AUTHOR CONTRIBUTIONS
S.‐K. C. and R. P. conceived and designed the experiments; Y.‐I. K., I.‐K. N., D.‐K. L., S. B., L. C., S. K., J.‐Y. L., K. H., S.‐J., and J. N. L.
performed experiments; H.‐S. S., N. L., and S.‐K. C. analyzed data; N.
L., R. P. and S.‐K. C. wrote the manuscript.
ORCID
Seong‐Kyu Choe http://orcid.org/0000-0002-2102-973X
REFERENCES
Agrimi, G., Russo, A., Scarcia, P., & Palmieri, F. (2012). The human gene
SLC25A17 encodes a peroxisomal transporter of coenzyme A, FAD
and NAD+. Biochemical Journal, 443(1), 241–247. https://doi.org/10.
1042/BJ20111420
Baumgart, E., Vanhorebeek, I., Grabenbauer, M., Borgers, M., Declercq, P. E.,
Fahimi, H. D., & Baes, M. (2001). Mitochondrial alterations caused by
defective peroxisomal biogenesis in a mouse model for Zellweger
syndrome (PEX5 knockout mouse). American Journal of Pathology,
159(4), 1477–1494. https://doi.org/10.1016/S0002‐9440(10)62534‐5Berger, J., Dorninger, F., Forss‐Petter, S., & Kunze, M. (2016). Peroxisomes
in brain development and function. Biochimica Et Biophysica Acta‐Molecular Cell Research, 1863(5), 934–955. https://doi.org/10.1016/j.
bbamcr.2015.12.005
Bernhardt, K., Wilkinson, S., Weber, A. P. M., & Linka, N. (2012). A
peroxisomal carrier delivers NAD plus and contributes to optimal fatty
acid degradation during storage oil mobilization. Plant Journal, 69(1),
1–13. https://doi.org/10.1111/j.1365‐313X.2011.04775.xdoi:DOI
Bhandari, S., Lee, J. N., Kim, Y. I., Nam, I. K., Kim, S. J., Kim, S. J., … Park, R.
(2016). The fatty acid chain elongase, Elovl1, is required for kidney and
swim bladder development during zebrafish embryogenesis. Organogen-
esis, 12(2), 78–93. https://doi.org/10.1080/15476278.2016.1172164
Braverman, N. E., Raymond, G. V., Rizzo, W. B., Moser, A. B., Wilkinson, M.
E., Stone, E. M., … Bose, M. (2016). Peroxisome biogenesis disorders in
the Zellweger spectrum: An overview of current diagnosis, clinical
manifestations, and treatment guidelines. Molecular Genetics and
Metabolism, 117(3), 313–321. https://doi.org/10.1016/j.ymgme.2015.
12.009
Brown, F. R., 3rd, McAdams, A. J., Cummins, J. W., Konkol, R., Singh, I.,
Moser, A. B., & Moser, H. W. (1982). Cerebro‐hepato‐renal (Zellwe-
ger) syndrome and neonatal adrenoleukodystrophy: Similarities in
phenotype and accumulation of very long chain fatty acids. Johns
Hopkins Medical Journal. JHMJAX, 151(6), 344–351 http://www.ncbi.
nlm.nih.gov/pubmed/7176294
Delille, H. K., Bonekamp, N. A., & Schrader, M. (2006). Peroxisomes and
disease ‐ an overview. International Journal of Biomedical Science, 2(4),
308–314 http://www.ncbi.nlm.nih.gov/pubmed/23674998
Delmaghani, S., Defourny, J., Aghaie, A., Beurg, M., Dulon, D., Thelen, N., …
Petit, C. (2015). Hypervulnerability to sound exposure through
impaired adaptive proliferation of peroxisomes. Cell, 163(4),
894–906. https://doi.org/10.1016/j.cell.2015.10.023
Dorninger, F., Forss‐Petter, S., & Berger, J. (2017). From peroxisomal
disorders to common neurodegenerative diseases ‐ the role of ether
phospholipids in the nervous system. FEBS Letters, 591(18),
2761–2788. https://doi.org/10.1002/1873‐3468.12788
Fransen, M., Lismont, C., & Walton, P. (2017). The peroxisome‐mitochondria
connection: How and why? International Journal of Molecular Sciences,
18(6), 1126. https://doi.org/10.3390/Ijms18061126doi:Artn 1126
Fujiki, Y., Yagita, Y., & Matsuzaki, T. (2012). Peroxisome biogenesis
disorders: Molecular basis for impaired peroxisomal membrane
assembly: In metabolic functions and biogenesis of peroxisomes in
health and disease. Biochimica et Biophysica Acta/General Subjects,
1822(9), 1337–1342. https://doi.org/10.1016/j.bbadis.2012.06.004
Gronemeyer, T., Wiese, S., Ofman, R., Bunse, C., Pawlas, M., Hayen, H., …
Warscheid, B. (2013). The Proteome of human liver peroxisomes:
Identification of five new peroxisomal constituents by a label‐freequantitative proteomics survey. PLoS One, 8(2), e57395. https://doi.
org/10.1371/journal.pone.0057395doi:ARTN e57395
Gutierrez‐Aguilar, M., & Baines, C. P. (2013). Physiological and patholo-
gical roles of mitochondrial SLC25 carriers. Biochemical Journal, 454,
371–386. https://doi.org/10.1042/Bj20121753
Hediger, M. A., Clemencon, B., Burrier, R. E., & Bruford, E. A. (2013). The
ABCs of membrane transporters in health and disease (SLC series):
Introduction. Molecular Aspects of Medicine, 34(2‐3), 95–107. https://doi.org/10.1016/j.mam.2012.12.009
Hein, S., Schonfeld, P., Kahlert, S., & Reiser, G. (2008). Toxic effects of X‐linked adrenoleukodystrophy‐associated, very long chain fatty acids
on glial cells and neurons from rat hippocampus in culture. Human
Molecular Genetics, 17(12), 1750–1761. https://doi.org/10.1093/hmg/
ddn066
Heymans, H. S., Schutgens, R. B., Tan, R., vanden Bosch, H., & Borst,
P. (1983). Severe plasmalogen deficiency in tissues of infants without
peroxisomes (Zellweger syndrome). Nature, 306(5938), 69–70 http://
www.ncbi.nlm.nih.gov/pubmed/6633659
Huang, Y., & Linsen, S. E. (2015). Partial depletion of yolk during zebrafish
embryogenesis changes the dynamics of methionine cycle and
metabolic genes. BMC Genomics, 16, 427. https://doi.org/10.1186/
s12864‐015‐1654‐6Islinger, M., Voelkl, A., Fahimi, H. D., & Schrader, M. (2018). The peroxisome:
An update on mysteries 2.0. Histochemistry and Cell Biology, 150(5),
443–471. https://doi.org/10.1007/s00418‐018‐1722‐5Kasahara, M., & Hinkle, P. C. (1976). Reconstitution of D‐glucose
transport catalyzed by a protein fraction from human erythrocytes
in sonicated liposomes. Proceedings of the National Academy of Sciences
of the United States of America, 73(2), 396–400 http://www.ncbi.nlm.
nih.gov/pubmed/1061142
Kim, Y. I., Bhandari, S., Lee, J. N., Yoo, K. W., Kim, S. J., Oh, G. S., … Choe, S.
K. (2014). Developmental roles of D‐bifunctional protein‐A Zebrafish
model of peroxisome dysfunction. Molecules and Cells, 37(1), 74–80.
https://doi.org/10.14348/molcells.2014.2300
Kim, Y. I., Lee, J. N., Bhandari, S., Nam, I. K., Yoo, K. W., Kim, S. J., …Park, R.
(2015). Cartilage development requires the function of estrogen‐relatedreceptor alpha that directly regulates sox9 expression in zebrafish.
Scientific Reports, 5, https://doi.org/10.1038/Srep18011.doi:Artn 18011.
Kimmel, C. B., Ballard, W. W., Kimmel, S. R., Ullmann, B., & Schilling, T. F.
(1995). Stages of embryonic development of the zebrafish. Developmental
Dynamics, 203(3), 253–310. https://doi.org/10.1002/aja.1002030302
Lieschke, G. J., & Currie, P. D. (2007). Animal models of human disease:
Zebrafish swim into view. Nature Reviews Genetics, 8(5), 353–367.
https://doi.org/10.1038/nrg2091
Lodhi, I. J., & Semenkovich, C. F. (2014). Peroxisomes: A nexus for lipid
metabolism and cellular signaling. Cell Metabolism, 19(3), 380–392.
https://doi.org/10.1016/j.cmet.2014.01.002
Miyares, R. L., deRezende, V. B., & Farber, S. A. (2014). Zebrafish yolk lipid
processing: A tractable tool for the study of vertebrate lipid transport
and metabolism. Disease Models & Mechanisms, 7(7), 915–927. https://
doi.org/10.1242/dmm.015800
DeMunter, S., Verheijden, S., Regal, L., & Baes, M. (2015). Peroxisomal
disorders: A review on cerebellar pathologies. Brain Pathology, 25(6),
663–678. https://doi.org/10.1111/bpa.12290
14 | KIM ET AL.
Palmieri, F. (2013). The mitochondrial transporter family SLC25: Identification,
properties and physiopathology. Molecular Aspects of Medicine, 34(2‐3),465–484. https://doi.org/10.1016/j.mam.2012.05.005
Perez‐Gil, J. (2008). Structure of pulmonary surfactant membranes and
films: The role of proteins and lipid‐protein interactions. Biochimica Et
Biophysica Acta‐Biomembranes, 1778(7‐8), 1676–1695. https://doi.org/10.1016/j.bbamem.2008.05.003
Pickart, M. A., Klee, E. W., Nielsen, A. L., Sivasubbu, S., Mendenhall, E. M.,
Bill, B. R., … Ekker, S. C. (2006). Genome‐wide reverse genetics
framework to identify novel functions of the vertebrate secretome.
PLoS One, 1, e104. https://doi.org/10.1371/journal.pone.0000104
Schlegel, A., & Stainier, D. Y. R. (2006). Microsomal triglyceride transfer
protein is required for yolk lipid utilization and absorption of dietary
lipids in zebrafish larvae. Biochemistry, 45(51), 15179–15187. https://
doi.org/10.1021/bi0619268
Schrader, M., Costello, J., Godinho, L. F., & Islinger, M. (2015). Peroxisome‐mitochondria interplay and disease. Journal of Inherited Metabolic
Disease, 38(4), 681–702. https://doi.org/10.1007/s10545‐015‐9819‐7Stainier, D. Y. R., Raz, E., Lawson, N. D., Ekker, S. C., Burdine, R. D., Eisen, J.
S., … Moens, C. B. (2017). Guidelines for morpholino use in zebrafish.
PLoS Genetics, 13(10), e1007000. https://doi.org/10.1371/journal.
pgen.1007000doi:ARTN e1007000
Torday, J. S., & Rehan, V. K. (2016). On the evolution of the pulmonary
alveolar lipofibroblast. Experimental Cell Research, 340(2), 215–219.
https://doi.org/10.1016/j.yexcr.2015.12.004
Vamecq, J., Cherkaoui‐Malki, M., Andreoletti, P., & Latruffe, N. (2014). The
human peroxisome in health and disease: The story of an oddity
becoming a vital organelle. Biochimie, 98, 4–15. https://doi.org/10.
1016/j.biochi.2013.09.019
Verheijden, S., Beckers, L., DeMunter, S., VanVeldhoven, P. P., & Baes, M.
(2014). Central nervous system pathology in MFP2 deficiency:
Insights from general and conditional knockout mouse models.
Biochimie, 98, 119–126. https://doi.org/10.1016/j.biochi.2013.08.009
Visser, W. F., vanRoermund, C. W. T., Ijlst, L., Waterham, H. R., &Wanders, R. J.
A. (2007). Metabolite transport across the peroxisomal membrane.
Biochemical Journal, 401, 365–375. https://doi.org/10.1042/Bj20061352
Visser, W. F., vanRoermund, C. W. T., Waterham, H. R., & Wanders, R. J. A.
(2002). Identification of human PMP34 as a peroxisomal ATP
transporter. Biochemical and Biophysical Research Communications,
299(3), 494–497. https://doi.org/10.1016/S0006‐291x(02)02663‐3doi:Pii S0006‐291x(02)02663‐3
Wanders, R. J. (2014). Metabolic functions of peroxisomes in health and
disease. Biochimie, 98, 36–44. https://doi.org/10.1016/j.biochi.2013.
08.022
Waterham, H. R., & Wanders, R. J. (2012). Metabolic functions and
biogenesis of peroxisomes in health and disease. Biochimica et
Biophysica Acta/General Subjects, 1822(9), 1325. https://doi.org/10.
1016/j.bbadis.2012.06.001
Winata, C. L., Korzh, S., Kondrychyn, I., Zheng, W. L., Korzh, V., & Gong, Z.
Y. (2009). Development of zebrafish swimbladder: The requirement of
Hedgehog signaling in specification and organization of the three
tissue layers. Developmental Biology, 331(2), 222–236. https://doi.org/
10.1016/j.ydbio.2009.04.035
Wylin, T., Baes, M., Brees, C., Mannaerts, G. P., Fransen, M., &
VanVeldhoven, P. P. (1998). Identification and characterization of
human PMP34, a protein closely related to the peroxisomal integral
membrane protein PMP47 of Candida boidinii. European Journal of
Biochemistry, 258(2), 332–338. https://doi.org/10.1046/j.1432‐1327.1998.2580332.xdoi:DOI
Zhang, J. W., Kim, J., Alexander, A., Cai, S. L., Tripathi, D. N., Dere, R., …
Walker, C. L. (2013). A tuberous sclerosis complex signalling node at
the peroxisome regulates mTORC1 and autophagy in response to
ROS. Nature Cell Biology, 15(10), 1186–U1145. https://doi.org/10.
1038/ncb2822
Zhang, J. W., Tripathi, D. N., Jing, J., Alexander, A., Kim, J., Powell, R. T., …
Walker, C. L. (2015). ATM functions at the peroxisome to induce
pexophagy in response to ROS. Nature Cell Biology, 17(10),
1259–1269. https://doi.org/10.1038/ncb3230+
Zheng, W. L., Wang, Z. Y., Collins, J. E., Andrews, R. M., Stemple, D., &
Gong, Z. Y. (2011). Comparative transcriptome analyses indicate
molecular homology of zebrafish swimbladder and mammalian
lung. PLoS One, 6(8), e24019. https://doi.org/10.1371/journal.
pone.0024019doi:ARTN e24019
How to cite this article: Kim Y‐I, Nam I‐K, Lee D‐K, et al.Slc25a17 acts as a peroxisomal coenzyme A transporter and
regulates multiorgan development in zebrafish. J Cell Physiol.
2019;1–15. https://doi.org/10.1002/jcp.28954
KIM ET AL. | 15
Δ Δ
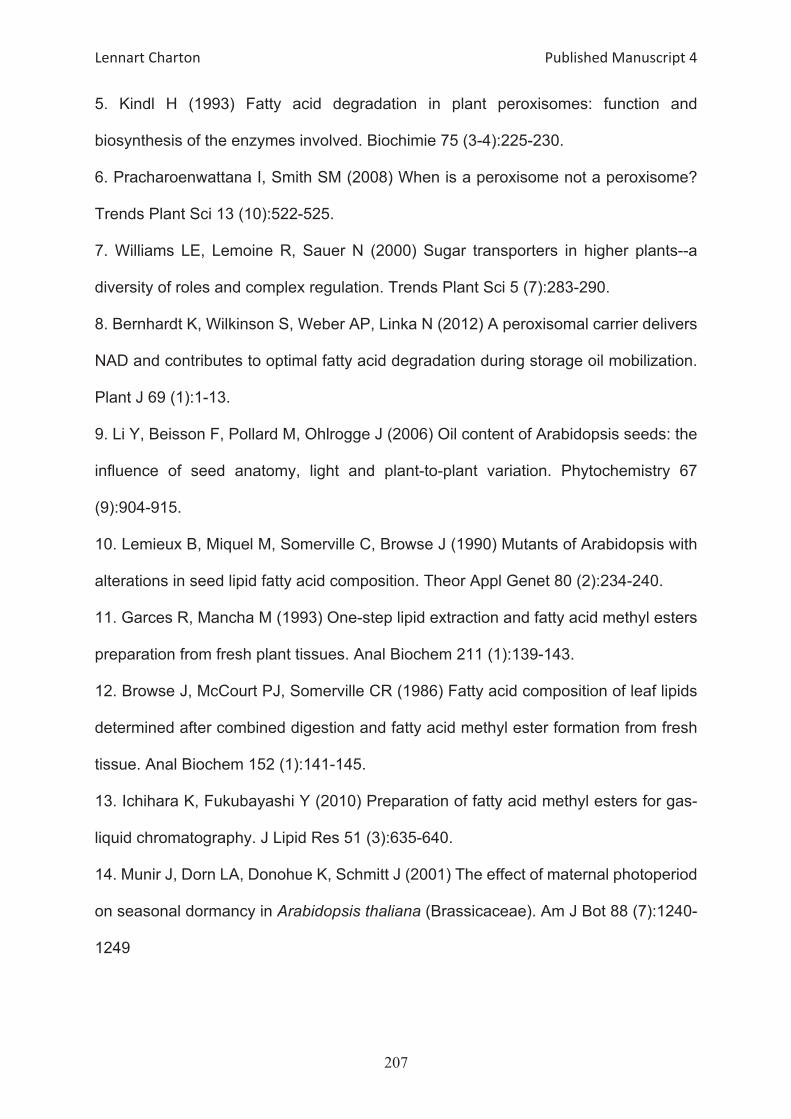
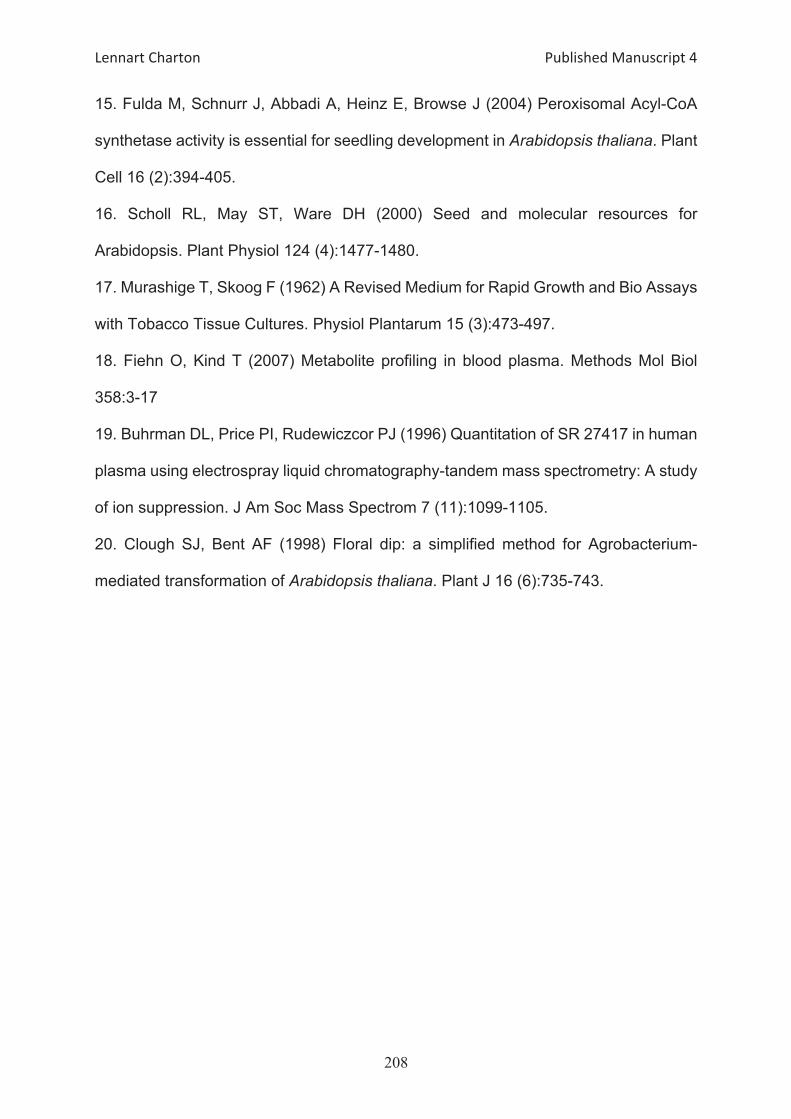
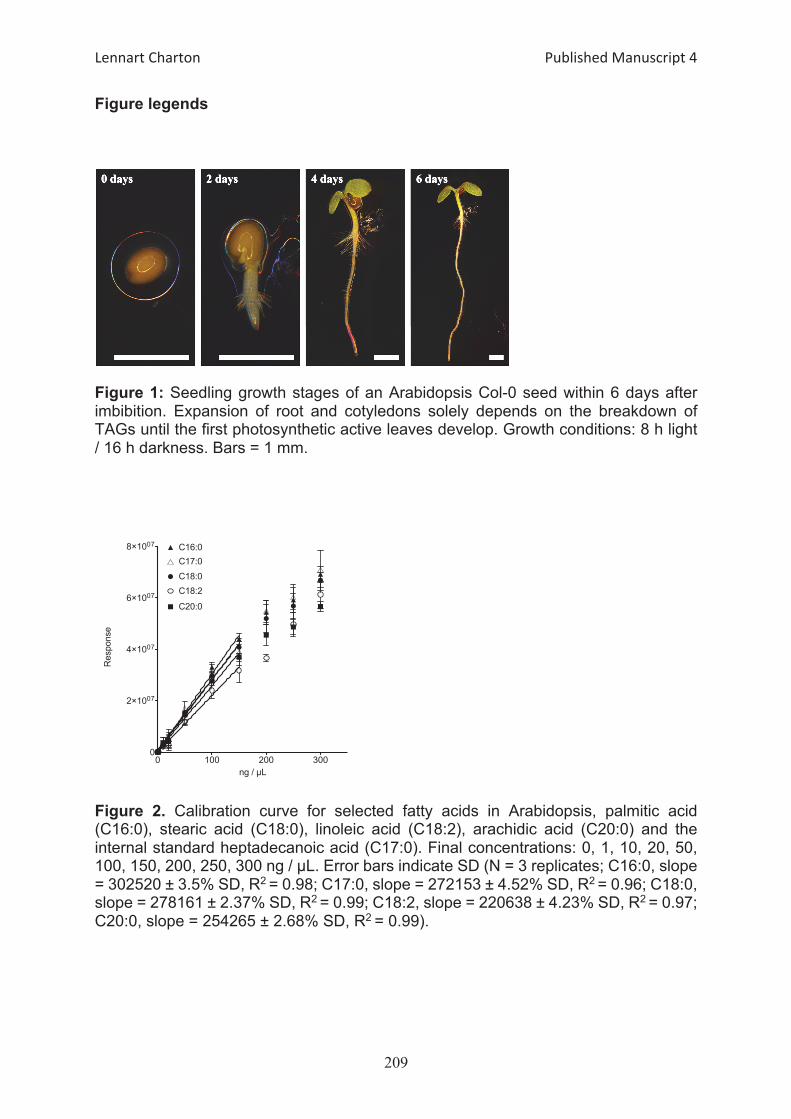
0 100 200 3000
2×1007
4×1007
6×1007
8×1007 C16:0C17:0C18:0C18:2
C20:0
ng / µL
Res
pons
e
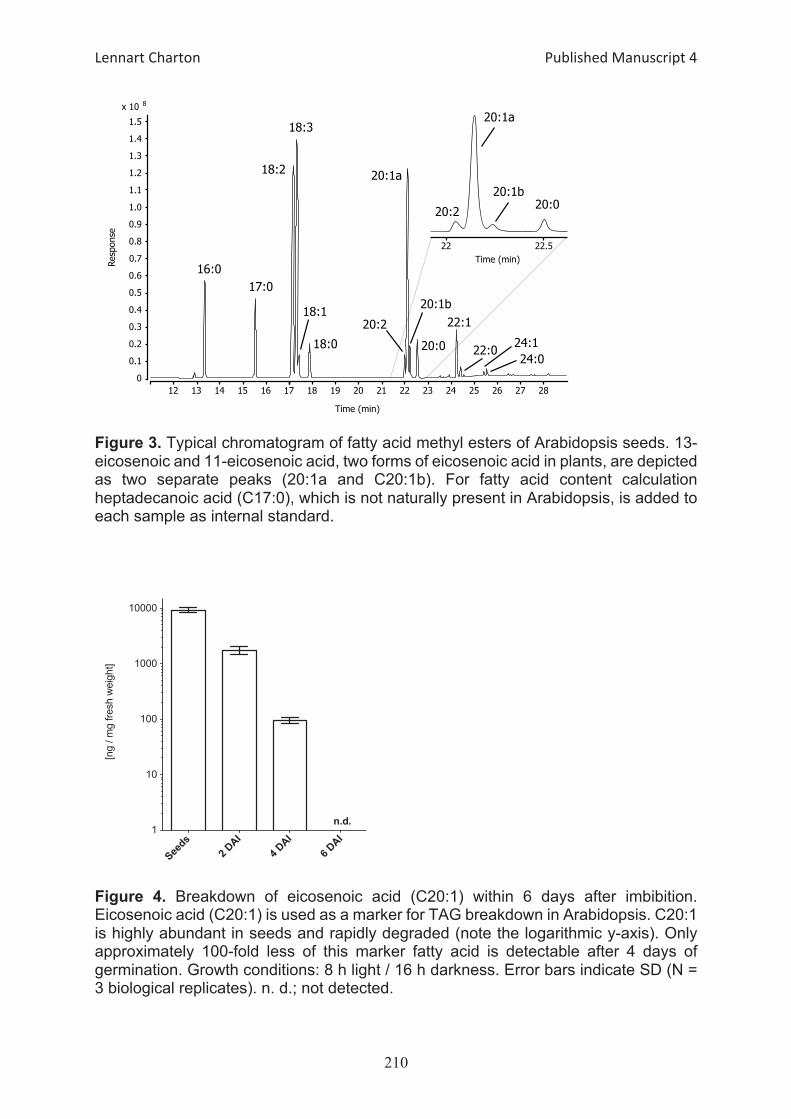
Seeds
2 DAI
4 DAI
6 DAI
1
10
100
1000
10000
n.d.
[ng
/ mg
fresh
wei
ght]
The Peroxisomal NAD Carrier from ArabidopsisImports NAD in Exchange with AMP1[OPEN]
Carlo W. T. van Roermund2, Martin G. Schroers2, Jan Wiese, Fabio Facchinelli, Samantha Kurz,Sabrina Wilkinson, Lennart Charton, Ronald J. A. Wanders, Hans R. Waterham, Andreas P. M. Weber,and Nicole Link*
Laboratory Genetic Metabolic Diseases, Laboratory Division, Academic Medical Center, University ofAmsterdam, 1105AZ Amsterdam, The Netherlands (C.W.T.v.R., R.J.A.W., H.R.W.); and Institute for PlantBiochemistry and Cluster of Excellence on Plant Sciences (CEPLAS), Heinrich Heine University,40225 Düsseldorf, Germany (M.G.S., J.W., F.F., S.K., S.W., L.C., A.P.M.W., N.L.)
ORCID IDs: 0000-0001-5182-8076 (C.W.T.v.R.); 0000-0002-6853-1399 (S.K.); 0000-0003-0970-4672 (A.P.M.W.); 0000-0002-1400-717X (N.L.).
Cofactors such as NAD, AMP, and Coenzyme A (CoA) are essential for a diverse set of reactions and pathways in the cell.Specific carrier proteins are required to distribute these cofactors to different cell compartments, including peroxisomes. Wepreviously identified a peroxisomal transport protein in Arabidopsis (Arabidopsis thaliana) called the peroxisomal NAD carrier(PXN). When assayed in vitro, this carrier exhibits versatile transport functions, e.g. catalyzing the import of NAD or CoA, theexchange of NAD/NADH, and the export of CoA. These observations raise the question about the physiological function ofPXN in plants. Here, we used Saccharomyces cerevisiae to address this question. First, we confirmed that PXN, when expressed inyeast, is active and targeted to yeast peroxisomes. Secondl, detailed uptake analyses revealed that the CoA transport function ofPXN can be excluded under physiological conditions due to its low affinity for this substrate. Third, we expressed PXN indiverse mutant yeast strains and investigated the suppression of the mutant phenotypes. These studies provided strongevidences that PXN was not able to function as a CoA transporter or a redox shuttle by mediating a NAD/NADH exchange,but instead catalyzed the import of NAD into peroxisomes against AMP in intact yeast cells.
NAD is a ubiquitous biological molecule that par-ticipates in many fundamental processes within theliving cell (Pollak et al., 2007; Houtkooper et al., 2010).NAD and its phosphorylated form act as electron ac-ceptors and donors in numerous redox reactions, and itis also involved in the generation and scavenging ofreactive oxygen species that serve as signaling mole-cules (Dröge, 2002; Mittler, 2002). Furthermore, NAD isalso a precursor for cADP-ribose, which modulates therelease of calcium as a second messenger (Pollak et al.,
2007; Houtkooper et al., 2010). Moreover, it also plays arole in transcription and post-translational modifica-tion through histone deacetylation and ADP ribosyla-tion of proteins (Chang and Guarente, 2014; Bai et al.,2015).
Since NAD has multiple essential functions, its cel-lular levels need to be maintained either through denovo synthesis or salvage pathways, which involvesrecycling of NAD degradation products. In eukaryoticcells, both pathways take place in the cytosol, and thusNAD has to be always distributed to diverse cell com-partments. As a consequence, transport proteins arerequired to shuttle NAD across intracellular mem-branes. In plants, humans, and fungi, members of themitochondrial carrier family mediate the import ofNAD into mitochondria, plastids, and peroxisomes(Todisco et al., 2006; Palmieri et al., 2009; Agrimi et al.,2012a, 2012b; Bernhardt et al., 2012). These transportershave been characterized by in vitro uptake assays usingrecombinant protein reconstituted into lipid vesicles(liposomes). Based on these biochemical data, the NADcarriers function as antiporters, importing NAD in astrict counter-exchange with another molecule (Todiscoet al., 2006; Palmieri et al., 2009; Agrimi et al., 2012a,2012b; Bernhardt et al., 2012).
In the case of plastids and mitochondria, the carrierscatalyze the uptake of NAD in counter-exchange withAMP or ADP (Todisco et al., 2006; Palmieri et al., 2009).The efflux of adenine nucleotides is compensated by
1 This work was supported by Deutsche Forschungsgemeinschaft(grant nos. 1781/2-1 to N.L., GRK1525 to N.L., and EXC1028 toA.P.M.W.).
2 These authors contributed equally to the article.*Address correspondence to [email protected] author responsible for distribution of materials integral to the
findings presented in this article in accordance with the policy de-scribed in the Instructions for Authors (www.plantphysiol.org) is:Nicole Linka ([email protected]).
C.W.T.v.R. and M.G.S. performed most of the experiments andanalyzed the data; J.W. and F.F. conducted the subcellular localiza-tion in yeast; S.K. participated in the AMP uptake experiments; S.W.generated the ndt1/ndt2D doublemutant and performed the suppres-sion analysis; L.C. contributed the Ant1p uptake data; R.J.A.W.,H.R.W., and A.P.M.W. helped in designing experiments; N.L. wrotethe manuscript and designed the experiments; and all authors readand approved the final version of the article.
[OPEN] Articles can be viewed without a subscription.www.plantphysiol.org/cgi/doi/10.1104/pp.16.00540
Plant Physiology�, July 2016, Vol. 171, pp. 2127–2139, www.plantphysiol.org � 2016 American Society of Plant Biologists. All Rights Reserved. 2127
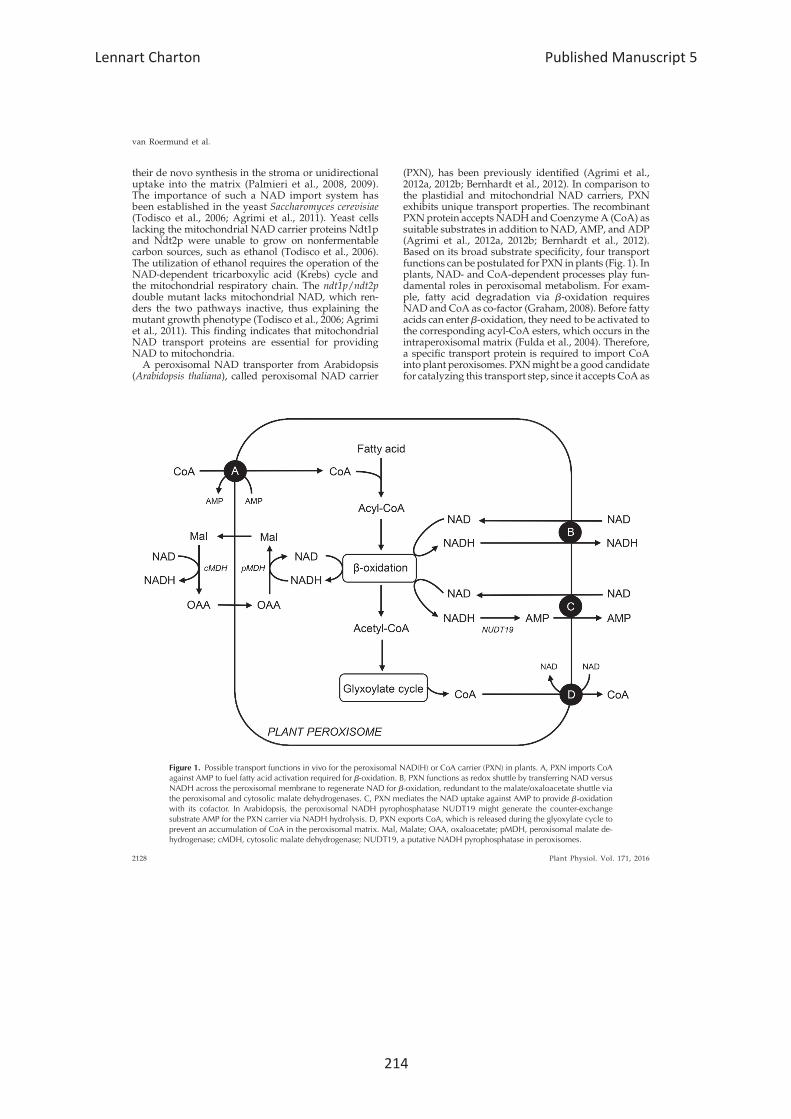
their de novo synthesis in the stroma or unidirectionaluptake into the matrix (Palmieri et al., 2008, 2009).The importance of such a NAD import system hasbeen established in the yeast Saccharomyces cerevisiae(Todisco et al., 2006; Agrimi et al., 2011). Yeast cellslacking the mitochondrial NAD carrier proteins Ndt1pand Ndt2p were unable to grow on nonfermentablecarbon sources, such as ethanol (Todisco et al., 2006).The utilization of ethanol requires the operation of theNAD-dependent tricarboxylic acid (Krebs) cycle andthe mitochondrial respiratory chain. The ndt1p/ndt2pdouble mutant lacks mitochondrial NAD, which ren-ders the two pathways inactive, thus explaining themutant growth phenotype (Todisco et al., 2006; Agrimiet al., 2011). This finding indicates that mitochondrialNAD transport proteins are essential for providingNAD to mitochondria.
A peroxisomal NAD transporter from Arabidopsis(Arabidopsis thaliana), called peroxisomal NAD carrier
(PXN), has been previously identified (Agrimi et al.,2012a, 2012b; Bernhardt et al., 2012). In comparison tothe plastidial and mitochondrial NAD carriers, PXNexhibits unique transport properties. The recombinantPXN protein accepts NADH and Coenzyme A (CoA) assuitable substrates in addition to NAD, AMP, and ADP(Agrimi et al., 2012a, 2012b; Bernhardt et al., 2012).Based on its broad substrate specificity, four transportfunctions can be postulated for PXN in plants (Fig. 1). Inplants, NAD- and CoA-dependent processes play fun-damental roles in peroxisomal metabolism. For exam-ple, fatty acid degradation via b-oxidation requiresNAD and CoA as co-factor (Graham, 2008). Before fattyacids can enter b-oxidation, they need to be activated tothe corresponding acyl-CoA esters, which occurs in theintraperoxisomal matrix (Fulda et al., 2004). Therefore,a specific transport protein is required to import CoAinto plant peroxisomes. PXNmight be a good candidatefor catalyzing this transport step, since it accepts CoA as
Figure 1. Possible transport functions in vivo for the peroxisomal NAD(H) or CoA carrier (PXN) in plants. A, PXN imports CoAagainst AMP to fuel fatty acid activation required for b-oxidation. B, PXN functions as redox shuttle by transferring NAD versusNADH across the peroxisomal membrane to regenerate NAD for b-oxidation, redundant to the malate/oxaloacetate shuttle viathe peroxisomal and cytosolic malate dehydrogenases. C, PXN mediates the NAD uptake against AMP to provide b-oxidationwith its cofactor. In Arabidopsis, the peroxisomal NADH pyrophosphatase NUDT19 might generate the counter-exchangesubstrate AMP for the PXN carrier via NADH hydrolysis. D, PXN exports CoA, which is released during the glyoxylate cycle toprevent an accumulation of CoA in the peroxisomal matrix. Mal, Malate; OAA, oxaloacetate; pMDH, peroxisomal malate de-hydrogenase; cMDH, cytosolic malate dehydrogenase; NUDT19, a putative NADH pyrophosphatase in peroxisomes.
2128 Plant Physiol. Vol. 171, 2016
van Roermund et al.
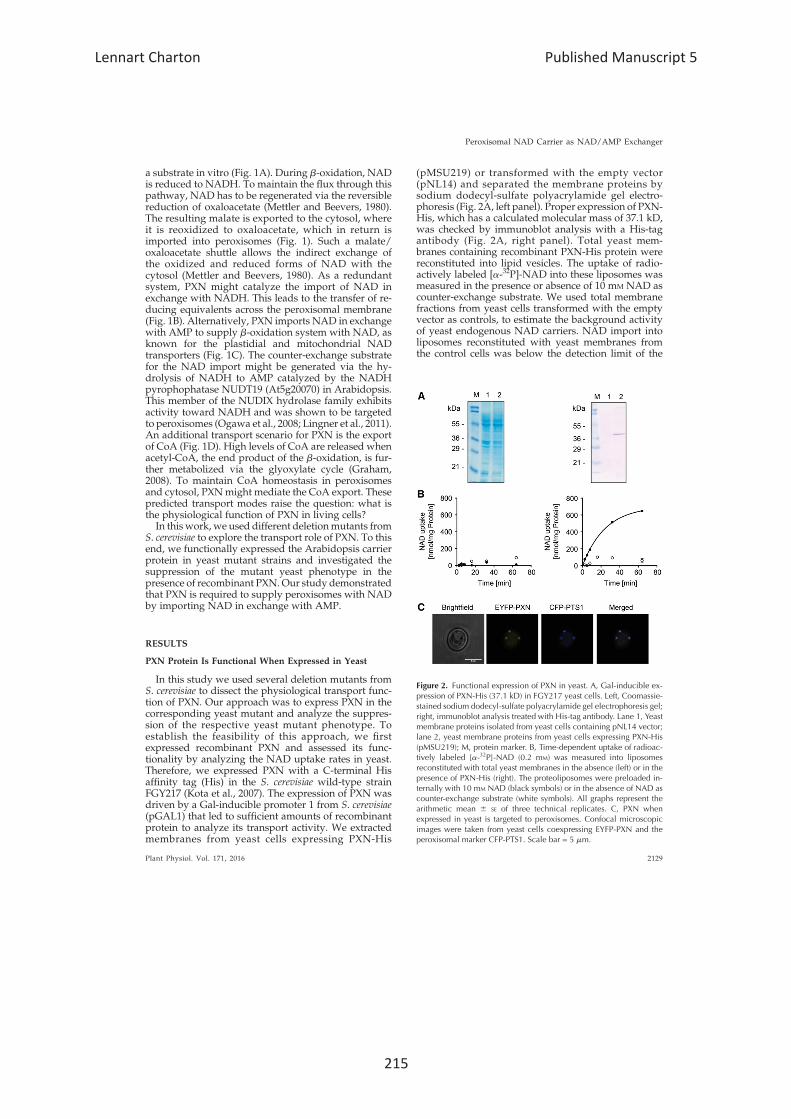
a substrate in vitro (Fig. 1A). During b-oxidation, NADis reduced to NADH. To maintain the flux through thispathway, NAD has to be regenerated via the reversiblereduction of oxaloacetate (Mettler and Beevers, 1980).The resulting malate is exported to the cytosol, whereit is reoxidized to oxaloacetate, which in return isimported into peroxisomes (Fig. 1). Such a malate/oxaloacetate shuttle allows the indirect exchange ofthe oxidized and reduced forms of NAD with thecytosol (Mettler and Beevers, 1980). As a redundantsystem, PXN might catalyze the import of NAD inexchange with NADH. This leads to the transfer of re-ducing equivalents across the peroxisomal membrane(Fig. 1B). Alternatively, PXN imports NAD in exchangewith AMP to supply b-oxidation system with NAD, asknown for the plastidial and mitochondrial NADtransporters (Fig. 1C). The counter-exchange substratefor the NAD import might be generated via the hy-drolysis of NADH to AMP catalyzed by the NADHpyrophophatase NUDT19 (At5g20070) in Arabidopsis.This member of the NUDIX hydrolase family exhibitsactivity toward NADH and was shown to be targetedto peroxisomes (Ogawa et al., 2008; Lingner et al., 2011).An additional transport scenario for PXN is the exportof CoA (Fig. 1D). High levels of CoA are released whenacetyl-CoA, the end product of the b-oxidation, is fur-ther metabolized via the glyoxylate cycle (Graham,2008). To maintain CoA homeostasis in peroxisomesand cytosol, PXNmight mediate the CoA export. Thesepredicted transport modes raise the question: what isthe physiological function of PXN in living cells?In this work, we used different deletionmutants from
S. cerevisiae to explore the transport role of PXN. To thisend, we functionally expressed the Arabidopsis carrierprotein in yeast mutant strains and investigated thesuppression of the mutant yeast phenotype in thepresence of recombinant PXN. Our study demonstratedthat PXN is required to supply peroxisomes with NADby importing NAD in exchange with AMP.
RESULTS
PXN Protein Is Functional When Expressed in Yeast
In this study we used several deletion mutants fromS. cerevisiae to dissect the physiological transport func-tion of PXN. Our approach was to express PXN in thecorresponding yeast mutant and analyze the suppres-sion of the respective yeast mutant phenotype. Toestablish the feasibility of this approach, we firstexpressed recombinant PXN and assessed its func-tionality by analyzing the NAD uptake rates in yeast.Therefore, we expressed PXN with a C-terminal Hisaffinity tag (His) in the S. cerevisiae wild-type strainFGY217 (Kota et al., 2007). The expression of PXN wasdriven by a Gal-inducible promoter 1 from S. cerevisiae(pGAL1) that led to sufficient amounts of recombinantprotein to analyze its transport activity. We extractedmembranes from yeast cells expressing PXN-His
(pMSU219) or transformed with the empty vector(pNL14) and separated the membrane proteins bysodium dodecyl-sulfate polyacrylamide gel electro-phoresis (Fig. 2A, left panel). Proper expression of PXN-His, which has a calculated molecular mass of 37.1 kD,was checked by immunoblot analysis with a His-tagantibody (Fig. 2A, right panel). Total yeast mem-branes containing recombinant PXN-His protein werereconstituted into lipid vesicles. The uptake of radio-actively labeled [a-32P]-NAD into these liposomes wasmeasured in the presence or absence of 10 mM NAD ascounter-exchange substrate. We used total membranefractions from yeast cells transformed with the emptyvector as controls, to estimate the background activityof yeast endogenous NAD carriers. NAD import intoliposomes reconstituted with yeast membranes fromthe control cells was below the detection limit of the
Figure 2. Functional expression of PXN in yeast. A, Gal-inducible ex-pression of PXN-His (37.1 kD) in FGY217 yeast cells. Left, Coomassie-stained sodium dodecyl-sulfate polyacrylamide gel electrophoresis gel;right, immunoblot analysis treated with His-tag antibody. Lane 1, Yeastmembrane proteins isolated from yeast cells containing pNL14 vector;lane 2, yeast membrane proteins from yeast cells expressing PXN-His(pMSU219); M, protein marker. B, Time-dependent uptake of radioac-tively labeled [a-32P]-NAD (0.2 mM) was measured into liposomesreconstituted with total yeast membranes in the absence (left) or in thepresence of PXN-His (right). The proteoliposomes were preloaded in-ternally with 10 mM NAD (black symbols) or in the absence of NAD ascounter-exchange substrate (white symbols). All graphs represent thearithmetic mean 6 SE of three technical replicates. C, PXN whenexpressed in yeast is targeted to peroxisomes. Confocal microscopicimages were taken from yeast cells coexpressing EYFP-PXN and theperoxisomal marker CFP-PTS1. Scale bar = 5 mm.
Plant Physiol. Vol. 171, 2016 2129
Peroxisomal NAD Carrier as NAD/AMP Exchanger
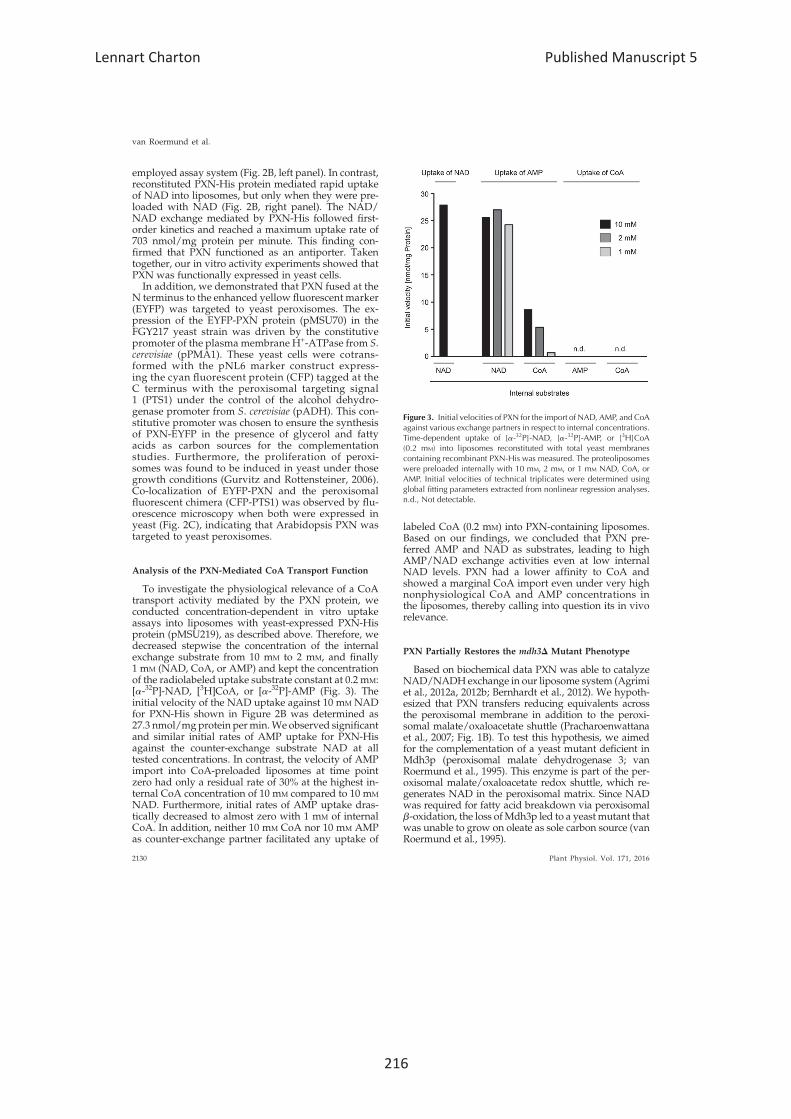
employed assay system (Fig. 2B, left panel). In contrast,reconstituted PXN-His protein mediated rapid uptakeof NAD into liposomes, but only when they were pre-loaded with NAD (Fig. 2B, right panel). The NAD/NAD exchange mediated by PXN-His followed first-order kinetics and reached a maximum uptake rate of703 nmol/mg protein per minute. This finding con-firmed that PXN functioned as an antiporter. Takentogether, our in vitro activity experiments showed thatPXN was functionally expressed in yeast cells.
In addition, we demonstrated that PXN fused at theN terminus to the enhanced yellow fluorescent marker(EYFP) was targeted to yeast peroxisomes. The ex-pression of the EYFP-PXN protein (pMSU70) in theFGY217 yeast strain was driven by the constitutivepromoter of the plasma membrane H+-ATPase from S.cerevisiae (pPMA1). These yeast cells were cotrans-formed with the pNL6 marker construct express-ing the cyan fluorescent protein (CFP) tagged at theC terminus with the peroxisomal targeting signal1 (PTS1) under the control of the alcohol dehydro-genase promoter from S. cerevisiae (pADH). This con-stitutive promoter was chosen to ensure the synthesisof PXN-EYFP in the presence of glycerol and fattyacids as carbon sources for the complementationstudies. Furthermore, the proliferation of peroxi-somes was found to be induced in yeast under thosegrowth conditions (Gurvitz and Rottensteiner, 2006).Co-localization of EYFP-PXN and the peroxisomalfluorescent chimera (CFP-PTS1) was observed by flu-orescence microscopy when both were expressed inyeast (Fig. 2C), indicating that Arabidopsis PXN wastargeted to yeast peroxisomes.
Analysis of the PXN-Mediated CoA Transport Function
To investigate the physiological relevance of a CoAtransport activity mediated by the PXN protein, weconducted concentration-dependent in vitro uptakeassays into liposomes with yeast-expressed PXN-Hisprotein (pMSU219), as described above. Therefore, wedecreased stepwise the concentration of the internalexchange substrate from 10 mM to 2 mM, and finally1 mM (NAD, CoA, or AMP) and kept the concentrationof the radiolabeled uptake substrate constant at 0.2 mM:[a-32P]-NAD, [3H]CoA, or [a-32P]-AMP (Fig. 3). Theinitial velocity of the NAD uptake against 10 mM NADfor PXN-His shown in Figure 2B was determined as27.3 nmol/mg protein permin.We observed significantand similar initial rates of AMP uptake for PXN-Hisagainst the counter-exchange substrate NAD at alltested concentrations. In contrast, the velocity of AMPimport into CoA-preloaded liposomes at time pointzero had only a residual rate of 30% at the highest in-ternal CoA concentration of 10 mM compared to 10 mM
NAD. Furthermore, initial rates of AMP uptake dras-tically decreased to almost zero with 1 mM of internalCoA. In addition, neither 10 mM CoA nor 10 mM AMPas counter-exchange partner facilitated any uptake of
labeled CoA (0.2 mM) into PXN-containing liposomes.Based on our findings, we concluded that PXN pre-ferred AMP and NAD as substrates, leading to highAMP/NAD exchange activities even at low internalNAD levels. PXN had a lower affinity to CoA andshowed a marginal CoA import even under very highnonphysiological CoA and AMP concentrations inthe liposomes, thereby calling into question its in vivorelevance.
PXN Partially Restores the mdh3D Mutant Phenotype
Based on biochemical data PXN was able to catalyzeNAD/NADHexchange in our liposome system (Agrimiet al., 2012a, 2012b; Bernhardt et al., 2012). We hypoth-esized that PXN transfers reducing equivalents acrossthe peroxisomal membrane in addition to the peroxi-somal malate/oxaloacetate shuttle (Pracharoenwattanaet al., 2007; Fig. 1B). To test this hypothesis, we aimedfor the complementation of a yeast mutant deficient inMdh3p (peroxisomal malate dehydrogenase 3; vanRoermund et al., 1995). This enzyme is part of the per-oxisomal malate/oxaloacetate redox shuttle, which re-generates NAD in the peroxisomal matrix. Since NADwas required for fatty acid breakdown via peroxisomalb-oxidation, the loss ofMdh3p led to a yeastmutant thatwas unable to grow on oleate as sole carbon source (vanRoermund et al., 1995).
Figure 3. Initial velocities of PXN for the import of NAD, AMP, and CoAagainst various exchange partners in respect to internal concentrations.Time-dependent uptake of [a-32P]-NAD, [a-32P]-AMP, or [3H]CoA(0.2 mM) into liposomes reconstituted with total yeast membranescontaining recombinant PXN-His was measured. The proteoliposomeswere preloaded internally with 10 mM, 2 mM, or 1 mM NAD, CoA, orAMP. Initial velocities of technical triplicates were determined usingglobal fitting parameters extracted from nonlinear regression analyses.n.d., Not detectable.
2130 Plant Physiol. Vol. 171, 2016
van Roermund et al.
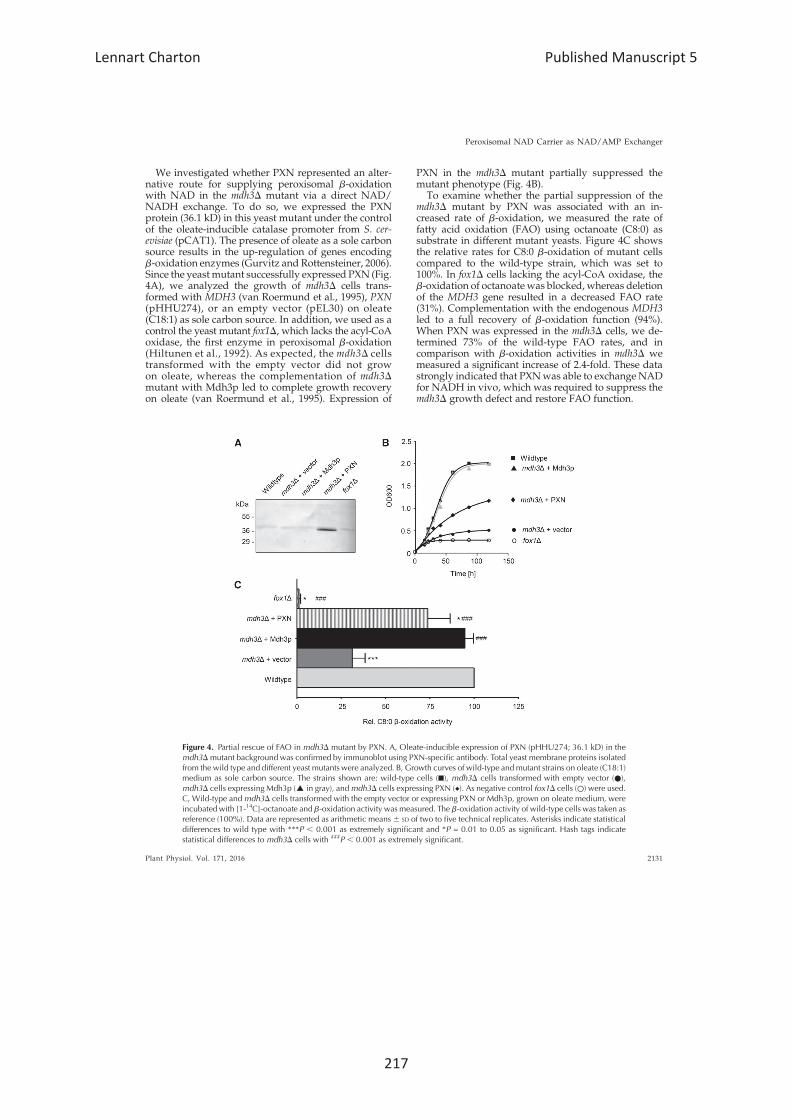
We investigated whether PXN represented an alter-native route for supplying peroxisomal b-oxidationwith NAD in the mdh3D mutant via a direct NAD/NADH exchange. To do so, we expressed the PXNprotein (36.1 kD) in this yeast mutant under the controlof the oleate-inducible catalase promoter from S. cer-evisiae (pCAT1). The presence of oleate as a sole carbonsource results in the up-regulation of genes encodingb-oxidation enzymes (Gurvitz and Rottensteiner, 2006).Since the yeastmutant successfully expressed PXN (Fig.4A), we analyzed the growth of mdh3D cells trans-formed with MDH3 (van Roermund et al., 1995), PXN(pHHU274), or an empty vector (pEL30) on oleate(C18:1) as sole carbon source. In addition, we used as acontrol the yeast mutant fox1D, which lacks the acyl-CoAoxidase, the first enzyme in peroxisomal b-oxidation(Hiltunen et al., 1992). As expected, the mdh3D cellstransformed with the empty vector did not growon oleate, whereas the complementation of mdh3Dmutant with Mdh3p led to complete growth recoveryon oleate (van Roermund et al., 1995). Expression of
PXN in the mdh3D mutant partially suppressed themutant phenotype (Fig. 4B).
To examine whether the partial suppression of themdh3D mutant by PXN was associated with an in-creased rate of b-oxidation, we measured the rate offatty acid oxidation (FAO) using octanoate (C8:0) assubstrate in different mutant yeasts. Figure 4C showsthe relative rates for C8:0 b-oxidation of mutant cellscompared to the wild-type strain, which was set to100%. In fox1D cells lacking the acyl-CoA oxidase, theb-oxidation of octanoate was blocked, whereas deletionof the MDH3 gene resulted in a decreased FAO rate(31%). Complementation with the endogenous MDH3led to a full recovery of b-oxidation function (94%).When PXN was expressed in the mdh3D cells, we de-termined 73% of the wild-type FAO rates, and incomparison with b-oxidation activities in mdh3D wemeasured a significant increase of 2.4-fold. These datastrongly indicated that PXNwas able to exchange NADfor NADH in vivo, which was required to suppress themdh3D growth defect and restore FAO function.
Figure 4. Partial rescue of FAO in mdh3D mutant by PXN. A, Oleate-inducible expression of PXN (pHHU274; 36.1 kD) in themdh3Dmutant background was confirmed by immunoblot using PXN-specific antibody. Total yeast membrane proteins isolatedfrom the wild type and different yeast mutants were analyzed. B, Growth curves of wild-type andmutant strains on oleate (C18:1)medium as sole carbon source. The strains shown are: wild-type cells (▪), mdh3D cells transformed with empty vector (●),mdh3D cells expressing Mdh3p (▴in gray), andmdh3D cells expressing PXN (◆). As negative control fox1D cells (○) were used.C, Wild-type andmdh3D cells transformed with the empty vector or expressing PXN or Mdh3p, grown on oleate medium, wereincubatedwith [1-14C]-octanoate and b-oxidation activity was measured. The b-oxidation activity of wild-type cells was taken asreference (100%). Data are represented as arithmetic means6 SD of two to five technical replicates. Asterisks indicate statisticaldifferences to wild type with ***P , 0.001 as extremely significant and *P = 0.01 to 0.05 as significant. Hash tags indicatestatistical differences to mdh3D cells with ###P , 0.001 as extremely significant.
Plant Physiol. Vol. 171, 2016 2131
Peroxisomal NAD Carrier as NAD/AMP Exchanger
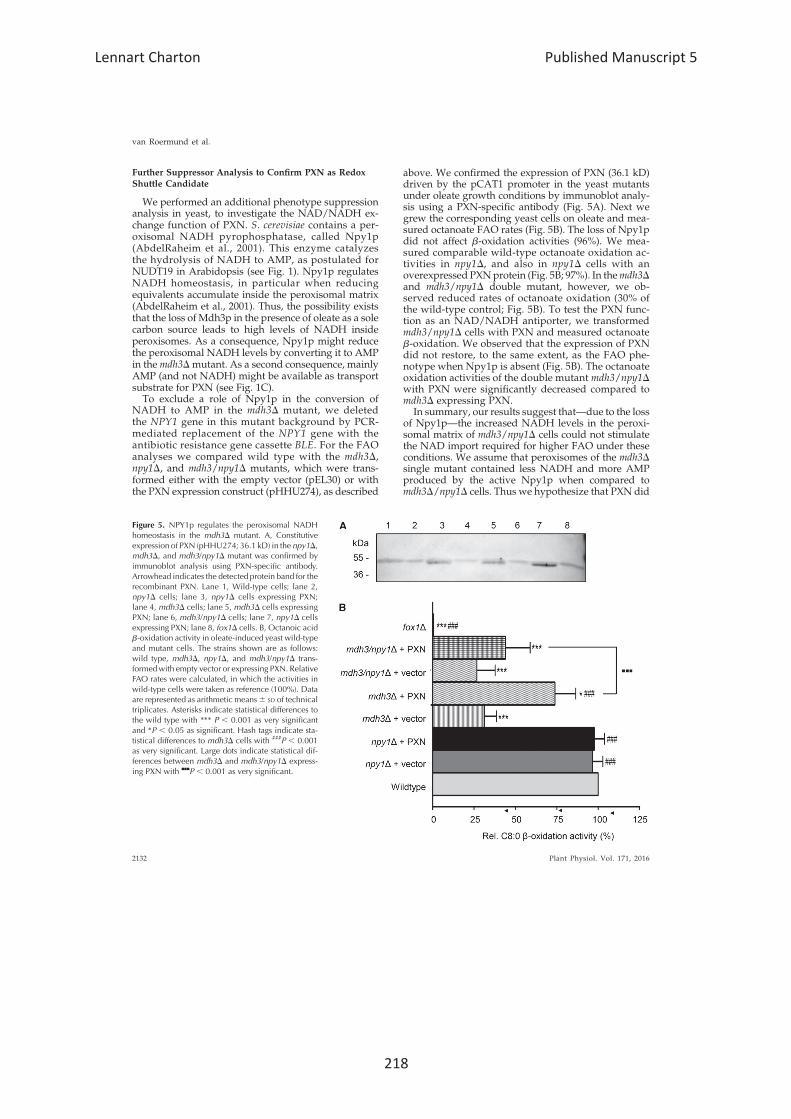
Further Suppressor Analysis to Confirm PXN as RedoxShuttle Candidate
We performed an additional phenotype suppressionanalysis in yeast, to investigate the NAD/NADH ex-change function of PXN. S. cerevisiae contains a per-oxisomal NADH pyrophosphatase, called Npy1p(AbdelRaheim et al., 2001). This enzyme catalyzesthe hydrolysis of NADH to AMP, as postulated forNUDT19 in Arabidopsis (see Fig. 1). Npy1p regulatesNADH homeostasis, in particular when reducingequivalents accumulate inside the peroxisomal matrix(AbdelRaheim et al., 2001). Thus, the possibility existsthat the loss of Mdh3p in the presence of oleate as a solecarbon source leads to high levels of NADH insideperoxisomes. As a consequence, Npy1p might reducethe peroxisomal NADH levels by converting it to AMPin the mdh3Dmutant. As a second consequence, mainlyAMP (and not NADH) might be available as transportsubstrate for PXN (see Fig. 1C).
To exclude a role of Npy1p in the conversion ofNADH to AMP in the mdh3D mutant, we deletedthe NPY1 gene in this mutant background by PCR-mediated replacement of the NPY1 gene with theantibiotic resistance gene cassette BLE. For the FAOanalyses we compared wild type with the mdh3D,npy1D, and mdh3/npy1D mutants, which were trans-formed either with the empty vector (pEL30) or withthe PXN expression construct (pHHU274), as described
above. We confirmed the expression of PXN (36.1 kD)driven by the pCAT1 promoter in the yeast mutantsunder oleate growth conditions by immunoblot analy-sis using a PXN-specific antibody (Fig. 5A). Next wegrew the corresponding yeast cells on oleate and mea-sured octanoate FAO rates (Fig. 5B). The loss of Npy1pdid not affect b-oxidation activities (96%). We mea-sured comparable wild-type octanoate oxidation ac-tivities in npy1D, and also in npy1D cells with anoverexpressed PXNprotein (Fig. 5B; 97%). In themdh3Dand mdh3/npy1D double mutant, however, we ob-served reduced rates of octanoate oxidation (30% ofthe wild-type control; Fig. 5B). To test the PXN func-tion as an NAD/NADH antiporter, we transformedmdh3/npy1D cells with PXN and measured octanoateb-oxidation. We observed that the expression of PXNdid not restore, to the same extent, as the FAO phe-notype when Npy1p is absent (Fig. 5B). The octanoateoxidation activities of the double mutant mdh3/npy1Dwith PXN were significantly decreased compared tomdh3D expressing PXN.
In summary, our results suggest that—due to the lossof Npy1p—the increased NADH levels in the peroxi-somal matrix of mdh3/npy1D cells could not stimulatethe NAD import required for higher FAO under theseconditions. We assume that peroxisomes of the mdh3Dsingle mutant contained less NADH and more AMPproduced by the active Npy1p when compared tomdh3D/npy1D cells. Thus we hypothesize that PXN did
Figure 5. NPY1p regulates the peroxisomal NADHhomeostasis in the mdh3D mutant. A, Constitutiveexpression of PXN (pHHU274; 36.1 kD) in the npy1D,mdh3D, and mdh3/npy1D mutant was confirmed byimmunoblot analysis using PXN-specific antibody.Arrowhead indicates the detected protein band for therecombinant PXN. Lane 1, Wild-type cells; lane 2,npy1D cells; lane 3, npy1D cells expressing PXN;lane 4, mdh3D cells; lane 5, mdh3D cells expressingPXN; lane 6, mdh3/npy1D cells; lane 7, npy1D cellsexpressing PXN; lane 8, fox1D cells. B, Octanoic acidb-oxidation activity in oleate-induced yeast wild-typeand mutant cells. The strains shown are as follows:wild type, mdh3D, npy1D, and mdh3/npy1D trans-formedwith empty vector or expressing PXN. RelativeFAO rates were calculated, in which the activities inwild-type cells were taken as reference (100%). Dataare represented as arithmetic means6 SD of technicaltriplicates. Asterisks indicate statistical differences tothe wild type with *** P , 0.001 as very significantand *P , 0.05 as significant. Hash tags indicate sta-tistical differences to mdh3D cells with ###P , 0.001as very significant. Large dots indicate statistical dif-ferences between mdh3D and mdh3/npy1D express-ing PXN with ▪▪▪P , 0.001 as very significant.
2132 Plant Physiol. Vol. 171, 2016
van Roermund et al.
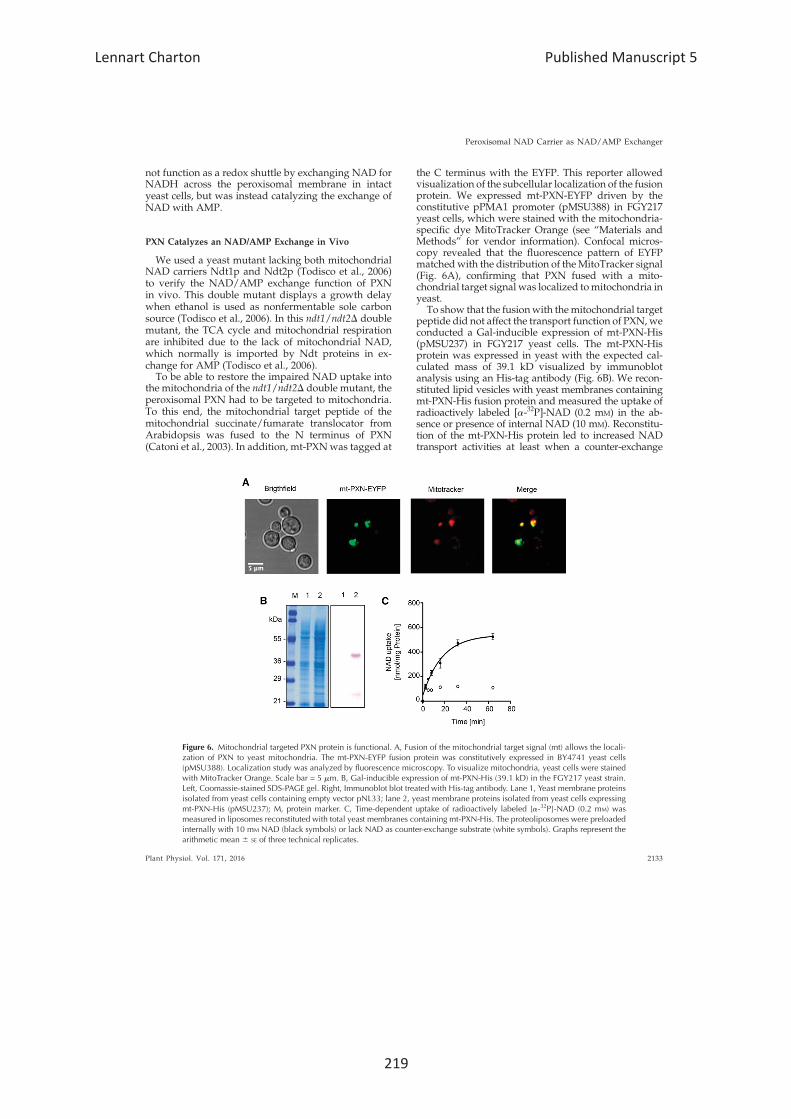
not function as a redox shuttle by exchanging NAD forNADH across the peroxisomal membrane in intactyeast cells, but was instead catalyzing the exchange ofNAD with AMP.
PXN Catalyzes an NAD/AMP Exchange in Vivo
We used a yeast mutant lacking both mitochondrialNAD carriers Ndt1p and Ndt2p (Todisco et al., 2006)to verify the NAD/AMP exchange function of PXNin vivo. This double mutant displays a growth delaywhen ethanol is used as nonfermentable sole carbonsource (Todisco et al., 2006). In this ndt1/ndt2D doublemutant, the TCA cycle and mitochondrial respirationare inhibited due to the lack of mitochondrial NAD,which normally is imported by Ndt proteins in ex-change for AMP (Todisco et al., 2006).To be able to restore the impaired NAD uptake into
the mitochondria of the ndt1/ndt2D double mutant, theperoxisomal PXN had to be targeted to mitochondria.To this end, the mitochondrial target peptide of themitochondrial succinate/fumarate translocator fromArabidopsis was fused to the N terminus of PXN(Catoni et al., 2003). In addition, mt-PXNwas tagged at
the C terminus with the EYFP. This reporter allowedvisualization of the subcellular localization of the fusionprotein. We expressed mt-PXN-EYFP driven by theconstitutive pPMA1 promoter (pMSU388) in FGY217yeast cells, which were stained with the mitochondria-specific dye MitoTracker Orange (see “Materials andMethods” for vendor information). Confocal micros-copy revealed that the fluorescence pattern of EYFPmatchedwith the distribution of theMitoTracker signal(Fig. 6A), confirming that PXN fused with a mito-chondrial target signal was localized tomitochondria inyeast.
To show that the fusionwith themitochondrial targetpeptide did not affect the transport function of PXN, weconducted a Gal-inducible expression of mt-PXN-His(pMSU237) in FGY217 yeast cells. The mt-PXN-Hisprotein was expressed in yeast with the expected cal-culated mass of 39.1 kD visualized by immunoblotanalysis using an His-tag antibody (Fig. 6B). We recon-stituted lipid vesicles with yeast membranes containingmt-PXN-His fusion protein and measured the uptake ofradioactively labeled [a-32P]-NAD (0.2 mM) in the ab-sence or presence of internal NAD (10 mM). Reconstitu-tion of the mt-PXN-His protein led to increased NADtransport activities at least when a counter-exchange
Figure 6. Mitochondrial targeted PXN protein is functional. A, Fusion of the mitochondrial target signal (mt) allows the locali-zation of PXN to yeast mitochondria. The mt-PXN-EYFP fusion protein was constitutively expressed in BY4741 yeast cells(pMSU388). Localization study was analyzed by fluorescence microscopy. To visualize mitochondria, yeast cells were stainedwith MitoTracker Orange. Scale bar = 5 mm. B, Gal-inducible expression of mt-PXN-His (39.1 kD) in the FGY217 yeast strain.Left, Coomassie-stained SDS-PAGE gel. Right, Immunoblot blot treated with His-tag antibody. Lane 1, Yeast membrane proteinsisolated from yeast cells containing empty vector pNL33; lane 2, yeast membrane proteins isolated from yeast cells expressingmt-PXN-His (pMSU237); M, protein marker. C, Time-dependent uptake of radioactively labeled [a-32P]-NAD (0.2 mM) wasmeasured in liposomes reconstituted with total yeast membranes containing mt-PXN-His. The proteoliposomes were preloadedinternally with 10 mM NAD (black symbols) or lack NAD as counter-exchange substrate (white symbols). Graphs represent thearithmetic mean 6 SE of three technical replicates.
Plant Physiol. Vol. 171, 2016 2133
Peroxisomal NAD Carrier as NAD/AMP Exchanger
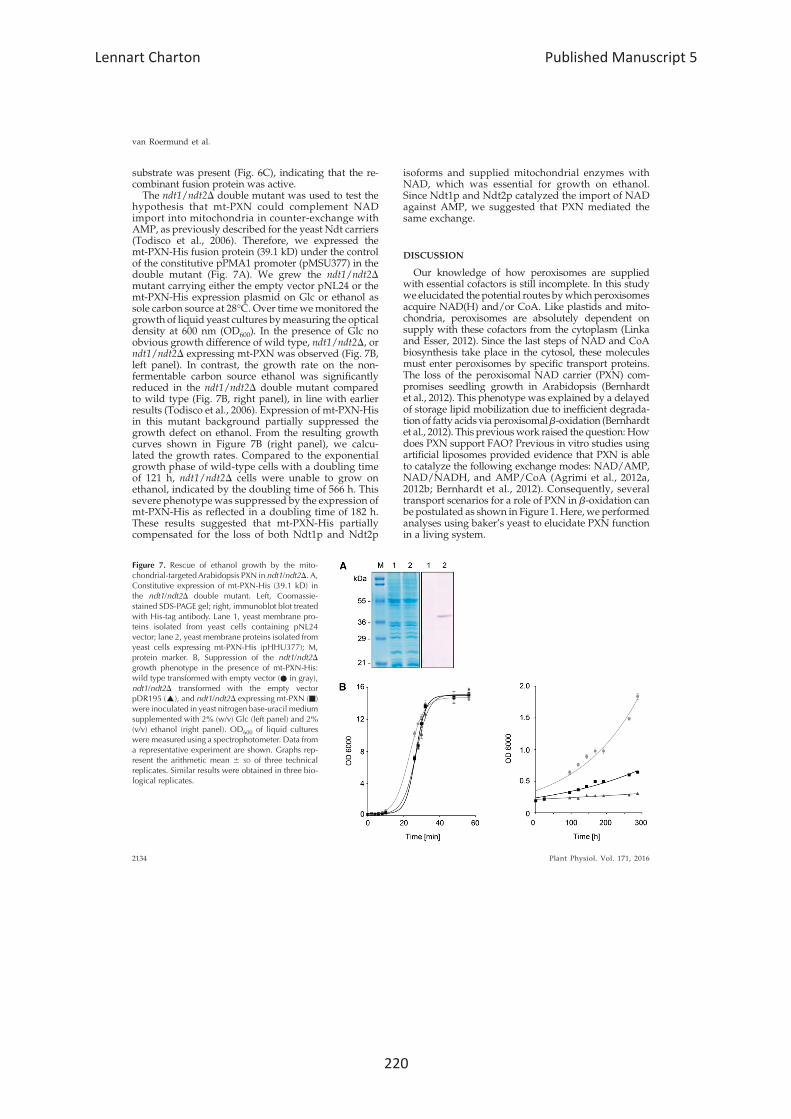
substrate was present (Fig. 6C), indicating that the re-combinant fusion protein was active.
The ndt1/ndt2D double mutant was used to test thehypothesis that mt-PXN could complement NADimport into mitochondria in counter-exchange withAMP, as previously described for the yeast Ndt carriers(Todisco et al., 2006). Therefore, we expressed themt-PXN-His fusion protein (39.1 kD) under the controlof the constitutive pPMA1 promoter (pMSU377) in thedouble mutant (Fig. 7A). We grew the ndt1/ndt2Dmutant carrying either the empty vector pNL24 or themt-PXN-His expression plasmid on Glc or ethanol assole carbon source at 28°C. Over timewemonitored thegrowth of liquid yeast cultures bymeasuring the opticaldensity at 600 nm (OD600). In the presence of Glc noobvious growth difference of wild type, ndt1/ndt2D, orndt1/ndt2D expressing mt-PXN was observed (Fig. 7B,left panel). In contrast, the growth rate on the non-fermentable carbon source ethanol was significantlyreduced in the ndt1/ndt2D double mutant comparedto wild type (Fig. 7B, right panel), in line with earlierresults (Todisco et al., 2006). Expression of mt-PXN-Hisin this mutant background partially suppressed thegrowth defect on ethanol. From the resulting growthcurves shown in Figure 7B (right panel), we calcu-lated the growth rates. Compared to the exponentialgrowth phase of wild-type cells with a doubling timeof 121 h, ndt1/ndt2D cells were unable to grow onethanol, indicated by the doubling time of 566 h. Thissevere phenotype was suppressed by the expression ofmt-PXN-His as reflected in a doubling time of 182 h.These results suggested that mt-PXN-His partiallycompensated for the loss of both Ndt1p and Ndt2p
isoforms and supplied mitochondrial enzymes withNAD, which was essential for growth on ethanol.Since Ndt1p and Ndt2p catalyzed the import of NADagainst AMP, we suggested that PXN mediated thesame exchange.
DISCUSSION
Our knowledge of how peroxisomes are suppliedwith essential cofactors is still incomplete. In this studywe elucidated the potential routes bywhich peroxisomesacquire NAD(H) and/or CoA. Like plastids and mito-chondria, peroxisomes are absolutely dependent onsupply with these cofactors from the cytoplasm (Linkaand Esser, 2012). Since the last steps of NAD and CoAbiosynthesis take place in the cytosol, these moleculesmust enter peroxisomes by specific transport proteins.The loss of the peroxisomal NAD carrier (PXN) com-promises seedling growth in Arabidopsis (Bernhardtet al., 2012). This phenotype was explained by a delayedof storage lipid mobilization due to inefficient degrada-tion of fatty acids via peroxisomalb-oxidation (Bernhardtet al., 2012). This previouswork raised the question: Howdoes PXN support FAO? Previous in vitro studies usingartificial liposomes provided evidence that PXN is ableto catalyze the following exchange modes: NAD/AMP,NAD/NADH, and AMP/CoA (Agrimi et al., 2012a,2012b; Bernhardt et al., 2012). Consequently, severaltransport scenarios for a role of PXN in b-oxidation canbe postulated as shown in Figure 1. Here, we performedanalyses using baker’s yeast to elucidate PXN functionin a living system.
Figure 7. Rescue of ethanol growth by the mito-chondrial-targeted Arabidopsis PXN in ndt1/ndt2D. A,Constitutive expression of mt-PXN-His (39.1 kD) inthe ndt1/ndt2D double mutant. Left, Coomassie-stained SDS-PAGE gel; right, immunoblot blot treatedwith His-tag antibody. Lane 1, yeast membrane pro-teins isolated from yeast cells containing pNL24vector; lane 2, yeast membrane proteins isolated fromyeast cells expressing mt-PXN-His (pHHU377); M,protein marker. B, Suppression of the ndt1/ndt2Dgrowth phenotype in the presence of mt-PXN-His:wild type transformed with empty vector (● in gray),ndt1/ndt2D transformed with the empty vectorpDR195 (▴), and ndt1/ndt2D expressing mt-PXN (▪)were inoculated in yeast nitrogen base-uracil mediumsupplemented with 2% (w/v) Glc (left panel) and 2%(v/v) ethanol (right panel). OD600 of liquid cultureswere measured using a spectrophotometer. Data froma representative experiment are shown. Graphs rep-resent the arithmetic mean 6 SD of three technicalreplicates. Similar results were obtained in three bio-logical replicates.
2134 Plant Physiol. Vol. 171, 2016
van Roermund et al.
First, we confirmed that PXN can be properlyexpressed in S. cerevisiae and that the protein is bothfunctional and targeted to the correct organelle, theperoxisome (Fig. 2). The transport activity of PXN wasanalyzed in a reconstituted system. Measurement ofthe uptake of labeled substrate into lipid vesiclesagainst a preloaded counter-exchange substrate led tohigh NAD exchange activities against NAD (Fig. 2B,right panel).In the same experimental setup, we tested CoA as a
putative substrate for PXN and compared the initialvelocities of different CoA exchange combinations tothe AMP/NAD exchange (Fig. 3). In contrast to thehigh uptake rates and high affinity for the AMP im-port against NAD, we detected only marginal CoAtransport activities of PXN when CoA was offered athigher concentrations, indicating a lower affinity ofPXN to this substrate. In context to the physiologicalsituation, the free CoA levels are rather low. In animaltissue, the cytosolic and peroxisomal CoA concen-trations are estimated between 0.02 and 0.14 mM andapproximately 0.7 mM, respectively (Leonardi et al.,2005). Under our experimental conditions, we do notexhibit a significant CoA exchange with 10 mM ofCoA or AMP. Therefore, a physiological role of PXNin supplying peroxisomes with CoA in plants is un-likely.To address the in vivo transport function of PXN, we
used different S. cerevisiae mutant strains. First, we an-alyzed a yeast strain deficient in the redox shuttle dueto the deletion of the peroxisomal malate dehydro-genase. This mutant is unable to grow on fatty acids,because the NAD required for b-oxidation cannot beregenerated via the malate/oxaloacetate shuttle (vanRoermund et al., 1995). Our complementation assayrevealed that the growth on oleate and the activityof octanoate oxidation were partially restored in thepresence of PXN (Fig. 4), indicating that PXN mightcatalyze a NAD/NADH exchange. When the per-oxisomal enzyme Npy1p, which degrades NADHto AMP (thereby preventing NADH accumulation;AbdelRaheim et al., 2001, was deleted in the mdh3Dmutant, PXN was unable to suppress the b-oxidationphenotype of the corresponding double mutant (Fig.5). From this result, we conclude that PXN substitutesthe loss of MDH3 via the import of cytosolic NAD inexchange with peroxisomal AMP, the latter beinggenerated by Npy1-linked NADH degradation. ThisPXN-catalyzed transport mode allows b-oxidationwith NAD even when the redox shuttle is compro-mised. We confirmed this hypothesis with a secondindependent yeast mutant. We artificially targetedPXN to yeast mitochondria (Fig. 5) and demonstratedthat PXN was able to replace the endogenous NADcarriers Ndt1p and Ndt2p (Fig. 6). The successfulsuppression of ndt1/ndt2D mutant phenotype withPXN indicated that this carrier catalyzes the NAD/AMP exchange under in vivo conditions.Our work provides strong evidence that the main
function of PXN is to supply peroxisomeswith NAD. In
other eukaryotic organisms, an analogous peroxisomalNAD import system has not yet been identified (Visseret al., 2007; Linka and Theodoulou, 2013). However, theloss of the MDH3 gene in S. cerevisiae did not fullyabolish FAO activity. Indeed, in the mdh3D mutant wedetected significant residual FAO activity that amountsto approximately 30% of wild type (Fig. 4). Thus, weassume that the impaired redox shuttle across the per-oxisomal membrane is partially compensated by analternative redox shuttle or/and endogenous NADcarriers of yeast peroxisomes. The abundance of thislast protein is lower than the constitutively expressedPXN in the yeast mutant background. The higher im-port activity of the recombinant PXN protein led to asignificant restoration of the mutant phenotype (Fig. 4).One prime candidate for mediating the NAD importinto yeast peroxisomes is the peroxisomal ATP carrierAnt1p (Palmieri et al., 2001; van Roermund et al., 2001),which is the closest relative of PXN in yeast. Uptakestudies using recombinant protein confined the sub-strate specificity of Ant1p to ATP, ADP, and AMP(Tumaney et al., 2004). However, only (desoxy) nucle-otides were tested in this study (Palmieri et al., 2001).Thus, we investigated whether cell-free expressedAnt1p has a larger substrate spectrum (SupplementalFig. S1). Based on our analysis, Ant1p is unable totransport NAD across the liposomal membrane, im-plying that other putative carrier proteins are involvedin the uptake of NAD into yeast peroxisomes. Furtheryeast candidates for the peroxisomal NAD transportare the two mitochondrial Ndt proteins (Todisco et al.,2006). These carriers are able to specifically importNAD andmight be dual-targeted to yeast peroxisomes,since several mitochondrial proteins have been alsofound in peroxisomes (Theodoulou et al., 2013; Astet al., 2013; Carrie et al., 2009; Yogev and Pines, 2011).Ndt1p has been demonstrated by GFP fusion to be lo-cated to mitochondria (Todisco et al., 2006), whereasthe mitochondrial localization of Ndt2p has not beenexperimentally validated. Alternative routes for sup-plying yeast peroxisomes with NAD are the glycerol3-P shuttle or via vesicular traffic from the endoplasmicreticulum, but up to now there is no evidence for thisroute (Hoepfner et al., 2005).
In this work we showed that PXN did not mediatea CoA transport or NAD/NADH exchange underphysiologically relevant conditions. Consequently, ad-ditional transport systems in the peroxisomal mem-brane must exist to mediate CoA transport or the redoxshuttle in plants. In humans, a peroxisomal CoA carrierhas been identified that belongs to the mitochondrialcarrier family (MCF;Agrimi et al., 2012a), as is the case forPXN. Recently, two MCF transport proteins have beenidentified as mitochondrial CoA carriers in Arabidopsis(Zallot et al., 2013). Thus, one of the 58 MCF membersencoded by the Arabidopsis genome might providethe peroxisomal b-oxidation with CoA (Haferkampand Schmitz-Esser, 2012). An independent uptakeroute for this cofactor might be also the peroxisomalfatty acid transporter, called Comatose (also known as
Plant Physiol. Vol. 171, 2016 2135
Peroxisomal NAD Carrier as NAD/AMP Exchanger
PXA1, PED3, ACN2, and AtABCD1 (Hu et al., 2012)).It has been suggested that this membrane protein hasan additional intrinsic enzymatic function. During theimport of activated fatty acids into plant peroxisomes,the thioesterase activity of Comatose releases the CoAmoiety into the cytosol or in the peroxisomal lumen. Inthe latter case, the CoA release results in a net CoAuptake into peroxisomes (De Marcos Lousa et al.,2013).
A peroxisomal pore-forming channel (porin) hasbeen proposed to mediate the exchange of malate andoxaloacetate, which acts as a redox shuttle that connectsthe cytosolic and peroxisomal NAD/NADH pools(Linka and Theodoulou, 2013). Such a porin has beencharacterized by electrophysiological experiments us-ing spinach leaf peroxisomes and castor bean glyox-ysomes (Reumann et al., 1995, 1996, 1997), but theidentity of the corresponding proteins has remainedelusive. The Arabidopsis ortholog of peroxisomalPxmp2, which has been characterized as a channel-forming protein in mammals (Rokka et al., 2009),might represent a candidate protein for linking theperoxisomal and cytosolic pools of NAD(H) in plants(Linka and Theodoulou, 2013). A major challenge forthe future will be to identify the genes responsible forthe transport processes mentioned above, which arerequired to execute the great diversity of peroxisomalfunctions in plants.
CONCLUSION
We showed that PXN acts as a NAD/AMP trans-porter in vivo while other postulated transport func-tions for PXN could be excluded in physiologicallyrelevant conditions. Thus, PXN imports cytosolic NADinto plant peroxisomes. The uptake of NAD by PXNoccurs in a strict counter-exchange with peroxisomalAMP. Our yeast complementation studies revealed thatthe NAD transport into yeast peroxisomes is linked toa peroxisomal NADH pyrophosphatase. This enzymemaintains the NADH homeostasis by degrading NADHand thus preventing the accumulation of NADH, forexample, during high flux of FAO. In Arabidopsis,NUDT19 might be responsible for hydrolysis of NADHto AMP. The resulting AMP might be used by PXN as acounter-exchange substrate for the NAD import. Theexported AMP can be fed into the salvage pathway tosynthesize NAD in the cytosol. Future studies are re-quired to investigate whether the interplay betweenPXN and NUDT19 in Arabidopsis plays a role in regu-lating the NAD/NADH redox state as an ancillary sys-tem to the malate/oxaloacetate shuttle.
MATERIALS AND METHODS
Materials
Chemicals were purchased from Sigma-Aldrich (www.sigmaaldrich.com).Reagents and enzymes for recombinant DNA techniques were obtained from
New England Biolabs (www.neb.com), Qiagen (www.qiagen.com), Thermo-Fischer Scientific (www.thermofisher.com), and Promega (www.promega.com). Anion-exchange resin was purchased from Bio-Rad Laboratories (www.bio-rad.com). Radiochemical [a-32P]-AMP, [a-32P]-NAD, and [3H]CoA wereobtained from Hartmann Analytic (www.hartmann-analytic.de) and PerkinElmer (www.perkinelmer.de).
Cloning Procedures
In silico DNA sequences for cloning were retrieved from the Aramemnondatabase (aramemnon.uni-koeln.de) and the Saccharomyces Genome data-base (www.yeastgenome.org). Cloning was performed according to stan-dard molecular techniques (Sambrook and Russell, 2001). Sequences wereverified by DNA sequencing (Macrogen; dna.macrogen.com). Primers weresynthesized by Sigma-Aldrich. The oligonucleotide sequences used in thisstudy are listed in Supplemental Table S1. The coding DNA sequence (CDS)of PXN (At2g39970) was amplified via PCR using the cDNA clone pda.00682provided by the Riken BioResource Center (www.en.brc.riken.jp) as atemplate.
For the in vitro uptake studies, the peroxisomalNADcarrier, PXN,was fusedat the C terminuswith aHis-tag under the control of theGal-inducible promoterpGAL1. The pYES2 vector (ThermoFischer Scientific) was chosen, in which alinker sequence (NL230/NL231) encoding for 6His residueswas introduced viaBamHI andXbaI, yielding pNL14. The gene-specific primers NL33 (HindIII) andNL34 (BamHI) were used to clone the PXN CDS into the pNL14 expressionvector, resulting in pMSU219.
To generate the constructs for the peroxisomal localization studies in yeast,PXN CDS was amplified using the primers NL7 (XhoI) and NL8 (BamHI). Theresulting PCR product was cloned into pDR195 (Rentsch et al., 1995). Theprimers NL9 and NL10 (XhoI) were used to clone EYFP CDS via XhoI intopDR195. The insertion of both DNA fragments led to pMSU70 expressingEYFP-PXN via the constitutive pMA1 promoter. The clone (a peroxisomalfluorescence marker protein, CFP-PTS1) and the sequence of the Ser-Lys-Leumotif were fused to the CFP sequence via the primers NL254/NL255. The CFP-PTS1 sequence was then inserted via HindIII into the expression vector pACTII(Clontech Laboratories; www.clontech.com) carrying the constitutive pADHpromoter, yielding the pNL6 construct.
For the complementation of the mdh3D and mdh3/nyp1D mutants, the cellswere transformed with the yeast expression vector pEL30 containing the PXNcoding sequence. The primers NL631 and NL632 were used to clone PXN CDSinto pEL30 via BamHI and HindIII. The expression of PXN was under thecontrol of the oleate-inducible catalase A promoter (pCTA1; Elgersma et al.,1993).
To complement the ndt1/ndt2Dmutant with PXN, the transporter had to betargeted to yeast mitochondria. Therefore, the target sequence from the mito-chondrial succinate/fumarate carrier from Arabidopsis (Arabidopsis thaliana;At5g01340) was fused to the N terminus of PXN. To do so, the mitochondrialtarget peptide (mt) was amplified from Arabidopsis cDNA using the primer(P75/P76) and introduced via HindIII and BamHI into pYES2 (ThermoFischerScientific). The inducible pGAL1 promoter was exchangedwith the constitutivepPMA1 promoter frompDR195 (Rentsch et al., 1995). The EYFPCDS (amplifiedbyNL350/NL351) was introduced via BamHI andXbaI into pNL24. Finally, thePXN CDS (amplified by NL335/NL34) was cloned in frame with the mt andEYFP sequence via BamHI, resulting pMSU388.
To investigate whether the mt-PXN fusion protein is functionally expressedin yeast, themitochondrial target peptidewas amplified as described above andintroduced viaHindIII and BamHI into pNL14, leading to pNL33. The PXNCDSwas amplified by NL335/NL34 and inserted into pNL33 via BamHI. Theresulted pMSU237 construct was used for the Gal-inducible expression ofmt-PXN-His fusion protein in yeast, which was functionally analyzed byin vitro uptake studies.
The mt-PXN-His expressing construct was cloned for rescuing the ndt1/ndt2D yeast mutant phenotype. Therefore, the PXN CDS was amplified byNL335/NL34 and inserted into the frame with a mitochondrial target sequenceof pNL24 via BamHI, leading to the construct pMSU377. The synthesis ofmt-PXN-His was driven by the constitutive pPMA1 promoter.
Yeast Strains and Culture Conditions
The Saccharomyces cerevisiae strain FGY217 (MATa, ura3-52, lys2D201,pep4D; Kota et al., 2007) was used for PXN uptake studies and subcellular lo-calization analyses of EYFP-PXN and mt-PXN-EYFP.
2136 Plant Physiol. Vol. 171, 2016
van Roermund et al.
For complementing the mdh3D and mdh3/npy1D mutant phenotype, theBJ1991 yeast cells (MATa, leu2, trp1, ura3-251, prb1-1122, pep4-3, gal2) were usedas a wild-type strain. The following derivatives of this strain, all impaired inb-oxidation, were used: fox1D and mdh3D (carrying a deletion of the acyl-CoAoxidase or peroxisomal malate dehydrogenase, respectively). These mutantswere constructed from BJ1991 as described by van Roermund et al. (1995). Themdh3/npy1D double mutant was made by replacing the wholeNPY1 CDS fromthe mdh3D:LEU mutant by the BLE gene conferring resistance to Zeocin. TheNPY1 deletion construct was made by PCR using the pUG66 plasmid(Gueldener et al., 2002) as a template and the CVR1 and CVR2 primers. BLE+transformants were selected for integration in the NPY1 gene by PCR analysis.Yeast transformants were selected and grown in minimal medium containing6.7 g/L yeast nitrogen base without amino acids, supplemented with 5 g/L Glcand amino acids (20 mg/L) if required. For the induction of peroxisome pro-liferation, cells were shifted to YPO medium containing 5 g/L potassium Pbuffer pH 6.0, 3 g/L yeast extract, 5 g/L peptone, 1.2 g/L oleate, and 2 g/L
Tween-80. Prior to shifting to these media, the cells were grown in minimal5 g/L Glc medium for at least 24 h.
For the generation of the ndt1/ndt2Ddoublemutant, the ndt1D singlemutant(BY4741; MATa, his3D1, leu2D0, met15D0, ura3D0; YIL006w::kanMX4) wasobtained from the EUROSCARF collection (web.uni-frankfurt.de/fb15/mikro/euroscarf). The NDT2 gene in ndt1D single mutant was disrupted by PCR-mediated gene replacement using the LEU2 cassette, amplified from pUG73(Gueldener et al., 2002) with the primer set NL352/353. Transformed yeast cellsthat were able to grow in the absence of Leuwere selected and the presence of theLEU2 cassette was verified by PCR analysis.
Yeast cells were transformed according to standard protocols for lithiumacetate/PEG transformation (Gietz and Schiestl, 2007). Yeast cells were selectedon synthetic complete medium (SC; 0.67% [w/v] yeast nitrogen base supple-mented with appropriate amino acids and bases for auxotrophy and a carbonsource).
Heterologous Protein Expression in Yeast forUptake Studies
For the heterologous expression, the FGY217 strainwas transformedwith theempty vectors pNL14 and pNL33 or the expression constructs pMSU219 (PXN-His) and pMSU237 (mt-PXN-His). Fifty milliliters of SC-Ura liquid mediumsupplemented with 2% (w/v) Glc were inoculated with an overnight cultureand cultured to an OD600 of 0.4. The yeast cells were grown for 6 h aerobically at30°C. Control cultures with the empty vectors were processed in parallel.Harvest and enrichment of total yeast membranes without and with heterolo-gously expressed PXN proteins were achieved according to Linka et al. (2008).
Protein Biochemistry
Sodiumdodecyl sulfate polyacrylamide gel electrophoresis and immunoblotanalyses were conducted as described in Sambrook and Russell (2001). Forimmunodetection, either a-poly-His HPR-conjugated mouse IgG1 antibody(MACS Molecular; www.miltenyibiotec.com) or the PXN-specific antibody(Bernhardt et al., 2012) was used. No tagged PXN variants were visualizedusing anti-PXN-specific serum (Bernhardt et al., 2012) and AP-conjugated anti-rabbit IgG (Promega). PageRuler Prestained Protein Ladder (New EnglandBiolabs) was used to estimate molecular masses. Protein concentrations weredetermined using a bicinchoninic acid assay (ThermoFischer Scientific).
Reconstitution of Transport Activities into Liposomes
Yeastmembraneswere reconstituted into 3% (w/v) L-a-phosphatidylcholineby a freeze-thaw-sonication procedure for in vitro uptake studies, as describedin Linka et al. (2008). Proteoliposomes were either preloaded with 10 mM NAD;10 mM, 2 mM, or 1 mM AMP; 10 mM, 2 mM, or 1 mM CoA; or produced withoutpreloading (negative control). Counter-exchange substrate, which was not in-corporated into proteoliposomes, was removed by gel filtration on SephadexG-25M columns (GE Healthcare; www.gehealthcare.com).
Transport assays were started via adding 0.2 mM [a-32P]-AMP (6000 Ci/mmol), [a-32P]-NAD (800 Ci/mmol), or [3H]CoA (5 Ci/mmol). The uptakereaction was terminated via passing proteoliposomes over AG1-X8 Dowexanion-exchange columns (Merck Millipore; www.merckmillipore.com). Theincorporated radiolabeled compounds were analyzed by liquid scintillationcounting. Time-dependent uptake data were fitted using nonlinear regression
analysis based on one-phase exponential association using GraphPad Prism 5.0software (GraphPad; www.graphpad.com). The background activities in theabsence of PXN-His were subtracted. The initial velocity of uptakes were cal-culated using the equation slope ¼ ðPlateau2Y0Þ3 k, whereas Y0 was set to 0.The values for the Plateau and k were extracted from the nonlinear regressionanalyses using a global fit from three technical replicates.
Suppression Analysis of the mdh3D andmdh3/npy1D Mutant
PXN expression construct pHHU274 and empty pEL30 vector were trans-formed into the following strains: BJ1991 wild-type cells, mdh3D single mutant,npy1D single mutant, andmdh3/npy1D double mutant. Transformed yeast cellswere selected accordingly to the yeast strain genotype and pEL30 autotrophy.
b-Oxidation Activity Measurements
b-oxidation assays in intact yeast cells were performed as described previ-ously by van Roermund et al. (1995) and optimized for the pH and the amountof protein. Oleate-grown cells were washed in water and resuspended in 0.9%NaCl (OD = 0.5). Aliquots of 2 mL of cell suspension were used for b-oxidationmeasurements in 200 mL of 50 mM MES (pH 6.0) and 0.9% (w/v) NaCl sup-plemented with 10 mM [1-14C]-octanoate. Subsequently, [1-14C]-CO2 was trap-pedwith 2 MNaOH and used to quantify the rate of FAO. Results are presentedas percentage relative activity to the rate of oxidation of wild-type cells. In wild-type cells, the rates of octanoate oxidation is 7.846 1.09 nmol21 min21 OD cells21.
Suppression Analysis of the ndt1/ndt2D Double Mutant
Wild-type strain BY4741 and ndt1/ndt2D double mutant were transformedwith the empty vector pNL24 and pMSU377 expressing mt-PXN-His. Yeastcells were grown on SC-Ura supplemented with either 2% (w/v) Glc or 2%(v/v) ethanol, as described in Todisco et al. (2006).
Fluorescence Microscopy
For peroxisomal localization studies in yeast, FGY217 cells werecotransformed with pMSU70 and pNL6 expressing EYFP-PXN or peroxi-somal fluorescent chimera (CFP-PTS1), respectively. Both fluorescent pro-teinswere synthetizedunder the control of the constitutive pPMA1promoter.Yeast cells harboring both constructs were selected on SC agar medium with2% (w/v) Glc in the absence of uracil (pMSU70) and Leu (pNL6). The selectedyeast cells were grown overnight at 30°C in SC-Leu-Ura with 3% (w/v)glycerol, 0.1% (w/v) oleate, and 0.2% (w/v) Tween-80 to induce peroxisomeproliferation. The expression of the EYFP-PXN and CFP-PTS1 was analyzedwith a confocal laser scanning microscope model no. 510 Meta (Carl Zeisswww.zeiss.de). CFP fluorescence was excited at 405 nm; fluorescenceemission was detected with a 470- to 500-nm band-pass filter. EYFP fluo-rescence was excited at 514 nm, and the emission was recorded with a 530- to600-nm band-pass filter.
Targeting of mt-PXN to yeast mitochondria was validated by transformingFGY217 yeast cells with pMSU388 ensuring constitutive expression of themt-PXN-EYFP fusion protein via the pPMA1 promoter. Yeast cells carryingpMSU388were grown in liquid culture overnight in SC-Ura with 2% (w/v) Glc.Yeast cells were harvested by centrifugation for 5 min at 3000g, washed with25 mM HEPES-KOH (pH 7.3) and 10 mM MgCl2 and then stained with 50 mM
MitoTracker ORANGE CMTMRos (Life Technologies/Thermo Scientific) for10 min at room temperature. Residual MitoTracker dye was removed bywashing with wash buffer twice. Yeast cells were immobilized on poly-L-Lyscoated microscope slides for confocal microscopy. Analysis of yeast cells wasperformed with a confocal laser scanning microscope model no. 510 Meta (CarlZeiss). MitoTracker fluorescence was excited at 561 nm, fluorescence emissionwas detected with a 575- to 615-nm band-pass filter. EYFP fluorescence wasexcited at 514 nm and the emission was recorded with a 530- to 600-nm band-pass filter.
Accession Numbers
Sequence data from this article can be found in the GenBank/EMBL datalibraries under accession numbers NP_181526.1.
Plant Physiol. Vol. 171, 2016 2137
Peroxisomal NAD Carrier as NAD/AMP Exchanger
Supplemental Data
The following supplemental materials are available.
Supplemental Table S1. Primer used in this study; restriction sites (RS) areunderlined.
Supplemental Figure S1. Substrate specificity of the peroxisomal ATP car-rier Ant1p from S. cerevisiae.
ACKNOWLEDGMENTS
Authors thank Jeanine Schlebusch and Daniel Wrobel for assistance withobtaining yeast growth curves. For technical assistance, the authors acknowl-edge Kirsten Abel. We thank Dr. R. van der Bend from Saxion Hogeschool (LifeScience, Engineering, and Design) in Deventer for assistance in generating thenpy1D andmdh3/npy1D double mutants and grateful to Lodewijk IJlst for stim-ulating discussion.
Received April 2, 2016; accepted April 29, 2016; published May 2, 2016.
LITERATURE CITED
AbdelRaheim SR, Cartwright JL, Gasmi L, McLennan AG (2001) TheNADH diphosphatase encoded by the Saccharomyces cerevisiae NPY1nudix hydrolase gene is located in peroxisomes. Arch Biochem Biophys388: 18–24
Agrimi G, Brambilla L, Frascotti G, Pisano I, Porro D, Vai M, Palmieri L(2011) Deletion or overexpression of mitochondrial NAD+ carriers inSaccharomyces cerevisiae alters cellular NAD and ATP contents and af-fects mitochondrial metabolism and the rate of glycolysis. Appl EnvironMicrobiol 77: 2239–2246
Agrimi G, Russo A, Scarcia P, Palmieri F (2012a) The human geneSLC25A17 encodes a peroxisomal transporter of coenzyme A, FAD andNAD+. Biochem J 443: 241–247
Agrimi G, Russo A, Pierri CL, Palmieri F (2012b) The peroxisomal NAD+
carrier of Arabidopsis thaliana transports coenzyme A and its derivatives.J Bioenerg Biomembr 44: 333–340
Ast J, Stiebler AC, Freitag J, Bölker M (2013) Dual targeting of peroxi-somal proteins. Front Physiol 4: 297
Bai P, Nagy L, Fodor T, Liaudet L, Pacher P (2015) Poly(ADP-ribose)polymerases as modulators of mitochondrial activity. Trends Endo-crinol Metab 26: 75–83
Bernhardt K, Wilkinson S, Weber APM, Linka N (2012) A peroxisomalcarrier delivers NAD⁺ and contributes to optimal fatty acid degradationduring storage oil mobilization. Plant J 69: 1–13
Carrie C, Kühn K, Murcha MW, Duncan O, Small ID, O’Toole N, WhelanJ (2009) Approaches to defining dual-targeted proteins in Arabidopsis.Plant J 57: 1128–1139
Catoni E, Schwab R, Hilpert M, Desimone M, Schwacke R, Flügge UI,Schumacher K, Frommer WB (2003) Identification of an Arabidopsismitochondrial succinate-fumarate translocator. FEBS Lett 534: 87–92
Chang HC, Guarente L (2014) SIRT1 and other sirtuins in metabolism.Trends Endocrinol Metab 25: 138–145
De Marcos Lousa C, van Roermund CWT, Postis VLG, Dietrich D, KerrID, Wanders RJA, Baldwin SA, Baker A, Theodoulou FL (2013) In-trinsic acyl-CoA thioesterase activity of a peroxisomal ATP bindingcassette transporter is required for transport and metabolism of fattyacids. Proc Natl Acad Sci USA 110: 1279–1284
Dröge W (2002) Free radicals in the physiological control of cell function.Physiol Rev 82: 47–95
Elgersma Y, van den Berg M, Tabak HF, Distel B (1993) An efficientpositive selection procedure for the isolation of peroxisomal import andperoxisome assembly mutants of Saccharomyces cerevisiae. Genetics 135:731–740
Fulda M, Schnurr J, Abbadi A, Heinz E, Browse J (2004) Peroxisomal Acyl-CoA synthetase activity is essential for seedling development in Arabi-dopsis thaliana. Plant Cell 16: 394–405
Gietz RD, Schiestl RH (2007) High-efficiency yeast transformation usingthe LiAc/SS carrier DNA/PEG method. Nat Protoc 2: 31–34
Graham IA (2008) Seed storage oil mobilization. Annu Rev Plant Biol 59:115–142
Gueldener U, Heinisch J, Koehler GJ, Voss D, Hegemann JH (2002) Asecond set of loxP marker cassettes for Cre-mediated multiple geneknockouts in budding yeast. Nucleic Acids Res 30: e23
Gurvitz A, Rottensteiner H (2006) The biochemistry of oleate induction:transcriptional upregulation and peroxisome proliferation. Biochim Bio-phys Acta 1763: 1392–1402
Haferkamp I, Schmitz-Esser S (2012) The plant mitochondrial carrierfamily: functional and evolutionary aspects. Front Plant Sci 3: 2
Hiltunen JK, Wenzel B, Beyer A, Erdmann R, Fosså A, Kunau WH (1992)Peroxisomal multifunctional b-oxidation protein of Saccharomyces cer-evisiae. Molecular analysis of the fox2 gene and gene product. J BiolChem 267: 6646–6653
Hoepfner D, Schildknegt D, Braakman I, Philippsen P, Tabak HF (2005)Contribution of the endoplasmic reticulum to peroxisome formation.Cell 122: 85–95
Houtkooper RH, Cantó C, Wanders RJ, Auwerx J (2010) The secret life ofNAD+: an old metabolite controlling new metabolic signaling pathways.Endocr Rev 31: 194–223
Hu J, Baker A, Bartel B, Linka N, Mullen RT, Reumann S, Zolman BK(2012) Plant peroxisomes: biogenesis and function. Plant Cell 24: 2279–2303
Kota J, Gilstring CF, Ljungdahl PO (2007) Membrane chaperone Shr3 as-sists in folding amino acid permeases preventing precocious ERAD.J Cell Biol 176: 617–628
Leonardi R, Zhang YM, Rock CO, Jackowski S (2005) Coenzyme A: backin action. Prog Lipid Res 44: 125–153
Lingner T, Kataya AR, Antonicelli GE, Benichou A, Nilssen K, Chen X-Y,Siemsen T, Morgenstern B, Meinicke P, Reumann S (2011) Identifi-cation of novel plant peroxisomal targeting signals by a combination ofmachine learning methods and in vivo subcellular targeting analyses.Plant Cell 23: 1556–1572
Linka N, Esser C (2012) Transport proteins regulate the flux of metabolitesand cofactors across the membrane of plant peroxisomes. Front Plant Sci3: 3
Linka N, Theodoulou FL (2013) Metabolite transporters of the plantperoxisomal membrane: known and unknown. Subcell Biochem 69:169–194
Linka N, Theodoulou FL, Haslam RP, Linka M, Napier JA, NeuhausHE, Weber APM (2008) Peroxisomal ATP import is essentialfor seedling development in Arabidopsis thaliana. Plant Cell 20: 3241–3257
Mettler IJ, Beevers H (1980) Oxidation of NADH in glyoxysomes by amalate-aspartate shuttle. Plant Physiol 66: 555–560
Mittler R (2002) Oxidative stress, antioxidants and stress tolerance. TrendsPlant Sci 7: 405–410
Ogawa T, Yoshimura K, Miyake H, Ishikawa K, Ito D, Tanabe N,Shigeoka S (2008) Molecular characterization of organelle-type Nu-dix hydrolases in Arabidopsis. Plant Physiol 148: 1412–1424
Palmieri F, Rieder B, Ventrella A, Blanco E, Do PT, Nunes-Nesi A, TrauthAU, Fiermonte G, Tjaden J, Agrimi G, et al (2009) Molecular identi-fication and functional characterization of Arabidopsis thaliana mito-chondrial and chloroplastic NAD+ carrier proteins. J Biol Chem 284:31249–31259
Palmieri L, Rottensteiner H, Girzalsky W, Scarcia P, Palmieri F,Erdmann R (2001) Identification and functional reconstitution of theyeast peroxisomal adenine nucleotide transporter. EMBO J 20: 5049–5059
Palmieri L, Santoro A, Carrari F, Blanco E, Nunes-Nesi A, Arrigoni R,Genchi F, Fernie AR, Palmieri F (2008) Identification and characteri-zation of ADNT1, a novel mitochondrial adenine nucleotide transporterfrom Arabidopsis. Plant Physiol 148: 1797–1808
Pollak N, Dölle C, Ziegler M (2007) The power to reduce: pyridinenucleotides—small molecules with a multitude of functions. BiochemJ 402: 205–218
Pracharoenwattana I, Cornah JE, Smith SM (2007) Arabidopsis peroxi-somal malate dehydrogenase functions in b-oxidation but not in theglyoxylate cycle. Plant J 50: 381–390
Rentsch D, Laloi M, Rouhara I, Schmelzer E, Delrot S, Frommer WB(1995) NTR1 encodes a high affinity oligopeptide transporter in Arabi-dopsis. FEBS Lett 370: 264–268
Reumann S, Bettermann M, Benz R, Heldt HW (1997) Evidence for thepresence of a porin in the membrane of glyoxysomes of castor bean.Plant Physiol 115: 891–899
2138 Plant Physiol. Vol. 171, 2016
van Roermund et al.
Reumann S, Maier E, Benz R, Heldt HW (1996) A specific porin is involvedin the malate shuttle of leaf peroxisomes. Biochem Soc Trans 24: 754–757
Reumann S, Maier E, Benz R, Heldt HW (1995) The membrane of leafperoxisomes contains a porin-like channel. J Biol Chem 270: 17559–17565
Rokka A, Antonenkov VD, Soininen R, Immonen HL, Pirilä PL, Bergmann U,Sormunen RT, Weckström M, Benz R, Hiltunen JK (2009) Pxmp2 is achannel-forming protein in Mammalian peroxisomal membrane. PLoSOne 4: e5090
Sambrook J, Russell DW (2001) Molecular Cloning: A Laboratory Manual.Cold Spring Harbor Laboratory Press, Cold Spring Harbor, NY
Theodoulou FL, Bernhardt K, Linka N, Baker A (2013) Peroxisomemembrane proteins: multiple trafficking routes and multiple functions?Biochem J 451: 345–352
Todisco S, Agrimi G, Castegna A, Palmieri F (2006) Identification of themitochondrial NAD+ transporter in Saccharomyces cerevisiae. J Biol Chem281: 1524–1531
Tumaney AW, Ohlrogge JB, Pollard M (2004) Acetyl coenzyme A con-centrations in plant tissues. J Plant Physiol 161: 485–488
van Roermund CWT, Drissen R, van Den Berg M, Ijlst L, Hettema EH,Tabak HF, Waterham HR, Wanders RJA (2001) Identification of aperoxisomal ATP carrier required for medium-chain fatty acid b-oxi-dation and normal peroxisome proliferation in Saccharomyces cerevisiae.Mol Cell Biol 21: 4321–4329
van Roermund CWT, Elgersma Y, Singh N, Wanders RJA, Tabak HF(1995) The membrane of peroxisomes in Saccharomyces cerevisiae is im-permeable to NAD(H) and acetyl-CoA under in vivo conditions. EMBO J14: 3480–3486
Visser WF, van Roermund CWT, Ijlst L, Waterham HR, Wanders RJA(2007) Metabolite transport across the peroxisomal membrane. BiochemJ 401: 365–375
Yogev O, Pines O (2011) Dual targeting of mitochondrial proteins: mech-anism, regulation and function. Biochim Biophys Acta 1808: 1012–1020
Zallot R, Agrimi G, Lerma-Ortiz C, Teresinski HJ, Frelin O, Ellens KW,Castegna A, Russo A, de Crécy-Lagard V, Mullen RT, et al (2013)Identification of mitochondrial coenzyme A transporters from maizeand Arabidopsis. Plant Physiol 162: 581–588
Plant Physiol. Vol. 171, 2016 2139
Peroxisomal NAD Carrier as NAD/AMP Exchanger
ABSTRACT
gpt2
gpt1
gpt1
GPT1
gpt1
INTRODUCTION
de novo
PEX16 sse1
gpt1
Arabidopsis thaliana
pgd2
gpt1
RESULTS
GPT1 dually targets plastids and the ER
Brassicaceae
C-short
Z membranes
C-full
C-full
full-length
N-5MD
N-2MD,
N-term
The first 155 amino acids of GPT1 are crucial for ER targeting
2MD:8MD 5MD:5MD
2MD:8MD 5MD:5MD
2MD:8MD
5MD:5MD
medial
2MD:8MD 5MD:5MD
2MD:8MD
5MD:5MD
GPT1 dimer formation occurs at plastids and substructures of the ER
GPT1 recruitment to the ER involves redox transmitters
h7 h7
c1 c1
h7 c1
c1
h7 c1
N-2MD
GPT1 contacts peroxins Pex3 and Pex16 at the ER
C-full
C-full
C-full
Pro35S
ProGPT1
GPT1 may be recruited to peroxisomes and preferentially exchanges G6P for
Ru5P
ro
full-length mature mature
Pro35S:GFP-GPT1 gpt1-2
mature
C-short
mature
Stress and developmental stimuli enhance ER targeting of GPT1
C-mat
GPT1-
GPT2- -GFP C-
short
E. coli
gpt2
xpt-2 tpt-5
mature
in planta gpt2
mature
mature full-length
gpt2-2 gpt2-3
tpt-5
xpt-2 gpt2-3
GPT1 is required both at plastids and peroxisomes during fertilization
pgd2
GPT
gpt1
MAS GPT1
gpt1
35S GFP-GPT1
GPT2 gpt1
GPT1
ProGPT1:GPT2
gpt1-1 gpt1-2
ProMAS:GPT2
ProGPT1:GPT2
Pro35S:GFP-GPT1
ProGPT1:GPT2
gpt1 GPT1 gpt1-2 ProGPT1:GPT2
GPT1 gpt1-2 Pro35S:GFP-GPT1 C-mat
ProGPT1:GPT2 gpt1-2
ProGPT1:GPT2
ProGPT1:GPT1
GPT1
ro
gpt1 ProGPT1:GPT1
ProGPT1:GPT2
gpt1
GPT1 gpt1
ProGPT1 GPT2
GPT1
DISCUSSION
GPT1 and GPT2 differ in several aspects
Oryza sativa Zea maize
c1
c2
GPT2
GPT1
The GPT1 N-terminus mediates dual targeting
N-long
mat
medial
Chlamydomonas reinhardtii
–
C-mature
c1 h7
en route
Evidence for redox transmitters in GPT1 recruitment to the ER/peroxisomes
holdase foldase
h7 c1
foldase
holdase
h m
c1
h C1
h7 c1 in planta
c1
c1
grxc1
h2 h7 h8 h9 c1
c2
GPT1 behaves like a class-II PMP
–
GPT1
GPT1 transport preference differs from GPT2
ro
‘positive inside
rule’
tpt xpt
rpi2
rpi2
GPT1’s function, flux rates are not
Dual targeting of GPT1 is essential during fertilization
GPT2
GPT1
GPT2
gpt1
gpt1-2
GPT2 GPT1
gpt1-2
Pro35S:GFP-GPT1_
gpt1
’s
gpt1-2
Pro35S:GFP-GPT1_
ProGPT1 GPT1_
gpt1
GPT1
pgd2
gpt2
c1 h7
in planta
grxc1 grxc2
T1’s presence
MATERIALS AND METHODS
Bioinformatics
Arabidopsis thaliana
Physcomitrella patens
Cloning of Fluorescent Reporter Fusions
h7
Reporter vector Sites for N-terminal fusions Sites for C-terminal fusions
∆NcoI*∆NcoI
*
Site-directed Mutagenesis
Heterologous Protein Expression in Yeast Cells
full-length mature
full-length
mature
mature
C-mat
(MATa, his3∆1, leu2, trp1 52/MATα,his3∆1, leu2, trp1
Uptake Studies Using Proteoliposomes
α
adding 0.2 mM [α
Arabidopsis Mutants
gpt1-1 gpt1-2
gpt1-1
gpt1-2
gpt2-2
gpt2-3 xpt-2 tpt-5
Plant Growth
Nicotiana
tabacum
Protoplast Transfection and Microscopy
ro
m
Immunoblot analyses
E. coli
GPT Constructs for Rescue Analyses
ProMAS:GPT2 GPT1
GPT2 5’ GPT1
GPT1
(ProGPT1:GPT2-T35S
35S:GFP-GPT1
GPT1_ GPT1
GPT1
35S GPT1
GPT1 NOS
gpt1
ProGPT1-GPT1
ProMAS:GPT2
ProGPT1:GPT2
Pro35S:GFP-GPT1
ProGPT1:GPT2
GPT1_
”
Determination of Ovule-Abortion Frequencies
Acknowledgements
gpt1
ro
ro
Author contributions
Conflict of interest
Supplemental Data
Supplemental Tables
Supplemental Table 1.
Supplemental Table 2.
Supplemental Table 3.
Supplemental Figures
Supplemental Figure 1.
Brassicaceae
Supplemental Figure 2.
Supplemental Figure 3.
Supplemental Figure 4.
Supplemental Figure 5. medial
Supplemental Figure 6. medial 2MD:8MD
Supplemental Figure 7.
Supplemental Figure 8.
Supplemental Figure 9. h7 c1
Supplemental Figure 10.
Supplemental Figure 11. Pro35S ProGPT1
Supplemental Figure 12. ro
Supplemental Figure 13.
Supplemental Figure 14.
Supplemental Figure 15. GPT2 gpt1
Supplemental Figure 16. gpt1-2
Supplemental Figure 17. GPT1 GPT2
Supplemental Figure 18. GPT1
Supplemental Figure 19.
Supplemental Figure 20.
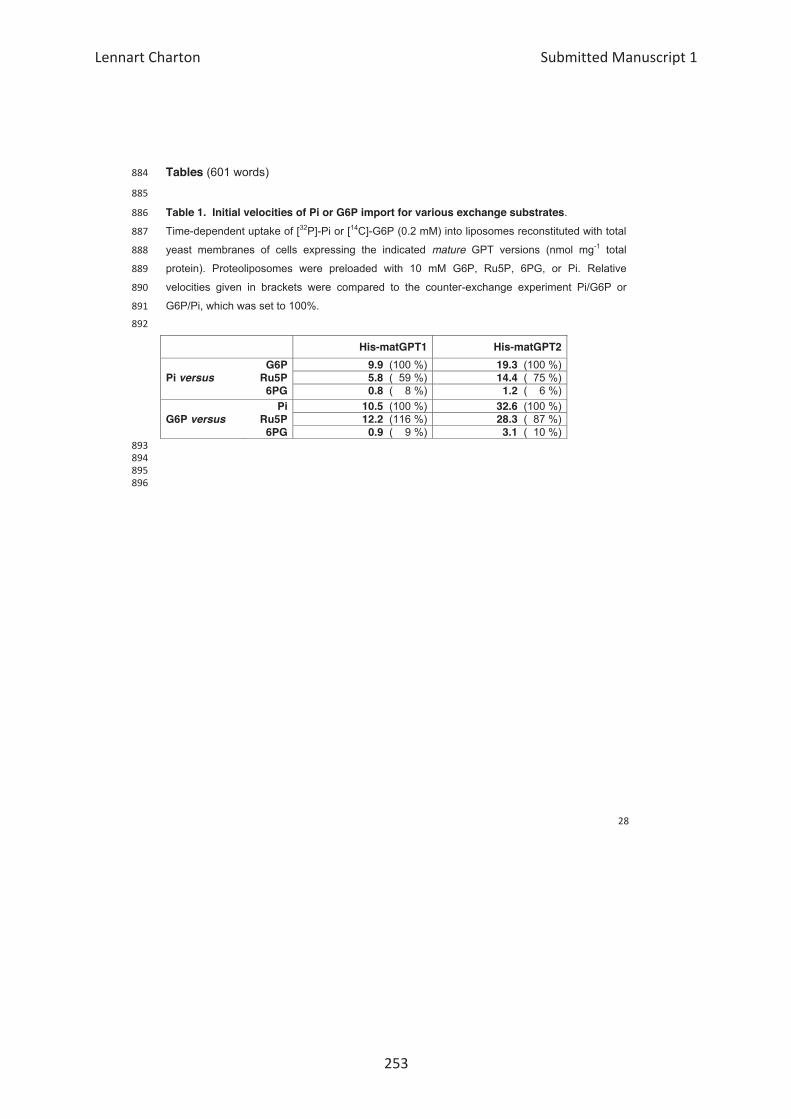
Tables
Table 1. Initial velocities of Pi or G6P import for various exchange substrates32
mature
His-matGPT1 His-matGPT2
G6P 9.9 19.3 Pi versus Ru5P 5.8 14.4 6PG 0.8 1.2 Pi 10.5 32.6 G6P versus Ru5P 12.2 28.3 6PG 0.9 3.1
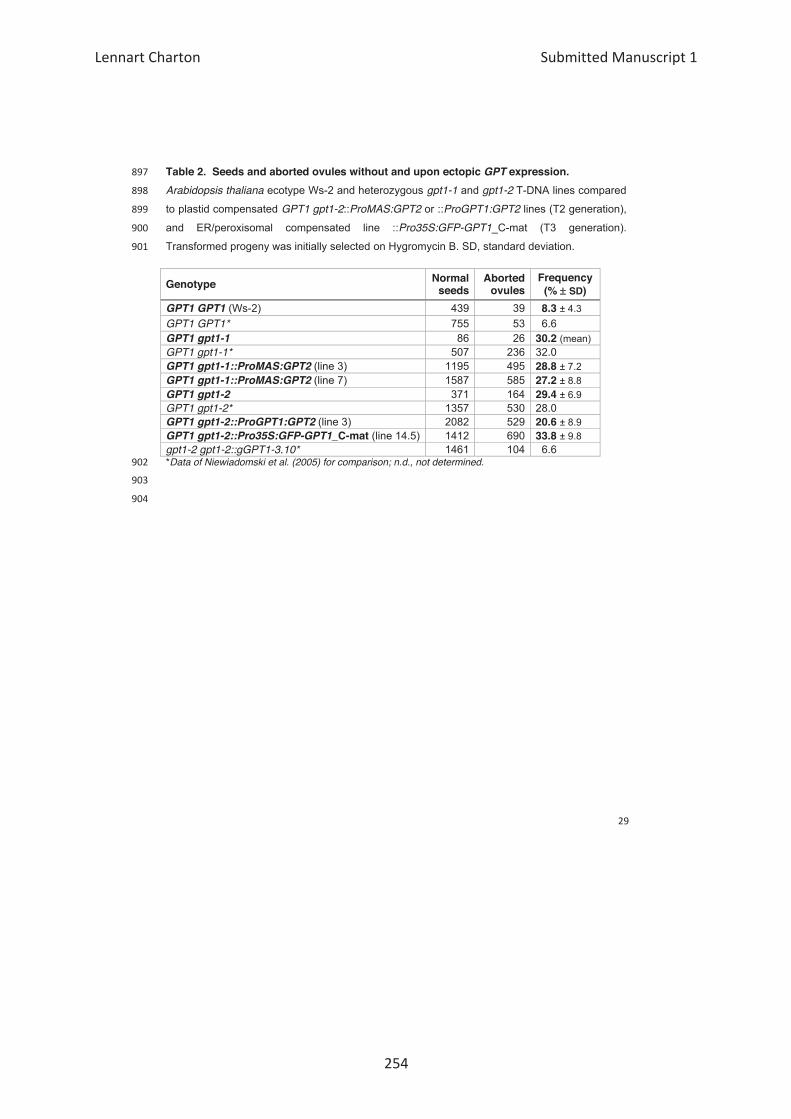
Table 2. Seeds and aborted ovules without and upon ectopic GPT expression.
Arabidopsis thaliana gpt1-1 gpt1-2
GPT1 gpt1-2 ProMAS:GPT2 ProGPT1:GPT2
Pro35S:GFP-GPT1
Genotype Normal seeds
Aborted ovules
Frequency (% SD)
GPT1 GPT1 8.3 GPT1 GPT1* GPT1 gpt1-1 30.2 GPT1 gpt1-1* GPT1 gpt1-1::ProMAS:GPT2 28.8 GPT1 gpt1-1::ProMAS:GPT2 27.2 GPT1 gpt1-2 29.4 GPT1 gpt1-2* GPT1 gpt1-2::ProGPT1:GPT2 20.6GPT1 gpt1-2::Pro35S:GFP-GPT1_C-mat 33.8 gpt1-2 gpt1-2::gGPT1-3.10* Data of Niewiadomski et al. (2005) for comparison; n.d., not determined.
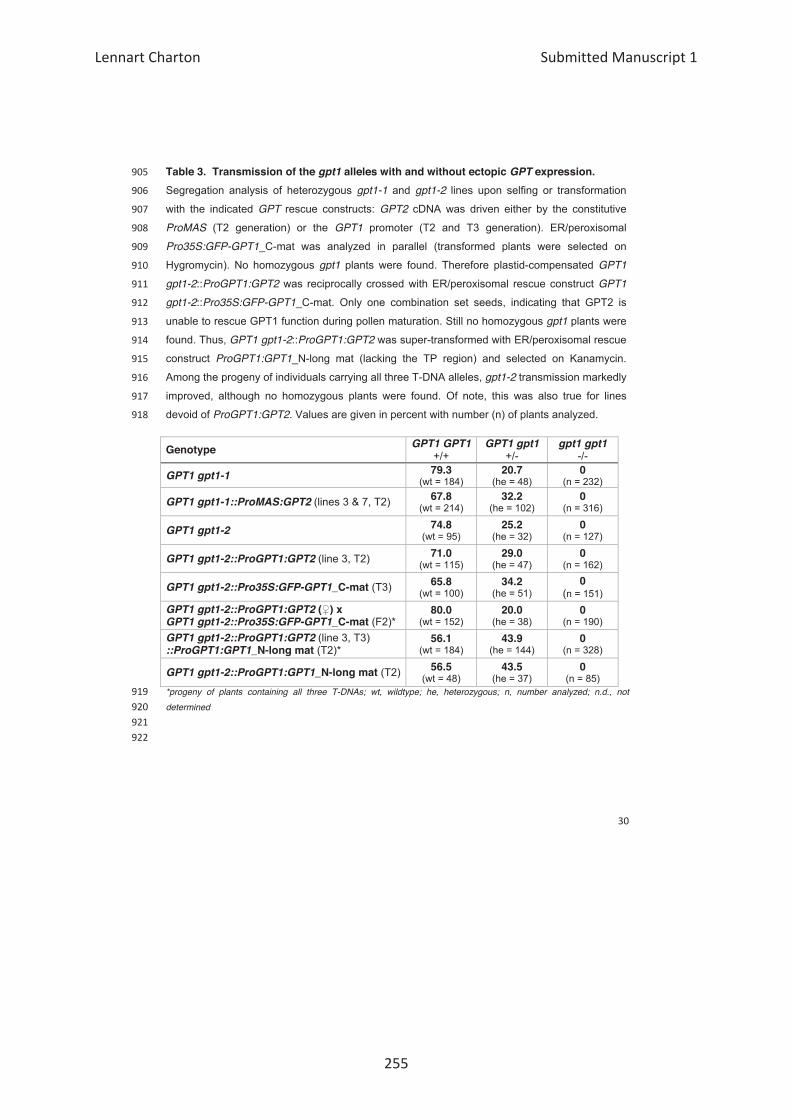
Table 3. Transmission of the gpt1 alleles with and without ectopic GPT expression.
gpt1-1 gpt1-2
GPT GPT2
ProMAS GPT1
Pro35S:GFP-GPT1
gpt1 GPT1
gpt1-2 ProGPT1:GPT2 GPT1
gpt1-2 Pro35S:GFP-GPT1
gpt1
GPT1 gpt1-2 ProGPT1:GPT2
ProGPT1:GPT1
gpt1-2
ProGPT1:GPT2
Genotype GPT1 GPT1 GPT1 gpt1 gpt1 gpt1
GPT1 gpt1-1 79.3
20.7
0
GPT1 gpt1-1::ProMAS:GPT2 67.8 32.2 0
GPT1 gpt1-2 74.8 25.2 0
GPT1 gpt1-2::ProGPT1:GPT2 71.0 29.0 0
GPT1 gpt1-2::Pro35S:GFP-GPT1_C-mat 65.8 34.2 0
GPT1 gpt1-2::ProGPT1:GPT2 (♀) x GPT1 gpt1-2::Pro35S:GFP-GPT1_C-mat
80.0
20.0
0
GPT1 gpt1-2::ProGPT1:GPT2 ::ProGPT1:GPT1_N-long mat
56.1
43.9 0
GPT1 gpt1-2::ProGPT1:GPT1_N-long mat 56.5
43.5 0
*progeny of plants containing all three T-DNAs; wt, wildtype; he, heterozygous; n, number analyzed; n.d., not
determined
REFERENCES
–
–
–
–
–
–
–
–
–
–
–
–
–
–
–
–
–
–
–
–, Meyer, E.H., Taylor, N.L., Bussell, J.D., O’Toole, N., Heazlewood, J.L., Castleden, I.,
–
–
–
–
–
–
–
–
–
–
–
–
Regulated α
–
–
W.X. (2008). PhosPhAt : A database of phosphorylation sites in Arabidopsis thaliana and a –
––
–
–
–
–
–
–
–
–
–
–
–
–
–
–
–
–
–
–
–
–
–-–
–
–
–
–
–
–
–
–
–
–
–
–
of the “ER semi autonomous peroxisome maturation and replication” model for –
–
–
–
–
–
–
–
––
–
–
–
–
–
–
–
–
–
–
–
–
–
–
–
–
–
–
–
–
–like kinase ASKα
–
–
–
–
–
–
–myristoylation and βγ play
roles beyond anchorage in the palmitoylation of the G protein α(o) subunit. J. Biol. Chem. –
–
–
–al. (2007). An “Electronic Fluorescent Pictograph” Browser for Exploring and
–
–
–
–
–
–
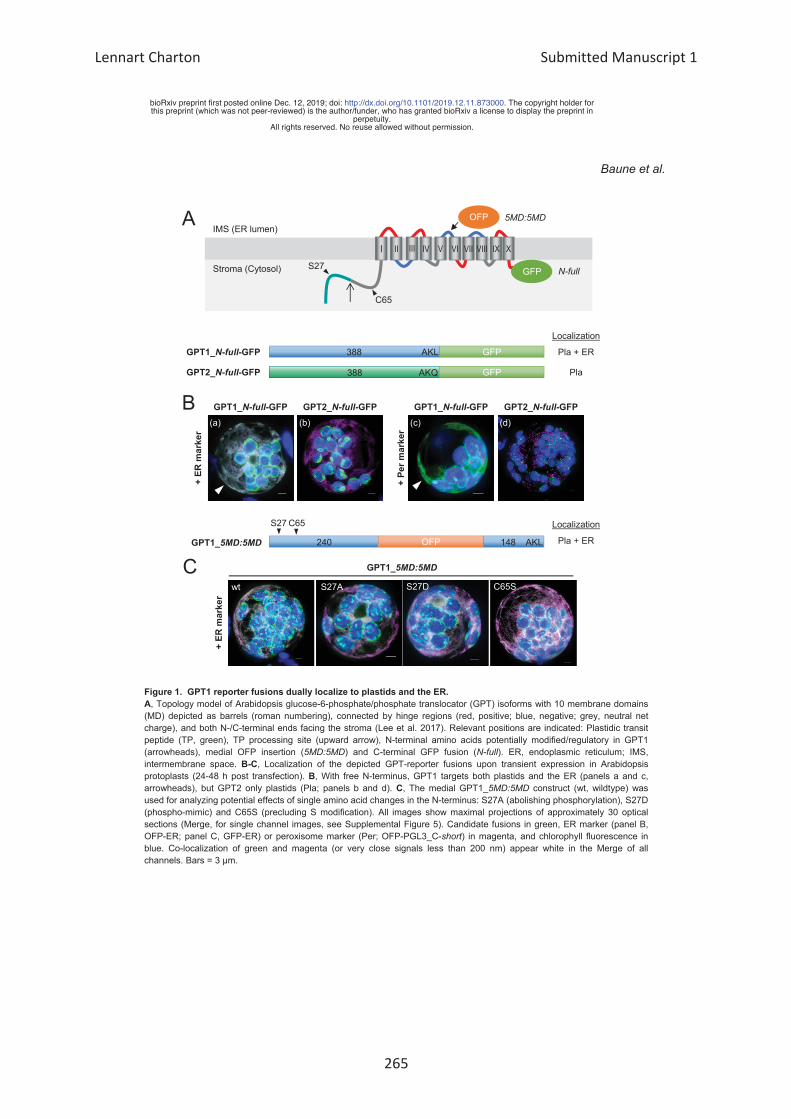
All rights reserved. No reuse allowed without permission. perpetuity.
this preprint (which was not peer-reviewed) is the author/funder, who has granted bioRxiv a license to display the preprint in The copyright holder for. http://dx.doi.org/10.1101/2019.12.11.873000doi: bioRxiv preprint first posted online Dec. 12, 2019;
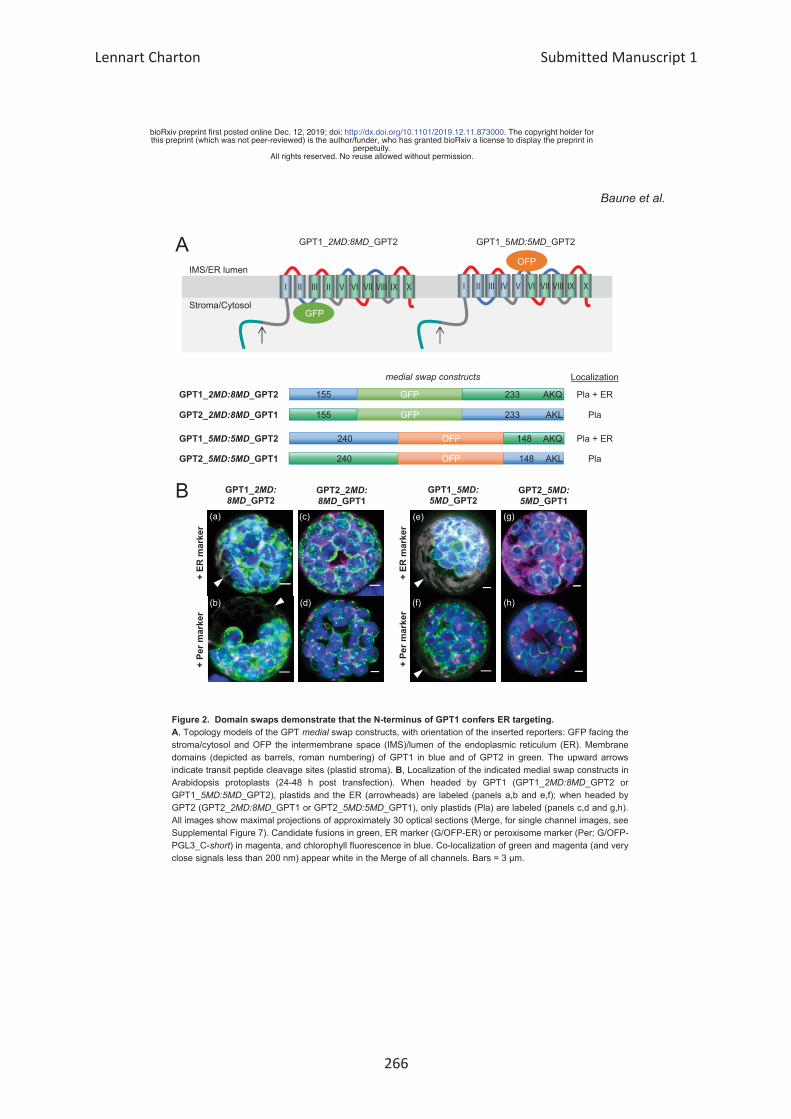
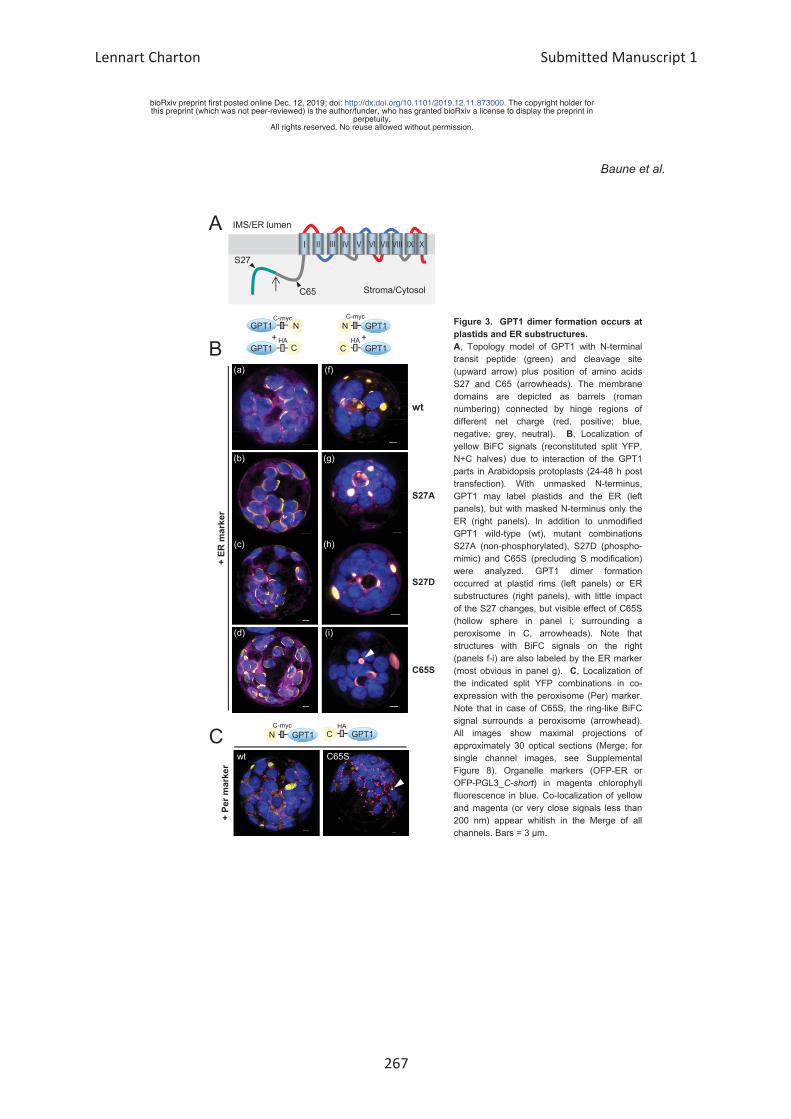
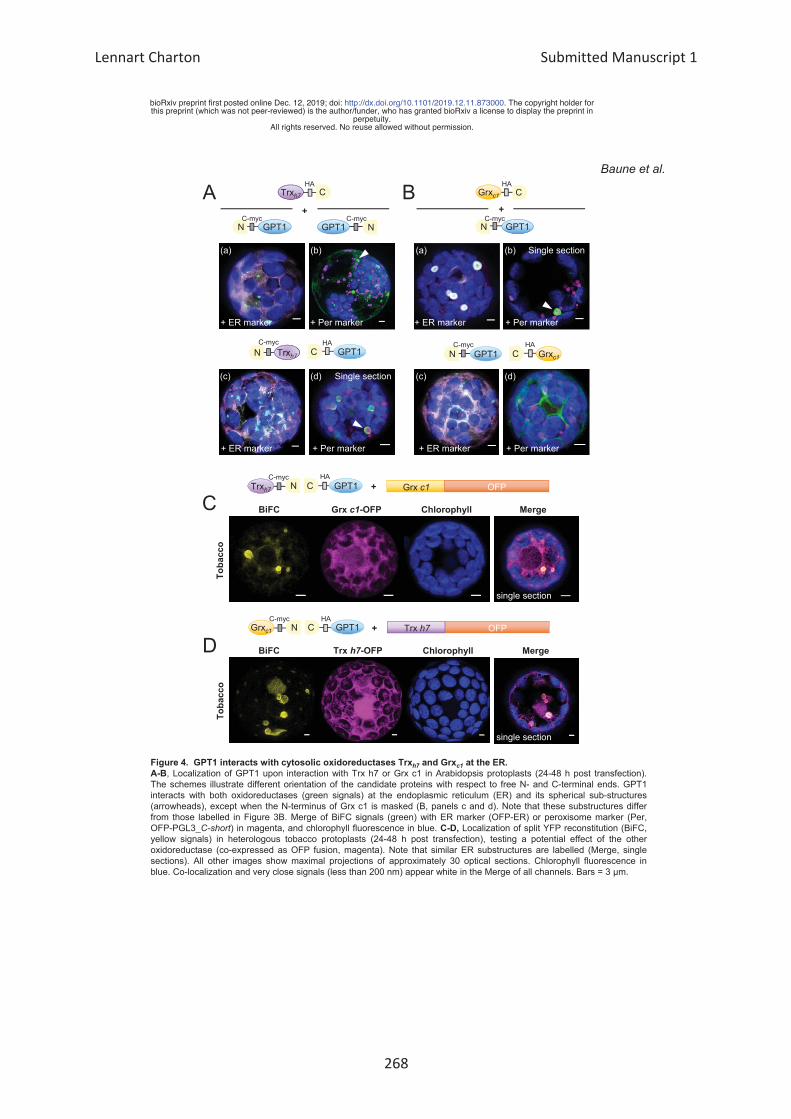
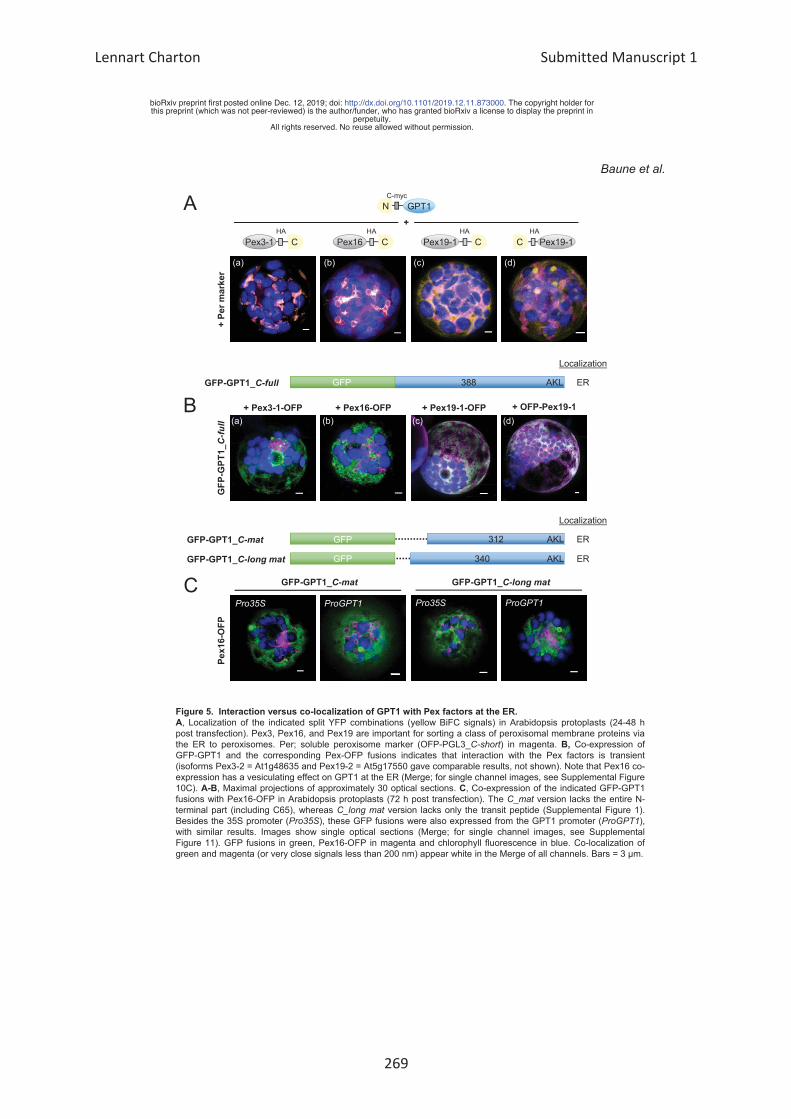
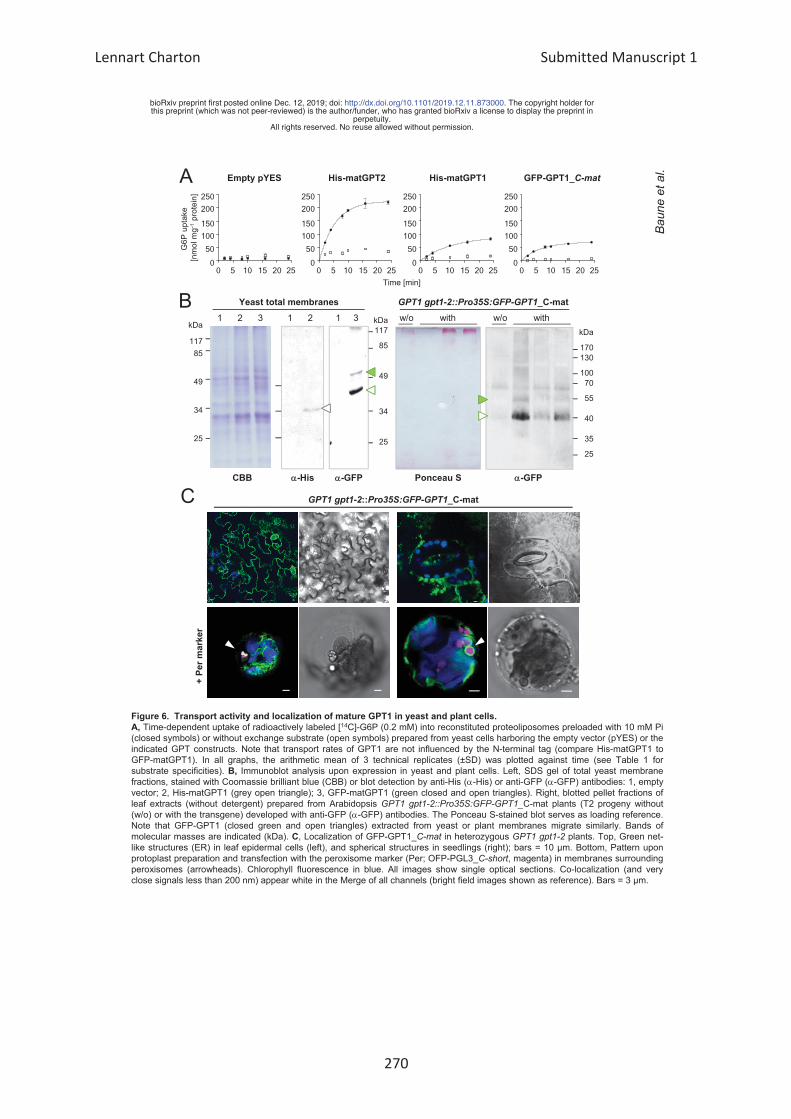
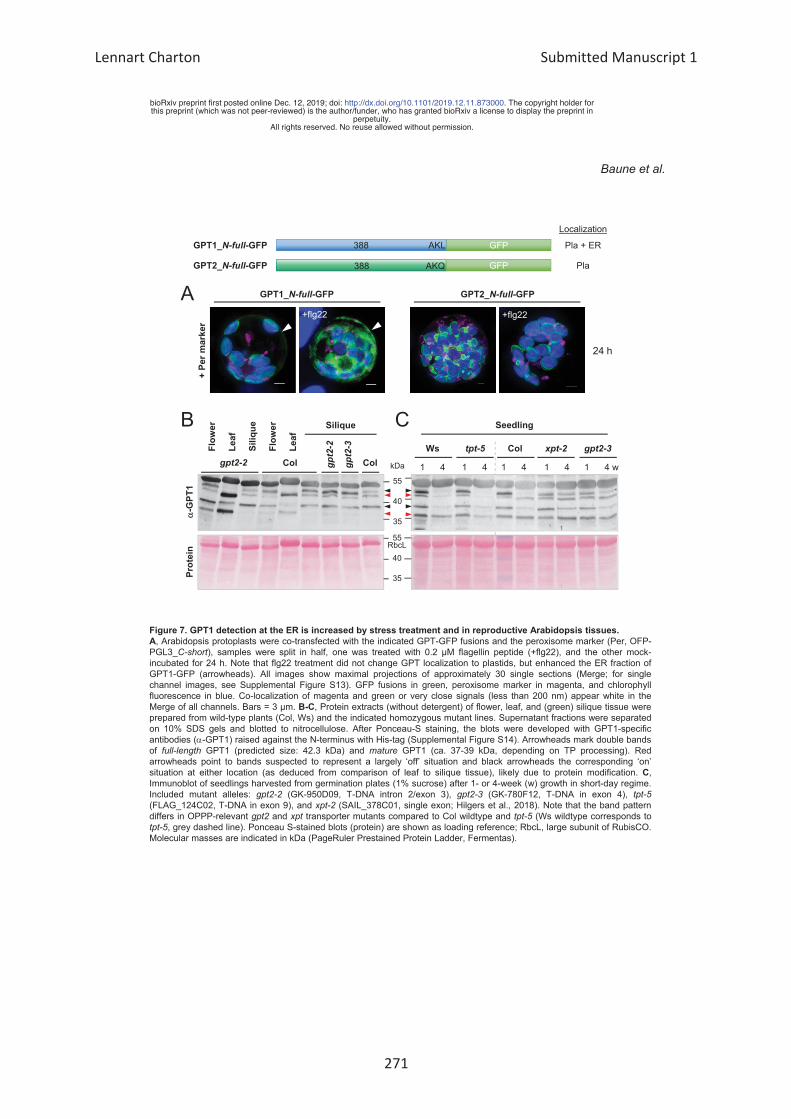
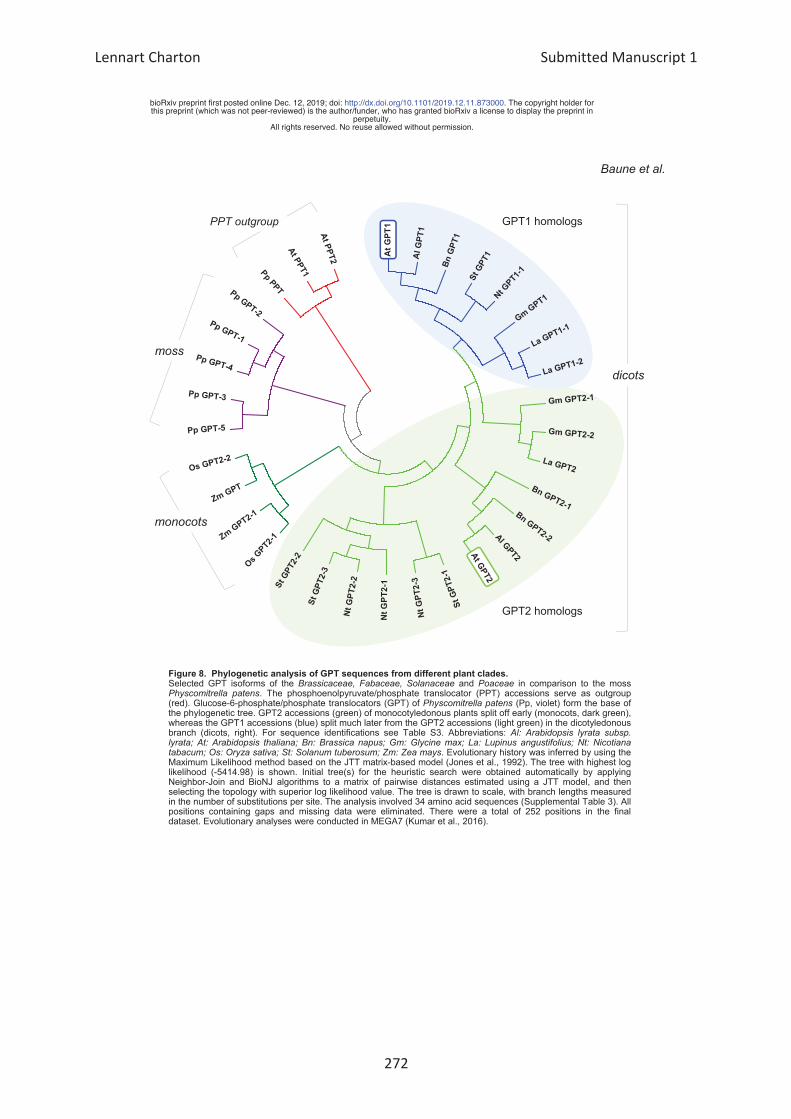
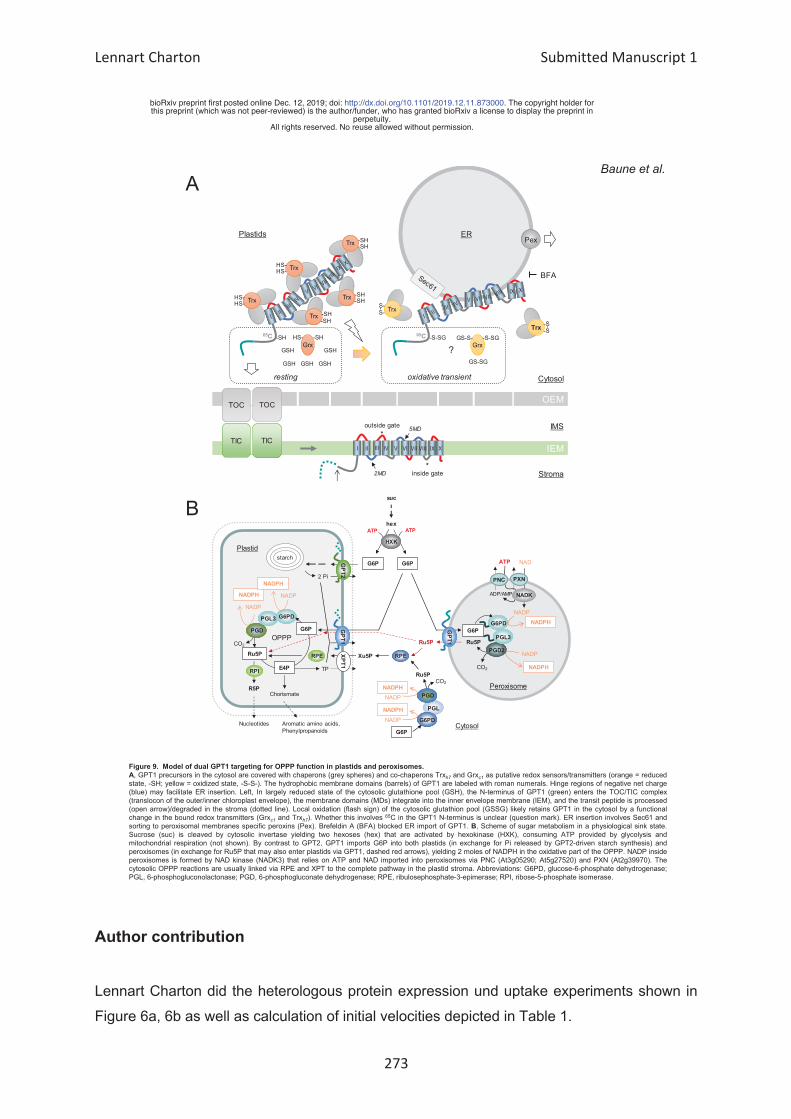
ABSTRACT
At At
Escherichia coli
At
5’
At
At AtSFC1
At
At
INTRODUCTION
Arabidopsis thaliana
Saccharomyces
cerevisiae At
At
–
At
SFC1
At
At
SFC1
A. thaliana
At
At At
At
SFC1
At
At
At
AtSFC1
At At
At
MATERIAL AND METHODS
Sequence search and analysis
At
Bacterial expression and purification of AtSFC1
At E. coli
–
At
At
Reconstitution of AtSFC1 into liposomes
At
g
α
Transport assays
–
were added simultaneously to the labeled substrate according to the “inhibitor
stop” method
citrate were loaded with 5 μM
Subcellular localization of AtSFC1
AtSFC1
AtSFC1Fw (3’
5’) and AtSFC1Rv (3’
5’).
AtSFC1
Pfu
At
Agrobacterium tumefaciens
Nicotiana benthamiana
At
–
Plant material and growth conditions
A. thaliana
μ
Generation of AtSFC1 transgenic lines
AtSCF1
At
nos
SCF1
Agrobacterium tumefaciens
Hygromycin
hygromycin
hygromycin
Expression analysis by real-time PCR
DNA sequence of SFC1 and the 3′
forward primer 5’
3’ and reverse primer 5’
3’). To cor
At
ΔΔCt
ΔΔCt
relative to internal calibrator (ΔC mature leaf (ΔΔCtΔΔCt
ΔΔCt ΔCt sample ΔCt
Germination, root growth and root respiration measurements
μ
Measurements of photosynthetic parameters
a a
g
A
Metabolite measurements of seeds, seedlings and leaves
–
Statistical analysis
t
P
RESULTS
Bacterial expression of AtSFC1
AtSFC1 E. coli
E. coli
Biochemical functional characterization of AtSFC1
At
α
At
At
At
cis trans
α At
enol
α
At
At
At
At
At
At
Kinetic characteristics of recombinant AtSFC1
At
At
At
Cis
At
Efflux of citrate from AtSFC1-reconstituted liposomes
At
At
Phylogenetic analysis
At
At
S. cerevisiae
At
Subcellular localization of AtSFC1
At Agrobacterium
At
At
At
At
Arabidopsis thaliana
Expression patterns of AtSFC1
AtSFC1
in silico AtSFC1
At
At
At
AtSFC1
Generation and molecular characterization of 35S-AtSFC1 antisense lines
At
At
At
AtSFC1
Hygromycin
.
AtSFC1
sfc1 sfc1 sfc1 AtSFC1
Physiological characterization of seed germination and roots of the
AtSFC1 antisense lines
At
sfc1
sfc1
SFC1
sfc1
At
At
sfc1
AtSFC1
Analysis of storage oil mobilization in AtSFC1 antisense lines
sfc1 sfc1
AtSFC1
–
AtSFC1
sfc1
sfc1 sfc1
sfc1
sfc1
At
Metabolite profile of seedlings from AtSFC1 antisense lines
AtSFC1
At
sfc1
sfc1 sfc1
sfc1 sfc1 sfc1-
sfc1 sfc1
sfc1 sfc1
cysteine, tyrosine and β
sfc1
sfc1 sfc1
β
sfc1 sfc1
Reduction in AtSFC1 expression results in unaltered photosynthetic
parameters and plant growth
At
sfc1
sfc1 At
sfc1
sfc1-
sfc1
DISCUSSION
AtSFC1 transports citrate, isocitrate and aconitate, and, to a lesser extent, fumarate and succinate
At
At
S. cerevisae Sc
At
At
At
cis trans
– At
sfc1
At
At
A functional role for AtSFC1 during seed germination and seedling development
At
At
At
At
At
At
At
SFC1
A functional role for AtSFC1 in radicle growth
AtSFC1
At
At
At
At
At
The role of AtSFC1 in illuminated leaves
AtSFC1
At
At
At
At
At At
AtSFC1
At
Acknowledgements
Financial support was provided by Conselho Nacional de
Desenvolvimento Científico e Tecnológico (CNPq) (Grant 204133/2017 3 to
ANN), Fundação de Amparo à Pesquisa do Estado de Minas Gerais
(FAPEMIG) [Grant RED 00053 16] and Max Planck Society to ANN, TO and
WLA. This work was also supported by the Ministero dell’Università e della
Ricerca (MIUR) [the Italian Human ProteomeNet GrantRBRN07BMCT_009 to F.
P.]. ARF acknowledges the support of the Deutsche Forschungsgemeinschaft in
the framework of the trans regional collaborative research centre TRR175.
Research fellowships granted by CNPq to ANN and WLA, Coordenação de
Aperfeiçoamento de Pessoal de Nível Superior (CAPES) to DSB are also
gratefully acknowledged. The CEPLAS Plant Metabolism and Metabolomics
Laboratory is funded by the Deutsche Forschungsgemeinschaft (DFG, German
Research Foundation) under Germany´s Excellence Strategy – EXC 2048/1 –
Project ID: 390686111. APMW appreciates funding from CRC 1208. We
acknowledge the excellent technical assistance of Elisabeth Klemp, Katrin
Weber, and Maria Graf for GC MS measurements as well as Jessica Albers for
manual data curation.
Conflict of Interest
Author contribution
At
At
Figure Legends
Figure 1. Homo-exchange activities of various substrates in
proteoliposomes reconstituted with AtSFC1
were significant (Student’s t P
Figure 2. Substrate specificity of AtSFC1. Liposomes reconstituted with
AtSFC1 were preloaded internally with various substrates (concentration, 10
mM). Transport was started by adding 0.13 mM [14
C]citrate and terminated after
1 min. The values are means SE of at least three independent experiments in
duplicate for each internal substrate investigated. Differences between the
activities of [14
C]citrate uptake with internal citrate, isocitrate and cis aconitate
and the activities with internal succinate and fumarate were significant
( tudent’s t P < 0.05). Differences between the activities of [14
C]citrate
uptake with internal fumarate and succinate and the activity with internal NaCl
and no substrate were significant ( tudent’s t P < 0.05). Differences
between the activities of citrate uptake with internal malate, maleate,
oxoglutarate and oxaloacetate and the activity with internal NaCl and no
substrate were not significant ( tudent’s t P > 0.05). Abbreviation: PEP,
phosphoenolpyruvate.
Figure 3. Kinetics of [14C]citrate transport in proteoliposomes reconstituted with AtSFC1. (A) Time courses of citrate uptake by
AtSFC1 reconstituted liposomes containing no substrate or various substrates.
Proteoliposomes were preloaded internally with 10 mM citrate ( ), fumarate
( ), succinate ( ), oxaloacetate ( ) or NaCl and no substrate (O). Transport
was initiated by adding 1 mM citrate and terminated at the indicated times.
Similar results were obtained in at least four independent experiments in
duplicate. (B) Efflux of citrate from liposomes reconstituted with AtSFC1
and preloaded internally with 2 mM citrate. The internal substrate pool was
labeled with citrate by carrier mediated exchange equilibration. Then the
proteoliposomes were passed through Sephadex G 75. The efflux of citrate
was started by adding buffer A alone ( ) or in buffer A 5 mM citrate ( ),
fumarate ( ), succinate ( ), 5 mM citrate plus 30 mM pyridoxal 5' phosphate
and 20 mM bathophenanthroline ( ) or 30 mM pyridoxal 5' phosphate and 20
mM bathophenanthroline ( ). Similar results were obtained in three
independent experiments in duplicate.
Figure 4. Characterization and expression of SFC1 in Arabidopsis. A)
Expression analysis in wild type plants in different stages of development. The
relative quantification was performed according to the comparative method (2ΔΔCt). Actin2 was employed as a reference gene. (B) Schematic representation
of the antisense construct. A fragment of 930 bp of the gene AtSFC1 was
inserted in the antisense orientation under the control of the 35S promoter. The
cassette also contained a hygromycin resistance marker gene (HygR) and nos
terminator. (C) Real time PCR analysis for AtSFC1 in leaves of wild type and
antisense lines. Values are means ± SE of three independent biological
replicates; an asterisk indicates values that were determined by the Student’s t
test to be significantly different (P < 0.05) from the wild type.
Figure 5. Phenotypic characterization of AtSFC1 mitochondrial carrier. Seed germination rate of wild type (Wt) and 35S SFC1 antisense lines grown
on agar plates containing half strength Murashige and Skoog (MS) medium plus
1% (w/v) (A) sucrose or (B) sucrose free. Radicle emergence was used as a
morphological marker for germination. Values are means ± standard error (SE)
of four independent biological replicates. (C) Root length of the Wt and 35S
SFC1 antisense lines at 11 days after germination. Ten seeds per genotype
were germinated on vertical plates for 2 days in the dark and then transferred to
8 h of light/16 h of dark regime. Values are means ± SE of ten measurements
from six biological replicates. (D) Root oxygen consumption in darkness. The
measurements were performed in 4 week old plants. Values are means ± SE of
four individual determinations per line. The asterisk indicates values that were
determined by the Student’s t-test to be significantly different (P < 0.05) from the
Wt. Abbreviation: FW, fresh weight.
Figure 6. Relative amount of fatty acids and metabolites in seedlings. Seedlings of 35S SFC1 antisense lines and wild type (Wt) grown on agar plates
containing half strength Murashige and Skoog (MS) medium without sucrose.
(A) Fatty acids; (B) organic acids; (C) nitrogen and amino acids metabolism;
and (D) sugars that presented a substantial changes. Values are mean ± SE of
three biological replicates. Asterisks indicate values that were determined by the
Student’s t test to be significantly different (P < 0.05) from the Wt. Additional
determinations of metabolites and fatty acids are provided in supplemental
Figure S7 and S8.
Figure 7. Proposed roles of the mitochondrial SFC1 carrier in Arabidopsis
thaliana.
At
At
–
γ
peroxisomal membrane protein of 22 kDa; SFC1, citrate/isocitrate carrier 1;
At
Supplementary Files
Supplemental Table 1.
determined by Student’s t P
sfc1-12 24.9 0.36 29.9 0.66 0.69 0.01 sfc1-10 28.6 0.84 0.83 0.01 sfc1-8 25.2 0.59
Supplemental Figure S1. Expression of AtSFC1 in E. coli and its
purification
c –
E. coli
At
AtSFC1 (about 10 μg) derived from the bacteria shown in
Supplemental Figure S2. Effect of inhibitors on the citrate/citrate exchange by AtSFC1. Liposomes were reconstituted with AtSFC1 and
preloaded internally with 10 mM citrate. Transport was initiated by adding 0.13
mM citrate and terminated after 1 min. Thiol reagents were added 2
minutes before the labeled substrate; the other inhibitors were added together
with the labeled substrate. The final concentrations of the inhibitors were 10 μM
(CAT, carboxyatractyloside; BKA, bongkrekic acid), 30 mM (PLP, pyridoxal 5
phosphate), 25 mM (BAT, bathophenanthroline), 0.2 mM (pHMB, p
hydroxymercuribenzoate; MER, mersalyl), 1 mM (NEM, N ethylmaleimide); 2
mM (BM, butylmalonate; Phesuc, phenylsuccinate; 1,2,3 BTA, 1,2,3
benzenetricarboxylate; 1,3,5 BTA, 1,3,5 benzenetricarboxylate), 0.1% (TAN,
tannic acid), 0.2 mM (BrCP, bromocresol purple) and 0.1 mM HgCl2. Similar
results were obtained in at least three independent experiments in duplicate.
Supplemental Figure S3. Phylogenetic tree of AtSFC1 and its closest relatives from some plants, fungi and metazoa. The tree was constructed
using 39 sequences comprising the known mitochondrial di and tri carboxylic
acid carriers from Arabidopsis thaliana, S. cerevisiae and H. sapiens, and the
sequences more similar to AtSFC1 from other dicot (Glycine max and Vitis
vinifera) and monocot plants (Zea mays and Oryza sativa), other fungi
(Ustilago maydis, Trichoderma reseei, Neurospora crassa, Candida albicans),
and an insect (Drosophila melanogaster); the best hit in a blast search for
vertebrates, the sequence from the fish Ictalurus puctatus, was also included in
the tree. The names of the mitochondrial carriers and/or their accession
numbers are found on the terminal nodes. The phylogenetic tree was
constructed as reported in the Methods.
Supplemental Figure S4. Subcellular localization of transient expressed
AtSFC1 GFP fusion protein in N. benthamiana protoplasts. (A) Fluorescent
signals of AtSFC1 GFP (green); (B) mitochondrial marker IVD eqFP611 (red);
(C) chlorophyll a/chloroplasts (blue); and (D) merge showing the overlap of the
fluorescent signals (yellow) detected by confocal laser scanning microscopy.
Supplemental Figure S5. In silico AtSFC1
At
At
Supplemental Figure S6. (A) Total lipids; (B) starch; and (C) protein content in
Arabidopsis seeds from wild type and 35S SFC1 antisense lines. Values are
mean ± SE of five independent biological replicates. The data were normalized
by dry weight. Asterisks indicate values that were determined by the Student’s t-
test to be significantly different (P < 0.05) from the wild type.
Supplemental Figure S7. 35S
SFC1 antisense lines
values that were determined by the Student’s t
P
Supplemental Figure S8. Relative amount of metabolites in seedlings of 35S
SFC1 antisense lines and wild type (Wt) grown on agar plates containing half
strength Murashige and Skoog (MS) medium without sucrose. Values are mean
± SE from at three independent biological replicates. Asterisks indicate values
that were determined by the Student’s t test to be significantly different (P <
0.05) from the Wt.
Supplemental Figure S9. Effect of decreased AtSFC1 expression on
photosynthesis of five weeks old plants. (A) CO2 assimilation rate (A); (B)
stomatal conductance (gs); (C) dark respiration; (D) transpiration rate (E).
Values are the mean ± SE of six individual plants per line.
Supplemental Figure S10. Effect of decreased AtSFC1 expression on relative
metabolite levels of expanded leaves from five weeks old plants. Data are
normalized with respect to the mean response calculated for the wild type (Wt).
The colors indicate values that represent the mean ± SE of measurements
made on six individual plants per line. Asterisk indicates differences that were
determined by the Student’s t test to be significantly different (P < 0.05) from the
Wt.
Supplemental Figure S11. Changes in the metabolites content in leaves of
35S SFC1 antisense lines. (A) Starch; (B) protein; (C) amino acids. Samples
were taken from mature source leaves. Values are means ± SE of six individual
determinations per line. An asterisk indicates values that were determined by
the Student’s t-test to be significantly different (P < 0.05) from the wild type. FW:
fresh weight.
REFERENCES
417
–
534 –
9 –
66 –
34
23 –
131 –
73 –
1863 –
6 –
59 –
62 –
172 –
277 –
26 –
22 –
1778 –
20 –
260 –
Arabidopsis thaliana
89 –
80 –
16 –
β
50 –
69 –
20
572 –
-130 –
265
–
977 –
294 –
88 –
17 –
15 –
165 –
211 –
72
– 23 –
157 –
Spinacia oleracea
103 –
119
–
28 –
294 –
Arabidopsis thaliana
33 –
α
283 –
Saccharomyces cerevisiae 50 –
Arabidopsis thaliana
44 –
443 –
148 –
249 –
Arabidopsis thaliana 1847 –
289 –
142 –
Arabidopsis thaliana
293 –
766 –
139 –
1069 –
Saccharomyces cerevisiae
31 –
285 –
289 –
1065 –
Saccharomyces cerevisiae 462 –
Saccharomyces
cerevisiae
393 –
71 –
7
9
15 –
7
Arabidopsis thaliana.
16 –
48 –
Coffea canephora 47
–
1 –
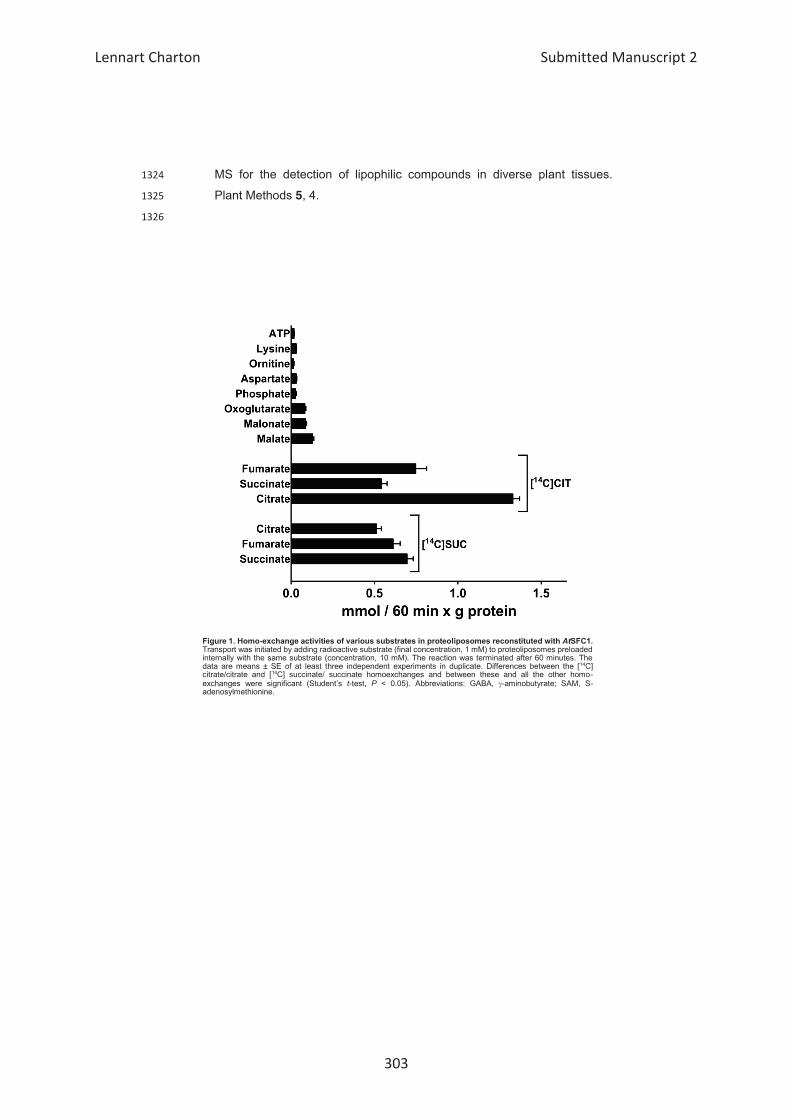
5