Embed Size (px)
Citation preview
October-December 2017Number 4Volume 8
EMBASE
by Sde cr oe pv uo sC
SCOPUS IJPHRD CITATION SCORE
Indian Journal of Public Health Research and Development
Scopus coverage years: from 2010 to 2016 Publisher:
R.K. Sharma, Institute of Medico-Legal Publications
ISSN:0976-0245E-ISSN: 0976-5506 Subject area: Medicine:
Public Health, Environmental and Occupational Health
CiteScore 2015- 0.02
SJR 2015- 0.105
SNIP 2015- 0.034
Number 4 April 2018
Indian Journal of Public Health Research & DevelopmentEXECUTIVE EDITOR
Prof Vidya SurwadeProf Dept of Community Medicine SIMS, Hapur
INTERNATIONAL EDITORIAL ADVISORY BOARD1. Dr. Abdul Rashid Khan B. Md Jagar Din, (Associate Professor) Department of Public Health Medicine, Penang Medical College, Penang, Malaysia2. Dr. V Kumar (Consulting Physician) Mount View Hospital, Las Vegas, USA3. Basheer A. Al-Sum, Botany and Microbiology Deptt, College of Science, King Saud University,
Riyadh, Saudi Arabia4. Dr. Ch Vijay Kumar (Associate Professor) Public Health and Community Medicine, University of Buraimi, Oman5. Dr. VMC Ramaswamy (Senior Lecturer)
Department of Pathology, International Medical University, Bukit Jalil, Kuala Lumpur6. Kartavya J. Vyas (Clinical Researcher)
Department of Deployment Health Research, Naval Health Research Center, San Diego, CA (USA)
7. Prof. PK Pokharel (Community Medicine) BP Koirala Institute of Health Sciences, Nepal
NATIONAL SCIENTIFIC COMMITTEE1. Dr. Anju Ade (Associate Professor)
Navodaya Medical College, Raichur,Karnataka2. Dr. E. Venkata Rao (Associate Professor) Community Medicine,
Institute of Medical Sciences & SUM Hospital, Bhubaneswar, Orissa.3. Dr. Amit K. Singh (Associate Professor) Community Medicine,
VCSG Govt. Medical College, Srinagar – Garhwal, Uttarakhand4. Dr. R G Viveki (Associate Professor) Community Medicine,
Belgaum Institute of Medical Sciences, Belgaum, Karnataka5. Dr. Santosh Kumar Mulage (Assistant Professor)
Anatomy, Raichur Institute of Medical Sciences Raichur(RIMS), Karnataka6. Dr. Gouri Ku. Padhy (Associate Professor) Community and Family
Medicine, AII India Institute of Medical Sciences, Raipur7. Dr. Ritu Goyal (Associate Professor)
Anaesthesia, Sarswathi Institute of Medical Sciences, Panchsheel Nagar8. Dr. Anand Kalaskar (Associate Professor)
Microbiology, Prathima Institute of Medical Sciences, AP9. Dr. Md. Amirul Hassan (Associate Professor)
Community Medicine, Government Medical College, Ambedkar Nagar, UP10. Dr. N. Girish (Associate Professor) Microbiology, VIMS&RC, Bangalore11. Dr. BR Hungund (Associate Professor) Pathology, JNMC, Belgaum.12. Dr. Sartaj Ahmad (Assistant Professor),
Medical Sociology, Department of Community Medicine, Swami Vivekananda Subharti University, Meerut,Uttar Pradesh, India
13. Dr Sumeeta Soni (Associate Professor) Microbiology Department, B.J. Medical College, Ahmedabad, Gujarat,India
NATIONAL EDITORIAL ADVISORY BOARD1. Prof. Sushanta Kumar Mishra (Community Medicine)
GSL Medical College – Rajahmundry, Karnataka2. Prof. D.K. Srivastava (Medical Biochemistry)
Jamia Hamdard Medical College, New Delhi3. Prof. M Sriharibabu (General Medicine) GSL Medical College, Rajahmundry,
Andhra Pradesh4. Prof. Pankaj Datta (Principal & Prosthodentist)
Indraprastha Dental College, Ghaziabad
NATIONAL EDITORIAL ADVISORY BOARD5. Prof. Samarendra Mahapatro (Pediatrician)
Hi-Tech Medical College, Bhubaneswar, Orissa6. Dr. Abhiruchi Galhotra (Additional Professor) Community and Family
Medicine, AII India Institute of Medical Sciences, Raipur7. Prof. Deepti Pruthvi (Pathologist) SS Institute of Medical Sciences &
Research Center, Davangere, Karnataka8. Prof. G S Meena (Director Professor)
Maulana Azad Medical College, New Delhi9. Prof. Pradeep Khanna (Community Medicine)
Post Graduate Institute of Medical Sciences, Rohtak, Haryana10. Dr. Sunil Mehra (Paediatrician & Executive Director)
MAMTA Health Institute of Mother & Child, New Delhi
11. Dr Shailendra Handu, Associate Professor, Phrma, DM (Pharma, PGI Chandigarh)
12. Dr. A.C. Dhariwal: Directorate of National Vector Borne Disease Control Programme, Dte. DGHS, Ministry of Health Services, Govt. of India, Delhi
Print-ISSN: 0976-0245-Electronic-ISSN: 0976-5506, Frequency: MonthlyIndian Journal of Public Health Research & Development is a double blind peer reviewed international journal. It deals with all aspects of Public Health including Community Medicine, Public Health, Epidemiology, Occupational Health, Environmental Hazards, Clinical Research, and Public Health Laws and covers all medical specialties concerned with research and development for the masses. The journal strongly encourages reports of research carried out within Indian continent and South East Asia.
The journal has been assigned International Standards Serial Number (ISSN) and is indexed with Index Copernicus (Poland). It is also brought to notice that the journal is being covered by many international databases. The journal is covered by EBSCO (USA), Embase, EMCare & Scopus database. The journal is now part of DST, CSIR, and UGC consortia.
Website : www.ijphrd.com©All right reserved. The views and opinions expressed are of the authors and not of the Indian Journal of Public Health Research & Development. The journal does not guarantee directly or indirectly the quality or efcacy of any product or service featured in the advertisement in the journal, which are purely commercial.
EditorDr. R.K. Sharma
Institute of Medico-legal Publications501, Manisha Building, 75-76, Nehru Place,
New Delhi-110019 Printed, published and owned by
Dr. R.K. SharmaInstitute of Medico-legal Publications501, Manisha Building, 75-76, Nehru Place,
New Delhi-110019 Published at
Institute of Medico-legal Publications501, Manisha Building, 75-76, Nehru Place,
New Delhi-110019
I
1. A Study of Perception and Motives Towards Participation in Clinical Research in India ............................ 1Amit Marwah, Neyaz Ahmed, Nidhi, Rajesh Ranjan, Mitasha Singh, Ranabir Pal
2. Assessment of Knowledge Regarding Post Exposure Prophylaxis Following Needle Stick Injury among B. Sc. Nursing Students .................................................................................... 6
Anjana A. P., Gisha Joseph, Revathy A.Valsan
3.EffectofBodyMassIndexandAgeonVisualReactionTimeinRecreationalBadmintonPlayers. A Cross-Sectional Study .............................................................................................................................. 11
Rrutu Rajkumar Singhal, Ashish Prabhakar, Shyam Krishnan k, Gopala Krishna Alaparthi
4. Cytomegalovirus Pneumonia in Critically Ill Patients ................................................................................ 16Gurmeet Singh
5. Knowledge, Attitude and Risk Perception for Diabetes among Pregnant Women with Gestational Diabetes Mellitus ..................................................................................................................... 19
Judith A Noronha, Sushmitha R Karkada, Anusuya Prabhu, Shobha, Sonia RB D’Souza,Sweety J Fernandes, Pratibha Kamath
6. Study to Assess the Seizure Severity, Depression and Quality of Life among Patients with Epilepsy at AIMS, Kochi ............................................................................................................................ 25
Antony T, Kanmani J, Anjana.A.P
7.FactorsInfluencingNon-useofFamilyPlanningamongRuralAdolescentGirlsinMalawi 30Kennedy Machira, Beston B. Maonga
8. Performance Evaluation of Adtree, Functional Tree and LMTClassifierswithCFS Subset Evaluator for Intelligent Heart Disease Prediction ...................................................................................... 37
Lakshmi Devasena C
9. Assess the Level of Stress among Antenatal Mothers ................................................................................. 43Linda Varghese, Aswathy Krishnan, Anitha Joseph, Dimna Davis
10.DevelopmentandStatisticAnalysisofPsychology-NumerologyModulefor Character Building in Malaysia ................................................................................................................... 48
Mohammad Aziz Shah Mohamed Arip, Nadratul Shima Salim, Bazlan Mustafa, Fauziah Sa’ad
11. Establishing Internal Consistency of the Attitudes to Back Pain Scale (ABS-mp) in Indian Physiotherapists ................................................................................................................................ 54
Nitesh Bansal, Puja Chhabra Sharma, Raju K Parasher
12. Knowledge, Attitude and Practice of Tobacco use among Children in a School, Pune: A Cross Sectional Survey ............................................................................................................................ 59
Aditi Mahalle, Mamatha G.S Reddy, Srushti Putta, Nitin Gupta, Supriya Kheur
I
Indian Journal of Public Health Research &
Development
www.ijphrd.com
Volume 8 Number 4 October-December 2017
1. Detention, Nepotism and Truancy as Predictors of Workplace Deviance in.....................................................................01
Service Organizations: India's Experience
Sainath Malisetty, K Vasanthi Kumari
2. A Comparative Study of Satisfaction of Midwives and Mothers of Adherence to Patient Rights..................................07
Maryam Soheily, Akram Peyman, Beheshteh Tabarsy
3. Indian Diabetes Risk Score for Screening of Undiagnosed Diabetes...................................................................................13
Individuals of Eluru City, Andhra Pradesh, India
Chandrasekhar Vallepalli, K Chandra Sekhar, U Vijaya Kumar, P G Deotale
4. Awareness and Predictors of PCOD among Undergraduate Students ..............................................................................18
CAnn Mary Nelson, Lekha Viswanath, Anju Philip T
5. The Effectiveness of Mindfulness on the Reduction of Anxiety...........................................................................................23
and Depression of Divorced Women
Yasamin Hojatifar, Mina Hosein Zadeh, Fariborz Dortaj
6. A Study on Clinical Profile and Trend in Suicide Attempters in Psychiatry Consultation...............................................28
D Naveen Kumar
7. A Study of Organo-phosphorous Compound Poisoning with Reference to....................................................................33
Blood Sugar and Pseudocholinesterase Levels
Nithinkumar S Kadakol, Sunilkumar S Biradar, Smitha M, Mallikarjun KBiradar
8. Prevalence of Intestinal Parasitic Infections in School Going Children in...........................................................................37
Rural Areas of Hapur District, UP, India
KamyaVerma, Krati R Varshney, Sanjeev Dimri, S P Garg
9. Study of Osteoporosis in Women of Malwa Region of Punjab............................................................................................41
Veerendra Choudhary
10. The Effectiveness of Mindfulness-Based Group Therapy on Reducing Internet...............................................................44
Addiction and Increasing the General Health of Adolescent Girls
Nasrin Rahimi Shadbad
11. Role of Social Support and Coping Styles in Mental Health of Women Who Apply for Divorce..................................49
Farhad Asghari, Hajar Ramazannia
Contents
Volume9,Number4 April2018
II
13. Reproductive Health Problems Associated with Thyroid Disorders among Health Science Students 64Nitin Joseph, Aditya Reddy GR, Vishakha Patel, Divya Joy, Pooja Santhosh, Shatarupa Das, K. Siddharth Reddy
14.EffectivenessofShortMessageService(SMS)InterventionforPromotingSafeSexamong Army Conscripts in a Province in Thailand ................................................................................................ 69
P. Eaimkhong, U. Perngparn
15. Work Life Balance among IT Industry-An Empirical Study ...................................................................... 75R. Amutha
16.EffectivenessofGooseberryJuicewithHoneyandGuavaJuicewithHoneyComparedwithControl on Physiological Parameters among Adolescent Girls Studying in Selected Schools ................................ 79
R. Reeta, R. Vijayaraghavan, Rajeswari Vaidyanathan
17. A Study on Knowledge, Attitude and Practice on the Usage of Edible Salt among the Population in an Urban Area ....................................................................................................................... 85
A Revanth Kumar, N Partha Sarathy, Chandrasekhar Reddy B, M. Ravikiran
18.AProspectiveStudyofClinicalProfileandRoleofFiberOpticBronchoscopyinPatientswith Sputum Negative for AFB with Undiagnosed Lung Lesions in Chest X-Ray ........................................... 91
Rajesh B P, Saroja C Kamatar, Vijay kumar
19.RandomizedControlStudyofFoleyBulbandVaginalMisoprostolComparedwithVaginal Misoprostol alone in Induction of Labour .................................................................................................. 96
Ashwini M N, Saroja C Kamatar, Deepika Mann
20.IodineDeficiencyDisorderinRuralPopulation:ACommunityBasedObservationalStudyon PrevalenceinCoastalAreaofTamilNaduState,SouthIndia..................................................................100
Senthilvel Vasudevan, Priyankaraj CK, Sumathi Senthilvel, Jayanthi Sureshbabu
21. The Study of the Relationship between Normative and Informative Identity Styles with DifferentiationofSelfandPsychologicalWell-beingoftheStudents......................................................106
Parvin Ghader, Fatemeh Moradi
22.StudyofManagementProgrammesin“BenignParoxysmalPositionalVertigo”.....................................112Shilpi Jindal, Rajendra Sharma
23. Knowledge and Attitude about Internet Resources among Physiotherapy students in Mangalore 116Vijay Kumar. K, Shreekanth D. Karnad
24.StudyofCorrelatesofInfertilityamongFemalesAttendingInfertilityClinicinTertiaryCareCentre 120Shweta N. Salphale, Vinod D. Mundada, Ganesh S. Lokhande, B. M. Kuril, Mohan K. Doibale
25.Depressionandit’sRiskFactorsamongPatientsWaitingforSolidOrganTransplantation Attending Selected Units of a Tertiary Hospital, Kochi ............................................................................ 124
Sreedevi PA, Shiney William, Shania Mathew, Sandhya P Sudhakar
26.ExploratoryStudyonExperienceofDomesticViolenceamongWomen.................................................129Raveesh Kaimal, Sreedevi P. A., Febu Elizabeth joy
27.EffectofQualityofAntenatalCareandPerinatalandPostnatalOutcomesamongWomenAvailing Routine Antenatal Services in a Primary Health Care Setting in a Rural Area of South India 135
Avita Rose Johnson, Surekha A, Suguna A, Twinkle Agrawal, Naveen Ramesh, SulekhaThimmaiah
28. Noncompliance and its Contributing Factors among Patients with Tuberculosis ..................................... 141Thanu K. M., Maya M. S., Nimmi Francis
III
29. The Determinants of Safety Behavior in Hospital .................................................................................... 147Tri Martiana, Suarnianti
30.RelationshipBetweenNutrition,SocioeconomicStatusandFitnessinElementarySchoolChildren: A Review of the Literature ....................................................................................................................... 154
Kshitija Patki, Barkha Bhatnagar, Raju K. Parasher
31.AStudyofCoffeeAddictionintheMedicalCollege,EngineeringStudentsandin GeneralPopulationofinandaroundPondicherry...................................................................................160
E.Prabhakar Reddy, R.Senthil Kumar, S.Arun, R.Srikumar, R.Chidambaram
32. Biological War and Chemical Warfare-Status of AIDS ............................................................................ 165T. Mohana Lakshmi, B. Sai Ravi Kiran, E Prabhakar Reddy
33.EvaluationofTotalandConjugateBilirubinLevelsBeforeandAfterPhototherapy...............................170E. Prabhakar Reddy, B. Muthukumaraswamy, S. Paneerselvam, B. Sai Ravi Kiran
34. Macronutrient Status in Children Aged 1-6 Years in and around Pondicherry ......................................... 174E. Prabhakar Reddy, R. Geetharani, K. M. Roop Kumar, T. Mohana Lakshmi, Rajini
35. EvaluationofVitaminAandELevelsinChronicRenalFailure.............................................................179Salma Mahaboob, R. Geetharani, T. Mohana Lakshmi, E. Prabhakar Reddy
36. TenderCoconutWaterUses,HealthBenefits,GoodNutritiveValueandAntioxidantCapacity.............184E. Prabhakar Reddy, K. M. Roop kumar, T. Mohana Lakshmi, Sai Ravi Kiran
37. The Strategy in Improving Quality of Health Services for Patient Satisfaction in CommunityHealthClinic(Puskesmas)NorthJayapura,JayapuraCity...................................................189
Vince Tebay
38.EffectofNutritionPeerCounselingandBreastfeedingtheImprovementinExclusiveBreastfeeding and Infant Nutrition Status in Sub LubukPakam and TanjungMorawa, Deli Serdang ................................ 194
Mahdiah, Albiner Siagian, Evawany Y Aritonang, Namora Lumongga Lubis
39. RelationshipofEmployeeEthnicBackgroundinValidationofSituationalLeadershipTheory.............200Fitriani, Philipus Betaubun, Ermelinda A.G. Pure, Dedy Tikson, Edoardus E. Maturbongs, Theresia Widi asih Cahyanti, Ruloff Fabian Waas
40.TheNewSpesiesAnopheles aitkeniastheThreatofMalariainIndonesia..............................................206Mursid R, Yusniar HD, Praba G
41. Self-Care Activity Determination of Diabetes Mellitus Type-2 Patient in Labuang Baji Hospital ........... 211Ida Leida Maria, Natalia Paskawati Adimuntja, Ridwan Thaha, Nurhaedar Jafar
42. The Keiki Formation and the Flowering of Pseudobulb of Dendrobium johannis Rchb. f. ...................... 216Ni Luh Sri Suryaningsih, La Hisa, Amelia Agustina Limbongan
43.RiskAnalysisofDengueFeverOccurrenceinBoneProvinceSulawesiSouthUsing Temporal Spatial Geostatistical Model ..................................................................................................... 221
Stang Abdul Rahman, Amran Rahim, Anwar Mallongi
44. Analysis of Risk on the Incidence of Scabies Personal Hygiene in Boarding School Darul Arqam Gombara Makassar .............................................................................................................. 227
Anwar Mallongi, Ayu Puspitasari, Muhammad Ikhtiar, Arman, Arsunan, A. A.
IV
45. Feasibility Analysis of Facilities and Hygiene Workers and Firms in UPTDCattleSlaughterofKendariCityin2017......................................................................................232
Yusuf Sabilu, Jafriati, Farit rezal, Andi Faisal Fachlevy, Fifi Nirmala, La Ode Ahmad Saktiansyah, Syawal Kamiluddin Saptaputra
46. Behavior of Tuberculosis Pulmonary Disease Prevention in South Sulawesi, Indonesia ......................... 238Herman, Edi Sukamto, Syahida Djasang
47. Evaluation of Irrigation Performance in Semangga, Merauke Regency, Indonesia .................................. 243Yosehi Mekiuw, Diana Sri Susanti, Jayadi
48.EffectivenessofNonPharmacologicTherapythroughSurveillanceApproachto Blood Pressure Degradation in Primary Hypertension Patients, Indonesia .............................................. 249
Masriadi, Rahmawati Azis, Eha Sumantri, Anwar Mallongi
49. Expression of Foxp3 mrna on Preeclampsia with Adaptation Theory 256Yudit Patiku, Rosdiana Natzir, Mochammad Hatta, AriyantiSaleh, EllySyattar, YusminaHala, Salmah Arafah
50.LivedExperiencesofPatientswithChronicObstructivePulmonaryDiseases(COPD)-Qualitative Review 262Flavia Castelino, Mukhyaprana Prabhu, Mamatha Shivananda Pai, Asha Kamath, Aswini K Mohapatra, Elsa Sanatombi Devi
51. Worker Personality as a Predictor in Compliance Model on Work Safety Regulations ........................... 266Hadi Prayitno, Heru Santoso Wahito Nugroho
52.EffectivenessofMindfulnessBasedCognitiveTherapy(MBCT)onSelf- EfficacyEnhancementoftheWarWounded.............................................................................................271
Mohammad Ebrahim Hokmabadi, Abbas Kalantar, Mohammad Javad Asghari Ebrahimabad, Sepideh Rezapoor Lakani, Hossren Khosroshahi, Shamim Razaghi Kashani, Seyed Mohammad Mahdi Moshirian Farahi
53. Age Related Changes in Proximal Femoral Morphometry: A Cross Sectional Study on EsternOdishaPopulation..........................................................................................................................277
Lopamudra Nayak, Pratima Baisakh, Susmita Senapati, Prafulla Kumar Chinara
54.EffectivenessofanAwarenessProgrammeonExclusiveBreastfeedingforthe ASHA Workers of Udupi District .............................................................................................................. 282
Shashidhara YN, Ansuya, Celastin, Anice George
55. Increasing Inpatient Service Quality of Using Quality Function Deployment Method in Nene Mallomo Hospital of Sidrap Regency, Indonesia ............................................................................ 287
Darmawansyah, Muhaiminah Said, RahmatiaYunus, Sukri Palutturi
56. Determination of Birth Weight from Placental Morphometry .................................................................. 292Senapati Susmita, Shashi Shankar behera, Lopamudra Nayak, Prafulla kumar chinara
57. Testing the Level of Awareness on Testicular Cancer among the UAE Residents ................................... 296Elizabeth Topolskaya, Iqra Ghani, Jessica D’Silva, Abdulrahman Abdulwahab, Siraj AlAbayechi, Rami El Khatib
58.ImprovingNursingResearchReporting:AGuidetoReportingGuidelines.............................................301Renjulal Yesodharan, Vishnu Renjith, Tessy Treesa Jose
59. AThreeYearReviewofUterineRuptureinTertiaryHospital:LessonsforObstetricCare....................307Parveen Rajora, Amanjot Rajpal
60.SensoryMotorStimulationandWeightGainamongPretermNewborns.................................................312Maheswari.G., N. Ganapathy, Radha Kumar
61.IsReallyPrefeedingSensoryMotorStimulationshadSignificantImpactonFeeding Parameters in Premature Infants?–An Evidence Based Report ................................................................ 315
Maheswari.G., N. Ganapathy, Radha Kumar
62. A Study to Assess Functional Assessment and Lived Experiences of Cervical Cancer Patients Admitted to a Tertiary Level Hospital of Udupi District, Karnataka-a Mixed Method Protocol .............. 321
Sonia R.B D’Souza, Ranjani P, Sweety Fernandes, Pratibha, Judith Noronha, Sushmitha Karkada, Shoba Kamath
63.InfluencePerceivedBenefitandPerceivedSelfEfficacywithIntentionof Adolescent Girls in Consuming FE Tablet ................................................................................................ 326
Faradina Nur Annisa, Ira Nurmala
64. The Level of Environmental Sanitation and the Incidence of Tuberculosis in JemberandSitubondo,Indonesia..............................................................................................................330
Isa Ma’rufi, Abu Khorir, Khaidar Ali, Heru Santoso Wahito Nugroho
65.AnalysisofInterestintheFirstHealthFacilitytoReferPatientstoJombangGeneralHospitalas AdvanceHealthFacilityandtheInfluenceFactors...................................................................................336
Sandu Siyoto, Rosa Indrawati
A Study of Perception and Motives Towards Participation in Clinical Research in India
Amit Marwah1, Neyaz Ahmed2, Nidhi2, Rajesh Ranjan3, Mitasha Singh4, Ranabir Pal5
1Adjunct Professor, 2Department of Centre for Translational and Clinical Research, Faculty of Science and Dept. of Pharmacology, Faculty of Pharmacy, Jamia Hamdrad, New Delhi-110062; 3Associate Professor,
4Assistant Professor, 5Professor and Head, Department of Community Medicine, ESIC Medical College and Hospital, Faridabad, Haryana- 121001
AbSTRACT
background: Clinical trials involving healthy volunteer studies can be considered to be a double edged sword. Increased participation from developing countries raises various ethical queries.
Objective: To explore the perception and motivating factors toward participation in bioavailability and bioequivalence (BA/BE) studies.
Methodology: Healthy volunteers (200) within the age group 18-45 years who signed the informedconsent and underwent screening procedure with the intention to participate in BA/BE studies at Clinical Pharmacologyunit,MajeediaHospital,JamiaHamdard,NewDelhiwereincludedinthestudy.
Results: Therandomlyselected200healthyvolunteersreportedthathealthbenefitswerethemajorreasonfor participating in the studies (57.5%). The perception about the outcome of these clinical trials was positive among all the volunteers, with 47.5 percent believing that safe medicines will be produced through these experiments. Majority of the participants (76%) had earlier participated in healthy volunteer studies.
Conclusion: Increasing proportion of professional volunteers needs a check. Due consideration needed to consider the motivating factors for recruiting participants in future trials.
Keywords: motives and perception, BA/BE studies, trials, India, healthy volunteer
Corresponding Author:Dr. Rajesh RanjanAssociate Professor, Department of Community Medicine,ESIC Medical College and Hospital,Faridabad,Haryana-121001Ph: 9212736852Email: [email protected]
INTROduCTION
Clinical trials most commonly evaluate new drugs, medical devices, biological, or other interventions on patientsinstrictlyscientificallycontrolledsettings,andare required for their regulatory authority approval. Trialsmaybedesignedtoassessthesafetyandefficacyof an experimental therapy, to evaluate whether the new intervention is better than standard therapy and to compare the efficacy of the two standard ormarketedinterventions.1
The advantages to conducting clinical trials in India are availability of large, multiethnic, and multiracial patient population patients, rapid patient recruitment, spectrum of diseases are similar to or exceed rates seenintheWestanddrugcompaniescansaveupto60percent by conducting trials in India as compared to the West. It is estimated that one in four clinical trials in the world are now conducted in India.2
Clinical research studies on healthy subjects are of fundamental importance in drug development process as healthy volunteer studies are used to investigate certain aspects of kinetics i.e. Bioavailability/Bioequivalence (BA/BE)andeffectsofdrugsinthehumanbodyandinthe target population. BA/BE is a strategy to produce generic equivalents of innovator drugs to lower the cost of medication through proper assessment as per
DOI Number: 10.5958/0976-5506.2018.00245.0
2 Indian Journal of Public Health Research & Development, April 2018, Vol.9, No. 4
applicable Drugs Controller General of India (DCGI). At the same time, clinical trial for a drug is normally done by one company on certain number of volunteers, whereas BA/BE studies are being done by any company which wants to develop this drug as generic version all across the globe, which necessitates huge number of volunteers to be exposed.3
In view of this, a study was planned with the objective of exploring the perception and motivating factors toward participation in clinical research including bioavailability and bioequivalence (BA/BE) studies.
MeThOdOlOgy
This cross-sectional exploratory study on volunteers participating in a contract research organization of Delhi dealing with BA/BE studies using convenience sampling . The study was conducted in a case study mode using simple random sampling on volunteers who are found healthy after undergoing\ screening procedure with the intention to participate in BA/BE studies at Clinical Pharmacologyunit,MajeediaHospital,JamiaHamdard,New Delhi. Healthy volunteers within the age group 18-45 years who signed the informed consent were includedinthestudy.Usingrandomnumbertable,200volunteers participating in the current studies (for the year2012-13)wereselected.Primarydata was collected from volunteers using semi-structured confidentialschedule in vernacular language (Hindi). Data collected overaspecifiedtimeperiodofoneyearfromFebruary2012 through January 2013. IEC approval was taken from JHIEC.A questionnaire consist of 12 questionsand is derived from the questionnaire used by Luis Almeida(2007)5andVanGelderin(1993)8.
ReSulTS
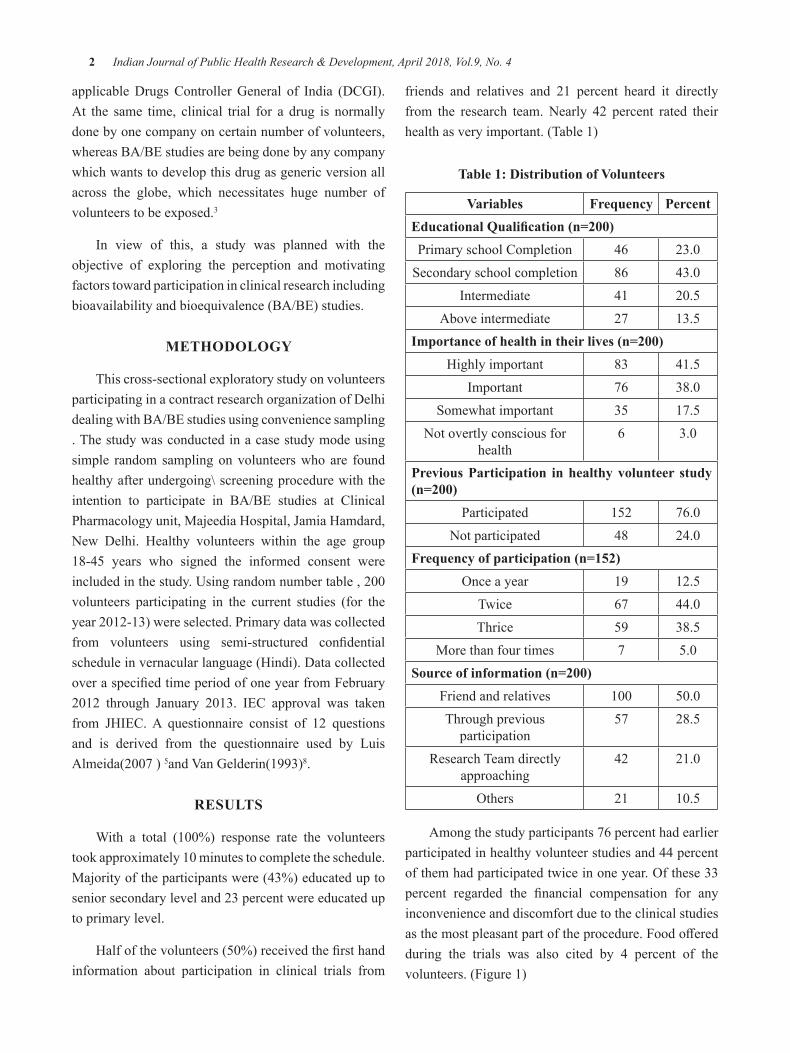
With a total (100%) response rate the volunteerstookapproximately10minutestocompletetheschedule.Majority of the participants were (43%) educated up to senior secondary level and 23 percent were educated up to primary level.
Halfofthevolunteers(50%)receivedthefirsthandinformation about participation in clinical trials from
friends and relatives and 21 percent heard it directly from the research team. Nearly 42 percent rated their health as very important. (Table 1)
Table 1: distribution of Volunteers
Variables Frequency PercentEducational Qualification (n=200)Primary school Completion 46 23.0
Secondary school completion 86 43.0Intermediate 41 20.5
Above intermediate 27 13.5Importance of health in their lives (n=200)
Highly important 83 41.5Important 76 38.0
Somewhat important 35 17.5Not overtly conscious for
health6 3.0
Previous Participation in healthy volunteer study (n=200)
Participated 152 76.0Not participated 48 24.0
Frequency of participation (n=152)Onceayear 19 12.5
Twice 67 44.0Thrice 59 38.5
More than four times 7 5.0Source of information (n=200)
Friend and relatives 100 50.0Through previous
participation57 28.5
Research Team directly approaching
42 21.0
Others 21 10.5
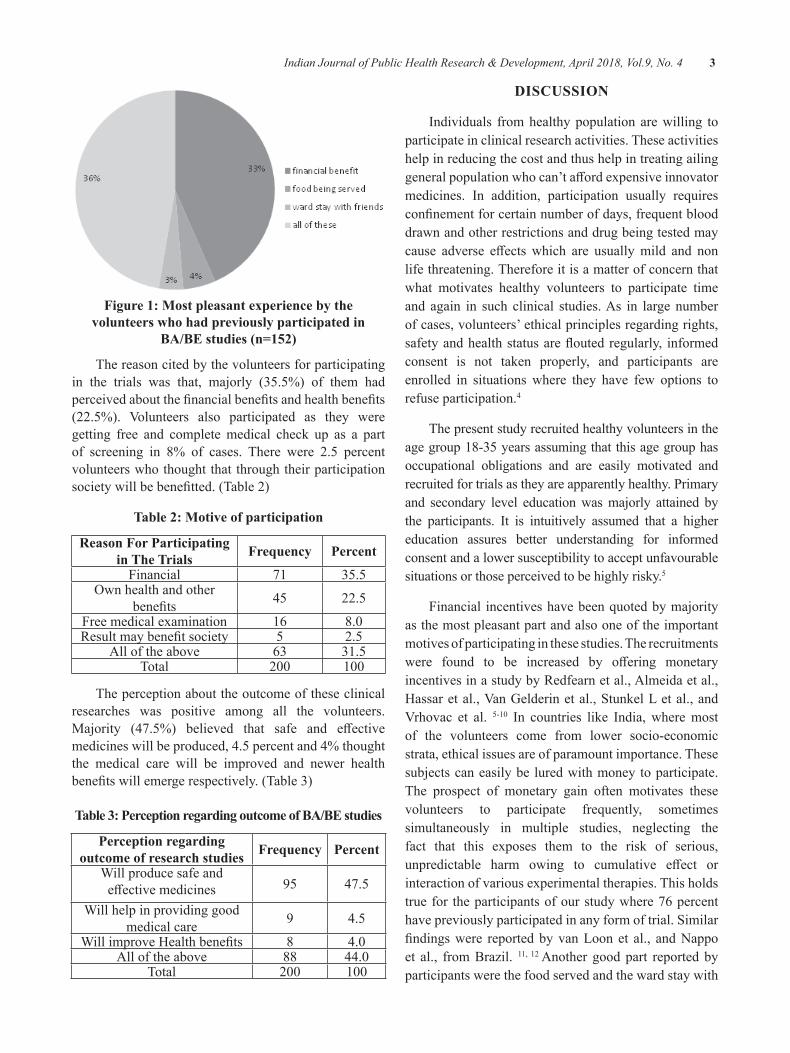
Among the study participants 76 percent had earlier participated in healthy volunteer studies and 44 percent ofthemhadparticipatedtwiceinoneyear.Ofthese33percent regarded the financial compensation for anyinconvenience and discomfort due to the clinical studies asthemostpleasantpartoftheprocedure.Foodofferedduring the trials was also cited by 4 percent of the volunteers. (Figure 1)
Indian Journal of Public Health Research & Development, April 2018, Vol.9, No. 4 3
Figure 1: Most pleasant experience by the volunteers who had previously participated in
BA/BE studies (n=152)
The reason cited by the volunteers for participating in the trials was that, majorly (35.5%) of them had perceivedaboutthefinancialbenefitsandhealthbenefits(22.5%). Volunteers also participated as they weregetting free and complete medical check up as a part of screening in 8% of cases. There were 2.5 percent volunteers who thought that through their participation societywillbebenefitted.(Table2)
Table 2: Motive of participation
Reason For Participating in The Trials Frequency Percent
Financial 71 35.5Ownhealthandother
benefits 45 22.5
Free medical examination 16 8.0Resultmaybenefitsociety 5 2.5
All of the above 63 31.5Total 200 100
The perception about the outcome of these clinical researches was positive among all the volunteers. Majority (47.5%) believed that safe and effectivemedicines will be produced, 4.5 percent and 4% thought the medical care will be improved and newer health benefitswillemergerespectively.(Table3)
Table 3: Perception regarding outcome of bA/be studies
Perception regarding outcome of research studies Frequency Percent
Will produce safe and effectivemedicines 95 47.5
Will help in providing good medical care 9 4.5
WillimproveHealthbenefits 8 4.0All of the above 88 44.0
Total 200 100
dISCuSSION
Individuals from healthy population are willing to participate in clinical research activities. These activities help in reducing the cost and thus help in treating ailing generalpopulationwhocan’taffordexpensiveinnovatormedicines. In addition, participation usually requires confinementforcertainnumberofdays,frequentblooddrawn and other restrictions and drug being tested may cause adverse effectswhich are usuallymild and nonlife threatening. Therefore it is a matter of concern that what motivates healthy volunteers to participate time and again in such clinical studies. As in large number of cases, volunteers’ ethical principles regarding rights, safetyandhealthstatusarefloutedregularly, informedconsent is not taken properly, and participants are enrolled in situations where they have few options to refuse participation.4
The present study recruited healthy volunteers in the age group 18-35 years assuming that this age group has occupational obligations and are easily motivated and recruited for trials as they are apparently healthy. Primary and secondary level education was majorly attained by the participants. It is intuitively assumed that a higher education assures better understanding for informed consent and a lower susceptibility to accept unfavourable situations or those perceived to be highly risky.5
Financial incentives have been quoted by majority as the most pleasant part and also one of the important motives of participating in these studies. The recruitments were found to be increased by offering monetaryincentives in a study by Redfearn et al., Almeida et al., Hassaretal.,VanGelderinetal.,StunkelLetal.,andVrhovac et al. 5-10 In countries like India, where most of the volunteers come from lower socio-economic strata, ethical issues are of paramount importance. These subjects can easily be lured with money to participate. The prospect of monetary gain often motivates these volunteers to participate frequently, sometimes simultaneously in multiple studies, neglecting the fact that this exposes them to the risk of serious, unpredictable harm owing to cumulative effect orinteraction of various experimental therapies. This holds true for the participants of our study where 76 percent have previously participated in any form of trial. Similar findingswere reportedbyvanLoonet al., andNappoet al., from Brazil. 11, 12 Another good part reported by participants were the food served and the ward stay with
4 Indian Journal of Public Health Research & Development, April 2018, Vol.9, No. 4
friends and family. This has also been discussed by Shah et al., for countries like India where even if the trial does notofferanymonetarycompensation,thefreecareandtreatment serves as a strong attraction for patients who otherwisecannotaffordthecostoftreatment.13
Very few also reported benefit to society as amotivatingfactorincontrasttoJoshietal.,whopresenteda significant number citing the same.14 Altruistic motivations have emerged as a new theme through the meta analysis on the volunteers of clinical trials with theaimofbenefitingailingpatientsaroundtheworld.5 Theparticipantsgotbenefittedfromtheprovisionoffreehealth check up and satisfaction of having contributed towards as a whole (conditional altruism) whereas altruism was not a common motivator and when it was mentioned it was never the primary reason.5
Source of information reported by majority was word of mouth through friends and relatives. However previous participation has lured many to participate again in these trials. Thus, measures are needed to discourage undue participation by healthy volunteers to protect their health. To check this, it might be suggested to maintain a nationwide biometrics based Volunteerdatamanagementsystem(VDMS)similartotheinternetbased central register that is used by most phase I units in the United Kingdom. This central registry, called The Over- Volunteering Prevention System (TOPS)15
requiresthephaseIunitstofirstregisterwithachosenusername and password, and then to provide certain personal data for each volunteer participating in a study, such asfingerprints, anddate of last dosing forthat subject. These data are then stored on the registry as the registration history of the volunteer and can be looked up by any registered user to check if a particular volunteer is available for a study.16
Free medical checkup has been a driving factor to participateinthesetrialsbymajority.Thisfindingwasconfirmedbyameta-analysisofIndianstudiesbyShahet al. 13Personalhealthbenefitsasamotivetoparticipatehas been reported by 47 percent Indians in a meta-analysisandour studyconfirms thismotivewithevenhigher prevalence of 57.5 percent.13Personalbenefitisanatural human tendency for any important decisions like participation in a clinical trial.17
Oneofthelimitationsofourstudycouldbereportingbias by the volunteers who have participated earlier in the trials and present with socially desirable responses.
Repeated participation (76% in our analysis) of healthy volunteer in clinical research raises ethical consideration. The unsound research is wasteful, if this research places volunteers at risk, and then it is itself unethical. In case of drug research, simultaneous or repeat participation might be a safety issue as the risk of drug interactions could increase substantially with repeat volunteers may be harmed if there is inadequate time between two trials.18 Multiplying the number of investigational drugs absorbed by a subject over short time can considerably increase the risk of drug reaction and of severe adverse drug reaction.19 To conclude financialgainsandhealthbenefitsarethemajordrivingfactors for healthy volunteer study. Also more and more healthy volunteers are tempted to re-participate in trials for which they are usually paid for their time and inconvenience. These are the people who are labeled as ‘professional volunteers’.17,20
It is high time when the government needs to protect the ethical issues related to participants in BA/BE studies initiatives and guidelines should be made to avoid participation from illiterate low income group of society. To disseminate information so that unbiased participation can be ensured for all strata of society nationwide networking of research centre should be done to avoid their frequent participation. This being a two way process we also need to understand the motives and attitude of the volunteers participating in these trials before blaming the authorities. The better way to keepvolunteersmotivatedistofirstprovidethemwithoptimum information about ins and outs of the research study and a personal approach towards the volunteers during the trial.
Strengths of the study: Oneof thepioneer studies inthis under researched topic.
limitations of the study: Single centre study and less sample size due to single researcher and time constraint
Future directions of the study: Multi centre, multi city study to be conducted
CONCluSIONS
The healthy volunteers willing to participate in clinical trials are motivated by variety of reasons, among them financial motive was the primary. Significantnumber of participants are young aged. Many of the volunteers participating time and again. Showing that
Indian Journal of Public Health Research & Development, April 2018, Vol.9, No. 4 5
they are utilising this option as a regular and easy means of income
Recommendations: IEC strategies to be strengthened so that volunteers from all kinds of socio Demographic strata should participate
Conflict of interests: NoConflictofinterest
Source of Funding: Self
ethical Clearance/IeC Approval: Approved by JHIRB(Letterattached)
ReFeReNCeS 1. ICH Harmonised Tripartite Guideline. Guideline
for Good Clinical Practice E6 (R1). Proceedings of International Conference on Harmonisation of Technical Requirements for Registration of PharmaceuticalsforHumanUse;2005.[Online][cited2017Jun30]Retrievedfrom:http://www.ich.org
2. Poongothai S, Unnikrishnan R, Balasubramanian J, Nair MD, Mohan V. Why are clinical trialsnecessary in India? Perspectives in Clinical Research.2014;5(2):55-59.
3.Clinical research Organisation – registration.2009[Online][cited2017Jun30]Retrievedfrom:http://cdsco.nic.in/schedule%20y1%20_cro_.pdf
4. Clinical trials in India: ethical concerns. Bulletin of the World Health Organization.[Internet]2008. [cited 2017 Jun 30] ; 86(8) : 577-656.Available from: http://www.who.int/bulletin/volumes/86/8/08-010808/en/index.html
5.AlmeidaL,AzevedoB,NunesT,VazdaSilvaM,Soares da Silva P. Why healthy subjects volunteer for Phase I studies and how they perceive them participation? Eur J Clin Pharmacol. 2007; 63:1085-94
6. Redfearn S.Knowledge of trial process can drive awayvolunteers.2011Jan.10[Online][cited2017Jun27]Retrievedfrom:http://www.centerwatch.com/news-online/article/1025
7. Hassar M, Pocelinko R, Weintraub M, Nelson D, Thomas G, Lasagna L. Free living volunteer’s motivations and attitudes toward pharmacologic studies in man. Clin Pharmacol Ther. 1977; 21:515-9
8.VanGalderinCEM,SavelkoulTJF,vanDokkumW, Meulenbelt. Motives and perceptions of healthy volunteers who participate in experiments. EurJClinPharmacol.1993;45:15-21
9.Vrhovac R, Francetic I, Rotim K. Drug trialson healthy volunteers inYugoslovia. Int J ClinPharmacolTher1990;28:375-9
10.Stunkel L , Grady C. More than the money: areview of literature examining healthy volunteer motivations.ContempClinTrials.2011;32:342-52
11.VanLoonK,LindeggerG. Informedconsent inclinical trials: Perceptions and experiences of a sample of South African researchers’. Health SA Gesondheid.2009;14(1):463
12. Nappo SA, Lafrate GB, Sanchez ZM. Motives for participating in a clinical research trial: a pilot studyinBrazil.BMCPublicHealth.2013;13:19
13.Shah JY, Phadtare A, Rajgor D, Vaghasia M,Pradhan S, Zelko H, et al. What Leads Indians to Participate in Clinical Trials? A Meta-Analysis of QualitativeStudies.Plosone.2010;5(5):e1073
14.JoshiVD,OkaGA,KulkarniAA,BivalkarVV.Public awareness and perception of clinical trials: Quantitative study in Pune. Perspect Clin Res. 2013;4(3):169-74
15.BoyceM,WaltherM,NentwichH,KirkJ,SmithS,WarringtonS.TOPS:aninternetbasedsystemto prevent healthy subjects from over-volunteering for clinical trials. European Journal of ClinicalPharmacology.2012;68(7):1019-24.
16. Roberson NL. Clinical trial participation: Viewpoints from racial/ethnic groups. Cancer.1994; 74: 2687-91.
17. Royal College of Physicians. Research on healthy volunteers. A report of the Royal College of Physicians.JRCollPhysicians.1986;20:3-17
18. Tishler CL, Bartholomae S. Repeat participation among normal healthy research volunteers: professional guinea pigs in clinical trials? Perspect BiolMed.2003;56:508-20
19. Tishler CL, Bartholomae S. The recruitment of normal healthy volunteers: a review of literature on theuseoffinancialincentives.JClinPharmacol.2002;42:365-75
20.AssociationoftheBritishPharmaceuticalIndustry.Guidelines for phase 1 clinical trials. Association of theBritishPharmaceuticalIndustry,London;2007
Assessment of Knowledge Regarding Post exposure Prophylaxis Following Needle Stick Injury among
b. Sc. Nursing Students
Anjana A. P.1, gisha Joseph2, Revathy A.Valsan2
1Assistant Professor, 2Post Basic B. Sc Nursing Students, Amrita College of Nursing, Amrita Vishwa Vidyapeetham, Kochi, Kerala
AbSTRACT
Needle stick injuries constitute a major hazard for the transmission of viral diseases such as Hepatitis B, HepatitisC,andHIV.Intheclinicalsettings,lackofclinicalexperienceandinsufficientattentiontopersonalsafety put nursing students at high risk for occupational exposure to blood borne pathogens through needle stick injuries and sharp injuries. The purpose of the study was to determine the knowledge regarding post exposure prophylaxis (PEP) following needle stick injuries among B.Sc. Nursing students.
Materials and methods: The research design adopted for the study was descriptive design. The study was conducted among 134 B.Sc. Nursing students using convenience sampling technique. The data were collected using semi structured knowledge questionnaire and analyzed by using descriptive and inferential statistics with the help of SPSS package.
Results: The results revealed that out of 134 respondents 125(93%) had an average knowledge regarding post exposure prophylaxis following needle stick injury, and also revealed that there is no significantassociation between level of knowledge regarding PEP following needle stick injury with demographic variables.RegardingstudentsknowledgeondifferentvariablesonPEPfollowingneedlestickinjurytheyhave a good knowledge on prevention, average knowledge regarding meaning and risk factor of needle stick injuries and the lowest mean score in the area of management and complications of PEP.
Conclusion:Basedonthefindingsofthestudy,itisconcludedthatthenursingstudentshaveanaverageknowledge regarding post exposure prophylaxis following needle stick injury. Further analysis revealed that student had least knowledge on areas like management and complications of PEP. Therefore there is a need for regular training and education to update the awareness and knowledge about post exposure prophylaxis whichservesasaneffectivestrategytopreventthespreadofbloodbornedisease.
Keywords: Knowledge, Post exposure prophylaxis, Needle stick injury, Nursing students.
Corresponding Author:Anjana A. P.Assistant Professor, Amrita College of Nursing,AmritaVishwaVidyapeetham,Kochi-41,KeralaMob.:9446586056E-mail:[email protected]
INTROduCTION
A needle stick injury is a percutaneous piercing wound typically set by a needle point, but possibly also by other sharp instruments or objects.1 Nursing students like any other health care workers who come into contact
with patients blood and body fluids may be exposedto fatal infections when they perform their clinical activities in the hospital. Nursing students are vulnerable to needle stick and sharp injuries as they start their work of patient care in the hospital from first year of theirtrainingcurriculumbecausetheymighthaveinsufficientbackground to recognize the level of risk that is posed by patients and insufficient knowledge about standardinfection control principles for blood borne pathogens.2
Post exposure prophylaxis refers to comprehensive medical management to minimize the risk of infection among health care personnel following potential
DOI Number: 10.5958/0976-5506.2018.00246.2
Indian Journal of Public Health Research & Development, April 2018, Vol.9, No. 4 7
exposuretobloodbornepathogens(HIV,HBV&HCV).This includes counselling, risk assessment, relevant laboratory investigations based on informed consent of thesourceandexposedperson,firstaidanddependingonthe risk assessment, the provision of short term (4weeks) of antiretroviral drugs, with follow up and support.3
There are evidences which shows that there was an information gap in the health care setups regarding PEP. For example, a study conducted in London indicated that only22%ofdoctorsidentifiedallthethreedrugsthatarerecommended. A study conducted in Ethiopia, showed that 83.9% of total health care workers had inadequate knowledgeaboutPEPforHIVandamongtheexposedrespondents, 81.6% did not use PEP. In a study conducted in West Bengal among interns, 69.2% knew the basic regimen of PEP, 55.4% knew the expanded regimen of PEP and only 46.9% knew that PEP should be continued for 4 weeks.4
As there were inadequate studies done to evaluate the knowledge of PEP following needle stick injuries among nursing students in South India we sought to assess knowledge of nursing students towards PEP following needle stick injuries.
MATeRIAlS ANd MeThOd
Research Approach and design: Quantitative approach with descriptive research design was used for the study
Research Setting: The study was conducted in Amrita College of Nursing, Kochi.
Population
Target Population: All the B. Sc Nursing students of Amrita College of Nursing, Kochi
Accessible Population: Second and third year of B.Sc Nursing students of Amrita College of Nursing
Sample and Sampling Technique: Second and third year of B Sc Nursing students of Amrita College of Nursing was selected as samples. The sampling technique used for the study was convenience sampling technique. Sample size was calculated as 114.
data collection instruments: After an extensive review of relevant literature, a semi structured questionnaire was developed. Tool consists of two section. Section I: socio- demographic data which consists of 11 items
and section II consists of knowledge questionnaire comprised of 20 items. Content validity of the semistructured questionnaire was determined through a panel of experts. Reliability of the tool was computed by split half method.
Procedure for data collection: The ethical clearance was obtained from Thesis Review committee and Head of the Institution for conducting the study. Purpose of the study was explained and an informed consent was obtained from the samples. A pilot study was conducted to ensure the reliability of the tool, applicability of items and identify the obstacles and problems that may be encountered in data collection, this number were excluded from the studied sample. The data was analyzed using descriptive and inferential statistics.
ReSulTS ANd dISCuSSION
Sample characteristics based on socio demographic variables:
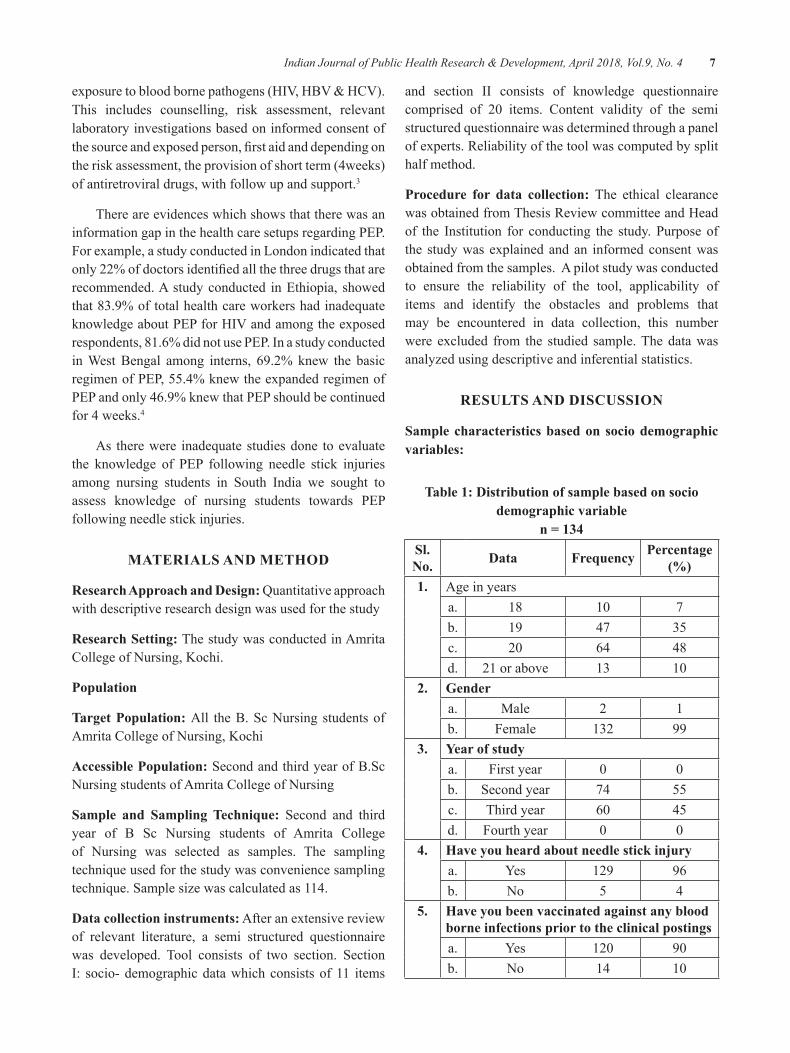
Table 1: distribution of sample based on socio demographic variable
n = 134Sl. No. data Frequency Percentage
(%)1. Age in years
a. 18 10 7b. 19 47 35c. 20 64 48d. 21 or above 13 10
2. gendera. Male 2 1b. Female 132 99
3. year of studya. First year 0 0b. Second year 74 55c. Third year 60 45d. Fourth year 0 0
4. have you heard about needle stick injurya. Yes 129 96b. No 5 4
5. have you been vaccinated against any blood borne infections prior to the clinical postingsa. Yes 120 90b. No 14 10
8 Indian Journal of Public Health Research & Development, April 2018, Vol.9, No. 4
Contd…6. have you ever experienced needle stick
injuriesa. Yes 19 14b. No 115 86
7. have you ever reported needle stick injuries to the supervisor
a. Yes 17(among 19) 89
b. No 2 118. do you have previous knowledge on post
exposure prophylaxisa. Yes 92 69b. No 42 31
9. have you ever got any training regarding infection control programme in the past 1 yeara. Yes 107 80b. No 27 20
10.do you had any training regarding the preventive measures of needle stick injury in the past 1 yeara. Yes 72 54b. No 62 46
11.Is Post exposure prophylaxis is, effective in preventing transmission of blood borne diseasesa. Yes 119 89b. No 15 11
Table 1 shows the distribution of samples based on socio demographic characteristics. Among the subjects majority of the subjects 64(48%) belongs to the age of 20 years and 132(99%) were females. Most of them129(96%) were heard about needle stick injury. Most of the subjects120(90%)werevaccinatedagainstbloodborneinfections. 19(14%) subjects had experienced needle stick injury and among them 17(89%) were reported. Majority of the subjects 92(69%) had previous knowledge on postexposureprophylaxisand107(80%)hadundergonetraining programme regarding infection control in the past one year. Most of the subjects 119(89%) agreed that post exposure prophylaxis is an effective in preventingtransmission of blood borne disease.
In contrast to this study a cross sectional study conducted by Prasuna J, Sharma R, BhattA,Arazoo,Painuly D, Butola H,Yadav A on occurrence and knowledge about needle stick injury in nursing students on2016inAbbottabad.Thestudyparticipantscomprisedof 83 nursing students studying in fourth year B.Sc Nursing and third year GNM. Students were questioned regarding their occurrence to needle stick injury (NSI) throughout their clinical training and measure taken following the exposure. The study among 83 nursing students includes 43(51.81%) GNM Third year and 40 (48.19%)B.ScNursing students.Out of a total 83students,75(90.36%)werefemales.TheoccurrenceofNSI during their course was reported by 33(39.76%) participants. The maximum NSI occurred during firstyear of course was 57.57%.It was found that 18(54.54%) of NSIs, were not reported. They concluded that a high incidence of needle stick injuries among nursing students with more under-reported cases and subjects were not aware of post exposure measure5
VaccinationisoneofthebestwaystoprotectHCW’Sfrom these blood borne pathogens but vaccination is availableonlyforHBV.Inourstudy90%studentswerefully vaccinated. In a study from Uttarakhand Garima M et al reported 64.3% of the students were vaccinated1
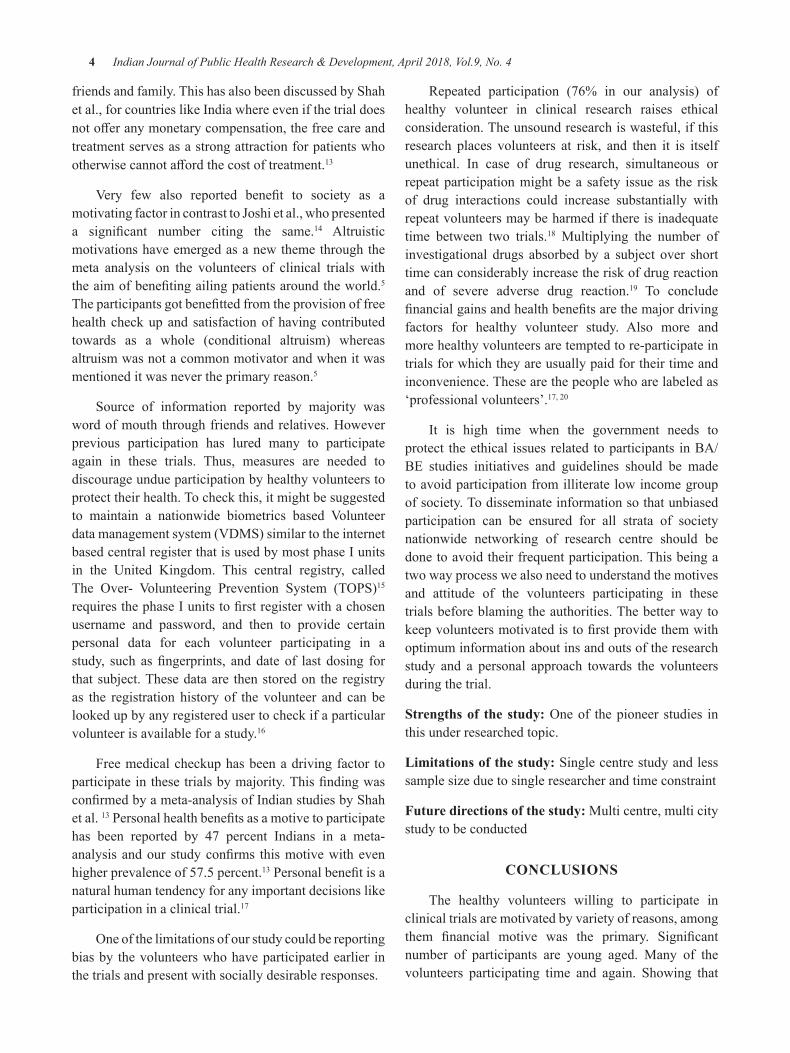
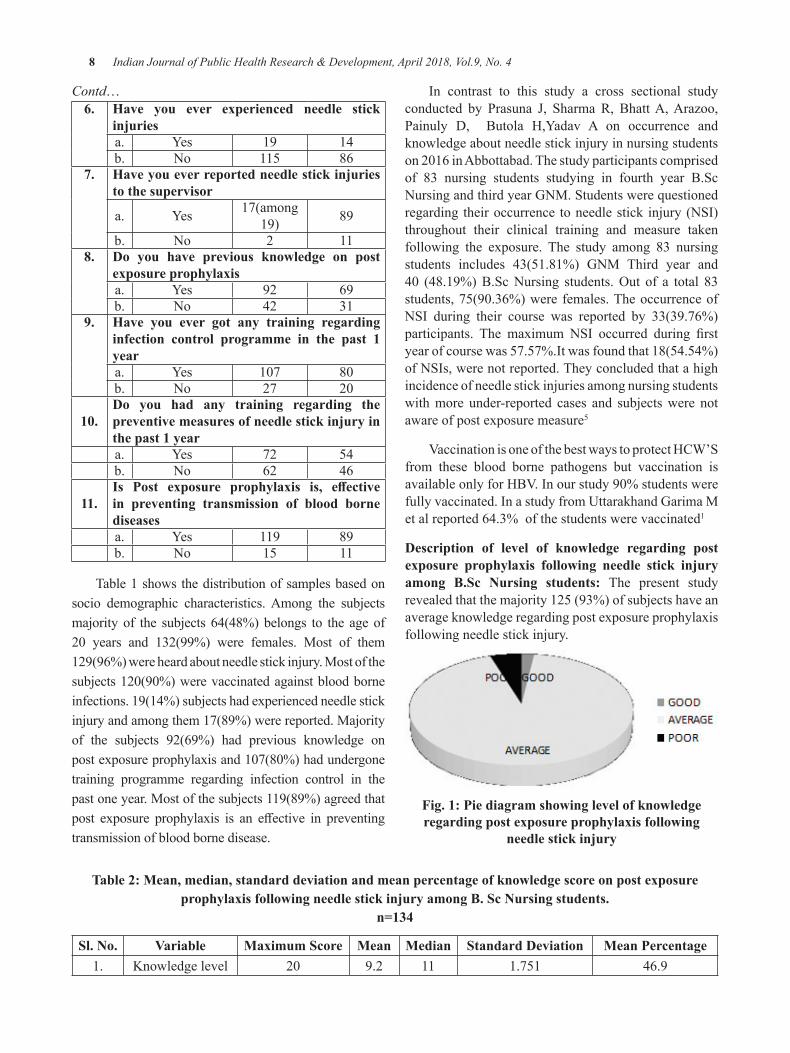
description of level of knowledge regarding post exposure prophylaxis following needle stick injury among b.Sc Nursing students: The present study revealed that the majority 125 (93%) of subjects have an average knowledge regarding post exposure prophylaxis following needle stick injury.
Fig. 1: Pie diagram showing level of knowledge regarding post exposure prophylaxis following
needle stick injury
Table 2: Mean, median, standard deviation and mean percentage of knowledge score on post exposure prophylaxis following needle stick injury among b. Sc Nursing students.
n=134
Sl. No. Variable Maximum Score Mean Median Standard deviation Mean Percentage1. Knowledge level 20 9.2 11 1.751 46.9
Indian Journal of Public Health Research & Development, April 2018, Vol.9, No. 4 9
Table 2 depicts the knowledge of nursing students regarding post exposure prophylaxis following needle stick injurywithamean scoreof10.611and standarddeviation of 1.751.The median value is 11 and mean percentagevalueiscalculated53.055.Thisindicatesthatthe subjects possess nearly average knowledge on post exposure prophylaxis following needle stick injury.
Table 3: Item wise analysis of knowledge score with respect to components
n = 134
Sl. No. Components
Maximum possible
scoreMean Mean
Percentage
1. Meaning 2 0.93 46.642. Risk factors 5 2.75 55.073. Prevention 3 2.51 83.834. Management 7 2.7 37.35. Complications 3 0.4 12
Regarding students’ knowledge on differentvariables on PEP following needle stick injury they have a good knowledge on prevention, average knowledge regarding meaning and risk factor of needle stick injuries and the lowest mean score in the area of management and complications of PEP.
AsimilarstudyconductedbyMajJilmyAnuJose,MadumitaNandi, SeemaMehra,Greeshma, JyothiK,Neha Tiwari, Kamalesh Verma, on February 2014 inPune, A study to assess the knowledge regarding post exposureprophylaxisforHIVinfectionamongnursingstudents of a selected medical college. A cross sectional study was conducted by using a structured questionnaire among 45 nursing students of a selected medical college. Structured questionnaire include demographic data and knowledge questionnaire on PEP. Knowledge were scored in to 4 groups of excellent, good, average and poor. Sample was selected by computer based random sampling technique and questionnaire administered to 45 students after taking informed consent. The researchers included second year, third year and fourth year B.Sc Nursing students, and found that the level of knowledge increases with the year of experience. The studyrevealedthat46.6%hadgoodknowledge,40%hadaverage knowledge and 13.4% had poor knowledge. The mean knowledge score of samples was 11.5 with SD+/-
2.16.Outoftotal91.1%ofsampleswereawareofriskof acquiring HIV infection on occupational exposureofblood.Outof45samplesonly15wereawareaboutprobability of acquiring HIV after getting exposed toneedlestickinjuryfromHIVpositiveindividual.6
A quasi experimental study conducted by Seham A. Abd El-Hay on the effectiveness of educationalprogramme regarding prevention of needle stick and sharp injuries during clinical training among undergraduate nursing students in Dammam University at Egypt in 2015.The sampleswere all available (33) second andthird year nursing students. Data collection tools consist of 2 parts; socio demographic part and assessment of undergraduate nursing students knowledge and practice regarding needle stick and sharp injuries during clinical training.Thestudyshowedthattherewasasignificantimprovement in nursing students’ knowledge related to different items about infection control measures from54.5% preprogram to 84.8% post educational program interventionatp≤0.05.2
A study was conducted by Benzy Paul, Anant Pawar, Durgesh Kumar, Sujesh . P.K on knowledge, attitude and practice of universal precautions among Medical and Nursingstudentsin2014atKozhikode,Kerala.Thecrosssectionalstudywasconductedamong50nursingand50medical students of teritiary care hospital in Kerala. A questinonnairewaspreparedbasedontheWHOandCDCguidelines. This was a comparative study, which used a standardized, structured self administered questionnaire to survey knowledge, attitude and practice of study population. In the present study overall correct response from medical students was 75.6% and from nursing students was 85%. Inspite of high level of awareness programmes for all health professionals knowledge of study subjects regarding universal precautions is low. Compliance in Universal Precautions is good to average in nursing students but poor to average in Medical students. Most of the medical students 34% were not aware that universal precautions are required beyond HIV andHepatitis B. 42% ofmedical students didn’tknow that sodium hypochlorite is used to decontaminate soiled articles. Most of the nursing students that is 56% had misconceptions regarding isolation of patients with blood borne pathogens. And also revealed that 44% of medical students and 62% of nursing students had habit of recapping needles.8
10 Indian Journal of Public Health Research & Development, April 2018, Vol.9, No. 4
CONCluSION
Basedonthefindingsof thestudy, it isconcludedthat the nursing students have an average knowledge regarding post exposure prophylaxis following needle stick injury. Further analysis revealed that student had least knowledge on areas like management and complications of PEP. Therefore there is a need for regular training and education to update the awareness and knowledge about post exposure prophylaxis which servesasaneffectivestrategy toprevent thespreadofblood borne disease.
Conflict of Interest:Therearenoconflictsofinterest.
Source of Funding: Nil
ReFeReNCeS
1. Garima M, Anmol RKT, Garwal R K, Pratima G Priyanka G. Knowledge, awareness and prevalence of needle stick injury among students of Medical college of Uttarakhand, International JournalofRecentScientificResearch2015;6(3)Available from http://www.recentscientific.com
2. Seham A, Abd EIH. Prevention of needle stick and sharp injuries during clinical training among undergraduate Nursing students: Effectof educational programme Damam University, Egypt.2015;Availablefromwww.iosrjournals.org
3. Shivaprakash G, Suvarna P, Pallavi LC. Assessment of knowledge of post exposure prophylaxisforHIVamonghealthcareworkersattertiarycarehospital,WorldJournalofPharmacyandPharmaceuticalSciences2015;4(3)
4.Angadi N, Davalgi S,Vanitha SS. Needle stickinjuries and awareness towards post exposure prophylaxis for HIV among private generalpractioners of Davangere city Medical college Karnataka, 2016;Available from http..//www.ijcmph.com
5.PrasunaJ,SharmaR, BhattA,Arazoo,PainulyD,ButolaH,YadavA.Occuranceandknowledgeabout needle stick injury in Nursing students, AyubMedCollAbbottabad2015;27(2)
6.NandiM,MehraS,Greeshma, JyothiK,TiwariN, Verma K. A study to assess the knowledgeregarding post exposure prophylaxis for HIVinfection among nursing students of a selected medical college, Global Journal of ResearchAnalysis2014;5(4)
7. Polit FD, Hungler P. B.Essentials of Nursing Research.4th Edition. Philadelphia. Lippincott Publisher; 1997.P: 151-195,247-291.
8. Paul B, Pawar A, Kumar D, Sujesh.PKA. study on knowledge, attitude and practice of universal precautions among medical and nursing students. Scholars Journal of applied medical science2014;2(5).p:1821-23;Availablefromhttp..//www.saspublisher.com
9. Swe K M M, Somrongthong R, Bhardwaj A, Johor.Needlestickinjuryamongmedicalstudentsduring clinical training. International journal of collaboratve research on internal medicine and public health 2014 ;6(5) Available fromwww.iomcworld.com
10.Elisabetta R. Ustin P. Yuvan H; Assessing theburden of disease from sharps injuries to health care workers at national and local levels. World Health Organization .Geneva.2005 Availablefrom www.who.int>publications>ebd11
11. Universal precautions for prevention of transmission ofHIVandother bloodborne infections.[online]Available from http://www.cdc.gov./ncidod/dhqp/bp-universal precautions.html
12. Chakravarthy M, Singh S, Arora A, Sengupta S, Munshi N, Rangaswamy S, et al. Epidemiology of sharp injuries - Prospective EPINet data from fivetertiarycarehospitalsinIndia-Datafor144cumulated months, 1.5 million inpatient days. Clin EpidemiolGlobalHealth2014;2(3):121-126.
13. Chakravarthy M, Singh S, Arora A, Sengupta S, Munshi N. The epinet data of four Indian hospitals on incidence of exposure of healthcare workers to bloodandbodyfluid:Amulticentricprospectiveanalysis.IndianJMedSci2010;64(12):540-551.
Effect of Body Mass Index and Age on Visual Reaction Time in Recreational badminton Players. A Cross-Sectional Study
Rrutu Rajkumar Singhal1, Ashish Prabhakar2, Shyam Krishnan k2, gopala Krishna Alaparthi3
1BPT Department of Physiotherapy, 2Asst. Professor, Senior scale, 3Associate Professor, Kasturba Medical College ( Manipal Academy of Higher Education (MAHE)), Bejai, Mangalore
AbSTRACT
Purpose: To analyse the relationship between Body Mass Index (BMI) and reaction time in recreational badminton players.
Methodology: 52 healthy recreational badminton players who met the inclusion and exclusion criteria were selected for a cross sectional study. Reaction time and body mass index were evaluated for each subject using standardised test procedures and the degree and direction of the relationship between linear related variableswascalculatedusingKarlPearson’scorrelationcoefficient.
Results:Outof52subjects,37weremales(71.15%)15werefemales(28.85%).Meanagewas31.94years(SD±7.14). Mean BMI was 24.61kg/m2(SD±3.95).KarlPearsoncorrelationcoefficientbetweenBMIandreactiontimewas0.308(p=0.026)and0.500(p=0.000)betweenageandreactiontime.
Conclusion: From the results we conclude that there is a weak to moderate positive correlation between body mass index and reaction time in recreational badminton players. A strong positive correlation was found between age and reaction time.
Keywords: Reaction time, racket players, body mass index, ruler drop test.
Corresponding Author:Mr.AshishJPrabhakar.MPTAsst- professor, Senior Scale Department of PhysiotherapyKasturba Medical College(Manipal Academy of Higher Education (MAHE))Bejai,Mangalore-575004Mobile:+91-8123223092Email: [email protected]
INTROduCTION
Badminton, a well-known sport, is one that can be practised by anyone irrespective of age. The game demands high levels of speed, nervous conductivity and agility.1 Since the official inclusion of badmintonintheBarcelonaOlympicgamesin1992thepopularityof badminton has increased tremendously around the world.2 It is considered one of the fastest racket sports and the game performance demands numerous skill related movement patterns in the nature of jumps, leaps, lunges, sprints, stops & starts, twists & turns, rapidchanges of direction and a variety of strokes.1, 2, 3.
The players have to constantly analyse the situation during the match forcing them to plan instantly and perform movements for interception of the shuttlecock in time.1,4 The literature review revealed a variety of research resultsconfirmingthatelitebadmintonplayersdisplayashorter reaction time.1, 4, 5,6 Reaction time is defined asthe period of time that elapses between the occurrence of a stimulus and initiation of movement.1Research shows that following an opponent’s attack, a player in thedefensivepositionhas0.1storeact.1
Visualreactiontimeisthetimerequiredinresponseto a visual stimuli. It has been established from previous studies that badminton players display a shorter visual reaction time.1, 6 Reaction time can provide a true measure of the rate at which sensory stimuli are perceived and processed by the central nervous system and carried out in the form of a motor response. Reaction time serves as an important means to study a person’s stimulus response to speed and thus helps determine the alertness of a person.4, 5, 6
DOI Number: 10.5958/0976-5506.2018.00247.4
12 Indian Journal of Public Health Research & Development, April 2018, Vol.9, No. 4
Therefore they possess the ability to react swiftly to situations during the match and anticipate the opponent’s movements. This can be attributed to regular training, which enhances muscular coordination, improves concentration and promotes alertness of the external environment. There are various individual factors influencingreactiontime;inclusiveofage,gender,handdominance, central versus peripheral vision and amount of practice which along with exercise, personality trait, type of stimulus, fatigue and any related medical condition contribute as a whole to the overall reaction time.1, 5, 6
Thephysicalfitnessofaplayerhowever,canserveasa prime element of success in the course of a tournament. Bodymass,animportantfactoroffitness,caninfluenceone’s performance in sports.3Arecentstudyconfirmedthatbodymassindexhadapositiveinfluenceonupperbody power, upper body strength, aerobic endurance and speed.7Body mass index (BMI) is a simple index of weight-for-height that is commonly used to classify underweight, overweight and obese individuals. It is definedastheweightinkilogramsdividedbythesquareof the height in meters (kg/m2).8
Badminton involves countering gravity against one’s body weight and therefore fat would serve as an added disadvantage contributing to the overall body weight required to be lifted. Fat offers a property ofinsulation and therefore lower levels of fat in the body provide a more effective gradient of heat transfer tooccur rapidly during fast paced high intensity exercise thereby enhancing one’s game. It also contributes to one’s speed in allowing them to move across the court and leap for a smashmore quickly and effectively.3 A badminton player’s main aim would involve thwarting the opponent’s ability to reach the shuttlecock for a possible play by strategically directing it to points on the court out of reach of the opponent.9
There are evidences in literature comparing the simple reaction time and BMI in footballers, cricket playersandtaekwondopractitionersshowingsignificantdifferences.10,11Ontheotherhand,thereisnoretrievabledata of this having been conducted in recreational badminton players.
Due to the paucity of research on the following topic, and in order to take positive contributory steps in improving the overall gameplay by identifying a link, it was essential to note any association between
the reaction time and BMI of recreational badminton players. The aims of the study was as follow 1) To note any relationship between BMI and reaction time 2) To note any relationship between age and reaction time.The null hypothesis of the study is that there would be no association between BMI and age with reaction time.
MeThOdOlOgy
A cross-sectional study was conducted on 52 healthy recreational badminton players consisting of 37 malesand15femalesintheagegroup0f20-40yearsinthemonthJanuary2017.Thesamplesizewasestimatedusing the results of a previous study1,at90%powerand95%confidence interval¸ formulausedwas with theassumptionofcorrelationcoefficientbeing0.6(betweenbody mass index and reaction time.
The study was approved by Institutional Ethical Committee.Datawascollectedfromsportsandfitnesscentres affiliated with the University. Subjects whoupon explaining the study purpose, consented for participation, were screened for criteria for inclusion. Healthy individuals who had been playing badminton 3-5 times a week for at least the past one month were eligible for participation, and subjects with a history of musculoskeletal issues of the upper quadrant or on prescription beta blockers were excluded.
The parameters measured were height (m), weight (kg) and reaction time (s).Standing height was measured using a wall mounted Stadiometer. Players were instructedtostandwithshoesoff,feettogetherandarmsby the sides, heels, buttocks and upper back in contact withwall.Heightwasmeasuredtowithin0.1cm.Heightof each subject was converted in units of meters. Weight was measured using the calibrated weighing scale whose leastcountwas0.5kg. Theplayerswere instructed tostand with minimal movement with hands by their side withshoesoff.Weightreadingwastaken.
VisualreactiontimewasassessedbyusingtheRulerDrop Test11, 12.Ametalrulerwith2.5cmwidthand100cmlength was used for the same. For the ruler drop test participant was made to stand keeping their shoulders neutral, elbows flexed to 90o, forearm in mid-prone position, wrist in functional position, and their thumb and indexfingerparted1cmfromeachother.Theexaminerstood on the test side of the participant and held the ruler vertically in the air between the participants thumb and
Indian Journal of Public Health Research & Development, April 2018, Vol.9, No. 4 13
indexfinger,withouttouchingit.Thezeromark(at0cm)was alignedwith the subject’sfinger.Instructionsweregiven to the participant to indicate when they were ready, following which the ruler was dropped without warning.The participant was expected to catch the ruler using a pinch grip as quickly as possible as soon as they saw it fall.The distance at which the ruler was caught was recorded in centimeters. The test was repeated thrice and an average of the 3 readings was taken.
dATA ANAlySIS
Statistical Package for Social Sciences (SPSS) version 17.0was employed to statistically analyse theobtained data. Karl Pearsons correlation test was used to estimate the relationship between reaction time and the variables, BMI and age. Difference in reactiontime between males and females were compared using Independent sample T test.
ReSulTS
Table 1: descriptive data of demographic variables
Age Height (m) Weight (kg) BMI (kg/m2) Reaction time (s)N 52 52 52 52 52
Mean 31.94 1.71 73.24 24.84 0.15Median 33.50 1.73 74.50 24.61 0.14Mode 40 1.73 78 23 0.14
Standard deviation 7.14 0.92 12.29 3.95 12.29Inter quartile range 25-39 1.68-1.78 64-80 22-26 64-80
Table 2: Relationship between Reaction time and demographic variables
Variable r value p valueReaction time (s)
VsBMI* 0.308 0.026
Reaction time(s)VsAge** 0.500 0.000
Reaction timeVsWeight 0.181 0.200
ReactiontimeVsHeight -0.153 0.283
*Indicatesstatisticalsignificancep<0.05.**Indicatesstatisticalsignificancep<0.01
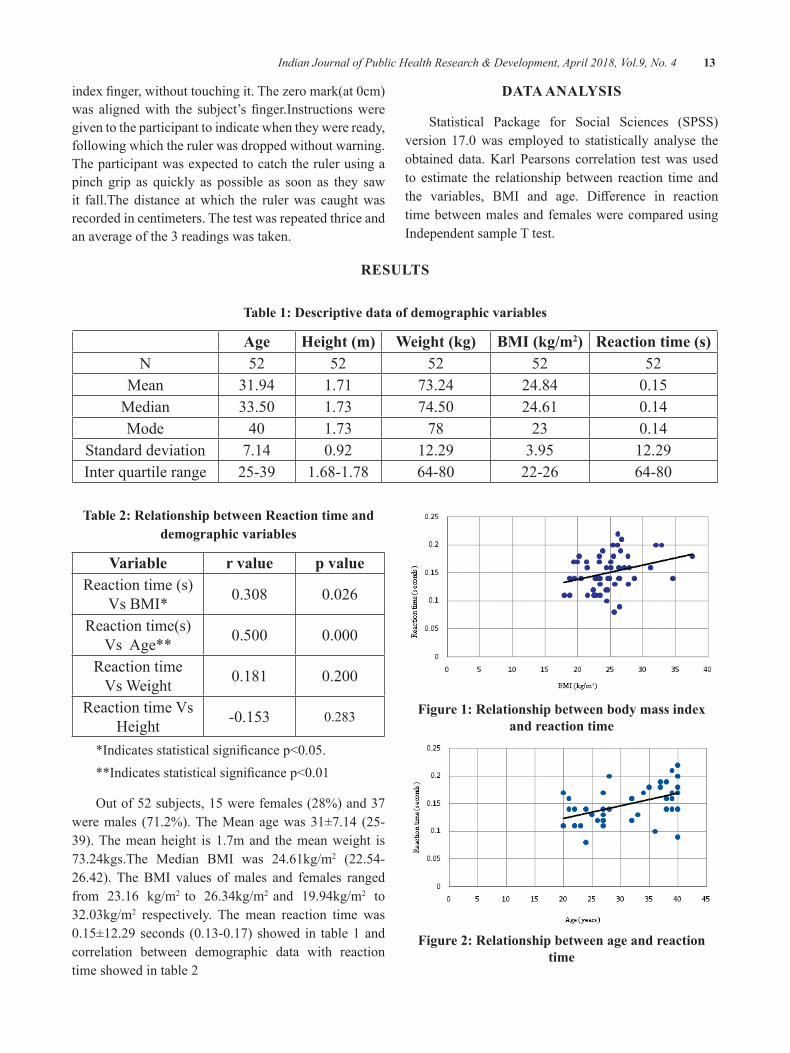
Outof52subjects,15werefemales(28%)and37were males (71.2%). The Mean age was 31±7.14 (25-39). The mean height is 1.7m and the mean weight is 73.24kgs.The Median BMI was 24.61kg/m2 (22.54-26.42). The BMI values of males and females ranged from 23.16 kg/m2 to 26.34kg/m2 and 19.94kg/m2 to 32.03kg/m2 respectively. The mean reaction time was 0.15±12.29seconds (0.13-0.17)showed in table1andcorrelation between demographic data with reaction time showed in table 2
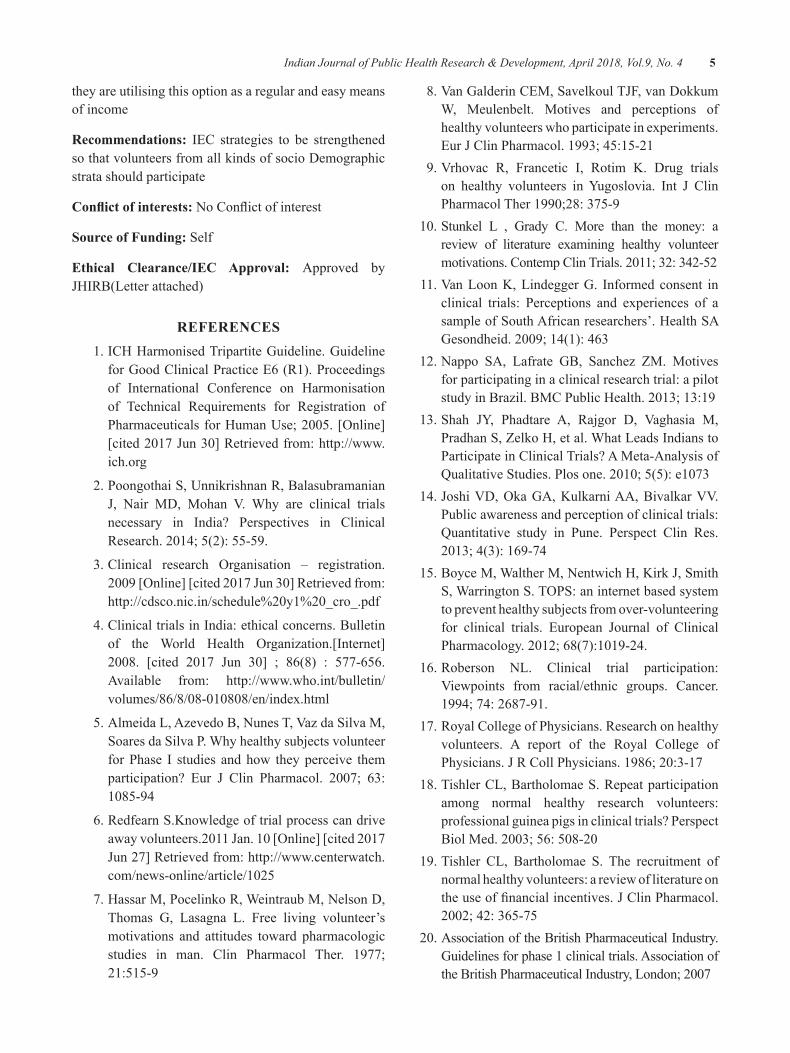
Figure 1: Relationship between body mass index and reaction time
Figure 2: Relationship between age and reaction time
14 Indian Journal of Public Health Research & Development, April 2018, Vol.9, No. 4
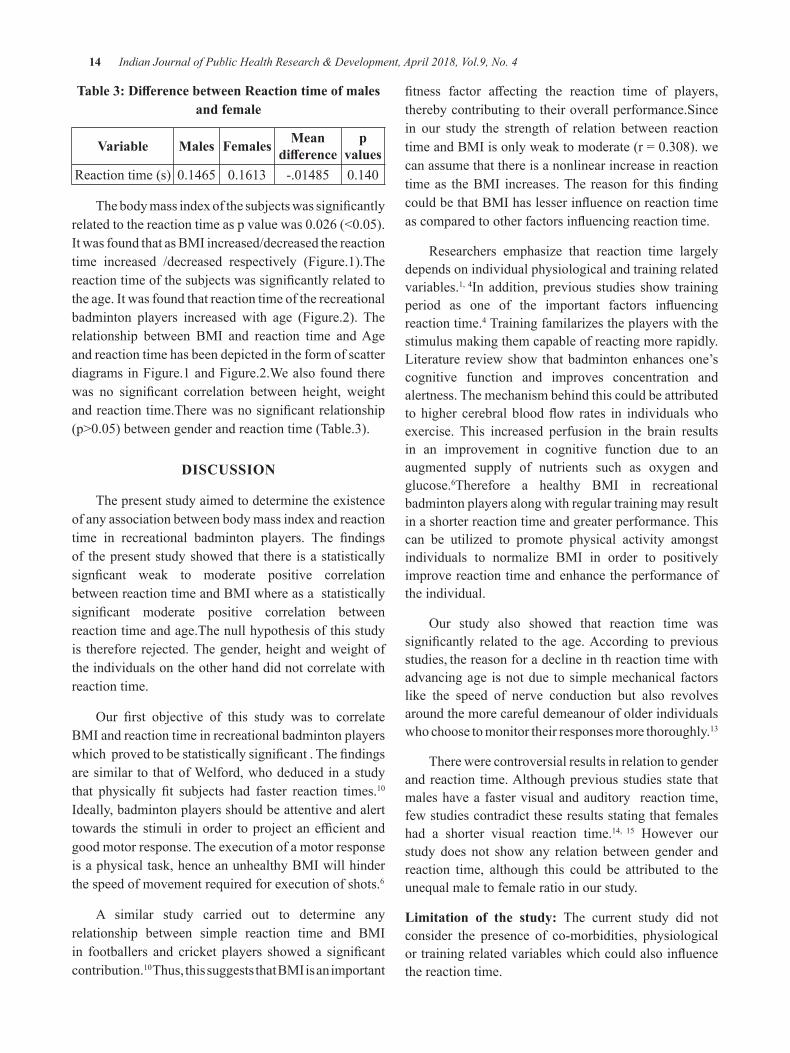
Table 3: Difference between Reaction time of males and female
Variable Males Females Mean difference
p values
Reaction time (s) 0.1465 0.1613 -.01485 0.140
Thebodymassindexofthesubjectswassignificantlyrelatedtothereactiontimeaspvaluewas0.026(<0.05).It was found that as BMI increased/decreased the reaction time increased /decreased respectively (Figure.1).The reactiontimeofthesubjectswassignificantlyrelatedtothe age. It was found that reaction time of the recreational badminton players increased with age (Figure.2). The relationship between BMI and reaction time and Age and reaction time has been depicted in the form of scatter diagrams in Figure.1 and Figure.2.We also found there was no significant correlation between height, weightandreactiontime.Therewasnosignificantrelationship(p>0.05)betweengenderandreactiontime(Table.3).
dISCuSSION
The present study aimed to determine the existence of any association between body mass index and reaction time in recreational badminton players. The findingsof the present study showed that there is a statistically signficant weak to moderate positive correlationbetween reaction time and BMI where as a statistically significant moderate positive correlation betweenreaction time and age.The null hypothesis of this study is therefore rejected. The gender, height and weight of the individuals on the other hand did not correlate with reaction time.
Our first objective of this study was to correlateBMI and reaction time in recreational badminton players whichprovedtobestatisticallysignificant.Thefindingsare similar to that of Welford, who deduced in a study that physically fit subjects had faster reaction times.10 Ideally, badminton players should be attentive and alert towards thestimuli inorder toprojectanefficientandgood motor response. The execution of a motor response is a physical task, hence an unhealthy BMI will hinder the speed of movement required for execution of shots.6
A similar study carried out to determine any relationship between simple reaction time and BMI in footballers and cricket players showed a significantcontribution.10Thus, this suggests that BMI is an important
fitness factor affecting the reaction time of players,thereby contributing to their overall performance.Since in our study the strength of relation between reaction timeandBMIisonlyweaktomoderate(r=0.308).wecan assume that there is a nonlinear increase in reaction timeas theBMI increases.The reason for thisfindingcouldbethatBMIhaslesserinfluenceonreactiontimeascomparedtootherfactorsinfluencingreactiontime.
Researchers emphasize that reaction time largely depends on individual physiological and training related variables.1, 4In addition, previous studies show training period as one of the important factors influencingreaction time.4 Training familarizes the players with the stimulus making them capable of reacting more rapidly. Literature review show that badminton enhances one’s cognitive function and improves concentration and alertness. The mechanism behind this could be attributed to higher cerebral bloodflow rates in individualswhoexercise. This increased perfusion in the brain results in an improvement in cognitive function due to an augmented supply of nutrients such as oxygen and glucose.6Therefore a healthy BMI in recreational badminton players along with regular training may result in a shorter reaction time and greater performance. This can be utilized to promote physical activity amongst individuals to normalize BMI in order to positively improve reaction time and enhance the performance of the individual.
Our study also showed that reaction time wassignificantly related to the age.According to previousstudies, the reason for a decline in th reaction time with advancing age is not due to simple mechanical factors like the speed of nerve conduction but also revolves around the more careful demeanour of older individuals who choose to monitor their responses more thoroughly.13
There were controversial results in relation to gender and reaction time. Although previous studies state that males have a faster visual and auditory reaction time, few studies contradict these results stating that females had a shorter visual reaction time.14, 15 However our study does not show any relation between gender and reaction time, although this could be attributed to the unequal male to female ratio in our study.
limitation of the study: The current study did not consider the presence of co-morbidities, physiological ortrainingrelatedvariableswhichcouldalsoinfluencethe reaction time.
Indian Journal of Public Health Research & Development, April 2018, Vol.9, No. 4 15
Future study: The future scope can be to study the relationship between reaction time and BMI in a more homogenous group of athletes in terms of training period, experience and other physiological variables so astominimisetheinfluenceofnonstudiedvariables.
CONCluSION
From the result, we found that there does exist an association between BMI & reaction time, age &reaction time in recreational badmminton players. With this we can conclude that badminton players maintaining a healthy BMI can probably have a lesser reaction time.
Source of Funding: Self
Conflict of Interest: None declared
ReFeReNCeS
1.Bańkosz Z, Nawara H, Ociepa M. Assessmentof Simple Reaction Time in Badminton Players.TSS.2013,February6;1(20):54-61
2.OoiC,TanA,AhmadA,Kwong.Physiologicalcharacterestics of elite and sub- elite badminton players.JSportsSci.2009;27(14):1591-1599.
3. Yahaya A. Correlation of Body Mass Index and Flexibility among Selected Badminton Players in Northern Nigeria. Sport & Exercise for Health,Fitness&Wellness.2011Dec19:81.
4.Loureiro Jr LD, Freitas PB. Influence of thePerformance Level of Badminton Players in Neuromotor aspects during a target-pointing task. RBME.2012,June;18(3):203-7.
5. Dube SP, Mungal SU, Kulkarni MB. Simple Visual Reaction Time in Badminton Players.AComparativeStudy.NJPPP.2015,5(1):18-20
6.BhabhorM,VidjaK,DubalG,PadaliaM,JoshiV.AComparativeStudyofVisualReactionTime
in Badminton Players and Healthy Controls. IJBAMR.2013;15(20):76-82.
7.CinthujaP,etal.PhysicalfitnessfactorsofschoolbadmintonplayersinKandydistrict.EJSES.2015,4(2):14-25
8.WHO.Global Database on Body Mass Index[Internet]. Apps.who.int. 2017 [cited 21 March2017]. Available from: http://apps.who.int/bmi/index.jsp?introPage=intro_3.html
9.Loureiro JrLD, Freitas PB.Development of anagility test for badminton players and assessment of its validity and test-retest reliability.IJSPP.2016;11(3):305-310
10.Dr.KarS.Relationshipbetweenbodymassindexandsimplereactiontimeofplayers.IJCRLS.2015,February;4(2):116-9
11. Fong S, Ng S, Chung L. Health through martial arts training:PhysicalfitnessandreactioninadolescentTaekwondopractitioners.Health.2013;5(6):1-5
12. Carmeli E, Bar-Yossef T, Ariav C, Levy R, Liebermann D.G. Perceptual-motor coordination in persons with mild intellectual disability. DisabilityandRehabilitation.2008;30:323-329.
13.Chandak P,Makwana J. Ageing and reactiontime in Indian population.PJSR.2012, January;5(1):36-9
14. Tonnessen E. Reaction time aspects of elite sprinters in athletic world championships.JSCR.2013,April;27(4):885-92.
15.Jain A, Bansal R, Kumar A, Singh KD. Acomparative study of visual and auditory reaction times on the basis of gender and physical activity levels of medical first year students.IJABMR.2015;5(2):124-127.
Cytomegalovirus Pneumonia In Critically Ill Patients
gurmeet Singh
Respirology and Critical Illness Division, Internal Medicine Department, Universitas Indonesia, Faculty of Medicine/ Cipto Mangunkusumo Hospital, Jl. Diponegoro No 71, Central Jakarta 10430, Indonesia
AbSTRACT
Cytomegalovirus(CMV)belongstothehumanß-herpesvirusgroupwithahighseroprevalenceinadults,and it is one of the important causes of morbidity and mortality in immunosuppressed patients, i.e, patients withorgantransplantation,hematologymalignancyandAcquiredImmuneDeficiencySyndrome(AIDS).The infection is usually latent. Reactivation also occurs in critically ill immunocompetent patients and is associated with prolonged ICU stay and increased mortality. Reactivation occurs when cell mediated immunity is disturbed. Cytomegalovirus infection is rarely monitored and remains unrecognized in critical ill patients1,2andCMVincidenceisbetween0to36%inthecriticallyillpopulation.Infectionusuallyoccursbetween four to 12 days after hospitalization in ICU with sepsis, mechanical ventilation more than 21 days, andmultiplebloodtransfusionsaspotentialriskfactorsforCMVreactivation.3 Rapid and accurate diagnosis of the etiology of pneumonia is needed in critically ill patients for a better outcome.4 Cytomegalovirus infectioncanbedetectedintissuebiopsyandrapidPolymeraseChainReaction(PCR)CMVculturesofurineandbronchoalveolarlavage(BAL)fluidwithshellvialmethod.5
Keywords: Bronchoalveolar Lavage, Cytomegalovirus Pneumonia, Polymerase Chain Reaction
Corresponding Author:Gurmeet SinghJl.DiponegoroNo71,CentralJakarta10430,IndonesiaPhonenumber:+62(21-3149704)Facsimilenumber:+62(21-31902461)E-mail adress: [email protected]
INTROduCTION
Cytomegalovirus infection is common with a high seroprevalencerate.Followingprimaryinfection,CMVbecomes latent in multiple organs and asymptomatic viral shedding can be detected in saliva or urine. Severe dysregulation of the immune system can promote reactivation due to the release of immunomodulatory cytokines.3 Several studies have reported the reactivation ofCMVin“non-immunosuppressedpatients”(0-35%)such as septic shock, trauma, and other critically ill patients.6PneumoniaisoneofthedirecteffectsofCMVInfection. Cytomegalovirus pneumonia is considered to be a rare and serious complication in critically ill patients and it is a form of reactivation rather than primary infection.3,7,8 Longer ICU stay and prolonged use of ventilator (median 18 days) were observed in patientswithapositiveBALforCMV.Cytomegalovirus
pneumonia can develop in all populations of critically ill patients (trauma, chronic lung disease and surgical).1,7 EvaluationofCMVpneumoniaisusuallydoneinlaterstages of the disease and is most probably neglected as a cause of pneumonia. A case series was conducted by Singh G in Cipto Mangunkusumo Hospital, Indonesia fromJanuarytoSeptember2016.From31criticallyillpatientssuspectedwithCMVpneumonitisinfection,18(58%)wasconfirmedaspositivewithPCRevaluationusing BAL specimens.
Clinical Profile And Risk Factor: Previous studies have not been able to clearly define the risk factorsfor CMV reactivation, and reactivation is associatedwith unfavorable outcomes, prolonged mechanical ventilation, increased length of ICU stay, and higher mortality rates. Reactivation is higher in severely ill patients or patients with a higher disease severity index.9
One study by Papazian and co-workers in Marseille,France,givessomeinformationabouttheclinicalprofileforCMVpneumoniapatients.CMVpneumoniapatientshad longer ICU stay (median 18 days), bilateral interstitial infiltrates on chest x-ray, seropositive CMV, multipleblood transfusions, and positive PCR BAL specimen.10 Risk factors varied in different studies. Mechanical
DOI Number: 10.5958/0976-5506.2018.00248.6
Indian Journal of Public Health Research & Development, April 2018, Vol.9, No. 4 17
ventilation at admission, CMV PCR > 1000 copies/ml, bacterial pneumonia, transfusion of blood products within 24 hour of admission, and sepsis were reported tobesignificantfactorsforreactivation incritically illpatients. Corticosteroid use was reported as a risk factor in one study.3 Rituximab has been associated with the development of CMV infection.5 Age, malignancy, and the disease severity score [Acute Physiology andChronic Health Evaluation (APACHE) II score, Sepsis-related Organ Failure Assessment (SOFA) score, orSimplifiedAcutePhysiologyScore (SAPS)II]werenotassociatedwithCMVpneumonia.3 Several risk factors have been described in Table 1.11
Table 1: Risk Factor for the CMV Reactivation in Critically Ill Patients11
z The usage of mechanical ventilation
z Presence of bacterial or fungal infection
z Sepsis infection
z Corticosteroid therapy
z Burn injury
z Enteral feeding
z Recent hospital admission
z Prolonged pre-treatment (patients treated at a hospital ward >1 week before ICU admittance)
CMV:cytomegalovirus,ICU:intensivecareunit
Cytomegalovirus reactivation is associated with unfavorable outcome. Table 2 describes clinical variables associatedwithactiveCMVinfection.11
Table 2: Clinical outcome associated with CMV reactivation11
Increased mortality and morbidityProlonged length of stay (ICU and non-ICU)
Prolonged use of mechanical ventilationIncreased CD3 count and nosocomial bacterial
infectionsMultiple organ dysfunction (hepatic, pulmonary, and
kidney)
CMV:cytomegalovirus,ICU:intensivecareunit
diagnostic Method: Cytomegalovirus pneumonia and CMVgastrointestinaldiagnosishaveremainedthesame
over the past 2 decades. Cytomegalovirus reactivation in the lungs is thought to occur earlier, more frequently, and at greater levels than another sites, but data regarding this information is limited.
The detection of antigens (the pp65 antigenemia assay), DNA, and mRNA are tests frequently used for detectingCMVinfection.TheuseofquantitativeDNAdetection techniques are increasing due to the high sensitivity in providing prognostic information. The negative predictive value of PCR is high and can be used to rule out disease. In the appropriate clinical context, a highviralload(VL)inBALandtissuecorrelatesbestwithadisease,butoneimportantissueisthatCMVreactivatessilently in seropositive patients with no disease.3 A study byChemalyandcolleagues reported thatahighCMVVLintheBALoflungtransplantrecipientsisstronglyassociatedwithCMVpneumonitis andmightbemorepredictivethanbloodVL.12 Another study by Chemaly and colleagues, reported that immunohistochemistry andCMVVLinBALispredictiveforthedevelopmentofinvasiveCMVdisease.13 This technique is rapid and more useful in critically ill patients as compared to conventional cultures which need 1-4 weeks to establish CMV diagnosis.7 Cytomegalovirus DNA found in plasma shows a good correlationwithCMV infectionin BAL specimens. The study by Rasmussen reported adirectcorrelationbetweenPCRVLandriskofCMVdisease. CMV infection may be detected as early astwo weeks with PCR and has the advantage for early preemptive therapy.14
Antiviral treatment: Ganciclovir or Foscarnet is the drug of choice for the treatment ofCMVdisease.Recommended ganciclovir dose is 5mg/BW/day intravenous route, as an induction dose for 2-3 weeks, followed by another 3-4 weeks maintenance dose via the oral route.8Valganciclovirispreferredfororalroute.The drug dose is adjusted in critically ill patients with renal function problems. Intravenous immunoglobulin isrecommendedforthetreatmentofCMVpneumonia.8 Some studies report that CMV disease in critically illpatients might not benefit from antiviral therapy, andpreemptive therapy (Ganciclovir) in this population has not been tested. Studies in mice models show that prophylactic therapy prevents reactivation and CMVassociatedpulmonaryfibrosisthandelayedtreatment.1
18 Indian Journal of Public Health Research & Development, April 2018, Vol.9, No. 4
CONCluSION
Cytomegalovirus is an important emerging pathogen. Althoughnotcommonlyseen,CMVpneumoniacannotbe ignored and should be considered in critically ill nosocomial pneumonia patients, as it might rapidly progress into adult respiratory distress syndrome with fatal outcome.1,15
Conflict of Interest:Thereisnoconflictofinterest
Source of Funding: Souce of funding is from Author’s own expenses
ethical Clearance: Ethical clearance is not required as it is a review article
ReFeReNCeS
1.Müller LV, KlemmA, Weiss M, Schneider M,Suger-Wiedeck H, et al. Active Cytomegalovirus Infection in Patients with Septic Shock. Emerging InfectiousDiseases2006;12:1517-22.
2. Nakashima K, Aoshima M, Suzuki F, Watanabe J, Otsuka Y. Cytomegalovirus Colitis in aCritically Ill Patient Following Severe Legionella Pneumonia with Multiple Organ Failure. InternMed2016;55:527-31.
3.Osawa R, Singh N. Cytomegalovirus Infectionin Critically Ill Patients: A Systematic Review. CriticalCare2009doi:10.1186/cc7875.
4.VélezL,CorreaLT,MayaMA,Mejía P,OrtegaJ, et al.DiagnosticAccuracy ofBronchoalveolarLavage Samples in Immunosuppressed Patients with Suspected Pneumonia: Analysis of a Protocol. RespiratoryMedicine2007;101:2160-7.
5. Chang H, Tang TC, Hung YS, Lin TL, Kuo MC, et al. Cytomegalovirus Infection in Non-transplant Patients with Hematologic Neoplasms: A Case Series.ChangGungMedJ2011;34:65-74.
6.JainM,DuggalS,ChughTD.CytomegalovirusInfection in Non-immunosuppressed Critically Ill Patients.JInfectDevCtries2011;5:571-9.
7. Papazian L, Fraisse A, Garbe L, Zandotti C, Thomas P, et al. Cytomegalovirus: An Unexpected Cause of Ventilator-associated Pneumonia.Anesthesiology1996;84:280-7.
8. Boeckh M. Complications, Diagnosis, Management,andPreventionofCMVInfections:CurrentandFuture.Hematology2011:305-9.
9.LimayeAP,BoeckhM.Cytomegalovirus(CMV)in Critically-ill Patients: Pathogen or Bystander? RevMedVirol2010;20:372-9.
10.Park DR. The Microbiology of Ventilator-Associated Pneumonia. Respiratory Care 2005;50:742-65.
11.LinssenCFM,BergmansDCJJ,MookWNKAV.ImpactofLatentViralInfectionsinMechanicallyVentilatedPatients.CurrentRespiratoryMedicineReviews2012;8:200-7.
12.Chemaly RF, Yen-Lieberman C, Chapman J,Reilly A, Bekele BN, et al. Clinical Utility of CytomegalovirusViralLoad inBronchoalveolarLavage in Lung Transplant Recipients. American JournalofTransplantation2005;5:544-8.
13. Chemaly RF, Yen-Lieberman C, Castilla EA, Reilly A, Arrigain S, et al. Correlation between Viral Loads of Cytomegalovirus in Blood andBronchoalveolar Lavage Specimens from Lung Transplant Recipients Determined by Histology and Immunohistochemistry. J Clin Microbiol2004;42:2168-72.
14.JahanM.LaboratoryDiagnosisofCMVInfection:AReview.BangladeshJMedMicrobiol2010;4:39-44.
15.SuMY,TanCK,YuWL.Difficult-to-Treat,Life-Threatening Cytomegalovirus Pneumonia in a PatientwithChronicRenalDisease. Int J Infect2016doi:10.17795/iji-35300.
Knowledge, Attitude and Risk Perception for diabetes among Pregnant Women with gestational diabetes Mellitus
Judith A Noronha1, Sushmitha R Karkada2, Anusuya Prabhu2, Shobha3, Sonia Rb d’Souza4, Sweety J Fernandes2, Pratibha Kamath2
1Professor and HOD/Associate Dean, 2Assistant Professor, 3Lecturer, 4Associate Professor, Department of OBG Nursing, Manipal College of Nursing Manipal, Manipal University, Karnataka, India
AbSTRACT
background: Gestational Diabetes Mellitus (GDM) has gained increasing attention as a predictor of future diabetes in women. Women with GDM are six times more likely to develop type 2 diabetes later in life thanwomenwithoutGDM.GDMhasarecurrencerateof35–80%,andriskofrecurrentGDMisdirectlyassociated with previous pregnancies with GDM.
Methods: Institutional based cross sectional survey design was used to collect data from the participants. Informedconsentwasobtainedfromalltheparticipants.AllpregnantwomenconfirmedbyanabnormalglucosechallengetestaspertheWHOcriteriatohaveGDMwereincluded.PregnantwomenwithType2diabetes/preexistingdiabeteswereexcluded.Datawascollectedfrom100mothers.
Results: The mean age of the mothers was 26.7±3.7 years. The mothers were recruited for the study as early as24weeksto39weekswithameanPOGof31.75±4.3weeks.Alsothereexistsperfectpositivecorrelationbetweenknowledgeandattitude(r=1,p=0.073).SeventysevenpercentofthepregnantwomenwithGDMperceived low risk of developing Type 2 diabetes in future.
Conclusion: This study highlights the need for culturally accepted way of education and health promotion activities for women with GDM to prevent the early onset of Type 2 diabetes Mellitus.
Keywords: Knowledge, attitude, risk perception, gestational diabetes mellitus (GDM)
Corresponding Author:JudithANoronha,ProfessorandHOD/AssociateDean,DepartmentofOBGNursing,Manipal College of Nursing Manipal,Manipal University, Karnataka, IndiaE-mail: [email protected]
INTROduCTION
Diabetes Mellitus is a growing global public health concern and priority with a shift to a younger age of onset 1.Gestational diabetes mellitus (GDM) has gained increasing attention as a predictor of future diabetes in women2. Although the rise in glucose during pregnancy returns to normal after delivery, women diagnosed with diabetes have seven fold increased risk of developing Type II diabetes.For instance, a study conducted in New York showed the prevalence of South-Asian (Indian, Sri Lankan, Pakistani, Fijian Indian) women having
GDM are generally higher than the risk of South-East Asian(Cambodian,Vietnamese,Laotian,Thai,Filipino,Malaysian) women and the East-Asian (Chinese, South Korean, Taiwanese and Japanese) women. Theprevalence of GDM in women who were born in Asian countriesvariedfrom3.0%to21.2%3.The highest risk appears to belong to women from South Asia and their adjusted relative risk is quoted by Savitz et al 3 to be as high as 7.1 (95%CI: 6.8 to 7.3).
A meta-analysis done by Bellamy and team published in 2009 showed that women had a relativerisk of 4.69 which will be doubled to 9.34 within 5 years 4. It is also reported that one third of children born to GDM mothers have evidence of Impaired glucose tolerance independent of genetic predispositions to Type 2Diabetes Mellitus.4
Type 2 diabetes in India is gaining momentum among young adults and had posed serious adverse
DOI Number: 10.5958/0976-5506.2018.00249.8
20 Indian Journal of Public Health Research & Development, April 2018, Vol.9, No. 4
effectshinderingthequalityoflifeandlifeexpectancyin the world by 20305. The US Diabetes Prevention Program (DPP) provided evidence that lifestyle change works for women post-GDM, their Type 2 diabetes mellitusriskreducedby50%.5, 6 Therefore, addressing GDM constitutes a window of opportunity for early intervention and reduction of the future burden of Type 2 Diabetes mellitus.
Aninterviewcarriedoutamongfivewomen2to3years after the onset of GDM, women reported that they were told that diabetes disappeared after the birth of the baby, hence they reverted to their dietary habits after birth without applying the advice in terms of diet and physical activity provided during pregnancy. Perception of risk is important to motivate women for both follow-uptestinganduptakeoflifestylemodification7.
Despite understanding the association between GDM and Type 2Diabetes Mellitus, women with GDM do not perceive themselves to be at elevated risk 8,9,10. The lack of perceived self-risk of developing T2DM is common in women 9 and awareness amongst health professionals and the general public of GDM’s risk is also low.10
Adoption of preventive health behaviors is based on the perception of perceived vulnerability to develop a particular disease 11women who perceive themselves having low risk of developing type II diabetes in future isabarriertolifestylemodificationandfutureregularscreening. 9,12
However little is known about the perception of risk for T2DM among gestational diabetes women. Hence this study was planned so as to assess the knowledge and risk perception and take appropriate preventive measures to prevent the development of GDM in subsequent pregnancies and diabetes in future.
MeThOd
Study design: Institutional based cross sectional survey design was used to assess the knowledge, attitude and risk perception of women regarding gestational diabetes and Type II diabetes in future.
Study population and setting: The study was conducted in selected hospitals of Udupi District, South India. All pregnant women who were diagnosed to have Gestational diabetes mellitus during pregnancy were
enrolled in the study. TheWorld Health Organization(WHO) criteria using a 2-hour 75 g oral glucosetolerancetest(OGTT)withathresholdplasmaglucoseconcentration of greater than 140 mg/dL at 2 hours,similar to that of IGT (> 140 mg/dL and < 199 mg/dL) or a clinical diagnosis of GDM documented in the medical record by their obstetric provider was used for the enrollment of subjects. Pregnant women with Type II diabetes /preexisting diabetes were excluded.
Sample size and Sampling: The required sample size was determined using single-population proportion with the following assumption: 25 % of women perceived high risk of developing diabetes, 95% of confidenceinterval, 10 % marginal error, adding 20 % for non-response rate the final sample size was 86.Purposivesampling technique was used to select the subjects. Henceatotalof100pregnantwomenwithGDMwereconsidered for the study.
data collection instruments: Demographic proforma was used to collect baseline information from the women. Knowledge Questionnaire on GDM having 22 items in the areas of normal serum glucose values, signs and symptoms of GDM, diagnostic methods, treatment options and its prevention was used. The items in the attitude scale and risk perception survey was derived from university of Michigan Diabetes Research and Training center after seeking permission form the primary author and was modified based on the studysetting. Reliability of the knowledge questionnaire was established by Split half method and attitude scale by Cronbach’salphaandrwas0.8and0.9respectively
The study was approved by the institutional ethical committee. Informed consent was taken from the participants.Confidentialitywasassured.
ReSulTS
data analysis:Datawas collected from100pregnantwomen diagnosed to have gestational diabetes Mellitus. TheSPSSversion16.0wasusedfortheanalysisofdata.
Description of sample characteristics of 100 samples: The mean age of the pregnant women was 26.7±3.7 years. The pregnant women were recruited for the study as early as24weeksto39weekswithameanPOGof31.75±4.3weeks.Fiftyfivemothersweremarriedfor1-3yearsandmajority 74(74) were primigravid mothers. Eighty two percentage of mother belonged to Hindu religion, 51(51)
Indian Journal of Public Health Research & Development, April 2018, Vol.9, No. 4 21
were from nuclear family.Almost all of them 80(80)were home makers. Sixty nine percent of mothers had any one of their parents with history of type 2 DM. All mothers followed a similar pattern of weight gain with meanweightgainof5.89±1.83 (inkilograms)after20weeksofgestation.Outof26multigravidamothers,7(27)mothers had delivered previously big baby (more than 3.5kg). Thirteen mothers (13) had history of previous abortion and one had history of congenital anomalies. None of them had history of vaginal infections and one reported of having repeated UTI.
description of Knowledge and Attitude Scores: The data presented in table 2 shows that the mean knowledge was 11.74 ± 2.96. This shows that in spite of having GDM in present pregnancy mothers had average knowledge regardingGDM.Theknowledgewasexploredinspecificareas.Fiftyfivepercentofthepregnantwomenreportedto respond correctly to questions addressing causes of GDM. Knowledge regarding the area of screening test and normal blood sugar ranged from 53 percent to 68 percentamongthepregnantwomen.Only39percentofthe pregnant women reported to have some knowledge regarding the preventive measures
Thedatapresentedintable2showsthatamong100women, 62 women had favorable attitude and remaining 38 women had unfavorable attitude towards DM with mean attitude score of 21.68 ± 3.95 . The Pearson’s correlation was used to correlate knowledge and attitude scores. The data presented in table 1 shows that there is a perfect positive correlation however it was statistically insignificant.Themean knowledge scorewas 11.74 ±2.96 and the attitude score was 21.68 ± 3.95.
description of risk perception among mothers with gdM: Risk status was categorized into 2 categories perceived low risk and perceived high risk. Seventy seven percent of mothers perceived themselves to be at low risk and remaining 23(23) perceived themselves to be at high risk for developing Type II DM in future. Perceived low risk is due to average and poor knowledge 85(85) of mothers regarding GDM. Also mothers 58(58) agreed to modify their present lifestyles. The data in table2 showed that there was no significant association between riskperception and selected demographic variables. Inspite of having good knowledge and favorable attitude, mothers stilldonotfindthematriskofgettingdiabetesinfuturewhich is very alarming situation.
dISCuSSION
This study explored the patient related aspects in GDM. Although, the women had average knowledge but their attitude towards disease was positive.
The present study reported that only twelve percent of pregnant women had good knowledge regarding GDM and 85 percent of them had average and poor knowledge. The study done on awareness of gestational diabetes mellitus among antenatal women in a primary health center in South India supports the present study findings, and reports that only a small proportion ofrural antenatal women (17.5%) had good knowledge about GDM. A greater proportion of the women were aware of the conditions of DM and GDM. Results of the study done by Carolan et al to assess knowledge and attitude among multiethnic cohort in Australia contradictsthefindingsofthepresentstudyandreportsthatthemajorityofpeoplefromdifferentethnicitieshadappropriate knowledge, but they had a negative attitude toward GDM.
The study reported that 62 women had favorable attitude towards management and prevention of GDM in future and remaining 38 women had unfavorable attitude towards DM. A study was conducted in United Arab Emirates on type 2 diabetic patients, which is consistent with the outcomes of this study in terms of knowledgeandattitudeinwhichpatientshadsufficientlevel of knowledge on diabetes, but they had a negative attitude toward having diabetes18.Twenty three percent perceived themselves to be at high risk for developing Type 2diabetes in future. Majority of the pregnant women were at lower age with mean age of 26 years. If they take adequate preventive measures perceiving the risk of developing diabetes at the future the onset of diabetes could be delayed
The findings was supported by a study done toassess the risk perception among women with GDM in postpartum period revealed that younger the age lowered the perception of risk. They also reported that although patients with high perceived risk were not more likely to have intentions to adopt healthier lifestyle in the future (high26.0%vs.low29.2%;P0.69)12.
Thefindings fromotherstudiesstated that ninetypercent of women recognized that GDM was a risk factor for future diabetes, but only 16% believed that they
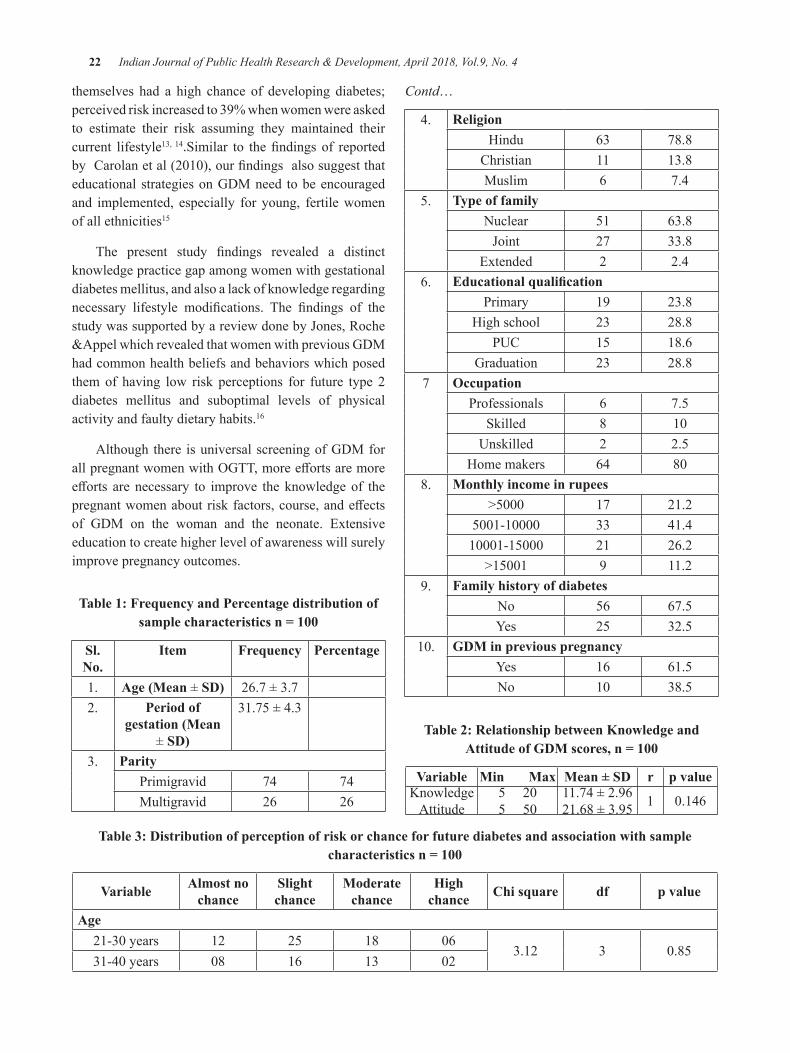
22 Indian Journal of Public Health Research & Development, April 2018, Vol.9, No. 4
themselves had a high chance of developing diabetes; perceived risk increased to 39% when women were asked to estimate their risk assuming they maintained their current lifestyle13, 14.Similar to thefindings of reportedbyCarolanetal(2010),ourfindingsalsosuggestthateducational strategies on GDM need to be encouraged and implemented, especially for young, fertile women of all ethnicities15
The present study findings revealed a distinctknowledge practice gap among women with gestational diabetes mellitus, and also a lack of knowledge regarding necessary lifestyle modifications. The findings of thestudywassupportedbyareviewdonebyJones,Roche&AppelwhichrevealedthatwomenwithpreviousGDMhad common health beliefs and behaviors which posed them of having low risk perceptions for future type 2 diabetes mellitus and suboptimal levels of physical activity and faulty dietary habits.16
Although there is universal screening of GDM for allpregnantwomenwithOGTT,moreeffortsaremoreefforts are necessary to improve theknowledgeof thepregnantwomenaboutriskfactors,course,andeffectsof GDM on the woman and the neonate. Extensive education to create higher level of awareness will surely improve pregnancy outcomes.
Table 1: Frequency and Percentage distribution of sample characteristics n = 100
Sl. No.
Item Frequency Percentage
1. Age (Mean ± SD) 26.7 ± 3.72. Period of
gestation (Mean ± SD)
31.75 ± 4.3
3. ParityPrimigravid 74 74Multigravid 26 26
Contd…
4. ReligionHindu 63 78.8
Christian 11 13.8Muslim 6 7.4
5. Type of familyNuclear 51 63.8Joint 27 33.8
Extended 2 2.46. Educational qualification
Primary 19 23.8High school 23 28.8
PUC 15 18.6Graduation 23 28.8
7 OccupationProfessionals 6 7.5
Skilled 8 10Unskilled 2 2.5
Home makers 64 808. Monthly income in rupees
>5000 17 21.25001-10000 33 41.410001-15000 21 26.2
>15001 9 11.29. Family history of diabetes
No 56 67.5Yes 25 32.5
10. gdM in previous pregnancyYes 16 61.5No 10 38.5
Table 2: Relationship between Knowledge and Attitude of GDM scores, n = 100
Variable Min Max Mean ± Sd r p valueKnowledge
Attitude520550
11.74 ± 2.9621.68 ± 3.95 1 0.146
Table 3: distribution of perception of risk or chance for future diabetes and association with sample characteristics n = 100
Variable Almost no chance
Slight chance
Moderate chance
high chance Chi square df p value
Age21-30years 12 25 18 06
3.12 3 0.8531-40years 08 16 13 02
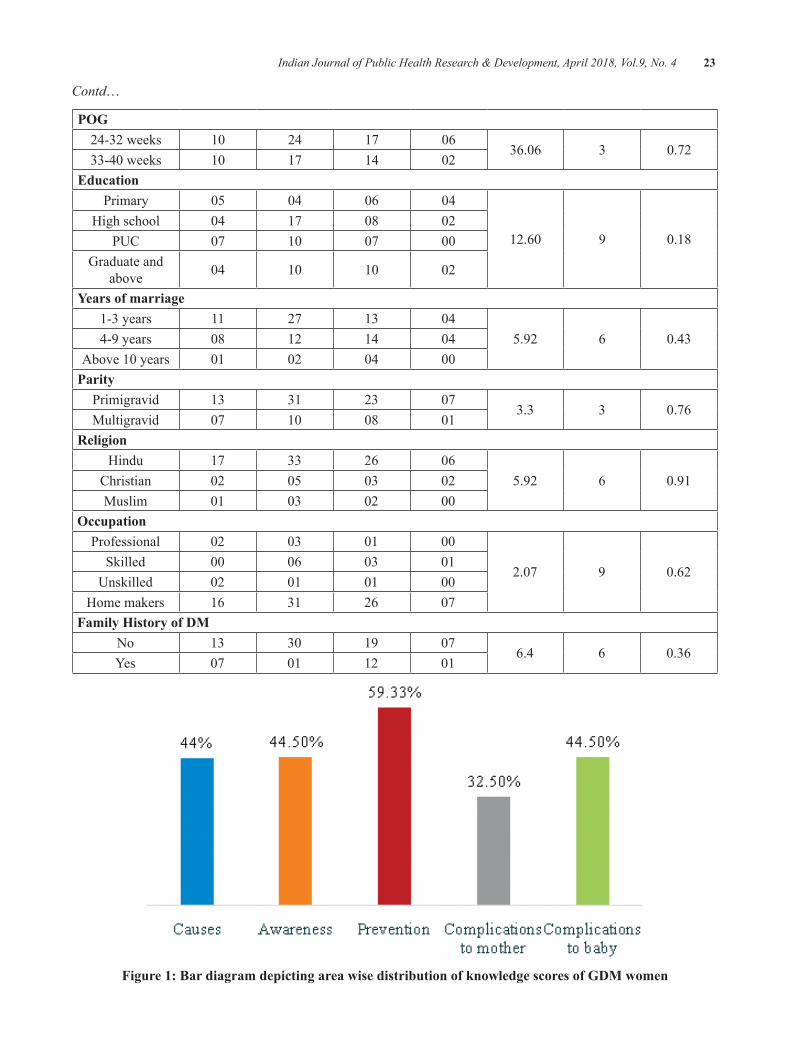
Indian Journal of Public Health Research & Development, April 2018, Vol.9, No. 4 23
Contd…
POg24-32 weeks 10 24 17 06
36.06 3 0.7233-40weeks 10 17 14 02
educationPrimary 05 04 06 04
12.60 9 0.18High school 04 17 08 02
PUC 07 10 07 00Graduate and
above 04 10 10 02
years of marriage1-3 years 11 27 13 04
5.92 6 0.434-9 years 08 12 14 04Above10years 01 02 04 00
ParityPrimigravid 13 31 23 07
3.3 3 0.76Multigravid 07 10 08 01
ReligionHindu 17 33 26 06
5.92 6 0.91Christian 02 05 03 02Muslim 01 03 02 00
OccupationProfessional 02 03 01 00
2.07 9 0.62Skilled 00 06 03 01
Unskilled 02 01 01 00Home makers 16 31 26 07
Family history of dMNo 13 30 19 07
6.4 6 0.36Yes 07 01 12 01
Figure 1: bar diagram depicting area wise distribution of knowledge scores of gdM women
24 Indian Journal of Public Health Research & Development, April 2018, Vol.9, No. 4
CONCluSIONS
Prevalence of diabetes is increasing rapidly globally, hence there is an urgent need to develop preventive strategiesandtoidentifyhighriskpopulationtobenefitthem from diabetes prevention.Gestational diabetes mellitus not only has adverse outcomes on women’s health but predisposes a greater risk of Diabetes mellitus in the offspring. Hence early counselling of pregnantwomen to adopt preventive behaviors is very essential to prevent the onset of GDM in pregnancy.
Conflict of Intrest: None. The authors declared that they have no competing interests.
Source of Funding: None
ReFeReNCeS
1.World Health Organisation. Global report ondiabetes. WHO website (http://www.who.int). 2016:4-84.
2. Maimunha, M., Mazza,D. Preconception care of women with diabetes: a review of current guideline recommendations. BMC Women’s Health.2010.10(5):2-7.
3.SavitzDA,JanevicTM,EngelSM,KaufmanJS,Herring AH. Ethnicity and gestational diabetes in New York City, 1995-2003. BJOG. 2008;115:969–978.
4.BellamyL,CasasJP,HingoraniAD,WilliamsD.Type 2 diabetes mellitus after gestational diabetes: A systematic review and meta-analysis. Lancet. 2009May23;373(9677):1773–1779
5.ShawJE,SicreeRA,ZimmetPZ.Globalestimatesoftheprevalenceofdiabetesfor2010and2030.Diabetes Res Clin Pract. 2010;87:4–14. doi:10.1016/j.diabres.2009.10.007
6. Ratner RE, Christophi CA, Metzger BE, Dabelea D, Bennett PH, Pi-Sunyer X, Fowler S, Kahn SE. Diabetes Prevention Program Research Group. Prevention of diabetes in women with a history ofgestationaldiabetes:Effectsofmetforminandlifestyleinterventions.J.Clin.Endocrinol.Metab.2008,93,4774–4779.
7.KimC,McEwenLN,PietteJD,GoeweyJ,FerraraA, Walker EA. Risk perception for diabetes among
women with histories of gestational diabetes mellitus. Diabetes Care. 2007 Sep;30(9):2281–2286.[PubMed]
8. Keely E, Clark H, Karovitch A, Graham I. Screening for type 2 diabetes following gestational diabetes: Family physician and patient perspectives. Canadian Family Physician. 2010;56(6):558-563..
9.MorrisonMK,LoweJM,CollinsCE.Australianwomen’s experiences of living with gestational diabetes.WomenBirth.2014,27,52–57.
10.BrewerNT,WeinsteinND,CuiteCL,HerringtonJE. Risk perceptions and their relation to riskbehavior.AnnBehavMed.2004Apr;27(2):125–130
11.MorrisonMK,LoweJM,CollinsCE.Perceivedrisk of type 2 diabetes in australian women with a recent history of gestational diabetes mellitus. DiabetMed.2010Aug;27(8):882–886
12. Diabetes Prevention Program Research Group. 10-year follow-up of diabetes incidence andweight loss in the Diabetes Prevention Program Outcomes Study. Lancet. 2009;374(9702):1677-1686.
13. Marie-France H, Ana SW, Peter S, Richard W G, James B M. Diabetes Risk Perception andIntention to Adopt Healthy Lifestyles Among Primary Care Patients. Diabetes Care 2009,32:1820–1822
14.Catherine K, Laura NM, JohnD P, Jennifer G,Assiamira F, Elizabeth AW. Risk Perception for Diabetes among Women with Histories of Gestational Diabetes Mellitus. Diabetes Care 2007,30(9),2281–2286.
15. Carolan M, Steele C, Margetts H. Attitudes towards gestational diabetes among a multiethnic cohort inAustralia. Journal ofClinicalNursing.2010;19:p.2446-2453.
16.JonesEJ,RocheCC,AppelSJ.A reviewof thehealth beliefs and lifestyle behaviors of women with previous gestational diabetes. Journalof Obstet Gynecol Neonatal Nurs. 2009 Sep-Oct;38(5):516-26.
Study to Assess the Seizure Severity, depression and Quality of life among Patients with epilepsy at AIMS, Kochi
Antony T1, Kanmani J2, Anjana.A.P3
1M.Sc., Nursing Student, 2Professor, 3Assistant Professor, Department of Medical Surgical Nursing, Amrita College of Nursing, Amrita Vishwa Vidyapeetham, Kochi, Kerala
AbSTRACT
Introduction: Epilepsy is a condition that has life consequences that extend well beyond the experience of having seizures.
Objectives: The objective of the study were to identify the seizure severity, depression and quality of life, findouttherelationshipbetweenseizureseverity,depressionandqualityoflifeandtofindouttheassociationbetween seizure severity, depression, quality of life and selected demographic and clinical variables.
Materials and Method:Atotalof100patientswithepilepsywerestudiedbystandardizedSeizureSeverityQuestionnaire, Becks Depression Inventory, and Quality of Life in Epilepsy 31.
Results: showed that 78 (78 %) of subjects with epilepsy were having have moderate degree of seizure severity,12(12%)havingsevere,10(10%)havingmilddegreeofseizureseverity.Thedepressionshowed55 (55 %) of subjects with epilepsy having normal level, 31 (31%) having mild mood disturbance, 11 (11%) has moderate depression, three (3%) has borderline clinical depression and no severe and extreme depression. The quality of life in epilepsy showed 62 (62%) having low quality of life and 38 (38%) having highqualityoflife.Therewasasignificantstrongnegativecorrelationexistrelationshipbetweendepressionandqualityof life (r= -.563) and seizure severity andqualityof life (r=-.343).Therewasa significantpositivecorrelationbetweenseizureseverityanddepression(r=.226).Asignificantassociationbetweendepressionandeducationalstatus(χ2=3.88),qualityoflifequalityoflifeandeducationalstatus(χ2=9.283)andtypeofseizureandqualityoflife(χ2=6.84).
Conclusion: The study concluded that seizure severity and depression were predictive indicators for assessing quality of life.
Keywords: Seizure severity, depression and quality of life , patients with epilepsy
Corresponding Author:KanmaniJ,Professor, Amrita College of Nursing,AmritaVishwaVidyapeetham,HealthSciencesCampus,Kochi-682041,KeralaContactNo.09446986374Email ID: [email protected]
INTROduCTION
Epileptic disorder is a chronic neurological condition characterized by recurrent epileptic seizures.1
The brain is made up of billions of nerve cells or neurons that communicate through electrical and chemical signals2. When there is a sudden excessive electrical
discharge that disrupts the normal activity of the nerve cells it results in seizure. Thus seizure tendency persist between epileptic seizure. Epileptic disorder comprise epileptic syndromes and the epilepsies2. Depending on the patient, seizure may occur frequently or infrequently. Underlying causeof seizure are reflected inpatient ofage, sex and time period, CNS infections, brain tumor, drug withdrawal, eclampsia etc.
Theadverseeffectsofepilepsyoftengobeyondtheoccurrence of clinical seizures, and the extent of these effects largely depends on the etiology of the seizuredisorder, the degree to which the seizures are controlled, andthepresenceofsideeffectsfromantiepileptictherapy.Patients with seizures secondary to developmental
DOI Number: 10.5958/0976-5506.2018.00250.4
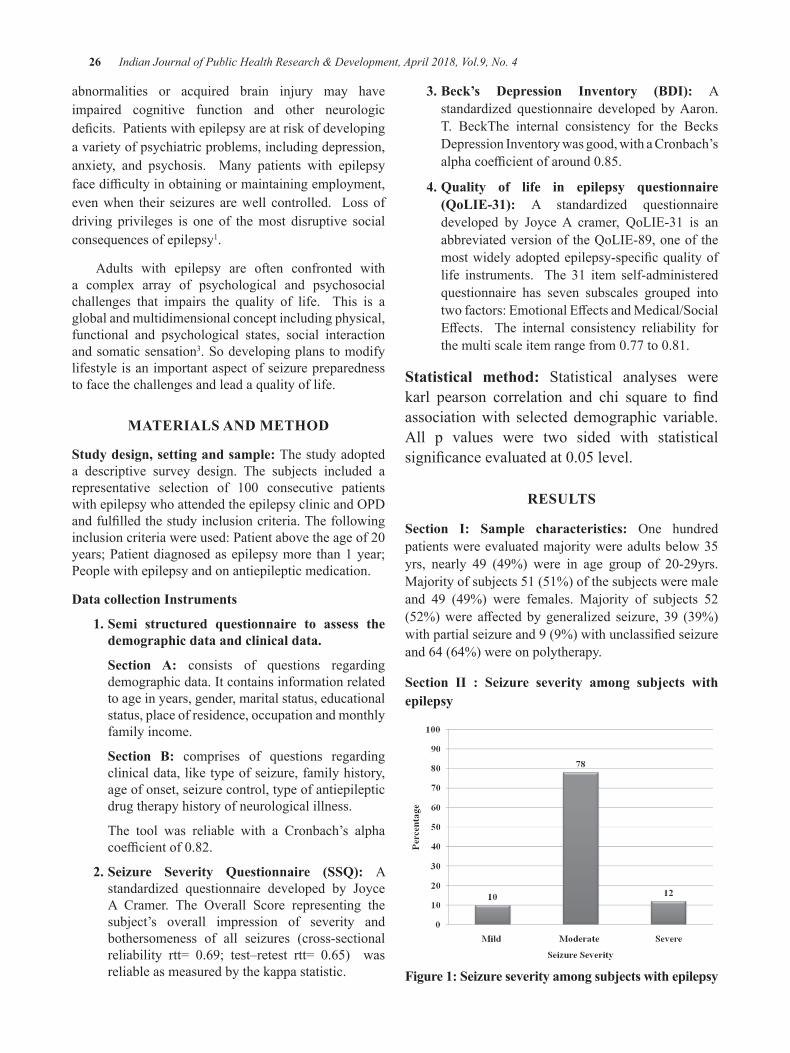
26 Indian Journal of Public Health Research & Development, April 2018, Vol.9, No. 4
abnormalities or acquired brain injury may have impaired cognitive function and other neurologic deficits.Patientswithepilepsyareatriskofdevelopinga variety of psychiatric problems, including depression, anxiety, and psychosis. Many patients with epilepsy facedifficultyinobtainingormaintainingemployment,even when their seizures are well controlled. Loss of driving privileges is one of the most disruptive social consequences of epilepsy1.
Adults with epilepsy are often confronted with a complex array of psychological and psychosocial challenges that impairs the quality of life. This is a global and multidimensional concept including physical, functional and psychological states, social interaction and somatic sensation3. So developing plans to modify lifestyle is an important aspect of seizure preparedness to face the challenges and lead a quality of life.
MATeRIAlS ANd MeThOd
Study design, setting and sample: The study adopted a descriptive survey design. The subjects included a representative selection of 100 consecutive patientswithepilepsywhoattendedtheepilepsyclinicandOPDandfulfilledthestudyinclusioncriteria.Thefollowinginclusioncriteriawereused:Patientabovetheageof20years; Patient diagnosed as epilepsy more than 1 year; People with epilepsy and on antiepileptic medication.
data collection Instruments
1. Semi structured questionnaire to assess the demographic data and clinical data.
Section A: consists of questions regarding demographic data. It contains information related to age in years, gender, marital status, educational status, place of residence, occupation and monthly family income.
Section b: comprises of questions regarding clinical data, like type of seizure, family history, age of onset, seizure control, type of antiepileptic drug therapy history of neurological illness.
The tool was reliable with a Cronbach’s alpha coefficientof0.82.
2. Seizure Severity Questionnaire (SSQ): A standardized questionnaire developed by JoyceA Cramer. The Overall Score representing thesubject’s overall impression of severity and bothersomeness of all seizures (cross-sectional reliability rtt= 0.69; test–retest rtt= 0.65) wasreliable as measured by the kappa statistic.
3. Beck’s Depression Inventory (BDI): A standardized questionnaire developed by Aaron. T. BeckThe internal consistency for the Becks Depression Inventory was good, with a Cronbach’s alphacoefficientofaround0.85.
4. Quality of life in epilepsy questionnaire (QoLIE-31): A standardized questionnaire developed by JoyceA cramer, QoLIE-31 is anabbreviated version of the QoLIE-89, one of the mostwidelyadoptedepilepsy-specificqualityoflife instruments. The 31 item self-administered questionnaire has seven subscales grouped into twofactors:EmotionalEffectsandMedical/SocialEffects. The internal consistency reliability forthemultiscaleitemrangefrom0.77to0.81.
Statistical method: Statistical analyses were karl pearson correlation and chi square to findassociation with selected demographic variable. All p values were two sided with statistical significanceevaluatedat0.05level.
ReSulTS
Section I: Sample characteristics: One hundredpatients were evaluated majority were adults below 35 yrs, nearly 49 (49%) were in age group of 20-29yrs.Majority of subjects 51 (51%) of the subjects were male and 49 (49%) were females. Majority of subjects 52 (52%)were affectedbygeneralized seizure, 39 (39%)withpartialseizureand9(9%)withunclassifiedseizureand 64 (64%) were on polytherapy.
Section II : Seizure severity among subjects with epilepsy
Figure 1: Seizure severity among subjects with epilepsy
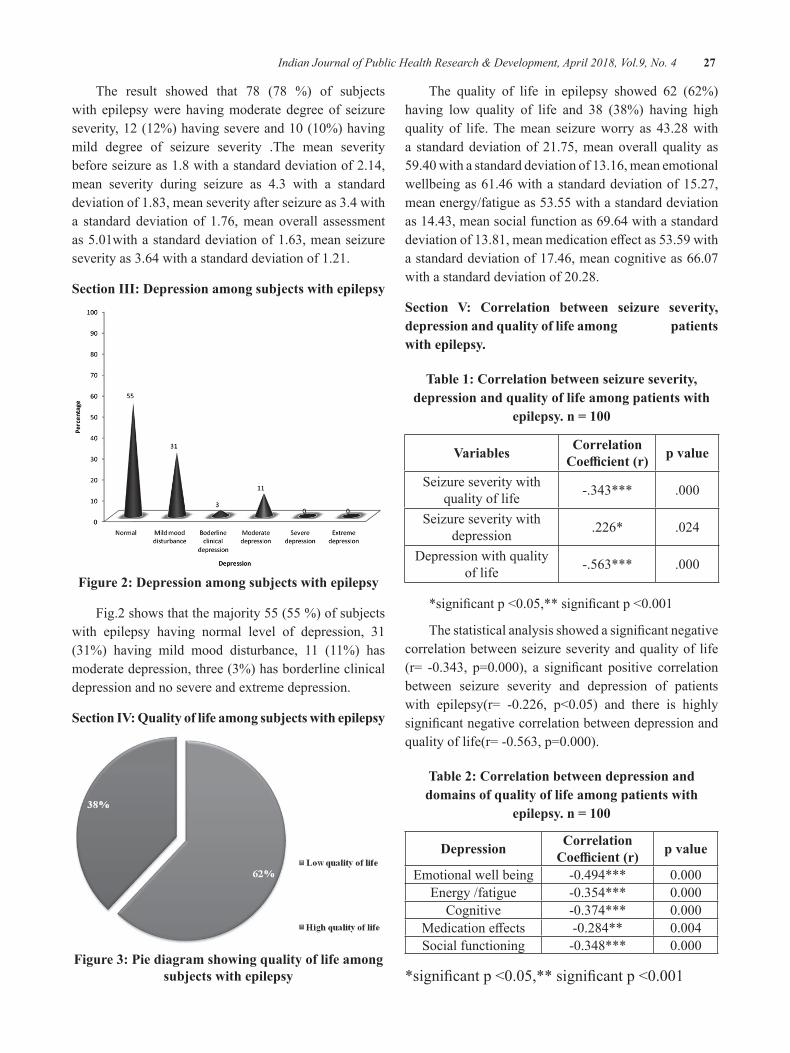
Indian Journal of Public Health Research & Development, April 2018, Vol.9, No. 4 27
The result showed that 78 (78 %) of subjects with epilepsy were having moderate degree of seizure severity,12(12%)havingsevereand10(10%)havingmild degree of seizure severity .The mean severity before seizure as 1.8 with a standard deviation of 2.14, mean severity during seizure as 4.3 with a standard deviation of 1.83, mean severity after seizure as 3.4 with a standard deviation of 1.76, mean overall assessment as5.01withastandarddeviationof1.63,meanseizureseverity as 3.64 with a standard deviation of 1.21.
Section III: depression among subjects with epilepsy
Figure 2: depression among subjects with epilepsy
Fig.2 shows that the majority 55 (55 %) of subjects with epilepsy having normal level of depression, 31 (31%) having mild mood disturbance, 11 (11%) has moderate depression, three (3%) has borderline clinical depression and no severe and extreme depression.
Section IV: Quality of life among subjects with epilepsy
Figure 3: Pie diagram showing quality of life among subjects with epilepsy
The quality of life in epilepsy showed 62 (62%) having low quality of life and 38 (38%) having high quality of life. The mean seizure worry as 43.28 with a standard deviation of 21.75, mean overall quality as 59.40withastandarddeviationof13.16,meanemotionalwellbeing as 61.46 with a standard deviation of 15.27, mean energy/fatigue as 53.55 with a standard deviation as 14.43, mean social function as 69.64 with a standard deviationof13.81,meanmedicationeffectas53.59withastandarddeviationof17.46,meancognitiveas66.07withastandarddeviationof20.28.
Section V: Correlation between seizure severity, depression and quality of life among patients with epilepsy.
Table 1: Correlation between seizure severity, depression and quality of life among patients with
epilepsy. n = 100
Variables Correlation Coefficient (r) p value
Seizure severity with quality of life -.343*** .000
Seizure severity with depression .226* .024
Depression with quality of life -.563*** .000
*significantp<0.05,**significantp<0.001
Thestatisticalanalysisshowedasignificantnegativecorrelation between seizure severity and quality of life (r= -0.343, p=0.000), a significant positive correlationbetween seizure severity and depression of patients with epilepsy(r= -0.226, p<0.05) and there is highlysignificantnegativecorrelationbetweendepressionandqualityoflife(r=-0.563,p=0.000).
Table 2: Correlation between depression and domains of quality of life among patients with
epilepsy. n = 100
depression Correlation Coefficient (r) p value
Emotional well being -0.494*** 0.000Energy /fatigue -0.354*** 0.000
Cognitive -0.374*** 0.000Medicationeffects -0.284** 0.004Social functioning -0.348*** 0.000
*significantp<0.05,**significantp<0.001
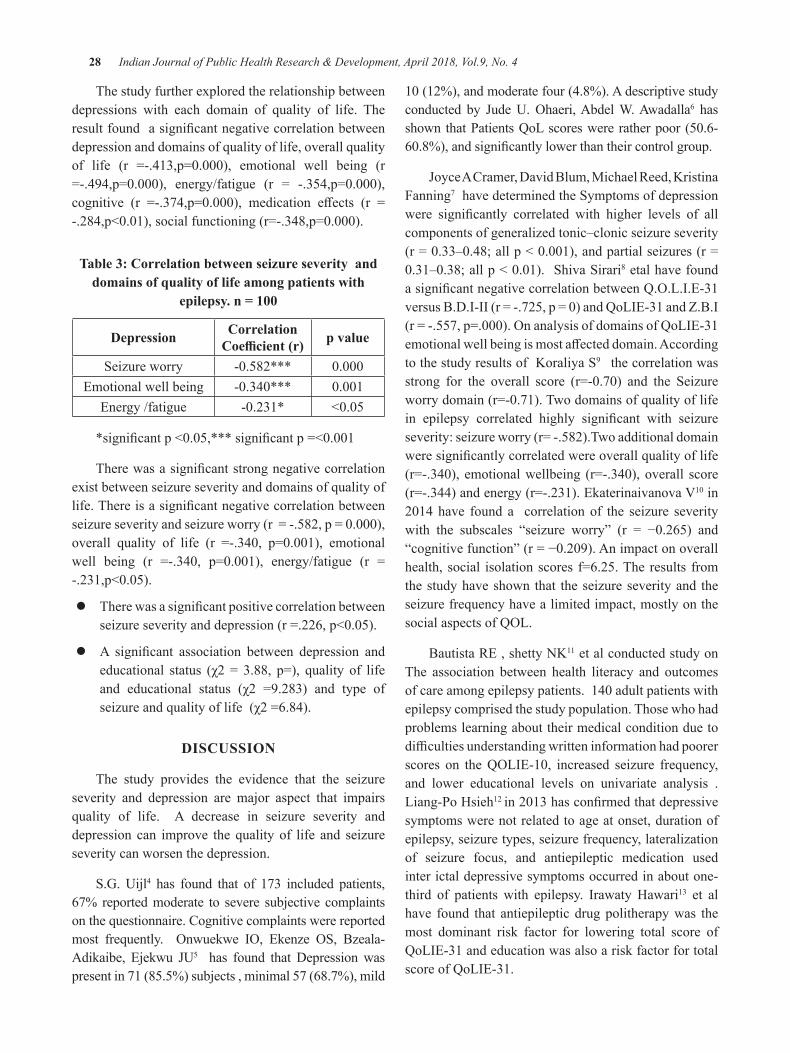
28 Indian Journal of Public Health Research & Development, April 2018, Vol.9, No. 4
The study further explored the relationship between depressions with each domain of quality of life. The resultfoundasignificantnegativecorrelationbetweendepression and domains of quality of life, overall quality of life (r =-.413,p=0.000), emotional well being (r=-.494,p=0.000), energy/fatigue (r = -.354,p=0.000),cognitive (r =-.374,p=0.000), medication effects (r =-.284,p<0.01),socialfunctioning(r=-.348,p=0.000).
Table 3: Correlation between seizure severity and domains of quality of life among patients with
epilepsy. n = 100
depression Correlation Coefficient (r) p value
Seizure worry -0.582*** 0.000Emotional well being -0.340*** 0.001
Energy /fatigue -0.231* <0.05
*significantp<0.05,***significantp=<0.001
Therewasasignificantstrongnegativecorrelationexist between seizure severity and domains of quality of life.Thereisasignificantnegativecorrelationbetweenseizureseverityandseizureworry(r=-.582,p=0.000),overall quality of life (r =-.340, p=0.001), emotionalwell being (r =-.340, p=0.001), energy/fatigue (r =-.231,p<0.05).
z Therewasasignificantpositivecorrelationbetweenseizureseverityanddepression(r=.226,p<0.05).
z A significant association between depression andeducational status (χ2 = 3.88, p=), quality of lifeand educational status (χ2 =9.283) and type ofseizureandqualityoflife(χ2=6.84).
dISCuSSION
The study provides the evidence that the seizure severity and depression are major aspect that impairs quality of life. A decrease in seizure severity and depression can improve the quality of life and seizure severity can worsen the depression.
S.G. Uijl4 has found that of 173 included patients, 67% reported moderate to severe subjective complaints on the questionnaire. Cognitive complaints were reported most frequently. Onwuekwe IO, Ekenze OS, Bzeala-Adikaibe, Ejekwu JU5 has found that Depression was present in 71 (85.5%) subjects , minimal 57 (68.7%), mild
10(12%),andmoderatefour(4.8%).Adescriptivestudyconducted by JudeU.Ohaeri,AbdelW.Awadalla6 has shownthatPatientsQoLscoreswereratherpoor(50.6-60.8%),andsignificantlylowerthantheircontrolgroup.
JoyceACramer,DavidBlum,MichaelReed,KristinaFanning7 have determined the Symptoms of depression were significantly correlated with higher levels of allcomponents of generalized tonic–clonic seizure severity (r=0.33–0.48;allp<0.001),andpartialseizures(r=0.31–0.38;allp<0.01).ShivaSirari8 etal have found asignificantnegativecorrelationbetweenQ.O.L.I.E-31versusB.D.I-II(r=-.725,p=0)andQoLIE-31andZ.B.I(r=-.557,p=.000).OnanalysisofdomainsofQoLIE-31emotionalwellbeingismostaffecteddomain.Accordingto the study results of Koraliya S9 the correlation was strong for the overall score (r=-0.70) and the Seizureworrydomain(r=-0.71).Twodomainsofqualityoflifein epilepsy correlated highly significant with seizureseverity:seizureworry(r=-.582).Twoadditionaldomainweresignificantlycorrelatedwereoverallqualityoflife(r=-.340), emotionalwellbeing (r=-.340),overall score(r=-.344)andenergy(r=-.231).EkaterinaivanovaV10 in 2014have found a correlationof the seizure severitywith the subscales “seizure worry” (r = −0.265) and“cognitivefunction”(r=−0.209).Animpactonoverallhealth, social isolationscores f=6.25.Theresults fromthe study have shown that the seizure severity and the seizure frequency have a limited impact, mostly on the socialaspectsofQOL.
Bautista RE , shetty NK11 et al conducted study on The association between health literacy and outcomes ofcareamongepilepsypatients.140adultpatientswithepilepsy comprised the study population. Those who had problems learning about their medical condition due to difficultiesunderstandingwritteninformationhadpoorerscores on theQOLIE-10, increased seizure frequency,and lower educational levels on univariate analysis . Liang-Po Hsieh12 in2013hasconfirmedthatdepressivesymptoms were not related to age at onset, duration of epilepsy, seizure types, seizure frequency, lateralization of seizure focus, and antiepileptic medication used inter ictal depressive symptoms occurred in about one-third of patients with epilepsy. Irawaty Hawari13 et al have found that antiepileptic drug politherapy was the most dominant risk factor for lowering total score of QoLIE-31 and education was also a risk factor for total score of QoLIE-31.
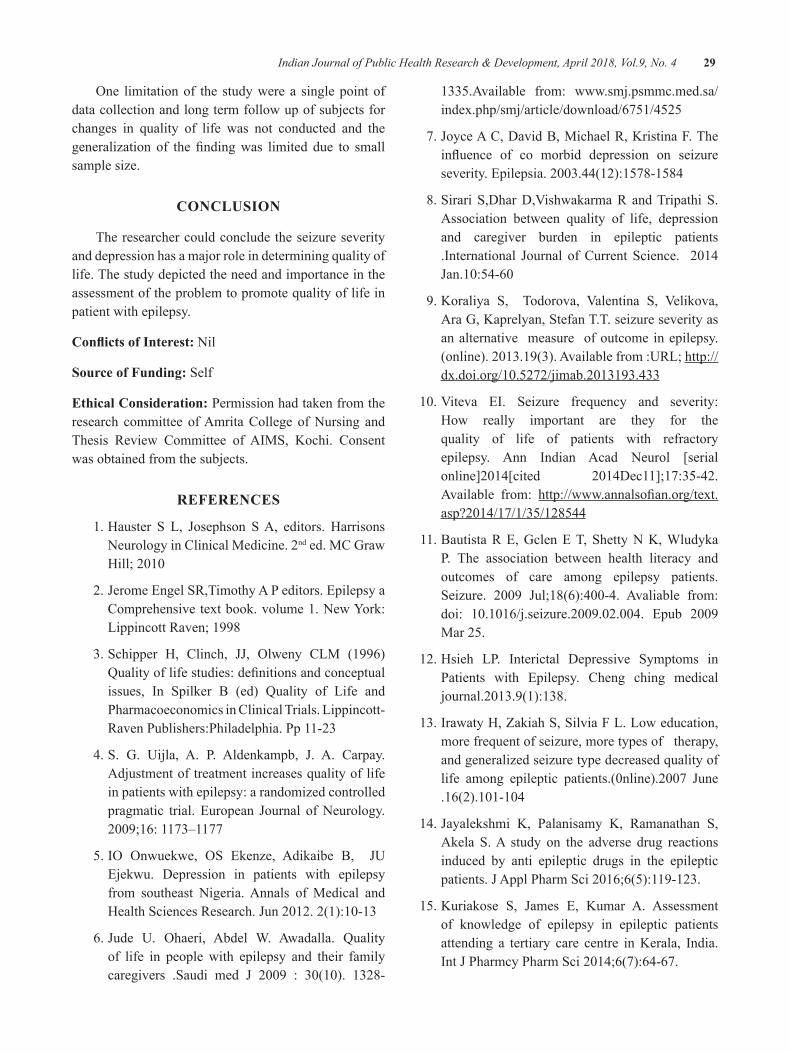
Indian Journal of Public Health Research & Development, April 2018, Vol.9, No. 4 29
One limitationof the studywerea singlepointofdata collection and long term follow up of subjects for changes in quality of life was not conducted and the generalization of the findingwas limited due to smallsample size.
CONCluSION
The researcher could conclude the seizure severity and depression has a major role in determining quality of life. The study depicted the need and importance in the assessment of the problem to promote quality of life in patient with epilepsy.
Conflicts of Interest: Nil
Source of Funding: Self
ethical Consideration: Permission had taken from the research committee of Amrita College of Nursing and Thesis Review Committee of AIMS, Kochi. Consent was obtained from the subjects.
ReFeReNCeS
1.Hauster S L, Josephson SA, editors. HarrisonsNeurology in Clinical Medicine. 2nd ed. MC Graw Hill;2010
2.JeromeEngelSR,TimothyAPeditors.EpilepsyaComprehensive text book. volume 1. New York: Lippincott Raven; 1998
3.Schipper H, Clinch, JJ, Olweny CLM (1996)Qualityoflifestudies:definitionsandconceptualissues, In Spilker B (ed) Quality of Life and Pharmacoeconomics in Clinical Trials. Lippincott-Raven Publishers:Philadelphia. Pp 11-23
4.S. G. Uijla, A. P. Aldenkampb, J. A. Carpay.Adjustment of treatment increases quality of life in patients with epilepsy: a randomized controlled pragmatic trial. European Journal ofNeurology.2009;16:1173–1177
5.IO Onwuekwe, OS Ekenze, Adikaibe B, JUEjekwu. Depression in patients with epilepsy from southeast Nigeria. Annals of Medical and HealthSciencesResearch.Jun2012.2(1):10-13
6.Jude U. Ohaeri, Abdel W. Awadalla. Qualityof life in people with epilepsy and their family caregivers .Saudi med J 2009 : 30(10). 1328-
1335.Available from: www.smj.psmmc.med.sa/index.php/smj/article/download/6751/4525
7.JoyceAC,DavidB,MichaelR,KristinaF.Theinfluence of co morbid depression on seizureseverity.Epilepsia.2003.44(12):1578-1584
8.Sirari S,DharD,VishwakarmaR andTripathi S.Association between quality of life, depression and caregiver burden in epileptic patients .International Journal ofCurrent Science. 2014Jan.10:54-60
9.Koraliya S, Todorova, Valentina S, Velikova,Ara G, Kaprelyan, Stefan T.T. seizure severity as an alternative measure of outcome in epilepsy. (online).2013.19(3).Availablefrom:URL;http://dx.doi.org/10.5272/jimab.2013193.433
10.Viteva EI. Seizure frequency and severity:How really important are they for the quality of life of patients with refractory epilepsy. Ann Indian Acad Neurol [serialonline]2014[cited 2014Dec11];17:35-42.Available from: http://www.annalsofian.org/text.asp?2014/17/1/35/128544
11. Bautista R E, Gclen E T, Shetty N K, Wludyka P. The association between health literacy and outcomes of care among epilepsy patients. Seizure. 2009 Jul;18(6):400-4. Avaliable from:doi: 10.1016/j.seizure.2009.02.004. Epub 2009Mar 25.
12. Hsieh LP. Interictal Depressive Symptoms in Patients with Epilepsy. Cheng ching medical journal.2013.9(1):138.
13. Irawaty H, Zakiah S, Silvia F L. Low education, more frequent of seizure, more types of therapy, and generalized seizure type decreased quality of life among epileptic patients.(0nline).2007 June.16(2).101-104
14.Jayalekshmi K, Palanisamy K, Ramanathan S,Akela S. A study on the adverse drug reactions induced by anti epileptic drugs in the epileptic patients.JApplPharmSci2016;6(5):119-123.
15.Kuriakose S, James E, Kumar A. Assessmentof knowledge of epilepsy in epileptic patients attending a tertiary care centre in Kerala, India. IntJPharmcyPharmSci2014;6(7):64-67.
Factors Influencing Non-use of Family Planning among Rural Adolescent girls in Malawi
Kennedy Machira1,2, beston b. Maonga2
1North West University-Mafikeng, Population and Research Unit, Mmabatho, Republic of South Africa; 2Lilongwe University of Agriculture and Natural Resources. Faculty of Development Studies, Department
of Agricultural and Applied Economics, Lilongwe.
AbSTRACT
Contraceptives uptake among rural adolescent girls remains amajor challenge despite efforts aimed atpromoting adolescent health inMalawi. The study, therefore, examined factors influencing non-use offamilyplanningmethodsamongruraladolescentgirls.Asampleof4358ruraladolescentgirlsfrom2010Malawi Demographic and Health Survey and using logistic regression was used to estimate determinants. About90.1%oftheruralgirlshadneverusedfamilyplanningmethods.Communityfactorssuchasdistancetoaccesshealthcareandinsufficientknowledgeaboutcontraceptivesexplainednon-usestatus.Theneedto implement community based family planning interventions, targeting rural adolescent girls is paramount not only improve family planning uptake practices, but also their health well-being for country’s socio-economicdevelopmentbenefits.
Keywords: Family planning, contraceptives, teen mothers, sexual intercourse, Malawi
INTROduCTION
In 21st Century, family planning (FP) is one of the top 10 public health achievements around the world1. Despite the achievement, little gains have been reaped inanefforttohavelowtotalfertilitylevelperwoman,more especially in developing countries.2 Young mothers below the ages of 19 are the major victims3, and this is attributed to differentials in socioeconomicstatus in developing countries, Malawi included 4, 5 This is attributed to high occurrence of teenage marriage, a factor increasing proportion of teen motherhood in rural communities.6, 7 Yet, the 1989 United Nations Convention on the Right of the Child stipulated the dangers of child marriage on young women health, their babies and increased risk of mortality or morbidity compared to their counterpartsagedover20.Nevertheless,inlowincomesocieties, young women continue falling pregnant despite contraceptives availability. This consequently translates into policy and public health relevance as younger women susceptibility to reproductive health risks increases.8 9 This consequently affect younger womenparticipation towards socio-economic development.10
In Malawi, the 2010 Demographic and HealthReport indicate that the proportion of teen mothers is gradually increased to 71.6%.11 This is partly explained
by younger women exposes to risk sexual risk practices which disadvantages them greatly, a factors would have been avoided if family planning was adequately used.10 This social imbalances exacerbate rural community poverty, more especially among young couples. It is worth noting that despite registered remarkable increase in contraceptive prevalence in Malawi from 13% in 1992 to46.1%in2010,10,11teen-motherhood proportion is on the increase,11, 12 implying that unmet need for family planning methods exist. Despite numerous studies done on contraceptives in Malawi, little is known on adolescent girls’ non-use of contraceptive products.7, 13, 14 Therefore, anexaminationondeterminantsinfluencingnon-useoffamily planning on rural adolescent girls at individual, household and community level is imperative.
MATeRIAlS ANd MeThOd
The study used 2010 Malawi Demographic andHealthSurvey(MDHS)inwhichatotalof23020womenparticipatedofwhich5040(21%)wereadolescentgirls.Among them, 86.5% (4358) were from rural, of which, 90.1%reportedtohaveneverusedcontraceptives.
In the study, “non-use of Family Planning (FP) was definedas1 ifnotusingand0forotherwise. In terms
DOI Number: 10.5958/0976-5506.2018.00251.6
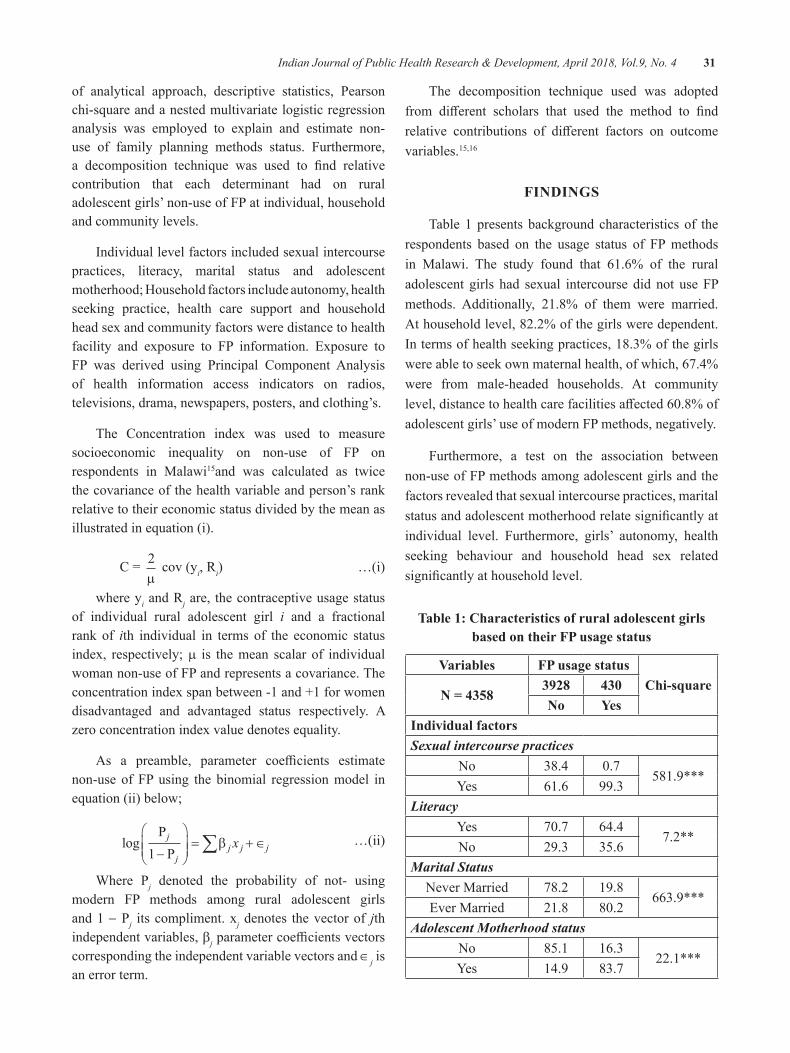
Indian Journal of Public Health Research & Development, April 2018, Vol.9, No. 4 31
of analytical approach, descriptive statistics, Pearson chi-square and a nested multivariate logistic regression analysis was employed to explain and estimate non-use of family planning methods status. Furthermore, a decomposition technique was used to find relativecontribution that each determinant had on rural adolescent girls’ non-use of FP at individual, household and community levels.
Individual level factors included sexual intercourse practices, literacy, marital status and adolescent motherhood; Household factors include autonomy, health seeking practice, health care support and household head sex and community factors were distance to health facility and exposure to FP information. Exposure to FP was derived using Principal Component Analysis of health information access indicators on radios, televisions, drama, newspapers, posters, and clothing’s.
The Concentration index was used to measure socioeconomic inequality on non-use of FP on respondents in Malawi15and was calculated as twice the covariance of the health variable and person’s rank relative to their economic status divided by the mean as illustrated in equation (i).
C= 2m
cov (yi, Ri) …(i)
where yi and Rj are, the contraceptive usage status of individual rural adolescent girl i and a fractional rank of ith individual in terms of the economic status index, respectively; m is the mean scalar of individual woman non-use of FP and represents a covariance. The concentration index span between -1 and +1 for women disadvantaged and advantaged status respectively. A zero concentration index value denotes equality.
As a preamble, parameter coefficients estimatenon-use of FP using the binomial regression model in equation (ii) below;
logP
P
j
jj j jx
1�
�
���
�
��� � ���b …(ii)
Where Pj denoted the probability of not- using modern FP methods among rural adolescent girls and 1 − Pj its compliment. xj denotes the vector of jth independent variables, bjparametercoefficientsvectorscorresponding the independent variable vectors and ∈j is an error term.
The decomposition technique used was adopted from different scholars that used the method to findrelative contributions of different factors on outcomevariables.15,16
FINdINgS
Table 1 presents background characteristics of the respondents based on the usage status of FP methods in Malawi. The study found that 61.6% of the rural adolescent girls had sexual intercourse did not use FP methods. Additionally, 21.8% of them were married. At household level, 82.2% of the girls were dependent. In terms of health seeking practices, 18.3% of the girls were able to seek own maternal health, of which, 67.4% were from male-headed households. At community level,distancetohealthcarefacilitiesaffected60.8%ofadolescent girls’ use of modern FP methods, negatively.
Furthermore, a test on the association between non-use of FP methods among adolescent girls and the factors revealed that sexual intercourse practices, marital statusandadolescentmotherhoodrelatesignificantlyatindividual level. Furthermore, girls’ autonomy, health seeking behaviour and household head sex related significantlyathouseholdlevel.
Table 1: Characteristics of rural adolescent girls based on their FP usage status
Variables FP usage statusChi-square
N = 43583928 430No yes
Individual factorsSexual intercourse practices
No 38.4 0.7581.9***
Yes 61.6 99.3Literacy
Yes 70.7 64.47.2**
No 29.3 35.6Marital Status
Never Married 78.2 19.8663.9***
Ever Married 21.8 80.2Adolescent Motherhood status
No 85.1 16.322.1***
Yes 14.9 83.7
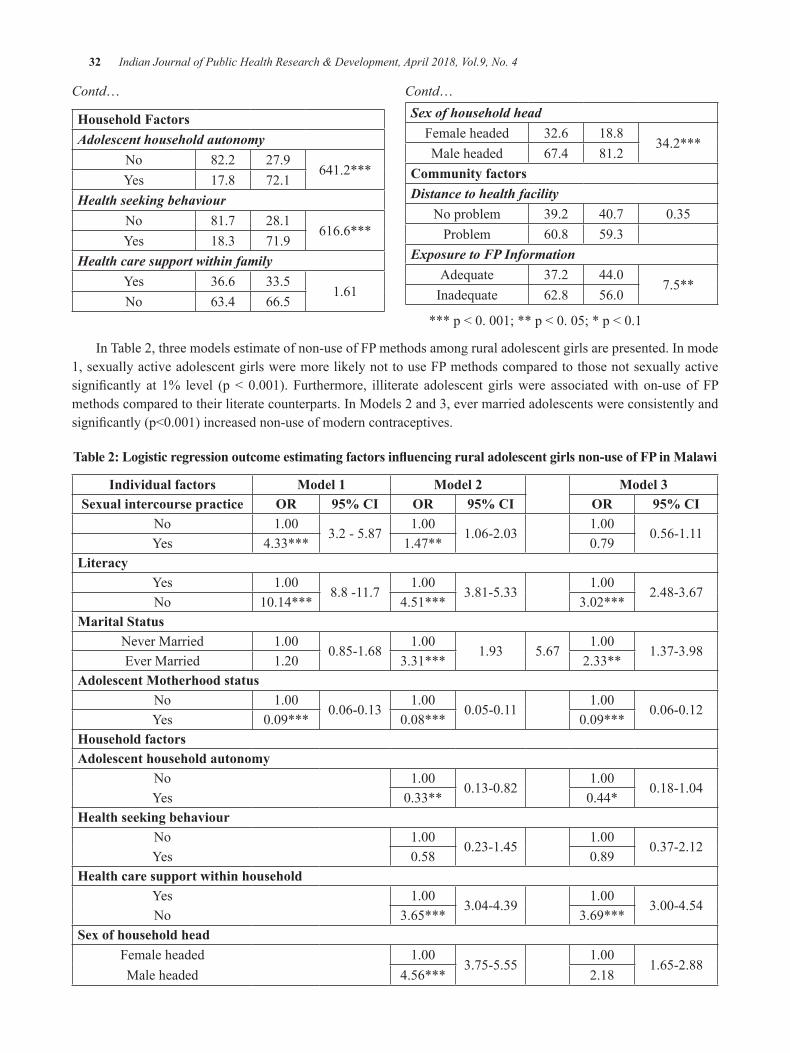
32 Indian Journal of Public Health Research & Development, April 2018, Vol.9, No. 4
Contd…
household FactorsAdolescent household autonomy
No 82.2 27.9641.2***
Yes 17.8 72.1Health seeking behaviour
No 81.7 28.1616.6***
Yes 18.3 71.9Health care support within family
Yes 36.6 33.51.61
No 63.4 66.5
Contd…Sex of household head
Female headed 32.6 18.834.2***
Male headed 67.4 81.2Community factorsDistance to health facility
No problem 39.2 40.7 0.35Problem 60.8 59.3
Exposure to FP InformationAdequate 37.2 44.0
7.5**Inadequate 62.8 56.0
***p<0.001;**p<0.05;*p<0.1
In Table 2, three models estimate of non-use of FP methods among rural adolescent girls are presented. In mode 1, sexually active adolescent girls were more likely not to use FP methods compared to those not sexually active significantly at 1% level (p< 0.001). Furthermore, illiterate adolescent girlswere associatedwith on-use of FPmethods compared to their literate counterparts. In Models 2 and 3, ever married adolescents were consistently and significantly(p<0.001)increasednon-useofmoderncontraceptives.
Table 2: Logistic regression outcome estimating factors influencing rural adolescent girls non-use of FP in Malawi
Individual factors Model 1 Model 2 Model 3Sexual intercourse practice OR 95% CI OR 95% CI OR 95% CI
No 1.003.2 - 5.87
1.001.06-2.03
1.000.56-1.11
Yes 4.33*** 1.47** 0.79literacy
Yes 1.008.8 -11.7
1.003.81-5.33
1.002.48-3.67
No 10.14*** 4.51*** 3.02***Marital Status
Never Married 1.000.85-1.68
1.001.93 5.67
1.001.37-3.98
Ever Married 1.20 3.31*** 2.33**Adolescent Motherhood status
No 1.000.06-0.13
1.000.05-0.11
1.000.06-0.12
Yes 0.09*** 0.08*** 0.09***household factorsAdolescent household autonomy
No 1.000.13-0.82
1.000.18-1.04
Yes 0.33** 0.44*health seeking behaviour
No 1.000.23-1.45
1.000.37-2.12
Yes 0.58 0.89health care support within household
Yes 1.003.04-4.39
1.003.00-4.54
No 3.65*** 3.69***Sex of household head
Female headed 1.003.75-5.55
1.001.65-2.88
Male headed 4.56*** 2.18
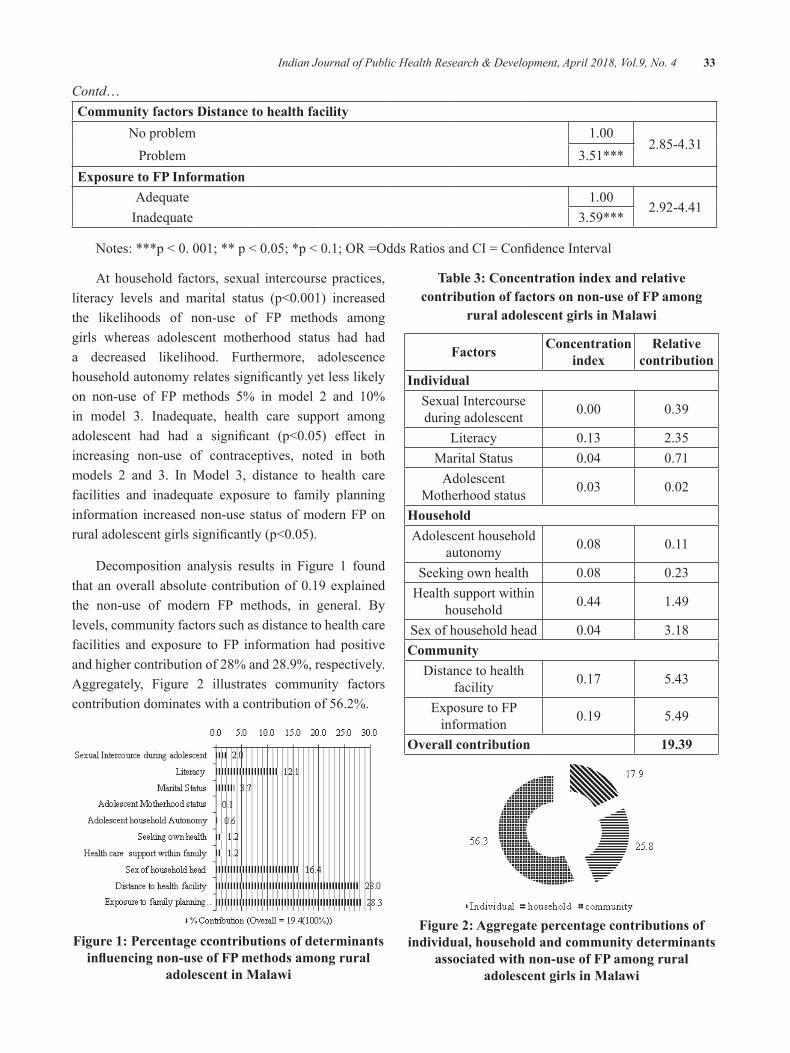
Indian Journal of Public Health Research & Development, April 2018, Vol.9, No. 4 33
Contd…Community factors distance to health facility
No problem 1.002.85-4.31
Problem 3.51***exposure to FP Information
Adequate 1.002.92-4.41
Inadequate 3.59***
Notes:***p<0.001;**p<0.05;*p<0.1;OR=OddsRatiosandCI=ConfidenceInterval
At household factors, sexual intercourse practices, literacy levels and marital status (p<0.001) increasedthe likelihoods of non-use of FP methods among girls whereas adolescent motherhood status had had a decreased likelihood. Furthermore, adolescence householdautonomyrelatessignificantlyyetlesslikelyon non-use of FP methods 5% in model 2 and 10%in model 3. Inadequate, health care support among adolescent had had a significant (p<0.05) effect inincreasing non-use of contraceptives, noted in both models 2 and 3. In Model 3, distance to health care facilities and inadequate exposure to family planning information increased non-use status of modern FP on ruraladolescentgirlssignificantly(p<0.05).
Decomposition analysis results in Figure 1 found thatanoverall absolutecontributionof0.19explainedthe non-use of modern FP methods, in general. By levels, community factors such as distance to health care facilities and exposure to FP information had positive and higher contribution of 28% and 28.9%, respectively. Aggregately, Figure 2 illustrates community factors contribution dominates with a contribution of 56.2%.
Figure 1: Percentage ccontributions of determinants influencing non-use of FP methods among rural
adolescent in Malawi
Table 3: Concentration index and relative contribution of factors on non-use of FP among
rural adolescent girls in Malawi
Factors Concentration index
Relative contribution
IndividualSexual Intercourse during adolescent 0.00 0.39
Literacy 0.13 2.35Marital Status 0.04 0.71
Adolescent Motherhood status 0.03 0.02
householdAdolescent household
autonomy 0.08 0.11
Seeking own health 0.08 0.23Health support within
household 0.44 1.49
Sex of household head 0.04 3.18Community
Distance to health facility 0.17 5.43
Exposure to FP information 0.19 5.49
Overall contribution 19.39
Figure 2: Aggregate percentage contributions of individual, household and community determinants
associated with non-use of FP among rural adolescent girls in Malawi
34 Indian Journal of Public Health Research & Development, April 2018, Vol.9, No. 4
dISCuSSION
The study decomposes individual, household and community inequalities in order to understand factors highly contributes more on non-use of modern contraceptives among rural adolescent girls in Malawi. The study found that community barriers such as distance to health care facilities and inadequate exposure to FP information are the major predictors associated with non-use of modern FP methods. Also to note, percentage contribution from decomposition methods foundthesefactorsrankedhighlyininfluencingnon-useof contraceptives among girls in Malawi. At household level, sex of household head contributed 16.4% towards inequalities to non-use of FP yet other factors had marginally low contribution. This implies better support initiatives among girls at household level their utilization pattern of modern contraceptives would increase.14, 18 The study also found that low income status contribute greatly on non-use of contraceptives among girls in Malawi. Thisresultconcurswiththefindingsofasimilarstudyin Mexico, despite low income status among married women, proper financial supported from their spousesincreases contraceptives uptake significantly.19 This implies that if rural women are oriented and supported, their uptake of contraceptives increase.
These results provide a justification for policyapproaches to tackle problems associated with low uptake and non-use of contraceptives among rural adolescent girls. Such approaches may include interventions using informal media to ensure information regarding opportunitiesandbenefitsofcontraceptivesareadvocatedin the country. This is attainable through enacting innovative best-practices aimed at improving use of contraceptives.20,21Similarly, improved literacy position targeting adolescents provides a competitive advantage that reduces teenage pregnancy, sexual risk behaviour,7, 13,
21 and their improved health dividends.22, 23, 24
At community level, due to distance in Malawi, the odds of non-use of modern family planning methods increases. It is echoed that proper and adequate Family planning information access from structured institutions has had a subsequent positive impact in promoting women’s use of modern contraceptives and thereby improved health outcome. 7, 19, 21 On the contrary, inthe current study, inefficient access to familyplanninginformation at community level, increased non-use of
FP among rural adolescent girls. This finding relatesto a study that reiterates that inadequate exposure to FP information through relevant media among women predicts low contraceptives utilizations.23, 24
CONCluSIONS
The study findings indicate that community levelfactors such as distance to the health facility and insufficientFPinformationdisseminatedthroughdifferentmedia are major significant factors that contributetowards non-use of modern methods in the country. Other factors include sexual intercourse practices,illiteracy, marital status, adolescent motherhood status, and sex of household head are also predictors of non-use of modern FP methods among rural adolescent girls in Malawi but to a lesser extent.
The study therefore, recommends promotion of community based family planning interventions, targeting rural and underserved adolescent girls. This would improve uptake of FP methods among girls in this reproductive age group. Such efforts should aimat reducing barriers to health care facilities and ensure improved access of FP among adolescent girls in the country. This development would motivate the rural and underserved adolescent girls’ access to knowledge aboutthesignificanceofFPandconsequentlyimproveupdateofdifferentmethodsmix.Suchpromotion,wouldresult in rural adolescent girls minimise increased risk of maternal morbidity and mortality aggravated by early motherhood assumed statuses. As such the country’s quest to attain maternal health statuses adopted through Sustainable Development Goals, a reality.10
This study recognizes the need to have a longitudinal record of community level data, therefore, a recommendation for a more robust and comprehensive approach to conduct an assessment on the impact on non-use of modern FP in Malawi, despite gain in contraceptive prevalence, is imperative. The results have however, provided an important and significantstep to formulate community based reproductive health strategies and policy to achieve improved use of modern family planning methods among adolescent girls. The study asserts that addressing community based challenges and promoting use of modern contraceptives requires introduction of family planning from early ages of the adolescent reproductive health.
Indian Journal of Public Health Research & Development, April 2018, Vol.9, No. 4 35
Conflict of Interest: None
ethical Clearance: Secondary data was provided by Measuredhs and upon given authenticity to use it. Issues of ethics were handled by them as they are data custodian.
Source of Funding: Self
ReFeReNCeS
1. French M, Albanese A, Gossett DR. Postpartum contraceptive choice after high-risk pregnancy: a retrospective cohort analysis. Contraception. 2016;94(2):173-80.
2. Council NR, Population Co. Growing up global: The changing transitions to adulthood in developing countries: National Academies Press; 2005.
3. Sedgh G, Finer LB, Bankole A, Eilers MA, Singh S. Adolescent pregnancy, birth, and abortion rates acrosscountries:levelsandrecenttrends.JournalofAdolescentHealth.2015;56(2):223-30.
4.Coyne CA, D’Onofrio BM. Some (but notmuch) progress toward understanding teenage childbearing: A review of research from the past decade. Advances in child development and behavior.2012;42:113.
5.KorenmanS,FalesS.Thesocioeconomiceffectsof teenage childbearing: a review of the recent literature. Report to the Bureau of Maternal, Infant, and Reproductive Health, New York City Department of Health and Mental Hygiene New York: Baruch College, City University of New York,SchoolofPublicAffairs.2011.
6. Kothari M, Wang S, Head S, Abderrahim N. Trends in adolescent reproductive and sexual behaviors.2012.
7. Palamuleni ME. Socio-economic and demographicfactorsaffectingcontraceptiveuseinMalawi: original research article. African journal ofreproductivehealth.2013;17(3):91-104.
8.Nove A, Matthews Z, Neal S, Camacho AV.Maternal mortality in adolescents compared with women of other ages: evidence from 144 countries. TheLancetGlobalHealth.2014;2(3):e155-e64.
9. Singh PK, Rai RK, Alagarajan M, Singh L. Determinants of maternity care services utilization among married adolescents in rural India. PloS one.2012;7(2):e31666.
10.WHO. Sustainable Development Goals 2015.Geneva,Switzerland:WorldHealthOrganisation;2015.
11.NSO IM. Demographic and Health Survey.Zomba, Malawi: National Statistics Office andICFMacroInternational;2011.
12.NSOIM.DemographicandHealthSurvey1992.Zomba, Malawi: National Statistics Office andICF Macro International; 1993.
13. Kalanda B. Repositioning family planning through community based distribution agents in Malawi.MalawiMedicalJournal:theJournalofMedicalAssociationofMalawi.2010;22(3):71.
14.HenninkM,MadiseN.Influenceofuserfeesoncontraceptive use in Malawi. African Population Studies.2013;20(2).
15.Wagstaff A, Watanabe N, van Doorslaer E.On decomposing the causes of health sectori nequalities with an application to malnutrition inequalitiesinVietnam.2001.
16. Goli S, Doshi R, Perianayagam A. Pathways of economic inequalities in maternal and child health in urban India: a decomposition analysis. PLoSOne.2013;8(3):e58573.
17.Schatz E, Gómez-OlivéX, RalstonM,MenkenJ,TollmanS.The impact of pensions on healthand wellbeing in rural South Africa: Does gender matter? Social Science & Medicine.2012;75(10):1864-73.
18. Cohen B. Family planning programs, socioeconomic characteristics, and contraceptive use in Malawi. World Development. 2000;28(5):843-60.
19. Barber SL. Family planning advice and postpartum contraceptive use among low-income women in Mexico. International family planning perspectives.2007:6-12.
20.Sabia JJ. Does sex education affect adolescentsexuasl behaviors and health? Journal of PolicyAnalysisandManagement.2006;25(4):783-802.

36 Indian Journal of Public Health Research & Development, April 2018, Vol.9, No. 4
21.KohlerPK,ManhartLE,LaffertyWE.Abstinence-only and comprehensive sex education and the initiation of sexual activity and teen pregnancy. JournalofAdolescentHealth.2008;42(4):344-51.
22. Girma S, Paton D. Is education the best contraception: The case of teenage pregnancy in England? Social Science&Medicine.2015;131:1-9.
23. Stephenson R, Baschieri A, Clements S, Hennink M,MadiseN.Contextualinfluencesontheuseofhealth facilities for childbirth in Africa. American journalofpublichealth.2006;96(1):84-93.
24.Peipert J, Madden T, Allsworth JE, Secura G.Preventing unintended pregnancies by providing no-costcontraception.ObstetricsandGynecology.2013;121(4):875.
Performance evaluation of Adtree, Functional Tree and lMT Classifiers with CFS Subset evaluator for Intelligent heart
disease Prediction
lakshmi devasena C
Department of IT and Operations, IBS Hyderabad, IFHE University, Hyderabad
AbSTRACT
Healthcare analytics an emerging research area, which analyses existing clinical data, provide better support for clinical practices and decision making. In healthcare analytics, medical data mining an important research fieldwhichprovidesupportforhealthcarepractitionersandworkingasathirdumpireforseniorspecialist,who gets confused in complex medical cases. Medical data mining (MDM) used to predict numerous diseases in which Heart disease is the chief cause of increasing mortality rate worldwide and is estimated to be the crucialcauseofdeathgloballyby2030[1]. Predicting the heart disease in early stage with some demographic and clinical data before going for Angiography and direct high level treatment will reduce the expense of thepatient.However,thediagnosisofheartdiseaseanditsseveritymightbedifficultforpracticingmedicaldoctors, who are not specialized in cardiovascular diseases. There are many papers in literature which can compare the existing algorithms in heart disease prediction[2-36], but none of the papers discussed tree based classifierswithcorrelationbasedfeaturesubsetselectionevaluator,whichmayimprovethepredictionrate.Therefore, this research work would be helpful to establish the improvement in accuracy, which might be appreciatedbythemedicalpractitioners.Inthisresearchwork,differenttreebasedclassifierslikeADTree,FunctionalTree(FT),andLogisticModelTree(LMT)Classifierswereexaminedandcomparedwithandwithout applying Correlation-based Feature Selection (CFS) subset evaluation and the results are analyzed. For this research work, the heart disease data set [37] is takenforanalysis.Variousmeasuresareusedforcomparison.Aftercomparison,itisrevealedthatalltheclassifierswithCFSattributeselectionevaluatorhasbetter or equal accuracy as compared without CFS attribute selection evaluator (CFSAE).
Keywords: Heart Disease Prediction, Medical Data Mining, Performance Analysis, Tree-based classifiers, CFS Evaluator
INTROduCTION
MDMan exploringfield of datamining (DM), inwhichvariousdataclassificationandminingtechniquesare used to foresee the diseases based on the existing medical data. Medical industries store enormous data of patients and could be used for this purpose. Even the severe diseases like ‘Heart Attack’ have some common indications which are used to foretell the disease. Based on the historic data if a classificationmodel could beprepared, and then it is easy for the doctor to predict the disease using basic medical data and start the treatment without waiting for other medical modality results. Medical decision support systems use data mining approach to support diagnosing process. Predominantly classificationalgorithmsperformanimportantrolehere.Thecorrectnessoftheclassificationresultwillbebased
on the accurate and enough training data availability. Ranges of classification algorithms exist to foreseethe diseases and Computer Science researchers have a chance to scrutinize the algorithms and recommend the best algorithm for MDM.
Plentiful research works are undergoing for better heart disease prediction. Researchers show interest in this area to find the better algorithms which givessuperioraccuracybyanalyzingdifferentalgorithmsandcomparing them using various measures. The algorithms like neuro-fuzzy integrated approach, collective techniques of Maximal Frequent Item set Algorithm with C4.5 and K-means algorithm, Artificial NeuralNetwork (ANN) with Feature Subset Selection (FSS) and Principal component Analysis (PCA) are analyzed for heart disease prediction in [2-5]. Sequential Pattern
DOI Number: 10.5958/0976-5506.2018.00252.8
38 Indian Journal of Public Health Research & Development, April 2018, Vol.9, No. 4
Mining algorithm with Nearest Neighbor Classifier,Genetic Algorithm for variety of Optimal ReducedSet of Attributes and Naive Bayes with Decision Tree classifier, C4.5 and C5.0 decision tree algorithmwithRule reduction are compared and investigated in[6-8]. Cluster based Association Rule Mining, Sequential Minimal Optimization (SMO), Logistic Function andMultilayer Perceptron, K- Nearest Neighbor algorithm are scrutinized and compared in[9-12]. Review reports on heart disease prediction by several researchers are précisedin[13-16].Thepotentials,benefitsandusageofDMin Healthcare to predict diseases are expounded in[17-18]. Adaptive Neuro-Fuzzy Inference with Hybrid Learning algorithm, ANN with Multilayer Perceptron using Back Propagation algorithm, Classification and RegressionTree (CART) algorithms are explored and elaborated in[17-21] and these algorithms are compared for accuracy ofclassifierswithotherclassifiersinexistingliterature.Naive Bayes(NB), ANN and Decision tree combination, CascadedNeuralNetworkclassifierandSupportvectormachine (SVM) algorithm, combination of CART,ID3 and Decision Tree classifier are investigated andcompared in[22-25]. Equal Frequency Discretization Gain Ratio Decision Tree, Decision Tree classifierand Bagging algorithm, ANN, SVM and K-MeansClustering combination are examined and compared in[26-
27].DecisionTable,NBandJ48algorithmcombinationsuggested in[28]. Decision Tree with K-Means, NB and WeightedAssociativeClassifierwithAprioriAlgorithmcombination are examined and compared in[29]. SVMandNBclassifierareseparatelyassessedandcomparedin [30].NBwithJelinek-mercersmoothingcombinationisexplained in [31].RandomForestandJ48Classifiersareseparately evaluated and compared in[32]. LMT and FT Classifiersareseparatelyexamined(withallattributes)and compared in[33].MemoryBasedClassifiers(withallattributes) are separately analyzed and compared in[34]. ZeroR,RIDORandPARTClassifiers(withallattributes)are separately tested and compared in[35]. Functional TreeClassifier andRandomForestClassifier (with allattributes) are separately examined and compared in[36]. This work investigated and compared the performance ofADTree, FT and LMT classifiers with CFSAE forpredicting Heart Disease.
MATeRIAl ANd MeThOd
This research work uses the Heart Disease dataset [37] withasumof270instanceswith13medicalattributes.Thisdatasetcontainsinstancesof150patientswithout
heart disease and 120 patientswith heart disease.Theclassvalue”1”isusedtoindicatethehealthypatientandclassvalue“2”isusedtoindicateheartdiseaseaffectedpatient. The attributes are as: age, sex, chest, trestbps, chol, fasting blood sugar, restecg, thalach, exang, oldpeak, slope, ca, and thal.
ADTree Classifier: An alternating decision tree (ADTree) generalizes decision trees and has links to boosting. An ADTree comprises of an alternation of decision nodes, which postulate a predicate condition, and prediction nodes, which contain a single number. An instanceisclassifiedbyanADTreebyensuingallpathsfor which all decision nodes are true, and summing any prediction nodes that are traversed.
Functional Tree Classifier: FT Classifier constructs“FunctionalTrees”. Ithas logistic regression functionsat the inner nodes and leaves. The FT algorithm can manage numeric and nominal attributes, binary and multi class variables and missing values.
LMT Classifier: LMT is a combination of Logistic Regression and Decision Tree algorithm, which makes a tree with binary and multiclass variables. LMT constricts a single outcome in the form of tree containing binary splits on numeric attributes.
Performance Measures used: VariousmeasureswereusedtoscaletheperformanceofaboveclassifierswithCFS evaluator.
Classification Accuracy: Classification accuracy isfigured as correctly classified instances divided bynumberoftotalinstancesmultipliedby100.
Mean Absolute Error (MAE): MAE defined as theaverage of the variance between projected and actual value in all instances. It is a good measure to measure the performance.
Root Mean Square Error (RMSE): RMSE is used to scale variations between values actually professed and the values projected by the model. It is same as taking the square root of the mean square error.
FINdINgS
TheperformanceofADTree,FTandLMTClassifierswith CFSAE separately investigated for heart disease
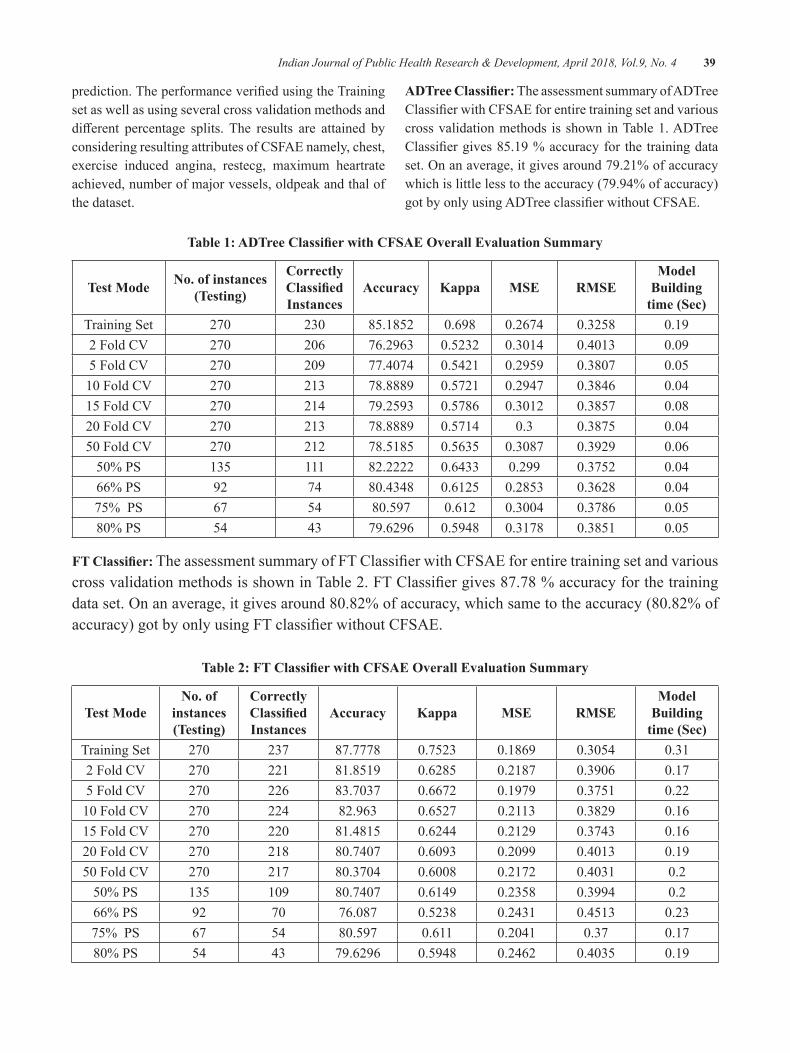
Indian Journal of Public Health Research & Development, April 2018, Vol.9, No. 4 39
prediction.TheperformanceverifiedusingtheTrainingset as well as using several cross validation methods and different percentage splits. The results are attained byconsidering resulting attributes of CSFAE namely, chest, exercise induced angina, restecg, maximum heartrate achieved, number of major vessels, oldpeak and thal of the dataset.
ADTree Classifier: The assessment summary of ADTree ClassifierwithCFSAEforentiretrainingsetandvariouscross validation methods is shown in Table 1. ADTree Classifiergives85.19%accuracyfor thetrainingdataset.Onanaverage,itgivesaround79.21%ofaccuracywhich is little less to the accuracy (79.94% of accuracy) gotbyonlyusingADTreeclassifierwithoutCFSAE.
Table 1: ADTree Classifier with CFSAE Overall Evaluation Summary
Test Mode No. of instances (Testing)
Correctly Classified Instances
Accuracy Kappa MSe RMSeModel
building time (Sec)
Training Set 270 230 85.1852 0.698 0.2674 0.3258 0.192FoldCV 270 206 76.2963 0.5232 0.3014 0.4013 0.095FoldCV 270 209 77.4074 0.5421 0.2959 0.3807 0.0510FoldCV 270 213 78.8889 0.5721 0.2947 0.3846 0.0415FoldCV 270 214 79.2593 0.5786 0.3012 0.3857 0.0820FoldCV 270 213 78.8889 0.5714 0.3 0.3875 0.0450FoldCV 270 212 78.5185 0.5635 0.3087 0.3929 0.0650%PS 135 111 82.2222 0.6433 0.299 0.3752 0.0466% PS 92 74 80.4348 0.6125 0.2853 0.3628 0.0475% PS 67 54 80.597 0.612 0.3004 0.3786 0.0580%PS 54 43 79.6296 0.5948 0.3178 0.3851 0.05
FT Classifier: TheassessmentsummaryofFTClassifierwithCFSAEforentiretrainingsetandvariouscrossvalidationmethodsisshowninTable2.FTClassifiergives87.78%accuracyforthetrainingdataset.Onanaverage,itgivesaround80.82%ofaccuracy,whichsametotheaccuracy(80.82%ofaccuracy)gotbyonlyusingFTclassifierwithoutCFSAE.
Table 2: FT Classifier with CFSAE Overall Evaluation Summary
Test ModeNo. of
instances (Testing)
Correctly Classified Instances
Accuracy Kappa MSe RMSeModel
building time (Sec)
Training Set 270 237 87.7778 0.7523 0.1869 0.3054 0.312FoldCV 270 221 81.8519 0.6285 0.2187 0.3906 0.175FoldCV 270 226 83.7037 0.6672 0.1979 0.3751 0.2210FoldCV 270 224 82.963 0.6527 0.2113 0.3829 0.1615FoldCV 270 220 81.4815 0.6244 0.2129 0.3743 0.1620FoldCV 270 218 80.7407 0.6093 0.2099 0.4013 0.1950FoldCV 270 217 80.3704 0.6008 0.2172 0.4031 0.250%PS 135 109 80.7407 0.6149 0.2358 0.3994 0.266% PS 92 70 76.087 0.5238 0.2431 0.4513 0.2375% PS 67 54 80.597 0.611 0.2041 0.37 0.1780%PS 54 43 79.6296 0.5948 0.2462 0.4035 0.19
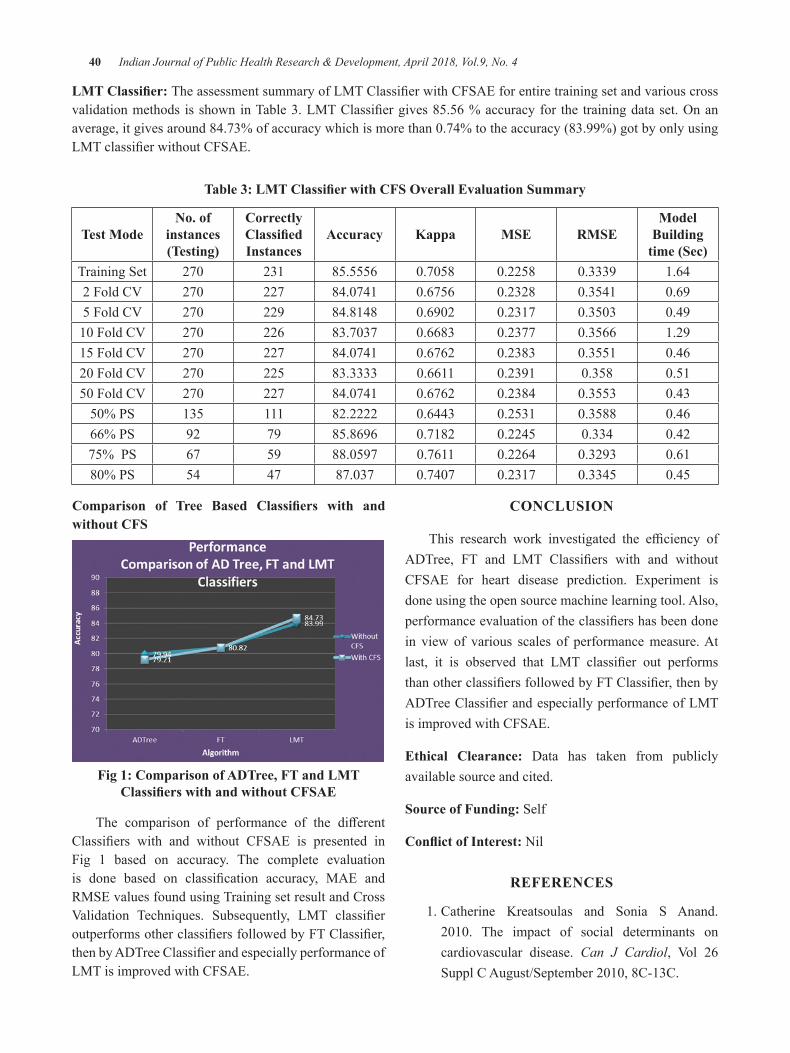
40 Indian Journal of Public Health Research & Development, April 2018, Vol.9, No. 4
LMT Classifier: TheassessmentsummaryofLMTClassifierwithCFSAEforentiretrainingsetandvariouscrossvalidationmethods isshowninTable3.LMTClassifiergives85.56%accuracyfor the trainingdataset.Onanaverage,itgivesaround84.73%ofaccuracywhichismorethan0.74%totheaccuracy(83.99%)gotbyonlyusingLMTclassifierwithoutCFSAE.
Table 3: LMT Classifier with CFS Overall Evaluation Summary
Test ModeNo. of
instances (Testing)
Correctly Classified Instances
Accuracy Kappa MSe RMSeModel
building time (Sec)
Training Set 270 231 85.5556 0.7058 0.2258 0.3339 1.642FoldCV 270 227 84.0741 0.6756 0.2328 0.3541 0.695FoldCV 270 229 84.8148 0.6902 0.2317 0.3503 0.4910FoldCV 270 226 83.7037 0.6683 0.2377 0.3566 1.2915FoldCV 270 227 84.0741 0.6762 0.2383 0.3551 0.4620FoldCV 270 225 83.3333 0.6611 0.2391 0.358 0.5150FoldCV 270 227 84.0741 0.6762 0.2384 0.3553 0.4350%PS 135 111 82.2222 0.6443 0.2531 0.3588 0.4666% PS 92 79 85.8696 0.7182 0.2245 0.334 0.4275% PS 67 59 88.0597 0.7611 0.2264 0.3293 0.6180%PS 54 47 87.037 0.7407 0.2317 0.3345 0.45
Comparison of Tree Based Classifiers with and without CFS
Fig 1: Comparison of AdTree, FT and lMT Classifiers with and without CFSAE
The comparison of performance of the differentClassifiers with and without CFSAE is presented inFig 1 based on accuracy. The complete evaluation is done based on classification accuracy, MAE andRMSE values found using Training set result and Cross Validation Techniques. Subsequently, LMT classifieroutperformsotherclassifiersfollowedbyFTClassifier,thenbyADTreeClassifierandespeciallyperformanceofLMT is improved with CFSAE.
CONCluSION
This research work investigated the efficiency ofADTree, FT and LMT Classifiers with and withoutCFSAE for heart disease prediction. Experiment is done using the open source machine learning tool. Also, performanceevaluationoftheclassifiershasbeendonein view of various scales of performance measure. At last, it is observed that LMT classifier out performsthanotherclassifiersfollowedbyFTClassifier,thenbyADTreeClassifierandespeciallyperformanceofLMTis improved with CFSAE.
ethical Clearance: Data has taken from publicly available source and cited.
Source of Funding: Self
Conflict of Interest: Nil
ReFeReNCeS
1. Catherine Kreatsoulas and Sonia S Anand. 2010. The impact of social determinants oncardiovascular disease. Can J Cardiol, Vol 26SupplCAugust/September2010,8C-13C.
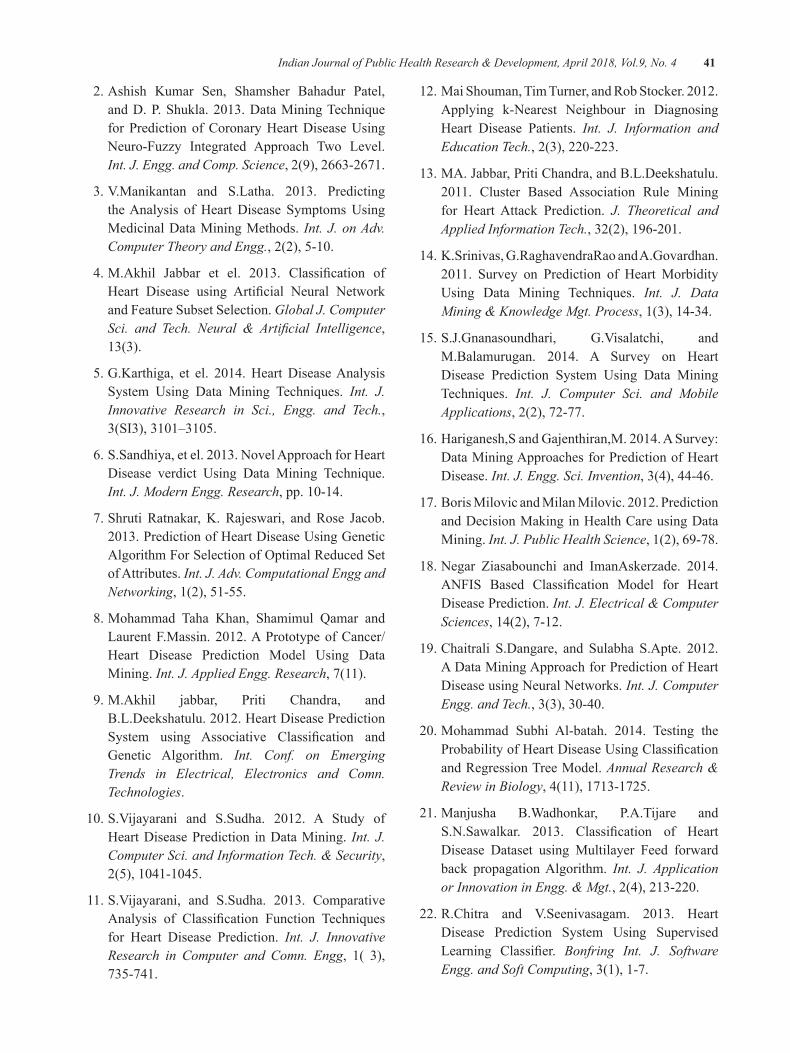
Indian Journal of Public Health Research & Development, April 2018, Vol.9, No. 4 41
2. Ashish Kumar Sen, Shamsher Bahadur Patel, andD.P.Shukla.2013.DataMiningTechniquefor Prediction of Coronary Heart Disease Using Neuro-Fuzzy Integrated Approach Two Level. Int. J. Engg. and Comp. Science, 2(9), 2663-2671.
3.V.Manikantan and S.Latha. 2013. Predictingthe Analysis of Heart Disease Symptoms Using Medicinal Data Mining Methods. Int. J. on Adv. Computer Theory and Engg.,2(2),5-10.
4.M.Akhil Jabbar et el. 2013. Classification ofHeart Disease using Artificial Neural Networkand Feature Subset Selection. Global J. Computer Sci. and Tech. Neural & Artificial Intelligence, 13(3).
5.G.Karthiga, et el. 2014.Heart DiseaseAnalysisSystem Using Data Mining Techniques. Int. J. Innovative Research in Sci., Engg. and Tech., 3(SI3),3101–3105.
6.S.Sandhiya,etel.2013.NovelApproachforHeartDisease verdict Using Data Mining Technique. Int. J. Modern Engg. Research,pp.10-14.
7.Shruti Ratnakar,K. Rajeswari, andRose Jacob.2013.PredictionofHeartDiseaseUsingGeneticAlgorithmForSelectionofOptimalReducedSetof Attributes. Int. J. Adv. Computational Engg and Networking, 1(2), 51-55.
8. Mohammad Taha Khan, Shamimul Qamar and LaurentF.Massin.2012.APrototypeofCancer/Heart Disease Prediction Model Using Data Mining. Int. J. Applied Engg. Research, 7(11).
9. M.Akhil jabbar, Priti Chandra, and B.L.Deekshatulu.2012.HeartDiseasePredictionSystem using Associative Classification andGenetic Algorithm. Int. Conf. on Emerging Trends in Electrical, Electronics and Comn. Technologies.
10.S.Vijayarani and S.Sudha. 2012. A Study ofHeart Disease Prediction in Data Mining. Int. J. Computer Sci. and Information Tech. & Security, 2(5),1041-1045.
11.S.Vijayarani, and S.Sudha. 2013. ComparativeAnalysis of Classification Function Techniquesfor Heart Disease Prediction. Int. J. Innovative Research in Computer and Comn. Engg, 1( 3), 735-741.
12.MaiShouman,TimTurner,andRobStocker.2012.Applying k-Nearest Neighbour in Diagnosing Heart Disease Patients. Int. J. Information and Education Tech.,2(3),220-223.
13.MA.Jabbar,PritiChandra,andB.L.Deekshatulu.2011. Cluster Based Association Rule Miningfor Heart Attack Prediction. J. Theoretical and Applied Information Tech.,32(2),196-201.
14. K.Srinivas, G.RaghavendraRao and A.Govardhan. 2011. Survey on Prediction of Heart MorbidityUsing Data Mining Techniques. Int. J. Data Mining & Knowledge Mgt. Process, 1(3), 14-34.
15.S.J.Gnanasoundhari, G.Visalatchi, andM.Balamurugan. 2014. A Survey on HeartDisease Prediction System Using Data Mining Techniques. Int. J. Computer Sci. and Mobile Applications, 2(2), 72-77.
16.Hariganesh,SandGajenthiran,M.2014.ASurvey:Data Mining Approaches for Prediction of Heart Disease. Int. J. Engg. Sci. Invention, 3(4), 44-46.
17.BorisMilovicandMilanMilovic.2012.Predictionand Decision Making in Health Care using Data Mining. Int. J. Public Health Science, 1(2), 69-78.
18.Negar Ziasabounchi and ImanAskerzade. 2014.ANFIS Based Classification Model for HeartDisease Prediction. Int. J. Electrical & Computer Sciences, 14(2), 7-12.
19.Chaitrali S.Dangare, and Sulabha S.Apte. 2012.A Data Mining Approach for Prediction of Heart Disease using Neural Networks. Int. J. Computer Engg. and Tech.,3(3),30-40.
20.Mohammad Subhi Al-batah. 2014. Testing theProbabilityofHeartDiseaseUsingClassificationand Regression Tree Model. Annual Research & Review in Biology, 4(11), 1713-1725.
21. Manjusha B.Wadhonkar, P.A.Tijare and S.N.Sawalkar. 2013. Classification of HeartDisease Dataset using Multilayer Feed forward back propagation Algorithm. Int. J. Application or Innovation in Engg. & Mgt.,2(4),213-220.
22.R.Chitra and V.Seenivasagam. 2013. HeartDisease Prediction System Using Supervised Learning Classifier. Bonfring Int. J. Software Engg. and Soft Computing, 3(1), 1-7.
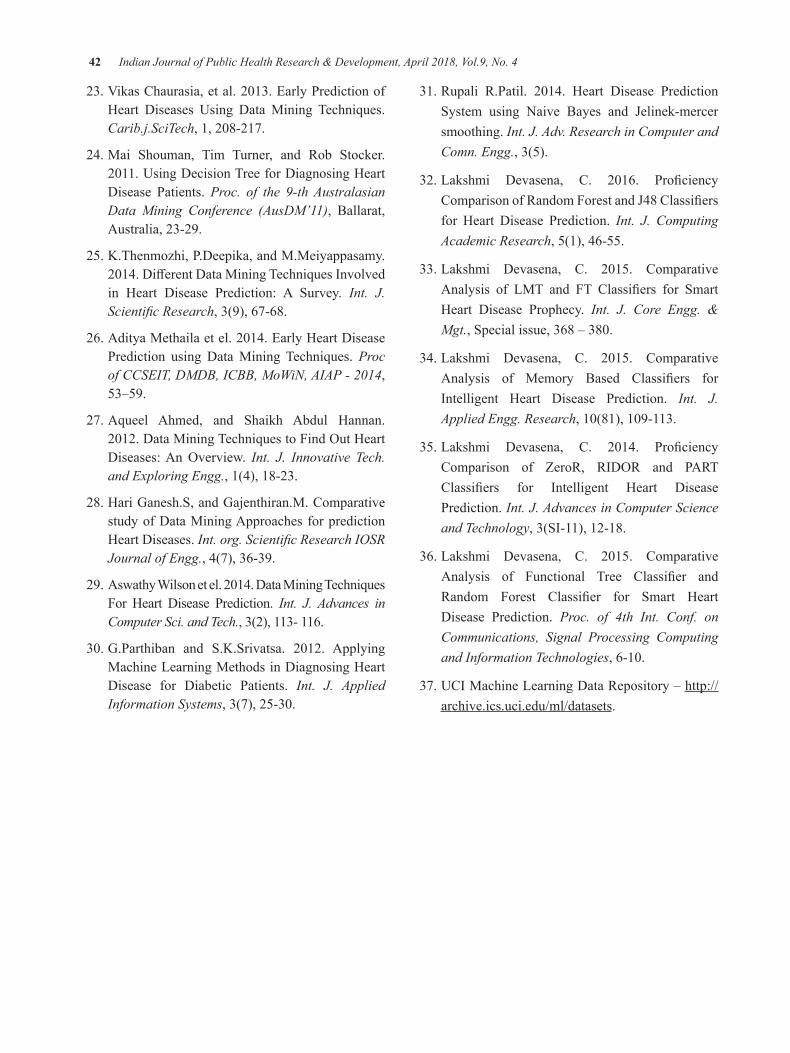
42 Indian Journal of Public Health Research & Development, April 2018, Vol.9, No. 4
23.VikasChaurasia,etal.2013.EarlyPredictionofHeart Diseases Using Data Mining Techniques. Carib.j.SciTech,1,208-217.
24. Mai Shouman, Tim Turner, and Rob Stocker. 2011.UsingDecisionTreeforDiagnosingHeartDisease Patients. Proc. of the 9-th Australasian Data Mining Conference (AusDM’11), Ballarat, Australia, 23-29.
25. K.Thenmozhi, P.Deepika, and M.Meiyappasamy. 2014.DifferentDataMiningTechniquesInvolvedin Heart Disease Prediction: A Survey. Int. J. Scientific Research, 3(9), 67-68.
26.AdityaMethailaetel.2014.EarlyHeartDiseasePrediction using Data Mining Techniques. Proc of CCSEIT, DMDB, ICBB, MoWiN, AIAP - 2014, 53–59.
27. Aqueel Ahmed, and Shaikh Abdul Hannan. 2012.DataMiningTechniquestoFindOutHeartDiseases:AnOverview. Int. J. Innovative Tech. and Exploring Engg., 1(4), 18-23.
28. Hari Ganesh.S, and Gajenthiran.M. Comparative study of Data Mining Approaches for prediction Heart Diseases. Int. org. Scientific Research IOSR Journal of Engg., 4(7), 36-39.
29.AswathyWilsonetel.2014.DataMiningTechniquesFor Heart Disease Prediction. Int. J. Advances in Computer Sci. and Tech., 3(2), 113- 116.
30.G.Parthiban and S.K.Srivatsa. 2012. ApplyingMachine Learning Methods in Diagnosing Heart Disease for Diabetic Patients. Int. J. Applied Information Systems,3(7),25-30.
31.Rupali R.Patil. 2014. Heart Disease PredictionSystem using Naive Bayes and Jelinek-mercersmoothing. Int. J. Adv. Research in Computer and Comn. Engg., 3(5).
32.Lakshmi Devasena, C. 2016. ProficiencyComparisonofRandomForestandJ48Classifiersfor Heart Disease Prediction. Int. J. Computing Academic Research, 5(1), 46-55.
33.Lakshmi Devasena, C. 2015. ComparativeAnalysis of LMT and FT Classifiers for SmartHeart Disease Prophecy. Int. J. Core Engg. & Mgt.,Specialissue,368–380.
34.Lakshmi Devasena, C. 2015. ComparativeAnalysis of Memory Based Classifiers forIntelligent Heart Disease Prediction. Int. J. Applied Engg. Research,10(81),109-113.
35.Lakshmi Devasena, C. 2014. ProficiencyComparison of ZeroR, RIDOR and PARTClassifiers for Intelligent Heart DiseasePrediction. Int. J. Advances in Computer Science and Technology, 3(SI-11), 12-18.
36.Lakshmi Devasena, C. 2015. ComparativeAnalysis of Functional Tree Classifier andRandom Forest Classifier for Smart HeartDisease Prediction. Proc. of 4th Int. Conf. on Communications, Signal Processing Computing and Information Technologies,6-10.
37. UCI Machine Learning Data Repository – http://archive.ics.uci.edu/ml/datasets.
Assess the level of Stress among Antenatal Mothers
linda Varghese1, Aswathy Krishnan2, Anitha Joseph3, dimna davis3
1Assistant Professor, 2Lecturer, 3IV Year B.Sc Nursing Students, Amrita College of Nursing, Amrita Vishwa Vidyapeetham, Kochi, Kerala
AbSTRACTbackground of the study: Pregnancy is a special time for a woman and her family. It is a time of many changes in a pregnant woman’s body. Stress during pregnancy may lead to several problems to the mother and unborn child. Stress reacts physically, mentally and emotionally to the various conditions. The aim ofthisstudywastofindoutthelevelofstressamongantenatalmothersanditsassociationwithselecteddemographic variables among antenatal mothers.
Materials and Method:Studywasconductedon150antenatalmothersattending inGynecologyOPD,AIMS, Kochi, Kerala. The research design used was non experimental descriptive design.
Result: The present study reveals that more than half of the mothers (51%) had average to high level of stress. Majority of the sample (64%) had average level of stress in the second trimester .A statistically significantassociationwasobservedforeducationofantenatalwomenandstress.
Conclusion: stress during antenatal period was observed among more than half the women and most of the mothershadaveragelevelofstressinsecondtrimester.Stresswassignificantassociationwithtypeofwork
Keywords: Stress, Antenatal mothers
Corresponding Author:Mrs.LindaVargheseAssistant ProfessorAmrita College of NursingAmritaVishwaVidyapeethamHealth Science Campus-Kochi – 41, KeralaContact number: 9446842535E-mail ID:[email protected]
INTROduCTION
“A healthy baby begins with a healthy pregnancy.
Being stress free will help promote a healthy pregnancy.”
Being a woman is just a human but being a mother is divine. Having a baby is one of the most important events in a woman’s lifetime and, as well as being a time of great joy1. Having a child is a major life change, and mothers need support from those around them, both during pregnancy and after the baby arrive2.In2015,anestimated303000womendiefromcomplicationsrelatedto pregnancy or childbirth. We must give the information
and support she needs to address her reproductive health needs, help her through a pregnancy, and care for her and her newborn well into childhood.3WHOdefinestheperinatal period commences at 22 completed weeks of gestation and ends seven completed days after birth. Anxiety, depression, and stress in pregnancy are risk factors for adverse outcomes for mothers and children3. Research shows that stress hormones - which play a crucial role in the development of the unborn baby - shoot up in women who are depressed during pregnancy. High levels of these hormones are involved in triggering labor, leading scientists to believe they could be behind manyof the45,000prematurebirths that occur in theUK each year - with potentially devastating results4.
A study by Pais, Maria and Pai was conducted onstress among 160 antenatal women in India.Adescriptive study design used for the study. The study revealsthatnoormildstresslevelamong107(66.9)andmoderate moderate to severe stress in 53(33.3)2.
A study by MunaSilwal, Jacob V and Imran S.(2015) was conducted to assess the level of anxiety
DOI Number: 10.5958/0976-5506.2018.00253.X
44 Indian Journal of Public Health Research & Development, April 2018, Vol.9, No. 4
and depression among antenatal mothers in a selected hospital Mangalore.They adopted a descriptive study approachforthestudyand100antenatalmotherswereselected through purposive sampling technique from a selected hospital Mangalore.The results from the study indicatedthattherewasasignificantassociationbetweenlevel of anxiety and selected variables like number of pregnancies, number of full term delivery, number of abortion, number of live children, planned pregnancies, history of depression and history of counseling5.
Even a normal pregnancy can result in some stress in women. As per research, there is an excessive secretion of hormones during pregnancy. This process creates emotional stress, which can be very severe. Stress is unfortunately a common and ordinary side effect ofliving. Stress can however be particularly harmful during pregnancy, thus it is important that mothers work to reduce their stress and anxiety levels during pregnancy as much as possible6.
AIMS ANd ObJeCTIVeS
AIM: Theaimofthisstudywastofindoutthelevelofstress among antenatal mothers attending Gynecology OPD,AMIS,Kochi,Kerala,India.
ObJeCTIVeS OF The STudy
1. Identify the stress among antenatal mothers in three trimesters
2. Compare the level of stress among antenatal mothers in three trimesters
3. Associate the level of stress among antenatal mothers and selected demographic variables
MATeRIAlS ANd MeThOd
TheStudywasconductedon150antenatalmothers11 and the research design used was non experimental descriptive design6. The subjects were selected by convenience sampling technique based on inclusion criteria and a rapport was established with them. The researcher explained the purpose of the study and obtained an informed consent from them and the tools were administered. The demographic data was obtained from the subject themselves and the clinical data were collected from the medical records. The data regarding stress was
obtained usingPerceived Stress Scale (PSS). Each sample took15minutestofillthequestionnaire.Thedataobtainedwas analyzed using descriptive and inferential statistics and association was assessed using Chi Square.
dATA COlleCTION INSTRuMeNTS
1. Tool I.: demographic proforma: A semi structured questionnaire was constructed to assess the demographic and clinical data of mothers. The tool consists of two sections, Section A was Socio-demographic dataand it consists of questions regarding demographic data. It contains information regarding age, marital status, religion, occupation, income, type of job. Section B was Clinical data and it comprises of questions regarding clinical data like parity, Gestational age, LMP, EDD, Date of Delivery, type of delivery, Anesthesia used, duration of Labor, complications etc.
2. Tool II. Stress scale: The stress scale used for the study was a Standardized tool – Perceived Stress Scale (PSS)
The Perceived Stress Scale (PSS) is the most widely used psychological instrument for measuring the perception of stress. It is a measure of the degree to which situations in one’s life are appraised as stressful. The questions in the PSS ask about feelings and thoughts during the last month. In each case, respondents are asked howoftentheyfeltacertainway.Thescalecontains10items and the data collected will be evaluated on the ratingof:0=Never1=AlmostNever2=Sometimes3=FairlyOften4=VeryOften7.
ReSulTS ANd dISSCuSSION
Section I. Socio demographic characteristics of the subject.
Table 1: distribution of subjects based on socio demographic characteristics n = 150
Variables Frequency Percentage (%)Age in yearsa. 18-25 years 57 38b. 26-35years 83 55.3c. >35years 10 6.7
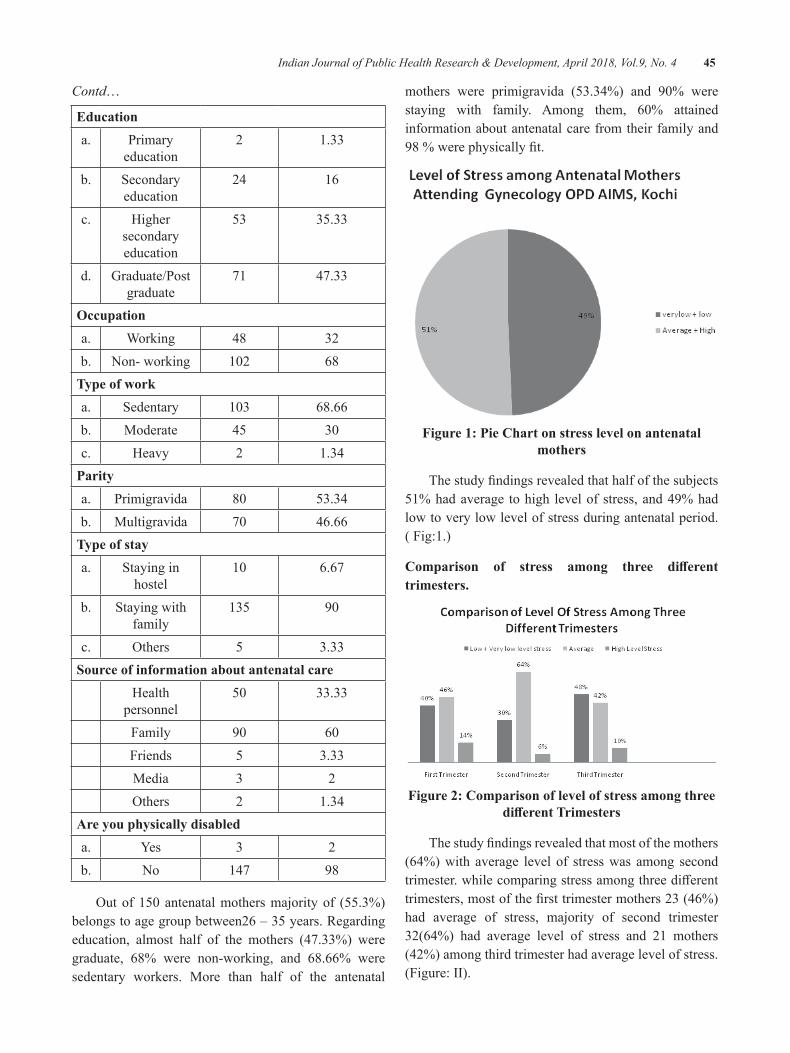
Indian Journal of Public Health Research & Development, April 2018, Vol.9, No. 4 45
Contd…
educationa. Primary
education2 1.33
b. Secondary education
24 16
c. Higher secondary education
53 35.33
d. Graduate/Post graduate
71 47.33
Occupationa. Working 48 32b. Non- working 102 68
Type of worka. Sedentary 103 68.66b. Moderate 45 30c. Heavy 2 1.34
Paritya. Primigravida 80 53.34b. Multigravida 70 46.66
Type of staya. Staying in
hostel10 6.67
b. Staying with family
135 90
c. Others 5 3.33Source of information about antenatal care
Health personnel
50 33.33
Family 90 60Friends 5 3.33Media 3 2Others 2 1.34
Are you physically disableda. Yes 3 2b. No 147 98
Outof150antenatalmothersmajorityof (55.3%)belongs to age group between26 – 35 years. Regarding education, almost half of the mothers (47.33%) were graduate, 68% were non-working, and 68.66% were sedentary workers. More than half of the antenatal
mothers were primigravida (53.34%) and 90% werestaying with family. Among them, 60% attainedinformation about antenatal care from their family and 98%werephysicallyfit.
Figure 1: Pie Chart on stress level on antenatal mothers
Thestudyfindingsrevealedthathalfofthesubjects51% had average to high level of stress, and 49% had low to very low level of stress during antenatal period.( Fig:1.)
Comparison of stress among three different trimesters.
Figure 2: Comparison of level of stress among three different Trimesters
Thestudyfindingsrevealedthatmostofthemothers(64%) with average level of stress was among second trimester.whilecomparingstressamongthreedifferenttrimesters,mostofthefirsttrimestermothers23(46%)had average of stress, majority of second trimester 32(64%) had average level of stress and 21 mothers (42%) among third trimester had average level of stress. (Figure: II).
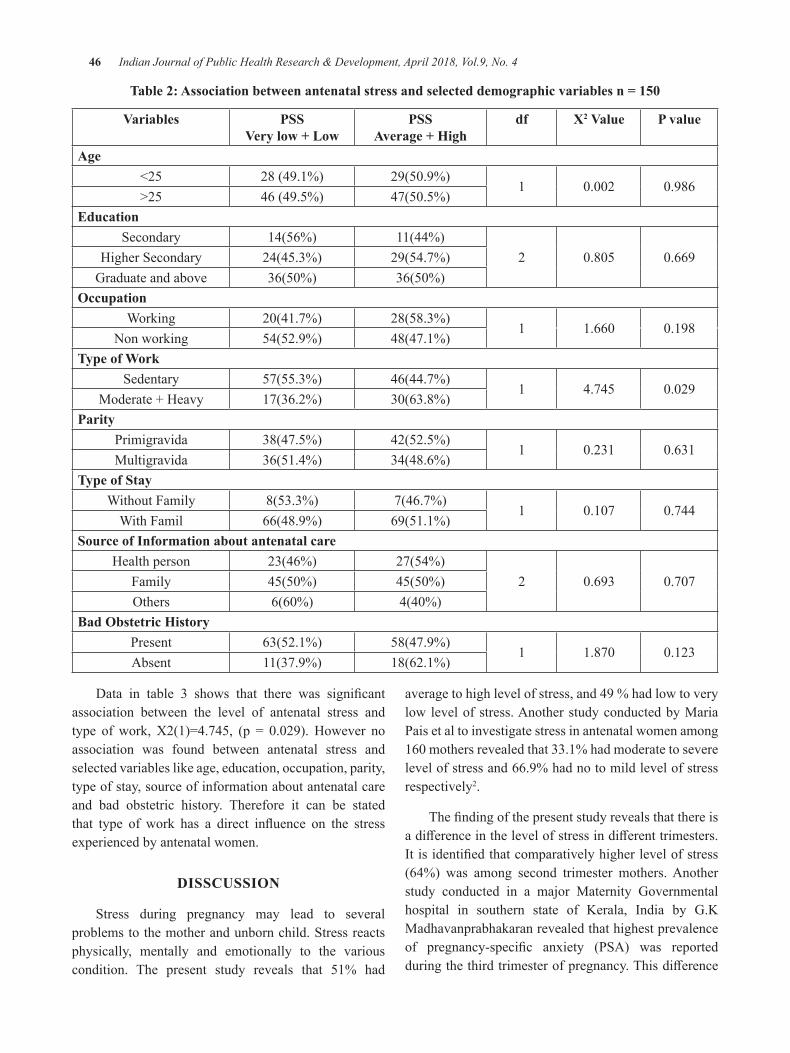
46 Indian Journal of Public Health Research & Development, April 2018, Vol.9, No. 4
Table 2: Association between antenatal stress and selected demographic variables n = 150
Variables PSSVery low + low
PSSAverage + high
df X2 Value P value
Age<25 28 (49.1%) 29(50.9%)
1 0.002 0.986>25 46 (49.5%) 47(50.5%)
educationSecondary 14(56%) 11(44%)
2 0.805 0.669Higher Secondary 24(45.3%) 29(54.7%)Graduate and above 36(50%) 36(50%)
OccupationWorking 20(41.7%) 28(58.3%)
1 1.660 0.198Non working 54(52.9%) 48(47.1%)
Type of WorkSedentary 57(55.3%) 46(44.7%)
1 4.745 0.029Moderate + Heavy 17(36.2%) 30(63.8%)
ParityPrimigravida 38(47.5%) 42(52.5%)
1 0.231 0.631Multigravida 36(51.4%) 34(48.6%)
Type of StayWithout Family 8(53.3%) 7(46.7%)
1 0.107 0.744With Famil 66(48.9%) 69(51.1%)
Source of Information about antenatal careHealth person 23(46%) 27(54%)
2 0.693 0.707Family 45(50%) 45(50%)Others 6(60%) 4(40%)
bad Obstetric historyPresent 63(52.1%) 58(47.9%)
1 1.870 0.123Absent 11(37.9%) 18(62.1%)
Data in table 3 shows that there was significantassociation between the level of antenatal stress and type ofwork,X2(1)=4.745, (p = 0.029). However noassociation was found between antenatal stress and selected variables like age, education, occupation, parity, type of stay, source of information about antenatal care and bad obstetric history. Therefore it can be stated that type of work has a direct influence on the stressexperienced by antenatal women.
dISSCuSSION
Stress during pregnancy may lead to several problems to the mother and unborn child. Stress reacts physically, mentally and emotionally to the various condition. The present study reveals that 51% had
average to high level of stress, and 49 % had low to very low level of stress. Another study conducted by Maria Pais et al to investigate stress in antenatal women among 160mothersrevealedthat33.1%hadmoderatetoseverelevel of stress and 66.9% had no to mild level of stress respectively2.
Thefindingofthepresentstudyrevealsthatthereisadifferenceinthelevelofstressindifferenttrimesters.Itisidentifiedthatcomparativelyhigherlevelofstress(64%) was among second trimester mothers. Another study conducted in a major Maternity Governmental hospital in southern state of Kerala, India by G.K Madhavanprabhakaran revealed that highest prevalence of pregnancy-specific anxiety (PSA) was reportedduringthethirdtrimesterofpregnancy.Thisdifference
Indian Journal of Public Health Research & Development, April 2018, Vol.9, No. 4 47
may be due to the influence of extraneous variableslike economic status, education, etc9. Another study conducted by B. Prasad Babu to study the level of stress during the first, second and third trimester identifiedthat there isnodifference in the levelof stressamongthe pregnant women irrespective of their period of pregnancy10. The reason may be the fears, anxieties and risk involved Number of Pregnancy in pregnancy. In all stages of pregnancy, common syndromes can occur, i.e., pain in lower back, cramps, edema, and insomnia and of stress among the pregnant women irrespective of number of nightmares, varicose veins etc.
It is also identified that in the present study, thatthere is significant association between the level ofstress among mothers and type of work. Another Study conducted my Maris Pais, on the other hand showed significant association between the level of stress andgravid, educational status and monthly income1
CONCluSION
Pregnancy is a physiological process but giving birth to a child requires strength both mentally and physically. Each mother while pregnant goes through sires of events that cause stress in her life. It can arise from various situations like her economic status, lack of knowledge or support, type of work, parity etc. This stress regardless of its severity may adversely affectthe health of both the mother and infant. Therefore measures must be taken during the time of pregnancy like providing psychological support, antenatal check – ups, counselling, family support, etc. to reduce the level of stress among antenatal mothers.
Conflict of Interest:Thereisnoconflictofinterest.
Financial Support: Nil
ethical Clearence: Obtained from Research committeeof Amrita College of Nursing and Institutional Ethics Committee of Amrita Institute of Medical Sciences, Kochi.
ReFeReNCeS
1.Stressduringpregnancy(online)2010march,p–no 264(cited URL:http/(www.coaltionofwomen.org/articles/stressduring/pregnancyhttm
2.Pais, Maria and Pai, Muralidhar V andKamath,Asha and George,Anice .Stress among antenatalwomeninIndia.InternationalJournalofNursing Care,2(2).pp.63-671.
3.World Health Organization. Why do somany women still die in pregnancy or child birth(online).2015Nov12;Avilablefrom:URL:http://www.who.int/features/qa/12/en/
4. Kwadabeka Community Health Centre,Incidence of Obstetric and Foetal Complications duringLabor and Delivery at a Community Health Centre, Midwives Obstetric Unit of Durban,SouthAfrica,ObstetGynecol.2011;2011:259308
5.VanBusselJC,SpitzB,DemyttenaereK.Women’smental health before, during, and after pregnancy: a population – based controlled cohort study. Birth33:297-302.
6.Vijayp,SharmaphD,mindpublicationstressandcopingduringpregnancycanaffectchild’shealth,2008,24-28
7.Kanth JM, Sumathy S, Sreedhari S, RajammalB, Usha MG, Sheejamol VS. Comparativestudy of cesarean myomectomy with abdominal myomectomy in terms of blood loss in single fibroid. Journal of Obstetrical and GynecologyIndia2016;66:287-291.Setting
8. C Sheldon. Perceived Stress Scale,1994:http://www.mindgarden.com/132-percived-stress-scale
9. GK Madhavanprabhakarana, MD Sheila. Prevalence of pregnancy and associated factors. InternationalJournalofAfricaNursingSciences.July03;2015.
10.B Prasad,S Mohan.Stress amongpregnant women.Indian J of Health andWellbeing.2012;3(3):754-756
11.Udayan S,Viswanath L,Varghese L.Awarenessregarding antenatal investigations among antenatal mothers attending selected tertiary hospital, Kochi, Kerala.JSAFOG2014;6(3):129-132.
development and Statistic Analysis of Psychology- Numerology Module for Character building in Malaysia
Mohammad Aziz Shah Mohamed Arip1, Nadratul Shima Salim2, bazlan Mustafa1, Fauziah Sa’ad3
1Associate Professor, Faculty of Education and Human Development, Sultan Idris Education University, Tanjong Malim, Perak, Malaysia, 2Faculty of Education and Human Development, Sultan Idris
Education University, Tanjong Malim, Perak, Malaysia, 3Doctor, Faculty of Education and Human Development,Sultan Idris Education University, Tanjong Malim, Perak, Malaysia
AbSTRACT
The purpose of this study is to build, acquire statistic analysis based on content validity and reliability of Psycho-Numerology Module for Character Building in Malaysia. This module is developed based on depth study of Numerology literature that has been integrated with Cognitive Behavioural Therapy (CBT). This module is developed based on Psycho-Numerology Modules drafted by Mohammad Aziz Shah1 (2010)which has six strategies with 28 independent activities, i.e., 1) Introduction to Psycho-Numerology, 2) Psycho-Numerology and Law of Energy, 3) Calculation of Inverted Pyramid in Psycho-Numerology, 4) Usage of a Single Matrix Psycho-Numerology, 5) Usage of 2 Atom Psycho-Numerology Matrix, and 6) Application of Psycho-Numerology Guidance Session. The design of the studies that have been used are descriptive studies which obtained the content validity value of the sessions and activities and the reliability valueofPsycho-NumerologyModule.Therespondentsinthisstudyconsistof40schoolstudents,48PublicUniversities(IPTA)studentsand40governmentservants.Thevalueforreliabilityanalysismoduleishighwhich is divided into three section; school student at .99, Public Universities (IPTA) students at .96 and government servants at .99. The results of content validity analysis module based on recommendations by Russell2(1974)obtainedhighcontentvaliditywhichis0.89(88.63%).Forthecontentvaliditybasedonthe suitability of the module sessions and activities proposed by Mohammad Aziz Shah1(2010)alsohigh,atbetween0.85(85.00%)to0.90(89.54%).Thus,thisstudysucceedsindevelopingandrunthestatisticalanalysis of Psycho-Numerology Module for Character Building in Malaysia with a strong theoretical basis, high reliability values and with high content validity values to be applied in the real environment in the development of individual character.
Keywords: Content Validity, Reliability, Psychology-Numerology Module, Character Development
INTROduCTION
This module is developed from the original concept of numerology to assess the effect of numbers on thecharacteristics of human. According to Mohammad3 (2009), numerology is a study related to numbers andsymbols and one of the ways in which human express their hidden talents and character tendencies (Mc Clain4, 2010).
Largerquist and Lenard5 (2004) stated thatnumerology is the science of metaphysics that studies the knowledge of the future. Numerology helps to sensibly recognize the knowledge genuinely and purely. Eddy
Rosyadie6 (2009) stated thatmetaphysical scienceis a philosophy that explains the reality of natural events in the real world. Webb7(2001)statedthatnumerologyrefers to any system, traditions or beliefs in a mystical or esoteric relationship between numbers and it is considered as a living thing.
Mc Clain4(2010)arguedthatthenumberscanshowcharacter, direction in life, support, and hidden talent which are not explicitly exhibited. Numerologists use the numbers to determine the best time to set themselves in everyday life. As the study is conducted by researchers on the character development matrix, the use of birth date plays an important role in determining the tendency of an individual character
DOI Number: 10.5958/0976-5506.2018.00254.1
Indian Journal of Public Health Research & Development, April 2018, Vol.9, No. 4 49
According to Eddy Rosyadie6 (2009), the methodof calculating the date of birth called Astro-numerology Dynamics’ was first implemented in Malaysia bycorrelating various techniques in a method. Research was conducted to explain the pattern and cycle of a behaviour or event. The method of calculating the date of birth is to help the individual to recognize and understand, manage and enhance ones potential, correct an error or condition, prevent threats and opportunities for correction, improvement, prevention and as an alternative way to haveabetterorganizedandeffectivelife.
In this module, numerology calculation refers to the concept of coding that was applied and adapted from Integrated Psycho-Numerology Module. However, in this integrated module, only the basic interpretation is taken as a reference to be expanded and adapted to thecontextof thefieldofpsychologyandcounsellingas well as numerology. Psycho-Numerology prioritize applications that have been adapted in line with the concept of psychology and counselling that can be practiced in counselling and did not violate the ethics of the profession as a therapist-counsellor and psychologist.
ReSeARCh MeThOdOlOgy
This descriptive study is conducted quantitatively to determine the validity and the reliability of the data statistics module that was carried out in the survey. According to Sidek8(2002),adescriptivestudydesignaims to provide a systematic description of the facts and features of a population or an area of interest with accuracy. Mohd Majid 9(2005)statedthatthestudywasadescriptive study which aims to explain a phenomenon. Itisalsotoexploreafieldthathasnotbeenadequatelyexamined. It requires no effort to control somethingand was not intended to test the truth of a hypothesis. The study is divided into two forms namely descriptive preliminary study (preliminary study) and the study to examine the validity and reliability of the survey module.
Phase 1: development of Psycho-Numerology Module for Character building in Malaysia: Thefirststudyisdesigned as a preliminary study that formed the literature review to identify and evaluate the best literature and theory in developing modules. It is also establishing the activities consisted in Psycho-Numerology Module for Character Building in Malaysia. In this section, the study focused on the construction and writing of the module.
Phase 2: Obtaining Content Validity: The second study was a descriptive research survey to test the content validity of the Psycho-Numerology Module for Character Building in Malaysia. Two key variables in this study are the Content Validity value of thePsycho-Numerology Module and the Validity Valueof Compliance Strategies and Psycho-Numerology Activities Module. For the purpose of determining the content validity and appropriateness of the strategy and activities of this module, 22 panels of expert comprising of psychologists and counsellors from public and private sector of various educational backgrounds and institutions have assessed the validity of the content of Psycho-Numerology Module for Character Building in Malaysia.
The panel of experts have been subsequently given a questionnaire relating to the validity of Psycho-Numerology Module for Character Building in Malaysia thatconsistsoftwosections.PartAistheValidityModuleSurvey based on recommendations by Russell2 (1974), whichoutlinesfiveimportantcriteriaintheprocurementof good validity for the developed module. While sectionBcomprisedofContentValidityQuestionnaireand Compliance Strategies and Activities. The module was built by Mohammad Aziz Shah1(2010)fordetailedvalidity of the entire module and sub module has been built. There is the entire expert panel appraisal given time to determine the validity of Psycho-Numerology module for Character Building in Malaysia.
Phase 3: Analysis of Reliability: The research was designed as a descriptive survey research to test the reliability of the Psycho-Numerology module. The main variables in this study are Psycho-Numerology module and Psycho-Numerology sub module. A total of 128 respondents from Psycho-Numerology seminar participants were selected to test the reliability of the established Psycho-Numerology module.
The participants will attend Psycho-Numerology seminar for two days. After completing the workshop, participants will be considered as respondents for the study by answering a set of questionnaire related to the reliability of the Psycho-Numerology module for Character Building in Malaysia. The questionnaire has 71 questions covering 28 activities and six strategies.
The study subjects and study location: This study consisted of 22 panels of expert assessors appointed
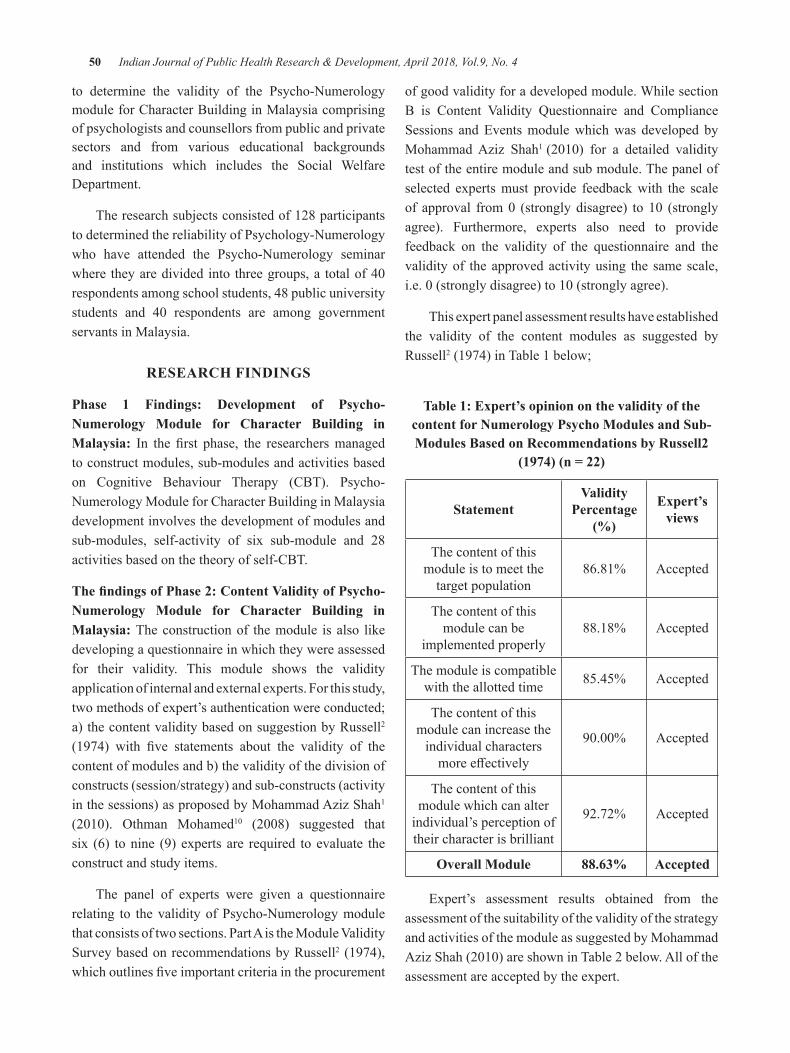
50 Indian Journal of Public Health Research & Development, April 2018, Vol.9, No. 4
to determine the validity of the Psycho-Numerology module for Character Building in Malaysia comprising of psychologists and counsellors from public and private sectors and from various educational backgrounds and institutions which includes the Social Welfare Department.
The research subjects consisted of 128 participants to determined the reliability of Psychology-Numerology who have attended the Psycho-Numerology seminar where theyaredivided into threegroups,a totalof40respondents among school students, 48 public university students and 40 respondents are among governmentservants in Malaysia.
ReSeARCh FINdINgS
Phase 1 Findings: development of Psycho-Numerology Module for Character building in Malaysia: In the first phase, the researchersmanagedto construct modules, sub-modules and activities based on Cognitive Behaviour Therapy (CBT). Psycho-Numerology Module for Character Building in Malaysia development involves the development of modules and sub-modules, self-activity of six sub-module and 28 activities based on the theory of self-CBT.
The findings of Phase 2: Content Validity of Psycho-Numerology Module for Character building in Malaysia: The construction of the module is also like developing a questionnaire in which they were assessed for their validity. This module shows the validity application of internal and external experts. For this study, two methods of expert’s authentication were conducted; a) the content validity based on suggestion by Russell2 (1974) with five statements about the validity of thecontent of modules and b) the validity of the division of constructs (session/strategy) and sub-constructs (activity in the sessions) as proposed by Mohammad Aziz Shah1 (2010). Othman Mohamed10 (2008) suggested thatsix (6) to nine (9) experts are required to evaluate the construct and study items.
The panel of experts were given a questionnaire relating to the validity of Psycho-Numerology module thatconsistsoftwosections.PartAistheModuleValiditySurvey based on recommendations by Russell2 (1974), whichoutlinesfiveimportantcriteriaintheprocurement
of good validity for a developed module. While section B is Content Validity Questionnaire and ComplianceSessions and Events module which was developed by Mohammad Aziz Shah1 (2010) for a detailed validitytest of the entire module and sub module. The panel of selected experts must provide feedback with the scale of approval from0 (stronglydisagree) to10 (stronglyagree). Furthermore, experts also need to provide feedback on the validity of the questionnaire and the validity of the approved activity using the same scale, i.e.0(stronglydisagree)to10(stronglyagree).
This expert panel assessment results have established the validity of the content modules as suggested by Russell2 (1974) in Table 1 below;
Table 1: expert’s opinion on the validity of the content for Numerology Psycho Modules and Sub-Modules based on Recommendations by Russell2
(1974) (n = 22)
StatementValidity
Percentage (%)
expert’s views
The content of this module is to meet the
target population86.81% Accepted
The content of this module can be
implemented properly88.18% Accepted
The module is compatible with the allotted time 85.45% Accepted
The content of this module can increase the
individual characters moreeffectively
90.00% Accepted
The content of this module which can alter
individual’s perception of their character is brilliant
92.72% Accepted
Overall Module 88.63% Accepted
Expert’s assessment results obtained from the assessment of the suitability of the validity of the strategy and activities of the module as suggested by Mohammad AzizShah(2010)areshowninTable2below.Alloftheassessment are accepted by the expert.
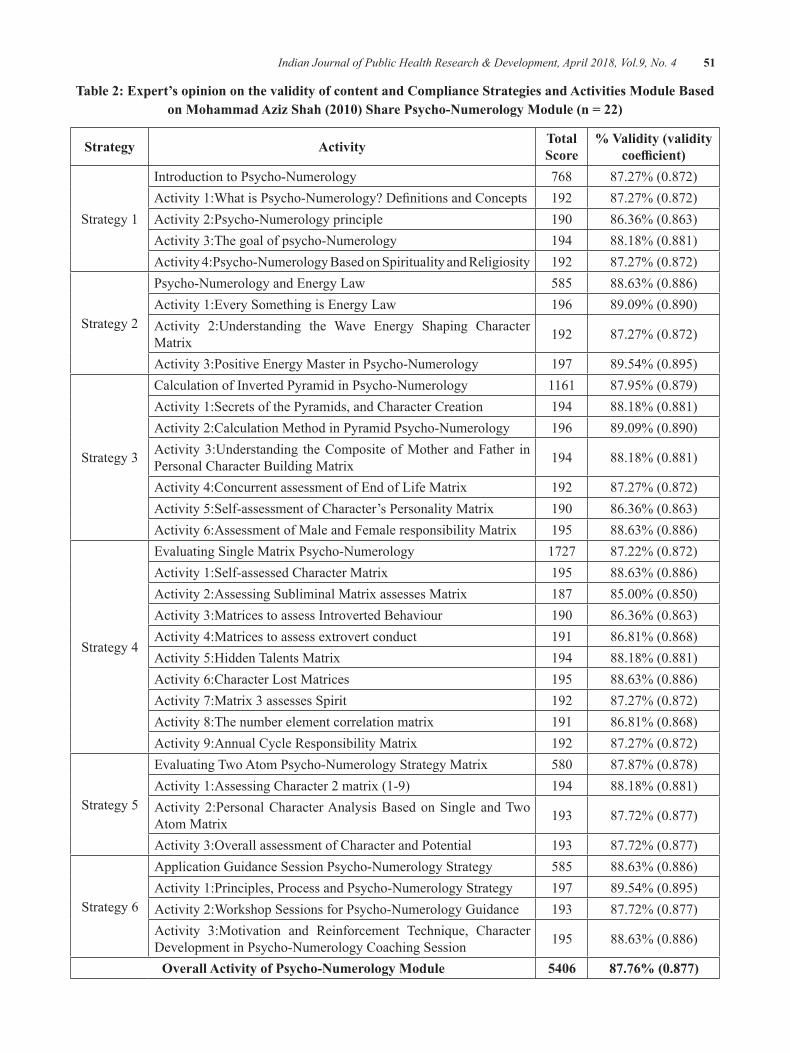
Indian Journal of Public Health Research & Development, April 2018, Vol.9, No. 4 51
Table 2: expert’s opinion on the validity of content and Compliance Strategies and Activities Module based on Mohammad Aziz Shah (2010) Share Psycho-Numerology Module (n = 22)
Strategy Activity Total Score
% Validity (validity coefficient)
Strategy 1
Introduction to Psycho-Numerology 768 87.27%(0.872)Activity1:WhatisPsycho-Numerology?DefinitionsandConcepts 192 87.27%(0.872)Activity 2:Psycho-Numerology principle 190 86.36%(0.863)Activity 3:The goal of psycho-Numerology 194 88.18%(0.881)Activity 4:Psycho-Numerology Based on Spirituality and Religiosity 192 87.27%(0.872)
Strategy 2
Psycho-Numerology and Energy Law 585 88.63%(0.886)Activity 1:Every Something is Energy Law 196 89.09%(0.890)Activity 2:Understanding the Wave Energy Shaping Character Matrix 192 87.27%(0.872)
Activity 3:Positive Energy Master in Psycho-Numerology 197 89.54%(0.895)
Strategy 3
Calculation of Inverted Pyramid in Psycho-Numerology 1161 87.95%(0.879)Activity 1:Secrets of the Pyramids, and Character Creation 194 88.18%(0.881)Activity 2:Calculation Method in Pyramid Psycho-Numerology 196 89.09%(0.890)Activity 3:Understanding the Composite of Mother and Father in Personal Character Building Matrix 194 88.18%(0.881)
Activity 4:Concurrent assessment of End of Life Matrix 192 87.27%(0.872)Activity 5:Self-assessment of Character’s Personality Matrix 190 86.36%(0.863)Activity 6:Assessment of Male and Female responsibility Matrix 195 88.63%(0.886)
Strategy 4
Evaluating Single Matrix Psycho-Numerology 1727 87.22%(0.872)Activity 1:Self-assessed Character Matrix 195 88.63%(0.886)Activity 2:Assessing Subliminal Matrix assesses Matrix 187 85.00%(0.850)Activity 3:Matrices to assess Introverted Behaviour 190 86.36%(0.863)Activity 4:Matrices to assess extrovert conduct 191 86.81%(0.868)Activity 5:Hidden Talents Matrix 194 88.18%(0.881)Activity 6:Character Lost Matrices 195 88.63%(0.886)Activity 7:Matrix 3 assesses Spirit 192 87.27%(0.872)Activity 8:The number element correlation matrix 191 86.81%(0.868)Activity 9:Annual Cycle Responsibility Matrix 192 87.27%(0.872)
Strategy 5
Evaluating Two Atom Psycho-Numerology Strategy Matrix 580 87.87%(0.878)Activity 1:Assessing Character 2 matrix (1-9) 194 88.18%(0.881)Activity 2:Personal Character Analysis Based on Single and Two Atom Matrix 193 87.72%(0.877)
Activity3:OverallassessmentofCharacterandPotential 193 87.72%(0.877)
Strategy 6
Application Guidance Session Psycho-Numerology Strategy 585 88.63%(0.886)Activity 1:Principles, Process and Psycho-Numerology Strategy 197 89.54%(0.895)Activity 2:Workshop Sessions for Psycho-Numerology Guidance 193 87.72%(0.877)Activity 3:Motivation and Reinforcement Technique, Character Development in Psycho-Numerology Coaching Session 195 88.63%(0.886)
Overall Activity of Psycho-Numerology Module 5406 87.76% (0.877)
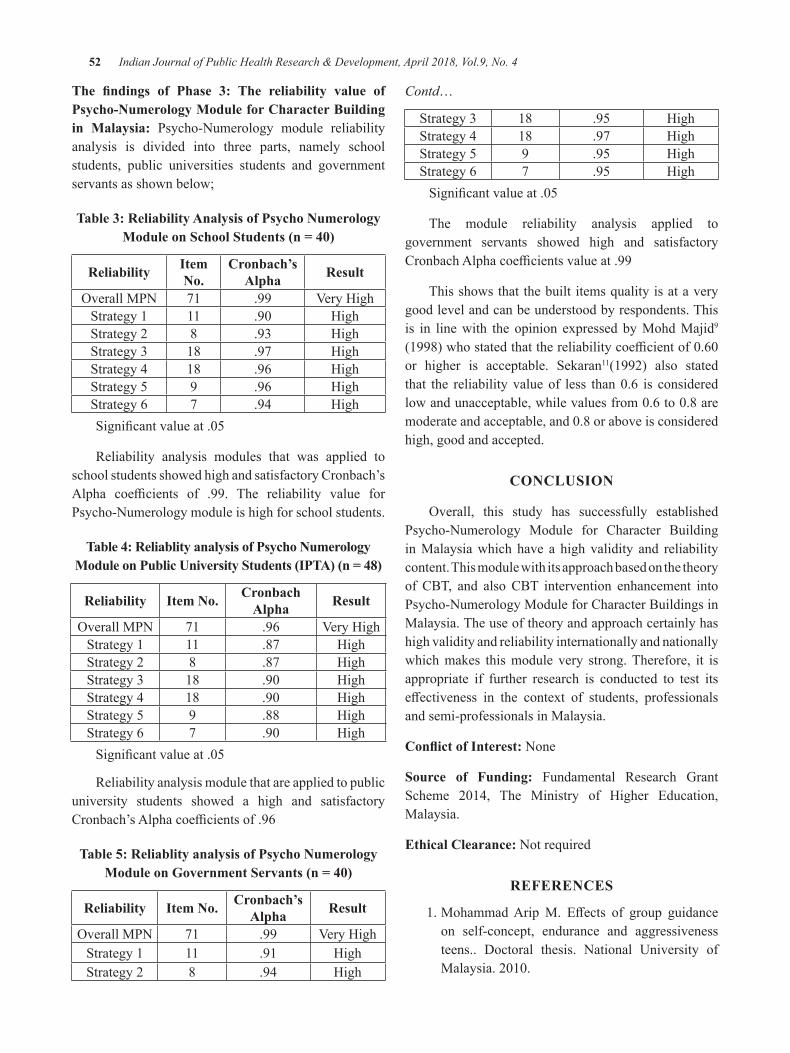
52 Indian Journal of Public Health Research & Development, April 2018, Vol.9, No. 4
The findings of Phase 3: The reliability value of Psycho-Numerology Module for Character building in Malaysia: Psycho-Numerology module reliability analysis is divided into three parts, namely school students, public universities students and government servants as shown below;
Table 3: Reliability Analysis of Psycho Numerology Module on School Students (n = 40)
Reliability Item No.
Cronbach’s Alpha Result
OverallMPN 71 .99 VeryHighStrategy 1 11 .90 HighStrategy 2 8 .93 HighStrategy 3 18 .97 High Strategy 4 18 .96 High Strategy 5 9 .96 HighStrategy 6 7 .94 HighSignificantvalueat.05
Reliability analysis modules that was applied to school students showed high and satisfactory Cronbach’s Alpha coefficients of .99. The reliability value forPsycho-Numerology module is high for school students.
Table 4: Reliablity analysis of Psycho Numerology Module on Public University Students (IPTA) (n = 48)
Reliability Item No. Cronbach Alpha Result
OverallMPN 71 .96 VeryHighStrategy 1 11 .87 HighStrategy 2 8 .87 HighStrategy 3 18 .90 HighStrategy 4 18 .90 HighStrategy 5 9 .88 HighStrategy 6 7 .90 HighSignificantvalueat.05
Reliability analysis module that are applied to public university students showed a high and satisfactory Cronbach’sAlphacoefficientsof.96
Table 5: Reliablity analysis of Psycho Numerology Module on Government Servants (n = 40)
Reliability Item No. Cronbach’s Alpha Result
OverallMPN 71 .99 VeryHighStrategy 1 11 .91 HighStrategy 2 8 .94 High
Contd…
Strategy 3 18 .95 High Strategy 4 18 .97 HighStrategy 5 9 .95 HighStrategy 6 7 .95 HighSignificantvalueat.05
The module reliability analysis applied to government servants showed high and satisfactory CronbachAlphacoefficientsvalueat.99
This shows that the built items quality is at a very good level and can be understood by respondents. This is in line with the opinion expressed by Mohd Majid9 (1998)whostatedthatthereliabilitycoefficientof0.60or higher is acceptable. Sekaran11(1992) also stated that the reliabilityvalueof less than0.6 is consideredlowandunacceptable,whilevaluesfrom0.6to0.8aremoderateandacceptable,and0.8oraboveisconsideredhigh, good and accepted.
CONCluSION
Overall, this study has successfully establishedPsycho-Numerology Module for Character Building in Malaysia which have a high validity and reliability content. This module with its approach based on the theory of CBT, and also CBT intervention enhancement into Psycho-Numerology Module for Character Buildings in Malaysia. The use of theory and approach certainly has high validity and reliability internationally and nationally which makes this module very strong. Therefore, it is appropriate if further research is conducted to test its effectiveness in the context of students, professionalsand semi-professionals in Malaysia.
Conflict of Interest: None
Source of Funding: Fundamental Research Grant Scheme 2014, The Ministry of Higher Education,Malaysia.
ethical Clearance: Not required
ReFeReNCeS
1.MohammadAripM. Effects of group guidanceon self-concept, endurance and aggressiveness teens.. Doctoral thesis. National University of Malaysia.2010.
Indian Journal of Public Health Research & Development, April 2018, Vol.9, No. 4 53
2.Russell,J.D.ModularInstruction:AGuidetoTheDesign, Selection, Utilization and Evaluation of Modular Materials. New York: Publishing Company. 1974.
3. Hamdan M. Free Report Secret Date of Birth. [internet]. 2009.Available from URL: www.Kod-Diri on 1stFebruary2016
4.McClain,M.AstrologyandNumerology.[Internet]2010. Available from URL: http://www.astrologynumerology.com/,accessedon30thJanuary2016.
5.Lagerquist,K.&Leonard,L.The Complete Idiot’s Guide Numerology.USA:Penguin.2004.
6. Mohd Samsury. E. . Love, Dating and Marriage: Dynamic Potential Study Method. Selangor: Book PrimaSdn.Bhd.2009.
7.Webb, J. Feminist Numerology. [Internet] 2001.AvailablefromURL:http://scienceafrica.co.za/200,accessed on 8thFebruary2016.
8. Mohd Noah S. Design Research: Philosophy, Theory and Practice. Serdang Universiti Putra Malaysia. 2002.
9. Konting, M. Educational Research Methodology. KualaLumpur:DewanBahasadanPustaka.2005
10.Mohamed O. Thesis Writing in Applied SocialScience. 4th Edition. Serdang: Published by UniversitiPutraMalaysia.2008.
11. Sekaran, U. Research methods for bussiness: a skillbuilding approach. NewYork: JohnWiley &Sons, Inc. 1992.
establishing Internal Consistency of the Attitudes to back Pain Scale (ABS-mp) in Indian Physiotherapists
Nitesh bansal1, Puja Chhabra Sharma2, Raju K Parasher3
1Research Scholar, Ansal University & Registrar, GD Goenka University, Gurgaon, 2Professor, School of Management, Ansal University, Gurgaon, 3Director/Principal, Amar Jyoti Institute of Physiotherapy, University of Delhi
AbSTRACT
Introduction: Low back pain (LBP) is reportedly one of the most common musculoskeletal problems that ismanagedbyphysiotherapistsglobally.Itisobservedthatattitudesandbeliefsofacliniciansignificantlyimpacts the management of LBP and consequently its outcomes. The attitude and beliefs to Back Pain Scale for Musculoskeletal Practitioner (ABS - mp) has been used to measure the attitudes and beliefs of clinicians towards the management of low back pain1,2 and consists of two sub-dimensions: personal interaction and treatment orientation.However, as beliefs, attitudes and clinical practice are influenced by culture,psychologicalandsocialdimensions,thepurposeofourstudywasasafirststeptoevaluatetheinternalconsistency of the ABS-mp, prior to using it to measure attitudes and beliefs of Indian physiotherapists treatingLBP,whichconsequentlywillhelpdevelopIndiaspecifictreatmentguidelinesofthecondition.
Method: The Self-administered questionnaire ABS-mp was sent electronically to total of over 250Physiotherapists (PT) across the country. Two reminders were given at regular intervals to the physiotherapists to complete the questionnaire. 147 questionnaires, with a return rate 58% were compiled and analyzed using SPSSversion16.InternalConsistencywasevaluatedusingCronbachalphacoefficient.
Results:Ofthe147questionnaires27werediscardedasparticipantshadnotansweredallthequestions.Around 55.5% of the physiotherapists from our sample worked in Inpatient as well as outpatient care setups. During their clinical time, 63.7% of the therapists treated six (6) or more patients/day, of which 67.1% patients had musculoskeletal problems. Approximately 65.1% of the therapists used a combination of manual therapy and electrotherapy to treat their patients and almost 77% of the therapists followed LBP guidelines.TheCronbachalphacoefficientforinternalConsistencyofABS-mpwas0.746,with0.754forthepersonalinteractionsub-domainand0.76fortreatmentorientation.
Conclusion:OveralltheABS-mpalongwithitssub-scaleshasgoodinternalconsistency.Hencethisscalecan be used to study attitudes and beliefs of clinicians towards LBP management in future cross sectional studies in Indian Physiotherapists.
Keywords: ABS-mp, Internal Consistency, Indian Physiotherapist
Corresponding Author:Nitesh Bansal,Registrar, GD Goenka University,GD Education City, Gurgaon Sohna Road,Gurgaon-122103
INTROduCTION
Low back pain is reportedly one of the most common musculoskeletal problems that is managed by physiotherapists globally3 anditconstitutesasignificanthealth problem with a heavy economic burden to the
patient as well as the community. Physiotherapists treat a large number of patients with low back pain, accounting for approximately half their workload. Studies show that prevalence of LBP among Indian populations ranges from 6.2% to 92%.4
Low back pain is a descriptive term that manifests as a result of injury to muscles, ligaments, intervertebral discs and other connective tissues located in the low back area. Reasons for injury can be aberrant loading and stress on tissues due to inactivity due to modern life styles, manual handling, repetitive movements and/or sustained incorrect postures. Evidence-based treatment for low
DOI Number: 10.5958/0976-5506.2018.00255.3
Indian Journal of Public Health Research & Development, April 2018, Vol.9, No. 4 55
back pain other than conventional physiotherapy (PT) treatments includes counseling, educational informative sessions, painkillers and exercises under supervision. Guidelines for the treatment of low back pain recommend that practitioners identify risk factors and intervene early. However,theseguidelinesdonotofferspecificguidanceas to how clinicians should address risk factors during their clinical practice. Hence, the implementation of theseguidelineshaveessentiallynotmadeasignificantimpact on the management of LBP. 2
In the management of low back pain, it has been suggested that instead of focusing only on individual differences in the response to treatment in patients,specific interventions and other methods by whichclinicians manage patients, also need to be investigated. Importantly, it has been observed that attitudes and beliefs of a practitioner impacts management and consequently outcomes5,6. These include over or under treating, referrals to appropriate specialists when patients do not respond to treatment etc. A recent study has reported that 10%ofmusculoskeletal physiotherapists continueto treat patients of subacute back pain, even though they are not responding to the treatment.1 Accordingly, it has been suggested that factors related to attitudes and beliefs of physiotherapists towards the management of LBP should be comprehensively investigated. This, it is believed would facilitate the development and implementationofculturallyandsociallyspecificLBPmanagement guidelines1.
The word ‘attitude’ describes a ‘way’ of doing something in terms of what one thinks is proper. While beliefs are our cultural, professional, religious and/or moral identity that is based on real life experiences. Thus,aphysiotherapist’sattitudesandbeliefscanaffectthe way one interacts and works with their clients/patients. For an example, treatment can be based upon our assumptions about what our clients/patients can (or cannot) do for themselves independently7,8. Several studies have reported that clinicians demonstrate a range of attitudes and beliefs that are related to the treatment they give their patients. It is hence suggested that to understand the complexity of pain behavior in terms professional practice, factors related to a clinician’s attitudes and beliefs warrants further investigation.9
Several measurement scales have been developed to measure attitudes and beliefs of clinicians towards the management of pain. For an example, the pain attitudes and beliefs scale for physiotherapists 8, the health care provider’s pain and impairment relationship scale 10,
backs beliefs questionnaire, the physical sub-section of the Fear-avoidance belief questionnaire 11 etc. More recently,Pincusetal(2006)developedacomprehensiveattitude and beliefs to back pain scale for musculoskeletal practitioner (ABS - mp). This measurement scale consists of two sub-dimensions: Personal Interaction, which consist of four factors (limitation of sessions, psychological, connection to healthcare system, confidence andconcern), andTreatmentOrientation,which consists oftwo factors (re-activation and biomedical). Accordingly, the ABS - mp encompasses the practitioner’s attitudes and beliefs to real-life clinical decisions and thus, makes it the measurement tool of choice. Pincus et al developed and tested the questionnaire and reported that the Abs-mp questionnaire to be reliable and valid. However, a systemic review, reported that factor analysis of the Abs-mp had established validity but reliability had not been explicitly tested.2
The treatment and management of LBP is a huge economic burden to the healthcare system of a country given the biological and psychosocial complexities of the condition. It is thus, imperative that all healthcare professionals, including physiotherapists deal with it in the most efficient manner possible. Towards thisgoal, it is important that we understand and measure attitudes and beliefs of physiotherapists with regards to the treatment of LBP and thereafter develop and implementcountryspecifictreatmentguidelines.Giventhat India has a widely diverse population–biologically, psychologically, socially and culturally, it is prudent that asafirststep,toestablishtheinternalconsistencyoriten-reliability of the ABS–mp in a sample of diverse Indian physiotherapists. Internal consistency or reliability is a measure of item-reliability that establishes if the items addressing the construct being measured are consistent and thus, is dependent on clarity and the derived meaning or understanding of the item.
Thus, the purpose of this study was to establish the internal consistency of the ABS – mp in a sample of diverse Indian physiotherapists.
MeThOd
Participants: Physiotherapists who met the following inclusion criteria were included in the study:
z Qualifiedphysiotherapistsworkingingovernmenthospitals, private clinic, private hospitals, academic institutes and private practitioners.
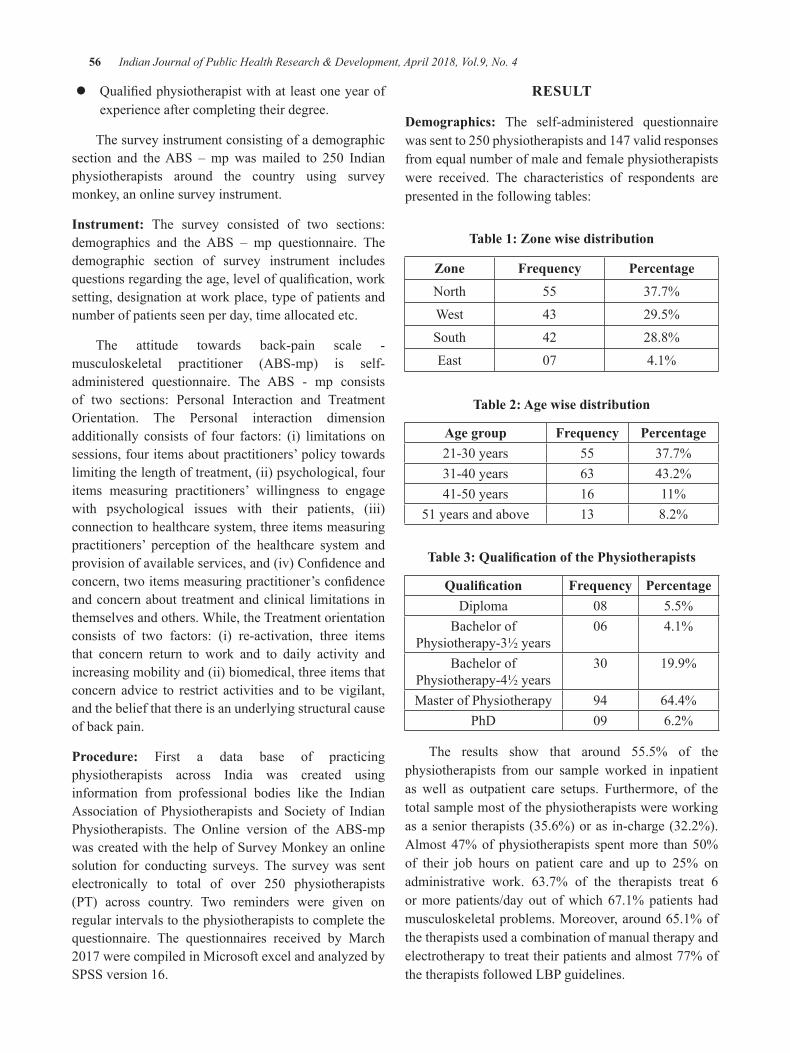
56 Indian Journal of Public Health Research & Development, April 2018, Vol.9, No. 4
z Qualifiedphysiotherapistwithatleastoneyearofexperience after completing their degree.
The survey instrument consisting of a demographic section and theABS –mpwasmailed to 250 Indianphysiotherapists around the country using survey monkey, an online survey instrument.
Instrument: The survey consisted of two sections: demographics and the ABS – mp questionnaire. The demographic section of survey instrument includes questionsregardingtheage,levelofqualification,worksetting, designation at work place, type of patients and number of patients seen per day, time allocated etc.
The attitude towards back-pain scale - musculoskeletal practitioner (ABS-mp) is self-administered questionnaire. The ABS - mp consists of two sections: Personal Interaction and Treatment Orientation. The Personal interaction dimensionadditionally consists of four factors: (i) limitations on sessions, four items about practitioners’ policy towards limiting the length of treatment, (ii) psychological, four items measuring practitioners’ willingness to engage with psychological issues with their patients, (iii) connection to healthcare system, three items measuring practitioners’ perception of the healthcare system and provisionofavailableservices,and(iv)Confidenceandconcern,twoitemsmeasuringpractitioner’sconfidenceand concern about treatment and clinical limitations in themselves and others. While, the Treatment orientation consists of two factors: (i) re-activation, three items that concern return to work and to daily activity and increasing mobility and (ii) biomedical, three items that concern advice to restrict activities and to be vigilant, and the belief that there is an underlying structural cause of back pain.
Procedure: First a data base of practicing physiotherapists across India was created using information from professional bodies like the Indian Association of Physiotherapists and Society of Indian Physiotherapists. The Online version of the ABS-mpwas created with the help of Survey Monkey an online solution for conducting surveys. The survey was sent electronically to total of over 250 physiotherapists(PT) across country. Two reminders were given on regular intervals to the physiotherapists to complete the questionnaire. The questionnaires received by March 2017werecompiledinMicrosoftexcelandanalyzedbySPSS version 16.
ReSulT
demographics: The self-administered questionnaire wassentto250physiotherapistsand147validresponsesfrom equal number of male and female physiotherapists were received. The characteristics of respondents are presented in the following tables:
Table 1: Zone wise distribution
Zone Frequency PercentageNorth 55 37.7%West 43 29.5%South 42 28.8%East 07 4.1%
Table 2: Age wise distribution
Age group Frequency Percentage21-30years 55 37.7%31-40years 63 43.2%41-50years 16 11%
51 years and above 13 8.2%
Table 3: Qualification of the Physiotherapists
Qualification Frequency PercentageDiploma 08 5.5%
Bachelor of Physiotherapy-3½ years
06 4.1%
Bachelor of Physiotherapy-4½ years
30 19.9%
Master of Physiotherapy 94 64.4%PhD 09 6.2%
The results show that around 55.5% of the physiotherapists from our sample worked in inpatient as well as outpatient care setups. Furthermore, of the total sample most of the physiotherapists were working as a senior therapists (35.6%) or as in-charge (32.2%). Almost47%ofphysiotherapists spentmore than50%of their job hours on patient care and up to 25% on administrative work. 63.7% of the therapists treat 6 or more patients/day out of which 67.1% patients had musculoskeletal problems. Moreover, around 65.1% of the therapists used a combination of manual therapy and electrotherapy to treat their patients and almost 77% of the therapists followed LBP guidelines.
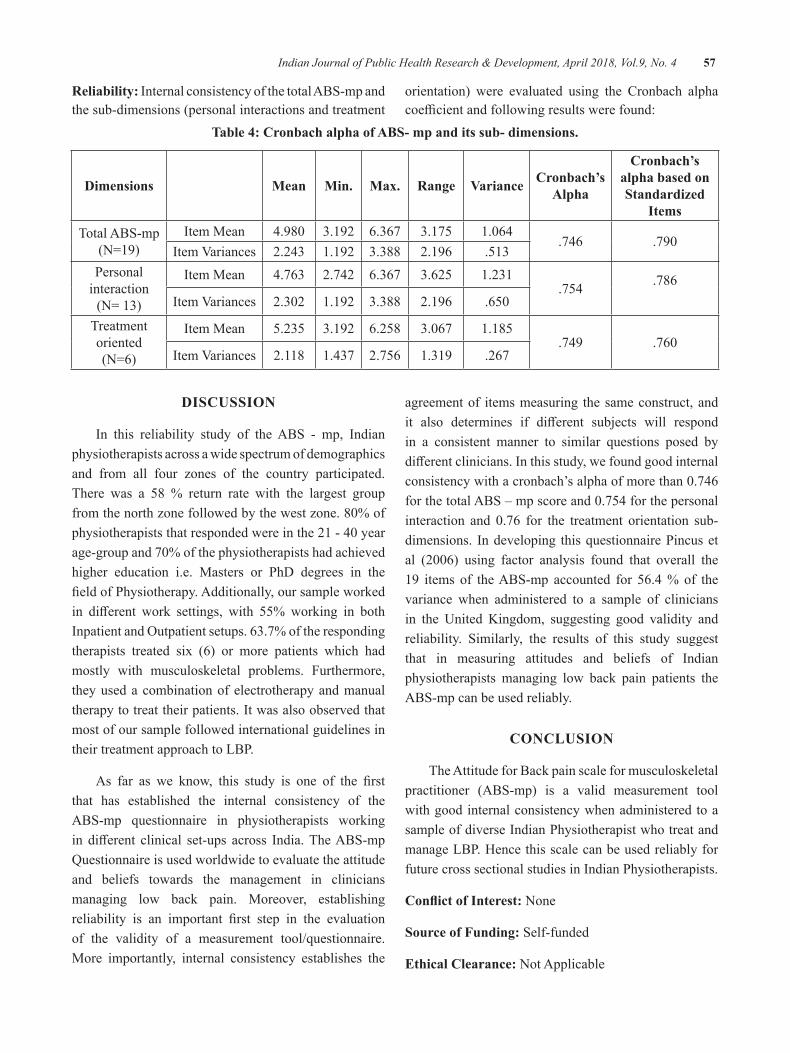
Indian Journal of Public Health Research & Development, April 2018, Vol.9, No. 4 57
Reliability: Internal consistency of the total ABS-mp and the sub-dimensions (personal interactions and treatment
orientation) were evaluated using the Cronbach alpha coefficientandfollowingresultswerefound:
Table 4: Cronbach alpha of AbS- mp and its sub- dimensions.
dimensions Mean Min. Max. Range Variance Cronbach’s Alpha
Cronbach’s alpha based on Standardized
ItemsTotal ABS-mp
(N=19)Item Mean 4.980 3.192 6.367 3.175 1.064
.746 .790ItemVariances 2.243 1.192 3.388 2.196 .513
Personal interaction(N=13)
Item Mean 4.763 2.742 6.367 3.625 1.231.754 .786
ItemVariances 2.302 1.192 3.388 2.196 .650
Treatment oriented(N=6)
Item Mean 5.235 3.192 6.258 3.067 1.185.749 .760
ItemVariances 2.118 1.437 2.756 1.319 .267
dISCuSSION
In this reliability study of the ABS - mp, Indian physiotherapists across a wide spectrum of demographics and from all four zones of the country participated. There was a 58 % return rate with the largest group fromthenorthzonefollowedbythewestzone.80%ofphysiotherapiststhatrespondedwereinthe21-40yearage-groupand70%ofthephysiotherapistshadachievedhigher education i.e. Masters or PhD degrees in the fieldofPhysiotherapy.Additionally,oursampleworkedin different work settings, with 55% working in bothInpatientandOutpatientsetups.63.7%oftherespondingtherapists treated six (6) or more patients which had mostly with musculoskeletal problems. Furthermore, they used a combination of electrotherapy and manual therapy to treat their patients. It was also observed that most of our sample followed international guidelines in their treatment approach to LBP.
As far as we know, this study is one of the firstthat has established the internal consistency of the ABS-mp questionnaire in physiotherapists working in different clinical set-ups across India.TheABS-mpQuestionnaire is used worldwide to evaluate the attitude and beliefs towards the management in clinicians managing low back pain. Moreover, establishing reliability is an important first step in the evaluationof the validity of a measurement tool/questionnaire. More importantly, internal consistency establishes the
agreement of items measuring the same construct, and it also determines if different subjects will respondin a consistent manner to similar questions posed by differentclinicians.Inthisstudy,wefoundgoodinternalconsistencywithacronbach’salphaofmorethan0.746forthetotalABS–mpscoreand0.754forthepersonalinteraction and 0.76 for the treatment orientation sub-dimensions. In developing this questionnaire Pincus et al (2006) using factor analysis found that overall the19 items of the ABS-mp accounted for 56.4 % of the variance when administered to a sample of clinicians in the United Kingdom, suggesting good validity and reliability. Similarly, the results of this study suggest that in measuring attitudes and beliefs of Indian physiotherapists managing low back pain patients the ABS-mp can be used reliably.
CONCluSION
The Attitude for Back pain scale for musculoskeletal practitioner (ABS-mp) is a valid measurement tool with good internal consistency when administered to a sample of diverse Indian Physiotherapist who treat and manage LBP. Hence this scale can be used reliably for future cross sectional studies in Indian Physiotherapists.
Conflict of Interest: None
Source of Funding: Self-funded
ethical Clearance: Not Applicable
58 Indian Journal of Public Health Research & Development, April 2018, Vol.9, No. 4
ReFeReNCeS
1.PincusT,VogelS,SantosR,BreenA,FosterNE,Underwood MR. The Attitudes to Back Pain Scale in musculoskeletal practitioners (ABS-mp); The development and testing of a new questionnaire. ClinJPain.2006;22:378–86.
2. Bishop A, Foster NE. Do physical therapists in the United Kingdom recognize psychosocial factors inpatientswithacutelowbackpain?Spine.2005;30:1316–22.
3. Maniadakis N, Gray A. The economic burden of backpainintheUK.Pain2000;84:95–103.
4.Supreet Bindra, SinhaA.G.K & BenjaminA.I.Epidemiology of Low Back Pain in Indian Population: A Review; International Journal ofBasicandAppliedMedicalSciences;2015Vol.5(1)January-April;166-179
5. Daykin AR, Richardson B. Physiotherapists’ pain beliefsandtheirinfluenceonthemanagementofpatientswithchroniclowbackpain.Spine.2004;29:783–95.
6.VlaeyenJW,LintonSJ.Arewe ‘fear-avoidant’?Pain.2006;124:240–1.
7.RainvilleJ,CarlsonN,PolatinP,GatchelRJ,IndahlA. Exploration of physicians’ recommendations for activities in chronic low back pain. Spine. 2000;25:2210–20.
8.OsteloRW,Stomp-vandenBergSG,VlaeyenJW,Wolters PM, deVetHC.Health care provider’sattitudes and beliefs towards chronic low back pain: the development of a questionnaire. Man Ther.2003;8:214–22.
9. Foster NE, Pincus T, Underwood MR, et al. Understanding the process of care for musculoskeletal conditions: why a biomedical approach is inadequate. Rheumatism. 2003; 42:401–440.
10.Rainville J, Bagnall D, Phalen L. Health careproviders’ attitudes and beliefs about functional impairmentsandchronicbackpain.ClinJPain.1995; 11:287–95.
11.Linton SJ, Vlaeyen J, Ostelo R. The back painbeliefs of health care providers: are we fear-avoidant?JOccupRehabil.2002;12:223–32.
Knowledge, Attitude and Practice of Tobacco use among Children in a School, Pune: A Cross Sectional Survey
Aditi Mahalle1, Mamatha g.S Reddy2, Srushti Putta3, Nitin gupta4, Supriya Kheur5
1Lecturer, 2Reader, 3Under-graduate Student, 4Lecturer, Department of Public Health Dentistry, 5Professor and Head, Department of Oral Pathology and Microbiology, Dr.D.Y.Patil Vidyapeeth,
Dr. D.Y.Patil Dental College and Hospital, Pimpri,Pune
AbSTRACT
Objective: The study was conducted to assess knowledge, attitude and practice on tobacco consumption among school children.
Materials and method: The study was carried out among 11-15 years old school children in two stages which included questionnaire administration and oral examination.
Results:Outof566students8.83%weretobaccousers,outofwhich0.06%ofgirlsreportedtobaccouseand16.78%boysweresmokers,whichwassignificantlyhigherinmalesascomparedtofemales.Therewasadecreaseinageofinitiationoftobaccoabuseto11.5yearsThemostcommonoralfindingsweretobaccorelated stains (5.3%), hyperkeratosis (1.9%), smoker’s palate and discolouration (1.5%). A striking presence oforalpotentiallymalignantdisorderlikeleukoplakia(0.8%)wasfound.
Conclusion: Based on these results, more emphasis should be given on conducting anti-tobacco awareness programs for school children.
Keywords: Leukoplakia, Potentially malignant disorders, School children, Tobacco habit
Corresponding Author:Dr. Nitin GuptaLecturer, Department of Public Health Dentistry,Dr.DYPatilVidyapeethDr. D Y Patil Dental College and Hospital,Pimpri,Pune-18Phone No.:7676474377Email: [email protected]
INTROduCTION
Tobacco is a leading preventable cause of death globally,andby2030,itisestimatedtoaccountforover10millionannualdeathsworldwide,70%ofwhichwillbe in developing world.1 The risks of tobacco use are highest among those who start early and continue its use for a long period. This underlines the urgent need to intervene and protect this vulnerable group from falling prey to this addiction.2 With changes in the dynamics of the societies, the prevalence of smoking among women and young children has increased many folds. Among the Indian studies, the mean age of initiation of tobacco
use has been found to vary from 8 to 15 years. The majority of the tobacco users worldwide have reportedly first tried tobacco prior to age 18, some starting asyoung as 10 years. There is a recent downward shiftin age at uptake of tobacco habit among children.3 The hope that simple information given through educational programswillbe sufficient toprevent substanceabusedependence is frequently expressed, however, there is no evidence to support it.4 Tobacco associated lesions suchasoralleukoplakiaandoralsubmucousfibrosisarethe potentially malignant disorders of the oral mucosa that are seen in young adolescent population in India.5
Addictions developed in adolescence are likely to persist into adult life.6 In India tobacco use is estimated to cause 800,000deathsannually.SouthEasternregionofWHOis specifically facing with multiplicity of tobacco usemodalities and nationally representative and reliable prevalence data on tobacco consumption is scarce.7
Hence the necessity of this study was to generate data on knowledge, attitude and practice of tobacco consumption amongschoolchildrenandseekrelatedclinicalfindings.
DOI Number: 10.5958/0976-5506.2018.00256.5
60 Indian Journal of Public Health Research & Development, April 2018, Vol.9, No. 4
MATeRIAlS ANd MeThOdOlOgy
A cross sectional study was carried out in a Pimpri Chinchwad Municipal Corporation School in Pune in theyear2015 foraperiodof2months (July-August).Total of 566 volunteer school children of 11-15 years were included in the study. Those who were absent at the time of study were excluded. Prior Permission and consent from the school authority was taken to carry out the study. The study was carried out in two stages, Stage1:QuestionnaireAdministrationandStage2:OralExamination.
A close ended questionnaire was designed with 21 questions related to Knowledge, Attitude and Practice on tobacco consumption. The validated questionnaire was provided in both English and Marathi. Data was collected on the use of tobacco, age of initiation, smoking habitsofparentsandsibling,peer influence, reasonofinitiation of tobacco, places of tobacco consumption and purchase of tobacco. Tobacco use was classifiedas, ever use (use of tobacco even once) and current use.7 In the second stage, oral examination was done by trained professionals using diagnostic instruments. Oral examination for tobacco related oral lesions likestains, attrition, gingivitis,periodontitis, tobacco pouch keratosis, smoker’s palate, leukoplakia, erythropakia and oral cancer. Data was collected into an excel sheet and descriptive analysis was done using statistical software programs(SPSS)version20.
ReSulTS
Outof570students,566studentswhoparticipatedin the study were females 51.41 % and 48.59 % were males. The response rate in the present study was 99.29%.Out of total participants,8.83%were tobaccousers;out of them, 16.78% of males were smokers and only0.06%offemalesreportedtobaccouseintheformof quid placement. The mean age of initiation for tobacco use was around 11.5 yrs.
Onassessingthepracticesofformsoftobaccouse,the frequencyof smoking showed0.5%studentsweredaily smokers, 7.2 % had habit of smoking, 4.2% were studentssmokedoccasionallyandasignificantamountofstudents,i.e.87.4%werenonsmokers(Table1).Onduration of habit analysis, 87.7% of tobacco smokers had smoked less than 6 months ago, 8.1% had smoked for overayearandonly0.4%hadbeensmokingforabout
4-8 years(Table 1).Among the students that were found positive for smoking, 88% of them smoked less than 5 cigarettesperday,10%smoked10-15cigarettesand0.4% smokedmore than 20 cigarettes on daily basis.6%and0.5%smokedtobaccointheformsofacigaretteandbeedi respectively.1.8% of them had consumed gutka and 15.8% had tobacco along with the betel leaf (paan). 20%ofstudentshadhabitofalcoholconsumption(Table1).30%ofthestudentsgavehistoryofparentalsmoking.
It was found that 52.2% of them were aware that tobacco use causes dental staining. 61.9% and 50.7%of them recognized the health hazard of lung and oral cancer respectively.48.2% of students were aware about the sale of tobacco in the vicinity of the school.
6.7 % of the students commenced smoking due to their peers. 3.2% of the smokers stated that according to them smoking raised their social standard.1.6% students attempted smoking out of curiosity.0.5% of studentsreportedinitiationduetostress.0.4%ofthemstatedthatfamilial environment was the reason for their tobacco use.Peer groups were found out to be the most preferred company for smoking 8.8% of students revealed that they smoke with their peers. 3% of the students stated thattheypreferredsmokingalone.0.4%ofthestudentsclaimedthattheysmokedwiththeirparents.0.9%ofthesmoking population said that they also smoked in the schoolpremises.Parentalsmokingalsoinfluenced38%of the students. 70.4% students stated that they werenever educated about the health hazards of tobacco. 81.2% students reported that they have been made aware about the ill-effects of tobacco abuse either bytheir doctors, parents or friends. 35% and 3.9% of the students claimed that they were satisfactory and poor in their academics respectively. 1.4% of tobacco users reported that they placed quid on various sites in the mouth for more than 10 minutes out of which 1.6%consume it alongwith slake limeand0.2%withbetelnut leaf.The most common site of quid placement was buccal mucosa followed by labial mucosa.
In second stage, on oral examination tobacco related stainswerenotedasmostcommonfinding in5.3%ofstudents. Tobacco pouch keratosis was noted in 1.9% and smoker’s palate and discoloration in 1.5% students. Leukoplakiaandattritionwasnotedin0.8%cases.Outof the 5 cases of leukoplakia, 4 were homogeneous and 1 case was of non-homogeneous leukoplakia (Table 1).
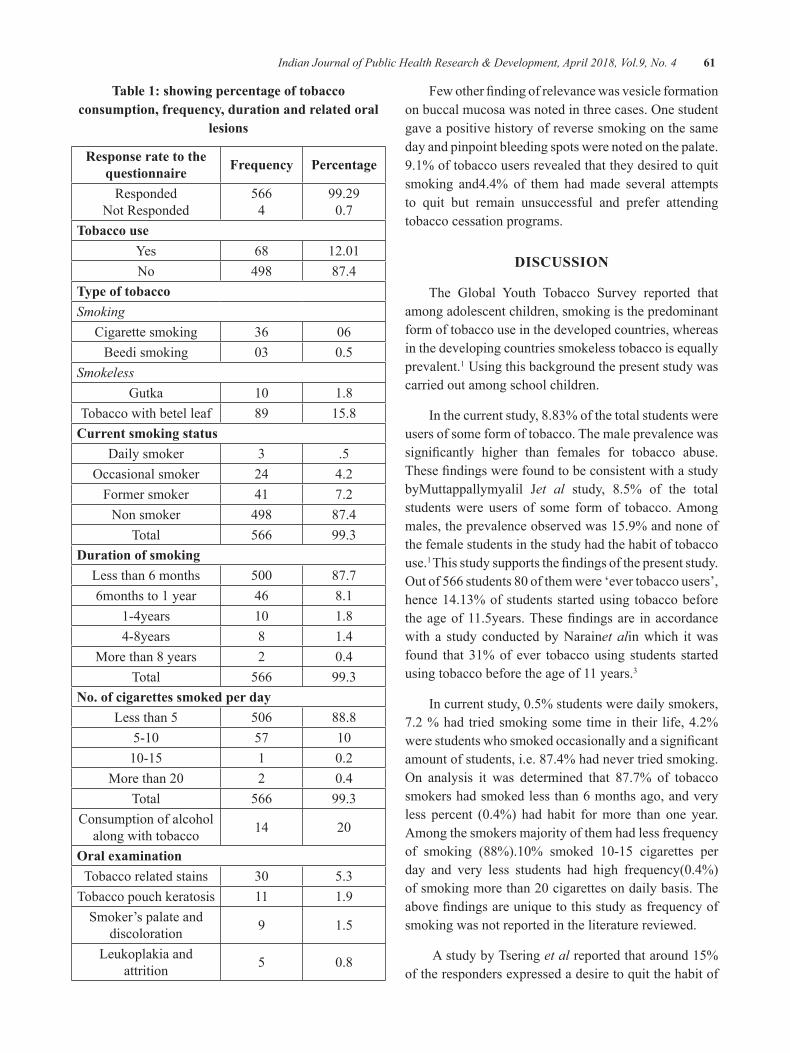
Indian Journal of Public Health Research & Development, April 2018, Vol.9, No. 4 61
Table 1: showing percentage of tobacco consumption, frequency, duration and related oral
lesions
Response rate to the questionnaire Frequency Percentage
RespondedNot Responded
5664
99.290.7
Tobacco useYes 68 12.01No 498 87.4
Type of tobaccoSmoking
Cigarette smoking 36 06Beedi smoking 03 0.5
SmokelessGutka 10 1.8
Tobacco with betel leaf 89 15.8Current smoking status
Daily smoker 3 .5Occasionalsmoker 24 4.2
Former smoker 41 7.2Non smoker 498 87.4
Total 566 99.3duration of smoking
Less than 6 months 500 87.76months to 1 year 46 8.1
1-4years 10 1.84-8years 8 1.4
More than 8 years 2 0.4Total 566 99.3
No. of cigarettes smoked per dayLess than 5 506 88.8
5-10 57 1010-15 1 0.2
Morethan20 2 0.4Total 566 99.3
Consumption of alcohol along with tobacco 14 20
Oral examinationTobacco related stains 30 5.3
Tobacco pouch keratosis 11 1.9Smoker’s palate and
discoloration 9 1.5
Leukoplakia and attrition 5 0.8
Fewotherfindingofrelevancewasvesicleformationonbuccalmucosawasnotedinthreecases.Onestudentgave a positive history of reverse smoking on the same day and pinpoint bleeding spots were noted on the palate. 9.1% of tobacco users revealed that they desired to quit smoking and4.4% of them had made several attempts to quit but remain unsuccessful and prefer attending tobacco cessation programs.
dISCuSSION
The Global Youth Tobacco Survey reported that among adolescent children, smoking is the predominant form of tobacco use in the developed countries, whereas in the developing countries smokeless tobacco is equally prevalent.1 Using this background the present study was carried out among school children.
In the current study, 8.83% of the total students were users of some form of tobacco. The male prevalence was significantly higher than females for tobacco abuse.ThesefindingswerefoundtobeconsistentwithastudybyMuttappallymyalil Jet al study, 8.5% of the total students were users of some form of tobacco. Among males, the prevalence observed was 15.9% and none of the female students in the study had the habit of tobacco use.1 Thisstudysupportsthefindingsofthepresentstudy.Outof566students80ofthemwere‘evertobaccousers’,hence 14.13% of students started using tobacco before theageof11.5years.Thesefindingsare inaccordancewith a study conducted by Narainet alin which it was found that 31% of ever tobacco using students started using tobacco before the age of 11 years.3
Incurrentstudy,0.5%studentsweredailysmokers,7.2 % had tried smoking some time in their life, 4.2% werestudentswhosmokedoccasionallyandasignificantamount of students, i.e. 87.4% had never tried smoking. On analysis it was determined that 87.7% of tobaccosmokers had smoked less than 6 months ago, and very less percent (0.4%) had habit formore than one year.Among the smokers majority of them had less frequency of smoking (88%).10% smoked 10-15 cigarettes perday and very less students had high frequency(0.4%)ofsmokingmorethan20cigarettesondailybasis.Theabovefindingsareuniquetothisstudyasfrequencyofsmoking was not reported in the literature reviewed.
A study by Tsering et al reported that around 15% of the responders expressed a desire to quit the habit of
62 Indian Journal of Public Health Research & Development, April 2018, Vol.9, No. 4
substance abuse4 whereas in this study 9.1% of tobacco users revealed that they desired to quit smoking and 4.4% of them had made several attempts to do so but were not successful.
In this study,the use of smokeless tobacco was more as compare to smoking.10.5% students had smokedtobacco in the forms of a cigarette and beedi.1.8% of them had consumed gutka and 15.8% had tobacco powder along with the betelnut leaf (paan). A study done by Narainet al has also reported 5.3% of students had ever smoked cigarette.3 Out of total tobaccoconsumption, 46.4% of males consumed gutka in the study conducted by Dongre et al [6]which was more than thepercent (1.8%)observed in thepresentstudy.Veryfew(0.66%)offemaleshadhabitofgutkaconsumption.Anotherimportantfindingwas20%ofthestudentshadhabit of alcohol consumption along with the tobacco.
52.2%, 61.9% and 50.7% of studentswere awarethat tobacco use causes dental staining, lung and oral cancer respectively.Dongreet al also noted that reasons for non-use of tobacco among students were fear of cancer and poor oral health.6 Sagarkaret al reviewed that exposure to second hand smoke in public places is high whichwas in accordance to this study as 30% of thestudents have fallen prey to passive smoking.2
In this study 48.2% of students were aware about the sale of tobacco in the vicinity of the school.Muttappallymyalilet al found that 39% of the students revealed that the tobacco products were purchased from the shops located near the schools.1
Reasons for initiation for tobacco consumption were assessed and it was found that peer pressure acted as a primary influence. 6.7 % of the studentscommenced smoking due to their peers. 3.2% of the smokers stated that according to them smoking raised their social standard.1.6% students attempted smoking out of curiosity.0.5% of students reported initiationduetostress.SimilarfindingswerenotedinastudybyDongreet al where overall 47.3% adolescents consumed tobacoo products due to peer pressure and 32.7% felt well due to its consumption.
Dongre et al noted that, in rural settings, family members and neighbors who often ask young children to get tobacco from nearby shops, local media advertisements and colourful attractive packing of
tobaccoproductsactsasanotherprotobaccoinfluencesfor new children to take up tobacco habit which relates withthefindingsofthisstudyinwhich0.4%ofstudentstated that familial environment was the reason for their tobacco use.6Ontheotherhand,77%ofstudentsinthisstudy found the anti- smoking advertisements helpful in creating awareness.
In thisstudy0.9%of thesmokingpopulationsaidthat they smoked in the school premises.Narain et al stated that low socioeconomic status of government school students may be responsible for tobacco use, as it is readily available and inexpensive.3 The knowledge imparted by the school authorities can help students avoid adverse habits, unfortunately, in the present study 70.4% students stated that they were nevereducated about the health hazards of tobacco and its use. Although 81.2% students reported that they have been madeawareabouttheill-effectsoftobaccoabuseeitherby their doctors, parents or friends. Many studies have emphasized on the necessity of implementing tobacco awareness programme for school children.Shamimet al hasdiscussed the significanceof training todelivereffectivetobaccodependenceinterventionprogrammes.5
In current study 1.4% of tobacco users reported that they placed quid on various sites in the mouth formore than10minutesoutofwhich1.6%consumeit alongwith slake lime and0.2%with betel nut leaf.Muttappallymyalilet al showed that smokeless tobacco forms are applied to the mandibular or labial groove for10-15minutesbymostpeopleand then theychewit slowly.1
Staining was the most common finding observedin 5.3%, followed by hyperkeratosis in 1.9% and smoker’s palate and discoloration in 1.5% of students. Very few percent of students showed leukoplakia andattrition (0.8%). Out of the 5 cases of leukoplakia, 4were homogeneous and 1 case was of non-homogeneous leukoplakia.
Other findings in the study were about 14.13%students were ‘ever tobacco users’. The most common site of quid placement was buccal mucosa followed by labial mucosa.Similar findings are noted by Shamim,stating that tobacco associated lesions such as oral leukoplakiaandoralsubmucusfibrosisarethepotentiallymalignant disorders of the oral mucosa that are seen in the young adolescent population in India.5
Indian Journal of Public Health Research & Development, April 2018, Vol.9, No. 4 63
Being a premalignant lesion, the finding ofleukoplakia is an alarming and disturbing sign as it is most likely to undergo malignant transformation if the tobacco usage continues. The students who were positive for such lesions were counseled and referred to nearby tertiary dental hospital for further diagnosis and treatment.
CONCluSION
A disturbing aspect has been noted that despite having high awareness of tobacco abuse, the prevalence of tobacco consumption is relatively high and there is increased downward shift in the age of initiation of the same. The students of low socioeconomic status from government schools are more prone to the habit of tobacco abuse so more emphasis should be given on conducting anti-tobacco awareness programs.
ethical Clearance: Taken from Dr. D Y Patil Dental College and Hospital ethics committee
Source of Funding:ItsanICMRSTSFUNDEDPROJECT
ReFeReNCeS
1.MuttappallymyalilJ,SreedharanJ,DivakaranB.Smokeless tobacco consumption among school children.IndJCancer.2010;47(1):s19-s23.
2. Sagarkar AR, Sagarkar RM, Arrabi KC, Shivmallappa SM. A substantive review on tobacco use among school going adolescents in India. J Ind Soc of Prev Commun Dent. 2013;3(1):7-11.
3. Narain R, Sardana S, Gupta S, Sehgal A. Age at initiation & prevalence of tobacco use amongschool children in Noida, India: A cross-sectional questionnairebasedsurvey.IndJMedRes.2011;133,300-307.
4. Tsering D, Pal R and Dasgupta. A.Substance use among adolescent high school students in India: Asurvey of knowledge, attitude, and opinion. JPharmBioalliedSci.2010;2(2):137–140.
5. Shamim T. Smokeless tobacco use in pediatric population: What is role of dental surgeon in India?LungInd.2012;29(3):305-306.
6. Dongre AR, Deshmukh PR, Murali N, Garg BS. Tobacco consumption among adolescents in rural Wardha: Where and how tobacco control should focusitsattention?IndJCancer.2008;45:100-6.
7. Madan Kumar PD, Poorni S, Ramachandran S. Tobacco use among school children in Chennai city,India.IndJCancer.2006;43:127-31.
Reproductive health Problems Associated with Thyroid disorders among health Science Students
Nitin Joseph1, Aditya Reddy gR2, Vishakha Patel2, divya Joy2, Pooja Santhosh2, Shatarupa das2, K. Siddharth Reddy2
1Associate Professor, Department of Community Medicine, 2MBBS Student, Kasturba Medical College, Manipal Academy of Higher Education, Mangalore, India
AbSTRACT
background: Thyroid disorders feature among the most frequent endocrine disorders in India. There is rarity of studies with respect to reproductive health problems faced by women with thyroid disorders.
Objectives: This study was done to assess reproductive health problems among female students with thyroid disorders.
Settings and design: Cross sectional study done at a private medical, dental and nursing college.
Method and Materials: Data was collected among female students using a self-administered questionnaire. Height and weight of all participants was recorded using standard procedures.
Statistical Analysis: Chi square test
Results:Meanageofthe466participantswas20.4+1.5years.Asmanyas25(5.4%)hadthyroiddisordersand all these were cases of hypothyroidism. Difficulty in maintaining ideal body weight (P=0.006)and trouble in controlling excessweight (P<0.001) in the past 6monthswas significantlymore amonghypothyroid participants. Similarly these cases reported frequent late menstrual periods (P=0.027) andirregularmenstrualperiods(P=0.001)overthepast6months.Overweightwassignificantlymoreamonghypothyroidparticipantscomparedtoothers(P=0.045).
Conclusions: Reproductive health problems were associated with hypothyroidism among participants in this settings. Suitable remedial measures added with awareness programs on these aspects needs to be conducted among students with hypothyroidism.
Keywords: Hypothyroidism, Reproductive health problems, Overweight, University students, Females
Corresponding Author:Dr.NitinJosephAssociate Professor, Department of Community Medicine,Kasturba Medical College, Manipal Academy of Higher Education, Mangalore, IndiaPh:00919448732896,FaxNo.918242428183E-mail: [email protected]
INTROduCTION
Thyroid disorders feature among the most frequent endocrine disorders in India with an estimated 42
million cases in the general population.1,2 Several factors like age, gender, consumption of cyanogenic plant foods, iodine content in food and soil have been implicated in its occurrence in the population.3,4 Studies have found that it is ten times more common among females than males.5-7 Thyroid disorders, the most frequent of which is hypothyroidism, can lead to several reproductive problems such as dyslipidemia and weight gain8, fatigability and miscarriages during pregnancy9, menstrual irregularities 10,11 and infertility12.
There is a rarity of studies with respect to reproductive health problems faced by women with thyroid disorders in Mangalore, a coastal city situated in south India. This
DOI Number: 10.5958/0976-5506.2018.00257.7
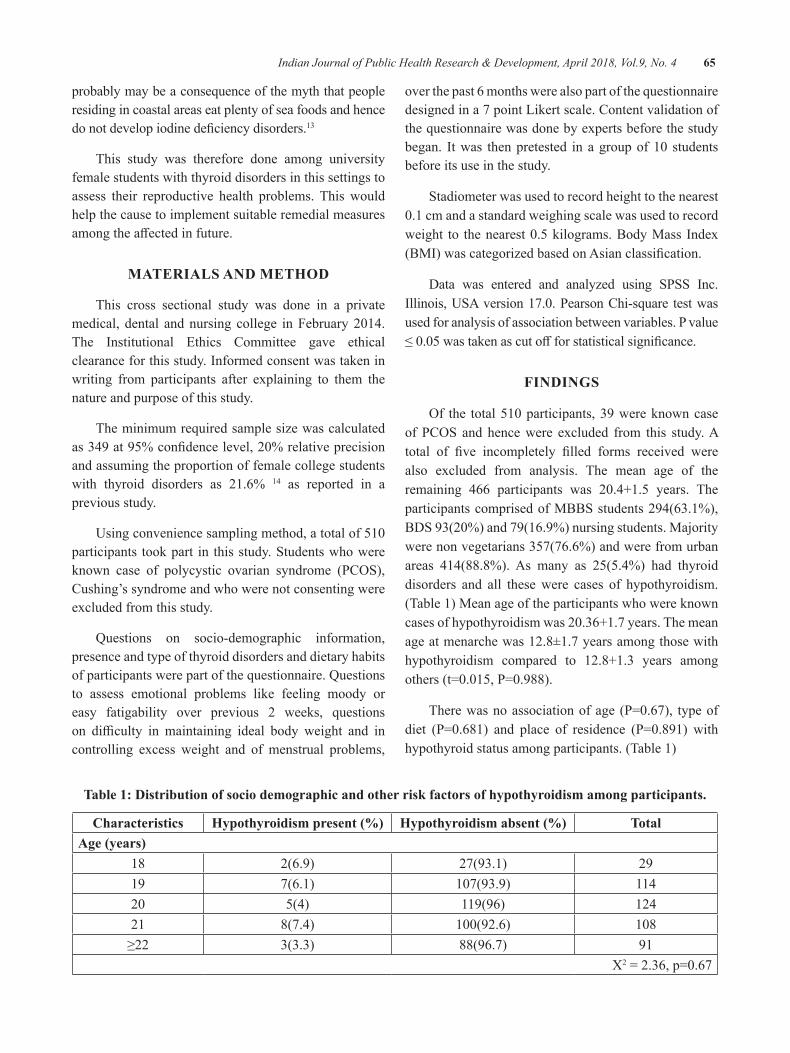
Indian Journal of Public Health Research & Development, April 2018, Vol.9, No. 4 65
probably may be a consequence of the myth that people residing in coastal areas eat plenty of sea foods and hence donotdevelopiodinedeficiencydisorders.13
This study was therefore done among university female students with thyroid disorders in this settings to assess their reproductive health problems. This would help the cause to implement suitable remedial measures amongtheaffectedinfuture.
MATeRIAlS ANd MeThOd
This cross sectional study was done in a private medical, dental andnursing college inFebruary2014.The Institutional Ethics Committee gave ethical clearance for this study. Informed consent was taken in writing from participants after explaining to them the nature and purpose of this study.
The minimum required sample size was calculated as349at95%confidencelevel,20%relativeprecisionand assuming the proportion of female college students with thyroid disorders as 21.6% 14 as reported in a previous study.
Usingconveniencesamplingmethod,atotalof510participants took part in this study. Students who were known case of polycystic ovarian syndrome (PCOS),Cushing’s syndrome and who were not consenting were excluded from this study.
Questions on socio-demographic information, presence and type of thyroid disorders and dietary habits of participants were part of the questionnaire. Questions to assess emotional problems like feeling moody or easy fatigability over previous 2 weeks, questions on difficulty in maintaining ideal body weight and incontrolling excess weight and of menstrual problems,
over the past 6 months were also part of the questionnaire designed in a 7 point Likert scale. Content validation of the questionnaire was done by experts before the study began. Itwas thenpretested inagroupof10 studentsbefore its use in the study.
Stadiometer was used to record height to the nearest 0.1cmandastandardweighingscalewasusedtorecordweight to thenearest0.5kilograms.BodyMass Index(BMI)wascategorizedbasedonAsianclassification.
Data was entered and analyzed using SPSS Inc. Illinois,USAversion17.0.PearsonChi-square testwasused for analysis of association between variables. P value ≤0.05wastakenascutoffforstatisticalsignificance.
FINdINgS
Of the total510participants,39wereknowncaseofPCOSandhencewere excluded from this study.Atotal of five incompletely filled forms received werealso excluded from analysis. The mean age of the remaining 466 participants was 20.4+1.5 years. Theparticipants comprised of MBBS students 294(63.1%), BDS93(20%)and79(16.9%)nursingstudents.Majoritywere non vegetarians 357(76.6%) and were from urban areas 414(88.8%). As many as 25(5.4%) had thyroid disorders and all these were cases of hypothyroidism. (Table 1) Mean age of the participants who were known casesofhypothyroidismwas20.36+1.7years.Themeanage at menarche was 12.8±1.7 years among those with hypothyroidism compared to 12.8+1.3 years among others(t=0.015,P=0.988).
Therewasnoassociationofage (P=0.67), typeofdiet (P=0.681) and place of residence (P=0.891) withhypothyroid status among participants. (Table 1)
Table 1: distribution of socio demographic and other risk factors of hypothyroidism among participants.
Characteristics Hypothyroidism present (%) Hypothyroidism absent (%) TotalAge (years)
18 2(6.9) 27(93.1) 2919 7(6.1) 107(93.9) 11420 5(4) 119(96) 12421 8(7.4) 100(92.6) 108≥22 3(3.3) 88(96.7) 91
X2=2.36,p=0.67
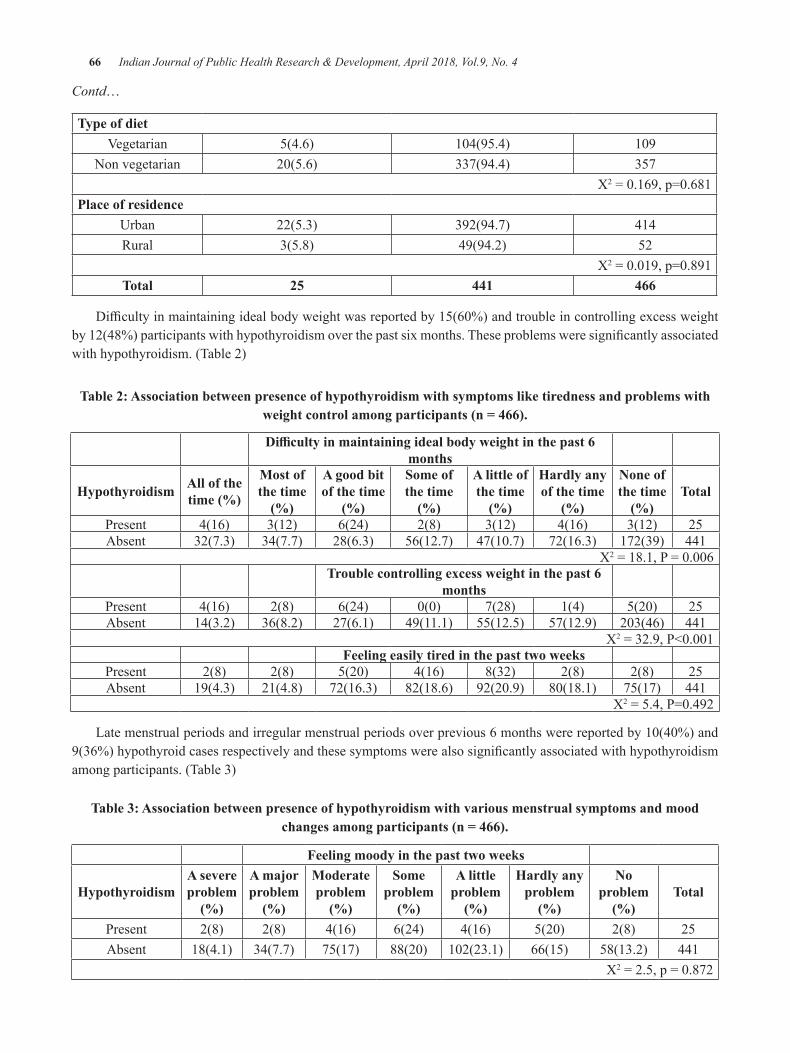
66 Indian Journal of Public Health Research & Development, April 2018, Vol.9, No. 4
Contd…
Type of dietVegetarian 5(4.6) 104(95.4) 109
Non vegetarian 20(5.6) 337(94.4) 357X2=0.169,p=0.681
Place of residenceUrban 22(5.3) 392(94.7) 414Rural 3(5.8) 49(94.2) 52
X2=0.019,p=0.891Total 25 441 466
Difficultyinmaintainingidealbodyweightwasreportedby15(60%)andtroubleincontrollingexcessweightby12(48%)participantswithhypothyroidismoverthepastsixmonths.Theseproblemsweresignificantlyassociatedwith hypothyroidism. (Table 2)
Table 2: Association between presence of hypothyroidism with symptoms like tiredness and problems with weight control among participants (n = 466).
Difficulty in maintaining ideal body weight in the past 6 months
hypothyroidism All of the time (%)
Most of the time
(%)
A good bit of the time
(%)
Some of the time
(%)
A little of the time
(%)
hardly any of the time
(%)
None of the time
(%)Total
Present 4(16) 3(12) 6(24) 2(8) 3(12) 4(16) 3(12) 25Absent 32(7.3) 34(7.7) 28(6.3) 56(12.7) 47(10.7) 72(16.3) 172(39) 441
X2=18.1,P=0.006Trouble controlling excess weight in the past 6
monthsPresent 4(16) 2(8) 6(24) 0(0) 7(28) 1(4) 5(20) 25Absent 14(3.2) 36(8.2) 27(6.1) 49(11.1) 55(12.5) 57(12.9) 203(46) 441
X2=32.9,P<0.001Feeling easily tired in the past two weeks
Present 2(8) 2(8) 5(20) 4(16) 8(32) 2(8) 2(8) 25Absent 19(4.3) 21(4.8) 72(16.3) 82(18.6) 92(20.9) 80(18.1) 75(17) 441
X2=5.4,P=0.492
Latemenstrualperiodsandirregularmenstrualperiodsoverprevious6monthswerereportedby10(40%)and9(36%)hypothyroidcasesrespectivelyandthesesymptomswerealsosignificantlyassociatedwithhypothyroidismamong participants. (Table 3)
Table 3: Association between presence of hypothyroidism with various menstrual symptoms and mood changes among participants (n = 466).
Feeling moody in the past two weeks
hypothyroidismA severe problem
(%)
A major problem
(%)
Moderate problem
(%)
Some problem
(%)
A little problem
(%)
hardly any problem
(%)
No problem
(%)Total
Present 2(8) 2(8) 4(16) 6(24) 4(16) 5(20) 2(8) 25Absent 18(4.1) 34(7.7) 75(17) 88(20) 102(23.1) 66(15) 58(13.2) 441
X2=2.5,p=0.872
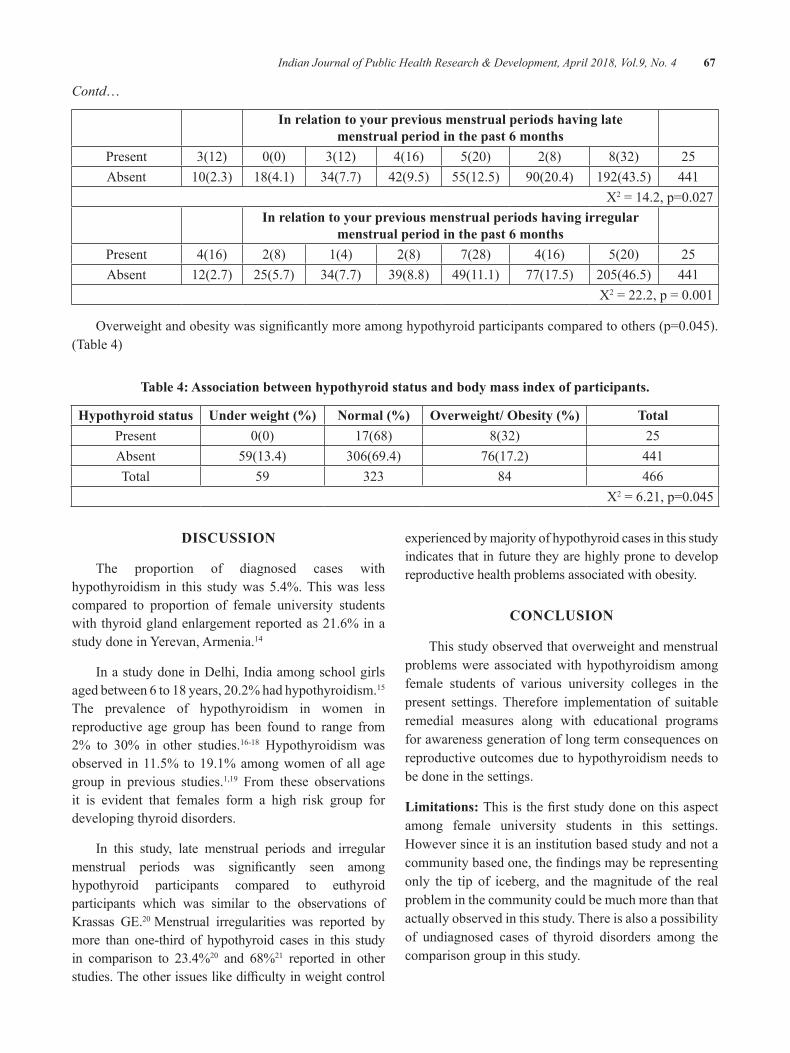
Indian Journal of Public Health Research & Development, April 2018, Vol.9, No. 4 67
Contd…
In relation to your previous menstrual periods having late menstrual period in the past 6 months
Present 3(12) 0(0) 3(12) 4(16) 5(20) 2(8) 8(32) 25Absent 10(2.3) 18(4.1) 34(7.7) 42(9.5) 55(12.5) 90(20.4) 192(43.5) 441
X2=14.2,p=0.027In relation to your previous menstrual periods having irregular
menstrual period in the past 6 monthsPresent 4(16) 2(8) 1(4) 2(8) 7(28) 4(16) 5(20) 25Absent 12(2.7) 25(5.7) 34(7.7) 39(8.8) 49(11.1) 77(17.5) 205(46.5) 441
X2=22.2,p=0.001
Overweightandobesitywassignificantlymoreamonghypothyroidparticipantscomparedtoothers(p=0.045).(Table 4)
Table 4: Association between hypothyroid status and body mass index of participants.
hypothyroid status Under weight (%) Normal (%) Overweight/ Obesity (%) TotalPresent 0(0) 17(68) 8(32) 25Absent 59(13.4) 306(69.4) 76(17.2) 441Total 59 323 84 466
X2=6.21,p=0.045
dISCuSSION
The proportion of diagnosed cases with hypothyroidism in this study was 5.4%. This was less compared to proportion of female university students with thyroid gland enlargement reported as 21.6% in a study done in Yerevan, Armenia.14
In a study done in Delhi, India among school girls agedbetween6to18years,20.2%hadhypothyroidism.15 The prevalence of hypothyroidism in women in reproductive age group has been found to range from 2% to 30% in other studies.16-18 Hypothyroidism was observed in 11.5% to 19.1% among women of all age group in previous studies.1,19 From these observations it is evident that females form a high risk group for developing thyroid disorders.
In this study, late menstrual periods and irregular menstrual periods was significantly seen amonghypothyroid participants compared to euthyroid participants which was similar to the observations of Krassas GE.20Menstrual irregularities was reported by more than one-third of hypothyroid cases in this study in comparison to 23.4%20 and 68%21 reported in other studies.Theotherissueslikedifficultyinweightcontrol
experienced by majority of hypothyroid cases in this study indicates that in future they are highly prone to develop reproductive health problems associated with obesity.
CONCluSION
This study observed that overweight and menstrual problems were associated with hypothyroidism among female students of various university colleges in the present settings. Therefore implementation of suitable remedial measures along with educational programs for awareness generation of long term consequences on reproductive outcomes due to hypothyroidism needs to be done in the settings.
limitations: Thisisthefirststudydoneonthisaspectamong female university students in this settings. However since it is an institution based study and not a communitybasedone,thefindingsmayberepresentingonly the tip of iceberg, and the magnitude of the real problem in the community could be much more than that actually observed in this study. There is also a possibility of undiagnosed cases of thyroid disorders among the comparison group in this study.
68 Indian Journal of Public Health Research & Development, April 2018, Vol.9, No. 4
Conflict of Interest: None declared
Source of Support: Nil
ethical Clearance:ObtainedfromInstitutionalEthicsCommittee of Kasturba Medical College, Mangalore.
Source of Funding: None
Conflict of Interest: None declared
ReFeReNCeS
1.AbrahamR,MuruganSV,PukazhvanthenP,SenSK. Thyroid disorders in women of Puducherry. IndianJClinBiochem.2009;24:52-9.
2. Kochupillai N. Clinical endocrinology in India. CurrSci.2000;79:1061-7.
3. Delang F. The disorders induced by iodine deficiency.Thyroid1994;4:107-28.
4. Chandra AK, Mukhopadhyay S, Lahari D, Tripathy S. Goitrogenic content of Indian cyanogenic plant foods&theirinvitroanti-thyroidalactivity.IndianJMedRes.2004;119:180-5.
5.VanderpumpMP,TurnbridgeWM.Epidemiologyand prevention of clinical and subclinical hypothyroidism.Thyroid2002;12:839-47.
6.VanderpumpMPJ.The epidemiologyof thyroiddiseases. In: Braverman LE, Utiger RD, editors. Werner and Ingbar’s The Thyroid: A Fundamental and Clinical Text. 9th ed. Philadelphia: JBLippincott-Raven;2005.p.398-496.
7.VanderpumpMPJ.The epidemiologyof thyroiddisease.BrMedBull.2011;99:39-51.
8.SinghBM,GoswamiB,MallikaV.Associationbetween insulin resistance and hypothyroidism in femalesattendingatertiarycarehospital.IndianJClinBiochem.2010;25:141-5.
9.De Groot LJ, Mestman J. Hypothyroidism andpregnancy [Internet]. California: HormoneHealth Network; 2015 [Cited 2015 Aug 15].Available from: http://www.hormone.org/patient-guides/2012/hypothyroidism-after-pregnancy
10.Poppe K, Velkeniers B, Glinoer D. Thyroiddisease and female reproduction. Clin Endocrinol (Oxf).2007;66:309-21.
11. Krassas GE, Pontikides N, Kaltsas T, PapadopoulouP,PaunkovicJ,PaunkovicN,etal.Disturbances of menstruation in hypothyroidism. ClinEndocrinol(Oxf).1999;50:655-9.
12.RahmanD,FatimaP.BanuJ.Thyroiddisordersinfemalesubfertility.JCMCTA2008;19:46-50.
13. Kapil U, Singh P, Pathak P. Status of iodine nutriture and salt iodization in union territory of Pondicherry,India.PakJNutr.2002;1:234-5.
14. Manukyan H. Prevalence of thyroid gland enlargement among 18-20 year old femaleuniversity and college students in Yerevan, Armenia: Screening survey [Dissertation].Yerevan:AmericanUniversityofArmenia;2003.
15.Chauhan VK, Manchanda RK, Narang A,Marwaha RK, Arora S, Nagpal L. Prevalence of thyroid disorders in school children In Delhi – post iodizationscenario.IndianJournalofResearchinHomoeopathy2009;3:29-33.
16. Wang C, Crapo LM. The epidemiology of thyroid disease and implications for screening. Endocrinol Metab Clin North Am. 1997;26:189-218.
17.Bjoro T, Holmen J, Kruger O, Midthjell K,Hunstad K, Schreiner T, et al. Prevalence of thyroid disease, thyroid dysfunction and thyroid peroxidase antibodies in a large, unselected population. The Health Study of Nord-Trondelag (HUNT).EurJEndocrinol.2000;143:639–47.
18.UNICEF,WFP, UNHCR and MOH [Armenia].The health and nutritional status of children and women in Armenia. Yerevan, UNICEF; 1998.
19. Das A, Shalini L, Sangeeta N, Paul S, Chanchal L, Singh SD, et al. Prevalence of thyroid hormone dysfunction among female patients, attending a multispecialityhospitalinManipur.IOSRJournalofDentalandMedicalSciences2013;10:7-11.
20.Krassas GE. Thyroid disease and femalereproduction.FertilSteril.2000;74:1063-70.
21.Joshi JV, Bhandarkar SD, Chadha M, BalaiahD, Shah R. Menstrual irregularities and lactation failure may precede thyroid dysfunction or goitre. JPostgradMed.1993;39:137–41.
Effectiveness of Short Message Service (SMS) Intervention for Promoting Safe Sex among Army Conscripts in a
Province in Thailand
P. eaimkhong1, u. Perngparn2
1Researcher, 2Assistant Professor, College of Public Health Sciences, Chulalongkorn University; Thailand
AbSTRACT
Objective: ThisstudyexaminedtheeffectivenessofShortMessageService(SMS)interventiontopromotesafe sex among army conscripts in a province in Thailand.
design: A quasi-experimental design.
Setting: Military conscripts in Lop Buri province Thailand.
Methods: Amulti-stagesamplingofrespondents(n=192)werestratifiedinto3groups:1-way,2-waySMSand a control groups. Both 1-way and 2-way SMS groups received a text messaging 2 times/weeks during the 3 months of the intervention period. The 2-way SMS group, they were allowed to send SMS back when they need more information. Data were collected at baseline, followed at 1, 3 and 6 months after intervention.
Results: Safe sex with condom use was significantly different for 1-way SMS group (p-value<0.05).Abstinence from alcohol drinking before or during having sex was different for 2-way SMS group(p-value<0.05).
discussion and Conclusion: ThestudyhasdemonstratedthebenefitsofSMSinterventioninpromotingsafer sex practices either 1-way or 2-way SMS, but a strengthening program is required for fostering safe sex behaviors among army conscripts.
Keywords: Short Message Service (SMS), Safe sex, Conscripts
INTROduCTION
Risky sexual behaviors are a major threat to the healthandaffectthequalityoflifeacrossallagegroups.Young army conscripts exhibit more of these behaviors. Conscripts are mostly young and sexually active, often far away from their family and spouse, more directed by peer pressure, and are more likely to engage in casual sex (1, 2). Overall, military personnel have been at ahigh risk forSTDandHIV infection (3). Data showed that 48.8% of Thai conscripts were having sex outside marriage, 22.3% having sex with female sex workers and 3.8% having sex with other men (4). This could then leadtoagreaterriskofcontractingSTIsorevenHIV/AIDS.The prevalence rates ofHIV among conscriptsintheRoyalThaiArmy(RTA)between2010and2014were,0.6,0.5,0.6,0.5,and0.7respectively (5). To reduce sexual risk behavior, self-regulation theory is a method for enhancing safer sex in this study. Self-regulation
refers to thoughts, feelings and actions that are planned and adapted to the attainment of personal goals and may protect against risk factors for sexual risk-taking (6). Thai conscripts are more likely to drinking alcohol. The behavioral surveyofThailand in2011 found that93.5% of them drink alcohol and the trend was raised every yearfrom92.4%in2006to93.5%(7, 8).
Mobile technologies and short message service (SMS) are one of the most important techniques that can give any information directly to individuals at any time and setting. Because SMS is accessible on all cell phones and no need internet access. The systematic review about mobile health needs and opportunities in developing countries examined mobile technology for contributing to a nation’s health care system at the regional, community, and individual levels(9). There are two ways of communication channels; 1-way and 2-way communications.One-way SMSwas sent to the large
DOI Number: 10.5958/0976-5506.2018.00258.9
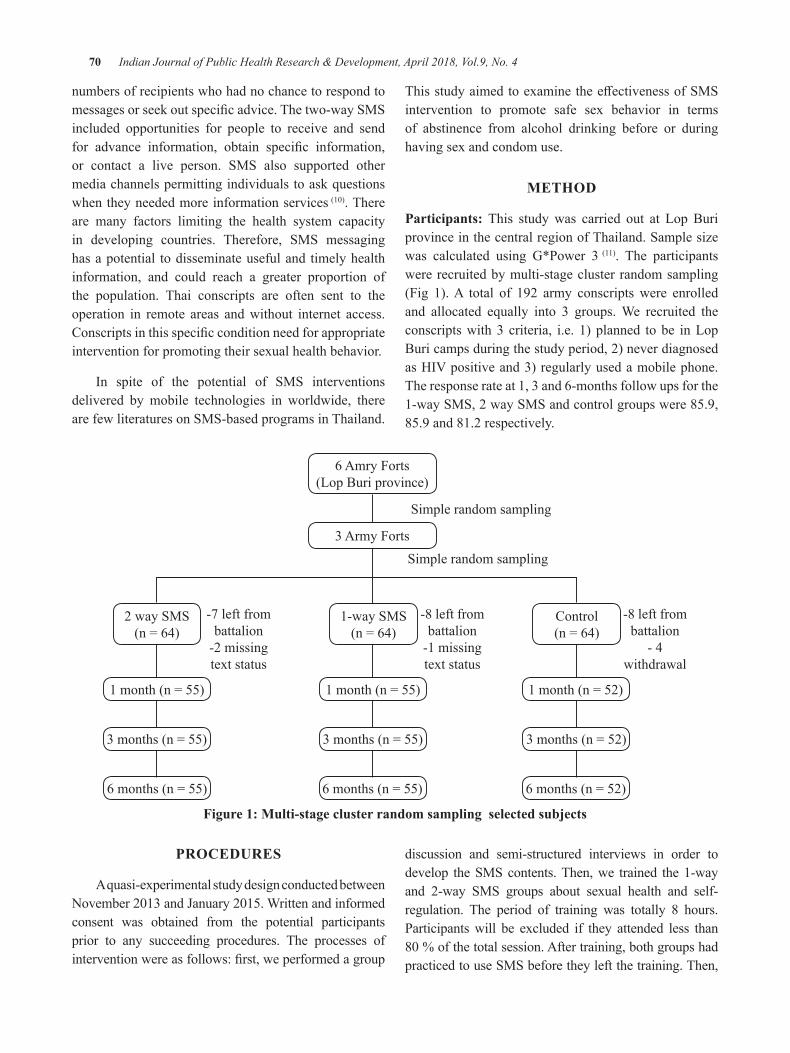
70 Indian Journal of Public Health Research & Development, April 2018, Vol.9, No. 4
numbers of recipients who had no chance to respond to messagesorseekoutspecificadvice.Thetwo-waySMSincluded opportunities for people to receive and send for advance information, obtain specific information,or contact a live person. SMS also supported other media channels permitting individuals to ask questions when they needed more information services(10). There are many factors limiting the health system capacity in developing countries. Therefore, SMS messaging has a potential to disseminate useful and timely health information, and could reach a greater proportion of the population. Thai conscripts are often sent to the operation in remote areas and without internet access. Conscriptsinthisspecificconditionneedforappropriateintervention for promoting their sexual health behavior.
In spite of the potential of SMS interventions delivered by mobile technologies in worldwide, there are few literatures on SMS-based programs in Thailand.
ThisstudyaimedtoexaminetheeffectivenessofSMSintervention to promote safe sex behavior in terms of abstinence from alcohol drinking before or during having sex and condom use.
MeThOd
Participants: This study was carried out at Lop Buri province in the central region of Thailand. Sample size was calculated using G*Power 3 (11). The participants were recruited by multi-stage cluster random sampling (Fig 1). A total of 192 army conscripts were enrolled and allocated equally into 3 groups. We recruited the conscripts with 3 criteria, i.e. 1) planned to be in Lop Buri camps during the study period, 2) never diagnosed asHIVpositiveand3)regularlyusedamobilephone.The response rate at 1, 3 and 6-months follow ups for the 1-way SMS, 2 way SMS and control groups were 85.9, 85.9 and 81.2 respectively.
6 Amry Forts(Lop Buri province)
3 Army Forts
Simple random sampling
Simple random sampling
1-way SMS (n=64)
2 way SMS (n=64)
Control (n=64)
-7 left from battalion
-2 missing text status
-8 left from battalion
-1 missing text status
-8 left from battalion
- 4 withdrawal
1month(n=55)
3months(n=55)
6months(n=55)
1month(n=55)
3months(n=55)
6months(n=55)
1month(n=52)
3months(n=52)
6months(n=52)
Figure 1: Multi-stage cluster random sampling selected subjects
PROCeduReS
A quasi-experimental study design conducted between November2013andJanuary2015.Writtenandinformedconsent was obtained from the potential participants prior to any succeeding procedures. The processes of interventionwereasfollows:first,weperformedagroup
discussion and semi-structured interviews in order to develop the SMS contents. Then, we trained the 1-way and 2-way SMS groups about sexual health and self-regulation. The period of training was totally 8 hours. Participants will be excluded if they attended less than 80%ofthetotalsession.Aftertraining,bothgroupshadpracticed to use SMS before they left the training. Then,
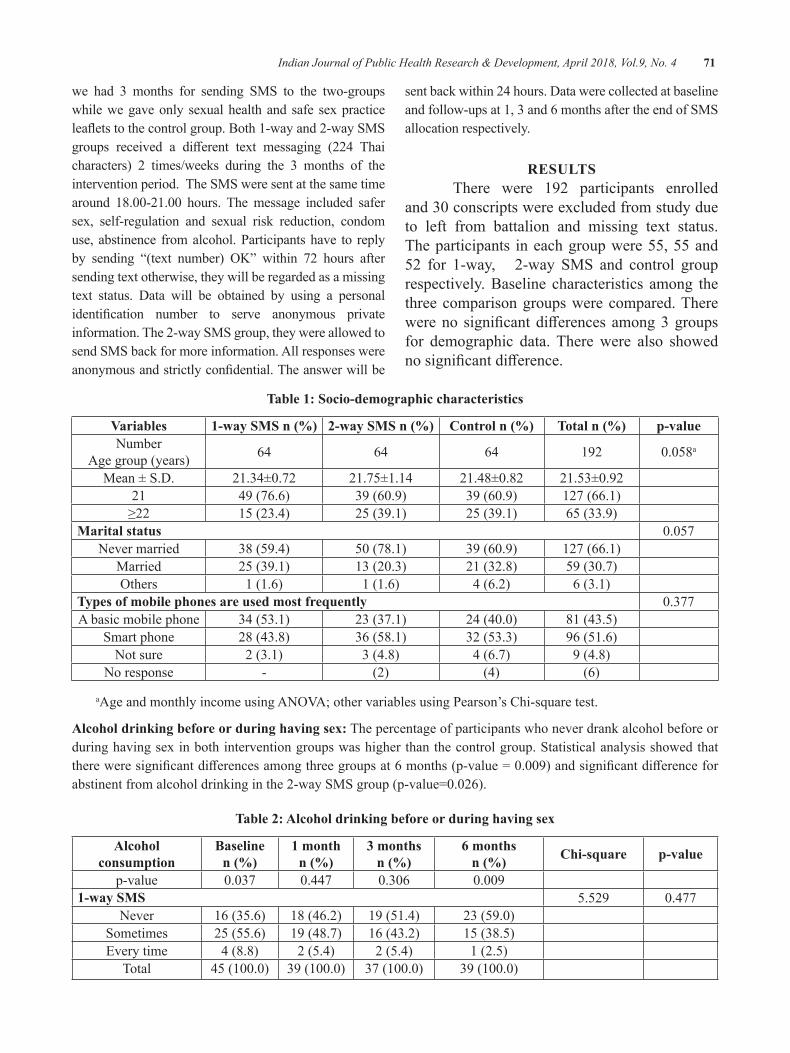
Indian Journal of Public Health Research & Development, April 2018, Vol.9, No. 4 71
we had 3 months for sending SMS to the two-groups while we gave only sexual health and safe sex practice leafletstothecontrolgroup.Both1-wayand2-waySMSgroups received a different text messaging (224 Thaicharacters) 2 times/weeks during the 3 months of the intervention period. The SMS were sent at the same time around 18.00-21.00 hours. Themessage included safersex, self-regulation and sexual risk reduction, condom use, abstinence from alcohol. Participants have to reply by sending “(text number) OK” within 72 hours aftersending text otherwise, they will be regarded as a missing text status. Data will be obtained by using a personal identification number to serve anonymous privateinformation. The 2-way SMS group, they were allowed to send SMS back for more information. All responses were anonymousandstrictlyconfidential.Theanswerwillbe
sent back within 24 hours. Data were collected at baseline and follow-ups at 1, 3 and 6 months after the end of SMS allocation respectively.
ReSulTSThere were 192 participants enrolled
and30conscriptswereexcludedfromstudydueto left from battalion and missing text status. The participants in each group were 55, 55 and 52 for 1-way, 2-way SMS and control group respectively. Baseline characteristics among the three comparison groups were compared. There wereno significantdifferencesamong3groupsfor demographic data. There were also showed nosignificantdifference.
Table 1: Socio-demographic characteristics
Variables 1-way SMS n (%) 2-way SMS n (%) Control n (%) Total n (%) p-valueNumber
Age group (years) 64 64 64 192 0.058a
Mean ± S.D. 21.34±0.72 21.75±1.14 21.48±0.82 21.53±0.9221 49 (76.6) 39(60.9) 39(60.9) 127 (66.1)≥22 15 (23.4) 25 (39.1) 25 (39.1) 65 (33.9)
Marital status 0.057Never married 38 (59.4) 50(78.1) 39(60.9) 127 (66.1)
Married 25 (39.1) 13(20.3) 21 (32.8) 59(30.7)Others 1 (1.6) 1 (1.6) 4 (6.2) 6 (3.1)
Types of mobile phones are used most frequently 0.377A basic mobile phone 34 (53.1) 23 (37.1) 24(40.0) 81 (43.5)
Smart phone 28 (43.8) 36 (58.1) 32 (53.3) 96 (51.6)Not sure 2 (3.1) 3 (4.8) 4 (6.7) 9 (4.8)
No response - (2) (4) (6)
aAgeandmonthlyincomeusingANOVA;othervariablesusingPearson’sChi-squaretest.
Alcohol drinking before or during having sex: The percentage of participants who never drank alcohol before or during having sex in both intervention groups was higher than the control group. Statistical analysis showed that thereweresignificantdifferencesamongthreegroupsat6months(p-value=0.009)andsignificantdifferenceforabstinentfromalcoholdrinkinginthe2-waySMSgroup(p-value=0.026).
Table 2: Alcohol drinking before or during having sex
Alcohol consumption
baseline n (%)
1 month n (%)
3 months n (%)
6 months n (%) Chi-square p-value
p-value 0.037 0.447 0.306 0.0091-way SMS 5.529 0.477
Never 16 (35.6) 18 (46.2) 19 (51.4) 23(59.0)Sometimes 25 (55.6) 19 (48.7) 16 (43.2) 15 (38.5)Every time 4 (8.8) 2 (5.4) 2 (5.4) 1 (2.5)
Total 45(100.0) 39(100.0) 37(100.0) 39(100.0)
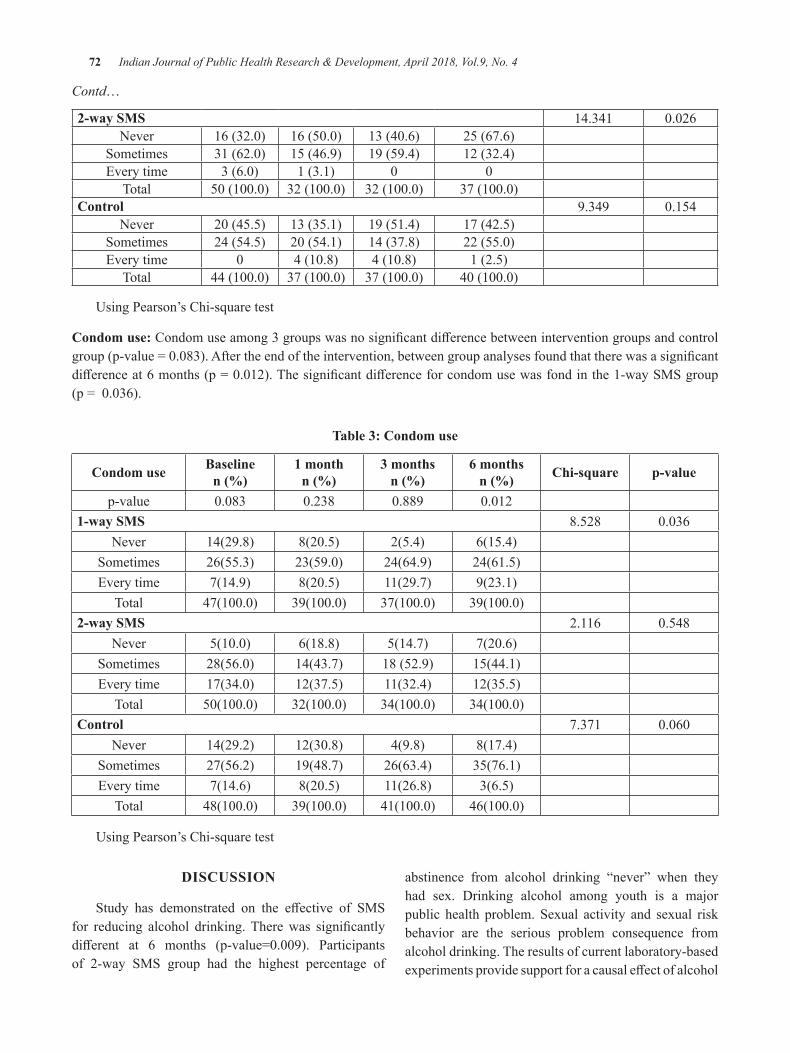
72 Indian Journal of Public Health Research & Development, April 2018, Vol.9, No. 4
Contd…
2-way SMS 14.341 0.026Never 16(32.0) 16(50.0) 13(40.6) 25 (67.6)
Sometimes 31(62.0) 15 (46.9) 19 (59.4) 12 (32.4)Every time 3(6.0) 1 (3.1) 0 0
Total 50(100.0) 32(100.0) 32(100.0) 37(100.0)Control 9.349 0.154
Never 20(45.5) 13 (35.1) 19 (51.4) 17 (42.5)Sometimes 24 (54.5) 20(54.1) 14 (37.8) 22(55.0)Every time 0 4(10.8) 4(10.8) 1 (2.5)
Total 44(100.0) 37(100.0) 37(100.0) 40(100.0)
Using Pearson’s Chi-square test
Condom use:Condomuseamong3groupswasnosignificantdifferencebetweeninterventiongroupsandcontrolgroup(p-value=0.083).Aftertheendoftheintervention,betweengroupanalysesfoundthattherewasasignificantdifferenceat6months(p=0.012).Thesignificantdifferenceforcondomusewasfondinthe1-waySMSgroup (p=0.036).
Table 3: Condom use
Condom use baselinen (%)
1 monthn (%)
3 monthsn (%)
6 monthsn (%) Chi-square p-value
p-value 0.083 0.238 0.889 0.0121-way SMS 8.528 0.036
Never 14(29.8) 8(20.5) 2(5.4) 6(15.4)Sometimes 26(55.3) 23(59.0) 24(64.9) 24(61.5)Every time 7(14.9) 8(20.5) 11(29.7) 9(23.1)
Total 47(100.0) 39(100.0) 37(100.0) 39(100.0)2-way SMS 2.116 0.548
Never 5(10.0) 6(18.8) 5(14.7) 7(20.6)Sometimes 28(56.0) 14(43.7) 18 (52.9) 15(44.1)Every time 17(34.0) 12(37.5) 11(32.4) 12(35.5)
Total 50(100.0) 32(100.0) 34(100.0) 34(100.0)Control 7.371 0.060
Never 14(29.2) 12(30.8) 4(9.8) 8(17.4)Sometimes 27(56.2) 19(48.7) 26(63.4) 35(76.1)Every time 7(14.6) 8(20.5) 11(26.8) 3(6.5)
Total 48(100.0) 39(100.0) 41(100.0) 46(100.0)
Using Pearson’s Chi-square test
dISCuSSION
Study has demonstrated on the effective of SMSfor reducing alcohol drinking.Therewas significantlydifferent at 6 months (p-value=0.009). Participantsof 2-way SMS group had the highest percentage of
abstinence from alcohol drinking “never” when theyhad sex. Drinking alcohol among youth is a major public health problem. Sexual activity and sexual risk behavior are the serious problem consequence from alcohol drinking. The results of current laboratory-based experimentsprovidesupportforacausaleffectofalcohol
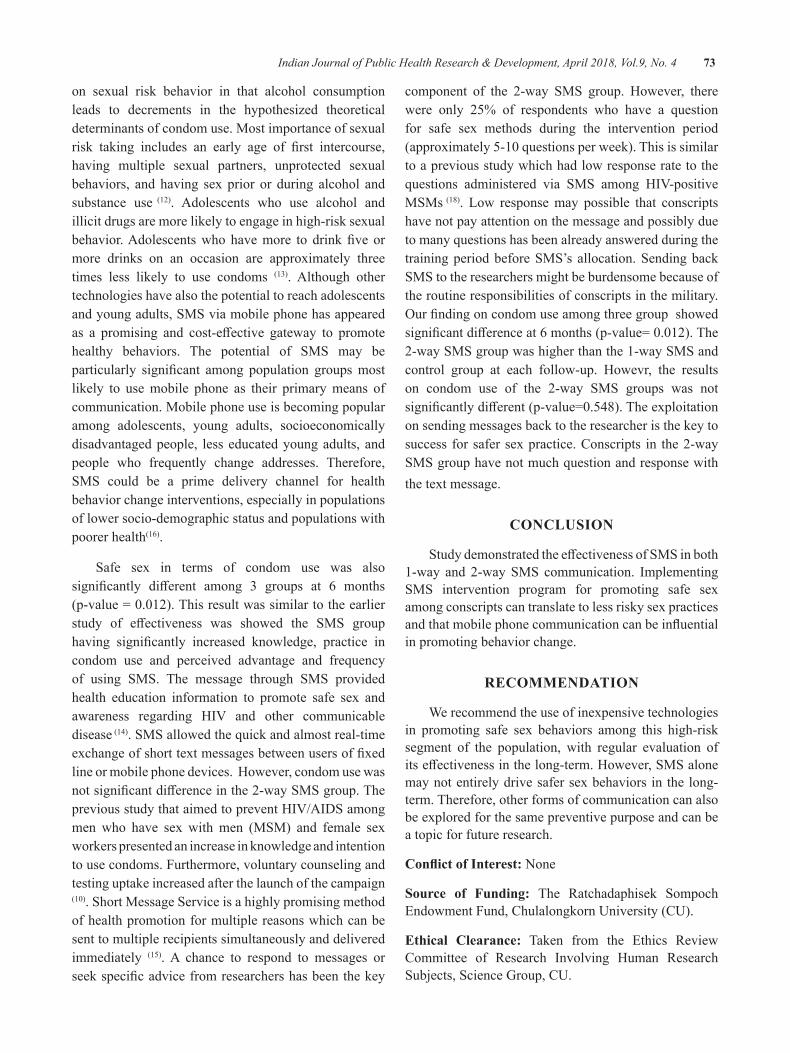
Indian Journal of Public Health Research & Development, April 2018, Vol.9, No. 4 73
on sexual risk behavior in that alcohol consumption leads to decrements in the hypothesized theoretical determinants of condom use. Most importance of sexual risk taking includes an early age of first intercourse,having multiple sexual partners, unprotected sexual behaviors, and having sex prior or during alcohol and substance use (12). Adolescents who use alcohol and illicit drugs are more likely to engage in high-risk sexual behavior.Adolescentswhohavemore to drinkfiveormore drinks on an occasion are approximately three times less likely to use condoms (13). Although other technologies have also the potential to reach adolescents and young adults, SMS via mobile phone has appeared as a promising and cost-effective gateway to promotehealthy behaviors. The potential of SMS may be particularly significant among population groupsmostlikely to use mobile phone as their primary means of communication. Mobile phone use is becoming popular among adolescents, young adults, socioeconomically disadvantaged people, less educated young adults, and people who frequently change addresses. Therefore, SMS could be a prime delivery channel for health behavior change interventions, especially in populations of lower socio-demographic status and populations with poorer health(16).
Safe sex in terms of condom use was also significantly different among 3 groups at 6 months(p-value=0.012).Thisresultwassimilartotheearlierstudy of effectiveness was showed the SMS grouphaving significantly increased knowledge, practice incondom use and perceived advantage and frequency of using SMS. The message through SMS provided health education information to promote safe sex and awareness regarding HIV and other communicabledisease (14). SMS allowed the quick and almost real-time exchangeofshorttextmessagesbetweenusersoffixedline or mobile phone devices. However, condom use was notsignificantdifferenceinthe2-waySMSgroup.ThepreviousstudythataimedtopreventHIV/AIDSamongmen who have sex with men (MSM) and female sex workers presented an increase in knowledge and intention to use condoms. Furthermore, voluntary counseling and testing uptake increased after the launch of the campaign
(10). Short Message Service is a highly promising method of health promotion for multiple reasons which can be sent to multiple recipients simultaneously and delivered immediately (15). A chance to respond to messages or seekspecificadvicefromresearchershasbeenthekey
component of the 2-way SMS group. However, there were only 25% of respondents who have a question for safe sex methods during the intervention period (approximately5-10questionsperweek).Thisissimilarto a previous study which had low response rate to the questions administered via SMS among HIV-positiveMSMs (18). Low response may possible that conscripts have not pay attention on the message and possibly due to many questions has been already answered during the training period before SMS’s allocation. Sending back SMS to the researchers might be burdensome because of the routine responsibilities of conscripts in the military. Ourfindingoncondomuseamongthreegroupshowedsignificantdifferenceat6months(p-value=0.012).The2-way SMS group was higher than the 1-way SMS and control group at each follow-up. Howevr, the results on condom use of the 2-way SMS groups was not significantlydifferent(p-value=0.548).Theexploitationon sending messages back to the researcher is the key to success for safer sex practice. Conscripts in the 2-way SMS group have not much question and response with the text message.
CONCluSION
StudydemonstratedtheeffectivenessofSMSinboth1-way and 2-way SMS communication. Implementing SMS intervention program for promoting safe sex among conscripts can translate to less risky sex practices andthatmobilephonecommunicationcanbeinfluentialin promoting behavior change.
ReCOMMeNdATION
We recommend the use of inexpensive technologies in promoting safe sex behaviors among this high-risk segment of the population, with regular evaluation of itseffectivenessinthelong-term.However,SMSalonemay not entirely drive safer sex behaviors in the long-term. Therefore, other forms of communication can also be explored for the same preventive purpose and can be a topic for future research.
Conflict of Interest: None
Source of Funding: The Ratchadaphisek Sompoch Endowment Fund, Chulalongkorn University (CU).
ethical Clearance: Taken from the Ethics Review Committee of Research Involving Human Research Subjects, Science Group, CU.
74 Indian Journal of Public Health Research & Development, April 2018, Vol.9, No. 4
ReFeReNCeS
1.BaO,O’ReganC,NachegaJ,CooperC,AnemaA,RachlisB,etal.HIV/AIDSinAfricanmilitaries:an ecological analysis. Medicine, conflict, andsurvival.2008;24(2):88-100.
2. Yeager R, Hendrix CW, Kingma S. International militaryhumanimmunodeficiencyvirus/acquiredimmunodeficiency syndrome policies andprograms: strengths and limitations in current practice.Militarymedicine.2000;165(2):87-92.
3.UNAIDS.HIV/AIDSpreventionandcontrol:anexperience of the Royal Thai Army in Thailand (EngaginguniformedservicesinthefightagainstHIV/AIDS.casestudy3)2004.
4. Sapprasert K. et al. Thailand behavioral Surveillance System in male conscripts 2010[cited20135April].Availablefrom:http://www.boe.moph.go.th/reportphp?cat=82.
5. Armed Forces Research Institute of Medical Sciences.HIVprevalenceanddemographicdataofmale conscriptswho inducted inMay, 2012.2013.
6. Zimmerman B. Attaining self-regulation: A social cognitive perspective.
In: M. Boekaerts, P. Pintrich, Zeidner M, editors. Handbook of self-regulation. Burlington, MA: ElseveirAcademicPress;2000.
7. Quinn PD, Fromme K. Self-regulation as a protective factor against risky drinking and sexual behavior. PsycholAddictBehav.2010;24(3):376-85.
8. Bureau of Epidemiology. Number, prevalence and deathrateofHIV/AIDS.Bangkok:2012.
9.KahnJG,YangJS,KahnJS.‘Mobile’healthneedsand opportunities in developing countries. Health Aff(Millwood).2010;29(2):252-8.
10.DegliseC,SuggsLS,OdermattP.Shortmessageservice (SMS) applications for disease prevention
in developing countries. Journal of medicalInternetresearch.2012;14(1):e3.
11. Faul F, Erdfelder E, Lang A-G, Buchner A. G*3Power3: A flexible Statistical poweanalysis program for the social, behavioral, and biomedical sciences. Behavior research methods. 2007;39:175-91.
12. Center for Disease Control and Prevention. Adolescent and school health 2012 [cited 2012March 30].Available from:http://www.cdc.gov/healthyyouth/adolescenthealth/protective.htm.
13. Hingson RW, Strunin L, Berlin BM, Heeren T. Beliefs about AIDS, use of alcohol and drugs, and unprotected sex among Massachusetts adolescents. AmJPublicHealth.1990;80(3):295-9.
14. Kaoaiem H, Taneepanichskul S, Somrongthong R, SaengdidthaB,LertmaharitS.Theeffectofsquadleader mentors through short message services for mobile phones in promoting safe sex among first (central) army area conscripts of Thailand.JournaloftheMedicalAssociationofThailand=Chotmaihetthangphaet.2012;95(2):249-56.
15.GoldJ,LimMS,HellardME,HockingJS,KeoghL. What’s in a message? Delivering sexual health promotion to young people in Australia via text messaging.BMCpublichealth.2010;10:792.
16. Fjeldsoe BS, Marshall AL, Miller YD. Behavior change interventions delivered by mobile telephone short-message service. American journal ofpreventivemedicine.2009;36(2):165-73.
17.Tan JY, Huedo-Medina TB, Warren MR,CareyMP, Johnson BT.A meta-analysis of theefficacy of HIV/AIDS prevention interventionsinAsia, 1995-2009. Social science&medicine.2012;75(4):676-87.
18.Furberg RD, Uhrig JD, Bann CM, LewisMA, Harris JL, Williams P, et al. TechnicalImplementation of a Multi-Component, Text Message-Based Intervention for Persons Living withHIV.JMIRresearchprotocols.2012;1(2):e17.
Work life balance among IT Industry-An empirical Study
R. Amutha
Associate Professor & Head, Department of Commerce, Justice Basheer Ahamed Sayeed College for Women (Autonomous), Chennai
AbSTRACT
Changesinthesocial,politicalandeconomicfabricofsocietyhaveinfluencedandcontinuetoinfluenceboth the nature of employment and its relationship outside of work. Changing employment pattern changes thedemographicstructureoftheworkforce,whichhasresultedinadifferentrealityinthe21stcentury.Instead of trying to manage the copious amounts of leisure time, many workers are instead trying to juggle numerousresponsibilitieswhichareincreasedandintensifieddemandsofwork.Thetraditionalassumptionthat employees should be willing and able to make work is the top priority in life, which is no longer tenable. Under this context, the notion of ‘work-life balance’ has come to the fore in policy debates. This studyisusedtofindtheWork-lifebalanceamongITmanagersemployedintopITCompanies,Chennai.TheCurrent study was used to derive with the help of CHI-SQUARE, Weighted Average etc.
Keywords: Workforce, employment, employee willingness
INTROduCTION
Work-life balance emerged as a term to replace family-friendly and work-family in order to reflect abroader and more inclusive way of conceptualizing the various issues. Though Work life balance is not a new concept, but the changes in lifestyles, drastic stress levels, negativelyaffectingintheworklife,etc.,hasmademanyorganizations rethink on the strategies to sustain with the work life balance. Proper balancing of work life generally creates a high satisfied workforce that contributes toproductivity and profit for the organization. (SwathiPriyadarhini&ManjuBhagat,2014)[1].
ObJeCTIVeS OF The STudy
z To explore and evaluate the nature of work-life balance culture.
z Tofindout thebarriers for employees to achieveWork life balance.
z To make suggestions for improvements of work life balance among IT employees in Chennai.
ReVIeW OF lITeRATuRe
Ramya.R(2014)[2], articulated that WLB is a broad concept indicated with a suitable prioritize between Work (ambition and career) & Lifestyle (Pleasure,health, spiritual etc.). Nowadays, most of the women do not want to stay at home, inspite they want to make a career in their areas of interest, rightly balancing between personal and professional career. The best ways to balance the daily routine a) Build down daily Schedule b) Rethink your errands etc. Woods. D (2011)[3] has focused on the issues related to the work life balance and leadership. Managers in the US, UK and Germany believe that employee health and well being practices are important as a policy issue, but disagree when asked about their personal opinions of the practices. Dan Forth S.(2011)[4] has opined that Leaders recognize stress and generally focus on the issues of work strain. Most of the leaders today, know that employee stress declines the productivity and performance. Only individuallevel practices used to be utilized to reduce employee strain, but now it is seen as a more macro-level issue. Leaders need to learn how to recognize the strain in their employees and then help their subordinates deal with theirstrain.JenniferandSusan(2010)[5], has found that
Corresponding Author:Dr. R. Amutha,Associate Professor and Head, Department of Commerce,Justice Basheer Ahamed Sayeed College for Women(Autonomous), Chennai-18.E-mail:[email protected]
DOI Number: 10.5958/0976-5506.2018.00259.0
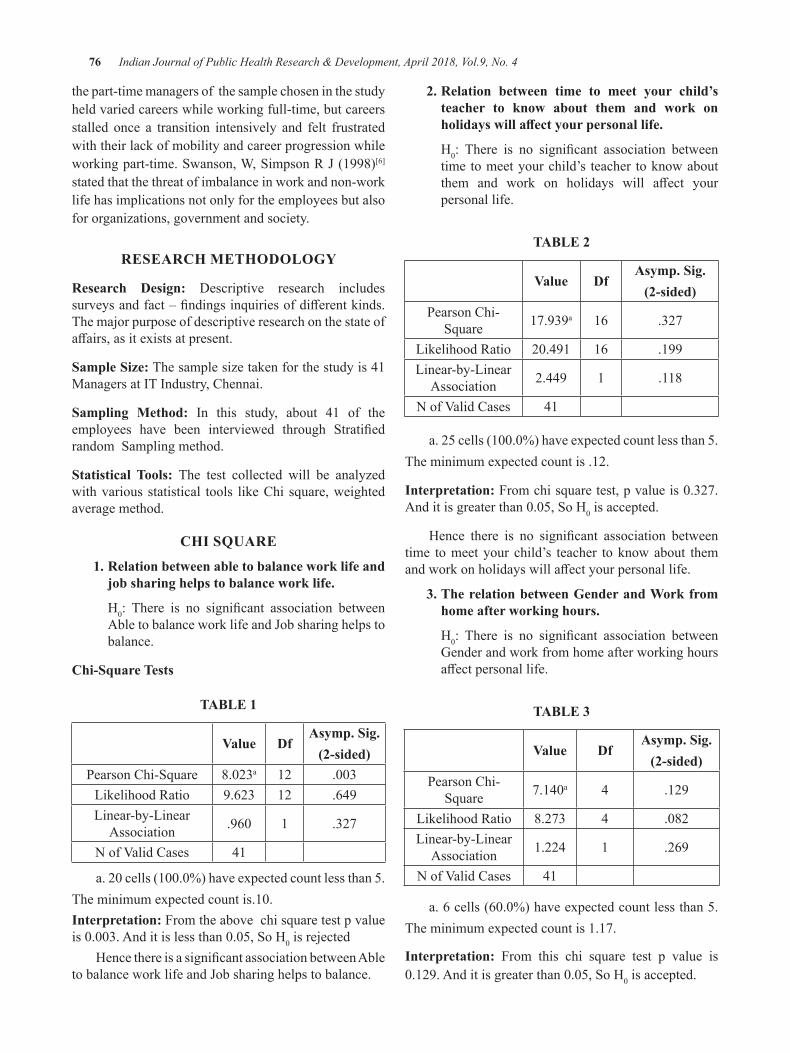
76 Indian Journal of Public Health Research & Development, April 2018, Vol.9, No. 4
the part-time managers of the sample chosen in the study held varied careers while working full-time, but careers stalled once a transition intensively and felt frustrated with their lack of mobility and career progression while workingpart-time.Swanson,W,SimpsonRJ(1998)[6] stated that the threat of imbalance in work and non-work life has implications not only for the employees but also for organizations, government and society.
ReSeARCh MeThOdOlOgy
Research design: Descriptive research includes surveysandfact–findingsinquiriesofdifferentkinds.The major purpose of descriptive research on the state of affairs,asitexistsatpresent.
Sample Size: The sample size taken for the study is 41 Managers at IT Industry, Chennai.
Sampling Method: In this study, about 41 of the employees have been interviewed through Stratifiedrandom Sampling method.
Statistical Tools: The test collected will be analyzed with various statistical tools like Chi square, weighted average method.
ChI SQuARe
1. Relation between able to balance work life and job sharing helps to balance work life.
H0: There is no significant association betweenAbletobalanceworklifeandJobsharinghelpstobalance.
Chi-Square Tests
TAble 1
Value dfAsymp. Sig.
(2-sided)Pearson Chi-Square 8.023a 12 .003
Likelihood Ratio 9.623 12 .649Linear-by-Linear
Association .960 1 .327
NofValidCases 41
a.20cells(100.0%)haveexpectedcountlessthan5.Theminimumexpectedcountis.10.Interpretation: From the above chi square test p value is0.003.Anditislessthan0.05,SoH0 is rejected
HencethereisasignificantassociationbetweenAbletobalanceworklifeandJobsharinghelpstobalance.
2. Relation between time to meet your child’s teacher to know about them and work on holidays will affect your personal life.
H0: There is no significant association betweentime to meet your child’s teacher to know about them and work on holidays will affect yourpersonal life.
TAble 2
Value dfAsymp. Sig.
(2-sided)Pearson Chi-
Square 17.939a 16 .327
Likelihood Ratio 20.491 16 .199Linear-by-Linear
Association 2.449 1 .118
NofValidCases 41
a.25cells(100.0%)haveexpectedcountlessthan5.The minimum expected count is .12.
Interpretation:Fromchisquaretest,pvalueis0.327.Anditisgreaterthan0.05,SoH0 is accepted.
Hence there is no significant association betweentime to meet your child’s teacher to know about them andworkonholidayswillaffectyourpersonallife.
3. The relation between gender and Work from home after working hours.
H0: There is no significant association betweenGender and work from home after working hours affectpersonallife.
TAble 3
Value dfAsymp. Sig.
(2-sided)Pearson Chi-
Square 7.140a 4 .129
Likelihood Ratio 8.273 4 .082Linear-by-Linear
Association 1.224 1 .269
NofValidCases 41
a.6cells(60.0%)haveexpectedcountlessthan5.The minimum expected count is 1.17.
Interpretation: From this chi square test p value is 0.129.Anditisgreaterthan0.05,SoH0 is accepted.
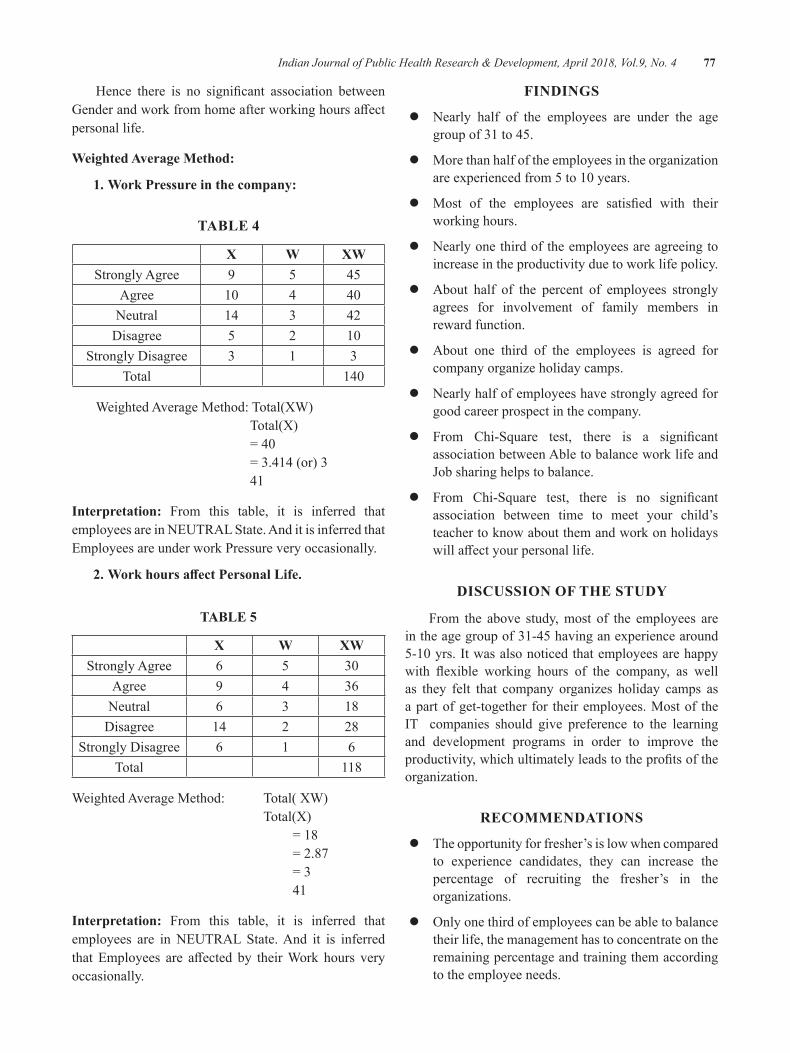
Indian Journal of Public Health Research & Development, April 2018, Vol.9, No. 4 77
Hence there is no significant association betweenGenderandworkfromhomeafterworkinghoursaffectpersonal life.
Weighted Average Method:
1. Work Pressure in the company:
TAble 4
X W XWStrongly Agree 9 5 45
Agree 10 4 40Neutral 14 3 42
Disagree 5 2 10Strongly Disagree 3 1 3
Total 140
Weighted Average Method: Total(XW) Total(X) =40 =3.414(or)3 41
Interpretation: From this table, it is inferred that employees are in NEUTRAL State. And it is inferred that Employees are under work Pressure very occasionally.
2. Work hours affect Personal Life.
TAble 5
X W XWStrongly Agree 6 5 30
Agree 9 4 36Neutral 6 3 18
Disagree 14 2 28Strongly Disagree 6 1 6
Total 118
Weighted Average Method: Total( XW) Total(X) =18 =2.87 =3 41
Interpretation: From this table, it is inferred that employees are in NEUTRAL State. And it is inferred that Employees are affected by theirWork hours veryoccasionally.
FINdINgS
z Nearly half of the employees are under the age group of 31 to 45.
z More than half of the employees in the organization areexperiencedfrom5to10years.
z Most of the employees are satisfied with theirworking hours.
z Nearly one third of the employees are agreeing to increase in the productivity due to work life policy.
z About half of the percent of employees strongly agrees for involvement of family members in reward function.
z About one third of the employees is agreed for company organize holiday camps.
z Nearly half of employees have strongly agreed for good career prospect in the company.
z From Chi-Square test, there is a significantassociation between Able to balance work life and Jobsharinghelpstobalance.
z From Chi-Square test, there is no significantassociation between time to meet your child’s teacher to know about them and work on holidays willaffectyourpersonallife.
dISCuSSION OF The STudy
From the above study, most of the employees are in the age group of 31-45 having an experience around 5-10yrs.Itwasalsonoticedthatemployeesarehappywith flexible working hours of the company, as wellas they felt that company organizes holiday camps as a part of get-together for their employees. Most of the IT companies should give preference to the learning and development programs in order to improve the productivity,whichultimatelyleadstotheprofitsoftheorganization.
ReCOMMeNdATIONS
z The opportunity for fresher’s is low when compared to experience candidates, they can increase the percentage of recruiting the fresher’s in the organizations.
z Onlyonethirdofemployeescanbeabletobalancetheir life, the management has to concentrate on the remaining percentage and training them according to the employee needs.
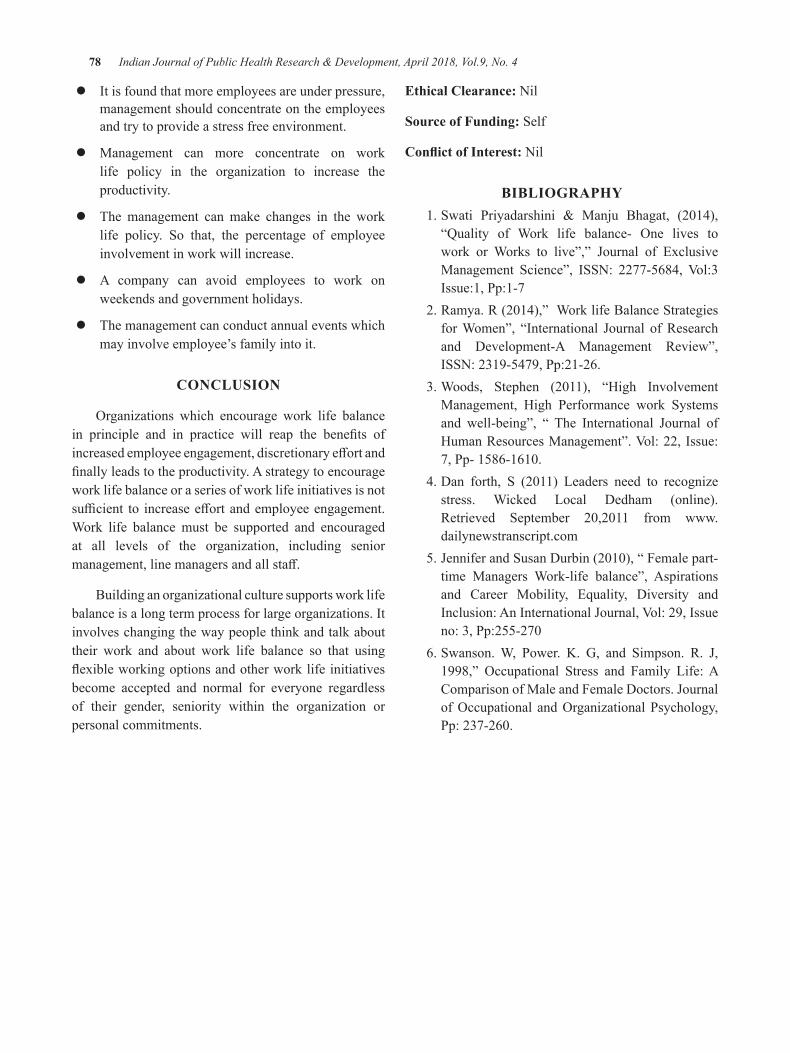
78 Indian Journal of Public Health Research & Development, April 2018, Vol.9, No. 4
z It is found that more employees are under pressure, management should concentrate on the employees and try to provide a stress free environment.
z Management can more concentrate on work life policy in the organization to increase the productivity.
z The management can make changes in the work life policy. So that, the percentage of employee involvement in work will increase.
z A company can avoid employees to work on weekends and government holidays.
z The management can conduct annual events which may involve employee’s family into it.
CONCluSION
Organizations which encourage work life balancein principle and in practice will reap the benefits ofincreasedemployeeengagement,discretionaryeffortandfinallyleadstotheproductivity.Astrategytoencouragework life balance or a series of work life initiatives is not sufficient to increaseeffortandemployeeengagement.Work life balance must be supported and encouraged at all levels of the organization, including senior management,linemanagersandallstaff.
Building an organizational culture supports work life balance is a long term process for large organizations. It involves changing the way people think and talk about their work and about work life balance so that using flexibleworkingoptionsandotherworklifeinitiativesbecome accepted and normal for everyone regardless of their gender, seniority within the organization or personal commitments.
ethical Clearance: Nil
Source of Funding: Self
Conflict of Interest: Nil
bIblIOgRAPhy 1.Swati Priyadarshini & Manju Bhagat, (2014),
“Quality of Work life balance- One lives towork or Works to live”,” Journal of ExclusiveManagement Science”, ISSN: 2277-5684,Vol:3Issue:1, Pp:1-7
2.Ramya.R(2014),”WorklifeBalanceStrategiesforWomen”, “International Journal ofResearchand Development-A Management Review”,ISSN: 2319-5479, Pp:21-26.
3.Woods, Stephen (2011), “High InvolvementManagement, High Performance work Systems and well-being”, “ The International Journal ofHumanResourcesManagement”.Vol:22,Issue:7,Pp-1586-1610.
4.Dan forth, S (2011) Leaders need to recognizestress. Wicked Local Dedham (online). Retrieved September 20,2011 from www.dailynewstranscript.com
5.JenniferandSusanDurbin(2010),“Femalepart-time Managers Work-life balance”, Aspirationsand Career Mobility, Equality, Diversity and Inclusion:AnInternationalJournal,Vol:29,Issueno:3,Pp:255-270
6.Swanson.W, Power. K. G, and Simpson. R. J,1998,” Occupational Stress and Family Life:AComparisonofMaleandFemaleDoctors.JournalofOccupational andOrganizationalPsychology,Pp:237-260.
Effectiveness of Gooseberry Juice with Honey and Guava Juice with honey Compared with Control on Physiological Parameters
among Adolescent girls Studying in Selected Schools
R. Reeta1, R. Vijayaraghavan2, Rajeswari Vaidyanathan3
1PhD Scholar, 2Director Research, Saveetha University, Thandalam, Chennai, Tamil Nadu, India; 3Professor & Retd., Principal Sri Ramachandra University, Chennai, Tamil Nadu, India.
AbSTRACT
Nutritional and the health needs of the adolescents are also more because of the growth spurt and the increase in physical activity in them. Inadequate nutrition during adolescent period can have serious consequences throughout the reproductive years of life.
Aim: Theaimofthisstudyistoeffectivenessofgooseberryjuicewithhoneyandguavajuicewithhoneycompared with control group on physiological parameters among adolescent girls studying in selected government schools at Dharmapuri, Tamilnadu.
Methods:Pretestandposttestdesignwasusedforthisstudy.255irondeficiencyanaemicadolescentgirlswere selected from schools at Dharmapuri district Tamilnadu. The samples were divided in to 3 groups bypurposivesamplingtechnique.ExperimentalgroupI(n=85)werereceived25mlofgooseberryjuicewithhoney,experimentalgroupII(n=85)werereceivedguavajuicewithhoneyandcontrolgroup(n=85)werenotreceivedanyintervention.Hb,RBCandPCVlevelsofthesampleswasmeasuredaspretest,intermittent(21 days) and post test(45 days).
Results:TherewasasignificantdifferencesbetweencontrolandexperimentalgroupIandII.MoreoverexperimentalgroupI(gooseberryjuicewithhoney)ismoreeffectiveinimprovingHb,RBCandPCV.
Conclusion: Gooseberryjuiceismoreeffectivethantheguavajuicewhichhelpsinironabsorptionandreducing the anaemia.
Keywords: Anaemia, Adolescent girls, Effectiveness, Honey mixed Gooseberry juice, Honey mixed Guava juice, Haemoglobin, Red blood corpuscles and packed cell volume.
Corresponding Author:R. REETA5B, Subramaniya swami koil street,Kumaraswami pettai, DharmapuriTamil naduMobile No. 9444356784Email:[email protected]
INTROduCTION
When a child develops to adolescence various changes occur. Some of the changes are visible and some are invisible. Adolescence is defined as atransitional period between childhood and adulthood marked by profound physical, physiological sexual and
psychological changes. In that, physical development which include rapid increase in height, weight, muscle size, head and face size, and is called as adolescence growth spurt(1).
The most widespread micronutrient deficiencyis iron deficiency anaemia. It affects all the groupsirrespective of gender, caste, creed, and religion. There are inter – state differences in prevalence of anaemiathat are perhaps attributable partly to difference indietary intake and to access to health care(2). In India iron deficiency anaemia is an iceberg disease especially inthe reproductive age groups. Developing countries like Indiaholds226million(20.5%)adolescentpopulation,whereas 16.4 million (15%) are school going adolescent
DOI Number: 10.5958/0976-5506.2018.00260.7
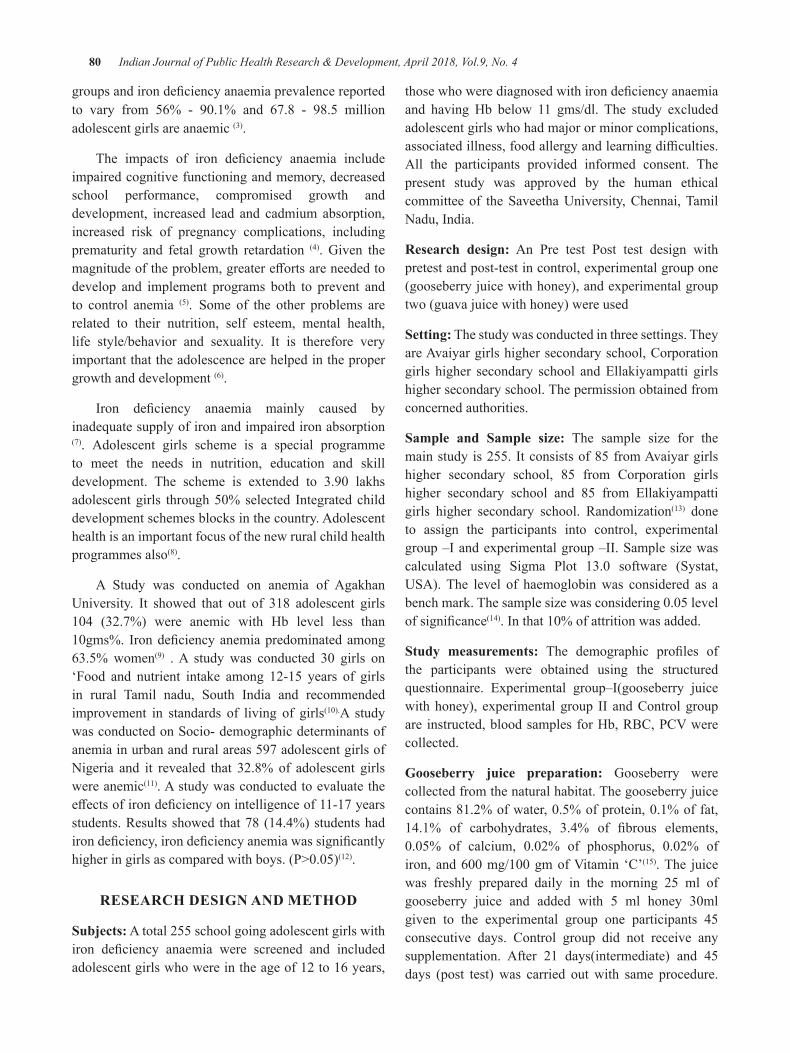
80 Indian Journal of Public Health Research & Development, April 2018, Vol.9, No. 4
groupsandirondeficiencyanaemiaprevalencereportedto vary from 56% - 90.1% and 67.8 - 98.5 millionadolescent girls are anaemic (3).
The impacts of iron deficiency anaemia includeimpaired cognitive functioning and memory, decreased school performance, compromised growth and development, increased lead and cadmium absorption, increased risk of pregnancy complications, including prematurity and fetal growth retardation (4). Given the magnitudeoftheproblem,greatereffortsareneededtodevelop and implement programs both to prevent and to control anemia (5). Some of the other problems are related to their nutrition, self esteem, mental health, life style/behavior and sexuality. It is therefore very important that the adolescence are helped in the proper growth and development (6).
Iron deficiency anaemia mainly caused byinadequate supply of iron and impaired iron absorption (7). Adolescent girls scheme is a special programme to meet the needs in nutrition, education and skill development. The scheme is extended to 3.90 lakhsadolescentgirls through50%selected Integratedchilddevelopment schemes blocks in the country. Adolescent health is an important focus of the new rural child health programmes also(8).
A Study was conducted on anemia of Agakhan University. It showed that out of 318 adolescent girls 104 (32.7%) were anemic with Hb level less than10gms%. Irondeficiencyanemiapredominatedamong63.5% women(9) .A study was conducted 30 girls on‘Food and nutrient intake among 12-15 years of girls in rural Tamil nadu, South India and recommended improvement in standards of living of girls(10).A study was conducted on Socio- demographic determinants of anemia in urban and rural areas 597 adolescent girls of Nigeria and it revealed that 32.8% of adolescent girls were anemic(11). A study was conducted to evaluate the effectsofirondeficiencyonintelligenceof11-17yearsstudents. Results showed that 78 (14.4%) students had irondeficiency,irondeficiencyanemiawassignificantlyhigheringirlsascomparedwithboys.(P>0.05)(12).
ReSeARCh deSIgN ANd MeThOd
Subjects: A total 255 school going adolescent girls with iron deficiency anaemia were screened and includedadolescent girls who were in the age of 12 to 16 years,
thosewhowerediagnosedwithirondeficiencyanaemiaand having Hb below 11 gms/dl. The study excluded adolescent girls who had major or minor complications, associatedillness,foodallergyandlearningdifficulties.All the participants provided informed consent. The present study was approved by the human ethical committee of the Saveetha University, Chennai, Tamil Nadu, India.
Research design: An Pre test Post test design with pretest and post-test in control, experimental group one (gooseberry juice with honey), and experimental group two (guava juice with honey) were used
Setting: The study was conducted in three settings. They are Avaiyar girls higher secondary school, Corporation girls higher secondary school and Ellakiyampatti girls higher secondary school. The permission obtained from concerned authorities.
Sample and Sample size: The sample size for the main study is 255. It consists of 85 from Avaiyar girls higher secondary school, 85 from Corporation girls higher secondary school and 85 from Ellakiyampatti girls higher secondary school. Randomization(13) done to assign the participants into control, experimental group –I and experimental group –II. Sample size was calculated using Sigma Plot 13.0 software (Systat,USA). The level of haemoglobin was considered as a benchmark.Thesamplesizewasconsidering0.05levelofsignificance(14).Inthat10%ofattritionwasadded.
Study measurements: The demographic profiles ofthe participants were obtained using the structured questionnaire. Experimental group–I(gooseberry juice with honey), experimental group II and Control group are instructed,bloodsamplesforHb,RBC,PCVwerecollected.
gooseberry juice preparation: Gooseberry were collected from the natural habitat. The gooseberry juice contains81.2%ofwater,0.5%ofprotein,0.1%offat,14.1% of carbohydrates, 3.4% of fibrous elements,0.05% of calcium, 0.02% of phosphorus, 0.02% ofiron,and600mg/100gmofVitamin ‘C’(15). The juice was freshly prepared daily in the morning 25 ml of gooseberry juice and added with 5 ml honey 30mlgiven to the experimental group one participants 45 consecutive days. Control group did not receive any supplementation. After 21 days(intermediate) and 45 days (post test) was carried out with same procedure.
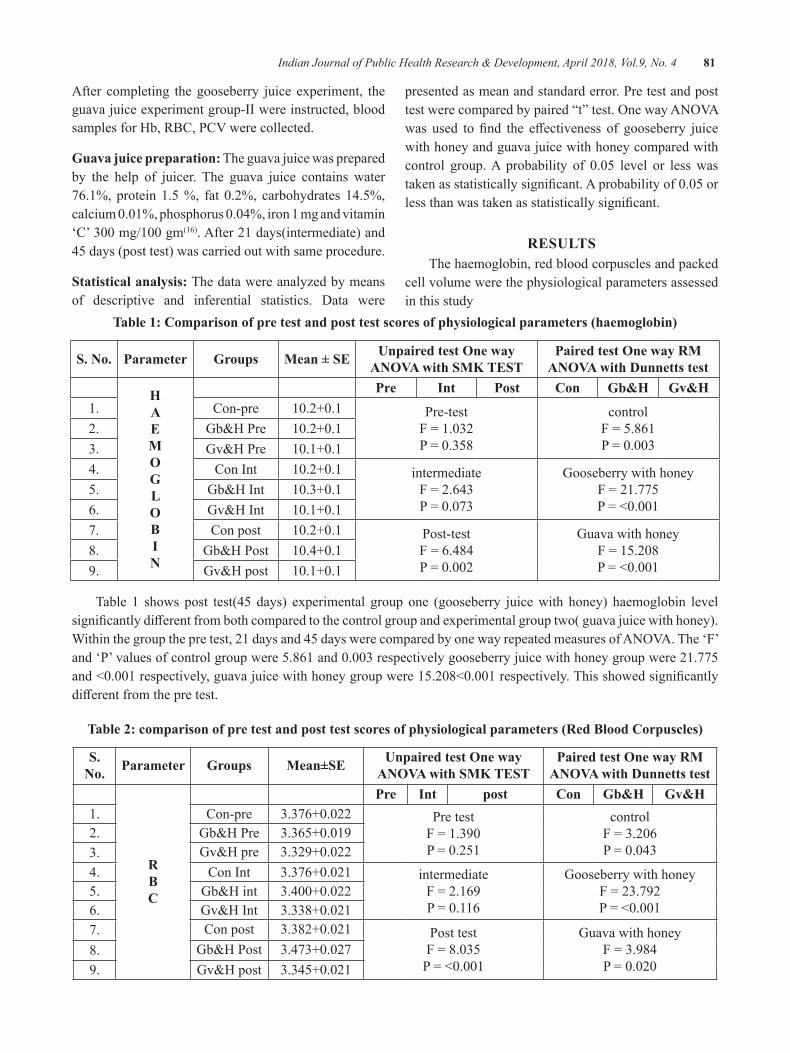
Indian Journal of Public Health Research & Development, April 2018, Vol.9, No. 4 81
After completing the gooseberry juice experiment, the guava juice experiment group-II were instructed, blood samplesforHb,RBC,PCVwerecollected.
guava juice preparation: The guava juice was prepared by the help of juicer. The guava juice contains water 76.1%,protein1.5%, fat 0.2%, carbohydrates14.5%,calcium0.01%,phosphorus0.04%,iron1mgandvitamin‘C’300mg/100gm(16). After 21 days(intermediate) and 45 days (post test) was carried out with same procedure.
Statistical analysis: The data were analyzed by means of descriptive and inferential statistics. Data were
presented as mean and standard error. Pre test and post testwerecomparedbypaired“t”test.OnewayANOVAwas used to find the effectiveness of gooseberry juicewith honey and guava juice with honey compared with control group.A probability of 0.05 level or lesswastakenasstatisticallysignificant.Aprobabilityof0.05orlessthanwastakenasstatisticallysignificant.
ReSulTSThe haemoglobin, red blood corpuscles and packed
cell volume were the physiological parameters assessed in this study
Table 1: Comparison of pre test and post test scores of physiological parameters (haemoglobin)
S. No. Parameter groups Mean ± Se unpaired test One way ANOVA with SMK TeST
Paired test One way RM ANOVA with dunnetts test
hAeMOglObIN
Pre Int Post Con gb&h gv&h1. Con-pre 10.2+0.1 Pre-test
F=1.032P=0.358
controlF=5.861P=0.003
2. Gb&HPre 10.2+0.13. Gv&HPre 10.1+0.14. Con Int 10.2+0.1 intermediate
F=2.643P=0.073
Gooseberry with honeyF=21.775P=<0.001
5. Gb&HInt 10.3+0.16. Gv&HInt 10.1+0.17. Con post 10.2+0.1 Post-test
F=6.484P=0.002
Guava with honeyF=15.208P=<0.001
8. Gb&HPost 10.4+0.19. Gv&Hpost 10.1+0.1
Table 1 shows post test(45 days) experimental group one (gooseberry juice with honey) haemoglobin level significantlydifferentfrombothcomparedtothecontrolgroupandexperimentalgrouptwo(guavajuicewithhoney).Withinthegroupthepretest,21daysand45dayswerecomparedbyonewayrepeatedmeasuresofANOVA.The‘F’and‘P’valuesofcontrolgroupwere5.861and0.003respectivelygooseberryjuicewithhoneygroupwere21.775and<0.001respectively,guavajuicewithhoneygroupwere15.208<0.001respectively.Thisshowedsignificantlydifferentfromthepretest.
Table 2: comparison of pre test and post test scores of physiological parameters (Red Blood Corpuscles)
S. No. Parameter groups Mean±Se unpaired test One way
ANOVA with SMK TeSTPaired test One way RM
ANOVA with dunnetts test
RbC
Pre Int post Con gb&h gv&h1. Con-pre 3.376+0.022 Pre test
F=1.390P=0.251
controlF=3.206P=0.043
2. Gb&HPre 3.365+0.0193. Gv&Hpre 3.329+0.0224. Con Int 3.376+0.021 intermediate
F=2.169P=0.116
Gooseberry with honeyF=23.792P=<0.001
5. Gb&Hint 3.400+0.0226. Gv&HInt 3.338+0.0217. Con post 3.382+0.021 Post test
F=8.035P=<0.001
Guava with honeyF=3.984P=0.020
8. Gb&HPost 3.473+0.0279. Gv&Hpost 3.345+0.021
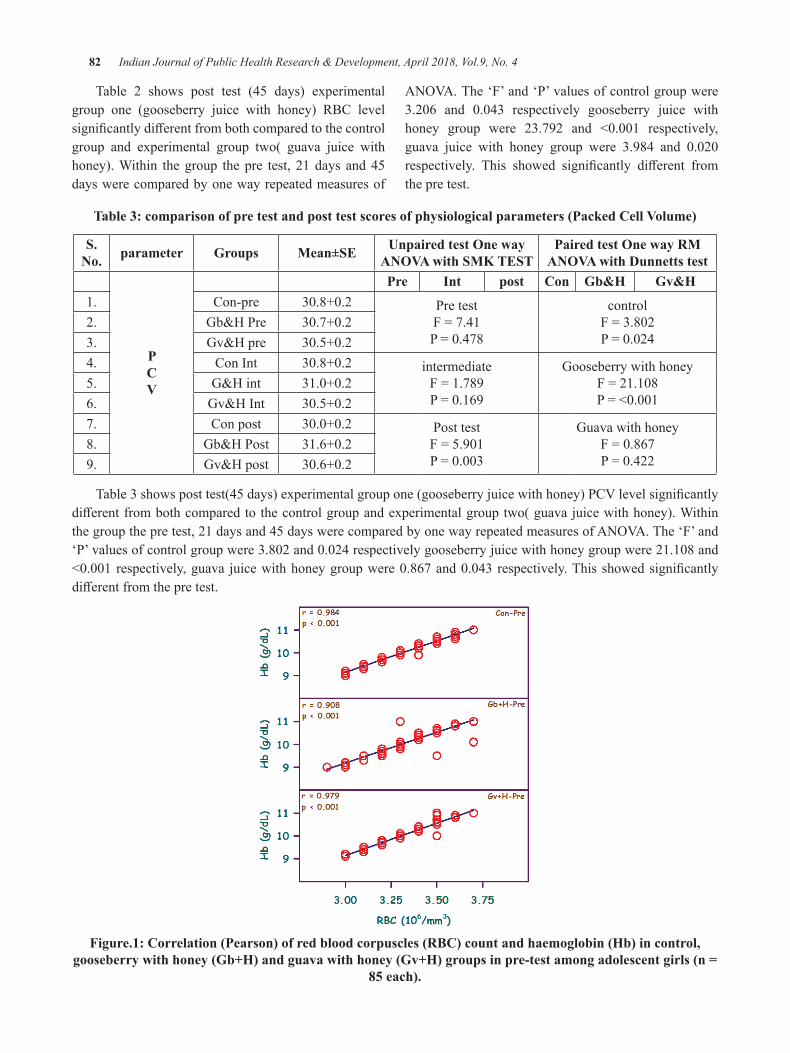
82 Indian Journal of Public Health Research & Development, April 2018, Vol.9, No. 4
Table 2 shows post test (45 days) experimental group one (gooseberry juice with honey) RBC level significantlydifferentfrombothcomparedtothecontrolgroup and experimental group two( guava juice with honey). Within the group the pre test, 21 days and 45 days were compared by one way repeated measures of
ANOVA.The‘F’and‘P’valuesofcontrolgroupwere3.206 and 0.043 respectively gooseberry juice withhoney group were 23.792 and <0.001 respectively,guava juice with honey group were 3.984 and 0.020respectively. This showed significantly different fromthe pre test.
Table 3: comparison of pre test and post test scores of physiological parameters (Packed Cell Volume)
S. No. parameter groups Mean±Se unpaired test One way
ANOVA with SMK TeSTPaired test One way RM
ANOVA with dunnetts test
PCV
Pre Int post Con gb&h gv&h1. Con-pre 30.8+0.2 Pre test
F=7.41P=0.478
controlF=3.802P=0.024
2. Gb&HPre 30.7+0.23. Gv&Hpre 30.5+0.24. Con Int 30.8+0.2 intermediate
F=1.789P=0.169
Gooseberry with honeyF=21.108P=<0.001
5. G&Hint 31.0+0.26. Gv&HInt 30.5+0.27. Con post 30.0+0.2 Post test
F=5.901P=0.003
Guava with honeyF=0.867P=0.422
8. Gb&HPost 31.6+0.29. Gv&Hpost 30.6+0.2
Table3showsposttest(45days)experimentalgroupone(gooseberryjuicewithhoney)PCVlevelsignificantlydifferentfrombothcomparedtothecontrolgroupandexperimentalgrouptwo(guavajuicewithhoney).Withinthegroupthepretest,21daysand45dayswerecomparedbyonewayrepeatedmeasuresofANOVA.The‘F’and‘P’valuesofcontrolgroupwere3.802and0.024respectivelygooseberryjuicewithhoneygroupwere21.108and<0.001respectively,guava juicewithhoneygroupwere0.867and0.043respectively.Thisshowedsignificantlydifferentfromthepretest.
Figure.1: Correlation (Pearson) of red blood corpuscles (RBC) count and haemoglobin (Hb) in control, gooseberry with honey (Gb+H) and guava with honey (Gv+H) groups in pre-test among adolescent girls (n =
85 each).
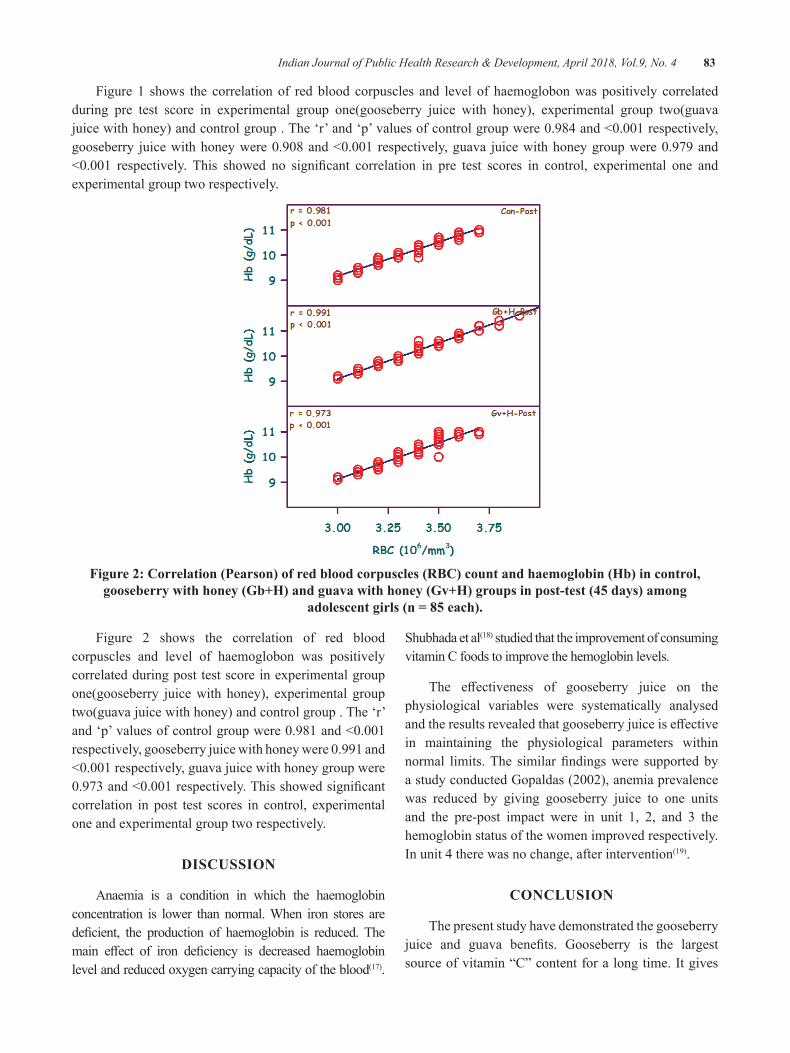
Indian Journal of Public Health Research & Development, April 2018, Vol.9, No. 4 83
Figure 1 shows the correlation of red blood corpuscles and level of haemoglobon was positively correlated during pre test score in experimental group one(gooseberry juice with honey), experimental group two(guava juicewithhoney)andcontrolgroup.The‘r’and‘p’valuesofcontrolgroupwere0.984and<0.001respectively,gooseberry juicewithhoneywere0.908and<0.001 respectively,guava juicewithhoneygroupwere0.979and<0.001 respectively. This showed no significant correlation in pre test scores in control, experimental one andexperimental group two respectively.
Figure 2: Correlation (Pearson) of red blood corpuscles (RBC) count and haemoglobin (Hb) in control, gooseberry with honey (Gb+H) and guava with honey (Gv+H) groups in post-test (45 days) among
adolescent girls (n = 85 each).
Figure 2 shows the correlation of red blood corpuscles and level of haemoglobon was positively correlated during post test score in experimental group one(gooseberry juice with honey), experimental group two(guava juice with honey) and control group . The ‘r’ and‘p’valuesofcontrolgroupwere0.981and<0.001respectively,gooseberryjuicewithhoneywere0.991and<0.001respectively,guavajuicewithhoneygroupwere0.973and<0.001respectively.Thisshowedsignificantcorrelation in post test scores in control, experimental one and experimental group two respectively.
dISCuSSION
Anaemia is a condition in which the haemoglobin concentration is lower than normal. When iron stores are deficient, the production of haemoglobin is reduced. Themain effect of iron deficiency is decreased haemoglobinlevel and reduced oxygen carrying capacity of the blood(17).
Shubhada et al(18) studied that the improvement of consuming vitamin C foods to improve the hemoglobin levels.
The effectiveness of gooseberry juice on thephysiological variables were systematically analysed andtheresultsrevealedthatgooseberryjuiceiseffectivein maintaining the physiological parameters within normal limits.The similarfindingswere supported byastudyconductedGopaldas(2002),anemiaprevalencewas reduced by giving gooseberry juice to one units and the pre-post impact were in unit 1, 2, and 3 the hemoglobin status of the women improved respectively. In unit 4 there was no change, after intervention(19).
CONCluSION
The present study have demonstrated the gooseberry juice and guava benefits. Gooseberry is the largestsourceofvitamin“C”contentforalongtime.Itgives
84 Indian Journal of Public Health Research & Development, April 2018, Vol.9, No. 4
relief also in the weakness of the nerves and the heart. Gooseberryjuiceismoreeffectivethantheguavajuicewhich helps in iron absorption and reducing anaemia.
Conflict of Interst: Nil
Source of Funding: Self
ReFeReNCeS
1. Lal S, Pankaj A. Editors. Textbook of Community Medicine (Preventive and Social Medicine).1st ed. New Delhi: CBS Publishers and Distributors; 2007;166-68.
2. Park K Preventive and Social Medicine 21st Edition, M/s Banarsidas Bhanot Publishers. K (2011).593.
3.World Health Organization, Regional Officefor South-East Asia. Adolescent health – India Factsheet. In: Adolescent health at a glance in South–EastAsiaRegion.NewDelhi(2007)WHO/SEARO.
4.Lawless JW, Latham MC, Stephenson LS.Iron supplementation improves appetite and growth in anaemic Kenyan primary schoolchildren.JNutr.1994:124:645-654.
5.World Health Organization, United NationsChildrens Fund, United Nations University Indicators for assessing iron deficiency andstrategies for its prevention (draft based on a WHO/UNICEF/UNU Consultation, 6-10December1993).Geneva:WHO.
6. K.K.Gulani. Community Health Nursing Principles and Practices First Edition, Kumar PublishingHouse.2005:464.
7. Wong’s. Nursing care of Infants and children 8th
edition,Elsevirpublication(2007).1517.
8. Park K Preventive and Social Medicine 21st Edition, M/s Banarsidas Bhanot Publishers.K (2011).575,593.
9. Guidelines for eradication of iron deficiencyanemia INACG Washington. 29 (16).
10. Brittenham et. Al, food and nutrient intake among adolescent girls, Indian journal of public health.
11. Dairo,et.al., Socio Demographic determinants of anemia,(2004)www.google.com.
12. Goudarzi, Pak Bio Science, The effects of irondeficiency anemia on intelligence quotientMay2008.
13.Suresh. K.sharma. Nursing research &statistics,(4th ed) ,ELSEVIER pvt ltd,2014:101:110-111.
14. CR.Kothari. Research methodology, 2nd edition, newageinternationalpublishers,2012.
15.Dr.D.K.Gala. Juice Diet for Perfect Health,Navneet publications, 75-76.
16.Dr.D.K.Gala. Juice Diet for Perfect Health,Navneetpublications,90
17. Wong’s Nursing care of Infants and children 8th
edition,Elsevierpublication(2007)1517
18. Shubhada and Sheevani. Ascopric acid and hemoglobinlevel,Retrieved,July2004;17,www.nuritioi-i.org
19. Gopaldas,Tara,Iron-deficiencyanemiainyoungworking women can be reduced by increasing the consumption of cereal-based fermented foods or gooseberry juice at the workplace,food and nutrition bulletin, Food & Nutrition Bulletin, March2002,Volume23,Number1;pp.94-105.
A Study on Knowledge, Attitude and Practice on the usage of edible Salt among the Population in an urban Area
A Revanth Kumar1, N Partha Sarathy2, Chandrasekhar Reddy b3, M. Ravikiran4
1Post Graduate Student, 2Professor and HOD, Department of Community Medicine, Alluri Sitarama Raju Academy of Medical Sciences (ASRAMS), Eluru, 3Associate Professor, Department of Community
Medicine, Mahavir institute of Medical Sciences, Vikarabad, TS. 4Post Graduate Student, Department of Community Medicine, ASRAMS, Eluru.
AbSTRACT
background: Iodinedeficiency is amajornutritionalproblem in India.Fortificationof edible saltwithIodine is a good strategy being implemented by the government to bring down the goitre prevalence. Type ofediblesaltusedbypeopleindifferentpartsofthecountryvariesconsiderably.Henceinthisstudyanendeavorwasmadetoknowtheusagepatternofediblesaltandtheawareness&usageofiodizedsaltamongtheresidentpopulationinthefieldpracticeareaoftheUrbanHealthCentreattachedtoaMedicalCollege.
Methods: After obtaining approval from the Institutional Ethical Committee, a cross-sectional study of all thehouseholdswasconductedinthefieldpracticeareaofASRAMMedicalCollege,Eluru.Thedatawascollectedbyusingapredesigned,pretested&semi-structuredquestionnaireoveraperiodoftwomonths.CollecteddatawascompiledinM.S.Excel2013andanalyzedinPASWVersion23(trialversion).
Results: Studypopulationconsisted2591residents,1300(50.2p.c)males&1291(49.8p.c)females.Inthestudypopulation,89.7p.crespondentshadtheknowledgeofIodizedsalt,butonly20.4p.cwereusingitforcookingpurposeandonly12.8p.cwereconsuming<5gramsaltperday.
Conclusion: Knowledgeof Iodized saltwas relativelygoodbuthardly20p.cwereusing it for cookingpurpose. There is an urgent need for behavior change communication in the community towards Iodized salt consumption.
Keywords: Edible Salt, Fortification, Goiter, Iodine deficiency
Corresponding Author:Dr. A. Revanth KumarPost Graduate Student,Department of Community Medicine, ASRAMS, EluruMob:8008586279Email ID: [email protected]
INTROduCTION
Iodinedeficiencyisamajorpreventablenutritionalproblem in India and no state can be said to be free from goitre.1-5 Iodinedeficiencyleads toproblemslikemiscarriage, goitre, mental retardation, etc3. To prevent IDD occurrence, minimum Iodine supplementation suggestedis100–150microgramperday6. An estimate of200millionpeopleinIndiaareexposedtotheriskofiodinedeficiencyandmorethan71millionsufferfrom
goiter and other iodine deficiency disorders (NFHS-3).Majority of the consequences of Iodine deficiencyare invisible and irreversible but at the same time preventable1.
Salt is an essential commodity in preparation of our food tomake it tasty and palatable. Fortificationof salt with Iodine was a good strategy implemented by the government (1983-84) to bring down the goitre prevalence&Iodinedeficiency.
In India the programme on salt iodization dates backtolate1950’sintheclassicalstudyofProfessorV.RamalingaswamyandhisassociatesinKangraValleyofHimachalPradeshstatehadestablishediodinedeficiencyas the causative factor for endemic goiter and consuming salt iodized with as the most economic and easiest
DOI Number: 10.5958/0976-5506.2018.00261.9
86 Indian Journal of Public Health Research & Development, April 2018, Vol.9, No. 4
preventive and control measure in a population. Based on the experience gained in the above study, Government of India launched the National Goiter Control Programme (NGCP) in 1962. The Central Council of Health in 1984 took a historic decision to iodize the entire edible salt in a phased manner by 1992.7
Accordingtolawwhichwaseffectivefrom17th May 2006,onlyiodizedsaltisallowedtobesold,boughtandused for direct consumption purpose in India. This is a centralpillaroftheNationalIodineDeficiencyDisordersControl Programme, which seeks to eliminate iodine deficiencydisordersfromthecountry. 8 Use of iodized salt varies greatly by region; it is highest in the North-East Region, and in some states in the North Region and also in Kerala.
Un-iodized salt and rock salt are available in India in different forms, which can be classified into twocategories: Halite (rock salt, sendha namak, Pakistani namak,Lahorinamak) andVolcanichalite (black salt,kala namak). The common beliefs for talking non-iodized salt were religious sanction for use during fasts, better flavor, perceived medicinal property, perceivedlaxative effect, perceived strengthening effect and lessexpensive.9
Excess salt consumption also has a risk of elevating the blood pressure which is a major risk factor for developing cardiovascular diseases & other non-communicable diseases.10 Restricting amount of salt consumption to <5 gram per day can substantiallyreducemeanBPinthepopulation(WHO).11 Reduction ofsaltintakeisoneofthemostcost-effectivestrategiesto prevent cardiovascular disease.12
Mean urinary iodine excretion levels in West Godavari district was >200.0 microgram/l and Iodinecontentofsaltsamplescollectedatbeneficiarylevelwas85.6p.c(<15ppm)and14.2p.c> 15 ppm.13
ObJeCTIVeS
1. To study the usage pattern of edible salt among thepopulation residing in thefieldpracticeareaof the Urban Health Training Centre of ASRAM Medical College.
2. To study their knowledge and attitude on the benefitsofconsumingIodizedsalt.
MATeRIAlS ANd MeThOd
A household based, cross-sectional study was conducted in Yetigattu area, Ashok Nagar, Eluru which is one of the field practice areas of Urban HealthTraining Centre, ASRAM Medical College, Eluru, Andhra Pradesh State. Study was conducted for a period of two months (1st August to 30th September’ 2016)after obtaining clearance from the Institutional Ethical committee.
All the households in the field practice areawereconsidered for the study and data could be collected from only 858 households after obtaining verbal consent from the respondents who had approved for the study. A Predesigned, Pretested and Semi-structured Questionnaire (Schedule) was used to collect the data. The study was done with the support of interns, posted in the department. The interns were trained on the methodology of collecting data using the questionnaire and a pilot study was conducted in 45 households at Komuvodolu (Venkatapuram) area. Two interns wereteamed up as one team and were instructed to collect data fromamaximumoffivehouseholdseachdayduringthestudyperiod.Allthehouseholdsinthedefinedareawereincluded in the study. But the households found locked or no adult respondent found in at least 3 consecutive visits were excluded.
The collected data was compiled in M.S. Excel 2013 and analyzed in Predictive Analytic Software(PASW)Version23(trialversion).Resultswereshowninproportionsandpercentagesusing tables,pie&bardiagrams. Knowledge, Attitude and Practice were ranked by scoring each question in respective categories and one wayANOVA testwas appliedwith the total scores toidentify their associations with variables like education of family head, occupation of family head, family diet and socio economic status. (The socioeconomic status of thefamilieswasassessedusingUpdatedModifiedB.GPrasad’sClassification’2016.)
FINdINgS
Total population in all the households was 2591 with1300males(50.2p.c)&1291females(49.8p.c).
Knowledge:Awarenessonwhichtypeofsalt(Fig.1&2) is good for cooking where 741 (86.4 p.c) responded for iodized powdered salt, followed by crystal salt 65
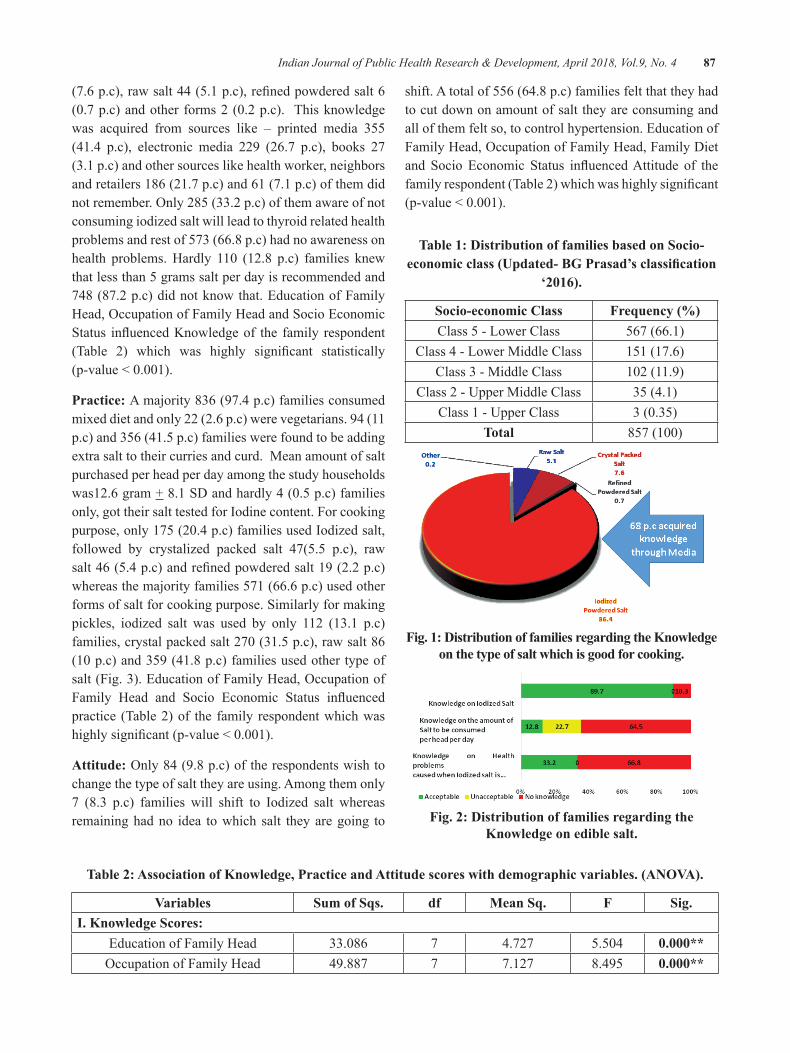
Indian Journal of Public Health Research & Development, April 2018, Vol.9, No. 4 87
(7.6p.c),rawsalt44(5.1p.c),refinedpowderedsalt6(0.7p.c)andother forms2(0.2p.c). Thisknowledgewas acquired from sources like – printed media 355 (41.4 p.c), electronic media 229 (26.7 p.c), books 27 (3.1 p.c) and other sources like health worker, neighbors and retailers 186 (21.7 p.c) and 61 (7.1 p.c) of them did notremember.Only285(33.2p.c)ofthemawareofnotconsuming iodized salt will lead to thyroid related health problems and rest of 573 (66.8 p.c) had no awareness on health problems.Hardly 110 (12.8 p.c) families knewthat less than 5 grams salt per day is recommended and 748 (87.2 p.c) did not know that. Education of Family Head,OccupationofFamilyHeadandSocioEconomicStatus influencedKnowledgeof the family respondent(Table 2) which was highly significant statistically(p-value<0.001).
Practice: A majority 836 (97.4 p.c) families consumed mixed diet and only 22 (2.6 p.c) were vegetarians. 94 (11 p.c) and 356 (41.5 p.c) families were found to be adding extra salt to their curries and curd. Mean amount of salt purchased per head per day among the study households was12.6 gram +8.1SDandhardly4(0.5p.c)familiesonly, got their salt tested for Iodine content. For cooking purpose,only175(20.4p.c)familiesusedIodizedsalt,followed by crystalized packed salt 47(5.5 p.c), raw salt46(5.4p.c)andrefinedpowderedsalt19(2.2p.c)whereas the majority families 571 (66.6 p.c) used other forms of salt for cooking purpose. Similarly for making pickles, iodized salt was used by only 112 (13.1 p.c) families,crystalpackedsalt270(31.5p.c),rawsalt86(10p.c)and359(41.8p.c)familiesusedothertypeofsalt(Fig.3).EducationofFamilyHead,OccupationofFamily Head and Socio Economic Status influencedpractice (Table 2) of the family respondent which was highlysignificant(p-value<0.001).
Attitude: Only84(9.8p.c)oftherespondentswishtochange the type of salt they are using. Among them only 7 (8.3 p.c) families will shift to Iodized salt whereas remaining had no idea to which salt they are going to
shift. A total of 556 (64.8 p.c) families felt that they had to cut down on amount of salt they are consuming and all of them felt so, to control hypertension. Education of FamilyHead,OccupationofFamilyHead,FamilyDietand Socio Economic Status influencedAttitude of thefamilyrespondent(Table2)whichwashighlysignificant(p-value<0.001).
Table 1: distribution of families based on Socio-economic class (Updated- BG Prasad’s classification
‘2016).
Socio-economic Class Frequency (%)Class 5 - Lower Class 567 (66.1)
Class 4 - Lower Middle Class 151 (17.6)Class 3 - Middle Class 102(11.9)
Class 2 - Upper Middle Class 35 (4.1)Class 1 - Upper Class 3(0.35)
Total 857(100)
Fig. 1: distribution of families regarding the Knowledge on the type of salt which is good for cooking.
Fig. 2: distribution of families regarding the Knowledge on edible salt.
Table 2: Association of Knowledge, Practice and Attitude scores with demographic variables. (ANOVA).
Variables Sum of Sqs. df Mean Sq. F Sig.I. Knowledge Scores:
Education of Family Head 33.086 7 4.727 5.504 0.000**OccupationofFamilyHead 49.887 7 7.127 8.495 0.000**
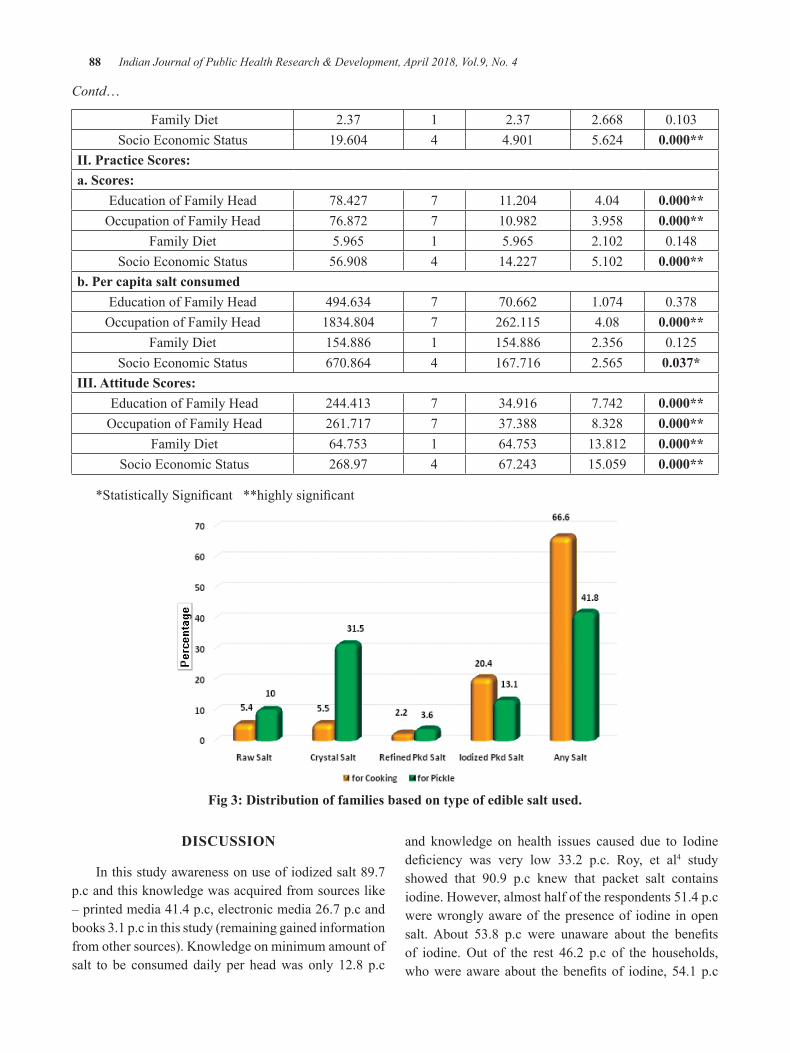
88 Indian Journal of Public Health Research & Development, April 2018, Vol.9, No. 4
Contd…
Family Diet 2.37 1 2.37 2.668 0.103Socio Economic Status 19.604 4 4.901 5.624 0.000**
II. Practice Scores:a. Scores:
Education of Family Head 78.427 7 11.204 4.04 0.000**OccupationofFamilyHead 76.872 7 10.982 3.958 0.000**
Family Diet 5.965 1 5.965 2.102 0.148Socio Economic Status 56.908 4 14.227 5.102 0.000**
b. Per capita salt consumedEducation of Family Head 494.634 7 70.662 1.074 0.378OccupationofFamilyHead 1834.804 7 262.115 4.08 0.000**
Family Diet 154.886 1 154.886 2.356 0.125Socio Economic Status 670.864 4 167.716 2.565 0.037*
III. Attitude Scores: Education of Family Head 244.413 7 34.916 7.742 0.000**OccupationofFamilyHead 261.717 7 37.388 8.328 0.000**
Family Diet 64.753 1 64.753 13.812 0.000** Socio Economic Status 268.97 4 67.243 15.059 0.000**
*StatisticallySignificant**highlysignificant
Fig 3: distribution of families based on type of edible salt used.
dISCuSSION
In this study awareness on use of iodized salt 89.7 p.c and this knowledge was acquired from sources like – printed media 41.4 p.c, electronic media 26.7 p.c and books 3.1 p.c in this study (remaining gained information from other sources). Knowledge on minimum amount of salt to be consumed daily per head was only 12.8 p.c
and knowledge on health issues caused due to Iodine deficiency was very low 33.2 p.c. Roy, et al4 study showed that 90.9 p.c knew that packet salt containsiodine. However, almost half of the respondents 51.4 p.c were wrongly aware of the presence of iodine in open salt.About 53.8 p.c were unaware about the benefitsof iodine. Out of the rest 46.2 p.c of the households,whowereawareabout thebenefitsof iodine,54.1p.c
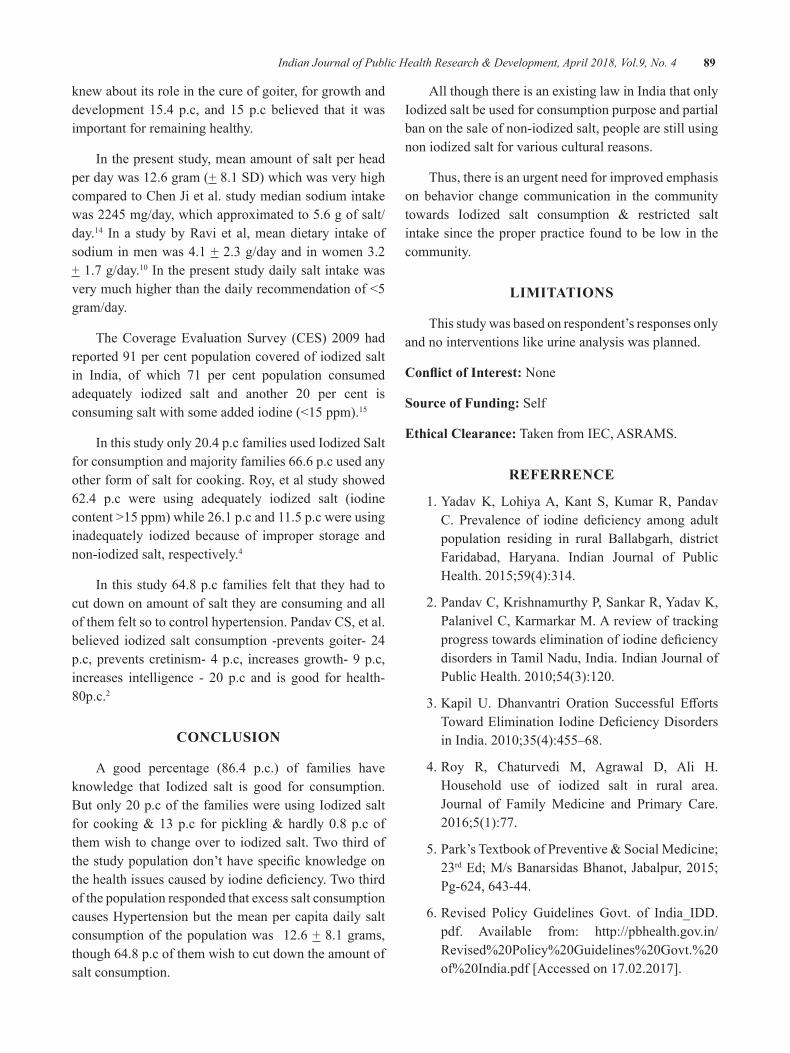
Indian Journal of Public Health Research & Development, April 2018, Vol.9, No. 4 89
knew about its role in the cure of goiter, for growth and development 15.4 p.c, and 15 p.c believed that it was important for remaining healthy.
In the present study, mean amount of salt per head per day was 12.6 gram (+ 8.1 SD) which was very high comparedtoChenJietal.studymediansodiumintakewas 2245 mg/day, which approximated to 5.6 g of salt/day.14 In a study by Ravi et al, mean dietary intake of sodium in men was 4.1 + 2.3 g/day and in women 3.2 + 1.7 g/day.10 In the present study daily salt intake was verymuchhigherthanthedailyrecommendationof<5gram/day.
TheCoverageEvaluationSurvey (CES)2009hadreported 91 per cent population covered of iodized salt in India, of which 71 per cent population consumed adequately iodized salt and another 20 per cent isconsumingsaltwithsomeaddediodine(<15ppm).15
Inthisstudyonly20.4p.cfamiliesusedIodizedSaltfor consumption and majority families 66.6 p.c used any other form of salt for cooking. Roy, et al study showed 62.4 p.c were using adequately iodized salt (iodine content >15 ppm) while 26.1 p.c and 11.5 p.c were using inadequately iodized because of improper storage and non-iodized salt, respectively.4
In this study 64.8 p.c families felt that they had to cut down on amount of salt they are consuming and all of them felt so to control hypertension. Pandav CS, et al. believed iodized salt consumption -prevents goiter- 24 p.c, prevents cretinism- 4 p.c, increases growth- 9 p.c, increases intelligence - 20 p.c and is good for health-80p.c.2
CONCluSION
A good percentage (86.4 p.c.) of families have knowledge that Iodized salt is good for consumption. Butonly20p.cofthefamilieswereusingIodizedsaltfor cooking&13p.c forpickling&hardly0.8p.cofthem wish to change over to iodized salt. Two third of thestudypopulationdon’thavespecificknowledgeonthehealthissuescausedbyiodinedeficiency.Twothirdof the population responded that excess salt consumption causes Hypertension but the mean per capita daily salt consumption of the population was 12.6 + 8.1 grams, though 64.8 p.c of them wish to cut down the amount of salt consumption.
All though there is an existing law in India that only Iodized salt be used for consumption purpose and partial ban on the sale of non-iodized salt, people are still using non iodized salt for various cultural reasons.
Thus, there is an urgent need for improved emphasis on behavior change communication in the community towards Iodized salt consumption & restricted saltintake since the proper practice found to be low in the community.
lIMITATIONS
This study was based on respondent’s responses only and no interventions like urine analysis was planned.
Conflict of Interest: None
Source of Funding: Self
ethical Clearance: Taken from IEC, ASRAMS.
ReFeRReNCe
1. Yadav K, Lohiya A, Kant S, Kumar R, Pandav C. Prevalence of iodine deficiency among adultpopulation residing in rural Ballabgarh, district Faridabad, Haryana. Indian Journal of PublicHealth.2015;59(4):314.
2. Pandav C, Krishnamurthy P, Sankar R, Yadav K, Palanivel C, Karmarkar M. A review of tracking progresstowardseliminationofiodinedeficiencydisordersinTamilNadu,India.IndianJournalofPublicHealth.2010;54(3):120.
3.Kapil U. Dhanvantri Oration Successful EffortsTowardEliminationIodineDeficiencyDisordersinIndia.2010;35(4):455–68.
4. Roy R, Chaturvedi M, Agrawal D, Ali H. Household use of iodized salt in rural area. Journal of Family Medicine and Primary Care.2016;5(1):77.
5.Park’sTextbookofPreventive&SocialMedicine;23rdEd;M/sBanarsidasBhanot,Jabalpur,2015;Pg-624, 643-44.
6.Revised Policy Guidelines Govt. of India_IDD.pdf. Available from: http://pbhealth.gov.in/Revised%20Policy%20Guidelines%20Govt.%20of%20India.pdf[Accessedon17.02.2017].
90 Indian Journal of Public Health Research & Development, April 2018, Vol.9, No. 4
7.Salt T, Ramalingaswamy V, Valley K, PradeshH,DeficiencyI,ValleyK,etal.NationalIodineDeficiencyDisordersControlProgram(NIDDCP)SaltIodizationPrograminINDIA.2017;2–3.
8. Chandra A, Debnath A, Tripathy S, Goswami H, Mondal C, Chakraborty A, et al. Environmental factors other than iodine deficiency in thepathogenesis of endemic goiter in the basin of river Ganga and Bay of Bengal, India. BLDE Univ J Heal Sci [Internet]. 2016;1(1):33. Availablefrom: http://www.bldeujournalhs.in/text.asp? 2016/1/1/33/183283.
9. Kalra S, Kalra B, Sawhney K. Usage of non-iodized salt in North West India. Thyroid Res Pract [Internet]. 2013;10(1):12.Available from:http://www.thetrp.net/text.asp?2013/10/1/12/105840.
10.RaviS,BermudezOI,HarivanzanV,KennethChuiKH,VasudevanP,MustA,etal.SodiumIntake,Blood Pressure, and Dietary Sources of Sodium in an Adult South Indian Population. Ann Glob Heal [Internet]. Elsevier Inc; 2016;82(2):234–
42. Available from: http://dx.doi.org/10.1016/j.aogh.2017.02.001
11. Guideline : Sodium intake for adults and children. Available from: http://apps.who.int/iris/bitstream/10665/77985/1/9789241504836_eng.pdf?ua=1&ua=1
12. Lee H, Cho H, Bae E, Kim YC. Not Salt Taste Perception but Self-Reported Salt Eating Habit Predicts Actual Salt Intake. 2014;(January2017):91–6.
13. Kapil U, Singh P, Pathak P. Current status of iodine nutritive and iodine content of salt in AndhraPradesh.IndianPediatrics2004;41:165-9.
14.JiC,CappuccioFP.SocioeconomicinequalityinsaltintakeinBritain10yearsafteranationalsaltreductionprogramme.2014;1–9.
15.UNICEF. Coverage Evaluation Survey 2009,All India Report. Ministry of Health and Family Welfare,GovernmentofIndia,NewDelhi;2010.Available from: http://www.unicef.org/ India/health.html,accessedonMarch1,2017.
A Prospective Study of Clinical Profile and Role of Fiber Optic bronchoscopy in Patients with Sputum Negative for AFb with
undiagnosed lung lesions in Chest X-Ray
Rajesh b P1, Saroja C Kamatar2, Vijay kumar3
1Associate Professor, Department of Pulmonology; 2Assistant Professor, Department of OBG; 3Senior Resident, (Pulmonology), J J M Medical College, Davangere
AbSTRACT
Respiratory diseases come with wide range of presentations.Some of these cases present with various undiagnosedlunglesionsinthechestxray.Theadventandavailabilityoffiberopticbronchoscopehasbeena major advance in pulmonary medicine.
This is aprospective studydone in50patientswhopresentedwithvarious respiratory symptoms toourhospitalwithundiagnosedlunglesionsinthechestx-ray.TheyunderwentFiberopticbronchoscopy(FOB),BALfluidanalysisandforcepsbiopsyandevaluated.
Among20patientssuspectedofsputumnegativepulmonarytuberculosis7(35%)turnedoutaspositivefor Acid Fast Bacilli (AFB). Among 21 patients categorized into malignancy 15 (71.42%) turned out as malignancy. Most common cell type in our study was of Squamous Cell Carcinoma (SqCC). Bronchoscopy results inadefinitivediagnosis innearlyhalfof thepatientsanalyzedwithapositiveyieldof46%(23patients).
Fiberopticbronchoscopy(FOB) isan important investigation indetermining theetiologyanddefinitivediagnosis in patients presenting with various respiratory symptoms with undiagnosed lung lesions in the chest x-ray.
Keywords: Fiber optic bronchoscopy(FOB), Acid Fast Bacilli (AFB), Squamous Cell Carcinoma(SqCC). ), Bronchoalveolar Lavage (BAL)
Corresponding Author:Dr Rajesh B PAssociate ProfessorDepartmentofPulmonology,JJMMedicalCollegeDavangere-577004KarnatakaMob:09620326244E-mail: [email protected] [email protected]
INTROduCTION
Today, bronchoscopy and interventional pulmonology have become an integral part of pulmonary medicine and an established subspecialty.The properties offiberopticsenablethebronchoscopetobendallowingfor easy navigation throughout the tracheo-bronchial tree. It canbe done on outpatient and inpatient settings1.
Modificationstotherigidbronchoscopenowallowfor maintenance of ventilation, improved visualization with the use of optical telescopes, and passage of various instruments for diagnostic and therapeutic procedures2,3
Theflexiblefiberopticbronchoscopehascontinuedto evolve since its introduction in 1967.Ultra-thin bronchoscopes for the evaluation of small distal airways are now available and have an external diameter of 2.7 mm. A wide variety of ancillary equipment may be used with the flexible fiberoptic bronchoscope, includingbiopsy forceps, protected and non-protected brushes for cytological and microbiologic studies and devices for transbronchial needle aspiration. Flexible bronchoscopy is usually performed with local anesthesia and may or may not require conscious sedation.
DOI Number: 10.5958/0976-5506.2018.00262.0
92 Indian Journal of Public Health Research & Development, April 2018, Vol.9, No. 4
MeThOdOlOgy
Source of data: The source of data for the study is from the patients attending Department of respiratory medicine, J.J.M medical college, both out patientsand in patients. The present study was a prospective studyperiod during 2015 -16 with aminimumof 50cases. The course of study procedure is explained and informed consent taken.
Thestudyiscarriedouttoevaluatetheeffectivenessof bronchial washings(BW) in the diagnosis of sputum smear for acid fast bacilli(AFB) negative cases of pulmonarytuberculosisanduseofBAL&forcepsbiopsythroughFOBinthediagnosisofmalignantlesions.
Inclusion Criteria:
1. Patients aged 18 and above.
2. Suspected patients of PTB(as per RNTCP guidelines).
3. Clinic radiological suspicion of malignancy.
4. Hemoptysis with localizing chest radiograph.
5. Chest x-ray showing non resolving pneumonia.
6. Chest x-ray with undiagnosed lung lesion.
exclusion Criteria:
1.PatientswhoisaknownorsuspectedcaseofHIVinfection.
2. Patients with bleeding diathesis.
3. Patients with history of myocardial infarction, arrhythmias.
4. Patients on anti-tubercular therapy (ATT) for more than 1 month.
Detailed history of patients was taken with physical examination. All patients underwent the investigations; Complete hemogram,Urine routine, RBS, Chest X-ray, Sputum examination for AFB -2 samples(1-spot sample &1-earlymorningsample)carriedoutbyZiehl-Neelsentechnique ,other bacteria, fungi, malignant cells. ECG, HIV(ICTC), HBSAg, CT-Scan of thorax. Spirometryand Mantoux test.
Fiber Optic bronchoscopy: For this procedure informed consent. Indication, findings, Provisionaldiagnosis,reports&finaldiagnosisarenoted.FOBwill
be used to examine bronchial tree and obtain Broncho-alveolar lavage(BAL)
endobronchial biopsy: Post bronchoscopy sputum for smear microscopy for AFB using Ziehl- Nelson staining method will be collected in all patients after bronchoscopy procedure.
Relevant specimens will be sent for culture of Mycobacterium tuberculosis on Lowenstein-Jensenmedium&histopathological examination for evidenceof malignant cells.
PROCeduRe
Bronchoscopies may be performed in endoscopy suites, operating rooms, radiology departments, or at the patient’s bedside. Pre-procedure preparation is done. PatientsareniloralwithIVline.Bloodpressure,oxygensaturation, and electrocardiogram should be monitored and oxygen administered to maintain oxygen saturation greaterthan90%.
Anesthesia: Local anesthesia with Lidocaine is safest topical agent and is applied to the nares, oropharynx, vocal cords, and tracheobronchial tree4
Insertion Techniques
The patient should be placed in either a semi-recumbent or supine position. Topical anesthetic agent isapplied.The flexible bronchoscope can be introducedthrough the nose, mouth, tracheostomy, or endotracheal tube.Theoralrouteispreferredforflexiblebronchoscopyif frequent removal and reinsertion of the bronchoscope is anticipated or if endotracheal intubation is to be performed. The nasal route avoids the possible complication of damage to the bronchoscope if the patient bites down in the absence of a bite block. In the intensive care unit (ICU), a patient requiring bronchoscopy may already have an endotracheal tube in place. This can pose problems if the tube is too small to accommodate an average bronchoscope.Asize8.0orgreaterendotrachealtubeisrecommended for ease of passage of the bronchoscope and for adequate ventilation.
The bronchoscope is introduced either through the nose or mouth with a bite block in place. The oropharynx is examined. After a thorough examination is performed and on reaching the vocal cords, the patient is usually again anesthetized topically. The vocal
Indian Journal of Public Health Research & Development, April 2018, Vol.9, No. 4 93
cords are examined for abduction and adduction. The bronchoscope is passed through the vocal cords, and a complete airway inspection is performed5,6.
Both therapeutic and diagnostic procedures can be performedduringflexiblebronchoscopy.Dependingonthe indications7, the following diagnostic procedures can be performed: BAL, endobronchial or transbronchial biopsies, cytological wash or brush, and TBNA, endobronchial ultrasound (EBUS).
endobronchial lung biopsy: Bronchoscopy is often the only technique by which material from the endo-bronchial tumor can be taken and sent to the pathologist for histological or cytological classification of thetumor. Different typesof forcepsareused forbiopsy.Thematerialobtainedissentforcytologyorafterfixingwith 10% formalin for histopathological examination.Upto3to5biopsiesaresufficient.Ifitisanticipatedthatbiopsy specimens may be required at bronchoscopy, oral anticoagulants should be stopped at least 3 days before bronchoscopy or they should be reversed with low dose vitamin K.
Transbronchial lung biopsy: This is done in situations where the lesion is beyond the bronchoscopic vision or in bilateral diffuse lungdiseases. In lesions outsidebronchoscopicvision,biopsyunderfluoroscopicvisionwill increase yield as well as decrease complications.
In diffuse lung diseases biopsy is usually takenfrom either of lower lobes; middle lobe is generally avoided. Platelet count, prothrombin time, and partial thromboplastin time should be checked before performing transbronchial biopsies.
bronchial Washing & bal: Bronchoalveolar lavage is an important extension to the diagnostic usefulness of fiberopticbronchoscopy;Itprovidedviablecells,intactproteins and enzymes for analysis, which can give a dynamic and kinetic impression of the disease process8. 20mlaliquotsof0.9%normalsalinesolution,devoidofany bacteriostatic material at 37° C is instilled in to the distal air spaces through the wedged bronchoscope and then aspirated through the instrument’s suction channel. Thisfluidmaybesubjectedtoavarietyoftestsdependingontheclinicalsituation:microbiologictesting,specificcytological analysis and cell count, immunologic parameters, presence of various biochemical mediators related to pathologic processes, tissue markers,
polymerase chain reaction, electron microscopy, flowcytometry and DNA probes.
For quantitativeBAL, 120ml aliquot of saline isadequate for sampling a pulmonary sub segment. For this,athresholdof104cfupermilliliterisusedforthediagnosis of pneumonia, reflecting a concentration of105-106 bacteria per milliliter of the original sample.Whenthevolumeofsalineissmall(i.e.,10-20ml)andis sprayed in to the vicinity of the lesion, the procedure is described as bronchial washing.
Quantitative BAL may be superior to protected specimen brush (PSB) in ventilator associated pneumonia (VAP), sinceBAL samplesmuch larger proportion oflungparenchymaandisestimatedtorecover5-10timesas many organisms as PSB.
yield of diagnostic Procedures
lung Cancer
a. Visible endobronchial tumour: The diagnostic yield from biopsy of visible endobronchial tumourisover90%.Thereisgoodevidencethatthe positive yield is increased if specimens are sent for both cytology and biopsy. False positives may occur with cytology, but are rare.
b. Peripheral tumor: The diagnostic yield in case of peripheral tumour beyond bronchoscopic vision is bound to be less and variable.
c. Pulmonary infections: In Mycobacterium tuberculosis the positive yield was 63% in direct smear and 37% only on culture. Transbronchial lung biopsy was positive in 30-50%. Militarytuberculosis can be diagnosed bronchoscopically, the highest yield coming from transbronchial lung biopsy followed by bronchial lavage.
Fungal infections, especially, in Pneumocystis sensitivity for BAL was 89%, compared with 97% for transbronchial lung biopsy. Bronchoscopy is not ordinarily used to diagnose the microbial cause of pneumonia in immunocompromised patients.
COMlICATIONS
Hypoxemia, Bronchospasm, Cardiovascular events, Pneumothorax, Bleeding, Fever, Pneumonitis, and complications related to anesthesia.
94 Indian Journal of Public Health Research & Development, April 2018, Vol.9, No. 4
Statistical Analysis: Data was analyzed using paired T test and chi-square test.
ReSulTS
Of the 50 patients 36 (72%) were males and14(28%) were females.Analysis of symptoms among patients, who were included in the study Showed that cough was the most common symptom occurring in 45 patients (90%)andhemoptysisoccurred in10patients(36%). Shortness of breath, fever and chest pain were seen in decreasing frequency in that order in 32 (64%) 30(60%),4(8%)respectively.
TAble 1: RAdIOlOgICAl FINdINgS
Sl. No. Symptom Number Percent1. Hilar
adenopathy2 4%
2. Collapse 4 8%3. Fiberocavity 7 14%4. Mass 10 20%5. Normal 9 18%6. Pneumonia/
Unresolved pneumonia
18 36%
Analysis of radiological findings among the 50patients studied showed that pneumonia or unresolved pneumonia was the most common finding occurringin 18 (36%) patients. it was followed by radiological masslesionin10(10%)patientsand9(18%)ofpatientshad a normal or unremarkable chest X-ray, however fibrocavitary changes secondary Koch’s were seen in7(14%) patients, 4(8%) patients presented with collapse on chest X-ray and 2(4%) patients had Hilar adenopathy on presentation(Table 1).
TAble 2 : PRebRONChOSCOPIC dIAgNOSIS
Prebronchoscopic diagnosis Number PercentChronic cough 3 6%
Hemoptysis 6 12%Sputum negative Kochs 20 40%
Malignancy 21 42%
42% of the bronchoscopieswere done to confirmor rule out diagnosis of malignancy.40% for sputumnegative pulmonary Koch’s for obtaining samples for
acidfastbacillistainandmycobacterialculture..Otherindications included Hemoptysis (12%) andchornic cough (6%) with normal chest x-ray, which was refractory in nature to medical line of management.(Table 2)
Amongthe20patientswhowereincludedunderthecategory of sputum negative pulmonary tuberculosis, BW was done in all the patients and a positive microscopic yield in 4 of 20 patients was obtained.Mycobacterial culture was positive in 2 of the 5 patients inwhomculturewasdone,henceaBWfluidtotalyieldof 24% endobronchial biopsy was taken in 4 patients with a positive yield in 1 (25%) patients.
Post bronchoscopic sputum for AFB staining was doneinhalfofthepatients10withapositiveyieldinthe2patients(20%)
A preliminary diagnosis of malignancy was made in21patients,BWwasdonein20ofthesepatientswithapositiveyield in9 (45%)of them.Of the15patientin whom endobronchial biopsy was taken. 13(86.66%) turned out to be positive for malignancy.
Among the 15 patients with definite diagnosis ofmalignancy, most common cell type in our study was of Squamous Cell Carcinoma occurring in 7(46.66%) of patients. the exact cell type could not be identifiedin4(30.77)patientsandweremanagedinthelinesofnon small lung carcinoma. Adenocarcinoma occurred in about3(20%)patientsandothermalignanciesoccurredin 1 (6.66%) patients.
The complications following bronchoscopic procedure were very few, minor hemorrahage following forceps biopsy was seen in 2(4%) patients, hypoxia requiring postponement of the procedure to a later date occurred in 1(2%) patient and respiratory distress requiring observation following the procedure occurred in 1(2%) patient
dISCuSSION
Nearly half of the patients 42% included in our studyhadasuspecteddiagnosisofmalignancy&40%had a prebronchoscopic diagnosis of sputum negative pulmonary Koch`s. A pre bronchoscopic diagnosis of hemoptysis with normal chest x ray was done in 12% of our patients. 3(6%) patients with chronic cough with non localizingchestxraywerealsoincluded.Ourfindingsare similar to study by Sinha et al.9
FOb Findings:Vocalcordswereinvolvedin2of50(4%)patientsinourstudy.Inflammatorylesionswerethemostcommonbronchoscopicfindingsseenin15(30%)patients
Indian Journal of Public Health Research & Development, April 2018, Vol.9, No. 4 95
followed by intra luminal growth in 11(22%). However in 8(16%) of bronchoscopies were normal. Structural changes in the form of atrophic mucosa or distorted anatomyorbronchostenosiswasseenin6(12%)&extraluminal compression occurred in 12%, followed by bleedingsite,abnormalanatomy&foreignbodyoccurredin3(6%),1(2%),0%patientsrespectively.
In sputum smear negative case of pulmonary tuberculosis, the overall diagnostic yield of smear examination and MTB culture from bronchial washing, post bronchoscopy sputum and histopathological studies of forceps biopsy was found to be 35% in our study comparable with the study by Yuksekol I et al10.
Bronchial washing alone showed evidence of pulmonary Koch’s on MTB culture and smear examination in 28% of cases. I n our study the positive yield of lavage fluid smear for AFB was 20.33%patients,bronchoscopic forceps biopsy was 25% and PBS(20%)whichissimilartostudybyChawlaetal11.
In our study 21 patients were evaluated. Yield of bronchoscopic procedures in diagnosis of lung cancer was 71.42%.
In our study the positive yield from bronchial washings was 45% and forceps biopsy yielded 86.66% .Combinations of biopsy and brushing or biopsy and washings are usually done. It is well established that combination increases the yield.
Among the complications ,minor hemorrhage following forceps biopsy occurred in 2(4%) patients, hypoxia resulting in postponing the procedure to later date resulted in 2% (1 patient),1 patient(2%) developed respiratory distress requiring observation following the procedure. However there were no other serious complications like arrhythmia or cardiac arrest.
Conflict of Interest: None
Source of Support: Self-funding.
ethical Clearance: Taken from Institution Ethics Committee
CONCluSION
The most common symptom in our study was cough followed by breathlessness & fever. Most commonindication in our study was malignancy followed by SputumsmearsnegativepulmonaryKoch’s.FOBaidsintheconfirmationofthediagnosisofpulmonaryKoch’sin 35 of sputum negative cases, which otherwise would have been missed.
FOB was extremely useful in the diagnosis ofmalignancy, with forceps biopsy being the most yielding procedure with an overall yield of 86.66%. Apart from identifying the site of bleeding in few cases, FOB inpatientswithhemoptysis&normalchestxraydidnotaddmuchtodiagnosis.Fiberopticbronchoscopy(FOB)is an important investigation in determining the etiology and definitive diagnosis in patients presenting withvarious respiratory symptoms with undiagnosed lung lesions in the chest x-ray.
ReFeReNCeS
1. Panchabhai TS, Mehta AC. Historical perspectives of bronchoscopy. Connecting the dots. Annals of the American Thoracic Society. 2015May;12(5):631-41.
2.Jackson C. Bronchoscopy: past, present andfuture.NEnglJMed1928;199:758–763.
3.Andersen HA, Fontana RS, Harrison EG, Jr.Transbronchoscopic lung biopsy in diffusepulmonary disease. Dis Chest 1965; 48:187 – 192.
4. Kirkpatrick MB. Lidocaine topical anesthesia for flexiblebronchoscopy.Chest1989;96:965–967.
5.Credle,W, Smiddy, J, Elliott, R Complicationsof fiberoptic bronchoscopy. Am Rev RespirDis1974;109,67-72.[PubMed]
6. Dreison, RB, Albert, RK, Talley, PA, et al Flexible fiberopticbronchoscopyintheteachinghospital.Chest1978;74,144-149.[PubMed][CrossRef]
7.James PL Utz ,Udaya BS Prakash; Indicationsfor and contraindications to Bronchoscopy; Bronchoscopy;Ed.1994;Pub Raven Press Ltd.,New York;81-89
8. Bernard L GEE;Robert B jr.; Bronchoalveolar lavage;Thorax1980,35;1-8.
9.Sinha S ,Guleria R,Pande JN ,Pande RN et alBronchoscopy in adults at tertiary care center: indications and complications. J indian MedAssoc.2004Mar;102(3):152-4,156
10.YuksekolI,BalS,OzkanM,BedirhanI,etal;Thevalueoffiberopticbronchoscopyinthediagnosisof smear negative pulmonary tuberculosis; Tuberk Toraks.2003;51(4):405-9
11.Chawla R, Pant K,Jaggi OP, Chandrashekar S,Thukral SS; Fibreoptic bronchoscopy in smear negative pulmonary tuberculosis; Eur Respir J.1988Oct;1(9);804-6
Randomized Control Study of Foley bulb and Vaginal Misoprostol Compared with Vaginal Misoprostol Alone in
Induction of labour
Ashwini M N1, Saroja C Kamatar2, deepika Mann3
1Associate Professor, 2Assistant Professor, 3Senior Resident. (OBG), Department of Obstetrics and Gynaecology, J J M Medical College, Davangere, Karnataka
AbSTRACT
Purpose: To test the hypothesis that the use of Foley bulb and vaginal misoprostol will result in shorter induction to delivery time compared to vaginal misoprostol alone.
Methods:AprospectiveevaluationofwomenattendinglaborroominhospitalsattachedtoJ.J.M.MedicalCollege,Davangere.100patientswereenrolled,50ineachgroup.Vaginalmisoprostolonlygroup(GroupA) received25μgofmisoprostol every4hours (maximum6doses).Once the cervixbecame favorableor patient was in active labor, misoprostol was discontinued. The combination group (Group B) received vaginalmisoprostol25μgevery4hours.Inaddition,aFoleybulbwasinsertedthroughinternalcervicalosfilledwith50mlofnormalsaline.Otheraspectsoflabourmanagementweresimilarforbothgroups,including continuous electronic fetal monitoring.
Results: The mean induction to delivery time was shorter with the combination of Foley bulb and vaginal misoprostol when compared to vaginal misoprostol alone (7.32±3.26 hours vs 12.19±7.22 hours). Caesareansectionsweremoreinmisoprostolgroupascomparedtocombinationgroup(10%vs4%).Laborcomplications or adverse neonatal and maternal outcomes were less with combination group.
Conclusion: A combination of Foley bulb and vaginal misoprostol resulted in a shorter induction to delivery time when compared with vaginal misoprostol alone without increasing any labor complications.
Keywords: Induction; Cervical ripening; Foley catheter; Misoprostol
Corresponding Author:Dr Saroja C KamatarAssistantProfessorDepartmentofObstetricsandGynaecologyJJMMedicalCollege,Davangere-577004.KarnatakaMob.:09886710853E-mail: [email protected] [email protected]
INTROduCTION
The aim of successful induction of labour is to achieve vaginal delivery when continuation of pregnancy presents a threat to the life or well being of the mother or her unborn child. The infant should be delivered in good condition in an acceptable time frame and with a minimumofmaternaldiscomfortandsideeffects.1
In order to be successful, induction of labour must fulfillthreeaims.First,itshouldresultinlabournamelyadequate uterine contractions and progressive dilatation of cervix, second this labour should result in vaginal delivery, as there is little purpose in bringing about as a mere preparation for cesarean delivery, third, in viable pregnancies, these aims must be achieved with a minimum of discomfort and risk to both mother and fetus. Achievement of these goals is largely dependent ontheconditionofcervix.A`ripe‟softyieldingcervixrequires a lower quantum of uterine work than an `unripe‟hardandrigidonewould.Anunripecervixfailsto dilate well in response to myometrial contractions.2
The phenomenon of labour is dynamic, Liggins has stated that “Hypothesis for the initiation of labour is incomplete unless it includes a satisfactory explanation forthestructuralchangesincervix”.3,4
DOI Number: 10.5958/0976-5506.2018.00263.2
Indian Journal of Public Health Research & Development, April 2018, Vol.9, No. 4 97
Labour induction in the presence of an unfavourable cervix is associated with an increased likelihood of prolonged labour and an increased incidence of chorioamnionitis and cesarean delivery.5 Variousmethodsof ripening for the unfavourable cervix and induction of labour are being used by many obstetricians, still, the best agent and method for induction of labour remains uncertain. Thus this study was undertaken to evaluate the safety and efficacy of a combination of the Foleybulb and vaginal misoprostol with vaginal misoprostol alone for labour induction.
MeThOdOlOgy
Source of data: A randomized control study of pregnant women in labour attending the hospitals attached to J.J.M.MedicalCollege,Davangere,betweenNovember2014toSeptember2016.
MATeRIAl ANd MeThOd
A prospective evaluation of women attending labor room in hospitals attached to J.J.M.Medical College,Allgravidaeofagedbetween19-35yearswhofulfilltheinclusion criteria were included in the study.
Inclusion criteria: Singleton pregnancies, Vertexpresentation, Unfavorable cervix (Bishop Score <6),gestational age greater than 28 weeks gestation,
exclusion criteria: Anomalous fetus. Women with Fetal malpresentation, Multifetal gestation, Fetal demise, Contraindication to prostaglandins, Non- reassuring fetal heart rate tracing, Oligohydramnios, CephaloPelvic Disproportion (CPD),Contracted pelvis, Placenta praevia,Previouscaesareandeliveryorothersignificantuterine surgery.
One hundred patients were enrolled, 50 in eachgroup. An informed and written consent was taken from each patient. The course of study is explained. All patients underwent nvestigations like complete hemogram, serum proteins, Blood grouping and typing,routine urine examination, HIV test, HbSAg and Obstetricultrasound.The patients were divided into two groups namelyGroupAandGroupB.Vaginalmisoprostolonlygroup (GroupA) received 25μg of misoprostol every4 hours (maximum6 doses).Once the cervix becamefavorable or patient is in active labor, misoprostol was discontinued. In the Combined group (Group B) a 16
F foley catheter was inserted through internal cervical osunderallasepticprecautionsandfilledwith50mlofnormal saline. Catheter was then pulled against os and taped to inner side of the thigh. Simultaneously they received 25micrograms of misoprostol per vaginum for every four hours for a maximum of 6 doses. Partograph was maintained throughout the labour. Other aspectsof labor management were similar for both groups, including continuous electronic fetal monitoring. In all patients, the cervical status was assessed by using Bishop Score prior to induction. Repeat Bishop Scores were assessed prior to each dose. Following parameters were recorded –number of doses, the interval between induction to onset of uterine contraction, induction-delivery interval, mode of delivery, maternal and neonatalcomplicationsandadverseeffectsof thedruglike fever, diarrhea, nausea and others.
Statistical Analysis: Data was analyzed using paired T test and chi-square test.
ReSulTS
Mean age was comparable in both the groups (23.7±3.4 vs 23.7±3.4 years). Postdated pregnancy formed the largest group of indication for induction in either group constituting 42% in misoprostol group and 34% in combination group, followed by gestational hypertension constituting the second major indication for induction in both the groups. There was almost an equal distribution of both primigravida and multigravida patients in both misoprostol and combination group. In misoprostol group full term (FT) pregnancies constituted upto 58% and postdated pregnancies constituted upto 42% of the total. Where as in combination group, full term pregnancies formed upto 66% of the total and postdated pregnancies formed upto 34% of the total cases.
In present study, 50%of cases requiredonedose,24% of cases required two doses, 16% of cases required 3dosesand10%ofcasesrequired4dosesofintravaginalmisoprostol. In combination group, 64% of cases required one dose, 36% of cases required two doses. P-valuewas significant (p<0.002) and less number ofcases in combination group required more than one dose of misoprostol.
The induction to pain interval ranged from 1-4 hours (2.82±0.77) in misoprostol group and 0.5 – 4hours(2.55±0.96)incombinationgroupandbothwerecomparable.
98 Indian Journal of Public Health Research & Development, April 2018, Vol.9, No. 4
The induction delivery interval ranged from 4.5-32.5 hours with a mean of 12.19±7.22 hours in misoprostol group, while in the combination group it ranged from 4-16 hours with a mean of 7.32±3.26 hours. 5 cases in vaginal misoprostol group and 2 cases in combination group were taken for caesarean section. There was statistically highly significant difference ininduction delivery interval between the misoprostol and combination group. In the present study, 84% of total cases in misoprostol group and 92% of the total cases in combination group had spontaneous vaginal delivery. Full term outlet forceps delivery occurred in 4% of the cases in the misoprostol group as well as in the combination group. Full term vacuum delivery occurred in 2% of the cases in misoprostol group when compared to none in combination group. Caesarean sections weremoreinmisoprostolgroup(10%)ascomparedtocombination group (4%).Failed induction was present in 6% of the cases in misoprostol group and 2% of the cases in combination group and LSCS was the mode of delivery in failed induction cases..44 of total cases in misoprostol group and 47 of total cases in combination group had clear liquor. 4% of the total cases in misoprostol group and 2% of total cases in combination group had thick meconium stained liquor and babies required NICU care. 8% of the total cases in misoprostol group and 4% of the total cases in combination group had thin meconium stained liquor. The placenta was complete in all the cases in both misoprostol and combination group.
No maternal complication occurred in any case of combination group. Tachysystole occurred in 2% of the total cases in misoprostol group. Fetal distress occurred in 8% of cases in vaginal misoprostol group and 6% of cases in combination group.6% of the babies in vaginal misoprostol group required NICU care and none required NICU care in combination group. In the present study, initial Bishop Score was 3-4 in 78% of the cases in misoprostol group and 94% of the cases in combination group.66% of the cases in misoprostol group, delivered before T12 and 84% of the cases delivered before T12 in combination group.
dISCuSSION
The induction delivery interval as shown by the previous studies 6-11 was shorter in combination group when compared to misoprostol group alone and it was statistically significant. In the present study, the
findings correlated with previous studies. It isevident from the previous studies6,-11, that there is more of vaginal deliveries in combination group when compared to misoprostol group. In the present study, 84% of the total cases in misoprostol group and 92% of the total cases in combination group delivered vaginally. Full term outlet forceps delivery occurred in 4% of the cases in the misoprostol group as well as in the combination group. Full term vacuum delivery occurred in 2% of the cases in the misoprostol group. Caesarean sections were more in misoprostol group as compared to combination group. Failed induction was present in 6% of the cases in misoprostol group and 2% of the cases in combination group.
In a randomized controlled trial conducted by Carbone et al11 inyear2013,itisseenthatmajorcategories for indication for induction were postdated pregnancies, chronic hypertension and pre-eclampsia. In a study conducted by Dahiya et al10 in2016,postdatismandpre-eclampsiawerethe leading indications for induction of labour.In the present study, post dated pregnancy formed largest group of indication constituting 42% in misoprostol group and 34% in combination group and is in conformation with other studies.
It was observed in the study conducted by Carbone et al11 that maternal complications such as tachysystole was more with only misoprostol group. It was 17.9% in combination group and 19.7% in misoprostol group.In ameta analysis conducted byChenW.,Xue J. et al12 risk of tachysystole with fetal heart rate changes was less with combination group (RR 0.58, 95% CI 0.38– 0.91; p=0.02).In the present study, tachysystolewasobserved in 2% of the cases with misoprostol group and none with combination group. 4% of the total cases in misoprostol group and 2% of total cases in combination group had thick meconium stained liquor. 8% of the total cases in misoprostol group and 4% of the total cases in combination group had thin meconium stained liquor.
Conflict of Interest: None
Indian Journal of Public Health Research & Development, April 2018, Vol.9, No. 4 99
Source of Support: Self-funding.
ethical Clearance: Taken from Institution Ethics Committee
CONCluSION
Inductionoflabourisindicatedwhenthebenefitstoeither the mother or the fetus outweigh those of continuing thepregnancy.Ariskbenefitanalysisisnecessarybeforeany induction of labour. Combination of Foleys bulb andintravaginalmisoprostolismoreeffectiveagentforcervical ripening and labour induction than intravaginal misoprostol alone. Both the modes of induction require close observation during course of labour as tachysystole often occur. Babies with meconium stained liquor need expert resuscitation and NICU care. Prior counseling is needed before induction of labour and with regard to the long term outcome of babies admitted to NICU. Combined method of induction will go long way of its ability to induce labour and its outcome. But one should be cautious of its unpredictable risk.
ReFeReNCeS
1. Dasgupta S. Induction of labour : Recent trends. NewDelhi,JPpublications.RecentAdvinObstetand Gynecol 4:13-28.
2. Chandraharan E, Amarasinghe I. physiopharmacoiogy of labour. In :Kumaran SA, editor.Themanagementoflabour.2nded.OrientLongman, p.1-22.
3.ConardJT,UelandK.Physicalcharacteristicsofcervix.ClinObstetGynecol1983;26(l):27-36.
4. Liggins GC, Forster CS, Grieves SA, Schwarts AL. Control of parturition in man. BiolReprod 1977; 16:39.
5. Abramovici D, Goldvvasser S, Mabie BC, Mercer BM, Goldwasser R, Sibai BM. A randomized comparison of oral misoprostol versus foley
catheter and oxytocin for induction of labour at term.AmJObstetGynecol1999;181:1108-1112
6.Ande AB, Ezaenochie CM, Olagnuji NB.Induction of labor in prolonged pregnancy with unfavorable cervix: comparison of sequential intracervicalfoley catheter- intravaginal misoprostol and intravaginal misoprostol alone. ArchGynaecolObstet2012;285(4):967-71.
7.HillJB,ThigpenBD,BofillJA,MagannE,MooreLE, Martin JN Jr. A randomized clinical trialcomparing vaginal misoprostol versus cervical Foley plus oral misoprostol for cervical ripening andlaborinduction.AmJPerinatol2009;26;33-8.
8. Kehl S, Ehard A, Berlit S, Spaich S, Sutterlin M, Siemer J. Combination of misoprostol andmechanical dilation for induction of labor: a randomizedcontrolledtrial.EurJObstetGynecolReprodBiol2011;159;315-9.
9. Lanka S, Surapaneni T, Nirmalan PK. Concurrent use of foley catheter and misoprostol for induction oflabor:arandomizedclinicaltrialofefficacyandsafety.JObstetGynaecolRes.2014;40(6):1527-33.
10.Dahiya K,Charaya E .A comparative study ofcombined Foley Bulb and Vaginal Misoprostolwith Vaginal Misoprostol alone for cervicalripeningandInductionoflabour.BrJMedHealthRes.2016;3(5).
11.JeanineF.Carbone,MethodiusG.Tuuli,PatriciaJ. Fogertey, Kimberly A.Roehi, George A.Macones. Combination of foley bulb and vaginal misoprostol compared with vaginal misoprostol alone for cervical ripening and labor induction. ObstetGynecol2013;121:247-52.
12.Chen W,Xue J ,Peprah MK,WenSW,WalkerM,GaoY,Tang Y.A systematic review and network meta-analysis comparing the use of Foley catheter, misoprostol and dinoprostone for Cervical ripeningand inductionof labour.BJOG2016Feb;123(3):346-54.
Iodine Deficiency Disorder in Rural Population: A Community based Observational Study on Prevalence in Coastal Area of
Tamil Nadu State, South India.
Senthilvel Vasudevan1, Priyankaraj CK2, Sumathi Senthilvel3, Jayanthi Sureshbabu4
1Assistant Professor, HOD, Department of Biostatistics, Amrita Institute of Medical Sciences, Amrita Vishwa Vidyapeetham, AIMS–Ponekkara, Kochi, Kerala; 2Associate Professor, Department of Public Health and Epidemiology, Oman Medical College, Sohar, Sultanate of Oman; 3Assistant Professor in Nursing, Amrita College of Nursing, Amrita Vishwa Vidyapeetham, AIMS–Ponekkara, Kochi, Kerala;
4Formerly Tutor in Medical Entomology, Department of Community Medicine, Pondicherry Institute of Medical Sciences, Kalapet, Pondicherry
AbSTRACT
background and Objectives: Iodine is an essential micronutrient needed for normal human growth and brain development.Methods and Study design: A community based observational study was done in Anichakuppam, Villupuramdistrict,TamilNadu,SouthIndiaintheyearof2012withasampleof2830individualsfrom1233 households. Eight villages were randomly selected and data were collected by house-to-house survey. Allagegroupswereincludedwithanexclusionof<2yearsinthispresentstudy.Results: In the present study, overall goiter prevalence was 8% of which the visible goiter rate was 2.6%. The prevalence of goiter is more in the lower socio-economic group, higher prevalence was found in females as compared to males’ population.Conclusion: We have concluded that the prevalence of goiter would be reduced by consuming mineral water for drinking purpose and by a program of distribution of iodized salt has been initiated to eliminate goiter problem.Keywords: iodine deficiency disorder, rural population, prevalence, goiter, source of water
Corresponding Author:Dr.SenthilvelVasudevan,AssistantProfessor–Cum–HODin-chargeinBiostatistics,Department of Biostatistics,Amrita Institute of Medical Sciences and Research Centre,AmritaVishwaVidyapeetham,AIMS-Ponekkara,Kochi,Kerala–682041MobileNo:9387651050Email ID: [email protected]
INTROduCTION
Iodine is an essential micronutrient needed for normal human nutrition, health, growth and brain development1,2. The higher prevalence of mental retardation was found in 73 – 120 months of agedchildren3.Iodinedeficiencydisordersareamajorpublichealth problem in both developed and developing
countries. Human beings from age groups 9–13 and above70yearsareneediodinerangingfrom120to150micrograms every day4. Iodine deficiency is the mostcommon preventable cause of brain damage with more than2billionpeoplefrom130countriesatrisk.Theyarea threat to the social and economic development of these countries5.Outof587districtsinthecountryintheyear,241 of the 282 districts surveyed for IDD were found to be endemic. These 241 districts covered all the states and Union Territories in India6. IDD would be controlled by the coordination of the stakeholders in India, making policy and by some Food Safety and Standards Act, 2006andbysomeotheractivities7, 8. Iodinedeficiencyis the prominent and most important preventable cause of brain damage in all over the world3, 9. In 1990 lessthanone infivehouseholds in theworldused iodizedsalt.By2007,morethan70%ofhouseholdshadaccess
DOI Number: 10.5958/0976-5506.2018.00264.4
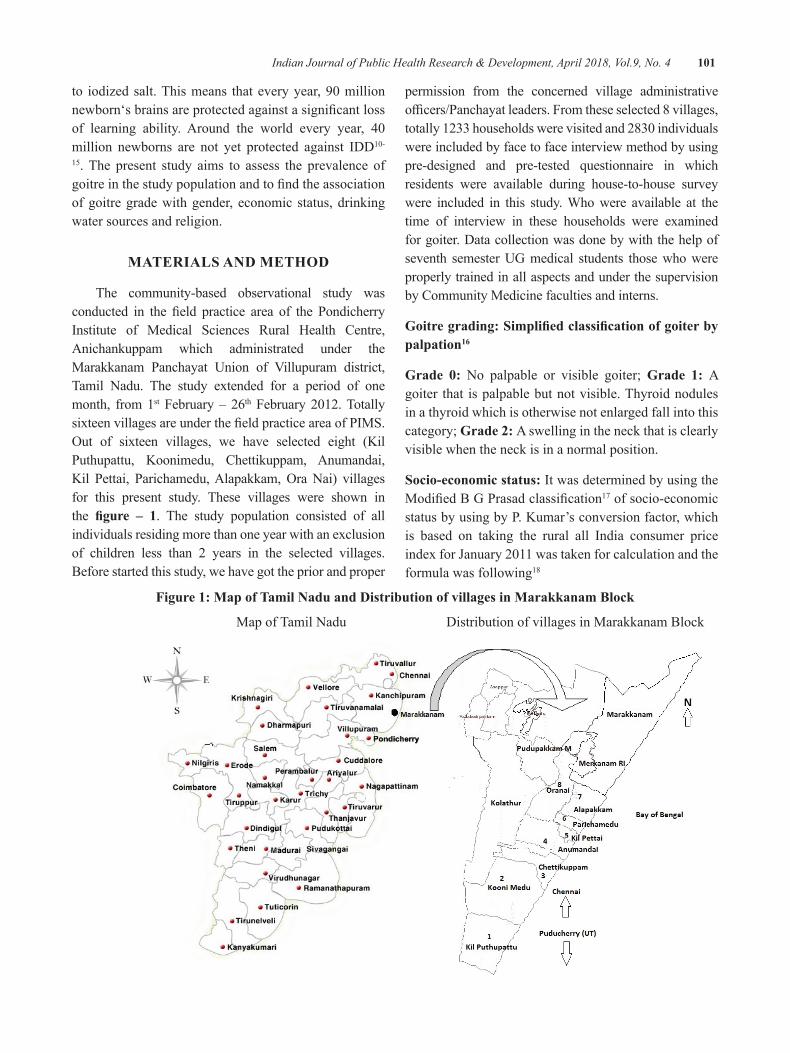
Indian Journal of Public Health Research & Development, April 2018, Vol.9, No. 4 101
to iodizedsalt.Thismeans thateveryyear,90millionnewborn‘sbrainsareprotectedagainstasignificantlossof learning ability. Around the world every year, 40million newborns are not yet protected against IDD10-
15. The present study aims to assess the prevalence of goitreinthestudypopulationandtofindtheassociationof goitre grade with gender, economic status, drinking water sources and religion.
MATeRIAlS ANd MeThOd
The community-based observational study was conducted in the field practice area of the PondicherryInstitute of Medical Sciences Rural Health Centre, Anichankuppam which administrated under the Marakkanam Panchayat Union of Villupuram district,Tamil Nadu. The study extended for a period of one month, from 1st February – 26th February2012.TotallysixteenvillagesareunderthefieldpracticeareaofPIMS.Out of sixteen villages, we have selected eight (KilPuthupattu, Koonimedu, Chettikuppam, Anumandai, Kil Pettai, Parichamedu,Alapakkam,OraNai) villagesfor this present study. These villages were shown in the figure – 1. The study population consisted of all individuals residing more than one year with an exclusion of children less than 2 years in the selected villages. Before started this study, we have got the prior and proper
permission from the concerned village administrative officers/Panchayatleaders.Fromtheseselected8villages,totally1233householdswerevisitedand2830individualswere included by face to face interview method by using pre-designed and pre-tested questionnaire in which residents were available during house-to-house survey were included in this study. Who were available at the time of interview in these households were examined for goiter. Data collection was done by with the help of seventh semester UG medical students those who were properly trained in all aspects and under the supervision by Community Medicine faculties and interns.
goitre grading: Simplified classification of goiter by palpation16
Grade 0: No palpable or visible goiter; grade 1: A goiter that is palpable but not visible. Thyroid nodules in a thyroid which is otherwise not enlarged fall into this category; grade 2: A swelling in the neck that is clearly visible when the neck is in a normal position.
Socio-economic status: It was determined by using the ModifiedBGPrasadclassification17 of socio-economic status by using by P. Kumar’s conversion factor, which is based on taking the rural all India consumer price indexforJanuary2011wastakenforcalculationandtheformula was following18
Figure 1: Map of Tamil Nadu and distribution of villages in Marakkanam block
Map of Tamil Nadu Distribution of villages in Marakkanam Block
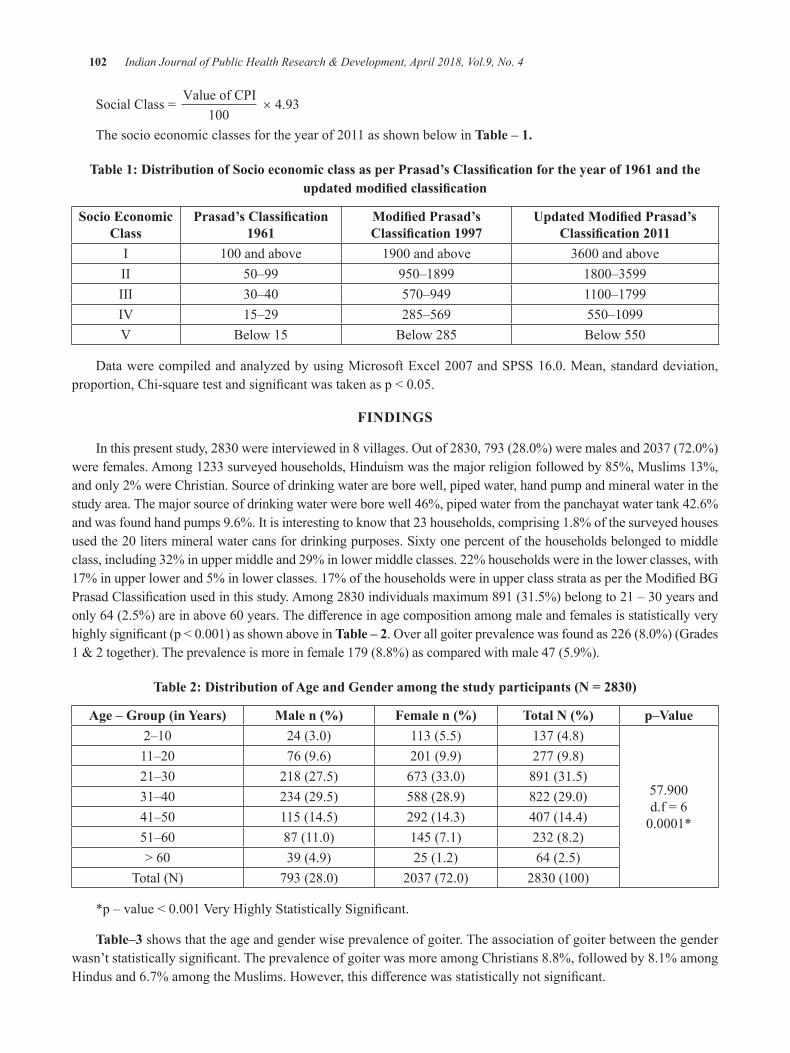
102 Indian Journal of Public Health Research & Development, April 2018, Vol.9, No. 4
SocialClass= Value of CPI
100 × 4.93
Thesocioeconomicclassesfortheyearof2011asshownbelowinTable – 1.
Table 1: Distribution of Socio economic class as per Prasad’s Classification for the year of 1961 and the updated modified classification
Socio economic Class
Prasad’s Classification 1961
Modified Prasad’s Classification 1997
Updated Modified Prasad’s Classification 2011
I 100andabove 1900andabove 3600andaboveII 50–99 950–1899 1800–3599III 30–40 570–949 1100–1799IV 15–29 285–569 550–1099V Below 15 Below 285 Below550
Data werecompiledandanalyzedbyusingMicrosoftExcel2007andSPSS16.0.Mean,standarddeviation,proportion,Chi-squaretestandsignificantwastakenasp<0.05.
FINdINgS
Inthispresentstudy,2830wereinterviewedin8villages.Outof2830,793(28.0%)weremalesand2037(72.0%)were females. Among 1233 surveyed households, Hinduism was the major religion followed by 85%, Muslims 13%, and only 2% were Christian. Source of drinking water are bore well, piped water, hand pump and mineral water in the study area. The major source of drinking water were bore well 46%, piped water from the panchayat water tank 42.6% and was found hand pumps 9.6%. It is interesting to know that 23 households, comprising 1.8% of the surveyed houses usedthe20litersmineralwatercansfordrinkingpurposes.Sixtyonepercentofthehouseholdsbelongedtomiddleclass, including 32% in upper middle and 29% in lower middle classes. 22% households were in the lower classes, with 17%inupperlowerand5%inlowerclasses.17%ofthehouseholdswereinupperclassstrataaspertheModifiedBGPrasadClassificationusedinthisstudy.Among2830individualsmaximum891(31.5%)belongto21–30yearsandonly64(2.5%)areinabove60years.Thedifferenceinagecompositionamongmaleandfemalesisstatisticallyveryhighlysignificant(p<0.001)asshownaboveinTable – 2.Overallgoiterprevalencewasfoundas226(8.0%)(Grades1&2together).Theprevalenceismoreinfemale179(8.8%)ascomparedwithmale47(5.9%).
Table 2: Distribution of Age and Gender among the study participants (N = 2830)
Age – Group (in Years) Male n (%) Female n (%) Total N (%) p–Value2–10 24(3.0) 113 (5.5) 137 (4.8)
57.900d.f=60.0001*
11–20 76 (9.6) 201(9.9) 277 (9.8)21–30 218 (27.5) 673(33.0) 891 (31.5)31–40 234 (29.5) 588 (28.9) 822(29.0)41–50 115 (14.5) 292 (14.3) 407(14.4)51–60 87(11.0) 145 (7.1) 232 (8.2)>60 39 (4.9) 25 (1.2) 64 (2.5)
Total (N) 793(28.0) 2037(72.0) 2830(100)
*p–value<0.001VeryHighlyStatisticallySignificant.
Table–3 shows that the age and gender wise prevalence of goiter. The association of goiter between the gender wasn’tstatisticallysignificant.TheprevalenceofgoiterwasmoreamongChristians8.8%,followedby8.1%amongHindusand6.7%amongtheMuslims.However,thisdifferencewasstatisticallynotsignificant.
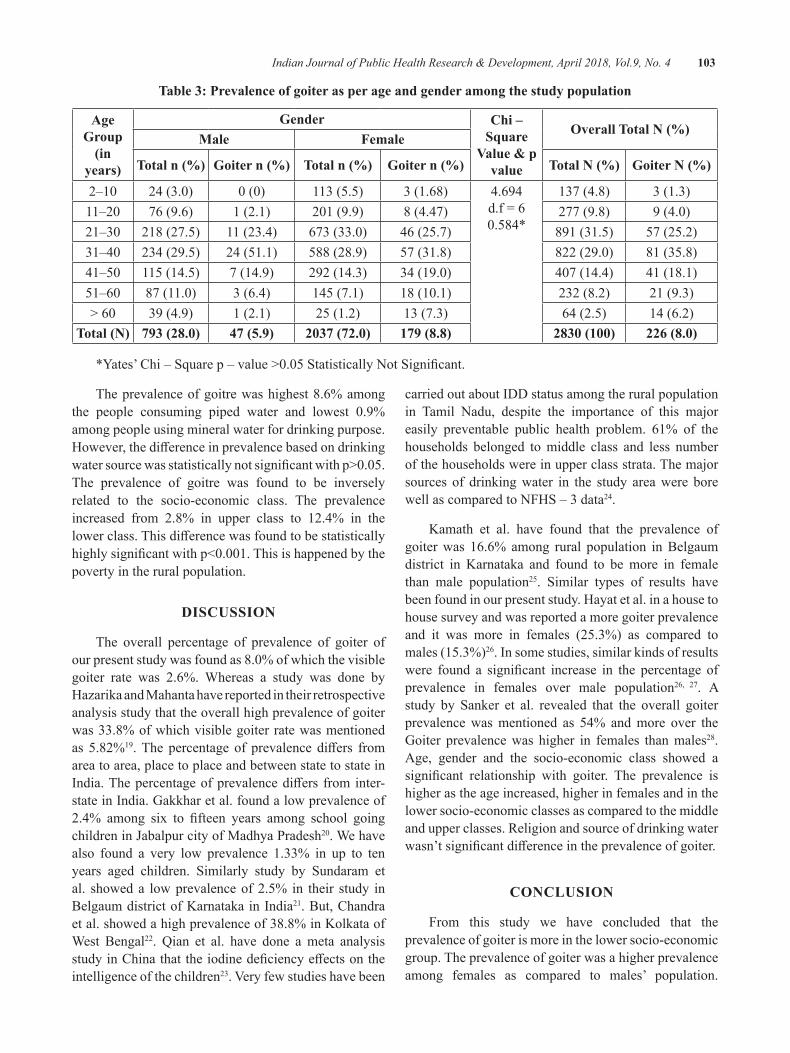
Indian Journal of Public Health Research & Development, April 2018, Vol.9, No. 4 103
Table 3: Prevalence of goiter as per age and gender among the study population
Age group
(in years)
gender Chi – Square
Value & p value
Overall Total N (%)Male Female
Total n (%) Goiter n (%) Total n (%) Goiter n (%) Total N (%) Goiter N (%)
2–10 24(3.0) 0(0) 113 (5.5) 3 (1.68) 4.694d.f=60.584*
137 (4.8) 3 (1.3)11–20 76 (9.6) 1 (2.1) 201(9.9) 8 (4.47) 277 (9.8) 9(4.0)21–30 218 (27.5) 11 (23.4) 673(33.0) 46 (25.7) 891 (31.5) 57 (25.2)31–40 234 (29.5) 24 (51.1) 588 (28.9) 57 (31.8) 822(29.0) 81 (35.8)41–50 115 (14.5) 7 (14.9) 292 (14.3) 34(19.0) 407(14.4) 41 (18.1)51–60 87(11.0) 3 (6.4) 145 (7.1) 18(10.1) 232 (8.2) 21 (9.3)>60 39 (4.9) 1 (2.1) 25 (1.2) 13 (7.3) 64 (2.5) 14 (6.2)
Total (N) 793 (28.0) 47 (5.9) 2037 (72.0) 179 (8.8) 2830 (100) 226 (8.0)
*Yates’Chi–Squarep–value>0.05StatisticallyNotSignificant.
The prevalence of goitre was highest 8.6% among the people consuming piped water and lowest 0.9%among people using mineral water for drinking purpose. However,thedifferenceinprevalencebasedondrinkingwatersourcewasstatisticallynotsignificantwithp>0.05.The prevalence of goitre was found to be inversely related to the socio-economic class. The prevalence increased from 2.8% in upper class to 12.4% in the lowerclass.Thisdifferencewasfoundtobestatisticallyhighlysignificantwithp<0.001.Thisishappenedbythepoverty in the rural population.
dISCuSSION
The overall percentage of prevalence of goiter of ourpresentstudywasfoundas8.0%ofwhichthevisiblegoiter rate was 2.6%. Whereas a study was done by Hazarika and Mahanta have reported in their retrospective analysis study that the overall high prevalence of goiter was 33.8% of which visible goiter rate was mentioned as 5.82%19.The percentage of prevalence differs fromarea to area, place to place and between state to state in India.Thepercentageofprevalencediffers frominter-state in India. Gakkhar et al. found a low prevalence of 2.4% among six to fifteen years among school goingchildreninJabalpurcityofMadhyaPradesh20. We have also found a very low prevalence 1.33% in up to ten years aged children. Similarly study by Sundaram et al. showed a low prevalence of 2.5% in their study in Belgaum district of Karnataka in India21. But, Chandra et al. showed a high prevalence of 38.8% in Kolkata of West Bengal22. Qian et al. have done a meta analysis studyinChinathattheiodinedeficiencyeffectsontheintelligence of the children23.Veryfewstudieshavebeen
carried out about IDD status among the rural population in Tamil Nadu, despite the importance of this major easily preventable public health problem. 61% of the households belonged to middle class and less number of the households were in upper class strata. The major sources of drinking water in the study area were bore well as compared to NFHS – 3 data24.
Kamath et al. have found that the prevalence of goiter was 16.6% among rural population in Belgaum district in Karnataka and found to be more in female than male population25. Similar types of results have been found in our present study. Hayat et al. in a house to house survey and was reported a more goiter prevalence and it was more in females (25.3%) as compared to males (15.3%)26. In some studies, similar kinds of results were found a significant increase in the percentage ofprevalence in females over male population26, 27. A study by Sanker et al. revealed that the overall goiter prevalence was mentioned as 54% and more over the Goiter prevalence was higher in females than males28. Age, gender and the socio-economic class showed a significant relationship with goiter. The prevalence ishigher as the age increased, higher in females and in the lower socio-economic classes as compared to the middle and upper classes. Religion and source of drinking water wasn’tsignificantdifferenceintheprevalenceofgoiter.
CONCluSION
From this study we have concluded that the prevalence of goiter is more in the lower socio-economic group. The prevalence of goiter was a higher prevalence among females as compared to males’ population.
104 Indian Journal of Public Health Research & Development, April 2018, Vol.9, No. 4
Through IEC program educate public to use the iodized rich salt, selling iodized salt by all stakeholders as well as by the retail shopkeepers to eliminate or to control the IDDproblemeffectivelyinruralpopulation.
Conflict of Interest: None
Source of Funding: No funding from any agencies/financialinstitutions.
ethical Clearance: Ethical approval was taken from Institutional Ethics Committee of Pondicherry Institute of Medical Sciences, Pondicherry before conducting our study. We have explained about our study and its importance in local language TAMIL and no incentives wasgiventothem.Anonymityandconfidentialitywereensured throughout the study.
ReFeReNCeS
1.World Health Organization. Iodine. In: Traceelements in human nutrition and health. Geneva: Macmillan, 1996:49-71. ISbN: 9241561734 Available from: http://apps.who.int/iris/bitstream/10665/37931/2/9241561734_eng.pdf
2. Delange F. The role of iodine in brain development. ProcNutrSoc2000;59(1):75-9.PMId:10828176
3. Sharma S, Raina SK, Bhardwaj AK, Chaudhary S,KashyapV,ChanderV.PrevalenceofMentalRetardation in Urban and Rural Populations of the GoiterZone inNorthwest India. IndianJPublicHealth 2016;60:131-7. dOI: 10.4103/0019-557X.184545
4. Kapil U. Health Consequences of Iodine Deficiency.SultanQaboosUnivMedicalJournal2007;7(3):267-72.
5. Universal Salt Iodization (USI). Newsletter of the United Nations System: Standing Committee on Nutrition. No.35 2007;1–80. ISSN: 1564–3743 London. Global progress and public health success stories to address IDD through USI, Key programme components, lessons learned at country level, and the way forward to research USI globally. Available from: http://www.unsystem.org/scn/Publications/SCNNews/scnnews35.pdf.
6. Kapil U. Progress made in elimination of IDD and possible impact of lifting ban on sale of non-iodizedsalt.JAcadHospAdmin2000;12(2):33-1.
7. Pandav CS, Yadav K, Srivastava R, Pandav R, Karmarkar M.G. Iodine deficiency disorders(IDD) control in India. Indian J Med Res2013;138:418-33.PMCID:PMC3818611
8.AburtoNJ,AbudouM,CandiasV,TiaxiangWu.WHO:Effectandsafetyofsaltiodizationtopreventiodine deficiency disorders: a systematic reviewwith meta-analysis. WHO report Switzerland2014; 1-151. ISBN: 9789241508285. Availablefrom: http://apps.who.int/iris/bitstream/10665/148175/1/9789241508285_eng.pdf
9.Assessment of Iodine Deficiency Disordersand Monitoring their Elimination. A guide for programme managers. Second Edition. WHO2001;1-124. Available from: http://www.who.int/nutrition/publications/en/idd_assessment_monitoring_eliminination.pdf
10.Recommendediodinelevelsinsaltandguidelinesformonitoring theiradequacyandeffectiveness.Geneva,WorldHealthOrganization, 1996:1-12.Available from:
http://apps.who.int/iris/bitstream/10665/63322/1/WHO_NUT_96.13.pdf
11. Delange F, Fisher D, Malvaux P. Adaptation to iodinedeficiencyduringgrowth:Etiopathogenesisof endemic goiter and cretinism. Pediatric Thyroidology 1985:295–26.
12.DumontJE,ErmansAM,MaenhautC.etal.Largegoiter as a maladaptation to iodine deficiency.ClinicalEndocrinology1995;43(1):1–10.
13.HetzelBS.Iodinedeficiencydisorders(IDD)andtheir eradication. Lancet 1983; 2(8359):1126 –9.
14. Bleichrodt N, Born MP. A meta-analysis of research on iodine and its relationship to cognitive development. In:StanburyJB,ed.Thedamagedbrain of iodine deficiency. New York, NY:CognizantCommunication1994;195–0.
15.Delange F. Iodine deficiency as a cause ofbrain damage. Postgraduate Medical Journal2001;77:217–20.DOI:10.1136/pmj.77.906.217
16.World Health Organization. In: Goitre as adeterminant of the prevalence and severity of iodine deficiency disorders in populations.Vitamin and Mineral Nutrition Information
Indian Journal of Public Health Research & Development, April 2018, Vol.9, No. 4 105
System. Switzerland WHO report 2014;1-6. Available from: http://apps.who.int/iris/bitstream/10665/133706/1/WHO_NMH_NHD_EPG_14.5_eng.pdf?ua=1
17.Prasad B.G. Social Classification of Indianfamilies.JIndianMedAssoc1961;37:250-1.
18.Kumar P. Social classification need for constantupdating.IndianJCommunityMed1993:18:60-1.
19.HazarikaNC,Mahanta J. Environmental IodineDeficiencyandGoiterPrevalenceinABlockAreaof the North Eastern Region: A Retrospective Analysis.JHumEcol2004;15(2):113-7.
20.GakkharRK,BharadwajVK,ChansoriaM,JainS,VisnoiR.Prevalenceofgoiterinschool-goingchildreninJabalpur.IndianJPediatr2001;68:229-33. PMID: 11338218
21.Sundaram J, Sugunammani BK, ChandrashekarK. Goitre prevalence in Karnataka. Indian JCommunityHealth1997;3:98-105.
22. Chandra AK, Tripathy S, Ghosh D, Debnath A, Mukhopadhyay S. Iodine Nutritional status and prevalence of goiter in Sundarban delta of south 24 parganas-West Bengal. Indian J Med Res2005;122:419-24.PMID:16456256
23.QianM,WangD,WatkinsWE, GebskiV,YanYQ, Li M, Chen ZP. The effects of iodine onintelligence in children: a meta-analysis of studiesconductedinChina.AsiaPacJClinNutr2005;14(1):32-2.
24. National Family Health Survey (NFHS – 3) in the year 2005 – 06: Report 2008.Availablefrom: http://rchiips.org/nfhs/NFHS-3%20Data/TamilNadu_report.pdf
25.KamathR,VinodBhat,RaoRSP,AcharyaDas,Ganesh KS, Asha Kamath. Prevalence of Goiter in rural area of Belgaum district, Karnataka. Indian J Community Med 2009;34(1):48-1. PMCID:PMC2763667DOI:10.4103/0970-0218.45373
26.Hayat J, Srivasthva VK, Udai M, jain VC.PrevalenceofIodinedeficiencydisordersinruralpopulationofLucknow.IndianJCommunityMed1987;12:84-90.
27. Patowary S, Patowary AC, Sarma EC, Goswami V,AhmedCC,DasMK.Endemicgoiter:Anewlyemerged health problem. Indian J CommunityMed 1998;13:9-13.
28. Sankar R, Pulger T, Gomathi S, Bimal R, Gyatso TR, Pandav CS. Epidemiologic endemic goiter in Sikkim.JAssocPediatrI1987;45:936-9.
The Study of the Relationship between Normative and Informative Identity Styles with Differentiation of Self and
Psychological Well-being of the Students
Parvin ghader1, Fatemeh Moradi1
1MA of Psychology, Vali-e-Asr University of Rafsanjan, Rafsanjan, Iran
AbSTRACT
This study aimed to investigate the relationship between normative and informative identity style with differentiationofselfandpsychologicalwell-beingofthestudentsofValiasrUniversityofRafsanjancity.This is a descriptive correlational study. Statistical population consisted of all 2000 students ofValiasrUniversityofRafsanjanwhoresideinthedormitories,ofwhom,320studentsfromeightdormitorieswereselectedusingthesingle-stagerandomizedclustersampling.Datawerecollectedbydifferentiationofselfquestionnaire (1988), Reef’s psychological well-being questionnaire (1989), and Identity Style Inventory (1989). This study examined the Pearson correlation coefficient between informative identity style anddifferentiation of self; results showed no significant correlation between these variables, however, therewasasignificantcorrelationbetweennormativeidentitystyleanddifferentiationofself.Finally,theresultsshowed that therewasno significant correlationbetween informational identity style anddifferentiationofself,however,therewasasignificantrelationshipbetweennormativedimensionanddifferentiationofself.Moreover,therewasasignificantcorrelationbetweeninformativeandnormativeidentitystylewithpsychological well-being.
Keywords: Informative Identity Style, Normative Identity Style, Differentiation of Self, Psychological Well-being
Corresponding Author:Parvin GhaderEmail: [email protected]
INTROduCTION
Leaving home and entering the new academic new environment is challenging for most of the students and the solutions that students use to solve this problem, whether inside or outside of the university is often incomplete; because there aremany factors that affectthis situation 1.Differentiationoremotionalautonomyisone of the main issues of the young people notably early yearsoftheuniversity.Differentiatedpeoplecanclearlydefinethemselvesandbeliefs,choosetheirlifedirections,control highly emotional situations that sometimes lead to involuntary behaviors and unsuccessful decisions and make rational and logical decisions. On the contrary,undifferentiatedpeoplewhocannotdefinetheiridentityand make decision based on the emotional atmosphere of their family in their interpersonal issues experience high chronic anxiety and they are vulnerable to the
psychological problems and may show symptoms of the diseases2. Differentiation of self is the mostprominent concept of the Bowen family systems theory, indicatingthepersonalabilityindifferentiatingrationaland emotional processes. In other words, it means achieving a degree of emotional autonomy in emotional situations without drowning in an emotional atmosphere of those situations and making decisions rationally and autonomously3. Differentiation as the theoreticalcornerstone of Buaen (1987) is formed within family and leads to unity or being together or, conversely, individuality4. Different levels of differentiation areeffective in adjustment of familymembers and highersatisfaction with family relations 5.Differentiation canbe examined at two levels. At the personal level, lack of differentiation or fusion, occurs when people donot separate their emotions from their thoughts and drown in their emotions. At the interpersonal level, an undifferentiatedpersontendstobeabsorbedbyothers’feelings or moves with the emotional atmosphere of the environment or on the contrary, react to others6. At the interpersonal level, differentiation is divided into
DOI Number: 10.5958/0976-5506.2018.00265.6
Indian Journal of Public Health Research & Development, April 2018, Vol.9, No. 4 107
two levels of performance and base 7. Preventing the diseases and mental and behavioral disorders in student life is important and can be achieved by promoting the psychological wellbeing of the students. Wellbeing has preoccupied scholars’ mind for centuries and recently it has been focused in a branch of psychology called positive psychology.
Positive psychology is the scientific study ofoptimal human functioning and focuses on how human and his abilities are flourishing8. Psychological well-beingisdefinedasgrowthofrealtalentsofthepeople8. According to the Ericsson’s theory identity styles are one oftheparametersinfluencingpsychologicalwell-beingand mental health 9.BerzonskyandKuk(2005)believethat identity style refers to the solutions that people use when decision making and problem solving and analyze their personal information. When encountering the information that do not adapt with the self-concept, they can review their behaviors and ideas and accept the new concepts. Brozownsky raises three identity styles including informative identity style, normative identity styleanddiffuse-avoidantidentity10.
Informative identity style: It refers to people who achieve a sense of identity through active searching and evaluating information on themselves. These people test, review and adapt their identity structure with the new information and conditions when encountering with thedifferentinformation.Thisstyleischaracterizedbyactive self-exploration, informative decision-making, autonomy in judgment, high levels of cognitive complexity and high requirement for recognition. Furthermore, these people successfully cope with the stress and anxiety and use the problem-focused coping11.
Normative identity style: It refers to the people who internalize the standards of authority and other important people and coordinate with them12. They are conservative towards the data that threatening their beliefs and values andflexiblyaccepttheoccupational,religiousandfamilyvalues and seek to defend them and to be committed to these values11.Ericssondefinesidentityastheorganizingfundamental principle that evolves over the life, gives people a sense of the continuous self-interaction with others (self-similarity), and provides a framework for distinguishing self and others (integrity) 13. Achieving identity helps people to grow a sense of true intimacy as the main adulthood concern14. Habibipour et al in a study entitled‘Therelationshipbetweenthedifferentiationof
self and psychological well-being’ found that the early family relationships lead to the formation of higher levels of differentiation and this initial experience directlyaffectspsychologicalwell-beinginadulthood15, 16.
MeThOd
This is a descriptive correlational study. Statistical population consisted of all 2000 students of ValiasrUniversity of Rafsanjan who reside in the dormitories, of whom, 320 students from eight dormitories wereselected using the single-stage randomized cluster sampling.
ReSeARCh TOOlS
Identity Style Inventory (ISI): This questionnaire was developed in 1989 and consists of 40 items, basedonthe five-point Likert scale from strongly disagree to strongly agree and measures four informational styles: informative, normative and diffuse - avoidant identity.The validity of the questionnaire was confirmed byWhiteetal.(1998)usingconfirmatoryfactoranalysis17.
Differentiation of self questionnaire: This questionnaire was designed and administered in 1998 by Skowron and Friedlander with 43 items.Then, in 2003,itwasrevisedbySkowronandSmithandthefinalquestionnairewasdevelopedbyJacksonwith46itemsand four factors based on Bowen’s theory. Skowron and Smith(2003)showedthehighreliabilityandvalidityofthis questionnaire. Reliability of its revised form was 0.92usingCronbach’salphaforthetotalscale18.
Psychological Well-being Questionnaire: This questionnaire was developed in 1989 by Reef, consisting of 84 items and 6 factors. Items are scored based on a six-point scale; 47 items are directly scored and 37 items are inversely scored. For measuring the validity of the questionnaire, its relationship with the measurements of the personality traits that were also regarded as the psychological well-being index such as the Bradburn’s emotional balance, Newcarton’s life satisfaction and Rosenberg’s self-esteem were used. Correlational results of Reef test was acceptable with each of the above scales; therefore,itconstructvaliditywasconfirmed.Cronbachalpha in Reef test was as follows: self-acceptance as 0.93,positiverelationswithothersas0.91,autonomyas0.86,environmentalmasteryas0.90,purposeinlifeas0.90andpersonalgrowthas0.8712.
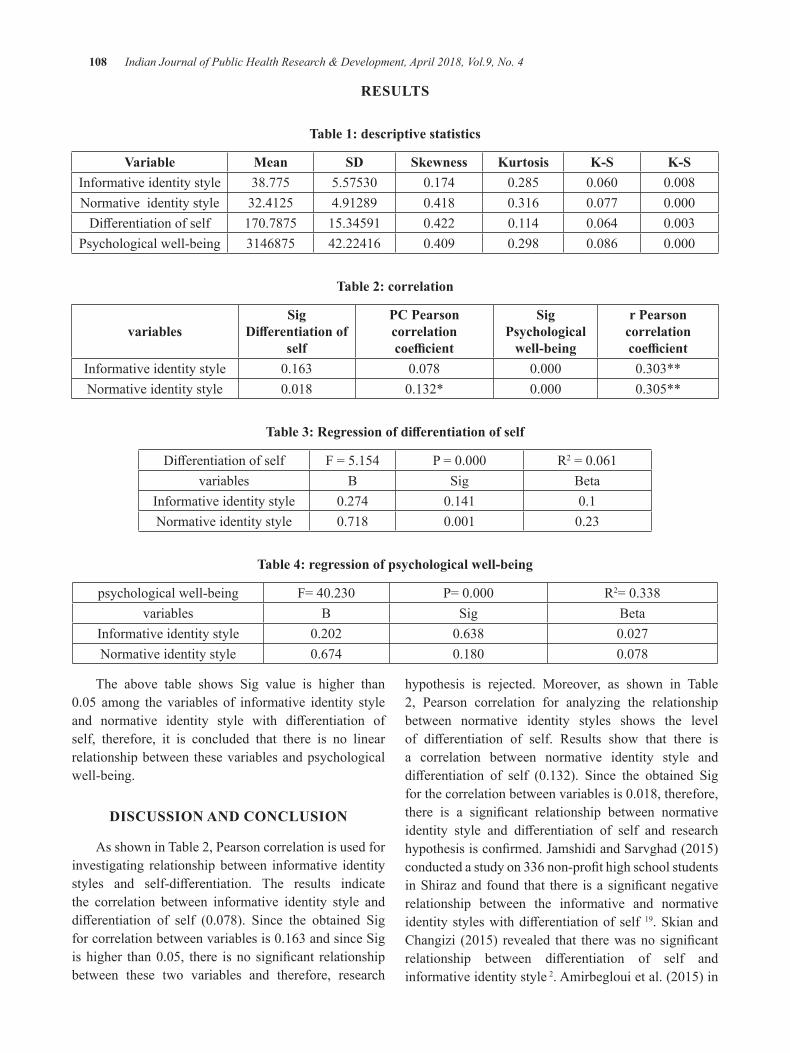
108 Indian Journal of Public Health Research & Development, April 2018, Vol.9, No. 4
ReSulTS
Table 1: descriptive statistics
K-SK-SKurtosisSkewnessSdMeanVariable0.0080.0600.2850.1745.5753038.775Informative identity style0.0000.0770.3160.4184.9128932.4125Normative identity style0.0030.0640.1140.42215.34591170.7875Differentiationofself0.0000.0860.2980.40942.224163146875Psychological well-being
Table 2: correlation
r Pearson correlation coefficient
Sig Psychological
well-being
PC Pearson correlationcoefficient
Sig Differentiation of
selfvariables
0.303**0.0000.0780.163Informative identity style0.305**0.0000.132*0.018Normative identity style
Table 3: Regression of differentiation of self
R2=0.061P=0.000F=5.154DifferentiationofselfBetaSigBvariables0.10.1410.274Informative identity style0.230.0010.718Normative identity style
Table 4: regression of psychological well-being
R2=0.338P=0.000F=40.230psychological well-beingBetaSigBvariables0.0270.6380.202Informative identity style0.0780.1800.674Normative identity style
The above table shows Sig value is higher than 0.05 among the variables of informative identity styleand normative identity style with differentiation ofself, therefore, it is concluded that there is no linear relationship between these variables and psychological well-being.
dISCuSSION ANd CONCluSION
As shown in Table 2, Pearson correlation is used for investigating relationship between informative identity styles and self-differentiation. The results indicatethe correlation between informative identity style and differentiation of self (0.078). Since the obtained Sigforcorrelationbetweenvariablesis0.163andsinceSigishigher than0.05, there isno significant relationshipbetween these two variables and therefore, research
hypothesis is rejected. Moreover, as shown in Table 2, Pearson correlation for analyzing the relationship between normative identity styles shows the level of differentiation of self. Results show that there isa correlation between normative identity style and differentiation of self (0.132). Since the obtained Sigforthecorrelationbetweenvariablesis0.018,therefore,there is a significant relationship between normativeidentity style and differentiation of self and researchhypothesisisconfirmed.JamshidiandSarvghad(2015)conductedastudyon336non-profithighschoolstudentsinShirazandfound that there isasignificantnegativerelationship between the informative and normative identitystyleswithdifferentiationofself 19. Skian and Changizi (2015) revealed that therewasno significantrelationship between differentiation of self andinformative identity style 2.Amirbeglouietal.(2015)in
Indian Journal of Public Health Research & Development, April 2018, Vol.9, No. 4 109
a study entitled ‘Emotional maturity and identity styles ofthestudentswithasampleof200psychologystudentsof Islamic Azad University of Roodhen concluded that thereisaninverseandsignificantrelationshipbetweentotal score of the emotional maturity and informative and normative identity styles. There was an inverse and significant relationship between informative identitystyle with all five components of emotional maturity,and normative identity style with four components of emotional instability, emotional return, social dysfunction, and personality collapse. There was an inverse and significant relationship between diffuse -avoidant identity styles and emotional return and there wasadirectandsignificantrelationshipbetweendiffuse- avoidant identity styles and social maladjustment and lackof autonomyand therewasan inverse significantrelationship between commitment style and personality collapse. Personality collapse and emotional instability could predict informative identity style and three components of emotional return, social maladjustment and lack of autonomy explained the changes in normative identitystyleanddiffuse-avoidant identitystyles. Personality collapse could predict the changes in commitmentstyle.Therewasasignificantrelationshipbetween informative and normative identity style with the rate of emotional maturity and predictions can be done based on the components of emotional maturity for identity styles17.
As shown in Table 2, Pearson correlation is used for investigating relationship between informative identity styles and psychological well-being. The results indicate the correlation between informative identity style and psychological well-being (0.303). Since the obtainedSig forcorrelationbetweenvariables is0.000, there isa significant relationship between the identity stylesand psychological well-being and therefore, research hypothesis is confirmed.Moreover, as shown inTable2, Pearson correlation for analyzing the relationship between normative identity styles shows the level of psychological well-being. Results show that there is a correlation between normative identity style and psychologicalwell-being(0.305).SincetheobtainedSigforthecorrelationbetweenvariablesis0.000,therefore,thereisasignificantrelationshipbetweenidentitystylesand psychological well-being and research hypothesis is confirmed. Shokri et al. (2007) conducted a studyentitled ‘Individual differences in identity style andpsychological well-being: the role of the identity’
concluded that results have a correlational matrix so that there is a positive and significant relationshipbetween informative identity style and psychological well-being. Moreover, there is a positive significantrelationship between the normative identity style and psychological well-being scales (except autonomy that is negative and insignificant).There is also anegativeandsignificantrelationshipbetweendiffuseidentitystyleand autonomy scales, environmental mastery, personal growth and purpose in life and there is a negative and insignificant relationshipbetweendiffuse identitystyleand autonomy scales and scales of positive relationships with others and self-acceptance. Moreover, there is a positive and significant relationship between identitycommitment and six scales of psychological well-being. Thereisapositiveandsignificantrelationshipbetweeninformative and normative identity style and identity commitment and there is a negative and significantrelationship between the diffuse-avoidant style andidentity commitment 20. The results of most of the conducted studies are consistentwith this finding thatthere is a direct relationship between more successful identity styles namely informative and normative styles and psychological well-being and it can be concluded that more successful identity styles are good predictors forpsychologicalwell-being.Ontheotherhand,identitycommitment in these two identity styles is higher than the diffuse.The results ofmost of the conductedstudies21, are consistent with this finding that there isa direct relationship between more successful identity styles namely informative and normative styles and psychological well-being and it can be concluded that more successful identity styles are good predictors for psychological well-being. On the other hand, identitycommitment in these two identity styles is higher than the diffusestyle.Resultsofthestudyshowedthatthereisnosignificantrelationshipbetweentheinformativeidentitystyle and normative identity style with differentiationof self; however, there was a significant relationshipbetweennormative identity styleanddifferentiationofself. In addition, the results of this study indicated that thereisasignificantrelationshipbetweenalldimensionsof the identity style and psychological well-being. This study was conducted of the BA and MA students; therefore, the results should be cautiously generalized. Self-report tests were used in this study that may show the respondents’ biases. Using other measurement tools such as interview and observation and conducting the study for other educational levels are recommended.
110 Indian Journal of Public Health Research & Development, April 2018, Vol.9, No. 4
ethical Clearance: Related departments should be assured about the confidentiality of the results ofquestionnaires.
Conflict of Interest:Theauthors reportnoconflictofinterest.
Source of Funding: Self
ReFeReNCeS
1.Amirbegloui,M.etal.(2015).Emotionalmaturityand identity style of the students. Journal ofContemporary Psychology, pp 158-161.
2.Berzonsky,M.D.(2003).Identitystyleandwell-being: Does commitment matter? Identity: An InternationalJournalofTheoryandResearch,3:131-142.
3.Berzonsky, M. D., &Kuk, L.S. Identity style,psychosocial maturity and academic performance .PersonalityandIndividualDifferences,2005;30:235-247.
4. Bonde R, Cohen F. Relations between attachment styles, ageism and quality of life in late life .international psychologyriatrics, 2010; 22(8),1353-1361
5.Dastjerdi, R. et al. (2011). The role of five bigpersonality factors in predicting the psychological well-being.ScientificJournalofMedicalScienceUniversity of Birjand, 2 (18): 126-133.
6.Duriez,B.,Soenens,B.,&Beyers,W.Religiosity,personality, and identity styles: An integrative study among late adolescents in Flanders (Belgium). JournalofPersonality,2008;72:877–910.
7.Fallahian, R. et al. (2014). The effect of thepsychological between on the mental health of the students of Islamic Azad University of Khorasgan. Journal ofScience andResearch inPsychology,15 (2), 14-24.
8. Garcia, D., Archer, T., Moradi, S., Andersson, A. Exercise Frequency, High Activation Positive Affect and Psychological Well-Being: BeyondAge, Gender and Occupation, GöteborgsUniversitet,Psychology),2012;(4),328-336.
9.Goldenberg,g.(2008).Familytherapy.Translatedby Hasanshahi, HR. et al. Tehran: Nashr-e-Ravan.
10.Habibipour,M.etal.(2014).Relationshipbetweenthedifferentiationofselfandpsychologicalwell-being of the married teachers. First National Conference on Sustainable Development in Psychology, Social and Cultural Studies, Mehr Arvand Institute of Higher Education, Center of Solutions to Achieve Sustainable Development.
11.Jamshidi,M.&Sarvghad,S.(2015).Theroleofmediator of the identity styles in the relationship between differentiation of self and Internetaddiction in thenon-profithigh school students.JournalofPsychologicalMethodsandmodels,(6)20,p.37-53.
12.Michaeili,F.(2010).Analysisofthepsychologicalwell-being of the BA students of Urmia University. Horizon of Knowledge Quarterly of Medical Sciences and Health Services University of Gonabaad, 4.
13.Pashasharifi, H. et al. (2014). Psychometricexaminationofself-differentiationquestionnaire.Journalofindustrial/organizationalpsychology,5 (18), 9-22.
14.Qaderi, Z. & Yousefi, M. (2014). The role ofmediation of the identity styles in relationship withthedifferentiationofselfandpsychologicalwell-being of the married teachers of Bavanat County. Master’s thesis, Islamic Azad University of Shiraz.
15.Roytburd, M. Predictors of soviet JewishrefugeesacculturationDifferentiationofselfandacculturativestressculturaldifferentiationofselfand acculturative steress. Cultural diversity and Ethnicminoritypsychology,2008,14:67-74.
16.Shokri,O.etal.(2007).Individualdifferencesinidentity style and psychological well-being: the roleofidentitycommitment.JournalofCognitiveScience News, 9 (2), pp. 33-46.
17.Skian, P. & Changizi, F. (2005). Analysis ofthe effect of psychodrama on increasing thedifferentiation of the person from their originalfamily of the male and female high school students in District 5 of Tehran. Master’s thesis in consulting. Tarbiyat Moalem University of Tehran.
18.Skowron,E.A.&Dendy,A.K.Differentiationofself and attachment in adulthood. Contemporary familytherapy,2004;26(3).337-35y.

Indian Journal of Public Health Research & Development, April 2018, Vol.9, No. 4 111
19.Skowron, HS. Deconstructing differentiation:self-regulation interdependent relating and well-being in adulthood. Contemporary family therapy, 2003;26:29-38.
20.Weiskarami, H. et al. (2014). Simple andmultiple relationship of differentiation of selfand identity styles with psychological well-being of the couples. First National Conference on
Sustainable Development in Psychology, Social and Cultural Studies, Mehr Arvand Institute of Higher Education, Center of Solutions to Achieve Sustainable Development.
21. Wong L. self-construal as a moderator between differentia of self and trait anxiety. Dissertationcommittee, MA, psychology (counseling psychology)universityofCalifornia.2010.
Study of Management Programmes in “benign Paroxysmal Positional Vertigo”
Shilpi Jindal1, Rajendra Sharma2
1Head of Department and Lecturer, Department of Physical Medicine and Rehabilitation, Meerut; 2Director All India Institute of Physical Medicine and Rehabilitation, Mumbai
AbSTRACT
BPPV is a disorder of vestibular labyrinth. The purpose of this study was to analyse the efficacy ofexercise management. Patient with non vestibular causes for Dizziness like progressive central disorders wereexcluded.Fiftypatientswereincludedinthestudyandweredividedintotwogroupsoftwentyfivepatientseach.Thefirstcontrolgroupwasgivenstandardmedicalcarewhichprimarilyincludedþ-histineHydrochloride. The second study group was put on exercise programme and medication was used only under Emergency circumstances. Patients were followed weekly for one month and fortnightly for next fivemonths.ResultswereanalysedaftersixmonthsoftreatmentofbothgroupsbyDizzinesshandicappedInventory Score. The control group patients responded with drug treatment but had not shown any decrease in frequency of acute attacks due to which patients become handicapped. In the study group result showed marked decrease in frequency of acute attacks of vertigo with drug and patient regained both skill and confidenceinbalanceandtheyovercamethefearofactivitiesthatmayelicitdisorientation.ItisanstudyinwhichfiftypatientswereincludedandtherebysubjecttheresulttoStatisticalAnalysis.
Keywords: BPPV- Benign paroxysmal positional vertigo, ENG-Electro nystagmography, VSS-vertigo severity scale, DHI-Diziness Handicapped Inventory.
Corresponding Author:Dr.ShilpiJindalHead of Department and Lecturer,Department of Physical Medicine and RehabilitationLLRM Medical College, MeerutE-mail : [email protected]
INTROduCTION
BPPV is probably the commonest cause ofdizziness1.BPPVwasfirstreportedbyBarany2 in 1921 and later on by Dix and Hallpike in 1952. Etiology of BPPVisoftenunknown.
However, among the patients in whom the diagnosis could be made it may be due to head trauma, viral neuronitis or the other rarer causes including the treated casesofMeniere’sdisease,VertebrobasilarInsufficiency,Migraine, Multiple Sclerosis and Post Surgical trauma (Stapedectomy). This condition is usually described as sudden onset of Dizziness or Vertigo, precipitatedby specific head movements2. The most common
provoking movements are rolling over in bed, bending over and looking upward3. Each episode lasts only 3-45 sec but the course of the illness may run several weeks or even years with remissions during which the patient experiences no episodes of vertigo2.
TherearetwodifferenttheoriesaboutthepathogenesisofBPPV–Cupulolithiasis4 and Canalithiasis5. According to Cupulolithiasis theory (Schuknecht-1969)6, the degenerative debris from the utricle, probably fragment of otoconia fall onto the cupola of the posterior canal, making the ampulla gravity sensitive7. When the head comes below the horizontal plane, there is in-appropriate deflection of cupola which causesVertigoand Nystagmus. This further increases the head tilt, again increasing vertigo. Decrease in symptoms is due to adaptation5 According to Canalithiasis theory (Hall et al)
8, the degenerative debris is not adherent to cupola of the posteriorcanalbutinsteadisfreefloatinginendolymph.When the head is moved in provoking position, the endolymph moved by the following otoconia, pulls on the cupola, thus exciting the neurons5. The latency of the
DOI Number: 10.5958/0976-5506.2018.00266.8
Indian Journal of Public Health Research & Development, April 2018, Vol.9, No. 4 113
response is related to the time required for the cupola tobedeflectedbythepullofendolymph.TheincreaseinVertigoisrelatedtotherelativedeflectionofcupola.ThedecreaseinVertigoaspositioninmaintainedisdueto cessation of endolymph movement5.IncaseofBPPVafter Viral neuronitis, Head trauma or Stapedectomythe particles which evoke vertigo might be blood cells, phagocytes and endothelial debris. Vertigo isprecipitated by certain critical positions of head, usually occurringwhenthepatientliesflatwiththeheadturnedtoaffectedside(HallpikeManeuver).Thisbeginsafteralatencyof3-4sec,witharangevaryingfrom1-40sec.Themanifestationwillsubsideafter10-60sec.andmayabate even in precipitating position. With re-attainment of seated position, the vertigo may revive in the opposite direction, but lasts only several seconds. Although the patient case history is important in the diagnosis of Benign paroxysmalBPPVbserving a classic responseduring Dix and Hallpike maneuver. A classic response asdefinedbyDixandHallpike9, 2has four components : Latency period of few seconds, rotatory nystagmus towards undermost ear (Rt. Ear anti clock wise, left ear clock wise), fatigue after repeated maneuver, duplication ofthepatientreportofVertigo.HoweverinBPPVENGresults are normal as are the results of Posturography and other clinical tests.
MATeRIAl ANd MeThOd
The study was conducted in Department of Rehabilitation. Study group patients came directly in department of rehabilitation and were referred from the Department of ENT after thorough clinical examination and investigation like caloric testing and audiogram. Baseduponthefollowingdiagnosticbasis,fiftypatientswere included in the study. The patients were divided into two groups: Group I – Patients treated by beta histine hydrochloride only, Group II – Patients treated by Vestibulartraining,withdruggivenonlyinemergencycircumstances. Patients in whom provisional diagnosis ofBPPVwasestablishedinouroutpatientdepartment,beta histine hydrochloride (minimum doses of 8mg three times daily) were given for one month of pre treatment period for acute attack of vertigo to settle down. In pre treatment period with help of beta histine hydrochloride the severity of vertigo, dizziness, nausea or vomiting etc. was similar in all patient before their categorization in group I or II. In group I Beta histine hydrochloride was administered as a standard anti vertiginous drug at a dose
of 8mg three times daily for one month. During the next fivemonths,thedrugwasgivenwhenpatientcamewithsame complaints of dizziness or vertigo, for a period of fifteendaysortillsymptomssubsided.In-groupIIbetahistine hydrochloride was given only when patient had acute attack of nausea or vomiting during the exercise programme of vestibular training. Training was stopped untilacuteattacksettleddownaroundfifteendays.Twotypes of exercises – Brandt’s Exercises10 as proposed by BrandtandDaroff.HabituationExercisesasproposedbyNoore and Deewerdt11 and Three Phases of Exercises as described by Tangerman and Wheeler12 Phase I – Similar toBrandtandDaroffProtocolPhaseII&III–Cawthorne&CookseyexerciseswhichincorporateEyeandHeadMovementsandVarietyofBalanceExerciseswereusedin our study. Patients were asked to do exercises every threehoursforfifteenminutesduringdayuntilpatienthad no episodes of vertigo for two consecutive days. Patients were advised to do exercises fifteen minutesthree times daily for remaining study period. All patients were instructed to continue their usual daily activities during the study period. In-patients in group II during Vestibulartrainingifacuteattackofnauseaorvomitingset in thenVestibular trainingwas stopped until acuteattack settled down and usually the training is stopped for fifteen days.Using a scoring systemVSS severityof symptoms such as vertigo, dizziness and nausea and abnormality of signs in examinations such as Mann’s test, Stepping test and Postural and Positioning test of Dix and Hallpike were evaluated. A comprehensive evaluation of dizziness and disability including the burden of chronic deficits and disability was done bymultiple system assessments like Disability scale and Dizzinesshandicapinventory.Vertigoseverityscalewasdeveloped by Harrison MS13 in 1975. The evaluation of each patient was done by change in total sum of numerical value of a score for each item during study period. A global judgment of treatment effect was defined by aseverity score for all items or a sum of all scores in each patient and was classified accordingly. Data collectedfrom all the variables were entered into a computer using a data base programme . Cross checking of the data for any inconsistensy was done before the data was put for statistically analysis which included both descriptive and inferential statistics. Statistically analysis is done by using non parametric Wilcoxon signed rank test on pre and post treatment results of both groups. Then these results of both groups were again compared statistically by using non parametric Mann Whitney test
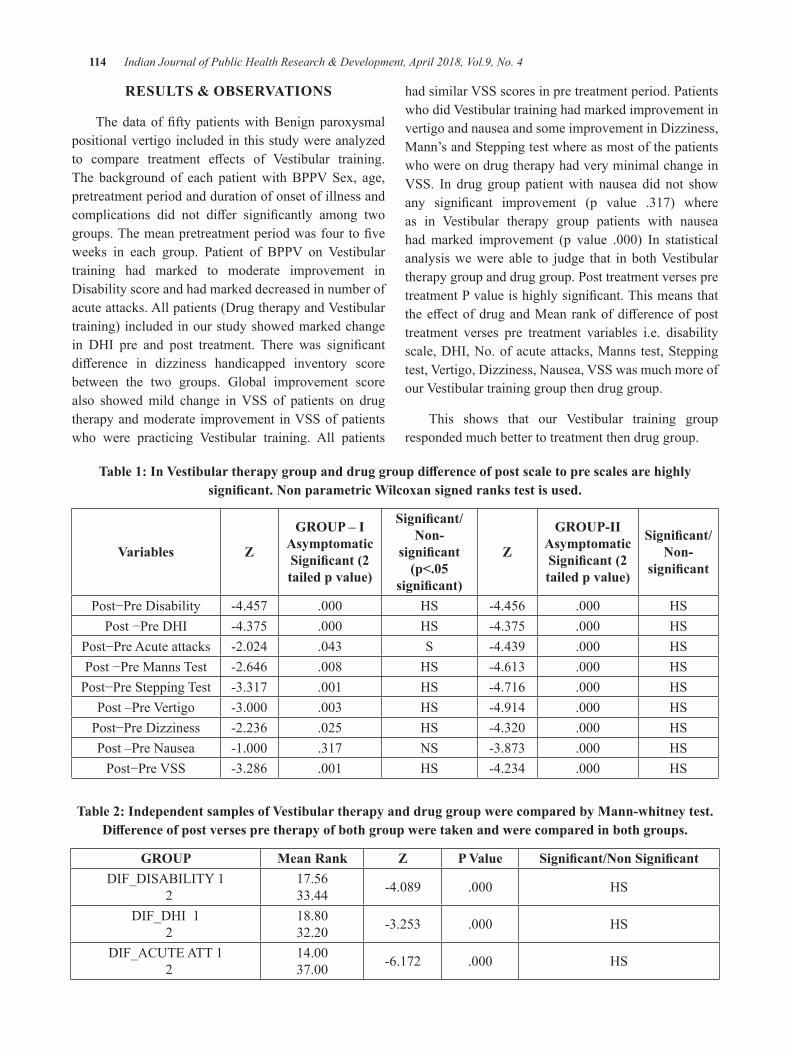
114 Indian Journal of Public Health Research & Development, April 2018, Vol.9, No. 4
ReSulTS & ObSeRVATIONS
ThedataoffiftypatientswithBenignparoxysmalpositional vertigo included in this study were analyzed to compare treatment effects of Vestibular training.The background of each patientwithBPPVSex, age,pretreatment period and duration of onset of illness and complications did not differ significantly among twogroups.Themeanpretreatmentperiodwasfourtofiveweeks in each group. Patient of BPPV on Vestibulartraining had marked to moderate improvement in Disability score and had marked decreased in number of acuteattacks.Allpatients(DrugtherapyandVestibulartraining) included in our study showed marked change in DHI pre and post treatment. There was significantdifference in dizziness handicapped inventory scorebetween the two groups. Global improvement score also showedmild change inVSS of patients on drugtherapyandmoderate improvement inVSSofpatientswho were practicing Vestibular training. All patients
hadsimilarVSSscoresinpretreatmentperiod.PatientswhodidVestibulartraininghadmarkedimprovementinvertigo and nausea and some improvement in Dizziness, Mann’s and Stepping test where as most of the patients who were on drug therapy had very minimal change in VSS. In drug group patientwith nausea did not showany significant improvement (p value .317) whereas in Vestibular therapy group patients with nauseahad marked improvement (p value .000) In statisticalanalysiswewere able to judge that inbothVestibulartherapy group and drug group. Post treatment verses pre treatmentPvalueishighlysignificant.ThismeansthattheeffectofdrugandMeanrankofdifferenceofposttreatment verses pre treatment variables i.e. disability scale, DHI, No. of acute attacks, Manns test, Stepping test,Vertigo,Dizziness,Nausea,VSSwasmuchmoreofourVestibulartraininggroupthendruggroup.
This shows that our Vestibular training groupresponded much better to treatment then drug group.
Table 1: In Vestibular therapy group and drug group difference of post scale to pre scales are highly significant. Non parametric Wilcoxan signed ranks test is used.
Variables Z
GROUP – IAsymptomatic Significant (2 tailed p value)
Significant/Non-
significant (p<.05
significant)
Z
gROuP-IIAsymptomatic Significant (2 tailed p value)
Significant/Non-
significant
Post−PreDisability -4.457 .000 HS -4.456 .000 HSPost−PreDHI -4.375 .000 HS -4.375 .000 HS
Post−PreAcuteattacks -2.024 .043 S -4.439 .000 HSPost−PreMannsTest -2.646 .008 HS -4.613 .000 HSPost−PreSteppingTest -3.317 .001 HS -4.716 .000 HS
Post–PreVertigo -3.000 .003 HS -4.914 .000 HSPost−PreDizziness -2.236 .025 HS -4.320 .000 HSPost –Pre Nausea -1.000 .317 NS -3.873 .000 HSPost−PreVSS -3.286 .001 HS -4.234 .000 HS
Table 2: Independent samples of Vestibular therapy and drug group were compared by Mann-whitney test. Difference of post verses pre therapy of both group were taken and were compared in both groups.
gROuP Mean Rank Z P Value Significant/Non SignificantDIF_DISABILITY1
217.5633.44 -4.089 .000 HS
DIF_DHI1 2
18.8032.20 -3.253 .000 HS
DIF_ACUTEATT1 2
14.0037.00 -6.172 .000 HS
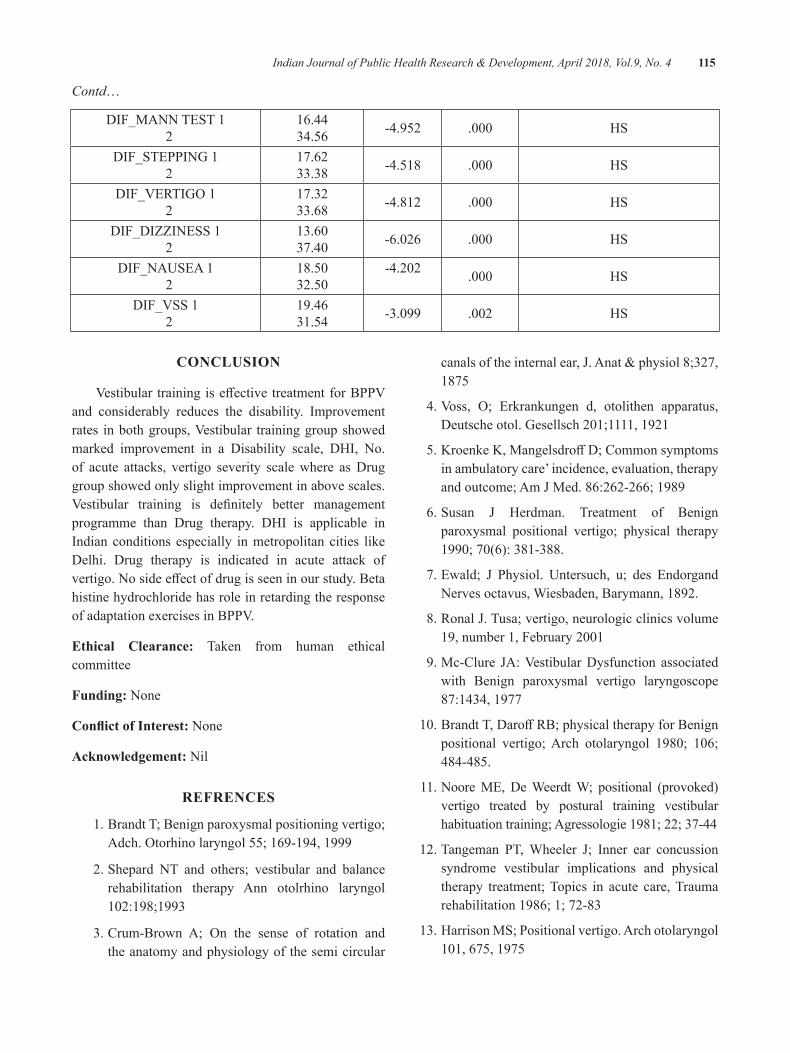
Indian Journal of Public Health Research & Development, April 2018, Vol.9, No. 4 115
Contd…
DIF_MANNTEST1 2
16.4434.56 -4.952 .000 HS
DIF_STEPPING1 2
17.6233.38 -4.518 .000 HS
DIF_VERTIGO1 2
17.3233.68 -4.812 .000 HS
DIF_DIZZINESS1 2
13.6037.40 -6.026 .000 HS
DIF_NAUSEA1 2
18.5032.50
-4.202 .000 HS
DIF_VSS1 2
19.4631.54 -3.099 .002 HS
CONCluSION
VestibulartrainingiseffectivetreatmentforBPPVand considerably reduces the disability. Improvement rates inbothgroups,Vestibular traininggroupshowedmarked improvement in a Disability scale, DHI, No. of acute attacks, vertigo severity scale where as Drug group showed only slight improvement in above scales. Vestibular training is definitely better managementprogramme than Drug therapy. DHI is applicable in Indian conditions especially in metropolitan cities like Delhi. Drug therapy is indicated in acute attack of vertigo.Nosideeffectofdrugisseeninourstudy.Betahistine hydrochloride has role in retarding the response ofadaptationexercisesinBPPV.
ethical Clearance: Taken from human ethical committee
Funding: None
Conflict of Interest: None
Acknowledgement: Nil
ReFReNCeS
1. Brandt T; Benign paroxysmal positioning vertigo; Adch.Otorhinolaryngol55;169-194,1999
2. Shepard NT and others; vestibular and balance rehabilitation therapy Ann otolrhino laryngol 102:198;1993
3.Crum-Brown A; On the sense of rotation andthe anatomy and physiology of the semi circular
canalsoftheinternalear,J.Anat&physiol8;327,1875
4.Voss, O; Erkrankungen d, otolithen apparatus,Deutscheotol.Gesellsch201;1111,1921
5.KroenkeK,MangelsdroffD;Commonsymptomsin ambulatory care’ incidence, evaluation, therapy andoutcome;AmJMed.86:262-266;1989
6.Susan J Herdman. Treatment of Benignparoxysmal positional vertigo; physical therapy 1990;70(6):381-388.
7.Ewald; J Physiol. Untersuch, u; des EndorgandNerves octavus, Wiesbaden, Barymann, 1892.
8.RonalJ.Tusa;vertigo,neurologicclinicsvolume19,number1,February2001
9.Mc-Clure JA:VestibularDysfunction associatedwith Benign paroxysmal vertigo laryngoscope 87:1434, 1977
10.BrandtT,DaroffRB;physicaltherapyforBenignpositional vertigo;Arch otolaryngol 1980; 106;484-485.
11. Noore ME, De Weerdt W; positional (provoked) vertigo treated by postural training vestibular habituation training; Agressologie 1981; 22; 37-44
12.Tangeman PT,Wheeler J; Inner ear concussionsyndrome vestibular implications and physical therapy treatment; Topics in acute care, Trauma rehabilitation 1986; 1; 72-83
13. Harrison MS; Positional vertigo. Arch otolaryngol 101,675,1975
Knowledge and Attitude about Internet Resources among Physiotherapy students in Mangaluru
Vijay Kumar. K1, Shreekanth d. Karnad2
1Associate Professor, 2Assistant Professor, Dept. of Physiotherapy, Kasturba Medical College Mangaluru,, Manipal Academy of Higher Education, India
AbSTRACT
In recent years, the World Wide Web usage has become the important source of information among professionals, nonprofessionals and being used to deliver educational materials to students, importantly in medical schools. This survey which used a self-administered close ended questionnaire was aimed at observing the level of knowledge and attitude towards the use of internet resources among physiotherapy students of Mangalore.
The present study revealed, even though 83.8% of students are regular users and 53.8% of students had knowledge of the educational related sources, only 19.7 % of students used internet for educational purposes. Present survey also showed that post graduate students had comparatively good knowledge of source than undergraduates(p.000).
Although the knowledge of the source is good its academic application was limited compared to general purpose especially in undergraduate students. Having greater percentage of positive attitude of students towards internet usage for teaching purpose, use of the same as supplement is encouraged.
Keywords: Internet, Physiotherapy, Attitude, Knowledge
Corresponding Author:Shreekanth D. KarnadAssistant Professor, Dept. of Physiotherapy,Center for Basic Sciences,KMC Bejai, Mangaluru,ManipalAcademyofHigherEducation,575004,IndiaE-mail: [email protected],[email protected]
INTROduCTION
In recent years World Wide Web use has increased and has become important source of information among professionals and nonprofessionals.1 The Internet is a technology which is used as ordinary as telephone or television. It is a user friendly communication medium, which can be accessed from anywhere without time limitation.2,3 Use of internet in health care is well established in developed countries, whereas in developing countries it is still on the path of improvement.4 With the constant change in medical education, many medical schools are implementing strategies to integrate medical informatics into the curriculum.5,6 Internet has also
become the popular medium for delivering educational materials, and majorly for medical research.7
With the evolving concern on evidence based health care, the need for computer and internet usage is increasing. Previous study done by Romanov K et.al has also highlighted that quality of health care is enhanced following the use of online information systems by medical professionals.8 Another study done by Peterson et.al showed that majority of medical student’s preferred electronic sources as primary resources of information.9
There are several studies done to evaluate the extent of internet literacy, attitude about use of internet among medical professionals.10-12As thefield of rehabilitationis evolving in developing countries there is a need to know the level of knowledge and attitude of the Physical therapy students towards use of internet resources. Since there is paucity of the studies on internet usage among Physical therapy students the present survey aimed at observing the level of knowledge of internet resources and attitude towards use of internet resources in academic teaching.
DOI Number: 10.5958/0976-5506.2018.00267.X
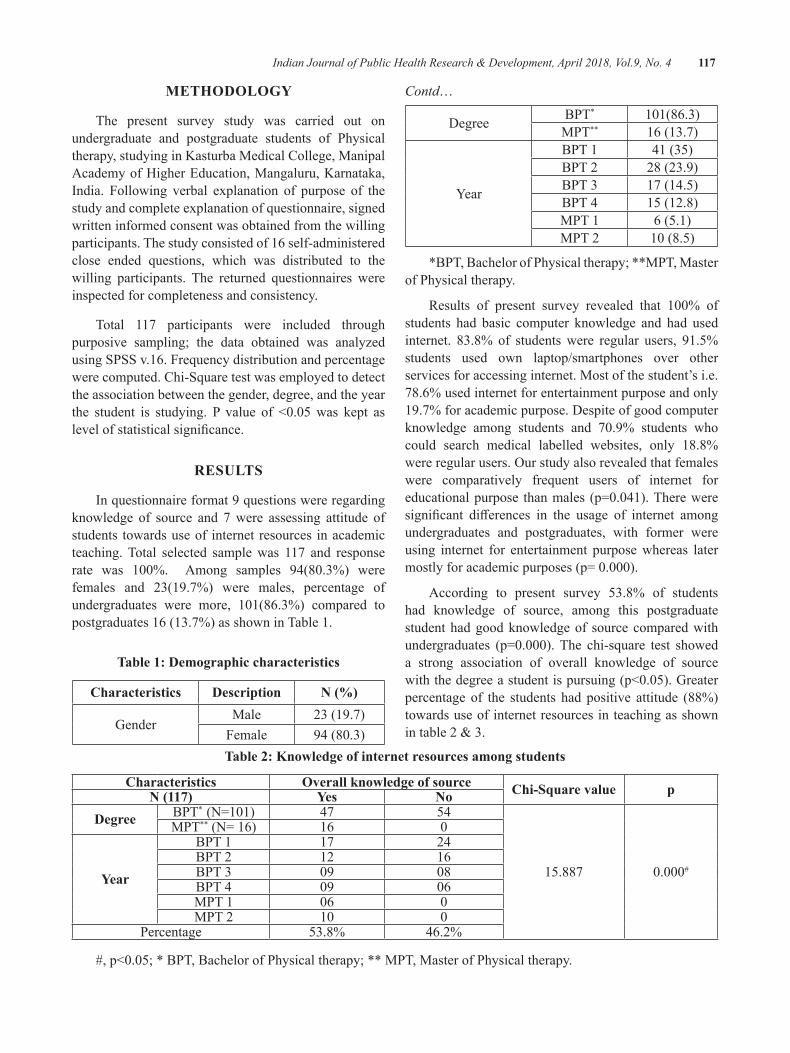
Indian Journal of Public Health Research & Development, April 2018, Vol.9, No. 4 117
MeThOdOlOgy
The present survey study was carried out on undergraduate and postgraduate students of Physical therapy, studying in Kasturba Medical College, Manipal Academy of Higher Education, Mangaluru, Karnataka, India. Following verbal explanation of purpose of the study and complete explanation of questionnaire, signed written informed consent was obtained from the willing participants. The study consisted of 16 self-administered close ended questions, which was distributed to the willing participants. The returned questionnaires were inspected for completeness and consistency.
Total 117 participants were included through purposive sampling; the data obtained was analyzed using SPSS v.16. Frequency distribution and percentage were computed. Chi-Square test was employed to detect the association between the gender, degree, and the year the student is studying. P value of <0.05was kept aslevelofstatisticalsignificance.
ReSulTS
In questionnaire format 9 questions were regarding knowledge of source and 7 were assessing attitude of students towards use of internet resources in academic teaching. Total selected sample was 117 and response rate was 100%. Among samples 94(80.3%) werefemales and 23(19.7%) were males, percentage of undergraduates were more, 101(86.3%) compared topostgraduates 16 (13.7%) as shown in Table 1.
Table 1: demographic characteristics
Characteristics description N (%)
GenderMale 23 (19.7)
Female 94(80.3)
Contd…
Degree BPT* 101(86.3)MPT** 16 (13.7)
Year
BPT 1 41 (35)BPT 2 28 (23.9)BPT 3 17 (14.5)BPT 4 15 (12.8)MPT 1 6 (5.1)MPT 2 10(8.5)
*BPT,BachelorofPhysicaltherapy;**MPT,Masterof Physical therapy.
Results of present survey revealed that 100% ofstudents had basic computer knowledge and had used internet. 83.8% of students were regular users, 91.5% students used own laptop/smartphones over other services for accessing internet. Most of the student’s i.e. 78.6% used internet for entertainment purpose and only 19.7% for academic purpose. Despite of good computer knowledge among students and 70.9% students whocould search medical labelled websites, only 18.8% wereregularusers.Ourstudyalsorevealedthatfemaleswere comparatively frequent users of internet for educationalpurpose thanmales (p=0.041).Thereweresignificant differences in the usage of internet amongundergraduates and postgraduates, with former were using internet for entertainment purpose whereas later mostlyforacademicpurposes(p=0.000).
According to present survey 53.8% of students had knowledge of source, among this postgraduate student had good knowledge of source compared with undergraduates (p=0.000).The chi-square test showeda strong association of overall knowledge of source withthedegreeastudentispursuing(p<0.05).Greaterpercentage of the students had positive attitude (88%) towards use of internet resources in teaching as shown intable2&3.
Table 2: Knowledge of internet resources among students
Characteristics Overall knowledge of source Chi-Square value pN (117) yes Nodegree BPT*(N=101) 47 54
15.887 0.000#
MPT**(N=16) 16 0
year
BPT 1 17 24BPT 2 12 16BPT 3 09 08BPT 4 09 06MPT 1 06 0MPT 2 10 0
Percentage 53.8% 46.2%
#,p<0.05;*BPT,BachelorofPhysicaltherapy;**MPT,MasterofPhysicaltherapy.
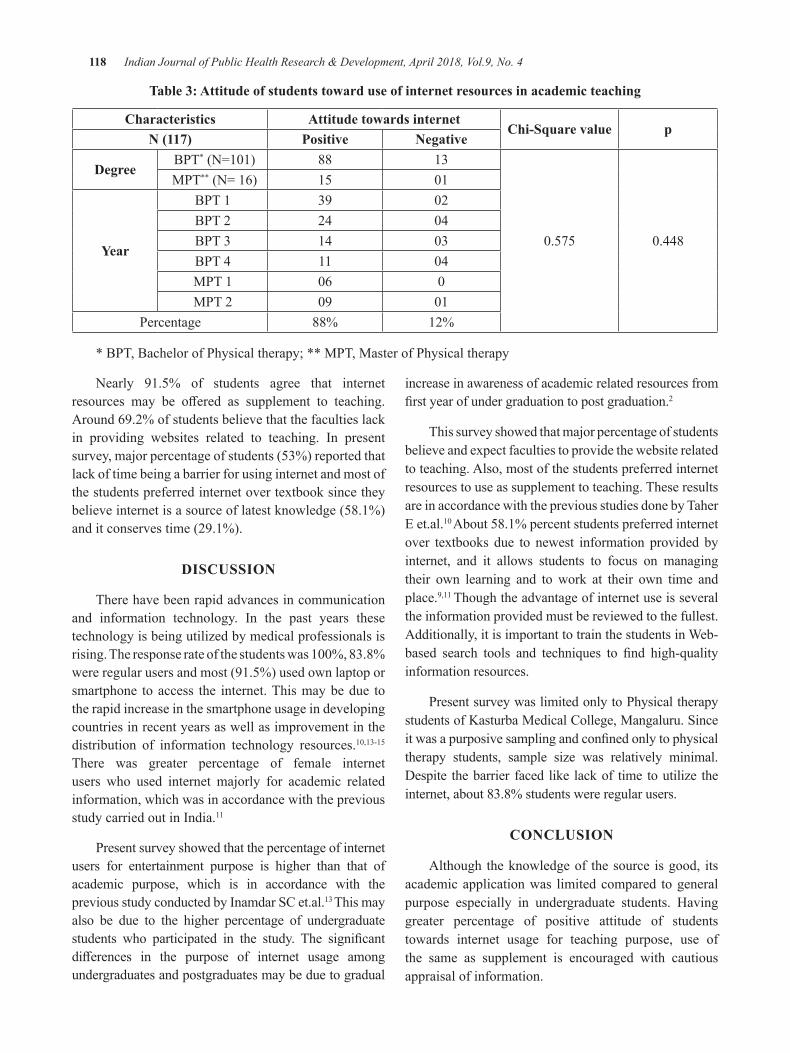
118 Indian Journal of Public Health Research & Development, April 2018, Vol.9, No. 4
Table 3: Attitude of students toward use of internet resources in academic teaching
Characteristics Attitude towards internetChi-Square value p
N (117) Positive Negative
degree BPT*(N=101) 88 13
0.575 0.448
MPT**(N=16) 15 01
year
BPT 1 39 02BPT 2 24 04BPT 3 14 03BPT 4 11 04MPT 1 06 0MPT 2 09 01
Percentage 88% 12%
*BPT,BachelorofPhysicaltherapy;**MPT,MasterofPhysicaltherapy
Nearly 91.5% of students agree that internet resources may be offered as supplement to teaching.Around 69.2% of students believe that the faculties lack in providing websites related to teaching. In present survey, major percentage of students (53%) reported that lack of time being a barrier for using internet and most of the students preferred internet over textbook since they believe internet is a source of latest knowledge (58.1%) and it conserves time (29.1%).
dISCuSSION
There have been rapid advances in communication and information technology. In the past years these technology is being utilized by medical professionals is rising.Theresponserateofthestudentswas100%,83.8%were regular users and most (91.5%) used own laptop or smartphone to access the internet. This may be due to the rapid increase in the smartphone usage in developing countries in recent years as well as improvement in the distribution of information technology resources.10,13-15There was greater percentage of female internet users who used internet majorly for academic related information, which was in accordance with the previous study carried out in India.11
Present survey showed that the percentage of internet users for entertainment purpose is higher than that of academic purpose, which is in accordance with the previous study conducted by Inamdar SC et.al.13 This may also be due to the higher percentage of undergraduate students who participated in the study. The significantdifferences in the purpose of internet usage amongundergraduates and postgraduates may be due to gradual
increase in awareness of academic related resources from firstyearofundergraduationtopostgraduation.2
This survey showed that major percentage of students believe and expect faculties to provide the website related to teaching. Also, most of the students preferred internet resources to use as supplement to teaching. These results are in accordance with the previous studies done by Taher E et.al.10About 58.1% percent students preferred internet over textbooks due to newest information provided by internet, and it allows students to focus on managing their own learning and to work at their own time and place.9,11 Though the advantage of internet use is several the information provided must be reviewed to the fullest. Additionally, it is important to train the students in Web-based search tools and techniques to find high-qualityinformation resources.
Present survey was limited only to Physical therapy students of Kasturba Medical College, Mangaluru. Since itwasapurposivesamplingandconfinedonlytophysicaltherapy students, sample size was relatively minimal. Despite the barrier faced like lack of time to utilize the internet, about 83.8% students were regular users.
CONCluSION
Although the knowledge of the source is good, its academic application was limited compared to general purpose especially in undergraduate students. Having greater percentage of positive attitude of students towards internet usage for teaching purpose, use of the same as supplement is encouraged with cautious appraisal of information.
Indian Journal of Public Health Research & Development, April 2018, Vol.9, No. 4 119
Conflict of Interest: None declared
ethical Clearance: The study protocol was reviewed and approved by the department head.
Source of Funding: This was a self-funded project
ReFeReNCeS
1. Larkin M. Non-US web use rising fast. Lancet 2000;356:1451.
2.Unnikrishnan B, Kulshrestha V, SarafA, et al.Pattern of computer use and internet use among medical students in Costal South India. S East AsianJMedEduc.2008;2:18-25.
3.AyatollahiJ,AyatollahiF,BahrololoomiR.UsingtheinYazad.DentResJ.2010;7:7-11.
4.KumarS,TadakamadlaJ,TibdewalH,etal.Internetusage among undergraduate dental students in India.RevOdontoCienc.2010;25:261-4.
5. Kaufman DM. Integrating informatics into an undergraduate medical curriculum. Medinfo.1995;2:1139-43.
6. Koschmann T. Medical education and computer literacy: learning about, through and with computers.AcadMed.1995;70:818-21.
7.Odusanya OO, Bamgbala O. Computing andinformationtechnologyskillsoffinalyearmedicaland dental students at the College of Medicine, University of Lagos, Nigeria. Niger Post grad MedJ.2002;9:189-93.
8. Romanov K, Arnio M. A survey of the use of electronicscientificinformationresourcesamongmedical and dental students. BMC Med Educ. 2006;6:28.
9.PetersonMW,RowatJ,KreiterC,etal.Medicalstudents use of information resources: Is the digitalagedawning?.AcadMed.2004;79:89-95.
10.TaherE,AhmedD.Theextentofcomputerliteracyamong medical students at Cairo university and their attitudes towards its use in medical education. Internationalpublichealthforum.2014;1:30-6.
11.JailPK,SinghS,BabajiP,etal.Knowledgeandattitude about computer and internet usage among dentalstudentsinwesternRajasthan,India.JIntSocPrevCommunityDent.2014;17-22.
12.Jadoon NA, Hussain M, Shahzad MA, et al.Internet use among students of Nishtar Medical College,Multan.NishtarMedical journal.2009;1:24-8.
13. Inamdar SC, Rotti SB. Computer use among medical students in an institution in southern India.NatiMedJIndia.2004;17:8-10.
14.Ward JPT, Gordon J, Field MJ, et al.Communication and information technology in medicaleducation.Lancet.2001;357:792-6.
15. Chudasamab R, Godara N, Srivastava S. Assessing computer literacy and attitude toward e-learning amongfinalyearmedicalstudents.InternetJMedInform.2009;5:1-10.
Study of Correlates of Infertility among Females Attending Infertility Clinic in Tertiary Care Centre
Shweta N. Salphale1, Vinod d. Mundada2, ganesh S. lokhande3, b. M. Kuril2, Mohan K. doibale4
1Junior Resident, 2Associate Professor, 3Assistant Professor, 4Professor and Head, Department of Community Medicine, GMCH, Aurangabad
AbSTRACT
Introduction:Infertilityisworldwideproblemaffectingpeopleofallcommunities,thoughthecauseandmagnitude may vary with geographical location and socioeconomic status.
Objective: To study the different correlates like sociodemographic factors and risk factors influencingfemale infertility in patients attending infertility clinic of tertiary care centre, Aurangabad.
Material and Methodology: It is a cross-sectional study carried out in infertility clinic in Tertiary care centreofGovt.MedicalCollege,Aurangabadoverperiodof3month(Oct-Dec2016).About100patientswere included in the study. Patients visiting for first timewere included in the study. Female infertilepatients were interviewed with predesigned pretested questionnaire.
Results:Outof100femalepatients70(70%)werewithprimaryinfertilityand30(30%)werewithsecondaryinfertility.Thecausesofprimaryinfertilityfoundinthisstudyareuterineanomalies,PCOD,PID,menstrualabnormalities,fibroid,obesity, andhypothyroidism.Thecausesof secondary infertility in this studyarePID, menstrual abnormalities,hyperprolactinemia, recurrent abortions, tubal blockage, and hypothyroidism .Statistical tests were applied to results whenever necessary.
Conclusion: Infertility has become a global challenge at present time; to overcome the problem mass awarenesshastobecreatedwithavailabilityofeffectivetreatmentfacilities.Thisstudyhasyieldedimportantinformation regarding the risk factors influencing infertility.Efforts to raiseawareness in thepopulationabout the causes of primary infertility are needed and facilities should be made available for early diagnosis and treatment.
Keywords: Female infertility, PCOD, PID, Menstrual abnormality.
Corresponding Author:Dr.VinodD.MundadaAssociate Professor, Department of Community Medicine Government Medical College, Aurangabad-431001,Maharashtra,IndiaMobile: 919975629132, 9422289312E mail: [email protected], [email protected]
INTROduCTION
Infertility is the inability of a couple to achieve pregnancy within 12 months of unprotected intercourse. Infertilityisworldwideproblemaffectingpeopleofallcommunities, though the cause and magnitude may vary
with geographical location and socioeconomic status. It is estimated that globally60-80million couples sufferfrom infertility every year, of which between15-20millions are in India alone.1
WHO defines Infertility is “A disease of thereproductivesystemdefinedbythefailuretoachieveaclinical pregnancy after 12 months or more of regular unprotected sexual intercourse.” WHO estimates theprevalence of primary infertility in India to be between 3.9 to 16.8%.2
Infertility is not merely a health problem; it is also a matter of social injustice and inequality. Infertility is the medical problem, but childlessness is the couple’s problem. Approximately one-third of the cases of
DOI Number: 10.5958/0976-5506.2018.00268.1
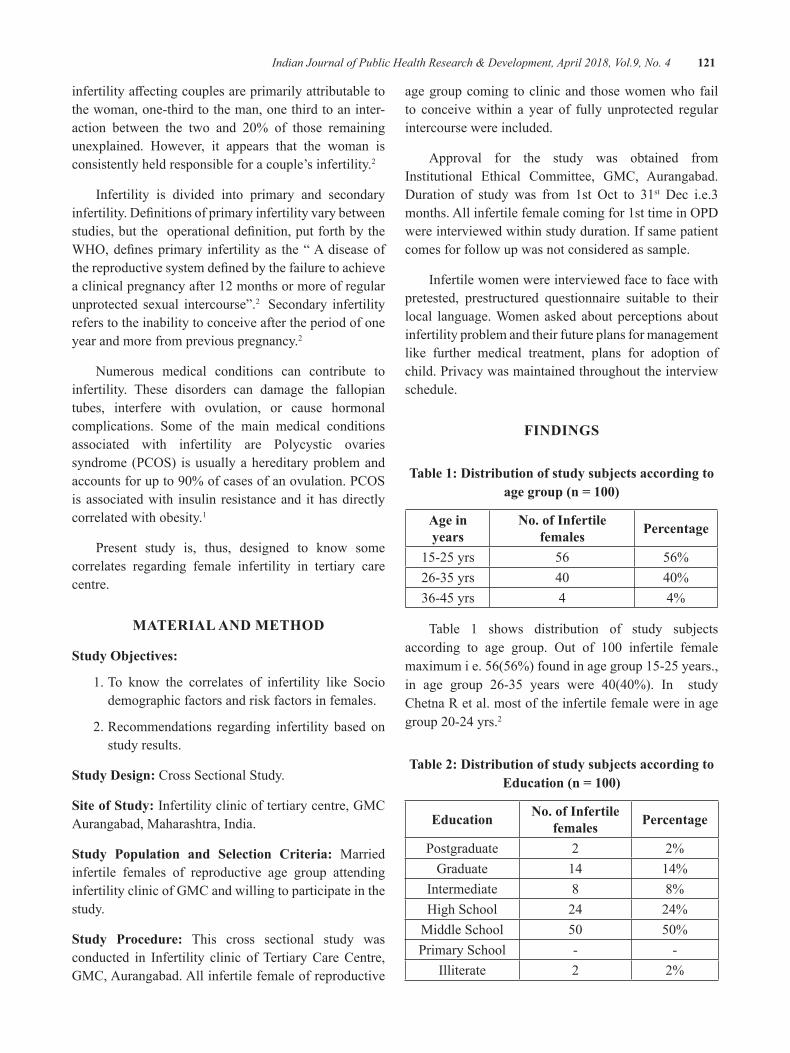
Indian Journal of Public Health Research & Development, April 2018, Vol.9, No. 4 121
infertilityaffectingcouplesareprimarilyattributabletothe woman, one-third to the man, one third to an inter-action between the two and 20% of those remainingunexplained. However, it appears that the woman is consistently held responsible for a couple’s infertility.2
Infertility is divided into primary and secondary infertility.Definitionsofprimaryinfertilityvarybetweenstudies,buttheoperationaldefinition,putforthbytheWHO,definesprimary infertilityas the“Adiseaseofthereproductivesystemdefinedbythefailuretoachievea clinical pregnancy after 12 months or more of regular unprotected sexual intercourse”.2 Secondary infertility refers to the inability to conceive after the period of one year and more from previous pregnancy.2
Numerous medical conditions can contribute to infertility. These disorders can damage the fallopian tubes, interfere with ovulation, or cause hormonal complications. Some of the main medical conditions associated with infertility are Polycystic ovaries syndrome(PCOS) isusuallyahereditaryproblemandaccountsforupto90%ofcasesofanovulation.PCOSis associated with insulin resistance and it has directly correlated with obesity.1
Present study is, thus, designed to know some correlates regarding female infertility in tertiary care centre.
MATeRIAl ANd MeThOd
Study Objectives:
1. To know the correlates of infertility like Socio demographic factors and risk factors in females.
2. Recommendations regarding infertility based on study results.
Study design: Cross Sectional Study.
Site of Study: Infertility clinic of tertiary centre, GMC Aurangabad, Maharashtra, India.
Study Population and Selection Criteria: Married infertile females of reproductive age group attending infertility clinic of GMC and willing to participate in the study.
Study Procedure: This cross sectional study was conducted in Infertility clinic of Tertiary Care Centre, GMC, Aurangabad. All infertile female of reproductive
age group coming to clinic and those women who fail to conceive within a year of fully unprotected regular intercourse were included.
Approval for the study was obtained from Institutional Ethical Committee, GMC, Aurangabad. Duration of study was from 1st Oct to 31st Dec i.e.3 months.Allinfertilefemalecomingfor1sttimeinOPDwere interviewed within study duration. If same patient comes for follow up was not considered as sample.
Infertile women were interviewed face to face with pretested, prestructured questionnaire suitable to their local language. Women asked about perceptions about infertility problem and their future plans for management like further medical treatment, plans for adoption of child. Privacy was maintained throughout the interview schedule.
FINdINgS
Table 1: distribution of study subjects according to age group (n = 100)
Age in years
No. of Infertile females Percentage
15-25 yrs 56 56%26-35 yrs 40 40%36-45 yrs 4 4%
Table 1 shows distribution of study subjects according to age group. Out of 100 infertile femalemaximum i e. 56(56%) found in age group 15-25 years., in age group 26-35 years were 40(40%). In studyChetna R et al. most of the infertile female were in age group20-24yrs.2
Table 2: distribution of study subjects according to Education (n = 100)
education No. of Infertile females Percentage
Postgraduate 2 2%Graduate 14 14%
Intermediate 8 8%High School 24 24%
Middle School 50 50%Primary School - -
Illiterate 2 2%
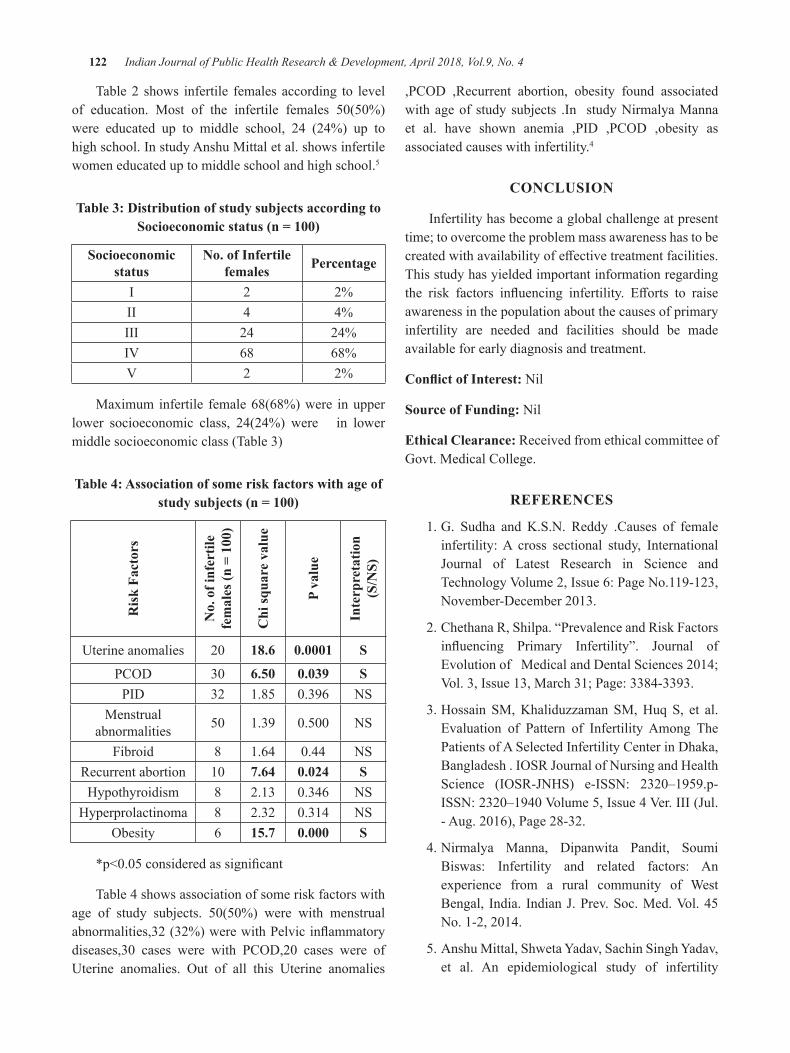
122 Indian Journal of Public Health Research & Development, April 2018, Vol.9, No. 4
Table 2 shows infertile females according to level of education. Most of the infertile females 50(50%)were educated up to middle school, 24 (24%) up to high school. In study Anshu Mittal et al. shows infertile women educated up to middle school and high school.5
Table 3: distribution of study subjects according to Socioeconomic status (n = 100)
Socioeconomic status
No. of Infertile females Percentage
I 2 2%II 4 4%III 24 24%IV 68 68%V 2 2%
Maximum infertile female 68(68%) were in upper lower socioeconomic class, 24(24%) were in lower middle socioeconomic class (Table 3)
Table 4: Association of some risk factors with age of study subjects (n = 100)
Ris
k Fa
ctor
s
No.
of i
nfer
tile
fem
ales
(n =
100
)
Chi
squa
re v
alue
P va
lue
Inte
rpre
tatio
n
(S/N
S)
Uterine anomalies 20 18.6 0.0001 S
PCOD 30 6.50 0.039 SPID 32 1.85 0.396 NS
Menstrual abnormalities 50 1.39 0.500 NS
Fibroid 8 1.64 0.44 NSRecurrent abortion 10 7.64 0.024 SHypothyroidism 8 2.13 0.346 NS
Hyperprolactinoma 8 2.32 0.314 NSObesity 6 15.7 0.000 S
*p<0.05consideredassignificant
Table 4 shows association of some risk factors with age of study subjects. 50(50%) were with menstrualabnormalities,32(32%)werewithPelvicinflammatorydiseases,30 cases were with PCOD,20 cases were ofUterine anomalies. Out of all this Uterine anomalies
,PCOD ,Recurrent abortion, obesity found associatedwith age of study subjects .In study Nirmalya Manna et al. have shown anemia ,PID ,PCOD ,obesity asassociated causes with infertility.4
CONCluSION
Infertility has become a global challenge at present time; to overcome the problem mass awareness has to be createdwithavailabilityofeffectivetreatmentfacilities.This study has yielded important information regarding the risk factors influencing infertility. Efforts to raiseawareness in the population about the causes of primary infertility are needed and facilities should be made available for early diagnosis and treatment.
Conflict of Interest: Nil
Source of Funding: Nil
ethical Clearance: Received from ethical committee of Govt. Medical College.
ReFeReNCeS
1. G. Sudha and K.S.N. Reddy .Causes of female infertility: A cross sectional study, International Journal of Latest Research in Science andTechnologyVolume2,Issue6:PageNo.119-123,November-December2013.
2. Chethana R, Shilpa. “Prevalence and Risk Factors influencing Primary Infertility”. Journal ofEvolutionofMedicalandDentalSciences2014;Vol.3,Issue13,March31;Page:3384-3393.
3. Hossain SM, Khaliduzzaman SM, Huq S, et al. Evaluation of Pattern of Infertility Among The Patients of A Selected Infertility Center in Dhaka, Bangladesh.IOSRJournalofNursingandHealthScience (IOSR-JNHS) e-ISSN: 2320–1959.p-ISSN:2320–1940Volume5,Issue4Ver.III(Jul.-Aug.2016),Page28-32.
4. Nirmalya Manna, Dipanwita Pandit, Soumi Biswas: Infertility and related factors: An experience from a rural community of West Bengal, India. IndianJ.Prev.Soc.Med.Vol.45No.1-2,2014.
5. Anshu Mittal, Shweta Yadav, Sachin Singh Yadav, et al. An epidemiological study of infertility
Indian Journal of Public Health Research & Development, April 2018, Vol.9, No. 4 123
among urban population of Ambala, Haryana.International Journal of Interdisciplinary andMultidisciplinary Studies (IJIMS), 2015, Vol 2,No.4,124-130.
6.Patel Mital, Jain Shefali, Jain Dinesh etal.PrevalenceofDifferentFactorsResponsibleforInfertility. Research Journal of Recent SciencesISSN 2277 – 2502.Vol. 1(ISC-2011), 207-211(2012)
7. Kerala S Shamila and SL Sasikala. Primary Report ontheRiskFactorsAffectingFemaleInfertilityin
South Indian Districts of Tamil Nadu and Kerala. IndianJournalofCommunityMedicine2011;36(1): 59-61
8. Dabral S, Malik SL. Demographic study of gujarsofDelhi:Factorsaffectingfertility, InfantmortalityanduseofBCM.JournalofHum.Ecol.2005;17:85-92.2.
9. Dutta S, Guha A. A clinico-anatomical study on the etiological factors pertaining to primary infertility in females using some common investigative procedures.JAnatSocIndia.2007;56:14-7
depression and it’s Risk Factors among Patients Waiting for Solid Organ Transplantation Attending Selected units of
a Tertiary hospital, Kochi
Sreedevi PA1, Shiney William2, Shania Mathew2, Sandhya P Sudhakar2
1Professor, 2Fourth year B.Sc. Nursing, Amrita College Nursing, Amrita Viswa Vidyapeetham, Health Care Campus, Kochi
AbSTRACTOrgantransplantation(OT)hasemergedasalifesavingmeasureforpatientswithendstageorganfailure.ThewaitingperiodforOTisperceivedbythepatientandfamilyasthemostpsychologicallystressfultimein the whole transplant experience.Objectives: to identify depression and its risk factors among patients waiting for solid organ transplantation.Materials and methods:Thisdescriptivestudywasdoneinaconvenientlyselected60subjectswhoarewaitingforrenal/livertransplantationinAIMS,Kochi.ThetoolsusedwereSociodemographic&illnessrelated variables questionnaire, Beck’s Depression Inventory (to assess depression) and a checklist to assess the Risk factors of depression.Results: Clinical depression was observed in 23.4% of the sample. Also a considerable proportion of the sample (41.6%) had mild mood disturbance. Depression was seen more in prospective liver transplantation candidates.Variables likemale gender, lack of family support, family history of depression, history ofstressful life events andpresenceof co-morbidmedical conditionswere identifiedas the risk factorsofdepression among patients waiting for solid organ transplantation.Conclusion: Patients waiting for solid organ transplantation experience borderline to severe levels of depression. Patients waiting for liver transplantation experience more depression than those who are waiting for renal transplantation.Keywords: Solid Organ Transplantation, Depression, Risk Factors, Waiting for.
Corresponding Author:Prof. Sreedevi. P. A.Head of the Department of Mental Health NursingAmrita College of NursingAmritaViswaVidyapeetham,Health Care Campus, Kochi-41, India.Contact No. 9446317338Email id: [email protected]
INTROduCTION
Organ Transplantation (OT) is the therapeuticgrafting of an organ from a living or dead body to a living body1. It has emerged as the saving grace for thosewho are suffering fromend stageorgandisease,decreasing morbidity and mortality. For most types of solid organ transplant, the demand for organs outweighs
the supply, resulting in the need to institute a waiting list for suitable patients who cannot immediately receive an organ2.There are currently 122,403 peoplewaitingforlifesavingorgantransplants.OTevaluationinvolvesvarioussteps toachieveOTcandidacy,at thecost of a performance anxiety and the fear of omission. Also it is bound to legal and ethical issues. In end-stage organ failure, the patient has to face his/her limited life expectancy and the need for organ transplantation. Fear ofdeath,innerconflicts,andtheuncertaintyofatimelytransplantation are prevailing emotional stressors in this stage of the illness3. Waiting for organ is the most distressing phase4. It is a challenging process for patients, caregivers and medical professionals. It is associated with substantial emotional distress with tremendous life style changes and psychological stresses in the patients and the caregivers5.
DOI Number: 10.5958/0976-5506.2018.00269.3
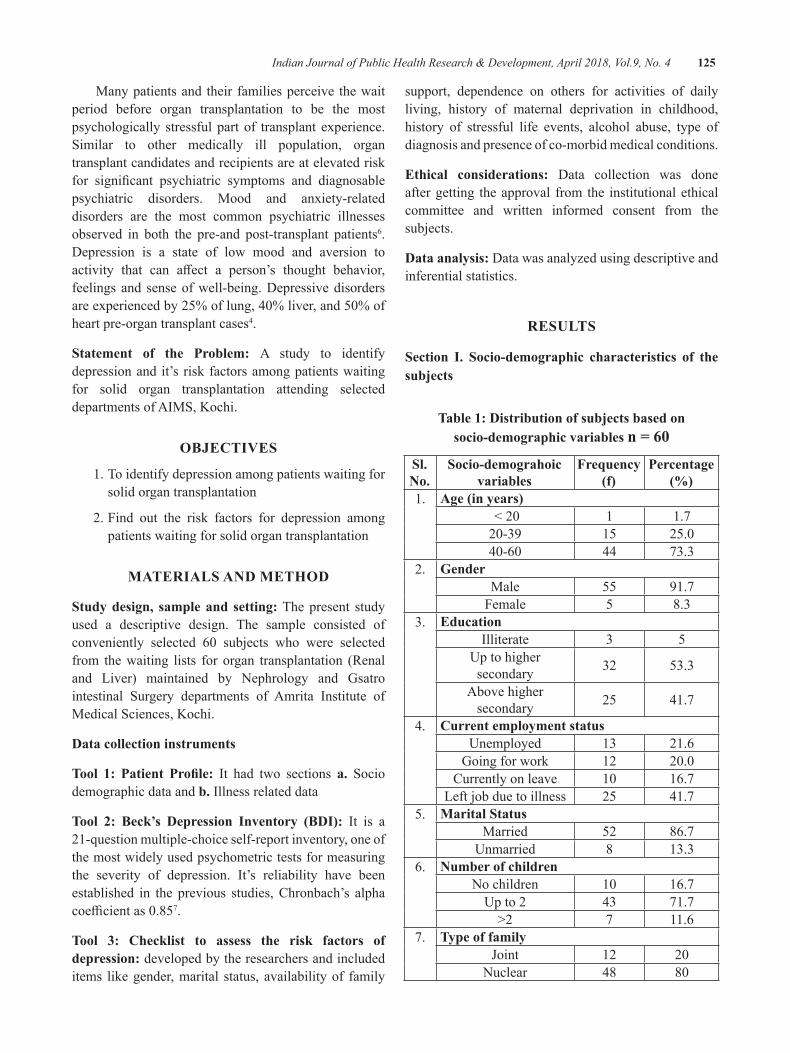
Indian Journal of Public Health Research & Development, April 2018, Vol.9, No. 4 125
Many patients and their families perceive the wait period before organ transplantation to be the most psychologically stressful part of transplant experience. Similar to other medically ill population, organ transplant candidates and recipients are at elevated risk for significant psychiatric symptoms and diagnosablepsychiatric disorders. Mood and anxiety-related disorders are the most common psychiatric illnesses observed in both the pre-and post-transplant patients6. Depression is a state of low mood and aversion to activity that can affect a person’s thought behavior,feelings and sense of well-being. Depressive disorders areexperiencedby25%oflung,40%liver,and50%ofheart pre-organ transplant cases4.
Statement of the Problem: A study to identify depression and it’s risk factors among patients waiting for solid organ transplantation attending selected departments of AIMS, Kochi.
ObJeCTIVeS
1. To identify depression among patients waiting for solid organ transplantation
2. Find out the risk factors for depression among patients waiting for solid organ transplantation
MATeRIAlS ANd MeThOd
Study design, sample and setting: The present study used a descriptive design. The sample consisted of conveniently selected 60 subjects who were selectedfrom the waiting lists for organ transplantation (Renal and Liver) maintained by Nephrology and Gsatro intestinal Surgery departments of Amrita Institute of Medical Sciences, Kochi.
data collection instruments
Tool 1: Patient Profile: It had two sections a. Socio demographic data and b. Illness related data
Tool 2: Beck’s Depression Inventory (BDI): It is a 21-question multiple-choice self-report inventory, one of the most widely used psychometric tests for measuring the severity of depression. It’s reliability have been established in the previous studies, Chronbach’s alpha coefficientas0.857.
Tool 3: Checklist to assess the risk factors of depression: developed by the researchers and included items like gender, marital status, availability of family
support, dependence on others for activities of daily living, history of maternal deprivation in childhood, history of stressful life events, alcohol abuse, type of diagnosis and presence of co-morbid medical conditions.
ethical considerations: Data collection was done after getting the approval from the institutional ethical committee and written informed consent from the subjects.
data analysis: Data was analyzed using descriptive and inferential statistics.
ReSulTS
Section I. Socio-demographic characteristics of the subjects
Table 1: distribution of subjects based on socio-demographic variables n = 60
Sl. No.
Socio-demograhoic variables
Frequency (f)
Percentage (%)
1. Age (in years)<20 1 1.720-39 15 25.040-60 44 73.3
2. genderMale 55 91.7
Female 5 8.33. education
Illiterate 3 5Up to higher secondary 32 53.3
Above higher secondary 25 41.7
4. Current employment statusUnemployed 13 21.6
Going for work 12 20.0Currently on leave 10 16.7
Left job due to illness 25 41.75. Marital Status
Married 52 86.7Unmarried 8 13.3
6. Number of childrenNo children 10 16.7
Up to 2 43 71.7>2 7 11.6
7. Type of familyJoint 12 20
Nuclear 48 80
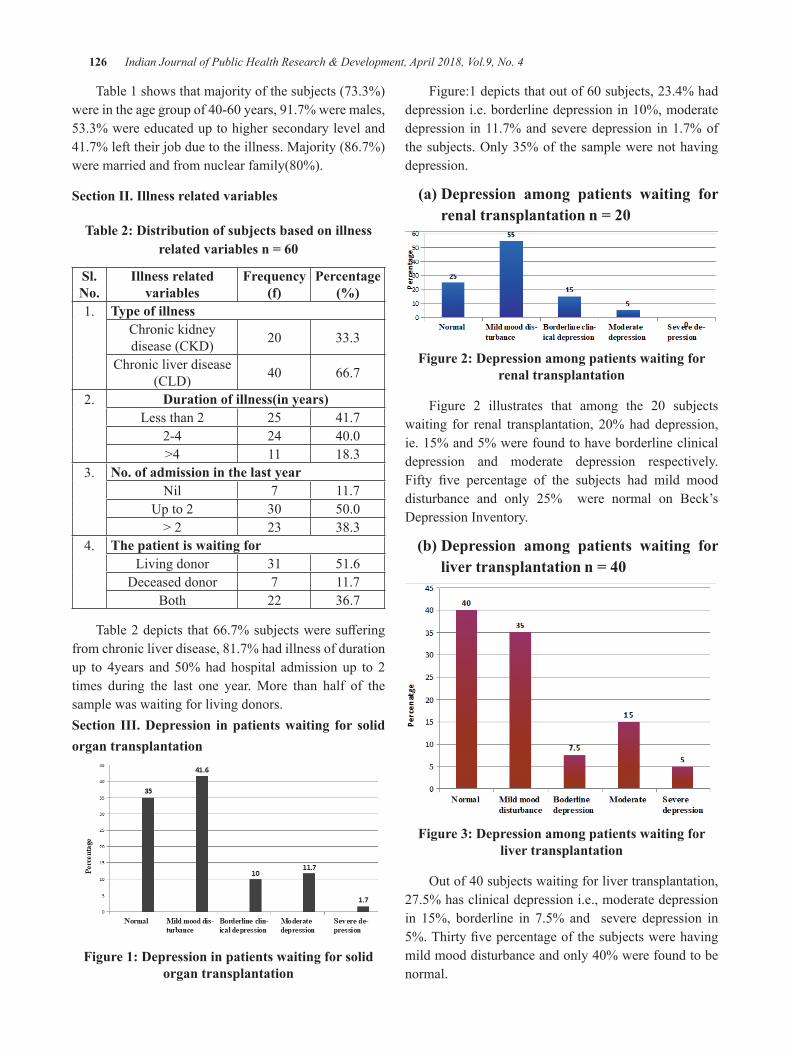
126 Indian Journal of Public Health Research & Development, April 2018, Vol.9, No. 4
Table 1 shows that majority of the subjects (73.3%) wereintheagegroupof40-60years,91.7%weremales,53.3% were educated up to higher secondary level and 41.7% left their job due to the illness. Majority (86.7%) weremarriedandfromnuclearfamily(80%).
Section II. Illness related variables
Table 2: distribution of subjects based on illness related variables n = 60
Sl. No.
Illness related variables
Frequency (f)
Percentage (%)
1. Type of illnessChronic kidney disease (CKD) 20 33.3
Chronic liver disease (CLD) 40 66.7
2. Duration of illness(in years)Less than 2 25 41.7
2-4 24 40.0>4 11 18.3
3. No. of admission in the last yearNil 7 11.7
Up to 2 30 50.0> 2 23 38.3
4. The patient is waiting forLiving donor 31 51.6
Deceased donor 7 11.7Both 22 36.7
Table2depicts that66.7%subjectsweresufferingfrom chronic liver disease, 81.7% had illness of duration up to 4years and 50%had hospital admission up to 2times during the last one year. More than half of the sample was waiting for living donors.Section III. depression in patients waiting for solid organ transplantation
Figure 1: depression in patients waiting for solid organ transplantation
Figure:1depictsthatoutof60subjects,23.4%haddepressioni.e.borderlinedepressionin10%,moderatedepression in 11.7% and severe depression in 1.7% of thesubjects.Only35%of thesamplewerenothavingdepression.
(a) Depression among patients waiting for renal transplantation n = 20
Figure 2: depression among patients waiting for renal transplantation
Figure 2 illustrates that among the 20 subjectswaiting for renal transplantation, 20%haddepression,ie. 15% and 5% were found to have borderline clinical depression and moderate depression respectively. Fifty five percentage of the subjects had mild mooddisturbance and only 25% were normal on Beck’s Depression Inventory.
(b) Depression among patients waiting for liver transplantation n = 40
Figure 3: depression among patients waiting for liver transplantation
Outof40subjectswaitingforlivertransplantation,27.5% has clinical depression i.e., moderate depression in 15%, borderline in 7.5% and severe depression in 5%.Thirtyfivepercentageofthesubjectswerehavingmildmooddisturbanceandonly40%werefoundtobenormal.
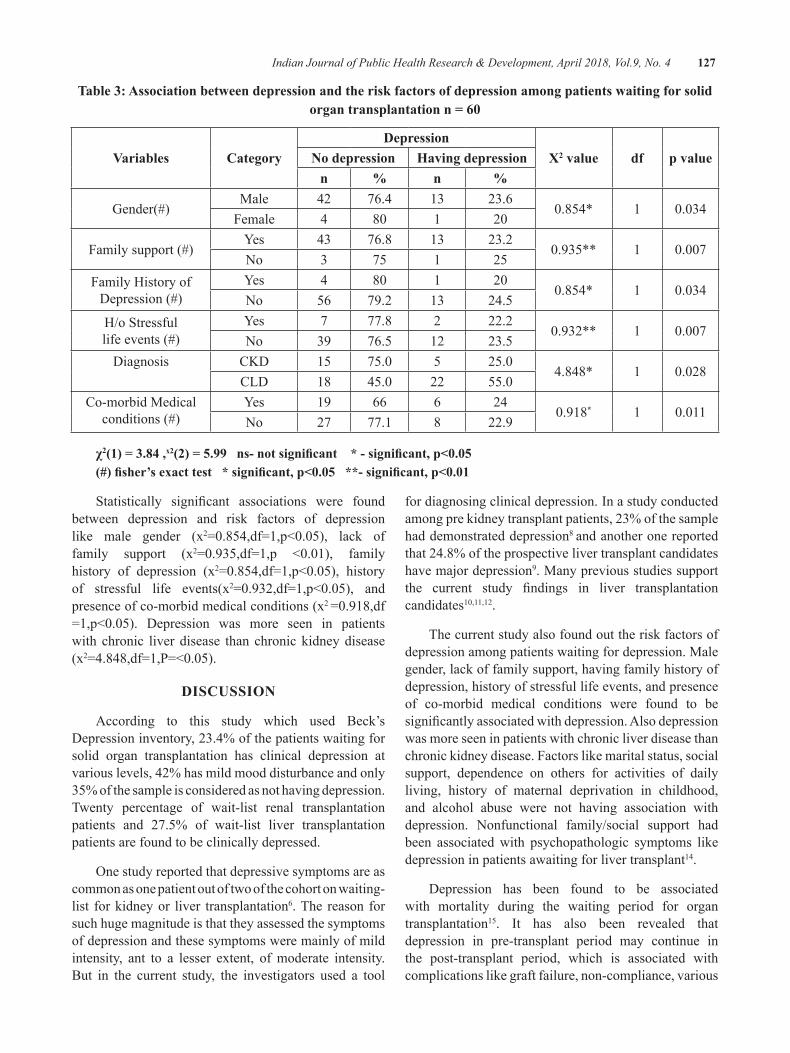
Indian Journal of Public Health Research & Development, April 2018, Vol.9, No. 4 127
Table 3: Association between depression and the risk factors of depression among patients waiting for solid organ transplantation n = 60
Variables Categorydepression
Χ2 value df p valueNo depression having depressionn % n %
Gender(#)Male 42 76.4 13 23.6
0.854* 1 0.034Female 4 80 1 20
Family support (#)Yes 43 76.8 13 23.2
0.935** 1 0.007No 3 75 1 25
Family History ofDepression (#)
Yes 4 80 1 200.854* 1 0.034
No 56 79.2 13 24.5H/o Stressful life events (#)
Yes 7 77.8 2 22.20.932** 1 0.007
No 39 76.5 12 23.5Diagnosis CKD 15 75.0 5 25.0
4.848* 1 0.028CLD 18 45.0 22 55.0
Co-morbid Medical conditions (#)
Yes 19 66 6 240.918* 1 0.011
No 27 77.1 8 22.9
χ2(1) = 3.84 ,x2(2) = 5.99 ns- not significant * - significant, p<0.05(#) fisher’s exact test * significant, p<0.05 **- significant, p<0.01
Statistically significant associations were foundbetween depression and risk factors of depression like male gender (x2=0.854,df=1,p<0.05), lack offamily support (x2=0.935,df=1,p <0.01), familyhistory of depression (x2=0.854,df=1,p<0.05), historyof stressful life events(x2=0.932,df=1,p<0.05), andpresence of co-morbid medical conditions (x2 =0.918,df=1,p<0.05). Depression was more seen in patientswith chronic liver disease than chronic kidney disease (x2=4.848,df=1,P=<0.05).
dISCuSSION
According to this study which used Beck’s Depression inventory, 23.4% of the patients waiting for solid organ transplantation has clinical depression at various levels, 42% has mild mood disturbance and only 35% of the sample is considered as not having depression. Twenty percentage of wait-list renal transplantation patients and 27.5% of wait-list liver transplantation patients are found to be clinically depressed.
Onestudyreportedthatdepressivesymptomsareascommon as one patient out of two of the cohort on waiting-list for kidney or liver transplantation6. The reason for such huge magnitude is that they assessed the symptoms of depression and these symptoms were mainly of mild intensity, ant to a lesser extent, of moderate intensity. But in the current study, the investigators used a tool
for diagnosing clinical depression. In a study conducted among pre kidney transplant patients, 23% of the sample had demonstrated depression8 and another one reported that 24.8% of the prospective liver transplant candidates have major depression9. Many previous studies support the current study findings in liver transplantationcandidates10,11,12.
The current study also found out the risk factors of depression among patients waiting for depression. Male gender, lack of family support, having family history of depression, history of stressful life events, and presence of co-morbid medical conditions were found to be significantlyassociatedwithdepression.Alsodepressionwas more seen in patients with chronic liver disease than chronic kidney disease. Factors like marital status, social support, dependence on others for activities of daily living, history of maternal deprivation in childhood, and alcohol abuse were not having association with depression. Nonfunctional family/social support had been associated with psychopathologic symptoms like depression in patients awaiting for liver transplant14.
Depression has been found to be associated with mortality during the waiting period for organ transplantation15. It has also been revealed that depression in pre-transplant period may continue in the post-transplant period, which is associated with complications like graft failure, non-compliance, various
128 Indian Journal of Public Health Research & Development, April 2018, Vol.9, No. 4
kinds of morbidity and mortality in patients6. Previous studies report that pre-transplant psychological status predicts post-transplant psychological status, length of hospitalization, and even the success of the surgery16.
CONCluSION
All prospective organ transplantation candidates especially those with risk factors of depression must undergo thorough screening for depression and other psyhosocial evaluations. Prompt recognition and effectiveinterventionfordepressionisthoughttoensurethe best outcomes for both patients and their families.
Source of Funding: Self.
Conflict of Interest: Nil.
ReFeReNCeS 1.NewDelhi:MinistryofLaw,JusticeandCompany
Affairs(LegislativeDepartment);1994.Jul11th,TheTransplantationofHumanOrgansAct1994.No. 42.
2. Kuntz K, Weinland S R, Butt Z. Psychosocial Challenges in Solid Organ Transplantation.Journal of Clinical Psychology in MedicalSettings2015Sep;22(2-3):122-35.
3. Schulz KH, Kroencke S Psychosocial challenges before and after organ transplantation Transplant researchandRiskManagement2015.7(11)45—58
4.BNAnilKumar,SurendraKumarMattoo.Organtransplant&thepsychiatrist:Anoverview.IndianJMedRes2015Apr;141(4):408–416.
5. Igwe M, Uwakwe R et-al Factors associated with depression among patients waiting for solid organ transplantation. African Health Sciences. (Serial online){Citedon2013March}13(1):68-77
6. Emmanuelle Corrouble, Caroline Barry, Isabelle Varescon, AntoineDubach, Dibier Samuel,Philippe Lang, Denis Castaing, Bernard Charpentier. Report of depressive symptoms on waiting list and mortality after liver and kidney transplantation. A Prospective cohort study”;BiomedCentralPsychiatry.2011.11:182
7.AmbrosiniPJ,MetzC,BianchiMD,RabinovichH, Undie A. Concurrent validity and psychometric properties of the Beck Depression Inventory in outpatientadolescents.JournaloftheAmericanAcademy of Child and Adolescent Psychiatry. (January1991)30(1):51–7
8. Helge H. Müller, Matthias Englbrecht, Michael S. Wiesener, Stephanie Titze, Katharina Heller, Teja W. Groemer1 , Georg Schett, Kai-Uwe Eckardt, Johannes Kornhuber, Juan ManuelMaler. Depression, Anxiety, Resilience and Coping Pre and Post Kidney Transplantation – Initial Findings from the Psychiatric Impairments inKidneyTransplantation(PI-KT)-Study.PLOSONE.Nov.2015 1-15
9. Szeifert L, Molnar M Z, Ambrus C, Koczy AB, KovacsAZ,VamosEP,KeszeiA,MucsiI,NovakM. Symptoms of depression in kidney transplant recipients:across-sectionalstudy.AmericanJournalofKidneyDiseases.2010Jan;55(1):132-40.
10.Telles-CorreiaD.,BarbosaA.,MegaI.,DireitinhoM., Morbey A., Monteiro E. Psychiatric differences between liver transplant candidateswith familial amyloid polyneuropathy and those with alcoholic liver disease. Progress in Transplantation.2008;18:134–139
11. Norris ER, Smallwood GA, Connor K, McDonell K, Martinez E, Stieber AC, Heffron TG:Prevalence of Depressive Symptoms in Patients Being Evaluated for Liver Transplantation. TransplantationProceedings.2002,34:3285-6.
12.Lopez-NavasA, RiosA, RiquelmeA,Martínez-Alarcón L, Pons JA, Miras M, San Martín A,RamírezP,ParrillaP.Importanceofintroductionofa psychological care unit in a liver transplantation unit.TransplantationProceedings.2010,42:302-5
13. Maryam Banihashemi, Mohsen Hafez, Mohsen Nasiri, Ali Jafarian, Mohammad Reza Abbasi,Mohammad Arbabi, Maryam Abdi, Mahzad Khavarian, Ali Akbar Nejatisafa. Psychosocial status of liver transplant candidates in Iran and its correlation with health-related quality of life and depression and anxiety.JTransplant.2015;2015:329615
14.Lopez-NavasA,RíosA,RiquelmeA,Martínez-Alarcón L, Pons JA, Miras M, Sanmartín A,Febrero B,, Parrilla P. Psychological care: social and family support for patients awaiting a liver transplant. Transplant proceedings. 2011Apr;43(3):701-4.
15.Zimmermann PR, Camey SA, Mari J, de J: Acohort study to assess the impact of depression onpatientswithkidneydisease.IntJPsychiatryMed.2006,36:457-68.
16. Bunzel B, Wollenek G. Heart transplantation: are there psychosocial predictors for clinical success of surgery? Thorac. Cardiovasc. Surg.1994;42(2):103–107)
exploratory Study on experience of domestic Violence among Women
Raveesh Kaimal1, Sreedevi P. A.2, Febu elizabeth joy3
1M.Sc. Nursing student, 2Professor, 3Asst. Professor; Amrita College of Nursing, Amrita Viswa Vidyapeetham Health Care Campus, Kochi, India
AbSTRACT
background of the study: Domestic violence is a serious problem around the world. Statistics on the prevalence of the problem indicate that domestic violence is a worldwide epidemic.
Objective: to explore the experience of domestic violence among women and assess the knowledge of them regarding domestic violence.
Materials and methods: A descriptive survey design was used to collect the data. Sample comprised of 200womenbetween the ageof 18-60years selectedbyproportionate stratified randomsampling. Data were collected using predesigned tools developed by the researcher. Personal interview was conducted to collect the data on experience of domestic violence and knowledge of women regarding various aspects of domestic violence. The data then obtained was analyzed using descriptive statistics (percentage and frequency distribution).
Results: Forty three percentage of the subjects were experiencing domestic violence at the time of the study. Majority of the subjects (49%) had poor knowledge and 18% had good knowledge regarding various aspects of domestic violence.
Conclusion:Thefindingsofthestudyshowthatthisevilisstillgrowinginoursociety.Alsotheknowledgeof the women about domestic violence is found to be poor. It shows the need for gender sensitization and empowerment programmes.
Keywords: domestic violence,women, experience, knowledge
Corresponding Author:Prof. Sreedevi P. A.Head of the Department of Mental Health NursingAmritaCollegeofNursing,AmritaViswaVidyapeethamHealth Care Campus. Kochi-41ContactNo.9446317338/04842858212Email ID: [email protected]
INTROduCTION
Domestic violence is a serious problem around the world. It violates the fundamental human rights of women and often results in serious injury or death. Statistics on the prevalence of the problem indicate that domestic violence is a worldwide epidemic.1 The WorldHealthOrganization reports that the proportionof women who had ever experienced physical or sexual violence or both by an intimate partner ranged from 15% to 71%, with the majority between 29% and 62%.2
India’s National Family Health Survey-III, carried out in29statesduring2005-06,hasfoundthatasubstantialproportion of married women have been physically or sexually abused by their husbands at some time in their lives. The survey indicated that, nationwide, 37.2% of women“experiencedviolence”aftermarriage.Biharwasfound to be the most violent, with the abuse rate against married women being as high as 59%. Strangely, 63% of these incidents were reported from urban families rather than the state’s most backward villages. It was followed by Madhya Pradesh (45.8%), Rajasthan (46.3%), Manipur (43.9%), Uttar Pradesh (42.4%), Tamil Nadu (41.9%) and WestBengal(40.3%).2
Over the last two decades, domestic violence hasemerged as one of the most serious problem faced by women in Kerala. They are experiencing physical
DOI Number: 10.5958/0976-5506.2018.00270.X
130 Indian Journal of Public Health Research & Development, April 2018, Vol.9, No. 4
and psychological violence not only from their in-laws but also often from their intimate partner. The state government’s Economic Review 2004 admits that atrocities against women in the state have increased 300%intheperiod1991-2001.Violenceagainstwomenis a common everyday occurrence in our country3. High rejection sensitivity (HRS) in one or both the spouses leads to personal distress as well as maladaptive behaviours that strain the marital bond4. Every day, women are slapped, beaten, humiliated threatened and sexually abused. Women who are abused are often afraid of articulating their concerns due to socio-cultural pressure and norms3.
The domestic violence cases are just the tip of an iceberg, as most of the cases are suppressed within the conclaves of their homes. In our community atrocities against women comes in to the limelight through various medias only when the repercussions of such incidents are beyond any timely interventions or help. The study thus helps the various institutions like NGOs and alsothe public to understand the nature of the problem in our societyandwillenable them tofightagainst this socialevil. The studies done in Kerala regarding domestic violence are very few in number, for taking necessary actions thisfieldrequires toknowthecurrentstatusofwomen experiencing violence. The present study will help to identify the existence and nature of domestic violence in the community and it will help to sensitize the healthcareproviderstoofferhelpasandwhenrequired.
MeThOdOlOgy
Study setting, sampling design, and sampling: The study was conducted in a rural community of a selected Panchayath of Ernakulum District. The sample comprisedof200womenagedbetween theagegroupof 18-60 years who were selected by proportionatestratifiedrandomsampling.Thestratificationwasdonewith respect to age of subjects. The researcher divided thewomenagedbetweentheagegroupof18-60years(500innumber)into3stratabasedontheagei.e.strataI- 18-32 years(182 in number), strata II-33-46 years(165 women)andstrataIII47-60years(153women).Samplewas selected by proportionate random sampling from each strata that is 72 subjects from strata I, 66 from
strata II and 62 subjects from strata III, i.e. 36%, 33% and 31% of the sample size respectively. The study used quantitative approach with a descriptive design
data Collection Instruments
Tool I: demographic data of subjects.
Tool II: Semi-structured interview schedule to explore the experience of domestic violence among women: This was developed by the researchers and it included 10 questions exploring the type, forms,frequency of domestic violence experienced by the women and it’s consequences and eight questions to explore the characteristics of the perpetrator.
Tool III: Knowledge Questionnaire on domestic violence: This tool consisted of 20 questions to assesswomen’s knowledge on various aspects of domestic violence like domestic violence act, services available to the victims of violence, rights of women, misconceptions about domestic violence etc. The score was interpreted as:
14-20Goodknowledge
7-13 - Average knowledge
0-6-Poorknowledge
Reliability coefficient of the tool IIwas estimatedas0.78(test-retestmethod)andthatoftool-IIIwas0.88(split half method).
dATA COlleCTION
ethical Considerations: Ethical permission was obtained from the Institutional Ethical Committee, formal permission was obtained from President of Panchayath before data collection. Informed consent was obtained from the subjects before collecting the data.
After selecting the sample the researcher personally visited the residence of each subject who met the inclusion criteria. The data was collected using semi-structured interview schedule and self-administered knowledge questionnaire.
data analysis: Data were optically scrutinized and entered into SPSS-19. The data were analyzed using descriptive statistics.
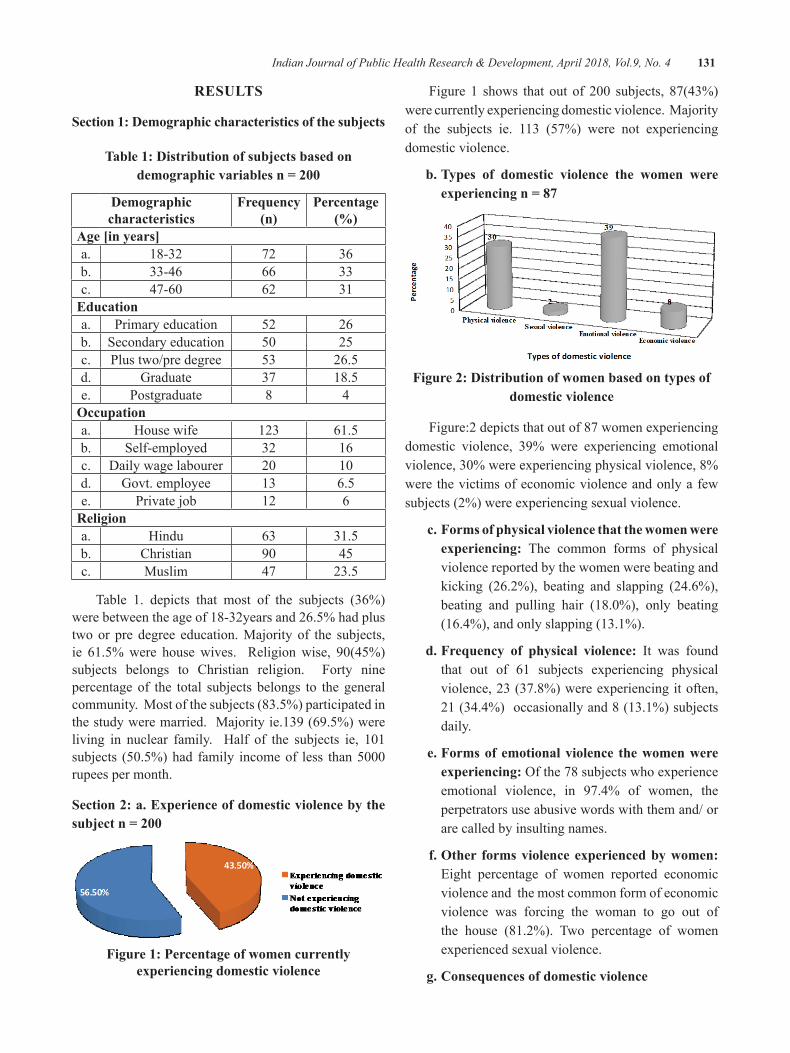
Indian Journal of Public Health Research & Development, April 2018, Vol.9, No. 4 131
ReSulTS
Section 1: demographic characteristics of the subjects
Table 1: distribution of subjects based on demographic variables n = 200
demographic characteristics
Frequency (n)
Percentage (%)
Age [in years]a. 18-32 72 36b. 33-46 66 33c. 47-60 62 31
educationa. Primary education 52 26b. Secondary education 50 25c. Plus two/pre degree 53 26.5d. Graduate 37 18.5e. Postgraduate 8 4
Occupationa. House wife 123 61.5b. Self-employed 32 16c. Daily wage labourer 20 10d. Govt. employee 13 6.5e. Private job 12 6
Religiona. Hindu 63 31.5b. Christian 90 45c. Muslim 47 23.5
Table 1. depicts that most of the subjects (36%) were between the age of 18-32years and 26.5% had plus two or pre degree education. Majority of the subjects, ie 61.5%were housewives. Religionwise, 90(45%)subjects belongs to Christian religion. Forty nine percentage of the total subjects belongs to the general community. Most of the subjects (83.5%) participated in the study were married. Majority ie.139 (69.5%) were living in nuclear family. Half of the subjects ie, 101subjects (50.5%)had family incomeof less than5000rupees per month.
Section 2: a. experience of domestic violence by the subject n = 200
Figure 1: Percentage of women currently experiencing domestic violence
Figure 1 shows that out of 200 subjects, 87(43%)were currently experiencing domestic violence. Majority of the subjects ie. 113 (57%) were not experiencing domestic violence.
b. Types of domestic violence the women were experiencing n = 87
Figure 2: distribution of women based on types of domestic violence
Figure:2 depicts that out of 87 women experiencing domestic violence, 39% were experiencing emotional violence,30%wereexperiencingphysicalviolence,8%were the victims of economic violence and only a few subjects (2%) were experiencing sexual violence.
c. Forms of physical violence that the women were experiencing: The common forms of physical violence reported by the women were beating and kicking (26.2%), beating and slapping (24.6%), beating and pulling hair (18.0%), only beating(16.4%), and only slapping (13.1%).
d. Frequency of physical violence: It was found that out of 61 subjects experiencing physical violence, 23 (37.8%) were experiencing it often, 21 (34.4%) occasionally and 8 (13.1%) subjects daily.
e. Forms of emotional violence the women were experiencing:Ofthe78subjectswhoexperienceemotional violence, in 97.4% of women, the perpetrators use abusive words with them and/ or are called by insulting names.
f. Other forms violence experienced by women: Eight percentage of women reported economic violence and the most common form of economic violence was forcing the woman to go out of the house (81.2%). Two percentage of women experienced sexual violence.
g. Consequences of domestic violence
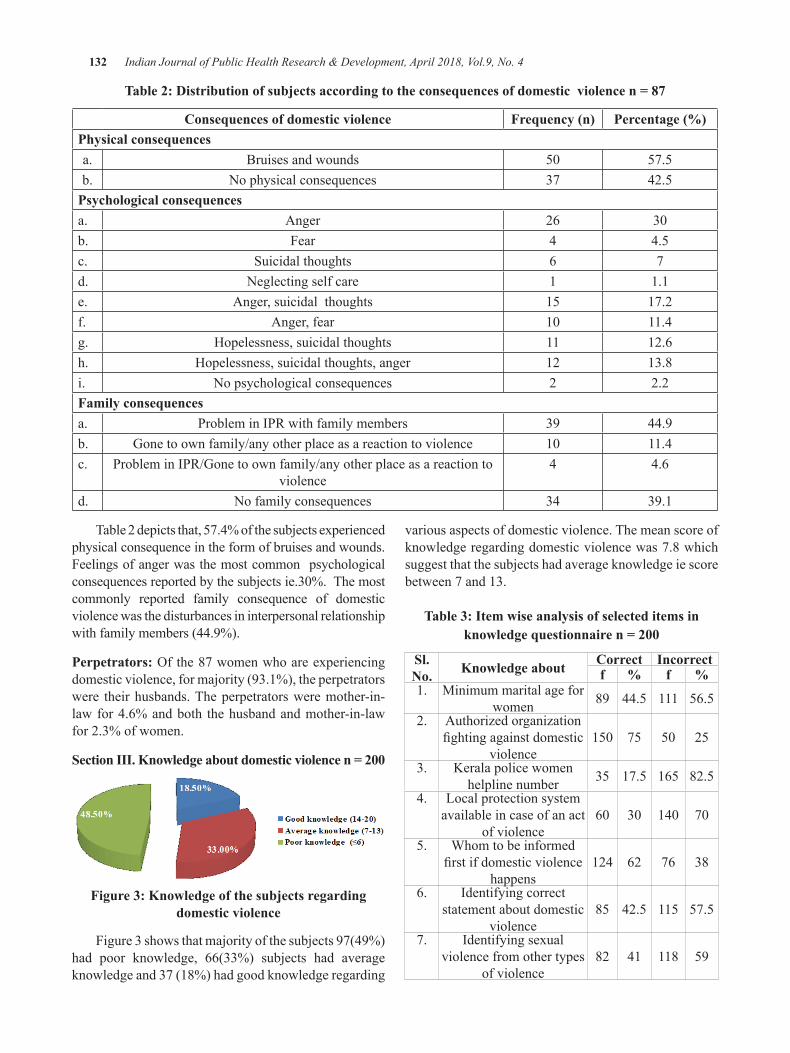
132 Indian Journal of Public Health Research & Development, April 2018, Vol.9, No. 4
Table 2: Distribution of subjects according to the consequences of domestic violence n = 87
Consequences of domestic violence Frequency (n) Percentage (%)Physical consequencesa. Bruises and wounds 50 57.5b. No physical consequences 37 42.5
Psychological consequencesa. Anger 26 30b. Fear 4 4.5c. Suicidal thoughts 6 7d. Neglecting self care 1 1.1e. Anger, suicidal thoughts 15 17.2f. Anger, fear 10 11.4g. Hopelessness, suicidal thoughts 11 12.6h. Hopelessness, suicidal thoughts, anger 12 13.8i. No psychological consequences 2 2.2Family consequencesa. Problem in IPR with family members 39 44.9b. Gone to own family/any other place as a reaction to violence 10 11.4c. Problem in IPR/Gone to own family/any other place as a reaction to
violence4 4.6
d. No family consequences 34 39.1
Table 2 depicts that, 57.4% of the subjects experienced physical consequence in the form of bruises and wounds. Feelings of anger was the most common psychological consequencesreportedbythesubjectsie.30%.Themostcommonly reported family consequence of domestic violence was the disturbances in interpersonal relationship with family members (44.9%).
Perpetrators:Ofthe87womenwhoareexperiencingdomestic violence, for majority (93.1%), the perpetrators were their husbands. The perpetrators were mother-in-law for 4.6% and both the husband and mother-in-law for 2.3% of women.
Section III. Knowledge about domestic violence n = 200
Figure 3: Knowledge of the subjects regarding domestic violence
Figure 3 shows that majority of the subjects 97(49%) had poor knowledge, 66(33%) subjects had average knowledge and 37 (18%) had good knowledge regarding
various aspects of domestic violence. The mean score of knowledge regarding domestic violence was 7.8 which suggest that the subjects had average knowledge ie score between 7 and 13.
Table 3: Item wise analysis of selected items in knowledge questionnaire n = 200
Sl. No. Knowledge about Correct Incorrect
f % f %1. Minimum marital age for
women 89 44.5 111 56.52. Authorized organization
fightingagainstdomesticviolence
150 75 50 25
3. Kerala police women helpline number 35 17.5 165 82.5
4. Local protection system available in case of an act
of violence60 30 140 70
5. Whom to be informed firstifdomesticviolence
happens124 62 76 38
6. Identifying correct statement about domestic
violence85 42.5 115 57.5
7. Identifying sexual violence from other types
of violence82 41 118 59
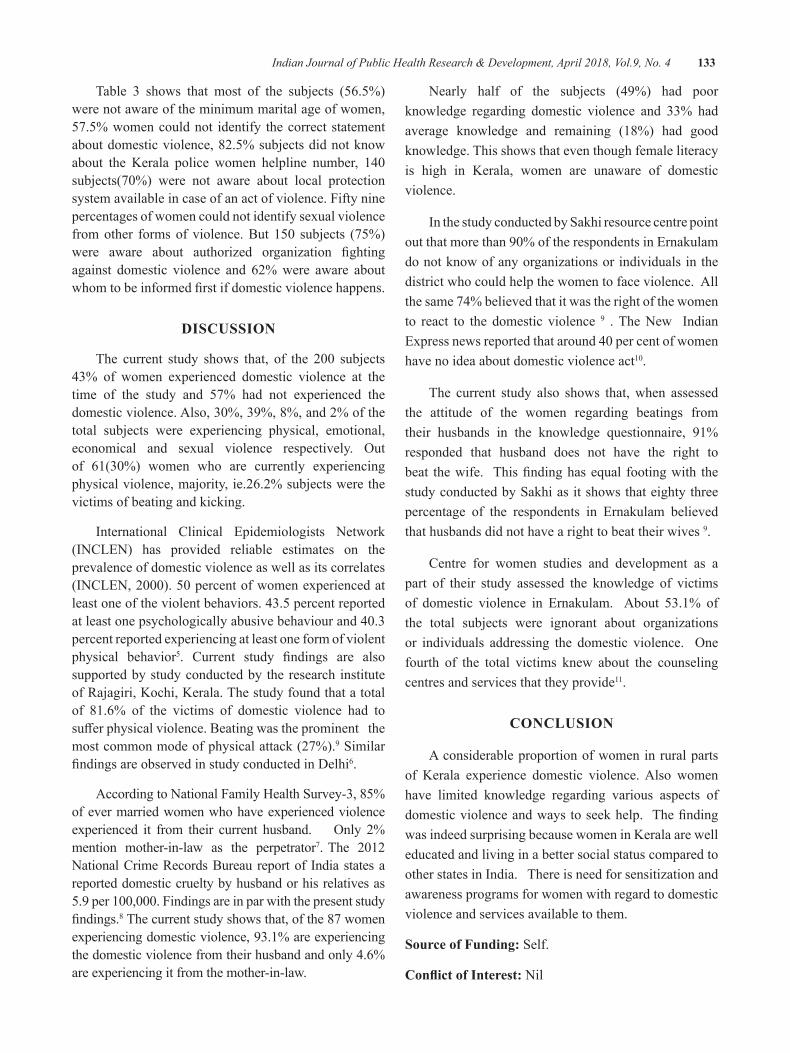
Indian Journal of Public Health Research & Development, April 2018, Vol.9, No. 4 133
Table 3 shows that most of the subjects (56.5%) were not aware of the minimum marital age of women, 57.5% women could not identify the correct statement about domestic violence, 82.5% subjects did not know about the Kerala police women helpline number, 140subjects(70%) were not aware about local protectionsystem available in case of an act of violence. Fifty nine percentages of women could not identify sexual violence fromother formsofviolence.But150 subjects (75%)were aware about authorized organization fightingagainst domestic violence and 62% were aware about whomtobeinformedfirstifdomesticviolencehappens.
dISCuSSION
The current study shows that, of the 200 subjects43% of women experienced domestic violence at the time of the study and 57% had not experienced the domesticviolence.Also,30%,39%,8%,and2%ofthetotal subjects were experiencing physical, emotional, economical and sexual violence respectively. Outof 61(30%) women who are currently experiencingphysical violence, majority, ie.26.2% subjects were the victims of beating and kicking.
International Clinical Epidemiologists Network (INCLEN) has provided reliable estimates on the prevalence of domestic violence as well as its correlates (INCLEN,2000).50percentofwomenexperiencedatleast one of the violent behaviors. 43.5 percent reported atleastonepsychologicallyabusivebehaviourand40.3percent reported experiencing at least one form of violent physical behavior5. Current study findings are alsosupported by study conducted by the research institute of Rajagiri, Kochi, Kerala. The study found that a total of 81.6% of the victims of domestic violence had to sufferphysicalviolence.Beatingwastheprominentthemost common mode of physical attack (27%).9 Similar findingsareobservedinstudyconductedinDelhi6.
According to National Family Health Survey-3, 85% of ever married women who have experienced violence experienced it from their current husband. Only 2%mention mother-in-law as the perpetrator7. The 2012National Crime Records Bureau report of India states a reported domestic cruelty by husband or his relatives as 5.9per100,000.Findingsareinparwiththepresentstudyfindings.8 The current study shows that, of the 87 women experiencing domestic violence, 93.1% are experiencing the domestic violence from their husband and only 4.6% are experiencing it from the mother-in-law.
Nearly half of the subjects (49%) had poor knowledge regarding domestic violence and 33% had average knowledge and remaining (18%) had good knowledge. This shows that even though female literacy is high in Kerala, women are unaware of domestic violence.
In the study conducted by Sakhi resource centre point outthatmorethan90%oftherespondentsinErnakulamdo not know of any organizations or individuals in the district who could help the women to face violence. All the same 74% believed that it was the right of the women to react to the domestic violence 9 . The New Indian Expressnewsreportedthataround40percentofwomenhave no idea about domestic violence act10.
The current study also shows that, when assessed the attitude of the women regarding beatings from their husbands in the knowledge questionnaire, 91% responded that husband does not have the right to beat thewife. Thisfindinghasequal footingwith thestudy conducted by Sakhi as it shows that eighty three percentage of the respondents in Ernakulam believed that husbands did not have a right to beat their wives 9.
Centre for women studies and development as a part of their study assessed the knowledge of victims of domestic violence in Ernakulam. About 53.1% of the total subjects were ignorant about organizations or individuals addressing the domestic violence. Onefourth of the total victims knew about the counseling centres and services that they provide11.
CONCluSION
A considerable proportion of women in rural parts of Kerala experience domestic violence. Also women have limited knowledge regarding various aspects of domesticviolenceandwaystoseekhelp. Thefindingwas indeed surprising because women in Kerala are well educated and living in a better social status compared to other states in India. There is need for sensitization and awareness programs for women with regard to domestic violence and services available to them.
Source of Funding: Self.
Conflict of Interest: Nil
134 Indian Journal of Public Health Research & Development, April 2018, Vol.9, No. 4
ReFeReNCeS
1.Epidemiologyofdomesticviolence[Internet];[Lastmodified 2011 Dec].Available from:.http://en.wikipedia.org/wiki/Epidemiology_of_domestic_violence
2. Kaur R, Garg S. Addressing domestic violence against women:An unfinished agenda. Indian JCommunityMed[serialonline]2008[cited2012Feb 22]; 33:73-6. Available from: http://www.ijcm.org.in/text.asp?2008/33/2/73/40871
3.NeenaJoseph.GearingupGovernanceToCombatDomestic Violence through the ImplementationofDomesticViolenceAct.Availablefrom:http://www.napsipag.org/PDF/NEENA_JOSEPH.pdf
4. Sreehari R, Natarajan G. Detrimental Impact of Rejection Sensitivity in Marital Relationship. PsycolStud2014;59(4):351-356.
5. International Clinical Epidemiologists Network (INCLEN). Domestic Violence in India 3: ASummary Report of a Multi-Site Household Survey, Washington, DC: International Centre
for Research on Women and The Center for DevelopmentandPopulationActivities.2000.
6. A situational analysis of domestic violence against women in Kerala sponsored by centre forwomen’sstudies&developmenttheresearchinstitute Rajagiri college of social sciences, Kochi, KeralaSeptember,2005.
7.NationalFamilyHealthSurvey(NFHS-3),2005–06.Mumbai:InternationalInstituteforPopulationSciences (IIPS) and Macro International. 2007.VolumeI.
8. These National Crimes Record Bureau, Crime in India2012–Statistics.GovernmentofIndia.May2013.
9. Sakhi Resource Center for Women. A study on gender based violence in Kerala. Trivandrum: GovernmentofKerala;15thJune2004.\
10.TheNewIndianExpress.August2013 11. Centre for women’s studies and Development. A
situational analysis of domestic violence against women in Kerala. Ernakulam: Government of India;Sept2005
Effect of Quality of Antenatal Care and Perinatal and Postnatal Outcomes among Women Availing Routine
Antenatal Services in a Primary health Care Setting in a Rural Area of South India
Avita Rose Johnson1, Surekha A2, Suguna A2, Twinkle Agrawal3, Naveen Ramesh4, SulekhaThimmaiah5
1Assistant Professor, Department of Community Health, St. John’s Medical College, Sarjapur Road, John Nagar, Bangalore, India; 2Assistant Professor, Department of Community Medicine, Mahatma
Gandhi Medical College & Research Institute (MGMCRI); 3Assistant Professor, 4Associate Professor, 5Additional Professor, Department of Community Health, St. John’s Medical College,
Sarjapur Road, John Nagar, Bangalore, India
AbSTRACT
Introduction: Antenatal care is a type of preventative care with the goal of providing regular check-ups that allow doctors or midwives to treat and prevent potential health problems throughout the course of the pregnancywhilepromotinghealthylifestylesthatbenefitbothmotherandchild.
Objectives: To assess and compare perinatal and postnatal outcomes among pregnant women based on the quality of antenatal care at a rural primary health care setting.
Methodology: This was a longitudinal study, carried out among mothers who had availed antenatal services ataruralhospital,covering14villagesinAnekalTalukofBangaloreUrbanDistrict,between2009to2013.Details of antenatal care received by the mothers were documented from hospital records. The quality of antenatal care received by the mothers was assessed. The mothers were then contacted in person and after obtaining informed consent, a pretested semi structured questionnaire was administered to record perinatal outcomes.
Results:Around60%of thewomenhadreceivedonlyBasicantenatalcare,24.6%hadreceivedBasicantenatal care along with blood investigations and only 15.4% of the women underwent an ultrasound in addition. Adverse perinatal and neonatal outcomes like stillbirth or neonatal deaths, preterm delivery, low birthweight,maternalpostpartumcomplicationsandneonatalcomplicationsweresignificantlylowerasthequality of antenatal care improved.
Conclusion: In a primary health care setting, better perinatal and postnatal outcomes were found among women undergoing routine laboratory investigations with or without ultrasound, in addition to basic antenatal care.
Keywords: Perinatal and Postnatal outcomes, antenatal care, rural health care, India
Corresponding Author:Dr Surekha AAssistant Professor,Department of Community Medicine,MahatmaGandhiMedicalCollege&ResearchInstitute(MGMCRI)Contact No.: 9972478291Email: [email protected]
INTROduCTION
Intheyear2000,theMillenniumSummitissuedaglobal call for a 75% decrease in maternal mortality, and a two-third reduction in under-5 child deaths by the year 2015.Evenso,accordingtoWorldHealthOrganisation-MilleniumDevelopmentGoals(WHO-MDG)report,nearly 800 women in the world die every day frommaternal causes. Most of these deaths (99%) occur in
DOI Number: 10.5958/0976-5506.2018.00271.1
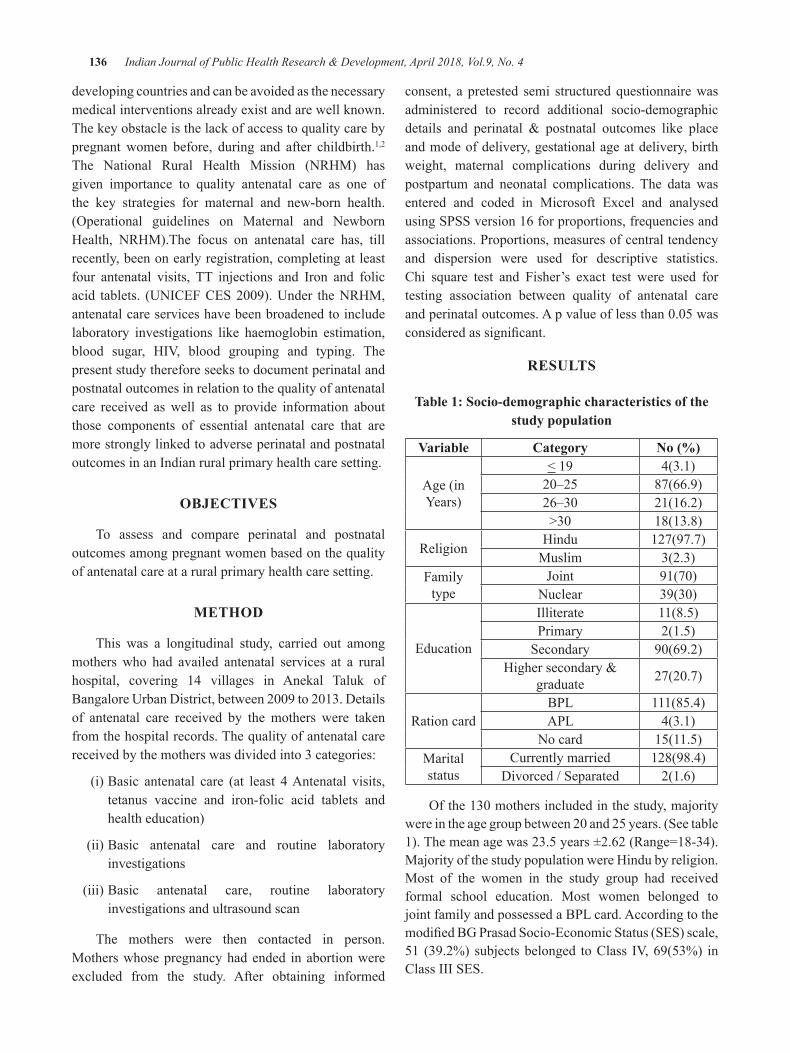
136 Indian Journal of Public Health Research & Development, April 2018, Vol.9, No. 4
developing countries and can be avoided as the necessary medical interventions already exist and are well known. The key obstacle is the lack of access to quality care by pregnant women before, during and after childbirth.1,2 The National Rural Health Mission (NRHM) has given importance to quality antenatal care as one of the key strategies for maternal and new-born health. (Operational guidelines on Maternal and NewbornHealth, NRHM).The focus on antenatal care has, till recently, been on early registration, completing at least four antenatal visits, TT injections and Iron and folic acid tablets. (UNICEFCES2009).Under theNRHM,antenatal care services have been broadened to include laboratory investigations like haemoglobin estimation, blood sugar, HIV, blood grouping and typing. Thepresent study therefore seeks to document perinatal and postnatal outcomes in relation to the quality of antenatal care received as well as to provide information about those components of essential antenatal care that are more strongly linked to adverse perinatal and postnatal outcomes in an Indian rural primary health care setting.
ObJeCTIVeS
To assess and compare perinatal and postnatal outcomes among pregnant women based on the quality of antenatal care at a rural primary health care setting.
MeThOd
This was a longitudinal study, carried out among mothers who had availed antenatal services at a rural hospital, covering 14 villages in Anekal Taluk of BangaloreUrbanDistrict,between2009to2013.Detailsof antenatal care received by the mothers were taken from the hospital records. The quality of antenatal care received by the mothers was divided into 3 categories:
(i) Basic antenatal care (at least 4 Antenatal visits, tetanus vaccine and iron-folic acid tablets and health education)
(ii) Basic antenatal care and routine laboratory investigations
(iii) Basic antenatal care, routine laboratory investigations and ultrasound scan
The mothers were then contacted in person. Mothers whose pregnancy had ended in abortion were excluded from the study. After obtaining informed
consent, a pretested semi structured questionnaire was administered to record additional socio-demographic details and perinatal & postnatal outcomes like placeand mode of delivery, gestational age at delivery, birth weight, maternal complications during delivery and postpartum and neonatal complications. The data was entered and coded in Microsoft Excel and analysed using SPSS version 16 for proportions, frequencies and associations. Proportions, measures of central tendency and dispersion were used for descriptive statistics. Chi square test and Fisher’s exact test were used for testing association between quality of antenatal care andperinataloutcomes.Apvalueoflessthan0.05wasconsideredassignificant.
ReSulTS
Table 1: Socio-demographic characteristics of the study population
Variable Category No (%)
Age (in Years)
< 19 4(3.1)20–25 87(66.9)26–30 21(16.2)>30 18(13.8)
Religion Hindu 127(97.7)Muslim 3(2.3)
Family type
Joint 91(70)Nuclear 39(30)
Education
Illiterate 11(8.5)Primary 2(1.5)
Secondary 90(69.2)Highersecondary&
graduate 27(20.7)
Ration cardBPL 111(85.4)APL 4(3.1)
No card 15(11.5)Marital status
Currently married 128(98.4)Divorced / Separated 2(1.6)
Ofthe130mothersincludedinthestudy,majoritywereintheagegroupbetween20and25years.(Seetable1).Themeanagewas23.5years±2.62(Range=18-34).Majority of the study population were Hindu by religion. Most of the women in the study group had received formal school education. Most women belonged to joint family and possessed a BPL card. According to the modifiedBGPrasadSocio-EconomicStatus(SES)scale,51 (39.2%)subjectsbelonged toClass IV,69(53%) inClass III SES.
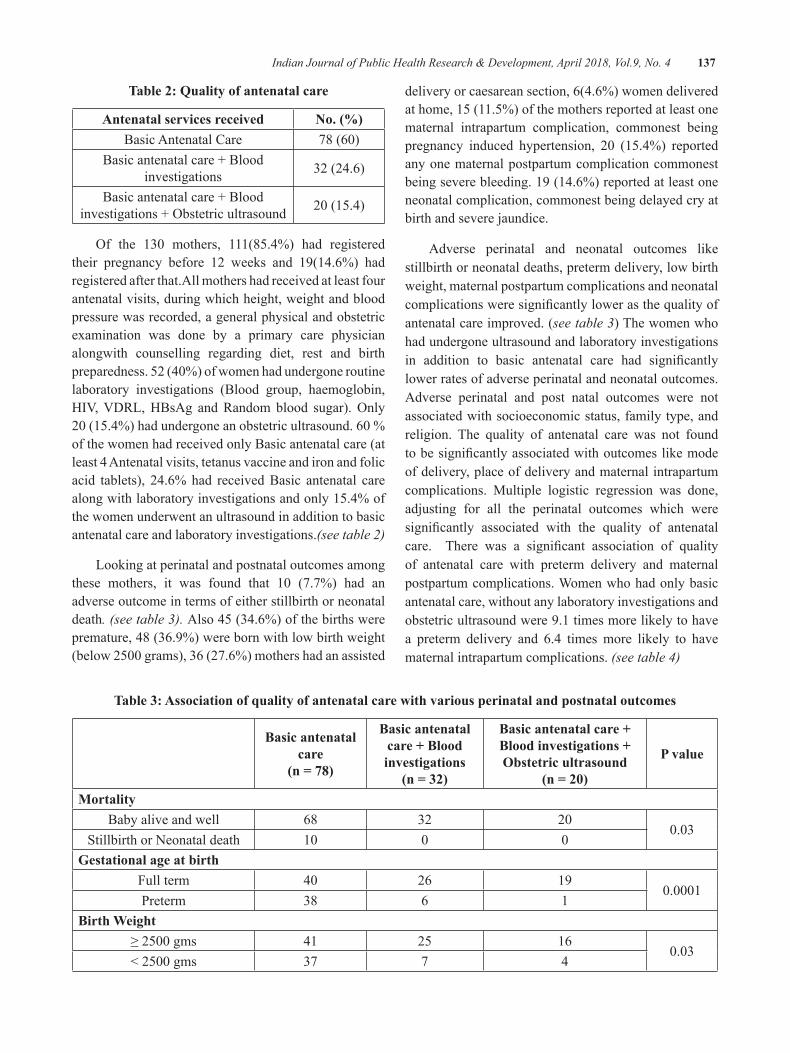
Indian Journal of Public Health Research & Development, April 2018, Vol.9, No. 4 137
Table 2: Quality of antenatal care
Antenatal services received No. (%)Basic Antenatal Care 78(60)
Basic antenatal care + Blood investigations 32 (24.6)
Basic antenatal care + Blood investigations+Obstetricultrasound 20(15.4)
Of the 130 mothers, 111(85.4%) had registeredtheir pregnancy before 12 weeks and 19(14.6%) had registered after that.All mothers had received at least four antenatal visits, during which height, weight and blood pressure was recorded, a general physical and obstetric examination was done by a primary care physician alongwith counselling regarding diet, rest and birth preparedness.52(40%)ofwomenhadundergoneroutinelaboratory investigations (Blood group, haemoglobin, HIV,VDRL,HBsAg andRandomblood sugar).Only20(15.4%)hadundergoneanobstetricultrasound.60%of the women had received only Basic antenatal care (at least 4 Antenatal visits, tetanus vaccine and iron and folic acid tablets), 24.6% had received Basic antenatal care along with laboratory investigations and only 15.4% of the women underwent an ultrasound in addition to basic antenatal care and laboratory investigations.(see table 2)
Looking at perinatal and postnatal outcomes among these mothers, it was found that 10 (7.7%) had anadverse outcome in terms of either stillbirth or neonatal death. (see table 3). Also 45 (34.6%) of the births were premature, 48 (36.9%) were born with low birth weight (below2500grams),36(27.6%)mothershadanassisted
delivery or caesarean section, 6(4.6%) women delivered at home, 15 (11.5%) of the mothers reported at least one maternal intrapartum complication, commonest being pregnancy induced hypertension, 20 (15.4%) reportedany one maternal postpartum complication commonest being severe bleeding. 19 (14.6%) reported at least one neonatal complication, commonest being delayed cry at birth and severe jaundice.
Adverse perinatal and neonatal outcomes like stillbirth or neonatal deaths, preterm delivery, low birth weight, maternal postpartum complications and neonatal complicationsweresignificantlylowerasthequalityofantenatal care improved. (see table 3) The women who had undergone ultrasound and laboratory investigations in addition to basic antenatal care had significantlylower rates of adverse perinatal and neonatal outcomes. Adverse perinatal and post natal outcomes were not associated with socioeconomic status, family type, and religion. The quality of antenatal care was not found tobesignificantlyassociatedwithoutcomeslikemodeof delivery, place of delivery and maternal intrapartum complications. Multiple logistic regression was done, adjusting for all the perinatal outcomes which were significantly associated with the quality of antenatalcare. There was a significant association of qualityof antenatal care with preterm delivery and maternal postpartum complications. Women who had only basic antenatal care, without any laboratory investigations and obstetric ultrasound were 9.1 times more likely to have a preterm delivery and 6.4 times more likely to have maternal intrapartum complications. (see table 4)
Table 3: Association of quality of antenatal care with various perinatal and postnatal outcomes
basic antenatal care
(n = 78)
basic antenatal care + blood investigations
(n = 32)
basic antenatal care + blood investigations + Obstetric ultrasound
(n = 20)
P value
MortalityBaby alive and well 68 32 20
0.03Stillbirth or Neonatal death 10 0 0
gestational age at birthFull term 40 26 19
0.0001Preterm 38 6 1
birth Weight≥2500gms 41 25 16
0.03<2500gms 37 7 4
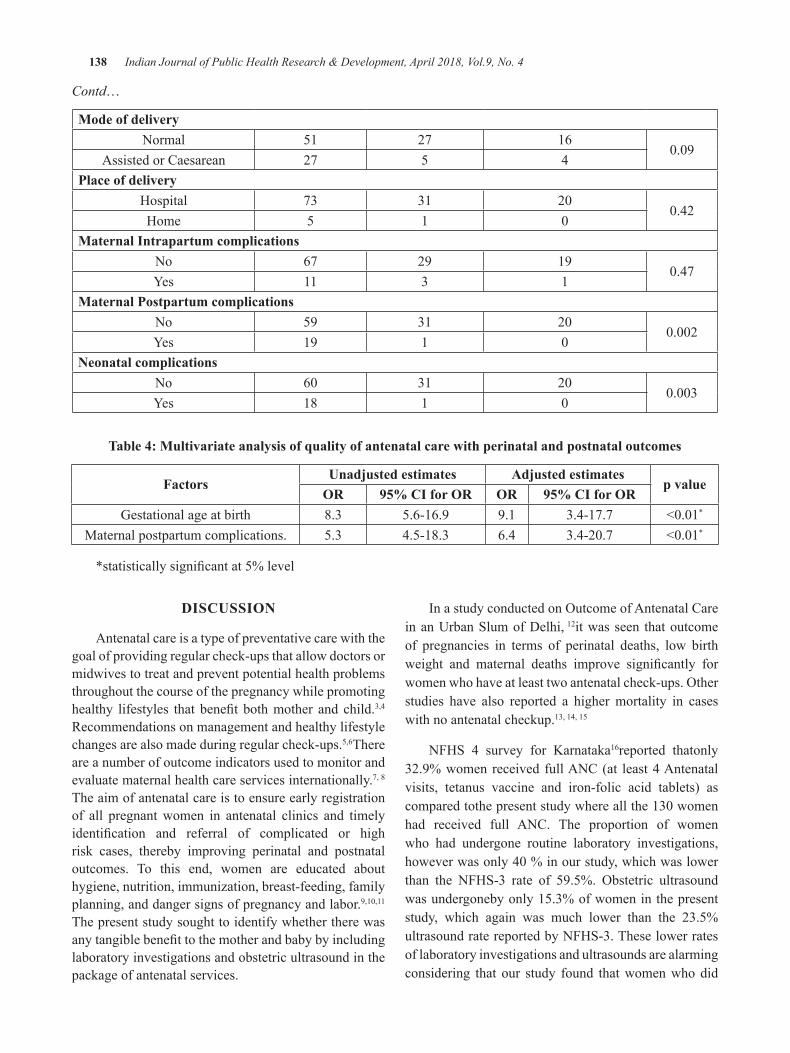
138 Indian Journal of Public Health Research & Development, April 2018, Vol.9, No. 4
Contd…
Mode of deliveryNormal 51 27 16
0.09Assisted or Caesarean 27 5 4
Place of deliveryHospital 73 31 20
0.42Home 5 1 0
Maternal Intrapartum complicationsNo 67 29 19
0.47Yes 11 3 1
Maternal Postpartum complicationsNo 59 31 20
0.002Yes 19 1 0
Neonatal complicationsNo 60 31 20
0.003Yes 18 1 0
Table 4: Multivariate analysis of quality of antenatal care with perinatal and postnatal outcomes
Factorsunadjusted estimates Adjusted estimates
p valueOR 95% CI for OR OR 95% CI for OR
Gestational age at birth 8.3 5.6-16.9 9.1 3.4-17.7 <0.01*
Maternal postpartum complications. 5.3 4.5-18.3 6.4 3.4-20.7 <0.01*
*statisticallysignificantat5%level
dISCuSSION
Antenatal care is a type of preventative care with the goal of providing regular check-ups that allow doctors or midwives to treat and prevent potential health problems throughout the course of the pregnancy while promoting healthy lifestyles that benefit bothmother and child.3,4
Recommendations on management and healthy lifestyle changes are also made during regular check-ups.5,6There are a number of outcome indicators used to monitor and evaluate maternal health care services internationally.7, 8
The aim of antenatal care is to ensure early registration of all pregnant women in antenatal clinics and timely identification and referral of complicated or highrisk cases, thereby improving perinatal and postnatal outcomes. To this end, women are educated about hygiene, nutrition, immunization, breast-feeding, family planning, and danger signs of pregnancy and labor.9,10,11The present study sought to identify whether there was anytangiblebenefittothemotherandbabybyincludinglaboratory investigations and obstetric ultrasound in the package of antenatal services.
InastudyconductedonOutcomeofAntenatalCarein an Urban Slum of Delhi, 12it was seen that outcome of pregnancies in terms of perinatal deaths, low birth weight and maternal deaths improve significantly forwomenwhohaveatleasttwoantenatalcheck-ups.Otherstudies have also reported a higher mortality in cases with no antenatal checkup.13, 14, 15
NFHS 4 survey for Karnataka16reported thatonly 32.9% women received full ANC (at least 4 Antenatal visits, tetanus vaccine and iron-folic acid tablets) as comparedtothepresentstudywhereallthe130womenhad received full ANC. The proportion of women who had undergone routine laboratory investigations, howeverwasonly40%inourstudy,whichwaslowerthan the NFHS-3 rate of 59.5%. Obstetric ultrasoundwas undergoneby only 15.3% of women in the present study, which again was much lower than the 23.5% ultrasound rate reported by NFHS-3. These lower rates of laboratory investigations and ultrasounds are alarming considering that our study found that women who did
Indian Journal of Public Health Research & Development, April 2018, Vol.9, No. 4 139
not have these investigations done had significantlypoorer perinatal outcomes. The common reason for not undergoing laboratory investigations was that the nearby primary health centre did not have stock of the kits required to perform these investigations and the womencouldnotaffordtopayforthesetestsataprivatelaboratory. Similarly, the women who did not undergo anultrasound,statedfinancialdifficultyasthereason.
In India, 9.7% babies are born preterm17, and over one infive(23%)babiesborninruralIndiaareoflowbirthweight, that is weighing less than 2.5 kg.18 However, in the present study, the proportion of low birth weight was much higher at 36.9% and mothers who had received only basic antenatal care were significantly morelikelytodeliveralowbirthweightbaby.Oneprobableexplanation is that laboratory investigations can detect anaemia, which if corrected can improve birth weight and lower the risk of preterm labour,19,20,21 Obstetricultrasound can detect intrauterine growth retardation which can be corrected with supplementary nutrition.22
Thepresent study founda significant reduction inperinatal mortality among women who had undergone laboratory investigations with or without an ultrasound, in addition to basic antenatal care. This finding wassimilar to that in a meta-analysis of 15,935 pregnancies from four randomized controlled trials, where perinatal mortality was found to be significantly lower amongwomen who had a routine obstetric ultrasound.23
However, Cochrane database reviews of eight trials with 27,024women24 andofeleventrialswith37,505women25, and a study in Israel26overa4.5yearperiod,didnotfindanybenefitofultrasoundscansinpregnancyintermsofimproved perinatal outcomes. In the present study it was found that adverse perinatal and neonatal outcomes like stillbirth or neonatal deaths, preterm delivery, low birth weight, maternal postpartum complications and neonatal complicationsweresignificantlylowerasthequalityofantenatal care improved.
CONCluSION
Better perinatal and postnatal outcomes were found among women who had undergone laboratory investigations with or without ultrasound, in addition to basic antenatal care. It is recommended that all women must undergo basic laboratory investigations as a part of routine antenatal care. The public health system should
ensure that the required testing kits are stocked at all Primary Health Centres to increase access to laboratory investigations.
ethical Clearance: Taken from St. John’s MedicalCollege Institutional Ethical committee
Source of support: Nil
Conflict of interest: Nil
ReFeReNCeS
1. Millennium Development Goals (MDGs) [Internet].WorldHealthOrganization.2016[cited7Oct2016].Availablefrom:http://www.who.int/mediacentre/factsheets/fs290/en/
2. Resolutions adopted by the General Assembly, United Nations Millennium Declaration. Fifty fifth session,18September2000.Availablefrom:http://www.un.org/millennium/index.html
3. Factsheet on Women’s health. Available from: http://www.womenshealth.gov/publications/our-publications/fact-sheet/prenatal-care.cfm. Retrievedon11March2012
4.Prenatal care [Internet]. TheFreeDictionary.com. 2016 [cited 7 Sep 2016].Available from:http://medical-dictionary.thefreedictionary.com/prenatal+care
5. Resolutions adopted by the General Assembly, United Nations Millennium Declaration. Fifty sixth session, 18 September, 2000. Availablefrom: http://www.un.org/millennium/index.html
6. Reproductive health indicators for global monitoring. Report of the second interagency meeting, Geneva,WHO. 2001.Available from:http://www.softgeneva.ch/RHR/
7.Trends in Maternal Mortality: 1990 -2015.Estimates by WHO, UNICEF, UNFPA,World Bank group and the United Nations Population Division. [Internet] 2016 [cited 8Sep 2016]. Available from: https://data.unicef.org/wp-content/uploads/2015/12/Trends-in-MMR-1990-2015_Full-report_243.pdf
8.Donner A, Piaggio G, Villar J, Pinol A, Al-Mazrou Y, Ba’aqeel H et al. Methodological considerations in the design of the WHO
140 Indian Journal of Public Health Research & Development, April 2018, Vol.9, No. 4
Antenatal Care -Randomised Controlled Trial. PaediatricandPerinatalEpidemiology[Internet]1998[cited20July2016];(12)Suppl.2:59±74.DOI:10.1046/j.1365-3016.1998.00007.x
9. Saving mothers: Policy and Management Guidelines for Common Causes of Maternal Deaths, by Department of Health. Pretoria: DepartmentofHealth.2001;
10.Guidelines for Maternity Care in South Africa – A Manual for Clinics, Community Health Centres and District Hospitals. Pretoria: Department of Health; 2002; (2)Available fromURL: http://healthweb.kznhealth.gov.za/maternityguidelines.pdf
11. Human genetics policy guidelines for the management and prevention of genetic disorders, birth defects and disabilities. Pretoria: Department of Health. 2001; Available from URL: http://www.doh.gov.za/docs/policy/humangenetics.Pdf
12.OutcomeofAntenatalCareinanUrbanSlumofDelhi. Indian Journal of Community Medicine2006;31(3):189
13.MurthyGV,GoswamiA,Narayanan.Utilisationpatternofantenatalservicesinanurbanslum.J.Obst.Gynae.ofIndia,1990;40(1):42-6.
14.SacharRK,SoniRK,SinghWP,Dhot,GillPJS,Arora Sona, Singh, Dhiman B. Perinatal mortality and pregnancy wastage in ten Punjab villages - A populationbased study. Ind. Jr.ofComm.Med.1998;23:3:99-104.
15. Gupta PK, Gupta AP. Perinatal Mortality. Indian Pediatrics.1985;22:201-5.
16. National Family Health Survey (NFHS)-4 factsheet. Ministry of Health and Family Welfare, GovernmentofIndia[Internet]2015-16.[citedon2Aug2016].Availableathttp://rchiips.org/nfhs/pdf/NFHS4/KA_FactSheet.pdf
17. Preterm Birth Program. National Institute of Biomedical Genomics [Internet]. Nibmg.ac.in.2016[citedAug21].Availablefrom:http://www.nibmg.ac.in/?q=content/preterm-birth-program
18. National Family Health Survey -3, Ministry of Health and Family Welfare, Government
of India [Internet] 2005-06.[cited on 2 Aug2016] Available from: http://cbhidghs.nic.in/writereaddata/linkimages/NFHS-3%20key%20Findings5456434051.pdf
19.ZhangQ,AnanthCV,LiZ,SmulianJC.Maternalanaemia and preterm birth: a prospective cohort study.IntJEpidemiol[Internet]2009Oct[cited1 Aug 2016];38(5):1380-9. doi: 10.1093/ije/dyp243.
20.SchollTO,HedigerML,FischerRL,andShearerJW.Anemiavsirondeficiency:increasedriskofpretermdeliveryinaprospectivestudy.AmJClinNutr [Internet] May 1992[cited 15 July 2016];55(5): 985-988
21.Lindsay H Allen. Anemia and iron deficiency:effects on pregnancy outcome.Am J Clin Nutr[Internet]May2000 [cited15 July2016];71(5):1280s-1284s
22. Pinho-Pompeu M, Surita FG, Pastore DA, PaulinoDS,PintoESilvaJL.Anemiainpregnantadolescents: impact of treatment on perinatal outcomes.JMatern Fetal NeonatalMed[Internet] 2016[cited15July2016];17:1-5.
23.H C Bucher and J G Schmidt. Does routineultrasound scanning improve outcome in pregnancy? Meta-analysis of various outcome measures.BMJ.1993Jul3;307(6895):13–17.
24.Bricker L, Neilson JP, Dowswell T. Routineultrasound in late pregnancy (after 24 weeks’ gestation). The Cochrane database of systematic reviews. 2008;(4):CD001451.doi:10.1002/14651858.CD001451.pub3.
25.BelizánJMandCafferataML.Ultrasoundforfetalassessment in early pregnancy : RHL commentary TheWHOReproductiveHealthLibrary;Geneva:World Health Organization. (last revised: 1September2011).
26. Levmore-Tamir M, Tsafrir A, Boldes R, Rabinowitz R,Armon S, ShenO. Early secondtrimester transvaginal ultrasound anomaly scan does not cause adverse perinatal outcome. Early HumDev [Internet] 2015 [cited 24Aug 2016];91(3):239-42.
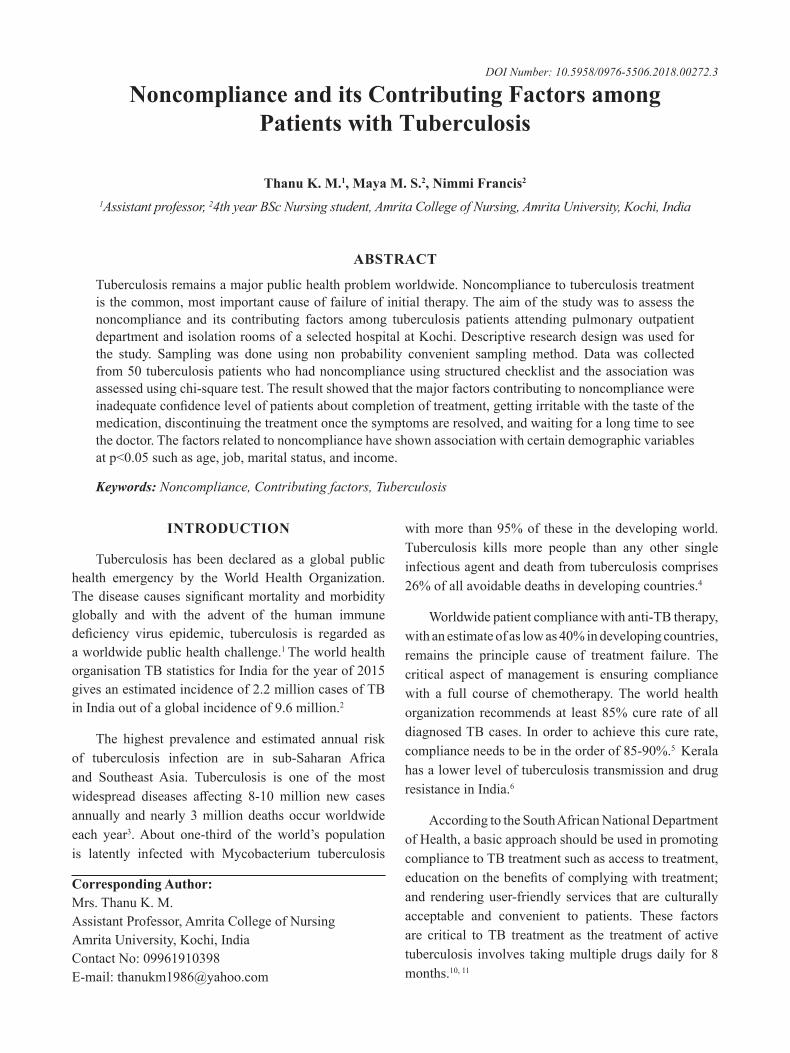
Noncompliance and its Contributing Factors among Patients with Tuberculosis
Thanu K. M.1, Maya M. S.2, Nimmi Francis2
1Assistant professor, 24th year BSc Nursing student, Amrita College of Nursing, Amrita University, Kochi, India
AbSTRACT
Tuberculosis remains a major public health problem worldwide. Noncompliance to tuberculosis treatment is the common, most important cause of failure of initial therapy. The aim of the study was to assess the noncompliance and its contributing factors among tuberculosis patients attending pulmonary outpatient department and isolation rooms of a selected hospital at Kochi. Descriptive research design was used for the study. Sampling was done using non probability convenient sampling method. Data was collected from50tuberculosispatientswhohadnoncomplianceusingstructuredchecklistandtheassociationwasassessed using chi-square test. The result showed that the major factors contributing to noncompliance were inadequateconfidencelevelofpatientsaboutcompletionoftreatment,gettingirritablewiththetasteofthemedication, discontinuing the treatment once the symptoms are resolved, and waiting for a long time to see the doctor. The factors related to noncompliance have shown association with certain demographic variables atp<0.05suchasage,job,maritalstatus,andincome.
Keywords: Noncompliance, Contributing factors, Tuberculosis
Corresponding Author:Mrs. Thanu K. M.Assistant Professor, Amrita College of NursingAmrita University, Kochi, IndiaContactNo:09961910398E-mail: [email protected]
INTROduCTION
Tuberculosis has been declared as a global public health emergency by the World Health Organization.Thediseasecauses significantmortalityandmorbidityglobally and with the advent of the human immune deficiency virus epidemic, tuberculosis is regarded asa worldwide public health challenge.1 The world health organisationTBstatisticsforIndiafortheyearof2015gives an estimated incidence of 2.2 million cases of TB in India out of a global incidence of 9.6 million.2
The highest prevalence and estimated annual risk of tuberculosis infection are in sub-Saharan Africa and Southeast Asia. Tuberculosis is one of the most widespread diseases affecting 8-10 million new casesannually and nearly 3 million deaths occur worldwide each year3. About one-third of the world’s population is latently infected with Mycobacterium tuberculosis
with more than 95% of these in the developing world. Tuberculosis kills more people than any other single infectious agent and death from tuberculosis comprises 26% of all avoidable deaths in developing countries.4
Worldwide patient compliance with anti-TB therapy, withanestimateofaslowas40%indevelopingcountries,remains the principle cause of treatment failure. The critical aspect of management is ensuring compliance with a full course of chemotherapy. The world health organization recommends at least 85% cure rate of all diagnosed TB cases. In order to achieve this cure rate, complianceneedstobeintheorderof85-90%.5 Kerala has a lower level of tuberculosis transmission and drug resistance in India.6
According to the South African National Department of Health, a basic approach should be used in promoting compliance to TB treatment such as access to treatment, educationonthebenefitsofcomplyingwithtreatment;and rendering user-friendly services that are culturally acceptable and convenient to patients. These factors are critical to TB treatment as the treatment of active tuberculosis involves taking multiple drugs daily for 8 months.10,11
DOI Number: 10.5958/0976-5506.2018.00272.3
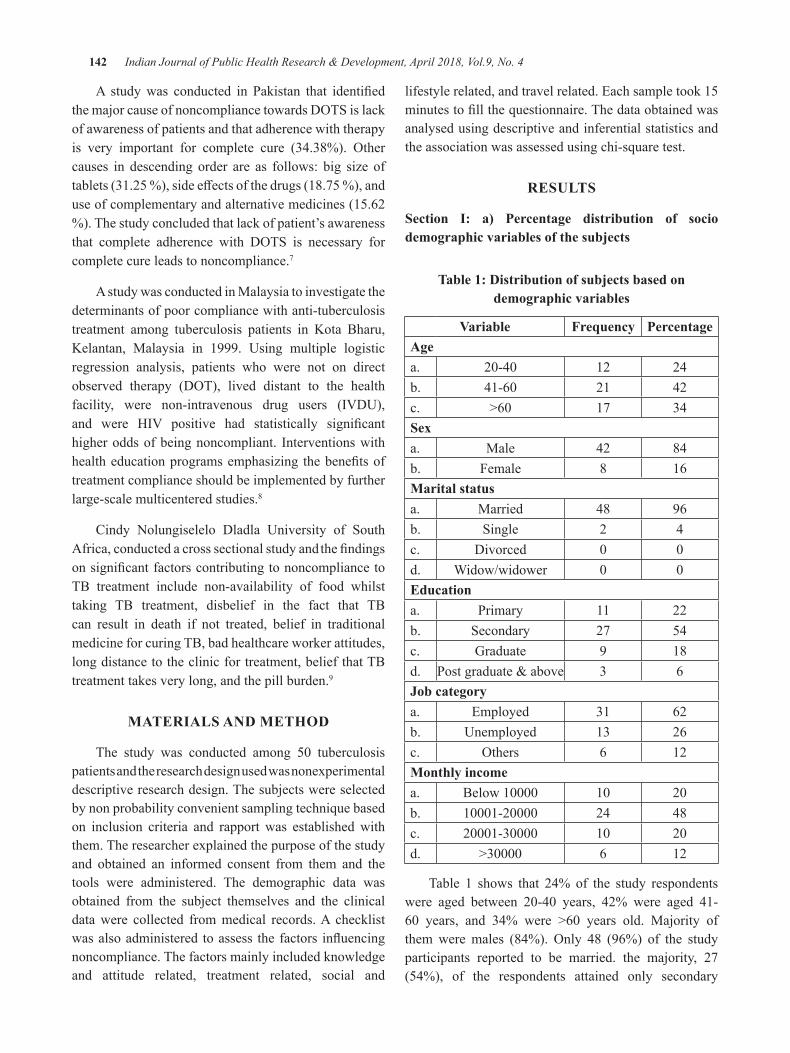
142 Indian Journal of Public Health Research & Development, April 2018, Vol.9, No. 4
A studywas conducted in Pakistan that identifiedthemajorcauseofnoncompliancetowardsDOTSislackof awareness of patients and that adherence with therapy is very important for complete cure (34.38%). Othercauses in descending order are as follows: big size of tablets(31.25%),sideeffectsofthedrugs(18.75%),anduse of complementary and alternative medicines (15.62 %). The study concluded that lack of patient’s awareness that complete adherence with DOTS is necessary forcomplete cure leads to noncompliance.7
A study was conducted in Malaysia to investigate the determinants of poor compliance with anti-tuberculosis treatment among tuberculosis patients in Kota Bharu, Kelantan, Malaysia in 1999. Using multiple logistic regression analysis, patients who were not on direct observed therapy (DOT), lived distant to the healthfacility, were non-intravenous drug users (IVDU),and were HIV positive had statistically significanthigher odds of being noncompliant. Interventions with healtheducationprogramsemphasizing thebenefitsoftreatment compliance should be implemented by further large-scale multicentered studies.8
Cindy Nolungiselelo Dladla University of South Africa, conducted a cross sectional study and thefindingsonsignificantfactorscontributingtononcompliancetoTB treatment include non-availability of food whilst taking TB treatment, disbelief in the fact that TB can result in death if not treated, belief in traditional medicine for curing TB, bad healthcare worker attitudes, long distance to the clinic for treatment, belief that TB treatment takes very long, and the pill burden.9
MATeRIAlS ANd MeThOd
The study was conducted among 50 tuberculosispatients and the research design used was nonexperimental descriptive research design. The subjects were selected by non probability convenient sampling technique based on inclusion criteria and rapport was established with them. The researcher explained the purpose of the study and obtained an informed consent from them and the tools were administered. The demographic data was obtained from the subject themselves and the clinical data were collected from medical records. A checklist wasalsoadministered toassess thefactors influencingnoncompliance. The factors mainly included knowledge and attitude related, treatment related, social and
lifestyle related, and travel related. Each sample took 15 minutestofillthequestionnaire.Thedataobtainedwasanalysed using descriptive and inferential statistics and the association was assessed using chi-square test.
ReSulTS
Section I: a) Percentage distribution of socio demographic variables of the subjects
Table 1: distribution of subjects based on demographic variables
Variable Frequency PercentageAgea. 20-40 12 24b. 41-60 21 42c. >60 17 34Sexa. Male 42 84b. Female 8 16Marital statusa. Married 48 96b. Single 2 4c. Divorced 0 0d. Widow/widower 0 0educationa. Primary 11 22b. Secondary 27 54c. Graduate 9 18d. Postgraduate&above 3 6Job categorya. Employed 31 62b. Unemployed 13 26c. Others 6 12Monthly incomea. Below10000 10 20b. 10001-20000 24 48c. 20001-30000 10 20d. >30000 6 12
Table 1 shows that 24% of the study respondents were aged between 20-40 years, 42% were aged 41-60 years, and 34% were >60 years old. Majority ofthemweremales (84%). Only 48 (96%) of the studyparticipants reported to be married. the majority, 27 (54%), of the respondents attained only secondary
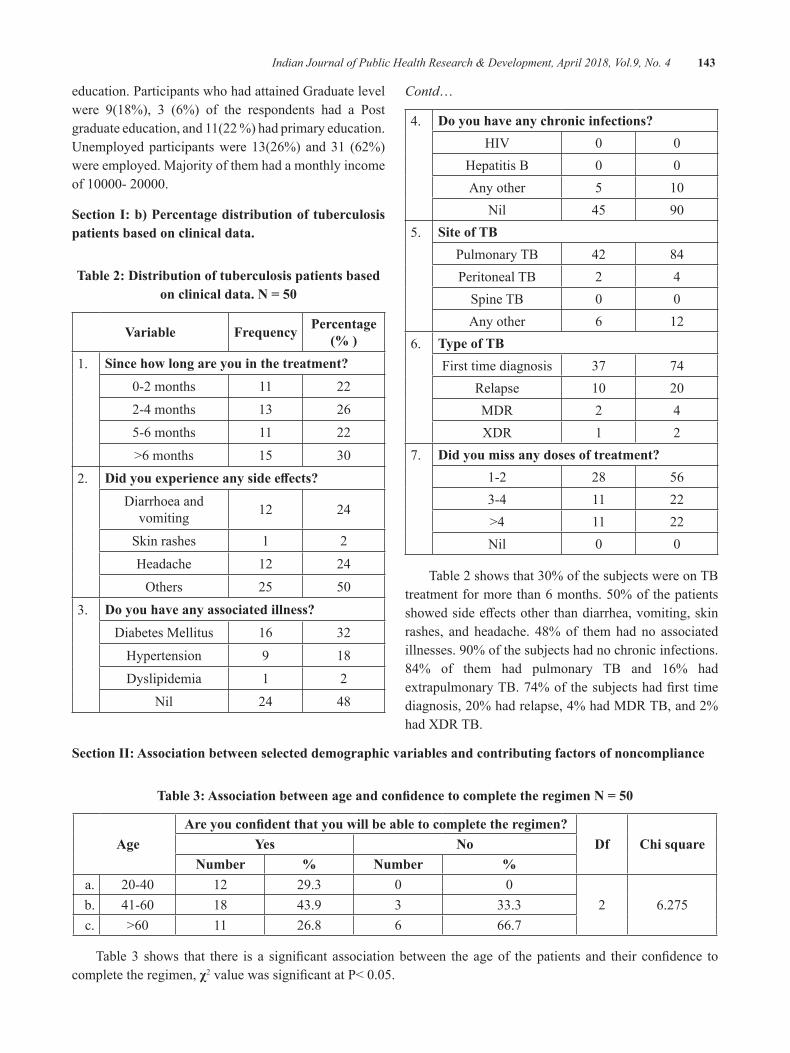
Indian Journal of Public Health Research & Development, April 2018, Vol.9, No. 4 143
education. Participants who had attained Graduate level were 9(18%), 3 (6%) of the respondents had a Post graduate education, and 11(22 %) had primary education. Unemployed participants were 13(26%) and 31 (62%) were employed. Majority of them had a monthly income of10000-20000.
Section I: b) Percentage distribution of tuberculosis patients based on clinical data.
Table 2: distribution of tuberculosis patients based on clinical data. N = 50
Variable Frequency Percentage (% )
1. Since how long are you in the treatment?0-2months 11 222-4 months 13 265-6 months 11 22>6 months 15 30
2. Did you experience any side effects?Diarrhoea and
vomiting 12 24
Skin rashes 1 2Headache 12 24Others 25 50
3. do you have any associated illness?Diabetes Mellitus 16 32
Hypertension 9 18Dyslipidemia 1 2
Nil 24 48
Contd…
4. do you have any chronic infections?HIV 0 0
Hepatitis B 0 0Any other 5 10
Nil 45 905. Site of Tb
Pulmonary TB 42 84Peritoneal TB 2 4
Spine TB 0 0Any other 6 12
6. Type of TbFirst time diagnosis 37 74
Relapse 10 20MDR 2 4XDR 1 2
7. did you miss any doses of treatment?1-2 28 563-4 11 22>4 11 22Nil 0 0
Table2showsthat30%ofthesubjectswereonTBtreatmentformorethan6months.50%ofthepatientsshowedsideeffectsotherthandiarrhea,vomiting,skinrashes, and headache. 48% of them had no associated illnesses.90%ofthesubjectshadnochronicinfections.84% of them had pulmonary TB and 16% had extrapulmonaryTB.74%ofthesubjectshadfirst timediagnosis,20%hadrelapse,4%hadMDRTB,and2%had XDR TB.
Section II: Association between selected demographic variables and contributing factors of noncompliance
Table 3: Association between age and confidence to complete the regimen N = 50
AgeAre you confident that you will be able to complete the regimen?
df Chi squareyes NoNumber % Number %
a. 20-40 12 29.3 0 02 6.275b. 41-60 18 43.9 3 33.3
c. >60 11 26.8 6 66.7
Table3 shows that there is a significant associationbetween the ageof thepatients and their confidence tocomplete the regimen, χ2valuewassignificantatP<0.05.
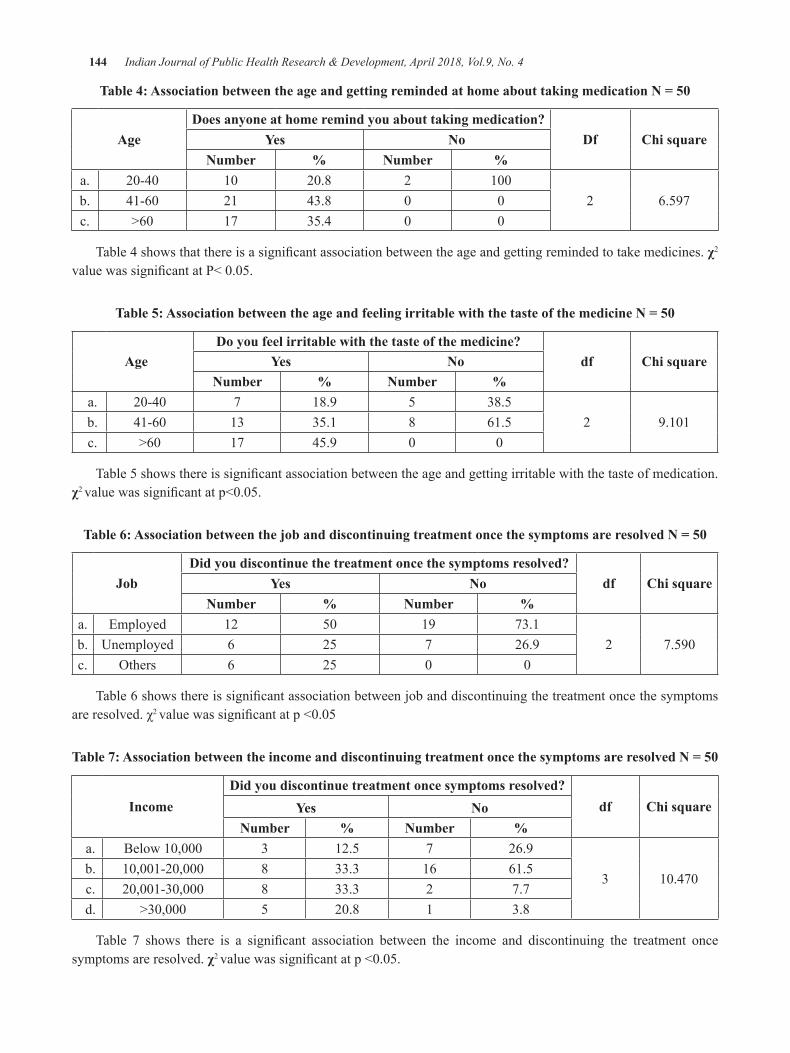
144 Indian Journal of Public Health Research & Development, April 2018, Vol.9, No. 4
Table 4: Association between the age and getting reminded at home about taking medication N = 50
Agedoes anyone at home remind you about taking medication?
df Chi squareyes NoNumber % Number %
a. 20-40 10 20.8 2 1002 6.597b. 41-60 21 43.8 0 0
c. >60 17 35.4 0 0
Table4showsthatthereisasignificantassociationbetweentheageandgettingremindedtotakemedicines.χ2
valuewassignificantatP<0.05.
Table 5: Association between the age and feeling irritable with the taste of the medicine N = 50
Agedo you feel irritable with the taste of the medicine?
df Chi squareyes NoNumber % Number %
a. 20-40 7 18.9 5 38.52 9.101b. 41-60 13 35.1 8 61.5
c. >60 17 45.9 0 0
Table5showsthereissignificantassociationbetweentheageandgettingirritablewiththetasteofmedication.χ2 valuewassignificantatp<0.05.
Table 6: Association between the job and discontinuing treatment once the symptoms are resolved N = 50
Jobdid you discontinue the treatment once the symptoms resolved?
df Chi squareyes NoNumber % Number %
a. Employed 12 50 19 73.12 7.590b. Unemployed 6 25 7 26.9
c. Others 6 25 0 0
Table6showsthereissignificantassociationbetweenjobanddiscontinuingthetreatmentoncethesymptomsareresolved.χ2 valuewassignificantatp<0.05
Table 7: Association between the income and discontinuing treatment once the symptoms are resolved N = 50
Incomedid you discontinue treatment once symptoms resolved?
df Chi squareyes NoNumber % Number %
a. Below10,000 3 12.5 7 26.9
3 10.470b. 10,001-20,000 8 33.3 16 61.5c. 20,001-30,000 8 33.3 2 7.7d. >30,000 5 20.8 1 3.8
Table 7 shows there is a significant association between the income and discontinuing the treatment oncesymptoms are resolved. χ2 valuewassignificantatp<0.05.
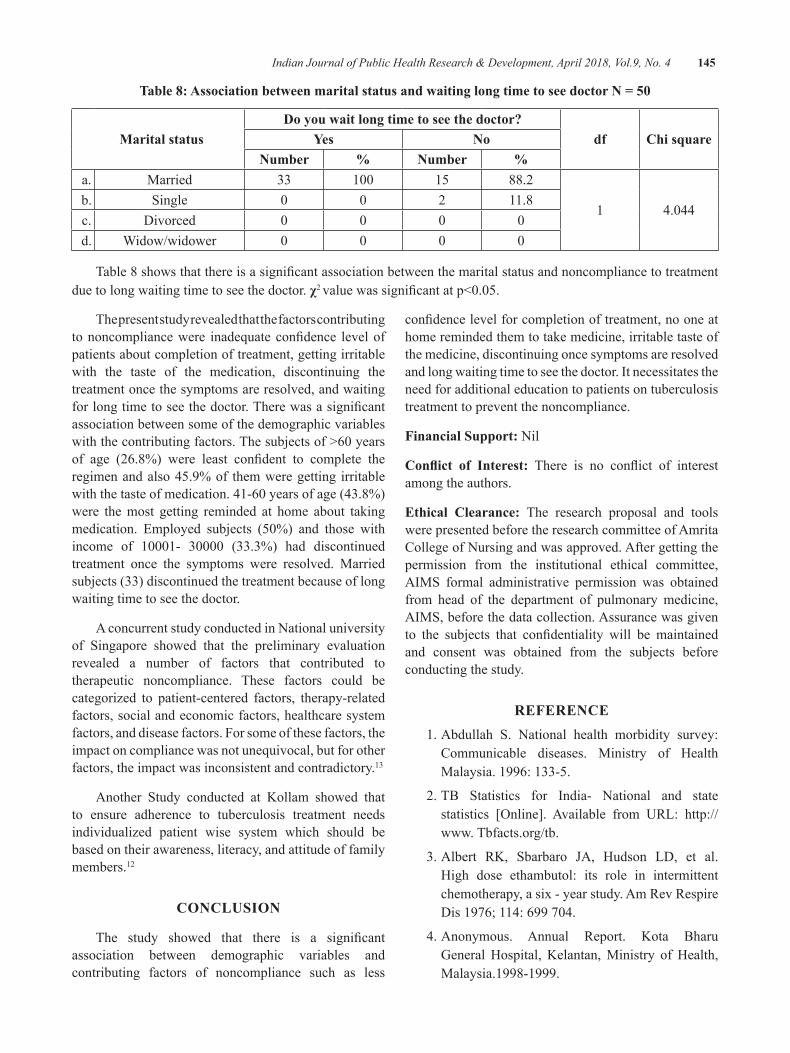
Indian Journal of Public Health Research & Development, April 2018, Vol.9, No. 4 145
Table 8: Association between marital status and waiting long time to see doctor N = 50
Marital statusdo you wait long time to see the doctor?
df Chi squareyes NoNumber % Number %
a. Married 33 100 15 88.2
1 4.044b. Single 0 0 2 11.8c. Divorced 0 0 0 0d. Widow/widower 0 0 0 0
Table8showsthatthereisasignificantassociationbetweenthemaritalstatusandnoncompliancetotreatmentdue to long waiting time to see the doctor. χ2 valuewassignificantatp<0.05.
The present study revealed that the factors contributing tononcompliancewere inadequateconfidence levelofpatients about completion of treatment, getting irritable with the taste of the medication, discontinuing the treatment once the symptoms are resolved, and waiting forlongtimetoseethedoctor.Therewasasignificantassociation between some of the demographic variables withthecontributingfactors.Thesubjectsof>60yearsof age (26.8%) were least confident to complete theregimen and also 45.9% of them were getting irritable withthetasteofmedication.41-60yearsofage(43.8%)were the most getting reminded at home about taking medication. Employed subjects (50%) and those withincome of 10001- 30000 (33.3%) had discontinuedtreatment once the symptoms were resolved. Married subjects (33) discontinued the treatment because of long waiting time to see the doctor.
A concurrent study conducted in National university of Singapore showed that the preliminary evaluation revealed a number of factors that contributed to therapeutic noncompliance. These factors could be categorized to patient-centered factors, therapy-related factors, social and economic factors, healthcare system factors, and disease factors. For some of these factors, the impact on compliance was not unequivocal, but for other factors, the impact was inconsistent and contradictory.13
Another Study conducted at Kollam showed that to ensure adherence to tuberculosis treatment needs individualized patient wise system which should be based on their awareness, literacy, and attitude of family members.12
CONCluSION
The study showed that there is a significantassociation between demographic variables and contributing factors of noncompliance such as less
confidencelevelforcompletionoftreatment,nooneathome reminded them to take medicine, irritable taste of the medicine, discontinuing once symptoms are resolved and long waiting time to see the doctor. It necessitates the need for additional education to patients on tuberculosis treatment to prevent the noncompliance.
Financial Support: Nil
Conflict of Interest: There is no conflict of interestamong the authors.
ethical Clearance: The research proposal and tools were presented before the research committee of Amrita College of Nursing and was approved. After getting the permission from the institutional ethical committee, AIMS formal administrative permission was obtained from head of the department of pulmonary medicine, AIMS, before the data collection. Assurance was given to the subjects that confidentiality will be maintainedand consent was obtained from the subjects before conducting the study.
ReFeReNCe 1. Abdullah S. National health morbidity survey:
Communicable diseases. Ministry of Health Malaysia. 1996: 133-5.
2. TB Statistics for India- National and state statistics [Online]. Available from URL: http://www. Tbfacts.org/tb.
3.Albert RK, Sbarbaro JA, Hudson LD, et al.High dose ethambutol: its role in intermittent chemotherapy, a six - year study. Am Rev Respire Dis1976;114:699704.
4. Anonymous. Annual Report. Kota Bharu General Hospital, Kelantan, Ministry of Health, Malaysia.1998-1999.
146 Indian Journal of Public Health Research & Development, April 2018, Vol.9, No. 4
5. Barnes PF, Barrows SA. Tuberculosis in the 1990’s.AnnInternMed1993;119:400-10.
6.RakeshPS,BalakrishnanS,JayasankarS,AsokanRV.TBmanagementbyprivatepractitioners–Isitbadeverywhere?IndianJTuberc2016;63(4):251-254.
7.BifaniPJ,PlikaytisBB,KapurV,etal.Originandinterstate spread of a New York City multidrug - resistant Mycobacterium tuberculosis lone family. JAMA1996;275:452-7.
8.Brudney K, Dobkin J. A tale of two cities:tuberculosis control in Nicaragua and New York City. Sem respire Infect 1991a; 6: 261-72.
9.Brudney K, Dobkin J. Resurgent tuberculosis inNew York City: human immunodeficiency virus,homelessness, and the decline of tuberculosis control programs. Am Rev respire Dis 1991b; 144; 745-9.
10.CantwellMF,SniderDE,CauthenGM,OnoratoIM. Epidemiology of tuberculosis in the United States, 1985 through 1992. JAMA 1994; 272:535-9.
11.ChauletP,LarbaouiD,GrossetJ,etal.Intermittentchemotherapy with isoniazid and streptomycin in Algieers. Tubercle 1967; 48: 128-36.
12.Rakesh PS, Balakrishnan S, Krishnaveni V,Narayanan V, Pillai S, Thomas SM. Patients’perception towards directly observed treatment – A qualitative study from Kollam district, Kerala, southernIndia.IndianJTuberc2017;64(2):93-98.
13.JingJin,GrantEdwardSklar,VernonMinSenOh,Shu Chuen Li. Department of Pharmacy, National University of Singapore, literature search of the Medlinedatabasefrom1970-2005;269-68.
The determinants of Safety behavior in hospital
Tri Martiana1, Suarnianti2
1Lecturer in Department of Occupational Health and Safety, Faculty of Public Health, Universitas Airlangga Kampus C Mulyorejo 60115, Surabaya-Indonesia; 2Lecturer in Department of Nursing Science,
STIKES Nani Hasanuddin Makassar, Jl. P. Kemerdekaan, Makassar-Indonesia
AbSTRACT
Nosocomial infection poses a serious thread if the health care workers (HCWs) did not perform safety behavior. The complete implementation of universal precautions indicates that the HCWs perform good safety behavior. The objective of this research was to analyze the determinants of HCWs’ safety behavior inhospital.Theresearchwasconductedintwohospitalsinvolving120nursesassample.Thedependentvariable was safety behavior in the implementation of universal precautions while the external variables were: management commitment, management communication, employee involvement, risk response appreciation, work pressures, rules and procedures, work environment and supervision environment. Data analysis was performedusinglogisticregression.TheresultshowedInternalvariableinfluencesafetybehaviorwassex(p-value=0.039)whiletheexternalvariableswere:managementcommunication(p-value=0.003),employeeinvolvement(p-value=0,041),workpressures(p-value=0,047).Inconclusion,safetybehaviorinhospitalwasinfluencedbysex,managementcommunication,employeeinvolvement,andworkpressures
Keywords: safety behavior, hospital, universal precautions
Corresponding Author:Prof. Dr. Tri Martiana, dr., MS.Lecturer in Department of OccupationalHealthandSafety,Faculty of Public Health, Universitas AirlanggaKampusCMulyorejo60115,Surabaya-IndonesiaE-mail: [email protected]
INTROduCTION
Safety behavior is an issue in hospital. The risks of injuries and infectious disease transmissions in hospital can be prevented if all HCWs in hospital perform good safety behavior. HCWs are at risk of work-related injuries and illnesses.1 Hospital is one of hazardous workplaces that can cause work-related injuries and illnesses.2 The number of work related injury and illness cases in hospitalswasatthefirstplaceamongotherworkplaces(construction, manufacturing, and other private sectors).3
More than 18 million health care worker are at high risk toexperienceworkplaceviolenceand80%ofthemarea women.4Between 2011 and 2013workplace assaultoccurredrangedfrom23.540and25.630annuallywith70 to 74% occurring in healthcare and social caring.3
The number of serious workplace violence of health care workers was four times higher than of private industry workers.5 The result of a research conducted by the National Safety Council stated that 88% of occupational injuries in hospital were caused by unsafe behavior and 10%ofthemwerecausedbyunsafeaction.Theresearchwas in line with the research conducted by Cooper6 stating that the main cause of occupational injuries was unsafe behavior.
Hazards in hospital are complex. They can be biological, psychological, and ergonomic, or chemical hazards.7 8 9 The main hazard in hospital is biological factor in the form of germs that can spread from patient to health care worker. Disease transmissions from patient to HCWs possible happen through work activities and tools used in hospitals.10 The infectious pollutant can be blood, serum, pus, sputum, and droplet infection. Safety behaviorofnursesimplementedthroughUniversalSOPin hospital can prevent the transmission of occupational diseases from patients.11 Thus, work-related injuries and diseases can be prevented.
Some components to form safety behavior as self-protection effort to prevent infectious disease
DOI Number: 10.5958/0976-5506.2018.00273.5
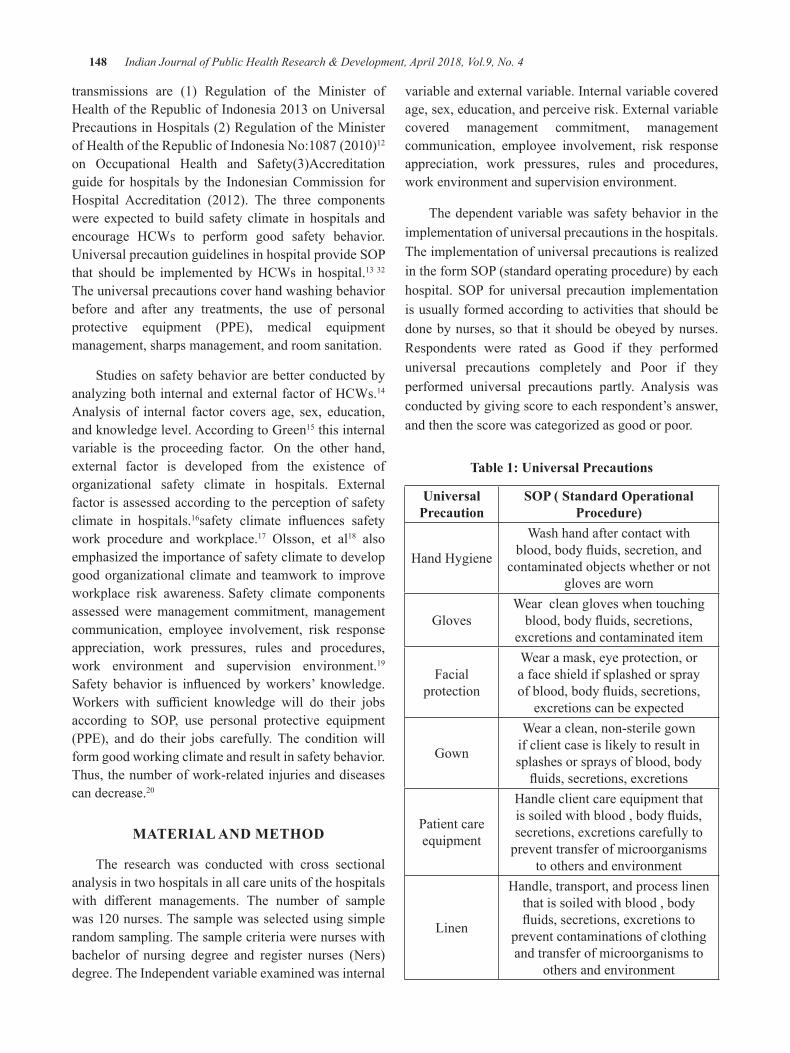
148 Indian Journal of Public Health Research & Development, April 2018, Vol.9, No. 4
transmissions are (1) Regulation of the Minister of HealthoftheRepublicofIndonesia2013onUniversalPrecautions in Hospitals (2) Regulation of the Minister ofHealthoftheRepublicofIndonesiaNo:1087(2010)12
on Occupational Health and Safety(3)Accreditationguide for hospitals by the Indonesian Commission for Hospital Accreditation (2012). The three componentswere expected to build safety climate in hospitals and encourage HCWs to perform good safety behavior. UniversalprecautionguidelinesinhospitalprovideSOPthat should be implemented by HCWs in hospital.13 32 The universal precautions cover hand washing behavior before and after any treatments, the use of personal protective equipment (PPE), medical equipment management, sharps management, and room sanitation.
Studies on safety behavior are better conducted by analyzing both internal and external factor of HCWs.14 Analysis of internal factor covers age, sex, education, and knowledge level. According to Green15 this internal variable is the proceeding factor. On the other hand,external factor is developed from the existence of organizational safety climate in hospitals. External factor is assessed according to the perception of safety climate in hospitals.16safety climate influences safetywork procedure and workplace.17 Olsson, et al18 also emphasized the importance of safety climate to develop good organizational climate and teamwork to improve workplace risk awareness. Safety climate components assessed were management commitment, management communication, employee involvement, risk response appreciation, work pressures, rules and procedures, work environment and supervision environment.19
Safety behavior is influenced byworkers’ knowledge.Workers with sufficient knowledge will do their jobsaccording to SOP, use personal protective equipment(PPE), and do their jobs carefully. The condition will form good working climate and result in safety behavior. Thus, the number of work-related injuries and diseases can decrease.20
MATeRIAl ANd MeThOd
The research was conducted with cross sectional analysis in two hospitals in all care units of the hospitals with different managements. The number of samplewas120nurses.Thesamplewasselectedusingsimplerandom sampling. The sample criteria were nurses with bachelor of nursing degree and register nurses (Ners) degree. The Independent variable examined was internal
variable and external variable. Internal variable covered age, sex, education, and perceive risk. External variable covered management commitment, management communication, employee involvement, risk response appreciation, work pressures, rules and procedures, work environment and supervision environment.
The dependent variable was safety behavior in the implementation of universal precautions in the hospitals. The implementation of universal precautions is realized intheformSOP(standardoperatingprocedure)byeachhospital. SOP for universal precaution implementationis usually formed according to activities that should be done by nurses, so that it should be obeyed by nurses. Respondents were rated as Good if they performed universal precautions completely and Poor if they performed universal precautions partly. Analysis was conducted by giving score to each respondent’s answer, and then the score was categorized as good or poor.
Table 1: universal Precautions
universal Precaution
SOP ( Standard Operational Procedure)
Hand Hygiene
Wash hand after contact with blood,bodyfluids,secretion,and
contaminated objects whether or not gloves are worn
GlovesWear clean gloves when touching blood,bodyfluids,secretions,
excretions and contaminated item
Facial protection
Wear a mask, eye protection, or a face shield if splashed or spray ofblood,bodyfluids,secretions,
excretions can be expected
Gown
Wear a clean, non-sterile gown if client case is likely to result in splashes or sprays of blood, body fluids,secretions,excretions
Patient care equipment
Handle client care equipment that issoiledwithblood,bodyfluids,secretions, excretions carefully to
prevent transfer of microorganisms to others and environment
Linen
Handle, transport, and process linen that is soiled with blood , body fluids,secretions,excretionsto
prevent contaminations of clothing and transfer of microorganisms to
others and environment
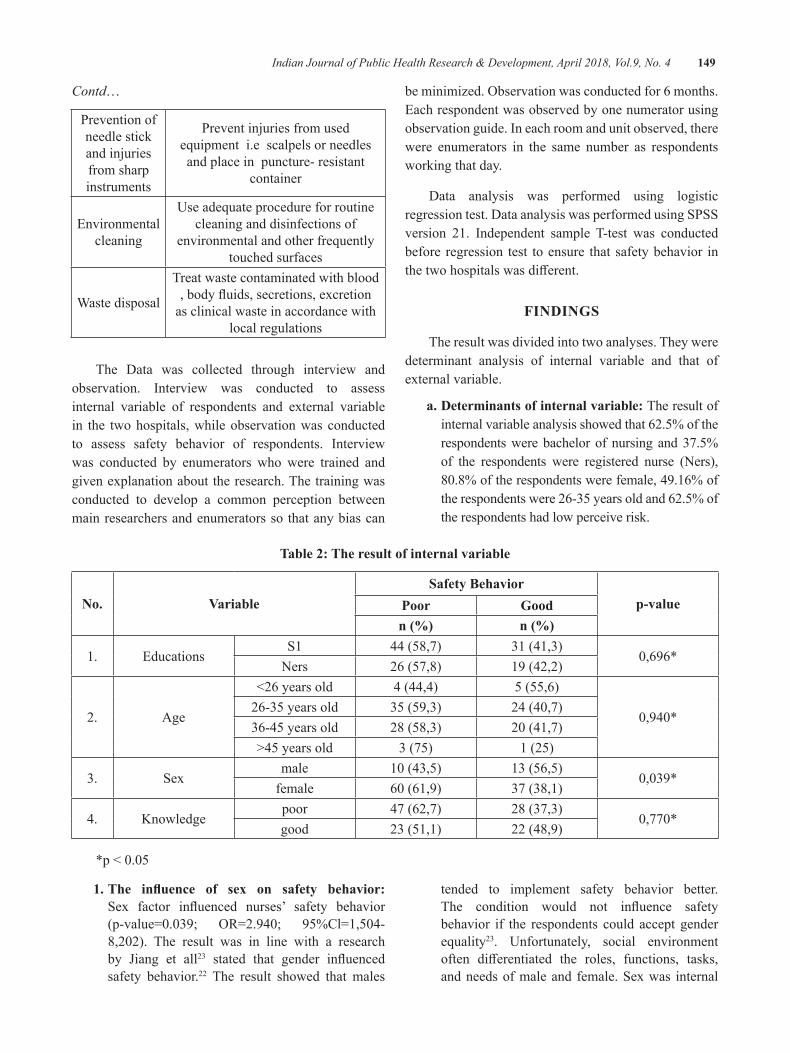
Indian Journal of Public Health Research & Development, April 2018, Vol.9, No. 4 149
Contd…
Prevention of needle stick and injuries from sharp instruments
Prevent injuries from used equipment i.e scalpels or needles and place in puncture- resistant
container
Environmental cleaning
Use adequate procedure for routine cleaning and disinfections of
environmental and other frequently touched surfaces
Waste disposal
Treat waste contaminated with blood ,bodyfluids,secretions,excretion
as clinical waste in accordance with local regulations
The Data was collected through interview and observation. Interview was conducted to assess internal variable of respondents and external variable in the two hospitals, while observation was conducted to assess safety behavior of respondents. Interview was conducted by enumerators who were trained and given explanation about the research. The training was conducted to develop a common perception between main researchers and enumerators so that any bias can
beminimized.Observationwasconductedfor6months.Each respondent was observed by one numerator using observation guide. In each room and unit observed, there were enumerators in the same number as respondents working that day.
Data analysis was performed using logistic regression test. Data analysis was performed using SPSS version 21. Independent sample T-test was conducted before regression test to ensure that safety behavior in thetwohospitalswasdifferent.
FINdINgS
The result was divided into two analyses. They were determinant analysis of internal variable and that of external variable.
a. determinants of internal variable: The result of internal variable analysis showed that 62.5% of the respondents were bachelor of nursing and 37.5% of the respondents were registered nurse (Ners), 80.8%oftherespondentswerefemale,49.16%ofthe respondents were 26-35 years old and 62.5% of the respondents had low perceive risk.
Table 2: The result of internal variable
No. VariableSafety behavior
p-valuePoor goodn (%) n (%)
1. EducationsS1 44 (58,7) 31 (41,3)
0,696*Ners 26 (57,8) 19 (42,2)
2. Age
<26yearsold 4 (44,4) 5 (55,6)
0,940*26-35 years old 35 (59,3) 24(40,7)36-45 years old 28 (58,3) 20(41,7)>45 years old 3 (75) 1 (25)
3. Sexmale 10(43,5) 13 (56,5)
0,039*female 60(61,9) 37 (38,1)
4. Knowledgepoor 47 (62,7) 28 (37,3)
0,770*good 23 (51,1) 22 (48,9)
*p<0.05
1. The influence of sex on safety behavior: Sex factor influenced nurses’ safety behavior(p-value=0.039; OR=2.940; 95%Cl=1,504-8,202). The result was in line with a researchby Jiang et all23 stated that gender influencedsafety behavior.22 The result showed that males
tended to implement safety behavior better. The condition would not influence safetybehavior if the respondents could accept gender equality23. Unfortunately, social environment often differentiated the roles, functions, tasks,and needs of male and female. Sex was internal
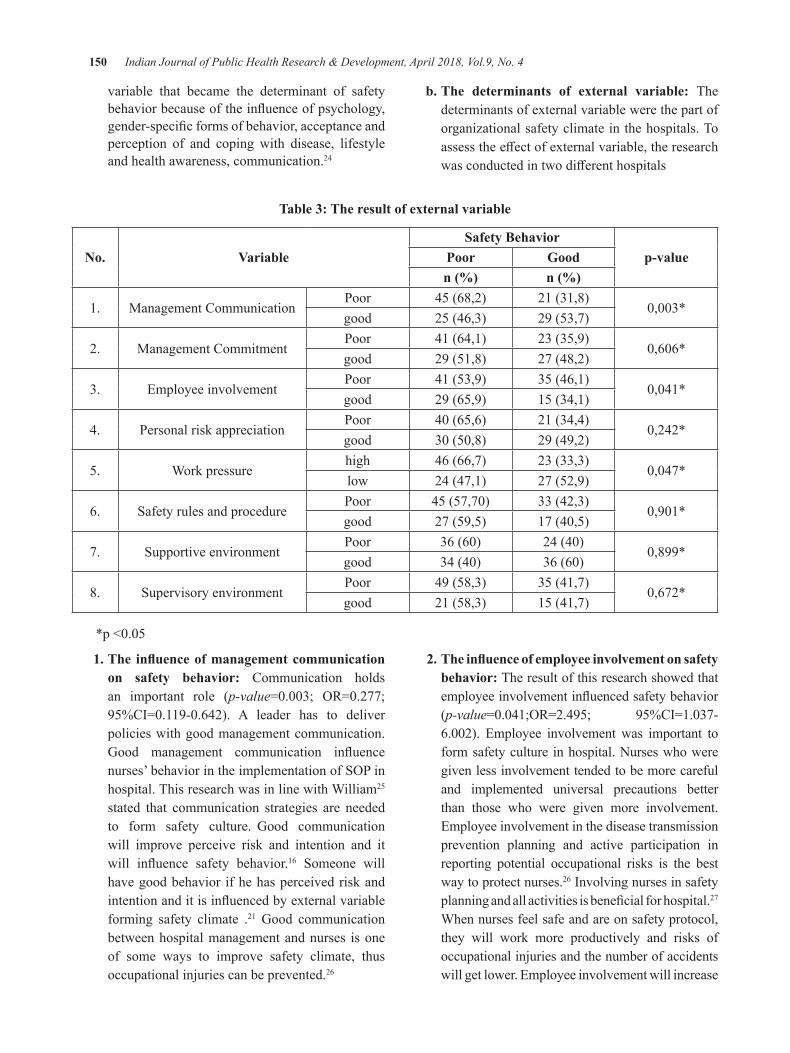
150 Indian Journal of Public Health Research & Development, April 2018, Vol.9, No. 4
variable that became the determinant of safety behaviorbecauseoftheinfluenceofpsychology,gender-specificformsofbehavior,acceptanceandperception of and coping with disease, lifestyle and health awareness, communication.24
b. The determinants of external variable: The determinants of external variable were the part of organizational safety climate in the hospitals. To assesstheeffectofexternalvariable,theresearchwasconductedintwodifferenthospitals
Table 3: The result of external variable
No. VariableSafety behavior
p-valuePoor goodn (%) n (%)
1. Management CommunicationPoor 45 (68,2) 21 (31,8)
0,003*good 25 (46,3) 29 (53,7)
2. Management CommitmentPoor 41 (64,1) 23 (35,9)
0,606*good 29 (51,8) 27 (48,2)
3. Employee involvementPoor 41 (53,9) 35 (46,1)
0,041*good 29 (65,9) 15 (34,1)
4. Personal risk appreciationPoor 40(65,6) 21 (34,4)
0,242*good 30(50,8) 29 (49,2)
5. Work pressurehigh 46 (66,7) 23 (33,3)
0,047*low 24 (47,1) 27 (52,9)
6. Safety rules and procedurePoor 45(57,70) 33 (42,3)
0,901*good 27 (59,5) 17(40,5)
7. Supportive environmentPoor 36(60) 24(40)
0,899*good 34(40) 36(60)
8. Supervisory environmentPoor 49 (58,3) 35 (41,7)
0,672*good 21 (58,3) 15 (41,7)
*p<0.05
1. The influence of management communication on safety behavior: Communication holds an important role (p-value=0.003; OR=0.277;95%CI=0.119-0.642). A leader has to deliverpolicies with good management communication. Good management communication influencenurses’behaviorintheimplementationofSOPinhospital. This research was in line with William25
stated that communication strategies are needed to form safety culture. Good communication will improve perceive risk and intention and it will influence safety behavior.16 Someone will have good behavior if he has perceived risk and intentionanditisinfluencedbyexternalvariableforming safety climate .21 Good communication between hospital management and nurses is one of some ways to improve safety climate, thus occupational injuries can be prevented.26
2. The influence of employee involvement on safety behavior: The result of this research showed that employeeinvolvementinfluencedsafetybehavior(p-value=0.041;OR=2.495; 95%CI=1.037-6.002). Employee involvementwas important toform safety culture in hospital. Nurses who were given less involvement tended to be more careful and implemented universal precautions better than those who were given more involvement. Employee involvement in the disease transmission prevention planning and active participation in reporting potential occupational risks is the best way to protect nurses.26 Involving nurses in safety planningandallactivitiesisbeneficialforhospital.27 When nurses feel safe and are on safety protocol, they will work more productively and risks of occupational injuries and the number of accidents will get lower. Employee involvement will increase
Indian Journal of Public Health Research & Development, April 2018, Vol.9, No. 4 151
nurses’ awareness of hazards in hospital, sources and importance of safety culture in hospital. This will increase safety culture in workplace. Kimmel stated that when workers are given opportunity to contribute to safety planning in hospital, they will prevent occupational accidents better and control hazards in hospital better.28
3. The influence of work pressures on safety behavior: Work pressures have negative correlation with safety behavior (p-value=0.047;OR=0.499; 95%CI=0.203-0.991). This researchwas in line with the research conducted by Tawaih and Adu29 where high work pressures will make nurses less obedient to safety behavior.
Decreasing work pressures can be done by combining organizational change intervention and stress management.30 Organizational changeis done to decrease stressor in workplace by redesigning jobs and organization. Some actions that can be done are: to ensure that nurses work based on capacity and skill, to clarify rights and responsibilities of nurses, to involve nurses in the planning and development of hospital, to improve communication, and to improve mutual interaction among nurses. good management communication would reduce stress on workers. The lower the stress, the lower work pressures resulted so that safety behavior could be implemented. Kallberg31 also stated that high workload, lack of control andcommunicationinfluencedsafetybehaviorofnurses. High workload will increase work pressures and result in the absence of safety behavior.
CONCluSION
Safety behavior among nurses in hospital was influenced by sex, management communication,employee involvement, and work pressures. It is suggested that there should be gender equality awareness improvement, organizational climate improvement to improve management communication, employee involvement, and work pressure reduction.
Conflict of Interest: ThisManuscript has no conflictinterest
Source of Funding: This Research was funded by Faculty of Public Health, Universitas Airlangga- Indonesia
ethical Clearance: This research has passed ethics test based on faculty of Public Health Universitas Airlangga ethical committee No 52 KEPK 2017 issued on 23February2017
ReFeReNCe
1. Alison M, et all. Patient Safety and Quality. Maryland.NCBI[internet].2008.[CitedApril20,2017].Available fromhttps://www.ncbi.nlm.nih.gov/books/NBK2661/
2.OSHA. Fact about hospital worker safety[internet].September 2013. [Cited 20 April,2017].Availablefromhttps://www.osha.gov/dsg/hospitals/documents/1.2_Factbook_508.pdf.
3.OSHA. Injury and Illness Prevention Program,White paper. United State Department of Labor. January2012
4.CDC. Healthcare worker [internet]. march 14,2017. [cited April 16,2017]. Available from :https://www.cdc.gov/niosh/topics/healthcare/
5.OSHA. Workplace violence inhealthcare[internet].2017.[cited April 16,2017]. Available from : https://www.osha.gov/Publications/OSHA3826.pdf
6.Jones H. Human Behavior[internet].Texas.2012.[Cited January 2017]. Available from http://www.socialemotiveneuroscience.org/pubs/ehj_dissonance_encyclopedia_human_minda.pdf
7.McDiarmidM.hazardofhealth sector. JournalAnnas of Global Health[internet]. 2014;80(4) :315–319 available from : https://doi.org/10.1016/j.aogh.2014.08.001
8.CDC.OccupationalHazardinHospital[internet].Atlanta . 2001. [cited January 2017] Availablefrom : https://www.cdc.gov/niosh/docs/2001-115/pdfs/2001-115.pdf
9.WHO. Occupational Hazard [internet]. Geneva.2017. [Cited January 2017] available from :http://www.who.int/occupational_health/topics/hcworkers/en/
10.Marthur P. journal. Indian journal of medicalresearch[internet]. 2011.[Cited January2017];134(5) : 611–620. Available from : Doi:10.4103/0971-5916.90985
152 Indian Journal of Public Health Research & Development, April 2018, Vol.9, No. 4
11.Tietjen L. Infections prevention. JHPIEGO[internet].Maryland.2007.[ Cited april 2017]available from : http://pdf.usaid.gov/pdf_docs/Pnact433.pdf.
12. MoH Indonesia. Regulation of the MoH of the Republic of Indonesia No:1087/MENKES/SK/VIII/2010
13. Kemenkes RI.Kewaspadaan Universal di RumahSakit.Jakarta:KemenkesRI:2013
14.GellerS. behaviormodification.Safety and riskmanagement [internet]. .2005[Cited January2017]; 29(3): 539-561. Available from: Doi:10.1177/0145445504273287
15. Green, L.W.Health Educations Planning: a diasnogtic approach. California: MayfieldPublishingCompany:1980
16. Haktanir, Prediction of Safety-Related Behavior Among Turkish Nurses: The Graduate School of Social Science of Middle East Technical University [internet]: May 2011.[Cited January 2017]. Available from http://ci teseerx.ist .psu.edu/viewdoc/download? doi=10.1.1.459.6068&rep=rep1&type=pdf.
17.Vu Trang, De CieriHelen. Safety climate,employee safety voice, workplace social relations and OHS. Department of Management MonashUniversity [internet] : May 2016. [cited April17,2017]Availablefrom:http://www.iscrr.com.au/__data/assets/pdf_file/0003/533568/060_REP_RES_R07-Safety-climate-in-aged-care.pdf
18.Olsson, C, Forsberg A, Bjerså. Safety climateand readiness for implementation of evidence and person centered. BMC Nursing [internet].2016. [Cited February 2017]: 15(54) availablefrom:https://bmcnurs.biomedcentral.com/articles/10.1186/s12912-016-0174-2 DOI:10.1186/s12912-016-0174-2.
19. Pecquet. Measuring Safety Climate as an Indicator ofInfluenceSafetyandHealthProgramsinTheConstruction Industry .A .Lousiana. Lousinana state university [Dissertation]: May 2013.[Cited January2017]. available fromhttp://etd.lsu.edu/docs/available/etd-03252013-122934/unrestricted/Pecquet_Dissertation_3-26-13.pdf.
20.Demak. Analisis perilaku aman pada perawatdi RS Islam Assobirin Tangerang selatan tahun
2013. Jakarta .UIN Jakarta [internet].2013.[cited February 2017]. Available from : http://repository.uinjkt.ac.id/ dspace/ bitstream/ 123456789/24156/1/ DENISA%20LISTY%20KD-fkik.pdf
21.Cooper MD, Phillips,R.A, 2004. Exploratoryanalysis of the safety climate and safety behavior relationship. Journal of safety research[internet].35(2004).[CitedFebruary2017]497-512. Pergamo Avilable from : DOI:10.1016/j.jsr.2004.08.004https://www.ncbi.nlm.nih.gov/pubmed/15530924
22.JiangB,SzeMak,LarsenL,ZhongH.Minimizingthegenderdifferenceinperceifedsafery.JurnalofEenviromentalPsychology[internet] .2017[citedJanuary 2017];51: 117-131 available from :https://doi.org/10.1016/j.jenvp.2017.03.012
23. Guntur Prayoga. Kesetaraan gender perawat laki-laki dan perempuan dalam pelayanan kesehatan. Semarang.UNS[internet].2009.[CitedFebruary2017]. Available from: https://digilib.uns.ac.id/dokumen/download/8925/
24.St Vincent’s Hospital. Gender Mainstreamingin Hospital Organisation. 2016. St Vincent’sHospital Ltd, Linz[internet]. 2006.[ citedFebruary 2017] available from : http://www.bmgf.gv.at /cms/home/at tachments/6/4/7/CH1566/CMS1466077061581/gm_hospital_organisation_27062.pdf
25.WilliamJ.Communicationstrategyforachievinga total safety culture. Ehs today [internet]. Juli2008.[ Cited January 2017]. Available from:http://ehstoday.com/safety/ehs_imp_81509.
26.EUOSHA.WorkerparticipationinOccupationalhealth and safety.[internet] 2012. [cited March2017]. Available from: https://osha.europa.eu/en/tools-and-publications/publications/reports/workers-participation-in-OSH_guide
27. DuPont. EmployEEInvolvEmEnt: ArE your WorkErsEngAgEd In thEIroWnsAfEty?. Copyright©2011CoastalTrainingTechnologiesCorp[internet]. 2011. [Cited March 2017]available from :https://ohsonline.com/~/media/ 544378D258B14BE99D004B78700AA6F9.pdf
28. Kimmel D. employee involvement. Michigan occupationalsafetyHealth[internet].2012.[cited
Indian Journal of Public Health Research & Development, April 2018, Vol.9, No. 4 153
February 2017] available from : http://www.michigan.gov/documents/lara/lara_miosha_employee_involvement_452856_7.pdf
29. Tawaih KA, Adu MA. Work pressure and safety behaviors among health worker in Ghana: The moderating role of managemen commitment to safety.Journalsafetyandhealthatwork[internet].2016[citedJanuary2017];7:340-346.availablefrom: doi :10.1016/j.shaw.2016.05.001
30.CDC. Exposure to stress.2008.Atlanta Georgiahttps://www.cdc.gov/niosh/docs/2008-136/pdfs/2008-136.pdfcitedMarch2017
31. Kallberg A, Ehrenberg. Physician and nurses perceptions of safety risk in the emergency depertement. Juournal international emergenynurcing [internet].2017 [cited January 2017].Available from: http://dx.doi.org/10.1016/j.ienj.2017.01.002
32. Gershon RR, Karkashian, Grosch. Hospital safety climate and its relationship with safe work practice and work place exposure incidents. American JournalofInfectioncontrol[internet].2000[citedDecember 2016]: 28(3): 211-221. Availableonline:DOI:10.1067/mic.2000.105288
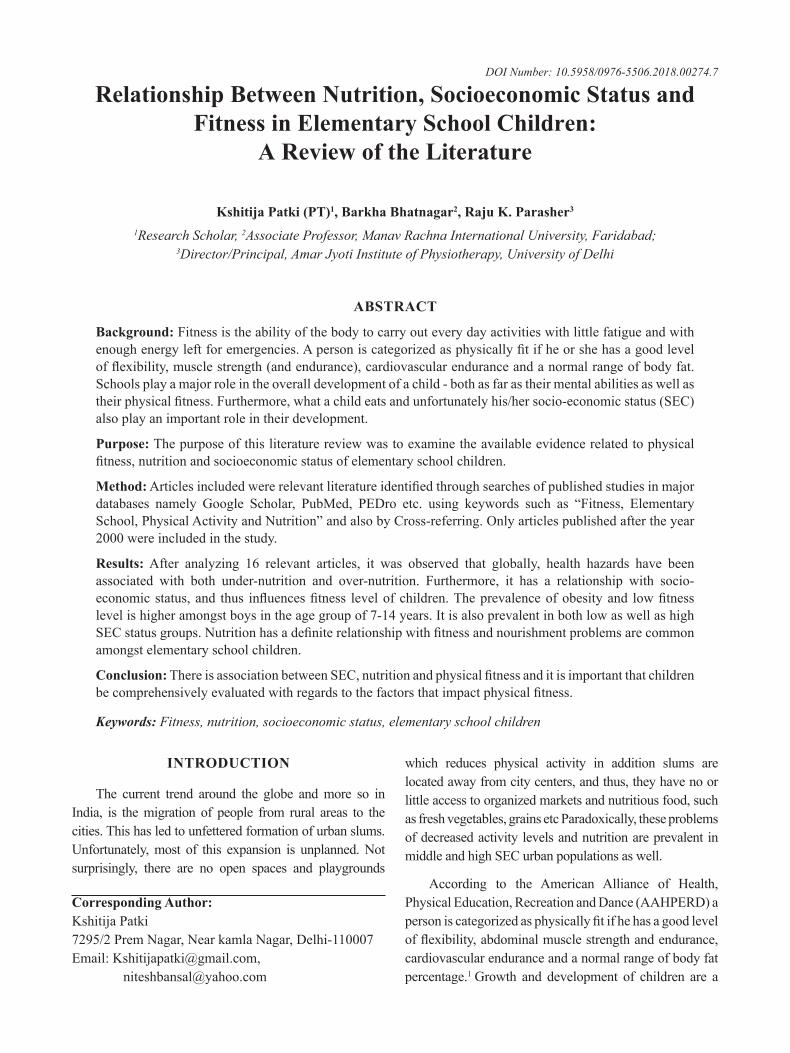
Relationship between Nutrition, Socioeconomic Status and Fitness in elementary School Children:
A Review of the literature
Kshitija Patki (PT)1, barkha bhatnagar2, Raju K. Parasher3
1Research Scholar, 2Associate Professor, Manav Rachna International University, Faridabad; 3Director/Principal, Amar Jyoti Institute of Physiotherapy, University of Delhi
AbSTRACT
background: Fitness is the ability of the body to carry out every day activities with little fatigue and with enoughenergyleftforemergencies.Apersoniscategorizedasphysicallyfitifheorshehasagoodlevelofflexibility,musclestrength(andendurance),cardiovascularenduranceandanormalrangeofbodyfat.Schools play a major role in the overall development of a child - both as far as their mental abilities as well as theirphysicalfitness.Furthermore,whatachildeatsandunfortunatelyhis/hersocio-economicstatus(SEC)also play an important role in their development.
Purpose: The purpose of this literature review was to examine the available evidence related to physical fitness,nutritionandsocioeconomicstatusofelementaryschoolchildren.
Method:Articlesincludedwererelevantliteratureidentifiedthroughsearchesofpublishedstudiesinmajordatabases namely Google Scholar, PubMed, PEDro etc. using keywords such as “Fitness, Elementary School,PhysicalActivityandNutrition”andalsobyCross-referring.Onlyarticlespublishedaftertheyear2000wereincludedinthestudy.
Results: After analyzing 16 relevant articles, it was observed that globally, health hazards have been associated with both under-nutrition and over-nutrition. Furthermore, it has a relationship with socio-economicstatus,and thus influencesfitness levelofchildren.Theprevalenceofobesityand lowfitnesslevel is higher amongst boys in the age group of 7-14 years. It is also prevalent in both low as well as high SECstatusgroups.Nutritionhasadefiniterelationshipwithfitnessandnourishmentproblemsarecommonamongst elementary school children.
Conclusion:ThereisassociationbetweenSEC,nutritionandphysicalfitnessanditisimportantthatchildrenbecomprehensivelyevaluatedwithregardstothefactorsthatimpactphysicalfitness.
Keywords: Fitness, nutrition, socioeconomic status, elementary school children
Corresponding Author:Kshitija Patki7295/2PremNagar,NearkamlaNagar,Delhi-110007Email: [email protected], [email protected]
INTROduCTION
The current trend around the globe and more so in India, is the migration of people from rural areas to the cities. This has led to unfettered formation of urban slums. Unfortunately, most of this expansion is unplanned. Not surprisingly, there are no open spaces and playgrounds
which reduces physical activity in addition slums are located away from city centers, and thus, they have no or little access to organized markets and nutritious food, such as fresh vegetables, grains etc Paradoxically, these problems of decreased activity levels and nutrition are prevalent in middle and high SEC urban populations as well.
According to the American Alliance of Health, Physical Education, Recreation and Dance (AAHPERD) a personiscategorizedasphysicallyfitifhehasagoodlevelofflexibility,abdominalmusclestrengthandendurance,cardiovascular endurance and a normal range of body fat percentage.1 Growth and development of children are a
DOI Number: 10.5958/0976-5506.2018.00274.7
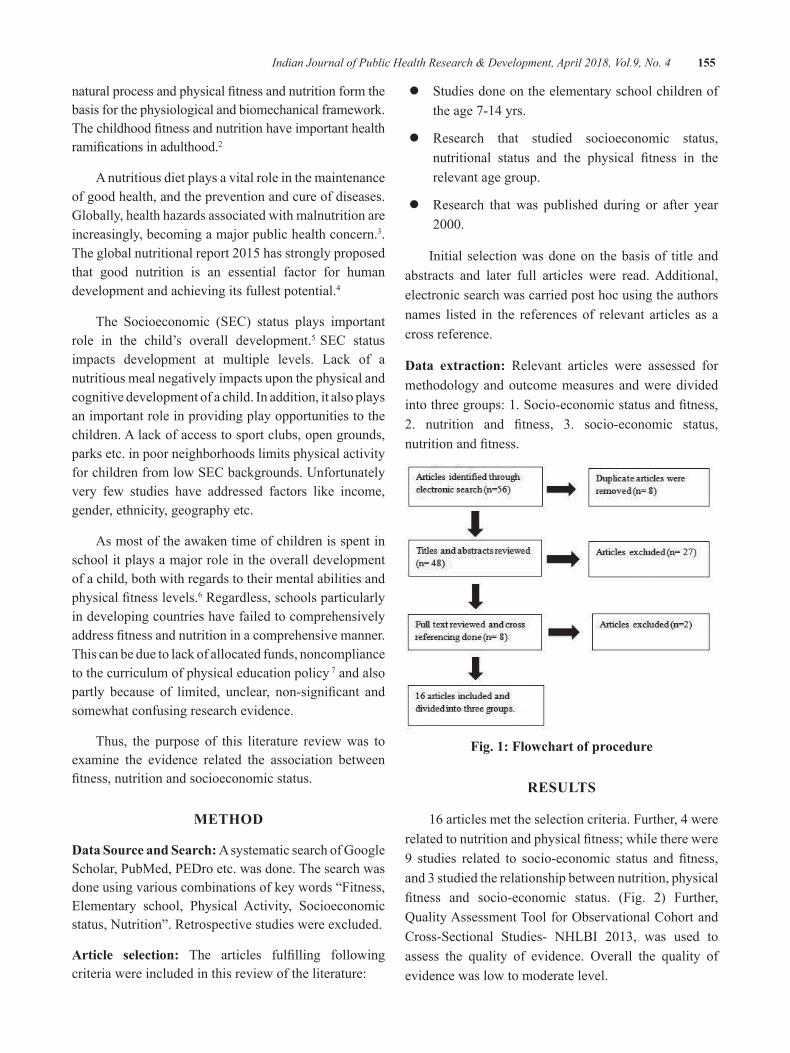
Indian Journal of Public Health Research & Development, April 2018, Vol.9, No. 4 155
naturalprocessandphysicalfitnessandnutritionformthebasis for the physiological and biomechanical framework. Thechildhoodfitnessandnutritionhaveimportanthealthramificationsinadulthood.2
A nutritious diet plays a vital role in the maintenance of good health, and the prevention and cure of diseases. Globally, health hazards associated with malnutrition are increasingly, becoming a major public health concern.3. Theglobalnutritionalreport2015hasstronglyproposedthat good nutrition is an essential factor for human development and achieving its fullest potential.4
The Socioeconomic (SEC) status plays important role in the child’s overall development.5 SEC status impacts development at multiple levels. Lack of a nutritious meal negatively impacts upon the physical and cognitive development of a child. In addition, it also plays an important role in providing play opportunities to the children. A lack of access to sport clubs, open grounds, parks etc. in poor neighborhoods limits physical activity for children from low SEC backgrounds. Unfortunately very few studies have addressed factors like income, gender, ethnicity, geography etc.
As most of the awaken time of children is spent in school it plays a major role in the overall development of a child, both with regards to their mental abilities and physicalfitnesslevels.6 Regardless, schools particularly in developing countries have failed to comprehensively addressfitnessandnutritioninacomprehensivemanner.This can be due to lack of allocated funds, noncompliance to the curriculum of physical education policy 7 and also partly because of limited, unclear, non-significant andsomewhat confusing research evidence.
Thus, the purpose of this literature review was to examine the evidence related the association between fitness,nutritionandsocioeconomicstatus.
MeThOd
data Source and Search: A systematic search of Google Scholar, PubMed, PEDro etc. was done. The search was done using various combinations of key words “Fitness, Elementary school, Physical Activity, Socioeconomic status,Nutrition”.Retrospectivestudieswereexcluded.
Article selection: The articles fulfilling followingcriteria were included in this review of the literature:
z Studies done on the elementary school children of the age 7-14 yrs.
z Research that studied socioeconomic status, nutritional status and the physical fitness in therelevant age group.
z Research that was published during or after year 2000.
Initial selection was done on the basis of title and abstracts and later full articles were read. Additional, electronic search was carried post hoc using the authors names listed in the references of relevant articles as a cross reference.
data extraction: Relevant articles were assessed for methodology and outcome measures and were divided intothreegroups:1.Socio-economicstatusandfitness,2. nutrition and fitness, 3. socio-economic status,nutritionandfitness.
Fig. 1: Flowchart of procedure
ReSulTS
16 articles met the selection criteria. Further, 4 were relatedtonutritionandphysicalfitness;whiletherewere9 studies related to socio-economic status and fitness,and 3 studied the relationship between nutrition, physical fitness and socio-economic status. (Fig. 2) Further,QualityAssessmentToolforObservationalCohortandCross-Sectional Studies- NHLBI 2013, was used toassess the quality of evidence. Overall the quality ofevidence was low to moderate level.
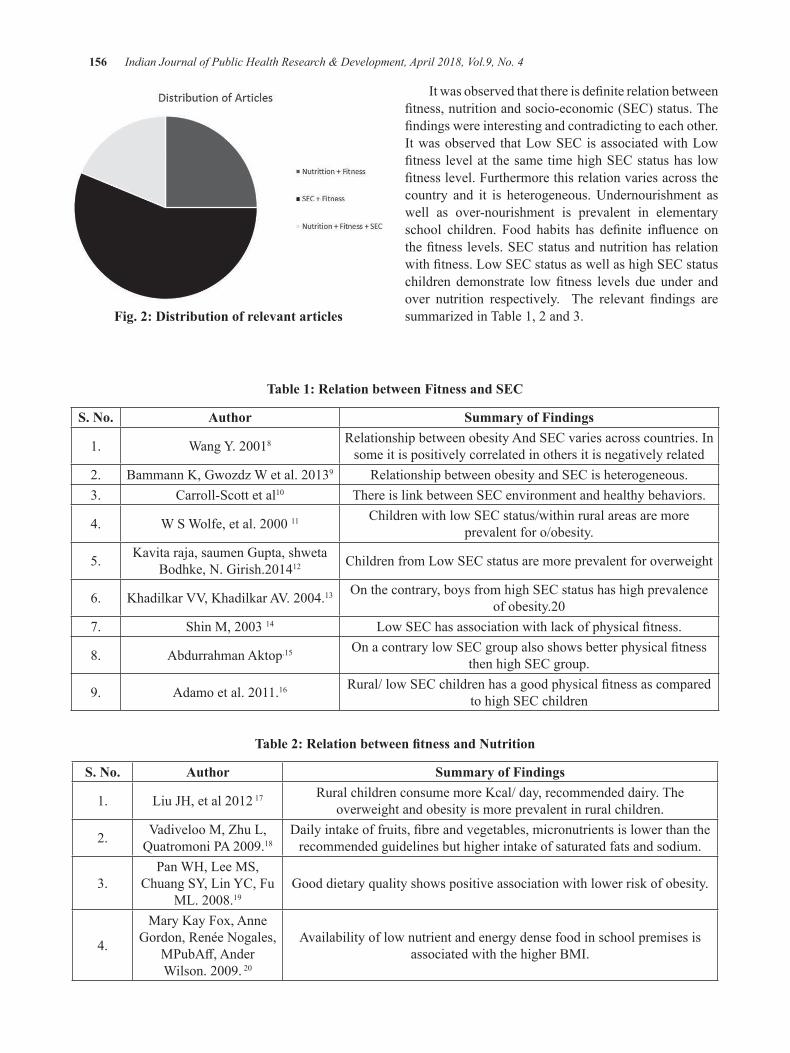
156 Indian Journal of Public Health Research & Development, April 2018, Vol.9, No. 4
Fig. 2: distribution of relevant articles
Itwasobservedthatthereisdefiniterelationbetweenfitness,nutritionandsocio-economic(SEC)status.Thefindingswereinterestingandcontradictingtoeachother.It was observed that Low SEC is associated with Low fitness levelat thesametimehighSECstatushas lowfitnesslevel.Furthermorethisrelationvariesacrossthecountry and it is heterogeneous. Undernourishment as well as over-nourishment is prevalent in elementary school children. Food habits has definite influence onthefitnesslevels.SECstatusandnutritionhasrelationwithfitness.LowSECstatusaswellashighSECstatuschildren demonstrate lowfitness levels due under andover nutrition respectively. The relevant findings aresummarized in Table 1, 2 and 3.
Table 1: Relation between Fitness and SeC
S. No. Author Summary of Findings
1. WangY.20018 Relationship between obesity And SEC varies across countries. In some it is positively correlated in others it is negatively related
2. BammannK,GwozdzWetal.20139 Relationship between obesity and SEC is heterogeneous.3. Carroll-Scott et al10 There is link between SEC environment and healthy behaviors.
4. WSWolfe,etal.200011 Children with low SEC status/within rural areas are more prevalent for o/obesity.
5. Kavita raja, saumen Gupta, shweta Bodhke,N.Girish.201412 Children from Low SEC status are more prevalent for overweight
6. KhadilkarVV,KhadilkarAV.2004.13 Onthecontrary,boysfromhighSECstatushashighprevalenceofobesity.20
7. ShinM,200314 LowSEChasassociationwithlackofphysicalfitness.
8. Abdurrahman Aktop.15 OnacontrarylowSECgroupalsoshowsbetterphysicalfitnessthen high SEC group.
9. Adamoetal.2011.16 Rural/lowSECchildrenhasagoodphysicalfitnessascomparedto high SEC children
Table 2: Relation between fitness and Nutrition
S. No. Author Summary of Findings
1. LiuJH,etal2012 17 Rural children consume more Kcal/ day, recommended dairy. The overweight and obesity is more prevalent in rural children.
2. VadivelooM,ZhuL,QuatromoniPA2009.18
Dailyintakeoffruits,fibreandvegetables,micronutrientsislowerthantherecommended guidelines but higher intake of saturated fats and sodium.
3.Pan WH, Lee MS,
Chuang SY, Lin YC, Fu ML.2008.19
Good dietary quality shows positive association with lower risk of obesity.
4.
Mary Kay Fox, Anne Gordon,RenéeNogales,
MPubAff,AnderWilson.2009.20
Availability of low nutrient and energy dense food in school premises is associated with the higher BMI.
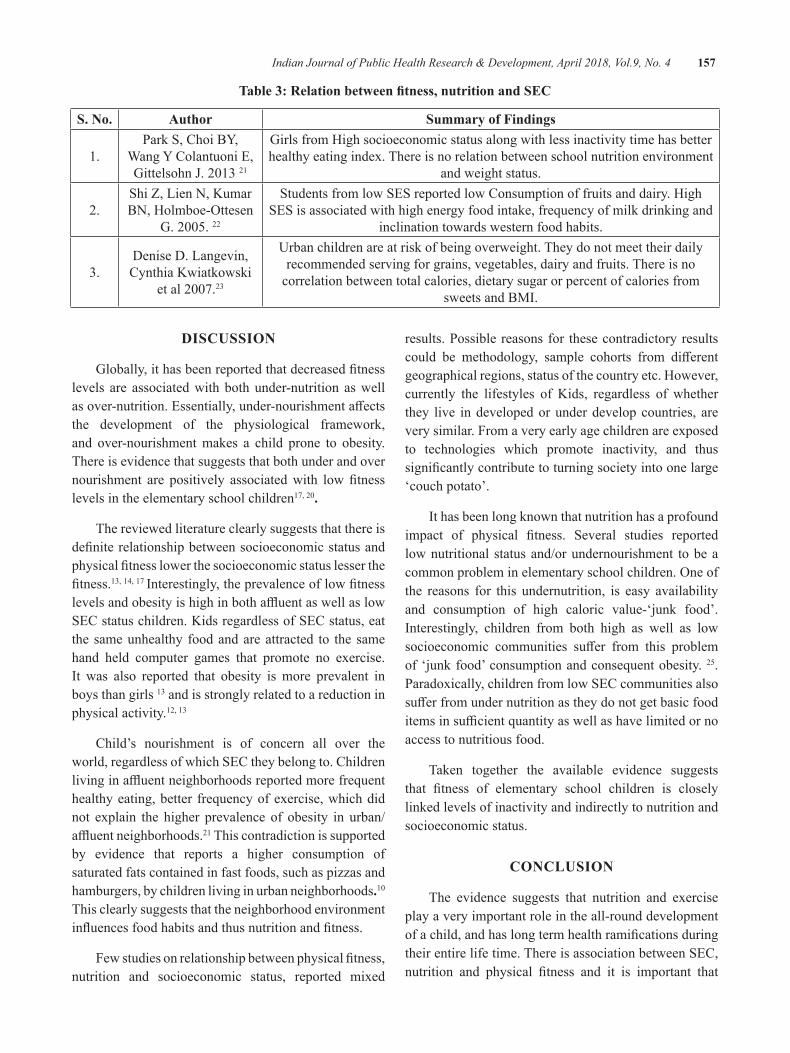
Indian Journal of Public Health Research & Development, April 2018, Vol.9, No. 4 157
Table 3: Relation between fitness, nutrition and SEC
S. No. Author Summary of Findings
1.Park S, Choi BY,
Wang Y Colantuoni E, GittelsohnJ.201321
Girls from High socioeconomic status along with less inactivity time has better healthy eating index. There is no relation between school nutrition environment
and weight status.
2.Shi Z, Lien N, Kumar BN,Holmboe-Ottesen
G.2005.22
Students from low SES reported low Consumption of fruits and dairy. High SES is associated with high energy food intake, frequency of milk drinking and
inclination towards western food habits.
3.Denise D. Langevin,Cynthia Kwiatkowski
etal2007.23
Urban children are at risk of being overweight. They do not meet their daily recommended serving for grains, vegetables, dairy and fruits. There is no
correlation between total calories, dietary sugar or percent of calories from sweets and BMI.
dISCuSSION
Globally,ithasbeenreportedthatdecreasedfitnesslevels are associated with both under-nutrition as well asover-nutrition.Essentially,under-nourishmentaffectsthe development of the physiological framework, and over-nourishment makes a child prone to obesity. There is evidence that suggests that both under and over nourishment are positively associatedwith lowfitnesslevels in the elementary school children17,20.
The reviewed literature clearly suggests that there is definiterelationshipbetweensocioeconomicstatusandphysicalfitnesslowerthesocioeconomicstatuslesserthefitness.13, 14, 17 Interestingly,theprevalenceoflowfitnesslevelsandobesityishighinbothaffluentaswellaslowSEC status children. Kids regardless of SEC status, eat the same unhealthy food and are attracted to the same hand held computer games that promote no exercise. It was also reported that obesity is more prevalent in boys than girls 13 and is strongly related to a reduction in physical activity.12, 13
Child’s nourishment is of concern all over the world, regardless of which SEC they belong to. Children livinginaffluentneighborhoodsreportedmorefrequenthealthy eating, better frequency of exercise, which did not explain the higher prevalence of obesity in urban/affluentneighborhoods.21 This contradiction is supported by evidence that reports a higher consumption of saturated fats contained in fast foods, such as pizzas and hamburgers, by children living in urban neighborhoods.10 This clearly suggests that the neighborhood environment influencesfoodhabitsandthusnutritionandfitness.
Fewstudiesonrelationshipbetweenphysicalfitness,nutrition and socioeconomic status, reported mixed
results. Possible reasons for these contradictory results could be methodology, sample cohorts from differentgeographical regions, status of the country etc. However, currently the lifestyles of Kids, regardless of whether they live in developed or under develop countries, are very similar. From a very early age children are exposed to technologies which promote inactivity, and thus significantlycontributetoturningsocietyintoonelarge‘couch potato’.
It has been long known that nutrition has a profound impact of physical fitness. Several studies reportedlow nutritional status and/or undernourishment to be a commonprobleminelementaryschoolchildren.Oneofthe reasons for this undernutrition, is easy availability and consumption of high caloric value-‘junk food’. Interestingly, children from both high as well as low socioeconomic communities suffer from this problemof ‘junk food’ consumption and consequent obesity. 25. Paradoxically, children from low SEC communities also sufferfromundernutritionastheydonotgetbasicfooditemsinsufficientquantityaswellashavelimitedornoaccess to nutritious food.
Taken together the available evidence suggests that fitness of elementary school children is closelylinked levels of inactivity and indirectly to nutrition and socioeconomic status.
CONCluSION
The evidence suggests that nutrition and exercise play a very important role in the all-round development ofachild,andhaslongtermhealthramificationsduringtheir entire life time. There is association between SEC, nutrition and physical fitness and it is important that
158 Indian Journal of Public Health Research & Development, April 2018, Vol.9, No. 4
children be comprehensively evaluated with regards to thefactorsthatimpactphysicalfitness.
Conflict of Interest: None
Source of Funding: Self-funded
ethical Clearance: Approved by Manav Rachna International University
ReFeReNCeS
1.Pate, R. R.: A new definition of youth fitness.Physician Sports Med. 1983. 11: 77-83.
2.Sallis,J.F,SimonsMortanB.G,StoneEJ,CarbinC B, et al . (1992) Determinants of physical activity and interventions in youth. Med. Sci. Sports Exercise, 24(6): 248-257.
3. Nutrition foundation of India. Nutrition and Physical performance in school aged children.2009.
4. Global Nutrition Report. Action and accountability to advance nutrition and sustainable development. Internationalfoodpolicyresearchinstitute.2015.www.ifpri.org
5.RoxaneR.Jones-Matre,GregoryJ.Welk,MiguelA. Calabro MS, Daniel W. Russell,et al. Rural–UrbanDifferences inPhysicalActivity,PhysicalFitness,andOverweightPrevalenceofChildren.JournalofRurralhealth.2008:24(1):49-54.
6.Joseph E. Donnelly, Dennis J. Jacobsen, JanetE.Whatley, James O. Hill, et al. Nutrition andPhysicalActivity Program toAttenuate Obesityand Promote Physical and Metabolic Fitness in Elementary School Children. OBESITYRESEARCH. 1996 May. 4 (3):
7.SunilDutt.Healthrelatedhysicalfitnessofboysaged8to18years.Journalofexercisescienceandphysiotherapy.2005;1(1):12-22.
8. Wang Y. Cross-national comparison of childhood obesity: the epidemic and the relationship betweenobesityandsocioeconomicstatus. Int JEpidemiol.2001;30(5):1129.
9. Bammann k, Gwozdz W, Lanfer A et al. Socioeconomic factors and childhood overweight in Europe: results from the multi centre IDEFICS study.Paediatr.Obes.2013;8(1):1-12.
10.Carroll-Scott A, Gilstad-Hayden K, RosenthalL, Peters SM, McCaslin C, Joyce R, IckovicsJR. Disentangling neighborhood contextualassociations with child body mass index, diet and physical activity: the role of built, socioeconomic andsocialenvironment.Soc.Sci.Med.2013.95:106-614.
11.WSWolfe,CCCampbell,EAFrongilloJr,JDHaas,andTAMelnik.Overweightschoolchildrenin New York State: prevalence and characteristics. AmericanJournalofPublicHealth.1994;84(5):807-813.
12. Kavita raja, saumen Gupta, shweta Bodhke, N. Girish. Fitness levels in school going children of8-14yearsfromudupi.Int.J.Health&alliedsciences.20014;3(2):95-99.
13.Khadilkar VV, Khadilkar AV. Prevalence ofobesity in affluent school boys in pune. IndianPadiatr.2004;41:857-58.
14. Shin M, Dumke KA, Goran MI, Simon PA. The association between community level economic hardship and childhood obesity prevalence in Los Angeles.Pediatr.Obes.2003;8,(6):411-17.
15. Abdurrahman Aktop. Socioeconomic status, Physical fitness, Self-concept, Attitute towardphysical education and academic achievement of children, Akdeniz University. Perceptual and MotorSkills.2010,110:531-546.
16.AdamoKB,SheelAW,OnyweraV,WaudoJ,BoitM,TremblayMS.Childobesityandfitnesslevelsamong Kenyan and Canadian children from urban and rural environments: A KIDS-CAN Research Alliance Study. Paediatric obesity. 2011; 6(2):225-232.
17.Liu JH, Jones SJ, Janice HS C, Probst AnwarT, Merchant Philip Cavicchia. Diet, physical activity, and sedentary behaviors as risk factors for childhood obesity: an urban and rural comparison. ChildObes.2012;8(5):440-48.
18.Vadiveloo M, Zhu L, Quatromoni PA Diet andphysical activity patterns of school-aged children.JournalAmDietAssoc.2009;109(1):145-51.
19. Pan WH, Lee MS, Chuang SY, Lin YC, Fu ML. Obesity pandemic correlated factors andguidelinestodefinescreenandmanageobesityinTaiwan.ObesRev.2008;9(1):22-31
Indian Journal of Public Health Research & Development, April 2018, Vol.9, No. 4 159
20.Mary Kay Fox, Anne Gordon, Renée Nogales,MPubAff, Ander Wilson. Availability andConsumption of Competitive Foods in US PublicSchools.JournaloftheAmericanDieteticAssociation,2009;109(2):S57–S66.
21. Park S, Choi BY, Wang Y Colantuoni E, Gittelsohn J.Schoolandneighborhoodnutritionenvironmentand their association with students’ nutrition behaviors and weight status in Seoul, South Korea. Jour.AdolescHealth.2013;53(5):655-662.
22.ShiZ,LienN,KumarBN,Holmboe-OttesenG.Socio-demographic differences in food habitsandpreferencesofschooladolescentsinJiangsuProvince,China.EurJClinNutr.2005;59(12):1439-48.
23. Denise D. Langevin, Cynthia Kwiatkowski et al 2007
24. Karppanen AK, Ahonen SM, Tammelin T et al. Physical activity and fitness in 8 year old
overweight and normal children and their parents. Int.j.circumpolarhealth.2012;23(71):17621.
25.Mayén AL, Vidal PM, Paccaud F, Bovet P,Stringhini S. Socioeconomic determinants of dietary patterns in low and middle-income countries: a systematic review.Am JClinNutr.2014;100(6):1520-31.
26. Som S, Pal M, Bhattacharya B, Bharati S Bharati P.Socieconomicdifferentialsinnutritionalstatusof children in the states of West Bengal and Assam.JBiosocSci200638(5):625-42.
27. Rajaram S, Sunil TS, Zottarelli LK. An analysis of childhoodmalnutrition in Kerala and Goa. JBiosocSci.2003;35(3)335-51.
28. Chaterjee P. Child malnutrition rises in India despiteeconomicboom.TheLancet.2007;369:1417-18.
A Study of Coffee Addiction in the Medical College, engineering Students and in general Population of in and
Around Pondicherry
e. Prabhakar Reddy1, R.Senthil Kumar2, S. Arun3, R. Srikumar4, R. Chidambaram5
1Professor of Biochemistry, 2Professor of Physiology, 3Assistant Professor of Psychiatry, 4Reserach Associate, Centre for Research, 5Professor and Head of Radiology & Research Director (R&D)
Medical, Sri Lakshmi Narayana Institute of Medical Sciences, Puducherry, India
AbSTRACT
Caffeine is themost commonly usedCentralNervous system stimulant.Caffeine has the desired effectofdelayingsleep,but ingeneral, it ismanifested through theirdifferentactions. Instudents, itpreventsdrowsinessandincreasesalertness,whichiswhystudentsprefersomecaffeinatedfoodstuffduringlatenightstudies.Inworkers,itpreventseffectswhichmayariseduetodrowsiness.Thequestionnaire-basedstudywascarriedoutonlinethroughasurvey.Individualitywasensuredwhenthesubjectsfilledupthesurvey.The participants who undertook the survey are undergraduate students of a Sri Lakshmi Narayana Institute ofMedicalSciencesMedicalstudents(100)andBharathEngineeringcollegestudents(100)collegesandGeneralpopulation(100)inandaroundPondicherrypopulation.Atotalof15questionswereaskedtodetectifthesubjectsshowedsymptomsofcaffeineaddiction.Thedatasuggeststhatmorethanhalfofthestudentsbelieve thatcaffeinehas increased theiractivenessduring theday.Caffeinehasbeenproven to increasealertnessandhasanadvantage.Atthesametime,over-intakeofcaffeinemaycauseadverseeffects,whichmightbetheneedtokeepacheckontheintakeofcaffeine.
Keywords: Coffee; Central Nervous system; Depression; Adrenaline; Immunity.
Corresponding Author:E.Prabhakar Reddy,Professor of Biochemistry and Central Laboratory Head,Sri Lakshmi Narayana Institute of Medical SciencesPuducherry-605502.Mobile no. +91 9159186879Mobile No. +91 9159186879Email id: [email protected]
INTROduCTION
Many of us depend on an early morning “Jo” toget us on the go. Some of us need refills as the dayprogresses.Stillothersusecoffeetogetoverdepressionoranxiety,eventhoughcaffeinecancreatemorefightorflighthormonesandtaxouradrenalglandsbypumpingus with adrenaline. The adrenaline rushes lead to more retention of cortisol, leading to a vicious cycle of more stress and anxiety. Many of us may have to look into our coffeedrinkinghabitstodeterminewhethertodecrease
consumption or quit altogether, even with the threat of withdrawal symptoms.
Caffeine is the most commonly used CentralNervous system stimulant. Its chemical name is 1, 3, 7-Trimentylpurine- 2, 6- dione. Being aware of its effects or not, people are consuming it to a largeextent. Chemically, it is a psychoactive drug of the methylxanthine class of psychoactive drugs. Coffee isthemostcommonmodeofcaffeineingestion,theothermodes including coke, tea, energy drinks, chocolates, etc.MeancaffeineaddictionamongadultsintheUnitedStates has been estimated to be 280mg/daywhich isequivalenttoabout6ozcupsofcoffeeor516ozbottlesof soft cola drink1.
Adrenalinewearsofftowardacrash,cortisolslowlybuilds up. If this cycle is repeated often enough, the cortisolbuildsupandcreatesthesameeffectsaschronicstress: Fatigue, anxiety, nervousness, irritability, and lowered immunity2.
DOI Number: 10.5958/0976-5506.2018.00275.9
Indian Journal of Public Health Research & Development, April 2018, Vol.9, No. 4 161
A recipe for disaster is working a stressful job and drinkinglotsofcoffeetocopewithit!Adrenalinerushescan be addictive, just ask any gambler or sports nut. But it appears dopamine’s mood elevation may be the hook thatmakesithardtokickcaffeineandremovetheadrenalstressthatcauseslongtermnegativehealtheffects3.
Many experts consider the caffeine cure fordopaminedeficiencythemostaddictivequalityofcoffeedrinking. Getting off caffeine slowly or cold-turkeycan create withdrawal symptoms such as headaches, irritability, mild depression, and mental fogginess4. Nutritional consultant and author of The Body Ecology Diet, Donna Gates, recommends a naturally sourced non-essential amino acid supplement L-Tyrosine to help you kick the caffeine habit effortlessly. It is a naturalprecursor to the brain’s dopamine production and it helps people be alert5.
Basedontheabovebackgroundofcoffeewefirstthing to consider is whether you can do without. If not, there is some level of addiction. There is a way to ease caffeinewithdrawalandthisaddictionmightbeessentialto avert futher physiological complications.
MATeRIAl ANd MeThOd
The questionnaire- based study was carried out online through a survey. Individuality was ensured when the subjects filled up the survey. The participants whoundertook the survey are undergraduate students of a Sri Lakshmi Narayana Institute of Medical Sciences Medical students(100)andBharathEngineeringcollegestudents(100) colleges and General population (100) in andaround Pondicherry population. A total of 15 questions were asked to detect if the subjects showed symptoms of caffeineaddiction.Thequestionsincludedare:
1.Doyouhavecaffeinatedbeverages?(Thisincludestea,coffee,coketec.)
2.Whatisyourmostpreferredcaffeinatedbeverage?
3. When did you start consuming this food substance?
4. How often do you consume this food/ day?
5. While situation do you consume it to a higher extent?
6.Doyouthinkthatcaffeineisessentialforyoutoget through a day at work/college?
7. How long can you be without taking that particular caffeinatedfood?
8.Doyoufeelthatcaffeineincreasesyouralertnessand activeness during the day?
9. Do you have a strong urge to have that particular food at the thought of it?
10.Onceyoucouldnotgetthatfoodstuff,didyoutellyourself to eat it as soon as possible?
11. How much hours of sleep do you get usually?
12. Do you feel sleepy during the day?
13. Do you feel or did anyone tell you that there are certain changes in your behaviour after taking that particularcaffeinatedfood?
14.Doyouthinkthatyouareaddictedtocaffeine?
15.Doyoufeelthatyouarecaffeineaddiction?
Based on the responses from the subjects, statistical analysis was performed and the results were tabulated systematically.
ReSulTS ANd dISCuSSION
It’s common to start our morning with a cup of coffeeortea.Almosteveryoneisaddictedtocoffeeandespeciallyresearchersconsumealotmoreofcoffeethanothers. There are a lot of positiveeffect of coffee butwitheverypositiveeffecttherecomesanegativeeffect.Thereforeitsimportanttoknowtheeffectsofcoffeeonyour health.
In the data collected among Medical and Engineering and Pondicherry general population in the study. Medical college students, about 29.% ,Engineering students were 31%andGeneralpopulation40%werefoundtointakecaffeinated beverages, among which about in all thegroups 15 % intake was in the form of tea, remaining all aretakingcoffeeinmorningandevenings.InthisgroupEngineeringstudentsweretakingcoffee3timesperday,Medical students and general population they were taking 2timesperday.Caffeinemaypromotetheconsumptionofthecaffeine-containingbeveragesbythedevelopmentof flavour preferences where individuals associateunconsciouslyaflavour,leadingtoitshighintake3.
Medical students repots are showing most preferred caffeinatedbeverage iscoffee than inEngineeringandgeneral population.
162 Indian Journal of Public Health Research & Development, April 2018, Vol.9, No. 4
For question When do you consume it to a higher extentandHowoftendoyouconsumethis food,80%Medical students repots are whenever exams and boring timeand70%engineeringstudentstheytoldwheneverwe get boar that time and 85% general population they told tension and stress time consume more times they will take.
The negative effects of a caffeine-generatedadrenaline surge are not just behavioral. Researchers at Carnegie Mellon University found that large doses of caffeine raise blood pressure, stimulate the heart,and produce rapid shallow breathing, which readers of Emotional Intelligence 2.0 know deprives the brain of the oxygen needed to keep your thinking calm and rational.
Doyouthinkthatcaffeineisessentialforyoutogetthrough a day at work/college for this they told all group ofstudents(Medical85%andEngineering80%)theytold said no as a answer and general population 90%they told yes when ever we are in work tension at that time most essential thing in working areas.
Mostpeoplestartdrinkingcaffeinebecauseitmakesthem feel more alert and improves their mood. Many studiessuggestthatcaffeineactuallyimprovescognitivetask performance (memory, attention span, etc.) in the short-term. Unfortunately, these studies fail to consider the participants’ caffeine habits. New research fromJohnsHopkinsMedicalSchoolshowsthatperformanceincreases due to caffeine intake are the result ofcaffeine drinkers experiencing a short-term reversalof caffeine withdrawal. By controlling for caffeineuse in study participants, John Hopkins researchersfound that caffeine-related performance improvementisnonexistentwithoutcaffeinewithdrawal.Inessence,comingoffcaffeinereducesyourcognitiveperformanceand has a negative impact on your mood. The only way togetbacktonormalistodrinkcaffeine,andwhenyoudo drink it, you feel like it’s taking you to new heights. In reality, the caffeine is just takingyourperformanceback to normal for a short period6.
Do you have a strong urge to have that particular food at the thought of it-for this all college students ( Medical65%andEngineering70%)theytoldyeswehaveverystrongurgetotakeparticularfoodlikecoffee,even night times also they are ready to go even 10kilometersfordrinkcoffee.
Caffeine is physiologically and psychologicallyaddictive.Ifyoudochoosetoloweryourcaffeineintake.The researchers at Johns Hopkins found that caffeinewithdrawal causes headache, fatigue, sleepiness, and difficultyconcentrating7.Somepeoplereportfeelingflu-like symptoms, depression, and anxiety after reducing intake by as little as one cup a day. Slowly tapering yourcaffeinedosageeachdaycangreatlyreducethesewithdrawal symptoms8.
Onceyoucouldnotgetthatfoodstuff,didyoutellyourself to eat it as soon as possible ,for this all three groups Medical 60%,Engineering 70% and generalpopulation 55 % of people they told, there is no alternate foodforcoffee,theirmindalwayspinpointingforlackof that.
The action of adenosine is discussed in detail. But while it sounds like advanced science, it’s really pretty simple. As adenosine is created in the brain, it binds to adenosine receptors. This binding causes drowsiness by slowing down nerve cell activity. In the brain, this also causes blood vessels to dilate, most likely to let more oxygen into that organ during sleep9.
To a nerve cell, caffeine looks like adenosine:Caffeine binds to the adenosine receptor. However,caffeine doesn’t slow down the cell’s activity likeadenosine would. As a result, the cell can no longer identify adenosine because caffeine is taking up allthe receptors that adenosine would normally bind to. Instead of slowing down because of the adenosine’s effect, the nerve cells speed up. Caffeine also causesthe brain’s blood vessels to constrict, because it blocks adenosine’sabilitytoopenthemup.Thiseffectiswhysomeheadachemedicines likeAnacincontaincaffeineconstricting blood vessels in the brain can help stop a vascular headache 9.
Caffeine’s effect on the brain causes increasedneuronfiring.Thepituitaryglandsensesthisactivityandthinks some sort of emergency must be occurring, so it releases hormones that tell the adrenal glands to produce adrenaline (epinephrine). Adrenaline is the “fight orflight”hormone.
Here’swhyyou’llwant to:caffeinehasasix-hourhalf-life, which means it takes a full twenty-four hours to work its way out of your system. Have a cup of joe ateighta.m.,andyou’llstillhave25%ofthecaffeinein
Indian Journal of Public Health Research & Development, April 2018, Vol.9, No. 4 163
your body at eight p.m. Anything you drink after noon willstillbeat50%strengthatbedtime.Anycaffeineinyour bloodstream with the negative effects increasingwith the dose makes it harder to fall asleep10.
How much hours of sleep do you get usually, students group Medical 85%,Engineering 75 % they told almost 8to10hrsofsleepperdayandgeneralpopulation80%they told maximum 8 hrs we are sleeping.
Do you feel sleepy during the day students group Medical 75%, Engineering 75% they told almost sleepy during the day but in general group 25%, they told they won’t have this problem.
Do you feel or did anyone tell you that there are certain changes in your behavior after taking that particularcaffeinatedfood,studentsgroupMedical60%,Engineering70%theytoldyeslotofchangesduringthedaysleepinessandothergroup80%theyfeellikeaftertakingofcoffeetheyareveryactivetoworkinstressfullconditions.Veryrelaxingfeeltheygot.
When you do finally fall asleep, the worst is yetto come. Caffeine disrupts the quality of your sleepby reducing rapid eye movement (REM) sleep, the deep sleep when your body recuperates and processes emotions.Whencaffeinedisruptsyoursleep,youwakeup the next day with an emotional handicap. You’re naturallygoingtobeinclinedtograbacupofcoffeeoran energy drink to try to make yourself feel better. The caffeine produces surges of adrenaline, which furtheryour emotional handicap. Caffeine and lack of sleepleave you feeling tired in the afternoon, so you drink more caffeine, which leaves even more of it in yourbloodstream at bedtime.Caffeine very quickly createsa vicious cycle9.
Do you think that you are addicted to caffeine,students group Medical 55%, Engineering 52% they told almostnoaddictionforcoffeeandothergeneralgroup60%theytoldsometimestheywillfeellikeaddiction.
Doyouhaveanideaoncaffeineaddiction-Medicalstudents60%grouptheytoldyesweknowbutinfuturewe won’t take but in Engineering students 70% andothergeneralgroup70%theyansweredwedon’thaveany idea regarding addiction.
Caffeine is the most widely used psychoactivesubstance and has sometimes been considered a drug of abuse.Classicdrugsofabuseleadtospecificincreasesin
cerebral functional activity and dopamine release in the shell of the nucleus accumbens (the key neural structure for reward, motivation, and addiction). In contrast, caffeine at doses reflecting daily human consumptiondoes not induce a release of dopamine in the shell of the nucleus accumbens but leads to a release of dopamine in the prefrontal cortex, which is consistent with its reinforcing properties11.
Furthermore, caffeine increases glucose utilizationin the shell of the nucleus accumbens only at high concentrations; this, in turn, nonspecifically stimulatesmost brain structures and thus likely reflects the sideeffectslinkedtohighcaffeineingestionalone.Moreover,thisdose is5-10 timeshigher than thedosenecessaryto stimulate the caudate nucleus (extrapyramidal motor system) and the neural structures regulating the sleep-wake cycle, the 2 functions that are most sensitive to caffeine6.
Italsoimportanttoknowhowdoescoffeeorcaffeineworks in the body.To a nerve cell caffeine just lookslike adenosine. Adenosine is a purine nucleotide which is involved in many physiological process and is also involvedinregulationofbloodflowtovariousorgans.So,whencaffeineisinjectedinthebodyitdoesn’tslowtheeffectthecell’sactivitybutthecellcannotidentifyadenosine because all the receptors are being taken up bycaffeineandthiscauses thenervecells tospeedupinstead of slowing down 9,12.
Afterconsumptionofcoffeethereisanincreaseinneuronalcellfiringwhichinturnincreasestheproductionof adrenaline. Caffeine increases the dopamine levelinthebrainjust likedrugsdo.Thebodylikescaffeineinjection in short term especially when you are sleep deprived and want to stay awake. When you inject caffeine it blocks the adenosine receptors and therebythere is increase production of adrenaline in the body which results in a boost. It also changes the dopamine production and thereby makes you feel good or give a sense of satisfaction 11,13.
Study reports regarding addiction Medical students 60%areawareofaddictionthinkthattheyareaddictedto caffeine on their own,without proper diagnosis bya specialist.And other Engineering students 70% andgeneral population70% theydon’t knowany idea ofaddiction, they were not ready to any answer. This might indicate that with proper diagnosis, more subjects are probabletobeconfirmedtobeaddictedtocaffeine.
164 Indian Journal of Public Health Research & Development, April 2018, Vol.9, No. 4
CONCluSION
The data suggests that more than half of the students believethatcaffeinehasincreasedtheiractivenessduringtheday.Caffeinehasbeenproventoincreasealertnessand has an advantage. At the same time, over-intake of caffeine may cause adverse effects, which mightbe theneed tokeepa checkon the intakeof caffeine.More research may be required to enlighten the society on the addiction of caffeine and its adverse effects onhealth and disease. The Pondicherry government has to take initiation to give awareness programmes in and around Pondicherry general population and Engineering collegesregardinginaddictionofcoffee.
Conflict of Interest: Nil
ethical Clearance:No.IEC/C-P/014/2016
Source of Funding: self
ReFeReNCeS
1. Graham T. E., Hibbert E, and Sathasivam P. Metabolicandexerciseenduranceeffectsofcoffeeandcaffeineingestion.JApplPhysiol.1998;85:883-889.
2. Available from: http://www.vitaminsdiary.com/nutrients/dopamine.html
3. Available from: http://www.gethelpfordepression.info/lowdopamine.aspx
4. Available from: http://cortisol.com/quick-facts/#1
5. Available from: http://en.wikibooks.org/wiki/Demystifying_Depression/The_Stress_System
6.Graham T. E., Rush J. W. E, and Van SoerenM. H. Caffeine and exercise: metabolism andperformance. Can. J. Appl. Physiol. 1994; 19:111-138.
7. Graham T. E., Hibbert E, and Sathasivam P. Metabolicandexerciseenduranceeffectsofcoffeeandcaffeineingestion.JApplPhysiol.1998;18:883-889.
8.Kendler KS, Prescott CA. Caffeine intake,tolerance, and withdrawal in women: a population based twin study.Am J Psychiatry. 1999; 156:223-228.
9.StevenMeredithE,LauraJulianoM,JohnHughesRandRolandGriffithsR.Caffeineusedisorder:A Comprehensive review and research agenda. JournalofCaffeineResearch;2013:13:114-130.
10.Dace Svikis S, Nathan Berger, Nancy HaugA, Roland Griffiths R. Caffeine dependence incombination with a family history of alcoholism asapredictorofcontinueduseofcaffeineduringpregnancy.AmJPsychiatry.2005;65:12.
11.Available from: .http://science.howstuffworks.com/caffeine.html.
12. Swan GE, Carmelli D, Cardon LR. The consumption of tobacco, alcohol, and coffee inCaucasian male twins: a multivariate genetic analysis.JSubstAbuse.1996;18:18-31
13. vailable from: http://pharmrev.aspetjournals.org/content/51/1/83.long–Actionofcaffeineon thebrain – Zvartau et al.
biological War and Chemical Warfare-Status of AIdS
T. Mohana lakshmi1, b. Sai Ravi Kiran2, e Prabhakar Reddy3
1Research Scholar of Microbiology, 2Assistant professor of Biochemistry, 3Professor of Biochemistry and Central Lab Head, Sri Lakshmi Naryana Institute of Medical Sciences, Puducherry
AbSTRACT
Lack of ‘war ethics’ lead to quite a few interesting occurrences of biological as well as chemical warfare, and shows us that nearly every advanced biochemical weapon today has an ancient prototype. Understanding the unique aspects of these agents can help in preparing for such disasters with the intent of mitigating injury and loss of life. Chemical agents are solids, liquids, or gases, which, through their chemical properties, producelethalordamagingeffectsinman,animals,plants,ormaterials.Biologicalagentsarealsotheonlygroupinwhichsecondaryperson-to-persontransmissioncanoccur.TheAIDSPlaguewillaffectsocietyinwaysthatyoucannotnowimagine.AIDSis100%fatal.Scientistsandmedicalresearchpeoplearenotoptimisticaboutanimmediatecureto[or]vaccine.
Prisoner microbiologists worked on a variety of new weapons and vaccines, including bubonic plague and tularemia (rabbit fever). By World War II the Soviets were prepared to retaliate vigorously to any use by the Germans of chemical and biological warfare agents. Antibiotic resistances, and recombinant DNAtechnologyallvery,veryusefultotheSovieteffortinbiowar.It is importanttoassesstheriskofpotential threats, thereby allowing disaster planning and preparation to be proportional and aligned with the actual casuality event. Neurological complications of chemical, biological and explosive weapons which have or may be used by terrorists are reviewed by international experts in some review article publication. Managementandtreatmentprofilesareoutlined.
Keywords: Chemical agents; Biological agents; Weapons; World War.
Corresponding Author:E Prabhakar ReddyProfessor of Biochemistry and Central Lab Head,Sri Lakshmi Naryana Institute of Medical Sciences,Puducherry-605502.Ph:09159186879E-mail: [email protected]
INTROduCTION
The end of the First World War, the Allied governments almost immediately seemed to forget what they had learned during the war about being prepared forfuturechemicalwarfare.Thefirstmajorconcernsforthe chemical warfare detachments of the Allied forces then were to ensure they survived demobilization. In both Britain and the United States cases were presented for the need for a permanent chemical warfare research establishment. At the beginning of the Second World War, the experience of the First World War gave most of the combatants the expectation that chemical warfare would
be used to an even greater extent, despite the Geneva Protocol having been put into place in the inter-war period. Chemical warfare had resurfaced in 1937 in Abysinnia (Ethiopia) and in China, and it was clear that another great conflictwas nearing and chemicalweaponswereexpected tobeused,bothon thebattlefieldandagainstcivilian populations1. Dr. Fedorov, has long campaigned against the secrets and environmental health issues caused by chemical weapons manufacturing and storage in the former Soviet Union. This book describes the history of chemical weapons using information from Soviet archives (military, state, economic and communistic, etc.) 2. The History of preparation of the Soviet Country to the offensivechemicalwarwhichhasfoundallattributesofwar total, to its citizens is not known3.
This lack of ‘war ethics’ lead to quite a few interesting occurrences of biological as well as chemical warfare, and shows us that nearly every advanced biochemical weapon today has an ancient prototype. Military researches on Biological and Toxin Weapons
DOI Number: 10.5958/0976-5506.2018.00276.0
166 Indian Journal of Public Health Research & Development, April 2018, Vol.9, No. 4
duringfirsthalfof20thcentury.Thenwedescribe thesubsequent researches in several Countries and the actual attempts in United Nations to revise the Convention on the Prohibition of Biological and Toxin Weapons and on their Destruction4. Newspaper articles and popular fictionpredictedthatchemicalwarfarewouldturnentireregions of Europe into lifeless wastelands. The entry into force of the 1993 CWC on 29 April 1997 was unique in the history of arms control. This agreement both banned an entire class of weapons and simultaneously addressed chemical proliferation concerns. It was not, however, the attention to non-proliferation that made the Convention unique, rather that the CWC incorporated an elaborate international system for verification of compliance.1Chemical warfare, as it is understood today the military exploitation of the properties of certain chemicals against people or the environment began in April 1915. TheuseofchemicalweaponssincehavebeenconfirmedbyItalyinAbyssinia,JapanandChinainthe1930sandearly1940s,byEgyptintheYemen,byIraqagainstIran,andinKorea,VietnamandtheGulfWar.
The threat of chemical and biological weapons of mass destruction has intensified because of improveddelivery systems and advances in chemistry, genetics, and other sciences 5. The use of chemical and biological agents as terrorist weapons both in the United States and elsewhere in the world is reviewed. These are agents that are water soluble, stable, and resistant to water treatment and/or disinfection6. Terrorists’ use of explosive, biologic, chemical, and nuclear agents constitutes the potential for catastrophic events. Understanding the unique aspects of these agents can help in preparing for such disasters with the intent of mitigating injury and loss of life. Chemical agents are solids, liquids, or gases, which, through their chemical properties, produce lethal or damaging effects in man, animals, plants,or materials. Historically, chemical agents have been divided into categories based on the major physiological impact caused by the agent or the target organ they attack. Nerve agents disrupt the function of the nervous systemandproduceeffectsonskeletalmuscles,varioussensitive organs, and the nervous system. Blister agents, alsoknownasvesicants,affecttheeyes,lungsandskinby destroying cell tissue. Blood agents are compounds which affect the ability of the blood system to eithercarry oxygen or transfer oxygen from the blood to cells. Choking agents are compounds that can cause the lungs tobecomefilledwithfluid.Incapacitatingagentsproducephysiological effects that inhibit concerted effort.Tear
agentscauseintenseeyepainandtears.Vomitingagentscause regurgitation. While useful on the battlefield,thisclassificationsystemmaybemisleadingtocivilianresponders. Within a given agent class the reactivity, decomposition, and environmental fate of agents can vary greatly. However, inhalation of agent vapors also causes vomiting (vomiting agents) and pulmonary edema (choking agents). Contact with the liquid will blister the skin(blisteragents).Further,militaryclassificationsofagents can also change with time. Hydrogen cyanide, forexample,wasatonetimeclassifiedasanerveagent.Biological agents may be any type of organism that can cause disease in man, animals, or plants 7.
Usually these are bacteria, viruses, or fungi, but may also include plasmodia, prions, or even insects. In addition, biological agents may also be categorized by pathogens are those that can cause diseases that are expected to produce a low mortality rate of less than two percent for individuals who do not receive medical attention. Individuals exposed to incapacitating biological agents are therefore expected to fully recover without medical assistance. Biological agents have some unique characteristics among weapons of mass destruction. A practical understanding of potential biologic, chemical, and nuclear agents, their attendant clinical symptoms, and recommended management strategies is an important prerequisite for optimal preparation and response to these less frequently used agents of mass casualty8. Biological agents can multiply in the environment and the amount of agent can increase with time. Biological agents are also the only group in which secondary person-to-person transmission can occur. In addition, unlike many chemical agents and toxins, there is always an asymptomatic latent period due to incubation of the pathogen in the body. These latency periods range from hours up to several weeks8.
“TheAIDS Plaguewill affect society inways thatyoucannotnowimagine.AIDSis100%fatal.Scientistsand medical research people are not optimistic about an immediate cure to [or] vaccine.They do not expect todevelopaneffectivevaccinewithinthenexttwodecades.Public health officials estimate that as many as 2.4billion people (half the world’s population) will die from AIDSwithin thenext15-20years.”“Economically, theinsurance and medical health systems could be devastated in the 1990’s. Nothing short of a spectacular medicalbreakthroughwillkeepWesterncivilizationfromsufferingtheworstcatastropheinthehistoryoftheworld.”
Indian Journal of Public Health Research & Development, April 2018, Vol.9, No. 4 167
ReSulTS ANd dISCuSSION
The Main Types of Chemical Weapons: A chemical weapon is any weapon that uses a manufactured chemicaltokillpeople.ThefirstChemicalweaponusedeffectivelyinbattlewaschlorinegas9, which burns and destroys lung tissue. Chlorine is not an exotic chemical. Most municipal water systems use it today to kill bacteria. It is easy to manufacture from common salt. In World War I, the German army released tons of the gas to create a cloud that the wind carried toward the enemy. Modern chemical weapons tend to focus on agents with much greater killing power, meaning that it takes a lot less of chemical to kill the same number of people10. Nerve agent: highly lethal, kills in very small dosages. If inhaled it severely damages the lungs, which often leads to death 11.These agents produce injury to the lungs and irritation of the eyes and the respiratory tract12.1. ‘Chemical Weapons’ means the following, together or separately:
(a) Toxic chemicals and their precursors, except where intended for purposes not prohibited under this Convention, as long as the types and quantities are consistent with such purposes; (b) Munitions and devices, specifically designed to cause death orother harm through the toxic properties of those toxic chemicalsspecifiedinsubparagraph(a),whichwouldbereleased as a result of the employment of such munitions and devices; (c)Any equipment specifically designedfor use directly in connection with the employment of munitionsanddevicesspecifiedinsubparagraph(b).2.‘Toxic Chemical’ means: Any chemical, which through its chemical action on life processes can cause death, temporary incapacitation or permanent harm to humans or animals. This includes all such chemicals, regardless of their origin or of their method of production, and regardless of whether they are produced in facilities, in munitions or elsewhere.
Poisons and incendiaryweaponsfirst described inancient myths included arrows dipped in serpent venom, water poisoned with drugs, plagues unleashed on armies, and secret formulas for combustible weapons. However, even if that rare natural recombination of the monkey AIDS virus were to occur in a single human, normal contact between other humans and the infected human istotallyinsufficienttoprovideanysubstantialinfectionrate unless the rate of infection of new individuals is
greatly assisted and vastly speeded up by some other outside mechanism for example, by something like AIDS contaminated vaccine and a mass inoculation program. To the layman, the infection and reproduction by retroviruses is peculiar to say the least. Genetically, the cells of any person infected with AIDS or any other recombinant retrovirus have been permanently transformed. Literally that person has acquired a new set ofgenes.Heorshehasbeenconvertedintoa“factory”forproducing—andspreading—thevirus13.
Administration of these vaccines by the World Health Organization is precisely correlated to the subsequentoutbreakoftheAIDStheVaccineConnection13 epidemics in those countries. This strongly indicates that the vaccine itselfwasthe“precursor”agentinitiatingthestartoftheAIDS infection. A documented U.S. Army incident is a case in point. New U.S. Army recruits are routinely vaccinated against a range of diseases.One of them issmallpox, in case an enemy should try to use smallpox as a biological warfare agent. A healthy 19-year old Army recruit developed AIDS after vaccination, and was admitted to Walter Reed Army Medical Center, where he died.InapaperpublishedintheNewEnglandJournalofMedicine, Walter Reed medical team scientists reported their discovery of the connection between vaccination and stimulated AIDS disease. Lenin himself ordered a major effortmountedtodevelopandmanufacturechemicalandbiological weapons, for he understood the implications of such mass-destruction weapons13.
The Red Army was fully equipped and psychologically prepared to wage chemical and biological warfare. Continuing today, the Soviet forces have the highest training in chemical warfare of any troops in the world. Red Army soldiers practice regularly, often using actual chemical agents. Decontamination is a standard measure and practiced as a matter of course. The Soviets have never ceased development of such weapons. In the1930’s,asecretSovietbacteriologicalinstitutewasset up at the town of Suzdal. Prisoner microbiologists worked on a variety of new weapons and vaccines, including bubonic plague and tularemia (rabbit fever). By World War II the Soviets were prepared to retaliate vigorously to any use by the Germans of chemical and biological warfare agents.
After the war, Soviet research and development in chemical and biological weapons continued apace. The chemical warfare nerve agents are a class of extremely
168 Indian Journal of Public Health Research & Development, April 2018, Vol.9, No. 4
toxic chemicals developed during the period surrounding World War II. The nerve agents are cholinesterase (ChE)-inhibiting organophosphorus compounds that are related through structure and mechanism of action to pesticides, but are much more potent. Five of the most common nerve agents are tabun, sarin, soman, cyclosarin.
Other Effects following distribution throughout the body: Irrespective of the exposure route, once the nerve agent enters the systemic circulation it will be distributed throughout the tissues of the body, possibly resulting in a cascade of additional toxic signs. These effects arediscussed in detail in other chapters of this volume. Exposure to chemical nerve agent atmospheres leads to a myriad of toxic signs that are primarily mediated though acetylcholinesterase inhibition at target tissues. The initial signs of chemical nerve agent vapor and aerosolexposureareattributedtodirecteffectsontargettissues which are most accessible to vapor aerosols including the eyes and respiratory tract. Thus, some of thefirstnoticeableeffectsofnerveagentvapororaerosolinhalation exposure are miosis, rhinorrhea, and tightness inthechest.Becauseitisacommonfindinginexposedindividuals, and because it can occur at concentrations much lower than those necessary to cause other signs of toxicity, miosis is often used as a marker of exposure to a nerve agent vapor or aerosol. In a real-world situation, the most common scenarios of exposure would involve the percutaneous or inhalation routes.
CONCluSION
In this Review we shall try to discuss a matter of that senseless history. Unfortunately, scale preparation foroffensivechemicalwarhasappearedveryruinousfornot too rich country. And it is obvious. However, it was represented important to estimate as well consequences for people and for the ground of our country of that preparation for unnecessary war. This Review article discusses the history of chemical and biological warfare, existing and potential weapons, the proliferation of weapons and delivery systems, ways to prevent the use of these weapons, and ways to protect populations from their effects. .Antibiotic resistances, and recombinantDNA technology—all very, very useful to the Sovieteffort in biowar. As was pointed out, the WHOinoculation program is wellcorrelated as the precursor or “initiator”oftheAIDSepidemic.WhereWHOsmallpoxvaccination occurred, the mysterious symptoms of AIDS
disease appeared in due time. Even the eventual spread of the AIDS virus to the U.S. homosexual community is explainable. In clinicallyOrthopaedic surgeons shouldbe aware of the principles of management of catastrophic events. Stress is less an issue when one is adequately prepared. Decontamination is essential both to manage victims and prevent further spread of toxic agents to first responders andmedical personnel. It is importantto assess the risk of potential threats, thereby allowing disaster planning and preparation to be proportional and aligned with the actual casuality event. Neurological complications of chemical, biological and explosive weapons which have or may be used by terrorists are reviewed by international experts in this publication. Management and treatment profiles are outlined.Thelevel of knowledge required to chemical and biological weapons. So our conclusion chemical or biological weaponsprovidemorebangforthebuckkilling(HIV)their victims with less cost than bullets or bombs.
Conflict of Interest: Nil
Source of Funding: Self
ethical Clearance No.:IEC/C-P/025/2016
ReFeReNCeS
1. Kim.Coleman.A History of Chemical Warfare-2005.
2. Fedorov. L. Introduction to Chemical Armament in the War Against People (the Russian’s Tragic Experience.JMedCBR.2009;7:30;8.
3. Fedorov. L.The long way to chemical war .2009; 1.392.
4. Rizzo.G. Biological war: historical and political aspectsAnnIg.2004;16:4:597-601.
5.Orient J.M. Chemical and biological warfare.Should defenses be researched and deployed? JAMA.1989;4:262(5):644-8.
6. Harry Salem. Issues in Chemical and Biological Terrorism. International Journal ofToxicology.2003:22:6; 465-471.
7. D. Hank Ellison, C. H. M. M. Handbook of Chemical and Biological Warfare- agents.CRC Press Boca Raton London New York Washington,D.C.2000.
Indian Journal of Public Health Research & Development, April 2018, Vol.9, No. 4 169
8. Born.C.T..Disasters and mass casualties: II. explosive, biologic, chemical, and nuclear agents. JAmAcadOrthopSurg. 2007;15:8:388-396.
9. Prentiss AM.1937. Chemicals in War. New York, McGraw-Hill Book Company Inc.
10.MarrsTC,MaynardRL,Sidell FR.ChemicalWa r f a re Agents – Toxicology and Treatment. NewYork,JohnWiley&Sons.1997.
11.M a y n a rdR.L,BeswickFW.Org a n o ph o s p h o ru s Compounds as Chemical Warfare Agents. Clinical and Experimental Toxicology of Organophosphates and
Carbamates. In: Ballantyne B and Marrs TC, eds, Oxford:Butterworth Heinemann; 1992.373 – 385.
12.StoberW,Mc.ClellanRO,MorrowPE.Approaches to Modelling Disposition of Inhaled Particles and Fibers in the Lung. In Gardner DE, Crapo JD,McClellanRO, eds.Toxicology ofthe Lung, 2nd ed, New York: Raven Press.1993; 527-602.
13. Thomas E, Bearden. AIDS Biological Awarefare-TheVaccineConnection.Chapter1thevaccineConnection.1998;Jan.17
evaluation of Total and Conjugate bilirubin levels before and After Phototherapy
e. Prabhakar Reddy1, b. Muthukumaraswamy2, S. Paneerselvam3, b. Sai Ravi Kiran4
1Professor of Biochemistry and Central Lab Head, 2Professor and Head of General Medicine, 3Professor of General Medicine, 4Assistant Professor of Biochemistry,
Sri Lakshmi Naryana Institute of Medical Sciences, Puducherry.
AbSTRACT
About50%oftermand80%ofpretermbabiesdevelopjaundice,whichusuallyappears2to4daysafterbirth.Jaundiceiscausedbybilirubindepositionintheskin.Mostjaundiceinnewborninfantsisaresultof increased red cell breakdown and decreased bilirubin excretion. Breast feeding, haemolysis, and some metabolic and genetic disorders also increase the risk of jaundice.Unconjugated bilirubin can be neurotoxic, causing an acute or chronic encephalopathy that may result in cerebral palsy, hearing loss, and seizures. Thisstudywasconducted50Neonatesfromdec2013toDecember2016attheDepartmentofpaediatricsSLIMS, Pondicherry. A long-term follow-up of a large population of such infants might identify which of these suggested approaches is preferred.
Keywords: Neonatal jaundice, Bilirubin, Phototherapy, Haemolysis.
INTROduCTION
For centuries, neonatal jaundice (icterus neonatorum) has been observed in newborns. As early as 1724, Juncker, in the Conspectus Medicinae Theoreticopraticae, began distinguishing between “true jaundice” and “the icteric tinge which may beobserved in infants, immediatelyafterbirth.” In1875,Orthnoticedduringautopsiesthepresenceofbilirubinin the basal ganglia of infants who had severe jaundice, which was labeled kernicterus by Schmorl in 19031. An apparent fading away of the yellow pigmentation in the skin of the jaundiced babies when they had been a short time in sunlight2. Neonatal jaundice is a commonphenomenonduringthefirstweekofpostnatallife affecting almost two thirds of term newborns3-4. The mechanism of neonatal hyperbilirubinemia is multifactorial, comprising primarily processes that
contribute to increased bilirubin load, or diminished bilirubin clearance3-5. The former may result from causes that potentiate bilirubin production and the enterohepatic circulation, whereas the latter may result from immature conjugative capacity, and/or impaired hepatic uptake or excretion 3-5.
Approximately 60% of term and 80% of pretermbabies develop jaundice in the first week of life, andabout 10%of breastfed babies are still jaundiced at 1month. For most babies, jaundice is not an indication of an underlying disease, and this early jaundice (termed ‘physiological jaundice’) is generally harmless. There are devices that measure transcutaneous bilirubin, but these aregenerallyforscreeningpurposes.Jaundicehasmanypossible causes, including blood group incompatibility (most commonly Rhesus or ABO incompatibility),other causes of haemolysis (breaking down of red blood cells), sepsis (infection), liver disease, bruising and metabolicdisorders.Deficiencyofaparticularenzyme,glucose-6-phosphate-dehydrogenase, can cause severe neonatal jaundice. Glucose-6-phosphate-dehydrogenase deficiencyismorecommonincertainethnicgroupsandruns in families.
Bilirubin is formed in the reticuloendothelial system as the end product of heme catabolism through a series of
Corresponding Author:E.Prabhakar Reddy,Professor of Biochemistry and Central Laboratory Head,Sri Lakshmi Narayana Institute of Medical Sciences,PuducherryMobile No. +919159186879Email id: [email protected]
DOI Number: 10.5958/0976-5506.2018.00277.2
Indian Journal of Public Health Research & Development, April 2018, Vol.9, No. 4 171
oxidation-reduction reactions. The predominant bilirubin isomer in humans is IX-alpha (Z,Z), which, because of its lipophilic nature, can cross phospholipid membranes. In fetal life, this characteristic permits passage of bilirubin through the placenta into the maternal organism for excretion. Postpartum, this same characteristic enables passage of bilirubin across the blood-brain barrier, which is why clinicians worry about jaundice in newborns. Bilirubin is transported in serum bound to albumin. When the bilirubin-albumin complex reaches the liver, bilirubin is transferred into the hepatocytes, where it is bound to ligandin. The next step, which occurs inside the hepatocyte, is binding of bilirubin to glucuronic acid (conjugation) through the enzyme uridine diphosphate glucuronyl transferase (UDPGT). Both ligandin and UDPGT have very low concentrations and activities in the fetus, but activity increases greatly after birth. However, during the time required to increase these enzyme activities, bilirubin accumulates. An important factor in this process is increased bilirubin production through the breakdown of fetal erythrocytes. Onceconjugated in the liver, bilirubin is excreted into the bile and transported through the gut with food and further broken down, contributing to the color of stool. Deconjugation and reabsorption of bilirubin can occur in the bowel, a process known as enterohepatic circulation. Increased enterohepatic circulation is believed to contribute to prolonged jaundice in some newborns and may be partially responsible for human milk-associated jaundice.
In the absence of conjugates, the total bilirubin concentration in plasma is the sum of bilirubin bound to albumin plus a minimal amount of free bilirubin. Bilirubin is excreted more slowly in newborns than in adults. Although no clinical tests can measure bilirubin uptake and conjugation by the liver, an elevated hour-specifictotalbilirubinvaluewhenbilirubinproductionis normal or decreasing is a sign of impaired or abnormallydelayedbilirubinexcretion.Thedifferentialdiagnosisinthisolderagegroupdiffersmarkedlyfromthat in newborns and young infants. Jaundicemay bethe presenting feature of life-threatening conditions such as fulminant liver failure, a prompt and logical evaluation is necessary to identify the more serious disorders that require urgent management. Bilirubin is a product of heme metabolism. Heme is converted in the reticuloendothelial (RE) system to biliverdin and then to bilirubin by heme oxygenase and biliverdin reductase,
respectively.In most cases, the elevation of serum-conjugated bilirubin is a biochemical manifestation of cholestasis, which is the pathologic reduction in bile formationorflow.Itisacommonproblemthatcanbethe presenting sign for many disorders. The challenge for the physician is to identify patients who need additional evaluation. The differential diagnosis for jaundice isage-specific the study aim is to compareTotal Serumbilirubin (TSB) and Conjugate Serum Bilirubin (CSB) readings before and after phototherapy.
MATeRIAl ANd MeThOd
This study was conducted 50 Neonates from dec2013toDecember2016attheDepartmentofpaediatricsSri Lakshmi Naryana Institute of Medical Sciences, Pondicherry. The institutional ethical committee was obtained. Participants Term and preterm neonates who had a birthweight 2000 gwhowere cared for in theoutpatient clinic or being admitted to the NICU after delivery and requiring phototherapy were eligible to participate in the study. Infants who had previous phototherapy or exchange transfusion were excluded. Written informed consent was obtained from parents. Neonates receiving in-hospital phototherapy underwent measurements alongside routine Total and Conjugate Bilirubin before and after treatment. Phototherapy The needforthebaselinephototherapythresholdissetat20mg/dL. For corrected gestational age below 38 weeks, the threshold was calculated as gestational age in weeks minus 20 (mg/dL).The thresholdwas further reducedby 2 mg/dL for a positive antiglobulin test and for each day below age 3 days. All neonates received 1 or more complete cycles of intermittent phototherapy, consisting of 3 consecutive 4-hour treatment/4-hour pause periods, giving a total light exposure of 12 hours. The need for an additional cycle was based on serum bilirubin levels, by using the decision criteria described above. Assessed totalandconjugateBilirubinlevels(T&CSB)beforeandafter phototherapy, Time points for measurement were scheduled according to clinical appraisal. Comparison of bilirubin levels before phototherapy was based on the last simultaneous pair of TSB and TCB before treatment. Measures after cessation of light exposure were categorized in groups of 24, 48, 72 hrs and 8th day before and after phototherapy.
Statistical Analysis: Only cases with information ondate of birth, start and duration of phototherapy, and
172 Indian Journal of Public Health Research & Development, April 2018, Vol.9, No. 4
both TSB and TCB measurement before phototherapy were included in this analysis. Statistical analysis was done by Anova method using Microsoft
Excel and SPSS for windows version 11.5 (SPSS, Inc.,Chicago).ApvalueP<0.005consideredassignificant.
ReSulTS
Table.1: Total bilirubin and conjugate bilirubin levels and after phototherapy (Mean ± SD)
hours/daysTotal Bilirubin (mg/dl) Conjugate Bilirubin(mg/dl)
P valuebefore Phototherapy
After Phototherapy
before Phototherapy
After Phototherapy
24 Hrs 15.6 ± 2.4 15.0±2.2 10.3±1.7 9.3 ±1.6 <0.00172 Hrs 16.2 ± 2.3 12.3 ± 1.9 9.2 ± 1.5 0.8±0.1 <0.0018th Day 2.1±0.3 --- 0.4±0.08 --- <0.001
dISCuSSION
Clinical recognition and assessment of jaundice can be difficult.This is particularly, so in babieswithdarkerskintones.Oncejaundiceisrecognised,thereisuncertainty about when to treat, and there is widespread variation in the use of phototherapy and exchange transfusion. There is a need for more uniform, evidence-based practice and for consensus-based practice where such evidence is lacking. This guideline provides guidance regarding the recognition, assessment and treatment of neonatal jaundice. The advice is based on evidence where this is available and on consensus-based practice where it is not. In our study we found in neonates of 24hrs increased levels of total Bilirubin levels (15.6±2.4) and after 72 hrs highly increased levels (16.2±2.3). After photo therapy the total Bilirubin levels were decreased levels (15.0±2.2) after 24 hrs and wefoundafter72hrs(12.3±1.9)(P<0.001)andconjugatedBilirubinlevelswereincreased(10.3±1.7)infirst24hrshighly increased (9.2±1.5) conjugate Bilirubin levels upto 72 hrs. After phototherapy conjugate Bilirubin levels were found to decreased (9.3±1.6) for 24 hrs and (0.8±0.1)(p<0.001)for72hrs.Boththeparametersagainassessed on 8thdayaftercompletionoffinalphototherapy,total bilirubin levels were decreased(2.1±0.3) andconjugate bilirubin levels were decreased(0.4±0.08)(p<0.001) levelswere found inour studyafter7th day total conjugated bilirubin levels were came down to normal after phototherapy. There are no good data to guide the clinician in dealing with the occasional infant who has a significant elevation of direct-reacting orconjugated bilirubin. Kernicterus has been described in terminfantswithTSBlevels>20mgdl/1(314mmoll/1)butinwhom,becauseofsignificantelevationsindirect
bilirubin levels, the indirect bilirubin levels were well below20mg/dl6-7. There is some evidence that elevated direct bilirubin levels can decrease the infant’s albumin-binding capacity8 and it has been suggested, but not confirmed,thatinfantswiththebronzebabysyndromemight be at an increased risk of developing bilirubin encephalopathy8-9. As a general rule, when considering the use of phototherapy or exchange transfusion, the direct-reacting (or conjugated) bilirubin level should not be subtracted from the total. Infants with conjugated bilirubin levels >50% of the TSB require individualexpert evaluation.
Hemolytic disease Infants with hemolytic disease are generally considered to be at a greater risk for the development of bilirubin encephalopathy than are nonhemolyzing infants with similar bilirubin levels10. Thus, exchange transfusion is recommended at lower levels for infants who have hemolytic disease. The use of intravenous gamma-globulin has been shown, in several randomized controlled trials, to reduce the need for exchange transfusions inbothRhandABOhemolyticdisease.
Phototherapy in most infant’s p35 weeks of gestation is generally used in a prophylactic mode the goal being to preventfurtherelevationoftheTSB.Themosteffectiveirradiance is delivered by a light source (such as special bluefluorescentlampsorLEDsystems)thatwilldeliverirradiancepredominatelyinthe430to490nmband11-12. Detailed information on phototherapy use can be found in a recent technical report12. If, in spite of phototherapy, the TSB continues to rise, either the irradiance can be increased by bringing the phototherapy lamp closer to the baby (except when halogen or tungsten lights are used) or
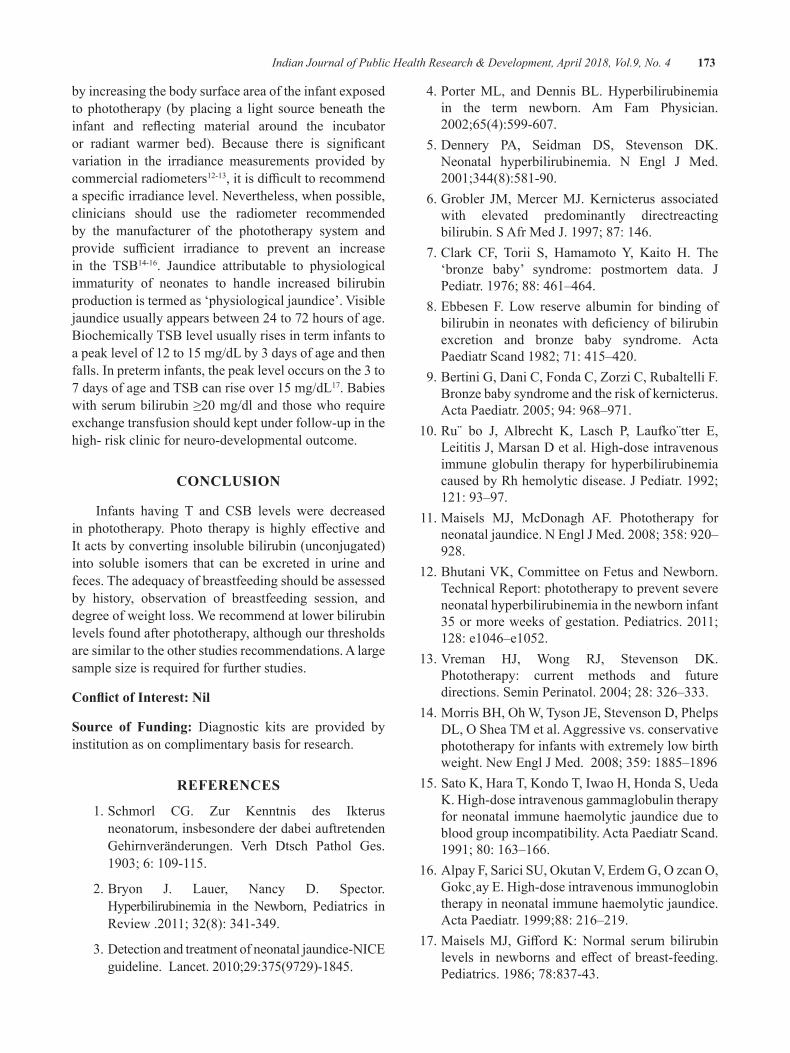
Indian Journal of Public Health Research & Development, April 2018, Vol.9, No. 4 173
by increasing the body surface area of the infant exposed to phototherapy (by placing a light source beneath the infant and reflecting material around the incubatoror radiant warmer bed). Because there is significantvariation in the irradiance measurements provided by commercial radiometers12-13,itisdifficulttorecommendaspecificirradiancelevel.Nevertheless,whenpossible,clinicians should use the radiometer recommended by the manufacturer of the phototherapy system and provide sufficient irradiance to prevent an increasein the TSB14-16. Jaundice attributable to physiologicalimmaturity of neonates to handle increased bilirubin productionistermedas‘physiologicaljaundice’.Visiblejaundice usually appears between 24 to 72 hours of age. Biochemically TSB level usually rises in term infants to a peak level of 12 to 15 mg/dL by 3 days of age and then falls. In preterm infants, the peak level occurs on the 3 to 7 days of age and TSB can rise over 15 mg/dL17. Babies withserumbilirubin≥20mg/dland thosewhorequireexchange transfusion should kept under follow-up in the high- risk clinic for neuro-developmental outcome.
CONCluSION
Infants having T and CSB levels were decreased in phototherapy. Photo therapy is highly effective andIt acts by converting insoluble bilirubin (unconjugated) into soluble isomers that can be excreted in urine and feces. The adequacy of breastfeeding should be assessed by history, observation of breastfeeding session, and degree of weight loss. We recommend at lower bilirubin levels found after phototherapy, although our thresholds are similar to the other studies recommendations. A large sample size is required for further studies.
Conflict of Interest: Nil
Source of Funding: Diagnostic kits are provided by institution as on complimentary basis for research.
ReFeReNCeS
1. Schmorl CG. Zur Kenntnis des Ikterus neonatorum, insbesondere der dabei auftretenden Gehirnveränderungen. Verh Dtsch Pathol Ges.1903;6:109-115.
2.Bryon J. Lauer, Nancy D. Spector.Hyperbilirubinemia in the Newborn, Pediatrics in Review.2011;32(8):341-349.
3. Detection and treatment of neonatal jaundice-NICE guideline.Lancet.2010;29:375(9729)-1845.
4. Porter ML, and Dennis BL. Hyperbilirubinemia in the term newborn. Am Fam Physician. 2002;65(4):599-607.
5. Dennery PA, Seidman DS, Stevenson DK. Neonatal hyperbilirubinemia. N Engl J Med.2001;344(8):581-90.
6.Grobler JM,MercerMJ. Kernicterus associatedwith elevated predominantly directreacting bilirubin.SAfrMedJ.1997;87:146.
7. Clark CF, Torii S, Hamamoto Y, Kaito H. The ‘bronze baby’ syndrome: postmortem data. JPediatr. 1976; 88: 461–464.
8. Ebbesen F. Low reserve albumin for binding of bilirubininneonateswithdeficiencyofbilirubinexcretion and bronze baby syndrome. Acta PaediatrScand1982;71:415–420.
9. Bertini G, Dani C, Fonda C, Zorzi C, Rubaltelli F. Bronze baby syndrome and the risk of kernicterus. ActaPaediatr.2005;94:968–971.
10.Ru¨ bo J, Albrecht K, Lasch P, Laufko¨tter E,LeititisJ,MarsanDetal.High-doseintravenousimmune globulin therapy for hyperbilirubinemia causedbyRhhemolyticdisease.JPediatr.1992;121: 93–97.
11.Maisels MJ, McDonagh AF. Phototherapy forneonataljaundice.NEnglJMed.2008;358:920–928.
12.BhutaniVK,CommitteeonFetusandNewborn.Technical Report: phototherapy to prevent severe neonatal hyperbilirubinemia in the newborn infant 35ormoreweeksofgestation.Pediatrics.2011;128:e1046–e1052.
13.Vreman HJ, Wong RJ, Stevenson DK.Phototherapy: current methods and future directions.SeminPerinatol.2004;28:326–333.
14.MorrisBH,OhW,TysonJE,StevensonD,PhelpsDL,OSheaTMetal.Aggressivevs.conservativephototherapy for infants with extremely low birth weight.NewEnglJMed.2008;359:1885–1896
15. Sato K, Hara T, Kondo T, Iwao H, Honda S, Ueda K. High-dose intravenous gammaglobulin therapy for neonatal immune haemolytic jaundice due to blood group incompatibility. Acta Paediatr Scand. 1991;80:163–166.
16.AlpayF,SariciSU,OkutanV,ErdemG,OzcanO,Gokc¸ayE.High-doseintravenousimmunoglobintherapy in neonatal immune haemolytic jaundice. Acta Paediatr. 1999;88: 216–219.
17.MaiselsMJ,GiffordK:Normal serum bilirubinlevels in newborns and effect of breast-feeding.Pediatrics. 1986; 78:837-43.
Macronutrient Status in Children Aged 1-6 years in and around Pondicherry
e. Prabhakar Reddy1, R. geetharani2, K. M. Roop Kumar3, T. Mohana lakshmi4, Rajini5
1Professor of Biochemistry and Central Lab Head, 2Professor of General Medicine, Sri Lakshmi Naryana Institute of Medical Sciences, Puducherry, 3Associate Professor of Forensic Medicine, Sri Venkateswara Medical college, Pondicherry, 4Research scholar in Microbiology, 5Associate Professor of Community
Medicine, Sri Lakshmi Naryana Institute of Medical Sciences, Puducherry
AbSTRACT
Lowbloodlipidandproteinlevelsareknowntobeaffectedfrominadequateintakesofproteinandenergy.Ouraim is reported the protein and lipid nutritional status of school children aged 1-6 years in Pondicherry.,India. All childrenaged1-6years(N=200;100boys,100girls)fromgovernmentschoolsofpondicherry.Awholebloodsample of 3 mL was obtained from all the students and it was measured for total protein, albumin, globulin, lipid profile.All biochemical valuesobtainedwere comparedwith the referencevaluesby age.Descriptive statistics,analysisofvariancewereusedtoanalysethedataOnly3-7%ofthestudychildrenhadserumtotalproteinatorbelow6.1g%whichindicatedlowserumtotalprotein.Noneofthemhadlowserumalbumin(<3.5g%).Mostchildrenhadserumtotalcholesterollevellowerthan170mg%andserumLDL-Clevellessthan130mg%.Only12-18%of children had hypercholesterolemia. Not many Government school children aged 1-6 years had low blood protein levels.Only1/6ofchildrenhadhighhypercholesterolemia.Theywerefromverypoorfamily.
Keywords: Nutritional status; Lipid profile; Protein; Children.
Corresponding Author:E. Prabhakar ReddyProfessor of Biochemistry and Central Lab Head,Sri Lakshmi Naryana Institute of Medical Sciences,Puducherry,Mobile No. +91 9159186879Email ID: [email protected]
INTROduCTION
The global burden of malnutrition follows a similar socio-economic, demographic and geographic distribution. One in six people worldwide aremalnourished, most in developing countries1. Childhood undernutrition, in particular, is highly prevalent in developingcountries.One-thirdofchildrenunderfiveyears old in developing countries are stunted in growth2, meaningthat theirheight-for-age issignificantly lowerthan would be expected in a well-nourished population.
Malnutrition literally means “bad nutrition” andtechnically includes both over- and under- nutrition. In the context of developing countries, under-nutrition
is generally the main issue of concern, though industrialization and changes in eating habits have increased the prevalence of over-nutrition. Nonetheless, within the context of World Food Programme (WFP) programs and assessments, malnutrition refers to under-nutritionunlessotherwisespecified.
The main underlying causes of malnutrition resulted in low blood lipid and protein levels include inadequate access to food and nutrients, inadequate care of mothers and children, inadequate health services, and unhealthy environments. The most widespread form of protein and lipid malnutrition in children is protein and energy under-consumption. It is associated with decreased muscle mass (wasting), and lack of growth and development3-4.
Malnutrition can result from a lack of macronutrients (carbohydrates, protein and fat), micronutrients (vitamins andminerals),orboth.Macronutrientdeficienciesoccurwhen the body adapts to a reduction in macronutrient intake by a corresponding decrease in activity and an increased use of reserves of energy (muscle and fat), or decreased growth. Consequent3.
DOI Number: 10.5958/0976-5506.2018.00278.4
Indian Journal of Public Health Research & Development, April 2018, Vol.9, No. 4 175
It causes poor learning ability and is also harmful to the immune system, making malnourished children more prone to diseases such as measles, diarrhea, respiratory infection, tuberculosis, and malaria, than normal children4.The rate of malnutrition tends to be higher in the city among vegetarian and village children5.Ouraimis to study serum lipid and protein status resulted from malnutrition in Pondicherry town and in and around Pondicherry village school children aged 1-6 years.
Measuring Malnutrition: Anthropometric information can be used to determine an individual’s nutritional status compared with a reference mean. The basic information and measurements that constitute anthropometric measurements in children are: age, sex, length, height, weight, oedema. These measurements are the key building blocks of anthropometrics and are essential for measuring and classifying nutritional status in children under 5 years.
MeThOdOlOgy
Study subjects All children aged 1-6 years (N =358; 183 boys, 175 girls) from Pondicherry government and in and around Pondicherry government school stdents were studied. All subjects’s were taken a patients information concern and taken Institutional Ethical committee clearance (IEC). All the students’ 3ml blood sampleswerecollectedanddonetheassayslipidprofileand Total Protein and Albumin.
Statistical Analysis: Descriptive statistics, analysis of variance were used to analyses the data.
ReSulTSTables 1 showed mean and standard deviation of all the study biochemical parameters for boys and girls, respectively.
None of the study children had serum total protein below 5 g% (Table 2).
About 4.8% of boys and 3.9% of gilrs had serum total protein at or below 6.1 g% (Table 2). None of the studychildrenhad lowalbuminor<3.5g%(Table2).The percentage of children had serum globulin below andabovecut-offlevelswereshowninTable2.
Most children had serum total cholesterol (TC) lower than 170mg% (Table 3). Only 7% of childrenhadserumTC>=200mg%.Accordingtoagegroup1-3years, only 15.6% of boys had serum TC >182 mg% (Table 3). According to age group 4-6 years, only 6% of girls had serum TC >189 mg% (Table 3).
About 59% of children had serum triglycerides aboveorequal100mg%(Table3)and45.2%ofboysand50.6%ofgirlshadserumhighdensity lipoproteincholesterol (HDL-C) below 35mg% (Table 3). Only1.3% of boys and 2.6% of girls had serum low density lipoproteincholesterol(LDL-C)>=130mg%(Table3).Noneof thestudychildrenhadLDL/TCratio>4. Onaverage, only 9.6% of children had LDL/HDL ratio >4.
dISCuSSION
Access to medical care has been found to have a positive effect on child health outcomes though thereis some debate in the literature as to the mechanism through which the access-health link is mediated. It is not surprisingly that in the future, these children will face several kinds of problems such as health conditions, illnesses and malnutrition6.
In the present study, few percent of the study children had serum total protein at or below 6.1 g% which indicated low serum total protein. Also, none of themhadlowserumalbumin(<3.5g%).Thesefindingscorresponded to the incidence of mild and moderate under nutrition (not the severe form of malnutrition such as marasmus and kwashiorkor) found in these children. Rural area of pondicherry children ate enough portions from the meat and cereal groups, but had inadequate intakes of milk, fruits and vegetables. Therefore, although total protein intakes exceeded the RDA’s, the quality of protein in the diets of rural children can be improved by increased milk intakes. It is possible that not enough essential amino acids are taken in for protein synthesis and growth. Additionally, in low energy diets as seen in the rural children, dietary proteins could be used as an energy source and not for protein synthesis.
The percentages of children who had low or high serum total cholesterol and other lipid profiles varied.However, most children had serum total cholesterol
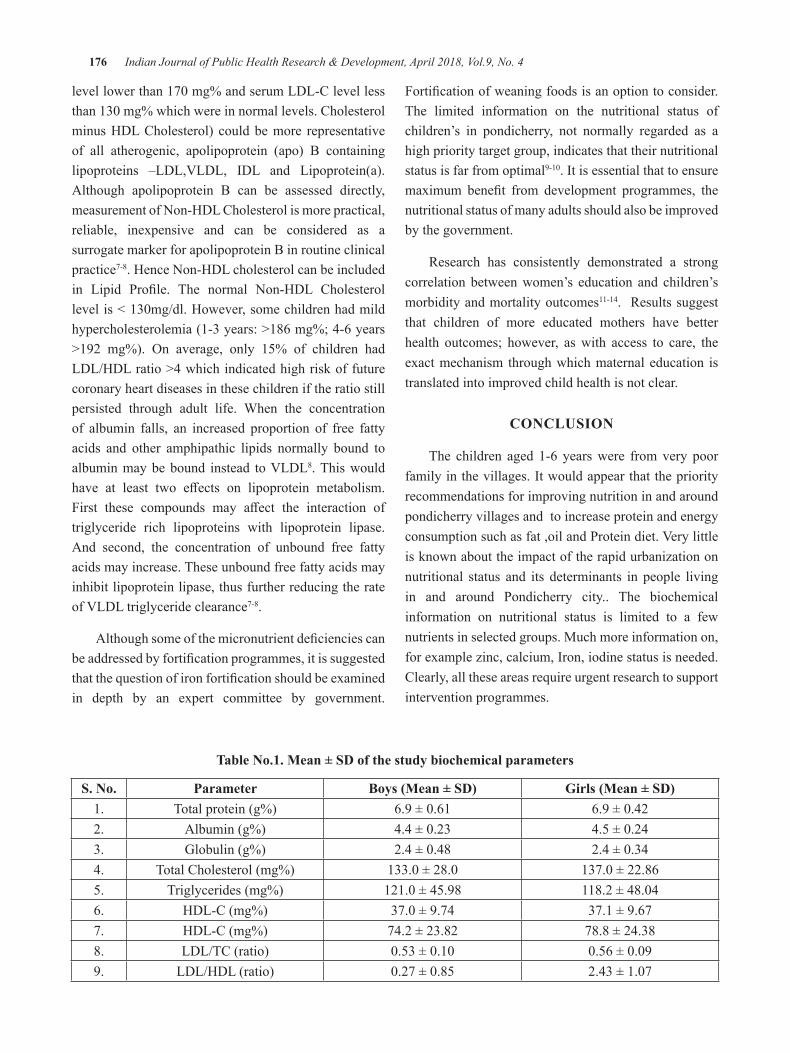
176 Indian Journal of Public Health Research & Development, April 2018, Vol.9, No. 4
levellowerthan170mg%andserumLDL-Clevellessthan130mg%whichwereinnormallevels.Cholesterolminus HDL Cholesterol) could be more representative of all atherogenic, apolipoprotein (apo) B containing lipoproteins –LDL,VLDL, IDL and Lipoprotein(a).Although apolipoprotein B can be assessed directly, measurement of Non-HDL Cholesterol is more practical, reliable, inexpensive and can be considered as a surrogate marker for apolipoprotein B in routine clinical practice7-8. Hence Non-HDL cholesterol can be included in Lipid Profile. The normal Non-HDL Cholesterollevelis<130mg/dl.However,somechildrenhadmildhypercholesterolemia (1-3 years: >186 mg%; 4-6 years >192 mg%). On average, only 15% of children hadLDL/HDL ratio >4 which indicated high risk of future coronary heart diseases in these children if the ratio still persisted through adult life. When the concentration of albumin falls, an increased proportion of free fatty acids and other amphipathic lipids normally bound to albuminmaybebound instead toVLDL8. This would have at least two effects on lipoprotein metabolism.First these compounds may affect the interaction oftriglyceride rich lipoproteins with lipoprotein lipase. And second, the concentration of unbound free fatty acids may increase. These unbound free fatty acids may inhibit lipoprotein lipase, thus further reducing the rate ofVLDLtriglycerideclearance7-8.
Althoughsomeofthemicronutrientdeficienciescanbeaddressedbyfortificationprogrammes,itissuggestedthatthequestionofironfortificationshouldbeexaminedin depth by an expert committee by government.
Fortificationofweaningfoodsisanoptiontoconsider.The limited information on the nutritional status of children’s in pondicherry, not normally regarded as a high priority target group, indicates that their nutritional status is far from optimal9-10. It is essential that to ensure maximum benefit from development programmes, thenutritional status of many adults should also be improved by the government.
Research has consistently demonstrated a strong correlation between women’s education and children’s morbidity and mortality outcomes11-14. Results suggest that children of more educated mothers have better health outcomes; however, as with access to care, the exact mechanism through which maternal education is translated into improved child health is not clear.
CONCluSION
The children aged 1-6 years were from very poor family in the villages. It would appear that the priority recommendations for improving nutrition in and around pondicherry villages and to increase protein and energy consumptionsuchasfat,oilandProteindiet.Verylittleis known about the impact of the rapid urbanization on nutritional status and its determinants in people living in and around Pondicherry city.. The biochemical information on nutritional status is limited to a few nutrients in selected groups. Much more information on, for example zinc, calcium, Iron, iodine status is needed. Clearly, all these areas require urgent research to support intervention programmes.
Table No.1. Mean ± Sd of the study biochemical parameters
S. No. Parameter Boys (Mean ± SD) Girls (Mean ± SD)1. Total protein (g%) 6.9±0.61 6.9±0.422. Albumin (g%) 4.4±0.23 4.5±0.243. Globulin (g%) 2.4±0.48 2.4±0.344. Total Cholesterol (mg%) 133.0±28.0 137.0±22.865. Triglycerides (mg%) 121.0±45.98 118.2±48.046. HDL-C (mg%) 37.0±9.74 37.1 ± 9.677. HDL-C (mg%) 74.2 ± 23.82 78.8 ± 24.388. LDL/TC (ratio) 0.53±0.10 0.56±0.099. LDL/HDL (ratio) 0.27±0.85 2.43±1.07
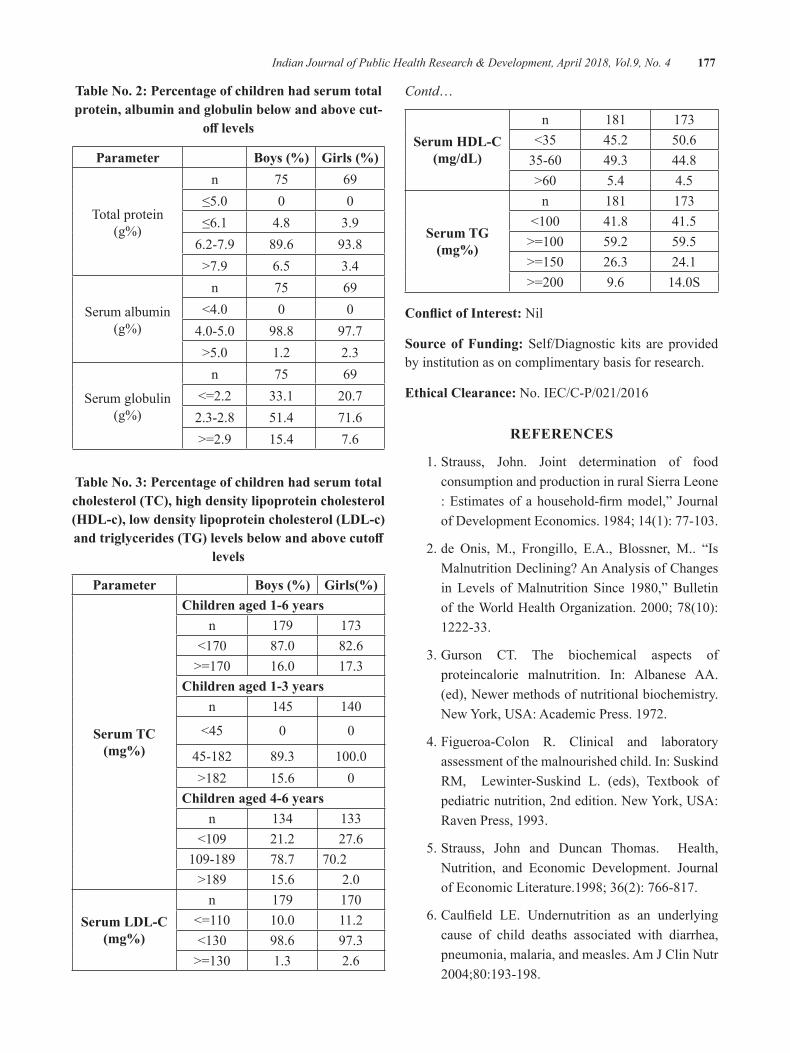
Indian Journal of Public Health Research & Development, April 2018, Vol.9, No. 4 177
Table No. 2: Percentage of children had serum total protein, albumin and globulin below and above cut-
off levels
Parameter Boys (%) Girls (%)
Total protein (g%)
n 75 69≤5.0 0 0≤6.1 4.8 3.9
6.2-7.9 89.6 93.8>7.9 6.5 3.4
Serum albumin (g%)
n 75 69<4.0 0 04.0-5.0 98.8 97.7>5.0 1.2 2.3
Serum globulin (g%)
n 75 69<=2.2 33.1 20.72.3-2.8 51.4 71.6>=2.9 15.4 7.6
Table No. 3: Percentage of children had serum total cholesterol (TC), high density lipoprotein cholesterol (HDL-c), low density lipoprotein cholesterol (LDL-c) and triglycerides (TG) levels below and above cutoff
levels
Parameter Boys (%) Girls(%)
Serum TC (mg%)
Children aged 1-6 yearsn 179 173
<170 87.0 82.6>=170 16.0 17.3
Children aged 1-3 yearsn 145 140
<45 0 0
45-182 89.3 100.0>182 15.6 0
Children aged 4-6 yearsn 134 133
<109 21.2 27.6109-189 78.7 70.2
>189 15.6 2.0
Serum ldl-C (mg%)
n 179 170<=110 10.0 11.2<130 98.6 97.3>=130 1.3 2.6
Contd…
Serum hdl-C (mg/dL)
n 181 173<35 45.2 50.635-60 49.3 44.8>60 5.4 4.5
Serum Tg (mg%)
n 181 173<100 41.8 41.5>=100 59.2 59.5>=150 26.3 24.1>=200 9.6 14.0S
Conflict of Interest: Nil
Source of Funding: Self/Diagnostic kits are provided by institution as on complimentary basis for research.
ethical Clearance:No.IEC/C-P/021/2016
ReFeReNCeS
1.Strauss, John. Joint determination of foodconsumption and production in rural Sierra Leone :Estimatesofahousehold-firmmodel,” JournalofDevelopmentEconomics.1984;14(1):77-103.
2.de Onis, M., Frongillo, E.A., Blossner, M.. “IsMalnutrition Declining? An Analysis of Changes in Levels ofMalnutrition Since 1980,”BulletinoftheWorldHealthOrganization.2000;78(10):1222-33.
3. Gurson CT. The biochemical aspects of proteincalorie malnutrition. In: Albanese AA. (ed), Newer methods of nutritional biochemistry. New York, USA: Academic Press. 1972.
4. Figueroa-Colon R. Clinical and laboratory assessment of the malnourished child. In: Suskind RM, Lewinter-Suskind L. (eds), Textbook of pediatric nutrition, 2nd edition. New York, USA: Raven Press, 1993.
5.Strauss, John and Duncan Thomas. Health,Nutrition, and Economic Development. Journalof Economic Literature.1998; 36(2): 766-817.
6.Caulfield LE. Undernutrition as an underlyingcause of child deaths associated with diarrhea, pneumonia,malaria,andmeasles.AmJClinNutr2004;80:193-198.
178 Indian Journal of Public Health Research & Development, April 2018, Vol.9, No. 4
7. Anne L.Peters. Clinical relevance of Non-HDL cholesterol in patients with diabetes.Clinical Diabetes.2008;26(1):3-7.
8.Shafrir E, Levy E. Lipoproteins in nephrosis. JClin Invest.1958; 37:1755.
9. World Food Programme. Food and Nutrition Handbook.Rome:WorldFoodProgramme;2000.
10.DivisionofNutrition,MinistryofPublicHealth,Thailand. National nutrition survey. January –March, 1995.
11. World Resource Institute. World resources, environmental change and human health. The World Resources Institute, the United Nations
Environment Programme and the World Bank. NewYork,USA:OxfordUniversityPress,1998.
12. Nandy S. Poverty, child undernutrition and morbidity: new evidence from India. Bull World HealthOrgan2005;83:210-216
13. Tienboon P. Nutritional status of children (1-12 years) living in Lumpoon province. Chiang Mai Med Bull. 1997;36:95.
14. Tienboon P, Wangpakapattanawong P. Nutritional status, body composition and health conditions of the Karen hill tribe children aged 1-6 years in Northern Thailand. Asia Pac J Clin Nutr.2007;16(2):279-285.
evaluation of Vitamin A and e levels in Chronic Renal Failure
Salma Mahaboob1, R. geetharani2, T. Mohana lakshmi3, e. Prabhakar Reddy4
1Research Scholar in Biochemistry, 2Professor of General Medicine, 3Research Scholar in Microbiology, 4Professor of Biochemistry and Central Lab Head, Sri Lakshmi Narayana Institute of Medical Sciences, Pondicherry
AbSTRACT
Anyatomormolecule that containsoneormoreunpairedelectrons isdefinedas free radical, themostknown reactive species. An unpaired electron is an electron that occupies an orbital alone, but electrons usually associate in pairs in orbital’s of atoms and molecules. The present study focuses on the extent of free radical damage on lipid and Lipid peroxidation end products (measured as malondialdehyde, MDA) and effectonantioxidantdefensemechanism(measuredasvitaminEandvitaminCintheserumofCRFpatientspredialytically. The study was Carried in Sri Lakshmi narayana Institute of Medical Sciences,Pondicherry. 50casesand50controlsbetweenagegroupof30-60weretaken.LipidperoxidationwasmeasuredintermsofMDAandantioxidantsweremeasuredasvitaminEandVitaminCinserumofCRFpatientsbeforedialysis.The levelofMDA, serumurea andCreatininewas significantly increased, antioxidantvitaminlevels (C and E) were decreased in CRF patients as compared to normal subjects. Though there is evidence for production of oxygen free radicals in CRF, reports on net oxidative imbalance in the uremic state, as evidenced by increase in oxidant markers and decrease in antioxidant vitamins status in CRF patients. Oxidativeinjurygenerallytakesplaceonlywhenlocaloxidantproductionexceedsantioxidantdefense.
Keywords: Antioxidant; Lipid peroxidation; Diet; Malondialdehyde
Corresponding Author:E. Prabhakar ReddyProfessor of Biochemistry and Central Laboratory In charge,Sri Lakshmi Narayana Institute of Medical Sciences,Puducherry-605502Mobile: +919159186879Email: [email protected]
INTROduCTION
Forms of the molecule like dehydroascorbic acid. Ascorbate and ascorbic acid are both naturally Antioxidants are the substances that protect the body against free radical attack by preventing free radical formation, by blocking chain reaction or by repairing the oxidatively damaged biomolecules. Reactive oxygen species (ROS) play a significant role in pathogenesisof chronic renal failure (CRF), leading to damage to protein, lipid and DNA.
The reactive oxygen species produced in cells include hydrogen peroxide (H2O2), hypochlorous acid (HClO),and free radicals such as the hydroxyl radical (·OH) and the superoxide anion (O2
−). The hydroxyl
radical is particularly unstable and will react rapidly and non-specifically with most biological molecules. Thisspecies is produced from hydrogen peroxide in metal-catalyzed redox reactions such as the Fenton reaction(1) These oxidants can damage cells by starting chemical chain reactions such as lipid peroxidation, or by oxidizing DNA or proteins. Damage to DNA can cause mutations and possibly cancer, if not reversed by DNA repair mechanisms.
Vitamins have a variety of biochemical functions.Some vitamins play a crucial role in act as antioxidants (vitamins C and E) .It is generally well tolerated. Large doses may cause gastrointestinal discomfort, headache, troublesleeping,andflushingoftheskin.Normaldosesare safe during pregnancy.[4] Vitamin C is an essential nutrient involved in the repair of tissue. Foods that contain vitamin C include citrus fruit, tomatoes, red peppers, and potatoes. Vitamin C is an essential nutrient for certain animals includinghumans.VitaminCdescribes severalvitamers that have vitamin C activity in animals, including ascorbic acid and its salts, and some oxidized present in the body when either of these is introduced into cells, since the forms interconvert according to pH. Vitamin
DOI Number: 10.5958/0976-5506.2018.00279.6
180 Indian Journal of Public Health Research & Development, April 2018, Vol.9, No. 4
C is a cofactor in at least eight enzymatic reactions, including several collagen synthesis reactions that, when dysfunctional, cause the most severe symptoms of scurvy In animals, these reactions are especially important in wound-healing and in preventing bleeding from capillaries. Ascorbate also acts as an antioxidant, protecting against oxidative stress(2).
The presence of glutathione in cells and extracellular fluids helpsmaintain ascorbate The biological role ofascorbate is to act as a reducing agent, donating electrons to various enzymatic and a few non-enzymatic reactions. The one- and two-electron oxidized forms of vitamin C, semidehydroascorbic acid and dehydroascorbic acid, respectively, can be reduced in the body by glutathione and NADPH-dependent enzymatic mechanismsin a reduced state(3).
In humans, vitamin C is essential to a healthy diet aswell as being a highly effective antioxidant, acting to lessen oxidative stress; a substrate for ascorbate peroxidase in plants (APX is plant specific enzyme)and an enzyme cofactor for the biosynthesis of many importantbiochemicals.VitaminCacts as anelectron donor for important enzymes(4).
Ascorbate is required for a range of essential metabolic reactions in all animals. It is made internally by almost all organisms; the main exceptions are most bats, all guinea pigs, capybaras, and the Haplorrhini (one of the two major primate suborders, consisting of tarsiers, monkeys, and humans and other apes). Ascorbate is also notmadebymanyspeciesofbirdsandfish.Allspeciesthat do not make ascorbate require it in the diet(5).VitaminC is found in high concentrations in immune cells, and is consumed quickly during infections. It is not certain how vitamin C interacts with the immune system; it has been hypothesized to modulate the activities of phagocytes, the production of cytokines and lymphocytes, and the number of cell adhesion molecules in monocytes.It has been claimed that the α-tocopherol form is themost important lipid-soluble antioxidant, and that it protects membranes from oxidation by reacting with lipid radicals produced in the lipid peroxidation chain reaction. This removes the free radical intermediates and prevents the propagation reaction from continuing. This reactionproducesoxidisedα-tocopheroxylradicalsthatcan be recycled back to the active reduced form through reduction by other antioxidants, such as ascorbate, retinolorubiquinol.Thisisinlinewithfindingsshowingthat α-tocopherol, but not water-soluble antioxidants,efficiently protects glutathione peroxidase 4 (GPX4)-
deficientcellsfromcelldeath.GPx4istheonlyknownenzyme that efficiently reduces lipid-hydroperoxideswithin biological membranes(6).
Thus vitamin E and vitamin C prevent oxidative damage by countering the free radical activity and provide protection against Oxidative stress in CRF.Based on this the extent of free radical- mediated damageonlipids(measuredasMDAlevels)andeffecton antioxidant defense mechanism(measured as vitamin C and vitamin E) was studied in CRF patients before dialysis to show the role of antioxidant in preventing the progression of CRF and for monitoring and optimization of antioxidant therapy.
MATeRIAl ANd MeThOd
The blood samples for the present study were collected from Medicine (Nephrology) department, Sri Lakshmi Narayana Institute of Medical Sciences, Pondicherry, The healthy volunteers who come for blood donation served as controls.The caseswere 50CRFpatients,age30-60years,havinginclusioncriteriaof serum creatinine more than 2mg/dl predialytically. The exclusion criteria were patients with no clinical or laboratory evidence of diabetes mellitus, liver diseases, lupus nephritis, acute illness, respiratory diseases. None of the patients had history of antioxidant vitamin supplementation.Theywere50healthyvolunteersfrombloodbankofage30-60yearsofeithersexwhoservedas controls.
Informed consent was obtained from each patient before sample collection. The study was approved by Institutional Ethical Committee (IEC) from Sri Lakshmi Narayana Institute of Medical Sciences, From each patient 5 ml blood was collected before dialysis in sterilevacutainer without adding any additives and then centrifuged. The resulting serum was used for studies.
ReSulTS
The level of serum creatinine, Serum urea, MDA, vitamin E and vitamin C are presented in Table 1. The level of serum creatinine, Serum urea and MDA are significantlyhigherincaseswhencomparedtocontrols.ThelevelsofvitaminEandvitaminCaresignificantlylower in cases as compared to controls.
The correlation between serum creatinine, Serum urea and MDA is represented in Table 2. Serum creatinine and BUN correlates positively with MDA.
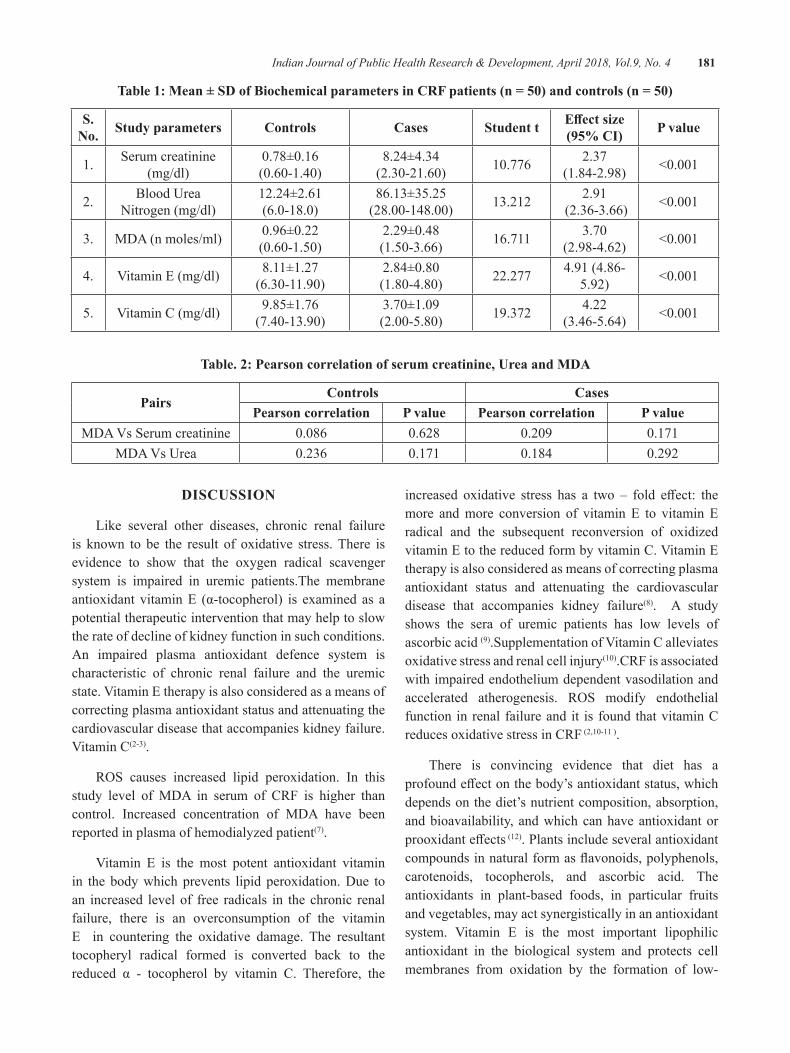
Indian Journal of Public Health Research & Development, April 2018, Vol.9, No. 4 181
Table 1: Mean ± SD of Biochemical parameters in CRF patients (n = 50) and controls (n = 50)
S. No. Study parameters Controls Cases Student t Effect size
(95% CI) P value
1. Serum creatinine (mg/dl)
0.78±0.16(0.60-1.40)
8.24±4.34(2.30-21.60) 10.776 2.37
(1.84-2.98) <0.001
2. Blood Urea Nitrogen (mg/dl)
12.24±2.61(6.0-18.0)
86.13±35.25(28.00-148.00) 13.212 2.91
(2.36-3.66) <0.001
3. MDA (n moles/ml) 0.96±0.22(0.60-1.50)
2.29±0.48(1.50-3.66) 16.711 3.70
(2.98-4.62) <0.001
4. VitaminE(mg/dl) 8.11±1.27(6.30-11.90)
2.84±0.80(1.80-4.80) 22.277 4.91 (4.86-
5.92) <0.001
5. VitaminC(mg/dl) 9.85±1.76(7.40-13.90)
3.70±1.09(2.00-5.80) 19.372 4.22
(3.46-5.64) <0.001
Table. 2: Pearson correlation of serum creatinine, urea and MdA
PairsControls Cases
Pearson correlation P value Pearson correlation P valueMDAVsSerumcreatinine 0.086 0.628 0.209 0.171
MDAVsUrea 0.236 0.171 0.184 0.292
dISCuSSION
Like several other diseases, chronic renal failure is known to be the result of oxidative stress. There is evidence to show that the oxygen radical scavenger system is impaired in uremic patients.The membrane antioxidant vitaminE (α-tocopherol) is examined as apotential therapeutic intervention that may help to slow the rate of decline of kidney function in such conditions. An impaired plasma antioxidant defence system is characteristic of chronic renal failure and the uremic state.VitaminEtherapyisalsoconsideredasameansofcorrecting plasma antioxidant status and attenuating the cardiovascular disease that accompanies kidney failure.VitaminC(2-3).
ROS causes increased lipid peroxidation. In thisstudy level of MDA in serum of CRF is higher than control. Increased concentration of MDA have been reported in plasma of hemodialyzed patient(7).
Vitamin E is the most potent antioxidant vitaminin the body which prevents lipid peroxidation. Due to an increased level of free radicals in the chronic renal failure, there is an overconsumption of the vitamin E in countering the oxidative damage. The resultant tocopheryl radical formed is converted back to the reduced α - tocopherol by vitamin C. Therefore, the
increased oxidative stress has a two – fold effect: themore and more conversion of vitamin E to vitamin E radical and the subsequent reconversion of oxidized vitaminEtothereducedformbyvitaminC.VitaminEtherapy is also considered as means of correcting plasma antioxidant status and attenuating the cardiovascular disease that accompanies kidney failure(8). A study shows the sera of uremic patients has low levels of ascorbic acid (9).SupplementationofVitaminCalleviatesoxidative stress and renal cell injury(10).CRF is associated with impaired endothelium dependent vasodilation and accelerated atherogenesis. ROS modify endothelialfunction in renal failure and it is found that vitamin C reduces oxidative stress in CRF(2,10-11).
There is convincing evidence that diet has a profoundeffectonthebody’santioxidantstatus,whichdepends on the diet’s nutrient composition, absorption, and bioavailability, and which can have antioxidant or prooxidanteffects (12). Plants include several antioxidant compoundsinnaturalformasflavonoids,polyphenols,carotenoids, tocopherols, and ascorbic acid. The antioxidants in plant-based foods, in particular fruits and vegetables, may act synergistically in an antioxidant system. Vitamin E is the most important lipophilicantioxidant in the biological system and protects cell membranes from oxidation by the formation of low-
182 Indian Journal of Public Health Research & Development, April 2018, Vol.9, No. 4
reactivity tocopheroxyl radicals(11).VitaminCisoneofthe most important hydrosoluble antioxidants; it exerts itsbeneficialeffectsbyinhibitionof lipidperoxidationanddirectlyscavengesO2andOH−(1).Thelower-than-normal plasma concentration of vitamin C observed in our patients comparing with controls.
Ourstudyshowedasignificantdecreaseinthelevelsof vitamin C as well as vitamin E in the chronic renal failure patients as opposed to the healthy individuals with normal renal function.Vitamin E and vitamin Cbeing the most abundant micronutrient antioxidants in the body which provide protection against free radical damage, their decreased levels could be indicative of oxidative stress.
An increased serum creatinine level is the firstindicator of an impaired renal function. People having an increased muscle mass may show slightly elevated creatinine levels. However, in case of chronic renal failure, a gradual and significant increase is observedover a period of time. In the initial stages, there may not be any marked increase in the serum creatinine levels.
But as the GFR declines and reaches below 10mL/min/1.73 m2, their levels increase rapidly and lead to systemic manifestations.(2) Therefore, even mild elevations of serum creatinine persisting for a longer time are worthy of evaluation for possible decrease in kidney function (5). A high value of serum Urea, most often, indicates a less than normal kidney function. serum Urea levels may also increase due to other factors like heart failure, dehydration or a diet rich in protein. Bleeding in the intestines and certain medications may also make the serum Urea higher than normal. However a marked increase in serum Urea along with an increased creatinine level in the serum may be indicative of renal failure (6). The patients included in our study showed significantly elevated levels of serumUrea aswell asserum creatinine indicating a greatly impaired renal function (12).
CRF is associated with oxidative stress as evidenced by increase in MDA level with decrease in antioxidant vitamins because of their overconsumption or loss in urine. Further study is needed on a large sample size for better understanding of the concept so that supplementation of antioxidant vitamins may be helpful in preventing oxidative stress and related complication in chronic renal failure patients.
CONCluSION
Our results indicate that even a low intake ofantioxidants in the short termhasbeneficialeffectsonthe antioxidant system as shown by improved levels of vitamins A and C and supplementation of antioxidants caneffectivelyreducefreeradicalsas oxidativestressin CRF patients. An increased oxidative stress can lead to increased incidences of cardiovascular complications. Hence, it is important to supplement these patients with the recommended dosage of the vitamins. At present it is untimely to give practical recommendations with regard to antioxidant treatment of patients with renal failure.
Conflict of Interest: Nil
Source of Funding: Self/Diagnostic kits are provided by institution as on complimentary basis for research.
ethical Clearance No.:No.IEC/C-P/042/2016
ReFeReNCeS
1.Biomedical Research 2011; 22 (1): 63-68.Evaluation of Plasma Malondialdehyde as a Biomarker in Patients with Carcinoma of stomach. Aparna R. Bitla1, E. Prabhakar Reddy1, K.Sambasivaih2, M.M. Suchitra1, V. SeshadriReddy1,P.V.L.N.SrinivasaRao1
2.Reddy EP, Reddy VS, Chandra Mouli K, RaoPVLNS. Physiological antioxidant system andoxidative stress in stomach cancer patients with normalrenalandhepaticfunction.OnlineJHealthAlliedScs.2009;8(4):9
3.Evaluation of Oxidative Stress Presented inPatients with Diabetes Mellitus and Metabolic Syndrome .B.Sai Ravi Kiran, 2T.Mohana Lakshmi, 3SLV. Sankeerthi.Ch, 4G.SuryaPrakash, 5V.Seshadri Reddy, 6S.Arul Murugan,7E.PrabhakarReddy.Volume2,Issue1,January-March2014.JournAlofcurrenttrendSInclInIcAlMedIcIne&lAborAtorybIocheMIStry
4.B. Sai Ravi Kiran*, 2T. Mohana Lakshmi,3R.Srikumar,4E. Prabhakar Reddy .Total Antioxidant StatusandOxidativeStressinDiabetesMellitusandMetabolicSyndrome.Int.J.Pharm.Sci.Rev.Res., 40(1), September –October 2016;ArticleNo. 49, Pages: 271-277.
Indian Journal of Public Health Research & Development, April 2018, Vol.9, No. 4 183
5.Iron Deficiency Anemia in Chronic KidneyDisease.E. Prabhakar Reddy*, 2T. MohanaLakshmi,3C.Aravind,4S.Rajasekaran.Volume1,Issue2,July-September2013.JournAlofcurrenttrendS In clInIcAl MedIcIne & lAborAtorybIocheMIStry
6. Ramakrishna P, Reddy E P, Suchitra M M, Bitla AR,SrinivasaRaoPV,SivakumarV.Effectofreuse of polysulfone membrane on oxidative stress during hemodialysis. Indian J Nephrol2012;22:200-5.
7.BaligaR,UedaN,ShahSV.Oxidantmechanismin glomerular disease. In : Current Nephrology , Gonick , H C ed. St. Louis: Mosby Year Book 1997;20:35-151.
8.Michael J Fryer. Vitamin E as a protectiveantioxidant in progressive renal failure. Nephrology2000;5(1-2):1-7.
9.BakaevVV,EfremovAV,TityaevII.Lowlevelofdehydroascorbic acid in uraemic serum and partial correctionofdehydroascorbicaciddeficiencybyhemodialysis. Nephrol dial transplant 1999; 14: 1472 1474.
10.FreiB,EnglandL,AmesBN.Ascorbicacidisanoutstanding antioxidant in human blood plasma. Proc. Natl. Acad. Sci USA 1989; 6: 6377- 6381
11. Wolf G. The discovery of the antioxidant function of vitamin E: the contribution of Henry A. Mattill. JNutr2005;135:363-6.
12.TraberMG.VitaminE. In: ShilsME,ShikeM,Ross AC, Caballero B, Cousins R etal, editors. Modern Nutrition in Health and Disease. Baltimore :Williams&Wilkins,10thed;2006:396-411.
Tender Coconut Water Uses, Health Benefits, Good Nutritive Value and Antioxidant Capacity
e. Prabhakar Reddy1, K. M. Roop kumar2, T. Mohana lakshmi3, Sai Ravi Kiran4
1Professor of Biochemistry and Central Lab Head, Sri Lakshmi Naryana Institute of Medical Sciences, Puducherry, 2Associate Professor of Forensic Medicine, Sri venkateswara Medical college, Pondicherry,
3Research Scholar in Microbiology, 4Assisatnt Professor of Biochemistry, Sri Lakshmi Naryana Institute of Medical Sciences, Puducherry
AbSTRACT
Tender coconut water is natural drink , healthy , nutritious , provided by nature and is widely available in tropicalcountrie.Tendercoconutwaterhastherapeuticeffects,containingvariousnutrientssuchasminerals,vitamins, antioxidants, amino acids , enzymes. 16 Recent studies suggest that tender coconut water is rich in free amino acid ,source L- arginine and vitamin C, which can prevent heart diseases and peroxidation. Some of the medicinal properties of Tender Coconut Water discussed in this review. Despite the facts that tender coconut water is a natural, harmless, vegetable product available in a perfect transportable container, good nutritive value with no propensity of adverse events, it has not gained popularity as an ideal intravenous fluid.Consumption450mL/dayoftendercoconutwaterfor30dayincreasesantioxidantenzymaticSOD,CAT, GPx and decreases lipid peroxidation reported in Mercury contaminated workers. Based on this Tender coconut water health properties like antioxidant capacity has more and it has to be implemented in all type of acute and chronic diseases like psoriasis,thyroidism,Cancer etc.
Keywords: Tender coconut water, Amino acids, Vitamins, Minerals.
Corresponding Author:E. Prabhakar ReddyProfessor of Biochemistry and Central Lab Head,Sri Lakshmi Naryana Institute of Medical Sciences,PuducherryMobile:. +919159186879,Email: [email protected]
INTROduCTION
Coconut water refers to the liquid endosperm of a tender coconut at an age of approximately 9 months from time of pollination, the period before the solid endosperm or white meat forms. It is a pure and nutritious beverage in the natural state. The coconut husk is an excellent package for the water which contains sugars, minerals, amino acids and vitamins1.
Tender coconut water is a natural source of electrolytes, minerals, vitamins, complex carbohydrates, amino acids and other nutrients. The natural carbohydrate
content is between 4-5% of the liquid solution. This make coconut water particularly suitable for the burgeoning sports drink market.
Numerous medicinal properties of tender coconut water reported are: 1.Goodforfeedinginfantssufferingfromintestinal
disturbances, 2.Oralrehydrationmedium, 3. Contains organic compounds possessing growth
promoting properties, 4. Keeps the body cool, 5. Application on the body prevents prickly heat and
summer boils and subsides the rashes caused by small pox, chicken pox, measles, etc.,
6. Kills intestinal worms, 7. Presence of saline and albumen makes it a good
drink in cholera cases, 8. Checks urinary infections, 9. Excellent tonic for the old and sick,
DOI Number: 10.5958/0976-5506.2018.00280.2
Indian Journal of Public Health Research & Development, April 2018, Vol.9, No. 4 185
10.Curesmalnourishment, 11. Diuretic, 12.Effectiveinthetreatmentofkidneyandurethral
stones, 13. Can be injected intravenously in emergency case, 14. Found as blood plasma substitute because it is
sterile, does not produce heat, does not destroy red blood cells and is readily accepted by the body,
15. Aids the quick absorption of the drugs and makes their peak concentration in the blood easier by its electrolyticeffect2-5.
Sugars: Sugars in the forms of glucose and fructose form an important constituent of the tender nut water. The concentration of sugars in the nut water steadily increases from about 1.5 per cent to about 5-5.5 per cent in the early months of maturation and then slowly falls reaching about 2 per cent at the stage of the full maturity of the nut. In the early stages of maturity sugars are in the form of glucose and fructose (reducing sugars) and sucrose (non-reducing sugar) appears only in later stages which increases with the maturity while the reducing sugarsfall.Inthefullymaturenutapproximately90percent of the total sugars is sucrose.
Minerals: Tender coconut water contains most of the minerals such as potassium, sodium, calcium, phosphorous, iron, copper, sulphur and chlorides. Among the minerals more than half is potassium the concentrationofwhichismarkedlyinfluencedbypotashmanuring. Tender coconut water being rich in potassium and other minerals plays a major role to increase the urinary output.
Protein: Coconut water contains small amounts of protein. The percentage of arginine, alanine, cystine and serene in the protein of tender coconut water are higher than those in cow’s milk. Since it does not contain any complex protein the danger of producing shock to the patients is minimized.
Vitamins: Tender coconut water contains both ascorbic acid and vitamins of B group. The concentration of ascorbic acid ranges from 2.2 to 3.7mg per ml, which gradually diminishes as the kernel surrounding the water begins to harden.
Thus the present Review was written based on the original article they conducted to investigate the effectsoftendercoconutwateronantioxidantstatusand
lipid peroxidation in mercury exposure workers6. The study findings demonstrate that tender coconut waterconsumption can reduce oxidative stress and increase antioxidant status indicated by reduced MDA level , increasedantioxidantenzymessuchasSOD,CATandGPx.Based on this findings health benefitswritten inthis Review.
dISCuSSION
Medicinal properties of Tender Coconut Water: Some of the medicinal properties of Tender Coconut Water reported are:
1.Goodforfeedinginfantssufferingfromintestinaldisturbances.
2.Oralrehydrationmedium.
3. Contains organic compounds containing growth promoting properties.
4. Keeps the body cool.
5. Application on the body prevents prickly heat and summer boils and subsides the rashes caused by small pox, chicken pox and measles etc.
6. Presence of saline and albumin makes it a good drink in cholera cases.
7. Excellent tonic for the old and the sick.
8.Diuretic(asubstancewhichtendstoincreaseflowof urine).
9. Can be injected intravenously in emergency cases such as cholera and dysentery when other pyrogen-freefluidsarenotavailable.
10.Canbeusedasabloodplasmasubstitutebecauseit is sterile, pyrogen - free and does not produce heat, and does not destroy blood cells.
11. Aids the quick absorption of drugs and make their peak concentration in the blood easier by its electrolyteeffect.
12. Urinary antiseptic and eliminates poisons in case of mineral poisoning.
Uses and Health Benefits: Coconut water can used as a high-electrolyte beverage with a low glycemic index (54 ± 4) for hydration purposes. (Based on the study conducted by PCA on the Development of a High Electrolyte, Low Glycemic Index Coco Water Drink in
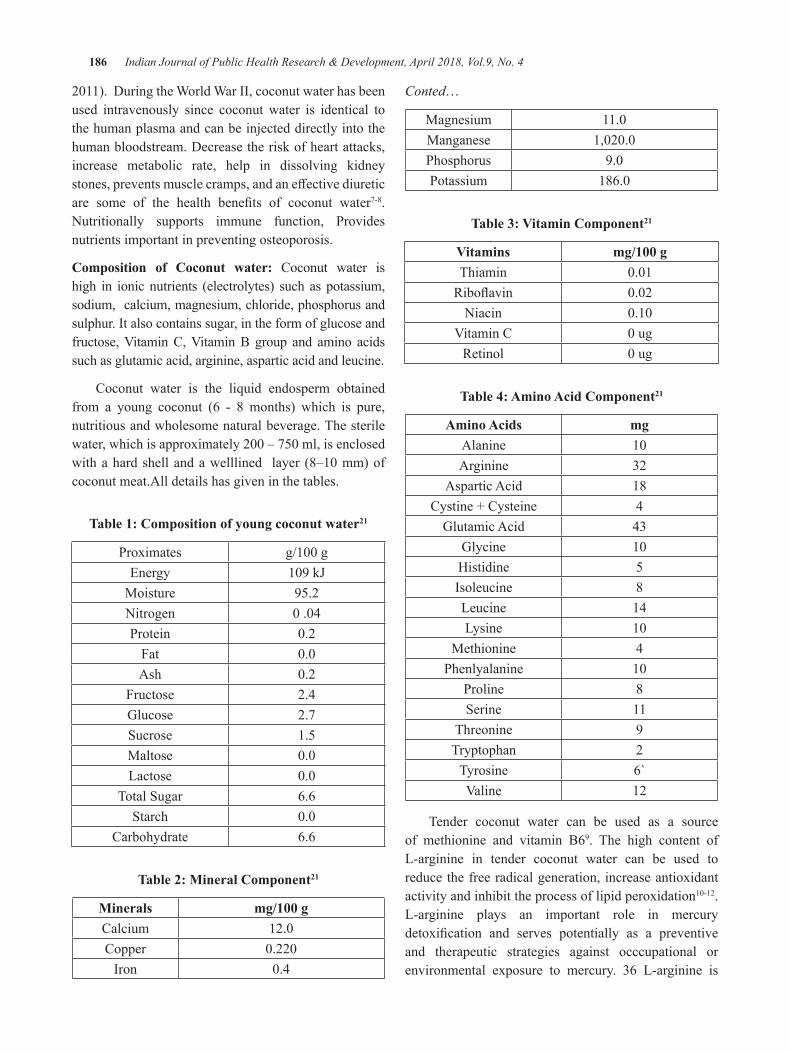
186 Indian Journal of Public Health Research & Development, April 2018, Vol.9, No. 4
2011).DuringtheWorldWarII,coconutwaterhasbeenused intravenously since coconut water is identical to the human plasma and can be injected directly into the human bloodstream. Decrease the risk of heart attacks, increase metabolic rate, help in dissolving kidney stones,preventsmusclecramps,andaneffectivediureticare some of the health benefits of coconut water7-8. Nutritionally supports immune function, Provides nutrients important in preventing osteoporosis.
Composition of Coconut water: Coconut water is high in ionic nutrients (electrolytes) such as potassium, sodium, calcium, magnesium, chloride, phosphorus and sulphur. It also contains sugar, in the form of glucose and fructose,VitaminC,VitaminB group and amino acidssuch as glutamic acid, arginine, aspartic acid and leucine.
Coconut water is the liquid endosperm obtained from a young coconut (6 - 8 months) which is pure, nutritious and wholesome natural beverage. The sterile water,whichisapproximately200–750ml,isenclosedwithahardshellandawelllined layer (8–10mm)ofcoconut meat.All details has given in the tables.
Table 1: Composition of young coconut water21
Proximates g/100gEnergy 109kJ
Moisture 95.2Nitrogen 0.04Protein 0.2
Fat 0.0Ash 0.2
Fructose 2.4Glucose 2.7Sucrose 1.5Maltose 0.0Lactose 0.0
Total Sugar 6.6Starch 0.0
Carbohydrate 6.6
Table 2: Mineral Component21
Minerals mg/100 gCalcium 12.0Copper 0.220
Iron 0.4
Conted…
Magnesium 11.0Manganese 1,020.0Phosphorus 9.0Potassium 186.0
Table 3: Vitamin Component21
Vitamins mg/100 gThiamin 0.01Riboflavin 0.02
Niacin 0.10VitaminC 0ug
Retinol 0ug
Table 4: Amino Acid Component21
Amino Acids mgAlanine 10Arginine 32
Aspartic Acid 18Cystine + Cysteine 4
Glutamic Acid 43Glycine 10Histidine 5Isoleucine 8Leucine 14Lysine 10
Methionine 4Phenlyalanine 10
Proline 8Serine 11
Threonine 9Tryptophan 2
Tyrosine 6`Valine 12
Tender coconut water can be used as a source of methionine and vitamin B69. The high content of L-arginine in tender coconut water can be used to reduce the free radical generation, increase antioxidant activity and inhibit the process of lipid peroxidation10-12. L-arginine plays an important role in mercury detoxification and serves potentially as a preventiveand therapeutic strategies against occcupational or environmental exposure to mercury. 36 L-arginine is
Indian Journal of Public Health Research & Development, April 2018, Vol.9, No. 4 187
a source of nitrid oxide (NO).NOcan inhibit xantineOxidase(XO),increaselevelsofSOD,totalthiol(TSH),vitamin C, total antioxidant (TAC)13-15.IftheXOactivitydecreases, the amount of superoxide will also decrease sothatthelevelsofSODincreasebecausetheneedofSODtodecomposesuperoxideintohydrogenperoxideisalso less. Fang et al. reported that superoxide can also be formedduetothereductionofO2byNOsynthasewhena shortage of arginine and tetrahidribiopterin (BH4) occurs, so that L-arginine can be used as an alternative to reduce production of superoksida16.
The increase of Thiol levels after giving of L-arginine can increase the conversion of ascorbic acid radicals into ascorbat acid14. Treatment by L-arginine can increase GPx activity in rats exposed with Pb17. The high content of vitamin C in tender coconut water makes coconut water effective to increase the levelof antioxidants as vitamin C can reduce superoxide radicals, hydrogen peroxide and reactive oxygen derived from activated neutrophils and monocytes. The work of ascorbic acid as an antioxidant indirectly regenerates membrane antioxidant bonding, such as α-tocopherol,byraisingperoxylradicalsandsingletoxygen.VitaminC works synergistically with vitamin E. Vitamin Eoxidized by free radicals can react with vitamin C, after obtaining the hydrogen ions of vitamin C and then it will convert into tokoferol18. Tender coconut water contains selenium, GPx activity is strongly influenced by thepresenceof selenium,seleniumdeficiency in thebodycandecrease theactivityofGPxup to90.42Mercuryhas strong affinity to bind selenium19, and both are antagonis20. Giving tender coconut water for workers exposed to mercury can be used as a source of selenium to increase the activity of GPx. High nutrient content in tender coconut water can be used as a source of minerals which is essential to the body, one of them is as a natural cofactorantioxidantsSODcontainedinthebody.
Previous studies shown that consumption 450mL/day of tender coconut water for 30 day increasesantioxidant enzymatic SOD, CAT,GPx and decreaseslipid peroxidation in mercury exposure workers.
Market for tender coconut water is increasing considerably due to its medicinal, nutritional and sensory properties. Further market for processed bottled tender coconut water also increasing to reduce transport cost
and easily available in all locations throughout a year. However, there is a challenge for developing process to ensure that the product is available with safety and high nutritional and sensory quality. Generally, the tender coconut water present inside the fruit is shelf sterile and stable for few days, but shelf life of extracted tender coconut water is very less. Due to its nutritive value, it gets contaminated easily, therefore autoclaved coconut water was also analyzed for any change in nutritional value and shelf life.
CONCluSION
The potential anti-cancer properties of specificcytokinins could bring encouraging and novel perspectives infinding cures for the different types ofcancers. The recent discovery of other medicinal values ofcoconutwatersignifiesagoodpotentialinimprovinghuman health. Better insights and understanding of the functions and properties of the individual components of coconut water will, therefore, help us to better utilize this marvelous and multidimensional liquid with special biological properties from nature. Coconut and coconut related products help in maintaining wellness with a range ofhealthbenefits.Itisagiftofnatureforbestremedialforthirstandprovidingbetterhealth.Antioxidanteffectandanticancerpropertiesofdifferentcomponentsofitgive a better choice for removing thepoisoning effectof other food which is part of modern life. There is increasing scientific evidence that supports the role ofcoconut water in health and medicinal applications.
Despite the facts that tender coconut water is a natural, harmless, vegetable product available in a perfect transportable container, good nutritive value with no propensity of adverse events, it has not gained popularity as an ideal intravenous fluid. The favourable profileof tender coconut water makes it an ideal parenteral substitutefluid.Furtherextensive largeclinicalstudiesare suggested particularly on human volunteers.
Conflict of Interest: Nil
Source of Funding: Self
ethical Clearance: Taken from institutional ethical committeeNo.IEC/C-P/038/2016
188 Indian Journal of Public Health Research & Development, April 2018, Vol.9, No. 4
ReFeReNCeS
1. E Prabhakar Reddy, T.Mohana Lakshmi. Coconut Water -Properties,Uses,NutritionalBenefits inHealth and Wealth and in Health and Disease:A Review. Journal of Current trends in CliniCalMediCine & laboratory biochemistry. 2014;2(2):22-24.
2.Halliwel B. Oxygen Spesies Radikal in Livingsystem. Source biochemistry and role in human decease.AmJ1991;91:110-5.
3. Priya SR, Ramaswamy L. Tender Coconut WaterNatures Elixir to Mankid. International Journal of Recent Scientific Research.2014;5(8):1485-90.
4. Fife B. Coconut Water for Health and Healing. USA:PiccadilyBooks,Ltd;2008.
5.AlexiaP,DornierM,DiopN,PainJ-P.CoconutWater Uses, Composition and properties : a review.Fruits.2011;67:87-107.
6. Houston MC. The role of mercury and cadmium heavy metals in vascular disease, hypertension, coronary heart disease and myocardial infarction. Alternative Therapies in Health and Medicine. 2007;13:128-33
7.Al-azzawieHF,UmranA,HyaderNH.OxidativeStress, Antioxidant Status and DNA Damage in aMercuryExposureWorkers.BritishJournalofPharmacologyandToxicology.2013;4(3):80-8.
8.Devasagayam T, Tilak J, Boloor K, Sane KS,Ghaskadbi SS, Lele R. Free Radicals and Antioxidants in Human Health: Current Status andFutureProspects.JAPI.2004;52
9.YongJWH,GeL,NgYF,TanSN.TheChemicalComposition and Biological Properties of Coconut (Cocos nucifera L) water. Molecules. 2009;14:5144-64.
10.BhagyaD,PremaL,RajamohanT.TherapeutikEffects of Tender Coconut water on OxidativeStress in fructosa fed Insulin Resistant Hypertensive Rats. Asian Pasific Journal ofTropicalMedicine.2012:270-6.
11.AnuragP,RajamohanT.Cardioprotectiveeffectoftender coconut water in experimental myocardial infarction..PlantsFoodsHumNutr.2003;58:1-12.
12.AnuragP,RajamohanT.Beneficialeffectoftendercoconut water against isoproterenol induced toxicity on heart mitochondrial activities in rats. Indian Journal of Biochemistry and Biophysics2003;40:278-80.
13.Tripathi P, M.Chandra, Misra MK. OralAdministration of l-Arginine in Patients with Angina or following Myocardinal Infarction may be Protective by Increasing Plasma Superoxida Dismutase and Total Thiol with Reduction in Serum Cholesterol and Xanthine oxidase. OxidMedCellLongev.2009;2(4):231-7.
14. Tripathi P, Misra MK. Therapeutic Role of L-Arginine on Free Radical Scavenging System in Ischemic Heart Diseases. Indian Journal ofBiochemistry&Biophysics.2009;46:498-502.
15.Fazelian S, HoseiniM, Namazi N, Heshmati J,KishMS,MirfatahiM,etal.EffectsofL-ArginineSupplementation on Antioxidant Status and Body CompositioninObesePatientswithPre-diabetes: A Randomized Controlled Clinical Trial. Adv PharmBull.2014;4(1):449-54.
16. Fang YZ, Yang S, Guoyao. Free Radicals, Antioxidant,andNutrien.Nutrition.2002;18:872-9.
17. Tkachenko H, Kurhalyuk N. Role of L-Arginine Against lead Toxicity in Liver of Rats with Different Resistance to Hypoxia. Pol J EnvironStud.2011;20(5):1319-25.
18.Sivanandham V. free Radicals in Health andDiseases - A Mini Review. Pharmacologyonline 2011;1:1062-77.
19.SamZiff.TheToxicTimeBombCanTheMercuryin Your Dental Fillings Poison You. 4 ed. USA: AuroraPress;2002.
20.Yang DY, Chen YW, Gunn JM, Belzile N.SeleniumandMercuryinOrganism:InteractionsandMechanisms.EnvironRev.2008;16:71-92.
21. Philippine coconut authority. Young coconut water.FPDDGuideNo.1.Seriesof2014.
The Strategy in Improving Quality of health Services for Patient Satisfaction in Community Health Clinic (Puskesmas)
North Jayapura, Jayapura City
Vince Tebay
Faculty of Political and Social Sciences of Cenderawasih University
AbSTRACT
Community Health Clinic (Puskesmas) is the technical implementation unit of district/municipal health office responsible for organizinghealth development in aworking area.The existence ofPuskesmas inthe community is very important because Puskesmas is the spearhead of health service provided by Local Government.
In this research, the method used is a mixed method that is quantitative and qualitative approach, where QuantitativeMethodwillbeusedtoseewhetherservicequalitywillinfluencepatientsatisfaction,whilequalitativedescriptiveapproachisusedtoobtaindataandinformationthatsupporttomakeSWOTanalysis.ThisresearchwasconductedatImbiDistrictPublicHealthUnitofNorthJayapuraDistrict,withsamplemethodusingslovinmethod,usingformulaandwith100respondents.Asfortheinterviewconductedtothe Head of Puskesmas and also Puskesmas employee. Multiple linear regression analysis with classical assumption test control (normality, autorelation and multicolionerity) became the main model chosen in this study, after passing the validity test and the reliability of the instrument can be concluded: 1. Analyze how the quality of service which includes: physical evidence, reliability, responsiveness, assurance and empathy at Puskesmas Imbi get good perception frompatient; 2. Proving descriptively throughSWOTanalysis,foundobstaclesfacedbytheHeadofPuskesmasandHealthOfficersintermsofincreasingpatientsatisfaction and formulated strategies that can be applied to improve patient satisfaction.
Keywords: Satisfaction, Physical Evidence, Responsiveness, Reliability, Guarantee And Empaty
INTROduCTION
The development and health services are still understood as technical issues only, where health services involve only doctors, nurses and other medical personnel. Puskesmas is the Technical Implementation Unit of District/Municipal Health Office responsiblefor organizing health development in a working area1. The existence of Puskesmas in the community is very important because Puskesmas is the spearhead of health service provided by Local Government. Good health services provided by government agencies will indirectly alleviate the government’s burden. Healthi becomes priority to all human activities, therefore the public should get assurances from the government that they will always get the necessary health services. Pukesmas are required to provide good quality services in terms of management, resources, facilities and infrastructure so that the services provided in accordance with Standard
OperatingProcedures(SOP)andprovidesatisfactiontousers of Puskesmas services.
In providing quality health services, the local government of Jayapura City has built Puskesmas -Puskesmas in each District, is in 5. Puskesmas in North Jayapura District is Puskesmas Imbi, Puskesmas islocated in Imbi Village Center. In conducting healthservices to the community, researchers observed that Imbi health center faces some obstacles such as equipment that is less supportive in performing services to emergency patients, so that if there is an emergency patient then the medical parties in Imbi Puskesmas will conduct patient referrals to hospitals RSUD Dok 2 Jayapura,andotherhospitals located inJayapuraCity.This is greatly disquieted by the community because sometimes it is still waiting because the number of patients and doctors who handle is still relatively small, while the patient exceeded the limit. It is hoped that the governmentcanfindasolutiononthisissue.
DOI Number: 10.5958/0976-5506.2018.00281.4
190 Indian Journal of Public Health Research & Development, April 2018, Vol.9, No. 4
Another obstacle faced by Imbi puskesmas is the inadequate supply of drugs. The number of generic drugs available has not been able to meet the existing needs, while essential drug supplies have exceeded the required amount. And sometimes prescriptions given by doctors are not available at Imbi Puskesmas and require patients to redeem drugs in pharmacies, while pharmacies in Imbi District available drugs are also not complete yet. Imbi Puskesmas when viewed from the physical side of the building is still good and feasible because it has just undergone a renovation, but on the existing media equipment at Imbi Puskesmas, the patient’s bed isnotsufficienttobeused,alsointheEmergencyRoom(UGD) there arefew equipment which hasn’t sterile yet. According to the information that the authors get,Imbi Puskesmas already included in the Puskesmas Plus2.
TofindoutwhetherifImbiPuskesmashassucceededin providing high satisfaction to the patient, a study of patient satisfaction level is needed. This research is a tool to gather information about the needs and wants of patients. Information generated from this study can be used to better understand the needs of patients, and know the level of patient satisfaction and can be used as input in formulating strategies to improve patient satisfaction.
Imbi Puskesmas as a public organization that has the main duty and function of providing health services require information about the quality of services that exist within the organization, so that can be done by the organization can meet the expectations and satisfy the service users. Concerning the quality of service occurs because the quality has not been considered as an important thing and it shows the government’s inability to make the quality of service as an important policy agenda, so it is not uncommon to find a recruitmentof a position based on consideration like and dislike leadership and paternilism culture.
MATeRIAlS ANd MeThOd
In this research, the method has used mixed methodology. Mixed methodology produces more comprehensive facts in researching research problems, as the researcher has the freedom to use all data collection tools according to the type of data required. While quantitative or qualitative is only limited to certain types of data collection tools only.
Mixed methods are methods that combine quantitative and qualitative approaches in methodology (as in the data collection phase), and mixed model studies incorporate two approaches in all stages of the research process. The mixed method is also referred to as a methodology that provides philosophical assumptions in pointing directions or providing guidance on how data is collected and analyzing data and combining quantitative and qualitative approaches through several phases of research.
The strategy of mixed methods used in this study was to identify the concept component (subconsep) through quantitative data analysis and then collect qualitative data to expand the available information. The point is to unite quantitative and qualitative data in order to obtain a more complete analysis4.
The research specifications has used descriptiveanalysis which aims to create a description or description of the facts, properties and the relationship between the phenomena being investigated. This descriptive research is a study that is not intended to test a particular hypothesis but merely describes what it is about something variable, symptom, or state4. Data collection by depicting as it is, is not accompanied by a review or analytical view of the author5.
As the basis of the research is survey research. Survey research is a study that takes samples from a population and uses a questionnaire as a basic data collection tool6-8. While the characteristics of this study is to collect data from respondents who many in number by using questionnaires.
While the scope studied in this study is to discuss about the strategy in the quality of Imbi Puskesmas’s service to improve patient or community satisfaction in north JayapuraDistrict JayapuraDistrict.The locationof this research took place at Imbi Public Health Center located in Imbi village precisely in north JayapuraDistrictJayapuraDistrict.Inthisresearch,theresearcherwill share question (questionnaire) to the Community who did the treatment at Imbi Puskesmas.
Key Informant: Key informants are people who really understand of the issues being studied. The key informants in this study were Head of Imbi Puskesmas District of north Jayapura, Head of SubUnit, and allmedicalandnonmedicalmedicalofficerwhoservedinImbi Puskesmas and community (Patient) who did the treatment at Puskesmas Imbi.
Indian Journal of Public Health Research & Development, April 2018, Vol.9, No. 4 191
data Collection Technique: There are several techniques performed by researcher as follows:
(a) To obtain the primary data, the authors use research techniques as follows:
z Interview is a way of collecting data that is done by researcher with asking the questions orally to the respondent to obtain the necessary data, in this case the researcher will do question and answer with the community who perform treatment at health center and employees-officers who served in ImbiPuskesmas.
z Questionnaire is a data collection technique that was done by giving written questions to respondents to be answered. Data collection technique was done by distributing questionnaires to respondents. The mechanism of data collection by giving questionnaires to the community as recipients of services in Imbi Puskesmas;
z Observationisatechniqueofdatacollectionby way of observation and record with systematic symptoms related to the problem under study.
(b) Secondary data is obtained data through literature study (Library Reseach) by reading or researching books, magazines or brochures and regulations or materials relevant to the issues discussed.
Processing Techniques and data Analysis: On thisdata, research uses three stages:
1. data reduction: the obtained data from fieldprettyenough,forwhichtheresearcherwillrecord carefully by detail, summarizing, selecting the main points, focusing on the important things, and throwing things that are not important.
2. Presentation of data: as a set of arranged information that gives the possibility of drawing conclusions and taking action for researchers to answer research.
3. Conclusion: The third step is a drawing conclusion andverification.
data Analysis Technique: Data analysis tools being used in research are as follows;
(a) Descriptive analysis, which is part of statistic studying tools, techniques, or procedures used to describe the data collection or observation results that have been done, in other words explain in detail the answers of respondents to questions (questionnaires) that have been disseminated or distributed. To analyze qualitative descriptive data, quantitative by using Likert scale with purpose to measure attitude, perception or opinion of someone or group about social phenomenon that happened.
(b) For the purposes of quantitative analysis, the accepted answers will be scored, then the value of each indicator is measured using Likert scale. The overall data that has been in the analysis will use the help of computer software application program SPSS (Statistical Product and Service Solutions). This data analysis does not use manual calculations.
(c) Quantitative descriptive analysis, which explains in detail the results of research by using multiple regression. Multiple regression is a statistical methodusedtodeterminetheeffectbetweenmorethan one independent variable with one dependent variable.
dISCuSSION
1. Respondent’s Characteristics: In this chapter, we will discuss the satisfaction of the patients who did the treatment at Imbi Puskesmas. This calculation serves to determine the extent to which theinfluenceofindependentvariablesconsistingof Tangibles, Realibility, Responsinevess, Assurance and Empaty of dependent variable in the form of patient satisfaction10. This calculation process using SPSS program and obtained the results of the analysis as follows:
Respondents who fill out the questionnaire andanswer the interviews are the people who did the treatmentaswellasthehealthofficersattheImbiPuskesmas. The total results of the questionnaires were 100 questionnaires / respondents. In thestudy of the characteristics of respondents will focus on several factors, among others: (1) Gender, (2) Latest Education, (3) Employment, (4) Income month.
192 Indian Journal of Public Health Research & Development, April 2018, Vol.9, No. 4
2. Service Quality Effects on Patient Satisfaction: Based on the result of statistical test showed that tangibels, reliability, responsiveness, assurance and empaty simultaneously have significanteffectonpatientsatisfactionatImbiDistrictnorthJayapura Puskesmas and tangibels variablespartially influence the satisfaction of patient atPHBDistrictHealthCenterofNorthJayapura.
Thus the quality of service which includes tangibels, reliability, responsiveness, assurance andempathygreatlyaffectthepatientsatisfactionatPHCMofDistrict ofNorth Jayapura, this isindicated by the improvement of service given to the patient in the case of comfortable building, the availability of seat, location, ,timeliness of service, nurse appearance, doctor, service accuracy, communication ability, empathy to patient, attention to patient and others.
From the results of research also found that the satisfaction of patients in the Public Health Center Imbi District North Jayapura most dominantinfluenced by variable tangibels. In relation totheinfluenceofthesetangibelstheImbiDistrictHealth Center of North Jayapura did not interms of physical buildings, tools, cleanliness of the room forpatients to feel satisfied.Healthcentre gives total service means able to provide services from the beginning of the patient to come thoroughly given so that patients feel satisfiedservices provided9-14.
Efforts to Increase Patient Satisfaction: In order to keep the patient for using the services provided by the ImbiPuskesmasDistrictofNorthJayapuraandincreasethe satisfaction of the Public Health Center Imbi District NorthJayapurathroughthefollowingefforts:
a.Tangibels(PhysicalMeans),inanefforttoshowthe performance of Imbi Puskesmas District of NorthJayapuraforpatienthasprovidedconvenientfacilities with good interior arrangement, equip with equipment with high technology equipment and also show the officers who always neat inserving customer.
b. Reliability (Reliability), in order to ensure reliability of the services of the Imbi District North Jayapura Puskesmas, nurses and doctors havethe knowledge and skills in providing patient care accurately,ontime,sothatpatientsfeelsatisfied.
c.Responsiveness, in an effort to improvecommunication between PHOTI PuskesmasImbi District staff of Jayapura Utara with thepatient, the form of service that need to be given is determined by attitude, profession and response to patient complaint Responsiveness shown to the patient that is: appearance and facial expression in giving Service to patient, mastery, skill and skill ofofficeringivingservicetopatientandresponsefrom puskesmas for service given.
d.Assurance (Assurance), in effort to provideassurance in the form of a convincing attitude, the motivation shown, the suitability in a variety of services that certainly provide a separate value that can be believed by every patient for the quality of services provided.
e.Emphaty (Empathy), in effort to foster loyaltyto the services of the Imbi Puskesmas District of NorthJayapura,emphasizespatientsatisfactioninits services by improving communications among staff(nurses)withpatientsbyunderstandingwhatpatients need in terms of information technology and modern tools.
SWOT Analysis: AftertheSWOTanalysisdone,thenit can be explained alternative strategies being used to improve patient satisfaction at Imbi Puskesmas, that is:
(a)Alternative SO strategies (Strengths -Opportunities)>ComparativeAdvantage
This alternative strategy is a blend of two elements into an advantage when used with a tub will providesatisfaction to the patients who perform treatment at Imbi Puskesmas.
(b) Strategic alternative ST (Strengths - Threats)> Mobilization
This alternative strategy is an interaction between the strength and the threat, namely by mobilizing resources which is a force to soften the threat from outside, even turning threats into opportunities.
(c)Alternative WO strategy (Wekanesses-Opportunities)>Divestment/Investmen
This alternative strategy is an interaction between weakness and external fraying based on the utilization of existing opportunities by minimizing existing weaknesses.
(d) Alternative strategy WT (Weaknesses - Threats)> Damage Control
Indian Journal of Public Health Research & Development, April 2018, Vol.9, No. 4 193
This alternative strategy is the weakest because it is a meeting between weakness and external threats. The strategy to be taken is to control the losses so as not to become defensive and to try to minimize weaknesses and avoid threats.
CONCluSION
Based on the results of regression analysis can be concluded that:
1. Simultaneously, the result of this research proves that H0 hypothesis is rejected and H1 accepted that Tangible, Reliability, Responsiveness, Assurance, Empathy simultaneously have a significantpositive effect on patient satisfaction at ImbiPuskesmasDistricofNorthJayapurawithFvaluecount36,299.Significantvalue0.000.
2. All variables of service quality dimensions (Tangible, Reliability, Responsiveness, Assurance, Empathy)togetherhaveapositiveandsignificantinfluence on patient satisfaction of PHB ImbiDistrictofNorthJayapura.Theseresultsshowthatthe alternative hypothesis (Ha) is acceptable and the null hypothesis (Ho) is rejected, the greatest effectistheTangiblevariable(0.267)followedbyEmpathy (0.222), Reliability (0.220),Assurance(0.199)Responsiveness(0.145)patient.
3.The result isR2of (0.641) It shows that64.1%variable of patient satisfaction can be explained by service quality that is Tangible, Reliability, Responsiveness, Assurance, Empathy while the other 35,9% is explained other variable not included in this research model.
ethical Clearance: Taken from university committee and the agreement with communities
Source of Funding: Author herself
Conflict of Interest: None
ReFeReNCeS
1.Nazir, Moh. 2003. Metode Penelitian, Jakarta,Penerbit Ghalia Indonesia
2.Christa V. Urbinas. 2014. Analisis Kualitas Pelayanan Jasa Terhadap Kepuasan Pelanggan Di Grapari Telkomsel Jayapura.
Disertasitidakditerbitkan Jayapura : ProgramPascaSarjana Universitas Cenderawasih.
3.Hamidi. 2004. Metode Penelitian Kualitatif: Aplikasi Praktis Pembuatan Proposal dan Laporan Penelitian. Malang: UMM Press. p.14-16
4.Arikunto, Suharsimi. 2010.Prosedur Penelitian Suatu Pendekatan Praktik. Rineka Cipta.
5.Sugiyono. 2012. Metode Penelitian Kuantitatif Kualitatif dan R&D. Bandung: Alfabeta.
6.Singarimbun, Masridan Sofian Effendi. 1995.Metode PenelitianSurvei.Jakarta:LP3ES.
7. Azwar, Azrul. 1988. Pengantar Administrasi Kesehatan. Jakarta:PTBinarupaAksara.
8. Azwar, Azrul. 1995. Program Menjaga Mutu Pelayanan. Jakarta:YayasanPenerbitIDI.
9. Rosmala Nur, Nikmah Utami Dewi, Khairunnisa and Anwar Mallongi, 2017. Golden standardfeeding and the risk of 25-60 month-oldunderweight children in Central Sulawesi, Indonesia.AsianJ.Clin.Nutr.,9:104-110.
10.Sugiman 2014. Pengaruh Kualitas Pelayanan Perusahaan Daerah Air Minum Terhadap Kepuasan Pelanggan Di Kota Jayapura. Disertasi tidakditerbitkanJayapura:ProgramPascaSarjanaUniversitas Cenderawasih ( TESIS )
11. Anwar Mallongi, Ruslan La Ane and Agus Bintara Birawida,2017.Ecologicalrisksofcontaminatedlead and the potential health risks among school children inMakassar coastal area, Indonesia. J.Environ.Sci.Technol.,10:283-289.
12.Tjiptono, Fandy, 2000. Manajemen Jasa, Edisi Kedua,AndyOffset.Jakarta
13.Robby Kayame, Anwar Mallongi., 2018.Relationships between smoking Habits and the Hypertension occurrence among the Adults of Communities in Paniai Regency, Papua Indonesia. Indian Journal of Public Health Research &Development,January2018,Vol.9,No.1
14.Masriadi Idrus, Anwar Mallongi and JulianiIbrahim, 2017. Surveillance system model forpulmonary tuberculosis suspected in Pangkep region, Indonesia. Curr. Res. Tuberculosis, 9: 1-7.
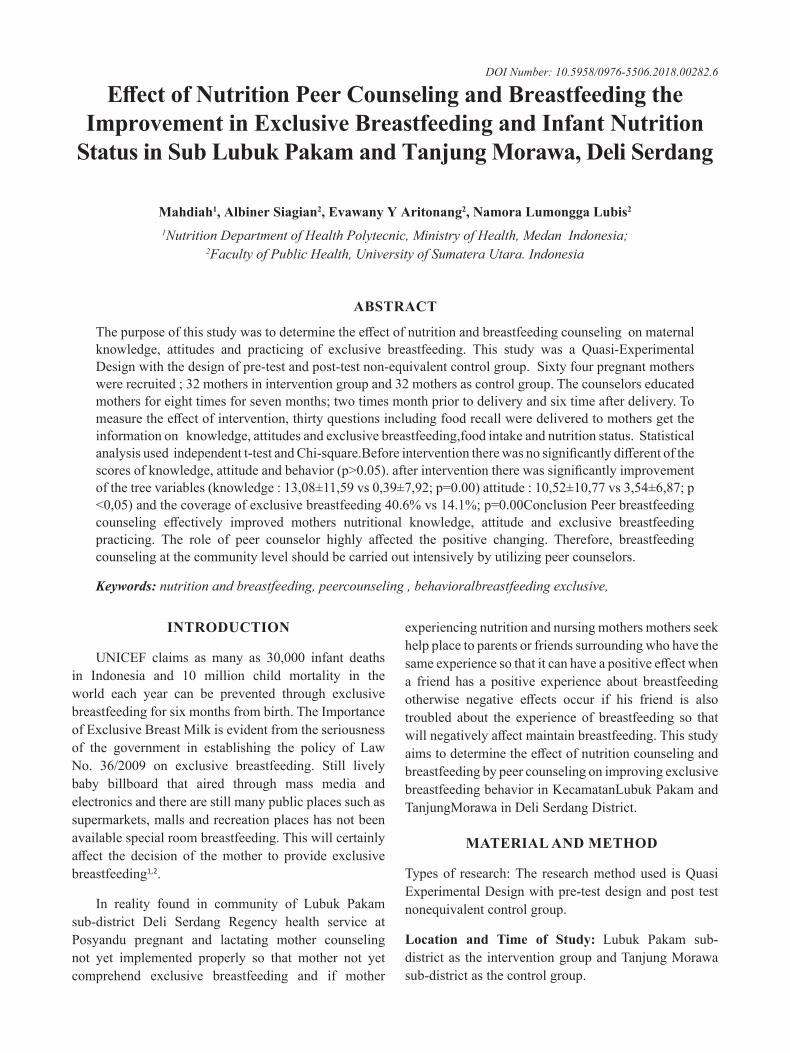
Effect of Nutrition Peer Counseling and Breastfeeding the Improvement in exclusive breastfeeding and Infant Nutrition
Status in Sub lubuk Pakam and Tanjung Morawa, deli Serdang
Mahdiah1, Albiner Siagian2, evawany y Aritonang2, Namora lumongga lubis2
1Nutrition Department of Health Polytecnic, Ministry of Health, Medan Indonesia; 2Faculty of Public Health, University of Sumatera Utara. Indonesia
AbSTRACT
Thepurposeofthisstudywastodeterminetheeffectofnutritionandbreastfeedingcounselingonmaternalknowledge, attitudes and practicing of exclusive breastfeeding. This study was a Quasi-Experimental Design with the design of pre-test and post-test non-equivalent control group. Sixty four pregnant mothers were recruited ; 32 mothers in intervention group and 32 mothers as control group. The counselors educated mothers for eight times for seven months; two times month prior to delivery and six time after delivery. To measuretheeffectofintervention,thirtyquestionsincludingfoodrecallweredeliveredtomothersgettheinformation on knowledge, attitudes and exclusive breastfeeding,food intake and nutrition status. Statistical analysisusedindependentt-testandChi-square.Beforeinterventiontherewasnosignificantlydifferentofthescoresofknowledge,attitudeandbehavior(p>0.05).afterinterventiontherewassignificantlyimprovementofthetreevariables(knowledge:13,08±11,59vs0,39±7,92;p=0.00)attitude:10,52±10,77vs3,54±6,87;p<0,05)andthecoverageofexclusivebreastfeeding40.6%vs14.1%;p=0.00ConclusionPeerbreastfeedingcounseling effectively improved mothers nutritional knowledge, attitude and exclusive breastfeedingpracticing. The role of peer counselor highly affected the positive changing. Therefore, breastfeeding counseling at the community level should be carried out intensively by utilizing peer counselors.
Keywords: nutrition and breastfeeding, peercounseling , behavioralbreastfeeding exclusive,
INTROduCTION
UNICEF claims as many as 30,000 infant deathsin Indonesia and 10 million child mortality in theworld each year can be prevented through exclusive breastfeeding for six months from birth. The Importance of Exclusive Breast Milk is evident from the seriousness of the government in establishing the policy of Law No. 36/2009 on exclusive breastfeeding. Still livelybaby billboard that aired through mass media and electronics and there are still many public places such as supermarkets, malls and recreation places has not been available special room breastfeeding. This will certainly affect the decision of themother to provide exclusivebreastfeeding1,2.
In reality found in community of Lubuk Pakam sub-district Deli Serdang Regency health service at Posyandu pregnant and lactating mother counseling not yet implemented properly so that mother not yet comprehend exclusive breastfeeding and if mother
experiencing nutrition and nursing mothers mothers seek help place to parents or friends surrounding who have the sameexperiencesothatitcanhaveapositiveeffectwhena friend has a positive experience about breastfeeding otherwise negative effects occur if his friend is alsotroubled about the experience of breastfeeding so that willnegativelyaffectmaintainbreastfeeding.Thisstudyaimstodeterminetheeffectofnutritioncounselingandbreastfeeding by peer counseling on improving exclusive breastfeeding behavior in KecamatanLubuk Pakam and TanjungMorawa in Deli Serdang District.
MATeRIAl ANd MeThOd
Types of research: The research method used is Quasi Experimental Design with pre-test design and post test nonequivalent control group.
location and Time of Study: Lubuk Pakam sub-district as the intervention group and Tanjung Morawa sub-district as the control group.
DOI Number: 10.5958/0976-5506.2018.00282.6
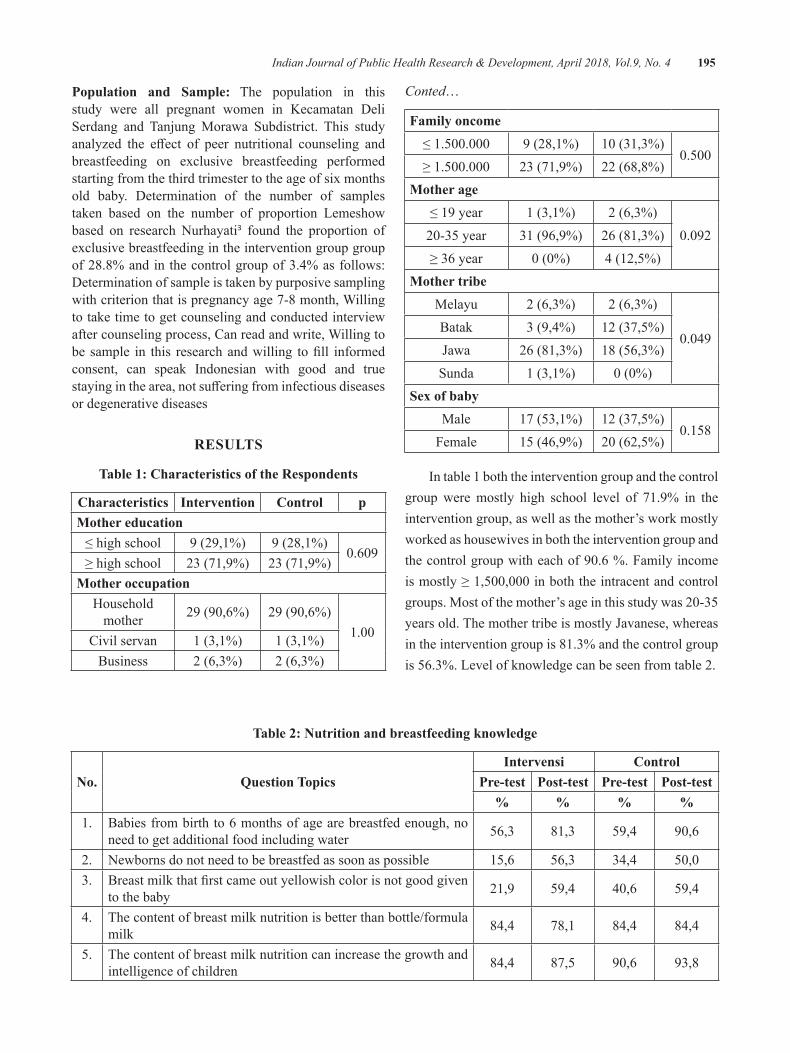
Indian Journal of Public Health Research & Development, April 2018, Vol.9, No. 4 195
Population and Sample: The population in this study were all pregnant women in Kecamatan Deli Serdang and Tanjung Morawa Subdistrict. This study analyzed the effect of peer nutritional counseling andbreastfeeding on exclusive breastfeeding performed starting from the third trimester to the age of six months old baby. Determination of the number of samples taken based on the number of proportion Lemeshow based on research Nurhayati3 found the proportion of exclusive breastfeeding in the intervention group group of 28.8% and in the control group of 3.4% as follows: Determination of sample is taken by purposive sampling with criterion that is pregnancy age 7-8 month, Willing to take time to get counseling and conducted interview after counseling process, Can read and write, Willing to be sample in this researchandwilling tofill informedconsent, can speak Indonesian with good and true stayinginthearea,notsufferingfrominfectiousdiseasesor degenerative diseases
ReSulTS
Table 1: Characteristics of the Respondents
Characteristics Intervention Control pMother education≤highschool 9 (29,1%) 9 (28,1%)
0.609≥highschool 23 (71,9%) 23 (71,9%)
Mother occupation Household
mother 29(90,6%) 29(90,6%)1.00Civil servan 1 (3,1%) 1 (3,1%)
Business 2 (6,3%) 2 (6,3%)
Conted…
Family oncome≤1.500.000 9 (28,1%) 10(31,3%)
0.500≥1.500.000 23 (71,9%) 22 (68,8%)
Mother age≤19year 1 (3,1%) 2 (6,3%)
0.09220-35year 31 (96,9%) 26 (81,3%)≥36year 0(0%) 4 (12,5%)
Mother tribeMelayu 2 (6,3%) 2 (6,3%)
0.049Batak 3 (9,4%) 12 (37,5%)Jawa 26 (81,3%) 18 (56,3%)
Sunda 1 (3,1%) 0(0%)Sex of baby
Male 17 (53,1%) 12 (37,5%)0.158
Female 15 (46,9%) 20(62,5%)
In table 1 both the intervention group and the control group were mostly high school level of 71.9% in the intervention group, as well as the mother’s work mostly worked as housewives in both the intervention group and thecontrolgroupwitheachof90.6%.Familyincomeismostly≥1,500,000inboththeintracentandcontrolgroups.Mostofthemother’sageinthisstudywas20-35yearsold.ThemothertribeismostlyJavanese,whereasin the intervention group is 81.3% and the control group is 56.3%. Level of knowledge can be seen from table 2.
Table 2: Nutrition and breastfeeding knowledge
No. Question TopicsIntervensi Control
Pre-test Post-test Pre-test Post-test% % % %
1. Babies from birth to 6 months of age are breastfed enough, no need to get additional food including water 56,3 81,3 59,4 90,6
2. Newborns do not need to be breastfed as soon as possible 15,6 56,3 34,4 50,03. Breastmilkthatfirstcameoutyellowishcolorisnotgoodgiven
to the baby 21,9 59,4 40,6 59,4
4. The content of breast milk nutrition is better than bottle/formula milk 84,4 78,1 84,4 84,4
5. The content of breast milk nutrition can increase the growth and intelligence of children 84,4 87,5 90,6 93,8
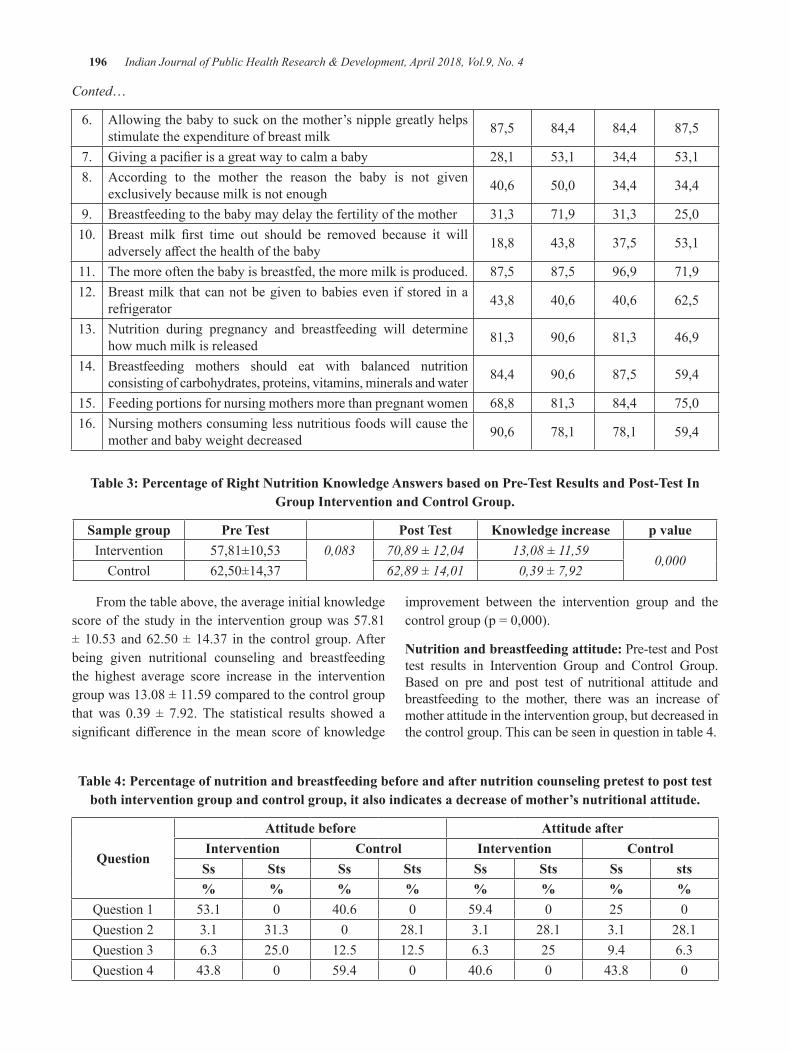
196 Indian Journal of Public Health Research & Development, April 2018, Vol.9, No. 4
Conted…
6. Allowing the baby to suck on the mother’s nipple greatly helps stimulate the expenditure of breast milk 87,5 84,4 84,4 87,5
7. Givingapacifierisagreatwaytocalmababy 28,1 53,1 34,4 53,18. According to the mother the reason the baby is not given
exclusively because milk is not enough 40,6 50,0 34,4 34,4
9. Breastfeeding to the baby may delay the fertility of the mother 31,3 71,9 31,3 25,010. Breast milk first time out should be removed because it will
adverselyaffectthehealthofthebaby 18,8 43,8 37,5 53,1
11. The more often the baby is breastfed, the more milk is produced. 87,5 87,5 96,9 71,912. Breast milk that can not be given to babies even if stored in a
refrigerator 43,8 40,6 40,6 62,5
13. Nutrition during pregnancy and breastfeeding will determine how much milk is released 81,3 90,6 81,3 46,9
14. Breastfeeding mothers should eat with balanced nutrition consisting of carbohydrates, proteins, vitamins, minerals and water 84,4 90,6 87,5 59,4
15. Feeding portions for nursing mothers more than pregnant women 68,8 81,3 84,4 75,016. Nursing mothers consuming less nutritious foods will cause the
mother and baby weight decreased 90,6 78,1 78,1 59,4
Table 3: Percentage of Right Nutrition Knowledge Answers based on Pre-Test Results and Post-Test In group Intervention and Control group.
Sample group Pre Test Post Test Knowledge increase p valueIntervention 57,81±10,53 0,083 70,89 ± 12,04 13,08 ± 11,59
0,000Control 62,50±14,37 62,89 ± 14,01 0,39 ± 7,92
From the table above, the average initial knowledge score of the study in the intervention group was 57.81 ±10.53and62.50±14.37 in thecontrolgroup.Afterbeing given nutritional counseling and breastfeeding the highest average score increase in the intervention groupwas13.08±11.59comparedtothecontrolgroupthat was 0.39 ± 7.92. The statistical results showed asignificant difference in themean score of knowledge
improvement between the intervention group and the controlgroup(p=0,000).
Nutrition and breastfeeding attitude: Pre-test and Post test results in Intervention Group and Control Group. Based on pre and post test of nutritional attitude and breastfeeding to the mother, there was an increase of mother attitude in the intervention group, but decreased in the control group. This can be seen in question in table 4.
Table 4: Percentage of nutrition and breastfeeding before and after nutrition counseling pretest to post test both intervention group and control group, it also indicates a decrease of mother’s nutritional attitude.
Question
Attitude before Attitude afterIntervention Control Intervention ControlSs Sts Ss Sts Ss Sts Ss sts% % % % % % % %
Question 1 53.1 0 40.6 0 59.4 0 25 0Question 2 3.1 31.3 0 28.1 3.1 28.1 3.1 28.1Question 3 6.3 25.0 12.5 12.5 6.3 25 9.4 6.3Question 4 43.8 0 59.4 0 40.6 0 43.8 0
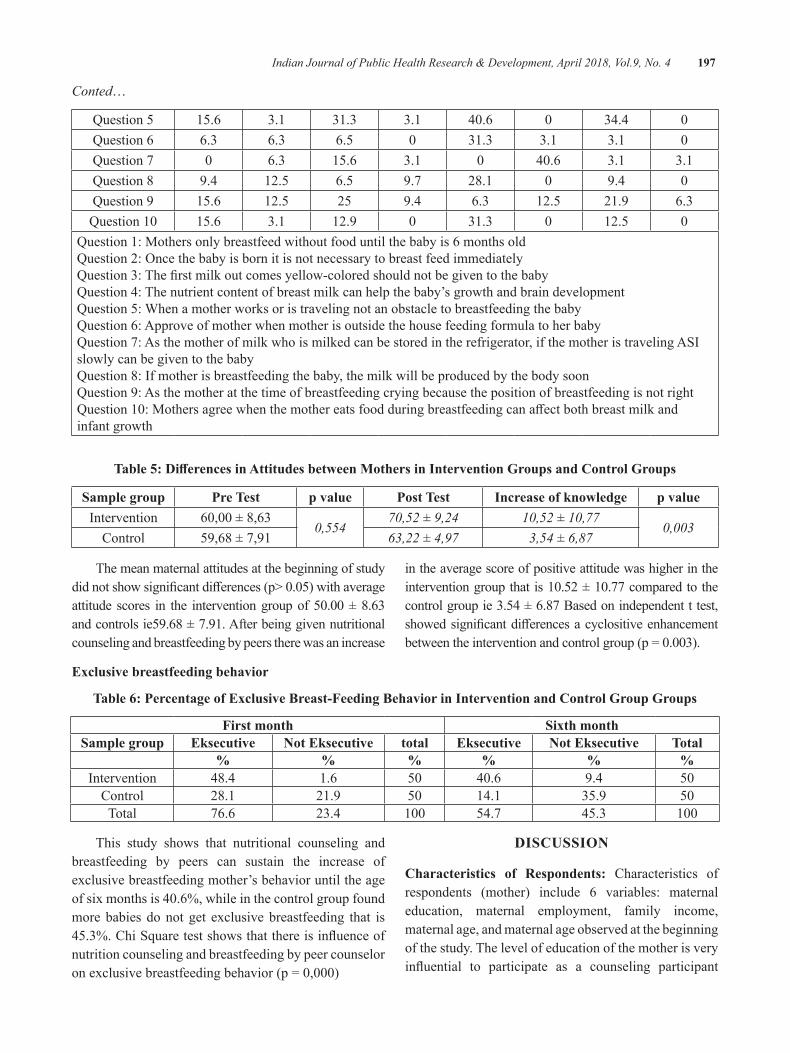
Indian Journal of Public Health Research & Development, April 2018, Vol.9, No. 4 197
Conted…
Question 5 15.6 3.1 31.3 3.1 40.6 0 34.4 0Question 6 6.3 6.3 6.5 0 31.3 3.1 3.1 0Question 7 0 6.3 15.6 3.1 0 40.6 3.1 3.1Question 8 9.4 12.5 6.5 9.7 28.1 0 9.4 0Question 9 15.6 12.5 25 9.4 6.3 12.5 21.9 6.3Question10 15.6 3.1 12.9 0 31.3 0 12.5 0
Question 1: Mothers only breastfeed without food until the baby is 6 months oldQuestion2:OncethebabyisbornitisnotnecessarytobreastfeedimmediatelyQuestion3:Thefirstmilkoutcomesyellow-coloredshouldnotbegiventothebabyQuestion 4: The nutrient content of breast milk can help the baby’s growth and brain developmentQuestion 5: When a mother works or is traveling not an obstacle to breastfeeding the babyQuestion 6: Approve of mother when mother is outside the house feeding formula to her babyQuestion 7: As the mother of milk who is milked can be stored in the refrigerator, if the mother is traveling ASI slowly can be given to the babyQuestion 8: If mother is breastfeeding the baby, the milk will be produced by the body soonQuestion 9: As the mother at the time of breastfeeding crying because the position of breastfeeding is not rightQuestion10:Mothersagreewhenthemothereatsfoodduringbreastfeedingcanaffectbothbreastmilkandinfant growth
Table 5: Differences in Attitudes between Mothers in Intervention Groups and Control Groups
Sample group Pre Test p value Post Test Increase of knowledge p valueIntervention 60,00±8,63
0,55470,52 ± 9,24 10,52 ± 10,77
0,003Control 59,68 ± 7,91 63,22 ± 4,97 3,54 ± 6,87
The mean maternal attitudes at the beginning of study didnotshowsignificantdifferences(p>0.05)withaverageattitude scores in the interventiongroupof50.00±8.63and controls ie59.68 ± 7.91. After being given nutritional counseling and breastfeeding by peers there was an increase
in the average score of positive attitude was higher in the interventiongroupthatis10.52±10.77comparedtothecontrol group ie 3.54 ± 6.87 Based on independent t test, showedsignificantdifferencesacyclositiveenhancementbetweentheinterventionandcontrolgroup(p=0.003).
exclusive breastfeeding behavior
Table 6: Percentage of exclusive breast-Feeding behavior in Intervention and Control group groups
First month Sixth monthSample group eksecutive Not eksecutive total eksecutive Not eksecutive Total
% % % % % %Intervention 48.4 1.6 50 40.6 9.4 50
Control 28.1 21.9 50 14.1 35.9 50Total 76.6 23.4 100 54.7 45.3 100
This study shows that nutritional counseling and breastfeeding by peers can sustain the increase of exclusive breastfeeding mother’s behavior until the age ofsixmonthsis40.6%,whileinthecontrolgroupfoundmore babies do not get exclusive breastfeeding that is 45.3%.ChiSquaretestshowsthatthereisinfluenceofnutrition counseling and breastfeeding by peer counselor onexclusivebreastfeedingbehavior(p=0,000)
dISCuSSION
Characteristics of Respondents: Characteristics of respondents (mother) include 6 variables: maternal education, maternal employment, family income, maternal age, and maternal age observed at the beginning of the study. The level of education of the mother is very influential to participate as a counseling participant
198 Indian Journal of Public Health Research & Development, April 2018, Vol.9, No. 4
and respond to nutrition and breastfeeding counseling activities.
In a study conducted by Bahriyah et al,4 showed that respondents who did not work exclusively breastfed by 54.8% more than those who exclusively breastfed by 45.2%, while the respondents who worked exclusively breastfed amounted to 67.6 % more than non Exclusive breastfeedingof32.4%.Arifiati5 in research on 3 types of work performed by the mother such as factory workers, privateemployeesandcivilservants.Ofthethreetypesof work, the largest proportion still continue to provide exclusive breastfeeding ie civil servants at 60%whileprivateemployeesonly9.7%and0%forworkers.
Peer Nutrition and breastfeeding Counseling: Peer nutritional counseling and breastfeeding by involving health cadres in breastfeeding mothers who are peer counselors. Empowerment of health cadres in the provision of mental support to mothers undergoing relactation periods through home visits conducted by cadres concerned from posyandu in the mother’s neighborhood6
Differences in Mother’s Knowledge GivenPeer Nutrition and Breastfeeding Counseling Knowledge is the result of knowing, and this happens after people make sense to a particular object. Sensing occurs through the senses of man, namely the sense of sight, hearing, smell, taste, and touch. Much of human knowledge is obtained through eyes and ears7,8. The same thing with Ambarwati9 in his research group knowledge that gets intensive lactation counseling is higher than the control group. Based on research conducted by Evans et al10 states that peer counseling conducted in the WIC Carolina group showed interest to provide Exclusive Breast Milk. In contrast, Wojcicki et al11 research suggests that there is a low level of knowledge because thereisaloweducationaleffectontheAfrican-Americanmother group because the mother misjudged every breastmilkandthebenefitsofbreastfeedingwithlongerduration. Increased knowledge of mothers through peer nutrition counseling and breastfeeding causes mothers to better understand the baby’s diet early in life so that the mother makes consistent breastfeeding early in life and avoid the provision of pralactal food. The same thing by (Shakyaet.al.12 main media used in this study is mother training with the provision of peer nutrition counseling and breastfeeding.
exclusive breast Milk behavior: The longer the breast milk is sucked by baby the more breast milk consumed and this will speed up the emptying of breast milk so that the hormone prolactin will produce more milk and so breast milk can meet the nutritional needs of infants 13-15.
Research Innovative: This research utilizes local community resources, health cadres where during this time, cadres are only given the task of measuring the weightofchildrenunderfive.Thisstudyoftrainedcadresprovides peer nutrition and breastfeeding counseling performed continuously for seven times (twice in the final trimester of pregnancy and five times duringbreastfeeding).
Implications of Research on Public health Programs: The existence of peer nutritional counseling and breastfeeding becomes very important to increase coverage of exclusive breastfeeding. The experience of this research indicates that the role of peer counselors by empowering local communities to establish health counselors to visit clients (Mothers) prior to delivery and after delivery to ask questions about breastfeeding and reastfeeding nutrition and together with mothers solving nutritional and lactating problems so that mothers understand about ASI is exclusive and can maintain exclusive breastfeeding until the age of six months. DeliSerdangHealthOfficeasapolicymakerneedstoutilize cadres as peer counselors in providing nutrition counseling and breastfeeding simply.
CONCluSION
The role of peer counselor highly affected thepositive changing. Therefore, breastfeeding counseling at the community level should be carried out intensively by utilizing peer counselors
ethical Clearance: The ethical clearance was taken from Faculty committee and community agreement.
Source of Funding: All authors contribution
Conflict of Interest: None
ReFeReNCeS
1.Unicef Indonesia,2012.RingkasanKajian GiziIbu dan Anak, Indonesia
2.Sriwati,Nyorong,M.,Natsir,S.,2014.HambatanPemberian ASI Eksklusif di Wilayah kerja
Indian Journal of Public Health Research & Development, April 2018, Vol.9, No. 4 199
Puskesmas Maniangpajo Kabupaten Wajo. Wajo: Universitas Hasanuddin.
3. Nurhayati Ai,Pengaruh Konseling Gizi pada Keluarga Miskin Terhadap Pemberian ASI Eksklusif dalam Disertasi Program Studi Gizi Masyarakat dan Sumber Daya Keluarga Sekolah PascasarjanaInstitutPertanianBogor,2009
4. Bahriyah Fitriyani, Monifa Putri , Abdul Khodir Jaelani,2017,Kopertiswilayahx113hubunganpekerjaan ibu terhadap pemberian asi eksklusif padabayi,JournalEndurance2(2),(113-118)
5.Arifiati Nurce, 2017, Analisis faktor yangmempengaruhi pemberian ASI ekslusif
6.Ramlan, dkk. 2015. Pengaruh konseling gizi danlaktasi intensif dan dukungan suami terhadap pemberian air susu ibu (asi) eksklusif sampai umur 1bulan.JurnalGiziIndonesia(ISSN:1858-4942)
7. Azwar, A, 1996. Pengantar Administrasi Kesehatanedisiketiga,BinarupaAksara,Jakarta.
8.Notoadmodjo.2003.Ilmukesehatanmasyarakat.jakarta.rineka cipta.
9. Ambarwati Ria, Muis Fatimah Siti, Susantin Purwanti. 2013. Konseling Laktasi intensif dan Pemberian Air Susu Ibu (ASI) Eksklusif Sampai 3 Bulan, Media Medika Indonesiana volume 46, 2012p201-208
10.Evans, Kelly, Labbok Miriam, and Sheryl W.Abrahams,2011,WICandBreastfeedingSupportServices:Does theMixofServicesOfferedVarywith Race and Ethnicity, BREASTFEEDING MEDICINEVolume6,Number6
11.Wojcicki, J,M,Gugig,R,Tran,C ,Kathiravan,S,Holbrook,K,andHeyman,M,B,2010,EarlyExclusive Breastfeeding and Maternal Attitudes Towards Infant.
12.Shakya,Prakash,et all, 2017 Effectiveness ofcommunity-based peer support for mothers to improve their breastfeeding practices: A systematic reviewandmeta analysis,PLOSPublishedhttps://doi.org/10.1371/journal.pone.0177434
13. Ambarwati Ria, Muis Fatimah Siti, Susantin Purwanti. 2012. Konseling Laktasi intensif dan Pemberian Air Susu Ibu (ASI) Eksklusif Sampai 3 Bulan, Media Medika Indonesiana volume 46, 2012p201-208
14. Rosmala Nur, Nikmah Utami Dewi, Khairunnisa and Anwar Mallongi, 2017. Golden standardfeeding and the risk of 25-60 month-oldunderweight children in Central Sulawesi, Indonesia.AsianJ.Clin.Nutr.,9:104-110.
15. Lawrence R, Lawrence RM. Approach to breastfeeding. Dalam:WalkerWA,Watkins JB,penyunting. Nutrition in pediatrics.Edisi ke-3. London:BCDeckerInc;2003.h.562-79.
Relationship of employee ethnic background in Validation of Situational leadership Theory
Fitriani1, Philipus betaubun2, ermelinda A.g. Pure3, dedy Tikson4, edoardus e. Maturbongs1, Theresia Widi asih Cahyanti5, Ruloff Fabian Waas6
1Faculty of Social Science and Politic Science, 2Faculty of Engineering, Musamus University, Merauke,Indonesia; 3Faculaty of Teacher Training and Education, 4Faculty of Fisip, Hasanuddin University; 5Faculty of Engineering, 6Faculty of Law, Musamus University, Merauke, Indonesia
AbSTRACT
Situational leadership theory although many use it, but empirical theory testing is related to ethnic background factorjust a few. The purpose of this research will be to test the assumption leader’s effectiveness inbureaucracy organization, by including external factor that is ethnic background of leader and subordinate, by reason of heterogeneous cultural origin to employees in bureaucracy organization in Papua. Quantitative research method with hypothesis statistical test by using statistical test of Sommer’sdyx and Lambda with experimentaltreatmentapproachtoleaderandsubordinateasrespondentatthetimeoffillingquestioner.The results of this study (1) theory is validated, but lacks the support of theoretical assumptions; (2) managed tofindasignificantdifferencebetweentheweakethnicoriginandthelevelofmaturityofsubordinates;(3)findotherinfluencingfactors(subordinatemotivation,andegostatebehaviorpatterns).Themainsuggestionof this research is to deal with the methodology and avoid the psychological sensitive factors.
Keywords: leadership, situational, bureaucracy, ethnic
INTROduCTION
Applying appropriate leadership styles to subordinates will impact on improved service performance, as Paul Hersey’s 1,2 dissertation suggests that effective leaders dependon how leadership stylesrelate to the situations in which they work-situations.
Essentially this research is similar to that done by Ger Thompson and Robert P. Vecchio3 conducted research by combining how many issues in identifying situational theory, one of which is the original theory statement; 1972, thisstudyalsousesseveralissuesbutstillitsfirstissueisthe statement of the original theory, in 1972 by adding the issue of ethnic origin of leaders and subordinates in bureaucraticorganizations(nonprofit).
The consideration of incorporating cultural elements is a statement that in general the prevailing leadership theory is that 98% of empirical evidence comes from America,whichtogetheralsoidentifiesparticularlytheculture and behavior of leaders in general, only scholars concerned with cross cultural issues4 In addition, it is theprojectofTheGlobeLeadershipandOrganizationBehavior Effectiveness (GLOBE) about seeking
influence by seeking the impact of cultural values onleadershipeffectivenessin62countries,withtheaimofestablishing the foundations of cross-cultural leadership theory 5,6 who conduct research to find leadershipstrategies from various cultural backgrounds and seek the strategic impact of a leader’s characteristics based on personal. There are at least four individual characteristics in relation to the execution of work that is (1) biographical characteristics, (2) ability characteristics, (3) personality characteristics, and (4) learning characteristics.
Thisstudyfocuseson theeffectivenessof leaders,maturity of subordinates and ethnic origin of each employee in bureaucratic organizations in the province of Papua, with the aim is to test the rationalization of situational theory about the function of compatibility between leadership style with the level of maturity of subordinates, by connecting with the ethnic origin of leadership and subordinates.
MATeRIAlS ANd MeThOd
This research is a quantitative research through statistical testing of several hypotheses. With the analytical unit are individuals (leaders and subordinates)
DOI Number: 10.5958/0976-5506.2018.00283.8
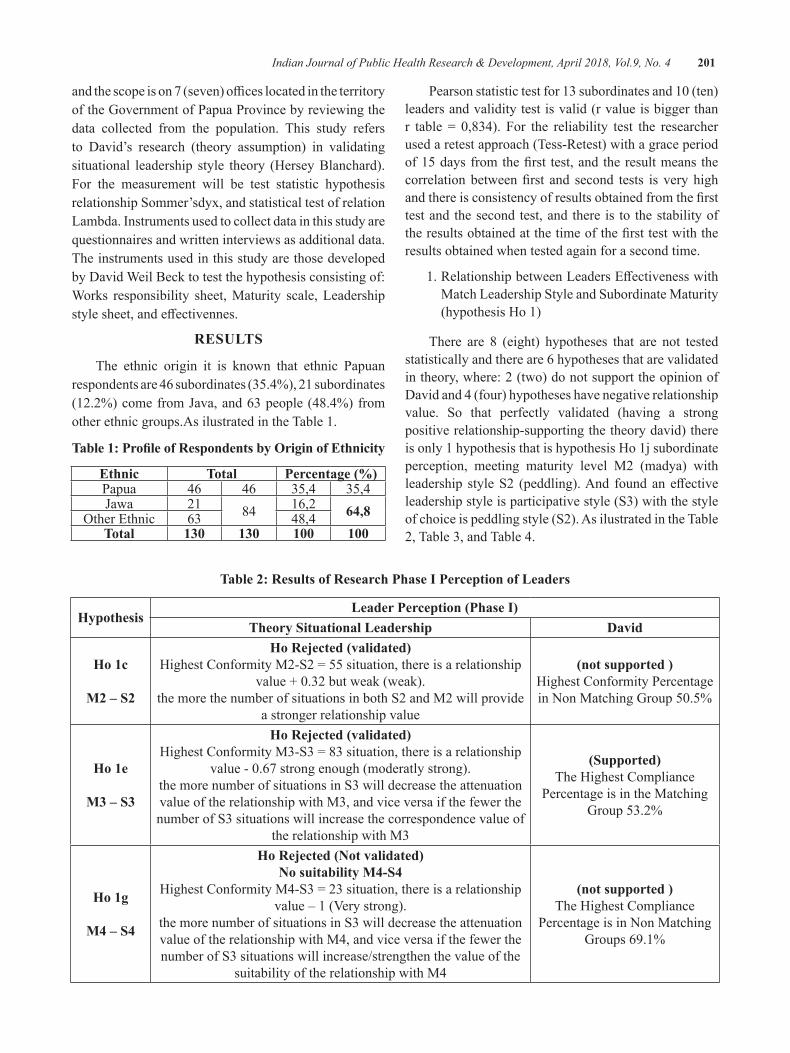
Indian Journal of Public Health Research & Development, April 2018, Vol.9, No. 4 201
andthescopeison7(seven)officeslocatedintheterritoryof the Government of Papua Province by reviewing the data collected from the population. This study refers to David’s research (theory assumption) in validating situational leadership style theory (Hersey Blanchard). For the measurement will be test statistic hypothesis relationship Sommer’sdyx, and statistical test of relation Lambda. Instruments used to collect data in this study are questionnaires and written interviews as additional data. The instruments used in this study are those developed by David Weil Beck to test the hypothesis consisting of: Works responsibility sheet, Maturity scale, Leadership stylesheet,andeffectivennes.
ReSulTS
The ethnic origin it is known that ethnic Papuan respondents are 46 subordinates (35.4%), 21 subordinates (12.2%)comefromJava,and63people(48.4%)fromother ethnic groups.As ilustrated in the Table 1.
Table 1: Profile of Respondents by Origin of Ethnicity
ethnic Total Percentage (%)Papua 46 46 35,4 35,4Jawa 21 84 16,2 64,8OtherEthnic 63 48,4Total 130 130 100 100
Pearsonstatistictestfor13subordinatesand10(ten)leaders and validity test is valid (r value is bigger than r table = 0,834). For the reliability test the researcherused a retest approach (Tess-Retest) with a grace period of15daysfromthefirst test,andtheresultmeansthecorrelationbetweenfirst and second tests is veryhighandthereisconsistencyofresultsobtainedfromthefirsttest and the second test, and there is to the stability of theresultsobtainedatthetimeofthefirsttestwiththeresults obtained when tested again for a second time.
1.RelationshipbetweenLeadersEffectivenesswithMatch Leadership Style and Subordinate Maturity (hypothesis Ho 1)
There are 8 (eight) hypotheses that are not tested statistically and there are 6 hypotheses that are validated in theory, where: 2 (two) do not support the opinion of David and 4 (four) hypotheses have negative relationship value. So that perfectly validated (having a strong positive relationship-supporting the theory david) there is only 1 hypothesis that is hypothesis Ho 1j subordinate perception, meeting maturity level M2 (madya) with leadership styleS2 (peddling).And foundaneffectiveleadership style is participative style (S3) with the style of choice is peddling style (S2). As ilustrated in the Table 2, Table 3, and Table 4.
Table 2: Results of Research Phase I Perception of leaders
hypothesisLeader Perception (Phase I)
Theory Situational leadership david
ho 1c
M2 – S2
Ho Rejected (validated)HighestConformityM2-S2=55situation,thereisarelationship
value+0.32butweak(weak).the more the number of situations in both S2 and M2 will provide
a stronger relationship value
(not supported )Highest Conformity Percentage inNonMatchingGroup50.5%
ho 1e
M3 – S3
Ho Rejected (validated)HighestConformityM3-S3=83situation,thereisarelationship
value-0.67strongenough(moderatlystrong).the more number of situations in S3 will decrease the attenuation value of the relationship with M3, and vice versa if the fewer the number of S3 situations will increase the correspondence value of
the relationship with M3
(Supported)The Highest Compliance
Percentage is in the Matching Group 53.2%
ho 1g
M4 – S4
Ho Rejected (Not validated)No suitability M4-S4
HighestConformityM4-S3=23situation,thereisarelationshipvalue–1(Verystrong).
the more number of situations in S3 will decrease the attenuation value of the relationship with M4, and vice versa if the fewer the number of S3 situations will increase/strengthen the value of the
suitability of the relationship with M4
(not supported )The Highest Compliance
Percentage is in Non Matching Groups 69.1%
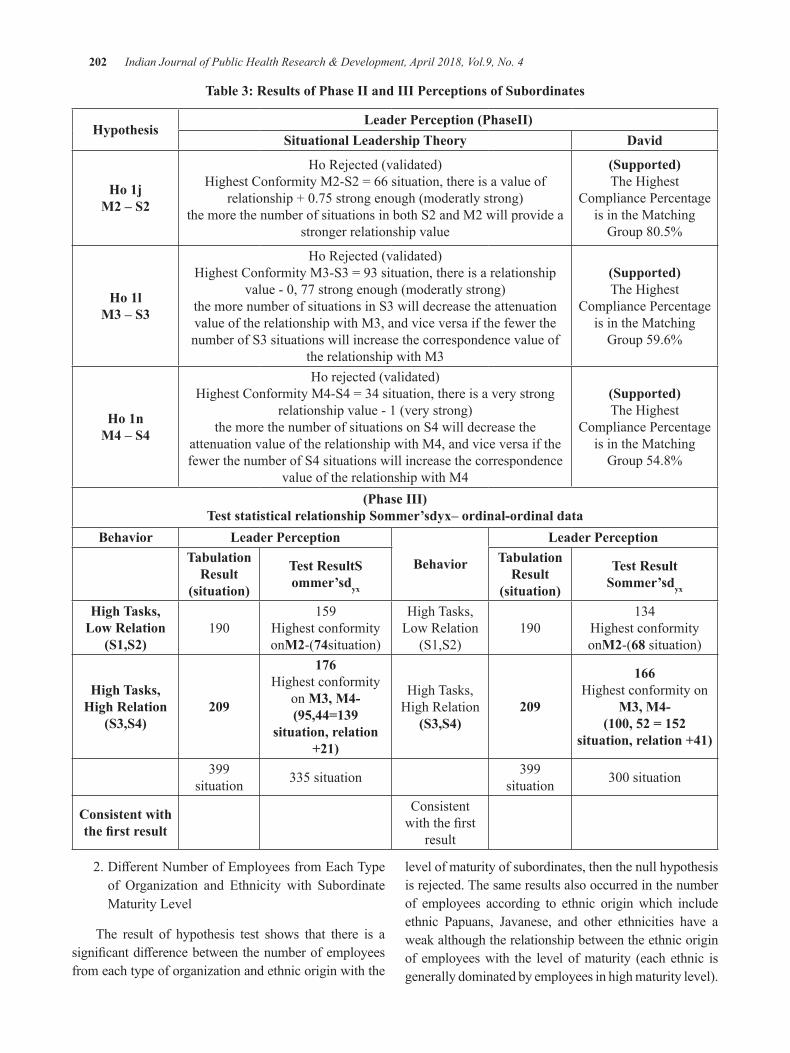
202 Indian Journal of Public Health Research & Development, April 2018, Vol.9, No. 4
Table 3: Results of Phase II and III Perceptions of Subordinates
hypothesisLeader Perception (PhaseII)
Situational leadership Theory david
ho 1j M2 – S2
Ho Rejected (validated)HighestConformityM2-S2=66situation,thereisavalueof
relationship+0.75strongenough(moderatlystrong)the more the number of situations in both S2 and M2 will provide a
stronger relationship value
(Supported)The Highest
Compliance Percentage is in the Matching Group80.5%
ho 1lM3 – S3
Ho Rejected (validated)HighestConformityM3-S3=93situation,thereisarelationship
value-0,77strongenough(moderatlystrong)the more number of situations in S3 will decrease the attenuation value of the relationship with M3, and vice versa if the fewer the number of S3 situations will increase the correspondence value of
the relationship with M3
(Supported)The Highest
Compliance Percentage is in the Matching
Group 59.6%
ho 1n M4 – S4
Ho rejected (validated)HighestConformityM4-S4=34situation,thereisaverystrong
relationship value - 1 (very strong)the more the number of situations on S4 will decrease the
attenuation value of the relationship with M4, and vice versa if the fewer the number of S4 situations will increase the correspondence
value of the relationship with M4
(Supported)The Highest
Compliance Percentage is in the Matching
Group 54.8%
(Phase III)Test statistical relationship Sommer’sdyx– ordinal-ordinal data
behavior leader Perception
behavior
leader PerceptionTabulation
Result(situation)
Test ResultS ommer’sdyx
Tabulation Result
(situation)
Test Result Sommer’sdyx
high Tasks, low Relation
(S1,S2)190
159Highest conformity onM2-(74situation)
High Tasks, Low Relation
(S1,S2)190
134Highest conformity onM2-(68 situation)
high Tasks, high Relation
(S3,S4)209
176Highest conformity
on M3, M4-(95,44=139
situation, relation +21)
High Tasks, High Relation
(S3,S4)209
166Highest conformity on
M3, M4-(100, 52 = 152
situation, relation +41)
399 situation 335 situation 399
situation 300situation
Consistent with the first result
Consistent withthefirst
result
2.DifferentNumberofEmployeesfromEachTypeof Organization and Ethnicity with SubordinateMaturity Level
The result of hypothesis test shows that there is a significantdifferencebetweenthenumberofemployeesfrom each type of organization and ethnic origin with the
level of maturity of subordinates, then the null hypothesis is rejected. The same results also occurred in the number of employees according to ethnic origin which include ethnic Papuans, Javanese, and other ethnicities have aweak although the relationship between the ethnic origin of employees with the level of maturity (each ethnic is generally dominated by employees in high maturity level).
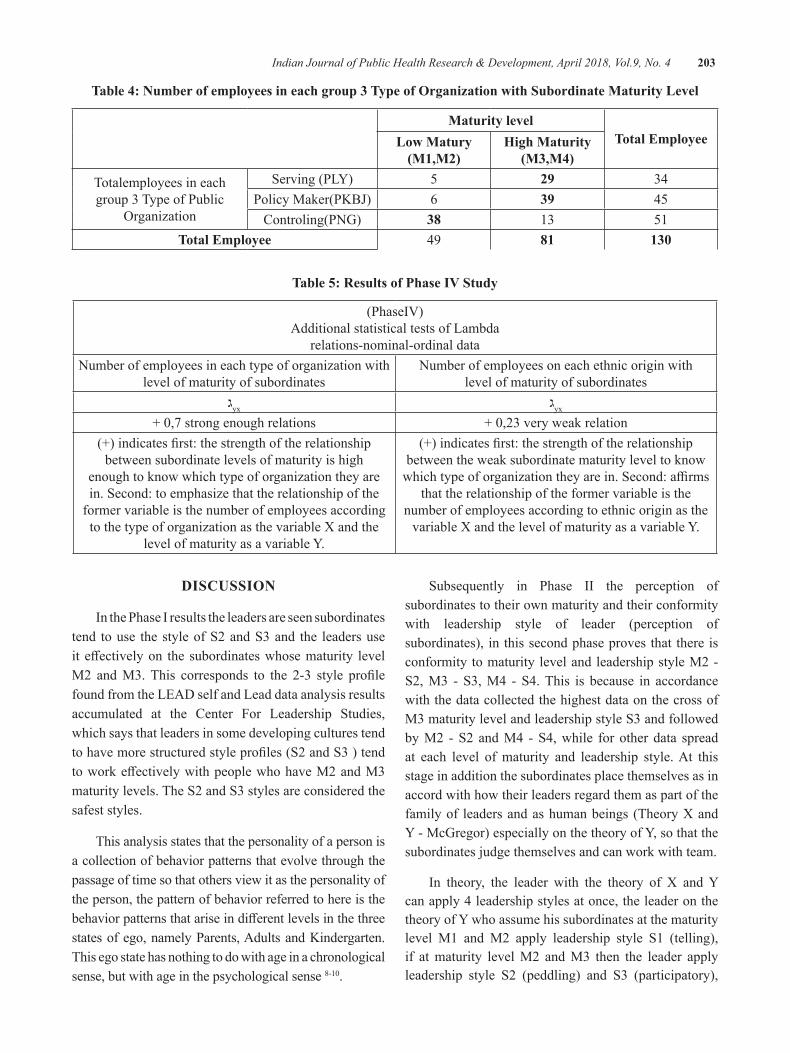
Indian Journal of Public Health Research & Development, April 2018, Vol.9, No. 4 203
Table 4: Number of employees in each group 3 Type of Organization with Subordinate Maturity level
Maturity levelTotal employeelow Matury
(M1,M2)high Maturity
(M3,M4)
Totalemployees in each group 3 Type of Public
Organization
Serving (PLY) 5 29 34PolicyMaker(PKBJ) 6 39 45
Controling(PNG) 38 13 51Total employee 49 81 130
Table 5: Results of Phase IV Study
(PhaseIV)Additional statistical tests of Lambda
relations-nominal-ordinal dataNumber of employees in each type of organization with
level of maturity of subordinatesNumber of employees on each ethnic origin with
level of maturity of subordinatesyxג yxג
+0,7strongenoughrelations +0,23veryweakrelation(+)indicatesfirst:thestrengthoftherelationship
between subordinate levels of maturity is high enough to know which type of organization they are in. Second: to emphasize that the relationship of the
former variable is the number of employees according to the type of organization as the variable X and the
level of maturity as a variable Y.
(+)indicatesfirst:thestrengthoftherelationshipbetween the weak subordinate maturity level to know whichtypeoforganizationtheyarein.Second:affirms
that the relationship of the former variable is the number of employees according to ethnic origin as the
variable X and the level of maturity as a variable Y.
dISCuSSION
In the Phase I results the leaders are seen subordinates tend to use the style of S2 and S3 and the leaders use iteffectivelyon thesubordinateswhosematurity levelM2 andM3.This corresponds to the 2-3 style profilefound from the LEAD self and Lead data analysis results accumulated at the Center For Leadership Studies, which says that leaders in some developing cultures tend tohavemorestructuredstyleprofiles(S2andS3)tendtoworkeffectivelywithpeoplewhohaveM2andM3maturity levels. The S2 and S3 styles are considered the safest styles.
This analysis states that the personality of a person is a collection of behavior patterns that evolve through the passage of time so that others view it as the personality of the person, the pattern of behavior referred to here is the behaviorpatternsthatariseindifferentlevelsinthethreestates of ego, namely Parents, Adults and Kindergarten. This ego state has nothing to do with age in a chronological sense, but with age in the psychological sense 8-10.
Subsequently in Phase II the perception of subordinates to their own maturity and their conformity with leadership style of leader (perception of subordinates), in this second phase proves that there is conformity to maturity level and leadership style M2 - S2, M3 - S3, M4 - S4. This is because in accordance with the data collected the highest data on the cross of M3 maturity level and leadership style S3 and followed by M2 - S2 and M4 - S4, while for other data spread at each level of maturity and leadership style. At this stage in addition the subordinates place themselves as in accord with how their leaders regard them as part of the family of leaders and as human beings (Theory X and Y - McGregor) especially on the theory of Y, so that the subordinates judge themselves and can work with team.
In theory, the leader with the theory of X and Y can apply 4 leadership styles at once, the leader on the theory of Y who assume his subordinates at the maturity level M1 and M2 apply leadership style S1 (telling), if at maturity level M2 and M3 then the leader apply leadership style S2 (peddling) and S3 (participatory),
204 Indian Journal of Public Health Research & Development, April 2018, Vol.9, No. 4
and if at M4 maturity level the leader uses S4 leadership style (delegate). While the position of subordinates who areconsideredasafamilybytheleaderfinallyputthesubordinates to assess the leader as a good parent and himself as a good family member who respects the position of parents.
In Phase III, the review from Stage I and II, the researcher assumed that the leadership in 7 (seven) offices inPapuaProvinceGovernmentwasoriented tothe relationship and the situation of his subordinates. This relationship-oriented leadership embodies the work of prioritizing mutual interaction between leaders and their subordinates based on respectful human relationships respecting and respecting each other. Leaders with this orientation are very open to the participation of subordinates and provide opportunities to subordinates to excel in accordance with their respective capabilities and leaders also emphasize the relationship of cooperation between subordinates and between subordinates-leaders, this is in line with the leadership style S3 (participatory)11-15.
Psychological variables consist of perception, attitude, personality, learning and motivation.16-18 In this personality factor is very much influenced by cultureand social. The individual personality has several major powers affecting him, namely cultural strength,hereditary power, the strength of family relationships and the power of the social class and the power of group membership.
CONCluSION
First, the study found a relationship between the effectivenessofleaderswiththesuitofleadershipstyleand maturity of subordinates. So this study successfully validates the Situational Leadership Theory - Hersey Blanchardon7(seven)ProvincialGovernmentOfficesofPapua,as thefirstacademicbenefit that isexpectedto match the leadership style S2-M2, S3-M3 and S4-M4, which is also known the most effective style isS3 style (participatory) and the choice of both styles is the S2 style (peddling) -as the only perfectly validated subordinate perception hypothesis.
Second, find a significant difference between thenumber of employees of each type of organization and ethnic origin with the level of maturity of subordinates. The results of this study describe that employees or
subordinates according to the type of organization and ethnic origin are at a high level of maturity, both of which have strong relation (organizational type) and weak (ethnic origin).
Source of Funding: Musamus University
Conflict of Interest: Authors declare no conflict ofinterest within this research
ethical Clearence: Taken from university and communities agreement
ReFeReNCeS
1. Paul Hersey, Ken Blanchard. 1982. Manajemen Perilaku Organisasi :Pendayagunaan SumberDayaManusia.EdisiKeempat.Erlangga,Jakarta.
2. Paul Hersey. 1976. Situasional Leadership : Some Aspect of Influence On OrganizationalDevelopment. Dissertation.University of Massachusetts, Business Administration.
3. Geir Thompson, Robert P. Vecchio.2009.,Situationalleadership theory: A test of three versions, The Leadership Quarterly (Volume20,Issue5,October),Pages837-848,
4.Fu,P.P.,andYulk,G.,2000.PerceivedeffectivenessofinfluencetastictintheUnitedStatesandChina.Leadership Quarterly, 11: 251-266
5.House, R.J.,Javidan, M., Dorfman, P.W.,and Gupta, V., 2004, Leadership culture andorganizations:TheGLOBEstudyof62societies.Beverly Hills, CA: Sage.
6.House, R.J., Javidan, M.,Hanges, P., andDorfman, P., 2002. Understanding cultures andimplicit leadership theories across the globe : An introductiontoprojectGLOBE.JournalofWorldBudiness,37:3-10.
7.Gibson, Ivancevich,Donnelly,1985.Organisasi,EdisiKelima,Jilid1,Erlangga,Jakarta
8.Clark Newton Arthur Jr. 1980. EducationalLeadership : A Field Test Of Hersey AndBlancahard’s Situational Leadership Theory. Dissertation.UniversityOfMassachusetts.
9.H. George Frederickson. 1997. The Spirit OfPublic Administration. Jossey-Bass Inc, SanFrancisco, California.
Indian Journal of Public Health Research & Development, April 2018, Vol.9, No. 4 205
10.Ermaya Suradinata. 2004. Management OfChange And Strategies : Creative Leadership. NationalResilienceInstitute,Jakarta.
11. Hui Wang, David A. Waldman, Hongyu Zhang. 2012.,Strategic leadership across cultures: Current findings and future research directions,Journal ofWorld Business (Volume 47, Issue 4October),Pages571-580,
12.Fred Luthans, 2006. Perilaku Organisasi, EdisiKesepuluh, Edisi 1, Penerbit Andi, Yogyakarta.
13.Mallongi,A. and Herawaty, 2015.Assessmentof Mercury Accumulation in Dry Deposition, Surface Soil and Rice Grain in Luwuk Gold Mine, CentralSulawesi.Res.J.Appl.Sci.,10:22-24.
14.Silverthorne,C.,2001,Leadershipeffectivenessandpersonality: A cross cultural evaluation. Personality andIndividualDifference,30:303-309.
15. Anwar Mallongi, Ruslan La Ane and Agus Bintara Birawida,2017.Ecologicalrisksofcontaminatedlead and the potential health risks among school children inMakassar coastal area, Indonesia. J.Environ.Sci.Technol.,10:283-289.
16.Sutarto. 2006. Dasar-Dasar KepemimpinanAdministrasi. Gadjah Mada University Press, Yoyakarta.
17.Gary Yulk. 1981. Leadership In Organization.Prentice-HallInc,NewJersey.
18. Enos Henok Rumansara, Anwar Mallongi, 2018.,TenggengDanceCaseasaFreesexMediain Lani PeopleCulture and its Impact on the transmission of sexually transmitted Diseases andHIV/AIDs.IndianJournalofPublicHealthResearch&Development,January2018,Vol.9,No. 1
The New Spesies Anopheles aitkeni as the Threat of Malaria in Indonesia
Mursid R1, yusniar hd1, Praba g1
1Environmental Health of Faculty of Public Health, Diponegoro University Semarang, Indonesia
AbSTRACT
background:TheClimatechangehaveseveralimpactforlive.Therainyandanddryseasonwereaffectedbyclimatechange.Theextremeweatheraffectedoftheecologicalsystemincludingtheflora,faunaandhuman.Thedynamicsofthevectorofmalariacausedbytheinfluenceofweatherchanges.Increasingthetype and density vector becomes a factor high rates of malaria in Indonesia. Malaria was continuing health problem in IndonesiawithAPI2014was0.99, decrease as0, 85 (2015).Malariahasbeen targeted foreliminationfromIndonesiaby2030.Purworejodistricthasstillofendemicmalariaarea(2015)withAPI1,8 (1.364 case of malaria).
Methods: The descriptive analitical reserach with crossectional survey, for analyze of the Anopheles bionomic. The observation going on intermediate season as peak of malaria. Bionomic survey of temperature and vector densities were sampled of 12 villages covering settings available, on 12 hour research, base on ManualonPracticalEntomologyInMalaria,WHODivisionofMalariaandOtherParasiticDiseases,PartI,IIforvectoridentification.Elisaanalisysforvectorconfirmatiftest.
Results: Anopheles aitkeni was the new discovered species of Anopheles, by the 4 sp/day density. Nine species were found before as : An.balabacensis; An.aconitus; An.barbirostris; An.vagus; An.anullaris; An.kochi; An.maculatus; An.indifinitus; An.subpictus. Topographically species Anopheles disperse as 82.35% research area, with their bionomic.
Conclusions: The weather changes as triggers of an increase of the species Anopheles. The Anopheles aitkeniiwasidentifiedasthenewspecies,by4sp/daydensity,asthevectoroftransmittingmalaria.
Keywords: Weather changes, Anopheles aitkenii, Malaria, Practical Entomology, and Parasitic Diseases
INTROduCTION
The climate change has several impact for live1, the air temperature increases all regions globally2. The emissions of industries have impact on climate change. Naturally there is the phenomenon of La Nina and El Ninoinfluenceontheweather3.The rainy and dry season wereaffectedbyclimatechange.Themonthly rainfallof season indicates a changing4. October -April as abenchmark of change of the seasons has been a chengaed. Purworejo district have experienced several years withoutdryseasonof2010and2016inPurworejo.Thechanging of the dry season and the rainy season in each regiontogiveeffectthedynamicsofspeciesAnopheles3
The changes of the weather will have a direct impact on ecological systems, so that the habitat of living5. The
weather changes will have an impact on concentration of minerals, water, and energy, in every habitat6. The grawthing and development of living is affected bythe concentration of mineral, water, and energy. The dynamics of density and species of living things, will occur as a result of climate change in the region7
Leibig states there are the limiting factors in each organism. The abundance of the limiting factor becomes thetriggerfororganismlives.Organismareinoptimumgraw thing condition with similar factor. The species have its dynamics as a limiting factor variability. The extreme weather affected of the ecological systemIncludingtheflora,faunaandhuman8.
The dynamics of the vector of malaria the caused bytheinfluenceofweatherchanges.Increasingthetype
DOI Number: 10.5958/0976-5506.2018.00284.X
Indian Journal of Public Health Research & Development, April 2018, Vol.9, No. 4 207
and density of vector Becomes a factor of high rates of malaria in Indonesia. The spescies of Anopheles in Purworejo ever identified as many as 14. These species are An. minimus; An.tesselatus, An. flavirostri; An.arbumrosus; An.sundaikus; An. Balabecensis; An.aconitus; An.barbirostres; An.vagus; An.anularis; An.kochi; An.maculatus; An.indifinitus; An.subpictus9. Overall the unidentified species as a vector. Some species are experiencing the shifting role as a vector. In a study in 2013 found the An.balabacensis, and An.maculatus.
Malaria has been targeted for elimination from Indonesia by 2030. Purworejo district still has areasofendemicmalaria in2015withAPI1.8 (1,364casesof malaria). Diversity vectors of malaria in Purworejo, became one of the supporting factors of malaria cases hasfluctuated.
MATeRIAlS MeThOd
The population is the villages in the sub district Kaligesing ever a case of malaria in Purworejo, in the period2010-2015.Thetotalpopulationof21villagesadministratively. The analysis unit with 12 village, that composed of several of the population. Each class has region characteristic. Suppose for analysis with Low Case Incidence (LCI) has four members; Middle region Case Incidence (6), while for the area of High Case Incidence (2) .This unit of analysis that produced a region where there is ecological processes and life thereon. The units of analysis as the smallest unit formed have differentcharacteristicsandprovidessupportdifferenttothelifeabove.Environmentalprofileisusedtoillustratethe characteristics of each unit of land, the dynamics that occur spatially and temporally pattern.
The research of density of the mosquitoes is done by using the guidelines of the “Manual on Practical EntomologyinMalaria,WHODivisionofMalariaandOther Parasitic Diseases, Part I.Research density ofmosquitoesforeachlocationdoatnightbetween18:00to06:00aclock11.
Identification density vector was done: VillageMalariaPerson(JMD),confirmatorytestusingtheElisatest to ascertain the role of the species as a vector.The population is a village with malaria cases as much as 21 villages.Overallsamplecalculationresultclassnumber
4,boundOferrorat95%confidencelevel, is takenas1, (Nasir, 1983; Lapao, 2012). The formula used toDeterminethenumberofsamplesis:n=(LΣNi2.Σi2)/(N2D+ΣNi.Σi2),D=B2/4,with95%confidence.The number of samples rounded locations 11.68, or 12 sampling location12
The air temperature was measured every hour at each location of the observations from6 p.m. to 6:00a.m. by portable thermometer. The type and density of vector arrests every hour, on 12 hours. Research of mosquito density is done by using the guidelines of the “Manual on Practical Entomology In Malaria, WHODivisionofMalariaandOtherParasiticDiseases,PartI, II). Identification of speciesCarried in ParasitologyGadjah Mada University Laboratory11
ReSulTS ANd dISCuSSION
daily Temperature: The temperature at 06:00 pm to6:00 amhave variety. The maximum air temperatureof 27°C while the minimum temperature of 19°C. The average air temperature at night around 24.5°C - 22.7°C. At06:00pmthehighesttemperaturesanddecreasedtothelowesttemperaturein05:00pm.Lowairtemperatureoccurs in the hilly region (Sudorogo), until 19°C. The study was conducted in October, usuallyas the dryseason. Actually the research is still high rainfall, with 180mm,aswetseason,seeTable1.
Spesies of Anopheles: There are three (3) spesies of Anopheles dispers on 12 study locations. All of these species are An.balabacensis, An.vagus,and An.aitkeni. Besides the four species are also found Culexand Aedes Albopictus species, throughout the night during the arrest. Number of species caught decreased if be compared with previous studies that An.balabacensis; An.aconitus; An.barbirostris; An.vagus; An.anullaris; An.kochi; An.maculatus; An.indifinitus; An.subpictus.
The species of An.balabacens is present at almost allthenight,withapeakdensityat02:00a.mto03:00a.m. The presence of these species in the late hours gives an indication that breedingplace, so far from the bitting area in the residence. An.vagus species was found at midnight(11:00to03:00a.m),givinganindicationthatthebreedingplacenearfrombittingarea.Otherspeciesfound are An.aitkeni,wasfoundatnightuntil05.00a.m.
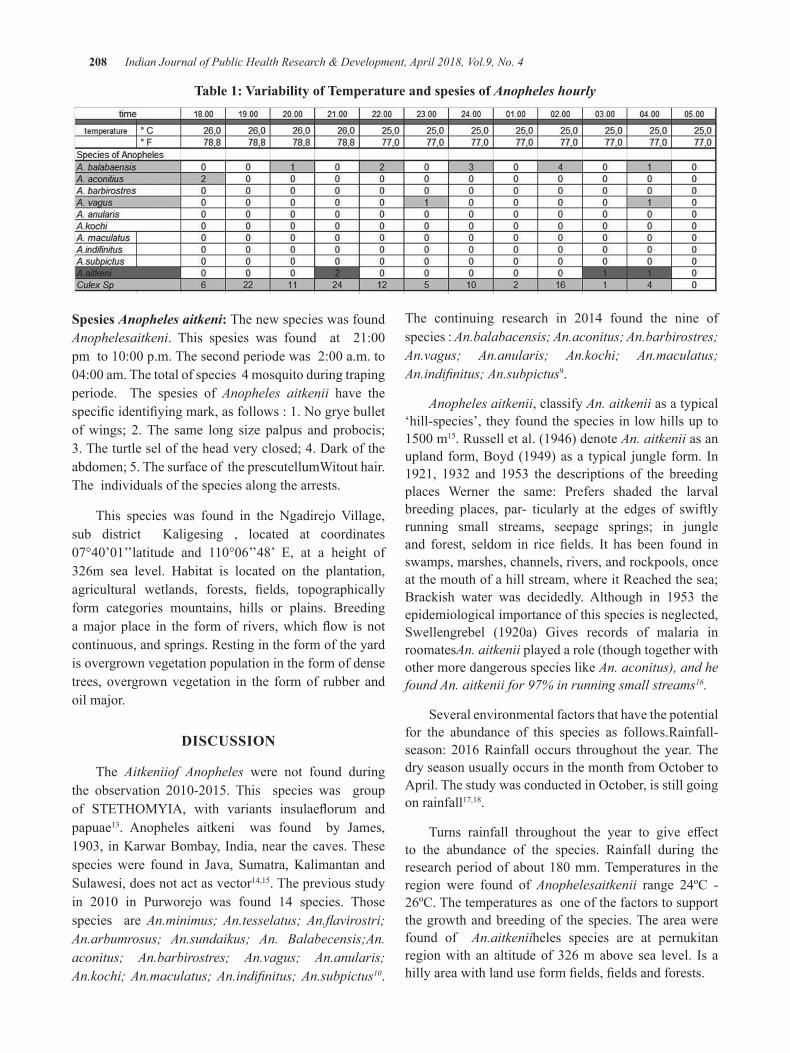
208 Indian Journal of Public Health Research & Development, April 2018, Vol.9, No. 4
Table 1: Variability of Temperature and spesies of Anopheles hourly
Spesies Anopheles aitkeni: The new species was found Anophelesaitkeni. This spesies was found at 21:00pmto10:00p.m.Thesecondperiodewas2:00a.m.to04:00am.Thetotalofspecies4mosquitoduringtrapingperiode. The spesies of Anopheles aitkenii have the specificidentifiyingmark,asfollows:1.Nogryebulletof wings; 2. The same long size palpus and probocis; 3. The turtle sel of the head very closed; 4. Dark of the abdomen; 5. The surface of the prescutellumWitout hair.The individuals of the species along the arrests.
This species was found in the Ngadirejo Village,sub district Kaligesing , located at coordinates 07°40’01’’latitude and 110°06’’48’ E, at a height of326m sea level. Habitat is located on the plantation, agricultural wetlands, forests, fields, topographicallyform categories mountains, hills or plains. Breeding amajorplace in the formof rivers,whichflow isnotcontinuous, and springs. Resting in the form of the yard is overgrown vegetation population in the form of dense trees, overgrown vegetation in the form of rubber and oil major.
dISCuSSION
The Aitkeniiof Anopheles were not found during the observation 2010-2015. This species was groupof STETHOMYIA, with variants insulaeflorum andpapuae13. Anopheles aitkeni was found by James,1903, inKarwarBombay,India,near thecaves.Thesespecieswere found in Java, Sumatra,Kalimantan andSulawesi, does not act as vector14,15. The previous study in 2010 in Purworejo was found 14 species. Thosespecies are An.minimus; An.tesselatus; An.flavirostri; An.arbumrosus; An.sundaikus; An. Balabecensis;An.aconitus; An.barbirostres; An.vagus; An.anularis; An.kochi; An.maculatus; An.indifinitus; An.subpictus10.
The continuing research in 2014 found the nine ofspecies : An.balabacensis; An.aconitus; An.barbirostres; An.vagus; An.anularis; An.kochi; An.maculatus; An.indifinitus; An.subpictus9.
Anopheles aitkenii, classify An. aitkenii as a typical ‘hill-species’, they found the species in low hills up to 1500m15. Russell et al. (1946) denote An. aitkenii as an upland form, Boyd (1949) as a typical jungle form. In 1921, 1932 and 1953 the descriptions of the breeding places Werner the same: Prefers shaded the larval breeding places, par- ticularly at the edges of swiftly running small streams, seepage springs; in jungle and forest, seldom in rice fields. It has been found inswamps, marshes, channels, rivers, and rockpools, once at the mouth of a hill stream, where it Reached the sea; Brackish water was decidedly. Although in 1953 the epidemiological importance of this species is neglected, Swellengrebel (1920a) Gives records of malaria inroomatesAn. aitkenii played a role (though together with other more dangerous species like An. aconitus), and he found An. aitkenii for 97% in running small streams16.
Several environmental factors that have the potential for the abundance of this species as follows.Rainfall-season:2016Rainfall occurs throughout theyear.ThedryseasonusuallyoccursinthemonthfromOctobertoApril.ThestudywasconductedinOctober,isstillgoingon rainfall17,18.
Turns rainfall throughout the year to give effectto the abundance of the species. Rainfall during the researchperiodofabout180mm.Temperatures in theregion were found of Anophelesaitkenii range 24ºC - 26ºC. The temperatures as one of the factors to support the growth and breeding of the species. The area were found of An.aitkeniiheles species are at pernukitan region with an altitude of 326 m above sea level. Is a hillyareawithlanduseformfields,fieldsandforests.
Indian Journal of Public Health Research & Development, April 2018, Vol.9, No. 4 209
Size Breeding place: Some rivers with continuous flow,aitkeniiAnophelesfoundinhabitat.Riversbecamea breeding ground for the species. Depth Breeding place: intheareaof researchfoundariverwithadepth<0.5m.freefromcontaminantsandturbidity<25NTU.Thepresenceofpredatorssuchasfishcannotbefoundinaculture.Watertendstohavemovement(flow),withapHofabout6,thenitrateconcentrationoflessthan50mg/l.
The role of Anopheles aitkenii as a vector for the transmission of malaria, still in the review process. Although the history of this species not act as vectors16. The potential for changes to be vectors is possible. The results showed the changing role of vectors of malaria inPurworejo.Researchin2010foundasvectorspeciesis An.aconitus10.In2014thespecieswasdifferentasavector that is An.balabacencis and An.maculatus9. Most possible An.aitkenii species act as vectors.
The annualy of temperature variete by weather.Therearethreefactorsthatinfluencetheweatherineachregion, namely topography, inter-tropical convergen zone (ITCZ), and monsoonal19. Global climate change on extreme conditions, giving effect to the microclimate3 Global climate change continues to this day. Extreme weather with high air temperature, and low air temperatures up to blizzard felt in many parts of the world 2,1. Climate change impact on various aspects of life18,19.Direct influence on climate change in eachregion.Indonesiaisamongcountriesaffectedbyclimatechange. Extreme weather increases the risk of the spread of infectious diseases including diarrhea, vector-based disease (vector-borne diseases), including non-communicablediseasesmalaria,floods4.
Purworejo potentially affected by global climatechange7,9. In 2010 the average flawed rainfall occursthroughout the year, with the average temperature is lower than the annual average temperature. Substitution seasonhaschangedfromOctobertoApril tothenextmonthPurworejoalsofluctuateddurationofwetanddrymonths, which is one of climatic factors 17.
Land units used as the basis for the analysis. Land units resulting from the conduct overlaying various environmental characteristic parameters produces land units. Environmental characteristic parameters used maybealtituderegion,classificationofcasesofmalaria,
land use, and other environmental parameters. Land units have characteristic as the habitat of oraginsm. In these habitats will be found a life of mutual interaction and interdependence20.The existence of an organism in anareainfluencedby:1.Thedispersoforganismsinaregion;2.Theinfluenceofthelimitingfactorsthatdonotallow the organisms to live and develop according to the tolerance range of living organisms; 3. The changes in the environment that causes the organism is not capable of adaptation or mutation 21,22,23.
The organism is controlled by the environment (habitat) in two ways: the threshold in the number of organisms required by all organisms to survive, and the limits of tolerance in which the organism is able to survive and thrive (Black’s Law Mann About the limiting factor)24. The reaction of the organism in response to environmental changes can be various stages include migration, adaptation or mutation25,26.
Environmental characteristics resulting from the reaction of various environmental changes make a habitat for living beings. At the habitat of living beings will grow and evolve organisms. Anopheles are always experiencing dynamic organism, which behaves to grow and thrive. Anopheles aitkenii as vector, was coclude by laboratory research on parasitology Gadjahmada University. This is the seriously treath of the malaria transmission. Purworejo have several spesies as vector : An.aconitus; An.balabacensis; An. Maculatus. This research conclude new spesies An.aitkenii as a vector.
CONCluSION
1. Habitat of Anopheles aitkenii was area with high rainfall intensity. Breeding place as the river with flows,withlowturbidity<25NTU.Restingplacewas area with temperatures around 24ºC-26ºC.
2. Anopheles aitkenii was conclude new spesies and as vector malaria in Purworejo
ethical Clearance: The ethical clearance was taken from Faculty committee and community agreement.
Source of Funding: The funding of this research comes from all authors contribution
Conflict of Interest: Authors declares that there is no anyconflictofinterestwithinthisresearch
210 Indian Journal of Public Health Research & Development, April 2018, Vol.9, No. 4
ReFeReNCeS
1.Dixon G.P, 2010, Climate Change and HumanHealth, special issue of International Journal of Environmental Research and Public Health,Vol5: 78-91
2, EasterbrookDJ, Global Research, Departmentof Geology, Western Washington University and Global ResearchBy, June 28, 2014, http://www.globalresearch.ca/global-cooling-is-here/10783
3.Mursid R, 2015, Global and Micro ClimateChange Related to the Dynamics of Anopheles, spin Malaria-Endemic Area Purworejo City, CentralJava,ICRPH,Proceeding,Makasar
4.IPPC a,b,c, 2013, Ecosystem, Human Health, Intergovernmental Panel on Climate Change, Cambridge University Press, Cambridge
5.Gillian H. S, 2009, Beyond Temperature AndPrecipitation: Ecological Risk Factors That Modify Malaria Transmission, Acta Tropica, Vol 116 : 167-172
6.IPPC J.McCarthy; O Canciani; 2001, Impact, Adaptation and Vulnerability, Cambride Univercity Press, Cambridge
7.AyalaD,CostantiniC,2009, HabitatSuitabilityAndEcologicalNicheProfileOfMajorMalariaVectorsInCameroon,Malaria Journal, Vol:8:307
8. Brewer R, 1993, The Science of Ecology, Second Edition, Saunders College Publishing, New York
9.MursidR, 2012, EnvironmentalVariabilityAndHabitatSuitabilityOfMalariaVectorInPurworejoDistrict, Central Java Indonesia, proceeding ofInternational Conference, Diponegoro Univercity, Indonesia
10.SukowatiS,2011,ThebehaviorofmalariavectorsinPurworejo,researchreports,Jakarta,Researchand Development,Litbangkes
11.WHO Study Group, 1995, Vector Control for Malaria and Other Mosquito-Borne Disease, WHO, Geneva and WHO, 1975, Mannual of Practical Entomology in Malaria,Geneva,WHO.
12. Nasir M, 1986, Metode Penelitian, Ghalia Indonesia,Jakarta
13.ReidJ.A,1964,(online2016)ArevisionoftheAnopheles aitkenii group in Malaya and Borneo.
14.W.Takken1,W.B.Snellen2,J.P.Verhave3,B.G.J.Knols, and S. Atmosoedjono, Department of Entomology, Agricultural University, Wageningen the Netherlands, 1990
15.DepartmentofZoology,2013,PublicHealthandMalaria Control, University of Oxford, Oxford,UnitedKingdomandDirectorateofVector-BorneDiseases,IndonesianMinistryofHealth,Jakarta,Indonesia.
16.Elyazar, Marianne E. S, Peter W, 2013, TheDistribution and Bionomics of Anopheles Malaria VectorMosquitoesinIndonesia
17.Agency ofIrrigation, 2013,.Annual IrrigationReport of meteorology, Purworejo
18.Sinka, M.E., Rubio-Palis, Y., Manguin, (2010).The dominant Anopheles vectors of human malaria in the Americas: occurrence data, distribution mapsandbionomicprécis.Parasites & Vectors, 3:72
19.Li Li, Biang L, Yan G,2008, A Study Of TheDistribution And Abundance Of The AdultMalaria Vector In Western Kenya Highlands,International Journal of Health Geographics.
20.GratzNG:1999,Emerging and resurging vector-borne diseases, Annu Rev Entomol, 44:51-75
21.OkeTR,1987,Boundary Layer Climate, Second Edition, Routledge, London
22.PartzJA,GraczykTK,GellerN,2000, :Effects of environmental change on emerging parasitic diseases,IntJParasitol,30:1395-1405;
23.OdumT,1988,BasicofEcology,NewYork,JohnWiley&SonsLTD
24.TellalBA,JonathanC,2009,SpatialandTemporalDistribution of Malaria Mosquito Anapheles arabiensis in Northen Sudan, Malaria Jornal, 8:123
25.BeroyaAM,2000,Mengenal Lingkungan Hidup, RinekaCipta,Jakarta
26. Stang Abdul Rahman, Amran Rahim and Anwar Mallongi. 2017. Forecasting ofDengueDiseaseIncident Risks Using Non-stationary Spatial of Geostatistics Model in Bone Regency Indonesia. J.Entomol.,14:49-57.
Self-Care Activity determination of diabetes Mellitus Type-2 Patient in labuang baji hospital
Ida leida Maria1, Natalia Paskawati Adimuntja1, Ridwan Thaha2, Nurhaedar Jafar3
1Department Epidemiology, 2Department Health Promotion, 3Department Nutrition
AbSTRACT
Noninfectiousdiseasesinthecommunityareasignofepidemiologicaltransition.Oneofthenoninfectiousdiseases that are found is Diabetes Mellitus (DM) type-2 diseases. The purpose of this research is to know the determination of self-care diabetes activity in patients with type-2 diabetes at Labuang Baji Hospital in Makassar City. The research design is cross-sectional study. The population were all patients with DM type-2treatmentin2016.Samplingwasdonebyprobabilitysamplingtechniquewithsimplerandomsamplingmethod and the number of sample was 136 people. The results showed that respondents with self-care activitieswerelessthan35people(25.7%)andrespondentswithgoodself-careactivitiesasmanyas101people(74.3%).Theresultofbivariateanalysis(chi-square)showedthatsignificantfactorwascorrelatedwithself-careactivityofDMtype2patientswithp-value<0,05isknowledge(p=0,000),healthinsuranceownership(p=0,022)healthworkerssupport(p=0,000).Theresultoflogisticregressionanalysisshowedthatthefactorssignificantlycorrelatedwiththeself-careactivityinDiabetesMellitustype-2patientswereknowledge (OR=7.900;95%CI:2,497-24,998).Theconclusionofknowledge is a factor significantlyassociated with diabetes self-care activities.
Keywords: Type-2 Diabetes Mellitus, Self-Care, Non infectious disease, epidemiological transition, health workers support
INTROduCTION
Non Infectious Diseases is the leading cause of death cases against 36 million people (63%) of all deaths worldwide. Prevalence of Diabetes according to World Health Organization(WHO)datain2015is20.9%.1 It is estimated that more than 285 million people worldwide sufferfromDiabetesMellitusType-2.2 Diabetes Mellitus Type-2 patients suffering from other comorbidities(complications) will have an impact on the declining quality of patient’s life.3
In Indonesia, the incidence of Diabetes Mellitus based on the doctor’s diagnosis or symptoms that is equal to 2.1%. Diabetes Mellitus prevalence data based on doctor’s diagnosis and symptoms increase with age, but starting at age ≥ 65 years will tend to decrease.4 Prevalence of Diabetes Mellitus in South Sulawesi Province diagnosed by doctor is 1.6%, whereas diagnosed by doctor or by symptom is 3.4%. The number of DM diseasecasesin2014inSouthSulawesiisasmanyas27.470newcasesand66.780oldcaseswith747deaths.
The number of Diabetes Mellitus cases in Makassar City in2013was34.396casesandthenincreasedto61.677cases, in 2014 and decreased by 2015, which were36.873 cases. While for the data of death cases in the year2013were338casesofdeaththenincreasedto668cases of death in 2014 and decreased to 352 cases ofdeathby2015.5
Data of medical records at Labuang Baji Hospital (RSUD) showed the number of cases of Diabetes Mellitus Type-2 in 2014 were 188 cases of DMwith12 deaths, then increased by the year 2015 as manyas 277 cases anddecreased again in 2016 asmany as231 cases with 21 deaths. Nursing theory reveals a theory related to self-care is as an activity undertaken by a person where the individual begins and performs an action based on his wishes in order to maintain life, health and well-being. Self-care activities that can be done is diet, physical activity / exercise, blood glucose control, taking medication regularly, foot treatment and conducting lifestyle changes.
DOI Number: 10.5958/0976-5506.2018.00285.1
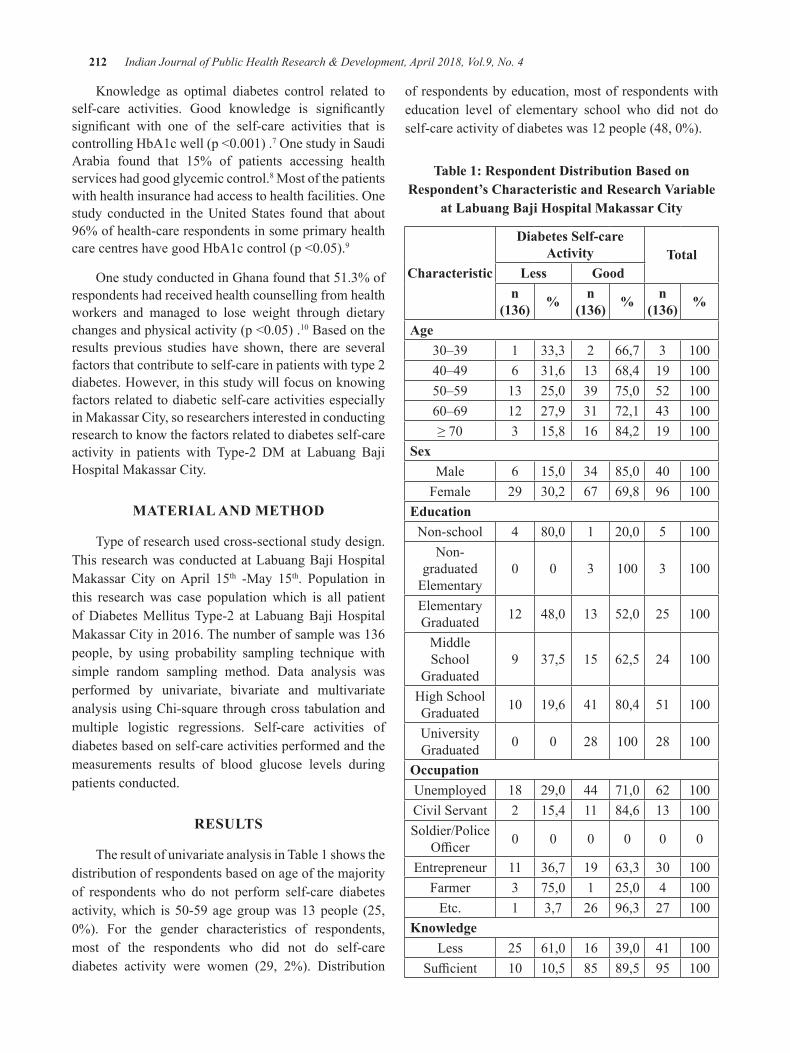
212 Indian Journal of Public Health Research & Development, April 2018, Vol.9, No. 4
Knowledge as optimal diabetes control related to self-care activities. Good knowledge is significantlysignificant with one of the self-care activities that iscontrollingHbA1cwell(p<0.001).7OnestudyinSaudiArabia found that 15% of patients accessing health services had good glycemic control.8 Most of the patients withhealthinsurancehadaccesstohealthfacilities.Onestudy conducted in the United States found that about 96% of health-care respondents in some primary health carecentreshavegoodHbA1ccontrol(p<0.05).9
OnestudyconductedinGhanafoundthat51.3%ofrespondents had received health counselling from health workers and managed to lose weight through dietary changesandphysicalactivity(p<0.05).10 Based on the results previous studies have shown, there are several factors that contribute to self-care in patients with type 2 diabetes. However, in this study will focus on knowing factors related to diabetic self-care activities especially in Makassar City, so researchers interested in conducting research to know the factors related to diabetes self-care activity in patients with Type-2 DM at Labuang Baji Hospital Makassar City.
MATeRIAl ANd MeThOd
Type of research used cross-sectional study design. This research was conducted at Labuang Baji Hospital Makassar City on April 15th -May 15th. Population in this research was case population which is all patient of Diabetes Mellitus Type-2 at Labuang Baji Hospital MakassarCityin2016.Thenumberofsamplewas136people, by using probability sampling technique with simple random sampling method. Data analysis was performed by univariate, bivariate and multivariate analysis using Chi-square through cross tabulation and multiple logistic regressions. Self-care activities of diabetes based on self-care activities performed and the measurements results of blood glucose levels during patients conducted.
ReSulTS
The result of univariate analysis in Table 1 shows the distribution of respondents based on age of the majority of respondents who do not perform self-care diabetes activity,which is50-59agegroupwas13people (25,0%). For the gender characteristics of respondents,most of the respondents who did not do self-care diabetes activity were women (29, 2%). Distribution
of respondents by education, most of respondents with education level of elementary school who did not do self-careactivityofdiabeteswas12people(48,0%).
Table 1: Respondent distribution based on Respondent’s Characteristic and Research Variable
at labuang baji hospital Makassar City
Characteristic
diabetes Self-care Activity Total
less goodn
(136) % n (136) % n
(136) %
Age30–39 1 33,3 2 66,7 3 10040–49 6 31,6 13 68,4 19 10050–59 13 25,0 39 75,0 52 10060–69 12 27,9 31 72,1 43 100≥70 3 15,8 16 84,2 19 100
SexMale 6 15,0 34 85,0 40 100
Female 29 30,2 67 69,8 96 100education
Non-school 4 80,0 1 20,0 5 100Non-
graduated Elementary
0 0 3 100 3 100
Elementary Graduated 12 48,0 13 52,0 25 100
Middle School
Graduated9 37,5 15 62,5 24 100
High School Graduated 10 19,6 41 80,4 51 100
University Graduated 0 0 28 100 28 100
OccupationUnemployed 18 29,0 44 71,0 62 100Civil Servant 2 15,4 11 84,6 13 100Soldier/Police
Officer 0 0 0 0 0 0
Entrepreneur 11 36,7 19 63,3 30 100Farmer 3 75,0 1 25,0 4 100
Etc. 1 3,7 26 96,3 27 100Knowledge
Less 25 61,0 16 39,0 41 100Sufficient 10 10,5 85 89,5 95 100
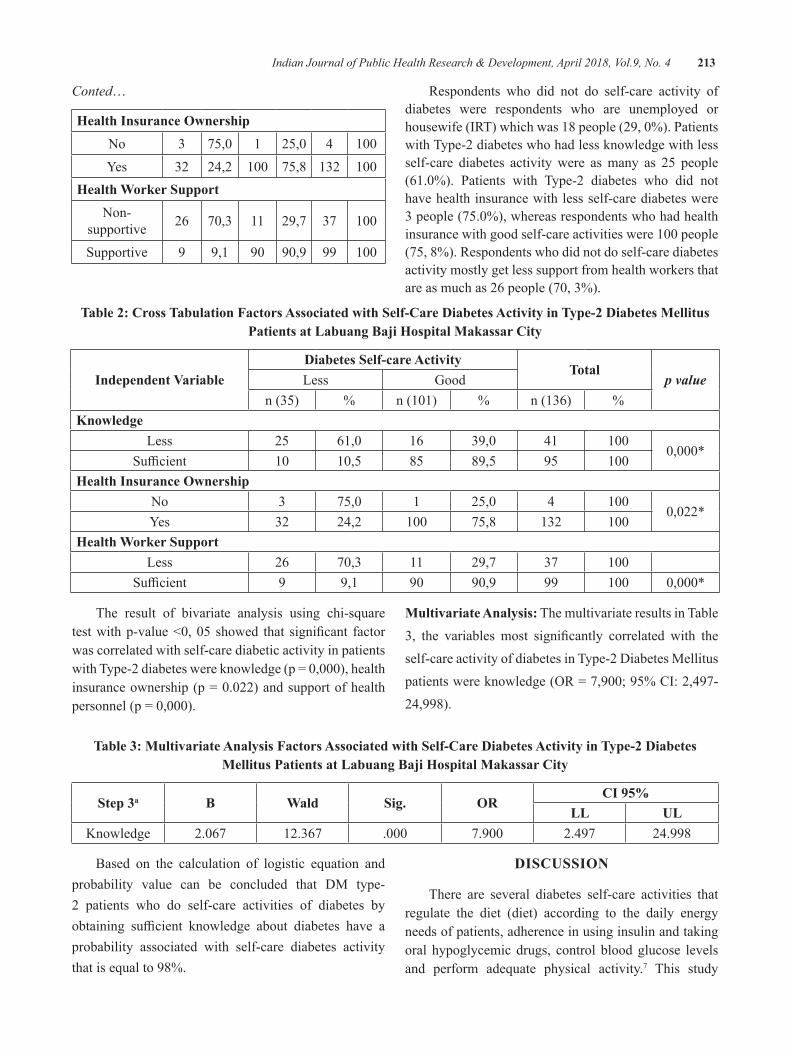
Indian Journal of Public Health Research & Development, April 2018, Vol.9, No. 4 213
Conted…
health Insurance OwnershipNo 3 75,0 1 25,0 4 100Yes 32 24,2 100 75,8 132 100
health Worker SupportNon-
supportive 26 70,3 11 29,7 37 100
Supportive 9 9,1 90 90,9 99 100
Respondents who did not do self-care activity of diabetes were respondents who are unemployed or housewife(IRT)whichwas18people(29,0%).Patientswith Type-2 diabetes who had less knowledge with less self-care diabetes activity were as many as 25 people (61.0%). Patients with Type-2 diabetes who did nothave health insurance with less self-care diabetes were 3people(75.0%),whereasrespondentswhohadhealthinsurancewithgoodself-careactivitieswere100people(75, 8%). Respondents who did not do self-care diabetes activity mostly get less support from health workers that areasmuchas26people(70,3%).
Table 2: Cross Tabulation Factors Associated with Self-Care diabetes Activity in Type-2 diabetes Mellitus Patients at labuang baji hospital Makassar City
Independent Variablediabetes Self-care Activity
Totalp valueLess Good
n (35) % n(101) % n (136) %Knowledge
Less 25 61,0 16 39,0 41 1000,000*
Sufficient 10 10,5 85 89,5 95 100health Insurance Ownership
No 3 75,0 1 25,0 4 1000,022*
Yes 32 24,2 100 75,8 132 100health Worker Support
Less 26 70,3 11 29,7 37 100Sufficient 9 9,1 90 90,9 99 100 0,000*
The result of bivariate analysis using chi-square testwithp-value<0,05 showed that significant factorwas correlated with self-care diabetic activity in patients withType-2diabeteswereknowledge(p=0,000),healthinsuranceownership(p=0.022)andsupportofhealthpersonnel(p=0,000).
Multivariate Analysis: The multivariate results in Table 3, the variables most significantly correlated with theself-care activity of diabetes in Type-2 Diabetes Mellitus patientswereknowledge(OR=7,900;95%CI:2,497-24,998).
Table 3: Multivariate Analysis Factors Associated with Self-Care diabetes Activity in Type-2 diabetes Mellitus Patients at labuang baji hospital Makassar City
Step 3a b Wald Sig. ORCI 95%
ll ulKnowledge 2.067 12.367 .000 7.900 2.497 24.998
Based on the calculation of logistic equation and probability value can be concluded that DM type-2 patients who do self-care activities of diabetes by obtaining sufficient knowledge about diabetes have aprobability associated with self-care diabetes activity that is equal to 98%.
dISCuSSION
There are several diabetes self-care activities that regulate the diet (diet) according to the daily energy needs of patients, adherence in using insulin and taking oral hypoglycemic drugs, control blood glucose levels and perform adequate physical activity.7 This study
214 Indian Journal of Public Health Research & Development, April 2018, Vol.9, No. 4
found on the results of chi- square, the knowledge variable has a relationship with self-care diabetes activity (p=0.000).This result is also in accordancewith theresultsofmultivariatetestthatobtainedpvalue=0.000,thismeans that theknowledgevariable is significantlyrelated to diabetes self-care activities.
Sufficient knowledge can shape the patient’sskills to support behavior change and improve patient understanding of DM type-2 disease suffered.Knowledge of diabetes can be obtained from education and training conducted through DM education from health workers. It is intended to maintain optimal health status. So that patients with Type-2 diabetes can do a self-care or diabetes self-care properly.11
One of the pillars of the five main pillars in themanagement of DM disease is DM education. The role of educators by health workers is very important in educating patients of Type-2 DM. The role of health personnel is to provide health education on the management of DM independently and periodically, interventions to DM management counselling that can be done by DM patients themselves. The result of thisactivity isexpected thepatientcanhavesufficientknowledge to be skilled in doing self-care through self-care diabetes activity. Adequate knowledge can help Type-2 DM patients to minimize health problems experienced.12Oneistheriskofcomplicationsresultingfrom a lack of treatment and monitoring of the behavior or lifestyle of Type-2 DM patients.
Patients with Type-2 diabetes with low knowledge tend to be less self-care diabetic activities. Because of their lack of awareness of the importance of regulating the diet (diet), regularity of taking medication and doing physical activity on blood glucose levels. While patientswhohavesufficientknowledgeaboutdiabetesalso encourage them to be skilled at performing self-care diabetes activities well.13 This variable of health insurance ownership is also related to the state of the patient’s economic status. National Health Insurance held by the Government is a solution in combating the problem of public access to health services. The study found that in the chi-square test results, the health insurance ownership variable was related to self-care diabetes (p = 0.022). This result did not match themultivariate test result that obtained p value = 0.584,this means that the health insurance ownership variable wasnotcorrelatedsignificantlywith self-carediabetesactivity in Type-2 DM patient. The findings in thisstudy were DM Type-2 patients who did not have health insurance have less self-care diabetes activity while
most patients with Type-2 DM who have been registered as participants of National Health Insurance have done good self-care diabetes. Thus, ownership of health insurance is associated with self-care diabetes activity in patients with type-2 DM.
Information on self-care activities of diabetes can be known because most people with Type-2 diabetes have access to health care.14 Patients with Type-2 DM who have taken advantage of health insurance in health services have a positive impact on patients with Type-2 diabetes, as they understand the importance of controlling HbA1c and blood glucose regularly, regulating diet, regularly taking medication and doing sufficientphysicalactivity.9 The study found that in chi-square test results, variables of health personnel support wererelatedtoself-carediabetes(p=0.000).Thisresultdid not match the multivariate test result that obtained p value=0.105,itmeansthatthevariableofhealthworkersupport did not correlate significantly with self-carediabetes activity in DM Type-2 patient.
Health workers through counselling and diabetes counselling encourage DM Type-2 patients to perform self-care diabetes activities.10 One effort to controldiabetes done by health personnel is through provision of information by way of education and counselling related dietary rules and physical activity, because Type-2 Diabetes Mellitus is related to the lifestyle of the patient. The existence of this education and counselling, the patient is expected to have sufficient knowledgeabout diabetes which can further change its behavior so it is expected to control the condition of the disease, one of them by doing self-care diabetes routine.15
It is intended that through the communication that is established, the patient can easily understand and comfortably make recommendations from health workers and regular access to health services. Because the respondents in this study are mostly elderly (elderly) patients who cannot access their own health information, so the role of officers through counselling is needed.Thisshouldbesupportedbytheaffordabilityofhealthservices both in terms of distance, services and adequate facilities. Therefore, health workers who provide health services should understand related to diabetes which includes counselling, treatment and management of DM by means of a good self-care diabetes activities so that DM patients obedient in self-care.
ethical Clearance: Taken from university committee
Source of Funding: Authors their selves
Conflict of Interest: Nil
Indian Journal of Public Health Research & Development, April 2018, Vol.9, No. 4 215
CONCluSION
Knowledge variable (p = 0.000), health insuranceownership (p = 0.022), and support from healthpersonnel (p = 0.000) were significant factors relatedto diabetic self-care activity in Type-2 DM patients. Factorssignificantlyassociatedwithself-careactivitiesof diabetes in patients with Type-2 diabetes at Labuang Baji Hospital. For families accompanying patients in managingdiabetessufferedbypatients,itisadvisabletoprovide adequate support to patients with type-2 DM to monitor the patient’s self-care diabetes activity, one of which is by providing home glucometer to measure and monitor the patient’s blood glucose level. For officersshould provide education and counselling to patients clearly, because in the study most of the respondents were elderly patients who are difficult to access theirown health information.
Source of Funding: Authors their selves
Conflict of Interest: Authors declare no conflict ofinterest within this research
ethical Clearence: Taken from university and communities agreement
ReFeReNCeS
1.NCHS NCfHS. Health, United States, 2015:with Special Feature on Racial and Ethnic Health Disparities.2016.
2.TchicayaA, Lorentz N, Demarest S, Beissel J,Wagner DR. Relationship Between Self-Reported Weight Change, Educational Status, and Health-Related Quality of Life in Patients with Diabetes in Luxembourg. Health and Quality of Life Outcomes.2015;13:149.
3. Rahimian Boogar I, Mohajeri-Tehrani MR, Besharat MA, Talepasand S. The Effect ofSociostructural and Collaborative Decision-Making on Diabetes Self-Management. Iranian Journal of Public Health.2013;42(3):280-92.
4.Kemenkes RI. Riset Kesehatan Dasar. Jakarta:Badan Penelitian dan Pengembangan Kesehatan KementerianKesehatanRI,2013.
5. Dinkes Provinsi Sulawesi Selatan. Data Penyakit Tidak Menular Tahun 2014. Makassar: DinasKesehatanProvinsiSulawesiSelatan,2015.
6. Rekam Medik RSUD Labuang Baji. Data Penyakit Diabetes Melitus Tahun 2014-2016. Makassar:RSUDLabuangBaji,2017.
7.FenwickEK,XieJ,ReesG,FingerRP,LamoureuxEL. Factors Associated with Knowledge of Diabetes in Patients with Type 2 Diabetes Using the Diabetes Knowledge Test Validated withRasch Analysis. PloS one.2013;8(12):e80593.
8.Al Johani K, Kendall G, Snider P. Self-management Practices among Type 2 Diabetes Patients Attending Primary Health-Care Centres in Medina, Saudi Arabia/Pratiques d’auto-prise en charge chez des patients atteints de diabete de type 2 frequentant des centres de soins de sante primaires a Medine (Arabie saoudite). Eastern Mediterranean Health Journal.2015;21(9):621.
9.ZhangJX,HuangES,DrumML,KirchhoffAC,Schlichting JA, Schaefer CT, et al. InsuranceStatus and Quality of Diabetes Care in Community Health Centers. American Journal of Public Health.2009;99(4):742-7.
10.Mogre V, Wanaba P, Apala P, Nsoh JA. Self-reported Receipt of Healthcare Professional’s Weight Management Counselling Is Associated with Self-Reported Weight Management Behaviours of Type 2 Diabetes Mellitus Patients. SpringerPlus.2016;5(1):379.
11. Bains SS, Egede LE. Associations between Health Literacy, Diabetes Knowledge, Self-Care Behaviors, and Glycemic Control in a Low Income Population with Type 2 Diabetes. Diabetes Technology & Therapeutics.2011;13(3):335-41.
12.Juárez-Ramírez C, Théodore FL, Villalobos A,Jiménez-Corona A, Lerin S, Nigenda G, et al.Social Support of Patients with Type 2 Diabetes in Marginalized Contexts in Mexico and Its Relation to Compliance with Treatment: A Sociocultural Approach. PloS one.2015;10(11):e0141766.
13.MoralesMC, NavasAF, JimenezMFR, RamosJMR.Health-Related Quality of Life in Patients with Type 2 Diabetes Mellitus in a Rural Area. 2015;6(7).
14. Hsu C-C, Lee C-H, Wahlqvist ML, Huang H-L, Chang H-Y, Chen L, et al. Poverty Increases Type 2 Diabetes Incidence and Inequality of Care Despite Universal Health Coverage. Diabetes Care.2012;35(11):2286-92.
15.Mayberry LS, Osborn CY. Family Involvementis Helpful and Harmful to Patients’ Self-Care and Glycemic Control. Patient Education and Counseling.2014;97(3):418-25.
The Keiki Formation and the Flowering of Pseudobulb of Dendrobium johannis Rchb. f.
Ni luh Sri Suryaningsih1, la hisa1, Amelia Agustina limbongan1
1Faculty of Agriculture, Musamus University Jl. Kamizaun Mopah Lama, Merauke
AbSTRACT
Dendrobium johannis Rchb.f. is an endemic orchid and has been cultivated in Merauke with conventional cultivation techniques through the separation of its clumps and tillers which requires 2-3 months to grow. Accelerating the Keiki formation can be applicated with an organic PGR (plant growth regulators) such as coconutwater.Thisstudywasaimedtodetermine theeffectof immersion timeinseveralconcentrationlevelsofcoconutwaterontheKeikiformationandpseudobulbsfloweringinJohannisorchids.Thestudyused randomized block design with two factors (the time of pseudobulb immersion in coconut water and its concentrations)withthreereplications.TheresultshowedthatinteractionsdonotaffecttoKeikiformationandvegetativegrowth,but significantlyaffect thegenerativegrowth.Thebest treatment to increase thenumberofflowerbudperstalkoftheinflorescenceis4hourssoakingtimewith500mll-1 concentration whichgenerated2.67flowerbuds.
Keywords: coconut water, inflorescence, Johannis orchids, Keiki, pseudobulb.
Corresponding Author:Ni Luh Sri SuryaningsihFaculty of Agriculture,MusamusUniversityJl.KamizaunMopahLama,Merauke-99611Email: [email protected], [email protected]
INTROduCTION
Dendrobium johannis Rchb.f. known as Johannisorchid is now valued in the orchid market with great demand, so it is now cultivated as floriculturecommodities.MostofthelocalfarmersinWasurVillage,Merauke Regency cultivated the orchid conventionally with taking the wild species, separate the clumps and move it to a temporary pot or sell it directly without preservation.
The conventional (exploitation) technique economically more profitable because the seedlingwas taken directly from nature without any cost but will impact the population in the future. Conventional technique also has several degradations, e.g. the orchid quality is not optimal and the growth is not in uniformity so the economic value will decrease, moreover wild
orchid exploitation without preservation will impact its populationtoscarceandextinct.Vegetativecultivationneeds to be done in order for preserving the Johannisorchid population.
AnalternativeofvegetativecultivationofJohannisorchid is to grow the Keiki on buds from the stalk of old pseudobulb that has no leaves. The conventional Keiki propagationthroughcuttings,separationofoffshootsandKeiki is produced from the old stems resulting in a few propagules after 2–3 years1. The utilization of PGR is an alternative treatment to accelerate the Keiki formation onpseudobulbandincreasethenumbersofflowers.
Coconut water is an example of PGR which easily applicated by the local farmers. Yong et.al.2 concluded that coconut water empirically contains phytohormone e.g. cytokinins (5.8 mg l-1), auxin (0.07 mg l-1) and gibberellin which contribute to cell division and plant growth. Coconut water enabless to used as an alternative PGR for vegetative propagation and the flowering ofpseudobulb Johannis orchid. In this study, we focusour attention to investigate how the interaction between soaking time and the coconut water concentration on the formationofKeikiandthefloweringofpseudobulbofJohannisorchid.
DOI Number: 10.5958/0976-5506.2018.00286.3
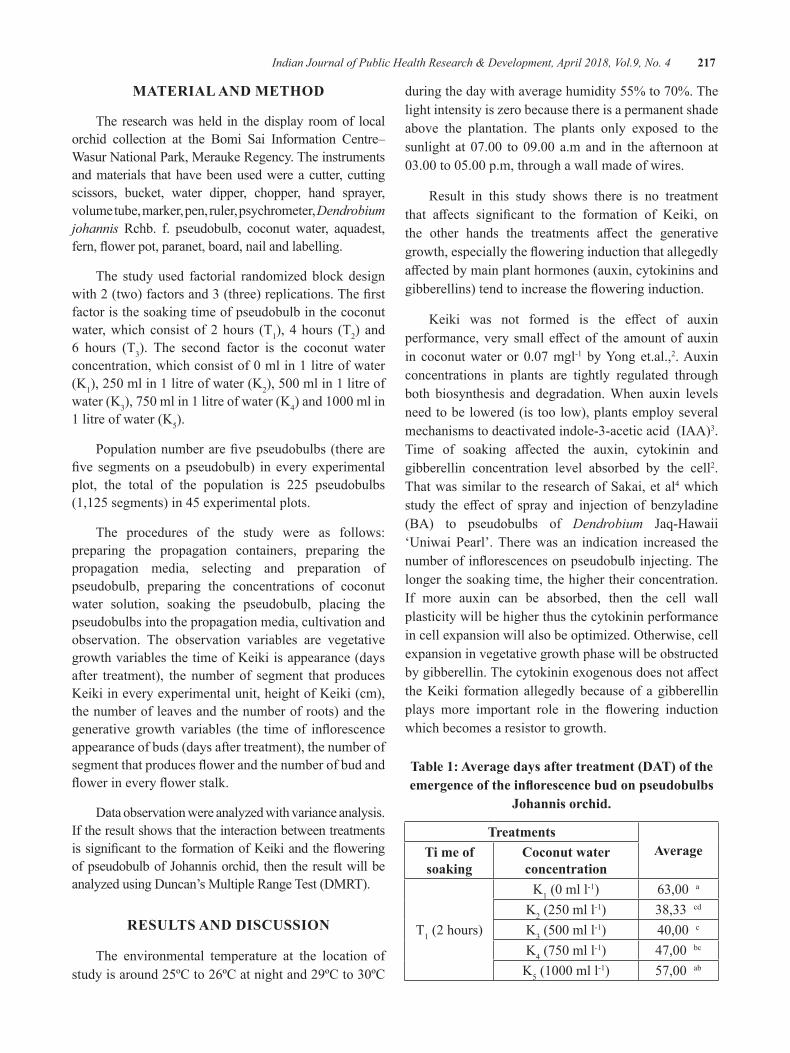
Indian Journal of Public Health Research & Development, April 2018, Vol.9, No. 4 217
MATeRIAl ANd MeThOd
The research was held in the display room of local orchid collection at the Bomi Sai Information Centre–Wasur National Park, Merauke Regency. The instruments and materials that have been used were a cutter, cutting scissors, bucket, water dipper, chopper, hand sprayer, volume tube, marker, pen, ruler, psychrometer, Dendrobium johannis Rchb. f. pseudobulb, coconut water, aquadest, fern,flowerpot,paranet,board,nailandlabelling.
The study used factorial randomized block design with2(two)factorsand3(three)replications.Thefirstfactor is the soaking time of pseudobulb in the coconut water, which consist of 2 hours (T1), 4 hours (T2) and 6 hours (T3). The second factor is the coconut water concentration,whichconsistof0mlin1litreofwater(K1),250mlin1litreofwater(K2),500mlin1litreofwater (K3),750mlin1litreofwater(K4)and1000mlin1 litre of water (K5).
Populationnumberarefivepseudobulbs(therearefive segmentson apseudobulb) in every experimentalplot, the total of the population is 225 pseudobulbs (1,125 segments) in 45 experimental plots.
The procedures of the study were as follows: preparing the propagation containers, preparing the propagation media, selecting and preparation of pseudobulb, preparing the concentrations of coconut water solution, soaking the pseudobulb, placing the pseudobulbs into the propagation media, cultivation and observation. The observation variables are vegetative growth variables the time of Keiki is appearance (days after treatment), the number of segment that produces Keiki in every experimental unit, height of Keiki (cm), the number of leaves and the number of roots) and the generative growth variables (the time of inflorescenceappearance of buds (days after treatment), the number of segmentthatproducesflowerandthenumberofbudandflowerineveryflowerstalk.
Data observation were analyzed with variance analysis. If the result shows that the interaction between treatments issignificanttotheformationofKeikiandthefloweringofpseudobulbofJohannisorchid, then theresultwillbeanalyzed using Duncan’s Multiple Range Test (DMRT).
ReSulTS ANd dISCuSSION
The environmental temperature at the location of studyisaround25ºCto26ºCatnightand29ºCto30ºC
duringthedaywithaveragehumidity55%to70%.Thelight intensity is zero because there is a permanent shade above the plantation. The plants only exposed to the sunlight at 07.00 to09.00 a.mand in the afternoon at03.00to05.00p.m,throughawallmadeofwires.
Result in this study shows there is no treatment that affects significant to the formation of Keiki, onthe other hands the treatments affect the generativegrowth,especiallythefloweringinductionthatallegedlyaffectedbymainplanthormones(auxin,cytokininsandgibberellins)tendtoincreasethefloweringinduction.
Keiki was not formed is the effect of auxinperformance,verysmalleffectof theamountofauxinin coconutwater or 0.07mgl-1 by Yong et.al.,2. Auxin concentrations in plants are tightly regulated through both biosynthesis and degradation. When auxin levels need to be lowered (is too low), plants employ several mechanisms to deactivated indole-3-acetic acid (IAA)3. Time of soaking affected the auxin, cytokinin andgibberellin concentration level absorbed by the cell2. That was similar to the research of Sakai, et al4 which study the effect of spray and injection of benzyladine(BA) to pseudobulbs of Dendrobium Jaq-Hawaii‘Uniwai Pearl’. There was an indication increased the numberofinflorescencesonpseudobulbinjecting.Thelonger the soaking time, the higher their concentration. If more auxin can be absorbed, then the cell wall plasticity will be higher thus the cytokinin performance incellexpansionwillalsobeoptimized.Otherwise,cellexpansion in vegetative growth phase will be obstructed bygibberellin.Thecytokininexogenousdoesnotaffectthe Keiki formation allegedly because of a gibberellin plays more important role in the flowering inductionwhich becomes a resistor to growth.
Table 1: Average days after treatment (DAT) of the emergence of the inflorescence bud on pseudobulbs
Johannis orchid.
TreatmentsAverageTi me of
soakingCoconut water concentration
T1 (2 hours)
K1(0mll-1) 63,00a
K2(250mll-1) 38,33 cd
K3(500mll-1) 40,00c
K4(750mll-1) 47,00bc
K5(1000mll-1) 57,00ab
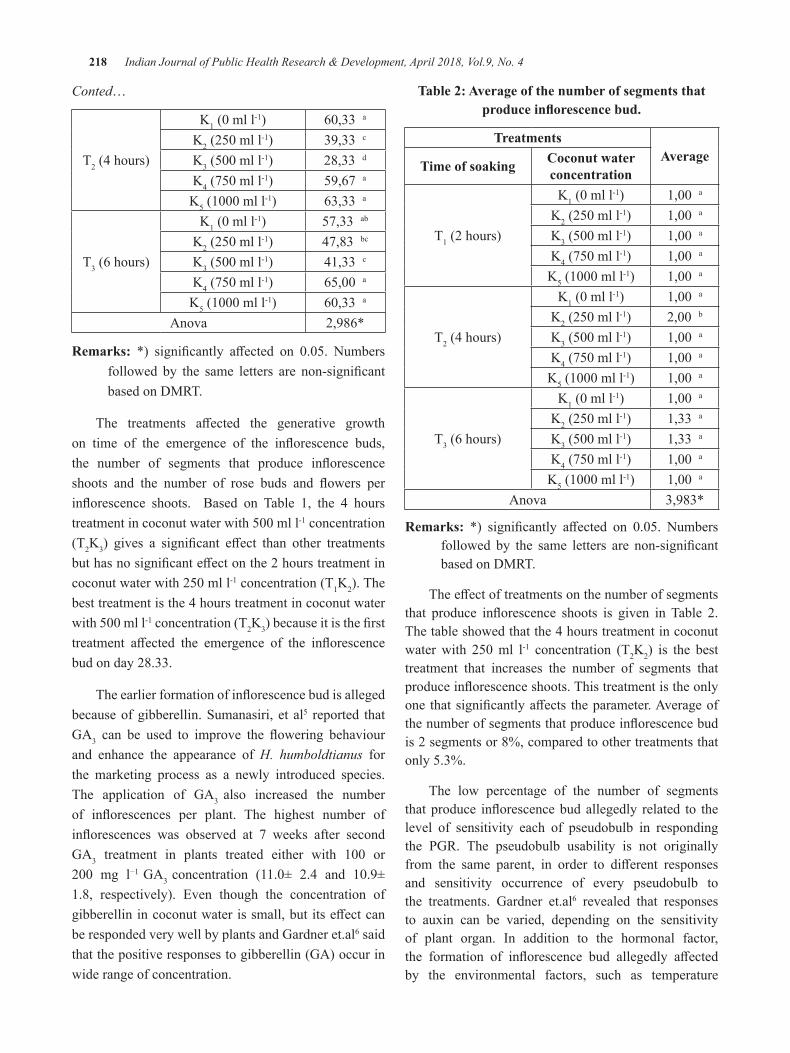
218 Indian Journal of Public Health Research & Development, April 2018, Vol.9, No. 4
Conted…
T2 (4 hours)
K1(0mll-1) 60,33a
K2(250mll-1) 39,33 c
K3(500mll-1) 28,33 d
K4(750mll-1) 59,67 a
K5(1000mll-1) 63,33 a
T3 (6 hours)
K1(0mll-1) 57,33 ab
K2(250mll-1) 47,83 bc
K3(500mll-1) 41,33 c
K4(750mll-1) 65,00a
K5(1000mll-1) 60,33a
Anova 2,986*
Remarks: *) significantly affected on 0.05. Numbersfollowed by the same letters are non-significantbased on DMRT.
The treatments affected the generative growthon time of the emergence of the inflorescence buds,the number of segments that produce inflorescenceshoots and the number of rose buds and flowers perinflorescence shoots. Based on Table 1, the 4 hourstreatmentincoconutwaterwith500mll-1 concentration (T2K3) gives a significant effect than other treatmentsbuthasnosignificanteffectonthe2hourstreatmentincoconutwaterwith250mll-1 concentration (T1K2). The best treatment is the 4 hours treatment in coconut water with500mll-1 concentration (T2K3)becauseitisthefirsttreatment affected the emergence of the inflorescencebud on day 28.33.
Theearlierformationofinflorescencebudisallegedbecause of gibberellin. Sumanasiri, et al5 reported that GA3 can be used to improve the flowering behaviourand enhance the appearance of H. humboldtianus for the marketing process as a newly introduced species. The application of GA3 also increased the number of inflorescences per plant. The highest number ofinflorescences was observed at 7 weeks after secondGA3 treatment in plants treated either with 100 or200 mg l−1 GA3 concentration (11.0± 2.4 and 10.9±1.8, respectively). Even though the concentration of gibberellinincoconutwaterissmall,butitseffectcanbe responded very well by plants and Gardner et.al6 said that the positive responses to gibberellin (GA) occur in wide range of concentration.
Table 2: Average of the number of segments that produce inflorescence bud.
TreatmentsAverage
Time of soaking Coconut water concentration
T1 (2 hours)
K1(0mll-1) 1,00a
K2(250mll-1) 1,00a
K3(500mll-1) 1,00a
K4(750mll-1) 1,00a
K5(1000mll-1) 1,00a
T2 (4 hours)
K1(0mll-1) 1,00a
K2(250mll-1) 2,00b
K3(500mll-1) 1,00a
K4(750mll-1) 1,00a
K5(1000mll-1) 1,00a
T3 (6 hours)
K1(0mll-1) 1,00a
K2(250mll-1) 1,33 a
K3(500mll-1) 1,33 a
K4(750mll-1) 1,00a
K5(1000mll-1) 1,00a
Anova 3,983*
Remarks: *) significantly affected on 0.05. Numbersfollowed by the same letters are non-significantbased on DMRT.
Theeffectoftreatmentsonthenumberofsegmentsthat produce inflorescence shoots is given inTable 2.The table showed that the 4 hours treatment in coconut waterwith 250ml l-1 concentration (T2K2) is the best treatment that increases the number of segments that produceinflorescenceshoots.Thistreatmentistheonlyone thatsignificantlyaffects theparameter.Averageofthenumberofsegmentsthatproduceinflorescencebudis 2 segments or 8%, compared to other treatments that only 5.3%.
The low percentage of the number of segments thatproduce inflorescencebudallegedly related to thelevel of sensitivity each of pseudobulb in responding the PGR. The pseudobulb usability is not originally from the same parent, in order to different responsesand sensitivity occurrence of every pseudobulb to the treatments. Gardner et.al6 revealed that responses to auxin can be varied, depending on the sensitivity of plant organ. In addition to the hormonal factor, the formation of inflorescence bud allegedly affectedby the environmental factors, such as temperature
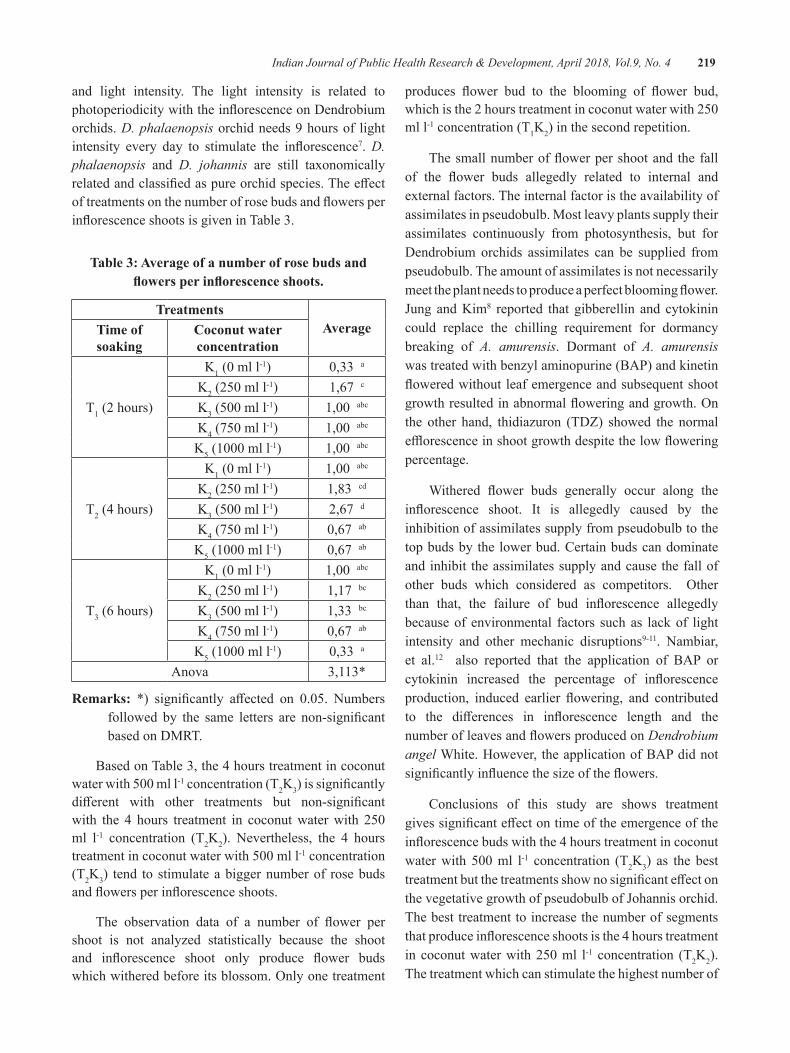
Indian Journal of Public Health Research & Development, April 2018, Vol.9, No. 4 219
and light intensity. The light intensity is related to photoperiodicitywiththeinflorescenceonDendrobiumorchids. D. phalaenopsis orchid needs 9 hours of light intensity every day to stimulate the inflorescence7. D. phalaenopsis and D. johannis are still taxonomically relatedandclassifiedaspureorchidspecies.TheeffectoftreatmentsonthenumberofrosebudsandflowersperinflorescenceshootsisgiveninTable3.
Table 3: Average of a number of rose buds and flowers per inflorescence shoots.
TreatmentsAverageTime of
soakingCoconut water concentration
T1 (2 hours)
K1(0mll-1) 0,33a
K2(250mll-1) 1,67 c
K3(500mll-1) 1,00abc
K4(750mll-1) 1,00abc
K5(1000mll-1) 1,00abc
T2 (4 hours)
K1(0mll-1) 1,00abc
K2(250mll-1) 1,83 cd
K3(500mll-1) 2,67 d
K4(750mll-1) 0,67ab
K5(1000mll-1) 0,67ab
T3 (6 hours)
K1(0mll-1) 1,00abc
K2(250mll-1) 1,17 bc
K3(500mll-1) 1,33 bc
K4(750mll-1) 0,67ab
K5(1000mll-1) 0,33a
Anova 3,113*
Remarks: *) significantly affected on 0.05. Numbersfollowed by the same letters are non-significantbased on DMRT.
Based on Table 3, the 4 hours treatment in coconut waterwith500mll-1 concentration (T2K3)issignificantlydifferent with other treatments but non-significantwith the 4 hours treatment in coconutwaterwith 250ml l-1 concentration (T2K2). Nevertheless, the 4 hours treatmentincoconutwaterwith500mll-1 concentration (T2K3) tend to stimulate a bigger number of rose buds andflowersperinflorescenceshoots.
The observation data of a number of flower pershoot is not analyzed statistically because the shoot and inflorescence shoot only produce flower budswhichwitheredbeforeitsblossom.Onlyonetreatment
produces flower bud to the blooming of flower bud,whichisthe2hourstreatmentincoconutwaterwith250ml l-1 concentration (T1K2) in the second repetition.
Thesmallnumberofflowerpershootandthefallof the flower buds allegedly related to internal andexternal factors. The internal factor is the availability of assimilates in pseudobulb. Most leavy plants supply their assimilates continuously from photosynthesis, but for Dendrobium orchids assimilates can be supplied from pseudobulb. The amount of assimilates is not necessarily meettheplantneedstoproduceaperfectbloomingflower.Jung andKim8 reported that gibberellin and cytokinin could replace the chilling requirement for dormancy breaking of A. amurensis. Dormant of A. amurensis was treated with benzyl aminopurine (BAP) and kinetin floweredwithoutleafemergenceandsubsequentshootgrowthresultedinabnormalfloweringandgrowth.Onthe other hand, thidiazuron (TDZ) showed the normal efflorescenceinshootgrowthdespitethelowfloweringpercentage.
Withered flower buds generally occur along theinflorescence shoot. It is allegedly caused by theinhibition of assimilates supply from pseudobulb to the top buds by the lower bud. Certain buds can dominate and inhibit the assimilates supply and cause the fall of other buds which considered as competitors. Otherthan that, the failure of bud inflorescence allegedlybecause of environmental factors such as lack of light intensity and other mechanic disruptions9-11. Nambiar, et al.12 also reported that the application of BAP or cytokinin increased the percentage of inflorescenceproduction, induced earlier flowering, and contributedto the differences in inflorescence length and thenumberofleavesandflowersproducedonDendrobium angel White. However, the application of BAP did not significantlyinfluencethesizeoftheflowers.
Conclusions of this study are shows treatment givessignificanteffectontimeoftheemergenceoftheinflorescencebudswiththe4hourstreatmentincoconutwaterwith 500ml l-1 concentration (T2K3) as the best treatmentbutthetreatmentsshownosignificanteffectonthevegetativegrowthofpseudobulbofJohannisorchid.The best treatment to increase the number of segments thatproduceinflorescenceshootsisthe4hourstreatmentincoconutwaterwith250ml l-1 concentration (T2K2). The treatment which can stimulate the highest number of
220 Indian Journal of Public Health Research & Development, April 2018, Vol.9, No. 4
flowerbudisthe4hourstreatmentincoconutwaterwith500mll-1 concentration (T2K3). This research provides a solutiontoaneffective,efficientandeconomicalflowerregeneration system to sustain endangered endemic orchids.
ethical Clearance: Taken from the University committee and the agreement with the respondents
Source of Funding: This research was funded by authors their selves and from Musamus University
Conflict of Interest: Authors declare that there is no any conflictofinterest.
ReFeReNCeS
1.Bhattacharyya, P., Suman Kumaria, Nikhil Job,Pramod Tandon (2016) En-masse productionof elite clones of Dendrobium crepidatum: A threatened, medicinal orchid used in Traditional Chinese Medicine (TCM). Journalof Applied Research on Medicinal and Aromatic Plants (in press). https://doi.org/10.1016/j.jarmap.2016.04.001.
2.Yong, J.W.H., L. Ge, Y.F. Ng, and S.N. Tan(2009)TheChemicalCompositionandBiologicalProperties of Coconut (Cocos nucifera L.) Water. Molecules 14: 5144-5164.
3.Gao,Y. and Y.Zao (2014)AuxinBiosynthesisand Catabolism. In EvaZažímalová,JanPetrasek,Eva Benková, eds, Auxin and Its Role in Plant Development.doi.org/10.1007/978-3-7091-1526-8_2.
4.Sakai, W.S., J. Courtney-Sutlle, J. Clarke,M. Munekata and R. Kaipo (1998) Inducing Dendrobium Orchid Inflorescence Growthby Injection of a Solution of Benzyladine. J.HawaiianPacificAgric.9:33-36.
5.Sumanasiri, H., S.A. Krishnarajah, and J.P.Eeswara (2013) Effect of gibberellic acid ongrowthandfloweringofHenckelia humboldtianus Gardner (Ceylon Rock Primrose). Scientia Horticulturae, 159: 29-32.
6. Gardner, F.P., R.B. Pearce and R.L. Mitchell. (2010) Physiology of Crop Plants. ScientificPublishers,Jodhpur,India.
7.Lopez,R.G.andE.S.Runkle(2005)EnvironmentalPhysiologyofGrowthandFloweringofOrchids.HortScience,40(7):1969-1973.
8.Jung,H.H.andK.S.Kim(2011)FloweringofAdonis amurens is by Breaking Dormancy using Gibberellins and Cytokinins. Hort. Environ. Biotechnol. 52(3):246-251. doi 10.1007/s13580-011-2011-6.
9. Syamsiar S. Russeng, Lalu Muhammad saleh, Devintha Virani, Ade Wira Listrianti Latief,AnwarMallongi.,2018.TheInvestigationoftheLactic Acid Change among employee of national electrical Power Plan. Indian Journal of PublicHealthResearch&Development,January2018,Vol.9,No.1
10.AnwarMallongi,RuslanLaAneandAgusBintaraBirawida,2017.Ecologicalrisksofcontaminatedlead and the potential health risks among school children inMakassar coastal area, Indonesia. J.Environ.Sci.Technol.,10:283-289.
11. Amran, Stang, and Anwar Mallongi, AIP Conference Proceedings 1825, 020002 (2017);doi:10.1063/1.4978971
12.Nambiar,N.,T.C.SiangandM.Mahmood(2012)Effectof6-BenzylaminopurineonFloweringofaDendrobium orchid.Australian Journal of CropScience 6(2): 225-231.
Risk Analysis of dengue Fever Occurrence in bone Province Sulawesi South using Temporal Spatial geostatistical Model
Stang Abdul Rahman1, Amran Rahim2, Anwar Mallongi3
1Department of Biostatistics, Faculty of Public Health, Hasanuddin University; 2Department of Mathematics, Faculty of Mathematics and Natural Sciences, Hasanuddin; 3Environmental Health Section,
Faculty of Public Health, Hasanuddin University
AbSTRACT
The purpose of this research is to get the best model prediction of dengue fever risk in Bone District using spatial temporal geostatistical model. Time series model is used to describe the dynamics of dengue fever changes with stages: Identification of data, Model identification, model estimation, model assumptioncheck, best model selection and forecasting stage. Implementation of time series model in Bone District incident data and climatic factors shows that the model obtained has a good accuracy. The results showed that: The prediction model of dengue fever occurrence in Tanete Riattang Barat, China, and Mare sub district using ARIMAX model. Dengue prediction model for Ajangale District, Barebbo, Bengo, Two Boccoe and TellusiattinggeusingMAXmodel.Rainfallisanexogenousvariablethataffectstheincidenceofdenguefever.Humidity,temperatureandwindspeedhavenoeffectontheoccurrenceofdenguefever.
Keywords: Spatial, Temporal, ARIMAX, Dengue Fever, Geostatistical Model, and Model assumption check
INTROduCTION
The number of dengue fever cases in the year 20012 there are 412 cases or incident rate 54/100.000population, in2013 increased to603casesor incidentrate79/100.000population,2014decreasedto303casesor incident rate 40/100.000, 2015 increased again to777caseor incidentrateof104/100.0001-4. Patterns of disease and health problems in a community, changing overtime,fromseasontoseasonanddifferentfromoneplace to another. This change is in line with changes in various health risk factors such as population, socioeconomic and geographical or ecosystem5. This pattern change needs to be paid attention particularly to the temporal dimension in overcoming DHF problems through a temporal approach. So far, there is no antiviral drug available against dengue, but a vaccine has been recently marketed6.
Kinley Wangdi, et al7, and concludes that the ARIMAX model is much more accurate when compared to the ARIMA model because it takes into account the independent variables. Liu et al8 conducted a study related to the symptoms of Hemorrhagic fever in China using ARIMAmodelfortheannualdatafrom1978to2008sothat in predicting have less precision because the period
used is too big. In addition Martinez et al9 conducted a study related to cases of dengue outbreak in Brazil using SARIMAmethodin1998-2008,butinthisstudydidnotinvolve independent variables in the model.
Based on the above description, then in this research used ARIMAX and MAX model because this model besides using dependent variable (incident rate of dengue also pay attention to independent variable which influence the incidence of dengue fever case, WestTanete Riattang, Cina and Mare subdistrict is modeled as Arimax because it has time series symptoms on the incidence rate data of stationary dengue incidence and incident rate incidence rate from time to time Ajangale, Barebbo, Bengo, Dua Boccoe and Tellusiattingge subdistricts can be modeled with Max because they have time series symptoms on the incidence rate incidence dengue fever is stationary but there is no incidence rate correlation over time.
MATeRIAlS ANd MeThOd A. data Source: The data used in this research is
DHFdataasinBoneDistrictfrom2013to2017and rainfall data sourced from the Ministry of Public Works. Temperature, humidity and wind
DOI Number: 10.5958/0976-5506.2018.00287.5
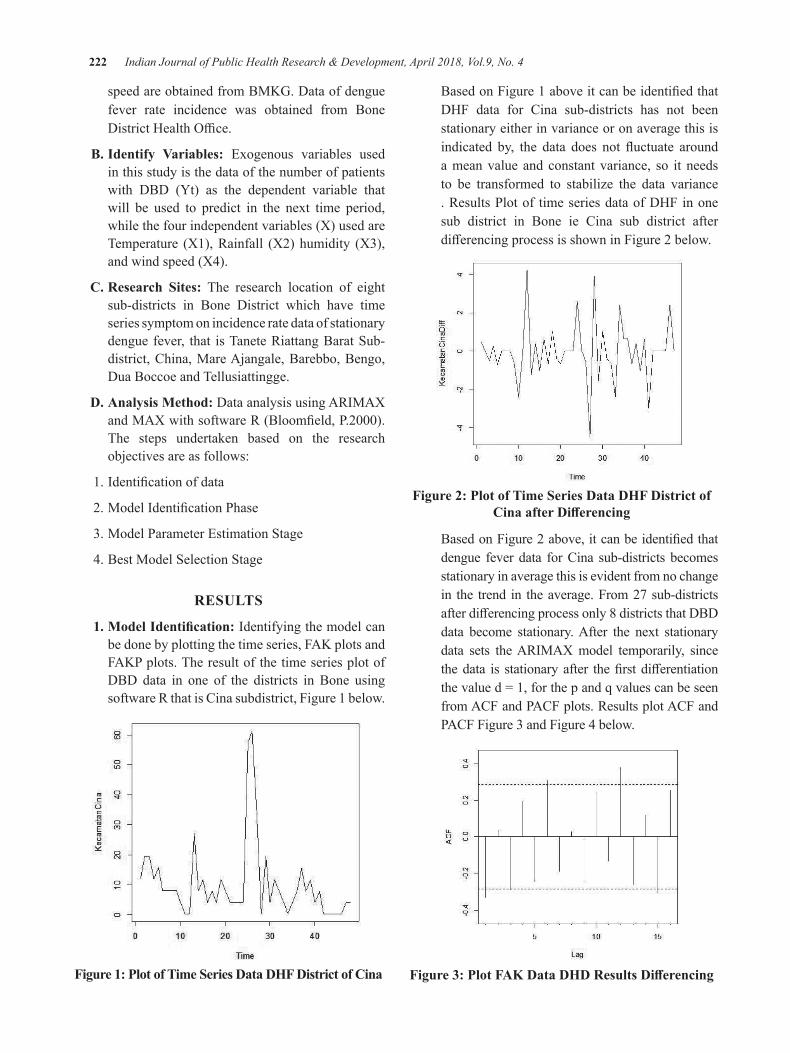
222 Indian Journal of Public Health Research & Development, April 2018, Vol.9, No. 4
speed are obtained from BMKG. Data of dengue fever rate incidence was obtained from Bone DistrictHealthOffice.
b. Identify Variables: Exogenous variables used in this study is the data of the number of patients with DBD (Yt) as the dependent variable that will be used to predict in the next time period, while the four independent variables (X) used are Temperature (X1), Rainfall (X2) humidity (X3), and wind speed (X4).
C. Research Sites: The research location of eight sub-districts in Bone District which have time series symptom on incidence rate data of stationary dengue fever, that is Tanete Riattang Barat Sub-district, China, Mare Ajangale, Barebbo, Bengo, Dua Boccoe and Tellusiattingge.
d. Analysis Method: Data analysis using ARIMAX andMAXwithsoftwareR(Bloomfield,P.2000).The steps undertaken based on the research objectives are as follows:
1.Identificationofdata
2.ModelIdentificationPhase
3. Model Parameter Estimation Stage
4. Best Model Selection Stage
ReSulTS
1. Model Identification: Identifying the model can be done by plotting the time series, FAK plots and FAKP plots. The result of the time series plot of DBD data in one of the districts in Bone using software R that is Cina subdistrict, Figure 1 below.
Figure 1: Plot of Time Series data dhF district of Cina
BasedonFigure1aboveitcanbeidentifiedthatDHF data for Cina sub-districts has not been stationary either in variance or on average this is indicated by, the data does not fluctuate arounda mean value and constant variance, so it needs to be transformed to stabilize the data variance . Results Plot of time series data of DHF in one sub district in Bone ie Cina sub district after differencingprocessisshowninFigure2below.
Figure 2: Plot of Time Series data dhF district of Cina after Differencing
BasedonFigure2above,itcanbeidentifiedthatdengue fever data for Cina sub-districts becomes stationary in average this is evident from no change in the trend in the average. From 27 sub-districts afterdifferencingprocessonly8districtsthatDBDdata become stationary. After the next stationary data sets the ARIMAX model temporarily, since thedata is stationaryafter thefirstdifferentiationthevalued=1,forthepandqvaluescanbeseenfrom ACF and PACF plots. Results plot ACF and PACF Figure 3 and Figure 4 below.
Figure 3: Plot FAK Data DHD Results Differencing
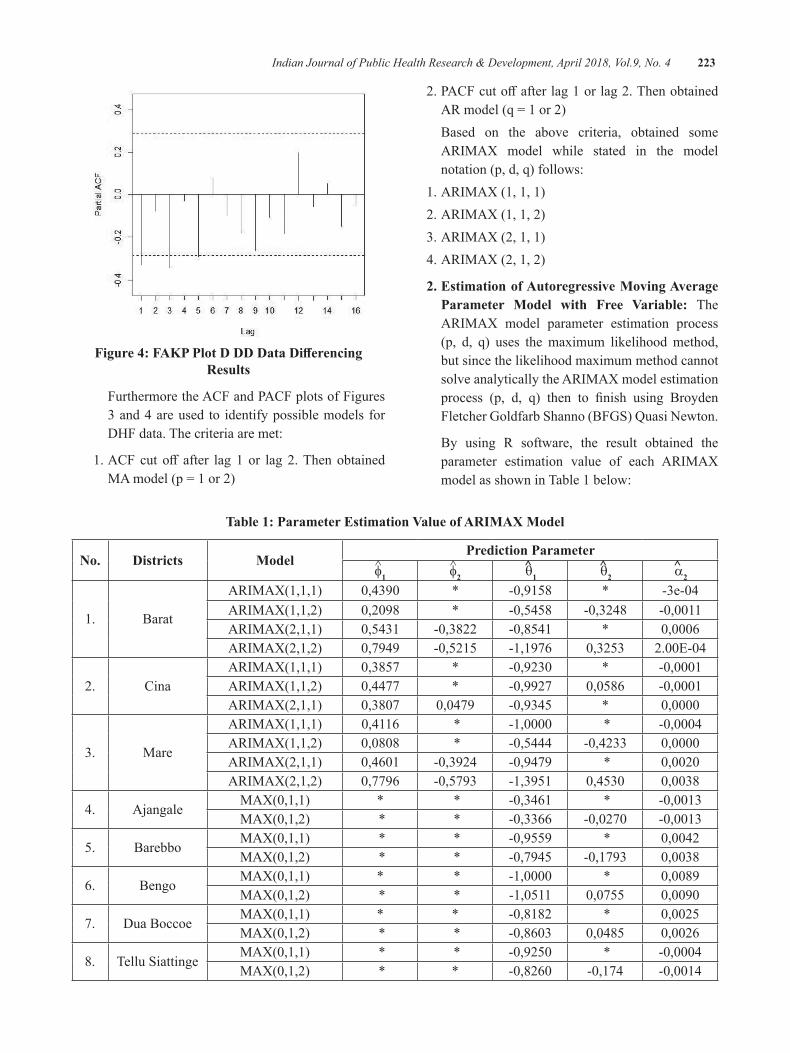
Indian Journal of Public Health Research & Development, April 2018, Vol.9, No. 4 223
Figure 4: FAKP Plot D DD Data Differencing Results
Furthermore the ACF and PACF plots of Figures 3 and 4 are used to identify possible models for DHF data. The criteria are met:
1.ACFcut off after lag1or lag2.ThenobtainedMAmodel(p=1or2)
2.PACFcutoffafterlag1orlag2.ThenobtainedARmodel(q=1or2)
Based on the above criteria, obtained some ARIMAX model while stated in the model notation (p, d, q) follows:
1. ARIMAX (1, 1, 1) 2. ARIMAX (1, 1, 2) 3. ARIMAX (2, 1, 1) 4. ARIMAX (2, 1, 2)
2. estimation of Autoregressive Moving Average Parameter Model with Free Variable: The ARIMAX model parameter estimation process (p, d, q) uses the maximum likelihood method, but since the likelihood maximum method cannot solve analytically the ARIMAX model estimation process (p, d, q) then to finish using BroydenFletcher Goldfarb Shanno (BFGS) Quasi Newton.
By using R software, the result obtained the parameter estimation value of each ARIMAX model as shown in Table 1 below:
Table 1: Parameter estimation Value of ARIMAX Model
No. districts ModelPrediction Parameter
^ f1^ f2
^ q1^ q2
^ a2
1. Barat
ARIMAX(1,1,1) 0,4390 * -0,9158 * -3e-04ARIMAX(1,1,2) 0,2098 * -0,5458 -0,3248 -0,0011ARIMAX(2,1,1) 0,5431 -0,3822 -0,8541 * 0,0006ARIMAX(2,1,2) 0,7949 -0,5215 -1,1976 0,3253 2.00E-04
2. CinaARIMAX(1,1,1) 0,3857 * -0,9230 * -0,0001ARIMAX(1,1,2) 0,4477 * -0,9927 0,0586 -0,0001ARIMAX(2,1,1) 0,3807 0,0479 -0,9345 * 0,0000
3. Mare
ARIMAX(1,1,1) 0,4116 * -1,0000 * -0,0004ARIMAX(1,1,2) 0,0808 * -0,5444 -0,4233 0,0000ARIMAX(2,1,1) 0,4601 -0,3924 -0,9479 * 0,0020ARIMAX(2,1,2) 0,7796 -0,5793 -1,3951 0,4530 0,0038
4. AjangaleMAX(0,1,1) * * -0,3461 * -0,0013MAX(0,1,2) * * -0,3366 -0,0270 -0,0013
5. BarebboMAX(0,1,1) * * -0,9559 * 0,0042MAX(0,1,2) * * -0,7945 -0,1793 0,0038
6. BengoMAX(0,1,1) * * -1,0000 * 0,0089MAX(0,1,2) * * -1,0511 0,0755 0,0090
7. Dua BoccoeMAX(0,1,1) * * -0,8182 * 0,0025MAX(0,1,2) * * -0,8603 0,0485 0,0026
8. Tellu SiattingeMAX(0,1,1) * * -0,9250 * -0,0004MAX(0,1,2) * * -0,8260 -0,174 -0,0014
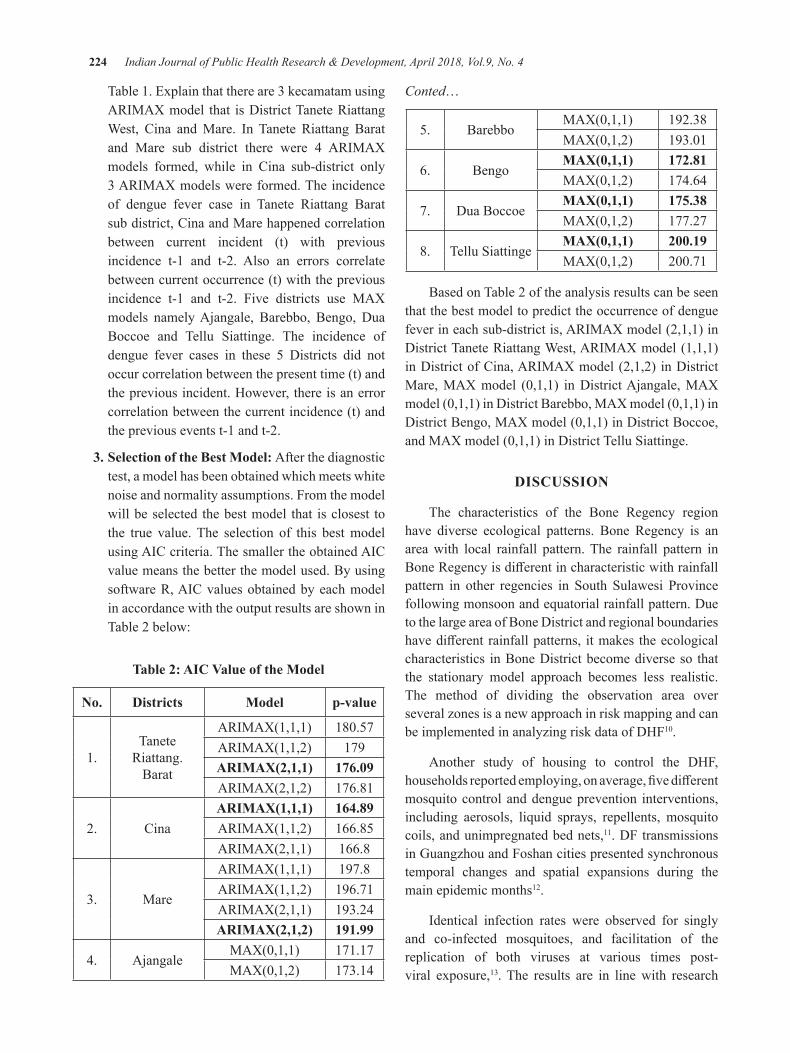
224 Indian Journal of Public Health Research & Development, April 2018, Vol.9, No. 4
Table 1. Explain that there are 3 kecamatam using ARIMAX model that is District Tanete Riattang West, Cina and Mare. In Tanete Riattang Barat and Mare sub district there were 4 ARIMAX models formed, while in Cina sub-district only 3 ARIMAX models were formed. The incidence of dengue fever case in Tanete Riattang Barat sub district, Cina and Mare happened correlation between current incident (t) with previous incidence t-1 and t-2. Also an errors correlate between current occurrence (t) with the previous incidence t-1 and t-2. Five districts use MAX models namely Ajangale, Barebbo, Bengo, Dua Boccoe and Tellu Siattinge. The incidence of dengue fever cases in these 5 Districts did not occur correlation between the present time (t) and the previous incident. However, there is an error correlation between the current incidence (t) and the previous events t-1 and t-2.
3. Selection of the best Model: After the diagnostic test, a model has been obtained which meets white noise and normality assumptions. From the model will be selected the best model that is closest to the true value. The selection of this best model using AIC criteria. The smaller the obtained AIC value means the better the model used. By using software R, AIC values obtained by each model in accordance with the output results are shown in Table 2 below:
Table 2: AIC Value of the Model
No. districts Model p-value
1.Tanete
Riattang. Barat
ARIMAX(1,1,1) 180.57ARIMAX(1,1,2) 179ARIMAX(2,1,1) 176.09ARIMAX(2,1,2) 176.81
2. CinaARIMAX(1,1,1) 164.89ARIMAX(1,1,2) 166.85ARIMAX(2,1,1) 166.8
3. Mare
ARIMAX(1,1,1) 197.8ARIMAX(1,1,2) 196.71ARIMAX(2,1,1) 193.24ARIMAX(2,1,2) 191.99
4. AjangaleMAX(0,1,1) 171.17MAX(0,1,2) 173.14
Conted…
5. BarebboMAX(0,1,1) 192.38MAX(0,1,2) 193.01
6. BengoMAX(0,1,1) 172.81MAX(0,1,2) 174.64
7. Dua BoccoeMAX(0,1,1) 175.38MAX(0,1,2) 177.27
8. Tellu SiattingeMAX(0,1,1) 200.19MAX(0,1,2) 200.71
Based on Table 2 of the analysis results can be seen that the best model to predict the occurrence of dengue fever in each sub-district is, ARIMAX model (2,1,1) in District Tanete Riattang West, ARIMAX model (1,1,1) in District of Cina, ARIMAX model (2,1,2) in District Mare,MAXmodel (0,1,1) inDistrictAjangale,MAXmodel(0,1,1)inDistrictBarebbo,MAXmodel(0,1,1)inDistrictBengo,MAXmodel(0,1,1)inDistrictBoccoe,andMAXmodel(0,1,1)inDistrictTelluSiattinge.
dISCuSSION
The characteristics of the Bone Regency region have diverse ecological patterns. Bone Regency is an area with local rainfall pattern. The rainfall pattern in BoneRegencyisdifferentincharacteristicwithrainfallpattern in other regencies in South Sulawesi Province following monsoon and equatorial rainfall pattern. Due to the large area of Bone District and regional boundaries havedifferentrainfallpatterns, itmakes theecologicalcharacteristics in Bone District become diverse so that the stationary model approach becomes less realistic. The method of dividing the observation area over several zones is a new approach in risk mapping and can be implemented in analyzing risk data of DHF10.
Another study of housing to control the DHF, householdsreportedemploying,onaverage,fivedifferentmosquito control and dengue prevention interventions, including aerosols, liquid sprays, repellents, mosquito coils, and unimpregnated bed nets,11. DF transmissions in Guangzhou and Foshan cities presented synchronous temporal changes and spatial expansions during the main epidemic months12.
Identical infection rates were observed for singly and co-infected mosquitoes, and facilitation of the replication of both viruses at various times post-viral exposure,13. The results are in line with research
Indian Journal of Public Health Research & Development, April 2018, Vol.9, No. 4 225
conducted by14 explaining the temperature and rainfall factorsalsoaffecttheincidenceofdenguefever.Inthesub district In Tanete Riattang Barat District obtained from the analysis that every increase of one rainfall will raise0.0006incidenceofdenguefever.
Similarly in Districts Mare every increase of one rainfallwillraise0.0036incidenceofdenguefever.Incontrast to the Chinese district happens otherwise every increase of rainfall will decrease 0,0001 incidence ofdengue fever. In addition study by Liyanage found that the strongest association with dengue risk centred around 6to10weeksfollowingrainfallsofmorethan300mmper week15,16. The main outcomes investigated were dengue cumulative incidence, disability-adjusted life years (DALYs), and the direct costs per intervention,17. For the interactive effects, the combination of highprecipitation, high temperature, and high road density might result in increased dengue fever incidence. Moreover, urban villages might be the dengue fever hot spots18. Further, review highlights the need and sets the stage for a rigorous multi-system modeling approach to improve our knowledge about Aedes presence/abundancewithin their flight range in response to theinter action between environmental, socioeconomic, and meteorological systems19.
The results of the analysis for Districts Ajangale, Barebbo, Bengo, Dua Boccoe and Tellusiattingge use MAX model. Dengue epidemic in 5 districts there is no correlation of dengue fever from month to month with previous time incidence. Although there is no correlation occurrence of dengue fever over time but error correlation occurrence of month t with previous time events. OfthefivedistrictshavethesameMAXmodel(0,1,1)andexogenousvariablesthatinfluencetheincidenceofdengueonly rainfall. In Districts Ajangale it was found that every single rainfall increase would result in a decrease in dengue incidenceby0.0013.This incident iscausedbyother factors such as 3M behavior that is draining, closing and burying can reduce the incidence of dengue fever20. InBarebbodistrict,theeffectofrainfallisdifferentfromAjangale sub-district every one of the increase of rainfall willresultinanincreaseofdengueincidenceby0,0042.InBengodistrict,therainfalleffectequaltoBarebboeveryone rainfall increase will result in an increase of dengue incidenceby0,0089.Likewiseintwosub-districts,namelyDistrict Boccoe and Tellu Siattinge every one increase of rainfall will result in an increase of dengue incidence respectivelyby0.0025and0.0004.
CONCluSIONS
1. Dengue prediction model in Tanete Riattang West District, China, and Mare using ARIMAX model.
2. Dengue prediction model for Ajangale, Barebbo, Bengo, Dua Boccoe and Tellusiattingge using MAX model.
3.Rainfallisanexogenousvariablethataffectstheincidence of dengue fever.
4. Humidity, temperature and wind speed have no effectontheoccurrenceofdenguefever
ethical Clearance: Ethical clearance was taken from Faculty Committee
Source of Funding: From all authors contribution
Conflict of Interest: None
ReFeReNCeS
1.Dinkes,2012,Profil kesehatan Propinsi Sulawesi Selatan tahun 2012, Dinas Kesehatan Propinsi Sulawesi Sealatan.
2.Dinkes,2013,Profil kesehatan Propinsi Sulawesi Selatan tahun 2013, Dinas Kesehatan Propinsi Sulawesi Sealatan.
3.Dinkes,2014,Profil kesehatan Propinsi Sulawesi Selatan Tahun 2014, Dinas Kesehatan Propinsi Sulawesi Sealatan.
4.Dinkes,2015,Profil kesehatan Propinsi Sulawesi Selatan Tahun 2015, Dinas Kesehatan Propinsi Sulawesi Sealatan.
5.Achmadi, U. F. (2010). Manajemen DemamBerdarah Berbasis Wilayah. Buletin Jendela Epidemiologi, Vol. 2, Agustus 2010.
6.ElSahili,A.,&Lescar,J. (2017).DengueVirusNon-Structural Protein 5. Viruses, 9(4), 91.
7.Wangdy, Kinley. dkk (2010) Development oftemporal modelling for forecasting and prediction of malaria infections using time-series and ARIMAX analyses: A case study in endemic districts of Bhutan. Malaria Journal. Page:2-9.2010.
8.Q. Liu, X dkk (2011) Forecasting incidence ofhemorrhagic fever with renal syndrome in China
226 Indian Journal of Public Health Research & Development, April 2018, Vol.9, No. 4
using ARIMA model, BMC Infect. Dis.,vol. 11, no. 1, p.218.
9.E.Z.Martinezdkk.2011.ASARIMAforecastingmodel to predict the number of cases of dengue in Campinas, State of Sao Paulo.
10.Stang.A.R.,Amran,Anwar.M.2017Forecastingof Dengue Disease Incident Risks Using Non-stationary Spatial of Geostatistics Model in Bone Regency Indonesia, Journal of Entomology, Pakistan.
11. Heydari, N., Larsen, D., Neira, M., Beltrán Ayala, E., Fernandez, P., Adrian, J. Stewart-Ibarra,A.(2017).HouseholdDenguePreventionInterventions, Expenditures, and Barriers to Aedes aegypti Control in Machala, Ecuador. International Journal of Environmental Research and Public Health, 14(2), 196.
12.Ren,H., Zheng, L., Li,Q.,Yuan,W.,&Lu, L.(2017). Exploring Determinants of SpatialVariations in theDengueFeverEpidemicUsingGeographically Weighted Regression Model: A Case Study in the Joint Guangzhou-FoshanArea, China, 2014. International Journal of Environmental Research and Public Health, 14(12), 1518.
13. Le Coupanec, A., Tchankouo-Nguetcheu, S., Roux, P., Khun, H., Huerre, M., Morales-Vargas, R., Choumet, V. (2017). Co-Infectionof Mosquitoes with Chikungunya and Dengue VirusesRevealsModulationoftheReplicationofBothVirusesinMidgutsandSalivaryGlandsofAedes aegypti Mosquitoes. International Journal of Molecular Sciences, 18(8),1708.
14.Stang,MuhammadIkhsan,Ruslan,2014,Modelanalysis of dengue fever occurrence based on behavior and environmental aspects by using spatial approach in Tanete Riattang district and West Tanete Riattang, Bone Regency,
International Journal of Research in Health Science, India.
15. Liyanage, P., Tissera, H., Sewe, M., Quam, M., Amarasinghe,A.,Palihawadana,P.,...Rocklöv,J. (2016).ASpatialHierarchicalAnalysisof theTemporal Influences of the El Niño-SouthernOscillation andWeather onDengue inKalutaraDistrict, Sri Lanka. International Journal of Environmental Research and Public Health, 13(11),1087.
16. Anwar Mallongi, Ruslan La Ane and Agus Bintara Birawida,2017.Ecologicalrisksofcontaminatedlead and the potential health risks among school children inMakassar coastal area, Indonesia. J.Environ.Sci.Technol.,10:283-289.
17.Mendoza-Cano, O., Hernandez-Suarez, C.,Trujillo,X.,OchoaDiaz-Lopez,H.,Lugo-Radillo,A., Espinoza-Gomez, F., Murillo-Zamora, E. (2017). Cost-Effectiveness of the Strategies toReduce the Incidence of Dengue in Colima, México. International Journal of Environmental Research and Public Health, 14(8),890.
18.Cao,Z.,Liu,T.,Li,X.,Wang, J.,Lin,H.,Chen,L.,Ma, W. (2017). Individual and InteractiveEffects of Socio-Ecological Factors on DengueFever at Fine Spatial Scale: A Geographical Detector-Based Analysis. International Journal of Environmental Research and Public Health, 14(7), 795.
19.Sallam,M., Fizer, C., Pilant,A., &Whung, P.-Y. (2017). Systematic Review: Land Cover,Meteorological, and Socioeconomic Determinants of Aedes Mosquito Habitat for Risk Mapping. International Journal of Environmental Research and Public Health, 14(10),1230.
20.Fathi,Keman, S danWahyuni,CU2005, Peranfaktor lingkungan dan perilaku terhadap penularan demam berdarah dengue di kota mataram, Jurnal Kesehatan Lingkungan, Vol.2.No.1,hlm.1-10.
Analysis of Risk on the Incidence of Scabies Personal hygiene in boarding School darul Arqam gombara Makassar
Anwar Mallongi1, Ayu Puspitasari2, Muhammad Ikhtiar3, Arman3, Arsunan, A. A.4
1Professor of Environmental Health Department, Faculty of Public Health, Hasanuddin University; 2Environmental Health Department, Faculty of Public Health, Muslim State University, Makassar;
3Senior Lecturer of Faculty of Public Health, Muslim State University, Makassar, South Sulawesi Indonesia; 4Professor of Epidemiology Department, Faculty of Public Health, Hasanuddin University
AbSTRACT
Research Purposes: To analyze the risk factors on the incidence of scabies Personal Hygiene in Boarding Darul Arqam Gombara Makassar.
Methods: The study design was observational analytic with case control study design. The sample population is the population in this study are all Student Son recorded live in Pesantren Darul Arqam Gombara Makassar. Data were collected through interviews using a questionnaire. Components of the questionnaire includes personal hygiene.
Result: Having performed statistical tests showed that skin Cleanliness is not a risk factor for the incidence ofscabies (OR=0.481;95%CI=0.216 to1.074),HandHygieneandNails isnota riskfactor for theincidenceofscabies(OR=0.785;95%CI=0.200-3.087),towelsCleanlinessisnotariskfactorfortheincidenceofscabies(OR=0.376;95%CI=0.157to0.3448),HygieneBedsandbedlinenareriskfactorsontheincidenceofscabies(OR=3.111;95%CI=0.314-30.840),directcontactwithpatientsisariskfactorfortheincidenceofscabies(OR=2.069;95%CI=1.722to2.551).
Keywords: Scabies, Personal Hygiene, Risk Factor
Corresponding Author:Anwar MallongiProfessor of Environmental Health Department,Faculty of Public Health, Hasanuddin UniversityEmail:[email protected]
INTROduCTION
Scabies disease can attack all social levels starting from the bottom, middle and high.Scabies can about all races and classes world throughout.Scabies disease is an endemic disease in the community. This disease may affectallagegroupsandsocialgroupsworldwide.Morethan300millioncasesofscabiesoccurintheworldeachyear. In developing countries more than a quarter of the population could be infected with the scabies disease.1
Factors that were most responsible for the transmission of scabies is hygiene. Personal hygiene includes hand washing habits, after using towels, bathing
frequency, frequency of changing underwear, frequency of changing bed sheets, and custom direct contact such as shaking hands or sleeping together sufferers. PoorPersonal Hygiene can cause the body to various diseases such as skin diseases, infectious diseases, diseases of the mouth and can eliminate the function of certain body parts such as Skin. In Indonesia still there are many social communities and lower economic, due to the lack of hygienic behavior and inadequate availability sanitation.2
According to data obtained from the South Sulawesi ProvincialHealthOffice,therewasasignificantincreaseoftheincidenceofscabiesamongasmanyas130peoplethe second quarter and the third quarter as many as 298 peoplein2015.3
Some of Islamic Boarding School in Makassar who has done counseling process so well that the incidence of scabies in schools can be decreased. Many factors affect addition to counseling regularly,knowledgeand
DOI Number: 10.5958/0976-5506.2018.00288.7
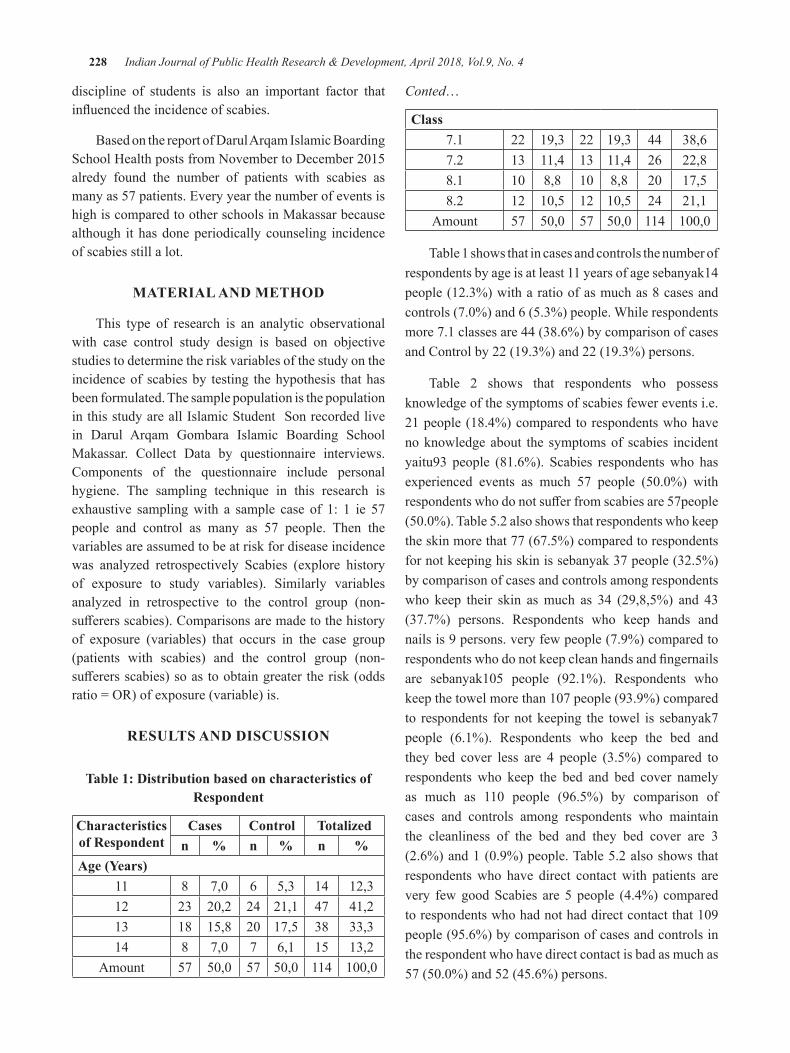
228 Indian Journal of Public Health Research & Development, April 2018, Vol.9, No. 4
discipline of students is also an important factor that influencedtheincidenceofscabies.
Based on the report of Darul Arqam Islamic Boarding SchoolHealthpostsfromNovembertoDecember2015alredy found the number of patients with scabies as many as 57 patients. Every year the number of events is high is compared to other schools in Makassar because although it has done periodically counseling incidence of scabies still a lot.
MATeRIAl ANd MeThOd
This type of research is an analytic observational with case control study design is based on objective studies to determine the risk variables of the study on the incidence of scabies by testing the hypothesis that has been formulated. The sample population is the population in this study are all Islamic Student Son recorded live in Darul Arqam Gombara Islamic Boarding School Makassar. Collect Data by questionnaire interviews. Components of the questionnaire include personal hygiene. The sampling technique in this research is exhaustive sampling with a sample case of 1: 1 ie 57 people and control as many as 57 people. Then the variables are assumed to be at risk for disease incidence was analyzed retrospectively Scabies (explore history of exposure to study variables). Similarly variables analyzed in retrospective to the control group (non-sufferersscabies).Comparisonsaremadetothehistoryof exposure (variables) that occurs in the case group (patients with scabies) and the control group (non-sufferersscabies)soastoobtaingreater therisk(oddsratio=OR)ofexposure(variable)is.
ReSulTS ANd dISCuSSION
Table 1: distribution based on characteristics of Respondent
Characteristics of Respondent
Cases Control Totalizedn % n % n %
Age (Years)11 8 7,0 6 5,3 14 12,312 23 20,2 24 21,1 47 41,213 18 15,8 20 17,5 38 33,314 8 7,0 7 6,1 15 13,2
Amount 57 50,0 57 50,0 114 100,0
Conted…
Class7.1 22 19,3 22 19,3 44 38,67.2 13 11,4 13 11,4 26 22,88.1 10 8,8 10 8,8 20 17,58.2 12 10,5 12 10,5 24 21,1
Amount 57 50,0 57 50,0 114 100,0
Table 1 shows that in cases and controls the number of respondents by age is at least 11 years of age sebanyak14 people (12.3%) with a ratio of as much as 8 cases and controls(7.0%)and6(5.3%)people.Whilerespondentsmore 7.1 classes are 44 (38.6%) by comparison of cases and Control by 22 (19.3%) and 22 (19.3%) persons.
Table 2 shows that respondents who possess knowledge of the symptoms of scabies fewer events i.e. 21 people (18.4%) compared to respondents who have no knowledge about the symptoms of scabies incident yaitu93 people (81.6%). Scabies respondents who has experienced events as much 57 people (50.0%) withrespondentswhodonotsufferfromscabiesare57people(50.0%).Table5.2alsoshowsthatrespondentswhokeepthe skin more that 77 (67.5%) compared to respondents for not keeping his skin is sebanyak 37 people (32.5%) by comparison of cases and controls among respondents who keep their skin as much as 34 (29,8,5%) and 43 (37.7%) persons. Respondents who keep hands and nails is 9 persons. very few people (7.9%) compared to respondentswhodonotkeepcleanhandsandfingernailsare sebanyak105 people (92.1%). Respondents whokeepthetowelmorethan107people(93.9%)comparedto respondents for not keeping the towel is sebanyak7 people (6.1%). Respondents who keep the bed and they bed cover less are 4 people (3.5%) compared to respondents who keep the bed and bed cover namely as much as 110 people (96.5%) by comparison ofcases and controls among respondents who maintain the cleanliness of the bed and they bed cover are 3 (2.6%)and1(0.9%)people.Table5.2alsoshowsthatrespondents who have direct contact with patients are very few good Scabies are 5 people (4.4%) compared torespondentswhohadnothaddirectcontactthat109people (95.6%) by comparison of cases and controls in the respondent who have direct contact is bad as much as 57(50.0%)and52(45.6%)persons.
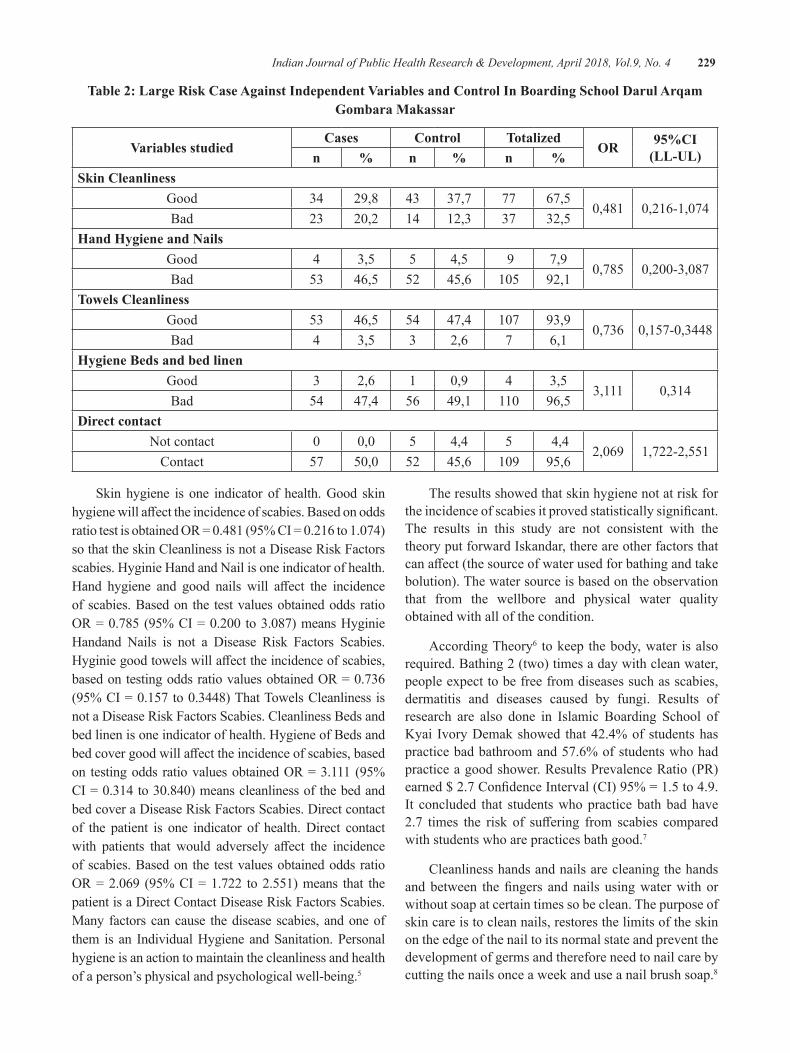
Indian Journal of Public Health Research & Development, April 2018, Vol.9, No. 4 229
Table 2: large Risk Case Against Independent Variables and Control In boarding School darul Arqam gombara Makassar
Variables studiedCases Control Totalized
OR 95%CI (LL-UL)n % n % n %
Skin CleanlinessGood 34 29,8 43 37,7 77 67,5
0,481 0,216-1,074Bad 23 20,2 14 12,3 37 32,5
hand hygiene and NailsGood 4 3,5 5 4,5 9 7,9
0,785 0,200-3,087Bad 53 46,5 52 45,6 105 92,1
Towels CleanlinessGood 53 46,5 54 47,4 107 93,9
0,736 0,157-0,3448Bad 4 3,5 3 2,6 7 6,1
hygiene beds and bed linenGood 3 2,6 1 0,9 4 3,5
3,111 0,314Bad 54 47,4 56 49,1 110 96,5
direct contactNot contact 0 0,0 5 4,4 5 4,4
2,069 1,722-2,551Contact 57 50,0 52 45,6 109 95,6
Skin hygiene is one indicator of health. Good skin hygienewillaffecttheincidenceofscabies.BasedonoddsratiotestisobtainedOR=0.481(95%CI=0.216to1.074)so that the skin Cleanliness is not a Disease Risk Factors scabies. Hyginie Hand and Nail is one indicator of health. Hand hygiene and good nails will affect the incidenceof scabies. Based on the test values obtained odds ratio OR=0.785(95%CI=0.200 to3.087)meansHyginieHandand Nails is not a Disease Risk Factors Scabies. Hyginiegoodtowelswillaffecttheincidenceofscabies,basedontestingoddsratiovaluesobtainedOR=0.736(95%CI=0.157to0.3448)ThatTowelsCleanlinessisnot a Disease Risk Factors Scabies. Cleanliness Beds and bed linen is one indicator of health. Hygiene of Beds and bedcovergoodwillaffecttheincidenceofscabies,basedon testingodds ratiovaluesobtainedOR=3.111(95%CI=0.314to30.840)meanscleanlinessofthebedandbed cover a Disease Risk Factors Scabies. Direct contact of the patient is one indicator of health. Direct contact with patients that would adversely affect the incidenceof scabies. Based on the test values obtained odds ratio OR=2.069 (95%CI=1.722 to2.551)means that thepatient is a Direct Contact Disease Risk Factors Scabies. Many factors can cause the disease scabies, and one of them is an Individual Hygiene and Sanitation. Personal hygiene is an action to maintain the cleanliness and health of a person’s physical and psychological well-being.5
The results showed that skin hygiene not at risk for theincidenceofscabiesitprovedstatisticallysignificant.The results in this study are not consistent with the theory put forward Iskandar, there are other factors that canaffect(thesourceofwaterusedforbathingandtakebolution). The water source is based on the observation that from the wellbore and physical water quality obtained with all of the condition.
According Theory6 to keep the body, water is also required. Bathing 2 (two) times a day with clean water, people expect to be free from diseases such as scabies, dermatitis and diseases caused by fungi. Results of research are also done in Islamic Boarding School of Kyai Ivory Demak showed that 42.4% of students has practice bad bathroom and 57.6% of students who had practice a good shower. Results Prevalence Ratio (PR) earned$2.7ConfidenceInterval(CI)95%=1.5to4.9.It concluded that students who practice bath bad have 2.7 times the risk of suffering from scabies comparedwith students who are practices bath good.7
Cleanliness hands and nails are cleaning the hands andbetween thefingers andnails usingwaterwithorwithout soap at certain times so be clean. The purpose of skin care is to clean nails, restores the limits of the skin on the edge of the nail to its normal state and prevent the development of germs and therefore need to nail care by cutting the nails once a week and use a nail brush soap.8
230 Indian Journal of Public Health Research & Development, April 2018, Vol.9, No. 4
The results showed that hand hygiene and nails is not a risk factor for the incidence of scabies in Darul Arqam Gombara Islamic Boarding School Makassar and it proved to be statistically significant. This contrastswith research conducted on students of State Elementary SchoolJatinagorthatpersonalhygieneismorethanhalfthe students sampled studies do not maintain hygiene hands and nails are good.
Theory10 presented in accordance with the results of theresearch,therearemanyfactorsthatcanaffecte.g.only interact with each other (playing together, shake hands, and touch) so that the results of this interaction could be a medium of transmission of disease scabies. According to the results of research in the field thatdirect contact is important and higher risk of incidence of scabies.
The results showed that the cleanliness of towels is not a risk factor for the incidence of scabies in Bajipamai Villageand thisprovedstatisticallysignificant.This isnot in accordance with the theory of towels role in the transmission of scabies mites through indirect contact. Should not be allowed to wear towels together as easily transmit the bacteria from patient to others. Moreover, when the towels never dried under the sun or had not been washed in a long period of time then it is likely the number of bacteria in the towels aplenty and very risky to transmit to the others.11-13
The results shows that the cleanliness of the bed and linens is not a risk factor for the incidence of scabies in theVillageBajipamai isnot a risk factor, it provedtobestatisticallysignificant.This isnot inaccordancewith teori12 which states that the transmission of the mite usually occurs through direct contact with an infected person, for example to bed with scabies, or also through indirect contact through the sheets, pillowcases etc. The results same was found in the village of Bajipamai Maros which indicates that the cleanliness of the bed and linens arenotariskfactor,itprovedsignificantstatisticc.13-19
The results indicates that direct contact with patients is a risk factor for the incidence of scabies in Darul Arqam Gombara Islamic Boarding School, and itprovedtobestatisticallysignificant.thisisaccordingto research at Darul Hijrah Islamic Boarding School Banjarmasin explaining that direct contact with patients is a risk factor that main most.14
CONCluSION ANd ReCOMMeNdATIONS
Research shows that skin Cleanliness, Hygiene hands and nails, Hygiene towels are not a risk factor Hygiene person, bed and linens experiencing direct contact with patients is a risk factor for Personal Hygiene in Darul Arqam Gombara Islamic Boarding School Makassar. Researchers suggest the Pupils must Improves Hygiene Skin, and Nails Improving Hand Hygiene, Hygiene Towels Improve, Improve Hygiene Beds and Bed Sheet, maintain direct contact with patients
ethical Clearance: Taken from university committee and the agreement with communities
Source of Funding: Author herself
Conflict of Interest: None
ReFeReNCeS
1.Dwi,S.2014.RelationshipsantriwatiKnowledgeAbout Disease scabies with scabies Disease PreventionBehaviour In IslamicSchools; 2014.Gaster. 11 (2): 25-26
2.Fitri. Birth weight as a factor of 2012. Theoccurrence Dominant Stunting In Toddlers (12-59 months) in Sumatra (Analysis Data Riskesdas 2010).Thesis.FKMUI:Depok
3.South Sulawesi Provincial Health Office. 2015.The Health Profile of South Sulawesi in 2015,Makassar
4. Potter, P.A, Perry, A.G.Buku Festive Fundamentals of Nursing: Concepts, Process, and Practice. 4th Edition .Volume 2. Expert Language: RenataKomalasari,etal.Jakarta:EGC.2005
5.Widodo, A. 2004. Factors Related to SkinDiseases at Full business Jatibarang landfillwaste in Semarang. Essay. Faculty of Medicine, University of Diponegoro. Semarang.
6.Tarwoto&Wartonah.2014.BasicHumanNeedsand the Nursing Process. Fifth Edition. Salemba Medika:Jakarta.
7.Sutrisno,T.,etal.2010.WaterSupplyTechnology.Seventhmold.RinekaCopyright:Jakarta.
8.Yuzzi,A. 2011. Relationship Between PersonalHygiene Practices and Figures Genesis Scabies
Indian Journal of Public Health Research & Development, April 2018, Vol.9, No. 4 231
InIvoryKyaiPeantrenDemakdistrict.JournalofUniversityofDiponegoroinSemarang;2011.
9.Annisa et al, 2013. The Relationship BetweenPersonal Hygiene With Scabies At boarding school incident Roudlotul Muttaqin Mijen Semarang2013.JournaloftheMedicalFacultyoftheUniversityofDianNuswantoro2013.
10.Anna, 2012. Personal Hygiene ElementarySchoolStudentsJatinangor.JournalofFacultyofNursing, University of Padjadjaran.
11.Stevens, P. 2014.Nursing.VolumeTwoSecondEdition.EGC:Jakarta.
12.Lita,S.2015.PupilsBehaviorInScabiesDiseasePrevention Efforts In boarding school UlummuStabat Qur’an. USU. Press. Field.
13.HandokoRP.2011.scabies.In:DermatologyandVenereal. 6th edition.Agency Publisher Facultyof Medicine, University of Indonesia, Jakarta,Indonesia, p. 122-125
14.NellyA.,SittiDR.,AgnesS.2012.RiskFactorsScabies at boarding school students (Studies in Pondok Pesantren Darul Hijrah, keluarahan Cindai Alus, District Martapura, Banjar regency,
SouthKalimantanProvince.BuskiJournalVol.4,No..1,June2012Page14-22
15.Robby Kayame, Anwar Mallongi., 2018.Relationships between smoking Habits and the Hypertension occurrence among the Adults of Communities in Paniai Regency, Papua Indonesia. Indian Journal of Public Health Research &Development,January2018,Vol.9,No.1
16.Irwan, Anwar Mallongi, 2018., Model ofHypertension transmission Risks to Communities inGorontalo Province. Indian Journal of PublicHealthResearch&Development,January2018,Vol.9,No.1
17.Masriadi Idrus, Anwar Mallongi and JulianiIbrahim, 2017. Surveillance system model forpulmonary tuberculosis suspected in Pangkep region, Indonesia. Curr. Res. Tuberculosis, 9: 1-7.
18.Nur, R., and Mallongi, A., 2016. Impact ofViolenceonHealthReproductionAmongWivesinDonggala.PakistanJournalofNutritionVolume15,Number11,980-988.
19. Amran, Stang, and Anwar Mallongi, AIP Conference Proceedings 1825, 020002 (2017);doi:10.1063/1.4978971
Feasibility Analysis of Facilities and hygiene Workers and Firms in UPTD Cattle Slaughter of Kendari City in 2017
yusuf Sabilu1, Jafriati1, Farit rezal1, Andi Faisal Fachlevy1, Fifi Nirmala1, la Ode Ahmad Saktiansyah1, Syawal Kamiluddin Saptaputra1
1Faculty of Public Health, Halu oleo University, Kendari, Indonesia
AbSTRACT
Animal slaughter houses require high hygiene and technical requirements to get a quality product. Hygiene environmental conditions and hygiene work practices can certainly create quality and hygienic meat products that can reduce the potential for infectious diseases (food borne disease). The purpose of this study is to determinethefeasibilityoffacilitiesandhygieneworkersandfirmsinUPTDCattleSlaughterofKendariCityin2017.ThisresearchisadescriptivestudybymakingobservationsusingchecklistsheetinUPTDslaughtering Animal Kendari City. Based on the observation result, it is known that there are several aspects of the feasibility of facilities and hygiene that have not met the requirements. Improved and supervised effortsonfeasibilityaspectsoffacilitiesandhygienethathavenotmettherequirementsinaccordancewiththe rules and standard set
Keywords: Feasibility of facilities, employee and company hygiene, House of Animal Slaughter.
INTROduCTION
Animal Cutting House (RPH) is a building or building complex with special design and construction that meets certain technical and hygienic requirements and is used as a slaughterhouse1. Animal slaughter shall be carried out at the Slaughter House (RPH) or other slaughterhouses designated by the competent authorities, except in certain circumstances such as for the purposes of traditional ceremonies, religious and emergency deductions2, in view of its vital function so as to require a slaughter houses designed and constructed in the right location. Healthy and halal products can be guaranteed by RPH which has a means for checking animal health, means for hygiene, as well as adhering to the code of ethics and procedures for proper slaughtering. The RPH location should be outside the city and away from the settlements and have sewerage and sewage treatment in accordance with AMDAL3.
Awareness of occupational hazards is a form of the role of the workers themselves in minimizing the occurrence of work accidents. Successful implementation ofOSH program is not only from the aspect of RPHmanagement but also must be supported by all related institutions contained in the scope4.
The results of preliminary observations and previous studies show that facilities and hygiene in UPTD Animal Cutting there are aspects that have not met the requirementsandthefinalproductproducedthereisstillmicrobial contamination so that further research on the feasibility aspects of facilities and hygiene of employees and companies needs to be done to be a guide for improving the quality of UPTD of Kendari City Animal Cutting.
MATeRIAlS ANd MeThOd
This research is descriptive research which aims to know waste management in UPTD of Kendari City Slaughtering year 2017. Observation using check listsheet and taking biochemical and microbiological waste sampling at UPTD of animal slaughtering of Kendari City then further examination. Observations made bycheck list based on the requirement of Slaughter House (RPH) waste management according to the Environment RegulationNumber02Year2006inArticle9.Samplingis done in some sampling point ie clean water sample, SPAL, Deposition, Wastewater end, end result waste. The parameters measured were total suspended solids (TSS),BOD,COD,andNH3.
DOI Number: 10.5958/0976-5506.2018.00289.9
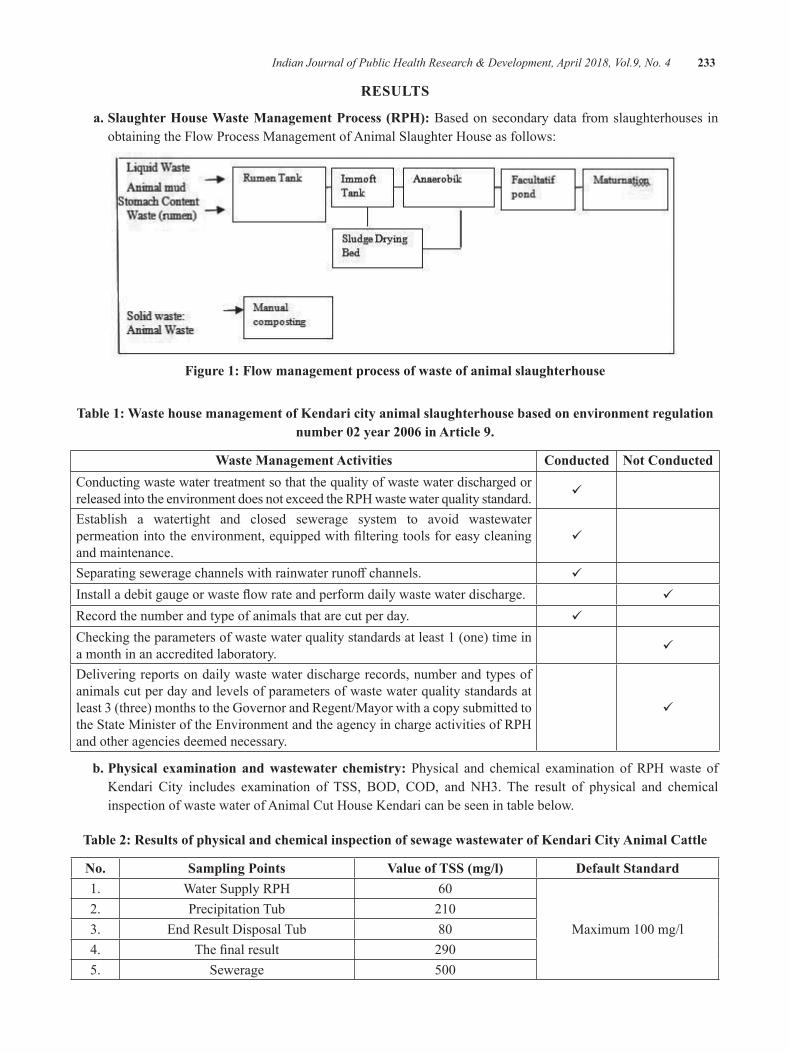
Indian Journal of Public Health Research & Development, April 2018, Vol.9, No. 4 233
ReSulTS
a. Slaughter House Waste Management Process (RPH): Based on secondary data from slaughterhouses in obtaining the Flow Process Management of Animal Slaughter House as follows:
Figure 1: Flow management process of waste of animal slaughterhouse
Table 1: Waste house management of Kendari city animal slaughterhouse based on environment regulation number 02 year 2006 in Article 9.
Waste Management Activities Conducted Not ConductedConducting waste water treatment so that the quality of waste water discharged or released into the environment does not exceed the RPH waste water quality standard.
Establish a watertight and closed sewerage system to avoid wastewater permeationintotheenvironment,equippedwithfilteringtoolsforeasycleaningand maintenance.
Separatingseweragechannelswithrainwaterrunoffchannels.
Installadebitgaugeorwasteflowrateandperformdailywastewaterdischarge.
Record the number and type of animals that are cut per day.
Checking the parameters of waste water quality standards at least 1 (one) time in a month in an accredited laboratory.
Delivering reports on daily waste water discharge records, number and types of animals cut per day and levels of parameters of waste water quality standards at least 3 (three) months to the Governor and Regent/Mayor with a copy submitted to the State Minister of the Environment and the agency in charge activities of RPH and other agencies deemed necessary.
b. Physical examination and wastewater chemistry: Physical and chemical examination of RPH waste of Kendari City includes examination of TSS, BOD, COD, and NH3. The result of physical and chemicalinspection of waste water of Animal Cut House Kendari can be seen in table below.
Table 2: Results of physical and chemical inspection of sewage wastewater of Kendari City Animal Cattle
No. Sampling Points Value of TSS (mg/l) default Standard1. Water Supply RPH 60
Maximum100mg/l2. Precipitation Tub 2103. End Result Disposal Tub 804. Thefinalresult 2905. Sewerage 500
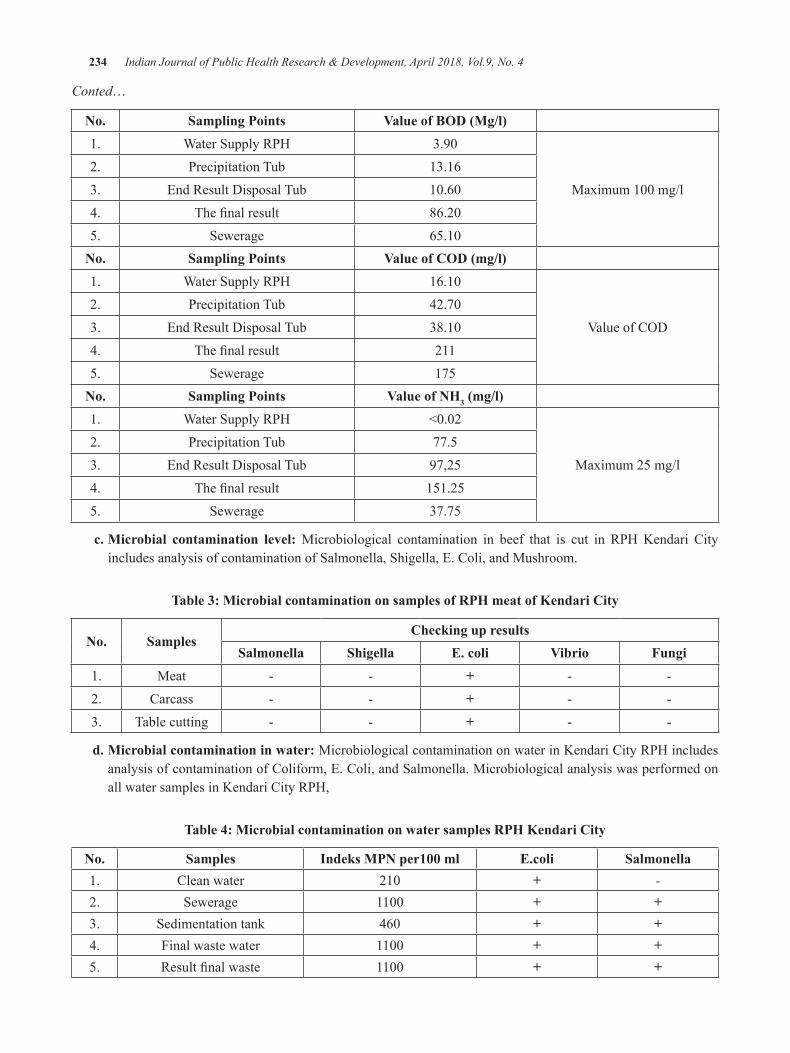
234 Indian Journal of Public Health Research & Development, April 2018, Vol.9, No. 4
Conted…
No. Sampling Points Value of BOD (Mg/l)1. Water Supply RPH 3.90
Maximum100mg/l2. Precipitation Tub 13.163. End Result Disposal Tub 10.604. Thefinalresult 86.205. Sewerage 65.10
No. Sampling Points Value of COD (mg/l)1. Water Supply RPH 16.10
ValueofCOD2. Precipitation Tub 42.703. End Result Disposal Tub 38.104. Thefinalresult 2115. Sewerage 175
No. Sampling Points Value of Nh3 (mg/l)1. Water Supply RPH <0.02
Maximum 25 mg/l2. Precipitation Tub 77.53. End Result Disposal Tub 97,254. Thefinalresult 151.255. Sewerage 37.75
c. Microbial contamination level: Microbiological contamination in beef that is cut in RPH Kendari City includes analysis of contamination of Salmonella, Shigella, E. Coli, and Mushroom.
Table 3: Microbial contamination on samples of RPh meat of Kendari City
No. SamplesChecking up results
Salmonella Shigella e. coli Vibrio Fungi 1. Meat - - + - -2. Carcass - - + - -3. Table cutting - - + - -
d. Microbial contamination in water: Microbiological contamination on water in Kendari City RPH includes analysis of contamination of Coliform, E. Coli, and Salmonella. Microbiological analysis was performed on all water samples in Kendari City RPH,
Table 4: Microbial contamination on water samples RPh Kendari City
No. Samples Indeks MPN per100 ml e.coli Salmonella1. Clean water 210 + -2. Sewerage 1100 + +3. Sedimentation tank 460 + +4. Final waste water 1100 + +5. Resultfinalwaste 1100 + +
Indian Journal of Public Health Research & Development, April 2018, Vol.9, No. 4 235
dISCuSSION
a. liquid Waste Management Process: Theeffluentnature of RPH is easier to decompose if it is not treated properly, so it can pollute the environment5. Liquid effluents from slaughterhouses such asurine, blood, fat, carcass wash water and stomach contents (rumen) from cuts in transplant to the rumen reservoir that serves to clean the contents of the stomach (rumen), then taken to the imfot tank that serves to separate the solids that can settle with thefluid contained in themud, thenflowedto drying bed mud to separate water mixed with mud through a process of evaporation that is aided by sunlight and then pumped then processed using anaerobic decay which aims to remodel organic materials in wastewater into a simpler material that is not dangerous, then streamed again in a facultative pond or commonly called a lagoon that has two layer ie aerobic layer pa at the top and anaerobiclayeratthebottom,thenthefinalprocessresult of the management of slaughterhouses is fed tothepurificationclinicalshelterwhichwill thenbe discharged into the drainage channel directly into the river.
b. Solid Waste Management Process: Average RPH Waste Production consists of feed residues, cow dung, feed plus dirt, and the contents of rumen is known to produce electrical energy even in a little6. Waste solids in the form of animal waste and the rest of the feed is processed by making compost. In accordance with Law No.32 of 2009 on theprotection and management of the environment, then every business besides earn profit orprofit should also preserve the environmentalenvironment by minimizing the waste pile and even waste into a product of value. Based on the observations made by RPH condition of Kendari City, if adjusted to the requirements of Slaughter House (RPH) waste management according to the MinisterofEnvironmentNo.02of2006inarticle9, the management is still not maximal.
c. TSS, bOd, COd, and Nh3 parameters: High levels of COD and BOD if directly dischargedinto the environment will exceed the ability of assimilationinthewaterflowsothatthebacteriawill grow quickly and consume all dissolved oxygen and consequently will create anaerobic
conditions7. Condition of liquid waste in RPH is managed simply by deposited through shelters. All the tubs are interconnected at the bottom, the condition of the tub looks vulnerable, some walls that can absorb the surrounding environment waste. Impact of pollution in UPTD Animal Cutting can be several forms, among others.
d. Air Pollution (Odor): Odorsourcecomesfromanimal solid waste (feces), liquid waste in the form of urine and blood, and the rest of the feed. Sotheeffectofbadodoronhumans,onthesocialand economic level of society, even at the level of a region’s resources. The spread of odor present inanareaisinfluencedbytheclimateofthearea,ie wind direction. This is in accordance with the opinion of Septianing in Mawa’dah8 that the stinging smell appears when rain falls and strong winds, but the smell will become accustomed if the community has long lived adjacent to the farm. Treatment of home wastewater Cutting animals requires further integration of biological processes and oxidation in terms of modeling, optimization,andcost-effectiveness9.
e. Water pollution: Water pollution is the entry of living things, substances, energy or other components into the water causing the quality of polluted water. These inputs are often referred to as pollutants, which in practice are routine discharges such as liquid waste disposal. Aspects of the perpetrator / cause can be caused by nature, or by humans. Pollution caused by nature cannot have legal implications, but the Government still has to cope with the pollution. While the aspects of theeffectcanbeseenbasedonwaterqualitydown to a certain level.10,11
The result of Wibowomoekti12 research from the liquid waste of Cakung Animal Slaughterhouse, Jakarta thatflowed intoBuaran river resulted indecreased water quality, caused by free sulfideand ammonia content above the maximum water quality criteria. In addition, Salmonella sp. which endanger human health.
The water channel around the houses and close to slaughterhouses is not polluted by any waste or waste process from slaughterhouses, as evidenced by the results of research which states that Anggoeya community does not feel contaminated
236 Indian Journal of Public Health Research & Development, April 2018, Vol.9, No. 4
with water channels around the area. This is in the opinion of Lahamma13 which states that the proper waste treatment so as not to disturb the residents and the waste should be processed so as not to pollute the environment. This is in accordance with the opinion of Roihatin14 the physical quality of water can be seen from indicators of smell, taste, turbidity, temperature, color and amount of dissolved solids.
f. health Policy Analysis: RPH sites should be located outside the city and away from the settlements and have sewerage and sewage treatment in accordance with AMDAL15. Slaughterhouses may be designated for one type of cattle, such as cattle, pigs, sheep, goats or rabbits, or other16.An SSOPH is required in relation toRPH management that can ensure sanitation and hygiene aspects in slaughterhouses. The establishedSSOPHshallmeetthe7keysanitaryrequirements included in the net production to minimizewasteandcontaminationof foodstuffsasclassifiedasfollows:
1. Water Security. Maintain no cross link between clean water and unclean water and other contaminants
2. Maintain the condition of surface hygiene that is in contact with food. Surface hygiene in contact with food is required to keep the product from being contaminated with contaminants.
3. Prevention of Cross Contamination between foodstuffandcontamination
4. Hand washing, Sanitation and Toilet Facilities. 5.ProtectionofMaterials.Ensurethatfoodstuffs,
equipment, and direct contact surfaces with food are protected from microbial, chemical and physical contamination
6. Supervision of the health condition of personnel that may lead to contamination Manage personnel who have signs of disease, injury or other conditions that may source microbiological contamination 7. Eliminating pests from processing units. Ensure the absence of pest (pest) in processing buildings
Activities in animal slaughtering businesses that are essentiallyhumaneffortstoimprovelivingstandardsand
the economy, sometimes make people forget the waste they generate17. Household waste cuts and livestock residues come from the type of organic waste used to produce biogas18. Biogas is a form of renewable energy produced from biomass through anaerobic digestion process19-22. Required cross-sectoral cooperation to create slaughterhouses in sanitation and hygiene practices in place of production, equipment, personal, post-slaughter handling at Animal Slaughterhouses will increase environmental contamination.
CONCluSION
1.Thesamplingpointonthesettlingbasin,thefinalwaste tub, and the SPAL exceed the standard TSS parameter
2.TheBODparameters at all sampling points arebelowthestandardBODparameter
3.TheCODparameters at all sampling points arebelowthestandardCODparameter
4. The sampling point on the sedimentation basin, final disposal basin, Final Results and SPALexceeds the standard of NH3 parameters
5. There is contamination of E. Coli on meat sample, Carcass, and Cutting table
6. There is contamination of E. Coli on clean water samples,SPAL,Tubs,Wastewater,finalwaste
7. Salmonella contaminants are present on SPAL water samples, Upper Washers, Wastewater ends, finalwasteproducts
ethical Clearance: The ethical clearance was taken from Faculty committee and community agreement.
Source of Funding: The funding of this research comes from all authors contribution
Conflict of Interest: Authors declares that there is no anyconflictofinterestwithinthisresearch
ReFeReNCeS
1.Wahyono, Sri; Sahwan, Firman L. 2008.Dinamika Perubahan Temperatur Dan Reduksi Volume Limbah Dalam Proses Pengomposan.J.Tek.Ling.Vol. 9.No. 3.Hal. 255-262. ISSN1441-318X.
Indian Journal of Public Health Research & Development, April 2018, Vol.9, No. 4 237
2. Kuntoro, Bambang; Maheswari, Rarah R.A; Nuraini, Henny. 2012. Hubungan PenerapanStandard Sanitation Operasional Procedure (SSOP) Terhadap Mutu Daging Ditinjau DariTingkat Cemaran Mikroba. Jurnal Ilmiah Ilmu-Ilmu Peternakan Vol. XV No.2 November 2012
3.Wambui,J.,Karuri,E.,Lamuka,P.,&Matofari,J.(2017).Goodhygienepracticesamongmeathandlersin small and medium enterprise slaughterhouses in Kenya. Food Control, 81, 34–39.
4.Kementerian Lingkungan Hidup.2002.Kebijaksanaan Produski Bersih di Indonesia. Diakses:2Januari2012
5.Rizki, Achmy M; Oktiawan, Wiharyanto;Wardhana, Irawan Wisnu. 2015. PengolahanLimbah Rumah Pemotongan Hewan (Rph) Menjadi Pupuk Cair Yang Diperkaya Dengan Unsur Magnesium (Mg) Yang Berasal Dari Limbah Garam (Bittern). JurnalTeknikLingkungan,Vol4,No3(2015).
6.Aini; Sriasih, Made; Kisworo, Djoko. (2017).Studi Pendahuluan Cemaran Air Limbah Rumah Potong Hewan di Kota Mataram. olume 15 Issue 1 (2017) : 42-48. ISSN 1829-8907
7.Mawa’da. 2012.Persepsi Masyarakat Terhadap Keberadaan Peternakan Babi di Kampung Katimbang Kelurahan Paccerakkang, Kecamatan Biringkanaya, Makassar. JurusanSosialEkonomiPeternakan. Universitas Hasanuddin, Makassar.
8.Bustillo-lecompte,C.F.,&Mehrvar,M.(2016).Treatment of an actual slaughterhouse wastewater by integration of biological and advanced oxidation processes : Modeling , optimization , and cost-effectiveness analysis. Journal of Environmental Management, 182, 651–666.
9.Hamdan, W.2010. Pencemaran Lingkungan. (DiaksesTanggal29Januari2013).
10.UmarFahmiAchmadi,YuliKristianingsih,AnwarMallongi, 2018. Relationships between BloodMercury Levels and sGPt among Communities exposed to Mercury in small scale Gold Mining Village of Indonesia, 2017. Indian Journal ofPublicHealthResearch&Development,January2018,Vol.9,No.1
11. Wibowomoekti P S. 1997. Kandungan Salmonella spp. dari limbah cair Rumah Pemotongan Hewan (Studi Kasus RPH Cakung, Jakarta). Tesis Program Pascasarjana Institut Pertanian Bogor, Bogor.
12.Lahamma,A. 2006. Persepsi Peternak tentang Limbah Pertanian dalam Pemanfaatannya sebagai Pakan Ternak Sapi di Kecamatan Sukamaju Luwu Utara. Universitas Hasanuddin, Makassar.
13.Roihatin. A dan RizqiA. K. 2007 Pengolahan Air Limbah Rumah Pemotongan Hewan (RPH) dengan Cara Elektrokoagulasi Aliran Kontinyu. JurusanTeknikKimiaFakultasTeknikUniversitasDiponegoro, Semarang.
14.Suardana. IW. 2009. Berita Biologi 9(6). Laboratorium Kesehatan Masyarakat Veteriner.Fakultas Kedokteran Hewan Universitas Udayana. KampusBukitJimbaran,Denpasar-Bali
15.Lestari, P.T.B.A., 2012. Rumah Pemotongan Hewan Ruminansia Indonesia. PT. Bina Aneka Lestari,Jakarta
16. Ma, P., Bugallo, B., Andrade, L. C., Agrelo, M., Torre, D., & López, R. T. (2014). Scienceof the Total Environment Analysis of the slaughterhouses in Galicia (NW Spain). Science of the Total Environment, The, 481, 656–661.
17.Widya,N;S,WBudiarsa;Mahendra,MS.2008.Ecotrophic.3(2):55-60.ISSN:1907-5626.
18.Afazeli, H., Jafari, A., Ra, S., & Nosrati, M.(2014). An investigation of biogas productionpotential from livestock and slaughterhouse wastes, 34,380–386.
19. Anwar Mallongi, Ruslan La Ane and Agus Bintara Birawida,2017.Ecologicalrisksofcontaminatedlead and the potential health risks among school children inMakassar coastal area, Indonesia. J.Environ.Sci.Technol.,10:283-289.
20.Rodríguez-abalde,Á., Flotats,X.,&Fernández,B. (2017). Optimization of the anaerobic co-digestion of pasteurized slaughterhouse waste, pig slurry and glycerine,61,521–528.
21.NoorBahriNoer,VeniHadju,RidwanMThaha,Anwar Daud, Andi Imam Arundhana, Anwar Mallongi, 2018., Malaria and nutritional statusamong Female Adolescents in West sulawesi, Indonesia. Indian Journal of Public HealthResearch&Development,January2018,Vol.9,
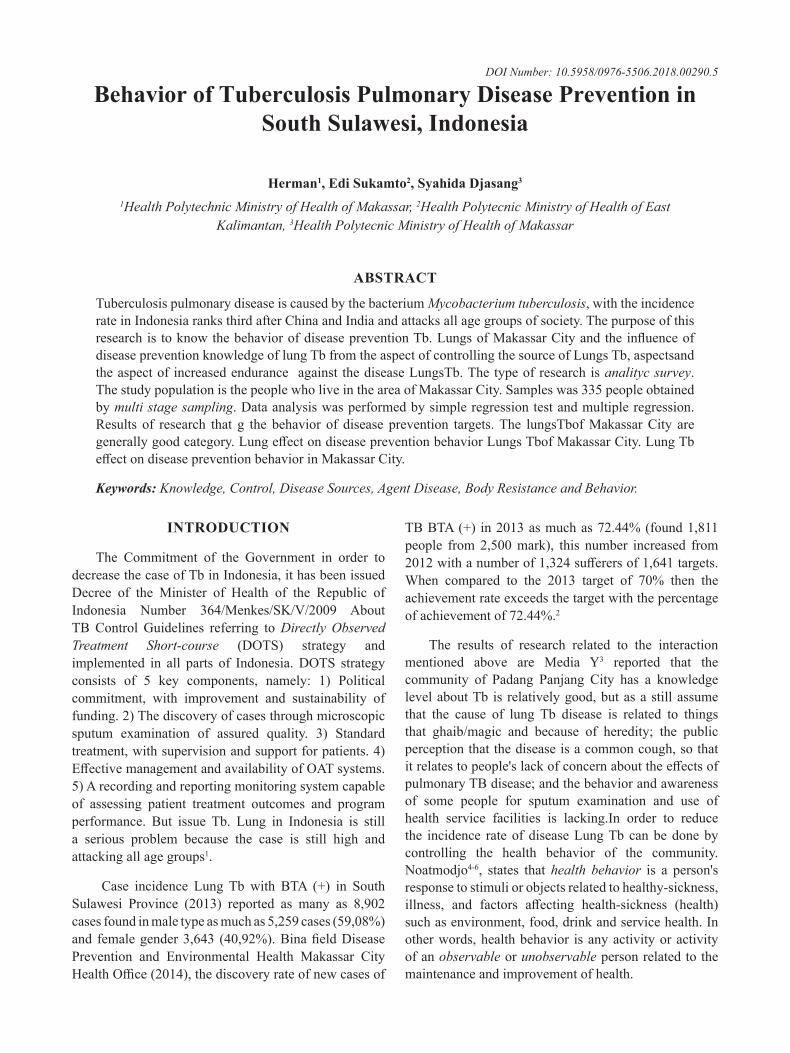
behavior of Tuberculosis Pulmonary disease Prevention in South Sulawesi, Indonesia
herman1, edi Sukamto2, Syahida djasang3
1Health Polytechnic Ministry of Health of Makassar, 2Health Polytecnic Ministry of Health of East Kalimantan, 3Health Polytecnic Ministry of Health of Makassar
AbSTRACT
Tuberculosis pulmonary disease is caused by the bacterium Mycobacterium tuberculosis, with the incidence rate in Indonesia ranks third after China and India and attacks all age groups of society. The purpose of this researchis toknowthebehaviorofdiseasepreventionTb.LungsofMakassarCityandtheinfluenceofdisease prevention knowledge of lung Tb from the aspect of controlling the source of Lungs Tb, aspectsand the aspect of increased endurance against the disease LungsTb. The type of research is analityc survey. The study population is the people who live in the area of Makassar City. Samples was 335 people obtained by multi stage sampling. Data analysis was performed by simple regression test and multiple regression. Results of research that g the behavior of disease prevention targets. The lungsTbof Makassar City are generallygoodcategory.LungeffectondiseasepreventionbehaviorLungsTbofMakassarCity.LungTbeffectondiseasepreventionbehaviorinMakassarCity.
Keywords: Knowledge, Control, Disease Sources, Agent Disease, Body Resistance and Behavior.
INTROduCTION
The Commitment of the Government in order to decrease the case of Tb in Indonesia, it has been issued Decree of the Minister of Health of the Republic of Indonesia Number 364/Menkes/SK/V/2009 AboutTB Control Guidelines referring to Directly Observed Treatment Short-course (DOTS) strategy andimplemented in all parts of Indonesia.DOTS strategyconsists of 5 key components, namely: 1) Political commitment, with improvement and sustainability of funding. 2) The discovery of cases through microscopic sputum examination of assured quality. 3) Standard treatment, with supervision and support for patients. 4) EffectivemanagementandavailabilityofOATsystems.5) A recording and reporting monitoring system capable of assessing patient treatment outcomes and program performance. But issue Tb. Lung in Indonesia is still a serious problem because the case is still high and attacking all age groups1.
Case incidence Lung Tb with BTA (+) in South Sulawesi Province (2013) reported as many as 8,902casesfoundinmaletypeasmuchas5,259cases(59,08%)and femalegender3,643 (40,92%).BinafieldDiseasePrevention and Environmental Health Makassar City HealthOffice(2014),thediscoveryrateofnewcasesof
TBBTA(+) in2013asmuchas72.44%(found1,811people from2,500mark), this number increased from2012withanumberof1,324sufferersof1,641targets.When compared to the 2013 target of 70% then theachievement rate exceeds the target with the percentage of achievement of 72.44%.2
The results of research related to the interaction mentioned above are Media Y3 reported that the community of Padang Panjang City has a knowledge level about Tb is relatively good, but as a still assume that the cause of lung Tb disease is related to things that ghaib/magic and because of heredity; the public perception that the disease is a common cough, so that itrelatestopeople'slackofconcernabouttheeffectsofpulmonary TB disease; and the behavior and awareness of some people for sputum examination and use of health service facilities is lacking.In order to reduce the incidence rate of disease Lung Tb can be done by controlling the health behavior of the community.Noatmodjo4-6, states that health behavior is a person's response to stimuli or objects related to healthy-sickness, illness, and factors affecting health-sickness (health)such as environment, food, drink and service health. In other words, health behavior is any activity or activity of an observable or unobservable person related to the maintenance and improvement of health.
DOI Number: 10.5958/0976-5506.2018.00290.5
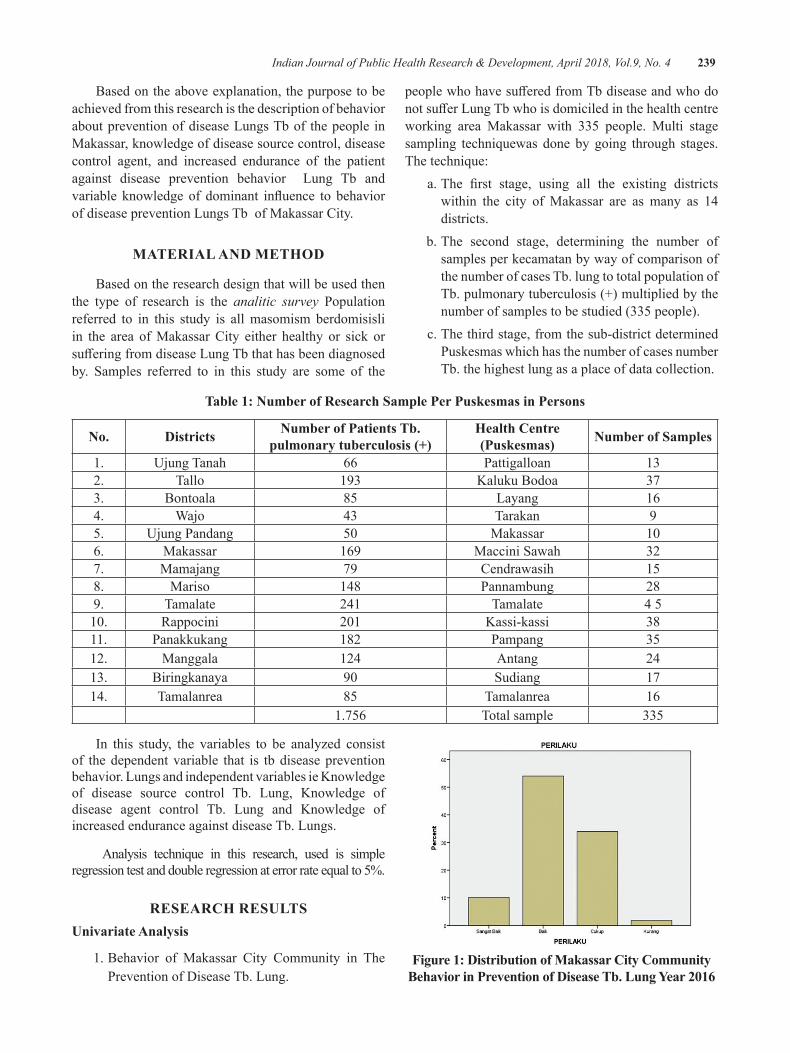
Indian Journal of Public Health Research & Development, April 2018, Vol.9, No. 4 239
Based on the above explanation, the purpose to be achieved from this research is the description of behavior about prevention of disease Lungs Tb of the people in Makassar, knowledge of disease source control, disease control agent, and increased endurance of the patient against disease prevention behavior Lung Tb and variable knowledgeof dominant influence to behaviorof disease prevention Lungs Tb of Makassar City.
MATeRIAl ANd MeThOd
Based on the research design that will be used then the type of research is the analitic survey Population referred to in this study is all masomism berdomisisli in the area of Makassar City either healthy or sick or sufferingfromdiseaseLungTbthathasbeendiagnosedby. Samples referred to in this study are some of the
peoplewhohavesufferedfromTbdiseaseandwhodonotsufferLungTbwhoisdomiciledinthehealthcentreworking area Makassar with 335 people. Multi stage sampling techniquewas done by going through stages. The technique: a.The first stage, using all the existing districts
within the city of Makassar are as many as 14 districts.
b. The second stage, determining the number of samples per kecamatan by way of comparison of the number of cases Tb. lung to total population of Tb. pulmonary tuberculosis (+) multiplied by the number of samples to be studied (335 people).
c. The third stage, from the sub-district determined Puskesmas which has the number of cases number Tb. the highest lung as a place of data collection.
Table 1: Number of Research Sample Per Puskesmas in Persons
No. districts Number of Patients Tb. pulmonary tuberculosis (+)
health Centre (Puskesmas) Number of Samples
1. Ujung Tanah 66 Pattigalloan 132. Tallo 193 Kaluku Bodoa 373. Bontoala 85 Layang 164. Wajo 43 Tarakan 95. Ujung Pandang 50 Makassar 106. Makassar 169 Maccini Sawah 327. Mamajang 79 Cendrawasih 158. Mariso 148 Pannambung 289. Tamalate 241 Tamalate 4 510. Rappocini 201 Kassi-kassi 3811. Panakkukang 182 Pampang 3512. Manggala 124 Antang 2413. Biringkanaya 90 Sudiang 1714. Tamalanrea 85 Tamalanrea 16 1.756 Total sample 335
In this study, the variables to be analyzed consist of the dependent variable that is tb disease prevention behavior. Lungs and independent variables ie Knowledge of disease source control Tb. Lung, Knowledge of disease agent control Tb. Lung and Knowledge of increased endurance against disease Tb. Lungs.
Analysis technique in this research, used is simple regression test and double regression at error rate equal to 5%.
ReSeARCh ReSulTSunivariate Analysis
1. Behavior of Makassar City Community in The Prevention of Disease Tb. Lung.
Figure 1: distribution of Makassar City Community Behavior in Prevention of Disease Tb. Lung Year 2016
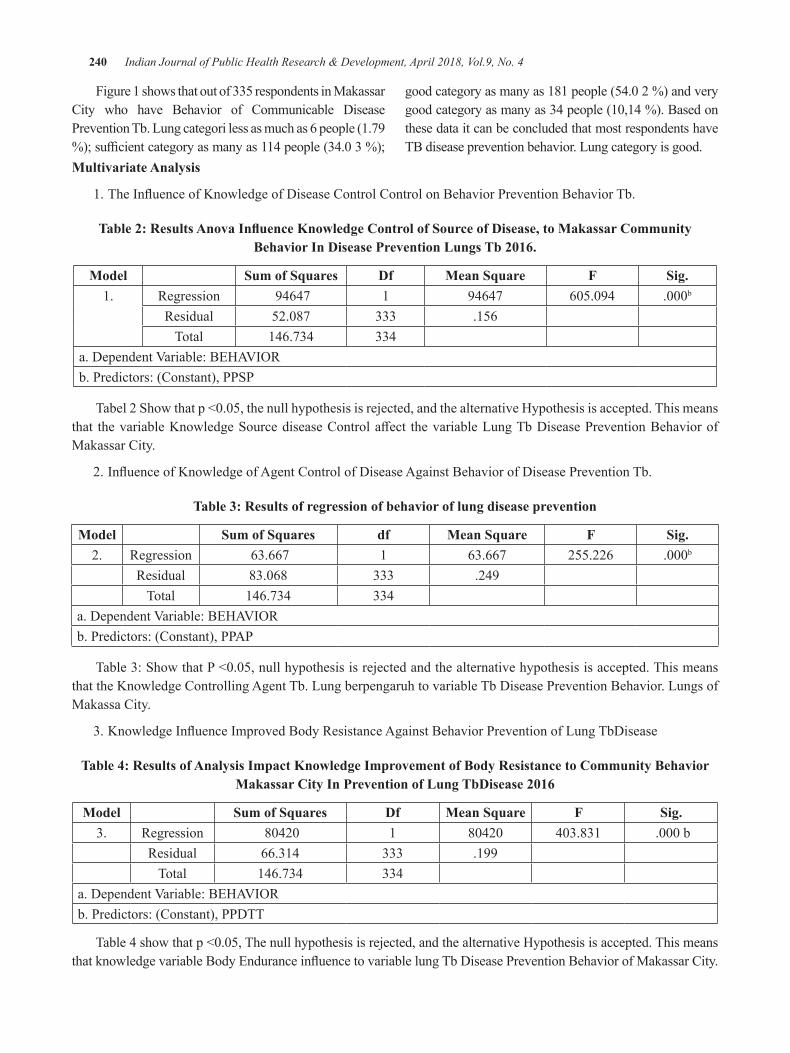
240 Indian Journal of Public Health Research & Development, April 2018, Vol.9, No. 4
Figure 1 shows that out of 335 respondents in Makassar City who have Behavior of Communicable Disease Prevention Tb. Lung categori less as much as 6 people (1.79 %);sufficientcategoryasmanyas114people(34.03%);
goodcategoryasmanyas181people(54.02%)andverygoodcategoryasmanyas34people(10,14%).Basedonthese data it can be concluded that most respondents have TB disease prevention behavior. Lung category is good.
Multivariate Analysis
1.TheInfluenceofKnowledgeofDiseaseControlControlonBehaviorPreventionBehaviorTb.
Table 2: Results Anova Influence Knowledge Control of Source of Disease, to Makassar Community Behavior In Disease Prevention Lungs Tb 2016.
Model Sum of Squares df Mean Square F Sig.1. Regression 94647 1 94647 605.094 .000b
Residual 52.087 333 .156Total 146.734 334
a.DependentVariable:BEHAVIORb. Predictors: (Constant), PPSP
Tabel2Showthatp<0.05,thenullhypothesisisrejected,andthealternativeHypothesisisaccepted.Thismeansthat thevariableKnowledgeSourcediseaseControlaffect thevariableLungTbDiseasePreventionBehaviorofMakassar City.
2.InfluenceofKnowledgeofAgentControlofDiseaseAgainstBehaviorofDiseasePreventionTb.
Table 3: Results of regression of behavior of lung disease prevention
Model Sum of Squares df Mean Square F Sig.2. Regression 63.667 1 63.667 255.226 .000b
Residual 83.068 333 .249Total 146.734 334
a.DependentVariable:BEHAVIORb. Predictors: (Constant), PPAP
Table3:ShowthatP<0.05,nullhypothesisisrejectedandthealternativehypothesisisaccepted.Thismeansthat the Knowledge Controlling Agent Tb. Lung berpengaruh to variable Tb Disease Prevention Behavior. Lungs of Makassa City.
3.KnowledgeInfluenceImprovedBodyResistanceAgainstBehaviorPreventionofLungTbDisease
Table 4: Results of Analysis Impact Knowledge Improvement of body Resistance to Community behavior Makassar City In Prevention of Lung TbDisease 2016
Model Sum of Squares df Mean Square F Sig.3. Regression 80420 1 80420 403.831 .000b
Residual 66.314 333 .199Total 146.734 334
a.DependentVariable:BEHAVIORb. Predictors: (Constant), PPDTT
Table4showthatp<0.05,Thenullhypothesisisrejected,andthealternativeHypothesisisaccepted.ThismeansthatknowledgevariableBodyEnduranceinfluencetovariablelungTbDiseasePreventionBehaviorofMakassarCity.
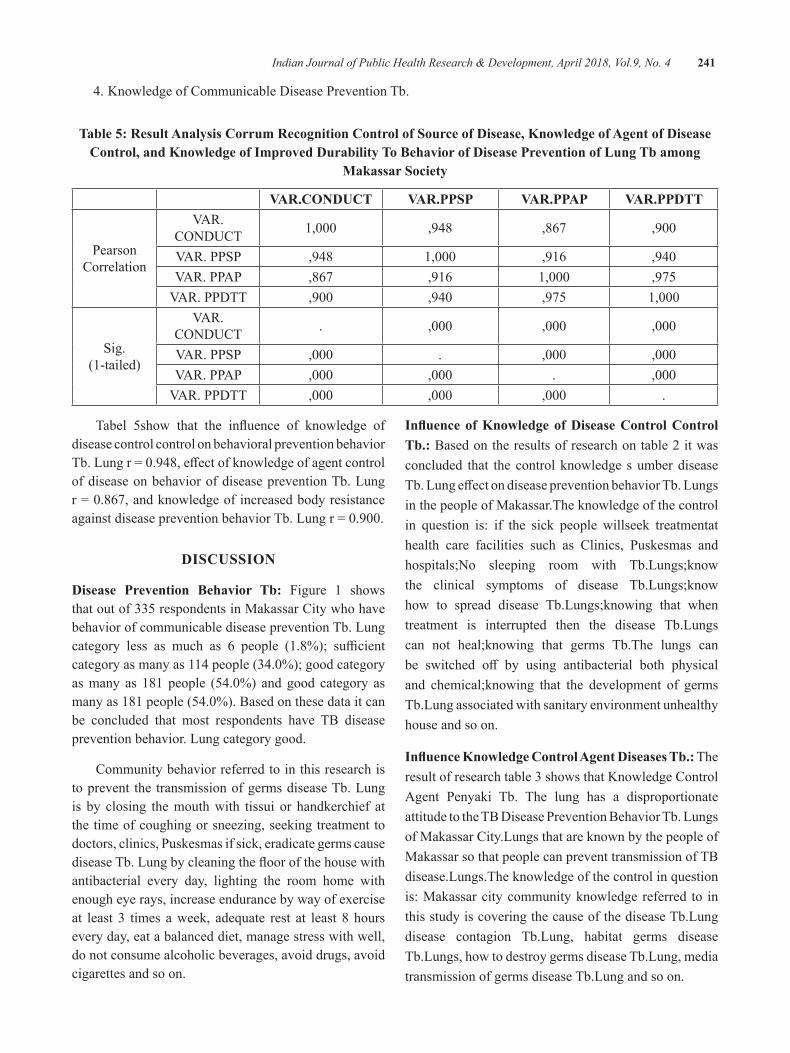
Indian Journal of Public Health Research & Development, April 2018, Vol.9, No. 4 241
4. Knowledge of Communicable Disease Prevention Tb.
Table 5: Result Analysis Corrum Recognition Control of Source of disease, Knowledge of Agent of disease Control, and Knowledge of Improved durability To behavior of disease Prevention of lung Tb among
Makassar Society
VAR.CONduCT VAR.PPSP VAR.PPAP VAR.PPdTT
Pearson Correlation
VAR.CONDUCT 1,000 ,948 ,867 ,900
VAR.PPSP ,948 1,000 ,916 ,940VAR.PPAP ,867 ,916 1,000 ,975VAR.PPDTT ,900 ,940 ,975 1,000
Sig. (1-tailed)
VAR.CONDUCT . ,000 ,000 ,000
VAR.PPSP ,000 . ,000 ,000VAR.PPAP ,000 ,000 . ,000VAR.PPDTT ,000 ,000 ,000 .
Tabel 5show that the influence of knowledge ofdisease control control on behavioral prevention behavior Tb.Lungr=0.948,effectofknowledgeofagentcontrolof disease on behavior of disease prevention Tb. Lung r=0.867,andknowledgeofincreasedbodyresistanceagainstdiseasepreventionbehaviorTb.Lungr=0.900.
dISCuSSION
disease Prevention behavior Tb: Figure 1 shows that out of 335 respondents in Makassar City who have behavior of communicable disease prevention Tb. Lung category less as much as 6 people (1.8%); sufficientcategoryasmanyas114people(34.0%);goodcategoryasmany as 181people (54.0%) andgood category asmanyas181people(54.0%).Basedonthesedataitcanbe concluded that most respondents have TB disease prevention behavior. Lung category good.
Community behavior referred to in this research is to prevent the transmission of germs disease Tb. Lung is by closing the mouth with tissui or handkerchief at the time of coughing or sneezing, seeking treatment to doctors, clinics, Puskesmas if sick, eradicate germs cause diseaseTb.Lungbycleaningthefloorofthehousewithantibacterial every day, lighting the room home with enough eye rays, increase endurance by way of exercise at least 3 times a week, adequate rest at least 8 hours every day, eat a balanced diet, manage stress with well, do not consume alcoholic beverages, avoid drugs, avoid cigarettes and so on.
Influence of Knowledge of Disease Control Control Tb.: Based on the results of research on table 2 it was concluded that the control knowledge s umber disease Tb.LungeffectondiseasepreventionbehaviorTb.Lungsin the people of Makassar.The knowledge of the control in question is: if the sick people willseek treatmentat health care facilities such as Clinics, Puskesmas and hospitals;No sleeping room with Tb.Lungs;know the clinical symptoms of disease Tb.Lungs;know how to spread disease Tb.Lungs;knowing that when treatment is interrupted then the disease Tb.Lungs can not heal;knowing that germs Tb.The lungs can be switched off by using antibacterial both physicaland chemical;knowing that the development of germs Tb.Lung associated with sanitary environment unhealthy house and so on.
Influence Knowledge Control Agent Diseases Tb.: The result of research table 3 shows that Knowledge Control Agent Penyaki Tb. The lung has a disproportionate attitude to the TB Disease Prevention Behavior Tb. Lungs of Makassar City.Lungs that are known by the people of Makassar so that people can prevent transmission of TB disease.Lungs.The knowledge of the control in question is: Makassar city community knowledge referred to in this study is covering the cause of the disease Tb.Lung disease contagion Tb.Lung, habitat germs disease Tb.Lungs, how to destroy germs disease Tb.Lung, media transmission of germs disease Tb.Lung and so on.
242 Indian Journal of Public Health Research & Development, April 2018, Vol.9, No. 4
Influence of Knowledge Increased Body Resistance diseases Tb: Results of the study showed that tabel 4 Knowledge level Body Endurance affect againstTb Disease Prevention Behavior of Makassarcity community.Knowledge of increasing body endurance is an effort to increasebody resistanceagainstdiseaseLung Tb is known by the people of Makassar so that people can prevent the transmitters of diseaseofLungs Tb and due to the environment sanitation7.
The results mentioned above,in line with some research results have been reported, among others: Hamidi H8,in the results of his research suggests that there is a relationship between knowledge prevention disease Lung Tbwith incidence Lungs Tbin children aged0-14yearsoldpeopleSalatiga.HerdaA9 there is a significant relationship between the level of knowledgewith the compliance of patients with pulmonary Tb in Pekakesmas Pekauman Banjarmasin. This means that the better the level of knowledge of the patient to the disease, the mode of transmission and treatment of Lung Tb will be the better the compliance, and vice versa. Lung Glugur community of Medan. This means that the higher the level of knowledge of drug consumption the more obedient the patient in drug consumption or vice versa10,11.
CONCluSION
Based on the results of research and discussion on this study, it can be concluded that g behavior prevention behavior of Tb. The lungs of the people of Makassar are generally good category, knowledge of disease source Tbcontrol.LungeffectondiseasepreventionbehaviorLungTb of Makassar City, knowledge of disease agent control Lung Tbeffect on disease prevention behaviorTb. Lung of Makassar city, knowledge of body resistance against disease Lung Tb effect on disease preventionbehavior Lungs Tb of Makassar City, a variable that is veryinfluentialondiseasepreventionbehaviorTb.Thelungs of the people of Makassar City are the knowledge of controlling the disease source LungTb, further knowledge of increased body resistance against disease Lung Tb and finally the knowledge of agent diseasecontrol Lungs Tb.
ethical Clearance: Taken from the Campus committee and the agreement with the respondents
Source of Funding: This research was funded by authors their selves
Conflict of Interest: Authors declare that there is no any conflictofinterest.
ReFeReNCeS 1.Ministry of Health (2015). Ministry of Health
StrategyPlan2015-2019. 2.Dinkes Prov. Sul-Sel (2010).Health Profile of
South Sulawesi Province.http://www.google.com./search.RetrievedFebruary10,2013.
3.MediaY(2012).Knowledge,AttitudesandBehaviorof Communities Who Bekaitan With Disease (Tb) Lung at Puskesmas Koto Katik Padang Panjang (Sumatera Barat) https://www.google.com/search. DiaksesdatedFebruary3,2013.
4. Syamsiar S. Russeng, Lalu Muhammad saleh, Devintha Virani, Ade Wira Listrianti Latief,AnwarMallongi.,2018.TheInvestigationoftheLactic Acid Change among employee of national electrical Power Plan. Indian Journal of PublicHealthResearch&Development,January2018,Vol.9,No.1
5.Notoatmodjo S, (2010).Science of HealthBehavior.Jakarta.RinekaCipta.
6.NotoatmodjoS, (2013).PublicHealthScience&Art.Jakarta:RinekaCipta.
7. Anwar Mallongi, Ruslan La Ane and Agus Bintara Birawida,2017.Ecologicalrisksofcontaminatedlead and the potential health risks among school children inMakassar coastal area, Indonesia. J.Environ.Sci.Technol.,10:283-289.
8.Hamidi H. (2010). Relationship BetweenKnowledge , Attitudes, And Mother Behavior About Prevention of Lung Disease With Pediatric LungTB0-14YearsAtLungDiseaseTreatmentCenter of Salatiga City. Department of Public Health Sciences. Faculty of Arts Science . Universita Negeri Semarang. Retrieved http://lib.unnes.ac.id/608/1/7310.pdf
9.HerdaA.(2016).KnowledgeLevelRelationshipsWith Compliance In Treatment Of PulmonaryTuberculosis At Pekakesmas Pekauman Banjarmasin, South Kalimantan . Journal ofPharmascienceVol.3No.2.accessed
10.Masriadi Idrus, Anwar Mallongi and JulianiIbrahim, 2017. Surveillance system model forpulmonary tuberculosis suspected in Pangkep region,Indonesia. Curr. Res. Tuberculosis, 9: 1-7.
11.Robby Kayame, Anwar Mallongi., 2018.Relationships between smoking Habits and the Hypertension occurrence among the Adults of Communities in Paniai Regency, Papua Indonesia. Indian Journal of Public Health Research &Development,January2018,Vol.9,No.1
evaluation of Irrigation Performance in Semangga, Merauke Regency, Indonesia
yosehi Mekiuw1, diana Sri Susanti2, Jayadi3
1University of Musamus, Faculty of Agriculture, Study Program of Agricultural Engineering; 2University of Musamus, Faculty of Agriculture, Study Program of Agricultural; 3University of Musamus,
Faculty of Engineering, Study Program of Electro
AbSTRACT
Agriculture is an important sector in developing economy, because it has a role as the sources of food, energy,andthesourcesofavillage’seconomy.Oneof thegovernment’spriorityprogramsinIndonesiais the agricultural sector and Meraukeis one of the areas for the development. Merauke is proclaimed as the national food barn for rice crops. The objective of this study is to evaluate the irrigation’s facilities. Sampling survey was conducted to observe the parameters researched. The primary data were obtained from the research survey by observing the physical condition of irrigation facilities directly. The obtained were analyzed and evaluated to assess the work system of the irrigation facilities. Based on the result, the effectivenessoftheirrigationnetworkintheareaisgood.However,thephysicalconditionofthenetworkisbad.Onaverage,therewas40%damageonthenetworkandtheoperationandmaintenancescorewaslessthan1(from1-10)basedonIndonesianstandard.Basedontheevaluationresult,Indonesiangovernmentshould develop the irrigation network to realize Merauke’s role as the national food barn.
Keywords: Merauke, rainfed rice field, simple irrigation
INTROduCTION
Agriculture is an important sector in developing economy, because it has a role as the sources of food, energy, and the sources of a village’s economy. Rice-based agricultural sector development is not only a national issue but also an international issue. This statement is in linewithFAOSTAT’s (2014)statementin Sali and Monaco1 that stated rice is one of the superior food crops and rice field development is a strategicactivity for some countries in the world2. The relation between rice-based agricultural system and the villagers in Asia, Latin America, and Africa, where the agricultural sector has a prominent role, is very close. According to Wachyuni, et al.3 the role of agricultural sector is very strategic in national economy, so irrigation as one of the elements that supports the successful agricultural development has a very important role. This idea is also stated by Munir, et al; Mallongi A.4,5, irrigation is one of the main needs in cropland agriculture. A good irrigation system is expected to meet the need of water for crops andfields.Therefore,theproductivitywillincrease.
One of the government’s priority programs inIndonesia is the agricultural sector and Merauke becomes one of the areas for the development. Merauke is proclaimed as the national food barn for rice crops. Rice is a crop that needs a lot of water in its vegetative phase until its generative phase. For this reason, water supply is the focus in realizing Merauke as the national food barn. Indonesia has wide agricultural land and it has the potential to achieve food security in Papua. Indonesian government has announced Merauke Integrated Food andEnergyEstateprogramin2007,becausericeisthemain food for most Indonesian people6.
The agricultural land in Merauke is rainfed land. The main water source of the irrigation for the cropland inSemanggaAreaisfromtheeffectiveprecipitationandthewaterthatisaccommodatedinthefieldreservoirorlong storage 7. According to Hendrisman and Djaenudin8, thewatersupplyinMeraukeisaffectedbytheclimatecondition. Merauke has a very clear climate between wetseasonanddryseason.Theratherspecificclimatecharacteristicwithprecipitationthatoccursisinfluenced
DOI Number: 10.5958/0976-5506.2018.00291.7
244 Indian Journal of Public Health Research & Development, April 2018, Vol.9, No. 4
by monsoon winds, both west-northwest monsoon (wet monsoon) and east-southeast monsoon (dry monsoon), and the topography and elevation conditions.
Based on the irrigation network’s complete facilities inMerauke,itisclassifiedasasimpleirrigationnetwork.Therefore, in order to maintain the cropland’ productivity, there must be adequate water supply, both from the sides of water resource and the irrigation’s facilities. The facilities in the ricefields shouldworkeffectivelyandefficiently so that the rice fields’ productivity will beoptimized.
The objective of this study is evaluating the irrigation’s facilities in Semangga area, so that an illustration can be given to the government as a consideration in making decision about the development of cropland. The evaluation of irrigation system’s performance can also be a recommendation for fixingand improving the irrigation system’s performance in order to realize Merauke as the national food barn.
MATeRIAl ANd MeThOd
The research was conducted within one month (May–June 2017), in Semangga District, MeraukeRegency, Papua Province, Indonesia. The tools used during the research were GPS, camera, and measuring roller. Sampling survey was employed as the research method by observing the parameters researched. The primary data were obtained from the research survey by observing the physical condition of irrigation facilities directly. There were primary channel, secondary channel, drainage channel, sluice gate, long storage and reservoir. Then, the data that had been gathered were analyzed and evaluated to assess the work system of the irrigation facilities. The steps in conducting the research are listed below:
1. Determining the spot to take sample that was done by using areal indicator including the irrigated area and the planted area, the intensity of planting, the intensity of irrigation, and the ease of transportation access. Determining the spot to take the sample was done by conducting a survey.
2. The evaluation of irrigation network on the spot of taking sample was done by assessing the effectiveness indicators of facilities ormaintenance of the irrigation including:
(a)The effectiveness of the irrigation networkfacility (%) is the comparison between the number of the operating buildings or channels and the total number of buildings/ channels.9
(b) The physical condition of irrigation network (%) is the number of the network’s primary building’s condition, building’s condition for and of tapping network, network channel’s condition, disposal channel’s condition, and building’s condition of the disposal channel.10
(c) The evaluation of the operation performance and maintenance of the irrigation system. The evaluation of the operation performance and maintenance of the irrigation system was based on some parameters including: functional performance of irrigation network infrastructure (the physical condition of irrigation network infrastructure and functional condition of irrigation network infrastructure), water supply performance (water adequacy level and water supply accuracy level), government’s institution performance or institutional and human resource management and farmer institution performance.11
According to Munir,et.,al.4 the evaluation of operation performance and maintenance of an irrigation system is based on some parameters, including: functional performance of irrigation network infrastructure (the physical condition of irrigation network infrastructure and functional condition of irrigation network infrastructure), water supply performance (water adequacy level and water supply accuracy level), government’s institution performance or institutional and human resource management and farmer institution performance. These parametersarethenscoredby0–100%andratedby1– 4. Based on the Ministry Regulation Number 32 Year 2007onthephysicalconditionofanirrigationnetworkinfrastructure, the irrigation network infrastructure is classifiedinto4classes;
1. Irrigation network infrastructure condition with damagelevellessthan10%iscategorizedinthevery good criteria.
2. Irrigation network infrastructure condition with damagelevel10–20%iscategorizedintheverygood criteria.
3. Irrigation network infrastructure condition with damage level 21–40% is categorized in the badcriteria.
4. Irrigation network infrastructure condition with damagelevelmorethan40%iscategorizedinthevery bad criteria.
According to Setyawan11, evaluation of operation performance and maintenance of irrigation system are based on some parameters including functional

Indian Journal of Public Health Research & Development, April 2018, Vol.9, No. 4 245
performance of the irrigation network infrastructure (the physical condition of irrigation network infrastructure and functional condition of irrigation network infrastructure).Theseparametersarescoredby0–100%andratedby1–4,orclassifiedas;
1. Irrigation system operation and maintenance in very good criteria: score 3–4.
2. Irrigation system operation and maintenance in good criteria: score 2–2.9.
3. Irrigation system operation and maintenance in medium criteria: score 1–1.9.
4. Irrigation system operation and maintenance in badcriteria:score<1.
ReSulT ANd dISCuSSION
TheareaofSemanggais32,695.06hawhichhaswetland potential of 31,735 ha 12. Based on the morphological conditionoftheland,Semanggaareahasflatlandandtheslopeislessthan2%withfinesoiltexture8.
Manikmas, et al.12 stated that some channels have been built in the location including Semangga District. The total number of irrigation network in the food central area (Semangga District, Tanah Miring, Kurik) is shown on Table 1 and it shows that there was 5% irrigation facilityadditioninnineyears(2006–2015)whichmeansthat the improvement for the irrigation is needed.
Table 1: Irrigation Network data in Food Central Area
Irrigation Network 2006 2015Prmary Irrigation Channel 235,895 km 346,245 km
Secondary Irrigation Channel 446,631 km 736,071kmTertiary Irrigation Channel 108,868km 108,868km
Drainage Channel 6,650km 6,650kmFlood embankment 93,450km 221,700km
Sluice gate 151 151Water distriburion box 308 308
Pumping Station - 2Reservoir 2 2
Based on the result of the survey, the irrigation network in the area is a simple irrigation network. According toKP-01,13 simple irrigation network is an irrigation network that does not have permanent intake box, the irrigation channels are made from soil, the water distribution is not regulated and measured, the excessing waterwillflowtothewaterdisposal,irrigationchanneland water disposal channel are not separated and the
farmers using the water are from the same social class. The main irrigation building is not a permanent building. Its ability to measure and regulate the water debit is low. The irrigation channels and the water disposal channels are not separated. There is no tertiary network being developed.Then, the total efficiency is less than 40%andtheirrigatedareaislessthan500ha.Theresultofthe irrigation network survey is shown in Table 2.
Table 2: The average condition of irrigation network in Semangga Area
Irrigation Network Physical Condition Effectiveness (%) Physical Condition (%)Primary Channel functioning/very dirty 100 100
Secondary Channel functioning/very dirty 100 100Drainage Channel functioning/very dirty 100 100
Sluice Gate 6 not functioning/dirty, 4 functioning/dirty 40 60
Reservoir functioning/dirty 100 100Long Storage functioning/ dirty 100 100
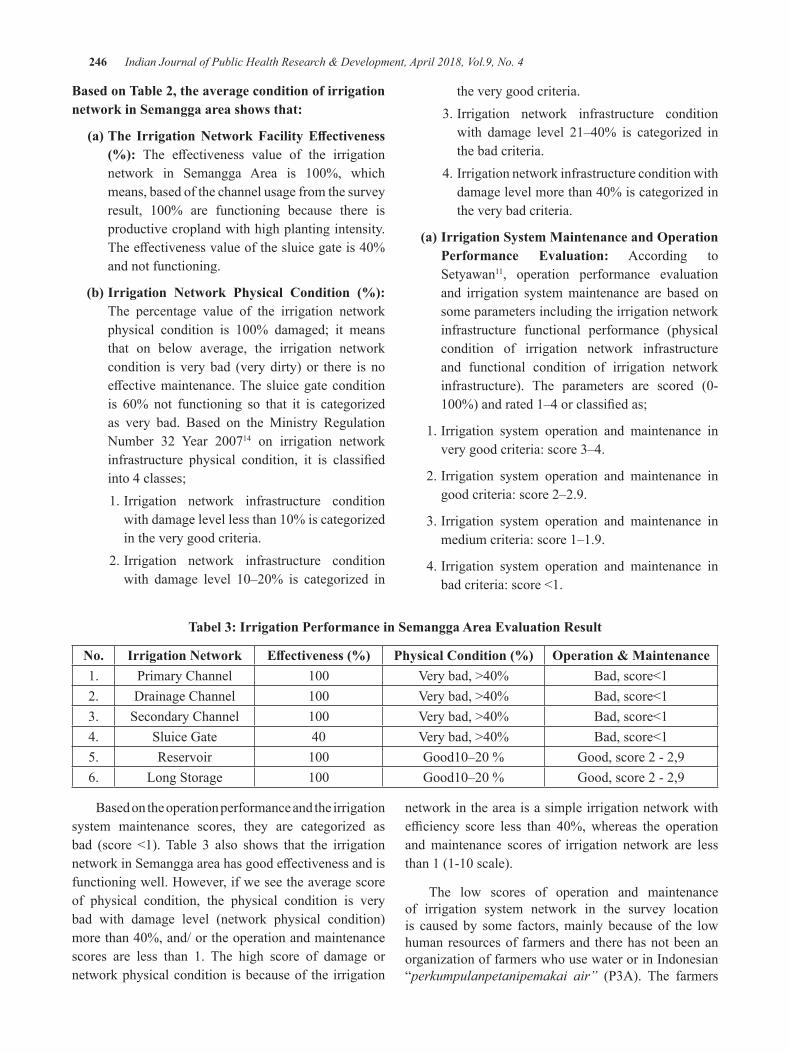
246 Indian Journal of Public Health Research & Development, April 2018, Vol.9, No. 4
based on Table 2, the average condition of irrigation network in Semangga area shows that:
(a) The Irrigation Network Facility Effectiveness (%): The effectiveness value of the irrigationnetwork in Semangga Area is 100%, whichmeans, based of the channel usage from the survey result, 100% are functioning because there isproductive cropland with high planting intensity. Theeffectivenessvalueofthesluicegateis40%and not functioning.
(b) Irrigation Network Physical Condition (%): The percentage value of the irrigation network physical condition is 100% damaged; it meansthat on below average, the irrigation network condition is very bad (very dirty) or there is no effectivemaintenance.Thesluicegateconditionis 60% not functioning so that it is categorizedas very bad. Based on the Ministry Regulation Number 32 Year 200714 on irrigation network infrastructure physical condition, it is classifiedinto 4 classes;
1. Irrigation network infrastructure condition withdamagelevellessthan10%iscategorizedin the very good criteria.
2. Irrigation network infrastructure condition with damage level 10–20% is categorized in
the very good criteria. 3. Irrigation network infrastructure condition
with damage level 21–40% is categorized inthe bad criteria.
4. Irrigation network infrastructure condition with damagelevelmorethan40%iscategorizedinthe very bad criteria.
(a) Irrigation System Maintenance and Operation Performance evaluation: According to Setyawan11, operation performance evaluation and irrigation system maintenance are based on some parameters including the irrigation network infrastructure functional performance (physical condition of irrigation network infrastructure and functional condition of irrigation network infrastructure). The parameters are scored (0-100%)andrated1–4orclassifiedas;
1. Irrigation system operation and maintenance in very good criteria: score 3–4.
2. Irrigation system operation and maintenance in good criteria: score 2–2.9.
3. Irrigation system operation and maintenance in medium criteria: score 1–1.9.
4. Irrigation system operation and maintenance in badcriteria:score<1.
Tabel 3: Irrigation Performance in Semangga Area evaluation Result
No. Irrigation Network Effectiveness (%) Physical Condition (%) Operation & Maintenance1. Primary Channel 100 Verybad,>40% Bad,score<12. Drainage Channel 100 Verybad,>40% Bad,score<13. Secondary Channel 100 Verybad,>40% Bad,score<14. Sluice Gate 40 Verybad,>40% Bad,score<15. Reservoir 100 Good10–20% Good, score 2 - 2,96. Long Storage 100 Good10–20% Good, score 2 - 2,9
Based on the operation performance and the irrigation system maintenance scores, they are categorized as bad (score <1). Table 3 also shows that the irrigationnetworkinSemanggaareahasgoodeffectivenessandisfunctioning well. However, if we see the average score of physical condition, the physical condition is very bad with damage level (network physical condition) morethan40%,and/ortheoperationandmaintenancescores are less than 1. The high score of damage or network physical condition is because of the irrigation
network in the area is a simple irrigation network with efficiency score less than 40%,whereas the operationand maintenance scores of irrigation network are less than1(1-10scale).
The low scores of operation and maintenance of irrigation system network in the survey location is caused by some factors, mainly because of the low human resources of farmers and there has not been an organization of farmers who use water or in Indonesian “perkumpulanpetanipemakai air” (P3A). The farmers
Indian Journal of Public Health Research & Development, April 2018, Vol.9, No. 4 247
are still solitary and there has not been guidance from the government. Chaundhry15 stated that in the improvement of the water usage efficiency in irrigation, the activerole from the government and farmers is needed. The government will give full responsibility to the farmers or to the association of farmers who use water in managing the water for irrigation in a form of Irrigation Management Transfer (IMT), Participatory Irrigation Management (PIM), and Farmer Managed Irrigation Systems (FMIS). The government has to give full responsibility to the farmers or the association of farmers who use water to effectivelymanagethelocalwaterresourceormanagethe irrigation system maintenance fund.
According to Munir, et.,all4 irrigation management is one of the main supporting sectors for the successful agriculture development, mainly in improving the food production, especially rice crops. The lack of concern on the irrigation facilities will not be able to make Merauke as the national food barn and healthier communities with a good sanitation16,17.
CONCluSION ANd SuggeSTION
Based on the result of the research, the irrigation network in Semangga area is functioning well and effectively. However, the average physical conditionis still very bad with damage level (network physical condition) is more than 40% and/ or the operationand maintenance scores are less than 1. Based on the evaluation in this research, the Indonesian government has to improve the irrigation network system to make Merauke as the national food barn.
ethical Clearance: The ethical clearance was taken from Faculty committee and community agreement involved on this study.
Source of Funding: The funding of this research comes from all authors’ contribution and Musamus University
Conflict of Interest: Authors declares that there is no anyconflictofinterestwithinthisresearch
ReFeReNCeS
1.Sali,GandMonaco,F.2018.Howwateramountsand management options drive Irrigation Water Productivity of rice. Agricultural Water Management,Volume195,1January2018.
2. Mallongi, A., P. Pataranawat and P. Parkian, 2014. Mercury emission from artisanal buladu
gold mine and its bioaccumulation in rice grain, Gorontalo Province, Indonesia, Adv. Mater. Res., 931-932: 744-748
3.Wachyuni, S., Wiyono,A., Rismanto. 2013.Peranserta petani dalam operasi dan pemeliharaan Infrastruktur jaringan irigasi dengan pendekatan Theory of planned behavior (TPB) (studi kasus : daerah irigasiciraseaKabupatenBandung,JawaBarat).JurnalSosioteknologiEdisi30.http://oaji.net/articles/2015/1967-1430791308.pdf.
4.Munir,A.P.,Sumono.,Sebayang,S.M.2014.TheOperationWorkEvaluation andMaintenance ofMedan Krio Irrigation System in Sunggal District Deli Serdang Regency.KeteknikanPertanianJ.RekayasaPangandan Pert., Vol.2 No. 3.https://jurnal.usu.ac.id/index.php/jrpp/article/viewFile/Muhammad%20Satria%20Sebayang/pdf
5. Anwar Mallongi, Ruslan La Ane and Agus Bintara Birawida,2017.Ecologicalrisksofcontaminatedlead and the potential health risks among school children inMakassar coastal area, Indonesia. J.Environ.Sci.Technol.,10:283-289.
6. Prahesti,R,R., at all.2017.TheAssessmentofSoilQuality at Paddy Fields in Merauke, Indonesia. BulgarianJournalofAgriculturalScience,23(No3)2017,443–448AgriculturalAcademy.
7.Mekiuw,Y.,2013. StudiNeraca Air WadukLapangan (long storage)diDesaSemanggaJayaKabupaten Merauke. Jurnal Agricola FakultasPertanian Universitas Musamus, volume 3, Nomor 2, Sepetember 2013 .Merauke. http://ejournal.unmus.ac.id/ index. php/agricola/article/view/120/82
8.Hendrisman,MdanDjaenudin,D. 2008. ProspekPengembangan Tanaman Pangan Lahan Kering DiKabupatenMerauke.JurnalLitbangPertanian.http://pustaka.litbang.pertanian.go.id/publikasi/p3272083.pdf
9. Snellen.W.B.,dkk. 1996. Metodologi Untuk Menilai Keragaan Pengelolaan Irigasi dan Drainase. Jurnal VISI Irigasi Indonesia.PSI-UNAND. Padang.
10.Balitbang PU, 2012. Operasidan PemeliharaanIrigasi Partisipatif di Chea. Kementerian PekerjaanUmumRepublikIndonesia,Jakarta.
248 Indian Journal of Public Health Research & Development, April 2018, Vol.9, No. 4
11.Setyawan, C., S. Susanto dan Sukirno., 2011.EvaluasiKinerjaSistemIrigasi. JurnalTeknotanVol.7,No.2.
12.Manikmas.,M.O.,dkk.2007. PengembanganMaster dan Business Plan Merauke Integrated Rice Estate (MIRE).PT.Ekistindo Prima Konsultan.
13.KP-01. 1986. Kementerian Pekerjaan UmumDirektorat JenderalSumberDayaAirDirektoratIrigasi dan Rawa, Kriteria perencanaan Bagian Jaringan Irigasi. http://www.cs.unsyiah.ac.id/ ~frdaus/ Penelusuran Informasi /File-Pdf/kp-01-1986.pdf
14. Peraturan Menteri Pekerjaan Umum No. 32 Tahun 2007,TentangPenyelenggaraanOperasi JaringanIrigasi.
15.Chaudhry,Anita M. 2017. Improving on-farmwater use efficiency: Role of collective actioninirrigation management.Water Resources and Economics.
16.PeraturanPemerintahNo.20Tahun2006TentangIrigasi.
17.Anwar Mallongi, Veni Hadju, Ruslan La Ane,Agus Bintara Birawida, A.L. Rantetampang, Moehammad Iqbal Sultan, M. Nadjib Bustan, Hasnawati Amqan, Noer Bahri Noor and Apollo, 2017. Assessing the Target Hazard Risks ofCadmium Pollutant due to Consumption of Aquatic Biota and Food Snack Among School Children in Tallo Coastal Area of Makassar. Research Journal of Toxins, 9: 1-7.
Effectiveness of Non Pharmacologic Therapy through Surveillance Approach to blood Pressure degradation in
Primary hypertension Patients, Indonesia
Masriadi1, Rahmawati Azis1, eha Sumantri2, Anwar Mallongi3
1Department of Epidemiology, 2Department of Nutrition, Institute of Health Science Tamalatea, Makassar; 3Department of Environmental Health, Faculty of Public Health, Hasanuddin University, Makassar Indonesia
AbSTRACT
This study aims to determine the risk factors for hypertension which subsequently carried out intervention efforts.Theeffectivenessoftheinterventioncanbeknownbylookingattheresultsofpre-testandpost-test blood pressure of hypertensive patients. The type of research is pre-experiment with one group pretest posttestdesign.Sampleinthisresearchispatientofprimaryhypertensionthatis70people.DataanalysiswasperformedbyusingWilcoxontestwithα=0.05.Theresultofp-valueonsystolicbloodpressurebeforeandafter interventionwas0.000(<0.05), therewasaneffectontheinterventioneffortonsystolicbloodpressurechange,pvalueatdiastolicbloodpressurebeforeandafterinterventionwas0.000(<0.05),therewasaneffectontheinterventioneffortonchangesinsystolicbloodpressure.Theconclusionoftheresearchresultsistheinterventionofhealthylifestyleeffectivetolowerbloodpressureinpeoplewithhypertension.It is therefore advisable to patients with primary hypertension to always maintain a healthy lifestyle and check blood pressure to health workers regularly so that blood pressure can be controlled.
Keywords: Non Pharmacologic Therapy, Primary Hypertension Risk Factors and Surveillance.
INTROduCTION
The surveillance method applied in accordance with theWHOrecommendationistheStep1methodstatedlifestyle data and risk factors that can be obtained through interviews.1,2,3Masriadi,Agustin,Teti,Masriadi, Jusni,& Marsuki1,4,5 explains that the flow of a nationwidesurveillance system begins with health personnel diagnosing every patient visiting the health facility (Hospital, Puskesmas, Laboratory) patient registration. The data in the registration book are analyzed in order to prepare the report.
In addition, Gunawan L, Masriadi6,7 explains that hypertension is defined as persistent blood pressurewhere the systolic pressure is above 140 mmHg anddiastolic over 90mmHg.While normal systolic bloodpressure 110-140 mmHg and diastole70-90 mmHg.Subkhi, Wahyu8 states that according to the World Health Organization (WHO) and the InternationalSocietyofHypertension (ISH) currently there are600million people with hypertension worldwide, and 3 million of whom die each year. Puspitasari9 states that
AHA (American Heart Association) in America, high blood pressure found one out of every three people or 65 millionpeopleand28%or59millionpeoplesufferingfrom pre-hypertension. According Ekowati Rahajang10, hypertensionsufferersinAsiarecorded38.4millionin2000andispredictedtoincreaseto67.4millionpeopleby2025.Untilnow,hypertensionisstillabigchallengein Indonesia. Imagine, hypertension is a condition that is often found in primary health care health. This is a health problem with a high prevalence of 25.8%, in accordance withRiskesdas2013.11 In addition, hypertension control is inadequate even though effective drugs are widelyavailable.12-15
Data of Maros regency health office in the year,explains that thepatternof10maindiseases inMarosregency, the highest primary hypertension disease is 11.428. The primary hypertension data at Tompobulu Public Health Center Tompobulu Sub-district, Maros regency in2011 is807cases, in2012asmanyas819cases, cases, 2014 asmany as 867 cases, and in2015as many as 957 cases. In the data collection activities conducted in patients with hypertension in Pucak village
DOI Number: 10.5958/0976-5506.2018.00292.9
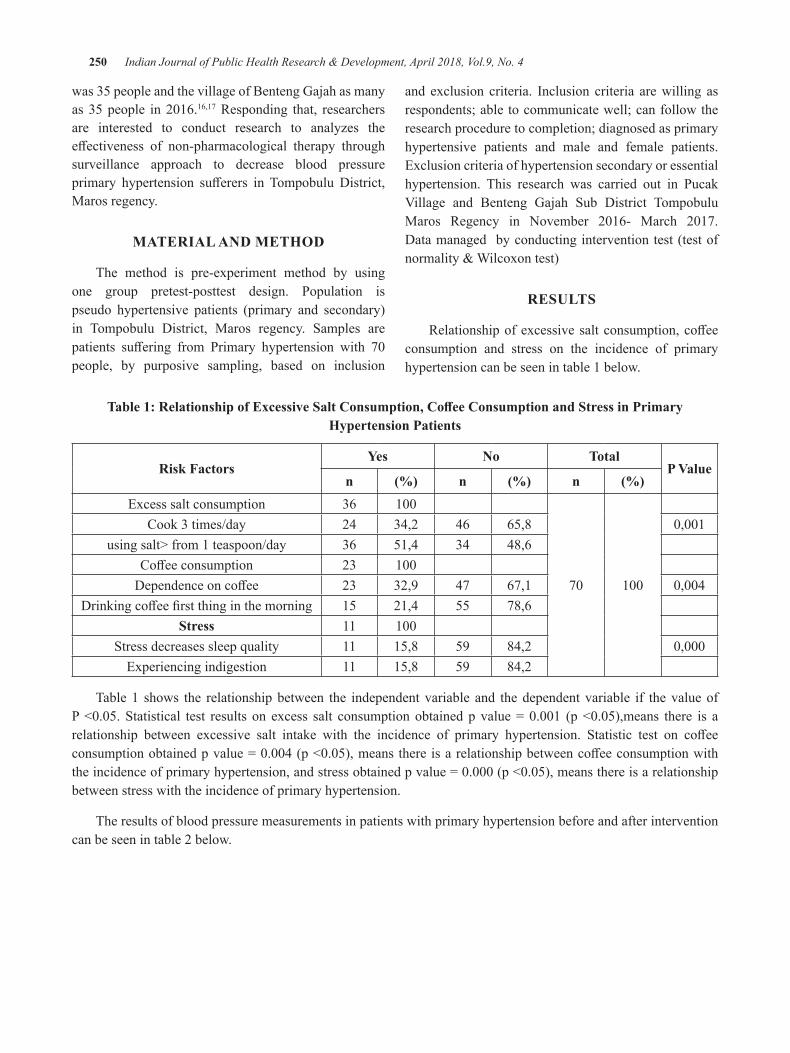
250 Indian Journal of Public Health Research & Development, April 2018, Vol.9, No. 4
was 35 people and the village of Benteng Gajah as many as35people in2016.16,17 Responding that, researchers are interested to conduct research to analyzes the effectiveness of non-pharmacological therapy throughsurveillance approach to decrease blood pressure primary hypertension sufferers in Tompobulu District,Maros regency.
MATeRIAl ANd MeThOd
The method is pre-experiment method by using one group pretest-posttest design. Population is pseudo hypertensive patients (primary and secondary) in Tompobulu District, Maros regency. Samples are patients suffering from Primary hypertension with 70people, by purposive sampling, based on inclusion
and exclusion criteria. Inclusion criteria are willing as respondents; able to communicate well; can follow the research procedure to completion; diagnosed as primary hypertensive patients and male and female patients. Exclusion criteria of hypertension secondary or essential hypertension. This research was carried out in Pucak Village and Benteng Gajah Sub District TompobuluMaros Regency in November 2016- March 2017.Data managed by conducting intervention test (test of normality&Wilcoxontest)
ReSulTS
Relationshipofexcessivesaltconsumption,coffeeconsumption and stress on the incidence of primary hypertension can be seen in table 1 below.
Table 1: Relationship of Excessive Salt Consumption, Coffee Consumption and Stress in Primary hypertension Patients
Risk Factorsyes No Total
P Valuen (%) n (%) n (%)
Excess salt consumption 36 100
70 100
Cook 3 times/day 24 34,2 46 65,8 0,001using salt> from 1 teaspoon/day 36 51,4 34 48,6
Coffeeconsumption 23 100Dependenceoncoffee 23 32,9 47 67,1 0,004
Drinkingcoffeefirstthinginthemorning 15 21,4 55 78,6Stress 11 100
Stress decreases sleep quality 11 15,8 59 84,2 0,000Experiencing indigestion 11 15,8 59 84,2
Table 1 shows the relationship between the independent variable and the dependent variable if the value of P<0.05.Statistical test results on excess salt consumptionobtainedp value=0.001 (p<0.05),means there is arelationship between excessive salt intake with the incidence of primary hypertension. Statistic test on coffeeconsumptionobtainedpvalue=0.004(p<0.05),meansthereisarelationshipbetweencoffeeconsumptionwiththeincidenceofprimaryhypertension,andstressobtainedpvalue=0.000(p<0.05),meansthereisarelationshipbetween stress with the incidence of primary hypertension.
The results of blood pressure measurements in patients with primary hypertension before and after intervention can be seen in table 2 below.
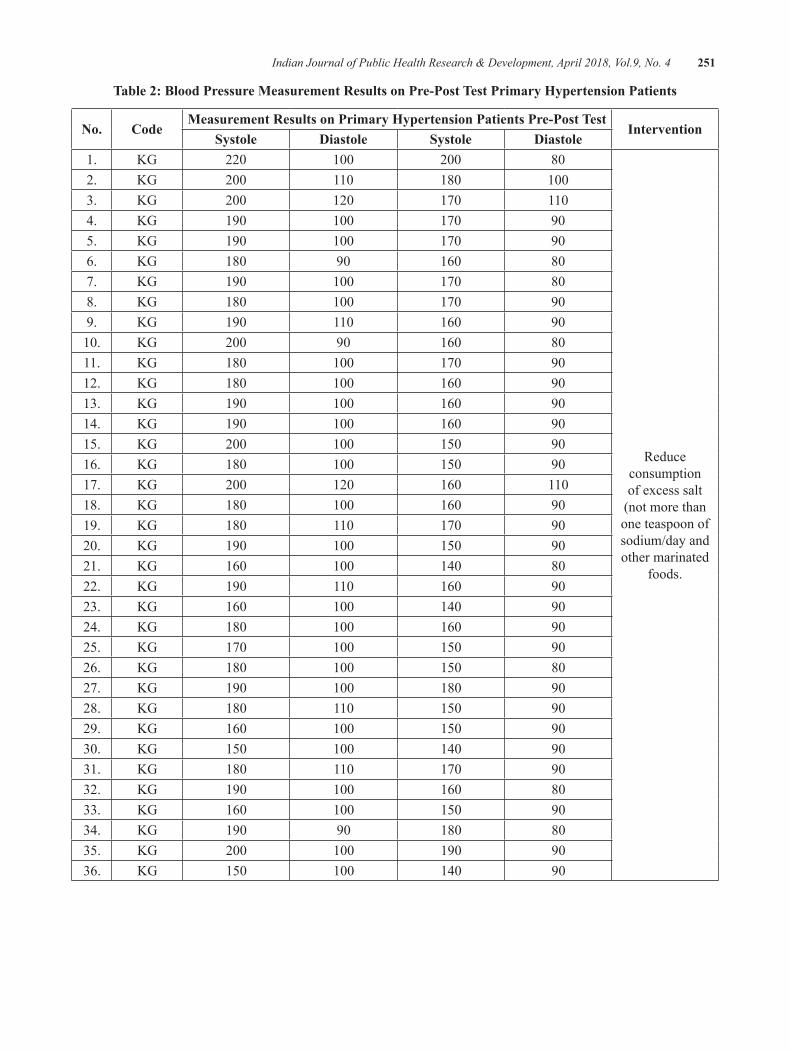
Indian Journal of Public Health Research & Development, April 2018, Vol.9, No. 4 251
Table 2: blood Pressure Measurement Results on Pre-Post Test Primary hypertension Patients
No. CodeMeasurement Results on Primary hypertension Patients Pre-Post Test
InterventionSystole diastole Systole diastole
1. KG 220 100 200 80
Reduce consumption of excess salt
(not more than one teaspoon of sodium/day and other marinated
foods.
2. KG 200 110 180 1003. KG 200 120 170 1104. KG 190 100 170 905. KG 190 100 170 906. KG 180 90 160 807. KG 190 100 170 808. KG 180 100 170 909. KG 190 110 160 9010. KG 200 90 160 8011. KG 180 100 170 9012. KG 180 100 160 9013. KG 190 100 160 9014. KG 190 100 160 9015. KG 200 100 150 9016. KG 180 100 150 9017. KG 200 120 160 11018. KG 180 100 160 9019. KG 180 110 170 9020. KG 190 100 150 9021. KG 160 100 140 8022. KG 190 110 160 9023. KG 160 100 140 9024. KG 180 100 160 9025. KG 170 100 150 9026. KG 180 100 150 8027. KG 190 100 180 9028. KG 180 110 150 9029. KG 160 100 150 9030. KG 150 100 140 9031. KG 180 110 170 9032. KG 190 100 160 8033. KG 160 100 150 9034. KG 190 90 180 8035. KG 200 100 190 9036. KG 150 100 140 90
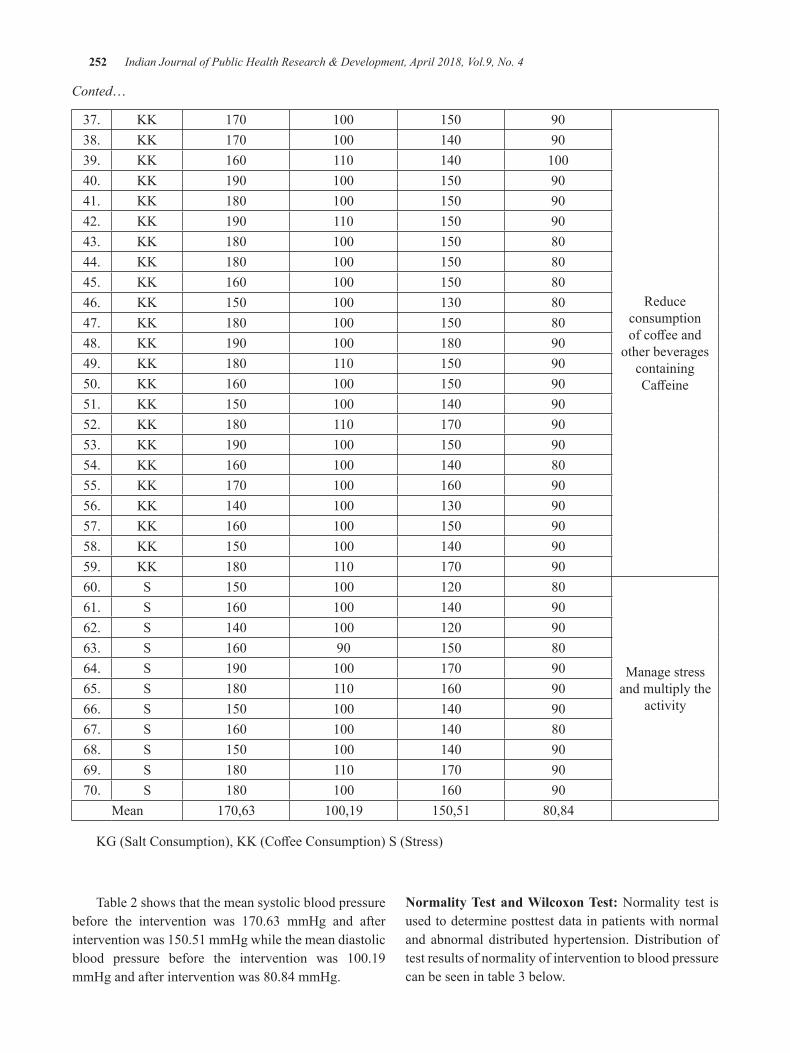
252 Indian Journal of Public Health Research & Development, April 2018, Vol.9, No. 4
Conted…
37. KK 170 100 150 90
Reduce consumption ofcoffeeand
other beverages containing Caffeine
38. KK 170 100 140 9039. KK 160 110 140 10040. KK 190 100 150 9041. KK 180 100 150 9042. KK 190 110 150 9043. KK 180 100 150 8044. KK 180 100 150 8045. KK 160 100 150 8046. KK 150 100 130 8047. KK 180 100 150 8048. KK 190 100 180 9049. KK 180 110 150 9050. KK 160 100 150 9051. KK 150 100 140 9052. KK 180 110 170 9053. KK 190 100 150 9054. KK 160 100 140 8055. KK 170 100 160 9056. KK 140 100 130 9057. KK 160 100 150 9058. KK 150 100 140 9059. KK 180 110 170 9060. S 150 100 120 80
Manage stress and multiply the
activity
61. S 160 100 140 9062. S 140 100 120 9063. S 160 90 150 8064. S 190 100 170 9065. S 180 110 160 9066. S 150 100 140 9067. S 160 100 140 8068. S 150 100 140 9069. S 180 110 170 9070. S 180 100 160 90
Mean 170,63 100,19 150,51 80,84
KG(SaltConsumption),KK(CoffeeConsumption)S(Stress)
Table 2 shows that the mean systolic blood pressure before the intervention was 170.63 mmHg and afterinterventionwas150.51mmHgwhilethemeandiastolicblood pressure before the intervention was 100.19mmHgandafterinterventionwas80.84mmHg.
Normality Test and Wilcoxon Test: Normality test is used to determine posttest data in patients with normal and abnormal distributed hypertension. Distribution of test results of normality of intervention to blood pressure can be seen in table 3 below.
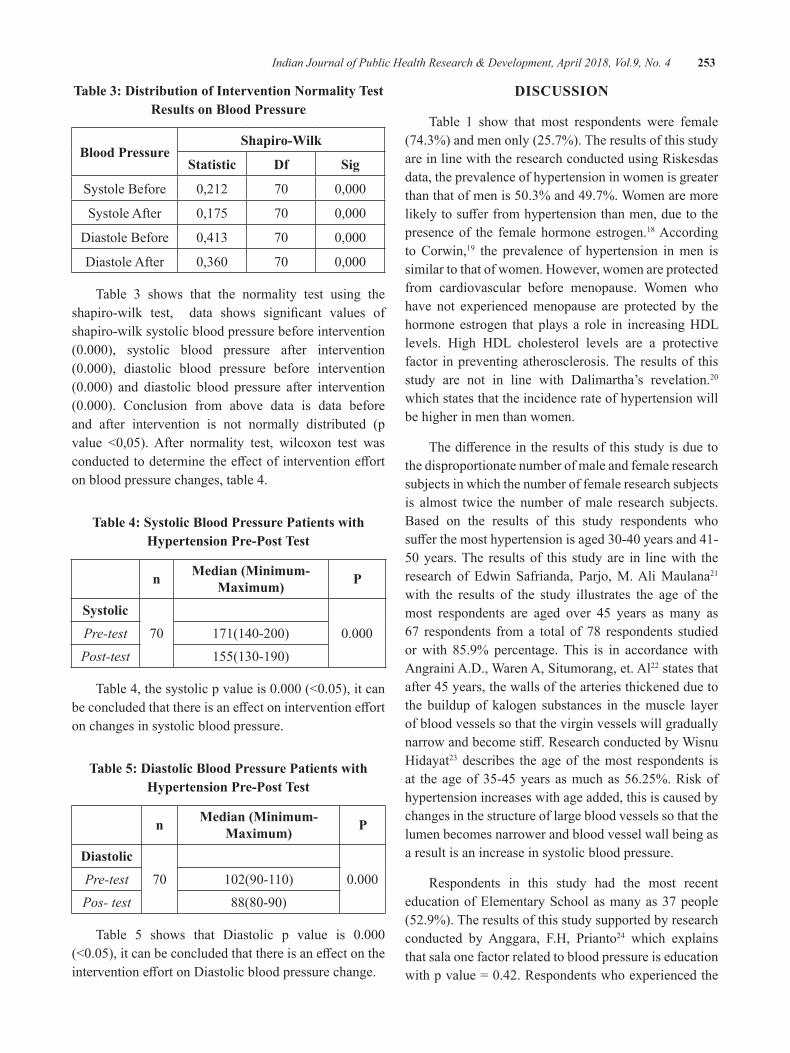
Indian Journal of Public Health Research & Development, April 2018, Vol.9, No. 4 253
Table 3: distribution of Intervention Normality Test Results on blood Pressure
blood PressureShapiro-Wilk
Statistic df Sig
Systole Before 0,212 70 0,000
Systole After 0,175 70 0,000
Diastole Before 0,413 70 0,000
Diastole After 0,360 70 0,000
Table 3 shows that the normality test using the shapiro-wilk test, data shows significant values ofshapiro-wilk systolic blood pressure before intervention (0.000), systolic blood pressure after intervention(0.000), diastolic blood pressure before intervention(0.000) and diastolic blood pressure after intervention(0.000). Conclusion from above data is data beforeand after intervention is not normally distributed (p value <0,05).After normality test, wilcoxon test wasconductedtodeterminetheeffectofinterventionefforton blood pressure changes, table 4.
Table 4: Systolic blood Pressure Patients with hypertension Pre-Post Test
n Median (Minimum-Maximum) P
Systolic70 0.000Pre-test 171(140-200)
Post-test 155(130-190)
Table4,thesystolicpvalueis0.000(<0.05),itcanbeconcludedthatthereisaneffectoninterventionefforton changes in systolic blood pressure.
Table 5: diastolic blood Pressure Patients with hypertension Pre-Post Test
n Median (Minimum-Maximum) P
diastolic70 0.000Pre-test 102(90-110)
Pos- test 88(80-90)
Table 5 shows that Diastolic p value is 0.000(<0.05),itcanbeconcludedthatthereisaneffectontheinterventioneffortonDiastolicbloodpressurechange.
dISCuSSION
Table 1 show that most respondents were female (74.3%) and men only (25.7%). The results of this study are in line with the research conducted using Riskesdas data, the prevalence of hypertension in women is greater thanthatofmenis50.3%and49.7%.Womenaremorelikelytosufferfromhypertensionthanmen,duetothepresence of the female hormone estrogen.18 According to Corwin,19 the prevalence of hypertension in men is similar to that of women. However, women are protected from cardiovascular before menopause. Women who have not experienced menopause are protected by the hormone estrogen that plays a role in increasing HDL levels. High HDL cholesterol levels are a protective factor in preventing atherosclerosis. The results of this study are not in line with Dalimartha’s revelation.20 which states that the incidence rate of hypertension will be higher in men than women.
Thedifferenceintheresultsofthisstudyisduetothe disproportionate number of male and female research subjects in which the number of female research subjects is almost twice the number of male research subjects. Based on the results of this study respondents who sufferthemosthypertensionisaged30-40yearsand41-50years.The resultsof this studyare in linewith theresearch of Edwin Safrianda, Parjo, M. Ali Maulana21 with the results of the study illustrates the age of the most respondents are aged over 45 years as many as 67 respondents from a total of 78 respondents studied or with 85.9% percentage. This is in accordance with Angraini A.D., Waren A, Situmorang, et. Al22 states that after 45 years, the walls of the arteries thickened due to the buildup of kalogen substances in the muscle layer of blood vessels so that the virgin vessels will gradually narrowandbecomestiff.ResearchconductedbyWisnuHidayat23 describes the age of the most respondents is at the age of 35-45 years as much as 56.25%. Risk of hypertension increases with age added, this is caused by changes in the structure of large blood vessels so that the lumen becomes narrower and blood vessel wall being as a result is an increase in systolic blood pressure.
Respondents in this study had the most recent education of Elementary School as many as 37 people (52.9%). The results of this study supported by research conducted by Anggara, F.H, Prianto24 which explains that sala one factor related to blood pressure is education withpvalue=0.42.Respondentswhoexperiencedthe
254 Indian Journal of Public Health Research & Development, April 2018, Vol.9, No. 4
highest occupational hypertension were respondents with a job as farmers as many as 38 people (54.3%).
The mean systolic blood pressure of the respondents before the intervention was 170.63mmHg and afterundergoing intervention to 150.51 mmHg with anaverage decrease of 20.12 mmHg. The differencebetween systolic pressure before and after treatment is known by wilcoxon test using SPSS. In wilcoxon test, thedataaresaidtohavedifferentvaluesbeforeandafterwhenp<0.05.FromtheWilcoxontest it is found thatp=0.000(<0.05),so itcanbeconcluded that there isadifferencebetweensystolicbloodpressurebeforeandafter treatment by changing lifestyle of hypertension primers that regulate eating patterns such as reducing salt intake, coffee consumption (caffeine) andmanagestress by multiplying the activity.
The mean diastolic blood pressure in the respondents before the treatment was 100.19 mmHg and aftertreatmentwas 80.84mmHgwith an average decreaseof19.35mmHg.Differencesindiastolicbloodpressurebefore and after treatment are known by conducting the Wilcoxon test. Test obtained that the value p = 0.000(<0.05),soitcanbeconcludedthattherearesignificantdifferences in blood pressure before and after givenintervention.
CONCluSION
Analysis result found that the factors causing hypertension in patients with primary hypertension is excessive salt consumption, coffee consumptionand stress. Improve lifestyle quality such as reducing excessive salt consumption, consumption caffeineandmanage stress effectively to lower blood pressurein people with hypertension. Interventions are very effective and meaningful. It was seen afterWilcoxontest on systolic blood pressure p value = 0.000 <0.05anddiastolicbloodpressurewithpvalue=0.000<0.05.
ethical Clearance: The ethical clearance was taken from Faculty committee and community agreement.
Source of Funding: The funding of this research comes from all authors contribution
Conflict of Interest: Authors declares that there is no anyconflictofinterestwithinthisresearch
ReFReNCeS
1. Masriadi. Model Sistem Surveilans TB Paru Kepulauan.Yogyakarta:PustakaTimur,2012.
2. Inda, Dwi Tirta, Dina Nur A.N.Evaluasi Input Sistem Survailans Hipertensi Di Wilayah Kerja Dinas Kesehatan Kota Magelang BerdasarkanPedoman Sistem Surveilans Penyakit Tidak Menular. Unnes JournalofPublicHealth4(2),2015.
3.Masriadi Idrus, Anwar Mallongi and JulianiIbrahim. Surveillance System Model for Pulmonary Tuberculosis Suspected in Pangkep Region, Indonesia.Curr.Res.Tuberculosis,9(1):1-7,2017.
4. Agustin, Teti.Pengetahuan dan Dukungan Keluarga Mengenai Perawatan Hipertensi pada Lansia di Wilayah Kerja Puskesmas Sambongpari KotaTasikmalaya,JurnalKesehatanBaktiTunasHusada,Volume13Nomor1Februari2015.
5.Masriadi,JusniandMarsuki.SurveillancePatternof Cases of Type 2 Diabetes Mellitus in Bone Regency.Pak.J.Nutr.,16(4):261-272,2017
6. Gunawan L. Hipertensi Tekanan Darah Tinggi, PenerbitKanisius,Yogyakarta,20011.
7. Masriadi. Epidemiologi Penyakit Tidak Menular. Jakarta:CV.TransInfoMedia,2016.
8.Subkhi,Wahyu.GambaranDemografiPolaMakandan Tingkat Stres Penderita Hipertensi Usia Produktif di Puskesmas Kartosuro Sukoharjo.Jurnal Keperawatan Fakultas Ilmu KesehatanUniversitasMuhammadiyahSurakarta2015.
9. Pusparani I.D. Gambaran Gaya Hidup Pada Penderita Hipertensi Dipuskesmas Ciangsana KecamatanGunungPutriKabupatenBogor,2016.
10.Ekowati,Rahajeng.PedomanSurveilansPenyakitTidakMenular,2013.
11. Kemenkes. Pedoman Surveilans Pengendalian PenyakitTidakMenular,2016.
12.RisetKesehatanDasar(Riskesdas)2013.LaporanHasilRisetKesehatanDasar Indonesia. Jakarta:Badan Penelitian dan Pengembangan Kesehatan, KemenkesRI,2013.
13.Kenny,Putu R.E & Luh Made K.S.KepatuhanMengonsumsiObatPasienHipertensidiDenpasarDitinjau dari Kepribadian Tipe A dan Tipe B.
Indian Journal of Public Health Research & Development, April 2018, Vol.9, No. 4 255
JurnalPsikologiUdayana,2013.Vol.1,No.1,32-42. Program Studi Psikologi, Fakultas Psikologi, Universitas Udayana.
14. Masriadi, Sri Mulyani. Faktor Risiko Kejadian HipertensipadaPasiendiUnitRawatJalanRSUDKabupatenDompuTahun2013.Jurnal Al-Sihah, UIN,Vol.1,No.1,Jan-Juni,2013.
15.DinasKesehatanProvinsiSulawesiSelatan.ProfilKesehatanTahun2015
16. Puskesmas Tompobulu. Laporan Tahunan Puskesmas Tompobulu Kecamatan Tompobulu KabupatenMaros,2016.
17.Dinas Kesehatan Kabupaten Maros. ProfilKesehatanKabupatenMarosTahun2015.
18. Riset Kesehatan Dasar (Riskesdas). Laporan Hasil RisetKesehatanDasarIndonesia.Jakarta:BadanLitbangkes,DepkesRI,2007
19.Corwin, Elizabeth J. Buku Saku: Patofisiologi.Jakarta:EGC,2009.
20.Dalimartha.S.CareYourSelfHipertensi.Jakarta:PenebarPlus,2008.
21. Edwin Safrianda, Parjo, M. Ali Maulana. Efektivitas Terapi Bekam Basah Terhadap Perubahan Tekanan Darah Pada Penderita Hipertensi di Rumah Terapi Thibbun Nabawy Pontianak, Junal Keperawatan FK UniversitasPontinak,2015.
22. Anggraini, A. D., Waren, A., Situmorang, E., Asputra, H., & Siahaan, S. S. Faktor-Faktor yang Berhubungan dengan Kejadian Hipertensi pada Pasien yang Berobat di Poliklinik Dewasa Puskesmas Bangkinang. Pekanbaru: Faculty of Medicine, UniversityofRiau,2009.
23. Wisnu Hidayat. Efektivitas Pemberian Tambahan Terapi Non Farmakologis Untuk Mencegah Kenaikan Tekanan Darah pada Penderita Hipertensi Stadium I (Studi di Wilayah Kerja Puskesmas Baturetno I Kabupaten Wonogiri Tahun2010.
24.Anggara, F. H., & Prayitno, N. Faktor yangBerhubungan dengan Tekanan Dadrah di Puskesmas Telaga Murni, Cikarang Barat Tahun 2013.JurnalIlmiahKesehatan.
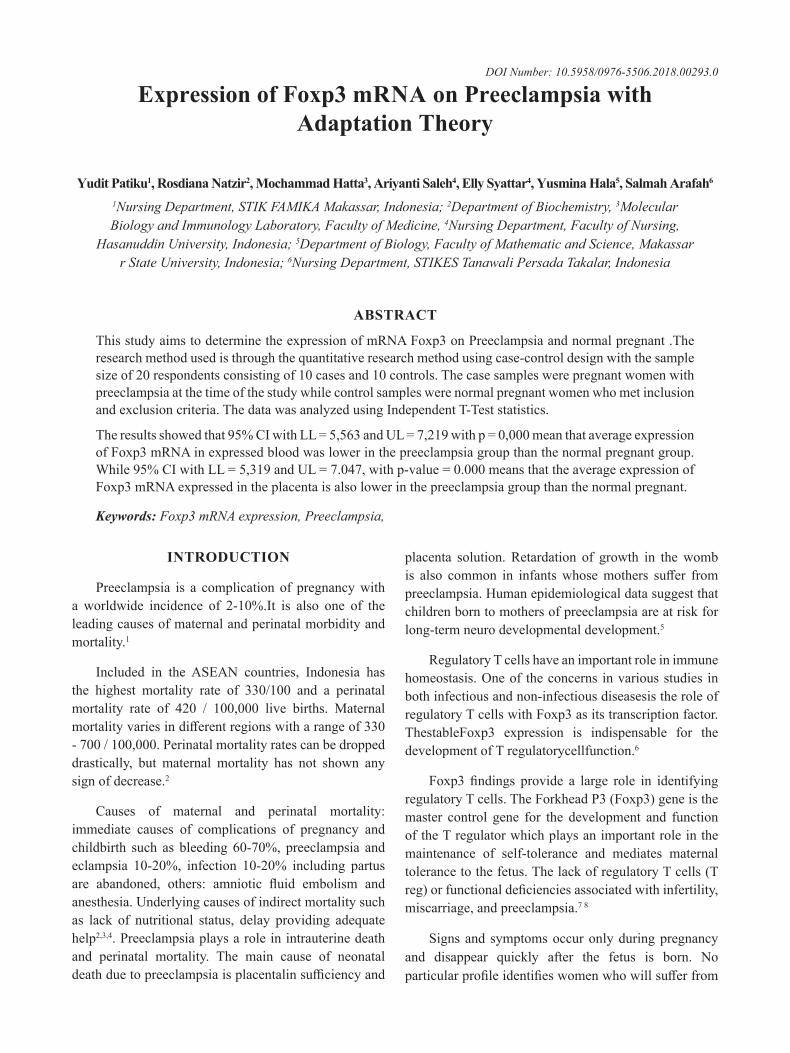
expression of Foxp3 mRNA on Preeclampsia with Adaptation Theory
yudit Patiku1, Rosdiana Natzir2, Mochammad hatta3, Ariyanti Saleh4, elly Syattar4, yusmina hala5, Salmah Arafah6
1Nursing Department, STIK FAMIKA Makassar, Indonesia; 2Department of Biochemistry, 3Molecular Biology and Immunology Laboratory, Faculty of Medicine, 4Nursing Department, Faculty of Nursing,
Hasanuddin University, Indonesia; 5Department of Biology, Faculty of Mathematic and Science, Makassar r State University, Indonesia; 6Nursing Department, STIKES Tanawali Persada Takalar, Indonesia
AbSTRACT
This study aims to determine the expression of mRNA Foxp3 on Preeclampsia and normal pregnant .The research method used is through the quantitative research method using case-control design with the sample sizeof20respondentsconsistingof10casesand10controls.Thecasesampleswerepregnantwomenwithpreeclampsia at the time of the study while control samples were normal pregnant women who met inclusion and exclusion criteria. The data was analyzed using Independent T-Test statistics.
Theresultsshowedthat95%CIwithLL=5,563andUL=7,219withp=0,000meanthataverageexpressionof Foxp3 mRNA in expressed blood was lower in the preeclampsia group than the normal pregnant group. While95%CIwithLL=5,319andUL=7.047,withp-value=0.000meansthattheaverageexpressionofFoxp3 mRNA expressed in the placenta is also lower in the preeclampsia group than the normal pregnant.
Keywords: Foxp3 mRNA expression, Preeclampsia,
INTROduCTION
Preeclampsia is a complication of pregnancy with a worldwide incidence of 2-10%.It is also one of theleading causes of maternal and perinatal morbidity and mortality.1
Included in the ASEAN countries, Indonesia has the highest mortality rate of 330/100 and a perinatalmortality rate of 420 / 100,000 live births. Maternalmortalityvariesindifferentregionswitharangeof330-700/100,000.Perinatalmortalityratescanbedroppeddrastically, but maternal mortality has not shown any sign of decrease.2
Causes of maternal and perinatal mortality: immediate causes of complications of pregnancy and childbirth such as bleeding 60-70%, preeclampsia andeclampsia 10-20%, infection 10-20% including partusare abandoned, others: amniotic fluid embolism andanesthesia. Underlying causes of indirect mortality such as lack of nutritional status, delay providing adequate help2,3,4. Preeclampsia plays a role in intrauterine death and perinatal mortality. The main cause of neonatal deathduetopreeclampsiaisplacentalinsufficiencyand
placenta solution. Retardation of growth in the womb is also common in infantswhosemothers suffer frompreeclampsia. Human epidemiological data suggest that children born to mothers of preeclampsia are at risk for long-term neuro developmental development.5
Regulatory T cells have an important role in immune homeostasis.Oneof theconcerns invariousstudies inboth infectious and non-infectious diseasesis the role of regulatory T cells with Foxp3 as its transcription factor. ThestableFoxp3 expression is indispensable for the development of T regulatorycellfunction.6
Foxp3 findings provide a large role in identifyingregulatory T cells. The Forkhead P3 (Foxp3) gene is the master control gene for the development and function of the T regulator which plays an important role in the maintenance of self-tolerance and mediates maternal tolerance to the fetus. The lack of regulatory T cells (T reg)orfunctionaldeficienciesassociatedwithinfertility,miscarriage, and preeclampsia.7 8
Signs and symptoms occur only during pregnancy and disappear quickly after the fetus is born. No particularprofileidentifieswomenwhowillsufferfrom
DOI Number: 10.5958/0976-5506.2018.00293.0
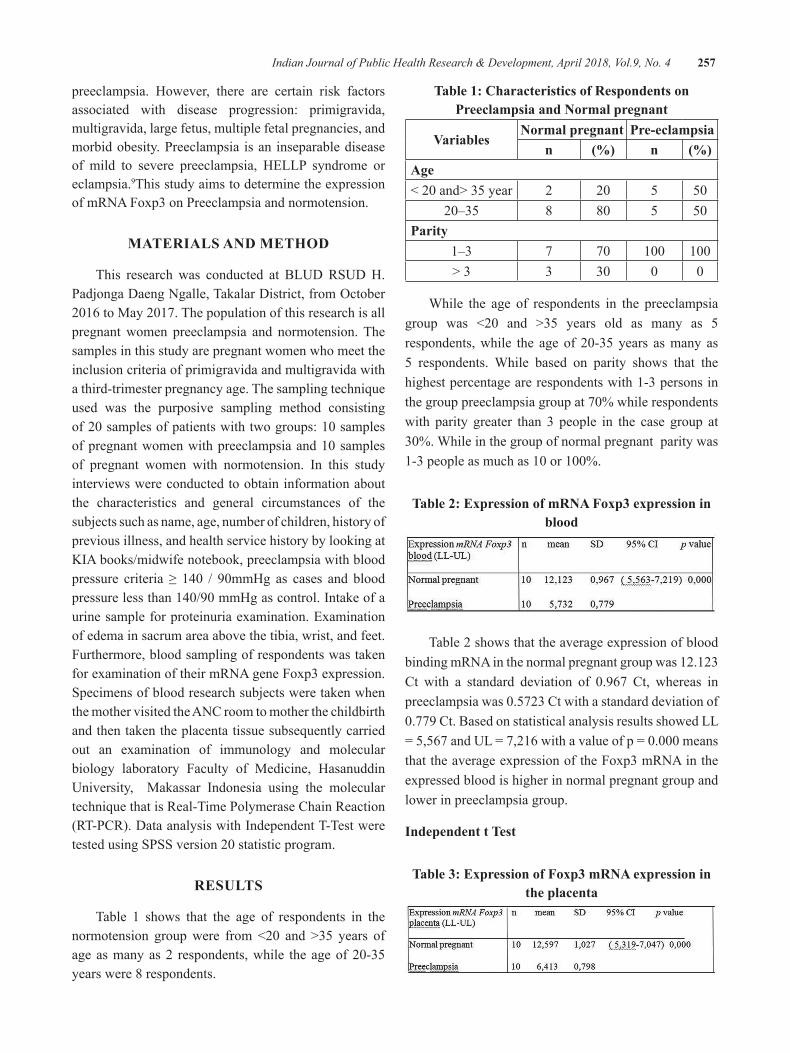
Indian Journal of Public Health Research & Development, April 2018, Vol.9, No. 4 257
preeclampsia. However, there are certain risk factors associated with disease progression: primigravida, multigravida, large fetus, multiple fetal pregnancies, and morbid obesity. Preeclampsia is an inseparable disease of mild to severe preeclampsia, HELLP syndrome or eclampsia.9This study aims to determine the expression of mRNA Foxp3 on Preeclampsia and normotension.
MATeRIAlS ANd MeThOd
This research was conducted at BLUD RSUD H. PadjongaDaengNgalle,TakalarDistrict,fromOctober2016toMay2017.Thepopulationofthisresearchisallpregnant women preeclampsia and normotension. The samples in this study are pregnant women who meet the inclusion criteria of primigravida and multigravida with a third-trimester pregnancy age. The sampling technique used was the purposive sampling method consisting of20samplesofpatientswithtwogroups:10samplesofpregnantwomenwithpreeclampsiaand10samplesof pregnant women with normotension. In this study interviews were conducted to obtain information about the characteristics and general circumstances of the subjects such as name, age, number of children, history of previous illness, and health service history by looking at KIA books/midwife notebook, preeclampsia with blood pressure criteria ≥ 140 / 90mmHg as cases and bloodpressurelessthan140/90mmHgascontrol.Intakeofaurine sample for proteinuria examination. Examination of edema in sacrum area above the tibia, wrist, and feet. Furthermore, blood sampling of respondents was taken for examination of their mRNA gene Foxp3 expression. Specimens of blood research subjects were taken when the mother visited the ANC room to mother the childbirth and then taken the placenta tissue subsequently carried out an examination of immunology and molecular biology laboratory Faculty of Medicine, Hasanuddin University, Makassar Indonesia using the molecular technique that is Real-Time Polymerase Chain Reaction (RT-PCR). Data analysis with Independent T-Test were testedusingSPSSversion20statisticprogram.
ReSulTS
Table 1 shows that the age of respondents in the normotension groupwere from <20 and >35 years ofageasmanyas2 respondents,while theageof20-35years were 8 respondents.
Table 1: Characteristics of Respondents on Preeclampsia and Normal pregnant
VariablesNormal pregnant Pre-eclampsia
n (%) n (%)Age<20and>35year 2 20 5 50
20–35 8 80 5 50Parity
1–3 7 70 100 100> 3 3 30 0 0
While the age of respondents in the preeclampsia group was <20 and >35 years old as many as 5respondents,while the age of 20-35years asmany as5 respondents. While based on parity shows that the highest percentage are respondents with 1-3 persons in thegrouppreeclampsiagroupat70%whilerespondentswith parity greater than 3 people in the case group at 30%.Whileinthegroupofnormalpregnantparitywas1-3peopleasmuchas10or100%.
Table 2: expression of mRNA Foxp3 expression in blood
Table 2 shows that the average expression of blood binding mRNA in the normal pregnant group was 12.123 Ct with a standard deviation of 0.967 Ct, whereas inpreeclampsiawas0.5723Ctwithastandarddeviationof0.779Ct.BasedonstatisticalanalysisresultsshowedLL=5,567andUL=7,216withavalueofp=0.000meansthat the average expression of the Foxp3 mRNA in the expressed blood is higher in normal pregnant group and lower in preeclampsia group.
Independent t Test
Table 3: expression of Foxp3 mRNA expression in the placenta
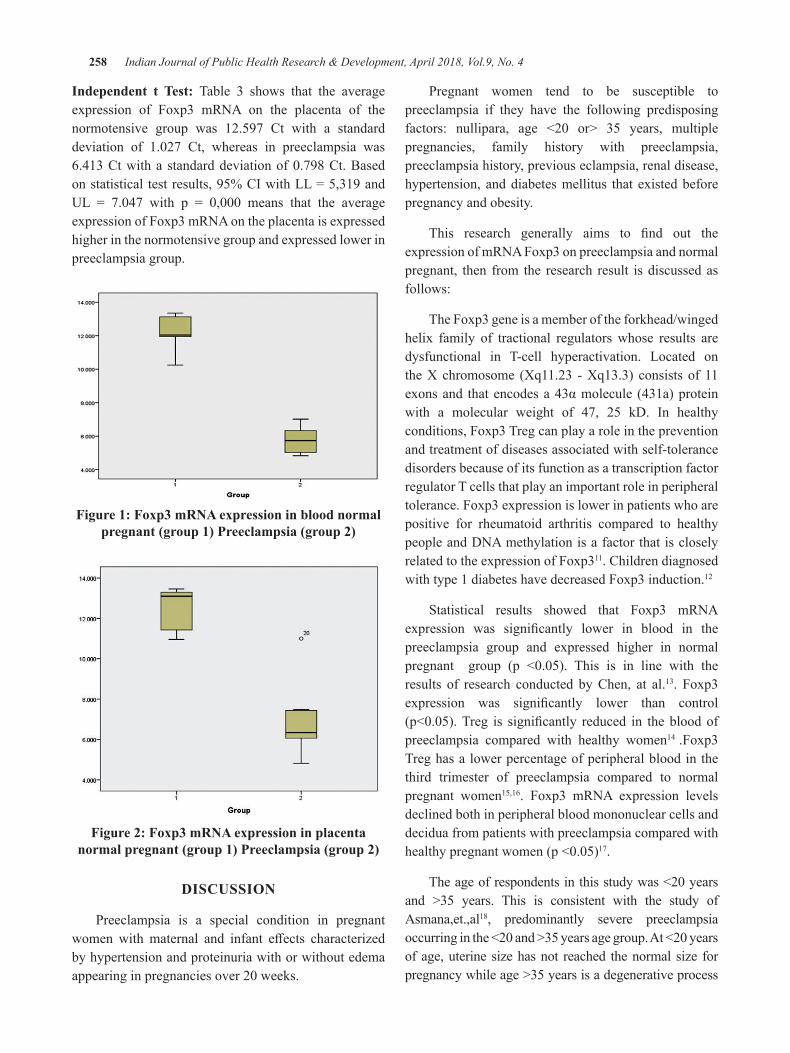
258 Indian Journal of Public Health Research & Development, April 2018, Vol.9, No. 4
Independent t Test: Table 3 shows that the average expression of Foxp3 mRNA on the placenta of the normotensive group was 12.597 Ct with a standard deviation of 1.027 Ct, whereas in preeclampsia was6.413Ctwithastandarddeviationof0.798Ct.Basedonstatisticaltestresults,95%CIwithLL=5,319andUL = 7.047 with p = 0,000 means that the averageexpression of Foxp3 mRNA on the placenta is expressed higher in the normotensive group and expressed lower in preeclampsia group.
Figure 1: Foxp3 mRNA expression in blood normal pregnant (group 1) Preeclampsia (group 2)
Figure 2: Foxp3 mRNA expression in placenta normal pregnant (group 1) Preeclampsia (group 2)
dISCuSSION
Preeclampsia is a special condition in pregnant womenwithmaternal and infant effects characterizedby hypertension and proteinuria with or without edema appearinginpregnanciesover20weeks.
Pregnant women tend to be susceptible to preeclampsia if they have the following predisposing factors: nullipara, age <20 or> 35 years, multiplepregnancies, family history with preeclampsia, preeclampsia history, previous eclampsia, renal disease, hypertension, and diabetes mellitus that existed before pregnancy and obesity.
This research generally aims to find out theexpression of mRNA Foxp3 on preeclampsia and normal pregnant, then from the research result is discussed as follows:
The Foxp3 gene is a member of the forkhead/winged helix family of tractional regulators whose results are dysfunctional in T-cell hyperactivation. Located on the X chromosome (Xq11.23 - Xq13.3) consists of 11 exonsand thatencodesa43αmolecule (431a)proteinwith a molecular weight of 47, 25 kD. In healthy conditions, Foxp3 Treg can play a role in the prevention and treatment of diseases associated with self-tolerance disorders because of its function as a transcription factor regulator T cells that play an important role in peripheral tolerance. Foxp3 expression is lower in patients who are positive for rheumatoid arthritis compared to healthy people and DNA methylation is a factor that is closely related to the expression of Foxp311. Children diagnosed with type 1 diabetes have decreased Foxp3 induction.12
Statistical results showed that Foxp3 mRNA expression was significantly lower in blood in thepreeclampsia group and expressed higher in normal pregnant group (p <0.05). This is in line with theresults of research conducted by Chen, at al.13. Foxp3 expression was significantly lower than control(p<0.05).Treg is significantly reduced in thebloodofpreeclampsia compared with healthy women14 .Foxp3 Treg has a lower percentage of peripheral blood in the third trimester of preeclampsia compared to normal pregnant women15,16. Foxp3 mRNA expression levels declined both in peripheral blood mononuclear cells and decidua from patients with preeclampsia compared with healthypregnantwomen(p<0.05)17.
Theageofrespondentsinthisstudywas<20yearsand >35 years. This is consistent with the study of Asmana,et.,al18, predominantly severe preeclampsia occurringinthe<20and>35yearsagegroup.At<20yearsof age, uterine size has not reached the normal size for pregnancy while age >35 years is a degenerative process
Indian Journal of Public Health Research & Development, April 2018, Vol.9, No. 4 259
that results in structural and functional changes that occur in the blood vessels. Endothelial dysfunction is an increase in nitric oxide, vascular cell adhesion molecule-1 (VCAM-), ICAM-1, Prostacyclin (PGI2). In thiscondition, there is an imbalance of vasoactive substance so that hypertension can occur. Endothelial dysfunction also causes increased vascular permeability resulting in edema and proteinuria.Cell-mediated immunity produces T-helper cells Th1 and Th2 which will play a role in the activity of macrophage cells to activate NK cells with cytokines in the process of pregnancy20. T-cell regulator with Foxp3 transcription factor is considered to inhibit T-helper 1 (Th1) and T-helper 2 (Th2) cells. The opinion that T regulators prevent the development of Th1 and Th2 through direct contact21.
Continuous expression of Foxp3 is needed to maintain transcription and program function during the development of Treg cells22. The balance of the immune system and the functioning of the autoimmune response is the result ofhomeostasisbetweenTcelleffectorswithTregulatorcell activity. The induction of the Foxp3 gene in normal naïve T cells converts it into regulatory T cells. Direct T cell proliferation is usually followed by decreased or even dysfunctional Treg cell function so that the therapeutic agentthatreceivesmuchattentionisthatitcanaffectboththeeffectorsofTcellsaswellasonTregulatorycells.Treg cells are associated with preeclampsia. Foxp3 is involved in the development and functionality of Treg23.Immune suppression is a major function of regulatory T cells (Treg) or Th3 which act to limit the specificantigenic immune response24.The decrease of Foxp3 and T regulator as the body response is maladaptive namely preeclampsia.InlinewithLockwood’sresearch,200820, deviation of adaptation to the immune system will lead to a mal-adaptation of the maternal immune system that will clinically cause preeclampsia.
Conversely, if the body’s response is adapted so that no endothelial dysfunction occurs, the Foxp3 expression is elevated to maintain immune system balance as macrophage activation and pro-inflammatory cytokineincrease as a normal response of the body. T increased regulator that transcribed Foxp3 needed to control the balance of immune response in order to avoid excessive response and result in tissue damage so that pregnant women do not experience preeclampsia. Inadequate expression of Foxp3 is associated with recurrent spontaneous abortion, infertility, repetitive implantation
failure and preeclampsia. Normal pregnancy requires mother’s immunity as tolerance to the fetus. During pregnancy, the immune system should maintain tolerance to the fetus, so changes in cytokine balance can cause the pregnancy to be impaired. Treg cells play an important role in maintaining the immune system.8,14.
Based on statistical test results showed 95% CI value with LL value = -1,422 and UL=0,0599 withp-value=0,490(p>0,05)meaningthatthereisdifferenceof expression of mRNA Foxp3 of blood and placenta in group of preeclampsia that is not significant. Theresults of this study are in line with a study conducted by Prins,et.,al.25 in pregnant women with preeclampsia having a percentage of Foxp3 and T regulators significantlylowerinblood.
Endothelial dysfunction is caused by exposure to inflammatory cytokines, oxidative stress, andhypercholesterolemia. As a result of endothelial dysfunction occurs placental blood perfusion. Babies born to preeclamptic mothers will have neonatal asphyxia, this is because in preeclampsia there is a decrease in placental blood supply and result in the baby experiencing hypoxia. Prematurity is associated with high placental cortisol in preeclampsia (OR 0.12,95%CI0.02-0.5)26.
Preeclampsia is a systemic disease of maternal endothelial dysfunction and immune maladaptation in the placental compartment caused by inadequate induction of maternal tolerance to paternal antigen and unfavorable combinations of genetically maternal leukocyte receptors and fetal antigen27,
CONCluSION
Foxp3 mRNA expression is lower in the blood in preeclampsia than in normal pregnant. Foxp3 mRNA expression is lower in placenta than normal pregnant.
Conflict of Interest: No obstacles were found in the sampling of blood and placenta at the hospital in both the preeclampsia and normotensive patients
Source of Funding: The funding of this research comes all authors contribution
ethical Clearance: The Ethical Clearance obtained from the Hasanuddin University committee with number UH16080648
260 Indian Journal of Public Health Research & Development, April 2018, Vol.9, No. 4
ReFFeReNCeS
1. Wang L L, Cao XW . Patients with preeclampsia in peripheral blood and umbilical CD+4 CD+25 of Foxp3 + of T reg levels. Shandong Medical Journal50(26):10.(2010)
2.Manuaba ,G, I.,. Gawat Darurat Obstetri-Ginekologi & Obstetri Untuk Profesi BidanEGC:Kedokteran,Jakarta(2008)
3. Lailiana., Noo.N,. Suryatni. Gizi Kesehatan Reproduksi.Penerbit EGC Buku Kedokteran,Jakarta.(2010).
4. Paath,E,F.,Rumdasih,Y. Heryati.Gizi dalam Kesehatan Reproduksi,Penerbit Buku Kedokteran,Jakarta.(2004)
5. Carver, A, R,.Tamayo E, Perez-Polo ,J,R.,Saade,G.R.,Hankins,G,D.,Costantine, M,M.HEffectof Maternal Pravastatin Therapy onAdverseSensorimotorOutcomesofTheOffspringinMurineModelofPreeclampsia(2013)
6.Van Loosdregt,J.,Fleskens, V.,Fu.,JBrenkman,Arjan B., Bekker,Cornelis P.J., Pals, CorneliekeE.G.M., Coffer, Paul J. Stabilization of theTranscrption Factor Foxp3 by the Deubiquitinase USP7 Increases Treg-Cell-Suppressive Capacity. Immunity, 39(2), 259-271.doi: 10.1016/j.immuni.2013-05.018(2013)
7.Bennett CL,Christie J.,RamsdellFetal..The immune dysregulation,polyendocrinopathy, X- linked syndrome (IPEX) is caused by mutation of Foxp3.Nat.Genet2001,27:20-1
8.Jahan, P., Sreenivagasari, R., Goudi, P.,Komaravalli , P.L., Ishag, M.; . Role of Foxp3 Gene in Maternal Susceptibility to Pre-eclampsia – A Study From South India , Departement of Genetics, Osmania University, Hyderabad, AP,India.ScandinavianJournalofImmunology,104–108.(2012)
9.Bobak,L.J.Buku Ajar Keperawatan MaternitasEGCKedokteranJakarta(2005)
10.Abbas,A.K., Lichtman,A.H., Pillai,S. ImmunitytoTumors,ed.7,Ch17:395–402.(2012)
11. Kennedy,A.,Schmidt, E.M., Cribbs, A.P., Penn, H., Amjadi, P., Syed.K.Brennan, F.M.. A novel upstream enhancer of Foxp3 sensitive
to methylation-induced silencing, exhibitsdys regulated methylation in rheumatoid arthritis Treg cell . Eur J immunol, 44(10),2968-2978.doi:10.1002/eji.201444453(2014)
12.Honkanen,J.,Skarsvik,S.,Knip,M.,&Vaarala,O.Poor in vitro induction of Foxp3 and ICOS intype1 cytokine environment activated T-cells fromchildren with type 1 diabetes. Diabetes metab Res Rev ,24(8),635-641.doi : 10.1002/dmrr.904.(2008)
13.Chen, X., Gan.T.,Liao,Z., Chen,S., Xiao,J;.Foxp3(2/ATT) Polymorphism Contributes to the Susceptibility of Preeclampsia. PLoS ONE8(4):e59696.doi:10.1371/journal.pone.0059696(2013)
14.VargasRMI, J.2016.MaternalFetalNeonatalMed.
15.Yu, 2017, Decreased Frequency of PeripheralBlood CD8(+) CD 25(+) Foxp3(+) regulatory T cells Correlates with IL-33 levels in Preeclampsia
16.Nagayama ,S, Ohkuchi,A, Shirasuna, K.,Takahashi, K, Suzuki, H, Hirashima, C, 2015.The Frecuency of Peripheral Blood CD 4 Foxp3 Regulatory T cells in Women with Preeclampsia and Those with High-risk Factors for Preeclampsia, Journal hipertension in Precnancy, Vol 28,page300-311.
17.Jianjun, Z., Yali, H., Zhiqun. W, Mingmin. Z,Xia.Z., 2010. Imbalance of T-cell TranscriptionFactors Contributes to The Th1 Type Immunity Predominant in Preeclampsia . Am J.Reprodimunol.Jan;63(1):38-45
18.Asmana, S.K.,Syahredi.,Noza Hilbertina.,2006.Hubungan Usia dan Paritas dengan Kejadian Preeklampsia Berat di Rumah Sakit Achmad Mochtar Bukittinggi tahun 2012-2013. http://Jurnal.fk.unand.ac.id
19.Rozhikan,2007 .Faktor-faktor Risiko TerjadinyaPreeklampsia Berat di Rumah Sakit Dr H. Soewondo Kendal. Tesis. Semarang. Universitas Diponegoro.
20.LockwoodJ.Charles,YenFengChih,BasarMurat.Preeclampsia-Related Inflammatory CytokinesRegulate Interleukin-6 Expression in Human DecidualCells.TheAmericanJournalofPathology,Vol172,no6.Juni2008.Page1571-1579
Indian Journal of Public Health Research & Development, April 2018, Vol.9, No. 4 261
21.Orihara,K.,NakaeS,Pawankar,R.,andSaito.H,.Role ofRegulatory and ProinflammatoryT-CellPopulations inAllergicDiseases.WAO, Journal2008,9-14
22. Wiiliams L.M, Rudensky A.Y. Maintenance of the Foxp3–dependent developmental program in mature regulatory T cells requires continoud expression on Foxp3.NatImmunol2007;8:277-84.
23.Nourouzian M, 2016. Foxp3 Gene PromoterPolymorphism Affects Susceptibility toPreeklampsia Hum Immunol
24.Park O, Grishina I, Leung PS, Gershwin ME,Prindiville T. Analysisof the Foxp3⁄Scurfin
gene in Crohn’s disease. Ann N Y AcadSci2005;1051:218–28.
25.Prins,J.R.,Boelens.H.MHeimweg,J.,van derHeide ,Dubois, A.E., van Oosterhout., 2009.Preeclampsia is Associated with Lower Percentasges of Regulatory T Cells in Maternal Blood.,JournalHipertensionofPregnancy.
26. Aufdenblatten, M .,Baumann M, RaioL.,Dick B., Frey BM., Schneider H.,Surbek D., Hocher B., MohauptMC.,2009.Prematurityisrelatedtohighplacental cortisol in preeclampsia. Pubmed
27.Cudihy.D&Lee,R.V.,2009.ThePathophysiologyof Preeclampsia : Current Clinical Concepts. Journal of Obstetrics and Gynaecology. Vol.29.Pages 576-582.
lived experiences of Patients with Chronic Obstructive Pulmonary Diseases (COPd)-Qualitative Review
Flavia Castelino1, Mukhyaprana Prabhu2, Mamatha Shivananda Pai3, Asha Kamath4, Aswini K Mohapatra5, elsa Sanatombi devi6
1PhD Scholar, Manipal College of Nursing; 2Professor, Department of Medicine, Kasturba Hospital; 3Professor and HOD, Department of Child Health Nursing, MCON; 4Professor and HOD, Department of Statistics; 5Professor, Department of Pulmonary Medicine, Kasturba Hospital; 6Professor and HOD,
Department of Medical Surgical Nursing, Manipal College of Nursing, MAHE, Manipal
AbSTRACT
Chronicobstructivepulmonarydisease(COPD)isacommon,debilitatingillnessofagedpopulationwhichcauses consequential mortality and morbidity. The purpose of the study was to examine the qualitative research focused on lived experiences of COPD patients. Focus of the study was qualitative meta-synthesison research integrationbycombining thefindingsof similar topics fromqualitativestudies.Acomprehensivesearchfororiginalrelevantresearchstudieswhicharepublishedbetween2000and2016wasconductedamongthreescientificdatabasesofPubMed,OvidMedlineandCINAHL.Datawasextractedindependently from the included studies by reviewers into the pre-designed structured data extraction forms. The study adopted a summative approach of qualitative content analysis to synthesize the data. The initial search produced 672 studies, after removing the duplicates 494 studies were included for title screen. After removing the non-relevant, non-English and quantitative studies, only ten articles were included for the fulltextreview.Basedontheinclusioncriteriasixrelevantarticleswereincludedinthefinalreview.Thefourareasofconcernwere,feelingincapacitatedwherebreathingdifficultyandbulkofcarryingportableoxygen systems were the key factors for restricted walking and activities. Social isolation; here the social participationandphysicalinvolvementwasinterpretedaspossibleforfewandwasdifficultforothers.Inviewsondeathanddying;thoughtsabout“suicide”and“whyliving”andthoughtaboutfutureconcernsrelated to aging, decline in cognitive function and deterioration in health were the major areas discussed.
Keywords: COPD, feeling incapacitated, Social isolation, death and dying, future concerns
Corresponding Author:Ms. Flavia CastelinoPhD Scholar,Department of Medical Surgical Nursing,Manipal College of Nursing,Manipal Academy of Higher Education, ManipalEmail:[email protected]
INTROduCTION
Chronic obstructive pulmonary disease (COPD)is a common, debilitating illness of aged population which causes consequential mortality and morbidity5,
6. It has enormous systemic effects and associated co-morbid conditions such as osteoporosis, muscle wasting and cardiovascular diseases. It impacts psychologically resulting in anxiety and depression. Nutritional status of
anelderlyCOPDpatientisalsoaffectedtremendously.AllthesefactorscollectivelyaffectsthequalityoflifeofCOPDpatient6.
Socialization and enjoying the hobbies has been preventedamongCOPDvictimsduetoimpairedQOL.Not being able to do the things which they want to do also makes them angry and feel frustrated. For measuring the impactofchronicdisease,QOLisanimportantdomainamong these clients11.
In-depth understanding of human experiences, emotions, attitude and behaviors can be done through qualitative researches8. Qualitative research findingsprovides a range of depth experiences and meanings from the participant’s perspectives.Thefindings of primarystudies can be brought together to form a conceptual or
DOI Number: 10.5958/0976-5506.2018.00294.2
Indian Journal of Public Health Research & Development, April 2018, Vol.9, No. 4 263
theoretical framework which helps in identifying the gap and developing a new intervention9.
A very few qualitative reviews are conducted on QOL among COPD patients. Increase in volume ofqualitative studies and expansion of qualitative research, in the area of COPD emphasizes the opportunity forsynthesisoffindingintheareaoflivedexperiences.
Purpose of research question: The purpose of study was to examine the qualitative research focused on lived experiences of COPD patients. Researchers aimed atgatheringthefindingsfromvariouspublishedqualitativeresearch, on the research question “What are the lived experiencesofCOPDpatients?”
Study design: Focus of the study was qualitative meta-synthesis on research integration by combining the findingsofsimilartopicsfromqualitativestudies.
MeThOd
A comprehensive search for original relevant researchstudieswhicharepublishedbetween2000and2016was conducted among three scientificdatabasesof PubMed, Ovid Medline and CINAHL. Followingcombination of keywords, “COPD”, “Chronicobstructive pulmonary disease”, “HRQL” and MeSHterms used were “COPD”, “Chronic obstructivepulmonary disease” “Health related quality of Life”.ThesearchwasperformedbetweenDecember2016toMarch2017byusingtermsincombinationwithBooleanoperators‘AND’,‘OR’,‘NOT’.
Inclusion criteria was qualitative research articles which included participants diagnosed as COPD, fulltext and original articles published in English language andstudiespublishedafter2000.Investigatorscreenedthe titles and abstracts for the inclusion criteria. Full text of the required articles was then retrieved for further assessment.
data extraction: Data was extracted independently from the included studies by reviewers into the pre-designed structured data extraction forms.
data Synthesis: The study adopted a summative approach of qualitative content analysis to synthesize the data.
ReSulTS
The initial search produced 672 studies. After removing the duplicates 494 studies were included for title screen. After removing the non-relevant, non-English and quantitative studies, only ten articles were included for the full text review. Based on the inclusion criteria six relevantarticleswereincludedinthefinalreview.
Sample characteristics: Based on the inclusion criteria sevenrelevantarticleswereincludedinthefinalreview.And among seven, two studies were represented more than one database. The demographic and methodological characteristics of chosen studies shown below. Data analysis was done by reading each qualitative study carefully. The findings were highlighted from eachstudy and the themes and subthemes were extracted to synthesizethefinalcorecategoryofthemes.
demographic characteristics of the study: A study conducted by WilliamsVetal(2007)on6participantscontaining 4 men and 2 women of 64 to 83 years of age with an aim of exploring “What really matters to patients with chronic obstructive pulmonary disease?”. Theydid thematic analysis of the transcripts, and the results were showing the patients had physical restriction like walking, household activities and driving due to their breathlessness and oxygen therapy. In this study social integration was ‘two contrasting themes’ those were ‘social participation’ and ‘social integration’.
GuthrieSJ.,HillKM.,MuersMF(2001)conducteda qualitative study “living with COPD:A qualitativeexplorationoftheexperiencesofpatientsinLeeds”.Atotal of 20 participantswere interviewed among them8 were males and 12 were females, non-computerized qualitative analysis was done. Quality of life was seen as depending mainly on family relationships, opportunities afforded locally for neighborliness and freedom fromfear, mobility and independence in the activities of daily living, and the absence or successful mitigation of symptoms of concomitant disease.
GradinerCet.al(2009)conductedqualitativestudyon “living with advanced chronic obstructive pulmonary disease:patients concerns regardingdeathanddying”.Here 21 (8 male, 13 female) Mean age 70.3 years(SD=7.5) were included in the study. Data analysiswas done by NVivo 8 programme and results werethe ‘concerns that their condition might deteriorate’,
264 Indian Journal of Public Health Research & Development, April 2018, Vol.9, No. 4
patients had particular concerns regarding the manner of their death; the overriding fear was dying due to breathlessnessorsuffocation.
Hallding AG., Heggdal K., Wahl A. (2011)conducted a qualitative study “Experiences of self-blame andstigmatizationforself-inflictionamongindividualsliving with COPD”. They had 18 participants, exactmale female ratio is not mentioned and analysis was done by qualitative content analysis by N6software. The main theme was a feeling of being exiled in the world of the healthy, because of self-blame and society’s stigmatizationofCOPDasaself-inflicteddisease.Theparticipants experienced feelings of disgrace through subtle blame and a lack of support from their social network, health care encounters and larger society. This seemed to increase illness-related strain and a need for defensive actions.
Pinnock H et.al (2011) conducted a study on“Living and dying with severe chronic obstructive pulmonary disease: Multi-perspective longitudinal qualitativestudy”.Participantwere21 (14maleand7female) and qualitative data software programme (QSR NVivoversion7)isusedforanalysis.Theresultswereacceptance ofCOPD as “away of life”.The story ofCOPD-Astorywithnobeginning;middlethatisawayof life; An unpredictable and unanticipated end.
Ek K., Ternestedt B conducted a Phenomenological study living with chronic obstructive pulmonary disease at the end of life. Participants number is not available andProcedureofGiorgiandGiorge(2003)wasusedinanalysis. The result shows that the patients feel lacking of physical strength, being forced to forgo activities and material things, being socially and existentially alone, experiencing meaninglessness, and belongingness.
Common themes derived from all studies: The common themes from the review can be categorized under the themes feeling incapacitated, social isolation, views on death and dying and future concerns.
Feeling incapacitated: Breathingdifficultyandbulkofcarrying portable oxygen systems were the key factor for restricted walking and activities. However, walking was also an enjoyable activity and highlighted as a motivation forthepatientswithCOPD10. Physical symptoms such as breathlessness and fear of breathlessness hinders the physical activity and fear of it3. However, some people
also do not consider health status as a restricting factor when discussing plans for future socially in social engagements and planning for holidays2. Distressing breathlessness was accepted among few and managing the symptoms as it comes, interpreting negatively and perception of insurmountable problem was evident in few contexts7. Inability to carryout everyday activities was lamented. Activities of daily living, washing, breathing, visiting to the hospital were incredibly draining. Breathing difficulty also imposes greatest restrictionson daily life. Situations where infections leading to clogging of the airway resulting in breathlessness was quiet anxious and panicky1.
Social isolation: Social participation and physical involvement was interpreted as possible for few and was difficultforothers.Goingawayonaholidayandthetravelwith oxygen was cumbersome. Going out and maintaining the social life is important and the physical restrictions due to the condition were the hindering factors. Social isolation, loneliness and feeling housebound is common amongpeoplewithCOPD10. Constraints on going out for social purposes due to non-availability of own vehicles and requiring physical exertion. Fear of being a dead weight for the companions, increasing disability, increased dependency are the factors causing social isolation3. After diagnosis ofCOPD, the personal needs receivedminorattention, isolated in social circles and developed feeling of refugees in everyday life. Society driven negative judgments related to cause of COPD was common4. Situations with lack of physical strength was an experience of shamefulness and embarrassment. Social isolation was experienced despite of having access to close relations. Avoidance of relationships was also experienced by the COPDpatientsforhavinglessstrength1.
Views on death and dying: Thoughts about suicide, recalling the neighbor’s experience, expressing it as a terrificway and reminiscencewere some of thewaysto describe meaning in life and death3. However, many COPDpatientsareunawarethatthechestconditionsarethe causes of death and not discussed their fears about dyingfromCOPD2. End of life issues were not generally discussed as death was not considered as imminent threat. The death was described as reminiscent of normal expectations, than unanticipated consequence7.
Future concerns: Future concerns related to aging, decline in cognitive function and deterioration in health2. Since the symptoms were severe, the future
Indian Journal of Public Health Research & Development, April 2018, Vol.9, No. 4 265
was considered as uncertain7. Uncertainty about future in terms of coping with disease, whether or not having physical strength for coping was described. Living is of not worthy due to long standing symptoms and anxiety1.
dISCuSSION
The findings of the review showed that peoplesuffering from COPD have had concerns related tophysical, psychosocial, disease related and future. Because of the disease they have physical restrictions which made them feel lonely. Their social participation was decreased as a result they felt isolated. Future seemed unpredictable. The quality of life was seen to be depending on physical activity, independence, social participation and family relationships.
CONCluSION
People living with COPD will have physical,psychosocial and disease related problems. These problems will make the people feel isolated, immobile anddepressed.Earlyidentificationoftheproblemswillhelp in developing the plan of care to deal with people livingwithCOPD.
Source of Funding: Nil.
Conflicts of Interest: The authors declare that they have no competing interests.
ethical clearance: Not required as it is a review article.
ReFeReNCeS
1.Ek,K.,&Ternestedt,B.-M.(2008).Livingwithchronic obstructive pulmonary disease at the end of life: a phenomenological study. Journal compilation,470-478.
2. Gardiner , C., Gott, M., Small , N., Payne , S., Seamark, D., Barnes, S., . . . Ruse, C. (2010).Living with advanced chronic obstructive pulmonary disease: patients concerns regarding death and dying. Palliative medicine .
3.Guthrie, S. J., Hill, K. M., & Muers, M. F.(2001).Livingwith severeCOPD.Aqualitativeexploration of the experiece of patinets in Leeds. Respiratory Medicine,196-204.
4.Halding,A.-G.,Heggdal,K.,&Wahl,A.(2010).Experiences of Self-Blame and stigmatisation for self-inflictionamong individuals living withCOPD.Scandinavian Journal of Caring Sciences, 100-107.
5.Murphy , T. F., & Sethi, S. (2002). ChronicObstructive pulmonary disease, role of bacteriaand guide to antibacterial selection in the older patient. Drugs and aging, 761-775.
6.Nazir, S.A.,&Erbland,M.L. (2009).Chronicobsrtuctive pulmonary disease An update on diagnosis and management issues in older adults. Drugs & aging, 813-831.
7. Pinnock, H., Kendall, M., Murray, S. A., Levack, P.,Porter,M.,MacNee,W.,&Sheikh,A. (211).Living and dying with severe chronic obstructive pulmonary disease: multiperspective longitudinal qualitative study. BMJ,1-10.
8.Polit, D. F., & Beck , C. T. (2012). Nursing research: Generating and assessing evidence for nursing practice. New Delhi: Wolters Kluver Pvt Ltd.
9.Tong, A., Flemming, K., Mclnnes, E., Oliver,S.,&Craig,J.(2012).Enhancingtranparencyinreporting the synthesis of qualitative research-ENTREQ. Biomed Central, 2-8.
10.Williams, V., Bruton , A., Ellis-Hill, C., &McPherson, K. (2007). What really mattersto patients living with chronic obstructive pulmonary disease? An exploratory study . Chronic Respiratory Disease, 1-9.
11. Zamzam, M. A., Azab, N. Y., Wahsh, R. A., Ragab,A.Z.,&Allam,E.M.(2012).QualityoflifeofCOPDpatients.Egyptian Journal of CHest Diseases and Tberculosis, 281-289.
Worker Personality as a Predictor in Compliance Model on Work Safety Regulations
hadi Prayitno1, heru Santoso Wahito Nugroho2
1Faculty of Social and Political Sciences, University of Jember, Indonesia; 2Health Polytechnic of Ministry of Health at Surabaya, Indonesia
AbSTRACT
The high incidence of workplace accidents in industry at both the global and national levels is closely associated with the worker behavioral factors, particularly those related to the worker personality factor. This studyaimstoanalyzeworkerpersonalityfactorthataffectsworkercompliancewithworksafetyregulationsin the industrial sector. This research employed a quantitative approach using analytical observation with cross sectional study. The data was gained through standardized questionnaires. The population involved allworkersofPT.Xfromwhich210workersofmanufacturingdivisionwerechosenasresearchsampleby using purposive sampling technique. For descriptive statistical test, SPSS program was used to analyze thedata,whilefor thestatistic test,SEMtestwaschosenbyusingAMOSprogram.Theresultsshowedthat worker conscientiousness traits through organizational commitment and occupational safety culture were the predictors of worker compliance with work safety regulations, that worker agreeableness traits through occupational safety participation were the predictors of worker compliance with safety regulations, and that worker neuroticism traits through occupational safety participation were the predictors of worker compliance with work safety regulations.
Keywords: Workers, Workplace accidents, Personality factors, Compliance, Work safety regulations, Industry
Corresponding Author:Heru Santoso Wahito NugrohoHealth Polytechnic of Ministry of Health at Surabaya,IndonesiaPucangJajarTengahStreet56Surabaya,IndonesiaEmail: [email protected]
INTROduCTION
Inthelastfivedecadesevery15secondstherehasbeenoneworkerdiedand160workerswereinjuredduetowork-related accident(1).In2014thetotalcompensationpaid in relation to accident cases reached 118.8 US $, representing the highest amount to be paid compared to other types of industries(2),(3). The International LaborOrganization reported that the severity ofworkaccidents in Indonesia was quite high(4). From every 100,000 workers who experience accidents, 20 ofwhomareclassifiedfatal.Amongtheemployeeactionsthat directly cause workplace injuries, up to 29.8% of which are caused by the use of faulty or defective equipment, non-compliance with safety instructions or regulations applicable to companies in which they
work, and less cautiousness or over confidence whenworking.Theoccupational insecurity factorwill affectworker compliance on safety(5). The main causes of occupational accidents are prone to worker behavioral aspects (6). This statement reinforced the opinion by Cooperwhichpinpointed that 80% - 95%of allworkaccidents were caused by unsafe behavior.(7)Oneofthemost generally accepted personality taxonomies today is the personality traits.(8) Seibokaite, et. al. demonstrates that personality traits research is crucial in regulating performance and predicting work motivation and the perceived security climate inhigh-riskfirms.(9) Pervin. et. al. stated that human personality factors consisted of openness to experience, conscientiousness, extraversion, agreeableness and neuroticism.(10)The purpose of this study was to analyze worker personality factor that can affect compliancewithwork safety regulations inconstruction industry.
MATeRIAl ANd MeThOd
This research employed quantitative approach using analytical observation and the design was cross sectional
DOI Number: 10.5958/0976-5506.2018.00295.4
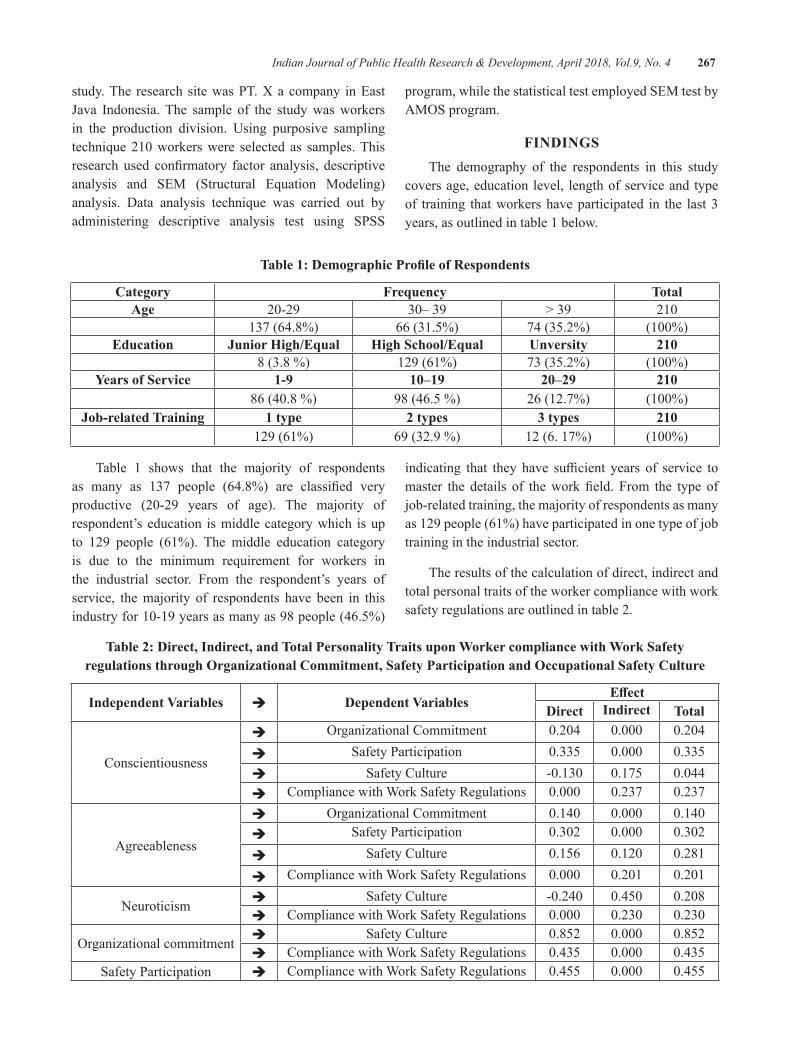
Indian Journal of Public Health Research & Development, April 2018, Vol.9, No. 4 267
study. The research site was PT. X a company in East Java Indonesia.The sample of the studywasworkersin the production division. Using purposive sampling technique210workerswere selected as samples.Thisresearch used confirmatory factor analysis, descriptiveanalysis and SEM (Structural Equation Modeling) analysis. Data analysis technique was carried out by administering descriptive analysis test using SPSS
program, while the statistical test employed SEM test by AMOSprogram.
FINdINgSThe demography of the respondents in this study
covers age, education level, length of service and type of training that workers have participated in the last 3 years, as outlined in table 1 below.
Table 1: Demographic Profile of Respondents
Category Frequency TotalAge 20-29 30–39 > 39 210
137 (64.8%) 66 (31.5%) 74 (35.2%) (100%)education Junior high/equal high School/equal unversity 210
8 (3.8 %) 129 (61%) 73 (35.2%) (100%)years of Service 1-9 10–19 20–29 210
86(40.8%) 98 (46.5 %) 26 (12.7%) (100%)Job-related Training 1 type 2 types 3 types 210
129 (61%) 69 (32.9 %) 12 (6. 17%) (100%)
Table 1 shows that the majority of respondents as many as 137 people (64.8%) are classified veryproductive (20-29 years of age). The majority ofrespondent’s education is middle category which is up to 129 people (61%). The middle education category is due to the minimum requirement for workers in the industrial sector. From the respondent’s years of service, the majority of respondents have been in this industryfor10-19yearsasmanyas98people(46.5%)
indicating that they have sufficient years of service tomaster the details of theworkfield. From the type ofjob-related training, the majority of respondents as many as 129 people (61%) have participated in one type of job training in the industrial sector.
The results of the calculation of direct, indirect and total personal traits of the worker compliance with work safety regulations are outlined in table 2.
Table 2: direct, Indirect, and Total Personality Traits upon Worker compliance with Work Safety regulations through Organizational Commitment, Safety Participation and Occupational Safety Culture
Independent Variables è dependent VariablesEffect
direct Indirect Total
Conscientiousness
è OrganizationalCommitment 0.204 0.000 0.204
è Safety Participation 0.335 0.000 0.335è Safety Culture -0.130 0.175 0.044è Compliance with Work Safety Regulations 0.000 0.237 0.237
Agreeableness
è OrganizationalCommitment 0.140 0.000 0.140è Safety Participation 0.302 0.000 0.302
è Safety Culture 0.156 0.120 0.281
è Compliance with Work Safety Regulations 0.000 0.201 0.201
Neuroticism è Safety Culture -0.240 0.450 0.208è Compliance with Work Safety Regulations 0.000 0.230 0.230
Organizationalcommitment è Safety Culture 0.852 0.000 0.852è Compliance with Work Safety Regulations 0.435 0.000 0.435
Safety Participation è Compliance with Work Safety Regulations 0.455 0.000 0.455
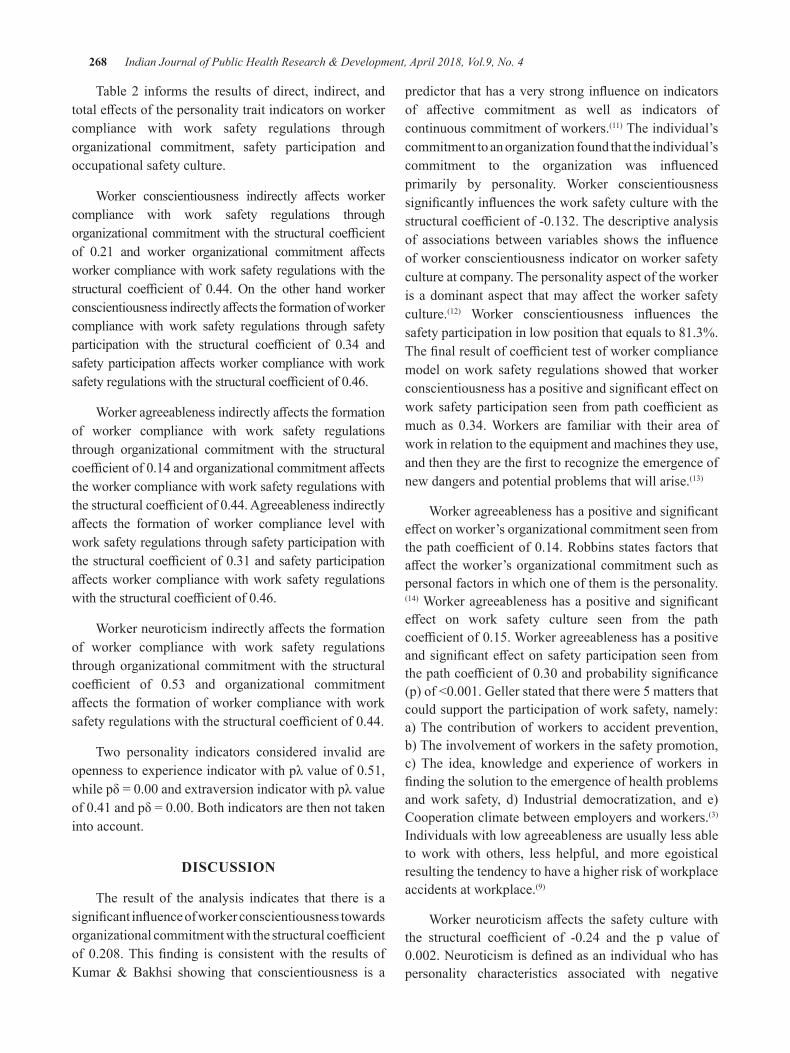
268 Indian Journal of Public Health Research & Development, April 2018, Vol.9, No. 4
Table 2 informs the results of direct, indirect, and totaleffectsofthepersonalitytraitindicatorsonworkercompliance with work safety regulations through organizational commitment, safety participation and occupational safety culture.
Worker conscientiousness indirectly affects workercompliance with work safety regulations through organizationalcommitmentwiththestructuralcoefficientof 0.21 and worker organizational commitment affectsworker compliance with work safety regulations with the structural coefficient of 0.44. On the other handworkerconscientiousnessindirectlyaffectstheformationofworkercompliance with work safety regulations through safety participation with the structural coefficient of 0.34 andsafetyparticipationaffectsworkercompliancewithworksafetyregulationswiththestructuralcoefficientof0.46.
Workeragreeablenessindirectlyaffectstheformationof worker compliance with work safety regulations through organizational commitment with the structural coefficientof0.14andorganizationalcommitmentaffectsthe worker compliance with work safety regulations with thestructuralcoefficientof0.44.Agreeablenessindirectlyaffects the formation of worker compliance level withwork safety regulations through safety participation with thestructuralcoefficientof0.31andsafetyparticipationaffectsworkercompliancewithwork safety regulationswiththestructuralcoefficientof0.46.
Workerneuroticismindirectlyaffectstheformationof worker compliance with work safety regulations through organizational commitment with the structural coefficient of 0.53 and organizational commitmentaffects the formationofworker compliancewithworksafetyregulationswiththestructuralcoefficientof0.44.
Two personality indicators considered invalid are opennesstoexperienceindicatorwithpλvalueof0.51,whilepδ=0.00andextraversionindicatorwithpλvalueof0.41andpδ=0.00.Bothindicatorsarethennottakeninto account.
dISCuSSION
The result of the analysis indicates that there is a significantinfluenceofworkerconscientiousnesstowardsorganizationalcommitmentwiththestructuralcoefficientof 0.208.Thisfinding is consistentwith the results ofKumar & Bakhsi showing that conscientiousness is a
predictorthathasaverystronginfluenceonindicatorsof affective commitment as well as indicators ofcontinuous commitment of workers.(11) The individual’s commitment to an organization found that the individual’s commitment to the organization was influencedprimarily by personality. Worker conscientiousness significantlyinfluencestheworksafetyculturewiththestructuralcoefficientof-0.132.Thedescriptiveanalysisof associations between variables shows the influenceof worker conscientiousness indicator on worker safety culture at company. The personality aspect of the worker isadominantaspect thatmayaffect theworkersafetyculture.(12) Worker conscientiousness influences thesafety participation in low position that equals to 81.3%. Thefinalresultofcoefficienttestofworkercompliancemodel on work safety regulations showed that worker conscientiousnesshasapositiveandsignificanteffectonworksafetyparticipationseen frompathcoefficientasmuch as 0.34.Workers are familiarwith their area ofwork in relation to the equipment and machines they use, andthentheyarethefirsttorecognizetheemergenceofnew dangers and potential problems that will arise.(13)
Workeragreeablenesshasapositiveandsignificanteffectonworker’sorganizationalcommitmentseenfromthepathcoefficientof0.14.Robbinsstatesfactorsthataffect theworker’sorganizationalcommitmentsuchaspersonal factors in which one of them is the personality.(14)Workeragreeablenesshasapositiveandsignificanteffect on work safety culture seen from the pathcoefficientof0.15.Workeragreeablenesshasapositiveandsignificanteffectonsafetyparticipationseenfromthepathcoefficientof0.30andprobabilitysignificance(p)of<0.001.Gellerstatedthattherewere5mattersthatcould support the participation of work safety, namely: a) The contribution of workers to accident prevention, b) The involvement of workers in the safety promotion, c) The idea, knowledge and experience of workers in findingthesolutiontotheemergenceofhealthproblemsand work safety, d) Industrial democratization, and e) Cooperation climate between employers and workers.(3) Individuals with low agreeableness are usually less able to work with others, less helpful, and more egoistical resulting the tendency to have a higher risk of workplace accidents at workplace.(9)
Worker neuroticismaffects the safety culturewiththe structural coefficient of -0.24 and the p value of0.002.Neuroticismisdefinedasanindividualwhohaspersonality characteristics associated with negative
Indian Journal of Public Health Research & Development, April 2018, Vol.9, No. 4 269
emotions such as worry and insecurity.(15) This suggests that neuroticism, which has been connoted negatively as an individual character, does not always mean negative in reality, precisely in the context of certain types of work related to the construction sector that has a high accident risk as well as high level of complexity of problem. This condition requires a worker to have dominant neuroticism in order to be able to add compliance with the regulations in his work environment, one of which is compliance with work safety regulations strictly set by the company. The goal is no other than for the creation of workplace safety which is ultimately expected to increase work productivity.
The intermediate variables that bridge variables between the three factors of the worker personality are conscientiousness, agreeableness and neuroticism for the formation of the worker compliance with work safety regulations in the construction industry including organizational commitment variables, safety culture variables and safety participation variable which vary from one variable to another.
Theinfluenceofworkerorganizationalcommitmentonwork safety culture with the structural coefficientsof 0.85 and the probability significance (p) of <0.001indicates the strong influence of the variable.Workerorganizational commitment related to safety culture has the same goal of creating character, values, and attitudes that shape the behavior of organizations and individuals to achieve professionalism with a high level of effectiveness. Worker organizational commitmentpartially has an effect on worker safety culture. Thecompany that provides good lighting during work timehasbiggestmeanofhealthworkvariable.Ontheother hand, the organizational commitment of worker simultaneously has a significant effect on the workersafety culture.(16) Organizational commitment has apositive and significant impact on compliance withwork safety regulations. This can be seen from the path coefficient of 0.44 and the probability significance (p)of <0.001. Masial and Pienar found that the workerorganizational commitment had a significant effect onworker safety compliance.(5)
CONCluSION
The study found three factors of worker personality as predictors in shaping worker compliance with work safetyregulationsthroughthefollowingfivepaths:
1. Worker conscientiousness is the predictor of compliance with work safety regulations through worker organizational commitment variable.
2. Worker conscientiousness is the predictor of compliance with work safety regulations through worker safety participation variable.
3. Worker agreeableness is the predictor of compliance with work safety regulations through worker organizational commitment variable.
4. Worker agreeableness is the predictor of compliance with work safety regulations through worker safety participation variable.
5. Worker neuroticism is the predictor of compliance with work safety regulations through worker organizational commitment variable.
Conflict of Interest: The authors declare that there is no conflictofinterestrelatedtothisresearch.
Source of Funding: All funds used to support research comes from the researchers themselves.
ethical Clearance: Ethical clearance taken from Health Research Ethics Committee, Faculty of Public Health, AirlanggaUniversitywithnumber“492-KEPK”.
ReFeReNCeS
1. International Labour Organisation. GlobalEstimate of Forced Labour: Result and Methodology, Special Action Programe to CombatForcedLabour.Geneva:ILO;2013.
2. The US Bureau of Labor Statistics. Bureau of LaborStatisticsdata(OnLine);2014.Available:http//www.bls.gov/(accessed,17Agustus2014).
3. Galler BS. Behavior Bassed Safety and Occupational Risk Manajemen. BehaviorModificationJournal.2005;29(3).
4.International Labour Organization. GuidelinesonOccupationalSafetyandHealthManagementSystems.Geneva:ILO;2015.
5.Masial U, Pienaar, J. Unravelling SafetyCompliance in the Mining Industry: Examining the RoleofWork stress, Job Insecurity,Satisfactionand Commitment as Antecedents. SA Industrial PsychologiJournal.PotchefstroomSouthAfrica:OASIS;2011.
270 Indian Journal of Public Health Research & Development, April 2018, Vol.9, No. 4
6.Suizer A, Austin J. Does BBS Work?. BehaviorBased Safety and Injury Reduction: A Survey of The Evidence.ProfessionalSafety.2000;45(7):19-24.
7. Cooper D. Behavior Safety Interventions, A Review of Process Design Factors. Professional Safety.2009;36-45.
8.John OP, Srivastava S. The Big-Five TraitTaxonomy: History, Measurement, and TheoreticalPerspectives.InL.A.Pervin&O.P.John(Eds.),NewYork:GuilfordPress.Handbookof personality: Theory and research. 1999; 2(27):102-138.
9. Seibokaite L, Endriulaitiene A. The Role of Personality Traits, Work Motivation and Organizational Safety Climate in RiskOccupational Performance of ProfessionalDrivers. Baltic Journal of Management.2012;7(1):123-128.
10.Pervin LA, Cervone D, John OP. Personality:Theory and Research (9thed.).Hoboken,NJ:JohnWiley&Sons;2005.
11. Kumar K, Bakhsi A. The Five Factor Model of Personality and Organizational Commitment: IsThereAnyRelationship?. Jammu:University of
Jammu.Hummanity&SocialSciencesJournal.2010;5(1):56-62.
12.Sholihah Q, Kuncoro W. Occupational Safetyand Health: Concepts, Developments &Implementation of Safety Culture (Keselamatan-Kesehatan Kerja: Konsep, Perkembangan &Implementasi Budaya Keselamatan). Jakarta:EGC;2013.
13.Seaman, P. Effective Employee Participation.Patrick Seaman Workplace Safety Ltd. Safeguard’s Journal.2006;5(17):56-59.
14.RobbinsSP,JudgeTA.OrganizationalBehavior,14thed.UpperSaddleRiver,NewJersey:PearsonEducationInc.Sh;2011.
15.Feist J, Feist GJ. Theories of Personality (7th,Seventh Edition). New York. USA: McGraw-Hill; 2008.
16.Budianto F. Effect of Occupational Safetyand Health on Organizational Commitment ofEmployees in Production Section PT. Sumber Kencana at Bojonegoro (Pengaruh Keselamatan dan Kesehatan Kerja Terhadap Komitmen OrganisasionalKaryawanpadaBagianProduksiPT. Sumber Kencana di Bojonegoro).AGORA.2014;2(1):55-59.
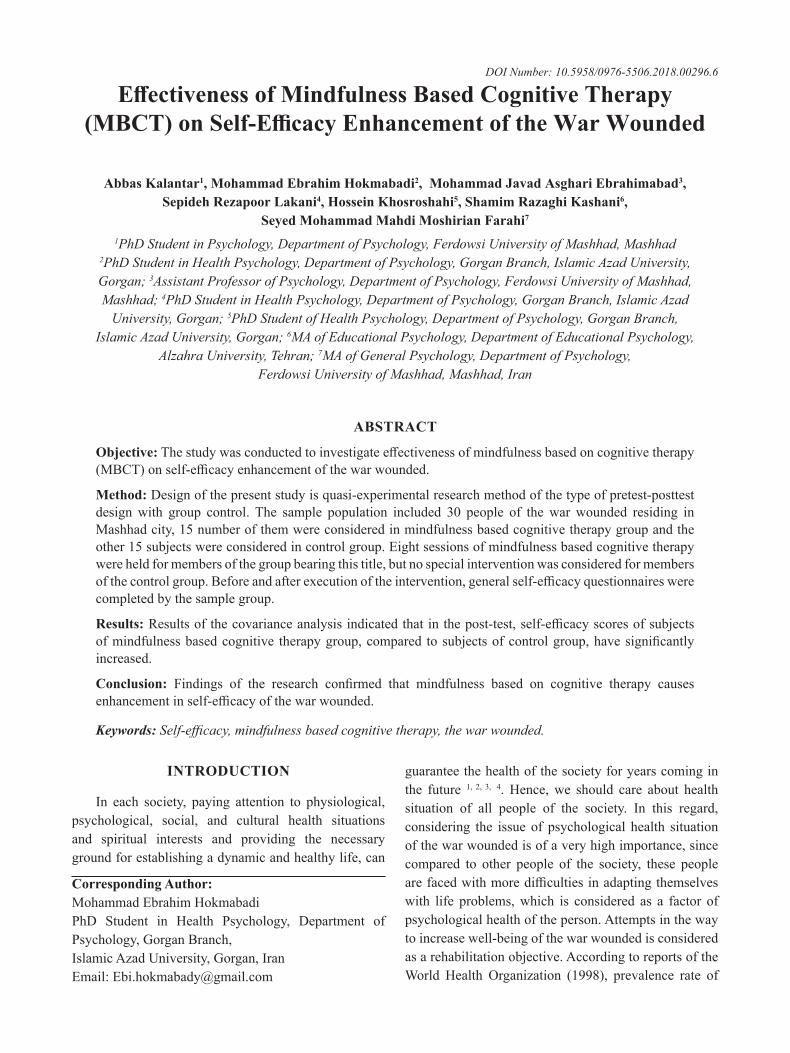
Effectiveness of Mindfulness Based Cognitive Therapy (MBCT) on Self-Efficacy Enhancement of the War Wounded
Abbas Kalantar1, Mohammad ebrahim hokmabadi2, Mohammad Javad Asghari ebrahimabad3, Sepideh Rezapoor lakani4, hossein Khosroshahi5, Shamim Razaghi Kashani6,
Seyed Mohammad Mahdi Moshirian Farahi7
1PhD Student in Psychology, Department of Psychology, Ferdowsi University of Mashhad, Mashhad 2PhD Student in Health Psychology, Department of Psychology, Gorgan Branch, Islamic Azad University, Gorgan; 3Assistant Professor of Psychology, Department of Psychology, Ferdowsi University of Mashhad, Mashhad; 4PhD Student in Health Psychology, Department of Psychology, Gorgan Branch, Islamic Azad
University, Gorgan; 5PhD Student of Health Psychology, Department of Psychology, Gorgan Branch, Islamic Azad University, Gorgan; 6MA of Educational Psychology, Department of Educational Psychology,
Alzahra University, Tehran; 7MA of General Psychology, Department of Psychology, Ferdowsi University of Mashhad, Mashhad, Iran
AbSTRACT
Objective:Thestudywasconductedtoinvestigateeffectivenessofmindfulnessbasedoncognitivetherapy(MBCT)onself-efficacyenhancementofthewarwounded.
Method: Design of the present study is quasi-experimental research method of the type of pretest-posttest designwith group control. The sample population included 30 people of thewarwounded residing inMashhad city, 15 number of them were considered in mindfulness based cognitive therapy group and the other 15 subjects were considered in control group. Eight sessions of mindfulness based cognitive therapy were held for members of the group bearing this title, but no special intervention was considered for members ofthecontrolgroup.Beforeandafterexecutionoftheintervention,generalself-efficacyquestionnaireswerecompleted by the sample group.
Results:Resultsofthecovarianceanalysisindicatedthatinthepost-test,self-efficacyscoresofsubjectsofmindfulnessbasedcognitive therapygroup,compared tosubjectsofcontrolgroup,havesignificantlyincreased.
Conclusion: Findings of the research confirmed that mindfulness based on cognitive therapy causesenhancementinself-efficacyofthewarwounded.
Keywords: Self-efficacy, mindfulness based cognitive therapy, the war wounded.
Corresponding Author:Mohammad Ebrahim HokmabadiPhD Student in Health Psychology, Department of Psychology, Gorgan Branch, Islamic Azad University, Gorgan, IranEmail: [email protected]
INTROduCTION
In each society, paying attention to physiological, psychological, social, and cultural health situations and spiritual interests and providing the necessary ground for establishing a dynamic and healthy life, can
guarantee the health of the society for years coming in the future 1, 2, 3, 4. Hence, we should care about health situation of all people of the society. In this regard, considering the issue of psychological health situation of the war wounded is of a very high importance, since compared to other people of the society, these people arefacedwithmoredifficultiesinadaptingthemselveswith life problems, which is considered as a factor of psychological health of the person. Attempts in the way to increase well-being of the war wounded is considered as a rehabilitation objective. According to reports of the World Health Organization (1998), prevalence rate of
DOI Number: 10.5958/0976-5506.2018.00296.6
272 Indian Journal of Public Health Research & Development, April 2018, Vol.9, No. 4
warinjuriesbetweenages25to40yearsold,hasbeen10in10000persons,andbyincreasingtheage,thisrateincreases so that in the age60yearsold it reaches44persons per 1000people.Of course this rate varies indifferentcountries.Forinstance,regardingIran,studieshave reported higher rates.
Oneofthepsychologicalfactorsthathasanoticeableeffectonhealthsituationofthewarwounded,istheirself-efficacy.Mostbehaviorsofthehumancanbemotivatedandcontrolledbyself-influencingmechanisms.Amongself-influencing mechanisms, there is no mechanismmore important and comprehensive than believing in self-efficacy. If a person believes that he/she cannotachieve the expected results, or believes that cannot prevent inacceptable behaviors, his/her motivation for fulfillmentofthejobwouldbereduced.Thus,therearesome other factors acting as human motivators, but they areallafunctionoftheperson’sbelief.Self-efficacyisaconstructive power through which behavioral, emotional, social and cognitive skills of the human are organized in aneffectivemannerforrealizingvariousobjectives5, 6,
7. Individualswithhigh self-efficacy, considerdifficultassignments and jobs as challenges that they can handle, and in case of rise of any problem, they keep trying 8.
Up to now, various therapy methods have been applied for improving psychological health of the war wounded. But in the recent years, new patterns such as mindfulness based cognitive therapy, has established a huge evolution in treatment of psychological problems related to war wounds. Mindfulness based cognitive therapy includes elements of cognitive therapy which cause separation of the attitude of the individual from his/her thoughts and prevents the individual from focusing on them. For instance, statements such as “thoughts are notreal”and“Iamnotmythoughts”9.
Mindfulness based cognitive therapy is resulted from a comprehensive research in the field of identificationof factors and predictor cognitive processes of relapse of psychological disorders 10, 11, 12. Mindfulness based on cognitive therapy is a new promising method in advancing behavioral cognitive approach in treatment of psychological disorders, since training mindfulness together with metacognitive learnings and new behavioral strategies for attention control is accompanied with expansion of new thoughts and reduction of unpleasant excitements, reduction of rumination and anxious-based responses 13. This approach definitelyfocuses on identifying factors warning about imminent
relapse of the signs and educates patients to learn how to conquer their threatening discomforts. Patients learn to be in contact with the present time, without obsessing their mind with thinking about the past events or be worried about the future 14. By applying decentralization technique, this approach is also applied for body senses and excitements 10.
Mindfulness based cognitive therapy facilitates cognitive change 15, strengthens tranquilizing responses against stress 16, results in more compatible metacognitive process 17,reducesinflexibledominationof verbal rules governing the behavior 18, enhances self-efficacyandadaptivecoping19, reduces prevention from experiencing and deepens emotional process 20, and improves emotional adjustment, emotional awareness, and emotional understanding 21.
Considering issues mentioned above, it seems that mindfulnessbasedcognitivetherapyiseffectiveinself-efficacyofthewarwounded.Therefore,theobjectiveofthepresentresearchistoinvestigatetheeffectivenessofmindfulness based cognitive therapy in group style, on enhancementofself-efficacyofthewarwounded.
MeThOd
This research which is considered as an applied research, is designed and conducted in quasi-experimental method of type of group control pretest-posttest experiment. In the descriptive level of analysis of data, standard deviation and mean statistics are used, and in inferential level, covariance analysis is used.
Population, Sample, and Sampling Method: All the war wounded residing at Mashhad city are included in this research. Due to existence of various limitations, it was not possible to use random sampling, so in this study, the available purposive sampling method with random placement was used. Since in the experimental and quasi-experimental studies it is proposed to have a population volume of 30 individuals 21, the researcher chose a sample population with this number of subjects among individuals existed in the primary population according to meeting the required criteria (having war wounds). The chosen subjects were considered in two groups in a random placement style, so that in each group there were 15 individuals. Average age of subjects of the experiment group was 48.93, and that of the control group was 47.93 year old.
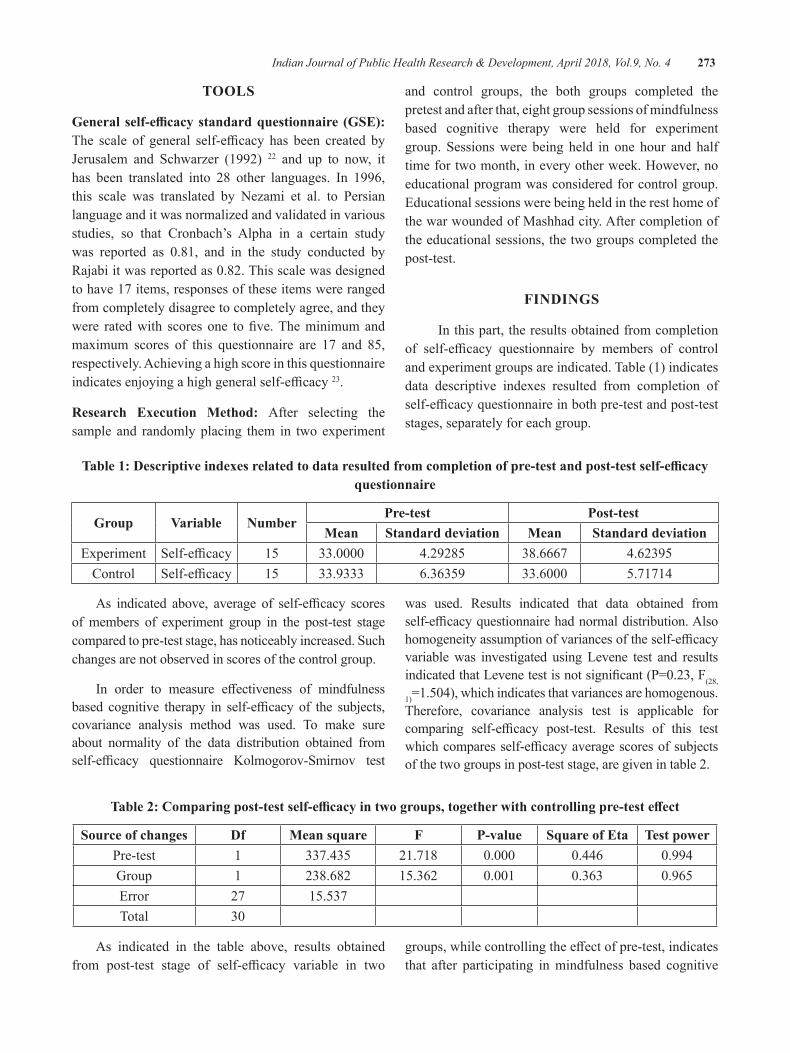
Indian Journal of Public Health Research & Development, April 2018, Vol.9, No. 4 273
TOOlS
General self-efficacy standard questionnaire (GSE): The scale of general self-efficacy has been created byJerusalem and Schwarzer (1992) 22 and up to now, it has been translated into 28 other languages. In 1996, this scale was translated by Nezami et al. to Persian language and it was normalized and validated in various studies, so that Cronbach’s Alpha in a certain study was reported as 0.81, and in the study conducted byRajabiitwasreportedas0.82.Thisscalewasdesignedto have 17 items, responses of these items were ranged from completely disagree to completely agree, and they were ratedwith scoresone tofive.Theminimumandmaximum scores of this questionnaire are 17 and 85, respectively. Achieving a high score in this questionnaire indicatesenjoyingahighgeneralself-efficacy23.
Research execution Method: After selecting the sample and randomly placing them in two experiment
and control groups, the both groups completed the pretest and after that, eight group sessions of mindfulness based cognitive therapy were held for experiment group. Sessions were being held in one hour and half time for two month, in every other week. However, no educational program was considered for control group. Educational sessions were being held in the rest home of the war wounded of Mashhad city. After completion of the educational sessions, the two groups completed the post-test.
FINdINgS
In this part, the results obtained from completion of self-efficacy questionnaire by members of controland experiment groups are indicated. Table (1) indicates data descriptive indexes resulted from completion of self-efficacyquestionnaireinbothpre-testandpost-teststages, separately for each group.
Table 1: Descriptive indexes related to data resulted from completion of pre-test and post-test self-efficacy questionnaire
group Variable NumberPre-test Post-test
Mean Standard deviation Mean Standard deviationExperiment Self-efficacy 15 33.0000 4.29285 38.6667 4.62395
Control Self-efficacy 15 33.9333 6.36359 33.6000 5.71714
As indicated above, average of self-efficacy scoresof members of experiment group in the post-test stage compared to pre-test stage, has noticeably increased. Such changes are not observed in scores of the control group.
In order to measure effectiveness of mindfulnessbased cognitive therapy in self-efficacy of the subjects,covariance analysis method was used. To make sure about normality of the data distribution obtained from self-efficacy questionnaire Kolmogorov-Smirnov test
was used. Results indicated that data obtained from self-efficacyquestionnairehadnormaldistribution.Alsohomogeneityassumptionofvariancesoftheself-efficacyvariable was investigated using Levene test and results indicatedthatLevenetestisnotsignificant(P=0.23,F(28,
1)=1.504),whichindicatesthatvariancesarehomogenous.Therefore, covariance analysis test is applicable for comparing self-efficacy post-test. Results of this testwhichcomparesself-efficacyaveragescoresofsubjectsof the two groups in post-test stage, are given in table 2.
Table 2: Comparing post-test self-efficacy in two groups, together with controlling pre-test effect
Source of changes df Mean square F P-value Square of eta Test powerPre-test 1 337.435 21.718 0.000 0.446 0.994Group 1 238.682 15.362 0.001 0.363 0.965Error 27 15.537Total 30
As indicated in the table above, results obtained from post-test stage of self-efficacy variable in two
groups,whilecontrollingtheeffectofpre-test,indicatesthat after participating in mindfulness based cognitive
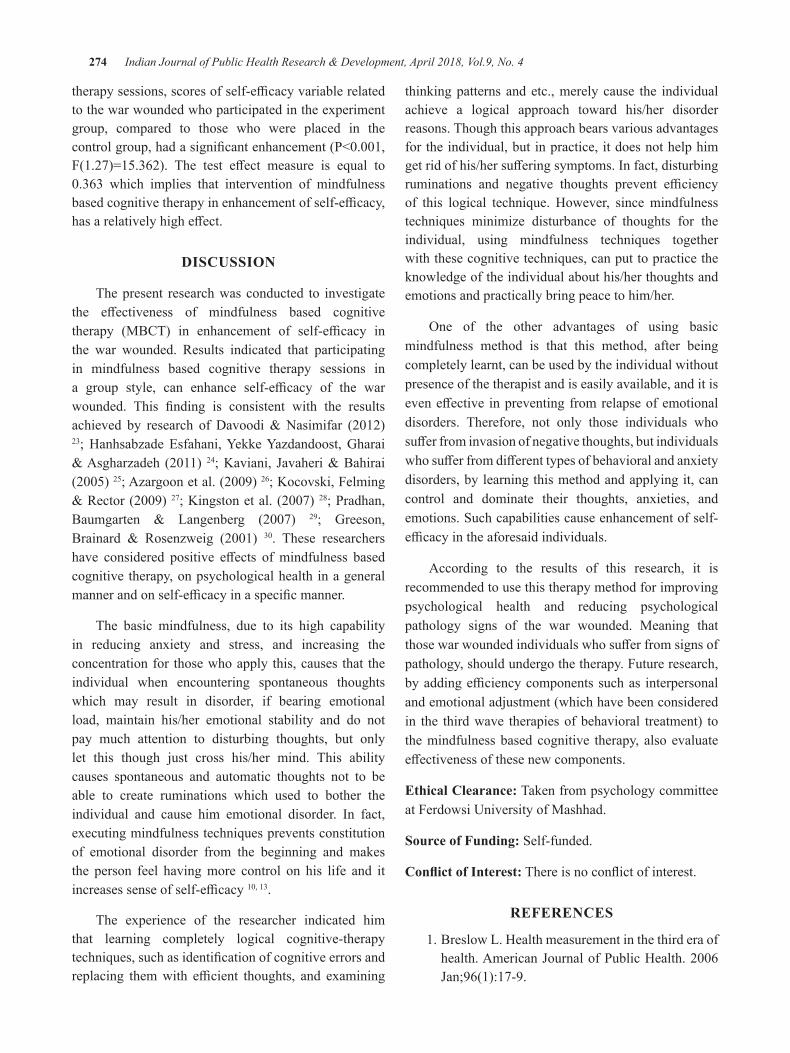
274 Indian Journal of Public Health Research & Development, April 2018, Vol.9, No. 4
therapysessions,scoresofself-efficacyvariablerelatedto the war wounded who participated in the experiment group, compared to those who were placed in the controlgroup,hadasignificantenhancement(P<0.001,F(1.27)=15.362). The test effect measure is equal to0.363 which implies that intervention of mindfulnessbasedcognitivetherapyinenhancementofself-efficacy,hasarelativelyhigheffect.
dISCuSSION
The present research was conducted to investigate the effectiveness of mindfulness based cognitivetherapy (MBCT) in enhancement of self-efficacy inthe war wounded. Results indicated that participating in mindfulness based cognitive therapy sessions in a group style, can enhance self-efficacy of the warwounded. This finding is consistent with the resultsachieved by research ofDavoodi&Nasimifar (2012)23; Hanhsabzade Esfahani, Yekke Yazdandoost, Gharai &Asgharzadeh (2011) 24;Kaviani, Javaheri&Bahirai(2005)25;Azargoonetal.(2009)26; Kocovski, Felming &Rector(2009) 27;Kingstonetal.(2007) 28; Pradhan, Baumgarten & Langenberg (2007) 29; Greeson, Brainard & Rosenzweig (2001) 30. These researchers have considered positive effects ofmindfulness basedcognitive therapy, on psychological health in a general mannerandonself-efficacyinaspecificmanner.
The basic mindfulness, due to its high capability in reducing anxiety and stress, and increasing the concentration for those who apply this, causes that the individual when encountering spontaneous thoughts which may result in disorder, if bearing emotional load, maintain his/her emotional stability and do not pay much attention to disturbing thoughts, but only let this though just cross his/her mind. This ability causes spontaneous and automatic thoughts not to be able to create ruminations which used to bother the individual and cause him emotional disorder. In fact, executing mindfulness techniques prevents constitution of emotional disorder from the beginning and makes the person feel having more control on his life and it increasessenseofself-efficacy10,13.
The experience of the researcher indicated him that learning completely logical cognitive-therapy techniques,suchasidentificationofcognitiveerrorsandreplacing themwith efficient thoughts, and examining
thinking patterns and etc., merely cause the individual achieve a logical approach toward his/her disorder reasons. Though this approach bears various advantages for the individual, but in practice, it does not help him getridofhis/hersufferingsymptoms.Infact,disturbingruminations and negative thoughts prevent efficiencyof this logical technique. However, since mindfulness techniques minimize disturbance of thoughts for the individual, using mindfulness techniques together with these cognitive techniques, can put to practice the knowledge of the individual about his/her thoughts and emotions and practically bring peace to him/her.
One of the other advantages of using basicmindfulness method is that this method, after being completely learnt, can be used by the individual without presence of the therapist and is easily available, and it is eveneffective inpreventingfromrelapseofemotionaldisorders. Therefore, not only those individuals who sufferfrominvasionofnegativethoughts,butindividualswhosufferfromdifferenttypesofbehavioralandanxietydisorders, by learning this method and applying it, can control and dominate their thoughts, anxieties, and emotions. Such capabilities cause enhancement of self-efficacyintheaforesaidindividuals.
According to the results of this research, it is recommended to use this therapy method for improving psychological health and reducing psychological pathology signs of the war wounded. Meaning that thosewarwoundedindividualswhosufferfromsignsofpathology, should undergo the therapy. Future research, byaddingefficiencycomponentssuchas interpersonaland emotional adjustment (which have been considered in the third wave therapies of behavioral treatment) to the mindfulness based cognitive therapy, also evaluate effectivenessofthesenewcomponents.
ethical Clearance: Taken from psychology committee at Ferdowsi University of Mashhad.
Source of Funding: Self-funded.
Conflict of Interest:Thereisnoconflictofinterest.
ReFeReNCeS
1. Breslow L. Health measurement in the third era of health.AmericanJournalofPublicHealth.2006Jan;96(1):17-9.
Indian Journal of Public Health Research & Development, April 2018, Vol.9, No. 4 275
2. Phillips D. Quality of life: Concept, policy and practice.Routledge;2006Feb16.
3. Blair C, Zelazo PD, Greenberg MT. The measurement of executive function in early childhood. Developmental neuropsychology. 2005Oct1;28(2):561-71.
4. Karami S, Piraste A. Investigation psychological health of students of medical sciences university ofZanjan.ScientificJournalofmedicalsciencesuniversity and therapy-health services of Zanjan. 2001;5(9):66-73.
5.BanduraA.Selfefficacy:Theexerciseofcontrol.NewYork:Freeman,2006.
6.Schwarzer R, Luszczynska A. Self-efficacy,adolescents’ risk-taking behaviors, and health. Self-efficacy beliefs of adolescents. 2006 Feb1;5:139-59.
7.Sullivan KR, Mahalik JR. Increasing CareerSelf‐Efficacy for Women: Evaluating aGroup Intervention. Journal of Counseling &Development.2000Jan1;78(1):54-62.
8. Karademas EC, Kalantzi-Azizi A. The stress process, self-efficacy expectations, andpsychological health. Personality and individual differences.2004Oct1;37(5):1033-43.
9.Omidi A, Mohammadkhani P. Instruction ofImmediacy as a clinical intervention: empirical andconceptual review. Journalofpsychologicalhealth.2008;1(1)1:29-38.
10.Crane, R.Mindfulness based cognitive therapy.1sted.NewYork:Routledge.2009press;35.
11. Barnhofer T, Crane C, Hargus E, Amarasinghe M,Winder R,Williams JM.Mindfulness-basedcognitive therapy as a treatment for chronic depression: A preliminary study. Behaviour researchandtherapy.2009May1;47(5):366-73.
12. Craighead WE, Craighead LW. Behavioral and Cognitive‐Behavioral Psychotherapy. Handbookofpsychology.2003.
13.MaSH,TeasdaleJD.Mindfulness-basedcognitivetherapy for depression: replication and exploration ofdifferential relapsepreventioneffects.Journalof consulting and clinical psychology. 2004Feb;72(1):31.
14. EXPERIENCE M. Metacognition, mindfulness and the modification of mood disorders. Clin.Psychol. Psychother. 1999;6:146-55.
15. Borkovec TD, Sharpless B. Generalized Anxiety Disorder: Bringing Cognitive-Behavioral Therapy intotheValuedPresent.
16.WellsA.GAD,Meta‐cognition,andMindfulness:An Information Processing Analysis. Clinical Psychology: Science and Practice. 2002 Mar1;9(1):95-100.
17. Hayes SC. Acceptance, mindfulness, and science. ClinicalPsychology:ScienceandPractice.2002Mar1;9(1):101-6.
18.Craske MG, Hazlett‐Stevens H. Facilitatingsymptom reduction and behavior change in GAD: The issue of control. Clinical Psychology: Science andPractice.2002Mar1;9(1):69-75.
19.RoemerL,OrsilloSM.Mindfulness:Apromisingintervention strategy in need of further study. Clinicalpsychology:Scienceandpractice.2003Jun1;10(2):172-8.
20.Mennin DS, Heimberg RG, Turk CL, FrescoDM. Applying an emotion regulation framework to integrative approaches to generalized anxiety disorder. Clinical Psychology: Science and Practice.2002Mar1;9(1):85-90.
21. Yalom, D. I. Leszcz, M. The Theory and Practice ofGroupPsychotherapy.2005.NewYork,BasicBooks.
22.Jerusalem M, Schwarzer R. Self-efficacy as aresource factor in stress appraisal processes. Self-efficacy:Thoughtcontrolofaction.1992;195213.
23.Davoodi I, Nasimifar N. Effectiveness of stressreducing method based on mindfulness, on pain relieving and the strategy to cope with disaster occurrence in females suffering frommusculoskeletal chronic pains. New Findings in Psychology.2012;7(22):45-62.
24. Hanasabzadeh Esfahani M, Yekke Yazdandoost R, Gharai B, Asgharnejad Farid A. Primary investigation of efficiency of guidance of mindfulness basedcognitive therapy (MBCT) for depressed patients with suicide thoughts: Case study report. Clinical psychology.2009;1(1):35-45.
276 Indian Journal of Public Health Research & Development, April 2018, Vol.9, No. 4
25.KavianiH,JavaheriF,BohiraiH.Effectivenessofmindfulness based cognitive therapy (MBCT) on reducingautomaticnegativethoughts,inefficientattitude,depressionandanxiety:60-dayprogram.Newsofcognitivesciences.2007;7(1)(successive25):49-59.
26. Azargoon H, Kajbaf MB, Molavi H, Abedi MR. The effect of mindfulness training on mentalrumination and depression of the students of IsfahanUniversity.2009.
27.KocovskiNL,FlemingJE,RectorNA.Mindfulnessand acceptance-based group therapy for social anxiety disorder: An open trial. Cognitive and BehavioralPractice.2009Aug1;16(3):276-89.
28.Kingston J,ChadwickP,MeronD,SkinnerTC.A pilot randomized control trial investigating the
effectofmindfulnesspracticeonpain tolerance,psychological well-being, and physiological activity.Journalofpsychosomaticresearch.2007Mar1;62(3):297-300.
29. Pradhan EK, Baumgarten M, Langenberg P, Handwerger B, Gilpin AK, Magyari T, Hochberg MC, Berman BM. Effect of Mindfulness‐Based stress reduction in rheumatoid arthritis patients. Arthritis Care & Research. 2007 Oct15;57(7):1134-42.
30.ReibelDK,GreesonJM,BrainardGC,RosenzweigS. Mindfulness-based stress reduction and health-related quality of life in a heterogeneous patient population.Generalhospitalpsychiatry.2001Jul1;23(4):183-92.
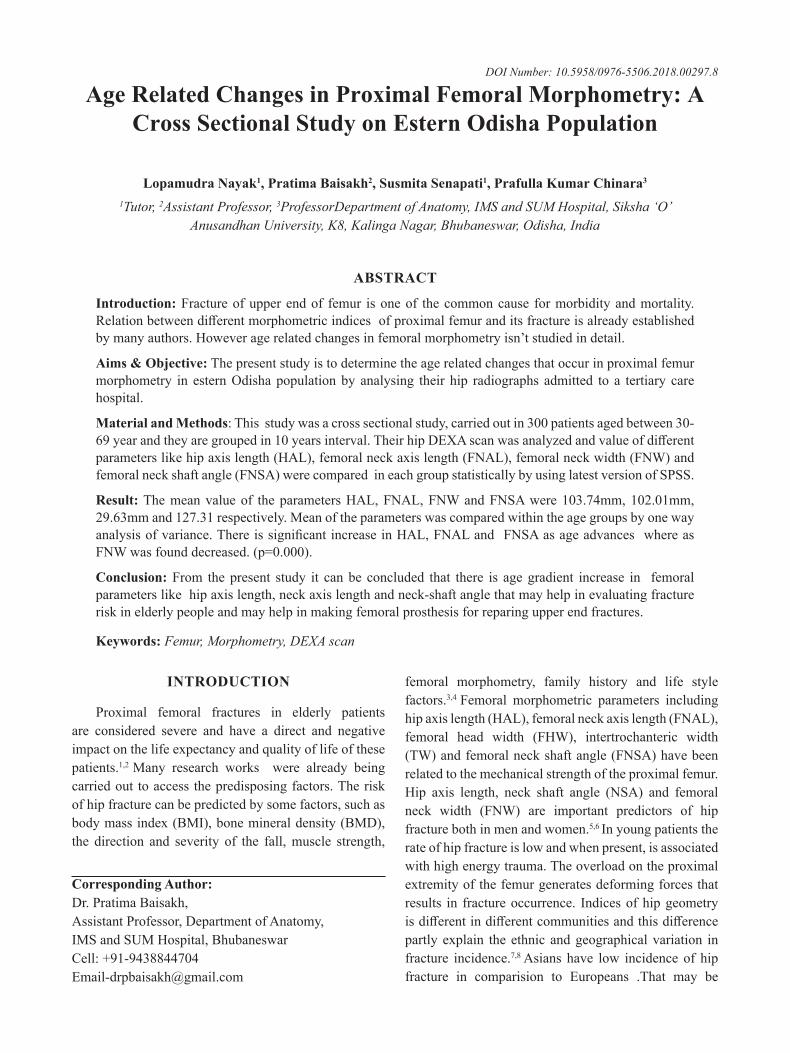
Age Related Changes in Proximal Femoral Morphometry: A Cross Sectional Study on estern Odisha Population
lopamudra Nayak1, Pratima baisakh2, Susmita Senapati1, Prafulla Kumar Chinara3
1Tutor, 2Assistant Professor, 3ProfessorDepartment of Anatomy, IMS and SUM Hospital, Siksha ‘O’ Anusandhan University, K8, Kalinga Nagar, Bhubaneswar, Odisha, India
AbSTRACT
Introduction: Fracture of upper end of femur is one of the common cause for morbidity and mortality. Relationbetweendifferentmorphometricindicesofproximalfemuranditsfractureisalreadyestablishedby many authors. However age related changes in femoral morphometry isn’t studied in detail.
Aims & Objective: The present study is to determine the age related changes that occur in proximal femur morphometry in esternOdishapopulationby analysing their hip radiographs admitted to a tertiary carehospital.
Material and Methods:Thisstudywasacrosssectionalstudy,carriedoutin300patientsagedbetween30-69yearandtheyaregroupedin10yearsinterval.TheirhipDEXAscanwasanalyzedandvalueofdifferentparameters like hip axis length (HAL), femoral neck axis length (FNAL), femoral neck width (FNW) and femoral neck shaft angle (FNSA) were compared in each group statistically by using latest version of SPSS.
Result:Themeanvalueof theparametersHAL,FNAL,FNWandFNSAwere103.74mm,102.01mm,29.63mm and 127.31 respectively. Mean of the parameters was compared within the age groups by one way analysisofvariance.ThereissignificantincreaseinHAL,FNALandFNSAasageadvanceswhereas FNWwasfounddecreased.(p=0.000).
Conclusion: From the present study it can be concluded that there is age gradient increase in femoral parameters like hip axis length, neck axis length and neck-shaft angle that may help in evaluating fracture risk in elderly people and may help in making femoral prosthesis for reparing upper end fractures.
Keywords: Femur, Morphometry, DEXA scan
Corresponding Author:Dr. Pratima Baisakh,Assistant Professor, Department of Anatomy,IMS and SUM Hospital, BhubaneswarCell:[email protected]
INTROduCTION
Proximal femoral fractures in elderly patients are considered severe and have a direct and negative impact on the life expectancy and quality of life of these patients.1,2 Many research works were already being carried out to access the predisposing factors. The risk of hip fracture can be predicted by some factors, such as body mass index (BMI), bone mineral density (BMD), the direction and severity of the fall, muscle strength,
femoral morphometry, family history and life style factors.3,4 Femoral morphometric parameters including hip axis length (HAL), femoral neck axis length (FNAL), femoral head width (FHW), intertrochanteric width (TW) and femoral neck shaft angle (FNSA) have been related to the mechanical strength of the proximal femur. Hip axis length, neck shaft angle (NSA) and femoral neck width (FNW) are important predictors of hip fracture both in men and women.5,6 In young patients the rate of hip fracture is low and when present, is associated with high energy trauma. The overload on the proximal extremity of the femur generates deforming forces that results in fracture occurrence. Indices of hip geometry isdifferentindifferentcommunitiesandthisdifferencepartly explain the ethnic and geographical variation in fracture incidence.7,8 Asians have low incidence of hip fracture in comparision to Europeans .That may be
DOI Number: 10.5958/0976-5506.2018.00297.8
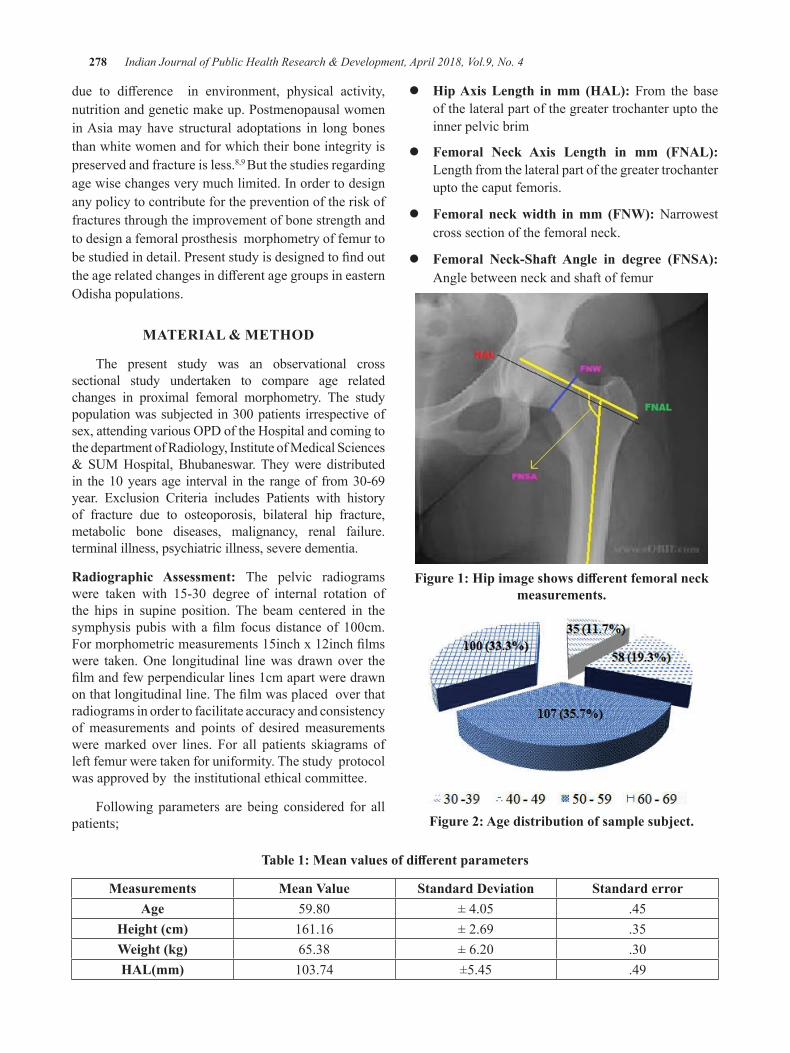
278 Indian Journal of Public Health Research & Development, April 2018, Vol.9, No. 4
due to difference in environment, physical activity,nutrition and genetic make up. Postmenopausal women in Asia may have structural adoptations in long bones than white women and for which their bone integrity is preserved and fracture is less.8,9 But the studies regarding age wise changes very much limited. In order to design any policy to contribute for the prevention of the risk of fractures through the improvement of bone strength and to design a femoral prosthesis morphometry of femur to bestudiedindetail.PresentstudyisdesignedtofindouttheagerelatedchangesindifferentagegroupsineasternOdishapopulations.
MATeRIAl & MeThOd
The present study was an observational cross sectional study undertaken to compare age related changes in proximal femoral morphometry. The study populationwassubjectedin300patients irrespectiveofsex,attendingvariousOPDoftheHospitalandcomingtothe department of Radiology, Institute of Medical Sciences &SUMHospital, Bhubaneswar.Theywere distributedin the10yearsage interval in the rangeof from30-69year. Exclusion Criteria includes Patients with history of fracture due to osteoporosis, bilateral hip fracture, metabolic bone diseases, malignancy, renal failure. terminal illness, psychiatric illness, severe dementia.
Radiographic Assessment: The pelvic radiograms were taken with 15-30 degree of internal rotation ofthe hips in supine position. The beam centered in the symphysispubiswith afilm focusdistanceof100cm.Formorphometricmeasurements15inchx12inchfilmswere taken.One longitudinal linewas drawnover thefilmandfewperpendicularlines1cmapartweredrawnonthatlongitudinalline.Thefilmwasplacedoverthatradiograms in order to facilitate accuracy and consistency of measurements and points of desired measurements were marked over lines. For all patients skiagrams of left femur were taken for uniformity. The study protocol was approved by the institutional ethical committee.
Following parameters are being considered for all patients;
z Hip Axis Length in mm (HAL): From the base of the lateral part of the greater trochanter upto the inner pelvic brim
z Femoral Neck Axis Length in mm (FNAL): Length from the lateral part of the greater trochanter upto the caput femoris.
z Femoral neck width in mm (FNW): Narrowest cross section of the femoral neck.
z Femoral Neck-Shaft Angle in degree (FNSA): Angle between neck and shaft of femur
Figure 1: Hip image shows different femoral neck measurements.
Figure 2: Age distribution of sample subject.
Table 1: Mean values of different parameters
Measurements Mean Value Standard deviation Standard errorAge 59.80 ±4.05 .45
Height (cm) 161.16 ± 2.69 .35Weight (kg) 65.38 ±6.20 .30HAL(mm) 103.74 ±5.45 .49
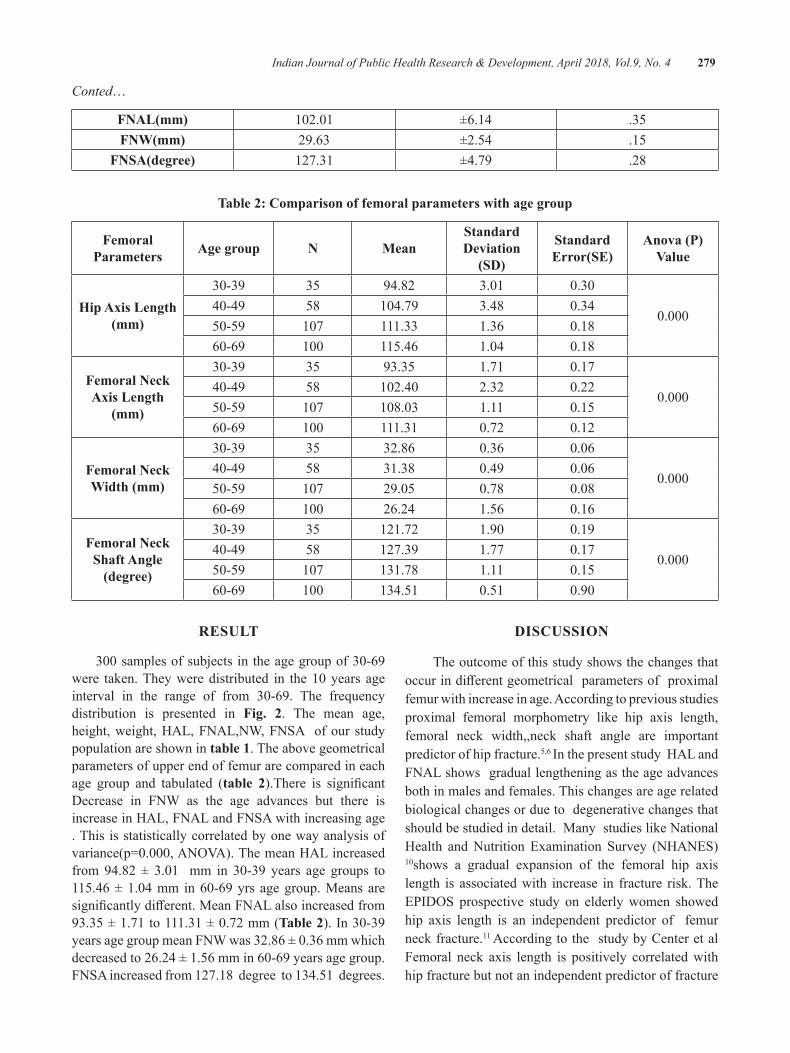
Indian Journal of Public Health Research & Development, April 2018, Vol.9, No. 4 279
Conted…
FNAL(mm) 102.01 ±6.14 .35FNW(mm) 29.63 ±2.54 .15
FNSA(degree) 127.31 ±4.79 .28
Table 2: Comparison of femoral parameters with age group
Femoral Parameters Age group N Mean
Standard deviation
(SD)
Standard Error(SE)
Anova (P) Value
hip Axis length (mm)
30-39 35 94.82 3.01 0.30
0.00040-49 58 104.79 3.48 0.3450-59 107 111.33 1.36 0.1860-69 100 115.46 1.04 0.18
Femoral Neck Axis length
(mm)
30-39 35 93.35 1.71 0.17
0.00040-49 58 102.40 2.32 0.2250-59 107 108.03 1.11 0.1560-69 100 111.31 0.72 0.12
Femoral Neck Width (mm)
30-39 35 32.86 0.36 0.06
0.00040-49 58 31.38 0.49 0.0650-59 107 29.05 0.78 0.0860-69 100 26.24 1.56 0.16
Femoral Neck Shaft Angle
(degree)
30-39 35 121.72 1.90 0.19
0.00040-49 58 127.39 1.77 0.1750-59 107 131.78 1.11 0.1560-69 100 134.51 0.51 0.90
ReSulT
300samplesofsubjects intheagegroupof30-69were taken.Theyweredistributed in the10years ageinterval in the range of from 30-69. The frequencydistribution is presented in Fig. 2. The mean age, height, weight, HAL, FNAL,NW, FNSA of our study population are shown in table 1. The above geometrical parameters of upper end of femur are compared in each age group and tabulated (table 2).There is significantDecrease in FNW as the age advances but there is increase in HAL, FNAL and FNSA with increasing age . This is statistically correlated by one way analysis of variance(p=0.000,ANOVA).ThemeanHALincreasedfrom94.82 ± 3.01 mm in 30-39 years age groups to115.46±1.04mm in60-69yrs agegroup.Meansaresignificantlydifferent.MeanFNALalsoincreasedfrom93.35±1.71to111.31±0.72mm(Table 2).In30-39yearsagegroupmeanFNWwas32.86±0.36mmwhichdecreasedto26.24±1.56mmin60-69yearsagegroup.FNSA increased from 127.18 degree to 134.51 degrees.
dISCuSSION
The outcome of this study shows the changes that occurindifferentgeometricalparametersofproximalfemur with increase in age. According to previous studies proximal femoral morphometry like hip axis length, femoral neck width,,neck shaft angle are important predictor of hip fracture.5,6 In the present study HAL and FNAL shows gradual lengthening as the age advances both in males and females. This changes are age related biological changes or due to degenerative changes that should be studied in detail. Many studies like National Health and Nutrition Examination Survey (NHANES) 10shows a gradual expansion of the femoral hip axis length is associated with increase in fracture risk. The EPIDOS prospective study on elderlywomen showedhip axis length is an independent predictor of femur neck fracture.11 According to the study by Center et al Femoral neck axis length is positively correlated with hip fracture but not an independent predictor of fracture
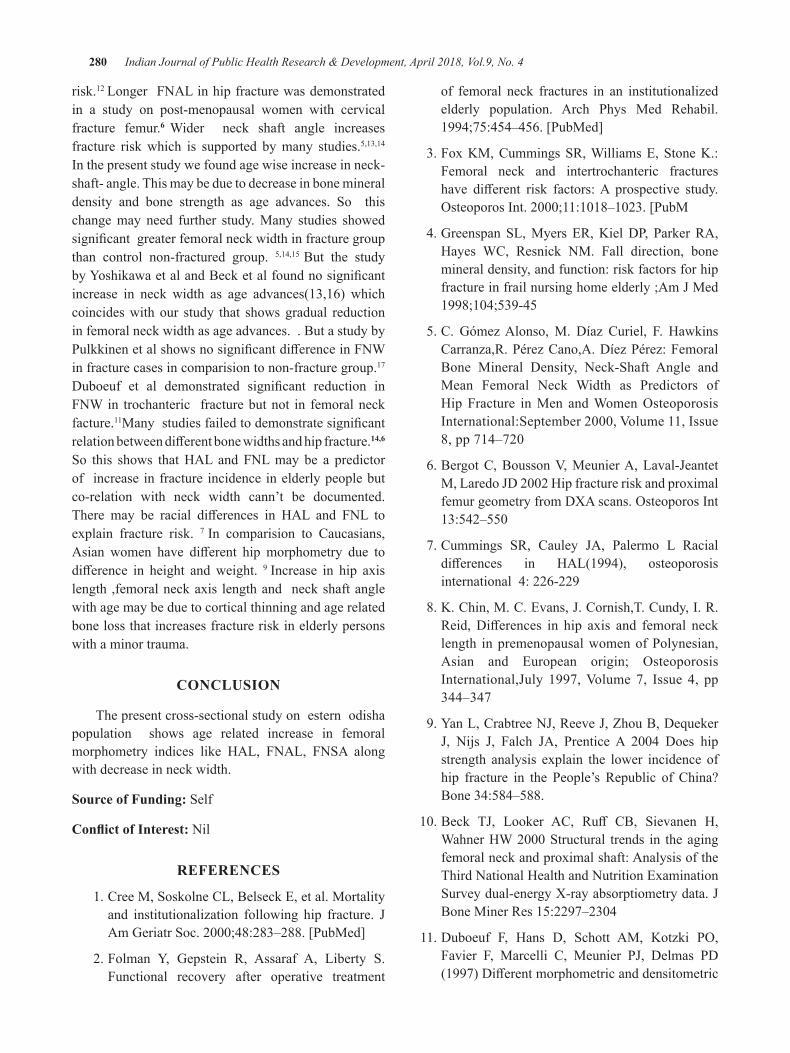
280 Indian Journal of Public Health Research & Development, April 2018, Vol.9, No. 4
risk.12 Longer FNAL in hip fracture was demonstrated in a study on post-menopausal women with cervical fracture femur.6 Wider neck shaft angle increases fracture risk which is supported by many studies.5,13,14
In the present study we found age wise increase in neck-shaft- angle. This may be due to decrease in bone mineral density and bone strength as age advances. So this change may need further study. Many studies showed significantgreaterfemoralneckwidthinfracturegroupthan control non-fractured group. 5,14,15 But the study byYoshikawaetalandBecketalfoundnosignificantincrease in neck width as age advances(13,16) which coincides with our study that shows gradual reduction in femoral neck width as age advances. . But a study by PulkkinenetalshowsnosignificantdifferenceinFNWin fracture cases in comparision to non-fracture group.17
Duboeuf et al demonstrated significant reduction inFNW in trochanteric fracture but not in femoral neck facture.11Manystudiesfailedtodemonstratesignificantrelationbetweendifferentbonewidthsandhipfracture.14,6
So this shows that HAL and FNL may be a predictor of increase in fracture incidence in elderly people but co-relation with neck width cann’t be documented. There may be racial differences in HAL and FNL toexplain fracture risk. 7 In comparision to Caucasians, Asian women have different hip morphometry due todifference in height andweight. 9 Increase in hip axis length ,femoral neck axis length and neck shaft angle with age may be due to cortical thinning and age related bone loss that increases fracture risk in elderly persons with a minor trauma.
CONCluSION
The present cross-sectional study on estern odisha population shows age related increase in femoral morphometry indices like HAL, FNAL, FNSA along with decrease in neck width.
Source of Funding: Self
Conflict of Interest: Nil
ReFeReNCeS
1. Cree M, Soskolne CL, Belseck E, et al. Mortality and institutionalization following hip fracture. JAmGeriatrSoc.2000;48:283–288.[PubMed]
2. Folman Y, Gepstein R, Assaraf A, Liberty S. Functional recovery after operative treatment
of femoral neck fractures in an institutionalized elderly population. Arch Phys Med Rehabil. 1994;75:454–456.[PubMed]
3. Fox KM, Cummings SR, Williams E, Stone K.: Femoral neck and intertrochanteric fractures have different risk factors:A prospective study.OsteoporosInt.2000;11:1018–1023.[PubM
4. Greenspan SL, Myers ER, Kiel DP, Parker RA, Hayes WC, Resnick NM. Fall direction, bone mineral density, and function: risk factors for hip fractureinfrailnursinghomeelderly;AmJMed1998;104;539-45
5.C. GómezAlonso,M. Díaz Curiel, F. HawkinsCarranza,R.PérezCano,A.DíezPérez:FemoralBone Mineral Density, Neck-Shaft Angle and Mean Femoral Neck Width as Predictors of HipFracture inMen andWomenOsteoporosisInternational:September2000,Volume11,Issue8,pp714–720
6.BergotC,BoussonV,MeunierA,Laval-JeantetM,LaredoJD2002HipfractureriskandproximalfemurgeometryfromDXAscans.OsteoporosInt13:542–550
7.Cummings SR, Cauley JA, Palermo L Racialdifferences in HAL(1994), osteoporosisinternational 4: 226-229
8.K.Chin,M.C.Evans,J.Cornish,T.Cundy,I.R.Reid,Differences in hip axis and femoral necklength in premenopausal women of Polynesian, Asian and European origin; OsteoporosisInternational,July 1997,Volume 7, Issue 4, pp344–347
9.YanL,CrabtreeNJ,ReeveJ,ZhouB,DequekerJ, Nijs J, Falch JA, PrenticeA 2004 Does hipstrength analysis explain the lower incidence of hip fracture in the People’s Republic of China? Bone 34:584–588.
10.Beck TJ, Looker AC, Ruff CB, Sievanen H,WahnerHW2000Structural trends in theagingfemoral neck and proximal shaft: Analysis of the Third National Health and Nutrition Examination Surveydual-energyX-rayabsorptiometrydata.JBoneMinerRes15:2297–2304
11.Duboeuf F, Hans D, Schott AM, Kotzki PO,Favier F, Marcelli C, Meunier PJ, Delmas PD(1997)Differentmorphometricanddensitometric
Indian Journal of Public Health Research & Development, April 2018, Vol.9, No. 4 281
parameters predict cervical and trochanteric hip fracture: the EPIDOS Study. J BoneMinerRes12:1895–1902
12.Center JR,NguyenTV,PocockNA,NoakesKA,KellyPJ,EismanJA,SambrookPN.Femoralneckaxis length, height loss and risk of hip fracture in malesandfemalesOsteoporosInt.1998;8(1):75-81
13.Karlsson KM, Sernbo I, Obrant KJ, Redlund-JohnellI,JohnellO1996Femoralneckgeometryand radiographic signs of osteoporosis as predictorsofhipfracture.Bone18:327–330
14. Gnudi S, Ripamonti C, Lisi L, Fini M, Giardino R,GiavaresiG2002Proximalfemurgeometrytodetect and distinguish femoral neck fractures from
trochanteric fractures in postmenopausal women. OsteoporosInt13:69–73
15. Faulkner KG ,Wacker WK, Barden HS, Simonelli C , Burke PK, Ragi S, Del Rio L; Femur strength index predicts hip fracture independent of bone densityandhipaxislengthOsteoporosInt(2006)17: 593–599
16. Yoshikawa T1, Turner CH, Peacock M, Slemenda CW, Weaver CM, Teegarden D, Markwardt P, Burr DB Geometric structure of the femoral neck measured using dual-energy x-ray absorptiometry. JBoneMinerRes.1994Jul;9(7):1053-64
17.Pulkkinen P,Partanen J et al 2004, osteoporosisinternational15:274-280
Effectiveness of an Awareness Programme on Exclusive breastfeeding for the AShA Workers of udupi district
Shashidhara yN1, Ansuya2, Celastin3, Anice george4
1Associate Professor and HOD, 2Assistant Professor, 3Lecturer, Department of Community Health Nursing, Manipal College of Nursing, MAHE, Manipal Karnataka. 4Dean, Manipal College of Nursing
AbSTRACT
Thebasicfoodforinfantfeedingismilk.Breastfeedingisthemostnaturalwaytofeedthechild.Itoffersnutrientsandenergywhichareessential for the requirementduring thefirst6monthsand itcontinuoustoprovideuptothe2yearofage.AtthecommunitylevelASHAworkersplayvitalrolefortheeffectiveimplementation MCH services at the grass root level. Their knowledge and skills on educating mothers on breastfeeding can prevent malnutrition among children. The study Objectives were to assess the knowledge ofASHAworkersonexclusivebreastfeeding,determinetheeffectivenessofanawarenessprogrammeonKnowledgeregardingexclusivebreastfeedingandtofindtheassociationbetweenlevelofknowledgeonexclusive breastfeeding and selected variables.
Methodology:Onegrouppretestposttesttestdesignwasadoptedtoachievetheobjectives.The86ASHAworkers were selected by purposive sampling techniques from four PHCs and 2 CHCs of Udupi taluk, Karnataka. After obtaining consent from study participants Knowledge questionnaire was administered and Awareness progamme was implemented in selected PHCs and CHCs. The posttest was conducted after 7 days.Results:About66.6%ofthemwereintheagegroupof31-50years,64%ofthemhadmorethan5years of Experience and 77% of ASHA workers reported they have undergone training on MCH service activities. In pretest mean knowledge score was 13. 6 and 17.4 during the posttest which shows there was a significantimprovementintheknowledgescore.
Conclusion: The ASHA workers are having knowledge on the exclusive breastfeeding and need reinforcement which will help them in updating their knowledge and skills on feeding practices.
Keywords: Exclusive breastfeeding, ASHA workers, Infant feeding, Knowledge, feeding practices
Corresponding Author:Dr Shashidhara YNAssociateProfessorandHOD,Department of Community Health Nursing,Manipal College of NursingEmail: [email protected]
INTROduCTION
The basic food for infant feeding is milk. Breastfeeding is the most natural way to feed the child. Itoffersnutrientsandenergywhichareessentialfortherequirementduringthefirst6monthsanditcontinuousto provide up to the two years of age.1
AnIdealfeedingisdefinedasexclusivebreastfeedingfrom birth to six months of age and further it should be
continued to breastfeeding for two years and beyond with an adequate, safe and proper additional foods and liquids after 6 months of age to meet the nutritional needs of a young child.2
InIndia,therateofexclusivebreastfeedinthefirstsixmonthsisabout55%andlessthan50%ofchildrenare breastfed within an hour of birth. Initiation of breastfeeding and exclusive breastfeeding can prevent nearly 99,499 deaths of children every year.3
A study conducted by Ashok Dorle at Kalodi Bagalkot among anganwadi workers regarding Knowledge and attitude towards infant and young child feeding practice with the training programme. In this study 76 subjects werefilled theknowledgequestionnairewhichconsistof 12 itmes. Before the trainig only 12 participants had
DOI Number: 10.5958/0976-5506.2018.00298.X
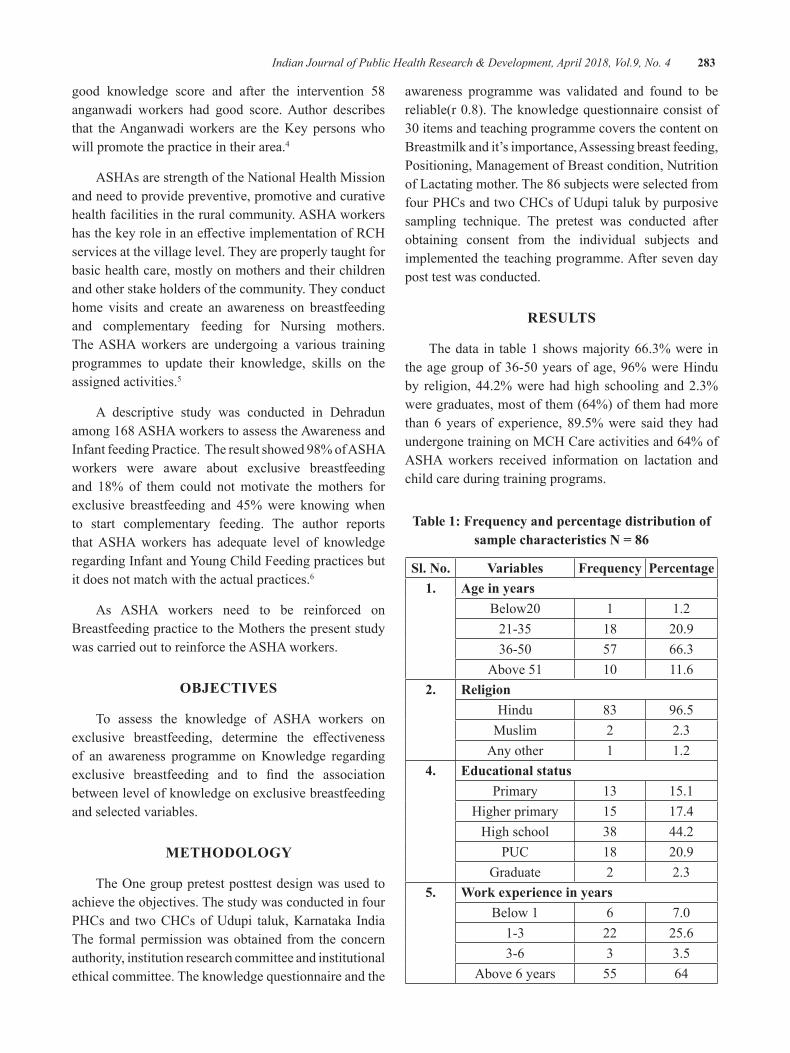
Indian Journal of Public Health Research & Development, April 2018, Vol.9, No. 4 283
good knowledge score and after the intervention 58 anganwadi workers had good score. Author describes that the Anganwadi workers are the Key persons who will promote the practice in their area.4
ASHAs are strength of the National Health Mission and need to provide preventive, promotive and curative health facilities in the rural community. ASHA workers hasthekeyroleinaneffectiveimplementationofRCHservices at the village level. They are properly taught for basic health care, mostly on mothers and their children and other stake holders of the community. They conduct home visits and create an awareness on breastfeeding and complementary feeding for Nursing mothers. The ASHA workers are undergoing a various training programmes to update their knowledge, skills on the assigned activities.5
A descriptive study was conducted in Dehradun among 168 ASHA workers to assess the Awareness and Infant feeding Practice. The result showed 98% of ASHA workers were aware about exclusive breastfeeding and 18% of them could not motivate the mothers for exclusive breastfeeding and 45% were knowing when to start complementary feeding. The author reports that ASHA workers has adequate level of knowledge regarding Infant and Young Child Feeding practices but it does not match with the actual practices.6
As ASHA workers need to be reinforced on Breastfeeding practice to the Mothers the present study was carried out to reinforce the ASHA workers.
ObJeCTIVeS
To assess the knowledge of ASHA workers on exclusive breastfeeding, determine the effectivenessof an awareness programme on Knowledge regarding exclusive breastfeeding and to find the associationbetween level of knowledge on exclusive breastfeeding and selected variables.
MeThOdOlOgy
TheOnegrouppretestposttestdesignwasusedtoachieve the objectives. The study was conducted in four PHCs and two CHCs of Udupi taluk, Karnataka India The formal permission was obtained from the concern authority, institution research committee and institutional ethical committee. The knowledge questionnaire and the
awareness programme was validated and found to be reliable(r0.8).Theknowledgequestionnaireconsistof30itemsandteachingprogrammecoversthecontentonBreastmilk and it’s importance, Assessing breast feeding, Positioning, Management of Breast condition, Nutrition of Lactating mother. The 86 subjects were selected from four PHCs and two CHCs of Udupi taluk by purposive sampling technique. The pretest was conducted after obtaining consent from the individual subjects and implemented the teaching programme. After seven day post test was conducted.
ReSulTS
The data in table 1 shows majority 66.3% were in theagegroupof36-50yearsofage,96%wereHinduby religion, 44.2% were had high schooling and 2.3% were graduates, most of them (64%) of them had more than 6 years of experience, 89.5% were said they had undergone training on MCH Care activities and 64% of ASHA workers received information on lactation and child care during training programs.
Table 1: Frequency and percentage distribution of sample characteristics N = 86
Sl. No. Variables Frequency Percentage1. Age in years
Below20 1 1.221-35 18 20.936-50 57 66.3
Above 51 10 11.62. Religion
Hindu 83 96.5Muslim 2 2.3
Any other 1 1.24. educational status
Primary 13 15.1Higher primary 15 17.4
High school 38 44.2PUC 18 20.9
Graduate 2 2.35. Work experience in years
Below 1 6 7.01-3 22 25.63-6 3 3.5
Above 6 years 55 64
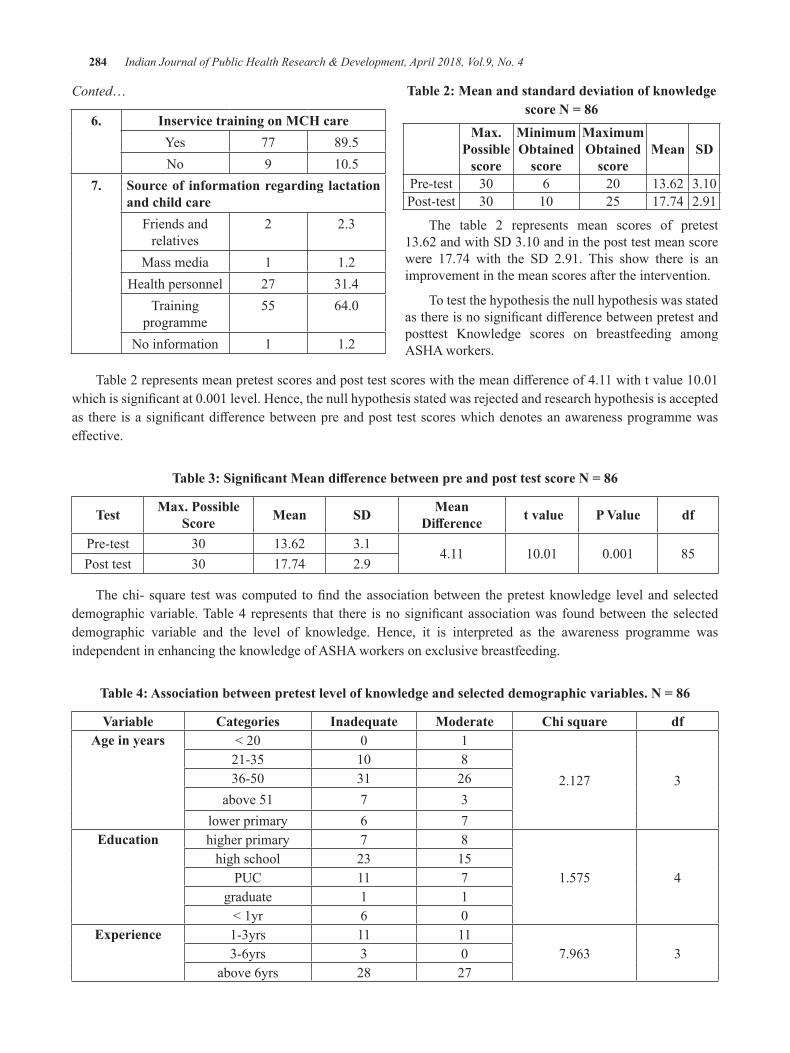
284 Indian Journal of Public Health Research & Development, April 2018, Vol.9, No. 4
Conted…
6. Inservice training on MCh careYes 77 89.5No 9 10.5
7. Source of information regarding lactation and child care
Friends and relatives
2 2.3
Mass media 1 1.2Health personnel 27 31.4
Training programme
55 64.0
No information 1 1.2
Table 2: Mean and standard deviation of knowledge score N = 86
Max. Possible
score
Minimum Obtained
score
Maximum Obtained
scoreMean Sd
Pre-test 30 6 20 13.62 3.10Post-test 30 10 25 17.74 2.91
The table 2 represents mean scores of pretest 13.62andwithSD3.10andintheposttestmeanscorewere 17.74 with the SD 2.91. This show there is an improvement in the mean scores after the intervention.
To test the hypothesis the null hypothesis was stated asthereisnosignificantdifferencebetweenpretestandposttest Knowledge scores on breastfeeding among ASHA workers.
Table2representsmeanpretestscoresandposttestscoreswiththemeandifferenceof4.11withtvalue10.01whichissignificantat0.001level.Hence,thenullhypothesisstatedwasrejectedandresearchhypothesisisacceptedas there isasignificantdifferencebetweenpreandpost testscoreswhichdenotesanawarenessprogrammewaseffective.
Table 3: Significant Mean difference between pre and post test score N = 86
Test Max. Possible Score Mean Sd Mean
Difference t value P Value df
Pre-test 30 13.62 3.14.11 10.01 0.001 85
Post test 30 17.74 2.9
Thechi- square testwascomputed tofind theassociationbetween thepretestknowledge levelandselecteddemographicvariable.Table4 represents that there isno significantassociationwas foundbetween the selecteddemographic variable and the level of knowledge. Hence, it is interpreted as the awareness programme was independent in enhancing the knowledge of ASHA workers on exclusive breastfeeding.
Table 4: Association between pretest level of knowledge and selected demographic variables. N = 86
Variable Categories Inadequate Moderate Chi square dfAge in years <20 0 1
2.127 321-35 10 836-50 31 26
above 51 7 3lower primary 6 7
education higher primary 7 8
1.575 4high school 23 15
PUC 11 7graduate 1 1<1yr 6 0
experience 1-3yrs 11 117.963 33-6yrs 3 0
above 6yrs 28 27
Indian Journal of Public Health Research & Development, April 2018, Vol.9, No. 4 285
dISCuSSION
In India grass root workers are key functionaries in improving health statistics of the country. There should be key member who should connect the community to the public health system. In this regard the ASHA workers are essential in implementing the Reproductive and Child health services in the villages. The need to be supported with appropriate orientation, training and reinforcement programmes. In the present study majority 66.3% were intheagegroupof36-50yearsofage,96%wereHinduby religion, 44.2% were had high schooling and 2.3% were graduates, most of them (64%) of them had more than six years of experience, 89.5% were said they had undergone training on MCH Care activities and 64% of ASHA workers received information on lactation and child care during training programs. It was reported that person with pink saree at worker and the youngest employed workers as ASHAs at Karnataka state and most of them were belong the age group of 25- 45 years with minimumeducationqualificationwillbe8th standard as per the National Rural Health Mission, Ministry of Health and family welfare.5
In the present study mean scores of pretest 13.62 and withSD3.10andintheposttestmeanscorewere17.74with the SD 2.91. This show there is an improvement in themeanscoresafter the interventionwith the tValue10.01(P<0.001).Thestudyissupportedby(Thakre,etal.,2012)thestudyconductedatNagpurinNorthpartof India has reported in their study that the mean pretest score as15.11±1.89, andposttestmeanwas17.30±1.59,whichwassignificantimprovement(0.001)7. The studyconductedatBijapur(Shashank&Angadi,2015)Majority of ASHA workers were aware about exclusive breastfeeding duration which should be practiced by the lactating mother. It was also reported that about 69.7% of ASHAs reported that breastfeeding should be between 18-24 months8.
CONCluSION
An appropriate Breastfeeding and complementary feeding is essential in prevention of Malnutrition in the country. This cannot be achieved unless we create an awareness among the members of the community. The ASHAs need to be supported with proper training and incentives to improve the Maternal Child health.
lIMITATION
The study result is limited to the study settings and onlyonegroupwasusedtoassesstheeffectivenessofanawareness programme on exclusive breastfeeding.
Conflict of Interest: None was reported
Source of Funding: No funds were received for this projects.
ethical Clearance: Received permission obtained from Institutional Ethics Committee.
ReFeReNCeS
1. Prell C, Koletzko B. Breastfeeding and Complementary Feeding: Recommendations on Infant Nutrition. Deutsches Ärzteblatt International. 2016;113 (25):435-444.doi:10.3238/arztebl.2016.0435
2.Motee A, Jeewon R. Importance of ExclusiveBreastfeeding and Complementary Feeding amongInfants.CurrResNutrFoodSci2014;2(2).doi:http://dx.doi.org/10.12944/CRNFSJ.2.2.02
3. India Ranks Low on Breastfeeding Practices: Study - Times of India Sushmi Dey - https://t imesofindia. indiatimes.com/india/india-ranks-low-on-breastfeeding-practices-study/articleshow/59890663.cms
4. Ashok Dorle, Manjula , Basavaraj Mannapur, Lalitha Hiremath, Chandrashekar. Knowledge and Attitude towards infant and Yourng child feeding Practices Among Anaganwadi Workers. Media Innovatica .2012.Volume 1. Issue 2http://www.medicainnovatica.org/December%20issue/2.pdf
5.National Health Mission. 2014.. Retrieved fromMinistry of Health and Family Welfare India: http://nhm.gov.in/communitisation/asha/about-asha.html
6.SAXENA, Vartika; KUMARI, Ranjeeta. Infantand Young Child Feeding – Knowledge and Practices of ASHA workers of Doiwala Block, DehradunDistrict.IndianJournalofCommunityHealth,[S.l.],v.26,n.1,p.68-75,mar.2014.
7. Sushama S. Thakre, Subhash B. Thakre, Amol D.Thakre, Samir H. Golawar, Suresh M. More,

286 Indian Journal of Public Health Research & Development, April 2018, Vol.9, No. 4
Arun Y. Humne. Effectiveness of The TrainingCourseOfAshaOnInfantFeedingPracticesAtARural Teaching Hospital: A Cross Sectional Study. Journal of Clinical and Diagnostic Research .2012August.:1038-1040.
8.ShashankKJ,AngadiMM.A study to evaluatethe knowledge of ASHA workers on antenatal and postnatal care inBijapurdistrict. Int JResMedSci2015;3:2299-302.
9. BPNI . Infant and child feeding counselling: A training course. New Delhi: Indian Academy of Pediatrics.2013.
10.IndiaRankslowonbreastfeedingpractices:studyAvailable from (Internet) 2017August 3 http://timesofindia.indiatimes.com/india/ india_ranks_onbreastfeeding_practices
Increasing Inpatient Service Quality of using Quality Function deployment Method in Nene Mallomo hospital of Sidrap
Regency, Indonesia
darmawansyah1, Muhaiminah Said2, Rahmatiayunus3, Sukri Palutturi1
1Department of Health Policy and Administration School of Public Health, Hasanuddin University; 2Health Office of Sidrap Rappang Regency; 3Departmentof Economics, School of Economics and Business, Indonesia
AbSTRACT
background: A Hospital is required to provide a quality service based on patients’ expectation. This research aimed to produce design and plan for the increase of inpatient service quality based on customers’ expectation with Quality Function Deployment (QFD) method in Nene Mallomo Hospital of Sidenreng Rappang Regency.
Methods: Theresearchusedadescriptivestudy.Populationswereallinpatientsandofficials.Samplesweresomeinpatientstreatedmorethan2x24hoursusingproportionalsamplingmethod.Officialswereusingpurposive sampling method. Data were obtained through interview using questionnaire and FGD with the management and the head of the installation. Data were analyzed using QFD.
Results: The results of the research indicate that the priorities of the patients’ needs are: the doctors try to calm down and reduce the anxiety of patients with the diseases they have; the facilities of inpatient room are complete and well functioned; the medicine needed is available at the hospital pharmacy; the nurses/midwives prepare themselves to talk to patients; the doctors/nurses/midwives note all the actions taken.
Conclusions: ThisstudyconcludesthatthetechnicalprioritiessuchasSOPimplementation,leaderandstaffcommitment,andeffectivecommunicationareessential.
Keywords: Service Quality, QFD, House of Quality
Corresponding Author:Sukri PalutturiDepartment of Health Policy and AdministrationSchool of Public Health, Hasanuddin University,IndonesiaEmail: [email protected]
INTROduCTION
The tight competition between hospitals requires hospitals to make quality improvements aimed at getting hospitals not to lose customers and to have unique in terms of service delivery to customers. Service quality is a measure of how well the service package can meet customer expectations 1. Andaleeb in 2, states that customer satisfaction is an important key to health care.
Based on the Decree of the Minister of Health of the Republic of Indonesia Number 129/Menkes/SK/
II/2008 concerning theminimum service standards ofthe hospital and the Regent’s Regulation No. 37 year 2011SidenrengRappangstipulatesthatthestandardofinpatientserviceincludes10indicators,includingforcedhomeincidence≤5%andpatientdeathover48hours≤0.24% and incidence of nosocomial infection≤ 1.5%.The total achievement of Minimum Service Standard of Nene Mallomo Hospital in 2014 is only 65.74%.The incidence of forced home events is higher than the standardof10.3%in2013,6.84%in2014.Deaths>48harealsohigherthanthestandardof1.22%in2013and0.9%in2014Inaddition, theincidenceofnosocomialinfections is also higher than the national standard of 3.01%in20143.
Another problem that arises is the BOR whichdecreasedfrom73%in2010to52%in2013and64%in 2014, lowAvlOS ie 4 days in 2014 3. LowAvlOSindicates patient dissatisfaction with inpatient services
DOI Number: 10.5958/0976-5506.2018.00299.1
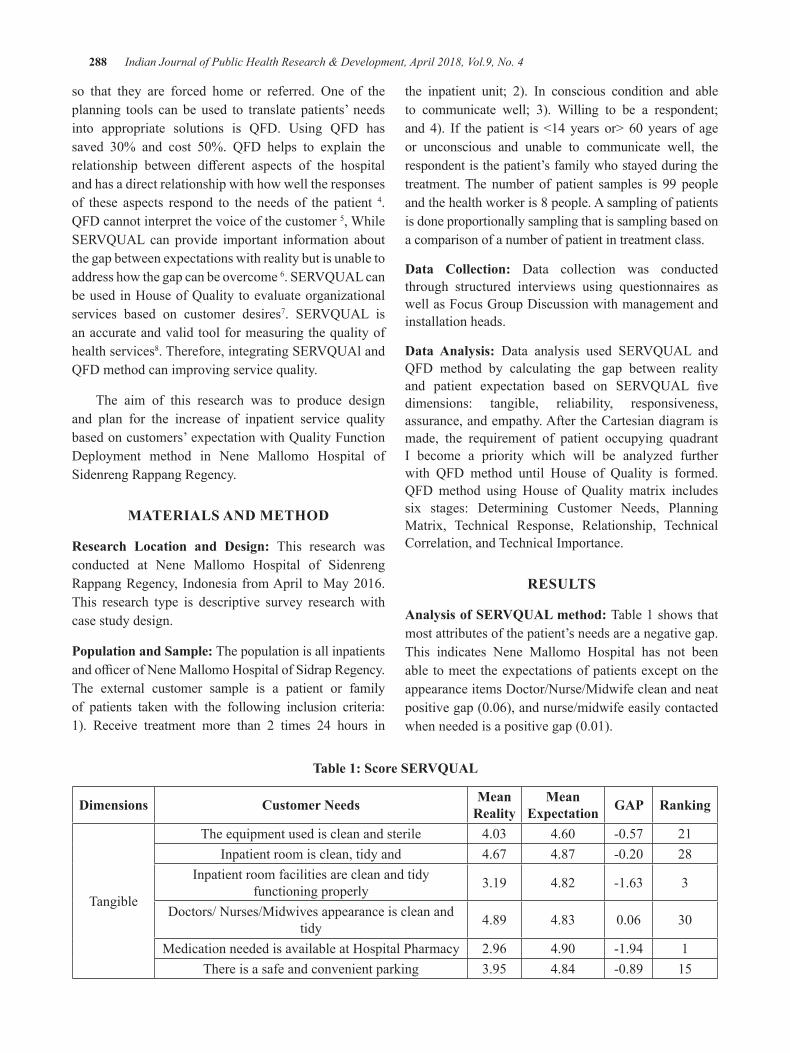
288 Indian Journal of Public Health Research & Development, April 2018, Vol.9, No. 4
so that they are forced home or referred. One of theplanning tools can be used to translate patients’ needs into appropriate solutions is QFD. Using QFD has saved 30% and cost 50%. QFD helps to explain therelationship between different aspects of the hospitaland has a direct relationship with how well the responses of these aspects respond to the needs of the patient 4. QFD cannot interpret the voice of the customer 5, While SERVQUAL can provide important information aboutthe gap between expectations with reality but is unable to address how the gap can be overcome 6.SERVQUALcanbe used in House of Quality to evaluate organizational services based on customer desires7. SERVQUAL isan accurate and valid tool for measuring the quality of health services8.Therefore,integratingSERVQUAlandQFD method can improving service quality.
The aim of this research was to produce design and plan for the increase of inpatient service quality based on customers’ expectation with Quality Function Deployment method in Nene Mallomo Hospital of Sidenreng Rappang Regency.
MATeRIAlS ANd MeThOd
Research location and design: This research was conducted at Nene Mallomo Hospital of Sidenreng RappangRegency, Indonesia fromApril toMay2016.This research type is descriptive survey research with case study design.
Population and Sample: The population is all inpatients andofficerofNeneMallomoHospitalofSidrapRegency.The external customer sample is a patient or family of patients taken with the following inclusion criteria: 1). Receive treatment more than 2 times 24 hours in
the inpatient unit; 2). In conscious condition and able to communicate well; 3). Willing to be a respondent; and 4). If the patient is <14 years or> 60 years of ageor unconscious and unable to communicate well, the respondent is the patient’s family who stayed during the treatment. The number of patient samples is 99 people and the health worker is 8 people. A sampling of patients is done proportionally sampling that is sampling based on a comparison of a number of patient in treatment class.
data Collection: Data collection was conducted through structured interviews using questionnaires as well as Focus Group Discussion with management and installation heads.
data Analysis: Data analysis used SERVQUAL andQFD method by calculating the gap between reality and patient expectation based on SERVQUAL fivedimensions: tangible, reliability, responsiveness, assurance, and empathy. After the Cartesian diagram is made, the requirement of patient occupying quadrant I become a priority which will be analyzed further with QFD method until House of Quality is formed. QFD method using House of Quality matrix includes six stages: Determining Customer Needs, Planning Matrix, Technical Response, Relationship, Technical Correlation, and Technical Importance.
ReSulTS
Analysis of SeRVQuAl method: Table 1 shows that most attributes of the patient’s needs are a negative gap. This indicates Nene Mallomo Hospital has not been able to meet the expectations of patients except on the appearance items Doctor/Nurse/Midwife clean and neat positivegap(0.06),andnurse/midwifeeasilycontactedwhenneededisapositivegap(0.01).
Table 1: Score SeRVQuAl
dimensions Customer Needs Mean Reality
Mean expectation gAP Ranking
Tangible
The equipment used is clean and sterile 4.03 4.60 -0.57 21Inpatient room is clean, tidy and 4.67 4.87 -0.20 28
Inpatient room facilities are clean and tidy functioning properly 3.19 4.82 -1.63 3
Doctors/ Nurses/Midwives appearance is clean and tidy 4.89 4.83 0.06 30
Medication needed is available at Hospital Pharmacy 2.96 4.90 -1.94 1There is a safe and convenient parking 3.95 4.84 -0.89 15
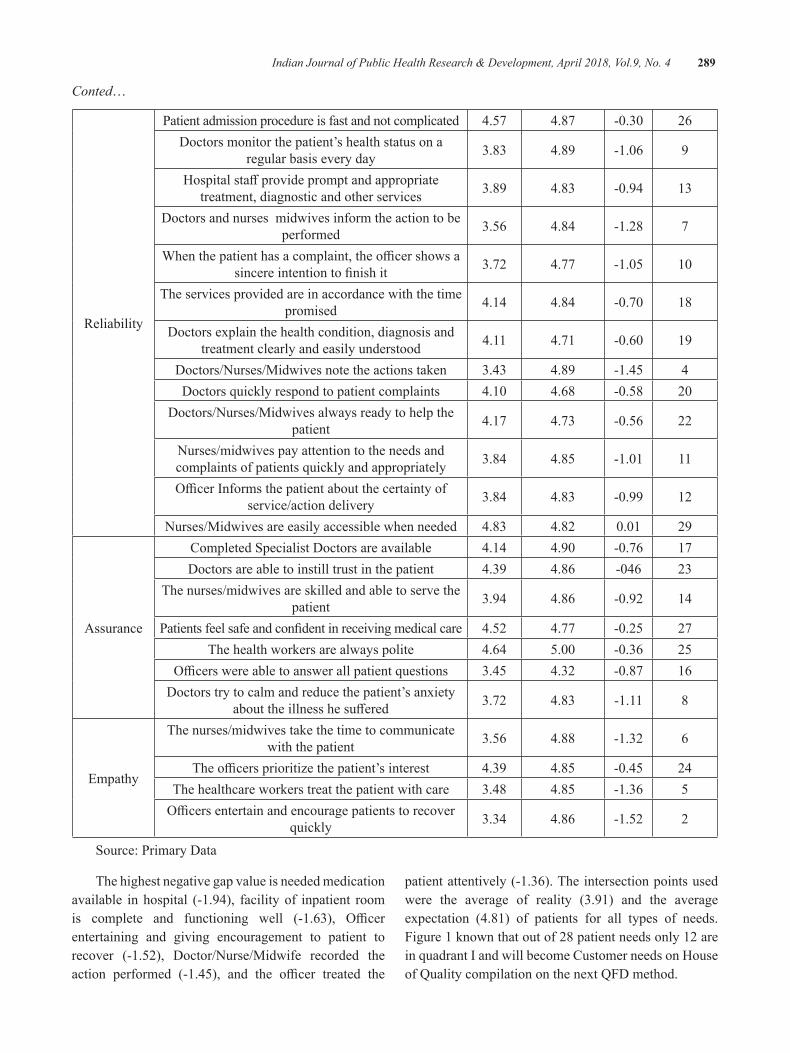
Indian Journal of Public Health Research & Development, April 2018, Vol.9, No. 4 289
Conted…
Reliability
Patient admission procedure is fast and not complicated 4.57 4.87 -0.30 26Doctors monitor the patient’s health status on a
regular basis every day 3.83 4.89 -1.06 9
Hospitalstaffprovidepromptandappropriatetreatment, diagnostic and other services 3.89 4.83 -0.94 13
Doctors and nurses midwives inform the action to be performed 3.56 4.84 -1.28 7
Whenthepatienthasacomplaint,theofficershowsasincereintentiontofinishit 3.72 4.77 -1.05 10
The services provided are in accordance with the time promised 4.14 4.84 -0.70 18
Doctors explain the health condition, diagnosis and treatment clearly and easily understood 4.11 4.71 -0.60 19
Doctors/Nurses/Midwives note the actions taken 3.43 4.89 -1.45 4Doctors quickly respond to patient complaints 4.10 4.68 -0.58 20
Doctors/Nurses/Midwives always ready to help the patient 4.17 4.73 -0.56 22
Nurses/midwives pay attention to the needs and complaints of patients quickly and appropriately 3.84 4.85 -1.01 11
OfficerInformsthepatientaboutthecertaintyofservice/action delivery 3.84 4.83 -0.99 12
Nurses/Midwives are easily accessible when needed 4.83 4.82 0.01 29
Assurance
Completed Specialist Doctors are available 4.14 4.90 -0.76 17Doctors are able to instill trust in the patient 4.39 4.86 -046 23
The nurses/midwives are skilled and able to serve the patient 3.94 4.86 -0.92 14
Patientsfeelsafeandconfidentinreceivingmedicalcare 4.52 4.77 -0.25 27The health workers are always polite 4.64 5.00 -0.36 25
Officerswereabletoanswerallpatientquestions 3.45 4.32 -0.87 16Doctors try to calm and reduce the patient’s anxiety
abouttheillnesshesuffered 3.72 4.83 -1.11 8
Empathy
The nurses/midwives take the time to communicate with the patient 3.56 4.88 -1.32 6
Theofficersprioritizethepatient’sinterest 4.39 4.85 -0.45 24The healthcare workers treat the patient with care 3.48 4.85 -1.36 5Officersentertainandencouragepatientstorecover
quickly 3.34 4.86 -1.52 2
Source: Primary Data
The highest negative gap value is needed medication available in hospital (-1.94), facility of inpatient room is complete and functioning well (-1.63), Officerentertaining and giving encouragement to patient to recover (-1.52), Doctor/Nurse/Midwife recorded the action performed (-1.45), and the officer treated the
patient attentively (-1.36). The intersection points used were the average of reality (3.91) and the average expectation (4.81) of patients for all types of needs. Figure 1 known that out of 28 patient needs only 12 are in quadrant I and will become Customer needs on House of Quality compilation on the next QFD method.
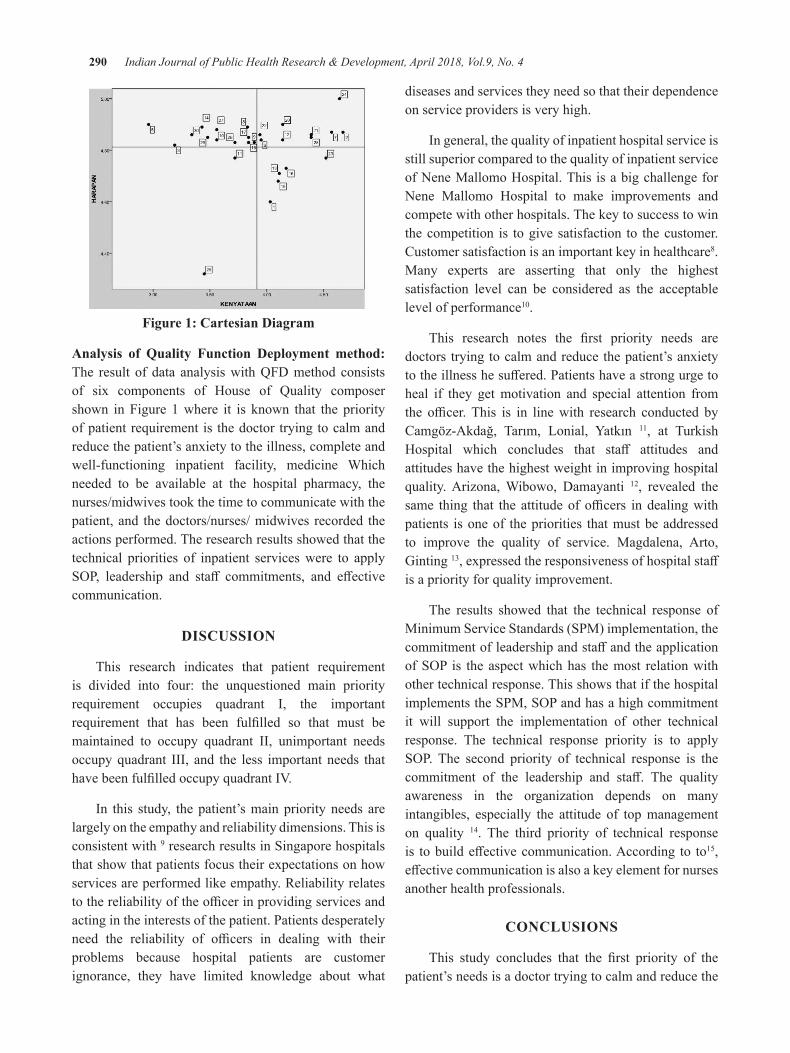
290 Indian Journal of Public Health Research & Development, April 2018, Vol.9, No. 4
Figure 1: Cartesian diagram
Analysis of Quality Function deployment method: The result of data analysis with QFD method consists of six components of House of Quality composer shown in Figure 1 where it is known that the priority of patient requirement is the doctor trying to calm and reduce the patient’s anxiety to the illness, complete and well-functioning inpatient facility, medicine Which needed to be available at the hospital pharmacy, the nurses/midwives took the time to communicate with the patient, and the doctors/nurses/ midwives recorded the actions performed. The research results showed that the technical priorities of inpatient services were to apply SOP, leadership and staff commitments, and effectivecommunication.
dISCuSSION
This research indicates that patient requirement is divided into four: the unquestioned main priority requirement occupies quadrant I, the important requirement that has been fulfilled so that must bemaintained to occupy quadrant II, unimportant needs occupy quadrant III, and the less important needs that havebeenfulfilledoccupyquadrantIV.
In this study, the patient’s main priority needs are largely on the empathy and reliability dimensions. This is consistent with 9 research results in Singapore hospitals that show that patients focus their expectations on how services are performed like empathy. Reliability relates tothereliabilityoftheofficerinprovidingservicesandacting in the interests of the patient. Patients desperately need the reliability of officers in dealing with theirproblems because hospital patients are customer ignorance, they have limited knowledge about what
diseases and services they need so that their dependence on service providers is very high.
In general, the quality of inpatient hospital service is still superior compared to the quality of inpatient service of Nene Mallomo Hospital. This is a big challenge for Nene Mallomo Hospital to make improvements and compete with other hospitals. The key to success to win the competition is to give satisfaction to the customer. Customer satisfaction is an important key in healthcare8. Many experts are asserting that only the highest satisfaction level can be considered as the acceptable level of performance10.
This research notes the first priority needs aredoctors trying to calm and reduce the patient’s anxiety totheillnesshesuffered.Patientshaveastrongurgetoheal if they get motivation and special attention from the officer.This is in linewith research conducted byCamgöz-Akdağ, Tarım, Lonial, Yatkın 11, at Turkish Hospital which concludes that staff attitudes andattitudes have the highest weight in improving hospital quality. Arizona, Wibowo, Damayanti 12, revealed the same thing that the attitudeofofficers indealingwithpatients is one of the priorities that must be addressed to improve the quality of service. Magdalena, Arto, Ginting 13,expressedtheresponsivenessofhospitalstaffis a priority for quality improvement.
The results showed that the technical response of Minimum Service Standards (SPM) implementation, the commitmentofleadershipandstaffandtheapplicationofSOP is theaspectwhichhas themost relationwithother technical response. This shows that if the hospital implementstheSPM,SOPandhasahighcommitmentit will support the implementation of other technical response. The technical response priority is to apply SOP. The second priority of technical response is thecommitment of the leadership and staff. The qualityawareness in the organization depends on many intangibles, especially the attitude of top management on quality 14. The third priority of technical response is tobuildeffectivecommunication.According to to15, effectivecommunicationisalsoakeyelementfornursesanother health professionals.
CONCluSIONS
This study concludes that the first priority of thepatient’s needs is a doctor trying to calm and reduce the
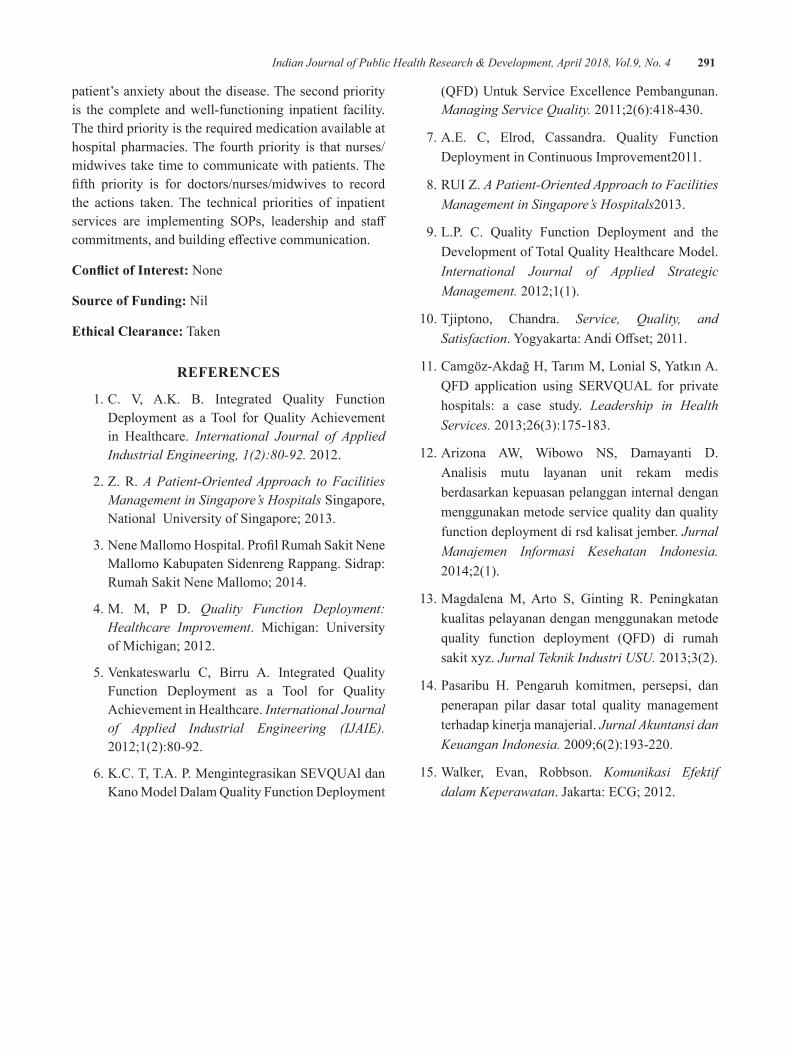
Indian Journal of Public Health Research & Development, April 2018, Vol.9, No. 4 291
patient’s anxiety about the disease. The second priority is the complete and well-functioning inpatient facility. The third priority is the required medication available at hospital pharmacies. The fourth priority is that nurses/midwives take time to communicate with patients. The fifth priority is for doctors/nurses/midwives to recordthe actions taken. The technical priorities of inpatient services are implementing SOPs, leadership and staffcommitments,andbuildingeffectivecommunication.
Conflict of Interest: None
Source of Funding: Nil
ethical Clearance: Taken
ReFeReNCeS
1.C. V, A.K. B. Integrated Quality FunctionDeployment as a Tool for Quality Achievement in Healthcare. International Journal of Applied Industrial Engineering, 1(2):80-92. 2012.
2. Z. R. A Patient-Oriented Approach to Facilities Management in Singapore’s Hospitals Singapore, NationalUniversityofSingapore;2013.
3.NeneMallomoHospital.ProfilRumahSakitNeneMallomo Kabupaten Sidenreng Rappang. Sidrap: RumahSakitNeneMallomo;2014.
4. M. M, P D. Quality Function Deployment: Healthcare Improvement. Michigan: University ofMichigan;2012.
5.Venkateswarlu C, Birru A. Integrated QualityFunction Deployment as a Tool for Quality Achievement in Healthcare. International Journal of Applied Industrial Engineering (IJAIE). 2012;1(2):80-92.
6.K.C.T,T.A.P.MengintegrasikanSEVQUAldanKano Model Dalam Quality Function Deployment
(QFD) Untuk Service Excellence Pembangunan. Managing Service Quality. 2011;2(6):418-430.
7. A.E. C, Elrod, Cassandra. Quality Function DeploymentinContinuousImprovement2011.
8. RUI Z. A Patient-Oriented Approach to Facilities Management in Singapore’s Hospitals2013.
9. L.P. C. Quality Function Deployment and the Development of Total Quality Healthcare Model. International Journal of Applied Strategic Management. 2012;1(1).
10.Tjiptono, Chandra. Service, Quality, and Satisfaction.Yogyakarta:AndiOffset;2011.
11.Camgöz-AkdağH,TarımM,LonialS,YatkınA.QFD application using SERVQUAL for privatehospitals: a case study. Leadership in Health Services. 2013;26(3):175-183.
12. Arizona AW, Wibowo NS, Damayanti D. Analisis mutu layanan unit rekam medis berdasarkan kepuasan pelanggan internal dengan menggunakan metode service quality dan quality function deployment di rsd kalisat jember. Jurnal Manajemen Informasi Kesehatan Indonesia. 2014;2(1).
13. Magdalena M, Arto S, Ginting R. Peningkatan kualitas pelayanan dengan menggunakan metode quality function deployment (QFD) di rumah sakit xyz. Jurnal Teknik Industri USU. 2013;3(2).
14. Pasaribu H. Pengaruh komitmen, persepsi, dan penerapan pilar dasar total quality management terhadap kinerja manajerial. Jurnal Akuntansi dan Keuangan Indonesia. 2009;6(2):193-220.
15. Walker, Evan, Robbson. Komunikasi Efektif dalam Keperawatan.Jakarta:ECG;2012.
determination of birth Weight from Placental Morphometry
Senapati Susmita¹, Shashi Shankar Behera², Lopamudra Nayak³, Prafulla kumar chinara⁴1Tutor, Department of Anatomy, IMS & SUM hospital l,SOA university,Bhubaneswar; 2Professor,
Department of Obstetrics & Gynaecology, KIMS, KIIT University, Bhubaneswar; 3Tutor, Department of Anatomy, IMS & SUM Hospital l, SOA University, Bhubaneswar; 4Professor, Department of Anatomy, IMS
& SUM Hospital l, SOA University, Bhubaneswar
AbSTRACT
Aim and Objectives: Birth weight is one of the most important factors to determine the outcome of aneonate.Alowbirthweightbabyisdefinitelyachallengetotheobstetrician&neonatologist.Italsoincreasesthemorbidity&mortalityinnewborns.Thewellbeingofthefoetusisinfluencedby a number of factors all of which are clearly seen in terms of the birth weight. An important criteria and determinant of the survival, growth and development of the child is the birthweight. This study is undertaken to access the changes of placental morphometric in normal birthweight and low birth weight.
Material and Method: The studywasconductedintheObstetricsandGynaecologydepartmentofKIMShospitalandIMS&SUMhospitalBhubaneswar.Underthisstudy,placentawascollectedfromatotalof800uncomplicatedpregnantpatientswhowereadmitted to the indoordepartmentof thehospitals fromJanuary2013toJune2016.Themorphometricexaminationofvariousparametersliketheweightof theplacenta ,surface area of foetal and maternal side of placenta ,the total number of cotyledons and the site of insertion of the umbilical cords, birth weight of neonates were taken.
Result: It was observed that placental diameter, surface area, placental circumference and placental weightweresignificantlylowerinLBWascomparedtonormalweightneonates.(P<0.05)
Keywords: placenta, low birth weight, surface area, cotyledons, neonate.
Corresponding Author:Dr Shashi Shankar Behera,Professor,DepartmentofObstetrics&GynaecologyA/10,EmeraldGreens,Kalarahanga,Patia,BhubaneswarMob.:9437197047Email: [email protected]
INTROduCTION
Thewell beingof the foetus is influencedbya number of factors all of which are clearly seen in terms of the birth weight. The placenta which is thegatewaybetweenmother&foetusalongwiththe umbilical cord plays a vital role in the growth & development of foetus. The placenta is a vital organ that functions as a connection between the uterine wall and the developing foetus.1 A low birth weight baby is definitely a challenge to the obstetricianand to the neonatologist. So accurate estimation of foetal weight in antenatal period is helpful in
propermanagementofthepregnantmother&alsodecreases the associated morbidity.2InObstetricstherelationship of birth weight and the perinatal outcome has long been appreciated. However an often neglected parameter is the morphology of the placenta, an organ which plays a key role in foetal growth.3 Low birth weight is a major health problem in developing countries likeIndia.Asperthenationalfamilyhealthsurvey2005,theprevalenceofLBWbabiesis22.2%inIndia.WHOestimates that globally about 25 million low birth weight babies areborn eachyear&constitute about28% ofall live births in India (ParkK2009)⁴ Many studies have been done on placental weight in relation to birth weightofnewborn&foeto-placentalratio.Hencethepresent cross sectional study was undertaken to evaluate the relationship of placental morphometry (weight, surface area, number of cotyledons, umbilical insertion) indifferentbirthweightgroups.
DOI Number: 10.5958/0976-5506.2018.00300.5
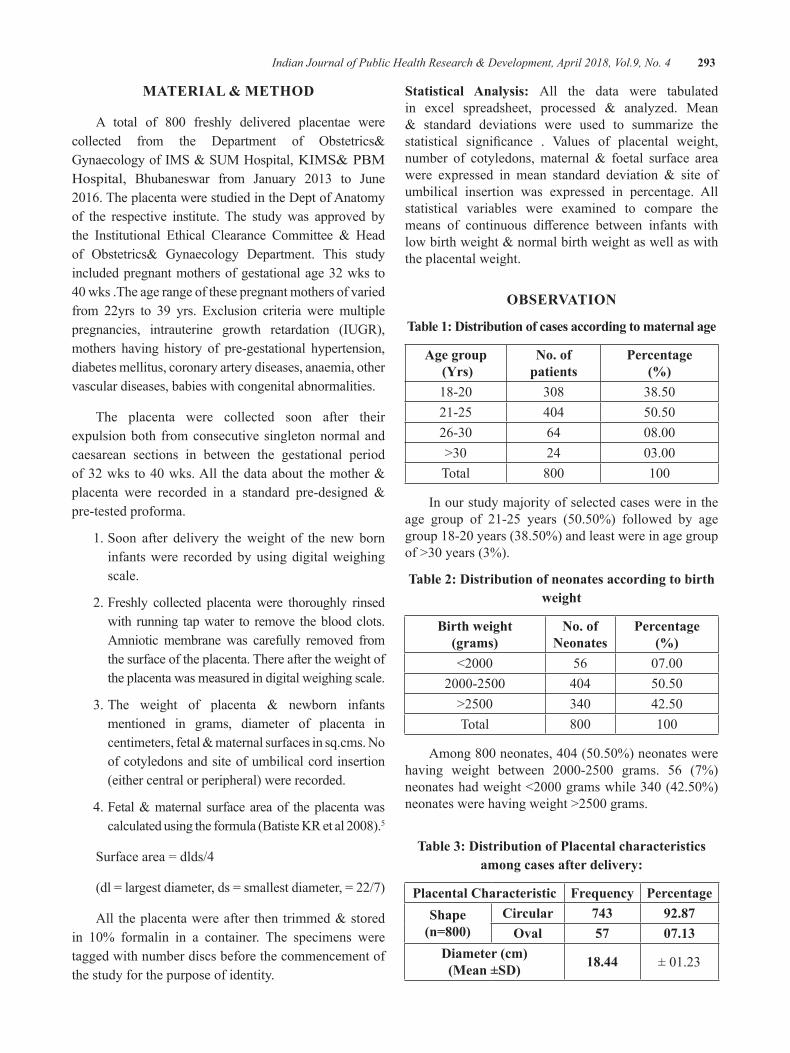
Indian Journal of Public Health Research & Development, April 2018, Vol.9, No. 4 293
MATeRIAl & MeThOd
A total of 800 freshly delivered placentae werecollected from the Department of Obstetrics&GynaecologyofIMS&SUMHospital,KIMS&PBMHospital, Bhubaneswar from January 2013 to June2016.TheplacentawerestudiedintheDeptofAnatomyof the respective institute. The study was approved by the Institutional Ethical Clearance Committee & Headof Obstetrics& Gynaecology Department. This studyincluded pregnant mothers of gestational age 32 wks to 40wks.Theagerangeofthesepregnantmothersofvariedfrom 22yrs to 39 yrs. Exclusion criteria were multiple pregnancies, intrauterine growth retardation (IUGR), mothers having history of pre-gestational hypertension, diabetes mellitus, coronary artery diseases, anaemia, other vascular diseases, babies with congenital abnormalities.
The placenta were collected soon after their expulsion both from consecutive singleton normal and caesarean sections in between the gestational period of32wks to40wks.All thedataabout themother&placenta were recorded in a standard pre-designed &pre-tested proforma.
1. Soon after delivery the weight of the new born infants were recorded by using digital weighing scale.
2. Freshly collected placenta were thoroughly rinsed with running tap water to remove the blood clots. Amniotic membrane was carefully removed from the surface of the placenta. There after the weight of the placenta was measured in digital weighing scale.
3.The weight of placenta & newborn infantsmentioned in grams, diameter of placenta in centimeters,fetal&maternalsurfacesinsq.cms.Noof cotyledons and site of umbilical cord insertion (either central or peripheral) were recorded.
4.Fetal&maternal surfaceareaof theplacentawascalculatedusingtheformula(BatisteKRetal2008).5
Surfacearea=dlds/4
(dl=largestdiameter,ds=smallestdiameter,=22/7)
All theplacentawereafter then trimmed&storedin 10% formalin in a container. The specimens weretagged with number discs before the commencement of the study for the purpose of identity.
Statistical Analysis: All the data were tabulated in excel spreadsheet, processed & analyzed. Mean& standard deviations were used to summarize thestatistical significance . Values of placental weight,number of cotyledons,maternal& foetal surface areawere expressed in mean standard deviation & site ofumbilical insertion was expressed in percentage. All statistical variables were examined to compare the means of continuous difference between infants withlowbirthweight&normalbirthweightaswellaswiththe placental weight.
ObSeRVATION
Table 1: distribution of cases according to maternal age
Age group (Yrs)
No. of patients
Percentage(%)
18-20 308 38.5021-25 404 50.5026-30 64 08.00>30 24 03.00Total 800 100
In our study majority of selected cases were in the age group of 21-25 years (50.50%) followed by agegroup18-20years(38.50%)andleastwereinagegroupof>30years(3%).
Table 2: distribution of neonates according to birth weight
birth weight(grams)
No. of Neonates
Percentage(%)
<2000 56 07.002000-2500 404 50.50>2500 340 42.50Total 800 100
Among800neonates,404(50.50%)neonateswerehaving weight between 2000-2500 grams. 56 (7%)neonateshadweight<2000gramswhile340(42.50%)neonateswerehavingweight>2500grams.
Table 3: distribution of Placental characteristics among cases after delivery:
Placental Characteristic Frequency PercentageShape
(n=800)Circular 743 92.87
Oval 57 07.13Diameter (cm)(Mean ±SD) 18.44 ±01.23
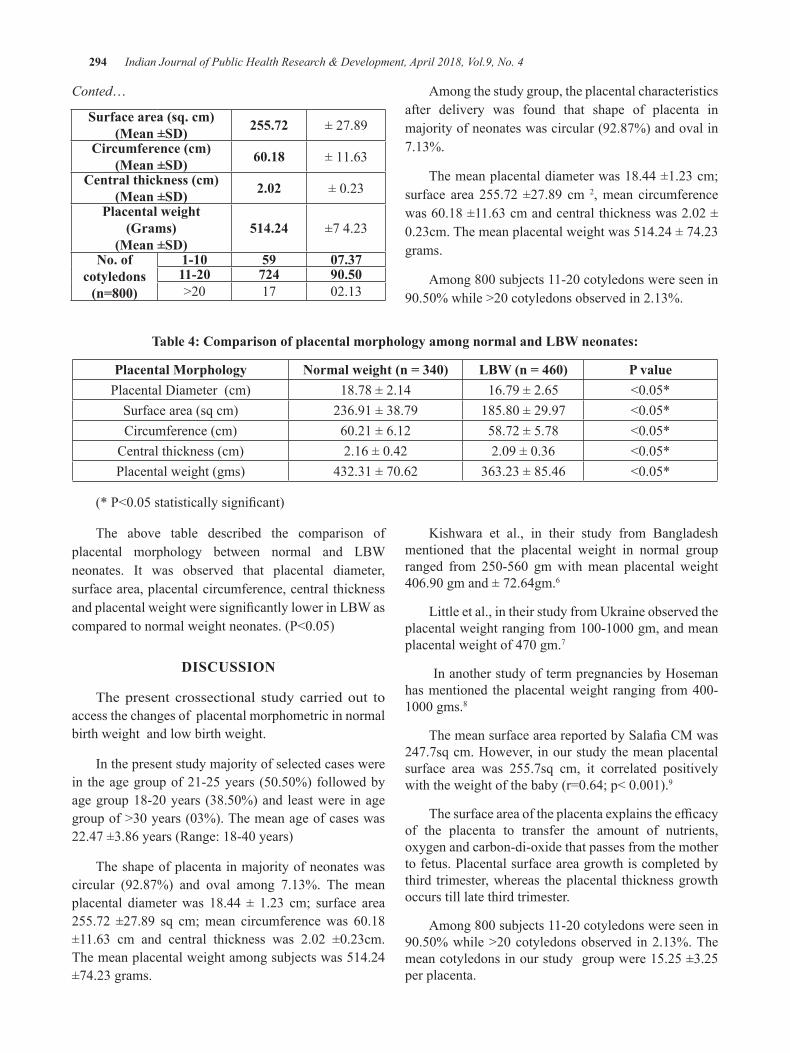
294 Indian Journal of Public Health Research & Development, April 2018, Vol.9, No. 4
Conted…
Surface area (sq. cm)(Mean ±SD) 255.72 ± 27.89
Circumference (cm)(Mean ±SD) 60.18 ± 11.63
Central thickness (cm)(Mean ±SD) 2.02 ±0.23
Placental weight (Grams)
(Mean ±SD)514.24 ±7 4.23
No. of cotyledons
(n=800)
1-10 59 07.3711-20 724 90.50>20 17 02.13
Among the study group, the placental characteristics after delivery was found that shape of placenta in majority of neonates was circular (92.87%) and oval in 7.13%.
The mean placental diameter was 18.44 ±1.23 cm; surface area 255.72 ±27.89 cm 2, mean circumference was60.18±11.63cmandcentralthicknesswas2.02±0.23cm.Themeanplacentalweightwas514.24±74.23grams.
Among800subjects11-20cotyledonswereseenin90.50%while>20cotyledonsobservedin2.13%.
Table 4: Comparison of placental morphology among normal and lbW neonates:
Placental Morphology Normal weight (n = 340) LBW (n = 460) P valuePlacental Diameter (cm) 18.78 ± 2.14 16.79 ± 2.65 <0.05*
Surface area (sq cm) 236.91 ± 38.79 185.80±29.97 <0.05*Circumference (cm) 60.21±6.12 58.72 ± 5.78 <0.05*
Central thickness (cm) 2.16±0.42 2.09±0.36 <0.05*Placental weight (gms) 432.31±70.62 363.23 ± 85.46 <0.05*
(*P<0.05statisticallysignificant)
The above table described the comparison of placental morphology between normal and LBW neonates. It was observed that placental diameter, surface area, placental circumference, central thickness andplacentalweightweresignificantlylowerinLBWascomparedtonormalweightneonates.(P<0.05)
dISCuSSION
The present crossectional study carried out to access the changes of placental morphometric in normal birth weight and low birth weight.
In the present study majority of selected cases were in theagegroupof21-25years (50.50%)followedbyagegroup18-20years (38.50%)and leastwere inagegroupof>30years(03%).Themeanageofcaseswas22.47±3.86years(Range:18-40years)
The shape of placenta in majority of neonates was circular (92.87%) and oval among 7.13%. The mean placental diameter was 18.44 ± 1.23 cm; surface area 255.72 ±27.89 sq cm;mean circumferencewas 60.18±11.63 cm and central thickness was 2.02 ±0.23cm.The mean placental weight among subjects was 514.24 ±74.23 grams.
Kishwara et al., in their study from Bangladesh mentioned that the placental weight in normal group ranged from 250-560 gmwithmean placental weight406.90gmand±72.64gm.6
Little et al., in their study from Ukraine observed the placentalweightrangingfrom100-1000gm,andmeanplacentalweightof470gm.7
In another study of term pregnancies by Hoseman hasmentioned theplacentalweight ranging from400-1000gms.8
ThemeansurfaceareareportedbySalafiaCMwas247.7sq cm. However, in our study the mean placental surface area was 255.7sq cm, it correlated positively withtheweightofthebaby(r=0.64;p<0.001).9
Thesurfaceareaoftheplacentaexplainstheefficacyof the placenta to transfer the amount of nutrients, oxygen and carbon-di-oxide that passes from the mother to fetus. Placental surface area growth is completed by third trimester, whereas the placental thickness growth occurs till late third trimester.
Among800subjects11-20cotyledonswereseenin90.50%while>20cotyledonsobserved in2.13%.Themean cotyledons in our study group were 15.25 ±3.25 per placenta.
Indian Journal of Public Health Research & Development, April 2018, Vol.9, No. 4 295
Similar findings were seen in study done by S.Majumdar et al where mean cotyledons among normal study group were 17 ± 2 per placenta.10
PlACeNTAl MORPhOlOgy AMONg NORMAl ANd lbW NeONATeS
It was observed that placental diameter, surface area, placental circumference, central thickness and placental weightweresignificantlylowerinLBWascomparedtonormalweightneonates.(P<0.05)
Similar findingswere seen in study done byR.D.Virupaxi et al morphometric parameters of placental weight,volumeweresignificantlylowerinLBWgroupbabies as compared to full term normal group babies, thesevalueswerestatisticallysignificant(p<0.0001).11
The earlier workers attended to the morphology and morphometry of placenta in relation to baby weight in term and preterm deliveries. It is well known that in normal preterm and term infants there is a direct relation between birth weight and weight of the placenta. Relations between birth weight and placental area and placental volume have also been described in various studies.
A study conducted by Hellman LM et al on ultra sonographic volume of the placenta found that, placental volume was directly proportional to the birth weight of the babies.12 They concluded that measurement of the placental volume may help in determination of baby’s growth. There was significant correlation was foundbetween birth weight and placental volume (p<0.001)Thus it confirms that morphometric observation ofplacenta was associated with foetal weight. So an early examination of not only the fetus, techniques like ultrasonography will be helpful to predict and to avoid low birth weight babies with better preventive measures.
CONCluSION
The above study clearly depicts that there is changes in placental morphometry in LBW and normal birth weight. The placental morphometries are in lower side in LBW neonates. So this knowledge may prove a important tool for obsteriticians to predict birth weight by estimating placental morphometry and there by preventing LBW child and mortality and morbidity.
Source of Funding: The above mentioned study is funded by the authors. No external funding.
Conflict of Interest:Thereisnoconflictofinterest inthis study
ReFeReNCeS 1. Pouhg etal, Herpetology (1992). 3rd ed. Pearson
PrenticeHall:PearsonEducationInc2002. 2.Luz,H.S.,López,S.R.,Olivares,E.T.,Terrazas,
M. C., Silva, M. A. R. and Carrillo M. L. Relation between Birth Weight and Placenta Weight. Neonatology, Biology of the Neonate, (2001)80:113-117.
3.Lo,Y. F., Jeng,M. J., Lee,Y. S., Soong,W. J.andHwang,B.(2002)Placentalweightandbirthcharacteristics of healthy singleton newborns. Journal of PracticalObstetrics andGynecology,43:21-25.
4. Park K. In:Textbook of Preventive and social Medicine20thed.Jabalpur:BanarsidasBhanotPublisher.2009:460-61.
5.Baptiste-Roberts, K., Salafia, C. M., Nicholson,W. K., Duggan, A., Wang, N. Y. and Brancati, F. L. Maternal risk factors for abnormal placental growth: the national collaborative perinatal project. BMC Pregnancy and Childbirth(2008) 8: 44.
6. Kishwara S, Nurunnabi ASM, Begum M, Abu RayhanK,AraS.Effectofmaternalpreeclampsiaon the weight of the placenta. Bangladesh Journal of Anatomy. 2010;8(2):69-71.
7.LittleRE,ZadorozhnajaTD,HulchiyOP,MendelNA, Shykyryak- NyzhnkZA, Chyslovska N, et al. Placental weight and its ratio to birthweight in a Ukrainian city. Early Hum Dev 2003;71:117-27.
8. Hoseman H. Duration of pregnancy and weight of the placenta. Archives of Gynecology. 1946; 176: 453.
9.SalafiaCM,MisraDP,MillerRK,CharlesAK.Non-linear and gender-specific relationshipsamong placental growth measures and the fetoplacental weight ratio. Placenta. 2009;30:1052-57.
10.Majumdar S, Dasgupta H, Bhattacharya K,Bhattacharya A. A Study of Placenta In Normal andHypertensivePregnancies.J.Anat.Soc.India.2005;54(2)1-9.
11.Virupaxi RD, Potturi BR, Shirol VS, Desai SPHukkeri VB. Morphology of placenta and itsrelation with small for date babies in 950 Livebirths. Recent Research in Science and technology. 2011;3(2):123-26.
12. L.M .Hellman, M .Kobayashi, Fillisti L et al: Growth and development of the human fetus prior to the twentiethweekofgestation.AmJObstetGynecol.1969;103:789-800.
Testing the level of Awareness on Testicular Cancer among the uAe Residents
elizabeth Topolskaya1, Iqra ghani1, Jessica d’Silva1, Abdulrahman Abdulwahab1, Siraj AlAbayechi1, Rami el Khatib2
1B.Sc. Health Organization Management, 2Associate Professor, Department of Environmental Health Sciences, Canadian University Dubai, Sheikh Zayed Rd., Dubai, UAE
AbSTRACT
This research article presents a quantitative study conducted in the UAE in efforts to test the level ofawareness regarding general knowledge on testicular cancer (TC) and self-examination practices among male and female residents. The determined level of understanding will help tailor the educational campaigns in order to provide information specific to the public need.The survey focusedon529UAE residents,prioritizingmales(71%)abovefemales(29%).Lessthan25%correctlyidentifiestheagegroup,whichhasthehighestriskofdevelopingTC.Onlyapproximately30%ofparticipantschosecorrectriskfactorsfordevelopingTC.Furthermore,almost50%ofthesurveyedindividualsthoughtoflackofsexualfunctionasa symptom of spread TC, which could create a fear barrier towards contacting health professionals in case of any concerns. Lastly, the results revealed that nearly half of male respondents either never or rarely self-examined.Ourstudysuggestedthatthegeneralpublicintheregioncurrentlypossesseslittleinformationregarding the symptoms, risk groups and self-examination practices; thus, showcasing the necessity of educational campaigns targeted at improving levels of awareness. Using some of the recommendations we highlight as a means to address the current situation.
Keywords: Testicular cancer, Awareness, UAE residents, Education
Corresponding Author:Dr. Rami El KhatibAssociate Professor,Department of Environmental Health Sciences,Canadian University Dubai,Sheikh Zayed Rd., Dubai, UAEEmail: [email protected]
lITeRATuRe ReVIeW
Testicular Cancer (TC), despite being less frequent than other types of cancer, has nevertheless risen rapidly among males worldwide over the past four decades [1];[2]. Moreover, younger adults are surprisingly more prone to falling victims of TC, with statistics revealing an 84% prevalence among the age group 15-44 years; while the remaining 15% prevail among the age group 45 and above, and only 1% in boys below the age of 15[1].
The risk of developing TC can be attributed to numerous environmental and genetic factors of varying kinds, including family history of TC [3]; [4], cryptorchidism
(i.e. undescended testicles), [1], as well as the undergoing of orchiopexy (the primary surgical treatment for cryptorchidism) at later stages of 13 years and older [1]; [3].Otherassociated risk factors includeahistoryofprior occurrence [5]; [6], testicular dysgenesis syndrome, congenital defects like hypospadias and testicular atrophy among others. While other factors like infertility, ethnicity; and lifestyle factors like diet and smoking habits, are also commonly presumed to be related risks, furtherresearchisyettoconfirmthepossibleassociationtowards TC [6].
Mostoften,TCcanbeidentifiedinitsinitialstages[3];[7]; however, many may not experience symptoms until much later during advanced stages [7], which is primarily why doctors suggest examination of testicles being included in the general physical exam process for males [8]. Typically, symptoms of TC include a lump or swelling of the testicle more than usual, as well as, possible discomfort or any deformation in the scrotum [9];[10]. The diagnosis of TC is most commonly possible through ultrasounds, as well as blood tests, other imaging tests
DOI Number: 10.5958/0976-5506.2018.00301.7
Indian Journal of Public Health Research & Development, April 2018, Vol.9, No. 4 297
like X-rays, CT, MRI, PET and bone scans; and very rarely, biopsies, due to the risk of spreading the cancer[8].
Fortunately, due to the advances in medical treatment and management procedures [1]TC has a 95% successful cure rate after early diagnosis [3]. However, if left untreated, TC has the potential to metastasize and may result in eventual death [11]. Treatment options usually vary depending on the stage and nature of the cancer [7]; the most effective intervention includesorchiectomy (i.e. the surgical removal of the affectedtesticle and spermatic cord). Subsequent to this, it is also imperative to employ post-chemotherapy or radiography to eliminate the spread of any potential lingering cancer cells [3]; [12]. Finally, and most importantly, continuing observation, follow-up or laboratory testing are essential to prevent a re-occurrence[3];[10]. The overall long-term survival rate of TC with early treatment still remains neartheremarking100%[3].
Empirical research has proven that through the active promotion of testicular cancer awareness and self-examinationoverthepast40years,thetumorsizesfirstpresented to the healthcare provider gradually decrease in size over time [16]. Furthermore, the delay in diagnosis dwindled to 2 weeks [17]. Public campaigns tend to be quite effective in delivering the necessary informationand increasing awareness[13];[17].
Testicular cancer is a sensitive subject to males; several social, cognitive and emotional factors may avert them from seeing the provider [18]. Anxiety and shame may end up discouraging men from seeking the help of the providers and refraining from screening [19]. Fear of loss of masculinity due to the removal of testicle tendstonegativelyaffectthescreeningbehaviour[20];[21]. However, anticipated regret associated with engaging in self-care activities has actually shown to promote testicular self-examination (TSE) [22]; [23].Other factors,which facilitate the prediction of screening behaviours, include knowledge and awareness about TC and TSE, as well as, the value an individual sees in health education and personal attitudes[24].
A review of 11 studies established that generally, interventions on TC/TSE awareness tend to be successful, as they increased knowledge of TC and the intention to conduct a self-exam[25]. Pamphlets, personalized messages to participants and group training sessions were preferred as educational tools for TC/TSE [24]. Fortunately, studies confirm that ifmales are
provided with necessary instructions, they are willing to learn about TC and perform TSE [8];[26]. Another possible outcome of regular screening can be improved patient-provider relationship[27], which is particularly important given that men were found to be more reluctant to discuss the health issues with their provider, for both preventive and treatment interventions[28].
MeThOdOlOgy
Aim: The aim of this research paper was to assess the level of awareness of UAE residents by testing their knowledge concerning various aspects of TC. Moreover, we were striving to improve understanding of TC through the display of educational materials to promote TSE and,optimistically,benefittheoverallhealthofthemalepopulation in the UAE through understanding the gaps in current knowledge, for designing future campaigns tailored to the region’s population.
Sample: The study’s target population consisted of randomly selected UAE residents of various nationalities aged fifteen and older who were surveyed (n = 542).Females and parents aged 35 and above were included as well, as adults may be able to spread the knowledge regarding TC to their kids and relatives.
design: The primary measuring instrument was a self-administered online-based questionnaire (using Survey Monkey service), structured based on background research of TC. The questions were approved by a non-profit organization Friends of Cancer Patients, basedin Sharjah, UAE. The survey was straightforward, avoided medical terms to ensure the ease of participants’ understanding,andwasinitiallypilotedon10peopletoassess average completion time and usability. During the data collection phase, participants were shown a video upon survey completion and given an educational pamphlet on the basics of TC and TSE. The identity of all participants remained anonymous.
limitations: The timeframe defined for the projectwas pressing. Moreover, some participants considered certain questions too sensitive and personal and refused to participate.
ReSulTS
Among 529 survey participants, 71% were males and 29% females; and approximately 65% were between theage20-35yearsold,21%were50andabove,while
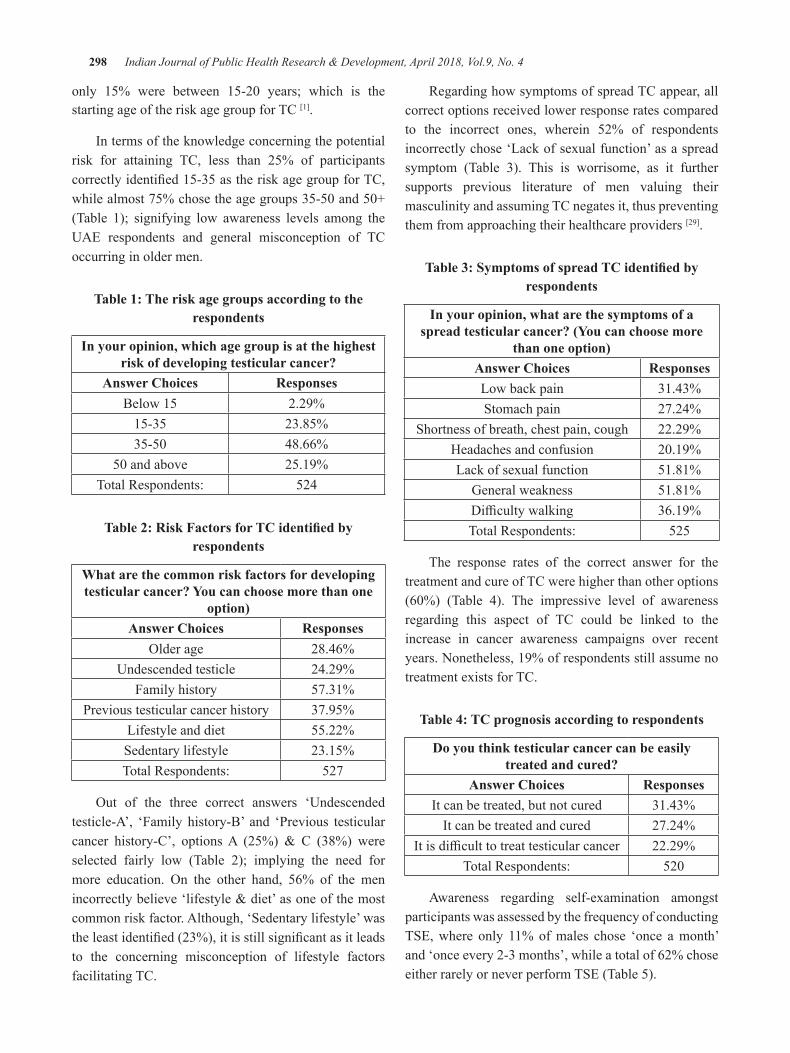
298 Indian Journal of Public Health Research & Development, April 2018, Vol.9, No. 4
only 15% were between 15-20 years; which is thestarting age of the risk age group for TC [1].
In terms of the knowledge concerning the potential risk for attaining TC, less than 25% of participants correctlyidentified15-35astheriskagegroupforTC,whilealmost75%chosetheagegroups35-50and50+(Table 1); signifying low awareness levels among the UAE respondents and general misconception of TC occurring in older men.
Table 1: The risk age groups according to the respondents
In your opinion, which age group is at the highest risk of developing testicular cancer?
Answer Choices ResponsesBelow 15 2.29%
15-35 23.85%35-50 48.66%
50andabove 25.19%Total Respondents: 524
Table 2: Risk Factors for TC identified by respondents
What are the common risk factors for developing testicular cancer? you can choose more than one
option)Answer Choices Responses
Olderage 28.46%Undescended testicle 24.29%
Family history 57.31%Previous testicular cancer history 37.95%
Lifestyle and diet 55.22%Sedentary lifestyle 23.15%Total Respondents: 527
Out of the three correct answers ‘Undescendedtesticle-A’, ‘Family history-B’ and ‘Previous testicular cancer history-C’, optionsA (25%) & C (38%) wereselected fairly low (Table 2); implying the need for more education. On the other hand, 56% of the menincorrectlybelieve‘lifestyle&diet’asoneofthemostcommon risk factor. Although, ‘Sedentary lifestyle’ was theleastidentified(23%),itisstillsignificantasitleadsto the concerning misconception of lifestyle factors facilitating TC.
Regarding how symptoms of spread TC appear, all correct options received lower response rates compared to the incorrect ones, wherein 52% of respondents incorrectly chose ‘Lack of sexual function’ as a spread symptom (Table 3). This is worrisome, as it further supports previous literature of men valuing their masculinity and assuming TC negates it, thus preventing them from approaching their healthcare providers [29].
Table 3: Symptoms of spread TC identified by respondents
In your opinion, what are the symptoms of a spread testicular cancer? (You can choose more
than one option)Answer Choices ResponsesLow back pain 31.43%Stomach pain 27.24%
Shortness of breath, chest pain, cough 22.29%Headaches and confusion 20.19%Lack of sexual function 51.81%
General weakness 51.81%Difficultywalking 36.19%Total Respondents: 525
The response rates of the correct answer for the treatment and cure of TC were higher than other options (60%) (Table 4). The impressive level of awarenessregarding this aspect of TC could be linked to the increase in cancer awareness campaigns over recent years. Nonetheless, 19% of respondents still assume no treatment exists for TC.
Table 4: TC prognosis according to respondents
do you think testicular cancer can be easily treated and cured?
Answer Choices ResponsesIt can be treated, but not cured 31.43%
It can be treated and cured 27.24%Itisdifficulttotreattesticularcancer 22.29%
Total Respondents: 520
Awareness regarding self-examination amongst participants was assessed by the frequency of conducting TSE, where only 11% of males chose ‘once a month’ and ‘once every 2-3 months’, while a total of 62% chose either rarely or never perform TSE (Table 5).
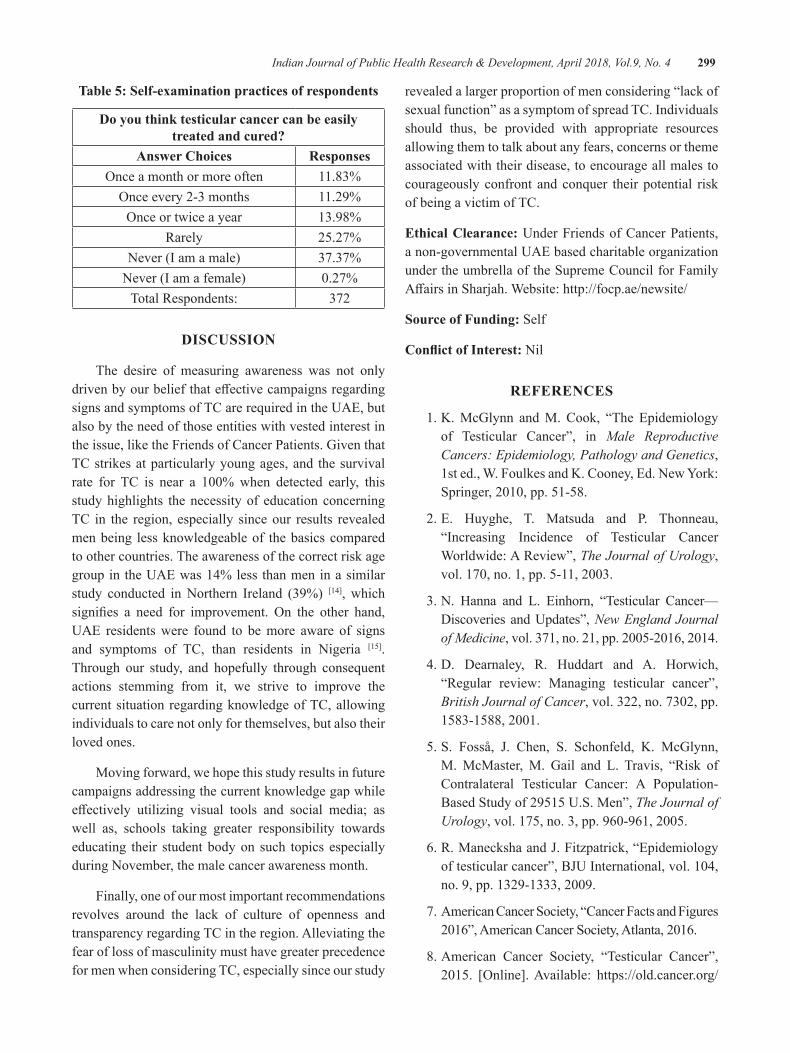
Indian Journal of Public Health Research & Development, April 2018, Vol.9, No. 4 299
Table 5: Self-examination practices of respondents
do you think testicular cancer can be easily treated and cured?
Answer Choices ResponsesOnceamonthormoreoften 11.83%Onceevery2-3months 11.29%Onceortwiceayear 13.98%
Rarely 25.27%Never (I am a male) 37.37%
Never (I am a female) 0.27%Total Respondents: 372
dISCuSSION
The desire of measuring awareness was not only drivenbyourbeliefthateffectivecampaignsregardingsigns and symptoms of TC are required in the UAE, but also by the need of those entities with vested interest in the issue, like the Friends of Cancer Patients. Given that TC strikes at particularly young ages, and the survival rate for TC is near a 100%when detected early, thisstudy highlights the necessity of education concerning TC in the region, especially since our results revealed men being less knowledgeable of the basics compared to other countries. The awareness of the correct risk age group in the UAE was 14% less than men in a similar study conducted in Northern Ireland (39%) [14], which signifies a need for improvement. On the other hand,UAE residents were found to be more aware of signs and symptoms of TC, than residents in Nigeria [15]. Through our study, and hopefully through consequent actions stemming from it, we strive to improve the current situation regarding knowledge of TC, allowing individuals to care not only for themselves, but also their loved ones.
Moving forward, we hope this study results in future campaigns addressing the current knowledge gap while effectively utilizing visual tools and social media; aswell as, schools taking greater responsibility towards educating their student body on such topics especially during November, the male cancer awareness month.
Finally, one of our most important recommendations revolves around the lack of culture of openness and transparency regarding TC in the region. Alleviating the fear of loss of masculinity must have greater precedence for men when considering TC, especially since our study
revealed a larger proportion of men considering “lack of sexualfunction”asasymptomofspreadTC.Individualsshould thus, be provided with appropriate resources allowing them to talk about any fears, concerns or theme associated with their disease, to encourage all males to courageously confront and conquer their potential risk of being a victim of TC.
ethical Clearance: Under Friends of Cancer Patients, a non-governmental UAE based charitable organization under the umbrella of the Supreme Council for Family AffairsinSharjah.Website:http://focp.ae/newsite/
Source of Funding: Self
Conflict of Interest: Nil
ReFeReNCeS
1. K. McGlynn and M. Cook, “The Epidemiology of Testicular Cancer”, in Male Reproductive Cancers: Epidemiology, Pathology and Genetics, 1st ed., W. Foulkes and K. Cooney, Ed. New York: Springer,2010,pp.51-58.
2. E. Huyghe, T. Matsuda and P. Thonneau, “Increasing Incidence of Testicular Cancer Worldwide:AReview”,The Journal of Urology, vol.170,no.1,pp.5-11,2003.
3.N. Hanna and L. Einhorn, “Testicular Cancer—Discoveries andUpdates”,New England Journal of Medicine,vol.371,no.21,pp.2005-2016,2014.
4. D. Dearnaley, R. Huddart and A. Horwich, “Regular review: Managing testicular cancer”,British Journal of Cancer,vol.322,no.7302,pp.1583-1588,2001.
5.S. Fosså, J. Chen, S. Schonfeld, K. McGlynn,M. McMaster, M. Gail and L. Travis, “Risk of Contralateral Testicular Cancer: A Population-BasedStudyof29515U.S.Men”,The Journal of Urology,vol.175,no.3,pp.960-961,2005.
6.R.ManeckshaandJ.Fitzpatrick,“Epidemiologyoftesticularcancer”,BJUInternational,vol.104,no.9,pp.1329-1333,2009.
7. American Cancer Society, “Cancer Facts and Figures 2016”,AmericanCancerSociety,Atlanta,2016.
8.American Cancer Society, “Testicular Cancer”,2015. [Online].Available: https://old.cancer.org/
300 Indian Journal of Public Health Research & Development, April 2018, Vol.9, No. 4
acs/groups/cid/documents/webcontent/003142-pdf.pdf.
9. G. Bosl and R. Motzer, “Testicular Germ-Cell Cancer”,TheNewEnglandJournalofMedicine,vol. 337, no. 4, pp. 242-254, 1997.
10.J.Shaw,“DiagnosisandTreatmentofTesticularCancer”, American Academy of FamilyPhysicians,vol.77,no.4,pp.469-474,2008.
11. T. Shanmugalingam, A. Soultati, S. Chowdhury, S. RudmanandM.VanHemelrijck,“Globalincidenceand outcome of testicular cancer”, ClinicalEpidemiology,vol.5,no.1,pp.417-424,2013.
12.BMJ,PatientinformationfromBMJ,1sted.BMJPublishingGroupLimited,2017,pp.1-4.
13.M.Saab,M.LandersandJ.Hegarty,“PromotingTesticular Cancer Awareness and Screening”,CancerNursing,vol.39,no.6,pp.473-487,2016.
14. R. Roy and K. Casson, “Attitudes Toward Testicular Cancer and Self-Examination Among Northern Irish Males”, American Journal ofMen’sHealth,vol.11,no.2,pp.253-261,2016.
15. H. Ugboma and H. Aburoma, “Public awareness of testicular cancer and testicular self-examination in academic environments: a lost opportunity”,Clinics,vol.66,no.7,pp.1125-1128,2011.
16.L.McGuinness,S.Obeidat,B.HickertonandR.Long, “Has increasing public health awareness influenced the size of testicular tumours amongadultpopulationsoverthelast40years?”,JournalofPublicHealth,vol.39,no.1,pp.90-94,2016.
17.N.Vasudev, J. Joffe,C.Cooke,F.Richards andW. Jones, “Delay in the diagnosis of testiculartumours—changesoverthepast18years”,BritishJournalofGeneralPractice,vol.54,no.505,pp.595-597,2004.
18. L. Shepherd, C. Watt and B. Lovell, “The role of social-cognitive and emotional factors on testicular self-examination”, 2016. [Online].Available:http://dx.doi.org/10.1002/pon.4097.
19. M. Balfe and R. Brugha, “What prompts young adults in Ireland to attend health services for STI testing?”,BMCPublicHealth,vol.9,no.1,2009.
20.A. Chapple, S. Ziebland and A. McPherson,“Qualitative study of men’s perceptions of why
treatment delays occur in the UK for those with testicular cancer”, British Journal of MedicalPractice,vol.54,no.498,pp.25-32,2004.
21. A. Moore, A. Higgins and D. Sharek, “Barriers and facilitators for oncology nurses discussing sexual issues with men diagnosed with testicular cancer”,EuropeanJournalofOncologyNursing,vol.17,no.4,pp.416-422,2013.
22.L. Lechner, A. Oenema and J. de Nooijer,“Testicular self-examination (TSE) among Dutch young men aged 15-19: determinants of theintentiontopracticeTSE”,HealthEducationResearch,vol.17,no.1,pp.73-84,2002.
23. C. McGilligan, C. McClenahan and G. Adamson, “Attitudes and Intentions to Performing Testicular Self-Examination: Utilizing an Extended Theory of Planned Behavior”, Journal of AdolescentHealth,vol.44,no.4,pp.404-406,2009.
24.M. Rovito, T. Gordon, S. Bass and J. DuCette,“Perceptions of Testicular Cancer and Testicular Self-Examination Among College Men”,AmericanJournalofMen’sHealth,vol.5,no.6,pp.500-507,2011.
25.M.Saab,M.LandersandJ.Hegarty,“TesticularCancer Awareness and Screening Practices: A Systematic Review”, OncologyNursing Forum,vol.43,no.1,2016.
26.M. Rovito, J. Leone and C. Cavayero, “”Off-Label” Usage of Testicular Self-Examination(TSE): Benefits Beyond Cancer Detection”,AmericanJournalofMen’sHealth,2015.
27.M.Rovito,J.Manjelievskaia,J.Leone,M.Lutzand A. Nangia, “From ‘D’ to ‘I’: A critique of the current United States preventive services task force recommendation for testicular cancer screening”,PreventiveMedicineReports,vol.3,pp.361-366,2016.
28.M. Addis and J. Mahalik, “Men, masculinity,and the contexts of help seeking.”, AmericanPsychologist,vol.58,no.1,pp.5-14,2003.
29.A. Singleton, “”It’sBecause of the InvincibilityThing”:YoungMen,Masculinity,andTesticularCancer”, International Journal ofMen’sHealth,vol.7,no.1,pp.40-58,2008.
Improving Nursing Research Reporting: A guide to Reporting guidelines
Renjulal yesodharan1, Vishnu Renjith2, Tessy Treesa Jose3
1Lecturer, Department of Psychiatric Nursing, 2Junior Research fellow, Department of Medical Surgical Nursing, 3Professor and Head, Department of Psychiatric Nursing, Manipal College of Nursing Manipal,
Manipal Academy of Higher Education
AbSTRACT
Enhancing the quality of the nursing research reporting through structured approach is the key in solving the problems related to reporting. Complete and transparent reporting of nursing research with the standard guidelinessuchas,TheStrengtheningtheReportingofObservationalStudiesinEpidemiology(STROBE),ConsolidatedStandardsofReportingTrials(CONSORT),PreferredReportingItemsforSystematicReviewsand Meta-Analyses (PRISMA), Standards for reporting qualitative research (SRQR), Consensus-based Clinical CaseReportingGuideline(CARE)andConsolidatedcriteriaforreportingqualitativeresearch(COREQ)willensurethetransparencythroughtheminimumsetofitemsrequiredtoreflectwhatwasonedone?Whataretheoutcomes?Whatarethebenefits?Whataretheissuesthatbringbiasandwhataretheharms?The‘EnhancingtheQualityandTransparencyofHealthResearch’(EQUATOR)networkand‘PenelopeResearch’alsohelpstheauthorstosolveproblemoffindingoutofrelevantreportingguidelines.Whatevermaybethereasonwritingand publishing high impact nursing and health research is the need of the day.
Keyword: EQUATOR, Reporting guidelines, Report writing, Reporting standards.
INTROduCTION
Research reports are factual and objective information collected through the process of research. In the last decade nursing research has increased to such an extent that the number of nursing related article published in biomedical journals are in their highest. In spite of the revolutionary increase in the nursing related research there are also serious concerns exist. Incomplete, inaccessible and unusable reports are some of that which cannot help the stakeholders and the end users (1). A recent review of articles published in the clinical nursing journals showed that research articles pertaining to nursing were only 7.6 % of the total journal articles cited in publications(2).
There is no simple and single solution for the global problem of poor reporting because the problems are usually happens within each stage of production of research. Some of the factors which can have an impact on reporting are poorly formed research questions, inequality and discrimination among researchers from resource-poor and resource-rich settings(3), limited access to scientific literature, bias of international biomedicaljournals, lack of skills in preparation and presentation of manuscripts (4) inadequate training in research methods and reporting (1), complex and inappropriate statistics(5), misapplication of newer advanced technique(6) Secondary analyses that extend or replicate already publishedfindings.
Improving the quality of the research reporting through structured approach is the key in solving the problems related to reporting. Journals can encouragetransparent and complete reporting of research with the help of structured and standard guidelines already developed for Randomized controlled trials (RCT)(7), systematic reviews, Meta-analysis of RCTs(8), observational studies(9) (10) studies of diagnostic test,
Corresponding Author:Mr Renjulal YesodharanLecturer, Department of Psychiatric NursingManipal College of Nursing ManipalManipalAcademyofHigherEducation,Manipal-576104Mobile:8095900592Email:[email protected]
DOI Number: 10.5958/0976-5506.2018.00302.9
302 Indian Journal of Public Health Research & Development, April 2018, Vol.9, No. 4
case reports(11) and preclinical animal studies (12). Use of reporting guidelines offers effective and efficientmeans for accomplishing consistency and completeness of reporting the research(13). Several other factors were also motivated the use of guidelines more in reporting the research studies that includes the recent changes in the standards of conduct of research and stringent ethical considerations.
RePORTINg guIdelINeS
(a) Consolidated Standards of Reporting Trials (CONSORT)-Guidelines for reporting randomized trials, clinical trials and experimental studies: CONSORT14 provides a standard way of preparing and reporting randomized trial findings. The main product of CONSORTis ‘CONSORT Statement’, an evidence basedset of recommendations which helps authors to report the randomized trials. It includes a flowdiagram and a checklist which primarily focus on the reporting of design, analysis and interpretation of analysiswhereas the flow diagram shows howthe participants were recruited and handled during the courseof the trial.CONSORTcanbeused toreport a wider class of randomized trails including factorial trials, crossover trails, cluster trails (15) Pragmatic trails and non-inferiority and equivalence trail. Extensions of CONSORT for the reportingof herbal interventions16 and Non pharmacological treatment interventions are also been published (17). ExtensionofCONSORTguidelinesisalsoavailableto report randomized trials in pediatric population (CONSORT-C) (18). Reporting of randomized pilot and feasibility trials are also can be done with the helpofCOSORTextensions.
The CONSORT lacks guidance in reporting‘Patient Reported Outcomes’ (PROs) suchas ‘Health-Related Quality of Life’ (HRQL), subjective symptoms, utilities, and satisfaction ratingswhicharereportedbythepatients.PROsare poorly reported in the randomized control trials (RCTs). To improve the quality transparency ofthereportingofPROsinRCTsinwhichPROsare primary or important secondary end points, CONSORT-PROguidelines (19) were developed.
The usefulness of CONSORT guidelines arebeyond writing manuscripts. It has a greater
potential to be used as a comprehensive guide for writing funding proposals and designing randomized trials. It can be also used for teaching research design and concepts to postgraduate and doctoral students in Nursing(20).
(b) The Strengthening the Reporting of Observational Studies in epidemiology (STROBE)-Guidelines for reporting observational studies: STROBE guidelines aredeveloped as initiatives to accurate and complete report of observational studies (21). Research designs like cohort, case-control, and cross-sectional studies were cover under the scope of STROBE. The components include a checklistwith 22 items and a detailed explanation and elaboration document9.
STROBE also has extension guidelines.STrengthening the REporting of Genetic Association Studies (STREGA), an extension which is currently in use to report special observation studies associated with genetics(22). STROBE-ID and STROBE-ME are other twoextensions used for reporting studies related to molecular epidemiology and molecular epidemiology for infectious disorders respectively(23).Whereas,STROBE-nut (24) is used to report nutrition epidemiological studies and dietary assessment researches
Observational studies associated with neonatalinfection can be reported with STROBE-NI (25) and studies related to antimicrobial resistance can be reported with STROBE-AMS. MAREguidelinesalongwithSTROBEguidelinescanbeused to report medical abortion related studies.
(c) Preferred Reporting Items for Systematic Reviews and Meta-Analyses (PRISMA): The explicit and systematic methods used to identify, select, critically appraise relevant research and to collect and analyze the data from the studies makes the systematic reviews more critical and important (26) Statistical techniques may or may not use to analyze the result of the studies included in the systematic review. If it is used which may then called as Meta-analysis. (26).
The PRISMA statement comprises 27 item checklistandafourphaseflowdiagramwithanobjective to improve the reporting of systematic
Indian Journal of Public Health Research & Development, April 2018, Vol.9, No. 4 303
reviews and meta-analysis. It focuses primarily on meta-analysis and systematic reviews of randomized control trials but can be also used for reporting meta-analysis and systematic reviews of other interventional studies. Other than thePRISMA statement a supporting explanation and evaluation document also published by the PRISMA group (27)
The specialized extensions of PRISMA are PRISMA-Equity, PRISMA-Abstracts, PRISMA-P, PRISMA-IPD, PRISMA-extensions for network meta-analysis and PRISMA-harms in which PRISMA-Equity is an extension developed in2012toreportthesystematicreviewsfocusedon health equity. PRISMA- Abstracts help the authors to report the abstract in journals and conference. PRISMA-P and PRISMA-IPD are aimed at reporting systematic review protocols and Individual participant data respectively. The network meta-analysis of health care interventions can be reported by using PRISMA-extensions for network meta-analysis.
Alongwiththeaccurateknowledgeofthebenefitof health care interventions accurate knowledge of harms is also needed. Failure of reporting harms intheprimarystudiescanaffectthereportingofsystematics reviews. PRISMA-harms checklist has been developed to improve the reporting of ‘harms’ in systematic review reports.
(d) Consensus-based Clinical Case Reporting Guideline (CARE): Systematic, complete and transparent reporting of cases studies is important for the medical and nursing practice. Implementation of the CARE guidelines (28) improves the reporting of case reports. The CARE guideline includes a 13 item checklist which also contains the narrative of a case report. Case reports which follow CARE guidelines will be useful in providing practice-based data on interventions and clinical outcomes that can be compared with other interventions and outcomes.
The SCARE Statement (29) is an extension of CARE to report surgically focused case reports.
(e) Standards for reporting qualitative research (SRQR): The SRQR gives a complete framework and recommendations to report a broad range of qualitative studies. It consists of 21 items
considered to be essential for complete, transparent reporting of qualitative researches (30).
(f) Consolidated criteria for reporting qualitative research (COREQ): The COREQ guidelineshelp the authors to report qualitative researches that use interviews and focus groups(31). Thirty two items in 3 domains were included in the COREQ checklist.Domain 1 is ‘Research teamand flexibility’ Domain 2 is ‘Study design’ andDomain 3 is ‘Analysis and findings’. COREQguidelines are developed to improve the quality of reporting of qualitative studies, which in turn improve conduct, and recognition of qualitative research (31).
(g) Meta-analysis of observational studies in epidemiology (MOOSE): Guidelines for reporting meta-analysis of observational studies in epidemiology: The reporting of Meta-analysis of observational studies are challenging due to the difference in the studydesign and the biases8. TheMOOSEchecklistconsist of 35 items which incorporates recommendations for reporting background of the study, search strategy, methods, results, discussion, and conclusions (32).
(h) The MORECare Statement: The MORECarestatement is a checklist of components that require when designing and conducting research studies evaluating services and treatments associated with end of life care to improve quality and standard of future research studies. It is useful in experimental studies, mixed methods studies, and observational studies. MORECare contains 36recommendations for reporting introduction, study design, ethics, participant’s procedure, outcome measures, missing data, implementation and cost effectiveness. It also includes recommendationsfor mixed method studies(33).
(i) Template for intervention description and replication (TIDieR): Reporting of interventions: TIDieR checklist is provided for describing the interventions in detail and allowing others to replicate. It should be used along with the CONSORTstatementwhena randomized trial is
304 Indian Journal of Public Health Research & Development, April 2018, Vol.9, No. 4
being reported and also with the SPIRIT statement when a clinical trial protocol is being reported. TIDieRchecklist has 12 items inwhich10th and 12th items are not relevant for protocol and need to describe after completing the study. Along with TIDieR checklist, TIDieR guide is also available which contains an explanation and elaboration for each item.(34)
(j) SPIRIT 2013 Statement: Guidelines for writing protocol for clinical trials: SPIRIT 2013Statement serves as a guideline forwritingclinical protocol with minimum content required. It contains 33 items which primarily focusing on the content of the protocol rather than the structure. The check list includes items related to Administrative information, introduction, Methods, Data collection management& analysis, Ethics& disseminationand Appendices(35). Along with the check list, SPIRIT2013ExplanationandElaborationneedtobereadforthefullunderstandingandclarificationof the items
CONCluSION
Transparency and reproducibility are very much important in nursing and health care research. Promoting transparency itself will improve the reproducibility. Reporting guidelines will ensure the transparency through the minimum set of items required to reflectwhat was one done? What are the outcomes? What are thebenefits?Whataretheissuesthatbringbiasandwhataretheharms?Usingarelevantguidelineissignificantinresearchreporting.Sometimesfindingarightguidelineissomewhatlikefindinganeedleinthehaystack.
Conflict of Interest: Authors declare no conflict ofinterest
ethical Clearance: Not Applicable
Source of Funding: Nil
ReFeReNCeS
1. Chalmers, Glasziou. Avoidable Waste in the Production and Reporting of Research Evidence. Lancet.2009;374:p.86–89.
2.Oermann,Nordstrom,Wilmes,DenisonD,WebbS, Featherst D, et al. Dissemination of research
in clinical nursing journals. Journal of ClinicalNursing.2008;17:p.149–156.
3. Siriwardhana. Promotion and Reporting of Research from Resource-Limited Settings. InfectiousDiseases.2015;8:p.25–29.
4.Langer, Díaz-Olavarrieta , Berdichevsky , VillarJ. Why is research from developing countriesunderrepresented in international health literature, and what can be done about it? Bulletin of the World HealthOrganization.2004;82(10):p.802–8.
5. Bordage. Reasons Reviewers Reject and Accept Manuscripts: The Strengths and Weaknesses in Medical Education Reports. Academic Medicine. 2001September;76(9):p.889–896.
6. Altman D. Poor-quality Medical Research: What canJournalsdo?JAMA.2002;287(21):p.2765-2767.
7. Moher, Hopewell , Schulz , Montor , Gøtzsc C, ElbourneD,etal.CONSORT2010Explanationand Elaboration: updated guidelines for reporting parallel group randomised trials. Journal ofClinical Epidemioogyl. 2012 March; 65(3): p.1-37.
8.Moher, Cook J, Eastwood , Olkin I, RennieD, Stroup. Improving the quality of reports of meta-analyses of randomised controlled trials: the QUOROM statement. The Lancet. 1999November27;354(9193):p.1896–1900.
9.Vandenbroucke JP, Elm EV, Altman DG,Gøtzsche PC, Mulrow CD, Pocock SJ, et al.Strengthening the Reporting of ObservationalStudiesinEpidemiology(STROBE):ExplanationandElaboration.PLoSMedicine.2007October;4(10):p.1628-1654.
10.Stroup DF, Berlin JA, Morton SC, Olkin I,Williamson D, Moher D, et al. Meta-analysis of Observational Studies in Epidemiology: AProposalforReporting.JAMA.2000;283(15):p.2008-2012.
11.GagnierJJ,RileyD,AltmanDG,MoherD,SoxH, Kienle G. The CARE Guidelines: Consensus-Based Clinical Case Reporting Guideline Development. Deutsches Ärzteblatt International. 2013September;110(37):p.603–608.
Indian Journal of Public Health Research & Development, April 2018, Vol.9, No. 4 305
12. Kilkenny C, Browne W, Cuthil C, Emerson , Altman G. Improving Bioscience Research Reporting:TheARRIVEGuidelinesforReportingAnimalResearch.PLOSBiology8(6):e1000412.doi:10.1371/journal.pbio.1000412.2010June29;8(6).
13.FullerT,PearsonM,PetersJ,AndersonR.WhatAffectsAuthors’ and Editors’ Use of ReportingGuidelines?FindingsfromanOnlineSurveyandQualitativeInterviews.PLoSOne.2015;10(4).
14. Schulz KF, Altman DG, Moher D, Group ftC. CONSORT2010Statement:UpdatedGuidelinesfor Reporting Parallel Group Randomised Trials. PLoSMedicine.2010March24;7(3).
15. Campbell MK, Piaggio G, Elbourne DR, Altman DG.Consort2010Statement:ExtensiontoClusterRandomised Trials. British Medical Journal.2012;:p.1-21.
16.GagnierJ,Boon ,RochonP,MoherD,Barnes ,Bombardier. Reporting Randomized, Controlled Trials of Herbal Interventions:An Elaborated CONSORT Statement. Annals of InternalMedicine.2006;144:p.364-367.
17. Boutron, Moher D, Altman DG, Schulz KF, Ravaud. Extending the CONSORT Statementto Randomized Trials of Nonpharmacologic Treatment: Explanation and Elaboration. Annals ofInternalMedicine.2008;148(4):p.295-309.
18. Saint-Raymond, Hill, Martines, Bahl, Fontaine, BeroL.CONSORT2010.TheLancet.2010July24;376(9737):p.229-230.
19. Calvert, Blazeby, Altman DG, Revicki A, Moher , Brundage D. Reporting of Patient-Reported OutcomesinRandomizedTrials:TheCONSORTPRO Extension. JAMA. 2013 February 27;309(88).
20.Bennett A. The Consolidated Standards ofReporting Trials (CONSORT): Guidelines forReporting Randomized Trials. Nursing Research. 2005April;54(2):p.128–132.
21. Elm Ev, Altman DG, Egger M, Pocock SJ, Vandenbroucke JP. The Strengtheningthe Reporting of Observational Studies inEpidemiology (STROBE)Statement:Guidelinesfor Reporting Observational Studies. PLoSMedicine.2007;4(10).
22. Little , Higgins , Ioannidis PA, Moher , Gagnon , Elm , et al. STrengthening the REporting of Genetic Association Studies (STREGA)— AnExtension of the STROBE Statement. PLoSMedicine.2009;6(2):p.151-162.
23.Gallo V, Egger M, McCormack V, FarmerPB, Ioannidis JP, Kirsch-Volders M, et al.STrengthening the Reporting of OBservationalstudies in Epidemiology – Molecular Epidemiology (STROBE-ME): An extensionof theSTROBE statement.European Journal ofClinical Investigation. ; 42(1): p. 1-16.
24.LachatC,HawwashD,OckéMC,BergC,HörnellA, Larsson C, et al. Strengthening the Reporting of Observationa lStudies in Epidemiology—Nutritional Epidemiology (STROBE-nut): AnExtension of the STROBE Statement. PLoSMedicine.2016June7;13(6).
25.Fitchett J, Seale AC, Vergnano , Sharland M,Heath , Saha , et al. Strengthening the Reporting of Observational Studies in Epidemiology forNewborn Infection (STROBE-NI): an extensionoftheSTROBEstatementforneonatal infectionresearch. The Lancet Infectious Diseases. 2016October;16(10):p.e202–e213.
26. Cochrane Handbook for Systematic Reviews of Interventions Version 5.1.0 [updated March2011]. [Online].: The Cochrane Collaboration;2011 [cited 2016December 14.Available from:http://handbook.cochrane.org./.
27.Liberati A, Altman G, Tetzlaff , Mulrow C,Gøtzsche PC, Ioannidis JP, et al. The PRISMAStatement for Reporting Systematic Reviews and Meta-Analyses of Studies That Evaluate Health Care Interventions: Explanation and Elaboration. PLoSMedicine.2009July21.
28.GagnierJ,KienleG,AltmanD,MoherD,Sox,Riley. The CARE guidelines: consensus-based clinical. Journal ofMedicalCaseReports. 2013September10;7(223).
29.AghaRA,FowlerAJ,Saeta ,Barai ,RajmohanS,Orgill P.The SCAREStatement:Consensus-based surgical case report guidelines. International JournalofSurgery.2016;34:p.180-186.
306 Indian Journal of Public Health Research & Development, April 2018, Vol.9, No. 4
30.O’Brien C, Harris IB, Beckman TJ, Reed DA,Cook DA. Standards for Reporting Qualitative Research: A Synthesis of Recommendations. AcademicMedicine.2014;89(9):p.1245-1251.
31.Tong,SainsburyP,CraigJ.Consolidatedcriteriaforreportingqualitativeresearch(COREQ):a32-item checklist for interviews and focus groups. InternationalJournalforQuality inHealthCare.2007September14;19(6):p.349–357.
32.Stroup DF, Berlin JA, Morton SC, Olkin I,Williamson DG, Rennie D, et al. Meta-analysis of Observational Studies in Epidemiology:AProposal for Reporting. JAMA. 2000April 19;283(15):p.2008-2012.
33.Higginson J, Evans CJ, Grande , Preston N,Morgan , McCrone , et al. Evaluating complex interventionsinEndofLifeCare:theMORECareStatement on good practice generated by a synthesis of transparent expert consultations and systematic reviews.BMCMedicine. 2013April24; 11(111): p. 1-11.
34.HoffmannTC,Glasziou PP, Boutron I, PereraunR, Moher D, Altman DG, et al. Better reporting of interventions: template for intervention description andreplication(TIDieR)checklistandguide.BMJ.2014March7;348(1687):p.1-12.
35.ChanAW,TetzlaffJM,AltmanDG,LaupacisA,GøtzschePC,Krleža-JerićK,etal.SPIRIT2013Statement: Defining Standard Protocol Itemsfor Clinical Trials. Annals of Internal Medicine. 2013;158(3):p.200-207.
A Three year Review of uterine Rupture in Tertiary hospital: lessons for Obstetric Care
Parveen Rajora1, Amanjot Rajpal2
1Associate Prof. Deptt.of Obst. & Amp, 2Assistant Prof. Deptt. of Anesthesia, Gynae Ggsmc Faridkot
AbSTRACT
background: Uterine rupture is a potentially catastrophic event during child birth leading to maternal and fetalmortalityandmorbidity.Thisdisastercanbepreventable,still inIndiaitaccountsfor5-10%ofallmaternal deaths.
Aim:Ouraimwastoanalyzethecasesofruptureuteruswiththeobjectivetoproposepreventivemeasures.
Method: It is a three year retrospective analysis of uterine rupture cases recorded from 1stJune2010to31st May2013inGuruGobindSinghMedicalCollegeandHospitalFaridkot.
Results: A total of 28 cases of rupture uterus were recorded among 2722 deliveries making the incidence of 10.29per1000deliveries.Wefoundcloseassociationofpreviouscaesareansection75%,injudicioususeofoxytocin 35.71%, grand multiparity 35.71% and obstructed labour 25% with ruptue uteri.
Repairwasdonein60.71%andhysterectomywasdonein39.28%ofcases.Neonataloutcomewasnilincomplete rupture. Common maternal complications faced were shock, sepsis and bladder trauma.
Conclusion: We just need to upgrade our health system starting from the level of TBA and dai’s creating more awareness among pregnant ladies especially with previous caesarean section.
Keywords: Rupture uteri, TBA, Caesarean section, Obstetric care
Corresponding Author:Dr. Parveen RajoraHouse No. 49, Medical College Campus, FaridkotMobile:9988383140EMail: [email protected]
INTROduCTION
Uterine rupture is a potentially catastrophic event during child birth in which the integrity of the myometrial wall is breached. In a complete rupture there is full thickness separation of the uterine wall with the expulsion of the fetus and/or placenta into the abdominal cavity where as the overlying serosa or peritoneum is spared in an incomplete rupture. [1] Rupture of the uterus is more dangerous then that occurring in pregnancy because shock is great and infection is almost inevitable.[2]
Trial of labor on scarred uterus and the use of uterotonics during the labor are the most frequent causes in the developed world while neglected and obstructed
labor, multiparity stands as the principal factors in the developing countries.[3]
Majority of population living in rural area do not have an easy accessibility to essential obstetric care. Thisisdifferentindevelopedcountrieswhereefficientantenatal and intrapartum care had almost eradicated this obstetric catastrophe.[4]
Uterine rupture stands as a single obstetric accident thatexposestheflawsandinequitiesofhealthsystemandthe society at large due to degree of neglect that it entails. In India it still accounts for 5 to 10% of allmaternaldeaths. In most of cases however maternal mortality and disability can be prevented with appropriate health interventions.[5]
Considering the suffering and agony pregnantwoman go through it is an indictment on society if proactive interventions are not put in place to make pregnancy and delivery safe. It is against this background we have conducted this study.
DOI Number: 10.5958/0976-5506.2018.00303.0
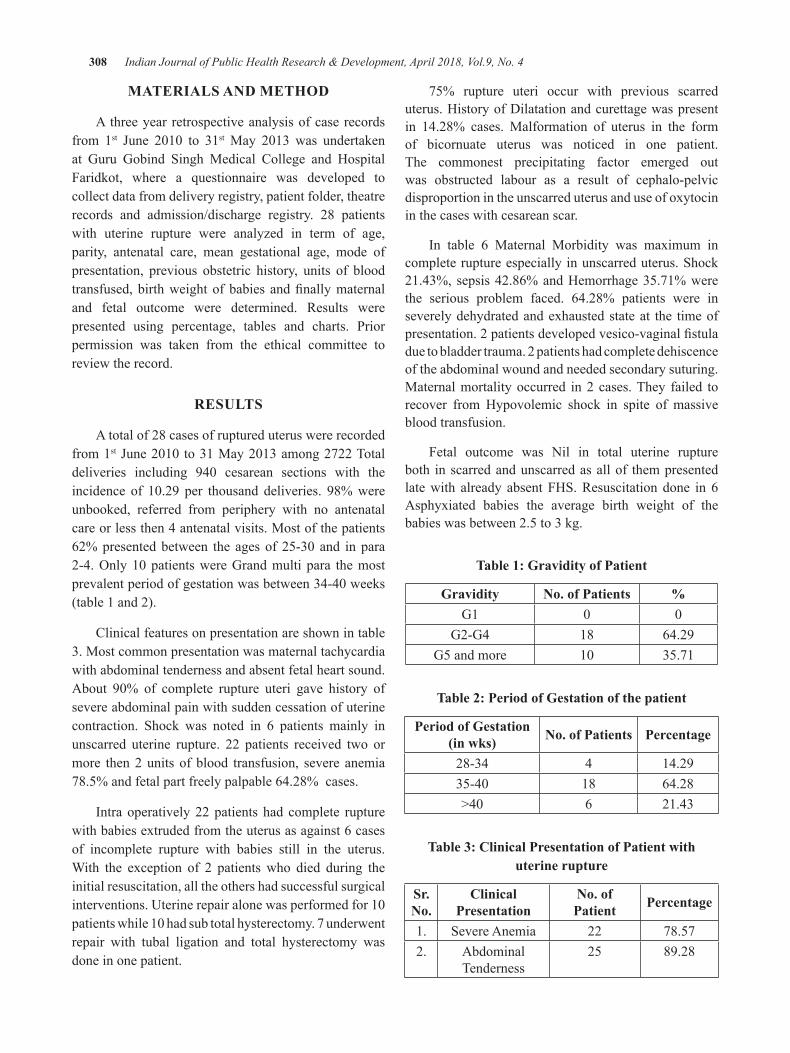
308 Indian Journal of Public Health Research & Development, April 2018, Vol.9, No. 4
MATeRIAlS ANd MeThOd
A three year retrospective analysis of case records from 1st June 2010 to 31stMay 2013 was undertakenat Guru Gobind Singh Medical College and Hospital Faridkot, where a questionnaire was developed to collect data from delivery registry, patient folder, theatre records and admission/discharge registry. 28 patients with uterine rupture were analyzed in term of age, parity, antenatal care, mean gestational age, mode of presentation, previous obstetric history, units of blood transfused,birthweightofbabies andfinallymaternaland fetal outcome were determined. Results were presented using percentage, tables and charts. Prior permission was taken from the ethical committee to review the record.
ReSulTS
A total of 28 cases of ruptured uterus were recorded from 1stJune2010to31May2013among2722Totaldeliveries including 940 cesarean sections with theincidence of 10.29 per thousand deliveries. 98%wereunbooked, referred from periphery with no antenatal care or less then 4 antenatal visits. Most of the patients 62%presentedbetween the agesof25-30and inpara2-4.Only10patientswereGrandmultipara themostprevalentperiodofgestationwasbetween34-40weeks(table 1 and 2).
Clinical features on presentation are shown in table 3. Most common presentation was maternal tachycardia with abdominal tenderness and absent fetal heart sound. About 90% of complete rupture uteri gave history ofsevere abdominal pain with sudden cessation of uterine contraction. Shock was noted in 6 patients mainly in unscarred uterine rupture. 22 patients received two or more then 2 units of blood transfusion, severe anemia 78.5% and fetal part freely palpable 64.28% cases.
Intra operatively 22 patients had complete rupture with babies extruded from the uterus as against 6 cases of incomplete rupture with babies still in the uterus. With the exception of 2 patients who died during the initial resuscitation, all the others had successful surgical interventions.Uterinerepairalonewasperformedfor10patientswhile10hadsubtotalhysterectomy.7underwentrepair with tubal ligation and total hysterectomy was done in one patient.
75% rupture uteri occur with previous scarred uterus. History of Dilatation and curettage was present in 14.28% cases. Malformation of uterus in the form of bicornuate uterus was noticed in one patient. The commonest precipitating factor emerged out was obstructed labour as a result of cephalo-pelvic disproportion in the unscarred uterus and use of oxytocin in the cases with cesarean scar.
In table 6 Maternal Morbidity was maximum in complete rupture especially in unscarred uterus. Shock 21.43%, sepsis 42.86% and Hemorrhage 35.71% were the serious problem faced. 64.28% patients were in severely dehydrated and exhausted state at the time of presentation.2patientsdevelopedvesico-vaginalfistuladue to bladder trauma. 2 patients had complete dehiscence of the abdominal wound and needed secondary suturing. Maternal mortality occurred in 2 cases. They failed to recover from Hypovolemic shock in spite of massive blood transfusion.
Fetal outcome was Nil in total uterine rupture both in scarred and unscarred as all of them presented late with already absent FHS. Resuscitation done in 6 Asphyxiated babies the average birth weight of the babies was between 2.5 to 3 kg.
Table 1: gravidity of Patient
gravidity No. of Patients %G1 0 0
G2-G4 18 64.29G5 and more 10 35.71
Table 2: Period of gestation of the patient
Period of gestation(in wks) No. of Patients Percentage
28-34 4 14.2935-40 18 64.28>40 6 21.43
Table 3: Clinical Presentation of Patient with uterine rupture
Sr. No.
Clinical Presentation
No. of Patient Percentage
1. Severe Anemia 22 78.572. Abdominal
Tenderness25 89.28
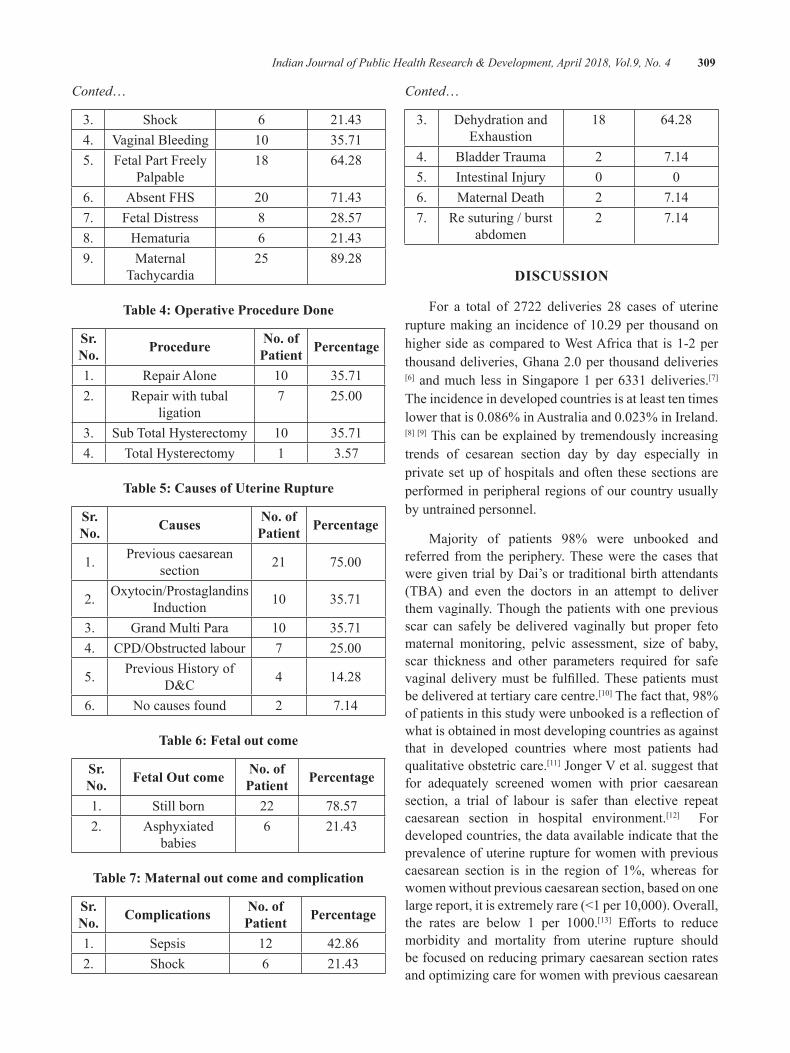
Indian Journal of Public Health Research & Development, April 2018, Vol.9, No. 4 309
Conted…
3. Shock 6 21.434. VaginalBleeding 10 35.715. Fetal Part Freely
Palpable18 64.28
6. Absent FHS 20 71.437. Fetal Distress 8 28.578. Hematuria 6 21.439. Maternal
Tachycardia25 89.28
Table 4: Operative Procedure done
Sr. No. Procedure No. of
Patient Percentage
1. Repair Alone 10 35.712. Repair with tubal
ligation7 25.00
3. Sub Total Hysterectomy 10 35.714. Total Hysterectomy 1 3.57
Table 5: Causes of uterine Rupture
Sr. No. Causes No. of
Patient Percentage
1. Previous caesarean section 21 75.00
2. Oxytocin/ProstaglandinsInduction 10 35.71
3. Grand Multi Para 10 35.714. CPD/Obstructedlabour 7 25.00
5. Previous History of D&C 4 14.28
6. No causes found 2 7.14
Table 6: Fetal out come
Sr. No. Fetal Out come No. of
Patient Percentage
1. Still born 22 78.572. Asphyxiated
babies6 21.43
Table 7: Maternal out come and complication
Sr. No. Complications No. of
Patient Percentage
1. Sepsis 12 42.862. Shock 6 21.43
Conted…
3. Dehydration and Exhaustion
18 64.28
4. Bladder Trauma 2 7.145. Intestinal Injury 0 06. Maternal Death 2 7.147. Re suturing / burst
abdomen2 7.14
dISCuSSION
For a total of 2722 deliveries 28 cases of uterine rupturemakingan incidenceof10.29per thousandonhigher side as compared to West Africa that is 1-2 per thousanddeliveries,Ghana2.0per thousanddeliveries[6] and much less in Singapore 1 per 6331 deliveries.[7] The incidence in developed countries is at least ten times lowerthatis0.086%inAustraliaand0.023%inIreland.[8][9] This can be explained by tremendously increasing trends of cesarean section day by day especially in private set up of hospitals and often these sections are performed in peripheral regions of our country usually by untrained personnel.
Majority of patients 98% were unbooked and referred from the periphery. These were the cases that were given trial by Dai’s or traditional birth attendants (TBA) and even the doctors in an attempt to deliver them vaginally. Though the patients with one previous scar can safely be delivered vaginally but proper feto maternal monitoring, pelvic assessment, size of baby, scar thickness and other parameters required for safe vaginaldeliverymustbe fulfilled.Thesepatientsmustbe delivered at tertiary care centre.[10] The fact that, 98% ofpatientsinthisstudywereunbookedisareflectionofwhat is obtained in most developing countries as against that in developed countries where most patients had qualitative obstetric care.[11]JongerVetal.suggestthatfor adequately screened women with prior caesarean section, a trial of labour is safer than elective repeat caesarean section in hospital environment.[12] For developed countries, the data available indicate that the prevalence of uterine rupture for women with previous caesarean section is in the region of 1%, whereas for women without previous caesarean section, based on one largereport,itisextremelyrare(<1per10,000).Overall,the rates are below 1 per 1000.[13] Efforts to reducemorbidity and mortality from uterine rupture should be focused on reducing primary caesarean section rates and optimizing care for women with previous caesarean
310 Indian Journal of Public Health Research & Development, April 2018, Vol.9, No. 4
section. In our study 75% of uterine rupture had history of caesarean section as compared to 41.66% and 52% in other studies.[14][15]
Majority 62% of these patientswere less than 30years of age, which is in accordance with Veena p.showing 82% between 20 and 30 years. [16] However ourresultwasdifferentfromFofieCOetal.whonoteda higher incidence among the age group 30-45 yearsandlowestamongpatientsinthe20-29years.[6] In our society set up this can be explained on the basis of early marriage and too many births with in short interval.
Grand multi para > 5 child were seen to another risk factor specially in unscarred uterus similar to study done by Malik HS. [17] However Gardreil et al reported only 2 cases among 39,529 multigravid. [18] Dr. Yasmeen Akhtar quoted that certain changes in the muscle and connective tissue occur in the uterus with multiple and old age making them weak and inert. To overcome this problem Dai’s and traditional birth attendants use oxytocins injudiciously in higher doses contributing to rupture uterus. [10] However rupture uterus in scarred and unscarred uterus in our study occurred more in para 2-4 which is in accordance with many studies. [14] Risk factor evaluation shows an association of lack of antenatal care financialSupport,mismanagementoflaborbyuntrainedpersonal and poor nutritional supplements. Instrumental delivery especially the mid cavity, outlet forceps and uterine perforation unnoticed by previous dilatation and curettage are also important causes for this mishap. The area of perforation become weak and gives away during labour in next pregnancy leading to uterine rupture. [10]To avoid such accidents family planning services and health care facilities for pregnant patients must be made up to standard.
Unlike in developed countries where fetal heart rate abnormalities are the first identified manifestation ofrupture uterus [19] late signs like abdominal tenderness, tachycardia, vaginal bleeding and severe anemia were the most common ones in our study. In Shipp et al study anemia was present in just 25% [20] in contrast to our study 78.57%. Whereas Sahu Latika reported 100%anemia rate in her study. [5]This could be explained by the fact that the Shipp et al study group were for trial of labour after caesarean section. As high up 78.57% women with rupture uterus required blood transfusion in our study. This is probably due to poor hemodynamic state and high prevalence of anemia in pregnancy which is in accordance with other studies. In contrast Leung et al reported a much less number of cases 29% requiring blood transfusion.[21]
The common antecedent factor was obstructed labour 25% specially in unscarred group whereas use of oxytocin 35.71% contributed maximally to rupture in scarred uterus similar findingswere reported by otherauthor’s.[4][5][14]
Most of the rupture uteri were managed according to site, state and extent of injury. Subtotal hysterectomies were performed in only grand multi para’s and in those with extensive and irreparable injury. Repairs with orwithout tubal ligationwas done in 60.71%ofcases, which is in accordance with Nigerian study. [4] But Chuni N reported more of the hysterectomy rate as compared to the repair procedure in her study. [22] We are reporting 39.28% hysterectomy rates somewhere closer to Chibber et al. study reporting rate of 45% in rupture uterus. [15] Child birth after uterine rupture is not being recommended routinely but most women with previous uterine rupture with meticulous tertiary level antenatal care can have a favorable outcome in subsequent pregnancies. [15] So one should not show over enthusiasm for hysterectomy in rupture uterus rather management should be individualized according to the extent of the injury, desire of child bearing and hemodynamic stability of the patient.
Maternal Morbidity in the form of anemia, vesicovaginal fistula, Hemorrhage, acute renal failure,sepsis and shock were in accordance with other studies.[6]
PerinatalmortalitywasslightlyhigherthenVeenaetal. [16] but was in accordance with Adanu and Elkady . [23][24] this could be due to late referral with already absent fetal heart at the time of presentation.
CONCluSION ANd SuggeSTIONS
We concluded that there is strong association of rupture uterus with previous scarred uterus, grand multipara, obstructed labor and with injudiciously use of uterotonics.
Antenatal care coverage in the country is quite acceptable, more over national schemes like free delivery,freeneonatalcare,108transportfacilitiesarequite appreciable still the quality of care offered byhealth centers andmedia education about the benefitsof hospital delivery definitely need to be upgraded.The cases with rupture uteri must be followed for the previous management during labour and the responsible person’s must be properly trained in tertiary hospitals.
Approximately 5800 women die every year ofpregnancy related causes and less than 1% of these
Indian Journal of Public Health Research & Development, April 2018, Vol.9, No. 4 311
deaths occur in developed countries demonstrating that these deaths could be avoided if resources and services were available.
Source of Funding: No special funding.
Conflict of Interest: Nil.
ReFeReNCeS
1. Khan S, Parveen Z, Begum S, Alam I. Uterine rupture: A review of 34 cases at Ayub teaching hospitalAbbottabad.JAyubMedCollAbbottabad.2003Oct-Dec;15(4):50-2.
2. Miller DA, Goodwin TM, Gherman RB Paul H. Intrapartum rupture of unscarred uterus. ObstetGynecol 1997: 671-3.
3.PlaucheW,VonAlmenW,MullerR.Catastrophicuterinerupture.ObstetGynecol.1984;64:792–3.
4.Nyengidiki TK, Allagoa DO. Rupture of thegravid uterus in a tertiary health facility in the Niger delta region of Nigeria: A 5-year review. NigerMedJ.2011Oct;52(4):230-4.
5.SahuLatika.A10yearanalysisofuterineruptureat a teaching institution. JObstetGynecol 2006Nov-Dec;56(6):502-506
6.Fofie CO., and P. Baffoe. “A two-year reviewofuterineruptureinaregionalhospital.”Ghanamedicaljournal2010Sep;44(3):98-102
7. Chen LH, Tain KH, Yeo GS. A ten-year review of uterine rupture in modern obstetric practice. Ann AcadMedSingapore.1995;24:830–5.
8.Lynch JC, Pardy JP. Uterine rupture and scardehiscence.Afiveyearsurvey.AnaesthIntensivecare1996;24:699-704.
9.Gardiel f, Daly S, Turner MJ. Uterine rupturein pregnancy reviewed. Eur J Obstet GynecolRepordBiol1994;56:107-10.
10.Akhtar Y. Ruptured uterus;an ongoing tragedyof motherhood. Professional Med J Jun 2010;17(2):314-317.
11.OgunowoT,OlayemiO,AimakhuCO.Uterinerupture: UCH, Ibadan experience. West Afr JMed.2003;22:236–9.
12.JongenVH,HalfwerkMG,BauwerWK.Vaginaldelivery after previous cesarean section for failure
of second stage of labor. Br J Obstet Gynaecol1998;105:1079-81.
13.WHO systematic review of maternal mortalityand morbidity: the prevalence of uterine rupture. BJOG.Sept.2005,Vol.112,pp.1221–1228
14. Rizwan N, Abbasi RM, Uddin SF. Uterine rupture, frequency of cases and fetomaternal outcome. JPakMedAssoc.2011Apr;61(4):322-4.
15.Chibber R, El-Saleh E,Al Fadhli R,Al JassarW,AlHarmi J. Uterine rupture and subsequentpregnancy outcome--how safe is it? A 25-year study.JMatern Fetal NeonatalMed. 2010May;23(5):421-4.
16.VeenaP,HabeebullahS,ChaturvedulaL.Areviewof 93 cases of ruptured uterus over a period of 2 yearsinatertiarycarehospitalinSouthIndia.JObstetGynaecol.2012Apr;32(3):260-3.
17. Malik HS. Frequency, predisposing factors and fetomaternal outcome in uterine rupture. J CollPhysiciansSurgPak2006;16:472-5.
18.Gardiel f, Daly S, Turner MJ. Uterine rupturein pregnancy reviewed. Eur J Obstet GynecolRepordBiol1994;56:107-10.
19.Yap OW, Kim ES, Laros RK Jr. Maternal andneonatal outcomes after uterine rupture in labor. AmJObstetGynecol.2001Jun;184(7):1576-81.
20.ShippTD,ZelopC,RepkeJT,etal.Theassociationof maternal age and symptomatic uterine rupture during a trial of labor after prior cesarean delivery. ObstetGynecol.2002;99(4):585–588.
21. Leung AS, Leung EK, Paul RH. Uterine rupture after previous cesarean delivery: maternal and fetalconsequences.AmJObstetGynecol.1993;169(4):945–950.
22. Chuni N. Analysis of uterine rupture in a tertiary center in Eastern Nepal: lessons for obstetric care. JObstetGynaecolRes.2006Dec;32(6):574-9.
23.AdanuRMK,ObedSA.Ruptureduterus:Aseven-yearreviewofcasesfromAccra,Ghana.JObstetGynaecolCan.2003;25(3):225–230.
24. Elkady AA, Bayomy HM, Bekhiet MT, Nagib HS, Wahba AK. A review of 126 cases of ruptured gravid uterus. Int Surg. 1993; 78(3):231–35.
Sensory Motor Stimulation and Weight gain among Preterm Newborns
Maheswari.g.1, N. ganapathy2, Radha Kumar3
1Research Scholar, 2Critical Care Physcian, Dhanvantri Critical Care Centre, 3HOD, Saveetha Medical College, Saveetha University, Chennai
AbSTRACT
Experts in health care delivery system recommending consistent weight gain with gradual increase in average weight gain per day as criteria for discharge. Consistent weight gain in preterm is an important marker for normal growth achievements as like full term newborn. This true experimental study aimed to assess the effectivenessofsensorymotorstimulationbeforefeedingonaverageweightgainperdayamongpreterminNICU.The60sampleswereselected.The30samplesinexperimentalgroupwerereceived10minutessensorymotorstimulationtwiceadayfor10daysandcomparedtheresultswithcontrolgroupinwhichthe newborns were under routine hospital care. The study concluded that the sensory motor stimulation was mosteffectiveinenhancingtheweightgainamongpreterminNICU.
Keywords: weight gain, preterm, newborn, sensory motor stimulation
INTROduCTION
The preterm are prone to get many physical and physiological problems after birth due to its immature organ system and failure to adapt to external environment. The infants born as preterm are expected tohavehigher rateof feedingdifficulties than the fullterm infants.(1) The clinical evidence shows most of the preterm newborns encountering feeding problems. The poor feeding skills among these populations must be considered as an emerging problem due to its negative impact on later health and quality of life.(2) The feeding problems in preterm causes poor weight gain and delayed growth and development.(3)
Neanaa M. Fayed examined the impact of physical stimulationonweightgainamong60prematureinfants.ModerateLBW,stablevitalsignsand<34weekswerethe inclusion criteria. The intervention group premature had better weight gain than control group. The significant difference in weight gain between controland experimental group showed the impact of physical stimulation among preterm low birth weight babies. The study recommended for including physical stimulation as a part of clinical practice guidelines in NICU.(4)
L J Moyer Mileu compared the effectiveness ofPreterm daily physical activity administered by the
infant’s mother in intervention group I and trained therapist in intervention group II with control group. Physical activity consisted of range of motion movements against passive resistance to all extremities for5to10mindaily.Thepretermgainsweightgreaterinboth the intervention groups compared to the control.(5)
Very few evidences demonstrating that massagetherapy increases feeding related physiological parameters including weight gain, gastrointestinal function and motor function.(6) There is lack of consistent evidences on impact of sensory motor stimulation over feeding parameters, which needs strong evidences for practice.(7)
Most of the NICU provides only routine supportive care to the preterm in India. Literally there are few evidences to support effectiveness of sensory motorstimulations. But practically no infants receive sensory motor stimulations during NICU stay. The sensory motor stimulations will be an excellent care in enhancing the weight gain during NICU stay.
MeThOdOlOgy
The true experimental study was conducted in CK hospital, Erode. The main objective of this study was to compare theeffectivenessof sensorymotor stimulationon weight gain among preterm newborn. The study was
DOI Number: 10.5958/0976-5506.2018.00304.2
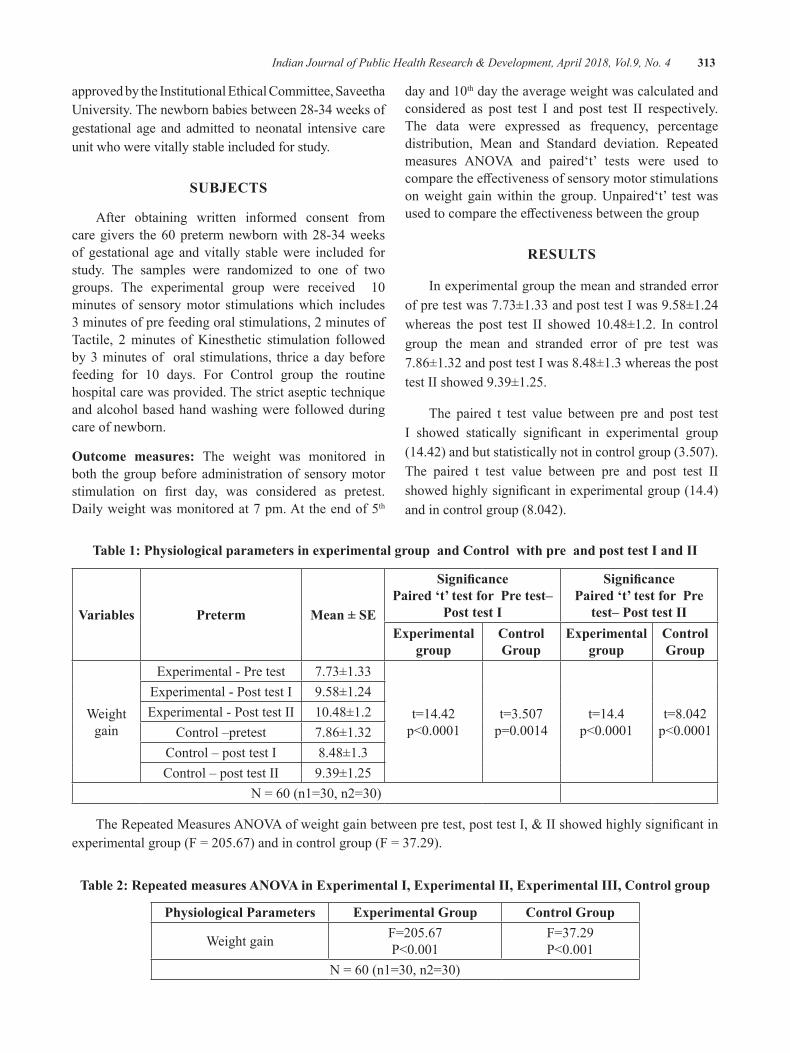
Indian Journal of Public Health Research & Development, April 2018, Vol.9, No. 4 313
approved by the Institutional Ethical Committee, Saveetha University. The newborn babies between 28-34 weeks of gestational age and admitted to neonatal intensive care unit who were vitally stable included for study.
SubJeCTS
After obtaining written informed consent from caregivers the60pretermnewbornwith28-34weeksof gestational age and vitally stable were included for study. The samples were randomized to one of two groups. The experimental group were received 10minutes of sensory motor stimulations which includes 3 minutes of pre feeding oral stimulations, 2 minutes of Tactile, 2 minutes of Kinesthetic stimulation followed by 3 minutes of oral stimulations, thrice a day before feeding for 10 days. For Control group the routinehospital care was provided. The strict aseptic technique and alcohol based hand washing were followed during care of newborn.
Outcome measures: The weight was monitored in both the group before administration of sensory motor stimulation on first day, was considered as pretest.Daily weight was monitored at 7 pm. At the end of 5th
dayand10th day the average weight was calculated and considered as post test I and post test II respectively. The data were expressed as frequency, percentage distribution, Mean and Standard deviation. Repeated measures ANOVA and paired‘t’ tests were used tocomparetheeffectivenessofsensorymotorstimulationson weight gain within the group. Unpaired‘t’ test was usedtocomparetheeffectivenessbetweenthegroup
ReSulTS
In experimental group the mean and stranded error of pre test was 7.73±1.33 and post test I was 9.58±1.24 whereas the post test II showed 10.48±1.2. In controlgroup the mean and stranded error of pre test was 7.86±1.32 and post test I was 8.48±1.3 whereas the post test II showed 9.39±1.25.
The paired t test value between pre and post test I showed statically significant in experimental group(14.42)andbutstatisticallynotincontrolgroup(3.507).The paired t test value between pre and post test II showedhighlysignificantinexperimentalgroup(14.4)andincontrolgroup(8.042).
Table 1: Physiological parameters in experimental group and Control with pre and post test I and II
Variables Preterm Mean ± Se
SignificancePaired ‘t’ test for Pre test–
Post test I
SignificancePaired ‘t’ test for Pre
test– Post test IIexperimental
groupControl group
experimental group
Control group
Weight gain
Experimental - Pre test 7.73±1.33
t=14.42p<0.0001
t=3.507p=0.0014
t=14.4p<0.0001
t=8.042p<0.0001
Experimental - Post test I 9.58±1.24Experimental - Post test II 10.48±1.2
Control –pretest 7.86±1.32Control – post test I 8.48±1.3Control – post test II 9.39±1.25
N=60(n1=30,n2=30)
TheRepeatedMeasuresANOVAofweightgainbetweenpretest,posttestI,&IIshowedhighlysignificantinexperimentalgroup(F=205.67)andincontrolgroup(F=37.29).
Table 2: Repeated measures ANOVA in experimental I, experimental II, experimental III, Control group
Physiological Parameters experimental group Control group
Weight gain F=205.67P<0.001
F=37.29P<0.001
N=60(n1=30,n2=30)
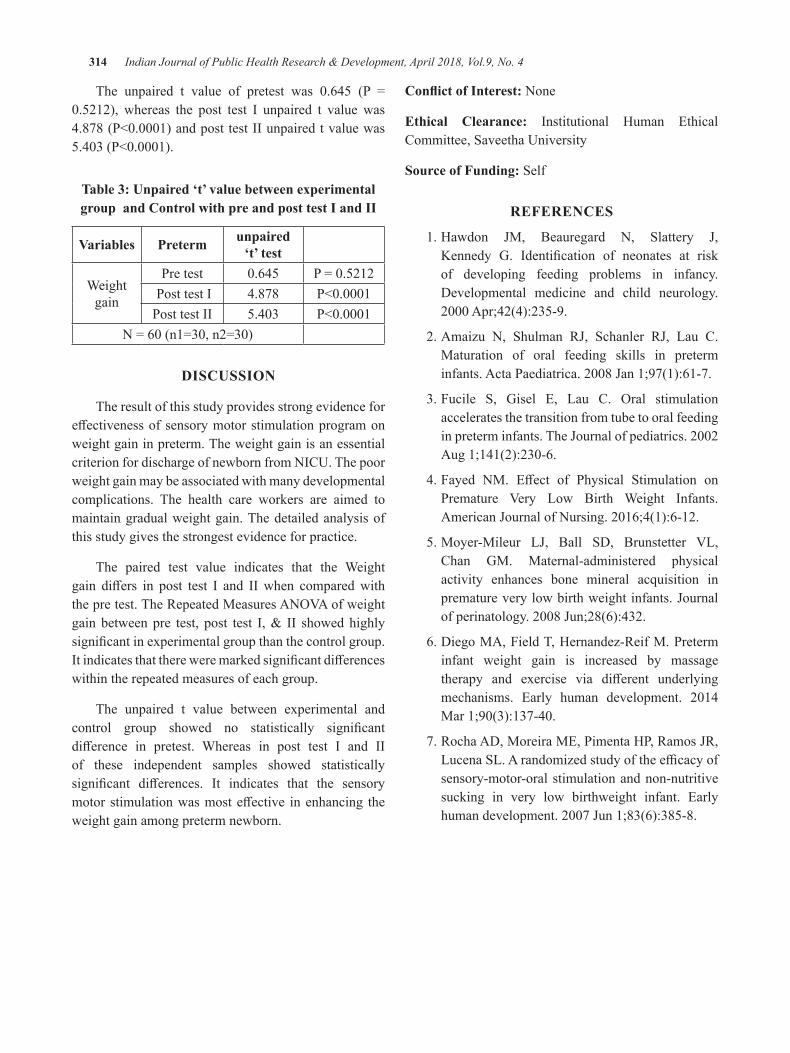
314 Indian Journal of Public Health Research & Development, April 2018, Vol.9, No. 4
The unpaired t value of pretest was 0.645 (P =0.5212), whereas the post test I unpaired t value was4.878(P<0.0001)andposttestIIunpairedtvaluewas5.403(P<0.0001).
Table 3: unpaired ‘t’ value between experimental group and Control with pre and post test I and II
Variables Preterm unpaired ‘t’ test
Weight gain
Pre test 0.645 P=0.5212 Post test I 4.878 P<0.0001Post test II 5.403 P<0.0001
N=60(n1=30,n2=30)
dISCuSSION
The result of this study provides strong evidence for effectivenessofsensorymotorstimulationprogramonweight gain in preterm. The weight gain is an essential criterion for discharge of newborn from NICU. The poor weight gain may be associated with many developmental complications. The health care workers are aimed to maintain gradual weight gain. The detailed analysis of this study gives the strongest evidence for practice.
The paired test value indicates that the Weight gain differs in post test I and IIwhen comparedwiththepretest.TheRepeatedMeasuresANOVAofweightgain betweenpre test, post test I,& II showedhighlysignificantinexperimentalgroupthanthecontrolgroup.Itindicatesthatthereweremarkedsignificantdifferenceswithin the repeated measures of each group.
The unpaired t value between experimental and control group showed no statistically significantdifference in pretest. Whereas in post test I and IIof these independent samples showed statistically significant differences. It indicates that the sensorymotorstimulationwasmosteffective inenhancing theweight gain among preterm newborn.
Conflict of Interest: None
ethical Clearance: Institutional Human Ethical Committee, Saveetha University
Source of Funding: Self
ReFeReNCeS
1.Hawdon JM, Beauregard N, Slattery J,Kennedy G. Identification of neonates at riskof developing feeding problems in infancy. Developmental medicine and child neurology. 2000Apr;42(4):235-9.
2.Amaizu N, Shulman RJ, Schanler RJ, Lau C.Maturation of oral feeding skills in preterm infants.ActaPaediatrica.2008Jan1;97(1):61-7.
3.Fucile S, Gisel E, Lau C. Oral stimulationaccelerates the transition from tube to oral feeding inpreterminfants.TheJournalofpediatrics.2002Aug1;141(2):230-6.
4.Fayed NM. Effect of Physical Stimulation onPremature Very Low Birth Weight Infants.AmericanJournalofNursing.2016;4(1):6-12.
5.Moyer-Mileur LJ, Ball SD, Brunstetter VL,Chan GM. Maternal-administered physical activity enhances bone mineral acquisition in prematureverylowbirthweightinfants.Journalofperinatology.2008Jun;28(6):432.
6. Diego MA, Field T, Hernandez-Reif M. Preterm infant weight gain is increased by massage therapy and exercise via different underlyingmechanisms. Early human development. 2014Mar1;90(3):137-40.
7.RochaAD,MoreiraME,PimentaHP,RamosJR,LucenaSL.Arandomizedstudyoftheefficacyofsensory-motor-oral stimulation and non-nutritive sucking in very low birthweight infant. Early humandevelopment.2007Jun1;83(6):385-8.
Is Really Prefeeding Sensory Motor Stimulations had Significant Impact on Feeding Parameters in Premature
Infants?–An Evidence Based Report
Maheswari.g.1, N. ganapathy2, Radha Kumar3
1Research Scholar, 2Critical Care Physcian, Dhanvantri Critical Care Centre, 3HOD, Saveetha Medical College, Saveetha University, Chennai
AbSTRACT
The premature infants are born with poor feeding skills. The feeding skills are the most important determinants of growth and development. Always the discharge criterion of preterm depends on the feeding abilitiesofnewborn.Thisstudyaims toexamine theeffectivenessofmultipleprefeedingsensorymotorstimulations. The randomized controlled complex factorial research design which includes 3 experimental andonecontrolgroup,conductedinNICUatCKHospitalErode.The120sampleswererandomizedtooneoffourgroupsbySNOSE.TheresultsindicatethattheexperimentalgroupIIInewbornshowsmoreeffectivenessinallfeedingparametersandfeedingskillthantheotherexperimentalandcontrolgroups.
Keywords: preterm, feeding parameters, CK hospital, Erode, SNOSE, pre feeding sensory motor stimulations.
INTROduCTION
Successful oral feeding is achieved with in few minutes in normal full term newborn where adaptation to external environment is possible with ability to maintain coordination between neuro-physiological and external environmental factors. Most of the full term can establish better coordination within few hours after birth.{1,2,3} In case of preterm the success of oral feeding is and gradual and challenging process and interfered with many factors, needs attention of health care team{4}.
Preterm baby displays hard feeding difficultieswith early gestational age and mortality associated with prematurity, particularly respiratory system mortality. The mechanism behind this is poor suck–swallow–breath coordination and poor sucking skills. {5,6} The incident rate of preterm in is increased around 12–13% in the USA 5-9% in other developed countries. The perinatal mortality caused by prematurity is increasing every year in all developed and developing countries. {7} In2010theprevalenceofpretermbirthwas11.1%ofalllive births in the world and approximately 14.9 million babies born as preterm.{8}
Inadequate information is available for supporting the pre feeding sensory motor stimulations. Different
methods of pre feeding sensory motor stimulations not investigated in pretermwith feedingdifficulties inIndia.Lackofresearchworkoncomparisonofdifferentmethod of pre feeding stimulations motivated to conduct the present study
MeThOdOlOgy
This was a randomized controlled complex factorial research design which includes 3 experimental and one control group, conducted in NICU at CK Hospital Erode over three months. The main objective of this studywas to compare the effectivenessof pre feedingoral stimulation, pre feeding tactile/kinesthetic, and pre feeding Multi oral–tactile/kinesthetic stimulations on feeding parameters among preterm in experimental group I, II and III. The study was approved by the Institutional Ethical Committee, Saveetha University. The newborn babies between 28-34 weeks of gestational age and admitted to neonatal intensive care unit who were vitally stable included for study.
Subjects: The 120 samples were randomized to oneof four groups by SNOSE (Sequentially NumberedOpaque Sealed envelopes) method after obtainingwritten informed consent from parents. The concealment
DOI Number: 10.5958/0976-5506.2018.00305.4
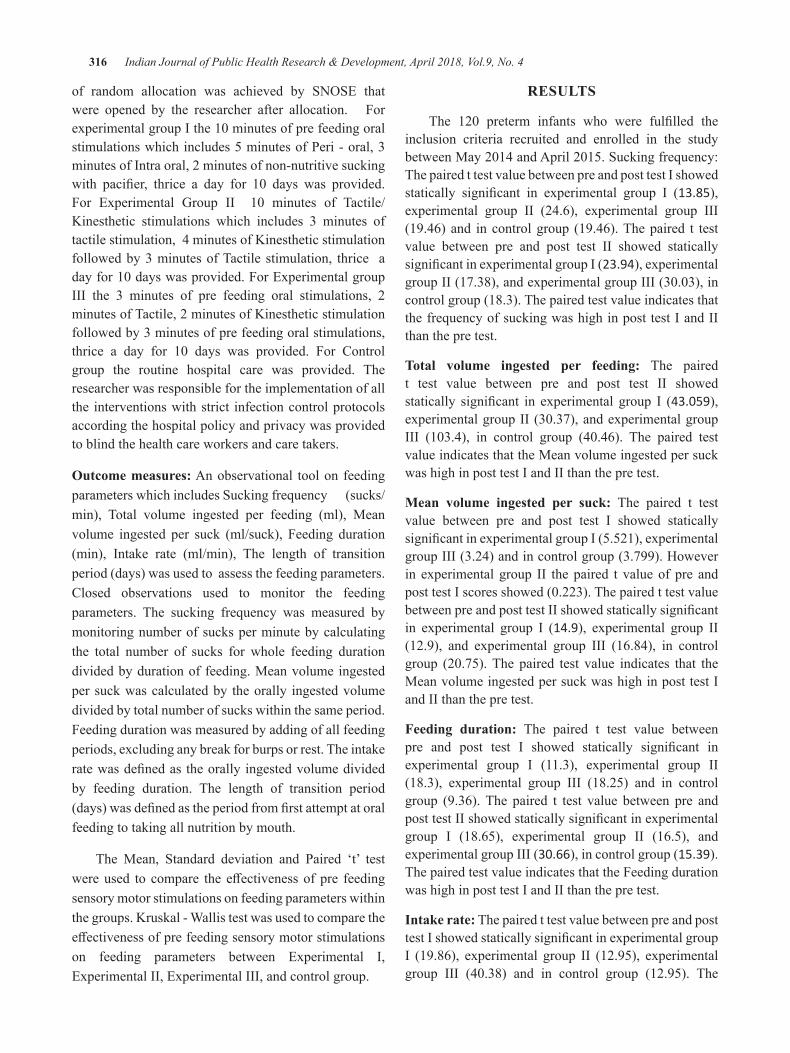
316 Indian Journal of Public Health Research & Development, April 2018, Vol.9, No. 4
of random allocation was achieved by SNOSE thatwere opened by the researcher after allocation. For experimentalgroupIthe10minutesofprefeedingoralstimulations which includes 5 minutes of Peri - oral, 3 minutes of Intra oral, 2 minutes of non-nutritive sucking with pacifier, thrice a day for 10 days was provided.For Experimental Group II 10 minutes of Tactile/Kinesthetic stimulations which includes 3 minutes of tactile stimulation, 4 minutes of Kinesthetic stimulation followed by 3 minutes of Tactile stimulation, thrice a dayfor10dayswasprovided.ForExperimentalgroupIII the 3 minutes of pre feeding oral stimulations, 2 minutes of Tactile, 2 minutes of Kinesthetic stimulation followed by 3 minutes of pre feeding oral stimulations, thrice a day for 10 days was provided. For Controlgroup the routine hospital care was provided. The researcher was responsible for the implementation of all the interventions with strict infection control protocols according the hospital policy and privacy was provided to blind the health care workers and care takers.
Outcome measures: An observational tool on feeding parameters which includes Sucking frequency (sucks/min), Total volume ingested per feeding (ml), Mean volume ingested per suck (ml/suck), Feeding duration (min), Intake rate (ml/min), The length of transition period (days) was used to assess the feeding parameters. Closed observations used to monitor the feeding parameters. The sucking frequency was measured by monitoring number of sucks per minute by calculating the total number of sucks for whole feeding duration divided by duration of feeding. Mean volume ingested per suck was calculated by the orally ingested volume divided by total number of sucks within the same period. Feeding duration was measured by adding of all feeding periods, excluding any break for burps or rest. The intake ratewasdefinedastheorallyingestedvolumedividedby feeding duration. The length of transition period (days)wasdefinedastheperiodfromfirstattemptatoralfeeding to taking all nutrition by mouth.
The Mean, Standard deviation and Paired ‘t’ test wereused to compare the effectivenessofpre feedingsensory motor stimulations on feeding parameters within the groups. Kruskal - Wallis test was used to compare the effectivenessofprefeedingsensorymotorstimulationson feeding parameters between Experimental I, Experimental II, Experimental III, and control group.
ReSulTS
The 120 preterm infants who were fulfilled theinclusion criteria recruited and enrolled in the study betweenMay2014andApril2015.Suckingfrequency:The paired t test value between pre and post test I showed statically significant in experimental group I (13.85), experimental group II (24.6), experimental group III (19.46) and in control group (19.46). The paired t test value between pre and post test II showed statically significantinexperimentalgroupI(23.94), experimental groupII(17.38),andexperimentalgroupIII(30.03),incontrol group (18.3). The paired test value indicates that the frequency of sucking was high in post test I and II than the pre test.
Total volume ingested per feeding: The paired t test value between pre and post test II showed statically significant in experimental group I (43.059), experimentalgroupII(30.37),andexperimentalgroupIII (103.4), in control group (40.46). The paired testvalue indicates that the Mean volume ingested per suck was high in post test I and II than the pre test.
Mean volume ingested per suck: The paired t test value between pre and post test I showed statically significantinexperimentalgroupI(5.521),experimentalgroup III (3.24) and in control group (3.799). However in experimental group II the paired t value of pre and posttestIscoresshowed(0.223).ThepairedttestvaluebetweenpreandposttestIIshowedstaticallysignificantin experimental group I (14.9), experimental group II (12.9), and experimental group III (16.84), in control group (20.75).The paired test value indicates that theMean volume ingested per suck was high in post test I and II than the pre test.
Feeding duration: The paired t test value between pre and post test I showed statically significant inexperimental group I (11.3), experimental group II (18.3), experimental group III (18.25) and in control group (9.36). The paired t test value between pre and posttestIIshowedstaticallysignificantinexperimentalgroup I (18.65), experimental group II (16.5), and experimental group III (30.66), in control group (15.39). The paired test value indicates that the Feeding duration was high in post test I and II than the pre test.
Intake rate: The paired t test value between pre and post testIshowedstaticallysignificantinexperimentalgroupI (19.86), experimental group II (12.95), experimental group III (40.38) and in control group (12.95). The
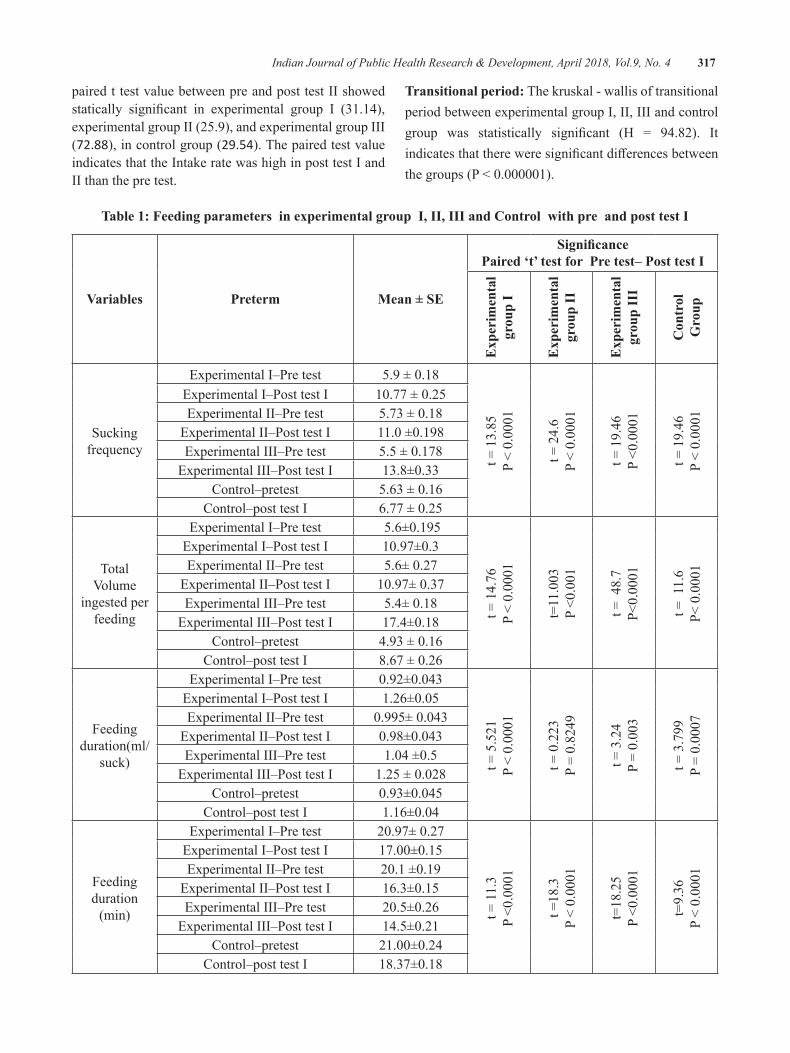
Indian Journal of Public Health Research & Development, April 2018, Vol.9, No. 4 317
paired t test value between pre and post test II showed statically significant in experimental group I (31.14),experimental group II (25.9), and experimental group III (72.88), in control group (29.54). The paired test value indicates that the Intake rate was high in post test I and II than the pre test.
Transitional period: The kruskal - wallis of transitional period between experimental group I, II, III and control group was statistically significant (H = 94.82). Itindicatesthatthereweresignificantdifferencesbetweenthegroups(P<0.000001).
Table 1: Feeding parameters in experimental group I, II, III and Control with pre and post test I
Variables Preterm Mean ± Se
SignificancePaired ‘t’ test for Pre test– Post test I
exp
erim
enta
l gr
oup
I
exp
erim
enta
l gr
oup
II
exp
erim
enta
l gr
oup
III
Con
trol
g
roup
Sucking frequency
Experimental I–Pre test 5.9±0.18
t=13.85
P<0.0001
t=24.6
P<0.0001
t=19.46
P<0.0001
t=19.46
P<0.0001
Experimental I–Post test I 10.77±0.25Experimental II–Pre test 5.73±0.18
Experimental II–Post test I 11.0±0.198Experimental III–Pre test 5.5±0.178
Experimental III–Post test I 13.8±0.33Control–pretest 5.63±0.16
Control–post test I 6.77±0.25
Total Volume
ingested per feeding
Experimental I–Pre test 5.6±0.195
t=14.76
P<0.0001
t=11.003
P<0.001
t=48.7
P<0.0001
t=11.6
P<0.0001
Experimental I–Post test I 10.97±0.3Experimental II–Pre test 5.6±0.27
Experimental II–Post test I 10.97±0.37Experimental III–Pre test 5.4±0.18
Experimental III–Post test I 17.4±0.18Control–pretest 4.93±0.16
Control–post test I 8.67±0.26
Feeding duration(ml/
suck)
Experimental I–Pre test 0.92±0.043
t=5.521
P<0.0001
t=0.223
P=0.8249
t=3.24
P=0.003
t=3.799
P=0.0007
Experimental I–Post test I 1.26±0.05Experimental II–Pre test 0.995±0.043
Experimental II–Post test I 0.98±0.043Experimental III–Pre test 1.04±0.5
Experimental III–Post test I 1.25±0.028Control–pretest 0.93±0.045
Control–post test I 1.16±0.04
Feeding duration
(min)
Experimental I–Pre test 20.97±0.27
t=11.3
P<0.0001
t=18.3
P<0.0001
t=18.25
P<0.0001
t=9.36
P<0.0001
Experimental I–Post test I 17.00±0.15Experimental II–Pre test 20.1±0.19
Experimental II–Post test I 16.3±0.15Experimental III–Pre test 20.5±0.26
Experimental III–Post test I 14.5±0.21Control–pretest 21.00±0.24
Control–post test I 18.37±0.18
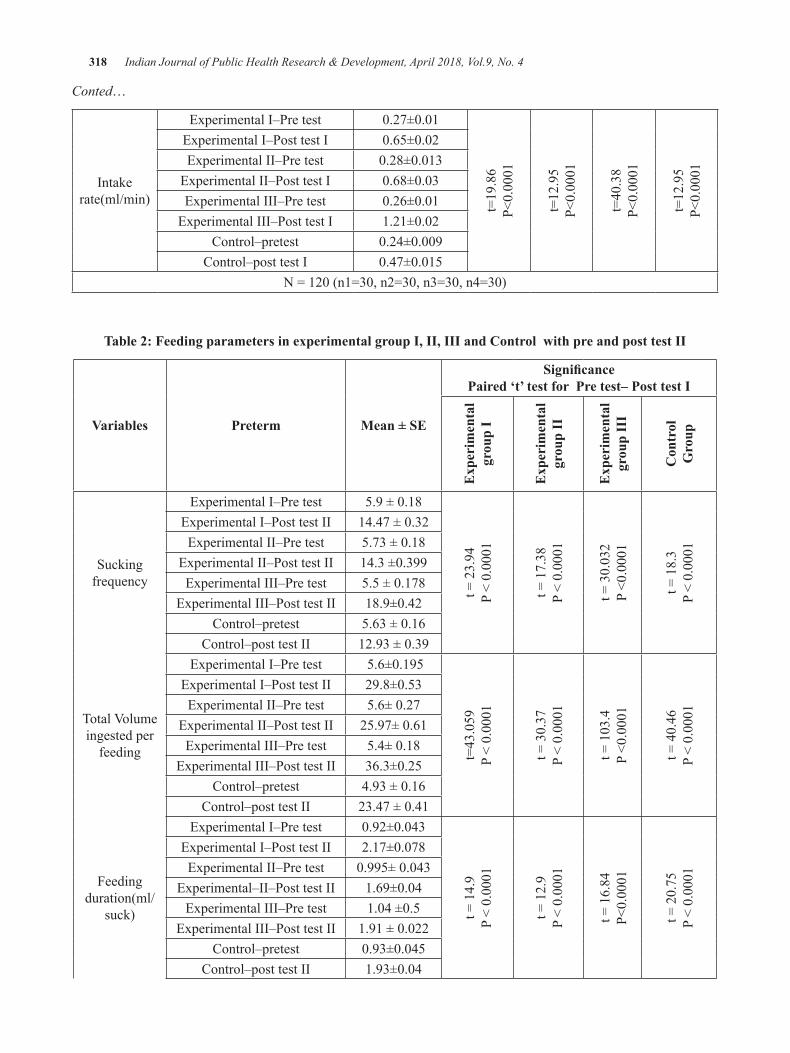
318 Indian Journal of Public Health Research & Development, April 2018, Vol.9, No. 4
Conted…
Intake rate(ml/min)
Experimental I–Pre test 0.27±0.01
t=19.86
P<0.0001
t=12.95
P<0.0001
t=40.38
P<0.0001
t=12.95
P<0.0001
Experimental I–Post test I 0.65±0.02Experimental II–Pre test 0.28±0.013
Experimental II–Post test I 0.68±0.03Experimental III–Pre test 0.26±0.01
Experimental III–Post test I 1.21±0.02Control–pretest 0.24±0.009
Control–post test I 0.47±0.015N=120(n1=30,n2=30,n3=30,n4=30)
Table 2: Feeding parameters in experimental group I, II, III and Control with pre and post test II
Variables Preterm Mean ± Se
SignificancePaired ‘t’ test for Pre test– Post test I
exp
erim
enta
l gr
oup
I
exp
erim
enta
l gr
oup
II
exp
erim
enta
l gr
oup
III
Con
trol
g
roup
Sucking frequency
Experimental I–Pre test 5.9±0.18
t=23.94
P<0.0001
t=17.38
P<0.0001
t=30.032
P<0.0001
t=18.3
P<0.0001
Experimental I–Post test II 14.47±0.32Experimental II–Pre test 5.73±0.18
Experimental II–Post test II 14.3±0.399Experimental III–Pre test 5.5±0.178
Experimental III–Post test II 18.9±0.42Control–pretest 5.63±0.16
Control–post test II 12.93±0.39
TotalVolumeingested per
feeding
Experimental I–Pre test 5.6±0.195
t=43.059
P<0.0001
t=30.37
P<0.0001
t=103.4
P<0.0001
t=40.46
P<0.0001
Experimental I–Post test II 29.8±0.53Experimental II–Pre test 5.6±0.27
Experimental II–Post test II 25.97±0.61Experimental III–Pre test 5.4±0.18
Experimental III–Post test II 36.3±0.25Control–pretest 4.93±0.16
Control–post test II 23.47±0.41
Feeding duration(ml/
suck)
Experimental I–Pre test 0.92±0.043
t=14.9
P<0.0001
t=12.9
P<0.0001
t=16.84
P<0.0001
t=20.75
P<0.0001
Experimental I–Post test II 2.17±0.078Experimental II–Pre test 0.995±0.043
Experimental–II–Post test II 1.69±0.04Experimental III–Pre test 1.04±0.5
Experimental III–Post test II 1.91±0.022Control–pretest 0.93±0.045
Control–post test II 1.93±0.04
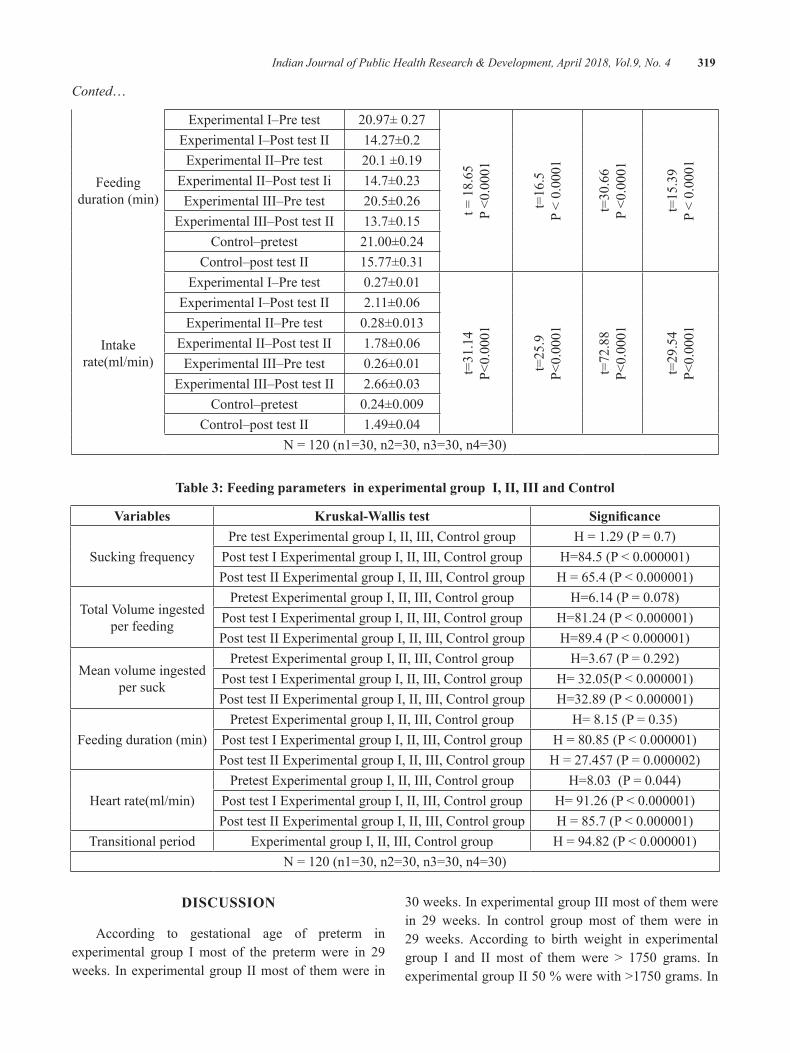
Indian Journal of Public Health Research & Development, April 2018, Vol.9, No. 4 319
Conted…
Feeding duration (min)
Experimental I–Pre test 20.97±0.27
t=18.65
P<0.0001
t=16.5
P<0.0001
t=30.66
P<0.0001
t=15.39
P<0.0001
Experimental I–Post test II 14.27±0.2Experimental II–Pre test 20.1±0.19
Experimental II–Post test Ii 14.7±0.23Experimental III–Pre test 20.5±0.26
Experimental III–Post test II 13.7±0.15Control–pretest 21.00±0.24
Control–post test II 15.77±0.31
Intake rate(ml/min)
Experimental I–Pre test 0.27±0.01
t=31.14
P<0.0001
t=25.9
P<0.0001
t=72.88
P<0.0001
t=29.54
P<0.0001
Experimental I–Post test II 2.11±0.06Experimental II–Pre test 0.28±0.013
Experimental II–Post test II 1.78±0.06Experimental III–Pre test 0.26±0.01
Experimental III–Post test II 2.66±0.03Control–pretest 0.24±0.009
Control–post test II 1.49±0.04N=120(n1=30,n2=30,n3=30,n4=30)
Table 3: Feeding parameters in experimental group I, II, III and Control
Variables Kruskal-Wallis test Significance
Sucking frequencyPre test Experimental group I, II, III, Control group H=1.29(P=0.7)
Post test I Experimental group I, II, III, Control group H=84.5(P<0.000001)Post test II Experimental group I, II, III, Control group H=65.4(P<0.000001)
TotalVolumeingestedper feeding
Pretest Experimental group I, II, III, Control group H=6.14(P=0.078)Post test I Experimental group I, II, III, Control group H=81.24(P<0.000001)Post test II Experimental group I, II, III, Control group H=89.4(P<0.000001)
Mean volume ingested per suck
Pretest Experimental group I, II, III, Control group H=3.67(P=0.292)Post test I Experimental group I, II, III, Control group H=32.05(P<0.000001)Post test II Experimental group I, II, III, Control group H=32.89(P<0.000001)
Feeding duration (min)Pretest Experimental group I, II, III, Control group H=8.15(P=0.35)
Post test I Experimental group I, II, III, Control group H=80.85(P<0.000001)Post test II Experimental group I, II, III, Control group H=27.457(P=0.000002)
Heart rate(ml/min)Pretest Experimental group I, II, III, Control group H=8.03(P=0.044)
Post test I Experimental group I, II, III, Control group H=91.26(P<0.000001)Post test II Experimental group I, II, III, Control group H=85.7(P<0.000001)
Transitional period Experimental group I, II, III, Control group H=94.82(P<0.000001)N=120(n1=30,n2=30,n3=30,n4=30)
dISCuSSION
According to gestational age of preterm in experimental group I most of the preterm were in 29 weeks. In experimental group II most of them were in
30weeks.InexperimentalgroupIIImostofthemwerein 29 weeks. In control group most of them were in 29 weeks. According to birth weight in experimental group I and II most of them were > 1750 grams. InexperimentalgroupII50%werewith>1750grams.In
320 Indian Journal of Public Health Research & Development, April 2018, Vol.9, No. 4
experimentalgroupIIImostofthemwerewith>1750grams.Incontrolgroupmostofthemwerewith1500to1750grams.AccordingtogenderinexperimentalgroupI most of them were males, in experimental group II most of the preterm were females, in experimental group III and control group males and females ratio were equal.
The detailed statistical analysis proved that the pre feeding sensory motor stimulation on feeding parameters wereeffectiveinallexperimentalandcontrolgroup.Thekruskal - wallis test between the groups indicated that the post test I and II scores were significantly differsfrom each others. The kruskal - wallis of transitional period between experimental group I, II, III and control group was statistically significant and indicated thattherewere significant differences between the groups.Thedifferencesintheeffectivenessbetweenthegroupsshowed statistically high significance. The studyconcluded that the multiple sensory motor stimulations weremosteffectiveinimprovingfeedingparametersandhelps for growth and development than the uni sensory motor stimulations.
Conflict of Interest: None
ethical Clearance: Institutional Human Ethical Committee,SaveethaUniversitydatedon15/11/2013
Source of Funding: Self
ReFeReNCeS
1.McGrath JM, BraescuAV. State of the science:feeding readiness in the preterm infant. The Journalofperinatal&neonatalnursing.2004Oct1;18(4):353-68.
2.RossES,BrowneJV.Developmentalprogressionof feeding skills: an approach to supporting feeding in preterm infants. InSeminars in Neonatology2002Dec1(Vol.7,No.6,pp.469-475). WB Saunders.
3.Fucile S, Gisel E, Lau C. Oral stimulationaccelerates the transition from tube to oral feeding inpreterminfants.TheJournalofpediatrics.2002Aug1;141(2):230-6.
4.DodrillP.Feedingdifficultiesinpreterminfants.ICAN: Infant, Child, & Adolescent Nutrition.2011Dec;3(6):324-31.
5. Pickler RH, Frankel HB, Walsh KM, Thompson NM.Effectsofnonnutritivesuckingonbehavioralorganization and feeding performance in preterm infants. Nursing research. 1996 May 1;45(3):132-5.
6.LauC,SmithEO,SchanlerRJ.Coordinationofsuck‐swallowandswallowrespirationinpreterminfants.ActaPaediatrica.2003Jun1;92(6):721-7.
7.GoldenbergRL,CulhaneJF,IamsJD,RomeroR.Epidemiology and causes of preterm birth. The lancet.2008Jan5;371(9606):75-84.
8.Blencowe H, Cousens S, Chou D, OestergaardM,SayL,MollerAB,KinneyM,LawnJ.Borntoo soon: the global epidemiology of 15 million preterm births. Reproductive health. 2013Nov;10(1):S2.
A Study to Assess Functional Assessment and lived experiences of Cervical Cancer Patients Admitted to a
Tertiary level hospital of udupi district, Karnataka-A Mixed Method Protocol
Sonia R.b d’Souza1, Ranjani P2, Sweety Fernandes3, Pratibha3, Judith Noronha4, Sushmitha Karkada5, Shoba Kamath6
1Professor, 2Assistant Professor-senior scale, 3Assistant Professor, 4Professor & HoD and Associate Dean, 5Assistant Professor-senior scale, 6Lecturer, Dept. of Obstetrics and Gynecological Nursing,
Manipal College of Nursing, Manipal Academy of Higher Education, Manipal
AbSTRACT
Aim: The aim of the study is to determine the quality of life by functional assessment, cancer related fatigue and describe the lived experiences of cervical cancer patients undergoing sensitization chemotherapy in a tertiary referral hospital.
background: Patients diagnosed with cancer at an advanced stage of the disease and receiving sensitization chemotherapy experience a variety of psychosocial problems in addition to their physical problems. Women with cervical cancer are more vulnerable to experience loss of functional wellbeing and thereby have poor quality of life. They also experience cancer related fatigue along with a variety of other physical symptoms and psychological problems when compared to other patients. Exploration of lived experiences of these women who have poor quality of life may help in providing a deeper understanding on the issues these women face day in and day out.
design: Mixed method; (Sequential exploratory design)
Method: The study comprises of two phases: (i) Quantitative phase: to determine the functional assessment–quality of life and cancer related fatigue in women with cervical cancer who are currently receiving sensitization chemotherapy; (ii) Qualitative phase: will adopt a nested sampling technique, for choosing women with cervical cancer with poor quality of life. The objective will be to describe the lived experiences of women with cervical cancer on sensitization chemotherapy. Qualitative data will be collected using an unstructured interview guide.
Conclusion: This study will help to provide information on the quality of life and cancer related fatigue of women with cervical cancer on sensitization chemotherapy. This study would further help in exploring the lived experiences of women with poor quality of life.
Keywords: cervical cancer, women, sensitization chemotherapy, quality of life, cancer related fatigue, lived experiences
Corresponding Author:Mrs. Ranjani PAssistant Professor-Senior ScaleManipal College of Nursing,Manipal Academy of Higher Education, ManipalPhone:0820-2922973Email: [email protected]
INTROduCTION
Cervical cancer is the fourth most common cancer in women, and the seventh overall, with an estimated 528,000 new cases in 2012. There were an estimated266,000deathsfromcervicalcancerworldwidein2012,accounting for 7.5% of all female cancer deaths.1 It is also believed that cervical cancer can be prevented by
DOI Number: 10.5958/0976-5506.2018.00306.6
322 Indian Journal of Public Health Research & Development, April 2018, Vol.9, No. 4
regular screening test and it is curable when it is treated early. However, more women in India die from cervical cancer than in any other country (National Cancer Registry). 2 Cancer patients who are in the advanced stage of the disease and who are receiving sensitization chemotherapy experience a variety of psychosocial problems in addition to their physical problems. Women with cervical cancer are more vulnerable to experience loss of functional wellbeing, cancer related fatigue along with a variety of other physical symptoms compared to other patients.
Women with cervical cancer are more vulnerable to experience loss of functional wellbeing, cancer related fatigue along with a variety of other physical symptoms compared to other patients. A study done to findthesexualfunctionincervicalcancerpatientsafterradiotherapy by using self-assessment questionnaire concluded that patients who underwent radiation therapy for cervical cancer are vulnerable to many physical problems including sexual problems.3 A comparative study done among cervical cancer survivors and the general population who were sexually active. Cervical cancer survivors expressed lack of interest in sex and problems that are more sexual in nature.4 It is a known fact that patients who are diagnosed at an advanced stage often have to undergo chemotherapy along with radiation called the sensitization chemotherapy. These patients are vulnerable to the physical problems as well as the psychosocial problems that makes them have a very poor quality of life. A review also found evidence to this that patients with cancer who underwent radiation therapy had less quality of life compared to patients whose treatment was limited to surgery and chemotherapy.5 Along with physical problems, psychosocial issues and poor quality of life, patients undergoing cancer treatment for advanced stageofthediseasealsosufferfromcancerrelatedfatigue.It is evident that cancer causes cancer related fatigue, which is exacerbated with sensitization chemotherapy. A cross sectional study found that cervical cancer survivors showed30%chronicfatigueascomparedto13%chronicfatigue in the general population.6
A qualitative study was done to study how women experienced living through gynaecological cancer. The study concluded that nurses can support the women by listening to their stories, accepting their emotions and informing them in detail. The study also attributed the clinicalsignificanceofallowingtimeforthewomentotalk with nurses about their cancer experiences, which
may be essential during the treatment and follow‐up.7 Although, several studies have been conducted on functional assessment and cancer related fatigue in patients with cancer, very few studies have focused on determining the quality of life through functional assessment, cancer related fatigue in women diagnosed with cervical cancer at an advanced stage and who are on sensitization chemotherapy. In addition, no study has focused on combining the quantitative assessment along with the qualitative understanding of the lived experiences of these vulnerable patients who have poor quality of life assessed through functional assessment. The present study also aims to provide in-depth understanding of how women lived through their disease and therapy along with quantitative assessment of their quality of life and cancer related fatigue.
Why this study is needed?
z There are limited studies in India, which focus on women diagnosed with cervical cancer at an advanced stage of the disease and who are receiving sensitization chemotherapy
z There is not much evidence from India regarding the quality of life and cancer related fatigue of women with cervical cancer receiving sensitization chemotherapy
z There are very few studies that focus on exploration of lived experiences of this population
Statement of the problem: A study to assess the functional assessment, quality of life and lived experiences of cervical cancer patients undergoing sensitization chemotherapy admitted to a tertiary level hospital of Udupi District, Karnataka- A Mixed Method Research.
Purpose: The purpose is to determine the functional assessment, quality of life and cancer related fatigue for acquiring a deeper understanding of the lived experiences of cervical cancer patients undergoing sensitization chemotherapy in a tertiary referral hospital. The study would help in gaining a deeper understanding of these patients who are undergoing therapy for advanced disease by correlating quantitative data with qualitative data. This study may further help to develop interventions to enhance the functional wellbeing, subsequently improve the quality of life and also reduce cancer related fatigue in patients with cervical cancer diagnosed at an advanced stage and who are currently undergoing sensitization chemotherapy.
Indian Journal of Public Health Research & Development, April 2018, Vol.9, No. 4 323
ObJeCTIVeS
The objectives of the study are to,
z determine the functional assessment of cervical cancer patients undergoing sensitization chemotherapy as measured by Functional Assessment of Cancer Therapy-Cervix (FACT-Cx).
z identify and describe cancer related fatigue in cervical cancer patients undergoing sensitization chemotherapy as measured by Cancer Fatigue Scale.
z find relation between functional assessment andcancer related fatigue of cervical cancer patients
z describe the lived experiences of cervical cancer patients by phenomenological approach
z describe the lived experiences of cervical cancer patients in relation to their quality of life
hypotheses
H1: There will be significant relationship among thedomains of functional assessment
H2: There will be significant relationship betweenfunctional assessment and cancer related fatigue in cervical cancer patients.
Variables
Outcome variables: Functional assessment and Cancer related fatigue
demographic variables: age,educationalqualification,occupation, family income, marital status
disease related variables: stage of cancer, co-morbidities, dose of radiation
Definition of terms
Cervical cancer: “Cervical cancer is a type of cancer thatoccursinthecellsofthecervix—thelowerpartoftheuterusthatconnectstothevagina.”
Sensitization Chemotherapy: A treatment of cervical cancer in the advanced stages with a medication in order to make it more susceptible to radiation treatment done concurrently.
Functional assessment: Refers to assessment of the domains of wellbeing (physical, social/family wellbeing,
emotional wellbeing, functional wellbeing) and other concerns of cervical cancer patients as measured by “Functional Assessment of Cancer Therapy-Cervix (FACT-Cx).”
Cancer related fatigue: “Distressing persistent, subjective sense of physical, emotional and/or cognitive tiredness or exhaustion related to cancer or cancer treatment that is not proportional to recent activity and interferes with usual functioning”-NationalComprehensive Cancer Network8
In this stud, cancer related fatigue refers to the fatigue experienced and reported by cervical cancer patients undergoing sensitization chemotherapy and as measured by cancer fatigue scale.
lived experiences: In this study lived experiences refers to the expressions of feelings by cervical cancer patients undergoing sensitization chemotherapy as narrated by them in response to the interview, which will be audio-taped.
Mixed method Research: Research in which both qualitative and quantitative data are collected and analyzedtoaddressdifferentbutrelatedquestions.9
MATeRIAlS ANd MeThOd
Research Approach and design: Mixed method using Sequential Exploratory design
Research Setting: OncologywardsofShirdiSaiBabaCancer Hospital, Kasturba Hospital, Manipal, which is a tertiary referral hospital
Population: Cervical cancer patients
Sample: CervicalcancerpatientsadmittedtoOncologywards of Shirdi Sai Baba Cancer Hospital, Kasturba Hospital, Manipal and who are currently undergoing sensitization chemotherapy for their advanced disease
Sample Size: Quantitativestudy:60;Qualitativestudy:30andaccordingtodatasaturation.
Sampling method: Quantitative study: Intensity sampling-Purposive sampling; Qualitative study: Nested sampling
324 Indian Journal of Public Health Research & Development, April 2018, Vol.9, No. 4
Sampling Criteria:
Inclusion criteria
Cervical cancer patients who are,
z able to communicate/speak and explain the experience in Kannada or English.
z stage of cervical cancer II B and above
z receiving sensitization chemotherapy
exclusion criteria
Cervical cancer patients who are,
z not able to communicate
z critically ill
Selection and development of Study Instruments: The instruments used will be,
1. Baseline Proforma including socio-demographic profile
2. Functional Assessment of Cancer Therapy-Cervix (FACT-Cx)
3. Cancer fatigue scale
4. In-depth interview guide
Validity, Pretesting and Reliability of Tools: The baseline proforma and the in-depth interview guide will be validated by giving it to experts. Pretesting and reliability of the tools will be done subsequently.
Reliability of the following standardized questionnaires’ will also be done.
z Functional Assessment of Cancer Therapy-Cervix (FACT-Cx)- Test retest method
z Cancer fatigue scale- inter-rater reliability
data collection procedure: Data analysis for the quantitative phase of the study i.e., the functional assessment and cancer related fatigue will be done by descriptive statistics and inferential statistics for exploring the relationship among the domains of functional assessment as well as to find relationshipbetween functional assessment and cancer related fatigue in cervical cancer patients. The data for quantitative study will be analysed using Statistical Package for Social Sciences(SPSS)Ver.15.0,SouthEastAsia,Bangalore.
For the qualitative phase of the study, description of the lived experiences of cervical cancer patients will be recorded by in-depth interview using an interview guide. The interviews will be recorded; researcher will listen to the participant’s verbal description and transcribe the interview into written verbatim. This will be followed by reading and re-reading the verbatim transcriptions or written responses to immerse in the data and to identify andalsotoextractsignificantmeanings/themes.Memberchecking will be done if required. The significantstatements will be extracted using open code software 4.02 version. These will be validated with experts aswell. The meanings will be formulated accordingly. A cluster of themes emerging will be formulated from the subthemes and codes obtained. Following this, the phenomenon will be developed and described.
ethical considerations: The study protocol is approved by the Institutional review committee (IRC), Manipal College of Nursing, Manipal Academy of Higher Education. Ethical committee clearance for the study is also obtained from the Institutional Ethics Committee of Kasturba Hospital, Manipal (IEC 310/2017). Thetrial will be registered in the Clinical Trials Registry of India (www.ctri.nic.in). Informed written consent will be obtained from the participants after providing participant information sheet to them.
CONCluSION
This study will help to provide information on the quality of life and cancer related fatigue of women with cervical cancer on sensitization chemotherapy. This study would also explore the lived experiences of women in relation to their poor quality of life. The study would thus help in gaining a deeper understanding of these vulnerable patients who are undergoing therapy for advanced disease by correlating quantitative data with qualitative data. The study may also contribute by help create an avenue for nurses to support these women by listening to them and accepting their emotions.
Source of Funding: Nil
Conflict of Interest: None declared.
ReFeReNCeS
1.GLOBOCAN Cancer Fact Sheets: Cervicalcancer.2012
Indian Journal of Public Health Research & Development, April 2018, Vol.9, No. 4 325
2. Three - Year Reports of Population Based Cancer Registries:2006-2008.Firstreportof20PBCRsin India, National Cancer Registry Programme. Indian Council of Medical Research. www.ncrpindia.org
3.PernilleTJensen,MogensGroenvold,MarianneC Klee, Ingrid Thranov, Morten Aa Petersen, David Machin. Longitudinal study of sexual function and vaginal changes after radiotherapy forcervicalcancer.IntJofRadOncol.2003;56:937–949.
4. Kristine A. Donovan , Lindsay A. Taliaferro, EvelynM.Alvarez,PaulB. Jacobsen,RichardG.Roetzheim, Robert M. Wenham. Sexual health in women treated for cervical cancer: Characteristics andcorrelates.GynecolOncol.2007;104:428–434.
5.VistadI,FossåSD,DahlA.Acritical reviewofpatient-rated quality of life studies of long-term
survivorsofcervicalcancer.GynecolOncol2006;102:563–72.
6.Vistad,FossaSD,KristensenGB.Chronicfatigueand its correlates in long-term survivors of cervical cancer treated with radiotherapy.BJOG.2007;114:1150–1158.
7.Ragnhild, JT Sekse, Målfrid Råheim, GunnhildBlåka, Eva Gjengedal, Living throughgynaecological cancer: three typologies, J CliNurs,2012,21,17-18.
8. National Comprehensive Cancer Network - NCCNPracticeguidelinesinOncology–v.1.2008
9. Polit DF, Beck CT. Nursing Research: Generalizing and Assessing Evidence for Nursing Practice. Philadelphia: Lippincott Williams &Wilkins.2012.
Influence Perceived Benefit and Perceived Self Efficacy with Intention of Adolescent girls in Consuming Fe Tablet
Faradina Nur Annisa1, Ira Nurmala2
1Student, 2Lecturer, Department of Health Promotion and Behavioral Sciences, Faculty of Public Health Universitas Airlangga, Indonesia
AbSTRACT
Maternal Mortality Rate (MMR) in Indonesia is relatively high when compared with ASEAN member countries. In2012,MMRin Indonesiaamounts to359/100,000 livebirths.ThemaincauseofmaternalmortalityinIndonesiaisbleedingfactor.Theprevalenceofirondeficiencyanemiaamong15-24yearoldgirls inIndonesia is18.4%.Thisstudywasconductedtodeterminethefactorsaffectingthe intentionofadolescentgirlsinconsumingFetabletsasanefforttopreventanemiainVocationalHighSchool(SMK)Wachid Hasyim 1 Surabaya. This research uses analytic observational method with cross sectional research design. Sampling technique using purposive sampling with the number of samples obtained as many as 63 students. The independent variables were perceived benefit and perceived self efficacy. The resultsshowedthattherewasasignificantinfluenceperceivedselfefficacy(p-value=0,041)andwhereasperceivedbenefitdidnothaveintentionofadolescentgirlsinconsumingFetablet.FactorsthataffecttheintentionofadolescentgirlsinconsumingFetabletsisperceivedselfefficacy.
Keywords: intention, Fe tablets, adolescent girls
INTROduCTION
Maternal Mortality Rate (MMR) is one indicator in determining women’s health status. Indonesia has a relatively high MMR when compared to ASEAN member countries.In2005thevalueofMMRwas202/100,000livebirths, in2007was228/100,000livebirthsandin2012was359/100,000livebirths1. The Directorate of MaternalHealthstatesthatfrom2010-2013thebiggestcause of maternal mortality is bleeding2.
Surabayacityin2013becamethelargestcontributorofmaternaldeathcasesinEastJavaprovinceasmanyas49 cases3.In2014,SurabayawasstillthecitywiththelargestcontributortoMotherMortalityRateinEastJavaas many as 39 case4. The causes of maternal mortality in Surabayain2014includepre/eclampsiaasmanyas11cases,HPP(Bleeding)asmanyas10cases,heartdisease2cases,HIV1case,pulmonary1case,hepatitis1caseand others as many as 13 cases, namely: embolism of amniotic fluid, lupus, hyperthyroidism, and diabetesmellitus5.
Anemia and Chronic Energy Deficiency (CED) inpregnant women become the main cause of bleeding and
infection which is the main cause of death in mother. The government and the community are responsible for ensuringthateverymotherhasaccesstoqualifiedmaternalhealth services, from the time of pregnancy, delivery assistance by skilled health personnel, and postpartum care to mothers and infants, special care and referral in case of complications and access to family planning.
More intervention to adolescent and young adult groups is important to do in accelerating the reduction of MMR6. Adolescence is a process of change from childhood to adulthood characterized by physiological and psychological changes. Physiological changes in adolescent girls include menstruation as a sign of functioning of reproductive organs7.Women are more often anemic than men, because of the physiological needs of women which increase during pregnancy and the occurrence of menstruation every month8.
The prevalence of anemia at the national level is still quitehigh.HouseholdHealthSurvey2005 shows thattheprevalenceofanemiainpregnantwomenis50.9%,post-natalwomen45.1%,adolescentsaged10-14years
DOI Number: 10.5958/0976-5506.2018.00307.8
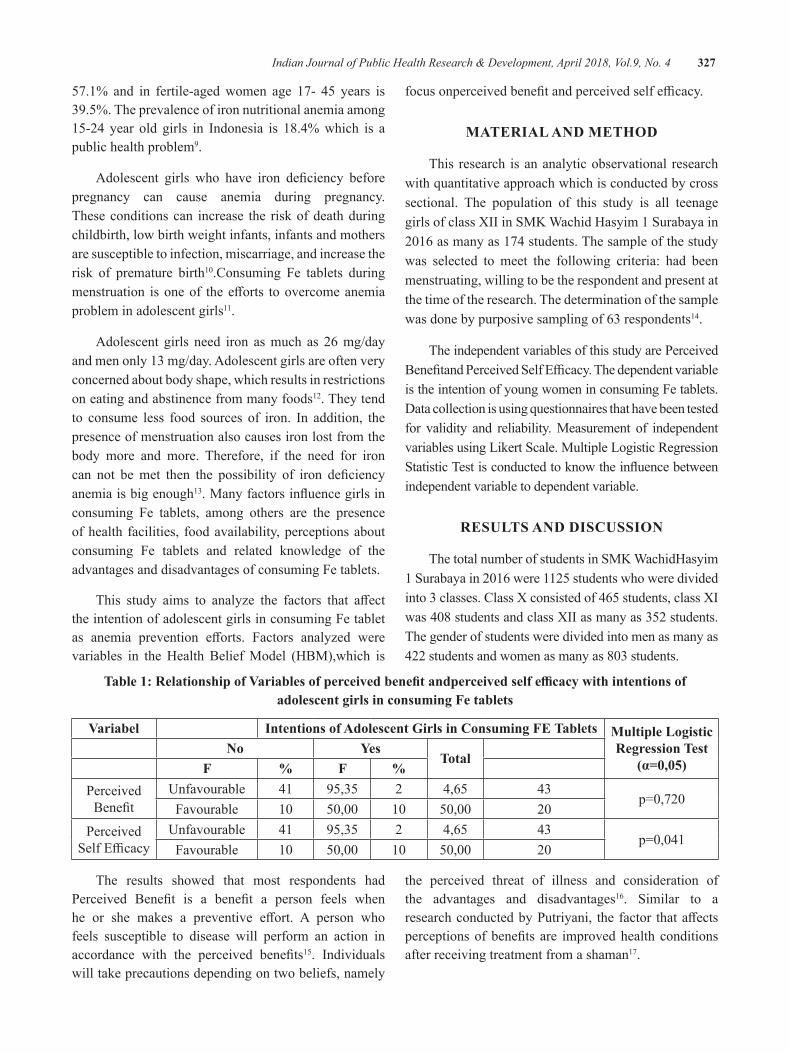
Indian Journal of Public Health Research & Development, April 2018, Vol.9, No. 4 327
57.1% and in fertile-aged women age 17- 45 years is 39.5%. The prevalence of iron nutritional anemia among 15-24 year old girls in Indonesia is 18.4% which is a public health problem9.
Adolescent girls who have iron deficiency beforepregnancy can cause anemia during pregnancy. These conditions can increase the risk of death during childbirth, low birth weight infants, infants and mothers are susceptible to infection, miscarriage, and increase the risk of premature birth10.Consuming Fe tablets during menstruation isoneof theefforts toovercomeanemiaproblem in adolescent girls11.
Adolescent girls need iron as much as 26 mg/day and men only 13 mg/day. Adolescent girls are often very concerned about body shape, which results in restrictions on eating and abstinence from many foods12. They tend to consume less food sources of iron. In addition, the presence of menstruation also causes iron lost from the body more and more. Therefore, if the need for iron can not bemet then the possibility of iron deficiencyanemia is big enough13.Manyfactorsinfluencegirlsinconsuming Fe tablets, among others are the presence of health facilities, food availability, perceptions about consuming Fe tablets and related knowledge of the advantages and disadvantages of consuming Fe tablets.
This study aims to analyze the factors that affectthe intention of adolescent girls in consuming Fe tablet as anemia prevention efforts. Factors analyzed werevariables in the Health Belief Model (HBM),which is
focusonperceivedbenefitandperceivedselfefficacy.
MATeRIAl ANd MeThOd
This research is an analytic observational research with quantitative approach which is conducted by cross sectional. The population of this study is all teenage girls of class XII in SMK Wachid Hasyim 1 Surabaya in 2016asmanyas174students.Thesampleofthestudywas selected to meet the following criteria: had been menstruating, willing to be the respondent and present at the time of the research. The determination of the sample was done by purposive sampling of 63 respondents14.
The independent variables of this study are Perceived BenefitandPerceivedSelfEfficacy.Thedependentvariableis the intention of young women in consuming Fe tablets. Data collection is using questionnaires that have been tested for validity and reliability. Measurement of independent variables using Likert Scale. Multiple Logistic Regression StatisticTestisconductedtoknowtheinfluencebetweenindependent variable to dependent variable.
ReSulTS ANd dISCuSSION
The total number of students in SMK WachidHasyim 1Surabayain2016were1125studentswhoweredividedinto 3 classes. Class X consisted of 465 students, class XI was408studentsandclassXIIasmanyas352students.The gender of students were divided into men as many as 422studentsandwomenasmanyas803students.
Table 1: Relationship of Variables of perceived benefit andperceived self efficacy with intentions of adolescent girls in consuming Fe tablets
Variabel Intentions of Adolescent girls in Consuming Fe Tablets Multiple logistic Regression Test
(α=0,05)No yes
TotalF % F %
Perceived Benefit
Unfavourable 41 95,35 2 4,65 43p=0,720
Favourable 10 50,00 10 50,00 20Perceived
SelfEfficacyUnfavourable 41 95,35 2 4,65 43
p=0,041Favourable 10 50,00 10 50,00 20
The results showed that most respondents had Perceived Benefit is a benefit a person feels whenhe or she makes a preventive effort. A person whofeels susceptible to disease will perform an action in accordance with the perceived benefits15. Individuals will take precautions depending on two beliefs, namely
the perceived threat of illness and consideration of the advantages and disadvantages16. Similar to a researchconductedbyPutriyani, thefactor thataffectsperceptionsofbenefits are improvedhealth conditionsafter receiving treatment from a shaman17.
328 Indian Journal of Public Health Research & Development, April 2018, Vol.9, No. 4
Table 1 shows that there is no significant effectbetweenperceivedbenefitandtheintentionofadolescentgirlstoconsumeFetablet(p=0,720).Thismeansthatthebeliefintheperceivedbenefitsofrespondentsmaynotnecessarily determine the intentions of respondents to consume Fe tablets. Cross-tabulation results have shown thattherearerespondentswhobelieveinthebenefitsofconsuming Fe tablets but do not have the intention to consume Fe tablets, and vice versa, there are respondents whodonotbelievethebenefitsofconsumingFetabletsbut she has the intention to consume Fe tablets.
Lack of information obtained by respondents aboutFe tabletsmakes themdonotknow thebenefitsof Fe tablets as a prevention effort to anemia. Theschool has never held a counseling activity about the importance of Fe tablets for adolescent girls. Students of SMK WachidHasyim 1 Surabaya appeared to be active when they were given socialization related to the importance of Fe tablet. They enthusiastically followed the socialization activities by asking some questions. It would be unfortunate if the enthusiastic attitude of respondents were not used to provide health-related socialization.
Therefore, it is expected that the school can give socialization cooperating with the health department related to the delivery of materials. In addition, media such as posters in schools were also still a little, the school just put posters related to school rules and regulations. Provision of information either directly or through the media is needed to improve the perception of student benefits,whichwilllateraffecttheirintentiontowanttoconsumeFetabletsasapreventionefforttoanemia.
SelfEfficacyisthebeliefandconfidenceintheabilityof yourself to do something you want18. The results of dataanalysisshowedthatthereisasignificantinfluencebetween perceived self efficacywith the intention ofadolescent girls to consume Fe tablets. This means that the belief in the ability of respondents to consume Fe tablets can determine the intentions of respondents to consume Fe tablets.
Self Efficacy can be defined as an assessment ofsomeone’s ability to perform an action19. If someone believesthatanewbehaviorisbeneficialtohim,buttheythink they can not do it, then that behavior will not be triedtobedone.BanduramentionsthatSelfEfficacywillbe the basis for him in doing something18. It is almost the
same as Pratiwi’s researchwhich shows a positive and significant influence between self efficacy to increaseaffectiveabilityofhealthcadreand impactonhealthydental behavior20. Also in another study, it showed thatthereisapositiveinfluenceofselfefficacyontheindependence of learning for the subjectOccupationalSafety and Health (K3) in SMKN 2 Depok21.
Female students of SMK WachidHasyim 1 Surabaya do not have the confidence to consume Fetablet due to experience related to it is not obtained by the respondents. This experience is most often obtained from families who advise on the importance of taking Fe tablets and also the habit of taking Fe tablets. It can form the perception of respondents which will be the basis of her intention to consume Fe tablets.
A person who has low self-efficacy feels lack ofconfidenceandtrustthatheorshecanperformatask.Theimpactoflowselfefficacymakesindividualsavoid,or even reluctant, to perform the task. In addition, the obstacles in consuming Fe tablets make respondents feeldifficultandlazytogetit.Lackofsupportfromthefamilyisalsooneofthefactorsaffectingtheselfefficacyof respondents.
Low socioeconomic background of the family keeps parents busy working to meet the needs of everyday life. This causes a lack of communication between parents and respondents. Parents lack the understanding of the need for their child’s health, so the support they provide is also low. Respondents felt that they did not get the impulse to consume Fe tablets and felt unable to consume it. If the respondentdoesnothaveselfefficacyorfeelunconvincedthat she is able to consume Fe tablet, the respondent willnothaveanyeffort to consume it.This iswhy therespondent has no intention to consume Fe tablets.
CONCluSION
Based on the results of research and discussion that havebeendone,itcanbeconcludedthatthereisinfluencebetween perceived self efficacy toward intention ofadolescent girls in consuming Fe tablet as a prevention efforttoanemia.ThereisnoinfluencebetweenperceivedbenefitwiththeintentionofadolescentgirlsinconsumingFetabletasanemiapreventioneffort.Thereneedstobeasubsidy from the Government regarding the price of Fe tablets, so that the group from loweconomy can easily obtain Fe tablets. The school and local health authorities
Indian Journal of Public Health Research & Development, April 2018, Vol.9, No. 4 329
can coordinate to provide intensive health information, especially about anemia in adolescent girls.
ethical Clearance: Related departments should be assured about the confidentiality of the results ofquestionnaires.
Conflict of Interest:Theauthors reportnoconflictofinterest.
Source of Funding: Self
ReFeReNCeS
1.BPS (2012). Survei Demografi KesehatanIndonesia2012.BPS,Jakarta.
2.KementerianK(2013).KesehatanIbu2010-2013.DirektoratKesehatanIbu,Jakarta.
3.Dinas Kesehatan Provinsi Jawa Timur (2013).Laporan Dinkes Provinsi Jawa Timur 2013.DinkesProvinsiJawaTimur,Surabaya.
4.DamayantiAN(2015).HealthyMomandBaby.Universitas Airlangga, Surabaya.
5.DinasKesehatanKotaSurabaya(2014).LaporanTahunan. Pemerintah Kota Surabaya, Surabaya: 2014.
6.Kementerian K (2015). Infodatin SituasiKesehatan Reproduksi Remaja. Kemenkes RI, Jakarta.
7.DepartemenKesehatan(2005).KumpulanMateriKesehatan Reproduksi Remaja. Departemen Kesehatan,Jakarta.
8.Departemen Kesehatan (2003). Gizi DalamAngka.DepartemenKesehatanRI,Jakarta.
9.Kementerian K (2013). Riset Kesehatan Dasar(RISKESDAS).BalitbangKemenkesRIJakarta.
10.KementerianK(2015).ProfilKesehatanIndonesiaTahun2014.KemenkesRI,Jakarta.
11. Departemen Gizi dan Kesehatan Masyarakat FKMUI(2011).GizidanKesehatanMasyarakat.RajaGrafindoPersada,Jakarta.
12.ArismanMB(2007).GiziDalamDaurKehidupan.PenerbitBukuKedokteran,Jakarta.
13.Tarwoto (2007). Buku Saku Anemia Pada IbuHamil, Konsep dan Penatalaksanaannya. Trans InfoMedia,Jakarta.
14. Lwanga SK, Lemeshow S (1991). Sample size determination in health studiesA practical manual. WHO,Geneva.
15.GlanzK,RimerBK,ViswanathK(2002).HealthBehavior and Health Education: Theory, research andPractice.Jossey-Bas,SanFancisco.
16.Raingruber B (2017). Contemporary healthpromotion in nursing practice. Jones & BartlettLearning, Massachusetts.
17.Putriyani(2013).PersepsitentangKesehatanDiridan Faktor-faktor yang Mempengaruhi Perilaku BerobatkeDukunCilikPonari.EMPATHYJurnalFakultas Psikologi, 2(1). Available from: http://www.jogjapress.com/index.php/EMPATHY/article/view/1556.
18.Bandura (1997). Self-Efficacy: The Exercise ofControl.W.H. Freeman and Company, New York.
19. Bart S (1994). Psikologi Kesehatan. Gramedia WidiasaranaIndonesia,Jakarta.
20.Pratiwi NL, Pradopo S (2006). Pengaruh SelfEfficacy terhadap Peningkatan KemampuanAfektif Kader Kesehatan dan Dampak pada Perilaku Sehat Gigi melalui Model Deteksi OHI-S,DMFTIndeks.BuletinPenelitianSistemKesehatan,9(1):51-60.
21.Widiyanto A (2013). Pengaruh Self Efficacydan Motivasi Berprestasi Siswa terhadap Kemandirian Belajar Mata Pelajaran Keselamatan dan Kesehatan Kerja (K3) di SMK N 2 Depok [Bachelorthesis].UNY,Yogyakarta.
The level of environmental Sanitation and the Incidence of Tuberculosis in Jember and Situbondo, Indonesia
Isa Ma’rufi1, Abu Khorir1, Khaidar Ali1, heru Santoso Wahito Nugroho2
1School of Public Health, University of Jember; 2Health Polytechnic of Ministry of Health at Surabaya, Indonesia
AbSTRACT
Tuberculosis is an important public health problem in worldwide, which World Health Organization(WHO)declarestuberculosis(TB)as“GlobalEmergency”in1992.Theaimofthisstudywastodescribethe hygiene and environmental sanitation conditions, and to determine the association between hygiene and environmental sanitation and Tuberculosis incident in Indonesia. The design of the study was cross sectional. The sample of the study was selected using simple random sampling. Data was analyzed using coefficientcontingencytest.Theresultofcoefficientcontingencytestwas0.7.ThemostofTBpatientshavelow hygiene and environmental sanitation, and environmental sanitation level and TB patients have strong association.
Keywords: Tuberculosis, Hygiene, Sanitation, Environment
Corresponding Author:Heru Santoso Wahito NugrohoHealth Polytechnic of Ministry of Health at Surabaya, IndonesiaPucangJajarTengahStreet56Surabaya,IndonesiaEmail: [email protected]
INTROduCTION
WHO reports in 2018 noted that tuberculosis isoneof the top10causesofdeathworldwide.In2016,10,4millionpeoplefellillwithTBand1,7milliondiedfrom the disease[1]. Furthermore, an estimated 1 million childrenbecameillwithTBand250,000childrendiedofTBin2016.Mostoftheestimatednumberofincidentcases in 2016 occurred in the South-EastAsia (45%),Africa (25%) and Western Pacific (17%), and thenthe smaller proportions of cases occurred on Eastern Mediterranean (7%), Europe (3%) and America (3%)[2].
Indonesia is one of countries that has high cases of TB. Indonesia has tropical climate, and this circumstance make Indonesia as one of the TB endemic countries. Tuberculosis is the third leading cause of death in Indonesia after cardiovascular disease and respiratory disease, then the first causes on infectious disease[3]. Based onWHO report, Indonesia has the highest TBcases in theworld after India. In 2016, 351,893 caseswere found in Indonesia, and the highest TB cases were
reported in province with high population density, such asWestJava,EastJavaandCentralJava,respectively[4].
Tuberculosis is caused by members of the Mycobacterium tuberculosis complex; usually the human tubercle bacillus, M. tuberculosis, but occasionally by the bovine tubercle bacillus, M. bovis, or by M. africanum[5]. The main cause of tuberculosis is: Poverty on community in development country, TB treatment failing (inadequate commitments of political and funding aspect, inadequate TB service organization, inadequatecasemanagement,misperceptionofbenefitsand effectiveness of Bacillus Calmette-Guerin, BCG),Demographic changes due to both the increasing of world population and the changing of age structure, The impact of pandemic[3]. Indonesian Health officealso noted TB is often associated with low sanitation level and limited access of healthy living behavior in community[6]. Environmental plays a role in disease development such as humidity and number of people living in the house, then adult crowding, increased family size, use of biofuels, overcrowded housing and poor ventilation increase both the likelihood of exposure to Mycobacterium tuberculosis and progression to disease[7],[8]. Furthermore, indoor air pollution and tobacco smokeplayasignificantroleatboththeindividualandpopulation level related with tuberculosis incident[9]. Therefore hygiene and environmental sanitation aspects have important role on Tuberculosis incident.
DOI Number: 10.5958/0976-5506.2018.00308.X
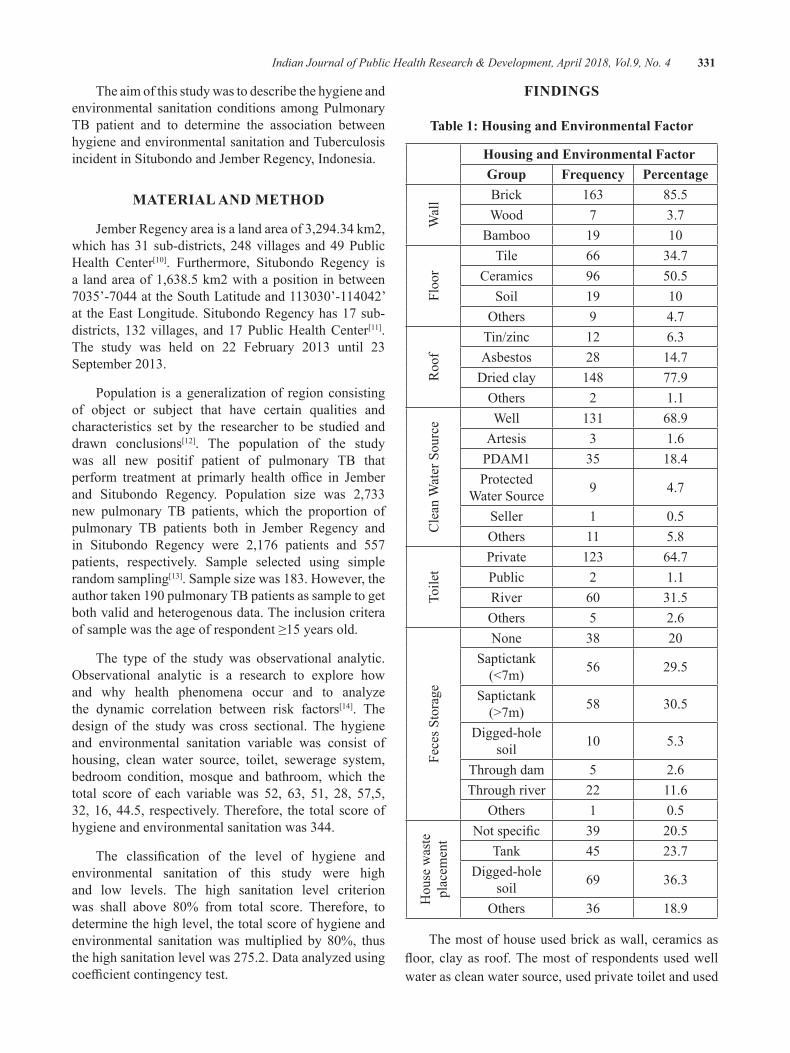
Indian Journal of Public Health Research & Development, April 2018, Vol.9, No. 4 331
The aim of this study was to describe the hygiene and environmental sanitation conditions among Pulmonary TB patient and to determine the association between hygiene and environmental sanitation and Tuberculosis incidentinSitubondoandJemberRegency,Indonesia.
MATeRIAl ANd MeThOd
JemberRegencyareaisalandareaof3,294.34km2,which has 31 sub-districts, 248 villages and 49 Public Health Center[10]. Furthermore, Situbondo Regency is a land area of 1,638.5 km2 with a position in between 7035’-7044attheSouthLatitudeand113030’-114042’at the East Longitude. Situbondo Regency has 17 sub-districts, 132 villages, and 17 Public Health Center[11]. The study was held on 22 February 2013 until 23September2013.
Population is a generalization of region consisting of object or subject that have certain qualities and characteristics set by the researcher to be studied and drawn conclusions[12]. The population of the study was all new positif patient of pulmonary TB that perform treatment at primarly health office in Jemberand Situbondo Regency. Population size was 2,733 new pulmonary TB patients, which the proportion of pulmonary TB patients both in Jember Regency andin Situbondo Regency were 2,176 patients and 557 patients, respectively. Sample selected using simple random sampling[13]. Sample size was 183. However, the authortaken190pulmonaryTBpatientsassampletogetboth valid and heterogenous data. The inclusion critera ofsamplewastheageofrespondent≥15yearsold.
The type of the study was observational analytic. Observational analytic is a research to explore howand why health phenomena occur and to analyze the dynamic correlation between risk factors[14]. The design of the study was cross sectional. The hygiene and environmental sanitation variable was consist of housing, clean water source, toilet, sewerage system, bedroom condition, mosque and bathroom, which the total score of each variable was 52, 63, 51, 28, 57,5, 32, 16, 44.5, respectively. Therefore, the total score of hygiene and environmental sanitation was 344.
The classification of the level of hygiene andenvironmental sanitation of this study were high and low levels. The high sanitation level criterion was shall above 80% from total score. Therefore, todetermine the high level, the total score of hygiene and environmental sanitationwasmultiplied by 80%, thusthe high sanitation level was 275.2. Data analyzed using coefficientcontingencytest.
FINdINgS
Table 1: housing and environmental Factor
housing and environmental Factor group Frequency Percentage
Wal
l Brick 163 85.5Wood 7 3.7
Bamboo 19 10
Floo
r
Tile 66 34.7Ceramics 96 50.5
Soil 19 10Others 9 4.7
Roo
f
Tin/zinc 12 6.3Asbestos 28 14.7
Dried clay 148 77.9Others 2 1.1
Cle
an W
ater
Sou
rce Well 131 68.9
Artesis 3 1.6PDAM1 35 18.4Protected
Water Source 9 4.7
Seller 1 0.5Others 11 5.8
Toile
t
Private 123 64.7Public 2 1.1River 60 31.5Others 5 2.6
Fece
s Sto
rage
None 38 20Saptictank (<7m) 56 29.5
Saptictank (>7m) 58 30.5
Digged-hole soil 10 5.3
Through dam 5 2.6Through river 22 11.6
Others 1 0.5
Hou
se w
aste
pl
acem
ent Notspecific 39 20.5
Tank 45 23.7Digged-hole
soil 69 36.3
Others 36 18.9
The most of house used brick as wall, ceramics as floor, clayas roof.Themostof respondentsusedwellwater as clean water source, used private toilet and used
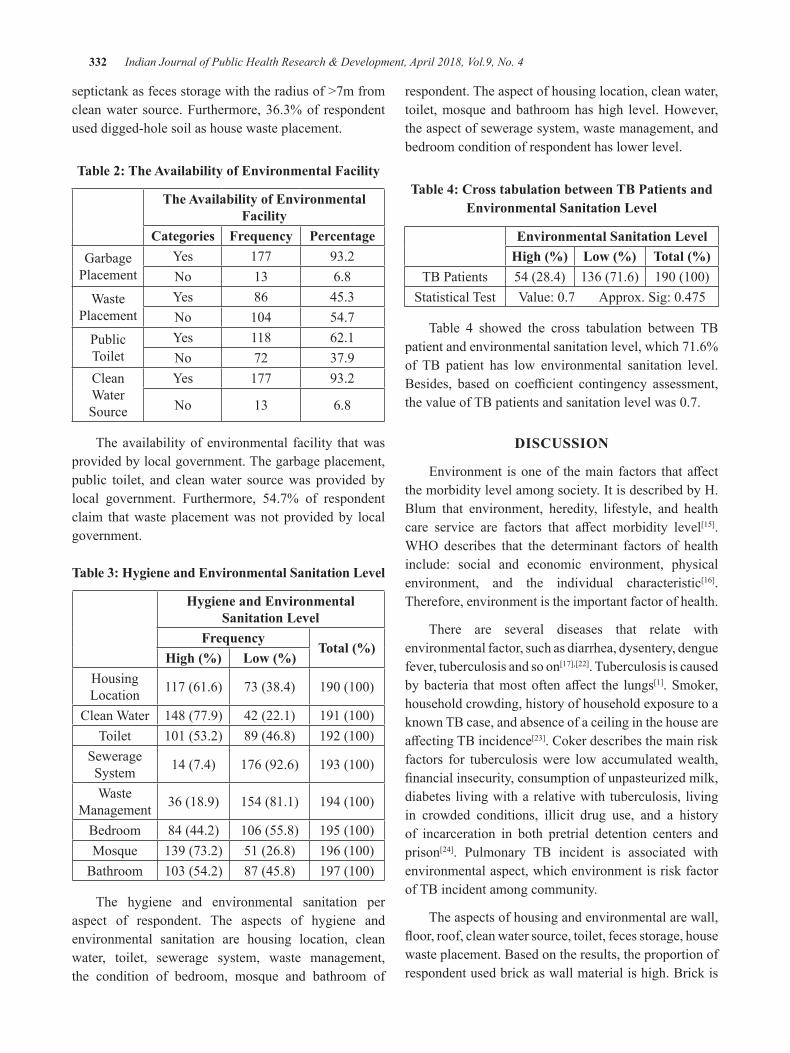
332 Indian Journal of Public Health Research & Development, April 2018, Vol.9, No. 4
septictank as feces storage with the radius of >7m from clean water source. Furthermore, 36.3% of respondent used digged-hole soil as house waste placement.
Table 2: The Availability of environmental Facility
The Availability of environmental Facility
Categories Frequency PercentageGarbage
PlacementYes 177 93.2No 13 6.8
Waste Placement
Yes 86 45.3No 104 54.7
Public Toilet
Yes 118 62.1No 72 37.9
Clean Water Source
Yes 177 93.2
No 13 6.8
The availability of environmental facility that was provided by local government. The garbage placement, public toilet, and clean water source was provided by local government. Furthermore, 54.7% of respondent claim that waste placement was not provided by local government.
Table 3: hygiene and environmental Sanitation level
hygiene and environmental Sanitation level
FrequencyTotal (%)
High (%) Low (%)Housing Location 117 (61.6) 73 (38.4) 190(100)
Clean Water 148 (77.9) 42 (22.1) 191(100)Toilet 101(53.2) 89 (46.8) 192(100)
Sewerage System 14 (7.4) 176 (92.6) 193(100)
Waste Management 36 (18.9) 154 (81.1) 194(100)
Bedroom 84 (44.2) 106(55.8) 195(100)Mosque 139 (73.2) 51 (26.8) 196(100)
Bathroom 103(54.2) 87 (45.8) 197(100)
The hygiene and environmental sanitation per aspect of respondent. The aspects of hygiene and environmental sanitation are housing location, clean water, toilet, sewerage system, waste management, the condition of bedroom, mosque and bathroom of
respondent. The aspect of housing location, clean water, toilet, mosque and bathroom has high level. However, the aspect of sewerage system, waste management, and bedroom condition of respondent has lower level.
Table 4: Cross tabulation between Tb Patients and environmental Sanitation level
environmental Sanitation levelHigh (%) Low (%) Total (%)
TB Patients 54 (28.4) 136 (71.6) 190(100)Statistical Test Value:0.7Approx.Sig:0.475
Table 4 showed the cross tabulation between TB patient and environmental sanitation level, which 71.6% of TB patient has low environmental sanitation level. Besides, based on coefficient contingency assessment,thevalueofTBpatientsandsanitationlevelwas0.7.
dISCuSSION
Environment isoneof themain factors thataffectthe morbidity level among society. It is described by H. Blum that environment, heredity, lifestyle, and health care service are factors that affect morbidity level[15]. WHO describes that the determinant factors of healthinclude: social and economic environment, physical environment, and the individual characteristic[16]. Therefore, environment is the important factor of health.
There are several diseases that relate with environmental factor, such as diarrhea, dysentery, dengue fever, tuberculosis and so on[17],[22]. Tuberculosis is caused bybacteria thatmostoftenaffect the lungs[1]. Smoker, household crowding, history of household exposure to a known TB case, and absence of a ceiling in the house are affectingTBincidence[23]. Coker describes the main risk factors for tuberculosis were low accumulated wealth, financialinsecurity,consumptionofunpasteurizedmilk,diabetes living with a relative with tuberculosis, living in crowded conditions, illicit drug use, and a history of incarceration in both pretrial detention centers and prison[24]. Pulmonary TB incident is associated with environmental aspect, which environment is risk factor of TB incident among community.
The aspects of housing and environmental are wall, floor,roof,cleanwatersource,toilet,fecesstorage,housewaste placement. Based on the results, the proportion of respondent used brick as wall material is high. Brick is
Indian Journal of Public Health Research & Development, April 2018, Vol.9, No. 4 333
ideal material for wall because brick is strong material. Therefore, it prevents the hazard condition among inhabitant. The proportion of respondent used ceramics as floor and dried clay is high. Bothwaterproof floorand easy to clean is used to prevent the bacteria to grow, whereas dried clay as roof material is used to decrease the temperature in house.
Generally, respondent get the clean water from well as source, and the proportion of respondent used private toilet is high. Most of respondent used saptic tank as feces storage, although the distance is >7m from clean water resource. Water is essential element for human, which daily water-need both male and female is 3.7L and 2.7L, respectively[25]. Therefore, human cannot separate with clean water source to improve their quality of life.
There are several clean water source found in Indonesia, such as well, artesian, PDAM (water provider institution), etc. However, the proportion of respondent used well is high. Budiarti Aqnes on Assessment of The Quality of Well Water showed that well water quality in Gubug Grobogan based on physical parameter have appropriated with standard but well near the Gubug village river have not appropriated with color standard, while based on microbiological parameter Coliform total have not appropriated with standard[26]. The potential components can contaminate well water is liquid waste penetrate of organic and inorganic fertilizer, domestic waste, and the distance of making the well with septic tank[27]. Based on The Regulation of Health Ministry of Indonesia, safewater todrinkmust fulfill thephysics,microbiological, chemistry, and radioactive parameter[28].
The proportion of respondent used digged-hole soil as house waste placement is high. The ideal form of house waste placement is waterproof tank and has cover to prevent vector growing, such as cockroach, mosquitos, fleas,etc.WHOnotedthatvector-bornediseaseaccountfor more than 17% of all infectious diseases, causing morethan70,000deathsannually[29].
Garbage placement, public toilet, and clean water source are provided by local government. However, waste placement facility is not provided. Generally, the availability of environmental facility is important in communities, because it can improve the environmental sanitation level. The availability of clean water source, garbage placement, public toilet, and sewerage system is necessary to prevent disease in community. Based on
HealthOfficeofEastJavaIndonesia,sanitationaccessrelatedwithOpenDefecationFree (ODF)has reached82.88%,andthenvillageswithODFstatushasreached2005 villages (25.96%) by 7724 village in East Java,Indonesia[30].
The hygiene and environmental sanitation level of housing location, clean water, mosque and bathroom is classified as high categories, while sewerage system,wastemanagement,andbedroomaspectsareclassifiedas low categories.One of several aspects of bedroomcondition is the density of inhabitant, which there are several research mention that pulmonary TB has correlation with high density level[23],[24].
RespondentswhohaspulmonaryTBareclassifiedlow level of environmental sanitation. This result is similar with Lienhardt’s study that environmental factors may have an impact on the incident of tuberculosis in a givenpopulationasa resultof theireffectonboth therisk of infection and the risk of disease once a person is infected[31], and physical condition of the house is a risk factor for pulmonary tuberculosis[32]. The environmental sanitation level and TB patients has strong association.
CONCluSION
Basedoncoefficientcontingency,theenvironmentalsanitation level and TB patients has strong association. Therefore, most of TB patients have low hygiene and environmental sanitation.
Conflict of Interest: The authors state that there is no conflictofinterestinthisstudy.
Source of Funding: All funds of this study comes from the researchers.
ethical Clearance: This research has passed in ethical assessmentatUniversityofJember.
ReFeReNCeS
1.WHO. Tuberculosis. Geneva: WHO; 2018.(Available: http://www.who.int/mediacentre/factsheets/fs104/en/)
2.WHO.GlobalTuberculosisReport2017.Geneva:WHO;2017.
3. Kemenkes RI. National Guidelines for TB Control (Pedoman Nasional Penanggulangan TBC). Jakarta:KemenkesRI;2007.
334 Indian Journal of Public Health Research & Development, April 2018, Vol.9, No. 4
4.Kemenkes RI. Indonesia Health Profile (ProfilKesehatan Indonesia). Jakarta: Kemenkes RI;2017.
5.GrangeJM,ZumiaA.TheGlobalEmergencyofTuberculosis:What IsThe Cause?.The Journalof The Royal society for the promotion of health. 2002;122:78.
6. Kemenkes RI. National Guidelines for Tuberculosis Control (Pedoman Nasional Pengendalian Tuberkulosis). Jakarta: KemenkesRI;2014.
7. Khaliq A, et al. Environmental Risk Factors and Social Determinants of Pulmonary Tuberculosis in Pakistan. Epidemiology (Sunnyvale). 2015;5(3):1-9.
8. Srivastava K, et al. Role of Environmental factors in Transmission of Tuberculosis. Dynamics of HumanHealth.2015;2(4).
9. Narasimhan P, et al. Risk Factor for Tuberculosis. PulmonaryMedicine.2013;1-11.
10.BPS. Jember in Figures 2017 (Jember DalamAngka2017).Jember:BPS;2016.
11.BPS. Situbondo in Figures 2017 (SitubondoDalamAngka2017).Jember:BPS;2016.
12.Sugiyono. Qualitative, Qualitative and R&DEducation Research Methods (Metode Penelitian PendidikanKualitantitatif,KualitatifdanR&D).Bandung:Alfabeta;2014.
13. Sastroasmoro, et al. The Basics of Clinical Research Methods (Dasar-Dasar Metode PenelitianKlinis).Jakarta:SagungSeto;2001.
14. Notoatmodjo S. Health Research Methodology (Metodologi Penelitian Kesehatan). Jakarta: PT.RinekaCipta;2005.
15. Blum H. Planning for Health: Genetics for the Eighties. 2nd ed. New York: Human Science Press; 1981.
16.WHO. The Determinants of Health. Geneva:WHO. (Available: http://www.who.int/hia/evidence/doh/en/)
17.PutraADP,etal.TheInfluenceofBasicSanitationand Personal Hygiene on The Incidence of Diarrhea in Toddlers in Work Area of Tasikmadu Public
Health Center, Karanganyar Regency (Hubungan Sanitasi Dasar dan Personal Hygiene dengan Kejadian Diare Pada Balita di Wilayah Kerja Puskesmas Tasikmadu Kabupaten Karanganyar). Jurnal Kesehatan Masyarakat (e-joural). 2017.5(1). pp. 422-429
18.SidhiAN,etal.The influenceofEnvironmentalSanitation and Bacteriological Quality of Clean Water on Diarrhea Incidence in Toddlers in Working Area of Adiwerna Public Health Center of Tegal Regency (Hubungan Kualitas Sanitasi Lingkungan dan Bakteriologis Air Bersih Terhadap Kejadian Diare Pada Belita di Wilayah Kerja Puskesmas Adiwerna Kabupaten Tegal). JurnalKesehatanMasyarakat(e-journal).2016;4(3):665-676.
19. Gundry SW, et al. Child Dysentery in the Limpopo Valley: A Cohort Study of Water, SanitationandHygieneRiskFactors.JournalofWaterandHealth.2009;259-266.
20.AliK,Ma’rufiI.StudyofFactorsCausedDengueHaemorrhagic Fever Case Study: Pasuruan, Jawa Timur-Indonesia. Journal of Medical andBioengineering.2016;5(2):108-112.
21. Shah SA, et al. Prevalence of Pulmonary Tuberculosis in Karachi Juvenile Jail, Pakistan.Eastern Mediterranean Health Journal.2003;9(4):667-674.
22. Asyary Al. Childhood Tuberculosis: A Neglected Paradigm in Developing Countries. Public Health ofIndonesia.2017;3(1):7-10.
23. Hill PC, et al. Risk Factors for Pulmonary Tuberculosis: A Clinic-Based Case Control Study inTheGambia.BMCPublicHealth.2006;1-7.
24. Coker R, et al. Risk Factors for Pulmonary TuberculosisinRussia:Case-ControlStudy.BMJ.2006;332:85-87. (Available: http://bmj.com/cgi/doi/10.1136/bmj.38684.687940.80)
25.Sawka MN, Scott JM. Fluid and ElectrolyteSupplementationforExerciseHeatStress.AmJClinNutr.2000;72:564-72.
26. Budiarti A, et al. Study of Well Water Quality as a DrinkingWater Source in Gubug Village,Gubug Sub-district, Grobongan District (Kajian Kualitas Air Sumur Sebagai Sumber Air Minum
Indian Journal of Public Health Research & Development, April 2018, Vol.9, No. 4 335
di Kelurahan Gubug Kecamata Gubug Kabupaten Grobongan). e-publikasi fakultas farmasi. 2013;10(1):7-12.
27. Istipsaroh et al. Water Quality Test of Well of Merjosari Village, Lowokwaru Sub-District,Malang City (Uji Kualitas Air Sumur Kelurahan Merjosari Kecamatan Lowokwaru Kota Malang). e-jurnalilmiahbiosaintropis.2016;2(1):19-24.
28.MinisterofHealthRegulationNo.429of2010onWater Quality Requirements (Peraturan Menteri Kesehatan RI No. 429 Tahun 2010 tentangPersyaratan Kualitas Air Minum). Jakarta:MenkesRI;2010.
29.WHO. Vector-borne Disease. Geneva: WorldHealthOrganization;2017.(http://www.who.int/mediacentre/factsheets/fs387/en/)
30.DinkesProvinsiJatim.HealthProfileofEastJavaProvince Year 2016 (Profil Kesehatan ProvinsiJawa Timur Tahun 2016). Surabaya: DinkesProvinsiJatim;2017.
31. Lienhardt C. From Exposure to Disease: The Role of Environmental Factors in Susceptibility to and Development of Tuberculosis. Epidemiologic Review.2000;23(2):288-301
32. Kenedyanti E, et al. Analysis of Mycobacterium Tuberculosis and Physical Conditions of Houses with Lung Tuberculosis (Analisis Mycobacterium Tuberculosis dan Kondisi Fisik Rumah dengan Kejadian Tuberkulosis Paru). Phd Diss. UniversitasAirlangga.2017;152-162.
Analysis of Interest in the First health Facility to Refer Patients to Jombang general hospital as Advance health
Facility and the Influence Factors
Sandu Siyoto1, Rosa Indrawati2
1Lecture of STIKes Surya Mitra Husada Kediri; 2Magister of Heath Study Programe of STIKes Surya Mitra Husada Kediri
AbSTRACT
ThepurposeofthisresearchistoknowinterestofFirstHealthFacilitytoreferpatienttoJombangGeneralHospital asAdvanced Health Facility and influencing factors. The design of this research is analyticcorrelationwithcrosssectionalapproach,withthepopulationofallFirstHealthFacilityinJombangareausingproportionedstratifiedrandomsamplingobtained61respondents.Datacollectedusingquestionnaireswereanalyzedbylogisticregressiontestwithα=0,05.Theresultoflogisticregressionanalysisobtainedperception factor (p-value = 0,048 <α = 0,05), medical motivation (p-value = 0,029 <α = 0,05) andsatisfaction (p-value = 0,046<α= 0,05 ) so thatH0 rejected andH1 acceptedwhichmeans there is asignificantinfluencebetweenperception,medicalmotivationandsatisfactionofinterestFirstHealthServiceFacilitytoreferspatienttoJombanggeneralhospitalasAdvancedHealthFacility,whilethenon-medicalmotivationvariableshowsp-value=0,350>α=0.05sothatH0acceptedandH1rejectedwhichmeansthereisnoinfluencebetweennon-medicalmotivationofFirstHealthFacilityinteresttoreferspatienttoJombanggeneral hospital as Advanced Health Facility.
Keyword: Perception of health services, Medical Motivation, Non-medical Motivation, Satisfaction, Interest refer
INTROduCTION
In the implementation of national health system the managed care principles are applied, where there are 4 (four) pillars of Promotive, Preventive, Curative and Rehabilitative. The principle will be focused on First Level Health Services. In National Health Insurance Programe, health services are tiered, from primary, secondary, to tertiary care facilities. Diseased people should access primary health care in advance, ie puskesmas, family doctors / self-employed and primary clinics. Therefore, Puskesmas, Pratama clinics and Doctors / Dentists of Independent Practice called First Level Health Facility are the spearhead and gate keeper thathasariverasentranceorfilterreferraltoAdvancedHealth Facility1,2.
First-level health facilities have obligation to refer patients to physicians who have better capability in the hospital as Advance Health Facility if unable to conduct an examination or treatment, so that in this National Health Insurance era health care is no longer centered in hospitals or Advance Health Facility except in
emergency situations , disasters, patient health problems, geographical considerations and the availability of health facilities3
AlthoughtheBPJShasbeenwellmanagedaccordingto the medical needs of tiered referral problem, but in the implementation there are still some problems that First Health Facility still have interest to refer to JombangGeneral Hospital of type B and accredited version of 2012/JCIwithplenarylevelsothatinJombangGeneralHospital there is accumulation of patient at home sick this government.
InJombangRegencythereare14hospitals/AdvanceHealth Facility working with BPJS. The fourteenthAdvance Health Facility consists of 1 type B hospital thatisJombangGeneralHospitaland13hospitalstypeD consisting of 1 RSUD Ploso and 12 private hospitals. With many options of Advance Health Facility referral sites, First Health Facility still has a tendency to make referrals to JombangGeneralHospitalwhich isa typeB hospital so that there is a buildup of patients in the government hospital.
DOI Number: 10.5958/0976-5506.2018.00309.1
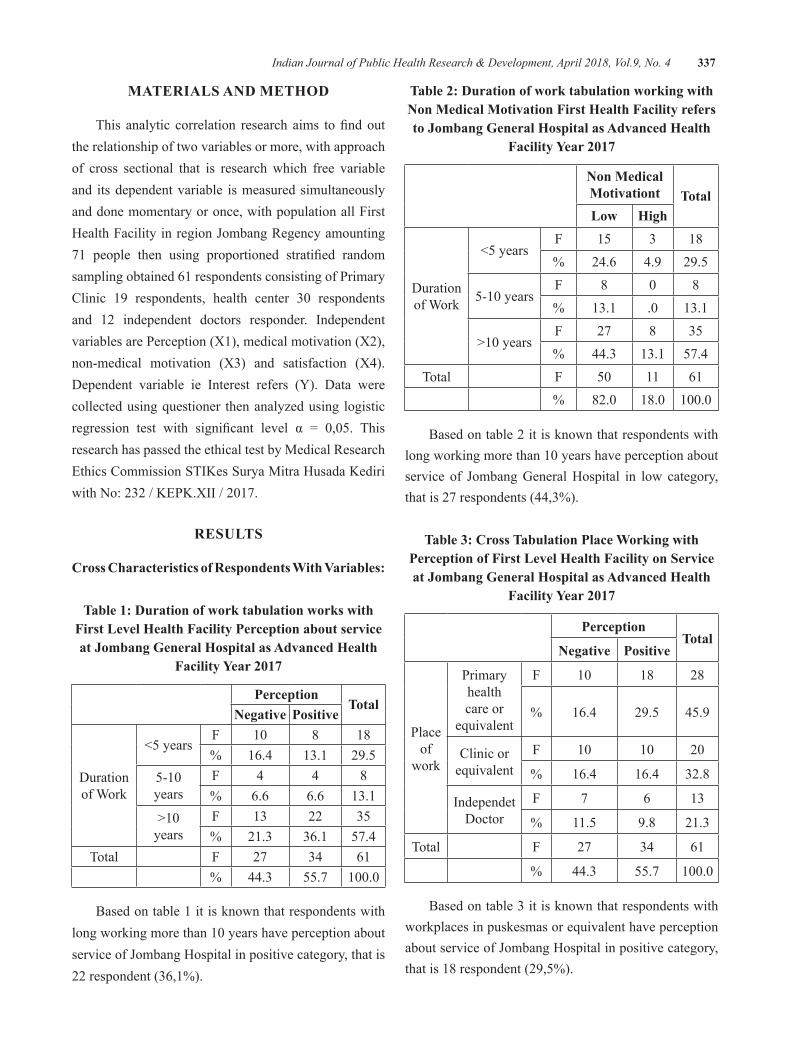
Indian Journal of Public Health Research & Development, April 2018, Vol.9, No. 4 337
MATeRIAlS ANd MeThOd
This analytic correlation research aims tofindoutthe relationship of two variables or more, with approach of cross sectional that is research which free variable and its dependent variable is measured simultaneously and done momentary or once, with population all First HealthFacilityinregionJombangRegencyamounting71 people then using proportioned stratified randomsampling obtained 61 respondents consisting of Primary Clinic 19 respondents, health center 30 respondentsand 12 independent doctors responder. Independent variables are Perception (X1), medical motivation (X2), non-medical motivation (X3) and satisfaction (X4). Dependent variable ie Interest refers (Y). Data were collected using questioner then analyzed using logistic regression test with significant level α = 0,05. Thisresearch has passed the ethical test by Medical Research Ethics Commission STIKes Surya Mitra Husada Kediri withNo:232/KEPK.XII/2017.
ReSulTS
Cross Characteristics of Respondents With Variables:
Table 1: duration of work tabulation works with First level health Facility Perception about service at Jombang general hospital as Advanced health
Facility Year 2017
PerceptionTotal
Negative Positive
Duration of Work
<5yearsF 10 8 18% 16.4 13.1 29.5
5-10years
F 4 4 8% 6.6 6.6 13.1
>10years
F 13 22 35% 21.3 36.1 57.4
Total F 27 34 61% 44.3 55.7 100.0
Based on table 1 it is known that respondents with longworkingmorethan10yearshaveperceptionaboutserviceofJombangHospitalinpositivecategory,thatis22 respondent (36,1%).
Table 2: duration of work tabulation working with Non Medical Motivation First health Facility refers to Jombang general hospital as Advanced health
Facility Year 2017
Non Medical Motivationt Totallow high
Duration of Work
<5yearsF 15 3 18% 24.6 4.9 29.5
5-10yearsF 8 0 8% 13.1 .0 13.1
>10yearsF 27 8 35% 44.3 13.1 57.4
Total F 50 11 61% 82.0 18.0 100.0
Based on table 2 it is known that respondents with longworkingmorethan10yearshaveperceptionaboutservice of JombangGeneralHospital in low category,that is 27 respondents (44,3%).
Table 3: Cross Tabulation Place Working with Perception of First level health Facility on Service at Jombang general hospital as Advanced health
Facility Year 2017
PerceptionTotal
Negative Positive
Place of
work
Primary health care or
equivalent
F 10 18 28
% 16.4 29.5 45.9
Clinic or equivalent
F 10 10 20
% 16.4 16.4 32.8
Independet Doctor
F 7 6 13
% 11.5 9.8 21.3
Total F 27 34 61
% 44.3 55.7 100.0
Based on table 3 it is known that respondents with workplaces in puskesmas or equivalent have perception aboutserviceofJombangHospitalinpositivecategory,that is 18 respondent (29,5%).
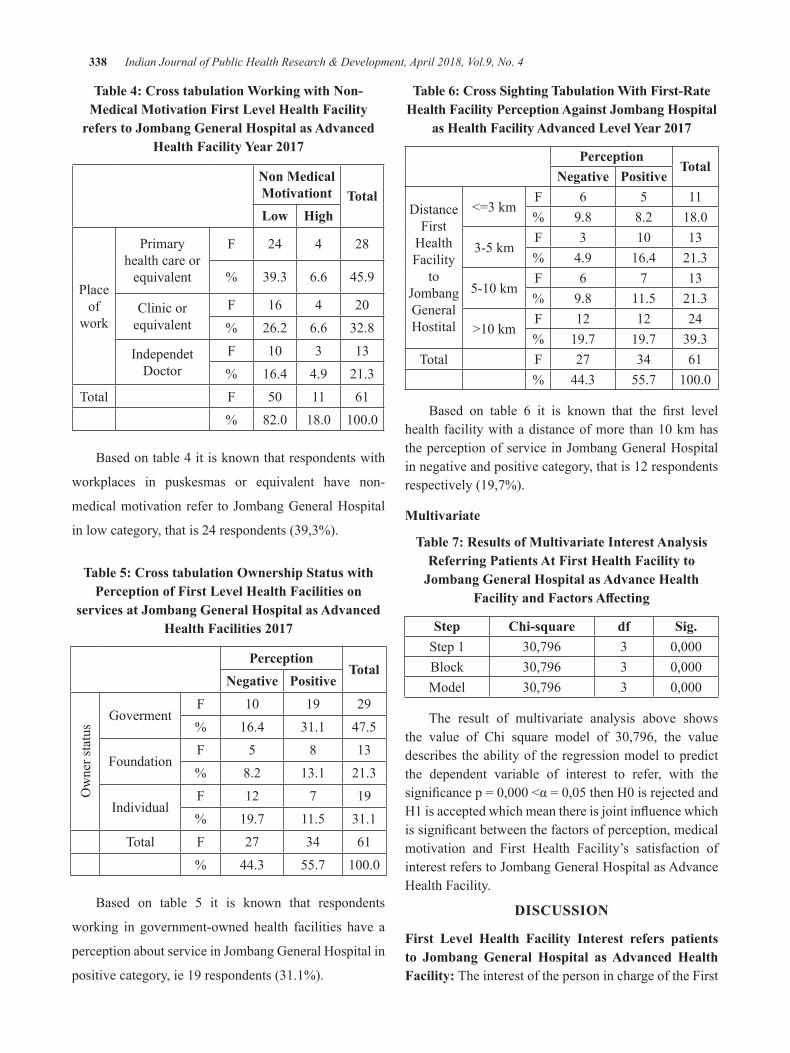
338 Indian Journal of Public Health Research & Development, April 2018, Vol.9, No. 4
Table 4: Cross tabulation Working with Non-Medical Motivation First level health Facility
refers to Jombang general hospital as Advanced Health Facility Year 2017
Non Medical Motivationt Totallow high
Place of
work
Primary health care or
equivalent
F 24 4 28
% 39.3 6.6 45.9
Clinic or equivalent
F 16 4 20% 26.2 6.6 32.8
Independet Doctor
F 10 3 13% 16.4 4.9 21.3
Total F 50 11 61% 82.0 18.0 100.0
Based on table 4 it is known that respondents with
workplaces in puskesmas or equivalent have non-
medicalmotivationrefer toJombangGeneralHospital
in low category, that is 24 respondents (39,3%).
Table 5: Cross tabulation Ownership Status with Perception of First level health Facilities on
services at Jombang general hospital as Advanced Health Facilities 2017
PerceptionTotal
Negative Positive
Ownerstatus
GovermentF 10 19 29% 16.4 31.1 47.5
FoundationF 5 8 13% 8.2 13.1 21.3
IndividualF 12 7 19% 19.7 11.5 31.1
Total F 27 34 61% 44.3 55.7 100.0
Based on table 5 it is known that respondents
working in government-owned health facilities have a
perceptionaboutserviceinJombangGeneralHospitalin
positive category, ie 19 respondents (31.1%).
Table 6: Cross Sighting Tabulation With First-Rate health Facility Perception Against Jombang hospital
as Health Facility Advanced Level Year 2017
PerceptionTotal
Negative Positive
Distance First
Health Facility
to JombangGeneral Hostital
<=3kmF 6 5 11% 9.8 8.2 18.0
3-5 kmF 3 10 13% 4.9 16.4 21.3
5-10kmF 6 7 13% 9.8 11.5 21.3
>10kmF 12 12 24% 19.7 19.7 39.3
Total F 27 34 61% 44.3 55.7 100.0
Based on table 6 it is known that the first levelhealthfacilitywithadistanceofmorethan10kmhastheperceptionofserviceinJombangGeneralHospitalin negative and positive category, that is 12 respondents respectively (19,7%).
Multivariate
Table 7: Results of Multivariate Interest Analysis Referring Patients At First health Facility to
Jombang general hospital as Advance health Facility and Factors Affecting
Step Chi-square df Sig.Step 1 30,796 3 0,000Block 30,796 3 0,000Model 30,796 3 0,000
The result of multivariate analysis above shows the value of Chi square model of 30,796, the valuedescribes the ability of the regression model to predict the dependent variable of interest to refer, with the significancep=0,000<α=0,05thenH0isrejectedandH1isacceptedwhichmeanthereisjointinfluencewhichissignificantbetweenthefactorsofperception,medicalmotivation and First Health Facility’s satisfaction of interestreferstoJombangGeneralHospitalasAdvanceHealth Facility.
dISCuSSION
First level health Facility Interest refers patients to Jombang general hospital as Advanced health Facility: The interest of the person in charge of the First
Indian Journal of Public Health Research & Development, April 2018, Vol.9, No. 4 339
Health Facility refer the patient to Jombang GeneralHospital as the Advanced Health Facility is known thatmostrespondentshaveinteresttorefertoJombangGeneralHospitalinhighcategory,thatis50respondents(82,0%).
Interest is essentially an acceptance of a relationship between itself and something outside of self. The stronger or closer the relationship, the greater the interest4,5. First Health Facility as a first-rate health provider as wellas acting as gate keeper must be able to perform four primary service functions which include first contact,continuity, comprehensiveness, and coordination of service6.
Perception of First level health Facilities on Jombang hospital Services as Advanced health Facilities: The perception of person in charge of First LevelMedicalServiceaboutJombangHospitalserviceas Advanced Health Facility is known most of respondent have perception about service of JombangHospital inpositive category, that is 34 respondent (55,7%).
Perception in the narrow sense is the vision, how one sees something, whereas in the broad sense perception is the view or understanding that is how one views or means something7. According to Robbins8 in Yuniarti9 argues that when an individual sees a target and seeks to interpret what he sees, that interpretation is strongly influenced by the personal characteristicsof the perceptive maker, such as attitudes, personality, motives, interests, experiences -experience of one’s past and expectations.
The result of cross tabulation shows that the responsible First Health Facility who has worked for more than 10 years have perception about service inJombangGeneralHospitalinpositivecategorythatis22respondents (36,1%). This is partly because by having more work time, many positive experiences gained in referringpatientstoJombangGeneralHospital.
Medical Motivation of First health Facility to Jombang general hospital as Advanced health Facility: The medical motivation of the first healthfacility responsible for referral to Jombang GeneralHospital as Advanced Health Facility is known that most respondents have medical motivation to refer to JombangGeneralHospital inhighcategory, that is40respondents (65,6%).
According to Suhardi10, motivation is the driving force that results in a person willing and willing to mobilize the ability in the form of skill or skill of his time and energy to organize various activities that are his responsibility and adjust his obligations in order to achieve the objectives of various pre-determined targets. In general the purpose of motivation is to move a person to arise desire and willingness to do something so as to obtain results and achieve goals11.
Non-medical Motivation of First health Facility to Jombang general hospital as Advanced health Facility: Non-medical motivation in charge of First HealthFacilityforreferraltoJombangGeneralHospitalas Advanced Health Facility is known that most respondents have non-medical motivation to conduct referral to JombangGeneralHospital in lowcategory,thatis50respondents(82,0%).
The result of cross-tabulation of non-medical motivation toward First Health Facility’s interest in referringpatientstoJombangGeneralHospitalshowsinhighcategorythatis40respondents(65,6%),meaneventhough First Health Facility work place at health center with distance more than 10 km and long work morethan10yearhavemotivationnonmedicalislowbuttheinteresttoreferthepatientishightoJombangGeneralHospital, this is because at time of referring patient, First Health Facility does not use non medical motivation but only use indication of its medical motivation only, so management of Jombang General Hospital needcomparative study to other hospital for good medical motivationandnonmedicaltorefertoJombangGeneralHospital in high category.
Satisfaction of First level health Facility on Jombang hospital Service as Advanced health Facility: Satisfaction of person in charge of First Level Medical Service about JombangHospital Service asAdvancedHealth Facility is known that most of respondent have satisfaction toserviceofJombangGeneralHospitalashealth facility of advanced level in satisfied category,that is 32 respondent (52,5%).
Satisfactionofabeneficiarycanbeachievediftheneeds, wishes, and expectations can be met through the services or products consumed. Satisfaction can be related to various aspects such as the quality of service given the speed of service delivery, procedures and attitudes provided by the health service providers themselves12.
340 Indian Journal of Public Health Research & Development, April 2018, Vol.9, No. 4
According to Andriani13 quality is a standard that must be achieved by the hospital health workers who provide services to patients with the best possible so that patients get satisfactory service.
Factors affecting the interest of the First Health Facility refer to Jombang general hospital as Advanced health Facility: The result of multivariate analysisshowsthevalueofChisquaremodelof30,796,the value describes the ability of the regression model to predict dependent variable of interest to refer, with the significancep=0,000<α=0.05thenH0isrejectedandH1isacceptedwhichmeanstogetherthereissignificantbetween perception factor, medical motivation and First Health Facility satisfaction of interest referred to JombangGeneralHospitalasAdvanceHealthFacility.Partially, the perception factor (p-value = 0,048 <α =0,05),medicalmotivation(p-value=0,029<α=0,05)andsatisfaction(p-value=0,046<α=0,05)soH0isrejectedandH1 is acceptedwhichmeans there is a significantinfluence between perception,medicalmotivation andsatisfactionofinterestoffirstlevelhealthfacilityreferspatienttoJombangGeneralHospitalasAdvancedHealthFacility while in non-medical motivation variable shows p-value=0,350>α=0.05sothatH0isacceptedandH1is rejectedwhichmeans there isno influencebetweennon-medicalmotivation to interest offirst level healthfacilityreferringpatienttoJombangGeneralHospitalasAdvanced Health Facility.
Based on the value of Exp (B) it can be concluded that factors of medical motivation have the most dominant tendencyininfluencinginterestinreferringthatisequalto 2.094, which means First Level Medical Facilitieswith high medical motivation tend to be more interested toconductreferralstoJombangGeneralHospital2.094times higher than First Health Facility with low medical motivation14,15.
CONCluSION
1.There is an influence between the perceptionof service to the interest of the first-rate healthfacilityreferringthepatient toJombangGeneralHospitalasAdvancedHealthFacility(p-value=0,048<α=0,05)
2. The variable of medical motivation (X2) shows p-value=0,029<α=0,05soH0isrejectedandH1isacceptedwhichmeansthereisinfluencebetween
medical motivation toward interest of first levelhealthfacilityreferringpatienttoJombangGeneralHospital as Advanced Health Facility.
3. Non-medical motivation variable (X3) shows p-value=0,350>α=0,05sothatH0isacceptedand H1 is rejected which means there is no influence between non-medical motivation tointerestoffirstlevelhealthfacilityreferspatientto JombangGeneralHospital asHealth FacilityAdvanced Level.
4.Satisfaction variable (X4) shows p-value =0.046<α=0.05sothatH0isrejectedandH1isacceptedwhichmeansthereisinfluencebetweensatisfactionofinterestoffirstlevelhealthfacilityreferringpatienttoJombangGeneralHospitalasAdvanced Health Facility.
ethical Clearance: Medical Research Ethics Commission STIKes Surya Mitra Husada Kediri with No:232/KEPK.XII/2017
Source of Funding: STIKes Surya Mitra Husada Kediri
Conflict of Interest: None
ReFeReNCeS 1.Yankes, 2013. Buku Saku Gatekeeper Dalam
Pelaksanaan SJSN. Jakarta: Dirjen PelayananKesehatan Kementerian Kesehatan RI.
2.KemenkesRI.2013. Peraturan Menteri Kesehatan Republik Indonesia Nomor 71 Tahun 2013 Tentang Pelayanan Kesehatan Pada Jaminan Kesehatan Nasional.Jakarta:KementerianKesehatan.
3.Faulina,A.C. 2016.Kajian Pelaksanaan Sistem Rujukan Berjenjang Dalam Program Jaminan Kesehatan Nasional JKN di UPT. Pelayanan Kesehatan Universitas Jember. Jurnal IKESMAISSN 1829-7773
4.Slameto. 2010.Belajar dan Faktor-Faktor Yang Mempengaruhinya.Jakarta:RinekaCipta
5.Azwar, S. 2009. Sikap Manusia Teori dan Pengukurannya. Yoguakarta: Pustaka Pelajar.
6.BPJS.2016. Pahami Lebih Dalam tentang Sistem Rujukan Berjenjang dan Pola Pembayaran BPJS Kesehatan ke Faskes. https://bpjs-kesehatan.go.id/bpjs/index.php/unduh/index/269 [Diaksestanggal10Oktober2017]
Indian Journal of Public Health Research & Development, April 2018, Vol.9, No. 4 341
7.Sobur, Alex. 2008. Psikologi Umum. Jakarta :Pustaka Pelajar
8.Robbins,StephenP.&A.Judge,Timothy.2011.Organizational behavior. Fourteenth Edition. NewJersey:Pearsoneducation.
9.Yuniarti, Siti. 2015.Hubungan Antara Kualitas Pelayanan Rumah Sakit dan Tingkat Kepuasan Pasien BPJS di Ruang Perawatan RSUD Sultan Syarif Alkadrie Kota Pontianak.Pontianak:JurnalUniversitas Tanjungpura.
10.Suhardi.2013.The Science Of Motivation Kitab Motivasi. Jakarta:PT.ElexMediaKomputindo.
11.Notoatmodjo, S. 2015. Ilmu kesehatan masyarakat.Jakarta:RinekaCipta.
12.Awinda, D 2004. Tingkat kepuasan pasien perusahaan dan pasien pribadi terhadap mutu
pelayanan ruang rawat inap kelas III RS. Permata Bunda Medan. Medan: USU Press.
13.Andriany,Aida.2017.Hubungan Mutu Pelayanan Kesehatan Dengankepuasan Pasien Diruangan Poli Umum Puskesmas Bukittinggi. JournalEndurance2(1)February2017(45-52)
14.Mthethwa,SR.2016.Comparing repeat and first visit patients’ satisfaction with service quality at Medunsa Oral Health Centre. Department of Maxillofacial Radiology, Sefako Makgatho Health Sciences University.
15.MasriadiIdrus,AnwarMallongiandJulianiIbrahim,2017.Surveillancesystemmodelfor pulmonary tuberculosis suspected in Pangkep region, Indonesia. Curr. Res. Tuberculosis, 9: 1-7.

Call for Papers/Article SubmissionThe editor invites scholarly articles that contribute to the development and understanding of all aspects of Public Health and all medical specialties. All manuscripts are double blind peer reviewed. If there is a requirement, medical statistician review statistical content. Invitation to submit paper; A general invitation is extended to authorstosubmitpapersforpublicationinIJPHRD.
The following guidelines should be noted:
• The article must be submitted by e-mail only. Hard copy not needed. Send article an attachment in e-mail.
• The article should be accompanied by a declaration from all authors that it is an original work and has not been sent to any other journal for publication.
• As a policy matter, journal encourages articles regarding new concepts and new information.
• Article should have a Title
• Names of authors
• Youraffiliation(designationswithcollegeaddress)
• Abstract
• Keywords
• Introduction or background
• Material and Method
• Findings
• Discussion
• Conclusion
• Interestofconflict
• Source of Funding
• Ethical Clearance
• ReferencesinVancouverstyle.
• Please quote references in text by superscripting
• Wordlimit2500-3000words,MSWORDFormat,singlefile.
All articles should be sent to: [email protected]
Our Contact Info:
Institute of Medico-legal Publications501,ManishaBuilding,75-76,NehruPlace,NewDelhi-110019
Mob.:09971888542,E-mail:[email protected]: www.ijphrd.com
Send all payment to :Institute of Medico-Legal Publications
501, Manisha Building, 75-76, Nehru Place, New Delhi-110019, Mob: 09971888542, Fax No. +91 11 3044 6500
E-mail: [email protected], Website: www.ijphrd.com

Published, Printed and Owned : Dr. R.K. SharmaPrinted : Printpack Electrostat G-2, Eros Apartment, 56, Nehru Place, New Delhi-110019
Published at: Institute of Medico Legal Publications Pvt. Ltd. 501, Manisha Building, 75-76, Nehru Place, New Delhi-110019 ,
Editor : Dr. R.K. Sharma, Mobile: + 91 9971888542, Fax No: +91 11 3044 6500


