Embed Size (px)
Citation preview


University of Novi Sad, Technical faculty “Mihajlo Pupin”,
Zrenjanin, Republic of Serbia
Szent István University, Faculty of Economics and Social Sciences,
Gödöllő, Hungary
Voronezh State University, Faculty of Economics,
Voronezh, Russia
University of Montenegro, Maritime Faculty
Kotor, Kotor, Montenegro
XII International Symposium
ENGINEERING MANAGEMENT AND
COMPETITIVENESS
(EMC 2022)
Proceedings
17-18th of June 2022, Zrenjanin, Serbia

II
XII International Symposium
Engineering Management and Competitiveness (EMC 2022) - Proceedings
Organizer of the Symposium:
University of Novi Sad, Technical faculty
“Mihajlo Pupin”, Zrenjanin, Republic of
Serbia
Partners:
Szent István University, Faculty of Economics
and Social Sciences, Gödöllő, Hungary
Voronezh State University, Faculty of
Economics, Voronezh, Russia
University of Montenegro, Maritime Faculty,
Kotor, Montenegro
Publisher: University of Novi Sad, Technical
faculty “Mihajlo Pupin”, Zrenjanin, Đure
Đakovića bb, 23000 Zrenjanin
For publisher: Dragica Radosav, Ph.D,
Professor, Dean of Technical faculty
Reviewers:
Ivana Berković, Ph.D, Professor, University of
Novi Sad, Technical faculty “Mihajlo Pupin”,
Zrenjanin, Republic of Serbia
Agneš Slavić, Ph.D, Professor, University of
Novi Sad, Faculty of Economics Subotica,
Subotica, Republic of Serbia
Technical treatment: Dragan Ćoćkalo, Ph.D, Professor, University of Novi
Sad, Technical faculty “Mihajlo Pupin”, Zrenjanin,
Republic of Serbia
Mihalj Bakator, Ph.D, Assistant, University of Novi
Sad, Technical faculty “Mihajlo Pupin”, Zrenjanin,
Serbia
Dragana Milosavljev, M.Sc, Assistant, University of
Novi Sad, Technical faculty “Mihajlo Pupin”,
Zrenjanin, Republic of Serbia
Verica Gluvakov, B.Sc, Teaching associate,
University of Novi Sad, Technical faculty
“Mihajlo Pupin”, Zrenjanin, Republic of Serbia
Cover design: Ivan Palinkaš, M.Sc, Assistant, University of Novi
Sad, Technical faculty “Mihajlo Pupin”, Zrenjanin,
Republic of Serbia
Lecturer: Edit Terek Stojanović, Ph.D, Assistant professor,
University of Novi Sad, Technical faculty
“Mihajlo Pupin”, Zrenjanin, Republic of Serbia
Printed by: Štamparija "DIGINET" Zrenjanin,
Ul. Đure Jakšića 14, Tel. 023/582-300
Circulation: 50
ISBN: 978-86-7672-353-9
By the resolution from 2nd April 2015, the resolution number: 114-451-402/2015-02, Provincial Secretariat for Science and Technological Development, Autonomous Province of Vojvodina, Republic of Serbia donated
financial means for printing Symposium Proceedings.
2022 University of Novi Sad, Technical faculty “Mihajlo Pupin”, Zrenjanin, Republic of Serbia. This
Proceedings is a part of the internal informational materials of EMC 2022.
CIP - Каталогизација у публикацији
Библиотеке Матице српске, Нови Сад
62:005(082)(0.034.2)
INTERNATIONAL Symposium Engineering Management and Competitiveness (12 ; 2022 ; Zrenjanin)
Proceedings [Elektronski izvor] / XII International Symposium Engineering Management and
Competitiveness (EMC 2022), 17-18th June 2022, Zrenjanin ; [organizer] Technical Faculty "Mihajlo Pupin", Zrenjanin. - Zrenjanin : Technical Faculty "Mihajlo Pupin", 2022. - 1 elektronski
optiĉki disk (CD ROM) ; 12 cm
Sistemski zahtevi: Nisu navedeni. - Dostupno i na: http://www.tfzr.rs/emc. - Nasl. sa naslovnog
ekrana. - Bibliografija uz svaki rad. - Registar.
ISBN 978-86-7672-353-9
а) Инжењерски менаџмент -- Зборници
COBISS.SR-ID 68068873

III
Program Committee:
Dragan Ćoćkalo, Ph.D, Professor, University of Novi Sad, Technical faculty “Mihajlo Pupin”,
Zrenjanin, Serbia – President of the Program Committee
Sanja Stanisavljev, Ph.D, Assistant Professor, University of Novi Sad, Technical faculty “Mihajlo
Pupin”, Zrenjanin, Serbia – Vice President of the Program Committee
Ješa Kreiner, Ph.D, Professor, California State University, Department of Engineering, Fullerton,
CA, USA
Poór József, Ph.D, Professor, Szent István University, Gödöllő, Hungary
Ali Reza Afshari, Ph.D, Assistant professor, Islamic Azad University, Iran
Mohammad Anisseh, Ph.D, Professor, Imam Khomeini International University, Qazvin, Iran
Ioannis Filippopoulos, Ph.D, Professor, University of Thessaly, Department of Computer Science,
Lamia, Greece
Boštjan Antonĉiĉ, Ph.D, Professor, University of Ljubljana, Faculty of Economics, Ljubljana,
Slovenia
Larisa Nikitina, Ph.D, Professor, Voronezh State University, Management Department, Russia
Danilo A. Đurović, Ph.D, Professor, University of Montenegro, Maritime Faculty, Kotor - Dobrota,
Montenegro
Robert Minovski Ph.D, Professor, “Ss. Cyril and Methodi” University in Skopje, Faculty of
Mechanical Engineering, Skopje, North Macedonia
Bojan Jovanovski, Ph.D, Associate professor, “Ss. Cyril and Methodi” University in Skopje, Faculty
of Mechanical Engineering, Skopje, North Macedonia
Maša Magzan, Ph.D, Assistant Professor, University of Rijeka, Croatia
Teodora Rutar Shuman, Ph.D, Professor and PACCAR Professor Mechanical Engineering, Seattle
University, College of Science and Engineering, USA
Zoran Filipi, Ph.D, Professor, Clemson University, Department of Automotive Engineering, South
Carolina, USA
Zdenek Dvořák, Ph.D, Professor, University of Ţilina, Faculty of Special Engineering, Slovakia
Vesna Spasojević Brkić, Ph.D, Professor, University of Belgrade, Mechanical faculty, Serbia
Cariša Bešić, Ph.D, Professor, University of Kragujevac, Faculty of Technical Sciences, Ĉaĉak,
Serbia
Matej Ĉerne, Ph.D, Associate Professor, University of Ljubljana, Faculty of Economics, Ljubljana,
Slovenia
Milan Delić, Ph.D, Associate Professor, University of Novi Sad, Faculty of Technical Sciences, Novi
Sad, Serbia
László Szabó, Ph.D, Assistant Professor, Budapest Business School, Zalaegerszeg Faculty of
Business Administration, Zalaegerszeg, Hungary
Jasna Auer Antonĉiĉ, Ph.D, Assistant Professor, University of Primorska, Faculty of Management,
Koper, Slovenia
Violeta Cvetkoska, Ph.D, Associate professor, “Ss. Cyril and Methodius” University, Faculty of
Economics, Skopje, North Macedonia
Miroslava Petrevska, Ph.D, Lecturer, The College of Tourism, Belgrade, Serbia
Srđan Bogetić, Ph.D., Belgrade Business and Arts Academy of Applied Studies, Belgrade, Serbia
Miloš Vorkapić, Ph.D., Scientific associate, University of Belgrade, Institute of Chemistry,
Technology and Metallurgy (ICTM) - Center of Microelectronic Technologies, Belgrade, Serbia
Zvonko Sajfert, Ph.D, Professor, University of Novi Sad, Technical faculty “Mihajlo Pupin”,
Zrenjanin, Serbia
Dejan Đorđević, Ph.D, Professor, University of Novi Sad, Technical faculty “Mihajlo Pupin”,
Zrenjanin, Serbia
Milan Nikolić, Ph.D, Professor, University of Novi Sad, Technical faculty “Mihajlo Pupin”,
Zrenjanin, Serbia – President of the Organizing Committee
Edit Terek Stojanović, Ph.D, Assistant Professor, University of Novi Sad, Technical faculty
“Mihajlo Pupin”, Zrenjanin, Serbia

IV
Organizing Committee:
Milan Nikolić, Ph.D, Professor, University of Novi Sad, Technical faculty “Mihajlo Pupin”,
Zrenjanin, Serbia - President of the Organizing Committee
Edit Terek Stojanović, Ph.D, Assistant professor, University of Novi Sad, Technical faculty
“Mihajlo Pupin”, Zrenjanin, Serbia – Vice President of the Organizing Committee
Dejan Đorđević, Ph.D, Professor, University of Novi Sad, Technical faculty “Mihajlo Pupin”,
Zrenjanin, Serbia
Dragan Ćoćkalo, Ph.D, Professor, University of Novi Sad, Technical faculty “Mihajlo Pupin”,
Zrenjanin, Serbia– President of the Program Committee
Sanja Stanisavljev, Ph.D, Assistant professor, University of Novi Sad, Technical faculty “Mihajlo
Pupin”, Zrenjanin, Serbia
Dragana Milosavljev, M.Sc, Assistant, University of Novi Sad, Technical faculty “Mihajlo Pupin”,
Zrenjanin, Serbia
Mihalj Bakator, Ph.D, Assistant, University of Novi Sad, Technical faculty “Mihajlo Pupin”,
Zrenjanin, Serbia
Verica Gluvakov, B.Sc, Teaching associate, University of Novi Sad, Technical faculty “Mihajlo
Pupin”, Zrenjanin, Serbia

V
INTRODUCTION
Department of Management and Technical faculty “Mihajlo Pupin” from Zrenjanin have started the
organization of International Symposium Engineering Management and Competitiveness (EMC) in
2011. Since 2013 the organization of the EMC symposium has been supported by the following foreign
partners: Szent István University, Faculty of Economics and Social Sciences, Gödöllő, Hungary,
Voronezh State University, Faculty of Economics, Voronezh, Russia and University of Montenegro,
Maritime Faculty, Kotor, Montenegro.
The objectives of the Symposium EMC are: presentation of current knowledge and the exchange of
experiences from the field of Engineering management, consideration of development tendencies and
trends in Serbia and the world as well, gathering researchers from this field with the aim of expanding
regional and international cooperation, raising the level of professional and scientific work at
Technical faculty “Mihajlo Pupin” from Zrenjanin, expanding cooperation with economic and
educational institutions and encouraging young researchers within this field. Taking into account that
this Symposium is international, the importance of this event is obvious for the town of Zrenjanin,
Banat region, Vojvodina and Serbia. Organization of EMC by the Technical faculty “Mihajlo Pupin”
from Zrenjanin represents this scientific-educational institution as one of the major representatives of
economic and social development in Banat.
Within this Proceedings all accepted papers received for XII International Symposium Engineering
Management and Competitiveness (EMC 2022) are presented. This year at the symposium we have 45
papers and 1 abstracts. The authors come from 9 countries: Bosnia and Herzegovina, Hungary, Iran,
Jamaica, North Macedonia, Russia, Slovenia, USA and Serbia. The papers are divided into seven
sessions: Plenary session, Session A: Management and operation management, Session B: Human
resource management, Session C: Marketing management, Session D: Economy, Session E: IT
Management, Session F: Abstracts.
We wish to thank the Technical faculty “Mihajlo Pupin” from Zrenjanin and the dean Prof. Ph.D
Dragica Radosav for their active role concerning the organization of the Symposium. We are also
expressing our gratitude to all authors who have contributed with their papers to the organization of
our twelfth Symposium EMC.
The EMC Symposiums become a traditional meeting of researchers in June, every year. We are open
and thankful for all useful suggestions which could contribute that the next International Symposium
Engineering Management and Competitiveness become better in an organizational and program
sense.
President of the Programming Committee
Professor Dragan Ćoćkalo, Ph.D.
Zrenjanin, June 2022.

VI
CONTENTS
Plenary session ...1
Ali Reza Afshari, Yasaman Mehran, Elaheh Tavakolian
IMPACT OF INTEGRATION MANAGEMENT ON MASHHAD CONSTRUCTION
PROJECTS MANAGEMENT PERFORMANCE ...3
Dragan Ćoćkalo, Dejan ĐorĊević, Mihalj Bakator, Sanja Stanisavljev,
Milan Nikolić, Edit Terek Stojanović
THE ROLE OF ENTREPRENEURSHIP IN NEW BUSINESS CONDITIONS ...11
Larisa Nikitina, Yuriy Treshchevskiy, Anton Prachenko, Sarkis Kazaryan, Sergey Tolochko
INNOVATIVE PROCESSES IN THE CONTEXT OF THE INSTITUTIONAL DYNAMICS
OF THE RUSSIAN REGIONS ...19
Dragana Sajfert, Jesa Kreiner, Ţivorad Vasić, Svetlana AnĊelić, Milorad Ţivković
RESEARCH ON THE IMPACT OF ETHICAL LEADERSHIP AND
EFFECT OF WORK ON REDUCING TURNOVER ...25
Marijana Vidas-Bubanja, SrĊan Bogetić, Cariša Bešić, Zoran Kalinić, Iva Bubanja
NEW KNOWLEDGE AND SKILLS FOR THE DIGITAL AGE ...31
Bruno Završnik
BOOKING AS A DIGITAL MARKETING CHANNEL IN TOURISM ...39
Session A: MANAGEMENT AND OPERATION MANAGEMENT ...45
Ali Reza Afshari, Ghazal Jamili Emami
CONSTRUCTION PROJECT COST MANAGEMENT USING BIM ...47
Ali Reza Afshari, Shirin Kardanimalekinezhad
CONSTRUCTION PROJECT DELAY MANAGEMENT ...54
Ali Reza Afshari, Sohrab Mohammadi
APPLICATION OF IOT TECHNOLOGIES IN THE HEALTH CARE 62
Ali Reza Afshari, Behsa Saeedi
CONSTRUCTION PROJECT FINANCING MANAGEMENT ...67
Zorana Antić, SrĊan Bogetić
TIME MANAGEMENT SKILLS - A CRITICAL ADVANTAGE IN PROFESSIONAL
AND PERSONAL DEVELOPMENT ...74
Dejan ĐorĊević, Mihalj Bakator, Dragan Ćoćkalo, Cariša Bešić, Ljiljana ĐorĊević
ANALYZING RESPONSIBILITY AND SUSTAINABILITY AS ASPECTS OF
THE MANAGEMENT PROCESS IN ENTERPRISES 80
Biljana Maljugić, Marija Matotek AnĊelić, SrĊanaTaboroši
RISK ANALYSIS AND RISK MANAGEMENT IN BUSINESS PRACTICE ...86
Vladan Paunović, Jasmina Vesić Vasović, Sanja Puzović
THE ANALYSIS OF OPPORTUNITIES TO USE THE LEAN CONCEPT
IN CONDITIONS OF INDUSTRIAL PRODUCTION ...92

VII
Vesna Spasojević Brkić, Mirjana Misita, Aleksandar Brkić, Zorica Veljković,
Martina Perišić, Neda Papić, Nemanja Janev
RISK MANAGEMENT AND EXCAVATOR DOWNTIME ANALYSIS ...98
Marija Stanojeska
INDUSTRY 4.0: AN INNOVATIVE SOLUTION FOR MONITORING THE PRODUCTION
PROCESS AND QUALITY CONTROL IN A TEXTILE FACTORY ...106
Marija Stanojeska, Robert Minovski, Bojan Jovanoski
ASSESSMENT OF THE VITALITY OF ORGANIZATIONAL LEARNING,
CUSTOMER FOCUS, AND CONTINOUS IMPROVEMENT IN MACEDONIAN
FOOD PROCESSING INDUSTRY FROM TQM PERSPECTIVE ...112
Ljiljana Stošić Mihajlović
OPERATIONAL MANAGEMENT OF PRODUCTION IN
SMALL AND MEDIUM ENTERPRISES IN SERBIA ...119
László Szabó
BLOCKCHAIN IN THE SUPPLY CHAIN ...125
Dijana Tadić
INFLUENCE OF QUALITY MANAGERS ON ORGANIZATION
QUALITY PERFORMANCES ...129
Session B: HUMAN RESOURCE MANAGEMENT ...135
Verica Gluvakov, Sanja Stanisavljev, Dragana Milosavljev,
Mila Kavalić, Maja Gaborov
OVERVIEW OF STUDIES RELATED TO THE IMPACT OF STRESS ON EMPLOYEE
PRODUCTIVITY AND STRESS MANAGEMENT IN COMPANIES ...137
Verica Gluvakov, Edit Terek Stojanović, Sanja Stanisavljev,
Dragana Milosavljev, Mila Kavalić
OVERVIEW OF STUDIES REGARDING THE IMPACT OF EMPLOYEE
MOTIVATION ON WORK PERFORMANCE 142
Predrag Mali, Bogdan Kuzmanović, Siniša Mitić,
Edit Terek Stojanović, Milan Nikolić
LEADERSHIP, EMPLOYEE JOB SATISFACTION AND FINANCIAL PERFORMANCE
OF THE ORGANIZATION ...146
Dragana Milosavljev, Verica Gluvakov, Mila Kavalić, Maja Gaborov,
Mlita Ćoćkalo-Hronjec, Luka ĐorĊević
THE IMPORTANCE OF CREATIVE POTENTIALS OF EMPLOYEES IN MODERN BUSINESS ...152
Dragana Sajfert, Svetlana AnĊelić, Milica N Jeremić
RESEARCH OF ESSENTIAL CHARACTERISTICS OF STUDENTS FOR
THEIR PLACEMENT IN THE POSITION OF STUDENT – DEAN ...157
Dijana Tadić
SELECTION OF CANDIDATE FOR ASSEMBLING BLINDS USING
THE TOPSIS METHOD ...163
Session C: MARKETING MANAGEMENT ...169
Anja Jakšić, Aleksandar Sofić, Branko Markoski, Slavko Rakić,
Ksenija Mitrović, Jelena Spajić
THE CONCEPT OF B2B CUSTOMER JOURNEY IN E-COMMERCE ...171

VIII
Milica Josimović, Milena Cvjetković
THE ROLE OF PUBLIC RELATIONS IN BUILDING A REPUTATION
AND COMPETITIVE ADVANTAGES ...176
Biljana Maljugić, SrĊanaTaboroši
THE ROLE OF PUBLIC RELATIONS IN CORPORATE SOCIAL RESPONSIBILITY ...181
SrĊana Taboroši, Aleksandra Kovaĉević, Biljana Maljugić
THE ROLE OF SOCIAL MEDIA IN THE DECISION-MAKING PROCESS ...187
Bruno Završnik
GAMBLING MARKETING COMMUNICATION ...192
Session D: ECONOMY ...197
Mihalj Bakator, Dejan ĐorĊević, Dragan Ćoćkalo,
SrĊan Bogetić, Sanja Stanisavljev
THE ROLE OF PRODUCTIVITY IN ACHIEVING COMPETITIVENESS ...199
Miloš Ivaniš, Ţivan Bajić
CHARACTERISTICS AND FACTORS OF INNOVATION OF SMALL
AND MEDIUM ENTERPRISES ...204
Miloš Ivaniš, Ţivan Bajić
INNOVATION CAPACITY OF SMALL AND MEDIUM ENTERPRISES ...209
Milica Josimović, Milena Cvjetković
THE ROLE OF THE CONCEPT OF SOCIETY 5.0 IN ACHIEVING
SUSTAINABLE DEVELOPMENT AND COMPETITIVENESS 214
Elena Joviĉić, Darko Marjanović
PERSPECTIVES ON THE STRENGTHENING OF THE SERBIAN EXPORT
COMPETITIVENESS IN THE POST-COVID PERIOD ...220
Stevan Luković, Miloš Pjanić, Boţidar Ĉakajac
THE ROLE OF INSURANCE COMPANIES IN THE SERBIAN FINANCIAL SYSTEM ...225
Darko Marjanović, Ivana Domazet, Elena Joviĉić
IMPACT OF THE COVID-19 PANDEMIC ON FOREIGN DIRECT INVESTMENT ...231
Nikola Milicevic, Nenad Djokic, Ines Djokic
CLIENT LOYALTY IN BANKING SECTOR ...237
Miloš Pjanić, Mirela Mitrašević, Stevan Luković
ANALYSIS OF THE CAPITAL MARKET OF THE REPUBLIC OF SERBIA ...242
Jelena Slavić, Jelena Vukajlović
APPLICATION OF THE INFORMATION TECHNOLOGY IN MITIGATION OF THE
PANDEMIC CRISIS CONSEQUENCES IN THE DOMESTIC ECONOMY ...248
Dijana Tadić
TRANSFORMATIONS OF SOCIETY AND REVOLUTIONS IN INDUSTRY -
A REVIEW OF THE REPUBLIC OF SERBIA ...254
Aleksandra Zhemkova
THE IMPACT OF CONSUMER DEMAND ON FIRMS’ PRODUCTIVITY ...259

IX
Session E: IT MANAGEMENT ...265
Vladimir Ilin, Nenad Saulić, Dragan Simić
INTERNET OF THINGS SYSTEM DESIGN IN SMART PARKING ARCHITECTURE ...267
Goran Janaćković, Dejan Vasović, Bojan Vasović
ON STANDARDIZATION IN THE FIELD OF USER INTERFACES ...272
Session F: ABSTRACTS ...279
Tashfeen Ahmad
ARTIFICIAL INTELLIGENCE AND BUSINESS MANAGEMENT:
OPPORTUNITIES AND CHALLENGES (ABSTRACT) 281
Author Index ...283

X

1
XII International Symposium Engineering Management and Competitiveness 2022 (EMC 2022)
17-18th June, Zrenjanin, Serbia
Plenary session
Papers (pp. 3-44):
Ali Reza Afshari, Yasaman Mehran, Elaheh Tavakolian
IMPACT OF INTEGRATION MANAGEMENT ON MASHHAD CONSTRUCTION
PROJECTS MANAGEMENT PERFORMANCE ...3
Dragan Ćoćkalo, Dejan Đorđević, Mihalj Bakator, Sanja Stanisavljev,
Milan Nikolić, Edit Terek Stojanović
THE ROLE OF ENTREPRENEURSHIP IN NEW BUSINESS CONDITIONS ...11
Larisa Nikitina, Yuriy Treshchevskiy, Anton Prachenko, Sarkis Kazaryan, Sergey Tolochko
INNOVATIVE PROCESSES IN THE CONTEXT OF THE INSTITUTIONAL DYNAMICS
OF THE RUSSIAN REGIONS ...19
Dragana Sajfert, Jesa Kreiner, Živorad Vasić, Svetlana Anđelić, Milorad Živković
RESEARCH ON THE IMPACT OF ETHICAL LEADERSHIP AND
EFFECT OF WORK ON REDUCING TURNOVER ...25
Marijana Vidas-Bubanja, Srđan Bogetić, Cariša Bešić, Zoran Kalinić, Iva Bubanja
NEW KNOWLEDGE AND SKILLS FOR THE DIGITAL AGE ...31
Bruno Završnik
BOOKING AS A DIGITAL MARKETING CHANNEL IN TOURISM ...39

2
3
XII International Symposium Engineering Management and Competitiveness 2022 (EMC 2022)
17-18th June, Zrenjanin, Serbia
IMPACT OF INTEGRATION MANAGEMENT ON MASHHAD
CONSTRUCTION PROJECTS MANAGEMENT PERFORMANCE
Ali Reza Afshari
Department of Construction Management, Shirvan Branch, Islamic Azad University, Shirvan, Iran
E-mail: [email protected]
Yasaman Mehran
Department of Construction Management, Mashhad Branch, Islamic Azad University, Mashhad, Iran
Elaheh Tavakolian
Department of Management, Shirvan Branch, Islamic Azad University, Shirvan, Iran
ABSTRACT
Construction project performance relies on different dimensions of project management. Among those,
integration management is of paramount importance since effective project management starts with the
integration of processes and people within a construction project. This study investigates the influence of various
components of project integration management on construction project management performance and quantifies
the relationship between those components and integration management. The proposed components of
integration management are the development of a project charter, knowledge integration, process integration,
staff integration, supply chain integration, and integration of changes; whereas the dimensions of project
management performance are time, cost, quality, safety, and client satisfaction. A questionnaire was designed
and administered to construction professionals and data from 121 projects was analyzed using structural equation
modeling. The data was analyzed by using software, called SPSS AMOS. The findings of the research indicate
that integration management has a strong impact on project management performance. The study contributes to
the project management body of knowledge in that it develops a conceptual framework consisting of specific
components for integration management, reveals the impact of integration management on performance, and
proposes several tools and strategies for enabling effective integration along the project life cycle. Industry
practitioners may benefit from the framework developed by considering the components proposed and following
strategies recommended for construction phases.
Key words: Construction management, Project Performance, Project Integration Management, Construction
Project management, Construction industry, Project management.
INTRODUCTION
Project integration management ensures the successful coordination among project activities. Asif et
al. (2010) mention integration as a deliberate process of developing a governance structure, which
makes the management of key stakeholder requirements more systematic. Project integration ensures
the proper coordination among project activities. Therefore, the impact of integration management on
project success should be well understood so that project managers might benefit from the positive
aspects of properly coordinated project activities. A major portion of existing research studies
(Halfawy and Froese, 2007; Ozorhon et al., 2014; Berteaux and Javernick-Will, 2015; Ospina-
Alvarado et al., 2016) has previously demonstrated the critical role of effective integration in project
management research. The Project Management Body of Knowledge Guide (PMBoK) lists the ten
main knowledge areas essential to project management and four additional areas in its Construction
Extension. Among those, project integration management is listed as the first knowledge area, which
involves combination, unification, and coordination processes of project management.
Because of the essential function of integration in project management, this study develops a
comprehensive framework which aims at illustrating the strong link between integration and project
management performance, which was not previously investigated. Within this perspective, the study

A.R. Afshari et al. / Impact of integration management on mashhad construction project...
4
proposes construction-specific components for integration management and measures project
management performance by means of different project success indicators. Moreover, a questionnaire
was designed based on the developed framework and administered to construction professionals in
Mashhad, Iran. The research investigates the hypothesized relationship between integration
management and project management performance and aims at measuring project management
performance according to the proposed indicators. To analyze the validity and the reliability of the
proposed measures for the framework, structural equation modeling (SEM) was used. The main
contribution of this study is to guide construction practitioners to adopt proposed measures for
integration and benefit from the strategies for integration in order to experience higher success rates.
CONSTRUCTION PROJECT PERFORMANCE
The impact of effective time management on enhanced project performance was highlighted in several
studies (Gayatri and Saurabh, 2013; Ngacho and Das, 2014). In Salazar-Aramayo et al.’s (2013) study, cost
was listed among the most important attributes of the project management model that they have developed.
Ali et al. (2013) emphasized that quality of work done is among the most important attributes of project
performance measurement. Popaitoon and Siengthai (2014) mentioned that project performance and
knowledge absorptive capacity of project teams are highly affected by project human resource management
practices. Badir et al. (2012) stated that communication is one of the key components of improved
performance. Hwang et al. (2014) revealed that effective risk management leads to improved project
performance. Eriksson and Westerberg (2011) indicated that collaborative procurement practices have a
positive influence on construction project performance. Stakeholder benefits and satisfaction were
demonstrated to be crucial for project success (Takim and Akintoye, 2002; Rad, 2003; Bassioni et al.,
2004) Moreover, Kagioglou et al. (2001) emphasized that stakeholder satisfaction is directly associated
with performance management in construction. Cheng et al. (2012) investigated the effect of safety
management practices on project performance in the construction industry. Montabon et al.'s (2007) study
revealed that there is a strong link between the effectiveness of project environmental management and
business performance. Akanni et al. (2015) stated that financial attributes are highly effective on project
performance. Halfawy and Froese (2007) presented a multitier component-based framework aiming to
facilitate the implementation of modular and distributed integrated project systems for supporting
multidisciplinary project processes through the project cycle. The main focus of the research was to
emphasize the required functionality and approach to developed integrated project systems. Within this
context, a framework was developed to define methods that have potential to improve the availability,
consistency, and integration of project information and processes. Ozorhon et al. (2014) focused on the
components of the innovation process. They defined the barriers of innovation including resistance to
change, inexperience, and unavailability of advanced products and they proposed integration of project
participants and effective leadership as one of the solutions to enhance the rate of innovation adoption.
However, the paper references one case study selected from the United Kingdom, so the conclusions made
could lead to diverse statements with different case studies. Berteaux and Javernick-Will (2015) indicated
that project-based organizations in the architecture, engineering, and construction (AEC) industry must
integrate knowledge and processes adapting to local environments. They investigated the challenges of
local adaptation and organizational integration processes by relating to project performance. They
concluded that projects having high integration result in richer information exchange than projects having
low integration. However, the research has a small sample size and organizational performance was not
included in the study, which is one of the limitations of the research. Ospina-Alvarado et al. (2016)
developed a framework for construction project integration by defining several attributes depending on
their critical importance. They proposed the framework as a useful tool for construction practitioners to
wisely use their resources for achieving a more integrated project. Despite the attributes mentioned in this
study such as coordination, collaboration, leadership, knowledge sharing, and trust, the paper still lacks a
complete understanding of integration attributes such as integration of changes and uncertainty
management in integration. These studies reported that projects experience higher success rates and
improved performance with the adoption of an integrative approach. However, these studies rather focused
on software integration, relational integration or contractual integration despite the fact that integration

EMC 2022, 17-18th June 2022, Zrenjanin, Serbia
5
must be evaluated as a core element encompassing different dimensions and impacting several other
variables in a project network.
The construction industry still suffers from poor project performance because of its nature where the work
is fragmented between different stakeholders and different sub-processes (Rahman and Kumaraswamy,
2004; Ospina-Alvarado and Castro-Lacouture, 2010; Harper, 2014). Moreover, previous studies lack a
complete understating of the relationship between integration and performance, which is essential to
successfully manage construction projects. However, the impact of integration management on project
management performance was not explicitly investigated in these studies; instead, they assess some of the
core components of integration on performance. There is no other study in the literature that proposes
construction specific components for integration management and analyzes the relationship between
integration and project management performance. Revealing this relationship may help construction
professionals to evaluate their projects with the essential parameters and understand the logic behind
project integration in the cases where it is hard to manage complex projects. It is essential for construction
practitioners to understand, quantify, visualize and simulate the components that affect construction work.
Hence, the need for conceptual framework arises to best reflect variables which influence construction
business. Construction is more challenging than other businesses in terms of its dynamic, fragmented and
complex nature since it requires involvement of different parties and successful management of processes.
This requires the development of well-set strategies and practices to compete against uncertainties and
risks. Cost and schedule variances might create undesired consequences, which lead to low customer
satisfaction. Therefore, it is crucial to determine underlying parameters that need to be addressed when
project success is of utmost importance. Several studies have been conducted to investigate performance
and its relation to different project management constructs. Vickery et al. (2003) mentioned the effects of
integrative supply chain on financial performance. Similarly, Kim (2006) investigated the linkage between
supply chain integration and firm performance. Mitchell (2006) rather considered the relationship between
knowledge integration and information technology performance. As reported, only a limited number of
studies the number reveal an explicit linkage between integration management and project management
performance. Crawford (2005) states that program or project directors, who use a high level of integration
and scope practices are more likely to be top performers. Huang and Newell (2003) also indicated that
knowledge integration is determined by three important components: the efficiency of integration, scope of
integration, and the flexibility of integration. Heising (2012) underlined the critical role of integration in
terms of project portfolio management. In addition, Mitropoulos and Tatum (2000) also indicated that
degree of project integration affects project performance. Previous research highlighted the essential
function of integration or its attributes on achieving a higher level of performance, success or innovation.
For example, Aronson et al. (2013) mentioned the impact of leader building activities and project spirit's
role on project success. Similarly, Ozorhon et al. (2014) listed integration and leadership as enablers in
construction innovation. Moreover, Crawford (2005) mentioned that project or program directors using
high level of integration and scope practices are more likely to be top performers in companies. Saraf et al.
(2007) implied that information integration with customers and business partners leads to better knowledge
sharing, which also results in business performance improvements. Berteaux and Javernick-Will (2015)
highlighted the organizational integration of knowledge, process, and strategy, informing that
organizational integration improves project performance through the capabilities developed on previous
projects and innovations across the organization, which helps the organization remain competitive. It is also
mentioned that integration of knowledge and processes improves project and organizational performance.
Since conceptualization and effective planning of projects are crucial, integration appears as a critical
component in the proper coordination of projects. As previously shown on above studies, integration is
strongly linked to the core elements and areas of project management. Hence, one might conclude that
integration has a clear and direct impact on project performance. Therefore, this study aims to fill this gap
by developing a framework picturing the core elements of integration and performance. The framework is
intended to reflect the relation between integration management and project management performance
based on the perceptions of construction companies.

A.R. Afshari et al. / Impact of integration management on mashhad construction project...
6
RESEARCH METHODOLOGY
The framework proposed in this study involves the components for integration management and
project management performance. In the initial step, based on a comprehensive literature review that
focused on studies regarding the integration management and performance, several components are
derived. Integration management and project management are factors and 17 components are derived
for these two factors. After conducting pilot studies with three university professors and two industry
practitioners, some of the components were either combined or removed to best reflect their
corresponding factors. Finally, a total of 11 components are obtained. The underlying components of
each factor are identified and explained below:
Figure 1: Link between integration management and project management performance
The following hypothesis is developed based on the strong evidence provided by the literature
considering the impact of integration management on project management performance.
H1: Effectiveness of “project integration management” has a direct and positive effect on “project
management performance” when controlling for project type and project size.
An online questionnaire was designed and administered to construction professionals in Mashhad
construction firms based on the proposed framework. The questionnaires were addressed to
Construction firms. From the 508 questionnaires sent, 121 were returned, where 22 were face-to-face
interviews, resulting in a response rate of 24%. Face-to-face interviews were conducted with 22
professionals to increase the response rate. Respondents were requested to fill in the questionnaires
considering the project management practices of their completed projects based on fourteen
knowledge areas. The collected data include information regarding 121 different construction projects,
which were undertaken by 82 different firms where some of the firms provided multiple data.
RESEARCH FINDINGS
The questionnaire collected data regarding the level of success achieved for each component.
Abbreviations were used for each component (I1 = Development of Project Charter, I2 =Knowledge
Integration, I3 = Process Integration, I4 = Staff Integration, I5 = Supply Chain Integration, I6 =
Integration of Changes). All components are rated around 3.5 and Cronbach's alpha value is calculated
as 0.896, which proves the reliability of the components in terms of explaining its construct. Also,
abbreviations were used for each component of project management performance (P1 = Time, P2 =
Cost, P3 = Quality, P4 = Safety, P5 = Client Satisfaction). It is seen that firms are more successful in
achieving “quality” in their projects. It is also shown that firms satisfy “safety” objectives as well as
“time”. The components omitted for the project integration management construct were: information
integration, scope integration, customer integration, and integration of project updates. After having
in-depth interviews with industry experts, university professors and based on subjective judgment,
some of the components were embedded in the other components since they were thought to be
repetitive for deciding on the core components. For example, information integration is evaluated part
of the knowledge integration by considering knowledge integration as a core component of integration

EMC 2022, 17-18th June 2022, Zrenjanin, Serbia
7
management. Similarly, scope integration and integration of project updates are evaluated part of
integration of changes since those represent the plan updates and changes in scope. Customer
integration is addressed in the context supply chain integration having a dominant role in supply chain
processes. Risk and scope were also selected as performance indicators in the first components matrix
but these two components were omitted since performance more relies on meeting cost, schedule,
quality, and safety objectives along with customer satisfaction. These two components were omitted
after taking expert opinions and in-depth literature review. Table 1 presents the factor loadings for the
latent and constituent variables of the model. Factor loadings for each factor prove that the all factors
are well represented by their variables.
Table 1: Latent and constituent variables of the model No Model variables Factor loadings
F1 Integration management
V1 Development of project charter 0.737
V2 Knowledge integration 0.813
V3 Process integration 0.851
V4 Staff integration 0.686
V5 Supply chain integration 0.708
V6 Integration of changes 0.763
F2 Project management performance
V7 Time 0.855
V8 Cost 0.729
V9 Quality 0.808
V10 Safety 0.755
V11 Client satisfaction 0.983
The hypothesis regarding the relation between integration and performance was validated. This reveals
the strong interaction between integration and performance. Integration is one of the most important
components of successful project execution. Hence, the construction industry is still in great need of
well-set practices and strategies. This study enlightens the critical role of integration management and
poses its clear link with project management performance. Based on the clear link between integration
management and project management performance, it is worth discussing the impact of individual
components of integration management on project management performance.
Development of Project Charter: Project charter is the document that authorizes the start of a project.
Therefore, it is critical to have the approval of the project charter on a timely manner. Provided with a high
factor loading (0.737), project charter is undoubtedly one of the most important components of integration
management affecting project success. PMI (2013) also implies the functionality of project charter in terms
of describing project manager's authority. Considering the role of project managers in project management
performance, one might conclude that projects managers are likely to achieve higher success in managing
projects where a solid project charter exists including clear and proper description of authorities.
Knowledge Integration: Knowledge exchange among stakeholders and project parties is crucial in terms
of project success. Heising (2012) also emphasizes that knowledge integration and ideation is essential in
sustainable success. Several research studies mentioned the essential role of knowledge integration in
project management performance (Schmickl and Kieser, 2008; Ritala and Hurmelinna-Laukkanen, 2009;
Song and Song, 2010; Brettel et al., 2011; Too, 2012). Provided with a high factor loading (0.813),
knowledge integration is concluded as a strong indicator of integration management. This leads to conclude
that firms achieving success in knowledge integration have potential to perform better in their projects.
Process Integration: Organized sequence of project activities and logical relationships within processes
frame process integration. Process integration may foster value creation when synthesized with human and
task integration (Birkinshaw et al., 2000). The role of process integration in project management
performance was also highlighted by several studies (Kleinschmidt et al., 2007). Provided with a high
factor loading (0.851), process integration is dominant in terms of explaining integration management. It is undeniable that firms implementing effective process integration activities are likely to achieve better

A.R. Afshari et al. / Impact of integration management on mashhad construction project...
8
performance in their projects. One might not discard the essential role of process integration in increased
success.
Staff Integration: Project staff constitutes an important place in project management success. Therefore,
integration of project staff, collaboration and coordination among them affect project management
activities. It is reported that integration increases team work effectiveness (Egan, 2002). Therefore,
composition of effectively working teams has a positive impact on project management performance.
Reported with a high factor loading (0.686), staff integration should be addressed properly in terms
experiencing higher levels of success. The necessity of staff integration as part of project management is
underlined in several studies (Carmeli and Meyrav, 2009; Zajac, 2009; Jonas, 2010; Tiller, 2012).
Supply Chain Integration: Supply chain is in the critical chain of construction activities in terms of
successful execution of projects. Its impact on project management is revealed in several studies (Gruner
and Homburg, 2000; Henard and Szymanski, 2001). Provided with a high factor loading (0.708), supply
chain integration is one of the core elements of integration management. The revealed link between
integration and performance makes supply chain integration as one of the most important components to be
addressed when firms desire to achieve higher rates of success.
Integration of Changes: Changes might create uncertainties in project management. Thus, timely handling
of changes is essential to the success of a project. Integration of changes covers activities such as review
and evaluation of change requests, modifications, and updates in project management plan. Research
studies underlined that integration of changes is of utmost importance to experience better performance in
managing projects (Hassner-Nahmias and Crawford, 2008; Cummings and Worley, 2009; Soderlund,
2010). Reported with a high factor loading (0.763), integration of changes becomes essential in integration
management. This might be interpreted as firms should carefully address integration of changes when
higher rates of success are desired.
CONCLUSION
This study investigates the relation between integration management and project management
performance. In this perspective, a set of construction-specific components were proposed for
integration and performance constructs. Data was collected from 121 projects through a questionnaire
survey. SEM was used to validate the framework and test the hypothesis of a possible relation between
integration and performance in addition to the potential impact of better integration management on
improved project management performance. Findings of the study reveal that integration management
has a considerable impact on project management performance, and it is suggested that this link is of
considerable strength. When past studies are examined for the exposition of this link, it is indicated
that there is a gap in the literature and the impact of integration management needs special emphasis.
Hence, this study demonstrates the core component of integration management with its construction
specific components and clearly visualizes the strong tie between integration and performance. With
respect to the strong influence of integration management on the project management performance, it
is essential that project managers effectively coordinate the processes and relevant parties. The
proposed project management performance framework could be used by project managers in the
construction industry to devise and implement effective strategies. It could be used to ensure project
success prior to the start of a project, as well as a post project evaluation tool upon the completion of a
project. The main limitations of this study are that the data was collected from Mashhad, Iran
companies and it reflects their experiences and opinions, and the proposed strategies are recommended
based on their needs. In this respect, data from different projects undertaken by different companies
might result in varying findings. In addition, the research also has some limitations in that some of the
performance measures are subjective measures, which were identified based on an extensive literature
review and expert opinions. Different measures might affect the results of the study. Information
regarding procurement methods of the project was not gathered in the questionnaire. Therefore, this
appears as another limitation of the study since different procurement methods might affect integration
management and in turn project management activities.

EMC 2022, 17-18th June 2022, Zrenjanin, Serbia
9
REFERENCES
Akanni, O.P., Oke, A.E., Akpomiemieb, A.O., (2015). Impact of environmental factors on building project
performance in Delta State, Nigeria. HBRC J. 11 (1), 91–97.
Ali, M.A.E.H., Al-Sulaihi, A.I., Al-Gahtani, S.K., (2013). Indicators for measuring performance of building
construction companies in Kingdom of Saudi Arabia. J. King Saud Univ. Eng. Sci. 25 (2), 125–134.
Aronson, Z.H., Shenhar, A.J., Patanakul, P., (2013). Managing the intangible aspects of a project: quantitative
and qualitative evidence on the effect of vision, artifacts, and leader values on project spirit and success in
technology driven projects. Proj. Manag. J. 44 (1), 35–58.
Asif, M., Fisscher, O.A.M., de Bruijn, E.J., Pagell, M., (2010). Integration of management systems: a
methodology for operational excellence and strategic flexibility.
Badir, F.Y., Buchel, B., Tucci, L.C., (2012). A conceptual framework of the impact of NPD project team and
leader empowerment on communication and performance: an alliance case context. Int. J. Proj. Manag. 30
(8), 914–926.
Bassioni, H.A., Price, A.D.F., Hassan, T.M., (2004). Performance measurement in construction. J. Manag. Eng.
20 (2), 42–50.
Berteaux, F., Javernick-Will, A., (2015). Adaptation and integration for multinational project-based
organizations. J. Manag. Eng. 31 (6), 04015008.
Birkinshaw, J., Bresman, H., Hakanson, L., (2000). Managing The post-acquisition integration process: how the
human integration and task integration processes interact to foster value creation. J. Manag. Stud. 37 (3),
395–425.
Brettel, M., Heinemann, F., Engelen, A., Neubauer, S., (2011). Cross-functional integration of R&D, marketing
and manufacturing in radical and incremental product innovations and its effects on project effectiveness
and efficiency. J. Prod. Innov. Manag. 28 (2), 251–269.
Carmeli, A., Meyrav, Y., (2009). How top management team behavioral integration and behavioral complexity
enable organizational ambidexterity: the moderating role of contextual ambidexterity. Leadersh. Q. 20 (2),
207–218.
Cheng, E.W.L., Ryan, N., Kelly, S., (2012). Exploring the perceived influence of safety management practices
on project performance in the construction industry. Saf. Sci. 50 (2), 363–369.
Crawford, C.B., (2005). Effects of transformational leadership and organizational position on knowledge
management. J. Knowl. Manag. 9 (6), 6–16.
Cummings, T., Worley, C., (2009). Organization, Development and Change. South-Western Cengage Learning,
Mason, OH.
Egan, J., (2002). Accelerating Change. Department of the Environment, Transport and the Regions, London.
Eriksson, P., Westerberg, M., (2011). Effects of cooperative procurement procedures on construction project
performance: a conceptual framework. Int. J. Proj. Manag. 29 (2), 197–208.
Gayatri, V., Saurabh, K., (2013). Performance indicators for construction project. Int. J. Adv. Electr. Electron.
Eng. 2 (1), 61–66.
Gruner, K.E., Homburg, C., (2000). Does customer interaction enhance new product success? J. Bus. Res. 49
(1), 1–14.
Halfawy, M., Froese, T., (2007). Component-based framework for implementing integrated
architectural/engineering/construction project systems. J. Comput. Civ. Eng. 21 (6), 441–452.
Harper, C.M., (2014). Measuring Project Integration Using Relational Contract Theory. (Ph.D. dissertation).
Univ. of Colorado at Boulder, Boulder, CO.
Hassner-Nahmias, A., Crawford, L.H., (2008). Project manager or change manager: who should be managing
organizational change? Proceedings of the PMI Research Conference, Warsaw Poland. Project
Management Institute, Newtown Square, Pennsylvania
Heising, W., (2012). The integration of ideation and project portfolio management - a key factor for sustainable
success. Int. J. Proj. Manag. 30 (5), 582–595.
Henard, D.H., Szymanski, D.M., (2001). Why some new products are more successful than others. J. Mark. Res.
38 (3), 362–375.
Huang, J.C., Newell, S., (2003). Knowledge integration processes and dynamics within the context of cross-
functional projects. Int. J. Proj. Manag. 21 (3), 167–176.
Hwang, G.B., Zhao, X., Toh, P.L., (2014). Risk management in small construction projects in Singapore: status,
barriers and impact. Int. J. Proj. Manag. 32 (1), 116–124.
Jonas, D., (2010). Empowering project portfolio managers: how management involvement impacts project
portfolio management performance. Int. J. Proj. Manag. 28 (8), 818–831.
Kagioglou, M., Cooper, R., Aouad, G., (2001). Performance management in construction: a conceptual
framework. Constr. Manag. Econ. 19 (1), 85–95.

A.R. Afshari et al. / Impact of integration management on mashhad construction project...
10
Kim, S., (2006). Effects of supply chain management practices, integration and competition capability on
performance. Supply Chain Manag. Int. J. 11 (3), 241–248.
Kleinschmidt, E.J., De Brentani, U., Salomo, S.R., (2007). Performance of global new product development
programs: a resource-based view. J. Prod. Innov. Manag. 24 (5), 419–441.
Mitchell, V., (2006). Knowledge integration and information technology project performance. Manag. Inf. Syst.
Q. 30 (4), 919–939.
Mitropoulos, P., Tatum, C., (2000). Management-driven integration. J. Manag. Eng. 16 (1), 48–58.
Montabon, F., Sroufe, R., Narasimhan, R., (2007). An examination of corporate reporting, environmental
management practices and firm performance. J. Oper. Manag. 25 (5), 998–1014.
Ngacho, C., Das, D., (2014). A performance evaluation framework of development projects: an empirical study
of constituency development fund cumulative distribution function construction projects in Kenya. Int. J.
Proj. Manag. 32 (3), 492–507.
Ospina-Alvarado, A., Castro-Lacouture, D., (2010). Interaction of processes and phases in project scheduling
using BIM for A/E/C/FM integration. Proceedings of Construction Research Congress, (2010, pp. 939–948
(Alberto, Canada).
Ospina-Alvarado, A., Castro-Lacouture, D., Robert, J.S., (2016). Unified framework for construction project
integration. J. Constr. Eng. Manag. 142 (7), 04016019.
Ozorhon, B., Abbott, C., Aouad, G., (2014). Integration and leadership as enablers of innovation in construction:
case study. J. Manag. Eng. 30 (2), 256–263.
PMI, (2013). A Guide to the Project Management Body of Knowledge. Project Management Institute, Newtown
Square, PA.
Popaitoon, S., Siengthai, S., (2014). The moderating effect of human resource management practices on the
relationship between knowledge absorptive capacity and project performance in project-oriented
companies. Int. J. Proj. Manag. 32 (6), 908–920.
Rad, P.F., (2003). Project success attributes. Cost Eng. 45 (4), 23–29.
Rahman, M., Kumaraswamy, M., (2004. Contracting relationship trends and transitions. J. Manag. Eng. 20 (4),
147–161.
Ritala, P., Hurmelinna-Laukkanen, P., (2009). What's in it for me? Creating and appropriating value in
innovation-related coopetition. Technovation 29 (12), 819–828.
Salazar-Aramayo, J., da-Silveira, R., de Almeida, R.M., de Castro-Dantas, T., (2013). A conceptual model for
project management of exploration and production in the oil and gas industry: the case of a Brazilian
company. Int. J. Proj. Manag. 31 (4), 589–601.
Saraf, N., Langdon, C.S., Gosain, S., (2007). IS application capabilities and relational value in interfirm
partnerships. Inf. Syst. Res. 18 (3), 320–339.
Schmickl, C., Kieser, A., (2008). How much do specialists have to learn from each other when they jointly
develop radical product innovations? Res. Policy 37 (6/7), 1148–1163.
Soderlund, J., (2010). Pluralism in project management: navigating the crossroads of specialization and
fragmentation. Int. J. Manag. Rev. 13 (2), 153–176.
Song, L.Z., Song, M., (2010). The role of information technologies in enhancing R&D-marketing integration: an
empirical investigation. J. Prod. Innov. Manag. 27 (3), 382–401.
Takim, R., Akintoye, A., (2002). Performance indicators for successful construction project performance.
Proceedings of 18th Annual ARCOM Conference, 2–4 September, University of North Umbria.
Association of Researchers in Construction Management. vol. 2, pp. 545–555.
Tiller, S., (2012). Organizational structure and management systems. Leadersh. Manag. Eng. 12 (1), 20–23.
Too, E.G., (2012). Capability model to improve infrastructure asset performance. J. Constr. Eng. Manag. 138
(7), 885–896.
Vickery, S., Jayaram, J., Droge, C., Calantone, R., (2003). The effects of an integrative supply chain strategy on
customer service and financial performance: an analysis of direct versus indirect relationships. J. Oper.
Manag. 21 (5), 523–539.
Zajac, C., (2009). Barriers to cultural and organizational integration in international holding groups - nature,
scope and remedial measures. J. Int. Manag. 1 (2), 50–58.

11
XII International Symposium Engineering Management and Competitiveness 2022 (EMC 2022)
17-18th June, Zrenjanin, Serbia
THE ROLE OF ENTREPRENEURSHIP IN NEW BUSINESS
CONDITIONS
Dragan Ćoćkalo
University of Novi Sad, Technical Faculty “Mihajlo Pupin” in Zrenjanin, Republic of Serbia
Dejan Đorđević
University of Novi Sad, Technical Faculty “Mihajlo Pupin” in Zrenjanin, Republic of Serbia
Mihalj Bakator
University of Novi Sad, Technical Faculty “Mihajlo Pupin” in Zrenjanin, Republic of Serbia
E-mail: [email protected]
Sanja Stanisavljev
University of Novi Sad, Technical Faculty “Mihajlo Pupin” in Zrenjanin, Republic of Serbia
Milan Nikolić
University of Novi Sad, Technical Faculty “Mihajlo Pupin” in Zrenjanin, Republic of Serbia
Edit Terek Stojanović
University of Novi Sad, Technical Faculty “Mihajlo Pupin” in Zrenjanin, Republic of Serbia
ABSTRACT
The globalized economy brought challenges to companies and countries across industries. As competitive
relations intensify, the achieving competitiveness is a struggle for the majority of enterprises. The new
conditions that define the modern business environment are affected by the global economic crisis, the
coronavirus pandemic, and the rapid development of modern ICTs. In such conditions, companies have to
address new business models. From here, entrepreneurship presents an impactful way of increasing
competitiveness of companies, which further can increase national competitiveness. In this paper, the
entrepreneurship economy model is discussed. In addition, the underlying mechanisms of Society 5.0 are
analyzed. The paper presents a model of domestic entrepreneurial economy development levels and elaborates
on which level requires what kind of improvements. This way, a significant insight into the potential of the
domestic entrepreneurial economy is provided.
Key words: Entrepreneurship, Society 5.0, Organization, Business, Competitiveness.
INTRODUCTION
The globalization of economy is the reality of the modern world. Globalization has led to an increase in the
number of competitors on the international market, which affects the intensification of competitive
relations. On the global market, enterprises face numerous challenges on a daily basis. These challenges are
related to establishing an adequate competitive advantage. Competitiveness on the global market is based
not only on innovation, but also on the price component and standardized product quality. The global
economic crisis has pointed to the fact that it is necessary to create new business models. Market turbulence
has become a new business reality. Today, business is taking place within the framework of the fourth
technological revolution - Industry 4.0 (Bakator et al., 2019). Transformations on the market are changing
the way individuals, governments and enterprises establish relationships with each other. Advanced
information-communication technologies (ICTs) that characterize Industry 4.0 significantly contribute to
the globalization of the economy, and presents one of the main sources of dynamic changes (Fukuda,
2019). On a global level, guidelines for sustainable development are defined, which should establish a
balance between the goals of economic development and social development, taking into account the need
for improvement and protection of the environment.
Furthermore, the crisis caused by the COVID-19 pandemic during 2020 and 2021 pointed to the need to
change and improve the business philosophy of modern business organizations. The global economy has

D. Ćoćkalo et al. / The role of entrepreneurship in new business conditions
12
shown fragility in the face of border closures, declining trade volumes and almost complete cessation of
some business sectors such as global tourism and transport. According to Ferguson (CNBC, 2021), the
pandemic makes the world divided, undermining globalization and multilateral institutions. The crisis
caused by the global pandemic could not have been predicted, which will affect the fact that its negative
effects will be greater in the future. Industrial nations have to deal with dangerous economic mega-trends
including rising energy and raw material prices (this trend will continue in the coming years despite some
fluctuations, because newly industrialized countries require resources for their own development), rising
prices of higher-end industrial product finalization, which will further affect the decline in the purchasing
power of industrialized countries.
On the other hand, further progress can be seen in the newly industrialized countries, primarily China, but
also India. These countries have based their development on a strong entrepreneurial commitment. The
economic center of the world is moving towards the Pacific. Today, it is obvious that the leader of the
Pacific region is China and that the main axis of cooperation in the world is China-USA. The biggest trade
is on both sides of the Pacific. The Shanghai region and Southern California are at the center of economic
attention in the global economy. The experiences of the countries of this region indicate the importance of
the nation's entrepreneurial determination.
The modern economy is turning to digital transformation. Digital transformation is changing the way we
think about competition, and it changes the mechanisms through which innovations are introduced in
business strategies. This also affects and changes the way of thinking when it comes to creating value for
the client.
In this paper, the aim is to present a model of potential domestic entrepreneurial economy development
levels. The various requirements of improvement translate into different levels of potential development.
This way a concise and significant overview on the potential of the domestic entrepreneurial economy
development is obtained. The paper consists of four main sections (excluding the Introduction and
Conclusion sections). The first section address current trends in entrepreneurship. Next, entrepreneurship
and Society 5.0 is analyzed. The third section discusses entrepreneurship in Serbia, and presents the
entrepreneurial development model. Finally, suggestions and guidelines for improving and developing an
entrepreneurial economy are discussed.
TRENDS IN ENTREPRENEURSHIP
The modern economy can be viewed as the economy of entrepreneurship. Private entrepreneurship is one
of the central phenomena of the economy, along with the market economy and free competition.
Entrepreneurial behavior is ubiquitous today in all forms of business and social life. In the economy of
entrepreneurship, all individuals should behave entrepreneurially. Entrepreneurial behavior should be
practiced regardless of employment status, meaning that self-employed, owners, or employees of an
enterprise should think and act in an entrepreneurial manner. According to some understandings (Đorđević,
& Ćoćkalo 2012), managing an enterprise is an entrepreneurial activity. Entrepreneurial behavior is a way
of thinking, determined by a creative and innovative approach to business.
The development of entrepreneurship and entrepreneurial behavior became especially important in the
early 1990s with the economic transformation of the socialist planned economies of Eastern Europe, as
well as with the economic transformation of China. At the beginning of the eighties of the twentieth
century, China opted for economic reforms, the center of which was entrepreneurship. The economy is
opening up to small entrepreneurs who can sign contracts with foreign companies without permits. In
practice, China is guided by Deng Xiaoping's famous maxim that "development is the only truth heard" and
that "it doesn't matter if a cat is black or white as long as it hunts mice", which translated into plain
language means: do whatever it takes to stimulate economic progress (Harari, 2018). Chinese President Xi
Jinping (Jiping, 2019) believes that China has achieved development in a few decades, which developed
countries took several centuries to achieve. This is the most amazing achievement in the history of the
world.

EMC 2022, 17-18th June 2022, Zrenjanin, Serbia
13
Chinese entrepreneurs are among the best in the world, and the same can be said for most Far Eastern
countries. Entrepreneurship development has been key to changing the economic behavior of both
individuals and business organizations in all Central and Eastern European countries, China and Russia.
The main role of entrepreneurship in the modern economy is reflected in innovative activities that create
conditions for technological development, the formation of flexible organizations and new employment.
Entrepreneurship, new technology and a strong state are key concepts for new and sustainable growth.
What is especially important is the fact that in the modern economy, an entrepreneur no longer has to be an
individual who owns a business. An entrepreneur can also be an individual who is employed by an
employer. According to Drucker (2003), business in an organization, regardless of size, must be managed
in an entrepreneurial way, in order for a company to become an entrepreneurial organization. The corporate
entrepreneurship model emphasizes teamwork and the members are motivated to work on achieving
success and accepting risks. In the economy of entrepreneurship, all individuals should behave
entrepreneurially. Additionally, all organizations, regardless of their activities and which type of industry
they belong to, should also behave entrepreneurially and continuously apply the basic postulates of
entrepreneurship. It is important to note that there are significant differences entrepreneurs/entrepreneurial
actions and business owners/business owning. These differences are presented in Table 1.
Table 1: Differences between entrepreneurship and owning a small business Approach/objective Owner of a small business Entrepreneur
Primary focus and motivation Make a living/financial stability Make an impact and promote change
Financial goal Regular income and cash flow Exit value of the enterprise
Career path objective Self-employment Financial freedom
Financing strategy Own assets or bank loans Investors
Business model and strategy Creating more sales and
revenue
Creating and providing value
Asset focus Real estate and inventory Customers and employees
Aversion to risk taking Focus on stability Preparedness and willingness to fail
Employee compensation Market rate or less Willing to pay for top talent
Work flow and work
environment
Extension of owner's residence Focus on fast-paced growth
Investment Owner of the company Involvement in different enterprises
Operational actions on a daily
basis
Day to day planning Growth, strategic collaboration
Work style No changes long-term,
repetitive
Short-term, lots of changes,
innovations
(Source: Oražem, 2014)
Based on Table 1., it is evident that entrepreneurship differs from traditional business owning. This also
indicates that simply owning a business doesn't necessarily drive innovation and economic prosperity on a
larger scale. Further, companies must consciously and organize and apply the entrepreneurial concept and
behave entrepreneurially, and to consciously embark on the process of innovation. The company must
establish such a system of connections and relationships in the company that will allow focusing on
entrepreneurial behavior. Entrepreneurial management is management focused on:
constant development and change,
creating and using opportunities for new business ventures,
accepting risks in innovating business and improving business performance,
finding new business potentials and opportunities,
developing and implementing a strategy for constant change and innovation.
Furthermore, according to some analysis (2010), older people will work harder, due to shifts in the leading
generations, as well as due to wider access to databases. Some governments have raised the retirement age,
and on the other hand, low interest rates and the collapse of defined benefit pensions will mean that many
people over the age of 65 will not have enough money to enjoy retirement benefits. This fact can change
the way we do business, so more and more people can start working for themselves. The main weapon of

D. Ćoćkalo et al. / The role of entrepreneurship in new business conditions
14
this group of people is experience, knowledge and networks of acquaintances, and they will probably have
more time and money compared to younger entrepreneurs.
On the other hand, in the last ten years, in developed countries, especially in EU countries, more and more
young people are deciding to start their own business and start entrepreneurship, especially in the service
sector and IT sector.
ENTREPRENEURSHIP WITHIN THE FRAMEWORK OF SOCIETY 5.0
Modern society is moving towards a new phase of its development, which can be characterized as Society
5.0. The concept of Society 5.0 is based on science and technology, as well as key development factors.
Tisen et al. (2006) believe that people live in a period of transition - the transition from the last days of the
industrial economy to the first days of the knowledge economy. Society is moving from automated
movement to automated knowledge. The service sector is becoming the main point to which attention is
focused. Employment in that area is growing, while in every other industry it is declining.
Society 5.0 puts man at the center and tries to balance economic benefits with solving social problems. It
includes a high degree of integration of physical and cyberspace. It is obvious that technology is the most
important factor that enables the movement of society towards this phase of development. Technology is an
essential factor in the development of the economy and society. In addition to technology, this society
implies a high degree of creativity of each individual, primarily those who are employed or who are
entrepreneurs. Organizations are based on knowledge and strive to constantly improve the productivity of
knowledge.
Advanced technology is one of the main pillars of the competitiveness of the economy. The basis of
advanced technology in science and the importance of research and development means the presence of a
significant number of researchers and engineers, but also a highly skilled workforce in companies that
develop and apply high technology. On the other hand, some authors, such as the famous British economic
historian and Harvard professor Niall Ferguson (2016), believe that the achievements of the last twenty-five
years were not so impressive, compared to what humanity achieved between 1935 and 1986. The speed of
traveling has dropped since the time of the Concord, and green energy is expensive. More information and
high volume information is not adequate for development.
The fifth industrial revolution - Industry 5.0 includes three elements: human focus, sustainability and
resilience. Doing Business in Industry 5.0 will mean creating such business models that include the
constant growth of business productivity and the creation of competitiveness, but also the need to create
environmental and social value. From an economic aspect, this implies achieving profitability and scaling
economies with business models that are socio-centric, while from an environmental aspect the aspect it
implies sustainability (development of circular economy). In Table 2. the changes from Society 4.0 to
Society 5.0 and its implications on entrepreneurship are presented.
Table 2: Changes from Society 4.0 and Society 5.0 and their implication on entrepreneurship Society 4.0 Society 5.0 Entrepreneurship implication
Economies of scale Problem solving and value
creation
Focus on creating and providing value for
customers
Uniformity Diversity Application of diverse abilities and
development of skills
Concentration Decentralization Seizing opportunities and taking chances
Vulnerability Resilience Taking more chances with less overhead
risk
High environmental impact Sustainability Focusing on change and green approaches
(Source: Hysa et al., 2021)

EMC 2022, 17-18th June 2022, Zrenjanin, Serbia
15
The changes that characterize Society 5.0 also affect the transformation of Industry 4.0 into Industry
5.0. The new business conditions dictate how entrepreneurship has to change in accordance with
sustainability. Economies of scale have to transform into economies that drive value and
sustainability. This further indicates the change towards an entrepreneurial economy.
ENTREPRENEURSHIP IN SERBIA AND ENTREPRENEURIAL ECONOMY
After the beginning of economic reforms in 2001, there was a process of economic transition. An
essential part of the economic reforms after 2001 was the privatization and liberalization of economic
relations, as was the case with the 1989 reforms. That is when there was a significant development of
entrepreneurship on the Serbian market. During that period, it seemed that a new economic
environment was being created that would enable fast and comprehensive development of
entrepreneurship and entrepreneurial initiatives. With the beginning of the world economic crisis in
2008, there was a slowdown in entrepreneurial initiative and entrepreneurial activities in the domestic
market.
What has always been dominant in the domestic economy (at least since the early 1990s until today) is
the phenomenon that entrepreneurship is tied to real private capital, which is invested in the SME
sector, and thus limited to less financial investments. Entrepreneurship has not been comprehensively
treated as an opportunity for an entrepreneurial initiative of an individual to enable the emergence of
large corporations, which will eventually become market leaders. In the domestic market,
entrepreneurship was positively viewed only in the context of the development of small and medium
enterprises and the ability of these companies to be shock absorbers for the transition recession -
primarily viewed from the aspect of creating new jobs and employment.
Serbia inherited an incomplete market system (functioning of the goods / services market, without the
existence of the labor market and the capital market), as well as a relatively fragmented model of
ownership over economic entities (state, social, private and cooperative ownership), which coexisted
but in unequal proportion). Additionally, the previous economic system had relatively little experience
with private entrepreneurship, which is equally accessible to all interested individuals (1989-1992).
On the other hand, most of the capital is still in the hands of the state and the state is still the largest
employer in the Republic of Serbia. Further, labor productivity in public companies is significantly
lower compared to productivity in the private sector.
The turn of the domestic economy towards the development of information and communication
technologies has in a way revived the entrepreneurial sector, which has been in stagnation since the
world economic crisis. The opening of new, small companies in the domain of information technology
significantly influenced the strengthening of the idea from an economic aspect that developing
entrepreneurship is an imperative. On the other hand, too much was expected from this area of
business on the domestic market. The group of small and medium enterprises on the domestic market
is dominated by companies in the field of trade and classic services (traffic, construction), and the
processing industry is dominated by the food industry, wood industry and machinery industry. The
development of entrepreneurship in the conditions of the modern market and the transition of the
economy and society towards the new phase of its development should be focused on the application
of modern technological achievements in all areas of business and digitalization of business.
Entrepreneurship alone needs to be technology-oriented. IT start-ups are just one of the types of
entrepreneurial activity, and the essence is to improve the technical and technological basis of
business, especially in the group of small and medium enterprises. The entrepreneurial economy is
different compared to the management economy, thus changes are necessary on multiple fronts. In
Table 3. the differences between an entrepreneurial economy and a economies of scale are presented.
D. Ćoćkalo et al. / The role of entrepreneurship in new business conditions
16
Table 3: Differences between entrepreneurial economies and economies of scale Category Economy of scale Entrepreneurial economy
Underlying macro-factors Globalization of markets
Jobs and high wages
Change
Localization
Business environment Specialization
Stability and status quo
Homogeneity
Diversity
Turbulence
Heterogeneous
Way of conducting business Controlled
Competing or collaborating
Scaling business
Market exchange
Motivation driven
Flexibility and adaptability
Government policies Output targeting
National locus
Constraining
Focus on output
Local locus
Entrepreneurship support
Enabling
Focus on input
(Source: Kuura,2006; Moyle et al., 2020)
Furthermore, on Figure 1. the potential of domestic entrepreneurial economy development is presented.
Figure 1: Potential levels of domestic entrepreneurial development (Source: Authors)
The presented potential levels of entrepreneurial economy development require improvements and changes
in multiple domains. First (1), the current state of the domestic economy and its entrepreneurship potential
are inadequate due to lack of sustainability, low productivity, low quality, lack of modern management
practices, lack of adequate government support, and old manufacturing equipment. Next, the levels of
entrepreneurial economy development depend on multiple factors and changes. These are not mutually-
exclusive, and all factors within one level have to be addressed in order to go to the next level. Here, the
lowest level (4) includes the implementation of ICTs, innovation, improved management practices, and
more fluent bureaucratic processes. The next level (3) indicates the necessity for newer manufacturing
equipment, strong government support, improving employees' knowledge and skills, and creating and
providing value to customers and users. Finally, the highest level (2) of entrepreneurial economy

EMC 2022, 17-18th June 2022, Zrenjanin, Serbia
17
development includes systematic improvements such as sustainability, entrepreneurial education,
entrepreneurial climate, and cluster formation between enterprises. The different levels of entrepreneurial
economy development correspond to the size of entrepreneurial change which starts in a micro-setting
(enterprise/entrepreneur) a expands to a macro-setting (national level entrepreneurship initiatives).
SUGGESTION AND GUIDELINES
Based on the discussed dynamics and importance of entrepreneurship, Society 5.0, and the overall new
conditions of conducting business the following most important directions of action in the function of the
development of an entrepreneurial economy are proposed:
Limiting the operation of the bureaucratic apparatus, bureaucracy;
Creating equal business conditions for all;
Establishing an entrepreneurial climate on national economic level;
Faster application of information and communication technologies within SMEs;
Improving entrepreneurial knowledge and skills.
What many do not understand when it comes to the domestic economy is that entrepreneurship is not just a
small business. An entrepreneur is equally an individual who owns a small business, as well as the owner
of a small or large company. An entrepreneur is also a director who manages a private business on behalf
of the owner of the capital. Entrepreneurship is a way of behaving in a market economy that is determined
by innovation and risk-taking.
For the development of entrepreneurship at the level of one national economy, it is especially important to
establish a stable economic situation (Ćoćkalo et al., 2020). Creating a secure political and economic
situation gives security to potential entrepreneurs for their business, especially to domestic investors.
Insufficient and stimulating business environment is the main reason for the involuntary development of
entrepreneurship on the domestic market.
It is obvious that domestic managers, especially in SMEs, do not have modern knowledge and skills to
successfully run their business organizations. In addition to the necessity for applying modern management
methods and techniques, domestic entrepreneurs must improve various skillsets. According to the research
of the World Economic Forum (WEF, 2020), critical thinking and solving business problems, creativity
and adequate human resource management, as well as coordination, are certainly important skills that will
be important in the future.
Overall, entrepreneurship is more than just conducting business. It involves the innovative actions that take
resources and transform them into products and services, which further provides value to the customer.
When the concept of sustainability is taken into consideration, then the process of obtaining and
transforming resources has to be in accordance with the sustainable development goals. More precisely,
economic goals have to be in balance with environmental aspects of conducting business.
CONCLUSION
The global market, the permanent development of technology, as well as the observed economic and social
effects of the global pandemic, require a new approach to managing business systems, and a new approach
for addressing behaviors between all individuals in the economic process. The experiences of companies
that have managed to amortize the effects of the economic decline during 2020 and 2021, indicate the need
for creative thinking in the function of problem solving, flexible market operations and good human
resource management, etc.
It can be concluded that the speed of change in the global market affects the increasing importance of
innovative action and flexibility in business. In that sense, entrepreneurship is today the basic model of
behavior of all organizations, regardless of the nature of the activity. The development of entrepreneurship

D. Ćoćkalo et al. / The role of entrepreneurship in new business conditions
18
in the modern market and the transition of the economy and society to a new phase of its development
should be focused on the application of modern technological achievements in all areas of business. This
also includes the digitalization of business, the application of modern management methods and skills, and
entrepreneurs in the new society. For future research, it is recommended to collect survey data from
enterprises to determine potential internal entrepreneurial intentions among employees. In addition,
intentions regarding advanced ICT implementation, and sustainable business strategy adoption can be
investigated.
ACKNOWLEDGEMENT
This paper has been supported by the Provincial Secretariat for Higher Education and Scientific
Research of the Autonomous Province of Vojvodina, number: 142-451-2706/2021-01.
REFERENCES
Bakator, M., Đorđević, D., & Ćoćkalo, D. (2019). Developing a model for improving business and
competitiveness of domestic enterprises. Journal of Engineering Management and Competitiveness
(JEMC), 9(2), 87-96.
CNBC (2021). 2021 Outlook – The road to recovery. www.cnbc./editorial 2021-outlook-the-road-to-
recovery/#2021 outlook
Ćoćkalo, D., Đorđević, D., Bogetić, S., & Bakator, M. (2020). Youth entrepreneurship development: A review of
literature and ten-year research results. Journal of Engineering Management and Competitiveness (JEMC),
10(2), 151-161.
Đorđević, D., & Ćoćkalo, D. (2012). Businees planing (In Serbian: Poslovno planiranje). Zrenjanin: TF Mihajlo
Pupin.
Drucker P. (2003). The Esential Drucker (In Serbian: Moj pogled na menadžment). Novi Sad: Adižes.
Ferguson N. (1996). Great degeneration (In Serbian: Velika degeneracija. Beograd: Plato
Fukuda, K. (2019). Science, Technology and Innovation Ecosystem Transformation Toward Society 5.0.
International Journal of Production Economics, 220, S0925527319302701–.
doi:10.1016/j.ijpe.2019.07.033
Harari, J.N. (2018). Homo Deus. Beograd: Laguna.
Hysa, B., Karasek, A., & Zdonek, I. (2021). Social Media Usage by Different Generations as a Tool for
Sustainable Tourism Marketing in Society 5.0 Idea. Sustainability, 13(3), 1018. doi:10.3390/su13031018
Jiping, X. (2019). Narrating Chinas governance – Stories in Xi Jiping speeches (In Serbian: Priče i kazvianja).
Beograd: Albatros Plus.
Kuura, A. (2006): Entrepreneurship Policy in Estonia. Munich Personal RePEc Archive, 676, 457-477.
Moyle, C., Moyle, B., Burgers, H. (2020). Entrepreneurial strategies and tourism industry growth. Tourism
Management Perspectives, 35(2020), 100708. doi:10.1016/j.tmp.2020.100708
Novac (2010). Inovacije koje će promeniti poslovanje. Beograd: Ringier.
Oražem, B. (2014). Value of IT service management for small and medium-sized enterprises leveraging cloud
computing. Northampton: University of Northampton.
Tisen, R., Andrisen, D., & Depre, F.L. (2006). The knowledge dividend (In Serbian: Dividenda znanja). Novi
Sad: Asee books
World Economic Forum - WEF (2020). Futures of Jobs Report 2020. https://www.weforum.org/reports/the-
future-of-jobs-report-2020

19
XII International Symposium Engineering Management and Competitiveness 2022 (EMC 2022)
17-18th June, Zrenjanin, Serbia
INNOVATIVE PROCESSES IN THE CONTEXT OF THE
INSTITUTIONAL DYNAMICS OF THE RUSSIAN REGIONS
Larisa Nikitina
Voronezh State University, Russian Federation
E-mail: [email protected]
Yuriy Treshchevskiy
Voronezh State University, Russian Federation
Anton Prachenko
Moscow State University of Sports and Tourism, Russian Federation
Sarkis Kazaryan
Voronezh State University, Russian Federation
Sergey Tolochko
Voronezh State University, Russian Federation
ABSTRACT
The paper is devoted to the identification of the state and trends of the effectiveness of innovation activity in the
regions of Russia in relation to the parameters of the institutional environment. The methodology of the study
includes cluster analysis, which made it possible to divide the regions of Russia into virtual clusters based on the
results of innovation activity and six institutional indicators, as well as comparative analysis. The study uses
official statistics data for 2005, 2010, 2015 and 2019. The results of using cluster analysis testify to the high
mobility of the institutional environment in the Russian regions. As a result, there are three groups in the Russian
regions: stable leaders, unstable leaders, outsiders. Each group of regions has its own combination of
institutional indicators. It is noted that high results of innovative activity can be achieved at the expense of
resources brought into the region, as evidenced by the abrupt increases and decreases in results in outsider
regions.
Key words: Innovation activity, Institutional environment, Interrelations, Innovation activity, Institutional
environment.
INTRODUCTION
Innovative development is the dominant trend in global socio-economic processes. In Russia, this task
was set at the government level in 2011, when the Strategy for Innovative Development of the Russian
Federation for the period up to 2020 was adopted.
In the scientific literature, the relationship of economic growth, innovative development with the
characteristics of the institutional environment has been studied for a long time, in particular, in the
works of North (1990), North (2010), Weber (2016), Baudrillard & Jaspers (2014), Brennan &
Buchanan (1986), Myrdal (1968), Galbraith (1973), Stiglitz (2012). In the Russian literature, the
problems of interrelations between economic and institutional phenomena are studied in detail in the
works of Auzan (2011).
Keynes (1978) quite definitely established the relationship between such institutional characteristics of
society as the propensity to consume and the propensity to save, on the one hand, and the phases of the
economic cycle, on the other. With regard to Russian conditions, conclusions about the quantitative
dependences of institutional conditions and economic parameters of the country's regions are made in
the works of Endovitsky et al. (2017), Kosobutskaya et al. (2020), Risin et al. (2017), Tabachnikova et
al. (2017), Treshchevsky, Nikitina et al. (2017).

L. Nikitina et al. / Innovative processes in the context of the institutional dynamics of...
20
RESEARCH METHODS
The study used official statistical information on the regions of Russia. We define the target indicator
"efficiency of innovative activity" as the share of innovative goods and services in their total volume.
The advantages of this indicator are its realism, since goods and services are produced and recognized
by the market as innovative.
In the system of institutional characteristics of regions, primary attention is paid to classical Keynesian
institutions: the propensity to consume and the propensity to save. At the same time, we believe that
Keynesian indicators can be detailed, since both consumption and saving have different forms.
Therefore, we supplemented them with a propensity for innovation, which theoretically should be
linked to the results of innovative activity. In addition, it is taken into account that savings can exist in
various forms and be transformed depending on the economic situation and other circumstances. In
this regard, additional categories have been introduced into circulation: propensity to monetize assets;
propensity to materialize assets. In addition, it is necessary to keep in mind that savings, at least
theoretically, are intended to be used for some purpose. Therefore, there must be an immobilization of
savings and, accordingly, a tendency to immobilize them. The composition of indicators, their
economic and institutional content, and methods of their calculation are presented in Table 1.
Table 1: Content and methods of calculating indicators Institutional and
Economic content of
indicators
Calculation of the indicator
Propensity to consume The share of cash income used to purchase goods and services (%)
Propensity to save The share of growth in financial assets in income (%).
Only those regions are taken into account where the values of the growth of
financial assets have a positive value. For regions with negative values, the
values "0" (zero) are accepted, that is, there is no propensity to save.
Propensity to monetize
assets
The share of the growth in cash that has a positive value (%).
Only those regions are taken into account where the values of the growth of
funds have a positive value. For regions with negative values, the values "0"
(zero) are accepted, that is, there is no propensity to monetize.
Propensity to immobilize
savings
The share of decrease in financial assets in income (%).
Only those regions are taken into account where the values of the growth of
financial assets have a negative value. For regions with positive values, the
values "0" (zero) are accepted, that is, there is no tendency to immobilize
assets.
Propensity to materialize
assets
The share of income directed to the acquisition of real estate (%)
Propensity to innovate Advanced manufacturing technologies used (units)
Effectiveness of innovation The share of innovative goods and services in total volume of shipped goods
and services (%)
The official statistics data (Regions of Russia, 2020) were used for calculations. Three groups of regions
are excluded from the calculations: 1) Moscow and St. Petersburg (because of their radical differences from
other regions of the country); 2) regions that are part of larger ones (to avoid double counting); 3) regions
for which there is no complete information for the analyzed period. Therefore, only 70 regions are included
in the final information array.
The following years were taken for analysis: 2005 (a period of high economic conjuncture); 2010 (post-
crisis period); 2015 (crisis year); 2019 (a period of low economic conditions). Various methods of data
processing were used for the analysis. At the first stage, an attempt was made to group the regions of the
country based on cluster analysis developed by Hartigan & Wong (1979) and a number of other
researchers. The method has received good approbation in the works of Russian researchers
(Treshchevsky, Kosobutskaya et al., 2021, Treshchevsky, Papin et al., 2018).
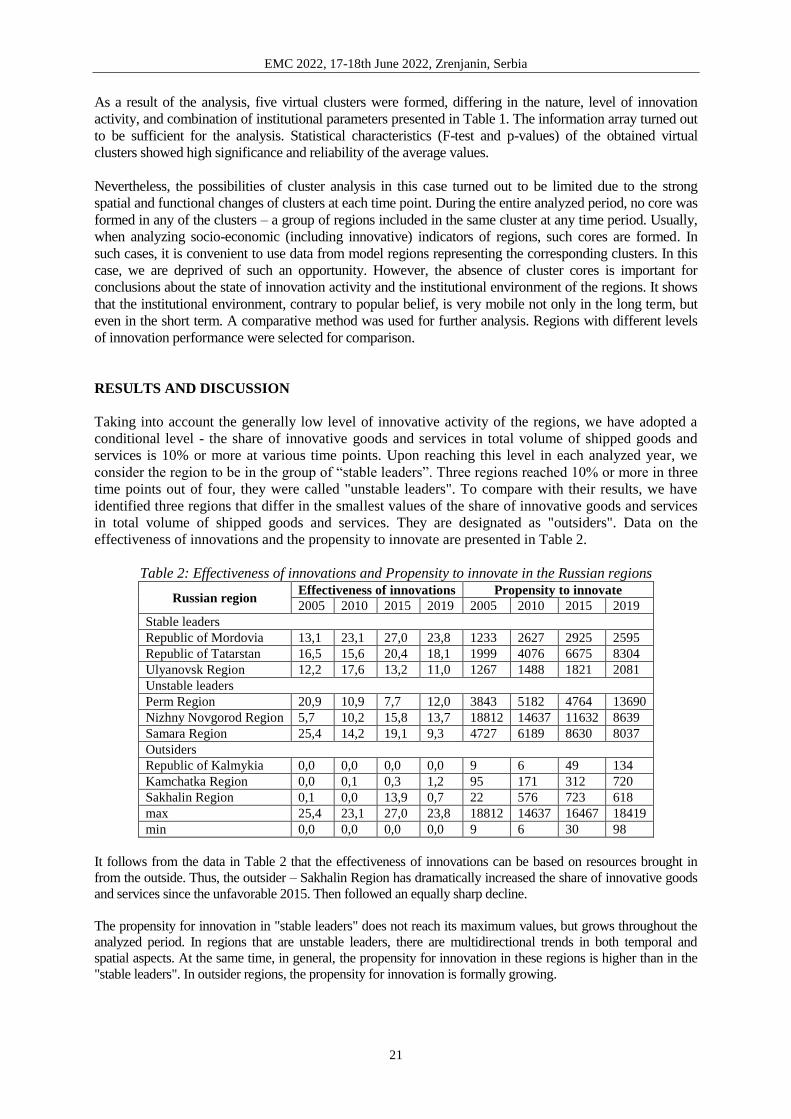
EMC 2022, 17-18th June 2022, Zrenjanin, Serbia
21
As a result of the analysis, five virtual clusters were formed, differing in the nature, level of innovation
activity, and combination of institutional parameters presented in Table 1. The information array turned out
to be sufficient for the analysis. Statistical characteristics (F-test and p-values) of the obtained virtual
clusters showed high significance and reliability of the average values.
Nevertheless, the possibilities of cluster analysis in this case turned out to be limited due to the strong
spatial and functional changes of clusters at each time point. During the entire analyzed period, no core was
formed in any of the clusters – a group of regions included in the same cluster at any time period. Usually,
when analyzing socio-economic (including innovative) indicators of regions, such cores are formed. In
such cases, it is convenient to use data from model regions representing the corresponding clusters. In this
case, we are deprived of such an opportunity. However, the absence of cluster cores is important for
conclusions about the state of innovation activity and the institutional environment of the regions. It shows
that the institutional environment, contrary to popular belief, is very mobile not only in the long term, but
even in the short term. A comparative method was used for further analysis. Regions with different levels
of innovation performance were selected for comparison.
RESULTS AND DISCUSSION
Taking into account the generally low level of innovative activity of the regions, we have adopted a
conditional level - the share of innovative goods and services in total volume of shipped goods and
services is 10% or more at various time points. Upon reaching this level in each analyzed year, we
consider the region to be in the group of “stable leaders”. Three regions reached 10% or more in three
time points out of four, they were called "unstable leaders". To compare with their results, we have
identified three regions that differ in the smallest values of the share of innovative goods and services
in total volume of shipped goods and services. They are designated as "outsiders". Data on the
effectiveness of innovations and the propensity to innovate are presented in Table 2.
Table 2: Effectiveness of innovations and Propensity to innovate in the Russian regions
Russian region Effectiveness of innovations Propensity to innovate
2005 2010 2015 2019 2005 2010 2015 2019
Stable leaders
Republic of Mordovia 13,1 23,1 27,0 23,8 1233 2627 2925 2595
Republic of Tatarstan 16,5 15,6 20,4 18,1 1999 4076 6675 8304
Ulyanovsk Region 12,2 17,6 13,2 11,0 1267 1488 1821 2081
Unstable leaders
Perm Region 20,9 10,9 7,7 12,0 3843 5182 4764 13690
Nizhny Novgorod Region 5,7 10,2 15,8 13,7 18812 14637 11632 8639
Samara Region 25,4 14,2 19,1 9,3 4727 6189 8630 8037
Outsiders
Republic of Kalmykia 0,0 0,0 0,0 0,0 9 6 49 134
Kamchatka Region 0,0 0,1 0,3 1,2 95 171 312 720
Sakhalin Region 0,1 0,0 13,9 0,7 22 576 723 618
max 25,4 23,1 27,0 23,8 18812 14637 16467 18419
min 0,0 0,0 0,0 0,0 9 6 30 98
It follows from the data in Table 2 that the effectiveness of innovations can be based on resources brought in
from the outside. Thus, the outsider – Sakhalin Region has dramatically increased the share of innovative goods
and services since the unfavorable 2015. Then followed an equally sharp decline.
The propensity for innovation in "stable leaders" does not reach its maximum values, but grows throughout the
analyzed period. In regions that are unstable leaders, there are multidirectional trends in both temporal and
spatial aspects. At the same time, in general, the propensity for innovation in these regions is higher than in the
"stable leaders". In outsider regions, the propensity for innovation is formally growing.

L. Nikitina et al. / Innovative processes in the context of the institutional dynamics of...
22
Calculations have shown that throughout the analyzed period, the propensity to immobilize assets in almost the
entire information array is zero. There are only some exceptions to this rule in both temporal and spatial aspects.
Table 3 presents data characterizing the propensity to consume and the propensity to save.
Table 3: Propensity to consume and Propensity to save in the Russian regions
Russian region Propensity to consume Propensity to save
2005 2010 2015 2019 2005 2010 2015 2019
Stable leaders
Republic of Mordovia 58,7 58,2 67,2 76,1 31,6 29,7 16,7 8,0
Republic of Tatarstan 68,0 75,8 76,7 84,3 20,6 14,5 12,0 0,9
Ulyanovsk Region 74,8 67,1 71,7 81,1 14,3 20,2 15,4 5,1
Unstable leaders
Perm Region 65,0 68,8 66,6 82,9 24,4 21,8 21,7 2,8
Nizhny Novgorod Region 71,4 70,0 72,1 82,0 18,1 19,3 16,4 4,9
Samara Region 80,2 71,6 77,9 85,4 9,7 19,4 8,8 0,0
Outsiders
Republic of Kalmykia 60,3 49,7 56,9 61,0 29,1 38,4 27,3 24,2
Kamchatka Region 47,7 52,0 70,7 67,3 39,9 31,8 10,9 12,7
Sakhalin Region 59,5 71,0 74,1 77,7 27,7 15,5 10,4 4,4
max 88,6 84,4 94,1 93,7 39,9 38,4 27,3 24,2
min 47,7 49,7 56,9 61,0 0,0 7,2 0,0 0,0
With regard to the propensity to consume the following conclusions can be drawn:
in the group of stable leaders, the values of indicators are in the same range as in the group of unstable
leaders, while the general trend for leaders is a steady increase in the values of the indicator;
in the group of unstable leaders, the values of indicators show less stable growth;
both groups are characterized by exceeding the value of 80% in 2019; the exception is the Republic of
Mordovia, where throughout the analyzed period the propensity to consume was significantly lower than in
the other five leading regions;
the group of outsiders are characterized by lower values of propensity to consume, however, there is a fairly
steady increase in propensity to consume (with the exception of the Republic of Kalmykia).
The propensity to save varies as follows:
in all groups of regions, two periods are quite clearly distinguished: 1) a high level of propensity to save in
2005-2010; 2) a decrease in the values of this indicator in 2015 and, especially, in 2019;
in 2005, the highest values of the indicator were for outsider regions, and the lowest were for unstable
leaders (while the Perm Region had higher values than a number of regions – stable leaders);
in 2010, there were multidirectional trends in all groups of regions;
2015 and 2019 showed an almost unambiguous trend – a decrease in the values of the indicator (the
exception is the Kamchatka Territory, in which there was an increase in 2019 compared to 2015;
in 2019, outsider regions showed the highest values of propensity to save.
Let's turn to the remaining pair of indicators: propensity to monetize assets and propensity to materialize assets
(Table 4). As can be seen from the data presented in Table 4, the propensity to monetize assets in groups of
regions differs as follows:
in the group of regions "stable leaders", the values of the indicator vary in a wide range both in temporal
and spatial aspects; in general, there is a noticeable decrease in the propensity to monetize assets in 2015-
2019;
in the group of regions "unstable leaders", the values of the indicator are generally in the same range, but
there are abrupt changes, especially pronounced in the Perm Krai and Samara region;
in the group of regions "outsiders", the spatial and temporal fluctuations of the indicator values are the
highest - from 0.0 to 24.6%; in 2005, the level of propensity to monetize assets is significantly higher than
in other groups of regions; the general trend is a decrease in the propensity to monetize assets, nevertheless
it is it remained at a higher level than the other groups of regions.
The propensity to materialize assets has the following trends:

EMC 2022, 17-18th June 2022, Zrenjanin, Serbia
23
significantly lower value of the indicator in all groups of regions in relation to the maximum in the Russian
Federation;
in both groups of leading regions, the indicator values are generally higher than in the outsider group
throughout the analyzed period;
in the regions that are stable leaders, there is an increase in the propensity to materialize assets, in the
regions that are unstable leaders, there is a decrease; in the outsider regions, the values of the indicator are
growing, however, remain at a lower level than in the groups of leaders.
Table 4: Propensity to monetize assets and Propensity to materialize assets in the Russian regions
Russian region
Propensity to monetize
assets
Propensity to materialize
assets
2005 2010 2015 2019 2005 2010 2015 2019
Stable leaders
Republic of Mordovia 17,4 13,7 10,0 8,7 0,8 3,4 2,1 2,1
Republic of Tatarstan 7,7 3,1 3,4 1,5 1,1 1,9 0,8 1,6
Ulyanovsk Region 5,1 9,0 7,0 6,3 1,5 4,6 1,5 1,3
Unstable leaders
Perm Region 6,2 8,5 14,8 4,2 1,3 0,8 0,8 1,0
Nizhny Novgorod Region 2,5 5,9 7,9 4,1 1,7 1,2 0,7 0,8
Samara Region 0,0 8,1 0,0 0,4 2,3 1,0 0,8 1,1
Outsiders
Republic of Kalmykia 24,6 31,0 10,1 8,4 0,4 1,0 0,9 0,9
Kamchatka Region 12,6 9,0 2,6 12,7 0,1 1,1 0,5 0,9
Sakhalin Region 12,6 0,0 2,5 3,7 0,2 1,5 1,0 0,9
max 30,9 31,0 14,8 15,3 8,0 11,4 4,6 6,0
min 0,0 0,0 0,0 0,0 0,1 0,1 0,2 0,3
CONCLUSION
There are three groups of Russian regions that differ significantly in the level of innovation results: stable
leaders, unstable leaders, outsiders. The number of regions in the leading groups is insignificant - there are
three regions in each group. The use of cluster analysis has shown that in the formed virtual clusters, built
according to the results of innovation activity and six institutional indicators, there are no cores - groups of
regions present in the same cluster at each time point. This indicates the high mobility of the institutional
environment not only in the long term, but also even in the short term.
Each group of regions has its own combination of institutional indicators. The key characteristics of the
selected groups of Russian regions were established using a comparative analysis. Stable leaders are
characterized by:
an increase in the propensity to innovate throughout the analyzed period with its lagging behind
unstable leaders;
high and unevenly growing propensity to consume;
low and unevenly decreasing propensity to save;
a wide range of values of the propensity to monetize assets with its uneven decline;
the propensity to materialize assets is low, but higher than in outsider regions; during the analyzed
period, the values of the indicator are growing.
Unstable leaders are characterized by:
high level, but unstable dynamics of the propensity to innovate;
high level, but unstable growth of propensity to consume;
the lowest level of propensity to save among all groups; unstable, but pronounced decrease in the
values of the indicator;
a wide range of values of the propensity to monetize assets in the regions with its uneven decline;
the propensity to materialize assets is low, but higher than in outsider regions; during the analyzed
period, the values of the indicator decrease.

L. Nikitina et al. / Innovative processes in the context of the institutional dynamics of...
24
Outsider regions are characterized by:
low, although increasing, level of propensity for innovation;
low, although growing, values of propensity to consume;
high values of the propensity to save with significant fluctuations in temporal and spatial aspects;
high values of the propensity to monetize assets with a general decrease in its values;
low, although growing, values of propensity to materialize assets.
REFERENCES
Auzan, A. (2011). Institutional Economics: New Institutional Economic Theory. Moscow: INFRA M.
Baudrillard, J., & Jaspers, K. (2014). Phantom of the crowd. Moscow: Algorithm.
Brennan, G., & Buchanan, J. (1986). The Reason of Rules: Constitutional Political Economy. Cambridge:
Cambridge University Press. doi:10.1017/CBO9780511895937
Endovitsky, D., Tabachnikova, M., & Treshchevsky Y. (2017). Analysis of the Economic Optimism of the
Institutional Groups and Socio-Economic Systems. Journal of Advanced Research in Law and Economics,
8(6), 1745-1752.
Galbraith, J.K. (1973). Economics and the Public Purpose. Boston: Houghton Mifflin Company.
Hartigan, J. & Wong, M. (1979). Algorithm AS 136: A k-Means Clustering Algorithm. Journal of the Royal
Statistical Society, Series C (Applied Statistics), 28, 100-108.
Keynes, J.M. (1978).The General Theory of Employment, Interest, and Money. Moscow: Progress.
Kosobutskaya, A., Nikitina, L., Tabachnikova, M., & Treshchevsky, Y. (2020). Advantages and Opportunities
for the Development of Small Business E-Commerce in the B2B Sector. In: Elena G. Popkova, Bruno S.
Sergi (eds) Digital economy: Complexity and Variety vs Rationality. Cham, Switzerland: Springer
International Publishing AG, 524–531 doi: 10.1007/978-3-030-29586-8
Myrdal, G. (1968). Asian Drama: An Inquiry into the Poverty of Nations. New York: Pantheon Books,
Twentieth Century Fund.
North, D. (1990). Institutions, Institutional Change and Economic Performance (Political Economy of
Institutions and Decisions). Cambridge: Cambridge University Press. doi:10.1017/CBO9780511808678
North, D. (2010). Understanding the Process of Economic Change (The Princeton Economic History of the
Western World, 32). Princeton: Princeton University Press.
On approval of the Strategy for Innovative Development of the Russian Federation for the period up to 2020.
(2011). https://digital.gov.ru/ru/documents/3622/
Regions of Russia. (2020). Socio-economic indicators. Moscow: Rosstat.
Risin, I., Treshchevsky, Y., Tabachnikova, M., & Franovskaya, G. (2017). Public Authorities and Business on
the Possibilities of Region’s Development. In: Popkova E. (eds) Overcoming Uncertainty of Institutional
Environment as a Tool of Global Crisis Management. Contributions to Economics. Cham, Switzerland:
Springer International Publishing AG, 55-62. doi:10.1007/978-3-319-60696-5_8.
Stiglitz, J. (2012). The Price of Inequality: How Today's Divided Society Endangers Our Future. New York: W.
W. Norton & Company.
Tabachnikova, M., Treshchevsky, Y., Frankovskay, G., Vertakova, Y., & Sogacheva O. (2017). Economic and
Institutional Development of Russian Regions in the Context of the Global Socio&Economic Processes.
Globalization and its socio-economic consequences. 17th
International Scientific Conference. University of
Zilina, The Faculty of Operation and Economics of Transport and Communications, Department of 4th
– 5th
October 2017. Rajecke Teplice, Slovak Republic. Part YI, 2642-2649.
Treshchevsky, Y., Kosobutskaya, A., Opoikova, E., & Tsebekova, E. (2021). Spatial and Functional Aspects of
Russian Foreign Economic Activity: Paradigm Shift. Proceedings of the 37th International
Business Information Management Association (IBIMA), 30-31 May 2021, Cordoba, Spain, 9682-9691.
Treshchevsky, Y., Nikitina, L., Litovkin, M. & Mayorova, V. (2017). Results of Innovational Activities of
Russian Regions in View of the Types of Economic Culture. In Popkova, E. (Ed.), Russia and the
European Union: Development and Perspectives. Part of the series: Contributions to Economics. Cham,
Switzerland: Springer International Publishing AG, 47-53. doi:10.1007/978-3-319-55257-6_7
Treshchevsky, Y., Papin, S., & Penina E. (2018). Structural Changes of the Consumer Market of Russia: from
Post Crisis Development to the Sanctions Period. Proceedings of the International Scientific Conference
"Competitive, Sustainable and Secure Development of the Regional Economy: Response to Global
Challenges" (CSSDRE 2018), Atlantis Press, 449-452. doi: 10.2991/cssdre-18.2018.92.
Weber, Max. (2016). Economy and Society: Essays on Interpretive Sociology (an excerpt). Journal of Economic
Sociology. 17. 13-29. doi:10.17323/1726-3247-2016-5-13-29.

25
XII International Symposium Engineering Management and Competitiveness 2022 (EMC 2022)
17-18th June, Zrenjanin, Serbia
RESEARCH ON THE IMPACT OF ETHICAL LEADERSHIP AND
EFFECT OF WORK ON REDUCING TURNOVER
Dragana Sajfert
ITS Information Tehnology School, Belgrade, Serbia
E-mail: [email protected]
Jesa Kreiner
California State University, Fullerton, Los Angeles, California, USA
Živorad Vasić
ITS Information Tehnology School, Belgrade, Serbia
Svetlana Anđelić
ITS Information Tehnology School, Belgrade, Serbia
Milorad Živković
International University of Brčko District of Bosnia and Herzegovina
ABSTRACT
This research aims to examine the impact of ethical leadership and the effects of work on turnover in companies
in Serbia. A conceptual framework has been developed that integrates ethical leadership as an intermediary
mechanism in explaining the link between ethical leadership, employee performance and reduced turnover. The
proposed research was done using data collected from a sample (n = 96) of companies in Serbia. The results of
the research reveal to us that ethical leadership has a positive effect with the performance of employees, while at
the same time increasing their intention not to leave the job. This study clarifies that, in companies in Serbia,
ethical leadership plays a key role in achieving performance goals and reducing turnover.
Key words: Ethical leadership, Job performance, Turnover intention, Satisfaction with comunikation.
INTRODUCTION
According to Sajfert, Đorđević, Bešić (2006) Fluctuation is the departure of employees from the
organization and the arrival of new employees. Seifert (2004) states that the fluctuation of the labor
force is the migration of human resources between companies, due to the departure of some and the
arrival of other resources. Fluctuation is conditioned by economic-social and technical-technological
factors. Seifert (2018) states in the research that their work presents the results of research on the
impact of ethical leadership behavior on certain individual and organizational effects in Serbian
companies. Thomas et. al. (2004) state in their paper that ethical leadership is imperative for
organizations because it helps them reduce business costs through fair and moral treatment of their
employees as well as other resources. Authors Piccolo et. al. (2010), Walumbwa et al. (2011),
Walumbwa et. al. (2012) state that relatively less attention has been paid to examining the relationship
between ethical leadership, employee performance, and their intention to leave an organization.
Alkavia (2017) states that a significant amount of research indicates that fluctuation is mainly the
result of a negative relationship between leaders and managers in the workplace and their followers.
Authors Wang and Yang (2016), Brown, Treviño, and Harrison, (2005) state that scientists pay little
attention to the interconnectedness of ethical leadership, employee performance, and employee
turnover. Wayne and Green (1993) point out that ethical leaders also emphasize two-way
communication with employees, so employees feel more responsible and make extra efforts to do their
job well. Ahn et. al. (2018) suggest in the paper that employees work harder and try to return with
their improved performance.

D. Sajfert et al. / Research on the impact of ethical leadership and effect of work on...
26
LITERATURE REVIEW
In their study, Demitras and Akdogan (2015) examine a mediated model of ethical leadership, intent for
change, and affective commitment. The results obtained by Demitras and Akdogan (2015) show that
ethical leadership has both direct and indirect effects on affective commitment and intention to change. In
their study, Shareef and Atan (2018) aimed to examine the effect of ethical leadership on followers
’organizational civic behavior (OCB) and intent for change, and to examine the mediating role of intrinsic
motivation in relationships. A study by Shareef and Atan (2018) came up with results that showed that
ethical leadership is positively associated with OCB, and in part with intentions for change.
This refers primarily to the works of Ciulla (1998), Heifetz (1994). In their works, five principles of ethical
leadership are presented: respect, helpfulness, fairness, honesty and togetherness. According to Brown, et.
al. (2005) increased research on the impact of ethical leadership on followers' attitudes toward
communication satisfaction. Ciulla (2001) explores ethical issues of leadership in a variety of contexts,
including, business, NGOs, and government. It integrates material on ethics and leadership from great
Eastern and Western philosophers with leadership literature and case studies. This multidisciplinary
approach of Ciulla (2001) helps to present ethical leadership as a fully integrated view of ethics with the
help of philosophers and scientists.
Johnson and Ridley (2008) conducted research on the most important and concise truths for a leader in all
areas, including issues of integrity, loyalty, fairness, respect, and delivery in a business environment. An
interesting study of ethical leadership was done by Chan et. al. (2016) which emerged as an important topic
related to understanding the effects of leadership within an organization. Chan et. al. (2016) believe that
leaders must demonstrate ethical behavior in order to set high moral standards and encourage ethical
behavior of followers toward growth. Research conducted by the Principles of Ethical Behavior of Leaders
has a positive effect on the attitudes of employees, but also on the ethical behavior of employees
themselves (Kalshoven, Den Hartog, 2009; Brown et al., 2005; Trevino, Brown, Hartman, 2003). In
addition, ethical leaders use power in a socially responsible way and view leadership as a process that
affects employee social responsibility (De Hoogh, Den Hartog, 2008). According to Hollander (1995), the
principles of ethical leadership are among the essential elements for the development of loyalty and trust in
the cooperation of leaders and followers. Palanski et. al. (2014) state that unlike ethical leadership, which
does not lead directly to job search, violent surveillance can also directly hinder people from initiating job
search behavior. Their findings show that even a low level of abuse can neutralize a high level of ethical
leadership.
Holtom et. al. (2008) conducted extensive research on the topic of voluntary employee turnover in the past
decade. Holtom et. al. (2008) developed new managerial approaches to employee retention, labor market
dynamics, and the evolution of research methodology and technology. Elci et. al. (2012) in their paper state
that the determinants of employee turnover have a significant impact on the performance of the
organization and that they have been extensively studied. Elci et. al. (2012) with this study sought to
understand the effects of ethical leadership and the effectiveness of employee intention to fluctuate.
METODOLOGY
Hypothesis
H1: Ethical leadership has a positive impact on employee performance.
H2: Ethical leadership has a positive relationship with employee intentions about turnover.
H3: Performance has a positive relationship with employee turnover intentions.
Sample
The research, which dealt with the impact of ethical leadership and the effects of work on employee
turnover in Serbia, was conducted during 2020-2021. The research that included the analysis included

EMC 2022, 17-18th June 2022, Zrenjanin, Serbia
27
95 respondents from different companies. Data collection was done through surveys of respondents,
but also through personal interviews. Respondents filled out a methodologically creative questionnaire
in advance, the answers to which formed the necessary database, whose further data processing led to
the necessary conclusions and future directions in this research.
Research Instruments
A 10-point scale, adapted from Brown, Treviño, and Harrison, (2005), was used to measure ethical
leadership on the Likert (1932) 5-point scale ranging from 1 - Strongly Disagree to 5 - Strongly Agree.
The items were based on the experience of employees as they feel about their leaders and the extent to
which their leaders care about them and involve them in the decision-making process. Elçi, et. al
(2012), O’Reilly, et. al. (1991), Rosin, and Korabik, (1991) was used to measure Intentional employee
turnover was measured using the Likert (1932) 5-point scale ranging from 1 - Strongly Disagree to 5 -
Strongly Agree .. Scale of 14 item was adapted to Lynch, Eisenberger and Armelia (1999) to measure
performance using the Likert (1932) 5-point scale ranging from 1 - Strongly disagree to 5 - Strongly
agree.
Research goals
The aim of this study is to examine the impact of ethical leadership and the effects of work on
reducing turnover. Ethical leadership and the effects of dada play an important role in anticipating and
reducing turnover. One could even say that work engagement mediates the relationship between
ethical leaders and employee turnover. The aim of the research is to discover the leadership approach
and the effects of work that involve employees, and in that way the turnover in the company is
reduced.
RESULTS
Reliability
The items were based on the experience of employees as they feel about their leaders and the extent to
which their leaders care about them and involve them in the decision-making process. The Cronbach's
alpha value shows a high internal consistency of the ethical leadership scale (α = 0.902). The
Cronbach's Alpha value shows a high internal consistency of the scale for job performance (α =
0.942). The Cronbach's alpha value shows a high internal consistency of the scale for the intention of
fluctuation (α = 0.935).
Corelation analysis
Correlation analysis (influence of ethical behavior of leadership and the effect of work on reducing
turnover). Table 1 shows the results of the correlation analysis between the dimensions of ethical
behavior of leaders and the dimensions of work effects and the dimensions of fluctuation reduction.
First, confirmatory factor analysis (CFA) was used to verify factor loads, validity, and reliability as
shown in Table 1. The factor loads of all indicators are greater than or equal to 0.50, and significant at
least at 0.05. The findings suggest that the instrument of this study successfully crossed the threshold
of convergent validity criteria.
Discriminant validity is checked by comparing the square roots of the extracted average variances
(AVEs) with the corresponding correlation between constructions. The square roots of AVE for latent
constructs are given in Table 2.
It was observed that the values of the square roots of AVE for each latent construct are greater than the
values of any correlation of the corresponding latent construct. Therefore, it is concluded that the
measurement model has satisfactory discriminant validity. The reliability of measurement models is

D. Sajfert et al. / Research on the impact of ethical leadership and effect of work on...
28
assessed using Cronbach's alpha (CA) and structural reliability (CR). The acceptability level of CA
and CR is greater than 0.70. CR and CA values also confirm that the constructions are reliable. The
findings reveal that the model meets widely accepted data validation criteria and recommend that
SEM-PLS findings can be trusted and have no problems measuring data.
Table 1: Factor loads, validity and reliability Items EL TI JP
EL1 (ethical leadership) 0,712
EL2 0,732
EL3 0,896
EL4 0,865
EL5 0,835
EL6 0,876
EL6 0,832
EL7 0,821
EL8 0,967
EL9 0,754
EL10 0,812
TI1 Turnover intention 0,943
TI2 0,932
TI3 0,963
TI4 0,975
TI5 0,979
TI6 0,943
JP1 (performance measurement) 0,765
JP2 0,786
JP3 0,756
JP4 0,734
JP5 0,843
JP6 0,776
JP7 0,727
JP8 0,712
JP9 0,735
JP10 0,747
JP11 0,783
JP12 0,774
JP13 0,767
JP14 0,786
CR 0,923 0,879 0,923
CA 0,913 0,854 0,931
AVE 0,545 0,589 0,503
Skewness -0,767 0,297 -1,121
Kurtosis 0,132 -0,765 2,211
Table 2: Descriptive Statistics. Variable N Min Max Mean SD Crombach alpha
1 Ethical leadership 95 1.00 5.00 3,7760 0,86437 .902
2 Job performance 95 1.00 5.00 4,4530 0,72320 .935
3 Turnover intention 95 1.00 5.00 2,8976 1,32180 .942
Table 2 shows the mean values, standard deviations, and correlations of the variables. Low and
medium level correlations confirm the absence of collinearity between indicators. The table gives,
among other things, the names of items and dimensions, a short name for each item or dimension,
mean values and standard values, as well as Cronbach’s Alpha for each dimension. Cronbach’s Alpha
values range from α = .899 to α = .942
Based on the results, it can be seen that all correlations between the dimensions of ethical leadership
and the dimensions of employee performance are positive and statistically significant (This, in a
broader sense, confirms hypothesis H1). Based on the results, it can be concluded that the correlation

EMC 2022, 17-18th June 2022, Zrenjanin, Serbia
29
between the dimensions of ethical leadership and employee intentions on turnover has a positive
relationship and statistical significance (This, in a broader sense, confirms hypothesis H2). Based on
the results, it can be seen that all correlations between the dimensions of work performance and the
dimensions of employee intentions, positive and statistically significant (This, in a broader sense,
confirmed hypothesis H3).
Table 3: Hypotheses testing Path Direct Indirect Total
EL - JS 0,476∗∗∗ 0,476∗∗∗
EL - JP 0,143∗∗∗ 0,324∗∗∗ 0,467∗∗∗
JS - TI 0,178 0,178
∗∗ statistically significant at 10%
∗∗∗ statistically significant at 1%
DISCUSION
Previous studies have highlighted the importance of leadership in terms of employee performance and
intent to fluctuate. However, relatively limited attention has been paid to understanding the underlying
mechanisms through which ethical leaders influence employees to achieve desired and / or desired
performance results. This study responds to calls that seek to investigate the relationship between
ethical leadership and employee performance through a mechanism to reduce turnover. This study
differs significantly from other research that only focused on the relationship between leaders and
employees as the main mechanism in elucidating the influential role of ethical leadership in shaping
employee performance and intentions to leave organizations. In short, the results of this study
propagate that ethical leadership can boost employee performance and reduce their intention to
fluctuate.
CONCLUSION
The main purpose of this study was to excavate our understanding of the relationship between ethical
leadership, performance, and employee turnover in Serbia. The data were collected from Serbia, which
has a vital role in the Balkans. If we compare Western theories and analyze the results obtained in
non-Western contexts, scientists and experts would have firm certainty about the wide applicability of
these theories to other parts of the world.
This research provides a better understanding of the applicability of ethical leadership, performance
and intent to fluctuate in Serbia. However, this research is just a small grain of sand in the sea, we
expect that it will motivate other researchers to seek to spread the insight of these concepts in other
countries.
REFERENCES
Ahn, J.; Lee, S. and Yun, S. (2018) Leaders’ core self-evaluation, ethical leadership, and employees’ job
performance: The moderating role of employees’ exchange ideology. Journal of Business Ethics 148(2),
457-470.
Avey, J. B.; Wernsing, T. S. and Palanski, M. E. (2012) Exploring the process of ethical leadership: The
mediating role of employee voice and psychological ownership. Journal of Business Ethics 107(1), 21-34.
Brown, M. E.; Treviño, L. K. and Harrison, D. A. (2005) Ethical leadership: A social learning perspective for
construct development and testing. Organizational Behavior and Human Decision Processes 97(2), 117-
134.
Chan, K. C., Fung, A., Fung, H. G., & Yau, J. (2016). A Citation Analysis of Business Ethics Research: A
Global Perspective, DOI:10.1007/s10551-014-2533-9. Journal of Business Ethics. 136, 557-573.
Ciulla, Joane, B. (1998). Ethics: The Heart of Leadership, ISBN-13: 9780275961206, Westport, CT: Grenwood
Publisher Group, Incorporated.

D. Sajfert et al. / Research on the impact of ethical leadership and effect of work on...
30
Ciulla, Joane, B. (2001). Carving Leaders From the Warped Wood of Humanity, Canadian Journal of
Administrative Sciences, Revie canadienne des sciences de l administration, 18(4), 313-319.
De Hoogh, A. H. B., & Den Hartog, D. N. (2008). Ethical and despotic leadership, relationship with leaders
social responsibility, top management team effectiveness and subordinates optimism: A multy.method
study. Leadership Quarterly, 19, 297-311.
Demitras Ozgur, Akdogan Asuman (2015) The Effect of Ethical Leadership Behavior onEthical Climate,
Turnover Intention, and Affective Commitment, Journal of Businness Ethics, 130, 59-67.
Elçi, M., Şener, İ., Aksoy, S. and Alpkan, L. (2012) The impact of ethical leadership and leadership
effectiveness on employees’ turnover intention: The mediating role of work related stress. Procedia-
Social and Behavioral Sciences 58, 289-297.
Heifetz, R. A. (1994). Leadership Without Easy Answers. Cambridge, MA: Harvard University Press.
Holander, E. P. (1995). Ethical Challenges in the Leader-Follower Relationship, Business Ethics Quarterly, 1,
(55-65).
Holtom, B. C., Mitchel, T. R., Lee, T. W., and Eberly, M. B. (2008) Turnover and Retention Research: A Glance
at the Past, a Closer Review of the Present, and a Venture into thw Future. Academy of Management, 2(1),
231-274.
Johnson, Brad, W., Ridley, & Charles R. (2008) The Elements of Ehics, for profesionals, St. Martins Press.
Palgrave Macmillan, Unitrd States-a division of St. Matrin’s Press, LLC, New York, ISBN 0-230-60391-2
Kalshoven, K., & Den Hartog, D. N. (2009). Ethical Leader Behavior and Leader Effectiveness: The Role of
Prototypicality and Trust. International Journal of Leadership Studies. 5(2), 102–119.Katz, D. and Kahn,
R.L. (1967) The social psychology of organizations. John Wiley & Sons, 1967.
Likert Rensis (1932).Technique for the Measurement of Attitudes, Archives of Psichology, 140, 1-55.
Lynch, P.D., Eisenberger, R. and Armeli, S. (1999) Perceived organizational support: Inferior versus superior
performance by wary employees. Journal of Applied Psychology 84(4), 467-483.
O’Reilly, C.A.; Chatman, J. and Caldwell, D.F. (1991) People and organizational culture: A profile comparison
approach to assessing person-organization fit. Academy of Management Journal 34(3), 487-516.
Palanski Michael, Avey James and Jiraporn Napatsorm (2014) The Effects of Ethical Leadership and Abusive
Supervision on Job Search Behaviors in the Turnover Process, Journal of Business Ethics, 121(1), 135-146.
Piccolo, R. F., Greenbaum, R., den Hartog, D. N. and Folger, R. (2010) The relationship between ethical
leadership and core job characteristics. Journal of Organizational Behavior 31(2-3), 259-278.
Rosin, H.M. and Korabik, K. (1991) Workplace variables, affective responses, and intention to leave among
women managers. Journal of Occupational and Organizational Psychology 64(4), 317-330.
Sajfert Z., (2004) Menadžment ljudskih resursa – apologija humanog kapitala, Univerzitet u Novom Sadu,
Tehnički fakultet “Mihajlo Pupin”, Zrenjanin.
Sajfert Z., Đorđević D., and Bešć C. (2006) Leksikon menadžmenta, Univerzitet u Novom Sadu, Tehnički
fakultet “Mihajlo Pupin”, Zrenjanin.
Sajfert, D. (2018) Etično ponašanje lidera u organizacijama kao faktor individualnih i organizacionih
preformansi, doktorska disertacija, Univerzitet u Novom Sadu, Tehnički fakultet “Mihajlo Pupin”,
Zrenjanin.
Shareef, Tarik Atan (2018) The influence of ethical leadership on acadenic employees’ organizational
citezenship behavior and turnover intention: Mediating role of intinsic motivation, Management Decision,
57(3) 583-605.
Thomas Terry, Schermerhorn R. John and Dienhart W. John (2004) Strategic leadership of ethical behavior
in business. The Academy of Management Executive 18(2), 56-66.
Trevińo, L. K., Brown, M., & Hartman, L. P. (2003). A Qualitative Investigation of Perceived Executive Ethical
Leadership: Perceptions from Inside and Outside the Executive Suite. Human Relations, 56, 5−37.
Walumbwa, Mayer, Wang, Workman, and Christensen (2011) Linking ethical leadership to employee
performance: The roles of leader–member exchange, self-efficacy, and organizational identification.
Organizational Behavior and Human Decision Processes 115(2), 204-213.
Walumbwa, Morrison, and Christensen (2012) Ethical leadership and group in-role performance: The mediating
roles of group conscientiousness and group voice. The Leadership Quarterly 23(5), 953-964.
Wang, Y. D. and Yang, C. (2016) How appealing are monetary rewards in the workplace? A study of ethical
leadership, love of money, happiness, and turnover intention. Social Indicators Research 129(3), 1277-
1290.
with leader’s social responsibility, top management team effectiveness and subordinates’ optimism: A multi-
method study. The Leadership Quarterly 19(3), 297-311, 2008,
Wayne, S.J. and Green, S.A. (1993) The effects of leader-member exchange on employee citizenship and
impression management behavior. Human Relations 46(12), 1431-1440.

31
XII International Symposium Engineering Management and Competitiveness 2022 (EMC 2022)
17-18th June, Zrenjanin, Serbia
NEW KNOWLEDGE AND SKILLS FOR THE DIGITAL AGE
Marijana Vidas-Bubanja
Belgrade Business and Arts Academy of Applied Studies, Belgrade, Republic of Serbia
Srđan Bogetić
Belgrade Business and Arts Academy of Applied Studies, Belgrade, Republic of Serbia
E-mail: [email protected]
Cariša Bešić
University of Kragujevac, Faculty of technical science, Čačak, Republic of Serbia
Zoran Kalinić
Independent University Banja Luka, Banja Luka, Bosna i Hercegovina
Iva Bubanja
Belgrade Business and Arts Academy of Applied Studies, Belgrade, Republic of Serbia
ABSTRACT
Modern business is facing major challenges brought about by technological changes, necessitating it for
companies to properly get their human resources ready for the new digital age. In this paper, the authors analyze
the relationship between the digital economy and the changes in the labour market field that have occurred as a
result of the intensive implementation of digital technology in business operations. Creativity, innovation,
flexibility and adequate human resource management are the most important determinants in the new business
philosophy. The key factor that decides the new model of organizational management in the global economy is
knowledge, as is the speed of acceptance of business changes. In addition, new business skills are gaining in
importance. The authors in this paper provide an attitude analysis expressed by domestic owners/executives/
managers on the needs for the acquisition of new knowledge and skills and open questions related to employee
reskilling.
Key words: Knowledge, Skills, Digital technologies, Competitiveness, Human resources.
INTRODUCTION
The business environment is constantly changing under the influence of intensive technological
development, changes in competitive relations in the late 1990s and the effects of the 2008 global
economic crisis. The world is reaching a new level of economic globalization where national
economies have become closely connected, which is characterised by necessary monitoring and
responses to the challenges and dynamics of the new business environment. At the micro-level of
personal activities, business organizations need to create new models of behaviour in relation to the
observed and expected changes, all in order to maintain competitiveness in the long run and ensure
constant growth dynamics (Đorđević et al., 2016, p. 120).
The profound effects of technological advances on the world economy, along with globalization and
demographic changes, have led to a burning social problem: how to empower people with the skills
necessary for their participation in the economy – both now and in the future. The new digital business
environment has accentuated the need to reconfigure and improve the supply of knowledge and skills
in the labour market so that workers at the global level can meet the needs of modern companies’ new
models of work and business operations. This asks for new kinds of support governments and
companies should provide to the educational system as well as the redefining of approches to work,
curriculum and mode of operation of educational institutions themselves (WEF, PWC, 2021, p. 4).
In addition, the COVID-19 pandemic has further brought to light the inadequate attitude of companies
towards the growing mismatch between people's current skills and those needed for jobs in the context of

M. Vidas-Bubanja et al. / New knowledge and skillse for digital age
32
the sophisticated technologies of the Fourth Industrial Revolution. Millions of workers have lost their jobs
due to unstable market conditions, the effects of COVID-19 or because they worked in industries that are
being replaced by new sectors. Thus, the critical need for reskilling and upskilling the workforce is
emphasized even further. Negative effects are equally present: 1) at the workers’ personal level, which
leads to growing social instability, 2) at the company level where companies do not secure adequate labour
for their business processes and therefore record a decline in revenue, 3) at the state level with falling tax
revenues and rising social welfare payments.
DIGITAL ECONOMY AND THE CHANGED LABOUR MARKET
Digital economy is usually defined as a new form of economy that uses digital technologies in its operations and
for most countries today it is one of the most attractive growth opportunities. These growth opportunities are
primarily related to the potential of this economy to create new chances for investment and innovation leading to
expanding business opportunities, creating improved business processes and models and thus creating new jobs.
Depending on the scope of the digital economy definition, estimates suggest that it currently accounts for
between 4.5% and 15.5% of the global GDP. Forecasts further confirm such upward dynamics with predictions
that by 2022 over 60% of the global GDP will be digitized and that 70% of new values created in the economy
in the next decade will be based on digitally-enabled platforms (UNCTAD, 2019).
Open platforms and increasingly advanced digital technologies are at the heart of the modern digital economy.
Therefore, a developed infrastructure is a prerequisite for modern digital age companies to be able to build value-
added services and processes. As a new infrastructure that connects the supply and demand of individuals in real
time and on a wide scale, digital platforms are revolutionizing the way business is done and the way both micro-
enterprises and industries as a whole operate. Economic theorists also point out that a platform infrastructure
characterized by the integration and alignment of multiple technologies (cloud, automation, analytics, artificial
intelligence, mobile communications, the Internet of Things) creates a new "as a service economy" - an economy
as a service, where system service becomes dynamic, on-demand, targeted (personalized) to each consumer
individually (Turban et al., 2018).
In addition to technology and capital, knowledge is the third pillar of the digital economy. Knowledge
encompasses the necessary infrastructure that enables digital transformation through the discovery,
understanding and learning of new technologies. When commenting on knowledge as a factor in creating
competitiveness for the new digital age, the IMD World Competitiveness Center divides it into three sub-
factors. The TALENT sub-factor includes the educated workforce and the skills available in a given economy to
carry out the digitization process. Talent availability is based on EDUCATION AND TRAINING which is
another sub-factor. The third sub-factor, SCIENTIFIC CONCENTRATION, indicates the importance of
investing in research and development and knowledge production which is necessary in the new digital economy
(IMD World Competitiveness Center, 2017).
The importance of knowledge and skills, particularly the mobility of skills, may be seen in the coinage of the
new term Skill economy, which emphasizes the importance of flexibility and knowledge transfer for the future
economy where jobs will be created or eliminated with each new technological wave. For example, research
conducted in Canada, a country with 18.5 million jobs, indicates that half of these jobs will be threatened by the
emergence of new technologies, but that at the same time digital technologies will create or open about 2.5
million new jobs (McKay, 2019). Furthermore, it is important to emphasize that the functioning of the digital
economy is determined not only by the knowledge of workers who appear on the labour market, but also by the
knowledge of various social categories participating in the digital economy, not as value creators, but as mentors,
advisors or simply users. The capital of the new age will be based on deep specialization in several important
areas, as well as on the acquisition of various knowledge and possibilities. An individual must be prepared for
various challenges both as a member of a team, but also as a project or solution leader based on the authority
earned by possessing deep, specialized knowledge (Vidas-Bubanja, 2019).
Technological innovations significantly profile the workings of the labour market, where there is a shift in
demand from routine and lower-skilled workers to a workforce with higher education and digital skills that can
respond to the challenges of new jobs. The growth in demand for skilled workers directly affects the growth of
wages for workers with adequate skills and the decline in wages or job losses for lower-skilled workers. Another

EMC 2022, 17-18th June 2022, Zrenjanin, Serbia
33
consequence of this shift in demand in the labour market is related to the fact that the lack of educated workers in
a large number of companies hinders the faster implementation of digital innovations and contributes to slower
growth of their productivity. As the differences in productivity and profitability between firms grow, so does the
pay gap between their workers. Industries that are experiencing greater market concentration and expansion, and
that earn higher economic rents, can offer their workers higher wages (Stansbury & Summers, 2018). Big and
powerful giants thus offer high wages and get the highest quality workforce. Thus, in addition to the monopoly
power in product markets that increases their margins and allows rent growth, these powerful companies now
also have monopoly power to dictate wages in the labour market. As the employers‘ market power strenghtens,
the workers‘ negotiating power weakens, with the decline of trade union association and the erosion of the law
on the minimum wage (Azar et al., 2017). All these factors increase social inequalities and open space for social
unrest.
As part of the growing preoccupation with the lack of workers with the skills and knowledge required by the
new digital economy on a global level, the fact that 65% of children attending school today will have a job in the
future that does not yet exist is often cited. At a time when most organizations are undergoing digital
transformation, the digital skills gap is hampering progress in 54% of companies and costing the global economy
billions of dollars (Burger, 2019).
One of the major challenges that globalization is confronting today's workers with is related not only to the level
of knowledge and skills an individual needs in order to be perceived as an recruit in a modern, open labour
market, but also to the growing competition between workers globally. This is due to the fact that digital
technologies are opening up and changing opportunities in such a way that production and skilled workers can
now be located anywhere in the world and work for a company from another country remotely. The difference
between them is again the level of knowledge they have, but also the flexibility of an individual to survive in
such a labour market and offer his or her multiple abilities (Vidas-Bubanja & Bubanja, 2019). In addition to the
direct competition from a provider of labour services located thousands of kilometres away, the modern worker
increasingly has machines for competitors. The question arises as to the further advances in the human-machine
relationship, or the robot-machine that is profiled through the concept of Industry 5.0 which asks for openness
and willingness to accept the changing role of the production worker and his direct cooperation with the robot as
a partner. Collaboration between robots and humans will enable joint work in production in many places where
this used to be risky or questionable for various reasons. This new type of robot that can work directly with
humans is called a collaborative robot or COBOT. Cobot and man can produce a better result together more
precisely and faster than they could by working alone. Furthermore, the predictions are that the coefficient of
artificial intelligence and robots could grow at an annual rate of 1-1.5 IQ points, which means that in ten years‘
time robotic intelligence will be higher than the intelligence of 90% of the human population (Nikolic, 2018).
TRAINING WORKERS FOR THE DIGITAL AGE On the supply side of the labour market, we encounter an education system that reacts slowly to dynamic
technological changes and the demand for new skills and knowledge. As a result, there is a mismatch between
the skills available and skills required that are offered in the labour market. The system capacity for continuing
education has been far exceeded by the growing need for worker in-service training and reskilling, and access to
reskilling is usually more complex for lower-skilled workers.
In this way, on the one hand, educational institutions are faced with the urgent need to change and improve their
educational content to better meet the requirements of the modern digital age and business, while, on the other
hand, they are brought into a position where they have to change their own way of working and functioning by
digitizing their offer. The outbreak of the COVID-19 pandemic has especially encouraged and accelerated the
process of digital transformation of educational systems, because the need for creating high-quality digital
educational content, distance learning, ICT education and training of teachers for the application of new digital
tools have been clearly recognized, and above all the importance of a good infrastructure which would support
the functioning of such transformed educational systems.
The fact that the educational systems in different countries are not equally prepared for such a digital
transformation has also been shown by research analysis conducted in the first half of 2020, as they indicate
divergent coverage in the delivery of digital educational content in educational institutions of different countries.

M. Vidas-Bubanja et al. / New knowledge and skillse for digital age
34
Distance learning in high-income countries encompasses about 80-85 per cent of students, dropping to less than
50 per cent in low-income countries (UNESCO-UNICEF-World Bank joint survey, 2020). This situation can be
largely attributed to the existing global digital divide, with vulnerable students in regions with limited access to
basic home services and a lack of technological infrastructure, but also where there are low levels of digital
literacy and training present among students, parents and teachers.
A particularly sensitive issue in the transformation of educational systems in the context of unstable economic
trends and the pandemic is the question of financing. In an environment where public funding is increasingly
focused on health and social care, or encouraging business activity, long-term public spending on education is
facing declining and limited funding. On the other hand, private financing will also become scarce as the
economy weakens and unemployment rises.
The complexity of the digital transformation process of the educational system is a serious task which must
involve all actors in the educational process, from schools and universities in the private and public sector, to
states and its institutions. This changed context in terms of the required knowledge and skills and the slow
reaction of the educational system highlights the important role companies must assume in employee reskilling
and upskilling. According to the McKinsey Global Institute, companies faced two employee education
challenges in the post-COVID-19 period. Namely, two changes that companies must adapt to have emerged. The
first is related to the fact that companies must take on a more prominent role in the field of reskilling and
employee training. The experience of successful companies has shown that this ensures greater mobility and
adaptability of employees to new market demands related to the increasing application of digital technologies in
business. Another change that some companies (Google, Hilton Hotels, Ernst & Young and IBM) have already
addressed, is related to the need to prioritize skills over academic education when selecting new staff.
In this way, companies secure themselves with better flexibility and mobility of employees in the business
processes. The prerequisite for such an employment approach is for a company to have a model of efficient
identification and assessment of applicants’ skills (Đorđević et al., 2021, p. 59).
In creating workforce training strategies, companies are guided by the core skills needed in the context of
the globalization of production and trade, which include: collaboration and teamwork; planning and
organizing; numeracy and literacy; basic digital skills; adaptability; self-management; learning to learn;
negotiation; conflict resolution; persuasiveness; customer service; strategic, creative, innovative and critical
thinking; communication; problem-solving; and decision-making (ILO, 2021, p. 11). Corporate culture is
now based on continuous training and development of the workforce in the workplace and LLL (lifelong
learning), because there will be a shift in the new workers‘ knowledge toward design thinking and working
instead of only "production" thinking. The key orientation of employee training, in addition to new digital
knowledge, therefore includes the competency to collaborate and cross-cultural knowledge. The technical
competency of workers will be rather interdisciplinary than narrowly specialized (Ronald Berger Think
Act, 2014).
EMPLOYEE TRAINING AND ADULT EDUCATION IN THE REPUBLIC OF SERBIA
According to the World Economic Forum report for 2019, which encompassed 141 countries across the
world, the Republic of Serbia ranked 72nd on the world scale in terms of competitiveness, while in 2018 it
ranked 65th in the world. This report covered the biggest problems of the domestic economy, of which the
intensity of employee training is one of the most significant. Namely, the report presents indicators on the
position of the Republic of Serbia according to the intensity of employee training, which shows insufficient
activity of domestic companies measured by this parameter (104th place). The long-term business practice
of domestic companies in this area is to invest in employee training, which is mostly attended by middle
and lower-level managers. Executive management usually does not have a developed awareness of the
importance of improving knowledge and skills and avoids any kind of engagement in this area.
Unfortunately, data related to adult education in Serbia are not up to date. The latest data that could provide
an overview of this area is the Adult Education Survey (AES) conducted periodically in 2011 and 2016.
Surveys have shown (Official Gazette, 2021) that the participation rate of adults in some form of

EMC 2022, 17-18th June 2022, Zrenjanin, Serbia
35
formal/non-formal education or training in Serbia was 19.8%, which is slightly higher than in 2011
(16.5%) but still significantly below the average of European Union member states (45.1%). Women were
more represented (21.4%) than men (18%) in some form of education and training in the 12 months
preceding the survey. The participation rate was highest among the population aged 25–34 (29.2%).
Based on the Adult Education Survey, we can analyze the structure of the research sample in the areas of
lifelong learning and various forms of non-formal education. Women from 25 to 34 years of age, who are
university graduates, employed and living in city areas represent the dominant group in the field of lifelong
learning. In addition, employed persons (32.5%) represent the group that most often engages in training.
Highly-educated respondents represent the group which has the most attendants in workshops, courses or
private lessons. Research has shown that non-formal education is mostly linked to the activities of the
company in which the respondent works, while the reason for attending this type of education is related to
retaining an existing job, promotion or getting a new job. What presents a problem in adult education may
be shown by two indicators: almost 80% of respondents did not participate in any form of formal or non-
formal education; out of the total number of respondents, 47% were not able to get involved in any form of
education due to the following reasons: lack of financial resources, inadequate training offer, inability to
adjust training dates with working hours and family reasons. The Adult Education Survey has shown that
informal learning as a model of education is extremely common among respondents. Most users of this
type of education take advantage of the following sources of educational content: computer (65.8%); help
from family members, friends or colleagues (63.6%); television/radio, video about 60%; printed materials
(57.5%).
When it comes to trends in adult education, it is worth pointing out education in the field of information
and communication technology (ICT), which is one of the three priority areas of the Europe 2020 strategy,
in the section entitled "Smart Growth". According to the data obtained from the 2011 census, in the
Republic of Serbia, in terms of computer literacy, out of 6,161,584 citizens over the age of 15, 34.21% are
computer literate, there is 14.78% of those who are partially computer literate, and 51.01% is computer
illiterate. Recognizing the importance of digital literacy as necessary for full participation in the 21st-
century society, and following European educational trends, where digital literacy is identified as one of the
eight key competencies, the Ministry of Education, Science and Technological Development has, within
Functional Adult Primary Education, introduced a special subject called Digital Literacy, which is studied
starting with the first cycle and has been implemented in 64 schools in Serbia (Official Gazette, 2021).
Non-formal adult education training programs for the acquisition of professional competencies are created
based on the following data: analysis of the labour market in the Republic of Serbia, employers’ planned
needs as well as the priorities defined by the national strategy. All accredited training programs planned in
the field of non-formal education are implemented by institutions working in this field. Participants receive
a certificate as proof of acquired professional competencies. A prerequisite for the realization of the process
of adult education is the creation of an environment in which the application of new knowledge and skills
in business is a comparative advantage over the competition. Also, there is a need for higher education to
follow the trends in the labour market and to harmonize its study programmes with new business trends
characterized by an intensive application of digital technologies, but also areas related to sustainable
development. It is imperative that companies, as well as current and future employees, be ready for the
challenges that await them in the digital age.
ANALYSIS ON COMPANIES’ ATTITUDES ON THE NEED TO APPLY EMPLOYEE NEW
SKILLS AND KNOWLEDGE IN THE REPUBLIC OF SERBIA
The research related to "Analysis of companies' attitudes on the need to apply employee new skills and
knowledge" was conducted in the period February-April 2022 on the territory of the Republic of Serbia, on
a sample of 50 companies, 94% of which are privately owned. According to the majority of respondents
(52%), in the last five years, companies have not changed the structure of required skills and knowledge for
employees in their human resources policy. The results of the research showed that teamwork (72%) and
kindness, approachability and good rapport in a community (62%), are the most common skills required of
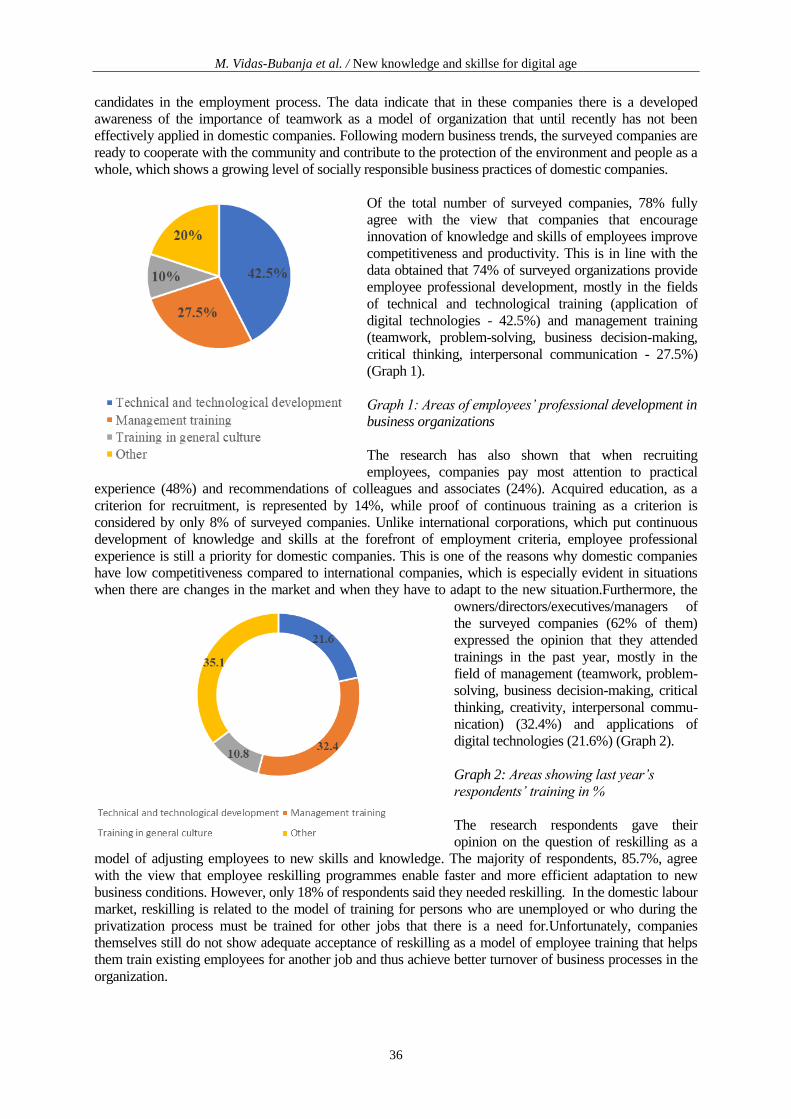
M. Vidas-Bubanja et al. / New knowledge and skillse for digital age
36
candidates in the employment process. The data indicate that in these companies there is a developed
awareness of the importance of teamwork as a model of organization that until recently has not been
effectively applied in domestic companies. Following modern business trends, the surveyed companies are
ready to cooperate with the community and contribute to the protection of the environment and people as a
whole, which shows a growing level of socially responsible business practices of domestic companies.
Of the total number of surveyed companies, 78% fully
agree with the view that companies that encourage
innovation of knowledge and skills of employees improve
competitiveness and productivity. This is in line with the
data obtained that 74% of surveyed organizations provide
employee professional development, mostly in the fields
of technical and technological training (application of
digital technologies - 42.5%) and management training
(teamwork, problem-solving, business decision-making,
critical thinking, interpersonal communication - 27.5%)
(Graph 1).
Graph 1: Areas of employees’ professional development in
business organizations
The research has also shown that when recruiting
employees, companies pay most attention to practical
experience (48%) and recommendations of colleagues and associates (24%). Acquired education, as a
criterion for recruitment, is represented by 14%, while proof of continuous training as a criterion is
considered by only 8% of surveyed companies. Unlike international corporations, which put continuous
development of knowledge and skills at the forefront of employment criteria, employee professional
experience is still a priority for domestic companies. This is one of the reasons why domestic companies
have low competitiveness compared to international companies, which is especially evident in situations
when there are changes in the market and when they have to adapt to the new situation.Furthermore, the
owners/directors/executives/managers of
the surveyed companies (62% of them)
expressed the opinion that they attended
trainings in the past year, mostly in the
field of management (teamwork, problem-
solving, business decision-making, critical
thinking, creativity, interpersonal commu-
nication) (32.4%) and applications of
digital technologies (21.6%) (Graph 2).
Graph 2: Areas showing last year’s
respondents’ training in %
The research respondents gave their
opinion on the question of reskilling as a
model of adjusting employees to new skills and knowledge. The majority of respondents, 85.7%, agree
with the view that employee reskilling programmes enable faster and more efficient adaptation to new
business conditions. However, only 18% of respondents said they needed reskilling. In the domestic labour
market, reskilling is related to the model of training for persons who are unemployed or who during the
privatization process must be trained for other jobs that there is a need for.Unfortunately, companies
themselves still do not show adequate acceptance of reskilling as a model of employee training that helps
them train existing employees for another job and thus achieve better turnover of business processes in the
organization.

EMC 2022, 17-18th June 2022, Zrenjanin, Serbia
37
CONCLUSION
The modern business environment has changed under the dominant influence of increasingly advanced and
sophisticated digital technologies (quantum computing, cloud, big data...) New development concepts such
as Industry 4.0 and Society 5.0 will profile the global digital economy in a new and different way,
redefining the ways of industrial production in the world. Few experts would dispute the fact that there will
be winners and losers in the development and implementation of these development concepts, and that the
whole world must face many risks of dynamic technological growth, such as the one indicated by a WEF
survey stating that digitalization in the industries of modern countries after 2020 could abolish five million
jobs (Brkić, 2016). In this sense, the world is facing a great challenge - protecting businesses and jobs using
the benefits of artificial intelligence and robotics wisely to alleviate economic stagnation and global
imbalances and ensure continued dynamics of sustainable growth globally.
The digital age requires companies and employees to be able to apply a variety of knowledge and skills.
Employees today need to be versed in diverse aspects, as this is the only way to respond to new market
needs. However, the problem is the mismatch between the available and required skills offered in the
labour market. Educational institutions have not adequately responded to dynamic technological changes
and the need for new skills and knowledge. Also, the concept of continuing education has been exceeded
by the growing need for training and reskilling of workers, and access to reskilling is usually more difficult
for lower-skilled workers.
Adult education in Serbia is still not at the satisfactory level required by highly developed economies. Data
from the Adult Education Survey show that the participation rate of adults in some form of formal or non-
formal education or training is significantly below the average of EU member states. An additional problem
in adult education lies in the fact that almost 80% of respondents did not participate in any form of
education (formal or non-formal), and that of the total number of respondents, 47% were unable to engage
in some form of education. The most common reasons for respondents not attending training are
insufficient financial resources, inadequate training offers, inconsistency of training dates with working
hours. In order to promote adult education, it is necessary to establish an effective system of incentives for
companies and employees in the field of acquiring new knowledge, skills and reskilling. The following
insitutions must have an active role in this area: the Serbian Chamber of Commerce, the Ministry of
Education, Science and Technological Development, the Ministry of Economy; Universities, higher
istitutions of professional education, but also non-governmental organizations dealing with adult education.
The research "Analysis of companies’ attitudes on the need to apply employee new skills and knowledge"
has shown that companies have a developed awareness of the needs for professional development of
employees, but also the management itself. The research indicated that the surveyed organizations
encourage employee professional development, mostly in the field of technical and technological training.
Furthermore, in addition to the employees themselves, the company's management is focused on its own
professional development in the field of management. However, when recruiting employees, companies
pay the least attention to proof of continuous training. Priority is given to the employees’ professional
experience and recommendations from colleagues. The surveyed companies understand the importance of
reskilling employees in order to adapt faster and more efficiently to new business conditions. However, in
practice, domestic companies still do not sufficiently apply this model of employee training, which would
allow workers to adapt to new digital business tools and enable companies the growing ability to faster
adapt and respond to dynamic changes in the modern business environment.
REFERENCES
Azar, J., Marinescu, I. and Steinbaum, M., “Labor Market Concentration,” NBER Working Paper, 24147,
December 2017. Brkić M., (2016) „Industry 4.0“ ili reindustrijalizacija Evrope“, preuzeto sa:
http://www.novimagazin.rs/ekonomija/industry-40-ili-reindustrijalizacija-evrope

M. Vidas-Bubanja et al. / New knowledge and skillse for digital age
38
Burger, B., (2019). Is digital intelligence the key to Globalization 4.0?, January,
https://www.weforum.org/agenda/2019/01/is-digital-intelligence-the-key-to-globalization-4-0/.
Đorđević D., Ćoćkalo D., Bešić C., Bogetić S., Bakator M., Uloga znanja u procesima unapređenja poslovanja u
uslovima nove ekonomske stvarnosti, Zbornik radova XVII Evropska nedelja kvaliteta – JUSK ENK 2021,
Jedinstveno udruženje Srbije za kvalitet – JUSK, 4-5 novembar, 2021., Beograd, str. 54-74 Đorđević D., Ćoćkalo D., Bogetić S. (2016)., The analysis of marketing concept implementation in domestic
enterprises, Journal of Engineering Management and Competitiveness (JEMC), TF Mihajlo Pupin,
Zrenjanin, Vol. 6, No.2., pp. 120-128 Evropska Komisija (2020), Komunikacija komisije europskom parlamentu, vijeću, europskom gospodarskom i
socijalnom odboru i odboru regija, Program vještina za Europu za održivu konkurentnost, socijalnu
pravednost i otpornost, Brisel Global framework on core skills for life and work in the 21st century, (2021), ILO, Switzerland IMD World Competitiveness Center (2017). IMD World Digital Competitiveness Ranking 2017, Swizerland,
https://www.imd.org/wcc/world-competitiveness-center-rankings/world-digital-competitiveness-rankings-
2017/. McKay, D., (2019). Humans wanted: why automation won’t kill off your job, January,
https://www.weforum.org/agenda/2019/01/humans-wanted-why-automation-wont-kill-off-your-job/. Nikolić, G., (2018). Moj prijatelj kobot, Smart InfoTrend, br. 208, str. 28-38.
Official Gazette RS, No. 20, 10.3.2021 Ronald Berger Think Act (2014) Industry 4.0 The new industrial revolution, How Europe will succeed, March. Stansbury, A. and Summers, L., “Productivity and Pay: Is the Link Broken?” Working Paper No. 18-5, Peterson
Institute for International Economics, 2018 Turban, E., Pollar, C., & Wood, G., (2018). Information Technology for Management: On Demand Strategies for
Performance, Growth and Sustainability, John Wiley & Sons. UNCTAD (2019). Digital Economy Report 2019, Value creation and capture: implications for developing
countries, Geneva. UNESCO-UNICEF-World Bank joint survey, May–June 2020. Out of 116 countries that responded, few
reported monitoring the actual use of distance learning. Available at http://tcg.uis.unesco.org/survey-
education-covid-school-closures
Vidas-Bubanja, M, Bubanja, I., (2019), „Globalizacija 4.0 - novi kvaliteti i novi izazovi“, The 16th International
Convention on Quality - ICQ 2019, Proceedings, UASQ, 4-6 th
June 2019, Belgrade, Serbia, str. 66-72.
Vidas-Bubanja, M. (2019), Izazovi Srbije u uslovima globalizacije 4.0, poglavlje u moniografiji Svet i Srbija
ekonomska i društvena gibanja, Centar za izdavačku delatnost Ekonomski fakultet Beograd, Beograd, str.
125-159. World Economic Forum, Upskilling for Shared Prosperity, (2021)

39
XII International Symposium Engineering Management and Competitiveness 2022 (EMC 2022)
17-18th June, Zrenjanin, Serbia
BOOKING AS A DIGITAL MARKETING CHANNEL IN TOURISM
Bruno Završnik
University of Maribor, Faculty of Economics and Business, Slovenia
E-mail: [email protected]
ABSTRACT
Digital marketing channels have a key role to play in companies today in effectively and consistently reaching
target groups. Compared to traditional marketing channels, digital marketing channels are also cost-effective and
measurable. Today, most companies use the Internet to buy and sell goods and services. Our research was focus
on the online sales of services, in particular online booking of services and the Booking.com platform. We also
wanted to check out the acceptance and satisfaction with the use of digital marketing channels for services such
as the Booking platform. The aim of the survey was to find out how many respondents have already used the
Booking platform, how satisfied they are with its use, and what kind of service they have booked. Research has
shown that most people travel with Booking in the age group of 18 to 30 years.
Key words: Marketing channel, Digital marketing, Booking platform.
INTRODUCTION
In the rapidly changing environment of the modern world, it is important that companies connect with
technology. By this we mean not only the digitization of products but also the digitization of services.
Due to new trends and newer technologies, the need for digitalization is increasing, and customers can
be in constant contact with information and services with the help of the Internet. It is for this purpose
that a good knowledge of the marketing channel is crucial for the success of the company.
There is no doubt that Digital Marketing is used by so many businesses of different industries and has
proven its worth in delivering many more leads to them. And of course, more leads mean more
business, and more business means more profit. The travel industry is no different and has adapted
well to the realm of the digital world to increase their brands' awareness and be able to reach more
possible customers as much as they could.
It is time for going beyond tourist experience by offering the necessary transformations, better
understanding a digital marketplace more centered on a complex consumer journey, monitoring travel
and digital trends and ensuring an adequate experience across all channels and interactions. Travel
organizations need to have an adequate infrastructure and to offer this engagement experience in the
traveler’s language and on the device of their choosing, reaching travelers through digital marketing
channels and viewing marketing ROI in terms of lifetime value of the customer. Ratiu & Purcarea
2015)
Online media and digital marketing are developing with fast pace and replacing other communication
channels, becoming one of the main tools for targeting customers. Nowadays, digital media plays a
significant role in various aspects of tourism. Many hospitality firms have introduced online
communities as new marketing channels in their business. further development of the Hoteliers
industry in this region.
Digital platforms help in getting maximum leads which helps in expanding the business and so as the
profit. With the help of digital marketing various travel deals and offers reaches the potential travelers
than traditional marketing. Social media has a strong impact on digital marketing. It helps in

B. Završnik / Booking as a digital marketing channel in tourism
40
developing brand awareness. The young travelers now do not rely on the travel agent. They use digital
platforms to decide the destination and plan their journey. Travelers are using all the digital media
which is boosting the tourism industries. Digital marketing has made it easy for tourists to plan their
complete journey, starting from selecting the destination to booking the tickets and hotel. It is helping
not only the customers but also the tourism businesses to build their strong networks and customers.
Digitization has brought great opportunities for tourism industries to implement variety of digital
marketing strategies, which will help them in creating awareness about the company and their services.
Large number of audiences can be reached using digital marketing. Exclusive offers can be provided
which will inspire travelers. Customers in any part of world can be connected by the means of
digitization. Customer’s needs and requirements can be understood even before they enquire about
services. “The best places to travel” is the most common and most searched line on search engines by
travelers does not matter if the person is a traveler or seasoned traveler. This is the reason it is very
important for the personnel in tourism industries to invest in search engine optimization. That helps in
increasing number of visitors who visit your pages and get to know your exclusive offers. Encouraging
the travelers to buy your product is not the only goal of digital marketing. (Avhad & Anute 2021).
Many tourism companies are getting online to promote and present their services online in order to
stimulate communication with clients, to sell more, and to reduce cost associated with interaction with
customers. The whole tourism sector is changing with the growth of information communication
technology and these changes has affected the methods through which tourism products and services
are communicated and delivered to customers around the world.
ONLINE BOOKING SYSTEM
Prior to the development of the Internet in the tourism sector, travel agencies and tour operators were
the only choice for hoteliers. Consequently, it was thought that the development of Information and
Communication Technologies (ICTs) would offer an ideal opportunity for disintermediation in
tourism. Digital evolution in the tourism industry has meant a change in the position of power of the
people involved. This process has led to changes in the contribution of the members of distribution
channels to the final tourism product, as they have been affected to a different extent. An improved
position of power entails an increase in responsibility in the value chain.
The above is evidence of how necessary it is for researchers to focus on tourism distribution channels,
particularly to achieve a more effective management which would contribute to a better multi-channel
marketing mix. This would fulfil the business objectives in the era of the new digital evolution.
Specifically, research must focus not only on relations between suppliers and distributors in the
tourism industry but go further and seek elements which configure these relations. The latter are
obviously influenced by internal management expertise in the making of decisions on marketing
strategies. (Kontis & Skoultsos, 2022)
The world-leading OTA (Online Travel Agency), Booking.com, is the perfect brand example whose
marketing activities are clear and well-executed. Beyond high numbers that speak for themselves,
Booking.com has another peerless advantage: the combination between a strong brand positioning and
a savvy social media strategy which translates into a front-of-mind brand for consumers who are
looking for travel services.
Marketed as not just a platform for booking accommodation, but a technology that makes travel easier,
Booking.com has been growing impressively and is one of the most recognizable travel brands
worldwide. (Stanciu, 2021)
Booking.com owns the website "www.booking.com" and the application (together they form the
"Platform"). Booking.com provides an online booking service through the Platform, through which -
among others - accommodation providers such as hoteliers and other providers (the "Provider") can
offer their products and booking services, and users of the Platform use this to make reservations.
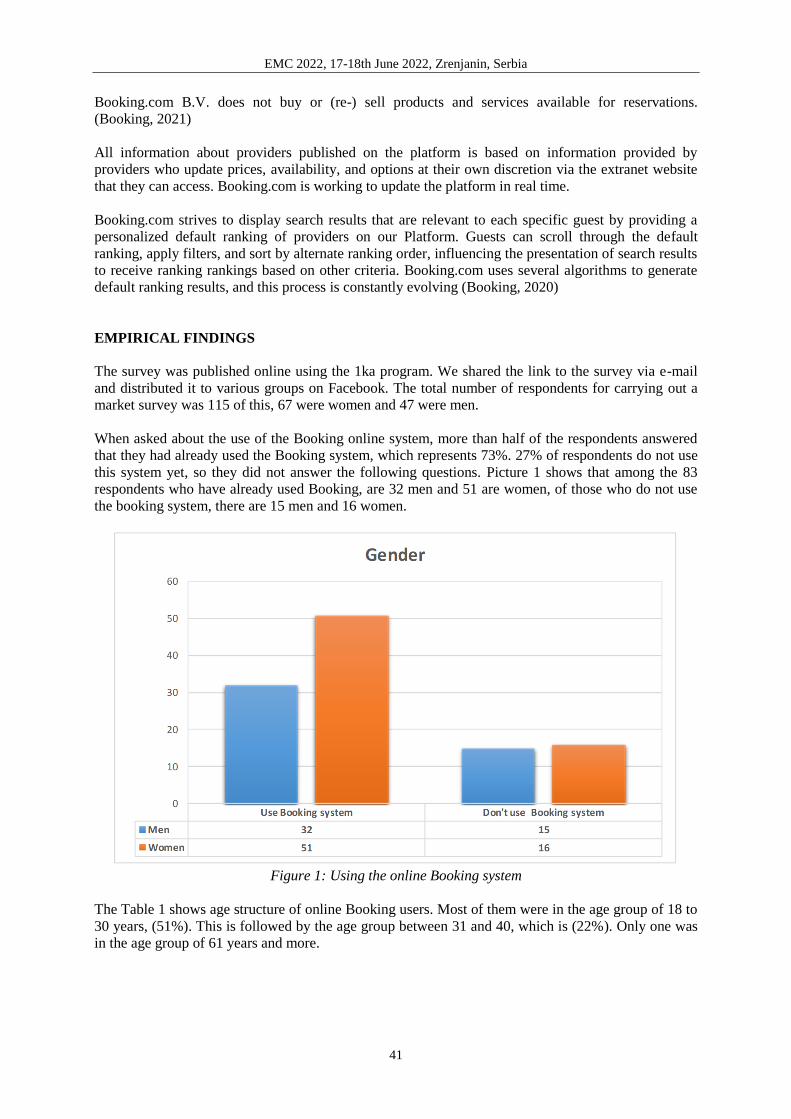
EMC 2022, 17-18th June 2022, Zrenjanin, Serbia
41
Booking.com B.V. does not buy or (re-) sell products and services available for reservations.
(Booking, 2021)
All information about providers published on the platform is based on information provided by
providers who update prices, availability, and options at their own discretion via the extranet website
that they can access. Booking.com is working to update the platform in real time.
Booking.com strives to display search results that are relevant to each specific guest by providing a
personalized default ranking of providers on our Platform. Guests can scroll through the default
ranking, apply filters, and sort by alternate ranking order, influencing the presentation of search results
to receive ranking rankings based on other criteria. Booking.com uses several algorithms to generate
default ranking results, and this process is constantly evolving (Booking, 2020)
EMPIRICAL FINDINGS
The survey was published online using the 1ka program. We shared the link to the survey via e-mail
and distributed it to various groups on Facebook. The total number of respondents for carrying out a
market survey was 115 of this, 67 were women and 47 were men.
When asked about the use of the Booking online system, more than half of the respondents answered
that they had already used the Booking system, which represents 73%. 27% of respondents do not use
this system yet, so they did not answer the following questions. Picture 1 shows that among the 83
respondents who have already used Booking, are 32 men and 51 are women, of those who do not use
the booking system, there are 15 men and 16 women.
Figure 1: Using the online Booking system
The Table 1 shows age structure of online Booking users. Most of them were in the age group of 18 to
30 years, (51%). This is followed by the age group between 31 and 40, which is (22%). Only one was
in the age group of 61 years and more.

B. Završnik / Booking as a digital marketing channel in tourism
42
Table 1: Age of the respondents
Age (Years) Frequency Percent
To 18 0 0%
18 - 30 42 50%
31 - 40 18 22%
41 - 50 9 11%
51- 60 13 16%
61 and more 1 1%
Total 83 100%
Those respondents who answered that they had already used the Booking online system then answered
the following question. We were interested in where or who introduced them Booking online system
(Figure 2).
Most of them answered that they were introduced by friends, then family, coworkers, and partner. As
another options, they mentioned that they got to know themselves online and the employees of the
travel agency.
47%
20%
16%
9%
0
5
10
15
20
25
30
35
40
45
50
Friends Family Coworkers Partner Others
Figure 2: Introduction to the online Booking system
With the next question, we wanted to find out what type of accommodation the respondents choose
using the online Booking system. Most of them chose the apartment, which represents 50%. In second
place as the type of accommodation they choose hotel with 46%. Then follows holiday house, a
cottage, and a resort. Several answers were possible (Figure 3).

EMC 2022, 17-18th June 2022, Zrenjanin, Serbia
43
Figure 3: Type of accommodation
Table 2: Statement regarding satisfaction with the online booking system
Statement Satisfaction with the online booking system
Very
satisfied Satisfied Undecided Dissatisfied
Very
dissatisfied
Realization of wishes (requirements) on
the trip 34 55 11 0 0
Website transparency 42 52 6 0 0
Availability of information 40 52 8 0 0
Understandable information 31 63 6 0 0
Quality of service provided 48 47 5 0 0
Clarity of the offer on the website 33 57 10 0 0
With the next question, we wanted from the respondents to agree or. disagree with different statement
Table 2).
34% of respondents were very satisfied with the first statement, 55% were satisfied and 11% were
undecided. From this we can conclude that most respondents are satisfied with the online booking
regarding on the requirements they have on the trip.
To the second statement, 42% respondents said they were very satisfied with the statement, 52% were
satisfied and 6% were undecided. We see that the respondents also agree with the second statement
and are satisfied with the transparency of the website.
40% respondents are very satisfied with the following statement, 52% are satisfied and 8% are
undecided. In short, we can see that respondents are satisfied with the availability of information. In
the fourth statement, the results showed that 31% respondents are very satisfied, 63% are satisfied and
6% are undecided about the understandable of the information.
The next statement is about quality of service provided. The results showed that 48%respondents are
very satisfied, 47% are satisfied and 5% are undecided. From this we conclude that the respondents are
very satisfied or satisfied with the quality of service provided.
The last statement was about the clarity of the offer on the website. 33% respondents are very
satisfied, 58% are satisfied and 10% are undecided.

B. Završnik / Booking as a digital marketing channel in tourism
44
CONCLUSION
Obviously, with the entrance of new powerful intermediaries a ‘re-intermediation’ takes place
following technological changes and new characteristics of business environment. This ‘re-
intermediation’ means that powerful new intermediaries enter the industry and that disintermediated
ones may also re-enter. A variety of tools are available to consumers through the Internet and mobile
technology allowing them to search for and purchase services directly from the suppliers. As a result,
e-intermediaries in tourism distribution channels are in the powerful position of exploiting this
situation, thus harming that of the suppliers. So, the power is now in the hands of the intermediaries
who use new technology rather than in the hands of the suppliers. (Nilead 2018).
Today’s travelers are using all types of devices and online channels to fulfill their travel planning
needs. Therefore, hoteliers need to build and execute a comprehensive online marketing strategy to
cover the most ground and always be where their customers are looking. By leveraging a wide variety
of online marketing initiatives and unique channels, hotel marketers can increase online visibility and
ultimately, the number of online hotel bookings. (Beach 2019).
The research also provides some opportunities for further research. We could compare the use of the
Booking platform with other digital online booking tools in the tourism industry. We could also take a
closer look at the current situation at the time of the Covi-19 epidemic. Booking's response to
reservations.
REFERENCES
Avhad, T.,& Anute N. (2021).Digital marketing strategies adopted by online tourism companies in india,
Vidyabharati International Interdisciplinary Research Journal 12(2).
Beach, G. (2019). Top 9 digital marketing channels for hoteliers to boost online booking rates.
https://www.productsup.com/blog/online-marketing-channels-hotel-bookings/,
Booking. (2020). Booking.com. https://www.booking.com/content/about.sl.html
Booking. (2021). Booking. com: https://www.booking.com/index.sl.html
Kontis, A.-P. and Skoultsos, S. (2022). Digital evolution in tourism marketing channels: Greek tourism industry
and Online Travel Agencies. European Journal of Tourism Research 30, 3004.
Nilead, (2018). Digital Marketing in Travel and Tourism Industry https://nilead.com/article/digital-marketing-in-
travel-and-tourism-industry.
Ratiu, M.P. & Purcarea, I.M. (2015). Reaching travelers through digital marketing channels,
https://www.researchgate.net/publication/343161955_Reaching_travelers_through_digital_marketing_chan
nels.
Stanciu, T. (2021). What is Booking.com's digital marketing strategy?
https://www.socialinsider.io/blog/booking-social-media-strategy/#aboutBooking.

45
XII International Symposium Engineering Management and Competitiveness 2022 (EMC 2022)
17-18th June, Zrenjanin, Serbia
Session A: MANAGEMENT AND OPERATION MANAGEMENT
Papers (pp. 47-134):
Ali Reza Afshari, Ghazal Jamili Emami
CONSTRUCTION PROJECT COST MANAGEMENT USING BIM ...47
Ali Reza Afshari, Shirin Kardanimalekinezhad
CONSTRUCTION PROJECT DELAY MANAGEMENT ...54
Ali Reza Afshari, Sohrab Mohammadi
APPLICATION OF IOT TECHNOLOGIES IN THE HEALTH CARE 62
Ali Reza Afshari, Behsa Saeedi
CONSTRUCTION PROJECT FINANCING MANAGEMENT ...67
Zorana Antić, Srđan Bogetić
TIME MANAGEMENT SKILLS - A CRITICAL ADVANTAGE IN PROFESSIONAL
AND PERSONAL DEVELOPMENT ...74
Dejan Đorđević, Mihalj Bakator, Dragan Ćoćkalo, Cariša Bešić, Ljiljana Đorđević
ANALYZING RESPONSIBILITY AND SUSTAINABILITY AS ASPECTS OF
THE MANAGEMENT PROCESS IN ENTERPRISES 80
Biljana Maljugić, Marija Matotek Anđelić, SrđanaTaboroši
RISK ANALYSIS AND RISK MANAGEMENT IN BUSINESS PRACTICE ...86
Vladan Paunović, Jasmina Vesić Vasović, Sanja Puzović
THE ANALYSIS OF OPPORTUNITIES TO USE THE LEAN CONCEPT
IN CONDITIONS OF INDUSTRIAL PRODUCTION 92
Vesna Spasojević Brkić, Mirjana Misita, Aleksandar Brkić, Zorica Veljković,
Martina Perišić, Neda Papić, Nemanja Janev
RISK MANAGEMENT AND EXCAVATOR DOWNTIME ANALYSIS ...98
Marija Stanojeska
INDUSTRY 4.0: AN INNOVATIVE SOLUTION FOR MONITORING THE PRODUCTION
PROCESS AND QUALITY CONTROL IN A TEXTILE FACTORY ...106
Marija Stanojeska, Robert Minovski, Bojan Jovanoski
ASSESSMENT OF THE VITALITY OF ORGANIZATIONAL LEARNING,
CUSTOMER FOCUS, AND CONTINOUS IMPROVEMENT IN MACEDONIAN
FOOD PROCESSING INDUSTRY FROM TQM PERSPECTIVE ...112
Ljiljana Stošić Mihajlović
OPERATIONAL MANAGEMENT OF PRODUCTION IN
SMALL AND MEDIUM ENTERPRISES IN SERBIA ...119
László Szabó
BLOCKCHAIN IN THE SUPPLY CHAIN ...125
Dijana Tadić
INFLUENCE OF QUALITY MANAGERS ON ORGANIZATION
QUALITY PERFORMANCES ...129

46

47
XII International Symposium Engineering Management and Competitiveness 2022 (EMC 2022)
17-18th June, Zrenjanin, Serbia
CONSTRUCTION PROJECT COST MANAGEMENT USING BIM
Ali Reza Afshari
Department of Construction Management, Shirvan Branch, Islamic Azad University, Shirvan, Iran
E-mail: [email protected]
Ghazal Jamili Emami
Department of Construction Management, Mashhad Branch, Islamic Azad University, Mashhad, Iran
ABSTRACT
The control of cost in construction projects is one of the most important issues in construction since the
emergence of the construction industry. A successful project should meet not only quality output standards, but
also time and budget objectives. The management and control of cost in construction is fundamental in every
project. An effective cost management and control technique for construction projects is important in managing
risk of cost overrun in completion of projects. Construction projects are becoming more complex as they now
involve many stakeholders from different disciplines. The emergence of Building Information Model (BIM), an
alternative technology is believed to solve issues related to project cost control as it efficiently increases
collaboration between stakeholders. The aim of this paper is to review and summarize the causes of cost overrun
in construction industries, which are the main causes of disputes and abandonment of projects in the industry. It
was found that cost overrun eats deep into the industry and leave the construction industry with a bad image for
decades even with rapid advancement in technology. The review of the applications of BIM showed that most of
the applications are geared towards minimizing construction cost spent on projects. This means that the use of
BIM in the management of construction projects has great impact on project cost.
Key words: Construction management, Building Information Model (BIM), Project cost management,
Construction Project management, Construction industry, Project management.
INTRODUCTION
Control of cost in a construction project is one of the most important issues in construction since the
emergence of the industry (Minchin et al., 2013). In this light, a successful project should not only meet
quality output standards, but also budget objectives. Cost performance is a fundamental criterion for the
success of any project. However, delay of project completion is very common in the construction industry
due to ineffective cost control (Forbes & Ahmed, 2010). The essence of cost control is to ensure that
projects are finished on time, and this is attainable through constant measurement of progress, evaluation of
plans and taking appropriate action on the project (Kerzner, 2013). Buttressing this also is the Project
Management Body of Knowledge (PMBOK), which suggests that in order to achieve the baseline
objectives of any project, there has to be effective monitoring of project cost control. Inherently, cost are
two major concerns in managing construction projects (Rasdorf & Abudayyeh, 1991). However,
construction projects are becoming more complex as they now involve many stakeholders from different
disciplines. Most of the features of projects that give rise to cost overruns do vary alongside with the project
type, location, size and scope. Most of the time, construction projects that are large in nature and scope are
characterized by their complexity and capital demands (Torp et al., 2016). In addition, the construction
industry has many branches, and as such, it encompasses a lot of information about any one construction
project. This is information that is very important to a project, and can be the basic foundation for decision-
making, procurement and collaboration. The success of a project requires cost management among other
factors to be considered before the commencement of the project (Masrom et al., 2015). Cost management
starts with quantification, which takes a lot of time and is tedious in nature. Traditionally, the process is
manually completed most of the time with high likelihood of human error, which tends to be higher when
preparing estimates for complex projects. The use of computer-related applications allows for the making
of more reliable decisions (Martínez-Rojas et al., 2016). Globally, the construction industry is replete with
A. R. Afshari and G. Jamili Emami / Construction project cost management using BIM
48
high-profile projects that are faced with significant cost overrun (Smith, 2014). Unfortunately, construction
project cost overrun is the norm in the Malaysian construction industry, leading to additional project costs
(Enshassi et al., 2009).
The Malaysian construction industry is regarded as an industry facing poor performance leading to failure in
achieving effective and efficient cost management. The emergence of alternative techniques is believed to
minimize the issues relating to project cost control. Furthermore, it is also believed that the emergence of the
Building Information Model (BIM) can lead to greater efficiency by means of increased collaboration (Zhang &
Gao, 2013). The National BIM Standard (NBIMS) Project Committee of the Building SMART alliance referred
to BIM as A digital representation of physical and functional characteristics of a facility, as such, it serves as a
shared knowledge resource for information about a facility, forming a reliable basis for decisions during its life-
cycle from inception onward. The BIM is a shared digital representation founded on open standards for
interoperability. (Succar, 2009) This suggests the Building Information Model (BIM) as an alternative approach
to construction design; it does not only make digital representation of designs easier; it also provides all the
necessary information for any project before construction (Xiao & Noble, 2014). Thus, the information
represented by BIM models is very useful and can be analyzed to optimize the design, planning and construction
processes (Azhar, 2011). Moreover, according to Bryde et al. (2013), BIM is an appropriate tool for project
managers and should be considered by project managers as a way to help manage construction projects.
However, BIM as an alternative technology in Malaysia needs to be studied to provide proof that it can satisfy
the industry’s need in improving cost control. It is also important to further investigate how cost control can be
improved upon using BIM technology.
CONSTRUCTION PROJECT COST MANAGEMENT
Project cost control is a vital ingredient for a successful project. Project cost control is the process of monitoring
the status of the project by updating the project costs and managing changes to the cost baseline. This provides
means for the recognition of variance from the plan so as to take corrective actions and reduce risk. This,
therefore, means that corrective action needs to be taken by personnel who incur cost in all companies
irrespective of their size. The process for project cost control involves three main parameters, which are input,
tools and techniques and output. The process and its parameters for input are project management plan, project
funding requirements, work performance data and organizational process assets. The tools and techniques
comprise earned value management (EVM), forecasting, to-complete performance index (TCPI), performance
reviews, project management software and reserve analysis, while the output process and its parameters include
work performance information, cost forecast, change request, project management plan updates, project
document updates and organizational process updates. However, even with the vast integrated knowledge areas
in project management, cost overrun are the most common issues in construction projects. Thus, it is significant
to note that the degree of success of a project is defined within the triangle of scope, time and cost. As such, it is
important to look at the causes of these cost overrun in projects. In this regard, delay is generally acknowledged
as the most common, costly, complex and risky problem encountered in construction projects. Previous research
conducted has shown that project delays are common and costly, making it an important study to know the
causes of these problems for effective project management.
In Jordan, Al-Momani (2000) examined 130 government projects and stated that changes that were initiated by
the designers, weather, client requirement, late deliveries, site condition and economic conditions were the main
causes of delay in construction projects. According to Frimpong et al. (2003), in Ghana, material procurement,
escalation of material prices, poor contractor management, poor technical performance and difficulties arising
from agencies’ monthly payment are the major causes of cost overrun in the construction of groundwater
projects. In Hong Kong, the major cause of cost overrun was identified to be the poor management of sites,
unforeseen ground conditions, change orders and poor decision making (Chan & Kumaraswamy, 2002).
Furthermore, according to Odeh and Battaineh (2002), from the viewpoint of contractors and consultants in the
construction industry, owner interference, inadequate contractor experience, finance and payment, labour
productivity, slow decision making, improper planning and subcontractors are the major causes of delay in
construction projects. Hsieh et al. (2004) conducted a study on 90 metropolitan projects in Taiwan, and identified
planning and design as the major cause of change orders in the projects leading to cost overrun, while
Sambasivan et al. (2007) stated that predominantly, delays are caused as a result of changes in design, poor
planning and labour productivity. Moreover, in a study conducted by Kaliba et al. (2009), other prime causes of

EMC 2022, 17-18th June 2022, Zrenjanin, Serbia
49
cost overrun are client organizations delaying in making payment, modification of contracts, economic hardship,
procurement materials, design changes, staffing issues, lack or unavailability of working equipment, poor
supervision, mistakes during construction, poor site coordination, specification changes and labour. Abd El-
Razek et al. (2008) conducted a survey on the causes of cost overrun and found that financial problems
experienced during construction by contractors, owners delaying payment to contractors, changes in design by
clients or their agents during construction and the lack of use of professional construction and contractual
management were the main causes of cost overrun. In addition, research by Le-Hoai et al. (2008) on the causes
of delay in Vietnam compared with those of other countries showed that in Vietnam, lack of experience, loose
deadlines, poor cost estimates, design inefficiencies, labour incompetence, government-related issues and
financial problems were the main causes of delay, whereas in Thailand, the main causes of delay were poor
design, resource and labour shortages, poor project planning, inefficient contractor management, financial
difficulties and change orders (Toor & Ogunlana, 2008). Cost overrun do occur internally and are generated by
the sponsors, design team, contractors and consultants. At the same time, they could be externally caused
through late material supply, government policies or weather conditions (Ahmed et al., 2003).
Olawale and Sun (2010) reported change in design as the most significant cause of poor cost control from the
practitioner’s point of view. The five main causes of delay in construction projects according to Alinaitwe et al.
(2013) comprise scope change, payment delays, high cost of capital, poor monitoring and control and political
insecurity and instability. Inadequate experience by the contractor, poor project planning, site management and
change orders were among the 15 main causes of delay in Turkey according to Gündüz et al. (2012).
Samarghandi et al. (2016) conducted a study on the reasons for delay and cost overrun in construction projects in
Iran and developed a statistical model that categorised delay factors into four main categories. The categories
include owners’ defect, contractors’ defect, consultants’ defect and government laws, regulations and other
general defects. Delay factors such as shortage of materials, change orders, delay in payment of suppliers, poor
management of site and late submission of drawings are the main causes of delay.
Alaghbari et al. (2007) conducted a study on the causes of delay and ranked them. The researcher found that
financial problems and coordination problems were the two most important factors causing delay in construction
projects in Malaysia. Similarly, Sambasivan and Soon (2007) conducted research using a questionnaire to
describe the 10 main causes of delay in Malaysian construction projects and found that they included poor site
management, late payment, labour supply, improper planning, lack of experience, problems with subcontractors
and shortage of materials. Al-Tmeemy et al. (2012) listed several causes of delay in Malaysia that included
labour productivity, slow decision making, inflation, material delivery and insufficient equipment. Shehu et al.
(2014) also stated that contract delays were predominantly caused by the contractors, while the other factors
were associated with finance. Ahmed et al. (2003) and Al-aghbari (2005) in their separate research classified the
factors causing cost overrun in Malaysian construction projects into four categories, which are contractor’s
responsibility, consultant’s responsibility, owner’s responsibility and external factors.
From the review above, one can conclude that the cause of cost overrun has eaten deep into the industry and
have given the construction industry a bad image for decades. Unfortunately, such causes keep recurring even
with the advancement in technology and rigorous research done to solve or minimize their recurrence. It is
believed that the application of BIM will solve these issues as it integrates all the major stakeholders from
different disciplines in a project when making and taking decisions.
BUILDING INFORMATION MODEL (BIM)
The contractor’s guide to Building Information Modelling (BIM) describes it as a process of developing and
implementing computer-generated models to combine the design, planning, construction and operation of a
facility. In this light, Masood et al. (2014) defined BIM as a 3D digital representation of a facility with essential
components and characteristics made up of intelligent building components. It is a means and practice of virtual
design construction throughout the facility life-cycle that serves as a platform for knowledge and data sharing for
communication between stakeholders (Eadie et al., 2015). While Olatunji et al. (2010) defined it as a
representation of the combination of fairly revolutionary ideals for design technology, it portrays the geometry,
geographic information spatial relationships, quantities and characteristics of building elements, material
inventories, cost estimates and schedule of performance. BIM is basically a 3D digital representation of a
facility. The model can be used to express the entire facility life-cycle. The model is data rich because of the

A. R. Afshari and G. Jamili Emami / Construction project cost management using BIM
50
quantity of material involved, its properties can be easily obtained and the scope of work required can easily be
defined and isolated from the model (Smith & Edgar, 2008). Contract documents, drawings, procurement
details, specifications and other construction documents can easily be interrelated using the model (Bazjanac,
2006; Khemlani, 2007). Thus, a series of techniques that enable the practice and processes of construction and
virtual designs through the project’s life-cycle is the main concept of BIM (Zhang, 2012).
A lot of tools have been developed as a result of the spread of the concept of BIM in achieving its perspectives.
These tools are used to manage construction projects, most of which are designed for specific purposes to meet
the need of users, while a few are designed for multiple functions and information collection. The type of tool to
be used depends on the purpose, user and stage in which it will be used. BIM tools enable 3D modelling and the
management of information. The use of these tools makes BIM a unified system that interacts with all its parts.
The table below shows some known BIM tools, their manufacturers and their functions.
Applications of BIM in Project Management
The potential of the application of BIM in the management of construction projects is similar to the Project
Management Body of Knowledge (PMBOK); hence, it is an important tool for effective and efficient project
management as it integrates stakeholders (Rokooei, 2015). BIM as a promising technology facilitates project
management and the possibility of integrating building models and products, giving it high potential for
management of project life-cycles (Gourlis & Kovacic, 2016) as it can be used throughout a project’s life-cycle.
It helps in understanding the project needs by the owner. It is also used for analysis, design and development of
the project by the design team. The contractor also makes use of it in managing the construction phase, as well as
in decommissioning, maintenance and operation carried out by the facility manager (Grilo & Jardim-Goncalves,
2010).
BIM is regarded as a great visualization tool as it provides 3D virtual representation of the facility (Zhang,
2012). This is the reason why in recent times, researchers and practitioners in the industry have been using it as
an alternative means of interdisciplinary information sharing; it enables users to have an idea of the functional
and physical characteristics of the facility in 3D visualization. Walk-through, rendering and sequence of the
model can be provided by the project manager during project bidding for ease of communication with interested
contractors. An outlook of the project, when completed, is provided through visualization of the model using
BIM techniques, which solve the issues of having to combine the different 2D views of the proposed project to
create a 3D view (Mohandes et al., 2015). The virtual models enhance collaboration and communication as it
can be shown to the owner and designers during meetings. The sequence of the construction work and planning
can be based upon the utility of the model component. The virtual models, which are cost effective, allow the
contractor and the design team to work on the constructability analysis of the building, thereby reducing risk and
potential design errors and saving time (Azhar et al., 2008).
Value for money can be improved through the use of BIM, as was shown through research conducted by Li et al.
(2014). The evidence provided to justify their finding was from the Shanghai Disaster Recovery Centre project,
which showed a potential benefit of optimized construction activities through cost-orientated activities.
Moreover, BIM reduces waste and also optimizes efficiency throughout the project life-cycle as it supports
integrated project delivery through a collaborative process (Glick & Guggemos, 2009).
Lavy et al. (2014) conducted research using a case study of the Solibri Model Checker (SMC), and it was found
out that maintainability of the facility could be checked during the design phase, which will reduce the cost of
maintenance during a project’s life-cycle. This is possible as the 3D model offers facility managers the
opportunity to anticipate maintenance accessibility problems and ways to resolve them. Lu et al. (2014)
conducted a study on the cost benefit of implementing BIM by comparing two projects i.e., one using BIM and
the other, conventional methods. It was found that the implementation of BIM saved cost by about 7% per
square meter for the project. At the construction stage, it decreased the cost per square meter of the gross floor
area by 8.61% when compared to the conventional designed and built project. According to Lu et al. (2016),
cash flow analysis can be automated and simplified through 3D modelling design by linking cost and schedule
information; this saves more time and cost compared with using the traditional method, which is time
consuming. On the contrary, Masood et al. (2014) stated that BIM has very low impact on cost reduction, time
and human resource in Pakistan’s construction industry. According to Underwood (2009), BIM presents a non-
redundant model of the project’s life-cycle information to streamline its processes, which solves the problem of

EMC 2022, 17-18th June 2022, Zrenjanin, Serbia
51
redundancy when using conventional methods. Improvement in quality of design, construction and minimizing
rework during construction are the three most important merits of using BIM. This was the perception of AEC
professionals in Pakistan’s construction industry (Masood et al., 2014).
Applications of BIM in Construction Project Cost Management
The adoption and implementation of BIM are steadily increasing in the built environment (Salleh et
al., 2014). Meanwhile, through the adoption and implementation of BIM in a building project, Wong
et al. (2009) believed that project stakeholders could maximize benefits regarding time, cost, and
quality. However, it is not easy to achieve a right balance between these three factors for the
construction projects, since so many strategies and solutions are needed to accomplish it, and
innovation can be one of the possible solutions to strike a balance between these three factors. Smith
and Tardif (2009) observed the contribution of BIM to improving communications among business
partners at the conceptual stage, and the overall reduction in the cycle time as well as the life cycle
cost of a project. In New Zealand, cost estimation is carried out based on 2D drawings (Both, 2012),
while in Australia, Aibinu and Venkatesh (2014) reported a low adoption of BIM by Australia's
quantity surveyors. One of the factors attributed to the low adoption in Australia was the “lack of trust
in the integrity of BIM” and “lack of demand by the clients” among other barriers. Meanwhile, based
on the desktop literature, key factors that influence the top management of firms to adopt BIM include
its ability to enhance the competitiveness in the market and facilitate the business operation. Utilizing
the innovative tools can help the firms to maintain their competitiveness within the industry because
BIM can improve project quality and minimize the risks as well as the cost of the construction projects
(Epstein, 2012).
CONCLUSION
The review highlighted the main causes of cost overrun in the construction industry. It is generally
acknowledged that the end result of cost overrun is costly and risky, leading to many disputes and
claims that end in lawsuits. Most of the causes of cost overrun as stated by previous researchers can be
classified into four categories. These are contractor’s responsibility, consultant’s responsibility,
owner’s responsibility and external factors. It is believed that the evolution of the Building
Information Model (BIM) will be able to increase efficiency and quality of output in the construction
industry by eliminating these causes of cost overrun. The application of BIM and the potential benefits
of its application were also reviewed. The benefits from using these applications are expected to
minimize cost overrun as they provide solutions for the main causes of cost overrun such as
estimation, clash detection, integration and many more.
REFERENCES
Abd El-Razek, M., Bassioni, H., & Mobarak, A. (2008). Causes of delay in building construction projects in
Egypt. Journal of Construction Engineering and Management, 134(11), 831–841.
AEC industry. Leadership and Management in Engineering, 11(3), 241–252.
Ahmed, S. M., Azhar. S., Kappagntula, P., & Gollapudil, D. (2003). Delays in construction: A brief study of the
Florida construction industry. Paper presented at the Proceedings of the 39th
Annual ASC Conference,
Clenson University, Clenson, SC.
Aibinu, A., & Venkatesh, S. (2014). Status of BIM adoption and the BIM experience of cost consultants in
Australia. Journal of Professional Issues in Engineering Education and Practice, 140(3), 04013021.
Al-Aghbari, M. (2005). Factors affecting construction speed of industrialized building system in Malaysia.
Serdang, Malaysia: Universiti Putra Malaysia.
Alaghbari, W. E., Razali A., Kadir, M., Salim, A., & Ernawati. (2007). The significant factors causing delay of
building construction projects in Malaysia. Engineering, Construction and Architectural Management,
14(2), 192–206.
Alinaitwe, H., Apolot, R., & Tindiwensi, D. (2013). Investigation into the causes of delays and cost overruns in
Uganda’s public sector construction projects. Journal of Construction in Developing Countries, 18(2), 33.

A. R. Afshari and G. Jamili Emami / Construction project cost management using BIM
52
Al-Momani, A. H. (2000). Construction delay: A quantitative analysis. International Journal of Project
Management, 18(1), 51–59.
Al-Tmeemy, S. M. H., Abdul-Rahman, H., & Harun, Z. (2012). Contractors’ perception of the use of costs of
quality system in Malaysian building construction projects. International Journal of Project Management,
30(7), 827–838.
Azhar, S. (2011). Building information modeling (BIM): Trends, benefits, risks, and challenges for the
Azhar, S., Hein, M., & Sketo, B. (2008). Building Information Modeling (BIM): Benefits, risks and challenges.
Auburn, Alabama: McWhorter School of Building Science, Auburn University.
Bazjanac, V. (2006). Virtual building environments (VBE)-applying information modeling to buildings. In A.
Dikbas & R. Scherer (Eds.), eWork and eBusiness in Architecture Engineering and Construction (pp. 58-
72). London: Taylor & Francis Group.
Both, P. V. (2012). Potentials and barriers for implementing BIM in the German AEC market: results of a
current market analysis.
Bryde, D., Broquetas, M., & Volm, J. M. (2013). The project benefits of building information modelling
Chan, D. W., & Kumaraswamy, M. M. (2002). Compressing construction durations: Lessons learned from Hong
Kong building projects. International Journal of Project Management, 20(1), 23–35.
Eadie, R., Browne, M., Odeyinka, H., McKeown, C., & McNiff, S. (2015). A survey of current status of and
perceived changes required for BIM adoption in the UK. Built Environment Project and Asset
Management, 5(1), 4–21.
Enshassi, A., Al-Najjar, J., & Kumaraswamy, M. (2009). Delays and cost overruns in the construction projects in
the Gaza strip. Journal of Financial Management of Property and Construction, 14(2), 126–151.
Epstein, E. (2012). Implementing successful building information modeling. Artech House.
Forbes, L. H., & Ahmed, S. M. (2010). Modern construction: Lean project delivery and integrated practices.
Boca Raton: CRC Press.
Frimpong, Y., Oluwoye, J., & Crawford, L. (2003). Causes of delay and cost overruns in construction of
groundwater projects in developing countries: Ghana as a case study. International Journal of Project
Management, 21(5), 321–326.
Glick, S., & Guggemos, A. (2009). IPD and BIM: Benefits and opportunities for regulatory agencies. In
Proceedings of the 45th
Associated Schools of Construction National Conference (pp. 2-4). Gainesville,
Florida.
Gourlis, G., & Kovacic, I. (2016). Building Information Modelling for analysis of energy efficient industrial
buildings – A case study. Renewable and Sustainable Energy Reviews, 68, 953-963.
Grilo, A., & Jardim-Goncalves, R. (2010). Value proposition on interoperability of BIM and collaborative
working environments. Automation in Construction, 19(5), 522–530.
Gündüz, M., Nielsen, Y., & Özdemir, M. (2012). Quantification of delay factors using the relative importance
index method for construction projects in Turkey. Journal of Management in Engineering, 29(2), 133–139.
Hsieh, T. Y., Lu, S. T., & Wu, C. H. (2004). Statistical analysis of causes for change orders in metropolitan
public works. International Journal of Project Management, 22(8), 679–686.
Kaliba, C., Muya, M., & Mumba, K. (2009). Cost escalation and schedule delays in road construction projects in
Zambia. International Journal of Project Management, 27(5), 522–531.
Kerzner, H. R. (2013). Project management: A systems approach to planning, scheduling, and controlling.New
Jersey: John Wiley & Sons.
Khemlani, L. (2007). Top criteria for BIM solutions. A survey conducted by AECbytes.
Lavy, S., Liu, R., & RA Issa, R. (2014). Design for maintenance accessibility using BIM tools. Facilities,
32(3/4), 153–159.
Le-Hoai, L., Dai Lee, Y., & Lee, J. Y. (2008). Delay and cost overruns in Vietnam large construction projects: A
comparison with other selected countries. KSCE Journal of Civil Engineering, 12(6), 367–377.
Lu, Q., Won, J., & Cheng, J. C. (2016). A financial decision making framework for construction projects based
on 5D Building information modeling (BIM). International Journal of Project Management, 34(1), 3–21.
Martínez-Rojas, M., Marín, N., & Miranda, M. A. V. (2016). An intelligent system for the acquisition and
management of information from bill of quantities in building projects. Expert Systems with Applications,
63, 284–294.
Masood, R., Kharal, M., & Nasir, A. (2014). Is BIM adoption advantageous for construction industry of
Pakistan? Procedia Engineering, 77, 229–238.
Masrom, M. A. N., Rahim, M. H. I. A., Mohamed, S., Chen, G. K., & Yunus, R. (2015). Successful criteria for
large infrastructure projects in Malaysia. Procedia Engineering, 125, 143–149.
Minchin, R. E., Li, X., Issa, R. R., & Vargas, G. G. (2013). Comparison of cost and time performance of design-
build and design-bid-build delivery systems in Florida. Journal of Construction Engineering and
Management, 139(10), 04013007.

EMC 2022, 17-18th June 2022, Zrenjanin, Serbia
53
Mohandes, S. R., Marsono, A. K., Omrany, H., Faghirinejadfard, A., & Mahdiyar, A. (2015). Comparison of
building existing partitions through building information modeling (BIM). Jurnal Teknologi, 75(1), 287-
298.
Odeh, A. M., & Battaineh, H. T. (2002). Causes of construction delay: Traditional contracts. International
Journal of Project Management, 20(1), 67–73.
Olatunji, O., Sher, W., Gu, N., & Ogunsemi, D. (2010). Building information modelling processes: benefits for
construction industry. Paper presented at the W078-Special Track 18th
CIB World Building Congress.
Salford, United Kingdom.
Olawale, Y. A., & Sun, M. (2010). Cost and time control of construction projects: Inhibiting factors and
mitigating measures in practice. Construction Management and Economics, 28(5), 509–526.
Rasdorf, W. J., & Abudayyeh, O. Y. (1991). Cost-and schedule-control integration: Issues and needs.
Rokooei, S. (2015). Building information modeling in project management: necessities, challenges and
outcomes. Procedia-Social and Behavioral Sciences, 210, 87–95.
Salleh, H., & Phui Fung, W. (2014). Building Information Modelling application: focus-group discussion.
Građevinar, 66(08.), 705-714.
Samarghandi, H., Tabatabaei, S. M. M., Taabayan, P., Mirhashemi, A., & Willoughby, K. (2016). Studying the
reasons for delay and cost overrun in construction projects: The case of Iran. Journal of Construction in
Developing Countries (in press).
Sambasivan, M., & Soon, Y. W. (2007). Causes and effects of delays in Malaysian construction industry.
Shehu, Z., Endut, I. R., & Akintoye, A. (2014). Factors contributing to project time and hence cost overrun in the
Malaysian construction industry. Journal of Financial Management of Property and Construction, 19(1),
55–75.
Smith, D. K., & Edgar, A. (2008). Building information modeling (BIM). Washington, U.S.A.: National Institute
of Building Sciences.
Smith, D. K., & Tardif, M. (2009). Building information modeling: a strategic implementation guide for
architects, engineers, constructors, and real estate asset managers. John Wiley & Sons.
Smith, P. (2014). Project cost management – Global issues and challenges. Procedia-Social and Behavioral
Sciences, 119, 485–494.
Succar, B. (2009). Building information modelling framework: A research and delivery foundation for industry
stakeholders. Automation in Construction, 18(3), 357–375.
Toor, S. U. R., & Ogunlana, S. O. (2008). Problems causing delays in major construction projects in Thailand.
Construction Management and Economics, 26(4), 395–408.
Torp, O., Belay, A. M., Thodesen, C., & Klakegg, O. J. (2016). Cost development over-time at construction
planning phase: Empirical evidence from Norwegian construction projects. Procedia Engineering, 145,
1177–1184.
Underwood, J. (2009). Handbook of research on building information modeling and construction informatics:
Concepts and technologies. United States of America, USA: IGI Global.
Wong, A. K., Wong, F. K., & Nadeem, A. (2009). Attributes of building information modelling and its
development in Hong Kong. HKIE Transactions, 16(2), 38-45.
Xiao, H., & Noble, T. (2014). BIM’s impact on the project manager. In Proceedings of the 30th
Annual ARCOM
Conference (pp. 693-702). Portsmouth, UK.
Zhang, D. (2012). Project time and cost control using building information modeling (Master’s Thesis). North
Dakota State University of Agriculture and Applied Science, North Dakota, U.S.A. ProQuest LLC,
(1550199).
Zhang, D., & Gao, Z. (2013). Project time and cost control using building information modeling. ICCREM 2013,
545–554.

54
XII International Symposium Engineering Management and Competitiveness 2022 (EMC 2022)
17-18th June, Zrenjanin, Serbia
CONSTRUCTION PROJECT DELAY MANAGEMENT
Ali Reza Afshari
Department of Construction Management, Shirvan Branch, Islamic Azad University, Shirvan, Iran
E-mail: [email protected]
Shirin Kardanimalekinezhad
Department of Construction Management, Mashhad Branch, Islamic Azad University, Mashhad, Iran
ABSTRACT
Delay to projects is one of the foremost concerns of the construction industry in Mashhad, Iran. The delays to the
projects are affecting the economies throughout the world. Delay to projects mean the slowdown of development
in all other related fields. The main aim and objective of this research is to evaluate the various types of delays
and the reasons for those delays that are currently affecting the construction projects in Mashhad. Measures from
previous researches to reduce or eliminate these delays by methods of mitigation or acceleration are analyzed for
the case studies considered for this research. A detailed case study has been carried out for one project in
Mashhad, Iran. Case study deals with a project which encountered delays and implemented measures of
mitigation and acceleration to reduce the delays. The finding from the case study is that the main delay to the
projects is compensable delays or owner caused, as seen case study where the owner delayed the nomination.
Key words: Construction management, Project delay, Construction Project management, Construction industry,
Project management.
INTRODUCTION
Projects are envisaged and visualized with the foresight of achieving the primary objective of timely
completion. Some projects are planned and executed successfully whereas others get delayed due to
reasons, some of which are analyzed and evaluated in this dissertation. Delay to projects is considered
to be one of the common problems in the construction industry. Delays have an negative effect on the
project in terms of performance, time and cost. Thus, it is essential to identify the types of delays that
normally occur in a project. The types of delays can be broadly split in two categories of delay by the
client (compensable delays) and the contractor (non excusable delays). The delays can be identified as
critical or non critical and whether the delay is concurrent or non concurrent. The identification of the
types of delays leads to the reasons of delay. The reasons for the delays are identified so that the effect
on construction projects can be reduced. The reasons for delays are client and contractor related.
Unreasonable project scope and inadequate early planning are the prime delays by the client. The
client interference and delay in the decision making process also major reasons for delays. The client
in some cases delays the design or changes the design leading to various other changes like design
related changes to drawings and their approval by the authorities. The contractor had delays related to
overambitious estimates and incorrect task assessment which lead to delays and affect the project. In
case of lack of task clarity, an inexperienced contractor or subcontractor may unknowingly delay the
works (Martyr, 2018).
The mitigation of delays can be achieved by adopting the process of knowledge management and
project learning which gives insight into the various problems and their solutions. In fact the lessons
leant feedback from projects is a real eye opener and helpful for others to avoid similar issues.
Prevention of delays by adopting innovative and teamwork helps in planning and analyzing the
requirements in detail which will allow the mapping of resources and identifying the risks. The works
can then be estimated, allocated and modularized for execution. The issues that can lead to delays need
to be escalated, identified and resolved on a priority to ensure that they do not become a reason for

EMC 2022, 17-18th June 2022, Zrenjanin, Serbia
55
delay. The issue of delay is further researched through case studies. The case study approach is
adopted for this research as the issue to a particular project can be analyzed in complete detail. These
case study have been taken from live project in the Mashhad, Iran. The case study is a completed
project which was delayed due to the client but completed by applying mitigation and acceleration
measures. The case study is a failure project as the client abandoned the project by putting the project
on hold and introducing a new stakeholder. The methodology for this study takes into account the key
data for each project which included the planning methodology, resources monitoring, cost
methodology and the critical decisions which are likely to delay the project. The justification for the
data considered is provided and further the method of data acquisition and data analysis is detailed to
substantiate the methodology. The analysis and of the data provided for the project is analyzed further
for case study for their planning, resources, cost and decisions processes. The recommendations for
project is given as to what could have been done to mitigate the delays. The knowledge gained in
some of the module is applied for recommendations which is applying the knowledge gained in a
purposeful manner. Conclusion is listed based on the areas analyzed for the methodology for the case
study to allow for better knowledge management in future. The aim of this research was to evaluate
the various types of delays that occur in construction projects in Mashhad and the reasons why delays
occur and the measures that can be implemented to reduce or eliminate these delays by mitigation or
acceleration. To achieve the aim the approach of case study is considered for this research (Harrison
et. al, 2017).
LITERATURE REVIEW
Delays are of various types and researchers have their own parameters to rate and identify them. Delays
have numerous reasons which vary from project to project and the reasons are different and unique for
every project. Efforts to reduce the delay by mitigation or eliminate the delay by acceleration are measures
that can be or may be applicable in some cases and will depend on the projects being considered for those
measures. Change is the primary cause for a delay. If projects do not have changes then the projects would
finish on time as there would be no or little disruptions to the works. The contractors would also like to
work on projects where the designs are finalized and there are no changes and disruptions. In a perfect
world, all construction projects would finish on time, without changes or disruptions. Despite the common
public perception that contractors cannot wait for the changes to start on a project because that is where
they allegedly “make their money”, most contractors would prefer their projects to complete without
changes (Molner , 2007 ).
However this is an idealistic situation, in reality changes are inherent to nearly all project of substantial size
due to the fact that projects rarely commence after all the designs are completed and approved. It is
important that all the key stakeholders for the project agree as to how the changes to the project would be
handled and by whom. This is in the interest of the project as beneficial to the owner and the contractor.
The continuous striving for improvement makes it necessary to incorporate changes even though they may
disrupt the works to a certain extent. However the overall result is likely to be better than the initial after
incorporating the changes and the satisfaction of achieving a better final product makes the changes more
acceptable rather than no changes at all. The stage at which changes are proposed to be implemented is
important as any major changes proposed when the project is in an advanced stage of progress will
complicate the works, impact the schedule and likely to cause delays to the completion. The changes will
increase the cost of the project as abortive works, modification and changes will come with a cost. Changed
work complicates a project, invites delays and increases the project cost, all things that make owners
unhappy ( Molner , 2007). A literature review for the objectives is done to evaluate the types ,reasons of
delay and the methods for the mitigation and prevention of delays. Before determining the impact of a
delay on the project, one must determine whether the delay is critical or non-critical. Additionally, all
delays are either excusable or non-excusable. Both excusable and non-excusable delays can be defined as
either concurrent or non-concurrent. Delays can be further broken down into compensable or non-
compensable delays (Kamandang & Casita, 2018).

A. R. Afshari and S. Kardanimalekinezhad / Construction project delaz management
56
The reasons for delays are project specific and vary from project to project. We identify the delays
generally as well project specific. Projects have a variety of reasons to experience delay. An investigation
to find out the reasons for the delays was conducted in Hong Kong where a questionnaire was developed
on factors that were identified in previous findings. The analysis of the findings indicated the difference in
perception of the factors that was between the key stakeholders of the project. There was general agreement
about the relative importance of delay factors such as unforeseen ground conditions (Pall et. al, 2019). The
delays can be controlled by improving productivity and factors that affect productivity are dealt with the
purpose of further increasing productivity and thereby reducing delays. The conclusion of the investigation
is ranking of the factors and factor categories that are considered by various project stakeholders. The areas
of disparity between the stakeholders is indicated by their experiences, prejudices and ineffective
communication. Thus the project scope factors can be supported by effective communications between all
stakeholders. According to Abdalla et al (2002), projects encounter massive delays and thereby overshoot
the initial time and cost estimates which in turn result in extensive delays providing a platform for claims
and disputes. A survey done with the objective of finding the most important reasons for delays as per the
traditional contracts indicate that contractors and consultants agreed that owner interference, inadequate
contractor experience, financing and payments, labor productivity, slow decision making, improper
planning, and subcontractors are among the top ten most important factors.
Delays to the projects can be reduced by applying measures which can be reflected as mitigation of delays.
This mitigation of delays is possible only by re-sequencing of the works where ever possible and without
increasing the resources and manpower. The works that can be achieved without any additional cost to the
project is the mitigation. The mitigation of delays can be possible by also applying the knowledge gained
through previous projects experience and these can be implemented where ever their application can be
suited for any specific requirement in the process of project learning. Such knowledge management will
help in mitigating delays and the awareness of such knowledge through lessons learnt feedback can in fact
be helpful in preventing the delays itself. Delays can be prevented by applying methods which can be
implemented from the project commencement itself like planning and analyzing the requirements in detail
which will allow the mapping of resources. The risk can be identified to allow the estimation and allocation
of works which is required to be modularized. Escalation of issues at the appropriate times also ensures that
the delays can be prevented. The prevention of delays is possible when all the project stakeholders work as
a team to ensure the success of the project. It is also important for the client to employ a proactive
consultant, freeze the design and details before the commencement of the project and employ good reputed
contractors for the project (Keng et. al, 2020).
In summary, Delay occurs when the critical activities are affected. This delay is either non contractor
caused or client caused, and mostly the delay is concurrent. The delays to projects is primarily emanating
from the client due to various reasons like project scope not being finalized at the initial stage, delay in
nominating subcontractors at the appropriate time. Delay due to inadequate early planning can be avoided
if the client implements risk management systems. Mitigation of delays can be implemented through
knowledge management, project learning and the lessons learnt feedback.
CASE STUDY
Projects are conceptualized and implemented with the primary aim of completion in time. Delay to the
project is a failure to implement project management principles. However in certain cases the delay is from
the primary stakeholder himself. The aim of the case study approach is to evaluate live and completed
projects which are undertaken in Mashhad, Iran and understand the types of delay, reasons for the delays
and measure to mitigate and eliminate the delays. There are various types of delays to projects and having
numerous reasons for every project. Also, every project is unique in its characteristics, priorities and value
and benefits. Delay to projects are also a result of various factors related to that project and every delay in a
particular project also has various factors and elements which require a detailed study and analysis. A
survey with some people may provide some insight into some types of delays for some type of projects and
the reasons for those delays. It may not give the entire picture of delays and its reasons ,implications and
measures taken to mitigate delays for a particular delay or many delays for a specific project. Also,

EMC 2022, 17-18th June 2022, Zrenjanin, Serbia
57
complete information related to the delays may not be available for various reasons which may again affect
the analysis and the results. Also, a survey is basically gathering information from various sources carrying
out a theoretical analysis and deriving results and conclusions. A case based study (Harrison et. al, 2017) is
done on a live and completed project which evaluates the entire project and all factors that were responsible
to the delay and all the mitigation or acceleration methods adopted to recover from those delays. A case
based study of different live projects having experienced different types of delays and different reasons for
delays would provide a deeper insight into the problems. Since, these delays have actually taken place, the
reactions and solutions would provide a clear idea as which of the theoretical solutions have been
implemented or which of the theoretical solutions have failed to succeed.
Case study had all the delay factors like delay from the client, consultant and contractor like Delay in
nominations, Delay to progress, Delay to Cash Flow Curve. The delay to the project was 10 months due to
the delay in nominations which was the critical delay. Finally, the project was completed 6 months beyond
the original completion date with partial mitigation and partial acceleration of 4 months. The client granted
the extension of time for the delayed period even though the entitlement was more than the actual time
required for the completion of the project. We are going to address a problem which can be considered to
be arising from internal factors. The project has section of aluminum works which are required to be
nominated by the client as per the conditions of contract. The client has nominated an aluminum company,
which is a client group company. There has been a delay in the nomination of the works package. This
delay in nomination is likely to delay the completion of the project. The main problem is that the nominated
company does not have any production facility and resources in Iran. Hence, in this particular project, we
have a planning and a resource management problem. We are going to analyze this issue and the impact of
the delay on the overall completion of the project. Also, we will highlight measures to mitigate the delays
by providing specific planning and resource management techniques. There has been a delay in the
nomination of the works package. This delay in nomination is likely to delay the completion of the
aluminum and glazing works and its successor activities.
Project Planning Problem: The program for the works package was delayed and only after much
insistence the program done by the aluminum subcontractor on M.S. Project, whereas the Baseline Master
Program of the main contractor was done in Primavera Project Planner. Also, the program was not detailed
enough for effective monitoring and also since the production facilities were outside the country,
information provided was not verifiable. The nominated company has design facilities abroad and no local
representation. For any design related issues, the local representative is required to communicate with the
design team in Italy, thereby delaying the approval process of the design itself. As the company was
proposing a new system of installation, the design and the suitability of the system itself was subject to
approvals, verifications and confirmations to give confidence in its implementation. Since, there was a
contractual requirement regarding the design to be approved by a third-party consultant, the process was
not given priority by the subcontractor. The process of finalizing the third-party consultant and seeking
their approval of design came into the picture only after it was brought to the notice of the aluminum
subcontractor that this is a requirement as per the specifications and the contract. The consultant had to wait
for a long period for the third-party approval who took their required time thus further delaying the
approval of design. The submission of the materials was delayed. Since, a new system was being proposed
the approval of materials like the aluminum section was required to be done. Materials like glass and
aluminum metal cladding were not provided with samples as per the architectural requirements. Delay in
procuring specific samples to obtain the approvals delayed the entire process. Also, in case of glass samples
the color of the sample glass was not as per requirement thereby affecting the subsequent process of
procurement, manufacture and delivery. The process of drawings preparation and approvals were delayed
as the preparation of drawings were being done in Italy and the pace of drawings submissions was delayed.
Also, the comments by the consultants on the drawings would not be attended quickly as hard copies were
commented and there was no provision to incorporate the changes locally thereby delaying the entire
approval process. The procurement process was delayed due to the delay in the drawing's approvals
process. The production facility is located in Italy. Hence, delay in nomination, material submission and
approvals, shop drawing preparation, submissions and approval, delay in procurement ultimately affected
the production process. The main factor resulting in delay was that the extrusion for the aluminum was to
be done locally and then the extruded material was to be exported to Italy for fabrication and production at

A. R. Afshari and S. Kardanimalekinezhad / Construction project delaz management
58
the Italy factory and then again re-exported back for installation. This meant that the process required the
export of the raw material and re-export of the finished product as reflected in the flow chart. The
production process was also affected due to the summer break in Europe where production is affected for a
period of 6 weeks. The production of the aluminum in the factory was initially delayed and further the
production was affected due to the summer holidays in Europe in falling the month of august. This affected
the production of the sections, frames, mullions, transforms and curtain wall glazing. Since the materials
have to be packed and shipped, it requires a further 6 weeks to reach the destination.
Project Resource Management Problem: The company does not have any manpower resources in the
local market and since it is newly established company. The lack of resources affected the progress of
works even though the overall manpower from the main contractor was less than planned for the major part
of the project as reflected in the following manpower histogram. The problem started when the local
subcontractors were quoting installation charges which were not in line with the budget considered for the
installation. Hence, the process of locating an installation subcontractor within the budget was inexorably
delayed. This further added to the initial delays and the delays went on increasing and no mitigation was
possible until the problem of manpower required for execution was resolved. The staff required for
monitoring and coordinating the works were newly recruited and were not aware of the requirements.
Moreover, the lack of coordination between the local staff and the head office was further affecting the
progress of works. No progress status was being provided to the local staff regarding the procurement,
production and delivery. Hence monitoring of the progress of works related to the design, materials and
shop drawings submission was affected and a clear picture was not available at regular intervals thereby
reducing the confidence of the consultant regarding the performance of the aluminum subcontractor.
Skilled Manpower from Europe who are aware of the installation process and the method of execution are
expensive and not accounted for in the resource management plan. Manpower if recruited locally will be
required to be given training for the new installation system which will require time, affect quality and will
result in low initial productivity thereby resulting in further delay.
Project Cost Management Problem: The works will not be possible to be achieved as per the budget due
the delay factors which have contributed to the time, resource and cost planning for the project. Also,
certain element of works was quoted not taking into consideration the specification requirements, the
alternatives of which was not accepted by the client/consultants who wanted the specifications to be
adhered to. The prices of materials and manpower have risen since the project was awarded and due to the
delay in design, submission, approvals and production. The prices were also affected due to the boom in the
construction industry at that time. There has been a delay in nomination of the aluminum works. The
aluminum works subcontractor is a client group company. Since the client wanted to allocate the specific
work package to his group company it took time as the quotation form the group company was much
higher than the competitors. Also, since the subcontractor was proposing a different system, it was not in
line with the project specifications. The delay of nomination was affecting the entire project as the
nomination was a critical nomination.
METHODOLOGY
Delay to projects is a result of inaction on part of the key stakeholders in the project. The client as the main
stakeholder does not nominate a critical subcontractor on the project gets delayed. The methodology for
evaluating the delay to a project is by acquiring all the information related to the project and its success and
failure. This key data is related to the planning of the project. The plan that is to be achieved will require
resources and cash as part of the requirements. Another major element is the decisions by the client in
nominating the key and critical subcontractors which will be required to perform for the successful
completion of the project. The key data will be required to be justified for its merits and will have to be
tested to verify its usefulness and importance. The method of the data acquisition is important and should
be verifiable and substantiated. This data is then analyzed by various methods for accuracy and
implementation. The methodology adopted in this research is to identify the key data required for
managing the issues of delay. The reasons for delays to projects will be considered based on live project

EMC 2022, 17-18th June 2022, Zrenjanin, Serbia
59
conditions and the measures to provide the solution to the problems will be from the knowledge gained in
the modules and steps taken to implement them to mitigate, eliminate or prevent those delays.
The project is monitored through a program of works which is a set of activities linked together in a proper
sequence to evaluate the time required to complete the works in line with the contract duration. This
program is then loaded with resources in man days and curve is generated from the man days for all
activities for monitoring the progress of works. This curve is called as the progress curve. The project is
monitored for progress, by a progress curve generated at the beginning of the project to highlight the rate of
progress for the entire duration of the project. The progress curve can also be generated by giving
weightage to the engineering and construction process. This is normally done for a design and build
projects. Large scale complex projects can also be done with this combination of weightage, but the criteria
for the allocation of the weightage is decided at the start of the project. The cost curve or cash flow curve or
the gross valuation can be used for monitoring of progress of works, but it is not as accurate as the man-
days progress curve. This is the cash flow curve or gross valuation curve based on cost and not on the basis
of man-days weightage for the activities of works. In large projects, due to the changing circumstances and
requirements it is likely that the decisions taken by the client are delayed. More so if the project is a design
and build project. In other projects also, the client expects to take decisions according to his criteria and
priorities. It is important to note that the successful completion of any project is related to the decisions by
the client at the appropriate time in line with the program of works.
The cash flow for any project is the lifeline as uninterrupted cash flow is required for the success of any
project. The value of work in cost is also a critical indicator for the works to be carried out for the project.
Any delay for any activities or the billing will immediately reflect on the cash flow of the project. This is
suitable method for evaluating the progress of works in small to medium size projects. However, in large
and complex projects this is not be a suitable method to monitor progress as it does not identify the critical
path and reasons causing the delay. The client may want to change an important decision like he may opt to
replace a nominated contractor later in the project as some other party may be willing to execute the works
at a much lower cost. From the client’s perspective this may make good economic sense but from the
projects point it could spell disaster. The client would not have considered that this decision could delay the
entire project. Hence, the requirement of decisions by the client in line with the program as per the
specified dates of nominations justifies the requirement.
The data acquisition for the planning issues like the Key performance index is the updates of the baseline
program. The key performance index is listed as milestones in the program and updated periodically. On a
weekly or fortnightly basis, the progress of works at site is recorded and the progress is discussed and
agreed with the project team. Then the progress percentages are verified and agreed with the consultant.
The progress of works is recorded for both the engineering and construction activities and the baseline
master program of works is updated. The Cash Flow curve is normally monitored on a monthly basis as the
billing for the project is done every month. The progress of works recorded for the updating the program is
utilized for the cash flow update as the bill is updated. The nominations are part of the baseline master
program of works which is monitored periodically. The nominations have to be communicated to the
contractor by the consultant through the client as the process of nominations is dealt by the client and
consultant. Hence information related to the nomination is forwarded to the contractor upon successful
selection of the subcontractor.
The updated program of works which is resource loaded will indicate whether the progress of works is in
line with the baseline master program of works. The progress curve for the project is monitored
periodically and plotted against the baseline progress curve. Any delay compared to the baseline curve is
probed further by analyzing the details of progress for activities on the critical path of the project. The cash
flow update is compared to the baseline cash flow curve and the information is useful to evaluate whether
the cash flow is line with the projections. The information for the cash flow update is from the program
updated percentages which are applied to the respective activities in the bill of quantities. The dates for the
nominations are planned as per the program and upon updating the program any due nominations are
finalized and any nominations pending will reflect a delay. Nomination if critical and not finalized will

A. R. Afshari and S. Kardanimalekinezhad / Construction project delaz management
60
reflect a delay on the project and will need to be taken up on a priority. Also, delayed nominations would
be dealt with contractually by making extension of time claims pursuant to the conditions of contract.
RESULTS
The analysis of all the factors mentioned in the case study and the methodology will be further analyzed
and the results of those analysis will indicate as what was the measure taken to implement the measures
like mitigation and acceleration. Example: regression analysis is implemented for case study, planning
analysis and is successfully implemented on the project. The analysis takes into consideration the factors
that have resulted in the failure of the project in terms of the resource management and cost management.
Example: Recovery cost curve proposed to recover the delays based the cash flow analysis. The decisions
by the clients are analyzed in each project and the analysis and results indicate that the client as the primary
stakeholder holds a greater responsibility for the success or failure of the project. The analysis and results
for the case study would be structured according to the methodology.
The selection of the third-party consultant should commence along with the commencement of the design
so that the third-party consultant is on board by the time the design is completed and ready for submission.
It is recommended that the design done at the head office in Italy should be forwarded to the third-party
consultant along with the project consultant so that precious time is saved. Design coordinators should be
available in the country to substantiate and clarify the design aspects to the project and third-party
consultant until the process of design approval is completed. The approval of the design by the project
consultants will not materialize until they have the approval from the third-party consultant. Hence, the
third-party consultant contact should specify the time frames within which they will review the design and
comment and give the necessary approvals. Since the third-party consultant is appointed by the aluminum
subcontractor, they should appoint a third-party consultant which meets their time requirements. The
materials submission related to the extruded material should be done on a priority as the extruded material
has to be exported to Italy for fabrication. Material samples like glass and metal works can be procured
locally or airlifted in case of specific requirements to avoid delay. Preparation of drawings can be split
between Italy and employing a local subcontractor for drawings. The delay that occurred in incorporating
the comments by the project consultants which took time to be sent to Italy could have been resolved by the
local subcontractor who would have been assigned that responsibility, thereby saving a considerable
amount of time. The extrusion from the local manufacturers and then exporting to Italy was one of the
factors which can be improved by extruding the material from an Italian supplier. It would have reduced
the time required for exporting to Italy.
The company can recruit subcontractors and offer a portion of works which can be done to reduce the
overall delay, even though the installation charges may not be in line with the budget. However, these will
still be cheaper compared to the option of skilled manpower for installation from Europe. Staff from the
Italy office needs to have a presence including deployment of permanent staff till the completion of the
project. Skilled locally recruited staff having work exposure to multinational companies can be good in
coordination and execution. Skilled manpower from Europe can be hired to achieve two objectives; namely
training and part section of works. The manpower from Europe would be experienced in this form of
installation and would achieve good productivity thereby mitigating some of the delays to the works. The
manpower recruited locally can be skilled and exposed to similar work packages to ensure good
productivity and quality. Also, subcontractors specialized in these works can be deployed to ensure that the
delay to the project is mitigated. The details of the progress of works and its delay even after the revised
program was issued were due to the lack of required manpower which has to be obtained locally to meet
the targets. The resource analysis reinforced the need for additional manpower to reduce the impact of
initial delay. The monitoring of works by the line of balance helped in achieving the recovery plan. Also,
the recruitment and training of local manpower helped in mitigating the delay.
The recommendation in regards to the budget is to implement a policy to complete the works in a way
which would minimize the negative effects which have arisen due to various factors already occurred. If
effective action is not taken to mitigate the delays the conditions of contract clauses related to penalty and

EMC 2022, 17-18th June 2022, Zrenjanin, Serbia
61
liquidated damages would be more harmful than the reduced level of profit or even loss. Also, it should be
remembered that every contract is accompanied by an escalation clause so it may be possible to reduce any
losses by making effective utilization of this clause in the contract. The Cost analysis indicated that the cash
flow was affected and measures such as acceleration had to be implemented to recover the delays. The
client kept the interior design package works as part of provisional sums for which the client has to
nominate a subcontractor to carry out the works. Since the project is to handed over to a reputed chain of
hotel operator which was not finalized, the final design could be feezed only after incorporating the
requirements of the hotel operator. The interior design consultant was also not selected at the time of award
of works; hence the interior design concept was not there. Another reason the client could not nominate is
the original scope and amount reserved as a provisional sum was found to be falling short to meet the final
design as the scope had increased and also the costs had increased due to a boom in the property market.
The cost of materials and manpower had increased significantly as the nomination was due later and the
quotations were very high compared to the allocated provisional sum value. The nominations delay by the
client affected the project and this was tackled by accretion and mitigation measures as highlighted in the
planning, resource and cost analysis.
CONCLUSION
Recommendations for the delays of different project will be different. However, some recommendations
are similar which are related to the client and contractor. The recommendation for the client is that he
should finalize the projects design before commencement of the works and should not make changes to the
project unless it is absolutely essential. The recommendations for the contractor are that the contractor
should play a proactive and cooperative role in the projects to ensure its successful completion.
Notwithstanding the contractual claims if any, the contractor should make all possible efforts to complete
the project on time. The conclusions for the case studies are that the client is primarily responsible for the
delays that take place in a project. This delay may be due late finalization for nominated subcontractors or
non-finalization of designs. The contractor should be also be involved in the process of selection of
subcontractors as the ultimate responsibility of completion lies with the contractor
REFERENCES
Abdalla M Odeh, Hussien T Battaineh. (2002) Causes of construction delay: Traditional contracts. International
Journal of Project Management. Kidlington: Jan 2002. Vol. 20, Iss. 1;
Harrison, H., Birks, M., Franklin, R., & Mills, J. (2017). Case study research: Foundations and methodological
orientations. In Forum qualitative Social for schung /Forum: qualitative social research (Vol. 18, No. 1,
pp. 1-17).
Kamandang, Z. R., & Casita, C. B. (2018). Delays in Construction Project: A Review. IPTEK Journal of
Proceedings Series, (6).
Keng, T. C., Ismail, A. S., & Ching, Y. K. (2020). Prelimary Studies of Delays in Construction Projects.
Malaysian Journal of Business and Economics (MJBE).
Martyr, T. (2018). Why Projects Fail: Nine Laws for Success. Business Expert Press
Molner, B. (2007). Project Delays, Disruptions, and Changes. Ater Wynne LLP.
Pall, G. K., Bridge, A. J., Gray, J., & Skitmore, M. (2019). Causes of delay in power transmission projects: An
empirical study. Energies, 13(1), 17.

62
XII International Symposium Engineering Management and Competitiveness 2022 (EMC 2022)
17-18th June, Zrenjanin, Serbia
APPLICATION OF IOT TECHNOLOGIES IN THE HEALTH CARE
Ali Reza Afshari
Department of Construction Management, Shirvan Branch, Islamic Azad University, Shirvan, Iran
E-mail: [email protected]
Sohrab Mohammadi
Department of Computer, Shirvan Branch, Islamic Azad University, Shirvan, Iran
ABSTRACT
The purpose of the IoT is to enable the connection of objects in the environment to interact and collaborate "at
any time, any place, with anything and everyone, and make the best use of any route or network and any
service". IoT-based health care network of countries play a significant role in information and communication
technologies and are involved in the development of medical information systems. The development of IoT-
based health care systems should ensure and enhance patient safety, quality of life, and other health care
activities. Tracing, routing and monitoring patients and the activities of healthcare actors are challenging
research topics. In this paper, we propose the general architecture of a health care system for monitoring at-risk
patients in intelligent ICUs. Real-time system tools and alerts, medical assistants will explain changes in vital
parameters or patient mobility, as well as significant changes in environmental parameters for preventive
measures.
Key words: Internet of things (IoT), Health care, Health Care Network, IoT-based health care.
INTRODUCTION
Currently there are many definitions of Internet of Things (IoT), which may vary depending on the
context, the effects and the views of the person giving the definition. The definition of IoT can be “a
dynamic global network infrastructure with self-configuring capabilities based on standard and
interoperable communication protocols where physical and virtual things have identities, physical
attributes, and virtual personalities” (Chiuchisan, 2014). The Internet of Things offers solutions based
on the integration of Information Technology (IT), which refers to hardware and software used to store
and process data, and Communications Technology, which includes electronic systems used for
communication between individuals. Internet of Things (IoT) is “a new revolution of the Internet”,
thanks to the ability to connect remote and mobile things or machines or assets through the use of
wireless communications and low-cost sensors, computing and storage devices. So, the Internet is now
advancing from a network of computers to a network of things (Gershenfeld, 2004).
The goal of the IoT is to enable a variety of things/objects present in the environment to be connected
in order to interact and cooperate “anytime, anyplace, with anything and anyone, ideally using any
path or network and any service”. It is estimated that the number of Internet-connected devices
exceeds the number of human beings on the planet in 2025. According to Cisco company there will be
at least 25 billion Internet-connected devices by 2025 and doubly to 50 billion by 2030 (Quasim,
2021). For every Internet-connected personal computer there will be 5 to 10 other types of devices
Internet-connected such as smart phones, gaming consoles, Wi-Fi routers, iPods, smart TV sets,
connected stereo systems and other media devices. In the IoT network the things or objects are
identifiable and can communicate information about them. The research and development of
technologies such as micro- and nano-electronics, communications, sensors, Radio¬frequency
identification (RFID), smart phones, embedded systems, cloud computing and software challenges
contribute to the creation of a world where the real, digital and virtual are converging to develop smart

EMC 2022, 17-18th June 2022, Zrenjanin, Serbia
63
environments that produces innovations in many different sectors. Potential applications of IoT are
many and diverse, and the main domains are (Vermesan & Friess, 2013):
Industry: which involves financial/commercial transactions between companies, such as smart
grid, water flow, liquid presence, tank level, photovoltaic installations, etc.;
Environment which includes activities regarding the protection, monitoring and development of
natural resources, such as forest fire detection, air pollution, landslide and avalanche prevention,
earthquake early detection, air quality, water quality, water leakages, river floods, etc.;
Society which includes initiatives regarding the development and inclusion of societies, cities and
people, such as health care systems, smart parking, traffic congestion, smart lightning, waste
management, intelligent transportation systems, etc.
Developing the technology in Europe will be much nearer to implementing smart environments by
2020. In the future computation, storage and communication services will be distributed. People, smart
devices, machines, platforms, equipped with wireless sensors or RFID tags, will create a general pool
of resources interconnected by a dynamic network of networks. In the following ten years, trillions of
sensors will be delivered. These sensors will be used to measure almost everything, from energy use,
health conditions, air pollution to acceleration and location etc. Application of IoT technologies in
green related and health care applications is one of the most encouraging market segments Shaikh et
al., 2015). As it is a technological basis of IoT, research and development is also needed in the area of
reconfigurable hardware, such as Field-Programmable Gate Array (FPGA), where the configuration
can be changed dynamically in order to introduce useful changes to the required description
(Chiuchisan, 2013).
HEALTH CARE AND INTERNET OF THINGS
Advances in information, telecommunication, and network technologies play a significant role in
health care systems and have contribution in development of medical information systems. However,
health care represents one of the important social and economic challenges that every country faces,
and health care administrators, clinicians, researchers, and other health practitioners are facing
increasing pressure to adjust to growing expectations from both the public and the private sector. A
major impact on the quality of people’s life is the rising cost of medical care and these costs are even
higher in the case of chronic diseases. The number of elderly is increasing continuously, which puts
pressure on social and health services (Tan & Cheng, 2005).
The development of health care systems demands a concerted effort to harness the power of
information and communications technologies in the service of health care in order to create more
efficient, effective, and secure data sharing, large-scale health information processing, and more
effective communications. A number of connected devices have been developed to improve health
care delivery using sensors to collect information and cloud hosted analytics software that analyses
data. Over the past 10-15 years, health care providers have increasingly become connected through the
use of mobile computers, tablets, PCs, smartphones, Wi-Fi phones, and communications badges and
help them to become far more proactive about Health Services Delivery (Chiuchisan, 2013). The
illustration from Sierra Wireless, showed in Fig. 1, describes how a health care provider could
theoretically use real time data collected from hospitals, wearable devices, home health monitoring
devices, and elsewhere to provide better services.

A. R. Ashari and S. Mohammadi / Application of IoT technologies...
64
Figure 1: Real time monitoring of patient health through IoT
Many patients who require constant health monitoring prefer the comfort of home monitoring to
hospital environment. In case of remote monitoring patients can use a variety of monitoring devices
such as glucose meters, pulse oxymeters, weight scales etc. The main difficulty in home monitoring is
making patients to provide accurate data to health care specialists. A number of companies are
developing further connectivity solutions to improve not only communications between health care
givers and patients, but real time monitoring of patient health as well (Zeadally & Sklavos, 2021).
The problems of the Romanian Health System are similar to those of other European countries. In
present, Romanian medical sector has not fully embraced the advantages and benefits of recent
technologies that are used in health care sector. For instance, the medical staff has to deal with
amounts of patient’s medical records. The health care services costs are expected to grow due to the
aging of the population and the increasing demand on health systems. The new health care systems
support the doctors and elderly people or patients with chronic diseases in managing the health care
process in order to achieve an optimal health status or to avoid a worsening of the illness as long as
possible. Recent evolution in health care domain has consistently shown that combined technologies
have the possibility to resolve particular problems of the health domain (Vlădescu, 2009).
HEALTH CARE SYSTEM FOR MONITORING OF PATIENTS
Technological advances in the communication field and embedded systems allow the design and
development of mobile communication systems with low power consumption and high computing.
These characteristics are essential for the development of mobile health monitoring systems. At the
same time, the aging of the population and the prevalence of chronic disease have increased the need
for at-home health care, but employing medical personnel will lead to an increase of medical costs. A
solution is remote monitoring or tele¬monitoring that helps the physicians to follow up the progress of
the patient and decide if a medical assistant or a doctor must be present or if the patient will be
transported to another medical facility. In this way patients retain the quality of medical services but at
lower cost. In this paper is proposed the architecture of a health care system for monitoring of patients
at risk in smart Intensive Care Units, using the concept of Internet of Things. The Intensive Care Unit
(ICU) is hospital sector where patients require close observation and need constant attention or special
drugs because they may have suffered serious injuries or they may have recently suffered major
surgery. The monitoring in the Intensive Care Unit is made through ICU monitors and all patients are
connected to a bedside monitor. This monitoring of patients includes diagnosis, monitoring of vital
parameters, prevention and treatment of all the vital functions. The patients have different types of

EMC 2022, 17-18th June 2022, Zrenjanin, Serbia
65
sensors or sensing devices attached to their body which are connected to the ICU monitor by wires.
The sensing devices send electronic signals through wires to the ICU monitor. This monitor displays
specific signals and can generate alarms, which can signal to the medical staff if a body function needs
attention. However, some patient’s movements can cause the removal of the sensing devices wires
(Dastgerdi, 2020).
The Intensive Care Unit monitor is used for monitoring and recording of, and to generate alarms for,
multiple physiological parameters of patients in a hospital environment. The most commonly
monitored functions are: breathing rate and oxygen saturation, heart rate and rhythm, blood pressure,
body temperature (Drews, 2008). The monitor can store or print the patient reports and is capable of
functioning with a wireless infrastructure. In order to monitor the movement of the patients at risk
from ICU and create a smart environment we will use the sensors from Microsoft XBOX Kinect. This
device has a set of sensors that is able to detect movements, identify faces and recognize speech,
through sensors that can acquire image, audio and depth information. The Kinect does not require the
patient to wear any kind of sensors or devices. We will use the NUI (Natural User Interface) Skeleton
Tracking module that provides a specific class for the management of the properties of the detected
skeleton. Kinect can detect at most six skeletons simultaneously, and the number of detected people is
limited only by how many they will fit in the field-of-view of the camera. When a patient is detected,
he/she is modelled with the class "Skeleton". Class Skeleton has several information fields related to
joints, position, tracking, etc. For each joint there are information related to the tracking and the
position, in space coordinates x, y and z, and each joint is marked as “tracked” or “inferred” (Vitale,
2012).
In order to monitor the environmental parameters from Intensive Care Unit inside hospitals we will
use a board that has sensors integrated to gather the information about the indoor parameters and send
it to a Gateway device. The sensors board has been designed to monitor temperature, humidity,
atmospheric pressure and different types of gases. As well, movement and vibrations can be measured
by the internal accelerometer. The device receives sensor data and forwards them to the Internet via
Ethernet, Wi-Fi or GPRS protocols depending on the connectivity options available in that area. In
case connectivity fails, data can be stored in an internal data base. The gateway sends the information
to the Tunneling machine that will send the information to Servers located on the Internet, where users
are connected. All health records and measurements were stored into a computer server and a data
base that can be accessed by the doctors/nurses through a user-friendly interface. The web-based
health monitoring application will analyze and process the data information from all the devices from
ICU and informs in almost real time the doctors about the changing of vital parameter or the
movement of the patients and also about the important changing in environmental parameters, in order
to take preventive measures (Al Janabi, 2020).
Another useful application of IoT concept is the remote monitoring of human’s vital signs, such as
blood pressure, electrocardiographic signal, oxygen saturation, body temperature and heart rate. This
can be done by means of embedded medical sensors and wireless technology Rotariu et al., 2010).
CONCLUSION
Internet of Things applications are pushing the development of platforms for implementing ambient
assisted living systems that will offer services in the areas of assistance in daily activities, health
monitoring, enhancing rapid access to medical and emergency systems. In present, the patients
monitoring in hospital environment are made by medical personnel in which case the human error is
inevitable. In this paper we propose the architecture of a health care system for monitoring of patients
at risk in smart Intensive Care Units (ICU) through the Internet of Things paradigm, using the recent
methods and devices such as XBOX Kinect and a set of sensors for monitoring of environmental
parameters. The main objective of our system is to enhance medical condition for people who need
permanent support or monitoring, to decrease barriers for monitoring important health parameters, to
avoid unnecessary health care costs and efforts, and to provide the right medical support at the right

A. R. Ashari and S. Mohammadi / Application of IoT technologies...
66
time. The authors have achieved system architecture acquiring the hardware parts and configuring the
software for XBOX Kinect. The system is in the process of testing and validation.
REFERENCES
Al_Janabi, S. (2020). Smart system to create an optimal higher education environment using IDA and IOTs.
International Journal of Computers and Applications, 42(3), 244-259.
Chiuchisan, I. (2013). A new FPGA-based real-time configurable system for medical image processing. In 2013
E-Health and Bioengineering Conference (EHB) (pp. 1-4). IEEE.
Chiuchisan, I., Costin, H. N., & Geman, O. (2014). Adopting the internet of things technologies in health care
systems. In 2014 International Conference and Exposition on Electrical and Power Engineering (EPE)
(pp. 532-535). IEEE.
Dastgerdi, A. K. (2020). A Review on Electronic Health Systems for Remote Monitoring Vital Symptoms of
Patients (Case Study: Wireless Body Sensor Networks). Majlesi Journal of Telecommunication Devices,
9(3).
Drews, F. A. (2008). Patient monitors in critical care: Lessons for improvement. Advances in patient safety: new
directions and alternative approaches (vol. 3: Performance and tools).
Gershenfeld, N., Krikorian, R., & Cohen, D. (2004). The internet of things. Scientific American, 291(4), 76-81.
Quasim, M. T. (2021). Challenges and applications of internet of things (IoT) in Saudi Arabia (No. 5316).
EasyChair.
Rotariu, C., Costin, H., Alexa, I., Andruseac, G., Manta, V., & Mustata, B. (2010). E-health system for medical
tele surveillance of chronic patients. International Journal of Computers, Communications and Control,
5(5), 900.
Shaikh, F. K., Zeadally, S., & Exposito, E. (2015). Enabling technologies for green internet of things. IEEE
Systems Journal, 11(2), 983-994.
Tan, J., & Cheng, W. (2005). E-NETWORKING. E-HEALTH CARE INFORMATION SYSTEMS, 163.
Vermesan, O., & Friess, P. (Eds.). (2013). Internet of things: converging technologies for smart environments
and integrated ecosystems. River publishers.
Vitale, P. (2012). EVALUATION ANDMEASUREMENTS OF KINECTMOVEMENT DETECTION IN
PHYSICAL THERAPY.
Vlădescu, C., Galan, A., Olsavszky, V., & Scîntee, S. G. (2009). Romanian health system strategic directions for
the next decade. Italian Journal of Public Health, 6(1).
Zeadally, S., Das, A. K., & Sklavos, N. (2021). Cryptographic technologies and protocol standards for Internet
of Things. Internet of Things, 14, 100075

67
XII International Symposium Engineering Management and Competitiveness 2022 (EMC 2022)
17-18th June, Zrenjanin, Serbia
CONSTRUCTION PROJECT FINANCING MANAGEMENT
Ali Reza Afshari
Department of Project Management and Construction, Mashhad Branch, Islamic Azad University, Mashhad, Iran
E-mail: [email protected]
Behsa Saeedi
Department of Project Management and Construction, Mashhad Branch, Islamic Azad University, Mashhad, Iran
ABSTRACT
Project financing continues to enjoy strong growth. Many countries have sought a greater role for the private
sector, seeking to balance budgetary constraints against a desire to develop infrastructure, including investment
in areas traditionally seen as the domain of the public sector. Project finance is the long-term financing of
construction projects based upon the projected cash flows of the project rather than the balance sheets of its
sponsors. Project finance is the process of financing a specific economic unit that the sponsors create, in which
creditors share much of the venture’s business risk and funding is obtained strictly for the project itself. Project
finance creates value by reducing the costs of funding, maintaining the sponsors financial flexibility, increasing
the leverage ratios, avoiding contamination risk, reducing corporate taxes, improving risk management, and
reducing the costs associated with market imperfections. This paper provides details on project finance
characteristics and players.
Key words: Construction Project Management, Project Finance, Project Financing Documentation, Project
Financial Management.
INTRODUCTION
Before examining how projects are structured and financed, it is worth asking why sponsors choose
project finance to fund their projects. Project finance is invariably more expensive than raising
corporate funding (Finnerty, 2007). Also, and importantly, it takes considerably more time to organise
and involves a considerable dedication of management time and expertise in implementing,
monitoring and administering the loan during the life of the project. There must, therefore, be
compelling reasons for sponsors to choose this route for financing a particular project. The following
are some of the more obvious reasons why project finance might be chosen: The sponsors may want to
insulate themselves from both the project debt and the risk of any failure of the project, A desire on the
part of sponsors not to have to consolidate the project’s debt on to their own balance sheets. This will,
of course, depend on the particular accounting or legal requirements applicable to each sponsor.
However, with the trend these days in many countries for a company’s balance sheet to reflect
substance over form, this is likely to become less of a reason for sponsors to select project finance,
There may be a genuine desire on the part of the sponsors to share some of the risk in a large project
with others. It may be that in the case of some smaller companies their balance sheets are simply not
strong enough to raise the necessary finance to invest in a project on their own and the only way in
which they can raise the necessary finance is on a project financing basis, A sponsor may be
constrained in its ability to borrow the necessary funds for the project, either through financial
covenants in its corporate loan documentation or borrowing restrictions in its statutes. The purpose of
this article is to address aspects of financing construction projects (Bueno, 2010). More attention is
also paid to project financing documents. This paper contributes to the body of knowledge by
reviewing existing policies, practices, and research efforts in the area of construction project financing.
Meanwhile, the findings from this paper benefit the industry as well, because they are able to provide
the practitioners with a holistic view of construction project financing, thereby enhancing their
knowledge and skills in this regard.

A. R. Afshari and B. Saeedi / Construction project financing management
68
PROJECT FINANCING IMPLEMENTATION AND MANAGEMENT
The implementation of a project financing is a complicated, time-consuming and difficult operation.
For most projects it is a case of years rather than months from inception of the project to reach
financial close. It is not unheard of for some complex and, perhaps, politically sensitive, projects to
have a gestation period in excess of five years. However, each project will have a unique timetable,
driven largely by the particular dynamics and circumstances of the project. With so many parties
involved having conflicting interests, the issue of effective project management assumes great
significance in most project financings. It does not matter whether the overall responsibility is
assumed by the sponsors and their advisers, or by the lenders and their advisers. What is crucial,
however, is that one of the influential parties assumes overall control for managing the project from its
inception to financial close. Without effective project management, a project can very easily go off the
rails, with each of the parties singularly concentrating on issues and documents that are relevant to it.
Because of the need to understand all aspects of the project with a view to assessing the overall risk
profile, it is often the lenders and their advisers, who are in the best position to manage effectively and
steer a project to financial close (Delmon, 2017).
PROJECT FINANCING PARTIES
One of the complicating and interesting, features of most projects is the considerable number of parties
with differing interests that are brought together with the common aim of being involved to a greater
or lesser extent with a successful project. It is one of the challenges of those involved with a project to
ensure that all of these parties can work together efficiently and successfully and cooperate in
achieving the project’s overall targets. It is inevitably the case that, although all of the parties will
share the same overall aim in ensuring that the project is successful, their individual interests will vary
considerably and, in many cases, will conflict. With many projects, there will be an international
aspect which will involve different project parties located in different jurisdictions and there will often
be tensions between laws and practices differing from one country to another. A common feature in
many project structures is that different parties will have particular roles to play. This is especially so
with many multi-sponsor projects where, for example, one sponsor may also be the turnkey contractor,
whereas another sponsor may be the operator and yet another sponsor may be a supplier of key raw
materials to the project or an offtake of product from the project. Frequently it is the case and
sometimes a requirement of local laws, that one of the sponsors is a local company. Even in those
countries where the involvement of a local company is not a requirement, this can have many
advantages particularly where the foreign sponsors have limited experience of business practices or
laws in the host country. Further, the involvement of a local company offers a degree of comfort, for
the foreign sponsors and lenders alike, that the project as a whole will not be unfairly treated or
discriminated against. No two projects will have the same cast of “players” but the following is a
reasonably comprehensive list of the different parties likely to be involved in a project finance
transaction (Steffen, 2018).
PROJECT FINANCING INVESTORS
These are investors in a project who invest alongside the sponsors. Unlike the sponsors, however,
these investors are looking at the project purely in terms of a return on their investments for the benefit
of their own shareholders. Apart from providing their equity, the investors generally will not
participate in the project in the sense of providing services to the project or being involved in the
construction or operating activities. Third-party investors typically will be looking to invest in a
project on a much longer time frame than, say, a typical contractor sponsor, who will in most cases
want to sell out once the construction has been completed. Many third-party investors are development
or equity funds set up for the purposes of investing in a wide range of projects and they are starting to

EMC 2022, 17-218th June 2022, Zrenjanin, Serbia
69
become a valuable source of capital for projects. Typically, they will require some involvement at
board level to monitor their investment (Danielis & Rotaris, 2021).
Banks: The sheer scale of many projects dictates that they cannot be financed by a single lender and,
therefore, syndicates of lenders are formed in a great many of the cases for the purpose of financing
projects. In a project with an international dimension, the group of lenders may come from a wide
variety of countries, perhaps following their customers who are involved in some way in the project. It
will almost certainly be the case that there will be banks from the host country participating in the
financing. This is as much for the benefit of the foreign lenders as from a desire to be involved on the
part of the local lenders. As with the involvement of local sponsors, the foreign lenders will usually
take some comfort from the involvement of local lenders. As is usually the case in large syndicated
loans, the project loan will be arranged by a smaller group of arranging banks. Often the arranging
banks are the original signatories to the loan agreement with the syndication of the loan taking place at
a later date. In such cases the arranging banks implicitly take the risk that they will be able to sell
down the loan at a later stage. However, participating in project financings is a very specialized area of
international finance and the actual participants tend to be restricted to those banks that have the
capability of assessing and measuring project risks. This is not to say that banks not having these skills
do not participate in project financings, but for these banks the risks are greater as they must also rely
on the judgement of the more experienced banks. The complexity of most project financings
necessitates that the arrangers are large banks with experience in this market, often having dedicated
departments of specialists. For the smaller banks with an appetite for this kind of lending, however,
there is usually no shortage of opportunities to participate in loans arranged by the larger banks.
Construction Company: In a construction project the contractor will, during the construction period
at least, be one of the key project parties. Commonly, it will be employed directly by the project
company to design, procure, construct and commission the project facility assuming full responsibility
for the on-time completion of the project facilities usually referred to as the “turnkey” model. The
contractor will usually be a company well known in its field and with a track record for constructing
similar facilities, ideally in the same part of the world. In some large Construction projects, a
consortium of contractors is used. In other cases, an international contractor will join forces with a
local contractor. In each of these cases one of the issues that will be of concern to both the project
company and the lenders is whether the contractors in the joint venture will assume joint and several
liability or only several liability under the construction contract. This may be dictated by the legal
structure of the joint venture itself. Lenders, for obvious reasons, will usually prefer joint and several
liability. Although most projects are structured on the basis that there will be one turnkey contractor,
some projects are structured on the basis that a number of companies are employed by the project
company to carry out various aspects of the design, construction and procurement process which are
carried out under the overall project management of either the project company or a project manager.
This is not a structure favored by lenders as it can lead to gaps in responsibilities for design and
construction. Lenders will also usually prefer that the project company divests itself of responsibility
for project management and that this is assumed by a creditworthy entity against whom recourse may
be had if necessary (Ragazzi, 2005).
Experts: These are the expert consultancies and professional firms appointed by the lenders to advise
them on certain technical aspects of the project. The sponsors will frequently also have their own
consultants to advise them. The areas where lenders typically seek external specialist advice are on the
engineering aspects of projects as well as insurances and environmental matters. Lenders will also
frequently turn to advisers to assist them in assessing risk in connection with the project. Each of these
consultancies' firms will be chosen for its expertise in the particular area and will be retained to
provide an initial assessment prior to financial close and, thereafter, on a periodic basis. An important
point to note is that these consultancies firms are appointed by and therefore answerable to the lenders
and not the borrower or the sponsors. However, the cost of these consultants' firms will be a cost for
the project company to assume and this can be a cause of friction. It is usual, therefore, for a fairly
detailed work scope to be agreed in advance between the lenders, the expert and the sponsors.
A. R. Afshari and B. Saeedi / Construction project financing management
70
Suppliers: These are the companies that are supplying essential goods or services in connection with a
particular project. In a power project, for example, the fuel supplier for the project will be one of the
key parties. In other projects, a particular supplier may be supplying equipment or services required
during either the construction or the operating phase of the project. Both the contractor and the
operator would also fall under this category. Many of the comments made with respect to the
contractor and the operator will also apply to the suppliers. However, it is not always the case that the
suppliers and for that matter the purchasers are as closely tied into a project structure as, say, the
contractor and operator. The lenders may not therefore be in a position to dictate security terms to
them to the same extent. Where there is no long-term supplier of essential goods or services to a
project, both the lenders and the project company are necessarily taking the risk that those supplies
will be available to the project in sufficient amounts and quality, and at reasonable prices.
Purchasers: In many projects where the project’s output is not being sold to the general public, the
project company will contract in advance with an identified purchaser to purchase the project’s output
on a long-term basis. For example, in a gas project there may be a long-term gas offtake contract with
a gas purchaser. Likewise in a power project the purchaser may be the national energy authority that
has agreed to purchase the power from the plant. However, it is not always the case that there is an
agreed off taker. In some projects such as oil projects there will be no pre-agreed long-term offtake
contract; rather the products will be sold on the open market and to this extent the banks will take the
market risk. In some projects essential supplies to the project such as fuel and the project’s output are
purchased by the project company or, as the case may be, sold on “take-or-pay” terms. In other words,
the purchaser is required to pay for what it has agreed to purchase whether or not it actually takes
delivery.
Insurers: Insurers play a crucial role in most projects. If there is a major catastrophe or casualty
affecting the project then both the sponsors and the lenders will be looking to the insurers to cover
them against loss. In a great many cases, if there was no insurance cover on a total loss of a facility
then the sponsors and lenders would lose everything. Lenders in particular, therefore, pay close
attention not only to the cover provided but also to who is providing that cover. Most lenders will want
to see cover provided by large international insurance companies and will be reluctant to accept local
insurance companies from emerging market countries. In some industries some of the very large
companies have set up their own offshore captive insurance companies, either for their own account or
on a syndicate basis with other large companies. This is, in effect, a form of self-insurance and lenders
will want to scrutinize such arrangements carefully to ensure that they are not exposed to any hidden
risks. In other cases, insurance cover for particular risks either may not be available or may be
available only at prohibitive premiums or from insurers of insufficient substance or repute. In such
cases the lenders will want to see that alternative arrangements are made to protect their interests in
the event of a major catastrophe or casualty.
PROJECT FINANCING DOCUMENTATION
The essence of project financing is the apportionment of project and other risks amongst the various
parties having an interest in that project. The way in which this risk allocation is implemented is,
essentially, through the complex matrix of contractual relations between the various project parties as
enshrined in the documentation entered into between them. There is no general body of law that
dictates how projects must be structured or how the risks should be shared amongst the project parties.
Rather, each project must fit within the legal and regulatory framework in the various jurisdictions in
which it is being undertaken or implemented. Accordingly, the contracts between the various project
parties assume a huge significance and it is these documents that are the instruments by which many
of the project risks are shared amongst the project parties. As will be apparent, there is no such thing
as a standard set of project documents. Each project will have its own set of documents specially
crafted for that particular project. Set out below is a brief description of some of the key documents
found in many projects financing structures (Morea & Gebennini, 2021).

EMC 2022, 17-218th June 2022, Zrenjanin, Serbia
71
Pre-Development Agreements: These are agreements entered into by two or more companies that
have agreed to undertake a feasibility study in relation to a proposed project. As the arrangements
between the parties will not usually be sufficiently well developed to warrant a formal shareholders’
agreement, this document can conveniently deal with such matters as initial decision-making and
allocation of tasks in relation to investigating a particular project or proposal. Typically, the agreement
would be for a limited duration and would be quite specific about the scope of the proposed
arrangements and the terms upon which a party could withdraw from the arrangements. It would also
deal with appointment of advisers and general cost sharing. One might also expect to see provisions
relating to confidentiality and restrictions on competing. Similar agreements may also be entered into
where parties join together to bid for a particular contract or concession and do not want to incur the
cost or expense of a formal joint venture agreement or shareholders’ agreement unless they are
successful in their bid.
Joint Venture Agreement: In those projects where the project is being undertaken using a special
purpose vehicle owned by two or more shareholders, those shareholders will usually regulate the
relationship between them by entering into a shareholders’ agreement. On the other hand, where a
joint venture structure is used, a joint venture agreement will usually be entered into. A shareholders’
agreement in relation to a project will not differ greatly from a shareholders’ agreement relating to the
ownership of any other company. A joint venture agreement will contain many of the same provisions
although will not need to deal with those matters concerning the setting up and management of a
special purpose vehicle. It will, however, have to deal with management of the project and voting in
connection with the project generally (Dewar, 2011).
Project Loan Agreement: In most projects this will be a syndicated loan agreement entered into
between the borrower, the project lenders and the facility agent. It will regulate the terms and
conditions upon which the project loans may be drawn down and what items of project expenditure the
loans may be used for. The agreement will contain the usual provisions relating to representations,
covenants and events of default found in other syndicated loan agreements but expanded to cover the
project, project documents and related matters. The provisions relating to the calculation and payment
of interest will be similar for standard Euro-currency, loans except that in most projects interest will be
capitalized during the construction period or until project revenues come on stream. Repayment terms
will vary from project to project and will often be tied to the receipt of project cash flows and/or the
dedication of a minimum percentage of the project’s cash flow towards debt service. The agreement
will normally provide for all project cash flows to flow through one of a number of project accounts
maintained by the agent, or a security trustee or account bank, and charged to the project lenders.
There will be detailed mechanics relating to the calculation of project cover ratios and the preparation
of banking cases and forecasting information with respect to the project. There will also be provision
for the appointment of consultants, advisers and technical experts by the project lenders.
Security Documents: The form of these will vary from jurisdiction to jurisdiction and will depend on
the nature and type of assets that are the subject of the security. In common, law-based jurisdictions
the taking of security in relation to project financing is usually through a fixed and floating charge
covering all of the property and assets of the project company. In civil law based and other legal
systems, however, the position is usually more complex, with different documents being required for
different categories of assets. In those jurisdictions that recognize trusts, it is usually convenient to
appoint a trustee, often one of the banks, to hold the security on trust for the lenders as this not only
insulates the security from the insolvency of the institution holding the security but also facilitates the
trading of rights and obligations by the banks without the risk of disturbing the security. Where a
security trustee is appointed by the project lenders, this is usually under a separate security trust deed
which sets out the terms of appointment, rights, duties and obligations of the security trustee, as well
as provides for the usual indemnity and exculpatory provisions for the benefit of the trustee. Also, the
security trust deed may deal with the order of application of payments amongst the various groups of
lenders, although this is frequently dealt with in a separate intercreditor agreement. The applicable
governing law for a security document will depend to a great extent on the location of the asset over
which security is being taken (Dewar, 2011).

A. R. Afshari and B. Saeedi / Construction project financing management
72
CONSTRUCTION PROJECT DOCUMENTS
In many projects, particularly Build-Operate-Transfer (BOT) projects, the concession agreement will
be the key project document as it is the document that will vest in the project company the right to
explore, exploit, develop or operate, as appropriate, the concession or other relevant rights to the
project. At the other end of the spectrum, all that may be needed for a project company to be vested
with the necessary legal rights to exploit is a license. On the other hand, in a BOT project, it will
invariably be the case that the project vehicle or its sponsors will be granted a concession by the host
government or one of its agencies with respect to the project. The concession agreement, often
comprising a BOT obligation, but sometimes a build-own-operate obligation, is popular particularly in
countries where political or budgetary constraints prevent governments from developing essential and
increasingly expensive infrastructure in the public sector (Gorshkov & Epifanov, 2016).
Construction Contracts: In an construction project where the project lenders are taking all or any
part of the construction risk, the construction contract will be one of the key project documents. There
are a number of standard form construction contracts in use but it is unlikely any of them will be
suitable for a project-financed contract without significant amendment. The closest to a suitable
international standard contract is probably the “Orange Book” published by FIDIC. The most common
arrangement is a turnkey contract, in which a single “general” contractor assumes all risk of on-time
completion of a project which meets guaranteed performance standards. In a turnkey contract, the
owner specifies overall performance and reliability standards for the plant, and the turnkey contractor
assumes full responsibility for design, construction, supply, installation, testing and commissioning of
the plant so as to enable it to meet those specified requirements. Subject to important limitations which
the contract will contain, the turnkey contractor essentially provides an overall guarantee of the
performance of all components and sub-contractors.
As an alternative arrangement to a turnkey contract, sponsors may consider that they have the
necessary experience to manage the design and construction of the project facility and may wish to
undertake this themselves, or to leave certain responsibilities for it with the project company. Sponsors
may perceive that they will be able to achieve an overall cost or time saving if they perform a role in
relation to some or all of the design or construction of the facility. If construction management
responsibilities are undertaken by the project company or sponsors, lenders will need to be satisfied
with their technical capacity and resources. They may wish to have additional sponsor support to
ensure adequate cover against the absence of a single contractor that has overall responsibility and the
likely consequences of mismanagement during design and construction. Even less popular with
lenders is a project management structure whereby a project management agreement is entered into
with one project managing company which will then arrange for individual contractors to enter into
contracts with the project company. In this case each of these individual contractors would carry out
different parts of the project. One of the reasons lenders have a very strong preference for turnkey
contracts is that they reduce the risk of claims arising between the different contractors and of
unallocated responsibilities relating to the project. If a turnkey contract is not utilized, then the project
lenders will need to spend considerably more time analyzing the construction contracts and the risks
arising from the construction arrangements.
Operating and Maintenance Agreements: Once the project is completed and commissioned it will
then move into the operation stage. The operation of most projects will require an experienced and
skillful operator and the performance of the operator in the performance of its tasks will be crucial to
the overall success of the project. Both the project company and the lenders will be keen to ensure that
the chosen operator is a company that has a proven track record of operating similar projects.
Sometimes it is the case that the project company itself will operate the project although the lenders
will want to be satisfied that it has both the experience and the necessary staffing, in place to
undertake this role. More often, the operator is a third party that specializes in project and facilities

EMC 2022, 17-218th June 2022, Zrenjanin, Serbia
73
operation and management and who will enter into an operating and maintenance agreement on arm’s-
length terms with the project company.
CONCLUSION
This paper has provided a guideline to project financing by outlining key features of various
documents that are often found in successful projects. Project financing is an area which requires some
degree of experience. Professional accountants, lawyers, and bankers may provide useful assistance to
a client or customers contemplating a project financing either as a developer or as a lender or investor
in a project. For example, the professional can assist a client or customer in developing the forecasted
statement of operating revenues and expenses which is required by lenders and investors as part of the
evaluation package for a project finance loan or equity investment. In addition, the professional can
assist a client or customer in selecting the business form in which the project will operate. Careful
structuring is necessary in order to achieve the most efficient use of tax benefits which are often of
major concern to the equity investor in the project. It is important to remember that a successful
project financing is executed as a team effort involving a developer, one or more lenders, equity
investors, and a variety of advisors ranging from investment bankers to attorneys, engineers, and
accountants.
REFERENCES
Bueno, J. C. (2010). Project Finance: Challenges and Trends. In 10ª Conferência Internacional da LARES.
LARES. São Paulo.
Danielis, R., & Rotaris, L. (2021). Transport Project Financing.
Delmon, J. (2017). Public-private partnership projects in infrastructure: an essential guide for policy makers.
Cambridge university press.
Dewar, J. (Ed.). (2011). International project finance: law and practice. Oxford University Press
Finnerty, J. D. (2007). Project financing: asset-based financial engineering (Vol. 386). John Wiley & Sons.
Gorshkov, R., & Epifanov, V. (2016). The mechanism of the project financing in the construction of
underground structures. Procedia Engineering, 165, 1211-1215.
Morea, D., & Gebennini, E. (2021). New Project Financing and Eco-Efficiency Models for Investment
Sustainability. Sustainability, 13(2), 786
Ragazzi, G. (2005). Tolls and project financing: a critical view. Research in Transportation Economics, 15, 41-
53.
Steffen, B. (2018). The importance of project finance for renewable energy projects. Energy Economics, 69, 280-
294.

74
XII International Symposium Engineering Management and Competitiveness 2022 (EMC 2022)
17-18th June, Zrenjanin, Serbia
TIME MANAGEMENT SKILLS - A CRITICAL ADVANTAGE IN
PROFESSIONAL AND PERSONAL DEVELOPMENT
Zorana Antić Belgrade Business and Arts Academy of Applied Studies, Belgrade, Republic of Serbia
Srđan Bogetić Belgrade Business and Arts Academy of Applied Studies, Belgrade, Republic of Serbia
E-mail: [email protected]
ABSTRACT
In the contemporary business environment, accomplishing good results and achieving business performance
usually imply time management skills and practices, which generally means that tasks and business activities are
performed efficiently and effectively. Time management is critical to achieving success and good performance in
any activity - both business and private. Bearing in mind that research has shown that everyday work consumes a
significant amount of time, as well as a lot of energy, it is necessary to find a way to achieve a balance between
work and private life. Improving the quality of life is essentially the goal of both personal development and the
application of time management skills. For that reason, it is necessary to constantly improve knowledge and
skills, including the skills of effective time management. Mastering this skill enables achieving better results
both on a business and individual level, but also improving personal performance related to behaviour, which
results in a change of attitudes and mindsets, thus enabling individual development.
Key words: Time management, Employees, Performance improvement, Personal development, Training.
INTRODUCTION
Success and development, both at the business and individual level, require permanent alternating practice
in education and training, i.e. acquiring and constantly innovating wider knowledge relevant to the
activities and goals of the organization (Pržulj, 2002) as well as improving employee performance by
enhancing specific knowledge, abilities, skills or behaviours, with a present temporal dimension being
taken into consideration (Goldstein et al., 2002). When individual learning results in a change in attitudes,
values, mindsets, we talk about individual development, whereas organizational learning is most often
defined as a change in cognitive structures and behaviours of members of an organization, leading to an
increased ability of the organization to adapt to the environment (Janićijević, 2006).
Modern business operations require employees to be active participants and initiators in improving their
knowledge and skills, personal and business performance, business activities, business processes, products
or services. As the success of the organization depends mostly on the knowledge, skills, creativity and
motivation of its employees, it is necessary to constantly improve their qualifications (possession of
appropriate education, training and skills to perform a particular job) and competencies (ability to apply
knowledge, skills and behaviour in practice to achieve the desired goals). Thus, employees must possess or
develop competencies that enable them to perform work tasks, as well as contribute to their personal
development (for example, through the development of communication and time management skills)
(Chisholm, 2021).
EFFECTIVE TIME MANAGEMENT
The term "time management" first appeared in Mackay's 1959 book “The Management of Time” (Ötken et
al., 2020). Mackay's time management model suggested the use of time logs as an effective way to track

EMC 2022, 17-18th June 2022, Zrenjanin, Serbia
75
managers' use of time. The goal was to ensure that the manager uses his or her time for those activities that
are in line with business goals. Back in 1967, in his work "The Effective Executive in Action”, Drucker
also emphasized the importance of time management as a key factor for the success of managers, where he
also warned of the dangers of wasting time and the consequences of constant busyness. In the 1960-1970
time period, improving the use of time was exclusively aimed at executives or managers, not employees
(McNamara, 2010).
Both in practice and literature, the time dimension of work has become increasingly important due to the
expansion of global competition and increasing demands for the immediate availability of products and
services. As a result, many researchers (Garhammer, 2002) point to a change in the pace of life which is
reflected in the tendency for activities to be performed faster, for more activities to be realized
simultaneously or for inadequately planned time for the realization of many activities. On the other hand,
studies show that the cause of a disturbed balance between business and private life problem lies in the
constant pressure to do too much in too little time (Major, et al., 2002).
The growing importance of time, as a resource, is reflected both in theory and in practice. Numerous
authors emphasize the need to include time in theoretical models and research design, as well as the need to
discover and improve the way people in organizations manage their time (Ancona et al, 2001). Continuous
pressure to perform activities for a shorter time period can be minimized by good time management
practices and the nurturing of work environment support.
Time management, in business terms, is a process of identifying needs, setting goals, setting priorities and
planning tasks that lead to the achievement of organizational goals (Sahito, 2017), i.e. it is a process that
should take place in accordance with the requirements of different tasks and activities to ensure the success
of the organization and maximize benefits, by spending time and energy rationally. At the personal level,
time management aims to provide sufficient time for personal development and achieving personal
development goals using successful planning and executing activities in a timely manner.
Effective time management presupposes using time in an optimal way in order to increase productivity and
success. It requires work schedule management to achieve organizational and personal goals through
advanced planning, organization, and implementation. The skill of time management is a critical advantage
for both individuals and organizations because it concerns the use of efficient methods and techniques that
ensure the completion of tasks in the required time and the required quality. As it is human nature to
schedule time according to interest and comfort, people both at work and outside of it tend to spend the
most time on simple tasks. However, the only way to develop good skills and habits for achieving
professional and personal success is - time management.
Effective time management enables (Forsyth, 2010): higher productivity, efficiency and effectiveness;
greater focus on self-directed tasks and facilitating working methods (for example through creativity);
higher probability of achieving goals; higher probability of long-term development (professional and
personal); greater satisfaction with the work or activities performed; balance between business and family
obligations.
Since time management directly affects results and efficiency, it has a direct impact on career advancement,
i.e. personal development, because good time management practice not only affects the organization
through the work of the individual and the results he or she generates but also affects the individual -
improves work satisfaction, state of mind and general well-being.
TIME MANAGEMENT SKILLS
The annual survey of the LinkedIn business network for 2019 showed that time management is one of the
five best and most desirable "soft skills" in 2019 and among the five most desirable skills on the labour
market for the same year (Charlton, 2019). Research conducted among students in the United States has
revealed that they single out management skills, interpersonal skills, teamwork and time management as

Z. Antić and S. Bogetić / Time management skills – A critical advantage in professional...
76
the four most important skills they believe they need in order to land a job after graduation (Kay et al,
2011). A survey conducted among students of the Aarhus University's technical faculties in Denmark has
found that students' ability to set goals and prioritize activities, as well as their own perceived time control -
time management activities have had the most significant positive correlation with the semester and
cumulative grade point average (Adams et al., 2019).
There are numerous research studies (Aeon et al., 2017) that deal with the skills underlying time
management. Here, time management is defined as a decision-making process that structures, protects, and
adjusts an individual’s time in changing environmental conditions. There are three particularly important
skills that separate successful from unsuccessful time management (Erich et al., 2020):
awareness: realistic understanding of your time realizing that it is a limited resource;
management: creating and organizing goals, plans, schedules and tasks in order to use time efficiently;
adaptation: monitoring the use of time during activities, including adjusting, interrupting or changing
priorities.
The aforementioned abilities that make up successful time management were tested on a sample of 1200
respondents and the results indicate the following (Erich et al., 2020): (1) all three abilities are equally
important for the overall performance of time management. Therefore, only improving one’s planning and
organization (i.e., management skills) ignores two-thirds of the competencies needed for effective time
management and will not result in mastering time management skills; (2) awareness and adaptation scores
were on average 24% lower than management ability scores. This result suggests that awareness and
adaptation are not only abilities that are less common but are more difficult to develop naturally, without
direct intervention. In addition, the developed awareness was the primary indicator of successfully
overcoming procrastination in the realization of tasks and goals, and the developed ability to adapt - the
primary indicator of successful prioritization of tasks and activities; (3) the results contradict popular
statements about both the advantages and disadvantages of multitasking. When asked how respondents feel
while performing several activities at the same time, the answers indicated that their preferences for
performing multiple tasks (what academics call “polychronicity”) were not actually related to time
management skills. How well or poorly people managed their time was not correlated to their preferences
for performing multiple tasks. Therefore, multitasking and promoting this ability is not a good way to
master the skill of time management; (4) the results obtained provide evidence that people cannot
accurately assess their own time management skills. Less than 1% of respondents achieved approximate
scores in self-assessment measures in contrast to objective assessment measures on the development of
time management skills. These results confirm the previous finding on the lack of developed awareness in
people regarding their own competencies, which affects personal and business achievements, but also the
potential for personal and professional development.
THE IMPACT OF TIME MANAGEMENT SKILLS ON PERSONAL AND PROFESSIONAL
DEVELOPMENT
The performance of any organization largely depends on the techniques and tools applied by employees,
which should also be flexible enough and adaptable to change, while at the same time achieving
organizational goals (Cannon, 1996). In this context, several researchers have argued that effective time
management is a key factor in determining organizational performance and can thus contribute to an
organization’s profitability (Sutharshini, 2019). In the business world, time is, in addition to knowledge,
one of the most important resources. Looking at it this way, several researchers point out that effective time
management can improve an organization’s performance (Grissom, 2015). Therefore, we can say that the
efficiency of the organization depends on the effectiveness of the use of time. Every executive, and
especially every managerial position requires that tasks be completed on time, so in order to gain a
competitive advantage, organizations face numerous appeals to increase their productivity, to seriously
approach efficiency advancements and improve time management, to be more creative and more
innovative (Fourie, 2013).

EMC 2022, 17-18th June 2022, Zrenjanin, Serbia
77
Permanent improvement of business effectiveness and efficiency is one of the requirements of the ISO
9000 standard, as well as one of the principles of quality management that promote continuous
improvement of knowledge and skills of employees at all levels, in order to advance the organization's
performance. Requirement 7.2 of the ISO 9001 standard emphasizes the importance of competence for
achieving the goals of the organization and states that competence (based on appropriate education, training
or experience) affects the performance and effectiveness of an organization (ISS, 2015).
The Collection of European Statistics (European Communities, 2004) on how Europeans spend their time,
published in 2004, aims to shed light on how women and men organize their daily lives in ten European
countries and provide information on opportunities to reconcile work and private life. The statistical
sources used for this publication were national surveys on the use of time conducted in ten European
countries: Belgium, Germany, Estonia, France, Hungary, Slovenia, Finland, Sweden, the United Kingdom
and Norway. Time use surveys, among other things, offer an indicator of participation and time spent
learning1 among people aged 20 to 74. The figures for the average day of the year are very low.
Participation rates and average time are approximately the same in all countries surveyed, but slightly less
learning time is observed in Estonia and the United Kingdom. There are small differences between women
and men. In Sweden, Slovenia and Finland, women learn slightly more than men. No clear differences can
be observed in other countries. These gender differences apply only to education at school and university.
Leisure studies do not show such differences. The study has clearly focused on young population groups.
Between 30 and 50% of members of the youngest age group of 15 to 24 spend some time studying on
average. That time is longer in Belgium and France, and shorter in Estonia and the United Kingdom than in
the other six European countries. There is a clear decline in the time spent learning after the early 20s.
Compared to other countries, people continue to study until later in life in Sweden and Finland. This may
be due to different school systems, the possibility of combining studies with employment or later
employment.
In its report on the use of time, the U.S. Bureau of Labor Statistics (U.S. Bureau of Labor Statistics, 2021),
presents data for the 2019-2020 period and states that Americans spend an average of 28 minutes a day on
educational activities. Here, too, it can be seen that teenagers spend much more time learning, with boys
learning 3 hours and 37 minutes a day, and girls an average of 2 hours and 29 minutes.
In their report on the use of time for the population over 15 years of age, published in 2008, including data
for 2006 as well, the Australians (Australian Bureau of Statistics, 2008) state that the amount of time spent
on educational activities in 2006. was an average of 30 minutes per day, similar to the 1992 survey and
more than 15% of the 1997 survey. In 2006, men and women spent a similar amount of time on education,
both as a whole (30 minutes each) and in each age group, and for both sexes, the time spent decreased as
age increased. For men aged 15 to 24, an average of 2 hours and 23 minutes a day was spent on education,
and for women 2 hours and 22 minutes. In the next age group, it drops to 12 minutes for men and 15
minutes for women.
Taking into account all theoretical assumptions and literature sources on the topic of time management, but
also studies on the use of time (both national surveys on the use of time and time monitoring studies at the
individual level), a study was conducted involving 53,957 participants, which allowed for a much more
precise, quantified assessment of the effectiveness of time management compared to qualitative reviews
and in 2021 a meta-analysis was published (Aeon, et al., 2021) offering the most comprehensive and
accurate assessment of time management so far. This meta-analysis shows that time management has a
moderate impact on performance at work, distinguishing between results-based performance and
behaviour-based performance. The results-based performance measures performance as an outcome (e.g.
performance appraisal by supervisors) while the latter measures performance as behavioural contributions
(e.g. motivation, job involvement). Time management is associated with both types of performance.
Furthermore, this meta-analysis has shown that the effect of time management on performance is
somewhat higher in the academic environment compared to the business one. There is a noticeable
1 Learning time includes school and college learning, homework, and leisure education. Training during working
hours was not included. Norway was not included due to a lack of information on leisure learning.

Z. Antić and S. Bogetić / Time management skills – A critical advantage in professional...
78
difference in performance improvement here, as the impact of time management on behaviour-based
performance has been shown to be much greater than on results-based performance. This finding suggests
that results-based performance in the academic environment is less dependent on time management than it
is in the business environment.
Time management has a slightly stronger impact on the general well-being than on performance, as shown
by the results of data analysis. This conclusion seems unexpected at first glance, given that the dominant
discourse indicates to a greater extent that time management is a skill for professional career development,
and to a lesser extent - a skill that achieves general well-being, improves quality of life and reduces stress.
The authors of the meta-analysis conclude that the fact that time management has a stronger impact on
general well-being does not in the least diminish the importance of time management skills in achieving
business performance. On the contrary, this finding calls into question the notion that time management is
more efficient for work than for other areas of life. This is supported by the data from the report - the effect
of time management on life satisfaction is 72% greater than the effect on job satisfaction.
The skill of time management does not generally depend on individual differences. Age, for example, has
almost no correlation with time management, whereas gender is weakly correlated with this skill, so
women have a slightly higher ability to manage time than men. The link between gender and time
management skills is weak, but women's time management has been shown to go stronger over the years.
This is probably not due to women's increasing ability to develop this skill over time, but more related to
the fact that women now have more freedom than before to manage their time. Other demographic
indicators, such as education and the number of children, appeared to have no relevance. As can be seen
from the above, the most comprehensive meta-analysis has shown that time management has an impact on
work performance, academic achievement, i.e. learning and personal development and general well-being,
i.e. the quality of life. Thus, by mastering the skill of time management, it is possible to influence all three
outcomes that play an important role in the life of every human being.
CONCLUSION
If we start from the assumption that time management involves the process of deciding on needs, setting
goals to meet those needs, setting priorities and planning tasks necessary to achieve these goals, then the
fact is that time management represents a key factor in improving individual performance, and hence
personal development. In an organizational context, time management is the ability to properly plan and
organize time to improve effectiveness and efficiency. Time management has been shown to mean the
ability to consistently use time to perform immediate tasks and work on long-term goals, and furthermore,
employees with better time management skills allocate the time they have differently depending on job
requirements (Sutharshini, et al, 2019). Therefore, time management is a key factor for improving
professional performance, i.e. for organizational development. Due to all of the above-mentioned facts,
individuals should focus on improving their own time management skills in order to complete their tasks
and duties on time. Organizations, on the other hand, need to focus on reducing the stress that employees
have at work and achieving a balance between business and private life, then on increasing employee
productivity and job satisfaction, by encouraging the improvement of individual performance. All of the
above can be achieved by mastering the skill of effective time management.
REFERENCES Adams, R., Blair, E., (2019), Impact of Time Management Behaviors on Undergraduate Engineering Students’
Performance, original research, SAGE Open, January-March 2019: 1–11, DOI:
10.1177/2158244018824506 Aeon B, Faber A, Panaccio A (2021) Does time management work? A meta-analysis. PLoS ONE 16(1):
e0245066. https://doi.org/10.1371/journal.pone.0245066
Aeon, B., Aguinis, H., (2017), It’s About Time: New Perspectives and Insights on Time Management, Academy
of Management Perspectives, Vol. 31, No. 4, 309–330.

EMC 2022, 17-18th June 2022, Zrenjanin, Serbia
79
Ancona, D.G., Goodman, P.S., Lawrence, B.S. and Tushman, M.L. (2001), “Time: a new research lens”,
Academy of Management Review, Vol. 26, pp. 645-63. Australian bureau of statistics, How Australians use their time (2008), preuzeto sa
https://www.abs.gov.au/statistics/people/people-and-communities/how-australians-use-their-time/latest-
release#data-download
Cannon, R., (1996), Time Management: A Review of Issues and Strategies for Academic Staff, Overview-
University of Wollongong Teaching & Learning Journal, Vol. 3, No. 1, pp. 37-44. Charlton, E., (2019), These are the 10 most in-demand skills, according to LinkedIn, World Economic Forum, preuzeto
sa https://www.weforum.org/agenda/2019/01/most-in-demand-skills-as-per-linkedin/ Chisholm L., Fennes, H., (2021), Competence development as workplace learning in Asia and Europe:
Introduction, preuzeto sa https://asemlllhub.org/wp-content/uploads/2021/06/resources_2165.pdf
Erich C. Dierdorff, E., (2020), Time Management Is About More Than Life Hacks, Harvard Business Review,
January 2020.
Forsyth, P., (2010), Successful Time Management, Kogan Page, London and Philadelphia, pp. 145 Fourie, I.,Fourie, H., (2013), “Getting It Done on Time”, Library Hi Tech, Vol. 31, No. 2, pp. 391-400 Garhammer, M. (2002), “Pace of life and enjoyment of life”, Journal of Happiness Studies, Vol. 3, pp. 217-56. Goldstein I.L & Ford K.J. (2002).Training in organizations – needs assessment, development, and evaluation,4
th edition, Wadsworth, Belmont., p.1
Grissom J A, Loeb S , Mitani H (2015), “Principal Time Management Skills: Explaining Patterns in Principals’
Time Use, Job Stress, and Perceived Effectiveness”, Journal of Educational Administration, Vol. 53, No. 6,
pp. 773-793.
How Europeans spend their time Everyday life of women and men, (2004), Office for Official Publications of the
European Communities, preuzeto sa https://ec.europa.eu/ https://business.linkedin.com/talent-solutions/blog/trends-and-research/2018/the-most-in-demand-hard-and-soft-
skills-of-2018
Janićijević, N., (2006), Organizaciono učenje u teoriji organizacionih promena, originlani naučni rad, Ekonomski
anali 171. str. 7-31, preuzeto sa http://www.doiserbia.nb.rs/img/doi/0013-3264/2006/0013-
32640671007J.pdf
Kay A. Hodge, Janet L. Lear, (2011), Employment Skills for 21st Century Workplace: The Gap Between Faculty
and Student Perceptions, Journal of Career and Technical Education, Vol. 26, No. 2, Winter, 2011, Pp.28-
41 Major, V.S., Klein, K.J. and Ehrhart, M.G. (2002), “Work time, work interference with family, and
psychological distress”, Journal of Applied Psychology, Vol. 87, pp. 427-36. McNamara, P., (2010), Factors influencing the time management behaviours of small business managers,
Business HDR Student Conference 2010-13. 3. Ötken, B., Bayram, A., Göl Beser, S., Kaya, C., (2020), Are Time Management and Cyberloafing Related?
Investigating Employees’ Attitudes, Global Business Review, 1-13. Pržulj Ž. (2002). Menadžment ljudskih resursa, Institut za razvoj malih i srednjih preduzeća
Sahito, Z., Vaisanen, P., (2017), Effect of Time Management on the Job Satisfaction and Motivation of Teacher
Educators: A Narrative Analysis, International Journal of Higher Education, Vol. 6, No. 2, pp. 213-224
SRPS ISO 9001 Sistemi menadžmenta kvalitetom – Zahtevi, ISS, 2015.
Sutharshini, B., Thevanes, N., Anton Arulrajah, A., (2019), Effective Time Management as a Tool for Individual
and Organizational Performance in Financial Institutions, The IUP Journal of Organizational Behavior,
Vol. XVIII, No. 2, pp. 25-41. U.S. Bureau of Labor Statistics, American Time Use Survey Summary – may to december 2019 and 2020 results,
(2021), July 22, preuzeto sa https://www.bls.gov/news.release/atus.nr0.htm

80
XII International Symposium Engineering Management and Competitiveness 2022 (EMC 2022)
17-18th June, Zrenjanin, Serbia
ANALYZING RESPONSIBILITY AND SUSTAINABILITY AS ASPECTS
OF THE MANAGEMENT PROCESS IN ENTERPRISES
Dejan Đorđević
University of Novi Sad, Technical Faculty “Mihajlo Pupin” in Zrenjanin, Republic of Serbia
Mihalj Bakator
University of Novi Sad, Technical Faculty “Mihajlo Pupin” in Zrenjanin, Republic of Serbia
E-mail: [email protected]
Dragan Ćoćkalo
University of Novi Sad, Technical Faculty “Mihajlo Pupin” in Zrenjanin, Republic of Serbia
Cariša Bešić
University of Kragujevac, Faculty of Technical Scienses Čačak, Republic of Serbia
Ljiljana Đorđević
Serbian Environmental Protection Agency, Republic of Serbia
ABSTRACT
Sustainability of conducting business is an imperative in the modern business environment. In order to achieve a
competitive position on the market, companies have to act responsible and to address sustainability when it
comes to preservation of the natural environment. The new conditions of conducting business dictate new
challenges for companies. Economic goals have to be in accordance with sustainable development goals. This
requires companies to increase and adequately practice corporate social responsibility along with sustainable
development. In this paper, social responsibility and sustainable approaches to conducting business are analysed.
The main goal of the paper is to highlight the importance of responsible business practices and sustainable
strategies for achieving competitiveness. The paper discusses suggestions and guidelines for improving
competitiveness of domestic companies through responsibility and sustainability. The paper provides an
important overview on how the new business environment and changes on a global scale affect how companies
conduct business.
Key words: Responsibility, Sustainability, Management processes, Organization, Business.
INTRODUCTION
The accumulated problems in the environment, which are the result of industrial society and industrial
decay, have influenced the need to talk more about the responsibility of modern business organizations
at the global and national levels. From the aspect of development priorities, preservation of natural
resources, and especially the rational use of all resources and their potentials, has acquired strategic
importance. On a global level, guidelines for sustainable development are defined, which should
establish a balance between the goals of economic development on the one hand and social
development on the other hand, taking into account the necessity for improving and protecting the
environment. All this influences business entities to be more serious about meeting the goals of a
larger number of interest groups in their environment, especially local communities. According to the
World Economic Forum (WEF, 2019), it has become clear that the issue of the environment, social
and economic development must be considered together in terms of forming a single agenda for
action. The process of managing the organization in the conditions of dynamic market changes
requires the right way of thinking, in order to achieve new value for all stakeholders. Business
organizations have become fully aware of the impact on society and the environment in which they
conduct their business. This knowledge has far-reaching consequences. The implementation of
corporate ethics principles also has a global character. The public interest is the primary interest of the
organization, which must be built into the business policy of the organization, and this has to be
viewed as a strict guideline for future business actions.

EMC 2022, 17-18th June 2022, Zrenjanin, Serbia
81
According to some understandings (Acharol, & Kotler, 2012), the new philosophy implies improving
the well-being of society and consumers in relation to the well-being of marketing management. The
key issues of global marketing will be the issue of sustainability and the issue of poverty reduction.
According to Kotler et al. (2014), sustainability, which implies the ability to meet the needs of
humanity without harming future generations, is a priority for many companies. Raising the level of
corporate social responsibility requires action in three directions, which include legal, ethical, and
socially responsible behaviour.
In this paper the social responsibility and sustainability are analysed and discussed as two main factors
in the modern business environment. The main goal of the paper is to provide an overview on the new
conditions of conducting business where responsible business strategies and sustainable approaches
are an imperative. The consists of three main sections (excluding the Introduction and Conclusion
sections). First, social responsibility and its importance in modern business is analysed. Next,
sustainability in the context of conducting business is addressed. The third section discusses
suggestions and guidelines for improving competitiveness of domestic enterprises through responsible
business practices and sustainable strategies.
SOCIAL RESPONSIBILITY AS A PREREQUISITE OF MODERN BUSINESS
Modern business philosophy implies that a company must be responsible for its actions and
consequences of these actions towards everyone in the environment. Drucker (2003) believes that
focusing on contribution is key for achieving effectiveness. An effective person focuses on
contributing from both an economic aspect and a social aspect as well. His emphasis is on
responsibility and that commitment to contribute has to include effective accountability. The company
is obliged to meet all the requirements of consumers, society, partners, workers and shareholders. It is
believed that the modern understanding of responsibility implies responsibility in the domain of
economy, environment, and society (Doshmanli et al., 2018; Lankoski, & Smith, 2021).
In the past, it was enough for the company to meet the basic economic goals - profit, as a basis for
achieving the goals of growth and development, and today the modern business organization has to
meet the requirements of all stakeholders. According to Kotler et al. (2014), raising the level of social
responsibility requires action in three directions, which include legal, ethical, and socially responsible
behaviour. Businesses must practice social responsibility through their legal, ethical, and social
expression and action.
Corporate Social Responsibility (CSR) is linked to the 1980s, when the focus of philanthropy was on
corporate ethics. Current trends in the field of good business practice relate to issues that refer to
human rights, environmental protection, consumer protection, anti-corruption, and support for social
problems (Bogetić et al., 2018). Total Quality Management (TQM) has incorporated the requirements
for social responsibility. According to this management model, business organizations should be
responsible for environmental protection, consumer protection, protection of workers' interests, and
improvement of labour productivity, and knowledge of all employees.
Achieving the goals of business excellence presupposes a built-in corporate social responsibility. It is
a voluntary commitment of an organization and its decision to select and apply contributing business
practices. Some of the reasons for the application and development of corporate social responsibility
are the following: increasing market share, strengthening brand position, strengthening corporate
image, improving the ability to attract and motivate employees, reducing business costs, increasing
attractiveness to investors.
The concept of corporate social responsibility is now standardized and is an integral part of integrated
management systems. The International Organization for Standardization has published ISO 26000
providing guidelines for corporate social responsibility (CSR). The ISO 26000 standard is aimed at

D. Đorđević et al. / Analyzing responsibility and sustainability as aspects of the management...
82
companies of all types, in the public and private sectors, in developed and developing countries. ISO
26000 adds value to the existing CSR initiative by ensuring harmonization, complying with global
guidelines based on international consensus and key stakeholder expert groups (Martis, 2018). This
way, the application of best practices in CSR worldwide are encouraged. ISO 26000 aims to help
organizations contribute to sustainable development. The intention is to encourage business
organizations to do more than what it implied and enforced by law.
The concept of quality management integrates the need for environmental protection. This doesn't only
refer to the living environment, but also the improvement of people's health as employees and as
consumers. The ultimate goal of applying the TQM concept is to achieve the overall quality of life
(TQL - Total Quality of Life) (Đorđević, & Ćoćkalo, 2007). These goals are directly based on the
concept of sustainable development. On the other hand, the integration of management standards
creates the preconditions for achieving the goals of business excellence and sustainable development.
According to some understandings (Bešić, & Đorđević, 2015), the goal of social responsibility is to
contribute to sustainable development. The performance of an organization in relation to the society in
which it operates, as well as its impact on the environment, has become a crucial part of measuring
overall performance and its ability to operate continuously and effectively.
SUSTAINABILITY AND BUSINESS ORGANIZATION MANAGEMENT
A modern business organization does not have to be socially responsible, but rather it must be in line
with the main principles of sustainability. Changes on the global market, rapid technological progress,
changes in competitive relations, as well as the consequences of the COVID-19 pandemic have
influenced the fact that modern business organizations have to conduct business in accordance with
the principles of sustainability.
In creating value, companies must focus on meeting the requirements of all stakeholders in the
business environment - employees, consumers, suppliers, business partners, the local community, etc.
The company should incorporate this principle into its long-term business policy. Furthermore, the
company serves its customers by providing value that best meets the needs of consumers and users
more broadly. The company should treat its employees with respect and dignity. In that sense, the
company should encourage diversity and enable employees to constantly improve working conditions.
When it comes to suppliers, the company should treat them as real business partners in the value
creation process. The company serves society through its activities that support local development and
pay poster taxes. Also, the company needs to constantly innovate and invest in sustainability, and
managers are agreed to create long-term value.
The next phase of technology and economy development is the fifth industrial revolution - Industry
5.0. It is believed that Industry 5.0 will be determined by rediscovered expediency, which goes beyond
the process of manufacturing or providing services. In this sense, Industry 5.0 sub-includes three main
elements: human focus, sustainability, and resilience (European Commission, 2020a). Doing Business
in Industry 5.0 will involve creating such business models that include the constant growth of business
productivity and the creation of competitiveness, but also the need to create environmental and social
value.
The Global Framework for Skills Development in the 21st Century (ILO, 2021) proposes the need to
raise environmental awareness and respect and readiness to learn about sustainable development,
which is the starting point for every citizen of the world who wants to facilitate a greener way of
thinking, living and acting. Moving to a sustainable environment will require basic skills, such as
improving efficiency and waste prevention, adaptability, teamwork, communication, negotiation,
analytical and innovative thinking, basic digital skills, literacy, strategic thinking and leadership. The
development of these skills will play a key role in industrial green restructuring, structural change, and

EMC 2022, 17-18th June 2022, Zrenjanin, Serbia
83
"greening" of existing jobs. In Table 1. practices and business factors in the domain of sustainability
and responsibility are presented.
Table 1: Sustainability and responsibility model Observed business factor Practice
Environmental management energy conservation
pollution prevention
environmental protection
sustainable transport and logistics
reduction of carbon footprint
Human resource management securing jobs
creating jobs
providing opportunities
training and development opportunities
employee health and safety management
optimal work-life balance for employees
Marketing truthful advertising
fair pricing
customer credit
after sales service quality
public integrated reporting
Operations management total quality management
innovations
outsourcing
pay invoices early and on time
evaluating and identifying inefficiencies
research and development
recycling and reusing
Internal control systems management control system
accounting management
strategic control
corporate governance
Regulatory stakeholders comply with legal and regulatory policies
issue and conflict resolution via dialogues and discussions
Communities conflict and issues resolution via discussions and dialogues
sponsor education
providing training opportunities
support local activities
Shareholders generating profit
Customers meet requirements
exceed expectations and needs
Suppliers responsible procurement
optimized supply chains
safeguard human rights
sustainable material use
(Source: Camilleri, 2017; Liakh, & Spigarelli, 2020)
Based on the presented information in Table 1., it is evident that responsibility and sustainability
include a large array of business practices across various business factors. This extensive list indicates
the already stated notion that achieving competitiveness in accordance with responsible business
practices and sustainable strategies is indeed challenging for companies. The challenges are even more
difficult for domestic enterprises as factors of a transitional economy also takes its toll on sustainable
development.

D. Đorđević et al. / Analyzing responsibility and sustainability as aspects of the management...
84
SUGGESTIONS AND GUIDELINES
Economic development must be in line with social development and the protection and improvement
of the environment. In 2020, the World Economic Forum published the Davos Manifesto, which is a
set of ethical principles for managing companies in the age of the fourth technological revolution -
Industry 4.0. This document is based on principles such as (WEF, 2020):
Companies should pay fair taxes;
Companies should show zero tolerance for corruption;
Uphold human rights through their global supply chains and advocate for a competitive economy.
In addition, it is necessary to mobilize companies and socially responsible entrepreneurs in order to
protect the environment. The main notes of the mentioned document are:
The purpose of the company is to engage all forces in creating sustainable value;
The company is more than an economic organization that aims to increase continuously profits;
A company operating in the global market and itself becoming a stakeholder.
The company's performance must be measured not only in relation to the classic economic indicators
of the organization's quality, but also in terms of sustainability and environmental impact, social
development, and good governance goals at the level of state administration. According to the
European Commission (European Commission, 2020b), several goals need to be met in the near future
including strengthening sustainable competitiveness, ensuring social justice, building resilience.
In sum, it is suggested that domestic enterprises should conduct business within legal procedures, tax
legislation, regulatory policies, reduce corruption rates, advocate and adapt to a competitive economy,
create and provide value to customers and users, build resilience to turbulent market dynamics, act
responsible to local communities, and strive towards fully sustainable business strategies.
CONCLUSION
Social responsibility is one of the pillars of the organization's business excellence. In the future, it is
necessary to achieve sustainable productive economic growth, which is key to improving the lives of
individuals. On the other hand, modern business organizations must turn to sustainability. Economic
goals, such as productivity and competitiveness, should not take precedence over environmental and
social goals.
It can be concluded that business performance must be measured not only in relation to classical
economic indicators, but also in terms of sustainability and impact on the environment and social
development. This can be achieved only through the application of business models, which
incorporate the need to create environmental and social value. For future research, it is recommended
to conduct a thorough meta-analysis in the domain of responsibility and sustainability of conducting
business.
ACKNOWLEDGEMENT
This work is a part of the current project TR-35017 funded by Ministry of Education, Science and
Technological Development of the Republic of Serbia.
REFERENCES
Acharol, R.S., & Kotler, P. (2012). Frontier of the marketing paradigm in the third millennium, Journal of
Academic Marketing Science, 40(1), 35-52. https://doi.org/10.1007/s11747-011-0255-4

EMC 2022, 17-18th June 2022, Zrenjanin, Serbia
85
Bešić, C., & Đorđević, D. (2015). Corporate social responsibility (In Serbian: Korporativna društvena
odgovornost). Čačak: FTN.
Bogetić, S., Đorđević, D., Ćoćkalo, D., & Vorkapić, M. (2018). Corporate social responsibility as a factor of
global competitiveness. Journal of Engineering Management and Competitiveness (JEMC), 8(1),11-19.
Camilleri, M. A. (2017). Corporate sustainability and responsibility: creating value for business, society and the
environment. Asian Journal of Sustainability and Social Responsibility, 2, 59-74.
https://doi.org/10.1186/s41180-017-0016-5
Đorđević, D., & Ćoćkalo, D. (2007). Quality management (In Serbian: Upravljanje kvalitetom). Zrenjanin: TF
Mihajlo Pupin.
Doshmanli, M., Salamzadeh, Y., & Salamzadeh, A. (2018). Development of SMEs in an emerging economy:
does corporate social responsibility matter?. International Journal of Management and Enterprise
Development, 17(2), 168. https://doi.org/10.1504/IJMED.2018.090827
Drucker, P. (2003). The Essential Drucker (In Serbian: Moj pogled na menadžment). Novi Sad: Adižes.
European Commission (2020a). Industry 5.0 – Towards a sustainable, human-centric and resilient European
industry. https://ec.europa.eu/info/news/industry-50-towards-more-sustainable-resilient-and-human-centric-
industry-2021-jan-07_en
European Commission (2020b). Program veština za Evropu za održivu konkurentnost, socijalnu pravednost i
otpornost. http://www.as.edu.rs/pdf/articles/481
Global framework on core skills for life and work in the 21st century, (2021), ILO, Switzerland.
Kotler, P., Keller, K. L., & Martinović, M., (2014). Marketing management (In Croatian: Upravljanje
marketingom). Zagreb: Mate.
Lankoski, L., & Smith, N. C. (2021). Corporate Responsibility Meets the Digital Economy (May 14, 2021).
INSEAD Working Paper No. 2021/23/ATL. https://ssrn.com/abstract=3845940 or
http://dx.doi.org/10.2139/ssrn.3845940
Liakh, O., & Spigarelli, F. (2020). Managing Corporate Sustainability and Responsibility Efficiently: A Review
of Existing Literature on Business Groups and Networks. Sustainability, 12(18), 7722.
https://doi.org/10.3390/su12187722
Moratis, L. (2018). Signalling Responsibility? Applying Signalling Theory to the ISO 26000 Standard for Social
Responsibility. Sustainability, 10(11), 4172. https://doi.org/10.3390/su10114172
World Economic Forum – WEF (2019). The Global Competitiveness Report 2019.
https://www.weforum.org/reports/how-to-end-a-decade-of-lost-productivity-growth
World Economic Forum – WEF (2020). The Davos Manifesto. www.weforum.org
https://www.weforum.org/agenda/2019/12/davos-manifesto-2020-the-universal-purpose-of-a-company-in-
the-fourth-industrial-revolution/

86
XII International Symposium Engineering Management and Competitiveness 2022 (EMC 2022)
17-18th June, Zrenjanin, Serbia
RISK ANALYSIS AND RISK MANAGEMENT IN BUSINESS
PRACTICE
Biljana Maljugić
Student at University of Novi Sad, Technical Faculty “Mihajlo Pupin”, Zrenjanin, Republic of Serbia
E-mail: [email protected]
Marija Matotek Anđelić
Technical College of Applied Studies in Zrenjanin, Republic of Serbia
SrđanaTaboroši
Student at University of Novi Sad, Technical Faculty “Mihajlo Pupin”, Zrenjanin, Republic of Serbia
ABSTRACT
Sudden and frequent changes in the market have conditioned the growing importance of risk management. Given
that small and medium enterprises are "weak" to change and react badly in crisis situations, risk analysis is
especially recommended. The risk management process optimizes business decisions in accordance with the
identified risks in order to control risk and reduce consequences. Ten risks per medium-sized enterprise and their
values are tabulated in the paper. The FMEA method was applied for risk analysis in the implementation of ISO
9001:2015 in a company that is not subject to standardization. The introduction of standardization carries certain
acceptance risks that can be appropriately minimized in a timely manner and directed towards more stable
operations.
Key words: Risk analysis, Criteria, Methods, Standardization, Risk management.
INTRODUCTION
In an unpredictable global environment, which is subject to daily changes, the company's business is
subject to various risks that need to be identified in a timely manner. Udovičić and Kadlec (2013) state
that risks in a business organization are closely related to the decision-making process and that the
most important thing is to manage risks properly. Operational or business risks occur due to
inadequate management, ie errors in the work of company and employee management, based on
incorrect assessments, omissions in information, inadequate work procedures and internal decision-
making (Merkaš, 2018).
The risk management process according to Pongrac and Majić (2015: 97) is a process by which risks
are identified, assessed and analyzed using frequent and repetitive procedures to generate a report and
monitor risk activities. Risk management does not eliminate risks, it creates an environment for
making optimal business decisions based on the identified risks and the consequences that these risks
can cause. After identifying the risk and performing the procedures, it is very important to choose the
appropriate technique for the best ways to eliminate or control the risk exposure. In transition
economies, as is the case in the Republic of Serbia, it is very important to determine the risks to the
company's operations. Risk identification is a process that should be carried out continuously due to
the company's exposure to various threatening environmental influences. Impacts can impair the
company's ability to perform its activities and achieve its strategic, financial and operational goals
(Lutovac, Živković, and Jović, 2020). Čupić (2015), based on theoretical research and the above
arguments in his work, confirmed that management can maximize the value of a corporation if it
optimizes its exposure. In particular, the author confirmed their hypothesis that "risk management can
contribute to maximizing the value of the corporation if it allows maintaining risk exposure at an
optimal level, where the benefits outweigh the costs of risk management" (Čupić, 2015: 220). When
talking about strategy management in medium-sized companies in the Republic of Serbia, Lutovac,

EMC 2022, 17-18th June 2022, Zrenjanin, Serbia
87
Živković, and Jović (2020) talk about business risk management. It is strategically very important to
first consider and measure the amount of risk that is acceptable for the company's operations, and then
determine the risks that can be controlled with available resources.
RISK ANALYSIS
Risk analysis criteria
In order to find out what the risk is, Adamović et al. (2008) responded by asking three questions that
need to be answered: "1. What can happen? 2. How often does it happen? 3. What are the
consequences if this happens?" (according to Nikolić, 2012: 50). An adverse event is associated with
the first question, the probability of an event with the second, and the consequences with the third
question. Based on the probability of the occurrence of a harmful event and the severity of the
consequences of that event, the risk is defined by the mathematical product of these two quantities
(Nikolić, 2012: 50). Čupić et al. (2001) refer to a risk analysis procedure consisting of seven steps: "1.
Identifying the criterion variable and the relevant variables that affect it; 2. Description of the
possibility of measuring all variables; 3.Examining and establishing dependency-independence
relationships between variables; 4. Estimating the probability distribution for all variables that affect
the criterion variable; 5. Determining the probability distribution of the criterion variable, using the
probability distributions obtained in step 4; 6. Application of Monte Carlo simulation to obtain a
satisfactory probability distribution of the criterion variable; 7. Evaluation of the project with the use
of information on the distribution of the probability of the criterion variable"(according to Nikolić,
2012: 51). Adamović et al. (2008) point out two basic approaches that determine risk analysis:
qualitative and quantitative. What both approaches have in common is that two estimates need to be
made: an assessment of the probability of the event occurring and an assessment of the consequences
of the event. In the qualitative approach, the probability of a phenomenon is described by the words:
very rare, rare, probably, very probable, and the consequences: insignificant, minor, significant,
critical, catastrophic. In the quantitative approach, the probability of occurrence of the event and the
consequences of the event are expressed by numerical values (according to Nikolić, 2012: 63).
Risk assessment criteria
Table 1: Probability of occurrence / typical evaluation criteria Qualitative
evaluations
Quantitative
evaluations
Criterion
very rare P<0,1 the estimated probability of occurrence does not exceed 10%
rare 0,1<P<0,4 the estimated probability of occurrence does not exceed 40%
probably 0,4<P<0,8 the estimated probability of occurrence does not exceed 80%
very probable P>0,8 the estimated probability of occurrence exceeds 80%,
the probability of recurrence is less than 10 years.
Source: Adamović et al. (2008, according to Nikolić, 2012: 63)
Table 2: Consequences of occurrence / typical evaluation criteria Qualitative
evaluations
Quantitative
evaluations
Criterion
insignificant C<0,1 minimal or insignificant consequences
minor 0,1<C<0,4 the consequences slightly affect the process being analyzed
significant 0,4<C<0,8 the consequences greatly contribute to the increase in costs
critical 0,8<C<0,9 the consequences seriously jeopardize the process and staff
catastrophic C>0,9 catastrophic consequences for the company, the environment and
people.
Source: Adamović et al. (2008, according to Nikolić, 2012: 64)

B. Maljugić et al. / Risk analysis and risk management...
88
Adamović et al. (2008, according to Nikolić, 2012: 65) point out that qualitative risk analysis can be
matrixed on the basis of previously set criteria and obtained values for assessing the probability of risk
occurrence and the value of consequence assessment.
Table 3: Example of a dimensional risk matrix 4 x 5
Probability of
occurrence
Very possible Low Middle High High High
Probably Low Middle High High High
Rarely Low Low Middle Middle High
Very rarely Low Low Low Low High
Insignificant Minor Significant Critical Catastrophic
Consequences of occurrence
Source: Adamović et al. (2008, according to Nikolić, 2012: 65)
Quantitative risk analysis according to Nikolić (2012: 65) is realized on the basis of assigning
quantitative values of the probability of an event and the consequences of the same event in order to
calculate the risk factor. When there are a large number of identified risk situations, the method
significantly defines the priorities of activities. The equation for calculating the risk factor is as
follows: RF = P x C, where: RF - risk factor, P - probability of occurrence, C - consequence of
occurrence.
Risk analysis methods
Adamović et al. (2008, according to Nikolić, 2012) single out several methods for risk analysis. It is
important to say that the division of methods into qualitative and quantitative. In relation to the
systemic approach to risk identification, methods can be deductive and inductive. Some of the most
important methods for risk analysis are (according to Nikolić, 2012):
PHA (Preliminary Hazard Analysis)
HAZOP (Hazard and Operability Analysis)
FMEA (Failure Mode and Effect Analysis)
FMECA (Failure Mode, Effect and Criticaly Analysis)
ETA (Event Tree Analysis)
FTA (Fault Tree Analysis)
Metod Markova
PRA (Probabilistic Risk Assessment)
In practice, FMEA analysis is mostly used (Nikolić, 2012; Džudović, Đurić, & Smiljanić, 2018).
Depending on the specific problem of risk analysis, the most widely used in business practice were the
analysis of the manner, effects (and criticality) of failure (FMEA and / or FMECA) and analysis of the
fault tree (failure) (FTA) (Džudović, Đurić, & Smiljanić, 2018).
RISK MANAGEMENT
ISO 9001:2015
According to the revision of the ISO 9001:2015 standard, the key requirements relate to "risk-based
thinking" (according to Džudović, Đurić, and Smiljanić, 2018: 164). At the core of this concept is
proactive action, to consider and analyze everything that can have an impact on business. In
accordance with business goals and strategies, it is necessary to use and control and take the necessary
measures and actions (Džudović, Đurić, and Smiljanić, 2018: 164).
Standard ISO 31000
Grozdanović and Stojiljković, (2013: 49) according to ISO 31000:2009 state the principles and
guidelines for the implementation of standards, which include five phases: "communication and

EMC 2022, 17-18th June 2022, Zrenjanin, Serbia
89
consulting, establishing context, risk assessment, risk treatment, monitoring and reporting".
Identification, analysis and evaluation activities are defined in the risk assessment phase.
ISO 31000:2018 is a new version of the Risk Management standard. Provides recommendation and
guidelines for managing the risks faced by organizations. The guidelines can be applied and adapted to
any organization and its context. The ISO 31000:2018 standard does not specify industries or sectors
but is intended and provides a common approach to the management of any type of risk. It can be
applied in all business activities and decision making at all levels (ISO). Business organizations that
have implemented ISO 31000:2018 in their business have better adapted to the situation of the sudden
economic crisis due to the COVID-19 pandemic (Maljugić, & Matotek-Anđelić, 2021).
Risk audit
The risk changes over time. Significant events are monitored by the auditors. This includes "analysis
of new official documents, external reports, media coverage and changes in the legal framework" (IA
COP, 2014: 31). The IA COP (2014) recommends that formal risk assessments be updated annually.
In addition, it is necessary to revert to the performed risk factor scoring in order to see whether the
priority of the subject of the audit has changed during the year (IA COP, 2014: 31).
EXAMPLES FROM BUSINESS PRACTICE
Identified risks in medium - sized enterprises in the Republic of Serbia
Lutovac, Živković, and Jović (2020) presented six groups that can gather important information to
identify most of the risks that pose a threat to the operation of the company. Groups for gathering
information on potential risks for the company, which help top management in making decisions that
include possible risks, are the following: external and internal auditors, government agencies, friendly
companies with which the company exchanges information, associations of which the company is a
member or observer (Lutovac, Živković, and Jović, 2020: 106).
In 2019, a survey was conducted and 35 medium-sized companies in the Republic of Serbia were
surveyed. Based on the results of this study, Lutovac, Živković, and Jović (2020) presented the
importance of nominal risk expression in medium-sized enterprises in the Republic of Serbia based on
risk presentation and nominally obtained mean values showing risks to medium-sized enterprises.
They suggested 10 possible risks for medium-sized companies. The categorization of the risk interval
was done in the manner of 1-10, where the highest risk is defined by size 10, and the lowest risk by
size 1.
Table 4: Basic risks for a medium-sized company Ordinal
number
Basic risks identified by internal
audit
Nominal presentation of mean
values related to individual risks
1 Reputation risks 6
2 Operational risk 6
3 Strategic risk 8
4 Risks associated with the rules
already adopted in the company 5
5 Social risk 5
6 Risk related to contracts concluded
in the company 4
7 Financial risk of the company 10
8 Management risk 9
9 Company regulatory risk 5
10 Technological risk of the company 7
Source: Lutovac, Živković, and Jović (2020: 107)

B. Maljugić et al. / Risk analysis and risk management...
90
Application of Risk Management in a telecommunications company
The FMEA method was applied in the risk analysis of the implementation of ISO 9001 in a
telecommunications company. The procedure includes establishing a framework, risk assessment and
risk treatment (Džudović, Đurić, and Smiljanić, 2018).
Establishing a framework is the scope of risk identification and analysis. In the specific case in
the implementation of the risks identified in the introduction of quality system management.
Risk assessment involves three steps: risk identification, analysis and assessment (according to
Džudović, Đurić, and Smiljanić, 2018: 165).
In the introduction of quality system management, it is necessary to identify sources of risk:
financial, cultural, infrastructural, legal, market and operational risks. Risk analysis generates
information for risk assessment. Risk assessment contains three levels: risky, medium risk and
low risk. It is necessary to define the estimates of the probability of the event, the severity of the
consequences of the event and the possibility of detection. An overview of the risks that can be
identified at the beginning of the implementation of ISO 9001 is presented in Table 3. Džudović,
Đurić, and Smiljanić (2018: 166) recommend that a risk assessment be performed for each phase
of implementation and that risk be treated to a minimum. The standard scales for FMEA were
used in the analysis, with the scale of assessing the possibility of detection being modified in 1 to
5, and the applied formula for calculating the risk is: Risk= Probability * Consequence *
Detection.
Table 5: Application of the FMEA method in risk assessment in the implementation
of requirements ISO 9001
ON
Risk (description of the
risk with the cause and
potential consequences
on the process)
Risk level Risk management plan
with a description of
measures of additional
mechanisms for identified
risk (avoidance, reduction,
transfer, acceptance)
Residual risk
P C D R=
P*C*D P C D
RPN=
P*C*D
1
Inadequate
organizational structure
and systematization of
jobs
4 6 2 48
Create a new organizational
structure and adapt the
systematization to new needs
1 3 2 6
2
Weak commitment of
the organization's
management to the
introduction of QMS
8 7 3 168
Present the benefits to
management, a case study of
an organization that has
successfully implemented
and made a leap in business
3 4 2 24
3 Not understanding the
system by employees 7 9 4 252
Present the benefits to
employees, a case study of
an organization that has
successfully implemented
and made a leap in business
and provided employees
with better working
conditions
3 4 2 24
4
Insufficient motivation
of employees to
participate in the
introduction of the
system
4 8 3 96
Organize with the
management to motivate
employees to participate in
the introduction
3 3 3 27
5 Poor process definition 3 9 2 54
Hold training on processes,
process definition, task
activities and input and
output activities
1 3 2 6
Source: Džudović, Đurić, and Smiljanić (2018: 166)
Risk treatment is a part of risk management that refers to measures to reduce or eliminate risks
(Džudović, Đurić, and Smiljanić, 2018). Based on the ISO 31000 standard (AS / NZS ISO 31000,
2009, p. 9) the same authors state in their paper that risk treatment is essentially a process of the

EMC 2022, 17-18th June 2022, Zrenjanin, Serbia
91
cycle that contains: "assessing the risk treatment, deciding whether the permitted levels of risks
are tolerable, and if not, creating a new risk treatment and assessing the effectiveness of that
treatment" (according to Džudović, Đurić, and Smiljanić, 2018: 166).
Risk reduction can be achieved with the help of several options: "model construction, instruction,
training, preventive actions" (according to Džudović, Đurić, and Smiljanić, 2018: 166).
CONCLUSION
Risk management in business organizations is one of the priorities of management in order to achieve
the goals of the organization. Unpredictable changes in the environment can disrupt business systems,
so risk priorities are set in order to optimize business. Risk management is important to apply in small
and medium enterprises that do not have high resilience to new and sudden changes. Although
financial risk, in the opinion of managers, carries the greatest value, technological risk also includes
activities of priority that need to be implemented in domestic companies.
Making business decisions in accordance with standardized management, ISO 9001:2015 in the
example of a telecommunications company, can be presented and applied in all companies for the
need to implement international standards.
REFERENCES
Adamović, Ž., Jovanov, G., Radojević, M., & Meza, S. (2008). Upravljanje rizikom. Zrenjanin: Tehnički
fakultet „Mihajlo Pupin“.
Čupić, M., Tummala, R., & Suknović, M. (2001). Odlučivanje: formalni pristup. Beograd: Fakultet
organizacionih nauka. Čupić, M. (2015). Upravljanje rizikom i vrednost korporacije. Ekonomski horizonti, 17(3), 215-228.
Džudović, S., Đurić, M., & Smiljanić, L. (2018). Menadžment rizika i znanja kao osnova sistema menadžmenta
kvaliteta u telekomunikacionoj kompaniji. Zbornik Međunarodnog kongresa o procesnoj industriji–
Procesing, 31(1), 163-172.
Grozdanović, M., & Stojiljković, E. (2013). Metode procene rizika. Niš: Fakultet zaštite na radu.
IA COP- Internal Audit Community Of Practice (2014). Procena rizika u planiranju revizije. Zajednice prakse
za internu reviziju (ZPIR).
ISO - ISO 31000:2018 - Risk management - Guidelines, 2018., Dostupno na:
https://www.iso.org/standard/65694.html, poslednji put posećeno:19.09.2021.
Lutovac, M., Živković, A., & Jović, Ž. (2020). Identifikacija rizika u procesu odlučivanja top menadžmenta kao
trajan proces edukacije u srednjim preduzećima u Republici Srbiji. In IX međunarodna naučna konferencija
Jahorinski poslovni forum 2020: Realni i finansijski sektor u svijetlu novih tehnologija, novih svijetskih
kretanja i novih izazova (pp. 105-109).
Maljugić, B., & Matotek-Anđelić, M. (2021, October 07-08). Analysis of the application of International
Standards in business practice. XI International Conference Industrial Engineering and Environmental
Protection (IIZS 2021), University of Novi Sad, Technical Faculty “Mihajlo Pupin”, Zrenjanin, Serbia.
Merkaš, Z. (2018). Rizici globalnog poslovnog okruženja–izazovi prve četvrtine 21. stoljeća. Zbornik sveučilišta
Libertas, 3(3), 95-106.
Nikolić, M., (2012). Metode odlučivanja. Zrenjanin: Tehnički fakultet „Mihajlo Pupin“.
Pongrac, B., & Majić, T. (2015). Upravljanje poslovnim rizicima. Tehnički glasnik, 9(1), 94-98.
Udovičić, A., & Kadlec, Ž. (2013). Analiza rizika upravljanja poduzećem. Praktični menadžment: stručni
časopis za teoriju i praksu menadžmenta, 4(1), 0-0.

92
XII International Symposium Engineering Management and Competitiveness 2022 (EMC 2022)
17-18th June, Zrenjanin, Serbia
THE ANALYSIS OF OPPORTUNITIES TO USE THE LEAN CONCEPT
IN CONDITIONS OF INDUSTRIAL PRODUCTION
Vladan Paunović
University of Kragujevac, Faculty of Technical Sciences, Čačak, Serbia
E-mail [email protected]
Jasmina Vesić Vasović
University of Kragujevac, Faculty of Technical Sciences, Čačak, Serbia
Sanja Puzović
University of Kragujevac, Faculty of Technical Sciences, Čačak, Serbia
ABSTRACT
This paper presents the impact of the Lean concept on the efficiency of order delivery to customers. The paper
aims to demonstrate the benefits of implementing a Lean concept in production organizations to meet customer
requirements. The Lean concept gives the company the ability to shorten the order execution time, to have higher
quality and lower prices - differences that separate one supplier from another. Because the impact of the Lean
concept is multiple, the work highlights the benefits of reducing order execution time, then maintaining low
inventory levels, as well as the benefits of reducing working capital requirements. As an example, we have
analyzed the production process of a complex product that is part of the production program of a manufacturing
company. Lean implementation requires that the company is always in transition and constantly improving. For
this reason, it should never start as a short-term project with a clearly defined start and end date. Also, for the
lean concept to be successfully implemented in industrial companies, there must be an equal desire and
motivation of both management and all employees.
Key words: Lean concept, Delivery time reduction, Inventory levels, Current assets.
INTRODUCTION
The origins of the Lean concept are largely attributed to Toyota, whose production system was
originally called just-in-time (JIT), but is commonly referred to today as Toyota’s manufacturing
system (TPS) (Fullerton et al., 2014). Womack et al. (1991) were the first to define the term "Lean
Production" in their first book, The Machine That Changed the World. In industrial systems, the Lean
concept is largely based on designing a work process that is applicable, flexible, consistent, and
sustainable in space and time. The application of the Lean concept is caused by customer requirements
and requires continuous improvement of work and production processes under the given
circumstances. By implementing the Lean concept, organizations are transformed from a traditional
structure, characterized as bottom-up with the improvement of projects led by middle managers, to one
where continuous improvement throughout the company is carried out by locally empowered teams
(Fullerton et al., 2014). This change in production strategy is associated with increased operational
efficiency and effectiveness, which positively affects the performance of the company (Yang et al.,
2011). No matter what product the company produces, it seems that every year more and more
competitors enter the market. The market is becoming more and more unstable, so understanding the
dynamics of the market is a crucial factor if we want to better design production systems (Gadalla,
2010). Each of the competitors offers some different attributes that set them apart from the
competition. Buyers become quite hesitant when shopping and show much less loyalty to long-
standing inherited business relationships. Lean Production believes in the simple fact that customers
will pay for the quality of the products they buy, but will not pay for mistakes (Ravabdeh, 2005).
These differences include shorter delivery times, higher quality, and lower prices. If the competition
offers the same cutting-edge technology, quality, and price as your technology, then another criterion

EMC 2022, 17-18th June 2022, Zrenjanin, Serbia
93
must be developed to distinguish your product from the competition of the product. There must be
some compelling reason to persuade customers to decide to buy your product before another
competing product. For example, when the customer notices that there is no difference between the
products, but expects fast delivery, the manufacturer with the ability to respond faster than the
competition comes into a situation to close the deal with the customer.
Industrial production in many developing countries are working on old and outdated production
techniques. Lean production differs from traditional production. Traditional production strategies are
geared toward inventory systems, while Lean production opposes this concept. Understanding the
differences between traditional manufacturing and Lean manufacturing is very important for all
companies if they want to follow Lean practices. When Lean production is successfully implemented,
it results in an increase in per capita production and a reduction in inventories of finished and semi-
finished products, as well as a reduction in production processes. The concept of Lean production may
seem easy, but its application is not an easy one. The introduction of the Lean concept in the
organization tends to change the work culture. Such changes are considered obstacles in the process of
applying the Lean concept. Changes that happen in the organization tend to change the workers in the
organization as well. Many studies and research show that only 5% add value during operations, and
the remaining 95% are losses. The lean concept is trying to remove that 95% of lost time and effort.
Many authors emphasize the advantages of implementing the Lean concept in manufacturing
companies. Lathin (2001) stated that traditional mass producers can expect a 90% reduction in
inventories, 90% quality costs, 90% shelf life, and a 50% increase in labor productivity. Claudius
Consulting (2004) insisted that the Lean concept can help organizations reduce costs by 15 to 70%,
reduce waste by 40%, increase productivity by between 15 and 40%, and reduce space and inventories
by 60%. Nistuen (2002) stated that product flow time can be reduced by 90%, inventories by 82%, and
product delivery time by 11% by applying the Lean concept in the organization. Eroglu and Hofer
(2011) in their research addressed the impact of inventories on organizational performance. They
found that there are 33% of industries show a significant effect of the Lean concept on the impact of
inventories on an organization’s performance. In the continuation of the paper, some possibilities of
the influence of the Lean concept on the possibility of faster product delivery are presented. A Lean
concept allows the company to shorten the execution time of the order, to have higher quality and
lower prices - differences that separate one supplier from another.
As an example, we analyzed the manufacturing process of a complex product, which is a part of the
production program of the Company JSC “Sloboda” Cacak. The data used to analyze the impact of the
Lean concept on the efficiency of order delivery to customers are the results of recording the
production process of a complex product “Missile laborated”. The product consists of 9 positions
whose development requires the implementation of a series of different operations, of different
duration, realized on different machines.
INFLUENCE OF LEAN CONCEPT ON REDUCTION OF DELIVERY TIME
One of the most common reasons for introducing the Lean concept is the desire of manufacturers to
reduce long delivery times in their companies. In most cases, the order execution time usually exceeds
the delivery time required by customers. Too long production time forces manufacturers to predict or
forecast future customer demand and final configuration. Quantities of raw materials, semi-finished
products and finished products are stored in preparation when ordering configured products. Strategies
of the so-called buffer inventories, or inventories that are available to stabilize variations in demand,
usually meet customer demand. But at the same time, they are an expensive solution. Manpower and
production machines represent the resources engaged to produce products before receiving current
orders from customers. Buyers expect orders to be delivered within the standard delivery time. If the
delivery time is longer than the expected delivery time, there is customer dissatisfaction, which can
have a negative impact on the potential order. Then alternative strategies can be used to meet customer
demand in a timely manner.

V. Paunović et al. / The analysis of opportunities to use the Lean concept...
94
For the aforementioned product, a detailed analysis of the technological process has been performed,
as well as the analysis of used machines and their capacities, available workers, the number of shifts,
based on which, for each position precisely a specified time for creating a series of 200000 pieces
which is necessary to produce monthly to meet the planned delivery dates.
Table 1: Lean concept strategy to reduce customer-dictated delivery time compared to some of the
traditional alternative strategies Lean concept
strategies What it means?
Traditional
alternative strategies What it means?
Supplier delivery
times dictate the
quantities of
materials
purchased
The amount of inventory
that is kept as a raw material
manages to establish a
balance between the time of
order execution and
investment in inventory.
Retaining components in the
raw material storage, where
the inventories with the
lowest costs available to the
manufacturer are located
Inform the customer
that he must accept
the current duration
of production
This solution is accepted as a
solution only if the company
has no competition, or if the
company is the only supplier
of products.
Assess customer
needs for highly
configured
products
Some customers will not
accept the production time,
plus the delivery time of the
suppliers needed to obtain
the specialized parts needed
for their orders. An
alternative Lean strategy for
these customers is to assess
their needs for highly
configured products and
then hold the components in
hand as just a raw material
in anticipation of receiving
their orders.
Provide inventories
of semi-finished
products, partially
completed
assemblies or
subassemblies
Provide inventories, which
can be fully assembled into
the final configuration of the
finished products, as soon as
the order is received. Semi-
finished items can be
converted into finished
products in less time than the
usual delivery time dictated
by the customer. Retaining
inventories of semi-finished
products, which are needed to
quickly respond to customer
demand, is an efficient but
expensive solution.
Purchase only the
necessary
materials
Refers to the necessary
materials needed for the
most common products.
Components are not ordered
from the supplier until the
customer's order is received.
A highly configured special
type of product is never
produced, as long as there is
no real customer demand for
that product.
Deliver products
from the warehouse
of finished products.
Retaining finished products
before receiving the order is a
functional solution if the
products are generic, ie if
their patent protection period
has expired. But it can also be
a very expensive solution.
The question is, how accurate are the forecasts of future demand? Based on the answer to this question, it
must be considered that the same forecasts of future customer demand and final configuration are used to
start planning and scheduling systems, as well as to approve the cost of production resources and develop a
production plan. Any orders issued in the warehouse of unsold products require the delivery of materials
before orders are received. They also require the engagement of labor and machine resources. Expensive
resources of the company are engaged in the production of products based on the optimistic assumption
that we hope that customers will eventually buy the products. By forecasting, programs with predetermined
quantities are transformed into large series with a large number of products that are directed through
production. When current customer demand was received and the combination and quantity of products
were not in line with the forecast, resources were used up and inventories were produced that remained
unsold. These unsold inventories, which cannot be further diverted for use in the production of other

EMC 2022, 17-18th June 2022, Zrenjanin, Serbia
95
products, are the main cause of the increase in inventories. Often unsold inventories of semi-finished
products are used to complete the production process of finished products, which are the most expensive
category of inventories.
Lean factories can produce products only in the total amount of their working time and thus will achieve a
significantly shorter order execution time, ie delivery time defined by the customer. The application of this
Lean concept brings manufacturers a great advantage over competitors who continue to use traditional
methods to direct their products through a functional factory. Shorter order execution times allow for a
faster response to customer demand. It also enables a reduction in the amount of inventories of finished
products and semi-finished products, ie buffer inventories, which are available in order to enable a faster
response to customer demand. When the time of execution of the order through production is shorter than
the current time of delivery, there is no need to keep unsold products in the warehouse of finished products.
The ability to respond quickly to customer demand is a key advantage that the manufacturer achieves in the
market compared to the competition. In the commodity market, the Lean concept ability to deliver products
faster ultimately leads to an increase in market share, which allows customers to have the fastest order
execution time as the most important criterion for making a purchase decision. When all other product
attributes on the market are the same, this criterion represents a huge difference and brings a serious
advantage to manufacturers over the competition.
Although shortening long delivery times is almost universally stated as the number one goal in Lean
business transformation, the Lean concept has other benefits that may be attractive to manufacturers based
on their specific manufacturing capabilities. Sometimes, in a hurry to answer a specific question such as
reducing delivery time, very little attention is paid to other improvements that result from the
transformation of the factory into a Lean concept. When these improvements stand out over time, they are a
great pleasure and surprise for the manufacturer.
The results of the applied measures of utilization of the Lean concept enable the reduction of the duration
of non-productive activities of the production process, such as ordering and receiving materials, transport,
inventories management, etc.
IMPACT OF LEAN CONCEPT ON MAINTENANCE OF INVENTORY LEVELS
Over time, various inventory strategies have been developed to adjust the time gap between the delivery
time dictated by the customer and the actual execution time of the order. The purchase of necessary
inventories of components, based on the projected projection of the final configuration that customers are
likely to order, is another inventory strategy used to respond quickly to customer demand. In any strategy,
if customers fail to purchase partially built product units or anticipated configurations, the result is the
excess, slow movement, or outdated inventory of parts. Regardless of the strategy chosen, it is always
necessary to invest in inventories for the strategy to work. The costs of these models are so-called. buffer
inventories can be huge. In addition to the material used for the amount of unsold inventories, machinery
and labor resources are also consumed during production, even before customers have committed to buy
them. If demand estimates are wrong, unsold inventories that ends up in the warehouse has used up
resources that cannot be recovered.
The duration of the offer dictated by the buyer determines the inventories management policy. Delivery
time dictated by the customer is the delivery time defined when the customer first sends the order to the
manufacturer, and there are no available inventories of products that would immediately fulfill the
customer's order. The time required by customers significantly affects the company's inventories policy.
The number of days of keeping inventories of finished and semi-finished products is equal to the number of
days dictated by the customer. The length of the period dictated by the customer determines the company's
inventories management policy. Each day of duration dictated by the customer represents 1 day of keeping
inventories of semi-finished products and 1 day of keeping inventories of finished products. If the delivery
time dictated by the customer is unacceptable, inventories of finished products and semi-finished products
allow fill the gap between the current delivery time and the current order execution time. Lean system
implementation can reduce inventory levels, this is shown in Table 2.

V. Paunović et al. / The analysis of opportunities to use the Lean concept...
96
Table 2: Benefits of Lean concept impact on maintenance of inventories levels
Lean concept
Benefits
Since the execution time of the order is shortened by the Lean system, the reasons
that justify the retention of inventories of semi-finished products, as a mechanism for
rapid response, are no longer valid.
The amount of possible reduction in inventories is directly proportional to the length
of time the order is executed.
Order execution time is the minimum time required to move a product through
production processes.
If the execution time of the order is less than the delivery time expected by the buyer,
the question arises whether it is necessary to have the so-called buffer inventories of
semi-finished or finished products?
In the Lean plant, production resources are not engaged in the production of the
product until the customer commits to purchase it.
Lean manufacturers continue to reduce order execution time by constantly aiming to
make production time shorter than the time dictated by the customer.
Based on the analysis of the presented benefits (Table 2), applying the Lean concept, some of how excess
inventories can be reduced so that we can maintain inventory levels are shown.
IMPACT OF LEAN CONCEPT ON REDUCTION OF CURRENT ASSETS NEEDS
A major but often untapped source of savings is the reduction in working capital needed to run a business. By
simply improving the response through production, working capital needs can be minimized. Less money
invested in inventories and a shorter response time to customers would provide a huge competitive advantage.
The amount of inventory present at the point of sale that is ready for distribution to interested consumers affects
the requirements of working capital. Regardless of the strategy chosen to reduce delivery time, the manufacturer
must determine the appropriate amount of inventory to be maintained to maximize customer satisfaction. Any
amount of inventories retained through any stage of the production process has an impact on a company’s
working capital. Working capital can be calculated using the following relation (Hobbs 20011):
Current assets = raw materials + intermediates + final products + receivables
amount of the obligations (material purchase) (1)
The money that is usually invested in purchased inventories can be analyzed on the example of a batch of
200,000 pieces of a complex product, which needs to be produced monthly to meet the planned delivery
deadlines. This product is a part of the production program of the Company “Sloboda” Cacak.
For the production of this series, the company must fulfill its obligations to suppliers within 60 days. If
suppliers expect payment in 60 days, then the paid purchased material stays in the warehouse for 60 days
before starting production work. Inventories older than 60 days represent cash investments.
If the conversion of production lasts 8 weeks, then the funds are tied for another 8 weeks to support semi-
finished products, while moving through production.
If the inventory levels are ready in 6 to 8 weeks, then the cash is tied for an additional 6 to 8 weeks.
Upon completion of production, the products can be delivered by customer orders. Customers may be
charged at this time. Typical claims are from 50 to 60 days. If the customers do not pay the invoices
immediately after the delivery of the product, then the funds are tied to the sale.
Based on the analysis of the previous example, the calculation of current assets can be performed using the
formula (1): raw materials = 8 weeks; intermediates = 8 weeks; final products = 8 weeks; receivables = 8 weeks;
obligations = 8 weeks; current assets = 24 weeks. In this typical example of investing in inventory, money is
invested for at least 24 weeks, resulting in an inventory turnover rate of 2,167 (52 weeks of the whole year ÷ 24
weeks in inventory). Working capital of ¢25 is required for every €1 delivered in revenue to support this level of
paid inventory.

EMC 2022, 17-18th June 2022, Zrenjanin, Serbia
97
A higher level of inventories requires relatively higher monetary investments. A high level of
inventory affects not only current assets, but also requires space in warehouses and distribution
centers. This space also requires costs. This increases the overhead costs of operations, ie costs that are
not directly related to production. The financial consequences can be very significant. Compensation
between achieving timely delivery goals to customers and maintaining ideal inventory levels is the
subject of much debate. Although shortened order execution time is a direct benefit to customers,
shortened order execution time through production also means less cash is needed to fund inventories.
In this way, the funds available to the company can be used for other purposes. Reduced inventories
also eliminate additional overheads and bookkeeping costs that can represent ± 12 to 20% of
inventories value. The reduction in inventories resulting from Lean business transformation is not a
one-time event.
CONCLUSION
The implementation of the Lean concept tries to increase the flow of value in customer demand and
eliminate losses in processes. This paper presents the advantages of the implementation of the lean
concept: reduction of delivery time, maintaining a low level of inventories, and reducing the need for
current assets. This concept also has many hidden advantages that play a vital role in the success of the
company, which are not seen at first. These advantages have a direct role in the success of the Lean
concept, but they have also the following very important indirect roles that cannot be neglected:
improving quality and safety; reduction of transport time; change in work culture; reduction of fatigue
and stress. The results obtained from the Lean concept utility analysis, which are presented, can be of
significant help to many managers who aim to transform traditional production into Lean production.
REFERENCES
Claudius Consulting. (2004). Lean manufacturing. York, UK: Claudius Consulting.
Demeter, K. & Matyusz, Z. (2011). The impact of lean practices on inventory turnover. International Journal of
Production Economics, 133 (1), 154-163.
Eroglu, C., & Hofer, C. (2011). Lean, leaner, too lean? The inventory-performance link revisited. Journal of
Operational Management, 29 (4), 356 – 369.
Fullerton, R. R., Kennedy, F. A., & Widener, S. K. (2014). Lean manufacturing and firm performance: The
incremental contribution of lean management accounting practices, Journal of Operations Management, 32
(7-8), 414–428.
Gadalla, M. A. (2010). A conceptual framework to excogitate agile from lean transformation. International
Journal of Rapid Manufacturing, 1 (3), 308 – 322.
Hobbs, D. P. (2004). Lean Manufacturing Implementation: A CompleteExecution Manual for Any Size
Manufacturer, J. Ross Publishing, Inc.
Hobbs, D. P. (2011). Applied Lean Business Transformation: A Complete Project Management Approach, J.
Ross Publishing, Inc.
Lathin, D. & Ron M. (2001). Lean manufacturing: Techniques, people and culture. American Society for Quality
Journal, 12, 2–9.
Nystuen, T. (2002). Big results with less - NIST program helps small organizations eliminate waste, Quality
Progress, 35 (10), 51 – 55.
Prajapati, M. R. & Deshpande, V. A. (2015). Cycle Time Reduction using Lean Principles and Techniques: A
Review. International Journal of Advance Industrial Engineering, 3 (4), 208-213.
Rawabdeh, I. A. (2005). A model for the assessment of waste in job shop environments. International Journal of
Operations & Production Management, 25 (8), 800 – 822.
Shah, D. & Patel, P. (2018). Productivity Improvement by Implementing Lean Manufacturing Tools In
Manufacturing Industry. International Research Journal of Engineering and Technology, 5(3), 3794-3798.
Womack, J. P., Jones D. T., & Roos, D. (1991). The Machine That Changed the World: The Story of Lean
Production, Harper Collins Publishers, New York.
Yang, M. G., Hong, P., & Modi S. B. (2011). Impact of lean manufacturing and environmental management on
business performance, International Journal of Production Economics, 129 (2), 251-261.

98
XII International Symposium Engineering Management and Competitiveness 2022 (EMC 2022)
17-18th June, Zrenjanin, Serbia
RISK MANAGEMENT AND EXCAVATOR DOWNTIME ANALYSIS
Vesna Spasojević Brkić
University of Belgrade, Faculty of Mechanical Engineering, Belgrade, Serbia
E-mail: [email protected]
Mirjana Misita
University of Belgrade, Faculty of Mechanical Engineering, Belgrade, Serbia
Aleksandar Brkić
Innovation center, Faculty of Mechanical Engineering, Belgrade, Serbia
Zorica Veljković
University of Belgrade, Faculty of Mechanical Engineering, Belgrade, Serbia
Martina Perišić
University of Belgrade, Faculty of Mechanical Engineering, Belgrade, Serbia
Neda Papić
University of Belgrade, Faculty of Mechanical Engineering, Belgrade, Serbia
Nemanja Janev
University of Belgrade, Faculty of Mechanical Engineering, Belgrade, Serbia
ABSTRACT
Nowadays, safety and sustainable business success cannot be viewed in isolation. Risk assessment is a
prerequisite for adequate planning of prevention of destruction of critical potentials, as well as preparation of a
strategy for response to failure in the context of prevention of consequences. An important part of all
construction equipment maintenance is proper record keeping, but it is not done often in practice although it is a
prerequisite of proper risk management. Proper maintenance of excavators maximizes fuel efficiency and
reduces operating costs as well as equipment failure. The aim of this paper is to present the missing facts, to
propose the methodology to be applied and show and analyze results obtained on excavator down time analysis
and risk management. This research analyzed the structure of downtime and consequences in excavator work in
six large Serbian companies during a period of one year. Delays in the observed transport and mining machines
were classified according to the type of downtime: technological downtime, power / electricity downtime,
mechanical downtime, misuse due to abuse, organizational downtime and downtime due to external influences.
In this research, the frequencies of downtime were monitored by the stated categories of downtime. The
consequences of the identified delays were then assessed, and the risk calculated.
Key words: Excavator, Downtime, Probability, Consequence, Risk management.
INTRODUCTION
Nowadays, safety and sustainable business success cannot be viewed in isolation (Spasojevic Brkic et
al., 2015). Accidents in the field of transport and mining equipment are still numerous (Brkic et al.,
2020). Motivation for research on risk prevention of transport and mining machines is based on the
following facts: a) only 12.87% of risk research focuses on transport problems, b) the greatest
potential for reducing incidents is in reducing the number of human errors, i.e. identification of human
and organizational factors in risk assessment, c) although ISO 31000 promotes a contextual
framework, the assessment of the impact of contextual factors is not available in many areas, including
this, d) risk assessment methods are usually not based on scientific methods (only 6.56% ), and e)
hybrid risk assessment methods are rarely represented in both research and practice (6.70%) (ISO
31000: 2018; Marhavilas et al., 2011; Shahin et al., 2018). However, risk analysis is, as a rule, always
very complex, due to the following factors:
uncertainty related to defining the problem,
difficulties that arise during the evaluation of facts,

EMC 2022, 17-18th June 2022, Zrenjanin, Serbia
99
complexity of discovering relevant values,
unpredictability of the behavior of participants in the process, and
ambiguity of process evaluation.
On the other hand, risk assessment is a prerequisite for adequate planning of prevention of destruction
of critical potentials, as well as preparation of a strategy for response to failure in the context of
prevention/remediation of consequences. The lack of precise definition of as well as the criteria of
indicators in risk analysis and assessment, imposes the need for novel methodology for risk
assessment. A typical causal chain of a risk event contains the following events (Yang et al., 2020):
Failure of certain elements of the system (internal disturbances) and/or unauthorized external
disturbances;
Occurrence of hazard factors in an unexpected place and/or at an unexpected time;
Malfunction or lack of protective equipment and/or inappropriate behavior (new dismissals);
Elements of the system in the new operating conditions and
The effect of hazard factors on system elements and/or environments.
Analysis of the causal chain of risk events based on the characteristic states of the system indicates
that the state of failure is preceded by the state of system risk. Therefore, studying the state of risk is
important for maintenance. On the one hand, it improves the quality of maintenance according to the
condition, and on the other hand, it provides the necessary information for planning and undertaking
specific preventive maintenance activities. Also, improvements are expected in terms of (Edwards and
Love, 2016):
Fault prevention.
Elimination of weaknesses in the means of work.
Innovation in maintenance.
Extension of the working life of working capital.
Reduce repair time.
Reducing the cost of materials, space, labor, tools and equipment, spare parts.
Excavators as heavy construction equipment with a bucket on the end of a jointed boom and a rotating
cab are designed for digging earth, loading material onto trucks and digging trenches, and they are
subjected to harsh climate, often operating in different weather conditions. Proper maintenance of
excavators maximizes fuel efficiency and reduces operating costs, as well as, equipment failure (Papic
et al., 2010). Every minute an excavator or other heavy equipment is offline due to a breakdown, costs
the operator money in wages and lost productivity (Rudakov et al., 2021). Scheduled maintenance can
help contain these expenses and maximize productivity (Kirin et al., 2021). An important part of all
construction equipment maintenance is proper record keeping, but it is not often done in practice,
although it is a prerequisite of proper risk management. The aim of this paper is to present the missing
facts, to propose the methodology to be applied and show and analyze obtained results.
PREVIOUS RESEARCH
As mentioned above, researh in this field are rare. One of the few is presented by Kumar and
Srivastava (2014), who developed an expert system for optimal excavator maintenance. The
methodology is based on the use of a database generated by the manufacturer, and specific user data is
entered into the system. Methodology of maintenance of excavators and failures on its components on
the basis of database, by applying FMEA, FMECA and condition based on maintenance - CBM
(condition based maintenance maintenance) methods for failure prediction is very useful (Pantelic et
al., 2020). Pareto method usage is also recommended (Brkic et al., 2020). The aim of the research was
to use the optimal maintenance methodology in order to reduce maintenance and production costs.
The first step in designing an expert system was to generate a database based on monitoring and
control. The data were recorded permanently and periodically, The selected data were saved in the
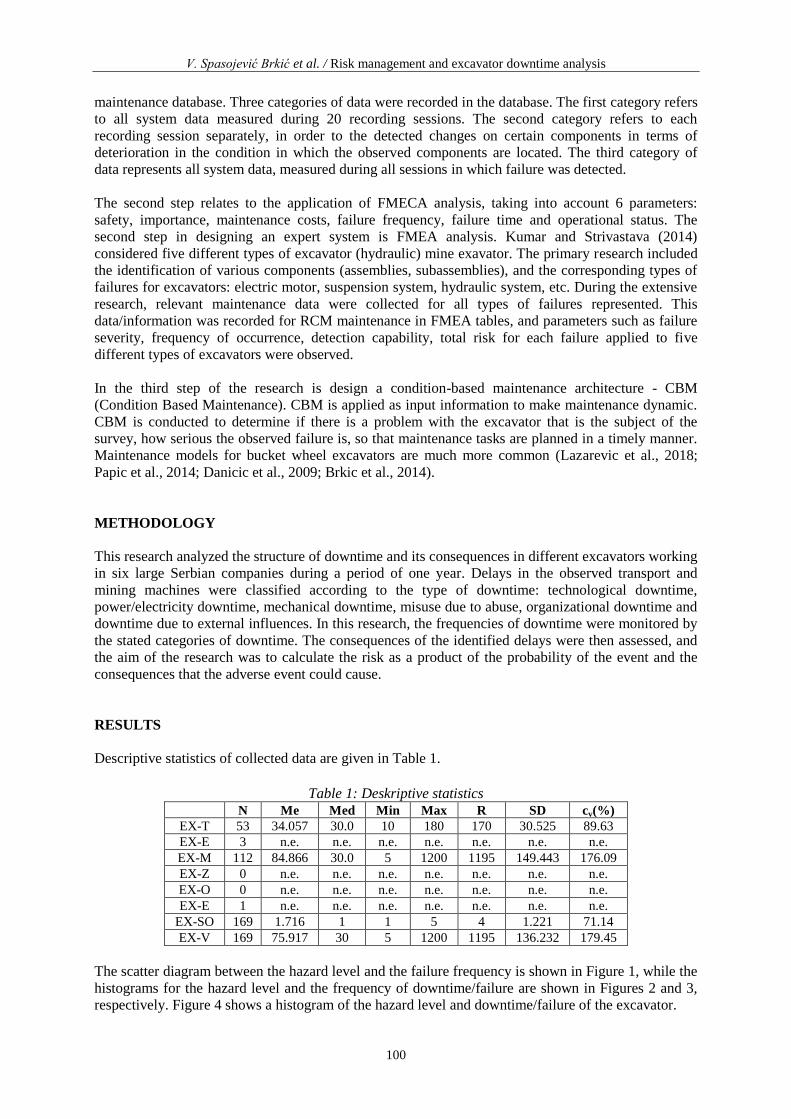
V. Spasojević Brkić et al. / Risk management and excavator downtime analysis
100
maintenance database. Three categories of data were recorded in the database. The first category refers
to all system data measured during 20 recording sessions. The second category refers to each
recording session separately, in order to the detected changes on certain components in terms of
deterioration in the condition in which the observed components are located. The third category of
data represents all system data, measured during all sessions in which failure was detected.
The second step relates to the application of FMECA analysis, taking into account 6 parameters:
safety, importance, maintenance costs, failure frequency, failure time and operational status. The
second step in designing an expert system is FMEA analysis. Kumar and Strivastava (2014)
considered five different types of excavator (hydraulic) mine exavator. The primary research included
the identification of various components (assemblies, subassemblies), and the corresponding types of
failures for excavators: electric motor, suspension system, hydraulic system, etc. During the extensive
research, relevant maintenance data were collected for all types of failures represented. This
data/information was recorded for RCM maintenance in FMEA tables, and parameters such as failure
severity, frequency of occurrence, detection capability, total risk for each failure applied to five
different types of excavators were observed.
In the third step of the research is design a condition-based maintenance architecture - CBM
(Condition Based Maintenance). CBM is applied as input information to make maintenance dynamic.
CBM is conducted to determine if there is a problem with the excavator that is the subject of the
survey, how serious the observed failure is, so that maintenance tasks are planned in a timely manner.
Maintenance models for bucket wheel excavators are much more common (Lazarevic et al., 2018;
Papic et al., 2014; Danicic et al., 2009; Brkic et al., 2014).
METHODOLOGY
This research analyzed the structure of downtime and its consequences in different excavators working
in six large Serbian companies during a period of one year. Delays in the observed transport and
mining machines were classified according to the type of downtime: technological downtime,
power/electricity downtime, mechanical downtime, misuse due to abuse, organizational downtime and
downtime due to external influences. In this research, the frequencies of downtime were monitored by
the stated categories of downtime. The consequences of the identified delays were then assessed, and
the aim of the research was to calculate the risk as a product of the probability of the event and the
consequences that the adverse event could cause.
RESULTS
Descriptive statistics of collected data are given in Table 1.
Table 1: Deskriptive statistics
N Me Med Min Max R SD cv(%)
EX-T 53 34.057 30.0 10 180 170 30.525 89.63
EX-E 3 n.e. n.e. n.e. n.e. n.e. n.e. n.e.
EX-M 112 84.866 30.0 5 1200 1195 149.443 176.09
EX-Z 0 n.e. n.e. n.e. n.e. n.e. n.e. n.e.
EX-O 0 n.e. n.e. n.e. n.e. n.e. n.e. n.e.
EX-E 1 n.e. n.e. n.e. n.e. n.e. n.e. n.e.
EX-SO 169 1.716 1 1 5 4 1.221 71.14
EX-V 169 75.917 30 5 1200 1195 136.232 179.45
The scatter diagram between the hazard level and the failure frequency is shown in Figure 1, while the
histograms for the hazard level and the frequency of downtime/failure are shown in Figures 2 and 3,
respectively. Figure 4 shows a histogram of the hazard level and downtime/failure of the excavator.

EMC 2022, 17-18th June 2022, Zrenjanin, Serbia
101
Figure 1: Scatter chart between the hazard level
and the time of failure/downtime for excavators
Figure 2: Histogram for the hazard level for
excavators
Figure 3: Histogram of standstill/
failure time for excavators
Figure 4: Histogram of product of failure
rate and standstill/failure time for excavators
Figure 5 shows the structure of stagnation by categories in excavator machines. A total of 170 outages
in excavator machines were identified, with 112 outages classified as mechanical, 54 technological
and 3 as electrical outages. Mechanical causes have the largest share in the structure of congestion,
66%, followed by technological congestion with 32%. Other categories of congestion have a smaller
percentage.
Figure 5: Measured structure of
stagnation by categories in
excavator machines
All delays in the observed mining and transport machines were assessed by experts according to the
hazard level, on a numerical scale of 1-10, where the highest score of 10 represents the highest hazard
level. During the assessment of the hazard level, the experts were guided by the assessment of the

V. Spasojević Brkić et al. / Risk management and excavator downtime analysis
102
danger of stagnation in relation to human safety and health, danger to the environment, danger of
damage to the posthumous type of transporting or mining machine, danger of financial loss.
Figure 6 shows the percentage of delays classified by hazard level in the excavators. The largest share
in the structure of the level of danger has the delays of the level of danger 6, i.e. 78%, followed by the
delays of the level of danger 7 and the delays of the level of danger 8 with the same percentage of 9%.
Figure 6: Structure of hazard
levels in excavators
In Table 2 the percentage of downtime frequencies for excavators is presented, by categories of
downtime and by hazard level. The presented percentage structure of downtime frequencies in
excavator machines has already been analyzed and shown in Figures 6, 7, 8 and 9.
Table 2: Percentage of downtime frequencies for excavators, by downtime categories and by hazard level Hazard level Technological Electrical Mechanical Misuse Organizational External Σ
Hazard level 6 0.28 0.01 0.49 0.00 0.00 0.00 0.78
Hazard level 7 0.02 0.01 0.06 0.00 0.00 0.01 0.09
Hazard level 8 0.02 0.01 0.06 0.00 0.00 0.00 0.09
Hazard level 9 0.00 0.00 0.04 0.00 0.00 0.00 0.04
TOTAL 0.32 0.02 0.66 0.00 0.00 0.01 1.00
Let the percentage share of frequencies of a certain delay be taken as the probability of occurrence of
the observed delay in the following period. The following notations have been introduced:
iP - probability of occurrence of certain malfunctions,
tP - probability of occurrence of technological malfunctions,
eP - probability of occurrence of electrical malfunctions,
mP - probability of occurrence of mechanical malfunctions,
zP - probability of occurrence of malfunction due misuse,
oP - probability of occurrence of malfunction due organizational problems,
eiP – probability of occurrence of malfunction due external influences.
Risk is calculated as the product of the probability of an adverse event and its consequences.
Therefore, hazard level represents potential harm due to the occurrence of an adverse event by:
i i oR P C (1)
where:
iR - Risk
oC - Hazard level
Table 3 presents the risk calculation for all categories of downtime by hazard level.

EMC 2022, 17-18th June 2022, Zrenjanin, Serbia
103
Table 3: Excavator risk calculation, by downtime categories and by hazard level Hazard level Technological Electrical Mechanical Misuse Organizational External Σ
Hazard level 6 16.59 0.35 29.65 0.00 0.00 0.00 46.59
Hazard level 7 1.65 0.41 4.12 0.00 0.00 0.41 6.59
Hazard level 8 1.41 0.47 5.18 0.00 0.00 0.00 7.06
Hazard level 9 0.00 0.00 3.71 0.00 0.00 0.00 3.71
TOTAL 19.65 1.24 42.65 0.00 0.00 0.41 63.94
6 6 7 7 8 8 9 9 0.28 60 0.02 70 0.02 80 0 90EXt t o t o t o t oR P C P C P C P C
0.28 60 0.02 70 0.02 80 0 90 16.95 1.65 1.41 19.65EXtR
6 6 7 7 8 8 9 9 0.01 60 0.01 70 0.01 80 0 90 1.24EXe e o e o e o e oR P C P C P C P C
6 6 7 7 8 8 9 9 0.49 60 0.06 70 0.06 80 0.04 90 42.65EXem m o m o m o m oR P C P C P C P C
6 6 7 7 8 8 9 9 0 60 0 70 0 80 0 90 0EXz z o z o z o z oR P C P C P C P C
6 6 7 7 8 8 9 9 0 60 0 70 0 80 0 90 0EXo o o o o o o o oR P C P C P C P C
6 6 7 7 8 8 9 9 0 60 0.01 70 0 80 0 90 0.41EXei ei o ei o ri o ei oR P C P C P C P C
EX EXt EXe EXem EXz EXo EXeiR R R R R R R
19.65 1.24 42.65 0 0 0.41 63.94EXR
Figure 7 shows the risk structure by levels of danger and types of downtime for excavators. The
greatest risk with hazards of danger level 6, have mechanical delays with a risk 29.65, followed by
technological delays with a risk 16.59.
Figure 7: Risk structure by
degrees of danger and types of
stagnation in excavators
Conversely, by categories of in the structure of mechanical delays (Figure 8), the greatest risk is caused by delays
for danger level 6 with a risk value of 29.65. In the case of technological downtime, the highest risk is also at the
hazard level 6, with a risk 16.59.
Figure 8: Risk structure by
degrees of danger and types of
downtime in excavators
Finaly, risk matrix is shown at Figure 9.

V. Spasojević Brkić et al. / Risk management and excavator downtime analysis
104
Figure 9: Risk matrix for excavators
CONCLUSION
Risk assessment is a prerequisite for adequate planning of prevention of destruction of critical potentials, as
well as preparation of a strategy for response to failure in the context of prevention of consequences. An
important part of all construction equipment maintenance is proper record keeping, but it is not done often
in practice although it is a prerequisite of proper risk management. Proper maintenance of excavators
maximizes fuel efficiency and reduces operating costs as well as equipment failure. The aim of this paper is
to present the missing facts, to propose the methodology to be applied and show and analyze results
obtained on excavator down time analysis and risk management. This research analyzed the structure of
downtime and consequences in excavator work in six large Serbian companies during a period of one year.
Delays in the observed transport and mining machines were classified according to the type of downtime:
technological downtime, power/electricity downtime, mechanical downtime, misuse due to abuse,
organizational downtime and downtime due to external influences. In this research, the frequencies of
downtime were monitored by the stated categories of downtime. The consequences of the identified delays
were then assessed, and the risk calculated. Results show that mechanical causes have the largest share in
the structure of congestion - 66%, followed by technological congestion with 32%, while other categories
of congestion have a small percentage. Anyhow, it is evident that there are no extreme risks (red zone).
Total risk amounts 63,94. Limitation of this research for sure is the data collected sample size, so its
extension is recommended. Further recommendation for future research is also a more detailed analysis on
collected data done by using more sophisticated statistical analysis tools based on larger sample size.
NOMENCLATURE
EX-T Excavator - technological failure/downtime Med median
EX-S Excavator - electrical failure/downtime Min minimum
EX-M Excavator - mechanical failure/standstill Max maximum
EX-Z Excavator - abuse R range
EX-O Excavator - organizational failure/downtime SD standard deviation
EX-E Excavator - external cause of failure/downtime cv(%) coefficient of variation
EX-SO Excavator - hazard level oP probability of occurrence
N number of measurements iR risk
n.e. not examined (insufficient data 0-3) oC hazard level
Me Mean value Med median
Occurance probability
Haz
ard
leve
l

EMC 2022, 17-18th June 2022, Zrenjanin, Serbia
105
ACKNOWLEDGEMENT
The paper is supported by grants from the Ministry of Education, Science and Technological
Development, grants from project E!13300 and RESMOD and contract 451-03-68/2022-14/200105
(subproject TR 35017).
REFERENCES
Brkić, A. D., Maneski, T., Ignjatović, D., Jovančić, P. D., & Brkić, V. S. (2014). Diagnostics of bucket wheel
excavator discharge boom dynamic performance and its reconstruction. Eksploatacja i Niezawodność,
16(2), 188-197.
Brkić, A. Đ., Misita, M. Ž., Spasojević-Brkić, V. K., & Perišić, M. B. (2020). Pareto analysis application in
research of crane related accidents. Tehnika, 75(2), 238-244.
Daničić, D., Jovančić, P., Ignjatović, D., & Maneski, T. (2009). Improvement of bucket wheel excavator
maintenance by on-line and off-line method of condition and behavior diagnostics. Tehnika-Rudarstvo,
geologija i metalurgija, 60(3), 9-14.
Edwards, D. J., & Love, P. E. (2016). A case study of machinery maintenance protocols and procedures within
the UK utilities sector. Accident Analysis & Prevention, 93, 319-329.
ISO 31000:2018. Risk Management-Guidelines; ISO/IEC: Geneva, Switzerland, 2018.
Kirin, S., Sedmak, A., Li, W., Brzaković, M., Miljanović, I., Petrović, A., & Sedmak, S. (2021). Human factor
risk management procedures applied in the case of open pit mine. Engineering Failure Analysis, 126,
105456.
Kumar, P., & Srivastava, R. K. (2014). Development of a condition based maintenance architecture for optimal
maintainability of mine excavators. IOSR Journal of Mechanical and Civil Engineering (IOSR-JMCE),
11(3), 18-22.
Lazarević, Ž., Aranđelović, I., & Kirin, S. (2018). The reliability of bucket wheel excavator-review of random
mechanical failures. Tehnički vjesnik, 25(4), 1259-1264.
Marhavilas, P. K., Koulouriotis, D. E., & Mitrakas, C. (2011). On the development of a new hybrid risk
assessment process using occupational accidents’ data: Application on the Greek Public Electric Power
Provider. Journal of Loss Prevention in the Process Industries, 24(5), 671-687.
Pantelić, M. P., Bošnjak, S. M., Misita, M. Z., Gnjatović, N. B., & Stefanović, A. Z. (2020). Service FMECA of
a bucket wheel excavator. Engineering Failure Analysis, 108, 104289.
Papic, L., & Pantelic, M. (2014). Maintenance-oriented safety control charts. International Journal of System
Assurance Engineering and Management, 5(2), 149-154.
Papic, L., Pantelic, M., Aronov, J., & Verma, A. K. (2010). Statistical safety analysis of maintenance
management process of excavator units. International Journal of Automation and Computing, 7(2), 146-
152.
Rudakov, M., Gridina, E., & Kretschmann, J. (2021). Risk-based thinking as a basis for efficient occupational
safety management in the mining industry. Sustainability, 13(2), 470.
Shahin, A., Labib, A., Emami, S., & Karbasian, M. (2018). Improving Decision-Making Grid based on
interdependence among failures with a case study in the steel industry. The TQM Journal. 31(2), 167-182.
Spasojević-Brkić, V. K., Milazzo, M. F., Brkić, A., & Maneski, T. (2015). Emerging risks in smart process
industry cranes survey: SAF€ RA research project SPRINCE. Serbian Journal of Management, 10(2), 247-
254.
Yang, Z., Baraldi, P., & Zio, E. (2020). A novel method for maintenance record clustering and its application to
a case study of maintenance optimization. Reliability Engineering & System Safety, 203, 107103.

106
XII International Symposium Engineering Management and Competitiveness 2022 (EMC 2022)
17-18th June, Zrenjanin, Serbia
INDUSTRY 4.0: AN INNOVATIVE SOLUTION FOR MONITORING
THE PRODUCTION PROCESS AND QUALITY CONTROL IN A
TEXTILE FACTORY
Marija Stanojeska
Part-time professor, School of Business Economics and Management, UACS, Skopje, RNM
E- mail: [email protected]
ABSTRACT
Industry 4.0 has the primary goal of improving organizational performance by enabling economic growth and
high competition in supply chains. Consequently, Industry 4.0 technologies can affect the entire business system
by using new tools to upgrade production systems to smart levels, generating flexible operations for quality
control, production and delivery. Although there is implicit relevance to the use of Industry 4.0 technologies in
the textile industry, the implementation of information and communications technology (ICT) tools to design
more reliable and improved processes is still an unexplored area. The purpose of this study is to present the
benefits of using software-oriented tools in the textile industry, as one of the most vulnerable types of industries
due to labor-intensive use, lack of technology, and increased costs in terms of a high percentage of non-
conformities. Namely, the research was conducted in a textile factory in which an intelligent platform was
installed for collecting, measuring, and analyzing data for quality control and overall monitoring of the process.
The findings indicate that the implementation of innovative techniques in Industry 4.0 allows for reducing the
number of non-conformities and improving the quality of the production process.
Key words: Industry 4.0 technologies, Quality control, Production process and Non-conformities.
INTRODUCTION
In today’s smart manufacturing environment, the textile industry faces challenges such as efficiency,
sustainability, and quick response to clients’ dynamic requirements as well as product quality and
regulatory compliance which ascertain its survival (Balogun et al., 2019; Fatorachian, 2018).
Production has been influenced due to a lack of technological advancement, leading to an negative
effect on overall performance including problems in terms of quality. Namely, textile manufacturing
as a labor-intensive industry is based on human skills and capabilities to a great extent. Thus, the
traditional approach to quality control means inspections by supervisors, selection of non-
conformities, and rework. In addition, the traditional approach results in bottlenecks, delays and
increased operational costs (Conci and Proença, 2002). The nature and complexities of garment
production make it difficult to implement a labor-saving technology (Lekamge and Ekanayake, 2021).
To cope with dynamic business environment, traditional textile industries are prone to integrating
advanced technologies for /production, management, and operational processes (Longo et al., 2017).
In this context it is worth to mention the large textile and apparel companies, such as Zara, Adidas,
Marks & Spencer, Max fashion, Red Tag, and H&M which makes it possible to track and monitor
different stages of production processes, and gain numerous benefits such as decreased operational
costs, improved quality of the products and on-time delivery of the goods (Khorram et al., 2019).
Consequently, automatic quality control has grown into one of the major challenges for achieving
overall success in a highly competitive environment.
Nowadays, most companies are moving towards higher technology by introducing Industry 4.0 ideas
(Judit et al. 2018; Tortorella et al., 2020). Most researchers and professionals agree that Industry 4.0
offers opportunities and promotes changes in markets, business models, supply chains, and the world

EMC 2022, 17-18th June 2022, Zrenjanin, Serbia
107
of work (Wang et al., 2016; Fogaca et al., 2022; Schneider, 2018). In that direction, understanding
how these technologies are linked to quality improvement in the textile industry is an issue that is
worth to be addressed, and that is relevant since globalization has made business values constantly
change (Imran et al., 2018; Denvura et al., 2019). It is important to note that some textile industries are
using advanced tools, especially under the Industry 4.0 concept (Rajnoha and Lesníková 2016;
Shahriar, et al., 2016; Carvalho et al., 2015; Istrat et al., 2017). However, Industry 4.0 requires textile
factories to create decision-making processes that improve the quality of the products impact the
customer focus (Grzybowska and Łupicka, 2017; Trieu, 2017; Lee et al., 2018), and attain greater
competitiveness in the market (Wang et al., 2016; Meyer, 2019; Fromhold-Eisebith et al., 2021).
However, the main prerequisite for the implementation of Industry 4.0 technology in the existing
textile factories is to implement digital technologies in the direction to establish a solid ground for
further improvements in the spirit of Industry 4.0 perspectives. Besides that, Industry 4.0 promotes
production which automatically increases the overall performance and has the ability to resolve
various issues through modern technologies. From that point of view, it is expected that this new
paradigm, which employs digital tools will significantly improve quality, productivity, process
efficiency, and competitiveness (Howaldt et al., 2017; Stentoft and Rajkumar, 2020). Furthermore,
Industry 4.0 is a new era of the industrial revolution in which textile industry companies are adopting
and integrating advanced technologies to achieve sustainability and a competitive edge (Ahmed et al.
2020; Demeter et al., 2020; Ghobakhloo et al., 2021; Dalenogare et al., 2018).
In that direction, organizations face new challenges because, although Industry 4.0 creates many
opportunities for companies, at the same time, it generates challenges derived from automation and
digitization (Aguilar-Rodriguez et al., 2021; Grzybowska & Łupicka, 2017; Wollschlaeger et al.,
2017; Fogaca et al., 2022; Singh et al., 2019; Iqbal et al., 2018; Haseeb et al., 2019).
Therefore, the objective of this study is to research the benefits of using digital tools for data collecting
and a processing, and on-time intervention in the direction of reducing the costs related to poor
quality, in one textile factory in an emerging economy. The created database is a useful digital
platform in the manager’s hands to make the right decision in terms of enhancing the overall
organization's performance.
RESEARCH DESIGN
The production process in the researched textile factory includes cutting, sewing (assembling),
buttoning, ironing, packing, and shipment (Fig. 1.). The factory, which is in the topic of research, is
equipped with two production lines. The first one is a standard/regular line where the control of the
quality is performed on-site, just before the packing phase, by a few supervisors, as shown in Fig 1.
Quality control
ShippingPackingIroningSewing/
Assembling
Cutting Buttoning
Figure. 1: Regular production line in the textile factory
This approach to quality control generates a high percent of non-conformities, detected just before
packing. In such conditions, the delays occur because of the spending time reworking and failures
correcting. Nevertheless, the delays in the textile industry are one of the major barriers to attaining
competitiveness in the market. Namely, delays in the production process affect delays in goods

M. Stanojeska / Industry 4.0: inovative solution for monitoring...
108
shipment, which is encompassed by low buyer satisfaction. Thus, inefficient quality control in the
process leads to a high number of non-conformities and needs to rework the failed products before the
execution of delivery. In that direction, the internal failure costs and in that point of view, the overall
operational costs increases, primarily because of the need for engagement of an additional workforce
for controlling, inspecting, reworking, and fixing failures.
The digital platform for tracking and monitoring the manufacturing process is implemented on the
other production line – “the pilot line” (Fig. 2.). In essence, the digital platform for full tracking and
monitoring of the manufacturing process includes collection and procession data using an appropriate
fit-to-use software system. Each machine performs a certain operation. Using a controller, the
particular operation mechanically performed on the respected machine is loaded as an input in the
controller. Thus, the data is saved in the monitor as long as the operation is performed by the operator.
The operation mechanically performed on the respected machine is fully synchronized with the data
loaded in the controller. Using a software program structured for this purpose, the collected data from
each monitor, are accurately processed, and valuable information in terms of executed tasks,
interruptions, bottlenecks, delays, and non-conformities, in real-time is gathered.
Quality control
ShippingPackingIroningSewing/
Assembling
Cutting Buttoning
Figure. 2: Pilot production line equipped with digital devices in the textile factory
Opposite to regular line, the quality control on the digitalized (pilot) line is performed in each stage of
the manufacturing, which means on time. In fact, every operator enters data related to non-
conformities, and of course, related to the executed tasks in controllers. Only one supervisor is
sufficient to monitor the entire process by the main computer unit. Regarding the processed
information, on-time actions are undertaken in the manufacturing process.
In that sense, the goal of this research is:
G: To determine the efficiency of the implementation of the innovative digital platform for process
monitoring and quality control in the textile factory, according to three criteria, internal failure costs,
number of non-conformities and rework time.
Methodology
For the purpose of this research, the methodology of collecting, analyzing, and comparing data was
implemented. The first set of data includes the data collected for the digitalized production line. Those
data were stored in the software system, for the period of twelve weeks. The second set of data
includes the data obtained through the same period (twelve weeks), which refers to the regular

EMC 2022, 17-18th June 2022, Zrenjanin, Serbia
109
production line. Those data were recorded by the five supervisor’s evidence. After collecting the
needed data, the next step of implemented methodology, which means data structuring and analysis,
was performed. In general, there were more criteria for data collecting and process monitoring, such as
the total number of produced items on each machine, calculation of the operator norm, percent of
utilization of the single machine, total time of active operating on single machines, etc. However, for
the aim of this research, an analysis according to the three criteria (i) rework time, (ii) number of non-
conformities, and (iii) internal failure costs, was conducted. In the third step of the research
methodology, the comparison of the databases was present and conclusions were given.
RESULTS AND DISCUSSION
According to the implemented research methodology, the finding data are present in Table 1.
Table 1: Collected data on a pilot line equipped with digital devices and regular line
Week No.
Pilot line equipped with digital devices Regular line
Number of
non-conformity
units
Rework
time
(h)
Internal
failure costs
(€)
Number of
non-conformity
units
Rework
time
(h)
Internal
failure costs
(€)
Week 1 85 8.3 166 138 14.4 288
Week 2 74 7.7 154 124 13.8 276
Week 3 72 7.5 150 120 13.0 260
Week 4 75 8.0 160 125 13.3 266
Week 5 72 7.5 150 140 15.0 300
Week 6 70 7.3 146 135 14.2 284
Week 7 70 7.3 146 129 13.0 260
Week 8 65 7.0 140 133 13.8 276
Week 9 71 7.0 140 138 14.4 288
Week 10 68 7.0 140 134 13.8 276
Week 11 67 7.1 142 124 13.0 260
Week 12 71 7.3 146 124 13.0 260
Total 860 89 1780 1564 164.7 3294
It is obvious that the number of defects identified on the line equipped with digital devices is lower
compared to the number of defects obtained from the regular production line. The explanation is the
delayed action and delayed taking corrective measures. Namely, the implemented digital platform
provides real-time information about the stability of the process. When operators entering data related
to the poor quality in the controllers, the supervisors can react very quickly to organize a team to fix
the problematic items. Thus, the number of non-conformities generate by the digitized line is lower for
45%. Despite of this, the time required for correction of non-conformed items is lower by 46%.
Regarding the costs for defects, for a period of 12 weeks, the total amount of costs in terms of poor
quality calculated for the regular line is 3294 euros, while the total amount of costs incurred due to
poor quality of the pilot line is 1780 euros. The average sum on daily bases is calculated, so the costs
incurred on the regular line are 54.9 euros/day, while the costs arising on the line equipped with digital
technology is 29.7 euros/day. According to the goal of this research, the benefits of the
implementation of innovative digital solution on one of the production lines are more than clear.
CONCLUSION
This research contributes in a practical dimension by explaining the implementation of digital
technology as a solid ground for further the implementation of Industry 4.0 techniques in the textile
industries. In fact, the software systems integrated by the textile industry to collect and process data
according to the performed operational tasks enable full monitoring of the production process and
gathering the relevant information in real-time. Therefore, the goal of this research is fulfilled, the
efficiency is increased, the number of non-conformities is decreased by 45% and the internal failure

M. Stanojeska / Industry 4.0: inovative solution for monitoring...
110
costs are reduced by 46%. At the same time, delays are decreased for 46% and a flexible
manufacturing process is designed.
However, using the software program based on the possibility of upgrading and fitting to the needs of
the process and to the user's requirements is the company's advantage to fulfill the customer's
expectation and achieve higher competitiveness in the market. Yet, the implemented digital
technology for monitoring the manufacturing process in the textile factory is not an ultimate state.
According to the findings, in the following period, the digitalization of the regular line is planned to be
made. Despite that, the created digital platform is one-step toward the implementation of more
advanced tools regarding Industry 4.0. To summarize, the implemented digital system for quality
control and process monitoring can be recognized as an intelligent platform for further process
improvement in the field of Industry 4.0. In addition, this smart platform will serve as a technology
benchmarking for other textile factories, especially in emerging economy countries.
REFERENCES
Aguilar-Rodriguez, I.E., Bernal-Torres, C.A., Aldana-Bernal, J.C., Acosta-Aguinaga, A.G., Artieda-Cajilema,
C.H. and Chala, P. (2021). Relationship between social culture, industry 4.0, and organizational
performance in the context of emerging economies. Journal of Industrial Engineering and Management,
14(4), 750-770. https://doi.org/10.3926/jiem.3560
Ahmad, S., Miskon, S., Alabdan, R. and Tlili, I. (2020). Towards Sustainable Textile and Apparel Industry:
Exploring the Role of Business Intelligence Systems in the Era of Industry 4.0. Sustainability, 12, 2632.
doi:10.3390/su12072632
Balogun, A.-L., Tyler, D., Han, S., Moora, H., Paco, A., Boiten, V.J., Ellams, D. and Leal Filho, W. (2019). A
review of the socio-economic advantages of textile recycling. J. Clean. Prod, 218, 10–20.
Carvalho, S., Portela, F., Santos, M.F., Abelha, A. and Machado, J. (2015). Step towards of a homemade
business intelligence solution - A case study in textile industry. In New Contributions in Information
Systems and Technologies, Springer: Berlin/Heidelberg, Germany.
Conci, A. and Proença, C.B. (2002). A system for real-time fabric inspection and industrial decision. SEKE '02.
Dalenogare, L.S., Benitez, G.B., Ayala, N.F. and Frank, A.G. (2018). The expected contribution of Industry 4.0
technologies for industrial performance. International Journal of Production Economics, 204, 383-394.
https://doi.org/10.1016/j.ijpe.2018.08.019
Demeter, K., Losonci, D., Marciniak, R., Nagy, J., Moricz, P. and Matyusz, Z. (2020). Industry 4.0 through the
lenses of technology, strategy, and organization: A compilation of case study evidence. Vezetéstudomány /
Budapest Management Review, 51 (11), 14-25. https://doi.org/10.14267/veztud.2020.11.02
Denuwara, N., Maijala, J. and Hakovirta, M. (2019). Sustainability benefits of RFID technology in the apparel
industry. Sustainability, 11, 6477.
Fatorachian, H. and Kazemi, H. (2018). The management of operations a critical investigation of Industry 4.0 in
manufacturing: Theoretical operationalisation framework. Prod. Plan. Control, 29, 633–644.
Fogaça, D., Grijalvo, M., and Sacomano Neto, M. (2022). An Institutional Perspective in The Industry 4.0
Scenario: A Systematic Literature Review. Journal of Industrial Engineering and Management, 15 (2),
309-322. https://doi.org/10.3926/jiem.3724
Ghobakhloo, M., Fathi, M., Iranmanesh, M., Maroufkhani, P. and Morales, M.E. (2021). Industry 4.0 ten years
on: A bibliometric and systematic review of concepts, sustainability value drivers, and success
determinants. Journal of Cleaner Production, 302, 127052. https://doi.org/10.1016/j.jclepro.2021.127052
Grzybowska, K. and Łupicka, A. (2017). Key competencies for Industry 4.0. Economics and Management
Innovations, 1 (1), 250-253. https://doi.org/10.26480/icemi.01.2017.250.253
Haseeb, M., Hussain, H.I., ´Slusarczyk, B. and Jermsittiparsert, K. (2019). Industry 4.0: A solution towards
technology challenges of sustainable business performance. Soc. Sci. 8, 154.
Howaldt, J., Kopp, R., and Schultze, J. (2017). Why Industrie 4.0 Needs Workplace Innovation - A Critical
Essay About the German Debate on Advanced Manufacturing. Workplace Innovation, 45-60. Springer
International Publishing. https://doi.org/10.1007/978-3-319-56333-6_4
Iqbal, M., Soomrani, A.R. and Butt, S.H. A study of big data for business growth in SMEs: Opportunities &
challenges. In Proceedings of the International Conference on Computing, Mathematics and Engineering
Technologies (iCoMET), Sukkur, Pakistan, 3 - 4 May, 2018.
Imran, M., Hameed, W. and Haque, A. (2018). Influence of Industry 4.0 on the Production and Service Sectors
in Pakistan: Evidence from Textile and Logistics Industries. Soc. Sci., 7, 246.
https://doi.org/10.3390/socsci7120246

EMC 2022, 17-18th June 2022, Zrenjanin, Serbia
111
Istrat, V. and Lali´c, N. (2017). Association rules as a decision making model in the textile industry. Fibres Text.
East. Eur, 25, 8–14.
Khorram, M., Torabi, S.A. and Nonino, F. (2019). Why manufacturers adopt additive manufacturing
technologies: The role of sustainability. J. Clean. Prod., 222, 381–392.
Lee, C., Huang, G.-H. and Ashford, S.J. (2018). Job insecurity and the changing workplace: Recent
developments and the future trends in job insecurity research. Annual Review of Organizational Psychology
and Organizational Behavior, 5 (1), 335-359. https://doi.org/10.1146/annurev-orgpsych-032117-104651
Lekamge, R. and Ekanayake, N. (2021). Internal Quality Failures of Apparel Industry: A Case from Sri
Lanka. Open Journal of Business and Management, 9, 2389-2406. doi: 10.4236/ojbm.2021.95129.
Longo, F., Nicoletti L. and Padovano, A. (2017). Smart operators in industry 4.0: A human-centered approach to
enhance operators’ capabilities and competencies within the new smart factory context. Comput. Ind. Eng.,
113, 144–159.
Fromhold-Eisebith M., Marschall P., Peters R. and Thomes P. (2021). Torn between digitized future and context
dependent past – How implementing ‘Industry 4.0’ production technologies could transform the German
textile industry, Technological Forecasting and Social Change, 166, 120620.
https://doi.org/10.1016/j.techfore.2021.120620.
Meyer, U. (2019). The emergence of an envisioned future. Sensemaking in the case of “Industrie 4.0” in
Germany. Futures, 109, 130-141. https://doi.org/10.1016/j.futures.2019.03.001
Judit, O., Karmazin, G., Pet˝o, K. and Popp, J. (2018). Information technology developments of logistics service
providers in Hungary. International Journal of Logistics Research and Applications, 21, 332–44.
Rajnoha, R. and Lesníková P. (2016). Strategic performance management system and corporate sustainability
concept-specific parametres in Slovak Enterprises. Journal of Competitiveness, 8, 107–24.
Schneider, P. (2018). Managerial challenges of Industry 4.0: An empirically backed research agenda for a
nascent field. Review of Managerial Sciencie, 12 (3), 803-848.
Shahriar, A., Wamba, S., Gunasekaran, A., Dubey R. and Childe. S.J (2016). How to improve firm performance
using big data analytics capability and business strategy alignment? International Journal of Production
Economics, 182, 113–31.
Singh, R.K., Kumar, P. and Chand, M. (2019). Evaluation of supply chain coordination index in context to
Industry 4.0 environment. Benchmarking, 28 (5), 1622-1637. https://doi.org/10.1108/BIJ-07-2018-0204
Stentoft, J. and Rajkumar, C. (2020). The relevance of Industry 4.0 and its relationship with moving
manufacturing out, back and staying at home. International Journal of Production Research, 58 (10), 2953-
2973. https://doi.org/10.1080/00207543.2019.1660823
Tortorella, G.L., Cawley Vergara, A.M., Garza-Reyes, J.A. and Sawhney, R. (2020). Organizational learning
paths based upon industry 4.0 adoption: An empirical study with Brazilian manufacturers. International
Journal of Production Economics, 219, 284-294. https://doi.org/10.1016/j.ijpe.2019.06.023
Trieu, V. (2017). Getting value from business intelligence systems: A review and research agenda. Decis.
Support Syst, 93, 111–124.
Wang, L. and Shen, B. (2017). A product line analysis for eco-designed fashion products: Evidence from an
outdoor sportswear brand. Sustainability, 9, 1136.
Wang, S., Wan, J., Li, D., and Zhang, C. (2016). Implementing smart factory of industrie 4.0: An outlook.
International Journal of Distributed Sensor Networks, 37, 517-527. https://doi.org/10.1155/2016/3159805
Wollschlaeger, M., Sauter, T., and Jasperneite, J. (2017). The future of industrial alcohols. IEEE Industrial
Electronics Magazine, 11 (1), 17-27. https://doi.org/10.1109/MIE.2017.2649104

112
XII International Symposium Engineering Management and Competitiveness 2022 (EMC 2022)
17-18th June, Zrenjanin, Serbia
ASSESSMENT OF THE VITALITY OF ORGANIZATIONAL
LEARNING, CUSTOMER FOCUS, AND CONTINOUS IMPROVEMENT
IN MACEDONIAN FOOD PROCESSING INDUSTRY FROM TQM
PERSPECTIVE
Marija Stanojeska
Part-time Professor, UACS, School of Business Economics and Management, Skopje, RNM
E- mail: [email protected]
Robert Minovski
Professor, Ss. Cyril and Methodius University in Skopje, Faculty of Mechanical Engineering, RNM
Bojan Jovanoski
Assistant Professor, Ss. Cyril and Methodius University in Skopje, Faculty of Mechanical Engineering, RNM
ABSTRACT
In today’s dynamic environment, where time often plays the most important role, it is particularly essential to
plan the dynamics of the development of every system, including the Quality Management System (QMS). It is
simply not enough to create a good QMS. Namely, it is generally accepted that QMS are quite weak and
vulnerable just after certification So, it is very important to maintain and foster its evolution throughout time.
Analysis of the dynamic development of the QMS represents a quite vague research area, because of the
complexity of the process and numerous influential factors. Still, the growth of the QMS can be related to the
(successful) implementation of the Total Quality Management (TQM) practices, like organizational learning,
customer focus, and continuous improvement. Nevertheless, the two challenges of this research are to assess the
importance of those TQM practices and to determine the duration to ascertain the improvement of the
organizational learning, customer focus, and continuous improvement. In that direction, a survey of 82
companies in the Macedonian food processing industry was conducted, using a structured questionnaire. The
results of the conducted survey indicate the employees have to direct almost similar efforts of their commitment
toward continuous improvement, organizational learning, and customer focus, based on the determined ratio
between analyzed TQM practices is as follows, CI (%) : OL (%) : CF (%) = 33.8 : 31.9 : 34.3. Regarding the
second challenge, the period of perceived improvements of continuous improvement, organizational learning,
and customer focus is different and respected in each TQM practice. To determine the selected three TQM
practices, organizational learning, customer focus, and continuous improvement, a survey of 82 companies in the
Macedonian food processing industry was conducted, using a structured questionnaire.
Key words: Organizational learning, Continous improvement, Customer focus, QMS and TQM practices.
INTRODUCTION
In healthy business culture, what is good for the organization and the customers come together and
become a driving force. Thus, it is important that the quality management system (QMS) adds value to
organizations (Gremyr et al., 2021). At the same time, the evidence suggests that QMS provides a
critical structure with the potential to create value for customers, contribute to product quality and
operational performance (Kafetzopoulos et al., 2015), and increase net assets value (Ochieng et al.,
2015). This potential, however, has not yet been fully exploited. From this point of view, all the
different factors for improving QMS and its transition to more advanced levels through the
implementation of total quality management (TQM) practices are explored (Respati and Ami, 2014;
McLein et al, 2017; Oliveira et al., 2017). The importance of TQM practices, such as top management
commitment, customer focus, process management, quality information management, supplier
management, remains the focus of numerous studies (McLein et al., 2017).

EMC 2022, 17-218h June 2022, Zrenjanin, Serbia
113
However, the discussion regarding the initiatives for the implementation of new methodologies always
starts from the top management but does not depend only on their commitment. It is well known that
top management plays a key role in establishing quality policies, providing resources, and stimulating
employee involvement (Dubey et al., 2012). In addition, employees are implementers and supporters
of all ideas generated by top management and their role can be significant in the process of
implementing TQM practices within organizations (Das et.al., 2008). Therefore, some of the
influential aspects that can contribute to the complexity of the QMS development process will be
discussed here, focusing mainly on TQM practices - organizational learning, customer focus, and
continuous improvement, because they were included in the system dynamics model designed to
transition QMS to TQM under the influence of top management commitment and its employee
motivation stimulus (Stanojeska et al., 2020).
Motivated employees and the learning capacity of the organization are essential for the organization to
achieve excellent service quality. Hays and Hill, (2001) defined organizational learning as the
development and implementation of new knowledge to change employee behavior, which in turn will
strengthen the organization to achieve improved results, adaptability to change, growth through
innovation, and create employee-oriented results.
Customer focus is considered to be one of the main drivers and a key factor in the long-term success
of an organization. From that point of view, customer satisfaction measures are used to understand the
factors that drive the market (Khan, 2011).
As one of the influential factors of TQM, continuous improvement is a constant effort to improve
products, and operations. In fact, processes valued by customers are constantly being evaluated and
improved in the light of their efficiency, effectiveness, and flexibility (Lenning and Gremyr, 2017).
The purpose of this paper is to explore how these three TQM practices correlate with quality
management perceptions. This study focuses on ISO 9001, ISO 22000, and HACCP-certified food
production organizations. This data was used to create a dynamic model for improving the status of
QMS. In the next section, some background on the use of QMS and improvement of the current state
of QMS development, TQM practices are given, followed by findings, and discussion of findings.
Finally, conclusions are drawn in the last section of the paper.
LITERATURE REVIEW
The importance of the QMS in current competitive environments has already been confirmed
(Solomon et al., 2017; Fonseca et al., 2017). In the paper of Brown and Wiele (1996), it was
concluded that the role of the top management whose responsibility is to provide adequate training for
the employees for improvement of QMS is emphasized. Therefore, the inclusion of employees should
be permanently encouraged and strengthened, through the managing the strategy of top management.
According to Swartling and Poksinska (2013), continuous improvement within the organizations is
enabled through the introduction of mechanisms for motivation of the employees, which leads to a
higher level of their involvement. Most researchers found that employees’ involvement is among the
most reported influential factors in direction of improvement of the state of the QMS (Jurburg et al.,
2016; Dubey and Bansal, 2012; Swartling and Poksinska, 2013). Indeed, if the level of employee
involvement is higher, the implementation of TQM practices will be more successful and will be
performed in a shorter period. In this paper, research on customer satisfaction, organizational learning,
and continuous improvement is conducted. The brief literature review related to each of the three
TQM practices is following. The satisfaction of customers is at the core of TQM. Customer focus is
evident in a proactive approach to identifying customers’ psychological, emotional, and business
needs, and their fulfillment (Anil and Satish, 2017). As mentioned before, the goal of satisfying the
customer is essential to QMS and it is expressed by the organization’s attempt to understand current
and future customer needs, and by meeting customers’ requirements through designing and delivering
quality products and services. (Mosadeghrad, 2014; Dubey and Bansal, 2012; Somlea et al., 2014;

M. Stanojeska et al. / Assessment of the vitality of organizational...
114
Anil and Satish, 2017). Another treated area in the study is organizational learning. Organizational
learning is one of the main resources to achieve and maintain competitive advantage, efficiency, and
growth for organizations (Lagrosen, 2017). The organization’s ability to preserve, retrieve, and apply
new knowledge, values, attitudes, and skills plays a critical role in organizational learning (Koh and
Low, 2010). Learning ensures that mistakes are not repeated and more important the learning that is
applied to the existing processes, the process task knowledge and of foundational knowledge on
organizational systems the profound knowledge stimulates continuous improvement (Hao and
Yunlong, 2013). The third TQM practice is continuous improvement. Namely, constant improvement
in products, services, and processes is essential to respond to changing customers’ preferences (Juran,
1995). Reevaluation of existing services and processes is important to affect improvements (Khan,
2011). This approach facilitates innovations, reduction in delivery time, costs associated with the
repair, rework, and yields cost competitiveness. (Mardani and Kazemilari, 2012; Jurburg et al., 2016).
These three factors, are significant determinants of the state of the QMS (Carmona-Márquez et al.,
2016; Sisnuhadi, 2014;).
CONCEPTUAL MODEL AND RESEARCH METHODOLOGY
As mentioned earlier, this research is a part of the efforts for modeling the of the development of the
QMS towards TQM. The conceptual model of that model is presented in Figure 1 (Stanojeska et al.,
2020).
State of
QMS
Organizational
learning
Policy and
infrastructures
Employee
involvement
Employees
motivation
+
Gap
Desired state of
QMS
Commitment in Policy and
infrastructures
TMC
Commitment in employee
improvement
+
+
+
+
+
+
+
+
+
-
-
-
Customer focus
+
Continuous
improvement+
+Job security
Financial
reward
+
+
+
Documented system
with clearly defined
instructions
Equipment and
maintenence
++
+
+
Figure 1: Conceptual model of the improvement of the state of QMS
In this occasion the detailed explanation of the model will be skipped. The focus will be on the
correlation of the three main influencing variables on the state of the QMS – organizational learning,
customer focus and continuous improvement (marked with dotted lines in Fig. 1), since it is the main
topic of this paper. The research methodology includes two steps. The first step refers to the validation
of the correlation between the variables (in the whole conceptual model), through a review of the
literature sources. The research findings are presented in Table 1. These findings validated the
correlation between the state of QMS and the three TQM practices - organizational learning (OL),
continuous improvement (CI), and customer focus (CF), (Stanojeska et al., 2016).

EMC 2022, 17-218h June 2022, Zrenjanin, Serbia
115
Table 1: Overview of literature: Validation of correlations included in the conceptual model
Nevertheless, the process of designing a functional dynamic model requires the use of quantified data.
From that point of view, the second step of the research methodology was focused on conducting a
survey using a structured questionnaire. In fact, this research faces two challenges: (1) assessment of
the contribution of CI, OL, and CF towards the improvement of the state of QMS and (2) determining
the period of perceived improvements of the aforementioned TQM practices. In other words, the goals
of this research are:
G1: Assessment of the vitality of continuous improvement, organizational learning, and customer
focus in direction of improvement of the state of QMS in Macedonian food processing
industries.
G2: Valuation of the period of perceived improvements of continuous improvement, organizational
learning, and customer focus.
RESULTS AN DISCUSSION
Data collection from the survey
According to the defined goals, an assessment of the importance of CI, OL, and CF, was conducted
through a survey with the Macedonian food processing industry. To clarify, the questionnaire included
three sections, and within one of the sections, the three TQM practices were treated. So, this paper
draws on a questionnaire section focusing on the management’s perceptions regarding the importance
of each of those three TQM practices and the duration of ascertaining the improvement of OL, CI, and
CF. The questionnaire included a brief explanation intended for the managerial level responders, based
on qualitative data developed through the validated findings presented in Table 1. According to the
researches findings - the increasing the level of OL, CI, and CF in the organization leads to improving
the overall quality system and more efficient implementation of TQM practices in the organization,
the responders assess the importance of the TQM practices and the duration to ascertain the
improvement of Ol, CI, and CF, using quantitative (numerical) values.
The questionnaires were distributed to 112 registered food Macedonian production organizations, with
valid ISO 9001 (27%), ISO 22000 (32%), or HACCP certificates (41%). A total of 82 food processing
organizations participated in the survey, resulting in a response rate of 73%. The participation of
surveyed organizations according to the criterion of number of employees was 43% of small
organizations (number of employees less than 50), 44% of medium-sized organizations (number of
employees 50-251), and 13% of large organizations (number of employees up to 251). The research
covered various types of food production (beverages industry – 16%, baking industry -13%, fruit, and
vegetables industry – 12%, dairy industry – 10%, meat industry – 10%, milling industry - 8%, etc.).
The respondents of this study were quality managers (49%), production managers (26%), and directors
(25%).
Discussion of the results
As previously mentioned, to bring the idea closer to the respondents, a schematic overview of the
impact of employee involvement through OL, CF, and CI, on the implementation of TQM practices,
Correlation between
TQM practices Literature source
State of QMS
CI Anil and Satish, (2017), Mardani et al. (2012), Koh et al. (2010), Das et al.
(2008), Dubey (2012), Swartling and Poksinska (2013), Jurburg et al. (2016).
OL Lagrosen (2017), Tamayo-Torres et al. (2014), Das et al. (2008), Koh and Low
(2010), Hao and Yunlong (2013), Sisnuhadi (2014).
CF Mardani et al. (2012), Dubey et al. (2012), Mosadeghrad (2014), Dubey and
Bansal (2012), Somlea et al. (2014), Anil and Satish (2017), Sisnuhadi (2014).
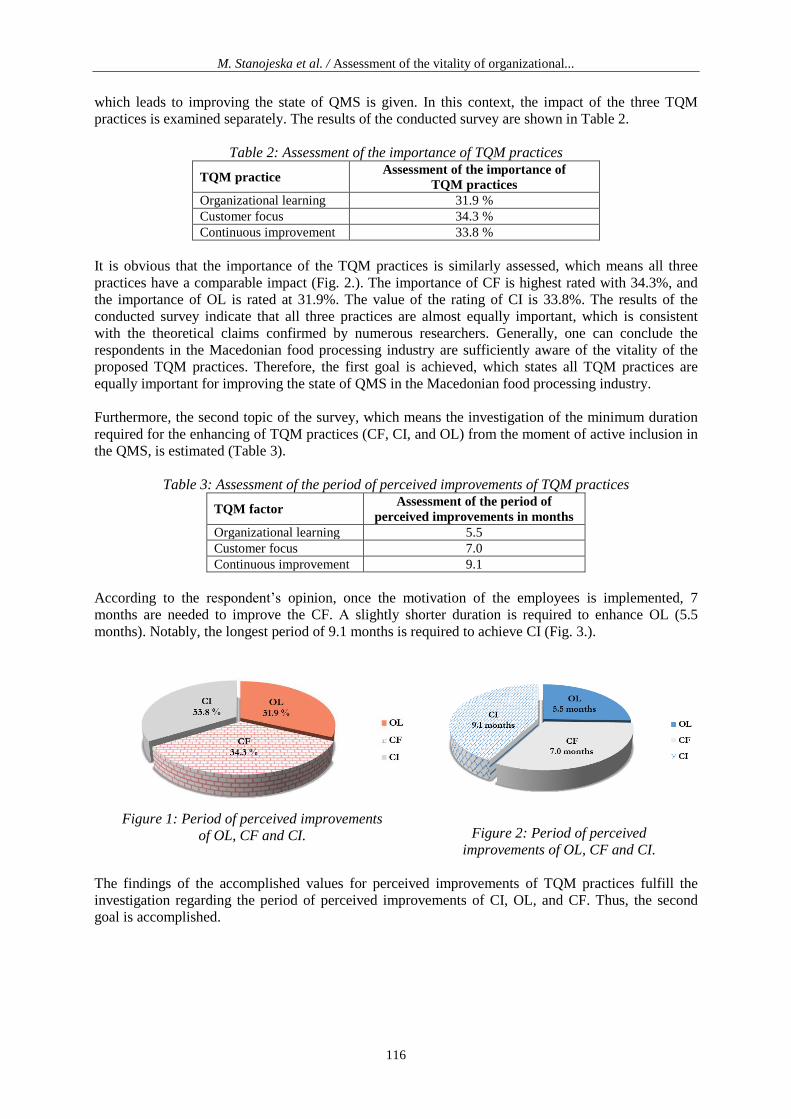
M. Stanojeska et al. / Assessment of the vitality of organizational...
116
which leads to improving the state of QMS is given. In this context, the impact of the three TQM
practices is examined separately. The results of the conducted survey are shown in Table 2.
Table 2: Assessment of the importance of TQM practices
TQM practice Assessment of the importance of
TQM practices
Organizational learning 31.9 %
Customer focus 34.3 %
Continuous improvement 33.8 %
It is obvious that the importance of the TQM practices is similarly assessed, which means all three
practices have a comparable impact (Fig. 2.). The importance of CF is highest rated with 34.3%, and
the importance of OL is rated at 31.9%. The value of the rating of CI is 33.8%. The results of the
conducted survey indicate that all three practices are almost equally important, which is consistent
with the theoretical claims confirmed by numerous researchers. Generally, one can conclude the
respondents in the Macedonian food processing industry are sufficiently aware of the vitality of the
proposed TQM practices. Therefore, the first goal is achieved, which states all TQM practices are
equally important for improving the state of QMS in the Macedonian food processing industry.
Furthermore, the second topic of the survey, which means the investigation of the minimum duration
required for the enhancing of TQM practices (CF, CI, and OL) from the moment of active inclusion in
the QMS, is estimated (Table 3).
Table 3: Assessment of the period of perceived improvements of TQM practices
TQM factor Assessment of the period of
perceived improvements in months
Organizational learning 5.5
Customer focus 7.0
Continuous improvement 9.1
According to the respondent’s opinion, once the motivation of the employees is implemented, 7
months are needed to improve the CF. А slightly shorter duration is required to enhance OL (5.5
months). Notably, the longest period of 9.1 months is required to achieve CI (Fig. 3.).
Figure 1: Period of perceived improvements
of OL, CF and CI.
Figure 2: Period of perceived
improvements of OL, CF and CI.
The findings of the accomplished values for perceived improvements of TQM practices fulfill the
investigation regarding the period of perceived improvements of CI, OL, and CF. Thus, the second
goal is accomplished.
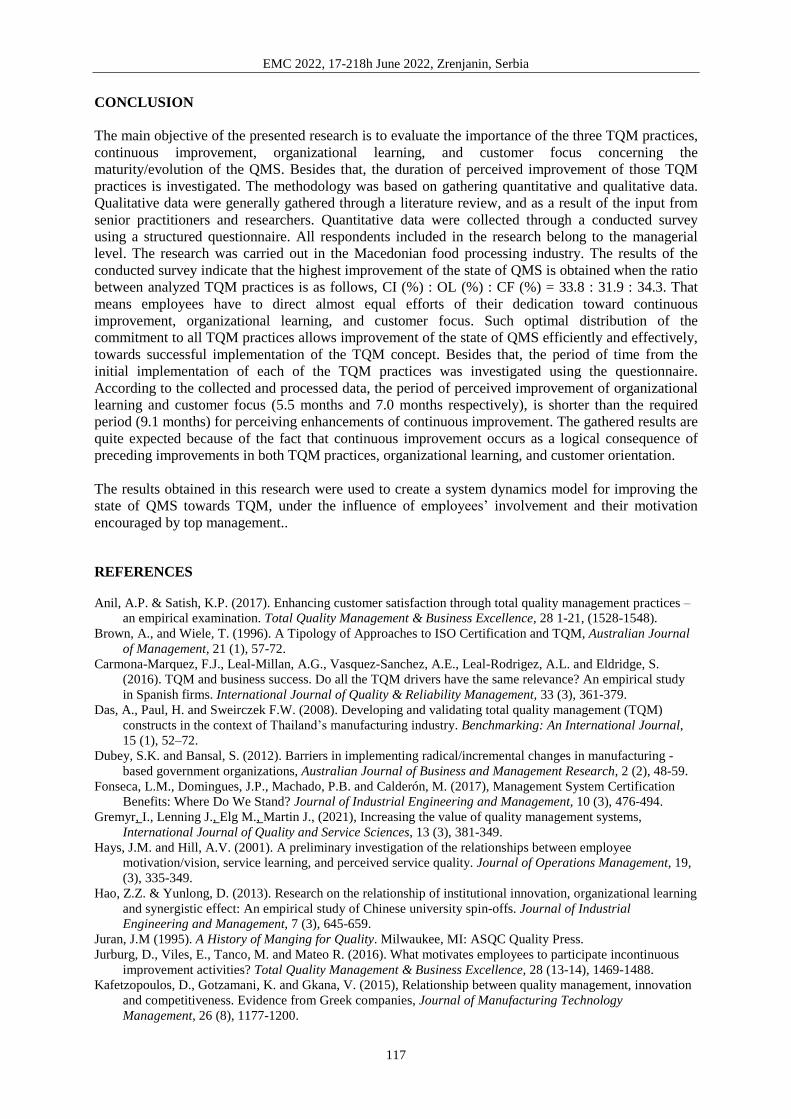
EMC 2022, 17-218h June 2022, Zrenjanin, Serbia
117
CONCLUSION
The main objective of the presented research is to evaluate the importance of the three TQM practices,
continuous improvement, organizational learning, and customer focus concerning the
maturity/evolution of the QMS. Besides that, the duration of perceived improvement of those TQM
practices is investigated. The methodology was based on gathering quantitative and qualitative data.
Qualitative data were generally gathered through a literature review, and as a result of the input from
senior practitioners and researchers. Quantitative data were collected through a conducted survey
using a structured questionnaire. All respondents included in the research belong to the managerial
level. The research was carried out in the Macedonian food processing industry. The results of the
conducted survey indicate that the highest improvement of the state of QMS is obtained when the ratio
between analyzed TQM practices is as follows, CI (%) : OL (%) : CF (%) = 33.8 : 31.9 : 34.3. That
means employees have to direct almost equal efforts of their dedication toward continuous
improvement, organizational learning, and customer focus. Such optimal distribution of the
commitment to all TQM practices allows improvement of the state of QMS efficiently and effectively,
towards successful implementation of the TQM concept. Besides that, the period of time from the
initial implementation of each of the TQM practices was investigated using the questionnaire.
According to the collected and processed data, the period of perceived improvement of organizational
learning and customer focus (5.5 months and 7.0 months respectively), is shorter than the required
period (9.1 months) for perceiving enhancements of continuous improvement. The gathered results are
quite expected because of the fact that continuous improvement occurs as a logical consequence of
preceding improvements in both TQM practices, organizational learning, and customer orientation.
The results obtained in this research were used to create a system dynamics model for improving the
state of QMS towards TQM, under the influence of employees’ involvement and their motivation
encouraged by top management..
REFERENCES
Anil, A.P. & Satish, K.P. (2017). Enhancing customer satisfaction through total quality management practices –
an empirical examination. Total Quality Management & Business Excellence, 28 1-21, (1528-1548).
Brown, A., and Wiele, T. (1996). A Tipology of Approaches to ISO Certification and TQM, Australian Journal
of Management, 21 (1), 57-72.
Carmona-Marquez, F.J., Leal-Millan, A.G., Vasquez-Sanchez, A.E., Leal-Rodrigez, A.L. and Eldridge, S.
(2016). TQM and business success. Do all the TQM drivers have the same relevance? An empirical study
in Spanish firms. International Journal of Quality & Reliability Management, 33 (3), 361-379.
Das, A., Paul, H. and Sweirczek F.W. (2008). Developing and validating total quality management (TQM)
constructs in the context of Thailand’s manufacturing industry. Benchmarking: An International Journal,
15 (1), 52–72.
Dubey, S.K. and Bansal, S. (2012). Barriers in implementing radical/incremental changes in manufacturing -
based government organizations, Australian Journal of Business and Management Research, 2 (2), 48-59.
Fonseca, L.M., Domingues, J.P., Machado, P.B. and Calderón, M. (2017), Management System Certification
Benefits: Where Do We Stand? Journal of Industrial Engineering and Management, 10 (3), 476-494.
Gremyr, I., Lenning J., Elg M., Martin J., (2021), Increasing the value of quality management systems,
International Journal of Quality and Service Sciences, 13 (3), 381-349.
Hays, J.M. and Hill, A.V. (2001). A preliminary investigation of the relationships between employee
motivation/vision, service learning, and perceived service quality. Journal of Operations Management, 19,
(3), 335-349.
Hao, Z.Z. & Yunlong, D. (2013). Research on the relationship of institutional innovation, organizational learning
and synergistic effect: An empirical study of Chinese university spin-offs. Journal of Industrial
Engineering and Management, 7 (3), 645-659.
Juran, J.M (1995). A History of Manging for Quality. Milwaukee, MI: ASQC Quality Press.
Jurburg, D., Viles, E., Tanco, M. and Mateo R. (2016). What motivates employees to participate incontinuous
improvement activities? Total Quality Management & Business Excellence, 28 (13-14), 1469-1488.
Kafetzopoulos, D., Gotzamani, K. and Gkana, V. (2015), Relationship between quality management, innovation
and competitiveness. Evidence from Greek companies, Journal of Manufacturing Technology
Management, 26 (8), 1177-1200.

M. Stanojeska et al. / Assessment of the vitality of organizational...
118
Khan, M. (2011). Total Quality management and organizational performance – moderating role of managerial
competencies, International Journal of Academic Research, 3 (5), 453-458.
Koh, T.Y. and Low, S.P. (2010). Empiricist Framework for TQM Implementation in Construction Companies.,
Journal of management in engineering, 26 (3), 133-143.
Lagrosen, Y. (2017). The Quality Café: developing the World Café method for organizational learning by
including quality management tools. Total Quality Management & Business Excellence, 28 (13-14), 1-13.
Lenning, J. and Gremyr, I. (2017). Making internal audits business-relevant. Total Quality Management and
Business Excellence, 28 (9/10), 1106-1121.
Mardani, A. and Kazemilari, M. (2012). Relationship between national culture and TQM implementation, Case
study: Iranian multinational electrical manufacturing companies, Asian Journal of Management Research,
3 (1).
McLein, R.S., Antony, J. and Dahlgaard, J.J. (2017). Failure of Continuous Improvement initiatives in
manufacturing environments: a systematic review of the evidence, Total Quality Mangement & Business
Excellence, 28 (3-4) 219-237.
Mosadeghrad, M. (2014). Why TQM programmes fail? A pathology approach. The TQM Journal, 26 (2), 160-
187.
Oliveira, G.S., Correa, J.E., Balestrassi, P.P., Martins, R.A. and Turrioni, J.B. (2017). Investigation of TQM
implementation: empirical study in Brazilian ISO 9001-registered SMEs. Total Quality Management &
Business Excellence, 28 (5-6), 1-19.
Ochieng, J., Muturi, D. and Njihia, S.N. (2015), The impact of ISO 9001 implementation on organizational
performance in Kenya, The TQM Journal, 27 (6), 761-771.
Respati, H., and Ami, R. (2014). Research on Continues Mediation: Employee Behaviour and TQM Practice as
ISO 9000 Strategy to Improve Performance of Manufacturing Company in East Java, Indonesia, European
Journal of Business and Management, 6 (29), 125-136.
Sisnuhadi, D. (2014). The relationship between soft factors and hard factors of TQM practices and
organizational learning, European scientific Journal, 10 (7), 85-99.
Solomon, N.P., Bester, A. and Moll, M. (2017). Diffusion of a quality management system: A case study, South
African Journal of Industrial Engineering, 28 (2), 149-164.
Somlea, I.N.H., Marian, L. and Ferencz, I.S. (2014). Customer satisfaction analysis by the implementation of
Quality Management System in a public institution. Procedia Economics and Finance, 15, 1071-1076.
Stanojeska, M., Minovski, R., and Jovanovski, B. (2020). Top management role in improving the state of
QMS under the infuence of employee’s involvement: Best practice from the food processing
industry, Journal of Industrial Engineering and Management, JIEM, 13 (1), 73-89.
Stanojeska, M., Minovski R. and Jovanoski B. Top Management role in improving the state of QMS through
management of employee motivation, VI International Symposium Engineering Management and
Competitiveness, EMC, June 17-18, Kotor, Montenegro, 2016.
Swartling, D., and Poksinska, B. (2013). Management Initiation of continuous improvement from a
Motivationlal perspective, Journal of Applied Economics and Business research, 3 (2), 81-94.
Tamayo-Torres, J., Gutierrez-Gutierezz, L.J., and Ruiz Moreno, J. (2014). The relationship between exploration
and exploitation strategies, manufacturing flexibility and organizational learning: An empirical comparison
between non-ISO and ISO certified firma. European Journal of Operational Research, 232 (1), 72-86.

119
XII International Symposium Engineering Management and Competitiveness 2022 (EMC 2022)
17-18th June, Zrenjanin, Serbia
OPERATIONAL MANAGEMENT OF PRODUCTION IN SMALL AND
MEDIUM ENTERPRISES IN SERBIA
Ljiljana Stošić Mihajlović
Academy of Technical and Vocational Studies, Nis - Department in Vranje, Serbia
E-mail: [email protected]
ABSTRACT
The most important area of management in any business, and especially in production, is operational
management, and it is of crucial importance in small and medium enterprises. Small and medium enterprises are
a generator of economic growth, employment and increasing living standards and prosperity of each country,
even in Serbia, where they make up almost 99% of the total number of enterprises. The aim of this paper is to
point out the specifics and importance of operational management in production in the sector of small and
medium enterprises in Serbia. Unlike strategic management, which is focused on economic efficiency,
operational management is focused on economic efficiency and rational use of total available human, financial
and material resources, when transforming inputs into outputs. In large companies, the roles of strategic and
operational managers are clearly divided and a defined order of decision-making and implementation in small
business is not the case. In small companies, these roles change and intertwine, and the owner is both a strategist
and an operative, who also performs all management functions. To succeed, he needs different knowledge,
competencies and skills, entrepreneurial spirit, creativity, and innovation.
Key words: Operational management, Production, Organizational structure, Small and medium enterprises.
INTRODUCTION
The need for management also exists in the sector of small and medium enterprises, as well as in all
organizations in which there are people and resources and in which it is necessary to achieve results
within a certain period of time. In essence, management is the management of people, resources and
processes, so it is necessary in organizations of all shapes, types and sizes. In the context of managing
specific situations and categories, there is crisis management, project management, marketing
management, financial management, change management, quality management, operational
management and others. Operational management in production ensures the transformation of
strategic long-term plans into operational plans - actions. Carriers of operational activities are
managers who are at the lower or middle level, depending on the form of organization of the company
and its size. Operational management is a rather complex process of coordinating and directing
operational activities, and in order to succeed, operational management must ensure the structure and
required quality of resources, and these resources should be directed towards the desired goal
expressed in financial rate of return. In the implementation of operational management, defined
operational goals and strategies for individual business functions (production, procurement, sales,
logistics, marketing) as well as for work operations and work tasks. When goals are allocated to
business functions and to the direct production process, it means that goals and results are measurable.
Measurability of operational results is the main feature of operational management.
ON OPERATIONAL PRODUCTION MANAGEMENT
Operational production management is the process of systematic directive and control of operations in
which the purchased inputs are transformed into finished products, goods and services. Operational
management includes such activities as procurement, inventory control, quality control of procured

Lj. Stošić Mihajlović / Operational management of production in small and medium...
120
materials and maintenance. Operational management includes the management of transformation processes
in material production and in the production of services, in an efficient manner. Operational production
management includes both the management of the transformation processes of material production and the
transformation processes of the service industry.
The work of the operational manager is conditioned not only by the need to know how much material is needed
for the production process, but also when the material needs to be ordered, ie procured from the supplier. Two
basic methods are used to determine when a material should be ordered: the fixed quantity method and the fixed
period method. The application of one or the other method depends on several circumstances, but above all on
market conditions, on the possibility of finding the necessary materials on the market.
For practice, the simplest is the inventory control system using the ABC method. It should be noted that this
method of inventory management is based on the value of individual materials used in the production process of
the company. Many companies have a small number of materials that fall into group A, but their greatest value is
in total stocks. Materials entering group B have a relatively small value, and materials entering group C have a
very small value of inventory.
Before the material enters the production process and its storage, it is necessary to control its quality and
quantity. When the control of the procured material is performed, a report is made and only then the material can
be received, stored and recorded as a stock. If the quality control commission finds that the purchased material is
not in accordance with the provisions of the contract, then the material is temporarily disposed of and an
appropriate complaint is made, which aims to force the supplier to act in accordance with the contract. The
management of the company can act in three ways: to return the purchased materials, to seek elimination of
identified deficiencies on the spot, if possible, and to accept materials, if the deficiencies are not such that they
will interfere with production and affect standard product quality, with certain collections included in the price.
SMALL AND MEDIUM ENTERPRISES IN SERBIA AND THE IMPORTANCE OF
OPERATIONAL MANAGEMENT
The importance of small business for the economy of every country is indisputable. How successful a
small business is largely depending on the knowledge and skills of management needed to make and
implement business decisions. Observed from the aspect of the objectives of the field of activity, and
the methods used, management has its strategic and operational component with its own
characteristics and specifics. In this paper, we will deal with its operational component and point out
its specifics and importance in small business. Operational management is focused on production
management, regardless of whether they are material products or services, which along with marketing
and finance is one of the three basic functions in every company. Operational management represents
the key processes in the organization when converting inputs into outputs. During these processes,
new values are created that are offered to customers in the market in the form of material products or
services. What Strategic Management outlines in the plans, operational management must translate
into practice. While strategic management is focused on economic effectiveness (doing the right
thing), operational oversees economic efficiency (doing the right thing). Thus, operational
management is focused on the design, production, delivery and improvement of products and services.
Effective operational management raises productivity and quality of products and services. In large
companies, top management delegates operational management tasks to lower levels of management
in order to achieve strategic goals. In a small business, the situation is different, because the owner
usually performs both tasks.
THE INFLUENCE OF SMALL BUSINESS ON THE OVERALL ECONOMIC
DEVELOPMENT OF SERBIA
for In the 21st century, which will be marked by globalization and entrepreneurship, small business is a
driver of development, creator of new jobs and generator of growth of living standards (Mahmutović,
Kulović, 2010). According to the Eurobarometer Team of the European Commission (2007) in the
EMC 2022, 17-18th June 2022, Zrenjanin, Serbia
121
European Union of over 200 million companies, 99% are small and medium-sized, and of that number as
many as 93% are companies with less than 10 employees. Innovation is their key feature. More than 60%
of employees in the European Union work in small and medium-sized enterprises. These companies are not
evenly distributed across sectors, with a significantly larger number belonging to the service sector than the
manufacturing sector, which can simply be explained by the smaller capital needed to start a business. The
largest turnover is realized by trade companies, which at the same time employ the largest number of
workers. These data lead us to the conclusion that small companies play an important role in the economy
of the European Union in terms of their number, number of employees and income. The situation is similar
in the USA, where in the period from 1990 to 2003, in small companies with less than 20 employees,
almost 80% of new jobs were created. Thus, small businesses are becoming more and more competitive
with large companies locally, but lately more and more globally.
The competitive advantage of small businesses is most pronounced in the field of flexibility and
innovation. Although large companies have incomparably more resources, have a built reputation and
operate in markets with only a few participants, small companies have a greater innovative capacity.
Simeonydis (1996) argues that small enterprises with less than 100 employees most often do not formally
develop a research and development function, however most innovation comes from these enterprises.
Small businesses are key innovators in today’s economy and market leaders in many areas. However, in the
conditions of globalization and intensified competition for innovation and economic success, it is necessary
to have and interconnect small and large enterprises. By establishing cooperation relations with small
companies, large companies can significantly reduce costs in certain business segments, which significantly
contributes to improving the competitiveness of both large companies and the economy. Aware of the
importance and role of small business for overall economic development, developed countries stimulate its
development in various ways. This is primarily reflected in the removal of business barriers, creating a
favorable macroeconomic environment, educating entrepreneurs, providing financial support, establishing
special institutions to support small businesses, etc.
In Serbia, almost all large companies were liquidated during the transition. Small and medium enterprises
are expected to become the engine of future economic development and significantly contribute to the
country's dynamic transition process and the creation of conditions for Serbia to become a member of the
European Union.
In 2020, there was an increase in the total number of registered business entities by 9,879 compared to the
beginning of 2019, it is stated in the announcement of the Agency for Business Registers. In 2020, the
establishment of 9,176 companies and 29,810 entrepreneurs was registered, which is 19 percent more
companies than in 2019, but also about 25 percent fewer entrepreneurs compared to 2019. Most of the
companies founded in 2020 registered the following activities: non-specialized wholesale trade, computer
programming, construction of residential and non-residential buildings, consulting activities related to
business and other management.
These are road freight transport, restaurant and mobile catering activities, retail trade via mail order or
internet, information technology consultancy, engineering and technical consultancy, rental and
management of own or leased real estate. Most entrepreneurs registered for the following activities:
restaurants and mobile catering facilities, consulting activities related to business and other management,
hairdressing and beauty salons, road freight transport, maintenance and repair of motor vehicles, beverage
preparation and serving services, other unmentioned specific construction works, computer programming,
engineering activities and technical consulting, installation of floor and wall coverings.
At the beginning of 2022, 414,705 business entities were registered on the territory of the Republic of
Serbia, 124,260 active companies and 290,445 entrepreneurs. That is 14,059 entities, 2,570 companies and
11,489 entrepreneurs, more than at the beginning of 2021. In 2021, 9,635 companies were established, 459
more than in 2020, and 478 more than in 2019. Also, 34,378 entrepreneurs were established, 4,568 more
than in 2020, but 2,782 less than in 2019, the before COVID-19- year, in which 37,160 entrepreneurs were
founded. Out of a total of 44,013 business entities established in the past year, 8.14%, or 3,584 entities,
were established through electronic registration.

Lj. Stošić Mihajlović / Operational management of production in small and medium...
122
Among the established companies, the TOP 10 activities include: non-specialized wholesale, construction
of residential and non-residential buildings, computer programming, consulting activities related to
business and other management, road freight transport, restaurant and mobile catering activities, retail trade
through mail or via the Internet, engineering and technical consultancy, rental and management of own or
leased real estate, information technology consultancy.
Among newly established entrepreneurs, the TOP 10 activities include: activities of restaurants and mobile
catering facilities, consulting activities related to business and other management, road freight transport,
activities of hairdressing and beauty salons, maintenance and repair of motor vehicles, computer
programming, preparation and serving services beverages, engineering activities and technical consulting,
other unmentioned specific construction works, installation of floor and wall coverings.
In 2021, 7,046 companies were deleted from the Register of Business Entities, which is 936 less than in
2020. In order to correctly understand the comparative data on deleted companies in 2019, it is important to
remind that 27,163 companies were deleted in that year, but 24,380 companies were deleted from the
register ex officio, after the forced liquidation procedure. with companies that have not submitted financial
reports for two consecutive years, but also for other reasons prescribed by the Law on Companies, have
acquired the conditions for initiating this procedure. In 2019, APR conducted the procedure of forced
liquidation for the first time, so that in that year the number of deleted persons increased many times
compared to all previous and years that followed 2019, so that these data are not comparable. Also, 22,934
entrepreneurs were deleted from the register, 882 less than in 2020, and 659 less than in 2019.
Among the deleted companies, the TOP 10 activities include: non-specialized wholesale trade, consulting
activities related to business and other management, restaurant and mobile catering activities, construction
of residential and non-residential buildings, road freight transport, computer programming, retail in non-
specialized stores, mainly food, beverages and tobacco, trade of cars and light motor vehicles, activity of
advertising agencies, other retail trade in non-specialized stores.
Among the deleted entrepreneurs, the TOP 10 activities include: activities of restaurants and mobile
catering facilities, beverage preparation and serving services, computer programming, hairdressing and
beauty salons, taxi transport, consulting activities related to business and other management, retail trade in
non-specialized shops, mainly food, beverages and tobacco, road freight transport, maintenance and repair
of motor vehicles, production of bread, fresh pastries and cakes (data from the Republic Bureau of
Statistics).
A set of new laws in line with European Union standards, and reform of the fiscal and financial system has
significantly improved the business environment for small businesses. However, small businesses in Serbia
face various barriers such as difficult access to funding sources, insufficient entrepreneurial and managerial
knowledge, unavailability of market information and lack of specialized services.
Table 1: Employees in legal entities (companies, enterprises, cooperatives, institutions, and other
organizations), self-employed persons, entrepreneurs, and their employees Number of
employees
Changes compared to
the previous year
2021. Differences Indices
Total employees 2212631 63532 103,0
Employees in the workplace 2154412 68033 103.3
Employees in legal entities 1759549 56953 103,3
Entrepreneurs 391863 11080 102.9
Total employees out of the relationship 61219 -4501 93,2
Employees in legal entities 57165 -4366 92,9
Entrepreneurs and persons who independently perform their activity 4054 -135 96,8
Source: publikacije.stat.gov.rs/G2022/G20221023.html

EMC 2022, 17-18th June 2022, Zrenjanin, Serbia
123
RELATIONSHIP BETWEEN STRATEGIC AND OPERATIONAL MANAGEMENT IN THE
STRUCTURE OF SMALL AND MEDIUM ENTERPRISES
Management is a universal activity present in all spheres of economy and society and all
organizations, of all types and sizes, at all levels. Management is focused on efficiency and
effectiveness to rationally use the available human, financial and material resources to achieve
organizational goals. Successful are those organizations that do the right things the right way.
No matter how different their roles are, managers at all levels perform four basic management
functions: planning, organizing, leading, and controlling. Harmonious and synchronized action of
these levels of management is necessary for the survival and development of the organization.
Operational management is at a lower level in the hierarchy and has the task of implementing strategic
management plans. So, we can say that operational management turns strategies into tangible tasks of
production management, with the goal of improving the competitive position of the company.
Production processes differ significantly in certain types of products and services, but what they all
have in common is the transformation of inputs into outputs. Therefore, the role of operational
management is to implement the transformation of inputs more efficiently into outputs, which should
result in a quality product or service. Considering that the biggest business costs are incurred during
the production process, ie. transformation of inputs into outputs, which means that it is the operational
management that has the most room to reduce production costs. To this end, operational management
defines the specific tasks and objectives of business functions and business units. For operational
management to be successful, it must first provide the structure and quality of the necessary resources,
and to direct and use them according to the desired goal. Schroeder (1999) linked the basic tasks of
operational management to the following functions:
quality
process design
capacity planning and scheduling
inventory management
Human Resource Management
Execution of jobs and tasks of one function is a prerequisite for the realization of others, and all
functions individually are links in the chain of functioning of the company. In order for the company
to maintain a competitive position, it is necessary that the operational activities are supported by the
strategy and vice versa, ie. to permeate each other.
SPECIFICS OF OPERATIONAL PRODUCT MANAGEMENT IN THE SME SECTOR
Small and medium-sized enterprises generally find it easier to adapt to changes in supply and demand
dictated by the market. In large companies, the organizational structure is rigid and formalized, while
small companies usually have a simple organizational structure, with a small number of employees
who perform multiple functions. This type of management is usually called entrepreneurial and differs
significantly from managerial management. The most important role is, of course, played by the
entrepreneur or founder, who performs all the most important tasks in the initial phase of
development. It follows that a manager in a small company must master the techniques and skills to
perform tasks that are performed by more managers in large companies, which at the same time means
greater responsibility in making and implementing decisions. Due to the lack of resources in small
enterprises, part of the work is usually entrusted to other entities and performed outside the enterprise
itself (Stošić Mihajlović, Lj., 2022).
All the above leads us to the conclusion that the management of small business has its own specifics in
relation to large companies, both strategically and operationally. An entrepreneur, unlike a manager,
must know equally well the skills and techniques of both operational and strategic management.
Problems usually arise when, due to accelerated growth and development, the scope of strategic and

Lj. Stošić Mihajlović / Operational management of production in small and medium...
124
operational work exceeds the capacity of one man-entrepreneur. Accelerated growth and development
of companies is usually not accompanied by adequate growth and development of management
knowledge and skills. An entrepreneur pressed by a bunch of strategic and operational issues that need
to be addressed does not have the time for education that is constantly needed, both on a practical and
theoretical level. The questions that need to be answered in operational management are mostly
specific and immediate, while strategic management is focused on the long-term issue of the
company's harmony with the environment. When resolving operational issues, the dominance of the
urgent over the important is very often present. In such a situation, strategic neglect in relation to
operational activities is most often neglected, which will bring the long-term company into crisis. A
crisis can be avoided if the entrepreneur hires a manager and delegates part of his powers to him and
other associates, which entrepreneurs are reluctant and rarely do. With the increase in the number of
people engaged in the company, the number of hierarchical levels increases, and the organizational
structure becomes more complicated, which of course increases business costs and inevitably requires
the delegation of authority. In doing so, the entrepreneur becomes a manager who predominantly deals
with strategic issues, while the operational entrusts to lower-level managers.
CONCLUSION
The importance and role of small business in the overall socio-economic development of every
country, including Serbia, is indisputable. The business success of a small business largely depends on
the knowledge and skills of management needed to make and implement business decisions. Small
business management has its own specifics in relation to large companies, both strategically and
operationally. Small businesses are better able to adapt to changes in supply and demand dictated by
an increasingly turbulent market. Unlike large ones, in small companies, different managerial roles
change and intertwine, and the owner in the form of an entrepreneur is both a strategist and an
operative. To succeed, he needs different knowledge, competencies, and skills, as well as
entrepreneurial spirit, creativity, and innovation. In the beginning, it is easier, but as the company
grows and develops, it exceeds its capacities, because the accelerated growth and development of the
company usually does not follow the appropriate growth and development of managerial knowledge
and skills. To overcome the challenges and avoid the crisis, it is necessary to hire new managers at a
lower hierarchical level who will deal with operational management issues. The further destiny and
business success of the company in an increasingly competitive environment will depend on the
adequate selection of staff and the delegation of authority.
REFERENCES
Chase, R.B., Jacobs, F.R., & Aquilano, N.J. (2004). Operations Management for Competitive Advantage (10th
ed.). McGraw-Hill/Irwin, Boston, 18-26.
Eurobarometer Team of the European Commission, (2007). Observatory of European SMEs, Flash
Eurobarometer, No. 196, Budapest, European Comission.
Heizer, J., & Render, B. (2006). Operations Management (8th ed.). Prentice Hall, New Jersey, 96-118.
Johnston, R., & Clark, G. (2008). Service Operations Management (3rd ed.). Financial Times-Prentice Hall,
Harlow, 96-111.
Mahmutović, H., & Kulović, Dž. (2010). Upravljanje preduzećem. Data status, Beograd.
publikacije.stat.gov.rs/G2022/HtmlL/G20221023.html Date of access: 15.01.2022.
Schroeder, R,. G. (1999). Upravljanje proizvodnjom: odlučivanje u funkciji proizvodnje. Mate, Zagreb, 45-52.
Stošić Mihajlović, Lj. (2022). Operativni proizvodni menadžment. Akademija tehničko.vaspitačkih strukovnih
studija, Niš, 62-63.
Symeonidis, G. (1996). Innovation, Firm Size, and Market Structure:Schumpeterian Hypotheses and Some New
Themes. OECD EconomicStudies, 27, 35-70.
www.apr.gov.rs/.htmnewsId, Date of access: 23.01.2022.
www.srbija.gov.rs/vest/porast-registrovanih-privrednih-subjekata-u-2020-godini.php Date of access: 21.01.2022.

125
XII International Symposium Engineering Management and Competitiveness 2022 (EMC 2022)
17-18th June, Zrenjanin, Serbia
BLOCKCHAIN IN THE SUPPLY CHAIN
László Szabó
Budapest Business School, Faculty of Finance and Accountancy, Budapest, Hungary
E-mail: [email protected]
ABSTRACT
Digital technology has transformed many aspects of our lives and brought significant change across industries.
Blockchain technology has been the focus of much research in recent years. In logistics and supply chain,
blockchain-centric solutions are being sought to perform infocommunications activities with distributed
databases. Business users expect supply chains to leapfrog in efficiency and speed. This article introduces
blockchain technology and provides insights into its areas of application for logistics.
Key words: Blockchain, Supply chain, Logistics, IoT.
INTRODUCTION
Digitalization started to transform the logistics industry in the late 1990s. The advent of artificial
intelligence (AI) revolutionized business practices. With the Internet of Things (IoT), businesses can
use real-time data to improve processes and reduce costs, making it a major player in the transport and
logistics sector. The concept of the blockchain is also coming into focus, and not coincidentally, this
technology can solve one of the biggest problems organizations face: securely managing information
shared across networks.
THE BLOCKCHAIN
Blockchain is a system of recording information in a way that makes it difficult or impossible to
change, hack, or cheat the system. The blockchain is essentially a digital ledger of transactions that is
replicated and distributed across the entire network of computer systems in the blockchain. Each block
in the chain contains transactions, and each time a new transaction is made on the blockchain, an entry
for that transaction is added to the ledger of all participants. A decentralized database managed by
several participants is called distributed ledger technology (DLT). (A blockchain is a type of DLT in
which transactions are recorded with an immutable cryptographic signature, called a hash.) This
means that if a block in a chain were changed, it would immediately become obvious that it had been
tampered with. If hackers wanted to tamper with a blockchain system, they would have to change
every block in the chain, in all distributed versions of the chain. (euromoney.com, 2020)

L. Szabó / Blockchain in the supply chain
126
Figure 1: The Properties of Distributed Ledger Technology (DLT)
(euromoney.com, 2020)
THE BLOCKCHAIN TECHNOLOGY COLLABORATION AND PROCESS COMPLEXITY
OF BLOCKCHAIN-BASED APPLICATIONS
Blockchain applications can be characterised along two basic dimensions that show the impact of
using a blockchain-based decentralised platform on existing collaboration structures and processes:
collaboration complexity and process complexity. As the technical features of the technology allow for
distributed management of all types of transactions, there is no longer a need for a trusted party to
authenticate transactions. This disintermediation not only leads to a "re-engineering" of processes, but
also to a change in the participants in existing business structures. (Heines, 2021)
Cooperation Complexity
One of the difficulties of using blockchain-based decentralized platforms is often the peer-to-peer
structure, which puts all participants on an equal footing. To implement such a platform, common
business processes and activities must first be translated into programmable logic and replicated in a
given blockchain technology stack. Thus, before launching a concrete blockchain network, different
actors need to agree on, for example, a common platform and a specific protocol. (Heines, 2021)
Process Complexity
The smart contract function, i.e. the automatic execution of rules and instructions based on business
logic stored in the blockchain, has huge potential for many companies. As the consistency of
transaction data is improved through the tamper-proof storage of a replicated ledger, smart contracts
enable the automatic execution of almost all upstream and downstream tasks. (Heines, 2021)
Based on these two dimensions, the following framework emerges with four dimensions: record
keeping, automation, tokenization, and platforming (Heines, 2021):
Record Keeping
All posts on the open blockchain can be tracked by all network participants under a pseudonym. Each
block consists of cryptographically sealed transaction data, which is more secure against manipulation.
Automation
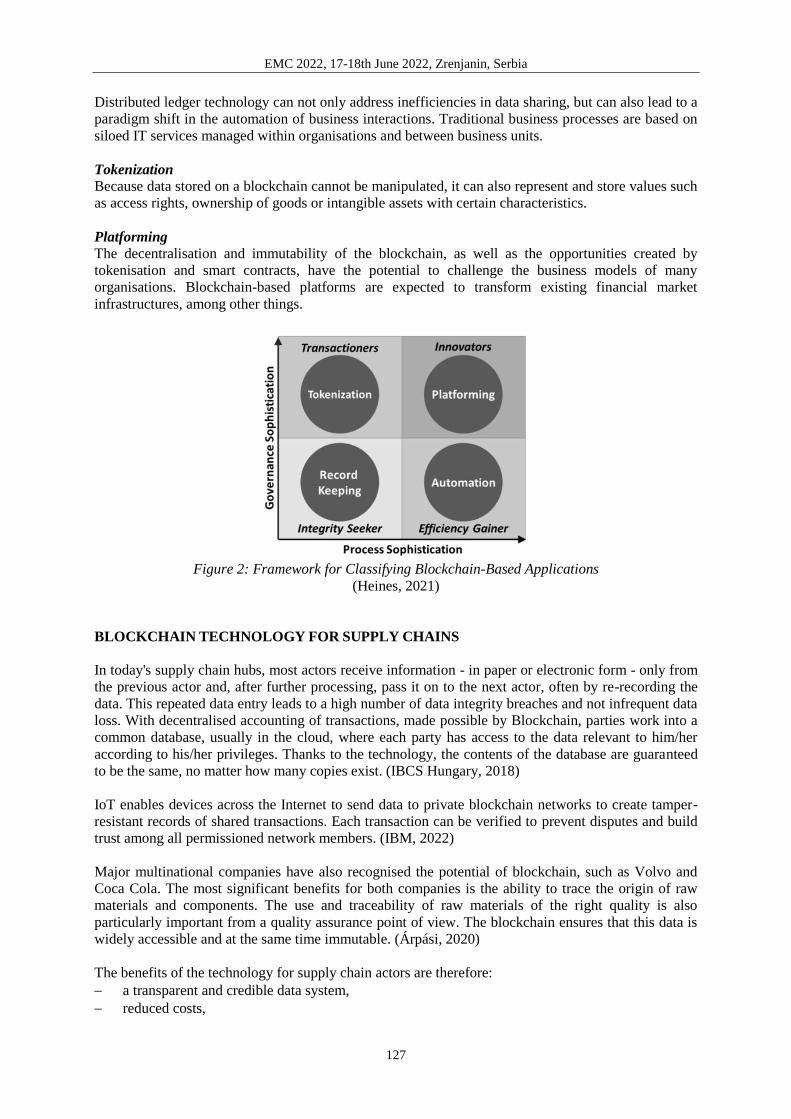
EMC 2022, 17-18th June 2022, Zrenjanin, Serbia
127
Distributed ledger technology can not only address inefficiencies in data sharing, but can also lead to a
paradigm shift in the automation of business interactions. Traditional business processes are based on
siloed IT services managed within organisations and between business units.
Tokenization
Because data stored on a blockchain cannot be manipulated, it can also represent and store values such
as access rights, ownership of goods or intangible assets with certain characteristics.
Platforming
The decentralisation and immutability of the blockchain, as well as the opportunities created by
tokenisation and smart contracts, have the potential to challenge the business models of many
organisations. Blockchain-based platforms are expected to transform existing financial market
infrastructures, among other things.
Figure 2: Framework for Classifying Blockchain-Based Applications
(Heines, 2021)
BLOCKCHAIN TECHNOLOGY FOR SUPPLY CHAINS
In today's supply chain hubs, most actors receive information - in paper or electronic form - only from
the previous actor and, after further processing, pass it on to the next actor, often by re-recording the
data. This repeated data entry leads to a high number of data integrity breaches and not infrequent data
loss. With decentralised accounting of transactions, made possible by Blockchain, parties work into a
common database, usually in the cloud, where each party has access to the data relevant to him/her
according to his/her privileges. Thanks to the technology, the contents of the database are guaranteed
to be the same, no matter how many copies exist. (IBCS Hungary, 2018)
IoT enables devices across the Internet to send data to private blockchain networks to create tamper-
resistant records of shared transactions. Each transaction can be verified to prevent disputes and build
trust among all permissioned network members. (IBM, 2022)
Major multinational companies have also recognised the potential of blockchain, such as Volvo and
Coca Cola. The most significant benefits for both companies is the ability to trace the origin of raw
materials and components. The use and traceability of raw materials of the right quality is also
particularly important from a quality assurance point of view. The blockchain ensures that this data is
widely accessible and at the same time immutable. (Árpási, 2020)
The benefits of the technology for supply chain actors are therefore:
a transparent and credible data system,
reduced costs,

L. Szabó / Blockchain in the supply chain
128
information freely available to stakeholders. (Árpási, 2020)
The practical benefits of blockchain in logistics:
facilitates container location
indicates the status of customs documents and waybills
unifies operations and partners in the transport process
allows you to improve your work
reduced operating costs
easier control
fewer intermediaries
limits the number of paper documents
shorter delivery times. (tokeny.pl, 2019)
In addition to the obvious benefits, there are of course also difficulties and limitations. Whilst
traceability and thus accountability for quality performance is a good thing for the end user, for
example, it is unlikely to be a benefit for all stakeholders. The rooting of a new system is always
complicated because it requires the agreement and integration of all stakeholders. Training and
education can be organized for both external and internal stakeholders, which takes time and
resources. (Árpási, 2020)
CONCLUSION
Once considered an oddity, blockchain technology has now become a more widely used process,
found in all areas of the economy.
Globally, organizations have been taking advantage of blockchain technology to improve traceability
in their supply chain. (Vyas et al., 2109) However, there are also problems that are slowing the rapid
spread of blockchain. Some are concerned about cyber security and regulatory complications. (Móray,
2020) However, it is safe to say that in the near future, the use of blockchain technologies in supply
chains will continue to grow because of the benefits it brings.
REFERENCES
Árpási, Z. (2020). Blokklánc a gyakorlatban: logisztika, ellátási lánc. Retrieved from
https://cryptofalka.hu/blokklanc-logisztika/
euromoney.com (2020). What is blockchain? Retrieved from https://www.euromoney.com/learning/blockchain-
explained/what-is-blockchain
IBCS Hungary (2018). Blockchain a logisztikában. Retrieved from https://ibcs.hu/hirek/blockchain-a-
logisztikaban/
Heines, R. (2021). Classification of Blockchain-Based Applications: A Conceptualization from a User
Perspective Retrieved from https://ccecosystems.news/en/classification-of-blockchain-based-applications-
a-conceptualization-from-a-user-perspective/
IBM (2022). How does IoT work with blockchain? Retrieved from https://www.ibm.com/topics/blockchain-iot
McKinsey & Company (2017). Blockchain technology for supply chains—A must or a maybe? Retrieved from
https://www.mckinsey.com/business-functions/operations/our-insights/blockchain-technology-for-supply-
chainsa-must-or-a-maybe
Móray, G. (2020). Mi az a blokklánc technológia és milyen lehetőségeket kínál? Retrieved from
https://computerworld.hu/tech/mi-az-a-blokklanc-technologia-es-milyen-lehetosegeket-kinal-285890.html
tokeny.pl (2019). Blockchain a logisztikában. Retrieved from https://tokeny.pl/hu/blockchain-a-
logisztik%C3%A1ban/
Vyas, N., Beije, A., & Krishnamachari, B. (2019). Blockchain and supply chain. Croydon (UK), Kogan Page.

129
XII International Symposium Engineering Management and Competitiveness 2022 (EMC 2022)
17-18th June, Zrenjanin, Serbia
INFLUENCE OF QUALITY MANAGERS ON ORGANIZATION
QUALITY PERFORMANCES
Dijana Tadić
University of Novi Sad, Technical Faculty "Mihajlo Pupin", Zrenjanin, Serbia
E-mail: [email protected]
ABSTRACT
The leadership of modern business organizations need a new vision of the world and a new framework for
behavior in it - for the changes that are constantly happening. Significant conceptual change of business is
brought about by Industry 5.0. Because they have to manage in times of great turbulence, executives need a
system for making better decisions, in different areas of business. The key to the setting of the paper is the
emphasis on the quality manager, which is expected to contribute to the concept of quality of the future - the
concept of 5.0. The aim is therefore to establish the basic elements of the theoretical model of the examined
relationship between the characteristics of quality managers and their impact on the performance of the
organization - the efficiency of introducing the highest point of quality and possible quality outcomes that
different quality management can cause.
Key words: Quality 5.0, Industry 5.0, Quality manager, Characteristics.
INTRODUCTION
From the 18th century onwards, there were industrial revolutions that, each in its own way, shaped the
world. In the 21st century, production is characterized by cyber-physical systems, information and
communication technologies, automation, artificial intelligence, robotics and many other technologies.
Their integration enables the realization of the highest form of quality, which is also called Quality
5.0. Quality 5.0 managers must possess certain characteristics, but also knowledge, in order to
contribute to increasing the quality performance of the organization.
This paper is based on a theoretical model, how the characteristics of managers affect the efficiency of
the introduction of Quality 5.0. Some of the possible outcomes, to which different management
contributes, are also presented. Through further research, based on this model, it will be possible to
discover exactly what qualities, qualifications and knowledge it is desirable to have a quality manager
in Industry 5.0. This will contribute to making more correct decisions when hiring a quality manager,
which will result in a more successful and faster implementation of the quality concept of the future.
CHARACTERISTICS OF QUALITY MANAGER 5.0
Every manager must possess moral qualities, intellectual abilities, physical qualities and knowledge
and experience in the jobs he manages (Bojić, 2018). This refers to the developed social awareness
and responsibility that the manager takes on; realism, objectivity and the ability to persuade; physical
and mental health; general and vocational education.
It is not news that they are successful leaders and leaders, both physically and spiritually. There is an
opinion that leaders are not appointed, elected or appointed, they stand out with their characteristics,
which make them leaders (Tomić & Glavač, 2019). In order for a quality manager in Industry 5.0 to be
successful, he must possess the qualities of a leader.

D. Tadić / Influence of quality managers on organization quality performances
130
The main characteristic of a leader is innovation (Buhač, 2020). Today's production takes place
through the cooperation of people and machines (Bharati, 2021), which results in greater creativity and
efficiency in production processes (Nahavandi, 2019). It can be said that the production flow is taking
place in an innovative way, compared to a few years ago, so a more innovative approach is expected
from the manager, more than ever before.
The human factor in production is crucial when it comes to product innovation and personalization
(Doyle-Kent & Kopacek, 2019), and Quality 5.0 strives for uniqueness and originality, which is made
possible by the aforementioned industrial revolution. The quality manager, therefore, must possess
traits such as: courage, flexibility, creativity, imagination, passion and drive to initiate change, to
realize the full potential of the many technological capabilities available to man, in order to introduce
and maintain Quality 5.0, and thus improve performance the quality of the whole organization.
Unlike previous revolutions, the human factor is at the center of all events (Kurniawan et al., 2019).
With the complete automation of production, the demand for human touch in the production process is
growing, with which customers emphasize their personality (Østergaard, 2018). It is believed that
modern technology will enable personalized production in the Fifth Industrial Revolution, but that
market demands will require greater human participation (Javaid & Haleem, 2020). Quality managers
must have adequate access to their team members, but also to other employees, in order to motivate
and inspire them to strive for better quality of the entire organization, but also to strive to propose new
ideas to achieve market success. In addition to intuition when assessing which team member will
perform the best task, it is also necessary to encourage the activity, and transfer personal will to it
(Nadoveza & Pešić, 2020). In this regard, Austin and Williams (2021) believe that every leader should
have the strength of will, a sense of proportion and tact, to be resilient and loyal to his work group, as
well as to have deep faith in people.
In addition to the above characteristics, quality managers must have a wide range of knowledge about
modern technologies and their capabilities. Today, technology is integrated into every aspect of human
life (Prastowo et al., 2020). Awareness of technological advances and a willingness to change business
habits, as well as the ability to help other employees more easily embrace innovation, will contribute
to a faster and easier introduction of Quality 5.0 into the organization.
Those managers who deliberately strive for achievement are said to be conscientious (Sokić et al.,
2019). Such people are adorned with qualities such as diligence, determination, caution and reliability.
By their example, they show others what conscientious business should look like, and what values the
organization is focused on. This feature is highly desirable for quality managers. The quality has
always had to be approached conscientiously, and the increasingly demanding market insists on an
even deeper and more thorough approach.
Table 1: Managerial characteristics that make him ideal
SAD Belgium Northern
France Eastern France
Nervous and physical energy 1 8 9 9
Consistency, audacity 2 5 1 1
Delight 3 3 5 5
Understanding people 4 6 4 4
Integrity 5 2 2 5
Mastery in techniques 6 10 8 7
Character strength 7 7 7 8
Intelligence 8 4 5 2
Pedagogical sense 9 9 10 10
Instilling confidence 10 1 3 3
Source: (Cambrea et al., 2021)
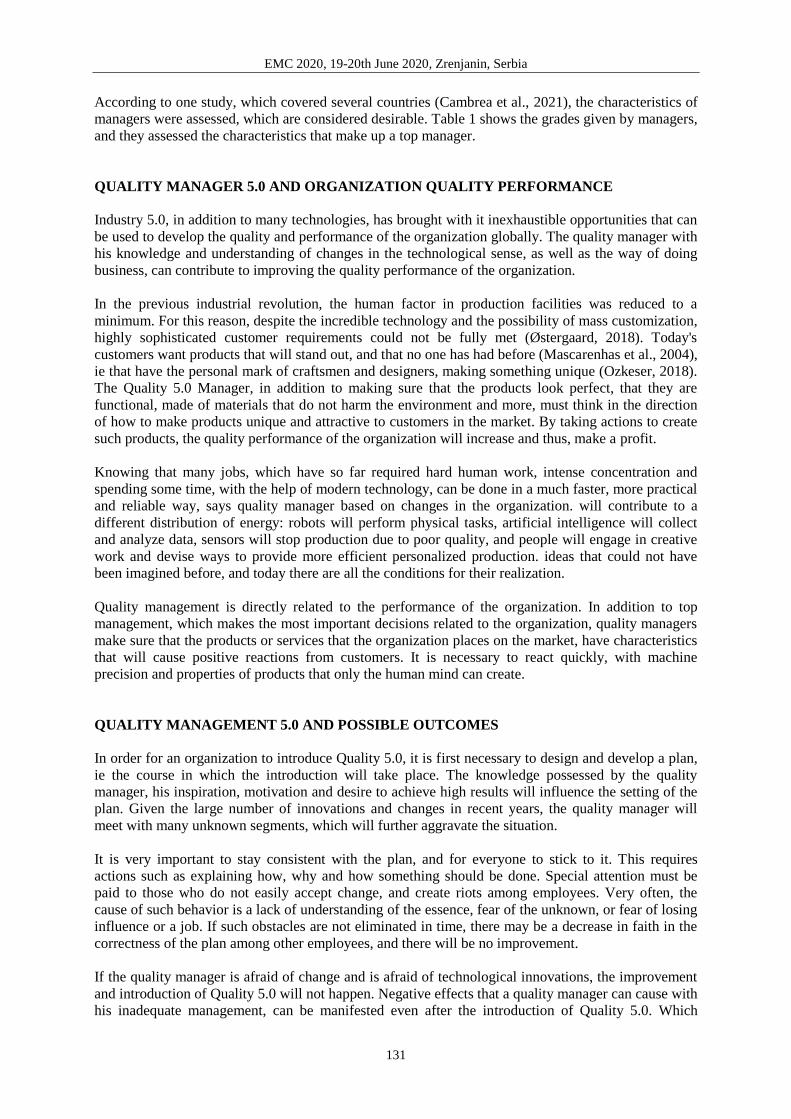
EMC 2020, 19-20th June 2020, Zrenjanin, Serbia
131
According to one study, which covered several countries (Cambrea et al., 2021), the characteristics of
managers were assessed, which are considered desirable. Table 1 shows the grades given by managers,
and they assessed the characteristics that make up a top manager.
QUALITY MANAGER 5.0 AND ORGANIZATION QUALITY PERFORMANCE
Industry 5.0, in addition to many technologies, has brought with it inexhaustible opportunities that can
be used to develop the quality and performance of the organization globally. The quality manager with
his knowledge and understanding of changes in the technological sense, as well as the way of doing
business, can contribute to improving the quality performance of the organization.
In the previous industrial revolution, the human factor in production facilities was reduced to a
minimum. For this reason, despite the incredible technology and the possibility of mass customization,
highly sophisticated customer requirements could not be fully met (Østergaard, 2018). Today's
customers want products that will stand out, and that no one has had before (Mascarenhas et al., 2004),
ie that have the personal mark of craftsmen and designers, making something unique (Ozkeser, 2018).
The Quality 5.0 Manager, in addition to making sure that the products look perfect, that they are
functional, made of materials that do not harm the environment and more, must think in the direction
of how to make products unique and attractive to customers in the market. By taking actions to create
such products, the quality performance of the organization will increase and thus, make a profit.
Knowing that many jobs, which have so far required hard human work, intense concentration and
spending some time, with the help of modern technology, can be done in a much faster, more practical
and reliable way, says quality manager based on changes in the organization. will contribute to a
different distribution of energy: robots will perform physical tasks, artificial intelligence will collect
and analyze data, sensors will stop production due to poor quality, and people will engage in creative
work and devise ways to provide more efficient personalized production. ideas that could not have
been imagined before, and today there are all the conditions for their realization.
Quality management is directly related to the performance of the organization. In addition to top
management, which makes the most important decisions related to the organization, quality managers
make sure that the products or services that the organization places on the market, have characteristics
that will cause positive reactions from customers. It is necessary to react quickly, with machine
precision and properties of products that only the human mind can create.
QUALITY MANAGEMENT 5.0 AND POSSIBLE OUTCOMES
In order for an organization to introduce Quality 5.0, it is first necessary to design and develop a plan,
ie the course in which the introduction will take place. The knowledge possessed by the quality
manager, his inspiration, motivation and desire to achieve high results will influence the setting of the
plan. Given the large number of innovations and changes in recent years, the quality manager will
meet with many unknown segments, which will further aggravate the situation.
It is very important to stay consistent with the plan, and for everyone to stick to it. This requires
actions such as explaining how, why and how something should be done. Special attention must be
paid to those who do not easily accept change, and create riots among employees. Very often, the
cause of such behavior is a lack of understanding of the essence, fear of the unknown, or fear of losing
influence or a job. If such obstacles are not eliminated in time, there may be a decrease in faith in the
correctness of the plan among other employees, and there will be no improvement.
If the quality manager is afraid of change and is afraid of technological innovations, the improvement
and introduction of Quality 5.0 will not happen. Negative effects that a quality manager can cause with
his inadequate management, can be manifested even after the introduction of Quality 5.0. Which

D. Tadić / Influence of quality managers on organization quality performances
132
further poses a threat that the achieved success will be nullified or the achieved results will be set
back.
Assessment of the qualities and characteristics of a quality manager can be determined very quickly
and efficiently using various personality tests; but it takes a little more time to manage. If a new
manager has taken a position, it takes some time to get acquainted with everything that makes up that
organization, and then to determine how he manages and how his behavior manifests itself to other
employees.
Possible outcomes of quality management can vary from very positive to those that do not lead to the
introduction of Quality 5.0. The worst possible outcome is not noticing the existence of a certain
problem, or attributing bad outcomes to something else. In such cases, it is very likely that it will be
too late to find out where the focus of the disturbance is.
GUIDELINES FOR FURTHER RESEARCH
The first condition for a quality manager to achieve noticeably positive results on the performance of
the organization, is to possess leadership qualities. Regardless of the wide range of knowledge he may
have about Quality 5.0, if he does not know how to pass it on to his associates, motivate them, move
them into action and create a spirit of community with the idea that they can do it, no effort will be
made. to bear fruit.
It is also necessary to establish what motivates such a quality manager. In addition to the innate, or
learned ability to lead others, the leader must be motivated to make every effort to achieve the goal.
Only motivated, he will motivate other employees. The introduction of Quality 5.0 is a complex
mission, which requires the participation of all employees.
In addition to qualities and motivation, the ability to handle modern technologies is necessary.
Inevitably, the technologies that marked the Fourth Industrial Revolution will continue to be used and
upgraded over time in Industry 5.0. According to research conducted by Efimova and Brish (2021),
the impact of technologies such as Big Data and Big Data analytics has contributed to transparency,
credibility, forecasting and data control, enabling more efficient quality management (Chiarini, 2020;
Zonnenshain & Kenett, 2020). In the future, an increase in the number of available data can be
expected, which will be analyzed by technological processing and provide an opportunity for quality
managers to improve their quality tools and improve the quality performance of the organization.
Therefore, the adaptation and application of these technological possibilities in production is essential.
In addition to the above, technologies that make a great contribution to quality management are
simulations and artificial intelligence (Efimova & Brish, 2021). Their application is a wise choice in
terms of the support necessary for successful quality management. The quality performance of
organizations directly depends (and this trend will continue in the future) on the decisions made by
managers, and those on the application of various types of technologies. Investing in upgrading
existing and purchasing other modern technologies is the key to the success of any company.
CONCLUSION
The managerial skills of a manager dictate the success of any organization. His characteristics,
competencies and motivation are one of the key factors for the introduction and maintenance of top
quality in the organization.
The technologies that marked Industry 4.0 are an indispensable segment in the introduction of Quality
5.0. Even more frequent and widespread use of technological possibilities can be expected, with the
constant development of their capabilities. With a larger number of data, their processing and analysis,

EMC 2020, 19-20th June 2020, Zrenjanin, Serbia
133
quality managers will make safer and better strategic decisions regarding the achievement of long-
term quality.
It can be said that the manager of Quality 5.0, represents a bridge between modern technologies and
the performance of the organization. The application of various technological possibilities provides
knowledge, the management of which will increase the possibilities of creating high results.
REFERENCES
Austin, A. A., Williams, L. T. (2021). Evaluating company adoptions of blockchain technology: How do
management and auditor communications affect nonprofessional investor judgments? Journal of
Accounting and Public Policy 40(5): 106882,
Bharati, S. (2021). Business intelligence and Industry 5.0. Journal of the International Academy for Case
Studies, 27, 1-3.
Bojić, M. (2018). Uticaj menadžera na kvalitet poslovanja organizacije. Univerzitet Privredna akademija u
Novom Sadu.
Buhač, I. (2020). Razvijanju liderskih sposobnosti zaposlenika (Doctoral dissertation, Josip Juraj Strossmayer
University of Osijek. Faculty of Economics in Osijek. Chair of Management, Organization and
Entrepreneurship).
Cambrea, D.R., Ponomareva, Y., Pittino, D., Minichilli, A. (2021). Strings attached: Socioemotional wealth
mixed gambles in the cash management choices of family firms. Journal of Family Business Strategy,
100466.
Chiarini, A. (2020). Industry 4.0, quality management and TQM world. A systematic literature review and a
proposed agenda for further research. The TQM Journal, 32(4), 603-616.
Doyle-Kent, M., & Kopacek, P. (2019, August). Industry 5.0: Is the manufacturing industry on the cusp of a new
revolution?. In Proceedings of the International Symposium for Production Research 2019 (pp. 432-441).
Springer, Cham.
Efimova, A., & Briš, P. (2021). Quality 4.0 for processes and customers. Quality Innovation Prosperity.
Javaid, M., & Haleem, A. (2020). Critical components of Industry 5.0 towards a successful adoption in the field
of manufacturing. Journal of Industrial Integration and Management, 5(03), 327-348.
Kurniawan, A., Komara, B. D., & Setiawan, H. C. B. (2019). Preparation and Challenges of Industry 5.0 for
Small and Medium Enterprises in Indonesia. Muhammadiyah International Journal of Economics and
Business, 2(2), 155-160.
Mascarenhas, O. A., Kesavan, R., & Bernacchi, M. (2004). Customer value‐chain involvement for co‐creating
customer delight. Journal of Consumer Marketing.
Mekkunnel, F. (2019). Industry 5.0: man-machine revolution (Doctoral dissertation, Wien).
Nadoveza, B., & H. Pešić. (2020). Održivi razvoj - proizvodna snaga savremenog društva. Održivi razvoj 2(1),
31-40.
Nahavandi, S. (2019). Industry 5.0 - A human-centric solution. Sustainability, 11(16), 4371.
Østergaard, E. H. (2018). Welcome to industry 5.0. Retrieved on February, 5, 2020.
Ozkeser, B. (2018). Lean innovation approach in Industry 5.0. The Eurasia Proceedings of Science Technology
Engineering and Mathematics, (2), 422-428.
Paschek, D., Mocan, A., & Draghici, A. (2019, May). Industry 5.0 - The expected impact of next Industrial
Revolution. In Thriving on Future Education, Industry, Business, and Society, Proceedings of the
MakeLearn and TIIM International Conference, Piran, Slovenia (pp. 15-17).
Prastowo, A. I., Firman, A. J., Mulyanto, T., & Wiranata, R. R. S. (2020, September). The Independent Learning
Curriculum Concept of Imam Zarkasyi's Perspective In Pesantren For Facing The Era of Society 5.0. In
Proceedings of the 4th International Conference on Learning Innovation and Quality Education (pp. 1-6).
Sokić, K., Gutić Martinčić, S. & Bakić, M. (2019). Uloga ličnosti u organizacijskom ponašanju. FIP – Financije
i pravo, 7(2), 23–50.
Tomić, Z. & Glavač, K. (2019). Političko vodstvo. South Eastern European Journal of Communication, 1(1), 9–
20.
Zonnenshain, A., & Kenett, R. S. (2020). Quality 4.0 — the challenging future of quality engineering. Quality
Engineering, 32(4), 614-626.

D. Tadić / Influence of quality managers on organization quality performances
134

135
XII International Symposium Engineering Management and Competitiveness 2022 (EMC 2022)
17-18th June, Zrenjanin, Serbia
Session B: HUMAN RESOURCE MANAGEMENT
Papers (pp. 136-168):
Verica Gluvakov, Sanja Stanisavljev, Dragana Milosavljev,
Mila Kavalić, Maja Gaborov
OVERVIEW OF STUDIES RELATED TO THE IMPACT OF STRESS ON EMPLOYEE
PRODUCTIVITY AND STRESS MANAGEMENT IN COMPANIES ...137
Verica Gluvakov, Edit Terek Stojanović, Sanja Stanisavljev,
Dragana Milosavljev, Mila Kavalić
OVERVIEW OF STUDIES REGARDING THE IMPACT OF EMPLOYEE
MOTIVATION ON WORK PERFORMANCE 142
Predrag Mali, Bogdan Kuzmanović, Siniša Mitić,
Edit Terek Stojanović, Milan Nikolić
LEADERSHIP, EMPLOYEE JOB SATISFACTION AND FINANCIAL PERFORMANCE
OF THE ORGANIZATION ...146
Dragana Milosavljev, Verica Gluvakov, Mila Kavalić, Maja Gaborov,
Mlita Ćoćkalo-Hronjec, Luka Đorđević
IMPORTANCE OF CREATIVE POTENTIALS OF EMPLOYEES IN MODERN BUSINESS ...152
Dragana Sajfert, Svetlana Anđelić, Milica N Jeremić
RESEARCH OF ESSENTIAL CHARACTERISTICS OF STUDENTS FOR
THEIR PLACEMENT IN THE POSITION OF STUDENT – DEAN ...157
Dijana Tadić
SELECTION OF CANDIDATE FOR ASSEMBLING BLINDS USING
THE TOPSIS METHOD ...163

136

137
XII International Symposium Engineering Management and Competitiveness 2022 (EMC 2022)
17-18th June, Zrenjanin, Serbia
OVERVIEW OF STUDIES RELATED TO THE IMPACT OF STRESS
ON EMPLOYEE PRODUCTIVITY AND STRESS MANAGEMENT IN
COMPANIES
Verica Gluvakov
University of Novi Sad, Technical faculty „Mihajlo Pupin“, Zrenjanin, Serbia
E-mail: [email protected]
Sanja Stanisavljev
University of Novi Sad, Technical faculty „Mihajlo Pupin“, Zrenjanin, Serbia
Dragana Milosavljev
University of Novi Sad, Technical faculty „Mihajlo Pupin“, Zrenjanin, Serbia
Mila Kavalić
University of Technical Sciences, Novi Sad, Serbia
Maja Gaborov
University of Novi Sad, Technical faculty „Mihajlo Pupin“, Zrenjanin, Serbia
ABSTRACT
This paper has aim to show the most significant causes of stress among employees as well as its impact on them
and the business itself. The conclusions were made on the basis of previously conducted research in different
companies. Different authors tried to answer the questions about stress and stress management among employees
using different research methods, and this paper will consider previously conducted research in order to present
what they all have in common. The conclusions of the paper will focus on stress and its effects in business
environment.
Key words: Stress management, Employee productivity, Business.
INTRODUCTION
Stress can be defined as a human response in the form of physiological, psychological or behavioral
deviations in response to an extreme situation. The term stress does not include an individual’s fear,
nervous tension or something that must be avoided. Stress can be defined as the mental and physical
effort that an individual feels as a result of environmental factors and needs to be studied for several
reasons. One of the reasons is that stress can cause a psychological disorder in a person as well as
psychological consequences on his health. Another reason to study the question of stress is that
employee stress is a common cause of employee absenteeism. Also, the reason for studying stress is
that there is a possibility of transferring stress to other employees in the business environment (Sajfert,
2008). The concept of stress at work can be defined as the result of inadequate demands of the work
environment and the capabilities of employees, and can occur not only as a result of pressure from the
work environment, but also as an expression of general imbalance between work situation
characteristics and individual characteristic. Stress at work can be the cause of certain diseases, less
motivation of employees, less productivity and less self-confidence in their own working abilities at
work (Juras, 2009). One of the most common causes of stress at work are organizational changes that
cause resistance among employees. However, in addition to this, there are several other causes of
stress at work (Popov, 2018):
Content of the work itself – uniformity of tasks and lack of dynamics.
Amount of work – too much or too little work and time-limited work.
Working hours – inflexible working hours and overtime stay at work.
Lack of career advancement, position and earnings – job insecurity, low chances of advancement,
lack of expertise and unfair performance rewards.

V. Gluvakov et al. / Overview of studies related to the impact of stress...
138
Interpersonal relationships – bad relationship with co-workers, loneliness and non-acceptance of
workers problems.
Organizational culture – poor communication, poor leadership and unclear goals.
Work-life balance – lack of understanding of house problem at work and vice versa.
Understanding stress and its impact on employee performance is the first phase in stress management,
where the manager needs to find out what is the relationship between the amount of stress and the
amount of employee performance.
Figure 1: The relationship between stress level and performance level
Source: Ivancevich et al., 2014, p. 237.
The picture shows that stress can be low, optimal and high, so that low or high stress corresponds with
low or high performance, while the performance of employees is on highest level in medium and
optimal stress. According to this, those individuals who feel optimal stress contribute to increased
performance, unlike others who feel extremely high or low stress, which has the effect of reducing
work performance. Identifying where there is stress in the organization is the second phase of stress
management. When it is precisely determined where stress exists, then it must be determined whether
the stress is at the appropriate level or whether it is high or low. Low stress can be increased to the
desired level by different psychological actions in contrast of high stress which can be reduced by
subtle methods on employees. The most difficult task for managers is to identify or recognize
employees who feel high level of stress. Identification of employees who feel high level stress can be
based on symptoms such as high blood pressure, mood swings and constant anxiety. Helping
employees to control or manage stress is the third phase in stress management. Factors that lead to
human stress are called stressors and in organizational environment, stressors can be tasks, level of job
complexity, level of responsibility, technology changes, organizational culture as well as other
employees (Ivancevich, 2014).
METHODOLOGY
The subject and The problem of Research
This paper will deal with considering the most common causes of stress in business environment, the
impact of stress on employees and business operations as well as determining ways to reduce and
manage stress in the organization. This paper won’t be focusing on specific aspect, rather try to
observe as many different studies as possible.
Research Goals
The main goal of this overview of studies is to determine the impact of stress on employees and their
productivity in companies, as well as presenting the causes of organizational stress. This paper also
aims to present some of the ways to reduce or eliminate stress in organization.

EMC 2022, 17-18th June 2022, Zrenjanin, Serbia
139
Research Question
Based on analyzed theories I will try to answer the following questions:
1. Which are the most common causes of stress in business environment?
2. How does organizational stress affect employees?
3. Which are the ways to manage organizational stress?
Research Method
This is a form of theoretical research in which conclusions are based on previous researches and their
comparison with one another. Research will consider different methodologies of other authors as well
as analyze results and compare them in hope of reaching universal conclusions.
RESULTS AND DISCUSSION
The first reviewed study aimed to discover the causes and intensity of stress among employees and
advice on preventive and corrective measures. The research was conducted in the company at the level
of organizational units. In the first phase of this research, a team of psychologists interviewed
employees based on which a questionnarie was made that contained 78 questions about specific
situations at work as well as 10 additional questions about life situations that can be significant
stressors. The answers in the qustionnarie were classified with grades from 1 do 5, and the average
grade of 3,5 or more was taken as the criterion of analysis. Questionnaries were delivered to each
organizational unit in aim to divide stressors into groups, and 51,16% of all employees participated in
this research, more precisely 664 persons. The analysis of the results identified seven groups of
stressors in the organization: work overload, poor management, problems in performing tasks, poor
working conditions, fear and insecurity, problems withs colleagues and poor conditions in the
restaurant. All groups of stressors were assesed by employees as very important for doing work and as
significant sources of stress. In the mentioned groups of stressors, highest grades of presence has the
factor of poor working conditions (2,95), followed by poor condition in the restaurant (2,89) and work
overload (2,87). The lowest grades have fear and insecurity (2,08) and problems with colleagues
(2,03). All grades are bellow 3,00 which indicates that at the company level no group of stressors is
expressed above average specifically in this research. The most common causes of stress that are
common to all categories of stressors are urgency of work, short deadlines and constant learning of
new things. Employees estimate that stressors outside the organization increase overall stressors from
2% for stressors caused by poor working conditions to 22% for stressors caused by fear and insecurity.
According to this, employees come to work tense, so they misjudge management, relationship with
colleagues and performing they own work (Lipnjak, 2011).
Another study shows some of the most common causes of stress in business. This research was
conducted in production organization. The research sample was consisted of 60 employees and, after
receiving the instructions for work, respodents filled out the questionnarie. Both sexes of different
ages who work in the organization for a certain period of time at their workplace were interviewed.
The questionnarie consisted of two parts. The first, general, part of the questionnarie referd to
demographic characteristics such as gender, age, years of service and education. The second part of
the questionnarie consisted of 30 statements which represented stressful events in business
environment. Stressful situations were examined through lack of support from superiors, non-job
duties, lack of opportunities for advancement, non-participation in task planning, poor employee
motivation and poor working conditions. The company conducted research on stressful events in the
workplace which are related to professional styles. According to this study, the most common causes
of stress in production organization are lack of opportunities for advancement, obtaining new or
unknown tasks, not receiving recognition for quality work, inadequate earnings and work with poorly
motivated colleagues (Vračar, 2020).

V. Gluvakov et al. / Overview of studies related to the impact of stress...
140
The question of stress at work is closely related to employee productivity, and this study presents how
stress affects employees and their work performance. The research was conducted on a sample of 270
employees in tobacco factory. The survey included 69% of male and 31% of female working
population aged 20 to 65 years with different levels of education. This research aimed to determine the
presence, level and sources of stress at work as well as their impact on health, absenteeism, quality of
life and working ability of employees based on subjective perception. The presence of elements of
stress at work was determined in 51% of interviewed employees, as well as the connection between
stress and work ability and quality of life. The elements of stress at work were subjectively perceived
by a larger number (83%) of employees with poor working ability and poor quality of life. It was also
determined that employees under stress used a larger number of sick days and had more verified
diagnoses compared to other employees. The conducted research came to the conclusion that there is a
significant connection between stress and the more frequent occurence of absenteeism, which directly
affects the reduction of employee productivity and the productivity of organization in general. Stress is
present in all business structures and the elements of stress in the workplace are work organization and
financial issues, work responsibility and professional requirements of the workplace which is the basis
for creating activities to improve mental health and psychosocial work environment (Ećimović, 2016).
Few years ago, work related stress has become the second most commonly reported work related
health problem in the UK and Europe. Several decades of stress research and studying with different
techniques and methods have shown that stress has consequences for employees from an individual
and organizational point. Different researches have demonstrated that certain job characteristics can be
causes of organizational stress, but individual employee characteristic such as personality and coping
behaviour are also important because employee vulnerability to stress is increased that way (Kelloway,
2008). According to all the above, responsibilities of employers are to assess physical and
psychosocial hazards to health in the workplace and to take steps adress these by focusing on key
areas such as demands, control, support, relationships, roles and change. There can be a form of
changing the nature of the job or the work environment to make it less stressful by introducing
primary level interventions such as job redesign an cultural change, by changing the attitudes and
behaviours of employees through secondary level interventions such as stress management training
and health promotion programs or by tertiary level interventions to provide support for the recovery of
distressed employees such as employee counseling. For example, researchers have found that the
primary level interventions designed to improve communication and consultation in a Dutch
construction company resulted in a 30% reduction of absenteeism. Primary level interventios are very
effective, however, studies found that in practice most interventions are individually focused and
directed at increasing the responsibility of employees to take better care of their health and to manage
stress more effectively. More precisely, most of the employers are using forms of stress management
programs focused on encouraging individuals to exercise more control over their health and to
increase their physical and psychosocial resistance to stress (Cartwright, 2014). Another study shows
that in the fiels of stress managing the role of cultural differences must be considered. For example,
social support is critical for some individuals, but individuals of different cultures may need other
types of support, such as financial help. Appreciating the role of a specific cultural framework is
essential for counselors who attempt to provide effective help to employees of various cultures (Chu-
Lien Chao, 2011).
CONCLUSION
Taking in consideration all previously mentioned researches and paper works following conclusions
were made. The most common cause of stress in business environment and among employees are poor
working conditions. Other important causes that affect employees are obtaining new or unknown
tasks, not receiving recognition for quality work and inadequate earnings (RQ:1). What is also
concluded is that stress among employees can greatly affect their productivity, because the fact that
employees who are under stress are often absent from work and have lack of work motivation, which
directly reduces their productivity as well as the productivity of the company in general (RQ:2).
Organizational stress can be managed and controlled in a several ways that are proven as effective

EMC 2022, 17-18th June 2022, Zrenjanin, Serbia
141
such as modifying or changing organizational culture of the company, prioritizing employees and
monitoring their behaviour as well as various health improvement and stress control programs (RQ:3).
The issue of stress in organizations and its impact on employees is an issue that needs to be studied
even more in the future in order to prevent the negative consequences of stress on both people and
business.
REFERENCES
Cartwrignht, S. & Cooper, C. L. (2014). Towards Organizational Health: Stress, Positive Organizational
Behaviour and Employee Well-Being. Bridging Occupational, Organizational and Public Health. pp 29-
42.
Chu-Lien Chao, R. (2011). Managing Stress and Maintaining Well-Being: Social Support, Problem-Focused
Coping and Avoidant Coping. Journal of Counseling & Development 83(3). pp 338-348.
Ećimović, I. (2016). Učestalost elemenata stresa na radnom mestu. Rauche zdravstveni časopis (7). ISSN 2303-
6907.
Ivancevich, J.M., Konopaske, R. & Matteson, M.T. (2014). Organizational behaviour and management. New
York: McGraw-Hill Irwin.
Juras, K., Knežević, B., Golubić, R., Milošević, M. & Mustajbegović, J. (2009). Stres na radu: Mere
prepoznavanja, rešenja i prevencija. Sigurnost 51(2). pp 121-126.
Kelloway, E.K., Hurrell, J.J. & Day, A. (2008). Workplace interventions for occupational stress. The individual
in the changing working life. Cambridge University Press. pp 419-441.
Lipnjak, G. (2011). Istraživanje uzroka stresa zaposlenih. Sigurnost 53(3). pp 219-226.
Popov, B. (2018). Stres u radnom okruženju. Novi Sad: Univezitet u Novom Sadu, Filozofski fakultet.
Sajfert, Z. (2008). Upravljanje promenama. Zrenjanin: Univerzitet u Novom Sadu, Tehnički fakultet „Mihajlo
Pupin“.
Vračar, A. (2020). Uticaj stresa na radne stilove u organizaciji. Novi Sad: Zbornik radova Fakulteta tehničkih
nauka.

142
XII International Symposium Engineering Management and Competitiveness 2022 (EMC 2022)
17-18th June, Zrenjanin, Serbia
OVERVIEW OF STUDIES REGARDING THE IMPACT OF
EMPLOYEE MOTIVATION ON WORK PERFORMANCE
Verica Gluvakov
University of Novi Sad, Technical faculty „Мihajlo Pupin“, Zrenjanin, Serbia
E-mail: [email protected]
Edit Terek Stojanović
University of Novi Sad, Technical faculty „Мihajlo Pupin“, Zrenjanin, Serbia
Sanja Stanisavljev
University of Novi Sad, Technical faculty „Мihajlo Pupin“, Zrenjanin, Serbia
Dragana Milosavljev
University of Novi Sad, Technical faculty „Мihajlo Pupin“, Zrenjanin, Serbia
Mila Kavalić
Faculty of Technical Sciences, Novi Sad, Serbia
ABSTRACT
This paper has aim to define the concept of employee motivation as well as the impact of employee motivation
on their work performance and the performance of the company in general. Also, the aim of this paper is to find
an answer to the question of the importance of employee motivation in the field of business. The paper will
contain a review of different studies by different authors in order to make conclusions. The analysis of various
conducted researches will lead to universal conclusions which will be presented in the paper.
Key words: Motivation, Employees, Work performance.
INTRODUCTION
The process of initiating activities in order to achieve certain goals, direct activities to certain facilities and
regulate the way in which they will act is called motivation. Those internal factors that drive the activity
which manage it in order to achieve certain goals are called motives. Motives are organic and
psychological factors that move or direct a person’s behavior, both his actions and his perception, learning
and thinking. The source of motivation are needs that can also be organic and psychological. Needs in the
case of motivation are defined as the lack of something (Rot, 1971). Motivation is a general term that refers
to a whole set of urges, demands, needs, desires and similar forces. It can be said that managers motivate
their employees so that they do tasks that they hope will satisfy the urges and demands of employees and
encourage them to behave in a desirable way. Motivation can be seen as a chain reaction: the needs we feel
lead to desires or goals that we strive for, which creates tension that strives to achieve goals, which
ultimately creates satisfaction. Human motives are based on needs, either conscious or subconscious. Some
needs are primary such as physiological needs for water, air, food and sleep. Other needs such as the need
for self-esteem, status of connection with others, achievement and self-expression can be considered
secondary (Sajfert, 2009). Motivators are things that motivate an individual to act. Although motivators
reflect desires, they are certain rewards or incentives that increase desires in order to satisfy them. What
managers need to do is to awake those motivators in people that will lead them to do work successfully for
the company that employs them. The difference between motivation and satisfaction is that motivation
refers to the aspiration and effort to satisfy desires or goals, while satisfaction refers to the fulfillment we
feel due to the satisfaction of desire. In other words, motivation implies striving for a result while
satisfaction is a consequence of that result. The issue of employee motivation is one of the issues related to
business management, which has been studied more and more in the last few years and is gaining more and
more importance. The current concepts of motivational systems, motivational techniques and strategies are
becoming insufficiently flexible, so it is necessary to develop and introduce new ones, which with their

EMC 2022, 17-18th June 2022, Zrenjanin, Serbia
143
elaboration and versatility will lead to high motivation and employee satisfaction as well as achieve
successful business (Ridgeway, 1982). In order to operate successfully, every company must find the
optimal combination of tangible and intangible factors for its employees which will depend on numerous
factors: the sector in which company operates, competition in the labor market, the nature of work and
employee structure. The importance of work motivation grows with the need to organize more efficient and
quality work engagement. Motivation is a very common subject of interest for scientists and practitioners,
primarily because of its great utilitarian value. There is almost no job, activity, profession or other human
activity for which motivation is not relevant and often a key problem (Mihailović, 2010). The work
performance of employees, managers and the overall performance of the organization derive from the
triangle shown in the Figure 1, which is based on:
Working conditions and opportunities
Abilities, knowledge and skills
Motivation.
Figure 1: The importance of
motivation Source: https://www.link-
elearning.com/site/kursevi/lekcija/6
177
METHODOLOGY
The subject and The problem of Research
This paper will deal with considering the importance of motivation in the workplace as well as the
impact of motivation on the organizational performance. Also, this paper will present the motivational
factors that affect employee performance. This paper won’t be focusing on specific aspect, rather try
to observe as many different studies as possible.
Research Goals
The main goal of this paper is to present the most common motivating factors on employees and their
impact on company performance. Also, the aim of this paper is to present the importance of
motivating employees in the organization.
Research Question
Based on analyzed theories I will try to answer the following questions:
1. Which are the most significant factors of employee motivation?
2. How does employee motivation affect work performance?
3. What are the consequences of inadequate application of motivational techniques in the organization?
Research Method
This is a form of theoretical research in which conclusions are made by studying previous conducted
researches. Research will consider different methodologies of other authors and analyze their results in
order to make universal conclusions.

V. Gluvakov et al. / Overview of studies regarding the impact of employee motivation...
144
RESULTS AND DISCUSSION
The first study shows that a fair reward system provides employees with greater motivation and stronger
incentives to complete tasks, and for the organization this means the ability to attract and retain people with
appropriate skills and abilities. The reward system consists of tangible and intangible compensations and,
according to this study, intangible rewards as a motivation factor represent an approach to increasing
employee motivation by meeting their non-cash needs. Among the most commonly used are job design,
management style, employee participation in decision making, flexible working hours and various types of
recognition. For example, research conducted in the United States has shown that flexible working hours
are becoming an imperative for modern organizations and, according to the data obtained, more than a
quarter of full-time employees in the United States use flexible work schedules. When it comes to the
European Union, there are significant differences between member states and the distinct application of this
motivational technique is in Denmark, Germany, Finland and Norway, where more than half of employees
use some form of flexibility in their working hours. The application of this motivating factor contributes to
the productivity of employees, general satisfaction and better organization of work, as well as reducing
delays and absences from work. However, the disadvantage of flexible working hours is that they cannot be
applied to every workplace. It is mainly applicable for professional and managerial jobs (Vidaković, 2012).
Another study shows that material motivation is one of the fundamental factors on which the organizational
practice of motivating employees is based. Salary and other material compensations are visible
mechanisms of motivation and evaluation of work within the policy and practice of each company. It is
important to know that there must be a connection between work results and rewards and that the reward
system must be based on the positive consequences of work behavior. Material rewards value the creative
potential of employees because it affects the improvement of business results (Buntak, 2013). The
following study combines the impact of tangible and intangible factors on employees and shows their
importance in business. A structured questionnaire was sent to 320 respodents from different companies in
order to assess the importance of tangible and intangible factors of motivation. The study included a total of
21 rural and urban municipalities of Kosovo territory. The results of this research show that about 53% of
employees consider salary as a very important factor of motivation, 39% of employees consider it
important, while 3,4% think it is less important. From the presented results, 43% of employees think that
continuous training is very important, 44% find it important and 5% think it is less important. Also, 46% of
employees think that the ease of promotion in their career is very important, 40% find it important and 4%
think it is less important. This study shows that the salary of workers, professional advancement and the
opportunity for promotion appear to be the most important factors of motivation. The other important
factors that the study revealed are work conditions as well as the evaluation and the objective assessment of
performance measurement (Ismajli, 2015).
Some studies show that identification with the collective in organization can affect employees in an
important way and this can also affect their task performing. The number of studies of the relationship
identification with motivation is small, but the conclusion is that identification is positively related to work
motivations, task performance and contextual performance to the extent that social identity is salient and
high performance is perceived to be in the group’s or organization’s interest. Membership in an
organization implies multiple group memberships: membership in the organization in general, in one
department, in one team or work unit etc. The question from the point of view of the social identity
approach is how these identifications affect organizational behavior and especially work motivation and
performance. Conclusion is that identification motivates group members to work for the group’s interests,
which in turn may affect performance (Knippenberg, 2000).
The following study shows the importance of motivation and consequences, respectively risks that the
organization faces if it has demotivated employees. According to this study, employees who lack
motivation in the workplace are a risk factor when it comes to executing day to day operations in business.
Some of the most common risks that organization faces in lack of motivation are operational risks such as
absenteeism, poor quality work and toxic work environment, personnel risks, reputational risks,
environmental risks and financial risks. In terms of quality results, disgruntled employees will not perform

EMC 2022, 17-18th June 2022, Zrenjanin, Serbia
145
at their best hence which will affect competitiveness of products and services at the market. In the lack of
motivation mutual relationship among employees will be disrupted and employees behavior will be
affected. Also, employees who are not satisfied with their job might resort to quitting. These are all
scenarios that should be avoided. For organizations to continue existing and retaining its workforce, they
must keep on working on strategies that can help in motivating its employees. Motivated employees have a
sense of belonging and loyalty to the organization. Production at work will bear more output in which it
will be able to generate much needed income. If employees are satisfied absenteeism will gbe reduced
thereby saving costs for the organization. Motivation have effect on employees as individuals to achieve
the results and to be innovative because they believe in themselves which will benefit the organization to
succeed. A further qualitative research on motivation strategies and theories is recommended because
organizations which are results oriented will motivate their employees for reach their goals (Badubi, 2017).
According to some authors, organizations should also select individuals who have high level of self-
efficacy. These people will be motivated to engage in the behaviors that will keep them to perform well in
the workplace. Organizations should consider employee level of self-efficacy when choosing among
candidates for development programs and training especially if the training budget is limited because these
people will tend to learn more from the training and to use that learning to enhance their job performance.
This technique can lead to higher levels of job performance from employees which is important for high
competitiveness.
CONCLUSION
Taking in consideration all previously mentioned paper works, studies and researches following
conclusions were made. The most significant factors of employee motivation are material
compensations such as salary, professional advancement and the opportunity for promotion (RQ:1).
Effective motivation of employees has an extremely good effect on both the work performance of
employees and the work performance of the company in general in terms of productivity,
competitiveness and good organizational conditions (RQ:2). The consequences of poor motivation in
the organization affect both employees and the results of the organization. Poor motivation results in
high level of absenteeism and stress among employees, poor interpersonal relationships in the
organization, high costs for the organization and poor productivity (RQ:3). The goal of employee
motivation is to improve and develop the abilities of employees, increase their work performance and
increase the efficiency of the organization. There are a large number of difficult and complex tasks
facing management, and managers must have knowledge in the field of organization and psychology
in addition to management and motivational techniques in order to properly encourage employees to
achieve organizational goals.
REFERENCES
Buntak, K., Drožđek, I., Kovačić, R. (2013). Materijalna motivacija u funkciji upravljanja ljudskim
potencijalima. Technical journal 7(1). pp 56-63.
Ismajli, N., Zekiri, J., Qosja, E., Krasniqi, I. (2015). The Importance of Motivation Factors on Employee
Performance in Kosovo Municipalities. J Pol Sci Pub Aff 3:152.
Knippenberg, D. (2000). Work Motivation and Performance: A Social Identity Perspective. Applied Psychology:
An International Review 49(3). pp 357-371.
Lunenburg, F. (2011). Self-Efficacy in the Workplace: Implications for Motivation and Performance.
International Journal of Management, Business and Administration 14(1).
Mihailović, D. (2010). Psihologija rada i organizacije. Beograd: Fakultet organizacionih nauka.
Ridgeway, C. (1982). Status in groups: The Importance of Motivation. American Sociological Review 47(1). pp
76-88.
Rot, N. (1971). Opšta psihologija. Beograd: Zavod za udžbenike SR Srbije.
Sajfert, Z. (2009). Menadžment. Zrenjanin: Univerzitet u Novom Sadu, Tehnički fakultet „Mihajlo Pupin“.
Vidaković, T. (2012). Nematerijalne nagrade i njihov uticaj na motivaciju zaposlenih. Časopis za ekonomiju i
tržišne komunikacije. pp 161-177.

146
XII International Symposium Engineering Management and Competitiveness 2022 (EMC 2022)
17-18th June, Zrenjanin, Serbia
LEADERSHIP, EMPLOYEE JOB SATISFACTION AND FINANCIAL
PERFORMANCE OF THE ORGANIZATION
Predrag Mali
University of Novi Sad, Faculty of Technical Sciences, Novi Sad, Serbia
Bogdan Kuzmanović
University of Novi Sad, Faculty of Technical Sciences, Novi Sad, Serbia
Siniša Mitić
University of Novi Sad, Faculty of Technical Sciences, Novi Sad, Serbia
Edit Terek Stojanović
niversity of Novi Sad, Technical Faculty “Mihajlo Pupin”, Zrenjanin, Serbia
E-mail: [email protected]
Milan Nikolić
University of Novi Sad, Technical Faculty “Mihajlo Pupin”, Zrenjanin, Serbia
ABSTRACT
In this paper, the impact of transformational and transactional leadership on employee job satisfaction and
financial performance of the organization is examined. The research was conducted in organizations in Serbia.
220 questionnaires were collected. The dimensions of leadership have strong and positive effects on the
dimensions of job satisfaction, as well as on the items of financial performance. Core transformational leader
behavior and Contingent reward behavior have the strongest impact and predictive effects, while Contingent
punishment behavior and High performance expectations have the weakest impact and predictive effects. There
is a greater impact and predictive effect on job satisfaction dimensions than on financial performance items.
Thus, leadership has a greater impact on individual performance, social relations and personal feelings of
individual employees, while business performance is also influenced by a number of external factors, such as the
market, competition and consumers.
Key words: Leadership, Job Satisfaction, Financial Performance, Employees, Serbia.
INTRODUCTION
Leadership has a significant impact on employee job satisfaction. For example, according to (Beebe,
Blaylock, Sweetser, 2009), job satisfaction grows in conditions where there is a good relationship with
the supervisor. Research in healthcare organizations (Platonova, Hernandez, Shewchuk, Leddy, 2006)
has shown that recognizing the work performance of employees by the organization and leaders makes
employees more satisfied. Likewise, leadership in healthcare institutions has an impact on nursing job
satisfaction (Do Rego Furtado, Da Graça Câmara Batista, Ferreira Silva, 2011). The importance of
transformational leadership for employee job satisfaction is especially emphasized. Thus, to the job
satisfaction of employees in financial companies (in Kenya and the USA), transformational leadership
has a strong and positive impact (Walumbwa, Orwa, Wang, Lawler, 2005). Transformational
leadership has a favorable impact on job satisfaction in hotel employees in Germany (Rothfelder,
Ottenbacher, Harrington, 2013). According to (Yang, Wu, Chang, Chien, 2011), transformational
leadership and job satisfaction are also closely related when it comes to military organizations.
The financial performance of an organization, among other things, depends significantly on
leadership. Yukl (2008) points out that in order to achieve high organizational effectiveness and high
financial performance, it is necessary for a leader to be cooperative, flexible and adaptable to changes
in the environment. Eubanks and Mumford (2010) suggest that mistakes made by a leader negatively
affect an organization’s performance. In the reference (Koene, Vogelaar, Soeters, 2002), it was
determined that leadership in stores has a connection with financial performance.

EMC 2022, 17-18th June 2022, Zrenjanin, Serbia
147
A special place in examining the impact of leadership on performance has a consideration of the ways
in which transformational and transactional leadership affect performance. Most of this research
favors transformational leadership, that is, it points to a positive link between transformational
leadership and performance, for example (Zhu, Chew, Spangler, 2005; Ensley, Pearce, Hmieleski,
2006; Ling, Simsek, Lubatkin, Veiga, 2008; MacKenzie, Podsakoff, Rich, 2001). At the same time,
the reference (Ensley, Pearce, Hmieleski, 2006) even emphasizes the negative impact of transactional
leadership, in the conditions of the existence of a dynamic environment (and such an environment is
not a rare occurrence). Finally, according to (Barling, Weber, Kelloway, 1996), the level of financial
performance of an organization can be significantly increased with the training of leaders to behave in
accordance with the principles of transformational leadership. Some references suggest that, both
transformational and transactional leadership have a positive impact on performance (Bass, Avolio,
Jung, Berson, 2003; Elenkov, 2002). Similarly, Waldman, Ramirez, House, and Puranam (2001) state
that charismatic and transactional leadership are predictors of financial performance. At the same time,
it should be emphasized that the influence of rewarding behavior is especially emphasized (Bass,
Avolio, Jung, Berson, 2003), as well as the fact that the influence of transformational leadership is still
greater (Elenkov, 2002).
Based on previous presentations, it is certain that leadership has a significant impact on employee job
satisfaction and financial performance of the organization. In this paper, the examination of these
connections and influences is performed in organizations in Serbia. The impression is that, so far, not
enough research has been done in Serbia that deals with this issue, so the scientific significance and
justification of the research stems from that. In this paper, four hypotheses were set up:
H1: There are statistically significant correlation between leadership dimensions and job satisfaction
dimensions, in organizations in Serbia.
H2: There are statistically significant correlation between leadership dimensions and financial
performance items, in organizations in Serbia.
H3: There is a statistically significant predictive effect of leadership dimensions on job satisfaction
dimensions, in organizations in Serbia.
H4: There is a statistically significant predictive effect of leadership dimensions on financial
performance items, in organizations in Serbia.
METHOD
Survey instruments. In this research, the next instruments were used:
Transformational leadership was measured using the Transformational Leadrship Behavior
Inventory (TLI) instrument (Podsakoff, MacKenzie, Moorman, Fetter, 1990; MacKenzie,
Podsakoff, Rich, 2001). There are 4 dimensions (14 items).
Transactional leadership is measured by the instruments Contingent reward behavior scale and
Contingent punishment behavior scale (Podsakoff, Todor, Grover, Huber, 1984; MacKenzie,
Podsakoff, Rich, 2001). There are 2 dimensions (7 items).
Employee job satisfaction was measured using the Job Satisfaction Survey (JSS) instrument
(Spector, 1985). There are 9 dimensions (36 items).
Financial performance is chosen based on performance that is often measured in other references,
for example (Tan, Litschert, 1994; Wang, Tsui, Xin, 2011). Thus, a set of seven financial
performances (items) was compiled, which were measured in this paper. All seven items were
considered separately, and also as one dimension composed of these seven items (financial
performance dimension).
Participants and data collection. The research was conducted in organizations in Serbia. A total of
250 questionnaires were distributed, but 220 questionnaires were used in further statistical analyzes
(88% successfully completed). The research included 28 organizations.

P. Mali et al. / Leadership, employee job satisfaction and financial performance...
148
RESULTS
The results of descriptive statistics are given in Table 1. The results of the correlation analysis are
given in Tables 2 and 3 (*p<0.05; **p<0.01). The results of the regression analysis are given in Tables
4 and 5. Statistically significant values in these tables are given in bold and shaded fields. All results
are given according to (Mali, 2021).
Table 1: Descriptive statistics for the observed dimensions and items
Dimensions and items Abbr. N Min Max Mean Std.
Dev. α
Core transformational leader behavior L1 220 1,000 7,000 5,220 1,642 0,959
High performance expectations L2 220 1,000 7,000 5,438 1,427 0,888
Supportive leader behavior L3 220 1,000 7,000 4,853 1,727 0,964
Intellectual stimulation L4 220 1,000 7,000 4,969 1,648 0,963
Contingent reward behavior L5 220 1,000 7,000 4,806 1,719 0,958
Contingent punishment behavior L6 220 1,000 7,000 5,097 1,552 0,945
Pay JS1 220 1,000 6,000 3,402 1,319 0,832
Promotion JS2 220 1,000 6,000 3,642 1,416 0,892
Supervision JS3 220 1,000 6,000 4,628 1,206 0,885
Fringe benefits JS4 220 1,000 6,000 3,598 1,367 0,884
Contingent rewards JS5 220 1,000 6,000 3,637 1,363 0,884
Operating procedures JS6 220 1,000 6,000 3,469 1,036 0,755
Coworkers JS7 220 1,000 6,000 4,276 1,142 0,817
Nature of work JS8 220 1,000 6,000 4,632 1,140 0,873
Communication JS9 220 1,000 6,000 4,224 1,185 0,831
Productivity FP1 220 1 5 3,62 ,816
Profitability FP2 220 1 5 3,50 ,830
Market share FP3 220 1 5 3,45 ,866
Sales growth FP4 220 1 5 3,20 ,905
Competitive status FP5 220 1 5 3,54 ,928
Asset growth FP6 220 1 5 3,34 ,874
Salaries FP7 220 1 5 3,25 ,826
Financial performance FP 220 1,286 5,000 3,414 ,685 0,902
Table 2: Coefficients of correlation between the leadership dimensions and job satisfaction
dimensions JS1 JS2 JS3 JS4 JS5 JS6 JS7 JS8 JS9
L1 ,481** ,626** ,704** ,561** ,572** ,492** ,553** ,490** ,607**
L2 ,303** ,393** ,528** ,358** ,354** ,361** ,458** ,473** ,458**
L3 ,492** ,595** ,692** ,584** ,569** ,494** ,515** ,419** ,554**
L4 ,495** ,604** ,680** ,574** ,585** ,486** ,517** ,435** ,558**
L5 ,524** ,632** ,641** ,594** ,624** ,539** ,507** ,386** ,573**
L6 ,358** ,372** ,387** ,379** ,393** ,417** ,414** ,351** ,368**
Table 3: Coefficients of correlation between the leadership dimensions and financial performance FP1 FP2 FP3 FP4 FP5 FP6 FP7 FP
L1 ,526** ,401** ,322** ,347** ,373** ,380** ,331** ,481**
L2 ,430** ,309** ,271** ,217** ,300** ,274** ,315** ,379**
L3 ,483** ,366** ,341** ,354** ,361** ,352** ,333** ,465**
L4 ,493** ,381** ,333** ,340** ,356** ,374** ,338** ,469**
L5 ,473** ,377** ,346** ,369** ,350** ,438** ,349** ,485**
L6 ,321** ,197** ,246** ,168* ,234** ,239** ,212** ,290**
DISCUSSION
Discussion of the results of correlation analysis (in accordance with Mali, 2021). There are
statistically significant, strong and positive correlations between the leadership dimensions and job
satisfaction dimensions. In this way, hypothesis H1 was confirmed. Similar results, according to which
leadership has an impact on job satisfaction, have been obtained in numerous references (Beebe,
Blaylock, Sweetser, 2009; Do Rego Furtado, Da Graça Câmara Batista, Ferreira Silva, 2011;
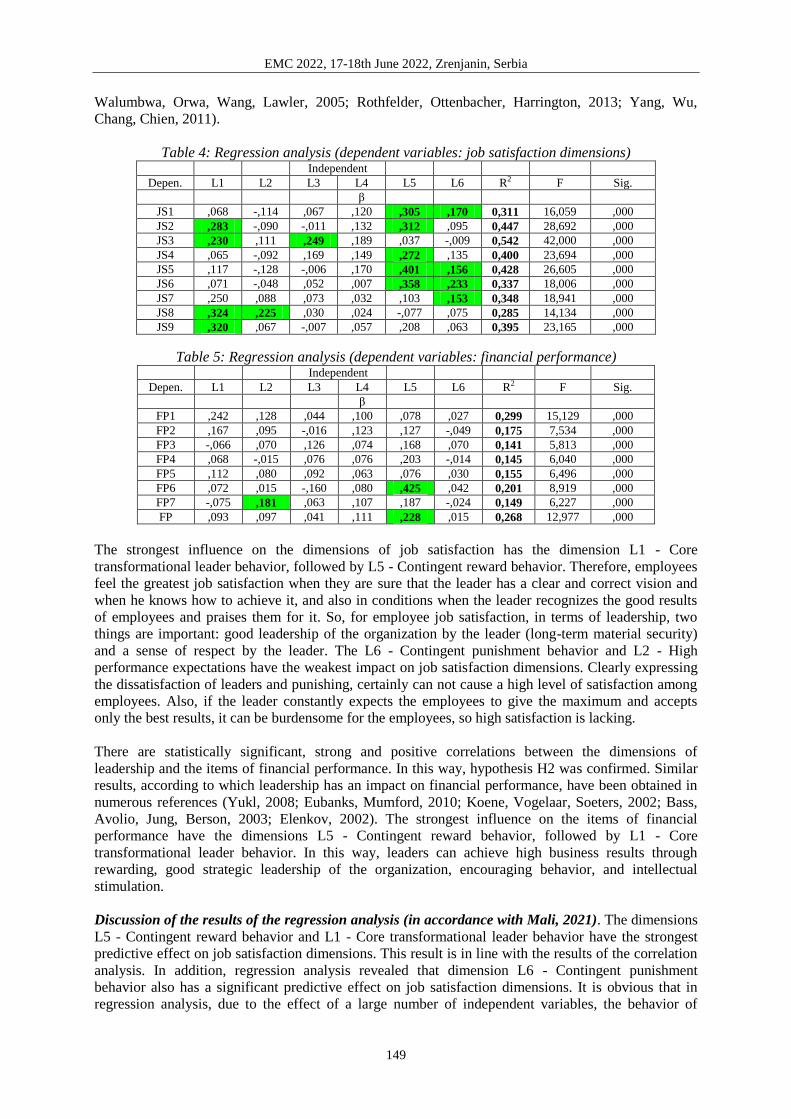
EMC 2022, 17-18th June 2022, Zrenjanin, Serbia
149
Walumbwa, Orwa, Wang, Lawler, 2005; Rothfelder, Ottenbacher, Harrington, 2013; Yang, Wu,
Chang, Chien, 2011).
Table 4: Regression analysis (dependent variables: job satisfaction dimensions) Independent
Depen. L1 L2 L3 L4 L5 L6 R2 F Sig.
β
JS1 ,068 -,114 ,067 ,120 ,305 ,170 0,311 16,059 ,000
JS2 ,283 -,090 -,011 ,132 ,312 ,095 0,447 28,692 ,000
JS3 ,230 ,111 ,249 ,189 ,037 -,009 0,542 42,000 ,000
JS4 ,065 -,092 ,169 ,149 ,272 ,135 0,400 23,694 ,000
JS5 ,117 -,128 -,006 ,170 ,401 ,156 0,428 26,605 ,000
JS6 ,071 -,048 ,052 ,007 ,358 ,233 0,337 18,006 ,000
JS7 ,250 ,088 ,073 ,032 ,103 ,153 0,348 18,941 ,000
JS8 ,324 ,225 ,030 ,024 -,077 ,075 0,285 14,134 ,000
JS9 ,320 ,067 -,007 ,057 ,208 ,063 0,395 23,165 ,000
Table 5: Regression analysis (dependent variables: financial performance) Independent
Depen. L1 L2 L3 L4 L5 L6 R2 F Sig.
β
FP1 ,242 ,128 ,044 ,100 ,078 ,027 0,299 15,129 ,000
FP2 ,167 ,095 -,016 ,123 ,127 -,049 0,175 7,534 ,000
FP3 -,066 ,070 ,126 ,074 ,168 ,070 0,141 5,813 ,000
FP4 ,068 -,015 ,076 ,076 ,203 -,014 0,145 6,040 ,000
FP5 ,112 ,080 ,092 ,063 ,076 ,030 0,155 6,496 ,000
FP6 ,072 ,015 -,160 ,080 ,425 ,042 0,201 8,919 ,000
FP7 -,075 ,181 ,063 ,107 ,187 -,024 0,149 6,227 ,000
FP ,093 ,097 ,041 ,111 ,228 ,015 0,268 12,977 ,000
The strongest influence on the dimensions of job satisfaction has the dimension L1 - Core
transformational leader behavior, followed by L5 - Contingent reward behavior. Therefore, employees
feel the greatest job satisfaction when they are sure that the leader has a clear and correct vision and
when he knows how to achieve it, and also in conditions when the leader recognizes the good results
of employees and praises them for it. So, for employee job satisfaction, in terms of leadership, two
things are important: good leadership of the organization by the leader (long-term material security)
and a sense of respect by the leader. The L6 - Contingent punishment behavior and L2 - High
performance expectations have the weakest impact on job satisfaction dimensions. Clearly expressing
the dissatisfaction of leaders and punishing, certainly can not cause a high level of satisfaction among
employees. Also, if the leader constantly expects the employees to give the maximum and accepts
only the best results, it can be burdensome for the employees, so high satisfaction is lacking.
There are statistically significant, strong and positive correlations between the dimensions of
leadership and the items of financial performance. In this way, hypothesis H2 was confirmed. Similar
results, according to which leadership has an impact on financial performance, have been obtained in
numerous references (Yukl, 2008; Eubanks, Mumford, 2010; Koene, Vogelaar, Soeters, 2002; Bass,
Avolio, Jung, Berson, 2003; Elenkov, 2002). The strongest influence on the items of financial
performance have the dimensions L5 - Contingent reward behavior, followed by L1 - Core
transformational leader behavior. In this way, leaders can achieve high business results through
rewarding, good strategic leadership of the organization, encouraging behavior, and intellectual
stimulation.
Discussion of the results of the regression analysis (in accordance with Mali, 2021). The dimensions
L5 - Contingent reward behavior and L1 - Core transformational leader behavior have the strongest
predictive effect on job satisfaction dimensions. This result is in line with the results of the correlation
analysis. In addition, regression analysis revealed that dimension L6 - Contingent punishment
behavior also has a significant predictive effect on job satisfaction dimensions. It is obvious that in
regression analysis, due to the effect of a large number of independent variables, the behavior of

P. Mali et al. / Leadership, employee job satisfaction and financial performance...
150
punishment comes to the fore and can be a predictor of certain dimensions of job satisfaction. These
are the dimensions JS1 - Pay, JS5 - Contingent rewards, JS6 - Operating procedures and JS7 -
Coworkers. In some cases, punishing behavior can motivate employees, who begin to perform better.
Also, in the conditions of behavior through punishment, there can be increased solidarity, greater
support and better relations between colleagues at work, so satisfaction with co-workers grows.
In Table 4, two more statistically significant predictive effects can be observed. One is the predictive
effect of dimension L2 - High performance expectations on dimension JS8 - Nature of work.
Expecting high performance from leaders can make employees feel that their job is important. Another
statistically significant predictive effect has the dimension L3 - Supportive leader behavior on the
dimension JS3 - Supervision. This is quite clear: if a leader expresses feelings and understanding for
employees, it will logically lead to increased satisfaction with superiors and supervision.
According to Table 4, the corrected determination indexes R2 have statistically significant and high
values, ranging from 0.285 to 0.542. In this way, it was confirmed that there is a statistically
significant predictive effect of the dimensions of leadership on the dimensions of job satisfaction, that
is, hypothesis H3 was confirmed. Observed according to individual dependent variables (dimensions
of job satisfaction), under the strongest predictive effect of leadership dimensions, there are
dimensions JS3 - Supervision, JS2 - Promotion and JS5 - Contingent rewards.
The predictive effect on the items of financial performance is somewhat weaker, and the L5 dimension
- Contingent reward behavior - has the strongest effect. Recognition of good employee results by
leaders can significantly encourage employees and lead to improved business performance of the
organization. In addition, regression analysis showed a statistically significant and positive predictive
effect of the L2 - High performance expectations dimension on item FP7 - Salaries. Thus, the
expectation of high performance may indicate good employee salaries.
According to Table 5, the corrected determination indexes R2 have statistically significant and fairly
high values, ranging from 0.141 to 0.299. In this way, it was confirmed that there is a statistically
significant predictive effect of the dimensions of leadership on the items of financial performance, that
is, hypothesis H4 was confirmed. Observed according to individual dependent variables (financial
performance items), under the strongest predictive effect of leadership dimensions, there are items FP1
- Productivity, FP - Financial performance and FP6 - Asset growth.
CONCLUSION
There are statistically significant, strong and positive correlations between the dimensions of
leadership and the dimensions of job satisfaction, as well as the item of financial performance. By
comparing the strength of influence and predictive effects of the dimensions of leadership, it can be
noticed that the predictive effect is stronger on the dimensions of job satisfaction. This is also logical:
leadership has a greater impact on individual performance, social relations and personal feelings of
individual employees, while business performance is also influenced by a number of external factors,
such as the market, competition and consumers.
Leaders and managers in organizations in Serbia must be aware of the importance and strength of the
influence of leadership on numerous organizational and business performances. Leaders and managers
must be ready to continuously improve and enhance their knowledge, skills and behaviors. They need
to improve their strategic action (vision, goals, employee motivation) and be prepared to praise
employees when they are doing well and to acknowledge their good results and commitment. At the
same time, leaders and managers need to reduce employee motivation through fear of expressing
dissatisfaction and punishment. Also, they need to be careful in expecting high performance,
especially to avoid punishment as a motivation for high employee performance.

EMC 2022, 17-18th June 2022, Zrenjanin, Serbia
151
REFERENCES
Barling, J., Weber, T., Kelloway, E.K. (1996). Effects of transformational leadership training on attitudinal and
financial outcomes: A field experiment. Journal of Applied Psychology, 81(6), 827-832.
Bass, B.M., Avolio, B.J., Jung, D.I., Berson, Y. (2003). Predicting unit performance by assessing
transformational and transactional leadership. Journal of Applied Psychology, 88(2), 207-218.
Beebe, A., Blaylock, A., Sweetser, K.D. (2009). Job satisfaction in public relations internships, Public Relations
Review, 35(2), 156-158.
Do Rego Furtado, L.C., Da Graça Câmara Batista, M., Ferreira Silva, F.J. (2011). Leadership and job satisfaction
among Azorean hospital nurses: an application of the situational leadership model. Journal of Nursing
Management, 19(8), 1047-1057.
Elenkov, D.S. (2002). Effects of leadership on organizational performance in Russian companies. Journal of
Business Research, 55(6), 467-480.
Ensley, M.D., Pearce, C.L., Hmieleski, K.M. (2006). The moderating effect of environmental dynamism on the
relationship between entrepreneur leadership behavior and new venture performance. Journal of Business
Venturing, 21(2), 243-263.
Eubanks, D.L., Mumford, M.D. (2010). Leader errors and the influence on performance: An investigation of
differing levels of impact. The Leadership Quarterly, 21(5), 809-825.
Koene, B.A.S., Vogelaar, A.L.W., Soeters, J.L. (2002). Leadership effects on organizational climate and
financial performance: Local leadership effect in chain organizations. The Leadership Quarterly, 13(3),
193-215.
Ling, Y., Simsek, Z., Lubatkin, M.H., Veiga, J.F. (2008). The impact of transformational CEOs on the
performance of small- to medium-sized firms: Does organizational context matter? Journal of Applied
Psychology, 93(4), 923-934.
MacKenzie, S.B., Podsakoff, Ph.M., Rich, G.A. (2001). Transformational and transactional leadership and
salesperson performance. Journal of the Academy of Marketing Science, 29(2), 115-134.
Mali, P. (2021). The influence of organizational culture and leadership on job satisfaction of employees and
financial performance of the organization. Specialist work, Faculty of Technical Sciences, Novi Sad,
Serbia.
Platonova, E.A., Hernandez, R.S., Shewchuk, R.M., Leddy, K.M. (2006). Study of the relationship between
organizational culture and organizational outcomes using hierarchical linear modeling methodology.
Quality Management in Health Care, 15(3), 200-209.
Podsakoff, Ph.M., MacKenzie, S.B., Moorman, R.H., Fetter, R. (1990). Transformational leader behaviors and
their effects on followers’ trust in leader, satisfaction, and organizational citizenship behaviors. The
Leadership Quarterly, 1(2), 107-142.
Podsakoff, Ph.M., Todor, W.D., Grover, R.A., Huber, V.L. (1984). Situational moderators of leader reward and
punishment behaviors: fact or fiction? Organizational Behavior and Human Performance, 34(1),21-63.
Rothfelder, K., Ottenbacher, M.C., Harrington, R.J. (2013). The Impact of Transformational, Transactional and
Non-Leadership Styles on Employee Job Satisfaction in the German Hospitality Industry. Tourism and
Hospitality Research, 12(4), 201-214.
Spector, P.E. (1985). Measurement of human service staff satisfaction: Development of the job satisfaction
survey. American Journal of Community Psychology, 13(6), 693-713.
Tan, J.J., Litschert, R.J. (1994). Environment-strategy relationship and its performance implications: An
empirical study of the Chinese electronics industry. Strategic Management Journal, 15(1), 1-20.
Walumbwa, F.O., Orwa, B., Wang, P., Lawler, J.J. (2005). Transformational leadership, organizational
commitment, and job satisfaction: A comparative study of Kenyan and U.S. financial firms. Human
Resource Development Quarterly, 16(2), 235-256.
Wang, H., Tsui, A.S., Xin, K.R. (2011). CEO leadership behaviors, organizational performance, and employees’
attitudes. The Leadership Quarterly, 22(1), 92-105.
Yang, F.H., Wu, M., Chang, C.C., Chien, Y. (2011). Elucidating the Relationships among Transformational
Leadership, Job Satisfaction, Commitment Foci and Commitment Bases in the Public Sector. Public
Personnel Management, 40(3), 265-278.
Yukl, G.A. (2008). How leaders influence organizational effectiveness. The Leadership Quarterly, 19(6), 708-
722.
Zhu, W., Chew, I.K.H., Spangler, W.D. (2005). CEO transformational leadership and organizational outcomes:
The mediating role of human–capital-enhancing human resource management. The Leadership Quarterly,
16(1), 39-52.

152
XII International Symposium Engineering Management and Competitiveness 2022 (EMC 2022)
17-18th June, Zrenjanin, Serbia
THE IMPORTANCE OF CREATIVE POTENTIALS OF EMPLOYEES
IN MODERN BUSINESS
Dragana Milosavljev
University of Novi Sad, Technical faculty „Mihajlo Pupin“, Zrenjanin, Serbia
E-mail: [email protected]
Verica Gluvakov
University of Novi Sad, Technical faculty „Mihajlo Pupin“, Zrenjanin, Serbia
Mila Kavalić
University of Novi Sad, Faculty of Technical Sciences, Novi Sad, Serbia
Maja Gaborov
University of Novi Sad, Technical faculty „Mihajlo Pupin“, Zrenjanin, Serbia
Melita Ćoćkalo-Hronjec
High school "Laza Kostic", Novi Sad, Republic of Serbia
Luka Đorđević
University of Novi Sad, Technical faculty „Mihajlo Pupin“, Zrenjanin, Serbia
ABSTRACT
One of the conditions for business success in a rapidly changing world is the ability to respond to changes in
technology, the use of new business models, production, human recource management, etc. In this environment,
the creativity of employees becomes imperative for the sustainability. Innovation and creative thinking provide
the necessary competitive advantage. The creative potential of employees is influenced by numerous factors,
such as the behavior of leaders, social interactions in the organization and team climate, communication and
cooperation processes, as well as the design of the job and workplace. In order to improve the creative potential
of employees it is necessary, first of all, for management to motivate its employees to be creative, influence their
self-confidence to express ideas, reduce stress, which is a killer of creativity and, finally, reward them for good
ideas.
Key words: Employees, Creativity, Innovation, Motivation, Leadership.
INTRODUCTION
The only constant factor in the business environment today is change. Companies are under constant
pressure to hire employees who will be productive, efficient, innovative, willing to take risks and
creative. In international business environment, one of the key successes of the organization is the
engagement of such employees (Stanley, Davidson & Matthews, 2014). Highly innovative
organizations are characterized by creative thinking and behavior of employees. Although creativity as
a research topic has been analyzed for several decades in various disciplines, in the field of
management and organization it became relevant only ten years ago (Boljević A, Strugar Jelača,
Boljević S., 2017).
Employees are very valuable to the organization in which they work because each individual brings a
certain knowledge and experience, which increases during work and it is considered as a human
capital. Scientists believe that everyone has a great creative capacity and the challenge is to develop it
(Stefanović, 2016). Creativity is defined as generating new and useful ideas and often requires
employees to deviate from existing business practices in order to propose new ideas and further
experiment and reearch with them (Amabile, 1983, Zhou & George, 2011, Liu, Pan & Zhu, 2021).
However, often emerging ideas are not realized. The reasons for this are that they do not find support
from leaders, they are difficult to implement, they require major changes, they are risky or
organizations do not have enough resources to implement them. It is after this rejection that many

EMC 2022, 17-18th June 2022, Zrenjanin, Serbia
153
employees are demotivated to continue working on new ideas and future engagements in creative
processes. For that reason, it is necessary to implement various methods, which would encourage
employees to develop and use their creative potentials and not to „run away“ from them.
What can be noticed is that the appearance of the COVID-19 pandemic required organizations and
employees to adjust their business to different conditions. In order for business to continue, it was
necessary for organizations to develop innovative ideas, which would solve this problem. The
innovation of organizations cannot be separated from the active participation of all employees.
Creative performance of employees, where a creative idea is useful, plays a key role in solving
problems, creating positive results and progress of the organization (Zhang & Zhao, 2021).
CREATIVITY IN MODERN BUSINESS
“Creativity is a characteristic given to all human beings at birth” – Abraham Maslow
Creativity is a characteristic of all people who have a wide view of the world, who notice and
remember. In an organizational environment, creative behavior involves generating new ideas that
change or improve the current situation in the organization or provide solutions to specific
organizational problems (De Clarcq & Pereira, 2020). For decades, psychologists have been interested
in personality characteristics that are associated with creative potential, and the most prominent are
(Stefanović, 2016):
strong intarzic motivation;
wide interest;
openness to new experiences;
self-acceptance;
conscientiousness;
impulsiveness and high level of autonomy.
Most organizations have great potential to be creative, however, what sets one apart from the other is
(Vuković, 2019):
open work environment – creating an open and positive organizational culture affects the
„psychological security" of employees.
diversity – the greater the differences in experience, knowledge and education are, the conditions
for creativity are better. People with different business experience and education look at the same
problem from different perpectives, so the approach to solving that problem will be more diverse.
trainings and education – in all jobs, pressure is often put on employees and almost no attention is
paid to invest in their additional training and education, which are crucial for success.
risk-taking – in order to be truly innovative, an organization must be prepared to deal effectively
with risk-taking. If employees are afraid that they will be punished for failure, they will not
propose new solutions, which will suppress creativity and innovation.
clear purpose of existence – a sense of belonging to the organization is extremely important for
encouraging creativity and innovation in employees.
FACTORS AFFECTING THE CREATIVE POTENTIALS OF EMPLOYEES
The success of an organization in turbulent business conditions requires a quick response to change. In
order for that to be possible, it is necessary to create a creative work environment, in which employees
will cultivate their creative potential, be more innovative, more productive, more satisfied with their
work and where the probability of fluctuation will be reduced to a minimum. The creation of a creative
work environment can be influenced by a number of factors, which can be grouped into four basic
areas (Stanley, Davidson & Metthews, 2014):
leadership behavior;

D. Milosavljev et al. / The importance of creative potentials...
154
team climate and social interactions;
communication and cooperation processes;
job design.
Research confirms that the nature and behavior of leaders have a significant impact on employee
behavior (Smith, et al., 2008). Leadership behavior includes communication style, participatory goals
setting, giving instructions and providing feedback focused on developing and modeling creative
behavior. It is recommended that leaders emphasize the importance of creativity and support creativity
with their behavior, to encourage employees to suggest new ideas, to acquire new knowledge and
skills to improve their business performance (Stanley, Davidson & Metthews, 2014). Participatory and
ethical leaders stand out here, who empower their employees to take responsibility for their work and,
therefore, have a high level of work autonomy. Work autonomy gives employees the opportunity to
explore new ideas, resulting in a higher level of creativity (Shafique, Ahmad & Klyar, 2019.,
Tourigny, et al., 2019., Liu, et al., 2020).
Team climate is a reflection of organizational culture and team-level climate. It is influenced by
various factors that are manifested in the patterns of behavior, attitudes, beliefs, values and feelings
that characterize life in the organization. Healthy team relationships contribute to the development of
creativity. Also, when people from the team make open and constant contacts with the outside world,
creativity in the workplace improves (Stanley, Davidson & Metthews, 2014).
Communication has an important impact in promoting creativity on many levels. According to
research by Monge, Cozzens and Contractor (1992), group communication is positively associated
with generating new ideas. The more open and direct the communication is, the greater is the flow of
knowledge and new ideas and the creativity of employees in the organization will be on higher level.
The key characteristics of the job have an important role in the engagement of employees at work,
where the job should suit the employee, more precisely, that the job requirements are tailored to the
interests, values and personality of the employee. The job should be designed to contribute to the
motivation and creative performance of employees. This means that tasks should not be simple and
routine, but complex and challenging with a high level of autonomy (Oldham & Cummings, 1996).
IMPROVING THE CREATIVE POTENTIALS OF EMPLOYEES
In most organizations, the way of thinking created is a basic obstacle to creativity. Leaders are the
ones who should identify and transform these ways of thinking and stimulate and motivate employees
to develop their creative potential (Roberto, 2019). There are different ways in which leaders can
stimulate employees to develop their creative potential. Some of the ways are (Eikenberry, n.d.):
believe in employees – above all, leaders must break free and believe that everyone in the
organization has creative potential. New ideas will never find their way if employees do not feel
trusted by their superiors;
show them examples from the past – in order to build self-confidence of employees, they need to
be constantly reminded of past successes. It is also necessary to show proof of success by one’s
own example;
redefine creativity – creativity is not just the creation of works of art or new ideas. Creativity is
also the modification and adaption of some already existing ideas. Both leaders and employees
should be aware of this;
encourage them – everyone needs encouragement! It is important to let employees know that
they are capable of doing their job. Also, it is important to give them feedback on the work done;
help them – not all work should be transferred to employees. It is important to help employees
and offer them the resources and space they need to be creative;
be unique – in order for employees to be creative and focus on the task, it is important that they
know exactly what needs to be solved;

EMC 2022, 17-18th June 2022, Zrenjanin, Serbia
155
give people time – employees in the middle of a meeting cannot be asked to be creative at the
moment. Creativity takes time.
CONCLUSION
Creativity in the workplace is a critical ability of an organization to innovate, gain a competitive
advantage, increase success and improve long-term performance, because all innovations start with
creative ideas. Creativity of employees means generating new and useful ideas, related to products,
services and methods of work. Employees often do not express their creative ideas. The reasons for
that are different, and some of them are that they may encounter condemnation/ridicule from
colleagues, that the management will not support their proposals as well as the risk of failure. In order
to really improve the creative potential of employees in the organization, „creative leadership” is
needed. At the same time, the leader does not have to be creative, but must lead teams and promote
creativity. This includes promoting open communication, psychological security of employees, their
exchange of knowledge and experiences, learning and creating conditions for generating new ideas.
People who work in organizations that encourage them to be cretive and innovative develop faster and
better which affects faster achieving of organizational goals. For that reason, it is necessary to develop
an organizational culture in which employees will be satisfied with both working conditions and
salary, but also motivated to express their creative potentials and to constantly develop them.
REFERENCES
Amabile, T.M. (1983). The social-psychology of creativity-a componential conceptualization. Journal of
Personality and Social Psychology, 45(2), 357-376. https://doi.org/10.1037/0022-3514.45.2.357
Boljević, A., Strugar Jelača, M., & Boljević, S. (2017). Research of organizational creativity elements in the
function of organization's sustainable development. Ekonomski pogledi, 19(2), 99-113.
https://doi.org/10.5937/EkoPog1702099B
De Clarcq, D., & Pereira, R. (2020). Knowledge-sharing efforts and employee creative behavior: the
invigorating roles of passion for work, time sufficiency and procedural justice. Journal of Knowledge
Management, 24(5), 1131-1155. https://doi.org/10.1108/JKM-06-2019-0274
Eikenberry, K. (n.d.). 7 Ways to Help Employees Reach Their Creative Potential. Bud to Boss.
https://www.budtoboss.com/personal-professional-development/7-ways-help-employees-reach-creative-
potential/
Liu, X., Baranchenko, Y., An, F., Lin, Z., & Ma, J. (2021). The impact of ethical leadership on employee
creative deviance: the mediating role of job. Leadership & Organization Development Journal, 42(2), 219-
232. https://doi.org/10.1108/LODJ-01-2020-0026
Liu, Z., Pan, X., & Zhu, T. (2021). Status-striving orientation, creative deviance engagement and employee
creativity: perspective of structural strain. Chinese Management Studies, 15(4), 821-842.
https://doi.org/10.1108/CMS-09-2020-0413
Monge, P.R., Cozzens, M.D., Contractor, N.S. (1992). Communication and Motivational Predictors of the
Dynamics of Organizational Innovation. Organization Science, 3(2), 250–274.
http://dx.doi.org/10.1287/orsc.3.2.250
Oldham, G.R., & Cummings, A. (1996). Employee Creativity: Personal and Contextual Factors at Work.
Academy of Management Journal, 39(3), 607-634.
Roberto, M.A. (2019, February 4). Unleashing Your Workforce’s Creative Potential. Training Industry.
https://trainingindustry.com/articles/strategy-alignment-and-planning/unleashing-your-workforces-creative-
potential/
Shafique, I., Ahmad, B. & Kalyar, M.N. (2019). How ethical leadership influences creativity and organizational
innovation: examining the underlying mechanisms. European Journal of Innovation Management, 23(1),
114-133. https://doi.org/10.1108/EJIM-12-2018-0269
Smith, M., Busi, M., Ball, P., & Van Der Meer, R. (2008). Factors Influencing an Organisation’s Ability to
Manage Innovation: A Structured Literature Review and Conceptual Model. International Journal of
Innovation Management, 12(4), 655–676. http://dx.doi.org/10.1142/S1363919608002138
Stanley, T., Davidson, P., & Matthews, J. (2014). Creative Work Environments and Employee Engagement:
Exploring Potential Links and Possibilities. Zesyty Naukowe, Uniwersytet Ekonomiczny w Krakowie,
9(933), 33-51. https://doi.org/10.15678/ZNUEK.2014.0933.0903

D. Milosavljev et al. / The importance of creative potentials...
156
Stefanović, A. (2016, October 20). Posedujete li kreativni potencijal? Samoobrazovanje RS.
https://samoobrazovanje.rs/kreativni-potencijal/
Tourigny, L., Han, J., Baba, V.V. & Pan, P. (2019). Ethical leadership and corporate social responsibility in
China: a multilevel study of their effects on trust and organizational citizenship behavior. Journal of
Business Ethics, 158(2), 427-440. https://doi.org/10.1007/s10551-017-3745-6
Vuković, A. (2019, April 7). Od zaposlenih tražite kreativnost tek pošto im pružite osnovne uslove za to.
Linkedin. https://www.linkedin.com/pulse/od-zaposlenih-tra%C5%BEite-kreativnost-tek-po%C5%A1to-
im-pru%C5%BEite-vukovic
Zhang, M., & Zhao, Y. (2021). Job characteristics and millennial employees’ creative performance: a dual-
process model. Chinese Management Studies, 15(4), 876-900. https://doi.org/10.1108/CMS-07-2020-0317
Zhou, J., & George, J.M. (2001). When job dissatisfaction leads to creativity: encouraging the expression of
voice. Academy of Management Journal, 44(4), 682-696. https://doi.org/10.2307/3069410

157
XII International Symposium Engineering Management and Competitiveness 2022 (EMC 2022)
17-18th June, Zrenjanin, Serbia
RESEARCH OF ESSENTIAL CHARACTERISTICS OF STUDENTS
FOR THEIR PLACEMENT IN THE POSITION OF STUDENT – DEAN
Dragana Sajfert
ITS Information Technology School, Zemun, Belgrade, Republic of Serbia
E-mail: [email protected]
Svetlana Anđelić
ITS Information Technology School, Zemun, Belgrade, Republic of Serbia
Milica N. Jeremić
ITS Information Technology School, Zemun, Belgrade, Republic of Serbia
ABSTRACT
The aim of this research was to examine which characteristics of an individual are important for his appointment
to the position of president of the student parliament - student vice dean. One of the student representatives is
also the student vice-dean, who is the main link between the students and the dean's office. As an instrument, a
questionnaire was used, which consisted of 9 items - the personality trait of the leader. By processing the
obtained data, 4 factors that influence the choice of the student vice-dean were singled out. The obtained factors
are: sociability, leadership, responsibility according to obligations and the ability of the student vice-dean.
Regardless of the situation, responsibility according to obligations has proven to be the most important in the
election, by giving the same priority to persons related to the sociability of the student - vice dean. If we look for
an answer to the question of the cruciality of four factors in these results, we can conclude that they indicate their
interaction.
Key words: Student placement, Student parliament, Student vice-dean, Responsibility, Charactersitics.
INTRODUCTION
According to Seifert Z. et. al. (2006) a leader is a man who has the ability to lead other people to
follow him, to do what he suggests. A leader knows how to win a group of people over to his idea, that
is, to follow his decisions in achieving the set goal and the desired necessary changes. Marvketti and
Kadolph (2010) leadership beliefs contribute to behaviors and attitudes. The purposes for conducting
this study were 1) to gain an understanding of undergraduate students’ leadership beliefs, 2) to
implement three distinct leadership modules into an introductory textiles and clothing course, and 3) to
assess the modules’ effectiveness in promoting empowering leadership beliefs. Strong et. al. (2013)
leadership is a versatile process that requires working with others in personal and professional
relationships to accomplish a goal. Cultivating leadership skills is important for students who are
developing professional competencies. Leadership characteristics and abilities should be evaluated to
assist in learning student traits to better prepare students for their professions. Ming (2015) this
research focused on a group of student leaders who have been elected by their peers to varius position
in societies and clubs in the university setting. It explorer the leadership qualities that student leaders
had and the unfluence of personality on those leadership qualities among student leaders. According to
Stankov (1991), the leader summarizes the qualities that the group highly values or pushes outwards,
as he states in his work, he is generally one of the best.
LITERATURE REVIEW RESEARCH OF STUDENT LEADER CHARACTERISTICS
Thomas Carlyle (1841/1994) in his book "On Heroes, Worship of Heroes and Heroic Society", Carlyle
argued that the history of the world is only a biography of great people. He believed that history was

D. Sajfert et al. / Research of essential characteristics of students for their placement…
158
made by great individuals. Thomas Carlyle (1841/1994) starts from their competencies, he tried to
identify the talents, skills and physical characteristics of people who rose to power. He created a
theory about a great man. Initial socio-psychological research on leaders was influenced by the
concept of "great people" as predestined leaders. Their focus was on the search for the characteristic
personality traits of a successful leader. Lewin, Lipitt, and White (1939) developed a significant thesis
on the impact of leadership on organizational performance. Byrd (1940) conducted research and came
to the conclusion that intelligence, initiative, sense of humor and extraterrestrialism are the most
important. Stogdil (1948) conducted a study of personality traits and divided them into: 1) abilities
(intelligence, ability to see the situation, verbal ability and adaptability, 2) traits of sociability (sense of
responsibility, activity and social perception, cooperation and popularity), motivational traits initiative
and perseverance). Research for which the first approach was chosen and followed the initial
hypothesis of the existence of significant differences between leaders and followers. Bell and French
(1950) found that there is great consistency in the choice of leader with respect to their personality.
Mann (1959) concluded in his research that the leader differs from the others in the expression of
seven characteristics: intelligence, adaptability, extravertedness, dominance, masculinity, interpersonal
sensitivity and low conservatism. The personality traits of the leader are determined by personality
tests or the experimental procedure LFD (leadreless group discussion), in which the behavior of all
members of the group is observed. Harari and McDavid (JW 1979) come to a similar set of leadership
traits in their synthesis. and a sense of responsibility for the functioning of the group that is manifested
in their willingness to take the initiative and the potential risk for actions that are expected to
contribute to the success of the group. According to research by Kirkpatrick and Locke (1991), key
traits of a leader include: instinct (a broader term that includes achievement, motivation, ambition,
energy, perseverance, and initiative); motivation of leadership (desire to lead, but not to seek power as
a goal in itself); honesty and integrity; self-confidence (which is associated with emotional stability);
cognitive abilities; and business knowledge. We believe that the key qualities of a leader help the
leader to acquire the necessary skills; formulate an organizational vision and an effective plan for its
implementation; and take the necessary steps to implement the vision into reality. According to
research by George, J. M. (1992) personality traits are relatively permanent personality traits that
explain their behavior and allow prediction of their behavior. George, J. M. (1992) believes that
understanding personality is important for many aspects, not only of individual but also of
organizational behavior. George, J. M. (1992) cites two traits (positive and negative affectivity)
presented as key dispositional determinants of affective reactions at work. The discussion focuses on
theorizing and researching person-environment fitting, a complementary perspective on person-
situation interactions and the relationship between personality and organizationally relevant outcomes.
In his work, Ronald Heifetz (1994) presents clear, concrete recipes for anyone who needs to take the
lead in almost any situation, in almost any organizational environment, no matter who is in charge. His
strategy applies not only to people at the top, but also to to those who have to lead without authority -
activists as well as presidents, managers, and front-line workers. Kretsch and Crutchfield (1980) state
that some people show a tendency to be leaders in a large number of situations, and others only in
some. With which personality traits is such leadership ability associated? Numerous studies of leaders
in various types of groups show that such qualities as intelligence, dominance, self-confidence, strong
ambition, and a strong sense of personal identity are very important. Krech, Crutchfield, and Balaki
(1972) state that it has been found that leaders are generally more intelligent than their followers. It
also seems to have been established by Mann (1959) in a review of published studies that leaders are
quite consistent in their tendency to be more aligned, more dominant, more masculine, less
conservative, and more interpersonal sensitive than ordinary members. Kretsch, Crutchfield, and
Balaki (1972) state that studies on the personality characteristics of leaders have failed to reveal a
single characteristic that would be common to all leaders. Certain traits such as, high intelligence,
superiority and dominance seem to characterize capable leaders in a wide variety of studies. Ciampa
(2007) lists the qualities a leader should have: A role model for employees, Self-aware, One who
learns, Enjoys change, Visionary, Fully aware of current reality, Ethical and principled, One who
thinks holistically, Good communicator, Positive thinking, Enthusiast, Realistic about yourself.
Kouzes and Posner (2006) conducted one of the more recent studies of the characteristics of an
effective leader. It was a survey with an enviable sample of leaders from five continents. The obtained
results derived from the opinions of followers systematized a set of characteristics of favorite leaders.

EMC 2022, 17-18th June 2022, Zrenjanin, Serbia
159
The order of these qualities is as follows: Honesty, Vision, Competence, Inspiration, intelligence, fair
play, breadth of vision, Empathy, Reliability, Determination, Imagination, Ambition, Courage,
Maturity, Loyalty, Possession, Self-control, Independence. The actions of a leader are moral if the
leader has the moral right to carry them out, if the actions do not endanger the rights of others and if
the actions promote the moral rights of others Schumann (2001). These theories are called virtue-
based theories and focus on what leaders are like as human beings. From this perspective, virtues
come from the heart of the individual and are available to them Pojman (1995). According to the
authors Rajkov and Seifert (1996), traits are certain personal qualities or characteristics of a person,
such as physical characteristics (height, weight, appearance, energy), personality characteristics
(dominance, extroversion, originality), skills and abilities (intelligence, knowledge). , technical
competence), and social factors (interpersonal skills, sociability and sociometric position). According
to the authors Mihailović and Ristić (2011) of the so-called theory of "great people" that prevailed
during the first half of the twentieth century, it is emphasized that effective leadership is crucial for a
leader to have a specific set of personality traits. According to previous research by Seifert, Z. et. al.
(2011) state that the greats of world business, according to their own admission, did not start their
careers with the intention of being leaders, but what they all have in common is that they strongly
wanted to succeed. they were all curious, all self-taught, and all learned every day of their whole lives.
The turning point outside the trait approach, however, came with two researchers, Stogdil (1948) and
Mann (1959), who reviewed earlier studies and suggested that there are no traits that consistently
distinguish leaders from non-leaders. The hypothesis on which the characteristics of a leader are based
is that the professional selection of the right people will increase the efficiency and their functions and
thus the organization. There is a hypothesis that organizations will work better if the people in
leadership positions belong to the appropriate leadership profiles. The task of this research is to use
various, primarily psychological techniques for personality assessment, to find students to assign them
to appropriate positions.
METHODOLOGY
Research procedure and instrument
The paper aims to examine the impact of the student's choice of vice-dean on a democratic basis. We
want to determine whether the voters of the student-vice-dean of the faculty chose independently.
Based on the characteristics of leaders obtained as a result of previous research, a questionnaire with
21 items was constructed. Items have those characteristics that are characteristic of students that were
assessed on the Likert five-point Likert scale (1932). Items are evaluated on a scale of 1-5, with 1 - I
do not agree at all, and 5 - I completely agree. Survey participants were asked to choose a number
from 1 to 5 that best describes the future performance of the student-vice dean.
characteristics characteristic of the faculty environment:
responsibility towards faculty obligations (Stogdil)
cooperative with fellow students (Stogdil)
persistence and skill in solving tasks (Stogdil)
acceptance or popularity among students (Borgatta)
sensitivity to the needs and requirements of students (McDavid and Harari)
take the initiative (McDavid and Harari)
taking risks for possible student parliament failures (Mac David and Harari)
readiness for conflict with professors.
Appreciated by the professor
Sample
Students of all years of study, all fields. 116 students completed the questionnaire.
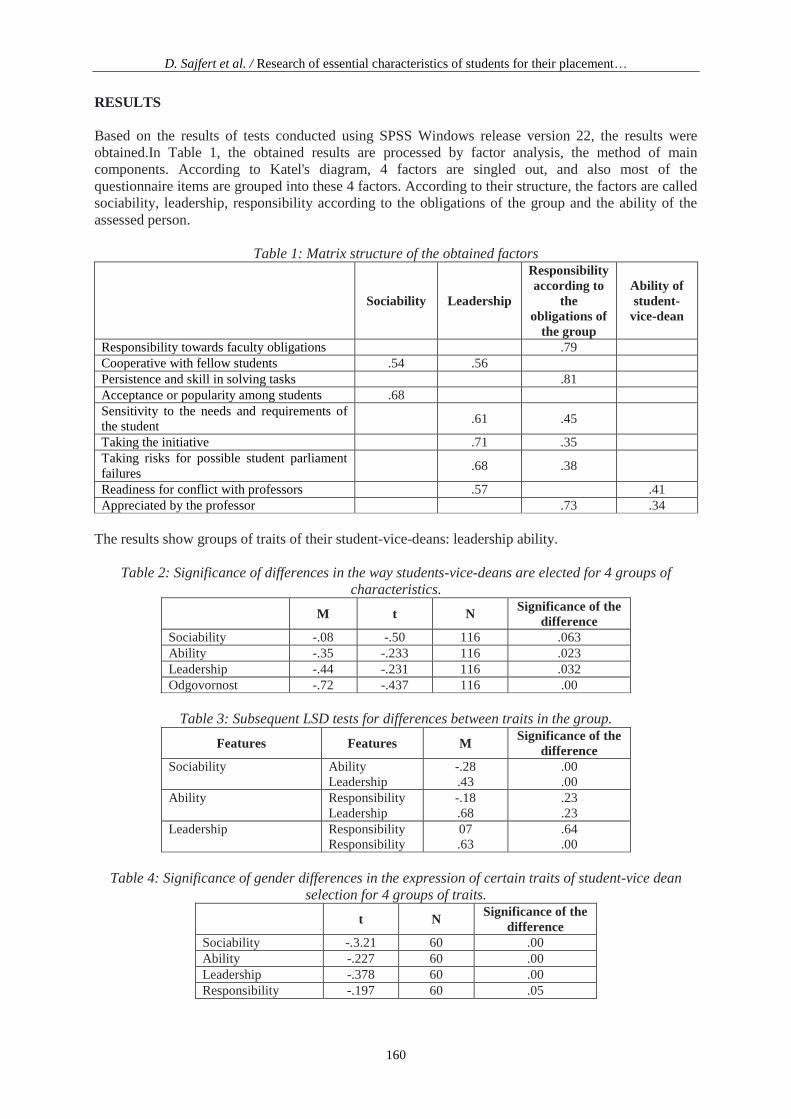
D. Sajfert et al. / Research of essential characteristics of students for their placement…
160
RESULTS
Based on the results of tests conducted using SPSS Windows release version 22, the results were
obtained.In Table 1, the obtained results are processed by factor analysis, the method of main
components. According to Katel's diagram, 4 factors are singled out, and also most of the
questionnaire items are grouped into these 4 factors. According to their structure, the factors are called
sociability, leadership, responsibility according to the obligations of the group and the ability of the
assessed person.
Table 1: Matrix structure of the obtained factors
Sociability Leadership
Responsibility
according to
the
obligations of
the group
Ability of
student-
vice-dean
Responsibility towards faculty obligations .79
Cooperative with fellow students .54 .56
Persistence and skill in solving tasks .81
Acceptance or popularity among students .68
Sensitivity to the needs and requirements of
the student .61 .45
Taking the initiative .71 .35
Taking risks for possible student parliament
failures .68 .38
Readiness for conflict with professors .57 .41
Appreciated by the professor .73 .34
The results show groups of traits of their student-vice-deans: leadership ability.
Table 2: Significance of differences in the way students-vice-deans are elected for 4 groups of
characteristics.
M t N Significance of the
difference
Sociability -.08 -.50 116 .063
Ability -.35 -.233 116 .023
Leadership -.44 -.231 116 .032
Odgovornost -.72 -.437 116 .00
Table 3: Subsequent LSD tests for differences between traits in the group.
Features Features M Significance of the
difference
Sociability Ability
Leadership
-.28
.43
.00
.00
Ability Responsibility
Leadership
-.18
.68
.23
.23
Leadership Responsibility
Responsibility
07
.63
.64
.00
Table 4: Significance of gender differences in the expression of certain traits of student-vice dean
selection for 4 groups of traits.
t N Significance of the
difference
Sociability -.3.21 60 .00
Ability -.227 60 .00
Leadership -.378 60 .00
Responsibility -.197 60 .05

EMC 2022, 17-18th June 2022, Zrenjanin, Serbia
161
DISCUSSION
By processing the obtained data, the questionnaire items were grouped into 4 factors.
Items are grouped by factors as follows in Table 1:
sociability: cooperative with peers in the faculty, acceptance or popularity among students,
leadership: cooperative with peers at the faculty, sensitivity to the needs and requirements of
students, taking the initiative, taking risks for possible failures of the student parliament,
willingness to conflict with professors.
responsibility: responsibility towards faculty obligations, persistence and skill in solving tasks,
sensitivity to the needs and requirements of students, taking the initiative, taking risks for possible
failures of the student parliament, appreciated by the professor.
abilities: readiness for conflict with professors, appreciated by professors.
Table 2. Shows the significance of differences in the way students-vice-deans are elected for 4 groups
of characteristics. Significant differences are shown, sociability .063, ability .023, leadership .032.
Table 3. Shows significance for responsibility .23, leadership .23, responsibility .64. Table 4 Shows
the significance of gender differences in the expression of student selection characteristics. The only
significance for responsibility is .05.
CONCLUSION
The results of this research indicate the existence of 4 factors that are important for the choice of
student-vice-dean.
sociability: cooperative with peers in the faculty, acceptance or popularity among students,
leadership: cooperative with peers at the faculty, sensitivity to the needs and requirements of
students, taking the initiative, taking risks for possible failures of the student parliament,
willingness to conflict with professors.
responsibility: responsibility towards faculty obligations, persistence and skill in solving tasks,
sensitivity to the needs and requirements of students, taking the initiative, taking risks for possible
failures of the student parliament, appreciated by the professor.
abilities: readiness for conflict with professors, appreciated by professors.
REFERENCES
Bell, G. B., & French, R. L. (1950). Consistency of individual leadership position in small groups of varying
membership. Journal of Abnormal and Social Psychology, 45, 764–767.
Bird, C. (1940) Social psychology. New-York,Appeleton-Century.
Carlyle Thomas (1841/1994) Sada i prije. M. Republika, str. 337.
Ciampa, G. (2007) Caring for the fallen: A personal story. World War II Chronicles, 33(Spring), 25-29.
Retrieved from.
George J. M. (1992). The role of personality in organizational life: Issues and evidence. Journal of Management,
18(2), 185-213.
Harari, H. and MCDavid, J. W. (1979) Situacional influence on moral justice: A study of “Finking”. Journal of
Personality and Social Psychology, 11, 240-244.
Heifetz Ronald (1994). Leadership without easy answers. Harvard University Press.
Kirkpatrick Shelly and Locke A. Edvin (1991). Leadership: Do Traits Matter, Academy of Management
Executive, 5(2), 48-60.
Kouzes, J. M., & Posner, B. Z. (2006). The Leadership Challenge. Jossey – Bass, San Francisco.
Kreč Dejvid, & Kračfild Ričard. (1980). Elementi psihologije. Naučna knjiga, Beograd.
Kreč, D., Kračfild, R.S., i Balaki, I. (1972). Pojedinac u društvu. Beograd: Zavod za udžbenike i nastavna
sredstva
Lewin Kurt, Lipitt Ronald i White Ralph (1939). Bulletin of the Society for the Psychological Study of Social
Issues, 10, 263-308.

D. Sajfert et al. / Research of essential characteristics of students for their placement…
162
Likert, R. (1932).Technique for the Measurement of Attitudes. Archives of Psychology, 22(140), 1-55.
Locke, E., & Kirkpatrick S. (1991). The Essence of Leadership: The four Keys to Leading Successfully.
Lexington Books
Mann, R. D. (1959) A review of the relationship between persinality and performance in small groups.
Psychological Bulletin, 56, 241/270.
Marcketti, B. S., & Kadolph, J. S. (2010) Expowering student leadership beliefs: An Exploratory study.
International Journal of Teaching and Learning in Higher Education, 22(2), 131-139.
Mihailović, D., & Ristić, S. (2011). Liderske kompetencije. Univerzitet u Beogradu, Fakultet Organizacionih
Nauka, Beograd.
Pojman, I. P. (1995). Ethical theory: Classical and contemporary readings (2nd
ed.). Belmont, CA: Wadsworth.
Rajkov, M., Sajfert, Z. (1996). Ljudska strana menadžmenta. Fakultet organizcionih nauka, Univerziteta u
Beogradu, Beograd.
Sajfert, Z., Đorđević D, & Bešić C. (2006) Leksikon menadžmenta. Univerzitet u Novom Sadu, Tehnički fakultet
“Mihajlo Pupin”, Zrenjanin.
Sajfert, Z., Nikolić, M., Jovanović, D., Tasić, I., & Kudumović, M. (2011). Researching the characteristics of
leaders in Serbia. Technics Technologies Education Management, 6(1), 140-146.
Schumann, P. L. (2001). A moral principles framework for human resource management ethics. Human
Resource Management Review, 11, 93-111.
Sing, M. C. (2015). Personality and Leadership Qualities among Student Leaders, American Journal of Applied
Psichology, 4(3), 27-32.
Stankov, L. (1991) Pažnja i inteligencija. Psihologija, 24(3-4), 65-92.
Stogdil, R. M. (1948). Personal factors associated with leadership: A survey of the literature. Journal of
Psychology, 25, 35-71.
Strong, R., Wynn, T., Irby, T., & Linder J. (2013). The Relationship Between Students Leadership Style and Self
Directed Learning Level. Journal of Agricultural Education, 35(2), 174-185.

163
XII International Symposium Engineering Management and Competitiveness 2022 (EMC 2022)
17-18th June, Zrenjanin, Serbia
SELECTION OF CANDIDATE FOR ASSEMBLING BLINDS USING
THE TOPSIS METHOD
Dijana Tadić
University of Novi Sad, Technical Faculty "Mihajlo Pupin", Zrenjanin, Serbia
E-mail: [email protected]
ABSTRACT
In this paper, the application of the TOPSIS method is presented, in the service of choosing the operator for
assembling blinds. The method was applied to solve the dilemma facing the production manager for production
blinds, in a medium-sized company based in the Central Banat District. Out of the five candidates who entered
the shortlist of the selection, the evaluation of the best candidate for the operator for preparation blinds. Thanks
to its characteristics, the TOPSIS method ranked the candidates according to the considered criteria, and
contributed to the support of the manager in making a decision.
Key words: TOPSIS method, Application, Operator selection.
INTRODUCTION
The selection of candidates for employment may include various criteria, such as general impression,
results of psychological and personality tests, testing of knowledge in a certain field, testing of motor
skills, speed of movement, etc. The results of shortlisted candidates often don't oscillate much, and
each of the potential employees predominates in at least one domain, and the choice often depends on
the nuances. When these differences are difficult to rank and make a decision, by applying the
TOPSIS method, which is considered one of the best in the world (Nikolić, 2012), doubts can be
removed, and based on the budget, contribute to easier selection of candidates who will best suit the
position.
The use of different methods in the selection of candidates is considered desirable in all companies
(Junker, 2020). In this paper, the application of the TOPSIS method is presented, when selecting one
of the five candidates for the position of blinds assembly. This position requires memory of over 100
different models of blinds, ie knowledge of how the blinds are assembled. Due to the large selection
and complexity of the model, it is desirable to express logical inference, in order to easily master
which actions should be taken depending on the type, size and model of the blind. In addition to the
expressed logic, it is desirable that the operator has positive qualities, which characterize team-minded
people. The working environment consists of dozens of other employees, who are closely related to
the position of assembling venetian blinds, and good cooperation and communication with them is
extremely important for the sake of a favorable working atmosphere. Of the other criteria, they were
taken into consideration; general impression of the candidate, work experience in the same or similar
positions, ie experience of working with a smaller or larger number of people, and notice period, if the
candidate is currently employed, due to the urgency of filling the vacancy.
Defining what is expected from the candidate significantly simplifies the selection process, and
finding the defined one is directly related to the further success of the company (Smoljan, 2020).
Based on the stated criteria, and their evaluation, the procedure of applying the TOPSIS method is
presented, the way in which the ideal solution was reached.

D. Tadić / Selection of candidate for assembling blinds using...
164
ABOUT THE TOPSIS METHOD
The method called "Technique for Order Preference by Similarity to Ideal Solution", abbreviated
TOPSIS, was developed by Ching-Lai Hwang and Kwangsun Yoon (1981). This method belongs to
the group of multi-criteria decision analysis methods (MCDA), and as such, it has been applied by
many researchers in various fields of study. The TOPSIS method is considered to be one of the most
popular methods of this set (Hwang & Yoon, 2012).
The success of solving complex multicriteria problems has been proven by numerous researchers
(Velasques & Hester, 2013; Zavadskas & Turskis, 2011), who have faced the challenge of decision-
making. Methods from this group of analysis have found their wide application in practice (Mahdevari
et al., 2014; Njegus, 2019; Şengül et al., 2015; Zavadskas et al., 2016; Zyoud & Fuchs-Hanusch,
2017), and the work on their advancement and improvement, does not abate even today (Wątróbski et
al., 2019). It is characteristic of this method that with the help of it, the answer is reached, which
action is the closest to the ideal solution, and which is the furthest. The outcome of the solution
depends on the weight of the criteria, which the assessor sets himself (Olson, 2004). Depending on the
ability to assess the importance of criterion, the TOPSIS method will rank the possibilities of choice,
and provide insight into the distance of the solution from the ideal. This method stands out for its
simplicity, computational efficiency and comprehensiveness of the mathematical concept (Palczewski
& Sałabun, 2019).
APPLICATION OF THE TOPSIS METHOD
When choosing a new operator, the production manager has the option to choose one of 5 shares: a1 –
Candidate 1, a2 – Candidate 2, a3 – Candidate 3, a4 – Candidate 4, a5 – Candidate 5. The selection is
made on the basis of the following attributes (criteria):
A1 – Work experience on the same or similar jobs year, (maximum requirement)
A2 – General impression that the candidate makes at the interview (qualitative assessment)
A3 – Personality test results (qualitative assessment)
A4 – Logic test results (qualitative assessment)
A5 – Notice period that the candidate must meet due to employment in another company day
(minimum requirement)
Estimates (quantitative and qualitative) of all actions according to attributes are given in the initial
decision matrix, Table 1:
Table 1: Stock ratings by attributes A1 A2 A3 A4 A5
O =
a1 5 excellent very good 1 7
a2 2 good very good 6 14
a3 1 bad good 3 7
a4 8 excellent good 7 7
a5 1 excellent very good 8 7
Qualitative grades are usually translated into the following grades: 1 - very low level, 3 - low, 5 -
average (medium), 7 - high and 9 - very high level. Therefore, the initial matrix obtained the following
values, Table 2:
Tabela 2: Transfer of qualitative to quantitative assessments A1 A2 A3 A4 A5
O =
a1 5 9 7 1 7
a2 2 5 7 6 14
a3 1 3 5 3 7
a4 8 9 5 7 7
a5 1 5 7 8 7

EMC 2022, 17-18th June 2022, Zrenjanin, Serbia
165
For further processing of the matrix, the normalized decision matrix N is determined. Normalization is
performed using formula no. 1.
Formula 1:
m
1i
2ij
ij
ij
x
xn
,
Where is:
i = 1, 2,..., m – number of shares,
j = 1, 2,..., n – attribute number.
Attribute A5 (number of days of notice period), had a request to transfer minimization Aj into
maximization Aj, and for this the following expression is used, formula 2:
Formula 2:
m
1i
2ij
ij
ij
x
x1n
Based on the calculated, the matrix obtained the following values, Table 3:
Table 3: Translating minimization to maximization for attribute A5 A1 A2 A3 A4 A5
N =
a1 0,5130 0,6271 0,4987 0,0793 0,6464
a2 0,2052 0,3484 0,4987 0,4758 0,2929
a3 0,1026 0,2090 0,3562 0,2379 0,6464
a4 0,8208 0,6271 0,3562 0,5551 0,6464
a5 0,1026 0,3484 0,4987 0,6344 0,6464
The weights of the criteria are defined according to the assessment of the decision maker. To
determine the choice of operator, the following values were taken:
w1 = 0,1
w2 = 0,2
w3 = 0,3
w4 = 0,3
w5 = 0,1
Weight normalized matrices are calculated using formula 3:
Formula 3:
V = W * N
After its use, the matrix obtained the following values, Table 4:
Table 4: Weight normalized matrix A1 A2 A3 A4 A5
V =
a1 0,0513 0,1254 0,1496 0,0238 0,0646
a2 0,0205 0,0697 0,1496 0,1427 0,0293
a3 0,0103 0,0418 0,1069 0,0714 0,0646
a4 0,0821 0,1254 0,1069 0,1653 0,0646
a5 0,0103 0,0697 0,1496 0,1903 0,0646

D. Tadić / Selection of candidate for assembling blinds using...
166
After this step, the selection of the ideal and negatively ideal solution is performed, the best solution is
selected for each criterion, according to possible actions. Therefore:
Ideal solution = 0,0821, 0,1254, 0,1496, 0,1903, 0,0293
Negatively ideal solution = 0,0103, 0,0697, 0,1069, 0,0238, 0,0646
The Euclidean distance to the ideal solution was then calculated using formula 4:
Formula 4:
m,...,2,1i,vvSn
1j
2
jiji
So it is:
S1* = 0,1730
S2* = 0,0957
S3* = 0,1713
S4* = 0,1221
S5* = 0,0975
And the distance to the negative ideal solution is obtained by the expression, formula 5:
Formula 5:
mivvSn
j
jiji ,...,2,1,1
2
So it is:
S1- = 0,0813
S2- = 0,1316
S3- = 0,1531
S4- = 0,1682
S5- = 0,1719
Then the relative proximity to the ideal solution was calculated, formula 6:
Formula 6:
m,...,2,1i,SS
SC
ii
ii
So it is:
C1* = 0,3197
C2* = 0,4746
C3* = 0,4718
C4* = 0,5794
C5* = 0,3619
The obtained solutions enable the ranking of actions according to the proximity of the ideal solution,
and as a solution the following was obtained:
1. Rank: action a4 (Candidate 4)
2. Rank: action a2 (Candidate 2)
3. Rank: action a3 (Candidate 3)
4. Rank: action a5 (Candidate 5)
5. Rank: action a1 (Candidate 1)

EMC 2022, 17-18th June 2022, Zrenjanin, Serbia
167
CONCLUSION
Based on the attached, it can be concluded that the procedure of the TOPSIS method is very easy and
simple to use. 6 formulas were used and 4 tables were made. This resulted in the result that Candidate
4 is the closest to the ideal solution, ie that it is the most suitable for filling a vacant job for assembling
blinds. Then, one can notice a very small difference in the qualifications of the 2nd and 3rd
Candidates, but that for a nuance Candidate 2 is closer to the ideal solution. Then Candidate 5 is
ranked, and as the last and least suitable Candidate 1.
The TOPSIS method can be applied to a very wide range of problems, and dilemmas that require
decision-making in the form of choices. The bigger the dilemma and the smaller the difference
between the qualifications of the actions, the more desirable the support of some of the methods. For
the sake of greater certainty in the correctness of the decision made, other methods can be applied, and
the results can be compared.
REFERENCES
Hwang, C. L., & Masud, A. S. M. (2012). Multiple objective decision making-methods and applications: a state-
-of-the-art survey (Vol. 164). Springer Science & Business Media.
Hwang, C. L., & Yoon, K. (1981). Methods for multiple attribute decision making. In Multiple attribute decision
making (pp. 58-191). Springer, Berlin, Heidelberg.
Junker, K. (2020). Personnel selection and employment (Doctoral dissertation, University of Rijeka. Faculty
of Maritime Studies, Rijeka. Department of Logistics and Management).
Mahdevari, S., Shahriar, K., & Esfahanipour, A. (2014). Human health and safety risks management in
underground coal mines using fuzzy TOPSIS. Science of the Total Environment, 488, 85-99.
Nikolić, M. (2012). Decision making methods. University of Novi Sad, Technical Faculty. ,Mihajlo Pupin“,
Zrenjanin, (pp. 132).
Njeguš, A. (2019). Application of multicriteria analysis methods in the selection of candidates for work in the
tourism industry. In Sinteza 2019-International Scientific Conference on Information Technology and Data
Related Research (pp. 505-510). Singidunum University.
Olson, D. L. (2004). Comparison of weights in TOPSIS models. Mathematical and Computer Modelling, 40(7-
8), 721- 727.
Palczewski, K., & Sałabun, W. (2019). The fuzzy TOPSIS applications in the last decade. Procedia Computer
Science, 159, 2294-2303.
Şengül, Ü., Eren, M., Shiraz, S. E., Gezder, V., & Şengül, A. B. (2015). Fuzzy TOPSIS method for ranking
renewable energy supply systems in Turkey. Renewable Energy, 75, 617-625.
Smoljan, D. (2020). Innovative employment systems in an IT company (Doctoral dissertation, The University of
Applied Sciences Baltazar Zaprešić. Chair of Economics, Management and Marketing).
Velasquez, M., & Hester, P. T. (2013). An analysis of multi-criteria decision making methods. International
Journal of Operations Research, 10(2), 56-66.
Wątróbski, J., Jankowski, J., Ziemba, P., Karczmarczyk, A., & Zioło, M. (2019). Generalised framework for
multi-criteria method selection. Omega, 86, 107-124.
Zavadskas, E. K., & Turskis, Z. (2011). Multiple criteria decision making (MCDM) methods in economics: an
overview. Technological and Economic Development of Economy, 17(2), 397-427.
Zavadskas, E. K., Mardani, A., Turskis, Z., Jusoh, A., & Nor, K. M. (2016). Development of TOPSIS method to
solve complicated decision-making problems - An overview on developments from 2000 to
2015. International Journal of Information Technology & Decision Making, 15(03), 645-682.
Zyoud, S. H., & Fuchs-Hanusch, D. (2017). A bibliometric-based survey on AHP and TOPSIS
techniques. Expert systems with applications, 78, 158-181.

D. Tadić / Selection of candidate for assembling blinds using...
168

169
XII International Symposium Engineering Management and Competitiveness 2022 (EMC 2022)
17-18th June, Zrenjanin, Serbia
Session C: MARKETING MANAGEMENT
Papers (pp. 171-196):
Anja Jakšić, Aleksandar Sofić, Branko Markoski, Slavko Rakić,
Ksenija Mitrović, Jelena Spajić
THE CONCEPT OF B2B CUSTOMER JOURNEY IN E-COMMERCE ...171
Milica Josimović, Milena Cvjetković
THE ROLE OF PUBLIC RELATIONS IN BUILDING A REPUTATION
AND COMPETITIVE ADVANTAGES ...176
Biljana Maljugić, SrđanaTaboroši
THE ROLE OF PUBLIC RELATIONS IN CORPORATE SOCIAL RESPONSIBILITY ...181
Srđana Taboroši, Aleksandra Kovačević, Biljana Maljugić
THE ROLE OF SOCIAL MEDIA IN THE DECISION-MAKING PROCESS ...187
Bruno Završnik
GAMBLING MARKETING COMMUNICATION ...192

170
171
XII International Symposium Engineering Management and Competitiveness 2022 (EMC 2022)
17-18th June, Zrenjanin, Serbia
THE CONCEPT OF B2B CUSTOMER JOURNEY IN E-COMMERCE
Anja Jakšić
University of Novi Sad, Faculty of Technical Sciences, Republic of Serbia
Aleksandar Sofić
University of Novi Sad, Faculty of Technical Sciences, Republic of Serbia
Branko Markoski
University of Novi Sad, Technical Faculty “Mihajlo Pupin”, Republic of Serbia
E-mail: [email protected]
Slavko Rakić
University of Novi Sad, Faculty of Technical Sciences, Republic of Serbia
Ksenija Mitrović
University of Novi Sad, Faculty of Technical Sciences, Republic of Serbia
Jelena Spajić
University of Novi Sad, Faculty of Technical Sciences, Republic of Serbia
ABSTRACT
In the last few years, the concept of the Customer Journey is very interesting among marketing researchers. This
concept has a significant value for companies to better understand their customers and build an inherent
relationship. The focus of the research of this paper is the Customer Journey in the field of Business-to-Business
(B2B) Electronic commerce (e-commerce). Through a relevant literature review, the theoretical background of
the B2B Customer Journey in e-commerce was examined. This paper aims to develop a clear understanding of
the Customer Journey in B2B e-commerce. The result of this research is a summary of key touchpoints in the
researched area based on the literature review.
Key words: Electronic commerce, E-commerce, Business-to-business, B2B, Customer journey.
INTRODUCTION
With the development of the Internet and communication technology, a new business opportunity has
been created. The rapid changes that are happening in the market have changed the way companies do
business. The big impact of marketing has led to new opportunities and challenges in comparison with
traditional B2B e-commerce (Bhandari, et al., 2017). New trends in the business shift offline business
processes to the online environment (Prajapati, Zhou, Zhang, Chelladurai, & Pratap, 2021). New
technologies have led to a change in the environment in which B2B participants operate, and an
increasing part of the business is moving to online platforms. To be as successful as possible,
companies adjust their strategies to be competitive in the market and increase the number of
customers. The new technology gives advantages in business processes to facilitate communication
with customers and provide the product or service that best meets their needs. One of the main
management goals is to create a powerful customer experience (Lemon & Verhoef, 2016) to secure a
market position. To better understand customer behavior and provide a strong customer experience,
the concept of the Customer Journey has become very important (Tueanrat, Papagiannidis, &
Alamanos, 2021). Rusthollkarhu et al. (2021) found a lack research of on the B2B Customer Journey
in the marketing literature. They examined papers from Scopus and Web of Science to research the
B2B model of Customer Journey (Rusthollkarhu, Aarikka-Stenroos, & Mero, 2021). In their paper,
they concluded that the Customer Journey concept cannot deal with the complexity of the B2B
environment. This paper presents the relevant literature review of the development of B2B e-
commerce and the concept of the Customer Journey in online business processes.

A. Jakšić et al. / The concept of B2B customer journey in e-commerce
172
LITERATURE REVIEW
The specifics of B2B e-commerce
E-commerce is „every type of business transaction, where users start and develop their business or
trade with products and services through electronic channels“ (Doluschitz, 2002). In terms of
management, e-commerce offers several advantages in trading, so online trading became popular and
the usage has significantly increased in recent years (Riester & Huber, 2015). It is a convenient way to
compare prices and products on one trading platform, instead of wasting time contacting each supplier
separately (Xiaoping, Chunxia, Dong, & Xiaoshuan, 2009). Established e-markets ensure the level of
trust for the customer, as only those who are members have the opportunity to trade (Xiaoping,
Chunxia, Dong, & Xiaoshuan, 2009). According to Butler and Fitzgerald, the key factor of success are
the functions that ensure competitive performance for an organization (Butler & Fitzgerald, 1999).
The latest price information and availability of products make it easier to achieve the best business
deals (Xiaoping, Chunxia, Dong, & Xiaoshuan, 2009). E-commerce is divided into three categories:
business-to-business (B2B), business-to-customer (B2C), and customer-to-customer (C2C) (Fernando,
Assegaff, & Rohayani, 2016). The development of new technologies is a very important element of
the creation of B2B buying and selling processes (Syam & Sharma, 2018). New trends in business are
affecting the growing number of business users who connect via the Internet to facilitate business
processes (Lin, 2006). B2B online communication platforms enable a business to transfer its offline
environment into an online space (Peruchi, Pacheco, Todeschini, & Caten, 2022). Sila (2013) defined
B2B e-commerce as “electronic information systems designed to handle in an effective manner
transaction between trading partners”. B2B e-markets function as an electronic hub, connecting large
numbers of buyers and sellers and automating business transactions (Kaplan & Sawhney, 1994). The
main role of B2B e-markets is to enable and facilitate the exchange of products and information and
support all segments of the exchange process (Bakos, 1997). Most B2B activities are focused on
online exchange (Wise & Morrison, 2000), which makes e-commerce an important competitive
advantage (Fauska, Kryvinska, & Strauss, 2013). At the global level, the majority of economies do
not use the whole potential of new technologies (Alsaad, Taamneh, Sila, & Elrehail, 2021). In the
study conducted in 2021, the authors compared the acceptance of B2B e-commerce in developed and
developing countries (Alsaad, Taamneh, Sila, & Elrehail, 2021). According to this study, elements of
B2B e-commerce vary according to the degree of economic development (Alsaad, Taamneh, Sila, &
Elrehail, 2021). In 2013, the research of adoption factors surged that company size and type and
management level are elements that impact the adoption of B2B e-commerce (Sila, 2013).
B2B Customer Journey
B2B e-market business models are determined by how well they can meet the needs of companies,
how much potential value they offer, and how much realized value they can provide to companies that
adopt this business model (Dai & Kauffman, 2002). “The ability to predict a customer’s response to a
digital action has remarkable value” (Bhandari, et al., 2017). Companies’ supply chains, products, and
marketing strategies, their processes, and operations even the business models – will be shaped by the
way B2B relationships are formed and transactions are conducted in e-markets (Wise & Morrison,
2000). Companies focus on customer experience through various touchpoints: from thought, searches,
purchase, usage to future repurchase (Spajić, Bošković, Milić, & Lalić, 2020). The evidence from the
study conducted in 2019, surges that the B2B Customer Journey is more complex than the B2C
Customer Journey (Østerlund, West, Stoll, & Kowalkowski, 2019). Some authors as main differences
between B2B and B2C point out the next elements: longer purchase decision time, smaller amount of
customers, fewer transactions of B2B customers in comparison with B2C customers (Bakhtievab,
2016). The complexity also can be observed in terms of transactions which rise with more expensive
purchases (Østerlund, West, Stoll, & Kowalkowski, 2019).
The great value of a customer experience in the case of e-commerce is the ability to “align customer
goals with business goals” (Ritonummi, 2020). The customers communicate with companies through
so many different channels which impact the customer experience (Lemon & Verhoef, 2016). Spajić et

EMC 2022, 17-18th June 2022, Zrenjanin, Serbia
173
all. (2020) explain in their research that “customer experience can be explained with a customer's
journey with a firm overtime during the purchase cycle across multiple touchpoints”. According to
Rusthollkarhu et al. (2021) the customer journey “has been identified as one of the most promising
concepts in understanding B2B buying and selling processes in modern digital environments”.
Besides the buying and selling processes, the B2B Customer Journey implies customer experience,
value creation, brand value, and social media (Rusthollkarhu, Aarikka-Stenroos, & Mero, 2021).
There are recognized three stages of the Customer Journey (Lemon & Verhoef, 2016):
Pre-purchase – every interaction with a brand before the purchase transaction
Purchase – all customer actions during the purchase
Post-purchase – all customer interactions with a brand after the purchase.
Other authors divided the Customer Journey into four stages (Fischer, Seidenstricker, Berger, &
Holopainen, 2021):
The consideration stage
The evaluation stage
The buying stage
The customer experiences the product and builds an expectation for future relationships.
In their paper, Lemon and Verhoef presented the scheme of the Customer Journey. In this scheme are
presented the touchpoints in each phase of the Customer Journey.
Figure 1: Customer Journey scheme with touchpoints
Source: (Lemon & Verhoef, 2016)
The understanding of the buying process has changed, with the customer journey, customer
experience, and touchpoints being modernized (Steward, Narus, Roehm, & Ritz, 2019). Thanks to new
technologies, B2B customers have access to more information, both about suppliers and other
customers' buying experiences (Steward, Narus, Roehm, & Ritz, 2019). According to Bhandari et al.
(2017), a model based on monitoring digital consumer behavior helps to realize sales potential,
through improving the customer experience and creating personalized marketing.
The key touchpoints of B2B customer journey in e-commerce
As it is mentioned above, the Customer Journey is divided into three phases: pre-purchase, purchase,
and post-purchase. Each touchpoint is independent and can be updated with the improvement of
technology (Micheaux & Bosio, 2018). Throughout the journey, customers interact with the company

A. Jakšić et al. / The concept of B2B customer journey in e-commerce
174
at specific touchpoints (Lemon & Verhoef, 2016). “Each touchpoint can lead to the positive or
negative customer experience” (Aichner & Gruber, 2017). The touchpoints are crucial for Customer
Journey mapping, providing the knowledge of what is happening in each moment (Micheaux & Bosio,
2018). Previous studies found out different types of touchpoints: brand-owned, partner-owned,
customer-owned, and social/external/independent (Lemon & Verhoef, 2016). In the study where were
examined only brand-owned touchpoints, throughout the company’s website and mobile application,
the result showed that the evaluation of the buying process differs significantly across different
channels and touchpoints (Wagner, Schramm-Klein, & Steinmann, 2018). Based on value, each
touchpoint can be categorized into four groups (Barann, Betzing, Niemann, Hoffmeister, & Becker,
2020):
1. Search and navigation,
2. Product information,
3. Selection and checkout and
4. Communication and support.
In this study, the authors realized that customers during their journey, are less interested to interact
with the company through communication and support (Barann, Betzing, Niemann, Hoffmeister, &
Becker, 2020). Other authors in their research claim that the website and social media are ones of
crucial touchpoints (Lim, Al-Aali, & Heinrichs, 2014). In terms of customer satisfaction, each
touchpoint plays an important role (Aichner & Gruber, 2017). Mapping the touchpoints during the
Customer Journey gives a company opportunity to improve their business, putting the client in the
center (Spajić, Bošković, Milić, & Lalić, 2020).
CONCLUSION
According to the literature review, transformation into online business affected marketing decisions
and actions of the companies. Customer expectations are changing rapidly with the advancement of
technology, and companies need to adjust their business as soon as possible. There has been developed
the concept of Customer Journey that explains the buying process in the new business environment.
Managing this Journey and touchpoints is one of the important steps for companies that want to be
competitive in the market and understand choices customers make during their journey. Depending on
the authors and previous research, each research had different touchpoints related to the industry
where the surveys were conducted. According to the cited authors, there is a gap in research in terms
of the digitalization of the B2B Customer Journey. This paper enriches the research of the B2B
Customer Journey and provides a summary of the key touchpoints.
REFERENCES
Aichner, T., & Gruber, B. (2017). Managing Customer Touchpoints and Customer Satisfaction in B2B Mass
Customization: A Case Study. International Journal of Industrial Engineering and Management, 131-140.
Alsaad, A., Taamneh, A., Sila, I., & Elrehail, H. (2021). Understanding the global diffusion of B2B E-commerce
(B2B EC): An integrated model. Journal of Information Technology, 36(3), 258-274.
doi:10.1177/0268396220961396
Bakhtievab, E. (2016). The role of the customer journey in B2B content marketing. 12th Annual International
Bata Conference for Ph.D. Students and Young Researchers (DOKBAT) (str. 31-42). Zlín: Tomas Bata
University in Zlín.
Bakos, J. (1997). Reducing buyer search costs: Implications for electronic marketplace. Management Science,
1676-1692.
Barann, B., Betzing, J. H., Niemann, M., Hoffmeister, B., & Becker, J. (2020). Exploring customers’ likeliness
to use e-service touchpoints in brick and mortar retail. Electronic Markets.
Bhandari, A., Rama, K., Seth, N., Niranjan, N., Chitalia, P., & Berg, S. (2017). Towards an Efficient Method of
Modeling “Next Best Action” for Digital Buyer’s Journey in B2B. Lecture Notes in Computer Science,
107-116. doi:10.1007/978-3-319-62416-7_8
Butler, T., & Fitzgerald, B. (1999). Unpacking the systems development process: an empirical application of the
CSF concept in a research context. The Journal of Strategic Information Systems, 351-371.

EMC 2022, 17-18th June 2022, Zrenjanin, Serbia
175
Dai, Q., & Kauffman, R. J. (2002). Business Models for Internet-Based B2B Electronic Markets. International
Journal of Electronic Commerce, 41-72.
Doluschitz, R. (2002). Electronic Business in der Agrar– und Ernährungswirtschaft – Ernüchterung und
Konsolidierung lösen die anfängliche Euphorie ab. German Journal of Agricultural Economics.
Fauska, P., Kryvinska, N., & Strauss, C. (2013). The role of e-commerce in B2B markets of goods and services.
International Journal of Services, Economics, and Management, 5, 41-71.
doi:doi:10.1504/ijsem.2013.051872
Fernando, E., Assegaff, S., & Rohayani, H. (2016). Trends Information Technology in E-Agriculture.
International Conference on Information Technology, Computer and Electrical Engineering (ICITACEE),
(str. 351-355). Semarang, Indonesia.
Fischer, H., Seidenstricker, S., Berger, T., & Holopainen, T. (2021). Digital Sales in B2B: Status and
Application.
Kaplan, S., & Sawhney, M. (1994). E-hubs: The new B2B marketplaces. Harvard Business Review, 93-115.
Lemon, & Verhoef. (2016). Understanding Customer Experience Throughout the Customer Journey. Journal of
Marketing: AMA/MSI Special Issue, 69-96.
Lim, J.-S., Al-Aali, A., & Heinrichs, J. H. (2014). Impact of satisfaction with retailers touchpoints on purchase
behavior: the moderating effect of search and experience product type. Marketing Letters, 26(2), 225–235.
doi:10.1007/s11002-014-9334-x
Lin, A. (2006). The acceptance and use of a business-to-business information system. International Journal of
Information Management, 26(5), 386-400. doi:doi:10.1016/j.ijinfomgt.2006.04.002
Micheaux, A., & Bosio, B. (2018). Customer Journey Mapping as a New Way to Teach Data-Driven Marketing
as a Service. Journal of Marketing Education. doi:10.1177/0273475318812551
Østerlund, M. M., West, S., Stoll, M. O., & Kowalkowski, C. (2019). Using customer journey mapping to
improve industrial sales and customer experience. 26th EurOMA Conference. Helsinki, Finland.
Peruchi, D., Pacheco, D., Todeschini, B., & Caten, C. (2022). Moving towards digital platforms revolution?
Antecedents, determinants, and conceptual framework for offline B2B networks. Journal of Business
Research, 344-363. doi:10.1016/j.jbusres.2021.12.036
Prajapati, D., Zhou, F., Zhang, M., Chelladurai, H., & Pratap, S. (2021). Sustainable logistics network design for
multi-products delivery operations in B2B e-commerce platform. Sādhanā. doi:10.1007/s12046-021-01624-
1
Riester, R., & Huber, J. (2015). Betriebsmittel. Agrarmärkte, 307-318.
Ritonummi, S. (2020). User experience on an ecommerce website - a case study. Jyväskylä University.
Rusthollkarhu, S., Aarikka-Stenroos, L., & Mero, J. (2021). B2B Customer Journey: Axioms and Actor Roles.
Proceedings of the European Marketing Academy, 50th. Madrid.
Sila, I. (2013). Factors Affecting the Adoption of B2B e-Commerce Technologies. Electronic Commerce
Research. doi:10.1007/s10660-013-9110-7
Spajić, J., Bošković, D., Milić, B., & Lalić, D. (2020). Boosting customer experience value through customer
journey design. 9th International Conference on Mass Customization and Personalization - Community of
Europe (MCP - CE 2020). Novi Sad.
Steward, M. D., Narus, J. A., Roehm, M. L., & Ritz, W. (2019). From transactions to journeys and beyond: The
evolution of B2B buying process modeling. Industrial Marketing Management.
doi:10.1016/j.indmarman.2019.05
Syam, N., & Sharma, A. (2018). Waiting for a sales renaissance in the fourth industrial revolution: Machine
learning and artificial intelligence in sales research and practice. Industrial Marketing Management, 135-
146.
Tueanrat, Y., Papagiannidis, S., & Alamanos, E. (2021). Going on a journey: A review of the customer journey
literature. Journal of Business Research, 336-353. doi:10.1016/j.jbusres.2020.12.02
Wagner, G., Schramm-Klein, H., & Steinmann, S. (2018). Online retailing across e-channels and e-channel
touchpoints: Empirical studies of consumer behavior in the multichannel e-commerce environment. Journal
of Business Research.
Wise, R., & Morrison, D. (2000, November-December). Business Models - The Future of B2B. Preuzeto sa
Harvard Business Review: https://hbr.org/2000/11/the-future-of-b2b
Xiaoping, Z., Chunxia, W., Dong, T., & Xia
176
XII International Symposium Engineering Management and Competitiveness 2022 (EMC 2022)
17-18th June, Zrenjanin, Serbia
THE ROLE OF PUBLIC RELATIONS IN BUILDING A REPUTATION
AND COMPETITIVE ADVANTAGES
Milica Josimović
University of Novi Sad, Technical Faculty ”Mihajlo Pupin”, Zrenjanin, Serbia
E-mail: [email protected]
Milena Cvjetković
College of Academic Studies, ”Dositej”, Belgrade, Serbia
ABSTRACT
Organizations strive to create a position and recognition in the market by creating the best possible image of
themselves. The organization creates the conditions for building the best possible reputation in the market by
establishing effective communication and public relations with stakeholders. It is a long-term process that
requires continuous labor and the effort that the organization invests in order to fight for its place in the market
and the loyalty of its customers. The paper analyzes the role of public relations in building a reputation through
which a company can create a competitive advantage in the market. Organizations that have recognized the
importance of establishing good relations with their stakeholders, have created the conditions for building
corporate reputation and identity. In conditions of fierce competition that is a powerful tool for improving
business competitiveness. Public relations in the context of integrated marketing communications has a
significant role that is becoming increasingly important in the digital age and communication through
information technology. The public relations strategy aims to create a favorable environment for the entire
business of the organization.
Key words:: Reputation, Identity, Competitive advantage, Marketing communication, Public relations.
INTRODUCTION
Public relations is considered a special management function whose assignment is to create and
preserve the organization's reputation, strengthen trust, understanding and goodwill between the
organization and its public groups, organize comprehensive business communications with various
stakeholders of the organization. Corporate identity emphasizes the uniqueness of an organization
through its culture, behavior, strategy, and organizational communication. The reputation of the
organization is the opinion of all stakeholders arising from the business of the organization. Effective
reputation management, as a strategic asset, contributes to business success and financial and non-
financial benefits. The trust, satisfaction and loyalty that result from the relationship between the
organization and other stakeholders serve to measure corporate reputation. Corporate reputation is
based on direct experience or convincing indirect information, which generates the attitudes and
emotions of an individual (or group) towards the organization (Vlastelica Bakić, 2012). So, reputation
is a consequence of corporate identity, performance and communication, and all that forms the beliefs
and attitudes of stakeholders and citizens towards the company. Moreover, corporate reputation is a
perceptual assessment of stakeholders in an organization (Walker, 2010).
Through corporate communications, the organization provides a basis for establishing and building
good relationships between the organization and other stakeholders (Beurer-Zuellig et al., 2009). The
strategy of corporate communications in the function of reputation management can be focused on
managing relations with the business community, organizing events and participating in important
events in the environment, generating publicity and adopting the philosophy of socially responsible
business. Empirical research (Vlastelica Bakić, 2012) confirmed the formation of a good reputation of
companies in Serbia, by achieving good performance in all five categories according to the model
EMC 2022, 17-18th June 2022, Zrenjanin, Serbia
177
developed by this research: business performance and work environment, products and services, social
responsibility, marketing communication, public relations.
THE IMPORTANCE OF PUBLIC RELATIONS FOR THE ORGANIZATION
Representing the public and building a personal brand, with the intention of being accepted, means the
application of integrated marketing communications (Milovanović et al., 2018). The modern moment
of business significantly changes the communication process. The consumer has taken control of
communications and he decides whether and when he will receive the message (Kitchen, Schultz,
2009).
It has been confirmed that the efficiency of communication affects the achievement of customer
loyalty more than when it comes to the quality of communication. This only indicates that
organizations must turn special attention to the choice of appropriate communication channels, similar
to the needs, requirements and preferences of customers (Hanninen, Karjaluoto, 2017). Maintaining a
competitive position in the market is conditioned by customer satisfaction, which is the result of
efficient interaction of services and promotional activities.
The research confirmed the strong influence of public relations on the image and reputation of the
bank, but also on the final business result. In addition, the interaction between clients and content
created by marketing communications is emphasized (Paponjak, Lalić, 2019). The results of the
research indicate that the potential of digital media for achieving two-way and symmetrical relations
between the organization and the public through PR services is insufficiently used. Strategic public
relations management can still be considered a highly normative model that has not fully taken root in
practice, despite studies that speak of its exceptionality (Milojević, 2015). Public relations, as a
managerial function, the implementation of all elements of socially responsible business, achieves it
has socially useful role, while taking on the role of "conscience" of the company (Skoko, Mihovilović,
2014). The results of the research confirm the existence of a significant direct link between public
relations and economic effects (Nikolić et al., 2011).
The priorities that companies need to make towards existing and potential customers include finding
the appropriate measure for the use of modern information and communication technologies. These
are the basic guidelines for establishing good long-term relationships in global business conditions, in
which there are smaller opportunities to achieve competitive advantages, which is why building good
relationships with customers is becoming a key area of exploitation of today's companies (Ratković et
al., 2011).
THE ROLE OF PUBLIC RELATIONS IN REPUTATION BUILDING
Reputation is a factor in differentiating companies in the market and creating a relationship of trust,
not only with consumers, but also with all other stakeholders. In this way, the company realizes
significant economic benefits. Reputation is a valuable assets of a company because it cannot be
imitated, bearing in mind that a good reputation requires many years of high or stable product quality,
constant innovation and flexibility in relation to the demands of stakeholders. Therefore, it is a
strategic asset, ie a resource that creates a competitive advantage (Krstić et al., 2021).
Good corporate image and identity over a long period of time affect the creation of reputation, which
contributes to improving business performance and creating long-term competitive advantage of
organizations (Stanković et al., 2007). They increase the value of the product or brand and represent a
kind of guarantee of quality. Corporate reputation is the result of comprehensive internal and external
activities of the organization, as well as ways of communicating with various stakeholders.

M. Josimović and M. Cvjetković / The role of public relations in building a reputation...
178
Public relations is stand out from the domain of marketing communications, because their immediate
goal is not to sell and make a profit, but to provide a favorable environment for the entire business
(Broom, 2010). However, in the long run, it can certainly contribute to achieving marketing goals and
achieving commercial effects, which is the basic goal of every company (Ognjanov, 2013). There are
numerous studies that have proven the positive relationship between corporate reputation and
company performance (Lopez, Iglesias, 2010). The strategic importance of reputation can be traced
through its roles through which it signals to stakeholders its values and strategic commitments, but
also provides them with a greater ability to predict the behavior of the same organization in the future
(Dowling, Moran, 2012).
Reputation is built in the process of communicating the company's strategic decisions to significant
stakeholders. It is defined as the perception they have about certain attributes of the company (for
example, innovation, quality of products and services, social responsibility, financial discipline,
building and retaining talented staff, etc.) compared to the competition (Mitić, Ognjanov, 2013).
Online communication can be used to influence stakeholders 'assessments of an organization's and
services' products, corporate responsibility, success, its ability to change and develop, and its public
image. In addition, online communication can generate reputational benefits by strengthening
relationships with stakeholders and building social capital for the organization (Aula, 2011).
Corporations are increasingly investing in social media, hoping to improve their corporate reputation
by engaging and managing relationships with a variety of stakeholders. The research confirmed that
the frequency of publishing company content on its Facebook is not a significant predictor of its
corporate reputation (Ji et al., 2017).
Reputation management requires coordination between internal understanding and external
expectations (Verčič, Ćorić, 2018). A corporation with a public relations or communications
department that has a well-defined job description is more likely to have a better reputation because it
has an open internal communication system and allows its employees to plan and work strategically
and efficiently (Kim, Cha, 2014). In addition to the fact that websites or social networks play an
important role in informing the public about socially responsible business (Tetrevova et al., 2019),
they also play an important role the company's annual reports, voluntary reports on socially
responsible business, voluntary environmental reports and corporate promotional materials and printed
materials (eg newspapers), which are often distributed online (Tetrevova, 2018).
Research on the practical use of communication channels and PR tools for creating public relations
among managers of Czech chemical industrial companies showed that the company's internet
presentation, sponsorship of sporting events and realization and presentation of environmental
information are the most commonly used and most effective PR tools (Jelinkova et al., 2020).
Companies recognize the importance of their reputation and PR skills. To improve their ability to
understand and communicate with stakeholders, companies continue to develop new PR techniques. In
order to improve customer orientation and price premium to gain profitability, companies must earn a
positive perception of their employees' capabilities, not only in CSR activities but also in other general
characteristics, by focusing on CSR strategy (Lee et. al., 2016).
PUBLIC RELATIONS AND COMPETITIVE ADVANTAGE
Companies that understand that communication is an integral part of their strategic success will not
only gain a competitive advantage but also maintain no matter unfavorable conditions. Moreover,
communication is a factor of differentiation to meet customer needs, engage and motivate employees,
drive innovation, improve efficiency, demonstrate social responsibility during the crisis and protect the
organization's interests from adverse rules and regulations (Nvabueze, Mileski, 2018).
The results of the research confirmed that the implementation of advertising and public relations
activities, innovative activities and new technologies and the implementation of socially responsible
business contributes to improving the company's image and has a positive effect on building

EMC 2022, 17-18th June 2022, Zrenjanin, Serbia
179
competitive advantages (Marakova et al., 2021). A company that wants an advantage over competitors
in the market must shape the image of the product in a way that starts a story about it, which is
achieved through adequate business communication. The integrated public relations / advertising
function contributes to the general image and reputation of the company and its products and services
(Miletić, 2010).
Shuba (2016) investigated the impact of innovative marketing on online and offline marketing
activities. In his research, he discovered that thanks to innovations, online marketing exceeds offline
marketing by 15%. Internet marketing is especially growing in the field of public relations. The
dimensions of communication models of public relations and public-organization relations have the
greatest influence and effect on the dimension of trust, then the dimension of expertise and finally the
dimension of financial performance. This indicates that there is a greater impact on the credibility of
the company than on the financial performance (Vlahović et al., 2020).
The results of the research on the impact of media relations on certain organizations and business
outcomes of companies in Serbia indicate that the greatest impact has modern media on the company's
credibility, as well as market share and sales growth when it comes to financial performance. By
improving media relations, the company creates a good basis for raising the level of organizational and
business performance, and it is best to use the synergistic effect of a number of media relations items
(Terek et al., 2015).
Research (Nikolić et al., 2012) confirmed a strong relationship between internal communication and
the strategic and economic effects of doing business in Serbian companies. Increasing the level of
internal communication improves both strategic and economic effects in companies.
CONCLUSION
Globalization, restructuring of the world economy, changes in the financing and implementation of
system projects, the ubiquitous use of information and communication technologies (ICT), and the
intensity of competition prevailing in the market force contractors to reconsider competitive strengths
and customer expectations. Marketing can help build a company to differentiate itself from its
competitors, cultivate and/or retain customers and thus create a competitive advantage.
The paper emphasizes the importance of public relations in building a reputation and gaining a
competitive advantage in the market. Corporate reputation and image are two valuable intangible
resources of the company, which aim to build its long-term competitive advantage and market value.
Good reputation and brand identity are very important to achieve competitive advantage. A continuous
and successful reputation is built on credibility and organizational transparency. Reputation and image
are two separate, intangible assets that support each other and companies need each of them to build
their competitive advantage.
REFERENCES
Aula, P. (2011). Meshworked reputation: Publicists’ views on the reputational impacts of online communication.
Public relations review, 37(1), 28-36.
Beurer-Zuellig, B., Fieseler, C., & Meckel, M. (2009). A descriptive inquiry into the corporate communication
profession in Europe. Public Relations Review, 35(3), 270-279.
Broom, G. (2010). Učinkoviti odnosi s javnošću, Zagreb: Mate
Dowling, G., & Moran, P. (2012). Corporate reputations: built in or bolted on?. California Management Review,
54(2), 25-42.
Hänninen, N., Karjaluoto, H. (2017). The effect of marketing communication on business relationship loyalty.
Marketing Intelligence and Planning, 35 (4), 458-472.
Jelinkova, M., Lostakova, H., & Machackova, K. (2020, June). The level of use of public relations tools and
evaluation of their impact on the reputation of chemical companies from the perspective of the Czech

M. Josimović and M. Cvjetković / The role of public relations in building a reputation...
180
public. In Proceedings of 11th International Scientific Conference Business and Management 2020. 293-
301.
Ji, Y. G., Li, C., North, M., & Liu, J. (2017). Staking reputation on stakeholders: How does stakeholders’
Facebook engagement help or ruin a company’s reputation?. Public Relations Review, 43(1), 201-210.
Kim, J. R., & Cha, H. (2014). The Effect of Public Relations and Corporate Reputation on Return on
Investment. Asia Pacific Public Relations Journal, 14.
Kitchen, P.J., Schultz, D.E. (2009). IMC: New horizon/false dawn for a marketplace in turmoil?. Journal of
marketing communications, 15 (2-3), 197-204.
Krstić, B., Jovanović, M., & Janjić, I. (2021). Značaj reputacije kao intelektualne imovine za konkurentnost
preduzeća. Naučne publikacije državnog univerziteta u Novom Pazaru Serija B: Društvene & humanističke
nauke, April 2021, 4 (1), 17-28.
Lee, E. M., Lee, H. J., Pae, J. H., & Park, S. Y. (2016). The important role of corporate social responsibility
capabilities in improving sustainable competitive advantage. Social Responsibility Journal, 12 (4), 642-653.
López, V. & Iglesias, S. (2010), A Reputational– Performance Framework in an SME Context: Some Empirical
Evidence from Spain, The Irish Journal of Management, Vol.29, No.2, str. 35-66
Marakova, V., Wolak-Tuzimek, A., & Tuckova, Z. (2021). Corporate Social Responsibility As a Source of
Competitive Advantage in Large Enterprises. Journal of Competitiveness, 13(1), 113-128.
Miletić, S. (2010). Komuniciranje imidža i konkurentska prednost preduzeća. Facta universitatis-Economics and
Organization, 7 (1), 119-128.
Milojević, A. (2015). Dvosmerni simetrični odnosi s javnošću i digitalne komunikacione tehnologije: između
teorije i prakse1. CM Komunikacija i mediji, 10(35), 81-108.
Milovanović, S., Lukinović, M., Baltezarević, R. (2018). Lični brend i integrisano marketing komuniciranje.
Megatrend Review, 15 (1), 177-186.
Mitić, S., & Ognjanov, G. (2013). Konkurentska prednost i korporativne komunikacije. Marketing, 44(4), 343-
353.
Nikolić, M., Savić, M., Ćoćkalo, D., Brkić, V. S., & Ivin, D. (2011). The impact of Serbian public relations on
economic indices. Public Relations Review, 37(3), 332-335.
Nikolić, M., Terek, E., Vukonjanski, J., & Ivin, D. (2012). The impact of internal communication on strategic
and economic effects in Serbian companies. Public Relations Review, 38 (2), 288-293.
Nwabueze, U., & Mileski, J. (2018). Achieving competitive advantage through effective communication in a
global environment. Journal of International Studies, 11(1).
Ognjanov, G. (2013). Marketinške komunikacije, Centar za izdavačku delatnost Ekonomskog fakulteta u
Beogradu, Beograd.
Paponjak, S., & Lalić, D. (2019). Uloga odnosa s javnošću u bankarskom sektoru. Zbornik radova Fakulteta
tehničkih nauka u Novom Sadu, 34(07), 1277-1280.
Ratković, M., Grubić, G., Tasić, S., Damnjanović, A., & Matić, R. (2011). Good relationship with customers as
competitiveness advantage factor. Conference: 14. Međunarodna konferencija Upravljanje kvalitetom i
pouzdanošću ICDQM-2011, Beograd, 180-186.
Shuba, S. (2016). Paths to and off purchase: quantifying the impact of traditional marketing and online consumer
activity. Journal of the Academy of Marketing Science, 44 (4), 440-453.
Skoko, B., & Mihovilović, M. (2014). Odnosi s javnošću u funkciji društveno odgovornog poslovanja. Praktični
menadžment: stručni časopis za teoriju i praksu menadžmenta, 5(1), 84-91.
Stanković, Lj., D. Radenković-Jocić & Đukić, S. (2007). Unapređenje poslovne konkurentnosti, Ekonomski
fakultet, Niš.
Terek, E., Nikolić, M., Vukonjanski, J., Gligorović, B., & Janković, B. (2015). The impact of media relations on
certain organizational and business performances: Serbian case. Public Relations Review, 41 (3), 370-372.
Tetrevova, L. (2018). Communicating CSR in high profile industries: case study of Czech chemical industry.
Inzinerine Ekonomika-Engineering Economics, 29, 478–487.
Tetrevova, L., Patak, M., & Kyrylenko, I. (2019). Webbased CSR Communication in Post-communist countries.
Applied Economics Letters, 26, 866– 871.
Verčič, A. T., & Ćorić, D. S. (2018). The relationship between reputation, employer branding and corporate
social responsibility. Public Relations Review, 44(4), 444-452.
Vlahović, M., Nikolić, M., Ivaniš, M., Tasić, I., & Terek, E. (2020). The impact of communication models of
public relations and organization–public relationships on company credibility and financial performance.
Communications, 45 (4), 479-502.
Vlastelica Bakic, T. (2012): Reputation management by applying concept of corporate social responsibility in
marketing and public relations, Doctoral Dissertation, University of Belgrade, Serbia.
Walker, K. (2010): A Systematic Review of the Corporate Reputation Literature: Definition, Measurement, and
Theory. Corporate Reputation Review, 12(4), 357–387

181
XII International Symposium Engineering Management and Competitiveness 2022 (EMC 2022)
17-18th June, Zrenjanin, Serbia
THE ROLE OF PUBLIC RELATIONS IN CORPORATE
SOCIAL RESPONSIBILITY
Biljana Maljugić
University of Novi Sad, Technical Faculty “Mihajlo Pupin”, Zrenjanin, Serbia
E-mail: [email protected]
SrđanaTaboroši
University of Novi Sad, Technical Faculty “Mihajlo Pupin”, Zrenjanin, Serbia
ABSTRACT
The field of communication includes Public Relations, but also Corporate Social Responsibility. The importance
of these business functions is increasingly recognized in their synergy and joint action, and it has been confirmed
in business practice. Information Technologies provide opportunities for new forms of communication that build
on the theory of Public Relations. Corporate Social Responsibility improves the business and the quality of life
of the entire society. The International Standard ISO 26000 provides guidelines for conducting socially
responsible business activities in a global environment. Greater commitment to this standard is recommended for
domestic companies in the Republic of Serbia in order to increase competitiveness and reputation.
Key words: Public relations, Corporate social responsibility, Communications, Digital media.
INTRODUCTION
The concept of publicity in the theory of public relations first appeared in England in the 17th century
in the fields of politics, economics, and culture. With the development of Enlightenment thought in a
democratic society until today, there have been changes in the application of this theory. Social
scientists, guided by the network concept of dynamic social life and the politics of the global
environment encompassed by digital communication technologies, have contributed to public relations
(Pieczka, 2019).
There are opinions and arguments that PR in society should have the role of advocacy and counter-
advocacy while respecting the traditional foundations of PR, ie mutual understanding, strategic
communication, relationship management, and reputation. The role of PR is persuasive
communication (Maloney, & McGrath, 2021).
In today’s ever-changing media environment, according to Yang and Saffer (2019), in order for
companies to build and maintain corporate legitimacy and reputation, effective CSR communication
on CSR initiatives is needed. This leads to the requirement for PR practitioners to overcome
communication barriers such as consumer skepticism and information overload. In the digital
communication environment, by overcoming the one-way communication model, PR practitioners will
achieve more efficient implementation of corporate responsibility programs by considering corporate
CSR messages on online social networks.
Digital and social media, as well as improved content on socially responsible business, sponsorships,
and community relations are only part of the activities of modern PR activities. In addition to being
structural, PR also has rhetorical power in society. The need for more complex PR has been
demonstrated in the theory of stakeholders and CSR in order to promote and defend the interests of the
organization in a competitive market (Maloney, & McGrath, 2021).

B. Maljugić and S. Taboroši / The role of public relations in corporate social responsibility
182
PUBLIC RELATIONS
Defining Public Relations
Đorđević and Bešić (2005) defined Public Relations - PR as a complex business activity that includes
several dimensions with knowledge of several different disciplines, such as psychology,
communication, journalism, economics, culture, and others, in order to combine them to achieve
effective communication (according to Nikolić, 2012).
Gordon (2011) states that public relations have developed from several different disciplines, such as
psychology, sociology, media communications, and management (according to Nikolić, 2012).
In the context of business organization, public relations is a business function of management that
through two-way communication has a very important role in representing the organization and
creating positive impressions with stakeholders.
If the value of information is raised to a higher level including theories of strategic management then
image and reputation, according to Wojcik (2021), help PR in managing the organization. In addition,
properly targeted image information values, and reputations through PR practice provide benefits in
management processes.
According to the authors Kriyantono and McKenna (2017), public relations has two propositions. The
first is that public relations is a function of management, and the second is that public relations take
responsibility for managing the relationship between the organization and the public.
Public Relations Activities
According to Nikolić (2012), shaping public opinion, ie the dominant attitude of society towards an
issue, phenomenon, or event, requires significant communication efforts of the organization directed
towards the public. Due to the growing number of media, the development of technologies, and fast
communications, public relations are constantly changing and adapting. Lately, PR is becoming an
increasingly dynamic discipline. It is especially important to emphasize the role of PR in building trust
with consumers and target groups, as well as the fact that PR is strategically important for the
organizations’ business, which has been confirmed in many practical studies (Nikolić, 2012).
Chen, Hung-Baesecke, and Chen, (2020) suggest theoretical and practical developments of a
dialogical approach to public relations. Given that information and communication technologies and
social media have reshaped all activities in modern society, the authors suggest improving the
dialogue theory of public relations that can be achieved by considering dialogue between the
organization and the public to identify important issues for further development.
Through online platforms, business organizations communicate with the general public and their users
of products/services in a new environment called the sharing economy, in which users themselves
participate in a certain way in communication. In the sharing economy, analyses of communications
on web platforms show that companies communicate with the public about the quality of social trust
relationships, as well as security and support (Knight, 2021).
New digital business solutions using artificial intelligence in the case of fashion technology start-ups
for interpreting user style and wardrobe management include the role of a business ecosystem, product
development tools, marketing campaigns, and PR channels (Ćwiklicki, Laurisz, & Mirzyńska, 2021).
PR activities can provide easier access to value creation processes among stakeholders in initiating
positive social change. In addition, PR shapes institutional arrangements as well as public discourse
and also provides platforms for recursive feedback loops of reflection to provide better service
ecosystems. PR directs collective efforts through its understanding of stakeholder expressions to
EMC 2022, 17-18th June 2022, Zrenjanin, Serbia
183
provide a basis for collectively identifying problems and needed solutions (Fehrer, Baker, & Carroll,
2022).
CORPORATE SOCIAL RESPONSIBILITY
Conceptual definition of Corporate Social Responses
Kotler and Lee (2007, p. 3) define Corporate Social Responsibility as “a commitment to improving the
well-being of the community through discretionary business practices and contributing to the
company’s resources”. The key element of this definition is the word discretionary. The authors point
out that the definition does not talk about business activities that are prescribed by law or by their
nature moral or ethical, specifically and expected, but about the voluntary commitment of a company
and the decision to choose and apply discretionary business practices to provide such contributions.
(according to Bešić, & Đorđević, 2015, p. 56).
Within the concept of socially responsible business, companies integrate social interests and business
effects according to the requirements of the natural environment and iteration towards business
partners on a voluntary basis (Bešić, & Đorđević, 2015). Six social initiatives that operate in the field
of corporate social responsibility are most often singled out: promotion of social goals, marketing
related to social goals, corporate social marketing, corporate philanthropy, volunteer work for the
community, socially responsible business practice (Đorđević, & Ćoćkalo, 2007).
According to Patel (2021), corporate social responsibility refers to work performed within and above
the legal framework for the benefit of society. Terminological responsibility in business has moral
obligations to society. In addition, corporate citizenship is associated with moral obligations in doing
business with society. When it comes to an integral part of society, companies identify with
individuals, so that their behavior is also guided by certain social norms.
Modern society is characterized by previously set principles that have taken their place in the
management of total quality TQM or business philosophy that speaks of permanent improvement of
the entire business of the organization. Combining technical, market, economic, organizational, and
ethical business goals. The social aspect of improving the quality of business of a modern organization
refers to the quality of life and well-being of the community (Bešić, & Đorđević, 2015). In Japan, back
in 1990, they noticed that responsible business towards society reflects on the productivity of work
and the productivity of the entire organization. By applying corporate social responsibility, a modern
organization can achieve the goals of business excellence (Bešić, & Đorđević, 2015).
Standard ISO 26000
Social Responsibility is defined by the International Standard ISO 26000: 2010. This standard, unlike
other standards, provides guidelines and not requirements and therefore cannot be certified. ISO 26000
provides explanations to understand social responsibility. In this way, it helps companies,
organizations to direct the principles in the implementation of activities on the example of best
practices of social responsibility in the global environment. The ISO 26000 standard is recommended
for all types of organizations, different activities and the size of the organization, as well as their
location. ISO 26000: 2010 contains a communication protocol that describes appropriate formulations
to assist organizations in communicating their use of this standard. It is important to point out that the
ISO 26000 documents are in line with the OECD for Multinational Enterprises and the United Nations
Agenda 2030, ie the Sustainable Development Goals (ISO).
The improvements that are achieved in the organization by applying the ISO 26000 standard are the
following: competitive advantage; reputation; ability to attract and retain employees, clients,
customers; morale, commitment and productivity of employees; attitudes of investors, donors, owners,
sponsorships and the financial community; relationship with companies, governments, media, business
associates and the community where the organization operates (Portal Quality).

B. Maljugić and S. Taboroši / The role of public relations in corporate social responsibility
184
PUBLIC RELATIONS AND CORPORATE SOCIAL RESPONSIBILITY
Interconnection of business functions PR and CSR
Given that PR service as well as CSR belongs to top management and that PR communication
relations improve the understanding of the organization and the public, there is a connection between
these two business activities. The PR service identifies and anticipates changes in the environment that
are related to the elements of social responsibility, and for these reasons, the importance of the
connection of these business functions is growing. In consultation with experts from other fields, the
PR service answers all questions regarding the organization's impact on the environment. Both
business management functions, PR and CSR, have a strategic character, but the importance of PR is
all the greater because it implements the principles of social responsibility (Nikolić, 2012).
Clark (2000) explains that PR and CSR have common goals in improving the quality of an
organization’s relationship with important stakeholder groups. The role of PR is to build quality
communication that CSR does not recognize, but in synergy with the communication management that
follows the political, social and historical environment, these two disciplines complement each other
to make business decisions in building the companys' competitiveness.
The Relationship between PR and CSR
The interaction between consumer perception of CSR and corporate credibility was considered in a
study in fashion industry companies. Based on a two-step model, before and after the crisis of
corporate public relations, research has shown that consumers' perceptions of corporate responsibility
have a significant impact on their guilt, which in turn negatively affects their perception of corporate
social responsibility and credibility. However, the previous perception of consumers about socially
responsible business and credibility plays an important role in regulating the end effects of the
corporate PR crisis. In addition, CSR and corporate credibility go through a successive update
mechanism (Souiden, Chaouali, Aldás‐Manzano, & Rachid Jamali, 2022).
In Indian companies, CSR implementation is still low. Some managers and industrialists view CSR as
a fashion statement or simply equate the term CSR with PR activities. Although most managers would
like to, they still do not know how to establish, adopt CSR in their business if it is not within the legal
framework (Patel, 2021).
Observed on the other hand, one of the examples showed that building a positive image of the
company and commercialization of CSR was achieved by the role of PR in publishing CSR programs.
In Indonesia, PT Aqua Danone is a WASH (Water Access, Sanitation and Hygine) study on water
access, remediation and hygiene used PR methods and the 3P (Planet, People, Profit) concept of
corporate social responsibility to confirm the role of PR in CSR, which resulted in a positive. PR
activities in this case took place through the company's website, social networks and interviews in the
mass media (Nugraheni, & Toni, 2022).
The results of a study conducted in Ghana, a developing country, showed that public relations has a
key role in building and maintaining a corporate reputation, the reputation of the organization (Anani-
Bossman, 2021). PR practitioners from multinational corporations, included in this research, have
demonstrated a number of reputation building activities. Interpersonal communication, corporate
social responsibility and community engagement stand out. In addition, it is important to point out that
PR practitioners of the observed organizations fulfill their roles through developed strategies (Anani-
Bossman, 2021).
From the aspect of management and marketing, Ji, Tao, and Rome, (2020) note that new opportunities
for knowledge about socially responsible business and communication are on the rise. In addition,

EMC 2022, 17-18th June 2022, Zrenjanin, Serbia
185
corporate social responsibility is practically and theoretically very important in the field of
communications.
Situation in the Republic of Serbia
Some managers of companies in Serbia expressed their views. Based on the results of the research, it
was concluded that over time, work must be done to increase the level of organizational culture and
public relations (Terek et al., 2011) in order to improve the business of domestic companies.
According to the results of the research from 2017, sustainability reporting in companies in the
Republic of Serbia is at a low level (Knežević et al., 2017). Given the compliance with the 2014 EU
Directive and the guidelines of the Global Reporting Initiative (GRI) which improve and set more
precise reporting requirements (Knežević et al., 2017), it is an opportunity for managers of domestic
companies to understand the need for corporate reporting according to new concepts. In the context of
corporate reputation of companies in Serbia, marketing activities and public relations significantly
contribute to public perception. Considering the intensity of information and advertising in different
ways from the aspect of marketing communications, media reporting and activities on the Internet are
part of the companys’ identity, so for these reasons it can be said that these activities affect the
perception of public opinion. The communication channels set up in this way are essentially
significant business activities that determine the companys’ reputation (Vlastelica et al., 2017).
CONCLUSION
Information and communication technologies and digital media, as well as social networks, provide
new opportunities for improving PR activities in two-way communication with the public. Practical
PR solutions and communication channels give some support to CSR business, so it can be concluded
that from the aspect of management, it is best to harmonize and perform these two business functions
at the same time.
In the case of domestic companies of the Republic of Serbia, insufficient engagement of these
management disciplines was noticed. First of all, public relations is usually more media-oriented in
one-way communication, specifically in the case of publishing important information. Second, a low
level of CSR representation in management can be observed. Perhaps the reasons should be sought in
the lack of understanding of the need or insufficient education, in order to harmonize domestic
business with international regulations, standards and guidelines, which would significantly improve
both domestic business and the situation in society.
REFERENCES
Anani-Bossman, A. A. (2021). Role of Public Relations in Corporate Reputation Management: A Study of PR
Practitioners in Selected Multinational Organisations in Ghana. Corporate Reputation Review, 24(4), 222-
233.
Bešić, C., & Đorđević, D. (2015). Korporativna društvena odgovornost. Čačak: Fakultet tehničkih nauka.
Chen, Y. R. R., Hung-Baesecke, C. J. F., & Chen, X. (2020). Moving forward the dialogic theory of public
relations: Concepts, methods and applications of organization-public dialogue. Public Relations Review,
46(1), 101878.
Clark, C. E. (2000). Differences between public relations and corporate social responsibility: An analysis. Public
relations review, 26(3), 363-380.
Ćwiklicki, M., Laurisz, N., & Mirzyńska, A. (2021). Case 7: Artificial Intelligence facilities customer
experience. Example of Getdressed. How to do business in digital era? Casebook, 55.
Đorđević, D., & Bešić, C. (2005). Odnosi s javnošću. Zrenjanin: Tehnički fakultet „Mihajlo Pupin“.
Đorđević, D., & Ćoćkalo, D. (2007). Poslovna etika i pravo. Zrenjanin: Tehnički fakultet „Mihajlo Pupin“.
Fehrer, J.A., Baker, J.J. and Carroll, C.E. (2022). The role of public relations in shaping service ecosystems for
social change. Journal of Service Management, Vol. ahead-of-print No. ahead-of-print.
https://doi.org/10.1108/JOSM-01-2022-0044

B. Maljugić and S. Taboroši / The role of public relations in corporate social responsibility
186
Gordon, A. E. (2011). Public Relations. Oxford, New York: Oxford University Press.
ISO, ISO 26000 - Social responsibility, https://www.iso.org/iso-26000-social-responsibility.html, Datum posete:
16.04. 2022.
Ji, Y. G., Tao, W., & Rim, H. (2020). Mapping corporate social responsibility research in communication: A
network and bibliometric analysis. Public Relations Review, 46(5), 101963.
Knežević, G. R., Pavlović, V. D., & Stevanović, S. V. (2017). Izveštavanje o održivom razvoju–karakteristike,
ograničenja i perspekiva u Republici Srbiji. Poslovna ekonomija, 11(1).
Knight, A. M. (2021). The Implications of The Sharing Economy for Public Relations Theory and Practice: A
Thematic Analysis of Airbnb, Uber and TaskRabbit (Doctoral dissertation, Virginia Tech).
Kotler, F., & Li, N. (2007). Korporativna društvena odgovornost. Beograd: Ekonomski fakultet, Čigoja.
Kriyantono, R., & Mckenna, B. (2017). Developing a culturally-relevant public relations theory for Indonesia.
Malaysian Journal of Communication, 33(1), 1-16.
Maloney, K., & McGrath, C. (2021). Rethinking public relations: Persuasion, democracy and society. Public
Relations Education, 7(1), 220-226.
Nikolić, M., & Terek, E. (2011). The analysis of the current state of organizational culture and public relations in
Serbian companies. Singidunum revija, 8(1), 207-215.
Nikolić, M., (2012). Odnosi s javnošću. Zrenjanin: Tehnički fakultet „Mihajlo Pupin“.
Nugraheni, A., & Toni, A. (2022). Peran Public Relation Dalam CSR “Program WASH” PT Aqua Danone
Indonesia. Jurnal Pustaka Komunikasi, 5(1), 106-120.
Patel, P. C. (2021). CSR Practices in India: The case study on CSR initiatives taken by TATA Group.
Management & Industry 4.0, NHRG, p.p. 142-155.
Pieczka, M. (2019). Looking back and going forward: The concept of the public in public relations theory.
Public Relations Inquiry, 8(3), 225-244.
Portal Kvalitet, Dostupno na: https://www.kvalitet.org.rs/infrastruktura/standardi/iso-26000, Datum posete:
20.04.2022.
Souiden, N., Chaouali, W., Aldás‐Manzano, J., & Rachid Jamali, D. (2022). Blame and culpability in explaining
changes in perceptions of corporate social responsibility and credibility. Business Ethics, the Environment
& Responsibility, 31(2), 363-385.
Vlastelica, T., Kostić-Stanković, M., & Cicvarić-Kostić, S. (2017). Conceptual approach to corporate reputation
modeling. Marketing, 48(3), 155-160.
Wojcik, K. (2021). Wizerunek i reputacja organizacji: informacyjny i zarządczy potencjał–część I. Studia
Medioznawcze, 22(4), 1061-1076.
Yang, A., & Saffer, A. J. (2019). Embracing a network perspective in the network society: The dawn of a new
paradigm in strategic public relations. Public Relations Review, 45(4), 101843.
187
XII International Symposium Engineering Management and Competitiveness 2022 (EMC 2022)
17-18th June, Zrenjanin, Serbia
THE ROLE OF SOCIAL MEDIA IN THE DECISION-MAKING
PROCESS
Srđana Taboroši
University of Novi Sad, Technical faculty “Mihajlo Pupin”, Zrenjanin, Serbia
E-mail: [email protected]
Aleksandra Kovačević
University of Novi Sad, Technical faculty “Mihajlo Pupin”, Zrenjanin, Serbia
Biljana Maljugić
University of Novi Sad, Technical faculty “Mihajlo Pupin”, Zrenjanin, Serbia
ABSTRACT
In this paper, the authors define the theoretical connections between social networks and decision-making
processes. Social networks have become a common part of everyday life, and all segments of society in some
way participate in communication with peers using some of these platforms. As the way and channel of
communication have changed, so have social networks strongly influenced the redesign of the way of thinking
and creating opinions in the population. Shared opinions on something in the population can have a significant
impact on the decision-making process within the company. With an adequate analysis of the attitudes of the
population on social networks, the company can react in a timely manner and improve business and using the
same communication channels, a certain decision within the company can be better approached and explained to
users, thus reducing resistance to changes that may occur in consumers. Social networks have a
multidimensional influence in the decision-making process and it is important to use their potential properly to
improve business and improve competitiveness, especially in times of crisis.
Key words: Decision-making, Social networks, Customer participation, Choice.
INTRODUCTION
Many things can influence the decision-making process of people, including the media, information
technology, the way of communication, as well as new media or social networks, which are a kind of
unified tool that encompasses all of the above. The way of communication and access to information
has changed a lot in recent years with the development of social networks and the growth of their
popularity among the population. According to Kaplan and Haenlein (2010), social networks are a set
of applications that allow users to create and share content. Almost every segment of the population
today has the opportunity to use one of the platforms by sharing, creating or consuming content, and
their diversity depends on the platform itself, thus forming generational or professional segments in
the population. Kaplan and Haelein (2010) define six different types of social media: blogs, content
communities, collaborative projects, social networking sites, virtual social worlds, and virtual game
worlds. From then until today, social networks have evolved, changed, disappeared and new ones were
created, but their influence on people has not weakened, but on the contrary, they have become part of
everyday life, their influence has expanded and deepened, and is expected of every company today, no
matter what they do professionally, to have and actively use social media to communicate with its
consumers.
The spread and deepening of the influence of social media on the population have led to changes in the
way of communication and channels for it. In addition to company-customer communication,
communication among employees within the company has also changed, as well as in the general case
population (Power and Phillips-Wren, 2011). According to the same authors, social networks strongly
alter opinions and influence the decisions and choices of both consumers and management. The

S. Taboroši et al. / The role of social media in the decision-making process
188
connectedness of the world's population has never been so strong, and this is achieved precisely
because of information technologies and social networks. This population connection leads to the
development of crow behavior, conformity, peer pressure, and communication saturation; very
influential forms of human behavior that extend to all aspects of life as well as business. The authors
of this paper provide a theoretical basis on the impact of social networks on decision making and
recommendations for further research to improve business processes and results.
SOCIAL MEDIA AND ITS INFLUENCE
The use of social networks in people evokes various emotions, from friendship and support to
disagreement and aggression. People's behavior and the type of influence of social networks can to
some extent be predicted depending on the type of social networks as well as the segment that makes
up their users (Leskovec, Huttenlocher and Kleinberg, 2010). Different social networks have different
degrees of influence on different populations. Thus, Gilani, Salimi, Jouyandeh, Tavasoli and Wong
(2019) through a meta-analysis of 412 scientific papers combine the influences of social networks,
where they show that the influence exists in the areas of:
marketing
tourism
environment
professional health
mental health and emotions
anti-vaccination
policy and government
IT
crisis and disaster management
organizations and enterprises.
When it comes to the impact of social networks, it must be taken into account that they work
according to certain algorithms, and are not simple platforms where users create all available content
that is equally visible. Successful social media companies, such as Facebook, have also been
associated with controversies where information flows have been manipulated to increase the impact
on users' emotions (Kleinsman and Buckley, 2015). This is a danger of social networks because
depending on the interests that the company supports, the impact on the population can be positive or
negative, and companies and management are not in a position to properly influence that impact.
Precisely because of this, upper management must be aware of the overall impact in order to develop
the right mechanisms to manage these consequences, both among employees at their level and among
subordinates.
The impact of social networks on certain areas can be expected, especially in the field of marketing.
This influence can be easily noticed through trends in fashion and tourism, as well as in other socio-
economic and political spheres. However, the influence of social networks on the decision-making
process has not been sufficiently researched, although it should not be neglected. It is important to
introduce such a subtle influence into decision-making methods so that all potential dangers in modern
business can be managed properly, taking into account that the influence of social networks continues
to deepen and trends show that growth will continue especially through meta-universe technologies.
DECISION-MAKING METHODS
Professionals are faced, in many business situations, with using some of the decision-making methods
to choose the most optimal solutions for the position they are in or the problem they are trying to
solve. These methods differ depending on the problems they solve, but also the expertise and personal
preferences of the person who performs this job. But all methods have established matrixes by which

EMC 2022, 17-18th June 2022, Zrenjanin, Serbia
189
they work, so whether professionals opt for the Technique for Order of Preference by Similarity to
Ideal Solution, Analytical Hierarchy Process, or Data Envelopment Analysis, the process of these tools
is clear (Liu, Eckert and Earl, 2020) . By defining multipe criteria, a certain intensity of their influence
on the result is estimated, and the optimal result is chosen. As the intensity of the impact of the criteria
is assessed based on the opinion of experts, the weakness of such methods can be noticed, because
experts must have a highly developed social intelligence in order to be aware of their own subjectivity
in this process.
According to Mardani, Jusoh and Zavadskas (2015), the Analytical Hierarchy Process or AHP is one
of the most commonly used tools in the decision-making process. This method defines the problem
through a hierarchy in descending order from goal to criteria and sub-criteria (Saati, 1990), and in this
way method enables the perception of connections and facilitates the understanding of the elements.
Then these elements are scored on a 9 level scale according to the strength of their influence. It is in
this process of assigning value to the elements on the scale that an error can occur, both due to the
imperfection of the method and due to certain influences to which the experts who participate in the
whole process are subject. In this paper, the authors try to look at the often-neglected impact of social
media on employees and the whole decision-making process.
DECISION-MAKING IN SOCIAL MEDIA ENVIRONMENT
Social perception, clarity of the message, as well as the ability of the message tend to influence the
quality of decision making (Daft and Lengel, 1984). Social media as a tool can significantly change
the way the population perceives certain information precisely because of its mass, as well as the
segmentation that certain networks allow because they provide "grouped" users based on their
preferences (Facebook and LinkedIn groups, etc.). Being surrounded by people who perceive reality
very similar, even virtually, can disrupt objectivity and criticism in the decision-making process,
which can have negative consequences in some cases. Social networks through user segmentation can
also affect the ability of users to understand a particular message in the right way because an altered
ability to perceive can also lead to miscommunications. This can also happen due to the impossibility
to convey the message clearly, because virtual space, although it has its advantages, also has its
limitations, and thus there can be an insufficient quality of communication due to media limitations.
All these influences can act harmlessly when it comes to everyday life, but they can negatively affect
consumers, and also employees and management, so mistakes can occur that can more or less
endanger business.
According to Kahai and Cooper (2003), the quality of the decision made also depends on the expertise
of the user. In the social media environment, it is not possible to control what information is
distributed to certain users and in what way, so their influence cannot be controlled. In addition, a kind
of peer pressure is created, as a group influences an individual to correct or change their attitudes,
values, or behavior in order to be in line with the group with which they identify. This phenomenon
can have a very strong influence on decision-making, because due to conformism, the person who
makes the decision turns to his environment in this process, and due to the desire to be accepted and
loved by their environment, they may succumb to pressure. According to Aronson, Wilson, and Ackert
(2007), conformity largely occurs on social media.
According to Power and Phillips-Wren (2010), information saturation can be another strong influence
of social networks on the decision-making process. Information saturation is considered to be an
overload of communication, which is very common on social networks, because users spend a lot of
time using these platforms. Users are burdened by the number of channels or accounts that are placed
as well as the amount of information in their social media environment. This diminishes their
perception and critical thinking and thus leads to a changed decision-making process.
Some research finds that social media can significantly influence individual decisions, but also
decisions within an organization. According to Kirkpatrick (2011), social media was the main initiator

S. Taboroši et al. / The role of social media in the decision-making process
190
of the "Arab Spring", and the influence of social networks on the presidential elections in the United
States, as well as on the protests in Hong Kong (Frosina, 2021), has been talked about for a long time.
As it is possible to notice such significant influences, there is no doubt that similar ones exist within
the companies.
According to Bulmer and DiMauro (2011), information technology and social media have changed
business in general, and the new model of online engagement has created a strong impact on the
decision-making process of the CEOs and managers. The same authors define several key influences
of social media on the decision-making process in employees:
For the purpose of improving business, employees belong to several groups of social networks
Facebook, Twitter, and LinkedIn have emerged as the dominant business social networks
The mobile phone has become the most important tool for accessing networks
The current traditional decision-making process is disturbed due to social networks
Professional networks have become a very important decision support tool
Employees have a high level of trust in the information they receive through social media
Peer input is necessary in the decision-making process
Employees in multiple social networks are more likely to use these tools to gather information in
the early stages of the decision-making process, and this is especially true for young people.
CONCLUSION
The influence of social networks on all aspects of society is growing and deepening as they develop.
Social media has come a long way from platforms where children and youngsters play games to
professional job-finding networks. Along the way, their influence grew and deepened, especially in the
business sector. Influencing the way people think can also disrupt the decision-making process. What
is worrying is that this influence continues to grow, and although it can be positive and negative for
employees and the company, it must not be neglected, but properly recognized and used to make the
business progress. By using social networks, the company has the opportunity to positively influence
its consumers and develop communication with them. However, the impact of social networks on top
management must be properly managed. Experts involved in the decision-making process must be
aware of this impact and properly manage it both within themselves in forming opinions and attitudes,
and in their professional activities. There is a need for deeper research into how social networks can
negatively influence decision-makers, as such research is lacking. The influence of social networks
needs to be introduced into the calculations of decision-making methods in certain activities in order
to modernize this process.
REFERENCES
Aronson, E., Wilson, T.D., & Akert, A.M. (2007). Social Psychology. 6th Ed. Upper Saddle River, NJ: Pearson
Prentice Hall.
Bulmer, D. & DiMauro, V. (2011). 2nd Annual New Symbiosis of Professional Networks study. Available at
http://dssresources.com/news/3255.php accesed 12.4.2022.
Daft, R.L. & Lengel R.H. (1984). Information richness: a new approach to managerial behavior and
organizational design. Research in Organizational Behavior. Cummings L.L. and Staw B.M. (Eds.), Vol. 6.
Homewood, IL: JAI Press, 1984, p. 191-233.
Frosina, K. (2021). Digital revolution: How Social Media Shaped the 2019 Hong Kong Protests. Available at:
https://www.ispionline.it/en/pubblicazione/digital-revolution-how-social-media-shaped-2019-hong-kong-
protests-30756 accesed on 25.3.2022.
Gilani, E., Salimi, D., Jouyandeh, M., Tavasoli, K & Wong, W. (2019). A trend study on the impact of social
media in decision making. International Journal of Data and Network Science, 3(3), 201-222.
Kahai, S. & Cooper, R. (2003). Exploring the Core Concepts of Media Richness Theory: The Impact of Cue
Multiplicity and Feedback Immediacy on Decision Quality. Journal of Management Information Systems.
20(1), 263-299.

EMC 2022, 17-18th June 2022, Zrenjanin, Serbia
191
Kaplan, A.M. & Haenlein, M. (2010). Users of the world, unite! The challenges and opportunities of Social
Media. Business Horizons, 53(1), 59-68.
Kirkpatrick, D. (2011). Wired and Shrewd, Young Egyptians Guide Revolt. The New York Times, February 9,
2011. Available at: https://www.nytimes.com/2011/02/10/world/middleeast/10youth.html accesed on
28.4.2022.
Kleinsman, J. & Buckley, S. (2015). Facebook study: a little bit unethical but worth it?. Journal of Bioethical
Inquiry, 12(2), 179–182.
Leskovec, J., Huttenlocher, D. & Kleinberg, J. (2010). Predicting positive and negative links in online social
networks. In Proceedings of the 19th international conference on World wide web (WWW '10). New York,
NY: Association for Computing Machinery, 641–650.
Liu, Y., Eckert, C.M. & Earl, C. (2020). A review of fuzzy AHP methods for decision-making with subjective
judgements. Expert Systems with Applications, 161, 113738–.
Mardani, A., Jusoh, A. & Zavadskas, E. K. (2015). Fuzzy multiple criteria decision-making techniques and
applications – Two decades review from 1994 to 2014. Expert Systems with Applications, 42, 4126-4148.
Saaty, T. L. (1990). How to make a decision: the analytic hierarchy process. European journal of operational
research, 48, 9-26.

192
XII International Symposium Engineering Management and Competitiveness 2022 (EMC 2022)
17-18th June, Zrenjanin, Serbia
GAMBLING MARKETING COMMUNICATION
Bruno Završnik
University of Maribor, Faculty of Economics and Business, Slovenia
E-mail: [email protected]
ABSTRACT
Nowadays, companies must very well know their customers and dedicate them to a lot of attention to achieving
their satisfaction. Only satisfied customers who return to the same organization each time, the goal of achieving
the potential profit can be met. This is especially true in the field of gambling, as players must always have
several information with which they help to decide on gambling. The aim of the survey was to find out how
often gamblers play, which activities of gambling providers persuade them the most to participate in gambling
and which factors are most influential for gambling. Research has shown that most information is given to the
participants of gambling on TV ads and social networks.
Key words: Gambling, Marketing communication, Customer satisfaction.
INTRODUCTION
Although it would be ideal from the viewpoint of gambling businesses if all customers could be
satisfied, this is not possible; thus marketers tend to choose the most profitable customers to market
their product to. The gambling industry has always used various inducements, techniques, and ploys to
attract new custom and to encourage people to gamble. An analysis of these methods shows that they
fall mainly into two categories. These are situational and structural characteristics. Situational
characteristics are those characteristics that induce people to gamble in the first place. These
characteristics are primarily features of the environment and can be considered the situational
determinants of gambling. They include such things as the location of the gambling outlet, the number
of gambling outlets in a specified area and the use of advertising in stimulating people to gamble.
(Zangeneh, Griffiths & Parke 2008)
Gambling advertising and marketing activity has a wide reach, encompassing existing gamblers but
also lapsed/non-gamblers who may be encouraged to start or restart gambling. With gambling
operators’ marketing across a range of media, from TV ads to sports team sponsorships, to social
media, there is a question about appreciating better the cumulative impact of all this activity on
consumers. The effects of gambling advertising may have been potentially exacerbated by the
pandemic, where many people have been at home more, watching more live TV, spending more time
online and on social media, and have seen their financial circumstances change. (Gambling
Commission 2021)
GAMBLING
In gambling, participants have the same chance of winning prizes to pay a certain amount, and the
outcome of the game depends exclusively or predominantly on chance or some uncertain event. We
divide them into classic gambling and special gambling.
The organization of gambling is an exclusive right of the Republic of Slovenia, which may be
organized only based on a permit or concession from the competent authority. The gaming device with
which they are arranged must comply with the prescribed technical and other requirements and have

EMC 2022, 17-18th June 2022, Zrenjanin, Serbia
193
the permission of the supervisory authority for use. The use and installation of gaming devices with
simulations of gambling or games in which a payable is used to pay for an individual game and to
determine the prize or winnings is allowed only to organizers who have a concession to organize
gambling. (Finančna Uprava 2021)
Gambling has been a part of humanity for a long time, and references to it have been found in some of
the earliest dated records. Literature on the topic has been accumulating since ancient times. The
advent of Internet technology along with its typical subsets provides a new approach to how gambling
is conducted in postmodern times. (Ozuem & Prasad 2015)
Changes in the media landscape in recent years have fundamentally altered gambling marketing
practice. Consumers can now gamble in real-time and from almost any location. Contemporary
gambling marketing now represents a multi-layered mix of mass media advertising (e.g., television),
consumer marketing (e.g., price offers) and subtle marketing (e.g., sponsorship). Advertising is a key
component of gambling marketing, and recent easing of restrictions has seen a proliferation of
gambling advertising in many countries. There is a need to examine recent evidence on the nature of
this advertising and its potential effects. (Newall, Moodie, Reith et al 2019)
The internet has changed the way in which we communicate with each other and entertain ourselves.
The gambling sector was an early adopter of online innovation. One of the major developments has
been the proliferation of social media, the communities and networks that enable the sharing of
content between groups of people.
Digital gambling marketing is broad, ranging from the marketing of online gambling websites to
communication and advertising on the social media and networks. Social networks are considered to
amount to a set of applications with various operating modes and uses general networking (Facebook,
MySpace), micro-blogging (Twitter), photo sharing, or exchange of ephemeral content (Instagram,
Snapchat, etc.). These companies broadcast messages directly by insertion of classic advertisements
into Internet users' news feeds, into stories, in the animation of official pages via community managers
(Facebook, Instagram), and in the creation of cultural, sporting, or festive events associated with the
brand. (Guillou-Landréat et.al 2021) Gambling companies have embraced social media as a means of
communicating with potential customers. (James & Bradley 2021)
EMPIRICAL FINDINGS
The survey was published online using the 1ka program. We shared the link to the survey via e-mail
and distributed it to various groups on Facebook. We first excluded from the analysis those who do not
gambling. The total number of respondents for carrying out a market survey was 100 of this, 58 were
men and 42 were women.
We first obtained data on the age structure of the respondents (Table 1).
Table 1: Age of the respondents Age (Years) Frequency Percent
18 - 30 42 42%
31 - 50 44 44%
51- 60 12 12%
61 and more 2 2%
Total 100 100%
In the next question, we were interested in the current status of the respondents (Table 2). More than
half of them described their status as "Employed". There were as many as 63% of them. The next
largest group are students 28%, followed by the unemployed 6% and retirees 3%.

B. Završnik / Gambling marketing communication
194
Table 2: Status of the respondents Status Frequency Percent
Employed 63 63%
Student 28 28%
Unemployed 6 6%
Retirees 3 3%
Total 100 100%
We were also interested in the net monthly income of the respondents (Table 3). Most respondents
chose the category from € 1,000 to € 2,000 (49%), followed by the category from € 500 to € 1,000
(40%). 10% of respondents indicated an answer of up to € 500 and 1% more than € 2,000.
Table 3: Net monthly income of the respondents Net monthly income Frequency Percent
To 500 euros 10 10%
From € 500 to € 1000 40 40%
From € 1000 to € 2000 49 49%
More than 2000 euros 1 1%
Total 100 100%
In the next question, we were interested in the ways of paying for gambling, namely whether it is
online or at points of sale (Table 4).
Table 4: Ways to pay for gambling
Net monthly income Frequency Percent
At point of sale (Petrol station,
Pošta Slovenije and Trafika 3dva) 46 46%
Specialized Lottery stores 39 39%
Online sales 15 15%
Total 100 100%
Most respondents pay for gambling at points of sale such as petrol stations, Pošta Slovenije and
Trafike 3dva, 40% of them, followed by specialized Lottery stores in Slovenia with 40% and finally
online sales with 15%.
When asked about the frequency of gambling, respondents answered the following. 43% of
respondents gambling once a month. It is followed by 22% of respondents with the answer once a
week, 16% with half a year 10% with more than once a week", 7% with once a year and 2% of
respondents with every day (Table 5).
Table 5: The frequency of gambling Frequency of gambling Frequency Percent
Once a year 7 7%
Half a year 16 16%
Once a month 43 43%
Once a week 22 22%
More than once a week 10 10%
Everyday 2 2%
Total 100 100%
In the next question, we were interested in what is most often reason for play gambling (Table 6). In
the first place, the expected answer is that 53% of respondents answered the amount of funds. This is
followed by sales promotions with 24% of respondents, TV or radio Ads with 8%, sales staff with 6%,
Facebook 4%, Ads in print media with 4% and 1% as the second (random).

EMC 2022, 17-18th June 2022, Zrenjanin, Serbia
195
Table 6: Factors influence the decision to gamble Factors of influence Frequency Percent
The amount of funds 53 53%
Sales promotions 24 24%
TV or Radio Ads 8 8%
Sales staff 6 4%
Facebook 4 4%
Ads in the print media 4 4%
Other 1 1%
Total 100 100%
With the next question, we focused more on advertising as part of marketing communication (Table
7). We found that ads on social networks (38%) attract the most attention, followed by TV ads (32%),
posters at points of sale (14%), radio ads (10%), ads on the website of gambling providers (5%) and
1% of respondents chose the answer “other”, citing television commercials and posters at the same
time.
Table 7: Obtaining information about gambling Sources of information Frequency Percent
Social networks 38 38%
TV 32 32%
Posters at points of sale 14 14%
Radio 10 10%
Gambling Provider Websites 5 5%
Other 1 1%
Total 100 100%
We were also interested in how satisfied the respondents were with the individual elements of
gambling providers. We used the Likert scale from 1 to 5, where 1 means “I am completely
dissatisfied” and 5 “I am completely satisfied”(Table 8).
Table 8: Satisfaction with individual elements of gambling providers
Statement Satisfaction with the element of gambling providers
Very
satisfied Satisfied Undecided Dissatisfied
Very
dissatisfied
The amount of funds 6 29 13 31 21
Gifts given 1 32 22 29 16
Variety of gambling 2 40 24 27 7
Sales promotions 13 51 14 18 6
Number of draws 4 63 16 15 2
Staff friendliness 18 63 12 5 2
Communication of gambling providers
with the public 2 50 33 14 1
Possibility to pay online 21 53 17 7 2
Interesting ads 3 51 34 9 3
Availability of gambling 32 52 9 6 1
The highest level of satisfaction was with the Availability of gambling, with an overall level of
satisfaction expressed by 84% of respondents, 9% were neither satisfied nor dissatisfied, 7% were
dissatisfied. It is followed by "Staff friendliness", with 81% of respondents satisfied (18% chose "I am
completely satisfied" and 62% "Satisfied"), 12% were undecided, 7% were totally dissatisfied.
A total of 74% of respondents were satisfied with the possibility of online payments, 17% were
undecided and 9% were dissatisfied. They are followed by the number of draws per week with a total
satisfaction of 67% of respondents, 16% undecided, 17% were dissatisfied. 62% of respondents
B. Završnik / Gambling marketing communication
196
expressed overall satisfaction with sales promotions such as a donated lottery ticket or a donated car,
14% undecided and 24% of respondents were dissatisfied. They are followed by interesting ads with a
total satisfaction of 54%, 34% of respondents were undecided, 12% dissatisfied and then the
communication of gambling providers with the public satisfaction expressed by 52% of respondents,
33% undecided and 15% dissatisfied. 42% of respondents expressed satisfaction with the variety of
gambling, 24% were undecided, 34% dissatisfied, while 35% of respondents expressed satisfaction
with the amount of funds, 13% were undecided and 52% dissatisfied. Respondents expressed the
lowest level of satisfaction with the gifts given, namely 33% were jointly satisfied, 22% undecided
and 45% dissatisfied.
CONCLUSION
With the research we wanted to find out what experience gamblers have with gambling providers. We
were also interested in the role of marketing communication in informing gamblers. Most customers
have played an important role in advertising, as they have learned about all the innovations that
gambling providers are introducing to the market. However, these innovations are practically a
necessary part of everyday life, as customers are becoming more and more demanding and meeting
their needs is becoming increasingly difficult.
In the field of sales promotion, some gambling providers often introduce a donated lottery ticket,
increase the possibility of a car prize in the Lotto draw, and receive an additional draw card at the
Eurojackpot game. In doing so, they not only increase the satisfaction of their customers, but they also
increase the sales of these products.
REFERENCES
Finančna uprava. (2021). https://www.fu.gov.si/drugo/posebna_podrocja/igre_na_sreco/#c1914
Gambling Commission. (2021). https://www.gamblingcommission.gov.uk/statistics-and-
research/publication/understanding-how-consumers-engaged-with-gambling-advertising-in-2020
Guillou-Landréat M., Gallopel-Morvan, K., Lever, D. Le Goff, Le Reste, J.Y. (2021). Gambling Marketing
Strategies and the Internet: What Do We Know? A Systematic Review. Frontiers in Psychiatry, Frontiers,
12, 10.3
James, R.J.E., Bradley, A. (2021). The Use of Social Media in Research on Gambling: a Systematic Review.
Curr Addict Rep 8, 235–245. https://doi.org/10.1007/s40429-021-00364-w.
Newall, P.W.S., Moodie, C., Reith, G. et al. (2019). Gambling Marketing from 2014 to 2018: a Literature
Review. Curr Addict Rep 6, 49–56. https://doi.org/10.1007/s40429-019-00239-1
Ozuem, W., & Prasad, J. (2015). Online Social Gambling and Its Implications for the Study of Marketing
Communications. International Journal of Applied Behavioral Economics (IJABE), 4(3), 22-50.
http://doi.org/10.4018/IJABE.2015070102
Zangeneh, M., Griffiths, M., Parke, J. (2008). The Marketing of Gambling. In: Zangeneh, M., Blaszczynski, A.,
Turner, N.E. (eds) In the Pursuit of Winning. Springer, Boston, MA.

197
XII International Symposium Engineering Management and Competitiveness 2022 (EMC 2022)
17-18th June, Zrenjanin, Serbia
Session D: ECONOMY
Papers (pp. 199-264):
Mihalj Bakator, Dejan Đorđević, Dragan Ćoćkalo,
Srđan Bogetić, Sanja Stanisavljev
THE ROLE OF PRODUCTIVITY IN ACHIEVING COMPETITIVENESS ...199
Miloš Ivaniš, Živan Bajić
CHARACTERISTICS AND FACTORS OF INNOVATION OF SMALL
AND MEDIUM ENTERPRISES ...204
Miloš Ivaniš, Živan Bajić
INNOVATION CAPACITY OF SMALL AND MEDIUM ENTERPRISES ...209
Milica Josimović, Milena Cvjetković
THE ROLE OF THE CONCEPT OF SOCIETY 5.0 IN ACHIEVING
SUSTAINABLE DEVELOPMENT AND COMPETITIVENESS 214
Elena Jovičić, Darko Marjanović
PERSPECTIVES ON THE STRENGTHENING OF THE SERBIAN EXPORT
COMPETITIVENESS IN THE POST-COVID PERIOD ...220
Stevan Luković, Miloš Pjanić, Božidar Čakajac
THE ROLE OF INSURANCE COMPANIES IN THE SERBIAN FINANCIAL SYSTEM ...225
Darko Marjanović, Ivana Domazet, Elena Jovičić
IMPACT OF THE COVID-19 PANDEMIC ON FOREIGN DIRECT INVESTMENT ...231
Nikola Milicevic, Nenad Djokic, Ines Djokic
CLIENT LOYALTY IN BANKING SECTOR ...237
Miloš Pjanić, Mirela Mitrašević, Stevan Luković
ANALYSIS OF THE CAPITAL MARKET OF THE REPUBLIC OF SERBIA ...242
Jelena Slavić, Jelena Vukajlović
APPLICATION OF THE INFORMATION TECHNOLOGY IN MITIGATION OF THE
PANDEMIC CRISIS CONSEQUENCES IN THE DOMESTIC ECONOMY ...248
Dijana Tadić
TRANSFORMATIONS OF SOCIETY AND REVOLUTIONS IN INDUSTRY -
A REVIEW OF THE REPUBLIC OF SERBIA ...254
Aleksandra Zhemkova
THE IMPACT OF CONSUMER DEMAND ON FIRMS’ PRODUCTIVITY ...260

198

199
XII International Symposium Engineering Management and Competitiveness 2022 (EMC 2022)
17-18th June, Zrenjanin, Serbia
THE ROLE OF PRODUCTIVITY IN ACHIEVING COMPETITIVENESS
Mihalj Bakator
University of Novi Sad, Technical Faculty “Mihajlo Pupin” in Zrenjanin, Republic of Serbia
E-mail: [email protected]
Dejan Đorđević
University of Novi Sad, Technical Faculty “Mihajlo Pupin” in Zrenjanin, Republic of Serbia
Dragan Ćoćkalo
University of Novi Sad, Technical Faculty “Mihajlo Pupin” in Zrenjanin, Republic of Serbia
Srđan Bogetić
Belgrade Academy of Business and Art Studies, Republic of Serbia
Sanja Stanisavljev
University of Novi Sad, Technical Faculty “Mihajlo Pupin” in Zrenjanin, Republic of Serbia
ABSTRACT
The global economy and the new conditions of conducting business brought challenges to companies across
industries. The creation of competitive advantage intensifies the struggles of companies on the globalized
market. The modern business environment is heavily affected by the coronavirus pandemic, by the fourth
industrial revolution - Industry 4.0, and the growing importance of sustainability and the accompanying
sustainable development goals. In this paper the role of productivity for achieving competitiveness of domestic
companies is analyzed. The main goal of the paper is to provide an overview on how productivity takes its role
in increasing competitive ability of companies amidst the dynamic changes that define the modern business
environment. Based on the analysis of literature and data in this domain, suggestions and guidelines for
improving competitiveness of domestic enterprises. The paper provides a solid basis for future research.
Key words: Globalization, Competitiveness, Quality, Productivity, Knowledge.
INTRODUCTION
The globalization of economic processes and technological development, are the cornerstone of the modern
economy. Because of this process, the economy becomes global and competition intensifies. Globalization
views the world as a single market in which the most efficient and competitive will thrive. The world is
economically interactive and interdependent. Competition in most industries has become internationalized
and companies are entering the market through global strategies. Continuously, the global competitive
situation becomes more complicated, and competitive relations between enterprises intensify (Bakator et
al., 2019).
Further, the modern economy is determined by new competitive conditions. According to Kotler and
Caslione (2009), the global economy is characterized by the emergence of hyper-competition. Hyper-
competition occurs when technologies and supply are so new that standards and rules are fluid that causes
competitive advances that are impossible to stop. It is characterized by intense and fast competitive shifts
between competitors on the market.
Further, the global crisis caused by the COVID-19 pandemic has highlighted the need to change the
modern business philosophy. The global economy has shown all its instability, and business in the
conditions of a pandemic has reduced the volume of global trade. Some business sectors, such as tourism,
have collapsed. The economic crisis caused by the global pandemic has shown how connected the global
world is. According to some estimates (Bešić, & Đorđević 2020), the global market and the establishment
of new competitive relations require a new approach in managing a business organization, which means
continuous innovation not only of products and services, but also of full-fledged business processes. The
M. Bakator et al. / The role of productivity in achieving competitiveness
200
success of the organization's business can be achieved only by improving the productivity of all key
business resources and improving the existing level of innovation. All the newly industrialized economies
of the world, China in particular, have based their development on the constant growth of business
productivity, while achieving an acceptable level of quality (Shen et al., 2020). The main problem of
domestic companies is non-competitiveness that occurs due to poor business productivity, lack of
application of new technologies and knowledge, and inadequate application of quality management. The
low level of technological equipment of domestic companies, high business costs, as well as the
inefficiency of business systems are just some of the problems that domestic companies face.
In this paper, key factors that define the modern business environment and the important role of
productivity in achieving competitiveness is analysed. The main goal is to provide an overview on how
productivity can increase and help develop a competitive advantage on the globalized market. The paper
consists of three main sections (excluding the Introduction and Conclusion sections). The first section
addresses key factors of modern business, which forms the new business paradigm. The second section
addresses productivity in the Republic of Serbia. Finally, the third section discusses suggestions and
guidelines for improving productivity and competitiveness of domestic enterprises.
KEY FACTORS OF MODERN BUSINESS
The global economy emphasizes business based on innovation, improving productivity, improving quality,
and improving knowledge. Drucker believes (1995) that the basic roadmaps in an entrepreneurial economy
must be productivity and innovation. Innovation in modern business is a factor of competitiveness. The
research and development function, focused on the continuous improvement of the product quality concept,
is the basic source of future growth and development of the company. Research and development should be
related to marketing, because the focus of modern business processes are the users, which means that the
analysis of their requirements is the starting point, and the analysis of their satisfaction is the final point of
the marketing process. Business excellence is the main goal of modern business. Business excellence
results in a competitive leadership position. Business excellence means that companies are constantly
working on the process of implementing quality and increasing the productivity and knowledge of each
employee. Business excellence can be achieved in two ways: by applying the concept of total quality
management (TQM) and by applying integrated management systems (IMS).
Productivity is an imperative of modern business and probably the most important factor of
competitiveness in the global market. Economic history since the beginning of the industrial revolution has
been marked by the need to improve labour productivity. According to some findings (Bešić, & Đorđević
2017), productivity is the most important factor of competitiveness in modern business. The struggle for
consumers and for stable market participation is essentially a struggle to increase business productivity.
The global economy has directly influenced the development of competitive relations in the global market.
New competitors have emerged in the global market, coming from the so-called. "Newly industrialized
countries", such as China, India, Brazil, South Africa, etc. Business organizations coming from these
countries are becoming competitive with companies from the most developed countries. It is considered
that (Bešić, & Đorđević 2019) companies coming from newly industrialized countries base their
competitiveness on lower business costs, which directly affect the improvement of their productivity,
standardized business models, use of modern technological achievements and optimization of price and
quality. In essence, companies from newly industrialized countries combine the effects of continuous
improvement of business productivity, with a focus on reducing costs, with modern achievements in the
field of management and technology. In modern business, quality is one of the main factors in achieving
the competitiveness on the globalized market. Quality is inextricably linked to productivity. It is considered
(Bešić, & Đorđević, 2019) that quality viewed exclusively as a management concept. Quality implies
building a certain model of quality management into the organizational structure (Popović, 2021). The most
important factors that influenced the improvement of the concept in practical and theoretical terms were:
increasing productivity, development of innovative activities, globalization of the market and the need to
achieve consumer satisfaction.

EMC 2022, 17-18th June 2022, Zrenjanin, Serbia
201
In modern business conditions in the process of organization management, business functions stand out,
which due to their market orientation have strategic importance. These business functions are marketing,
quality management, and research and development (Đorđević, & Ćoćkalo, 2010). Innovation is the result
of action, marketing, and research and development. Quality is a management phenomenon and focuses on
meeting the requirements and expectations of customers. Quality management should result in improved
business productivity and customer satisfaction. Marketing and quality begin with consumers' and
customers' demands, and end with the analysis of customer and user satisfaction. Modern economy is the
economy of knowledge. According to some considerations (Krebs, 2007), today we live in a knowledge
economy, in which knowledge is power, but only if it is a process of connecting knowledge. The
knowledge economy is based on connection complexity. They are all interconnected in a single economic
system. The modern economy is the information economy, which is driven by economic networks, as
opposed to the industrial economy, which is outdated and which was driven by economies of scale.
In the 21st century, knowledge is treated as operational knowledge that enables the improvement of other
activities, increasing business productivity, and creating an organization that uses knowledge in its business
to become competitive. Knowledge management is a systematic approach to finding ways to make the best
use of and implement knowledge in an organization. Its goal is to maintain sustainable competitiveness or
plan long-term business policy. From the aspect of managers, knowledge management can be seen as a
process for optimizing the effective use of intellectual capital to achieve the goals of the organization. The
task of a modern organization is to improve the knowledge of its employees because this further improves
business productivity. In an organization that can be defined as a learning organization, all employees are
responsible for personal development. Modern organizations need to be knowledge-intensive. Some of the
characteristics of the learning organization are the development of organization knowledge, spreading
knowledge in a hierarchical vertical, but also horizontally, commitment to improving knowledge,
commitment to knowledge as the most important business resource, competitiveness is achieved by
increasing knowledge productivity.
ANALYZING PRODUCTIVITY ASPECTS IN ENTERPRISES IN THE REPUBLIC OF
SERBIA
The problem of non-competitiveness of domestic companies is primarily related to low productivity of
domestic companies. The productivity of domestic companies is unsatisfactory. It is believed that the
productivity of domestic companies is three times lower than the EU average. Outdated equipment, high
business costs, inefficient organization and inadequate application of modern management methods and
techniques directly affect the problem of productivity of domestic companies.
According to the data of the Republic Bureau of Statistics (RZS, 2020), the productivity of the domestic
economy in the period between 2015 and 2019 increased by 14%. This is twice the GDP growth than
employment growth (18.3%). Only large companies had above average productivity in the observed
period, in 2019 medium-sized companies joined large companies. Resource productivity, as the ratio
between GDP and domestic consumption of materials in 2019, amounted to 39.2 dinars per kilogram,
which is 2.15% less compared to 2018.
The key problem of inadequate productivity of domestic companies is the age of manufacturing equipment.
Serbia has been lagging behind the European average for many years, when it comes to manufacturing
equipment age. Domestic entrepreneurs (private individuals) mostly buy repaired equipment abroad, which
is functional, but technologically lagging behind. The average age of equipment in domestic companies is
between 20 and 30 years. On the other hand, domestic managers do not sufficiently apply modern
management methods and techniques, and production takes place on outdated equipment.
It is considered that one of the biggest structural problems of the domestic economy (RZS, 2020) is the
slow change of technological structure of the processing industry. In the period between 2015 and 2019, in
the domain of manufacturing companies, the majority of companies had low and medium technological

M. Bakator et al. / The role of productivity in achieving competitiveness
202
complexity in their manufacturing and technological processes. In 2019, 43% of companies were in the
field of low technological complexity, 28% of companies were in the field of medium-low technological
complexity, 22.6% of companies were in the field of medium-high technological complexity and only
5.5% of companies has fallen into the realm of high technological complexity. If we take into account the
first and second groups of companies, then over 70% of companies have medium and low technological
intensity.
The largest number of fixed investments on the domestic market is directed towards labour-intensive
activities. These investments are focused on the construction of facilities and plants, as well as equipment,
while investments in new equipment and technology are minimal. Thus, there is an increase in employment
at the level of the economy. However, there is no real increase in business productivity, because it is
directly related to the application of high-tech solutions and new industrial equipment. Some of the
consequences of low productivity of domestic companies, besides the non-competitiveness on a global
scale, are an underdeveloped economy, falling consumption, growing foreign trade deficit, etc.
Increase in productivity is often determined by several main factors including production process
management and organization, product specialization, investments in human capital, scientific progress,
technological progress and innovation (Skapars et al., 2017). In the future productivity will be characterized
by striving towards organizational areas, continual upgrades of production cycles, automation and
information application in production processes, information and technology workflow improvements,
team-based design and concurrent engineering, and effective new product development processes
(Fragapane, 2022).
SUGGESTIONS FOR PRODUCTIVITY IMPROVEMENT IN DOMESTIC ENTERPRISES
A 1% increase in productivity is thought to lead to a 1% increase in GDP (WBG 2019). More productive
organizations and the ones that implements the best psychological practices have a better chance of
competing on a global level. On the other hand, quality and productivity are inextricably linked - when
quality is improved, productivity is also improved. The domestic economy has been in the process of
economic transition for over twenty years, which has led to the negative effects of the transitional
recession. These effects are multiplied by the negative effects of the global economic crisis of 2008. In
addition, serious consequences for the national economy are still expected as a result of the crisis due to the
global pandemic. Domestic companies struggled to maintain a minimum cooperativeness in conducting
business in the face of a chronic shortage of funds. There was not enough money to buy new equipment, as
well as to invest in new management methods and techniques. As quality and productivity are interrelated,
it is evident that due to the bad financial situation, domestic companies could not invest adequate financial
resources in equipment or in the implementation of the quality concept, and those who invested in quality
were pressured by foreign partners.
Continuous improvement of business processes is achieved through implementing the concept of quality
management, and quality itself is one of the most important elements of competition in global market
conditions. The following guidelines for improving business processes are proposed:
Quality must be applied as a management concept that permeates the entire organizational structure
and is focused on productivity and competitiveness;
Faster and more adequate application of integrated management systems;
Development of technical-technological infrastructure, primarily on the basis of procurement of new
equipment;
More intensive application of modern management methods and techniques.
Improving quality reduces business costs due to fewer alterations, errors, delays, scraps, as well as better
use of equipment, raw materials and supplies. Overall, better management of business resources is
achieved. Reducing business costs directly affects productivity. Lower costs and better productivity lead to
a more flexible pricing policy - selling standard quality products at lower prices than the competition. A
successful business organization must be able to simultaneously improve, expand and innovate. The

EMC 2022, 17-18th June 2022, Zrenjanin, Serbia
203
organization must be open to the acquisition of new knowledge and focused on the continuous
improvement of knowledge productivity in the function of improving business productivity and developing
competitive ability.
The essence of new technologies is in increasing business productivity, which improves the
competitiveness. The application of new technological solutions can increase the production capacity,
reduce the use of human labour and, in the end, reduce the cost of doing business per unit of product. There
is no better way to invest in the future than investing in knowledge.
CONCLUSION
Business excellence and world-class products and services can only be achieved on the basis of continuous
improvement of quality of business processes, which is based on increasing the productivity and
knowledge of each individual employee in the organization. The main problem of domestic companies is
non-competitiveness that occurs because of poor business productivity, lack of application of new
technologies and knowledge, and inadequate or non-existent application quality management.
It can be concluded that the issue of improving the productivity of domestic companies implies stronger
investment in the technical and technological basis of business, especially in the procurement of modern
equipment. In addition, it is important to implement global experience and modern management methods
and techniques, especially integrated management systems, which are the basis for improving business
efficiency and developing competitiveness in the global market. This paper provides a solid overview on
the importance of productivity when it comes to achieving competitiveness. For future research it is
recommended to address data from companies across industries in order to further investigate the
mechanisms that affect productivity and achieving competitiveness.
ACKNOWLEDGEMENT
This work is a part of the current project TR-35017 funded by Ministry of Education, Science and
Technological Development of the Republic of Serbia.
REFERENCES
Bakator, M., Đorđević, D., & Ćoćkalo, D. (2019). Developing a model for improving business and competitiveness of
domestic enterprises. Journal of Engineering Management and Competitiveness (JEMC), 9(2), 87-96.
Bešić C., i Đorđević D. (2017). Savremeni menadžment trendovi [in Serbian]. Čačak: FTN.
Bešić C., i Đorđević D. (2019). Strategijski menadžment [in Serbian]. Čačak: FTN.
Bešić C., i Đorđević D. (2020). Upravljanje promenama [in Serbian]. Čačak: FTN.
Draker, P. (1995). Menadžment za budućnost [in Serbian]. Beograd: PS Grmeč – Privredni pregled.
Đorđević, D., i Ćoćkalo, D. (2010). Osnove marketinga [in Serbian]. Zrenjanin: TF Mihajlo Pupin.
Fragapane, G., Ivanov, D., Peron, M. et al. (2022). Increasing flexibility and productivity in Industry 4.0 production
networks with autonomous mobile robots and smart intralogistics. Annals of Operation Research, 308, 125–143.
https://doi.org/10.1007/s10479-020-03526-7
Kotler, P., i Caslione, J. (2009). Kaotika [in Croatian]. Zagreb: Mate.
Krebs, V. (2007). Managing the 21.st century organization. IHRM Journal, 11(4), 2-8. www.orgnet.com
Popović, B. (2021). Evaluation of product quality with decibels. Journal of Engineering Management and
Competitiveness (JEMC), 11(2), 106-114.
Republički Zavod za Statisttiku - RZS (2020). Performanse poslovanja privrede Republike Srbije 2015-2019.
Beograd, 2020. https://publikacije.stat.gov.rs
Shen, Y., Yue, S., Sun, S., & Guo, M. (2020). Sustainable Total Factor Productivity Growth: The Case of China.
Journal of Cleaner Production, 120727–. https://doi.org/10.1016/j.jclepro.2020.120727
Skapars, R., Jekabsone, S., Priede, J., & Skribane, I. (2017). Productivity and its impact on the competitiveness of
Latvia. European Research Studies Journal, 20(3A), 920-930.

204
XII International Symposium Engineering Management and Competitiveness 2022 (EMC 2022)
17-18th June, Zrenjanin, Serbia
CHARACTERISTICS AND FACTORS OF INNOVATION OF SMALL
AND MEDIUM ENTERPRISES
Miloš Ivaniš
Euro Audit doo, Belgrade, Republic of Serbia
E-mail: [email protected]
Živan Bajić
Banka–Poštanska štedionica, Šabac, Republic of Serbia
ABSTRACT
Today's companies face serious and very diverse challenges: expansion of the global economy, fierce clash for
markets, drastical reduction of the product life, rapid technological changes, structural transformation, reducing
the size of companies, etc. To meet these challenges, enterprises must constantly increase productivity, improve
the quality of products and services, develop new products and services, and continuously examine consumer
demands and desires. In general, this means that companies must be invariably innovative, as the focus of
modern business is constant improvement in all components of business structure and operations. At the same
time, the company's ability to bring better, more functional, cheaper and more attractive products to the market is
an indicator of the development of innovative processes in a particular company. However, just as companies
need to be constantly renewed through innovation, so too national economies must constantly change. In this
context, innovation is crucial because it stimulates economic, employment and income growth, improves the
quality of life of the population and the competitiveness of the national economy. Accordingly, in modern
economies, small and medium enterprises have significant effects in the economy. Considering this fact, the aim
of this paper is to present the basic characteristics and factors of innovation processes in small and medium
enterprises.
Key words: Small and medium enterprises, Innovations, Innovation process, Entrepreneurship.
INTRODUCTION
Broadly speaking, it could be said that innovation refers to all scientific, technological, organizational,
financial and commercial activities which contribute to improving a product, working method or a service,
or to implement new, technologically advanced products and services. The introduction of novel
technologies, the development of human capital and significant improvements in the organization of
production has increased the efficiency of companies and enabled them to produce not only much better
products than their competitors, but also to reduce the costs. At the same time, new products and services
offered to consumers (customers) facilitate the development of a company and conquering new markets. In
this way, innovations enable innovative companies to differ from their competitors, as well as affect the
economy as a whole and its development and competitiveness. In order for innovation to appear on the
market and contribute to the realization of business success of an economic entity and thus lead to the
success of the economy as a whole, it is necessary that there is someone who will start the innovation. In
that context, it can be said that these are, above all, entrepreneurs in the sector of small and medium
enterprises. New ideas are being created in small and medium enterprises and fast and efficient economic
solutions are being sought. Seeking business opportunities and solving risks belongs to small and medium
enterprises, which are much more flexible and adaptable than large economic systems, because in SMEs
entrepreneurship as an organizational skill is, in fact, a form of adjustment.
In the context of the above, it is not surprising that in the last decade of this century, the importance of
innovative small and medium enterprises has greatly increased. Namely, many experiences of highly
developed countries show the growing importance and opportunities of small and medium enterprises in

EMC 2022, 17-18th June 2022, Zrenjanin, Serbia
205
the field of innovation development. A large number of studies have shown that the size of the company
contributes little to its intensity and innovative effort. Such attitudes are confirmed by the fact that more
than half of the 70 most important inventions in the 20th century come from individual inventors whose
innovative entrepreneurial spirit created many products such as personal computers, radar, jet engine,
biosynthetic insulin, cellophane, ballpoint pen, etc. This is also confirmed by the fact that 46 of the 58
inventions (inventions) in the USA and Western Europe in the 20th century actually belong to individuals
and small companies. Therefore, it is not surprising that in the last 10 years special importance is given to
the establishment and role of new (young) innovative small and medium enterprises which are considered
to have a de facto critical role in the development, dissemination and implementation of innovations, which
indirectly contributes to development and increasing the competitiveness of the overall economy.
INNOVATIVE CHARACTERISTICS OF SMALL AND MEDIUM ENTERPRISES
Innovative activities of small and medium enterprises represent a continuous process and have a much
more important role for economic growth and development of innovation in the economy than it was first
recognized. In addition to new, radical and economically significant innovations, innovation in the SME
sector also includes the introduction of existing but improved products, services and processes, new
appearances in new markets, the introduction of new or improved organization and management systems in
small and medium enterprises.
Also, it should be noted that, compared to large enterprises, small and medium enterprises have a
completely different role in the innovation process. Namely, the largest number of small and medium
enterprises is primarily market-oriented, and less research-oriented. In that regard, SMEs use new market
possibilities and development opportunities faster, they are more flexible and better adapt to market
demands, due to the fact that they are more focused on small gradual innovations. Analogously, the role of
small and medium enterprises in the innovation process is determined by a number of different factors
related to the technology itself, as well as the structure and requirements of the market. Unlike large
companies that have greater opportunities to attract financial, material and human resources and, owing to
this fact, can carry out innovative activities that require high capital investment, SMEs have a much more
significant role in innovation which is more focused on some segmented markets where the development of
specialized products and services in a way complements the offer of large companies and thus completes
the value chain in the economy.
Compared to large business systems, SMEs rely more on their own informal innovations rather than on
formal ones, as they are less able to use exclusively external inputs unlike larger enterprises. In addition,
their management structure is quite specific, because the forms, methods and principles of management in
small and medium enterprises are significantly different from large enterprises. Namely, management in
small and medium enterprises is relatively simple because there is no need to create complex and
cumbersome systems of planning, control and coordination of work within the company. In small and
medium enterprises, there are hardly any factors that contribute to the bureaucratization of management and
its separation from real problems and production. Consequently, in many small and medium enterprises,
management functions are not even separated from ownership. This contributes to the limitation of the
range of various administrative procedures and connecting, i.e. merging of management and engineering-
technical functions in small and medium enterprises. Also, a set of specialized management functions
(bookkeeping, rationalization of document circulation, etc.) is performed by the engagement of external
consultants.
In the context of the aforementioned, it should be noted that in the literature there is a large number of
reviews of the most significant advantages of SMEs over large enterprises, both in business and in their
innovative activities. From the perspective of innovation, the most significant characteristics of small and
medium enterprises are mainly the following:
1. Flexibility, initiative and dynamism in making management decisions;
2. Lack of inertia to adapt to changes and market conditions;
3. Expressed preference for new, original innovations and technologies;

M. Ivaniš and Ž. Bajić / Characteristcs and factors of innovation of small and medium...
206
4. Lack of excessive bureaucracy and formalism in innovation process organization;
5. High ability to provide diversified products in line with demand;
6. Relatively low capital intensity;
7. Rapid return on investment;
8. Matching SME production with modern market demand trends.
As can be seen from the aforementioned characteristics, innovation-oriented small and medium enterprises
appear as a unique source of diversification, flexibility and long-term improvement of the performance of
an innovation system. They play a primary role in discovering and developing new markets and expanding
supply in existing markets. In addition, these companies are testing, researching and pushing the boundaries
of production and consumption, seeking for new ways on how to better meet consumer needs, they are a
significant driver of overall economic development, as well as an important factor in creating new jobs and
increasing employment in the overall national economy. Simultaneously, the realization of the increasingly
relevant and important role of innovation-oriented small and medium enterprises in economic development
and increasing employment largely depends on the existence of a favourable business environment and
entrepreneurial culture.
Accordingly, it should be borne in mind that the development of entrepreneurial culture during the last
decade of this century has contributed to numerous social and economic factors, especially the
disadvantages of corporatism and knowledge of the problems of economies of scale and other
shortcomings of large enterprises and business systems. Namely, practice has shown that the effects of
economies of scale do not have to be as implied by economic theory, the size of companies has its
downsides and large companies are not necessarily more innovative and socially responsible than small and
medium enterprises. Also, the practice has shown that large companies are not the main creator of new
jobs. In addition, the development of entrepreneurial culture was facilitated by some psychological factors,
primarily the loss of employment security, which directly affected the reduction of the risk of starting a
business on one's own.
FACTORS OF INNOVATION OF SMALL AND MEDIUM ENTERPRISES
A large number of researches conducted during the last decade indicate the great role of inner (internal) and
outer (external) factors that determine the degree of innovation of small and medium enterprises. Among
the internal factors, the most important ones are the availability and quality of human resources, financial
strength and absorption capacity of small and medium enterprises. Among the external factors, the most
important ones include the possibility of connecting with other companies related to the field of innovation,
as well as favourable positioning within supply and value chains. At the same time, various authors tried to
find out what are the factors that determine the speed and quality of innovation in the sector of small and
medium enterprises. In such analyses, the eight most important factors have been identified, which we will
hereafter explain.
(1) Capital resources - are a significant factor that determines the speed and quality of innovation in small
and medium enterprises. When it comes to access to and disposal of resources, SMEs have relatively
limited opportunities and have more difficult access to funding. As a result, SMEs are more dependent on a
small number of products and services and cannot achieve economies of scale. Due to limited resources,
predominantly financial ones, SMEs usually have very limited resources for research and development
activities and find it more difficult to replace certain products within the product range, as well as
burdensome to test product models.
(2) Marketing and technical resources - are also a very important factor that affects the speed and quality of
innovation in small and medium enterprises. Similar to financial resources, small and medium enterprises,
in general, have fewer opportunities when it comes to marketing and technical resources compared to large
enterprises. Consequently, SMEs have less media and marketing presence in the market and find it much
more difficult to build recognizable trademarks of products and brands, which sets hurdles for their
promotion and presentation to potential consumers.

EMC 2022, 17-18th June 2022, Zrenjanin, Serbia
207
(3) Quality of management - is an almost predominant factor that determines the speed and quality of
innovation in small and medium enterprises. The most suitable model for these companies is the so-called
linear management structure, yet management in some SMEs often has limited and insufficient
management knowledge in the field of business management, business planning, implementation of
management activities, quality standards, etc. Small and medium business owners usually lack the
necessary education and work experience, which can be partially compensated by purchasing services from
professionals and consulting firms. However, the enthusiasm of the owners is not enough for the success of
the SME, as the appropriate management knowledge is also needed.
(4) The ability to innovate - is determined by multiple factors, and accordingly, there is a big difference in
the ability to innovate in small and medium enterprises, which is most pronounced in SMEs from different
industries. However, what most small and medium enterprises have in common is that they face limited
capital and human resources, insufficiently developed business culture, insufficient expertise of
management and lack of work experience, particularly when it comes to connecting companies into
different business networks.
(5) Innovation process - as a factor affecting the speed and quality of innovation in small and medium
enterprises implies that innovation processes in small and medium enterprises are characterized by being
less formalized and that an informal planning and communication strategy is applied, unlike in large
companies. Therefore, the quality of the innovation process in SMEs significantly depends on the ability of
the manager (owner) of the company. Consequently, obsession with new ideas should be the main
characteristic of innovative managers under modern business conditions, because if management is
intensively involved in encouraging and developing innovative activities this will lead to programmed
innovation processes in SMEs.
(6) Organization of business and innovation processes - is a very important factor that affects the speed and
quality of innovation in small and medium enterprises. This refers to the fact that one of the important
features of small and medium enterprises is flexibility, collective motivation and usually simple
organizational structure that allows them to accelerate decision making in relation to large companies and
business systems. Simplicity, speed and flexibility in making decisions usually depend on one or several
top managers of the company, who are usually fully aware of everything that happens in the company and
are able to competently cover different aspects of the company's business.
(7) Strategy and planning - are important factors for the speed and quality of innovation because they are of
a strategic nature. However, as such, they are not particularly important for small and medium enterprises,
as many SMEs avoid defining precise goals and clearly defining their business tasks. Consequently, it is
logical to conclude that strategic planning in small and medium enterprises is less formalized and varies in
importance from case to case. Nevertheless, the modern model of organization requires a model of
coordination between strategy, processes and business functions in order to smoothly implement the
strategy and feedback which speaks of the level of success in its implementation. This requirement can be
achieved only by appropriate innovations in the very concept and techniques of management (strategic
management).
(8) Alliance - is a factor that in certain conditions can be very significant when it comes to the speed and
possibility of innovative activities in the SME sector. SMEs are much more motivated and focused on
connecting to various associations, networks and business alliances, because in this way, they get the
opportunity to overcome some of the limitations inherent in the SME sector. By joining various alliances,
small and medium enterprises get the quality human and all other resources they need, increase the
importance and bargaining power in the market and thus reduce the benefits of large enterprises and
business systems. Also, the connections enable them to disperse financial risks, transfer technology easier,
as well as to increase their production efficiency and competitiveness.
On the other hand, it should be mentioned that through the system of economic integration there have been
very different forms of connecting small and medium enterprises with large enterprises, primarily in the

M. Ivaniš and Ž. Bajić / Characteristcs and factors of innovation of small and medium...
208
field of production. Large companies and business systems do not favour organizing narrowly specialized
production within their framework, as it carries too much of a variety of different products. Therefore, they
entrust part of their product range to SMEs that specialize in the production of one or more products (or
parts), which are then assembled into larger blocks and delivered to final consumers. In this way, the basic
production of SMEs consists of parts, assemblies and products of certain stages of the technological
process, and sometimes even operations on the assembly of the finished product. This type of connection is
especially suitable for small and medium enterprises which do not have a great chance of surviving on the
market on their own. This is especially true of technologically complex products whose organization of
production and sales requires large management, financial and technical resources which small and
medium enterprises do not possess.
CONCLUSION
Respecting all the factors that determine the speed and quality of innovation in small and medium
enterprises, the main conclusion is that due to the large number of these factors and their complexity, small
and medium enterprises need to find the most efficient way to manage limited financial, human, marketing,
innovation and other resources in order to be able to be innovative and competitive in the market. Despite
the large number of SMEs struggling to survive in highly developed countries today, the fact remains that
there are many very successful SMEs which take the lead in some industries and compete with much larger
companies based on technological advantages and specialization strategies. Such innovative small and
medium enterprises accept the philosophy that there is always a better way of doing business and they
tirelessly search for new ideas and innovations that will increase their value and reduce costs, because
innovation is the main driving force of development regardless of company size. Also, in the conclusion of
this paper, it would be useful to point out that small and medium enterprises as innovators have myriads of
advantages over large enterprises. In general, these benefits are essentially behavioural and related to the
internal organization of activities and the way SMEs communicate with customers and markets. Flexibility,
resourcefulness and speed are the basis of the innovative advantage of small and medium enterprises,
whereas they cannot compete with large enterprises in industries where resources and their management
are of great importance. Therefore, increasing the level of innovation of small and medium enterprises
probably requires measures that would also be aimed at improving access to resources, yet which also
contribute to maintaining the organizational flexibility of small and medium enterprises.
REFERENCES
Atkinson, R., Ezell, S. (2014). Ekonomika inovacija, Mate doo, Zagreb i Zagrebačka škola ekonomije i
menadžmenta, Zagreb.
Avlijaš, R. (2008). Preduzetništvo i menadžment malih i srednjih preduzeća, Univerzitet Singidunum,Beograd.
Deakins, D, Freel, M. (2012). Preduzetništvo i male firme, Data Status, Beograd.
Jančetović, M, Erić, I. (2012). Menadžment inovacija, Beogradska poslovna škola, Beograd.
Kontić, LJ. (2008). Inovacije – izazovi za budućnost, Zadužbina Andrejević, Beograd.
Levi Jakšić, M, Marinković, S, Petković, J. (2015). Menadžment inovacija i tehnološkog razvoja, Univerzitet u
Beogradu, Fakultet organizacionih nauka, Beograd.
Lukinović, M, Stamatović, M, Šarkić, N. (2017). Inovacije, pravno-ekonomski aspekti, Pravni fakultet
Univerziteta Union u Beogradu i Javno preduzeće ”Službeni glasnik”, Beograd.
Marinković, S. (2012). Menadžment inovacija u uslugama, Zadužbina Andrejević, Beograd.
Nikolić, M. (2014). Inovativnost malih i srednjih preduzeća kao faktor privrednog razvoja Srbije, (doktorska
disertacija), Univerzitet u Nišu, Ekonomski fakultet.
Novaković, V, Samardžić, D. (2000). Mali biznis i preduzetništvo, Drasler Partner, Beograd.
Novi Sad, Univerzitet Privredna akademija u Novom Sadu.
Ožegović, L, Đorđević, D. (2020). Preduzetništvo, Fakultet za ekonomiju i inženjerski menadžment,
Paunović, B. (2014). Preduzetništvo i upravljanje malim preduzećem, Ekonomski fakultet, Beograd.
Pećanac, R. (2009). Razvoj i upravljanje inovacionim procesima, Srbija Invent, Zrenjanin.
Penezić, N. (2010). Preduzetništvo – savremeni pristup, Akademska knjiga, Novi Sad.
Simonović, D, Joksić, J, Travica, J. (2019). Menadžment porodičnih preduzeća, Visoka škola strukovnih studija,
Aranđelovac.

209
XII International Symposium Engineering Management and Competitiveness 2022 (EMC 2022)
17-18th June, Zrenjanin, Serbia
INNOVATION CAPACITY OF SMALL AND MEDIUM ENTERPRISES
Miloš Ivaniš
Euro Audit doo, Belgrade, Republic of Serbia
E-mail: [email protected]
Živan Bajić
Banka–Poštanska štedionica, Šabac, Republic of Serbia
ABSTRACT
In recent years, the importance of innovation of small and medium enterprises in certain activities is growing,
specifically the ones where they gain an advantage in the development of innovations. However, not all SMEs
have the same need and capacity to innovate. Only a small number of fast-growing highly innovative SMEs are
significantly focused on innovation, creating new value for consumers, thereby contributing to the innovative
development of the economy. The innovative capacity of a company refers to its ability to successfully
implement innovations. Bearing in mind the fact that the innovation process includes the ability to find ideas
(invention) and its introduction to the market (innovation), the conclusion is that the innovation capacity of a
company is conditioned, on the one hand, by the ability to find new ideas and on the other hand, by possibilities
of their realisation. Therefore, the innovation capacity is not the same for all SMEs because it depends on a large
number of factors. Taking into consideration that the innovation capacity of a company predominantly
determines the scope and type of its competitive advantage, the conclusion is that if a company wants to gain and
maintain a competitive advantage, it must have a general innovation ability, i.e. innovation capacity. In this
context, the aim of this paper is to present a model of innovation capacity of SMEs, which is determined by eight
basic segments, i.e. components.
Key words: Small and medium enterprises, Innovations, Innovation capacity, Entrepreneurship.
INTRODUCTION
Innovation is the ability of a company to come up with new ideas, new ways of production, new
business models, new products and services, as well as to solve problems and challenges faced by
companies in a new way. At the same time, the main purpose of innovation is to change the status quo,
trends, procedures, costs of products and services, knowledge and skills of people and their actions to
achieve economic, social and other goals. Therefore, innovations aim to change the potential for
wealth creation, giving resources new properties and capabilities, incentivising new economic
activities and creating new power and new value creation, in order to transform worthless resources
into usable and significant ones.
The company's ability to innovate determines its position in the market and the ability to meet the
needs of consumers (customers). Accordingly, innovative activities of the company are a key driver
and source of business success. Innovation always leads to new ideas, new solutions and new types of
business, especially in the SME sector. Many small and medium enterprises have built the ability to
innovate efficiently, which allows them to improve their business and secure a significantly better
market position. For the reasons of survival and development, SMEs must implement and constantly
improve their innovation activities in order to be successful in creating and applying new knowledge
and innovations. Simultaneously, the capacity of SMEs to successfully innovate determines the scope
and type of their competitive advantage.
Innovative capacity means the ability of a company to successfully implement innovations. Bearing in
mind the fact that the innovative process includes the ability to come up with new ideas (invention)
and introduce them to the market (innovation) it follows that the innovation capacity of the company is

M. Ivaniš and Ž. Bajić / Innovation capacity of small and medium enterprises
210
conditioned, on the one hand, by the ability to find new ideas, and on the other hand, by possibilities
of their realisation. Innovation capacity is not the same for all small and medium enterprises because it
depends on a large number of factors, such as: the area in which the company operates, the business
environment, chances and opportunities for exchange of knowledge and information, innovative
cooperation of companies, the availability of professional, qualified and innovation-oriented staff in
the company, the ability to manage innovation processes, the accessibility to existing technologies,
financial funds, the availability and development of infrastructure, the existence of business networks
and alliances, etc.
Taking into account that the innovation capacity of a company determines the scope and type of its
competitive advantage, it could be concluded that innovation can be viewed as a specific strategy for
obtaining and maintaining the competitive advantage of the company. Analogously, the willingness to
react to change has become a basic principle in the management of small and medium enterprises.
This principle is called "innovation-based management". The main competitive advantage of any
company is its ability to innovate. Innovation results in an advantage over the competition, and the
achieved competitive advantage results in an increase in profits, which is the main goal of every
company, regardless of its size.
ENTERPRISE INNOVATION CAPABILITY MODEL
Innovation forms the basis for the future of every modern enterprise. Consequently, innovation should be a
key element of every company's strategy, regardless of whether it is a small, medium or a large enterprise.
In this context, there are three basic approaches to innovation, especially when it comes to small and
medium-sized enterprises, which include: Firstly, undertaking many small innovations in every business
activity, which in fact gives organizational competence that is difficult to copy; Secondly, undertaking
several valuable major innovations that keep pace with the current state of science; Thirdly, exploring
opportunities for systemic innovation that can provide radically different ways to meet consumer needs. If
the company wants to follow all three of these innovation approaches, then it must have a general
innovation capability that is presented in the model of innovation capability with 8 segments, i.e.
components. These include:
1. Component 1 – Enterprise
2. Component 2 – Energy
3. Component 3 – Authority
4. Component 4 – Experiment
5. Component 5 – Insight
6. Component 6 – Intention
7. Component 7 – Investment
8. Component 8 – Implementation
These segments-components of the enterprise innovation capability model are illustrated in Figure 1.
Considering their importance, we will hereafter explain each of the segments of aforementioned model in
more detail.
Component 1 - Enterprise. This component of enterprise innovation capability model refers to the fact that
new challenges should be constantly sought, whereby the organizational culture should support the
enterprise value system. Those people who lead innovations should adopt the so-called pirate spirit. The
stages of action for enterprise development should include the following: Firstly, identifying the value of
drivers (internal entrepreneurs); Secondly, accepting investments in the future; Thirdly, setting strategic
goals for exploring new areas.
Component 2 - Energy. This component of the enterprise innovation capability model refers to the fact that
innovative enterprises are full of energy and optimism. High energy levels are natural in team-based
businesses, but rigidity, narrow-mindedness, pessimism and fear can rob a company of excitement, passion
and enthusiasm. Such energy sinkholes undermine and destroy the innovative capability of the company.

EMC 2022, 17-18th June 2022, Zrenjanin, Serbia
211
Managers need to release latent energies and channel passion to explore the potential of new ideas. In doing
so, organizational leaders must be excited about ideas and must act enthusiastically. Last but not least, they
must be ringleaders. In this component of the enterprise innovation capability model, the stages of action
for the development of organizational energy include the following: Firstly, employing people of unusual
energy; Secondly, making quick positive decisions about what needs to be done; Thirdly, investing in the
personal development of key employees.
Figure 1: Enterprise innovation capability
model
Component 3 - Authority. This component of enterprise innovation capability model implies that many
people in the company, i.e. employees must be a source of information, and in order to be able to contribute
to innovation, they must all be authorized. Significant creativity is released when each employee feels the
need to look around and find new or better ways to do something. The authority for innovation encourages
people to search for ideas, experiment and come up with their own innovative proposals and solutions.
Since innovation initiatives may require certain resources, it is necessary for the company's management to
commit to this. Thus, innovation requires a partnership between authorized, creative employees and
determined company managers. Thereby, the basic stages of authority development are reflected in the
following: Firstly, ensuring expectations that everyone should contribute to innovation; Secondly, training
managers to authorize members of their teams; Thirdly, asking key workers to develop new ideas.
Component 4 - Experiment. This component of the enterprise innovation capability model emphasizes that
innovation requires experimentation. A huge number of ideas may need to be reviewed, examined and
researched, but only a fraction of them will be adopted. Hence, it makes sense to adopt only those ideas that
provide maximum benefits. The latent value of an idea is often hidden when it is first proposed. Therefore,
ideas need to be explored to make the costs and benefits of implementation more clear-cut. In this regard, it
should be noted that industries based on creativity, such as fashion, film industry and pharmaceutical
research, are very well-aware of the importance of experimentation, because they fully consciously and
deliberately test ideas and use the most objective procedures at their disposal to evaluate them. Such
techniques are most often used by the so-called growing industries. Experimentation is necessary for three
main reasons: firstly, experimentation incentivises the development of ideas; secondly, it reduces risk
because objective information provides a solid basis for decision making, and thirdly, experimentation
alone is an extremely powerful source of learning because those involved in the process of experimentation
gain first-hand insight into how realistic it is for an idea to be realized in practice. Incidentally, the basic
stages of action for the development of experimentation are reflected in the following: Firstly, establishing
a fund for the so-called speculative initiatives; Secondly, the formation of special groups and teams for
experimental work; Thirdly, accepting the fact that some projects may fail.

M. Ivaniš and Ž. Bajić / Innovation capacity of small and medium enterprises
212
Component 5 - Insight. This component of the enterprise innovation capability model implies that
organizations (enterprises) are not only engaged in innovation, but are engaged in innovation with a goal. In
other words, in order to know where innovations are needed, one must have an insight, i.e. an insight into
the wishes and needs of people. For these purposes, market research techniques are most commonly used.
Simultaneously, it is also of utmost importance to know the customers and have an insight into the very
potential of an idea. Insight requires the power of perception, openness of mind and great perseverance. It is
necessary to look further than others and to look at things more deeply. Therefore, this certainly requires
people with a vision working together to create an image of what the future holds. In this context, gaining
insight should become a de facto way of life. Additionally, it should be noted that the stages of action for
the development of insight are reflected in the following: Firstly, involving many people in approaching
consumers and market research; Secondly, researching the needs and desires of potential customers who are
not currently consumers; Thirdly, researching into the potential of the so-called emerging technologies.
Component 6 - Intention. This component of the enterprise innovation capability model implies directing
efforts towards the requirements of innovation by a clear presentation of intentions. Accordingly, it is
primarily the task of executives, i.e. managers who must clearly illuminate the direction in which the
organization (company) should go. Good ideas are usually found only because someone is looking for
them. While it is impossible to guarantee creativity, the fact remains that a targeted search for ideas often
yields good results. This also means that there is a close relationship between innovation and strategy. In
addition, it should be said that the stages of action for the development of intentions for innovation should
be reflected in the following: Firstly, establishing powerful ad hoc teams to explore the defined so-called
opportunity spaces; Secondly, forming alliances with innovative start-ups and sharing ideas with them;
Thirdly, developing scenarios regarding what the future may be and thereby defining one's role in it.
Component 7 - Investment. This component of the enterprise innovation capability model, logically, implies
that innovation requires investment, i.e. spending money. Although some innovations are completely free
because they require only the time and effort of people, in the later stages innovation may require the
investment of additional funds, including significant amounts of money and time of executives (managers).
Innovation requires very intensive work. When the management of a company chooses to invest in a large
innovation project, then one door of opportunity opens, but it will probably close some other one. This
practically means that a company can only deal with a certain amount of innovation. If an enterprise
follows too many ideas at the same time, then resources will be wasted and the creative and innovative
intensity of the company will debilitate.
Innovation poses many dilemmas for the company's financial executives because it is very difficult, and
sometimes even impossible, to predict the value that will be created at a point in time when the idea itself is
used or commercialized. Hence, such assessments require great knowledge, skills, rational mind and
intuition on the part of the company's financial executives. In addition, worth noting are the stages of action
for investments in innovation. These are mainly reflected in the following: Firstly, setting aside a precisely
defined fund that is needed for innovation; Secondly, it is better to invest in a few good initiatives (ideas)
than to waste resources irrationally; Thirdly, setting the so-called aggressive targets for all of the selected
and defined investment projects.
Component 8 - Implementation. This component of the enterprise innovation capability model implies the
possibility of selected ideas being applied in practice, i.e. their possible implementation as innovations,
which practically means that they can make a contribution to change. At the same time, the implementation
of smaller innovations often takes place among the working groups in the company, whereby such
innovations represent local challenges. However, large innovation initiatives can often require very
complex changes that require a lot of cooperation between different groups and, as such, they pose
significant challenges for company executives (managers). In this regard, some forms of innovation,
especially in technical products, start in the R&D department and later move to the production department.
In these cases, the effective implementation of product innovation requires that horizontal processes are
optimized and precisely arranged. In addition, it is worth mentioning that the basic stages of action to
improve the implementation of innovation are reflected in the following: Firstly, setting up an orderly
innovation process (e.g. identifying phases and outputs); Secondly, determining one person responsible for

EMC 2022, 17-18th June 2022, Zrenjanin, Serbia
213
the overall innovation process; Thirdly, trying to reduce useless boundaries between different groups of
employees in the enterprise.
Small and medium enterprises often do not have the opportunity to afford professional staff for
investments, marketing, product quality, management system, application of new technologies, etc. Due to
these and many other limitations, a lot of SMEs are not able to significantly develop their innovation
capacity and their innovation capability. Consequently, in order to initiate the components of innovation in
SMEs, certain consulting services are offered on the market. The role of the consultant in the process of
innovative approach in SMEs is important for several reasons: firstly, the consultant has a neutral approach
to the problem, secondly, they provide a completely different point of view, thirdly, they increase efficiency
and rationality in solving problems, and lastly, they focus on results, which practically gives SMEs new
quality and value.
CONCLUSION
Bearing in mind all of the above, the main conclusion is that innovation is a key element of the
strategy of every enterprise. It is an extremely complex process consisting of many different elements
and activities. Simultaneously, the main question that arises today is the possibility of innovation
management. At times it may seem de facto impossible to manage something so complex and
uncertain, due to the fact that many innovation projects fail. Nevertheless, some of them bring great
success and profits. Consequently, it could be concluded that successful innovative companies have
developed such innovation management techniques that, in spite of no firm guarantee of success, the
implementation of certain activities may increase the likelihood of innovation being successful.
Innovation is a key driver and source of business success of companies and collectively the economy
as a whole. Accordingly, the willingness to respond to change has become the main approach in the
management of SMEs, under the term "innovation-based management". This means that the main
competitive advantage of any enterprise is its ability to innovate, which represents its innovation
capacity. In conclusion, it should be borne in mind that innovation is, without any doubt, the key point
on which the future of every company is based on. That being the case, innovation should be a key
element of any company's business strategy, regardless of whether it is a small, medium or a large
enterprise.
REFERENCES
Atkinson, R., Ezell, S. (2014). Ekonomika inovacija, Mate doo, Zagreb i Zagrebačka škola ekonomije i
menadžmenta, Zagreb.
Avlijaš, R. (2008). Preduzetništvo i menadžment malih i srednjih preduzeća, Univerzitet Singidunum, Beograd.
Deakins, D, Freel, M. (2012). Preduzetništvo i male firme, Data Status, Beograd.
Jančetović, M, Erić, I. (2012). Menadžment inovacija, Beogradska poslovna škola, Beograd.
Kontić, LJ. (2008). Inovacije – izazovi za budućnost, Zadužbina Andrejević, Beograd.
Levi Jakšić, M, Marinković, S, Petković, J. (2015). Menadžment inovacija i tehnološkog razvoja, Univerzitet u
Beogradu, Fakultet organizacionih nauka, Beograd.
Lukinović, M, Stamatović, M, Šarkić, N. (2017). Inovacije, pravno-ekonomski aspekti, Pravni fakultet
Univerziteta Union u Beogradu i Javno preduzeće ”Službeni glasnik”, Beograd.
Marinković, S. (2012). Menadžment inovacija u uslugama, Zadužbina Andrejević, Beograd.
Nikolić, M. (2014). Inovativnost malih i srednjih preduzeća kao faktor privrednog razvoja Srbije, (doktorska
disertacija), Univerzitet u Nišu, Ekonomski fakultet.
Novaković, V, Samardžić, D. (2000). Mali biznis i preduzetništvo, Drasler Partner, Beograd.
Ožegović, L, Đorđević, D. (2020). Preduzetništvo, Fakultet za ekonomiju i inženjerski menadžment, Novi Sad,
Univerzitet Privredna akademija u Novom Sadu.
Paunović, B. (2014). Preduzetništvo i upravljanje malim preduzećem, Ekonomski fakultet, Beograd.
Pećanac, R. (2009). Razvoj i upravljanje inovacionim procesima, Srbija Invent, Zrenjanin.
Penezić, N. (2010). Preduzetništvo – savremeni pristup, Akademska knjiga, Novi Sad.
Simonović, D, Joksić, J, Travica, J. (2019). Menadžment porodičnih preduzeća, Visoka škola strukovnih studija,
Aranđelovac.

214
XII International Symposium Engineering Management and Competitiveness 2022 (EMC 2022)
17-18th June, Zrenjanin, Serbia
THE ROLE OF THE CONCEPT OF SOCIETY 5.0 IN ACHIEVING
SUSTAINABLE DEVELOPMENT AND COMPETITIVENESS
Milica Josimović
University of Novi Sad, Technical Faculty ”Mihajlo Pupin”, Zrenjanin, Serbia
E-mail: [email protected]
Milena Cvjetković
College of Academic Studies, ”Dositej”, Belgrade, Serbia
ABSTRACT
Society 5.0 expands the concept of Industry 4.0 in order to solve social problems and create conditions for
sustainable economic development. The transition from Industry 4.0 to Society 5.0 is made possible by the
action of various technologies such as artificial intelligence, Big data, Internet of Things and understanding the
connection between cyberspace and the real world. The application of these technologies has enabled significant
changes in society. Rapid technological advances have led to global challenges facing the world, such as the
depletion of natural resources, growing economic disparities and terrorism. The concept of society 5.0 aims to
focus on man to balance the application of modern technologies to solve the problems of competitiveness,
productivity and well-being of society. The aim is to maximize the human use of current technological
transformations. The paper analyzes the aspects of society 5.0 on the creation of a sustainable economy,
primarily through adequate quality management and improving competitiveness. The aim of the research is to
analyze the concept of society 5.0 to point out the guidelines and strategies for achieving sustainable economic
development of the domestic economy and improving the business and competitiveness of its economic entities.
Keywords:: Society 5.0, technology, Sustainable development, Quality, Competitiveness.
INTRODUCTION
The company has undergone a number of changes from the beginning of the development of Industry
1.0 in Europe until the development with the 4.0 revolution and to the current concept of 5.0 society.
Together with the idea of sustainable development goals, it begins to develop a society that is
integrated with technology. Technology is becoming a necessity needed to facilitate all the activities
of modern society. The knowledge that drives all this progress brings a social order and a human
civilization that is integrated with technology. Technology as a result of thinking from knowledge
creates a new human civilization, in which people perform their activities much more efficiently and
in a shorter time.
The concept of Society 5.0 aims to address social issues from a new perspective. The aim of this law is
to establish social foundations on which everyone can develop value, at any time and place, in a safe
environment and in harmony with the natural environment, without any restrictions that currently
exist. This new concept of society aims to focus on man to balance the application of big data
technologies, the Internet of Things (IoT) and artificial intelligence with solving major social problems
such as: competitiveness, productivity, connectivity and well-being.
FROM INDUSTRY 4.0 TO THE CONCEPT OF SOCIETY 5.0
The concept of Industry 4.0 arose as a result of combining information and communication
technologies, artificial intelligence and the Internet of Things and industrial activities. Thanks to this
technological development, companies have been able to organize their business processes and

EMC 2022, 17-18th June 2022, Zrenjanin, Serbia
215
connect global or dispersed production/service lines in a more efficient, faster and cheaper way (Arıcı,
Kitapci, 2021). The fourth industrial revolution was characterized by cyber physical systems with the
main goal of fulfilling the necessary agility in the production process in order to increase the overall
efficiency and effectiveness of the entire industry (Bakator et al., 2018). The most important
advantage of Industry 4.0 for customers is that it will enable companies to focus their business on
personalized customer-oriented processes. A limited range of companies will enable the production of
mass and individually tailored product thanks to Industry 4.0 (Büchi et al., 2018).
Industry 4.0 follows Society 5.0 to some extent, but while Industry 4.0 focuses on production, Society
5.0 aims to put human beings at the center of innovation, taking advantage of 4.0 technology and
results by deepening technological integration in improving quality of life, social responsibility and
sustainability (Holroid, 2022). Society 5.0 appears as a structure that suggests that it is human-oriented
for the first time and recommends the application of industrial elements with human-centered studies
(Salimova et al., 2019). The main purpose of Society 5.0 is to achieve solutions to the challenges of
today and tomorrow by implementing digital transformation at all levels and areas of society.
(Savaneviciene et al., 2019). Society 5.0 focuses on the application of technology in continuous
development and innovation stimulated for Industry 4.0 to address the problems of humanity such as
population aging, natural disasters, social inequality, security and improving the quality of human life.
The integration of technology with society will be crucial because it is relevant to the use of drones,
artificial intelligence, big data, autonomous trucks and robotics for the benefit of humanity in the near
future (Pereira et al., 2020).
In Society 5.0, a huge amount of information from sensors in physical space accumulates in
cyberspace. In cyberspace, these big data are analyzed by artificial intelligence (AI), and the results of
the analysis are returned to people in physical space in various forms. This process brings new value to
industry and society in ways that were not possible before (Onday, 2019). In this evolution, Society
5.0 is an information society built on Society 4.0, which aims for a prosperous, people-centered
society. (Fukuyama, 2018). For the development of Industry 4.0 and Society 5.0, the open innovation
approach is extremely important. The inclusion of society as a whole, supported by the technologies
provided by Industry 4.0, provides progress towards a society 5.0 that will be a creative society, where
digital transformation is combined with imagination and creativity of different people to solve social
problems and create value. Co-creation of values can be understood as another essential mechanism of
functioning through which individuals, obviously supported by more modern technologies, contribute
to the transition to society 5.0. (Aquilani et al., 2020).
CONCEPT SOCIETY 5.0
Society 5.0 implements technological solutions, innovative organization of the social system and
modeling of locally centered activities to overcome social problems through proactive work on
liberation from various types of social constraints (Higashihara, 2018; Nakanishi, 2019). Society 5.0
defines the ideal situation according to which each country should evolve in order to take full
advantage of continuous technological transformations, which would benefit all its citizens (Serpa,
Ferreira, 2018).
Activities of interaction between people and technologies are developed, adapted and improved based
on the needs of the time through efficient management, ensuring minimal deviation (Rahmawati et al.,
2021). Society 5.0 transcends the limits of technological and organizational transformation of the
industrial system. This includes considering social and human aspects in order to achieve a sustainable
environment in this technological context (Salimova et al., 2019). Intelligent robots and systems will
influence supply chains, emphasizing that the supply chain 5.0 is a trend that will include three main
perspectives: collaborative work between humans and robots (cobots), mass customization and
personalization and super smart society (Society 5.0) (Frederico, 2020). Industry 5.0 includes two
visions: one relates to the interaction between humans and robots, and the other approaches issues
related to the bioeconomy, which is quite related to sustainability issues (Demir et al., 2019).

M. Josimović and M. Cvjetković / The role of the concept of society 5.0 in achieving...
216
Research (Zengin et al., 2021) confirms that 5.0 is becoming a mandatory practice for achieving
stability in terms of a sustainable economy due to the emergence of Industry 4.0. The main idea of the
concepts of Industry 5.0 and Society 5.0 is evolving from digital manufacturing to digital society.
Industry 5.0 and Society 5.0 have the main goal of digital technology for the development of society
(Salimova et al., 2020).
SOCIETY 5.0 AND SUSTAINABLE DEVELOPMENT
Sustainable competitiveness of enterprises can be observed as: consistency and sustainability of socio-
eco-economic aspects of economic activity of enterprises in the short and long-term, diversity of
competitive advantages of the company (positive reputation, innovative potential, efficiency of
business processes, etc.) and availability and use of departmental (or cluster) advantages, possibilities
of building innovations, niche in international specialization of work, efficient chains of added value
(Salimova et al., 2019). From an organizational point of view, Society 5.0 strives to create new
methods for the functioning of individualistic systems in which companies, universities and
governments independently seek to create a common operational concept fueled by current social
cohesion (Michna, Kmieciak, 2020). A sustainable society is involved and takes care of its present
without jeopardizing the future, organizing in such a way as to improve the quality of life and
autonomy of its citizens and to strive for general well-being. Sustainability is a holistic approach that
considers different areas, and society is an important base among them (Aquilani et al., 2020).
Society 5.0 revealed the crucial importance of technological development and innovative changing
society for creating an integrated framework of sustainable development (Shiroishi et al., 2018). The
inclusion of technology, innovation and innovation in sustainability enables the improvement of the
expansion of organizations of available sustainable solutions, the creation of infrastructure and
capacities for sustainable business and behavior and the support of the improvement of priority
sustainable areas of society 5.0. Society 5.0 implements various technological and technical solutions
and goods that enable the substitution or replacement of natural resources designed to reduce
greenhouse gas emissions, increase responsible production, reduce food loss and more (Savaget et al.,
2019).
Sustainable development goals are general goals of improvement, despite the fact that arrangements
will vary depending on the financial circumstances or social foundations of the nation or district
(today, 2019). Within the development themes, the research (Pereira et al., 2020) focuses on
digitalization (eg turning a factory into a smart factory, developing intelligent life) and connecting all
devices to the Internet, and this on data storage and analysis, based on methods that use artificial
intelligence. Digital technologies also play an essential role in the field of environmental protection.
Increasing environmental awareness and increased producer responsibility have increased the need to
develop economic, environmental and socially sustainable business strategies. Necessary to mention
the policy of the establishment of a high-tech production industry for waste processing. Replacing old
products with new and more technologically advanced ones has become a strategic added value for the
company. Individually oriented services in Society 5.0 have been proven in several areas, such as
energy, food, health care, local regional infrastructure, climate change, and disaster prevention /
reduction (Haiashi et al., 2017).
THE ROLE OF SOCIETY 5.0 IN ACHIEVING QUALITY AND COMPETITIVENESS
Social quality is an education-oriented concept that has human values at its core and aims to enable
people to have a high quality of life by benefiting from technological development at every stage of
human life and encouraging the successful implementation of technological development in society
5.0 by combining the philosophy of total quality management, industry 4.0 and society 5.0 (Arıcı,
Kitapci, 2021). In the digital economy, the competitiveness management mechanism is based, as in the
traditional concept, on the implementation of tactical and strategic goals of the company, but

EMC 2022, 17-18th June 2022, Zrenjanin, Serbia
217
achieving competitive advantages is due to factors such as: development of information and
communication technologies, development of scientific potential of employees in the organization and
maintaining a favorable image of the company (Dubnitskii, Pisarkova, 2020). The competitiveness of
companies is primarily influenced by the practice of using the advantages of the digital economy, as
well as the scope of using information economy tools (Bagautdinova, Nikulin, 2018). The high-level
of competition in the existing market compels companies to overcome new challenges in terms of best
prices / costs, quality and delivery time. The industry must be able to respond to innovation and bring
new products to market in a short time due to current competition around the world. In order to
guarantee the competitiveness of the process along the value chain, it is imperative to devise
productive, efficient and flexible methods (Pereira et al., 2020).
Economic Society 5.0 is an economic situation that focuses on the community by providing solutions
through new technologies in all industries and social activities to achieve sustainable economic
development (Higashihara, 2018). One of the initiatives to build this community must start from
business organizations as the most influential institutions of modern society (Potocan et al., 2021).
One of the accelerated economic improvements is through economic digitalization, especially small
and medium enterprises (SMEs), to achieve an economic society 5.0. Economic Society 5.0 has a
close relationship with companies and super-innovative communities (Konno, Schillaci, 2021),
emphasizing digital factors in corporate governance. Competition in digital platforms is relatively
high, so it is necessary to use technology for innovation in digital platforms. Digital innovations have
become an integral part of digital users whose use depends on their level of internet skills (Dutta,
Sarma, 2021). The company's digital innovation is measured by the ownership, excellence, uniqueness
and novelty of its digital products (Khin, Ho, 2019).
The research (Bongomin et al., 2020) covered six countries and their six initiatives were compared in
terms of their goals and focus areas of the 4.0 technology industry. Countries that were the subject of
research are Germany, the United States, China and Japan because of their exceptional economic and
technological powers, while India and Mexico were also chosen because of their unprecedented
technological leap in the 21st century. These two countries managed to ”jump” directly from Industry
2.0 to Industry 4.0. Digital Strategy 2025 and High Technology Strategy 2025 (DS & HTS 2025) are
two complementary Industry 4.0 programs recently launched. The Digital Strategy 2025 initiative was
launched in 2016 and represents central focus is on the digitalization of everything, including products
and small and medium-sized enterprises in order to achieve a competitive advantage. The goal of MIC
2025 is to comprehensively improve, consolidate and balance the Chinese manufacturing industry,
making it a global leader in innovation and manufacturing. The Make in India flagship initiative aims
to aggressively transform India into a manufacturing and technology center. With its Industry 4.0
initiatives, Mexico strives to be competitive with technologically advanced manufacturing
superpowers (UK, Germany, USA, etc.).
The subject of the research (Alvarez-Aros, Bernal-Torres, 2021) was technological competitiveness
and new technologies of Industry 4.0 and Industry 5.0 in developed and developing countries. Smart
manufacturing systems are recognized in both economies as the primary element of Industry 4.0.
However, developed economies are building and deploying more advanced and technology-oriented
and 5.0-oriented technologies, such as automation, artificial intelligence, deep learning, machine
learning, information and communication technologies, virtual reality and augmented reality. Virtual
reality and augmented reality are essential elements for the development of new industrial waves, as
they will support decision-making and environmental manipulation (Bednar, Welch 2019).
The national competitiveness of the Serbian economy is inadequate in terms of developed countries.
Domestic companies strive to fight for competitive advantage in the international market, but they are
limited by business factors such as low quality and productivity, inadequate application of modern
technologies, lack of knowledge, etc. The concept of sustainable development strives to improve the
quality of life and work of all citizens of the Republic of Serbia. Serbia is a developing country that
does not have enough financial resources for fast and efficient implementation of the sustainable
development strategy. The domain of education is one of the key factors in achieving the concept of

M. Josimović and M. Cvjetković / The role of the concept of society 5.0 in achieving...
218
sustainable development (Pejić et al., 2019). When it comes to the goals of sustainable development in
the domestic economy, it can be seen that there is a high level of unemployment, knowledge and
technologies are not applied adequately in all industries, agriculture is based on traditional technology
without applying the concept of smart technology. In addition, the poverty rate is rising, youth
unemployment is falling, but a large number of young people are leaving the country, gender equality
has improved, inadequate exploitation and water management, little progress on sustainable
industrialization and investment in technical-technological research and development, inadequate
recycling rates, improvements in partnerships with other countries on technological research and
information development (Bakator et al., 2021).
CONCLUSION
Society 5.0 models a new cyber-physical environment through the implementation of Industry 4.0 and
Industry 5.0, which improve the connections between people, things, human subjects and technologies
in an advanced cyberspace environment. The era of society has become the era of unification of
people and technology, that is, it describes the period when people and their way of thinking are
trapped between material needs and the desire for existence. Technology has become a necessity that
all people must meet. Societies 5.0 with a sustainability approach proposes to face the challenges of
modern society through sustainable digital innovation to increase the potential of individual-
technology relationships in order to promote the improvement of people's quality of life through a
super-intelligent society - society 5.0.
It can be concluded that in order to achieve the goals of this super society, humanity is redirecting
projects to progress towards the era of industrial and social progress. In order for domestic economy
and their economic entities to improve their competitiveness and sustainability, it is necessary to
implement some of the initiatives of the concept of society 5.0. First, to focus on environmental
protection through efficient use of resources and water protection, as well as protection of human life
and health through an adequate health care system. The application of advanced technologies in
companies would ensure a sustainable level of business. The business of a company should be in line
with the goals of sustainable development in order to ensure the prosperity and development of society
and the economy as a whole.
REFERENCES
Alvarez-Aros, E. L., & Bernal-Torres, C. A. (2021). Technological competitiveness and emerging technologies
in industry 4.0 and industry 5.0. Anais da Academia Brasileira de Ciências, 93.
Aquilani, B., Piccarozzi, M., Abbate, T., & Codini, A. (2020). The role of open innovation and value co-creation
in the challenging transition from industry 4.0 to society 5.0: Toward a theoretical framework.
Sustainability, 12(21), 8943.
Arıcı, T., & Kitapci, H. (2021). An investigation of the impact of the concept of society 5.0 on total quality
management: the future of human-oriented technology studies social quality. Proceedings on Engineering,
3(1), 81-92.
Bagautdinova N.G. & Nikulin R.A. (2018). Model konkurentosposobnosti organizatsii v usloviyakh
informatsionnoj ekonomiki [Model of competitiveness of an organization in the conditions of information
economy]. Biznes. Obrazovanie. Pravo. Vestnik Volgogradskogo instituta biznesa - Business. Education.
Right. Bulletin of the Volgograd Institute of Business. 3 (44), 18-25.
Bakator, M., Đorđević, D., Ćoćkalo, D., Bešić, C., & Milosavljev, D. (2021). Achieving sustainable
development through the concept of Society 5.0. XI International Conference Industrial Engineering and
Environmental Protection 2021 (IIZS 2021) October 07-08, 2021, Zrenjanin, Serbia, 265-269.
Bakator, M., Đorđević, D., Ćoćkalo, D., Nikolić, M., & Vorkapić, M. (2018). Lean startups with industry 4.0
technologies: Overcoming the challenges of youth entrepreneurship in Serbia. Journal of Engineering
Management and Competitiveness (JEMC), 8(2), 89-101.
Bednar, P. M., & Welch, C. (2020). Socio-technical perspectives on smart working: Creating meaningful and
sustainable systems. Information Systems Frontiers, 22(2), 281-298.

EMC 2022, 17-18th June 2022, Zrenjanin, Serbia
219
Bongomin, O., Nganyi, E. O., Abswaidi, M. R., Hitiyise, E., & Tumusiime, G. (2020). Sustainable and dynamic
competitiveness towards technological leadership of industry 4.0: implications for East african community.
Journal of Engineering, 1-22.
Büchi, G., Cugno, M., & Castagnoli, R. (2018). Economies of Scale and Network Economies in
Industry 4.0. Symphonya, Emerging Issues in Management, 2, 66-76.
Demir, K. A., Döven, G., & Sezen, B. (2019). Industry 5.0 and human-robot co-working. Procedia computer
science, 158, 688-695.
Dubnytskyi, V. I., & Pysarkova, V. R. (2020). The digital economy of the region in the context of conditions to
increase its competitiveness, Eјибинiчнип вiсник ДВНЗ УДХТУ, 2 (12), 22-28.
Dutta, D., & Sarma, M. K. (2020). Adoption of Digital Innovation - Formulating Adopter Categories and Levels
of Adoption in a Digital Sphere in an Emerging Economy. International Journal of Innovation and
Technology Management, 17(08), 2050059.
Frederico, G. F. (2020). Supply Chain 5.0 - The Reconciliation between Humans and Machines. Supply Chain
Management Review, 2nd ed.; Peerless Media: Framingham, MA, USA.
Fukuyama, M. (2018). Society 5.0: Aiming for a New Human-Centered Society. Japan Spotlight, 4, 47-50.
Hayashi, H., Sasajima, H., Takayanagi, Y., & Kanamaru, H. (2017, September). International standardization for
smarter society in the field of measurement, control and automation. In 2017 56th Annual Conference of
the Society of Instrument and Control Engineers of Japan (SICE) (pp. 263-266). IEEE.
Higashihara, T. (2018), A Search for Unicorns and the Building of “Society 5.0”, World Economic Forum,
Davos.
Holroyd, C. (2022). Technological innovation and building a ‘super smart’society: Japan’s vision of society 5.0.
Journal of Asian Public Policy, 15(1), 18-31.
Khin, S., Ahmad, N. H., & Ramayah, T. (2012). The integrated effect of strategic orientations on product
innovativeness: moderating role of strategic flexibility. Procedia-Social and Behavioral Sciences, 65, 743-
748.
Konno, N., & Schillaci, C. E. (2021). Intellectual capital in Society 5.0 by the lens of the knowledge creation
theory. Journal of Intellectual Capital, 22 (3), 478-505.
Michna, A., & Kmieciak, R. (2020). Open-mindedness culture, knowledge-sharing, financial performance, and
industry 4.0 in SMEs. Sustainability, 12(21), 9041.
Nakanishi, H. (2019), Modern Society Has Reached Its Limits - “Society 5.0” Will Liberate us, World Economic
Forum, Davos.
Onday, O. (2019). Japan’s society 5.0: Going beyond Industry 4.0. Business and Economics Journal, 10(2), 1-6.
Pejić, S., Radivojević, R., & Marčeta, M. (2019). Razvoj strategije obrazovanja za održivi razvoj u Srbiji. XXV
Skup Trendovi razvoja: Kvalitet visokog obrazovanja, Kopaonik, 1-4.
Pereira, A. G., Lima, T. M., & Santos, F. C. (2020). Industry 4.0 and Society 5.0: opportunities and threats.
International Journal of Recent Technology and Engineering, 8(5), 3305-3308.
Potočan, V., Mulej, M., & Nedelko, Z. (2020). Society 5.0: Balancing of Industry 4.0, economic advancement
and social problems. Kybernetes, 50 (3), 794-811.
Rahmawati, M., Ruslan, A., & Bandarsyah, D. (2021). The Era of Society 5.0 as the unification of humans and
technology: A literature review on materialism and existentialism. Jurnal Sosiologi Dialektika, 16(2), 151-
162.
Salimova, T., Guskova, N., Krakovskaya, I., & Sirota E. (2019). From Industry 4.0 to Society 5.0: Challenges
for Sustainable Competitiveness of Russian Industry. IOP Conference Series: Materials Science and
Engineering, 497, 1 -7.
Salimova, T., Vukovic, N., & Guskova, N. (2020). Towards sustainability through Industry 4.0 and Society 5.0.
International Review, (3-4), 48-54.
Savaget, P., Geissdoerfer, M., Kharrazi, A. & Evans, S. (2019), The theoretical foundations of sociotechnical
systems change for sustainability: a systematic literature review, Journal of Cleaner Production, 206, 878-892.
Savaneviciene, A., Statnicke, G., & Vaitkevicius, S. (2019). Individual Innovativeness of Different Generations
in The Context Of The Forthcoming Society 5.0 In Lithuania. Inzinerine Ekonomika-Engineering
Economics, 30(2), 211 - 222.
Serpa, S., & Ferreira, C. (2018). Society 5.0 and social development: Contributions to a discussion. J. Manag.
Organ. Stud. 2018, 5, 26–31.
Shiroishi, Y., Uchiyama, K. & Suzuki, N. (2018), Society 5.0: for human security and well-being, Computer, 51
(7), 91-95
Zengin, Y., Naktiyok, S., Kaygın, E., Kavak, O., & Topçuoğlu, E. (2021). An investigation upon industry 4.0
and society 5.0 within the context of sustainable development goals. Sustainability, 13(5), 2682.

220
XII International Symposium Engineering Management and Competitiveness 2022 (EMC 2022)
17-18th June, Zrenjanin, Serbia
PERSPECTIVES ON THE STRENGTHENING OF THE SERBIAN
EXPORT COMPETITIVENESS IN THE POST-COVID PERIOD
Elena Jovičić
Institute of Economic Sciences, Belgrade Serbia
E-mail: [email protected]
Darko Marjanović
Institute of Economic Sciences, Belgrade, Serbia
ABSTRACT
International trade plays a crucial role in fostering economic development, which is particularly important for
relatively small open economies like Serbia. Apart from faster growth, international trade enables countries to
improve productivity and provide higher income and more opportunities to domestic companies and citizens.
The Covid-19 pandemic had a tremendous negative impact on global trade development. World merchandise
trade recorded a decline of 7.4% in 2020, but it was recovering fast, achieving a pre-crisis level by the end of
2021. Serbian trade declined 3.4% in 2020, while it marked a strong recovery with a growth of 25.5%. Despite a
recovery and remarkable growth rates, a non-diversified export structure with a high presence of low value-
added products, a low level of participation in GVCs, absence of a strategic approach to export promotion
remain the main challenges Serbian trade faces. In order to enhance export competitiveness, it is necessary to
make attempts for export diversification by attracting investments in strategically important industries and
sectors. Furthermore, it is essential to develop an active and well-conceived export promotion policy based on
appropriate measures and tools to support the export activities.
Key words: Serbia, Trade, Exports, Competitiveness.
INTRODUCTION
International trade is considered one of the main drivers of economic and social development (Bakari &
Mabrouki, 2017). The results of most empirical research show that openness to international trade
encourages economic growth (Marjanović, D. & Domazet, I. 2018). Apart from faster growth, international
trade enables countries to improve productivity and provide higher income and more opportunities to
domestic companies and citizens. According to Eberhard-Ruiz and Calabrese (2018), the level of export
competitiveness is of great importance for a country’s effective participation in international trade, as well
as eventual management of balance of trade distress. Export competitiveness is the ability of a country or
firm to produce and sell goods and services in foreign markets at a price and quality that ensure long-term
viability and sustainability (Gaglio, 2015). Exports contribute to higher levels of specialization in
production, which leads to higher productivity and increased economic growth (Nguyen, 2011). As exports
grow, resources are allocated more efficiently by shifting factors to more productive export sectors. It is
considered a key indicator of the success of firms through increased export of value-added goods and
services (Atkinson, 2013). Yet, export-led economic growth is crucial for enhancing economic growth in
developing countries (Hakobyan, 2017), and it is particularly important for small or relatively small
countries (such as Serbia), which are more dependent on cooperation with foreign partners (Baranenko &
Đukić, 2012).
International trade has been rising steadily during the last decade. But the situation was dramatically altered
by the Covid-19 pandemic when world merchandise trade recorded a decline of 7.4% in 2020, which is the
most considerable annual decrease since 2009 (fell by 22%) (UNCTAD, 2021). After a sharp decline,
world trade recovered in 2021. But although total world trade has reached pre-pandemic levels, a
significant imbalance among trade partners and products remained at the end of 2021, and not all

EMC 2022, 17-18th June 2022, Zrenjanin, Serbia
221
accumulated losses from previous steep declines have been offset (OECD, 2022). There were very
heterogeneous trade impacts on specific goods, services and trade partners, that created pressure on sectors
and supply chains. Furthermore, these impacts and pressures were much more prominent than during the
global financial crisis and signified high uncertainty and adjustment costs across products, sources and
destinations.
When it comes to Serbia, the Serbian merchandise trade also declined 3.4% in 2020, while it marked a
strong recovery with a growth of 25.5% in 2021. Despite a recovery and remarkable growth rates, there are
still many challenges Serbian trade faces. In this regard, the paper aims to investigate current global trends'
impact on the development of Serbian trade flows (with a special focus on exports). Also, the paper
attempts to identify the main obstacles and challenges Serbian trade/exports face and explore perspectives
on the strengthening of Serbian export competitiveness in the following, post-covid period.
METHODOLOGY
The analysis was carried out based on data from the Republic Statistical Office of Serbia and the National
Bank of Serbia. Merchandise trade data is presented in current euros and covers the period from 2017 to
2021. The changes in the trade structure are observed in terms of SITC (Standard International Trade
Classification). The average annual growth rates for trade and exports are based on geometric mean rate
calculation.
SERBIAN TRADE FLOWS DEVELOPMENT
In the period 2017 – 2021, the total trade of Serbia has been almost steadily growing, except in 2020
(Figure 1). Compared to 2017, total trade increased by 45.8%; exports and imports grew by 43.7% and
47.5%, respectively. The average annual growth rate of exports was 10% and 11% in terms of imports. In
2021, Serbia recorded a trade deficit of 6980.5 million euros, which is almost twice as high as in 2017. The
export-import coverage ratio stayed at a relatively high level of 75.6% in 2021, but a declining trend was
recorded from 2017 to 2020. The exports to GDP ratio slightly increased from 38.4% in 2017 to 40.6% in
2021, but the ratio (40.6%) does not represent a desirable level despite the upward trend.
Figure 1: Dynamics of Serbian trade in goods, 2017-2021 Source: Authors’ compilations based on Statistical Office of the Republic of Serbia data
When it comes to the impact of the Covid-19 pandemic, the exports declined by only 2.7% year-over-year,
while the import was lower by 3.8% in 2020. Serbia's trade deficit was reduced despite a reduction in

E. Jovičić and D. Marjanović / Perspectives on the strengthening of the Serbian export...
222
external demand and a significant increase in medical products and devices imports. Within the total
exports of goods, exports of manufactured products decreased by 5.0%, primarily due to lower external
demand and disruption of global production chains. On the other hand, exports of agricultural products
after a pleasant growing season grew by 19.8%. The data shows that the Serbian trade, generally, was not
affected so severely as trade in many other countries over the world. Furthermore, in 2021, total trade
experienced a robust recovery, amounting to 50222 million euros, which is an increase of 25.5% compared
to 2020. A remarkable growth was recorded in both exports (26.8%) and imports (24.6%).
According to the analysis of the data on the trade structure in terms of SITC, the structure of Serbian
exports has not significantly changed in the last five years, except for sector 2 - Raw materials, except fuels,
which share grew more than three times compared to 2017 (Table 1). The Machinery and transport
equipment and Miscellaneous manufactured articles remain the main sections with a share of 26.7% and
22.4% in total exports of goods, followed by Food and live animals, Miscellaneous manufactured articles
and Chemicals (14.1%, 11.4% and 10.3%, respectively).
The most highly affected by Covid-19 pandemic sectors in 2020 were: Commodities and transactions, n.e.s
(decline by 17.9% compared to 2019), Mineral fuels and lubricants (-16.7%), and Manufactured goods
classified by materials (-14.3%), or, in other words, sectors that experienced reduced demand for goods
including sectors that were more integrated into the global supply chains. Nevertheless, all sectors of SITC
recorded positive growth rates in 2021, showing signs of recovery.
Table 1: The structure of the Serbian exports of goods by sectors of SITC, 2017-2021, in million euros
2017 2018 2019 2020 2021
Total exports 15050.8 16282.0 17533.4 17054.5 21620.8
0 Food and live animals 2035.5 2052.1 2304.9 2580.7 3054.4
1 Beverages and tobacco 438.3 456.2 520.5 606.2 666.3
2 Raw materials, except fuels 532.8 562.1 558.2 677.4 1423.4
3 Mineral fuels and lubricants 382.5 492.9 469.1 390.8 630.4
4 Animal and vegetable oils and fats 166.3 143.0 198.8 193.5 259.7
5 Chemicals 1390.9 1575.1 1614.3 1694.8 2230.2
6 Manufactured goods classified by materials 3553.2 4039.9 4268.8 3657.5 4838.6
7 Machinery and transport equipment 4220.8 4515.1 4979.5 4821.7 5766.7
8 Miscellaneous manufactured articles 1997.6 2091.2 2296.7 2167.2 2458.9
9 Commodities and transactions, n.e.s 332.9 354.2 322.6 264.7 292.3
Source: Authors’ compilations based on Statistical Office of the Republic of Serbia data
Regarding the main export destinations, the most important trade partners (top 10) of Serbia in 2021 were:
Germany (12.7% of total exports), Italy (8.5%), Bosnia and Herzegovina (7.2%), Romania (5.5%),
Hungary (5.0%), the Russian Federation (3.9%), China (3.8%), Montenegro (3.8%), North Macedonia
(3.8%) and Poland (3.5%). Compared to 2017, there were several changes recorded. Firstly, the share of
China and Hungary in total exports remarkably increase (from 0.2% to 3.8%, and from 3,2% to 5.0%,
respectively). Secondly, the share of Italy and the Russian Federation decreased (from 13.2% to 8.5% and
from 5.9% to 3.9%).
DISCUSSION
Due to the high value of the trade-to-GDP ratio (110% in 2020 according to WB estimations), Serbia is
recognized as an open economy. The high degree of trade openness has been followed by steady export
growth, enhanced by expanding exports supply with a gradually increasing share of knowledge-intensive
products. Namely, according to the UNECE study (2021), export-oriented manufacturing enterprises are
exhibiting increased engagement in knowledge/technology-intensive activities, with many registering high
scores on both the product complexity index (PCI), as well as the economic complexity index (ECI).
Serbia’s score, for instance, was estimated at 0.68 in 2020, placing it in the 37th position in a ranking of
127 countries.

EMC 2022, 17-18th June 2022, Zrenjanin, Serbia
223
Despite certain improvements in trade structure, as well as significant achievements in generating inclusive
trade-led growth, there are some challenges the Serbian exports still face. First of all, the substantial
problem remains the non-diversified export structure - although there were recorded some positive changes
mentioned above, trade structure is characterized by a high presence of low value-added products. Export
of knowledge-intensive products is still on an insufficient level, while exports of raw materials and lower
value-added products, such as insulated wire, steel, copper, corn, wheat, tobacco, apples, and raspberries
are growing. As Frias et al. (2019) mentioned, Serbia introduced only 47 new export goods between 2008
and 2017, and the complexity of its exports did not increase.
One of the main challenges could be considered the fact that more than half of the Serbian exports originate
from foreign-owned companies that do not use the services and products of Serbian suppliers on a
sufficient level. For instance, domestic inputs, except for labor and energy, accounted for only 9% of input
costs in 2019, while almost 30 percent of the increase in exports included the imports of goods for
processing in Serbia in order to be exported later to the country of origin – which means there are few
opportunities for overflowing positive effects and participation of local companies in global value chains
(Rabrenović, 2020).
In addition, the low level of participation of Serbian companies in GVCs, the high presence of foreign-
owned companies in the exports, the low level of investments in new technologies and the absence of a
strategic approach to export promotion should be mentioned when indicating the obstacles that could also
prevent the growth of export competitiveness.
In order to overcome the main challenges, it is essential to focus the Serbian exports policy approach on
fostering exports competitiveness, primarily by the diversification of the exports structure, which means
attracting investments in strategically important industries and sectors producing goods of higher stages of
processing and thus bringing higher added value. In this regard, it is important, among other things, to
increase investments in R&D activities.
Further improvements are necessary within trade facilitation and an overall raising openness of the
domestic economy. Hence, Serbia should continue the process of creating a better environment for
exporters, which implies improvement of domestic regulations and the institutional framework, stability
and non-discrimination of the exchange rate, sound monetary and fiscal policy, reducing the level of
corruption and development of the business climate, upgrading export-supporting services, etc. (Ignjatović,
2020). Of great importance is also the implementation of an adequate policy of export-oriented domestic
companies’ support, especially for small and medium enterprises.
When it comes to the prospects of the future development of Serbian exports, since Serbia has succeeded in
providing of adequate response to the crisis provoked by the Covid-19 pandemic, which led to the
achievement of macroeconomic stability and recovery of the main macroeconomics indicators, it could be
expected that trade, as well as exports, will continue to increase in the forthcoming period. The global trade
revival, as well as the fact that the Covid-19 situation appears to be relatively stable and on a downward
trend, also argues in favor of that assumption.
CONCLUSION
The paper’s purpose was to investigate the impact of the Covid-19 pandemic on the Serbian trade flows
and exports development. Special attention was paid tempts to identifying the main obstacles and
challenges Serbian trade/exports face and exploring perspectives on the strengthening of Serbian export
competitiveness in the following period.
According to the conducted analysis, Serbian trade was not affected as severely as trade flows in many
other countries worldwide. Furthermore, in 2021, total trade experienced a robust recovery. A remarkable
growth was recorded in both exports and imports as well. The most highly affected by Covid-19 pandemic

E. Jovičić and D. Marjanović / Perspectives on the strengthening of the Serbian export...
224
sectors in 2020 were: Commodities and transactions, n.e.s, Mineral fuels and lubricants and Manufactured
goods classified by materials, or, in other words, sectors that experienced reduced demand for goods,
including sectors that were more integrated into the global supply chains. Nevertheless, all sectors of SITC
recorded positive growth rates in 2021, showing signs of recovery.
Despite certain improvements in trade structure and significant achievements in generating inclusive trade-
led growth, there still remain challenges that could negatively impact Serbian economy competitiveness
and hinder opportunities to increase exports. The most important obstacles are defined as follows: a non-
diversified export structure with a high presence of low value-added products, a high presence of foreign-
owned companies in exports, a low level of participation in GVCs, absence of a strategic approach to
export promotion, the low level of investments, etc.
In order to enhance export competitiveness, it is necessary to make attempts for export diversification by
attracting investments in strategically important industries and sectors. Furthermore, it is essential to
develop an active and well-conceived export promotion policy based on appropriate measures and tools to
support the export activities.
ACKNOWLEDGMENT
This paper is financed by the Ministry of Education, Science and Technological Development of the
Republic of Serbia.
REFERENCES
Antončič, B., & Hisrich, R. D. (2001). Intrapreneurship: Construct refinement and cross-cultural validation. Journal of
Business Venturing, 16 (5), 495-527.
Antončič, B., Cardon, M. S., & Hisrich, R. D. (2004). Internationalizing corporate entrepreneurship: The impact on
global HR management. In Katz, J. A., & Shepherd D. A. (Eds.), Corporate Entrepreneurship: Advances in
Entrepreneurship, Firm Emergence and Growth, Vol. 7. Oxford, UK: Elsevier, JAI, 173-197.
Baranenko, E., & Đukić, M. (2012). Ways for enhancement of export activities. In Andrade, J. S., Simões, M. C.N.,
Stošić, I.,| Erić, D.,| Hanić, H. (Eds.), Managing structural changes: trends and requirements, Coimbra, Portugal:
Faculty of Economics, 520-536.
Frias, J., Shimbov, B., Davies, E., & Ek, C. (2020). Serbia’s New Growth Agenda: Increasing Exports. Country
Economic Memorandum;. World Bank, Washington, DC. © World Bank.
Hisrich, R. D., Peters, M. P., & Shepherd, D. A. (2008). Entrepreneurship. 7th ed. Boston, MA: McGraw-Hill.
Ignjatović, J., Kisin, J., & Brajković, M. (2020). Exports as a trigger of economic growth of the Republic of Serbia.
Poslovna ekonomija, 18(2), 19-37.
Marjanović, D. & Domazet, I. (2018). Improving macro competitiveness - fiscal aspects. Belgrade: Institute of
Economic Sciences.
National Bank of Serbia. Available on: https://nbs.rs/en/drugi-nivo-navigacije/statistika/
Nguyen, H.T. (2011). Exports, Imports, FDI and Economic Growth. The University of Colorado at Boulder, Working
Paper No. 11-03.
OEC database. Available on: https://oec.world/en/profile/country/srb#most-complex-products
OECD. (2022). International trade during the COVID-19 pandemic: Big shifts and uncertainty. Available on:
https://www.oecd.org/coronavirus/policy-responses/international-trade-during-the-covid-19-pandemic-big-shifts-
and-uncertainty-d1131663/
Rabrenović, J. (2020). Srpski izvoz bez Srba. Politika. Available on:
https://www.politika.rs/scc/clanak/446135/Ekonomija/Srpski-izvoz-bez-Srba
Statistical Office of the Republic of Serbia. Available on: https://www.stat.gov.rs/en-us/
UNCTAD. (2021). Global merchandise trade exceeds pre-COVID-19 level, but services recovery falls short.
Available on: https://unctad.org/news/global-merchandise-trade-exceeds-pre-covid-19-level-services-recovery-
falls-short
UNECE. (2021). Regulatory and Procedural Barriers to Trade in Serbia: Needs Assessment. Available on:
https://unece.org/sites/default/files/2021-06/ECE-TRADE-460_0.pdf
World Bank database. Available on: https://data.worldbank.org/indicator/NE.TRD.GNFS.ZS

225
XII International Symposium Engineering Management and Competitiveness 2022 (EMC 2022)
17-18th June, Zrenjanin, Serbia
THE ROLE OF INSURANCE COMPANIES IN THE SERBIAN
FINANCIAL SYSTEM
Stevan Luković
University of Kragujevac, Faculty of Economics, Serbia
E-mail: [email protected]
Miloš Pjanić
University of Novi Sad, Faculty of Economics Subotica, Serbia
Božidar Čakajac
University of Kragujevac, Faculty of Economics, Serbia
ABSTRACT
Insurance companies play an important role in the global financial system. Their importance is particularly
pronounced in market-oriented financial systems characterized by a less dominant role of commercial banks
compared to capital markets. Hence, the countries with market-oriented financial systems have the most
developed insurance markets. On the other hand, in the Republic of Serbia, due to the bank-oriented nature of the
financial system, the share of insurance companies in total financial system assets is much smaller. Also, the
Serbian insurance market remains underdeveloped both due to the low domestic population awareness of the
importance of insurance and decades-long inheritance of the financial system design in which banks were
considered the most important financial institutions. This is supported by the indicators that show the share of
insurance companies in the assets and capital of the domestic financial system, but also by other parameters,
such as the number of employees and diversification of the sales network.
Key words: Insurance companies, Financial system, Republic of Serbia.
INTRODUCTION
The insurance sector, along with the banking sector and the capital market, is a very important element
of the financial system. However, it should be noted that the position and importance of insurance in
modern financial systems varies depending on the characteristics of the financial system. Thus,
insurance companies play an important role in market-oriented financial systems in which funds are
raised primarily in capital markets rather than in the banking sector (Grbić, 2019). On the other hand,
in bank-oriented financial systems, the banking sector dominates over the capital market and insurance
sector. Looking at transition economies, including the Republic of Serbia, the common feature of their
financial systems is the dominant role of commercial banks, underdeveloped capital markets and
moderately developed insurance markets (Čakajac&Luković, 2020). The primary factor that caused
the underdevelopment of the insurance market in transition economies is related to the reform process
mostly directed towards the banking sector, while the importance of insurance and capital markets was
practically marginalized.
In accordance with the above, the paper discusses the role and importance of the insurance sector in
the Republic of Serbia. The aim of the research is to show the extent to which insurance companies are
represented in the Serbian financial system compared to banking sector and other financial institutions.
Also, the paper aims to identify the key participants in Serbian insurance sector. Given that the
presence of foreign financial institutions is common for the financial systems of small and open
economies, the paper seeks to determine the extent to which this trend is present in Serbian insurance
market.

S. Luković et al. / The role of insurance companies...
226
THE POSITION OF THE INSURANCE SECTOR IN THE FINANCIAL SYSTEM OF
SERBIA
The simple analysis of the structure of the Serbian financial system reveals its extremely bank-oriented
nature, given that commercial banks have a dominant share in the financial system both in terms of total
assets and capital (Grbić&Luković, 2020). Thus, by looking at the total assets criterion, Table 1 shows that
commercial banks have a dominant share that in most years during the observed period (2004-2020)
exceeds 90%. In the second position are insurance companies whose share in total assets is far smaller
compared to the banking sector, although since 2007 an increase in the share of insurance companies has
been evident. The share of the remaining two groups of financial institutions - leasing companies and
voluntary pension funds - is practically negligible.
Table 1: The structure of Serbian financial system (in %)
Total assets (%) Total capital (%)
Banks Insurance
companies Leasing
Voluntary
pension
funds
Banks Insurance
companies Leasing
Voluntary
pension
funds
2004 90.5 5.5 4.0 - 85.8 13.5 0.7 -
2005 88.8 5.3 5.9 - 85.8 12.7 1.5 -
2006 90.4 4.3 5.3 - 89.8 8.6 1.6 -
2007 90.2 4.1 5.5 0.2 91.5 6.9 1.6 -
2008 89.3 4.3 6.2 0.2 93.0 5.6 1.4 -
2009 90.8 4.2 4.7 0.3 92.1 6.0 1.9 -
2010 91.8 4.2 3.6 0.4 92.5 6.0 1.5 -
2011 92.4 4.4 2.8 0.4 93.0 5.6 1.4 -
2012 92.6 4.5 2.3 0.6 93.2 5.6 1.2 -
2013 92.4 4.8 2.2 0.6 93.5 5.6 0.9 -
2014 92.0 5.2 2.0 0.8 93.6 5.3 1.1 -
2015 91.5 5.8 1.8 0.9 92.1 6.7 1.2 -
2016 91.1 6.1 1.9 0.9 91.5 7.3 1.2 -
2017 90.7 6.3 2.0 1.0 91.3 7.4 1.3 -
2018 90.2 6.7 2.1 1.0 90.5 8.2 1.3 -
2019 90.1 6.6 2.3 1.0 89.7 9.1 1.2 -
2020 91.0 6.0 2.2 0.8 89.3 9.6 1.2 -
Source: National Bank of Serbia, The insurance sector in Serbia, Annual Reports for 2004-2020 period
Almost identical conclusions can be drawn when the share in total capital of the financial sector is
considered. In 2004-2014 period a decrease in the insurance sector share in total capital of the financial
system occurred. In 2004, the share of insurance companies in total capital amounted to 13.5%, while in
2014 they accounted for only 5.3%. However, since 2015, there has been a slow but continuous increase in
share in total capital, although the share of banking sector has remained far higher than of insurance
companies. The higher insurance sector share in total capital at the beginning of the observed period can be
explained by the fact that in 2004 the largest number of insurance companies (40) operated on the Serbian
insurance market, but that number decreased steadily in the rest of the observed period.
The key reasons that explain the minor position of the insurance sector in Serbian financial system are the
inherited and historical circumstances that have influenced banks to be the most important institutions in
the domestic financial system for decades. Insurance companies existed in Serbia for a long time, but they
were not merely as important as banks, and such a situation has persisted to this day. An opportunity for
changing these tendencies arose during the reform wave at the beginning of the new millennium, when the
financial sector reform was marked as necessary step in establishing a modern market economy. However,
the radical reform of the insurance market has not been implemented, although the reform processes were
necessary given the following problems that characterized the domestic insurance market (Ostojić, 2004):
Lack of the effective protection of the insured;
The problems concerning the insurance claim payment process;
Lack of trust in insurance companies;
Inadequate risk management mechanisms;
Weak portfolio diversification.

EMC 2022, 17-18th June 2022, Zrenjanin, Serbia
227
Certain changes took place in 2004 when the Law on Insurance was adopted, which transferred the powers
of supervision over insurance business to the National Bank of Serbia (Šulejić, 2005). The mentioned Law
was the first step in reforming the insurance market, since far more serious monitoring of the insurance
market was established.
By observing the 2004-2020 period, it can be seen that the number of insurance companies had been halved
in Serbia, since 40 insurance companies were engaged in domestic insurance sector in 2004, but only 20 at
the end of 2020. This was certainly influenced by much stricter control by the National Bank of Serbia with
regard to requirements of risk management procedures and the appropriate amounts of capital supporting
the assumed risks. The trend of decreasing the number of insurance companies was interrupted between
2006 and 2013, since in this period the number of insurance companies increased by 11. However, since
2014 until the end of the observed period, there has been a continuous decrease in the number of insurance
companies, mostly as a result of the takeover of smaller insurers by large companies.
The reform process undertaken in 2004 influenced the increase in public confidence in the domestic
insurance sector over time (Rohrbach, 2007). This can be concluded on the basis of the dynamics of the
total insurance premiums shown in Figure 1. Between 2004 and 2008 a continuous growth of total
insurance premiums occurred. However, this period was followed by the emergence of Global financial
crisis and the Eurozone debt crisis between 2009 and 2015 that significantly slowed down the further rise
of the Serbian insurance market. Starting from 2015, the total insurance premiums continued to increase,
with the premiums at the highest level at the end of 2020.
Figure 1. The total insurance premium in Serbia, 2004-2020 (million Serbian dinars)
Source: National Bank of Serbia, The insurance sector in the Republic of Serbia, Annual Reports for 2004-2020
period
SERBIAN INSURANCE MARKET PARTICIPANTS
According to the annual reports provided by the National Bank of Serbia, most of insurance companies in
Serbia is engaged exclusively in insurance business. On the other hand, a significantly smaller number of
insurers are engaged exclusively in reinsurance business, with an increase in the number of reinsurers from
2 in 2004 to 4 in 2020. Concerning the composition of companies dealing exclusively with insurance, it can
be pointed out that the number of insurance companies that deal exclusively with life insurance decreased
from 6 in 2004 to 4 in 2020. The number of non-life insurance companies also decreased from 16 in 2004
to only 6 in 2020.
In the period from 2007 to 2017, the largest number of insurance companies was engaged exclusively in
non-life insurance, while in 2018-2020 period their number equaled the number of companies that jointly
conduct the life and non-life insurance business. Although in 2004 the non-life insurance companies and
companies that jointly conduct life and non-life insurance where prevalent compared to life insurance
companies, in the successive years the diversification of insurance sector has occurred that resulted in life
and non-life insurance being represented more evenly. This issue has had a positive impact on the
development of domestic insurance market and greater availability of insurance products.

S. Luković et al. / The role of insurance companies...
228
0
10
20
30
40
50
Domestic ownership Foreign ownership
Figure 2. The ownership structure of insurance companies
Source: National Bank of Serbia, The insurance sector in the Republic of Serbia, Annual Reports for 2004-
2020 period
When the ownership structure of insurance companies is taken into account, the reform process in the
insurance market has made the domestic insurance market far more accessible to foreign insurance
companies than was previously the case. As is the case with the banking sector, the arrival of foreign
companies in the insurance sector should improve the quality of the insurance product offer, encourage
competition and enable the introduction of new insurance products and greater satisfaction of insurance
clients (Stojaković, 2017). In case of Serbia, this was reflected in the ownership structure that changed
compared to the beginning of the observed period, which can be seen in Figure 2. In 2004-2006 period the
domestic insurance market was mostly represented by domestic-owned insurance companies, regardless of
whether they were state-owned or privately-owned companies. However, from 2007 to 2020, there was a
change in the ownership structure in favor of foreign insurers. In 2020, 75% of insurance companies were
foreign-owned, while only 25% were domestically-owned. The further analysis of foreign-owned insurance
companies in 2020 shows that these companies are originating from Austria (25%) and Slovenia (15%),
while only a few insurance companies come from Italy, Croatia, Russia, Hungary, the Netherlands, the
Czech Republic and Ireland.
LARGEST INSURANCE COMPANIES IN SERBIA
As reported in Table 2, the largest insurance company in 2019-2020 period was Dunav Insurance which
managed to further increase its share in total premiums in 2020 compared to 2019. The second place was
held by Generali Insurance, and these two companies are the only ones that had more than 20% share in the
total premium. It should be noted that in 2020 Generali Insurance recorded a decrease in share compared to
2019. In third place was the Austrian insurance company Wiener, which improved its ranking compared to
2019, when it occupied the fourth position. The fourth position in 2020 belonged to DDOR Insurance,
which recorded a worse rank by one position than in 2019 due to the fact that the company achieved a
slower increase in insurance premiums compared to Wiener. Finally, the fifth position was held by Triglav
Insurance, which in both observed years had almost identical share in total premium.
Table 2. Five largest insurance companies in Serbia, 2019-2020
Insurance company
2019 2020
Share in total gross
premiums (%) Rank
Share in total gross
premiums (%) Rank
Dunav 26.4 1 27.0 1
Generali 21.5 2 20.1 2
Wiener 11.7 4 12.1 3
DDOR 11.8 3 11.9 4
Triglav 6.4 5 6.5 5
Source: National Bank of Serbia, The insurance sector in the Republic of Serbia, Annual Reports for 2019-2020
period
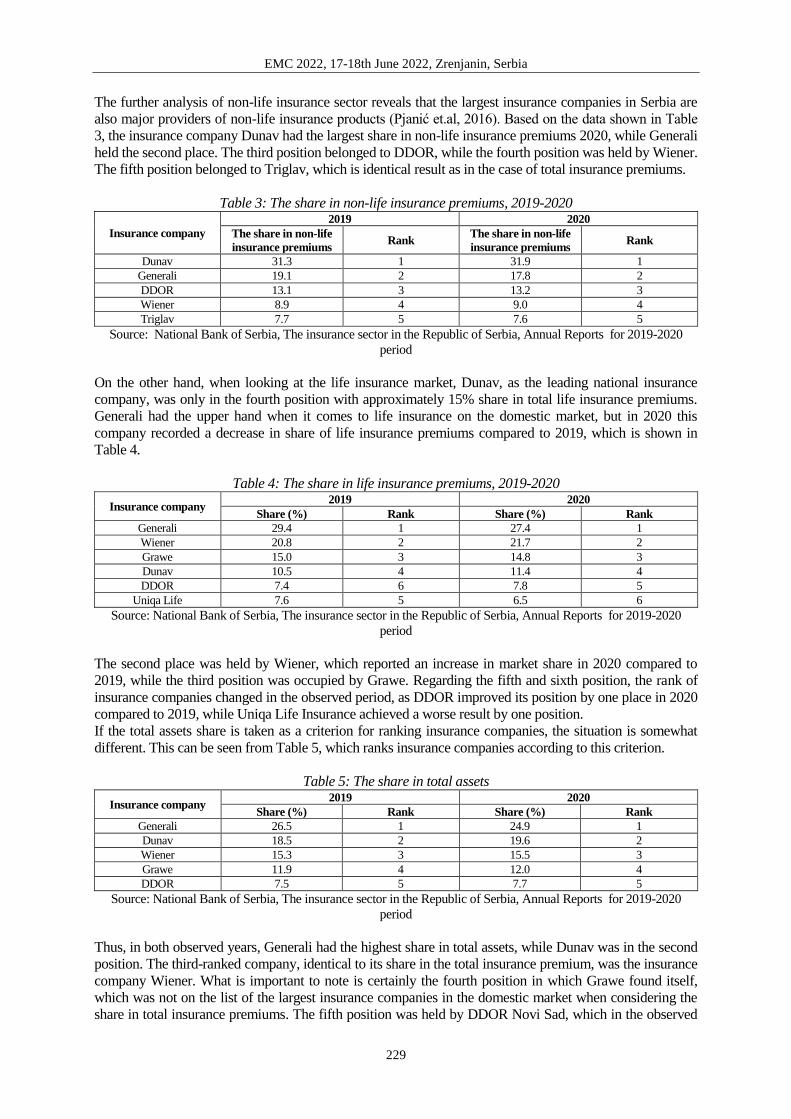
EMC 2022, 17-18th June 2022, Zrenjanin, Serbia
229
The further analysis of non-life insurance sector reveals that the largest insurance companies in Serbia are
also major providers of non-life insurance products (Pjanić et.al, 2016). Based on the data shown in Table
3, the insurance company Dunav had the largest share in non-life insurance premiums 2020, while Generali
held the second place. The third position belonged to DDOR, while the fourth position was held by Wiener.
The fifth position belonged to Triglav, which is identical result as in the case of total insurance premiums.
Table 3: The share in non-life insurance premiums, 2019-2020
Insurance company
2019 2020
The share in non-life
insurance premiums Rank
The share in non-life
insurance premiums Rank
Dunav 31.3 1 31.9 1
Generali 19.1 2 17.8 2
DDOR 13.1 3 13.2 3
Wiener 8.9 4 9.0 4
Triglav 7.7 5 7.6 5
Source: National Bank of Serbia, The insurance sector in the Republic of Serbia, Annual Reports for 2019-2020
period
On the other hand, when looking at the life insurance market, Dunav, as the leading national insurance
company, was only in the fourth position with approximately 15% share in total life insurance premiums.
Generali had the upper hand when it comes to life insurance on the domestic market, but in 2020 this
company recorded a decrease in share of life insurance premiums compared to 2019, which is shown in
Table 4.
Table 4: The share in life insurance premiums, 2019-2020
Insurance company 2019 2020
Share (%) Rank Share (%) Rank
Generali 29.4 1 27.4 1
Wiener 20.8 2 21.7 2
Grawe 15.0 3 14.8 3
Dunav 10.5 4 11.4 4
DDOR 7.4 6 7.8 5
Uniqa Life 7.6 5 6.5 6
Source: National Bank of Serbia, The insurance sector in the Republic of Serbia, Annual Reports for 2019-2020
period
The second place was held by Wiener, which reported an increase in market share in 2020 compared to
2019, while the third position was occupied by Grawe. Regarding the fifth and sixth position, the rank of
insurance companies changed in the observed period, as DDOR improved its position by one place in 2020
compared to 2019, while Uniqa Life Insurance achieved a worse result by one position.
If the total assets share is taken as a criterion for ranking insurance companies, the situation is somewhat
different. This can be seen from Table 5, which ranks insurance companies according to this criterion.
Table 5: The share in total assets
Insurance company 2019 2020
Share (%) Rank Share (%) Rank
Generali 26.5 1 24.9 1
Dunav 18.5 2 19.6 2
Wiener 15.3 3 15.5 3
Grawe 11.9 4 12.0 4
DDOR 7.5 5 7.7 5
Source: National Bank of Serbia, The insurance sector in the Republic of Serbia, Annual Reports for 2019-2020
period
Thus, in both observed years, Generali had the highest share in total assets, while Dunav was in the second
position. The third-ranked company, identical to its share in the total insurance premium, was the insurance
company Wiener. What is important to note is certainly the fourth position in which Grawe found itself,
which was not on the list of the largest insurance companies in the domestic market when considering the
share in total insurance premiums. The fifth position was held by DDOR Novi Sad, which in the observed

S. Luković et al. / The role of insurance companies...
230
period did not record significant changes in total assets’ share. At last, the sum of individual shares in total
assets shows that in 2020 top five insurance companies represented almost 80% of the entire Serbian
insurance sector.
CONCLUSION
According to the aforementioned, it can be stated that the position of insurance companies in the Serbian
financial system is largely marginalized. It should be noted that a significant improvement has been
achieved compared to the beginning of the new millennium, which has led to the insurance sector receiving
far more attention than was previously the case. The share of insurance companies in total capital and assets
of domestic financial sector between 2004 and 2020 did not exceed the double-digit percentage, which
unambiguously indicates the dominant position of banks, but also the low level of development of the
domestic financial system. As in the case of the banking sector, the insurance sector is dominated by
foreign-owned companies, as a result of the insurance market reform which has significantly facilitated
access to the domestic market for foreign insurers.
In the period from 2004 to 2020, the largest number of insurance companies was engaged exclusively in
non-life insurance business, and recently the number of insurance companies engaged in life insurance
business has increased. This is very important as disparities in the structure of the insurance product
provision are reduced, given that non-life insurance products still make up the dominant share of the range
of available insurance products.
With regard to leading insurance companies on the market, it can be concluded that among the five leading
insurance companies, four are foreign-owned, while the best listed domestic insurance company is Dunav
Insurance. This company primarily deals with the non-life insurance, thanks to which it has the largest
share in the insurance premiums. On the other hand, when the total insurance sector’ assets share is taken
into account, the leading position is held by Generali, whose market position is mainly supported by the life
insurance products.
REFERENCES
Čakajac, B., & Luković S. (2020). The comparative analysis of the insurance sectors in developed countries and
developing countries. The 25th Science Conference Regional development and demographic trends in the
Southeast Europe. Faculty of Economics, University of Niš, 635-643
Grbić, M. (2019). Theoretical and methodological aspects of the interdependence between the financial system
development and the economic growth. Faculty of Economics, University of Kragujevac
Grbić M., & Luković, S. (2020). Relationship between banks’ credit activity and economic growth: An empirical
research for the Republic of Serbia. Industry, 48 (2), 37-53
National Bank of Serbia (2019). The Insurance Sector in the Republic of Serbia - Report for 2019, available at
https://nbs.rs/export/sites/NBS_site/documents/osiguranje/izvestaji/izv_IV_2019.pdf
National Bank of Serbia (2020). The Insurance Sector in the Republic of Serbia - Report for 2020, available at
https://www.nbs.rs/export/sites/NBS_site/documents/osiguranje/izvestaji/izv_IV_2020.pdf
Ostojić, S. (2004). The importance of the insurance sector restructuring in Serbia. Economic Development, 47(1-2),
77-98
Pjanić M., Kalaš B., & Vasić N. (2016). The analysis of life insurance market in Serbia and countries in the region,
The Annals of the Faculty of Economics in Subotica, 52(36), 145-160
Rohrbach, W. (2007). Reorganization and prospective of Serbian insurance market. European Insurance Law Review,
3-2007, 675-702
Stojaković, A. (2017). Insurance industry in selected transition countries. The European Journal of Applied
Economics, 14(1), 32-47
Šulejić, P. (2005). The management in insurance companies according to the new regulations. Law and Economy,
42(5-8), 587-595

231
XII International Symposium Engineering Management and Competitiveness 2022 (EMC 2022)
17-18th June, Zrenjanin, Serbia
IMPACT OF THE COVID-19 PANDEMIC ON FOREIGN DIRECT
INVESTMENT
Darko Marjanović
Institute of Economic Sciences, Belgrade, Serbia
E-mail: [email protected]
Ivana Domazet
Institute of Economic Sciences, Belgrade, Serbia
Elena Jovičić
Institute of Economic Sciences, Belgrade, Serbia
ABSTRACT
Foreign direct investment is an important instrument in the economic growth and development of each national
economy. At the same time, they are considered one of the key elements of the globalization process, as they
significantly affect the mobility of production factors and world trade flows. Decisions on location choice and
form of investment can be made by foreign investors depending on the political and economic situation in the
country or the development and stability of specific sectors. The main goal of this paper is to determine whether
the crisis caused by the COVID-19 virus has affected FDI mobility. That is, whether in 2020, as the first year of
the pandemic, compared to the previous period (2018-2019), there were significant changes in FDI flows. The
period covered by the research is from 2018 to 2020. The methodology applied in this research is based on a
quantitative approach using available secondary data from the UNCTAD database. The results show that the
crisis caused by the COVID-19 virus contributed to a significant reduction in the fluctuation of capital.
Specifically, total FDI decreased by about 35% in 2020 compared to 2019, which indicates the negative impact
of the COVID-19 crisis on FDI flows.
Key words: Foreign direct investment, Competitiveness, COVID-19, Crisis.
INTRODUCTION
For a country to be able to attract foreign capital, it must first provide a favorable investment climate.
Therefore, it is very important that there are stable business conditions, political and social stability,
favorable foreign trade, customs, foreign exchange treatment of joint ventures, available, reliable,
trained workforce, and access to raw materials and other domestic sources of supply. Foreign
companies usually have better operational solutions that can transfer to the domestic economy. These
are most often large companies that often employ domestic suppliers and provide technical assistance,
education and information needed to improve the quality of their products. Thus, they can benefit not
only from increased revenue but also from increased production efficiency. On the other hand, by
creating a good investment climate for foreign investors, the state creates additional opportunities for
domestic companies and the development of new ideas. The positive impact of foreign direct
investment is most pronounced in industry, service development, trade, and the transfer of new
technologies. Industries of developing countries in which foreign capital has entered usually achieve
good business results and stimulate the country's overall economic recovery (Marjanović & Domazet,
2021a). With the greater globalization of economic activities and the fluctuation of foreign capital,
labor and services, countries have begun to "compete" with each other, which will attract as many
economic entities as possible to its territory, and thus investments.
The effects of potential foreign investment on the economy are mostly positive, and the key evidence
lies in their dynamic growth in recent decades. Until the beginning of 2020, we witnessed the success
of some countries in Southeast Europe, which with relatively high inflows of foreign direct
investment, experienced equally high export growth rates and attracted a significant number of large

D. Marjanović et al. / Impact of the COVID-19 pandemic on foreign direct investment
232
projects of multinational companies, especially in the automotive industry. Countries that are
competitive and provide foreign investors with an attractive investment environment have had
significant economic growth in the last 20 years. However, all that has changed in the last two years
due to the consequences of the COVID-19 pandemic.
LITERATURE REVIEW
Nowadays, foreign investments are a necessity and a need for most countries. This is one of the
reasons why countries are trying to be more competitive to attract new investments. One of the most
efficient ways to increase the country's comparative advantages is foreign direct investment
(Marjanović & Domazet, 2021a; Fang et al., 2021). Foreign investment is one of the success factors of
the national economy in the global market. Also, attracting foreign investment is necessary for most
countries for stable growth (Marjanović & Domazet, 2018). Most developing countries are largely
dependent on foreign direct investment and short-term external financing (Mehar, 2021). On the other
hand, multinational companies strive to consider all aspects of potential investment and make timely
decisions. In making investment decisions, foreign companies usually first take into account the
country's economic position (Marjanović et al., 2022; Sharma, 2021). The foreign company chooses
the location for investment based on the size of the country but also the potential risk that may
adversely affect the company's operations (Garcia et al., 2013). If the level of competitiveness of a
country is at a high level, a significant inflow of FDI can be expected, which to some extent may
affect its economic growth and development (Marjanović & Domazet, 2021). According to Giofre
(2021), portfolio investments react much faster to the interventions of the Government of one country,
which in the future may be important to minimize the negative effects produced by the COVID-19
pandemic.
The COVID-19 pandemic has led to a global economic, trade, and investment crisis (Handoyo, 2020).
It also caused great damage to the world economy, as it led to the closure of borders between
countries, which affected the economic activities of most countries. The negative trend was
particularly present in FDI inflows, rising unemployment, and declining foreign trade between
countries (Petrovskaya et al., 2022). Using bilateral FDI flows from 173 home countries and 192 host
countries, Hajakawa et al. (2022) measured the severity of the damage caused by COVID-19. Based
on the analysis, they concluded that the COVID-19 pandemic in the host country had a negative
impact on FDI in the manufacturing sector, while in the home countries, the impact on FDI was
insignificant. On the other hand, in the services sector, the COVID-19 pandemic had a negative impact
on FDI in both groups of countries, which was particularly pronounced in greenfield FDI.
DATA ANALYSIS AND FINDINGS
With the appearance of the COVID-19 virus, there was a significant increase in competition between
the countries of a certain region, all aiming to create opportunities and thus provide additional inflows
of foreign investment. This form of competition usually occurs between neighboring countries, with
significant tax reforms in terms of the competitiveness of tax systems. It is extremely important for
each country to be more competitive than the country in the immediate vicinity, which should
contribute to a greater inflow of foreign investment. This is especially important during the global
crisis when the fluctuation of free capital on the world market has significantly decreased.
The main feature of foreign direct investment is that it can significantly contribute to economic growth
and development of a national economy. Therefore, one of the goals of each country is to provide a
sufficient inflow of foreign direct investment. Until the advent of the COVID-19 virus, foreign direct
investment had a growing trend globally. However, at the beginning of 2020, with the appearance of
the COVID-19 virus, there was a reduction in the fluctuation of free capital on the world market. The
main goal of this paper was to determine whether the emerging crisis caused by the COVID-19 virus
affected the mobility of foreign direct investment. In order to obtain adequate answers and draw

EMC 2022, 17-18th June 2022, Zrenjanin, Serbia
233
certain conclusions, it was necessary to perform an analysis of FDI inflows in the two short-term
observed periods. That is, to determine the fluctuation of FDI in the first year of the pandemic (2020)
compared to the period before the pandemic (2018-2019). The period covered by this analysis was
from 2018 to 2020. An appropriate methodology based on a quantitative approach was applied, while
secondary data from the international UNCTAD database were used in the analysis.
In the first part of this paper, performed an analysis of FDI mobility at the global level. Table 1 shows
the total amount of foreign direct in countries categorized according to their economic development
(developed economies, developing economies, and transition economies) from 2018 to 2020.
Table 1: FDI inflows (millions of dollars) 2018 2019 2020
Developed economies 707,649 748,999 312,170
Developing economies 692,480 723,385 662,562
Transition economies 36,604 57,844 24,160
World total 1,436,732 1,530,228 998,891
Source: authors, based on the UNCTAD data
Based on the presented data, the inflow of foreign direct investments in 2018 and 2019 amounted to
about $ 700 billion, in both developed and developing countries. In the given period, countries in
transition lagged significantly behind these countries regarding FDI inflows. However, compared to
2018, during 2019, FDI in these countries increased by about 58%. These countries have realized that
creating an adequate investment climate that will favor FDI is necessary. That is a period when
countries in transition were largely trying to adapt their markets to the demands of foreign investors.
However, the COVID-19 pandemic has significantly affected FDI fluctuations globally. If we compare
the inflow of FDI in the year before the pandemic and the first year of the COVID-19 pandemic, the
situation is as follows:
a. the total amount of FDI in 2019 was $ 1,530 billion, while in 2020, the amount was $ 998 billion,
which is a reduction of FDI by about 35%;
b. the total amount of FDI in developed countries in 2019 was $ 749 billion, while in 2020, this
amount was $ 312 billion, which is a decrease in FDI by about 58%;
c. the total amount of FDI in developing countries in 2019 was $ 723 billion, while in 2020, this
amount was $ 662 billion, which is a decrease in FDI by about 8%;
d. the total amount of FDI in transition countries in 2019 was $ 58 billion, while in 2020, this
amount was $ 24 billion, which is a decrease in FDI by about 59%.
Figure 1: FDI inflows, 2018-2020 (millions of dollars)
Source: authors, based on the UNCTAD data
Based on all of the above, it can be concluded that the consequences of the COVID-19 pandemic
decreased by 35% at the global level. Countries in transition and developed countries are the most

D. Marjanović et al. / Impact of the COVID-19 pandemic on foreign direct investment
234
affected, given that in the first year of the pandemic, there was a decrease in FDI in these countries by
59% and 58%, respectively. The pandemic affected developing countries the least, as FDI inflows in
these countries, fell by only 8%.
In the second part of this paper, an analysis of the mobility of foreign direct investment in European
Union countries from 2018 to 2020. Data on FDI inflows to EU countries are shown in Table 2.
Table 2: FDI inflows in EU countries (millions of dollars)
2018 2019 2020
Austria 5,287 968 - 17,340
Belgium 30,821 2,886 8,437
Bulgaria 1,143 1,717 2,426
Croatia 1,171 1,336 1,304
Cyprus - 1,735 26,183 - 3,647
Czech Republic 11,010 10,108 6,293
Denmark 1,198 3,587 1,151
Estonia 1,498 3,091 3,156
Finland - 2,171 13,612 2,575
France 38,185 33,965 17,932
Germany 62,073 54,063 35,651
Greece 3,973 5,019 3,572
Hungary 6,410 3,884 4,169
Ireland - 16,096 81,104 33,424
Italy 37,682 18,146 - 388
Latvia 967 874 873
Lithuania 977 1,169 479
Luxembourg - 16,757 14,792 62,145
Malta 4,024 3,784 3,917
Netherlands 87,671 48,963 - 115,300
Poland 15,996 10,853 10,080
Portugal 7,115 12,084 6,324
Romania 6,219 5,791 2,322
Slovakia 1,675 2,449 - 1,930
Slovenia 1,384 1,227 529
Spain 53,495 8,515 8,928
Sweden 4,221 10,112 26,109
EU Total 347,437 380,281 103,190
Source: authors, based on the UNCTAD data
Looking at the total inflow of foreign direct investments at the level of the European Union (Table 2)
in 2018, it was over $ 347 billion. In the following year, FDI increased by 9% ($ 380 billion).
However, in the first year of the COVID-19 pandemic, there was a drastic reduction in FDI inflows to
EU countries, which was reflected in a 73% drop in these investments compared to 2019.
Some EU countries were in a situation of reduced FDI inflows even before the global crisis caused by
the COVID-19 virus. At the very beginning of the analysis, comparing the inflow of FDI in 2018
compared to 2019, it is clear that more than half of the EU countries have encountered the problem of
reduced FDI inflow. The COVID-19 virus has further caused reduced FDI intensity and fluctuation in
EU countries. If we talk about the decline in FDI in 2020, the negative record is held by the
Netherlands, followed by Austria, Cyprus, Italy, and Slovakia.
However, it is also worth noting that some EU countries attracted more FDI in 2020 compared to the
year before the pandemic. Observing individually by country, the largest recipient of FDI during 2020
was Luxembourg, with over $ 62 billion (an increase of 320% compared to 2019). Sweden also had a
higher inflow of FDI in 2020 with $ 26 billion (an increase of 158% compared to 2019). In addition to

EMC 2022, 17-18th June 2022, Zrenjanin, Serbia
235
these two countries, only Spain, Malta, Hungary, and Estonia can boast a small increase in FDI in the
first year of the COVID-19 pandemic compared to the previous year.
Perhaps it is even more important to determine how much foreign direct investment the EU countries
have managed to attract in the observed period concerning the overall fluctuation of these investments
at the global level.
Figure 2: Total FDI inflows, 2018-2020 (millions of dollars)
Source: authors, based on the UNCTAD data
According to official UNCTAD data, comparing total FDI at the global level and FDI at EU level, the
situation is as follows: (a) in 2018, EU countries attracted 24% of total world investment, (b) in 2019,
EU countries attracted 25% total world investment and (c) in 2020, EU countries attracted 10% of
total world investment.
Based on the above, it is more than clear that the global crisis caused by the COVID-19 virus has
greatly affected FDI mobility. Most countries in the European Union are particularly noteworthy in
decline in foreign direct investment. The situation is no better in other regions of the world. The trend
of decreasing FDI fluctuations continued in 2021, and it is expected that in 2022 the world market will
stabilize and recover from the consequences caused by the COVID-19 virus.
CONCLUSION
Foreign direct investment has a very significant impact on the economic growth and development of
each national economy. On the one hand, they increase the efficiency of multinational companies,
while on the other hand, they significantly help the development of that economy. If competition
increases, companies will seek to invest in other countries, which automatically means that
investments are based on efficiency. In contrast, the growth of FDI will significantly increase the
competitiveness of companies.
In a situation when the COVID-19 pandemic has significantly slowed down the flow of free capital on
the world market, foreign investors are taking special care of their investment. When the world
economy is in crisis, investors usually invest capital in countries with economic growth, pursue a
stable macroeconomic policy, and have a stable political situation. However, the consequence of the
economic and social crisis caused by the COVID-19 virus contributed to the decline in aggregate
demand, which was accompanied by a decline in investment, both domestic and foreign.
Developed countries and countries in transition most felt the lack of foreign direct investment. This
situation is very unfavorable for many economies, given that FDI has been significantly represented in
a large number of economies in recent years. In order to deal with the global crisis and the lack of FDI
in the most efficient way, countries need to pursue a rational economic policy, ensure a good fiscal
D. Marjanović et al. / Impact of the COVID-19 pandemic on foreign direct investment
236
position and create an economic environment that will allow foreign investors to invest in one of these
economies. It is very important to create a support program to attract foreign investment in targeted
sectors, which will be created as a response to the economic challenges facing countries, which are the
result of the COVID-19 pandemic.
ACKNOWLEDGEMENTS
This paper is financed by the Ministry of Education, Science, and Technological Development of the
Republic of Serbia.
REFERENCES
Fang, J., Collins, A., & Yao, S. (2021). On the global COVID-19 pandemic and China’s FDI. Journal of Asian
Economics, 74. https://doi.org/10.1016/j.asieco.2021.101300
Garcia, F., Jin, B., & Salomon, R. (2013). Does inward foreign direct investment improve the innovative
performance of local firms? Research Policy, 42, 231–244.
Giofre, M. (2021). COVID-19 stringency measures and foreign investment: An early assessment. The North
American Journal of Economics and Finance, 58. https://doi.org/10.1016/j.najef.2021.101536
Hajakawa, K., Lee, H.H., Park, C.Y. (2022). The Effect of COVID-19 on Foreign Direct Investment. Asian
Development Bank Economics Working Paper Series No. 653. https://doi.org/10.2139/ssrn.4060417
Handoyo, R.D. (2020). Editorial: Impact of Covid-19 on Trade, FDI, Real Exchange Rate and Era of
Digitalization: Brief Review Global Economy During Pandemic. Journal of Developing Economies, 5 (2),
84-88.
Marjanović, D., Domazet, I., & Vukmirović, I. (2022). Social Environment as a Factor of Capital Investment in
Serbia. Eastern European Economics. https://doi.org/10.1080/00128775.2022.2048181
Marjanović, D., & Domazet, I. (2021). Tax competitiveness as a significant factor in attracting foreign
investment – the case of Serbia. Argumenta oeconomica, 2 (47), 63-80.
https://doi.org/10.15611/aoe.2021.2.04
Marjanović, D., & Domazet, I. (2021). Foreign Direct Investments: A Key Factor for Business Globalization. In
Institutional, Economic, and Social Impacts of Globalization and Liberalization, edited by Yilmaz Bayar,
96-116. Hershey: IGI Global.
Marjanović, D., & Domazet, I. (2018). Unapređenje makro konkurentnosti – fiskalni aspekti [Improving macro
competitiveness - fiscal aspects]. Belgrade, Serbia: Institute of Economic Sciences.
Mehar, M.A.K. (2021). Bridge financing during covid-19 pandemics: Nexus of FDI, external borrowing and
fiscal policy. Transnational Corporations Review, 13, 109-124.
Petrovskaya, M.V., Chaplyuk, V.Z., Alam, R.M.K., Hossain, M.N. & Al Humssi, A.S. (2022), COVID-19 and
Global Economic Outlook. In: Popkova, E.G. & Andronova, I.V. (Ed.) Current Problems of the World
Economy and International Trade (Research in Economic Anthropology, Vol. 42), Emerald Publishing
Limited, Bingley, 127-139. https://doi.org/10.1108/S0190-128120220000042013
Sharma, B. (2021). Covid-19 and recalibration of FDI regimes: convergence or divergence? Transnational
Corporations Review, 13(1), 62-73. https://doi.org/10.1080/19186444.2021.1890433

237
XII International Symposium Engineering Management and Competitiveness 2022 (EMC 2022)
17-18th June, Zrenjanin, Serbia
CLIENT LOYALTY IN BANKING SECTOR
Nikola Milicevic
University of Novi Sad, Faculty of Economics in Subotica, Republic of Serbia
E-mail: [email protected]
Nenad Djokic
University of Novi Sad, Faculty of Economics in Subotica, Republic of Serbia
Ines Djokic
University of Novi Sad, Faculty of Economics in Subotica, Republic of Serbia
ABSTRACT
In the last few decades, significant changes have occurred on B2C market. The increased competition, especially
in the service sector, emphasized the importance of relationship marketing. Through the establishment of long-
term relations, companies are trying to create and improve clients’ loyalty. For this purpose, different strategies
and approaches have been used, including certain technological solutions. Bearing in mind that higher levels of
loyalty can be related with higher levels of revenue and profit, this theme did not bypass banking sector neither.
In this paper, the attention was dedicated to clients’ loyalty in banking sector. After presenting some
explanations related to loyalty concept, in the second part of the paper the focus was on its models and other
specifics associated to mentioned sector.
Key words: Loyalty, Banking sector, Client’s needs.
INTRODUCTION
Under the influence of technological development, clients (customers) are much more informed,
whereby, in some cases, they are able to analyze offers of different companies with just a few clicks.
Demanding customers, on one side, and increasingly intense competition, on the other, make the
struggle for market share more difficult, posing numerous challenges to companies; most of them are
related to satisfying customers’ needs in a more efficient way than competitors.
These issues didn’t bypass the banking sector neither. As in other industries, banks are trying to
establish long-term relationships with their clients. Through the development of lasting, long-term
bonds, they are establishing trust, commitment and loyalty (Levy, 2014). Bearing in mind that the
implementation of loyalty concept can generate larger market share and profit, in this paper the
attention is dedicated to its explanation, taking into account different aspects. In addition, several
models related to loyalty in banking sector are presented as well.
LOYALTY CONCEPT
In literature there are different explanations regarding loyalty. In the research of Yi and Jeon (2003),
“loyalty is defined as repeated purchases of particular products or services during a certain period of
time” (p. 231). Hereby, five different behavior types can be measured in order to operationalize
loyalty; besides the number of purchases per customer, they include the percentage of customers who
(Yi and Jeon, 2003):
− buy a brand,
− continue to buy the brand,
− are 100% loyal,
− also buy other brands.

N. Milicevic et al. / Client loyalty in banking sector
238
In addition to behavioral, for measuring loyalty, two more approaches (attitudinal and composite
measurements) can be applied (Bowen and Chen, 2001, pp. 213-214). As previously mentioned,
behavioral approach is related to customers repurchase behavior, which represents its main indicator.
The problem lies in a fact that repeat purchase doesn’t always stem from psychological commitment;
in the absence of a proper competitor, the reason for re-choosing a particular product or service may
be its current low price or a convenient location. The second, attitudinal approach is based on
measurements associated to customer’s psychological and emotional attachment as a characteristic of
loyalty. However, the application of this approach faces certain issues as well; in some situations,
customers can have positive attitude regarding a product or a service, whereby she/he will not buy the
product/service because, for example, it can be too expensive for her/him. The third, composite
approach combines behavioral and attitudinal dimensions, where “loyal customers are customers who
hold favorable attitudes toward the company, commit to repurchase the product/service, and
recommend the product to others” (Bowen and Chen, 2001, p. 214).
Loyalty can be considered in the context of business strategy; the focus is on creating stronger, long-
term relationships with customers (Duffy, 1998). Through the implementation of this strategy,
customers are becoming more proactive, whereby in certain point of time some of them will even
advocate the brand (Figure 1).
Figure 1: The loyalty hierarchy (Duffy, 1998, p. 439)
Bearing in mind its influence on company’s sale and profitability, loyalty represents very important
factor concerning market survival and sustainable business; due to deregulations that allowed
customers more flexible approach when choosing financial services, the importance of loyalty has
increased in this sector as well (Al-hawari, 2015).
LOYALTY IN BANKING SECTOR
In the last few decades significant changes have occurred in banking industry. Dynamic and
competitive environment, followed by informed clients and decreasing differences in offers of
financial products and services, resulted in certain business transformations; banks are changing their
emphasis, turning from product-oriented to customer-oriented companies by adopting the main
principles of relational marketing and focusing on customer loyalty (Beerli et al. 2004). Bearing in
mind these changes and the importance of client loyalty, many researchers have investigated this
concept in banking sector.
Bloemer et al. (1998) examined loyalty in retail banking taking into account perceived service quality,
satisfaction and image. At the global (construct) level, their results have shown that image and service
quality were indirectly related to bank loyalty via perceived quality and satisfaction, respectively.
Moreover, bank loyalty was directly affected by service quality and satisfaction (Figure 2). In addition
to a global level, the analysis was carried out at the level of construct dimensions, whereby position in
the market, as an image dimension, and reliability, as a quality dimension, were detected as relatively
important drivers of loyalty in retail banking.
Customer
Collaborator
Advocate

EMC 2022, 17-18th June 2022, Zrenjanin, Serbia
239
Figure 2: Retail bank loyalty (Bloemer et al. 1998, p. 281)
In the research of Beerli et al. (2004), banking loyalty was investigated in relation to satisfaction and
switching costs. Both variables (satisfaction and switching costs) affected loyalty, whereby the
influence of the former was greater. Besides mentioned variables, proposed model included perceived
quality (Figure 3). The obtained results revealed that this construct was significantly affected by
satisfaction; the explanation for this direction of the relationship potentially lies in the perception of
satisfaction construct as “an evaluative judgment of the value received by the customer” (Beerli et al.
2004, p. 269).
Figure 3: Model of customer loyalty (Beerli et al. 2004, p. 265)
Ladhari et al. (2011) set the model which included loyalty, recommendation, perceived service quality,
image and emotional satisfaction (Figure 4). In accordance to their findings, image, perceived service
quality and emotional satisfaction were considered as key drivers of recommendation and loyalty.
Figure 4: Loyalty and recommendation in banking industry (Ladhari et al. 2011, p. 113)
Positive relations were detected between perceived service quality, on one side, and emotional
satisfaction and image, on the other, as well as between emotional satisfaction and bank image. In the
research, the emphasis was also on mediating role of emotional satisfaction and image regarding the
indirect effects of perceived service quality on recommendation and loyalty.
Image
Loyalty
Recommendatio
n
Em. satisfaction
Service quality
Switching costs Loyalty
Quality
Satisfaction
Image
Satisfaction
Loyalty
Quality

N. Milicevic et al. / Client loyalty in banking sector
240
When analyzing bank trust and bank loyalty, van Esterik-Plasmeijer and van Raaij (2017) tested the
model of banking system trust (Figure 5). They focused on six variables: value congruence,
transparency, customer orientation, integrity, stability and competence. In addition to trust, bank
loyalty was explained by four more determinants: value congruence, transparency, stability and
competence.
Figure 5: Bank loyalty and bank trust (van Esterik-Plasmeijer and van Raaij, 2017, p. 103)
Bank loyalty was also examined in on-line conditions. In regard to online banking services, Levy
(2014) proposed a conceptual model which integrated service relative usage level, service quality
satisfaction, service convenience and bank loyalty (Figure 6). Research results pointed to the existence
of direct, significant and positive relationship between customer satisfaction with on-line banking
service quality and bank loyalty. Direct and significant, but negative relationship was recorded
between bank loyalty and service usage level. The subject of the analysis were also indirect effects on
bank loyalty; while the indirect effect of service quality satisfaction on loyalty via service relative
usage level was negative, the indirect effect of service convenience on bank loyalty via service quality
satisfaction was positive. Besides mentioned variables, the research included bank size and some
demographic characteristics.
Figure 6: Bank loyalty in on-line conditions (Levy, 2014, p. 294)
When it comes to mobile banking, Esmaeili et al. (2021) designed the model in order to investigate
customer loyalty. In addition to loyalty, it consisted of six more variables: perceived risk, usability,
relative advantages, customer service, trust and satisfaction. Customer loyalty was significantly and
positively affected by trust, satisfaction and relative advantages, and negatively by perceived risk.
Service quality
satisfaction Bank loyalty
Service usage
level
Service
convenience
Bank size Demographics
Moderating variables
Integrity
Customer orientation
Transparency
Value congruence
Loyalty
Competence
Stability
Institution trust System trust Person trust

EMC 2022, 17-18th June 2022, Zrenjanin, Serbia
241
CONCLUSION
Market changes reflected in more informed clients and increased competition have brought many
challenges in different business sectors, including banking industry. In order to overcome these issues,
various strategies and approaches have been implemented. Among them, special place belongs to
loyalty concept, based on establishing long-term relationship with clients.
Loyalty can been viewed from behavioral aspect; in this regard it is usually related to repeated
purchase, as a type of behavior. However, it can be observed from attitudinal and composite aspects as
well. While the former is associated to client’s psychological and emotional attachment, the latter
represents the combination of the previous two (behavioral and attitudinal) (Bowen and Chen, 2001).
Moreover, loyalty can be considered as a strategy, through which implementation, customers can even
become brands advocates (Duffy, 1998).
When it comes to banking sector, different models were used for the purpose of analyzing clients’
loyalty. In some of them, loyalty was examined in relation to service quality and satisfaction, as its
main predictors. Variables that were also included in these analyses were image, switching costs,
recommendation, trust, etc. It should be noted that in the case of on-line or mobile banking, special
models can be applied.
REFERENCES
Al-hawari, M.A. (2015). How the personality of retail bank customers interferes with the relationship between
service quality and loyalty. International Journal of Bank Marketing, 33(1), 41-57.
Beerli, A., Martín, J.D. & Quintana, A. (2004). A model of customer loyalty in the retail banking market.
European Journal of Marketing, 38(1/2), 253-275.
Bloemer, J., de Ruyter, K. & Peeters, P. (1998). Investigating drivers of bank loyalty: the complex relationship
between image, service quality and satisfaction. International Journal of Bank Marketing, 16(7), 276-286.
Bowen, J.T. & Chen, S. (2001). The relationship between customer loyalty and customer satisfaction.
International Journal of Contemporary Hospitality Management, 13/5, 213-217.
Duffy, D.L. (1998). Customer loyalty strategies. Journal of Consumer Marketing, 15(5), 435-448.
Esmaeili, A., Haghgoo1, I., Davidaviciene, V. & Meidute-Kavaliauskiene, I. (2021). Customer Loyalty in
Mobile Banking: Evaluation of Perceived Risk, Relative Advantages, and Usability Factors. Inzinerine
Ekonomika-Engineering Economics, 32(1), 70-81.
Ladhari, R., Souiden, N. & Ladhari, I. (2011). Determinants of loyalty and recommendation: The role of
perceived service quality, emotional satisfaction and image. Journal of Financial Services Marketing,
16(2), 111-124.
Levy, S. (2014). Does usage level of online services matter to customers’ bank loyalty? Journal of Services
Marketing, 28/4, 292-299.
van Esterik-Plasmeijer, P.W.J. & van Raaij, W.F. (2017). Banking system trust, bank trust, and bank loyalty.
International Journal of Bank Marketing, 35(1), 97-111.
Yi, Y. & Jeon, H. (2003). Effects of Loyalty Programs on Value Perception, Program Loyalty, and Brand
Loyalty. Journal of the Academy of Marketing Science, 31(3), 229-240.

242
XII International Symposium Engineering Management and Competitiveness 2022 (EMC 2022)
17-18th June, Zrenjanin, Serbia
ANALYSIS OF THE CAPITAL MARKET OF THE REPUBLIC OF
SERBIA
Miloš Pjanić
University of Novi Sad, Faculty of Economics, Subotica, Republic of Serbia
E-mail: [email protected]
Mirela Mitrašević
Univeerzitet u Istočnom Sarajevu, Fakultet poslovne ekonomije, Bijeljina, Bosnia and Herzegovina
Stevan Luković
University of Kragujevac, Faculty of Economics, Republic of Serbia
ABSTRACT
Before the global pandemic Covid 19, the Republic of Serbia stabilized its macroeconomic indicators, which had
a positive growth trend even after the global pandemic, in contrast to many developed world economies. All of
the above affected the decline in interest rates and borrowing costs in the domestic market, while reducing the
risk premium and credit rating by international credit agencies there is a decline in interest rates in the euro on
the money and capital market, which led to increased interest from foreign investors for long-term investment in
government securities. However, with the onset of the global pandemic, things in all world financial markets are
changing drastically, many capital markets are facing major problems in their functioning. Smaller capital
markets, such as ours, have withstood the effects of the pandemic relatively well. The aim of this paper is to
analyze the financial market with a special emphasis on the capital market. The first part analyzes the situation
and structure of the financial system in Serbia and the second part analyzes the current situation on the capital
market, pointing to current weaknesses of the capital market and opportunities for its development in the
function of overall capital market development and stability of the national financial system.
Key words: Financial market, Capital market, Development, Securities.
INTRODUCTION
Due to a large number of problems that our country faced in the last decade of the twentieth century,
there was a drastic weakening of the capital market and stock trading. The first shifts in stock
exchange trading and at the same time the revival of the domestic capital market began after 2000,
with the inclusion in the secondary trading of shares from previous privatization procedures, whereby
more intensive trading on the domestic stock exchange began. At the same time, with the adoption of
the Law on Privatization in 2001, which obliges all joint stock companies to be listed on the Belgrade
Stock Exchange, the number of given companies is growing and a large number of foreign investors
are becoming more present on the domestic market. Thanks to the growing presence of foreign
investors, stock prices on the Belgrade Stock Exchange as an index of the most liquid shares of
BELEX15 are achieving constant growth. Unfortunately, that growth did not last for a long time,
because already in 2007, with the first signs of the global financial crisis in the USA and the stock
market in Serbia, it began to record a constant decline, which eventually led to the collapse of the
entire stock exchange business. All of the above forced foreign investors to sell off their portfolios and
leave the domestic capital markets, which resulted in a drastic drop in stock prices and turnover on the
Belgrade Stock Exchange (Rakočević, 2016).
METHODOLOGY RESEARCH
Secondary research was applied in this paper. Among the basic methods of cognition, and for
theoretical considerations of the subject of research, analytical-synthetic, inductive-deductive, method

EMC 2022, 17-18th June 2022, Zrenjanin, Serbia
243
of abstraction and generalization were used. Among the scientific methods, the method of content
analysis was used. Data from available professional literature, scientific and professional papers, the
Internet and other sources were also used.
THE INFLUENCE OF THE FINANCIAL MARKET ON THE NATIONAL ECONOMY
In 2009, the entire world economy faced the biggest crisis since 1930, which resulted in a 1.6% drop
in global gross domestic product. Developing countries, such as Serbia, are recording a decline in
gross domestic product growth, with a much larger decline in developed countries, where only a few
developed countries have managed to achieve economic growth. The specificity is reflected in better
coping with the global economic crisis in developing countries compared to more developed countries,
but there are still huge differences between developing countries (Marović & Lemić-Saramandić,
2011).
At the end of 2010, there was a gradual recovery of the entire world economy, with global gross
domestic product growing by as much as 4% with a simultaneous decline in inflation. In the given
circumstances, Europe is facing the problem of the public debt crisis, with a decrease in the growth of
global gross domestic product in 2011, which amounted to 3%. By 2018, the global economy will
grow by 3%, with a significant impact on the mentioned growth rate had a drop in inflation and
interest rates.
Based on Table 1, it can be concluded that Serbia achieves variable growth rates in the observed
period when it comes to real gross domestic product, with a growth of 1.78% in 2015, and the largest
positive growth recorded in 2018 and amounts to 4, 30%. Due to the coronavirus pandemic, all
countries faced a decline in economic growth, with our country achieving a decline in economic
activity of -1.0%. Observing the inflation from the given table, it can be concluded that it is relatively
stable in the observed period. In 2018, it amounts to 2%, and the price of food, oil derivatives and
cigarettes primarily contributed to that. Nowadays, many countries are facing rising inflation, as is our
country, with that growth going as high as 10%.
Table 1: Macroeconomic indicators in Serbia% 2015. 2016. 2017. 2018. 2019. 2020.
Real Gross Domestic Product 1,78 3,34 2,05 4,30 4,3 -1,0
Inflation (consumer prices) 1,5 1,6 3,0 2,0 1,6 1,6
Source: (National Bank of Serbia, 2020)
The most important part of the financial system is the financial market. The development of the
financial market as well as its adequate functioning affects the overall economic development of each
country. When the financial market is adequately functioning, then the entire economic system is
ready for rapid adjustments that require any development (Kumalić, 2013).
A developed financial market significantly affects the entire national economy. Entities that exist
within less developed or underdeveloped capital markets, face problems of competitive position
because they have a difficult way to raise capital under financially unfavorable conditions. This means
that these entities generally have to obtain the necessary funds through bank loans because they do not
have the ability to issue debt securities. All of the above creates high borrowing costs because interest
rates on bank loans are higher than bond interest rates. In order for a financial market to be developed,
an adequate state strategy with precisely defined incentive measures is needed. Serbia's economy has
been facing the problem of illiquidity for years, with the financial market and especially the capital
market not developed enough to reduce the problem (Ivanišević, 2018).

M. Pjanić et al. / Analysis of the capital market…
244
Table 2: Structure of the financial market in Serbia 2015. 2016. 2017. 2018. 2019. 2020.
Banks 30 31 29 27 26 26
Insurance companies 24 23 21 20 20 20
Leasing 16 16 16 17 17 16
Voluntary pension funds 7 7 7 7 7 7
Source:(National Bank of Serbia, 2020)
A key feature of the national financial market is over-dependence on banks, dominated by foreign
banks, with the national economy paying off loans that are among the most expensive in Europe
(Đulić & Živković, 2012). Table 2 shows the bank-centric nature of the national financial market,
where it can be seen that the number of banks in 2015 was 30 and in the following year 31, so that the
number decreased in the last period and in 2020 there are 26 banks in our financial market. In the last
two years, the takeover, merger and acquisition of individual banks has been noticeable. In the
observed period, the number of insurance companies in the domestic financial market remained the
same and we have 20 insurance companies, and the number of leasing companies in the observed
period was almost unchanged. The number of voluntary pension funds in the observed period was
unchanged and amounted to 7 voluntary pension funds.
SITUATION AND POSSIBILITIES OF CAPITAL MARKET DEVELOPMENT IN SERBIA
The development of the capital market is a great challenge for our country, and a number of measures
must be taken into account, such as: changing the ownership structure of the economy, strengthening
the national economy, establishing macroeconomic stability, establishing and maintaining social peace
(Simić, 2011). After numerous problems in the 1990s and the practical non-existence of the capital
market, a significant impetus to the development of the capital market in Serbia was provided by the
adoption of the Law on Investment Funds, Voluntary Pension Funds, Securities and Other Financial
Instruments and the 2006 takeover. At the very beginning of their business and by passing the
mentioned laws, numerous institutions achieve enviable results and influence the development of the
capital market.
The Belgrade Stock Exchange is recording a record market capitalization with an increasing number
of foreign investors. However, the success of the domestic capital market was short-lived, because
only after two years of successful business on the domestic market, the global economic crisis of 2009
occurred, which spilled over from the United States to other European markets. The crisis has
seriously shaken business in both developed and developing countries such as Serbia. There is a
significant decline in trading on the Belgrade Stock Exchange, a decline in market capitalization, a
reduction in the listing of a large number of shares, as well as the abandonment of foreign investors in
the domestic financial market. After several years of weak business, there is a slight recovery of the
capital market, but still underdeveloped. All of the above has led to an increase in uncertainty as well
as investment risk (Radović & Vračarić, 2012).
The most important segment of the national financial market is the government bond market. By
selling them on the domestic financial market, the state obtains the necessary funds on relatively
favorable terms. This contributes to the increase in the dinarization of the domestic financial system
and the reduction of the state's exposure to currency risk. Due to the improved macroeconomic and
fiscal situation in the country, government indebtedness was reduced with fewer auctions, lower
amounts of securities offered for sale and favorable interest rates, with most government bond issues
related to longer-term dinar securities. At the end of 2020, 912.6 billion dinars of dinar government
bonds with a maturity of more than one year were sold, which is 17.9% more than at the end of the
previous year. Seven-year bonds had the largest share of 36.9%, while the share of three-year
government bonds increased from 17.8% to 20.5% (National Bank of Serbia).

EMC 2022, 17-18th June 2022, Zrenjanin, Serbia
245
The reduced need of the state for borrowing made it possible to accept only those offers with
sufficiently low interest rates. The bid-to-cover ratio, which indicates the ratio of the requested and
accepted amount of government dinar bonds, indicates a relatively favorable situation at primary sales
auctions. However, at the beginning of 2021, due to the situation caused by the coronavirus, all
countries were forced to take on additional debt, including Serbia (National Bank of Serbia).
Graph 1: Balance of dinar government securities in billion RSD
Source: (National Bank of Serbia, 2020)
During 2018, the share of foreign investors in the dinar government bond portfolio increased slightly,
from 28.6% in 2017 to 29.2% in 2018. Since the end of 2015, domestic banks have been the
predominant owners of government bonds, and their share in the dinar securities portfolio during 2018
decreased by about 0.7%. and amounted to 54.7%. Other investors are still significantly less
represented in the ownership of sold dinar government bonds, but in recent years it has been
noticeable that their share is increasing. Continuing to expand and strengthen the base of domestic
institutional investors will be of great importance in the coming period to improve the government
bond market, as well as to reduce the sensitivity of this part of the market to developments in the
international environment (National Bank of Serbia).
Graph 2. Demand for dinar government bonds in billion RSD
Source: National Bank of Serbia, 2020
The turnover on the secondary market of dinar government securities in 2020 was lower than in 2019,
when it amounted to 416.6 billion dinars. Secondary trading in securities denominated in euros
amounted to 664.7 million euros, and in 2019 to 672.2 million euros. At the end of 2015, long-term
government bonds were included in the Prime Listing of the Belgrade Stock Exchange, and the total
turnover of these bonds (denominated in dinars and euros on the Belgrade Stock Exchange in 2020
amounted to 43.7 billion dinars (National Bank of Serbia).

M. Pjanić et al. / Analysis of the capital market…
246
Now individual investors have easier access to trade in government bonds on the Belgrade Stock
Exchange, and thanks to that, trading in government bonds on the secondary market, affects greater
liquidity and transparency of the secondary market. At the same time, it is important to note that the
introduction of benchmark bond issues had a positive impact on the volume and continuity of
secondary trading. As in many foreign developed countries, the development of government securities
markets can be expected to be influenced by the use of financial derivatives and the introduction of the
function of primary dealers, which should contribute to the improvement of the primary and secondary
government securities market. (National Bank of Serbia).
Graph 3: The structure of the portfolio of dinar state hats of value
Source: National Bank of Serbia, 2020
The total market capitalization of the Belgrade Stock Exchange at the end of 2020 amounted to 523.4
billion dinars, which is about 9.6% of GDP. Compared to the previous year, it decreased in all market
segments. On the part of the listing for 25.1 billion dinars, and on the MTP115 segment for 10.6
billion dinars, and on the Open market segment for 10.5 billion dinars.
Graph 5: Market capitalization of the Belgrade Stock Exchange in billion RSD, (in% of GDP)
Source: National Bank of Serbia, 2020
On the Belgrade Stock Exchange, the total turnover of shares in 2020 amounted to 5.0 billion dinars,
which is 35.7 million dinars less than the previous year. Shares traded on the MTP and Open Market
segment of the Belgrade Stock Exchange at 1.4 billion dinars.

EMC 2022, 17-18th June 2022, Zrenjanin, Serbia
247
In order to improve the domestic capital market, it is necessary to encourage domestic companies to
finance their growth and development by raising capital through initial public offerings of shares. The
state intends to sell all public companies and for those companies to appear on the stock exchange. By
going public, it would list its shares and sell its shares, thus providing the necessary financial resources
for further growth and development. The state should, through certain regulations, try to prohibit all
owners of state-owned enterprises acquired through privatization from leaving the shareholder form of
organizing companies and enterprises (Šalić, 2018).
CONCLUSION
In the financial market of Serbia, there is still a large structural imbalance between banks and other
institutions such as insurance companies, voluntary pension funds, leasing companies, investment
funds and capital markets. The bank-centric nature of the financial system, the structural imbalance
between the mentioned institutions and the underdeveloped capital market is the current situation in
the national economy. For achieving economic growth, for state policy makers, the capital market is
one of the most important segments of the national economy. Faced with the consequences of the
global economic crisis and the Covid 19 crisis, many economies are unable to meet all the growing
needs for capital. At the same time, as a necessity of their survival and then growth and development,
there is a need for private investments through the capital market, ie the stock market.
Regardless of the existence of the necessary institutions, as well as the adoption of a number of laws
and regulations, the transition of the capital market in Serbia is still not over. One of the key problems
is great distrust in the domestic capital market, and this problem is very difficult to solve because
subjective feeling is more present than rational thinking. Huge quality and constant efforts are needed
to establish trust in order for the national capital market to become competitive in the global market. In
addition to all the above, it is necessary to establish more regulations in this area, because all of the
above would affect the inclusion and listing of a large number of shares of large companies on the
Belgrade Stock Exchange, which would result in increased turnover and overall market capitalization.
REFERENCES
Đulić, K., & Živković, B. (2012). Tržište korporativnih obveznica u Srbiji. Kvartalni monitor 30, 72-85.
Ivanišević, N. (2018). Postkrizna situacija na finansijskim tržištima u Srbiji i okruženju. Ekonomija teorija i
praksa 11(2), 51-63.
Kumalić, I. (2013). Razvijenost finansijskog tržišta u Bosni i Hercegovini. Časopis za ekonomiju i tržišne
komunikacije 1, 57-72.
Marović, B., & Lemić-Saramandić, M. (2011). Osiguranje kao determinanta održivog razvoja društva.
Ekonomika preduzeća 59(1-2), 65-72.
National Bank of Serbia. (2020). Годишњи извештај о стабилности финансијског система. Београд:
Народна банка Србије.
Radović, M., & Vračarić, V. (2012). Primena beta koeficijenta na tržištu kapitala u Srbiji. CIVITAS 4, 127-143.
Rakočević, R. (2016). Uticaj stranih investitora na Srpsko tržište akcija. Bankarstvo 45(3), 14-35.
Simić, A. (2011). Uticaj listiranja velikih javnih kompanija na nivo likvidnosti tržišta kacija u Republici Srbiji.
Škola biznisa 3, 176-186.
Šalić, R. (2018). Continuous fall of Belgrade stock exchange as a result of lack of quality companies in Serbia.
FBIM Transactions 6(1), 130-143.

248
XII International Symposium Engineering Management and Competitiveness 2022 (EMC 2022)
17-18th June, Zrenjanin, Serbia
APPLICATION OF THE INFORMATION TECHNOLOGY IN
MITIGATION OF THE PANDEMIC CRISIS CONSEQUENCES IN THE
DOMESTIC ECONOMY
Jelena Slavić
University of Novi Sad, Technical Faculty “Mihajlo Pupin”, Zrenjanin, Serbia
E-mail: [email protected]
Jelena Vukajlović
University of Novi Sad, Technical Faculty “Mihajlo Pupin”, Zrenjanin, Serbia
ABSTRACT
Nowadays, in current market conditions, it is essential for the attention to be focused on any business step or a
major decision that can affect the future operations of an organization. Introduction of the technology solutions
in business, in a higher percentage, could be of great importance for the Serbian economy. Many companies that
enjoyed a "secured" position on the market scene, due to the pandemic of the Covid-19 virus, which lasted from
December 2019 until today, were forced to adjust their business volume by reducing it or completely shutting
their company down. This paper will explore the extent to which domestic companies are ready to withstand the
turbulence of the forthcoming economic crisis as well as how to thrive in conquering new markets in such harsh
conditions.
Key words: Covid-19, economy, change, information technology, Serbia.
INTRODUCTION
In today's world, we are witnessing frequent changes, which are an indispensable part of every
economic area. Managing the changes drastically reduces the risk of failure and increases the chances
of a return on investment.
Scientific and technological progress, competition, international relations, market conditions and
globalization, cause constant changes that force companies to adapt themselves to changing conditions
accompanied by new challenges, to harmonize their development and business strategies, and then the
organizational structure, staff, skills and knowledge to survive in an environment that is subject to
change. (Vasić, 2005).
THE NEED FOR A CHANGE IN THE WAY OF DOING BUSINESS
Managing changes and making the right decisions is much easier when there is a steady path ahead for
a manager. Then it is even possible to predict a change, which opens the possibility for managers to
avoid certain problems or to solve them much easier because then the change is an event that had been
planned and already prepared for. The changes in the organization, regardless of the level at which
they are implemented, require that every part of the organization is involved in them, and most often
include changes in technology, production procedures, organizational structure, as well as the changes
in the structure of employees in the company. (Sajfert, 2008).
The transition in which our country finds itself, combined with the problems arising from the
environment and within our society and economy, has led to a significant economic crisis. Getting out
of the economic crisis means introducing deep and substantial changes at the level of the economy as
well as at the level of organizations.

EMC 2022, 17-18th June 2022, Zrenjanin, Serbia
249
Considering what is changing in the organization, it is possible to talk about four types of changes
within the organization: (Sajfert, 2008).
” technological changes,
changes in products and services,
structural and systemic changes,
changes in the structure of employees.”
Necessary changes that need to be implemented include all the areas of a business organization
functioning, starting from increasing labor productivity, responsible spending, cost reduction, then
efficient investment management, including training of employees and managers to acquire new
knowledge and skills. The most significant changes should take place in the field of production and
service provision, where it is necessary to apply the organization's restructuring process, which should
be followed by investments in the organization's development. In our companies, the process of
reorganization is the most common, which implies the transformation of the organizational model,
which can have an effect only if it is combined with the process of company program restructuring.
(Bogdanović, 2013).
It is expected that the crisis caused by Covid-19 will affect the Serbian economy primarily through the
processing industries in the field of export, and the production of durable goods. Producers, who are
exporters, employ by far the largest number of workers of all the sectors that could be affected by the
crisis. A negative may occur as demand for exports falls and logistics (e.g. raw material import)
become more complex. In addition, the demand for durable goods often declines sharply in crisis.
One of the conclusions of the research conducted by the Serbian Association of Employers, with the
technical support of the International Labor Organization (ILO) and in partnership with the European
Bank for Reconstruction and Development, was that the results of more than 50 percent of companies,
operating in the Republic of Serbia, stated that during the Covid-19 virus pandemic, they had negative
consequences for their finances and business in general, while small and micro-enterprises were the
most affected ones. The research was conducted in the period from April 7 to April 30 in 2020, and it
included a sample of 400 companies in the territory of the Republic of Serbia. The goal was to assess
the extent of the negative business impact caused by the Covid-19 pandemic. Further, the research
showed that 30 to 40 percent of the surveyed companies experienced the liquidity issue. Falling
turnover and demand, the problems with the delivery of goods and suppliers, and the absence of sick
employees are just some of the difficulties that Serbian businessmen still face. The catering sector has
suffered by far the largest loss. In that sector, the work regime was adjusted according to the number
of infected people, and at some time intervals, they were even completely forbidden to work. Of the
total number of survey participants, 91% of catering companies did not lay off their employees,
although more than 94% of surveyed businessmen had obvious problems with their finances, while
also many businessmen were left completely without income. Many industries and sectors had the
opportunity to operate smoothly or adapt to situations through remote working, startups companies,
transition to online business, etc. but the Covid-19 pandemic prevented the catering sector from any
kind of business, which was evident through numerous consequences such as financial difficulties and
closing the premises. The catering facilities closure has also negatively affected some other
companies, such as those that supply beverages and basic supplies.
In the first days of the epidemic, it was noticed that companies are extremely capable of reacting
quickly, being flexible, and adapting their work to the conditions of the state of emergency to run their
business smoothly. According to the survey of the Serbian Association of Employers, more than 80
percent of businessmen have managed to adapt to the situation and continue to do their business, both
from business premises and through distance work. (RTV, 2020).
In today's modern world and society, there are certainly differences and inequalities, so there are
different perspectives for development, which are very great. Therefore, the attitudes of the developed
countries, moderately developed or completely underdeveloped ones should be separately discussed.
Serbia is, in economic terms, a small country, and to achieve economic growth, its companies must

J. Slavić and J. Vukajlović / Application of the information technology in mitigation...
250
internationalize their business and turn themselves more to the foreign market. For now, the results
that Serbian business entities have achieved through the export activity, during the last few years,
cannot be considered satisfactory. (Vesić, 2010).
Considering that Serbia is a small country in the economic sense, the only way to achieve economic
growth is for its companies to internationalize their business activities and start, to a greater extent,
operating in foreign markets. For now, the results achieved by Serbian economic entities through an
export activity during the last few years cannot be considered satisfactory.
The development of information technologies has led to the emergence of new occupations and
increased knowledge among people. Many people were forced to learn to work with computers during
the pandemic, to use programs to run their businesses, mostly working from home. It can be said that
information technologies, under the influence of Covid-19, have an impact on management and
knowledge, but also contribute to improving the development of employees at a much higher level
than before. To survive, companies must follow trends, be innovative and invest in information
technology, as well as in technology in general, if they want to ensure survival and even better
positioning in the market.
ANALYSIS OF THE USE OF INFORMATION TECHNOLOGY FOR BUSINESS
IMPROVEMENT
Based on the research in 2020, conducted by Melluso Nicola and his colleagues from various
departments, some of whom are from the University of Information Technology and the University of
Industrial Engineering, we can observe and confirm the significant impact of information technology
during the Covid- 19. The research was conducted thoroughly, with 453 articles related to both Covid-
19 and information technology. The focus was on the impact that digital technology and Covid-19
have on the industry, the market, and the whole society. It was stated that due to the social distance,
the industries had to change and reorganize their production to survive and maintain the state that was
before the Covid-19 virus appeared. That change is a transformation that includes machines with
advanced technology, robots, Vi technology, and IoT devices. The low-cost access, based on IoT
devices and IT platforms (mostly small Manufacturing Execution Systems) is an affordable alternative
to digital transformation. (Melluso et al, 2020).
The crisis has caused the technology community to undergo serious adjustments due to many
constraints. However, the results of the research show that the modern technological environment
provides solutions quickly and efficiently thanks to information technology. Flexibility has also been
proven in the community of the startup companies and other industries. (Melluso et al., 2020).
In our country, the most significant problems are related to market, program, technological,
organizational, managerial, and some other changes and institutional transformations. The further
development of our economy depends on the degree of their success.
Without appropriate software, market, and technological transformations, our institutions remain in
their current state, often with outdated and unattractive production programs and inefficient
technology, which gives expensive and uncompetitive products. Organizational restructuring of
companies is a very complex and difficult process to implement and carries many problems at each
stage of its implementation.
The factors that can disrupt the adaptation, whether it is about the organization and its subsystems
or the environment, are the cause of the organizational changes. These organizational changes can be
external, which means that they come from outside the environment or the internal ones that come
from the inside of the organization.

EMC 2022, 17-18th June 2022, Zrenjanin, Serbia
251
The external factors, the ones that come from the outside of the organization, are the factors that
consist of the technological, political, or economic environment. The development of technology and
its progress is one of the key external factors. The changes brought by new technologies in the
epidemic are extremely important for the survival of the companies in the market and the achievement
of their competitive advantage. Unlike the external ones, the internal factors experience changes and
system disruptions within the companies.
Product diversification is considered one of the most productive strategies for change, i.e. to focus
companies on more promising markets to reduce certain risks, develop new products, or pay more
attention to research and development. This strategy also allows companies to grow and increase their
revenue. The management changes are important and effective if the managers themselves could look
at business differently if they have the creativity to develop new and quality ideas. (Pavlović, 2003).
Many companies have increased their financial productivity by reducing and rebuilding their
workforce. Serbia, as a smaller country without any problems, certainly has enough space to realize its
growth in the current globalization in many ways, in which foreign investments and poor use of
concessions such as the use of public goods, performance of work and service activities are most
noticeable.
In 2012, Serbia was in the 160th place based on the foreign investments at its disposal, while the share
of foreign investments was 27.4% a year before. In 2011, Serbia was one of the countries that were
highly dependent on foreign direct investment. Of all the countries in the Balkans, Montenegro was
the only one with a higher percentage of investments and thus was in 12th place. (Vesić, 2010).
Due to the difficult conditions caused by the Covid-19 pandemic, many educational institutions have
switched to an online system. They had to adapt to the current conditions and enable uninterrupted
teaching and further dissemination of knowledge to their students.
According to a survey of 14,715 respondents conducted by the Serbian Institute for the Improvement
of Education in 2020, the contribution and positive impact of information technology are confirmed,
although previously in Serbia this way of teaching was not applied at a significant level. More than
50% of the respondents answered that after the pandemic, they will even combine online and
traditional in-person classes. Distance learning has provided teachers with free resources and tools and
online training all thanks to information technology. Research has shown that more than 50% of
respondents are satisfied and pleasantly surprised with the wide range of available software tools,
resources, and materials provided by information technology.
The organization of the educational program as well as the distance learning in Serbia, in the extreme
conditions of the Covid-19 pandemic, confirmed the great importance of this type of education and the
application of modern technologies in the teaching process implementation. (Stojanović, 2020).
STEPS TO MITIGATE THE CONSEQUENCES OF THE PANDEMIC ON THE DOMESTIC
ECONOMY
The entire planet has been forced to face the Covid-19 pandemic and adapt to new business
conditions. Unfortunately, many companies, affected by the crisis, had to shut their business down,
since they failed to harmonize their business with the arrival of rapid changes in the market conditions,
where, at that time, there was room only for the strongest ones. To secure a place in the market, which,
more than ever before, requires rapid adoption of changes, and then adaptation to them, (Sood, 2020),
it is stated that the next seven steps would provide the insight into what problems companies should
prevent, as well as in which direction changes in business should take place, to improve efficiency,
maintain control over the company's finances, but also ensure a market position in such challenging
times.

J. Slavić and J. Vukajlović / Application of the information technology in mitigation...
252
1. Health and safety issues
"Are the best protection measures applied to protect employees?"
Are employees able to switch partially or completely to distance work?
Does the company have an emergency plan for the quarantined employees?
Is the paperwork process speeding up to reduce the financial troubles of laid-off employees?”
2. Preparation of the communication plan
"The communication plan should target employees, customers, i.e. consumers and suppliers." It is
crucial to create a clear and concise message, and then conduct regular updates and optimize the
available technologies for sending them.
3. Reaching out to customers
If a change in the way of doing business is reduced to business in the short term, it will result in an
appropriate effect on profit and the business itself.
4. Addressing suppliers
Supply chains are limited and if a supplier that cooperates with the company is abroad or relies
exclusively on imports, there is a risk that the product will not be present on the market in sufficient
quantities at all and thus the company might be put in an unenviable position in the eyes of the
customers.
5. Assessment of available capacity and resources
6. Building a weekly cash flow forecast
7. Preparing for recovery
The cash flow forecast is the key segment in the recovery phase. When things start to turn around, the
company will be forced to spend money, that is, to invest first, to get back what it had been invested,
and thus to make money. During the recovery, the company will have to consider the following steps
in advance:
“confirm and finalize orders,
make the procurement plan of materials,
plan an employee recall,
receive new shipments,
do the operationalization.” (Sood, 2020).
CONCLUSION
In the current conditions, it can be concluded that the positive dimensions of globalization are less
visible, unlike the negative ones. This is especially evident in terms of widening the gap between
developed and underdeveloped countries, which leads to the creation of a "global risk society." In such
circumstances, many countries, which need the benefits of globalization, are in danger of being
completely marginalized.
The need for changes in domestic companies should not be elaborated on in more detail. Ownership
and organizational changes, above all, are necessary for the survival of domestic organizations
because of the strong competition appearance in times of crisis. However, despite the clear and well-
known fact that deep strategic changes are needed, resistance will be present to a large extent. That is
why large forces must be engaged in recruiting employees for their participation in the implementation
of changes. Otherwise, the outcome of the market game is easily predictable: survival will be more
than uncertain.

EMC 2022, 17-18th June 2022, Zrenjanin, Serbia
253
REFERENCES
Bogdanović D. (2013), Change Management, University of Belgrade, Bor: Faculty of Engineering.
Melluso N., Fareru S., Fantoni G., Bonaccorsi A., Chiarello F., Manfredi P., Coli E., Giordano V.,Manafi Sh.
(2020). Lights and shadows of COVID-19, Technology and Industry 4.0, A preprint
Pavlović, M. (2003). Analysis of radical organizational changes, scientific paper,Belgrade: Institute of
Economics, Industrija 3-4.
RTV (2020). The crown crisis hit small businesses hardest, Novi Sad:An internet article. available
25.03.2022.https://rtv.rs/sr_lat/ekonomija/aktuelno/korona-kriza-najvise-pogodila-mala-
preduzeca_1138540.html
Sajfert, Z. (2008). Change management, Zrenjanin: Technical Faculty "Mihajlo Pupin".
Sood, A. (2020). COVID-19: 7 steps to sustain your business through the disruption, BDC online blog. Canada:
Business Development Bank of Canada. Available 05.04.2022 https://www.bdc.ca/en/articles-
tools/blog/covid-19-steps-to-sustain-your-business-through-disruption
Stojanović D. (2020). Analysis of the distant learning realization in Serbia during the Covid-19 pandemic,
Institute of Economic Sciences, p.121-140.
Vasić, Ž. (2005). Management system for the realization of investment projects in the function of change
management in the power industry, Ph.D. dissertation, Zrenjanin: Technical faculty “Mihajlo Pupin”.
Vesić, D. (2010). The impact of business globalization on the economic system of Serbia, Original scientific
paper, Professional Journal: "International Problems", vol. 62, p.136-134.
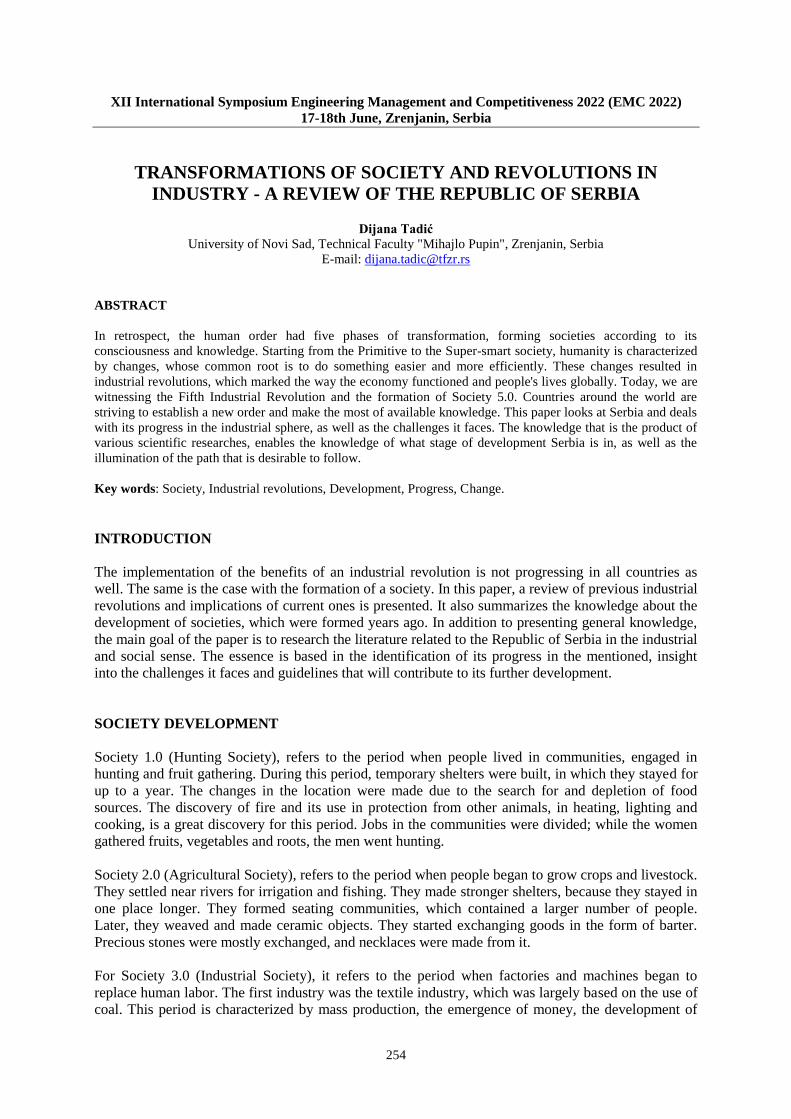
254
XII International Symposium Engineering Management and Competitiveness 2022 (EMC 2022)
17-18th June, Zrenjanin, Serbia
TRANSFORMATIONS OF SOCIETY AND REVOLUTIONS IN
INDUSTRY - A REVIEW OF THE REPUBLIC OF SERBIA
Dijana Tadić
University of Novi Sad, Technical Faculty "Mihajlo Pupin", Zrenjanin, Serbia
E-mail: [email protected]
ABSTRACT
In retrospect, the human order had five phases of transformation, forming societies according to its
consciousness and knowledge. Starting from the Primitive to the Super-smart society, humanity is characterized
by changes, whose common root is to do something easier and more efficiently. These changes resulted in
industrial revolutions, which marked the way the economy functioned and people's lives globally. Today, we are
witnessing the Fifth Industrial Revolution and the formation of Society 5.0. Countries around the world are
striving to establish a new order and make the most of available knowledge. This paper looks at Serbia and deals
with its progress in the industrial sphere, as well as the challenges it faces. The knowledge that is the product of
various scientific researches, enables the knowledge of what stage of development Serbia is in, as well as the
illumination of the path that is desirable to follow.
Key words: Society, Industrial revolutions, Development, Progress, Change.
INTRODUCTION
The implementation of the benefits of an industrial revolution is not progressing in all countries as
well. The same is the case with the formation of a society. In this paper, a review of previous industrial
revolutions and implications of current ones is presented. It also summarizes the knowledge about the
development of societies, which were formed years ago. In addition to presenting general knowledge,
the main goal of the paper is to research the literature related to the Republic of Serbia in the industrial
and social sense. The essence is based in the identification of its progress in the mentioned, insight
into the challenges it faces and guidelines that will contribute to its further development.
SOCIETY DEVELOPMENT
Society 1.0 (Hunting Society), refers to the period when people lived in communities, engaged in
hunting and fruit gathering. During this period, temporary shelters were built, in which they stayed for
up to a year. The changes in the location were made due to the search for and depletion of food
sources. The discovery of fire and its use in protection from other animals, in heating, lighting and
cooking, is a great discovery for this period. Jobs in the communities were divided; while the women
gathered fruits, vegetables and roots, the men went hunting.
Society 2.0 (Agricultural Society), refers to the period when people began to grow crops and livestock.
They settled near rivers for irrigation and fishing. They made stronger shelters, because they stayed in
one place longer. They formed seating communities, which contained a larger number of people.
Later, they weaved and made ceramic objects. They started exchanging goods in the form of barter.
Precious stones were mostly exchanged, and necklaces were made from it.
For Society 3.0 (Industrial Society), it refers to the period when factories and machines began to
replace human labor. The first industry was the textile industry, which was largely based on the use of
coal. This period is characterized by mass production, the emergence of money, the development of

EMC 2022, 17-18th June 2022, Zrenjanin, Serbia
255
railways and steamships. Due to the enabled transport, more frequent trips followed. People began to
acquire rights during this period.
Society 4.0 (Information Society), refers to the period when technologies simplified the use of
information. People are enabled to interact with each other thanks to the use of information and
communication technologies. After the discovery of this technology, people are connected regardless
of where they are. State governments have strengthened the technological characteristics of the
information society due to the positive effects on the economy.
“Society 5.0” points to the fifth transformation of society through history (Deguchi et al., 2020;
Mashur et al., 2019; Athens et al., 2021; Miwa, 2020; Supendi & Nurjanah, 2020; Twaróg &
Mieczkowski, 2019; Fukuda, 2020; Hanif & Iftikhar, 2020). Society 5.0 follows the previous four
phases and integrates everything discovered so far, in the service of creating the well-being of
humanity. In this era, people and machines are synchronized, and together they are focused on solving
social problems (Yazid, 2021).
DEVELOPMENT OF INDUSTRIAL REVOLUTIONS
The first industrial revolution lasted from 1780-1820. years. It is considered to be the most significant
transformation in human history. This revolution is characterized by steam-powered machines and
various forms of work organization. Since this revolution, civilization has grown from a survival-
driven society to a society that develops and thrives.
The second industrial revolution lasted from 1870-1914. years. The features of this transformation are
(among other things): the use of electricity, oil discovery, the creation of automatic machines, the
development of land transport and aircraft flights. The third industrial revolution took place in 1970.
The use of microchips and integrated electronic components led to the creation of the Information
Society. Thanks to the discovery of the Internet, the upcoming changes have led to dizzying progress
in all spheres.
The fourth industrial revolution began in 2001 (Soh & Connolly, 2021) and is characterized by new
technologies, sensors, big data, robotics, Internet of Things, cloud accounting and augmented reality,
which enabled fully automated production and personalization of products and services.
Industry 5.0 is characterized by cooperation between humans and machines (Bharati, 2021), in order
to achieve greater creativity and efficiency in production processes (Nahavandi, 2019), and to meet
market demand (Javaid & Haleem, 2020). This has resulted in the integration of artificial intelligence
into manufacturing facilities, in order to improve human capabilities (Martynov et al., 2019). The
transition from mass adaptation of Industry 4.0 to mass personalization of Industry 5.0 is now
expected (Javaid & Haleem, 2020). Figure 1 shows the intertwined development of society and
industrial revolutions.
INDUSTRY AND SOCIETY 5.0
From the 18th century onwards, there were industrial revolutions that, each in its own way, shaped the
world. In the 21st century, production is characterized by cyber-physical systems, information and
communication technologies, automation, artificial intelligence and more. Industry 5.0 is the name of
the last recognized industrial revolution, which strives to solve social problems by integrating physical
and virtual space (Skobelev & Borovik, 2017). This revolution is considered to be an improved
version of Industry 4.0 (Longo et al., 2020).
At the end of January 2016, the Government of Japan presented the concept of Society 5.0 (Salgues,
2018; Carraz & Hrayama, 2018; Rohim & Darwanto, 2020; Fukuyama, 2018), as a vision of human
existence, for the welfare of which technology works (Deguchi) et al., 2020; Önday, 2019).
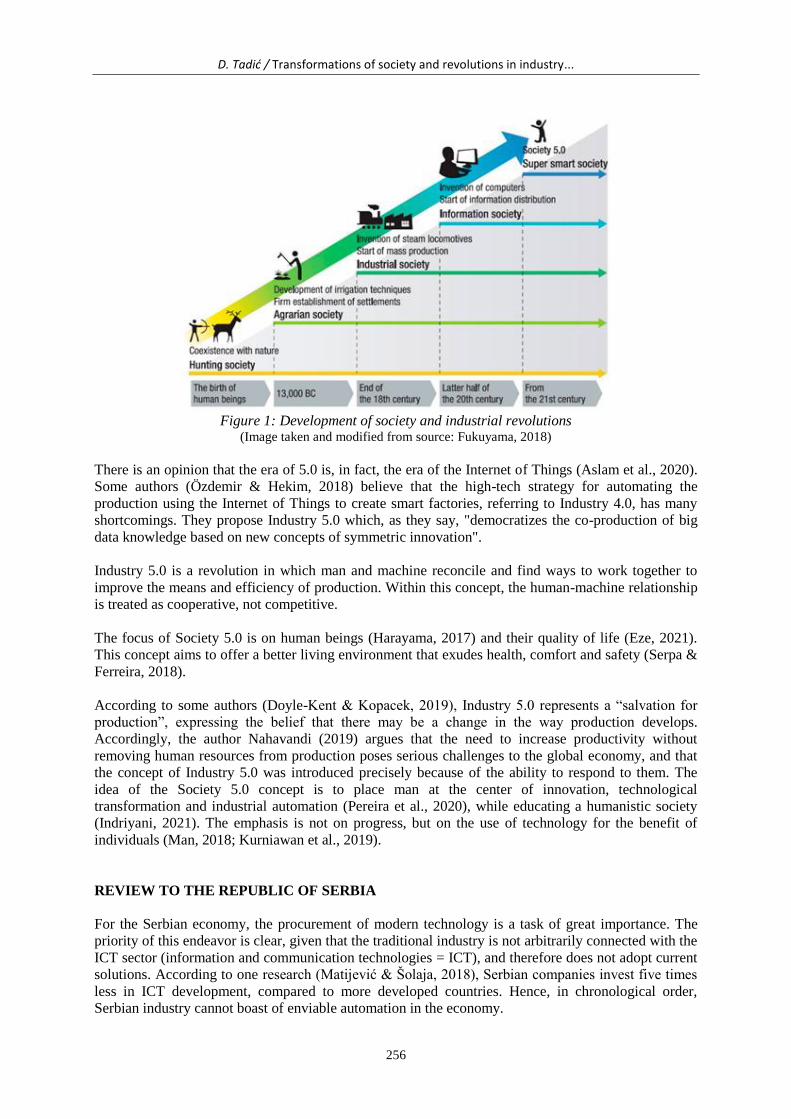
D. Tadić / Transformations of society and revolutions in industry...
256
Figure 1: Development of society and industrial revolutions
(Image taken and modified from source: Fukuyama, 2018)
There is an opinion that the era of 5.0 is, in fact, the era of the Internet of Things (Aslam et al., 2020).
Some authors (Özdemir & Hekim, 2018) believe that the high-tech strategy for automating the
production using the Internet of Things to create smart factories, referring to Industry 4.0, has many
shortcomings. They propose Industry 5.0 which, as they say, "democratizes the co-production of big
data knowledge based on new concepts of symmetric innovation".
Industry 5.0 is a revolution in which man and machine reconcile and find ways to work together to
improve the means and efficiency of production. Within this concept, the human-machine relationship
is treated as cooperative, not competitive.
The focus of Society 5.0 is on human beings (Harayama, 2017) and their quality of life (Eze, 2021).
This concept aims to offer a better living environment that exudes health, comfort and safety (Serpa &
Ferreira, 2018).
According to some authors (Doyle-Kent & Kopacek, 2019), Industry 5.0 represents a “salvation for
production”, expressing the belief that there may be a change in the way production develops.
Accordingly, the author Nahavandi (2019) argues that the need to increase productivity without
removing human resources from production poses serious challenges to the global economy, and that
the concept of Industry 5.0 was introduced precisely because of the ability to respond to them. The
idea of the Society 5.0 concept is to place man at the center of innovation, technological
transformation and industrial automation (Pereira et al., 2020), while educating a humanistic society
(Indriyani, 2021). The emphasis is not on progress, but on the use of technology for the benefit of
individuals (Man, 2018; Kurniawan et al., 2019).
REVIEW TO THE REPUBLIC OF SERBIA
For the Serbian economy, the procurement of modern technology is a task of great importance. The
priority of this endeavor is clear, given that the traditional industry is not arbitrarily connected with the
ICT sector (information and communication technologies = ICT), and therefore does not adopt current
solutions. According to one research (Matijević & Šolaja, 2018), Serbian companies invest five times
less in ICT development, compared to more developed countries. Hence, in chronological order,
Serbian industry cannot boast of enviable automation in the economy.

EMC 2022, 17-18th June 2022, Zrenjanin, Serbia
257
Mitrović R. (2019), said that Serbia must keep pace with technological trends and experiences of the
most developed countries in the world, and this can only be achieved with the help of partnerships
between the state, universities and the economy. He emphasizes that "Science, education and culture
are generators of the development of society" and that only they are able to respond to the complex
temptations of the modern world.
Knowledge is the main participant in modern economic development (Mitrović, 2019). A flexible
education system, on-the-job training and a flexible labor market could help predict the future sector
needs (Prašnikar et al., 2017), and by emphasizing digital skills in secondary schools, it would enable
faster entry into the labor market.
The exchange of knowledge between state-wide education systems is considered one of the important
issues that can improve education and create conditions for further development (Gao & Bernard,
2018). Schools must have the ability to prepare future employees for future work needs. Their task is
to adjust the education program to technological trends that will take place in the coming period.
Therefore, it can be said that it is necessary to invest in the education system, in order for it to be able
to respond to the upcoming challenges. Compared to the countries of Central and Eastern Europe,
Serbia invests much less in education (only 3.8% of GDP) (UNESCO UIS - Institute for Statistics,
2020).
CONCLUSION
Serbia is currently in a mix of Second, Third and Fourth Industrial Revolutions, with indications of
Industry 5.0. Electricity as the basis for starting production plants, connected with information and
communication technologies, with the use of cyber-physical systems, forms the basis of the Serbian
economy. It is recommended to invest as much as possible in education and educational institutions,
but also in advanced technologies.
Looking at the societies, it can be said that the population in Serbia is a combination of Industrial,
Information, but also Super-smart society. Technological progress provides each individual with many
opportunities in personal and business terms. The connection between man and industry has been
reduced, and the availability of almost all information has been made possible, which enables a much
greater choice of jobs and the pace of its development. Until recently, technology provided society
with unimaginable possibilities, and man came to shape those same possibilities according to his will,
desire and ambition.
REFERENCES
Aslam, F., Aimin, W., Li, M., & Ur Rehman, K. (2020). Innovation in the era of IoT and industry 5.0: absolute
innovation management (AIM) framework. Information, 11(2), 124.
Atina, V. Z., Mahmudi, A. Y., & Abdillah, H. (2021). Industry preparation in ceper klateo on Society 5.0.
International Journal of Economics, Business and Accounting Research (IJEBAR),5(2).
Bharati, S. (2021). Business intelligence and Industry 5.0. Journal of the International Academy for Case Studies, 27,
1-3.
Carraz, R., & Harayama, Y. (2018). Japan’s innovation systems at the crossroads: Society 5.0. Digital Asia, 33- 45.
Deguchi, A., Hirai, C., Matsuoka, H., Nakano, T., Oshima, K., Tai, M., & Tani, S. (2020). What is society 5.0.
Society, 5, 1-23.
Doyle-Kent, M., & Kopacek, P. (2019, August). Industry 5.0: Is the manufacturing industry on the cusp of a new
revolution?. In Proceedings of the International Symposium for Production Research 2019 (pp. 432-441).
Springer, Cham.
Eze, O. M. (2021, January). Implication of Mass Literacy, Adult and Non-Formal Education in Achieving Society 5.0
in Nigeria. In 1st International Conference on Continuing Education and Technology (ICCOET 2021) (pp. 69-
73). Atlantis Press.

D. Tadić / Transformations of society and revolutions in industry...
258
Fukuda, K. (2020). Science, technology and innovation ecosystem transformation toward society 5.0. International
Journal of Production Economics, 220, 107460.
Fukuyama, M. (2018). Society 5.0: Aiming for a new human-centered society. Japan Spotlight, 1, 47-50.
Gao, J., & Bernard, A. (2018). An overview of knowledge sharing in new product development. The International
Journal of Advanced Manufacturing Technology, 94(5), 1545-1550.
Hanif, M. I., & Iftikhar, L. (2020). Post COVID-19 industrial revolution 5.0. The dawn of cobot, chipbot and curbot.
Pakistan Journal of Surgery and Medicine, 1(2), 122-126.
Harayama, Y. (2017). Society 5.0: Aiming for a New Human-centered Society. Collaborative Creation through
Global R&D Open Innovation for Creating the Future. Hitachi Review, 66(6), 8-13.
Indriyani, D. (2021, March). Urgency Value of Local Awareness Pillars of Cianjur Culture in Forming a Community
5.0. In International Conference on Education of Suryakancana (IConnects Proceedings).
Javaid, M., & Haleem, A. (2020). Critical components of Industry 5.0 towards a successful adoption in the field of
manufacturing. Journal of Industrial Integration and Management, 5(03), 327-348.
Kurniawan, A., Komara, B. D., & Setiawan, H. C. B. (2019). Preparation and Challenges of Industry 5.0 for Small and
Medium Enterprises in Indonesia. Muhammadiyah International Journal of Economics and Business, 2(2), 155-
160.
Longo, F., Padovano, A., & Umbrello, S. (2020). Value-oriented and ethical technology engineering in industry 5.0: a
human-centric perspective for the design of the factory of the future. Applied Sciences, 10(12), 4182.
Man, D. I. N. G. (2018). " Society 5.0": The Way of Implementation of Japan's Super Smart Society. Contemporary
Economy of Japan.
Martynov, V. V., Shavaleeva, D. N., & Zaytseva, A. A. (2019, September). Information Technology as the Basis for
Transformation into a Digital Society and Industry 5.0. In 2019 International Conference" Quality Management,
Transport and Information Security, Information Technologies"(IT&QM&IS) (pp. 539-543). IEEE.
Mashur, R., Gunawan, B. I., Fitriany, F., Ashoer, M., Hidayat, M., & Aditya, H. P. K. P. (2019). Moving from
traditional to society 5.0: Case study by online transportation business. The Journal of Distribution Science,
17(9), 93-102.
Matijević, M., Šolaja, M. (2018). ICT in Serbia - At a Glance, Vojvodina ICT Cluster, Novi Sad, Republika Srbija.
Mitrović, R. (2019). SERBIA 4.0: A Future That Must Not Be Missed. Beograd: Zavod za udžbenike,[In Serbian].
Miwa, C. (2020, December). Early Childhood Care and Education Practices in Japan for the Era of Society 5.0. In
1st International Conference on Early Childhood Care Education and Parenting (ICECCEP 2019) (pp. 27-32).
Atlantis Press.
Nahavandi, S. (2019). Industry 5.0 - A human-centric solution. Sustainability, 11(16), 4371.
Önday, Ö. (2019), Japan’s Society 5.0: Going Beyond Industry 4.0, Business and Economics Journal, 10(2), pp.1-6.
Özdemir, V., & Hekim, N. (2018). Birth of industry 5.0: Making sense of big data with artificial intelligence, “the
internet of things” and next-generation technology policy. Omics: a journal of integrative biology, 22(1), 65-76.
Pereira, A. G., Lima, T. M., & Charrua-Santos, F. (2020). Industry 4.0 and Society 5.0: opportunities and threats.
International Journal of Recent Technology and Engineering, 8(5), 3305-3308.
Prašnikar, J., Redek, T., & Koman, M. (Eds.). (2017). Robots among us. Časnik Finance.
Rohim, H., & Darwanto, D. (2020, May). Pendidikan untuk menyambut masyambut masyarakat 5.0. In Prosiding
seminar nasional program pasasarjana universitas pgri palembang.
Salgues, B. (2018). Society 5.0 and the Management of the Future. Society 5.0: Industry of the Future, Technologies,
Methods and Tools, Wiley, pp.91-119.
Serpa, S., & Ferreira, C. (2018). Society 5.0 and social development: Contributions to a discussion. Management and
Organizational Studies, 5, 26-31.
Skobelev, P. O., & Borovik, S. Y. (2017). On the way from Industry 4.0 to Industry 5.0: From digital manufacturing to
digital society. Industry 4.0, 2(6), 307-311.
Soh, C., & Connolly, D. (2021). New frontiers of profit and risk: The Fourth Industrial Revolution’s impact on
business and human rights. New Political Economy, 26(1), 168-185.
Supendi, A., & Nurjanah, N. (2020, March). Society 5.0: Is It High-Order Thinking?. In International Conference on
Elementary Education, 2(1), pp. 1054-1059.
The World Bank. (2020, September). UNESCO UIS: Government expenditure on education as a percentage of GDP.
Available in: http://data.uis.unesco.org.
Twaróg, J., & Mieczkowski, P. (2019). A short story about the 5.0 community, designed to live and function in the
era of 4.0 and 5G. Warsaw: Polish Chamber of Commerce for Electronics and Telecommunications. In Polish]
Yazid, A. A. (2021). Existence of Islamic education in the era of society revolution 5.0. AMCA Journal of Religion
and Society,1(1), 13-15.

259
XII International Symposium Engineering Management and Competitiveness 2022 (EMC 2022)
17-18th June, Zrenjanin, Serbia
THE IMPACT OF CONSUMER DEMAND ON FIRMS’
PRODUCTIVITY
Aleksandra Zhemkova
Russian Presidential Academy of National Economy and Public Administration, Russia
E-mail: [email protected]
ABSTRACT
The paper presents the assessment of the expected market size impact on the stimulation of technological
development of Russian durable goods manufacturing firms. According to the directed technological change
theory, growing consumer demand is an important driver of investments in innovation and technological
progress. To conduct a quantitative assessment, we use the combined micro-data on durable goods households’
consumption and firms’ financial results. We use TFP, labor productivity and R&D expenditures as main
indicators of firms’ technological progress. To exclude endogeneity of market size, we construct Engel curves
for 26 durable goods and estimate potential market size for each product, independent of changes in its prices or
quality. The results indicate that the effect of the expected market size is quantitatively important in all
specifications: firms in sectors with growing market increase their productivity and innovation more rapidly. We
also identify sectors, in which manufacturers are most sensitive to changes in the expected market size. The
obtained assessments can be used to improve the demand stimulating policies, aimed at creating conditions for
the modernization and intensification of innovation and production.
Key words: Demand, Market size, Firm, Productivity, Innovation.
INTRODUCTION
The ability to create and adapt advanced technologies and practices is a key source of productivity
growth and technological development of countries (Acemoglu et al., 2015; Holmes et al., 2015).
According to the directed technological change (DTC) theory (Acemoglu, Zilibotti, 2001; Acemoglu,
2002), growing consumer demand is an important driver of investments in innovation and
technological progress. In regions or sectors with a growing market, the incentives for firms to invest
in new technologies development and innovations are higher, and the process of technology adoption
is faster. However, is the influence of the domestic market size still relevant in a globalized economy?
To what extent will domestic demand and the expectation of its growth in the future contribute to
productivity growth and technological progress of firms? If firms have a certain planning horizon, can
the expectation of industry market growth stimulate innovative activity in this industry? To answer
these questions, we conducted research of the expected market size impact on the creation of
incentives for the technological development of firms in the Russian manufacturing sector. For this
purpose, we used the example of the durable goods industries.
THEORY
According to DTC, the internal demand can be used to stimulate innovation activity: with the growth
of the consumer market, the demand for simple, low-tech goods is satisfying and the demand for more
technologically complex goods begins to grow. This encourages firms to increase investment in the
creation of technologically more complex products, which ultimately leads to increased innovation
and productivity, and, consequently, technological progress. Firms in industries with growing demand,
on average, invest more in creating or adopting new technologies than those in industries where
demand is stagnating. At the same time, it is assumed that economic growth changes the sectoral

A. Zhemkova / The impact of consumer demand on firms productivity
260
structure of domestic demand: as households become richer, they spend an increasing share of their
income on more high-tech, expensive durables (Fieler, 2011, Foellmi, Zweimuller, 2006). Hu,
Jefferson (2008) argue that the most important driver of technological progress is the change in the
structure of domestic consumption from low-tech to high-tech goods, for example, from bicycles to
cars. Jaravel (2016), examining the unequal returns on various innovative products in the United
States, showed that since the incomes of the wealthiest households are growing faster than the incomes
of the rest of the population, firms are investing in the creation of innovative products designed
specifically for this class to meet the growing demand from the wealthiest households. According to
Kuznets (1973), structural changes in the economy, defined as changes in the relative spending on
goods in different sectors, are one of the most important characteristics of economic growth and
development.
There is a small amount of empirical literature investigating the effect of expected market size on
innovation, and most of it is focused on the pharmaceutical market. This market, due to its
characteristics, can provide narrowly specified data for researchers, both for market size indicators
(volume of drugs sold), and innovative activity indicators (patents). Although the results of these
studies are specific to the pharmaceutical industry, they indicate a high impact of expected market size
on innovation activity (see, for example, Acemoglu, Linn, 2004; Finkelstein, 2004; Blume-Kohout,
Sood, 2012; Dubois et al., 2015).
However, in the last years, there were articles that investigate the effect of expected market size on a
broader set of industry sectors, for example, on the durable goods sector. Boppart, Weiss, 2013
assessed the impact of future market size on R&D expenditures across the US industry and showed
that a 1% increase in the future market size of a particular sector would have a positive impact on
R&D spending in that sector and lead to an increase in the TFP growth rate of about 0.3% over five
years. Similarly, Beerli et al., 2020 investigated the impact of domestic market size on technological
progress and innovation in China's durable goods sectors. They showed that the effect of the future
market size can be significant, and not only for the pharmaceutical industry.
METHODS
We applied the model, presented in Beerli et al., 2020 to assess the impact of the expected market size
on the technological progress of firms:
where is the technological progress indicator of the firm i in industry j at time t; is the
expected market size at the industry level, is the vector of a control variables (firm size,
ownership structure, age, exports and Herfindahl-Hirschman index of the industry); is the fixed
effect of the industry, which indicates the intensity of technological progress and innovation in a
particular industry, is a fixed time effect, indicating time shocks, is an estimation error. The
expected market size is defined as the sum of households’ new purchases of durable goods and
purchases in replacement of old goods, calculated by the depreciation rate. We consider a three-year
period for a market size as it is the most likely lag between the firms' investments in innovations and
their implementation.
Using the combined data from the Rosstat household survey, which contains information on durable
goods consumption of households, and micro-data on enterprises from the Bureau van Dijk's Ruslana
database, we conducted a quantitative assessment of the impact of the expected market size on several
indicators of firms' technological progress. We focused on six sectors of durable goods production:
automobiles, home appliances, electronics, home photo and video appliances, computers, and
motorcycles for the period from 2015 to 2020. We considered three key indicators of the technological
progress of firms: the total factor productivity (TFP) of firms, labor productivity (LP) and R&D

EMC 2022, 17-18th June 2022, Zrenjanin, Serbia
261
expenditures. TFP was calculated as the residuals of the estimated at the two-digit NACE code
production function by applying Olley, Pakes (1996) procedure. LP was calculated by dividing the
firm’s value added by its labor costs.
We assumed that firms could build their expectations about market size in two different ways:
adaptively, basing only on past market trends and dynamics but adjusting the forecast further; or
rationally, using all the best available information for forecasting and making no systematic errors, in
fact, accurately predicting the real size of the market.
The key hypothesis was that firms' expectations of the consumer market size for their product would
drive the firm's current technological development. However, the opposite situation is more likely:
technological progress can lower market prices or improve the quality of products, thereby increasing
sales and the size of the future market. To exclude endogeneity, we constructed Engel curves for 26
durable goods and estimated the dynamics of the expected market size for each product. This market
size indicator depended only on changes in the distribution of household income and was not affected
by changes in prices or quality of goods. This new expected market size indicator meant the intensity
of consumption of individual durable goods depending on income over the next three years and it was
used in further research.
FINDINGS AND DISCUSSION
This section discusses the results of an empirical estimation of the proposed models. First, we provide
basic results for the case of rational and adaptive expectations of firms (second-stage panel
regression). Then we test the hypothesis of different impact of expected market size for exporters and
non-exporters. At the end, we provide an industry analysis and investigation of the impact of the
market size of individual products.
Brief results of the assessment are presented in Table 1. Estimated model included all control
variables, industry, and time effects. The relationship between indicators of firms' technological
progress and expected market size was quite significant. If firms form rational expectations, the
expectation of a 1% growth in the size of the future market leads to an increase in firms' TFP by an
average of 0.33%, an increase in labor productivity and an increase in R&D spending by 0.38%. If
firms form expectations adaptively, the expectation of a 1% growth in the size of the future market
leads to an increase in firms' TFP by an average of 0.31%, an increase in labor productivity by 0.3%,
and an increase in R&D spending by 0.49%. These results confirm the high importance of the
expected market size impact on the technological development of firms, regardless of how firms form
their expectations.
Table 1: Basic results for the effect of the expected market size
logTFP logLP logR&D
Rational expectations
Expected market size 0.328***
(0.106)
0.377***
(0.085)
0.383***
(0.115)
R-sq 0.19 0.20 0.18
Adaptive expectations
Expected market size 0.307***
(0.096)
0.301***
(0.076)
0.489**
(0.213)
R-sq 0.21 0.20 0.22
The table presents the results of the second stage panel regression with random effects with standard errors in
brackets. *** p<0.01, ** p<0.05, * p<0.1***.

A. Zhemkova / The impact of consumer demand on firms productivity
262
Exporters and non-exporters
We further checked if the expected size of domestic market may have different significance for
exporting and non-exporting firms. For exporters the external market may play a more important role,
and the impact of the expected domestic demand may turn out to be insignificant. Table 2 presents the
results of testing this hypothesis for the case of rational and adaptive expectations of firms.
Table 2: The results of market size impact on TFP for exporters and non-exporters Переменная Non-exporters Exporters
Rational expectations
logTFP 0.330*** 0.307***
logLP 0.425*** 0.345***
logR&D 0.478*** 0.175***
Adaptive expectations
logTFP 0.463*** 0.259***
logLP 0.441** 0.287***
logR&D 0.574*** 0.322**
The table presents the results of the second stage panel regression with random effects with standard errors in
brackets. *** p<0.01, ** p<0.05, * p<0.1***.
The results showed that impact of the expected domestic market size is significant for both exporters
and non-exporters, but it is quantitatively more important for non-exporting firms – both for the case
of rational and adaptive expectations and for the most indicators. For exporting firms, the expansion of
the world market is more important than the domestic one. But since a rather small share of domestic
durable goods is shipped abroad, and the part that is supplied goes mostly to neighboring countries
that have similar consumer demand dynamics, the estimates turned out to be quantitatively important
for both groups of firms.
Sectoral results
We also identified sectors (and goods), in which manufacturers are most sensitive to changes in the
expected market size. The results of estimates obtained at the industry level are summarized in Figure
1. The most sensitive to the expected market size increase was the production of automobiles (an
increase in the expected market size by 1% led to an increase in the TFP of firms in this industry by an
average of 0.7 – 0.9% in different specifications) and computers (0.6 - 0.8% in different
specifications). The least sensitive was the production of photo and video equipment and motorcycles.
Considering the dynamics of the consumer markets, the result seems quite logical: the computer and
automobile markets are showing constant expansion; on the contrary, the markets for home photo and
video equipment, motorcycles have already reached saturation several years ago.
Figure 1: Sectoral results

EMC 2022, 17-18th June 2022, Zrenjanin, Serbia
263
Unfortunately, available firm statistics do not allow us to identify more narrow groups of producers of
individual goods within broad industry groups. For example, the consumer electronics sector includes
a wide range of products, some of which are currently showing positive dynamics of its market size,
while the consumption of others, on the contrary, is declining. Most often, the same firms are
manufacturers of several types of goods at once. In this regard, we assess the impact of the expected
market size of each of the group's products on all consumer electronics manufacturers. We will repeat
this procedure for each of the industry groups. We expect that the impact of the market size of
individual products will be different.
The results are presented below. For example, computer manufacturers were more sensitive to growth
in the expected size of the laptop market than desktop PCs - with an expected 1% increase in the
laptop market, manufacturers' TFP grew by an average of more than 1.18%, while with an increase in
the desktop PCs market – by only 0.43%. Consumer electronics manufactures were the most sensitive
to the growth of expected domestic market of the smartphones (1.69% with a 1% increase in the
smartphones market), e-readers (0.94%) and home theaters (0.77%). Consumer electronics
manufactures were completely insensitive to changes in the expected market size of radios, stereos,
and game consoles. A negative effect was revealed for the market of multimedia players (-0.195%),
which is not surprising, since the consumption of this product has already reached saturation.
For manufacturers of photo and video equipment, the impact of the expected market size for cameras
was 0.409%. However, a negative coefficient was obtained (-0.218%) for video cameras (the market
has already reached saturation). Due to these opposite effects, the impact of the whole expected
market size for photo and video equipment turned out to be insignificant. This highlights the
importance of analyzing disaggregated estimates.
Appliance manufacturers turned out to be low-sensitive to the growth of the expected market size for
almost all products: the largest coefficients were obtained for the market of dishwashers (0.34%), air
conditioners (0.28%), freestanding ovens (0.26%) and hobs (0.29%). Manufacturers turned out to be
completely insensitive to expected market size of gas stoves, dryers (perhaps there were too few of
them on the market to have a noticeable impact on the manufacturers). Manufacturers also turned out
to be low sensitive to changes in the expected market size of refrigerators and washing machines.
CONCLUSIONS AND IMPLICATIONS
Many studies argue that one of the most important sources of productivity growth and technological
development of countries is the ability to adapt advanced technologies and practices, as well as the
active investment in the adaptation and development of technologies. One of the drivers of investment
in innovation and technological progress, according to the theory of directed technological change, is
the expansion of the industry market size: in countries and regions with a growing size of the domestic
market, the process of technology development and adaptation will be faster.
In this paper we also discuss expectations about future demand growth as an important driver for the
firm's technological development. We assessed the impact of the expected market size on the
indicators of technological progress of firms: TFP, labor productivity and R&D. The results showed
that in average this effect is quantitatively important in all specifications, and was especially high for
non-exporting firms. Regardless of how expectations are formed, firms in industries with large
expected demand increase their productivity more rapidly and innovate more.
This effect could have important implications for technological progress and contribute to sustainable
growth in Russian manufacturing industry in the coming years. The obtained sensitivity assessments
can be used to improve the demand stimulating policies, aimed at creating conditions for the
modernization and intensification of production. The calculated estimates reflect the potential response
of manufacturers to the expectation of changes in future demand. Thus, if any demand stimulating
policy is introduced for a particular industry or a product, manufacturers will expect an increase in

A. Zhemkova / The impact of consumer demand on firms productivity
264
demand and, as a result, will increase investment in R&D and technological development. For
different products, the response of manufacturers may differ. According to the results, the most
sensitive are cars and computers manufacturers. In addition, manufacturers are most sensitive to the
expectation of an increase in demand for smartphones and their components, laptops, and home
cinemas. They are a little less sensitive to the expected demand growth for cameras, stationary PCs,
tape recorders. Home appliance manufacturers are less sensitive to expectations of their market
growth, but they are more responsive to expectations of increased consumption of dishwashers, air
conditioners, freestanding ovens, and hobs. Thus, for these industries, the demand stimulation policy
seems to be the most effective and can lead to the greatest growth in innovation activity and firms'
productivity.
REFERENCES
Acemoglu, D. (2002). Directed technical change. The review of economic studies, 69(4), 781-809.
Acemoglu, D., & Linn, J. (2004). Market size in innovation: theory and evidence from the pharmaceutical
industry. The Quarterly journal of economics, 119(3), 1049-1090.
Acemoglu, D., & Zilibotti, F. (2001). Productivity differences. The Quarterly Journal of Economics, 116(2),
563-606
Acemoglu, D., Gancia, G., & Zilibotti, F. (2015). Offshoring and directed technical change. American Economic
Journal: Macroeconomics, 7(3), 84-122.
Beerli, A., Weiss, F. J., Zilibotti, F., & Zweimüller, J. (2020). Demand forces of technical change evidence from
the Chinese manufacturing industry. China Economic Review, 60, 101157.
Blume-Kohout, M. E., & Sood, N. (2013). Market size and innovation: Effects of Medicare Part D on
pharmaceutical research and development. Journal of public economics, 97, 327-336.
Boppart, T., & Weiss, F. (2013). Non-homothetic preferences and industry directed technical change. Available
at SSRN 2277547.
Dubois, P., De Mouzon, O., Scott‐Morton, F., & Seabright, P. (2015). Market size and pharmaceutical
innovation. The RAND Journal of Economics, 46(4), 844-871. Fieler, A. C. (2011). Nonhomotheticity and bilateral trade: Evidence and a quantitative explanation.
Econometrica, 79(4), 1069-1101.
Finkelstein, A. (2004). Static and dynamic effects of health policy: Evidence from the vaccine industry. The
Quarterly Journal of Economics, 119(2), 527-564.
Foellmi, R., & Zweimüller, J. (2006). Income distribution and demand-induced innovations. The Review of
Economic Studies, 73(4), 941-960.
Holmes, T. J., McGrattan, E. R., & Prescott, E. C. (2015). Quid pro quo: Technology capital transfers for market
access in China. The Review of Economic Studies, 82(3), 1154-1193.
Hu, A. G., & Jefferson, G. H. (2009). A great wall of patents: What is behind China's recent patent explosion?.
Journal of Development Economics, 90(1), 57-68.
Jaravel, X. (2016). The unequal gains from product innovations. In 2016 Meeting Papers (No. 437). Society for
Economic Dynamics.
Kuznets, S. (1973). Modern economic growth: findings and reflections. The American economic review, 63(3),
247-258.
Olley, G. S., & Pakes, A. (1996). The Dynamics of Productivity in the Telecommunications Equipment Industry.
Econometrica, 64(6), 1263–1297.

265
XII International Symposium Engineering Management and Competitiveness 2022 (EMC 2022)
17-18th June, Zrenjanin, Serbia
Session E: IT MANAGEMENT
Papers (pp. 267-278):
Vladimir Ilin, Nenad Saulić, Dragan Simić
INTERNET OF THINGS SYSTEM DESIGN IN SMART PARKING ARCHITECTURE ...267
Goran Janaćković, Dejan Vasović, Bojan Vasović
ON STANDARDIZATION IN THE FIELD OF USER INTERFACES ...272

266

267
XII International Symposium Engineering Management and Competitiveness 2022 (EMC 2022)
17-18th June, Zrenjanin, Serbia
INTERNET OF THINGS SYSTEM DESIGN IN SMART PARKING
ARCHITECTURE
Vladimir Ilin
University of Novi Sad, Faculty of Technical Sciences, Department of Traffic Engineering, Novi Sad, Serbia
E-mail:[email protected]
Nenad Saulić
University of Novi Sad, Faculty of Technical Sciences, Department of Traffic Engineering, Novi Sad, Serbia
Dragan Simić
University of Novi Sad, Faculty of Technical Sciences, Department of Traffic Engineering, Novi Sad, Serbia
ABSTRACT
Internet of Things (IoT) is a relatively new concept in the field of computer science, electronics, and
transportation. Smart parking systems encompass various domains from the field of parking information
systems, including smart payment system, e-parking, and automated parking. In this paper, we have presented a
IoT system design, a smart parking system design, and their integration, named IoT system design in smart
parking architecture. In addition, we have explained physical layer, network layer, middleware layer, and
application layer in detail and, after that, we have shown their practical application in smart parking. The
proposed theoretical model aims to increase understanding of IoT paradigm in smart parking system design.
Key words: Internet of Things, Smart parking architecture, Parking information systems.
INTRODUCTION
A growing number of motorized vehicles in cities and particularly central zones of cities requires new
approaches in the field of stationary traffic. There are many negative aspects of traffic jams in central
zones of a city, such as driver’s frustration, increased full consumption, increased noise, and negative
impact on the environment (Ilin et al., 2021). The development of smart parking systems is therefore a
necessity in order to reduce these negative aspects. The use of various information and communication
technologies (ICT) is predominantly considered as a tool which can help in resolving the growing
traffic jams in central zones of cities. In major cities available parking lots in most cases do not
correspond to the increased degree of motorization.
In this paper, we consider a relatively new ICT concept, named internet of things (IoT). IoT consist of
objects that become “smart” through the installation of gateways. Each object is assigned a unique
identification number for authentication in the network. These enable them to communicate with other
parts of the ICT system using Internet connection. IoT can be divided into several IoT functionalities
including wearable devices (Smart Wearable), home automation devices (Smart Home),
environmental monitoring devices (Smart Environment), corporate infrastructure support devices
(Smart Enterprise), and urban infrastructure support devices (Smart City) (Perera et al., 2015). Also,
IoT can monitor, manage and control equipment in real-time and, therefore, IoT provide responsive,
reactive, and proactive services (Kim et al., 2017).
Smart parking is a relatively new coin, that aims to efficiently solve parking problems, particularly in
cities’ central zones, with the support of different ICTs. It usually means complete control of a parking
system in which a driver is informed about available parking lots in real-time. Depending on the
possibilities of the specific parking information system, a driver can be offered additional services,
such as parking reservation and/or on-line payment. New approaches, such as dynamic pricing context

V. Ilin et al. / Internet of Things design in smart...
268
and park-and-ride context can also be offered to drivers. In this paper, we explore the implementation
of IoT system design into smart parking architecture.
The rest of the paper is organized as follows. First, the IoT system design is presented and the main
layers are explained. After that, smart parking systems are discussed and a smart parking architecture
is elaborated. The paper concludes with the implications for researchers and future work.
INTERNET OF THINGS SYSTEM DESIGN
The IoT concept is becoming increasingly important in smart parking system design (Latif et al.,
2018). Recently, different smart parking systems architectures have been proposed (Shingare et al.,
2015; Saleem et al., 2022). However, most IoT-based systems consist of four layers, named physical
layer, network layer, middleware layer, and application layer (Figure 1).
Figure 1: The basic IoT system
design
The physical layer manages the physical sensors and accompanying embedded objects, that is, it deals
with the collected data. Using secured communication channels, the data are sent through the network
layer towards the middleware layer. The network layer includes different technologies, such as
Ethernet, Wi-Fi or Bluetooth to transfer collected data to higher layers. The middleware layer
encompasses different servers and databases for data collection. The application layer is used for
controlling graphical user interface. It basically deals with requests from users and provides responses
depending on each request.
SMART PARKING SYSTEM DESIGN
Smart parking system refers to parking management system that includes different ICT solutions, such
as mobile devices, sensors, Wi-Fi connection, SQL database, cloud computing technology, and IoT.
Smart parking system has evolved from traditional parking system that relied on manual tickets. An
example of the smart parking system design is presented in Figure 2.
Figure 2: An example of smart
parking system design (adapted from Puspitasari et al., 2021)

EMC 2022, 17-18th June 2022, Zrenjanin, Serbia
269
The smart parking system consists of multiple sensors, gateways, servers, and client nodes. The sensor
node is used for collecting data and also for information display to the user. It communicates with a
server through a gateway due to different communication protocols used to exchange massages. On
the other hand, the client node can directly communicate with the server. The server collects all the
data from sensor node and client node and that communication is two-way.
IOT SYSTEM DESIGN IN SMART PARKING ARHITECTURE
The use of IoT system design in smart parking architecture is based on four previously explained
layers: physical layer, network layer, middleware layer, and application layer. An illustration of IoT
system design in smart parking architecture is shown in Figure 3.
Figure 3: An illustration of IoT system design in smart parking architecture
(adapted from Biyik et al., 2021)
The physical layer consists of various sensors deployed throughout the parking system. In general,
sensors include RFID, lasers, radars, lasers, and so on. The use of IoT devices equipped with different
sensors has multiple purposes. First, information about free and occupied parking lots can be noted in
real-time. If a parking system has several platforms, on each of them large display can be installed to
show real-time information about the availability of parking lots in each section. If a parking system
has only one level, then a large display can be installed on the entrance to the parking location. In
addition, various additional tools can be available to drivers, such as routing mechanism throughout
the parking system. This service requires the use of the specific application through a mobile phone
and it is, once again, enabled by IoT devices equipped with sensors.
The network layer enables secured communication channels between the physical layer and the
middleware layer. Collected data through sensors are transmitted to upper layers to be processed and
after that used in the parking system. The network layer encompasses different technologies for
communication, such as LAN and WLAN. All networks have specific protocols, such as ZigBee
(Mainetti et al., 2016), and some even include wireless IoT protocol (Martinez-Balleste et al., 2013).
These technologies are used by the IoT devices equipped with sensors and service providers, but also
by users in the parking system.
The middleware layer includes different servers, including web servers, and different cloud-based
services. The data are transmitted through the network layer and stored on secured locations. New

V. Ilin et al. / Internet of Things design in smart...
270
technologies, such as Blockchain, offer highest degree of data protection. Based on data stored on
mentioned platforms, various applications can be developed and offered to users.
The application layer is the top layer of the proposed IoT system design in smart parking architecture.
It enables participants to interact with the parking system through mobile devices and remote
computers using web application. Different services can be offered to users, such as parking
reservation, online payment, and so on.
EXAMPLES FROM PRACTICE
A general data protection regulation (GDPR)-compliant IoT recommender (IoTRec) system is
developed within the framework of H2020 EU-KR WISE-IoT (Worldwide Interoperability for
Semantic IoT) project (Saleem et al., 2022). The proposed IoTRec system has four various domains.
First, it helps the user to find a free parking spot based on different metrics. Second, it recommends a
route from the user’s current location. Third, it provides the real-time provision of expected
availability of parking areas in a user-friendly manner. Finally, it provides a GDPR-compliant
implementation for operating in a privacy-aware environment (Saleem et al., 2022).
A parking management system for disabled people named DisAssist is developed by Lambrinos &
Dosis (2013). The parking system is developed using IoT technology and smart cities’ capabilities by
integrating smartphones, sensors, and mobile/wireless communications. DisAssist offers real-time
availability information about parking lots for disabled persons and allows them to reserve parking
lots.
FINAL REMARKS AND FUTURE WORK
Traditional parking systems equipped with ramps and controlled by employees that regulate the entry
and exit points in the parking system are becoming increasingly obsolete. The fast development of
various ICT solutions offer new approaches in smart parking design. The use of one of the new
technologies - IoT in smart system design is explored in this paper. First we described IoT system
design and explained four key layers in all IoT-based systems, named physical layer, network layer,
middleware layer, and application layer. After that, smart parking systems are explained and an
example of smart parking system design is provided. Finally, the integration between IoT and smart
parking design is illustrated.
In this theoretical paper we have tried to systemize the IoT concept, smart parking architecture and
their interconnection. Many recent papers described only one of these concepts (IoT or smart parking)
and only a few dealt with their integration. In future research the more extensive explanation of
different sensors, technologies, and protocols can be provided. Particular focus of future work can be
on routing algorithms customized for deployment in the parking system. The investigation of machine
learning techniques and their use in predicting the state of parking lots in the near future can be
examined. Furthermore, the implementation of an IoT-smart parking architecture in real environment
can be explored.
ACKNOWLEDGMENT
This research has been supported by the project "Development of innovative solutions with the aim of
improving the field of traffic and transport".

EMC 2022, 17-18th June 2022, Zrenjanin, Serbia
271
REFERENCES
Biyik, C., Allam, Z., Pieri, G., Moroni, D., O’Fraifer, M., O’Connell, E., Olariu, S., & Khalid, M. (2021). Smart
Parking Systems: Reviewing the Literature, Architecture and Ways Forward. Smart cities, 2, 623-642.
Ilin, V., Saulić, N, & Simić, D. (2021). Parking information systems for central zones of a city. In 11th
International Symposium Engineering Management and Competitiveness (EMC 2021), Zrenjanin, Serbia,
66-71.
Kim, T-h., Ramos, C., & Mohammed, S. (2017). Smart City and IoT. Future Generation Computer Systems, 76,
159-162.
Lambrinos, L. & Dosis, A. (2013). DisAssist: An Internet of Things and Mobile Communications Platform for
Disabled Parking Space Management, In IEEE Global Communications Conference (GLOBECOM), 2810–
2815.
Latif, S., Afzaal, H., & Zafar, N. A. (2018). Modelling of Graph-Based Smart Parking System Using Internet of
Things, In IEEE International Conference on Frontiers of Information Technology (FIT), 7-12.
Mainetti, L., Marasovic, I., Patrono, L., Solic, P., Stefanizzi, M.L., & Vergallo, R. (2016). A Novel IoT-aware
Smart Parking System based on the integration of RFID and WSN technologies. International Journal of
RF Technologies, 7(4), 175-199.
Martinez-Balleste, A., Perez-martinez, P.A., & Solanas, A. (2013). The pursuit of citizens' privacy: a privacy-
aware smart city is possible. IEEE Communications Magazine, 51(6), 136-141.
Perera, C., Liu, C., & Jayawardena, S. (2015). The Emerging Internet of Things Marketplace From an Industrial
Perspective: A Survey, In IEEE Transactions on Emerging Topics in Computing, vol. 3, no. 4, pp. 585-598.
Puspitasari, D., Muhammad N., Hendrawan, A., & Asmara, R.A. (2021). Development of smart parking system
using internet of things concept. Indonesian Journal of Electrical Engineering and Computer Science,
24(1), 611-620.
Saleem, Y., Sotres P., Fricker S., De La Torre C.L., Crespi N., Lee G.M., Minerva R., & Sanchez, L. (2022).
IoTRec: The IoT Recommender for Smart Parking System. IEEE Transactions on Emerging Topics in
Computing, 10(1), 280-296.
Shingare, A., Pendole, A., Chaudhari, N., Deshpande, P. & Sonavane, S. (2015). GPS supported city bus
tracking & smart ticketing system, In IEEE International Conference on Green Computing and Internet of
Things, 93-98.

272
XII International Symposium Engineering Management and Competitiveness 2022 (EMC 2022)
17-18th June, Zrenjanin, Serbia
ON STANDARDIZATION IN THE FIELD OF USER INTERFACES
Goran Janaćković
University of Niš, Faculty of Occupational Safety, Niš, Serbia
Dejan Vasović
University of Niš, Faculty of Occupational Safety, Niš, Serbia
E-mail: [email protected]
Bojan Vasović
Academy of Applied Studies South Serbia, Leskovac, Blace department, Serbia
ABSTRACT
Computer work is becoming part of daily work activities of an increasing number of employees, regardless of
whether it is their main or additional work activity. They do their work activities from home or at the office
using the available equipment. Equipment specifications and limitations can lead to certain difficulties in human-
computer interaction, where data entry via input devices and display of data on output devices are the causes of
some of these difficulties. Standardization of the user interface is one step towards the solving the problems of
human communication with computers, because defining adequate characteristics of user interface elements,
established meaning and way of displaying key elements on screens allows fast interaction and unambiguous
presentation of information. This paper presents representative ISO standards related to the user interface.
Key words: User interface, Standardization, Performance.
INTRODUCTION
Although safety is considered in organizations as a support activity, it is very important for achieving
organizational goals. In addition to affecting organizational functioning and achieving continuity of
core business activities, reducing the risks causes the improvement of employees’ performance and
well-being (Savić et al., 2021). Risk analysis primary considers work processes and equipment used at
work, as well as aspects of the environment (Mušicki et al., 2020, 2021). However, more and more
often, part of the work activities are performed using desktop computers or portable devices and
corresponding software executed on them. The characteristics of software aids can significantly affect
employees’ performance. Whether the software is used for business, educational or entertainment
purposes, it needs to have certain features that make it functional for users and convenient to use. The
way of presenting visual information, the size and color of letters, the shape and size of the basic
elements on the desktop, as well as the way of presenting adverse events is the basis for flawless
communication and timely response, which is very important in specific workplaces (Grozdanović et
al., 2017). The speed of reaction to an adverse event can often be crucial in reducing or eliminating the
consequences of adverse events.
Software risk and information security are increasingly attracting the attention of researchers
(Janaćković et al., 2019). Efforts for standardization have not bypassed this area either, and in line
with the development of knowledge, wider use and innovation, there has been a need to define clearer
criteria for describing usability and risks (Bevan, 2001; Xie et al., 2016; Barafort et al., 2017). There is
a need for standardized methodological approaches for their identification, analysis and reduction of
negative consequences, as well as for adequate evaluation of user experience and identification of
adequate assessment criteria (Guney, 2019; Zarour, 2020; Janaćković et al., 2020; Dawood et al.,
2021). All of this is significant not only for special purpose software, but also for standard software
used in everyday life, which also requires ease of communication, unambiguity and a logical
arrangement of user interface elements. The introduction of generally accepted standards in the field

EMC 2022, 17-18th June 2022, Zrenjanin, Serbia
273
of user interface and software ergonomics can significantly facilitate the development of easy-to-use
software.
STANDARDIZATION
The application of standards implies the implementation of certain, generally accepted in the industry
solutions that are important, especially in the field of security and protection. Ergonomics of human-
system interaction implies consideration and optimization of specific tasks in the communication
process. Particularly important is the contribution to the application of occupational safety standards
by defining safety conditions that result in a reduction in the occurrence of adverse events in the work
environment that may endanger the health of employees (Bretschneider-Hagemes et al., 2018).
User interface
The user interface enables communication between man and machine, with the aim of effectively
managing the process based on a sufficient column of information obtained from the process itself.
Different types of interfaces that enable communication between users and computers, based on basic
principles such as quality, uniformity and usability (Bevan, 2001; Dawood et al., 2021). In everyday
work on computers, users most often use a graphical interface with mouse and keyboard, while mobile
solutions can have a touch pad or touch screen as input device (for example, tablets). Sophisticated
users can also use the command line, while special types of devices use menu-based interfaces.
Modern research is aimed at developing conversational interfaces that will enable communication in
spoken language or by using special gestures that are treated as executive commands.
Based on (ISO, 2020), the user interface is part of an interactive system, which consists of several
elements. These elements enable the user to receive the necessary information from the system and to
realize the necessary tasks through the available controls. ISO 9241-11:2018 standard defines the
concept of usability in the context of interactive systems, which goes beyond ease-of-use, because it
defines the extent to which the system can be used by corresponding users to achieve the required
efficiency, effectiveness and satisfaction if used as intended and in a defined context (ISO, 2018). User
experience includes user perceptions caused by the use of the system, based on user subjective and
objective assessment of the functioning of a system. Special emphasis is placed on the development of
the system in the context of simpler and more efficient use, with a greater focus on assumed human
behavior and its responses. The Video Display Unit Directive 90/270 EEC (1990) emphasizes the
significant characteristics of the software, including the suitability of the task and ease of use, as well
as the obligation to apply the principles of software ergonomics.
Representative ISO standards
There are number of standards related to human-computer interaction, from those related to the
ergonomics of the interaction, consideration of usefulness and specificity of the user interface
implementation (Lee, 2014; Green, 2020; Norman and Kirakowski, 2018; Karwowski et al., 2021). A
representative series of standards, ISO 9241, defines interfaces for human-computer interaction, with
special emphasis on the importance of humane work design and requirements that must be met,
primarily reducing physical and mental strain caused by the use of computer equipment (ISO 9241-
11:2018). The basic principles of ergonomics of human-system interaction are described using main
interaction principles, among which suitability, self-descriptiveness, learnability and conformity with
user expectations should be emphasized (ISO 9241-110:2020).
The following tables provide an overview of representative standards related to software ergonomics,
with special emphasis on the user interface and its elements. Although there is a significant
relationship between these standards and other standards related to information technology and
ergonomics of computer system hardware elements used to interact with a computer, such as a

G. Janaćković et al. / On standardization in field of user interfaces
274
keyboard, they are not considered here. The table shows the name of representative standard, brief
description, classification and current status (development stage).
Table 1 shows representative standards form the ISO/IEC 11581 series of standards. These standards
describe characteristics of main graphical user interface elements presenting objects, pointers, tools,
actions, and interaction modes. A large number of standards from this group are standards with a long
tradition, which have gone through the process of confirmation.
Table 1: Standards for different user interface objects, their functions and representations Standard Description Classification Stage
ISO/IEC TR
11580:2007
User interface objects, actions and
attributes framework
35.240.20 Confirmed (90.93)
ISO/IEC 11581-1:2000 Icon symbols and functions - Icons -
General
35.240.20 Confirmed (90.93)
ISO/IEC TR 11581-
1:2011
User interface icons - introductory
analysis of icon standards
35.240.20 Published (60.60)
ISO/IEC 11581-2:2000 Object icons 35.240.20 Under review
(90.20)
ISO/IEC 11581-3:2000 Pointer icons 35.240.20 Under review
(90.20)
ISO/IEC 11581-5:2004 Tool icons 35.240.20 Confirmed (90.93)
ISO/IEC 11581-6:1999 Action icons 35.240.20 Review finished
(90.60)
ISO/IEC CD 11581-7 Icons for setting interaction mode 35.240.20 Close of comment
period (30.60)
ISO/IEC 11581-
10:2010
Framework and general guidance on user
interface icons
35.240.20 Confirmed (90.93)
The next table shows representative standards from the ISO/IEC 20071 series of standards. Their
primary goal is to propose how to present different kinds on information to be understandable to users.
Sometimes it is necessary to present alternatives of images in textual form or to put additional textual
description for audio information.
Table 2: Representative user interface standards from the ISO/IEC 20071 series Standard Description Classification Stage
ISO/IEC 20071-5:2022 Accessible user interfaces for accessibility
settings on information devices
35.240.20 Published (60.60)
ISO/IEC 20071-
11:2019
Guidance on text alternatives for images 35.240.20 Published (60.60)
ISO/IEC TS 20071-
15:2017
Guidance on scanning visual information
for presentation as text
35.240.20 Review finished
(90.60)
ISO/IEC TS 20071-
21:2015
Guidance on audio descriptions 35.240.20 Confirmed (90.93)
ISO/IEC 20071-
23:2018
Visual presentation of audio information
(including captions and subtitles)
35.240.20 Confirmed (90.93)
Table 3 presents additional user interface standards that are not classified only as IT applications in
office work (classification number 35.240.20), describing the describing the multidisciplinary
character of the problem under consideration. Among others, they analyze usability, cursor control,
cultural elements, navigation devices, virtual keyboards, readability and legibility of presented textual
material.
As can be seen from the previous tables, most of the standards are confirmed. With the development
of technology in recent years, there is a need to introduce new standards that will regulate this area in
more detail.

EMC 2022, 17-18th June 2022, Zrenjanin, Serbia
275
Table 3: Additional user interface standards and their current status Standard Description Classification Stage
ISO/IEC CD 4944 Natural user interfaces usability
assessment
13.180, 35.180 CD study/ballot
initiated (30.20)
ISO/IEC 10741-1:1995 Cursor control for text editing for the
purpose of dialogue interaction
35.240.20 Confirmed (90.93)
ISO/IEC 13066-1:2011 Interoperability with assistive technology
(AT) - Requirements and
recommendations for interoperability
35.180;
11.180.99
Review finished
(90.60)
ISO/IEC 13251:2019 Collection of graphical symbols for office
equipment
35.020;
01.080.20
Published (60.60)
ISO/IEC 15897:2011 Procedures for the registration of cultural
elements
35.060;
35.240.99
Under review
(90.20)
ISO/IEC 17549-1 Framework for UI requirements and
recommendations on menu navigation
35.240.20 Published (60.60)
ISO/IEC 17549-2:2020 Navigation with 4-direction devices 35.240.20
Published (60.60)
ISO/IEC DIS 17549-3 Navigation with 1-direction devices 35.240.20 Close of voting
(40.60)
ISO/IEC DIS 22121-2 Virtual keyboards user interfaces - On-
screen keyboards with touch interface
35.180 Approved as FDIS
(40.99)
ISO/IEC 18035:2003 Icon symbols and functions for controlling
multimedia applications
35.240.20 Confirmed (90.93)
ISO/IEC 18036:2003 Icon symbols and functions for WWW
browser toolbars
35.200 Confirmed (90.93)
ISO/IEC TR
19764:2005
Cultural and linguistic adaptability in
information technology products
01.120;
35.240.20
Confirmed (90.93)
ISO/IEC DIS 23859-1 Guidance on making written text readable
(legible) and understandable
35.240.20 Close of voting
(40.60)
ISO/IEC 24755:2007 Screen icons and symbols for personal
mobile communication devices
35.240.20 Confirmed (90.93)
DISCUSSION
There is a number of standards that describe the characteristics of human-computer interaction. They
are increasingly becoming the subject of analysis. Although the fields of ergonomics and information
technology are characterized by the need for detailed analysis, the number of these standards can often
be repulsive to potential users. This sometimes unjustifiably raises the question of their purpose or
need (Stewart, 2000). The ISO 9241 series standard contains a number of parts, grouped in areas, from
software ergonomics, through interaction processes, to physical input devices and means of displaying
information. In addition, they describe the principles of dialogue and presentation of information, the
criteria for the analysis of physical input devices, as well as the framework and recommendations for
tactile, haptic and gestural interactions (Green, 2020).
It is very important to consider the usability of the process, which is described at a high level by the
ISO/IEC 6502x series of standards. They describe how user requirements are specified, report on user
needs, and describe the context of use. ISO/IEC 11581 standards define various user interface objects,
actions that a user can perform and object attributes, object icons, pointer icons, action icons, tool
icons, as well as icons to define the interaction mode. Some standards that define software ergonomics
are in the process of being review. For example, ISO 14915-2: 2003 standard for software ergonomics
of multimedia user interfaces will be replaced by the ISO/CD 9241-115 standard, which will describe
user-system interaction design, user interface design and navigation.
The need for standardization also arises from user comments. The most common user complaints on
the UI are shown in the following table. These relate to non-compliance with user requirements,

G. Janaćković et al. / On standardization in field of user interfaces
276
complexity in performing certain routine operations, difficult identification of interface elements, and
unnecessary routine operations.
Table 4: The most common user complaints Complaints Description
User requirements The UI does not reflect user needs; not all necessary elements or actions are
implemented.
Complexity Performing certain routine operations requires additional mental effort of the user
or the order of execution of actions is not intuitive.
Elements identification UI elements are not visually recognizable compared to other desktop elements or
the appearance does not associate their purpose.
Unnecessary routine
activities
It takes more activities (accessing menus, opening dialogs, clicking the mouse)
than those to which the user is accustomed.
Non-intuitive
commands
Commands (especially gestures or voice commands) differ from local culture or
tradition.
Different users may interpret certain elements of the user interface differently. Also, the local
interpretation of certain elements may differ from one area or country to another, making it difficult to
implement the user interface by adding new specific requirements. Therefore, it is necessary to define
and use symbols of universal meaning, in which standards can also be helpful. Due to the different
physical abilities of users, assistive technologies are becoming more and more important, which
enable users with certain limitations to use computers normally. The ISO/IEC 13066 series standard
defines the requirements and recommendations for the interoperability and functionality of such
devices, i.e. what these devices are expected to provide to users.
Alternative representations of certain content, such as appropriate text instead of images, or visual
representations of audio information, are presented in the ISO/IEC 20071 series of standards. This
group of standards describes, among other things, how to scan visual information for display in textual
form. Standard ways of displaying user interface elements in the form of cursors, icons, navigation
menu need to be supplemented by new ways of communicating with devices, including pen gestures
(ISO/IES 14754) and voice commands (ISO/IEC 30122). The introduction of gestures and voice
commands leads to new problems, which are primarily related to inappropriate localization. For
example, the meaning of a certain gesture is not the same everywhere.
CONCLUSION
Software development is often not accompanied by adequate standardization, due to the large number
of innovations and rapid changes in industry trends. The development of an appropriate standard is
much slower than changes in the software market, so certain solutions proposed by the standards are
often unfairly ignored. Software design, primarily in the field of human-computer interaction, i.e. the
characteristics of the work environment, can benefit from the application of standards. When
introducing standards, attention should be paid to better identification of user requirements, taking into
account their needs, as well as limitations, cultural differences and habits, in order to translate these
requirements into the implementation of better interfaces.
ACKNOWLEDGMENT
The paper presents the results of research supported by the Ministry of Education, Science and
Technological Development of the Republic of Serbia (Agreement No. 451-03-68/2022-14/200148).
EMC 2022, 17-18th June 2022, Zrenjanin, Serbia
277
REFERENCES
Barafort, B., Mesquida, A.-L., & Mas, A. (2017). Integrating risk management in IT settings from ISO standards
and management systems perspectives. Computer Standards & Interfaces, 54 (3), 176-185.
Bevan, N. (2001). International standards for HCI and usability. International Journal of Human-Computer
Studies, 55 (4), 533-552.
Bretschneider-Hagemes, M., Korfmacher, S., & von Rymon Lipinski, K. (2018). The role of standardization for
occupational safety and health (OSH) and the design of safe and healthy human-computer interaction
(HCI). In Duffy, V. (eds) Digital human modelling - applications in health, safety, ergonomics, and risk
management, DHM 2018, Lecture notes in computer science (LNISA), 10917, Cham: Springer, 19-28.
Dawood, K. A., Sharif, K. Y., Ghani, A. A., Zulzalil, H., Zaidan, A. A., & Zaidan, B. B. (2021). Towards a
unified criteria model for usability evaluation in the context of open source software based on a fuzzy
delphi method. Information and Software Technology, 130, 1-15.
Green, P. (2020). ISO Human-computer interaction standards: finding them and what they contain. Proc. of the
HFES 64th international annual meeting, 400-404.
Grozdanović, M., Marjanović, D., Janaćković, G. Lj., Đorđević, M. (2017). The impact of character/background
colour combinations and exposition on character legibility and readability on video display units.
Transactions of the Institute of Measurement and Control, 39 (10), 1454-1465.
Guney, Z. (2019). Considerations for human–computer interaction: user interface design variables and visual
learning in IDT. Cypriot journal of educational science, 14 (4), 731-741.
ISO (2018). ISO 9241-11: 2018, Ergonomics of human-system interaction — Part 11: Usability: definitions and
concepts. International Organization for Standardization, Geneva: Switzerland.
ISO (2020). ISO 9241-110:2020, Ergonomics of human-system interaction — Part 110: Interaction principles.
International Organization for Standardization, Geneva: Switzerland.
Janaćković, G., Mušicki, S., Vasović, D. (2019). Information technology risks: management, standards, and
methods. Proc. of the IX International Symposium Engineering Management and Competitiveness 2019
(EMC 2019), Zrenjanin, Serbia, 179-184.
Janaćković, G., Mušicki, S., Vasović, D. (2020). Information security management standards: a Serbian
experience. Proc. of the 10th International Symposium Engineering Management and Competitiveness
2020 (EMC 2020), Zrenjanin, Serbia, 67-70.
Karwowski, W., Szopa, A., & Soares, M. M. (2021). Handbook of standards and guidelines in human factors
and ergonomics. 2nd ed. Boca Raton: CRC Press.
Lee, D. H. (2014). Review of ISO standards on human-system interaction published during 2008-2013. Journal
of the Ergonomics Society of Korea, 33 (5), 433-452.
Mušicki, S., Janaćković, G., Vasović, D. (2020). Standardization and system standards usage in the field of
occupational and environmental safety. 10th International Symposium Engineering Management and
Competitiveness 2020 (EMC 2020), Zrenjanin, Serbia, 89-92.
Mušicki, S., Janaćković, G., Vasović, D. (2021). OHS management: development perspectives defined by ISO
45000 series of standards. Proc. of the XI International Symposium Engineering management and
Competitiveness 2021 (EMC 2021), Zrenjanin, Serbia, 102-107.
Norman, K. L., & Kirakowski, J. (2018). The Wiley handbook of human computer interaction (Vol. 1). Hoboken,
NJ: John Wiley & Sons Ltd.
Savić, S., Stanković, M., & Janaćković, G. (2021). Teorija sistema i rizika – sistemnost u kontekstu
menadžmenta rizikom. Beograd: Akademska misao, Niš: Fakultet zaštite na radu u Nišu.
Stewart, T. (2000). Ergonomics user interface standards: are they more trouble than they are worth? Ergonomics,
43 (7), 1030-1044.
Video Display Unit Directive 90/270 EEC (1990). Council Directive 90/270/EEC on the Minimum Safety and
Health Requirements for Work with Display Screen Equipment. International journal of comparative
labour law and industrial relations, 6 (3), 209-215.
Xie, Z., Hall, J., McCarthy, I. P., Skitmore, M., & Shen, L. (2016). Standardization efforts: The relationship
between knowledge dimensions, search processes and innovation outcomes. Technovation, 48-49: 69-78.
Zarour, M. (2020). A rigorous user needs experience evaluation method based on software quality standards.
Telecommunication, computing, electronics and control, 18 (5), 2787-2799.

G. Janaćković et al. / On standardization in field of user interfaces
278

279
XII International Symposium Engineering Management and Competitiveness 2022 (EMC 2022)
17-18th June, Zrenjanin, Serbia
Session F: ABSTRACTS
Abstracts (pp. 281-282):
Tashfeen Ahmad
ARTIFICIAL INTELLIGENCE AND BUSINESS MANAGEMENT:
OPPORTUNITIES AND CHALLENGES (ABSTRACT) 281

280

281
XII International Symposium Engineering Management and Competitiveness 2022 (EMC 2022)
17-18th June, Zrenjanin, Serbia
ARTIFICIAL INTELLIGENCE AND BUSINESS MANAGEMENT:
OPPORTUNITIES AND CHALLENGES
Tashfeen Ahmad
The University of the West Indies, Jamaica
E- mail: [email protected]
ABSTRACT
Artificial Intelligence has changed the way we manage and market our businesses. This presentation will
highlight various examples of management and marketing where AI has disrupted what we learn in traditional
business courses. The examples given will be from various sectors and will help you rethink your concepts of
what AI can do by sensitizing you with what AI is already doing. Online available data was collected on how
businesses in various sectors are incorporating AI to improve their functions and what are the challenges they are
facing. From this information, a way forward was developed for the students to prepare a “future proof” career in
business management. Major finding is that the universities need to improve the way they are preparing their
students for the future of commerce. The presentation will also help you rethink your career path in light of
emerging trends in business management. This study is a generalized study and gives an overall state of affair
instead of giving a detailed AI adoption in a particular country. This presentation will help undergraduate
students in rethinking their strategy as they prepare for a career in commerce, marketing and management.
This presentation will share some business ideas to inspire your entrepreneurial thinking.
Key words: Artificial Intelligence, Management, Business, Opportunities, Skills.

282
283
XII International Symposium Engineering Management and Competitiveness 2022 (EMC 2022)
17-18th June, Zrenjanin, Serbia
Author Index
A
Afshari, Ali Reza, Islamic Azad
University, Department of Industrial
Engineering, Shirvan Branch,
Shirvan, Iran
3, 47
AnĊelić, Svetlana, ITS Information
Tehnology School, Belgrade,
Republic of Serbia
25, 157
Antić, Zorana, Belgrade Business and
Arts Academy of Applied Studies,
Belgrade, Republic of Serbia
74
B
Bakator, Mihalj, University of Novi
Sad, Technical Faculty “Mihajlo
Pupin” in Zrenjanin, Republic of
Serbia
11, 80
Bajić, Ţivan, Banka–Poštanska
štedionica, Šabac, Republic of Serbia
204, 209
Bešić, Cariša, University of
Kragujevac, Faculty of technical
sciences, Ĉaĉak, Republic of Serbia
31, 80
Brkić, Aleksandar, Innovation center,
Faculty of Mechanical Engineering,
Belgrade, Republic of Serbia
98
Bogetić, SrĊan, Belgrade Business
and Arts Academy of Applied
Studies, Belgrade, Republic of Serbia
74, 199
Bubanja, Iva, Belgrade Business and
Arts Academy of Applied Studies,
Belgrade, Republic of Serbia
31
C, Ć, Č
Cvjetković, Milena, College of
Academic Studies ”Dositej”,
Belgrade, Republic of Serbia
176, 214
Ćoćkalo, Dragan, University of Novi
Sad, Technical faculty “Mihajlo
Pupin”, Zrenjanin, Republic of Serbia
11, 80
Ćoćkalo-Hronjec, Melita, High school
"Laza Kostić", Novi Sad, Republic of
Serbia
152
Ĉakajac, Boţidar, University of
Kragujevac, Faculty of Economics,
Republic of Serbia
225
D, Đ
Domazet, Ivana, Institute of
Economic Sciences, Belgrade,
Republic of Serbia
231
Đokić, Ines, University of Novi Sad,
Faculty of Economics in Subotica,
Republic of Serbia
237
Đokić, Nenad, University of Novi
Sad, Faculty of Economics in
Subotica, Republic of Serbia
237
ĐorĊević, Dejan, University of Novi
Sad, Technical faculty “Mihajlo
Pupin”, Zrenjanin, Republic of Serbia
11, 80
ĐorĊević, Luka, University of Novi
Sad, Technical faculty “Mihajlo
Pupin”, Zrenjanin, Republic of Serbia
152
ĐorĊević, Ljiljana, Serbian
Environmental Protection Agency,
Republic of Serbia
80
G
Gaborov, Maja, University of Novi
Sad, Technical faculty “Mihajlo
Pupin”, Zrenjanin, Republic of Serbia
137, 152
Gluvakov, Verica, University of Novi
Sad, Technical faculty „Mihajlo
Pupin“, Zrenjanin, Republic of Serbia
137, 142
I
Ilin, Vladimir, University of Novi
Sad, Faculty of Technical Sciences,
Department of Traffic Engineering,
Novi Sad, Republic of Serbia
267
Ivaniš, Miloš, Euro Audit doo,
Belgrade, Republic of Serbia
204, 209
J
Jamili Emami, Ghazal, Department of
Construction Management, Mashhad
Branch, Islamic Azad University,
Mashhad, Iran
47
Janaćković, Goran, University of Niš,
Faculty of Occupational Safety, Niš,
Republic of Serbia
272

EMC 2022, 17-18th June 2022, Zrenjanin, Serbia
284
Janev, Nemanja, University of
Belgrade, Faculty of Mechanical
Engineering, Belgrade, Republic of
Serbia
98
Jakšić, Anja, University of Novi Sad,
Faculty of Technical Sciences,
Republic of Serbia
171
Jeremić, Milica N., ITS Information
Technology School, Zemun,
Belgrade, Republic of Serbia
157
Josimović, Milica, Republic of Serbia 176, 214
Jovanoski, Bojan, Ss. Cyril and
Methodius University in Skopje,
Faculty of Mechanical Engineering,
Republic of North Macedonia
112
Joviĉić, Elena, Institute of Economic
Sciences, Belgrade Republic of Serbia
220, 231
K
Kardanimalekinezhad, Shirin,
Department of Construction
Management, Mashhad Branch,
Islamic Azad University, Mashhad,
Iran
54
Kalinić, Zoran, Independent
University Banja Luka, Banja Luka,
Bosna i Hercegovina
31
Kavalić, Mila, Republic of Serbia 137, 142
Kazaryan, Sarkis, Voronezh State
University, Russian Federation
19
Kovaĉević, Aleksandra, Republic of
Serbia
187
Kreiner, Ješa, California State
University, Fullerton, Los Angeles,
California, USA
25
Kuzmanović, Bogdan, University of
Novi Sad, Faculty of Technical
Science, Novi Sad, Republic of Serbia
146
L
Luković, Stevan, University of
Kragujevac, Faculty of Economics,
Republic of Serbia
225, 242
M
Mehran, Yasaman, Department of
Construction Management, Mashhad
Branch, Islamic Azad University,
Mashhad, Iran
3
Mali, Predrag, University of Novi
Sad, Faculty of Technical Science,
Novi Sad, Republic of Serbia
146
Maljugić, Biljana, Republic of Serbia 86, 181
Marjanović, Darko, Institute of
Economic Sciences, Belgrade,
Republic of Serbia
220, 231
Markoski, Branko, University of Novi
Sad, Technical faculty “Mihajlo
Pupin”, Zrenjanin, Republic of Serbia
171
Matotek, AnĊelić Marija, Technical
College of Applied Studies,
Zrenjanin, Republic of Serbia
86
Milićević, Nikola, University of Novi
Sad, Faculty of Economics, Subotica,
Republic of Serbia
237
Milosavljev, Dragana, University of
Novi Sad, Technical faculty „Mihajlo
Pupin“, Zrenjanin, Republic of Serbia
137, 142
Minovski, Robert, Ss. Cyril and
Methodius University in Skopje,
Faculty of Mechanical Engineering,
Republic of North Macedonia
112
Misita, Mirjana, University of
Belgrade, Faculty of Mechanical
Engineering, Belgrade, Republic of
Serbia
98
Mitić, Siniša, University of Novi Sad,
Faculty of Technical Science, Novi
Sad, Republic of Serbia
146
Mitrašević, Mirela, Univeerzitet u
Istoĉnom Sarajevu, Fakultet poslovne
ekonomije, Bijeljina, Bosnia and
Herzegovina
242
Mitrović, Ksenija, University of Novi
Sad, Faculty of Technical Sciences,
Novi Sad, Republic of Serbia
171
Mohammadi, Sohrab, Department of
Computer, Shirvan Branch, Islamic
Azad University, Shirvan, Iran
62
N
Nikitina, Larisa, Voronezh State
University, Voronezh, Russian
Federation
19
Nikolić, Milan, University of Novi
Sad, Technical faculty “Mihajlo
Pupin”, Zrenjanin, Republic of Serbia
11, 146

EMC 2022, 17-18th June 2022, Zrenjanin, Serbia
285
P
Papić, Neda, University of Belgrade,
Faculty of Mechanical Engineering,
Belgrade, Republic of Serbia
98
Paunović, Vladan, University of
Kragujevac, Faculty of Technical
Sciences, Ĉaĉak, Republic of Serbia
92
Perišić, Martina, University of
Belgrade, Faculty of Mechanical
Engineering, Belgrade, Republic of
Serbia
98
Pjanić, Miloš, University of Novi
Sad, Faculty of Economics, Subotica,
Republic of Serbia
225, 242
Prachenko, Anton, Moscow State
University of Sports and Tourism,
Russian Federation
19
Puzović, Sanja, University of
Kragujevac, Faculty of Technical
Sciences, Ĉaĉak, Republic of Serbia
92
R
Rakić, Slavko, University of Novi
Sad, Faculty of Technical Sciences,
Novi Sad, Republic of Serbia
171
S, Š
Saeedi, Behsa, Department of Project
Management and Construction,
Mashhad Branch, Islamic Azad
University, Mashhad, Iran
67
Sajfert, Dragana, ITS Information
Tehnology School, Belgrade,
Republic of Serbia
25, 157
Saulić, Nenad, University of Novi
Sad, Faculty of Technical Sciences,
Department of Traffic Engineering,
Novi Sad, Republic of Serbia
267
Simić, Dragan, University of Novi
Sad, Faculty of Technical Sciences,
Department of Traffic Engineering,
Novi Sad, Republic of Serbia
267
Slavić, Jelena, Republic of Serbia 248
Sofić, Aleksandar, University of
Novi Sad, Faculty of Technical
Sciences, Republic of Serbia
171
Spajić, Jelena, , University of Novi
Sad, Faculty of Technical Sciences,
Republic of Serbia
171
Spasojević Brkić, Vesna, University
of Belgrade, Faculty of Mechanical
Engineering, Belgrade, Republic of
Serbia
98
Stanisavljev, Sanja, University of
Novi Sad, Technical faculty “Mihajlo
Pupin”, Zrenjanin, Republic of Serbia
11, 137
Stanojeska, Marija, School of
Business Economics and
Management, UACS, Skopje,
Republic of North Macedonia
106, 112
Stošić Mihajlović, Ljiljana, Academy
of Technical and Vocational Studies,
Nis - Department in Vranje, Republic
of Serbia
119
Szabó, László, Budapest Business
Budapest Business School, Faculty of
Finance and Accountancy, Budapest,
Hungary
125
T
Taboroši, SrĊana, Republic of Serbia 86, 181
Tadić, Dijana, Republic of Serbia 129, 163
Tavakolian, Elaheh, Department of
Management, Shirvan Branch,
Islamic Azad University, Shirvan,
Iran
3
Terek Stojanović, Edit, University of
Novi Sad, Technical faculty “Mihajlo
Pupin”, Zrenjanin, Republic of Serbia
11, 142
Tolochko, Sergey, Voronezh State
University, Russian Federation
19
Treshchevskiy, Yuriy, Voronezh State
University, Voronezh, Russian
Federation
19
V
Vasić, Ţivorad, ITS Information
Tehnology School, Belgrade,
Republic of Serbia
25
Vasović, Bojan, Academy of Applied
Studies South Serbia, Leskovac,
Blace department, Republic of Serbia
272
Vasović, Dejan, University of Niš,
Faculty of Occupational Safety, Niš,
Republic of Serbia
272
Veljković, Zorica, University of
Belgrade, Faculty of Mechanical
Engineering, Belgrade, Republic of
Serbia
98

EMC 2022, 17-18th June 2022, Zrenjanin, Serbia
286
Vesić Vasović, Jasmina, University of
Kragujevac, Faculty of Technical
Sciences, Ĉaĉak, Republic of Serbia
92
Vidas-Bubanja, Marijana, Belgrade
Business and Arts Academy of
Applied Studies, Belgrade, Republic
of Serbia
31
Vukajlović, Jelena, Republic of
Serbia
248
Z, Ž
Završnik, Bruno, University of
Maribor, Faculty of Economics and
Business, Slovenia
39, 192
Zhemkova, Aleksandra, Russian
Presidential Academy of National
Economy and Public Administration,
Russian Federation
259
Ţivković, Milorad, International
University of Brĉko District, Brĉko,
Bosnia and Herzegovina
25


