Embed Size (px)
Citation preview

Endogenously Determined CEO Turnover:
The Struggle for Continuance in Listed and Unlisted Firms
Esteban Lafuente*†Universitat Autònoma de Barcelona Department of Business Economics
EDIFICI B. 08193 BELLATERRA (BARCELONA). SPAIN Tel. +34 93 581 1209, Fax: + 34 93 581 2555
Email: [email protected]
Miguel A. García-Cestona† Universitat Autònoma de Barcelona Department of Business Economics
EDIFICI B. 08193 BELLATERRA (BARCELONA). SPAIN Tel. +34 93 581 1209, Fax: + 34 93 581 2555
Email: [email protected]
Draft version: May 12, 2009.
* Corresponding author † We gratefully acknowledge insightful comments by Jose Maria Labeaga and Judit Montoriol. This research was funded by a grant from the Spanish Ministry of Education and Science (SEJ2007-67895-CO4-02/ECON).

Endogenously Determined CEO Turnover:
The Struggle for Continuance in Listed and Unlisted Firms Abstract:
This paper examines the relationship between performance and CEO turnover in Spanish listed and large unlisted firms for the period 1998-2004. Following the Bover and Arellano (1997) approach, we carry out a dynamic binary choice model where the decision to replace a CEO includes lags of the dependent variable, previous performance, and previous changes in the chairman position as endogenous determinants of this governance intervention. We find that for both listed and unlisted firms, previous performance changes are negatively correlated with CEO turnover. Furthermore, listed and unlisted firms follow different paths when taking decisions linked to CEO replacements: whereas unlisted firms are less likely to replace a recently hired CEO, listed companies appear more impatient. Finally, ownership concentration and the presence of banks are also important determinants of CEO turnover decisions, but only for listed firms. Our results give support to the growing call by academics who highlight the importance of controlling endogeneity to correctly examine the determinants of governance interventions.
JEL Classification: C23, G21, G3
Keywords: Corporate governance, CEO turnover, ownership structure

1. Introduction During the last decades, corporate governance literature has remarked the role played by
CEO turnover as a key internal control mechanism, as it helps discipline managers and
alleviate agency costs when there is a separation between ownership and control. CEO
turnover is an important event in the life of a firm, and decisions linked to executive
turnover bring about important consequences in terms of operating and financial
decision making, strategic choices and even the survival of the firm. Nonetheless, this is
not a rare event; in fact, it is a relatively common one in many firms.
The negative relationship between performance and executive turnover has been widely
documented in corporate governance literature (Becht, et al., 2002 and Hermalin and
Weisbach, 2003), and concerns related to ownership structure, board composition, the
role of the markets, amongst others; have become relevant governance features
commonly found to help us achieve a better grasp of the organizational differences
amongst competing firms, as well as to better understand the ways trough which firms
undertake decisions linked to executive turnover.
At this point, academics not only have attempted to address the impact that CEO
turnover has on firm performance (Huson, et al., 2004), but also have studied the
determinants of CEO turnover (Hermalin and Weisbach, 2003). But we focus on a
different issue, as we want to know if this important disciplinary mechanism works
differently for public and private firms and if so, how sensitive is CEO turnover to some
important governance features such as changes in the chairman position, ownership
concentration and structure, and size in conjunction with the exposure to external
controls (listed status).
On one hand, we know that private firms allow higher levels of ownership
concentration and this feature could encourage the choice of participants’ efforts closer
to the first-best levels, once the managers have internalised the different agency costs.
Furthermore, they are not subject to the stock market and the possible economic short-
sightedness problems, that is, the rejection of projects or actions that could be optimal in
the long-term but that do not provide quick short-term results. Also, private firms may
1

face weaker constraints in their contract efforts. All these reasons could favour lower
levels of CEO turnover.
On the other hand, the usual arguments in favour of public firms are the financial
advantages of enjoying a deeper and larger access to finance and the disciplinary
presence of the market pressure, which can be valued by both owners and investors.
Higher levels of separation between ownership and control would accentuate agency
costs and the use of CEO turnover as a disciplinary mechanism would be further
justified. One would expect that large listed firms are more exposed to larger agency
costs.
In addition, there are not many papers addressing the governance differences in private
and public firms. The main reference would be Coles, et al. (2003). These authors find
that private firms are less profitable than similar public firms. In addition, and more
interesting for our purposes, they find that, given changes in accounting profitability
measures, CEO turnover is equally likely to occur in public firms than in large private
firms. Also, Sponholtz (2006) focuses on the determinants of CEO turnover in Danish
public and private firms. She studies the causes of CEO turnover by examining a whole
set of previously unexplored characteristics of the CEO and the firm, such as CEO’s
gender and age, tenure, health, compensation, as well as firm’s activity and leverage.
Despite the evidence and its theoretical implications, current research on the
effectiveness of corporate governance systems suffers from two main weaknesses. First,
an empirical problem related to the estimation approach. Problems like the inclusion of
pairwise observations that strictly show the event of interest (CEO turnover in our case),
and the adoption of econometric techniques that assume that all firms under analysis are
equally likely to replace a CEO are commonly found in the literature. Hermalin and
Weisbach (2003) emphasise a more difficult theoretical issue, which relates to the
difficulties of correctly examining governance mechanisms due to the presence of joint
endogeneity among the variables of interest. In their approach to governance, executive
turnover can be modelled as a function of past performance, as well as past board
characteristics and past board actions, i.e., decisions on executive replacement.
2

We are convinced that the methodological approach can make a difference in the study
of the past performance–CEO turnover relation in public and private firms. In this
paper, we focus on the Spanish case which presents, as in most European countries, an
insider corporate system characterised by high levels of ownership concentration and a
significant participation of banks in many listed firms’ ownership structure. In this
setting, and according to agency theory, one can arguably expect a more active
implementation of internal control mechanisms, since ownership concentration helps
overcome free-rider problems and improves monitoring tasks.
In this sense, does the inverse relation between firm performance and CEO turnover in
public and large private firms coincide with agency postulates? Also, and given the
importance that the exposure to equity markets has as a disciplinary mechanism, could
there be a differential effect when it comes to external control and its impact on CEO
turnover decisions? Furthermore, can we expect that the turnover of poorly performing
CEOs be conditioned by the presence of an active monitoring exerted by large
shareholders?
Our paper addresses these questions by considering the endogenous nature of executive
turnover. Following the approach proposed by Hermalin and Weisbach (2003), we
consider CEO turnover as an endogenous decision conditioned by previous changes in
the CEO and chairman positions, as well as former changes in firm performance. In
particular, we examine the effectiveness of the governance system in Spanish public and
large private companies for the period 1998–2004. This comparison enables us to
correctly examine whether CEO turnover is more intensively activated in firms exposed
to external equity markets, and to analyse the extent to which the poor performance–
CEO turnover relationship holds for firms outside the stock markets.
As for the empirical analysis, we follow the approach proposed by Bover and Arellano
(1997), which implies the estimation of a two-step within estimator for limited
dependent variables, including lags of the dependent variable and other endogenous
explanatory variables. This procedure allows us to include in our model specification
firms that report as well as those that do not experience a change in the CEO position in
the period under analysis.
3

Our paper contributes to the corporate governance literature in several ways. First, and
consistent with different performance measures, we find that CEOs are more likely to be
replaced following poor performance, irrespective of whether the firm is listed or not.
Also, we find that CEO turnover is more sensitive to change in scaled profitability in
public firms than in private firms. This is in accordance with agency theory, where
boards scrutinize CEOs and the threat of dismissal provides incentives to the CEO about
how to run the firm. However, we also find that private companies show more patience,
that is, recently hired CEOs have more time to show their abilities as managers. To the
contrary, boards of listed companies are more diligent monitors, meaning that the
incoming CEO can be replaced anytime, even in her first year as top manager. We
interpret this as evidence that listed companies are more exposed to punishment by
stock markets where (short-term) performance enlightens the way.
Second, we test whether changes in the chairman position increase the probability of
dismissing the CEO. Corporate governance literature provides some insights about the
expected effect of board changes on monitoring. Firms change their chairmen and their
boards to improve the quality of decision making processes and consequently, firm
performance from the shareholders’ perspective (Hermalin and Weisbach, 2003).
Therefore, a change in the chairman position is expected to improve the board’s ability
in its main responsibility: to select, monitor and replace managers. Interestingly, we find
that changes in the chairman position are not linked to future CEO turnover in general,
although a different picture emerges when looking at listed companies. Here, we
observe that when these companies consider changes in the market-to-book value as the
key performance indicator, there is an increase in the probability of replacing a CEO
following a change in the chairman position. As before, we believe that this path reveals
the need for corporate and managerial restructuring after bad years, given the pressure
linked to a greater exposure to external controls in stock markets.
Third, we explore the monitoring role played by banks. Our findings reveal that the
presence of a financial institution as main shareholder increases the probability to
replace an incumbent CEO, however, this relationship is not linked to poor performance
changes. These results are weak, and they hold for both listed and unlisted companies.
4

The remainder of the paper is organised as follows. Section two presents our theoretical
framework and hypotheses. An overview of the main characteristics of the Spanish
institutional setting is introduced in section three. Section four describes the sample and
the methodological approach. A discussion of the empirical results is offered in section
five, and final conclusions are displayed in section six.
2. Theoretical Framework and Hypotheses Over the past decades corporate governance has received increased attention from
academics and practitioners. In particular, academic research on this area highlights the
importance of the monitoring role played by the board of directors to improve the
quality of the firm’s governance system. Thus, there is a general consensus about the
negative relationship between management turnover and firm performance.
In the standard principal–agent framework, it is widely accepted that for a given period
(t) firm performance( can be modelled as a function of the non-observable effort
exerted by the agent (in this case the CEO) to manage the ith firm(
)itr
)itφ , and a set of
independently and normally distributed variables( which is not under the manager’s
control (Holmström, 1979 and Gibbons and Murphy, 1990). Hence, ,
where
)itε
( ),it it itr f φ ε=
0it
it
rφ∂ >∂
and is observable, indicating that firm performance can be seen as an
informative signal about the manager’s ability. We are aware of the difficulty in
separating performance variation due to the CEO skills from performance variation due
to luck. Hence, we follow Kim (1996) and Huson, et al. (2004), and assume that the
estimated effect of firm-specific performance on CEO dismissals becomes a mix of the
effects of skills and luck. This implies that the true effect of luck does not exceed the
true effect of skill, i.e., the coefficient on firm-specific performance is a downward
biased estimate of the actual effect of the CEO skill on the CEO turnover probability.
itr
The agency problem rises from the differences in the objective functions of the principal
and the agent. The principal’s utility is a function of the observed performance ,
whereas the agent’s utility is a function of the observed performance and her
( )( )P r
5

effort , where , meaning that effort is
costly for the agent, a fact that creates the conflict of interest between the two.
( )( ,A r φ ) φ( ) ( ) ( ) ( ), and 0A r U r C Cφ φ= − >
From this simple principal-agent framework, Hermalin and Weisbach (1998) remark
that offers information about the CEO’s ability, and based on this observable measure
the board decides whether or not to replace the CEO. In addition, the board makes an
estimate of the CEO’s ability in t+1 which can be assumed as the expected future
performance(
itr
)1itr + . In period t+1, and based on , the board again will decide whether
or not to replace the CEO. Hence, top management turnover is a process linked to the
monitoring task of the board. When the board receives the observable signal and this
indicates the presence of a poor performing CEO, that is , the board may
exert its monitoring role and replace her to enhance firm performance.
1itr +
, 1 0it itr +Δ <
Empirical evidence examining the presence of an inverse relationship between firm
performance and executive turnover is extensive and it has been carried out in different
countries. Without being exhaustive, we can mention the following: Warner, et al.
(1988), Weisbach (1988), Jensen and Murphy (1990), Denis and Denis (1995), Kim
(1996), Borokhovich, et al. (1996), Parrino (1997), Huson, et al. (2001), Engel, et al.
(2003) and Farell and Whidbee (2003) for the US; Cosh and Hughes (1997), Conyon
(1998), Franks, et al (2001), Conyon and Florou (2002), Dahya, et al. (2002), Hillier, et
al. (2005), and Florou (2005) for the UK; Kaplan (1994a, 1994b, 1995) for Germany,
the US, and Japan; Volpin (2002) and Brunello, et al. (2003) for Italy; Lausten (2002),
as well as Neumann and Voetmann (2005) for Denmark; Maury (2006) for Finland, and
Crespi, et al (2004) for Spain. All these papers support the assumption that the board’s
main objective is to monitor CEO actions and, consequently, the negative relationship
between performance and changes in the position of the CEO can be indicative of the
quality of the governance system in a firm. In this sense, Jensen and Murphy (1990:
238) remark that ‘… managers are more likely to leave their firms after bad years than
after good years and therefore are disciplined by the threat of termination’. Therefore,
the threat of dismissal for poor performance should provide stronger incentives to the
CEO when deciding how to run the firm, which in turn may have an impact on the
probability of CEO turnover. In addition, academic efforts have recently been made in
order to examine the effectiveness of governance systems in emerging economies.
6

Gibson (2003) for eight emerging economies, and Kato and Long (2006) for China,
show that governance systems in emerging contexts become as effective as the ones in
more developed economies, although the presence of active monitors seems to play a
significant role.
In their survey, Hermalin and Weisbach (2003) highlight that other than poor
performance, several factors may affect the probability of CEO turnover, such as the
presence of large investors and the participation in stock markets. In the latter case, both
product market competition and an active market for managers stimulate the survival of
the most efficient firms and foster efficiency by improving managerial incentives.
Consequently, competition may act as a substitute of internal governance mechanisms
because it positively affects firm performance. Despite the fact that most literature on
CEO turnover focuses on listed companies, we can find some academic documents that
compare the intensity of CEO replacement decisions between listed and unlisted firms.
Kaplan (1995) reports that, for his small sample of German listed and unlisted firms,
CEO turnover is more sensitive to poor stock returns and loss of earnings, but weaker
for accounting growth measures. Giannetti (2003) examines, for listed and unlisted
firms in eight European countries, how corporate finance decisions are affected by legal
rules and the degree of financial development. She finds that firms are more leveraged
in countries with less developed stock markets, and that unlisted firms are
systematically more indebted than listed firms. In addition, Nam and Ronen (2004)
report that, for the US, the stock market punishes those firms that hire managers who
were previously at firms that had poor performance records. Berzins, et al. (2008)
analyse the governance characteristics of Norwegian listed and unlisted firms. These
authors report that ownership concentration decreases with firm size, and that unlisted
firms have a higher level of concentration with less proportion of institutional
shareholding. They also find that unlisted firms have better operating performance
results (ROA), and that the listed status matters for improving governance practices and
for creating economic value. From all these arguments our first hypothesis emerges:
H1: (a) CEO turnover is negatively related to changes in firm performance.
(b) The negative relationship between CEO turnover and changes in performance
becomes stronger for listed companies.
7

The economic literature dealing with corporate governance usually assumes that all
firms are equally likely to implement control mechanisms, i.e., no assumption is made
for those firms that previously replaced either the CEO or the chairman in order to
enhance performance. But this is a major concern with studies on control mechanisms
and firm performance, since as Hermalin and Weisbach (2003) pointed out, both CEO
replacements and changes in the board, as well as corporate performance may be
endogenously determined events of a simultaneous process. Following these authors,
we argue that the decision to replace the CEO is linked to previous changes in the CEO
position, previous firm performance and the decisions concerning changes in the board
(in our case, changes in the chairman position). At this point, we consider important to
remark that we only consider those chairman replacements that occurred in firms where
the CEO and chairman positions are not vested in the same person (two-tier leadership
structure). Consequently, the intensity and effectiveness in the implementation of
control mechanisms are conditioned by firm-specific factors, since there is not a unique
threshold for all firms beyond which poor performance leads the board to replace an
incumbent CEO.
Therefore, an important question rising is how sensitive are boards to replace the CEO
if they have previously done it? One would think that recently appointed CEOs have
strong incentives to perform well. In fact, to survive as a CEO, she needs to improve her
reputation by impressing the board with her ability to run the firm (Fama, 1980). In
addition, to effectively monitor a CEO the board needs to learn about CEO’s ability by
acquiring signals about her effort( )r . Hence, those firms that have recently undergone a
change in the CEO position might be reluctant to replace the incoming CEO. Empirical
evidence dealing with path dependency of CEO replacement decisions is almost
inexistent. Hillier, et al. (2005) study the disciplinary effect that equity insurance has on
CEO replacement decisions in UK listed companies. Anecdotic results provided by
these authors show a negative and significant relationship between the probability to
replace a CEO and past CEO turnover. This leads us to formulate our second
hypothesis:
H2: The probability of CEO turnover diminishes for recently appointed CEOs
8

Our second control mechanism of interest relates to the board, and more specifically, to
changes in the chairman position. We focus on the chairman because his role is closely
tied to the CEO. A CEO can exert some influence on the chairman and other board
members, but certain sound decisions (strategic design, financial and dividend policies)
are exclusively reserved to the board, and in these cases the chairman may play a
significant role. The primary task of the chairman is not restricted to the monitoring of
the CEO, since he is also in charge of the nomination and appraisal processes of board
members, which reinforces his central role in the board.
Thus, when a firm is under-performing the principal may interpret that the board is not
conducting an effective monitoring over managers, and hence, the principal may decide
to replace the chairman (and other board members) in order to increase the alignment of
interests between shareholders and management. In this scenario, the outgoing chairman
is punished, and the incoming person chairing the board can show a more active
involvement in monitoring tasks when evaluating the CEO, signalling his competence
and expertise to both the principal and the manager’s market (Weisbach, 1988 and Fama
and Jensen, 1993). From this argument our third hypothesis emerges:
H3: (a) The appointment of a new chairman increases the probability of CEO turnover.
(b) The positive relationship between the appointment of a new chairman and
CEO turnover is stronger for listed companies.
Finally, we explore the role played by ownership structure. Academic research has
traditionally addressed the question of whether ownership exerts an impact over firm
performance, and results emerging from this effort are inconclusive. Hill and Snell
(1988) and Agrawal and Mandelker (1990) for the US; Kaplan and Minton (1994) and
Morck, et al. (2000) for Japan and Gorton and Schmidt (2000) for Germany report a
positive relation between ownership and performance. However, Leech and Leahy
(1991) and Mudambi and Nicosia (1998) for the UK; and Lehmann and Weigand
(2000) find that ownership concentration destroys value. In addition, Bøhren and
Ødegaard (2003) find that, in the case of Norwegian listed firms, outside ownership
destroys value whereas direct ownership is positively correlated to firm value. Finally,
Spanish literature dealing with ownership issues has mainly examined the ownership-
performance relation. For instance, Gutiérrez and Tribó (2004) examine the role of
9

ownership structure with multiple shareholders in listed and unlisted Spanish firms.
These authors show that ownership concentration and the type of controlling group vary
according to the characteristics of the firm. More specifically, firms participating in
stock markets and firms with larger rents are more likely to be controlled by a group of
shareholders with larger stakes. Also, De Miguel, et al. (2004 and 2005) find that
ownership concentration has a non-linear impact over Spanish firm’s value, and that
expropriation increases for highly concentrated firms.
In this paper, we are interested in examining to what extent the presence of large
shareholders affects the quality of corporate governance in Spanish firms. It is often
argued that ownership concentration mitigates free-riding problems of corporate control
associated with a scattered principal. Likewise, large investors have the incentive to
exercise a closer oversight and control of management, in order to reduce agency costs
and increase their monitoring role in the companies where they invest. Nevertheless,
large shareholders also have a strong preference for control, an this could lead to the
expropriation of minority shareholders’ wealth. Furthermore, Shleifer and Vishny
(1997: 758) remark that ‘…large investors represent their own interests, which need not
coincide with the interests of other investors of the firm, or with the interests of
employees or managers. In the process of using his control rights to maximize welfare,
the large investor can therefore redistribute wealth – in both efficient and inefficient
ways – from others’. Thus, the threat of expropriation may limit the ability of firms with
high ownership concentration to raise fresh funds from borrowing or share offerings.
This reduced liquidity capacity could also have negative (informational) implications
for a firm’s share value, and this would negatively affect market-oriented performance
measures (Holmström and Tirole, 1993).
Despite these concerns, and given that small shareholders have no incentives to monitor
managers in contexts characterised by high levels of ownership concentration, it is also
argued that one way to improve the quality of corporate governance is to ensure the
presence of (at least) one large shareholder.
More specifically, we focus on the role played by banks as owners. This is because in
Spain, as it occurs in Germany or Japan, banks have widened their traditional lending-
borrowing activities, leading to an increase in their presence as shareholders in listed
10

companies. Additionally, recently enacted European rules, together with the
deregulation of the Spanish financial system have enlarged this phenomenon.
Furthermore, Crespi and Garcia-Cestona (2002) highlight that the privatisation process
undergone in Spain facilitated banks the access to former state-owned firms by
replacing the State as main shareholder. The presence of a bank in a firm’s ownership
structure may be interpreted as evidence of their commitment to that firm, and this may
encourage small investors to become shareholders in these firms. Obviously, banks
might be tempted to expropriate minority shareholders, but financial market pressure
tends to hinder banks impulses to expropriate because the minority shareholders always
retain the option to take their investment elsewhere with minor costs.
Concerning the impact that ownership structure has on decisions related to top
management replacements, the empirical evidence is far from conclusive. Whereas
Weisbach (1988), Cosh and Hughes (1997) and Neuman and Voetmann (2005) find no
significant effect of ownership on CEO replacement decisions, Crespi, et al. (2004) and
Maury (2006) report a positive relationship between ownership structure and CEO
turnover. A possible explanation emerges when considering that controlling
shareholders can be institutions, board members and even top executives. Therefore, the
corporate governance forces of managerial competition, board monitoring, and large
shareholdings become interrelated (Warner, et al., 1988). This argument is supported by
Volpin (2002) who finds that, for the Italian case, CEO turnover is more sensitive to
poor performance when a coalition of shareholders (syndicates) controls the firm. Also,
Brunello, et al. (2003) report that the CEO turnover-performance relationship in Italian
listed firms is weaker when the CEO is also a large shareholder.
Finally, ownership concentration can also create costs within the firm that may
outweigh its benefits over some intervals of the distribution of ownership concentration.
In this sense, Zwiebel (1995) remarks that ownership concentration works differently in
accordance with the characteristics of the largest shareholder. This implies that, along
with ownership concentration, information about the presence of banks as main
shareholders could also be a relevant variable which helps explain CEO turnover paths.
The presence of banks as shareholders is potentially critical for an efficient governance
system, as banks are specialist in monitoring (Diamond, 1984), they are stable investors
11
able to provide funds to the firm to diminish the negative consequences of different
shocks, and finally, when a bank combines its role of shareholder to that of debtholder
is more likely to renegotiate debt contracts in order to alleviate financial difficulties
(Berlin, et al., 1996). In addition, the analysis of the effect that bank shareholding may
have on the implementation of governance mechanisms is especially relevant in the case
of Spain, where banks are important shareholders of listed firms (Crespi and Garcia-
Cestona, 2002). In this sense, evidence by Maury (2006) show that Finnish listed firms
controlled by a financial institution are more willing to replace poor performing CEOs,
as compared to firms controlled by the State of family groups. From these arguments
come our last hypothesis:
H4: (a) Ownership concentration improves monitoring and increases the probability to
replace an incumbent CEO.
(b) The positive relationship between ownership concentration and CEO turnover
is stronger in companies controlled by financial institutions.
3. Institutional setting in Spain According to La Porta, et al. (1999), Spain is a French civil law country where, as in
most European countries, the stock market shows an insider corporate system
characterized by high ownership concentration rates. Whereas in the US and the UK the
three largest shareholders control an average of 20% of the firm’s shares, in Spain this
rate stands at 50% (La Porta, et al., 1999). Given this fact, one could argue that, in
Spain, agency conflicts are more likely to occur between large shareholders and
minority shareholders, increasing the interest of (large) investors for participating in
corporate sound decision-making processes. However, the presence of large ownership
concentration structures might be consequence of a weaker investor protection, as
compared to the legal framework in the US, the UK, Germany, and Japan (La Porta, et
al., 1998). This increases expropriation risks, and consequently, the protectionist
behaviour exhibited by large shareholders as well.
Concerning the characteristics of the main shareholders, Crespi and Garcia-Cestona
(2002) and Faccio and Lang (2002) report that State shareholdings in Spanish listed
firms are almost negligible because of the privatisation processes undergone in the
12

nineties; being family groups and financial firms the most frequent large shareholders in
these companies.
As for the role of boards, Barca and Becht (2002) show that, in Spain, board members
in listed companies are more actively involved in management tasks, in accordance with
their conciliatory role between shareholders and managers. To the contrary, boards in
outside-oriented countries (especially in the US and the UK) operate more as a control
mechanism which main objective relies on mitigating conflicts between managers and
shareholders.
Finally, the number of listed firms in Spain has increased in the last decade, however, it
is still relatively small and there is a large number of medium-sized firms participating
in stock markets. This stands as a key feature, since the joint participation of large
corporations and medium-sized firms in Spain’s stock markets enables us to examine
top executive replacement decisions in listed and large unlisted firms.
One could argue that, relative to unlisted firms, listed companies disclose more
information, have a lower cost of capital (Pagano, et al., 1998), and tend to protect
minority shareholders (Reese and Weisbach, 2002). However, a direct comparison
between listed and large unlisted firms becomes relevant not only to evaluate the quality
of the governance system in firms facing with a similar agency problem, but also to
corroborate whether the exposure to external equity markets increases the quality of the
governance system in Spanish listed firms.
4. Methodology 4.1 Data and variable definition
The information to carry out this paper comes from two sources. First, we used the
Spanish database SABI (Sistema de Análisis de Balances Ibéricos) provided by Bureau
Van Dijk, as well as annual reports available from the Spanish Stock Exchange Market.
Accounting and organisational data was collected for a sample of 3,254 listed and large
unlisted companies.
13

Given the purpose of our study, and in the interest of following a rigorous methodology,
we carried out a sampling procedure aiming to ensure the robustness of our results.
First, unlisted firms were included in the sample on the basis that their total assets and
sales were located at least in the lower quartile of Spanish listed companies. Second, we
included in our final sample only those firms for which a complete dataset of CEO and
chairman replacements can be clearly identified.
Thus, our final sample comprises information for 1,493 listed and large unlisted Spanish
companies over the period 1998–2004. The number of listed firms in our dataset varies
between 89 in 1998 and 103 in 2004, and this only reflects new incorporations into
Spanish stock markets. Furthermore, we obtained information concerning the market-to-
book value for Spanish listed companies from Thomson Reuters Datastream©. At this
point, it is important to remark that we excluded banking firms from our final sample,
mainly because these firms are subject to different regulatory regimes, and they show
significant operating differences with respect to firms in other industries. In addition,
we excluded from the listed sample the company Telepizza, because reliable
information about CEO replacements and the market-to-book ratio were not available
neither from Spanish data sources nor from Thomson Datastream©.
Concerning the industry configuration of our sample, we obtained from our final data
the industry code for each firm based on the four-digit NACE classification. For
illustrative purposes, we catalogued the different industries in six categories (extractive,
manufacturing, distributive, business services, retail trade, and local market activities).
This aggregation allows us to present the industry configuration of our sample more
clearly. The highest proportion of both listed and unlisted firms is found in the local
market sectors (NACE codes: 1500–1799 and 6000–9305, excluding financial services),
which represents the 48.57% of the listed firms, whereas 33.29% of unlisted firms
operate in these sectors. Extractive firms (NACE codes: 0700–1499) represent 2.86%
and 1.65% of the listed and unlisted firms, respectively. Manufacturing firms (NACE
codes: 2000–3999) account for nearly 26% of the listed sample, whereas this proportion
stands at 35% in the unlisted sample. The proportion of distributive firms (NACE
codes: 4000–5199) is very similar when comparing listed (19.05%) and unlisted firms
(21.38%) in our final sample. Firms in the business service sectors (NACE codes:
7300–7399 and 8700–8799) only represent the 0.95% and the 0.22% of the listed and
14

unlisted firms in our sample, respectively. The major disparity is found in the Retailers
(NACE codes: 5200–5999) where the proportion of unlisted firms operating in these
sectors (8.82%) almost triples the value reported for the listed sample (nearly 3%).
Concerning the dependent variable, we measure CEO turnover as a dummy variable
taking the value of one if the identity of the CEO changed in two consecutive years. At
this point, an important qualification is also in order. We are aware about the costs of
jointly examining the effectiveness of governance systems in listed and unlisted firms.
In this sense, our data present two main shortcomings. First, because the characteristics
of our data, CEO turnover refers to all kind of dismissals. Nevertheless, voluntary
turnovers, usually linked to retirement or promotions, are unlikely to be correlated to
previous performance and these type of changes only add noise to our dependent
variable, which can lead to downward biased results (Hermalin and Weisbach, 2003,
and Huson et al., 2004). Second, exact departure dates are not available, especially for
unlisted companies, and this could affect our results. To solve this, and to avoid
potential miss-specification problems, in our econometric analysis we introduce lagged
terms of both exogenous and endogenous variables, that is, prior to the year that the
change in the CEO position took place.
It is also important to remark that Spanish listed firms are not homogenous, and firms
registered in the main stock market (IBEX-35) show important differences with respect
to those firms operating in other Spain’s stock markets. As we will see below, these
firms are not only larger, but also global players with different governance
characteristics. Therefore, we split the sub-sample of listed firms for descriptive and
analytical purposes in two groups: IBEX and non-IBEX firms.
Our final sample allows us to document 1,679 CEO replacements between 1998 and
2004, 127 of which took place in listed companies, and 1,552 occurred in unlisted firms.
From Table 1 we observe that listed companies show a significantly higher CEO
turnover rate (18.42%), as compared to that shown by unlisted firms (15.90%). In a
different way, unlisted companies show a slightly lower average number of CEO
replacements (1.12), as compared to the average number of events shown by listed
companies (1.25) between 1998 and 2004. No significant difference was found when
15

comparing the CEO turnover rate in the IBEX-35 firms (18.75%) and firms registered
in the rest of Spain’s stock markets (18.29%).
Table 1. CEO turnover: Descriptive statistics The sample includes information for 103 listed and 1,390 large unlisted Spanish firms for the period 1998 and 2004. CEO turnover is a dummy variable equal to one if we identify a change in the CEO position. The average number of CEO replacements indicates, for each firm in our sample, how many changes in the CEO position took place. The univariate test compares, for each variable, the difference in the mean values between listed and unlisted firms. Standard deviation is presented in brackets.
Listed companies Unlisted companies Overall Mean
(Std. dev.) Obs. Mean (Std. dev.) Obs. Mean
(Std. dev.) Obs.
CEO turnover 0.1842 *(0.3879) 685 0.1590
(0.3657) 9,766 0.1607 (0.3627) 10,451
Average number of CEO replacements
1.2451 (0.9058) 103 1.1157
(0.9886) 1,390 1.1246 (0.9833) 1,493
*, **, *** indicates significance at the 0.10, 0.05, and 0.01 level, respectively.
We further explore the characteristics of our sample of CEO replacements (Table 2).
Here it can be seen that, in our sample, CEOs are more exposed to replacement in listed
companies (nearly 80% of these firms report a change in this position). Also, 54% of the
IBEX firms showed one CEO replacement (19 firms). Concerning the number of
changes, 70% of listed firms report up to two CEO replacements during the period
under analysis (this figure stands at 79% for the IBEX firms), whereas only 59% of
unlisted firms have one or two CEO replacements (Table 2).
Table 2. Sample frequencies for CEO turnover The sample includes information for 103 listed and 1,390 large unlisted Spanish firms for the period 1998 and 2004. The table shows the distribution of firms in our sample according to the number of changes in the CEO position.
Listed companies Unlisted companies Overall Number of changes in the CEO position
Number of Firms % Number of
Firms % Number of Firms %
0 22 21.36 431 31.01 454 30.341 45 43.69 519 37.34 564 37.782 27 26.21 308 22.16 335 22.443 8 7.77 113 8.13 121 8.104 1 0.97 17 1.22 18 1.215 2 0.14 2 0.13
Number of firms 103 100 1,390 100 1,493 100
16

We are also interested in examining to what extent incoming CEOs are likely to be
removed. Table 3 presents, for those CEOs hired between 1998 and 2004, the average
speed of replacement as well as the frequency distribution for these events. Here, we
observe some differences in the removal time-span when comparing listed and unlisted
companies. The average tenure of incoming CEOs is similar for listed and unlisted
companies. However, the majority of dismissals in listed companies is concentrated in
the second and third years of operations (78%), but for unlisted firms replacements are
more scattered: 40% of CEOs hired between 1998 and 2004 were fired after the second
year, and more than 14% of these replacements took place after the fourth year (Table
3).
For listed companies that have undergone two changes in the CEO position, the time of
the removal was concentrated in the second year of operations of the incoming CEO
(56%). For those firms registered in the IBEX-35 index, 43% of incoming CEOs were
removed in the second year of operations. In the case of the sub-sample of unlisted
firms that went through two CEO changes, over 46% of these CEOs were replaced after
the second year (Table 3). We also observe important differences in the distribution of
firms that replaced three times the CEO. Whereas in listed companies the proportion of
replacements is more concentrated in the third year of tenure (62.50%) than in the
second one (37.50%), the opposite distribution is found in unlisted firms (61% of CEOs
were replaced in their second year and 30% were removed in the third period).
Finally, a few chosen number of firms replaced the CEO more than three times. These
troubled companies only account for 4.20% of the total group of firms that replaced the
CEO two or more times, however, the proportion of unlisted firms (4.32%) almost
doubles the rate of 2.78% exhibited in the listed sub-sample (just one firm) (Table 3).
17

Table 3. Sequence of replacement for incoming CEOs The table presents, by the number of changes in the CEO position, the distribution of firms in our sample according to the average turnover speed of incoming CEOs. The sample includes information for those listed and large unlisted firms that experience at least two changes in the CEO position between 1998 and 2004. Average tenure indicates the mean time (years) that incoming CEOs run the firm. Columns for the average turnover speed show the number of firms that replaced their incoming CEOs, according to the number of full years that the incoming CEO held the position before to be replaced.
Number of firms according to the average turnover
speed of the incoming CEO Number of changes in the CEO position
Average Tenure (Years)
Number of Firms 1 year
Between 1 and 2 years
Between 2 and 3 years
Between 3 and 4 years
More than 4 years
Panel A: Listed Sample
2 2.7241 27 2 15 4 6 0 3 2.4375 8 0 3 5 4 1.3333 1 0 1 5 Overall 2.6343 36 2 19 9 6 0 Panel B: Unlisted Sample
2 2.8827 308 55 110 43 36 64 3 2.0531 113 10 69 34 4 1.6275 17 0 17 5 1.5000 2 0 2 Overall 2.6129 440 65 198 77 36 64 Panel C: Full Sample
2 2.8690 335 57 125 47 42 64 3 2.0785 121 10 72 39 4 1.6111 18 0 18 5 1.5000 2 0 2 Overall 2.6145 476 67 217 86 42 64
As regard our set of independent variables, we follow Hermalin and Weisbach (2003)
and Huson, et al. (2004), and performance is measured through two variables based on
accounting information: the ratio of operating profit to total assets (ROA) and the ratio
of net profit to equity (ROE). To control for industry effects, and as Huson, et al. (2001)
and Huson, et al. (2004), we also create an adjusted version of these accounting
measures by subtracting the median value of the corresponding measure for all firms in
our sample with the same two-digit NACE industry code. We use a two-digit industry
18

definition to capture similarities among firms operating in the same sector, and this
classification has proved to be as effective as industry definitions based on three- or
four-digit groupings (Huson, et al., 2004). Over 97% of the sample firms are industry-
matched at the two-digit level, and for those firms with no direct comparison group,
based on the two-digit NACE definition, we proceed as Huson, et al. (2004) by
subtracting the median performance value of a control group with the same one-digit
NACE code. Since we aim to examine the differential impact that performance has on
the probability to replace a CEO, we introduce the unadjusted and industry-adjusted
accounting variables as changes between periods t-2 and t-1, that is, . 2, 1t tr− −Δ
From Table 4 we observe that average ROA is 5.99%, whereas mean ROE is 8.36%. In
addition, it can be noticed that firms participating in the stock market are the largest in
terms of size, and they also show the highest ROE ratio for the period under analysis
(9.14%). Differences in size are also remarkable when comparing the IBEX and non-
IBEX firms, being the mean size of the former group (5,620 millions of euro)
significantly larger, at the 1% level, than that showed by the latter (390 millions of
euro).
Concerning ROA, the highest ratio is shown by the unlisted firms (6.13%), which are
the smallest in terms of size, and this rate is significantly different at the 1% level than
that shown by listed firms (3.97%). The average change in ROA from year –2 to year –
1 ( )2, 1t tr− −Δ is 33.42%, (17.54% and 34.50% for listed and unlisted firms, respectively),
and this variation rate stood at –40% and 19.40% for those listed and unlisted firms that
replaced the CEO, respectively (significant at the 5% for listed firms). The mean ROE
change for the listed and unlisted sub-samples is 47% and 45%, respectively, but over
years –2 and –1 preceding the CEO replacement the mean change exhibited by listed
and unlisted firms was 14% and 33%, respectively. Differences in the mean ROE
change are not significantly different from zero. Also, there is no significant difference
between the ROA and ROE ratios exhibited by the IBEX firms (3.29% and 10.97%,
respectively) and the non-IBEX firms (4.24% and 8.43%, respectively). As for the
median industry-adjusted performance measures, we observe that listed firms show
smaller values than the unlisted sub-sample, but differences are only significant when
ROA is the performance variable (Table 4). For listed firms, the mean change in the
19
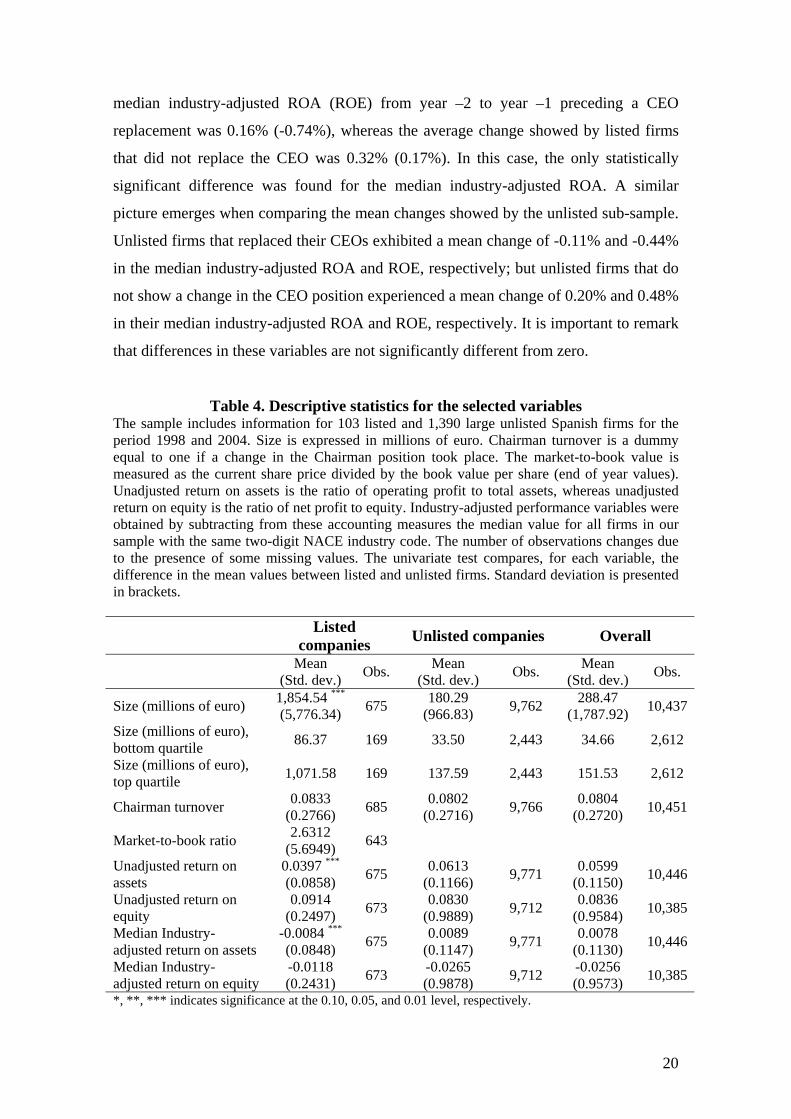
median industry-adjusted ROA (ROE) from year –2 to year –1 preceding a CEO
replacement was 0.16% (-0.74%), whereas the average change showed by listed firms
that did not replace the CEO was 0.32% (0.17%). In this case, the only statistically
significant difference was found for the median industry-adjusted ROA. A similar
picture emerges when comparing the mean changes showed by the unlisted sub-sample.
Unlisted firms that replaced their CEOs exhibited a mean change of -0.11% and -0.44%
in the median industry-adjusted ROA and ROE, respectively; but unlisted firms that do
not show a change in the CEO position experienced a mean change of 0.20% and 0.48%
in their median industry-adjusted ROA and ROE, respectively. It is important to remark
that differences in these variables are not significantly different from zero.
Table 4. Descriptive statistics for the selected variables The sample includes information for 103 listed and 1,390 large unlisted Spanish firms for the period 1998 and 2004. Size is expressed in millions of euro. Chairman turnover is a dummy equal to one if a change in the Chairman position took place. The market-to-book value is measured as the current share price divided by the book value per share (end of year values). Unadjusted return on assets is the ratio of operating profit to total assets, whereas unadjusted return on equity is the ratio of net profit to equity. Industry-adjusted performance variables were obtained by subtracting from these accounting measures the median value for all firms in our sample with the same two-digit NACE industry code. The number of observations changes due to the presence of some missing values. The univariate test compares, for each variable, the difference in the mean values between listed and unlisted firms. Standard deviation is presented in brackets.
Listed companies Unlisted companies Overall
Mean (Std. dev.) Obs. Mean
(Std. dev.) Obs. Mean (Std. dev.) Obs.
Size (millions of euro) 1,854.54 ***
(5,776.34) 675 180.29 (966.83) 9,762 288.47
(1,787.92) 10,437
Size (millions of euro), bottom quartile 86.37 169 33.50 2,443 34.66 2,612
Size (millions of euro), top quartile 1,071.58 169 137.59 2,443 151.53 2,612
Chairman turnover 0.0833 (0.2766) 685 0.0802
(0.2716) 9,766 0.0804 (0.2720) 10,451
Market-to-book ratio 2.6312 (5.6949) 643
Unadjusted return on assets
0.0397 ***
(0.0858) 675 0.0613 (0.1166) 9,771 0.0599
(0.1150) 10,446
Unadjusted return on equity
0.0914 (0.2497) 673 0.0830
(0.9889) 9,712 0.0836 (0.9584) 10,385
Median Industry- adjusted return on assets
-0.0084 ***
(0.0848) 675 0.0089 (0.1147) 9,771 0.0078
(0.1130) 10,446
Median Industry- adjusted return on equity
-0.0118 (0.2431) 673 -0.0265
(0.9878) 9,712 -0.0256 (0.9573) 10,385
*, **, *** indicates significance at the 0.10, 0.05, and 0.01 level, respectively.
20

An additional measure is used for listed companies: the market-to-book value measured
as the current share price divided by the book value per share. For this variable,
information from Thomson Datastream© is incomplete for five listed companies in our
sample. We point out that after the peaked in 1999 (3.50), this performance variable
shows a slight decreasing trend until 2002 (1.82). But after this year, mean values for
this ratio in our listed sample report an increase up to 2.77 in 2004. For this variable, the
mean value showed by firms registered in the IBEX-35 (3.99) is significantly different
from zero at the 1% than that reported for firms operating in other Spain’s stock markets
(2.12). The mean change in this variable from year –2 to year –1 preceding CEO
replacements is statistically significant at the 10%: –13% for firms that changed the
CEO, and nearly 1% for listed firms that did not experience a change in the CEO
position.
Concerning the chairman dismissal, we create a dummy variable that takes the value of
one if the firm experienced a change in the chairman position in two consecutive years,
and zero otherwise. In order to follow a rigorous methodology, we introduce this
variable in our econometric model as a lagged term. Also, and to avoid collinearity
problems, we only consider those chairman dismissals that occurred in firms with a dual
leadership structure, i.e., when the titles of CEO and chairman are not vested in the
same person. It can be seen that, in our sample, the rate of chairman turnover is 8.04%,
and no significant difference was found between the rate shown by listed (8.33%) and
unlisted companies (8.02%). However, the mean chairman removal rate in the IBEX-35
firms (5.73%) is significantly lower, at the 10% level, than the rate shown by firms
operating in other stock markets (9.35%).
Finally, we consider ownership structure in our analysis. From Table 5 we notice that
ownership concentration characterises Spanish companies. Whereas in listed companies
the main shareholder on average controls nearly a third of shareholder’s equity (32%),
in unlisted firms this figure stands at 78%. In addition, shareholders other than the
largest seem to have some power: the mean stake held by the second and third largest
shareholder is on average 21% and nearly 10%, being these values significantly lower in
our listed sample (Table 5). We find no significant differences when comparing the
IBEX and non-IBEX firms in terms of the stake held by the largest (30.83% for the
21

IBEX firms and 32.60% for the non-IBEX firms), the second largest (11.09% and
12.43%) and the third largest shareholder (7.42% and 7.50%).
Table 5. Ownership characteristics The sample includes information for 103 listed and 1,390 large unlisted Spanish firms for the period 1998 and 2004. The table shows the average stake held by the three largest shareholders. Financial institution as main shareholder is a dummy equal to one if a banking firm is the main shareholder. The number of observations changes due to the presence of some missing values. The univariate test compares, for each variable, the difference in the mean values between listed and unlisted firms. Standard deviation is presented in brackets.
Listed companies Unlisted companies Overall
Mean (Std. dev.) Obs. Mean
(Std. dev.) Obs. Mean (Std. dev.) Obs.
Stake held by the largest shareholder
0.3210 ***
(0.2415) 684 0.7801 (0.3000) 9,357 0.7488
(0.3181) 10,041
Stake held by the second largest shareholder
0.1205 ***
(0.0756) 632 0.2280 (0.2154) 3,497 0.2116
(0.2042) 4,129
Stake held by the third largest shareholder
0.0748 ***
(0.0469) 611 0.1108 (0.0913) 1,356 0.0996
(0.0819) 1,967
Financial institution as main shareholder
0.2018 ***
(0.4016) 684 0.0084 (0.0912) 9,766 0.0210
(0.1435) 10,450
*, **, *** indicates significance at the 0.10, 0.05, and 0.01 level, respectively.
We also control for the type of shareholder. Specifically, and considering the key role
played by financial institutions in Spain firms’ monitoring (Casasola and Tribo, 2004),
we introduce a dummy variable taking the value of one if the main shareholder is a
financial institution, and zero otherwise. As expected, in our sample financial
institutions have a strong preference for listed firms: they are the main shareholder in
20% of Spanish listed companies, but their presence in unlisted firms is almost
negligible (less than 1%). Moreover, and amongst listed firms, banks are the largest
shareholder in 33% of firms registered in the main Spain’s stock market (IBEX-35),
whereas for 15% of firms operating in other Spain’s stock markets a financial institution
is the largest shareholder (mean values are significantly different from zero at the 1%
level).
Concerning ownership structure, Table 6 presents the degree of concentration according
to the number of shareholders (1, 2, and more than 2). Despite that those listed firms
with reliable information for only one or two shareholders are highly concentrated (the
largest shareholder controls over 55%), the vast majority of listed firms show a
22

dispersed ownership structure, with a non-controlling largest shareholder holding on
average nearly 29% of shareholder’s equity, and a second largest shareholder owning on
average 12%. We also note that ownership in firms operating in the IBEX-35 index is
more scattered, and for firms with more than 3 large shareholders (32 firms) the largest
shareholder controls nearly 26% of shareholder’s equity, whereas the mean stake held
by the largest shareholder in firms operating in other Spain’s stock markets is 30%
(mean values are significantly different from zero at the 5% level). In the case of the
second and third largest shareholders, mean values reported by the IBEX (11.43% and
7.42%, respectively) and non-IBEX firms (12.29% and 7.50%, respectively) are not
significantly different at conventional levels.
In the case of the unlisted sample, we observe that these firms are mainly controlled by
one shareholder. Our sample of unlisted firms show a more concentrated ownership
concentration, where the average stake held by the largest shareholder is over 50%, no
matter the number of shareholders (Table 6).
Table 6. Ownership structure The sample includes information for 103 listed and 1,390 large unlisted Spanish firms for the period 1998 and 2004. The table presents the average stake held by the three largest shareholders, according to information available about the number of shareholder in the firm. The univariate test compares, for each type of shareholder (largest, second largest or third largest), the difference in the mean ownership stake between listed and unlisted firms.
Average ownership concentration
Number of shareholders Obs. Largest shareholder
Second largest shareholder
Third largest shareholder
Panel A: Listed Sample 1 52 0.5911 *** 2 21 0.5735 * 0.1215 ** 3 (and more) 611 0.2881 *** 0.1204 *** 0.0748 ***
Panel B: Unlisted Sample 1 5,860 0.8690 2 2,141 0.7068 0.2179 3 (and more) 1,356 0.5118 0.2440 0.1108 Panel C: Full Sample 1 5,912 0.8665 2 2,162 0.7059 0.2170 3 (and more) 1,967 0.4423 0.2056 0.0997 *, **, *** indicates significance at the 0.10, 0.05, and 0.01 level, respectively.
23

Having corroborated the presence of different paths when it comes to CEO
replacements between Spanish listed and unlisted companies, we now turn to examine
whether the implementation of this governance intervention is related to alternative
control mechanisms and performance, and whether the drivers of this behaviour affect
more intensively listed companies as compared to unlisted companies.
4.2 Methodological approach: Dynamic discrete choice models
The replacement of a CEO can be understood as a decision carried out within the firm in
a binary choice model. Thus, to identify the differentiating characteristics that affect the
likelihood to replace the CEO one can perform a random or a fixed effects logit model
estimated by conditional maximum likelihood (Rasch, 1960 and Andersen, 1970). This
model has the form and it follows
that (Honoré and Kyriazidou, 2000):
{ } ( )' 1,..., ; 1,...,1 0it it i it t T iy xβ η ε = == + + ≥ N
( ) ( )( )0 1
exp1 , , ,...,
1 expit i
it it i i itit i
xP y x y y
xβ η
ηβ η−
′ +′= =
′+ + [1]
where ity is the dependent variable, and where 0iy may or may not be observed, i
indexes firms in our sample for the period , is the parameter of
interest,
1,..., 2t T T= ∧ ≥ βx′ corresponds to the strictly exogenous explanatory variables, and is the
firm-specific effect potentially correlated with
iη
x′ .
In the case of the fixed effects logit approach, it is assumed that the logistic distributed
time-varying errors are i.i.d. over time and independent of all covariates in the
model( in all time periods. Moreover, strict exogeneity and time-varying
responses in the variable of interest are imposed in the non-linear fixed effects
procedure. This latter restriction implies that the responses to the event of interest
by the unit of analysis are a sufficient statistic for the individual specific
effect( , and it is used to estimate as follows (Arellano, 2003):
),it ix η′
2T ≥
1
T
itt
y=
⎛ ⎞⎟⎜ ⎟⎜ ⎟⎜ ⎟⎜ ⎟⎜⎝ ⎠∑
)iη β
24

( )1
1' '1 1
1,...,
1
exp,..., , ,..., ,
expiT
T
it itTt
it it it ii i Tt
it itd d Bt
y xP y y y x x
y x
βη
β
=
=∈
=
⎛ ⎞⎟⎜ ⎟⎜ ⎟⎜⎛ ⎞ ⎟⎜⎝ ⎠⎟⎜ ⎟⎜ ⎟⎜ ⎛ ⎞⎟⎜⎝ ⎠ ⎟⎜ ⎟⎜ ⎟⎜ ⎟⎜⎝ ⎠
′=
′
∑∑
∑ ∑ [2]
where iB refers to the set of all binary response sequences to the event of interest by
cases (individuals or firms).
From Equation [2] it can be derived that the conditional maximum likelihood function is
restricted to those cases for which varies over time, i.e., the contribution to the
conditional maximum likelihood function equals zero for those cases that do not show
any response in the event of interest, or have a fully positive response sequence in T
(one in every period) (Arellano and Honoré, 2001). Moreover, estimation of equation
[2] by maximum likelihood in datasets with limited number of observations and fixed T
leads to inconsistent estimation of . This is the so-called incidental parameters
problem, first considered by Neyman and Scott (1948). In this case only new
observations for case i give new information about , i.e., increase the sample size (N)
does not help out with the estimation of and add more parameters to be estimated.
Therefore, the maximum likelihood estimator of is only consistent whenT . In
the widely cited article, Manski (1987) demonstrates that it is possible to relax the
logistic assumption as well as to allow for serial correlation in the time-varying
disturbances. However, we do not further discuss this since Manski’s (1987) maximum
score estimator is based on the presence of strictly exogenous variables, excluding
dynamic models.
ity
iη
iη
iη
iη →∞
In addition, the econometric model explored assumes that ( )1 0i itE yη − = , which
clearly hinders the possibility to consider endogenous factors when explaining the
decision to replace a CEO. Research on corporate governance is usually based on this
standard assumption, and this may lead to results that are hard to interpret.
Nevertheless, and as remarked by Hermalin and Weisbach (2003), the decision to
replace the CEO can be considered as a dynamic process where previous CEO
25

replacements, changes in the board (in the Chairman position in our case), and previous
changes in performance play a key role. This implies the formulation of a dynamic
model with the following form:
1it it it it i ity y X Zγ β δ η−= + + + +ε T [3] ( )1,..., ; 1,...,i N t= =
where X is the vector of strictly exogenous variables, Z corresponds to the endogenous
variables, is the unobserved firm-specific effect and is the error term. iη itε
Equation [3] allows us to examine whether firms that previously dismissed a CEO are
less (or equally) likely to replace a CEO in the future than firms which have not
experienced a change in the CEO position. This stands as a key fact because, on the one
hand, it is possible that the probability of dismissing a CEO this period lowers the
probability of a change in this position next period (true state dependence). In this case,
the lagged decision about the replacement of the CEO enters the model in a structural
way as an explanatory variable, and if and is statistically significant then
incentives for replacing a CEO are weaker if the firm experienced a CEO replacement
in the past. On the other hand, if and this parameter is not statistically significant,
then firms have different propensities to experience the event of interest (CEO
replacement). Here, it is argued that some firms are permanently more likely to replace
their CEOs( , irrespective of whether they have undergone a change in the CEO
position in the previous period.
0γ<
0γ=
)iη
Nevertheless, the inclusion of the lagged dependent variable in the explanatory variable
set is not trivial, and the breaking of the strict exogeneity assumption brings about
important computational considerations that should be taken into account. Given the
relevance that the identification of persistence patterns has for academics, policy makers
and practitioners, the development of methods that deal with dynamic non-linear
models with fixed effects have recently received great attention (see Arellano and
Honoré, 2001). It is widely recognised that the main obstacle when estimating this type
of models arises from the initial conditions problem.
26

In this paper, we adopt the methodology proposed by Bover and Arellano (1997) which
implies the estimation of a two-step within estimator for limited dependent variables,
including lags of the dependent variable and other endogenous explanatory variables.
The within-groups estimator is based on the reduced form predictions of the dependent
variable where ( )1 0i itE yη − ≠ . Hence ( )i f Zη = as
, and given this we can derive the function for the
decision to replace the CEO as follows:
0 1 1 ...i T iTiz zη λ λ λ μ= + + + + i
) ε
i
(*1 0 1 1 ...it it i itT iTit iy y X z zγ β λ λ λ μ−= + + + + + + + [4]
The reduced form of the model can be rewritten as . Bover and Arellano
(1997) show how to derive consistent estimations of through conventional probit
specifications for each period, where is not directly observable and it represents a
good linear approximation of . This approach allows us to consider all possible pairs
of observations in the string of the dependent variable, irrespective on whether the
observation (firm) experienced a change in the CEO position. It is important to notice
that error terms are unlikely to be independent of the explanatory variables in period t-1,
because one of the explanatory variables is the lagged dependent variable. However,
Bover and Arellano (1997) prove that period-by-period maximum likelihood probits
provide consistent and asymptotically normal estimates of the reduced form of interest.
*i iy z μ= +∏
*iy
*iy
iy
Our specification of considers as endogenous factors changes in firm performance
from year –2 to year –1
*ity
( )2, 1t tr− −Δ , a lagged term accounting for changes in the chairman
position, and an interaction term between the two variables. In a second step, our final
model is estimated using a fixed-effects approach, and it considers that CEO turnover
can be explained as follows: *
1 1 1it i itit it itCEO CEO X Zγ β δ η− − −Δ = Δ + + + +μ [5]
where X denotes a vector of strictly exogenous variables with respect to the CEO
turnover decision (size, presence in the stock market and ownership structure) and Z
refers to the endogenous explanatory variables. Finally, it is important to remark that
27

instead of lags of , we use lags of to not condition current CEO turnover decisions
on lagged effects of past explanatory variables and past errors (Bover and Arellano,
1997).
*ity ity
5. Empirical Findings This section presents our empirical findings. In the different sub-sections we present our
results for the full sample and for the sub-sample of listed firms. Given that we use three
measures of firm performance, our econometric analysis implies the estimation of three
dependent variables (one for each performance measure: ROA, ROE, and market-to-
book value). Thus, results in Tables 7 to 12 were obtained using as dependent variable
the corresponding linear approximation, according to each performance measure.
Appendices 1 and 2 report, for the full sample and the sub-sample of listed firms,
respectively, regression results using the conditional fixed-effects logistic regression as
alternative technique (equation [2]). Appendices 3 and 4 present, for the full sample and
the listed sub-sample, respectively; regression results when the explanatory variables
are introduced individually. It is important to remark that, when performance is
measured as changes in the median industry-adjusted ROA and ROE, our results do not
significantly differ (and they are weaker for the sub-sample of listed firms) relative to
those obtained when performance is expressed as unadjusted changes in these financial
variables. Hence, we will not comment here the results obtained for the industry-
adjusted performance measures. Those regression results are presented in Appendices 5
and 6.
Also, our results when ROE is the dependent variable are weaker in terms of
significance of the parameter estimates. We think that the lack of significance may
indicate that this variable (ROE), which includes some extraordinary results and
financial figures, is more exposed to other corporate actions that are unrelated to the
firm’s core activity. In fact, we consider the ROA and the market-to-book ratios as more
informative variables concerning firm performance, and from now on our comments
will be based on the results involving these two variables.
28
5.1 Dynamic CEO Turnover
In this sub-section we address whether the decision to replace the CEO is conditioned
by previous poor performance and previous changes in the CEO and chairman
positions. Table 7 presents our results for the full sample, whereas Table 8 shows the
results for the sub-sample of listed firms. Model specifications in these tables capture
the effect that the different performance measures used in our analysis has over CEO
turnover decisions (ROA and ROE in Table 7, and the market-to-book ratio, ROA and
ROE in Table 8).
Our results give support to the negative relationship between changes in performance
and CEO turnover. This finding is consistent with the bulk of academic literature having
examined this relation, and it is in accordance with our hypothesis H1a. In addition,
from Table 7 we can observe that the increase in the probability to replace a CEO, given
a negative change in performance, is stronger for those firms operating in the Spanish
stock markets. To corroborate this, we estimate the relevant coefficient for the sub-
sample of listed firms (the sum of the coefficients of interest: previous performance
changes and the listed dummy). When ROA is the performance measure, this coefficient
is significant at the 1% (Specification 2 in Table 7: –0.0107), revealing that for listed
companies the threat of dismissal for poor performance clearly dominates CEO turnover
decisions (Table 7). This is in accordance with our hypothesis H1b which proposed that
the negative relationship between performance and CEO turnover decisions is stronger
for listed firms.
We also find that firms that previously replaced the CEO are less likely to replace the
incoming CEO (Table 7), confirming that incentives for replacing a CEO are weaker if
the firm experienced a CEO replacement in the past (state dependence). The interaction
term between previous CEO turnover and the listed dummy is not statistically
significant, which suggests that listed firms have different propensities to experience a
change in the CEO position, irrespective of whether they have undergone a change in
the CEO position in the previous period. We did obtain the relevant coefficient for the
sub-sample of listed firms, which equals the sum of the coefficients of interest (previous
CEO turnover and the listed dummy). Such coefficient is significant at the 10% (–
0.0244 and –0.0317 for ROA and ROE, respectively), indicating that state dependence
in CEO turnover decisions only hold for unlisted companies in our sample (Table 7).
29

We are therefore able to confirm our second hypothesis (H2), but only in the case of
large unlisted companies.
Table 7. CEO turnover in listed and large unlisted Spanish firms Fixed-effects regressions are estimated as follow (equation 5):
*1 1 1it it it it i itCEO CEO X Zγ β δ η− − −Δ = Δ + + + +μ
*itCEOΔ is the dependent variable (CEO turnover), and it represents the corresponding linear
approximation obtained from equation [4], according to each performance measure: return on assets (ROA), and return on equity (ROE). is a dummy equal to one if a change in the CEO position took place in the year t-1. X denotes a vector of strictly exogenous variables: size (natural log of total assets), a dummy equal to one if the firm is registered in any Spanish stock market (Listed) and ownership concentration, measured as the stake held by the largest shareholder (C1). Z refers to the endogenous explanatory variables: changes in performance between year –2 and –1, chairman turnover (dummy variable equal to one if we identify a change in the chairman position) and an interaction term between these two variables. Standard error is presented in brackets.
1itCEO −Δ
(1) (2) (3) (4)
Size t-1 (ln assets) 0.0144 (0.0134)
0.0154 (0.0133)
0.0140 (0.0134)
0.0142 (0.0134)
Listed 0.0142 (0.1996)
-0.0001 (0.2005)
0.0128 (0.2004)
-0.0023 (0.2018)
Listed×Size t-1 -0.0023 (0.0269)
-0.0063 (0.0275)
-0.0021 (0.0271)
-0.0050 (0.0276)
CEO turnover t-1 -0.0253 **
(0.0120) -0.0249 **
(0.0124) -0.0264 **
(0.0121) -0.0261 **
(0.0126) Listed× CEO turnover t-1 0.0005
(0.0449) -0.0056 (0.0454)
Chairman turnover t-1 0.0114 (0.0164)
0.0096 (0.0170)
0.0128 (0.0166)
0.0110 (0.0172)
Listed× Chairman turnover t-1 0.0188
(0.0628) 0.0235 (0.0632)
2, 1t tROA− −Δ -0.00027 ** (0.00013)
-0.00023 * (0.00013)
Listed 2, 1t tROA− −×Δ -0.0105 *** (0.0021)
2, 1t tROE − −Δ -0.0003 (0.0013)
-0.0002 (0.0013)
Listed 2, 1t tROE − −×Δ -0.0033 (0.0062)
Ownership concentration (C1) t-1
0.0016 (0.0457)
-0.0054 (0.0473)
0.0020 (0.0459)
-0.0055 (0.0476)
Listed×C1 t-1 0.1271 (0.1642) 0.0956
(0.1672) Time dummies Yes Yes Yes Yes
Intercept -1.3752 ***
(0.0717) -1.3760 ***
(0.0721) -1.3734 ***
(0.0721) -1.3686 ***
(0.0726) F – test 379.55 *** 287.21 *** 371.19 *** 278.32 ***
R square (within) 0.3909 0.3932 0.3878 0.3879 Observations 8,537 8,537 8,468 8,468
*, **, *** indicates significance at the 0.10, 0.05 and 0.01, respectively.
30
This stands as a key result since it indicates that, in our sample of unlisted firms, boards
are more willing to wait for signals about CEO’s performance before to make any
decision about bringing new blood to the helm. Regardless of the performance measure,
our results for previous changes in the chairman position show that this type of
governance intervention does not exert any significant impact of future CEO turnover
decisions. Consequently, we reject our hypothesis H3a, which proposes that a change in
the chairman position increases the probability of CEO turnover next period. Finally,
parameter estimates for ownership concentration also show as not significant in all
model specifications.
We now extend our analysis to the sub-sample of listed companies. Results, presented
in Table 8, use as performance measures changes in the market-to-book ratio (columns
1 and 2) as well as changes in ROA (columns 3 and 4), and ROE (columns 5 and 6).
Consistent with our previous results, we find that listed firms show no state dependence
path concerning CEO turnover, and poor performance seems to be the main driver
behind CEO turnover decisions.
Interestingly, when the change in the market-to-book ratio from year –2 to year –1 is
used as performance measure, we find that previous changes in the chairman position
exert a significant positive influence on future CEO turnover decisions. This result
allows us to partially confirm our hypothesis H3b, since the relationship between
changes in the chairman position and CEO turnover only holds for our market-oriented
performance variable. This finding suggests that the presence of external controls
reinforces the effectiveness of internal governance mechanisms.
31
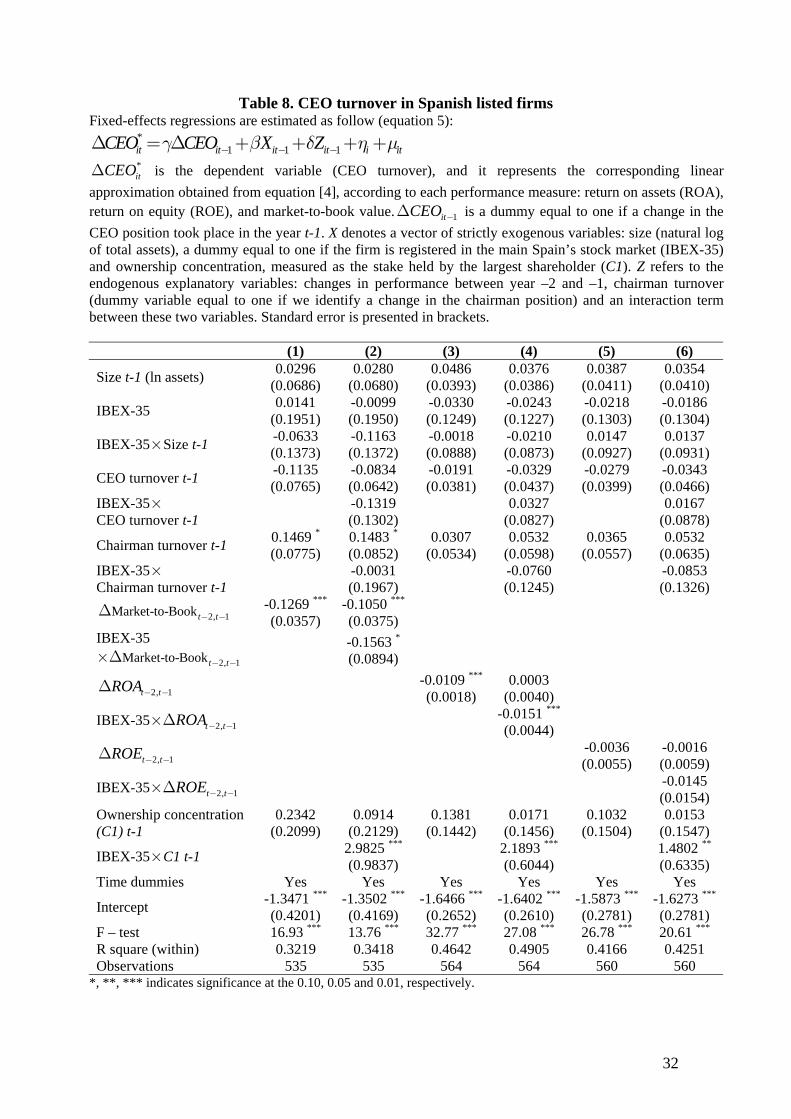
Table 8. CEO turnover in Spanish listed firms Fixed-effects regressions are estimated as follow (equation 5):
*1 1 1it it it it i itCEO CEO X Zγ β δ η− − −Δ = Δ + + + +μ
*itCEOΔ is the dependent variable (CEO turnover), and it represents the corresponding linear
approximation obtained from equation [4], according to each performance measure: return on assets (ROA), return on equity (ROE), and market-to-book value. is a dummy equal to one if a change in the CEO position took place in the year t-1. X denotes a vector of strictly exogenous variables: size (natural log of total assets), a dummy equal to one if the firm is registered in the main Spain’s stock market (IBEX-35) and ownership concentration, measured as the stake held by the largest shareholder (C1). Z refers to the endogenous explanatory variables: changes in performance between year –2 and –1, chairman turnover (dummy variable equal to one if we identify a change in the chairman position) and an interaction term between these two variables. Standard error is presented in brackets.
1itCEO −Δ
(1) (2) (3) (4) (5) (6)
Size t-1 (ln assets) 0.0296 (0.0686)
0.0280 (0.0680)
0.0486 (0.0393)
0.0376 (0.0386)
0.0387 (0.0411)
0.0354 (0.0410)
IBEX-35 0.0141 (0.1951)
-0.0099 (0.1950)
-0.0330 (0.1249)
-0.0243 (0.1227)
-0.0218 (0.1303)
-0.0186 (0.1304)
IBEX-35×Size t-1 -0.0633 (0.1373)
-0.1163 (0.1372)
-0.0018 (0.0888)
-0.0210 (0.0873)
0.0147 (0.0927)
0.0137 (0.0931)
CEO turnover t-1 -0.1135 (0.0765)
-0.0834 (0.0642)
-0.0191 (0.0381)
-0.0329 (0.0437)
-0.0279 (0.0399)
-0.0343 (0.0466)
IBEX-35× CEO turnover t-1 -0.1319
(0.1302) 0.0327 (0.0827) 0.0167
(0.0878)
Chairman turnover t-1 0.1469 *(0.0775)
0.1483 *(0.0852)
0.0307 (0.0534)
0.0532 (0.0598)
0.0365 (0.0557)
0.0532 (0.0635)
IBEX-35× Chairman turnover t-1 -0.0031
(0.1967) -0.0760 (0.1245) -0.0853
(0.1326)
2, 1Market-to-Book t t− −Δ -0.1269 *** (0.0357)
-0.1050 *** (0.0375)
IBEX-35 2, 1Market-to-Book t t− −×Δ -0.1563 *
(0.0894)
2, 1t tROA− −Δ -0.0109 *** (0.0018)
0.0003 (0.0040)
IBEX-35 2, 1t tROA− −×Δ -0.0151 *** (0.0044)
2, 1t tROE − −Δ -0.0036 (0.0055)
-0.0016 (0.0059)
IBEX-35 2, 1t tROE − −×Δ -0.0145 (0.0154)
Ownership concentration (C1) t-1
0.2342 (0.2099)
0.0914 (0.2129)
0.1381 (0.1442)
0.0171 (0.1456)
0.1032 (0.1504)
0.0153 (0.1547)
IBEX-35×C1 t-1 2.9825 *** (0.9837) 2.1893 ***
(0.6044) 1.4802 ** (0.6335)
Time dummies Yes Yes Yes Yes Yes Yes
Intercept -1.3471 ***
(0.4201) -1.3502 ***
(0.4169) -1.6466 ***
(0.2652) -1.6402 ***
(0.2610) -1.5873 ***
(0.2781) -1.6273 ***
(0.2781) F – test 16.93 *** 13.76 *** 32.77 *** 27.08 *** 26.78 *** 20.61 ***
R square (within) 0.3219 0.3418 0.4642 0.4905 0.4166 0.4251 Observations 535 535 564 564 560 560
*, **, *** indicates significance at the 0.10, 0.05 and 0.01, respectively.
32
From columns 1 and 2 in Table 8, we can observe that changes in the market-to-book
ratio are negatively correlated with changes in the CEO position. Also, no significant
difference was found for this variable when we compare the parameter estimates for
listed companies operating in the main Spanish stock market (IBEX-35), relative to
those firms operating in other Spanish stock markets. To the contrary, the negative
effect that changes in ROA has on CEO turnover only applies for those firms operating
in the IBEX-35 market (the comparison of the two parameter estimates is statistically
significant at the 5% level). This result indicates that listed firms are more likely to
replace the CEO after negative changes in market-oriented variables. Contrary to what
was found for the full sample, we find that ownership concentration (C1) becomes an
important disciplinary mechanism but only for those firms operating in the IBEX-35.
The relevant coefficient for the IBEX-35 dummy is significant at the 1% level,
irrespectively of the model specification (Table 8).
5.2 The role of owners: Active or apathetic players?
In this sub-section we extend our analysis on the relationship between ownership
structure and CEO turnover decisions. Specifically, we examine two aspects linked to
ownership structure: ownership concentration (Table 9) and the potential importance of
different shareholders to implement decisions related to the replacement of the CEO in
firms subject to external controls (Table 10).
Our empirical findings indicate that, for the full sample, the mere presence of one or
several large shareholder does not seem to improve the monitoring task of firm owners
(Table 9). However, from our descriptive analysis we know that unlisted firms are
controlled by a dominant shareholder holding on average more than 50%, irrespective
of the number of large shareholders (Table 6). Hence, this result could be a consequence
of the high concentration levels showed by large unlisted firms, where the lack of
control could discourage other large shareholders to exert any (costly) monitoring
action.
We also observe from Table 9 that the negative relationship between current and past
CEO turnovers dilutes as we control for the presence of other large shareholders in our
regressions. To further explore this interesting result, we tested for differences in the
33

CEO turnover rate in the different size groups of unlisted firms, according to the
number of shareholders. We find that the average CEO turnover rate for those firms
with only one large shareholder is 14.98% (mean size: €166 million in assets), whereas
this rate stands at 16.74% for those firms with two large shareholders (mean size: €176
million in assets). In addition, we found no statistically significant difference in the
CEO turnover rate between these two groups. Unlisted firms with more than two
shareholders (mean size: €285 million in assets) show a CEO turnover rate of 18.78%,
and this is significantly higher (at the 5% level) relative to the CEO turnover rate shown
by the group of unlisted firms with two large shareholders (16.74%). These findings
could give support to the argument that larger unlisted firms might be subject to a
higher pressure from shareholders and other stakeholders, a fact that could help explain
why they behave as impatient as listed firms, in terms of CEO turnover decisions.
We now proceed to evaluate to what extent large shareholders in our sub-sample of
listed firms rely on other large shareholders when it comes to CEO turnover decisions.
From Table 10 we observe that the parameter estimates for changes in the market-to-
book value are significant for all listed firms. This reinforces our argument about the
informative power of this variable for this group of firms, given that listed companies
are faced with a more intense pressure from market competition.
Consistent with our previous findings, we find a strong positive effect on CEO turnover
decisions derived from the potential associations between the largest and other large
shareholders (Table 10), but this result only holds for those listed firms operating in the
main Spain’s stock market (IBEX-35). This result is not unexpected, since from our
descriptive analysis we noticed that for the majority of listed firms the largest
shareholder controls 29% of shareholder’s equity (Table 6). This implies that sound
decisions, as the case of the replacement of the CEO, cannot be taken without the
support of other large shareholders, favouring their alignment.
Given that the link between ownership structure and CEO turnover only holds for the
sub-sample of listed firms, we partially confirm our hypothesis H4a, which states that
ownership concentration increases the probability to replace an incumbent CEO.
34

Table 9. CEO turnover: The alignment of shareholders (full sample) Fixed-effects regressions are estimated as follow (equation 5):
*1 1 1it it it it i itCEO CEO X Zγ β δ η− − −Δ = Δ + + + +μ
*itCEOΔ is the dependent variable (CEO turnover), and it represents the corresponding linear
approximation obtained from equation [4] using return on assets (ROA) as the performance measure. is a dummy equal to one if a change in the CEO position took place in the year t-1. X denotes a vector of strictly exogenous variables: size (natural log of total assets), a dummy equal to one if the firm is registered in any Spanish stock market (Listed) and ownership structure, measured as the stake held by the largest (C1), the two largest (C2) and the three largest (C3) shareholders. Z refers to the endogenous explanatory variables: changes in performance between year –2 and –1, chairman turnover (dummy variable equal to one if we identify a change in the chairman position) and an interaction term between these two variables. Standard error is presented in brackets.
1itCEO −Δ
(1) (2) (3)
Size t-1 (ln assets) 0.0154 (0.0133)
-0.0349 (0.0308)
0.0183 (0.0261)
Listed -0.0001 (0.2005)
-0.1779 (0.2926)
-0.0913 (0.2326)
Listed×Size t-1 -0.0063 (0.0275)
0.0165 (0.0350)
0.0052 (0.0283)
CEO turnover t-1 -0.0249 **
(0.0124) -0.0175 (0.0209)
-0.0272 (0.0218)
Listed× CEO turnover t-1
0.0005 (0.0449)
-0.0168 (0.0516)
-0.0070 (0.0374)
Chairman turnover t-1 0.0096 (0.0170)
-0.0037 (0.0296)
-0.0123 (0.0320)
Listed× Chairman turnover t-1
0.0188 (0.0628)
0.0227 (0.0711)
0.0242 (0.0522)
2, 1t tROA− −Δ -0.00023 * (0.00013)
0.0003 (0.0004)
-0.0030 *** (0.0007)
Listed× 2, 1t tROA− −Δ -0.0105 *** (0.0021)
-0.0111 *** (0.0022)
-0.0105 *** (0.0014)
C1 t-1 -0.0054 (0.0473)
Listed×C1 t-1 0.1271 (0.1642)
C2 t-1 0.0176 (0.0572)
Listed×C2 t-1 0.1232 (0.1786)
C3 t-1 0.0303 (0.0730)
Listed×C3 t-1 0.0896 (0.1209)
Time dummies Yes Yes Yes
Intercept -1.3760 ***
(0.0721) -1.1380 ***
(0.1608) -1.4136 ***
(0.1577) F – test 287.21 *** 75.50 *** 92.81 ***
R square (within) 0.3932 0.3124 0.5402 Observations 8,537 3,467 1,735
*, **, *** indicates significance at the 0.10, 0.05 and 0.01, respectively.
35

Table 10. CEO turnover: The alignment of shareholders (sub-sample of listed firms) Fixed-effects regressions are estimated as follow (equation 5):
*1 1 1it it it it i itCEO CEO X Zγ β δ η μ− − −Δ = Δ + + + +
*itCEOΔ is the dependent variable (CEO turnover), and it represents the corresponding linear approximation obtained from equation [4], according to each
performance measure: return on assets (ROA) and market-to-book value. is a dummy equal to one if a change in the CEO position took place in the year t-1. X denotes a vector of strictly exogenous variables: size (natural log of total assets), a dummy equal to one if the firm is registered in the main Spain’s stock market (IBEX-35) and ownership structure, measured as the stake held by the largest (C1), the two largest (C2) and the three largest (C3) shareholders. Z refers to the endogenous explanatory variables: changes in performance between year –2 and –1, chairman turnover (dummy variable equal to one if we identify a change in the chairman position) and an interaction term between these two variables. Standard error is presented in brackets.
1itCEO −Δ
(1) (1) (2) (2) (3) (3)
Size t-1 (ln assets) 0.0280 (0.0680)
0.0376 (0.0386)
0.0591 (0.0777)
0.0572 (0.0549)
0.0676 (0.0785)
0.0614 (0.0565)
IBEX -0.0099 (0.1950)
-0.0243 (0.1227)
-0.7242 **
(0.3588) -0.2967 (0.2050)
-0.8422 **
(0.3703) -0.2368 (0.2202)
IBEX Size t-1 × -0.1163 (0.1372)
-0.0210 (0.0873)
-0.1247 (0.1437)
-0.0257 (0.0971)
-0.1612 (0.1452)
-0.0399 (0.0998)
CEO turnover t-1 -0.0834 (0.0642)
-0.0329 (0.0437)
-0.0924 (0.0680)
-0.0432 (0.0480)
-0.1004 (0.0697)
-0.0455 (0.0505)
IBEX CEO turnover t-1 × -0.1319 (0.1302)
0.0327 (0.0827)
-0.1497 (0.1345)
0.0344 (0.0900)
-0.1432 (0.1353)
0.0410 (0.0939)
Chairman turnover t-1 0.1483 *(0.0852)
0.0532 (0.0598)
0.1421 (0.0882)
0.0487 (0.0642)
0.1418 (0.0901)
0.0429 (0.0668)
IBEX Chairman turnover t-1 × -0.0031 (0.1967)
-0.0760 (0.1245)
-0.0741 (0.2023)
-0.0998 (0.1339)
-0.0903 (0.2033)
-0.0929 (0.1372)
*, **, *** indicates significance at the 0.10, 0.05 and 0.01, respectively.
36

Table 10. Continued
(1) (1) (2) (2) (3) (3)
2, 1Market-to-Book t t− −Δ -0.1050 *** (0.0375) -0.1164 ***
(0.0404) -0.1189 *** (0.0405)
IBEX × 2, 1Market-to-Book t t− −Δ -0.1563 * (0.0894) -0.1936 **
(0.0929) -0.2056 ** (0.0930)
2, 1t tROA− −Δ 0.0003 (0.0040)
-0.0001 (0.0045)
-0.0001 (0.0046)
IBEX × 2, 1t tROA− −Δ -0.0151 *** (0.0044)
-0.0141 *** (0.0049)
-0.0137 *** (0.0050)
C1 t-1 0.0914 (0.2129)
0.0171 (0.1456)
IBEX C1 t-1 × 2.9825 *** (0.9837)
2.1893 *** (0.6044)
C2 t-1 0.1415 (0.2322)
0.0756 (0.1645)
IBEX C2 t-1 × 1.6416 **
(0.6972) 0.6844 *(0.3982)
C3 t-1 0.1071 (0.2207)
0.0865 (0.1587)
IBEX C3 t-1 × 1.6218 ***
(0.6190) 0.4497
(0.3702) Time dummies Yes Yes Yes Yes Yes Yes
Intercept -1.3502 ***
(0.4169) -1.6402 ***
(0.2610) -1.3339 ***
(0.4738) -1.6338 ***
(0.3389) -1.3072 ***
(0.4860) -1.6391 ***
(0.3547) F – test 13.76 *** 27.08 *** 11.17 *** 20.85 *** 10.84 *** 19.75 ***
R square (within) 0.3418 0.4905 0.3132 0.4492 0.3117 0.4438 Observations 535 564 502 521 492 505
*, **, *** indicates significance at the 0.10, 0.05 and 0.01, respectively.
37

5.3 Banks as owners
This sub-section examines the monitoring role of banks in what concerns CEO
replacement decisions. Our results for the full sample are presented in Table 11, whereas
Table 12 shows those obtained for the sub-sample of listed firms.
For the full sample, we find a weak association between bank shareholding and CEO
turnover decisions. Whereas the dummy variable identifying a bank as main shareholder
is positively correlated with CEO turnover when ROA is the performance variable
(specification 2 in Table 11), the interaction term between changes in ROA and the
dummy accounting for a bank as main shareholder shows as positive and statistically
significant. The relevant coefficient for the sub-sample of firms controlled by banks
(change in ROA and the dummy for firms controlled by a bank) is significant at the 1%
indicating that, amongst firms controlled a bank, the replacement of the CEO is not
linked to poor performance changes. This result should be read with some caution, since
from our descriptive statistics (Table 5) we know that in less than 1% of cases a bank is
the largest shareholder in our sub-sample of unlisted firms. In addition, it is important to
notice that, in our sample of unlisted firms, the CEO turnover rate increases with respect
to the presence of large shareholders other than banks: 15.86% for firms controlled by
one large shareholder to 18.62% for those unlisted firms with three large shareholders.
However, the opposite is found for those unlisted firms controlled by banks. Whereas the
CEO turnover rate exhibited by unlisted firms with a bank as the main shareholder
(average ownership: 41%) is 20.24%, this rate stands at 15.63% for unlisted firms where
the two and the three largest shareholders are banks (average ownership: 74%).
38

Table 11. CEO turnover and the role of banks as owners (full sample) Fixed-effects regressions are estimated as follow (equation 5):
*1 1 1it it it it i itCEO CEO X Zγ β δ η− − −Δ = Δ + + + +μ
*itCEOΔ is the dependent variable (CEO turnover), and it represents the corresponding linear
approximation obtained from equation [4], according to each performance measure: return on assets (ROA) and return on equity (ROE). is a dummy equal to one if a change in the CEO position took place in the year t-1. X denotes a vector of strictly exogenous variables: size (natural log of total assets), a dummy equal to one if the firm is registered in any Spanish stock market (Listed) and ownership structure, measured as a dummy variable equal to one if a financial institution is the main shareholder. Z refers to the endogenous explanatory variables: changes in performance between year –2 and –1, chairman turnover (dummy variable equal to one if we identify a change in the chairman position) and an interaction term between these two variables. Standard error is presented in brackets.
1itCEO −Δ
(1) (2) (3) (4)
Size t-1 (ln assets) 0.0125 (0.0124)
0.0112 (0.0124)
0.0120 (0.0126)
0.0120 (0.0126)
Listed 0.0091 (0.1953)
0.0010 (0.1949)
0.0076 (0.1962)
0.0019 (0.1962)
Listed×Size t-1 -0.0017 (0.0263)
-0.0002 (0.0263)
-0.0015 (0.0265)
0.0004 (0.0265)
Financial firm as main shareholder t-1
0.0508 (0.0534)
0.0991 *(0.0568)
0.0518 (0.0536)
0.0840 (0.0573)
CEO turnover t-1 -0.0249 **
(0.0115) -0.0219 *(0.0116)
-0.0259 **
(0.0116) -0.0231 **
(0.0118) CEO turnover t-1×Financial firm as main shareholder t-1 -0.0610
(0.0774) -0.1216 (0.0772)
Chairman turnover t-1 0.0109 (0.0158)
0.0116 (0.0160)
0.0123 (0.0160)
0.0134 (0.0162)
Chairman turnover t-1× Financial firm as main shareholder t-1
-0.0680 (0.0985) -0.0559
(0.0992)
2, 1t tROA− −Δ -0.00027 ** (0.00012)
-0.0003 *** (0.0001)
2, 1t tROA− −Δ × Financial firm as main shareholder t-1
0.0062 *** (0.0011)
2, 1t tROE − −Δ -0.0003 (0.0013)
-0.0003 (0.0013)
2, 1t tROE − −Δ × Financial firm as main shareholder t-1
-0.0028 (0.0108)
Time dummies Yes Yes Yes Yes
Intercept -1.3653 ***
(0.0582) -1.3605 ***
(0.0581) -1.3630 ***
(0.0589) -1.3642 ***
(0.0589) F – test 414.12 *** 334.88 *** 404.95 *** 324.14 ***
R square (within) 0.4010 0.4037 0.3978 0.3981 Observations 8,922 8,922 8,850 8,850
*, **, *** indicates significance at the 0.10, 0.05 and 0.01, respectively.
39

Table 12. CEO turnover and the role of banks as owners (sub-sample of listed firms) Fixed-effects regressions are estimated as follow (equation 5):
*1 1 1it it it it i itCEO CEO X Zγ β δ η− − −Δ = Δ + + + +μ
*itCEOΔ is the dependent variable (CEO turnover), and it represents the corresponding linear
approximation obtained from equation [4], according to each performance measure: return on assets (ROA), return on equity (ROE), and market-to-book value. is a dummy equal to one if a change in the CEO position took place in the year t-1. X denotes a vector of strictly exogenous variables: size (natural log of total assets), a dummy equal to one if the firm is registered in the main Spain’s stock market (IBEX-35) and ownership structure, measured as a dummy variable equal to one if a financial institution is the main shareholder. Z refers to the endogenous explanatory variables: changes in performance between year –2 and –1, chairman turnover (dummy variable equal to one if we identify a change in the chairman position) and an interaction term between these two variables. Standard error is presented in brackets.
1itCEO −Δ
(1) (2) (3) (4) (5) (6) Size t-1 (ln assets) 0.0313
(0.0689) 0.0371
(0.0687) 0.0448
(0.0393) 0.0464
(0.0394) 0.0352
(0.0411) 0.0359
(0.0412)
IBEX-35 0.0137 (0.1956)
0.0436 (0.1954)
-0.0323 (0.1246)
-0.0197 (0.1252)
-0.0208 (0.1301)
-0.0099 (0.1308)
IBEX-35×Size t-1 -0.0637 (0.1376)
-0.0356 (0.1375)
0.0022 (0.0887)
0.0098 (0.0890)
0.0183 (0.0926)
0.0228 (0.0929)
Financial firm as main shareholder t-1
-0.0282 (0.0872)
0.0162 (0.0930)
0.0956 (0.0590)
0.1163 * (0.0663)
0.0875 (0.0615)
0.1128 * (0.0663)
CEO turnover t-1 -0.1158 (0.0766)
-0.0787 (0.0627)
-0.0187 (0.0381)
-0.0040 (0.0423)
-0.0274 (0.0398)
-0.0120 (0.0443)
CEO turnover t-1×Financial firm as main shareholder t-1 -0.1796
(0.1492) -0.0707 (0.1025) -0.0853
(0.0667)
Chairman turnover t-1 0.1477 *(0.0777)
0.1501 *(0.0851)
0.0354 (0.0534)
0.0498 (0.0587)
0.0405 (0.0557)
0.0570 (0.0613)
Chairman turnover t-1× Financial firm as main shareholder t-1
0.0018 (0.1938) -0.0908
(0.1341) -0.0901 (0.1396)
2, 1Market-to-Book t t− −Δ -0.1250 *** (0.0357)
-0.1637 *** (0.0403)
2, 1Market-to-Book t t− −Δ × Financial firm as main shareholder t-1
0.1593 **
(0.0781)
2, 1t tROA− −Δ -0.0109 *** (0.0018)
-0.0111 *** (0.0018)
2, 1t tROA− −Δ × Financial firm as main shareholder t-1
0.0121 (0.0125)
2, 1t tROE − −Δ -0.0035 (0.0055)
-0.0035 (0.0063)
2, 1t tROE − −Δ × Financial firm as main shareholder t-1
0.0001 (0.0127)
Time dummies Yes Yes Yes Yes Yes Yes
Intercept -1.2838 ***
(0.4165) -1.3813 ***
(0.4172) -1.5966 ***
(0.2604) -1.6277 ***
(0.2619) -1.5490 ***
(0.2733) -1.5688 ***
(0.2750) F – test 16.79 *** 13.93 *** 33.04 *** 26.51 *** 27.01 *** 21.59 ***
R square (within) 0.3201 0.3296 0.4662 0.4685 0.4187 0.4201 Observations 535 535 564 564 560 560
*, **, *** indicates significance at the 0.10, 0.05 and 0.01, respectively.
40

For the sub-sample of listed firms, our results show that the positive relation between
CEO turnover and bank monitoring is significant only when performance is measured
through ROA and ROE (specifications 4 and 6 in Table 12). The fact that banks are more
concerned about operating performance could signal their interest for preserving the
quality of their investments (equity or debt). Given that banks have a strong preference
for listed firms in Spain (Table 5), we also explored the CEO turnover–bank ownership
path showed by listed firms. In this case, and similar to Casasola and Tribo (2004), we
find that banks control Spanish listed firms with relatively lower stakes as compared to
non-bank large shareholders. When a bank is the main shareholder and the three largest
shareholders are heterogeneous (mixture of banks and non-banks owners) it controls on
average 18.15% of shareholder’s equity, a stake which is lower than that reported in
Table 6 for the sub-sample of listed firms with three or more large shareholders
(28.81%). Likewise, from Table 6 we observe that, for the sub-sample of listed firms, the
mean ownership concentration of the three largest shareholders is 48.33%, whereas when
these three largest shareholders are banks their ownership stake is on average 40.61%.
Concerning the replacement of the CEO, we find dissimilar results. For those listed firms
where a bank is the main shareholder, and the second and third largest owner are not, the
CEO turnover rate is 14.84%, whereas listed firms controlled by a non-bank largest
shareholder dismissed 19.24% of their CEOs. To the contrary, when the two largest
shareholders are banks the CEO turnover rate is 24%, whereas for non-bank controlled
firms this rate is 18.76%. When the three largest shareholders are banks the CEO
turnover rate stands at 9.76%, but non-bank controlled firms show a managerial
replacement rate of 19.59% (p-value < 5%).
Finally, our results for the interaction term between changes in performance and the
dummy variable accounting for the presence of a financial firm as main shareholder
reveal that, active bank monitoring may increase the dismissal of incumbent CEOs,
however, this behaviour is not linked to negative changes in performance. The only
significant interaction term is that linking bank as main shareholder and the market-to-
book value (specification 2 in Table 12), but similar to our results for the full sample, the
41

coefficient is positive. Once more, we estimated the relevant coefficient for the group of
firms controlled by banks, which equals the sum of the coefficients of interest (change in
the market-to-book value and the listed dummy identifying a bank as main shareholder).
The coefficient is significantly different from zero at the 1% but close to zero (–0.0044),
reinforcing our argument that banks are active monitors, but the decision to replace a
CEO is not related to poor performance changes in firms controlled by financial
institutions. Thus, we reject our hypothesis H4b, which proposes that the probability to
dismiss a CEO increases in firms controlled by financial institutions.
6. Concluding Remarks The implementation of control mechanisms is increasingly being recognised as an
indispensable ingredient at the time of establishing efficient governance systems. The
academic research dealing with executive replacements is quite extensive, and it has
consistently found the importance of performance as an informative signal concerning
CEO’s ability. Furthermore, this signal has become the main tool in the hands of boards
to evaluate the quality of management, and decide on the CEO replacement. The
endogenous nature of the corporate governance mechanisms is a much less explored
issue. In fact, the cross effects between internal and external mechanisms seem to be
rather relevant. We have started to explore some links in this paper but further research
will be necessary.
As an additional consideration, and despite some recent theoretical and empirical efforts,
little is known about the effectiveness of control mechanisms for those firms operating
outside the stock markets. This feature is especially relevant in the Spanish context, an
environment characterised by a low protection of small investors, high levels of
ownership concentration, and where a significant number of medium-sized enterprises
participate in the stock market.
Our main objective in this paper has been to examine whether CEO turnover decisions
were equally intense for listed and large unlisted companies in Spain. To achieve this
goal we adopt the approach proposed by Bover and Arellano (1997), which enables us to
42

obtain a dynamic binary choice model based on a fixed-effects estimator that takes into
account lags of the dependent variable, previous changes in the chairman and previous
changes in performance as endogenous factors.
The main contribution of this study lies on the consideration of the endogenous nature of
executive turnover, where CEO turnover is assumed to be endogenously conditioned by
previous changes in the CEO and chairman positions, as well as previous changes in firm
performance. Our empirical results show that listed and unlisted firms follow different
paths when it comes to decisions concerning the replacement of their CEOs. For all firms
in our sample, negative changes in performance appear as the main driver to replace a
CEO, however, listed companies seem to be more impatient. In our interpretation,
unlisted firms are more willing to acquire further information about CEO’s abilities, and
this decreases the probability of dismissal for recently hired CEOs, whereas listed
companies monitor more diligently their CEOs. In fact, those CEOs can face dismissal
irrespectively of the time they have been running the firm. In addition, CEOs of listed
companies are more likely to be replaced after a change in the chairman position, but
only when the market-to-book value is used as performance measure. We argue that, for
listed firms, this distinction seems to steam from a more active monitoring and a greater
exposure to external markets, a context that reinforces the effectiveness of other internal
control mechanisms, which in our case is the replacement of the chairman.
Concerning ownership, we find that the monitoring benefits derived from ownership
concentration are exerted more intensively by those shareholders of listed firms showing
poor performance, and this disciplinary mechanism is especially relevant for firms
operating in Spain’s main stock market (IBEX-35). To the contrary, our findings show
that although banks play an important role in Spanish listed firms, the decision to replace
the CEO is not linked to poor performance changes in firms controlled by a bank.
The results of this paper give further support to the growing claim made by academics
who highlight the importance to examine the endogenous nature of control mechanisms
(Hermalin and Weisbach, 2003). The appropriateness of model specifications that address
43

the endogeneity issue becomes key to clearly understand the forces behind governance
interventions, as well as the dynamic relations between CEO turnover and other control
mechanisms.
Our study was limited to the analysis of the determinants of any type of CEO departure,
which represents our main limitation. However, we are trustful that our approach to CEO
turnover is appropriate, and that our results have helped open new lines for future
research. There is a need for greater research into the endogenous nature of corporate
governance mechanisms, and the potential substitutions or complementarities that may
exist between internal and external control mechanisms and their impact on the activation
of governance interventions.
References Agrawal A, Mandelker G. (1990). Large shareholders and the monitoring of managers:
the case of anti-takeover charter amendments. Journal of Financial and Quantitative Analysis 25: 143–161.
Andersen, E. (1970) Asymptotic Properties of Conditional Maximum Likelihood Estimators, Journal of the Royal Statistical Society (Series B), 32: 283–301.
Arellano, M. (2003) Discrete Choices with Panel Data, Investigaciones Económicas, 27 (3): 423–458.
Arellano, M., Honoré, B. (2001) Panel Data Models: Some Recent Developments. In J.J. Heckman and E. Leamer (eds.) The Handbook of Econometrics (Volume 5). Amsterdam: North-Holland.
Barca, F., Becht, M. (2002) The Control of Corporate Europe. Oxford: Oxford University Press.
Becht, M., Bolton, P., Röell, A. (2002) Corporate governance and control. European Corporate Governance Institute, Finance Working Paper 02-2002.
Berlin, M., John, K., Saunders, A. (1996) Bank Equity Stakes in Borrowing Firms and Financial Distress, Review of Financial Studies 9(3): 889–919.
Berzins, J., Bøhren, Ø., Rydland, P. (2008) Corporate finance and governance in firms with limited liability: Basic characteristics. Centre for Corporate Governance Research, Research Report 01/2008.
Bøhren, Ø., Ødegaard, B. (2003). Governance and performance revisited. European Corporate Governance Institute (ECGI) – Finance Working Paper No 28/2003.
Borokhovich, K., Parrino, R., Trapani, T. (1996) Outside Directors and CEO Selection, Journal of Financial and Quantitative Analysis 31: 337–355.
Bover, O., Arellano, M. (1997) Estimating Dynamic Limited Dependent Variable Models from Panel Data, Investigaciones Económicas 21: 141–165.
Brunello, G., Graziano, C., Parigi, B. (2003) CEO turnover in insider-dominated boards: The Italian case, Journal of Banking and Finance 27: 1027–1051.
44

Casasola, M.J., Tribo, J.A. (2004) Banks as Blockholders. Working paper 04-01, Department of Business Economics, Universidad Carlos III, Madrid (Spain).
Chamberlain, G. (1985) Heterogeneity, Omitted Variable Bias, and Duration Dependence. In J.J. Heckman and B. Singer (eds.) Longitudinal Analysis of Labor Market Data. Cambridge: Cambridge University Press.
Coles, J., Lemmon, M., Naveen, L. (2003) A Comparison of Profitability and CEO Turnover Sensitivity in Large Private and Public Firms, Social Science Research Network, working paper 391103, available at www.ssrn.com
Conyon, M. (1998) Directors’ Pay and Turnover: An Application to a Sample of Large UK Firms, Oxford Bulletin of Economist and Statistics 60: 485–507.
Conyon, M., Florou, A. (2002) Top Executive Dismissal, Ownership and Corporate Performance, Accounting and Business Research 32 (4): 209–226.
Cosh, A., Hughes, A. (1997) Executive Remuneration, Executive Dismissal and Institutional Shareholding, International Journal of Industrial Organization 15: 469–492.
Crespi, R., Garcia-Cestona, M.A. (2002) Ownership and control of Spanish listed firms. In F. Barca and M. Becht (eds.) The Control of Corporate Europe. Oxford: Oxford University Press.
Crespí, R., García-Cestona, M.A., Salas, V. (2004) Governance Mechanisms in Spanish Banks: Does ownership matter?, Journal of Banking and Finance 28: 2311–2330.
Dahya, J., McConnell J.J., Travlos, G.N. (2002) The Cadbury Committee, Corporate Performance and Top Management Turnover, Journal of Finance 57: 461–483.
De Miguel, A., Pintado, J., De la Torre, C. (2004). Ownership Structure and Firm Value: New Evidence from Spain, Strategic Management Journal 25: 1199–1207.
De Miguel, A., Pintado, J., De la Torre, C. (2005). How do Entrenchment and Expropriation Phenomena Affect Control Mechanisms?, Corporate Governance 13 (4): 505–516.
Demsetz, H., Lehn, K. (1985) The Structure of Corporate Ownership: Causes and Consequences, Journal of Political Economy 93 (6): 1155–1177.
Demsetz, H., Villalonga, B. (2001) Ownership Structure and Corporate Performance, Journal of Corporate Finance 7: 209–233.
Denis, D.J., Denis, D.K. (1995) Performance Changes Following Top-Management Dismissals, Journal of Finance 50: 1029–1055.
Diamond, D. (1984) Financial Intermediation and Delegated Monitoring, Review of Economic Studies, 51(3): 393–414.
Engel, E., Hayes, R., Wang, X. (2003) CEO turnover and properties of accounting information, Journal of Accounting and Economics 36: 197–226.
Faccio, M. and Lang, L.H. (2002) The Ultimate Ownership of Western European Corporations, Journal of Financial Economics 65: 365–395.
Fama, E. (1980) Agency Problem and the Theory of the Firm, Journal of Political Economy 88: 288–307.
Fama, E., Jensen, M. (1993) Separation of Ownership and Control, Journal of Law and Economics 26: 375–393.
Farrell, K., Whidbee, D. (2003) Impact of firm performance expectations on CEO turnover and replacement decisions, Journal of Accounting and Economics 36: 165–196.
45

Florou, A. (2005) Top Director Shake-up: The Link between Chairman and CEO Dismissal in the UK, Journal of Business Finance and Accounting 32: 97–128.
Franks, J., Mayer, C., Renneboog, L. (2001) Who disciplines management in poorly performing firms?, Journal of Financial Intermediation 10: 209–248.
Giannetti, M. (2003) Do better institutions mitigate agency problems? Evidence from corporate finance choices, Journal of Financial and Quantitative Analysis 38: 185–212.
Gibbons, R., Murphy, K. (1990) Relative performance evaluation for chief executive officers, Industrial and Labor Relations Review, 43 (3): 30–51.
Gibson, M. (2003) Is Corporate Governance Ineffective in Emerging Markets, Journal of Financial and Quantitative Analysis 38: 231–250.
Gispert, C. (1998) Board turnover and firm performance in Spanish companies. Investigaciones Económicas 22 (3): 517–536.
Gorton G, Schmidt A. (2000). Universal banking and the performance of German firms. Journal of Financial Economics 58: 29–80.
Goyal, V., Park Ch. (2002) Board leadership structure and CEO turnover, Journal of Corporate Finance 8: 49–66.
Gutiérrez, M. Tribó, J. (2004). Ownership Structure and Minority Expropriation in Non-Listed Firms: The Case for Multiple Large Shareholders. European Corporate Governance Institute (ECGI) – Finance Working Paper No 53/2004.
Heckman, J.J. (1981a) Heterogeneity and State Dependence. In S. Rosen (ed.) Studies of Labor Markets. Chicago: The National Bureau of Economic Research, The University of Chicago Press.
Heckman, J.J. (1981b) Statistical Models for Discrete panel Data. In C. Manski and D. McFadden (eds.) Structural Analysis of Discrete Panel Data with Econometric Applications. Cambridge, MA: MIT Press.
Hermalin, B. (1992) The effects of competition on executive behavior, RAND Journal of Economics 23 (3): 350–365.
Hermalin, B., Weisbach, M. (2003) Board of Directors as an Endogenously Determined Institution: A Survey of the Economic Literature, FRBNY Economic Policy Review 9: 7–26.
Hill C, Snell S. (1988). External control, corporate strategy, and firm performance in research-intensive industries. Strategic Management Journal 9(6): 577–590.
Hillier, D., Linn, S., McColgan, P. (2005) Equity Issuance, CEO Turnover and Corporate Governance, European Financial Management 11: 515–538.
Holmström, B. (1979) Moral hazard and observability, Bell Journal of Economics 10: 74–91.
Holmström, B. (1982) Moral hazard in teams, Bell Journal of Economics 13: 324–340. Holmström, B., Tirole, J. (1993) Market Liquidity and Performance Monitoring, Journal
of Political Economy 101(4): 678–709. Honoré, B., Kyriazidou, E. (2000) Panel Data Discrete Models with Lagged Dependent
Variables, Econometrica 68 (4): 839–874. Huson, M., Malatesta, P., Parrino, R. (2004) Managerial Succession and Firm
Performance. Journal of Financial Economics 74: 237–275. Huson, M., Parrino, R., Starks, L. (2001) Internal monitoring mechanisms and CEO
turnover: A longterm perspective. Journal of Finance 56: 2265–2297.
46

Jensen, M., Murphy, K. (1990) Performance pay and top management incentives, Journal of Political Economy 98: 225–264.
Kaplan S, Minton B. (1994). Appointments of outsiders to Japanese boards. Determinants and implications for managers. Journal of Financial Economics 23: 225–258.
Kaplan, S. (1994a) Top executives, turnover, and firm performance in Germany, Journal of Law, Economics and Organization 10: 142–159.
Kaplan, S. (1994b) Top executive rewards and firm performance: a comparison of Japan and the United States, Journal of Political Economy 102: 510–546.
Kaplan, S. (1995) Corporate governance and incentives in German companies: evidence from top executive turnover and firm performance European Financial Management 1: 23–36.
Kato, T., Long, Ch. (2006) CEO turnover, firm performance, and enterprise reform in China: Evidence from micro data, Journal of Comparative Economics 34: 796–817.
Kim, Y. (1996) Long-term firm performance and chief executive turnover: an empirical study of the dynamics, Journal of Law, Economics, and Organization 12: 480–496.
La Porta, R., Lopez-de-Silanes, F., Shleifer, A. (1999) Corporate Ownership Around the World, Journal of Finance 44: 471–517.
La Porta, R., Shleifer, A., Vishny, R., Lopez-de-Silanes, F. (1998) Law and Finance, Journal of Political Economy 106 (6): 1113–1150.
Lausten, M. (2002) CEO turnover firm performance and corporate governance: Empirical evidence on Danish firms, International Journal of Industrial Organization 20: 391–414.
Leech D, Leahy J. (1991). Ownership structure, control type classifications and the performance of large British companies. Economic Journal 101: 1418–1437.
Lehmann E, Weigand J. (2000). Does the governed corporation perform better? Governance structures and corporate performance in Germany. European Finance Review 4: 157–195.
Manski, C. (1987) Semiparametric Analysis of Random Effects Linear Models from Binary Panel Data, Econometrica 55: 357–362.
Maury, B. (2006) Corporate Performance, Corporate Governance and Top Executive Turnover in Finland, European Financial Management 12: 221–248.
McConnell, J., Servaes, H. (1990) Additional Evidence on Equity Ownership and Corporate Value, Journal of Financial Economics 27: 595–612.
Morck R, Nakamura M, Shivdasani A. (2000). Banks, ownership structure, and firm value in Japan. Journal of Business 73: 539–567.
Morck, R., Shleifer, A., Vishny, R. (1988) Management Ownership and Market Valuation: An Empirical Analysis, Journal of Financial Economics 20 (1/2): 293–315.
Mudambi R, Nicosia C. (1998). Ownership structure and firm performance: evidence from the U.K. financial services industry. Applied Financial Economics 8: 175–180.
Murphy, K.J. (1999) Executive compensation. In: Ashenfelter, Orley, Card, David (Eds.), Handbook of Labor Economics, vol. 3b. Elsevier Science, North-Holland, Amsterdam/New York/Oxford, pp. 2485–2563.
Nan, S., Ronen, J. (2004) Information transfer effects of senior executives’ migrations and subsequent write-offs, Working paper, New York University.
47

Neumann, R., Voetmann, T. (2005) Top executive turnovers: Separating decision and control rights, Managerial and Decision Economics 26: 25–37.
Neyman, J., Scott, E. (1948) Consistent estimates based on partially consistent observations, Econometrica 16: 1–32.
Pagano, M., Panetta, F., Zingales, L. (1998) Why Do Companies Go Public? An Empirical Analysis, Journal of Finance 53: 27–64.
Parrino, R. (1997) CEO turnover and outside succession: A cross-sectional analysis, Journal of Financial Economics 46: 165–197.
Rasch, G. (1960) Probabilistic Models for Some Intelligence and Attainment Tests. Copenhagen: Denmark Pædagogiske Institut.
Reese, W., Weisbach, M. (2002) Protection of Minority Shareholder Interests, Cross-Listings in the United States, and Subsequent Equity Offerings, Journal of Financial Economics 66: 65–104.
Shleifer, A., Vishny, R. (1997) A Survey of Corporate Governance, Journal of Finance 52: 737–783.
Sponholtz, C. (2006) Determinants of CEO Turnover in Public and Private Firms in Denmark - CEO and Firm Characteristics, Social Science Research Network, working paper 927424, available at www.ssrn.com
Suchard, J. A., Singh, M., Barr, R. (2001) The market effects of CEO turnover in Australian firms, Pacific-Basin Finance Journal 9: 1–27.
Tirole, J. (2001) Corporate Governance. Econometrica 69: 1 – 35. Volpin, P.F. (2002) Governance with poor investor protection: Evidence from top
executive turnover in Italy, Journal of Financial Economics 64: 61–90. Warner, J., Watts, R., Wruck, K. (1988) Stock prices and top management changes,
Journal of Financial Economics 20: 461–492. Weisbach, M. (1988) Outside directors and CEO turnover, Journal of Financial
Economics 20: 431–460. Wruck, K. (1989) Equity Ownership Concentration and Firm Value: Evidence from
Private Equity Financings, Journal of Financial Economics 23: 3–28. Zhou, X. (2000) CEO pay, firm size and corporate performance: Evidence from Canada,
Canadian Journal of Economics 33: 213 – 251. Zwiebel, J. (1995) Block Investment and Partial Benefits of Corporate Control, Review of
Economic Studies 62: 161–185.
48

APPENDIX 1. CEO turnover in listed and large unlisted Spanish firms
Conditional fixed-effects logit regressions are estimated from equation [2] as follow:
1 1 2 12 1 3 2, 1
23 2, 1 1 1
Size Listed Size Listed Performance
Performance Listed Listed
it it it it it it t
it t it k it k it it i it
CEO
CG CG
β β β β
β β β− − − −
− − − −
Δ = + + × + Δ
+ Δ × + + × + +∑ ∑ η μ
itCEOΔ is the dependent variable (CEO turnover), and it is a dummy equal to one if a change in the CEO position took place in the year t. Size is the natural log of total assets in t-1, listed is a dummy equal to one if the firm is registered in any Spanish stock market, and is the change in performance (ROA and ROE) between year –2 and –1. CG refers to the internal control mechanisms under analysis: CEO turnover in the period t-1, chairman turnover (dummy variable equal to one if we identify a change in the chairman position in the year t-1) and ownership concentration, measured as the stake held by the largest shareholder (C1) in t-1. Standard error is presented in brackets.
PerformanceΔ
(1) (2) (3) (4)
Size t-1 (ln assets) 0.5791 ***
(0.1166) 0.5827 ***
(0.1168) 0.5700 ***
(0.1165) 0.5721 ***
(0.1168)
Listed 4.7203 **
(1.8988) 4.2275 **
(1.9173) 4.6971 **
(1.8970) 4.1854 **
(1.9231)
Listed×Size t-1 -0.4399 **
(0.2167) -0.3989 *(0.2218)
-0.4357 **
(0.2164) -0.3885 *(0.2227)
CEO turnover t-1 -1.7408 ***
(0.1024) -1.6675 ***
(0.1045) -1.7302 ***
(0.1027) -1.6541 ***
(0.1048) Listed× CEO turnover t-1 -1.3085 **
(0.5513) -1.3869 **
(0.5517)
Chairman turnover t-1 0.3006 ***
(0.1148) 0.2908 **
(0.1186) 0.2859 **
(0.1158) 0.2758 **
(0.1196) Listed× Chairman turnover t-1 0.0621
(0.4952) 0.1434 (0.4818)
2, 1t tROA− −Δ -0.0002 (0.0016)
-0.0006 (0.0017)
Listed 2, 1t tROA− −×Δ -0.0940 * (0.0561)
2, 1t tROE − −Δ -0.0108 (0.0054)
-0.0003 (0.0105)
Listed 2, 1t tROE − −×Δ -0.1036 * (0.0589)
Ownership concentration (C1) t-1
-0.2153 (0.3313)
-0.2757 (0.3471)
-0.2355 (0.3313)
-0.2941 (0.3472)
Listed×C1 t-1 0.5396 (1.1644) 0.5254
(1.1451) Time dummies Yes Yes Yes Yes Log likelihood -1,884.97 -1,878.47 -1,865.78 -1,859.22 LR (chi2) 493.99 *** 506.98 *** 483.77 *** 496.88 ***
Pseudo R2 0.1022 0.1046 0.1012 0.1038 Observations 5,748 5,748 5,682 5,682
*, **, *** indicates significance at the 0.10, 0.05 and 0.01, respectively.
49

APPENDIX 2. CEO turnover in Spanish listed firms Conditional fixed-effects logit regressions are estimated from equation [2] as follow:
1 1 2 12 1 3 2, 1
23 2, 1 1 1
Size IBEX-35 Size IBEX-35 Performance
Performance IBEX-35 IBEX-35
it it it it it it t
it t it k it k it it i it
CEO
CG CG
β β β β
β β β− − − −
− − − −
Δ = + + × + Δ
+ Δ × + + × +∑ ∑ η μ+
itCEOΔ is the dependent variable (CEO turnover), and it is a dummy equal to one if a change in the CEO position took place in the year t. Size is the natural log of total assets in t-1, listed is a dummy equal to one if the firm is registered in the main Spain’s stock market (IBEX-35), and is the change in performance (Market-to-book value, ROA, ROE) between year –2 and –1. CG refers to the internal control mechanisms under analysis: CEO turnover in the period t-1, chairman turnover (dummy variable equal to one if we identify a change in the chairman position in the year t-1) and ownership concentration, measured as the stake held by the largest shareholder (C1) in t-1. Standard error is presented in brackets.
PerformanceΔ
(1) (2) (3) (4) (5) (6)
Size t-1 (ln assets) 0.1547 (0.3721)
0.1463 (0.3708)
0.3454 (0.3618)
0.3172 (0.3565)
0.3795 (0.3600)
0.3649 (0.3592)
IBEX-35 0.5161 (2.0779)
0.9133 (2.1427)
0.5255 (1.1839)
0.9299 (1.9770)
0.6040 (1.8754)
1.0639 (2.0197)
IBEX-35×Size t-1 -0.8718 (0.8557)
-1.0383 (0.9483)
-1.3330 (0.8193)
-1.4151 (0.8743)
-1.2696 (0.8022)
-1.3199 (0.8245)
CEO turnover t-1 -3.0359 ***
(0.5718) -2.7757 ***
(0.5790) -3.0314 ***
(0.5491) -2.7074 ***
(0.5584) -3.1368 ***
(0.5531) -2.8432 ***
(0.5637) IBEX-35× CEO turnover t-1 -35.8552
(54.2007) -32.8130 (108.0007) -32.6422
(108.0017)
Chairman turnover t-1 0.5269 (0.4708)
0.1966 (0.5613)
0.4488 (0.4825)
0.0674 (0.5864)
0.5222 (0.4701)
0.2427 (0.5739)
IBEX-35× Chairman turnover t-1 1.1809
(1.0153) 1.2374 (0.9863) 0.8961
(0.9809)
2, 1Market-to-Book t t− −Δ -0.5039 ** (0.2081)
-0.4752 ** (0.2111)
IBEX-35 2, 1Market-to-Book t t− −×Δ -0.3904
(0.8523)
2, 1t tROA− −Δ -0.1188 * (0.0710)
-0.1002 (0.0715)
IBEX-35 2, 1t tROA− −×Δ -0.2644 (0.3442)
2, 1t tROE − −Δ -0.1422 **
(0.0668) -0.1487 **
(0.0758) IBEX-35 2, 1t tROE − −×Δ 0.0478
(0.1482) Ownership concentration (C1) t-1
-0.3125 (1.0998)
-0.1469 (1.1289)
-0.2065 (1.0996)
-0.1665 (1.1186)
-0.1902 (1.0888)
-0.0821 (1.1199)
IBEX-35×C1 t-1 -2.5805 (6.4541) 1.9075
(5.8210) -0.8540 (5.4860)
Time dummies Yes Yes Yes Yes Yes Yes Log likelihood -120.05 -118.50 -128.57 -126.43 -126.36 -124.97 LR (chi2) 68.09 *** 71.18 *** 77.67 *** 81.95 *** 79.45 *** 82.24 ***
Pseudo R2 0.1880 0.1974 0.1982 0.2110 0.2053 0.2138 Observations 413 413 447 447 443 443
*, **, *** indicates significance at the 0.10, 0.05 and 0.01, respectively.
50

APPENDIX 3. Individual regressions: Determinants of CEO turnover (full sample) Fixed-effects regressions are estimated as follow (equation 5):
*1 1 1it it it it i itCEO CEO X Zγ β δ η μ− − −Δ = Δ + + + +
*itCEOΔ is the dependent variable (CEO turnover), and it represents the corresponding linear approximation obtained from equation [4], according to
each performance measure: return on assets (ROA) and return on equity (ROE). is a dummy equal to one if a change in the CEO position took place in the year t-1. X denotes a vector of strictly exogenous variables: size (natural log of total assets), a dummy equal to one if the firm is registered in any Spanish stock market (Listed) and ownership concentration, measured as the stake held by the largest shareholder (C1). Z refers to the endogenous explanatory variables: changes in performance between year –2 and –1, chairman turnover (dummy variable equal to one if we identify a change in the chairman position) and an interaction term between these two variables. Standard error is presented in brackets.
1itCEO −Δ
(1) (2) (3) (4) (5) (6) (7) (8) (9) (10) (11)
Size t-1 (ln assets) 0.0112 (0.0124)
0.0123 (0.0124)
0.0123 (0.0124)
0.0112 (0.0124)
0.0113 (0.0124)
0.0115 (0.0124)
0.0122 (0.0124)
0.0109 (0.0126)
0.0110 (0.0126)
0.0129 (0.0133)
0.0131 (0.0133)
Listed 0.0147 (0.1954)
0.0126 (0.1953)
0.0125 (0.1953)
0.0143 (0.1954)
0.0146 (0.1954)
0.0149 (0.1953)
0.0179 (0.1950)
0.0134 (0.1962)
0.0116 (0.1962)
0.0168 (0.1997)
0.0024 (0.2010)
Listed Size t-1 × -0.0024 (0.0264)
-0.0021 (0.0263)
-0.0020 (0.0263)
-0.0024 (0.0264)
-0.0028 (0.0264)
-0.0024 (0.0263)
-0.0020 (0.0263)
-0.0022 (0.0265)
-0.0019 (0.0265)
-0.0026 (0.0270)
-0.0059 (0.0275)
CEO turnover t-1 -0.0241** (0.0115)
-0.0239** (0.0119)
Listed ×CEO turnover t-1 -0.0034
(0.0436)
Chairman turnover t-1 0.0080 (0.0158)
0.0063 (0.0164)
Listed ×Chairman turnover t-1 0.0234
(0.0609)
2, 1t tROA− −Δ -0.0002** (0.0001)
-0.0002* (0.0001)
Listed 2, 1t tROA− −×Δ -0.0105*** (0.0020)
*, **, *** indicates significance at the 0.10, 0.05 and 0.01, respectively.
51

APPENDIX 3. Continued
(1) (2) (3) (4) (5) (6) (7) (8) (9) (10) (11)
2, 1t tROE − −Δ -0.0003 (0.0013)
-0.0002 (0.0013)
Listed 2, 1t tROE − −×Δ -0.0031 (0.0061)
Ownership concentration (C1) t-1 0.0019
(0.0457) -0.0061 (0.0474)
Listed C1 t-1 × 0.1042 (0.1642)
Time dummies Yes Yes Yes Yes Yes Yes Yes Yes Yes Yes Yes
Intercept -1.3627***
(0.0582) -1.3629***
(0.0582) -1.3629***
(0.0582) -1.3635***
(0.0582) -1.3635***
(0.0582) -1.3640***
(0.0582) -1.3690***
(0.0581) -1.3613***
(0.0589) -1.3616***
(0.0589) -1.3724***
(0.0717) -1.3670***
(0.0722) F – test 619.30 *** 551.23 *** 496.04 *** 550.46 *** 495.37 *** 551.31 *** 500.61 *** 539.01 *** 485.09 *** 504.57 *** 454.12 ***
R square (within) 0.4001 0.4005 0.4005 0.4002 0.4002 0.4005 0.4027 0.3973 0.3974 0.3901 0.3902 Observations 8,922 8,922 8,922 8,922 8,922 8,922 8,922 8,850 8,850 8,537 8,537
*, **, *** indicates significance at the 0.10, 0.05 and 0.01, respectively.
52
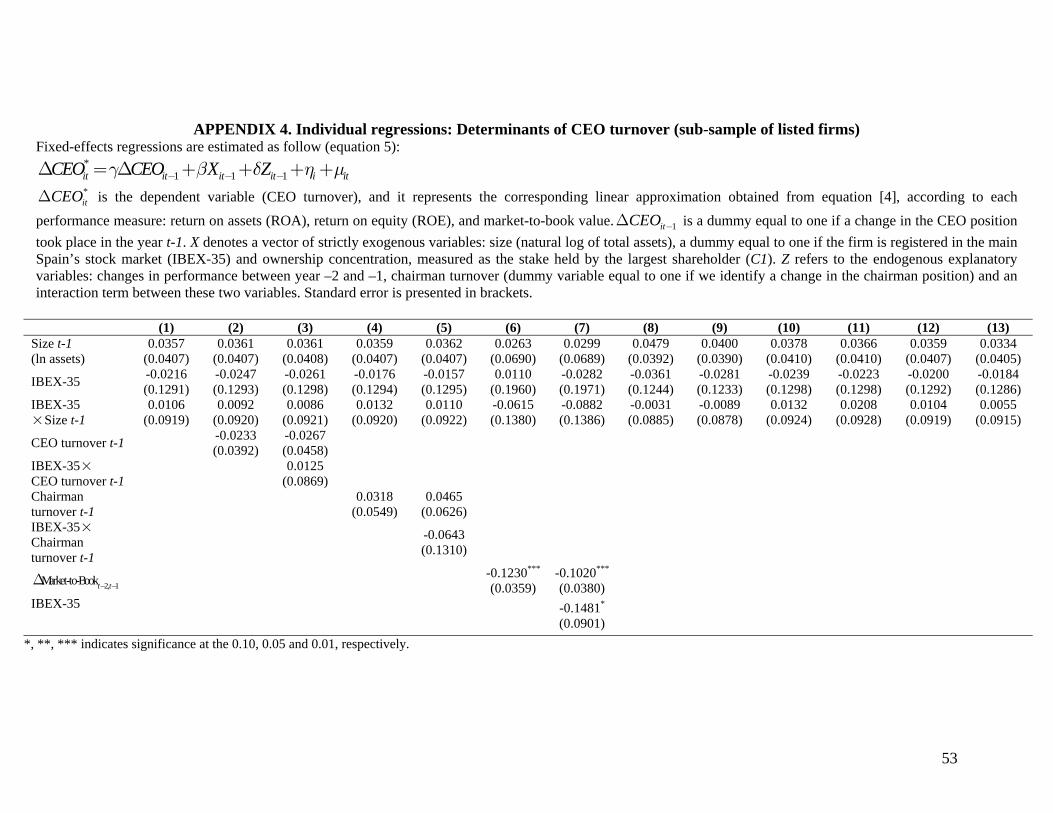
APPENDIX 4. Individual regressions: Determinants of CEO turnover (sub-sample of listed firms) Fixed-effects regressions are estimated as follow (equation 5):
*1 1 1it it it it i itCEO CEO X Zγ β δ η μ− − −Δ = Δ + + + +
*itCEOΔ is the dependent variable (CEO turnover), and it represents the corresponding linear approximation obtained from equation [4], according to each
performance measure: return on assets (ROA), return on equity (ROE), and market-to-book value. is a dummy equal to one if a change in the CEO position took place in the year t-1. X denotes a vector of strictly exogenous variables: size (natural log of total assets), a dummy equal to one if the firm is registered in the main Spain’s stock market (IBEX-35) and ownership concentration, measured as the stake held by the largest shareholder (C1). Z refers to the endogenous explanatory variables: changes in performance between year –2 and –1, chairman turnover (dummy variable equal to one if we identify a change in the chairman position) and an interaction term between these two variables. Standard error is presented in brackets.
1itCEO −Δ
(1) (2) (3) (4) (5) (6) (7) (8) (9) (10) (11) (12) (13) Size t-1 (ln assets)
0.0357 (0.0407)
0.0361 (0.0407)
0.0361 (0.0408)
0.0359 (0.0407)
0.0362 (0.0407)
0.0263 (0.0690)
0.0299 (0.0689)
0.0479 (0.0392)
0.0400 (0.0390)
0.0378 (0.0410)
0.0366 (0.0410)
0.0359 (0.0407)
0.0334 (0.0405)
IBEX-35 -0.0216 (0.1291)
-0.0247 (0.1293)
-0.0261 (0.1298)
-0.0176 (0.1294)
-0.0157 (0.1295)
0.0110 (0.1960)
-0.0282 (0.1971)
-0.0361 (0.1244)
-0.0281 (0.1233)
-0.0239 (0.1298)
-0.0223 (0.1298)
-0.0200 (0.1292)
-0.0184 (0.1286)
IBEX-35 ×Size t-1
0.0106 (0.0919)
0.0092 (0.0920)
0.0086 (0.0921)
0.0132 (0.0920)
0.0110 (0.0922)
-0.0615 (0.1380)
-0.0882 (0.1386)
-0.0031 (0.0885)
-0.0089 (0.0878)
0.0132 (0.0924)
0.0208 (0.0928)
0.0104 (0.0919)
0.0055 (0.0915)
CEO turnover t-1 -0.0233 (0.0392)
-0.0267 (0.0458)
IBEX-35 ×CEO turnover t-1 0.0125
(0.0869)
Chairman turnover t-1
× 0.0318
(0.0549) 0.0465
(0.0626)
IBEX-35 Chairman turnover t-1
-0.0643 (0.1310)
2, 1Market-to-Bookt t− −Δ -0.1230*** (0.0359)
-0.1020*** (0.0380)
IBEX-35
-0.1481*
(0.0901)
*, **, *** indicates significance at the 0.10, 0.05 and 0.01, respectively.
53

APPENDIX 4. Continued
(1) (2) (3) (4) (5) (6) (7) (8) (9) (10) (11) (12) (13)
2, 1t tROA− −Δ -0.0108*** (0.0018)
0.00001 (0.0040)
IBEX-35 2, 1t tROA− −×Δ
-0.0135***
(0.0044)
2, 1t tROE − −Δ -0.0033 (0.0054)
-0.0013 (0.0059)
IBEX-35 2, 1t tROE − −×Δ
-0.0136
(0.0154)
Ownership concentration (C1) t-1
0.1096 (0.1493)
0.0226 (0.1534)
IBEX-35 ×C1 t-1 1.4543**
(0.6280) Time dummies Yes Yes Yes Yes Yes Yes Yes Yes Yes Yes Yes Yes Yes
Intercept -1.5320***
(0.2694) -1.5260***
(0.2698) -1.5244***
(0.2703) -1.5423***
(0.2702) -1.5408***
(0.2704) -1.2678***
(0.4177) -1.2264***
(0.4177) -1.5961***
(0.2598) -1.5391***
(0.2581) -1.5478***
(0.2726) -1.5549***
(0.2728) -1.5680***
(0.2739) -1.6039***
(0.2731) F – test 41.41 *** 36.80 *** 33.05 *** 36.79 *** 33.08 *** 21.39 *** 19.60 *** 43.68 *** 40.95 *** 35.70 *** 32.19 *** 36.83 *** 34.00 ***
R square (within) 0.4197 0.4202 0.4202 0.4202 0.4205 0.3088 0.3131 0.4624 0.4731 0.4149 0.4159 0.4204 0.4271 Observations 564 564 564 564 564 535 535 564 564 560 560 564 564
*, **, *** indicates significance at the 0.10, 0.05 and 0.01, respectively.
54

APPENDIX 5. The sensitivity of CEO turnover to industry-adjusted performance measures (full sample)
Fixed-effects regressions are estimated as follow (equation 5): *
1 1 1it it it it i itCEO CEO X Zγ β δ η− − −Δ = Δ + + + +μ *itCEOΔ is the dependent variable (CEO turnover), and it represents the corresponding linear
approximation obtained from equation [4], according to each performance measure: median industry-adjusted return on assets (ROA) and median industry-adjusted return on equity (ROE). is a dummy equal to one if a change in the CEO position took place in the year t-1. X denotes a vector of strictly exogenous variables: size (natural log of total assets), a dummy equal to one if the firm is registered in any Spanish stock market (Listed) and ownership concentration, measured as the stake held by the largest shareholder (C1). Z refers to the endogenous explanatory variables: changes in performance between year –2 and –1, chairman turnover (dummy variable equal to one if we identify a change in the chairman position) and an interaction term between these two variables. Standard error is presented in brackets.
1itCEO −Δ
(1) (2) (3) (4)
Size t-1 (ln assets) 0.0126 (0.0133)
0.0128 (0.0133)
0.0141 (0.0133)
0.0138 (0.0133)
Listed -0.0048 (0.1991)
-0.0813 (0.2306)
0.0138 (0.1994)
-0.0589 (0.2306)
Listed×Size t-1 0.0001 (0.0269)
0.0041 (0.0276)
-0.0023 (0.0269)
0.0008 (0.0276)
CEO turnover t-1 -0.0251 **
(0.0119) -0.0243 **
(0.0124) -0.0251 **
(0.0119) -0.0247 **
(0.0124) Listed× CEO turnover t-1 -0.0091
(0.0450) -0.0060 (0.0450)
Chairman turnover t-1 0.0126 (0.0163)
0.0108 (0.0170)
0.0115 (0.0164)
0.0096 (0.0170)
Listed× Chairman turnover t-1 0.0244
(0.0628) 0.0228 (0.0629)
Median industry-adjusted ROA t-1 -0.3094 *** (0.0637)
-0.3164 *** (0.0657)
Listed×Median industry-adjusted ROA t-1 0.1185
(0.2732)
Median industry-adjusted ROE t-1 -0.0039 (0.0028)
-0.0038 (0.0028)
Listed×Median industry-adjusted ROE t-1 -0.0343
(0.0648)
Ownership concentration (C1) t-1 0.0018 (0.0451)
-0.0060 (0.0468)
0.0012 (0.0452)
-0.0068 (0.0468)
Listed×C1 t-1 0.0967 (0.1597) 0.1037
(0.1599) Time dummies Yes Yes Yes Yes
Intercept -1.3638 ***
(0.0713) -1.3575 ***
(0.0727) -1.3735 ***
(0.0714) -1.3641 ***
(0.0726) F – test 383.63 *** 287.64 *** 380.66 *** 285.42 ***
R square (within) 0.3929 0.3930 0.3911 0.3912 Observations 8,537 8,537 8,468 8,468 *, **, *** indicates significance at the 0.10, 0.05 and 0.01, respectively.
55

APPENDIX 6. The sensitivity of CEO turnover to industry-adjusted performance measures (sub-sample of listed firms)
Fixed-effects regressions are estimated as follow (equation 5): *
1 1 1it it it it i itCEO CEO X Zγ β δ η− − −Δ = Δ + + + +μ *itCEOΔ is the dependent variable (CEO turnover), and it represents the corresponding linear
approximation obtained from equation [4], according to each performance measure: median industry-adjusted return on assets (ROA) and median industry-adjusted return on equity (ROE). is a dummy equal to one if a change in the CEO position took place in the year t-1. X denotes a vector of strictly exogenous variables: size (natural log of total assets), a dummy equal to one if the firm is registered in the main Spain’s stock market (IBEX-35) and ownership concentration, measured as the stake held by the largest shareholder (C1). Z refers to the endogenous explanatory variables: changes in performance between year –2 and –1, chairman turnover (dummy variable equal to one if we identify a change in the chairman position) and an interaction term between these two variables. Standard error is presented in brackets.
1itCEO −Δ
(1) (2) (3) (4)
Size t-1 (ln assets) 0.0426 (0.0411)
0.0373 (0.0421)
0.0375 (0.0409)
0.0329 (0.0412)
IBEX-35 -0.0085 (0.1299)
-0.2786 (0.1915)
-0.0186 (0.1298)
-0.2842 (0.1910)
IBEX-35×Size t-1 0.0045 (0.0924)
-0.0007 (0.0928)
0.0112 (0.0923)
0.0093 (0.0932)
CEO turnover t-1 -0.0260 (0.0396)
-0.0303 (0.0464)
-0.0262 (0.0397)
-0.0317 (0.0464)
IBEX-35× CEO turnover t-1 0.0143
(0.0879) 0.0212 (0.0877)
Chairman turnover t-1 0.0361 (0.0554)
0.0579 (0.0634)
0.0360 (0.0556)
0.0583 (0.0636)
IBEX-35× Chairman turnover t-1 -0.0782
(0.1329) -0.0783 (0.1322)
Median industry-adjusted ROA t-1 0.2533 (0.2398)
0.2510 (0.2408)
IBEX-35×Median industry-adjusted ROA t-1 -0.0778
(0.2045)
Median industry-adjusted ROE t-1 0.0048 (0.0550)
-0.0080 (0.0573)
IBEX-35×Median industry-adjusted ROE t-1 -0.0566
(0.1027)
Ownership concentration (C1) t-1 0.1034 (0.0460)
0.0466 (0.1490)
0.1085 (0.1461)
0.0503 (0.1491)
IBEX-35×C1 t-1 0.9905 ** (0.4153) 0.9617 *
(0.5141) Time dummies Yes Yes Yes Yes
Intercept -1.5925 ***
(0.2762) -1.5390 ***
(0.2805) -1.5775 ***
(0.2763) -1.5322 ***
(0.2774) F – test 27.72 *** 21.04 *** 27.56 *** 20.93 ***
R square (within) 0.4229 0.4279 0.4214 0.4267 Observations 564 564 560 560 *, **, *** indicates significance at the 0.10, 0.05 and 0.01, respectively.
56


