Embed Size (px)
Citation preview

MARINE ECOLOGY PROGRESS SERIES Mar Ecol.Prog Ser I Published June 26
Energy balance of mussels Mytilus galloprovincialis: the effect of length and age
Ale jandro Perez C a m a c h o l ~ * , Uxio ~ a b a r t a ~ , Enrique ~ a v a r r o ~
'Instituto Espairol de Oceanografia, Centro Costero, Aptdo. 130, 15001 La Coruna, Spain 'CSIC, Instituto de Investigaciones Marinas, c/Eduardo Cabello 6,36208 Vigo, Spain
3Dpto de Biologia Animal y Genetica, Universidad del Pais Vasco. Aptdo. 644,48080 Bilbao, Spain
ABSTRACT: Clearance and ingestion rates, absorption efficiencies and respiration rates were mea- sured in mussels Mytilus galloprovjncjaljs Lmk of different lengths (53 to 89 mm) and age (10 to 24 mo) from cultivation rafts in the Ria de Arosa (Galicia, Spain). The experiments were carried out either in the laboratory, using monoalgal food (Isochrysjs galbana) with an organic content of 91 %, or under nat- ural conditions of food availability in cultivation rafts with seston, the organic content of which ranged from 33 to 69%. Food concentrations ranged from 0.57 to 1.00 mg 1-' of total particulate matter (TPM), a load which is below the threshold for the production of pseudofaeces in Mytdus. These experiments proved that the ingestion rate (1R = mg TPM h-') of food increases with the size of the mussel (measured as g of soft-tissue dry weight [DW]) according to the power equation IR = 1 2 . 6 6 1 ~ W ~ . ~ ' ~ , this model accounting for over 90% of the variance of the 1R. Behavioural patterns that tended to maintain con- stant 1R regardless of the density of the food were observed. Absorption efficiency (AE) is positively related to the organic content (OC) of the food according to the following hyperbolic equation: AE = 1.015 - 0.163(1/OC) (r = 0.940). AE is independent of mussel size for most of the size range used in this study, but there is a critical length around 85 mm, above which there is a noticeable decrease of AE. Metabolic expenditure, measured in terms of oxygen consumption standarized per unit of dry weight of flesh, tends to increase with the age of the mussel. The results obtained led to the conclusion that physiological traits such as the regulation of ingestion or differences in AE between groups do not explain the differences in growth between mussels of the same age. These differences must therefore be due to the limited food and space available as a result of the large numbers of mussels on the culti- vation rafts and the agglomeration of mussels on the cultivation ropes.
KEY WORDS: Mytdus . Ingestion rate . Respiration . Absorption efficiency . Food quality
INTRODUCTION
Unlike mussels from natural populations on inter- tidal rocks, which exhibit a certain regularity of length for each age group, mussels cultivated on rafts are strikingly different in length, although at the start of the cultivation, all the mussels on a rope are normally of the same age and origin and of very similar length.
The cultivation rafts, upon which over 10 000 million mussels can be found on the NW Spanish coast alone, are responsible for the role of the mussel as a key spe- cies in the ecosystem of the 'rias' (Tenore & Gonzalez 1976).
The growth of mussels depends on environmental factors, particularly the amount of food ingested and its quality, which strongly determine the efficiency of food assimilation. The filtering activity of bivalves tends to decrease as the food concentration in the water increases, thus regulating the amount of food ingested and maintaining the number of particles fil- tered in a given period of time relatively constant (Winter 1973, 1978, Foster-Smith 1975, Griffiths &King 1979, Widdows et al. 1979, Riisgdrd & Randlev 1981).
On the other hand, filtering activity, and hence the amount of food ingested, increases as the mussel grows according to an allometric function with b < 1. In conse- quence, the daily ration ingested, expressed as % of dry weight of flesh, decreases with increasing size of the mussels (Winter 1978, Navarro & Winter 1982).
O Inter-Research 2000 Resale of full article not permitted

150 Mar Ecol Prog Ser
Absorption efficiency (AE) varies inversely with the density of suspended food and hence the ingestion rate (Widdows & Bayne 1971, Thompson & Bayne 1972, 1974, Griffiths & King 1979, Griffiths 1980, Navarro & Winter 1982, Bayne et al. 1989). Although some authors have reported that AE is also influenced by body size (Bayne et al. 1976), most consider AE to be independent of this variable (Vahl 1973, Thompson & Bayne 1974, Widdows 1978, Navarro &Winter 1982).
Given these considerations, how can we explain dif- ferences in size between mussels of the same age or differences in age between mussels of the same size? It is clear that for mussels maintained under identical conditions in which AE is size independent, differ- ences in length between specimens of the same age should be expected to be due to differences in the rate of food uptake. This could be the consequence of limi- tations of food and space (see Frechette & Lefaivre 1990) that arise from the high density of mussels in the culture system. However, differences in growth rate could also be attributed to differences in feeding rate and/or AE that would have enabled some mussels to grow bigger in the same time span. The existence of such fast- and slow-growing groups of mussels could then be tested by comparing feeding behaviour of specimens of the same size and different age under common feeding conditions.
While size effects on several aspects of physiology of mussels have been extensively reported, we are not aware of any other study in which age effects have also been considered. In the present study we aimed to establish the influence of age and length on physio- logical variables of the mussels, and to determine to what extent differences in growth can be attributed to variations in feeding rate or AE, or whether they can be explained by variations in the amount of food available due to the agglomeration of mussels on the cultivation ropes (comparable to the aggregation of mussels in natural populations on intertidal rocks), which cannot be compensated for by changes in the clearance rate.
MATERIAL AND METHODS
Measurements. Total dry matter and organic matter: Samples of water and faeces from each mussel were filtered on pre-ashed GF/C filters and rinsed with iso- tonic ammonium formate. Total dry particulate matter (TPM) was computed from the increase in weight after the filters were dried to a constant weight at llO°C. Particulate organic matter (POM) corresponded to the weight lost after ignition to constant weight at 450°C in a muffle furnace. The weights of TPM and POM were measured in pg. Food quality was expressed in terms
of its organic content (OC) by weight (OC = POM/ TPM). Once these measurements were made, soft tis- sues from each mussel were excised, dried at 100°C and ashed at 450°C to determine dry weight (DW) and the weight of organic matter (OW) of the soft tissues. The weight of the valves (W) was also determined. The weights of DW, OW and VW were measured in mg. A condition index (CI) was calculated as follows (Perez Camacho et al. 1997):
Clearance and ingestion rates: In Expt 1, which was performed in the laboratory, mussels were acclima- tized for 1 wk under experimental conditions before measurements began. Clearance rate (CR) was deter- mined in triplicate for each of the 15 mussels used in the experiment (5 of each length), using individual 300 m1 metacrylate containers with running seawater (5 1 h-') and a concentration of 50000 cells rnl-' of Isochrysis galbana equivalent to 1.1 mg I-' of TPM with an organic content of 91.3 1 %. Containers without mussels were used to calculate any possible sedimen- tation of phytoplankton, which proved to be negligible. Flow was controlled with 12-channel variable-flow ISMATEC peristaltic pumps. The following equation was used to calculate the CR:
CR = f [(C, - Ce)/Ce]
where Ci and C, represent the concentration.of I. -gal- - .
bana (cells I-') in the inflow and outflow, respectively, and f is the flow measured in 1 h-'.
The ingestion rate (IR) (mg TPM h-') was determined using the following equation:
IR = CR X TPM
where TPM corresponds to the concentration of Isochrysis galbana (in mg I-'). The IR per gram of soft- tissue DW of the mussels, or mass-specific IR (IR,), was also determined.
In the experiments performed i n situ on the cultiva- tion rafts (Expts 2 and 3), the measurements were per- formed on mussels of the same origin cultivated on ropes at a depth of 6 m. The mussels were sorted according to their lengths, their byssus carefully cut and epibionts removed, after which they were placed in mesh bags which were suspended from the raft at a depth of 6 m for 24 h. Subsequently 18 mussels of each size-group were transferred to individual compart- ments in feeding tanks, which received a flow of 90 1 of seawater per hour from a submersible pump situated at a depth of 6 m in the same place where the mesh bags had been suspended. Samples of seawater for analysis were taken at half-hourly intervals, and the faeces every 2 h, using the methods described by Navarro et al. (1991) and Iglesias et al. (1996). In this

Perez Camacho et al.: Energy balance of Mytilus galloprovincialis 151
case the IR was calculated indirectly from the egestion and the inorganic content of the seston (Navarro et al. 1991, Iglesias et al. 1996) according to the following equation:
where ER is the egestion rate, measured in mg DW h-' of faeces, FIC is the fecal inorganic matter content (%) and SIC is the inorganic matter content of the seston. CR was then computed by the following expression:
Absorption efficiency: AE was calculated according to Conover (1966). Absorption rates (A) were estimated as the difference between organic ingestion rates (OIR) and organic egestion rates. Absorption efficien- cies (AE) corresponded to the ratio A/OIR.
Oxygen consumption rate: Oxygen consumption rate (V02, mg O2 h-') and mass-specific V02 (VO,) were estimated only for Expts 2 and 3 in the same mus- sels used to estimate the CR. Measurements were taken at half-hourly intervals, using YSI electrodes in 400 m1 glass chambers maintained at the environmen- tal temperature with flowing water pumped from the sea. Measurements were concluded before concentra- tion of oxygen in the chambers attained 50 % of the ini- tial concentration.
Experimental design. The experiments were car- ried out with mussels from the experimental cultures in the Ria de Arosa (Galicia, Spain). All the mussels shared the same origin (spat gathered from rocks on the Island of Salvora), and were of similar age and size at the start of cultivation. These mussels re- mained attached to ropes suspended from a raft for between 6 and 18 mo before the experiments began. Three different experiments were performed, 2 of which were intended to determine the influence of size on physiological variables, comparing results obtained in the laboratory with monoalgal food to those obtained on the raft with natural food, whilst the third was designed to study the independent effects of size and age of mussels on the same physi- ological variables.
Expt 1: This experiment was performed
Expt 2: This experiment took place on the cultivation raft, using natural food with an organic content of 69%, at a TPM concentration of 0.568 mg 1-l. Mussels used in this experiment were of the same origin as those used in Expt 1, were of the same age (24 mo), and were divided into 3 groups of 18 mussels each, with lengths ranging from 56 to 66,71 to 77 and 85 to 92 mm (average lengths: 60.1 rc_ 3.4, 73.9 * 2.8 and 88.5 i 2.6 mm, respectively).
Expt 3: This experiment was carried out under the same natural conditions as Expt 2, but the organic con- tent of seston was 33% and TPM concentration was 1.007 mg I-'. Mussels belonging to 2 age groups of 10 (juvenile) and 22 (old) mo were subsequently divided each into 2 size-groups. Groups of 'old mussels' had average lengths of 55.7 * 1.0 and 77.9 * 0.8 mm, and groups of 'juvenile mussels' had average lengths of 53.85 * 0.83 and 79.42 + 0.56 mm. Thus, measurements of Expt 3 were performed on 4 groups of mussels in whlch age and size varied independently.
Statistical methods. All statistical procedures were performed with STATGRAPHICS software. The differ- ences between means for the variables studied were compared by means of analysis of variance (ANOVA) and analysis of covariance (ANCOVA). The Bartlett test was used to check the homogeneity of the variances, with logarithmic transformations being performed when necessary. Multiple comparisons were carried out with the least significant differences (LSD) multiple range test (Snedecor & Cochran 1980, Zar 1984).
RESULTS
Expt l
Table 1 shows the mean values for size parameters (L, DW, OW and VW) of the mussels used in this exper- iment, and Table 2 those for physiological variables (CR, IR, OIR, IRs and AE). These data showed a clear increment of the feeding variables with the size of mussels (except AE and IRs), which were found to be
in the laboratory' using Isochrysis Table 1. Expt 1. Mean values for length (L), dry weight (DW) and organic as with an 91 % l weight (OW) of the soft tissues, and valve weight (VW) in mussels of dosed at a TPM concentration of 1.010 mg varying lengths (S, small; M, medium-sized; LA, large) of the different 1-1. Three groups of 5 mussels each were parameters analysed. The data correspond to the mean values i SE (n = 5)
used, measuring between 60 and 63 mm
proximate age of these mussels was 24 mo. 1 I
(average length: 61.6 -c 0.9 mm), 72 and 75 mm (average length: 73 -e 1.2 mm), and 87 and 90 mm (average length: 88.9 * 1.2 mm), respectively (means 2 standard
At the time the the ap-
L DW OW VW (mm) (9) (9) (9)
S 61.60 i 0.96 1.026 i 0.344 0.312 i 0.049 7.811 i 1.029 M 73.00 i 1.12 1.834 i 0.399 0.458 i 0.084 11.309 i 0.800 LA 88.90 i 1.24 3.762 i 1.016 1.058 i 0.441 19.644 i 2.542

152 Mar Ecol Prog Ser 199: 149-158,2000
Table 2. Expt 1. Mean values of the clearance rate (CR), seston ingestion rate (IR), organic matter ingestion rate (OIR), ingestion rate of total particulate matter per g of mussel soft tissue dry weight (IR,) and absorption efficiency (AE) in mussels of varying lengths (S, small; M, medium-sized; LA, large), and significance of the ANOVAs of the different parameters analysed. The data
correspond to the mean values i SE (n = 5)
CR 1R OIR IRs AE (1 h-') (ms h-') (m9 h-L) (mg h-' g-') ("/.l
S 2.051*0.250 2.256 * 0.275 2.060 * 0.250 2.199 * 0.268 88.34 + 0.58 M 4.159 * 0.321 4.575 * 0.353 4.177 2 0.320 2.495 * 0.193 88.21 * 0.38 LA 5.634 * 0.390 6.197 * 0.429 5.658 * 0.392 1.647 * 0.114 75.49 5 4.53 F-ratio 9.327 9.327 9.327 1.526 7.667 Significance level <0.01 <0.01 <0.001 >0.05 <0.01 df 2,12 2,12 2,12 2,12 2,12
statistically significant when testing for differences be- tween mean values of CR, IR and OIR for the 3 groups of mussels (ANOVA, p < 0.05). Differences were signif- icant between all groups (LSD test, p 0.05).
When ANOVA included the size of mussels (given as the soft-body DW) as a covariable, non-size-related differences were found to be non-significant for any of the above variables (p > 0.05). The same results were obtained by comparing IRs computed for different groups of mussels by ANOVA (p > 0.05).
The AE of the small- and medium-sized mussels were similar, whilst that of the large ones shows a noticeable decrease, its difference from the 2 former groups being statistically significant (ANOVA,- p < 0.01; LSD test, p < 0.05). This observation points to the existence of a critical length ( ~ 8 8 mm) above which AE declines drastically.
Expt 2
Table 3 shows the mean values for size and Table 4 those for physiological variables measured in mussels during this experiment. CR, IR and OIR increased with the size of the mussels. However, the only statistically significant differences in this case were those between the groups of small mussels and the medium-sized plus large ones (ANOVA, p 0.01; LSD test, p < 0.05), dif-
ferences between the latter 2 groups being not statisti- cally significant. This was probably connected with a lower range of weight in the mussels used in this experiment, coupled to the greater variability of the physiological determinations. The ANOVA for these parameters when the DW of the mussels is used as a covariable did not reveal significant differences (p > 0.05), and neither are the differences in IR, significant (ANOVA, p > 0.05).
As in Expt 1, the AE of the large mussels was signif- icantly lower than that of the small- and medium-sized ones (ANOVA, p < 0.001; LSD test, p < 0.05), for which there were no significant differences. This consistency confirms the existence of a critical size (88 mm) above which AE shows a noticeable decrease.
Expt 3
In accordance with the design of this experiment, the mean values for size parameters (L, DW, OW and VW) were significantly different between size groups (small- vs medium-sized; ANOVA, p < 0.001; LSD test, p 0.05), whilst there were no significant differences between age groups (juvenile vs old; LSD test, p > 0.05) (Table 5).
As in the previous experiments, there were signifi- cant differences in CR, IR and OIR of different sized
mussels (ANOVA, p < 0.001; LSD test, p 4 0.05). However, neither the
Table 3. Expt 2. Mean values for length (L), soft-tissue dry weight (DW) and organic weight (OW), and valve weight (VW) in mussels of varying lengths (S, ANOVA of these when DW small; M, medium-sized; LA, large) of the different parameters analysed. The Was used as a covariable (p > 0.05)
data correspond to the mean values * SE (n = 16) nor that of the IR, (ANOVA, p > 0.05) showed any significant differences
0.05). The mean AE for this group is
r DW OW VW (9) (9) (9)
60.06 i 0.84 0.848 + 0.059 0.653 i 0.05 15.684 i 0.187 M 73.50 + 0.77 * 0.089 0,064 10,350 0,319 LA 88.38 5 0.66 1 2.677 * 0.173 2.130 i 0.146 15.946 i 0.418
(Table 6). As for the AE, the small-old mus-
sels was the only group that showed any statistically significant difference (ANOVA, p < O.001; LSD test! p <
P6rez Carnacho et al.: Energy balance of Myidus galloprovincialis 153
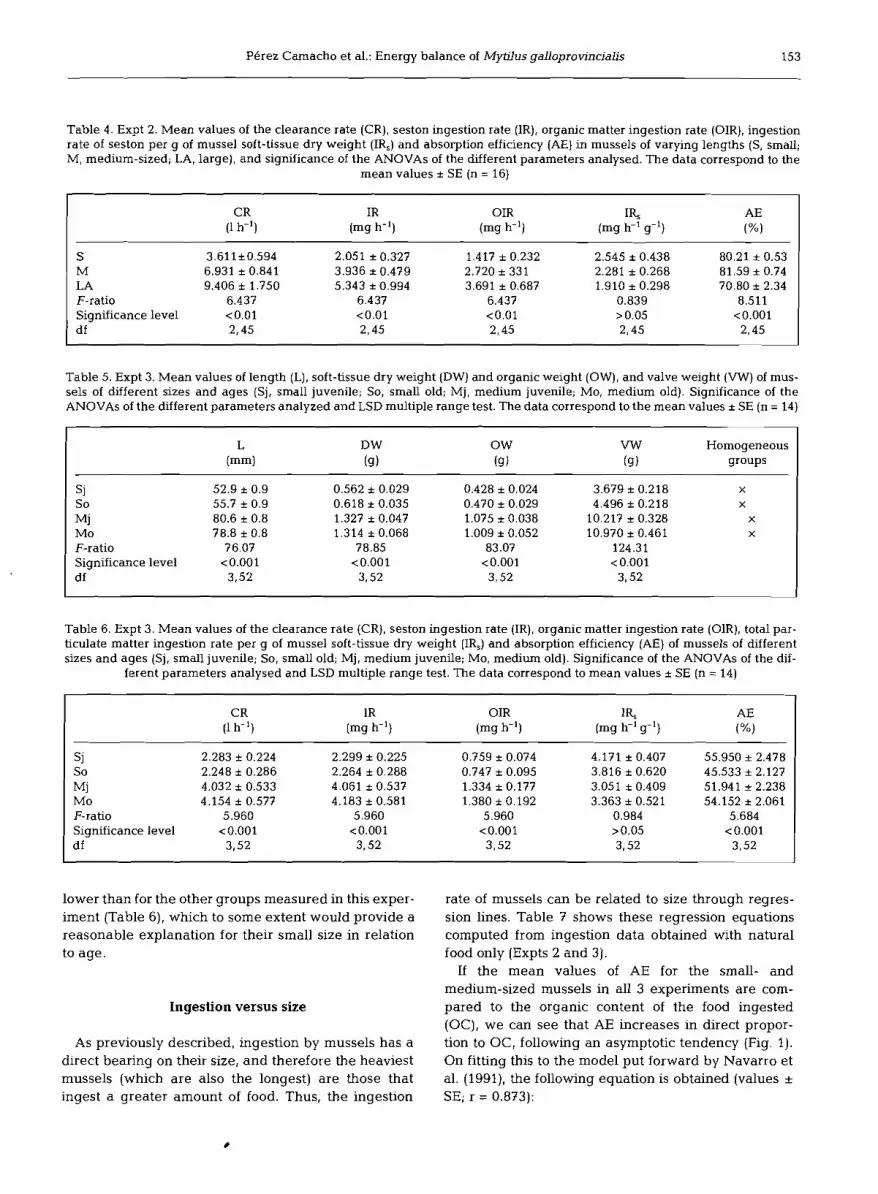
Table 4. Expt 2. Mean values of the clearance rate (CR), seston ingestion rate (IR), organic matter ingestion rate (OIR), ingestion rate of seston per g of mussel soft-tissue dry weight (IR,) and absorption efficiency (AE) in mussels of varying lengths (S, small; M, medium-sized; LA, large), and significance of the ANOVAs of the different parameters analysed. The data correspond to the
mean values i SE (n = 16)
CR IR OIR (l h-') (mg h-') (m9 h-')
IR, (mg h-' g-')
S 3.611*0.594 2.051 i 0.327 1.417 i 0.232 M 6.931 * 0.841 3.936 i 0.479 2.720 i 331 LA 9.406 i 1.750 5.343 i 0.994 3.691 i 0.687 F-ratio 6.437 6.437 6.437 Significance level <0.01 <0.01 <0.01 df 2.45 2,45 2,45
Table 5. Expt 3. Mean values of length (L), soft-tissue dry weight (DW) and organic weight (OW), and valve weight (W) of mus- sels of different sizes and ages (Sj, small juvenile; So, small old; Mj, medium juvenile; MO, medium old). Significance of the ANOVAs of the different parameters analyzed and LSD multiple range test. The data correspond to the mean values i SE (n = 14)
VW Homogeneous (9) groups
S j 52.9 * 0.9 0.562 i 0.029 0.428 i 0.024 3.679 i 0.218 X
So 55.7 i 0.9 0.618 i 0.035 0.470 i 0.029 4.496 i 0.218 X
M 1 80.6 i 0.8 1.327 i 0.047 1.075 i 0.038 10.217 i 0.328 X
MO 78.8 i 0.8 1.314 i 0.068 1.009 i 0.052 10.970 i 0.461 X
F-ratio 76.07 78.85 83.07 124.31 Significance level <0.001 <0.001 <0.001 <0.001 d f 3,52 3.52 3,52 3,52
Table 6. Expt 3. Mean values of the clearance rate (CR), seston ingestion rate (IR), organic matter ingestion rate (OIR), total par- ticulate matter ingestion rate per g of mussel soft-tissue dry weight (IR,) and absorption efficiency (AE) of mussels of different sizes and ages (Sj, small juvenile; So, small old; Mj, medium juvenile; MO, medium old). Significance of the ANOVAs of the dif-
ferent parameters analysed and LSD multiple range test. The data correspond to mean values + SE (n = 14)
CR 1R OIR 1'75 AE (l h-') (mg h-') (m9 h-') (mg h-' g-') (%l
S 1 2.283 i 0.224 2.299 i 0.225 0.759 i 0.074 4.171 i 0.407 55.950 * 2.478 So 2.248 i 0.286 2.264 i 0.288 0.747 i 0.095 3.816 i 0.620 45.533 * 2.127
Mj 4.032 i 0.533 4.061 5 0.537 1.334 i 0.177 3.051 i 0.409 51.941 i 2.238 MO 4.154 i 0.577 4.183 i 0.581 1.380 i 0.192 3.363 + 0.521 54.152 -c 2.061 F-ratio 5.960 5.960 5.960 0.984 5.684 Significance level <0.001 <0.001 <0.001 >0.05 <0.001 d f 3,52 3,52 3,52 3,52 3,52
lower than for the other groups measured in this exper- iment (Table 6), which to some extent would provide a reasonable explanation for their small size in relation to age.
Ingestion versus size
As previously described, ingestion by mussels has a direct bearing on their size, and therefore the heaviest mussels (which are also the longest) are those that ingest a greater amount of food. Thus, the ingestion
rate of mussels can be related to size through regres- sion lines. Table 7 shows these regression equations computed from ingestion data obtained with natural food only (Expts 2 and 3).
If the mean values of AE for the small- and medium-sized mussels in all 3 experiments are com- pared to the organic content of the food ingested (OC), we can see that AE increases in direct propor- tion to OC, following an asymptotic tendency (Fig. 1). On fitting this to the model put forward by Navarro et al. (1991), the following equation is obtained (values +- SE; r = 0.873):

154 Mar Ecol Prog Ser 199: 149-158, 2000
Table 7. Parameters of the regression lines of the total particulate matter ingestion rate (IR, mg h-') and mass-specific ingestion rate (IR,, mg h-' g-l) on the body size of Mytilus eduLis (DW, g of dry soft tissue; L, mm). a and bare fitted parameters in the allo- metric equation y = aXb; r is the correlation coefficient; IR, = IR X DW-l; n = 10 (the values are the mean of between 5 and 16
measurements)
l Parameter Estimate SE T value P I IR vs L a 0.001 0.000 -7.435 0.0001 0.952
b 1.970 0.225 8.751 0.0000 IR vs DW a 2.960 0.520 20.851 0.0000 0.934
b 0.599 0.081 7.385 0.0001 IRs vs DW a 2.960 0.520 20.851 0.0000 0.868
b -0.401 0.081 -4.949 0.001 1
When the regression of V02 over the DW of the soft tissues of the mussels (V02 = aDWb) is estimated for data obtained in these 2 experiments, it can be seen that, in both cases, DW accounts for over 84 % of the variation in V02 (Table 9). The values of the slopes and the intercepts of the 2 equations are very much alike, and no significant differences appeared when they were compared by means of an ANCOVA.
DISCUSSION ORGANIC CONTENT
Clearance and ingestion rates Fig. 1 . Absorption efficiency as a function of the proportional
organic content of the ration. The line was fitted by eye . -
AE = 0.919 0.188 (1 - e-2.?84 * 2.814 (OC -0.030 * 0.214) 1
where the exponential coefficients are not statistically significant. An improved fit is obtained if the AE is related to 1/OC along a linear regression (values * SE; r = -0.940):
In addition to a better description of data in statistical terms, the hyperbolic function also corresponds to the- oretical expectations (see Navarro et. al. 1991).
Respiration
The oxygen consumption rates (VOz) of the mussels from Expts 2 and 3 are shown in Table 8. In both these experiments, which were performed at temperatures of 17 to lg°C, the V02 increases with the weight (and length) of the mussels, with differences between the values of V02 for the different mussel groups being highly significant (p > 0.001) when compared by ANOVA. The LSD test also showed significant dif- ferences (p > 0.05) among all the size groups in both Expts 2 and 3.
The .relation between ingestion rates and body. size- .
in mussels (and other filter-feeders) has been broadly discussed in previous publications (e.g. Walne 1972, Winter 1978, Bayne & Hawkins 1990). In general terms it can be said that the amount of organic material ingested increases allometrically with the size of mus- sels (dry-tissue weight), with a value of b < 1 (Winter 1973, 1978, Navarro & Winter 1982). Our results on the whole agree with those of the above-mentioned stud- ies (see Table ?), and the slopes of the regression lines of ingestion (expressed as IR or as mass-specific IR) on dry-tissue weight are very similar to those reported by Navarro & Winter (1982) for Mytilus chilensis (-0.43 and between 0.38 and 0.42 respectively in the first case, and 0.62 and between 0.58 and 0.62 in the sec- ond).
As a general rule, clearance and ingestion rates will increase rapidly as the concentration of particles in- creases until the ingestion rate reaches a maximum. After this point, the clearance rate declines whilst the ingestion rate remains constant until the whole diges- tive apparatus collapses at a very high concentration of particles, and then the ingestion rate drops consid- erably (Winter 1978, Riisgbrd & Randl~v 1981, Bayne & Hawkins 1990). Our experiments provide clear evi- dence of this regulation since the ingestion rates of mussels of similar size are also very similar (Tables 1

Perez Camacho et al.: Energy balance of Mytilus galloprovincialis 155
Table 8. Oxygen consumption rates per individual (V02) and per mg soft-tissue dry weight (VO,) of the mussels in Expts 2 (L, large; M, medium; S, small) and 3 (Sj, small juvenile; So, small old; Mj, medium juvenile; MO, medium old). Means (n = 16) i SE. Relationship of homogeneous groups within each experiment according to the LSD multiple range test. Temperature: 17 to 19°C
Expt:
Mussel:
Dry flesh weight (g)
v02 (m1 h-')
vos (m1 h-' g-l)
Homogeneous groups ( V 0 4
Table 9. Parameters of the regression line of the oxygen consumption rate (m1 h-') versus soft-tissue dry weight (g dry flesh weight) of the mussels in Expts 2 and 3 (jm = 10 mo old mussels, om = 20 mo old mussels). a and bare fitted parameters in the
allometric equation y = aXb; r is the correlation coefficient
Range of dry Temp. Number of a flesh weight ("C) observations
Expt 2 0.80-2.68 18-19 18 0.329 + 0.045 0.647 i 0.070 0.917 ~ 0 . 0 0 1 Expt 3 0.90-2.60 18-19 32 0.325 * 0.037 0.690 * 0.054 0.918 ~ 0 . 0 0 1 Expts 2 and 3 0.56-2.68 18-19 50 0.328 + 0.028 0.674 * 0.042 0.918 ~ 0 . 0 0 1 Expt 3 (jm) 1.26-2.60 18-19 16 0.319 + 0.049 0.569 * 0.085 0.874 ~ 0 . 0 0 1 Expt 3 (om) 0.90-2.49 18-19 16 0.347 + 0.028 0.803 i 0.047 0.977 <0.001
to 6). These results are even more significant i f one takes into account the differences between the mus- sels used in the experiments (mussels of varying length and age), the different composition of food used (cultured phytoplankton and natural seston), and the different experimental conditions (laboratory and raft).
The concentration of particulate material in our experiments (from 0.5 to 1 mg 1-l) falls within the normal range for the Galician rias (Navarro et al. 1991) but is below values reported for other estuaries sustaining actively growing populations of mussels (Smaal et al. 1986, Bayne et al. 1993), and well be- low the threshold for the production of pseudo-faeces (3 mg 1-l, Bayne et al. 1993). Under these conditions, and in the absence of pre-ingestive selection that could increase the organic fraction of ingested food (Bayne et al. 1993), the regulation of the ingestion rate is based on TPM rather than organic material. A comparison of the results of Expts 1, 2 and 3 (Tables 2, 4 & 6) shows this to be the case, with similar IR, for mussels of simi- lar length, whilst the ingestion rates of organic mat- erial vary widely and are directly proportional to the organic content of the material.
Absorption efficiency
Not much information is available regarding the influence of the size of mussels on AE, although, as a general rule, AE appears to be size independent in Mytilus edulis (Vahl 1973), Mytilus chilensis (Navarro & Winter 1982) and Modiolus modiolus (Winter 1978). The results of Expts 1 and 2 in our study, performed with different food concentrations (1.01 mg and 0.57 mg TPM 1-') and organic contents (91 and 67 %), clearly show a noticeable decrease of AE in mussels reaching a length of 85 mm. This does not necessarily mean that there is a contradiction with the above men- tioned findings, since the specimens used in their experiments were well below the critical length of 85 mm, above which the 'ageing' of the mussel be- comes evident. Below this length the AE remains con- stant, regardless of the age and length of the mussels, with the exception of the small old mussels in Expt 3, whose reduced AE might well account for their low growth rates.
In Mytilus fed on concentrations of seston below the threshold level for the production of pseudo-faeces, the AE rises asymptotically with the increase in food qual-

156 Mar Ecol Prog Ser 199: 149-158, 2000
ity (Navarro et al. 1991) according to a function which in theory would be hyperbolic, and which can be trans- formed into a linear regression by means of the inverse transformation of the independent variable (Navarro et al. 1996). Our experimental data fit these theoretical expectations, as the hyperbolic model accounts for 97 % of the variance in AE as being dependent on the quality of ingested food (r = 0.940). The equations in Table 8 allow us to estimate the theoretical maximum value for AE, which would be 0.889 for 100% OC. Sim- ilarly, the OC below which AE would be negative is 0.160, which in terms of quality expressed as POM per unit of particulate volume would be 0.22. These values resemble those previously estimated by Navarro et al. (1991) for mussels from the Ria de Arousa.
Oxygen consumption rate
Oxygen consumption is a good measure of metabolic demands for activity in bivalves (Winter 1978). How- ever, differences in V02 associated with variable feed- ing conditions are not expected to be important since the metabolic cost of feeding and digestion represents a minor component of the overall metabolic rate (Bayne et al. 1989, Widdows & Hawkins 1989, Navarro et al. 1991). The main variation in oxygen consumption rates is accounted for by an allometric dependence on body size given- by the equation y = axb. Although b values reported in the literature are very variable, in our experiments the mean slope of this equation is 0.67, which is close to the arithmetic mean calculated by Bayne et al. (1976) using values of the slope esti- mated by several different authors (b = 0.71).
In addition to this, a detailed examination of values from Expt 3 (Table 8) would suggest that the mass-spe- cific V02 of young mussels is lower than that of old mussels of the same length. In fact, if the mussels used in this experiment are divided into 2 age groups ('young' and 'old' mussels), the ANCOVA applied to VO, data using DW as a covariable results in signifi- cant differences between both groups (Table 10). This demonstrates that there is a clear ageing effect which is evident irrespective of the size of the mussel, causing the mass-specific V02 to increase with age. The con- sistency of these data is supported by the similarity between the V02 of the 'old' mussels in Expt 3 and that of the mussels of the same length in Expt 2, which were
slope for the regressions between oxygen consumption and soft-tissue weight changes from 0.57 in 10 mo old mussels to 0.80 in 22 mo old mussels and which results in greater respiration rates predicted for old mussels of the same size. This difference in oxygen consumption associated with age may well provide an explanation, if only partial, for the noticeable variation in the coeffi- cients of equations calculated by various authors to relate oxygen consumption and body size in mussels (see Bayne et al. 1976), particularly when it is taken into account that the wide range of body sizes used necessarily implies age differences.
Growth rate
It is important here to point out that even if an age- ing effect has been described which may account for the decline of the growth rate in mussels of greater body size or age neither the variations between the dif- ferent body sizes and efficienciess nor the regulatory processes discussed herein are sufficient (except for small-old mussels, whose AE was noticeably lower than for large mussels) to account for the differences in growth between cultivated mussels of the same age, at least under the same environmental conditions. An alternative explanation for this phenomenon may be found in the limitations of food and space (see Frechette & Lefaivre 1990). that arise from the high - ~- density of mussels in the culture system, resulting in a limitation of ingestion rates, for both the whole raft and the individual cultivation ropes.
In the case of Galicia, the rafts are located in areas that are characterised by a low concentration of partic- ulate matter, which nevertheless has a high organic content (between 0.5 and 1 mg POM 1-' and 50% OC: Pkrez Camacho et al. 1991, Navarro et al. 1991, this study). The reduction in particle concentration in the water flowing past the raft (as high as 50%, Perez Camacho et al. 1991) and the decrease in ingestion
Table 10. ANCOVA of the oxygen consumption rate (m1 h-') of mussels of hfferent sizes and ages in the Expt 3 (co-
variate = DW, g dry flesh weight)
Factor F-ratio Significance level df I
clearly illustrated in Table 9, which shows that the L '
also of approximately the same age (Table 8). On the other hand, if the groups are established according to the length of the mussels, without taking age into account, then the ANCOVA with DW as a covariable does not show any significant differences (Table 10). The increase in oxygen consumption with age is
Length Covariate: DW 21,560 0.0001 Principal effect 0.3151 1,1,29
Age DW 183,341 0.0000
Principal effect 12.097 0.0016 1,1,29

Perez Camacho et al.: Energy balance of Mytilus galloproi.incialis 157
rate in mussels when the concentration of TPM d r o ~ s Frechette M, Lefaivre D (1990) Discriminatinq between food
below 0.4 mg 1-I (Riisgbrd & Randlsv 1981) may mean and space limitation in beithic suspension feeders using
that, at least at those times of the year when the pro- self-thinning relationships. Mar Ecol Prog Ser 65:15-23 Griffiths CL (1980) Filtration, respiration and assimilation in
portion of seston in the water is at its lowest and in the black mussel Choromytilus meridionalis. Mar Ecol spite of the regulation mechanism, the ingestion rates Pros Ser 3:63-70 of the mussels would be noticeably lower at the back of Gnffith; CL, &ng JA (1979) Some relationships between size,
a raft than at the front, leading to a clearly inferior food availability and energy balance in the ribbed mussel Aulacomya ater. Mar Biol51:141-149
growth rate in the former (a fact borne Out lglesias JIP, P6rez Camacho A, Navarro E, Labarta U, Beiras through the experience of the mussel growers). R, Hawkins AJS, Widdows J (1996) Microqeoqraphic vari-
In very much the same way the hiqh density of mus- ability, absorption and condition of mussels ( ~ y t i l u s qallo- - sels on the cultivation ropes (between 400 and 500 prov&cialis LMK.): a transplant experimeit . -~ shellfish
mussels m-') means that they are superimposed on Res 3:673-680 Jerrgensen CB, Merlenberg F, Sten-Knudsen 0 (1986) Nature
each other in several layers, with the subsequent com- of the relation between ventilation and oxygen consump- petition for food between mussels on the same string, tion in filter feeders. Mar Ecol Proq Ser 29:73-88 and a reduced availabilitv of seston for those mussels Navarro E, lqlesias JIP, Perez ~ a m a c h o A, Labarta U, Beiras R
that form the inner layers. If, in addition, we also con- (1991) he physiological energetics of mussels (Mytilus galloprovincialis Lmk) from different cultivation rafts in
sider the probable decrease in filtration and ingestion the Ria de Arosa (Galicia, N.W. Spain). Aquaculture 94: rates due to the reduced opening of the valves caused 197-212 by the pressure that the mussels exert on each other (Jsrgensen et al. 1986), the differences in growth rates between mussels with a common origin and of the same age, cultivated on the same rope, would easily be explained.
Acknowledgements. We are grateful to Daisy Arroyo, Gus- tavo Riestra, Jaime F. Ferreira, Jose L. Ortiz, Marcela Pascual, Zaul Garcia Esquivel and crew of RV 'J. M. Navaz' for help during the field measurements. We also thank Juan Turnes for help with laboratory measurements, and Helena Regueiro and Lourdes Nieto for technical assistance. This work was supported by Project PETRI 94-0026-Col-00 by the 'Comi- sion Interministerial de Ciencia y Tecnologia' (ClCYT), and the 'Organizacibn d e Productores de Mejill6n de Galicia' (OPMEGA).
LITERATURE CITED
Bayne BL, Hawkins AJS (1990) Filter-feeding in bivalve mol- luscs: control on energy balance. In: Mellinger J , Truchot JP, Lahlou B (eds) Animal nutrition and transport pro- cesses. No. 1. Nutrition in wild and domestic animals. Karger, Basel, p 70-83
Bayne BL, Thompson RJ, Widdow J (1976) Physiology: I. In: Bayne BL (ed) Marine mussels: their ecology and physiol- ogy. University Press, Cambridge, p 121-206
Bayne BL, Hawkins AJS, Navarro E, Iglesias J1P (1989) Effects of seston concentration on feeding, digestion and growth in the mussel Mytilus edulis. Mar Ecol Prog Ser 55:47-54
Bayne BL, Iglesias JIP, Hawkins AJS, Navarro E, Heral M, Deslous-Paoli JM (1993) Feeding behaviour of the mussel, Mytilus edulis: responses to variations in quantity and organic content of the seston. J Mar Biol Assoc UK 73: 813-829
Conover R (1966) Assimilation of organic matter by zooplank- ton. Limnol Oceanogr 11:338-354
Foster-Smith RL (1975) The effect of concentration of suspen- sion on the filtration rates and pseudofecal production for Mytilus edulis L., Cerastoderma edule L. and Venerupis pullastra (Montagu). J Exp Mar Biol Ecol 17:l-22
Navarro E, lglesias JIP, Perez Camacho A, Labarta U (1996) The effect of diets of phytoplankton and suspended bot- tom material on feeding an absorption of raft (MyWus gal- loprovincialis Lmk). J Exp Mar Biol Ecol 198: 175-1 89
Navarro JM, Winter JE (1982) Ingestion rate, assirmlation effi- ciency and energy balance in MytiJus chilensis in relation to body size and different algal concentration. Mar Biol 67:255-266
PCrez Camacho A, Gonzaez R, Fuentes J (1991) Mussel cul- ture in Galicia (N.W. Spain). Aquaculture 94:263-278
Perez Camacho A, Villaba A, Beiras R, Labarta U (1997) Absorption efficiency and condition of cultured mussels (Mytilus edulis galloprovincialis Linnaeus) of Galicia (NW Spain) infected by parasites Martedia refiingens Glizel et al. and Mytilicola intestinalis Steuer. J Shellfish Res 16:77-82
Riisgird HU, Randlav A (1981) Energy budgets, growth and filtration rates in Mytilus edulis at different algal concen- tration. Mar Biol 61:227-234
Smaal AC, Verhagen JHG, Coosen J , Haas HA (1986) lnter- action between seston quantity and quality and benthic suspension feeders in the Oosterschelde, The Nether- lands. Ophelia 26:385-399
Snedecor GW, Cochran WG (1980) Statistical methods. Iowa State University Press, Ames
Tenore KR, Gonzalez N (1976) Food chain patterns in the Ria de Arosa, Spain: area of intense mussel aquaculture. In: Persoone G, Jaspers E (eds) Population dynamic of marine organisms in relation with nutrient cycling in shallow waters. Proc 10th Eur Mar Biol Symp, Vol 2. Universal Press, Wettern, p 601-619
Thompson RJ, Bayne BL (1972) Active metabolism associated with feeding in the mussel Mytilus edulisL. J Exp Mar Biol Eco18:191-212
Thompson RJ, Bayne BL (1974) Some relationships between growth, metabolism and food in the mussel Mytilus edulis. Mar Biol27:317-326
Vahl 0 (1973) Pumping and oxygen consumption rates of Mytilus edulis L. of different sizes. Ophelia 12:45-51
Walne PR (1972) The influence of current speed, body size and water temperature on the filtration rate of five species of bivalves. J Mar Biol Assoc UK 52:345-374
Widdows J (1978) Combined effects of body size, food con- centration and season on the physiology of Mytilus edulis. J Mar Biol Assoc UK 58:109-124
Widdows J, Bayne BL (1971) Temperature acclimation of


