Embed Size (px)
Citation preview
Energy policies for sustainable development in South Africa’s residential and electricity sectors
Implications for mitigating climate change
by
HARALD WINKLER
Thesis presented for the Degree of
DOCTOR OF PHILOSOPHY
in the Energy Research Centre
UNIVERSITY OF CAPE TOWN
June 2006

i
TABLE OF CONTENTS
ABSTRACT ...............................................................................................................................................VI ACKNOWLEDGEMENTS ......................................................................................................................... VIII ABBREVIATIONS, ACRONYMS AND UNITS..................................................................................................X
PART I: INTRODUCTION TO ENERGY, SUSTAINABLE DEVELOPMENT AND CLIMATE
CHANGE ....................................................................................................................................................1
1. INTRODUCTION .............................................................................................................................1
1.1 ENERGY, SUSTAINABLE DEVELOPMENT AND CLIMATE CHANGE IN SOUTH AFRICA......................1 1.2 RESEARCH QUESTION...................................................................................................................3 1.3 METHODOLOGY ...........................................................................................................................3 1.4 OUTLINE OF THE THESIS...............................................................................................................8
2. SUSTAINABLE DEVELOPMENT, ENERGY AND CLIMATE CHANGE..............................9
2.1 WORKING DEFINITION OF SUSTAINABLE DEVELOPMENT..............................................................9 2.2 ENERGY FOR SUSTAINABLE DEVELOPMENT IN SOUTH AFRICA ..................................................12 2.3 SUSTAINABLE DEVELOPMENT AND CLIMATE CHANGE ...............................................................13 2.4 MAKING ENERGY DEVELOPMENT PATHS MORE SUSTAINABLE AS AN APPROACH TO CLIMATE
CHANGE MITIGATION ..............................................................................................................................18 2.5 CONCLUSION .............................................................................................................................21
PART II: ISSUES AND CONTEXT.......................................................................................................22
3. DEVELOPMENT OBJECTIVES..................................................................................................22
3.1 THE BROADER CONTEXT: SOUTH AFRICA’S DEVELOPMENT OBJECTIVES ...................................22 3.2 THE POLICY ENVIRONMENT IN THE ENERGY SECTOR..................................................................25 3.3 ROLE OF ELECTRICITY IN DEVELOPMENT ...................................................................................30 3.4 ECONOMIC AND INSTITUTIONAL ASPECTS ..................................................................................40 3.5 SOCIAL DIMENSIONS AND THE RESIDENTIAL SECTOR .................................................................46 3.6 ENVIRONMENTAL IMPACTS........................................................................................................50 3.7 CONCLUSIONS: COMPARING AND ASSESSING.............................................................................55
4. POLICY OPTIONS IN THE ELECTRICITY AND RESIDENTIAL SECTOR......................58
4.1 FURTHER EXTENDING AFFORDABLE ACCESS TO ELECTRICITY....................................................59 4.2 ENERGY GOVERNANCE – TO PRIVATISE OR NOT ? ......................................................................64 4.3 MANAGING ENERGY-RELATED ENVIRONMENTAL IMPACTS........................................................66 4.4 ECONOMIC DEVELOPMENT AND INSTRUMENTS ..........................................................................70 4.5 SECURING ELECTRICITY SUPPLY THROUGH DIVERSITY ..............................................................80 4.6 CONCLUSION .............................................................................................................................90
PART III: MODELING ENERGY POLICIES.....................................................................................91
5. TOOLS FOR MODELING ENERGY POLICIES.......................................................................91
5.1 PURPOSE OF MODELING IN THIS THESIS......................................................................................91 5.2 DEVELOPING POLICY CASES FOR ENERGY FUTURES ...................................................................91 5.3 MODELING TOOLS......................................................................................................................92 5.4 CRITICAL ANALYSIS OF MODELING TOOLS FOR ENERGY POLICIES..............................................94 5.5 CONCLUSION .............................................................................................................................97
6. MODELING ENERGY POLICIES...............................................................................................98
6.1 FOCUS OF POLICY MODELING.....................................................................................................99 6.2 DRIVERS OF FUTURE TRENDS AND KEY ASSUMPTIONS .............................................................103 6.3 THE BASE CASE........................................................................................................................112 6.4 OVERVIEW OF POLICY CASES ...................................................................................................120 6.5 RESIDENTIAL ENERGY POLICIES ..............................................................................................121 6.6 ELECTRICITY SUPPLY OPTIONS.................................................................................................132 6.7 CONCLUSION ...........................................................................................................................142

ii
7. DISCUSSION AND INTERPRETATION OF RESULTS ........................................................143
7.1 RESIDENTIAL ENERGY POLICIES...............................................................................................143 7.2 ELECTRICITY SUPPLY OPTIONS.................................................................................................156 7.3 CONCLUSION ...........................................................................................................................165
PART IV: SUSTAINABLE DEVELOPMENT, ENERGY AND CLIMATE CHANGE POLICIES
..................................................................................................................................................................166
8. EVALUATING ENERGY POLICIES AGAINST INDICATORS OF SUSTAINABLE
DEVELOPMENT...................................................................................................................................166
8.1 INDICATORS OF SUSTAINABLE DEVELOPMENT .........................................................................166 8.2 ECONOMIC ...............................................................................................................................169 8.3 ENVIRONMENTAL ....................................................................................................................177 8.4 SOCIAL ....................................................................................................................................184 8.5 COMPARISONS AND CONCLUSIONS ..........................................................................................191
PART IV: ENERGY FOR SUSTAINABLE DEVELOPMENT AND CLIMATE CHANGE........200
9. POLICY ANALYSIS.....................................................................................................................200
9.1 ENERGY POLICIES TO MAKE DEVELOPMENT MORE SUSTAINABLE ............................................200 9.2 IMPLICATIONS OF SUSTAINABLE ENERGY DEVELOPMENT PATHS FOR CLIMATE CHANGE
MITIGATION POLICY ..............................................................................................................................218 9.3 CONCLUSION ...........................................................................................................................226
10. CONCLUSION..........................................................................................................................228
APPENDICES..........................................................................................................................................233 REFERENCES .........................................................................................................................................236

iii
List of Tables
TABLE 3.1: SOUTH AFRICAN ENERGY POLICY PRIORITIES AND PROGRESS...................................................29 TABLE 3.2: LICENSED CAPACITY, MAXIMUM POWER, PEAK DEMAND AND CALCULATED ‘EXCESS CAPACITY’
FOR ESKOM, SELECTED YEARS............................................................................................................37 TABLE 3.3: NET ELECTRICITY SENT OUT (MWH) BY FUEL ..........................................................................39 TABLE 3.4: ELECTRICITY INTENSIVE SECTORS OF THE SA ECONOMY..........................................................44 TABLE 3.5: ESTIMATED ELECTRIFICATION LEVELS OF RURAL AND URBAN HOUSEHOLD BY INCOME QUINTILE
...........................................................................................................................................................48 TABLE 3.6: EMISSION FROM ESKOM POWER STATIONS, 2001 ......................................................................52 TABLE 3.7: ENERGY SECTOR CARBON DIOXIDE EMISSIONS INTENSITY AND PER CAPITA IN 2002 AND
CUMULATIVE EMISSIONS 1950-2000...................................................................................................52 TABLE 3.8: ENERGY AND ELECTRICITY CONSUMPTION, 2000......................................................................55 TABLE 3.9: ELECTRIFICATION RATES IN 2000 .............................................................................................56 TABLE 3.10: NATIONAL ENERGY INTENSITIES BETWEEN 1993 AND 2000....................................................56 TABLE 4.1: MEAN HOUSEHOLD EXPENDITURE ON ELECTRICITY AND OTHER FUELS AND ENERGY AS A
PERCENTAGE OF TOTAL HOUSEHOLD EXPENDITURE............................................................................61 TABLE 4.2: EXTERNALITIES ASSOCIATED WITH ELECTRICITY SUPPLY BY CLASS .........................................66 TABLE 4.3: SUMMARY OF EXTERNAL COSTS OF ESKOM COST-FIRED ELECTRICITY GENERATION PER UNIT
(1999 RANDS) ....................................................................................................................................69 TABLE 4.4: POTENTIAL FUTURE SAVINGS FROM ENERGY EFFICIENCY AND DEMAND SIDE MANAGEMENT
(CUMULATIVE CAPACITY EQUIVALENT IN MW) .................................................................................75 TABLE 4.5: INTERNATIONAL COST DATA FOR RENEWABLE ENERGY TECHNOLOGIES ...................................82 TABLE 4.6: ESTIMATES OF THEORETICAL POTENTIAL FOR RENEWABLE ENERGY SOURCES IN SOUTH AFRICA
...........................................................................................................................................................82 TABLE 4.7: TOOLS THAT GOVERNMENTS CAN USE TO PROMOTE RENEWABLE ELECTRICITY........................83 TABLE 4.8: OPTIONS FOR NEW ELECTRICITY SUPPLY...................................................................................87 TABLE 6.1: ACTION IMPACT MATRIX SCOPING THE IMPACT OF POLICY INTERVENTIONS ON DEVELOPMENT
GOALS ..............................................................................................................................................100 TABLE 6.2: SA POPULATION PROJECTIONS FROM VARIOUS SOURCES, MILLIONS .......................................106 TABLE 6.3: NUMBER AND SHARE OF HOUSEHOLDS, ESTIMATED FOR 2001 AND PROJECTED FOR 2025 ......108 TABLE 6.4: FUEL PRICES BY FUEL AND FOR SELECTED YEARS ...................................................................110 TABLE 6.5: COST DEFLATORS BASED ON GROSS VALUE ADDED...............................................................111 TABLE 6.6: TOTAL PRIMARY ENERGY SUPPLY BY FUEL GROUP IN BASE CASE............................................113 TABLE 6.7: ENERGY DEMAND BY HOUSEHOLD TYPE AND END USE FOR SELECTED YEARS.........................119 TABLE 6.8: SUMMARY OF POLICY CASES IN RESIDENTIAL AND ELECTRICITY SUPPLY SECTORS .................120 TABLE 6.9: INCOME AND EXPENDITURE IN URBAN AND NON-URBAN AREAS IN 2000 MARKET VALUES,
GROUPED BY 1995 QUINTILE.............................................................................................................122 TABLE 6.10: NUMBERS AND SHARES OF RURAL AND URBAN HOUSEHOLDS, ELECTRIFIED AND NOT ..........123 TABLE 6.11: SIX HOUSEHOLD TYPES, WITH TOTAL NUMBERS IN 2000, SHARES AND ASSUMPTIONS ..........123 TABLE 6.12: ENERGY DEMAND BY HOUSEHOLD TYPE FOR EACH END USE.................................................126 TABLE 6.13: KEY CHARACTERISTICS OF ENERGY TECHNOLOGIES IN THE RESIDENTIAL SECTOR................127 TABLE 6.14: CHARACTERISTICS OF ELECTRICITY SUPPLY TECHNOLOGIES IN POLICY CASES .....................133 TABLE 6.15: TECHNICALLY FEASIBLE POTENTIAL FOR RENEWABLE ENERGY BY TECHNOLOGY ................135 TABLE 6.16: CURRENT CAPACITY, INCREASES AND PROGRESS RATIOS FOR RE TECHNOLOGIES................137 TABLE 7.1: OVERVIEW OF RESULTS FOR RESIDENTIAL ENERGY POLICIES..................................................143 TABLE 7.2: REDUCTION IN MONTHLY EXPENDITURE ON ELECTRICITY WITH EFFICIENT HOUSES BY
HOUSEHOLD TYPE .............................................................................................................................145 TABLE 7.3: ENERGY SAVED AND COSTS FOR CLEANER WATER HEATING ...................................................149 TABLE 7.4: FUEL CONSUMPTION IN THE RESIDENTIAL SECTOR ACROSS POLICY CASES, 2014 AND 2025....154 TABLE 7.5: ENERGY CONSUMPTION BY END USE FOR HOUSEHOLD TYPES, 2025........................................155 TABLE 7.6: SHARE OF HOUSEHOLDS WITH ACCESS TO ELECTRICITY IN 2025 FOR ALL POLICY CASES ........158 TABLE 8.1: INDICATORS OF SUSTAINABLE DEVELOPMENT FOR ENERGY POLICIES .....................................168 TABLE 8.2: TOTAL ENERGY SYSTEM COSTS ACROSS RESIDENTIAL POLICIES..............................................170 TABLE 8.3: TOTAL COST OF ENERGY SYSTEM FOR ELECTRICITY SUPPLY OPTIONS.....................................172 TABLE 8.4: GWH ELECTRICITY GENERATED BY TECHNOLOGY IN ITS POLICY CASE...................................173 TABLE 8.5: COSTS OF ELECTRICITY SUPPLY TECHNOLOGIES PER CAPACITY AND UNIT OF GENERATION ....173 TABLE 8.6: SHADOW PRICE OF ELECTRICITY FOR POLICY CASES ...............................................................175 TABLE 8.7: DIVERSITY OF FUEL MIX FROM DOMESTIC SOURCES FOR ELECTRICITY SUPPLY OPTIONS BY 2025
.........................................................................................................................................................176

iv
TABLE 8.8: LOCAL AIR POLLUTANTS IN RESIDENTIAL POLICY CASES, 2025...............................................177 TABLE 8.9: GHG EMISSIONS IN RESIDENTIAL POLICIES CASES ..................................................................178 TABLE 8.10: LOCAL AIR POLLUTANTS IN ELECTRICITY POLICY CASES, 2025.............................................179 TABLE 8.11: GHG EMISSIONS FOR ELECTRICITY SUPPLY OPTIONS ............................................................181 TABLE 8.12: ESTIMATE OF ABATEMENT COST IN POLICY CASES ................................................................183 TABLE 8.13: RESIDENTIAL FUEL CONSUMPTION BY POLICY CASE .............................................................185 TABLE 8.14: SHADOW PRICES OF ELECTRICITY AND OTHER FUELS ACROSS POLICY CASES........................186 TABLE 8.15: INITIAL INVESTMENT IN TECHNOLOGY IN ITS POLICY CASE ...................................................187 TABLE 8.16: ELECTRICITY CONSUMPTION BY HOUSEHOLD TYPE...............................................................188 TABLE 8.17: MONTHLY EXPENDITURE ON ELECTRICITY BY HOUSEHOLD TYPE AND POLICY CASE.............189 TABLE 8.18: AVERAGE ANNUAL EXPENDITURE PER HOUSEHOLD BY QUINTILE GROUP, PLACE OF RESIDENCE
AND TYPE OF DWELLING ...................................................................................................................190 TABLE 8.19: DERIVED AVERAGE ANNUAL AND MONTHLY EXPENDITURE BY HOUSEHOLD TYPE................190 TABLE 8.20: ELECTRICITY BURDEN: SHARE OF MONTHLY HOUSEHOLD EXPENDITURE SPENT ON
ELECTRICITY.....................................................................................................................................191 TABLE 8.21: EVALUATION OF ALL POLICIES ACROSS THREE DIMENSIONS OF SUSTAINABLE DEVELOPMENT
.........................................................................................................................................................193 TABLE 9.1: SUBSIDY REQUIRED FOR MAKING EFFICIENT HOUSING AS AFFORDABLE FOR POORER AS FOR
RICHER HOUSEHOLDS .......................................................................................................................204 TABLE 9.2: COST OF SAVED ENERGY FOR SWH AND GEYSER BLANKETS ..................................................205 TABLE 9.3: ORDER OF MAGNITUDE OF CARBON REVENUES FOR DIFFERENT CARBON PRICES ....................221 TABLE 10.1: MONTHLY EXPENDITURE ON ELECTRICITY BY HOUSEHOLD TYPE AND POLICY CASE, 2001...235
List of Figures
FIGURE 1.1: METHODOLOGY FOR THE THESIS ...............................................................................................4 FIGURE 2.1: ELEMENTS OF SUSTAINABLE DEVELOPMENT............................................................................10 FIGURE 2.2: COMPARISON OF SRES REFERENCE EMISSIONS SCENARIOS (WITHOUT CLIMATE POLICY) AND
‘POST-SRES’ CLIMATE CHANGE MITIGATION SCENARIOS...................................................................17 FIGURE 2.3: EMISSIONS PATHS RELATIVE TO DEVELOPMENT LEVEL AND POSSIBILITY OF ‘TUNNELLING’....20 FIGURE 3.1: ENERGY DEMAND, 1992-2000 .................................................................................................32 FIGURE 3.2: SECTORAL CONTRIBUTION TO ECONOMY, 1967-2003..............................................................32 FIGURE 3.3: SHARE OF TOTAL PRIMARY ENERGY SUPPLY, 1999 ..................................................................33 FIGURE 3.4: TOTAL SALEABLE PRODUCTION, LOCAL SALES AND EXPORTS OF SOUTH AFRICAN COAL, 1992
TO 2001 ..............................................................................................................................................34 FIGURE 3.5: SHARE OF FINAL ENERGY CONSUMPTION, 2000 .......................................................................35 FIGURE 3.6: PERCENTAGE CHANGES IN ESKOM ELECTRICITY SALES AND CHANGE IN REAL GDP AT MARKET
PRICES ................................................................................................................................................35 FIGURE 3.7: ESKOM LICENSED CAPACITY AND PEAK DEMAND (MW)..........................................................37 FIGURE 3.8: MAP OF SA POWER STATIONS BY FUEL AND OWNERSHIP .........................................................38 FIGURE 3.9: ENERGY FLOW THROUGH THE ELECTRICITY SUPPLY INDUSTRY IN SOUTH AFRICA ..................40 FIGURE 3.10: SHARE OF FINAL ENERGY DEMAND BY ENERGY CARRIER.......................................................42 FIGURE 3.11: ELECTRICITY DEMAND, 1986-2000........................................................................................43 FIGURE 3.12: FINAL INDUSTRIAL ENERGY CONSUMPTION BY SUB-SECTOR..................................................45 FIGURE 3.13: FINAL RESIDENTIAL ENERGY DEMAND BY ENERGY CARRIER .................................................47 FIGURE 3.14: EMPLOYMENT IN COAL-BASED ELECTRICITY GENERATION IN SOUTH AFRICA .......................50 FIGURE 3.15: SOUTH AFRICA’S GREENHOUSE GAS INVENTORY BY SECTOR, 1994.......................................54 FIGURE 3.16: CHANGES IN ENERGY INTENSITY, 1993 – 2000 ......................................................................57 FIGURE 4.1: WELFARE ECONOMIC BASIS FOR POVERTY TARIFF...................................................................62 FIGURE 6.1: TRENDS IN GDP, 1946 - 2000 ................................................................................................104 FIGURE 6.2: POPULATION PROJECTIONS BY ASSA MODEL ........................................................................107 FIGURE 6.3: LEARNING CURVES FOR NEW AND MATURE ENERGY TECHNOLOGIES.....................................109 FIGURE 6.4: ELECTRICITY GENERATION (GWH) IN THE BASE CASE, GROUPED BY FUEL ............................115 FIGURE 6.5: ELECTRICITY CAPACITY (GW) IN THE BASE CASE..................................................................115 FIGURE 6.6: PROJECTED ENERGY DEMAND BY SECTOR IN THE BASE CASE.................................................116 FIGURE 6.7: TRENDS IN ELECTRIFICATION OF HOUSEHOLDS IN SA, 1995-2002.........................................117 FIGURE 6.8: PROJECTED CHANGES OF HOUSEHOLD NUMBERS IN THE BASE CASE, 2001 – 2025.................118

v
FIGURE 6.9: TRENDS IN FUEL SHARES IN THE RESIDENTIAL SECTOR IN THE BASE CASE .............................125 FIGURE 6.10: SCHEMATIC DESCRIPTION OF ASSUMED PBMR COSTS IN REFERENCE AND POLICY CASES ...138 FIGURE 7.1: IMPLICATIONS OF EFFICIENT HOUSES ON DEMAND FOR SPACE HEATING IN UHE HOUSEHOLDS
.........................................................................................................................................................145 FIGURE 7.2: CHANGES IN LIGHTING TECHNOLOGIES IN THE CFL POLICY CASE .........................................147 FIGURE 7.3: INVEST COSTS FOR SWH AND GEYSER BLANKETS BY HOUSEHOLD TYPE ...............................149 FIGURE 7.4: EQUIVALENT OF FOSSIL FUEL USE FOR SOLAR WATER HEATING, BY HOUSEHOLD TYPE (PJ) ..150 FIGURE 7.5: ENERGY USED FOR WATER HEATING BY URBAN LOW-INCOME ELECTRIFIED HOUSEHOLDS ....150 FIGURE 7.6: FUEL SWITCH TO LPG FOR THREE HOUSEHOLD TYPES ...........................................................152 FIGURE 7.7: RENEWABLE ENERGY FOR ELECTRICITY GENERATION BY POLICY CASE.................................156 FIGURE 7.8: CONTRIBUTION OF RENEWABLE ENERGY TECHNOLOGIES TO MEETING THE TARGET BY 2013157 FIGURE 7.9: NUCLEAR ENERGY (PBMR) FOR ELECTRICITY GENERATION BY POLICY CASE.......................159 FIGURE 7.10: UNUSED CAPACITY OF THE PBMR IN THE POLICY CASE ......................................................159 FIGURE 7.11: MARGINAL INVESTMENT REQUIRED FOR MORE PBMR CAPACITY ......................................160 FIGURE 7.12: IMPORTS OF HYDRO-ELECTRICITY AND IMPORT COSTS IN POLICY AND BASE CASE ..............161 FIGURE 7.13: ANNUALISED INVESTMENT IN COMBINED CYCLE GAS IN THE POLICY AND BASE CASE .........162 FIGURE 7.14: ELECTRICITY GENERATION WITHOUT FLUIDISED BED COMBUSTION...................................163 FIGURE 8.1: UNDISCOUNTED TOTAL INVESTMENT IN TECHNOLOGIES, SUPPLY AND DEMAND ...................169 FIGURE 8.2: INVESTMENT REQUIRED FOR RESIDENTIAL POLICIES IN THE RESPECTIVE POLICY CASE..........171 FIGURE 8.3: ANNUALISED INVESTMENTS IN ELECTRICITY SUPPLY TECHNOLOGIES BY POLICY CASE .........174 FIGURE 8.4: SO2 EMISSIONS IN ELECTRICITY POLICY CASES OVER TIME ....................................................179 FIGURE 8.5: CO2 EMISSIONS FOR ALL CASES OVER TIME ...........................................................................182 FIGURE 8.6: RENEWABLE ENERGY USE IN RESIDENTIAL POLICY CASES .....................................................185 FIGURE 8.7: SHADOW PRICES OF ENERGY CARRIERS OVER TIME ...............................................................187 FIGURE 8.8: ELECTRICITY SUPPLY OPTIONS RANKED BY ECONOMIC, SOCIAL AND ENVIRONMENTAL
INDICATOR........................................................................................................................................197 FIGURE 8.9: ELECTRICITY OPTIONS RANKED AGAINST MORE INDICATORS ................................................198 FIGURE 8.10: RESIDENTIAL POLICIES RANKED BY ECONOMIC, SOCIAL AND ENVIRONMENTAL INDICATOR 199 FIGURE 9.1: MARGINAL INVESTMENTS REQUIRED FOR EFFICIENT HOUSES AT 30% AND 10% DISCOUNT
RATES ...............................................................................................................................................203 FIGURE 9.2: DIVERSITY OF FUEL MIX FROM DOMESTIC SOURCES FOR ELECTRICITY SUPPLY OPTIONS BY 2025
.........................................................................................................................................................216 FIGURE 9.3: TOTAL CAPACITY FOR ELECTRICITY GENERATION AND ADDITIONS PER YEAR.......................217 FIGURE 9.4: WEDGES OF ELECTRICITY CAPACITY EQUIVALENT TO ONE ‘SIX-PACK’ EACH OVER 20 YEARS
.........................................................................................................................................................218 FIGURE 9.5: GHG EMISSIONS AVOIDED IN RESIDENTIAL POLICY CASES ....................................................219 FIGURE 9.6: GHG EMISSIONS AVOIDED IN ELECTRICITY POLICY CASES ....................................................220 FIGURE 10.1: ELECTRICITY GENERATION FROM ALL PLANTS IN THE BASE CASE........................................233 FIGURE 10.2: ELECTRICITY CAPACITY IN THE BASE CASE, ALL POWER PLANTS .........................................234
Abstract vi
Abstract
Harald Winkler’s thesis examines “Energy policies for sustainable development in South
Africa’s residential and electricity sectors: Implications for mitigating climate change”. The
research question asks whether there are energy policies that will make South Africa’s energy
development more sustainable economically, socially and environmentally, especially in the
context of the local environment. Energy policies for sustainable development are explored as
an approach to mitigating climate change.
A methodology combining three major components is developed - modeling, evaluation of
indicators of sustainable development and policy analysis. The analysis explicitly starts from
development objectives. ‘Backcasting’ from development objectives has been not been
implemented in national energy models in developing countries. Within the modeling
component, the residential sector is disaggregated into six household types for the first time in a
national energy model for South Africa.
Energy policies for sustainable development in two sectors are identified to meet the country’s
development objectives. Making residential energy more sustainable includes cleaner and more
efficient ways of providing energy services - lighting, water heating, cooking and heating. The
thesis also analyses four major electricity supply options – renewable energy, nuclear, importing
hydro or natural gas. The thesis develops an analytical approach that for considering energy
policies that incorporates environmental concerns.
Identified policies are quantified in an energy-economic modeling framework. A wide variety of
data sources is used, drawing on statistical information, official energy data, utility statistics,
journal articles and research reports. Indicators of sustainable development provide a framework
for assessing the suitability of suggested policy cases, while policy analysis considers their
implementation for both energy and climate policies. A contribution of the thesis lies in
combining these analytical tools to identify energy policies that promote both local sustainable
development and mitigate climate change.
The thesis finds solar water heating and efficient housing rank higher than alternatives in all
dimensions of sustainable development for the residential sector. These policies provide cleaner
energy services, reduce fuel use and yield cost savings for households. The latter is significant
in reducing the electricity burden, particularly for poorer households. A more equitable
distribution of energy services favours social sustainability and reduces inequalities..
Emissions in the order of 1- 10 Mt CO2-equiv / year can be avoided. The investment
requirement is relatively modest. However, the residential sector will not deliver the largest
absolute energy savings and associated emission reductions.

Abstract vii
Sustainable energy policies in the electricity sector will also be important for climate policy. In
this sector, the challenges are longer-term and more trade-offs are required, with no single
option preferable in all dimensions of sustainable development. The two import options require
the least domestic cost, while the two domestic options are found to increase diversity, albeit in
different ways. The challenge for electricity supply options, the thesis argues, is to diversify
rather than to pick a single energy source to supply all future needs.
In reducing greenhouse gases, the abatement cost of renewable energy appears to be lower.
Combining the suggested electricity supply options could avoid emissions up to 50 Mt CO2 /
year – although a combined case has the highest costs of all. A transition to a more sustainable
electricity supply sector will take several decades, but needs to be enabled by short-term
changes. Based on the findings, the thesis contends that the appropriate starting point -
conceptually and methodologically – for both energy and mitigation policy is sustainable
development. Climate change mitigation policy, it is argued, should start with local sustainable
development, rather than goals set in climate terms.
The thesis demonstrates that there are indeed policies that meet local sustainable development
objectives, and reduce greenhouse gases as a co-benefit. Combining residential and electricity
policies would offer a mix that overall provides a durable balance of economic development,
social sustainability, and both local and global environmental benefits. Energy policies
suggested in this thesis would assist South Africa in sustainable development of its energy
sector.
Acknowledgements viii
Acknowledgements
The work in this thesis is substantially my own. Yet it would not have been possible without a
number of people and organisations, whom I wish to acknowledge and thank.
My co-supervisors, Prof Ogunlade Davidson and Prof Sue Parnell, motivated me to embark on
this thesis in the first place and helped me sustain the effort needed to write it. I thank them
both for their insight and wise guidance.
My colleagues that the Energy Research Centre and the former Energy & Development
Research Centre helped me learn much of what I know about energy in South Africa. A special
thanks to Randall Spalding-Fecher, the foil for much of my early thinking informing this thesis.
Gisela Prasad gave generously of her time and advice on the process of working through a
thesis. As an organisation, ERC has been a place in which I have been able to explore the
pursuit of knowledge – for the sake of making a difference. The cited works of many of my
former and current colleagues – too numerous to mention individually - bear testimony to their
contribution.
The Munasinghe Institute for Development (MIND) in Sri Lanka offered me a place to
consolidate and write up a large part of the thesis. Their warm hospitality and the depth of
experience of the MIND director and staff are deeply appreciated as is the contribution of
UNITAR in providing the resources to make my stay in Sri Lanka possible.
Parts of this thesis have previously been published. Parts of chapter 4 relating to renewable
energy have been published in: Winkler, H 2004. Renewable energy policy in South Africa:
Policy options for renewable electricity. Energy Policy 33 (1): 27-38. The funding of the
Sustainable Energy & Climate Change Partnership for the underlying research is gratefully
acknowledged.
Chapter 6, in particular the analysis of the residential sector, was informed by work of the
author published in: Winkler, H, Spalding-Fecher, R, Tyani, L & Matibe, K 2002. Cost-benefit
analysis of energy efficiency in urban low-cost housing. Development Southern Africa 19 (5):
593-614. Although I was the lead author in the published work, the inputs of my colleagues
added significant value. The work for this thesis substantially elaborated the previous cost-
benefit analysis, adding new data and placing the residential sector in the context of a national
energy model. National energy modeling has been developed by the Energy Research Centre’s
modeling group. With respect to chapter 6, I led a recent project funded by the IAEA (Winkler
et al. 2005a), but acknowledge with thanks the valuable learning on the use Markal, and work
on the database by my colleagues Mark Howells and Thomas Alfstad. The work in the thesis
extends the previous analysis, particularly in my own focus areas of residential demand and
renewable energy in the electricity supply sector.

Acknowledgements ix
The ‘sustainable development policies and measures’ (SD-PAMs) approach is outlined in
chapter 9 and informs the methodology of the thesis, described in chapter 1. The SD-PAMs
concept was originally conceived and published as a peer-reviewed book chapter: Winkler, H,
Spalding-Fecher, R, Mwakasonda, S & Davidson, O 2002. Sustainable development policies
and measures: starting from development to tackle climate change. K Baumert, O Blanchard, S
Llosa and J F Perkaus (Eds). Building on the Kyoto Protocol: Options for protecting the
climate. Washington DC, World Resources Institute: 61-87. I was the lead author and primary
developer of the approach. The support of the World Resources Institute in undertaking the
conceptual work and publishing is gratefully acknowledged. The SD-PAMs approach has since
been elaborated in further case studies and publications, some which I have contributed to
(Winkler et al. 2002a; Bradley et al. forthcoming; Winkler et al. 2005b).
Thanks to my mother, Ruth Winkler, for her unwavering support, and my brother and sister-in-
law, Gunter and Gisela Winkler, for many conversations and hand-holding.
Finally, my warmest thanks to my children, Kristy and Ally Winkler, and my wife, Janet Small,
who gave me the time and space to do this work. Without their loving support, this thesis
would not have been written.
Abbreviations x
Abbreviations, acronyms and units
AGAMA Agama Energy (company)
AIM Action Impact Matrix
ANC African National Congress
c/kWh Cents per kilowatt-hour
CCGT Combined cycle gas turbine
CCT City of Cape Town
CDM Clean Development Mechanism
CFLs Compact fluorescent lamps
CGE Computable general equilibrium
CO2 Carbon dioxide
COP Conference of the Parties (to the UNFCCC)
CSD Commission on Sustainable Development
DBSA Development Bank of Southern Africa
DEAT Department of Environmental Affairs and Tourism
DME Department of Minerals and Energy
DoH Department of Housing
DPE Department of Public Enterprises
DTI Department of Trade and Industry
DSM Demand side management
DWAF Department of Water Affairs and Foresty
EBSST Electricity basic support services tariff (‘poverty tariff’)
EDI Electricity distribution industry
EDRC Energy & Development Research Centre – now part of ERC
ERC Energy Research Centre – University of Cape Town
ERI Energy Research Institute – now part of ERC
EE Energy efficiency
EIA Environmental Impact Assessment
ELI Efficient lighting initiative
FBC Fluidised bed combustion

Abbreviations xi
FGD Flue gas desulphurisation
GB Geyser blanket
GDP Gross Domestic Product
GEAR Growth Employment and Redistribution (macro-economic strategy)
GEF Global Environment Facility
GHG Greenhouse gasses
GJ Gigajoule (109 J)
GW Giga-watts (109W)
GWh Gigawatthour
HVAC Heating, ventilation and air conditioning
IAEA International Atomic Energy Agency
IEA International Energy Agency
IEP Integrated energy plan
IPCC Intergovernmental Panel on Climate Change
IPP Independent power producer
J Joule
kW Kilowatts (power measurement)
kWh Kilowatt-hour
LEAP Long-range Energy Alternatives Planning system
LFG Landfill gas
LNG Liquefied natural gas
LPG Liquefied petroleum gas
MARKAL MARKet ALlocation (modeling framework)
MDG(s) Millennium Development Goal(s)
MW Megawatt (106 W)
MWh Megawatthour (106 Wh, or 106 kWh)
NAAQS National ambient air quality standards
NECC National Electrification Coordinating Committee
NEPAD New Partnership for Africa’s Development
NER National Electricity Regulator
NCCC National Committee on Climate Change
NIRP National Integrated Resource Plan (for electricity)

Abbreviations xii
NGO Non-governmental organisation
NMVOC Non-methane volatile organic compounds
NOx Nitrogen oxides (plural, since they refer to nitrogen dioxide (NO2) and nitric
oxide (NO))
NPV Net present value
O&M Operation and maintenance
OECD Organisation for Economic Co-operation and Development
PAMs Polices and Measures
PBMR Pebble bed modular reactor (nuclear)
PF Pulverised fuel (coal)
PJ Petajoules (1015 J)
PPP Purchasing power parity
PWC Price Waterhouse Coopers
PWR Pressurised water reactor (nuclear)
PV Photovoltaic
R&D(&D) Research and development (and demonstration)
RDP Reconstruction and Development Programme
RE Renewable energy
RETs Renewable electricity technologies
REDs Regional electricity distributors
RIDCs Rapidly Industrialising Developing Countries
SA South Africa
SADC Southern African Development Community
SANEA South African National Energy Association
SAPP Southern African Power Pool
SARB South African Reserve Bank
SD-PAMs Sustainable development policies and measures
SEA Sustainable Energy Africa
SECCP Sustainable Energy and Climate Change Partnership
SHS Solar Home Systems
SOx Sulphur oxides
SRES Special Report on Emission Scenarios (of the IPCC)

Abbreviations xiii
SSA Statistics South Africa
SSN SouthSouthNorth (organisation)
SWH Solar water heaters
Toe Tons of oil equivalent
TOR Terms of Reference
TPES Total primary energy supply
TSP Total suspended particulates
UCT University of Cape Town
UNFCCC United Nations Framework Convention on Climate Change
W Watt
WCED World Commission on Environment and Development
WCD World Commission on Dams
WRI World Resources Institute
WSSD World Summit on Sustainable Development
Household types defined for the thesis:
RHE Rural higher-income electrified
RLE Rural lower-income electrified
RLN Rural lower-income non-electrified
UHE Urban higher-income electrified
ULE Urban lower-income electrified
ULN Urban lower-income non-electrified

Introduction 1
PART I: INTRODUCTION TO ENERGY, SUSTAINABLE DEVELOPMENT AND CLIMATE CHANGE
CCCCHAPTER HAPTER HAPTER HAPTER 1111
1. Introduction
1.1 Energy, sustainable development and climate change in South Africa
Making energy supply and use more sustainable is a central challenge in South Africa’s future
development path. Energy is a critical factor in economic and social development, while any
energy system has impacts on the environment. Managing energy-related environmental
impacts is a major goal of energy policy (DME 1998) and making energy development more
sustainable at a national level.
At the same time, mitigating climate change is primarily an energy problem in South Africa.
The challenge of climate change relates to the dependence of South Africa’s economy on fossil
fuels. Coal accounts for three-quarters of primary energy supply (DME 2003a), and for over
90% of electricity generation (NER 2002a). Industrial processes and agriculture also contribute
to greenhouse gas emissions, but energy-related emissions constitute 78% of the South Africa’s
inventory of greenhouse gases in 1994 (Van der Merwe & Scholes 1998). Making energy
development more sustainable at the national level can contribute to global sustainability by
mitigating climate change.
The local environment is affected by the particular features of the South African energy system.
At the point of use, electricity may is a clean energy carrier. But upstream environmental
impacts of coal mining and combustion mean that electricity supply and use does have
significant environmental impact. Outdoor air pollution is associated with burning of coal (often
of a poor quality) for electricity production. Indoor air pollution in South Africa is associated
with energy carriers other than coal. Transport fuels contribute to the ‘brown haze’ of local air
pollution; paraffin use results in burns, deaths and poisoning (Mehlwana 1999a; Lloyd 2002;
Biggs & Greyling 2001); and indoor use of coal and wood contributes to respiratory disease
(Qase et al. 2000; Van Horen 1996a; Spalding-Fecher et al. 2000a) (see section 3.6).
The connection between sustainable development and climate change works in two directions.
On the one hand, unmitigated growth in emissions has the potential to undermine sustainable
development. On the other hand, making development paths more sustainable can contribute to
climate change mitigation (Munasinghe & Swart 2005). In South Africa, the two-way
connection is particularly marked in the energy sector, the major source of GHG emissions.

Introduction 2
Under the United Nations Framework Convention on Climate Change (UNFCCC 1992) and its
Kyoto Protocol (UNFCCC 1997), industrialised countries adopted targets for climate change
mitigation framed in terms of reducing greenhouse gas emissions. However, asking for similar
targets for developing countries has been opposed as it is perceived as placing a limit on their
development (Agarwal & Narain 1991; Mwandosya 2000). A different approach is needed, one
that puts development first. The thesis investigates whether such an approach – starting from
making energy development more sustainable in local terms – is viable for South Africa and
could form the basis for both future energy and climate change policies.
The thesis therefore takes as its starting point development objectives, rather than climate
change targets. The form of climate action which it investigates is sustainable development
policies and measures (Winkler et al. 2002b). While sustainable development measures might in
practice be similar to climate change policy, the motivation is different – the one pursues
emission reductions, the other local development. Making development more sustainable locally
is a higher policy priority for most developing countries than addressing a global problem such
as climate change, particularly since the latter has been caused mainly by industrialised
countries. South Africa has a rather atypical emissions profile for a developing country – high
emissions per capita and per GDP. A development-focused approach seems more likely to be
implemented than the imposition of GHG targets by the international community – especially as
the country has adopted development targets such as the Millennium Development Goals (UN
GA 2000) and the Johannesburg Plan of Action (WSSD 2002).
Historically, greenhouse gases have been emitted mostly by industrialised countries; however,
the annual emissions of developing countries are growing rapidly (WRI 2005) – as they develop
(Pan 2002). However, emissions for some industrialised countries, e.g. the US, Japan, Norway
and Canada, continue to grow. The current multi-lateral framework under the UNFCCC and its
Kyoto Protocol sets emission targets only for industrialised countries. There is growing
realisation that the climate change problem is global and requires participation by all countries,
including action by developing countries that does not limit their development prospects. The
urgency for some developing countries to take on some kind of commitments is growing. In this
context, demonstrating at a national level that energy policies can both promote local
sustainable development and also reduce GHGs can make a major contribution to climate
change mitigation.
This thesis seeks to demonstrate energy policies for sustainable development in South Africa.
Are there obvious solutions that solve both energy and climate change problems, or do priorities
have to be traded off – and if so, where? Is there such a thing as an optimal solution, or do
considerations of durability (or sustainability) mean that multiple objectives must be balanced?

Introduction 3
This chapter outlines the research question, the methodology developed to investigate it and
describes the structure of the thesis.
1.2 Research question The research in this thesis explores whether there is a locally sustainable path of energy
development in the South African residential and electricity sectors that also reduces GHG
emissions. Making the development paths more sustainable would require increases in a set of
'development indicators' over time, without negative social, economic and environmental feed-
back (see chapter 2 for a working definition of sustainable development).
The research thus addresses as its central question:
Are there energy policies to make the development in South Africa’s residential and
electricity sectors more sustainable economically, socially and in terms of local
environment, and that also reduce GHG emissions?
To investigate the research question, the development objectives for the energy sector need to
be understood. The residential sector is particularly significant for social sustainability (see
chapter 8), while the electricity supply makes the largest contribution of a single sector to South
Africa’s total greenhouse gas emissions (calculated from RSA 2004a). Together, the two
sectors are key testing grounds for both local sustainable development and climate change
mitigation in South Africa.
The issues of sustainable development and climate change are of broader concern, especially for
a group of ‘rapidly industrialising developing countries’ (RIDCs) (Ott et al. 2004). Sustainable
development is acknowledged as an important problem by other RIDCs such as India (IIM
2003; Vajpayee 2002) and China (Pan 2002; Shukla et al. 2002) whose emissions are rising as
they seek to provide basic services.
This thesis argues that making energy development more sustainable can, in the first place,
achieve important development objectives, and secondly, is the most appropriate approach to
achieve climate change mitigation. A combination of methods is used to test the hypothesis of
the research question.
1.3 Methodology Set against a survey of international and local literature and experiences in assessing energy and
sustainable development, three major components are combined in the methodological
framework for this thesis – modeling, indicators of sustainable development and policy analysis.
The sequence of methodological steps is illustrated in Figure 1.1.
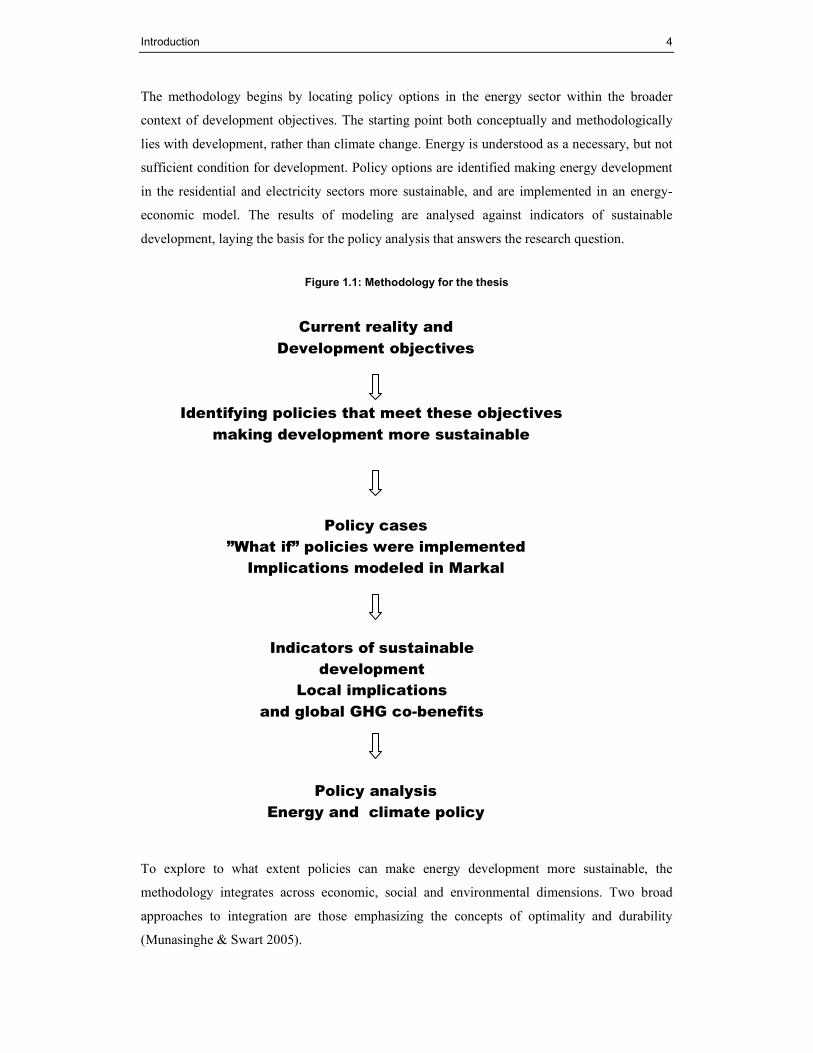
Introduction 4
The methodology begins by locating policy options in the energy sector within the broader
context of development objectives. The starting point both conceptually and methodologically
lies with development, rather than climate change. Energy is understood as a necessary, but not
sufficient condition for development. Policy options are identified making energy development
in the residential and electricity sectors more sustainable, and are implemented in an energy-
economic model. The results of modeling are analysed against indicators of sustainable
development, laying the basis for the policy analysis that answers the research question.
Figure 1.1: Methodology for the thesis
Current reality and
Development objectives
Identifying policies that meet these objectives
making development more sustainable
Indicators of sustainable
development
Local implications
and global GHG co-benefits
Policy cases
”What if” policies were implemented
Implications modeled in Markal
Policy analysis
Energy and climate policy
To explore to what extent policies can make energy development more sustainable, the
methodology integrates across economic, social and environmental dimensions. Two broad
approaches to integration are those emphasizing the concepts of optimality and durability
(Munasinghe & Swart 2005).

Introduction 5
The methodology combines modeling, which is at its core an energy-economic tool, with a
broader interpretation of indicators of sustainable development. Economic methods are typically
optimization tools, as is the case with the Markal modeling framework which is used in this
thesis. Its objective function is to minimize costs. Environmental and social variables can be
introduced as side constraints. Constraints are necessary particularly where the other objectives
are not easily monetized, for example, where ecological impacts are irreversible or high levels
of inequality reduce social capital. The constraints can be introduced under weak or strong
concepts of sustainability, i.e. maintaining overall non-decreasing stocks of capital, or each type
(economic, human, social, environmental) separately (Daly & Cobb 1989). Multiple objectives
can, in principle, be included even where monetary valuation is difficult, using multi-criteria
analysis and resulting trade-off curves (Munasinghe & Swart 2005).
Durability favours development paths that permit growth, but does not insist on economic
optimality. There is more willingness to trade off some economic optimality for greater safety,
or for a system that has higher resilience to external shocks. The difference, however, is one of
emphasis and perspective - optimality and durability have different emphases, but can
complement one another (Munasinghe & Swart 2005). The approach taken in this thesis is to
use both modeling and indicators to provide quantitative input for policy analysis – the analysis
of the research question.
The steps shown in Figure 1.1 can be elaborated a little further in a number of steps below. The
further elaboration makes clear how and where in the thesis modeling, indicators and policy
analysis are combined:
1. Describe the development objectives of the country (chapter 3)
2. Locate the energy sector within the broader development pathway (chapters 3 and 4)
3. Identify energy policies that can make development more sustainable (chapter 4)
4. Model cases of policies that meet development objectives (in a least-cost framework)
(chapters 5 and 6)
5. Analyse results of policy cases (chapter 7) against indicators of sustainable
development (chapter 8)
a. Including local environmental, social and economic dimensions
b. Examine co-benefits of GHG emission reduction
6. Policy analysis (chapter 9), combining quantified results with discussion of
a. implications for energy policy
b. climate change mitigation policy

Introduction 6
The practical approach taken in this thesis starts with development objectives. It starts from
development objectives, not climate change targets. The policy options identified for inclusion
in the modeling all have important development benefits. Development drives both emissions
and the capacity to mitigate climate change. The least-cost model tool (Markal) establishes an
optimized reference case. The model is used to examine policy cases, some of which are
designed in a way that ‘forces in’ particular energy policy interventions (step 3), beginning to
introduce considerations of durability. Step 4 lets the model choose the most economically
efficient path of meeting this constraint, amongst all the other constraints built into the model
(e.g. matching energy supply and demand). Environmental and social side constraints are
introduced, and hence indicators of sustainable development can be examined in the results,
providing a ‘bridge’ to policy analysis. Policy analysis is treated as a distinct activity (step 6),
not only drawing on the quantitative results from the modeling, but also examining important
areas where quantification reaches its limits. It is in this final step that durability is examined
most fully.
Modeling is used to explore the implications of electricity and residential energy policies in a
systematic, quantitative framework. The modeling tool used is Markal, which derives least-cost
solutions, so that policy cases are implemented in the most cost-effective and economically
sustainable way. A critical analysis of modeling tools – both optimization and simulation tools
– is presented in chapter 5, introducing the modeling chapters of the thesis.
The thesis focuses on policies in particular sectors – residential demand and electricity supply –
but places these within the broader context of the energy sector. Analysis of electricity supply
builds on similar approaches to those taken for national energy and electricity planning. The
modeling of the residential sector introduces significant changes, in that households (not
individuals) are the unit of analysis. A key innovation in the context of national energy system
modeling is disaggregating households into six categories, based on income, electrification
status and geographical location. The approaches to the two focus sectors are described in more
detail in chapter 6.
The results are evaluated against a broader set of indicators of sustainable development.
Indicators are chosen to represent key dimensions of sustainable energy development. A
fundamental indicator for access, for example, would be increasing electricity consumption per
capita over time, where the increase is not threatened by 'feedback' from either biophysical
impacts (local air pollution, greenhouse gas emissions), social impacts (social disruption) or
economic consequences (unaffordable tariffs, impaired economic development). Considering
policies against multiple objectives will show were policies are ranked higher in all dimensions
(economic, social and environmental) and where trade-offs are required. Projecting indicators

Introduction 7
over time can assist policy-makers in assessing contributions to making energy development
more sustainable.
The thesis demonstrates the importance of residential energy policies in contributing to social
sustainability. In assessing modeling results against indicators, it ranks policies that rank higher
in all three dimensions of sustainable development. But not all sectors show clear ‘winners’ –
finding durable electricity supply options probably require trade-offs. Diversifying energy
sources is a long-term challenge that requires changes in the near future.
Together, the findings from modeling and indicators lay the basis for policy analysis –
implementation in energy policy and implications for climate policy. Since the approach is
rooted in energy for sustainable development, several options for national climate policy that are
at the same time sound energy policies. On this basis, implications for South Africa’s
participation in the international climate change negotiations under the UN Framework
Convention on Climate Change and its Kyoto Protocol are examined (see chapter 9). The
realization that all countries need to act to solve the climate change problem places increasing
pressure on some developing countries to take on quantified emissions limitation targets. Non-
Annex I countries like South Africa, with high absolute and relative GHG emissions, may be
expected to act early (Ott et al. 2004; Winkler et al. 2001, 2002c). The thesis locates South
Africa’s policies on energy, sustainable development and climate change in the broader context
of multi-lateral climate agreements.
The thesis contributes to knowledge by implementing a methodology that works back from
development objectives. The methodology is an elaboration of my approach previously
published as Sustainable Development Policies and Measures (Winkler et al. 2002b). While
‘backcasting’ from development objectives has been outlined as a conceptual approach
internationally, it has not been implemented in national energy models in developing countries,
and not in South Africa. To conduct such an analysis, a methodology combining modeling,
evaluation of indicators of sustainable development and policy analysis is developed. Within
the modeling component, the residential sector is disaggregated into six household types for the
first time in a national energy model for SA. The thesis contends that the appropriate starting
point - conceptually and methodologically – for both energy and mitigation policy is sustainable
development. The thesis argues that a sustainable development approach to energy policy is the
most appropriate approach for climate change mitigation in South Africa. Climate change
mitigation policy should start with local sustainable development, rather than goals set in
climate terms.
The thesis draws on a wide variety of sources, from statistical information, government
publications of official energy data (e.g. published by the DME and NER), utility statistics
(Eskom), journal articles, book chapters, research reports and other sources. Where modeling

Introduction 8
data are used, the original data sources are referenced where they could be established, or
reference is made to the published plans (e.g. IEP and NIRP).
Having outlined the research question and the methodology proposed to investigate it, the
outline of the thesis is presented in the next section.
1.4 Outline of the thesis
The thesis is organized in four major parts, comprising ten chapters. Part I includes this
introduction and a literature review. Since the research question presented in this introduction
integrally involves sustainable development, the literature review in chapter 2 develops a
working definition, applied to the energy sector. Energy for sustainable development is the
particular component of the linkages between climate change and sustainable development most
relevant to this thesis, and so the literature on energy for sustainable development is also
reviewed. .
Part II sets out the context and key issues. Chapter 3 outlines the development objectives for
SA as a whole, before focusing in objectives for the energy sector. Chapter 4 identifies policy
options in the residential demand and electricity supply sectors, using the five major goals of
energy policy as a framework (DME 1998). In this part, the first step of policy analysis is taken,
by identifying options that can make energy development more sustainable.
The implications of future energy policies are examined in a modeling framework in Part III.
Chapter 5 outlines the purpose of modeling in the overall thesis and critically evaluates
available modeling tools. The strengths and limitations of using an optimizing tool such as
Markal are highlighted, particularly in the context of sustainability. Chapter 6 first outlines the
key drivers of energy development and the base case. It explains the model implementation of
policies in the electricity supply and residential demand sector. Results are discussed and
interpreted for each policy in chapter 7.
Part IV synthesizes the analysis of sustainable development, energy and climate change policy.
Chapter 8 evaluates the policies, drawing on modeling results, against a set of indicators of
sustainable development. Policy analysis in Chapter 9 starts with considerations of what is
required to shift energy policy that look good in analysis to implementation. The thesis
concludes with a consideration of the implications for domestic climate policy and South
Africa’s engagement in the international climate change negotiations.

Sustainable development, energy and climate change 9
CCCCHAPTER HAPTER HAPTER HAPTER 2222
2. Sustainable development, energy and climate change
The research question (outlined in chapter 1) implies that the concept of sustainable
development can be applied to South Africa's energy sector. This chapter explores how
sustainable development can be applied to energy, through a review of the literature relating the
concept to both energy and climate change. Sustainable development for the residential and
electricity sectors is conceived in all three of its dimensions – economic, social and
environmental.
This chapter develops a working definition of sustainable development, firstly in the context of
energy and secondly in relation to climate change. More sustainable energy development is the
approach to climate change mitigation taken in this thesis. It lays the conceptual basis for
developing indicators of energy for sustainable development, which are used to evaluate
different energy policies in the remainder of this thesis.
2.1 Working definition of sustainable development Sustainable development is a term widely used with many different associations and multiple
definitions.1 The concept emerged from concerns about a sustainable society and the
management of renewable resources (Brown 1981). Early debates on ‘green issues’ focuses on
preservation or conservation of natural resources and developed concepts such as maximum
sustained yield (Wilson 1989; Nash 1982). Another strand of the debate focused on ‘brown
issues’ such as pollution, population growth and the limits of resources (Ehrlich 1968; Meadows
et al. 1972). Questions were raised about the limits to growth, and sustainability conceived by
some as keeping society within ecological limits. In the 1980s, the concept of sustainable
development emerged in attempts to link concerns about ecological limits with those about
poverty and development (IUCN et al. 1980; WCED 1987). The concept was popularised by
the Brundtland Report as “development that meets the needs of the present without
compromising the ability of future generations to meet their own needs” (WCED 1987: 8). The
implication was that ecological sustainability could not be achieved if poverty was not
addressed, requiring action on both environment and development (Robinson 2004a). Perhaps it
is in implementing – the process of making development more sustainable – that the concept
becomes more clearly defined for a particular context, rather than in abstract definition.
1 For more extensive overviews of the concept of sustainable development, its history and the debate around it, see for example Pezzoli (1997), Guha & Martinez-Alier (1997) and Robinson (2004a).
Sustainable development, energy and climate change 10
While the Brundtland definition is commonly cited, there is no consensus in academic or policy
circles on the concept or how to apply it in practice (IPCC 2001a: 93). Despite the absence of
any single authoritative definition, in practice many people would recognise development that is
not sustainable. For the purposes of this thesis, a working definition of sustainable development
is required for the energy sector, not least because the South African government is committed
to this principle. Having hosted the World Summit on Sustainable Development (WSSD) in
2002, and ensured that the outcome took the form of an action plan, government has a vested
interest in realising at least some of the WSSD goals – after all, it is the Johannesburg Plan of
Implementation.
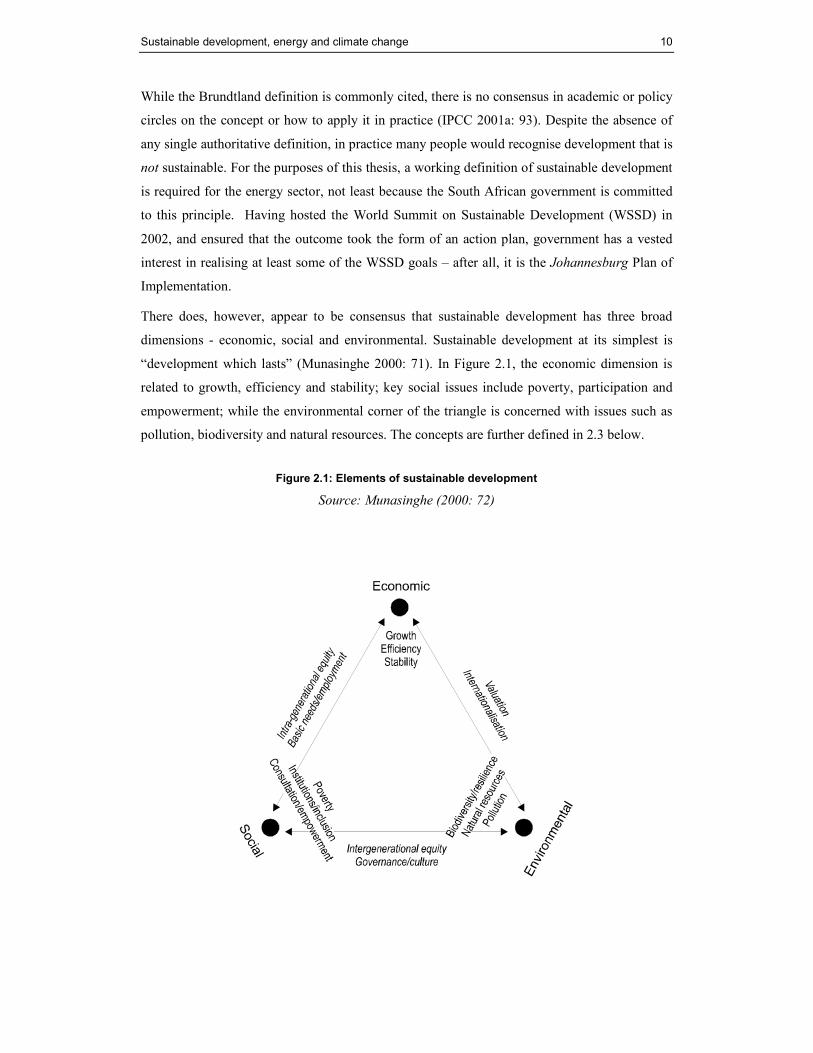
There does, however, appear to be consensus that sustainable development has three broad
dimensions - economic, social and environmental. Sustainable development at its simplest is
“development which lasts” (Munasinghe 2000: 71). In Figure 2.1, the economic dimension is
related to growth, efficiency and stability; key social issues include poverty, participation and
empowerment; while the environmental corner of the triangle is concerned with issues such as
pollution, biodiversity and natural resources. The concepts are further defined in 2.3 below.
Figure 2.1: Elements of sustainable development
Source: Munasinghe (2000: 72)

Sustainable development, energy and climate change 11
The concept of sustainability has been further defined in relation to non-declining stock of
capital, or wealth. “Any growth path characterised by non-decreasing stocks of assets (or
capital) is sustainable” (Munasinghe 2000: 76). This broad definition has been refined by Daly,
distinguishing between 'weak' and 'strong' forms of sustainability (Daly & Cobb 1989). Capital,
or assets capable of generating flows of goods and services, comes in different forms: natural
and human-made capital (the latter often being further sub-divided into manufactured, human
and socio-cultural sub-categories). Natural capital refers to natural resource assets, durable
structures or equipment are manufactured by human beings, human capital is the productive
potential of human beings, while social capital captures the norms and institutions that influence
human interactions (Banuri & Weyant 2001:94). Development may be considered sustainable if
capital is non-decreasing. Accumulating the various kinds of capital increases the resilience of
an economy, society and its environment to external shocks.
Weak sustainability assumes that different forms of capital are substitutes and can be traded off
against one another; strong sustainability assumes they are complements (Daly & Cobb 1989).
Weak sustainability requires only that capital stocks are maintained across all types, but a deficit
in one kind of capital can be made up in another. Strong sustainability, on the other hand,
requires that all kinds of capital increase. One implication is that increases in human-made
capital stocks cannot make up for losses of natural capital under strong sustainability.
A working definition of sustainable development needs to incorporate the concept of
maintaining or enhancing stocks over time, with assets relating to economic, social and
environmental dimensions. One approach that incorporates the concerns of sustainability and
development is provided by Munasinghe:
“[A]n approach that will (inter alia) permit continuing improvements in the present
quality of life at a lower intensity of resource use, while leaving behind for future
generations enhanced stocks of assets (i.e. manufactured, natural and social capital) that
will provide undiminished opportunities for improving their quality of life” (Munasinghe
2000: 71).
This conception is used as a working definition of sustainable development in this thesis. While
any definition of energy for sustainable development may be contested in abstract, it is possible
to identify which energy development paths are more sustainable than others. Sustainable
energy development is treated in this thesis not as an end-state, but rather different policy
options are compared to see which are more sustainable. Making development more sustainable
does not so much require a precise definition of some ideal state of sustainable development –
what is important is addressing those parts of current development trends that are clearly
unsustainable. In this sense, a working definition of energy for sustainable development is
needed for the thesis.

Sustainable development, energy and climate change 12
2.2 Energy for sustainable development in South Africa Sustainable development has as its primary aim the search for a path of economic progress
which does not impair the welfare of future generations (Pearce et al. 1989: 28). A sustainable
energy development path for the electricity sector would need to be socio-economically viable
as well as meeting local and global environmental criteria. A key global environmental impact
of electricity production and use is its likely impact on climate stability, while air pollution is a
significant local environmental impact of electricity supply and use (see chapter 3). The social
welfare of future generations will be determined in no small measure by employment and
income distribution. Sustainable development for the sector must therefore reduce energy
poverty,2 by promoting affordable access to modern energy services.
Sustainable energy development is more than sustainable energy growth. An energy growth
path may deliver increase in energy consumption per capita, but energy development should
also improve - or at least maintain - social and environmental quality. This has implications for
the pattern of energy development. Several studies document issues of energy and poverty in
South Africa (for some examples, see Eberhard & Van Horen 1995; for some examples, see
Bank et al. 1996; Jones et al. 1996; Mehlwana & Qase 1998). In the context of a society where
large sections of the population still suffer from energy poverty, growth in energy services is an
essential first step to energy development. Put in different terms, sustainable growth is a
necessary, but not sufficient condition for sustainable energy development. The Reconstruction
& Development Programme balanced social goals (electricity for all) with environmental
concerns (promoting diverse energy sources and energy efficiency) (ANC 1994: 2.7 Energy and
Electrification). The working definition of sustainable development above suggests that
sustainable energy development requires more than simply growth in energy consumption.
Some further working definitions are elaborated below (Adapted from Pearce et al. 1989: 33):
• Energy growth means that energy consumption per capita is increasing over time.
However, observation of such a trend does not mean that growth is sustainable.
• Sustainable energy growth means energy consumption per capita is increasing over
time and the increase is not threatened by 'feedback' from either biophysical impacts
(local air pollution, greenhouse gas emissions) or from social impacts (social disruption,
e.g. if services are unaffordable).
• Sustainable energy development means that a set of 'development indicators' is
increasing over time. Indicators would be drawn from social, economic and
2 Energy poverty is taken in this thesis to mean the absence of sufficient choice in accessing adequate, affordable, reliable, high-quality, safe and environmentally benign energy services to support economic and human development. For discussions of energy poverty in the African and South African context, see Karekezi (2002), Eberhard (1995), Mehlwana (1998) and Davidson (2002).

Sustainable development, energy and climate change 13
environment dimensions, but different stakeholders might emphasise various criteria.
The same feed-back requirements apply.
The definition could similarly be extended to the electricity sector, suggesting that growth in
electricity consumption per capita alone is necessary, but not sufficient to demonstrate
sustainable development. Growth in electricity consumption must not undermine its own
achievement by contributing to social disruption, and therefore have to remain affordable.
Social sustainability is particularly relevant in the residential sector, where affordable access to
modern energy services is a key goal. A core development indicator that needs to increase is
access to energy services. To meet criteria of strong sustainability, increasing electricity supply
and more affordable services should be achieved while minimizing local air pollution and global
environmental pollution. In this context, efficient use of energy is a necessary condition for
sustainable development. The debate on energy for sustainable development is integral to the
linkages between sustainable development and climate change.
2.3 Sustainable development and climate change The concept of sustainable development is widely applied in the climate change debate (Banuri
& Weyant 2001; Byrne et al. 1998; Davidson & Nakicenovic 2001; Markandya & Halsnaes
2002; Metz et al. 2002; Munasinghe 2001; Sachs 2000). Most simply, mitigating climate change
is part of the broader sustainable development agenda. Unchecked growth of GHG emissions
due to development is not sustainable, as it exceeds the capacity of the atmosphere to absorb
pollutants. The linkage between climate change and sustainable development is seen as
working in both directions - sustainable development is a key component of mitigating climate
change, while the impacts of unmitigated climate change threaten to undermine any possibility
of sustainable development (Munasinghe & Swart 2005; IPCC 2001a).
In the literature on energy and climate change, environmental, economic and social dimensions
were initially analysed separately and sustainability treated as their sum. More recently and
particularly in relation to climate change, the focus has shifted to analysing the potential areas
for synergies - as well as trade-offs - in realising sustainable development (Banuri & Weyant
2001; Byrne et al. 1998; Metz et al. 2002; Munasinghe 2001; Sachs 2000; Davidson 1996). The
IPCC's Third Assessment Report identifies three broad approaches to climate change: efficiency
and cost-effectiveness; equity and sustainable development; and global sustainability and
societal learning. It noted that consensus appeared limited to acceptance that three broad
dimensions must be integrated to achieve sustainable development – economic prosperity
(development), ecological integrity (sustainability) and social justice (equity) (Banuri & Weyant
2001: 93). This broader discussion (compared to a focus on poverty reduction, as in the
Millennium Development Goals) is used in this thesis to analyse the three dimensions of
Sustainable development, energy and climate change 14
sustainable development: development (primarily economic), sustainability (environmental) and
equity (social). This is an analytical distinction, recognising that all three dimensions are inter-
related.
2.3.1 Development Development is often associated with economic prosperity. In the first instance, economic
prosperity may be measured in total output. However, the concept of economic development
implies not only increase in total output over time (economic growth), but also progress towards
some set of social goals. In South African macro-economic policy GEAR, growth is allied to
goals of job-creation and redistribution of income (DTI 1996). More detailed development
objectives, however, are spelled out in the Reconstruction & Development Programme (ANC
1994).
If economic development is to be sustainable, its impact on the environment - human and
natural, social and ecological - must be limited. In the social context, the distribution of income
is as important as economic output (see discussions on equity below), otherwise social crises
that might arise from inequality may undermine economic development. Societies with high
levels of inequality – approximated by the Gini coefficient, for example - may struggle to
maintain the social stability needed for economic development. Environmental concerns require
that economic development should not undermine its own basis - ecosystems and their natural
resources and services. Sustainable development broadens the concept of development from its
narrow focus on economic growth to include human development, poverty eradication, and
social equity (Banuri & Weyant 2001: 93). The social dimension of development should include
measures that reduce vulnerability, improve equity and meet basic human needs (Munasinghe
2000: 73).
2.3.2 Sustainability Sustainability in simple terms means that something lasts over time. Sustainability is linked to
durability. But durability does not mean that no change takes place over time. In economic and
ecological systems, sustainability relates to its resilience, the ability to adapt to change, as well
as its vigour and level of organisation (Munasinghe 2000). It is often assumed that greater
diversity in ecological and economic systems makes them more resilient to shocks and stresses
(Pearce et al. 1989: 43). For development to be sustainable, it must improve the health of
ecological and socio-economic systems and their ability to adapt to change. “Policies must
address simultaneously the goals of social equity and ecological resilience” (Tellus 2001: 40).
Similarly in the economic dimension, greater resilience to external shocks and surprises is
important for sustainability.

Sustainable development, energy and climate change 15
2.3.3 Equity Does development with sustainability add up to sustainable development? Many argue that a
higher degree of social equity is also required by the standards of sustainable development
(Byrne et al. 1998; Nakicenovic 2000: 336; Sachs et al. 1998; Kartha et al. 1998). This is
consistent with a concept of development that does not undermine itself by causing disruption
through social inequality.
Developing countries have frequently expressed the concern that their development should not
be constrained by considerations of climate change (Mwandosya 2000; Sari 1998; Zhou 2001;
Agarwal 2000). This is considered unfair, given that industrialised countries bear most of the
responsibility for cumulative historical greenhouse gas emissions. For developing countries,
mitigation efforts might focus on de-linking economic growth from rising GHG emissions
(Banuri & Weyant 2001; Baumert et al. 1999).
Equity in the context of climate change requires "that neither the impact of climate change nor
that of mitigation policies exacerbates existing inequities both within and across nations"
(Banuri & Weyant 2001: 87). Given the time-frames of climate change, equity between
generations is part of this discussion. Clearly both mitigation and adaptation have implications
for equity.
Four central issues in the climate change negotiations have strong implications for equity:
o Fair allocation of costs to prevent further climate change;
o Sharing the costs of adapting to climate change impacts;
o Fair process to determine the previous two issues; and
o Fair allocation of greenhouse gases in the long term and the transition (Toth &
Mwandosya 2001: 669).
While mitigation can be enhanced by sustainable development, strict mitigation targets may
place a limit on sustainable development, especially in developing countries. The link is explicit
in Article 2 of the Framework Convention, which places three conditions on the ultimate
objective of stabilising greenhouse gas concentrations in the atmosphere – allowing ecosystems
to adapt naturally, avoiding threats to food production and enabling “economic development to
proceed in a sustainable manner” (UNFCCC 1992). This is reinforced in Article 3.4, which
recognises as one of its guiding principles that “Parties have a right to, and should promote
sustainable development”.3
3 The other principles are equity, common but differentiated responsibilities, precaution, cost-effective measures and support for an open international economic system (UNFCCC 1992: Article 3).

Sustainable development, energy and climate change 16
Equity is framed in the Convention process both in terms of greater historical responsibility of
industrialised countries, but also the limited capability of developing countries to divert
resources to climate change mitigation. These differences have become known as ‘common but
differentiated responsibilities’ of developed and developing countries in the climate change
regime. Non-Annex I countries (developing countries) do not currently have binding
commitments to reduce greenhouse gas emissions, to allow them to continue developing. Their
voluntary mitigation programmes under the Convention are to be enabled by funding and
technology transfer from Annex I countries (UNFCCC 1992: Article 4.1b). Under the Kyoto
Protocol, they may participate in the Clean Development Mechanism, which has sustainable
development as one of its two major goals (UNFCCC 1997: Article 12)
The emphasis in this thesis is on equity in mitigating climate change. Approaches that meet
local development needs (e.g. energy services) are presumed to be more equitable for
developing countries, since developed countries industrialised in the absence of climate
constraints (Mwandosya 2000). Hence an approach that starts from energy development
objectives is more appropriate and equitable for developing countries. The argument is that
more equitable approaches will help generate support for mitigation (see, for example, Agarwal
2000). Promotion of more sustainable development in developing countries both contributes to
international equity and enhances mitigation efforts by reducing emissions of the reference case
(Winkler et al. 2002b; IPCC 2001b). This has important implications for the economic analysis,
given the finding - in analysing the economics of the Kyoto Protocol - that "[i]n general, other
things being equal, the higher the reference case emissions, the higher the costs of implementing
the Protocol" (Weyant & Hill 1999: xxxv).
Figure 2.2 shows four of the families of scenarios from the IPCC’s Special Report on Emission
Scenarios (SRES). Each of the striped scenario families represents a different storyline of how
global emissions might evolve in future. The SRES scenarios deliberately do not consider
policies explicitly aimed at combating climate change. The striped reference scenarios shown in
Figure 2.2 do not include climate policy and are shown together with mitigation scenarios
resulting in atmospheric concentrations of CO2 ranging from 450 to 750 ppmv (various shades).

Sustainable development, energy and climate change 17
IPCC SRES B1 Scenarios
0
5
10
15
20
25
30
35
40
1990 00 10 20 30 40 50 60 70 80 90 2100
0
5
10
15
20
25
30
35
40
1990 00 10 20 30 40 50 60 70 80 90 2100
IPCC SRES A1FI Scenarios
A1F1
A2
B1
B2
IPCC SRES B2 Scenarios
0
5
10
15
20
25
30
35
40
1990 00 10 20 30 40 50 60 70 80 90 2100
IPCC SRES A2 Scenarios
0
5
10
15
20
25
30
35
40
1990 00 10 20 30 40 50 60 70 80 90 2100
Figure 2.2: Comparison of SRES reference emissions scenarios (without climate policy) and ‘post-SRES’ climate change mitigation scenarios
Source: (Morita & Robinson 2001: 151, fig. 2.14)

Sustainable development, energy and climate change 18
Choosing a sustainable development path means that the baseline - or reference – GHG
emissions are lower than in other possible futures. Put differently, a more sustainable
development path has lower emissions, even without any explicit climate policy. The IPCC's
Third Assessment Report found that this choice of future 'world' more important than the drivers
determining GHG emissions (Morita & Robinson 2001: 142).
The corollary is also true – development objectives can be met in more or less emission-
intensive ways. Beginning with one or more future development ambitions it would be possible
to describe paths towards those goals (Winkler et al. 2002b; Metz et al. 2002; Berk et al. 2001).
The selected scenarios show clearly that to reach the same atmospheric concentrations,
significantly less effort is required if reference emissions are low (in the B family) than if the
future world had higher emissions (in the A scenarios).4 A key challenge for South Africa’s
contribution mitigating GHG emissions is to make energy development paths more sustainable.
2.4 Making energy development paths more sustainable as an approach to climate change mitigation
The starting point for developing countries is development, and ways can be sought to make
energy development in particular more sustainable. Sustainable development policies are likely
to be more attractive as an approach to mitigation for developing countries, being closer to their
most important policy objectives than climate change (Winkler et al. 2002b). "The best climate
policies for some nations over the foreseeable future may have nothing specific to do with
climate" (Yohe 2001: 261). The approach taken in this thesis, therefore, seeks paths that meet
development objectives in a more sustainable manner, rather than emission reduction
objectives.
Focusing on policy for sustainable development raises the question how this differs from
climate policy. The motivation or intent of the policy is more relevant in distinguishing the two,
rather than the kind of action taken. Climate change mitigation policy focuses primarily on
reducing atmospheric GHG concentrations (Banuri & Weyant 2001: 85). Similarly, one could
say that sustainable development policies are primarily motivated by the aim of delivering
development services (water, housing, food, energy, etc) with due regard to social and
environmental impacts. These are more pressing concerns than conventional approaches to
climate change for most people (Berk et al. 2001: 11). In practice, however, climate and
sustainable development measures are often the same or similar, even if they are motivated by
different reasons.
4 The difference in emissions between the reference case in A1FI and 550 ppmv is much larger than the corresponding difference between B1 reference emissions and a path stabilising at the same level.

Sustainable development, energy and climate change 19
The IPCC's Third Assessment Report draws a distinction between climate and non-climate
policies (Morita & Robinson 2001: 122). Climate policies have GHG emission reductions as a
primary goal, while non-climate policies do not aim at this. The confusion arises when non-
climate policies nonetheless reduce emissions. Sustainable development policies are a classic
example - energy efficiency in low-cost housing may be motivated by sustainable development,
but have the effect of reducing the emissions compared to the baseline - the development path
that would have happened otherwise. Clear separation is not always possible, since many
policies have multiple goals.
The approach taken in this thesis focuses on non-climate policies, with GHG emission
reductions as a co-benefit. Supply options are examined that can make electricity generation
more sustainable. The South African electricity sector, which accounted for 40% of South
Africa’s greenhouse gas emissions in 1994 (calculated from RSA 2004a), implying that the
potential for climate co-benefits of cleaner electricity development is large. On the demand side,
residential energy policies are examined that make social development more sustainable. This
will entail not only increased access, but also making energy services more affordable for
households, in particular the poor.
South Africa’s development path in the electricity sector needs to ‘tunnel’ under a conventional
electricity development path (Munasinghe 1995). Figure 2.3 shows how a country’s emissions
might change with its level of development, as illustrated by the proxy of GDP per capita. In
the initial stages, emissions tend to increase for a number of reasons – economies tend to be
built around more energy-intensive primary sectors, and the fuel-mix may include fossil fuels,
as with coal in South Africa’s case. If South Africa’s development path for the electricity sector
were purely growth-oriented – without any change in the fuel mix on the supply side, or
efficiency on the demand side - then emissions will increase.

Sustainable development, energy and climate change 20
Figure 2.3: Emissions paths relative to development level and possibility of ‘tunnelling’
Source: (Munasinghe 2001: 45)
C
Safe limit
Development level (eg per capita income)
‘Tunnel’
ED
B
A
South Africa, with high emissions per GDP and per capita, is already high on the curve AB. The
main reasons for this emissions profile – and a similar picture for local pollutants – are due to
the coal-dominated fuel mix, energy-intensive primary and secondary economic sectors and
relatively inefficient use of energy (see section 3.6 further discussion). Depending on how one
defines a safe limit (not quantified in this heuristic diagram), South Africa perhaps already lies
above such a limit, on segment BC. South Africa’s per capita emissions were 6.91 tCO2 (1.88
tC) per person in 2000, which is well above the global average of 3.89 tCO2 (1.06 tC ) (IEA
2002a). Even more than for other developing countries, South Africa needs to de-couple
emissions from economic growth. The main opportunities for de-coupling lie in using energy
more efficiently, and in changes in the fuel mix. While coal continues to be used, increased
beneficiation – adding more value within the country – will be needed, as well as reducing
emissions through ‘cleaner coal’ technologies. In the longer-term, changes to less energy-
intensive economic sectors – typically secondary and tertiary sectors – can reduce emission
further, at a time when per capita incomes are also higher.
To stabilise the climate – which is the ultimate objective of the UNFCCC – the global average
needs to decrease. What is needed is a technological, infrastructural and institutional transition
to a sustainable electricity economy in SA that also reduces GHG emissions. It is for this
reason that the issue of climate change mitigation is approached from the perspective of energy
for sustainable development.

Sustainable development, energy and climate change 21
2.5 Conclusion The approach taken in this thesis puts development objectives first, focuses the analysis on
means of making development more sustainable, and considers reductions of GHG emissions as
co-benefits. The aim of this chapter was to examine the relevant literature on sustainable
development, energy and climate change.
A working definition of sustainable development embraces the economic, social and
environmental dimensions. Sustainable energy development means that a set of 'development
indicators' is increasing over time, contributing to economic welfare. The increase is not
threatened by 'feedback' from either biophysical impacts, social disruption, making it durable or
sustainable. Chapter 8 will define in more detail indicators to evaluate whether policies make
energy development more sustainable.
The literature on sustainable development and climate change focused on issues of
development, equity and sustainability. An important finding underpinning the approach taken
in this thesis is that reducing emissions in the reference scenario may be as important as climate
change policy. Making energy development more sustainable will have co-benefits in terms of
climate change mitigation. Pursuing a goal motivated by development policy is more
appropriate for countries like South Africa where development objectives are defined around
basic needs – issues such as reconstruction and poverty alleviation.
Development objectives 22
Part II: Issues and context
CCCCHAPTER HAPTER HAPTER HAPTER 3333
3. Development objectives
3.1 The broader context: South Africa’s development objectives
This chapter outlines electricity development objectives for South Africa. It does not relate
these explicitly to climate change, but rather starts from an analysis of the energy sector and its
relationship to broader development. The broad development objectives of the country are
reconstruction, development and poverty alleviation. These objectives were framed in the
Reconstruction and Development Programme (RDP) as targets for specific sectors. A review of
these sectoral targets sets the energy sector in its context of broader development objectives.
The energy development path of South Africa is assessed not only in terms of its own
objectives, but also in terms of sustainability in its economic, social and environmental
dimensions. To be sustainable, electricity development objectives must contribute to the broader
developmental goals of South African society. The chapter therefore assesses the historical
contribution of the electricity sector to social and economic development, as well as considering
the impacts of electricity supply and use on the environment. In so doing, it provides a starting
point for analysis of climate change mitigation that is firmly rooted in understanding the
objectives of the energy sector on its own terms. Considering the history and current status of
the electricity sector through the lens of sustainable development sets the framework for stories
about how electricity development can become more sustainable.
3.1.1 Development objectives in South Africa South Africa’s development objectives have been shaped deeply by Apartheid – a history of
racial oppression and patterns of economic exploitation. Apartheid systematically
underdeveloped black working-class communities and left a deep legacy of backlogs of basic
services in rural and urban areas.5 A central driver for policy since 1994 has been the redress of
the imbalance of Apartheid and the promotion of socio-economic development of poor
communities. A core document capturing the major objectives is the RDP. However, the
imperatives of reconstruction and development have been in tension with a macro-economic
framework that emphasises economic growth as the driver of development – the Growth,
5 Given South Africa’s history of Apartheid, racial categories remain significant. In presenting statistical information related to household energy use, categories of ‘black’, ‘white’, ‘coloured’, ‘Indian’ and ‘African’ are used as found in the literature. In defining household types, however, income categories (‘richer’ and ‘poorer’) are found to be more relevant.

Development objectives 23
Employment and Redistribution (GEAR) strategy (2002). Sectoral targets have had to be
pursued in a changing macro-economic framework.
Many of the detailed socio-economic development objectives were set out in the African
National Congress’ RDP (ANC 1994). It outlined job creation through public works and
meeting a range of basic needs as key priorities. Quantified goals were set for delivery of
several basic services. For instance, the RDP proposed to address the housing backlog of some
2-3 million houses by aiming to build 300 000 units each year for the first five years. In the
same period, 30% of the land was to be redistributed. In providing basic services of water and
sanitation, a short-term target of 25 litres of water per person per day was identified. In the
energy sector, the main aim of the RDP was ‘electricity for all’. The target of connection
250 000 households per year is one of the few that has been exceeded (Borchers et al. 2001).
These aspirational goals serve to illustrate the importance of socio-economic development,
conceived around delivery of basic services, in the broader context of South African policy.
While the status of RDP has become uncertain and lives in tension with macro-economic policy,
these overall development objectives continue to provide an important context for energy policy
as well. As the country has gained experience with implementation, new challenges – technical,
social, economic – have arisen and targets have had to be reformulated and refined.
The energy sector has performed well – relative to other sectors – in meeting such targets.
Significant progress has been made in extending access to electricity in particular, although
affordability and productive use remain difficult issues. Yet more remains to be done, and the
challenge of delivering energy in a sustainable manner. Sustainable development needs to take
into account not only the development objectives of the RDP, but also the economic imperatives
of GEAR.
3.1.2 Energy and development The GEAR framework sets macro-economic policy from approximately 1997 onwards. As the
name suggests, GEAR emphasised growth, employment and redistribution. Accelerated
economic growth is a key objective of government’s macro-economic policy. Key aims have
been to reduce the budget deficit (which has grown to 7% of GDP under the Apartheid
government), accelerate tariff reduction, tighten monetary policy, reach inflation targets
(between 3 and 6%), and limit increases in private and public sector wage increases (DTI 1996).
While explicit development goals are commonly associated with the RDP, the long-term vision
of GEAR includes a number of economic and social goals:
• a competitive, fast-growing economy which creates sufficient jobs for all work-seekers;
• a redistribution of income and opportunities in favour of the poor;

Development objectives 24
• a society in which sound health, education and other services are available to all; and
• an environment in which homes are secure and places of work are productive.
GEAR thus at least in principle includes some of the social development objectives of the RDP;
however, its focus in explicitly macro-economic and social goals is referenced to the earlier
document.
A major component of government’s macro-economic strategy is the privatisation of state-
owned enterprises. The main focus of these efforts is the four big parastatals: Eskom (electricity
utility), Transnet (transport), Telkom (telecommunications) and Denel (arms). In the energy
sector, the corporatisation of Eskom has already taken place, changing it from a parastatal to a
public company.
Some key themes have carried through the policy changes since 1994. Unemployment and the
creation of jobs have had high priority throughout the last ten years. With unemployment at
26% in 2004 according to the official definition6 (SSA 2005), this will remain a major priority.
Concerns about reducing poverty, at least in the sense of narrowing the gap in income
distribution, are part of both the RDP and GEAR, although less explicit in the latter.
The budget for 2005 again highlighted economic development, job creation, poverty alleviation
and social services as key issues. “We are acutely aware of the extent of need – for employment,
for broader participation in economic activity, for relief from the trap of persistent poverty, for
housing, better education and reliable health services” (Manuel 2005). As far as development
objectives go, the RDP objectives still enjoy wide support, both in government and civil society.
The vision of reconstruction of a country scarred by Apartheid emphasises the importance of
socio-economic development. The core of this notion of development is the delivery of basic
services.
While the budget deficit has been reduced substantially to about 1.5% of GDP (Manuel 2005),
several of GEAR’s targets, both macro-economic and social development oriented, have proved
elusive (Streak 2004). The strategy of privatisation as a means of delivering social benefits has
been re-examined. The ANC has accepted that GEAR is a ‘necessary, but not sufficient
condition’ for creating employment and redistribution (Streak 2004). With debt relatively low
and a declining interest burden, government has increasing scope for social expenditure
(Eberhard 2003). Some of the socio-economic goals have moved back into the mainstream of
6 The official definition is that unemployed are “those people within the economically active population who: (a) did not work during the seven days prior to the reference day, (b) wanted to work and were available to start work within two weeks, and (c) had taken active steps to look for work or to start some form of self-employment in the four weeks” (SSA 2005). The most recent statistics only include the official definition, and no longer an expanded one. The expanded unemployment rate excludes criterion (c), in other words it includes discouraged job seekers. Earlier statistics reported unemployment figures according to both definitions, e.g. by the stricter official definition, unemployment was 29.5% in 2001, while a broader definition put it at 40% (SSA 2003c).

Development objectives 25
policy. In 2004, the target of universal electrification was presented as being achieved by “our
integrated system of government, with a strengthened local government working with our state
enterprise, ESKOM” (Mbeki 2004a). Mention of sale of state-owned enterprises was notably
absent, replaced by indications of government returning to a focus on RDP-like service delivery
and a state intervening in development. Explicit reasons for this reportedly include that state-
owned enterprises are needed for job creation and economic growth (Robinson 2004b). Mbeki
himself wrote in an open letter that “the market is incapable of totally eradicating poverty and
underdevelopment” (Mbeki 2004b). The context of development policy in 2005, therefore, still
reflect macro-economic concerns (as in GEAR), but has increasingly returned to delivery of
social services (the priority in the RDP).
While tensions between RDP goals and macro-economic priorities continue, the overall
development objectives provide important background for energy policy. Policy in the energy
sector more broadly, and electricity in particular, must address not only access to energy
services, but also contribute to social goods – housing, jobs, water – and economic
development.
3.2 The policy environment in the energy sector The major objectives of government policy for the energy sector are spelled out in the 1998
White Paper on Energy Policy (DME 1998):
• Increasing access to affordable energy services;
• Improving energy governance;
• Stimulating economic development;
• Managing energy-related environmental impacts; and
• Securing supply through diversity.
Electrification has been a major way of extending access and universal access to electricity
continues to be a goal. Historically, provision of electricity in South Africa was limited to
established towns and areas of economic activity. In 1993, only some 36% of the total
population had access to grid electricity. Initiated by Eskom in 1991 under the slogan
‘electricity for all’, it was included as a RDP programme after the 1994 elections.
The first phase National Electrification Programme (1994-99) was implemented by Eskom and
municipalities. It was financed internally at a total cost of about R7 billion (Borchers et al.
2001), increasing electrification to about 66% nationally by 1999 (46% in rural areas, 80% in
urban areas) (NER 1999). The aim of Phase I was to provide access to electricity for an

Development objectives 26
additional 2.5 million households, mainly in previously disadvantaged and rural areas, and for
all schools and clinics without electricity. These targets have been met and exceeded, with a
total of 2.75 million connections in Phase 1 (Borchers et al. 2001) and an estimated 3.75 million
connections by 2004. During 2003, a further R 1.1 billion was spent on electrification, now
financed by government through the Department of Minerals and Energy. However, a third of
the country’s population still remains without electricity, with rural areas being the most
difficult and costly to electrify. Average costs per connection have declined over time, with
learning and diminishing infrastructure costs for Eskom (Borchers et al. 2001).
Increasing access to affordable energy services has to a large degree been interpreted as access
to electricity, even though other fuels play important roles as well (e.g. LPG for cooking; liquid
fuels for transport). Recognising the importance of rural energy, an off-grid rural concessions
programme has been launched, aiming to provide up to 50 000 Solar Homes Systems in 7
concession areas (Kotze 2001). Proposals have been made to extend the concept to a package
that would also include LPG for cooking and other uses. Other energy goals in the RDP are
improved rural electrification, a low-smoke coal programme, energy efficiency and the
regulation of liquid fuels.
A major change in the governance of the energy sector is the reform of the electricity industry.
Broader national development policy, as outlined above, interacts with global trends to reform
in the electricity sector. The way in which restructuring happens in the electricity sector will
have significant impact on delivery of services, as well as the future role of energy efficiency
and renewable energy (Winkler & Mavhungu 2001). Opportunities exist for independent power
producers to sell renewable energy (DME 2003b), but entry into the market is difficult (DME
2000a; Davidson & Turkson 2001).
Major changes in governance are also taking place in the liquid fuel sector, with the
establishment of a Gas Regulator. The first pipeline from Mozambique began delivering natural
gas in the first half of 2004 (Sasol 2004). The pipeline can supply 120 million Gigajoules per
annum and potentially raises the contribution of natural gas to primary energy supply from 1.5
percent to just over 4 percent.7 The natural gas is marketed by Sasol in Gauteng and Kwa-Zulu-
Natal to industries; with a domestic market operated by eGoli Gas. The option of introducing
liquefied natural gas (LNG) into South Africa is presently being examined (CEF 2005). The
amended Petroleum Products Act will change the licensing rules for petrol stations to give
government more influence, and the Petroleum Pipelines Bill is expected to establish pricing
and access rules for oil and gas pipelines. These will be the first major changes in petroleum
7 http://www.dme.gov.za/home.asp?menu=main

Development objectives 27
sector regulations in many years – and are revisions of regulations rather than full-scale
deregulation of the oil industry.
Energy-related environmental impacts are governed by environmental legislation. Of particular
note are the National Environmental Management Act and, for air pollution, the Atmospheric
Pollution Prevention Act (Act 45 of 1965). DEAT has published sulphur dioxide standards for
comment, which are part of an initiative to establish a National Ambient Air Quality Standard
(RSA 2001a). A Vehicle Emission Strategy (DEAT & DME 2003) could make a major
contribution to improved air quality, since transport energy has been identified as a major
source of local air pollutants in cities such as Cape Town (Wicking-Baird et al. 1997).
Institutional requirements are probably the key constraint to effective implementation – the lack
of people to effectively enforce existing regulations. The co-ordination and effective
communication between different national departments (DME, Transport and DEAT) as well as
different levels of government will also be necessary. Without compliance and enforcement
mechanisms, regulations are not meaningful. Accurate monitoring of emissions may soon be
required through the mechanisms created in the National Air Quality Management Bill, as well
as ensuring that such information is widely disseminated.
Diversity of supply is a major goal of energy policy. The Energy Minister made clear that South
Africa intends ‘to use every energy source optimally: coal, gas, oil, nuclear and renewable
energy’ (Mlambo-Ngcuka 2003). Starting from a coal-dominated base, the initial focus in terms
of securing supply through diversity has been on importing natural gas from Mozambique and
possibly Namibia, as well as more recent finds off South Africa (Marrs 2000a, 2000b; DME
2001a). Gas has been imported by pipeline from Mozambique since 2004, but its preferred use
has been for feedstock at SASOL’s chemical and synfuel plants (Sasol 2004). The first gas was
delivered via a pipeline from the Pande and Temane fields in Mozambique to Sasol’s plant in
Secunda. These investments – US$1 200 million in the Mozambique project alone (Venter
2001) – could promote a significant shift away from coal as a primary energy source, and
provide feedstock for high value added chemicals and the synfuels plants.
Renewable energy sources are another major option for increasing diversity. The focus has been
primarily on increased imports of hydro-electricity from within the Southern African Power
Pool (SAPP), if political stability is achieved in the country hosting a major possible source.
Despite some ongoing conflicts over the price of importing electricity, the region’s utilities are
working on a combined regional power expansion plan. Eskom has identified more than 9 000
MW potential for regional imports, even without the massive potential of the Grand Inga
scheme in the Democratic Republic of Congo. Grand Inga could potentially provide capacity of
up to 100,00 MW in the long term and over 40 000 MW in the medium term (Eskom 1997).
Regional co-operation on energy development is also a major drive within NEPAD.
Development objectives 28
In promoting greater diversity in supply, increasing the percentage of renewable energy in the
electricity generation mix is a particular goal. In 2003, the Department of Minerals & Energy
published a White Paper on Renewable Energy. The new policy document intends to
“give much needed thrust to renewable energy; a policy that envisages a range of
measures to bring about integration of renewable energies into the mainstream energy
economy. To achieve this aim Government is setting as its target 10 000 GWh (0.8 Mtoe)
renewable energy contribution to final energy consumption by 2013, to be produced
mainly from biomass, wind, solar and small-scale hydro. The renewable energy is to be
utilised for power generation and non-electric technologies such as solar water heating
and bio-fuels. This is approximately 4% (1667 MW) of the projected electricity demand
for 2013 (41539 MW). This is in addition to the estimated existing (in 2000) renewable
energy contribution of 115 278 GWh/annum (mainly from fuelwood and waste)” (DME
2003c).
The last sentence makes it clear that this amount is additional to current use of renewable
energy, most of which biomass. In contrast to earlier drafts, the focus is not exclusively on
renewable energy for electricity generation, but also for solar water heating and biofuels.
However, the total energy is then converted to a percentage of electricity demand (not total
energy demand). Biomass data is very unreliable, since fuelwood and waste are mostly not
traded commercially, so that the error in the data on biomass energy could be larger than the
target.
The Energy Minister’s 2003 budget speech had indicated that renewable energy policy would
“lead to the subsidization of Renewable Energy and develop a sustainable market share for
clean energy” (Mlambo-Ngcuka 2003). Following the approval of policy by Cabinet, the DME
is now developing a strategy to achieve the target. Several studies (some commissioned directly
by government, others by the NGO community) have analysed in some detail aspects of
renewable energy policy, including economic and financial analysis (DME 2004a), developing
market rules for renewable energy, in particular independent power producers (Sad-elec 2003),
policies and measures for renewable energy and energy efficiency (EDRC 2003a), and the
potential of renewable energy technologies to create jobs (AGAMA 2003). Non-governmental
organisations have called for significantly higher targets than the 4% in the final policy
document, viz. “10 % of electricity generation by renewable energy technologies by 2012 and
20% by 2020” (Energy Caucus 2002). However, analysis indicates that achieving the more
modest government target by 2013 will require substantial additional investment (Alfstad
2004a).
Government intends to take the results of these national-level studies and develop practical
projects that bring together developers and financiers (Otto 2004). The design of systems for an

Development objectives 29
office to administer subsidies for renewable energy projects is under way. Subsidies are
expected to be once-off for three years (2004-06), after which the approach will be evaluated.
3.2.1 Assessing overall progress against energy development objectives The five major energy policy goals spelled out in the 1998 White Paper remain current, with
some changes in emphasis over time. In the budget speech for 2005, the Energy Minister
interpreted these goals in the following way (Mlambo-Ngcuka 2005):
• “attaining universal access to energy by 2014;
• access, affordable and reliable energy especially for the poor;
• diversifying primary energy sources and reducing dependency on coal;
• good governance which must also facilitate and encourage private sector investments in
the energy sector;
• environmentally responsible energy provision”.
The Minister has consistently linked all these to the overall government goal of “pushing back
the frontiers of poverty” (Mlambo-Ngcuka 2003).
Overall progress against the five major objectives of energy policy was assessed in a 2002 study
as shown in Table 3.1. Within the major objectives, different policy priorities have emerged and
progress is assessed against these more detailed priorities.
Table 3.1: South African energy policy priorities and progress
Source: (Spalding-Fecher 2002a)
Objective Priorities Progress to date
• Electrification policy and implementation
• Address off-grid electrification
• Initiate second phase of electrification programme, including renewable energy for off-grid electrification
• Affordability
• Zero-rating of VAT on paraffin
• Poverty tariff
• Facilitate management of woodlands
• Promote improved fuel wood stoves
• No activity
Increased access to affordable energy services
• Establish thermal housing guidelines • Voluntary guidelines only
• Promulgate electricity regulatory bill • Postponed to 2002
• Manage deregulation of oil industry • No petroleum regulator; Petroleum Products and Pipelines Bills in 2002
• Implement new regulation of nuclear • Nuclear regulator established
• Restructure state energy assets • Eskom conversion bill passed
• PetroleumSA formed
• iGas formed
Improving energy governance
• Restructure DME budget
• Establish energy policy advisory board
• Establish information systems and research strategy
• Limited activity

Development objectives 30
Objective Priorities Progress to date
• Encourage black economic empowerment in energy sector
• Two multinational oil companies have sold 25% of business to BEE firms
• Manage electricity distribution industry restructuring
• Plan for REDs agreed; implementation in 2002
• Remove energy trade barriers & facilitate investment in energy sector
• Only Gas Bill to encourage investment in natural gas
• Introduce special levies to fund regulators & other energy agencies
• Implemented in all sub-sectors except nuclear
• Introduce competition in electricity • Outline of long term plans agreed by cabinet
• Establish cost-of-supply approach to electricity pricing
• Cost-of-supply and wholesale electricity tariff piloted
Stimulating economic development
• Promote energy efficiency and voluntary appliance labelling programme
• Limited activity outside of commercial building standard
• Improve residential air quality • Pilot programmes to improve air quality through low smoke fuels
• Proposals on ambient air quality standards under debate
• Monitor reduction on candle/paraffin fires resulting from electrification
• Hazards still very significant
• Introduce safety standards for paraffin stoves
• Under discussion
• Develop policy on nuclear waste management
• Under discussion
• Investigate options for coal discards • Significant research, but no programmes
• Investigate environmental levy • Not investigated
Managing energy-related environmental impacts
• Evaluate clean energy technology • Participation in Climate Change debate
• Develop Southern African Power Pool • SAPP regional co-ordination centre established and some joint planning
• Pursue international and regional co-operation
• SADC Regional Regulator’s forum and NEPAD
• Develop gas markets • Mozambique gas to Sasol, and Namibia also under discussion
• Stimulate use of new & renewable energy sources
• Piloting several programmes, Renewable Energy White Paper in 2002
Securing energy supply through diversity
• Stimulate energy research • Declining research funds
The table makes clear that the sectoral goals set for energy by the RDP in 1994, have had to be
refined and modified for policy reasons and technical reasons. Experience with electrification
showed that while the targets of physical connections were met and exceeded, additional policy
– the poverty tariff – was needed to make use of electricity affordable. Like all development
targets, energy objectives had to be achieved within a changing macro-economic framework.
Overall, although the sector has done relatively well, substantial work remains to be done and
the high standard of sustainability has not been reached.
3.3 Role of electricity in development Energy in general and electricity in particular have been central to South Africa’s development
path in the past. While energy on its own is not sufficient for development to occur, it is

Development objectives 31
certainly a necessary ingredient. Energy and particularly electricity will continue to be shaped
by future social and economic development.
3.3.1 Energy and electricity development in SA The South African energy sector has historically been at the centre of the country’s
development. The origins of the electricity supply industry in the first years of the twentieth
century, for example, were driven by the needs of the booming mining industry. Energy was a
critical ingredient in major investments in mining. Electricity supply, too, was shaped by the
demand from the mining industry as it emerged in the early twentieth century. The mining
sector in turn produces coal, South Africa’s pre-dominant fuel8 for electricity generation and
direct use in industry.
As manufacturing became more important in the economy than mining and agriculture, energy
continued to be a major driver of development. Much of the manufacturing sector is also linked
to mining activities through minerals beneficiation and metals production. Mining and the
various processes of beneficiation are all energy-intensive. In the South African context, the
availability of inexpensive coal and electricity were critical to the establishment of these
industries. The ‘minerals-energy complex’ (Fine & Rustomjee 1996) fundamentally formed the
energy economy of the country.
In the 1950s, the then apartheid government decided to develop a synthetic petroleum industry
and local nuclear capacity, reflecting concerns for energy security. With local fuels, it could
meet demand for liquid fuels and lessen its dependence on energy imports. The 1960s and ‘70s
saw large investment in electricity generation, resulting in excess capacity through the next two
decades (see 3.3.1 and Figure 3.7).
Under the democratic government after 1994, the focus shifted from supply to address demand,
and particularly broadened to include household access to electricity and making energy
services more affordable for the poor. The earlier period focused primarily on economic
development – in the sense of the growth of mining and manufacturing industries. Productive
activity was central to energy development.
8 Coal is currently most widely used, as illustrated in various graphics in this chapter. In terms of the total resource, however, it is smaller than uranium and certainly than solar energy, which is renewable each year.

Development objectives 32
Figure 3.1: Energy demand, 1992-2000
Source: Based on data in energy balances (DME 2002a)
0
500
1000
1500
2000
2500
1992 1993 1994 1995 1996 1997 1998 1999 2000
Residential
Commerce &public service
Agriculture
Transport
Mining & quarrying
Industry
Note: does not include consumption of renewable energy and waste, due to data uncertainties
Energy consumption has contributed primarily to industry, mining and transport. In the two key
economic sectors, industrial demand has been the major source of recent growth across all
energy carriers (see Figure 3.1). Some growth can be seen in the transport sector, while mining
production declined slightly towards the end of the past decade. These sectors make major
contributions to the economy, as seen in Figure 3.2. The manufacturing and commercial sector
have increased in importance over time, with mining and agriculture remaining fairly constant
in real terms and mining declining in recent years. If earlier time series were available, they
would show mining and agriculture contributing most economic output in the early 1900s.
Figure 3.2: Sectoral contribution to economy, 1967-2003
Source: Various issues of the SA Reserve Bank Quarterly Bulletin
Agriculture
Mining
Manufacture
Commerce
Transport
0
50000
100000
150000
200000
250000
300000
350000
400000
1967
19681969
1970
1971
1972
1973
1974
1975
1976
1977
1978
19791980
1981
1982
1983
19841985
1986
1987
1988
19891990
1991
1992
1993
1994
1995
1996
1997
1998
19992000
2001
2002
2003
Rm in basic prices

Development objectives 33
Figure 3.2 includes only selected primary and secondary sectors. Numbers represent gross value
added at basic prices of the sector.
Most of the energy used in the major economic sectors is produced from coal. Figure 3.3
illustrates the coal-dependence of the economy, with 73.8% of total primary energy supply
(TPES) coming from coal (DME 2001a). This compares to a share of 20% for the OECD and a
world average of 24% (IEA 2001).
Figure 3.3: Share of total primary energy supply, 1999
Source: (DME 2001a)
Coal73.8%
Petroleum16.5%
Gas1.5%
Nuclear3.0%
Biomass5.1%
South African coal reserves are large, with the best current estimate being 38 billion tons (ERC
2004a). This gives South Africa the world’s sixth biggest reserves after China, the USA, India,
Russia and Australia. Annual production of coal is around 230 million tons per year (see Figure
3.4), giving a life of about 165 years of production at current rates. Pinheiro’s detailed technical
analysis gives an estimated life of 139 to 151 years, assuming that coal producers find profitable
markets for their products, not only supply coal for electricity generation. (Pinheiro 1999: 31).
In 2001, Eskom burned 94.1 million tons of coal in their power stations (Eskom 2001: 126).

Development objectives 34
Figure 3.4: Total saleable production, local sales and exports of South African coal, 1992 to 2001
Source: (DME 2002b)
The high levels of energy and electricity consumption in SA, based as they are largely on coal,
have led to high GHG emissions relative to other developing countries (see section 3.6.2). In the
official GHG inventory (part of South Africa’s initial national communication to the UNFCCC),
the energy sector – both production and use – contributed 78% of GHG emissions in 1994, in
absolute amounts 297 564 Gg9 out of 379 842 Gg CO2 equivalent (RSA 2004a). Most of South
Africa’s greenhouse gas emissions are related to the production and consumption of energy.
Electricity generation contributes the largest part of the emissions from ‘energy industries’,
contributing over 40% of the total GHG emissions, almost exclusively in the form of CO2.10
Broken down by the economic sectors which consume final energy, Figure 3.5 illustrates the
dominance of the industrial and transport sectors. Non-energy refers to resources that could be
used for energy, but which are converted to other products like coal into chemicals and wood
into paper (SANEA 2003). Clearly major economic and social development would not be
possible without this energy.
9 One Gg equals 1 000 tons, so multiply Gg by 1 000 to get million tons. To adjust tons of CO2 to tons of carbon, divide by a factor of 44/12 or 3.66. 10 Eskom reported emissions of 2,154 tons of N2O in 2001, compared to 169,3 million tons of CO2 (Eskom 2002a). Converted by the Global Warming Potential of N2O, this means that nitrous oxide accounts for 0.4% of CO2-equivalent emissions, a factor that has remained constant for since 1997.
0
50
100
150
200
250
1992 1993 1994 1995 1996 1997 1998 1999 2000 2001
Millions of tons
Total Saleable Production
Local sales
Exports

Development objectives 35
Figure 3.5: Share of final energy consumption, 2000
Source: Based on SANEA (2003)
Agriculture
3%
Transport
20%
Other
2%
Commerce
3%
Residential
10%
Industry
45%
Non Energy
17%
The link between electricity and economic development is shown in similar growth rates. Growth rates for electricity consumption and economic output (approximated by GDP growth rates) have been roughly correlated, as shown in Figure 3.6. Total electricity sales are a good proxy for consumption, and have grown fairly consistently for the second half of the twentieth century. The figure shows the percentage change from the previous year, with higher growth rates between 6 and 13% for the 1950s to 1970s, but between 1 and 4% in the 1980s to 1990s. Economic growth was noticeably lower than electricity demand growth around the 1970s, although in general at lower percentage rates than electricity.
Figure 3.6: Percentage changes in Eskom electricity sales and change in real GDP at market prices
Source: (Eskom 1987, 1996; NER 2000; SARB 2002)
-4%
-2%
0%
2%
4%
6%
8%
10%
12%
14%
16%
1951
1955
1959
1963
1967
1971
1975
1979
1983
1987
1991
1995
1999
Percent change from previous year
Electricitydemandchange
GDPchange

Development objectives 36
The focus of energy development has recently broadened to include social development.
Improving the quality of life for South Africans by ensuring access to energy services is one
part of this. The residential sector has seen growth in access to electricity in particular, as noted
above, but access to transport services are important in relation to the liquid fuel sector. Energy
for economic development remains central, however, including the delivery energy that can
enable productive activity, particularly industry, commerce and agriculture. The history of
development of the electricity sector provides the back-drop for understanding its current status
and future potential.
3.3.2 Development of the electricity supply industry The pattern of electricity demand was briefly outlined above (see Figure 3.1). By 1948, the
industry was consolidated into a large and powerful state-owned, vertically integrated
monopoly, Escom. Massive power station projects were initiated in the 1960s and 1970s
(mostly coal-fired stations, but also including local nuclear capacity), in response to high
economic growth and assuming continued rapid increases in electricity demand – up to 16%
growth in peak demand between 1972 and 1982 (Eberhard 2003). By 1973, the transmission
grid was interconnected and controlled centrally. As in other sectors (transport,
telecommunications, water, iron & steel, synfuels, nuclear energy), the state assumed a
dominant role and owned Eskom (renamed in 1987) as a parastatal. With the isolation of the
Apartheid government, energy security has an important driver of policy and contributed to the
development of synthetic fuels, uranium production and nuclear power, as well as the
overcapacity of power plants (Steyn 2001).
By the 1980s, economic growth slowed down, but the long lead times of building power stations
meant that the programme continued. This left the national utility with large excess capacity in
the 1980s and 1990s. Construction of new plants was put on hold and plans for the final station
eventually cancelled (Eberhard 2003). Older plants with about 5000 MW capacity were
‘mothballed’. Eskom promoted growth in demand, particularly in minerals-beneficiation in
aluminium and ferrochrome. Nonetheless, maximum generating capacity still exceeded peak
demand by 63% in 1992 (Steyn 2001). Table 3.2 shows the gap between licensed capacity and
peak demand as ‘excess capacity’ between 1975 and 2000. The net maximum power produced
was lower than licensed capacity over the period, but still exceeded peak demand by a
substantial margin.

Development objectives 37
Table 3.2: Licensed capacity, maximum power, peak demand and calculated ‘excess capacity’ for Eskom, selected years
1975 1980 1985 1990 1995 2000
Eskom licensed capacity 11,242 18,349 25,716 35,673 37,840 39,870
Net maximum power produced 10,522 17,339 24,359 33,843 35,951 33,461
Peak demand 9,185 13,668 17,852 21,863 25,133 29,188
Difference: 'excess capacity' 2,057 4,681 7,864 13,810 12,707 10,682
Excess capacity has helped to keep electricity prices low, although this excess capacity will be
exhausted within the coming three to five years (Eskom 2000a). This excess capacity is
illustrated as the difference between total licensed capacity and peak demand in Figure 3.7. Note
that net maximum power is slightly lower than licensed capacity, but still significantly higher
than peak demand.
Figure 3.7: Eskom licensed capacity and peak demand (MW)
Sources: (Eskom 1987, 1996; NER 2000)
-
5,000
10,000
15,000
20,000
25,000
30,000
35,000
40,000
45,000
1975 1980 1985 1990 1995 2000
MW
Eskom licensed capacity Net maximum power produced
Peak demand Difference: 'excess capacity'
With little need for new investment in recent decades, debt has been reduced as most of the
capacity has already been paid off. When new investments have to be made, costs and
electricity prices are expected to rise. The presence of low energy prices, including coal-
generated electricity, has been one of South Africa’s key competitive advantages and continues
to drive much of new investment in industry (Eberhard & Van Horen 1995; Visser et al. 1999).
It has, however, given little incentive for efficient use of energy and contributed to local and
global environmental problems (Spalding-Fecher et al. 2000a; Davis & Steyn 1999; Van Horen
1996b).

Development objectives 38
3.3.3 Current status of electricity sector Most generation and transmission of electricity in South Africa is derived from Eskom. The
utility generated 95.9% of electricity sent out in 2002, with municipalities and private auto-
generators11 contributing 0.6% and 3.5% respectively. The total quantity of electricity generated
in 2002 was 203.6 TWh (NER 2002a).
South Africa’s generating technology is based largely on coal-fired power stations, mostly
concentrated near and to the east of Johannesburg – close to the main coal-mining areas as well
as the major demand centre. To avoid transport costs, all the large coal power stations are
concentrated around the coalfields in Mpumalanga, Gauteng and the Northern Province (see
Figure 3.8).
Figure 3.8: Map of SA power stations by fuel and ownership
Source: (Spalding-Fecher et al. 2000a)
At the end of 2000, there were 50 power stations in the country, of which 20 are coal-fired,
accounting for 90% of the total licensed capacity of 43 142 MW (including capacity in reserve
and under construction). Three older coal stations are currently in reserve because of excess
capacity, and constitute 3 556 MW. Net maximum power produced was lower than licensed
capacity at 35 324 MW. The only non-coal stations of significance are the Koeberg nuclear
11 Autogenerators are industries that generate electricity for their own use, including SASOL, sugar companies and the pulp & paper industry.

Development objectives 39
station (4.6% of operational capacity) and three pumped storage facilities (collectively 4.0 %)
(NER 2001a). These stations are the only ones that are not located in the northeast of the
country and assist with grid stability in the Western Cape.
Table 3.3 shows the share of electricity sent out by fuel type (note that percentages of capacity
and electricity generation can differ, depending on load factors).
Table 3.3: Net electricity sent out (MWh) by fuel
Source: (NER 2001a)
Eskom Municipal Private Total Share of total energy sent out
Coal 175 222 884 609 676 7 440 075 189,900,811 93.2%
Nuclear 10 718 623 - - 11,961,744 5.9%
Pumped storage -769 295 -67 545 - -816,755 -0.4%
Hydro 2 194 071 9 690 14 288 2,382,048 1.2%
Bagasse - - 306 878 259,317 0.1%
Gas -725 * 5 710 - 5,557 0.003%
Total 195,324,579 1,143,657 7,224,486 203,692,722
* Negative values: Pumped storage uses more electricity in pumping water up than it generates, and hence is a net consumer. For gas (using aeronautical diesel fuel in jet turbines), Acacia station consumed more for own use in its generation process than it generated in 2000. This is not always the case.
The flow of electricity from production, through distribution and to end use customers is shown in Figure 3.9. In addition to domestic resources, imports (primarily hydro-electricity) are shown. Note that the shares for different sectors in this figure are for electricity only, while those in Figure 3.1 were for all energy.

Development objectives 40
Figure 3.9: Energy flow through the electricity supply industry in South Africa12
Source: NER (2001a)
Privategeneration3.1%
4.1% 44.9%
55.1%91.5%
4.5%
96.5%
3.5%
0.3%
Municipal and otherdistributors44.9%
Eskomdistributors55.1%
SAPPExports fromS Africa
SAPPImports toS Africa
Domestic19.4%
Agriculture2.3%
Mining17.4%
Manufact-uring (ind.)
42.4
Commercial10.3%
Transport3.1%
General5.0%
Municipalgeneration1.3%
Ekomgeneration95.7%
T
R
A
N
S
M
I
S
S
I
O
N
3.4 Economic and institutional aspects How sustainable is South Africa’s energy economy? To answer this question, one needs to
consider how financially sustainable the sector is, but also what contribution it makes to overall
economic development. Sustainability in the energy sector is not only about the internal
dynamics of the sectors, but also about its relationship to the broader economy.
One of the features of South Africa’s energy economy that receives much attention is the
relatively low price of electricity. There are multiple reasons for this, and the price is low from
a utility perspective rather than affordable for all customers.
As a parastatal for most of its life, Eskom has received support from government over the years.
While it has contributed significantly to social development (notably electrification), this has
been made possible by a range of factors - low coal prices, utilising power station technologies
that maximize economies of scale and exploit the lowest value (and cost) of coal, exemption
from taxation and dividends, financing subsidies and over-capacity (Eberhard 2000: 13; Steyn
2000: 6-8; Clark 2001a: 128).
12 The original diagram gives no percentages for imports and exports. For 2000, however, 5 294 GWh were imported from SAPP utilities and 3 967 GWh exported. As a percentage of gross energy sent out of 198 206 GWh, imports constituted 2.6% and exports 2.0%. It is not exactly clear how this would change the percentages above, but the

Development objectives 41
South Africa has taken advantage of large economies of scale in coal mining and power
generation, and the power stations are situated near the mines and benefit from long term coal
contracts (Chamber of Mines 2001). Municipal distributors and large industrial and mining
customers contribute more than 80% of Eskom’s sales, which reduces overhead costs per unit of
sales (NER 2000). Given that power plants need to be near coalfields to avoid transport costs,
electricity generation is concentrated in the northeast of South Africa. Electricity has to be
transmitted to other major centres such as Richards Bay, Durban and East London.
Investments have effectively been subsidised with public money, for example through Reserve
Bank providing forward cover protecting Eskom against changes in exchange rates. As a
parastatal for most of its existence, Eskom did not have to pay tax and dividends, even after
these investments had been paid off. The estimated benefit to Eskom was R22 579 million
between 1986 and 1998 (Steyn 2000: 7). Even with this subsidy, Eskom’s debt burden was high
in the 1980s, but over time the loans have been paid off. Large investments were made in
previous decades led to significant overcapacity, so that Eskom has been able to pay off debt,
reduce financing costs, and price electricity at a very low marginal cost (Eberhard 2000; Van
Horen & Simmonds 1998; Davis & Steyn 1998)
Eskom’s high debt-equity ratio13 in 1986 at 2.93 declined to 0.85 in 1998 (Steyn 2000), and was
reduced further by 11.5% per year to 0.63 in 2000 (Eskom 2000b). In a commercial firm, lower
debt repayments would have been replaced by higher payments of dividends to shareholders,
but this did not happen with Eskom as a public company. With the capital costs having been
paid off, consumers are currently paying only for energy costs.
Over-investment in coal-fired power plants in the 1980s led to excess capacity, so that Eskom
has not had to invest significantly in new power stations for some years, which reduces overall
costs. In fact, three power stations are ‘mothballed’, and the debt for constructing power plants
has largely been paid off. When new investments have to be made (by ca. 2007), costs and
electricity prices will rise. Eskom expects that R100 billion of new investment will be required
over the next 25 years (Chalmers 2001a), for an estimated capacity of 15 000 – 25 000 MW
(Chalmers 2001b). In 2004, government announced that a tender for new generating capacity
needed by 2008, although in the same speech aiming that “administered prices do not
unnecessarily add to the general costs of production and inflationary pressures” (Mbeki 2004a).
impact of 1 327 GWh difference between imports and exports is unlikely to result in changes in front of the decimal point. 13 A debt-equity ratio of 1.00 would show equal debt and equity. In other words, only half of the liabilities of the company would be financed by borrowing (debt), the rest from other provisions, such as capital development funds, loans redeemed and other capital receipts that reflect the use of retained earnings of the company to support assets. A ratio greater than 1.00 shows more reliance on debt to finance operations, below 1.00 the operations are finances from retained earnings.

Development objectives 42
The overall effect is that the price of electricity does not reflect true costs (the value of the
inputs used to produce electricity): the full capital costs are not reflected (tariffs are not ‘cost-
reflective’), nor are externalities priced. Cheap electricity has had a large opportunity cost to
South Africa as a whole.
With the restructuring of the electricity supply industry, investment will not come exclusively
from Eskom. Independent power producers can enter the market. Eskom has been corporatised,
and up to 30% of its assets may be sold off. While previously tax-exempt, Eskom will have to
pay tax and dividends in future. Since the passing of the Eskom Conversion Act (2000), it has
made provision for future tax payments. The value of Eskom’s assets for tax purposes is
specified in the Act at R41 827.8 million at 1 January 2000 (DPE 2000: 8).
Having considered several internal dynamics affecting the economics within the energy sector,
we now consider the contribution of energy – and electricity in particular – to the broader
economy and its various sectors. To understand the role of electricity in productive activity, it is
useful to put electricity in the context of other major energy carriers. Figure 3.10 breaks down
final energy demand by carrier, and shows that liquid fuels and gas make up the largest single
share, followed by coal and electricity.
Figure 3.10: Share of final energy demand by energy carrier
Source: Based on data from (DME 2002a)
Coal
30%
Liquid fuels and gas
35%
Biomass
9%
Electricity
26%
Electricity makes up 26 per cent of final energy demand in South Africa, following coal and
liquid fuels (DME 2000b). This share underestimates the role that electricity plays, however, as
a high quality energy carrier and as a critical input to key economic sectors and productive
activity. At the point of final demand, electricity is efficient to use – the thermal losses have
already occurred upstream in the power stations and lines. Similarly, pollutants from electricity

Development objectives 43
generation are emitted where the coal is burned, but at the point of use electricity is a clean
‘fuel’. Other fuels, by contrast, are typically burned directly in industrial equipment – or indeed
in household appliances. Efficiency losses and pollution occur on site.
To understand the contribution of electricity to economic sectors, we need to investigate what
electricity is used for and how these uses contribute to productive activity. Figure 3.11 shows
the trends in electricity consumption for major economic sectors from 1986-2000 (ignoring
other energy carriers). The growth in aggregate demand in the sector is clearly evident. By
2000, manufacturing and mining together make up more than half of electricity demand, and
both sectors are also major contributors to economic growth and exports. Together with the
transport and commercial sectors all are essential to production, and together account for about
three-quarters (74%) of final energy consumption.
Figure 3.11: Electricity demand, 1986-2000
Source: Davis (1998), NER (2000)
180 000
160 000
140 000
120 000
100 000
80 000
60 000
40 000
20 000
0
General
Transport
Commercial
Manufacturing
Mining
Residential
1986 1989 19961992 2000
KEY
The input-output tables for the SA economy were used to establish the sectors in which
electricity contributed the highest share of input costs.
Figure 3.4 was based on the 1995 input-output tables and identified sectors with above national
average (7%) share of electricity as intermediate input cost. The mining and minerals
beneficiations sectors are at the top of the list, with cement and chemicals also paying a major
share of their input costs to electricity.

Development objectives 44
Table 3.4: Electricity intensive sectors of the SA economy
Source: Consult 101, EC & IDC (2001)
SIC Sector Sector description Electricity costs as percentage of total intermediary input
costs
2400 Gold Mining 31.8%
3710 Iron & Steel Basic Industries 18.9%
3610 Pottery 18.1%
3720 Non-Ferrous Metal Basic Industries 17.1%
2800 Other Mining (Diamonds & Other) 16.7%
4200 Water Supply 14.9%
3692 Cement 14.9%
3511 Industrial Chemicals 14.6%
3691 Bricks 12.2%
3513 Synthetic Resins 11.9%
2100 Coal Mining 11.8%
3620 Glass & Glass Products 11.7%
9800 Other Services, Non-Profit Seeking 10.3%
8310 Real Estate 9.5%
7100 Transport & Storage 9.0%
3411 Pulp & Paper 8.5%
6300 Catering & Accommodation Services 7.3%
AVERAGE FOR THE SA ECONOMY
6.8%
The contribution to productive activity can be understood in more detail by considering
characteristics of the major electricity-using sectors. The sub-sectors that consume the most
energy are manufacturing, mining, iron & steel and chemical industries are major energy users.

Development objectives 45
Figure 3.12: Final industrial energy consumption by sub-sector
Source: SANEA;(2003) 2001 total: 1302 PJ
Gold mining
6%
Iron & Steel
29%
Chemical
22%
Other mining
6%
Non-ferrous metals
5%
Non-metal minerals
5%
Pulp & paper
9%
Other Industry
9%
Food & Tobacco
9%
Industry (including both mining and manufacturing) is perhaps the classical sector of productive
activity. The sector includes energy- and electricity-intensive industries – e.g. minerals
beneficiation like aluminium smelting, as well as mining itself. It uses primarily coal (57% of
its final energy demand) and electricity (35%) (DME 2002a).
Few productive activities are possible without transport. Unsurprisingly, electricity plays a
relatively small role in a sector dominated by liquid fuels, notably petrol and diesel. Petroleum
products account for 97% of consumption; electricity is mostly used in rail transport. While rail
is important to production, it is overshadowed by road transport.
Electricity is the predominant form of energy carrier in the commercial sector. Government and
office buildings, financial services, information technology, educational institutions and
recreational sub-sectors primarily use electrical appliances, e.g. lights, air conditioning, heaters
and office equipment. The services offered by the commercial sector are an increasingly
important part of Gross Domestic Product. If energy-efficiency standards were made mandatory
for commercial buildings, significant savings – of electricity and money – could be made.
While agriculture has declined in terms of economic output (as approximated by GDP14), the
sector remains important for food production and as a source of rural employment. Data on
agricultural energy use is poor even for commercial farms, and almost non-existent for dense
14 As first mining and then manufacture increased their influence in the economy, agriculture has declined in its share of economic output, contributing 9.1% of GDP in 1965, for example, but only 4.0 % by 1998 (NDA 2000)

Development objectives 46
rural settlements and ‘subsistence farming’. For both sub-sectors, there is little data on energy
use, except of isolated studies (Auerbach & Gandar 1994). Most energy in this sub-sector is
used for land preparation and water pumping, with minor contributions from crop processing,
transport and lighting. The larger energy users are commercial farms, which are tending to
increase in size but decrease in number. Energy is used primarily in the form of diesel, followed
by electricity and coal (SANEA 2003; ERC 2003).
In summary, then, the electricity sector is characterised by relatively low tariffs, although this
has multiple reasons examined in this section. Although electricity is not the largest energy
carrier in South Africa, it makes an essential contribution to the full range of productive and
income-generating activities. The sector has contributed to economic development through the
provision of low-cost, reliable electricity supply.
Turning to social dimensions, the residential sector takes centre stage. Figure 3.11 illustrates
that the residential sector makes the third largest contribution to electricity demand. The share
of electricity demanded by this sector has grown in the last decade, as targets for development
have been pursued in energy and other sectors. The following section considers in more detail
how electricity relates to social development.
3.5 Social dimensions and the residential sector One of the most ambitious goals of the RDP was connecting a quarter of a million households to
electricity each year. Achieving this goal has made a major contribution to social development.
Has this contribution been achieved in a sustainable manner, and can it be extended more
broadly and deeply?
Electricity services are important in improving the quality of life for the previously
disadvantaged majority. As described above (section 3.2), electrification has been a key means
of delivering access to commercial energy services, increasing the share of connected
households from roughly one-third to two-thirds during the 1990s. By the same token,
however, every third household is still without electricity – every second one in rural areas. So
while major strides towards social sustainability have been made, more remains to be done.
And the experience of electrification has shown that numbers of connections are not the only
parameter. Finally, the question of affordability of energy services raises a critical question of
sustainability in its social dimension.
3.5.1 Electrification and multiple fuel use The National Electrification Programme, as described in section 3.2, has been the major vehicle
thus far for meeting the target of universal access to affordable energy services. It has
contributed to quality of life in several ways. Benefits included increased access to a modern
energy carrier, improved health care in clinics and adult education in evenings at schools. Small

Development objectives 47
retailers were able to extend business hours, and use electrical appliances. Reduced use of coal
in Gauteng improves indoor air quality, while less use of paraffin in the Western Cape reduces
the risk of fires. Access to electricity has increased not only for richer households, but also
poorer ones – 31% of those earning less than $1 per day had access to electricity in 2000,
compared to 20% in 1995 (SARPN 2005).
However, multiple fuel-use persist for many years after electrification (Borchers et al 2001).
Energy use in poor households continues to be characterised by the use of multiple fuels, with
paraffin, coal, fuel-wood and LPG often being used long after a household has been connected
(see Figure 3.13).
Figure 3.13: Final residential energy demand by energy carrier
Source: Based on SANEA (2003) and ERC (2003); 2001 total: 288 PJ
0
20
40
60
80
100
120
Wood
Vegetal
Wastes
Solar
Natural Gas
LPG
Kerosene
Electricity
Coal
Commercial
PJ in year 2001
Patterns of household energy demand differ significantly in rich and poor, urban and rural
households (Mehlwana & Qase 1998; Simmonds & Mammon 1996; Mehlwana 1999b). Middle-
and high-income households use a much higher share of electricity. For poor households, the
issue is not simply one of physical connection – access is also limited by affordability. Not only
are poor areas often the last to be electrified (ERC 2004a), but electricity is used only for
lighting and media, not for cooking and space heating. Multiple fuel use persists many years
after electrification, highlight the importance of affordable use of modern energy for cooking,
lighting, space heating and media.
When modern energy sources are not available or are not affordable, many households use
traditional biomass fuels. Used indoors, burning of wood, dung or other biomass causes high
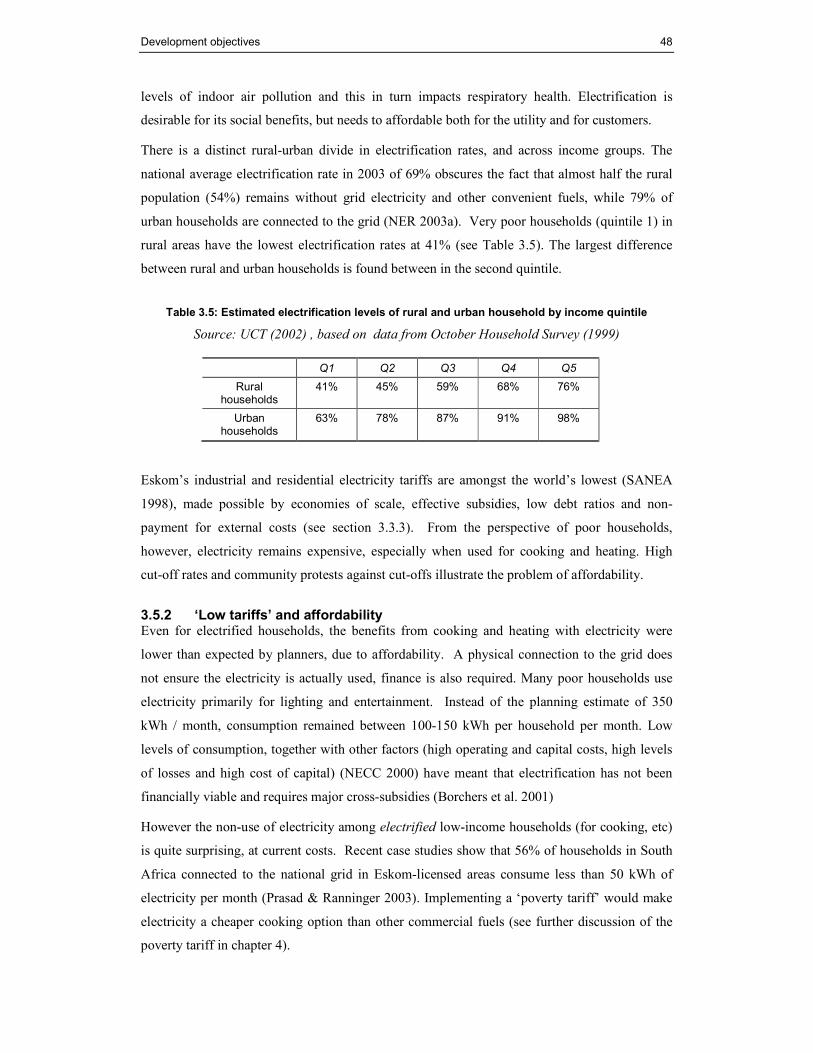
Development objectives 48
levels of indoor air pollution and this in turn impacts respiratory health. Electrification is
desirable for its social benefits, but needs to affordable both for the utility and for customers.
There is a distinct rural-urban divide in electrification rates, and across income groups. The
national average electrification rate in 2003 of 69% obscures the fact that almost half the rural
population (54%) remains without grid electricity and other convenient fuels, while 79% of
urban households are connected to the grid (NER 2003a). Very poor households (quintile 1) in
rural areas have the lowest electrification rates at 41% (see Table 3.5). The largest difference
between rural and urban households is found between in the second quintile.
Table 3.5: Estimated electrification levels of rural and urban household by income quintile
Source: UCT (2002) , based on data from October Household Survey (1999)
Q1 Q2 Q3 Q4 Q5
Rural households
41% 45% 59% 68% 76%
Urban households
63% 78% 87% 91% 98%
Eskom’s industrial and residential electricity tariffs are amongst the world’s lowest (SANEA
1998), made possible by economies of scale, effective subsidies, low debt ratios and non-
payment for external costs (see section 3.3.3). From the perspective of poor households,
however, electricity remains expensive, especially when used for cooking and heating. High
cut-off rates and community protests against cut-offs illustrate the problem of affordability.
3.5.2 ‘Low tariffs’ and affordability Even for electrified households, the benefits from cooking and heating with electricity were
lower than expected by planners, due to affordability. A physical connection to the grid does
not ensure the electricity is actually used, finance is also required. Many poor households use
electricity primarily for lighting and entertainment. Instead of the planning estimate of 350
kWh / month, consumption remained between 100-150 kWh per household per month. Low
levels of consumption, together with other factors (high operating and capital costs, high levels
of losses and high cost of capital) (NECC 2000) have meant that electrification has not been
financially viable and requires major cross-subsidies (Borchers et al. 2001)
However the non-use of electricity among electrified low-income households (for cooking, etc)
is quite surprising, at current costs. Recent case studies show that 56% of households in South
Africa connected to the national grid in Eskom-licensed areas consume less than 50 kWh of
electricity per month (Prasad & Ranninger 2003). Implementing a ‘poverty tariff’ would make
electricity a cheaper cooking option than other commercial fuels (see further discussion of the
poverty tariff in chapter 4).

Development objectives 49
3.5.3 Off-grid electrification programme Remote rural areas are more costly to electrify than denser urban settlements closer to the grid.
Building on a school & clinic off-grid electrification programme and an Eskom-Shell joint
venture which installed 6 000 solar home systems (SHS), a major off-grid electrification
programme that began in 2002 (Afrane-Okese 2003). The programme is targeting 350 000
homes for SHSs. Operational challenges early in the programme led to a shift from a concession
approach to a fee-for-service model (Afrane-Okese 2003).
Seven concessionaire companies were to provide non-grid electricity services for an agreed fee
to be paid by the customer – the fee-for-service. The companies retained ownership of the
systems they install and serviced them regularly. Government provided the concessionaires with
a capital subsidy of R 3 500 per system.
Initially, a flat monthly fee of R58 was paid for the service, regardless of the amount used. A
solar panel provides on average 62 kWh/year, so that even after the capital subsidy and the
poverty tariff, customers are paying 193c/kWh. This is five times the amount a grid-connected
customer pays without any subsidy (Spalding-Fecher 2002b). In reaction to this discrepancy and
the poverty tariff, government agreed to a monthly service subsidy of R48 as the equivalent of
the poverty tariff to grid-connected customers. The subsidy is paid to concessionaires, leaving
households paying R10 per month. However, problems with this approach led to the
withdrawal of the subsidy. The fluctuation of tariffs led to the near-collapse of the off-grid
programme in early 2004. By mid-2005, some companies providing a service were in
operation, with three service providers having signed agreements to install 8 000 systems each
(Banks 2005).
3.5.4 Electricity and job losses As shown in Figure 3.14, employment in Eskom and electricity-related mining has declined,
even as consumption of electricity (predominantly coal-based) has increased. The number of
employees in Eskom declined from 40 128 in 1993 to 29 359 in 2000 (Eskom 2002b). Coal-
mining shed more than half its jobs, from about 100 000 in 1986 to 49 000 in 2001 (SANEA
2003). In Figure 3.14, a share of job losses in coal mining is attributed to electricity generation
(AGAMA 2003), based on the 53% of non-export coal being consumed for electricity
generation (DME 2002a).
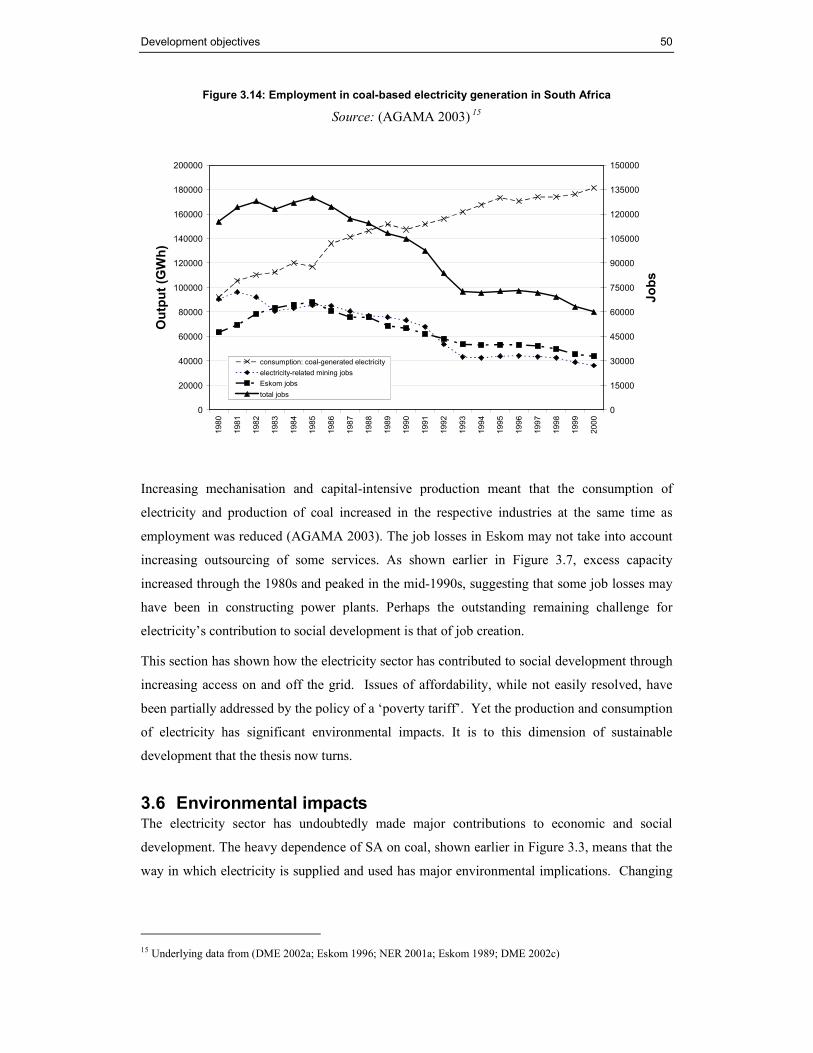
Development objectives 50
Figure 3.14: Employment in coal-based electricity generation in South Africa
Source: (AGAMA 2003) 15
0
20000
40000
60000
80000
100000
120000
140000
160000
180000
200000
1980
1981
1982
1983
1984
1985
1986
1987
1988
1989
1990
1991
1992
1993
1994
1995
1996
1997
1998
1999
2000
Output (GWh)
0
15000
30000
45000
60000
75000
90000
105000
120000
135000
150000
Jobs
consumption: coal-generated electricity
electricity-related mining jobs
Eskom jobs
total jobs
Increasing mechanisation and capital-intensive production meant that the consumption of
electricity and production of coal increased in the respective industries at the same time as
employment was reduced (AGAMA 2003). The job losses in Eskom may not take into account
increasing outsourcing of some services. As shown earlier in Figure 3.7, excess capacity
increased through the 1980s and peaked in the mid-1990s, suggesting that some job losses may
have been in constructing power plants. Perhaps the outstanding remaining challenge for
electricity’s contribution to social development is that of job creation.
This section has shown how the electricity sector has contributed to social development through
increasing access on and off the grid. Issues of affordability, while not easily resolved, have
been partially addressed by the policy of a ‘poverty tariff’. Yet the production and consumption
of electricity has significant environmental impacts. It is to this dimension of sustainable
development that the thesis now turns.
3.6 Environmental impacts The electricity sector has undoubtedly made major contributions to economic and social
development. The heavy dependence of SA on coal, shown earlier in Figure 3.3, means that the
way in which electricity is supplied and used has major environmental implications. Changing
15 Underlying data from (DME 2002a; Eskom 1996; NER 2001a; Eskom 1989; DME 2002c)

Development objectives 51
the fuel mix for electricity generation, and introducing safer, cleaner fuels for use in households,
transport and industry, remain major challenges.
At the point of use, electricity is a clean energy carrier. This is not true of many other energy
carriers, resulting in substantial energy-related environmental impacts not related to electricity.
Paraffin use has severe health and safety impacts (poisoning from ingestion, burns and deaths
from fires, destroyed housing), and is wide-spread in the Western Cape (Mehlwana 1999a;
Lloyd 2002; Biggs & Greyling 2001). In Gauteng, where locally available coal is burned
indoors, respiratory disease resulting from indoor air pollution is prevalent (Qase et al. 2000).
In rural areas, indoor wood fires have similar effects, as pollutants are confined in the house (see
Van Horen 1996a; Spalding-Fecher et al. 2000a). Switching from wood, paraffin, coal, candles,
batteries and various other fuels to electricity may have environment benefits at the local level
(Spalding-Fecher 2000a, 2005).
3.6.1 Local air pollution Environmental impacts occur upstream, in the generation of electricity and the mining of coal.
The impacts of electricity supply can be considered on two levels, the local and global
environment. Indoor air pollution is generally associated with other energy carriers. Electricity
can displace these fuels in theory and contribute to a healthier indoor environment. But with the
persistence of multiple fuel use even after electrification (see 3.5.1), serious environmental
health issues remain.
Outdoor air pollution is largely contributed to by the burning of coal (often of a poor quality) for
electricity production (and brown haze from the transport sector). Coal-fired power plants
generate 93% of South Africa’s electricity (NER 2001a) and this fuel mix changes only slowly,
as investments in this sector have life-times of 30 years and more. Investments made in energy
technologies today lock the country into a particular path for a generation. A key issue for
environmental sustainability of the electricity sector is the mix of energy technologies that will
be used to meet growing demand - renewable energy, nuclear power, petroleum, coal, natural
gas and others – see chapter 4).
South African coal has high ash, low sulphur and low calorific value. While Eskom has
developed considerable expertise in burning poor quality coal (including coal with a heating
value lower than 16 MJ/kg), it has not installed the costly equipment (e.g. flue gas
desulphurisation, bag filters) to reduce emissions. Coal-fired power stations produce large
amounts of pollutants, including local pollutants such as particulates and sulphur, as well as the
greenhouse gases (contributing to anthropogenic climate change) carbon dioxide and nitrous
oxide.

Development objectives 52
Table 3.6: Emission from Eskom power stations, 2001
Source: Eskom (2002a)
Particulate emissions, kt 59,64
Sulphur dioxide (SO2), kt 1 500
Nitrogen oxide (NOx)as NO2 , kt 684
Nitrous oxide (N2O), t 2 154
Carbon dioxide (CO2), kt 169 300
Probably the major local environmental impact associated with electricity is on outdoor air
pollution. The pollutants listed in Table 3.6 contribute to health impacts such as respiratory
ailments resulting from air pollution (Spalding-Fecher & Matibe 2003). Sulphur emissions are
associated with acid rain; and particulates have impacts on visibility in Mpumalanga where
most of the coal-fired stations are located. Mining the coal is associated with dust and methane;
and social impacts in the form of injuries and deaths in the coal-mining sector.
Water consumption per unit of electricity has been reduced by newer stations, which are dry-
cooled. Kendal and Matimba stations require 0.1 litres of water per kWh, compared to 1.8 l to 2
2.0 l per kWh for wet cooling through the conventional cooling towers. However, with the wet-
cooled stations still in operation, total water consumption has increased slightly, from 225 699
Ml in 1997 to 239 233 Ml in 2001 (Eskom 2002a).
3.6.2 Global greenhouse gas emissions In terms of global environmental impacts, South Africa is one of the most carbon emissions-
intensive countries in the world, due to the energy-intensive economy and high dependence on
coal for primary energy. South African per capita emissions are higher than those of many
European countries, and more than three and a half time the average for developing countries
(see Table 3.7).
Table 3.7: Energy sector carbon dioxide emissions intensity and per capita in 2002 and cumulative emissions 1950-2000
Sources: (IEA 2004a; WRI 2003)
CO2/cap CO2/GDP CO2/GDP PPP Cumulative energy CO2 emission from 1950 to 2000
tonnes/capita Kg/1995 US$ kg/1995 PPP US$ MtCO2 % of world total
South Africa 6.65 1.65 0.75 10,165 1.29%
Africa 0.89 1.16 0.45 13,867 1.75%
Non-OECD 1.65 1.33 0.45 318,117 40.23%
OECD 10.96 0.44 0.56 472,635 59.77%
World 3.89 0.68 0.56 790,753 100%

Development objectives 53
South Africa is a semi-industrialised country with an emissions profile that in some respects is
not typical of other developing countries. Some key characteristics of its economy and energy
sector are not favourable in terms of GHG emissions.
Among major developing countries South Africa’s emissions intensity is relatively high, in that
it emitted 0.75 kg CO2 per $ GDP (PPP)16 in 2002 (IEA 2004a), compared to averages 0.45 kg
CO2 / $ for non-OECD and African countries. South Africa is also well above the OECD and
world averages (see Table 3.7).
Similarly, emissions per capita are high at 6.65 tons of CO2 (tCO2) per capita, four times higher
than the non-OECD value of 1.65 tCO2 and higher than several OECD countries (IEA 2004a). 17
The values including other GHG emissions are higher, since IEA statistics include only for CO2
from fuel combustion.
South Africa’s share of historical cumulative emissions (1950 – 2000) is somewhat lower (1.17
percent) than its share of 2000 annual emissions (1.51 percent), reflecting more recent
industrialisation than in the North (Winkler et al. 2001).
While GDP per capita18 lies below the world average ($3,160 per capita compared to the global
average of $4,890 per capita19), this figure hides the gap between black and white, rich and poor
within the country.
Reliance on coal energy sources is the main reason behind South Africa’s high emissions. On
the supply side, major sources of greenhouse gases associated with electricity are coal mining
and power generation. Other major emission sources from energy – but not electricity - include
oil refining, production of synthetic liquid fuels, gas extraction, wood burning and the burning
of coal and oil to produce heat. On the demand side, high emissions stem from energy-intensive
industries such as iron and steel, aluminium, ferrochrome and chemicals – the same sectors that
make up a large share of South African exports. Energy is not used efficiently in these sectors,
by international comparison (DME 2003d; Hughes et al. 2002).
South Africa’s emission profile – somewhat atypical for a developing country – means that its
responsibility to mitigate is higher. It also implies that major changes in energy systems will be
needed over time, given the high proportion of energy-related GHG emissions. According to
16 Power-purchasing parity; US$ using 1990 prices and exchange rates. 17 A previous version of the IEA data, for 1998, showed a more dramatic difference, with SA at 1.81 kg CO2 per $ GDP (PPP), compared to a non-OECD average of 0.70 kg CO2. One reason for the difference may be a change from 1990 to 1995 base year. 18 GDP per capita is not directly part of the emissions profile, but a key characteristic shaping a countries ability to pay for mitigation and adaptation. 19 Reported as GNP per capita using exchange rates, based on 1999 dollars, by the World Bank Atlas method (World Bank 2000). South Africa was ranked 86th by this method; 69th when power purchasing parity is used.

Development objectives 54
South Africa’s draft Initial National Communication, total emissions of CO2, CH4 and N2O were
379 842 Gg20 CO2 equivalents in 1994 (RSA 2004a). This converts to 103.6 million tons
carbon, which can be attributed to major sectors of energy, industry, agriculture and waste.
The energy sector, including energy production and use, contributed 78% of GHG emissions
(297 564 Gg CO2 equivalent), agriculture 9.3%, industrial processes 8.0% and waste 4.3%.
Comparing the three greenhouse gases in the inventory, carbon dioxide contributed by far the
most, 83.2% in 1994. Methane contributed 11.4% and nitrous oxide 5.4% respectively. Given
the predominance of carbon dioxide, this analysis focuses on CO2 emissions.
Figure 3.15: South Africa’s greenhouse gas inventory by sector, 1994
Source: (RSA 2004a)
The energy sector is a key source of emissions (see Figure 3.15), which include a number of
critical energy related activities such as: energy industries (45% of total gross emissions),
energy used in manufacturing an industry (14%), energy used in transport (11%), fugitive
emissions from fuels (2%), and other energy related activities (6.6%), which include
commercial (0.2%), residential (2.0%) and agricultural (4.4%) use of energy (calculated from
RSA 2004a).
The future of energy development in South Africa is integrally related to climate change
mitigation. Having placed SA in the international context in this respect, the chapter concludes
by comparing the country to others in relation to energy.
20 One Gg equals 1,000 tons, so multiply Gg by 1,000 to get million tons. To adjust tons of CO2 to tons of carbon, multiply by 12/44.
Energy Industries
45%
Industrial energy
14%
Transport
11%
Other energy
7%
Fugitive emissions
2%
Industry
8%
Agriculture
9%
Waste
4%
Non-energy emissions

Development objectives 55
3.7 Conclusions: Comparing and assessing To assess how far South Africa has come in terms of energy development, some comparison to
other countries is helpful. Other developing countries have the same broad challenge of
development, but different energy and electricity sectors. Looking at levels of energy
consumption, access to electricity and energy intensity are particularly relevant to energy
development paths.
Compared to other developing countries, South Africa’s total primary energy supply (TPES) per
person is relatively high (see Table 3.8). The exceptions are other rapidly industrialising
countries, with some, such as South Korea, have higher consumption per capita. Total electricity
consumption for South Africa is high, particularly in the African context. The two-thirds of
South Africa’s population with access to electricity consumes close to 50% of Africa’s
electricity with only 5% of its population.
Table 3.8: Energy and electricity consumption, 2000
Source: IEA (2002a)
Total primary energy supply /capita Electricity consumption
Toe/capita TWh
South Africa 2.51 194
Africa 0.64 399
South Korea 4.10 279
Indonesia 0.69 82
Non-OECD 0.96 5 038
OECD 4.78 9 077
World 1.67 14 115
Note: TPES is shown per person, while electricity is in total consumption for whole countries or regions
Consumption levels of energy, particularly electricity, in South Africa are significantly higher
than in many other developing countries, mainly because of its strong industrial base. However,
this also reflects electrification rates that are now exceeding the average for developing
countries (see Table 3.9).

Development objectives 56
Table 3.9: Electrification rates in 2000
Source: IEA (2002b)
Electrification rate
Population without electricity
Population with electricity
% million million
South Africa 66.1 14.5 28.3
Africa 34.3 522.3 272.7
Indonesia 53.4 98.0 112.4
Developing countries 64.2 1 34.2 2 930.7
OECD 99.2 8.5 1108.3
World 72.8 1644.5 4 390.4
These relatively high levels of consumption also reflect high energy intensity, that is, a high
energy input per unit of gross national product (GDP). The Integrated Energy Plan (DME
2003) acknowledged that by “international standards, South Africa has a high energy intensity.
South Africa’s history, shaped as it is by the minerals-energy complex, has seen the abundance
of mineral deposits converted to low energy costs, but also an emphasis on primary extraction
and processing. These economic activities are highly energy intensive. The changes of GDP and
final energy consumption are repoted in Table 3.10
Table 3.10: National energy intensities between 1993 and 2000
Source: DME (2003d)
1993 1994 1995 1996 1997 1998 1999 2000
GDP- All industries at basic prices
R billion (constant 1995 prices)
472 486 500 521 534 538 549 571
Total Final Energy Consumption (renewable and waste excluded)
PJ 1766 1789 2016 1996 2071 2098 2026 2003
Energy intensity (Total energy consumption / GDP)
PJ / R billion 3.74 3.68 4.03 3.83 3.88 3.90 3.69 3.51
Figure 3.16 graphs South Africa’s energy intensity between 1993 and 2000, where post 1995,
GDP rises and final energy consumption falls resulting in a lowering of energy intensity over
that period. Improving energy intensity has been related to achieving the Millennium
Development Goals (MDGs) in South Africa, measured in energy per unit of GDP (SARPN
2005).

Development objectives 57
Figure 3.16: Changes in energy intensity, 1993 – 2000
Source: based on DME (2003d)
0
0.5
1
1.5
2
2.5
3
3.5
4
4.5
1993 1994 1995 1996 1997 1998 1999 2000
PJ / R billion
This chapter has considered the development objectives for electricity nested within the broader
energy sector, and framed by the overall development objectives of the country. Reconstruction
and development in the energy sector have to a significant degree been interpreted as universal
access to electricity – and the country is roughly half the way towards achieving this goal.
Electricity has contributed to social development through increasing access on and off the grid.
Yet sustainable development of the electricity sector does not begin and end with access to
electricity. Dealing with the legacy of Apartheid and the systematic underdevelopment of large
sections of the population remains challenging. Issues of affordability, while not easily
resolved, have been partially addressed by the policy of a ‘poverty tariff’.
In terms of economic development, the electricity sector has provided relatively low tariffs,
although this has multiple reasons as examined in this chapter. Electricity makes an essential
contribution to the full range of productive and income-generating activities.
Achieving economic development and delivering basic social services is complicated by the
tension with macro-economic parameters, as well as the ongoing challenge of achieving all this
while limiting environmental impacts. The emissions intensity of the energy and electricity
sectors, both strongly shaped by coal, mean that the environmental sustainability is particularly
challenging for South Africa. The next chapter examines policy options that might help to meet
this challenge.

Electricity and residential policy options 58
CCCCHAPTER HAPTER HAPTER HAPTER 4444
4. Policy options in the electricity and residential sector
This chapter21 examines the policy options that can move South Africa’s electricity sector from
its current position towards a more sustainable development path. While there are constraints to
policy choices in the electricity and residential sectors – notably privatization and non-
negotiable policy commitments – it is possible for SA to shift towards greater sustainability.
Policy options need to start from the current reality of energy and development (described in
chapter 3), but identify key levers that can move the sector towards a more sustainable future.
Scenario planning for the electricity sector involves the creative tension between current reality
and future possibility.
An essential input to the scenario modeling of the following chapters is a suite of policy options
that could enhance sustainable development in the electricity sector. Scenarios (essentially
combinations of policy options) will allow evaluation of the implication of electricity policy for
sustainable development in all its dimensions - economic, social and environmental.
Important policy and technology choices to be examined in this chapter include energy
efficiency in the near-term; investing in a cleaner, more diverse fuel mix; and new industrial
policies to make the economy less energy-intensive over time. Different instruments can be
used to achieve policy objectives, falling into two broad types - economic and regulatory
instruments. To reduce environmental impacts of electricity, for example, taxes can be used
internalize external costs, or regulatory standards can be set. Such more specific policy and
technology options within the broader choices are described in this chapter, laying the basis for
modeling policy options in future scenarios in the following chapters.
Extended affordable access to modern energy services is a policy imperative which other
initiatives will have to follow. As outlined in chapter 3, aaffordable access to energy services
has been advanced primarily through electrification, both through the grid and some off-grid
programmes. Universal access to electricity is to be achieved by “a strengthened local
government working with our state enterprise, Eskom … within the next eight years”, i.e. by
2012 (Mbeki 2004a). The commitment is so strong that policy-makers take it as a given. At the
same time, policy has dictated that energy tariffs – not only for industry, but also for households
– should be kept low. The challenge of affordability has been partly addressed through the
21 Parts of this chapter relating to renewable energy have been published in: Winkler, H 2004. Renewable energy policy in South Africa: Policy options for renewable electricity. Energy Policy 33 (1): 27-38.

Electricity and residential policy options 59
‘poverty tariff’ which provides 50 kWh of free electricity (DME 2004b). Any scenarios for the
electricity sector will need to contribute to affordable access to electricity.
The Energy Policy (DME 1998) goal of improving governance – including the introduction of
competition - sets constraints for electricity policy options. Privatisation is not the only aspect
of governance, but it is the one that determines the macro-economic framework for other
policies. Indeed, the role of the regulator is likely to change with the restructuring of the
distribution industry, and possible privatisation on the supply side (Eberhard 2003). From
licensing and setting tariffs for a virtual monopoly, the role would shift to setting rules for a
competitive market. This chapter considers the prospects of power sector reform, and the
implications for electricity policy that promotes sustainability.
Current electricity policy shares the five major goals of the White Paper on Energy Policy
(DME 1998: see ch 3 for details). Access to electricity is a particularly strong policy imperative.
Future policy options for the electricity sector will be framed by governance arrangements in
the sector, with the future of privatisation setting major parameters. Some of these options
contribute to reducing the environmental impact of energy supply and use. Major policy shifts
are possible in changing the energy economy, but are also a long-term process. Forward-
looking policy will seek security by diversifying the fuel mix, examining various fuel and
technology options.
4.1 Further extending affordable access to electricity Universal access to affordable electricity will remain a corner-stone of policy for the sector and
treated as a ‘given’ in considering policy choices. In urban areas, close to 100% of households
may be connected. The challenge for the future will be to achieve universal access in rural
areas, where half22 of the households were still without access to grid electricity by 2001 (NER
2001a). Governments commitment to achieving universal access has been reiterated in many
policy speeches (Mbeki 2004a; Mlambo-Ngcuka 2003, 2002a, 2004). With the rationalisation of
the electricity distribution industry, electrification will be carried out by the six new Regional
Electricity Distributors (REDs) – still combining Eskom and municipal distributors, but in a
new institutional configuration. All REDs are to be operational by 2006 (RSA 2005).
4.1.1 Electrification policy One challenge for the policy of electrification lies in the fact that the areas where electrification
is cheaper – urban areas and denser settlements – were electrified first. Even in this context,
electrification is not viable in financial terms (Borchers et al. 2001). As the programme reaches
the ‘deep rural’ areas, longer distribution lines are needed to connect more widely dispersed
22 National average rate of rural grid electrification was 49.1%, but some provinces were lower, with rural KwaZuluNatal only 35.6% electrified and Eastern Cape 37.7%

Electricity and residential policy options 60
customers with lower consumption, and the cost per connection increases. The prospects for the
off-grid concessions programme, despite its heavy subsidies for solar home systems, are
currently not good (see chapter 3, section 3.5.3).
Financing of continued electrification will most likely remain an important policy issue.
Government has already decided that the second phase of electrification will not be funded by
Eskom and channelled to municipalities, but will be paid for directly by national government
departments. In principle these funds might be balanced by the taxes and dividends which the
corporatised Eskom started to pay from 2003 (Eskom 2005). However, electrification will now
have to compete with other social expenditure in the budget for the first time. The medium-
term expenditure framework allocates R 1.1 billion to electrification in 2005/6 out of a total
departmental budget of R2.1 billion (DME 2004c) (see also 4.4.2). Electrification funding is
smaller than planned expenditure on housing of an average R4.5 billion per year for 2004-07
and comparable to capital programmes for basic water and sanitation of R 1 billion per year
(National Treasury 2003a: 180, 226). Operation of water services, however, requires another R
900 million per year.
Financing of the costs of connecting households is an issue for financial policy. Another is
whether there will be on-going subsidies for the provision of basic services. For electricity, the
poverty tariff has been the primary response to affordability so far (see sections 3.5.2 and 4.1.2).
4.1.2 Tackling affordability Even for households that have been connected to the grid, the affordability of using electricity
remains a major issue. Some municipalities across the country had already introduced free
electricity since July 2001, varying from 20 kWh to 100 kWh per month (Fowles 2004: 28). In
an attempt to address the question of affordability, national government committed itself to
implementing a free supply of electricity between 50 kWh per household per month (DME
2003e, 2003f).
The ‘poverty tariff’23 stipulates a uniform electricity basic support services tariff (EBSST) of 50
kWh at zero cost to all grid-connected poor customers. While reducing the energy burden of
poor households, the lifeline tariff is considered sufficient for lighting, ironing, water heating,
TV and radio (National Treasury 2003a), and could make cooking and heating more attractive.
By subsidising the use of electricity for some basic needs, government is seeking to increase the
social benefits of electrification (Gaunt 2003).
President Mbeki noted that the poverty tariff was not achieving its aims “if the benefits of free
basic electricity are accruing mainly to those who are relatively well off” (Mbeki 2005). A key

Electricity and residential policy options 61
challenge of a poverty tariff is identifying the poor, since means testing is administratively
expensive. One policy option that has been proposed is a ‘weak grid approach’, using a lower-
capacity grid e.g. 2.5A supply rather than typical urban 20A or 60A (UCT 2002). Such systems
reduce costs by using smaller transformers, lower capacity medium voltage T&D lines and local
lines. The system is designed for lower ADMD (‘after diversity maximum demand’)24 across a
whole community. While more communities can be connected for the same budget, the weak
grid will only meet some energy services and not all peak demand. Other fuels, e.g. liquefied
petroleum gas (LPG), will be needed for cooking and heating (ERC 2004a). This is what is
meant by using a broader set of energy carriers for ‘energisation’ rather than only electrification.
The EBSST is popularly known as a ‘poverty tariff’. The extent to which it alleviates poverty
depends on the energy burden (the percentage of the total household budget spent on energy).
Table 4.1: Mean household expenditure on electricity and other fuels and energy as a percentage of total household expenditure
Source: (Prasad & Ranninger 2003)
Expenditure on Before subsidy After subsidy Difference
Electricity (R/month) 38 31 7 18%
Fuels excluding electricity (R/month) 70 59 11 16%
Energy as % of household expenditure 18% 12% 6%
The energy burden of poor households in remote rural villages can be 18% of the total
household budget, according to data from a case study reported in Table 4.1 (Prasad &
Ranninger 2003). The 50 kWh provided by the poverty tariff would reduce the energy burden
by two-thirds (6 percentage points). Monthly expenditure on electricity and other fuels decline
by 18% and 16% respectively, due to the poverty tariff.
A reduced energy burden means that the poverty tariff makes sense for the economics of
households. At a national level, some consideration of an economic rationale for the poverty
tariff can help to make clear what the economy-wide benefits can be.
23 Official names include electricity basic support services tariff (EBSST). The national policy indicates 50kWh, although some municipal distributors are providing lower amounts, 20-50 kWh / household / month. Households in Eskom distribution areas receive 50 kWh. 24 Electricity demand is used here in the technical sense, where maximum demand is the maximum power consumed by customers. Individual consumers may require peak power at different times of day, so this ‘diversity’ effect can bring down the average peak power requirement for a community of consumers. Unfortunately, if a major electricity use occurs at the same time of day for many of the consumers (for instance, cooking meals) there is less demand diversity, and the average peak power requirement rises. The load factor then falls, indicating that the supply capacity required to cover the peak demand is severely under-utilised at other times of day, or seasonally (ERC 2004a).

Electricity and residential policy options 62
4.1.2.1 Theory of poverty tariff
The social benefits of a poverty tariff are clear, but the level of such a tariff can be justified in
using economic theory. Figure 4.1 shows two demand curves AB and GH, representative of
lower (I1) and higher (I2) income households; the poverty tariff PT over the minimum
consumption block from 0 to Qmin. If the economic tariff based on the long-run marginal cost is
at PE, the higher-income households will be consuming the optimal level Q2, but the poorer
households will not be able to afford the service (Munasinghe 1992).
Figure 4.1: Welfare economic basis for poverty tariff
Source: (Munasinghe 1992)
Government attaches weight to social benefits to poor households, so the consumer surplus
ABF is increased. Although A lies below PE, the weighted distance OA could be greater than
the marginal cost of supply. Adopting the poverty tariff PT for the first block, followed by PE,
allows the capture of the weighted consumer surplus. The richer households still consume close
to optimum, apart from the slight change due to their reduced expenditure for the first block. A
means of identifying the magnitude of Qmin should be based on criteria for identifying ‘lower-
income’ groups, and establishment of consumption levels. In developing countries, it is
typically around 50 kWh / month (Munasinghe 1992). A simple welfare model suggests that
PT = LRMC x (poor persons’ income / critical income)
Unit price
A
B F PT
I1
I2 > I1
G
H
Q1 Qmin Q2
0
PE
Quantity

Electricity and residential policy options 63
where critical income is a nationally established poverty line (Munasinghe 1992). In South
Africa, Qmin has been set at 50 kWh, but the tariff has been set at zero.
4.1.2.2 Funding continued electrification
Within the electricity sector, funding for both electrification and the use of electricity will
remain a high priority. Direct government subsidies will have to increase as more remote areas
are connected and as central government takes over funding. The National Electrification Co-
ordinating Committee (NECC) recommended that capital costs be covered within the DME
budget, with income from Eskom taxes and dividends after corporatisation (NECC 2000).
Operational shortfalls were to be borne by the electricity distribution industry, which would
initially not earn a return on electrification assets, but only provision for future refurbishment.
The DME has funded the Integrated National Electrification Programme (INEP) since 2001/2,
with future expenditure for 2004-7 expected to be around R 1.1 billion per year.25 Transfer are
made to Eskom and conditional grants will be allocated to municipalities, with responsibility for
the latter to be shifted to the Department of Provincial and Local Government (DPLG) in
2006/7 (DME 2004c).
Historically, Eskom has played an important role in distribution and has effectively funded the
first phase of electrification (Borchers et al. 2001). With funding in future from National
Treasury, Eskom will remain responsible for electrification in its supply areas, and will receive
a grant (National Treasury 2003a: 234). However, the relationship between municipalities and
Eskom has to be formalised in service level agreements from 2003 onwards (National Treasury
2003a: 237). These agreements will give effect to municipalities’ role as service authorities and
regulate Eskom’s activities within their areas.
As the price of electricity is expected to rise in future – with new capacity soon required and
restructuring and / or privatisation imminent – the affordability of using electricity is likely to
become an even greater issue. With the restructuring of the distribution industry, REDs will be
required to undertake local integrated resource planning (local IRP) – and if they supply small
customers who cannot negotiate tariffs, they will have to also show increases in tariff over the
next five years (NER 2002b: 12).
Government has allocated R300 million for poverty tariff nationally as part of the local
government equitable share of nationally raised revenue (National Treasury 2003a: 233). The
equitable share allocation contains an energy component (DME 2004b), but the funding is
unconditional and is typically absorbed into the general municipal income pool (Fowles 2004:
25 The medium-term expenditure estimates were R1 067 million for 2004/5; R 1 126 million for 2005/6; and R920 million for 2006/7 (DME 2004c). National Treasury gives a total of R3.3 billion over the period 2004-07 (National Treasury 2003a: 234)

Electricity and residential policy options 64
24). The largest transfer from national to local government is for a Consolidated Municipal
Infrastructure Programme; electrification falls into the second-largest group, making up 41.9%
of the ‘S grant’ (R 228 million out of an equitable share of 7 698 million for 2005/06 (National
Treasury 2003a: 38-39). Funds will be allocated to municipalities, who allocate funds to deliver
services to poor households (National Treasury 2003a: 235). Where Eskom is the distributor,
the municipality is invoiced at a rate of 34.5c/kWh (excluding VAT), a rate lower than the
standard ‘Homelight’ tariff (Fowles 2004: 27). Eskom only will provide 50 kWh to customers
using a 20A supply and who consume less than 150 kWh per month (Fowles 2004: 27).
How poor households are identified varies across municipalities, with one proposal being self-
targeting - consumers agreeing to use a reduced 10A level of supply (UCT 2003), the other
requiring municipalities to identify indigent households (Fowles 2004: 25). Government
considered both approaches, as well as a broad-based approach where all households would
receive the benefit (DME 2003f). The average cost of 50 kWh of free electricity is about R25
(National Treasury 2003a: 233), depending on tariffs.
Affordability is obviously shaped by electricity prices. Electricity prices (or tariffs) have been
strongly regulated in the past. The further the sector goes along the path of privatisation, the
more prices should be set by supply and demand. The extent to which markets should play a
role in energy governance is a major policy issue in its own right – the debate around
privatisation in the energy sector.
4.2 Energy governance – to privatise or not ? Reform of the electricity industry has been a major policy issue for the last decade globally. If
carried through to its full extent, it would re-shape the context in which all electricity policy
takes place. Before considering the impacts of privatisation on environmental and social
benefits (such as affordable tariffs), we first outline what privatisation is and why it is on the
agenda.
Privatisation26 of the electricity industry relates to generation (producing electricity at power
stations), transmission (at high voltage over long distances) and distribution of electricity (at
lower voltage over shorter distances). The process aims to increase competition, by changing
industry structure to include both more generators (wholesale competition) and more
distributors (retail competition).
The debates extend well beyond the electricity sector, with the restructuring of state-owned
enterprises in transport, telecommunications and defence also being re-considered (Robinson
26 Also referred to as ‘restructuring’ or ‘power sector reform’. Privatisation implies a change from public to private ownership, whereas restructuring suggest a process of rationalisation that may be independent of ownership (Clark

Electricity and residential policy options 65
2004c; Erwin 2004). Broader ideological debates on the role of markets and the state influence
the debate on restructuring in the power sector (Bond 2000). The South African debate on feeds
into a broader international discussion on the advantages and disadvantages of power sector
reform, particular its effect on the poor (Jannuzzi 2005; Wamukonya 2003a; Karekezi & Kimani
2002; Dubash 2002; TNI 2002; Johannson & Goldemberg 2002). The results of power sector
reform in other parts of Africa have been mixed at best (Clark 2001a; Turkson 2000;
Wamukonya 2003b).
While there are positive motivations for power sector reform, there is also substantial opposition
to privatisation in South Africa. Municipal government has objected to restructuring, fearing
loss of revenue and citing their constitutional rights to distribute electricity (NER 2001b). The
unions have been arguing strongly that the state should retain a role in development, in
particular in sectors delivering basic services (COSATU 2001). While the blueprints for
privatization make provision for continued electrification (PWC 2000), the fact that connections
have not been financially viable in the past makes their future in a highly competitive
environment uncertain. Electricity consumers have raised an important concern about rising
electricity prices, with tariffs set to increase anyway as new capacity needs to be financed.
Policy on privatisation is not fixed. The liberalisation agenda so strongly promoted at the
beginning of the GEAR macro-economic framework may not be realised, or only partially
(Streak 2004). After the 2004 elections, national government itself appeared more ambivalent
on privatisation. The Minister of Minerals & Energy cited negative experiences with power
sector reform in California and elsewhere in her 2004 budget speech. She drew the conclusion
“that the state has to put security of supply above all and above competition especially”
(Mlambo-Ngcuka 2004). The President drew lessons from experience in fighting poverty in
Europe to recognise that markets on their own are not sufficient to eradicate poverty and that
“public sector investment in social and economic infrastructure as well as productive capacity”
is needed (Mbeki 2004b).
In practice, power sector reform has proceeded piece-meal. On the supply side, Eskom has been
corporatised. The Eskom Conversion Act (Act 13 of 2001) gave effect to the commercialisation
and corporatisation of Eskom (RSA 2001b). Eskom is to be run more like a business, subject to
performance contracts. While still wholly owned by government, the corporation will now pay
taxes and dividends. Transmission remains a ‘natural monopoly, to be run by a separately
owned state company. The electricity distribution industry is in need of reform, due to the
several problems (Clark 2001a: 127-8). A key issue is the lack of financial viability, with many
2000a). The World Bank tends to promote power sector reform, with reform having the most positive association (Newbery 1995). All three terms are used in this chapter, depending on the context.

Electricity and residential policy options 66
municipalities close to bankruptcy and not paying Eskom for bulk supplies (NER 2001b). The
first Regional Electricity Distributor, Red One, was launched in Cape Town in mid-2005.
Policy on privatisation sets an important framework for future policy options in the residential
and electricity sectors. If power sector reform is not to undermine sustainability, public benefits
(both environmental and social public goods) need to be maintained or enhanced. Policy has
been proposed to continue funding for electrification, as a major social benefit, in a liberalised
electricity supply industry (Clark & Mavhungu 2000).
The impact on managing energy-related environmental impacts is ambivalent (Winkler &
Mavhungu 2001). On the one hand, privatisation opens up the market to IPPs, some of which
may use renewable energy sources (e.g. the Darling wind farm, DarlIPP). On the other hand,
private investors are arguably less likely to invest in renewable energy technologies due to their
higher upfront costs. Policies to promote renewable IPPs include standard contracts for IPPs and
non-discriminatory access to the grid (Dubash 2002).
4.3 Managing energy-related environmental impacts The major environmental impacts associated with energy in general were outlined in chapter 3
(see section 3.6). Electricity in particular is associated with impacts of outdoor air pollution in
the local environment, and emissions of greenhouse gases, contributing to global climate change
(Van Horen 1996b). Other issues relate to water consumption in the coal cycle, as well as fiscal
subsidies and other impacts of the nuclear cycle (Spalding-Fecher et al. 2000a). Significant
positive externalities are improved health from reduced indoor air pollution, which adds to the
socio-economic benefits of electrification (Spalding-Fecher & Matibe 2003). Table 4.2 classes
the major impacts as Class One (serious and measurable), Class Two (potentially serious but not
readily measurable), and Class Three (unlikely to be serious).
Table 4.2: Externalities associated with electricity supply by class
Source: (Spalding-Fecher & Matibe 2003)
Class One Class Two Class Three
Coal cycle
Air pollution and health ●
Air pollution and acidification
●
Air pollution and visibility ●
Water quality impacts ●
Water consumption and pricing
●

Electricity and residential policy options 67
Class One Class Two Class Three
Nuclear cycle
Fiscal subsidy ●
Other impacts (risk of accidents, waste)
●
Electrification
Health benefits ●
Socio-economic benefits ●
South Africa’s GHG emissions are high by international comparison, both per person and in
proportion to economic output (see Table 3.7). Similarly, energy intensity is relatively high –
and both realities are recognised by government (DME 2003d; RSA 2003). Policy instruments
need to be applied to minimize environmental impacts of electricity generation.
4.3.1 Regulatory policies Some policies to manage impacts of electricity supply have been discussed in the sections
above. Cleaner coal technologies can produce more electricity for the same amount of coal
burned and therefore emissions. More efficient use of electricity (see section 4.4.3) reduces
demand and hence indirectly emissions.
To directly address impacts of coal-fired electricity on outdoor air pollution, standards can be
set. The initial development of regulations for national ambient air quality standards (NAAQS)
have focused on sulphur dioxide (RSA 2001a), which would necessitate the use of flue gas
desulphurisation. Technical standards are being developed for common local pollutants (SO2,
NO2, CO, PM-10, O3, lead, benzene and dust), volatile organic compounds and air toxics
(Standards SA 2004a). The framework for regulation establishes limit values which are to be
attained over a period of time; lower target values which should be attained through long-term
planning to minimize impacts on environmental health; and higher alert thresholds, beyond
which there is an immediate risk to human health from brief exposure (Standards SA 2004b).
The new Air Quality Act (No. 39 of 2004) provides a regulatory framework that can address
both local air pollutants and global pollutants such as greenhouse gases (RSA 2004b). The Act
includes mechanisms in domestic legislation that can be used to implement international
obligations as well, by listing priority pollutants and activities, as well as requiring pollution
prevention plans to be submitted and controlling the use of certain fuels.
Another end-of-pipe solution, carbon capture and storage may become an option for policy-
makers in the longer-term (IPCC 2005). All these options, however, reduce the levels of
pollution per unit of electricity, although this might still lead to rising emissions depending on
the rate of growth of total electricity demand.

Electricity and residential policy options 68
Standards for GHG emissions – which are not included in the NAAQS - would be one policy
approach, in which case direct caps on power stations and other point sources might be more
cost-effective. Domestic emissions trading schemes could be set up as ‘cap-and-trade’,
allowing polluters to either meet targets in their own facility, or to sell excess reductions or buy
from others to meet shortfalls.
As with other technologies, a key policy question is who pays for incremental cost, given that
many advanced technologies have higher upfront capital costs than conventional coal. While
government require utilities to make investments, costs will ultimately be passed on to
consumers. As outlined in chapter 3, low tariffs are a major energy policy priority, both for
industrial competitiveness and to widen access to electricity. Dedicated funding mechanisms
are needed, with one possibility being the recycling of revenue from environmental taxes on
energy use.
4.3.2 Funding options A source of funding receiving much attention is the Clean Development Mechanism (CDM)
under the Kyoto Protocol. The CDM allows industrialised countries to invest in projects in
developing countries, in return for the emissions reductions generated. Industrialised countries
use these credits towards their quantified mitigation commitments under the Protocol, while the
CDM project should contribute to sustainable development in the developing country. CDM
investment is seen by government as an important source for funding the implementation of the
renewable energy target. The scale of funds allocated for CDM investment internationally had
reached $ 800 million (Ellis et al. 2004), but the funds are to be spent over several years. What
share of such investment will come to South Africa remains to be seen and depends in part on
the promotion of the country as an investment destination.
Use of economic instruments such as emissions trading and taxation would generate more
financial flows that are more directly linked to the scale of emissions in the country. Domestic
emissions trading would result in trading of certificates between facilities included under the
cap. An alternative policy option is tradable permits for electricity from low-emission sources,
such as the Tradable Renewable Energy Certificates (see section 4.5.1). In this case, it is the
‘good’ of clean electricity that is traded, rather than the ‘bad’ of emissions.
4.3.3 Pollution taxes Taxes could be levied either on GHG emissions (a ‘carbon tax’ as implemented in some
European countries) or on air pollutants. There has been some initial consideration of
environmental taxes by Treasury, including a focus on electricity (see 4.4.2). A carbon tax in
principle internalises the externalities of GHG emissions, a pollution tax may be more
politically acceptable. An air pollution tax could be associated with the regulatory framework
established by the National Air Quality Management Bill. It would have the effect of making

Electricity and residential policy options 69
coal energy-intensive products more expensive, and thus send price signals through the
economy that a shift to less pollution-intensive production and consumption is favoured (EDRC
2003a).
The risk of a tax on pollution, however, is that it could disadvantage the poor. In principle,
South Africa might follow the Dutch example of using a consumption threshold to protect low-
income groups from proportionally higher tax burdens (Nedergaard 2002: 28). Given the policy
objective of promoting affordable access to modern energy services, this is critical in South
Africa. Another means of dealing with the tension in policy objectives would be to recycle
revenue generated from pollution taxes, directing them toward reducing the general tax burden
on the poor (e.g. reducing VAT on basic food-stuffs) and promoting investment in cleaner
technologies and services (Winkler 2005). Recent analysis suggests that a reduction in food
prices may pay ‘triple dividends’ in mitigating unwanted effects of environmental taxes (Van
Heerden et al. 2006).
The tax should reflect the damage costs of power generation, industrial use of fuels, and
commercial and agricultural use of fuels. From an economic point of view, the tax should be set
so as to adjust the private marginal cost to the social marginal cost. In practice, the tax may be
adjusted based on negotiations between government and various stakeholders, and in response
to the observed effectiveness of the tax.
A considerable amount of research has been devoted to estimating the social and environmental
costs of energy supply and use in South Africa (Van Horen 1996a, 1996b; Spalding-Fecher &
Matibe 2003; Spalding-Fecher et al. 2000b; Spalding-Fecher 2000b). Such research faces
serious difficulties – absence of local epidemiological studies establishing dose-response
relationships; controversies about the ‘value of a statistical life’; broad estimates for morbidity.
Nonetheless, the most recent power sector study (Spalding-Fecher & Matibe 2003). summarises
low, central and high estimates of local and global pollution (see Table 4.3).
Table 4.3: Summary of external costs of Eskom cost-fired electricity generation per unit (1999 Rands)
Source: (Spalding-Fecher & Matibe 2003)
1999 c/kWh Per unit of coal-fired power produced
Low Central High
Air pollution and health 0.5 0.7 0.9
Climate change 1.0 4.3 9.8
Total 1.5 5.0 10.7
Note: this excludes the benefits of electrification from avoided use of dangerous household fuels.

Electricity and residential policy options 70
Externality costs for energy were consolidated as damage estimates per unit of pollutant were
reported more fully in EDRC (EDRC 2003a), including damages from Eskom power stations,
industrial and commercial energy use, household energy use, from municipal power stations27.
Cost estimates of negative externalities such as those described above can be used to set a
reasonable level for a pollution tax.
Economic instruments such as taxes and subsidies are important tools for managing the
environmental impacts of electricity supply. The next section further considers the use of such
instruments, as well as the contribution that future electricity policy can make to economic
development.
4.4 Economic development and instruments Economic policy sets the overall context for electricity policy options. At the same time, policy-
makers can make use of economic instruments to promote particular policy objectives. Changes
to electricity prices – such as taxes or subsidised tariffs – are examples of market-based policy
tools. Beyond individual policy interventions, however, lies the question of the energy structure
of the economy, and its intensive use of electricity in particular.
4.4.1 Changing the energy structure of the economy Chapter 3 outlined the history of the South African economy, with the ‘minerals-energy
complex’ at its centre (section 3.3). Driven in part by low-cost coal and electricity, energy-
intensive industries make up a large portion of the economy – mining itself, but also the
beneficiation of minerals.
Policy on industrial development has promoted electricity-intensive investments, such as the
smelting of aluminium at Coega or steel at Saldanha. Low electricity tariffs for industry are
seen as a competitive advantage in attracting aluminium smelters to SA rather than other
countries (Bond 2000). The marketing of investment opportunities highlights the availability of
electricity at “very favourable rates” as one of the attractions (CDC 2004)28
The risk of the current approach is that, while they may promote industrial development in the
short run, they carry a high risk of ‘locking in’ the economy into energy intensive industries,
when environmental, economic and social pressures may push South Africa in the opposite
direction (Spalding-Fecher 2001). The reason for the ‘lock in’ effect is that, once a major
investment like a smelter is made, there are very limited opportunities to improve the energy
27 Municipal power stations, because they are older, in urban areas, and have lower stack heights, will likely have much higher damages than Eskom power stations (Spalding-Fecher & Matibe 2003). For this reason, Eskom power station emissions are referred to as “high level” emissions in this study, while industrial and commercial emissions, as well as municipal power stations emissions, are referred to as “low level” emissions. 28 “There are sufficient electricity and water resources to meet the future demands within the Industrial Development Zone. These utilities are available in bulk at very favourable rates” (CDC 2004)

Electricity and residential policy options 71
efficiency or also the production process. Recent investments in steel and aluminium bear this
out – while the processes may be optimized for that technology, the wholesale switch to a more
efficient technology is very costly after construction (Visser et al. 1999).
Forward-looking economic and industrial policies could target less energy-intensive economic
sectors. “An active industrial policy is required to diversity the economy forward from South
Africa’s mineral-energy complex into capital and intermediate goods” (Michie & Padayachee
1998: 634).
Some Spatial Development Initiatives have been built around eco-tourism, for example in
Lebombo (DTI 2002), focusing on service delivery and job creation (Jourdaan 1998). In
general, service-oriented sectors, while still consuming substantial amounts of electricity, are
less energy-intensive than mining or minerals beneficiation. This would represent a major shift
in industrial policy and would take decades to complete, given large investments in
infrastructure. However, given the ‘lock-in’ effect, short-term decisions (the next power station,
the next smelter or not) are critical in changing the trajectory of South Africa’s energy
development path. ‘Bending the curve’ requires a long-term perspective, but also involves
policy changes in the immediate future (Raskin et al. 1998).
A policy for an economy with lower energy-intensity would require a very different approach to
competitiveness. As CO2 emissions from fossil-fuel combustion are priced in the emerging
international carbon market, electricity from lower-emissions sources is likely to become more
attractive. Rather than promoting SA as an investment destination due to low electricity tariffs
and the absence of emissions constraints, policy-makers would anticipate the future competitive
advantage of lower energy- and emissions-intensity.
It is perhaps fortuitous that DEAT combines environment and tourism, which environmental
concerns for lower emissions being consistent with tourism as a less energy-intensive sector.
However, DEAT’s promotion of tourism is not articulated as an approach to industrial policy.
Active promotion of lower-emissions sectors could limit the growth of negative environmental
externalities. In so far as external costs of electricity generation might be internalised in future,
this would dampen upward pressure on electricity prices – at least from environmental factors.
4.4.2 Policy on electricity prices, tariffs and taxes Electricity tariffs in South Africa have been low by international standards, although not
necessarily affordable to all customers. There are multiple reasons for low tariffs, as described
in chapter 3, including excess capacity, low debt and tariffs that do not reflect all costs, certainly
not external costs. The short-term marginal cost of generating electricity has been low, and large
customers have paid tariffs around 13-14 c/kWh– industry 12.88 c/kWh; mines 14.14 c/kWh
and redistributors (mainly municipalities) 14.09 c/kWh (Eskom 2002b: 135). Residential tariffs

Electricity and residential policy options 72
are higher per unit, at an average of 33.43 c/kWh in 2002 (ibid). Tariffs are likely to increase in
future, as new electricity generation capacity is needed (Eberhard 2003).
However, this rising trend is in tension with the established policy goal of keeping electricity
prices low. In reiterating the policy position of universal access to electricity, the President
qualified it with an acknowledgement that new power plants are needed with the concern that
“administered prices do not unnecessarily add to the general costs of production and inflationary
pressures in our economy” (Mbeki 2004a). The Energy Minister also reflects the tension that
while the “progressive rise of energy prices cannot be avoided South Africa still intends to keep
low electricity prices” (Mlambo-Ngcuka 2003).
Different drivers of tariff policy work in opposite directions, some favouring price increases and
others keeping them low. The NER, which regulates electricity tariffs, aims at multiple
objectives in developing a pricing policy for the future. Such policy “must balance affordable
electricity prices for households, low cost electricity for industrial consumers, efficient market
signals by accurately reflecting cost of supply and generate a price level that ensures the
financial sustainability of utilities” (NER 2003b). The first two priorities aim to keep prices low,
whereas the latter two could raise tariffs.
One of the key motivating factors to keep electricity prices low is affordability of residential
tariffs for poor households. Continued electrification makes little sense if customers are not able
to afford using their connections. Government is subsidising some limited use through the
poverty tariff (see 4.1.2), effectively setting the price of the first 50 kWh to zero. The second
main driver is industrial competitiveness and the policy of attracting energy-intensive industry.
In future, electricity prices are likely to be pushed upwards as the building of new generation
capacity will raise the cost of supply. A study considering the potential of renewable energy
predicted a future average tariff of 24-40c/kWh by 2010 (DME 2000a: 18). While previously
the NER had kept increases of electricity tariffs below inflation, Eskom has since 2001 applied
for above-inflation increases (but these have not always been approved) (Ensor 2001).
While competition theoretically should reduce prices, international experience has generally
been that privatisation has often led to higher prices (Dubash 2002). In the South African
context, the corporatisation of Eskom already requires payment of taxes and dividends, costs
that will eventually be passed on to customers. Without the financial cover that Eskom enjoyed
as a parastatal, private investors are likely to have higher financing costs and expect higher rates
of return than typical in public sector investment.
If the privatisation process extends to retail competition, some customers (contestable
customers) would be eligible to choose the company from which they purchase electricity

Electricity and residential policy options 73
(PWC 2000: 10). Contestable customers are defined as those using more than 100 GWh/year.29
Once competition between generators is established, these customers could be supplied by any
distributors. Smaller customers are confined to the distributor into whose area they fall and are
known as captive customers. They are unlikely to benefit from competitive supply and hence
require regulatory protection through control over tariffs and quality of service (PWC 2000: 12).
Policy options for future electricity tariffs will have to make choices in resolving the tension
between maintaining low tariffs for energy-intensive users, and internalising some costs of
supply and raising prices. A wholesale electricity pricing policy (WEPS) has been developed for
large customers, such as municipalities and energy-intensive industries (Ellman 2001). The first
phase of WEPS was implemented within Eskom by 2003 (Eskom 2003), with the second phase
to be extended to other wholesale customers (including municipalities). WEPS-3 is to be
introduced when Eskom is unbundled and REDs have been established (NER 2003c). Previous
tariffs have not been cost-reflective and cross-subsidies have been implicit and not transparent.
The WEPS takes a cost-of-supply approach (NER 2003c), unbundling the electricity bill of
wholesale customers into direct costs (e.g. energy, networks, transport, reliability) and more
indirect cost (taxes, levies, billing, administrative costs) (NER 2003c: 5). If wholesale
customers were to buy at cost-reflective tariffs, their current contribution to cross-subsidies
could stop (NER 2003c: 3). Moderately subsidised tariffs are needed for poor households
benefit from electrification (NER 2003b: 5).
A major objective of WEPS is to make making cross-subsidies transparent. Cross-subsidisation
of tariffs included geographic considerations (higher costs for transmitting electricity); subsides
across different tariffs and within tariff classes (averaging); and electricity levies (NER 2003c:
7-9). Large customers will continue to pay their electricity levies for electrification and
electricity supply to rural areas. (NER 2003c: 9). Thus the WEPS falls within the overall NER
pricing policy, which seeks to balance the long-term sustainability of suppliers, affordable
prices for the poor and cost-of-supply pricing for industrial customers (NER 2003b: 2).
Establishing a tariff agreement forms part of government’s programme of action (RSA 2005).
Policy instruments to internalise the social and environmental costs of electricity generation
(Van Horen 1996a; Spalding-Fecher et al. 2000a; Van Horen 1996b; Spalding-Fecher 2000a)
would be taxes or subsidies. Taxes could be levied either directly on air pollution, or on energy
to include the external costs of fossil fuel use in the fuel price. Carbon and pollution taxes have
been extensively implemented in Europe, but also proposed for South Africa (EDRC 2003a).
Taxes on local air pollutants may be more politically acceptable in developing countries than a
carbon tax, since responsibility for climate change rests primarily with industrialised countries.
29 A middle-class household uses about 0.01 of a GWh/year, 10 000 times too little to qualify.

Electricity and residential policy options 74
Given the central role of energy in development, there may similarly be reluctance to tax energy
for global environmental reasons. Taxes that relate more directly to local environmental
damage, such as the health impacts of air pollution, address local concerns more directly
(EDRC 2003a). In order not to place an increased burden on poor households, they could either
be exempted from such taxes or the tax revenue be recycled to reduce other taxes affecting the
poor. Examples would be zero-rating of VAT on essential food-stuffs or financing the poverty
tariff.
Initial work has been conducted for the National Treasury on environmental fiscal reform
(Eunomia & UP 2004) and a discussion document was developed (National Treasury 2003b).
An internal government policy paper was released for public comment in 2006 (National
Treasury 2006). The initial documents suggest that the energy sector is likely to receive
attention in future developments, particularly in relation to electricity generation and air
pollution. An input tax on fossil fuels used for electricity generation may be considered, as
might an electricity consumption tax. Such taxes would be likely to generate significant
revenues, larger than the loss in sales revenue to Eskom. Net revenues could be used to
compensate municipalities for their lost revenues under restructuring; to support transitions of
affected sectors; or to promote specific projects with environmental benefits such as end-use
energy-efficiency and renewable energy. Of particular interest are ‘tax shifting’ programmes
that use revenues from environmental taxes to offset taxes on labour. Taxes would have to be
levied at the bulk level and explicitly exclude poor households (EDRC 2003a; Nedergaard
2002).
Recent analysis using a computable general equilibrium (CGE) model to analyse environmental
taxes on energy investigated the potential for recycling. Taxes considered were on GHGs, fuel
inputs, electricity use, or energy. Revenue recycling could occur through in one of three ways:
(i) a direct tax break on both labour and capital, (ii) an indirect tax break to all households, or
(iii) a reduction in the price of food. The study concluded that with a “food tax handback”, all
four policies had the potential to reduce CO2 emissions, grow GDP and reduce poverty (Van
Heerden et al. 2006). However, in establishing an updated GHG inventory, the authors depart
from the standard IPCC methodology and rely entirely on energy balances. Future work with
combine the analysis in this thesis with the complementary work in the article (Van Heerden et
al. 2006), improving the rigour of GHG analysis while adding the benefit of indirect economic
effects from CGE modeling.
In summary, tariff policy in future faces choices between continuing to promote low-cost
electricity, or making the services more reflective of costs – financial, social and environmental.
A variety of other economic policy instruments are available, including subsidies for renewable
energy (described in section 4.5) and policies promoting the efficiency in electricity use.

Electricity and residential policy options 75
4.4.3 Policies promoting the efficient use of electricity In meeting the goal of the 1998 White Paper of stimulating economic development, energy
efficiency plays a particular role. Energy efficiency and economic concepts of the efficiency of
the market are quite distinct (Jochem 2000). Yet clearly producing higher levels of energy
efficiency allow more economic production for the same amount of energy. By reducing the
costs of a key input to many productive activities, efficiency contributes to economic
development. Some of the menu of policy options available to promote electricity efficiency in
is outlined in this section.
There is great potential for energy efficiency in South Africa, across a range of sectors from
industry, commercial, transport to residential. Interventions for energy efficiency in the
residential sector can contribute significantly to development for households – improved quality
of life at reduced cost (Winkler et al. 2000; Simmonds 1997; Clark 1997; Spalding-Fecher et al.
1999). The residential policies analysed in the thesis (see chapter 6-9) will examine the potential
for savings, in the framework of a national energy model.
Significant savings are also possible in the industrial sector, both through end-use efficiency
and load management (see Table 4.4). The National Electricity Regulator (NER) included
estimates of potential future savings in its Integrated Electricity Outlook (2002) and Integrated
Energy Plan (NER 2004a). Savings from energy efficiency are expressed as equivalent
cumulative electricity generation capacity (in MW) that would be avoided by efficiency
programmes up to 2010 and 2020. Since the market penetration of energy efficiency is critical
to the results, estimates reflecting different assumption are summarised above.
Table 4.4: Potential future savings from energy efficiency and demand side management (cumulative capacity equivalent in MW)
Source: NER (2002c)
Low penetration Moderate penetration High penetration
2010 2020 2010 2020 2010 2020
Industrial and commercial energy efficiency
567 878 889 1270 890 1270
Residential energy efficiency
171 514 537 930 537 930
Industrial and commercial load management
355 444 428 535 510 535
Residential load management
222 735 443 936 669 936
Total 1315 2571 2297 3671 2607 3671
Experience exists with innovative technologies and programmes for energy efficiency and
demand-side management. Eskom’s DSM programme has focused on three key areas: load
management, industrial equipment and efficient lighting. Such interventions include both load

Electricity and residential policy options 76
management, typically carried out by the utility, and energy efficiency improvements by end-
users. More detailed technologies and policies for electrical efficiency are examined below.
4.4.3.1 Energy efficiency in low-cost housing
Many interventions can be introduced in low-cost housing to improve energy efficiency, save
households money and improve the environment (Spalding-Fecher et al. 2002a). A possible
package of interventions in a standard 30m2 Reconstruction and Development Programme
(RDP) house could include a ceiling, roof insulation, wall insulation, window size, and
partition. All of these measures pay for themselves in short periods of time (Winkler et al.
2000).
Several government departments have been investigating a framework for regulation of
environmentally sound building for some time (DEAT et al. 1998). A recent decision to include
an additional R1 024 for damp-proofing in the housing subsidy may have the effect of providing
better efficiency cavity walls, plastering and ceilings. It applies in the ‘Southern Condensation
Area’, covering large parts of the Western and Southern Cape and some of the Eastern Cape.
An extension of this policy is modeled in section III, and chapter 9 picks up the policy
implications of making standards mandatory.
4.4.3.2 Building codes for commercial and residential buildings
Policy support for energy efficiency in buildings need not be limited to low-cost housing.
Residential and commercial building codes can require higher efficiency standards in middle-
and upper-income houses and commercial buildings. Since wealthier customers can afford to
pay the upfront cost to benefit from the long-term savings, regulation can be used rather than
outright subsidy. Government may still consider options for financing the initial costs through
concessionary loans. Local governments could finance efficiency measures and recoup the
outlay, by structuring tariffs to include the saved energy costs as repayments.
4.4.3.3 Concessionary loans for efficient industrial equipment
Industry, like richer households and commercial buildings, should be able to invest in more
efficient use of electricity. Measures often payback within periods of months or a few years (for
case studies, see ERI 2000a) and have significant potential for job creation (Jeftha 2003). Lack
of awareness and information is a key barrier that could be overcome by programmes promoting
energy efficiency. Technical interventions with large potential for energy efficiency savings
across many industries include variable speed drives, compressed air and HVAC (heating,
ventilation and air conditioning) systems (ERI 2000b).
The overall potential for greater efficiency of electricity use in industry is large (Spalding-
Fecher et al. 2004). A study using an input-output model of the SA economy, has shown that a
5% increase in electricity efficiency in 2010 would lead to a net increase of some 39 000 jobs
Electricity and residential policy options 77
and labour income of about R 800 million (Laitner 2001). The primary reason is that spending is
diverted away from sectors with lower wage and salary multipliers towards construction,
finance and manufacturing, which have higher income multipliers. The study did not specify
particular equipment to be replaced, but gave a sense of the benefits of across-the-board
efficiency improvements.
Industrial equipment still bears a higher upfront cost, and while government may not need to
pay for capital costs in full, concessionary finance can make investments more attractive.
Concessionary loans would offer lower than commercial repayment rates, and to be used
introduce more efficient technologies and production facilities. The focus of such a policy
should be on the most electricity-intensive equipment and industrial process. Loans in the range
of 10-20% of the incremental capital would likely be enough in many cases to tip the balance in
favour of energy efficiency investments (EDRC 2003a).
4.4.3.4 Efficient appliances: Labelling, regulation and financial incentives A first step to promoting the use of more efficient electrical equipment is to provide information
to users through labelling. Household appliances that might be labelled include lighting,
refrigerators/freezers, air conditioners, water heaters (electric or gas), cooking equipment,
clothes and dishwashers, and electronic equipment like TV, stereos and computers. Commercial
equipment will include HVAC (heating, ventilation and air conditioning) systems, water heating
systems, and electronic office equipment like computers, printers, copiers.
Equipment-labelling involves indicating a certain performance standard on the equipment based
on pre-testing appliances for their efficiency and may include estimated operating costs.
Appliance-labelling can be a voluntary programme, where government develops the guidelines
and testing procedures, but companies choose whether they wish to use the label. Labelling
could also be mandatory: all products would have the label, but with or without restrictions on
their efficiency.
The most stringent approach would be mandatory labelling, together with prescribed minimum
performance standards. Regulations would specify performance for different kinds of appliances
and equipment, and restrict the use of equipment that fails to meet the prescribed standard.
Generally such standards would be applied only to new appliances.
Using financial incentives rather than regulation, government can offer tax credits or direct
subsidies to tax payers for installing efficient electrical appliances. Financing, either in the form
of direct subsidies or in small-scale, affordable loans, for equipment and technical upgrades,
could be provided (EDRC 2003a).
Smaller appliances, e.g. compact fluorescent lights (CFLs) have lower first-cost barriers to
overcome than buildings. Nonetheless, prices need to be brought down, which has already
Electricity and residential policy options 78
happened to some extent under Eskom’s Efficient Lighting Initiative, which aims to install 18
million CFLs (Eskom 2000c). Municipal government can play a key role in promoting the
wider dissemination of CFLs, which reduce the power used for the same lighting by 75-80%.
Promoting solar water heaters
Solar water heaters (SWHs) deliver hot water from a renewable energy source, save energy by
displacing use of electricity and therefore avoid emissions. It combines energy efficiency and
use of renewable energy. The potential for SWHs is large, as acknowledge in the White Paper
on Renewable Energy, which assesses the savings as 18% of urban residential consumption30 or
equivalent to a large coal-fired power station (900 MW) (DME 2003c).
However, SWH projects have not been widespread, with the only significant project being in
Lwandle township (Thorne et al. 2000; Ward 2002; Lukamba-Muhiya & Davidson 2003).
despite DME announced support from the Global Environmental Facility project on a National
Solar Water Heating Programme (DME 2001a).
Possibly other models of delivery than grant-funded development projects are needed.
Electricity service companies might install SWH in institutions (e.g. hotels) in return for a fee
for the hot water service. In middle- and upper-income markets, financing for the higher upfront
cost could be facilitated through bonds. A barrier remains low public awareness of the
technology or its economic benefits (DME 2003c). Policies are need to create larger markets
and economies of scale, which would help bring down the relatively high capital costs. A larger
market for solar water heating in turn could build a local manufacturing industry and increased
employment opportunities (DME 2003c)
4.4.3.5 Encouraging utility demand side management
Demand-side management (DSM) encompasses a set of measures by electric utilities that save
energy and also reduce GHG emissions. Strategic growth of off-peak demand, load shifting,
geyser ripple control, interruptible load agreements, time-of-use tariffs and other measures
enable DSM in both the industrial and residential sector. The utility benefits by reducing the
peaks of consumption (‘shaving the peak’), reducing the need for installed capacity. DSM can
benefit the national economy by delaying the need to invest in supply-side capacity, at a lower
cost.
Eskom has a DSM programme, but further measures are needed to promote investment in these
technologies and to ensure that they continue as the electricity distribution industry is
restructured (Clark 2000b, 2001b). The structure of tariffs is important in this regard.
30 Assuming that some 30% of total domestic electricity consumption is used for water heating and that 60% of this electricity can be replaced by solar energy by using a hybrid solar-electric water heating system, then the potential savings for urban residential households come to 5 900 GWh (Thorne et al. 2000; Spalding-Fecher et al. 2002b).
Electricity and residential policy options 79
Regulated tariffs often link energy sales (kWh) with utility revenues and profits, with little
incentive for the utility to engage in DSM. Eskom is not exception in this regard, with the DSM
programme battling against the perception that it represents lost revenue. Tariffs can be
structured differently, de-coupling revenue from sales. Regulated tariffs are linked to some other
measures of service (EDRC 2003a).
If implementation of efficiency programmes were linked to revenue, this would directly
encourage investment in DSM measures. In USA, many state regulatory boards chose in the
1980s to base utility profits on a return on capital invested, including demand-side capital,
rather than a margin on each unit sold (Eto et al. 1998; Swisher et al. 1997). Utilities that can
show efficiency improvements may be allowed to earn higher profits and/or a higher rate of
return. In the design of this system, it is important that the DSM incentive is not offset by a rate
formula that rewards increased sales. In other words, the incentive only works where revenues,
not tariffs, are subject to regulated caps (EDRC 2003a).
Such regulatory policies may be needed to promote energy efficiency under power sector
reforms, since privatised utilities have little incentives to invest in measures that reduce their
sales revenues (Clark & Mavhungu 2000; Barberton 1999; Tyani 2000). Regulatory policy can
make energy efficiency investment a licensing requirements. The REDs, for example, could be
required by the NER to implement DSM, which would be consistent with the framework for
integrated resource planning (NER 2002d: 7, 13).
4.4.3.6 Turning the potential of efficiency into practice
While the more efficient use of electricity has great potential, achieving wide-spread
implementation requires effort. Theoretical gains are not always realised in practice, for either
technical or economic reasons. Removing key barriers – informational, institutional, social,
financial and market, and technical – is critical to the full realisation of energy efficiency
measures (EDRC 2003a). Important success factors to implement efficiency measures include
government policy (standards, incentives, recovery of programme costs), electricity pricing
mechanisms that do not penalise efficiency, and the effectiveness of DSM delivery agencies
(NER 2002c).
To put the wide variety of energy-efficiency measures together in a policy framework, the DME
recently published an ‘energy efficiency strategy’. The strategy set a goal for an improvement
in energy efficiency of 12% by 2014 (DME 2005a). While the DME document covers all
energy, the NER has approved policy for efficiency in the electricity sector in particular, with an
‘energy efficiency and demand side management policy’. However, the policy does not set
specific numerical targets. Its focus is on captive customers (i.e. small customers), under the
assumption that large contestable customers will respond efficiently to price signals (NER
2004b).

Electricity and residential policy options 80
Energy efficiency measures such as those outlined in this section are critical near-term
measures. Because they save energy costs and pay back on their investment in short periods,
they can be adopted quickly. Changing the fuel mix that generates electricity is a long-term
endeavour. Yet increasing diversity of supply not only gives greater energy security, it is
central to long-term sustainability.
4.5 Securing electricity supply through diversity Environmental concerns relate directly to another major energy policy objective, that of
securing supply through diversity. As described in chapter 3, the current fuel mix for electricity
generation is heavily dominated by coal. Moving to a more diverse mix of electricity
generation sources can both increase energy security – since diverse systems are more resilient
to external shocks – and at the same time reduce environmental impacts of electricity supply
and use.
Cleaner fuels have less environmental impact, for industrial use as well as for electricity
generation. In 2003, government adopted a new policy paper on renewable energy (DME
2003c), with earlier drafts indicating that a further policy position on other ‘cleaner energy
technologies’ were to be developed. Government has made it clear that it intends using all
energy sources and not choosing winners amongst technologies (Mlambo-Ngcuka 2003).Which
technologies are used will shape the electricity sector for several decades, given the long life-
times of energy technologies.
The excess capacity that the electricity sector has experienced for the last three decades of the
twentieth century (see chapter 3) is ending. In his 2004 State of the Nation speech, the President
acknowledged this by announcing that a tender would be awarded in the first half of 2005, to
deliver “new generating capacity to provide for the growing energy needs from 2008” (Mbeki
2004a). The key policy questions are who will supply new power stations, and what energy
sources will they use?(ERC 2004a)
The former question will be shaped by the framework of privatisation (see section 4.1).
Eskom’s market power will continue, but to some degree will be supplemented by independent
power producers (IPPs). Assuming that IPPs are profit-making firms, they will require higher
rates of return on their investment (say 15%) than typical of public utilities (ERC 2004a). This
would force electricity tariffs up, making the use of electricity less affordable.
In the light of the long life-times of energy infrastructure, choices made in the near-term will
shape the system for several decades, including the mix of fuels used to generate electricity. As
outlined in chapter 3, the current mix is dominated by coal for electricity (93%), with three-
quarters of total primary energy supply (all energy carriers, not just electricity) coming from
comparatively cheap coal. Given the priority given to industrial competitiveness and access to

Electricity and residential policy options 81
affordable electricity, achieving the Energy Policy White Paper goal of diversity of supply
requires substantial effort. Determined policy interventions will be required to initiate a
transition to a cleaner fuel mix for the electricity supply industry.
Three major options of diversifying fuels for electricity generation domestically are examined –
renewable energy sources, gas and nuclear. Major opportunities are already being set up within
the Southern African region for the import of hydro-electricity. Finally, since coal will continue
to dominate the sector for several decades, policies promoting cleaner technologies using the
‘old’ fuel are considered.
4.5.1 Renewable energy technologies for electricity generation The Minister of Minerals and Energy has recently re-stated that “renewable energy plays an
important role in the energy mix and increases supply security through diversification”
(Mlambo-Ngcuka 2002b). In practice, renewable electricity technologies (RETs)31 have
remained in the research, development and demonstration phase. In 2003, government adopted
a target of 10 000 GWh renewable energy consumption (DME 2003c). Although this is not
limited to electricity but also includes solar water heating and biofuels, the policy document
explicitly calculates that this would be 4% of expected electricity demand in 2013. The key
challenge is to implement this policy at scale, beyond pilot projects.
Renewable electricity sources are derived from natural flows of energy that are renewable –
solar, wind, hydro, biomass, geothermal and ocean energy. A recent estimate of the long-term
global technical potential of primary renewable energy by the IPCC was given as at least 2800
EJ/yr (IPCC 2001b: chapter 3). While this number exceeds the upper bound of estimates for
total energy demand, the realisable potential is lower, limited by the ability to capture dispersed
energy, markets and costs. While wind and solar photovoltaic technologies have grown at rates
around 30% over five years, they start from a low base (10 GW and 0.5 GW respectively
(UNDP et al. 2000); for comparison, South Africa’s total capacity is roughly 40 GW).
Perhaps the key factor limiting the potential of renewable energy technologies (RETs) globally
is cost. Table 4.5 shows international cost data for RETs, according to the World Energy
Assessment. Investment costs for coal or gas plants are under $ 1000 / kW, while the energy
cost in SA is below 2 c / kWh (although likely to rise in future).
31 For convenience, renewable electricity technologies are abbreviated as RETs, as short-hand for technologies using renewable energy sources. However, it is not the electricity that is renewable, but the energy source. RETs is often used for renewable energy technologies, not only those using electricity.

Electricity and residential policy options 82
Table 4.5: International cost data for renewable energy technologies
Source: UNDP (2000)
Technology for electricity generation
Operating capacity, end 1998
Capacity factor Turnkey investment costs
Current energy cost of new systems
Potential future energy cost
GWe % (US$ per kW) US c/kWh US c/kWh
Low High Low High Low High Low High
Biomass 40 25 80 900 3 000 5 15 4 10
Wind 10 20 30 1 100 1 700 5 13 3 10
Solar PV 0.5 8 20 5 000 10 000 25 125 5 25
Solar thermal 0.4 20 35 3 000 4 000 12 18 4 10
Small hydro 23 20 70 1 200 3 000 4 10 3 10
Geothermal 8 45 90 800 3 000 2 10 1 8
Tidal 0.3 20 30 1 700 2 500 8 15 8 15
South Africa’s potential for renewable energy lies overwhelmingly with solar energy, equivalent
to about 280 000 GW (Eberhard & Williams 1988: 9). Technological and economic potentials
would be lower than the theoretical potentials – by various estimates – shown in Table 4.6.
Other renewable energy sources – wind, bagasse, wood, hydro, and agricultural and wood waste
– are much smaller than solar.
Table 4.6: Estimates of theoretical potential for renewable energy sources in South Africa
Sources: (DME 2000a; Howells 1999; DME 2002d)
DANCED / DME Howells RE White Paper
Resource PJ / year
Wind 6 50 21
Bagasse 47 49 18
Wood 44 220
Hydro 40 20 36
Solar 8 500 000
Agricultural waste 20
Wood waste 9
The most recent estimates of the potential of renewable energy are being compiled for the South
African Renewable Energy Resource Database.32 More detailed GIS maps will be sold, with
revenues used to update the data (Otto 2003). In estimating economic potential, there is even
32 www.csir.co.za/environmentek/sarerd/contact.html

Electricity and residential policy options 83
less data. With little commercial use of renewable energy, there is not sufficient experience
regarding local costs and markets to provide estimates of much accuracy.
Demonstration projects will in future need to be scaled up to meet the renewable energy target.
The international literature suggests a variety of policy tools could be used by the SA
government to promote renewable energy (Winkler 2005). Feed-in tariffs guarantee prices for
developers, but lack certainty on the amount of renewable electricity such laws would deliver
under local conditions. This shortcoming would be addressed by a renewable portfolio standard
which sets a fixed share of renewable energy in the supply mix. The question for this
instrument would focus on the incremental upfront costs compared to future health and
environmental benefits. A renewables obligation, following the UK model, combines the setting
of a target with a tendering process, but may be bureaucratic to administer (Winkler 2005).
Neither setting targets or regulating prices alone, however, will be sufficient. More detailed
policies are needed, including power purchase agreements, access to the grid and creating
markets for green electricity. Given that renewable electricity technologies have to compete
with relatively low electricity tariffs, funding will be needed. The extent to which these are
utilised will determine the future mix of renewable energy in South Africa (Winkler 2005). An
overview of possible policies for electricity from renewable energy sources is provided in Table
4.7.
Table 4.7: Tools that governments can use to promote renewable electricity
Source: Oliver (2001)
Tool Advantages Disadvantages
Power purchase agreements Long-term, standard agreements help developers and facilitate investment
May require continuing unit subsidy to make the cost attractive
Investment incentives Overcome high first-cost barriers Encourage investment, not production
Production incentives Encourage renewable electricity production
Do not address high first-cost barrier and require continuing subsidies over the long term
Renewable set-asides / mandated market shares
Competitive bidding encourages cost reductions
Can be bureaucratic
Externality adders Allow for full-cost accounting in power planning
Implementation does not always follow planning
Environmental taxation Correct energy prices including costs of environmental impacts provide a more level playing field for renewable energy
Taxes are often politically unfavourable
Research, development and demonstration
Builds long-term foundation for technological and industrial development
Difficult to pick a technological winner for R&D investment
Government-assisted business development
Builds market infrastructure May become too bureaucratic
Green marketing Allows choice in power purchases
May be under-subscribed

Electricity and residential policy options 84
The new policy has effectively set aside a market share, moving beyond research, development
and demonstration (RD&D). In practical implementation, some initial progress has been made
on green electricity. The approach taken to modeling renewable energy is described in more
detail in section 6.6.2.
4.5.2 Switching fuels from coal to gas Energy security through diversity of supply is a well-established goal of energy policy. In the
electricity sector, this goal is being pursued largely through developing the Southern African
Power Pool, planning increased imports of hydro-power and developing gas markets. A
transition away from coal to cleaner fuels will in the short- to medium-term most likely include
natural gas imported by pipeline and / or liquefied natural gas. One of the technologies that can
further diversity the mix is gas-fired power, with environmental advantages for the country
(Graeber & Spalding-Fecher 2000)
The initial use of gas from Mozambique will probably not focus on electricity generation.
Energy plans by Eskom, DME and the NER, however, consider the use of natural gas in power
plants (DME 2003d; NER 2004a). Gas-fired plants can have simple cycles, with efficiencies
around 32-35%, or combined cycle – producing both heat and power – with efficiencies ranging
between 47 and 55%. Beyond their greater efficiencies, gas-fired power has further advantages
in being commercially mature, having short installation times, relatively low capital costs
(although gas prices influence variable costs), and low emissions levels of (including NOx).
Natural gas is about 60% cleaner than coal in terms of carbon dioxide emissions; however,
fugitive emissions (leaks of gas from the pipeline) need to be minimized.
4.5.3 Developing new nuclear technologies Uranium and gold are found together in mineral deposits and South Africa produces uranium as
a by-product of gold mining, with an estimated 261 000 tons of uranium in ‘reasonably assured
resources’ (205 000 tons) and ‘estimated additional resources’ of 56 000 tons (DME 1998). In
the apartheid era, South Africa manufactured finished fuel for the Koeberg nuclear power
station near Cape Town. Currently, however, the finished fuel is imported because it is cheaper
to do so (ERC 2004a).
National government has repeatedly stated its intention to develop all energy sources, including
nuclear (Mlambo-Ngcuka 2003, 2004, 2002c). The country currently has one nuclear light-
water reactor at Koeberg (1840 MWe), but Eskom is developing the Pebble-Bed Modular
Reactor (PBMR), further developing an earlier German design (Loxton 2004). The designers
claim it is ‘inherently safe’, using helium as the coolant and graphite as the moderator (PBMR
Ltd 2002). The fuel consists of pellets of uranium surrounded by multiple barriers and

Electricity and residential policy options 85
embedded in graphite balls (‘pebbles’). Cabinet has endorsed a 5 -10 year plan to develop the
skills base for a revived nuclear industry (Mlambo-Ngcuka 2004). The intention is to produce
this technology not only for domestic use, but also for export.
One of the conditions of approval of the Environment Impact Assessment for the first PBMR
demonstration module – to be built at Koeberg – was that a “Radioactive Waste Management
Policy and Strategy” be completed. This was published for comment during 2004 and was to
lead to a Nuclear Waste Management Policy and Strategy (Mlambo-Ngcuka 2004). This would
set the policy framework to deal with one of the key issues faced by nuclear technology, the
long-term disposal of high-level waste.
4.5.4 Importing hydro-electricity from the region One of the major options for diversifying the fuel mix for electricity is to meet growing demand
by importing hydro-electricity from Southern Africa. Hydroelectricity is generated using the
flow of water in a river or from a storage reservoir. SA itself has only small hydro resources
(0.8% of generation) (NER 2002a), and already imports electricity from the Cahora Bassa dam
in Mozambique. Further developments could add to imports of hydro-electricity. A promising
site is at Mepanda Uncua in Mozambique about 60 km downstream of the existing Cahora
Bassa Power Station on the Zambezi River. In the first stage of this project, which is being
considered, is the installation of capacity at the HV terminals with an 1300 MWe.
The scale of this is dwarfed by the potential at Inga Falls in the Democratic Republic of Congo
(DRC), estimated to range between 40 000 MW for run-of-river to 100 000 MW for a storage
reservoir (Games 2002; Mokgatle & Pabot 2002). Even the run-of-river capacity would equal
South Africa’s current total generation capacity.33
The Southern African Power Pool (SAPP) facilitates the trading of electricity. SAPP was
formally launched in Harare during 2003 (Mlambo-Ngcuka 2003). Southern African countries
agreed that an integrated electricity market can provide economies of scale and benefits from
shared resources. An operational control centre facilitates trading, and a short-term energy
market (STEM) began in 2001. STEM is currently trading three types of futures contracts for
electricity, namely daily, weekly and monthly contracts, although most trade still occurs through
fixed contracts (Spalding-Fecher 2002a). Contracts on a ‘take-or-pay’ basis lead to ongoing
tensions relating to the price of imported electricity, which at an average of 2.15 c / kWh is well
below the cost of generating electricity in SA (NER 2001a).
33 While licensed capacity was 43 165 MW, the total operational was 39 568 MW (NER 2001a), the difference mainly being accounted for by three moth-balled coal stations.

Electricity and residential policy options 86
4.5.5 Cleaner coal technologies Advanced and cleaner coal technologies will not diversify the fuel mix for electricity generation,
which is dominated by coal (see chapter 3 and 6). However, even under the most progressive
scenarios of shifting to renewable energy, coal continues to constitute the largest share.
A first step includes modifications to the existing pulverised fuel (PF) plants. Future plants are
likely to be dry cooled (reducing specific water use) and install flue gas desulphurisation
(removing SO2). Both have cost implications, with dry cooling reducing efficiency by about
one percentage point, and desulphurisation adding some 30% of the capital cost of stations
(EDRC 2003a). Other options, such as super-critical and IGCC plants, together with carbon
capture and storage, are considered likely only in the medium- to long-term future.
The Integrated Resource Plan considers fluidised bed combustion (FBC) as the key cleaner coal
technology. FBC plants mix coal with limestone and air is blown through it in a moving bed of
particles. This ‘fluidised bed’ keeps the coal in the combustion zone longer and therefore poorer
quality coal can be used. The process reduces local pollutants - sulphur emissions as the sulphur
combines with limestone and can be removed, and nitrous oxides due to lower temperatures.
The major economic advantage lies in the ability to use discard coal, of which SA produces
about 60 million tons per year (Howells 2000). The IRP base case envisages 466 MW of FBC
by 2013 (NER 2004a, 2001/2).
The promotion of advanced technologies for coal-fired electricity can contribute to more
diversity in technologies, albeit not fuels. Coal is the fuel with the highest GHG emissions per
unit of energy, so that such changes will always remain marginal improvements. Policy support
for cleaner coal technologies therefore needs to be part of a set of options that changes the fuel
mix. But given the importance of coal in the SA energy economy, this partial approach can
make an important contribution to managing the environmental impacts of electricity supply.
4.5.6 Summary of electricity supply options The major options for ensuring security of electricity supply through diversity have been
examined above. Scenarios to examine the options for future electricity generating capacity are
being examined for the next National Integrated Resource Plan (NIRP). A draft reference case
for the NIRP has been prepared by Eskom, the Energy Research Institute and the National
Electricity Regulator (NER 2004a). Table 4.8 summarises energy and cost characteristics of the
technologies being considered for this ‘base case’.

Electricity and residential policy options
87
Table 4.8: Options for new electricity supply
Source: (NER 2004a, 2004c)
Type of
station
No.
of units
Total
capacity
Unit
size
Life-
time
Nominal
capital
costs
Capex /
installed
capacity
PV of capex
at 10% disc
rate
Lead-
time
Fixed
O&M
costs
Variable
O&M
costs
Fuel
Price
Efficiency
(higher heat
values)
MW
MW
Years
Rm
R/Kw
R/Kw
Years
R/kW/a
R/MWh
R/t or GJ
%
New coal-fired plants
R/ton
CF 1 Dry excl FGD
Baseload
6
3942
657
30
35338
8964
11274
4
121.93
R 5.70
60
35.52
CF 1 Dry + FGD
Baseload
6
3850
642
30
37723
9799
12324
4
125.28
R 7.51
60
34.59
Pumped Storage
Braamhoek
Peaking
4
1330
333
40
4200
3158
5179
7
90.00
9.00
ms*
76
Generic
Peaking
3
998
333
40
7182
7200
8857
7
90.00
9.00
ms*
76
Gas Turbines
R/GJ
CCGT without trans benefits
pipe
Baseload
5
1935
387
25
9797
5063
5659
3
175.26
10.58
20
47.04
CCGT with trans benefits
pipe
Baseload
5
1935
387
25
4405
4925
3
156.48
9.45
20
47.04
CCGT without trans benefits
LNG
Baseload
5
1935
387
25
9797
5063
5659
3
175.26
10.48
32
47.04
CCGT with trans benefits
LNG
Baseload
5
1935
387
25
4405
4925
3
156.48
9.45
32
47.04
GT open cycle kerosene
Peaking
2
240
120
25
920
3833
3949
2
79.80
65.88
72
32.26
GT open cycle LNG
Peaking
2
240
120
25
920
3833
3949
2
79.80
65.88
32
32.26
GT open cycle Sasol gas
Peaking
2
240
120
25
920
3833
3949
2
79.80
65.88
28
32.26
GT open cycle LPG
Peaking
2
240
120
25
920
3833
3949
2
79.80
65.88
56
32.26
New coal (fluid. bed)
R/ton
Greenfield FBC
Baseload
2
466
233
30
4508
9669
11511
4
206.49
19.24
10
36.65
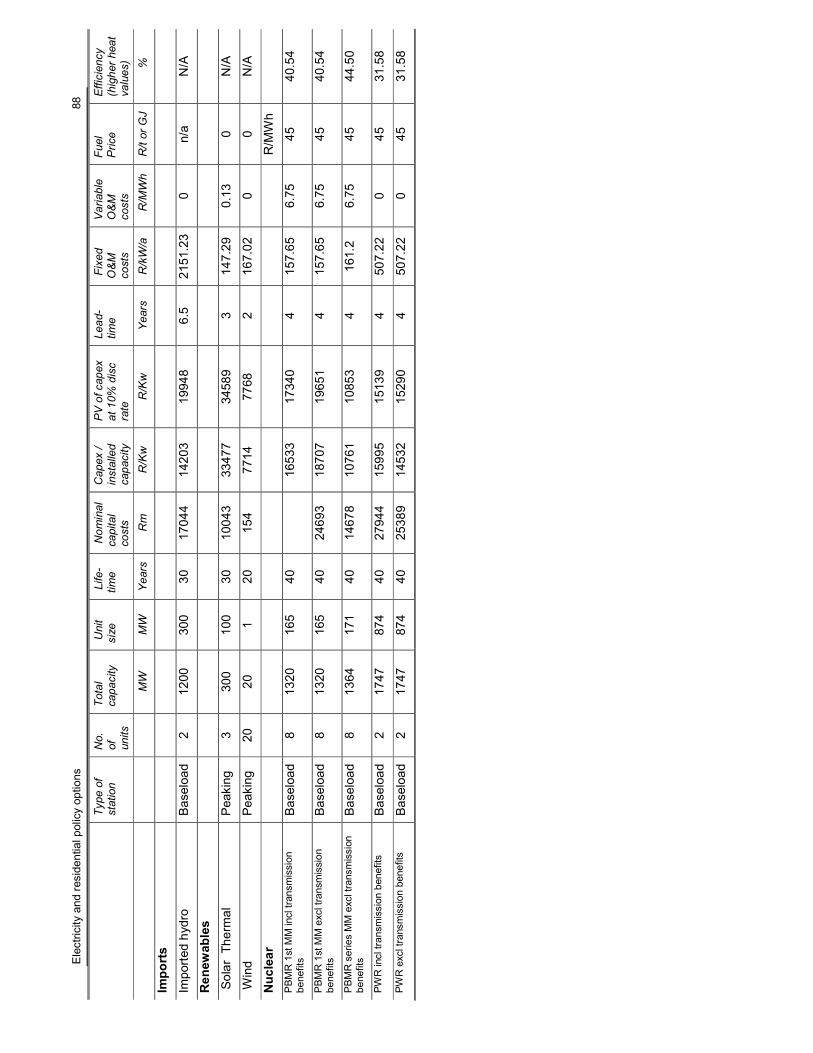
Electricity and residential policy options
88
Type of
station
No.
of units
Total
capacity
Unit
size
Life-
time
Nominal
capital
costs
Capex /
installed
capacity
PV of capex
at 10% disc
rate
Lead-
time
Fixed
O&M
costs
Variable
O&M
costs
Fuel
Price
Efficiency
(higher heat
values)
MW
MW
Years
Rm
R/Kw
R/Kw
Years
R/kW/a
R/MWh
R/t or GJ
%
Imports
Imported hydro
Baseload
2
1200
300
30
17044
14203
19948
6.5
2151.23
0
n/a
N/A
Renewables
Solar Thermal
Peaking
3
300
100
30
10043
33477
34589
3
147.29
0.13
0
N/A
Wind
Peaking
20
20
1
20
154
7714
7768
2
167.02
0
0
N/A
Nuclear
R/MWh
PBMR 1st MM incl transmission
benefits
Baseload
8
1320
165
40
16533
17340
4
157.65
6.75
45
40.54
PBMR 1st MM excl transmission
benefits
Baseload
8
1320
165
40
24693
18707
19651
4
157.65
6.75
45
40.54
PBMR series MM excl transmission
benefits
Baseload
8
1364
171
40
14678
10761
10853
4
161.2
6.75
45
44.50
PWR incl transmission benefits
Baseload
2
1747
874
40
27944
15995
15139
4
507.22
0
45
31.58
PWR excl transmission benefits
Baseload
2
1747
874
40
25389
14532
15290
4
507.22
0
45
31.58

Electricity and residential policy options 89
New coal-fired plants account for 29% of new capacity in the NIRP’s base case. Most of this is
made up of conventional coal plants, some with flue-gas desulphurisation (adding about 10% to
capital costs) and some without. Only two units are envisaged with fluidised bed combustion.
Shift to make coal technologies cleaner would require that more plants with FGD are
constructed.
Renewable energy technologies are represented by wind and solar thermal electricity (STE) in
the base case, but account just over 1% of total new capacity. The main reason is high upfront
costs – STE capital cost is almost three times the present value of a new coal-fired plant with
flue-gas desulphurisation (FGD). Wind is closer to competitive, with some 40% more costly in
capital costs, but with no variable operating and maintenance (O&M) or fuel costs, and only
slightly higher fixed O&M costs. Investment decisions that focus on initial capital costs will not
favour renewable energy, but if the longer-term variable costs are given more weight become
economically more attractive, even before considering externalities.
Imported hydroelectricity in the ‘base case’ only accounts for 4% of new capacity, which would
be built outside of the country. Capital costs are some 60% higher than coal plants in SA.
New nuclear options include the Pebble Bed Modular Reactor (PBMR) and Pressurised Water
Reactor (PWR). A total of 26% of new capacity is expected, made up of initial PBMR
demonstration modules, PBMR developed at scale and PWR. Demonstration plants are some
60% more expensive than a reference coal station , but this drops to around 40% additional cost
if the benefits of avoided transmission losses are taken into account. Assuming that costs
reduce by learning in the commercialisation process, the PBMR would eventually have lower
capex. The PBMR has O&M costs comparable to new coal, while the PBMR has a fixed
component, but no variable O&M costs.
A significant proportion of new capacity uses gas-fired turbines, which represents a shift from
coal to gas given that current generation capacity is 88% coal (NER 2002a). Together gas
plants make up just over 30% of total new capacity, mostly (27%) combined cycle and some
(3%) open cycle. Fuel costs depend strongly on international markets, but capital costs are
significantly lower – half of coal plants for combined cycle, and under 40% with the open cycle
(although the latter has much higher variable O&M costs). Cost factors, together with shorter
lead times in construction new plants, make it attractive to address the immediate urgency of
new capacity.
The options presented above are the National Electricity Regulator’s plan. The supply options
of a cleaner fuel mix for electricity generation will be examined in the policy scenarios to be
Electricity and residential policy options 90
modelled in chapter 6. Chapter 5 briefly outlines the modeling framework through which the
quantitative analysis for the policy cases is conducted.
4.6 Conclusion This chapter has argued that options exist for a transition from current constraints to a more
sustainable future for the electricity and residential sectors. Chapter 3 had outlined the
development objectives as the starting point of the analysis. Rather than making development fit
climate objectives, climate change mitigation is located in the context of sustainable energy
development. Such an approach would implement the policy options suggested in this chapter
as a basis for climate policy.
In identifying policy options for the future, the chapter lays the basis for scenario modeling in
the next section, which will combine different technological and policy options and examine
their implications for meeting energy development objectives and implications for climate
change.
Tools for modeling energy policies 91
Part III: Modeling energy policies
CCCCHAPTER HAPTER HAPTER HAPTER 5555
5. Tools for modeling energy policies
5.1 Purpose of modeling in this thesis
This chapter, together with chapters 6 and 7, uses modeling as a tool to examine policy cases in
South Africa’s energy sector. A variety of policy cases are constructed, focusing on the
residential demand and electricity supply sectors. In the methodology outlined in chapter 2,
modeling provides an important step in quantifying the implications of energy policies
identified.
Models provide a systematic framework to examine such policy cases in quantitative terms. The
potential and limitations of using models are discussed in section 5.4. The results of the
modeling will be interpreted in chapter 8 in economic, social, environmental terms – against
criteria of sustainable development. The interpretation of model results will inform the analysis
of implementation of policies in chapter 9. The modeling is therefore an important part of the
methodology, but not the only aspect of the methodology.
5.2 Developing policy cases for energy futures
Energy models allow the construction of policy cases in a quantified way. The implications of
policy interventions can be tested. Developing more than one policy case allows comparisons of
alternative development paths. In keeping with the methodology, the policy cases will have in
common some development objectives (e.g. increasing access to energy services, or supplying
electricity demand), but they differ in the way they reach the objective.
Analysis typically starts with a base case (or ‘business-as-usual’ case, see chapter 6), against
which different policy scenarios can be compared (for example, Nakicenovic 2000; NER 2004a;
for example, Bailie et al. 2001). Note that the base case itself includes changes from present
reality, but changes which are based on existing government policy. It would be possibly to
construct another case which simply extends current development trends. The difference, for
example, would be that the base case in this thesis (see chapter 6) includes ‘cleaner coal’
technologies; a ‘current development trends’ case could examine what would happen if only
conventional pulverised fuel was used for future electricity generation as in the past.

Tools for modeling energy policies 92
Policy cases are constructed to examine how South Africa’s energy development path can be
made more sustainable. Policy cases have both qualitative and quantitative aspects. The
‘storyline’ of a policy case captures the intuition of how a possible future might unfold. Some
aspects, such as behavioural changes, are better dealt with qualitatively. Energy policy cases
that seek to achieve strong sustainability, for example, would tell a story about the development
path that might lead a society in that direction.
While the descriptions of policy cases are important, the key function of modeling is to translate
them into quantitative terms. Policy cases make changes from the base case, for example
introducing greater end-use efficiency or switching fuels for electricity generation. The
implications for the energy system can be seen in the results. Modeling provides a framework
in which some interactions between policies and technologies are taken into account. An
advantage of the modeling framework is that double-counting can be avoided.
The policy cases are not ‘energy scenarios’ in the sense that that terms is used in the literature
(Nakicenovic 2000: 335; Flavin & Lenssen 1995; IWG 2000; Shell 2001; Mintzer et al. 2003).
Energy scenarios tend to examine the future of particular policies in the context of different
changes in the external environment. Scenarios might consider whether energy policy is robust
to changes in global oil prices, or the introduction of future carbon constraints, for example. To
distinguish, the terms ‘policy case’ and ‘energy policies’ are used, rather than scenarios. The
available tools to construct such policy cases are examined in the following two sections.
5.3 Modeling tools Various tools are available to develop policy cases quantitatively and to provide a consistent
framework for their analysis. At least two broad types of energy models can be distinguished,
simulation models and optimization models. The Long-Range Energy Alternative Planning
(LEAP) and the MARKet ALlocation (Markal) tools have both been used for energy analysis in
South Africa, and represent these two types. Optimization models use linear programming to
optimize an objective function subject to specified constraints. Typically, the objective function
is to minimize costs, subject to balance energy supply and demand, as well as other constraints.
Optimization models are prescriptive rather than descriptive and tell the user how to make the
best of a given situation in relation to a predefined goal (Alfstad 2004b).To perform this cost-
effectiveness analysis, optimization model include detailed technological information and costs.
A typical research question would ask what are the least-cost set of technologies to provide
energy supply and meet demands in the future.
Simulation models are based on case determined by the user, meaning that assumptions for a set
of potential futures are compiled. They also contain detailed data and sometimes costs, but

Tools for modeling energy policies 93
rather than calculating ‘optimal’ (least-cost) solutions, cases are defined by the modeler. The
simulation model is descriptive rather than prescriptive. This lends itself to ‘what if’ questions
– what are the implications if a user-specified set of energy supply and demand technologies
and policies are implemented.
5.3.1 Long-range Energy Alternatives Planning tool - LEAP
The Long-term Energy Alternatives Planning (LEAP) system is a simulation model and energy
planning tool. LEAP is a spread-sheet based tool that allows capture of detailed data of the
energy sector, rather than a model optimizing for any particular parameter (SEIB 2002).
Analysis is conducted by constructing one or several future cases, one of which may be the base
case to which different futures can be compared. These cases begin with the demand for useful
energy services, aggregating these to total demand which needs to be supplied by various
generation technologies available. The analysis therefore comes closer to modeling energy
services, not just the supply of energy (Laitner et al. 2001)
The base case reflects characteristics of a future under ‘business-as-usual’, assuming the
implementation of current government policy into the future. Different possible futures can also
be compared to one another. LEAP incorporates an environmental and technology database, so
that the environmental implications of energy futures can be readily explored – both climate
change and local environmental implications. Technology costs can be incorporated, but the
tool includes no explicit economic modeling of prices, industrial sectors or households. The
economic analysis tools offered by MARKAL are more powerful.
5.3.2 Optimizing tools - MARKAL Optimization models, by contrast, are prescriptive rather than descriptive and tell the user how
to make the best of a given situation in relation to a predefined goal (Alfstad 2004b). The
output represents the best way of accomplishing a particular goal, which is usually minimizing
costs. The question is ‘how to’ achieve this goal, given a well-defined set of alternatives.
Choosing between a set of technologies for electricity generation is an excellent example of
using an optimizing tool, and indeed a typical application of MARKAL.
The MARKAL (MARKet ALlocation) model, developed by the International Energy Agency
(IEA), has been a popular optimizing tool for analysing energy futures. Recently, MARKAL
has been integrated with planning approaches in the MESAP-TIMES model. 34
These models are part of the category of dynamic energy optimization models (Markandya &
Halsnaes 2001: 488). The analysis represents a partial equilibrium within the energy sector,
minimizing the total cost of the energy markets (including end-uses). They include significant

Tools for modeling energy policies 94
detail on energy technologies and their costs, including investment and operation costs. They
can also include assumptions about pollutant taxes (including GHGs). They are useful in
analysing changes in GHG emission reduction potential and costs. Some limited economic
modeling (aggregate macro-economic demand, in change in GDP) can be analysed in Markal-
Macro.
The objective function driving these models is to minimize costs subject to constraints. The
strength of MARKAL models lies in answering questions about the most cost-effective
technology solutions for energy systems. Both fuel costs and the cost of energy technologies are
considered (Howells & Solomon 2002). Constraints, which temper the drive to least cost, can
include environmental factors (e.g. emissions), limits on resource availability and dissemination
rates of policies and measures. Such constraints, however, are secondary to cost. As the
literature review has shown, it also leads the modeling into an assumption that the economy is
already operating at an efficient production possibility frontier.
MARKAL is a powerful analytical tool, but has its weaknesses and limitations. The least-cost
assumption is applied to the extent where it can become a weakness, assuming rational
optimization decisions are made by all actors. Multiple objectives and non-linear constraints are
not easily incorporated. The linear programming model is strongly influenced by bounds, so that
without careful design, the least-cost option will take over the entire energy market – something
not observed in practice. Most applications of the model implicitly assume that energy demand
will be met, and thus ignore energy poverty and unmet demand.
MARKAL is mostly used for analysis at the national level, with a focus on technologies.
MARKAL databases are technology-rich. Other parameters, however, such as households or
vehicles, can only be introduced in terms of their energy demand, or as units. This places some
limitation on the disaggregation of the residential sector (see chapter 7).
An approach that allows balance between economic, social and environmental dimensions is
more suitable for an analysis in terms of sustainable development.
5.4 Critical analysis of modeling tools for energy policies
There is great potential to gain insight by using models to create cases, but at the same time, the
limitations of modeling must be clearly understood to use the results appropriately. In short,
users of models and model results need to understand what models can and cannot do.
Models are useful in providing a systematic framework by which to examine different cases of
complex systems. The electricity sector is one such system, and models often contain thousands
34 MESAP: Modular Energy System Analysis & Planning; TIMES: The Integrated Markal Efom System.

Tools for modeling energy policies 95
of data entries (Alfstad 2004b). Models combine large amounts of data and organize it
systematically, enabling analysis of volumes of information that would be virtually impossible
to grasp without such a tool.
At the same time, models simplify real-life problems, making them analytically tractable. The
large volumes of data are combined through mathematical formulations. Computers are able to
interrelate a great number of factors, e.g. that the demand and supply for electricity are matched,
while a large number of other constraints are also met. While the answers generated by
computers may be faulty due to human error, computers are reliable in computation and logical
processes.
In making large amounts of data tractable, models abstract reality. Household fuel use patterns
provide a good example of relationships that are easily over-simplified. In standard energy
models, end-use devices only supply a single demand, e.g. stoves provide energy for cooking.
Especially in poor households, stoves are used for cooking, water heating and space heating.
Some solutions have been found to make models more flexible to allow appliances to provide
multiple end uses (Howells et al. 2005), but challenges remain in replicating multiple fuel use
patterns.
A related limitation in Markal is that households are represented in terms of their demands, or as
units, but do not enter the model itself. Formulations are possible that make the final unit in the
reference energy system a household, but this would lose resolution on the time of use.
In attempts to represent complex energy patterns, data is often lacking. Continuing the example
of household energy use, energy consumption can be disaggregated by several categories:
urban / rural, electrified / non-electrified, by several income groups, by fuel, by end use; by
different geographical and climatic regions. Implementing all these categories makes model
structure complex and increases data requirements. Furthermore, some data not measurable,
even in surveys, e.g. households can provide approximate consumption (or expenditure) on
paraffin per month, but not whether it is used for cooking, lighting or water heating. Modelers
have to make decisions about which categories are relevant to the policy questions being
researched, as well as considering what analysis the data will allow.
It should be clearly understood that models are not a panacea, with solutions to every problem.
They need to be designed carefully to answer specific policy questions. In this thesis, the
purpose of using models is to provide data for evaluating various cases of the future
development of the electricity sector.
A key weakness of models is that they are only as good as the assumptions and data fed into
them. While they might make no error in calculation, the results may be wrong if the

Tools for modeling energy policies 96
underlying data is inaccurate. Most modelers will readily acknowledge that the results of
models are sensitive to erroneous assumptions and model configuration, but users of model
results may be less sensitive to their assumptions. The line between data and key assumptions is
a blurry one, and modelers often fail to make their assumptions and input data sufficiently
transparent. The lack of transparency is made worse that models are commonly perceived as a
‘black box’ by all others than the modeler - and parts of the model are even a mystery to the
modelers.35 There is a trade-off between computational power and complexity on the one hand,
and transparency and ease-of-use on the other.
Because models are sophisticated tools, their results are often assumed to be accurate. The
results must be right ‘because the model says so’. Good modeling practice can mitigate this
weakness, by not only interpreting the results but also discussing the drivers of the results and
the level of confidence. Since modelers and other analysts are often different people,
interpretation of results is at times inadequate.
In particular, models attempting to simulate human behaviour should be aware that this is
possible only in a very limited sense. Optimization models, for example, typically provide the
least-cost solution given the constraints placed on the model. In reality, the cost of energy
services is one factor among others, including less tangible benefits such as status, convenience
and other considerations (Howells et al. 2002).
Models are typically sensitive to key parameters. In energy-economy-environment models, for
example, the discount rate chosen and the learning rate assumed for different technologies are
key parameters. Modelers are often pressed to give a single answer to a particular question, and
may neglect to undertake sensitivity analysis to key parameters. Much skill is required in
finding a good balance between showing ranges of results, without overwhelming readers with
too much data.
The sensitivity to data inputs and key assumptions allows models to be ‘tweaked’. Often such
tweaking is undertaken in good faith, to calibrate the model against known or ‘reasonable’
values. However, the process means that results at least reflect the modeler’s biases, and in the
worst cases, models can be abused to generated pre-determined results. A particular problem
with models used for future energy development is that – almost inevitably – some parameters
will be assumed to grow at a fixed rate into the future. Projections of GDP growth are a classic
example, as are projections of demand for electricity. The approach taken in chapter 6 is to state
the key drivers of the base case clearly upfront.
35 For example, the Markal model (see below, 5.3.2) runs in a linear programming language called GAMS. Reading code may be intelligible to a few, but eventually the model calls up a ‘solver’. Only the most mathematically versed users will fully understand how results are generated by the solver.

Tools for modeling energy policies 97
5.5 Conclusion Modeling of energy policies is an important component of the methodology for this thesis. The
MARKAL modeling framework is used to develop systematic, quantified representations of
energy policy cases. The aim in this thesis is not to develop new models, but as far as possible
to use existing models to test new policy cases and their implications for sustainable
development.
The MARKAL framework is used for a number of reasons. The database developed at the
Energy Research Center has been used to directly inform planning in the National Integrated
Resource Plan and Integrated Energy Plan (see chapter 6). LEAP would have provided a
simulation tool perhaps more closely aligned with a durability approach, but the tool does not
provide detailed cost results. With the central aim of meeting development objectives, a
detailed understanding of costs is required. The approach, then, is to use MARKAL as part of
the methodology. The analysis of the thesis, however, does not end with modeling results.
Rather, it uses these to inform a broader evaluation of indicators of sustainable development and
an analysis of the implications for energy and climate policy.

Modeling energy policies 98
CCCCHAPTER HAPTER HAPTER HAPTER 6666
6. Modeling energy policies Having considered the tools available for modeling energy policy scenarios in chapter 5, the
present chapter turns to the analysis of a focused set of energy policies. Energy planning in
the past was often pre-occupied with supply-side solutions. As outlined in chapter 3,
government energy policy since 1994 has paid much more attention to energy demand and the
provision of energy services. This thesis examines particular aspects of both demand- and
supply-side energy policies. On the demand-side, the focus is on the residential sector,36 while
electricity generation is considered on the supply side.
Previous work at the Energy Research Centre analysed energy policies against indicators of
sustainable development in the context of energy modeling (Winkler et al. 2005a).37 The work
presented here extends this analysis, particularly in the author’s own focus areas of residential
demand and renewable energy in the electricity supply sector.
An adequate understanding of these two sectors requires that their interactions with other
sectors are described – liquid fuels on the supply side, and demand in industry, transport,
commercial and agricultural sectors. These sectors are described much more briefly, based on
existing work, to provide context for the more detailed analysis of electricity and residential
energy. The industrial sector, for example, clearly makes a major contribution to economic
development, and offers potential for large energy savings. The broad contours of the
potential benefits for sustainable development will be outlined in the base case for all sectors,
but detailed policy cases are developed further for the focus areas.
The following section motivates the particular policy focus for this thesis, providing some
details on policies in the residential and electricity supply sectors. Next, the key drivers for
developments in the energy sector as a whole are described, and an overview of development
in the base case for the broader energy sector is presented. This lays the basis for considering
the base case, before considering several policy cases in the residential and electricity sector.
The current chapter outlines how the policy cases were implemented in the modeling
framework, while chapter 7 will present the results.
36 The author’s previous work on the residential sector has informed his work on the household sector (section 6.5). It was published as : Winkler, H, Spalding-Fecher, R, Tyani, L & Matibe, K 2002. Cost-benefit analysis of energy efficiency in urban low-cost housing. Development Southern Africa 19 (5): 593-614. December. 37 The author led this project, and gratefully acknowledges work on the database by his colleagues Mark Howells and Thomas Alfstad and the valuable learning he gained on the use Markal.

Modeling energy policies 99
6.1 Focus of policy modeling The residential sector is critical for the assessment of the social dimension of sustainability.
Its complex socio-economic patterns reflect in a variety of energy use patterns. Past analysis
has tended to focus on case studies and surveys (Mehlwana 1999b; Prasad & Ranninger 2003;
Thom & Afrane-Okese 2001; Thom 2000; Simmonds & Clark 1998; Davis & Ward 1995),
but the diversity of the sector has not been adequately reflected in national energy modeling.
The importance of this social dimension in SA is reflected in the first goal of energy policy,
‘increasing access to affordable energy services’ (DME 1998). The goal of managing energy-
related environmental impacts has an important dimension in the health impacts associated
with indoor air pollution. The residential sector allows at least a minimum of disaggregation
(by income, access to electricity and geographical location, see section 6.5.1 below), enabling
some analysis of the distributional impacts of policy, and hence social equity. This makes the
residential energy sector important in achieving other development goals, beyond energy
policy objectives.
The focus on the demand by households includes electricity, but other fuels cannot be ignored
– particularly the use of LPG for cooking and its potential for productive use. Chapter 3
outlined the importance of electricity to development on the supply side. This chapter
examines the major policy options for supplying electricity in the future. The major options –
cleaner coal, imported hydro, renewable energy, PBMR nuclear and imported gas - have
already been discussed in general in chapter 4.
One means of scoping the impact of a range of policies on major policy goals is the Action
Impact Matrix (AIM, see Table 6.1) (MIND 2005). The AIM tool is designed to understand
the interactions between national development goals and policy goals. This method is useful
to analyse how to make development more sustainable, and to motivate the scope of the
detailed work of this thesis. A later part of the AIM methodology examines the impacts of
climate change on both development and energy policy, but for the present purpose we only
use the first four steps of the methodology, the others being more focused on climate change
(MIND 2005: 4).

Modeling energy policies
100
Table 6.1: Action Impact Matrix scoping the impact of policy interventions on development goals
Industrial
EE
Commercial
CFL,SWH,
HVAC,
building
codes
Efficient
houses,
CFLs SWH,
LPG
Elec:
cleaner
coal
Elec:
imported
hydro
Elec:
renewables
Elec:
imported
LNG
Elec:
PBMR
nuclear
Imported
petroleum
products
Bio-fuels
Fuel tax,
with
recycled
revenue
Development goals
Job creation
+3
+3
+3
-2
-1
+3
-1
0
-3
+3
0
Economic growth
+3
+2
+1
+2
0
+2
0
+2
0
+2
0
More equitable distribution
of income
0
0
+3
0
0
0
0
0
0
+2
+2
Delivery of energy
services for basic needs
0
0
+3
+2
+1
+2
+1
+2
+2
+2
-1
Energy policy goals
Improving access to
affordable energy services
0
0
+3
+3
+1
+2
+1
+2
+2
+2
-1
Governance
0
0
0
0
0
0
0
0
0
0
+2
Stimulate economic
development
+3
+2
+1
+2
0
+2
0
+2
0
+3
+1
Manage energy-related
environmental impacts
+2
+2
+3
+1
0
+3
0
-2
0
+2
+3
Securing supply through
diversity
+2
+1
+1
-3
-1
+3
+2
+3
-3
+2
0

Modeling energy policies 101
The row headings of the matrix represent development objectives. The more detailed discussion
of development objectives in chapter 3 can be summarised, for the purposes of this thesis, in the
major goals of GEAR– growth, employment, redistribution and those of the RDP – the delivery
of services essential to meeting basic human needs. For the latter, we focus here on energy
services.38
The column headings are policy options. A broader set of energy policy interventions is taken
from a study of “South African energy policies for sustainable development” (Winkler et al.
2005a). It considers, amongst other policies, the major options for electricity supply, and
examines interventions in households that include CFLs, solar water heaters, geyser blankets,
more efficient building shells (mainly through ceilings). These policies are similar to the ones
proposed for this thesis, but the set here also includes industrial energy efficiency measures to
meet a national goal of 12% reduction in final demand (DME 2004d). A similar goal could be
achieved in commercial buildings with the introduction of building codes, efficient lighting and
HVAC systems, and SWHs. Liquid fuels are important for transport, and the policies
considered are importing petroleum products (rather than continuing with coal-to-liquids or gas-
to-liquids at SASOL) and refining bio-fuels. A cross-cutting policy, a fuel tax on coal for
electricity generation, is also included, with coal providing 93% of electricity generated.
For the purpose of focusing the thesis, the question of interest is the impact of the policy
interventions on development. A simple scoring system ranging from -3 to +3 is used, with -3
representing a high negative (undesirable) impact/effect and +3 high positive; scores of 1 being
low, 2 medium and 0 no impact / effect (MIND 2005). Typically this exercise would be
conducted with stakeholders, but here the scores simply reflect the author’s judgement.
The scores in Table 6.1 may be subjective, but they provide a systematic consistent motivation
for the focus taken in this thesis. Highlighting the high positive and negative scores, the
residential policy interventions (efficient housing shells, CFLs, SWH and geyser blankets) are
expected to have several high positive impacts on development. Amongst the electricity supply
options, the initial scoping suggests that there are positive and negative aspects for several
options. The one high negative score reflects the well-known problem of South Africa’s
dependency on coal, in the energy sector in general and even more acutely in electricity (see
chapter 4). The need for greater diversity makes it worthwhile examining all alternative options
in more detail through modeling.
Mobility is an important contributor to quality of life. The transport sector aims to ‘move South
Africa’ (DOT 1999). From an energy-environment perspective, the sector account for most
38 The focus is not on the contribution of energy policies to other services, e.g. energy efficiency measures housing providing better comfort in low-cost housing.

Modeling energy policies 102
energy used in local areas (Winkler et al. 2005c) and is the fastest-growing contributor to GHG
emissions (Prozzi & Sperling 2002; Naude et al. 2000). The growing of bio-fuels can be
decentralised to small growers with potentially significant socio-economic benefits. However,
significant data problems arise in analysing this sector, with collection of transport information
typically not providing energy data, and general energy analysis not disaggregating transport
sufficiently. Analysing transport energy infrastructure deserves detailed future analysis, but will
require a sophisticated understanding of vehicle stocks, ages, turnover rates; infrastructure and
its costs; and the possibilities for behavioural changes.
The policy option of importing refined petroleum products, instead of continuing with
production of synfuel from coal, might raise problems related to the volatility in the oil price.
From Table 6.1, it can be seen that securing supply through diversity faces major barriers, with
the current dependence on coal (see chapter 3). The 1998 White Paper on Energy Policy clearly
recognised this constraint (see the -3 for cleaner coal / diversity). Two major domestic energy
resources – flows of renewable energy and large stocks of uranium – exist to potentially meet
demand. From an environmental perspective, they are often consider polar opposites – yet from
the point of view of GHG emissions, both radically reduce emission (zero for operation, but
some in construction). These factors motivate the focus on the electricity supply.
The multiple high positive scores for efficiency and fuel switching measures confirm the
motivation for focusing on the residential sector. The potential contribution to reaching the
development objectives is large in this sector. The focus, then, is on residential policies on the
demand side, and options for electricity generation on the supply side.
Energy policies in the residential sector can make a major contribution to South Africa’s
development objectives, as outlined in chapter 3. Policy since 1994 has included the national
electrification programme, raising the rates of grid access from about one-third to two-thirds
over the 1990s. The issue of affordability is emerging as critical, with consumption levels of
newly electrified households remaining low. The poverty tariff has sought to address this issue.
The energy policy goal of ‘increasing access to affordable energy services’ (DME 1998) has
been pursued vigorously, but more needs to be done. Residential energy policies can contribute
to managing environmental health impacts, another major energy policy goal. The third
relevant energy policy goal is governance, with power sector reform concentrating on the
distribution side (see chapter 4).
Having identified and prioritised development objectives and energy policies, the thesis turns to
representing these in a modeling framework. Important drivers – including economic
development, population growth, technology, fuel prices and more – shape both policy cases

Modeling energy policies 103
and the base case. The next section discusses the key drivers of future trends and the
assumptions made about how these might change in the future.
6.2 Drivers of future trends and key assumptions Future energy needs depend on the number of people in a country, as well as the rate of
economic change. Two important drivers of future energy trends include economic growth and
population projections. A third important factor is technology, and the rate at which
technological learning occurs. Future fuel prices, fourthly, are important particularly for fuels
that are internationally traded. Fifth, the discount rate makes an enormous difference to any
modeling in an economic framework, and warrants discussion in relation to the Markal model
used here. Finally, the emission factors for local air pollutants and global GHGs are stated.
6.2.1 Economic growth increases energy demand In the absence of interventions that de-couple energy demand from economic growth,
projections of GDP are an important driver.
Figure 6.1 shows the historical trends, which are clearly upward in general, but with significant
downturns in the 1980s and 1990s. Economic growth over the next twenty-five years is hard to
predict year-on-year, but the upward trend can be assumed to continue.
GDP itself is an imperfect measure of economic growth (see inter alia Daly & Cobb 1989;
Pearce et al. 1989; Munasinghe 2001; see inter alia Norgaard 1994; Blignaut & De Wit 1999). It
accounts for all economic activity, even when that activity may have negative social or
environmental consequences. For example, the clean-up of an oil-spill or expenditure on
replacing stolen goods would add positively to GDP. GDP also accounts for the sale of natural
resources as positive income, thus assigning a zero value to implied depletion of scarce natural
assets (Munasinghe et al. 1999). Other indicators, such as the Human Development Index,
include a broader composite of social factors, including literacy, life expectancy and GDP per
capita (Atkinson et al. 1997), with the index having declined in the context of AIDS.

Modeling energy policies 104
Figure 6.1: Trends in GDP, 1946 - 2000
Source: SA Reserve Bank (SARB various)
Gross domestic product at market prices - Constant 95 prices
0
100000
200000
300000
400000
500000
600000
700000
1946
1948
1950
1952
1954
1956
1958
1960
1962
1964
1966
1968
1970
1972
1974
1976
1978
1980
1982
1984
1986
1988
1990
1992
1994
1996
1998
2000
R millions
Despite the critique of GDP, it is widely used in international comparison and for national
planning. Most SA government projections therefore assume a smooth growth rate into the
future. Annual GDP growth was assumed to be 2.8% per year in the first Integrated Energy Plan
(DME 2003d), while the Integrated Resource Plan also considers forecasts of 1.5% and 4%
(NER 2001/2). A central GDP growth figure of 2.8% seems a reasonable approach, even though
government targets higher growth in the future.
6.2.2 Population projections impact on energy consumption The number of people in the country drives energy consumption, unless per capita consumption
were reduced. For the residential sector, the household growth rate is important, and it turns out
that this differs significantly from the growth rate for population by individuals. Urban and
rural households differ in many respects, including their energy use patterns. The impact of
AIDS on all population projections makes a marked difference. All the factors have
implications future residential energy demand, discussed in section 6.3.3.
6.2.2.1 Urban - rural shares in future
The analysis of the residential sector will divide households into six types (see section 6.5.1),
distinguished along urban / rural, high / low-income and electrified / non-electrified lines.
The first of these distinctions, the urban-rural, is relevant, since energy use patterns differ
markedly. Rates of electrification are much higher in urban areas, and other fuel use patterns

Modeling energy policies 105
differ too. Urban population growth rates for earlier periods were substantially higher, e.g.
population growth from 1946 - 1970 was 3.45% per year, 3.09 % for 1970-1996 (SACN
2004).Overall, this gives a picture of a growing population, but growth slowing down to lower
rates. Will South Africa’s population continue to urbanise? There have been some suggestions
that rural populations have peaked and will stabilise or even decline (Calitz 1996).
This question is complicated by definitions of ‘urban’ and ‘rural’, and the intermediate
categories of peri-urban and dense rural settlements – the latter a legacy of Apartheid, where
large numbers of people were moved to rural ‘homelands’ and settlements developed with high
density but very little industrial or commercial base. Furthermore, the 2001 Census data no
longer reports by urban / rural division (SSA 2003a). For the analysis of energy demand, it
seems reasonable to assume that peri-urban and dense rural settlements are more similar to
urban areas than ‘deep rural’. The thesis assumes that virtually all the household growth –
moderate as it is projected to be - will occur in this broadly defined urban category and that rural
household numbers remain stable. Under these assumptions, 64% of the population will be
urbanised by 2030.
This assumption has some support in the analysis of migration patterns between provinces,
where Gauteng, Western Cape and North West had a positive net migration rate in 2004 – the
former two having large urban populations – while provinces with a higher percentage of rural
population, namely the Eastern Cape and Limpopo, had the highest outflow of people. The
DBSA approach of assuming stable numbers of rural households is adopted for this thesis (SSA
2004a).
6.2.2.2 Households and household size
Energy use in many respects relates more directly to households, rather than to individuals.
Electricity connections, for example, are made to each household. A notable trend across South
African cities is that households have been growing faster than population. Most of the
population growth is expected to occur in urban areas in future. Across South Africa’s nine
largest cities, population grew between 1996 and 2001 by 2.8% per year, but households
increased at 4.9% per year (SACN 2004:179). Possible reasons include people moving out of
backyard shacks and establishing new households; migration from rural areas to the cities; and
increased household formation.
The average number people per urban household has dropped from 3.98 in 1996 to 3.58 in 2001
(SACN 2004). In the national picture, it has dropped from 4.48 to 4.0 over the same time (SSA
2003a; 1996), although these trends are probably partly the result of reconsideration of earlier
Census data. Given demographic trends elsewhere in the world, it seems plausible to assume
that household size will continue to decline a little further, reaching 3.8 people per household by
2030.

Modeling energy policies 106
6.2.2.3 The impact of HIV/AIDS
Studies considering future – of energy development or other matters – have to consider the
potential impact of AIDS. While the topic is strongly debated, some highly respected studies
show a substantial levelling off in population during the study period. Major institutions have
conducted investigations that projected trends in population, some distinguishing between
scenarios with more or less impact of AIDS. However, due to the HIV/AIDS pandemic in the
country, population projection might be higher than actual. The Development Bank of Southern
Africa (DBSA) uses population projection, differentiating on low and high impacts of
HIV/AIDS (Calitz 2000a; 2000b). The first Integrated Energy Plan also included projections of
population growth (ERI 2001), which are shown together with other estimates in Table 6.2. Not
all studies covered all years.
Table 6.2: SA population projections from various sources, millions
DBSA low AIDS impact
DBSA high AIDS impact
ASSA 2002 (base run)
IEP assumptions
UN world population projection
This study
2001 45 44 43 44.8 39
46 46.4
2011 56 49 48 50 47.6
2016 61 50 48 45 48.5
2025 70 49 50 57 44 49.7
2030 50 50.0
Academically, studies by Prof Dorrington of the University of Cape Town Commerce Faculty
for the Actuarial Society of South Africa are well respected (ASSA 2002). The ASSA
projections seem reasonable, still indicating population growth over the period, but at lower
rates, growing 12% over the 30 year study period, with annual growth rates between 0.1 and
1.0%. For this thesis the assumption is that the past pattern of household / population growth
will continue, but, based on other studies, assume lower growth rates due to the impact of
AIDS.
39 The 2001 Census reported 44,819,778 people in South Africa (SSA 2003b) and we use this number instead of ASSA’s projection.

Modeling energy policies 107
Figure 6.2: Population projections by ASSA model
Data source: (ASSA 2002)
-
10
20
30
40
50
60
2001
2003
2005
2007
2009
2011
2013
2015
2017
2019
2021
2023
2025
2027
2029
Millions
6.2.2.4 The future of poverty
Perhaps one of the most difficult assumptions is about the future about poverty. The approach
taken here is a middle path between assuming that no inroads are made into the shares of poorer
households, and dramatic decreases of poverty. At least in absolute terms, we assume that
overall income levels increase so that 70% of urban households are non-poor (Van Ryneveld et
al. 2003), compared to 61% in 2001 (SSA 2002). Shares of low-income households decline to
60% in the base case by 2030, down from 69% in 2001. This overall affect does not claim to
address issues of relative poverty, where households may still consider themselves poor, as
high-income households have grown wealthier.
6.2.2.5 Future household numbers
In summary, population projections used for the base case in this study assume that the overall
population projections from the base run of the ASSA model are reasonable, and comparable
with the range in the literature. Population grows at moderate rates, reaching 50 million by
2030. Household numbers grow slightly more slowly as household size declines, increasing –
with growth in urban areas – from 11.2 million in 2001 to 12.9 million in 2030. Rural household
numbers stay constant. Electrification is almost complete in urban areas by the end of the
period, while 10% of rural households do not have electricity services – but all high-income
rural household are assumed to be electrified.
Given the data for the starting year of 2001 and the assumed changes as described above, the
changes in the numbers and shares of the six different household types in this study are shown
in Table 6.3.
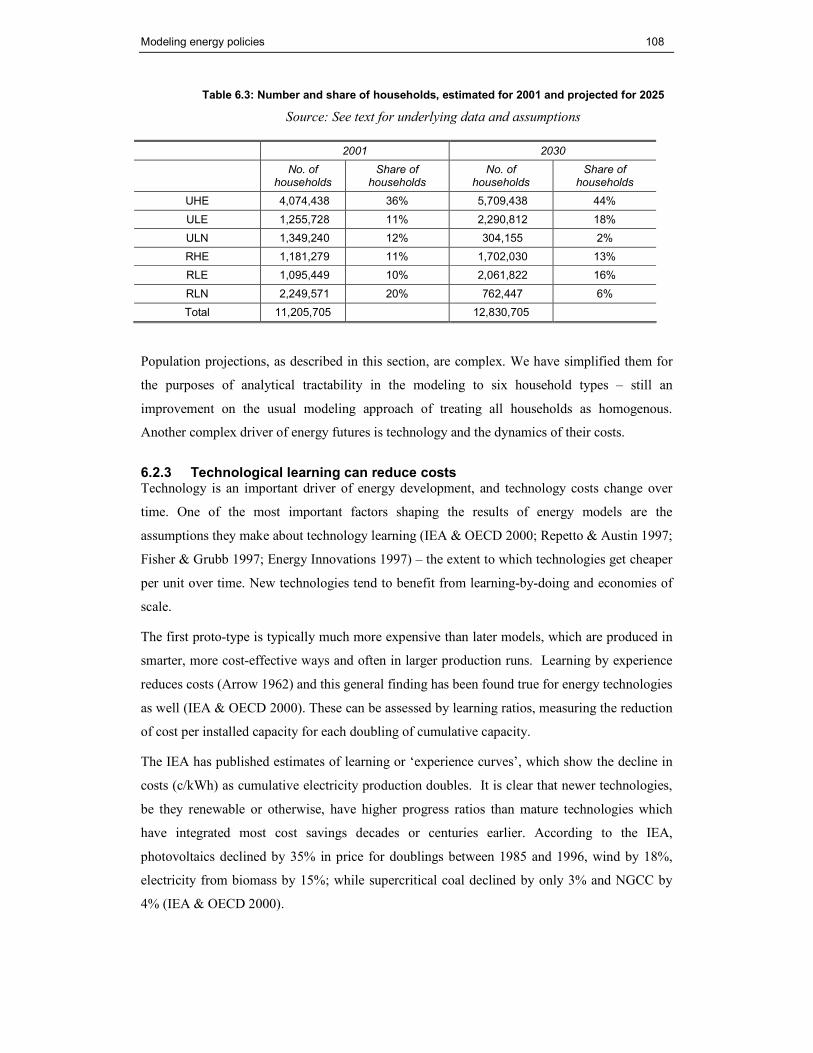
Modeling energy policies 108
Table 6.3: Number and share of households, estimated for 2001 and projected for 2025
Source: See text for underlying data and assumptions
2001 2030
No. of households
Share of households
No. of households
Share of households
UHE 4,074,438 36% 5,709,438 44%
ULE 1,255,728 11% 2,290,812 18%
ULN 1,349,240 12% 304,155 2%
RHE 1,181,279 11% 1,702,030 13%
RLE 1,095,449 10% 2,061,822 16%
RLN 2,249,571 20% 762,447 6%
Total 11,205,705 12,830,705
Population projections, as described in this section, are complex. We have simplified them for
the purposes of analytical tractability in the modeling to six household types – still an
improvement on the usual modeling approach of treating all households as homogenous.
Another complex driver of energy futures is technology and the dynamics of their costs.
6.2.3 Technological learning can reduce costs Technology is an important driver of energy development, and technology costs change over
time. One of the most important factors shaping the results of energy models are the
assumptions they make about technology learning (IEA & OECD 2000; Repetto & Austin 1997;
Fisher & Grubb 1997; Energy Innovations 1997) – the extent to which technologies get cheaper
per unit over time. New technologies tend to benefit from learning-by-doing and economies of
scale.
The first proto-type is typically much more expensive than later models, which are produced in
smarter, more cost-effective ways and often in larger production runs. Learning by experience
reduces costs (Arrow 1962) and this general finding has been found true for energy technologies
as well (IEA & OECD 2000). These can be assessed by learning ratios, measuring the reduction
of cost per installed capacity for each doubling of cumulative capacity.
The IEA has published estimates of learning or ‘experience curves’, which show the decline in
costs (c/kWh) as cumulative electricity production doubles. It is clear that newer technologies,
be they renewable or otherwise, have higher progress ratios than mature technologies which
have integrated most cost savings decades or centuries earlier. According to the IEA,
photovoltaics declined by 35% in price for doublings between 1985 and 1996, wind by 18%,
electricity from biomass by 15%; while supercritical coal declined by only 3% and NGCC by
4% (IEA & OECD 2000).

Modeling energy policies 109
Figure 6.3: Learning curves for new and mature energy technologies
Source: (IEA & OECD 2000)
Photovoltaics (~65%)
1985
1980Wind power – average (82%) Electricity from
biomasss (~85%)
NGCC (96%)
Supercritical coal (97%)
1995
10
0.1
1
0.01 10001001010.1
1985
19951980
NGCC (96%)
Wind power – best
performance (82%)
1995
0.01
0.01 10001001010.1
Technology costs for new energy technologies change over the period. Technology learning
rates are included in some of the policy cases on both the demand and supply-sides. Such
analysis should be conducted carefully, taking into account several factors:
• The cost reduction is a function of global cumulative production, especially where
significant components are imported
• A more detailed approach should consider the local content, and components where the
learning effect is likely less pronounced
• The applicability of international learning rates to SA remains to be examined.
6.2.4 Future fuel prices Prices of domestic fuels are important for the residential sector. Of particular concern, though,
is price volatility in imported and exported fuels. The oil price reached $ 50 / barrel, affecting
South Africa’s imports, with impacts on the local petrol and diesel price felt in SA. The prices
for exports of SA coal have been volatile (DME 2004e). Predicting these prices into the future is
uncertain. The prices for the base year (2001) are stated in Table 6.1, as are the assumptions for
the middle (2013) and end (2025) of the period.
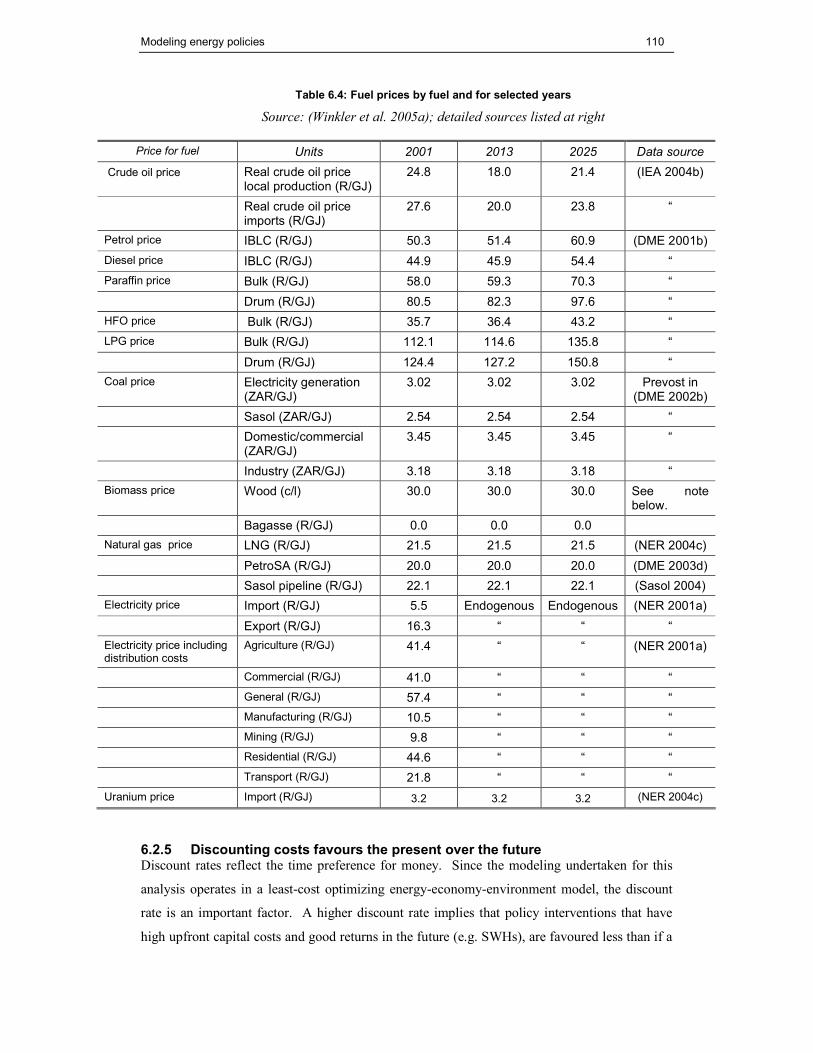
Modeling energy policies 110
Table 6.4: Fuel prices by fuel and for selected years
Source: (Winkler et al. 2005a); detailed sources listed at right
Price for fuel Units 2001 2013 2025 Data source
Crude oil price Real crude oil price local production (R/GJ)
24.8 18.0 21.4 (IEA 2004b)
Real crude oil price imports (R/GJ)
27.6 20.0 23.8 “
Petrol price IBLC (R/GJ) 50.3 51.4 60.9 (DME 2001b)
Diesel price IBLC (R/GJ) 44.9 45.9 54.4 “
Paraffin price Bulk (R/GJ) 58.0 59.3 70.3 “
Drum (R/GJ) 80.5 82.3 97.6 “
HFO price Bulk (R/GJ) 35.7 36.4 43.2 “
LPG price Bulk (R/GJ) 112.1 114.6 135.8 “
Drum (R/GJ) 124.4 127.2 150.8 “
Coal price Electricity generation (ZAR/GJ)
3.02 3.02 3.02 Prevost in (DME 2002b)
Sasol (ZAR/GJ) 2.54 2.54 2.54 “
Domestic/commercial (ZAR/GJ)
3.45 3.45 3.45 “
Industry (ZAR/GJ) 3.18 3.18 3.18 “
Biomass price Wood (c/l) 30.0 30.0 30.0 See note below.
Bagasse (R/GJ) 0.0 0.0 0.0
Natural gas price LNG (R/GJ) 21.5 21.5 21.5 (NER 2004c)
PetroSA (R/GJ) 20.0 20.0 20.0 (DME 2003d)
Sasol pipeline (R/GJ) 22.1 22.1 22.1 (Sasol 2004)
Electricity price Import (R/GJ) 5.5 Endogenous Endogenous (NER 2001a)
Export (R/GJ) 16.3 “ “ “
Electricity price including distribution costs
Agriculture (R/GJ) 41.4 “ “ (NER 2001a)
Commercial (R/GJ) 41.0 “ “ “
General (R/GJ) 57.4 “ “ “
Manufacturing (R/GJ) 10.5 “ “ “
Mining (R/GJ) 9.8 “ “ “
Residential (R/GJ) 44.6 “ “ “
Transport (R/GJ) 21.8 “ “ “
Uranium price Import (R/GJ) 3.2 3.2 3.2 (NER 2004c)
6.2.5 Discounting costs favours the present over the future Discount rates reflect the time preference for money. Since the modeling undertaken for this
analysis operates in a least-cost optimizing energy-economy-environment model, the discount
rate is an important factor. A higher discount rate implies that policy interventions that have
high upfront capital costs and good returns in the future (e.g. SWHs), are favoured less than if a

Modeling energy policies 111
lower rate is used. The current costs are counted fully, but future benefits are discounted.
Conversely, the higher discount rate favours technologies and policies with low initial costs, but
higher costs in the future (e.g. gas –fired power stations).
In South Africa, discount rates vary between social discount rates, reflecting public investment
at 8% (Borchers et al. 2001; Davis & Horvei 1995) and private lending rates between 15% and
20% (SARB 2001). The first IEP used a rate of 11% (DME 2003d), although this may be
revised for the second plan.
The general discount rate used in the study is 10%. However, we assume that poorer households
have a higher discount rate than high-income households but for poorer households, we assume
their time-preference for money is 30% (Spalding-Fecher et al. 2002a; Banks 1999). In other
words, poorer households strongly prefer money now to money later. The implication is that
they will be less likely than other sectors to invest in technologies that will lead to energy
savings in the future, even though it would reduce monthly energy bills.
Costs are reported in 2000 Rands; where there is a need to adjust cost data from other years, a
deflator based on Gross Value Added is used.
Table 6.5: Cost deflators based on Gross Value Added
Sources: (SARB 2005; SSA 2004b)
1994 62.5
1995 69.0
1996 74.8
1997 80.8
1998 86.4
1999 92.1
2000 100.0
2001 107.7
2002 118.6
2003 123.5
2004 128.8
6.2.6 Emission factors Emission factors are needed to convert energy consumption (in energy units, e.g. PJ or GJ) to
emissions. The IPCC default emission factors (in tC / TJ, or t CO2 / TJ) are used for emissions
of carbon dioxide (CO2), methane (CH4), nitrous oxide (N2O), nitrogen oxides (NOx), carbon
monoxide (CO), non-methane volatile organic compounds (NMVOC) and sulphur dioxide
(SO2) (IPCC 1996: Tables 1-2, 1-7, 1-8, 1-9, 1-10, 1-11 and 1-12 respectively). Following IPCC
methodology, local emission factors or adjustments to defaults based on local conditions are
made.

Modeling energy policies 112
For CO2 from other bituminous coal, 26.25 tC / TJ instead of the IPCC default of 25.8 tC / TJ.
The adjustment is based on direct measurements at South African coal-fired power station
(Lloyd & Trikam 2004). The higher emissions are consistent with the lower calorific value of
SA sub-bituminous coal at 19.59MJ/kg, whereas the IPCC default value is 25.09 MJ/kg coal.
Further measurements at more stations in future may lead to a submission of a SA-specific
emission factor to the IPCC.
The above list already includes important local air pollutants (SO2, NOx, CO, NMVOC), but
not particulate matter. Emission factors for particulates are highly technology-specific, and no
similar set of default factors as for other pollutants was readily found. An important area for
future research would be to examine the applicability of the international literature (IIASA
2005; US EPA 2000) to South Africa. Future research should review previous work in South
Africa (NER 2004a; Howells 2004) and establish a list of emission factors (kg TSP / TJ) for the
particular technologies.
6.2.7 Conclusions on drivers of future trends The discussion of economic growth, population, technology learning, fuel prices, discount rates
and emission factors shows that the base case implemented in the model is driven by a set of
complex factors. The critical assumptions made about these factors and how they might change
in the future have been outlined. The drivers are important for policy cases, but in particular in
shaping the base case.
The base case (sometimes also called the ‘reference scenario’) represents the continuation of
current development trends, including some existing policies. The base case provides a bench-
mark against which new policy cases can be measured – or implementation of policies which
are on the books, but have not been realised. The next section presents key elements of the base
case.
6.3 The base case The base case presents a path of South Africa’s energy development that can also be called
‘current development trends’ or a reference scenario. The base case for this analysis is similar to
that of government plans, the first Integrated Energy Plan (IEP) (DME 2003d) and for
electricity, the second National Integrated Resource Plan (NIRP) (NER 2004c). The
technologies chosen for the NIRP were described in the chapter on electricity policy (chapter 4).
Table 4.8 summarised the key characteristics of the technologies for electricity generation. The
reference case for the NIRP was conducted in collaboration Eskom, the NER with the ERC’s
modeling group (NER 2004a), and the assumptions for the base case here are very similar.

Modeling energy policies 113
An important difference relates to population projections. The assumptions made for this thesis
are clearly stated in section 6.2.2. The population projections used in the IEP were for 50
million (here: 47.4 million) and 57 million (49.1 million). While the IEP projections are
reduced from previous estimates, they are still higher. Another difference relates to confidential
data used in previous studies, which was not available for this thesis.
The time-frame for the base and policy cases is from 2001, the base year, until 2025. The
modeling approach was to extend the model run to 2030 to avoid sudden changes in the end
year. References to the ‘end of the period’ are for 2025. Costs are reported in year 2000 Rands.
The major changes reported here are those for future demand in the energy sector as a whole.
The broader analysis provides the context for the policies in the residential sector. The fuel mix
for electricity generation is reported on the supply side. More detailed results of the base case
will be elaborated, as the base case is used as a bench-mark for new policy cases.
6.3.1 Fuel mix on the supply side Given the focus of the analysis, the overall energy supply is reviewed briefly, before
considering electricity supply in the base case in a little more detail. The overall mix of fuels in
the base case is illustrated in Table 6.6:. Clearly, coal dominates total primary energy supply
(TPES), with most of it being used for electricity generation. Consumption at SASOL for coal-
to-liquids provides a major share, with ‘other’ coal supply feeding industry, other domestic
uses. Coal exports are deducted from indigenous production to reach the figure in ‘other’ coal
production. Discard coal, as the name suggests, is not mined separately, but would have been
discarded. It starts being used after 2010 for fluidised bed combustion. The amount of gas
production at PetroSA remains constant.
Table 6.6: Total primary energy supply by fuel group in base case
PJ 2001 2005 2010 2015 2020 2025
Coal for electricity 1,718 1,966 2,286 2,650 2,872 3,205
Coal other 624 647 648 646 648 490
Coal SASOL 859 859 859 859 859 859
Biomass 76 41 37 33 29 25
Crude oil 966 966 1,376 1,469 1,542 1,542
Discard coal - - - 962 1,080 1,169
Hydro 7 7 7 7 7 7
Gas 98 98 98 98 98 98
Total 4,347 4,583 5,311 6,723 7,134 7,395
The contribution of non-fossil, renewable fuel sources to primary energy supply declines. The
contribution of hydro-electricity remains constant, with few large new sites available, while

Modeling energy policies 114
biomass declines as other fuels are preferred. TPES in 2001 is within half a percent of the 4,370
PJ reported in the national energy balance for that year (DME 2003a).
The fuel mix for electricity generation is illustrated in two ways. Figure 6.4 shows the power
plants by the output of electricity generated. The plants are grouped by fuel to make the graph
more readable – for the full set of plants see Figure 10.1 in the Appendix. The most striking
feature is the continued dominance of coal-fired power plants. Most of these are Eskom plants,
but as generation from these levels off in the latter half of the 2020s, new coal (pulverised fuel)
and FBC plants using discard coal come in (see section 6.6.6). Nuclear power from Koeberg
adds some more baseload from its pressurized water reactor (PWR). Several types of plants
provide peaking power – pumped storage, natural gas combined cycle, small hydro and the only
renewable - bagasse co-generation.
Coal plants using pulverised fuel dominate the base case, warranting a brief summary of their
key characteristics (see also Table 6.14). The stations have an investment cost just under
R10 000 per installed kW. Variable operating and maintenance (O&M) costs are low reflecting
the relatively low cost of coal at R 3.02 / GJ. Costs are unlikely to decrease very significantly
over time and economies of scale have already been factored in. Since this is a mature
technology, efficiencies of such plants have been improved in the past already, and are assumed
to remain at similar levels, 35% (NER 2004c). Efficiencies assume that new stations are dry-
cooled and use flue-gas desulphurisation. For South African coal characteristics, about 65% of
sulphur must be removed (NER 2004a), so that the dry FGC method at 70% efficiency can be
used.
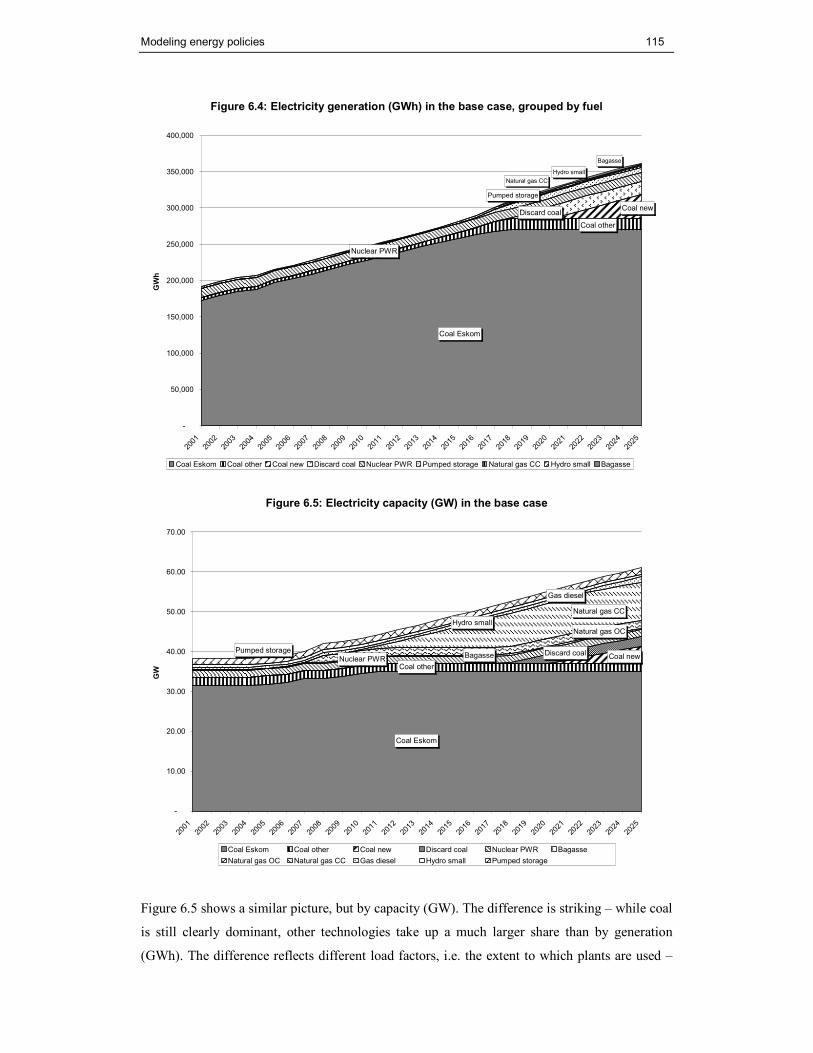
Modeling energy policies 115
Figure 6.4: Electricity generation (GWh) in the base case, grouped by fuel
Coal Eskom
Coal other
Coal newDiscard coal
Nuclear PWR
Pumped storage
Natural gas CC
Hydro small
Bagasse
-
50,000
100,000
150,000
200,000
250,000
300,000
350,000
400,000
2001
2002
2003
2004
2005
2006
2007
2008
2009
2010
2011
2012
2013
2014
2015
2016
2017
2018
2019
2020
2021
2022
2023
2024
2025
GWh
Coal Eskom Coal other Coal new Discard coal Nuclear PWR Pumped storage Natural gas CC Hydro small Bagasse
Figure 6.5: Electricity capacity (GW) in the base case
Coal Eskom
Coal other
Coal newDiscard coalNuclear PWR
Bagasse
Natural gas OC
Natural gas CC
Gas diesel
Hydro small
Pumped storage
-
10.00
20.00
30.00
40.00
50.00
60.00
70.00
2001
2002
2003
2004
2005
2006
2007
2008
2009
2010
2011
2012
2013
2014
2015
2016
2017
2018
2019
2020
2021
2022
2023
2024
2025
GW
Coal Eskom Coal other Coal new Discard coal Nuclear PWR Bagasse
Natural gas OC Natural gas CC Gas diesel Hydro small Pumped storage
Figure 6.5 shows a similar picture, but by capacity (GW). The difference is striking – while coal
is still clearly dominant, other technologies take up a much larger share than by generation
(GWh). The difference reflects different load factors, i.e. the extent to which plants are used –

Modeling energy policies 116
these would be high for baseload plants, and low for peaking plants. Several plant types have
capacity that do not generate electricity, notably open cycle gas and diesel turbines. Such plants
might be built to maintain the reserve margin and for emergency and peaking power. Since the
modeling framework chooses least-cost options, relatively expensive options would not be
chosen to generate electricity. Again, the full set of plants can be found in the Appendix, Figure
10.2.
The supply options exist to meet energy demand. The base case projections for energy demand
from all sectors is presented first, before honing in on residential demand more specifically.
6.3.2 Demand projections While the focus of analysis is the residential sector, the base case provides the context of the
broader energy system. Figure 6.6 shows that the demand for future energy services comes
predominantly from other sectors, the largest being industry and transport.
Figure 6.6: Projected energy demand by sector in the base case
Industrial
Transport
Residential
Commercial
Agriculture
0
500
1000
1500
2000
2500
3000
3500
2001
2003
2005
2007
2009
2011
2013
2015
2017
2019
2021
2023
2025
PJ
Fuel consumption in the base year for the reference case is dominated by industry at 54%, with
transport being the next highest at 29%. The other sectors make up smaller shares, with
residential (9%), commerce (4%) and agriculture (3%). The transport and agriculture shares are
similar to those reported in the national energy balance (DME 2003a). Industry is somewhat
higher, and commercial fuel consumption lower. Of particular note is that the residential sector
here has a share that is lower than the 16% of final energy consumption that can be calculated
from the energy balance. Examining the latter data more closely shows that almost half (49%)
of the residential consumption derives from ‘renewables and waste’, the category which
includes biomass (calculated from DME 2003a). Biomass data vary significantly for year to
year and are highly uncertain; on their own, they constitute 8% of final demand in the energy
balance, i.e. a greater amount than the difference between the share in this thesis and the energy

Modeling energy policies 117
balance. The approach taken here is to work with the detailed estimation of energy demand
derived through bottom-up analysis. Results comparing policies within residential sector would
be relative and unaffected; care should be taken if comparing policies across demand sectors.
6.3.3 Projections of residential energy demand Given that the residential sector is a major focus of the modeling for this thesis, a more detailed
description of future trends is warranted. The trends in the base case, i.e. without policy
intervention, are described here, followed by a section detailing the future policies.
One of the key changes since 1990 has been the electrification programme, which has gradually
moved energy use patterns to a greater reliance on electricity – although affordability of using
electricity remains an issue in low-income households. Many other fuels, such as kerosene, coal,
fuel-wood and LPG are used as well.
Figure 6.7: Trends in electrification of households in SA, 1995-2002
Data source: NER (2002a; 2001c)
21%
27%
38%
43%
48%46%
49%50%
76%
79%
74%
77%
80%
74%
77%
80%
50%
55%
60%
63%
66%
63%
66%68%
0%
10%
20%
30%
40%
50%
60%
70%
80%
90%
1995 1996 1997 1998 1999 2000 2001 2002
Percentage households electrified
Rural
Urban
Total
Note: The drop in urban electrification rates from 1999 to 2000 is explained by changes in the numbers of
households reported in the 1996 Census to new data. As a result, the number of households for statistical
purposes increased markedly from 1999 to 2000 (NER 2001c).
Figure 6.7 shows how electrification rates have increased since 1995, with urban centers
reaching 80% by 2002 despite their populations growing. While half of rural areas remained
non-electrified by 2002, this was a significant increase from 21% in 1995.
Universal access to affordable electricity will remain a corner-stone of policy for the sector and
treated as a ‘given’ in considering policy choices. Government’s commitment to achieving

Modeling energy policies 118
universal access has been reiterated in many policy speeches (Mbeki 2004a; Mlambo-Ngcuka
2003, 2002a, 2004).
The base case assumes that the current development trend of electrification continues. Having
moved from roughly one-third to two-thirds with access to electricity in the 1990s, the trends
continues. However, as the ‘easier’ connections were made first, the last third of households
will be more marginal – both geographically and economically. Some rural households might
remain distant from the grid, and their marginalisation in terms of poverty might mean that off-
grid options do not reach them either. By 2030, it is assumed that almost all urban households
and the 90% of rural households will have access to electricity.
Figure 6.8: Projected changes of household numbers in the base case, 2001 – 2025
0
1
2
3
4
5
6
2001
2002
2003
2004
2005
2006
2007
2008
2009
2010
2011
2012
2013
2014
2015
2016
2017
2018
2019
2020
2021
2022
2023
2024
2025
million households
UHE ULE ULN RHE RLE RLN
Continuing electrification has implications for the household types as defined here. The two
categories of non-electrified households (urban, ULN and rural, RLN) will decline, as can be
seen in Figure 6.8. The growth of numbers in other household types is the result of three trends
– increasing electrification, higher urbanisation and a moderate growth in total number of
households. The growth in UHE households – where all three factors are positive – is the
highest.
Projected future energy demand in the residential sector, in the first instance, would depend on
the changing number of households in each group, as well as the changes in the of energy
services consumed by each household. Future household numbers in turn is likely to depend on
population growth rates, the impact of HIV / AIDS, and migration patterns. Changes in useful
energy intensity would depend on changing fuel use (notably electrification) and income levels.
We assume that this pattern of household / population growth will continue, but that population
growth rates will be lower due to the impact of AIDS. Since this important assumption is a

Modeling energy policies 119
driver of future energy patterns beyond just the residential sector, it is discussed together with
other key assumption about the future in section 6.2.2.
The base case and all the policy cases assume increased access to electricity. Disaggregated by
household type, household numbers shift from non-electrified households (ULN, RLN) to
electrified household types. Assuming that urban electrification rates reach 99% and rural 90%
by 2025, there are some 3 million fewer poor households unelectrified by the end of the period.
Much of this is made up by 2.4 million more low-income electrified households (ULE, RLE),
plus a smaller shift into the higher-income category. All this occurs against a backdrop of
household growth occurring mainly in urban areas, with this group growing by almost 2 million
households over the period.
Changes in population have a relatively small direct impact on energy demand, since the
residential sector only accounted for 16% of final energy consumption in 2001 (DME 2003a).
However, demographic changes have significant indirect consequences. The impact of reduced
population growth would be felt more strongly through reduced labour, consumption of goods
and other factors reflected in GDP. Understanding potential changes in future residential energy
demand is also particularly important in social development and improving the quality of life of
ordinary South Africans.
Energy demands for different end uses by each household type are shown in Table 6.7.
Estimates of demands used in the modeling for the base, 2001 are shown together with
projections for the end year 2025 and an intermediate year, 2014, for which the energy
efficiency target is set.
Table 6.7: Energy demand by household type and end use for selected years
PJ RHE RLE RLN UHE ULE ULN
Cooking 2001 1.79 0.59 4.37 15.84 1.43 1.89
2014 2.22 0.87 2.8 19.29 2.06 1.1
2025 2.58 1.11 1.48 22.2 2.6 0.43
Lighting 2001 3.7 1.31 0.04 7.64 2.05 0.02
2014 4.58 1.93 0.02 9.3 2.96 0.01
2025 5.33 2.46 0.01 10.7 3.74 0
Other electrical 2001 3.28 0.08 12.57 0.11
2014 4.34 0.12 16.33 0.17
2025 5.33 0.16 19.86 0.22
Space heating 2001 1.68 0.53 4.8 16.31 2.42 1.83
2014 2.09 0.78 3.08 19.85 3.5 1.06
2025 2.43 1 1.63 22.85 4.41 0.41
Water heating 2001 2.85 0.67 2.75 23.22 4.35 0.87
2014 3.53 0.99 1.76 28.27 6.29 0.5
2025 4.11 1.26 0.93 32.54 7.93 0.2

Modeling energy policies 120
The demands are total demands for the household type, so that declines in the RLN and ULN
categories should be understood against the decline in numbers of these households. Overall,
energy demands are increasing over the period. Most of the increase derives from increasing
incomes – more households move from the poorer to richer classification, where more energy is
used per household.
Having outlined how energy patterns unfold in the base case, an overview of the policy cases is
presented in the following sections – first a brief overview, before the residential energy policies
and electricity supply options are each outlined in more detail.
6.4 Overview of policy cases
Sketching a policy case of sustainable development should not suggest that this is easy to
achieve. The challenge of building new power stations present a major opportunity to choose
cleaner technologies, but significant resources and effort are required to make such major
changes. Some models that focus on sustainability assume a shift away from fossil fuels for
coal-dependent countries too easily (Berk et al. 2001: 16). Such a transition involves major
changes in infrastructure and the requirements should be carefully examined in policy analysis.
A sustainable development policy that has low impact on the local environment, promotes
access and favours an equitable allocation of wealth and resources represents a major challenge.
A short overview of the policies in the residential demand and electricity supply sector is
provided in Table 6.8. The policies, described in more detail in the following two sections, are
grouped under electricity and residential sectors. The electricity policies focus on supply from
renewable energy, PBMR nuclear, importing hydro or gas, and also consider the impacts of
cleaner coal in the base case. On the residential demand side, efficiency in lighting, water
heating and space heating (houses) are complemented by a fuel switch to LPG.
Table 6.8: Summary of policy cases in residential and electricity supply sectors
Short name Key features MARKAL name
HOUSEHOLDS
SWH Cleaner and more efficient water heating is provided through increased use of solar water heaters and geyser blankets. The costs of SWH decline over time, as new technology diffuses more widely in the SA market
RESWHGB
CFL More efficient lighting, using compact fluorescent lights (CFLs) spreads more widely, with a slight further reduction in costs beyond that achieved already
RESCFL
Eff house The shell of the house is improved by insulation, prioritising ceilings. Since the technology has zero fuel costs, bounds are place to ensure that no more households are built than exist
RESHOUSE
LPG switch Households switch from electric and other cooking devices to LPG stoves and rings
RESLPG
Combined elec
The combined effect of all the above policies RESCMB
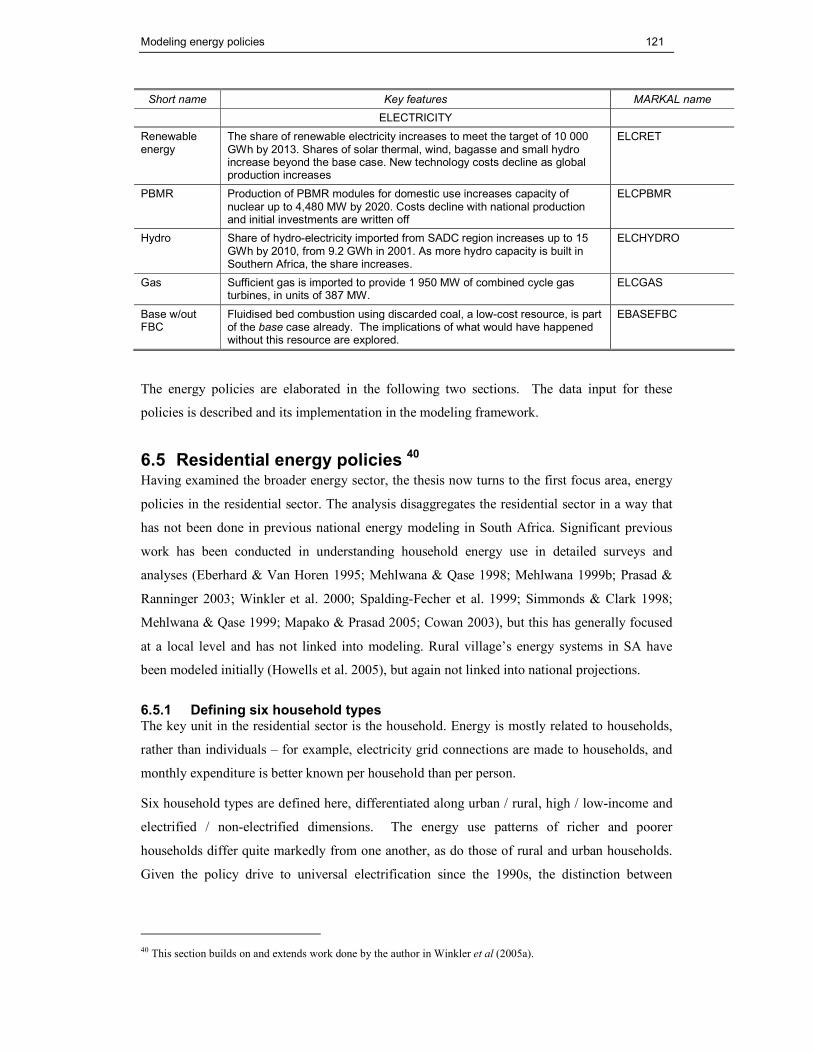
Modeling energy policies 121
Short name Key features MARKAL name
ELECTRICITY
Renewable energy
The share of renewable electricity increases to meet the target of 10 000 GWh by 2013. Shares of solar thermal, wind, bagasse and small hydro increase beyond the base case. New technology costs decline as global production increases
ELCRET
PBMR Production of PBMR modules for domestic use increases capacity of nuclear up to 4,480 MW by 2020. Costs decline with national production and initial investments are written off
ELCPBMR
Hydro Share of hydro-electricity imported from SADC region increases up to 15 GWh by 2010, from 9.2 GWh in 2001. As more hydro capacity is built in Southern Africa, the share increases.
ELCHYDRO
Gas Sufficient gas is imported to provide 1 950 MW of combined cycle gas turbines, in units of 387 MW.
ELCGAS
Base w/out FBC
Fluidised bed combustion using discarded coal, a low-cost resource, is part of the base case already. The implications of what would have happened without this resource are explored.
EBASEFBC
The energy policies are elaborated in the following two sections. The data input for these
policies is described and its implementation in the modeling framework.
6.5 Residential energy policies 40 Having examined the broader energy sector, the thesis now turns to the first focus area, energy
policies in the residential sector. The analysis disaggregates the residential sector in a way that
has not been done in previous national energy modeling in South Africa. Significant previous
work has been conducted in understanding household energy use in detailed surveys and
analyses (Eberhard & Van Horen 1995; Mehlwana & Qase 1998; Mehlwana 1999b; Prasad &
Ranninger 2003; Winkler et al. 2000; Spalding-Fecher et al. 1999; Simmonds & Clark 1998;
Mehlwana & Qase 1999; Mapako & Prasad 2005; Cowan 2003), but this has generally focused
at a local level and has not linked into modeling. Rural village’s energy systems in SA have
been modeled initially (Howells et al. 2005), but again not linked into national projections.
6.5.1 Defining six household types The key unit in the residential sector is the household. Energy is mostly related to households,
rather than individuals – for example, electricity grid connections are made to households, and
monthly expenditure is better known per household than per person.
Six household types are defined here, differentiated along urban / rural, high / low-income and
electrified / non-electrified dimensions. The energy use patterns of richer and poorer
households differ quite markedly from one another, as do those of rural and urban households.
Given the policy drive to universal electrification since the 1990s, the distinction between
40 This section builds on and extends work done by the author in Winkler et al (2005a).

Modeling energy policies 122
electrified and non-electrified households has become significant, with lack of electricity being
seen as similar to energy poverty.
For this sector, activity levels are defined by the number of households, which were 11,205,705
according to the 2001 Census (SSA 2003b). Definitions of urban and rural are technically
difficult in SA, exemplified by the existence of ‘dense rural settlements’ like Bushbuckridge or
Winterveld, and the Census no longer reports this distinction. Other statistical publications
continue to report different patterns of urban and ‘non-urban’ (e.g. SSA 2002; e.g. SSA 2000).
For the purposes of evaluating electrification, the National Electricity Regulator distinguishes
between urban and rural connections (NER 2002a; 2001a), so that for the purposes of this study,
we can assume a 60:40 split of urban to rural households.41
There is no single source breaking down these household types by income group. However, the
income and expenditure statistics are reported for urban and non-urban households (SSA 2002:
Fig 4.9), dividing each group into quintiles.
Table 6.9: Income and expenditure in urban and non-urban areas in 2000 market values, grouped by 1995 quintile
Source: SSA (2002)
Income
Urban Non-Urban
Quintile 1 (top) 18% 4%
Quintile 2 20% 9%
Quintile 3 23% 18%
Quintile 4 20% 29%
Quintile 5 (bottom) 19% 40%
It seems reasonable to define energy poverty for the purposes of this analysis by treating the
bottom two quintiles as ‘poor’, i.e. the poorer are those with an annual per capita income less
than R4033, and expenditure less than R3703 (SSA 2002: Fig 4.9).42 Consequently, 61% of
urban households could be considered not poorer or ‘rich’ (medium to high income), while in
rural areas only 31% would fall into this category. In other words, almost seven out of rural
households are poorer by these assumptions.
The average expenditure per household of the groups is reported by Statistics SA (SSA 2002:
Fig 4.9). The average income of ‘poor’ households can be taken as R7 547 (break point between
bottom two quintiles) and R 41 041 (upper point of quintile 2). For analysis of the household
types defined here, deductions about relative urban : rural incomes are possible, rural household
41 The percentages used in the modeling are 59.61% urban households, 40.39% rural, but reporting them with two decimals would give a false sense of accuracy.

Modeling energy policies 123
incomes were about 41% of urban in 2000 (SSA 2002: Fig 4.9). No breakdown of incomes
between electrified and non-electrified households was found at national aggregate level.
The proportion of poorer and richer households varies across urban and rural areas, with the
former having a much higher share of medium and high-income households. Similarly, the
share of electrified households is lower in rural areas, as shown in Table 6.10.
Table 6.10: Numbers and shares of rural and urban households, electrified and not
Source: Own calculations, based on NER (2002a)and (2002)
Electrified Unelectrified Rich Poor
Urban - households 5,330,166 1,349,240 4,074,438 2,604,968
Share of column total 79.8% 20.2% 61% 39%
Rural - households 2,276,729 2,249,571 31% 69%
Share 50.3% 49.7% 1,403,153 3,123,146
Taking three categories – richer / poorer, urban / rural, electrified / non-electrified would yield
eight household types. However, richer urban households are all electrified, and most rural
richer households are as well. Again there is no comprehensive statistical survey available, and
it is furthermore clear that access to electricity still differs by population group. Almost all
African (99%) and coloured (>99%) households in the highest expenditure category in urban
areas had access to electricity for lighting, as against proportionately fewer households in this
expenditure category in non-urban areas (79% of African and 93% of coloured households)
(SSA 2000: 70). These percentages only refer to the highest income group, and weighted by
population groups would give some 84% of richer rural households electrified. Further
calculations reveal that 33% of the rural poor are electrified, while not quite half (48%) of the
urban low-income households has access to electricity. With this information, it is possible to
derive the number of households in each of six household types shown in Table 6.11.
Table 6.11: Six household types, with total numbers in 2000, shares and assumptions
Source: Own calculations, based on assumptions and data in text
Household Acronym used in thesis
No. of households
Share of all households (HH)
Notes
Urban richer electrified
UHE 4,074,438 36.4% Virtually 100% of richer urban HH are electrified
Urban poorer electrified
ULE 1,255,728 11.2% remainder of urban electrified must be poorer
Urban poorer unelectrified
ULN 1,349,240 12.0% rest of urban HH must be non-electrified
42 At exchange rates of R6/$1, this works out to less than $2 per person per day.

Modeling energy policies 124
Household Acronym used in thesis
No. of households
Share of all households (HH)
Notes
Rural richer electrified
RHE 1,181,279 10.5% assume 84% of richer rural HH are electrified
Rural poorer unelectrified
RLE 1,095,449 9.8% remainder of rural electrified must be poorer
Rural poorer unelectrified
RLN 2,249,571 20.1% rest of rural HH must be non-electrified; number of HH includes the few richer rural not electrified
Of course, reducing all households in the country to six types still abstracts enormously from
the rich diversity of different energy patterns. However, for purposes of national level policy
cases provides some distinction of the major residential energy use patterns. Perhaps the biggest
omission is the lack of geographical disaggregation – poorer urban unelectrified households in
Cape Town, for example, would use paraffin extensively for cooking, heating and lighting
(Mehlwana & Qase 1999); while households in the same category in Gauteng are more likely to
use locally available coal (White et al. 1998). Apart from responding to different fuel
availability, there are also climatic differences.
Since each additional household type requires additional data in the modeling, the number of
household types needs to be limited. Further disaggregation could be achieved in future work,
but is constrained by our limited knowledge of distinctive energy use patterns. For example,
there is relatively little research on richer rural unelectrified households, compared to their
urban counter-parts.
6.5.2 Energy use patterns in the household types Energy use patterns in the residential sector show the continued use of multiple fuels. Five
major end uses are considered – cooking, space heating, water heating, lighting and electrical
appliances for other uses.
Multiple fuels are used in the residential sector, with electricity clearly dominating useful
energy demand (see Figure 6.9). This reflects both in the increased use of energy, but also the
relatively high efficiencies of electrical appliances. About 5% of the total electricity is sold to
the domestic sector, so that the bar for electricity in 2001 represents 34.6 TWh of final energy
(NER 2001).
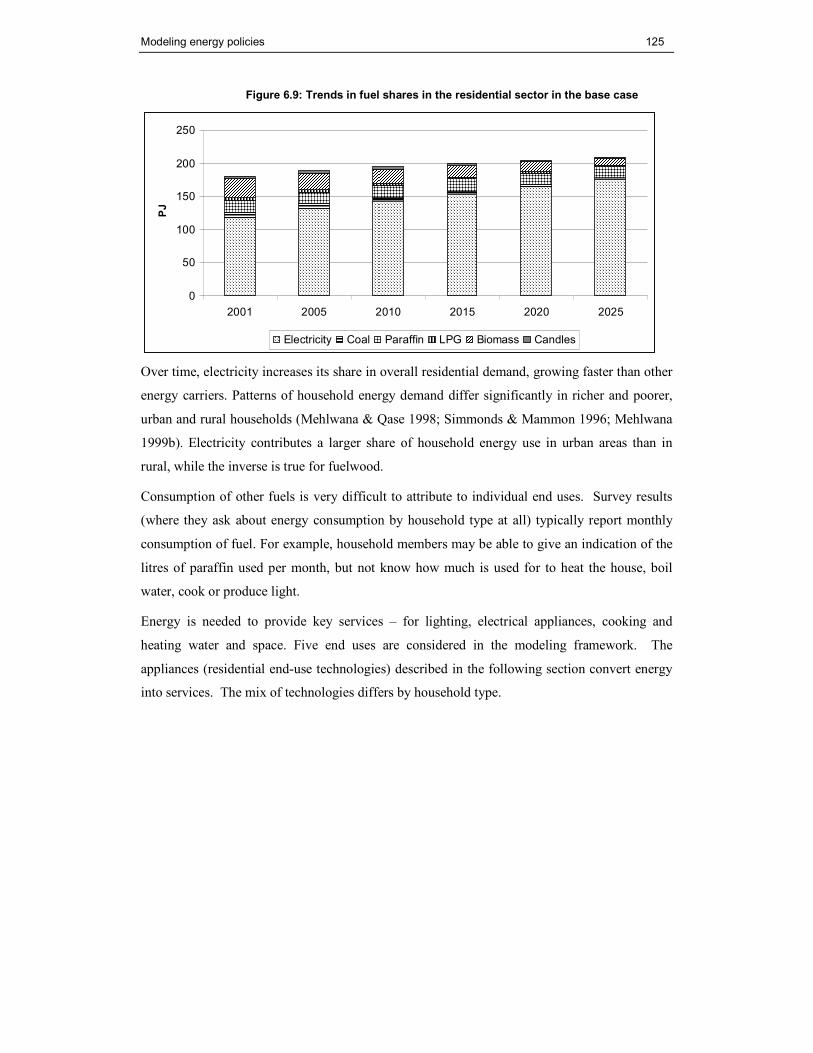
Modeling energy policies 125
Figure 6.9: Trends in fuel shares in the residential sector in the base case
0
50
100
150
200
250
2001 2005 2010 2015 2020 2025
PJ
Electricity Coal Paraffin LPG Biomass Candles
Over time, electricity increases its share in overall residential demand, growing faster than other
energy carriers. Patterns of household energy demand differ significantly in richer and poorer,
urban and rural households (Mehlwana & Qase 1998; Simmonds & Mammon 1996; Mehlwana
1999b). Electricity contributes a larger share of household energy use in urban areas than in
rural, while the inverse is true for fuelwood.
Consumption of other fuels is very difficult to attribute to individual end uses. Survey results
(where they ask about energy consumption by household type at all) typically report monthly
consumption of fuel. For example, household members may be able to give an indication of the
litres of paraffin used per month, but not know how much is used for to heat the house, boil
water, cook or produce light.
Energy is needed to provide key services – for lighting, electrical appliances, cooking and
heating water and space. Five end uses are considered in the modeling framework. The
appliances (residential end-use technologies) described in the following section convert energy
into services. The mix of technologies differs by household type.

Modeling energy policies 126
Table 6.12: Energy demand by household type for each end use
Urban high-med income electrified
Urban low income electrified
Urban low income non-
electrified
Rural high-med income electrified
Rural low income electrified
Rural low income non-
electrified
GJ / HH per year,
2001
UHE ULE ULN RHE RLE RLN
Cooking 3.9 1.1 1.4 1.5 0.5 1.9
Water heating 5.7 3.5 0.6 2.4 0.6 1.2
Space Heating 4.0 1.9 1.4 1.4 0.5 2.1
Lighting (in PJ) 1.9 1.6 0.01 3.1 1.2 0.02
Other electricity 3.1 0.1 2.8 0.1
Household energy use pattern vary across the six household types. Table 6.12 shows the
consumption for each end use for the base year 2001 (see Table 6.7 for aggregated demand,
projected into the future). The energy services related to each end use are delivered by multiple
technologies for most end uses, as can be seen from Table 6.13.
6.5.3 Characteristics of energy technologies MARKAL is a technology-rich modeling framework. Demand for useful energy services is met
by a range of technologies. The previous section indicated how these technologies provide
energy services for cooking, heating, lighting and other end uses. The key characteristics of
technologies included for the residential sector are shown in Table 6.13. Of course there are
many more technologies that are used in reality, but some of the major energy-consuming ones
have been included here. The information is organised by the services that households required
– the end uses of cooking, space heating, water heating, lighting and electrical appliances.
The nominal appliance costs were collected by the author for a study in early 2005 (Winkler et
al. 2005a). They were deflated from end of 2004 to provide costs in year 2000 Rands. Residual
capacity refers to the capacity available in the base year, without any further investment.

Modeling energy policies 127
Table 6.13: Key characteristics of energy technologies in the residential sector
Fuel consumed Device Efficiency Capital cost -nominal
Adjusted cost
Residual capacity
Lifetime
% 2005 Rand 2000 Rand PJ years
Cooking
electricity hot plate 65% R 229 R 178 0.6559 5
oven 65% R 2,349 R 1,823 16.2011 9
micro-wave 60% R 874 R 678 0.1004 5
paraffin wick 40% R 107 R 83 0.1657 3
primus 42% R 37 R 29 2.4558 6
LPGas ring 53% R 249 R 193 0.7088 5
stove 57% R 4,995 R 3,877 1.1136 9
Wood stove 25% R 848 R 687 4.1593 9
Coal stove 13% R 5,231 R 4,060 - 11
brazier 8% R 0 R 0 - 1
Water heating
electricity geyser dummy 100% R 2,172 R 1,686 29.1709 22
electricity geyser no blanket 70% 22
electricity geyser blanket 79.55% R 150 R 116 - 22
paraffin wick/kero/pot 35% R 37 R 29 1.8019 3
LPGas geyser 84% R 4,298 R 3,479 0.2936 22
Solar SWH (integral) 100% R 6,500 R 5,045 0.1922 17
Coal/wood/wastes stove(jacket/pot) 25% R 0 R 0 2.5709 1
Space Heating
electricity Radiant heater 100% R 100 R 78 11.8984 6
Rib/fin/radiator 100% R 968 R 751 7.3770 9
paraffin heater 73% R 59 R 46 3.4390 9
LPGas heater 75% R 993 R 771 0.3012 5
Wood open fire/stove 40% R 0 R 0 - -
Coal stove 59% R 5,231 R 4,060 - 11
brazier 8% R 0 R 0 - 1
Lighting
electricity incandescent 100.00% R 3 R 2 14.2820 1
fluorescent 290.29% R 13 R 10 - 4
CFLs 400.00% R 17 R 14 0.0989 10
paraffin wick 1.71% R 5 R 4 3.8536 4
pressure 7.43% R 192 R 155 - 4
LPGas Pressure 5.71% R 250 R 194 - 4
candles 0.05% R 1 R 1 - 0.01
Other electrical appliances
Electricity Appliances 80% 16.0407 5
Lifetimes and efficiencies are taken from previous studies (DME 2003d; De Villiers & Matibe
2000), updated in some cases by expert input (Lloyd 2005; Cowan 2005). For all end uses other

Modeling energy policies 128
than lighting, the efficiencies relate to the amount of useful energy delivered by the appliance
for each unit of final energy delivered to the household. For lighting, however, relative
efficiencies reflect the amount of lighting service produced, not thermal outputs.
Penetration rates for different technologies were derived from existing technology shares of
useful energy demand for the base case. In the modeling framework, upper and lower bounds
were set, by defining user constraints in Markal. In the base case, these remained at the same
level, the existing contribution of the technology to the end use. In policy cases, as described
below, different values can be set for upper and lower bounds. A lower bound will require a
certain amount of investment in the technology, but the model can seek the most cost-effective
solution between the lower and upper bounds. Upper bounds are useful to prevent investment
beyond known limits, e.g. the number of households in SA.
6.5.4 Policy interventions in the residential sector Having described the base case overall, and provided more background on current trends and
future projections for the residential sector, the attention shifts to the policy interventions. In
keeping with the methodology, the policy interventions in the residential sector modeled in this
thesis should contribute further to development objectives, beyond what has already been
achieved (see chapter 3 and the introduction to section 6.4). People do not want energy for its
own sake, but the services that it provides. The policies considered focusing on improving
access, using cleaner and more efficient fuels, to provide energy services – energy to heat water,
light houses and keep them warm, and to cook food.
6.5.4.1 Cleaner and more efficient water heating
Water heating uses up to 30% of household total energy (DME 2004a) and so an energy-saving
policy examines the installation of solar water heaters (SWH) in middle- and upper-income
households. Establishing local production of new SWH technology would assist in bringing
upfront costs down. For electrified poorer households (ULE, RLE), geyser blankets are
promoted. The policy case is referred to in short-hand as ‘efficient water heating’ or ‘SWH /
GB’ (solar water heaters / geyser blankets).
The development objectives of improving water heating by SWH / GB are:
• to make water heating more affordable due to reduced fuel (or electricity input);
• to enhance environmental health by avoiding the use of energy carriers other than solar
energy and electricity to heat water, reducing the health impacts of indoor use of fuels
such as coal and paraffin;
• to use electricity more efficiently, where regular geysers are used; and

Modeling energy policies 129
• to reduce household energy expenditure for water heating, with savings available to be
spent on other life-improving activities, or using more hot water (itself a benefit).
The broad characteristics of SWH and GB’s have been described in Table 6.13. A policy
promoting these technologies is implemented in the modeling framework by allowing wider
ranges for the penetration rates of SWH and GB for electrified households. In the base case,
energy for water heating continued in the proportions of the base year, although total energy use
could increase. However, one should consider the maximum penetration rates achieved
elsewhere, which was done in previous studies finding from 20% (De Villiers & Matibe 2000)
to 33% (DME 2004a). Based on calculations from the White Paper on Renewable Energy, a
more optimistic approach for the policy case could increase up to 60% (DME 2003c). A higher
level is assumed only for urban medium- to high-income households and that only after 25 years
(UHE: 50% for solar water heaters, 20% for geyser blankets). For urban low-income and richer
rural households, the analysis stays within the range (ULE and RHE, 30 % SWH and 20%
GBs); while poorer rural electrified households still achieve RLE still do 20% of each. A brief
sensitivity analysis on widening the ranges fully showed that the model would only invest in
SWH to the same extent as in the base case, providing no heuristic value. The modeled case
with the ranges stated above still allows the model room to choose between the most cost-
effective means for water heating, but requires a minimum level more efficient water heating
technologies of 10 to 20%. The results are then compared to the base case (chapter 7).
The initial cost of SWHs is significantly greater than for electric geysers (see Table 6.13), but
over time savings on electricity bills make up for the initial cost. 60% saving of electricity for
SWH are reported in the literature (Karekezi & Ranja 1997; Spalding-Fecher, Thorne &
Wamukonya forthcoming). Geyser blankets (GB), with lower upfront costs (~R150 (Borchers
2005)), are available to all households, including poorer ones. Currently, “virtually no SWH are
encountered in low-cost housing areas” (DME 2004a). Existing homes can also insulate electric
geysers, since only 1-3% currently do so (Borchers 2005), with the literature reporting 12%
saving (EDRC 2003a; Mathews et al. 1998).
The policy case assumes that SWH costs decline over time, as new vacuum tube technology
costs brings costs to a range of R4000 to R6000 per system (Borchers 2005). The technology
already exists in South Africa, but is not yet widely dispersed (Morris 2005). Since this cost
reduction relies on economies of imported components (the vacuum tube), it is likely to be a
step-change and not be continued. The modeling assumes that investment costs decrease from
R6500 to R5000. For the policy case, we assume that this cost reduction occurs by 2010,
providing a 5-7% reduction per year. Some further learning-by-doing and economies of scale in
local manufacturing are possible later, but it is assumed that this as a more moderate rate of 2-
3% per year.
Modeling energy policies 130
6.5.4.2 Efficient lighting
The policy case for efficient lighting examines increased penetration rates of CFLs.
Development objectives include providing more affordable lighting, saving on energy bills for
lighting, or using savings for increased lighting services. More lighting can contribute to
education – through studying at home – and safety. Lighting is one of the smaller end use
compared to water heating, cooking and space heating, but often is used extensively in newly
electrified households.
From the utility’s perspective, lighting demand has a high degree of co-incidence with peak
demand, especially in the winter when daylight fades early and the peak occurs in the evening.
CFLs can therefore reduce expensive peak demand. Efficient lighting practices include
switching off lights when a room is unoccupied, fitting lower power light bulbs where possible
and controlling security lighting with light or movement sensors.
Efficient lighting for UHE, ULE, RHE and RLE households occurs in the base case. The
efficient lighting initiative (ELI) pursued a strategy of buying down the price of CFLs through a
subsidy program with participation from major manufactures, in the expectation that prices
would stabilize at new lower levels (ELI 2005). This would lead to higher sales and market
penetration. One can assume that most of the price decline in CFLs has happened by 2005, but a
further drop to R10 in real terms by 2010 (Bredenkamp 2005) is included.
It is assumed in the base case, as in the second NIRP (NER 2004c) that the share of CFLs for
electric lighting could increase up to 20%. Even in the policy case, it is unlikely that 100% of
households will use CFLs, based on studies in the Netherlands, Germany, and Denmark where
penetration might be high. In these countries, about half the households have CFLs installed
(NL 56%, DE 50%, and DK 46%) (Kofod 1996). These high penetration rates are probably not
matched anywhere else in the world and are the upper bound for our reference case, at 40% for
poorer households and 50% for richer ones. The model still chooses the least-cost option, it is
not required to meet an upper bound.
6.5.4.3 Efficient houses
The DME suggested in a strategy that housing could be made more sustainable if “50% of all
new houses built (including RDP houses) … incorporate climate conscious solar passive design
principles in their construction (thereby eliminating the need for space heating and cooling)”
(DME 2001c). Housing developments in coastal areas already qualify for an incremental
subsidy of R1003 for ‘weatherisation’.
More efficient houses may make economic sense, but are they affordable? The issue of
affordability is prominent in this regard. While cost-benefit analysis of efficient houses indicates
that they make financial sense (Winkler et al. 2002d), the upfront costs are typically beyond the
reach of poorer households. The higher discount rate (30% against the general rate for the
Modeling energy policies 131
modeling of 10%) reflects the strong preference of these households for money in the present. A
relatively small additional investment in housing for poorer communities creates more comfort,
reduces household energy costs, as well as cutting emissions from the residential sector
(Winkler et al. 2002d). Financing mechanisms are an important policy consideration, as are
building codes to make efficiency measures in housing mandatory.
The development objectives of efficiency in housing have much in common with more efficient
water heating and lighting. Again there are energy savings for households, with reduced fuel
expenditure for space heating. Less indoor space heating with other fuels contributes to better
environmental health. Efficient houses are more comfortable, being cooler in summer and
warmer in winter, therefore improving quality of life. Background research for low-cost
efficient houses in Khayelitsha confirms this experience (SSN 2004).
Implementing the policy case in the model, one should first note that a constraint is needed in
the base case. Without a limit, the model would implement excessively in efficient housing,
since they have no fuel cost at all. Indeed, in an optimized base case, some 14 million efficient
houses would be built in the urban-richer category (UHE) alone – the projection is that there
might be about 3 million households in this category by 2025. A cap is placed on households in
the base case increasing from the current estimate of 0.5% of households to 5% by the end of
the period. The upper limit is an intermediate value between the estimates of current (0.5%) and
future (50%) levels. The policy case allows a much more generous upper limit, taking the DME
estimate. However, there is a gradual escalation from the low levels of the base case and year.
The full 50% is only assumed at the end of the period.
6.5.4.4 Cooking more efficiently with LPG
The policy cases examined thus far in the residential sector all have efficiency gains. For
cooking, it is not likely that appliances using a particular fuel, e.g. electric stoves, would get
very much more efficient. However, switching to other fuels can have benefits. Liquefied
petroleum gas (LPG) is the policy option examined here. It has the advantage that it is possible
to switch from electricity to LPG, but particularly for households not using electricity for
cooking, it is attractive. The other fuels – paraffin, coal and wood – all have significant health
impacts when used indoors for cooking. LPG can offer a cleaner, safer fuel which is also more
efficient.
As with other policy cases on the demand side, the modeling approach is to increase the range
for LPG for cooking. An increased lower bound means that some LPG must be used and the
implications are examined in the results. Lower limits were established at 20%, except where
the base case already indicated that LPG as a least-cost option achieved a higher rate (ULN
21%, RHE 33%). Upper bounds between 40% and 60% were set, depending on the level

Modeling energy policies 132
already achieved in the base case. Up to this limit, the model chooses the most cost-effective
mix.
Cost-effectiveness is similarly appropriate for electricity supply options. Electricity supply
needs to meet growing demand, and the cost of competing options is one key criterion. The
following section examines the major options and their characteristics.
6.6 Electricity supply options The excess capacity that SA developed in the 1970s and 1980s and lasted into the 1990s has
come to an end (see chapter 4). Over the next two to three decades, some 17 000 MW will need
to be built at approximately 1 000 MW per year. After 2020, many large stations will near the
end of their life, and although options for refurbishment will then be considered, significant
portion of existing capacity will need to be replaced.
The options for electricity supply were reviewed in the chapter on electricity policy (section
4.5). The options included all available energy resources and conversion technologies – coal,
nuclear, imported gas and hydro, and renewable energy. The options considered for the
National Integrated Resource Plan (NIRP) were reported in Table 4.8.
The major options included:
• Base-load coal stations, with flue-gas desulphurisation (FGD);
• ‘Cleaner coal’ technologies, in particular the Fluidised Bed Combustion (FBC)
technology;
• Nuclear technology in the form of the Pebble-Bed Modular Reactor;
• Imported hydro-electricity from Mozambique, Zambia or the DRC;
• Imported gas, and
• Renewable energy technologies (wind, solar thermal, biomass, small hydro).
6.6.1 Characteristics of electricity supply technologies in policy cases Key characteristics of the electricity supply options are summarised in Table 6.14. The data
served as input to the modeling and is broadly consistent with the second NIRP. Presenting the
data in a consolidated table allows comparison across the various options.

Modeling energy policies 133
Table 6.14: Characteristics of electricity supply technologies in policy cases
Source: Markal database for this model (see Winkler et al. 2005a), and NIRP database (NER
2004a) and also drawing on modeling for the first IEP (DME 2003d)
Units of capacity
Investment cost
Lifetime Lead Time
Effi-ciency
Availability
factor
Type MW R/kW Years Yrs % %
Imported gas
Combined cycle gas turbine
387 4,583 25 3 50% 85%
Open cycle gas turbine (diesel)
120 3,206 25 2 32% 85%
Imported hydro
Imported hydro 9200 GWh p.a.
40 6.5
Renewable energy
Parabolic trough 100 18,421 30 2 100% 24%
Power tower 100 19,838 30 2 100% 60%
Wind turbine 1 6,325 20 2 100% 25, 30, 35%
Small hydro 2 10,938 25 1 100% 30%
Land fill gas (medium) 3 4,287 25 2 n/a 89%
Biomass co-gen (bagasse)
8 6,064 20 2 34% 57%
Nuclear
PBMR initial modules 165 17,136 40 4 41% 82%
PBMR multi-modules 171 10,761 40 4 41% 82%
Coal
New pulverized fuel plant
642 9,980 30 4 35% 72%
Fluidized bed combustion (with FGD)
233 9,321 30 4 37% 88%
Storage
Pumped storage 333 6,064 40 7 storage 95%
The background to the energy technology characteristics and more details on their
implementation in the model are presented in the following sections.
6.6.2 The green option - renewable energy technologies
6.6.2.1 Meeting the target
The Minister of Minerals and Energy re-stated in 2002 that “renewable energy plays an
important role in the energy mix and increases supply security through diversification”
(Mlambo-Ngcuka 2002b). Renewable electricity technologies (RETs)43 can contribute not only
43 Renewable electricity technologies is used as short-hand for technologies using renewable energy sources. However, it is not the electricity that is renewable, but the energy source.
Modeling energy policies 134
to diversity of supply, but also to another major energy policy objective, managing the energy-
related environmental impacts. Whether these aims can be achieved at large scale, while also
meeting the socio-economic needs of the country, is a key question.
In 2005, the Renewable Energy Finance and Subsidy Office (REFSO) was established. The
REFSO mandate includes the management of renewable energy subsidies and provision of
advice to developers and other stakeholders on renewable energy finance and subsidies,
(including size of awards, eligibility, procedural requirements, etc).. A once-off capital grant has
been made available for project developers in 2005/06 – 2007/08 financial years. The subsidies
for 2005/6 are R250 / kW capacity for electricity; R 273 / kl capacity / year for biodiesel and R
167 / kl capacity / year for bio-ethanol or equivalents for other RE technologies. The subsidy
can not exceed 20% of the total capital cost, and minimum project size is 1 MW (for electricity),
implying a subsidy amount of R250 000. 44
RETs (other than hydro) in South Africa have been largely confined to the realm of research,
development and demonstration (see chapter 4). In 2003, government adopted a target of 10
000 GWh renewable energy consumption (DME 2003c). Although this is not limited to
electricity but also includes solar water heating and biofuels, the policy document explicitly
calculates that this would be 4% of expected electricity demand in 2013. The approach taken
here is to examine the durability of reaching 10 000 GWh of electricity from renewable energy
sources by 2013. A number of technologies could contribute to the goal, including solar
thermal electricity (both the parabolic trough and ‘power tower’ options, wind turbines, small
hydro facilities and biomass co-generation (already done in pulp and paper and sugar
industries).
6.6.2.2 Approach to modeling renewable energy technologies
To implement the policy case with various RE technologies in Markal, a lower bound was set to
meet the target, moving incrementally up to 10 000 GWh from renewable resources by 2013.
After 2013, a lower limit of 10 000 GWh is maintained; that is the model can choose to generate
more, as long as it does not exceed the capacity. Global capacities for renewable energy (RE)
were reviewed in chapter 4; more specific factors developed for SA are shown in Table 6.15.
44 http://www.dme.gov.za/dme/energy/refso.htm

Modeling energy policies 135
Table 6.15: Technically feasible potential for renewable energy by technology
Source: DME (2004a)
RE Technology Potential GWh Contribution
Percentage
Biomass pulp and paper 110 0.1%
Sugar bagasse 5,848 6.9
Landfill Gas 598 0.7%
Hydro 9, 245 10.3%
Solar Water Heating: commercial
2,026 2.0%
Solar water heating: residential
4,914 6%
Wind 64,102 74%
TOTAL 86,843 100%
The capacity for wind is higher than the range suggested in previous studies – the highest
estimate of theoretical potential in Table 4.6 was 50 PJ (13 889 GWh). One would expect
technical potential to be less than theoretical. However, since both this number and the estimate
above well exceed the renewable energy target, the 50 PJ limit for wind is used.
A more aggressive approach would have been to keep increasing the target linearly. The
approach taken here has the advantage of meeting the target, but allowing the model to choose
how to meet it with the various options.
• Solar thermal plants use various arrangements to collect sunlight on a central receiver,
generating steam to drive a turbine. The ‘power tower’ uses mirrors to focus on a central
receiver, with molten salt providing some temporary storage of energy. The parabolic
trough concentrates sunlight on long tubes contain suitable liquid. Areas of the Northern
Cape have insolation of 6,000 W / m2 (DME et al. 2001).
• Installed wind capacity in South Africa is limited to two projects in the Western Cape,
Eskom’s turbines at Klipheuwel and the Darling Wind Farm (DARLIPP). Eskom installed a
660 kW wind facility in August 2002. Eskom currently charges the Swartberg-Malmesbury
municipality approximately 20c/kWh, while Cape Town pays 11-12 c/kWh for bulk
electricity. Several areas in South Africa, especially along the coast, have a good wind sites,
with estimated mean annual wind speeds of between 4 and 8 m/s at a height of 10 m above
the ground (DME et al. 2001). However, wind is a site-specific resource, so that an upper
bound of 50 PJ is used (Howells 1999). Availability is an important factor with the
intermittency of wind. The turbine availability is considered high, even though ESKOM are
experiencing lower availabilities at Klipheuwel with their three turbines reporting 73%,

Modeling energy policies 136
90% and 75% (Smith et al. 2003). To accommodate uncertainty about the availability of the
wind resource itself, wind technologies at a range of availability factors between 25% and
35% are included. The load factor given for the Darling wind farm is 34.5% (personal
communication, Herman Oelsner) and that at Klipheuwel is expected to be 20-30% (Smith
et al. 2003). The life of each wind turbine is expected to be 20 years (IEA 2003).
• Small hydro stations are based on existing Eskom and private stations. The potential for
hydro within SA is limited, especially when compared to the scale of imported hydro-
electricity from SADC (a separate policy case).
• Bagasse co-generation stations are already used in the sugar and paper & pulp industries,
but new stations may also be installed.
• Hydro-electric capacity constitutes 6 facilities owned by Eskom, 3 by municipalities and 1
by a private generator, accounting for approximately 0.8% of electricity generation in South
Africa (NER 2001a). The future potential in domestic sites is limited, with much larger
options of importing hydro-electricity (see section 6.6.4).
• Landfill gas (LFG) derives from the organic content of municipal solid waste, and hence the
energy source is renewable. Whether it is based on sustainable waste management practices
is debated, in the context of initial CDM projects using LFG being proposed for South
Africa (Omar & Mncwango 2003; Lumby 1996; TNI 2003). The local benefits are
contested, but the benefits of reducing global GHG reductions are clear. LFG projects are
included in various size options, with limits on the total capacity related to the waste sites.
The characteristics of the renewable options are summarised for comparison in Table 6.14. The
data served as input to the modeling and is broadly consistent with the second NIRP. Presenting
the data in a consolidated table allows comparison across the various options. Investment costs
vary considerably, with solar thermal being the most expensive at present, while landfill gas and
bagasse being competitive compared to alternatives. For many renewable energy technologies,
O&M costs are only fixed ones, with no fuel costs. Efficiencies are typically assumed to be
100%, but availability factors are important in reflecting the intermittency of some resources.
Note that the molten salt storage for the solar power tower increases its availability relative to
the parabolic trough (without any storage).
6.6.2.3 Learning for renewable energy technologies
The initial capital costs of RE technologies are relatively high. Costs of new electricity
technologies can be expected to decline as cumulative production increases. To understand the
market and economic potential of RE sources for electricity generation, it is important to
consider international trends in costs. Chapter 4 reviewed some international cost data on
renewable energy technologies, as well as the theoretical potential of the resources.

Modeling energy policies 137
Table 6.16: Current capacity, increases and progress ratios for RE technologies
Sources: (UNDP et al. 2000; Laitner 2002; NREL 1999; World Bank 1999)
Technology for electricity generation
Operating capacity, end 1998 (GWe)
Increase in installed capacity in past five
years (%/yr)
Number of years for doubling at historical rate
1
Progress ratio2
Biomass 40 ~ 3 23 85%
Wind 10 ~ 30 3 82%
Solar photovoltaic 0.5 ~ 30 3 71%
Solar thermal, parabolic trough 0.4
~ 5 14 83%
Solar thermal, ‘power tower’ 0.4
~ 5 14 88%
Small hydro 23 ~ 3 23 -
Geothermal 8 ~ 4 17 -
Tidal 0.3 0 - -
1: Years of doubling own calculation, ln (2) / historical increase (%/yr), and rounding up for
small numbers of years.
2: Progress ratios from (Laitner 2002), except parabolic trough (NREL 1999)
Table 6.16 shows estimates, again from the World Energy Assessment (WEA), of how capacity
has increased from 1995 to 2000. Using the percentage growth, an estimate can be made of the
time it will take for capacity to double – assuming that current trends continue. In some cases,
cumulative capacity might double faster (or slower). The approach taken here is to use the
estimates based on current trends, together with the progress ratios from the literature. Progress
ratios are the changes in costs after doubling of cumulative capacity, as % of initial cost. Based
on these assumptions, the investment costs of RE technologies are assumed to decline in future.
6.6.3 The PBMR option - nuclear The Pebble Bed Modular Reactor (PBMR) was initially intended primarily for export, but plans
have shifted to include it for domestic electricity use. The policy case assumes that the PBMR
would be built domestically, and that the Environmental Impact Assessment would be
approved.45 The PBMR would be developed first with a demonstration module in about 2008,
after which modules of eight units of 140 MW each would be developed. The model is required
to build a fixed amount per year, an average of 373 MW. In practice this would be in increments
of 140 MW units, i.e. 280 MW or 420 MW, etc. The capital costs exclude benefits from avoided
transmission losses, if these stations are built at the coast.
45 The EIA for the PBMR was initially approved by the Department of Environmental Affairs and Tourism in 2004. However, the NGO Earthlife Africa brought a court case with the assistance of the Legal Resources Centre. The high court required a re-consideration of the decision, taking account of the objections by Earthlife.
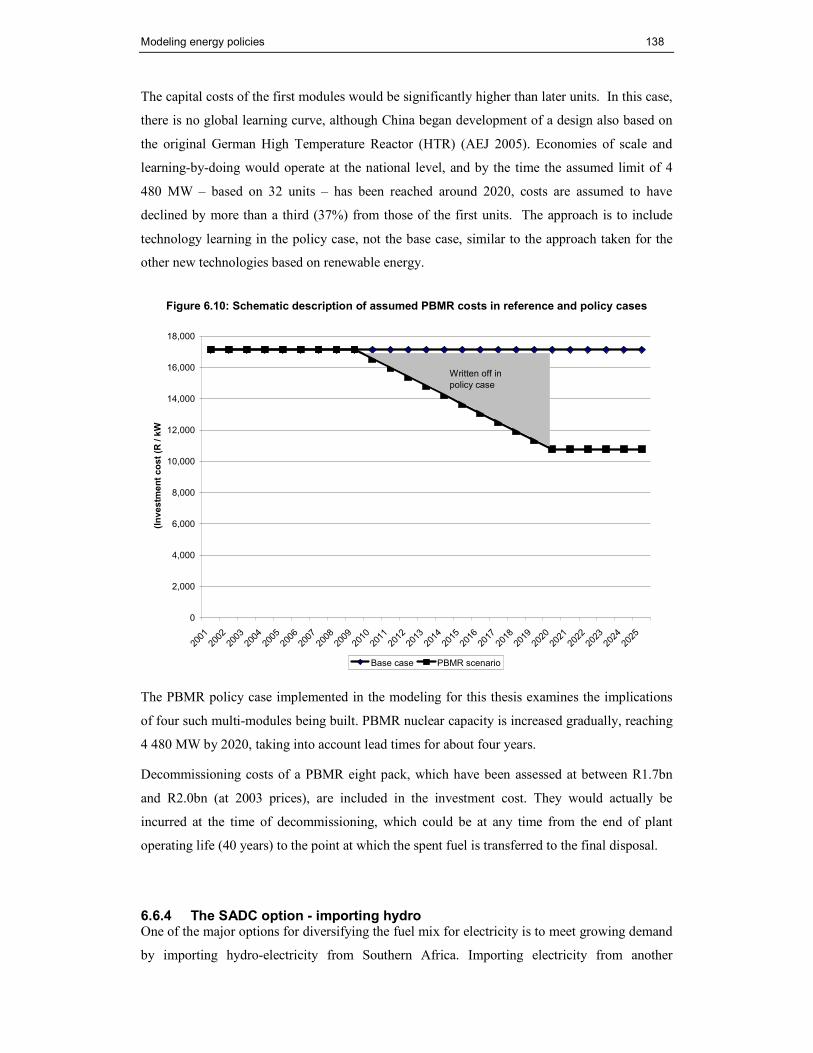
Modeling energy policies 138
The capital costs of the first modules would be significantly higher than later units. In this case,
there is no global learning curve, although China began development of a design also based on
the original German High Temperature Reactor (HTR) (AEJ 2005). Economies of scale and
learning-by-doing would operate at the national level, and by the time the assumed limit of 4
480 MW – based on 32 units – has been reached around 2020, costs are assumed to have
declined by more than a third (37%) from those of the first units. The approach is to include
technology learning in the policy case, not the base case, similar to the approach taken for the
other new technologies based on renewable energy.
Figure 6.10: Schematic description of assumed PBMR costs in reference and policy cases
0
2,000
4,000
6,000
8,000
10,000
12,000
14,000
16,000
18,000
2001
2002
2003
2004
2005
2006
2007
2008
2009
2010
2011
2012
2013
2014
2015
2016
2017
2018
2019
2020
2021
2022
2023
2024
2025
(Investment cost (R / kW
Base case PBMR scenario
Written off in
policy case
The PBMR policy case implemented in the modeling for this thesis examines the implications
of four such multi-modules being built. PBMR nuclear capacity is increased gradually, reaching
4 480 MW by 2020, taking into account lead times for about four years.
Decommissioning costs of a PBMR eight pack, which have been assessed at between R1.7bn
and R2.0bn (at 2003 prices), are included in the investment cost. They would actually be
incurred at the time of decommissioning, which could be at any time from the end of plant
operating life (40 years) to the point at which the spent fuel is transferred to the final disposal.
6.6.4 The SADC option - importing hydro One of the major options for diversifying the fuel mix for electricity is to meet growing demand
by importing hydro-electricity from Southern Africa. Importing electricity from another

Modeling energy policies 139
country, rather than generating it domestically, has impacts on the balance of payments. Only if
the imported electricity is cheap enough, will it be attractive to incur the extra expenditure and
the loss of local capacity and associated jobs. The potential to augment South Africa’s small
hydro resources (0.8% of generation)(NER 2002a) and imports from Cahora Bassa with further
imports was reviewed in chapter 4.
Given the uncertainty associated with the political situation in the Congo, the case for importing
hydro-electricity is based on firm power from Mepanda Uncua as for the NIRP (NER 2004c),
but assumes that additional hydro-electricity can be imported from Inga Falls (Inga 3). In total,
the additional imported hydro-electricity would be 15 TWh by 2010, approximately equally
derived from Mepanda Uncua and Inga 3. Imports of 9.2 TWh (NER 2001a).are set as an upper
bound in the reference case. The increase in the hydro policy case represents is about two-thirds,
increasing linearly thereafter.
The average cost of existing electricity imports was 2.15c/kWh, well below the cost of South
African generation in 2001 (NER 2001a). The import costs are part of a long-term agreement
with Mozambique for Cahora Bassa. The historical value (equivalent to R6 / GJ) is assumed for
imported electricity in the future.
6.6.5 The gas option – importing natural gas Running a gas-fired turbine requires importing gas, since South Africa’s domestic resources are
small. Gas is attractive because of its relatively low capital costs, and the contribution it can
make to meeting peak demand, a particular concern as reserve margins in SA are reduced.
Gas is being imported by pipeline from Mozambique since 2004, but its preferred use has been
for feedstock at SASOL’s chemical and synfuel plants. The alternative is shipping of Liquefied
Natural Gas, potentially landed at Saldanha in the Western Cape, Coega in the Eastern Cape or
Richards Bay in KwaZulu Natal. Construction of a LNG terminal would add two years to the
lead time of a project. Gas turbines have relatively short start-up times and play an important
role in meeting peak power. Chapter 4 provided some background on switching from coal to
gas.
Gas-fired turbines can be run with open cycle or a combined cycle, where the exhaust heat is
used in a second loop. Efficiencies of combined cycle gas turbine (CCGT) are about 50%,
significantly higher than for the open cycle (OCGT) at 32%. The capital costs of CCGT are,
however, some 43% higher (see Table 6.14).
The policy case modeled for imported gas assumes that 1950 MW of electricity is generated
from combined cycle gas turbines by 2020. Five units of 390 MW each are constructed with
lead times of 3 years spreading them over the period.

Modeling energy policies 140
Part of this supply could also be met by importing electricity from a gas-fired power station in
Namibia. The differences in this option are not quantified here explicitly. While gas-fired
electricity generation still has some emissions, these are significantly lower per GWh than for
coal-fired plants.
A fuel cost of R21.5/GJ is used for LNG and R45 / GJ for diesel run in an OCGT, based on
current wholesale fuel costs (see Table 6.4).
6.6.6 Cleaner coal technology (FBC) in the base case A potentially cleaner coal technology, namely fluidised bed combustion (FBC) plants, are also
taken up in the base case, see chapter 6. The major economic advantage lies in the ability to use
discard coal, of which South Africa produces about 60 million tons per year (Howells 2000).
The technologies are part of existing policy, with their inclusion in the National Integrated
Resource Plan (NER 2004c) indicating a good likelihood of them being built. No separate
‘cleaner coal’ policy case is constructed, but the benefits of FBC plant being built compared to
new pulverised fuel, or the continued operation of existing coal plants is examined.
The capital cost is similar to pulverised fuel plants, just under R10 000 / kW (see Table 6.14).
While technical construction time is assumed to be about 4 years, lead times eight and nine
years depending on political and technical considerations are reported in the international
literature (Van der Riet 2003). O&M costs are still included due to the need to transport the
discard coal to the power plant. Efficiencies are slightly higher than for other coal plants,
although these are expected to degrade over time.
Other technologies, notably integrated gasification combined cycle power plants, are not likely
to be introduced in the medium-term. Since FBC enters the base case, one could assume that it
requires no particular policy intervention. However, since there are no plants in operation yet, it
is worth briefly examining the impacts against a case without any FBC (i.e. only pulverised fuel
plants for coal). The IRP base case envisages 466 MW of FBC by 2013 (NER 2004a; 2001/2).
The modeling approach is to examine a version of the base case that explicitly excludes
electricity generation from FBC, to examine the contribution made by the technology.
6.6.7 Other options
6.6.7.1 New pumped storage
Pumped storage schemes are a net user of electricity, and therefore results are not reported as
one of the supply options. Nonetheless, they have an important role in meeting peak demand.
The demand for electricity is not uniform throughout the day or the year but has peaks in the
morning and evening and in mid-winter. By storing energy to meet these peak demands, one can
save on the capital expenditure for extra generation capacity. Electricity itself cannot be stored
except in limited quantities but energy can be stored in forms that can readily be converted into
Modeling energy policies 141
electricity. This can be done in batteries, by compressed air and by pumped storage. In pumped
storage schemes, water is pumped from a lower dam to a higher in off-peak times and then
allowed to flow through a turbo-generator to the lower dam in peak times to produce electricity.
South Africa already has pumped storage schemes at Drakensberg (1000 MWe) and Steenbras
(180 MWe), and further stations are considered in the second National Integrated Resource Plan
(NER 2004c).
6.6.7.2 Off-grid electricity
Off-grid electricity deserves a mention due to its importance in rural electrification (Cowan
2003; NER 2001d). The literature indicates significant operational and institutional barriers to
large-scale off-grid concession programmes (Afrane-Okese 2003; Thom & Afrane-Okese 2001;
ERC 2004b), and some of the perspectives of local communities were discussed in chapter 3.
The overall contribution to electricity supply – even if 350,000 households were supplied –
would amount to some 0.2% of residential electricity demand.46 This option is not modelled, but
some of the existing initiatives are highlighted below.
Currently, most use of renewable energy is for off-grid electricity system using photovoltaics, as
well as solar cooking and water heating. Photovoltaic (PV) systems are used as stand-alone
sources of electricity in areas remote from the grid, but are expensive compared to grid-
connected electricity in South Africa. A number of projects have been implemented:
• The Schools and Clinics Electrification Programme provided off-grid energy services
with solar home systems (SHSs) to community facilities. By 2000, 1 852 schools had
been connected, and an unspecified number of clinics (DME 2001d: 97).
• A Shell/Eskom joint venture for SHS electrification built 6 000 systems for residential
use by 2000 (DME 2001a; Spalding-Fecher 2002c); in 2002, indications were that 4 700
of these systems were operational (Afrane-Okese 2003). Based on recent reports (EC et
al. 2000; Stassen 2001), the size of the SHS market, outside of the major government
programmes, has been estimated at R28 million in 2000 (Spalding-Fecher 2002c).
• Roll-out of the off-grid electrification programme began in 2002. The programme will
target 350 000 homes for SHSs, but had been slowed down by negotiations among
government, Eskom, and the concessionaires. In 2002, DME agreed to the subsidy level
(Kotze 2001) and Eskom’s role in the programme was clarified. Concessionaires have
signed interim contracts, with NuonRAPS, EdF and Solar Vision each installing some
200 systems.
46 Own calculation of 0.06 TWh from SHS, as share of 34.6 TWh (NER 2002a).

Modeling energy policies 142
For residential customers who wish to use renewable energy with a grid connection, two-way
metering would be a benefit. Households can sell excess electricity during times when their
resource is high (e.g. the sun shines) but demand low. They obtain credit and buy electricity
from the grid when conditions are reversed – low supply but high demand.
6.7 Conclusion The chapter has motivated a focus on energy policies modeled for this thesis – the residential
demand and electricity supply sectors. Key drivers for changes in the base case were identified
as economic growth, population and technological change. Each of these factors is complex in
its own right, as the discussion of population growth made clear. The projections made about
future urban / rural dynamics, levels of poverty, household size and the impact of AIDS make
an important difference, and impact on the projections of residential energy demand. An
important change from previous analysis is the disaggregation of households into household
types, allowing at least a basic differentiation of energy use patterns in a national model.
The base case projections for residential demand was placed in the context of other demands,
with residential demand being one of the smaller sector. Supply was considered in the broader
mix of primary energy supply, and more specifically the fuel mix for electricity supply. In the
base case, SA will clearly remain dependent on coal for electricity generation up to 2025,
particularly if analysed by generation rather than capacity.
The heart of this chapter outlined energy policies and how they were modeled. On the supply-
side, the implications of increasing shares of four major options – renewable energy, PBMR
nuclear, importing hydro or natural gas – form the heart of the policy cases. The impacts of
cleaner coal, which is already represented through FBC in the base case, are considered as well.
Residential energy policies have a large component of efficiency, be it more efficient houses, or
specific appliances such as CFLs. Solar water heaters both use a cleaner energy source, and
improve the efficiency of providing energy for heating water. An option of geyser blankets was
included, being more affordable. The importance of energy for cooking meant that a switch
from electricity, paraffin, coal or wood to LPG is modeled.
While the focus in this chapter is on modeling, the overall development objectives that the
policies are intended to meet were not forgotten. The policies add up to a substantial
contribution to energy for sustainable development. In the next chapters, the results will be
analysed policy by policy (chapter 7) and against indicators of sustainable development (chapter
8).

Discussion and interpretation of results 143
CCCCHAPTER HAPTER HAPTER HAPTER 7777
7. Discussion and interpretation of results The policy cases specified in chapter 6 are examined in this chapter case by case. First, the results for policy cases
in the residential demand sector are reported, followed by electricity supply options. The base case serves as a
benchmark for each of the policy cases. An evaluation against indicators of sustainable development in chapter 8
will allow comparison across both demand- and supply-side policies. Table 8.21 provides a consolidated table of
quantitative results. The discussion here focuses on results of particular importance to the policy in question,
starting with residential energy policies.
7.1 Residential energy policies The results from the modeling of residential energy policies for social, environmental and economic dimensions are
summarized in Table 7.1. The table will be combined in chapter 8 with a similar one for electricity supply. The
results for each policy – i.e. column by column – are discussed in the following sections.
Table 7.1: Overview of results for residential energy policies
Indicator Unit Base case Efficient houses
CFLs Water heating - SWH / GB
LPG for cooking
Residential pol’s
combined
SOCIAL
Fuel consumption in residential sector PJ
Electricity 2014 98.9 93.1 98.9 95.9 96.4 98.3
2025 116.8 104.9 116.8 110.3 112.6 115.5
Liquid fuels 2014 51.9 43.0 51.9 51.9 41.3 51.9
2025 58.9 39.3 58.9 58.9 36.1 58.9
Renewable energy 2014 1.7 7.9 1.7 1.7 9.5 1.7
2025 3.5 16.7 3.5 3.5 20.1 3.5
Total fuel use 2014 201.1 195.3 201.1 201.5 195.2 200.5
2025 213.5 202.3 213.5 214.4 202.1 212.3
Cost of energy services to households c / kWh 37.8 34.2 34.8 34.8 34.8 34.2
electricity in common units R / GJ 105.1 95.1 96.7 96.7 96.7 95.1
Cost of energy services to households: Shadow price of non-electric fuels, residential
Coal for HHs R / GJ 3.5 3.5 3.5 3.5 3.5 3.5
Biomass 30.0 30.0 30.0 30.0 30.0 30.0
LPG 149.4 149.4 149.4 149.4 149.4 149.4
Paraffin 96.9 96.9 96.9 96.9 96.9 96.9
Candle wax 70.3 70.3 70.3 70.3 70.3 70.3

Discussion and interpretation of results 144
Indicator Unit Base case Efficient houses
CFLs Water heating - SWH / GB
LPG for cooking
Residential pol’s
combined
Monthly expenditure on electricity R / (HH * month)
RHE 87 78 80 80 80 78
RLE 16 15 15 15 15 15
UHE 164 148 151 151 151 148
ULE 62 56 57 57 57 56
ENVIRONMENTAL
Local air pollutants (in 2025)
Sulphur dioxide kt SO2 3,571 3,524 3,568 3,531 3,559 3,517
Non-methane volatile organic compounds t NMVOC 888,450 888,038 888,432 888,139 888,387 888,011
Nitrogen oxides t Nox 2,156,438 2,132,925 2,155,275 2,137,627 2,151,339 2,129,828
Carbon monoxide t CO 4,923,479 4,921,832 4,923,416 4,922,246 4,923,237 4,921,730
Global GHGs (in 2025)
Carbon dioxide, total kt CO2 630,053 622,540 629,686 624,117 628,685 621,827
Methane t CH4 50,325 50,234 50,323 50,261 50,380 50,301
Nitrous oxide t N2O 8,171 8,065 8,165 8,082 8,149 8,052
ECONOMIC
Total cost of energy system, cumulative over the period
R billions 6,120 6,119 6,119 6,115 6,121 6,115
Annualised investment in all residential technologies in 2025
R billions 29.78 30.23 29.58 29.71 30.65 29.75
7.1.1 Promoting efficient houses The policy case for efficient houses introduced greater efficiency in insulating the shell of the building, in particular
avoiding losses through the ceiling. Comparing the policy intervention to the base case, the first result that stands
out are energy savings.
Total fuel use in the residential sector declines by 2.9% by 2014 and by 5.3 % by 2025; the latter difference
amounting to 5.3 PJ in absolute terms (see Table 7.1 for the data here and in following). The energy used for space
heating per household varies considerably across households (from 0.49 GJ / (HH * month) for RLE as the lowest
to 4.0 for UHE), but does not differ significantly between the base and policy cases.
The reduction in overall fuel use is accompanied by a shift in consumption between groups of energy carriers.
Electricity consumption is reduced by 2 - 4% in electricity, 20-40% in liquid fuel, but four- to five-fold increase in
renewable energy use. Energy savings are achieved while keeping the demand for space heating constant, making
efficient houses more comfortable without heating space by burning fuel.
Figure 7.1 illustrates the implications of making houses in the richer urban areas (UHE) more efficient. The energy
consumption for active space heating, using electricity or gas, is compared to the effective contribution of passively
keeping the house warm. The efficient house is passive, in the sense that no fuel is burned for space heating. The

Discussion and interpretation of results 145
consumption of electricity for space heat in the base case (light wavy blocks) is clearly reduced in the policy case
(grey wavy blocks). The contribution of greater efficiency is seen clearly as the solid blocks are built from 2007
onwards.
Figure 7.1: Implications of efficient houses on demand for space heating in UHE households
0
2
4
6
8
10
12
2001
2002
2003
2004
2005
2006
2007
2008
2009
2010
2011
2012
2013
2014
2015
2016
2017
2018
2019
2020
2021
2022
2023
2024
2025
Gas base
Efficiency policy
Electricity policy
PJ of useful energy
Gas base Gas policy Efficiency policy Efficiency base Electricity policy Electricity base
The savings in energy translate into reduced energy bills. Fuel costs across household types 9.5% lower than in the
base case, with the shadow price of electricity in particular being reduced by 3.6 c / kWh. In other words, with
greater efficiency of using electricity in efficient houses, the opportunity cost of generating an additional unit of
electricity is reduced. These abstract economics translate into real reductions in household expenditure. The data
highlighted in Table 7.2 shows that UHE households save R 16 per household each month, with R 9 for RHE and
R 8 for ULE. The absolute reduction for RLE is low due to low electricity consumption.
Table 7.2: Reduction in monthly expenditure on electricity with efficient houses by household type
Monthly expenditure on electricity (R / (HH * month))
Base case Efficient houses
RHE 87 78
RLE 16 15
UHE 164 148
ULE 62 56
For the energy system as a whole, shows a 0.02% reduction in total system cost. The fraction is small since the
policy deals only with a small part of the overall system. The saving is worth R 0.9 billion over the entire period.

Discussion and interpretation of results 146
Despite a much greater investment in residential energy technologies compared to the base case – annualised
investment in 2025 is 2.9% higher in 2025, compared to the base case, an amount of R 0.87 billion).
Efficient houses reduce local and global air pollutants, as shown in the environmental section of Table 7.1. Local
air pollutants are reduced between 1 -2 % against the base case, amounting to 46 000 tons of SO2 and 23 000 tons
of NOx reduced. Reduction in GHG emissions of 7.5 Mt CO2-equivalent are achieved by the policy in 2025, which
derive mostly (97%) from CO2 from electricity generation. A simple estimate of abatement cost divides the total
emissions reductions (policy – base case) by the incremental costs of investments in technologies.
The results of the policy case have demonstrated higher investment in efficient technologies, reduced local and
global pollution, energy savings and reduced energy bills for households, and a benefit for the total energy system.
A key policy question (see chapter 9) is whether efficient houses are affordable, even if they make economic sense
at a national and household level.
7.1.2 Efficient lighting for improved services The lighting policy case considered the further spread of CFLs and a continued, albeit slight reduction in costs. The
changes seen in three household types illustrate the effects of the policy intervention, (Figure 7.2, policy shown on
the left, compared to the base case at right). A striking result is that the share of CFLs for richer urban electrified
(UHE) households looks bigger in the base case. This is indeed the case, although one should note that total
demand for lighting services is higher in the policy case (4 PJ versus 3 in the base case).

Discussion and interpretation of results
147
Figure 7.2: Changes in lighting technologies in the CFL policy case
0
0.51
1.52
2.53
3.54
2001
2003
2005
2007
2009
2011
2013
2015
2017
2019
2021
2023
2025
RLE policy case
PJ
0
0.51
1.52
2.53
3.54
4.5
2001
2003
2005
2007
2009
2011
2013
2015
2017
2019
2021
2023
2025
RLE base case
PJ
0
0.51
1.52
2.53
3.54
4.5
2001
2003
2005
2007
2009
2011
2013
2015
2017
2019
2021
2023
2025
RHE policy case
PJ
0
0.51
1.52
2.53
3.54
4.55
2001
2003
2005
2007
2009
2011
2013
2015
2017
2019
2021
2023
2025
RHE base case
PJ
0
0.51
1.52
2.53
3.54
4.5 20
01
2003
2005
2007
2009
2011
2013
2015
2017
2019
2021
2023
2025
UHE policy case
PJ
0
0.51
1.52
2.53
3.5
2001
2003
2005
2007
2009
2011
2013
2015
2017
2019
2021
2023
2025
UHE base case
PJ

Discussion and interpretation of results 148
The explanation for the finding, then, is partly that CFLs indeed are an intervention that should work well in the
market. Particularly more affluent households should be able to purchase CFL as a least-cost strategy, given the
price reductions that have already occurred (see chapter 6). The second factor is that some of the energy savings are
‘taken back’ by UHE households consuming more energy.
For RHE households, the pattern is more as expected, with CFLs displacing incandescent lights. Population growth
is projected to occur mainly in urban areas, so unlike the urban counterpart, growth in household numbers is not a
major factor. For poor rural households, consumption levels are low and CFLs show up only as a small band at the
top. ULE households (not shown) have a greater share of CFLs displacing paraffin and candles.
What implications do the changes in CFL penetration rates for the overall system (see Table 7.1). Overall system
costs are affected less than 0.1%, with lighting being a smaller end use than space heating, in the case of efficient
houses above. The annualised investment cost in residential technologies actually declines, only by 0.7%, by 2025.
The reasons are that the longer life of the CFLs, together with their declining costs, make them more competitive.
Households certainly can make energy savings, with total fuel use, in the form of electricity, declining by 1.23 PJ
against the base case (or 342 GWh in electricity units). The more efficient use of electricity reduces the opportunity
cost of electricity, the shadow price drops by 3 c / kWh. Reductions in household expenditure are highest for UHE
at R 13 per household per month. Consumption of lighting services in this group is highest, hence the largest
savings can be made. Arguably as significant is the almost R5 each poor urban electrified household can save from
more efficient lighting alone.
The implications for local air pollution are not large compared to other residential policy cases. Reductions in local
pollutants are small - CFLs mainly avoid incandescent electric lighting, with no local emissions. Even the limited
use of other fuels is contained, unlike for cooking. The absolute value of reduction of GHG emissions is moderate
at 336 kt CO2 avoided through CFLs in 2025.
7.1.3 Providing hot water with solar energy or insulation The solar water heater / geyser blanket (SWH/GB) policy case increased the range of cleaner and more efficient
water heating. Investments in SWH and geyser blankets total R 339 million in 2025 in the policy case. All but
R 7.6 million (2%) is invested in SWH. Figure 7.3 shows that the required investments for the policy case are
mostly spent in UHE households.

Discussion and interpretation of results 149
Figure 7.3: Invest costs for SWH and geyser blankets by household type
0
50
100
150
200
250
300
2002
2004
2006
2008
2010
2012
2014
2016
2018
2020
2022
2024
R millions
RHE blanket RLE blanket UHE blanket ULE blanket
RHE SWH RLE SWH UHE SWH ULE SWH
The aggregate figure only tells part of the story, however, as Table 7.3 shows.
Table 7.3: Energy saved and costs for cleaner water heating
Saved energy (policy – base case)
Total investment in policy case
Cost of saved energy
PJ R million R / GJ c / kWh
Geyser blanket 4.9 7.6 1.5 0.6
Solar water heater 13.3 331 25.0 9.0
The much lower investment cost of geyser blankets means that total investment is smaller. However, the energy
savings are relatively large, and the cost per unit of energy saved is significantly lower for geyser blankets. The
lower cost – both upfront and per unit of energy saved – suggests that geyser blankets are appropriate policy
interventions in poor electrified households.
The policy results in a three-fold increase in the use of solar energy in the residential sector; while the use of other
fuels, notably liquid fuels like paraffin, for water heating decline. Total fuel use is 3% lower with SWH and geyser
blankets than in the base case. Figure 7.4 shows the savings by representing the equivalent of fossil fuel use that
would have been consumed in the place of solar energy. The Markal model assigns a ‘fossil-equivalent’ to
renewable energy consumption, taking into account the relative efficiencies.47
47 The value of the parameter is a unitless 3.125 of fossil-fuel energy per unit of solar energy; the same value is used throughout the model.

Discussion and interpretation of results 150
Figure 7.4: Equivalent of fossil fuel use for solar water heating, by household type (PJ)
For all household types, the energy savings increase over the time – three years are selected here. Clearly, the
greatest savings are made in the UHE household type. And the policy case shows clear gains over the base case for
the respective household. To illustrate how the fuels used for water heating change over time, the example of ULE
households is shown in Figure 7.5.
Figure 7.5: Energy used for water heating by urban low-income electrified households
Electric geyser, no blanket
Electric geyser with blanketParaffin
Solar
0
1
2
3
4
5
6
7
8
9
2001 2013 2025
PJ
Electric geyser, no blanket Electric geyser with blanket Paraffin Solar
2001 2013
2025
Base RHE
Policy RHE Base RLE
Policy RLE Base ULE
Policy ULE Base UHE Policy UHE
0
2
4
6
8
10
12
14
PJ

Discussion and interpretation of results 151
The figure shows how solar water heaters increase their share over the period, completely displacing paraffin use at
the end. The reduction of paraffin use is important from the social perspective, given the problems associated with
its use in South Africa’s poor communities (Mehlwana 1999a; Lloyd 2002). Electric geysers provide most of the
water heating services, but an increasing portion are insulated with blankets.
The saving on energy bills for households is about 8% on the water heating bill. Continuing with the ULE
household example, this translates into R 5 less spent on water heating per household per month.
In terms of reducing local air pollution, reductions of 18 800 tons of NOx is notable, and SO2 emissions are 40 000
tons less than in the base case. From a climate change perspective, a reduction of 5.9 Mt CO2 can be achieved in
2025 at a cost of R 21 / tCO2 –equivalent.
7.1.4 Switching to LPG for cooking Cooking is one of the socially most important uses of energy. The LPG policy case requires households to switch
from electric and other cooking devices to LPG stoves and rings. Other cooking fuels commonly used by poor
households for cooking, such as paraffin, coal and wood, have health impacts when used indoors. Figure 7.6 shows
the changes resulting from wider ranges for LPG for three household types (policy shown at left compared to the
base case at right). For UHE households, the wider range that the model is allowed has the expected effect. LPG
stoves replace electric stoves for cooking needs. For the poorer urban electrified households (ULE), however, the
fuel switch to LPG does take place, but another switch happens at the same time. The use of paraffin primus stove
increases even more dramatically than for LPG.
The changes are the result of the model choosing least-cost options. The switches in fuels change relative prices of
fuel costs. Electric stoves have become too expensive, and are partly replaced by hotplates as well. In addition, the
investment costs of LPG cookers are slightly higher (R250) than for hotplates (R 230), and about double those for
paraffin primus (R107) and much higher than wick stoves (R37) (see Table 6.13 for the full range).

Discussion and interpretation of results
152
Figure 7.6: Fuel switch to LPG for three household types
UHE policy
Microwave
Electric stove
LPG ring
05
10
15
20
25
2001
2003
2005
2007
2009
2011
2013
2015
2017
2019
2021
2023
2025
PJ UHE base case
Microwave
Electric stove
LPG ring
05
10
15
20
25
2001
2003
2005
2007
2009
2011
2013
2015
2017
2019
2021
2023
2025
PJ
ULE base
Electric stove
Electric hotplate
LPG ring
Paraffin primus
Paraffin wick
0
0.51
1.52
2.53
2001
2003
2005
2007
2009
2011
2013
2015
2017
2019
2021
2023
2025
PJ
ULE policy
Electric hotplate
Electric stove
LPG ring
Paraffin primus
Paraffin wick
0
0.51
1.52
2.53
2001
2003
2005
2007
2009
2011
2013
2015
2017
2019
2021
2023
2025
PJ
ULN base
LPG ring
Paraffin primus
Paraffin wick
Wood stove
Coal brazier
0
0.51
1.52
200120032005200720092011
2013201520172019202120232025
PJ
ULN policy
LPG ring
Paraffin
primus
Paraffin wick
Wood stove
Coal brazier
0
0.51
1.52
2001
2003
2005
2007
2009
2011
2013
2015
2017
2019
2021
2023
2025
PJ

Discussion and interpretation of results 153
For non-electrified urban households (ULN), the effect of the policy case is negligible. The
declining overall use due to electrification far outweighs the impact of the fuel switch.
Considering all household types, the LPG policy case has a relatively small impact on total
energy system costs (see Table 7.1). The investments made are relatively modest. Investments
required in LPG cooking appliances are R 176 million in 2025, the lowest for all the residential
policies.
Despite this modest investment, 11 000 tons of SO2 can be avoided, as well as 5 000 tons of
NOx. While substantial in absolute amounts of local air pollutants avoided, these reductions are
below 1% compared to the cooking fuel mix in the base case. In addition, some 1.4 MtCO2 can
be avoided through the cooking with LPG, at a cost of only R 7.7 per ton of CO2.
Total fuel use (in energy units) increases by 0.9 PJ over the base case in 2025, but this amounts
to only 0.4% of total fuel use. Looking more closely at the fuels used, electricity consumption is
reduced by 6.5 PJ. For RHE households, associated expenditure on electricity for cooking is
reduced from R 87 / HH * month in the base case to R 80. However, given the patterns shown
in Figure 7.6, some subsidy for LPG may be required if higher penetration rates of a cleaner fuel
are desired (beyond UHE households). Such a ‘subsidy’ need not be directed at the fuel cost,
but at making the fuel more readily accessible.
7.1.5 Conclusions on residential policies Each of the residential policy cases modeled in Markal has been discussed separately above.
Table 7.1 provided an overview of results. In conclusion, the effects of combined policies are
considered. Given the importance of the analysis of residential energy by household type, some
concluding comments draw together the results from individual policies in this respect.
A policy case combining all four individual residential policies was included in the Markal
model. The combined policy case includes solar water heaters, geyser blankets, efficient houses,
CFLs and allows fuel switching to LPG. The results are reported in the last column of Table 7.1.
Fuel consumption in the combined case decreases against the base case. The rows showing
total fuel use in Table 7.4 indicate that the highest reduction comes from the efficient house
case. The effect is particularly due to the reduction in liquid fuels, mostly paraffin. Note also
the declining trend in paraffin for water heating, from the mid-term year 2014 to the end year
2025. The reduction makes the SWH / GB policy case the second-lowest in total fuel use of the
individual policies.

Discussion and interpretation of results 154
Table 7.4: Fuel consumption in the residential sector across policy cases, 2014 and 2025
PJ Base case CFL Efficient houses
LPG for cooking
Water heating - SWH /GB
Residential policies combined
Electricity 2014 98.9 98.3 96.4 95.9 98.9 93.1
2025 116.8 115.5 112.6 110.3 116.8 104.9
Liquid fuels 2014 51.9 51.9 41.3 51.9 43.0 43.0
2025 58.9 58.9 36.1 58.9 39.3 39.3
Renewable energy 2014 1.7 1.7 9.5 1.7 7.9 7.9
2025 3.5 3.5 20.1 3.5 16.7 16.7
Total fuel use 2014 201.1 200.5 195.2 201.5 197.8 195.3
2025 213.5 212.3 202.1 214.4 206.8 202.3
An important dimension of this thesis is the analysis of the residential sector across household
types. In the discussion of the results of individual policy cases, several examples of the
differential impact across household types were noted.
A consistent finding was that the greatest energy savings from efficiency were to be made in
UHE households. The reduction in fuel use for this household type was greater in absolute
terms. Beyond that, the expenditure on energy per household also decreased the most. Energy
savings translate directly into expenditure when measured in terms of Rand spent monthly on
energy per household. The case of efficient housing showed reductions in monthly energy
expenditure, where highest in Rands per month for UHE, but similar in the percentage saved.
Given the higher consumption, the higher savings for UHE households are trivial in one respect
– the same percentage saving applied to higher consumption (more kWh or GJ) would
automatically yield a greater saving. The policy question that arises, however, is how much the
savings affect affordability – what difference do the monetised savings make to household
income. Put another way, further analysis is needed to indicate to what extent the saving might
relieve the energy burden of the household.
A starting point is to consider energy consumption across housing types. Cutting across the
policies, Table 7.5 shows the variation of energy consumption for different household types by
2025. Policy cases are associated with particular end uses – CFLs with efficient lighting, SWH /
GB providing cleaner and more efficient water heating, better insulated housing shells reducing
the energy needed to heat space, and LPG use focusing on cooking.
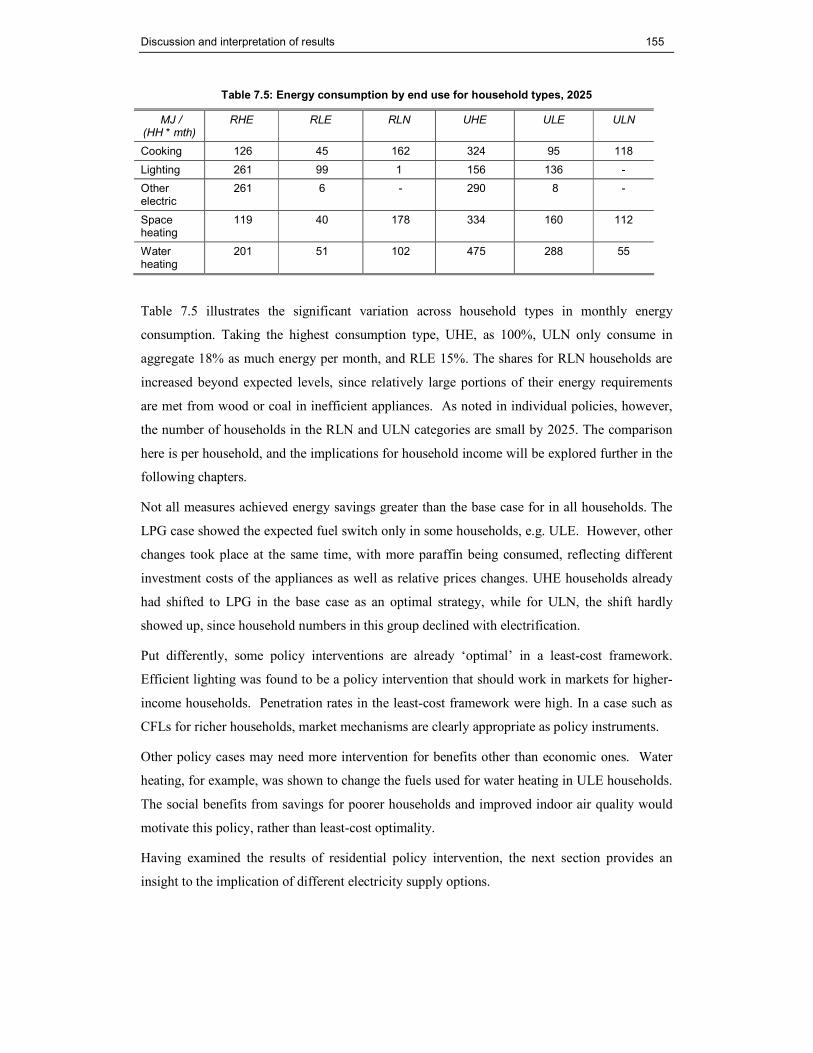
Discussion and interpretation of results 155
Table 7.5: Energy consumption by end use for household types, 2025
MJ / (HH * mth)
RHE RLE RLN UHE ULE ULN
Cooking 126 45 162 324 95 118
Lighting 261 99 1 156 136 -
Other electric
261 6 - 290 8 -
Space heating
119 40 178 334 160 112
Water heating
201 51 102 475 288 55
Table 7.5 illustrates the significant variation across household types in monthly energy
consumption. Taking the highest consumption type, UHE, as 100%, ULN only consume in
aggregate 18% as much energy per month, and RLE 15%. The shares for RLN households are
increased beyond expected levels, since relatively large portions of their energy requirements
are met from wood or coal in inefficient appliances. As noted in individual policies, however,
the number of households in the RLN and ULN categories are small by 2025. The comparison
here is per household, and the implications for household income will be explored further in the
following chapters.
Not all measures achieved energy savings greater than the base case for in all households. The
LPG case showed the expected fuel switch only in some households, e.g. ULE. However, other
changes took place at the same time, with more paraffin being consumed, reflecting different
investment costs of the appliances as well as relative prices changes. UHE households already
had shifted to LPG in the base case as an optimal strategy, while for ULN, the shift hardly
showed up, since household numbers in this group declined with electrification.
Put differently, some policy interventions are already ‘optimal’ in a least-cost framework.
Efficient lighting was found to be a policy intervention that should work in markets for higher-
income households. Penetration rates in the least-cost framework were high. In a case such as
CFLs for richer households, market mechanisms are clearly appropriate as policy instruments.
Other policy cases may need more intervention for benefits other than economic ones. Water
heating, for example, was shown to change the fuels used for water heating in ULE households.
The social benefits from savings for poorer households and improved indoor air quality would
motivate this policy, rather than least-cost optimality.
Having examined the results of residential policy intervention, the next section provides an
insight to the implication of different electricity supply options.

Discussion and interpretation of results 156
7.2 Electricity supply options The various options for electricity supply options are best compared across the major
dimensions of sustainable development – economic, social and environmental. Since the focus
of chapter 8 is such an evaluation, most of the comparison is reported in that chapter. Note also
that chapter 6 already reported important input parameters (see Table 6.14). In this chapter, key
results for each option are highlighted briefly, reporting policy by policy.
7.2.1 Renewable energy The renewable energy policy case was designed to meet the target of 10 000 GWh by 2013,
with a combination of technologies – biomass (bagasse and pulp & paper co-generation), wind,
solar thermal (trough and power tower), small hydro and landfill gas. Costs of renewable
energy technologies were assumed to decrease as global markets grow. The increase in
electricity generation from renewable resources is clearly apparent in Figure 7.7, which shows
the renewables case increase well above all other policy cases and the base case. Note that the
increase occurs gradually up to the 2013, the year the target is set, and beyond. The sharp turn-
up after 2020 reflects the fact that renewables have become competitive with other technologies.
Figure 7.7: Renewable energy for electricity generation by policy case
-
5,000
10,000
15,000
20,000
25,000
30,000
35,000
40,000
2001
2002
2003
2004
2005
2006
2007
2008
2009
2010
2011
2012
2013
2014
2015
2016
2017
2018
2019
2020
2021
2022
2023
2024
2025
GWh
Base Base w/out FBC Gas Hydro PBMR Renewables
Consequently, diversity in the fuel mix is increased. By 2025, the share of electricity generated
from renewable sources increases to 11%, while other, mainly generation decreases, notably
coal from 88% to 78%. Even in this policy case, however, three-quarters of electricity still
comes from coal over a 25-year period.
The renewable energy technologies chosen in the policy case include existing bagasse and small
hydro facilities (see Figure 7.8). New bagasse co-generation and wind are the two new

Discussion and interpretation of results 157
technologies that are chosen by the model. For wind, the technology assuming the highest
availability factor (35%) is chosen first, up the available capacity. Some wind at the lower
capacities is added in later years. The solar thermal and landfill gas technologies are not
chosen.
Figure 7.8: Contribution of renewable energy technologies to meeting the target by 2013
Bagasse co-genSmall hydro
Wind 35%
Wind 30%
Wind 25%
Existing bagasse
-
5,000
10,000
15,000
20,000
25,000
30,000
35,000
40,000
2001
2003
2005
2007
2009
2011
2013
2015
2017
2019
2021
2023
2025
GWh
One measure of the choice of technology is the marginal investment. The ‘investment marginal’
result parameter in Markal is not the same as the investment cost. Rather, it is the additional cost
to the energy system of adding another unit of the particular technology. The model seeks an
optimal, least-cost solution, the marginal investment if the difference between the cost of the
technology considered and the cost of the one it displaces in the optimal run. In the renewables
policy case, the investment marginals for solar thermal electricity have reduced from R10 803 to
R 9 408 per kW for the parabolic trough by 2025, and similarly from R 11 754 to R 7 731 / kW
for the ‘power tower’. However, the costs difference between other renewable energy and the
least-cost technology is even smaller at this point. Therefore, despite the reductions in the costs
of solar thermal electricity, the technology does not compete on a least-cost basis within the 25-
year period.
Overall, additional investment in electricity supply technologies is needed. Focusing only on
the investment in supply technology shows an increase of R 6 billion, but in the balance of the
energy model the increase in total system costs is significantly lower at R 1.9 billion. While this
is a large amount, it is 0.03% of the total system cost in the base case. For all policy cases, it
should be remembered that the total system cost is large and absolute Rand amounts should be
understood in this context.

Discussion and interpretation of results 158
Local air pollution is reduced in the renewables policy case, in particular for sulphur dioxide
and nitrogen oxides. SO2 emissions are 6% lower than in the base case (197 kt), while 96 kt
NOx can be avoided (4%).
Reduction of global greenhouse gases (GHGs) contributing to climate change are achieved with
renewables policy. GHG emissions in 2025 are 32 Mt CO2 or 5% lower than in the base case.
Looking at the individual GHGs, the change is mostly in the form of a reduction of CO2 (5%).
Nitrous oxide declines by 4% as well, but despite its higher global warming potential
contributes less to the total GHG reduction. The reduction in the two gases outweigh a 2%
increase in methane, which results from the increase in biomass used in some of the renewable
energy technologies.
Considering the social dimension, all the policy cases assume that electrification rates increase
as described in the base case. Urban households achieve higher rates of electrification by 2025,
as shown in Table 7.6.
Table 7.6: Share of households with access to electricity in 2025 for all policy cases
Electrified total 92%
Electrified urban 96%
Electrified rural 83%
The social dimensions of sustainability – often with important qualitative dimensions - will be
discussed more fully in chapter 8. The indirect effect of electricity supply options, via the price
of electricity, will be part of that discussion.
7.2.2 PBMR nuclear The PBMR policy case required 4 480 MW of nuclear electricity generation capacity to be built
by 2020, with costs declining as more units are built. As expected, such a requirement would
shift the fuel mix for electricity generation dramatically to nuclear energy, comprising a third of
the total (34%) by 2025. Figure 7.9 shows the increase of electricity generation in the PBMR
case, with all other policy cases following the base case. Virtually all the displaced generation
is coal-based for the PBMR policy case, with the share of renewable energy technologies
decline slightly from 1.0 to 0.8%. Note that when the requirement is relaxed after 2020, nuclear
generation capacity remains constant at the 2020 level.

Discussion and interpretation of results 159
Figure 7.9: Nuclear energy (PBMR) for electricity generation by policy case
-
20,000
40,000
60,000
80,000
100,000
120,000
140,000
2001 2002 2003 2004 2005 2006 2007 2008 2009 2010 2011 2012 2013 2014 2015 2016 2017 2018 2019 2020 2021 2022 2023 2024 2025
GWh
Base Base w/out FBC Gas Hydro PBMR Renewables
Greater diversity comes at a price. Annualising the investment costs for all electricity generation
technologies, and adding them up over the 25 years, indicates that 50% extra would be invested
in electricity supply technologies. For all electricity supply technologies, the cumulative
investment cost would be R 141 billion in the policy case, rather than R 93 billion in the base
case. However, again the balance of the electricity system means that investment costs are partly
off-set. The balance can only be struck partially, however, in the aggressive policy requirement
for building nuclear capacity, and is forced initially to leave much of the PBMR capacity
unused.
Figure 7.10: Unused capacity of the PBMR in the policy case
Unused capacity
0%
10%
20%
30%
40%
50%
60%
70%
80%
90%
2001
2002
2003
2004
2005
2006
2007
2008
2009
2010
2011
2012
2013
2014
2015
2016
2017
2018
2019
2020
2021
2022
2023
2024
2025

Discussion and interpretation of results 160
Only as costs decline from 2015 onwards, is the capacity utilised more effectively. The total
cost of the energy system increases by R 12 billion over the period, compared to the base case.
The unused capacity suggests that the policy case may be too ambitious. At least, nuclear
capacity should be phased in more gradually if it is built domestically at this scale.
Figure 7.11 shows the marginal investment required in both the base and PBMR cases. In the
base case, it declines gradually, but in the policy case more sharply. It reaches zero in years in
the policy case where actual investment takes place, but then rises again after 2020. However,
the investment marginal remains below the base case throughout, given the favourable
assumptions about decline in costs with domestic production.
Figure 7.11: Marginal investment required for more PBMR capacity
0
2,000
4,000
6,000
8,000
10,000
12,000
14,000
16,000
18,000
2001
2003
2005
2007
2009
2011
2013
2015
2017
2019
2021
2023
2025
R / kW
Base case PBMR
The PBMR case avoids significant amounts of local air pollutants, notably 210 ktSO2 (6% less
sulphur dioxide than in the base case), and 5% NOx (102 kt) in 2025. 33 MtCO2-equivalent of
global GHGs are reduced in that year, mostly in the form of CO2 with a small reduction in
nitrous oxides. As discussed above, the PBMR policy case meets the same goals of increasing
access to electricity as for all policy cases.
7.2.3 Importing hydro-electricity from SADC The policy case of importing hydro-electricity increases the amount of hydro-electricity, almost
doubling from current levels of 9.2 TWh to over 18 TWh by 2025. The imports incur a
resource cost, as shown in Figure 7.12 by the bars measured on the left-hand axis, reaching
R 395 million by 2025. Analysis of the direct costs, however, only tells part of the story, with
the reduction in investment in other supply side options being the other side. The modeling

Discussion and interpretation of results 161
framework shows that, over the period, cumulative investments in electricity supply technology
are reduced by R 11 billion. The reduction in total energy system costs, however, is much
lower at R 3 billion, off-setting the gains against import costs shown in the figure.
Figure 7.12: Imports of hydro-electricity and import costs in policy and base case
0
50
100
150
200
250
300
350
400
450
2001
2002
2003
2004
2005
2006
2007
2008
2009
2010
2011
2012
2013
2014
2015
2016
2017
2018
2019
2020
2021
2022
2023
2024
2025
R millions
0
2
4
6
8
10
12
14
16
18
20
TWh
Base cost
Policy costs
Base imports
Policy imports
Extra imported hydro-electricity increases the share of renewables by one-tenth of a percentage
point, but system changes reduce the share of coal-fired electricity from 88% to 87%.
Reductions in local air pollutants amount to 142 kt SO2 (4% less than base case) and 70 kt NOx
(3%). Total GHG emissions are reduced by 4% or 22 Mt CO2 -equivalent. However, it should
be noted that part of this is a reduction in methane emissions. The emissions of methane from
large dams are subject to on-going research (IPCC 2001b; Dos Santos et al. 2006), and the
assumption that hydro-electricity is zero-emissions may change as more information becomes
available.
7.2.4 Importing gas for electricity generation The imported gas policy case reduces the overall system cost by R 0.8 billion over the 25 year
time horizon, compared to the base case. As with hydro, the costs of the imported fuel need to
be taken into account. The shadow price of electricity is reduced to by 0.5 c/ kWh, completing
a picture where the reduced domestic investment costs outweigh the increase in expenditure on
importing gas. These results are sensitive to the assumptions made about future fuel prices in
chapter 6. The natural gas price was assumed to be R 21.5 / GJ (Table 6.4). The gas price was
significantly higher in Rand terms when the currency weakened against the dollar, apart from
fluctuations in the dollar-denominated prices of oil and gas in international markets.

Discussion and interpretation of results 162
The base case as reported in chapter 6 reflected the plans of the National Integrated Resource
Plan (NIRP) and reflected some capacity invested in gas. The policy to import a fixed quantity
of gas changes relatively little, but does optimize more effectively the use of the gas-fired
capacity which is built. The NIRP brought in the full capacity in 2008, whereas in the policy
case, a more gradual introduction allows better adjustment (see Figure 7.13). In both cases, a
lead time is required before the investment begins in 2008.
Figure 7.13: Annualised investment in combined cycle gas in the policy and base case
0
100
200
300
400
500
600
700
800
900
1000
2001
2003
2005
2007
2009
2011
2013
2015
2017
2019
2021
2023
2025
R millions
Investment policy Investment base
Importing gas makes no difference to the domestic fuel mix – the shares of electricity from coal
(88%), renewable energy (1.1%) and nuclear (11%) energy sources remains the same in
percentage terms as in the base case. The share of natural gas used is does not changed
significantly (less than 1%).
Despite the small changes, gas is a cleaner-burning fuel than coal, and some reductions in local
and global air pollutants are observed. Relative to the base case, the reduction for sulphur
dioxide, nitrogen oxides and greenhouse gases are all 2% lower for the policy case. The
reductions amount to 83 ktSO2, 42 kt NOx and 14 Mt CO2-equivalent.
7.2.5 Cleaner coal technology in the base case Chapter 6 outlined that fluidised bed combustion (FBC), a technology using discard coal for
electricity generation, is included in the base case and no separate policy case was constructed.
Here, the contribution made by the technology is examined by briefly presenting results for a
version of the base case that explicitly excludes electricity generation from FBC.
Figure 7.14 shows electricity generation grouped by fuel, comparable to Figure 6.4 for the base
case. By design, there is no discard coal, with the slack being taken up mostly by additional
new coal-fired plants (10,650 GWh in 2025), with a small increase in bagasse (811 GWh).

Discussion and interpretation of results 163
Figure 7.14: Electricity generation without Fluidised Bed Combustion
Coal Eskom
Coal other
Coal new
Nuclear PWR
Pumped storage
Natural gas CCHydro small
Bagasse
-
50,000
100,000
150,000
200,000
250,000
300,000
350,000
400,000
2001
2002
2003
2004
2005
2006
2007
2008
2009
2010
2011
2012
2013
2014
2015
2016
2017
2018
2019
2020
2021
2022
2023
2024
2025
GWh
Coal Eskom Coal other Coal new Nuclear PWR Pumped storage Natural gas CC Hydro small Bagasse
The total system costs with FBC are R 11 billion higher over the period, in other words the
removal of FBC electricity generation from the optimized case decreases costs. The higher cost
of the alternative technology (pulverised coal) outweighs the reduction in fuel costs, since a
discarded product is used for fuel. The fuel mix remains unchanged, as discard coal is replaced
by new coal. While FBC contributes to removing stockpiles of discard coal, there are small
increases in air pollutants. One factor contributing to this increase is the lower heating value in
the poorer quality coal; the other is that the modified base case is not fully optimized. SO2
emissions with FBC increase by 62 kt, i.e. the optimized base case has 2% less sulphur dioxide
emitted in 2025 than the case with FBC removed. Similarly, there is an increase of NOx with
FBC of 30 kt (1.4 %). Total GHG emissions, primarily in the form of carbon dioxide, increase
by 9.4 MtCO2 or 1.5% in 2025. A fuller investigation of ‘cleaner coal’ technologies as a policy
case would be a useful future piece of work; the approach here is to consider the take-up of FBC
as part of the base case.
7.2.6 Conclusions on electricity supply options The quantitative results of modeling electricity policy cases have been presented in this section.
Before turning to an evaluation of both residential and electricity policy cases against indicators
of sustainable development, some findings from the results are summarized.
The renewables case demonstrated that a mix of renewable energy technologies can supply
‘real’ electricity. The 2013 targets was met, and continued beyond that year, driven by

Discussion and interpretation of results 164
decreasing costs. Certainly the policy intervention incurred an increase in costs, but of the same
order of magnitude as other policy cases. The mix of renewable energy included existing small
hydro and bagasse, and brought in new bagasse co-generation and wind at various capacity
factors. Despite declining costs, solar thermal electricity technologies did not enter the system
over the 25-year period.
The PBMR policy case showed the increasing the share of nuclear energy to a third of total
electricity generation reduces air pollution, but incurs large increases in cost above the base
case. Building 32 modules (4 480 MW) into the system by 2020 is ambitious. Not only did
investment level off after 2020, but the new capacity was underutilized. If built, the technology
would better be phased in more gradually.
Imports of gas should also be phased in, as shown in the gas policy case’s more gradual
approach compared to the base case. Being an internationally traded commodity, the
introduction of gas depends on fluctuations in market prices, and is also sensitive to exchange
rates variations. The other import, hydro-electricity, was successfully increased in the policy
case. Its global environmental benefits assume that there are no methane emission from large
dams, which might change in future. The local impacts of large dams will be further discussed
in chapter 8. Brief consideration of FBC confirmed that it should be considered in the base case.
So far this section has considered the findings for individual policy cases, now it turns to the
combined effect. As for residential policies, a combined case including four electricity policy
options was developed. The combined electricity case includes renewable energy, PBMR
nuclear, imported hydro and gas. In contrast to the residential policies, which were aimed at
different end uses and complementary to some extent, each of the electricity cases has the same
aim, of supplying electricity to meet demand and increase access.
The share of renewable energy increases to 6%, about half of the level in the renewables case.
The share of nuclear is only slightly higher than in the base case, given the other requirements
to meet targets for renewable energy and to import hydro and gas. Coal remains dominant by
2025, reduced by five percentage points from 88% to 83%.
Unsurprisingly, the combination of requiring several switches from the least-cost base case
increases the avoided cost of electricity. The shadow price of electricity increases by 3 c / kWh,
more than in any electricity policy case on its own. In terms of investment costs, combining all
the policies increases the total cost to the energy system by R 11 billion. Most of the investment
costs are for the PBMR, which itself had a slightly higher increase.
From an environmental point of view, the combined case does yield the most reductions of local
and global emissions. The sum of the parts, however, is greater than the combined whole, i.e.
one cannot simply add up the emission reductions in the combined case, as different supply

Discussion and interpretation of results 165
options compete. Nonetheless, the reductions of 245 kt SO2 are a higher at 7% than in any
single policy case; as are the 120 kt NOx less than the base case in 2025 (6%). GHG emission
reductions add up to 40 Mt CO2-equivalent in 2025 (6%). 39.6 of these Mt are in the form of
carbon dioxide.
7.3 Conclusion
The results of modeling energy policies – both residential demand and electricity supply options
- yield useful quantitative information. They provide important input to the analysis of
indicators of sustainable development, examined in chapter 8. Further policy analysis of some
issues that are not easily quantified will receive attention in chapter 9.
A notable feature of the modeling results has been that they tended to focus on the energy
system and its economic and environmental dimensions. The social indicator of increased
access to electricity was constant across the policy cases. The social implications of electricity
supply options are less direct than those in the residential sector, where household energy use
and expenditure is affected directly. Of course, the choices about electricity supply affect
households not only through access to electricity, but also through the price. Hence the
differences in the costs to the energy system reported in this section have implications for the
burden that expenditure on electricity places on household budgets. Modeling can provide some
useful inputs, but more detailed policy analysis is required to compare the effects to total
household income (see chapter 8). The next chapter considers both residential and electricity
policies against indicators of sustainable development.

Evaluating policies against sustainable development criteria 166
Part IV: Sustainable development, energy and climate change policies
CCCCHAPTER HAPTER HAPTER HAPTER 8888
8. Evaluating energy policies against indicators of sustainable development
Chapter 8 evaluates the policies in the residential and electricity sectors against indicators of
sustainable development. A working definition of sustainable development was outlined in
chapter 2. There is broad agreement that sustainable development has social, economic and
environmental dimensions, and it is in these three categories that the evaluation is structured.
The evaluation does not seek to define thresholds for each indicator that would be considered
sustainable. Any particular definition of a level representing an end-state of sustainable
development could be contentious. In keeping with the methodology, the focus is on making
development more sustainable. Hence the comparison is relative, using the base case as a
benchmark to evaluate the sustainability of each policy case.
The modeling results presented in chapter 7 are an important input to this evaluation. The
analysis will show, however, that there are limits to the information obtained from the
modeling. The discussion of indicators therefore includes aspects that are more difficult to
quantify. The difficulty in describing the social implications of supply-side options is one
example. Some of the more qualitative aspects are important in the policy analysis in chapter 9.
8.1 Indicators of sustainable development The working definition of sustainable development in the energy context (chapter 2)
emphasised that energy consumption per capita is increasing over time and the increase is not
threatened by 'feedback' from either biophysical impacts (local air pollution, greenhouse gas
emissions), economic disincentives (high costs) or from social impacts (social disruption, lack
of affordability).
A wide range of energy indicators has been developed by various institutions and some have
been applied in South Africa (Spalding-Fecher 2003; IAEA; UNDESA; IEA; Eurostat; EEA
2005; UN DSD 1996; CSD 1995; Bossel 1998; Villavicencio forthcoming; Helio International
2000). It is worth reflecting on the purpose of choosing a set of indicators.
Indicators should be accurate in assessing sustainability in the energy sector, representing the
key dimensions of sustainable development (Spalding-Fecher 2002d). Each indicator is a single
figure that expresses an aspect of a country’s production and use of energy (IAEA; UNDESA;
IEA; Eurostat; EEA 2005). Taken together and assessing changes over time, the set of

Evaluating policies against sustainable development criteria 167
indicators can assist policy-makers in assessing progress (or lack thereof) in making
development more sustainable.
Indicators should be representative of the major dimensions of sustainable development
(Spalding-Fecher 2003). Some indicators focus on socio-economic aspects, e .g. the delivery of
essential services for reducing poverty, while other indicators focus on environmental effects.
The skill of the policy maker will be to select and weight indicators as appropriate for the
country situation so as to develop in a sustainable manner (IAEA; UNDESA; IEA; Eurostat;
EEA 2005).
However, more indicators are not necessarily better, since indicators need to be intelligible to a
range of stakeholders. Too many indicators can cause confusion - for example, the Commission
on Sustainable Development (CSD) has compiled a working list of more that 130 indicators,
including social, economic, environmental and institutional aspects of sustainable development
(CSD 1995). Such a broad list may be useful to enable countries to choose across all sectors, but
seems too broad for application to a single sector and country. A smaller set of indicators can
give a more concise message – but clearly the indicators need to be chosen with care. If
indicators are to be tracked over time, the data should be relatively easy to gather (Spalding-
Fecher 2002d).
The pragmatic approach taken in this thesis is to identify a small number of indicators for each
of the economic, social and environmental dimensions. The indicators should address both parts
of sustainable development – the sustainability of the dimension, and be relevant to
development.
The motivation for particular energy indicators for sustainable development in South Africa is
largely contained in chapter 3. The indicators should reflect the country’s development
objectives, be consistent with the energy policy goals spelled out there, and mark progress
towards sustainability in its economic, social and environmental dimensions. Given this broad
motivation, the specific indicators shown in Table 8.1 are motivated in the following way.
For the development of the South Africa energy sector, access to energy services in general and
electricity in particular is a major goal. One indicator is the share of households connected to
the grid. Development could be made more sustainable if the services become more affordable.
An indicator giving relevant information is the cost of energy services, for both electricity and
other fuels. A more complete understanding of the burden on household incomes, however, will
require further policy analysis.
Greater access to energy services can indirectly contribute to social sustainability. Better
lighting, for example, assists with education, giving household members the ability to study at
night with lighting. The initial cost of the options considered in policy cases needs to be
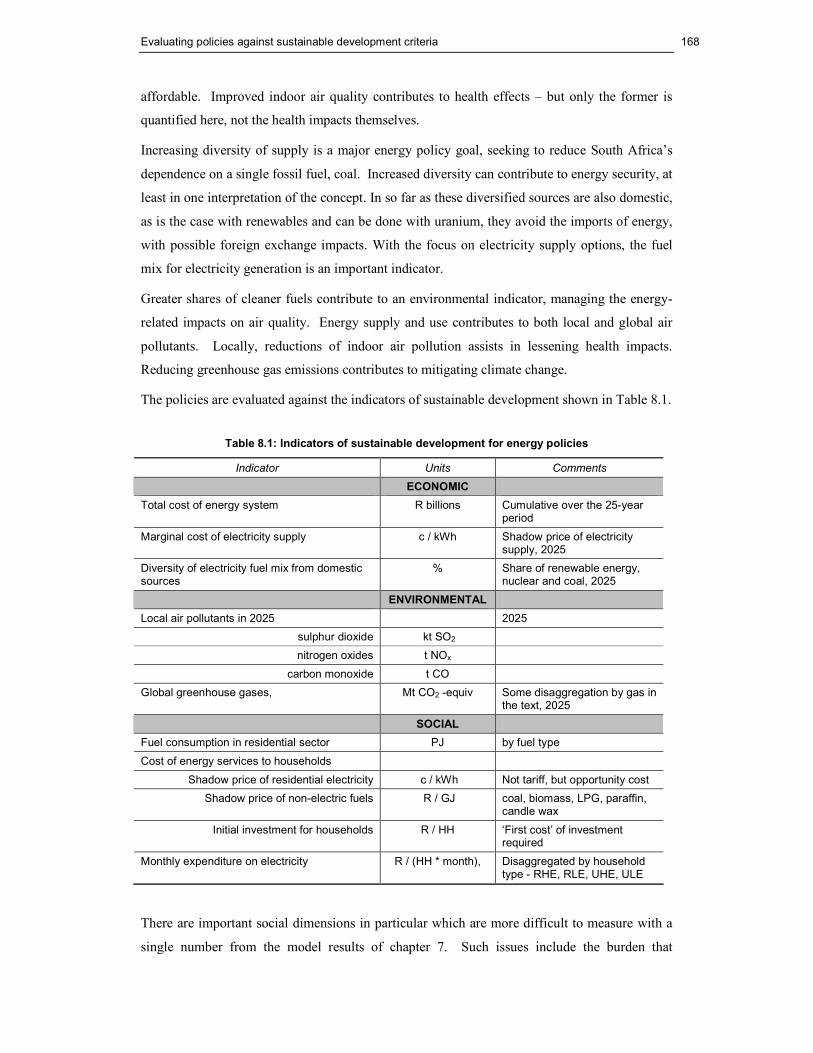
Evaluating policies against sustainable development criteria 168
affordable. Improved indoor air quality contributes to health effects – but only the former is
quantified here, not the health impacts themselves.
Increasing diversity of supply is a major energy policy goal, seeking to reduce South Africa’s
dependence on a single fossil fuel, coal. Increased diversity can contribute to energy security, at
least in one interpretation of the concept. In so far as these diversified sources are also domestic,
as is the case with renewables and can be done with uranium, they avoid the imports of energy,
with possible foreign exchange impacts. With the focus on electricity supply options, the fuel
mix for electricity generation is an important indicator.
Greater shares of cleaner fuels contribute to an environmental indicator, managing the energy-
related impacts on air quality. Energy supply and use contributes to both local and global air
pollutants. Locally, reductions of indoor air pollution assists in lessening health impacts.
Reducing greenhouse gas emissions contributes to mitigating climate change.
The policies are evaluated against the indicators of sustainable development shown in Table 8.1.
Table 8.1: Indicators of sustainable development for energy policies
Indicator Units Comments
ECONOMIC
Total cost of energy system R billions Cumulative over the 25-year period
Marginal cost of electricity supply c / kWh Shadow price of electricity supply, 2025
Diversity of electricity fuel mix from domestic sources
% Share of renewable energy, nuclear and coal, 2025
ENVIRONMENTAL
Local air pollutants in 2025 2025
sulphur dioxide kt SO2
nitrogen oxides t NOx
carbon monoxide t CO
Global greenhouse gases, Mt CO2 -equiv Some disaggregation by gas in the text, 2025
SOCIAL
Fuel consumption in residential sector PJ by fuel type
Cost of energy services to households
Shadow price of residential electricity c / kWh Not tariff, but opportunity cost
Shadow price of non-electric fuels R / GJ coal, biomass, LPG, paraffin, candle wax
Initial investment for households R / HH ‘First cost’ of investment required
Monthly expenditure on electricity R / (HH * month), Disaggregated by household type - RHE, RLE, UHE, ULE
There are important social dimensions in particular which are more difficult to measure with a
single number from the model results of chapter 7. Such issues include the burden that

Evaluating policies against sustainable development criteria 169
electricity places on household income, which is analysed a little further in chapter 9. The
impacts of economic measures on job creation would require either a detailed bottom-up study,
and / or the generation of employment multipliers through a social accounting matrix.
The partial ways in which health and education are addressed has been described above. Other
dimensions, such as the impacts on empowerment and participation of civil society, are not
usefully quantified.
The chapter proceeds by evaluating the economic, environmental and social dimension in turn,
using indicators outlined in Table 8.1. The policy cases described in chapters 6 and 7 are
evaluated, excluding the FBC case for electricity supply, since this was found to be better
represented in the base case (see 7.2.5). The overall comparison across all three dimensions and
supply- and demand-side policies is summarized in Table 8.21 at the end of the chapter.
8.2 Economic
8.2.1 Overall investment levels The levels of investment in supply and demand technologies in nominal terms rise sharply from
the base year, and then increase gradually over the period (Figure 8.1). The difference between
the various policy cases is relatively small, in the context of large absolute amounts of
investment. Whether SA chooses a least-cost path as represented in the base case, or particular
policy interventions, a large amount of total investment in the energy system will be needed.
The incremental costs of investment are not that large in relative terms, and the costs reported in
Figure 8.1 are undiscounted. Much of the further analysis will consider the costs to the entire
energy system, which are discounted. As context, it is useful to have an impression of the scale
of capital requirements.
Figure 8.1: Undiscounted total investment in technologies, supply and demand
0
20,000
40,000
60,000
80,000
100,000
120,000
2001
2003
2005
2007
2009
2011
2013
2015
2017
2019
2021
2023
2025
R millions
Base case Gas Hydro PBMR
Renewables Combined elec CFL Combined res
Eff house LPG SWH

Evaluating policies against sustainable development criteria 170
8.2.2 Residential policies and savings in energy system cost Residential policies have relatively little impact on overall energy system costs. The residential
sector is a fairly small part of total demand. In the base case, residential demand accounted for
9% of total fuel consumption (see base case in chapter 6). It is not surprising, therefore, to see
in Table 8.2 that the cost implications of policy cases in the tenths or hundredths of a percent.
Costs are dominated by supply and larger demand sectors.
Table 8.2: Total energy system costs across residential policies
Unit Base
case
CFLs Efficient
houses
LPG for
cooking
Water
heating -
SWH /GB
Residential
policies
combined
Total cost of energy system,
cumulative over the period
R
billions
6,120 6,119 6,119 6,121 6,115 6,115
Change policy - base case R
billions
-0.9 -0.9 0.6 -4.6 -5.0
Difference to base case % -0.01% -0.02% 0.01% -0.08% -0.08%
Since total costs are large, and the costs are considered over the 25-year period, the absolute
changes amount to billions of Rands. There are cost reductions for all policy cases, except for
LPG for cooking. The analysis in chapter 7 indicated that the policy case increased fuel
consumption, that other fuel switches (e.g. to paraffin) also took place and changed relative
prices.
Savings in the other policy cases range from R 900 million to R 5 billion. The largest reduction
in costs for the energy system for a single policy comes from water heating, with the
introduction of solar water heaters (SWH) and geyser blankets. The higher reduction reflects the
high proportion of energy used for water heating, the large savings from SWH and the low cost
of geyser blankets. The combined case does not simply add up these savings (and the higher
cost of the LPG case), but considers the combined effects without double counting.
8.2.3 Investment requirements for residential policies The investment costs of the four policy cases can be seen in Figure 8.2 for each year. Note that
the order of magnitude here is Rand millions, since only the direct monetary requirements are
reported here, not the discounted total system costs as above. The pattern of investments also
differs markedly. Investment of efficient housing occurs early on, and then declines. CFLs also

Evaluating policies against sustainable development criteria 171
show spikes, but investment is repeated as the life-time of the bulbs is shorter than 25 years
(unlike houses). Investment in water heating and cooking appliances and fuels is more evenly
spread over time.
Figure 8.2: Investment required for residential policies in the respective policy case
-
200
400
600
800
1,000
1,200
1,400
1,600
2002
2004
2006
2008
2010
2012
2014
2016
2018
2020
2022
2024
R millions
CFLs Efficient houses LPG for cooking Cleaner water heat
8.2.4 Financing residential policies The residential efficiency measures are economically attractive, with solar water heating /
geyser blankets standing out in particular. SWH and CFLs have been identified as policy
priorities already (see chapter 4), with efficient housing receiving less attention. The
investments required have to come from households, either those who can afford them or with
government support. The key policy question is how to assist households to invest in the upfront
costs.
Taking SWH with the biggest reduction as an example, the question is what policies would
promote greater uptake of the technology. In part, the design of the policy took these concerns
into account, by combining SWH with a low-cost option, geyser blankets. The analysis in
chapter 7 showed that SWH were taken up primarily in higher-income urban households, who
can afford the upfront costs. Chapter 9 will examine options for financing investments in
residential policies, using examples of subsidies for efficient housing and financing for solar
water heaters.

Evaluating policies against sustainable development criteria 172
8.2.5 Investments in electricity generation technologies The cost implications of different electricity supply options are an important indicator of
economic sustainability. Given the end of excess capacity (see Table 3.2 above), investment
will be required in new capacity. Some 20 GW of new capacity will be needed over the next 20
years. Eskom has announced investment plans of over R 100 billion for initial additions, but
now that it is no longer a para-statal, investment decisions will be even more closely scrutinized
(see section 3.4).
Table 8.3 shows the total cost of the energy system in all cases, in absolute terms as well as the
difference between base and policy cases. The changes expressed in percentages are small,
relative to the large absolute sums.
Total energy system cost increases for PBMR and renewable energy, and only introducing all
options at once has a higher cost. By contrast, importing gas or hydro reduces system costs.
Domestic investment is reduced, and the reduced expenditure is not made up by increased
imports. However, the increased expenditure on imports may have foreign exchange
implications. This issue also arises with the PBMR, for which processed fuel is expected to be
imported despite the local uranium resource. As noted in chapter 7 in the gas and hydro cases,
the results are sensitive to the assumed costs of the imported fuels. The combined case is the
second most expensive, as supply side options compete to provide supply (unlike residential
efficiency, where savings are highest in combination).
Table 8.3: Total cost of energy system for electricity supply options
Unit Base case Imported
gas
Imported
hydro
PBMR
nuclear
Renewable
electricity
Combined
electricity
Total energy system costs, cumulative over 25 years
R billions
6,120 6,119 6,117 6,132 6,122 6,131
Change policy - base R billions
-0.8 -3.1 11.7 1.9 10.9
Difference to base case % 0.0% -0.1% 0.2% 0.0% 0.2%
Note: Combined electricity includes the imported gas, hydro, nuclear and renewables cases.
Beyond changes in sign, one can note that importing hydro-electricity under the given
assumptions would have the greatest reduction of energy system costs, larger than for gas.
Similarly, the increase for the PBMR is significantly greater than for the renewables case.
However, the changes in total costs should be understood in the context of different goals being
set in each case. The electricity policy cases were designed as ambitious targets for the
particular technology, within reasonable bounds.

Evaluating policies against sustainable development criteria 173
Investment levels in the policy cases vary significantly. Smaller investments are required to
meet lower targets, and are associated with less installed capacity. Renewable energy, for
example, in the policy case reaches the target of 10 000 GWh in 2013 and increases to 37 000
GWh in 2025. The additional cost to the energy system is R 1.9 billion over 25 years. The
PBMR case installs 4 480 MW, adding R 11.7 billion to total system costs, but also generates
28 300 GWh in 2025. Despite the different objectives, the PBMR is therefore more expensive
in this comparison, as the ratio of additional costs is much greater than electricity generated. An
important reason is the unutilized PBMR capacity noted in chapter 7.
Table 8.4: GWh electricity generated by technology in its policy case
GWh Renewables PBMR Imported hydro Imported gas
In 2025 37,058 28,303 18,400 1,367
Over 25 years 290,719 166,681 370,067 11,567
Two other means of direct comparison are available. The assumed costs per kW as input
parameters (rather than results) are shown in Table 6.14 (repeated from chapter 6), together with
the fixed and variable operation and maintenance costs. The input parameter, however, does not
take into account the opportunity cost – the electricity generated from renewable or nuclear
energy displaces other, predominantly coal-fired electricity. The marginal investment is a better
reflection of the opportunity cost (see 0), but this measure is specific to each electricity
generation technology.
Table 8.5: Costs of electricity supply technologies per capacity and unit of generation
Sources: Markal database for this model (Winkler et al. 2005a), and NIRP database (NER
2004a) and also drawing on modeling for the first IEP (DME 2003d)
Investment cost Fixed O&M cost
Variable O&M cost
Type R/kW R / kW c / kWh
Imported gas
Combined cycle gas turbine 4,583 142 0.7
Open cycle gas turbine (diesel) 3,206 142 5.4
Imported hydro
Imported hydro 2.1
Renewable energy
Parabolic trough 18,421 121 0
Power tower 19,838 356 0
Wind turbine 6,325 289 0

Evaluating policies against sustainable development criteria 174
Investment cost Fixed O&M cost
Variable O&M cost
Type R/kW R / kW c / kWh
Small hydro 10,938 202 0
Land fill gas (medium) 4,287 156 24.2
Biomass co-gen (bagasse) 6,064 154 9.5
Nuclear
PBMR initial modules 17,136 317 0.7
PBMR multi-modules 10,761 317 0.7
Coal
New pulverized fuel plant 9,980 101 0.7
Fluidized bed combustion (with FGD) 9,321 186 2.9
Storage
Pumped storage 6,064 154 9.5
Note: The costs are input parameters, rather than results, and are included here to show differences in cost
per unit of capacity (R/kW) and electricity generation (c / kWh).
The pattern of investments over time is shown in Figure 8.3, where investments in new capacity
have been annualised over the life-time of the technology. All electricity technologies have a
lead-time, so investment picks up form 2005 onwards. The combined case has the highest costs
for most of the period, with the PBMR next. The same caveats apply that the investment costs
are achieving different objectives for each policy.
Figure 8.3: Annualised investments in electricity supply technologies by policy case
-
2,000
4,000
6,000
8,000
10,000
12,000
14,000
16,000
2001
2002
2003
2004
2005
2006
2007
2008
2009
2010
2011
2012
2013
2014
2015
2016
2017
2018
2019
2020
2021
2022
2023
2024
2025
R millions
Base Gas Hydro PBMR Renewables Combined elec
There are no clear winners among the options and the trade-offs required are further considered in the policy analysis in section 9.1.2.

Evaluating policies against sustainable development criteria 175
8.2.6 Price of electricity
8.2.6.1 Shadow prices and market prices
While data inputs to Markal are usually market prices, the model results are shadow prices.
Least-cost optimization draws on an economic theory that assumes perfect competition. It also
assumes that actors have perfect foresight, minimizing their costs over the entire time horizon of
the model. In such a situation, market prices would reflect true economic costs. In reality these
conditions seldom hold. Market prices are distorted by monopolies, external costs not
internalised by markets, taxes, subsidies and other factors (Munasinghe 1992). With such
distortions, market prices diverge from the shadow price, the future economic opportunity cost.
Shadow prices represent the cost of the foregone alternative, if an additional unit of a
technology is brought into the system.
For example, if the market price of electricity is subsidised for poor consumers, as in the
poverty tariff, then the shadow price reflecting the opportunity cost would reflect the economic
cost without the subsidy. In the SA electricity sector, prices are regulated – hence called tariffs –
rather than being set by a competitive market. Even in situations of power sector reform, tariffs
are likely to remain regulated, although possibly rationalised. Future tariffs might be adjusted
more closely to the Long Run Marginal Cost (LRMC), which can be defined as the
“incremental cost of optimal adjustments in the system expansion plan and system operations
attributable to a small increment of demand which is sustained into the future” (Munasinghe
1992: 109).
8.2.6.2 Shadow price of electricity
The shadow prices for electricity are shown in Table 8.6 for the electricity policy cases for the
end of the period, 2025. The shadow prices of electricity are broadly comparable, except for the
combined scenario which is higher. By requiring diversification in several directions, it has the
highest shadow price – when averaged across all times of the day. Importing gas or hydro-
electricity reduces the marginal cost of electricity supply. Importing gas or hydro-electricity
reduces the shadow price by 0.5 c / kWh. These options would therefore provide the most
favourable context for ensuring the financial viability of municipal or regional distributors.
Table 8.6: Shadow price of electricity for policy cases
Base case Imported
gas
Imported
hydro
PBMR
nuclear
Renewable
electricity
Base w/out
FBC
Combined
electricity
2025 19.3 18.8 18.8 19.3 19.3 19.3 22.3

Evaluating policies against sustainable development criteria 176
Comparing policy cases in 2025, the prices in the PBMR and renewables cases are the same as
in the base case. This is possible despite the large changes in energy system costs, since these
were small in relative terms (see Table 8.3). Also, the shadow prices in this analysis are
averaged across six time slices (day / night for three seasons - summer, winter and
intermediate). The results indicate that the respective advantages of the different technologies
balance out. Although significant investment are required, shift to technologies other than coal
are possible without large impacts on the shadow price of electricity. The combined case would
increase the shadow price of electricity by 3 c / kWh compared to the base case, an increase
which would further exacerbate financial difficulties of distributors.
8.2.7 Diversity of electricity supply The diversity of the fuel mix for electricity generation is shown in Table 8.7. There is little
variation across the first three cases shown, with fuels grouped into renewable energy, nuclear
and other, predominantly coal-based electricity. Imported fuels do not change the domestic fuel
mix. They do, however, contribute to reductions of local air pollutants (see environmental
section). Greater diversity of supply is achieved primarily through renewables or PBMR
nuclear, in two different ways.
Table 8.7: Diversity of fuel mix from domestic sources for electricity supply options by 2025
Indicator Base case Imported
gas
Imported
hydro
PBMR
nuclear
Renewable
electricity
Combined
electricity
(gas, hydro,
nuclear, RE)
Share of renewable energy 1.0% 1.1% 1.1% 0.8% 11% 6%
Share of nuclear 11% 11% 11% 34% 11% 11%
Share of other (mainly coal) 88% 88% 88% 66% 78% 83%
Table 8.7 shows the fuel mix by grouped fuels, are based on electricity output, not installed
capacity. The PBMR case, with a larger investment in greater capacity, achieves the largest
move away from coal. However, it is a shift to single other fuel, with only renewable energy
reduced to the lowest of all cases at 0.8%. The renewables case achieves the best diversity
across the three grouped fuel types. The renewables policy case has a lower investment
requirement than PBMR and lower installed capacity. The combined policy case does not
achieve greater diversity – either in terms of coal displaced, or variety of fuel type.
The focus so far has been on the economic dimension of sustainable development. Markal is a
least-cost optimizing tool, and hence the results shown above indicate the least-cost options.

Evaluating policies against sustainable development criteria 177
Even with constraints in the policy cases, the target set will be met with the least-cost resource
available.
Considerations other than cost, however, play an important role in shaping policy. The
following sections turn to the social and environmental dimensions of sustainable development
in the energy sector.
8.3 Environmental
8.3.1 Local air pollutants reduced by residential policies Increasing efficiency and using cleaner fuels in the residential policy cases contributes to
reducing local air pollutants. The largest changes were seen for sulphur dioxide and nitrous
oxide; changes in carbon monoxide and non-methane volatile organic compounds were less
than a tenth of a percent below the base case. Efficient houses and water heating achieve a
reduction of slightly over 1% from the base case, for both SO2 and NOx emissions (see Table
8.8). Efficient housing reduces 47 kt SO2 and 24 kt NOx in 2025; while SWH and geyser
blankets can reduce 40 kt SO2 and 19 kt NOx in that year.
Table 8.8: Local air pollutants in residential policy cases, 2025
Unit Base case CFLs Efficient
houses
LPG for
cooking
Water
heating -
SWH and
geyser
blankets
Residential
policies
combined
Sulphur dioxide kt SO2 3,571 3,568 3,524 3,559 3,531 3,517
Difference to base case % -0.1% -1.3% -0.3% -1.1% -1.5%
Nitrogen oxides t NOx 2,156,438 2,155,275 2,132,925 2,151,339 2,137,627 2,129,828
Difference to base case % -0.1% -1.1% -0.2% -0.9% -1.2%
The combined case considers only the net effect on emissions. The reductions of sulphur
dioxide emission in the combined policy case have significant amounts. Adding up the
percentage reductions would have yielded -2.8% from the base case, but the combined case only
reports 1.5%. An advantage of an modeling framework for such analysis is that the combined
effects are not exaggerated. For both SO2 and NOx, the combined case does slightly better than
the best individual policy (efficient houses), but by a small share.
GHG co-benefits in the residential sector. Table 8.9 shows total GHG emission in the base case
and residential policy cases. The emission reductions are shown both as tons reduced from the
base case and also as a percentage. The highest reductions of GHGs among residential policies
are achieved by efficient houses, followed by SWH and geyser blankets. The reductions reflect
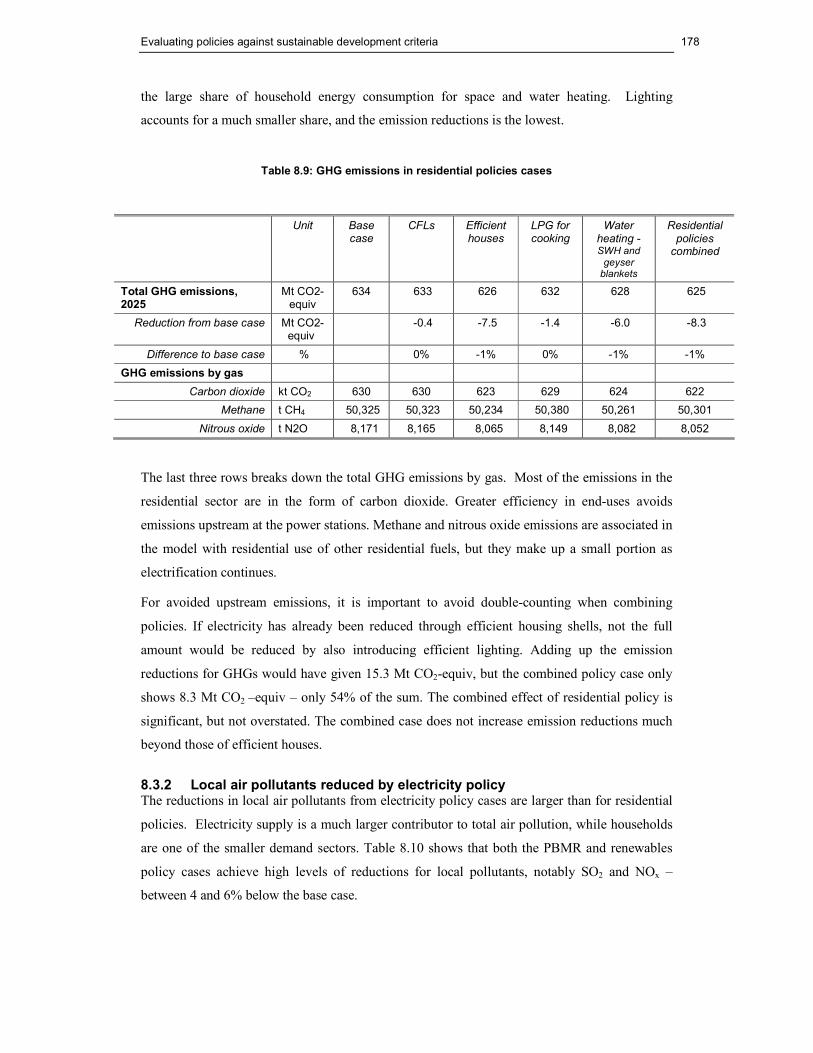
Evaluating policies against sustainable development criteria 178
the large share of household energy consumption for space and water heating. Lighting
accounts for a much smaller share, and the emission reductions is the lowest.
Table 8.9: GHG emissions in residential policies cases
Unit Base case
CFLs Efficient houses
LPG for cooking
Water heating - SWH and geyser blankets
Residential policies combined
Total GHG emissions, 2025
Mt CO2-equiv
634 633 626 632 628 625
Reduction from base case Mt CO2-equiv
-0.4 -7.5 -1.4 -6.0 -8.3
Difference to base case % 0% -1% 0% -1% -1%
GHG emissions by gas
Carbon dioxide kt CO2 630 630 623 629 624 622
Methane t CH4 50,325 50,323 50,234 50,380 50,261 50,301
Nitrous oxide t N2O 8,171 8,165 8,065 8,149 8,082 8,052
The last three rows breaks down the total GHG emissions by gas. Most of the emissions in the
residential sector are in the form of carbon dioxide. Greater efficiency in end-uses avoids
emissions upstream at the power stations. Methane and nitrous oxide emissions are associated in
the model with residential use of other residential fuels, but they make up a small portion as
electrification continues.
For avoided upstream emissions, it is important to avoid double-counting when combining
policies. If electricity has already been reduced through efficient housing shells, not the full
amount would be reduced by also introducing efficient lighting. Adding up the emission
reductions for GHGs would have given 15.3 Mt CO2-equiv, but the combined policy case only
shows 8.3 Mt CO2 –equiv – only 54% of the sum. The combined effect of residential policy is
significant, but not overstated. The combined case does not increase emission reductions much
beyond those of efficient houses.
8.3.2 Local air pollutants reduced by electricity policy The reductions in local air pollutants from electricity policy cases are larger than for residential
policies. Electricity supply is a much larger contributor to total air pollution, while households
are one of the smaller demand sectors. Table 8.10 shows that both the PBMR and renewables
policy cases achieve high levels of reductions for local pollutants, notably SO2 and NOx –
between 4 and 6% below the base case.

Evaluating policies against sustainable development criteria 179
Table 8.10: Local air pollutants in electricity policy cases, 2025
Unit Base case Imported
gas
Imported
hydro
PBMR
nuclear
Renewable
electricity
Combined
electricity
(gas, hydro,
nuclear, RE)
Sulphur dioxide kt SO2 3,571 3,487 3,429 3,361 3,374 3,326
Difference to base case % -2% -4% -6% -6% -7%
Nitrogen oxides t NOx 2,156,438 2,114,198 2,086,086 2,053,462 2,060,563 2,035,692
Difference to base case % -2% -3% -5% -4% -6%
Carbon monoxide t CO 4,923,479 4,918,409 4,916,535 4,913,639 4,962,143 4,960,353
Difference to base case % 0% 0% 0% 1% 1%
The trends in SO2 emissions are illustrated in Figure 8.4. In the base year, emissions are close to
1 760 kt SO2 in all cases, so that the variation in the policy cases appear small.
Figure 8.4: SO2 emissions in electricity policy cases over time
0
500
1,000
1,500
2,000
2,500
3,000
3,500
4,000
2001 2005 2010 2015 2020 2025
kt SO2
Base case Gas Hydro PBMR Renewables Combined elec
Some of the reductions in absolute terms were reported in chapter 7, with the PBMR case
reducing 210 kt SO2, renewables 197 kt and the combined case 245 kt SO2 in 2025. NOx
emissions were lowered from the base case by 103, 96 and 121 kt NOx for the respective cases.
8.3.3 Other local environmental impacts The focus on air pollution, both global and local emissions, should not lead one to ignore the
other environmental impacts of energy supply options.
Renewable energy is generally considered environmentally friendly, but should deal with its
impacts like any other energy technology – even if they are at a smaller scale. Biomass should
be sustainably harvested and not use up indigenous forest. The viability of growing fuel crops
will depend on scarce resources of arable land and water. Using biomass for energy will
compete with using it for food. Wind turbines face three main environmental concerns – sight

Evaluating policies against sustainable development criteria 180
pollution, bird strikes and turbine noise. For photovoltaics, it is the balance of system, such as
light fixtures, batteries and the solar panels, that require careful disposal (ERC 2004a).
The environmental impacts of large dams, including flooding sensitive areas, displacement of
people, possible seismic effects – have been outlined by the World Commission on Dams
(WCD 2000). The largest of South Africa’s hydro-electric facilities are Gariep (360 MW),
Vanderkloof (240 MW) – both on the Orange River – and Collywobbles (42 MW) on the
Mbashe River. None of these are very large by international comparison, and others are 11 MW
or smaller. Few sites exist for the development of large hydro facilities domestically; the
potential lies in the Southern African region. Nonetheless, the country has a unique biodiversity
endowment and ecological sensitivity that necessitates stringent environmental measures even
in the case of small hydro projects (ERC 2004a). The ecological reserve prescribed by the new
Water Act (DWAF 1998) requires the sufficient water be left to maintain river ecosystems.
The higher efficiency of combined cycle gas turbines can reduce GHG emissions and local
pollutants, such as NOx. However, the production, processing and transportation of gas by
pipeline can also be a major contributor to GHGs in terms of fugitive emissions. With a high
global warming potential, every ton of methane leaked has the equivalent effect of 23 tons of
CO2 . The social impacts of gas pipelines on communities over whose land they pass should
also be taken into account.
The social and environmental impacts of nuclear energy technologies - waste disposal, security,
and public acceptance – are discussed in chapter 9.
Coal-fired power stations, which dominate the base case, have important local implications for
water. Three main concerns are the effect of coal mining on water quality; that Eskom pays a
price for water that is probably below the opportunity cost; and the quantity of water used by
power stations (Spalding-Fecher et al. 2000a). Most of the coal stations dump their heat from
the condensers in conventional cooling towers, which use between 1.8 and 2.0 litres of water for
every kilowatt-hour of electricity generated. However, fresh water is South Africa’s most
critical resource, and so two stations, Kendal and Matimba, have dry cooling, and use only 0.1
litres of water for every kilowatt-hour (ERC 2004a).
While each energy technology should deal with its problems, the policy options examined here
have important positive benefits. A large ‘co-benefit’ of developing these energy technologies
lies in reduced GHG emissions.
8.3.4 GHG co-benefits for electricity supply options The electricity supply options were designed to meet development objectives – achieving
universal access in all cases, meeting a renewable energy target, investing in the PBMR or
importing energy. The co-benefits of electricity policy options in terms of reduced GHG

Evaluating policies against sustainable development criteria 181
emissions are summarized in Table 8.11. As would be expected, the emission reductions from
the base case are larger than for the residential sector.
In terms of GHG emission reductions, both the renewables and PBMR cases result in
approximately 5% reductions fro the base case in 2025. The PBMR achieves 1 Mt CO2 more
reduction in 2025 than renewables, but this must be considered against the larger capacity and
investment of the PBMR policy case. Section 8.3.5 below will show that the abatement costs
are correspondingly lower for renewables. The combined case does have the highest emission
reduction, but at a unit cost almost double that of renewables. Gas is a cleaner fossil fuel than
coal, and so still reduces emissions, but the least amongst the policy options.
Table 8.11: GHG emissions for electricity supply options
Unit Base case
Imported gas
Imported hydro
PBMR nuclear
Renewable electricity
Combined electricity
(gas, hydro, nuclear, RE)
Total GHG emissions, 2025
Mt CO2-equiv
634 620 611 601 602 594
Reduction from base case -14 -22 -33 -32 -40
Difference to base case -2% -4% -5% -5% -6%
GHG emissions by gas
Carbon dioxide Mt CO2 630 617 608 597 598 590
Difference to base case % -2% -4% -5% -5% -6%
Methane t CH4 50,325 50,035 49,941 49,811 51,352 51,262
Difference to base case % -1% -1% -1% 2% 2%
Nitrous oxide t N2O 8,171 7,981 7,849 7,695 7,884 7,776
Difference to base case % -2% -4% -6% -4% -5%
Renewables show an increase in methane, since biomass-based renewable energy technologies
contribute substantially to meeting the target. Counting the three major GHGs, however, the
small increase in methane is more than outweighed by the reduction in CO2.
8.3.5 Emission trends and abatement costs The upward trends in CO2 emissions can be seen in all policy cases (Figure 8.5). The upward
trend of emissions in all cases is readily apparent. The relative reductions of policy cases can be
seen, as the level of the bars in later years is reduced for renewables, PBMR and combined
electricity cases. The cost of reducing emissions from the base case is an important factor.

Evaluating policies against sustainable development criteria 182
Figure 8.5: CO2 emissions for all cases over time
-
100
200
300
400
500
600
700
Base case
Gas
Hydro
PBMR
Renewables
Combined elec
CFL
Combined res
Eff house
LPG
SWH
MtCO2
2001 2005 2010 2015 2020 2025
Detailed analysis of the costs of reducing emissions would require a separate study, drawing on
the literature for detailed abatement costing (Markandya & Halsnaes 2001; Halsnaes et al. 1998;
Fankhauser & Tol 1996; OECD 2000; IPCC 2001c; World Bank 1998; Krause et al. 2002).
This is not the focus of the thesis, and only a simple estimate of abatement costs is derived for
comparison across policies. Table 8.12 shows the incremental investment costs in technologies
in 2025. Only the investments required for technologies (supply and demand) are considered,
not total system costs. Costs are discounted to present value, and the increment is the difference
between each policy and the base case. Similarly, emission reductions are relative to the base
case. The simple measure of abatement cost is the emission reductions divided by the
incremental cost.

Evaluating policies against sustainable development criteria 183
Table 8.12: Estimate of abatement cost in policy cases
Electricity supply options Imported gas
Imported hydro
PBMR nuclear
Renewable electricity
Combined (gas, hydro, nuclear, RE)
Abatement cost R / ton CO2-eq
5.61 3.94 2.89 2.52 4.84
Rank (1 high, 10 low) 3 5 8 9 4
Emission reductions (policy - base case), 2025
Mt CO2-equiv
-14 -22 -33 -32 -40
Incremental costs of investment in technologies, 2025, discounted
R millions -76 -89 -95 -80 -192
Residential policies CFLs Efficient houses
LPG for cooking
Water heating - SWH and geyser blankets
Residential policies combined
Emission reductions / incremental cost
R / ton CO2-eq
167.37 0.12 7.72 3.50 3.07
Rank (1 high, 10 low) 1 10 2 6 7
Emission reductions (policy - base case), 2025
Mt CO2-equiv
-0.4 -8 -1 -6 -8
Incremental costs of investment in technologies, 2025, discounted
R millions -62 -1 -11 -21 -25
The range of costs is low, relative to a market price of carbon already reaching € 10 / t CO2
(R 80 / tCO2), and such prices are expected to be higher by 2025. Only the CFL case is above
this range, given the small emission reductions.
The most cost-effective policy for abatement comes from the residential sector as well, namely
in efficient housing. Renewable energy and the PBMR also have simple abatement cost
estimates below R 3/ t CO2. Solar water heating and geyser blankets cost about a Rand more per
ton. Imported gas and LPG become slightly more expensive. The overall implication, however,
is that the residential and electricity policies examined have an incremental abatement costs that
are within the range of carbon prices.

Evaluating policies against sustainable development criteria 184
8.4 Social The social dimension of sustainable energy development can be assessed most directly in the
residential sector. Earlier chapters have motivated that analysis needs to be conducted at the
level of the household, where many of the social interactions relating to energy occur.
Following the indicators outlined above, the fuel consumption patterns for households are
examined, changes in fuel prices and the implications for affordability evaluated.
The approach taking in this thesis is that meeting development objectives is the starting point.
With the particular focus on electricity in the residential sector, increased access to electricity
reflects this as a first approximation (see chapter 6 for how this changes by household type).
Access is primarily provided through the grid, but there are significant off-grid programmes in
South Africa, which are not captured by this approach. Even if 350 000 solar home systems
were installed, however, they would provide some 0.2% of electricity supplied by the grid to
domestic customers (NER 2002a). Affordability of using electricity is important as well; hence
physical connection to grid electricity is a necessary, but not sufficient condition for
development.
The implications of electricity supply for social sustainability are less direct than in the
residential sector. Electricity supply, however, has important implications for the price of
electricity in the residential sector. Decisions about energy supply are made implicitly by
governments, utilities and investors, with less discussion of their social consequences than the
indirect effects might merit. Electricity prices, expenditure and the burden it places on
households are discussed in sections 8.4.3 and 8.4.4. First, however, the more direct social
impacts of the consumption of household fuels and their prices are examined in the following
two sections.
8.4.1 Fuel consumption by households Chapter 7 showed how monthly fuel consumption varies substantially across household types
(Table 7.5). Poorer, rural and non-electrified (RLN, ULN) households were found to consume
only a fraction of the energy that richer urban and rural electrified (UHE, RHE) households use
each month. For the evaluation in this chapter, the variation across policy cases is examined (see
Table 8.13). When considering energy prices and affordability, the analysis returns to a
consideration of household types.
Table 8.13 shows the fuel consumption for electricity, liquid fuels (such as paraffin and LPG),
solid fuels (coal, candle wax), renewable energy and total fuel consumption. Electricity is the
largest portion of total fuel supply across time and all policy cases, consistent with the
assumptions about increasing electrification.

Evaluating policies against sustainable development criteria 185
Table 8.13: Residential fuel consumption by policy case
Base case CFL Eff house LPG Water heat
Combined res
Electricity 2014 99 98 96 96 99 93
2025 117 116 113 110 117 105
Liquid fuels 2014 52 52 41 52 43 43
2025 59 59 36 59 39 39
Renewable energy 2014 1.7 1.7 9.5 1.7 7.9 7.9
2025 3.5 3.5 20.1 3.5 16.7 16.7
Solid fuels 2014 49 49 49 52 48 51
2025 34 34 34 42 34 41
Total fuel use 2014 201 201 195 201 198 195
2025 213 212 202 214 207 202
Relative to the base case, reductions in electricity consumption can be seen in the policy cases.
The largest reduction in total fuel use by 2025 is achieved through efficient houses, consuming
11 PJ or 5% less than in the base case.
Renewable energy increases in the case of SWH and efficient housing, as well as the combined
case. Rather than avoiding electricity use, SWH and geyser blankets displace the consumption
of liquid fuels for water heating, since the model avoids the most costly alternative.
Figure 8.6: Renewable energy use in residential policy cases
0
5
10
15
20
25
2001
2002
2003
2004
2005
2006
2007
2008
2009
2010
2011
2012
2013
2014
2015
2016
2017
2018
2019
2020
2021
2022
2023
2024
2025
PJ
Base case CFLs Eff houses LPG SWH / GB
In Figure 8.6, the two cases can be clearly seen above the others - LPG, CFLs show the same
use of renewables as the base case. Efficient houses do not actively use any renewable energy
source, but are considered a renewable energy technology in the sense of ‘passive solar design’.
Certainly the installation of ceilings and better design reduce other fuel use.

Evaluating policies against sustainable development criteria 186
The type of fuel used has social implications in its own right. Electricity, while generating
emissions upstream, is clean at the point of use. Renewable energy is clean both in its
generation and use, with environmental issues confined to balance of system issues. Household
uses of paraffin and coal have significant impacts, such as indoor air pollution, paraffin
poisoning and fires. Efficient houses and SWH / geyser blankets are found to be most effective
in promoting cleaner fuel use.
8.4.2 Residential fuel prices Access to cleaner fuels is one matter, being able to afford the use of such fuels another. The
prices of cleaner fuels have to be brought down if households are to use them. Fuel prices are
important socio-economic indicators with implications for households. The measure used for
this indicator is the shadow prices of residential electricity (see Table 8.14). For electricity
above, we considered the shadow price of supplying electricity, here the indicator is the
opportunity cost of the energy carrier used in the household (see chapter 8).
Table 8.14: Shadow prices of electricity and other fuels across policy cases
Base case CFLs Efficient
houses
LPG for
cooking
Water
heating -
SWH and
geyser
blankets
Residential
policies
combined
Cost of energy services to households
Shadow price of electricity in the residential sector
c / kWh 37.8 34.8 34.2 34.8 34.8 34.2
Electricity in common units
R / GJ 105.1 96.7 95.1 96.7 96.7 95.1
Shadow price of non-electric fuels in the residential sector
Coal for HHs R / GJ 3.5 3.5 3.5 3.5 3.5 3.5
Biomass 30.0 30.0 30.0 30.0 30.0 30.0
LPG 149.4 149.4 149.4 149.4 149.4 149.4
Paraffin 96.9 96.9 96.9 96.9 96.9 96.9
Candle wax 70.3 70.3 70.3 70.3 70.3 70.3
The prices on non-electric fuels do not vary across residential policies. CFLs use electricity and
geyser blankets reduce the electricity required to heat water; the efficiency of houses and water
heating reduces the quantity of fuels used, but not their price; the LPG policy case allowed
switching to the fuel, but did not alter the price. Figure 8.7 shows that the shadow prices for

Evaluating policies against sustainable development criteria 187
some of the non-electric fuels change over time. The opportunity costs of LPG, paraffin and
candles increase over time; while biomass and coal remain constant.
Figure 8.7: Shadow prices of energy carriers over time
-
20
40
60
80
100
120
140
160
2001 2013 2025
R / GJ
Electricity for residential LPG Coal for HHs
Paraffin Candle wax Biomass
These trends are of some interest in themselves, but for comparison of policy cases the fuel of
interest is electricity, which does have a different opportunity costs depending on the policy
case. The shadow price of electricity in Table 8.13 is lowest for efficient houses at 3.6 c / kWh
less than the base case, a reduction of 9%. The other residential policies (for CFLs, LPG and
SWH / geyser blankets) achieve a slightly lower reduction, but still 3 c/ kWh. Overall, more
efficient use of resources means that the opportunity cost of using electricity is reduced. Lower
expenditure for the same amount of useful energy means that the cost of the more efficient
service is lower. Therefore, the difference between that cost and the least-cost alternative is also
reduced.
Table 8.15: Initial investment in technology in its policy case
Total investment over 25 years, R millions
Per household (2025 estimate)
Investment in efficient houses 5,159 398
Investment in LPG cooking 2,793 216
Investment in cleaner water heating
6,193 478
Investment in CFLs 8,891 686
More important than ‘shadow prices’ for poor households are the ‘first costs’. Table 8.15 shows
the total investment required in the appliances relevant to the polcy case (e.g. LPG in the LPG
for cooking case). The values are summed for all households over the period in the first column
and an indication of the cost per household taken in relation to the estimated 12.95 million
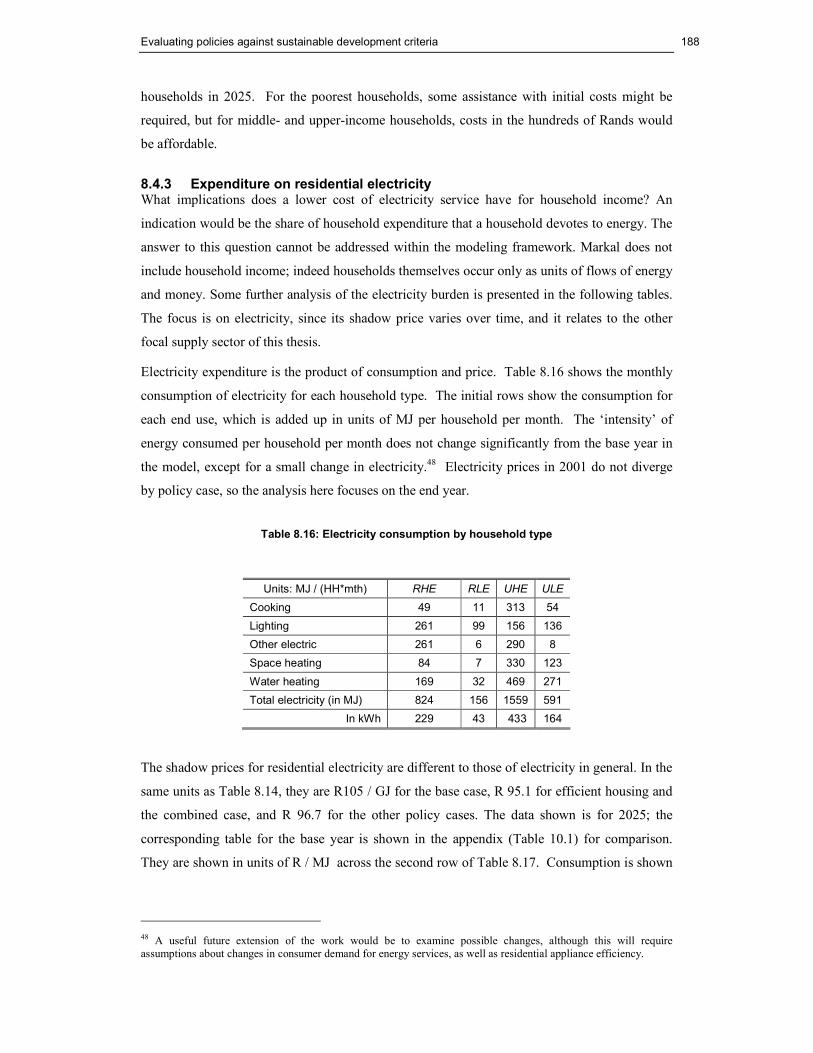
Evaluating policies against sustainable development criteria 188
households in 2025. For the poorest households, some assistance with initial costs might be
required, but for middle- and upper-income households, costs in the hundreds of Rands would
be affordable.
8.4.3 Expenditure on residential electricity What implications does a lower cost of electricity service have for household income? An
indication would be the share of household expenditure that a household devotes to energy. The
answer to this question cannot be addressed within the modeling framework. Markal does not
include household income; indeed households themselves occur only as units of flows of energy
and money. Some further analysis of the electricity burden is presented in the following tables.
The focus is on electricity, since its shadow price varies over time, and it relates to the other
focal supply sector of this thesis.
Electricity expenditure is the product of consumption and price. Table 8.16 shows the monthly
consumption of electricity for each household type. The initial rows show the consumption for
each end use, which is added up in units of MJ per household per month. The ‘intensity’ of
energy consumed per household per month does not change significantly from the base year in
the model, except for a small change in electricity.48 Electricity prices in 2001 do not diverge
by policy case, so the analysis here focuses on the end year.
Table 8.16: Electricity consumption by household type
Units: MJ / (HH*mth) RHE RLE UHE ULE
Cooking 49 11 313 54
Lighting 261 99 156 136
Other electric 261 6 290 8
Space heating 84 7 330 123
Water heating 169 32 469 271
Total electricity (in MJ) 824 156 1559 591
In kWh 229 43 433 164
The shadow prices for residential electricity are different to those of electricity in general. In the
same units as Table 8.14, they are R105 / GJ for the base case, R 95.1 for efficient housing and
the combined case, and R 96.7 for the other policy cases. The data shown is for 2025; the
corresponding table for the base year is shown in the appendix (Table 10.1) for comparison.
They are shown in units of R / MJ across the second row of Table 8.17. Consumption is shown
48 A useful future extension of the work would be to examine possible changes, although this will require assumptions about changes in consumer demand for energy services, as well as residential appliance efficiency.

Evaluating policies against sustainable development criteria 189
in the second column, and the monthly expenditure per household on electricity in the body of
the table.
Table 8.17: Monthly expenditure on electricity by household type and policy case
Table 8.17 demonstrates that all the residential policies reduce expenditure compared to the base
case. Since shadow prices of electricity vary by policy case, the expenditure patterns vary
across policy cases as well. However, the Rand amounts are not large, with the largest reduction
(efficient houses for UHE) amounts to R 16 per month. For RLE households, off a low base of
consumption, the savings are one or two Rand per month. The larger energy savings in efficient
housing and water heating carry through to the household level. The savings amount to a 9.5%
reduction from the base case, whereas other individual policies achieve 8%.
8.4.4 Assessing affordability: Electricity burden The electricity burden is defined for this analysis as expenditure on electricity divided by the
total average household expenditure. Electricity expenditure has been derived above from
model results for each household type. To understand the social implications of electricity
expenditure, it needs to be placed in the context of household income. Here the analysis goes
beyond the modeling framework. Markal does not include household income; indeed
households themselves occur only as units of flows of energy and money.
Statistics SA provides data on household expenditure for 2000 (SSA 2002).49 The data shown
in Table 8.18 were used in chapter 6 to define poorer and richer households, with the bottom
two quintiles taken as poorer.
49 The electricity expenditure is for 2025, while expenditure is for 2000, one year before the base year. No equivalent reports for 2001 were found. The approach taken is rather to report the burden in relative, percentage terms, not Rand amounts. The alternative to removing the inconsistency would have been to assume an increase in average household expenditure by 2025, or to adjust it by the ratio of electricity prices (2025 / 2001).
Units of expenditure: R / (HH*mth)
2025
Price (R / MJ)
Base case CFLs Efficient
houses
LPG for
cooking
Water
heating -
SWH / GB
Residential
policies
combined
Consumption (MJ /(HH*mth)
x 0.1051 0.0967 0.0951 0.0967 0.0967 0.0951
RHE 824 87 80 78 80 80 78
RLE 156 16 15 15 15 15 15
UHE 1,559 164 151 148 151 151 148
ULE 591 62 57 56 57 57 56

Evaluating policies against sustainable development criteria 190
Table 8.18: Average annual expenditure per household by quintile group, place of residence and type of dwelling
Source: SSA (2002: Tables 3.1 and 4.2)
Quintile Expenditure in 2000 Rand / (HH* year)
By place of residence
Rand / (HH * year)
By type of dwelling
Rand / (HH * year)
5 < 7 547 Urban 66,000 House 66,000
4 7 547 – 12 295 Non-urban 29,000 Informal dwelling 20,000
3 12 296 – 20 450
Traditional dwelling 18,000
2 20 451 – 41 040
1 41 041 +
For rural households, the average annual income of ‘poorer’ households can be taken as R7 547
(break point between bottom two quintiles) and R 41 041 (upper point of quintile 2). Urban
lower-income households will tend to have incomes at the high end of the range of poorer
households, confirmed by the much higher expenditure shown for urban than non-urban
households in the table. ULE households are likely to have a higher share of informal dwellings,
with much lower expenditure (R 20 000) than the urban average. The higher income of R66 000
is influenced by the higher proportion of richer households in urban areas. The approach is to
assume an average income for ULE households at the top of the fourth quintile, and to adjust
the UHE income to reflect the greater share of higher-income households. The monthly and
annual household expenditures used in the analysis are shown in Table 8.19.
Table 8.19: Derived average annual and monthly expenditure by household type
R / (HH *month)
R / (HH * year)
RHE 3,420 41,040
RLE 629 7,550
UHE 7,642 91,705
ULE 1,025 12,295
The electricity burden has been calculated as a share of monthly electricity expenditure (Table
8.17) over total monthly household expenditure (Table 8.19). The results are shown in Table
8.20 below, for each household type and policy case.

Evaluating policies against sustainable development criteria 191
Table 8.20: Electricity burden: Share of monthly household expenditure spent on electricity
Base case CFLs Efficient houses
LPG for cooking
Water heating - SWH / GB
Residential policies combined
RHE 2.5% 2.3% 2.3% 2.3% 2.3% 2.3%
RLE 2.6% 2.4% 2.4% 2.4% 2.4% 2.4%
UHE 2.1% 2.0% 1.9% 2.0% 2.0% 1.9%
ULE 6.1% 5.6% 5.5% 5.6% 5.6% 5.5%
The electricity burden varies by household type, being relatively higher for ULE households.
The burden reflects the lower assumed income of this household group, but increasing levels of
consumption of electricity. Given that these are poorer households, residential policies could
contribute to socially sustainable development if focused on this group. Comparing ULE to
RLE households, the low consumption levels of the rural households keep the electricity burden
lower. UHE households consume more electricity per month, but household incomes are higher
by a larger ratio.
Comparing the impact of policy cases on the electricity burden, it can be seen that in all policy
cases, the electricity burden of households is reduced. The reduction in the burden is highest
among the individual policy cases for efficient houses. The burden in this case is 9.5% lower
than in the base case. Only the combined case, which includes efficient housing, matches this
reduction. Other individual cases still achieve an 8% reduction compared to the base case.
8.5 Comparisons and conclusions In least-cost energy models, the assumption is typically that increases in average per capita
consumption will improve the lives of most or all individuals. Efficiency implies maximization
of output (or minimization of cost) subject to resource constraints. But if the distribution of
consumption worsens, total welfare might be declining (Munasinghe & Swart 2005). The
methodology adopted in this thesis combines least-cost energy-economic modeling with
indicators of sustainable development and policy analysis. The interactions between social
equity and economic efficiency deserve particular attention, since conflicts arise between them.
Hence this chapter has attempted to examine issues of social equity more closely, focusing on
the residential sector. The quantifiable indicator for increasing access to affordable energy
services was a reduced electricity burden for households. The analysis proceeded on a
household basis, drawing fuel consumption and electricity price information from the modeling
framework. Outside of the model, the expenditure on electricity was expressed as a share of
average household expenditure. Even this analysis remains partial and represents a narrow

Evaluating policies against sustainable development criteria 192
definition of social equity. Not only are other fuels not included, but broader dimensions such
as empowerment and participation defy quantification.
The analysis of the electricity burden gives only one indication of the contribution that
residential policies can make to social sustainability. Other dimensions of social sustainable
would include job creation and empowerment through participation, which are more difficult to
quantify. In addition, access to cleaner and more efficient energy services can contribute to
respiratory health and promote literacy through enhancing educational opportunities. Reducing
the pressure on household budgets is important, particularly for poorer households, and hence is
the one analysed here.
Chapter 7 outlined the results for the modeled policy cases. This chapter has examined
indicators for each of the dimensions of sustainable development in turn. The key indicators are
summarised in Table 8.21, drawing on the data presented in the text, tables and figures of the
sections above. The policy cases can here be compared across economic, social and
environmental indicators. The focus in the table is on quantifiable indicators. Some of the less
easily quantified dimensions of energy policies will be picked up in chapter 9.

Evaluating policies against SD criteria 193
Table 8.21: Evaluation of all policies across three dimensions of sustainable development
Indicator Unit Base case Imported
gas
Imported
hydro
PBMR
nuclear
Renewable
electricity
Combined
electricity
(gas, hydro,
nuclear, RE)
CFLs Efficient
houses
LPG for
cooking
Water
heating -
SWH and
geyser
blankets
Residential
policies
combined
ECONOMIC
Total cost of energy system, cumulative over the period
R billions
6,120 6,119 6,117 6,132 6,122 6,131 6,119 6,119 6,121 6,115 6,115
Difference to base case -0.8 -3.1 11.7 1.9 10.9 -0.9 -0.9 0.6 -4.6 -5.0
Shadow price of electricity, 2025
c / kWh 19.3 18.8 18.8 19.3 19.3 22.3
Diversity of electricity fuel mix from domestic sources by 2025
Share of renewable energy % 1.0% 1.1% 1.1% 0.8% 11% 6%
Share of nuclear % 11% 11% 11% 34% 11% 11%
Share of other (mainly coal) % 88% 88% 88% 66% 78% 83%
ENVIRONMENTAL
Local air pollutants, 2025
Sulphur dioxide kt SO2 3,571 3,487 3,429 3,361 3,374 3,326 3,568 3,524 3,559 3,531 3,517
Difference to base case % -2% -4% -6% -6% -7% 0% -1% 0% -1% -2%
Nitrogen oxides t Nox 2,156,438
2,114,198
2,086,086 2,053,462
2,060,563 2,035,692 2,155,275 2,132,925
2,151,339
2,137,627 2,129,828
Difference to base case % -2% -3% -5% -4% -6% 0% -1% 0% -1% -1%
Carbon monoxide t CO 4,923,479
4,918,409
4,916,535 4,913,639
4,962,143 4,960,353 4,923,416 4,921,832
4,923,237
4,922,246 4,921,730
Difference to base case % 0% 0% 0% 1% 1% 0% 0% 0% 0% 0%
Global GHGs, 2025
Total GHG emissions, 2025 Mt CO2-equiv
634 620 611 601 602 594 633 626 632 628 625
Difference to base case -2% -4% -5% -5% -6% 0% -1% 0% -1% -1%
Reduction from base case -14 -22 -33 -32 -40 -0 -8 -1 -6 -8
SOCIAL
Fuel consumption in residential sector
PJ
Electricity 2014 98.9 98.3 96.4 95.9 98.9 93.1
2025 116.8 115.5 112.6 110.3 116.8 104.9
Liquid fuels 2014 51.9 51.9 41.3 51.9 43.0 43.0
2025 58.9 58.9 36.1 58.9 39.3 39.3
Renewable energy 2014 1.7 1.7 9.5 1.7 7.9 7.9
2025 3.5 3.5 20.1 3.5 16.7 16.7
Solid fuels 2014 48.6 48.6 48.6 52.0 48.0 51.3
2025 34.4 34.4 34.3 41.7 34.0 41.3
Total fuel use 2014 201.1 200.5 195.2 201.5 197.8 195.3
2025 213.5 212.3 202.1 214.4 206.8 202.3
Cost of energy services to households
Shadow price of electricity in the residential sector
c / kWh 37.8 34.8 34.2 34.8 34.8 34.2
Electricity in common units R / GJ 105.1 96.7 95.1 96.7 96.7 95.1
Shadow price of non-electric fuels in the residential sector
Coal for HHs R / GJ 3.5 3.5 3.5 3.5 3.5 3.5
Biomass 30.0 30.0 30.0 30.0 30.0 30.0
LPG 149.4 149.4 149.4 149.4 149.4 149.4
Paraffin 96.9 96.9 96.9 96.9 96.9 96.9
Candle wax 70.3 70.3 70.3 70.3 70.3 70.3
Monthly expenditure on electricity
R / (HH *
month)
RHE 87 80 78 80 80 78
RLE 16 15 15 15 15 15
UHE 164 151 148 151 151 148
ULE 62 57 56 57 57 56

Evaluating policies against sustainable development criteria 194
The electricity supply options fall into three broad categories. Coal dominates the base case and
remains the largest fuel over the 25 years in all policy cases. Importing either gas or hydro-
electricity can be achieved at a reduction in the costs to the energy system, compared to the base
case. The third category comprises two domestic options, the PBMR nuclear and renewable
energy technologies.
Table 8.21 shows that both domestic options increase the total energy system cost. For the
PBMR, the cumulative discounted energy system costs rise by R 11.7 billion for the period for
renewables by R 1.9 billion. Only the combined case, requiring diversification in several
directions at once, requiring significant investments.
For the PBMR and renewables, the different levels of investment and capacity of each policy
case must be borne in mind. Even after adjusting for the greater capacity of the PBMR,
however (see discussion in section 8.2.5), the PBMR is more expensive than the renewables
case. The investment costs per unit of installed capacity differ for the various technologies used
in policy cases (see Table 6.14). The ambitious introduction of 32 modules within this time
period results in unutilized PBMR capacity. In the case of renewables, recall from chapter 7 that
investment went to existing technologies plus new wind and bagasse co-generation, but the
more expensive solar thermal options did not enter the policy case.
The indicators for diversity of energy supply yielded results with two aspects. Clearly, the
larger investment and capacity in the PBMR case achieved the greatest share (a third) of
electricity generation from non-coal technologies. The rapid transition to one other fuel meant
that the resulting system was dominated by two fuels. The renewables case achieved a better
mix of three fuel groups. The renewable case, with lower capacity and investment than the
PBMR, still had greater dependency on coal.
From an environmental perspective, the two domestic policy cases show significant reductions
for both local and global air pollutants. The largest reductions are achieved by the renewables
and PBMR cases, with 6% less SO2 than in the base case, and 4% and 5% respectively for NOx.
Both domestic electricity cases also achieve significant reductions of GHG emissions against
the base case. By 2025, the renewables policy case emits 32 Mt CO2-equivalent less than the
base case, and the PBMR 33 Mt. While this is a 5% reduction from emissions in the base case,
it is 10% of the 345 Mt CO2 emissions in 2000 (WRI 2003). It is a case not so much of emission
reductions, but of avoiding future emissions. Renewables achieve a similar reduction in GHG
emissions with lower capacity and investment. A simple estimate of abatement costs suggest
that the incremental costs of emission reductions are correspondingly lower for renewables than
PBMR.

Evaluating policies against sustainable development criteria 195
The social dimensions of sustainability are reflected in indicators for the residential sector. Two
residential policies stand out across economic, social and environmental criteria – efficient
houses and cleaner and more efficient water heating.
The two policies make the greatest fuel savings in 2025, with efficient housing saving 11 PJ
more than in the base case and SWH / GB saving 7 PJ.
It can be seen in Table 8.21 that the reduction of energy use translates into cost savings. In
aggregate terms, water heating reduces total system costs, being a large residential end use.
Introducing solar water heaters and geyser blankets can reduce system costs by R 4.6 billion
over 25 years. However, Table 8.17 records reduced energy expenditure in all policy cases, even
though the others are smaller in Rand terms. Comparing the economic impact in terms of
shadow prices of residential electricity, the reduction for efficient houses at 3.6 c / kWh is again
the highest.
Some additional analysis was conducted to quantify the contribution of policies to reducing the
electricity burden. In all policy cases, the share of household expenditure devoted to the
electricity burden of households is reduced. The efficient housing policy case reduced the
burden by the largest relative amount. More significant than variation across policies were the
results for different household types. The electricity burden for urban lower-income electrified
households was the most encouraging, being a household type with increasing electricity use
and low income. If poverty alleviation is a key policy consideration, this household type would
be a priority target group for residential policies.
Efficient houses and SWH / geyser blankets contribute the most to cleaner fuel use.
Contributing to diversity on the demand side, the two cases are the ones among residential
policies which increase the use of renewable energy –water heating in the active sense of using
solar energy and efficient housing through passive solar design.
Efficient houses and water heating achieved a similar percentage reduction for local air
pollutants in the form of SO2 and NOx emissions. Combining all policies increases the
reductions only a little. Efficient housing would be the best option, if the primary concern were
local air pollution. The same pattern is followed for emissions of GHGs, most of which are in
the form of CO2.
The combined case served in a number of cases to illustrate the value of considering individual
policies in the context of the whole energy system. Often policies are considered in isolation. If
several policies are implemented at the same time or in sequence, the combined effect is not
simply the sum of the individual policies. The combined case showed higher levels of avoided
emissions, for example, but not the amount if emission reductions from individual policies were

Evaluating policies against sustainable development criteria 196
added up. The lesson for policy-makers is that the cumulative effects of energy policies require
attention through integrated assessments.
The evaluation of residential policies has revealed more insights into social dimensions of
sustainability, while the larger investments in electricity supply options have a bigger impact on
economic factors. Changes to the costs of the energy system are generally larger from the
electricity policies (ignoring combined policies). However since two of the electricity policies
involve imports and therefore less capital expenditure domestically, they have cost reductions.
The large increases in system costs are associated with the PBMR and renewables cases,
whereas the largest reduction is through SWH / geyser blankets.
Both electricity supply and residential demand policies can assist in reducing environmental
impacts. Reductions of emissions are consistently larger for electricity policy cases. The
pattern holds true for both reductions of local air pollutants (SO2 and NOx) and avoided GHG
emissions (CO2, CH4 and N2O).
8.5.1 Comparing policies across all three dimensions of sustainable development
Do any of the policies satisfy the definition of sustainable energy development from chapter 2?
The working definition was that a set of ‘development indicators' is increasing over time. The
increase in electricity consumption is not threatened by 'feedback' from either biophysical
impacts (local air pollution, greenhouse gas emissions) or from social impacts (social
disruption, e.g. if services are unaffordable). Indicators would be drawn from social, economic
and environment dimensions, but different stakeholders might emphasise various criteria.
For the electricity supply options, there are no clear ‘winners’. Figure 8.8 draws together the
evaluation of social, economic and environmental indicators. The policies are ranked for a
single indicator in each of dimension – socially for reducing electricity costs; economically for
reducing system costs and environmentally for reducing emissions (local and global are same
rank order). Only rank orders are shown, with 1 representing low reductions of emissions, and
5 high. In other words, policy cases at the outside of the triangle are ranked higher in that
dimension. There is no attempt to define sustainability, merely an indication that one policy
case makes residential energy development more sustainable than the others. Where one triangle
completely contains another, it would higher-ranked in all three dimensions. In Figure 8.8, the
triangles overlap, so there are trade-offs.50
50 See Munasinghe (2002: 174). for a discussion on ‘win-win’ cases and trade-offs in multi-criteria analysis of energy policies against indicators of sustainable development.

Evaluating policies against sustainable development criteria 197
Figure 8.8: Electricity supply options ranked by economic, social and environmental indicator
0
1
2
3
4
5
Economic
EnvironmentalSocial
Renewables PBMR Import hydro Import gas Combined electricity
Reduce energy
system costs
1 - less sustainable
5 - more sustainable
Reduce emissions
(local and global)
Reduced cost
of electricity
overall
If the priority were to reduce energy system costs, the importing of gas or hydro-electricity
should be favoured, as that dimension is at the outer edge of the triangle for them, representing a
relatively more sustainable policy. Both imports reduce domestic capital expenditure and overall
system costs. Priorities of reducing emissions in South Africa would favour the two domestic
options, even though these show increases of costs. Of the two domestic options, the PBMR is
more expensive than renewables. The combined case might look attractive, except that it scores
poorly on costs, making emission reductions expensive. Diversity of supply is shown in the
figure only by the increased share of renewables. The renewables case still achieves a better mix
among the other fuels, but one would need another indicator (e.g. reduction in coal) to show that
the PBMR achieves the greatest diversity of supply in moving away from coal dependency.
Both domestic options achieve reduce local air pollutants and GHGs by similar percentages
from the base case, the simple ranking here puts the PBMR’s 33 Mt CO2 above renewables’ 32
Mt. Figure 8.8 cannot show all dimensions shown in Table 8.21, for example, the lower
abatement costs of renewables are relevant. More indicators for each of the three dimensions of
sustainable development are shown in Figure 8.9 for the same set of options. The figure does
not have clear social, environmental and economic ‘corners’, but ranks the same options in more
ways.
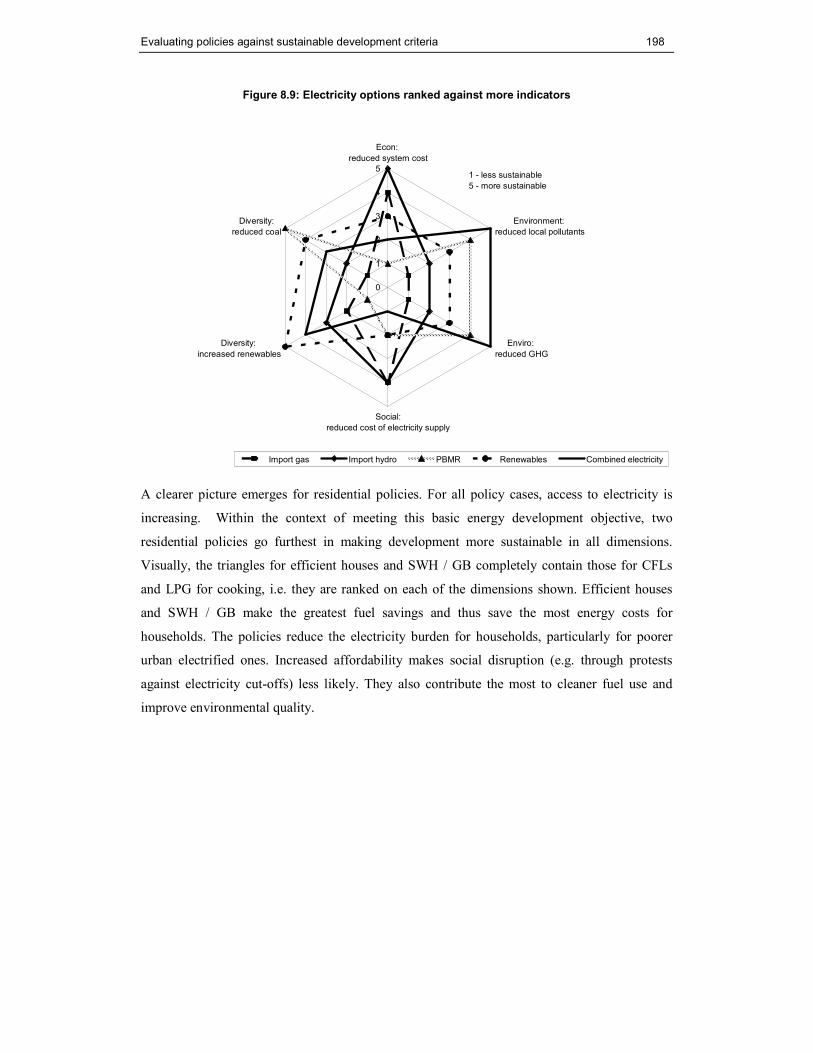
Evaluating policies against sustainable development criteria 198
Figure 8.9: Electricity options ranked against more indicators
0
1
2
3
4
5
Econ:
reduced system cost
Environment:
reduced local pollutants
Enviro:
reduced GHG
Social:
reduced cost of electricity supply
Diversity:
increased renewables
Diversity:
reduced coal
Import gas Import hydro PBMR Renewables Combined electricity
1 - less sustainable
5 - more sustainable
A clearer picture emerges for residential policies. For all policy cases, access to electricity is
increasing. Within the context of meeting this basic energy development objective, two
residential policies go furthest in making development more sustainable in all dimensions.
Visually, the triangles for efficient houses and SWH / GB completely contain those for CFLs
and LPG for cooking, i.e. they are ranked on each of the dimensions shown. Efficient houses
and SWH / GB make the greatest fuel savings and thus save the most energy costs for
households. The policies reduce the electricity burden for households, particularly for poorer
urban electrified ones. Increased affordability makes social disruption (e.g. through protests
against electricity cut-offs) less likely. They also contribute the most to cleaner fuel use and
improve environmental quality.

Evaluating policies against sustainable development criteria 199
Figure 8.10: Residential policies ranked by economic, social and environmental indicator
0
1
2
3
4
5
Environmental
EconomicSocial
CFLs Efficient houses LPG for cooking SWH / GB Combined resdential
1 - less sustainable
5 - more sustainable
Reduce HH
fuel costs
Reduce energy
system costs
Reduce emissions
(local and global)
Figure 8.10 appears skewed towards efficient houses, showing that this policy case scores high
in all respects. Solar water heaters rank next highest among, individual cases. For residential
policies, combining works well as shown by the bulge towards that end. LPG and CFLs look
flat.
Having compared both residential and electricity policies against each of the dimensions of
sustainable development in turn, Figure 8.8 and Figure 8.10 have given a some representation of
the synergies and trade-offs (without being able to show all the indicators at once). The analysis
against multiple criteria shows that there are clear win-win cases for residential policies, but
more trade-offs in electricity supply between the indicators of sustainable development. In
either case, however, policies developed theoretically by modeling or indicators need to be
implemented in reality. Some of the factors required to implement energy policy cases are
considered in chapter 9.

Policy analysis 200
Part IV: Energy for sustainable development and climate change
CCCCHAPTER HAPTER HAPTER HAPTER 9999
9. Policy analysis To answer the overall research question whether there energy policies to make the development
in South Africa’s residential and electricity sectors more sustainable, policies need to be
formulated, and consideration given to what is required to implement them. The present chapter
focuses on policy analysis. Results of modeling and indicators provide useful, policy-relevant
information, but further policy analysis is required. It is important to recognize that decision-
makers modify the results of economically ‘optimal’ model results before implementing them
(Munasinghe & Swart 2005). A good example was the Integrated Energy Plan, which was
based on least-cost modeling conducted by the Energy Research Institute. The final plan was
written by officials in the Department of Minerals and Energy. Which policies are finally
implemented will depend on investment decisions in which the boards of major energy
companies, such as Eskom or Shell, will have a determining voice.
The chapter addresses the implementation of those policies identified in chapter 8 as having
greater potential for making energy development more sustainable. Efficient houses and cleaner,
more efficient water heating stood out in the evaluation of residential policies against indicators
of sustainable development. Renewable energy had multiple benefits among electricity supply
options, but the trade-offs with the lower costs of imports require consideration. The chapter
discusses factors that promote the implementation of these energy policies, including
institutional capacity, access to finance, and demonstration of innovative technologies.
The second part of the research question related to whether sustainable energy policies also
reduce GHG emissions. Chapters 7 and 8 have provided information on the GHG co-benefits of
energy policies. The chapter considers the implications for national climate change policy. It
concludes by proposing ways in which sustainable development policies and measures – of the
kind analysed in this thesis – could be included in the international climate negotiations.
9.1 Energy policies to make development more sustainable The analysis in chapter 8 showed policies in the residential and electricity sectors that contribute
to sustainable development. What factors are needed to implement policies that make
development more sustainable? In general terms, one could say that policy implementation
requires enough money, good people / effective institutions and inspiring demonstrations (GEF
2004).

Policy analysis 201
Policies in the sense of regulation may include legislation, standards and certificates. Effective
institutions are needed to implement policy, both organs of government and good business
infrastructure. Access to adequate financing is a factor that is necessary for all successful
policies. In many cases, financial instruments and mechanisms need to be designed to increase
access to finance. Practical demonstration of innovative technologies and successful projects
can provide inspiration for higher levels of implementation.
The present chapter explores concrete examples of what is needed to implement the residential
and electricity policies identified in the previous chapters. How could more efficient housing be
financed? What can government do to promote the uptake of renewable energy technologies?
9.1.1 Implementing sustainable residential energy policies The evaluation of residential energy policies in chapter 8 concluded that efficient housing and
cleaner and more efficient water heating through solar water heaters and geyser blankets (SWH
/ GB) ranked highly in all dimensions of sustainable development. The finding does not suggest
CFLs and LPG should be ignored, but perhaps that efficient housing and SWH / GB have
priority for policy interventions.
CFLs certainly have important benefits, but not only is the consumption of energy for lighting
smaller than for water heating and cooking, but substantial progress has already been made in
disseminating CFLs. Increased penetration rates were seen in the base case, i.e. under least-cost
optimization, particularly in higher-income households. Further dissemination can be expected
to occur through the market. Other policy cases may need more intervention for social and
environmental benefits. Policies to promote LPG for cooking require a more detailed study of
relative price changes, and possibly some form of subsidy or means of making the fuel more
accessible.
Among a good set of residential policies, efficient housing and SWH / GB stand out with
highest energy savings, greatest reduction of the electricity burden, uptake of cleaner fuels and
improvement in local environmental quality. Policy-makers should give priority to these
policies, or a set of combined residential policies.
9.1.1.1 Inspiring demonstrations for residential policies
Demonstration projects exist for residential policies for efficient housing, SWH and lighting.
The efficient lighting initiative (ELI) aimed to install some 18 million CFLs and bought down
the price through a subsidy programme (see chapters 4 and 6; and Bredenkamp (2005)). An
LPG challenge has given initial consideration to means of making the fuel more accessible (IES
& AGAMA 2004). A number of housing projects have sought to include energy-efficiency
measures, particularly in low-cost housing (SEED 2002). There have been a several successful
projects, such as the Lwandle hostels-to-homes, the Shayamoya social housing scheme in Cato

Policy analysis 202
Manor, the Midrand Eco-City project in Ivory Park, the Missionvale project in Nelson Mandela
City, the Moshoeshoe ecovillage and Eco-Homes project in Kimberley and the All Africa
Games village in Alexandra (Spalding-Fecher et al. 2000b; SEED 2002; eg PEER Africa 1997;
van Gass 1999) but there are very few large-scale efforts at improving housing. South Africa’s
first registered CDM project at Kuyasa in Khayelitsha has combined efficient design, SWH and
CFLs (SSN 2004). Some 2,300 low-cost houses are to be built more efficiently, increasing the
scale of implementation to some extent. Yet the challenge remains to scale up good
demonstration projects through implementation of a broader policy – one that could apply to the
two or three million new houses that need to be built.
The results in chapter 7 demonstrated energy cost savings for households as well as the energy
system as a whole, accompanied by reduced local and global pollution. The policy question is
how to turn the economic theory in practical adoption. A first step is to set standards.
9.1.1.2 Set mandatory standards for efficient housing Political will is required to increase the share of housing that is built efficiently. The general
subsidy to build low-cost (‘RDP’) housing is subject to detailed and intense negotiations.
Money for efficiency measures in this context is not easily obtained from the general housing
subsidy of R 17,500 per household (EDRC 2003b). An important signal from government
would be to make housing guidelines mandatory.
Voluntary guidelines for efficient housing have existed for some time, in the form of the South
African Energy and Demand Efficiency Guidelines (DME 1999). Guidelines could be made
mandatory for new housing, in particular some measures that require no expenditure, but simply
better planning and design. These include orientation of the house with the longer axis
orientated east/west; positioning windows on the North to allow solar heat to penetrate the
glazing during the winter months; and designing roof overhang for shade in summer. A further
set of measures has a modest upfront cost, such as ceilings installed in the house of long-lasting
material (e.g. gypsum board), a layer of low-cost insulation above the ceiling and on the walls
(see Winkler et al. 2000, 2002d; see Holm 2000).
Both zero- and low-cost measures could be made mandatory for all new subsidy-supported
housing, based on the results in section 7.1.1. In addition, separate codes would be needed for
middle-upper income housing. The latter could be expected to pay for these measures
themselves upfront, and reap the benefits of energy savings in future years. For poorer
households, financing will be required and the upfront costs need to be made affordable for
households

Policy analysis 203
9.1.1.3 Subsidies for efficient houses
While energy efficiency makes sense from a societal perspective for low-cost housing, poor
households cannot afford the upfront costs of better thermal design or more efficient lighting
and water heating (Winkler et al. 2002d). To simulate the impact of a subsidy that would make
efficient houses more affordable, the higher discount rate of poorer households was reduced
from 30% (no subsidy) to 10% (‘subsidised’), the general discount rate for the model. In other
words, the case examines what would happen to investment in efficient housing if poor
households were more willing to invest now for future savings.
The lower discount rate approximates a subsidy, in the sense that the energy savings (which
happen in the future) are now valued more highly, and the upfront costs are valued
correspondingly less. The change was made only for efficient houses. The results are shown
below only for the poorer household types, since UHE and RHE households already had the
10% discount rate.
Figure 9.1: Marginal investments required for efficient houses at 30% and 10% discount rates
0
200
400
600
800
1000
1200
1400
2001
2002
2003
2004
2005
2006
2007
2008
2009
2010
2011
2012
2013
2014
2015
2016
2017
2018
2019
2020
2021
2022
2023
2024
2025
R / HH
RLE no sub RLE subsidised RLN no sub RLN subsidised
ULE no sub ULE subsidised ULN no sub ULN subsidised
Figure 9.1 shows that for each household type, the marginal investment required (Rand per
household) is lower for the subsidised case than without the subsidy. In two cases, ULE and
RLN, the marginal investment reaches zero in the subsidised case. In other words, no additional
investment is required and efficient houses would be built for these household types. For RLE
and ULN households, the marginal investment needed to build efficient houses is reduced, but
not sufficiently to lead to investment.

Policy analysis 204
The level of the subsidy can be approximated by comparing the marginal investment with the
higher and lower discount rates – with and without the ‘subsidy’. It should be remembered,
though, that the marginal investments in Markal represent shadow prices or opportunity costs,
not the prices of a real, imperfect market. 51
Table 9.1: Subsidy required for making efficient housing as affordable for poorer as for richer households
Unit: Rand / household
2001 2014 2025
RLE -169 -267 -326
RLN -739 -818 -958
ULE -618 -811 -930
ULN -407 -432 -531
Note: The values in technical terms show the reduction in marginal investment as a result of
lowering the discount rate for poor households from 30% to 10%.
Values are shown as negative values, the difference between the marginal investment with a low
discount rate (‘subsidy’) and a high discount rate (‘no subsidy’).
The reduction in investment needed is larger for the RLN and ULE, the two household types
which showed investment in efficient housing in Figure 9.1. The order of magnitude of the
subsidy required to make efficient housing as affordable for poorer households as for richer
ones is in the hundreds of Rands; less than a thousand Rand. A relatively small additional
investment in housing for poor communities creates more comfort, reduces household energy
costs, as well as cutting emissions from the residential sector. An extension of this policy could
improve the energy efficiency and save households money. Energy efficiency in RDP housing
is an area where a policy of direct state financial support to promote energy efficiency seems
warranted.
In practice, instead of changing the discount rate itself, a financial mechanism would be used to
make available the necessary upfront capital to poorer households. Municipal government could
play an important role in administering a subsidy scheme.
9.1.1.4 Affordability and household types
The question of where subsidies might be targeted can be further illuminated in relation to SWH
and geyser blankets. The context for the example is the finding throughout chapter 7 that energy
savings are largest for UHE households. The water heating policy was a clear example, where
SWH and GB reduced other fuels overwhelmingly in the UHE household category.
51 The subsidy levels found here are consistent with earlier studies that used market prices (Spalding-Fecher et al. 2002a; Holm 2000; Winkler et al. 2002e; Spalding-Fecher et al. 2001; Irurah 2000). However, none of the previous work disaggregated results by household type nor considered the feed-back effects in the context of a national energy models.

Policy analysis 205
The largest savings are made by those who least need to spend less; while the poorest
households consume little energy, and cannot save large amounts. A quandary for policy-
makers arises – should the policy focus be on the households where the greatest energy saving
can be made, or those who have the greatest need?
The inclusion of geyser blankets was intended as an option that might work better in lower-
income electrified households. The much lower investment cost of geyser blankets means that
total investment is smaller than for SWH (see Table 9.2), geyser blankets account for a good
part of the energy savings.
Table 9.2: Cost of saved energy for SWH and geyser blankets
Saved energy (policy – base case)
Total investment in policy case
Cost of saved energy
PJ R million R / GJ c / kWh
Geyser blanket 4.9 7.6 1.5 0.6
Solar water heater 13.3 331 25.0 9.0
The cost of saved energy for GB is below 1 c / kWh, while it is 9 c / kWh for SWH. The lower
cost – both upfront and per unit of energy saved – suggests that geyser blankets are more
affordable for poorer electrified households.
The greater energy and cost savings in UHE households only reflect one perspective. The
analysis of the electricity burden in chapter 8 showed that, in relative terms, ULE households
benefit the most from SWH / GB (at 5.6% reduction below base case, compared to 2.0 – 2.3 %
for other household types). Policies that seek to address affordability have a major aim of
alleviating poverty. From this perspective, it would be most beneficial to priorities poorer urban
households.
Some limitations of the analysis of energy burden by household type should be noted at this
point. The innovation of including six household types extended the boundaries of previous
national energy modeling, but still simplifies the complexity of residential energy use
enormously. Not only would a large research effort be needed to model 60 household types
(e.g. with geographic disaggregation, or more income groups), but some of the data is not
available. Energy use patterns for rich rural households, for example, are poorly understood.
Even if these can be surveyed, some data will remain unknown e.g. the split of fuels used for
different end uses. Markal as a tool is limited in its representation of households, which can
only be represented directly (rather than as energy demands or units) with loss of resolution on

Policy analysis 206
the time of use. Yet affordability is a critical policy issue. Hence the quantitative results from
modeling, and the analysis against indicators in chapter 8 must be supplemented by policy
analysis.
Of course, the discussion assumes that the policy needs to be targeted. If sufficient funds were
available, all households should be targeted. With government budgets limited, different
financing mechanisms could be considered. Donor funding for subsidies for SWH / GB in
poorer households would be an option, at least in the process of establishing a viable local SWH
manufacturing sector (see section 9.1.1.4). For higher-income households, SWH could be made
mandatory, but the financing be spread out through green bonds (EEU 2000). Effectively,
policy could provide direct financial support for poorer households, but only offer bridging
finance for those who can afford to invest upfront for future energy savings.
9.1.1.5 Making LPG more accessible
Affordability is an issue that applies to LPG as well as electricity. LPG is a desirable thermal
fuel, yet little switching from other fuels to LPG has been observed in South Africa (IES &
AGAMA 2004). Several barriers exist to the greater use of LPGas. Government is still in the
process of formulating a clear enabling policy and regulatory environment promoting LPG for
the poor. Promotion of LPG is a ‘poor cousin’ to the intense focus on electrification. For
customers, the affordability of LPG is a key issue, with the overall costs for boiling two litres of
water being 25c, compared to 20 cents for electricity and only 13c for paraffin (IES & AGAMA
2004). For rural areas, comparative energy costs for cooking were estimated at 48 c/kWh-
equivalent for LPG, compared to 30-40c for electricity (lower with the poverty tariff) and 28c
for paraffin (EDRC 2003b). Fuel costs make part of the difference, but the deposit on cylinders
and higher appliance cost (compared to paraffin) compounds the lack of affordability.
From the industry side, distribution systems are needed to increase retailer networks and
bringing these closer to end-users. Currently, most customers have to manage the final delivery
themselves, incurring transport costs and physically having to carry cylinders. LPG customers
have little choice of retailers, in contrast to paraffin which is sold at many outlets. Finally
negative perceptions of LPG, e.g. the feeling that gas is dangerous and can explode, need to be
addressed through raising awareness of the safe use of LPG.
One important intervention is raising awareness – of the comparative costs of energy choices,
health and safety issues, and practical information (EDRC 2003b). The issue of affordability can
be addressed through removal of VAT on LPG, increased competition, incentives to switch
fuels, and reducing costs of appliances (IES & AGAMA 2004). Reducing costs needs to be
accompanied by measures that facilitate access to LPG – establishing better delivery network
and encouraging more retailers by reducing barriers to entry.

Policy analysis 207
Energy centres can play an important role in facilitating access to LPG and reducing costs.
Existing rural energy centres have demonstrated that it is possible to sell LPG at lower prices
than current ones, due to bulk buying and modest profit margins (EDRC 2003b). Energy centres
also make physical access easier, and have worked on supplying cylinder in smaller sizes.
Smaller cylinders are easy to carry physically and allow purchase of smaller quantities for
poorer households. Energy centers may also be able to buy appliances in bulk. Together,
measures that increase access and promote affordability can help reduce energy poverty.
9.1.1.6 Poverty tariff: making the use of electricity more affordable
Policy to directly address the affordability of electricity has begun to be implemented through
the poverty tariff. From 2004, government committed itself to implementing a free supply of
electricity for basic needs (DME 2004b) (see details of the policy in chapter 4).
The affordability of using electricity is a problem of poverty. Policy solutions limited to the
electricity sector – for example the poverty tariff and weak grid – can only address the problem
partially. An overall solution must be part of a broader, cross-sectoral approach to poverty
eradication. Changes in the economy at large, such as job creation and higher incomes, will be
important in addressing affordability in its wider sense. President Mbeki in 2004 re-emphasised
the “central importance of the state as a social agent to effect the necessary resource transfers,
and ensure their productive utilisation” (Mbeki 2004b). A year later, he more concretely
indicated that government would “complete discussions with Eskom, the provincial
governments and local municipalities to ensure that free basic electricity is provided to all with
the minimum delay” (Mbeki 2005).
The analysis in chapter 8 found that policies could reduce the electricity burden between 2%
and 6%, depending on policy and household type. This is similar to the relative reduction found
by analysis of the impact of the poverty tariff for poor households, considering all households,
which saw a reduction of 6 percentage points (Prasad & Ranninger 2003). A recent study in the
poor areas of Cape Town showed that monthly electricity consumption has risen by 30 – 35
kWh/month per customer since the introduction of poverty tariff, a substantial rise against an
average consumption ranging from 100 to 150 kWh per month (Borchers et al. 2001). This rise
is less than the full 50 kWh/month, suggesting that households both make greater use of
electricity, but also value some saving on their energy bills (Cowan & Mohlakoana 2005).
A combination of the poverty tariff (aimed at social sustainability) and the residential policies
outlined in this thesis could improve affordability for poor households in two ways. The
residential policies reduce the consumption of energy needed to deliver the same service, while
the poverty tariff makes the price of electricity cheaper. Together, the policies have potential to
address the difficult issue of affordability. Instruments and mechanisms to finance such policies
will be needed.

Policy analysis 208
9.1.1.7 Develop financial instruments and mechanisms to support residential policies
Addressing the affordability of energy services requires setting up financial instruments and
mechanisms. Support for individual policies can be differentiated, as suggested with bridging
finance for SWH in richer households, but direct subsidies for poorer ones. Financing can help
to promote efficiency in two major ways: firstly by funding the costs of efficiency programmes,
and secondly by helping to finance the upfront costs for those who cannot afford them.
Specific funding for end-use energy efficiency could be drawn from the general fiscus, or raised
through a charge. To sustain investment in socially beneficial efficiency programmes – even
under power sector reform - the regulator could introduce a charge on all electricity sales. This
non-bypassable charge, sometimes called a ‘wires charge’, would be dedicated to funding public
benefits including energy efficiency (Winkler & Mavhungu 2001; Clark & Mavhungu 2000;
Winkler & Mavhungu 2002).
Financing is an essential element of promoting greater efficiency in the use of electricity. Direct
financial support – e.g. subsidies of efficient housing – is one means of contributing to
efficiency. As earlier parts of this section have shown, tariff structures that appropriately reflect
costs in the price of electricity are equally important.
9.1.1.8 Business capacity to manufacture locally
Institutional capacity to implement policies is required in both the public and private sectors.
The need for government to set mandatory standards has been outlined in section 9.1.1.2, but
government can also assist with setting up financing mechanisms for residential policies more
broadly (9.1.1.7 above). Institutional capacity is also needed in the business sector, however, as
the example of solar water heaters illustrates.
Adequate business infrastructure is needed for introducing vacuum tube technology, which
should reduce costs of SWH systems almost by half. Chapter 6 assumed some cost reductions
will occur, but in practice a step-change is needed to import technologies. Import of vacuum
tubes becomes economic at a certain scale. Aggregation among suppliers of SWH systems
would help, as might assistance from government with establishing trade.
The local component of SWH would benefit from the development of a local manufacturing
industry. If using imported vacuum tubes, locally manufactured components could be
combined in assembly with import vacuum tubes. The policy case of SWH / GB requires a
public-private partnership. Much as business capacity needs to be built to grow markets,
institutional capacity is needed in government for residential policies.

Policy analysis 209
9.1.1.9 Government capacity to administer residential policies
Residential policies form part of the energy efficiency strategy (DME 2005a), have a basis in
broader energy policy (DME 1998) and may soon be covered a new National Energy Act
(Surridge 2005). Policy and strategy, however, requires people and institutions to implement
them.
Institutional capacity could be established to benefit all residential policies. Capacity is needed
to not only to develop and enforce codes and standards, but also to promote policies. A National
Energy Efficiency Agency has been researched in a feasibility study, but has not been
established. Cooperation between agencies (DME, NER, Eskom) has many advantages. A
dedicated agency might provide clearer leadership if it had sufficient authority and adequate,
consistent streams of funding. In short, an institutional home for public-benefit energy
efficiency needs to be found.
The CABEERE (Capacity building in energy efficiency and renewable energy) initiative within
DME has provided some focus for energy efficiency research and projects, but a secure
institutional home has not been established. The organisational structures of the authorities,
notably the DME and NER, are important for public benefits, particularly in the context of
power sector reform. With the electricity distribution industry undergoing restructuring, the
pressures to compete are likely to increase. Energy efficiency measures reduce sales revenues,
and therefore the protection of public benefits is needed (Winkler & Mavhungu 2001; Clark &
Mavhungu 2000; Philpott & Clark 2002).
9.1.1.10 Conclusions An approach to sustainable development that emphasizes durability would require growth (e.g.
in terms of access). Rather than insisting on strict economic optimality, however, more
flexibility can be shown in making some trade-offs. In the residential sector, this approach has
been implemented by building the key development objective of increased access into all cases.
The optimizing framework ensures that goals are reached cost-effectively.
Considering a durability approach, some trade-off of economic optimality might provide greater
social benefits. An equitable distribution of energy services is important for social
sustainability, adding a further dimension to the priority often given to economically efficient
delivery. The residential policy cases illustrate that there is potential for policy-makers to
achieve benefits in all dimensions. More could be achieved if some measure of economic
optimality is traded off for other benefits, e.g. in the case of LPG for cooking.
The largest absolute energy savings (and associated emission reductions) will not occur in the
residential sector. Levels of energy consumption are relatively low, not only in unelectrified
households, but also in newly electrified households. However, the residential sector is critical

Policy analysis 210
for social development. Changing development paths in this sector will need to focus on
multiple issues, including more efficient use of electricity, but also switching to other fuels.
Increasing access to finance is critical for implementing policies. Several supportive policies
are needed. Subsidies of less than a thousand Rand / household should be sufficient to promote
an individual policy such as efficiency in the housing shell. Judging from a case with reduced
interest rates, it appears that such subsidies would make efficient housing attractive to ULE and
RLN households (in addition to UHE, who take up this intervention in the base case).
The household type with the largest savings need not always be the target group for policy
intervention. Policy analysis of water heating showed that while UHE have larger absolute
energy savings, the reduction in the electricity burden is proportionately greater for ULE. Low-
cost measures, such as geyser blankets, can be aimed at poorer household types – and have a
lower cost of saved energy than SWH.
A combination of the poverty tariff and residential policies could work together to reduce the
consumption of energy needed to deliver the same service, while at the same time making the
price of electricity cheaper. Financing instruments from the general fiscus, to funding for
residential policies from systems charges, should be examined.
Institutional capacity is needed in business to develop local manufacturing and reduce costs.
Capacity in government is needed to enforce policy, and a dedicated energy agency might
provide an important focal point.
9.1.2 Choosing electricity supply options for sustainability The policy challenge for electricity supply includes the need to:
• increase diversity of supply and lessen dependency on coal;
• reduce emissions of local and global air pollutants; while
• increasing access to affordable energy services (DME 1998).
The comparative analysis of electricity policies against sustainable development indicators in
chapter 8 (Figure 8.8) did not show clear ‘winners’ in economic, social and environment terms,
unlike the residential sector. The policy questions for electricity options relate to trade-offs of
different aspects, as well as specific requirements for implementation.
This section briefly reviews the policy choices that need to be made in comparative perspective.
Each electricity supply options faces specific issues, which are outlined next. The longer-term
perspective of durability, introduced in chapter 2, is revisited. On this basis, the challenge of
making near-term changes to meet long-term goals is outlined.

Policy analysis 211
9.1.2.1 Policy choices
Policy statements on future electricity supply have tended to emphasise that all energy sources
would be used (Mlambo-Ngcuka 2003, 2005). In practice, choices are being made about
investments in capacity, initially to meet peaking demand (NER 2004a). The analysis in chapter
8 has suggested that choices of electricity supply options have advantages in different
dimensions – there are trade-offs to be made.
On cost, imported options (gas or hydro) look attractive. Similarly, considerations of security of
supply might lead SA to look to domestic options. Coal will continue to provide a large share
for the next 20 years, as the base case and all policy cases illustrate. Of the other two domestic
options, the PBMR performed poorly in terms of cost, even more expensive than a combined
case. A mix of renewable energy options was more attractive.
With the assumption in all cases that electrification would increase, the social implications of
electricity supply are mainly through the price. Measured by the shadow price, the combined
case was clearly most expensive, followed by the PBMR and renewables in joint second rank.
Imports provided the lowest opportunity cost.
Environmental concerns of reducing local and global air pollutants would favour the two
domestic options (apart from coal), renewables and the PBMR. While the PBMR had high
reductions, renewables achieved similar reductions at lower cost. In this dimension, imports of
gas or hydro-electricity did not compare favourably, with the lowest reductions of both local
and global emissions.
9.1.2.2 Specific policy issues
9.1.2.2.1 Markets to scale up renewables
In chapter 7, the results for the renewables case showed that the target could be met. Electricity
generation from renewable energy sources increased beyond 2013, as technology costs declined.
The mix of renewables was primarily supplemented by bagasse co-generation and wind, in
addition to existing small hydro and bagasse. The environmental performance in reducing local
and global air pollution was good, second only to the PBMR, and at lower cost.
The policy challenge for renewables is to achieve the voluntary target. Institutional capacity, as
for residential policies, will be needed in both the public and private sectors. Government needs
to engage key stakeholders, including Eskom, in the challenge to meet the target. Setting up a
well-regulated market is important for business and for scaling up the capacity of renewables.
Key policy issues to achieve this are financing (subsidies and appropriate tariffs), ensuring
markets that include independent power producers (IPPs), power purchase agreements and
tradable permits.

Policy analysis 212
The Energy Minister’s 2003 budget speech indicated that renewable energy policy would “lead
to the subsidisation of Renewable Energy and develop a sustainable market share for clean
energy” (Mlambo-Ngcuka 2003). Two major types of subsidies can be considered:
• investment subsidies, as an up-front grant, given per unit of installed capacity; or
• production subsidies, through a rebate per kWh of renewable electricity produced.
While investment subsidies have the advantage of reducing the high up-front investment costs
of RETs, the major drawback is that facilities may be built to get the subsidy, but not
maintained to generate any electricity. Production subsidies more directly reward the on-going
production of electricity from RETs (EDRC 2003a). The DME during 2005 set up an office for
subsidies to renewables (see section 6.6.2.1).
The tariffs that producers of renewable electricity receive will be critical to their financial
viability. The National Electricity Regulator (NER) would play a key role in overseeing the
process of setting tariffs. Standard contracts or power purchase agreements would set tariffs and
guarantee a market fore renewable IPPs. Some observers suggest that establishing long-term
power purchase agreements for IPPs could tie government and consumers into non-competitive
prices for years to come (Eberhard 2000; Clark 2001a). They are, however, essential if
renewable IPPs are to have security that they will be able to recoup their high initial investment
costs.
Indeed, power purchase agreements need to be specifically structured to reflect the cost
structure of renewables. To avoid the lock-in to fixed prices, it might be desirable to limit the
agreements to small-scale projects, such as renewable energy projects smaller than 50 MW (and
energy efficiency equivalent to less than 10 MW). The assumption would be that, as renewable
IPPs become commercialised and grow, they are able to compete with other technologies, but
that while the technologies are still going through learning curves and reducing costs, they need
the security of fixed contracts.
The Darling wind farm has negotiated a preferential tariff of 50 c / kWh with the
City of Cape Town (CCT 2004; CCT & SEA 2003). Once the facility comes on-stream, the city
would offer customers the option of buying electricity from a renewable source, at a premium.
Available electricity would be 3 GWh per year, a small contribution to the 9 000 GWh
consumed by the city (CCT 2004). There would be some marketing of green power. More
generally, IPPs reportedly state that they require a tariff of 31 c / kWh to be financially viable
(Blignaut 2004).
The NER has policy on IPPs that aims to encourage multiple players to enter the market (NER
2003b). With Eskom having operated as a virtual monopoly, and continuing to exercise market
power, access to the single transmission system (often termed a natural monopoly) must be

Policy analysis 213
made available on fair terms. IPPs should enjoy non-discriminatory access to the grid, paying a
system charge rather than the full-avoided cost of electricity otherwise generated.
Subsidies, tariffs, and power purchase agreements contribute to setting up a market for
renewable electricity governed by clear rules. Market rules for independent power producers
using renewable energy sources are being developed for government. Such rules – including
grid access, power purchase agreements and certification procedures – in the long term need to
form part of a larger electricity market (Sad-elec 2003). Such business infrastructure will be
critical if renewables policy is to be implemented.
9.1.2.2.2 Addressing the issues of nuclear energy The PBMR faces a different set of issues to renewables. The results of the policy case in
chapter 7 showed a substantial diversification was possible, with reduced local and global air
pollution. However, this came at a high cost and with underutilized capacity.
The key policy questions that will need to be addressed for nuclear technology are waste
disposal, security, public acceptance and the economic viability of the technology.
The economics of the PBMR have been debated in the literature, with proponents claiming low
costs (PBMR Ltd 2002), but others claiming that these are severely understated (Auf der Heyde
& Thomas 2002). The debate will likely only be settled in practice. However, before the first
module can be constructed domestically, the EIA approval is required (see chapter 4). Initial
plans for the PBMR appeared to rely on export of PBMR modules, but with the entry of China
into PBMR production (AEJ 2005), the possibility for competition for exports of the technology
has increased. Beyond the cost of the initial units, the decline in costs assumed in the policy
case is only related to domestic production (unlike the renewables case, where it is a function of
doubling of global capacity).
Security of PBMR installations appears to be an issue which has received less attention than it
deserves. One of the attractions of the relatively small modules is the potential to spread them
across several sites.52 While providing benefits of avoiding transmission losses, each new site
and transport route would have to be secured, in turn adding to costs.
While costs of decommissioning have been included in the cost estimates for the policy case,
the issue of waste disposal remains to be addressed. A requirement of the EIA approval was
that the DME promulgate a policy on radioactive waste, and such a policy was approved by
Cabinet in 2005. The first national principle adopted in that policy is the “polluter pays
52 Another attraction of the modular design is that units can be built to more closely match supply – investment is not as ‘lumpy’ as for a Pressurised Water Reactor such as Koeberg (which has a capacity of some 15 PBMRs). The same applies to any smaller electricity generation options.

Policy analysis 214
principle”, stating that generators shall bear the financial burden for management of radioactive
waste (DME 2005b).
The PBMR, like nuclear technologies in general, face difficulties with public acceptance.
Nuclear power and its high-level radioactive waste have attracted the attention of academics,
NGOs and the press (Law & McDaid 2001; Gosling 1999; Auf der Heyde 2000; SECCP 2002).
Whether the initial costs of developing the PBMR should be written off, as implicitly assumed
in the policy case, would be a major policy decision. Critics of the PBMR have suggested that
funding of a particular technology at a larger scale than others, notably renewables, is
inequitable.
9.1.2.2.3 Imported gas and hydro-electricity
The policy issues for imports related primarily to prices and the security of receiving the
imports consistently. Chapter 7 suggested that imports of gas should be phased in more
gradually, while imports of hydro-electricity can be expanded as in the policy case.
Policy interventions to promote gas-fired power plants are mostly not in the electricity sector
itself. Apart from the regulation of gas pipelines, gas prices are a critical factor determining
viability. Fuel prices are set in international markets, beyond the control of national policy. The
anchor customers for gas from Mozambique is SASOL and industrial users in Gauteng, so that
policy on liquid fuels and industrial development influences the availability of gas. Another
option is importing liquefied natural gas (LNG) imported by tanker, which requires significant
investment in re-gasification plant.
Hydro-electricity is already imported from Mozambique on a contract highly favourable to SA,
and this option can be expanded with Mepanda Uncua. The large future potential, however, lies
at Inga Falls (see chapter 4). If the large potential in the DRC is to be tapped, the
interconnections between the national grids within SAPP would need to be strengthened. A
Western Corridor project plans to connect South Africa, Namibia, Botswana, Angola, and the
DRC with transmission lines. Several of the initiatives under NEPAD are interconnectors
(NEPAD 2002).
The prospect of increased interconnection and trade of electricity across borders requires
regulation. Different operating systems, markets, tariffs and policies need to be harmonised
sufficiently to allow trade. A Regional Electricity Regulators’ Association (RERA) was
formally approved by SADC Energy Ministers in July 2002. Members are Malawi, Namibia,
South Africa and Zambia, with observers from the regulatory authorities of Angola, Lesotho,
Mozambique, Tanzania and Zimbabwe and support form the SADC energy technical support
unit (NER 2002e).

Policy analysis 215
Political stability in the DRC is an important – but highly uncertain – pre-requisite for using this
option. In the Zambezi river basin, closer to South Africa, there is the potential for an additional
6000 MWe. Technical problems would be sufficient transmission capacity and line losses over
long distances, but these could be overcome (Kenny & Howells 2001). More important are
political uncertainties, and reaching agreement on contracts that promote the interests and
development of all countries involved.
With no single policy emerging as a ‘win-win’ option in a least-cost framework, the policy
approach should consider durability over a longer-time frame.
9.1.2.3 Durability: considering challenges over longer time-frames The methodology of the thesis (see chapter 1) made a distinction between optimality and
durability. The Markal modeling tool is fundamentally an optimizing one, although social and
environmental dimensions can be included, as demonstrated in chapters 7 and 8. However, they
remain side constraints to the objective function of minimizing costs.
Durability favours development paths that permit growth, but does not insist on economic
optimality. There is more willingness to trade off some economic optimality for greater safety,
or for a system that has higher resilience to external shocks. The difference, however, is one of
emphasis and perspective - optimality and durability have different emphases, but can
complement one another (Munasinghe & Swart 2005).
An example in the South African energy system is diversity of supply. The base case showed
that coal will remain the least-cost option over the 25 year period. ‘Cleaner coal’ technologies
were included in the base case. Policy considerations would be to ensure that all FBC complies
with emissions standards. Such standards can be set under the new Air Quality Act, with
mandatory and public reporting. Yet a key challenge remains to reduce the dependency on a
single fuel. The energy policy of objective of ensuring security of supply through diversity is
critical.
The analysis of diversity of supply (see chapter 8) showed two distinct dimensions. The move
away from coal (dominating ‘other fuels’ in Figure 9.2) is clearest for the PBMR, albeit at a
higher investment cost. The balance of different fuel types, however, is more diverse in the case
of renewables. The bar for renewables in Figure 9.2 below shows three distinct components,
while the first four cases have a barely visible sliver of renewable energy.
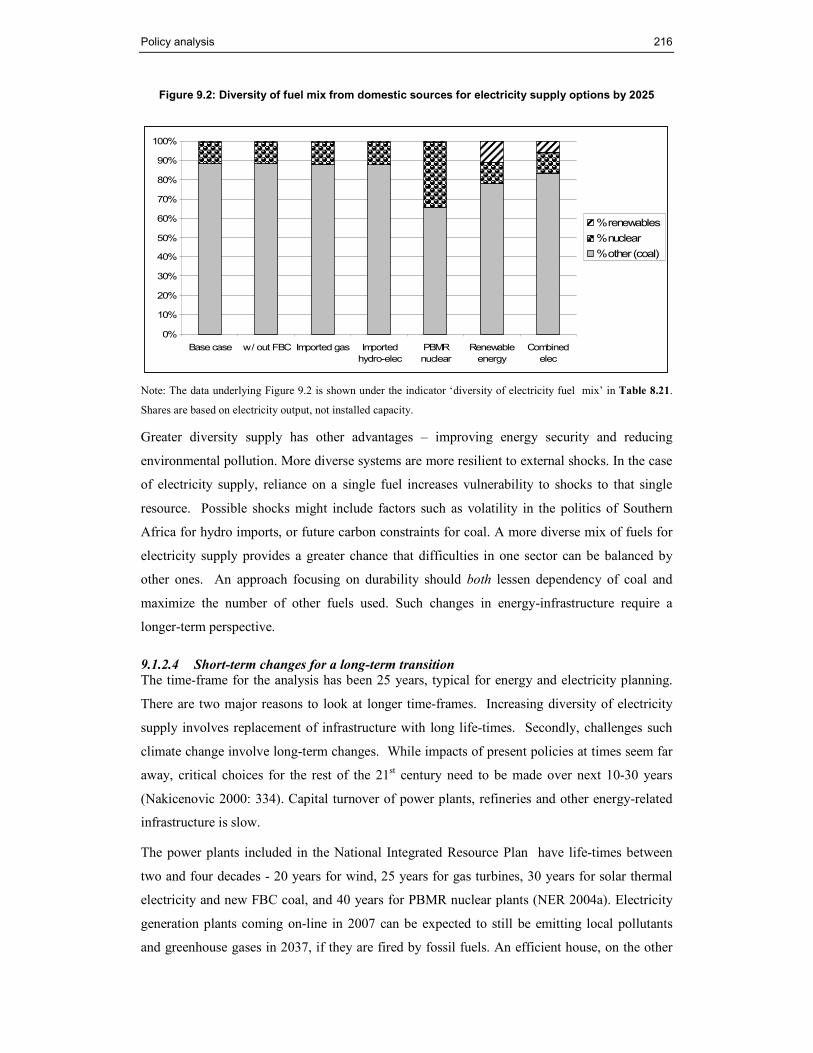
Policy analysis 216
Figure 9.2: Diversity of fuel mix from domestic sources for electricity supply options by 2025
0%
10%
20%
30%
40%
50%
60%
70%
80%
90%
100%
Base case w / out FBC Imported gas Imported
hydro-elec
PBMR
nuclear
Renewable
energy
Combined
elec
% renewables
% nuclear
% other (coal)
Note: The data underlying Figure 9.2 is shown under the indicator ‘diversity of electricity fuel mix’ in Table 8.21.
Shares are based on electricity output, not installed capacity.
Greater diversity supply has other advantages – improving energy security and reducing
environmental pollution. More diverse systems are more resilient to external shocks. In the case
of electricity supply, reliance on a single fuel increases vulnerability to shocks to that single
resource. Possible shocks might include factors such as volatility in the politics of Southern
Africa for hydro imports, or future carbon constraints for coal. A more diverse mix of fuels for
electricity supply provides a greater chance that difficulties in one sector can be balanced by
other ones. An approach focusing on durability should both lessen dependency of coal and
maximize the number of other fuels used. Such changes in energy-infrastructure require a
longer-term perspective.
9.1.2.4 Short-term changes for a long-term transition
The time-frame for the analysis has been 25 years, typical for energy and electricity planning.
There are two major reasons to look at longer time-frames. Increasing diversity of electricity
supply involves replacement of infrastructure with long life-times. Secondly, challenges such
climate change involve long-term changes. While impacts of present policies at times seem far
away, critical choices for the rest of the 21st century need to be made over next 10-30 years
(Nakicenovic 2000: 334). Capital turnover of power plants, refineries and other energy-related
infrastructure is slow.
The power plants included in the National Integrated Resource Plan have life-times between
two and four decades - 20 years for wind, 25 years for gas turbines, 30 years for solar thermal
electricity and new FBC coal, and 40 years for PBMR nuclear plants (NER 2004a). Electricity
generation plants coming on-line in 2007 can be expected to still be emitting local pollutants
and greenhouse gases in 2037, if they are fired by fossil fuels. An efficient house, on the other

Policy analysis 217
hand, constructed today will still be saving energy in 30 years, when SA may face restrictions
on carbon emissions. These considerations emphasise the importance of ‘lock-in’ to chosen
technologies (Kartha et al. 1998). Changes to existing coal-based energy economy and
electricity sector require planning for a hundred-year time-frame, but inform critical choices in
the next few years. To change the direction of large systems requires smaller changes in the
short-term, to enable larger future changes.
For the electricity sector, the need to replace electricity generation capacity is a challenge that
presents the opportunity of changing course. Not only is new capacity needed urgently in the
next few years, but replacement of existing stock will continue into the mid-term, as power
stations come to the end of their life. The additional capacity required in the 20 years from 2005
53 to 2025 amount to 22 750 MW of added capacity, as shown in Figure 9.3.
Figure 9.3: Total capacity for electricity generation and additions per year
-
10,000
20,000
30,000
40,000
50,000
60,000
70,000
2006
2007
2008
2009
2010
2011
2012
2013
2014
2015
2016
2017
2018
2019
2020
2021
2022
2023
2024
2025
MW total
-
500
1,000
1,500
2,000
2,500
MW added
Total capacity Capacity added per year
The total capacity (measured on the left-hand y-axis) increases from 40 to 60 GW over the 20
years. The added capacity (measured on the right-hand y-axis) is somewhat lumpy, with the
peak of 1950 MW representing the investment in a combined cycle gas turbine. On average,
just over 1 000 MW are needed per year.
The replacement of major infrastructure offers the opportunity to change direction. The new
capacity could be met by six new coal-fired power stations. These pulverized fuel stations,
known as ‘six-packs’, have capacity of around 3 600 MW each. If only two of the six were
53 There are no investments in the first years of the model run - which starts from 2001 - due to lead times.

Policy analysis 218
replaced by other options in the next two decades, this would represent a major shift in South
Africa’s energy development path. In fact, as shown conceptually in Figure 9.4, capacity in
each part could build up gradually over the initial 20 years.
Figure 9.4: Wedges of electricity capacity equivalent to one ‘six-pack’ each over 20 years 54
-
5,000
10,000
15,000
20,000
25,000
2005
2006
2007
2008
2009
2010
2011
2012
2013
2014
2015
2016
2017
2018
2019
2020
2021
2022
2023
2024
2025
MW
One 'six-pack' equiivalent
If, for example, one ‘six-pack-equivalent’ were to be from renewables, and another from PBMR
or imported electricity, significant institutional capacity would have been developed in the local
electricity supply industry. Longer-term goals of three six-packs over 30 years, and five over 50
years, might seem achievable. Changes in the next two decades will be critical in shaping not
only energy policy, but also South Africa’s response to climate change mitigation.
9.2 Implications of sustainable energy development paths for climate change mitigation policy
The research question in its last clause asked whether making energy policies more sustainable
could also reduce GHG emissions. From the preceding chapters, it is clear that there are a
number of policies that promote local sustainable development objectives. In the residential
54 The diagram draws on the concept of wedges for stabilising CO2 emissions using existing technologies (Pacala & Socolow 2004).

Policy analysis 219
sector, there were ‘win-win’ options with efficient housing and water heating. The electricity
supply options require more trade-offs between environmental, social and economic
dimensions, but offer opportunities to change each dimension at larger scale in the longer-term.
9.2.1 Options for SA mitigation policy South Africa’s national climate change response strategy (DEAT 2004) is centered around the
concept of sustainable development. The analysis in this thesis suggests specific ways in which
this policy can be realized.
South Africa’s climate policy will be more “durable” (Munasinghe & Swart 2005) if it does not
give sole priority to reducing costs, but also achieves social and local environmental benefits.
The policies modeled, evaluated and analysed in the preceding chapters can make important
contributions to both energy and climate policy.
Figure 9.5 shows the emissions avoided in each of the residential policy cases, i.e. reduced from
the emissions level in the base case. The upwards movement in all cases between 2018 and
2020 seems to be an artifact of a sharp increased in generation from two pumped storage plants
(Steenberg and Palmiet). The largest reductions are seen in the combined, efficient housing and
SWH / GB cases in that order. In the simple estimate of abatement costs in chapter 8, the
efficient housing case was also the most cost-effective.
The efficient housing and SWH / GB cases were already identified in previous chapters are
‘win-win’ opportunities, reducing local air pollutants, economic costs and the burden on
households. What can be seen from Figure 9.5 is that emissions in the order of 1- 10 M CO2-
equiv / year can be avoided through these policies.
Figure 9.5: GHG emissions avoided in residential policy cases
-9
-8
-7
-6
-5
-4
-3
-2
-1
-
2001
2002
2003
2004
2,005
2,006
2,007
2, 008
2, 009
2, 010
2011
2012
2013
2014
2015
2016
2017
2018
2019
2020
2021
2022
2023
2024
2025
Mt CO2
CFL Combined res Eff house LPG SWH
The avoided emissions in the case of efficient houses constitute 1.2% of the emission of GHGs
(CO2, CH4 and N20) compared to 2025 emissions in the base case. For comparison, they

Policy analysis 220
amount to 1.9% if divided by 2001 emissions in the base case. Energy policies such as efficient
housing and SWH / GB should make up an important component of South African climate
policy. They are cost-effective, address both social sustainability, local environmental issues
and GHG emissions.
The scale of emission reductions that might be required in the future, however, will need to
come from higher-emitting sectors. Emissions in the base case are projected to increase 80%
from 2001 to 2025. The electricity supply sector is central in this regard, accounting for 48% of
South Africa’s CO2 emissions and 37% of all greenhouse gases (Van der Merwe & Scholes
1998; RSA 2004a).
Avoided emissions for electricity supply options are shown in Figure 9.6, again showing the
difference of emissions between policies and the base case. The scale of avoided emissions is
indeed larger, reaching up to 50 Mt CO2 / year in the combined case. If SA is to make a
contribution to the emission reductions of 50 -70% from current levels which the science tells us
is required (IPCC 1995) then changes in this sector will be needed.
Figure 9.6: GHG emissions avoided in electricity policy cases
-60
-50
-40
-30
-20
-10
-
2001
2002
2003
2004
2,005
2,006
2,007
2,008
2, 009
2, 010
2011
2012
2013
2014
2015
2016
2017
2018
2019
2020
2021
2022
2023
2024
2025
Mt CO2
Gas Hydro PBMR Renewables Combined elec
The combined policy case shows the largest absolute emission reductions, followed by the
PBMR. As will be recalled from chapters 7 and 8, however, the investment costs associated
with these two cases are larger than for others. The two domestic cases reduce 5% of the
emissions projected for the base case in 2025.
Simple estimates of abatement costs indicated that renewables are most cost-effective in
achieving larger scale emission reductions, slightly cheaper at R 2.5 / t CO2 than the PBMR at
R2.9. Even the relatively higher costs of the combined case (R 4.8) and the two import cases
(R3.9 for hydro and R5.6 for gas) are well below market prices for carbon.

Policy analysis 221
Table 9.3: Order of magnitude of carbon revenues for different carbon prices
2005 2010 2015 2020 2025
Avoided emissions from both combined cases
Mt CO2 4 18 41 41 48
Revenue at €10 / tCO2 R million
355 1,444 3,315 3,245 3,840
Revenue at €20 / tCO2 R million
710 2,887 6,629 6,491 7,680
Revenue at €30 / tCO2 R million
1,065 4,331 9,944 9,736 11,520
The first row of Table 9.3 adds up the values of avoided emissions from the two combined case,
in other words avoiding double-counting of reductions. The carbon price is set at three values,
with €10 / t CO2 being close to 2005 prices, and expected higher levels in future represented by
modest increases to € 20 and 30 / t CO2. Further assuming a fixed exchange rate at R 8 / € 1,
revenues in the order of Rand millions to Rand billions per year are possible (over R 10 billion
in 2025 at to € 30 / t CO2).
What is not clear is whether South Africa would be able to sell credits for avoided emissions as
currently through the Clean Development Mechanism (CDM). By 2025, SA might need to
reduce emissions for meet a future commitment of its own. This question raises the implications
of the policies described so far for the international climate change regime, which is considered
in section 9.2.2 below.
The implications of energy policies for sustainable development for domestic climate polices
are two-fold. Firstly, residential energy policies permit growth of energy services and reduce
costs of those services, but also reduce local environmental pollution, provide social benefits.
These policies, in particular efficient housing and SWH / GB, can contribute to a thrust of
climate policy that is strongly allied to social sustainability and poverty alleviation. By
including these policies in an overall portfolio, climate policy will be made more relevant to
local development.
Since the absolute emission reductions achievable in this way are not adequate to the task, a
second component is needed. In the electricity supply sector, there is potential to make
development more sustainable, but no clear ‘winners’ emerge that are superior in every
dimension. A long-term climate perspective is one reason to make short-term changes to begin
a long-term transition. Greater flexibility will be needed in trading off some degree of economic
optimality, in favour of both local and global environmental benefits.
Recent analysis suggests that there may be means to soften the trade-offs. The thesis focuses on
the direct costs of energy policies. Complementary recent work has examined the broader

Policy analysis 222
economic effects of climate policies, including direct GHG taxes or energy taxes, using a CGE
model (see section 4.4.2 above). The use of a CGE model means that not only direct costs, but
the indirect economic benefits and costs are counted. However, note the limitations on the
approach to GHG analysis, as discussed in section 4.4.2. The authors argue that energy in South
Africa is complementary to capital and that this factor together with tax recycling that increases
unskilled labour demand can produce a double or even ‘triple dividend’. They find that
recycling environmental tax revenues through reduction in food costs is particularly effective in
achieving CO2 reduction, economic growth and poverty alleviation (Van Heerden et al. 2006).
Macro-economic analysis thus provides an indication that there may be synergies at the societal
level; yet climate policy would affect individual sectors, with winners and losers. Hence a
degree of trade-off is likely to remain.
The need for trade-offs should not be taken to suggest that no attention is paid to economic
costs. The electricity supply policies described in this thesis provide options to meet
environmental goals cost-effectively. And there are significant synergies that remain, even if
not all dimensions can be optimized at once. Synergies exist in meeting goals for improving
local air quality and reducing GHG emissions. Local benefits also accrue from greater diversity,
both in lessening dependence on coal and increasing resilience by increasing the number of
alternatives.
Combining residential and electricity policies would provide a mix that overall provides a
durable balance of economic development, social sustainability, and both local and global
environmental benefits. Together with other sectoral policies that are not the focus of this
thesis, an approach that starts from meeting sustainable development objectives can make a
major contribution to the multi-lateral effort to mitigate climate change.
9.2.2 Implications for approaches to climate negotiations 55 South Africa’s climate change policy is still in early stages of formulation, and influenced by
views from different interest groups. Early climate mitigation policy took a strict ‘no regrets’
approach, refusing to contemplate any actions other than those that were beneficial even without
climate change. Recently, the climate change response strategy has put sustainable development
at the centre (DEAT 2004), providing the basis for a more pro-active engagement with the
international climate framework (Van Schalkwyk 2005a). SA increasingly seeks to play a
bridge-building role (Van Schalkwyk 2005b) and an approach built around sustainable
development provides for important first steps towards a commitment by developing countries
such as South Africa. Forward-looking approaches have great potential to leverage funds to
promote energy policy objectives such as increasing access, diversity of supply, stimulating
55 This section draws on a peer-reviewed book chapter led by the author (Winkler et al. 2002b).

Policy analysis 223
economic development and managing energy-related environmental impacts. Notably, a more
sustainable approach to the development of the critical electricity sector has the potential to both
promote local sustainable development and contribute to global efforts to mitigate climate
change.
The policies examined here have been called sustainable development policies and measures
(SD-PAMs) (Winkler et al. 2002b). The SD-PAMs approach suggest a way of linking national
sustainable development policies into the multi-lateral climate regime under the UN Framework
Convention on Climate Change (UNFCCC).
To put it another way, the sustainable development approach to climate mitigation reduces
emissions from the reference case. Changing current development trends (e.g. coal in South
Africa’s electricity sector) to a more sustainable path contributes to mitigation by avoiding
emissions. “Assessing the climate challenge from a sustainable development perspective
immediately reveals that countries differ in ways that have dramatic implications for scenario
baselines and the range of mitigation options that can be considered” (Banuri & Weyant 2001:
76). Such an approach reflects the understanding that the reference scenario matters at least as
much, if not more than climate change policy (IPCC 2001b).
The steps involved in the SD-PAMs approach are similar to the methodology for this thesis. The
SD-PAMs approach starts with the development objectives and needs of developing countries.
Countries begin by examining their development priorities and identify how these could be
achieved more sustainably, either by tightening existing policy or by implementing new
measures. The next step is to identify synergies between sustainable development and climate
change, that is, those SD-PAMs that also result in reductions of greenhouse gas (GHG)
emissions. To obtain a realistic picture of the impact of a basket of SD-PAMs, those policies
and measures that increase GHG emissions also need to be identified (Winkler et al. 2002b).
What the SD-PAMs concept offers is the formalisation of the pledge to make development more
sustainable, in an approach that can be negotiated.
The SD-PAMs pledge builds on existing commitments of developing countries. Almost all
developing countries are signatories to the Convention. Under Article 4.1(b), all Parties commit
themselves to ‘formulate, implement, publish and regularly update national and, where
appropriate, regional programmes containing measures to mitigate climate change by addressing
anthropogenic emissions by sources and removals by sinks of all greenhouse gases.’ This
commitment is currently not quantified for developing countries in the same way as for
industrialized countries listed in Annex B of the Kyoto Protocol. SD-PAMs as a pledge-to
implement policies for sustainable development would be consistent with Article 10 of the
Protocol, which re-affirms existing Convention commitments and aims to ‘advance the

Policy analysis 224
implementation of these commitments in order to achieve sustainable development’ (UNFCCC
1997).
9.2.2.1 Sustainable development policies and measures (SD-PAMs)
The SD-PAMs pledge would be to implement and accelerate national sustainable development
plans. The ‘commitment’ would not be measured directly in GHG emissions units, but rather in
SD units – building a 100 000 energy efficient homes, rather than a specified reduction in tons
of CO2 emissions. Indirectly – as a co-benefit – SD-PAMs contribute to considerably lower
emissions than current development trends. The motivation for taking action, however, is to
pursue sustainable development at the national level, and hence the pledge is framed in terms of
action taken.
Energy-efficient low-cost housing in South Africa is one example of a SD-PAM. Other
examples could include the Brazilian ethanol programme (Moreira et al. 2005), China’s efforts
to reduce air pollution in the process of motorisation (Wei-Shiuen & Schipper 2005), or a
renewables-led approach to rural electrification in India (Dubash & Bradley 2005). Taking the
Brazilian case, the ethanol programme produces approximately one third of Brazil’s transport
fuel, reduces foreign exchange expenditure, has created over a million rural jobs and has climate
co-benefits estimated at 574 million tons of CO2 over the lifetime of the programme (Moreira et
al. 2005).
SD-PAMs commitments would initially be voluntary, although they could be made mandatory
for at least some developing countries. To formalize the approach, some need for reporting and
oversight through the Climate Change Convention would be necessary. Reporting would assist
in monitoring whether SD-PAMs are actually implemented, and this would require some
institutional capacity in the pledging country. At the same time, reporting can help to correct
the misperception that developing countries are doing nothing on climate change. As outlined in
section 2.2, the associated changes in GHG emissions are quantified.
While the SD-PAMs commitment would initially be voluntary, a simple reporting system
should be established in order to formalize the commitment of those countries who pledge to
implement SD-PAMs. National capacity to monitor, report and verify that targets are being met
would be an important dimension of the country’s capacity to implement SD-PAMs.
At the international level, reviewing the pledges would require a decision of the Conference of
the Parties to establish a registry of SD-PAMs. Rather than creating an entirely new institution,
a special SD-PAMs reporting registry would be created within the existing framework of the
UNFCCC (Bodansky et al. 2004). Such a registry would record data based on regular reporting
by Parties on their SD-PAMs, and support from the Secretariat for maintaining the records of
Policy analysis 225
implementation. If voluntary reporting proves successful, a next step would be to make
reporting of SD-PAMs mandatory for a group of middle-income developing countries. Some
developing countries might view this as intergovernmental control over national policy making,
which could present a political obstacle. However, there need be no prescribed list of SD-
PAMs, leaving it to the country to define its own policies, much as this thesis has examined
energy policies that would make South Africa’s development more sustainable.
Reporting would primarily review progress assessed in the metric of the target. For efficient
housing, for example, the pledge could be to implement a national programme building x00,000
houses more efficiently per year. In the electricity sector, the implementing and reaching the
renewable energy target of 10 000 GWh could be the SD-PAMs pledge.
Reporting would assist the joint assessment of pledged actions. Associated GHG abatement
could also be reported, in order to change the perception of some Annex I countries that
developing countries are not participating in climate protection. This reporting would be similar
in spirit to Article 12.4 of the Convention, where developing countries may voluntarily propose
mitigation projects. The proposed reporting would extend to all SD-PAMs, including those that
are not project-based. In order to assess progress against SD-PAMs pledges, a system of
indicators for sustainable development could be adapted.
Reporting of SD-PAMs could be included in national communications. This would have the
advantage that the information would be addressed in the in-depth reviews. However, the
process of national communications has become highly politicized, in particular around the
provision of technical and financial resources (See the language in UNFCCC (1992), Article
12.7). Given that some developing countries are not submitting their initial national
communications, it might be preferable to separate the register of SD-PAMs from this process.
In short, developing countries would formulate, implement and report on SD-PAMs. Reporting
and international review seem consistent with a facilitative approach to compliance.
9.2.2.2 Financing SD-PAMs
The issue of increasing access to finance was raised for residential policies above, and the
PBMR and renewable electricity supply options clearly have incremental costs above the base
case. Formalizing the SD-PAMs approach would offer the opportunity to channeling funding
for climate change into policies that meet local sustainable development objectives.
Determining who pays for SD-PAMs is integrally related to the question of formalizing the
pledge in the manner suggested above. Countries are unlikely to fulfill pledges unless they have
the resources for implementation. Under Article 4.3 of the Convention, developed country
Parties are already committed to paying ‘full agreed incremental costs’ of activities under
Article 4.1. The commitment to funding is repeated in Article 11 of the Protocol. If SD-PAMs

Policy analysis 226
are adopted under Article 4.1b, the question of payment should in principle be decided already.
The challenge is to ensure that funds actually flow.
The sources of funding would differ between those SD-PAMs that have synergies with GHG
reduction and those that are neutral or conflict. SD-PAMs that do not decrease GHG emissions
would need to use development funding, both domestic, bi-lateral and multi-lateral.
SD-PAMs with GHG reduction potential could receive climate change-related funding,
including investment through the Clean Development Mechanism (CDM), climate change funds
through the Global Environmental Facility (GEF), and the funds established at Marrakech under
the Convention (Special Climate Change Fund, LDC fund) and Protocol (Adaptation Fund).
Some of these funds would be most suited to projects (CDM), others to enabling activities
(GEF) or policy changes (e.g. under sectoral CDM).
SD-PAMs that reduce GHG emissions are likely to be good candidates for investment under the
Clean Development Mechanism (CDM.) The CDM requires that projects reduce emissions and
promote the sustainable development objectives of the host country, implying a clear synergy
with the SD-PAMs approach. Through the CDM and the certified emission reductions
generated, developing countries would have some link to the emerging market for carbon
credits. However, the SD-PAMs approach would be broader in scope, including emissions
reduction due to policies (such as changes in prices of energy) that could not qualify as CDM
projects, which tend to focus on investment in technologies, infrastructure or programmes.
The methodology adopted in this thesis explicitly started from development objectives. Much of
the contribution that this approach can make lies in considering the specific energy policies that
can meet national development objectives. Reaching them in a more sustainable manner has co-
benefits for climate change, as seen above. The approach to climate change mitigation, then, is
not one that seeks the least-cost solution to reducing GHG emissions from the energy sector. A
durable approach is one which combines ‘win-win’ policies with those that trade off some
economic optimality for local and global environmental benefits. The approach explored in this
thesis provides a solid basis for South Africa to engage in the next round of negotiations under
the UNFCCC.
9.3 Conclusion The policy analysis in this chapter considered the implications of the foregoing chapters for
energy and climate policy in South Africa. Opportunities for social sustainability are
particularly marked in residential energy policies, while large environmental benefits require
trade-off in the longer-term perspective of choosing electricity supply options. Economic
dimensions are important both for society as a whole, and for the budgets of poor households as
well.

Policy analysis 227
Policies that make South Africa’s energy development path more sustainable are a good
approach to climate policy as well. Not only do they provide a firm basis for domestic climate
policy, but sustainable development policies and measures (SD-PAMs) could also provide a
fresh approach in the multi-lateral climate negotiations. Having considered the implications for
energy and climate policy, a summary of key findings concludes the thesis in the following
chapter.

Conclusion 228
CCCCHAPTER HAPTER HAPTER HAPTER 10101010
10. Conclusion The overall research question of the thesis was whether there are energy policies to make the
development in South Africa’s residential and electricity sectors more sustainable economically,
socially and environmentally - particularly in the local environment - while also producing
GHG emission reductions as co-benefits. A methodology was outlined that deliberately starts
the assessment of practice in the residential energy sector from development objectives. Three
major components of the methodology were modeling, evaluation against indicators of
sustainable development and policy analysis. A contribution of the thesis lies in combining
these analytical tools to identify policies that promote both sustainable development and
mitigate climate change.
The first step in answering the research question was to start with a review of the concept of
sustainable development as applied to the energy sector. A literature review provided a working
definition of sustainable development. Sustainable energy development was taken to mean that a
set of 'development indicators' is increasing over time, contributing to economic welfare,
without being threatened by 'feedback' from either biophysical impacts, social disruption,
making it durable or sustainable.
Against the background of the development objectives for the broader South African energy
system, key energy policies were identified. The particular focus for making energy
development more sustainable was the residential and electricity sectors. Chapter 4 emphasised
the priority given to the energy policy goal of affordable access, to which any future policy in
the sector will have to contribute.
A review of current energy policy issues laid the basis for identifying potential future ones for
modeling. Tools for modeling energy policies were critically reviewed, and an energy-
economic-environmental framework chosen. Policy options were identified that can make
energy development in the residential and electricity sectors more sustainable, and were
implemented in an energy-economic model. Policy options thus included both demand- and
supply-side interventions; short-term opportunities, as well as interventions – such as changes in
the fuel mix – that require longer time-frames.
A wide variety of data sources was used, drawing on statistical information, official energy data,
utility statistics, journal articles and research reports. Data for the residential sector, both
primary and secondary, was gathered for the thesis and disaggregated into six household types.
This level of analysis within a national energy model goes beyond previous work, in showing
distinctive energy use patterns for these household types. The projections made about future

Conclusion 229
urban / rural dynamics, levels of poverty, household size and the impact of AIDS make an
important difference, and impact on the projections of residential energy demand.
The results of modeling were discussed and interpreted first by individual policy. Secondly,
they were analysed against indicators of sustainable development, laying the basis for the policy
analysis that answered the research question. In this way, the thesis demonstrated that policies
in the residential demand and electricity supply sectors that can help move South Africa’s
energy sector onto a more sustainable path. Detailed policy analysis for the residential demand
and electricity supply sectors elaborated what would be needed for implementation.
Overall then, the thesis argues that there are indeed policies that meet local sustainable
development objectives, and also deliver GHG co-benefits. It finds that the residential sector is
of particular importance for social sustainability. Extending access to affordable, modern energy
services is a policy imperative which all energy policies have to follow. The challenge of
access, it is contended, increasingly also has an economic dimension, as issues of affordability
come to the fore. This argument has particular bearing in South Africa where high emissions
intensity (per GDP and per capita) presents major problems, but will resonate with many middle
income nations where increased energy consumption drives growing emissions without
noticeable progress in meeting development targets.
The analysis of the residential sector identified opportunities that are sustainable economically,
socially and environmentally. Many of the near-term opportunities for contributing to climate
change mitigation lie in efficiency. CFLs provide efficient lighting, LPG allows better cooking,
houses can be designed with better thermal properties, and SWH use a cleaner energy source
and produce hot water more efficiently. The residential sector, it is argued on the basis of the
analysis, has some clear ‘winners’ that rank higher than alternatives in all dimensions of
sustainable development.
The thesis finds that solar water heating and efficient housing are durable policies for
sustainable development. Not only do they achieve the greatest fuel savings in aggregate, but
they also save the most energy costs for households. The latter is significant in reducing the
electricity burden, particularly for poorer urban households. The two policies contribute most
among environmentally by promoting cleaner fuel use, which helps to reduce local air pollution
and GHG emissions. It is also found that it is possible to combine residential policies in a
combined case that yields more benefits than any individual case. However, care should be
taken to undertake integrated assessments, such as in a modeling framework, to avoid double
counting and obtain an accurate picture of the cumulative effects. The whole is typically smaller
than the sum of the parts.

Conclusion 230
The greatest energy savings from efficiency were consistently found in UHE households –
which have higher consumption. The thesis argued, however, that this should not automatically
lead to a policy conclusion to target this household type. Taking into account the reduction in
the energy burden for households, the social benefits of promoting interventions in poorer
households become more apparent. The social benefits of savings from better water heating and
improved indoor air quality would motivate this policy among ULE households, rather than
least-cost optimality. Interventions that address energy poverty promote a more equitable
distribution of energy services, which would favour social sustainability and help reduce
inequality. For richer households, interventions that can be promoted through market
mechanisms – such as CFLs – were found appropriate. The thesis argued that low-cost
measures, such as geyser blankets, can be aimed at poorer household types.
The investment requirement is relatively modest per household, with less than a thousand Rand
per household making efficient housing attractive to ULE and RLN households, as well as
UHE. The thesis suggested that subsidies and direct financing for residential energy policies
can work together to alleviate energy poverty.
Considered in the context of the broader energy sector, the residential sector will not deliver the
largest absolute energy savings (and associated emission reductions). Levels of energy
consumption are relatively low, yet the sector is critical for social development. Changing
development paths in this sector will need to focus on multiple dimensions. The thesis argues
that policies in the electricity sector will also be important for climate policy based on energy
for sustainable development. In this sector, the challenges are longer-term and more trade-offs
are required. Not all solutions are economically optimal, not all policies can be ‘win-win’.
The base case for the electricity sector shows that SA will clearly remain dependent on coal for
electricity generation up to 2025. Cleaner coal technology in the form of fluidised bed
combustion also enters the base case. Four major supply options were analysed – renewable
energy, PBMR nuclear, importing hydro or natural gas.
The thesis argues that a cleaner fuel mix can make a major contribution to managing the
environmental impacts of electricity generation. While the social dimensions of choices about
electricity supply are not always readily apparent, the impacts on access and affordability
through the electricity price is considerable. South African policy-makers will have to consider
whether the lowest-cost option, coal, is to be pursued exclusively, or whether investment in
other options increases durability.
The two domestic electricity supply options increase energy system costs over the coal-
dominated base case. Importing gas or hydro-electricity reduces domestic capital expenditure
and overall system costs. Of the two domestic options, the PBMR is more expensive than

Conclusion 231
renewables. The thesis argues that both the PBMR and imported gas should be phased in
gradually.
The PBMR achieves the greatest diversity of supply in moving away from coal dependency, but
the thesis argues that it should be phased in more gradually than building 32 modules by 2020 to
avoid underutilised capacity. The renewables case achieves a higher diversity among the non-
coal fuels. Both domestic options achieve reduced local air pollutants and GHGs by similar
percentages from the base case. The abatement cost of renewables appears to be lower. While
showing increased costs, these were of the same order of magnitude as other policy cases. The
renewables case demonstrated that a mix of renewable energy technologies can supply ‘real’
electricity. The 2013 targets was met, and continued beyond that year, driven by decreasing
costs.
The challenge for electricity supply options, then, is not to pick a single energy source to supply
all future needs. Rather, diversity should be sought in both moving away from over-reliance on
a single source, coal, and diversifying the alternative as much as possible. A transition to a
more sustainable electricity supply sector will take several decades. Long-term goals help set a
direction. Yet changes in the near-term are needed, as capacity begins to be replaced. Given the
long life-times of energy infrastructure, choices made in the near-term will shape the system for
several decades.
The thesis argues that changes in the electricity supply sector need to consider changes in the
short-term to initiate a long-term transition to sustainable development. The long life-times of
power plants mean that decisions have implications well into the future – when South Africa
will likely face some kind of carbon constraint. Small changes in the near-term can create the
basis – institutionally and technologically – for larger changes in the future.
The evaluation against indicators of sustainable development showed that no single electricity
supply option is preferable economically, socially and environmentally. One implication is that
more trade-offs are required. Another is that short-term economic costs can not be the only
factor in providing solutions that are durable in the longer-term.
South Africa needs to replace significant parts of its electricity generation capacity over the next
few decades and provide for growing demand. The investments required present an opportunity
to ‘lock-in’ to a cleaner energy development path. This opportunity was conceptualized in the
form of six ‘wedges’, each equivalent to a coal-fired power station. The thesis argues that
making two of these wedges something other than coal would represent a major shift to
sustainability in the electricity sector.
Based on the findings for both the residential and electricity sectors, the thesis contends that the
appropriate starting point - conceptually and methodologically – for both energy and mitigation

Conclusion 232
policy is sustainable development. Climate change mitigation policy specifically, it is argued,
should start with local sustainable development, rather than goals set in climate terms.
The policies examined here have been called sustainable development policies and measures
(SD-PAMs) (Winkler et al. 2002b). While ‘backcasting’ from development objectives has been
outlined as a conceptual approach internationally, it has not been implemented in national
energy models in developing countries, and not in South Africa. The SD-PAMs approach
provides a conceptual framework to elaborate national climate change policy and be integrated
into the international negotiating framework.
The analysis in this thesis suggests concrete ways by which South Africa’s climate change
response strategy, based on sustainable development, could be implemented. Emissions in the
order of 1- 10 Mt CO2-equiv / year can be avoided through efficient housing and SWH / GB
cases. These reductions are relative to the reference case, an approach which the thesis argues is
critical for developing countries (as distinct from absolute emission reductions for industrialised
countries). Sustainable residential energy policies should make up an important part of SA
climate policy, addressing the social, environmental and economic dimensions of sustainability.
By including residential energy policies, the overall climate change mitigation portfolio will be
made more relevant to local development. Pursuing a goal motivated by development policy is
more appropriate for developing countries like South Africa.
However, the scale of emission reductions required will need to come from the larger emitters.
Electricity supply options could avoid emissions up to 50 Mt CO2 / year in the combined case.
However, electricity policy cases are not easily combined, and the combined case carries the
highest absolute cost – and similarly, the highest-reducing single policy case, the PBMR, has
the highest cost. By simple estimates of abatement cost, renewables are found to be most cost-
effective. Revenues from selling emission reductions in the emerging carbon markets are found
to be in the order of Rand millions to Rand billions. Synergies with improving local air quality
while reducing GHG emissions should also be taken into account. A durable approach to the
development of the critical electricity sector should promote local sustainable development and
contribute to climate change mitigation.
The policies analysed in this thesis can make energy development more sustainable. Combining
residential and electricity policies would provide a mix that overall provides a durable balance
of economic development, social sustainability, and both local and global environmental
benefits. Much of what is good for sustainable development in the national energy system also
has global benefits in mitigating climate change. The approach has been demonstrated for
South Africa, but will resonate with other rapidly industrialising developing countries. The
thesis demonstrates that there are indeed policies that meet local sustainable development
objectives, and reduce greenhouse gases as a co-benefit.

Appendices
233
Appendices
Figure 10.1: Electricity generation from all plants in the base case
-
50,000
100,000
150,000
200,000
250,000
300,000
350,000
400,000 20
01
2002
2003
2004
2005
2006
2007
2008
2009
2010
2011
2012
2013
2014
2015
2016
2017
2018
2019
2020
2021
2022
2023
2024
2025
GWh
Bagasse co-gen new
Bagasse sugar
Gas CC
FBC 1
FBC 2
FBC 3
FBC 4
FBC 5
Hydro Eskom
Hydro non-Eskom
Coal PF 1
Coal PF 2
Coal PF 4
Coal PF 5
Coal PF 6
Arnot coal
Camden coal
Duvha coal
Grootvlei coal
Hendrina coal
Kendal coal
Komati A coal
Komati B coal
Kriel coal
Letabo coal
Majuba coal, dry
Matimba coal
Majuba coal, wet
Matla coal
Coal munic 1
Coal munic 2
Koeberg nuclear
Sasol
Tutuka
PS Braamhoek
PS Drakensberg
PS Pal
PS Steenberg

Appendices
234
Figure 10.2: Electricity capacity in the base case, all power plants
0
10
20
30
40
50
60
70 2001200220032004200520062007200820092010201120122013201420152016201720182019202020212022202320242025
GW
Bagasse co-gen new
Bagasse co-gen
Gas CC
FBC 1
FBC 2
FBC 3
FBC 4
FBC 5
Acacia
Gas diesel
Gas munic
Gas
Port Rex
Hydro Eskom
Hydro non-Eskom
Coal PF 1
Coal PF 2
Coal PF 4
Coal PF 5
Coal PF 6
Arnot coal
Camden coal
Duvha coal
Grootvlei coal
Hendrina coal
Kendal coal
Komati A coal
Komati B coal
Kriel coal
Letabo coal
Majuba coal, dry
Matimba coal
Majuba coal, wet
Matla coal
Coal munic 1
Coal munic 2
Koeberg nuclear
Sasol
Tutuka
PS Braamhoek
PS Drakensberg
PS Palmiet
PS Steenberg

Appendices
235
Table 10.1: Monthly expenditure on electricity by household type and policy case, 2001
Units of
expenditure:
R / (HH*mth)
2001
Price
(R / MJ)
Base
case
CFLs
Efficient
houses
LPG for
cooking
Water
heating -
SWH / GB
Residential
policies
combined
Sum of
expenditure
per
household
Consumption
(MJ /(HH*mth)
x
0.0593
0.0513
0.0513
0.0513
0.0513
0.0513
RHE
747
44
38
38
38
38
38
236
RLE
124
7
6
6
6
6
6
39
UHE
1,530
91
78
78
78
78
78
483
ULE
614
36
31
31
31
31
31
194

References 236
References
AEJ 2005. Who's ahead in the HTR race - China or South Africa? African Energy Journal 7 (3): pp. 12-15.
Afrane-Okese, Y 2003. Operational challenges of large scale off-grid programme in South Africa. NER Quarterly Journal 1 (4): 33-52. http://www.ner.org.za/documents/NERQJNL_issue1iv.pdf.
AGAMA 2003. Employment potential of renewable energy in South Africa. A study commissioned by Sustainable Energy and Climate Change Partnership, a project of Earthlife Africa Johannesburg, in partnership with WWF, Denmark. Johannesburg, SECCP.
Agarwal, A & Narain, S 1991. Global Warming in an Unequal World: A Case of Environmental Colonialism. New Delhi, Center for Science and Environment.
Agarwal, A 2000. Making the Kyoto Protocol work: ecological and economic effectiveness, and equity in the climate regime. New Delhi, Centre for Science and Environment.
Alfstad, T 2004a. Meeting South African renewable energy targets. reCOMMEND 1 (2): pp. 1-3.
Alfstad, T 2004b. The application of energy models in developing countries. reCOMMEND.
ANC (African National Congress) 1994. The Reconstruction and Development Programme: A policy framework. Johannesburg, Umanyano.
Arrow, K J 1962. The economic implications of learning by doing. Review of Economic Studies 29: 155-173.
ASSA (Actuarial Society of South Africa) 2002. ASSA AIDS and demographic models: ASSA2002lite. http://www.assa.org.za/aidsmodel.asp.
Atkinson, G, Dubourg, R, Hamilton, K, Munasinghe, M, Pearce, D & Young, C 1997. Measuring sustainable development: Macroeconomics and the environment. Cheltenham, Edward Elgar.
Auerbach, R & Gandar, M 1994. Energy and small-scale agriculture. Report no. 7 South African energy policy research and training project. Cape Town, Energy & Development Research Centre, University of Cape Town.
Auf der Heyde, T & Thomas, S 2002. The PBMR project: an assessment of its economic viability. South African Journal of Science 98 (Jan / Feb): 36-42.
Auf der Heyde, T 2000. South African nuclear policy since 1993: too hot to handle? Energy for Sustainable Development 4 (4): 18-26.
Bailie, A, Bernow, S, Dougherty, W, Lazarus, M & Kartha, S 2001. The American Way to the Kyoto Protocol: An economic analysis to reduce carbon pollution. A study for the World Wildlife Fund. Boston, Tellus Institute.
Bank, L, Mlomo, B & Lujabe, P 1996. Social determinants of energy use in low-income metropolitan households in East London. Report No. EO9421. Pretoria, Department of Minerals and Energy.
Banks, D 1999. The consumer discount rate applicable for low-income households in South Africa. Cape Town, Energy & Development Research Centre, University of Cape Town.
Banks, D 2005. Personal communication. Remote Area Power Supply consulting. 15 September 2005.
Banuri, T & Weyant, J P 2001. Setting the stage: Climate change and sustainable development. Climate Change 2001: Mitigation: Contribution of WG III to the Third Assessment Report of the IPCC. Intergovernmental Panel on Climate Change, Cambridge University Press: 74-114.
Barberton, C 1999. Restructuring the electricity generation industry: factors likely to impact on environmental performance. Cape Town, Energy & Development Research Centre, University of Cape Town.
Baumert, K, Bhandari, R & Kete, N 1999. What might a developing country climate commitment look like? Washington DC, World Resources Institute. May 1999.
Berk, M M, Van Minnen, J G, Metz, B & Moomaw, W R 2001. Keeping our options open - a strategic vision on near-term implications of long-term climate policy options. Concise summary of the results of the Global Dialogue of the COOL-project (Climate OptiOns for the Long term). Bilthoven, RIVM.
Biggs, R & Greyling, A 2001. Project energy. Report for the Paraffin Safety Association of Southern Africa. Cape Town, Markinor.
Blignaut, J & De Wit, M 1999. Integrating the natural environment in macroeconomic policy: recommendations for South Africa. Agrekon 38 (3): 113-127.
Blignaut, J 2004. Personal communication. Renewables - market rules. Professor of economics, University of Pretoria. 11 June.
Bond, P 2000. Economic growth, ecological modernization or environmental justice? Conflicting discourses in South Africa today. Johannesburg, Municipal Services Project.
Borchers, M 2005. Personal communication. Sustainable Energy Africa. 14 March.

References 237
Borchers, M, Qase, N, Gaunt, T, Mavhungu, J, Winkler, H, Afrane-Okese, Y & Thom, C 2001. National Electrification Programme evaluation: Summary report. Evaluation commissioned by the Department of Minerals & Energy and the Development Bank of Southern Africa. Cape Town, Energy & Development Research Centre, University of Cape Town.
Bossel, H 1998. Indicators for Sustainable Development: Theory, Method, Applications, a report to the Balaton Group. Winnipeg, Canada, International Institute for Sustainable Development. http:/www.iisd.ca.
Bradley, R, Baumert, K & Pershing, J (Eds) forthcoming. Saving the climate by putting development first: sustainable development policies and measures. Washington DC, World Resources Institute.
Bredenkamp, B 2005. Personal communication. Efficient Lighting Initiative, Eskom manager. 23 February.
Brown, L 1981. Building a sustainable society. Washington DC, Worldwatch Institute.
Byrne, J, Wang, Y-D, Lee, H & Kim, J-d 1998. An equity- and sustainability-based policy response to global climate change. Energy Policy 26 (4): 335-43.
Calitz, J M 1996. Population of South Africa: Updated estimates, scenarios and projections, 1990 - 2020. Johannesburg, Development Bank of Southern Africa.
Calitz, J M 2000a. Provincial population projections, 1996-2001: Low HIV/AIDS impact. August. Johannesburg, Development Bank of Southern Africa.
Calitz, J M 2000b. Provincial population projections, 1996-2001: High HIV/AIDS impact. September. Johannesburg, Development Bank of Southern Africa.
CCT & SEA 2003. 'State of Energy' report for Cape Town. Situation assessment of energy issues and state of energy data of Cape Town. Cape Town, City of Cape Town & Sustainable Energy Africa.
CCT (City of Cape Town) 2004. City of Cape Town a leading African and world city in the energy sector. Media release. www.capetown.gov.za/press.
CDC 2004. Investment opportunity. by Coega Development Corporation. www.coega.co.za.
CEF 2005. iGas web-site. Central Energy Fund. 14 September 2005, http://www.cef.org.za/group/iGas/index.htm
Chalmers, R 2001a. SA needs to invest in the generation of its electricity. Business Day. 12 July.
Chalmers, R 2001b. SA must get it right first time. Business Day. 17 July.
Chamber of Mines (Chamber of Mines of South Africa) 2001. Annual Report 2000 / 2001: South Africa - mining for the world. Johannesburg.
Clark, A & Mavhungu, J 2000. Promoting public benefit energy-efficiency investment in new power contexts in South Africa. Cape Town, Energy & Development Research Centre, University of Cape Town.
Clark, A 1997. Economic analysis of Eskom's energy-efficient lighting programme for low-income households. Cape Town, Energy & Development Research Centre, University of Cape Town.
Clark, A 2000a. Demand-side management in restructured electricity industries: An international review. Energy & Development Research Centre, University of Cape Town.
Clark, A 2000b. Demand-side management in South Africa: barriers and possible solutions for new power sector contexts. Energy for Sustainable Development 4 (4): 27-35. December.
Clark, A 2001a. Implications of power sector reform in South Africa on poor people's access to energy: Lessons for Africa. Proceedings of the African high-level regional meeting on energy and sustainable development for the ninth session of the Commission on Sustainable Development, Nairobi, United Nations Environment Programme.
Clark, A 2001b. Making provision for energy-efficiency investment in changing markets: An international review. Energy for Sustainable Development V (2): 26-38.
Consult 101, EC & IDC (Consult 101, Environmental Counsel & Industrial Development Corporation of South Africa) 2001. How will responses of the developed countries to the United Nations Framework Convention on Climate Change affect South Africa? Submitted to the Fund of Research into Industrial Development, Growth and Equity (FRIDGE). Johannesburg, NEDLAC.
COSATU (Congress of South African Trade Unions) 2001. Submission on the electricity restructuring. Submitted to the Minerals and Energy Portfolio Committee, 19 September 2001. Cape Town.
Cowan, B & Mohlakoana, N 2005. Barriers to access modern fuels in low-income households: Khayelitsha. Cape Town, Energy Research Centre, University of Cape Town.
Cowan, B 2003. Understanding electricity and rural electrification in South Africa. Cape Town, Energy & Development Research Centre, University of Cape Town.
Cowan, B 2005. Personal communication. Senior researcher, Energy Research Centre.
CSD (Commission on Sustainable Development) 1995. Indicators of sustainable development: guidelines and methodologies. New York, United Nations. www.un.org/esa/sustdev/indisd/indisd-mg2001.pdf.
Daly, H E & Cobb, J B, Jr. 1989. For the common good: Redirecting the economy towards community, the environment and a sustainable future. Boston, Beacon Press.
Davidson, O & Nakicenovic, N 2001. Linking climate change to sustainable development. Nairobi, United Nations Environment Programme.

References 238
Davidson, O & Sokona, Y 2002. Think bigger, act faster: a new sustainable energy path for African development. Cape Town and Dakar, Energy & Development Research Centre, University of Cape Town & ENDA Tiers Monde.
Davidson, O & Turkson, J 2001. Overcoming financial barriers to wider use of renewable energy technology in Africa. International Journal of Global Energy Issues 15 (1-2): 117-131.
Davidson, O 1996. A sustainable energy path for Africa. Renewable Energy for Development 7 (3).
Davis, M & Horvei, T 1995. Handbook for economic analysis of energy projects. Johannesburg, Development Bank of Southern Africa.
Davis, M & Steyn, G 1998. Electricity in South Africa. London, Financial Times Energy.
Davis, M & Steyn, G 1999. Environmental effects of electricity in South Africa. ESI Africa 1.
Davis, M & Ward, S 1995. Household energy-use patterns in rural areas: the effects of access to electricity. Cape Town, Energy & Development Research Centre, University of Cape Town.
De Villiers, M & Matibe, K 2000. Greenhouse gas baseline and mitigation options for the residential sector. Cape Town, Energy & Development Research Centre.
DEAT & DME (Department of Environmental Affairs and Tourism & Department of Minerals and Energy) 2003. Joint implementation strategy for the control of exhaust emissions from road-going vehicles in the Republic of South Africa. Final draft, November. Pretoria. http://www.polity.org.za/pdf/notice3324.pdf.
DEAT (Department of Environmental Affairs and Tourism) 2004. A national climate change response strategy. Pretoria.
DEAT, DOH, DME & DWAF (Department of Environmental Affairs and Tourism, Department of Housing, Department of Minerals and Energy & Department of Water Affairs and Forestry) 1998. Environmentally Sound Low Cost Housing: Draft Guidelines for Implementation. Pretoria, Department of Housing.
DME (Department of Mineral and Energy Affairs) 2003b. Green power: Business opportunities in South Africa for renewable energy independent power producers. Pretoria.
DME (Department of Minerals & Energy) 2003f. Electricity basic services support tariff (free basic electricity) for the Republic of South Africa. Government Gazette, vol. 457 no. 25088. Pretoria, Republic of South Africa. http://www.info.gov.za/gazette/notices/2003/25088.pdf.
DME (Department of Minerals & Energy) 2004c. Minerals and Energy budget vote (vote 31). Cape Town, Parliament.
DME (Department of Minerals & Energy) 2005b. Radioactive waste management policy and strategy for the Republic of South Africa. Pretoria. http://www.dme.gov.za/newscentre/media_rel/radwaste_policy_2005%20.pdf.
DME (Department of Minerals and Energy) 1998. White Paper on Energy Policy for South Africa. Pretoria, DME. http://www.dme.gov.za.
DME (Department of Minerals and Energy) 1999. South African Energy and Demand Efficiency Guidelines. Pretoria, DME.
DME (Department of Minerals and Energy) 2000a. Background research on renewable energy independent power production, South Africa. Supported by DANCED. Pretoria.
DME (Department of Minerals and Energy) 2000b. Energy Balances for South Africa 1993-98. Pretoria, DME.
DME (Department of Minerals and Energy) 2001a. South Africa National Energy Balance 1999. Microsoft Excel Spreadsheet. Pretoria.
DME (Department of Minerals and Energy) 2001b. South African National Energy Database. Energy prices. Pretoria, DME.
DME (Department of Minerals and Energy) 2001c. Strategy on renewable energy. Draft. Pretoria.
DME (Department of Minerals and Energy) 2001d. Annual Report 2000 - 2001. Pretoria.
DME (Department of Minerals and Energy) 2002a. South Africa National Energy Balance 2000. Pretoria, DME.
DME (Department of Minerals and Energy) 2002b. South Africa's mineral industry 2001/2002. Pretoria. http://www.dme.gov.za.
DME (Department of Minerals and Energy) 2002d. Draft white paper on the promotion of renewable energy and clean energy development. June. Pretoria.
DME (Department of Minerals and Energy) 2003a. South Africa National Energy Balance 2001. Pretoria, DME.
DME (Department of Minerals and Energy) 2003c. White paper on renewable energy. Pretoria. www.dme.gov.za.
DME (Department of Minerals and Energy) 2003d. Integrated energy plan for the Republic of South Africa. Pretoria. www.dme.gov.za.
DME (Department of Minerals and Energy) 2003e. Electricity basic services support tariff (free basic electricity) policy for the Republic of South Africa. Pretoria.

References 239
DME (Department of Minerals and Energy) 2004a. Economic and financial calculations modelling for the renewable energy white paper and strategy formulation. Report No. 2.3.4 - 19, prepared by Conningarth Economists. Pretoria, DME - Capacity Building in Energy Efficiency and Renewable Energy project.
DME (Department of Minerals and Energy) 2004b. Free basic energy policy guidelines (Low income household energy support programme). Pretoria.
DME (Department of Minerals and Energy) 2004d. Draft energy efficiency strategy of the Republic of South Africa. April 2004. Pretoria, DME. www.dme.gov.za/energy/pdf/energy_efficiency_strategy.pdf.
DME (Department of Minerals and Energy) 2004e. South Africa's mineral industry 2003/2004. Pretoria. http://www.dme.gov.za.
DME (Department of Minerals and Energy) 2005a. Energy efficiency strategy of the Republic of South Africa. March 2005. Pretoria, DME. http://www.dme.gov.za/energy/pdf/ee_strategy_05.pdf.
DME 2002c. Table 59: Labour statistics - main mining commodity - coal. by Department of Minerals & Energy Pretoria. http://www.dme.gov.za/publications/pdf/stats/minerals/tables/tbl59.pdf.
DME, Eskom & CSIR (Department of Minerals and Energy, Eskom & Council for Scientific and Industrial Research) 2001. South African renewable energy resource database. Pretoria. www.csir.co.za/environmentek/sarerd/contact.html.
Dos Santos, M A, Pinguelli-Rosa, L, Sikar, B, Sikar, E & dos Santos, E O 2006. Gross greenhouse gas fluxes from hydro-power reservoir compared to thermo-power plants. Energy Policy 34 (4): 481-488.
DOT (Department of Transport) 1999. Moving South Africa. Pretoria, DOT.
DPE (Department of Public Enterprises) 2000. Eskom Conversion Bill. Government Gazette, Vol. 424, No. 21628, 13 October 2000. Pretoria.
DTI (Department of Trade and Industry) 1996. Growth, Employment and Redistribution: A macro-economic strategy. Pretoria.
DTI (Department of Trade and Industry) 2002. Creating new wealth in Southern Africa. Pretoria, Regional Spatial Development Initiative Support Unit.
Dubash, N & Bradley, R 2005. Pathways to rural electrification in India: Are national goals also an international opportunity? R Bradley, K Baumert and J Pershing (Eds). Growing in the greenhouse: Protecting the climate by putting development first. Washington DC, World Resources Institute.
Dubash, N (Ed) 2002. Power politics: Equity and environment in electricity reform. Washington DC, World Resources Institute.
DWAF 1998. The National Water Act.
Eberhard, A & Van Horen, C 1995. Poverty and Power: Energy and the South African state. London, Pluto Press and UCT Press.
Eberhard, A 2000. Competition and regulation in the electricity supply industry in South Africa. Paper for the Competition Commission. University of Cape Town.
Eberhard, A 2003. The political, economic, institutional and legal dimensions of Electricity Supply Industry reform in South Africa. Political Economy of Power Market Reform conference, 19-20 February, Stanford University.
Eberhard, A A & Williams, A 1988. Renewable energy resources and technology development in South Africa. Cape Town, Elan Press.
EC, DBSA & ISES (European Commission DG XVII, Development Bank of Southern Africa, International Solar Energy Society) 2000. Renewable energy technologies in SADC - a guide for investors. Midrand, Development Bank of Southern Africa.
EDRC (Energy & Development Research Centre) 2003a. Policies and measures for renewable energy and energy efficiency in South Africa. Prepared for the Sustainable Energy & Climate Change Partnership. Cape Town, EDRC, University of Cape Town.
EDRC (Energy & Development Research Centre) 2003b. The potential for increased use of LPG for cooking in South Africa: A rural case study. by B Cowan Energy & Development Research Centre, University of Cape Town.
EEU (Environmental Evaluation Unit) 2000. Green financing feasibility study for low income housing in South Africa. Cape Town, University of Cape Town.
Ehrlich, P 1968. The population bomb. New York, Ballantyne Books.
ELI (Efficient Lighting Initiative) 2005. Monitoring & evaluation report: Country chapters - South Africa. by B Bredenkamp.
Ellis, J, Corfee-Morlot, J & Winkler, H 2004. Taking stock of progress under the Clean Development Mechanism (CDM). COM/ENV/EPOC/IEA/SLT(2004)4/FINAL. Paris, Organisation for Economic Co-operation and Development/International Energy Agency. www.oecd.org/dataoecd/58/58/32141417.pdf.
Ellman, M J 2001. The Wholesale Electricity Pricing System (WEPS). Electricity Regulatory Journal February 2001 pp. 1-2.

References 240
Energy Caucus (South African NGO / civil society energy caucus) 2002. Energy position paper for the World Summit on Sustainable Development. Johannesburg.
Energy Innovations 1997. Energy innovations: a prosperous path to a clean environment. Washington, D.C., Alliance to Save Energy, American Council for an Energy Efficient Economy, Natural Resources Defense Council, Tellus Institute, Union of Concerned Scientists.
Ensor, L 2001. Eskom wins support for big tariff hikes. Business Day. 10 May.
ERC (Energy Research Centre) 2003. Unpublished modeling data. Cape Town.
ERC 2004a. Energy for sustainable development: South African profile. Phase 1 final report. Cape Town, Energy Research Centre, University of Cape Town.
ERC 2004b. Solar electrification by the concession approach in the rural Eastern Cape: Phase 2 monitoring survey. Cape Town, Energy Research Centre, University of Cape Town.
ERI (Energy Research Institute) 2000b. The 3E strategy: energy efficiency earnings. Management summary. University of Cape Town.
ERI (Energy Research Institute) 2001. Preliminary energy outlook for South Africa. 10 October. University of Cape Town. www.dme.gov.za.
ERI 2000a. The 3E strategy: energy efficiency earnings. Energy Management News 6 (3): 1-2. Energy Research Institute. September.
Erwin, A 2004. Government commitment to restructuring of State-Owned Enterprises. Pretoria, Department of Public Enterprises.
Eskom 1987. Statistical Yearbook 1987. Sandton, Eskom.
Eskom 1989. Statistical Yearbook 1989. Johannesburg, Eskom.
Eskom 1996. Eskom Statistical Yearbook 1996. Sandton, Eskom.
Eskom 1997. Integrated Electricity Planning 6 (IEP6). Sandton, Eskom.
Eskom 2000a. Environmental report 2000: Towards sustainability. Sandton, Eskom.
Eskom 2000b. Annual Report 2000. Sandton, Eskom. www.eskom.co.za.
Eskom 2000c. Efficient Lighting Initiative. Menlo Park, Eskom.
Eskom 2001. Annual Report 2001: Embracing sustainable development. Sandton, Eskom. www.eskom.co.za.
Eskom 2002a. Eskom environmental data: Statistics, acronyms: Performance statistics. www.eskom.co.za/Enviro%20data%202002/report01/stats.htm www.eskom.co.za/Enviro%20data%202002/report01/stats.htm
Eskom 2002b. Annual Report 2002: Vision Excellence Leadership. Sandton, Eskom. www.eskom.co.za.
Eskom 2003. Wholesale Electricity Pricing System (WEPS) customer information brochure. Draft - subject to NER approval. Johannesburg, Eskom. www.eskom.co.za/tariffs/weps.doc.
Eskom 2005. Annual Report: Building capacity, embracing the future. Sandton, Eskom Holdings. www.eskom.co.za.
Eto, J, Stoft, S & Kito, S 1998. DSM shareholder incentives: recent designs and economic theory. Utilities Policy 7: 47-62.
Eunomia & UP (Eunomia research & consulting and University of Pretoria) 2004. Development of a framework for market-based instruments to support environmental fiscal reform in South Africa. A draft final report for National Treasury of South Africa. Not for citation. Pretoria, Treasury.
Fankhauser, S & Tol, R S J 1996. Climate change costs: Recent advancements in the economic assessments. Energy Policy 24 (7): 665-673.
Fine, B & Rustomjee, Z 1996. The political economy of South Africa: from minerals-energy complex to industrialization. London, C. Hurst.
Fisher, J & Grubb, M 1997. The use of economic models in climate change policy analysis. 5. Royal Institute of International Affairs. October 1997.
Flavin, C & Lenssen, N 1995. Power surge: A guide to the coming energy revolution. London, Earthscan Publications.
Fowles, P 2004. Implementation of a free basic electricity allocation. Domestic use of energy, Cape Town, Cape Technikon. pp. 23-29.
Games, D 2002. Pooling resources: Special report - Eskom. Business in Africa July / August pp. 50-51.
Gaunt, T 2003. Researching a basic electricity support tariff in South Africa. Domestic Use of Energy Conference, Cape Town, Cape Technikon. pp. 23-28.
GEF (Global Environment Facility) 2004. Program study on climate change. Prepared by the GEF Office of Monitoring and Evaluation. Document GEF/ME/C.24/Inf.2. Washington DC. www.thegef.org.
Gosling, M 1999. Koeberg pocket nuke plan sparks outrage. Independent Online. 5 October, 1999. http://www.iol.co.za/news
Graeber, B & Spalding-Fecher, R 2000. Regional integrated resource planning and its role in the regional electricity co-operation and development in Southern Africa. Energy for Sustainable Development 4 (2): 32-37. September.

References 241
Guha, R & Martinez-Alier, J 1997. Varieties of environmentalism: Essays North and South. London, Earthscan.
Halsnaes, K, Callaway, J M & Meyer, H J 1998. Economics of greenhouse gas limitations: Methodological guidelines. Roskilde, Denmark, UNEP Collaborating Centre on Energy and Environment.
Helio International 2000. Guidelines for observer-reporters. November 28, 2000. www.helio-international.org/anglais/reports/reports2000.html
Holm, D 2000. Performance assessment of baseline energy-efficiency interventions and improved designs. D K Irurah (Ed). Environmentally sound energy efficient low-cost housing for healthier, brighter and wealthier households, municipalities and nation. Final report. Pretoria, Environmentally Sound Low-cost Housing Task Team and USAID: A-1-1 to A-2-27.
Howells, M 1999. Baseline and greenhouse gas mitigation options for bulk energy supply, South African Country Study on Climate Change. Draft. Energy Research Institute, University of Cape Town.
Howells, M I & Solomon, M 2002. An optimal energy and greenhouse gas mitigation path for South Africa in the short to medium term. Journal of Energy in Southern Africa 13 (4): 123-129.
Howells, M I 2000. Baseline and greenhouse gas mitigation options for bulk energy supply. Energy Research Institute, University of Cape Town.
Howells, M I 2004. Modelling multiple goals: Greenhouse gas mitigation and socio-economic development. Cape Town, Energy Research Centre, University of Cape Town.
Howells, M, Alfstad, T, Cross, N, Jeftha, L & Goldstein, G 2002. Rural energy modeling: Working Paper # 11. Presented to the Rural Energy Transitions conference, New Delhi, 5-7 November 2002.
Howells, M, Alfstad, T, Victor, D G, Goldstein, G & Remme, U 2005. A model of household energy services in a low-income rural African village. Energy Policy 33: 1833 –1851.
Hughes, A, Howells, M & Kenny, A 2002. Energy efficiency baseline study. Capacity building in energy efficiency and renewable energy (CABEERE) Report No. 2.3.4. Report no. P-54126. Pretoria, Department of Minerals & Energy.
IAEA; UNDESA; IEA; Eurostat; EEA (International Atomic Energy Agency, United Nations Department of Economic and Social Affairs, International Energy Agency, Eurostat and European Environment Agency) 2005. Energy indicators for sustainable development: Guidelines and methodologies. Vienna.
IEA & OECD (International Energy Agency, Organisation for Economic Cooperation and Development) 2000. Experience curves for energy technology policy. Paris.
IEA (International Energy Agency) 2001. Key World Energy Statistics from the IEA. Paris, IEA.
IEA (International Energy Agency) 2002a. Key World Energy Statistics from the IEA. Paris, IEA.
IEA (International Energy Agency) 2002b. World Energy Outlook: Energy & Poverty. Paris, IEA.
IEA (International Energy Agency) 2003. Renewables for power generation: Status & prospects. Paris, OECD/IEA.
IEA (International Energy Agency) 2004a. Key World Energy Statistics from the IEA. Paris, IEA.
IEA (International Energy Agency) 2004b. World Energy Outlook. Paris, IEA.
IES & AGAMA (Integrated Energy Solutions & Agama Energy) 2004. LPGas Rural Energy Challenge Workshop: Workshop background briefing paper. Report for Department of Minerals and Energy and the United Nations Development Programme. Pretoria, DME.
IIASA (International Institute for Applied Systems Analysis) 2005. Fuel combustion in stationary sources: PM emission factors. Laxenburg. http://www.iiasa.ac.at/~rains/PM/docs/documentation.html.
IIM (Indian Institute of Management) 2003. Development and climate: An assessment for India. Project team: PR Shukla, Rajesh Nair, Manmohan Kapshe, Amit Garg, S Balasubramaniam, Deepa Menon, KK Sharma. Ahmedabad.
IPCC (Intergovernmental Panel on Climate Change) 1995. Second assessment synthesis of scientific-technical information relevant to interpreting Article 2 of the UN Framework Convention on Climate Change. Rome.
IPCC (Intergovernmental Panel on Climate Change) 1996. Revised 1996 guidelines for national greenhouse gas inventories. Paris, Organisation for Economic Co-operation and Development.
IPCC (Intergovernmental Panel on Climate Change) 2001b. Climate Change 2001: Mitigation. Contribution of WG III to the Third Assessment Report of the IPCC. by B Metz, O Davidson, R Swart and J Pan Cambridge, Cambridge University Press for Intergovernmental Panel on Climate Change.
IPCC (Intergovernmental Panel on Climate Change) 2001c. Summary for policymakers: Climate Change 2001: Mitigation. Contribution of Working Group III to the Third Assessment Report. Accra.
IPCC (Intergovernmental Panel on Climate Change) 2005. Special report on carbon dioxide capture and storage. Technical summary. Geneva.
IPCC 2001a. Setting the stage: Climate change and sustainable development. T Banuri and J P Weyant (Eds). Climate Change 2001: Mitigation: Contribution of WG III to the Third Assessment Report of the IPCC. Geneva, Intergovernmental Panel on Climate Change: 74-114.
References 242
Irurah, D K (Ed) 2000. Environmentally sound energy efficient low-cost housing for healthier, brighter and wealthier households, municipalities and nation. Final report. Pretoria, Environmentally Sound Low-cost Housing Task Team and USAID.
IUCN, UNEP, WWF, FAO & UNESCO (International Union for the Conservation of Nature, United Nations Environment Programme, Worldwide Fund for Nature, Food and Agricultural Organisation & United Nations Economic and Social Commission) 1980. The World Conservation Strategy: Living resource conservation for sustainable development. Gland, Switzerland, International Union for the Conservation of Nature.
IWG (Interlaboratory Working Group on Energy-Efficient and Clean-Energy Technologies) 2000. Scenarios for a Clean Energy Future. Oak Ridge, TN and Berkeley, CA, Oak Ridge National Laboratory and Lawrence Berkeley National Laboratory.
Jannuzzi, G 2005. Power sector reforms in Brazil and its impacts on energy efficiency and research and development activities. Energy Policy 33: 1753 –1762.
Jeftha, L 2003. Energy efficiency and job creation: An input-output model approach. Journal of Energy in Southern Africa 14 (2): 54-62.
Jochem, E 2000. Energy end-use efficiency. United Nations Development Programme, United Nations Department of Economic and Social Affairs and World Energy Council (Eds). World energy assessment: energy and the challenge of sustainability. New York, United Nations Development Programme: 173-217.
Johannson, T B & Goldemberg, J (Eds) 2002. Energy for sustainable development: A policy action agenda. New York, United Nations Development Programme.
Jones, S, Aitken, R & Luckin, L 1996. Power, poverty and posterity: the social determinants of energy use in low-income metropolitan households in Durban. DME Report EO9422. Pretoria, Department of Minerals and Energy.
Jourdaan, P 1998. Spatial development initiatives (development corridors): their potential contribution to investment and employment creation. Pretoria, Department of Trade and Industry.
Karekezi, S & Kimani, J 2002. Status of power sector reform in Africa: the impact on the poor. Energy Policy 30 (11-12): 923-946. September.
Karekezi, S 2002. Poverty and energy in Africa—A brief review. Energy Policy 30: 915–919.
Kartha, S, Collin, K, Cornland, D, Bernow, S & Lazarus, M 1998. 'Meaningful participation' for North and South under the Kyoto Protocol. Paper presented during the Fourth Conference of the Parties to the United Nations Framework Convention on Climate Change. 8 November, Buenos Aires, Stockholm Environment Institute - Boston.
Kenny, A & Howells, M 2001. Energy futures: trends and options for the world and for South Africa, with emphasis on the generation of electricity. Energy Management News June. 7 (2): pp. 10-17. http://www.eri.uct.ac.za/Energy%20Managment%20News/June2001/01.pdf.
Kofod, C 1996. Large CFL potential in European homes. IAEEL newsletter 3 / 96.
Kotze, I A 2001. Letter from DME to off-grid concessionaries on evaluation of business plans. Pretoria, Department of Minerals and Energy. 11 July.
Krause, F, De Canio, S J, Hoerner, A & Baer, P 2002. Cutting carbon emissions at a profit (part 1): Opportunities for the US. Contemporary Economic Policy 20 (4): 339-365.
Laitner, J A 2002. LBD technology data. Spreadsheet. Washington DC, US Environmental Protection Agency.
Laitner, S 2001. Energy efficiency investments: A dynamic link between environmental quality and positive job benefits for South Africa. Proceedings of the ninth conference on Domestic Use of Energy Conference, Cape Town, 10-12 April. Cape Technikon.
Laitner, S, De Canio, S J & Peters, I 2001. Incorporating behavioral, social and organizational phenomena in the assessment of climate change mitigation options. E Jochem, D Bouille and J Sathaye (Eds). Society, behavior and climate change. Amsterdam, Kluwer.
Law, S & McDaid, L 2001. Trading in nuclear power and pebble-beds. Cape Town, Environmental Monitoring Group.
Lloyd, P J D & Trikam, A 2004. The determination of emission factors for South African power stations. Eskom Contract 1RE-000046. Cape Town, Energy Research Centre, University of Cape Town.
Lloyd, P J D 2002. The safety of paraffin & LPG appliances for domestic use. Proceedings of the tenth conference on the Domestic Use of Energy, Cape Town, 2-3 April. Cape Technikon. pp. 79-84.
Lloyd, P J D 2005. Personal communication. Honorary research fellow, Energy Research Centre.
Loxton, L 2004. SA 'needs a nuclear reactor'. Business Report. 23 June Johannesburg: 8.
Lukamba-Muhiya, J M & Davidson, O R 2003. Dissemination of solar water heaters in South Africa: Policy Perspectives. Journal of Energy in Southern Africa 14 (3): 99-105. August 2003.
Lumby, A 1996. Towards a sustainable energy strategy for South Africa: Landfill gas as a renewable energy option. Development Southern Africa 13 (2): 205 - 216.
Manuel, T 2005. Finance Ministry budget votes: Address to Parliament by Minister of Finance, 24 May 2005. Cape Town, Parliament. 24 May 2005. http://www.info.gov.za/speeches/2005/05052414451001.htm.

References 243
Mapako, M & Prasad, G 2005. The Free Basic Electricity (FBE) policy and rural grid-connected households, solar home system (SHS) users and unelectrified households. Domestic Use of Energy conference, Cape Town, 28-31 March. Cape Technikon.
Markandya, A & Halsnaes, K (Eds) 2002. Climate change & sustainable development: Prospects for developing countries. London, Earthscan.
Markandya, A & Halsnaes, K 2001. Costing Methodologies. IPCC (Ed). Climate Change 2001: Mitigation: Contribution of WG III to the Third Assessment Report of the IPCC. Intergovernmental Panel on Climate Change, Cambridge University Press: 451-498.
Marrs, D 2000a. Sasol takes over stakes in Temane gas field. Business Day. Business Day. 3 March Johannesburg.
Marrs, D 2000b. Cape power station likely after gas find. Business Day. 3 April Johannesburg.
Mathews, E, Kleingeld, M & Lombard, C 1998. The role of thermal performance of houses in strategic RDSM planning. Proceedings of the fifth Domestic Use of Electrical Energy Conference, Cape Town, 30 March - 1 April.
Mbeki, T 2004a. State of the Nation address by the President of South Africa, 21 May 2004. Cape Town, Republic of South Africa. www.gov.za/speeches/sotn2004.
Mbeki, T 2004b. The poor of this world rich in faith. ANC Today 16-22 July 2004. 4 (28): pp. 1-6. www.anc.org.za/ancdocs/anctoday/2004/at28.htm.
Mbeki, T 2005. State of the Nation address by the President of South Africa, 11 February 2005, at the Second Joint sitting of the third Democratic Parliament. Cape Town, Republic of South Africa. http://www.info.gov.za/speeches/2005/05021110501001.htm.
Meadows, D, Meadows, D, Randers, J & Brehrens III, W W 1972. The limits to growth: A report for the Club of Rome's project on the predicament of mankind. New York, Universe Books.
Mehlwana, A M & Qase, N 1998. The contours of domesticity, energy consumption and poverty. Cape Town, Energy & Development Research Centre, University of Cape Town.
Mehlwana, A M & Qase, N 1999. The contours of domesticity, energy consumption and poverty: The social determinants of energy use in low-income urban households in Cape Town's townships (1995-1997). Cape Town, Energy & Development Research Centre, University of Cape Town.
Mehlwana, A M 1998. The anthropology of fuels: situational analysis and energy use in low-income townships of South Africa. Energy for Sustainable Development 3 (5): 5-15.
Mehlwana, A M 1999a. The anatomy of a disaster: case studies of fuel-use problems in the shack areas of Greater Cape Town. Urban Health and Development Bulletin 2 (3): 29-37.
Mehlwana, A M 1999b. The economics of energy for the poor: fuel and appliance purchases in low- income urban households. Cape Town, Energy & Development Research Centre, University of Cape Town.
Metz, B, Berk, M M, Den Elzen, M, De Vries, B & Van Vuuren, D 2002. Towards an equitable global climate change regime: compatibility with Article 2 of the Climate Change Convention and the link with sustainable development. Climate Policy 2 (2-3): 211-230.
Michie, J & Padayachee, V 1998. Three years after Apartheid: Growth, employment and redistribution? Cambridge Journal of Economics 22: 623-635.
MIND 2005. Action Impact Matrix (AIM) application to climate change: Mitigation users manual. Prepared for C3D Project. Colombo, MIND.
Mintzer, I M, Leonard, J A & Schwartz, P 2003. US energy scenarios for the 21st century. Arlington, Pew Center on Global Climate Change.
Mlambo-Ngcuka, P 2002a. Parliamentary media briefing: Minister of Minerals & Energy, 15 February.
Mlambo-Ngcuka, P 2002b. Minister of Minerals and Energy. Parliamentary media briefing. 15 February. Cape Town, Ministry of Minerals and Energy.
Mlambo-Ngcuka, P 2002c. Budget vote speech by Minister of Minerals and Energy, Ms. Phumzile Mlambo-Ngcuka. Cape Town. 7 May 2002.
Mlambo-Ngcuka, P 2003. Budget vote speech by Minister of Minerals and Energy, Ms. Phumzile Mlambo-Ngcuka. Minerals and energy: a catalyst in pushing back frontiers of poverty. Cape Town, Parliament. 15 May 2003.
Mlambo-Ngcuka, P 2004. Budget vote speech by Minister of Minerals and Energy, Ms. Phumzile Mlambo-Ngcuka. 22 June. Cape Town, Parliament. 22 June 2004.
Mlambo-Ngcuka, P 2005. Budget vote speech by Minister of Minerals and Energy, Ms. Phumzile Mlambo-Ngcuka. 22 June. Cape Town, Parliament. 22 June 2004.
Mokgatle, D & Pabot, J L 2002. Highlighting the opportunities for taking the energy grid across Africa. 4th Annual Sub-saharan Power Conference, Midrand, 19-21 February.
Moreira, J R, Nogueira, L A H & Parente, V 2005. Biofuels for transport, development and climate change: Lessons from Brazil. R Bradley, K Baumert and J Pershing (Eds). Growing in the greenhouse: Protecting the climate by putting development first. Washington DC, World Resources Institute.

References 244
Morita, T & Robinson, J 2001. Greenhouse gas emission mitigation scenarios and implications. IPCC (Ed). Climate Change 2001: Mitigation: Contribution of WG III to the Third Assessment Report of the IPCC. Chapter 2. Intergovernmental Panel on Climate Change, Cambridge University Press: 115-166.
Morris, G 2005. Personal communication. Director, AGAMA Energy.
Munasinghe, M & Swart, R 2005. Primer on climate change and sustainable development: Facts, policy analysis and applications. Cambridge, Cambridge University Press.
Munasinghe, M 1992. Electric power economics. Colombo, IRPC.
Munasinghe, M 1995. Making growth more sustainable. Ecological Economics 15: 121-4.
Munasinghe, M 2000. Development, equity and sustainability (DES) in the context of climate change. R K Pachauri, T Taniguchi and K Tanaka (Eds). Cross-cutting issues guidance papers: IPCC supporting material for the Third Assessment Report. Geneva, Intergovernmental Panel on Climate Change.
Munasinghe, M 2001. Sustainable development and climate change: Applying the sustainomics transdisciplinary meta-framework. International Journal of Global Environmental Issues 1 (1): 13-55.
Munasinghe, M 2002. The sustainomics trans-disciplinary meta-framework for making development more sustainable: Application to energy issues. International Journal for Sustainable Development 5 (1/2): 135-182.
Munasinghe, M, Dreyer, S & Kurukulasurivy, P (Eds) 1999. Greening the national accounts: Relevance for South Asia. Colombo, Lanka International Forum on Environment and Sustainable Development and German Cultural Institute.
Mwandosya, M J 2000. Survival emissions: A perspective from the South on global climate change negotiations, Dar es Salaam University Press and the Centre for Energy, Environment, Science and Technology.
Nakicenovic, N 2000. Energy scenarios. Chapter 9. World Energy Assessment. New York, United Nations Development Programme, United Nations Department of Economic and Social Affairs, World Energy Council.
Nash, R 1982. Wilderness and the American mind. New Haven, Yale University Press.
National Treasury 2003a. Intergovernmental Fiscal Review 2003. Pretoria, Republic of South Africa.
National Treasury 2003b. Market-based instruments to support environmental fiscal reform in South Africa: A discussion document. Pretoria, National Treasury.
National Treasury 2006. A framework for considering market-based instruments to support environmental fiscal reform in South Africa. Draft policy paper. Pretoria, National Treasury Tax Policy Chief Directorate. http://www.treasury.gov.za/tax/default.htm.
Naude, C M, Coovadia, T & Pretorius, J 2000. Mitigation options: Transport sector. South African Country Studies on Climate Change. Pretoria.
NDA (National Department of Agriculture) 2000. Abstract of agricultural statistics. Pretoria. http://www.nda.agric.za/ see publications - statistics.
NECC (National Electrification Coordinating Committee) 2000. Electrification funding: Report from Fund & Levy Task Team of NECC.
Nedergaard, M 2002. The application of economic instruments in energy and climate change policies. Sustainable Energy & Climate Change Partnership: A project of WWF Denmark and Earthlife Africa Johannesburg.
NEPAD (New Partnership for Africa's Development) 2002. A summary of NEPAD action plans. Midrand and Ibadan.
NER (National Electricity Regulator) 1999. Electricity supply statistics for South Africa 1999. Sandton, NER.
NER (National Electricity Regulator) 2000. Electricity supply statistics for South Africa 2000. Pretoria, NER.
NER (National Electricity Regulator) 2001/2. National Integrated Resource Plan. Pretoria.
NER (National Electricity Regulator) 2001a. Electricity supply statistics for South Africa 2001. Pretoria, NER.
NER (National Electricity Regulator) 2001c. Lighting up South Africa 2001. Pretoria.
NER (National Electricity Regulator) 2002a. Electricity supply statistics for South Africa 2002. Pretoria, NER. www.ner.org.za/publs.htm.
NER (National Electricity Regulator) 2002b. Independent Power Producers regulatory framework. Policy NER 01 - 2002 IPP Rev I Draft 01. Pretoria.
NER (National Electricity Regulator) 2002c. An integrated electricity outlook for South Africa. Pretoria, NER. www.ner.org.za/publs.htm.
NER (National Electricity Regulator) 2002d. Framework for Integrated Resource Planning in the electricity supply industry. Policy framework NER 01 - 2002 - IRP. Pretoria.
NER (National Electricity Regulator) 2002e. Progress with the formation of the Regional Electricity Regulators' Association (RERA) of SADC. Johannesburg. www.ner.org.za.
NER (National Electricity Regulator) 2003a. Lighting up South Africa. Pretoria.
NER (National Electricity Regulator) 2003b. Monitoring the implementation of energy policy requirements at the NER (1998-2003). Johannesburg. www.ner.org.za/NERRegistry_3130.pdf.

References 245
NER (National Electricity Regulator) 2003c. Wholesale electricity pricing system. WEPS – Information on NER Website. Accessed June 2004. Johannesburg. www.ner.org.za/Weps/Weps.htm.
NER (National Electricity Regulator) 2004a. National Integrated Resource Plan 2003/4: Reference Case. Draft 27 February. Compiled by ISEP - Eskom (Resources and Strategy) and Energy Research Institute, University of Cape Town and the National Electricity Regulator. Pretoria, National Electricity Regulator. www.nersa.org.za.
NER (National Electricity Regulator) 2004b. Regulatory policy on energy efficiency and demand side management for South African electricity industry. Pretoria. http://www.ner.org.za/.
NER (National Electricity Regulator) 2004c. National Integrated Resource Plan 2 (NIRP2) 2003/4. Pretoria, National Electricity Regulator. www.ner.org.za.
NER 2001b. EDI restructuring update. Electricity Regulatory Journal August 2001 pp. 1-3.
NER 2001d. Non-grid electrification. Electricity Regulatory Journal February. pp. 4-5.
Newbery, D M 1995. A template for power reform. New York, World Bank.
Norgaard, R B 1994. Development betrayed: The end of progress and a coevolutionary revisioning of the future. London, Routledge.
NREL (National Renewable Energy Laboratory) 1999. The potential for low-cost Concentrating Solar Power systems. Report NREL/CP-550-26649. Golden, Colorado, NREL.
OECD 2000. Ancillary benefits and costs of greenhouse gas mitigation. IPCC co-sponsored workshop, Washington, Organisation for Economic Co-operation and Development.
Oliver, T, Lew, D, Redlinger, R & Prijyanonda, C 2001. Global energy efficiency and renewable energy policy options and initiatives. Energy for Sustainable Development V (2): 15-25.
Omar, I & Mncwango, S 2003. Landfill gas recovery and potential applications. Paper for the Domestic Use of Energy Conference. 31 March - 3 April, Cape Town, Cape Technicon.
Ott, H E, Winkler, H, Brouns, B, Kartha, S, Mace, M, Huq, S, Kameyama, Y, Sari, A P, Pan, J, Sokona, Y, Bhandari, P M, Kassenberg, A, La Rovere, E L & Rahman, A 2004. South-North dialogue on equity in the greenhouse. A proposal for an adequate and equitable global climate agreement. Eschborn, Gesellschaft für Technische Zusammenarbeit. www.erc.uct.ac.za/recentpub.htm or www.south-north-dialogue.net.
Otto, A 2004. Personal communication. Principal Energy Officer: Renewable Energy, Department of Minerals & Energy.
Pacala, S & Socolow, R H 2004. Stabilization wedges: Solving the climate problem for the next 50 years with current technologies. Science 305 (13 August): 968-972.
Pan, J 2002. Understanding human development potentials and demands for greenhouse gas emissions: with empirical analysis using time series and cross-sectional data. Beijing, Chinese Academy of Social Sciences.
PBMR Ltd (Pebble Bed Modular Reactor (Proprietary) Limited) 2002. PBMR: Report on the proposed demonstration module and potential commercialization of the pebble bed modular reactor. 011252-160. Sandton.
Pearce, D, Markandya, A & Barier, E 1989. Blueprint for a green economy. London, Earthscan.
PEER Africa 1997. Housing as if people mattered. The story of Kutlawanong, South Africa. A no regrets case study. United Nations Framework Convention on Climate Change Third Conference of the Parties, Kyoto, November.
Pezzoli, K 1997. Sustainable development: A transdisciplinary overview of the literature. Journal of Environmental Planning and Management 40 (5): 459-574.
Philpott, J & Clark, A 2002. South Africa: Electricity reform with a human face? N Dubash (Ed). Power politics: Equity and environment in electricity reform. Washington DC, World Resources Institute: 139-156.
Pinheiro, H J (Ed) 1999. Bulletin 113: A techno-economic and historical review of the South African coal industry in the 19th and 20th centuries and Analyses of coal product samples of South African collieries 1998-1999. Pretoria, South African Bureau of Standards.
Prasad, G & Ranninger, H 2003. The social impact of the basic electricity support tariff (BEST). Domestic use of energy, Cape Town, 2003. Cape Technikon. pp. 17-22.
Prozzi, J P & Sperling, D 2002. Transportation in developing countries: Greenhouse gas scenarios for South Africa. Arlington, Pew Center on Global Climate Change.
PWC (PriceWaterhouseCoopers) 2000. Consolidated emerging views. Electricity distribution industry restructuring project: Working paper 7. Johannesburg.
Qase, N, Lloyd, P J D & Van Zyl, H 2000. Intervention potential for low smoke fuels in the coal distribution chain, final report. Cape Town, Energy & Development Research Centre.
Raskin, P, Gallopin, G, Gutman, P, Hammond, A & Swart, R 1998. Bending the curve: Toward global sustainability. A report of the Global Scenario Group. Boston, Stockholm Environment Institute.
Repetto, R & Austin, D 1997. The costs of climate protection: A guide for the perplexed. Washington, World Resources Institute.
Robinson, J 2004a. Squaring the circle? Some thoughts on the idea of sustainable development. Ecological Economics 48: 369-384.
Robinson, V 2004b. No job, no food, please help. Mail & Guardian. May 14 to 20: 37.
References 246
Robinson, V 2004c. Tough times need new policies. Mail & Guardian. May 14 to 20: 37.
RSA (Republic of South Africa) 2001a. Technical Background Document for the Development of a National Ambient Air Quality Standard for Sulphur Dioxide. Government Gazette Vol 432, No. 22134, 1 June 2001. Pretoria, Department of Environmental Affairs & Tourism.
RSA (Republic of South Africa) 2001b. Eskom Conversion Act (Act No. 13 of 2001). Pretoria.
RSA (Republic of South Africa) 2003. A national climate change response strategy. Draft October 2003. Pretoria. unfccc.int/resource/docs/natc/zafnc01.pdf.
RSA (Republic of South Africa) 2004a. South Africa: Initial National Communication under the United Nations Framework Convention on Climate Change. Submitted at COP-9. Pretoria. unfccc.int/resource/docs/natc/zafnc01.pdf.
RSA (Republic of South Africa) 2004b. National environmental management: Air Quality Act (No. 39 of 2004). Government Gazette 27318, Notice No. 163, 24/2/2005. Pretoria, Department of Environmental Affairs & Tourism. http://www.info.gov.za/gazette/acts/2004/a39-04.pdf.
RSA (Republic of South Africa) 2005. Government’s programme of action - 2005: Economic cluster. Pretoria. http://www.info.gov.za/aboutgovt/poa/report/economic05.htm.
Sachs, W 2000. Globalization and sustainability. Berlin, Heinrich Böll Stiftung.
Sachs, W, Loske, R & Linz, M 1998. Greening the north: a post industrial blueprint for ecology and equity. London, Zed Books.
SACN (South African Cities Network) 2004. State of cities report. Johannesburg.
Sad-elec 2003. Review of Eskom Power Pool. Phase 2 of development of guidelines (market rules) for the introduction of independent power producers (IPPs) and private service providers (PSPs) in the South African electricity supply industry (ESI). Submitted to the Department of Mineral and Energy and the Multi-Market Model Working Group. Pretoria, Submitted by Sadelec leading the consortium with The Marketplace Company, Econ, PPA, Tsutsuma Energy Solutions and Canca.
SANEA (South African National Energy Association) 1998. South Africa Energy Profile. Sandton.
SANEA (South African National Energy Association) 2003. South African Energy Profile 2003. Melville, South Africa.
SARB (South African Reserve Bank) 2001. Quarterly Bulletin. Pretoria, SARB.
SARB (South African Reserve Bank) 2002. Quarterly Bulletin March 2002. Pretoria.
SARB (South African Reserve Bank) 2005. Quarterly Bulletin, March. Pretoria.
SARB (South African Reserve Bank) various. Quarterly Bulletin. Pretoria.
Sari, A P 1998. On equity and developing country participation. Berkeley, Energy & Resources Group, University of California, Berkeley.
SARPN (Southern African Regional Poverty Network) 2005. South Africa: Millenium development goals country report. http://www.sarpn.org.za/documents/d0001538/index.php.
Sasol 2004. Annual review and summarised financial information. Johannesburg.
SECCP (Sustainable Energy and Climate Change Partnership) 2002. Nuclear energy costs the earth. Johannesburg, SECCP, a project of Earthlife Africa Johannesburg, in partnership with WWF, Denmark.
SEED 2002. Innovative housing projects pave the way for others. Urban SEED Update 1 (2): pp. 1-10.
SEIB 2002. LEAP Long-range Energy Alternatives Planning System: User guide for LEAP version 2003. Boston, Stockholm Environment Institute.
Shell (Shell International) 2001. Energy needs, choices and possibilities: Scenarios to 2050. London.
Shukla, P R, Tudela, F, Davidson, O, Mwakasonda, S, Spalding-Fecher, R, Winkler, H, Mukheibir, P, Alpan-Atamer, S, Chandler, W, J.Secrest, T, Logan, J, Schaeffer, R, Szklo, A S, Schuler, M E, Dadi, Z, Kejun, Z, Yuezhong, Z & Huaqing, X 2002. Climate change mitigation in developing countries: Brazil, China, India, Mexico, South Africa, and Turkey. Washington DC, Pew Center on Global Climate Change. October.
Simmonds, G & Clark, A 1998. Energy strategies for the urban poor. Cape Town, Energy & Development Research Centre, University of Cape Town.
Simmonds, G & Mammon, N 1996. Energy services in low-income urban South Africa: A quantitative assessment. Cape Town, Energy & Development Research Centre, University of Cape Town.
Simmonds, G 1997. Financial and economic implications of thermal improvements. Cape Town, Energy & Development Research Centre, University of Cape Town.
Smith, I, Smit, R & Beckman, R 2003. Eskom's first experience with wind energy. Journal of Energy in Southern Africa July (Eskom special edition): 19-25.
Spalding-Fecher, R & Matibe, D K 2003. Electricity and externalities in South Africa. Energy Policy 31 (8): 721-734.
Spalding-Fecher, R 2000a. Environmental benefits of electrification in developing countries: a quantitative assessment in South Africa. International Society for Ecological Economics 2000 Conference, Canberra, 5-8 July.

References 247
Spalding-Fecher, R 2000b. Does electrification reduce national health costs? A first assessment for South Africa. Proceedings of the seventh conference on the Domestic Use of Energy, Cape Town, Cape Technikon. pp. 117-122.
Spalding-Fecher, R 2001. Energy and sustainability in South Africa: the 2001 Sustainable Energy Watch Report. Cape Town, Energy & Development Research Centre, University of Cape Town.
Spalding-Fecher, R 2002a. Energy and energy policies in South Africa: an overview. NER Quarterly Journal 1 (1): 1-18. October.
Spalding-Fecher, R 2002b. Financial and economic analysis of CDM projects. O Davidson and D Sparks (Eds). Developing energy solutions for climate change: South African research at EDRC. Cape Town, Energy & Development Research Centre, University of Cape Town: 83-103.
Spalding-Fecher, R 2002c. Energy sustainability indicators for South Africa. Cape Town, Energy & Development Research Centre, University of Cape Town.
Spalding-Fecher, R 2002d. Energy sustainability indicators for South Africa. Report prepared for the Sustainable Energy & Climate Change Partnership. Cape Town, Energy & Development Research Centre, University of Cape Town.
Spalding-Fecher, R 2003. Indicators of sustainability for the energy sector: a South African case study. Energy for Sustainable Development 7 (1): 32-46. March.
Spalding-Fecher, R 2005. Health benefits of electrification in developing countries: a quantitative assessment in South Africa. Energy for Sustainable Development IX (1): 23-32.
Spalding-Fecher, R, Afrane-Okese, Y, Davis, M & Matibe, K 2000a. Electricity & the environment. Paper No. 5: World Wildlife Fund Macroeconomic Reforms and Sustainable Development in Southern Africa Project. Cape Town, Energy & Development Research Centre, University of Cape Town.
Spalding-Fecher, R, Clark, A, Davis, M & Simmonds, G 1999. Energy efficiency for the urban poor: Economics, environmental impacts and policy implications. Cape Town, Energy & Development Research Centre, University of Cape Town.
Spalding-Fecher, R, Clark, A, Davis, M & Simmonds, G 2002a. The economics of energy efficiency for the poor - a South African case study. Energy: The International Journal 27 (12): 1099-1117. December.
Spalding-Fecher, R, Roy, J, Wang, Y & Lutz, W 2004. Potential for energy efficiency: Developing nations. C J Cleveland (Ed). Encyclopedia of Energy. San Diego, California, Academic Press/Elsevier Science. 5: 117-133.
Spalding-Fecher, R, Thorne, S & Wamukonya, N 2002b. Residential solar water heating as a potential Clean Development Mechanism project: a South African case study. Mitigation and adaptation strategies for global change. Mitigation and adaptation strategies for global change 7 (2): 135-153.
Spalding-Fecher, R, Williams, A & Van Horen, C 2000b. Energy and environment in South Africa: charting a course to sustainability. Energy for Sustainable Development 4 (4): 8-17. December.
Spalding-Fecher, R, Winkler, H & Tyani, L 2001. Affordability of energy efficient low cost housing - estimating financing and grant requirements. Proceedings of ninth conference on Domestic Use of Energy, Cape Town, 10-12 April. Cape Technikon. pp. 17-20.
SSA (Statistics South Africa) 1996. Census in Brief: The people of South Africa: population census 1996. Pretoria.
SSA (Statistics South Africa) 2000. Measuring poverty. Pretoria, SSA.
SSA (Statistics South Africa) 2002. Earning and spending in South Africa: Selected findings and comparisons from the income and expenditure surveys of October 1995 and October 2000. Pretoria.
SSA (Statistics South Africa) 2003a. Census in Brief: Census 2001. Pretoria. www.statssa.gov.za/SpecialProjects/Census2001/HTML/CinBrief/CIB%202001.htm.
SSA (Statistics South Africa) 2003b. Census 2001. Pretoria.
SSA (Statistics South Africa) 2004a. Mid-year population estimates, South Africa. Statistical release P0302. Pretoria, Statistics South Africa.
SSA (Statistics South Africa) 2004b. Stats in brief: Ten years of democratic governance. Pretoria, SSA.
SSA (Statistics South Africa) 2005. Stats in brief. Pretoria, SSA.
SSN (SouthSouthNorth) 2004. Project design document for the Kuyasa project. Submitted to the Executive Board of the Clean Development Mechanism. http://cdm.unfccc.int. Cape Town, SouthSouthNorth Project. www.southsouthnorth.org.
Standards SA (Standards South Africa - a division of SABS) 2004a. DRAFT: South African national standard: Ambient air quality — Limits for common pollutants. SANS 1929:200x Edition 1. Pretoria.
Standards SA (Standards South Africa - a division of SABS) 2004b. DRAFT: Framework for setting and implementing national ambient air quality standards. SANS 69:200X Edition 1. Pretoria.
Stassen, D 2001. Personal communication. 1 March.
Statement by the office of Marthinus van Schalkwyk, Minister of Environmental Affairs & Tourism, on 5 May 2005. Cape Town, Ministry of Environmental Affairs and Tourism. http://www.environment.gov.za.

References 248
Steyn, G 2000. A competitive electricity market for South Africa: The need for change and a strategy for restructuring South Africa's electricity supply industry. Pretoria, for the Department of Minerals & Energy.
Steyn, G 2001. Governance, Finance and Investment: Decision making and risk in the Electric Power Sector. Doctoral thesis. Science Policy Research Unit. Sussex, University of Sussex.
Streak, J C 2004. The Gear legacy: Did Gear fail or move South Africa forward in development. Development Southern Africa 21 (2): 271-288.
Surridge, A D 2005. Personal communication. Director: Coal & gas, Department of Minerals & Energy.
Swisher, J, Jannuzzi, G & Redlinger, R 1997. Tools and Methods for Integrated Resource Planning. Roskilde, UNEP Collaborating Centre on Energy & Environment.
Tellus (Tellus Institute) 2001. Halfway to the future: Reflections on the global condition on the occasion of the 25th anniversary of the Tellus Institute. Boston.
Thom, C & Afrane-Okese, Y 2001. Institutional arrangements in the South African off-grid electrification programme. Based on a paper presented at the World Solar Energy Congress. Energy & Development Research Centre, University of Cape Town.
Thom, C 2000. Use of grid electricity by rural households in South Africa. Energy for Sustainable Development 4 (4): 36-43. December.
Thorne, S, Spalding-Fecher, R & Wamukonya, N 2000. Residential solar water heating as a potential CDM project: A South African case study. Paper presented at workshop on Forging New Links and Reinforcing National Capacities on Climate Change: Challenges and Opportunities for CDM in Africa, 8-10 May 2000, Cape Town.
TNI (Transnational Institute) 2002. Lights off! Debunking the myths of power liberalisation. by D Chavez Amsterdam.
TNI (Transnational Institute) 2003. The sky is not the limit. TNI Briefing Series No. 2003/1. Amsterdam. www.tni.org/reports/ctw/skytext.pdf Accessed June 2005.
Toth, F L & Mwandosya, M J 2001. Decision-making frameworks. IPCC (Ed). Climate Change 2001: Mitigation: Contribution of WG III to the Third Assessment Report of the IPCC. Intergovernmental Panel on Climate Change, Cambridge University Press: 603-688.
Turkson, J (Ed) 2000. Power sector reform in Sub-saharan Africa. London, Macmillan Press.
Tyani, L 2000. Energy efficiency in a restructuring electricity distribution industry in South Africa: Analysis and policy strategies. MPhil. Energy & Development Research Centre. Cape Town, University of Cape Town: 90.
UCT (University of Cape Town) 2002. Options for a basic electricity support tariff: Analysis, issues and recommendations for the Department of Minerals & Energy and Eskom. Cape Town.
UCT 2003. Options for a basic electricity support tariff: supplementary report. Research project 400903. Cape Town, University of Cape Town. 2003.
UN DSD (United Nations Division of Sustainable Development) 1996. Indicators of Sustainable Development: Framework and Methodologies. New York, UN Department of Economic and Social Affairs. http://www.un.org/esa/sustdev/isd.htm.
UN GA (United Nations General Assembly) 2000. United Nations Millennium Declaration. Resolution adopted by the General Assembly A/RES/55/2. Washington DC. http://www.un.org/millenniumgoals/.
UNDP, UNDESA & WEC (United Nations Development Programme, United Nations Department of Economic and Social Affairs, World Energy Council) 2000. World Energy Assessment. New York.
UNFCCC (United Nations Framework Convention on Climate Change) 1997. Kyoto Protocol to the United Nations Framework Convention on Climate Change. Bonn, UNFCCC Secretariat. http://unfccc.int/resource/convkp.html.
UNFCCC 1992. United Nations Framework Convention on Climate Change. New York, United Nations. http://unfccc.int/resource/conv/index.html.
US EPA (United States Environmental Protection Agency) 2000. Air Chief: Emission factors. Washington.
Vajpayee, S A B 2002. Speech of India's Prime Minister at the High Level Segment of the Eighth Session of Conference of the Parties to the UN Framework Convention on Climate Change. 30 October. New Delhi. http://unfccc.int/cop8/latest/ind_pm3010.pdf.
Van der Merwe, M R & Scholes, R J 1998. South African Greenhouse Gas Emissions Inventory for the years 1990 and 1994. Pretoria, National Committee on Climate Change.
Van der Riet, M 2003. Personal communication. Technology Services International, Eskom.
van Gass, I 1999. All Africa Games village: showcase for water- and energy efficiency. Energy Management News 5 (2): 1,6,9. June.
Van Heerden, J, Gerlagh, R, Blignaut, J, Horridge, M, Hess, S, Mabugu, R & Mabugu, M 2006. Searching for triple dividends in South Africa: Fighting CO2 pollution and poverty while promoting growth. The Energy Journal 27 (2): 113-141.
Van Horen, C & Simmonds, G 1998. Energy efficiency and social equity: seeking convergence. Energy Policy 26 (11): 893-903. September.

References 249
Van Horen, C 1996a. Counting the social costs: Electricity and externalities in South Africa. Cape Town, University of Cape Town Press and Elan Press.
Van Horen, C 1996b. The cost of power: externalities in South Africa's energy sector. Doctoral dissertation. School of Economics. Cape Town, University of Cape Town.
Van Ryneveld, P, Parnell, S & Muller, D 2003. Indigent policy: Including the poor in the City of Cape Town’s income strategy. Cape Town, City of Cape Town.
Van Schalkwyk, M 2005a. SA braces for impacts of climate change; major conference to be held in October.
Van Schalkwyk, M 2005b. SA receives “Champion of the Earth” Award: Recognised for global enviro leadership. Speech by the Minister of Environmental Affairs & Tourism, Marthinus van Schalkwyk. New York, UNEP. 20 April 2005. http://www.info.gov.za/speeches/2005/05042011151001.htm.
Venter, I 2001. Africa's big gas adventure begins. Engineering News October 5-11 pp. 16-17.
Villavicencio, A forthcoming. The sustainability of energy systems. Roskilde, UNEP Collaborating Centre on Energy & Environment.
Visser, M, Spalding-Fecher, R & Leiman, A 1999. Manufacturing and economic growth. Paper No. 10: World Wildlife Fund Macroeconomic Reforms and Sustainable Development in Southern Africa Project. Cape Town, Energy & Development Research Centre, University of Cape Town.
Wamukonya, N 2003a. Power sector reform in developing countries: Mismatched agendas. Energy Policy 31: 1273-1289.
Wamukonya, N 2003b. African power sector reforms: Some emerging lessons. Energy for Sustainable Development VII (1): 7-16.
Ward, S 2002. The Energy Book for urban development in South Africa. Cape Town, Sustainable Energy Africa.
WCD (World Commission on Dams) 2000. Dams and development: A new frame-work for decision-making. London, Earthscan Publications.
WCED (World Commission on Environment and Development) 1987. Our Common Future. Oxford, Oxford University Press.
Wei-Shiuen, N & Schipper, L 2005. China motorization trends: Policy options in a world of transport challenges. R Bradley, K Baumert and J Pershing (Eds). Growing in the greenhouse: Protecting the climate by putting development first. Washington DC, World Resources Institute.
Weyant, J P & Hill, J 1999. Introduction and Overview. The Costs of the Kyoto Protocol: A Multi-Model Evaluation. Special Issue The Energy Journal: vii-xliv.
White, C, Crankshaw, O, Mafokoane, T & Meintjies, H 1998. Social determinants of energy use in low-income metropolitan households in Soweto. Report No. EO9423. Pretoria, Department of Minerals and Energy.
Wicking-Baird, M C, Dutkiewitz, R K & De Villiers, M 1997. Cape Town Brown Haze Study. Report No. GEN 182. Cape Town, Energy Research Institute, University of Cape Town.
Wilson, E O 1989. National Academies Press. Washington DC, National Academies Press.
Winkler, H & Mavhungu, J 2001. Green power, public benefits and electricity industry restructuring. Cape Town, Energy & Development Research Centre, University of Cape Town.
Winkler, H & Mavhungu, J 2002. Potential impacts of electricity industry restructuring on renewable energy and energy efficiency. Journal of Energy in Southern Africa 13 (2): 43 - 49.
Winkler, H 2005. Renewable energy policy in South Africa: Policy options for renewable electricity. Energy Policy 33 (1): 27-38.
Winkler, H, Borchers, M, Hughes, A, Visagie, E & Heinrich, G 2005c. Cape Town energy futures: Policies and scenarios for sustainable city energy development. Report for the COMMEND network. Cape Town, Energy Research Centre, University of Cape Town. www.erc.uct.ac.za.
Winkler, H, Howells, M & Alfstad, T 2005a. South African energy policies for sustainable development. Report for the International Atomic Energy Agency. Cape Town, Energy Research Centre.
Winkler, H, Howells, M & Baumert, K 2005b. Sustainable development policies and measures: Institutional issues and electrical efficiency in South Africa. Washington DC, Center for Clean Air Policy.
Winkler, H, Spalding-Fecher, R & Tyani, L 2001. What could potential carbon emissions allocation schemes and targets mean for South Africa? Cape Town, Energy & Development Research Centre, University of Cape Town.
Winkler, H, Spalding-Fecher, R & Tyani, L 2002c. Comparing developing countries under potential carbon allocation schemes. Climate Policy 2 (4): 303-318.
Winkler, H, Spalding-Fecher, R & Tyani, L 2002e. Energy efficiency in low-cost housing: Costs and benefits of global and local externalities. O Davidson and D Sparks (Eds). Developing energy solutions for climate change: South African research at EDRC. Cape Town, Energy & Development Research Centre, University of Cape Town: 44-57.

References 250
Winkler, H, Spalding-Fecher, R, Mwakasonda, S & Davidson, O 2002a. Sustainable development policies and measures: Tackling climate change from a development perspective. O Davidson and D Sparks (Eds). Developing energy solutions for climate change: South African research at EDRC. Cape Town, Energy & Development Research Centre, University of Cape Town: 176-198.
Winkler, H, Spalding-Fecher, R, Mwakasonda, S & Davidson, O 2002b. Sustainable development policies and measures: starting from development to tackle climate change. K Baumert, O Blanchard, S Llosa and J F Perkaus (Eds). Building on the Kyoto Protocol: Options for protecting the climate. Washington DC, World Resources Institute: 61-87.
Winkler, H, Spalding-Fecher, R, Tyani, L & Matibe, K 2000. Cost-benefit analysis of energy-efficiency in low-cost housing. Cape Town, Energy & Development Research Centre, University of Cape Town.
Winkler, H, Spalding-Fecher, R, Tyani, L & Matibe, K 2002d. Cost-benefit analysis of energy efficiency in urban low-cost housing. Development Southern Africa 19 (5): 593-614. December.
World Bank 1998. Greenhouse gas assessment handbook: a practical guidance document for the assessment of project-level greenhouse gas emissions. Washington, D. C., World Bank Global Environment Division. September.
World Bank 1999. Cost reduction study for solar thermal power plants. Prepared by Enermodal Engineering Ltd. Washington DC, World Bank.
World Bank 2000. World Development Report 2000/2001. Oxford, Oxford University Press.
WRI (World Resources Institute) 2003. Climate Analysis Indicators Tool (CAIT). Washington DC. www.wri.org.
WRI (World Resources Institute) 2005. Climate Analysis Indicators Tool (CAIT), version 3.0. Washington DC. http://cait.wri.org/.
WSSD (World Summit on Sustainable Development) 2002. Johannesburg Plan of Implementation. Adopted by the United Nations World Summit on Sustainable Development. Johannesburg.
Yohe, G 2001. Mitigative capacity - the mirror image of adaptive capacity on the emissions side: An editorial. Climatic Change 49: 247-262.
Zhou, P 2001. North-South dialogue. Tiempo: Global Warming and the Third World (40/41): pp. 1-7.


