Embed Size (px)
Citation preview
Energy Star Incentives:
Are they worth it?[Preliminary and Incomplete]
Souvik Datta∗
Sumeet Gulati†
September 19, 2008
Abstract
In this paper we study the impact of US state financial tax holidays and utility rebates on
the purchase of Energy Star labelled appliances. Specifically we estimate the increase in the
share of Energy Star appliances in the clothes washers market that can be attributed to these
financial incentives. To estimate the impact of these incentives we use the variation in timing
and size of the green sales tax holidays across the states. In addition several states did not
provide any green sales tax holidays. We will then use these estimates along with information
on the average energy saved by using an Energy Star clothes washer relative to the non-
Energy Star clothes washer forgone to provide a rough estimate on the cost per tonne of
carbon saved by these policies. Since Energy Star standards are typically 10% to 30% more
efficient than other products governments that wish to reduce greenhouse gas emissions in their
local jurisdictions would have an incentive to persuade consumers to shift to energy efficient
products. Consumers would also find it beneficial to purchase energy efficient products because
of the savings in utility bills which would offset the higher market price of these products. This
paper is significant as an analysis of the costs of this policy could inform the types of policies
that should be used to reduce individual greenhouse gas emissions.
∗PhD Candidate, Department of Economics, University of British Columbia, 997–1873 East Mall, Vancouver, BC,V6T 1Z1, Canada. Phone: +1–604–827–2124. <[email protected]>
†Assistant Professor, Food and Resource Economics, University of British Columbia, MCML 337–2357 Main Mall,Vancouver, BC, V6T 1Z4, Canada. Phone: +1–604–822–2144. <[email protected]>
1

1 Introduction Energy Star
1 Introduction
Eco-labelling programmes have been around since the late 1970s but they have garnered more
attention recently due to the interest and concern generated by various environmental problems
and the phenomenon of global warming. This has led to various initiatives, especially in the
developed nations, to cut down on the use of fossil fuels that generate greenhouse gases and switch
to renewable energy sources. However, most of the electricity is still generated in coal-fired power
plants and the initiative for governments is to devise ways to reduce the demand for energy and
hence, lead to more energy security. This can be accomplished by introducing new technologies that
are more energy-efficient than older ones. Also, the Kyoto Protocol has led to more concentrated
efforts to assess the existing carbon reduction policies. In the case of many countries, like the
United States and Canada, state and federal governments as well as local utility companies, have
been giving incentives like rebates and tax holidays to consumers to switch to more energy-efficient
appliances and other equipment. Consumers would also find it beneficial to purchase energy efficient
products because of the savings in utility bills which would offset the higher market price of these
products. In our paper we use the Energy Star energy efficiency programme introduced by the
US to study the effect of these various incentives on the sales of appliances and calculate the cost
of having such incentives on the carbon dioxide forgone.
Most of the recent empirical work that studies the impact of state and local incentives on envi-
ronmentally conscious products has focused on the market for hybrid vehicles and have found that
these incentives do have a positive effect on the sales. For example, Gallagher and Muehlegger
(2008) show that the effect of state and local incentives, rising gasoline prices and environmental
ideology are all important on hybrid vehicle sales. A similar paper, by Beresteanu and Li (2008),
finds that an increase in the price of gasoline and federal income tax incentives led to a large in-
crease in the sales of hybrid vehicles in 2006. There has been, to the best of our knowledge, no
research done on evaluating the efficacy of having policies in place to promote the sale of Energy
Star appliances. Research on the Energy Star programme has focused almost exclusively on
the energy, dollar and carbon savings or the overall success of the Energy Star programme.
2

1 Introduction Energy Star
B. Howarth et al. (2000) have looked at the success of two eco-labelling programmes in the US,
the Green Lights and Energy Star Office Products programmes and argue that there has been a
reduction in market failures related to problems of imperfect information and bounded rationality.
They also conclude that these programmes should have very little effect on the demand for energy
and that an improvement in the energy efficiency will lead to one-to-one reductions in energy use.
In terms of calculating savings estimates, Webber et al. (2000) conclude that 740 petajoules1 of
energy has been saved and 13 million metric tonnes of carbon avoided due to the Energy Star
programme. In a more recent study, Sanchez et al. (2008) estimate that the US EPA’s Energy
Star-labelled products have saved 4.8EJ2 of primary energy and avoided 82Tg C equivalent.
This paper makes several contributions to the empirical literature on eco-labelling. There has
been a lack of research in this particular area due to the non-availability of good data. While there
are several limitations to the data that we have access to in this paper, we are still able to evaluate
the policy implications of the Energy Star programme. Our paper makes use of sales data that
is publicly available from the Energy Star website and we construct our own data with regard
to the policy implementation that have been collected from various websites. This is a unique data
set that has not been previously used.
Furthermore, our work makes an important contribution for future policies of providing Energy
Star incentives. Our results show that incentives like the Green Sales Tax Holidays and utility
rebates have a positive effect on the sales of Energy Star qualified clothes washers. However,
the type of incentive matters a lot when it comes to its effect on Energy Star sales with utility
rebates showing a much stronger effect than the Green Sales Tax Holidays offered by a few US
states.
The rest of the paper is organised as follows. In the next section, we provide an overview of the
Energy Star programme. In the section following that we talk about the clothes washers market
since that is the focus of our interest. We then discuss the Energy Star programme for clothes11 petajoule = 1015 Joules2EJ = exajoule, 1EJ = 1018 Joules
3

2 An Overview of Energy Star Energy Star
washers and follow it up with a section describing the various policies that have been pursued so
far. Section 6 discusses the data and its limitations. The empirical strategy is laid out in section 7
and results are discussed in the section following that. The penultimate section discusses the policy
implications while the final section concludes.
2 An Overview of Energy Star
The Energy Star programme was introduced in 1992 by the United States Environmental Pro-
tection Agency (EPA) as a voluntary labelling programme that was designed to promote the use
of energy-efficient products and thus help to reduce the emissions of greenhouse gases. Its mission
is to set standards for the Energy Star label; label energy-efficient products; provide objective
information to consumers; work with national, regional and local groups to promote energy effi-
ciency; and lower the costs of owning energy efficient equipment and products through alternative
financing. The US EPA, in 1991, had already introduced another eco-labelling programme, the
Green Lights Program, which was a partnership programme designed to promote efficient light-
ing systems in commercial and industrial buildings. This was integrated into the Energy Star
programme for buildings in 1995.
The first products to be labelled under Energy Star were computers and monitors. This
was subsequently expanded by the EPA to include other office equipment products and residential
heating and cooling appliances. They included central air conditioners (CACs), air source heat
pumps, copiers, facsimiles, furnaces, geothermal heat pumps, printers, programmable thermostats,
transformers and new homes. The criterion for Energy Star qualified homes was that they had
to be 30% more efficient than the model energy code.
The Energy Star programme, which had been administered exclusively by the US EPA since
its beginning, became a partnership of the EPA and the US Department of Energy (DOE) in
June, 1996. Some more products, like exit signs, insulation and boilers, were added to the list of
qualified product categories. Later that year, in October, the Energy Star label for appliances
4

2 An Overview of Energy Star Energy Star
Figure 1: Energy Star logo
was announced. These included dishwashers, refrigerators and room air-conditioners (RACs). The
Energy Star label for clothes washers was announced in July of the following year while the
product categories was expanded to include products like residential light fixtures, multifunction
devices and scanners. The label, as shown in fig.1, is displayed on over 50 product categories
including major appliances, office equipment, lighting, home electronics and other products. It also
covers new homes and commercial and industrial buildings. By the end of 2002, Americans had
purchased more than one billion Energy Star qualified products3.
Figure 2: Clothes Washers (Source: Appliance Design (various years) and Energy Star)3Energy Star Milestones
5
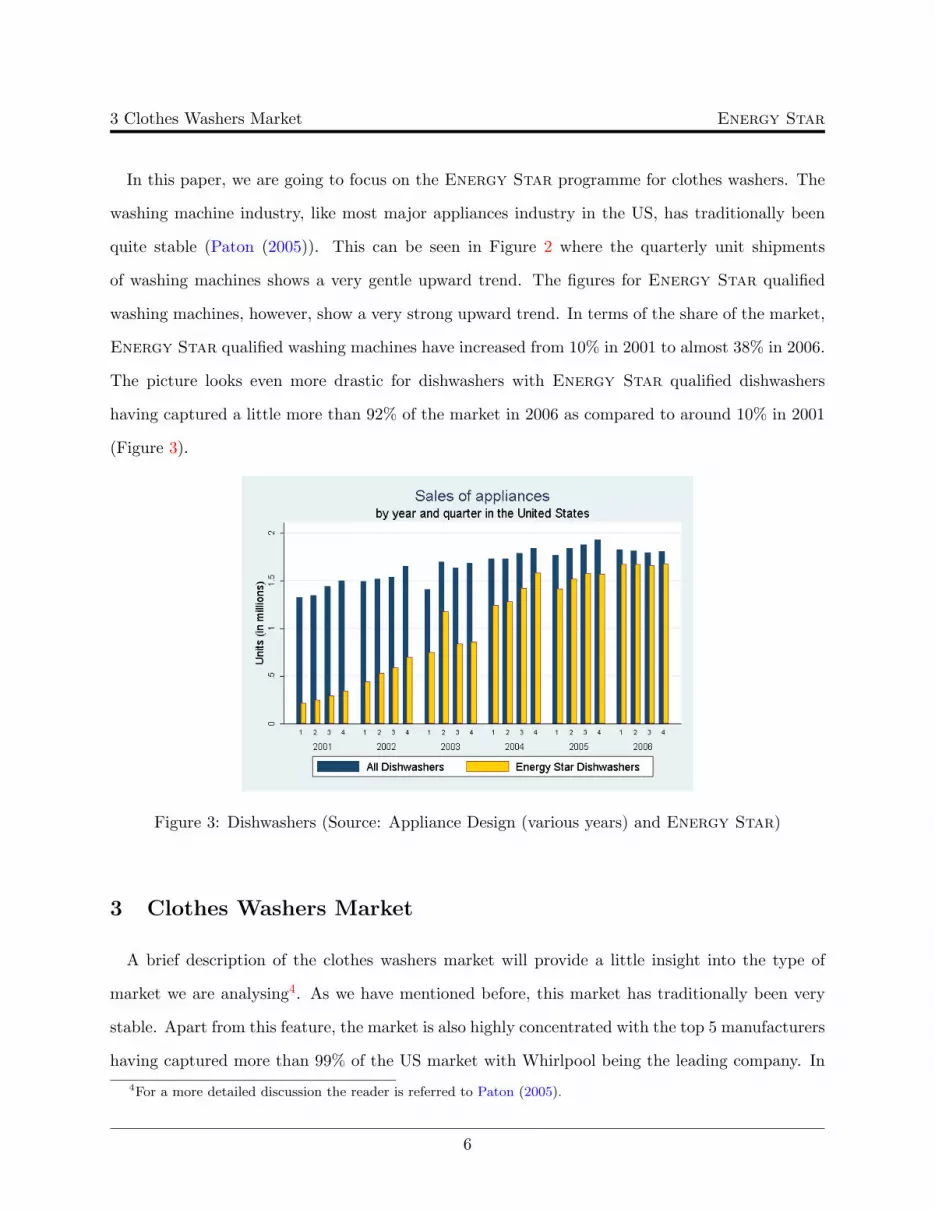
3 Clothes Washers Market Energy Star
In this paper, we are going to focus on the Energy Star programme for clothes washers. The
washing machine industry, like most major appliances industry in the US, has traditionally been
quite stable (Paton (2005)). This can be seen in Figure 2 where the quarterly unit shipments
of washing machines shows a very gentle upward trend. The figures for Energy Star qualified
washing machines, however, show a very strong upward trend. In terms of the share of the market,
Energy Star qualified washing machines have increased from 10% in 2001 to almost 38% in 2006.
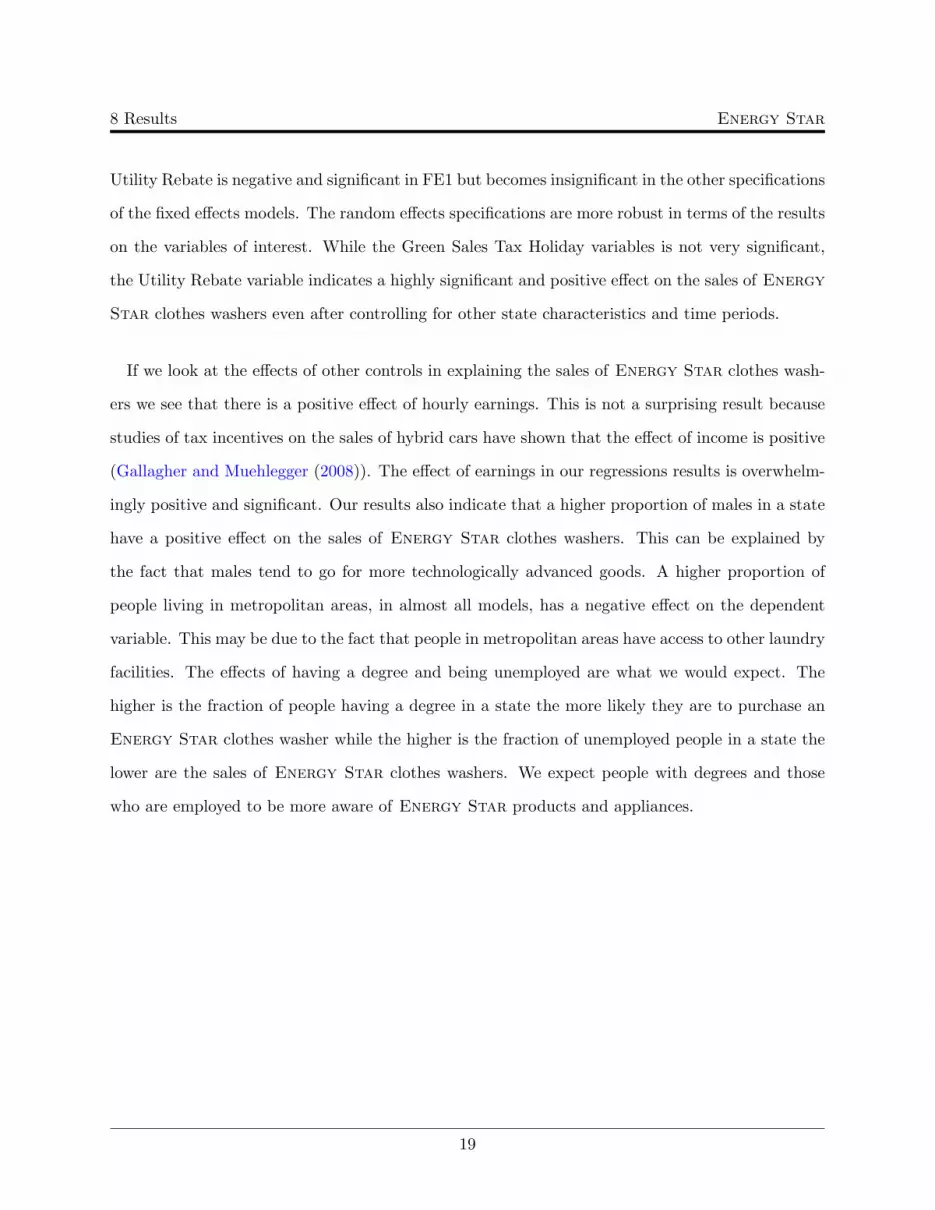
The picture looks even more drastic for dishwashers with Energy Star qualified dishwashers
having captured a little more than 92% of the market in 2006 as compared to around 10% in 2001
(Figure 3).
Figure 3: Dishwashers (Source: Appliance Design (various years) and Energy Star)
3 Clothes Washers Market
A brief description of the clothes washers market will provide a little insight into the type of
market we are analysing4. As we have mentioned before, this market has traditionally been very
stable. Apart from this feature, the market is also highly concentrated with the top 5 manufacturers
having captured more than 99% of the US market with Whirlpool being the leading company. In4For a more detailed discussion the reader is referred to Paton (2005).
6

3 Clothes Washers Market Energy Star
terms of product differentiation, washing machines are distinguished on the basis of their features,
quality and price. The most basic difference between washing machines is based on whether they
are of the horizontal-axis (h-axis) design or the vertical-axis (v-axis) design5.
The h-axis design washers operate much more efficiently than traditional v-axis design washers.
In the v-axis design washers agitators are used to clean the clothes while in the h-axis washers the
clothes are placed in a horizontally-oriented stainless steel drum that rotates and cleans the clothes
by tumbling them as in a dryer. The cleaning action occurs when clothes are tumbled through the
pool of water at the bottom of the cylinder. Specially designed baffles scoop up water and allow it
to rain down on the tumbling clothes. In some models the direction of rotation also alternates to
reduce tangling. Due to the different cleaning action h-axis machines use 35 to 50% less water than
v-axis machines thus saving 14,000 to 22,000 litres of water a year. Around 90% of the energy used
in a washing machine is for heating the water and this leads to a 50% saving in energy used to heat
the water. They also have higher rotating speeds and therefore extract more water. Subsequently,
less energy is needed to dry the clothes. Also, because of lower water levels, the amount of detergent
needed is less. This leads to saving money on detergent as well as being kinder on the environment.
The tumbling action also treats clothes more gently and there are fewer problems with off-balance
loads since there is no agitator. Tests have shown that the tumbling action is 25% more effective
in removing soil from clothes. The h-axis design can also accommodate more clothes since there is
more space available due to the lack of an agitator.
One of the drawbacks of h-axis washers is that they generally cost more than the v-axis counter-
parts but the higher purchase price can be offset by savings generated from higher energy efficiency.
The design also requires bending to add and remove laundry. This can be solved by putting the
machine on a pedestal while some models have a tilted design. Another, more significant, disad-
vantage is that wash times are typically longer, especially if the machine has an internal water5Horizontal-axis design is the industry term for front-loading washing machines while vertical-axis design refers
to top-loading machines. There are, however, some h-axis machines that are top-loading. The most well-knownmodels are produced by Staber Industries. New v-axis designs that use sprayers to wet the clothes from above canalso achieve substantial energy and water savings compared to conventional v-axis washers, but they may not cleanclothes as effectively, according to Consumer Reports.
7

4 Energy Star Clothes Washers Programme Energy Star
heater. The total cycle time for a North American-made washer is from 35 to 50 minutes while it
is 60 to 120 minutes for an European-made washer. A v-axis design typically has a 35 minute cycle
time. However, the longer cycle time will be offset by reduced drying time in models with high
spin speeds. Internal water heaters in some models increase peak electrical demand by around 1.8
kilowatts resulting in higher electricity costs.
4 Energy Star Clothes Washers Programme
Clothes washers have been in the Energy Star programme since 1997. There were no US
manufacturers whose washing machines satisfied the Energy Star standard when the programme
was proposed in 1994 by the DOE. The majority of the qualified products, being h-axis washers,
were being produced by European manufacturers. Therefore, this announcement caused a sharp
division within the industry. The first Energy Star qualified model produced by one of the large
US manufacturers was the Neptune model from Maytag. It was released in the market in June 1997
and was, not surprisingly, an h-axis washer. However, its price was nearly double that of a standard
v-axis model. Prior to the introduction of the Neptune market penetration for Energy Star
qualified washers was less than one percent. Other US manufacturers jumped on the bandwagon
and more Energy Star qualified washers were introduced and led to utility and regional efficiency
groups offering rebates and incentive promotions on these energy-efficient washers. The Energy
Star Clothes Washers programme has led to a significant increase in innovation and technological
advancement in the clothes washers industry.
Even within energy-efficient washers there is considerable variation in energy and water consump-
tion. The energy efficiency is indicated by the Modified Efficiency Factor (MEF). This is the new
rating introduced by the DOE and replaced the older Energy Factor (EF) rating in 2004. The EF
rating was based on the number of cubic feet of clothes that could be washed per kilowatt hour. The
new MEF takes into account the projected dryer usage based on the remaining moisture content as
8

4 Energy Star Clothes Washers Programme Energy Star
well as the machine energy and water heating energy of the washer6. A washer that spins clothes
drier will get a higher MEF rating than one that leaves more moisture in the washed clothes. A
higher MEF therefore signifies a more energy efficient washer. The federal clothes washer standard
was changed on January 1, 2004 from a minimum EF of 2.50 to a minimum MEF of 1.04 while
the Energy Star criteria was made more stringent from a minimum MEF of 1.26 to a minimum
of 1.42. There have been recommendations from utility and regional efficiency units to include
the amount of water used to calculate the Energy Star efficiency because some Energy Star
qualified washers use as much water as non-Energy Star qualified ones. Water Factor (WF)
measures the ratio of the quantity of water used in one cycle to the capacity of the washer. So, for
example, if a clothes washer uses 40 gallons of water per cycle and has a tub volume of 4.0 cubic
feet then the Water Factor for that particular machine would be 10.0. A washer that has a lower
WF is more efficient than one having a higher WF. Adding a maximum WF requirement would
ensure that Energy Star models save both water and energy. This prompted the DOE to add a
WF requirement to the existing Energy Star standard for washers January 1, 2007 onwards. The
current Energy Star standard, therefore, consists of both a minimum energy-efficiency standard
as well as a maximum water-efficiency standard of 1.72 MEF and 8.0 respectively. To be qualified
as Energy Star a clothes washer must have an MEF of 1.72 or above as well as a WF of 8.0 or
below. These standards have been scheduled to be revised and made more stringent again on July
1, 2009 with an energy-efficiency standard of 1.8 MEF and water-efficiency standard of 7.5 WF. A
further revision will be made on January 1, 2011 with the minimum MEF requirement being 2.0
and a maximum WF of 6.0.
There has been a gradual improvement in the energy-efficiency of clothes washers. The average
EF in 2001 was 1.55 while the most energy-efficient washers had a range from 2.5 to 3.5 EF.6As per the Energy Star website Frequently Asked Question on “What are Modified Energy Factor and Water
Factor on the ENERGY STAR qualified clothes washers list?”, MEF is the quotient of the capacity of the clothescontainer, C, divided by the total clothes washer energy consumption per cycle, with such energy consumptionexpressed as the sum of the machine electrical energy consumption, M, the hot water energy consumption, E, andthe energy required for removal of the remaining moisture in the wash load, D. The equation is
MEF =C
M + E + D
9

5 Green Sales Tax Holidays and Other Incentives Energy Star
The evolution of Energy Star qualified washers can be seen in Table 1. The average MEF for
Energy Star qualified washers was 1.65 when the new MEF standard of 1.26 was introduced in
the beginning of 2001. It increased to 1.70 in 2003 and further to 1.74 in 2004 before dropping
very slightly to 1.73 in mid-2004 due to the introduction of new models at the minimum Energy
Star MEF level. But, as the table shows, the average Energy Star washer showed an improved
efficiency in 2005 with the MEF increasing to 1.78.
Table 1: Average MEF Levels for Energy Star qualified Clothes WashersDate Minimum Energy Star Average MEF
criterion (MEF)
January 1, 2001 1.26 1.65January 1, 2002 1.26 1.65January 1, 2003 1.26 1.70January 1, 2004 1.42 1.74June 30, 2004 1.42 1.73January 1, 2005 1.42 1.78
We should note, however, the process that the DOE follows when setting the standard for an
appliance to quailify as Energy Star. The Energy Star label typically sets the efficiency
standard of the top 25% of the products in that particular appliance category. Therefore, when
the DOE set the efficiency criterion of 1.42 MEF in 2004 it captured around 25% of all available
washers in the market.
5 Green Sales Tax Holidays and Other Incentives
There have been a variety of ways in which US states and regional utility companies have tried
to encourage consumers to switch from standard appliances and other electric products to more
energy and resource efficient Energy Star products. Regional utility companies started offering
rebates on Energy Star appliances since around the time that the Energy Star programme
for appliances began. Energy Star-qualified clothes washers received a substantial amount of
promotion in 1998 in the northwest region of the US through rebates and incentives offered by the
10

6 Data Description Energy Star
Northwest Energy Efficiency Alliance. Supplemental rebates and financing was offered by a number
of utilities in Washington, Oregon, Montana and Idaho (Energy Star Sales Report, 1998). A similar
strategy was followed in California by most utility companies there as well as by utility companies
in New England (through the Northeast Energy Efficiency Partnerships, Inc.) and Wisconsin. This
trend continued the next year in these states. The active regions showed a much larger penetration
of Energy Star-qualified clothes washers than the inactive regions.
The push towards converting to more energy-efficient appliances and other products became
more earnest after the electricity crisis that happened in California in 2000 and 2001. Reserve
margins of electricity supply became restrictive, there were frequent power shortages and rolling
power outages7. However, the situtation was not as bad as had been forecast for the summer of
2001. Consumers in California had reduced electricity usage by 6% and average monthly peak
demand by 8% (Goldman et al. (2002)). According to Goldman et al. (2002), this was caused
by a reduction in demand for electricity by Californians. This response is attributed by Goldman
et al. (2002) to several factors like the media coverage and informational campaigns, real and/or
perceived increase in electricity rates and various policies and programmes initiated by the state
policymakers to reduce customer loads. One of these initiatives was to promote the sale of energy-
efficient Energy Star appliances and products. In view of this, California held an ‘Appliance
Awareness Week’ in August, 2001 to promote the sale of Energy Star appliances by offering
rebates on various appliances.
6 Data Description
In this paper we use data from a number of sources. The sales data of Energy Star qualified
clothes washers is from the website of the Energy Star programme8. Information about the rebates
and sales tax holidays on Energy Star products is from the Database of State Incentives for
Renewables and Efficiency (DSIRE) and the respective state revenue agency websites. Demographic7For a brief description of the causes the reader is referred to the article in Wikipedia8Energy Star Clothes Washers data
11

6.1 Energy Star Sales Energy Star
data come from the Current Population Survey’s Merged Outgoing Rotation Groups. We now
provide a more detailed description of the data sources and also mention certain limitations of our
dataset.
6.1 Energy Star Sales
The Energy Star website has data on sales of the four major appliances, viz. clothes washers,
dishwashers, air conditioners and refrigerators. The data are disaggregated by the type of major
appliance in each US state by quarter from 2001 to 2006. Unfortunately, the data are not disaggre-
gated at a finer level in the time dimension. Daily or even weekly data would be very useful in our
analysis. This is due to the nature of the state incentives like the rebates and sales tax holidays
that are usually held over a period of a week or a weekend. Daily or weekly data would have been
able to capture the effects of these incentives and rebates more precisely.
Sales of each appliance are categorised into Energy Star and non-Energy Star units. The
appliance manufacturers report the sale of Energy Star units to the US EPA every year. For
obtaining sales figures of non-Energy Star units the EPA uses the difference of the sales figures
of total Energy Star units sold and the total US sales obtained from industry reports.
6.2 Rebates and other Incentives
6.2.1 Incentives Provided by Utilities
There are two types of incentives in terms of the provider. The most common types of incentive
providers are the utility companies in various localities. Incentives are in the form of rebates
that vary in amount as well as by form across utility companies. They also vary across different
appliances but since we are looking at clothes washers only the rebates given on clothes washers are
considered. For example, in 2006, the City of Lompoc Utilities in California gave a rebate of $120
on Energy Star qualified clothes washers paid as a $10 per month credit on a consumer’s utility
bill. In another example, also in 2006, the customers of National Grid in Massachussets were given
a $100 either at the time of purchase or as a mail-in application.
12

6.2 Rebates and other Incentives Energy Star
The information about rebates and incentives provided by utilities was obtained from the Database
of State Incentives for Renewable Energy (DSIRE) that has comprehensive details of all incentives
offered by utilities since 2006. It mentions details about the incentive type, the programme name,
the amount of rebate offered, a summary of the rebate with the period of time the rebate is offered
and the appliances or products for which the rebate applies. Since our data on the fraction of
Energy Star clothes washers sold is restricted to the years between 2001 and 2006 we can use
only the 2006 data since that is the only year that is common to both the sales data and the utility
incentives data9.
6.2.2 Incentives Provided by States
States also give incentives to consumers for switching to Energy Star qualified appliances.
The incentives may be in the form of sales tax holidays or rebates. They were compiled from
the websites of the respective state revenue agencies as well as from the website of the Federation
of Tax Administrators10. Table 2 provides a list of all forms of state incentives from 2001. For
example, California had an Appliance Awareness Week in 2001 in which rebates were given for
purchasing Energy Star appliances. Encouraging consumers to switch to using more energy
efficient products was a part of various policies designed by the state to ensure that the electricity
crisis is not repeated. In most cases, however, the state incentives come in the form of abolishing
the sales tax for a period of time. These events are referred to as ‘Green Sales Tax Holidays’ to
distinguish from the more common sales tax holidays that are usually given before the beginning
of school. The Green Sales Tax Holidays are usually annual events once they begin, as shown in
Table 2 but in the case of Florida it was just a one-time event that took place in 2005. The Florida
Legislature did not reauthorize the ‘Energy Efficient Week’ programme for either 2007 or 200811.
However, Georgia has been having an annual Green Sales Tax Holiday since 2005 and a number
of US states have legislated the sales tax-free programme on Energy Star appliances in recent
years.9We are in the process of searching for more recent Energy Star sales data from 2007 and obtaining incentives
data from before 2006.10Federation of Tax Administrators11Joni Scott, Office of Public Services Florida Department of Environmental Protection, pers. comm.
13

6.3 Demographic Data Energy Star
Table 2: State Incentives for Energy Star AppliancesState Scheme Time Annual Incentive
California Appliance Awareness Week August 11-18, 2001 No RebateGeorgia Green Sales Tax Holiday October 6-9, 2005 Yes No Sales TaxGeorgia Green Sales Tax Holiday August 3-6, 2006 Yes No Sales TaxFlorida Energy Efficient Week October 5-11, 2006 No No 6% Sales TaxVirginia Green Sales Tax Holiday October 6-9 , 2006 Yes No Sales TaxConnecticut Green Sales Tax Holiday 2007 onwards Yes No Sales TaxVermont Green Sales Tax Holiday 2008 onwards Yes No Sales TaxWest Virginia Green Sales Tax Holiday September 1-7, 2008 Yes No Sales TaxNorth Carolina Green Sales Tax Holiday 2008 onwards Yes No Sales TaxTexas Green Sales Tax Holiday May 24-26, 2008 Yes No Sales TaxMissouri Green Sales Tax Holiday 2009 onwards Yes No Sales TaxSouth Carolina Green Sales Tax Holiday 2009 onwards Yes No Sales Tax
6.3 Demographic Data
Demographic data has been obtained from the Outgoing Rotation Groups of the Current Popu-
lation Survey (CPS). The CPS is a monthly household survey conducted by the Bureau of Labor
Statistics to measure participation and employment of the US labour force. The Outgoing Rotation
Groups is the group that was interviewed in the previous 3 months and is about to leave the CPS
in the fourth month. The advantage that these particular groups have over the other CPS survey
groups is that information on earning is included. Data on fraction of males in the state, average
age, fraction of people living in metropolitan areas, fraction of people with degrees and fraction of
people unemployed in the state is also obtained.
7 Empirical Strategy
We use the variation in terms of the timing of the various incentives across various states to
estimate the impact of the green sales tax holidays and rebates as well as utility rebates on the
sales of Energy Star clothes washers. There were also several states that did not provide any
14

7 Empirical Strategy Energy Star
such incentives to its residents. This variation in policy implementation will enable us to analyse
the efficacy of the incentives and estimate a rough estimate of the benefit of having such incentives
in place. This aspect of our research question is particularly important since a lot of US states
are in the process of or have already legislated such incentives. This also holds true for utility
companies that have been offering rebates in the past and the ones that want to offer them in the
future.
In terms of the regression specification, we will use a simple model to incorporate the various
state and utility rebate policies. As mentioned before, Energy Star sales data and state green
sales tax holidays is available from 2001 up to 2006 while utility rebates data are available only
from 2006. We use the logarithm of Energy Star share of clothes washers as the dependent
variable. The first specification, therefore, uses data from only 2006 and is of the following form:
log(Energy Star share)it = β0 + β1Sales Tax Holiday dummy
+ β2Utility Rebate dummy
+ β3Demographicsit + εit (1)
where i is the US state index and t is the year-quarter time index. We consider the ‘Sales Tax
Holiday dummy’ to be equal to unity if a particular US state has a state green sales tax holiday
or a rebate in a particular quarter while the ‘Utility Rebate dummy’ is equal to unity if a utility
company in a particular US state has given a rebate in a quarter. This specification will enable
us to control for various factors and estimate the impact of both sets of incentives, viz. incentives
provided by the state and those provided by particular utility companies. The coefficients of interest
are β1 and β2 because they provide the estimates of the impact of the various incentives on the
sales of Energy Star clothes washers. A positive estimate would signify that the policies are
having a favourable impact and that the government and utility companies are being successful
in encouraging people to switch to more energy-efficient technologies. However, that has to be
measured against the carbon emissions forgone.
15

7 Empirical Strategy Energy Star
In the second specification we use green sales tax holidays and other state incentives but ignore
the incentives provided by utility companies. Therefore, the specification is given by:
log(Energy Star share)it = β′0 + β
′1Sales Tax Holiday dummy
+ β′3Demographicsit + εit (2)
where, as in eq.(1), i is the US State index and t is the year-quarter time index. In this case,
the coefficient of interest is β′1 and a positive estimate would indicate a success of the green sales
tax holidays. However, we as we have noted before, the Energy Star sales data is not daily but
quarterly and the green sales tax holidays are usually held over a small period of time, typically an
extended weekend. We will, therefore, not be able to obtain the precise estimates of these incentives
on sales of Energy Star qualified appliances. The estimates will, most likely, have a downward
bias due to the assumption that the sales tax incentive over a weekend will capture all the effect
in a quarter. The specification in eq.(1) is, therefore, superior to the one in eq.(2) because the
utility rebates are for a much longer period of time, typically for a year or so and the effect of the
utility rebates can be identified across states. In cases where the rebates are over a period of three
quarters or less the effect of the utility rebates can be identified within states.
The demographic variables that we use as controls are the fraction of males, average age, fraction
of population living in metropolitan areas, fraction of the population having at least a degree, the
average hourly earnings (in logarithmic form) and the fraction of people unemployed within a
US State. The summary statistics of these variables are given in Table 3. We also have another
specification, namely eq.(2), that uses a different dataset. It is different in terms of the years covered
(from 2001 to 2006) and the policies considered (no utility rebates). The summary statistics of
that particular dataset are given in Table 4. We can treat this dataset as being a kind of a crude
robustness check for the more comprehensive (in terms of incentives considered) dataset used in
eq.(1).
16

8 Results Energy Star
Table 3: Summary statistics for 2006Variable Observations Mean Std. Dev. Min. Max.
(Log) Hourly earnings 200 7.225 0.082 7.035 7.481Fraction of males 200 0.478 0.014 0.441 0.522Fraction living in metropolitan areas 200 0.734 0.198 0.264 1.000Fraction of people with degrees 200 0.328 0.052 0.205 0.468Fraction of unemployed 200 0.027 0.007 0.012 0.054
Table 4: Summary statistics for 2001 – 2006Variable Observations Mean Std. Dev. Min. Max.
(Log) Hourly earnings 1200 7.158 0.096 6.880 7.481Fraction of males 1200 0.477 0.014 0.431 0.523Fraction living in metropolitan areas 1200 0.704 0.211 0.207 1.000Fraction of people with degrees 1200 0.317 0.049 0.174 0.468Fraction of unemployed 1200 0.031 0.008 0.010 0.065
8 Results
We now present the results of the two specifications and the methods used to estimate the
coefficients. We first use pooled OLS to estimate eq.(1) as well as eq.(2). The results of estimating
eq.(1) using pooled OLS are given in Table 5. The dependent variable is the log of share of Energy
Star clothes washers and we regress it on the Green Sales Tax Holiday dummy and the Utility
Rebate dummy in the simplest specification (POLS1). The results in Table 5 show that while the
estimated coefficient is positive in both cases it is positive as well as highly significant at the 1%
level in the Utility Rebate case. We then introduce the other controls in POLS2 and observe that
while the value of the estimated coefficients are smaller it is still highly significant and positive for
the Utility Rebate dummy variable. To control for aggregate changes over time we include time
dummies in specification POLS3 in Table 5. We find that the positive and highly significant effect
of the utility rebate still holds.
The specifications FE1, FE2 and FE3 in Table 6 estimate eq.(1) using a fixed effects panel data
model where the fixed effects are with respect to the 50 US States. We notice that the Green Sales
Tax Holiday is positive and significant but loses its significance when we include time dummies. The
17

8 Results Energy Star
Table 5: Pooled OLS Models of Energy Star Sales Tax Holidays for 2006
POLS1 POLS2 POLS3Variable Coefficient Coefficient Coefficient
Intercept -1.021*** -11.155*** -7.800***(0.033) (1.734) (1.889)
Sales Tax Holiday 0.128 0.053 -0.101(0.087) (0.085) (0.063)
Utility Rebate 0.267*** 0.140*** 0.144***(0.045) (0.041) (0.031)
Age -0.013 -0.012(0.012) (0.010)
Log (Hourly Earnings) 1.252*** 0.766***(0.222) (0.229)
Male 3.384*** 3.603***(1.238) (1.045)
Metropolitan -0.319*** -0.259***(0.082) (0.094)
Having a degree 1.685*** 1.798***(0.440) (0.403)
Unemployed -8.947*** -1.425(2.708) (2.066)
State dummies No No NoTime dummies No No Yes
Observations 200 200 200Groups 50 50 50F 17.799 45.995 76.729R̄2 0.139 0.496 0.818
Significance levels : ∗ : 10% ∗∗ : 5% ∗ ∗ ∗ : 1%
Robust standard errors in parentheses
Dep. variable: Log (Share of sales of Energy Star Clothes Washers)
18
8 Results Energy Star
Utility Rebate is negative and significant in FE1 but becomes insignificant in the other specifications
of the fixed effects models. The random effects specifications are more robust in terms of the results
on the variables of interest. While the Green Sales Tax Holiday variables is not very significant,
the Utility Rebate variable indicates a highly significant and positive effect on the sales of Energy
Star clothes washers even after controlling for other state characteristics and time periods.
If we look at the effects of other controls in explaining the sales of Energy Star clothes wash-
ers we see that there is a positive effect of hourly earnings. This is not a surprising result because
studies of tax incentives on the sales of hybrid cars have shown that the effect of income is positive
(Gallagher and Muehlegger (2008)). The effect of earnings in our regressions results is overwhelm-
ingly positive and significant. Our results also indicate that a higher proportion of males in a state
have a positive effect on the sales of Energy Star clothes washers. This can be explained by
the fact that males tend to go for more technologically advanced goods. A higher proportion of
people living in metropolitan areas, in almost all models, has a negative effect on the dependent
variable. This may be due to the fact that people in metropolitan areas have access to other laundry
facilities. The effects of having a degree and being unemployed are what we would expect. The
higher is the fraction of people having a degree in a state the more likely they are to purchase an
Energy Star clothes washer while the higher is the fraction of unemployed people in a state the
lower are the sales of Energy Star clothes washers. We expect people with degrees and those
who are employed to be more aware of Energy Star products and appliances.
19

8 Results Energy StarTab
le6:
Regress
ion
Models
of
Energy
Star
Sales
Tax
Holid
ays
for
2006
Fix
edEffec
tsR
andom
Effec
ts
FE1
FE2
FE3
RE1
RE2
RE3
Var
iable
Coeffi
cien
tC
oeffi
cien
tC
oeffi
cien
tC
oeffi
cien
tC
oeffi
cien
tC
oeffi
cien
t
Inte
rcep
t-0
.882
***
-12.
244*
**-1
.865
*-1
.016
***
-11.
240*
**-3
.875
***
(0.0
41)
(4.2
95)
(1.0
76)
(0.0
33)
(1.9
84)
(1.3
03)
Sale
sTax
Hol
iday
0.26
5***
0.19
5*-0
.031
0.20
3**
0.06
6-0
.034
(0.0
92)
(0.1
10)
(0.0
28)
(0.0
84)
(0.0
86)
(0.0
33)
Uti
lity
Reb
ate
-0.3
42**
-0.1
78-0
.022
0.24
0***
0.14
0***
0.16
2***
(0.1
56)
(0.1
19)
(0.0
60)
(0.0
54)
(0.0
38)
(0.0
42)
Age
-0.0
14-0
.002
-0.0
13-0
.010
(0.0
26)
(0.0
08)
(0.0
12)
(0.0
07)
Log
(Hou
rly
Ear
ning
s)1.
637*
**0.
147
1.28
5***
0.45
3**
(0.5
82)
(0.1
53)
(0.2
76)
(0.1
88)
Mal
e0.
074
-0.4
843.
153*
*0.
436
(1.7
02)
(0.4
48)
(1.2
87)
(0.5
16)
Met
ropo
litan
-0.4
281.
055*
**-0
.327
***
-0.1
87*
(1.5
58)
(0.3
64)
(0.0
98)
(0.1
10)
Hav
ing
ade
gree
2.68
5***
-0.9
31**
*1.
690*
**0.
861*
**(1
.015
)(0
.332
)(0
.436
)(0
.312
)U
nem
ploy
ed-1
7.24
4***
0.44
8-9
.475
***
0.19
7(3
.363
)(1
.033
)(2
.618
)(1
.403
)St
ate
dum
mie
s–
––
No
No
No
Tim
edu
mm
ies
No
No
Yes
No
No
Yes
Obs
erva
tion
s20
020
020
020
020
020
0G
roup
s50
5050
5050
50F
6.56
510
.416
193.
892
R̄2
0.02
50.
282
0.94
6
Sig
nifi
cance
level
s:
∗:
10%
∗∗:
5%
∗∗∗
:1%
,R
obust
standard
erro
rsin
pare
nth
eses
Dep
enden
tva
riable
isLog
(Share
ofsa
les
ofEnergy
Star
Clo
thes
Wash
ers)
20

8 Results Energy Star
Table 7: Pooled OLS Models of Energy Star Sales Tax Holidays (2001–2006)
POLS1a POLS2a POLS3aVariable Coefficient Coefficient Coefficient
Intercept -1.465*** -34.611*** -33.084***(0.050) (4.231) (4.211)
Sales Tax Holiday 0.602*** 0.264** 0.204*(0.138) (0.116) (0.104)
Age 0.028 0.027(0.033) (0.031)
Log (Hourly Earnings) 3.819*** 3.598***(0.616) (0.609)
Male 8.914*** 8.926***(2.086) (2.102)
Metropolitan -0.593*** -0.585***(0.206) (0.201)
Having a degree 2.272*** 2.446***(0.789) (0.765)
Unemployed -0.470 0.934(2.970) (2.835)
State dummies No No NoTime dummies No No Yes
Observations 1200 1200 1200Groups 50 50 50F 18.929 34.011 43.482R̄2 0.008 0.515 0.523
Significance levels : ∗ : 10% ∗∗ : 5% ∗ ∗ ∗ : 1%
Robust standard errors in parentheses
Dep. variable: Log (Share of sales of Energy Star Clothes Washers)
21

8 Results Energy Star
Tab
le8:
Regress
ion
Models
of
Energy
Star
Sales
Tax
Holid
ays
(2001–2006)
Fix
edEffec
tsR
andom
Effec
ts
FE1a
FE2a
FE3a
RE1a
RE2a
RE3a
Var
iable
Coeffi
cien
tC
oeffi
cien
tC
oeffi
cien
tC
oeffi
cien
tC
oeffi
cien
tC
oeffi
cien
t
Inte
rcep
t-1
.464
***
-52.
490*
**-5
3.47
4***
-1.4
64**
*-4
5.21
3***
-44.
393*
**(0
.015
)(1
.776
)(1
.829
)(0
.050
)(1
.623
)(1
.672
)Sa
les
Tax
Hol
iday
0.45
0***
0.01
40.
028
0.46
5***
0.13
40.
113
(0.1
40)
(0.0
98)
(0.0
87)
(0.1
21)
(0.0
97)
(0.0
91)
Age
0.02
50.
025
0.03
6**
0.03
5**
(0.0
17)
(0.0
17)
(0.0
15)
(0.0
15)
Log
(Hou
rly
Ear
ning
s)6.
776*
**6.
920*
**5.
611*
**5.
499*
**(0
.257
)(0
.263
)(0
.222
)(0
.230
)M
ale
1.25
31.
243
4.11
1***
4.14
4***
(1.1
98)
(1.1
92)
(1.1
94)
(1.1
95)
Met
ropo
litan
0.36
30.
413
-0.7
27**
*-0
.726
***
(0.2
75)
(0.2
73)
(0.1
20)
(0.1
19)
Hav
ing
ade
gree
1.16
0*1.
009
1.43
0***
1.46
2***
(0.6
62)
(0.6
64)
(0.4
68)
(0.4
71)
Une
mpl
oyed
5.63
8***
5.67
2***
1.62
52.
296
(1.7
18)
(1.7
38)
(1.8
22)
(1.8
60)
Stat
edu
mm
ies
––
–N
oN
oN
oT
ime
dum
mie
sN
oN
oY
esN
oN
oY
es
Obs
erva
tion
s12
0012
0012
0012
0012
0012
00G
roup
s50
5050
5050
50F
10.2
6217
3.31
513
3.11
5R̄
20.
005
0.55
90.
562
Sig
nifi
cance
level
s:
∗:
10%
∗∗:
5%
∗∗∗
:1%
,R
obust
standard
erro
rsin
pare
nth
eses
Dep
enden
tva
riable
isLog
(Share
ofsa
les
ofEnergy
Star
Clo
thes
Wash
ers)
22

9 Policy Implications Energy Star
9 Policy Implications
(To be completed)
10 Conclusion
In this paper we have looked at the efficacy of various incentives provided by US States and
utility companies on the sales of Energy Star clothes washers by utilising the variation in timing
and size of the Green Sales Tax holidays as well as utility rebates across the US states. The results
are quite positive in terms of the overall impact of such incentives though they appear to be not
so strong for the Green Sales Tax Holidays as compared to the rebates given by utility companies.
It could be because of the nature of the Energy Star sales data that are quarterly and not daily
as we would have liked them to be. We get better results for the utility rebates since they cover
at least a quarter. In the next version of the paper we would like to incorporate more data on
utility rebates and extend the period of analysis to at least 2 years for the specification in eq.(1).
Furthermore, from the estimates and with information on the average energy saved by using an
Energy Star clothes washer relative to the non-Energy Star clothes washer we can provide
a rough estimate on the cost per tonne of carbon saved by these policies. We also plan to use
a random coefficients logit model to analyse the determinants in the demand for Energy Star
clothes washers.
References
B. Howarth, R., Haddad, B., and Paton, B. (2000). The economics of energy efficiency: Insights
from voluntary participation programs. Energy Policy, 28(6-7):477–486.
Beresteanu, A. and Li, S. (2008). Gasoline Prices, Government Support, and the Demand for
Hybrid Vehicles in the US. Working paper.
Gallagher, K. S. and Muehlegger, E. (2008). Giving green to get green: Incentives and consumer
adoption of hybrid vehicle technology. Working paper, John F. Kennedy School of Government.
23

REFERENCES Energy Star
Goldman, C. A., Eto, J. H., and Barbose, G. L. (2002). California Customer Load Reductions
during the Electricity Crisis: Did They Help To Keep the Lights On? Working paper, Lawrence
Berkeley National Laboratory. available at http://repositories.cdlib.org/lbnl/LBNL-49733/.
Paton, B. (2005). Dynamics of Voluntary Product Labeling Programs: An Energy Star Case Study.
In de Bruijn, T. and Norberg-Bohm, V., editors, Industrial Transformation, pages 119–145. MIT
Press.
Sanchez, M., Brown, R., Webber, C., and Homan, G. (2008). Savings estimates for the United
States Environmental Protection Agency’s Energy Star voluntary product labeling program.
Energy Policy, 36(6):2098–2108.
Webber, C., Brown, R., and Koomey, J. (2000). Savings estimates for the Energy Star voluntary
labeling program. Energy Policy, 28(15):1137–1149.
24


