Embed Size (px)
Citation preview

Industry Roundtable – Resilient Facility Design for the Water Utility IndustryDate: November 17, 2020
Please consider the environment before printing.1
WATER UTILITYERock Talk Industry Roundtable SeriesResilient Facility Design for the Water Utility Industry
ENHANCE YOUR WEBINAR EXPERIENCE
• CloseEmail Programs Instant messengersOther programs not in use
• GoToWebinar Supporthttps://support.logmeininc.com/gotowebinar?labelid=4a17cd95
1
2

Industry Roundtable – Resilient Facility Design for the Water Utility IndustryDate: November 17, 2020
Please consider the environment before printing.2
WEBINAR SURVEY
• Immediately upon closing the webinar
Survey window opens
Thank you!
Products or Services Disclaimer
The mention of specific products or services in this webinar does not represent AWWA endorsement, nor do the opinions
expressed in it necessarily reflect the views of AWWA
AWWA does not endorse or approve products or services
3
4

Industry Roundtable – Resilient Facility Design for the Water Utility IndustryDate: November 17, 2020
Please consider the environment before printing.3
A Few Details
• Attendees are in listen-only mode
• If you have any questions, please submit using the Q&A tool
• All questions will be held until the Q&A session at the end
• The webinar will be recorded and a link to the recording will be sent shortly after the event
About the Panel
Pavani SilaparasettyProject Manager
AECOM
Allan SchurrModerator
Chief Commercial OfficerEnchanted Rock, LLC
Nazar Al-Khayat, PhDDirector of Engineering,
MicrogridAECOM Technical Services
Matthew Froehlich, P.E. Senior Project Manager
BGE, Inc.
5
6
Industry Roundtable – Resilient Facility Design for the Water Utility IndustryDate: November 17, 2020
Please consider the environment before printing.4
Agenda
• What Happens When the Power Goes Out?
• Industry Best Practices
• Trends in Facility Design
• Resiliency Considerations in Different Facility Types
WHAT HAPPENS WHEN THE POWER GOES OUT?
7
8

Industry Roundtable – Resilient Facility Design for the Water Utility IndustryDate: November 17, 2020
Please consider the environment before printing.5
INDUSTRY BEST PRACTICES
TRENDS IN FACILITY DESIGN
9
10
Industry Roundtable – Resilient Facility Design for the Water Utility IndustryDate: November 17, 2020
Please consider the environment before printing.6
RESILIENCY CONSIDERATIONS IN DIFFERENT FACILITY TYPES
Q&A
11
12

Industry Roundtable – Resilient Facility Design for the Water Utility IndustryDate: November 17, 2020
Please consider the environment before printing.7
Ask the Experts
Enter your question into the question pane on the right-hand side of the screen.
Please specify to whom you are addressing the question.
Pavani SilaparasettyProject Manager
AECOM
Allan SchurrModerator
Chief Commercial OfficerEnchanted Rock, LLC
Nazar Al-Khayat, PhDDirector of Engineering,
MicrogridAECOM Technical Services
Matthew Froehlich, P.E. Senior Project Manager
BGE, Inc.
Resources
www.enchantedrock.com
City of Houston Selects Enchanted Rock for 30MW
Microgrid Serving Water Expansion Project
City of Houston Selects Enchanted Rock for 30MW
Microgrid Serving Water Expansion Project
Press Releases
The North Fort Bend Water Authority Partners with
Enchanted Rock on Pump Station Resiliency Microgrid
The North Fort Bend Water Authority Partners with
Enchanted Rock on Pump Station Resiliency Microgrid
Enchanted Rock LLC Partners with Fort Bend County Levee Improvement District No. 2 on Emergency Pump
Resiliency Microgrid
Enchanted Rock LLC Partners with Fort Bend County Levee Improvement District No. 2 on Emergency Pump
Resiliency Microgrid
13
14
Industry Roundtable – Resilient Facility Design for the Water Utility IndustryDate: November 17, 2020
Please consider the environment before printing.8
Thank you!
Presenter Biography InformationPavani has worked on water and wastewater projects for several municipal clients for over 11 years. As PM at AECOM Pavani manages design and construction projects involving multiple disciplines, subconsultants, and stake holders. Pavani has been involved with WEAT and Southeast Section of WEAT for several years and serves as Section President for 2020-2021 WEAT year.Dr. Al-Khayat is an engineering director, responsible for the development and execution of microgrid projects. His work includes system engineering, analysis and design of renewable power plants, evaluation and qualifications of technologies. Dr. Al-Khayat has worked in the power generation and renewable sectors for the last 25 years, leading the development and introduction of several products and technologies as well as deployment of solutions. Dr. Al-Khayat is a charted engineer with a PhD in Power Systems.Matt is a Senior Project Manager at BGE. Over 17 years in the civil engineering consulting industry, he successfully completed many water, wastewater, street and drainage projects around the greater Houston area. Matt has worked with cities, counties, water authorities and utility districts of all sizes. He leads BGE’s team and Program Manager for the North Fort Bend Water Authority and Owner’s Advisor for the Gulf Coast Water Authority as well as serving as the District Engineer for Harris County MUD 106. Matt is the President of the Southeast Branch of the Texas Chapter of the American Public Works Association.Allan brings go-to-market expertise from over 30 years of experience in commercial and industrial energy services and innovative utility solutions. He is a registered Professional Engineer in the State of California, and he is a co-inventor on seven patents related to distributed energy.
15
16

Industry Roundtable – Resilient Facility Design for the Water Utility IndustryDate: November 17, 2020
Please consider the environment before printing.9
CE Credits (CEUs) and Professional Development Hours (PDHs)
AWWA awards webinar attendees CEUs.
If you viewed this webinar live, you will receive a certificate through the AWWA account associated with the email address you used to register.
If you viewed this webinar through a group registration, contact your proctor to log your participation.
If you viewed this as an archive webinar, follow the directions included in your archive webinar email to log your participation.
Certificates will be available on your AWWA account within 30 days of the webinar
How to Print Your Certificate of Completion
Within 30 days of the webinar, login to www.awwa.org or register on the website. If you are having problems, please email
Once logged in, go to:• My Account (click on your name in the top right corner)• My Transcripts
• To print your official transcript, click Print list• To print individual certificates, click Download Certificate
17
18

PRESS RELEASE
www.enchantedrock.com 1113 Vine St., Suite 101 |Houston, Texas, USA 77002
City of Houston Selects Enchanted Rock for 30MW Microgrid Serving Water Expansion Project
Largest U.S. Microgrid for a Water Pumping Facility to Provide Emergency Power for Critical Facility During Power Outages HOUSTON, TEXAS August 19, 2020 – Enchanted Rock, LLC announced that the City of Houston awarded Enchanted Rock a contract to provide electrical resiliency services to the City of Houston Northeast Water Purification Plant (NEWPP) Expansion facility. Enchanted Rock’s clean and quiet natural gas-fueled resiliency microgrid solution will provide facility backup for 100 percent of the required finished water production capacity during outages. The Enchanted Rock solution enables the city to fully comply with the regulatory requirements specified by the Texas Commission on Environmental Quality (TCEQ) for water treatment facilities and provide greater operational reliability during maintenance and grid outage periods. The new facility, which will service fast growing Harris and Fort Bend counties, is scheduled for completion in Spring 2022. “The NEWPP project will add 320 million gallons per day by 2024 to the existing water plant’s capacity,” said Ravi Kaleyatodi, P.E., Project Director, NEWPP Expansion Project, at City of Houston. “The City of Houston evaluated several companies and selected Enchanted Rock for this project based on technical requirements, performance of past projects, and competitive pricing.” “Wood Mackenzie reviewed 3,389 planned and operational microgrid projects that we track in the United States, and we determined this project will be the largest microgrid in the country supporting a water pumping plant when it comes online in 2022,” said Isaac Maze-Rothstein, Research Analyst at Wood Mackenzie. Headquartered in Houston, Texas, Enchanted Rock delivers long-duration backup power with the cleanest technology available. The company’s integrated Reliability on Call (iROC) service provides the City of Houston with worry-free reliability because Enchanted Rock owns, operates, and maintains the systems. The unique iROC model allows the NEWPP facility to receive backup at a fraction of the cost of a standard reliability system. “We are honored to have been selected by the City of Houston for such a critical project,” said Thomas McAndrew, Founder and CEO of Enchanted Rock. “This partnership will help ensure safe drinking water for the residents of Fort Bend and Harris counties during unexpected outages, which occur frequently in this storm prone region.”

PRESS RELEASE
www.enchantedrock.com 1113 Vine St., Suite 101 |Houston, Texas, USA 77002
About Enchanted Rock Enchanted Rock provides affordable, long duration backup power to commercial, industrial, and institutional customers by delivering a proven, full-service solution with the cleanest available technology. Enchanted Rock handles the design, construction, commissioning, operations, and maintenance of natural-gas powered generators so utilities can provide their customers with reliable backup power without the expense and challenges that come with maintaining a backup generation system. To learn more about offering electrical resiliency using Enchanted Rock solutions, visit www.enchantedrock.com or visit us on Twitter @ERock_LLC or LinkedIn. Press Contact: Erica Scardelletti Silverline Communications [email protected] (609) 954-4410

www.enchantedrock.com (713) 376-1742 [email protected]
MUNICIPAL FACILITIES – BACKUP POWER
Site MW Fort Bend LID No. 2
11.2
City of Houston
• Northeast Water Plant
• Southeast Water Plant
• East Water Plant
35.0
5.0
16.0
Coastal Water Authority
• Lynchburg Pumping Station
• Trinity River Pumping Station
15.0
8.0
Gulf Coast Water Authority
• Industrial Pumping Station
• Municipal Water Plant
5.0
2.5
Various MUDs
11.0
Texas A&M RELLIS Campus
9.6
HEB
149.0
Buc-ee’s
11.89
Citizens Medical Center
2.8
North Fort Bend Water Authority
2.4
Enchanted Rock is the market leader in reliability-as-a-
service, and the company has a long history of ensuring
uninterrupted power at many municipalities. Enchanted
Rock has installed over 350 MW of generation in Texas.
Enchanted Rock’s service fee is a small fraction of the
purchase price of a comparable system. By participating
in power markets during non-emergency situations,
Enchanted Rock can significantly reduce their service
fee and offset the cost of ongoing operations and
maintenance. For example, at Texas A&M Enchanted
Rock commissioned a 9.6 MW full-facility backup
solution for less than $1 million to the University. Included
in the price is the O&M for the life of the contract. Since
the generators run under load, the system is constantly
tested and conditioned, which leads to a higher level of
availability than traditional diesel backup. The system
runs loaded and runs often for maximum reliability.
Existing Texas Sites & Customers
Reliable 99.994% availability during power outages
Cost Effective 70 – 80% discount of a standard reliability system
Trouble Free Enchanted Rock operates and maintains gensets
Responsible Ultra-clean natural gas as a backup power solution
Quiet Quieter than an average vacuum cleaner
Supports Renewables Offsets the need for balancing intermittent renewables
Although Enchanted Rock’s business began with diesel
generators, the company has shifted to natural gas
because it is a far more resilient form of fuel. Natural gas
is delivered through a robust underground network,
which remains unaffected by flooding and other
damages from severe weather events. On the other
hand, the diesel supply chain can become very
challenged during natural disasters, such as Hurricane
Harvey, which can lead to widespread gasoline and
diesel shortages. Additionally, extreme flooding can
prevent delivery trucks from being able to reach sites
where it is needed, and National Guard units have the
right to commandeer fuel trucks destined for commercial
and industrial customers. Furthermore, natural gas is a
cleaner, quieter, and more efficient source of fuel which
can provide up to 100 percent availability for customers.
Move to Natural Gas
9.6 MW – Texas A&M RELLIS
www.enchantedrock.com (713) 376-1742 [email protected]
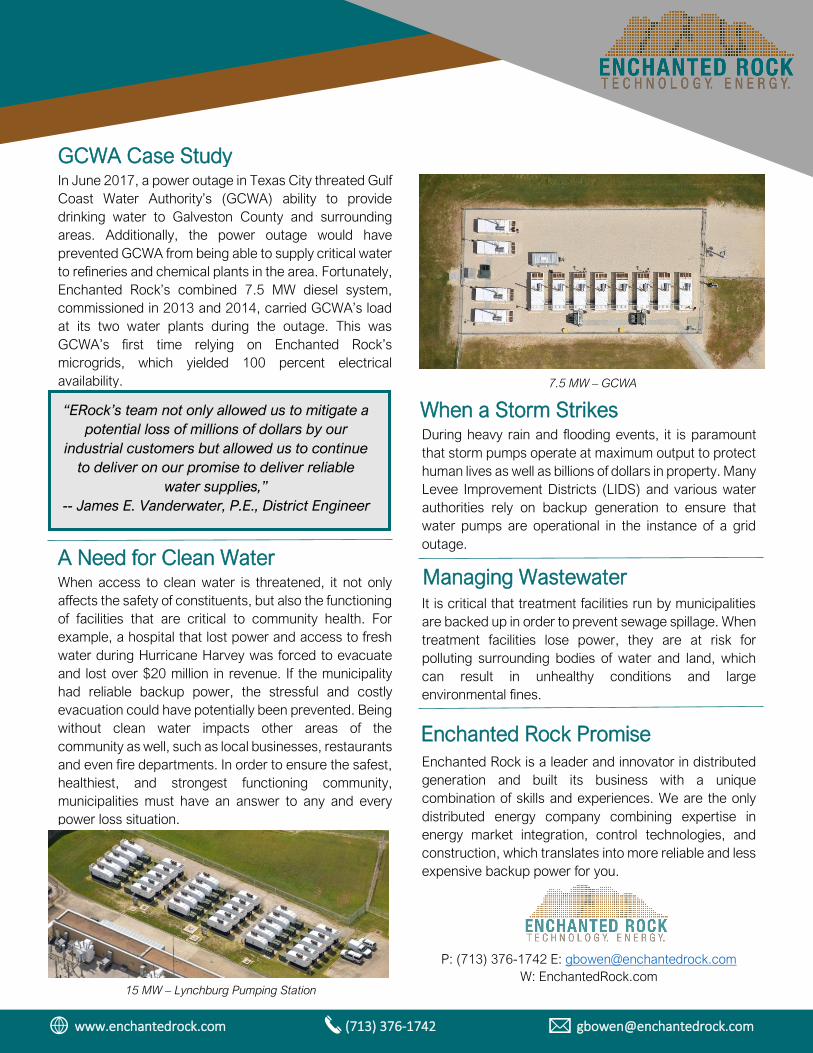
In June 2017, a power outage in Texas City threated Gulf
Coast Water Authority’s (GCWA) ability to provide
drinking water to Galveston County and surrounding
areas. Additionally, the power outage would have
prevented GCWA from being able to supply critical water
to refineries and chemical plants in the area. Fortunately,
Enchanted Rock’s combined 7.5 MW diesel system,
commissioned in 2013 and 2014, carried GCWA’s load
at its two water plants during the outage. This was
GCWA’s first time relying on Enchanted Rock’s
microgrids, which yielded 100 percent electrical
availability.
GCWA Case Study
“ERock’s team not only allowed us to mitigate a
potential loss of millions of dollars by our
industrial customers but allowed us to continue
to deliver on our promise to deliver reliable
water supplies,”
-- James E. Vanderwater, P.E., District Engineer
7.5 MW – GCWA
Enchanted Rock Promise
Enchanted Rock is a leader and innovator in distributed
generation and built its business with a unique
combination of skills and experiences. We are the only
distributed energy company combining expertise in
energy market integration, control technologies, and
construction, which translates into more reliable and less
expensive backup power for you.
P: (713) 376-1742 E: [email protected]
W: EnchantedRock.com
A Need for Clean Water When access to clean water is threatened, it not only
affects the safety of constituents, but also the functioning
of facilities that are critical to community health. For
example, a hospital that lost power and access to fresh
water during Hurricane Harvey was forced to evacuate
and lost over $20 million in revenue. If the municipality
had reliable backup power, the stressful and costly
evacuation could have potentially been prevented. Being
without clean water impacts other areas of the
community as well, such as local businesses, restaurants
and even fire departments. In order to ensure the safest,
healthiest, and strongest functioning community,
municipalities must have an answer to any and every
power loss situation.
When a Storm Strikes During heavy rain and flooding events, it is paramount
that storm pumps operate at maximum output to protect
human lives as well as billions of dollars in property. Many
Levee Improvement Districts (LIDS) and various water
authorities rely on backup generation to ensure that
water pumps are operational in the instance of a grid
outage.
Managing Wastewater It is critical that treatment facilities run by municipalities
are backed up in order to prevent sewage spillage. When
treatment facilities lose power, they are at risk for
polluting surrounding bodies of water and land, which
can result in unhealthy conditions and large
environmental fines.
15 MW – Lynchburg Pumping Station
Enchanted Rock LLC Partners with Fort Bend County Levee Improvement District No. 2 on Emergency
Pump Resiliency Microgrid
Innovative Solution Will Ensure Flood Management at Significant Savings
HOUSTON, June 26, 2019 – With service to the community as their priority, Fort Bend County Levee
Improvement District No. 2 (LID 2) entered into an agreement with Enchanted Rock Solutions, LLC.
(Enchanted Rock) to ensure the continuous functioning of their new stormwater pumping station when a
high Brazos River and heavy rains require pumping for drainage. Enchanted Rock’s clean and quiet backup
power solution provides LID 2 with a redundant electrical service that will ensure operational integrity of
the new pump station despite disruptions to the utility electricity supply.
As storms increase in intensity and frequency, Levee Improvement Districts (LIDs) are enacting flood
control plans to keep communities safe. Because pumping stations rely on electricity to function, LID 2
recognized a demand for uninterrupted power to safeguard 8,300 homes and more than $5 billion worth
of property from personal and economic loss.
“We are excited to extend our reliability services to LID 2 and the Fort Bend community,” said Thomas
McAndrew, CEO of Enchanted Rock. “We are proud to provide a solution that will increase the pumping
station’s reliability without disrupting the daily lives of residents.”
LID 2 selected Enchanted Rock’s natural gas generators based on their history of providing resilient backup
power during utility outages and severe weather events. Enchanted Rock, a Houston-based company,
delivers long-duration backup power with the cleanest technology available. The company’s integrated
Reliability On Call (iROC) service will provide LID 2 with worry-free reliability because Enchanted Rock
owns, operates, and maintains the systems. The unique iROC model allows LID 2 to receive full-facility
backup at a fraction of the cost of a standard reliability system.
“We are relieved to find such an effortless solution that addresses our reliability needs,” said André
McDonald, LID 2 Board President, “We feel confident knowing that our community will be better
protected from flooding during severe weather events and utility power outages.”
LID 2 joins the list of municipalities served by Enchanted Rock’s resiliency microgrids, which include CNP
MUD, Gulf Coast Water Authority (GCWA), and others. This service and the new LID 2 pump station are
expected to be in operation in Spring of 2021.
About Fort Bend County Levee Improvement District 2
LID2 is responsible for providing flood protection and storm water management services for major
portions of the City of Sugar Land in Fort Bend County, Texas. The District protects more than 5,300 acres
of property and operates and maintains 11 miles of levees, 8 miles of drainage ditches and two pump
stations. The flood control works constructed and operated by FBCLID2 protect 8,300 homes and
hundreds of businesses including Sugar Land Town Square and First Colony Mall. The combined value of
all property and structures located inside the district exceeds $5 billion in appraised value. To learn more,
visit www.FBCLID2.com
About Enchanted Rock, LLC

Enchanted Rock provides the most affordable, long duration backup power to commercial, industrial, and
institutional customers by delivering a proven, full-service solution with the cleanest available technology.
The company is responsible for the design, construction, commissioning, operations, maintenance, and
ownership of the natural-gas powered generators so customers can have reliable backup power without
the capital risk and challenges that come with maintaining a backup generation system. Enchanted Rock
has commissioned over 350 MW of distributed generation with over 50 MW under construction. To learn
more, visit www.enchantedrock.com

The Affordable Microgrid:
brought to you by
Copyright © 2018, Energy Efficiency Markets, LLC
Securing Electric Reliability through Outsourcing
The Affordable Microgrid: Securing Electric Reliability through Outsourcing
Copyright © 2018, Energy Efficiency Markets, LLC 2
Executive Summary
The number of widespread power outages caused by the hurricanes of 2017 and nor’easters of early 2018 were the latest reminders of the fragile nature of the grid across North America. With the risks of storms, fires, human error and potential physical and cyberattacks ever present, more and more businesses and institutions have shown interest in microgrids and the enhanced electric reliability and power quality they provide. Microgrids are local power generation resources that may be coupled with storage and controllers supplying power to a facility when the grid is down or unstable. However, some businesses and institutions find the upfront cost and operational complexities too daunting to go at it alone. This report introduces an innovative approach, reliability-as-a-service, that reduces the capital costs for microgrid customers and puts their operations in the hands of experts. Universities, business parks, research institutions, manufacturers and hospitals are but a few examples of enterprises deeply dependent on reliable electricity that are now turning to microgrids to ensure their power stays on during a crisis—without excessive cost or hassle.
In this report we compare the cost of power outages with the associated economic value of electric reliability. We explain the benefits of affordable microgrid services using natural gas as fuel, and we detail how microgrids can leverage wholesale power markets during normal
operations, enhancing their value proposition and strengthening the broader electric grid. We also discuss why these grid services become increasingly important as the electric grid becomes more dependent on renewable energy to generate power.
Finally, we offer real-world examples of how microgrids, using the reliability-as-a-service model, performed in Texas during Hurricane Harvey, keeping the lights on in stores and service stations for both customers and first responders in an otherwise darkened landscape.
ContentsExecutive Summary . . . . . . . . . . . . . . . . . . . . . . . . . . . . . . . 2Chapter 1 . . . . . . . . . . . . . . . . . . . . . . . . . . . . . . . . . . . . . . . . 3
Introduction . . . . . . . . . . . . . . . . . . . . . . . . . . . . . . . . . . . . 3Installing a microgrid before calamity . . . . . . . . . . . . . 3Why we wrote this report . . . . . . . . . . . . . . . . . . . . . . . . 4
Chapter 2 . . . . . . . . . . . . . . . . . . . . . . . . . . . . . . . . . . . . . . . . 4What is the monetary value of electric reliability to your operation? . . . . . . . . . . . . . . . . . . . . . . . . . . . . . . 4Who suffers most from outages . . . . . . . . . . . . . . . . . . . 4Valuable data for risk officers. . . . . . . . . . . . . . . . . . . . . 5What will it cost to avoid the loss? . . . . . . . . . . . . . . . . 5
Chapter 3 . . . . . . . . . . . . . . . . . . . . . . . . . . . . . . . . . . . . . . . . 6What is the affordable microgrid?. . . . . . . . . . . . . . . . . 6What drives microgrid costs? . . . . . . . . . . . . . . . . . . . . . 6Reliability-as-a-service . . . . . . . . . . . . . . . . . . . . . . . . . . 6The affordable microgrid . . . . . . . . . . . . . . . . . . . . . . . . 7
Chapter 4 . . . . . . . . . . . . . . . . . . . . . . . . . . . . . . . . . . . . . . . . 8Why a natural gas-fired microgrid?. . . . . . . . . . . . . . . . 8Reliability of natural gas . . . . . . . . . . . . . . . . . . . . . . . . . 8Natural gas as a clean fuel . . . . . . . . . . . . . . . . . . . . . . . 9
Chapter 5 . . . . . . . . . . . . . . . . . . . . . . . . . . . . . . . . . . . . . . . . 9Leveraging wholesale markets to create the affordable microgrid . . . . . . . . . . . . . . . . . . . . . . . . . . . . 9Wholesale power markets and microgrids . . . . . . . . 10How microgrids operate during price spikes . . . . . . 11The ERock model beyond Texas . . . . . . . . . . . . . . . . . 11
Chapter 6 . . . . . . . . . . . . . . . . . . . . . . . . . . . . . . . . . . . . . . . 11Profile: how microgrids served Texas during Hurricane Harvey . . . . . . . . . . . . . . . . . . . . . . . . . . . . . . 11
Conclusion. . . . . . . . . . . . . . . . . . . . . . . . . . . . . . . . . . . . . . 12About Enchanted Rock . . . . . . . . . . . . . . . . . . . . . . . . . . . 12
The Affordable Microgrid: Securing Electric Reliability through Outsourcing
Copyright © 2018, Energy Efficiency Markets, LLC 3
Chapter 1Introduction2017 proved to be one of the most destructive on record for North American power grids. Hurricanes, wildfires and an 11-hour outage at the world’s busiest airport in Atlanta validated the message that many in the microgrid industry have put forward for the last several years: Our interconnected grids are vulnerable. And 2018 started out with more of the same as winter storms and nor’easters impacted tens of millions of people.
Storms, fires, equipment failure, cyberattacks and human-caused outages can impact any part of the electric grid. Harm is particularly apt to come to the 6.3 million miles of distribution lines that connect homes and businesses to the grid. Falling trees, snow and ice, and heavy winds can bring down overhead lines and leave customers in the dark. The Department of Energy estimates that 90 percent of power disruptions occur because of problems on these wires. This statistic makes a strong argument for microgrids and other forms of onsite energy that deliver power without relying on miles of overhead wire.
However, as vicious as the storms of 2017 and early 2018 were, a successful cyberattack on the grid could be even worse. Not surprisingly, hackers and foreign enemies see the grid as a prime target, and government officials and utilities have warned of frequent attempts to undermine its cybersecurity. A cyberattack is particularly worrisome because it may not be as easy to fix as storm damage. Line workers from other utilities and states help repair poles and string new wire following a storm—which hastens recovery. But such teams would do little good in a cyberattack where needed fixes are buriedin computer code.
As digitization increases in the economy, reliable electricity becomes ever more important. Our businesses, governments and households cease to function when the power goes out. We cannot work. We cannot produce and distribute food. We cannot undergo modern-day health-care procedures. We cannot dispose of trash and waste. We cannot communicate; our cell phones no longer work.
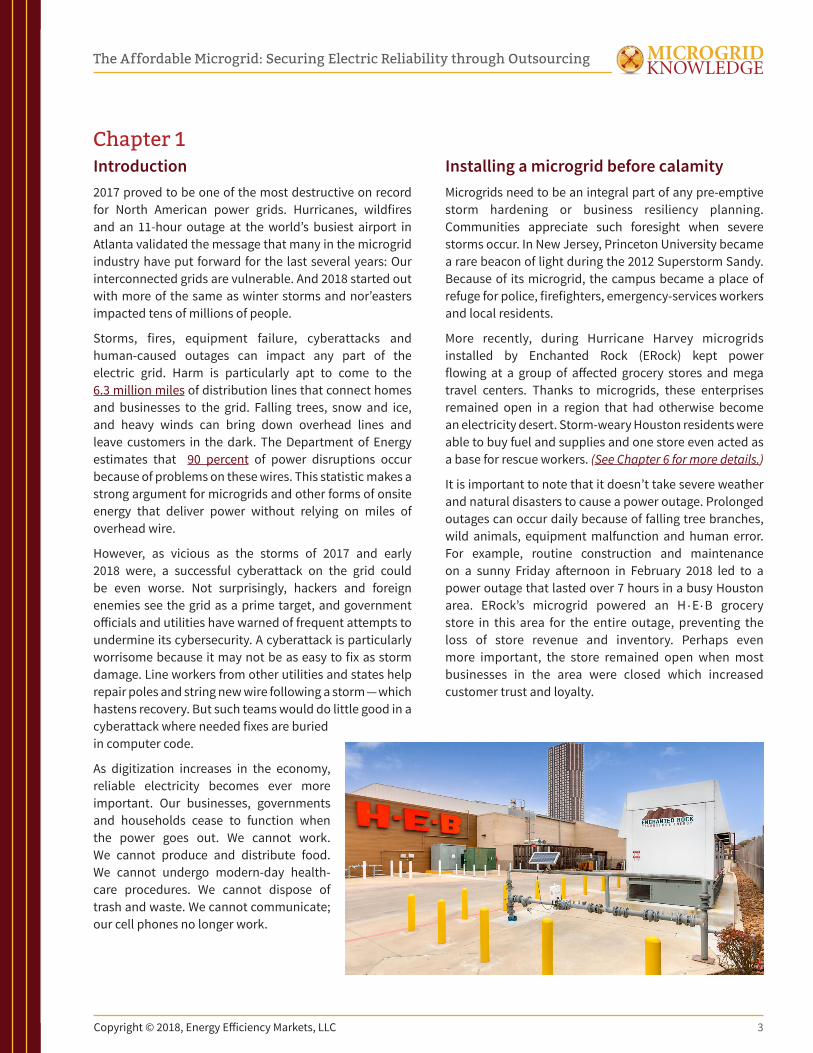
Installing a microgrid before calamityMicrogrids need to be an integral part of any pre-emptive storm hardening or business resiliency planning. Communities appreciate such foresight when severe storms occur. In New Jersey, Princeton University became a rare beacon of light during the 2012 Superstorm Sandy. Because of its microgrid, the campus became a place of refuge for police, firefighters, emergency-services workers and local residents.
More recently, during Hurricane Harvey microgrids installed by Enchanted Rock (ERock) kept power flowing at a group of affected grocery stores and mega travel centers. Thanks to microgrids, these enterprises remained open in a region that had otherwise become an electricity desert. Storm-weary Houston residents were able to buy fuel and supplies and one store even acted as a base for rescue workers. (See Chapter 6 for more details.)
It is important to note that it doesn’t take severe weather and natural disasters to cause a power outage. Prolonged outages can occur daily because of falling tree branches, wild animals, equipment malfunction and human error. For example, routine construction and maintenance on a sunny Friday afternoon in February 2018 led to a power outage that lasted over 7 hours in a busy Houston area. ERock’s microgrid powered an H . E. B grocery store in this area for the entire outage, preventing the loss of store revenue and inventory. Perhaps even more important, the store remained open when most businesses in the area were closed which increased customer trust and loyalty.
The Affordable Microgrid: Securing Electric Reliability through Outsourcing
Copyright © 2018, Energy Efficiency Markets, LLC 4
Knowing that reliable electric service is critical, what’s preventing us from installing microgrids more quickly? Why aren’t we taking advantage of this insurance policy?
Moreover, nascent market conditions can undermine the microgrid value proposition. Still relatively new, many of today’s microgrid projects lack replicability and standardization. They tend to be one-off, customized
projects that can be expensive. If you’re not a microgrid developer, installing and operating an onsite energy plant can seem daunting. You have other priorities; other places to focus your time, attention and resources.
Fortunately, the microgrid industry is evolving quickly and business models are emerging that make microgrids an attractive proposition for multiple applications.
Why we wrote this reportProduced by Microgrid Knowledge, in partnership with ERock, this report describes one innovative business model, called reliability-as-a-service, as a way to secure the benefits of a microgrid without the upfront costs or headaches of becoming a power plant developer, owner and operator.
We believe this report will be particularly valuable for cold storage facilities, petrochemical plants, retail stores, critical process manufacturers, senior living and hospitals, grocery stores, major universities, data centers, public sector or government agencies, communities and others concerned about the financial and human cost of power outages. To that end, we welcome you to download this special report, “The Affordable Microgrid: Securing Electric Reliability through Outsourcing” free of charge, and to widely distribute the link.
Chapter 2What is the monetary value of electric reliability to your operation?It is difficult to calculate what a power outage costs an economy or even an individual business. Losses tend to be determined in retrospect, after a storm or other calamity. They represent our best estimates of inputs, such as lost worker productivity, manufacturing disruptions, lost inventory or lost consumer purchases. Most of those losses are not recoverable. And, potentially more damaging, they affect customer confidence, which can result in the erosion of future revenues.
The numbers may not be exact, but they are substantial. A digital economy suffers mightily when it loses its most basic feedstock, electricity.
The 2017 hurricane season was particularly expensive. Estimates put Hurricane Harvey losses alone at $125 billion, making it one of the most costly natural disasters in U.S. history. The storm knocked out
10,000 MW of generating capacity, according to the U.S. Energy Information Administration, and it left hundreds of thousands of customers without electricity along Texas’ Gulf Coast.
One storm can have a tremendous effect.
Who suffers most from outagesSome businesses face steeper losses than others. Eight key U.S. market segments studied by energy consultant E Source forfeit about $27 billion per year due to power outages. On a more granular level, the E Source report found that manufacturers tend to suffer the most from long outages, followed by financial service companies, healthcare, and grocery stores. These industries also face significant losses during short outages and power quality disturbances. Consider a car manufacturer that makes about 1,200 cars a day: The cost for each car is roughly $50,000. That means just one day offline costs the factory $60 million.
Microgrid considerations
The problem is that many of us face several questions as we try to decide if a microgrid is right for our operation.
▶ Is the microgrid worth the cost—what’s the value of resiliency to my operation?
▶ Is the microgrid truly reliable—for how long and under what conditions will it operate?
▶ What kind of microgrid should I choose— especially if I am trying to meet certain availability, efficiency, or environmental goals?

The Affordable Microgrid: Securing Electric Reliability through Outsourcing
Copyright © 2018, Energy Efficiency Markets, LLC 5
Industries dealing with perishable products, from food to pharmaceuticals, are also vulnerable. In one dramatic example, the loss of power in Puerto Rico in the wake of Hurricane Maria resulted in shortages of medical supplies such as IV bags and some drugs. Puerto Rico pharmaceutical manufacturers produce about 10 percent of all drugs consumed by Americans, according to the U.S. Federal Drug Administration.
Food products are perishable at any stage along the supply chain, from manufacture to sale. In Winchester, Virginia, HP Hood installed a 15-MW microgrid at its 150-million gallon milk processing plant as insurance against outages. For Hood, even a brief loss of power could result in the plant shutting down for up to 12 hours to clean and re-sterilize equipment.
Loss of power is more critical at hospitals and military installations, where interruption of electrical service can be life threatening. The Department of Defense reported 127 outages of eight hours or longer in 2015, at a cost of $179,087 per day. The toll can be even higher at medical installations. Healthcare organizations face average costs of $690,000 per outage, according to a Ponemon Institute/Emerson Network Power report. Add in the potential for the loss of life, and that calculation becomes imponderable.
Valuable data for risk officersRetrospective studies aside, risk officers increasingly want to know what an outage might cost their business. The figure is useful in determining if a microgrid is a wise investment.
Traditionally, understanding outage costs also helps a business determine if it makes sense to shut down when the grid is under strain and energy prices spike. A planned outage is much less costly to a business than an unplanned outage. For example, if the price of electricity spiked to $200/MWh, a manufacturer of cast iron may decide it is not economic to continue to operate, so they shut down until prices stabilize and then resume operations.
On the other hand, there are certain processes that are costly to stop and start. The cost could be high for
a plastic manufacturer to shut down until the next day and have to clean cold plastic out of molds. Or an oil and gas producer working on tight margins could shut down to avoid electric price spikes but it might take the producer days to get back online. As a result, the producer’s customers might lose business because they can’t fulfill their contracts.
Under normal circumstances, businesses either reluctantly accept the losses from outages, or they may proactively curtail operations to avoid unplanned disruptions. However, reliability-as-a-service providers take on the responsibility of managing economic and system volatility, so that customers reap the benefits and are not burdened with making day-to-day decisions on when to disconnect from the grid or how to recover from an outage.
No single way exists to determine the value of reliability. Every business is different and operates under a unique set of circumstances. In some cases, the value of reliability could be as simple as the temporary loss of a process. Often, however, the value extends beyond the obvious.
“It is an education process for businesses to understand the implication of interrupted operations,” said Thomas McAndrew, founding partner, president and CEO of microgrid developer Enchanted Rock. “By jointly analyzing previous events, or reviewing data from similar organizations, we try to put a price on grid interruption or power disturbances, to make the decision much easier.”
What will it cost to avoid the loss? Once a business determines the cost of losing power, logical questions follow: What will it cost to avoid this loss? Is the investment worth it? What does a microgrid cost? Where do we find the expertise to build and operate a microgrid?
In the next chapter we explain why a microgrid can be affordable when it is offered through a reliability-as-a-service model.
The Department of Defense reported 127 outages of eight hours or longer in 2015, at a cost of $179,087 per day.
“It is an education process for businesses to understand the implication of interrupted operations,” said Thomas McAndrew, founding partner, president and CEO of microgrid developer ERock.
The Affordable Microgrid: Securing Electric Reliability through Outsourcing
Copyright © 2018, Energy Efficiency Markets, LLC 6
Chapter 3What is the affordable microgrid?Microgrids are often customized to meet the needs of the host, whether it is a municipality, hospital, retailer or manufacturer. Because each organization’s needs are unique, it is difficult to compare costs across different installations.
For example, population density in an urban setting can increase engineering costs. They can also involve more lengthy and difficult regulatory proceedings, also raising costs.
In a recent report GTM Research put advanced microgrid costs in a range from $1,100/kW to $4,400/kW, with university and island microgrids at the lower end and remote community and commercial microgrids on the higher end.
One important price trend, however, is that microgrid component costs—such as energy storage systems and control technologies—are falling as demand is increasing. In addition, natural gas, which fuels many microgrids, has experienced historically low prices in recent years
What drives microgrid costs?Overall, three main components drive microgrid costs: generation, infrastructure and automation or control. Generation assets are usually the highest cost in a microgrid, but this varies depending on whether the microgrid installation is a greenfield project or is being built on top of, or in addition to, existing infrastructure. The controller is usually the smallest cost component, but it is also one of the components that is more affected by economies of scale. A controller for a 10-kW system will be cheaper than a controller for a 100-kW system but will comprise a higher percentage of the project’s budget.
The microgrid’s purpose, usually driven by customer needs, determines the optimal design that affects costs. GTM Research expanded its definition of microgrids to include basic as well as advanced microgrids. Basic microgrids have one distributed energy resource (DER), usually a natural gas or diesel generator. In contrast, advanced microgrids use multiple DERs, such as generators, renewables and storage, as well as a sophisticated management system to serve multiple buildings and optimize loads effectively. The expansion of the definition resulted in GTM adding 1,500 microgrids to its database, bringing the total number of operating microgrids to 1,623.
A theme common to both basic and advanced microgrids is their ability to island, or disconnect, from the central grid and use their own energy assets to provide power to their customers for at least 24 hours. However, 24 hours of power would not be sufficient after a significant weather event. For example, after Hurricane Harvey, ERock powered 21 sites across Houston for as much as 105 hours.
As the microgrid market grows, the array of business models also expands. GTM estimates that about 58 percent of microgrids will be basic — built for customers who want resiliency but don’t have the experience or expertise to address regulatory and market complexities with an advanced microgrid.
These customers also may be reluctant to make a high upfront capital expenditure in their energy plant. They are not energy developers by nature, and a microgrid’s expense may deter from their core needs.
Reliability-as-a-serviceA business model growing in popularity allows customers to have the energy reliability benefit of a microgrid without the high upfront costs and hassle of developing and operating their own. Called “microgrid-as-a-service” or “reliability-as-a-service,” the model contracts with a third party that covers the project’s capital and operating costs in return for predictable service fees over time. This approach has proven key to growth in other energy markets, among them solar and energy efficiency, because it is a familiar approach: Customers are accustomed to paying for their energy monthly via utility bills.
ERock uses this model, which it calls On Demand Electric Reliability. ERock installs natural gas-fired generator microgrids on customer sites. Texas Microgrid, financed by an investment from Basalt Infrastructure Partners, owns the microgrid, and ERock operates and maintains the system for the life of the agreement. This arrangement lessens the financial burden on the customer as operation and maintenance expenses are one of the largest components of ongoing costs.
A business model growing in popularity allows customers to have the energy reliability benefit of a microgrid without the high upfront costs and hassle of developing and operating their own.
The Affordable Microgrid: Securing Electric Reliability through Outsourcing
Copyright © 2018, Energy Efficiency Markets, LLC 7
When customers are not using backup power, ERock aggregates the unused generation into a virtual power plant to provide energy and ancillary services to the bulk power grid or local utility in exchange for receiving payments that offset the costs of the microgrid system. By selling back to the grid, ERock is able to reduce the cost for the customer to about 10–15 percent of the cost of ownership of a standard natural gas system and 20 percent of a standard EPA Tier 2 emissions diesel system. ERock’s frequent grid interactions both reduce cost and increase reliability, as they provide constant testing and conditioning for the generators. ERock operates by the principle “run often, run loaded.”
The affordable microgrid“We are different than other microgrid developers,” McAndrew said. “They put the full financial burden on the customer. We are looking to finance the microgrid on market-based grid services and then minimize the customer payments significantly.”
That makes ERock’s model the most affordable solution with the highest reliability in the marketplace, he added.
ERock used that model for a deal with Buc-ee’s, a chain of Texas mega travel centers. The first phase covers 10 Buc-ee’s stores, but the chain eventually intends to use ERock’s microgrid reliability service at all locations.
ERock has also used the model in an agreement struck with H.E.B, a Texas based chain of 350 grocery stores. The initial phase covers 105 stores across Texas and continues to grow. The natural gas-fired microgrids allowed more than a dozen affected stores to remain in service when Hurricane Harvey knocked out conventional power to the area.
“It is a model that fits well for other customers that value reliability,” said Clark Thompson, founding partner and chief technology officer at ERock. In addition to large grocery store chains, he cited health care services, regional hospitals, universities, and data centers as likely beneficiaries of On Demand Electric Reliability.
In the next chapter, we explain the benefit of using a microgrid that operates on natural gas when employing the reliability-as-a-service model.
What is an ERock microgrid?
An ERock microgrid uses natural gas-fired generators, installed on the premises of a business, and configured via software into a microgrid. ERock manages the microgrids from its remote operations center in downtown Houston.
When the microgrid senses a power outage occurring on the electric grid, it automatically “islands” or disconnects the store from the grid and starts the natural gas generators. The changeover happens so seamlessly, those inside the store are unaware the grid has lost power and the electricity is now coming from the quiet, onsite generators.
When power is restored, the microgrid reconnects the store—again in a fashion invisible to anyone inside the building. There is no momentary outage or blinking lights as the store moves from being served by its onsite generators back to the central grid.
When the customer is not in need of the backup power, ERock aggregates the generators to provide service to the grid and earns revenue doing so. For example, ERock watches for sudden changes in the market and turns on its fast responding generators when there is a need for power in the market. This revenue can benefit the microgrid host site in the form of reduced service charges.
Thomas McAndrew, ERock president and CEO, points out that using the generators in this way offers benefits beyond cost. Because ERock operates the generators frequently—not just when there is a disaster—they can ensure that the generators are in good operating condition at all times.
This is no small point; it illustrates the difference between a microgrid and a simpler backup gener-ator. A microgrid typically operates often. A backup generator, on the other hand, is called upon to operate only in an emergency. Unfortunately, too often businesses find that when an emergency occurs, their backup generator isn’t working.
ERock also ensures reliability for the stores by using natural gas as a fuel. Natural gas is not only cleaner than diesel—a common fuel for backup generators —but it also is delivered via underground pipeline, where it is protected from extreme weather events.
The Affordable Microgrid: Securing Electric Reliability through Outsourcing
Copyright © 2018, Energy Efficiency Markets, LLC 8
Chapter 4Why a natural gas-fired microgrid?Reliability and resiliency are often listed among the top drivers of installing a microgrid. To meet those goals, however, it is important to consider what will power the microgrid’s assets.
Microgrids can have a variety of generation sources, including combustion generators, combined heat and power (CHP), flywheels, fuel cells, energy storage, solar panels and even wind turbines.
Because of its widespread availability, diesel has been the traditional solution for engine reliability, whether for backup generators or as part of a resiliency microgrid. But even this workhorse fuel has its limits related to operating cost, availability and environmental impact.
In particular, during Hurricane Harvey diesel supplies chain was extremely challenged. Many of the nation’s largest refineries closed, leading to widespread gasoline and diesel shortages across Texas. Even when diesel was available for purchase, extreme flooding, debris and downed trees and power lines often prevented delivery trucks from reaching sites that had run out of their supply.
Furthermore, when fuel delivery is possible after a major weather event, National Guard units have the right to commandeer fuel trucks destined for commercial and industrial customers.
By the same token, a solar-plus-storage microgrid does not solve the problem. Cloud cover severely limited solar production for five days as Hurricane Harvey battered the Houston area. From a resiliency standpoint, solar panels, even those backed by load-shifting batteries, were not able to perform as first the sun failed and then the batteries.
These problems have not gone unnoticed at ERock. “A resiliency microgrid has to have an infinite fuel source behind it, otherwise that resiliency is really not there,” said McAndrew.
This points to a key advantage of natural gas over other energy sources during hurricanes, as natural gas is transported by underground pipelines that remain unaffected by severe weather.
While diesel is still the number one microgrid fuel source, natural gas is number two and closing. Specifically, 82 percent of installed capacity is driven by fossil fuels; of this, about 60 percent is diesel and 40 percent is natural gas, according to “US Microgrids 2017: Market Drivers, Analysis and Forecast,” published in November 2017 by GTM Research.
Reliability of natural gasToday, the U.S. natural gas distribution system spans a network of about 3 million miles of pipelines, according to the U.S. Energy Information Administration (EIA), including about 1.5 million miles of low pressure, local distribution pipelines.
Most of those pipelines are underground, which puts them out of harm’s way from extreme weather events.
Natural gas also enjoys an inherently more resilient distribution network of about half a million producing wells in 30 states, and unlike electricity, can be stored on a large scale. It also moves slowly enough to be re-routed to bypass problems and potential disruptions, even through high pressure pipelines.
Fewer than 100,000 natural gas customers experienced disruptions in 2016, while 8.1 million Americans experienced power outages, according to the EIA. During the hurricanes that submerged Houston and swept up the East Coast in 2017, virtually no gas outages were reported. In fact, a plentiful supply of natural gas met existing contracts and filled spot market needs, according to the Natural Gas Supply Association. While many customers relying on overhead power lines suffered outages, natural gas demonstrated its reliability and versatility.
“A resiliency microgrid has to have an infinite fuel source behind it, otherwise that resiliency is really not there.– Thomas McAndrew, ERock
82 percent of installed capacity is driven by fossil fuels; of this, about 60 percent is diesel and 40 percent is natural gas, according to “US Microgrids 2017: Market Drivers, Analysis and Forecast.”
The Affordable Microgrid: Securing Electric Reliability through Outsourcing
Copyright © 2018, Energy Efficiency Markets, LLC 9
The supply of natural gas has also expanded rapidly in the past decade thanks to new sources made available from tight shale formations. Using hydraulic fracturing to reach into these formations made the United States the world’s top producer of natural gas and oil in 2016 for the fifth straight year, according to the EIA.
That flood of gas has also lowered prices. Hydraulic fracturing has resulted in natural gas prices to dropping 47 percent compared with what the price would have been prior to the drilling revolution in 2013, according to a Brookings Institute report. As a result, natural gas consumers have seen their bills drop $13 billion annually from 2007 to 2013. According to EIA projections, natural gas prices will remain relatively flat, about $5 per million British thermal unit (MMBTU) from 2030 to 2040. Current prices are around $3/MMBTU.
Natural gas as a clean fuelAs an alternative to diesel fuel, natural gas also delivers an environmental bonus in the form of lower nitrogen oxides (NOx) emissions. ERock’s gas generators permit
for <<0.14 lb/MWh NOx emissions, with an emission rate of less than one percent of a standard Tier 2 diesel generator and less than four percent of a standard Tier 4 diesel generator.
ERock calculates that they have avoided 13,651 lbs of NOx emissions under the assumption that a typical Tier 2 diesel generator would have emitted 13,686 lbs of NOx over the same period. Assuming degradation, in less than a year ERock’s natural gas microgrids have emitted 34.65 lbs of NOx during reliability runs.
All in all, a resilient microgrid powered by a gas-fired engine can provide a continuous supply of power with lower emissions and at competitive prices. Gas-fired engines are also among the most efficient forms of generation available. And, with the right design, they can be sited within a relatively small footprint and meet local air quality and noise requirements.
Equally important, a natural gas microgrid is a flexible asset that can be deployed quickly on the grid, unlike solar power or a CHP plant. This allows for the integration of renewables to the grid, as quick-start capacity can balance the grid when renewables are intermittent. As a result, the microgrid can provide various wholesale market services that support renewable energy, as we’ll explain in the next chapter.
Chapter 5Leveraging wholesale markets to create the affordable microgridGas-fired microgrids offer operational flexibility that is crucial to today’s electric grid and complex power markets.
Growing levels of renewable energy penetration are changing the nature of power markets, particularly in competitive wholesale markets. That is especially true in Texas, where 90 percent of the electricity consumed in the state flows through the Electric Reliability Council of Texas (ERCOT).
ERCOT is an independent system operator (ISO) which, like a regional transmission organization (RTO), acts as a clearinghouse between electricity supply (generation)
and demand (load). ISOs and RTOs are not-for-profit organizations that manage and operate wholesale power markets but do not themselves own any generation or transmission assets.
ISO participants typically include a wide variety of power producers, from operators of coal-fired and gas-fired plants to wind farms and nuclear power plants. They also include load serving entities, such as regulated distribution utilities.
Seven ISO/RTOs in the United States and three in Canada serve about 60 percent of North America’s electric load. Some serve a single state such as California or New York. Most are regional, such as PJM Interconnection, the largest among them, which serves 13 states and the District of Columbia.
Hydraulic fracturing has caused natural gas prices to drop 47 percent compared with what the price would have been prior to the drilling revolution in 2013, according to a Brookings Institute report.
The Affordable Microgrid: Securing Electric Reliability through Outsourcing
Copyright © 2018, Energy Efficiency Markets, LLC 10
Wholesale power markets and microgrids The basic mechanism of an ISO/RTO is the day-ahead market. Rules vary by region, but generators typically bid into the day-ahead market. The grid operator then ranks the bids and dispatches the generators from the lowest to the highest priced until all forecast load is filled.
In addition to a day-ahead market, ISO/RTOs can oversee markets for a variety of other functions that are needed to continuously balance supply and demand of electricity. These ancillary services include services referred to as frequency regulation, spinning reserves and operating reserves.
Wholesale markets across the country have seen growing levels of renewable energy penetration—particularly Texas. Last spring, ERCOT hit a record with wind power supplying just over 48 percent of load. The Southwest Power Pool also set a record with wind power supplying nearly 44 percent of load.
While high levels of wind power may be good for the environment, their unpredictable nature can create challenges on the smooth operation of the grid. When large amounts of surplus wind energy enter the grid, prices can go negative due to excess power availability. When the wind suddenly dies, the grid may run short on power and traditional fossil fuel generators cannot ramp up quickly enough to meet the near-instant demand for power.
In ERCOT, the growing presence of wind power combined with price volatility has made it tough for many traditional power plants to operate profitably. A total of about 5,625 MW of fossil fuel capacity in ERCOT (enough to supply the Austin and San Antonio, Texas metropolitan areas combined) is scheduled to be retired or mothballed in 2018. Even new, modern gas-fired combined-cycle plants, such as Panda Energy’s Temple plant, have had difficulty operating in this challenging market. In April 2017, Panda filed for bankruptcy court protection for the plant.
With the closing of these power plants, the Department of Energy (DOE) introduced a Notice of Proposed Rulemaking (NOPR) that would provide cost recovery for coal and nuclear plants that keep fuel on site. The NOPR was rejected by the Federal Energy Regulatory Commission (FERC), as there was no evidence to support the claim that these traditional power plants aid in grid resiliency. FERC Commissioner Richard Glick, however, acknowledged microgrids as a technology that does.
Resiliency is a defining feature of microgrids and industry leaders are actively discussing the benefits they can provide for the nation’s energy markets.
“ERock builds and operates ultra-clean and quiet resiliency microgrids specifically to provide electricity for critical services when the transmission and distribution cannot deliver,” McAndrew said. “We own and operate these microgrids, providing electrical resiliency as a very affordable service by maximizing revenues from selling to the electric grid, thus minimizing the price to our customer. When we sell to the grid, we respond very quickly to help buffer the intermittent nature of wind and solar, thus enabling continued growth of these renewables and decarbonization of electricity.”
Innovative microgrids could be the answer our power grid is looking for.
Microgrids can operate both within the grid and independently of it. McAndrew said ERock has adapted its business model to fit the economics of the modern wholesale market by looking beyond average wholesale market prices and at the more granular price opportunities resulting from intermittent resources. Hence, the operational flexibility of a gas-fired engine is an important consideration in the modern electric power market.
When large amounts of surplus wind energy enter the grid, prices can go negative due to excess power availability. When the wind suddenly dies, the grid may run short on power. Traditional fossil fuel generators cannot ramp up quickly enough to meet the near-instant demand for power.
“When we sell to the grid, we respond very quickly to help buffer the intermittent nature of wind and solar, thus enabling continued growth of these renewables and decarbonization of electricity.” – Thomas McAndrew, ERock

The Affordable Microgrid: Securing Electric Reliability through Outsourcing
Copyright © 2018, Energy Efficiency Markets, LLC 11
How microgrids operate during price spikesWhen continuously monitoring the wholesale power market, it becomes apparent that the “average price is made up of a lot of negative price periods and frequent price spikes,” McAndrew said.
For example, ERock’s microgrids at the 105 H . E. B grocery stores across Texas allow the stores to remain in business when the surrounding grid goes down. During normal operation, however, ERock sells the output from the generator into ERCOT’s energy and ancillary service markets, and offsets its capital and operating costs.
Any individual microgrid at one of the H.E.B stores may be small, but by aggregating them, ERock creates a virtual power plant that, with the assistance of software
controls, can watch for sudden changes in market conditions. Hence, a simultaneous spike in load and drop in wind production could indicate a need for fast responding generation.
ERock’s generators can respond more quickly than the fastest, centralized quick response generators, and much faster than the traditional natural gas combined cycle plants that provide much of ERCOT’s baseload fossil generation, according to McAndrew. ERock’s generators also respond more quickly than competing generators used for the same purpose, with response times as fast as one minute compared to five minutes for a comparable Wartsila generator. When market conditions change, ERock turns off its virtual power plant.
The ERock model beyond TexasSo far, ERock has employed its model in its home turf of Texas, but the company says it can work in many other parts of North America— and the world. As a result, ERock has begun expanding into other power markets.
Perhaps most important, the ERock approach —reliability-as-a-service— offers universal appeal to a range of potential microgrid customers, including retail stores, manufacturers, business parks, institutions and communities. ERock’s affordable microgrid brings them microgrid reliability with little capital expenditure and a predictable energy cost over time.
In the next chapter, we profile stores that kept the lights on during Hurricane Harvey using ERock microgrids.
Chapter 6Profile: how microgrids served Texas during Hurricane HarveyHurricane Harvey left Texas with $125 billion in damages, record rainfall, flooding that displaced 30,000 people, and destruction of more than 200,000 homes and businesses.
After the Category 4 Hurricane struck Aug. 25, 2017, Houston looked like little more than an inland sea dotted with islands, according to the New York Times.
In all, the hurricane caused 91 confirmed deaths.
But even as Harvey made its name as one of the most destructive storms in U.S. history, second only to Hurricane Katrina, there was some good news. Twenty-one grocery stores and gas stations were able to continue to provide food, fuel and water to beleaguered storm victims.
Those who found the H.E.B. and Buc-ee’s stores open were probably unaware that they were witnessing the demonstration of microgrid technology that energy insiders believe will help keep us safe as climate change leads to increasingly severe weather.
H.E.B food retailer
Founded in 1905, H.E.B. is one of the largest independently owned food retailers in the United States. H.E.B serves families all over Texas and Mexico in 155 communities, with more than 340 stores and over 100,000 employees. The company has won the retailer of the year award from Progressive Grocer Magazine because of its industry contribution, industry leadership, achievements with social responsibility and sustainability, community leadership, executive stewardship and corporate culture.
The Affordable Microgrid: Securing Electric Reliability through Outsourcing
Copyright © 2018, Energy Efficiency Markets, LLC 12
As more than a quarter of a million homes and businesses struggled in the dark, three Buc-ee’s and 18 H.E.B. stores were affected and still had power, thanks to ERock. In doing so, the stores were able to serve as an important community resource.
The Texas-based microgrid company describes its mission as “keeping businesses in business by ensuring electrical reliability.” But it did more than that as flood waters poured into Houston. ERock also discovered it was inadvertently in the business of helping rescue workers stay in business too.
Trying to coordinate rescue efforts during a power outage is a daunting task. Fortunately, workers found an electrified base of operations from which they could work: A Buc-ee’s store in Katy, Texas, still open because of its ERock microgrid. The region was heavily flooded, and many residents were forced to evacuate. But a National Guard unit, a search-and-rescue team and several state agencies were able to operate out of the store.
“Buc-ee’s was honored to host the first responders and national guardsmen at our Katy store during the recent disaster caused by hurricane Harvey. We were confident that our ERock generators would keep the lights on,” said Jeff Nadalo, Buc-ee’s General Counsel.
ConclusionElectricity is critical to our safety and well-being as digital technology governs more and more of our world. But severe storms, wildfires, equipment failure, and cyberattacks threaten to undermine the reliable flow of electricity. The time has come for more widespread implementation of the affordable microgrid.
The reliability-as-a-service model innovation leads the way for affordable microgrids by minimizing upfront capital costs for businesses and institutions that seek greater reliability. This model has the potential to make electrical resiliency accessible to 100x the number of commercial, industrial and institutional customers, while allowing the integration of renewable energy sources— reducing economic and community impact like never before.
About Enchanted RockFounded in 2006, Enchanted Rock, Ltd. builds and operates cost effective resiliency microgrids that help companies efficiently manage the risk associated with electricity interruptions. In 2010, ERock became the first in Texas to provide utility grade backup power as a service. The company is responsible for the design, project management, installation, and commissioning of 280 MW of distributed generation, including 160 MW of Distributed Power Generation projects and 120 MW of customer reliability systems. The company currently has 85 MW of customer resiliency microgrids under construction. ERock is the only distributed energy company combining expertise in energy market integration, control technologies, and construction, translating into more reliable and less expensive backup power for customers. ERock serves a wide range of industries including grocery stores, senior living facilities, travel centers, cold storage facilities, car dealerships, higher learning institutions and critical manufacturing facilities.
Buc-ee’s travel centers
Founded in 1982, Buc-ee’s operates travel centers — stores and fueling stations — at 40 locations in Texas and Florida. The company is noted for operating the world’s largest convenience store, a 67,000 square feet space in New Braunfels, Texas.
Buc-ee’s is in the Guinness World Record for world’s longest car wash, a 225-foot-long facility at its Katy, Texas store.
PRESS RELEASE
www.enchantedrock.com 1113 Vine St., Suite 101 |Houston, Texas, USA 77002
The North Fort Bend Water Authority Partners with Enchanted Rock on Pump Station Resiliency Microgrid Innovative Solution Will Ensure Water Delivery During Power Outages HOUSTON, TEXAS August 4, 2020 – The North Fort Bend Water Authority (“NFBWA”) has announced that it has entered into an agreement to ensure continuous operations of the NFBWA’s Bellaire Pump Station, a surface water pumping station, and uninterrupted service throughout its service area. Enchanted Rock’s clean and quiet natural gas-powered resiliency microgrid solution will provide the NFBWA with redundant power to prevent potential disruptions due to grid outages.
“We are excited about partnering with the NFBWA to help ensure reliable water supply for Fort Bend County,” said Thomas McAndrew, Founder and CEO of Enchanted Rock. “Water is such a critical resource, and the Enchanted Rock solution ensures resilient operations and water for the residents, even during extended power outages.”
The NFBWA selected Enchanted Rock based on their years of experience in providing resilient backup power during utility outages due to events such as Hurricane Harvey in 2017. Headquartered in Houston, Texas, Enchanted Rock delivers long-duration backup power with the cleanest technology available. The company’s integrated Reliability on Call (iROC) service will provide the NFBWA with worry-free reliability because Enchanted Rock operates and maintains the systems. The unique iROC model allows the NFBWA to receive full-facility backup at a fraction of the cost of a standard reliability system.
“We are delighted to find a trusted solution that addresses our reliability needs,” said Peter Houghton, NFBWA Board President. “This partnership enables us to better protect our community during grid outages.”
The NFBWA joins the list of other governmental entities served by Enchanted Rock’s resiliency microgrids, which include the Fort Bend County Levee Improvement District No. 2 and Gulf Coast Water Authority. This service is expected to be in operation in Spring of 2021.
The NFBWA resiliency project will be the latest addition to Texas Microgrid, a Houston-based, natural gas-powered distributed generation and microgrid platform. This new project demonstrates the commitment of the Texas Microgrid partners, Basalt Infrastructure Partners, LP and Enchanted Rock to advance the scale of Texas Microgrid’s existing 220 MW portfolio. The additions will be funded through the senior-secured construction and term financing that Texas Microgrid entered into during 2019.
PRESS RELEASE
www.enchantedrock.com 1113 Vine St., Suite 101 |Houston, Texas, USA 77002
About the North Fort Bend Water Authority The NFBWA is a regional water authority created in 2005 by the Texas Legislature to provide for a long-term alternative surface water supply to the Fort Bend County region. The NFBWA’s mission is to provide a plentiful supply of clean water from multiple sources, conserve groundwater and surface water supplies to provide for tomorrow’s water needs, and to educate people on the value of water, where our water comes from, and the importance of protecting this vital resource. To learn more, visit www.nfbwa.com.
About Enchanted Rock, LLC Enchanted Rock provides affordable, long duration backup power to commercial, industrial, and institutional customers by delivering a proven, full-service solution with the cleanest available technology. Enchanted Rock handles the design, construction, commissioning, operations, and maintenance of natural-gas powered generators so utilities can provide their customers with reliable backup power without the expense and challenges that come with maintaining a backup generation system. To learn more about offering electrical resiliency using Enchanted Rock solutions, visit www.enchantedrock.com or visit us on Twitter @ERock_LLC or LinkedIn.
About Texas Microgrid Texas Microgrid was formed in April 2016 to address the growing demand for reliable, backup generation among C&I customers in Texas. Texas Microgrid builds, finances, owns, and operates natural gas-based microgrids throughout Texas and sells utility grade backup generation under long term customer agreements.
The TMG microgrids rely on proven, quick response natural gas-fired and ultra-clean engines to provide electrical reliability to C&I facilities when normal utility power is not available. In exchange, TMG receives monthly payments from its C&I customers through 15-year contracts. Additional revenues are earned through sales of electricity and ancillary services in the ERCOT power market.
About Basalt Basalt Infrastructure Partners LLP is the exclusive investment adviser to the Basalt managed funds. Basalt I and Basalt II are infrastructure equity investment funds focusing on investments in utilities, power, transport, and communications infrastructure in the United States, Canada, and Europe. Helios Power represents Basalt’s eighth investment in the Basalt II fund. Other investments by the Basalt funds include the Upper Peninsula Power Company (UPPCO), Texas Microgrid, Detroit Renewable Energy and DB Energy Assets in the United States, and North Star, Mareccio Energia, Caronte and Tourist, Manx Telecom, and Connect Fibre in Europe. For more information, please visit www.basaltinfra.com.
Press Contact: Erica Scardelletti Silverline Communications [email protected] (609) 954-4410
The Joint Institute for Strategic Energy Analysis is operated by the Alliance for Sustainable Energy, LLC, on behalf of the U.S. Department of Energy’s National Renewable Energy Laboratory, the University of Colorado-Boulder, the Colorado School of Mines, the Colorado State University, the Massachusetts Institute of Technology, and Stanford University.
Contract No. DE-AC36-08GO28308
A Comparison of Fuel Choice for Backup Generators Sean Ericson and Dan Olis National Renewable Energy Laboratory
Technical Report NREL/TP-6A50-72509 March 2019
The Joint Institute for Strategic Energy Analysis is operated by the Alliance for Sustainable Energy, LLC, on behalf of the U.S. Department of Energy’s National Renewable Energy Laboratory, the University of Colorado-Boulder, the Colorado School of Mines, the Colorado State University, the Massachusetts Institute of Technology, and Stanford University.
JISEA® and all JISEA-based marks are trademarks or registered trademarks of the Alliance for Sustainable Energy, LLC.
The Joint Institute for Strategic Energy Analysis 15013 Denver West Parkway Golden, CO 80401 303-275-3000 • www.jisea.org Contract No. DE-AC36-08GO28308
A Comparison of Fuel Choice for Backup Generators Sean Ericson and Dan Olis National Renewable Energy Laboratory
Suggested Citation Ericson, Sean and Dan Olis. 2019. A Comparison of Fuel Choice for Backup Generators. Golden, CO: National Renewable Energy Laboratory. NREL/ TP-6A50-72509. https://www.nrel.gov/docs/fy19osti/72509.pdf.
Technical Report NREL/TP-6A50-72509 March 2019
NOTICE
This work was authored by the National Renewable Energy Laboratory, operated by Alliance for Sustainable Energy, LLC, for the U.S. Department of Energy (DOE) under Contract No. DE-AC36-08GO28308. Funding provided by Enchanted Rock, LLC. The views expressed herein do not necessarily represent the views of the sponsor, DOE, or the U.S. Government.
This report is available at no cost from the National Renewable Energy Laboratory (NREL) at www.nrel.gov/publications.
U.S. Department of Energy (DOE) reports produced after 1991 and a growing number of pre-1991 documents are available free via www.OSTI.gov.
Cover Photos: (left to right) NREL 04135, iStock 22779761, NREL 16933., NREL 15648, NREL 08466, NREL 21205
NREL prints on paper that contains recycled content.
iii This report is available at no cost from the National Renewable Energy Laboratory (NREL) at www.nrel.gov/publications.
Acknowledgements This work was sponsored by Enchanted Rock, LLC. The authors would like to thank Allan Schurr and Shannon Sauerhage from Enchanted Rock, LLC. for their support. The authors would also like to thank Bill Becker and Emma Elgqvist from the National Renewable Energy Laboratory (NREL) for their research of power markets for this report. In addition, the authors would like to thank NREL colleagues Kate Anderson, Jill Engel-Cox, Jeff Logan, Jeff Marqusee, and Pat Statwick for their valuable review and feedback. These reviews serve to make this report as technically sound as possible, however, any remaining errors or omissions are those of the authors. Furthermore, the views and opinions of authors expressed herein do not necessarily state or reflect those of the reviewers, their associated institutions, or the United States government or of any institution thereof.
iv This report is available at no cost from the National Renewable Energy Laboratory (NREL) at www.nrel.gov/publications.
Executive Summary The costs of a power outage to a business can be substantial, including losses in product, revenue, productivity, and customers. With increasing severe weather events and disasters triggering greater numbers of costly power outages, there is a growing interest in generators for reliable backup power. Businesses are either considering installing backup generators or—in the case of facilities such as hospitals and airports that are required to and already have backup power—are considering redundant backup systems for added resilience against grid outages. For decision makers to make informed choices, it is important to understand the cost and reliability associated with various backup system configurations.
This report discusses the costs and benefits of backup generator configurations. We analyze the relative costs and benefits—in terms of economics and reliability—of natural gas versus diesel as fuels for backup systems. We also compare the relative merits of grid-connected backup systems that enable financial benefits when the grid is functioning, versus backup-only systems that only generate energy for critical services when the primary grid is down.
We discuss how to assign value to the reliability of each system and the revenue streams related to backup generators. To provide concrete examples, we model diesel and natural gas backup systems installed at supermarkets located in Houston, Texas; Camden, New Jersey; and Orlando, Florida.
We find that, given our assumptions of fuel security for diesel and natural gas, natural gas generators are less likely than diesel generators to fail during a power outage. The differences in likelihoods of failure between natural gas and diesel generators are small for most regions and dependent on several assumptions. This indicates that differences in fuel source security are of second-order concern. We also find that grid-connected generators run for backup as well as additional services have higher reliability due to more frequent operation, and lower net costs than generators used solely for backup. At the same time, emergency-only systems may still be preferred, depending on permitting, noise, and air quality concerns.
Generators pose the risk of being unavailable due to problems with maintenance, failing to start and support load, and failing to run for the duration of the outage. Natural gas generators pose the additional risk of a loss of gas pressure, while diesel generators pose the additional risk of running out of fuel in situations where resupply is not possible. Fuel related risks are highest for widespread, long outages. Most power outages are short duration events, but long duration outages are not uncommon, especially in areas prone to natural disasters such as hurricanes, tornados, or wildfires.
We estimate that the higher reliability of the natural gas fuel supply compared to that of diesel fuel for long outages makes natural gas generators more reliable options than diesel generators, although there is very little data on the likelihood of fuel supply failures for either diesel or natural gas systems. The results are based on available data and should not be viewed as definitive evidence of the benefits of one system type over another.
We find that natural gas provides the largest additional reliability compared to diesel for regions that face high risks of long outages. Table ES-1 outlines the estimated chance of generators
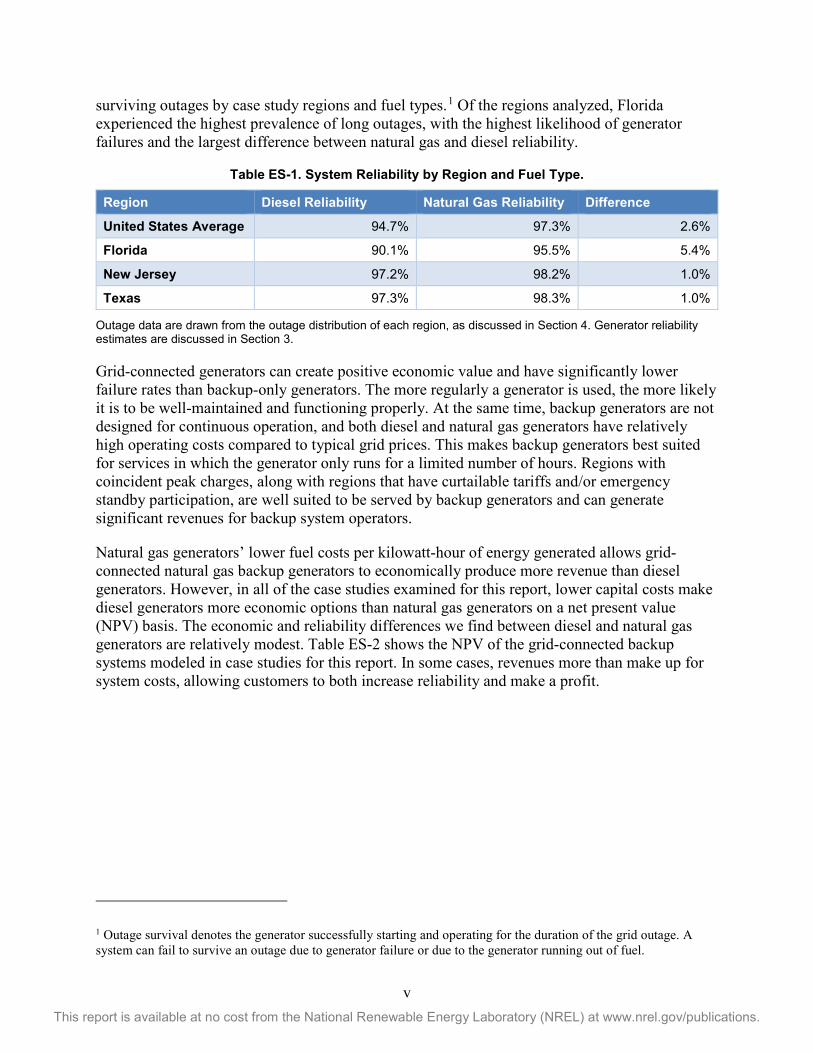
v This report is available at no cost from the National Renewable Energy Laboratory (NREL) at www.nrel.gov/publications.
surviving outages by case study regions and fuel types.1 Of the regions analyzed, Florida experienced the highest prevalence of long outages, with the highest likelihood of generator failures and the largest difference between natural gas and diesel reliability.
Table ES-1. System Reliability by Region and Fuel Type.
Region Diesel Reliability Natural Gas Reliability Difference
United States Average 94.7% 97.3% 2.6%
Florida 90.1% 95.5% 5.4%
New Jersey 97.2% 98.2% 1.0%
Texas 97.3% 98.3% 1.0%
Outage data are drawn from the outage distribution of each region, as discussed in Section 4. Generator reliability estimates are discussed in Section 3.
Grid-connected generators can create positive economic value and have significantly lower failure rates than backup-only generators. The more regularly a generator is used, the more likely it is to be well-maintained and functioning properly. At the same time, backup generators are not designed for continuous operation, and both diesel and natural gas generators have relatively high operating costs compared to typical grid prices. This makes backup generators best suited for services in which the generator only runs for a limited number of hours. Regions with coincident peak charges, along with regions that have curtailable tariffs and/or emergency standby participation, are well suited to be served by backup generators and can generate significant revenues for backup system operators.
Natural gas generators’ lower fuel costs per kilowatt-hour of energy generated allows grid-connected natural gas backup generators to economically produce more revenue than diesel generators. However, in all of the case studies examined for this report, lower capital costs make diesel generators more economic options than natural gas generators on a net present value (NPV) basis. The economic and reliability differences we find between diesel and natural gas generators are relatively modest. Table ES-2 shows the NPV of the grid-connected backup systems modeled in case studies for this report. In some cases, revenues more than make up for system costs, allowing customers to both increase reliability and make a profit.
1 Outage survival denotes the generator successfully starting and operating for the duration of the grid outage. A system can fail to survive an outage due to generator failure or due to the generator running out of fuel.
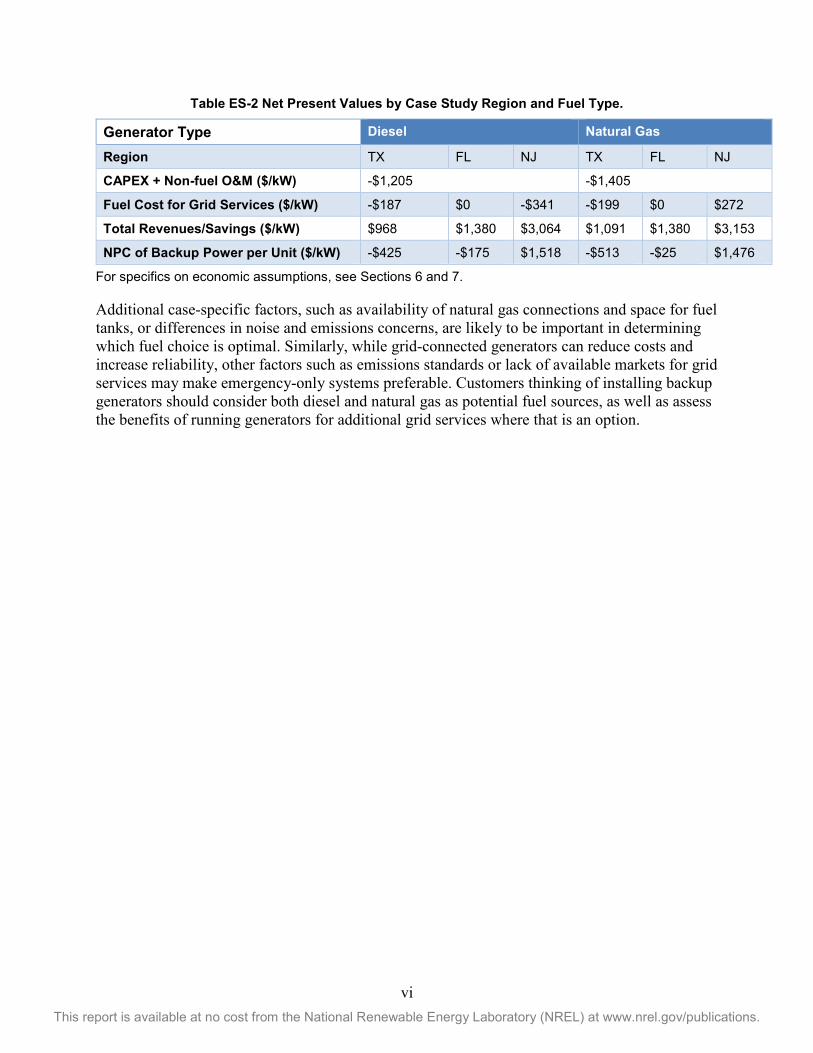
vi This report is available at no cost from the National Renewable Energy Laboratory (NREL) at www.nrel.gov/publications.
Table ES-2 Net Present Values by Case Study Region and Fuel Type.
Generator Type Diesel Natural Gas
Region TX FL NJ TX FL NJ
CAPEX + Non-fuel O&M ($/kW) -$1,205 -$1,405
Fuel Cost for Grid Services ($/kW) -$187 $0 -$341 -$199 $0 $272
Total Revenues/Savings ($/kW) $968 $1,380 $3,064 $1,091 $1,380 $3,153
NPC of Backup Power per Unit ($/kW) -$425 -$175 $1,518 -$513 -$25 $1,476
For specifics on economic assumptions, see Sections 6 and 7.
Additional case-specific factors, such as availability of natural gas connections and space for fuel tanks, or differences in noise and emissions concerns, are likely to be important in determining which fuel choice is optimal. Similarly, while grid-connected generators can reduce costs and increase reliability, other factors such as emissions standards or lack of available markets for grid services may make emergency-only systems preferable. Customers thinking of installing backup generators should consider both diesel and natural gas as potential fuel sources, as well as assess the benefits of running generators for additional grid services where that is an option.
vii This report is available at no cost from the National Renewable Energy Laboratory (NREL) at www.nrel.gov/publications.
Table of Contents 1 Introduction ........................................................................................................................................... 1 2 System Configurations ........................................................................................................................ 4
2.1 Primary Fuel Source ...................................................................................................................... 4 2.2 Services Provided .......................................................................................................................... 5
3 Calculating Backup System Reliability .............................................................................................. 6 3.1 Failure to Start (FTS) .................................................................................................................... 6 3.2 Failure to Run (FTR) ..................................................................................................................... 7 3.3 Failure of Fuel Supply (FFS) ........................................................................................................ 8 3.4 Summary of Reliability ............................................................................................................... 13
4 Outage Distributions .......................................................................................................................... 15 5 Likelihood of Failure .......................................................................................................................... 18 6 Costs and Benefits ............................................................................................................................. 20
6.1 Costs ............................................................................................................................................ 20 6.2 Benefits ....................................................................................................................................... 22
7 Case Studies ....................................................................................................................................... 24 7.1 Electrical Loads ........................................................................................................................... 24 7.2 Input Cost Assumptions .............................................................................................................. 25 7.3 Backup System ............................................................................................................................ 26 7.4 Grid Outage Distributions ........................................................................................................... 27 7.5 Markets and Revenue Opportunities ........................................................................................... 28 7.6 Market Analysis .......................................................................................................................... 29
8 Conclusion .......................................................................................................................................... 32
viii This report is available at no cost from the National Renewable Energy Laboratory (NREL) at www.nrel.gov/publications.
List of Figures Figure 1. Major electric disturbance events between 1984 and 2018. .......................................................... 2 Figure 2 Distribution of U.S. power outage durations between November 2016 and October 2018. ........ 15 Figure 3. Relation between outage duration and percentage of customers affected in utility area. ............ 16 Figure 4. Recovery periods from hurricane outages. .................................................................................. 17 Figure 5. Likelihood of surviving various duration outages given default parameters for backup-only
system. ................................................................................................................................... 18 Figure 6. Map of ISO/RTO regions. ........................................................................................................... 23 Figure 7. Fuel consumption for modeled generators. ................................................................................. 27 Figure 8. Customer outage-hour distributions by region. ........................................................................... 28 Figure 9. Houston, TX, life-cycle costs and revenues ($/kW) for diesel generator. ................................... 35 Figure 10. Houston, TX, life-cycle costs and revenues ($/kW) for natural gas generator. ......................... 35 Figure 11. Orlando, FL, life-cycle costs and revenues ($/kW) for diesel generator. .................................. 38 Figure 12. Orlando, FL, lifecycle costs and revenues ($/kW) for natural gas generator. ........................... 38 Figure 13. Camden, NJ, life-cycle costs and revenues ($/kW) for diesel generator. .................................. 42 Figure 14.Camden, NJ, life-cycle costs and revenues ($/kW) for natural gas generator. ........................... 43
List of Tables Table ES-1. System Reliability by Region and Fuel Type. .......................................................................... v Table ES-2 Net Present Values by Case Study Region and Fuel Type. ...................................................... vi Table 1. Electrical and Natural Gas Customer Outages During Select Natural Disasters. ......................... 13 Table 2. Estimates of System Failure Rates. ............................................................................................... 14 Table 3. Estimates of backup system reliability. ........................................................................................ 19 Table 4. Peak Demands for Modeled Supermarkets. .................................................................................. 25 Table 5. Capital and O&M Costs in $/kW. ................................................................................................. 25 Table 6. Fuel and Utility Cost Escalation Rates. ........................................................................................ 26 Table 7. Life Cycle Non-Fuel Unit Cost of Ownership of Backup Generator in $/kW. ............................. 26 Table 8. Marginal Levelized Cost of Energy from Generators. .................................................................. 27 Table 9. Generator Reliability by Region and Fuel Type. .......................................................................... 28 Table 10. Revenue Opportunities Modeled. ............................................................................................... 29 Table 11. Annualized Costs and Benefits per Unit of Backup Power ($/kW-year). ................................... 30 Table 12. Total Unit Costs and Revenues in Present Value. ...................................................................... 30 Table 13. Revenues by Type and Region. .................................................................................................. 31 Table 14. Modeled Rate Tariff in Texas. .................................................................................................... 33 Table 15 Modeled Rate Tariff in Florida. ................................................................................................... 37 Table 16. Modeled Rate Tariff in New Jersey. .......................................................................................... 40 Table A17. Lifecycle Revenues in Present Value for PV+BESS, Diesel Generator, and Diesel Hybrid
System for New Jersey Case Study. ....................................................................................... 45 Table A18. Revenues in Present Value for PV+BESS, Natural Gas Generator, and Natural Gas Hybrid
System (000’s?). ..................................................................................................................... 46 Table A19. Cost Assumptions for PV and BESS (000’s?). ........................................................................ 46
1 This report is available at no cost from the National Renewable Energy Laboratory (NREL) at www.nrel.gov/publications.
1 Introduction Modern life depends on a reliable supply of electricity. Power outages lead to a variety of negative business outcomes, such as reduced sales, damaged machinery, data loss, and product spoilage. In addition to disrupting daily life and interfering with services such as light and air conditioning, outages have tragic consequences when power is cut off to critical health and social services, such as lifesaving medical devices.
The electricity grid is vulnerable to a range of mechanical, operational, environmental, and human-related hazards (Preston, et al., 2016). As Figure 1 shows, both an aging grid and an increase in extreme weather events have led to an increase in power outages in recent years (Laws, Anderson, DiOrio, Li , & McLaren, 2018). Mechanical faults, line shorts, and animal interference are common causes of outages at the distribution level. Natural disasters such as fires, snow storms, and hurricanes can cause large and long outages.
As of January 2018, three of the top five most-expensive hurricanes to hit the United States occurred in 2017 (National Hurricane Center, 2018).2 Hurricanes Florence and Michael in 2018 resulted in widespread power outages, as well. In October 2018, the California utility Pacific Gas and Electric—in an effort to reduce the chance of wildfires caused by transmission lines—shut off power to 60,000 customers (Elias, 2018). The threat of high-impact, low-probability hazards such as cyberattacks have also been increasing (Preston, et al., 2016).
2 The five most expensive hurricanes as of January 2018 were Katrina (2005), Harvey (2017), Maria (2017), Sandy (2012), and Irma (2017).
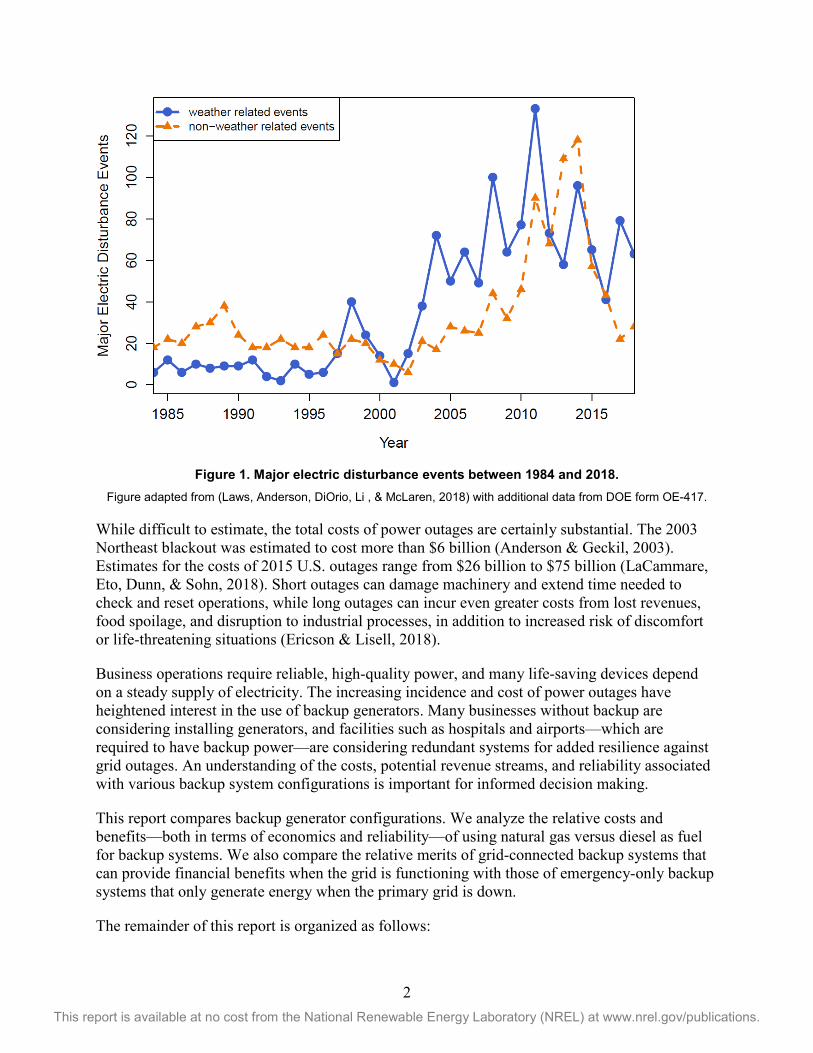
2 This report is available at no cost from the National Renewable Energy Laboratory (NREL) at www.nrel.gov/publications.
Figure 1. Major electric disturbance events between 1984 and 2018. Figure adapted from (Laws, Anderson, DiOrio, Li , & McLaren, 2018) with additional data from DOE form OE-417.
While difficult to estimate, the total costs of power outages are certainly substantial. The 2003 Northeast blackout was estimated to cost more than $6 billion (Anderson & Geckil, 2003). Estimates for the costs of 2015 U.S. outages range from $26 billion to $75 billion (LaCammare, Eto, Dunn, & Sohn, 2018). Short outages can damage machinery and extend time needed to check and reset operations, while long outages can incur even greater costs from lost revenues, food spoilage, and disruption to industrial processes, in addition to increased risk of discomfort or life-threatening situations (Ericson & Lisell, 2018).
Business operations require reliable, high-quality power, and many life-saving devices depend on a steady supply of electricity. The increasing incidence and cost of power outages have heightened interest in the use of backup generators. Many businesses without backup are considering installing generators, and facilities such as hospitals and airports—which are required to have backup power—are considering redundant systems for added resilience against grid outages. An understanding of the costs, potential revenue streams, and reliability associated with various backup system configurations is important for informed decision making.
This report compares backup generator configurations. We analyze the relative costs and benefits—both in terms of economics and reliability—of using natural gas versus diesel as fuel for backup systems. We also compare the relative merits of grid-connected backup systems that can provide financial benefits when the grid is functioning with those of emergency-only backup systems that only generate energy when the primary grid is down.
The remainder of this report is organized as follows:
3 This report is available at no cost from the National Renewable Energy Laboratory (NREL) at www.nrel.gov/publications.
• Section 2 discusses the differences between various backup system configurations.
• Section 3 discusses a framework for determining backup system reliability—the likelihood that a backup system will be able to meet electricity needs in the event of a loss of grid power.
• Section 4 provides an analysis of power outage distributions.
• Section 5 combines the likelihoods of failure discussed in Section 3 with the power outage durations described in Section 4 to estimate the likelihood that diesel and natural gas generators will be able to provide power for the duration of a grid outage.
• Section 6 discusses the costs and benefits of different system configurations.
• Section 7 provides a series of case studies comparing the monetary and reliability costs and benefits of different system configurations for a variety of locations.
• Section 8 concludes the report with key insights and takeaways.
4 This report is available at no cost from the National Renewable Energy Laboratory (NREL) at www.nrel.gov/publications.
2 System Configurations There is a wide array of potential backup system configurations, with the costs and benefits of each depending on specific operational requirements and desired level of reliability. Size, number, and quality of generators are key determinants of system reliability. Having more generators than the required minimum increases system installation and maintenance costs, but means the system can still meet load demands if a single generator is unavailable due to maintenance issues or failure. Frequency and quality of maintenance also help determine system cost and reliability.
In addition to generator quality and quantity, choices regarding fuel sources, maintenance, and operation have important ramifications for system reliability. Capital costs, fuel costs, and operations and maintenance (O&M) costs, as well as noise and emissions levels, vary by fuel choice and hours operated. Optimal system configuration depends on load characteristics, reliability, location, noise, emissions, and regulatory considerations. Permitting and federal and local regulatory requirements may place constraints on fuel and operation options.
The following sections describe the characteristics of backup system configurations as analyzed in this report. We compare the effects of using diesel or natural gas as the primary fuel, and of using the backup generator only during emergencies or to provide additional services, as well. We assume the backup system consists of a single generator that can fully meet peak building load demands.
2.1 Primary Fuel Source The type of fuel used in a backup system has important ramifications for system costs, reliability, noise, emissions, and ability to meet regulations and permitting requirements. While many fuels are available, roughly 95% of backup generators used by commercial buildings and critical facilities are powered by either diesel or natural gas (Philips, Wallace, Kudo, & Eto, 2016).3
Apart from differences in costs, which are discussed in Section 7, an important distinction between the two fuels is that diesel is supplied by truck deliveries and stored onsite, while natural gas is supplied by pipeline. As storage is generally not an option for natural gas, any event that disrupts the natural gas supply will disrupt operation of a natural gas-fueled generator. Natural gas generators are further constrained to locations with access to natural gas pipelines (Robinson, Atcitty, Zuffranieri, & Arent, 2006). On the other hand, diesel generators require fuel resupply to continue operating, which can prove difficult in the event of a long outage.
Fuel resupply can be especially problematic during extreme weather events, when roads, ports and/or terminals may be inoperable, and fuel shipments may be redirected to what are considered more critical needs (CSRIC, 2014; ACEP, 2015; Hampson, Bourgeois, Dillingham, & Panzarella, 2013; Victory, 2006). Furthermore, diesel fuel has a limited shelf life. The American Society for Testing and Materials rates diesel fuel stability at one year, after which it should be replaced (CSRIC, 2014). Degraded fuel can clog fuel filters and stall generators.
3 As of 2016, generators at 85% of the surveyed facilities used diesel and 10% used natural gas (Philips, Wallace, Kudo, & Eto, 2016). Most of the remaining facilities used propane.
5 This report is available at no cost from the National Renewable Energy Laboratory (NREL) at www.nrel.gov/publications.
Emissions levels vary dramatically by generator configuration and fuel type. Backup generators located in densly populated areas pose major air quality concerns (Ryan, Larsen, & Black, 2002) (NESCAUM, 2012). While modern diesel generators pollute significantly less than older models, they still present potential health risks. The Environmental Protection Agency currently requires backup generators that are used only during grid outages be Tier 2-compliant and generators that are used to provide additional services to be Tier 4-compliant (Harness, 2008). The Tier rating of a generator depends on the emissions rate of the generator. Tier 4 generators emit 94% less NOx and 91% less particulate matter than Tier 2 engines (NESCAUM, 2012), but also have greater capital and O&M costs than lower-tiered systems. Emissions from natural gas engines are less than those from Tier 2 diesel generators and, depending on engine characteristics, are on par with or less than those of Tier 4 diesel systems (NESCAUM, 2012).
Because natural gas engines often have significantly less sulphur and NOx emissions than comparable diesel engines, natural gas can more easily meet air quality requirements. This results in a simpler permitting process for natural gas compared to diesel. At the same time, many critical facilities, such as hospitals, are required to store fuel onsite—which is typically impossible with natural gas. The NFPA 110 Standard for Emergency and Standby Power Systems states that “between 48 and 96 hours of fuel for a Level 1 facility” (i.e., where “failure of the equipment to perform could result in loss of human life or serious injuries”) must be stored onsite (NFPA, 2019).
2.2 Services Provided Most backup systems are designed and permitted solely to provide power to critical loads in the event of a grid outage. However, some systems provide financial value through additional operational and grid services. Services include selling into wholesale markets, reducing facility peak loads, reducing facility loads during the grid peak loads, allowing the facility to switch to an interruptable tariff, and selling to grid emergency service markets. Each potential revenue source is discussed in more detail in Section 6.2. Revenues from additional services can significantly reduce the life-cycle costs of a backup power system.
The number of and participation in demand response programs has increased markedly in recent years (FERC, 2018). In 2016, the potential peak demand savings from retail demand response programs increased by 9.3%, from 32.8 GW to 35.9 GW (FERC, 2018). Opportunities to participate in demand response programs are increasing, and in some areas the revenue from participation is increasing, as well.
Not all demand response services can be monetized in all areas, and the revenues generated from additional grid services vary by region. In order to provide grid services, backup generators must meet more stringent emissions and permitting requirements, and often operators must pay additional interconnection fees. Therefore, the costs and benefits of configuring a backup system to provide grid services must be determined on a case-by-case basis.
The following sections discuss how to calculate the reliability of various system configurations and estimate the reliability of natural gas and diesel generators.
6 This report is available at no cost from the National Renewable Energy Laboratory (NREL) at www.nrel.gov/publications.
3 Calculating Backup System Reliability A backup system is considered to have failed when it has been unable to provide sufficient power to meet load during a power outage. The likelihood of failure varies with system configuration and across time. This section discusses the causes of system failures and the failure rates of various system configurations. Section 4 provides analysis on the distribution of outages, and Section 5 discusses the likelihood of failure across systems.
Due to data limitations, we are required to make a number of assumptions, which should be noted when interpreting results. Importantly, many of the failure estimates are for diesel generators, and we assume gas generators have similar failure profiles.
A backup system fails when the generator or supporting components fail to the extent that the system can no longer meet load demands.4 The causes of generator failure can be separated into three categories:
• Failure to start (FTS) • Failure to run (FTR) • Failure of fuel supply (FFS).
3.1 Failure to Start (FTS) FTS includes all failures that occur before the generator has ramped to speed and the output breaker has received a signal to close (Nuclear Energy Institute, 2013). Many emergency generators are run infrequently, especially in areas with high grid reliability. The low utilization levels can result in generators failing to start when they are needed most. Generators that provide grid services in addition to backup power are often run more frequently, which generally coincides with a lower FTS rate. Higher utilization can lead to lower failure rates, both because worn-out components are replaced more quickly and because conditions such as spoiled fuel are remedied by more frequent operation.
FTS can be separated into unavailability due to planned maintenance and unexpected unavailability. Necessary regular maintenance may lead, on occasion, to a generator being unavailable during a power outage due to planned maintenance and repair (Schroeder, 2018).
Depending on the amount of advance notice before an outage, it may be possible to reschedule maintenance to ensure generator availability. However, for unexpected outages, generator unavailability due to maintenance will contribute to FTS. Maintenance may also be scheduled during periods when outage costs would be minimal, such as periods of low anticipated demand.
A range of factors contribute to unexpected unavailability. One of the most common according to one analysis, a failure of one of the generator voltage controllers, caused 50% of total FTS for available emergency generators at nuclear power plants (Mrowca, 2011). Another typical cause of FTS is a dead starter battery (Dembski, 2007). Oil or coolant leaks, oil lubrication system 4 In some cases, backup systems have more than one generator and can have more generators than required. In this case, the backup system fails once a sufficient number of generators or related components fail, so that remaining generators cannot meet the desired load. To simplify the analysis, this report assumes that the system consists of a single generator.
7 This report is available at no cost from the National Renewable Energy Laboratory (NREL) at www.nrel.gov/publications.
failure, and user errors (e.g., forgetting to reset the generator to the “auto” position after testing or servicing) are also common causes of failure (Dembski, 2007; Mrowca, 2011).
In diesel generators, fuel degradation can lead to both FTS and FTR. Long-term storage of diesel results in microbial growth, which can clog filters, pipes, and fuel injectors. Diesel fuel that is not replaced every 6-12 months to maintain quality can increase the probability of system failure (CSRIC, 2014).
Regularly maintained and tested generators, along with generators that run more frequently, have a lower chance of failing to start. Malfunctioning components are more likely to be identified and replaced in generators that are run frequently, and many causes of FTS, such as fuel degradation, are mitigated by frequent generator operation. Generators that are run to provide grid services in addition to backup power are therefore likely to be more reliable than generators used exclusively for backup power (Smith, Donovan, & Bartos, 1990).
The most comprehensive data set on emergency generator reliability comes from the Institute of Nuclear Power Operations Consolidated Events Database, which tracks statistics on backup diesel generators at U.S. nuclear power plants.5 A review of failure rates at nuclear plants between 1998 and 2016 found that generators that were available to run—not down for maintenance and repair—failed to start and take load approximately 0.6% of the time (Schroeder, 2018).
Backup generators at commercial nuclear facilities are some of the best-maintained generators in operation, so it is likely that the typical backup generator for a site that requires less reliability than a nuclear plant will have higher FTS rates. The Institute of Electrical and Electronics Engineers (IEEE) states that well-maintained engines fail to start 0.89 times as often as the average engine, implying the average backup generator fails 1.12 times as often as a well-maintained generator (IEEE, 2007). Applying this weighting factor, we estimate an FTS rate for the typical available backup generator at 0.67%.
Generators in the Nuclear Power Operations Consolidated Event Database were estimated to be unavailable due to maintenance 1.48% of the time.6 Customers who strategically schedule maintenance during periods such as nights or weekends, when the cost of an outage is lower, can mitigate the effects of maintenance downtime on system reliability. Our base case assumes maintenance can be strategically planned, so that the generator is back in service and available to meet outages. However, we use the 1.48% estimate as a sensitivity check against the base case.
3.2 Failure to Run (FTR) FTR includes all mechanical failures that occur after the generator has successfully started and the output breaker has closed (Nuclear Energy Institute, 2013). Controllers and lubricating oil are common sources of FTR (Mrowca, 2011). Engine overheating and component structural failures are additional factors influencing FTR. Degraded fuel is an especially common cause of FTR, as it can allow the engine to start, but then stall as filters become clogged (Kirchner, 2012).
5 Data can be found at https://nrcoe.inl.gov/resultsdb/ 6 This equates to approximately 5.4 days of maintenance downtime per year
8 This report is available at no cost from the National Renewable Energy Laboratory (NREL) at www.nrel.gov/publications.
Unlike FTS, which is binary, FTR is dependent on the length of run time. Some FTR events, such as controller failure, are more likely to occur in early startup hours, rather than in later periods of operation. Other FTR events, such as engine overheating or structural failures, are more likely to occur in later hours, rather than when the generator first begins running. For simplicity, however, we assume the likelihood of FTR in each hour is constant. Using the hourly FTR rate of 0.154% estimated from the Nuclear Power Operations Consolidated Events Database, and applying the IEEE weighting factor of 1.12 described above, results in an hourly failure rate of 0.172%. This relates to a mean time to failure (MTTF) of 580 hours.7
The MTTF estimate of 580 hours aligns well with the Smith, Donovan, & Bartos (1990) analysis of backup power systems at commercial and military facilities, which estimated an MTTF of 545 hours for standby packaged diesel generators and an MTTF of 457 hours for all standby diesel generators.8 While Schroeder (2018) is a larger data set that also provides data on FTS and generator unavailability, the Smith, Donovan, & Bartos data set provides useful additional data, because the generator sizes analyzed (between 600-kW and 1800-kW systems) are closer to the sizes of backup generators found in most commercial systems. Smith, Donovan, & Bartos are additionally useful in that they provide failure rates for both standby and continuous generator systems.9
Diesel generators marked as used for continuous operations had a MTTF roughly twice as long as that of standby generators.10 Similarly, the likelihood of a failure in the starting system was 4.4 times more likely for a standby system than for a continuous system. Due to a lack of additional data, we use these multipliers when comparing emergency-only systems and grid-connected systems. Hence, we assume a grid-connected generator has an FTS rate of 0.15% and an hourly FTR rate of 0.086% (MTTF of 1,160 hours).
3.3 Failure of Fuel Supply (FFS) A failure of fuel supply (FFS) occurs when the generator is working properly but stalls due to insufficient diesel or natural gas. FFS for a diesel generator generally occurs when diesel resupply shipments are disrupted, and the generator exhausts its fuel tank. FFS for a natural gas generator coincides with a disruption of the supply of natural gas. We provide a discussion of relevant characteristics and FFS estimates for both diesel and natural gas generators below.
7 There is often confusion between MTTF, which denotes mean operating hours between failures, and mean time between failures (MTBF), which denotes mean calendar hours between failures. For continuously-operated machinery MTTF and MTBF are identical, but for backup generators the two numbers are drastically different due to the small amount of operating hours. If a generator operates 100 hours a year, and breaks down on average once every two years, then it has an MTTF of 200 hours, but a MTBF of two years (17,520 hours). Therefore, it is important to distinguish between the two metrics when modeling backup systems. 8 Generators are separated into auxiliary and packaged systems and marked as being used for continuous operation or for standby. 9 The term “continuous system” is somewhat misleading, as these systems are only utilized a few hours each day. The average capacity factor was 37% for a packaged diesel system identified as “continuous”, and was 6% for a system identified as “standby”. 10 Note that there is a typo in the original study where the operating hours for continuous and standby auxiliary diesel generators were reversed. We corrected for this mistake before calculating MTTF.
9 This report is available at no cost from the National Renewable Energy Laboratory (NREL) at www.nrel.gov/publications.
Diesel Fuel Supply
The fuel tank size for diesel generators varies by facility and by regulatory requirements. Many critical facilities, such as hospitals, are required to store between 48 and 96 hours of fuel onsite (NFPA, 2019). Retail stores with backup generators have a reported average fuel duration of 36 hours (Philips, Wallace, Kudo, & Eto, 2016). Because this report’s case studies focus on supermarkets, we use a 36-hour duration as a baseline assumption.11
Additional off-grid electricity sources such as on-site solar PV paired with battery storage can reduce generator fuel consumption and extend the periods of operation between refueling times (Anderson, et al., 2018). Anderson, et al., finds that renewable energy-generator hybrid systems can double or triple the amount of continuous service time compared to a standalone diesel generator with an equivalent fuel tank size.
Under normal conditions, fuel can be replenished well before a generator exhausts its fuel tank. However, long outages often coincide with abnormal conditions such as extreme weather events, which can close roads and impede normal transportation (ACEP, 2015; CSRIC, 2014; Hampson, Bourgeois, Dillingham, & Panzarella, 2013; Victory, 2006). Long outages also often affect an entire region, which can lead to increased fuel demand and regional fuel shortages. During Hurricane Katrina, for example, fuel intended to resupply commercial generators was redirected to support rescue efforts (Victory, 2006). FFS therefore can pose a significant risk to generators with limited storage in the event of a long outage.
While FFS occurs once the generator runs out of fuel, this does not necessarily imply that all fuel is exhausted. In some instances, the diesel storage tank is located separately from the generator, as is common when the generator is installed on the roof to prevent flooding or for air quality reasons. If the fuel pumps that supply the fuel from the remote tank to the generator get damaged or malfunction, then FFS can occur before the generator consumes all available fuel. During Hurricane Sandy in 2012, several large data centers and Bellevue Hospital were shut down due to water disabling the fuel pumps (Bernstein & Hartocollis, 2012; McNevin, 2012).
Despite common assertions regarding the ability, or inability, to resupply diesel generators during natural disasters, very little analysis has been conducted. To our knowledge, there is no data set with information on the likelihood of resupply during long outages.
In lieu of a more comprehensive data set, we rely on a survey of the impacts of Hurricane Sandy on hospitals for an initial point estimate (ACMP, 2015). Fourteen percent of hospitals that experienced power outages during Hurricane Sandy also experienced generator fuel shortages.12 For our analysis we assume that additional fuel resupplies are guaranteed if the initial fuel
11 Fuel supply is complicated by the variation of building load over time. Thus, an equal number of gallons of fuel related to different hours of runtime, depending on the building load profile. We resort to a constant runtime however in order to reduce problem complexity. 12 The sample set is notably small. Fourteen hospitals experienced a loss of power, and of these, two experienced generator issues due to fuel shortage.
10 This report is available at no cost from the National Renewable Energy Laboratory (NREL) at www.nrel.gov/publications.
resupply is successful. As fuel resupply generally becomes easier over time, this assumption significantly simplifies the process of estimation, while retaining an acceptable level of accuracy.
Note that the 14% likelihood of a failure of resupply should not be viewed as a precise estimate. The study is for a single storm event and includes data from a small number of participants. Hurricane Sandy was an exceptionally large storm, which resulted in high levels of road closures and significantly increased fuel demand. Average storm events may have lower likelihoods of fuel resupply failure. At the same time, hospitals are higher-priority facilities than commercial buildings and have larger fuel reserves than most commercial backup generators, implying fuel supply failures for commercial buildings may be more extreme than those estimated for hospitals. What can be stated with certainty is that resupply shipments to diesel generators during extreme weather events are common but far from guaranteed.
Natural Gas Fuel Supply
Unlike diesel, which is stored onsite, natural gas is supplied through a network of pipelines. Natural gas benefits from not requiring resupply shipments, but its use may be vulnerable to gas network incidents. The frequency of gas disruptions, especially those coincident with power outages, determines the relative reliability of natural gas backup generators compared to that of diesel generators.
A clear distinction should be made between natural gas backup generators and natural gas power plants. The use of natural gas-fired power plants to produce electricity more than doubled between 2001 and 2017 (EIA, 2001-2017), resulting in the development of a robust physical connection between bulk natural gas supply and the bulk power grid (NERC, 2017). The interruptible gas contracts purchased by most large natural gas power plants are less costly than firm contracts but are often the first services to be curtailed when demand exceeds supply (FERC, 1999). In intense cold snaps, such as recent “polar vortices” that brought unusual, extremely cold weather to the United States and Canada, natural gas power plants can be curtailed due to supplies being redirected to firm customers, potentially resulting in power brownouts or outages.
In contrast, backup generators are supplied through firm contracts, so they do not face the same threat of gas curtailment. The primary cause of disruption of fuel supply to a backup generator would be from disruption to the local gas distribution network.
Unplanned interruptions to gas service can result from human error (e.g., damage to pipelines by excavation activities), equipment malfunction, and from natural events such as flooding, fires, or earthquakes (Argonne National Laboratory, 2002). Damage to pipelines from third-party construction excavation activities is by far the most common cause of supply disruption (Argonne National Laboratory, 2002). However, disruptions caused by excavation activities usually do not coincide with electric power outages. In general, natural gas disruptions occur infrequently enough that they are highly unlikely to occur at the same time as an electrical outage.
Data on the reliability of natural gas fuel supply is very sparse, which makes estimating the reliability of fuel supply difficult. Natural gas utilities do not report reliability metrics, and there
11 This report is available at no cost from the National Renewable Energy Laboratory (NREL) at www.nrel.gov/publications.
is no data set with a compilation of natural gas outage events. What data does exist on incidents impacting natural gas infrastructure is primarily focused on pipelines (PHMSA, 2018). The natural gas network’s multiple redundancies mean supply can be rerouted (Judson, 2013), so there is generally little correlation between pipeline incidences and curtailment of customer load.
Perhaps the most comprehensive data set is from Liss & Rowley (2018), which uses survey data to estimate the outage rates for natural gas distribution operations. Discussions with industry experts, along with a variety of reports, provide additional insight into the cause of natural gas outages and the likelihood of natural gas outages during major disruption events (DOE, 2013; DOE, 2016; EIA, 2018; FERC/NERC, 2011; ICF, 2018; INTERCEP, 2013; Judson, 2013; Natural Gas Council, 2017; Smead, 2018). Natural gas supply is significantly more reliable than electricity (Judson, 2013). In 2016, for example, the number of natural gas customer disruptions in the United States was on the order of 100,000, while the number of electricity customers affected by power outages was 8.1 million (Natural Gas Council, 2017). Because pipelines are located underground, they are less vulnerable than overhead electrical lines (Judson, 2013). According to surveys of a range of utility companies, electricity outages are roughly 100 times more likely than natural gas outages (Liss & Rowley, 2018).
If electrical and natural gas outages are uncorrelated, then the risk of coincident outages of both natural gas and electricity services is negligible. This may best be shown with a concrete example. In 2017 the region with the highest average electricity interruption duration was Maine, at a little less than two days of outages per customer (EIA, 2018). As reported in Liss & Rowley (2018), the highest natural gas outage rate in the United States was approximately one outage every 25 years for each customer. If it is assumed that the average natural gas outage lasts for 24 hours, then the highest outage rate reported is roughly one outage day every 25 years. If natural gas and electric outages are uncorrelated, using these numbers (which are well above average), a customer will experience a coincident outage event only if the gas outage which occurs once every 25 years falls on the same day as one of the two grid outage days—a 0.02% chance of a coincident outage occurring in a given year.
Correlated Electric and Natural Gas Fuel Disruptions
Since natural gas systems are mostly underground, and natural gas distribution does not require a working electrical grid13, outages in the two systems are often uncorrelated. However, some events may lead to correlation of outages between the two networks. A natural gas explosion may damage the local electrical grid, leading to both gas and electrical outages. Natural disasters such as earthquakes, hurricanes, or extreme cold weather may damage both systems.
A higher correlation of outages between the two systems implies a higher likelihood of coincident electrical and natural gas outages. We separate likelihood of coincident gas and electric outages by whether the outage is short or long duration. Long duration outages likely have higher correlations between the systems due to the potential for large natural disasters to affect both the electrical grid and gas network. Reports of coincident electricity and natural gas
13 While the natural gas transmission network often depends on electrical motors—for example, to drive compressors—the local distribution network is less dependent on a functioning electrical grid.
12 This report is available at no cost from the National Renewable Energy Laboratory (NREL) at www.nrel.gov/publications.
outages during natural disasters, while incomplete, provide valuable data points on the likelihood of coincident electricity and natural gas outages. Table 1 provides information on electricity and natural gas outages for a variety of events.
During Hurricanes Irma and Harvey in 2017, the natural gas infrastructure was highly resilient. A combined total of four customers lost gas service during the two storms (ICF, 2018).14 During Hurricane Irene in 2011, the gas system experienced a relatively low curtailment rate, with less than 1% of customers who experienced power outages also experiencing natural gas curtailments.
During the 2011 Southwest cold weather event, most customers continued to receive gas supplies, though some equipment from the electrical and natural gas distribution networks was compromised, resulting in curtailments of both services (FERC/NERC, 2011). Similarly, according to discussions with natural gas operators regarding impacts of Hurricane Sandy in 2012, older pipes in the New York area were of low enough pressure to allow water to seep in, leading to relatively higher levels of natural gas curtailments. Finally, significant natural gas shutoffs occurred during a series of California wildfires in 2017 to avoid adding fuel to the fire.
According to a report on the effect of climate-related disasters on the natural gas sector, “Natural gas network shutoffs must also occur when aboveground infrastructure such as gas meters are incinerated, as happened during both California wildfires when homes and other natural gas end-using buildings were consumed. Such shutoffs, however, are area-wide and affect both damaged and undamaged buildings.” (ICF, 2018)
The high correlations between electricity and natural gas outages during the 2017 California wildfires are outliers, with the chance of natural gas curtailment during disasters other than wildfires generally being much lower than the chance of electricity curtailment. However, these examples do point to the fact that some types of disasters are more likely than others to affect both natural gas and electricity service.
14 The two gas curtailments during hurricane Irma were due to a downed power line igniting gas escaping from an underground main, while the curtailments during Harvey were due to a pipeline rupture caused by turbulent flood waters (ICF, 2018).
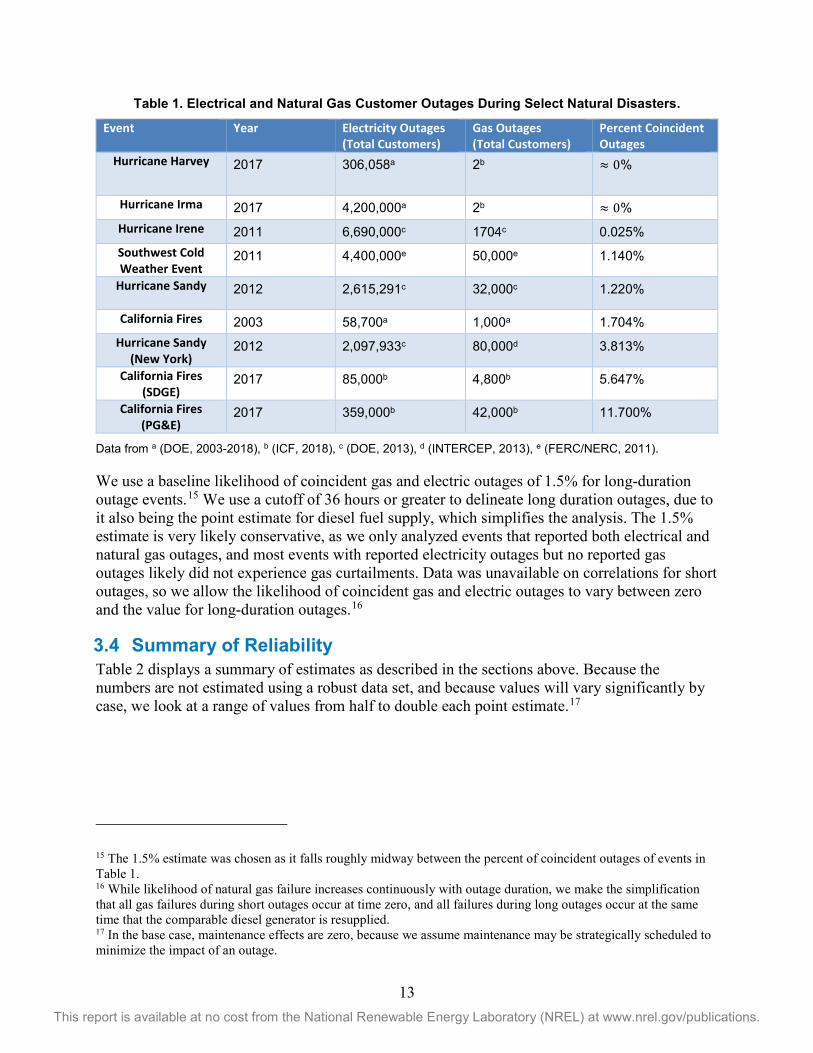
13 This report is available at no cost from the National Renewable Energy Laboratory (NREL) at www.nrel.gov/publications.
Table 1. Electrical and Natural Gas Customer Outages During Select Natural Disasters.
Event Year Electricity Outages (Total Customers)
Gas Outages (Total Customers)
Percent Coincident Outages
Hurricane Harvey 2017 306,058a
2b ≈ 0%
Hurricane Irma 2017 4,200,000a 2b ≈ 0% Hurricane Irene 2011 6,690,000c 1704c 0.025% Southwest Cold Weather Event
2011 4,400,000e 50,000e 1.140%
Hurricane Sandy
2012 2,615,291c 32,000c 1.220%
California Fires 2003 58,700a 1,000a 1.704% Hurricane Sandy
(New York) 2012 2,097,933c 80,000d 3.813%
California Fires (SDGE)
2017 85,000b 4,800b 5.647%
California Fires (PG&E)
2017 359,000b 42,000b 11.700%
Data from a (DOE, 2003-2018), b (ICF, 2018), c (DOE, 2013), d (INTERCEP, 2013), e (FERC/NERC, 2011).
We use a baseline likelihood of coincident gas and electric outages of 1.5% for long-duration outage events.15 We use a cutoff of 36 hours or greater to delineate long duration outages, due to it also being the point estimate for diesel fuel supply, which simplifies the analysis. The 1.5% estimate is very likely conservative, as we only analyzed events that reported both electrical and natural gas outages, and most events with reported electricity outages but no reported gas outages likely did not experience gas curtailments. Data was unavailable on correlations for short outages, so we allow the likelihood of coincident gas and electric outages to vary between zero and the value for long-duration outages.16
3.4 Summary of Reliability Table 2 displays a summary of estimates as described in the sections above. Because the numbers are not estimated using a robust data set, and because values will vary significantly by case, we look at a range of values from half to double each point estimate.17
15 The 1.5% estimate was chosen as it falls roughly midway between the percent of coincident outages of events in Table 1. 16 While likelihood of natural gas failure increases continuously with outage duration, we make the simplification that all gas failures during short outages occur at time zero, and all failures during long outages occur at the same time that the comparable diesel generator is resupplied. 17 In the base case, maintenance effects are zero, because we assume maintenance may be strategically scheduled to minimize the impact of an outage.
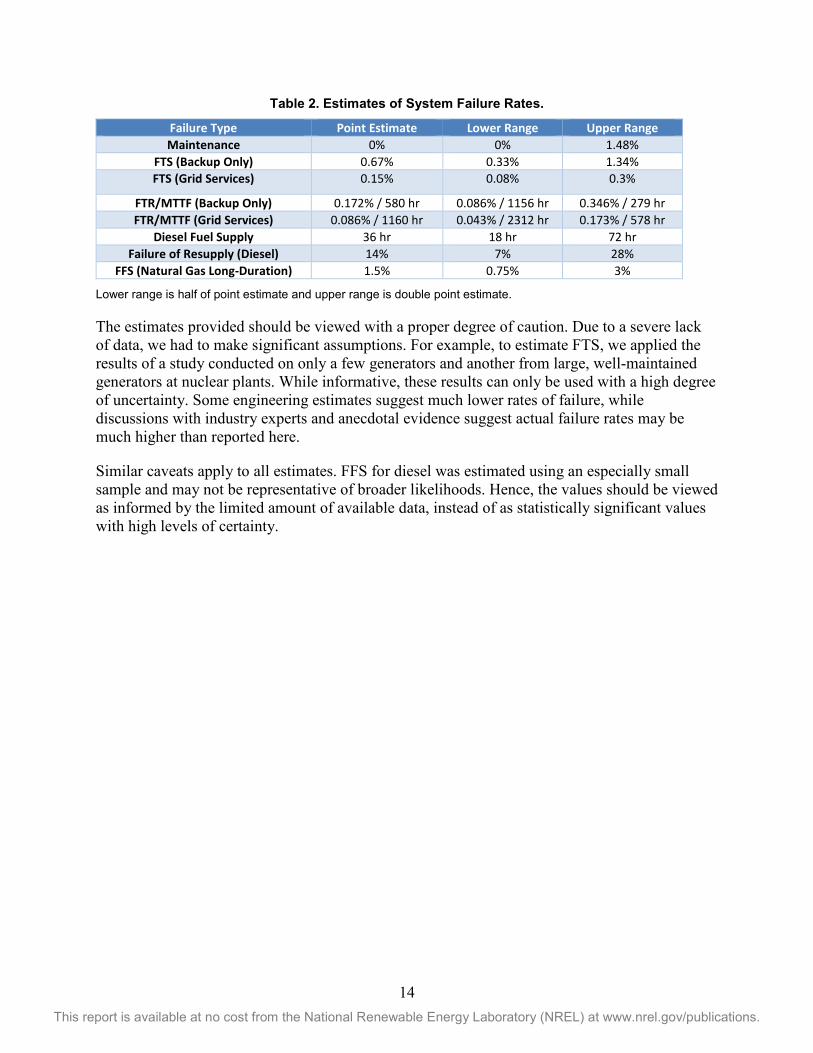
14 This report is available at no cost from the National Renewable Energy Laboratory (NREL) at www.nrel.gov/publications.
Table 2. Estimates of System Failure Rates. Failure Type Point Estimate Lower Range Upper Range Maintenance 0% 0% 1.48%
FTS (Backup Only) 0.67% 0.33% 1.34% FTS (Grid Services) 0.15% 0.08% 0.3%
FTR/MTTF (Backup Only) 0.172% / 580 hr 0.086% / 1156 hr 0.346% / 279 hr FTR/MTTF (Grid Services) 0.086% / 1160 hr 0.043% / 2312 hr 0.173% / 578 hr
Diesel Fuel Supply 36 hr 18 hr 72 hr Failure of Resupply (Diesel) 14% 7% 28%
FFS (Natural Gas Long-Duration) 1.5% 0.75% 3%
Lower range is half of point estimate and upper range is double point estimate.
The estimates provided should be viewed with a proper degree of caution. Due to a severe lack of data, we had to make significant assumptions. For example, to estimate FTS, we applied the results of a study conducted on only a few generators and another from large, well-maintained generators at nuclear plants. While informative, these results can only be used with a high degree of uncertainty. Some engineering estimates suggest much lower rates of failure, while discussions with industry experts and anecdotal evidence suggest actual failure rates may be much higher than reported here.
Similar caveats apply to all estimates. FFS for diesel was estimated using an especially small sample and may not be representative of broader likelihoods. Hence, the values should be viewed as informed by the limited amount of available data, instead of as statistically significant values with high levels of certainty.
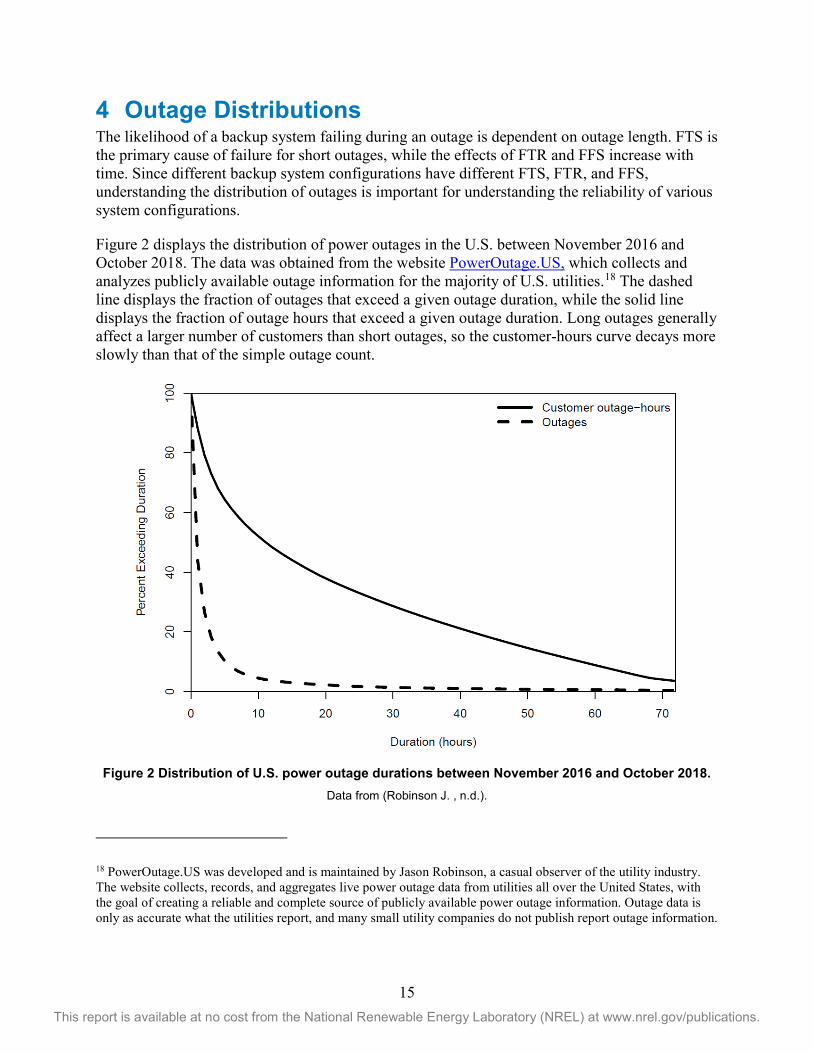
15 This report is available at no cost from the National Renewable Energy Laboratory (NREL) at www.nrel.gov/publications.
4 Outage Distributions The likelihood of a backup system failing during an outage is dependent on outage length. FTS is the primary cause of failure for short outages, while the effects of FTR and FFS increase with time. Since different backup system configurations have different FTS, FTR, and FFS, understanding the distribution of outages is important for understanding the reliability of various system configurations.
Figure 2 displays the distribution of power outages in the U.S. between November 2016 and October 2018. The data was obtained from the website PowerOutage.US, which collects and analyzes publicly available outage information for the majority of U.S. utilities.18 The dashed line displays the fraction of outages that exceed a given outage duration, while the solid line displays the fraction of outage hours that exceed a given outage duration. Long outages generally affect a larger number of customers than short outages, so the customer-hours curve decays more slowly than that of the simple outage count.
Figure 2 Distribution of U.S. power outage durations between November 2016 and October 2018.
Data from (Robinson J. , n.d.).
18 PowerOutage.US was developed and is maintained by Jason Robinson, a casual observer of the utility industry. The website collects, records, and aggregates live power outage data from utilities all over the United States, with the goal of creating a reliable and complete source of publicly available power outage information. Outage data is only as accurate what the utilities report, and many small utility companies do not publish report outage information.
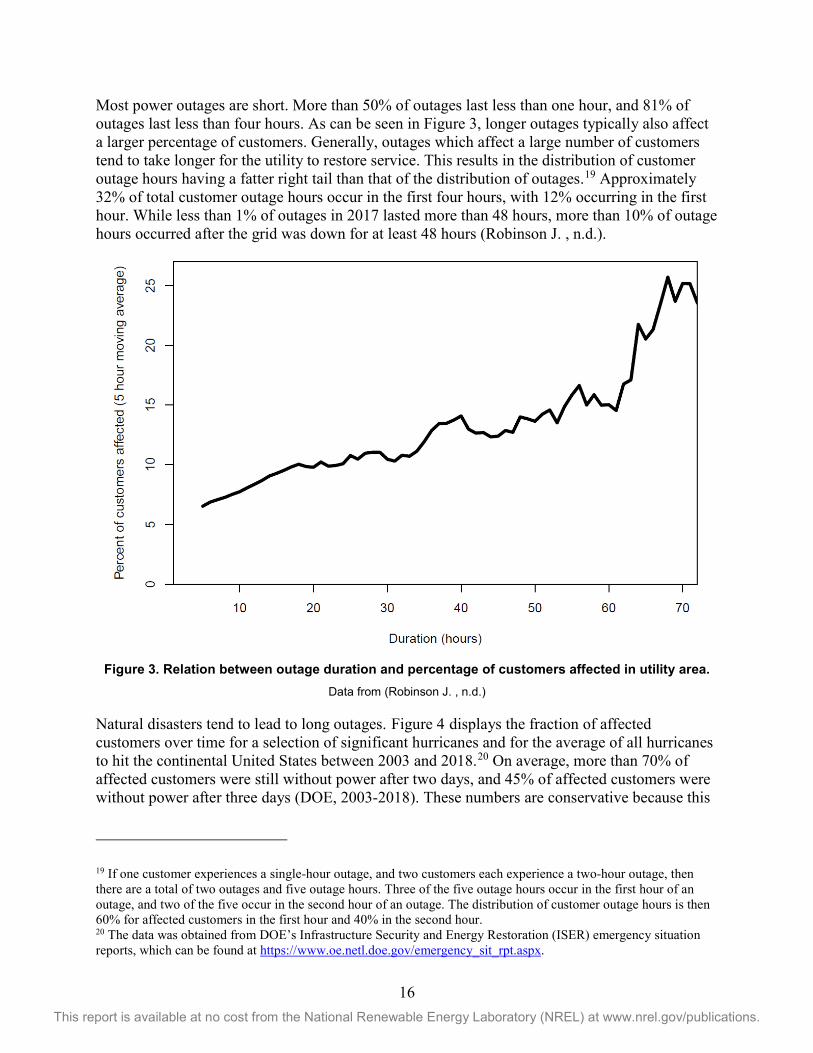
16 This report is available at no cost from the National Renewable Energy Laboratory (NREL) at www.nrel.gov/publications.
Most power outages are short. More than 50% of outages last less than one hour, and 81% of outages last less than four hours. As can be seen in Figure 3, longer outages typically also affect a larger percentage of customers. Generally, outages which affect a large number of customers tend to take longer for the utility to restore service. This results in the distribution of customer outage hours having a fatter right tail than that of the distribution of outages.19 Approximately 32% of total customer outage hours occur in the first four hours, with 12% occurring in the first hour. While less than 1% of outages in 2017 lasted more than 48 hours, more than 10% of outage hours occurred after the grid was down for at least 48 hours (Robinson J. , n.d.).
Figure 3. Relation between outage duration and percentage of customers affected in utility area.
Data from (Robinson J. , n.d.)
Natural disasters tend to lead to long outages. Figure 4 displays the fraction of affected customers over time for a selection of significant hurricanes and for the average of all hurricanes to hit the continental United States between 2003 and 2018.20 On average, more than 70% of affected customers were still without power after two days, and 45% of affected customers were without power after three days (DOE, 2003-2018). These numbers are conservative because this
19 If one customer experiences a single-hour outage, and two customers each experience a two-hour outage, then there are a total of two outages and five outage hours. Three of the five outage hours occur in the first hour of an outage, and two of the five occur in the second hour of an outage. The distribution of customer outage hours is then 60% for affected customers in the first hour and 40% in the second hour. 20 The data was obtained from DOE’s Infrastructure Security and Energy Restoration (ISER) emergency situation reports, which can be found at https://www.oe.netl.doe.gov/emergency_sit_rpt.aspx.
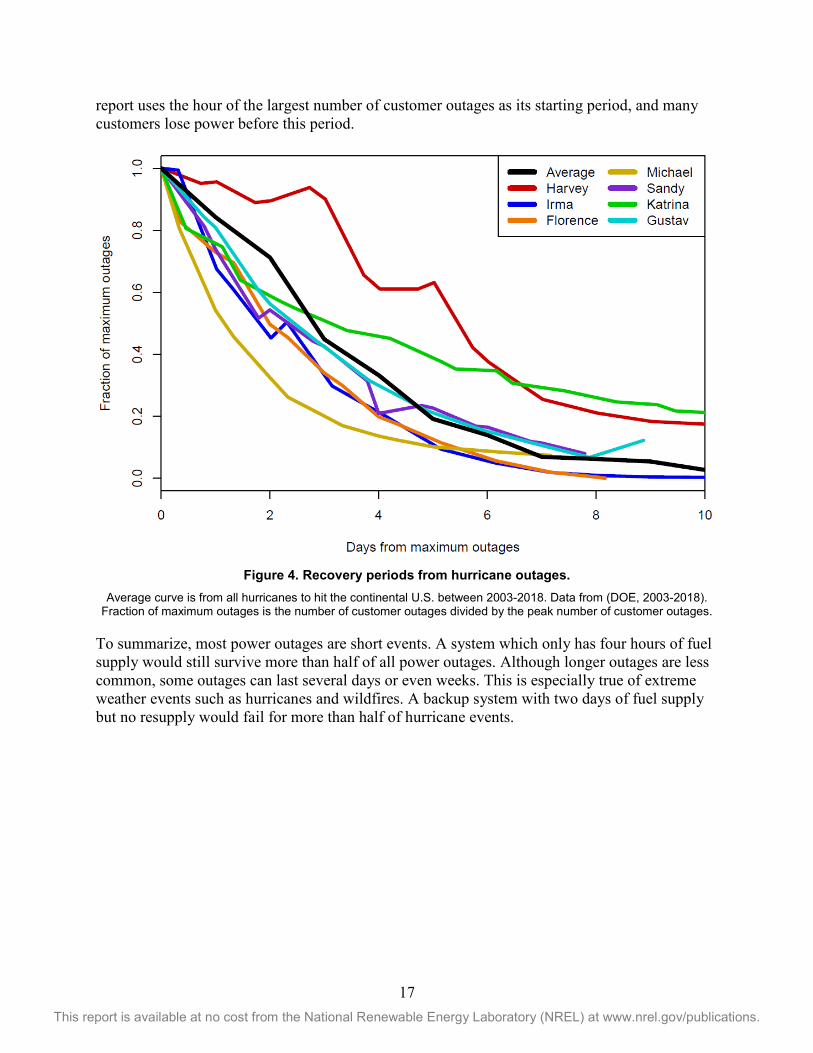
17 This report is available at no cost from the National Renewable Energy Laboratory (NREL) at www.nrel.gov/publications.
report uses the hour of the largest number of customer outages as its starting period, and many customers lose power before this period.
Figure 4. Recovery periods from hurricane outages.
Average curve is from all hurricanes to hit the continental U.S. between 2003-2018. Data from (DOE, 2003-2018). Fraction of maximum outages is the number of customer outages divided by the peak number of customer outages.
To summarize, most power outages are short events. A system which only has four hours of fuel supply would still survive more than half of all power outages. Although longer outages are less common, some outages can last several days or even weeks. This is especially true of extreme weather events such as hurricanes and wildfires. A backup system with two days of fuel supply but no resupply would fail for more than half of hurricane events.
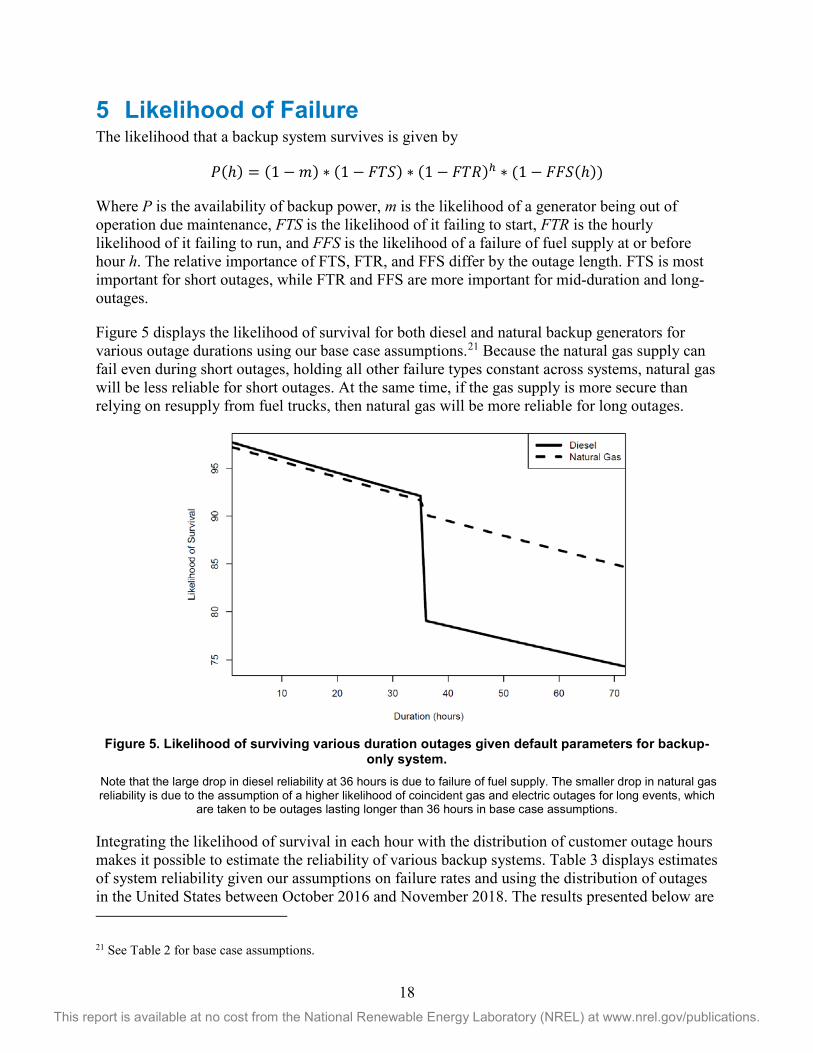
18 This report is available at no cost from the National Renewable Energy Laboratory (NREL) at www.nrel.gov/publications.
5 Likelihood of Failure The likelihood that a backup system survives is given by
𝑃𝑃(ℎ) = (1 −𝑚𝑚) ∗ (1 − 𝐹𝐹𝐹𝐹𝐹𝐹) ∗ (1 − 𝐹𝐹𝐹𝐹𝐹𝐹)ℎ ∗ (1 − 𝐹𝐹𝐹𝐹𝐹𝐹(ℎ))
Where P is the availability of backup power, m is the likelihood of a generator being out of operation due maintenance, FTS is the likelihood of it failing to start, FTR is the hourly likelihood of it failing to run, and FFS is the likelihood of a failure of fuel supply at or before hour h. The relative importance of FTS, FTR, and FFS differ by the outage length. FTS is most important for short outages, while FTR and FFS are more important for mid-duration and long- outages.
Figure 5 displays the likelihood of survival for both diesel and natural backup generators for various outage durations using our base case assumptions.21 Because the natural gas supply can fail even during short outages, holding all other failure types constant across systems, natural gas will be less reliable for short outages. At the same time, if the gas supply is more secure than relying on resupply from fuel trucks, then natural gas will be more reliable for long outages.
Figure 5. Likelihood of surviving various duration outages given default parameters for backup-
only system. Note that the large drop in diesel reliability at 36 hours is due to failure of fuel supply. The smaller drop in natural gas reliability is due to the assumption of a higher likelihood of coincident gas and electric outages for long events, which
are taken to be outages lasting longer than 36 hours in base case assumptions.
Integrating the likelihood of survival in each hour with the distribution of customer outage hours makes it possible to estimate the reliability of various backup systems. Table 3 displays estimates of system reliability given our assumptions on failure rates and using the distribution of outages in the United States between October 2016 and November 2018. The results presented below are 21 See Table 2 for base case assumptions.
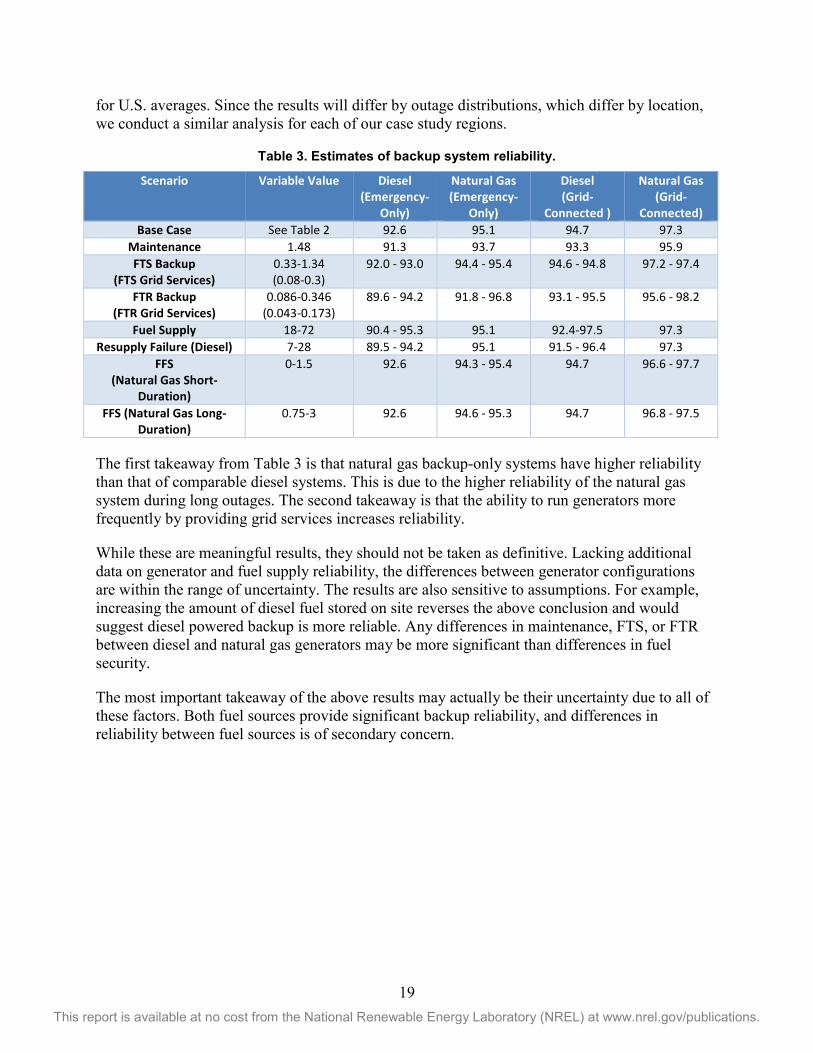
19 This report is available at no cost from the National Renewable Energy Laboratory (NREL) at www.nrel.gov/publications.
for U.S. averages. Since the results will differ by outage distributions, which differ by location, we conduct a similar analysis for each of our case study regions.
Table 3. Estimates of backup system reliability.
Scenario Variable Value Diesel (Emergency-
Only)
Natural Gas (Emergency-
Only)
Diesel (Grid-
Connected )
Natural Gas (Grid-
Connected) Base Case See Table 2 92.6 95.1 94.7 97.3
Maintenance 1.48 91.3 93.7 93.3 95.9 FTS Backup
(FTS Grid Services) 0.33-1.34 (0.08-0.3)
92.0 - 93.0 94.4 - 95.4 94.6 - 94.8 97.2 - 97.4
FTR Backup (FTR Grid Services)
0.086-0.346 (0.043-0.173)
89.6 - 94.2 91.8 - 96.8 93.1 - 95.5 95.6 - 98.2
Fuel Supply 18-72 90.4 - 95.3 95.1 92.4-97.5 97.3 Resupply Failure (Diesel) 7-28 89.5 - 94.2 95.1 91.5 - 96.4 97.3
FFS (Natural Gas Short-
Duration)
0-1.5 92.6 94.3 - 95.4 94.7 96.6 - 97.7
FFS (Natural Gas Long-Duration)
0.75-3 92.6 94.6 - 95.3 94.7 96.8 - 97.5
The first takeaway from Table 3 is that natural gas backup-only systems have higher reliability than that of comparable diesel systems. This is due to the higher reliability of the natural gas system during long outages. The second takeaway is that the ability to run generators more frequently by providing grid services increases reliability.
While these are meaningful results, they should not be taken as definitive. Lacking additional data on generator and fuel supply reliability, the differences between generator configurations are within the range of uncertainty. The results are also sensitive to assumptions. For example, increasing the amount of diesel fuel stored on site reverses the above conclusion and would suggest diesel powered backup is more reliable. Any differences in maintenance, FTS, or FTR between diesel and natural gas generators may be more significant than differences in fuel security.
The most important takeaway of the above results may actually be their uncertainty due to all of these factors. Both fuel sources provide significant backup reliability, and differences in reliability between fuel sources is of secondary concern.
20 This report is available at no cost from the National Renewable Energy Laboratory (NREL) at www.nrel.gov/publications.
6 Costs and Benefits Backup systems are purchased for reliability purposes. However, the costs of a system are important considerations in the decision of which system to purchase. A system with lower reliability may be preferred if its costs are sufficiently less than those of the more reliable alternatives. The cost of a backup system can be separated into installation, decommissioning, non-fuel operation, maintenance, and fuel costs. The benefits of a backup system can be separated into reliability benefits and revenues from providing grid services, although revenue generation potential has traditionally been a less common part of the cost-benefit calculus. This section provides a summary of backup generator costs and economic benefits.
6.1 Costs The primary economic parameter to be determined is the life-cycle cost of backup power over the assumed life of the backup generators. The general equation to solve is:
Life-Cycle Costs = Installation Costs + Decommissioning Costs + Maintenance Costs + Fuel Costs - Revenues
In addition to component costs, installation costs include other expenditures, such as planning, site preparation, permitting, remote control, communications, and grid interconnections. In the equation, revenues are the financial benefits the backup system might produce through grid-interactive operation, either by reducing electricity bills or selling services to the local utility or system operator. We do not attempt to quantify the avoided cost of a power outage or factor it in as potential revenue.
Diesel generators generally have lower component costs compared to those of natural gas generators, which partly explains why diesel has traditionally been the generator fuel of choice (Generac, 2010), (Lazard, 2017). Improvements in gas generators have reduced some of the differences in system costs, and additional air quality regulations have further reduced the cost advantage of diesel systems over natural gas systems. The permitting process may be costlier for diesel systems, and additional equipment is required to meet Tier 4 air quality standards.22 However, diesel systems commonly still have lower costs than equivalent natural gas systems. In the analysis of 500 KW generators, we use $800/kW for Tier 4 compliant diesel systems and $1000/kW for natural gas reciprocating engines.23
22 Stationary generators must comply with EPA Reciprocating Internal Reciprocating Internal Combustion Engine and New Emissions Standards for Hazardous Air Pollutants (RICE NESHAP) requirements. 23 A range of costs were found in the literature and in consultation with experts. In the online Generac Total Cost of Ownership calculator (Generac Power Systems, Inc., 2010), a 500-kW natural gas generator capable of grid-paralleling has a total installed cost of $580/kW, and the diesel generator costs $447/kW. The cost of the diesel assumes it is Tier 4 compliant. In the Lazard LCOE Analysis, natural gas reciprocating generators cost in the range of $650-$1,100/kW, while diesel generators are between $500-$800/kW (for 250 kW to 1,000 kW generators) (Lazard, 2017). The Lazard analysis notes these costs may not include emission control systems, which would presumably be higher for Tier 4 compliant diesel generators. The costs assumed in this analysis are at the higher end of the Lazard cost range, with a cost premium for natural gas engines over Tier 4 diesel of 25% on total installed costs.
21 This report is available at no cost from the National Renewable Energy Laboratory (NREL) at www.nrel.gov/publications.
Once a backup system is installed it must be periodically tested and maintained. We assume a maintenance cost of $35/kW-year for both engine types. Maintenance cost models for generators are often based on some combination of fixed costs ($/kW) and variable costs ($/kWh). Depending on the application, the weighting between fixed and variable costs may differ. In our analysis of backup-only generators, the engine duty cycle is assumed to be relatively low, thus fixed maintenance requirements are assumed to dominate annual maintenance costs. In an application that is for backup only, fixed costs will include labor to periodically test the units. In grid services applications where engine runtimes are not much greater than the runtime requirements for testing, we assume the annual maintenance costs remain dominated by fixed maintenance costs. If operational hours were high, there would be a need to consider additional wear on the engine and the need for more frequent maintenance, but we do not attempt to quantify that for the low duty cycles assumed here. Further, there would likely be differences in maintenance costs by generator type (diesel versus natural gas). For example, backup diesel generators can be subject to additional costs for maintaining fuel quality. Depending on location, diesel generators that do not run often may require “polishing” every two to five years to remove contaminants from the stored fuel. This is a cost that natural gas generators would not incur. This incremental cost for diesel fuel maintenance is relatively small according to Generac Power Systems (2019). Diesel generators run for grid services have enough operating hours to require refueling a few times per year, thereby eliminating the need for fuel polishing. For these reasons, the variable non-fuel O&M costs are considered low and uncertain, are not considered key drivers in the results of the analysis and are therefore not included. The variable costs of fuel are modeled separately.
Whereas diesel generators often have lower capital costs than natural gas generators, the opposite holds for fuel costs. The cost of fuel for natural gas generation is significantly lower than that for diesel generation. Differences in fuel costs have little effect for emergency-only systems, which tend to run only infrequently. For grid-connected systems however, differences in fuel costs can affect net benefits.
A variety of business models are available to monetize the benefits of grid-connected systems. For large, sophisticated companies, facility operations personnel could take on the responsibilities of running the generators to provide these grid services. However, it may be more likely to contract management of energy services to specialists, particularly for revenues that require monitoring and quick response to changing market conditions in order to fully capture financial opportunities in real time. Furthermore, for some grid services such as selling into wholesale markets, local regulations may require the company to contract through an approved third party.
A third party may be hired to register and operate a customer’s backup generators to participate in grid services such as demand response programs or power markets. This entity would provide technical and market expertise and operate the assets for a fee or for a share of the revenues. In another business model, an energy services provider could install and own the generators and provide backup power to the facility owner for a fee. Revenues generated or utility costs avoided could be assigned to either party or shared, depending on the contractual arrangement.
Under a scenario that involves a third party, there would be additional costs to cover this party’s profit. These would be added to the ledger of total project costs, either reducing the present value
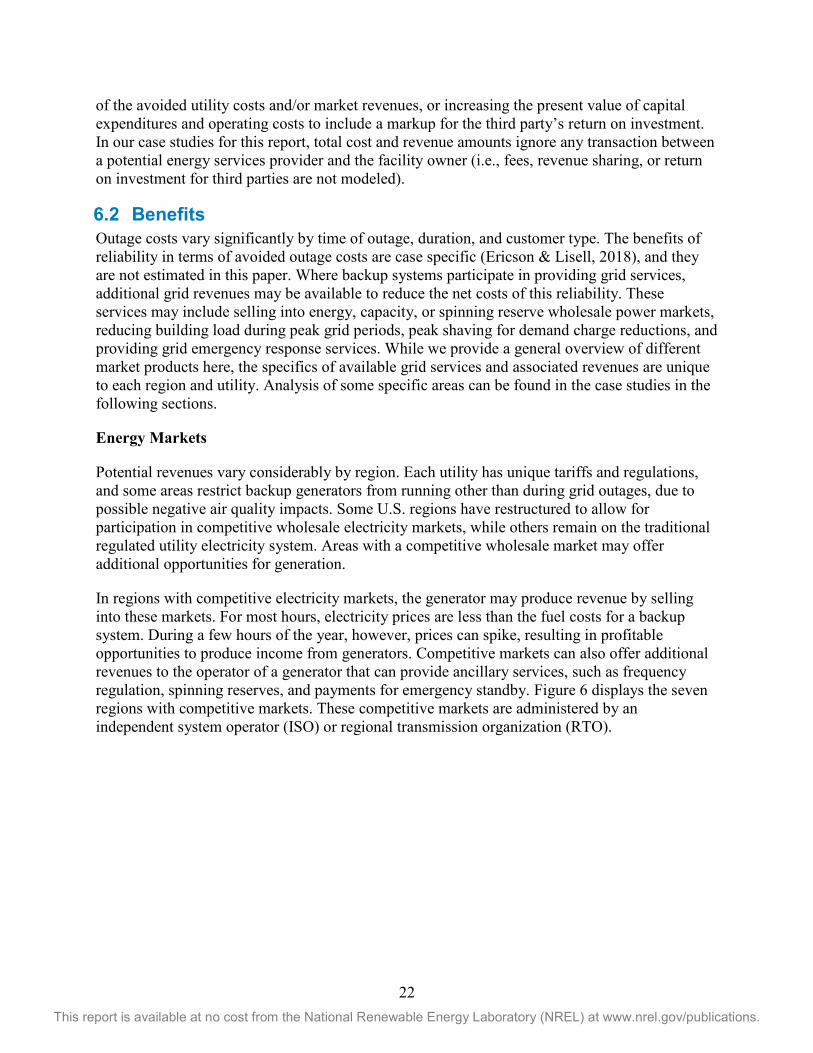
22 This report is available at no cost from the National Renewable Energy Laboratory (NREL) at www.nrel.gov/publications.
of the avoided utility costs and/or market revenues, or increasing the present value of capital expenditures and operating costs to include a markup for the third party’s return on investment. In our case studies for this report, total cost and revenue amounts ignore any transaction between a potential energy services provider and the facility owner (i.e., fees, revenue sharing, or return on investment for third parties are not modeled).
6.2 Benefits Outage costs vary significantly by time of outage, duration, and customer type. The benefits of reliability in terms of avoided outage costs are case specific (Ericson & Lisell, 2018), and they are not estimated in this paper. Where backup systems participate in providing grid services, additional grid revenues may be available to reduce the net costs of this reliability. These services may include selling into energy, capacity, or spinning reserve wholesale power markets, reducing building load during peak grid periods, peak shaving for demand charge reductions, and providing grid emergency response services. While we provide a general overview of different market products here, the specifics of available grid services and associated revenues are unique to each region and utility. Analysis of some specific areas can be found in the case studies in the following sections.
Energy Markets
Potential revenues vary considerably by region. Each utility has unique tariffs and regulations, and some areas restrict backup generators from running other than during grid outages, due to possible negative air quality impacts. Some U.S. regions have restructured to allow for participation in competitive wholesale electricity markets, while others remain on the traditional regulated utility electricity system. Areas with a competitive wholesale market may offer additional opportunities for generation.
In regions with competitive electricity markets, the generator may produce revenue by selling into these markets. For most hours, electricity prices are less than the fuel costs for a backup system. During a few hours of the year, however, prices can spike, resulting in profitable opportunities to produce income from generators. Competitive markets can also offer additional revenues to the operator of a generator that can provide ancillary services, such as frequency regulation, spinning reserves, and payments for emergency standby. Figure 6 displays the seven regions with competitive markets. These competitive markets are administered by an independent system operator (ISO) or regional transmission organization (RTO).
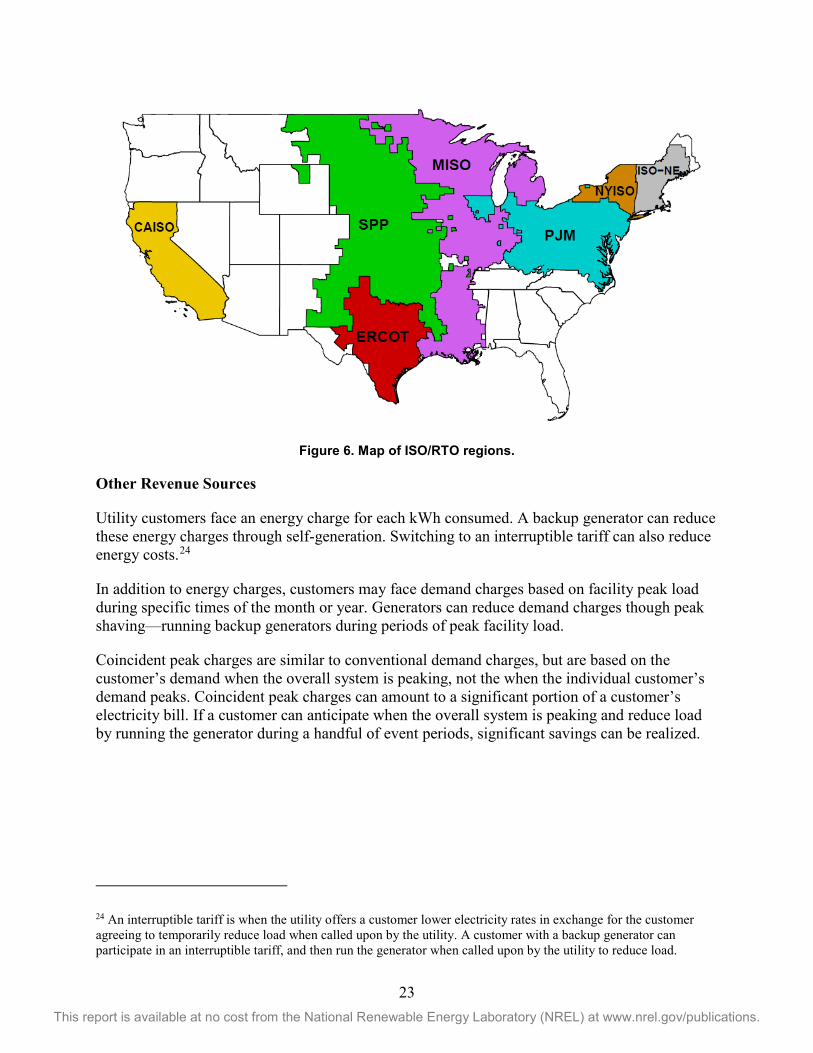
23 This report is available at no cost from the National Renewable Energy Laboratory (NREL) at www.nrel.gov/publications.
Figure 6. Map of ISO/RTO regions.
Other Revenue Sources
Utility customers face an energy charge for each kWh consumed. A backup generator can reduce these energy charges through self-generation. Switching to an interruptible tariff can also reduce energy costs.24
In addition to energy charges, customers may face demand charges based on facility peak load during specific times of the month or year. Generators can reduce demand charges though peak shaving—running backup generators during periods of peak facility load.
Coincident peak charges are similar to conventional demand charges, but are based on the customer’s demand when the overall system is peaking, not the when the individual customer’s demand peaks. Coincident peak charges can amount to a significant portion of a customer’s electricity bill. If a customer can anticipate when the overall system is peaking and reduce load by running the generator during a handful of event periods, significant savings can be realized.
24 An interruptible tariff is when the utility offers a customer lower electricity rates in exchange for the customer agreeing to temporarily reduce load when called upon by the utility. A customer with a backup generator can participate in an interruptible tariff, and then run the generator when called upon by the utility to reduce load.
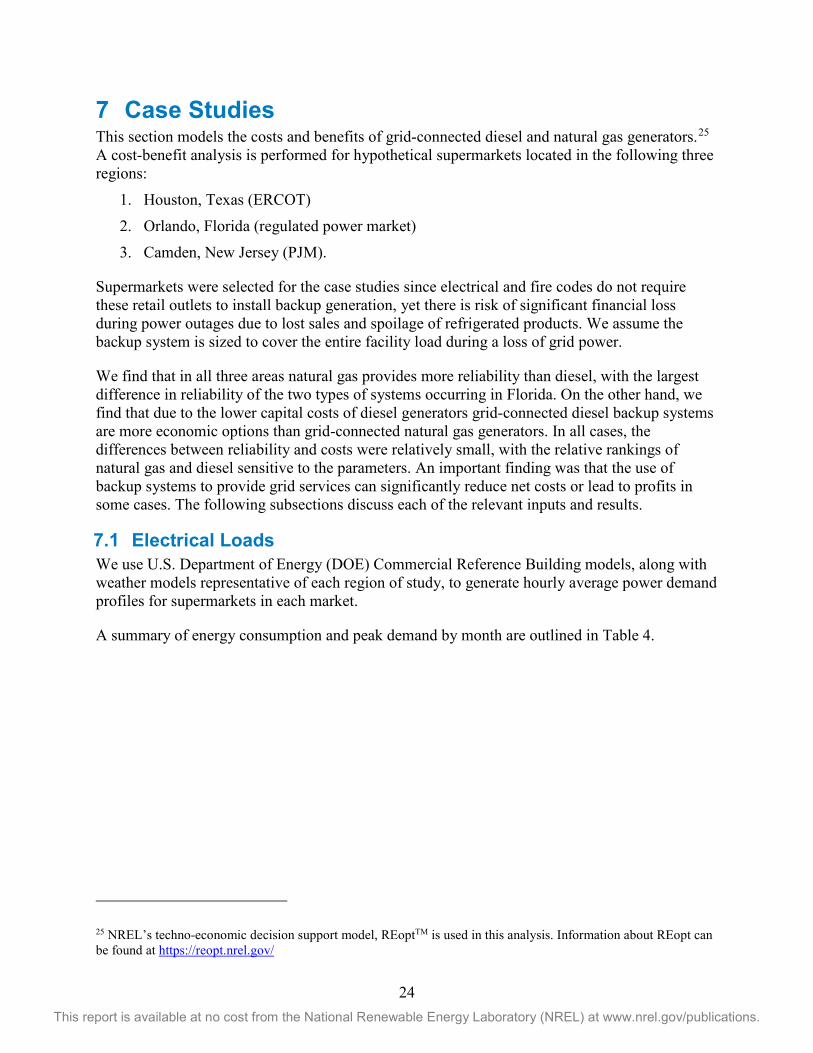
24 This report is available at no cost from the National Renewable Energy Laboratory (NREL) at www.nrel.gov/publications.
7 Case Studies This section models the costs and benefits of grid-connected diesel and natural gas generators.25 A cost-benefit analysis is performed for hypothetical supermarkets located in the following three regions:
1. Houston, Texas (ERCOT) 2. Orlando, Florida (regulated power market) 3. Camden, New Jersey (PJM).
Supermarkets were selected for the case studies since electrical and fire codes do not require these retail outlets to install backup generation, yet there is risk of significant financial loss during power outages due to lost sales and spoilage of refrigerated products. We assume the backup system is sized to cover the entire facility load during a loss of grid power.
We find that in all three areas natural gas provides more reliability than diesel, with the largest difference in reliability of the two types of systems occurring in Florida. On the other hand, we find that due to the lower capital costs of diesel generators grid-connected diesel backup systems are more economic options than grid-connected natural gas generators. In all cases, the differences between reliability and costs were relatively small, with the relative rankings of natural gas and diesel sensitive to the parameters. An important finding was that the use of backup systems to provide grid services can significantly reduce net costs or lead to profits in some cases. The following subsections discuss each of the relevant inputs and results.
7.1 Electrical Loads We use U.S. Department of Energy (DOE) Commercial Reference Building models, along with weather models representative of each region of study, to generate hourly average power demand profiles for supermarkets in each market.
A summary of energy consumption and peak demand by month are outlined in Table 4.
25 NREL’s techno-economic decision support model, REoptTM is used in this analysis. Information about REopt can be found at https://reopt.nrel.gov/
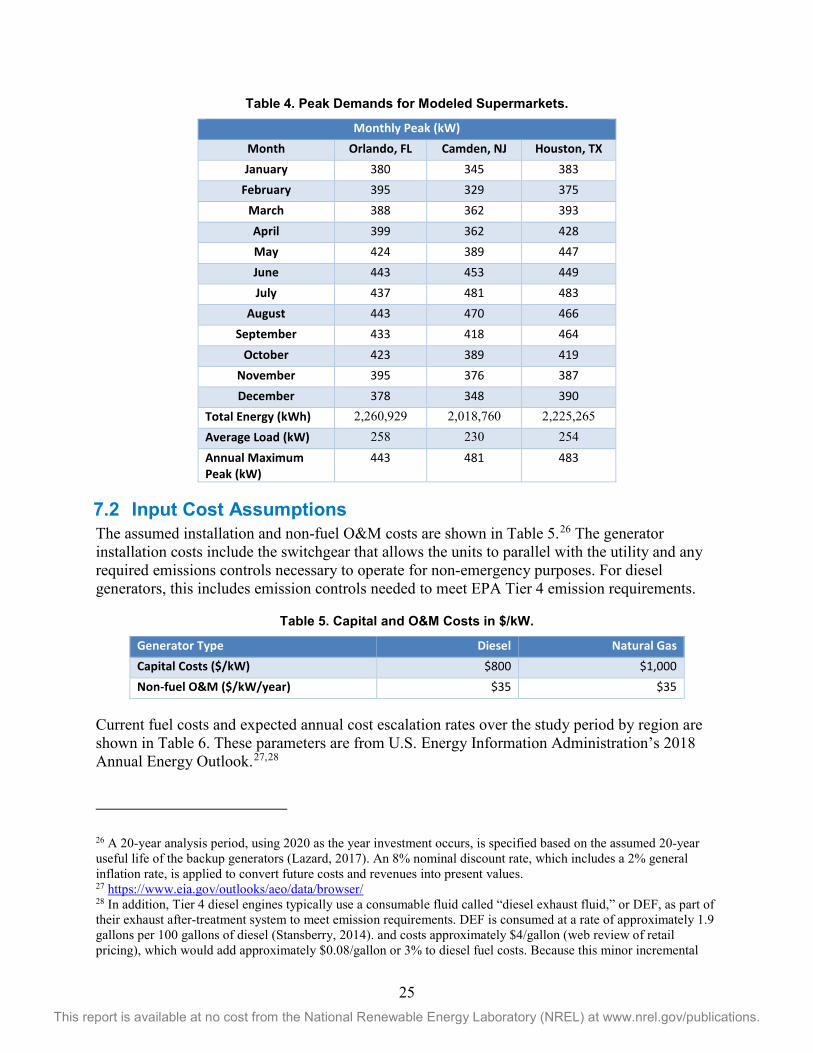
25 This report is available at no cost from the National Renewable Energy Laboratory (NREL) at www.nrel.gov/publications.
Table 4. Peak Demands for Modeled Supermarkets.
Monthly Peak (kW) Month Orlando, FL Camden, NJ Houston, TX January 380 345 383
February 395 329 375 March 388 362 393 April 399 362 428 May 424 389 447 June 443 453 449 July 437 481 483
August 443 470 466 September 433 418 464
October 423 389 419 November 395 376 387 December 378 348 390
Total Energy (kWh) 2,260,929 2,018,760 2,225,265 Average Load (kW) 258 230 254 Annual Maximum Peak (kW)
443 481 483
7.2 Input Cost Assumptions The assumed installation and non-fuel O&M costs are shown in Table 5.26 The generator installation costs include the switchgear that allows the units to parallel with the utility and any required emissions controls necessary to operate for non-emergency purposes. For diesel generators, this includes emission controls needed to meet EPA Tier 4 emission requirements.
Table 5. Capital and O&M Costs in $/kW.
Generator Type Diesel Natural Gas Capital Costs ($/kW) $800 $1,000 Non-fuel O&M ($/kW/year) $35 $35
Current fuel costs and expected annual cost escalation rates over the study period by region are shown in Table 6. These parameters are from U.S. Energy Information Administration’s 2018 Annual Energy Outlook.27,28
26 A 20-year analysis period, using 2020 as the year investment occurs, is specified based on the assumed 20-year useful life of the backup generators (Lazard, 2017). An 8% nominal discount rate, which includes a 2% general inflation rate, is applied to convert future costs and revenues into present values. 27 https://www.eia.gov/outlooks/aeo/data/browser/ 28 In addition, Tier 4 diesel engines typically use a consumable fluid called “diesel exhaust fluid,” or DEF, as part of their exhaust after-treatment system to meet emission requirements. DEF is consumed at a rate of approximately 1.9 gallons per 100 gallons of diesel (Stansberry, 2014). and costs approximately $4/gallon (web review of retail pricing), which would add approximately $0.08/gallon or 3% to diesel fuel costs. Because this minor incremental
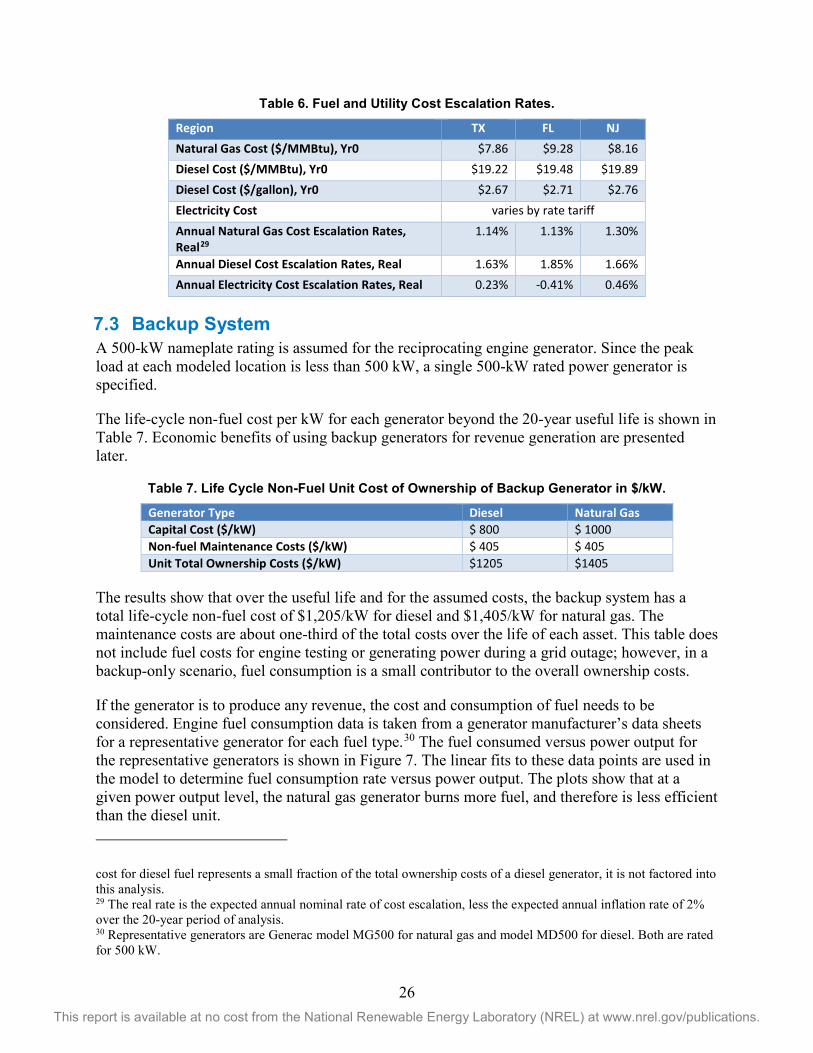
26 This report is available at no cost from the National Renewable Energy Laboratory (NREL) at www.nrel.gov/publications.
Table 6. Fuel and Utility Cost Escalation Rates.
Region TX FL NJ Natural Gas Cost ($/MMBtu), Yr0 $7.86 $9.28 $8.16 Diesel Cost ($/MMBtu), Yr0 $19.22 $19.48 $19.89 Diesel Cost ($/gallon), Yr0 $2.67 $2.71 $2.76 Electricity Cost varies by rate tariff Annual Natural Gas Cost Escalation Rates, Real29
1.14% 1.13% 1.30%
Annual Diesel Cost Escalation Rates, Real 1.63% 1.85% 1.66% Annual Electricity Cost Escalation Rates, Real 0.23% -0.41% 0.46%
7.3 Backup System A 500-kW nameplate rating is assumed for the reciprocating engine generator. Since the peak load at each modeled location is less than 500 kW, a single 500-kW rated power generator is specified.
The life-cycle non-fuel cost per kW for each generator beyond the 20-year useful life is shown in Table 7. Economic benefits of using backup generators for revenue generation are presented later.
Table 7. Life Cycle Non-Fuel Unit Cost of Ownership of Backup Generator in $/kW.
Generator Type Diesel Natural Gas Capital Cost ($/kW) $ 800 $ 1000 Non-fuel Maintenance Costs ($/kW) $ 405 $ 405 Unit Total Ownership Costs ($/kW) $1205 $1405
The results show that over the useful life and for the assumed costs, the backup system has a total life-cycle non-fuel cost of $1,205/kW for diesel and $1,405/kW for natural gas. The maintenance costs are about one-third of the total costs over the life of each asset. This table does not include fuel costs for engine testing or generating power during a grid outage; however, in a backup-only scenario, fuel consumption is a small contributor to the overall ownership costs.
If the generator is to produce any revenue, the cost and consumption of fuel needs to be considered. Engine fuel consumption data is taken from a generator manufacturer’s data sheets for a representative generator for each fuel type.30 The fuel consumed versus power output for the representative generators is shown in Figure 7. The linear fits to these data points are used in the model to determine fuel consumption rate versus power output. The plots show that at a given power output level, the natural gas generator burns more fuel, and therefore is less efficient than the diesel unit. cost for diesel fuel represents a small fraction of the total ownership costs of a diesel generator, it is not factored into this analysis. 29 The real rate is the expected annual nominal rate of cost escalation, less the expected annual inflation rate of 2% over the 20-year period of analysis. 30 Representative generators are Generac model MG500 for natural gas and model MD500 for diesel. Both are rated for 500 kW.
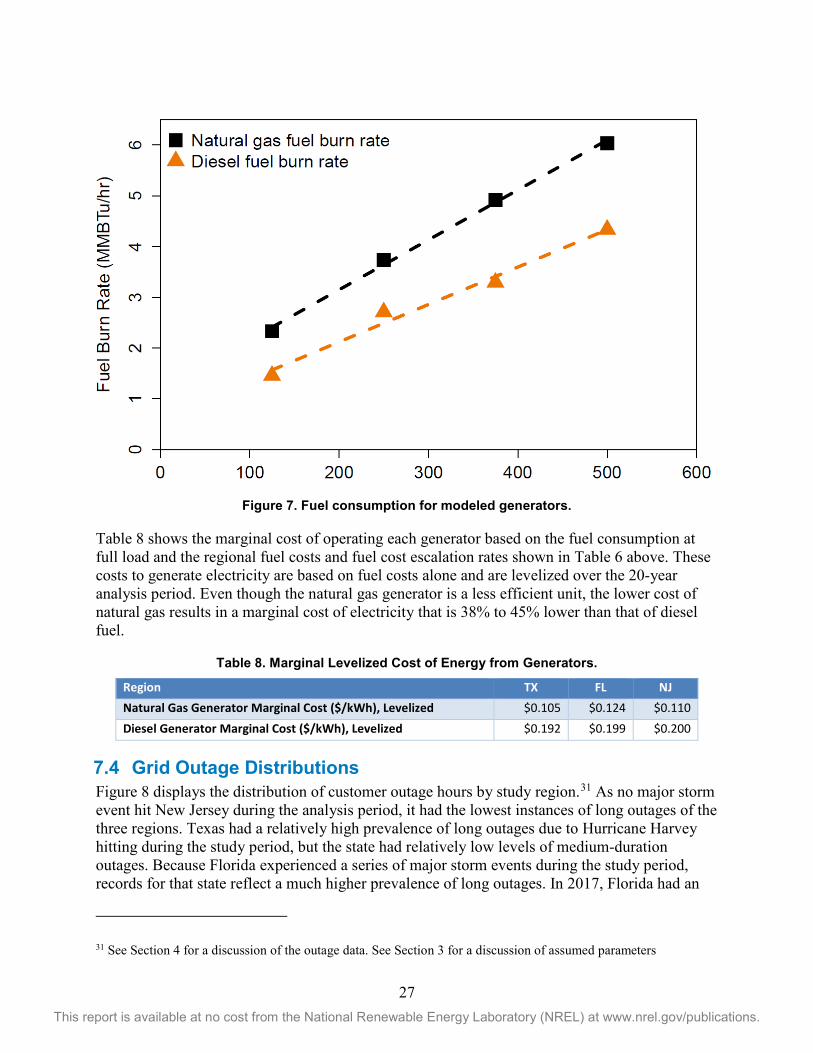
27 This report is available at no cost from the National Renewable Energy Laboratory (NREL) at www.nrel.gov/publications.
Figure 7. Fuel consumption for modeled generators.
Table 8 shows the marginal cost of operating each generator based on the fuel consumption at full load and the regional fuel costs and fuel cost escalation rates shown in Table 6 above. These costs to generate electricity are based on fuel costs alone and are levelized over the 20-year analysis period. Even though the natural gas generator is a less efficient unit, the lower cost of natural gas results in a marginal cost of electricity that is 38% to 45% lower than that of diesel fuel.
Table 8. Marginal Levelized Cost of Energy from Generators.
Region TX FL NJ Natural Gas Generator Marginal Cost ($/kWh), Levelized $0.105 $0.124 $0.110 Diesel Generator Marginal Cost ($/kWh), Levelized $0.192 $0.199 $0.200
7.4 Grid Outage Distributions Figure 8 displays the distribution of customer outage hours by study region.31 As no major storm event hit New Jersey during the analysis period, it had the lowest instances of long outages of the three regions. Texas had a relatively high prevalence of long outages due to Hurricane Harvey hitting during the study period, but the state had relatively low levels of medium-duration outages. Because Florida experienced a series of major storm events during the study period, records for that state reflect a much higher prevalence of long outages. In 2017, Florida had an
31 See Section 4 for a discussion of the outage data. See Section 3 for a discussion of assumed parameters
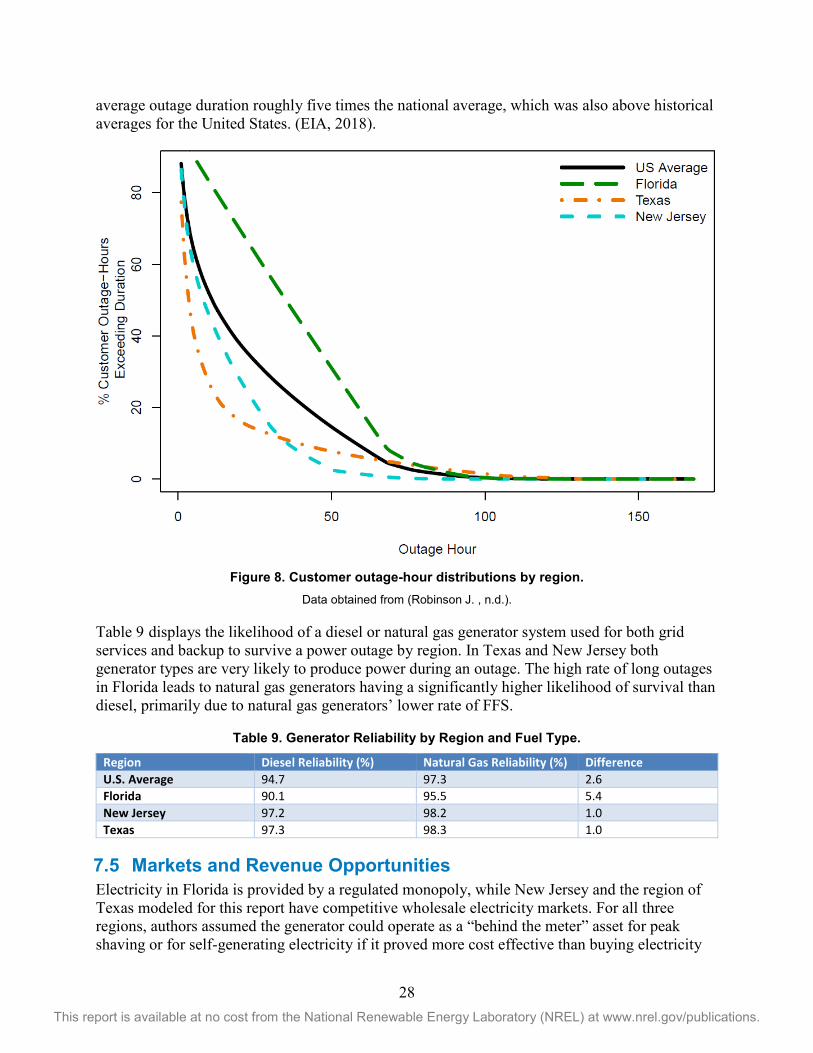
28 This report is available at no cost from the National Renewable Energy Laboratory (NREL) at www.nrel.gov/publications.
average outage duration roughly five times the national average, which was also above historical averages for the United States. (EIA, 2018).
Figure 8. Customer outage-hour distributions by region.
Data obtained from (Robinson J. , n.d.).
Table 9 displays the likelihood of a diesel or natural gas generator system used for both grid services and backup to survive a power outage by region. In Texas and New Jersey both generator types are very likely to produce power during an outage. The high rate of long outages in Florida leads to natural gas generators having a significantly higher likelihood of survival than diesel, primarily due to natural gas generators’ lower rate of FFS.
Table 9. Generator Reliability by Region and Fuel Type.
Region Diesel Reliability (%) Natural Gas Reliability (%) Difference U.S. Average 94.7 97.3 2.6 Florida 90.1 95.5 5.4 New Jersey 97.2 98.2 1.0 Texas 97.3 98.3 1.0
7.5 Markets and Revenue Opportunities Electricity in Florida is provided by a regulated monopoly, while New Jersey and the region of Texas modeled for this report have competitive wholesale electricity markets. For all three regions, authors assumed the generator could operate as a “behind the meter” asset for peak shaving or for self-generating electricity if it proved more cost effective than buying electricity
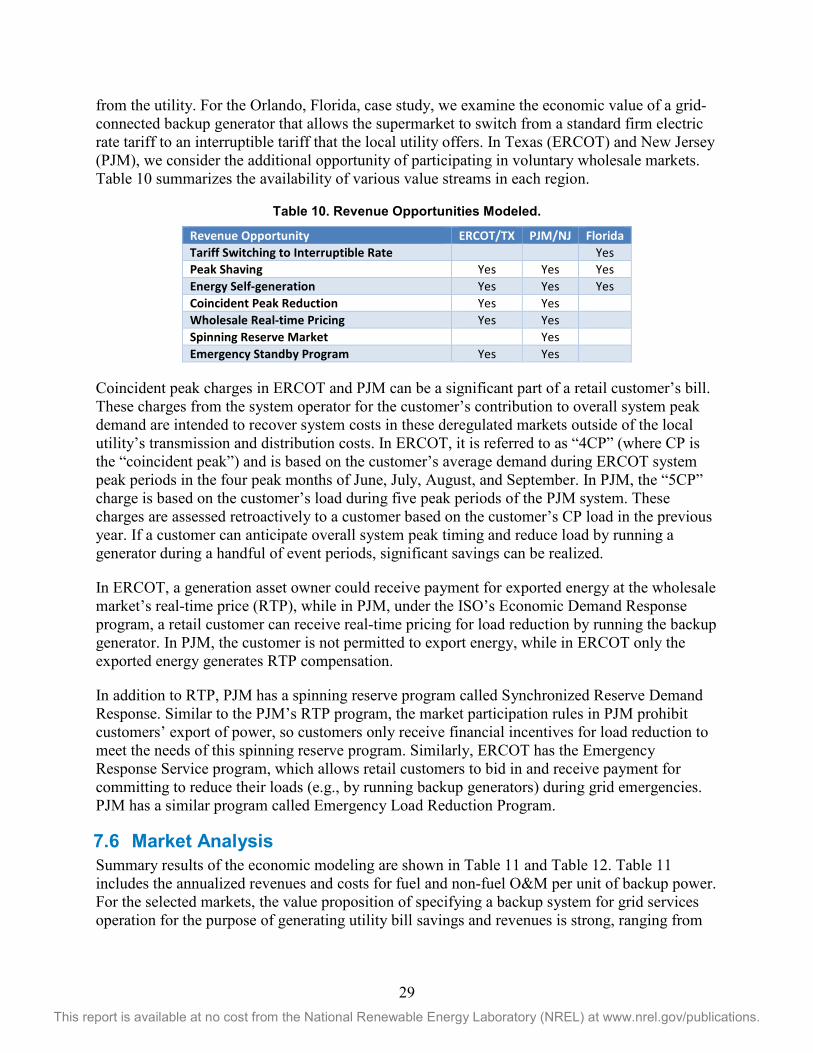
29 This report is available at no cost from the National Renewable Energy Laboratory (NREL) at www.nrel.gov/publications.
from the utility. For the Orlando, Florida, case study, we examine the economic value of a grid-connected backup generator that allows the supermarket to switch from a standard firm electric rate tariff to an interruptible tariff that the local utility offers. In Texas (ERCOT) and New Jersey (PJM), we consider the additional opportunity of participating in voluntary wholesale markets. Table 10 summarizes the availability of various value streams in each region.
Table 10. Revenue Opportunities Modeled.
Revenue Opportunity ERCOT/TX PJM/NJ Florida Tariff Switching to Interruptible Rate Yes Peak Shaving Yes Yes Yes Energy Self-generation Yes Yes Yes Coincident Peak Reduction Yes Yes Wholesale Real-time Pricing Yes Yes Spinning Reserve Market Yes Emergency Standby Program Yes Yes
Coincident peak charges in ERCOT and PJM can be a significant part of a retail customer’s bill. These charges from the system operator for the customer’s contribution to overall system peak demand are intended to recover system costs in these deregulated markets outside of the local utility’s transmission and distribution costs. In ERCOT, it is referred to as “4CP” (where CP is the “coincident peak”) and is based on the customer’s average demand during ERCOT system peak periods in the four peak months of June, July, August, and September. In PJM, the “5CP” charge is based on the customer’s load during five peak periods of the PJM system. These charges are assessed retroactively to a customer based on the customer’s CP load in the previous year. If a customer can anticipate overall system peak timing and reduce load by running a generator during a handful of event periods, significant savings can be realized.
In ERCOT, a generation asset owner could receive payment for exported energy at the wholesale market’s real-time price (RTP), while in PJM, under the ISO’s Economic Demand Response program, a retail customer can receive real-time pricing for load reduction by running the backup generator. In PJM, the customer is not permitted to export energy, while in ERCOT only the exported energy generates RTP compensation.
In addition to RTP, PJM has a spinning reserve program called Synchronized Reserve Demand Response. Similar to the PJM’s RTP program, the market participation rules in PJM prohibit customers’ export of power, so customers only receive financial incentives for load reduction to meet the needs of this spinning reserve program. Similarly, ERCOT has the Emergency Response Service program, which allows retail customers to bid in and receive payment for committing to reduce their loads (e.g., by running backup generators) during grid emergencies. PJM has a similar program called Emergency Load Reduction Program.
7.6 Market Analysis Summary results of the economic modeling are shown in Table 11 and Table 12. Table 11 includes the annualized revenues and costs for fuel and non-fuel O&M per unit of backup power. For the selected markets, the value proposition of specifying a backup system for grid services operation for the purpose of generating utility bill savings and revenues is strong, ranging from
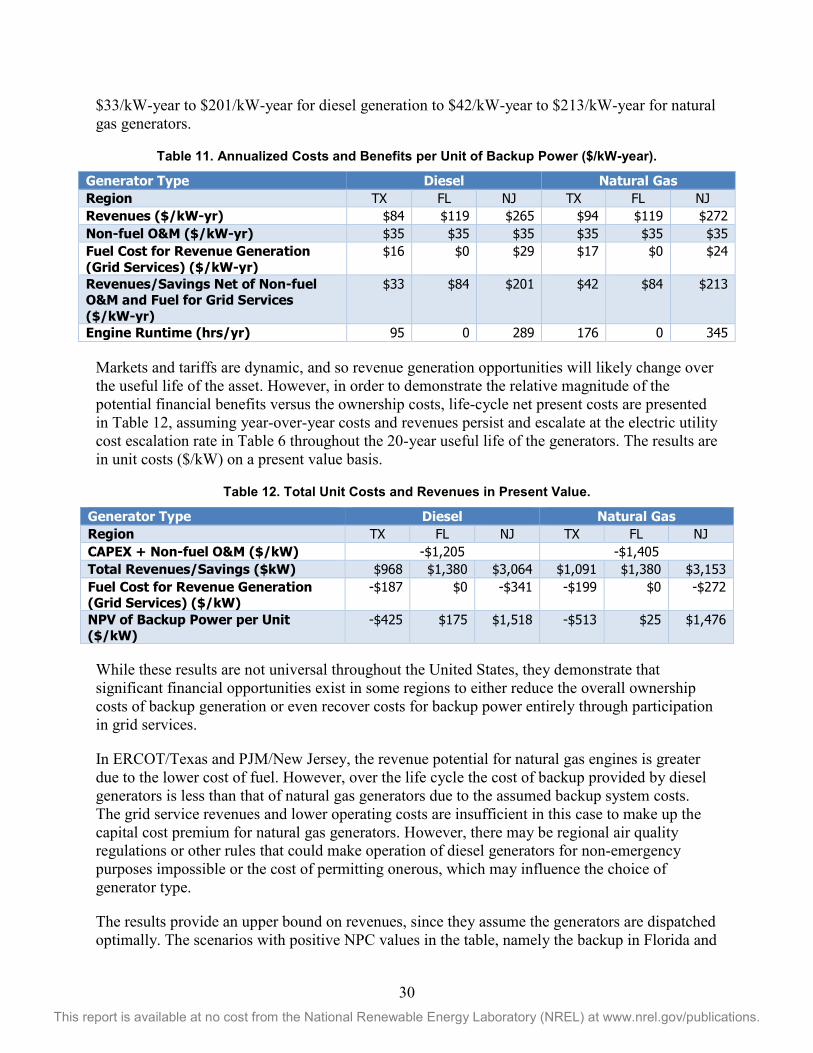
30 This report is available at no cost from the National Renewable Energy Laboratory (NREL) at www.nrel.gov/publications.
$33/kW-year to $201/kW-year for diesel generation to $42/kW-year to $213/kW-year for natural gas generators.
Table 11. Annualized Costs and Benefits per Unit of Backup Power ($/kW-year).
Generator Type Diesel Natural Gas Region TX FL NJ TX FL NJ Revenues ($/kW-yr) $84 $119 $265 $94 $119 $272 Non-fuel O&M ($/kW-yr) $35 $35 $35 $35 $35 $35 Fuel Cost for Revenue Generation (Grid Services) ($/kW-yr)
$16 $0 $29 $17 $0 $24
Revenues/Savings Net of Non-fuel O&M and Fuel for Grid Services ($/kW-yr)
$33 $84 $201 $42 $84 $213
Engine Runtime (hrs/yr) 95 0 289 176 0 345
Markets and tariffs are dynamic, and so revenue generation opportunities will likely change over the useful life of the asset. However, in order to demonstrate the relative magnitude of the potential financial benefits versus the ownership costs, life-cycle net present costs are presented in Table 12, assuming year-over-year costs and revenues persist and escalate at the electric utility cost escalation rate in Table 6 throughout the 20-year useful life of the generators. The results are in unit costs ($/kW) on a present value basis.
Table 12. Total Unit Costs and Revenues in Present Value.
Generator Type Diesel Natural Gas Region TX FL NJ TX FL NJ CAPEX + Non-fuel O&M ($/kW) -$1,205 -$1,405 Total Revenues/Savings ($kW) $968 $1,380 $3,064 $1,091 $1,380 $3,153 Fuel Cost for Revenue Generation (Grid Services) ($/kW)
-$187 $0 -$341 -$199 $0 -$272
NPV of Backup Power per Unit ($/kW)
-$425 $175 $1,518 -$513 $25 $1,476
While these results are not universal throughout the United States, they demonstrate that significant financial opportunities exist in some regions to either reduce the overall ownership costs of backup generation or even recover costs for backup power entirely through participation in grid services.
In ERCOT/Texas and PJM/New Jersey, the revenue potential for natural gas engines is greater due to the lower cost of fuel. However, over the life cycle the cost of backup provided by diesel generators is less than that of natural gas generators due to the assumed backup system costs. The grid service revenues and lower operating costs are insufficient in this case to make up the capital cost premium for natural gas generators. However, there may be regional air quality regulations or other rules that could make operation of diesel generators for non-emergency purposes impossible or the cost of permitting onerous, which may influence the choice of generator type.
The results provide an upper bound on revenues, since they assume the generators are dispatched optimally. The scenarios with positive NPC values in the table, namely the backup in Florida and
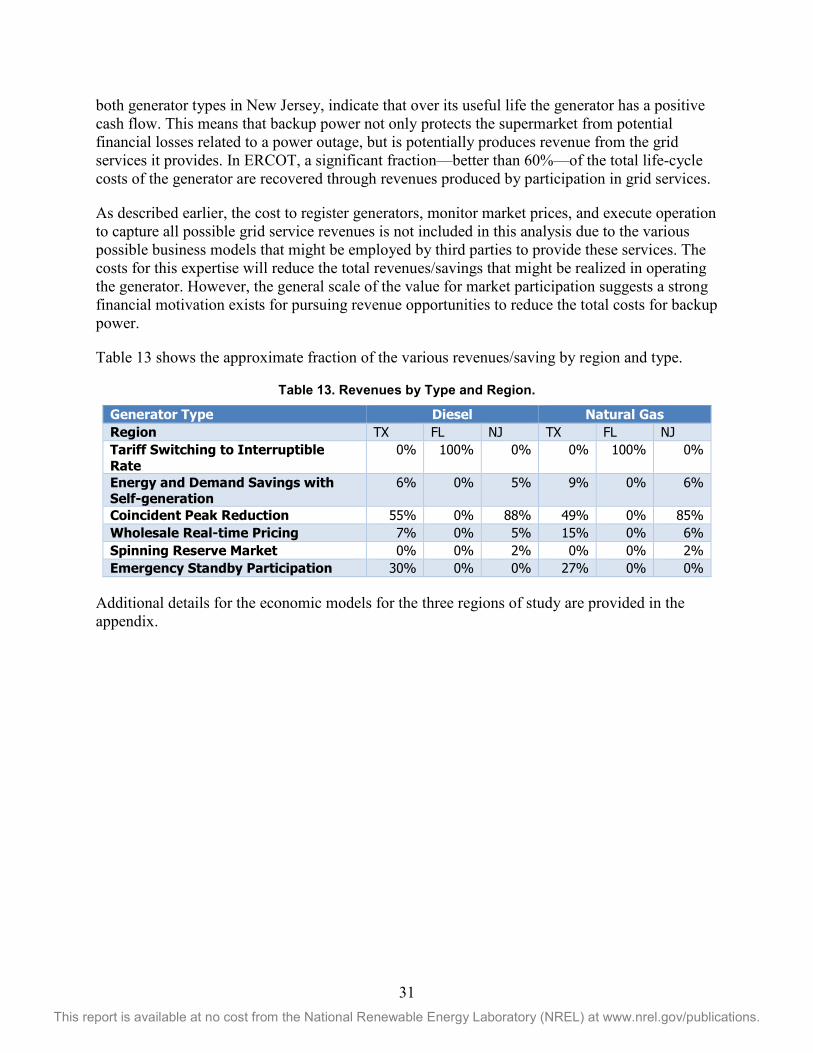
31 This report is available at no cost from the National Renewable Energy Laboratory (NREL) at www.nrel.gov/publications.
both generator types in New Jersey, indicate that over its useful life the generator has a positive cash flow. This means that backup power not only protects the supermarket from potential financial losses related to a power outage, but is potentially produces revenue from the grid services it provides. In ERCOT, a significant fraction—better than 60%—of the total life-cycle costs of the generator are recovered through revenues produced by participation in grid services.
As described earlier, the cost to register generators, monitor market prices, and execute operation to capture all possible grid service revenues is not included in this analysis due to the various possible business models that might be employed by third parties to provide these services. The costs for this expertise will reduce the total revenues/savings that might be realized in operating the generator. However, the general scale of the value for market participation suggests a strong financial motivation exists for pursuing revenue opportunities to reduce the total costs for backup power.
Table 13 shows the approximate fraction of the various revenues/saving by region and type.
Table 13. Revenues by Type and Region.
Generator Type Diesel Natural Gas Region TX FL NJ TX FL NJ Tariff Switching to Interruptible Rate
0% 100% 0% 0% 100% 0%
Energy and Demand Savings with Self-generation
6% 0% 5% 9% 0% 6%
Coincident Peak Reduction 55% 0% 88% 49% 0% 85% Wholesale Real-time Pricing 7% 0% 5% 15% 0% 6% Spinning Reserve Market 0% 0% 2% 0% 0% 2% Emergency Standby Participation 30% 0% 0% 27% 0% 0%
Additional details for the economic models for the three regions of study are provided in the appendix.
32 This report is available at no cost from the National Renewable Energy Laboratory (NREL) at www.nrel.gov/publications.
8 Conclusion We analyzed the relative costs and benefits—in terms of economics and reliability—of using natural gas versus diesel as the fuel source for a backup system. We also compared the relative merits of configuring a grid-connected backup system to provide grid-interactive financial benefits versus a backup-only system that generates power only when the primary grid is down.
Generators risk failing to start, failing to run, and failing due to a lack of fuel supply. Each failure type reduces system reliability. Failure to start has the greatest impact on short outages, while failure to run and failure of fuel supply have the strongest effect on long outages.
Natural gas generators face the risk of a loss of gas pressure, while diesel generators face the risk of running out of fuel. Both risks are greatest for large, long outages. Most power outages are short, but long outages are not uncommon, especially in areas prone to natural disasters such as hurricanes, tornados, or wildfires.
We estimate that the higher reliability of natural gas fuel supply compared to that of diesel fuel for long outages results in natural gas generators being more reliable than diesel generators, though these conclusions are based on estimates from small data sets and significant assumptions. We find that natural gas provides the largest reliability premium compared to diesel for regions that face high risks of long outages.
Using backup generators for grid services can significantly offset the costs of owning and maintaining power backup systems, and can even create positive economic value. Regions with coincident peak charges, along with regions that have curtailable tariffs and/or emergency standby participation, can generate significant revenues for backup system operators. More frequent operations can also improve system reliability. As generators have relatively high fuel costs, revenue streams which only require the generator to run frequently but for a limited number of hours each year are optimal.
While natural gas generators have lower fuel costs and can generate more revenue than diesel generators when both are run to provide grid services, in our case studies the lower capital cost makes diesel a more economic option than natural gas.
The differences between diesel and natural gas generators in terms of economics and reliability are relatively modest. Additional case-specific factors are likely to be important for determining which fuel choice is optimal. Examples of case-specific factors include availability of natural gas pipelines, difficulty of diesel resupply, air quality and noise concerns, and regulatory requirements such as those dictating onsite fuel storage.
Similarly, while we finds that generators used to provide grid services can reduce costs and increase reliability, other factors such as emissions concerns or lack of available markets for those grid services may make backup-only systems preferable. Customers considering installing a backup generator should look at both diesel and natural gas as potential fuel sources and consider the potential economic benefits of running the generator for more than just backup.
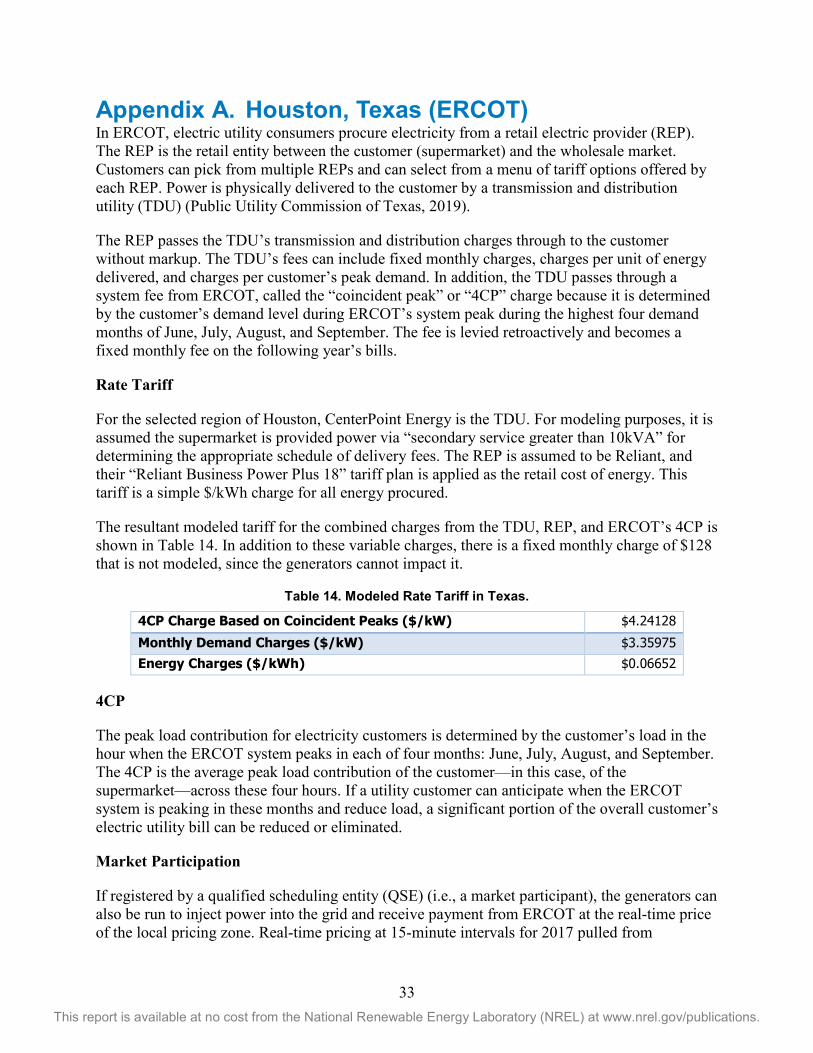
33 This report is available at no cost from the National Renewable Energy Laboratory (NREL) at www.nrel.gov/publications.
Appendix A. Houston, Texas (ERCOT) In ERCOT, electric utility consumers procure electricity from a retail electric provider (REP). The REP is the retail entity between the customer (supermarket) and the wholesale market. Customers can pick from multiple REPs and can select from a menu of tariff options offered by each REP. Power is physically delivered to the customer by a transmission and distribution utility (TDU) (Public Utility Commission of Texas, 2019).
The REP passes the TDU’s transmission and distribution charges through to the customer without markup. The TDU’s fees can include fixed monthly charges, charges per unit of energy delivered, and charges per customer’s peak demand. In addition, the TDU passes through a system fee from ERCOT, called the “coincident peak” or “4CP” charge because it is determined by the customer’s demand level during ERCOT’s system peak during the highest four demand months of June, July, August, and September. The fee is levied retroactively and becomes a fixed monthly fee on the following year’s bills.
Rate Tariff
For the selected region of Houston, CenterPoint Energy is the TDU. For modeling purposes, it is assumed the supermarket is provided power via “secondary service greater than 10kVA” for determining the appropriate schedule of delivery fees. The REP is assumed to be Reliant, and their “Reliant Business Power Plus 18” tariff plan is applied as the retail cost of energy. This tariff is a simple $/kWh charge for all energy procured.
The resultant modeled tariff for the combined charges from the TDU, REP, and ERCOT’s 4CP is shown in Table 14. In addition to these variable charges, there is a fixed monthly charge of $128 that is not modeled, since the generators cannot impact it.
Table 14. Modeled Rate Tariff in Texas.
4CP Charge Based on Coincident Peaks ($/kW) $4.24128 Monthly Demand Charges ($/kW) $3.35975 Energy Charges ($/kWh) $0.06652
4CP
The peak load contribution for electricity customers is determined by the customer’s load in the hour when the ERCOT system peaks in each of four months: June, July, August, and September. The 4CP is the average peak load contribution of the customer—in this case, of the supermarket—across these four hours. If a utility customer can anticipate when the ERCOT system is peaking in these months and reduce load, a significant portion of the overall customer’s electric utility bill can be reduced or eliminated.
Market Participation
If registered by a qualified scheduling entity (QSE) (i.e., a market participant), the generators can also be run to inject power into the grid and receive payment from ERCOT at the real-time price of the local pricing zone. Real-time pricing at 15-minute intervals for 2017 pulled from
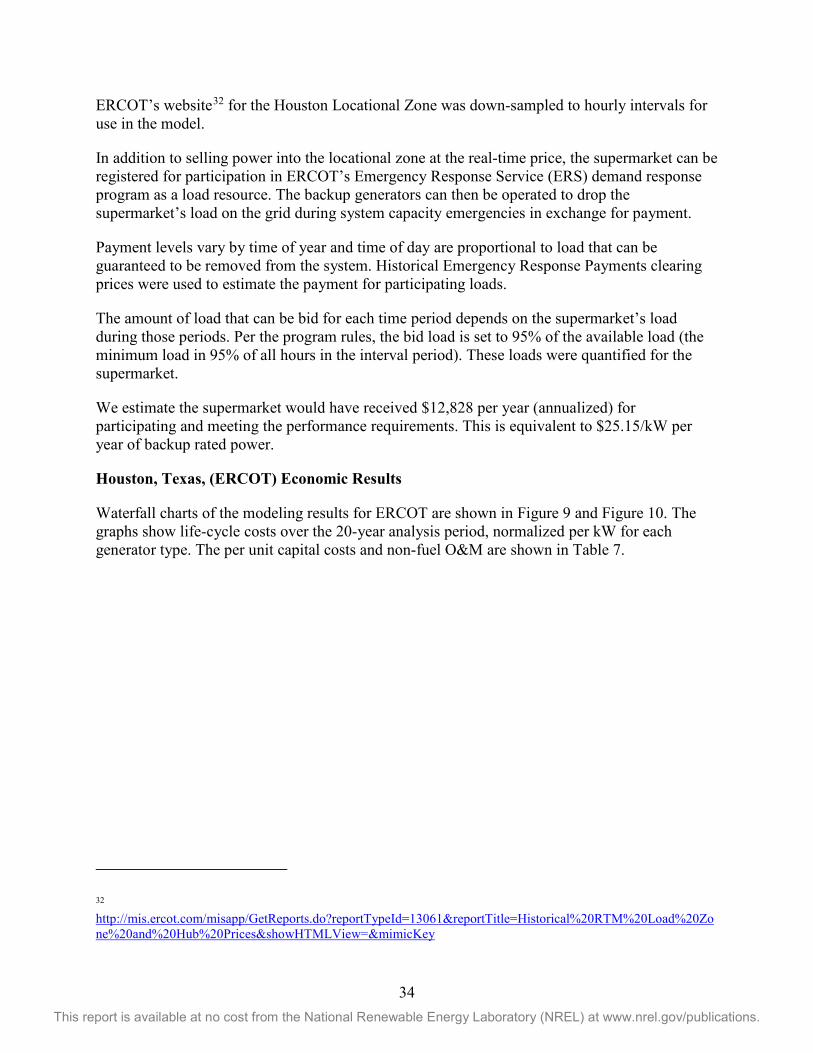
34 This report is available at no cost from the National Renewable Energy Laboratory (NREL) at www.nrel.gov/publications.
ERCOT’s website32 for the Houston Locational Zone was down-sampled to hourly intervals for use in the model.
In addition to selling power into the locational zone at the real-time price, the supermarket can be registered for participation in ERCOT’s Emergency Response Service (ERS) demand response program as a load resource. The backup generators can then be operated to drop the supermarket’s load on the grid during system capacity emergencies in exchange for payment.
Payment levels vary by time of year and time of day are proportional to load that can be guaranteed to be removed from the system. Historical Emergency Response Payments clearing prices were used to estimate the payment for participating loads.
The amount of load that can be bid for each time period depends on the supermarket’s load during those periods. Per the program rules, the bid load is set to 95% of the available load (the minimum load in 95% of all hours in the interval period). These loads were quantified for the supermarket.
We estimate the supermarket would have received $12,828 per year (annualized) for participating and meeting the performance requirements. This is equivalent to $25.15/kW per year of backup rated power.
Houston, Texas, (ERCOT) Economic Results
Waterfall charts of the modeling results for ERCOT are shown in Figure 9 and Figure 10. The graphs show life-cycle costs over the 20-year analysis period, normalized per kW for each generator type. The per unit capital costs and non-fuel O&M are shown in Table 7.
32 http://mis.ercot.com/misapp/GetReports.do?reportTypeId=13061&reportTitle=Historical%20RTM%20Load%20Zone%20and%20Hub%20Prices&showHTMLView=&mimicKey
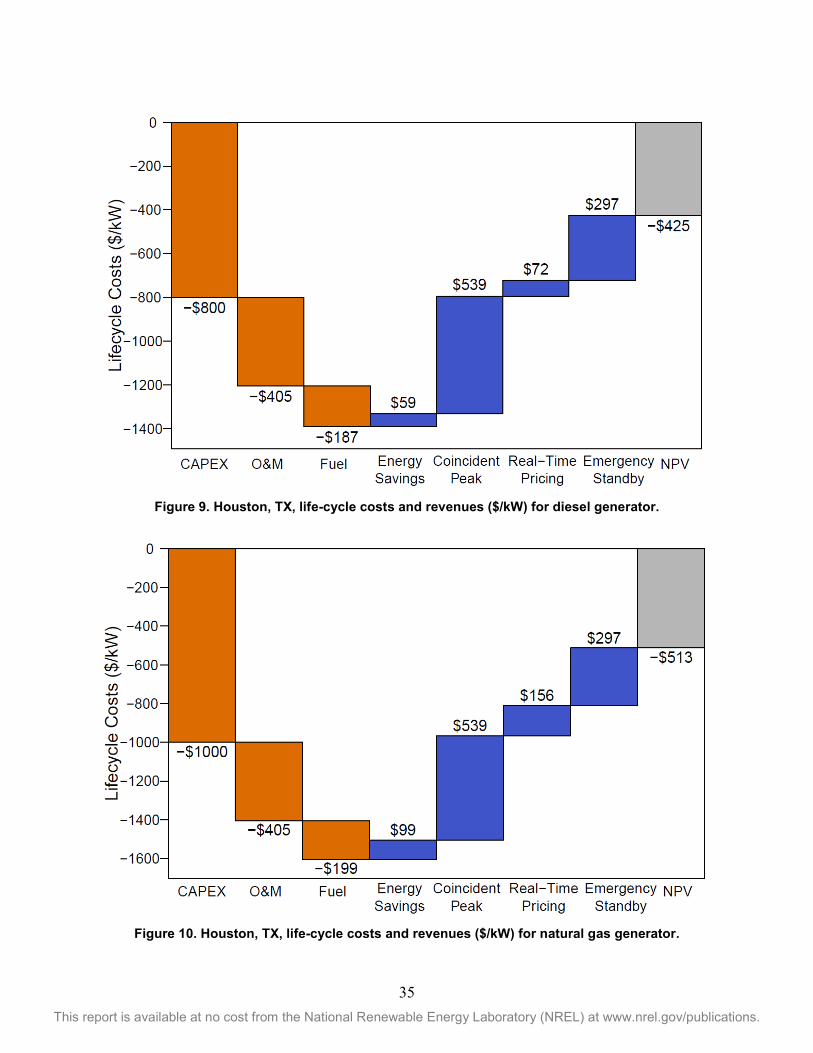
35 This report is available at no cost from the National Renewable Energy Laboratory (NREL) at www.nrel.gov/publications.
Figure 9. Houston, TX, life-cycle costs and revenues ($/kW) for diesel generator.
Figure 10. Houston, TX, life-cycle costs and revenues ($/kW) for natural gas generator.
36 This report is available at no cost from the National Renewable Energy Laboratory (NREL) at www.nrel.gov/publications.
The $187/kW life-cycle cost for diesel fuel in Figure 9 and $199/kW for natural gas in Figure 10 are the fuel costs for operating the generator to produce revenue. In ERCOT, the largest single financial opportunity is reducing the coincident peak charge, which is worth $539/kW in life-cycle costs. However, the other grid-interactive revenues, savings in energy and demand charges, wholesale real-time pricing, and emergency standby payments, total $428/kW for diesel and $552 for natural gas, making them significant contributors to the overall revenue potential for standby generation in this region. The net life-cycle costs for backup power in the Houston, Texas, case study are $425/kW for diesel and $513/kW for natural gas. Grid-interactive operation reduces the life-cycle ownership costs of backup power by 65% for diesel and 63% for natural gas.
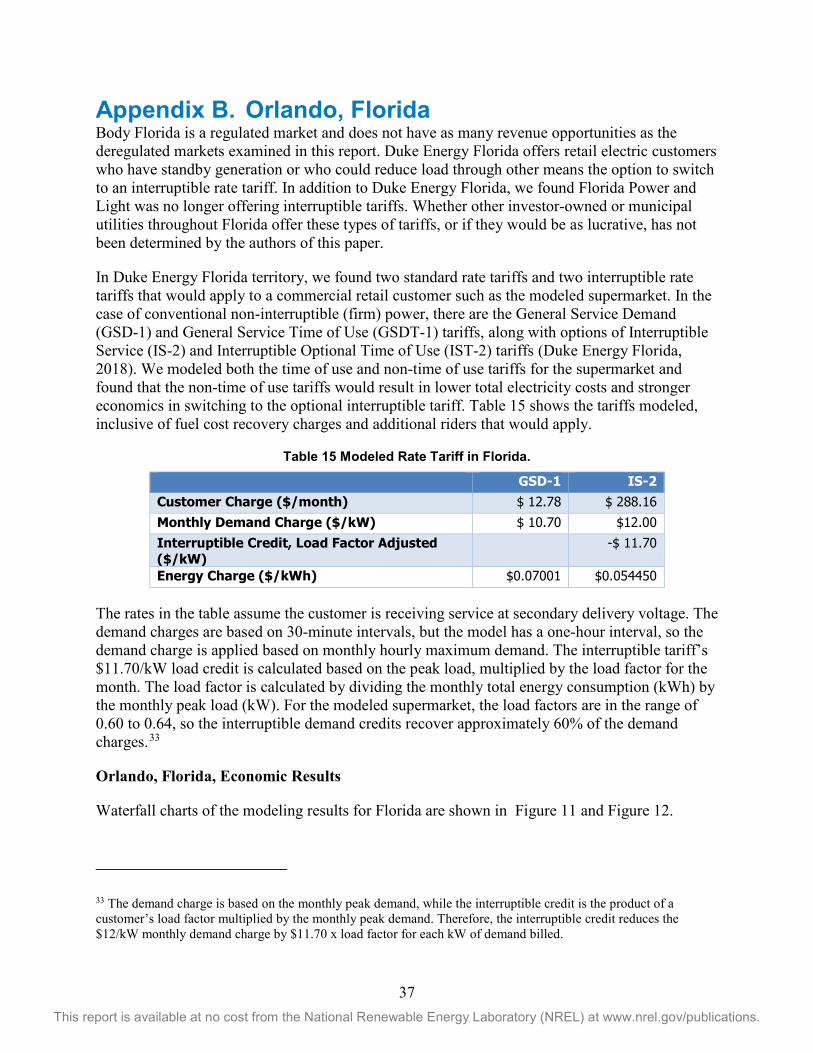
37 This report is available at no cost from the National Renewable Energy Laboratory (NREL) at www.nrel.gov/publications.
Appendix B. Orlando, Florida Body Florida is a regulated market and does not have as many revenue opportunities as the deregulated markets examined in this report. Duke Energy Florida offers retail electric customers who have standby generation or who could reduce load through other means the option to switch to an interruptible rate tariff. In addition to Duke Energy Florida, we found Florida Power and Light was no longer offering interruptible tariffs. Whether other investor-owned or municipal utilities throughout Florida offer these types of tariffs, or if they would be as lucrative, has not been determined by the authors of this paper.
In Duke Energy Florida territory, we found two standard rate tariffs and two interruptible rate tariffs that would apply to a commercial retail customer such as the modeled supermarket. In the case of conventional non-interruptible (firm) power, there are the General Service Demand (GSD-1) and General Service Time of Use (GSDT-1) tariffs, along with options of Interruptible Service (IS-2) and Interruptible Optional Time of Use (IST-2) tariffs (Duke Energy Florida, 2018). We modeled both the time of use and non-time of use tariffs for the supermarket and found that the non-time of use tariffs would result in lower total electricity costs and stronger economics in switching to the optional interruptible tariff. Table 15 shows the tariffs modeled, inclusive of fuel cost recovery charges and additional riders that would apply.
Table 15 Modeled Rate Tariff in Florida.
GSD-1 IS-2 Customer Charge ($/month) $ 12.78 $ 288.16 Monthly Demand Charge ($/kW) $ 10.70 $12.00 Interruptible Credit, Load Factor Adjusted ($/kW)
-$ 11.70
Energy Charge ($/kWh) $0.07001 $0.054450
The rates in the table assume the customer is receiving service at secondary delivery voltage. The demand charges are based on 30-minute intervals, but the model has a one-hour interval, so the demand charge is applied based on monthly hourly maximum demand. The interruptible tariff’s $11.70/kW load credit is calculated based on the peak load, multiplied by the load factor for the month. The load factor is calculated by dividing the monthly total energy consumption (kWh) by the monthly peak load (kW). For the modeled supermarket, the load factors are in the range of 0.60 to 0.64, so the interruptible demand credits recover approximately 60% of the demand charges.33
Orlando, Florida, Economic Results
Waterfall charts of the modeling results for Florida are shown in Figure 11 and Figure 12.
33 The demand charge is based on the monthly peak demand, while the interruptible credit is the product of a customer’s load factor multiplied by the monthly peak demand. Therefore, the interruptible credit reduces the $12/kW monthly demand charge by $11.70 x load factor for each kW of demand billed.
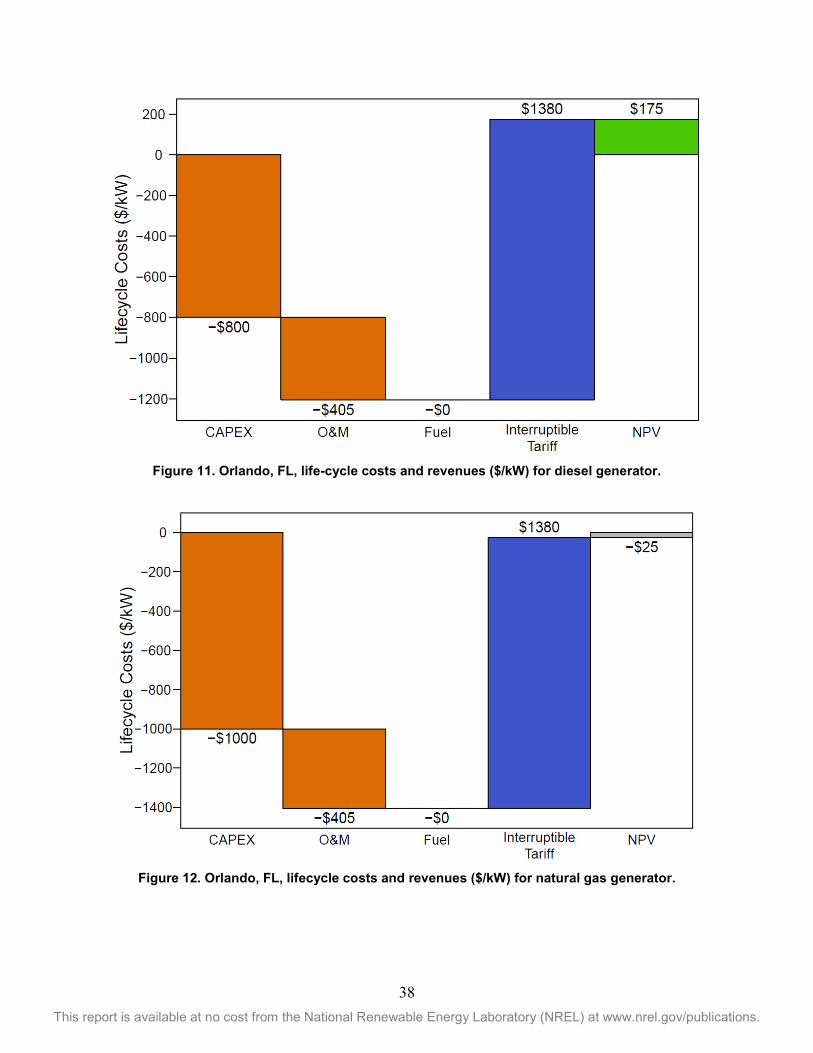
38 This report is available at no cost from the National Renewable Energy Laboratory (NREL) at www.nrel.gov/publications.
Figure 11. Orlando, FL, life-cycle costs and revenues ($/kW) for diesel generator.
Figure 12. Orlando, FL, lifecycle costs and revenues ($/kW) for natural gas generator.

39 This report is available at no cost from the National Renewable Energy Laboratory (NREL) at www.nrel.gov/publications.
In the Orlando, Florida, case study, all the revenue is produced by switching to the interruptible rate tariff. Although we allowed the generator to peak shave, the low demand charges do not warrant its operation to avoid this billing component. Also, since the interruptible tariff does not require significant operation of the generator, but only the ability to operate the generator, the cost of fuel for creating the revenues is negligible and therefore shown to be $0/kW in both Figure 11 and Figure 12. In Figure 11 the net cost of ownership for the diesel generator is a positive $175/kW, meaning the tariff switching makes up the full ownership cost of the generator and creates a net revenue over the life cycle. As shown in Figure 12, the natural gas generator has a net cost of $25/kW—98% of its life-cycle ownership costs are recovered by switching to the interruptible tariff.
40 This report is available at no cost from the National Renewable Energy Laboratory (NREL) at www.nrel.gov/publications.
Appendix C. Camden, New Jersey (PJM) New Jersey is within PJM’s control area, and the local utility selected for this analysis is Public Service Electric and Gas Company (PSEG).
Rate Tariff
PSEG’s General Lighting and Power delivery service fees are applied in the model. In this deregulated market, retail electric customers have an option to procure electricity from a third-party supplier, but for this analysis we assumed the supermarket purchases power on PSEG’s Basic Generation Service (BGS) electric supply tariff (PSEG, 2018) . The combined delivery and electric supply fees modeled are shown in Table 16.
Table 16. Modeled Rate Tariff in New Jersey.
Annual Demand Charge ($/kW) per Month, All Months $ 3.9274 Summer Demand Charge ($/kW) for Jun, Jul, Aug, Sep $ 13.776 Energy Charge, Oct thru May ($/kWh) $ 0.076919 Energy Charge, Jun thru Sep ($/kWh) $ 0.070096 5CP Capacity Charge ($/kW) $ 5.5048 5CP Transmission Charge ($/kW) $ 12.2883
The modeled tariff includes applicable riders and New Jersey taxes.
Capacity and Transmission 5CP
The capacity and transmission charges are the coincident peak charges based on a customer’s “5CP” charge applied to the customer’s average hourly load (kW) during the five hours that the PJM system peaks in the summer months (June through September). The transmission charge is calculated similarly, but it is based on the five summer hours of peak load in the PSEG service territory, not for the entire PJM system (Stansberry, 2014). This transmission charge is particularly high for PSEG (AEP Energy, 2018).
This analysis assumes that the generators would need to peak shave 30 hours of the supermarket’s load to reduce the five peak hours for each of the two charges, although certain of the PJM system peaks and PSEG zone peaks might overlap during some hours.34 This means in the model the generator is running between 30 and 60 hours to drive both the capacity and transmission 5CP levels to zero.
Market Participation
In PJM, retail customers can participate in certain wholesale markets through PJM demand response programs (DR). DR market participants do so by reducing their power demand on the 34 Monitoring of system loads and predicting peaking periods is conducted by a number of companies who will notify their customers when to reduce load in order to achieve savings of coincident peak charges. We assume in the analysis that uncertainty in predicting the peaking periods requires operation of the generator for 30 hours to be sure to hit the 5CP hours. After discussions with companies who operate generators to reduce 5CP hours, we believe the assumption of 30 hours of running time is conservative.
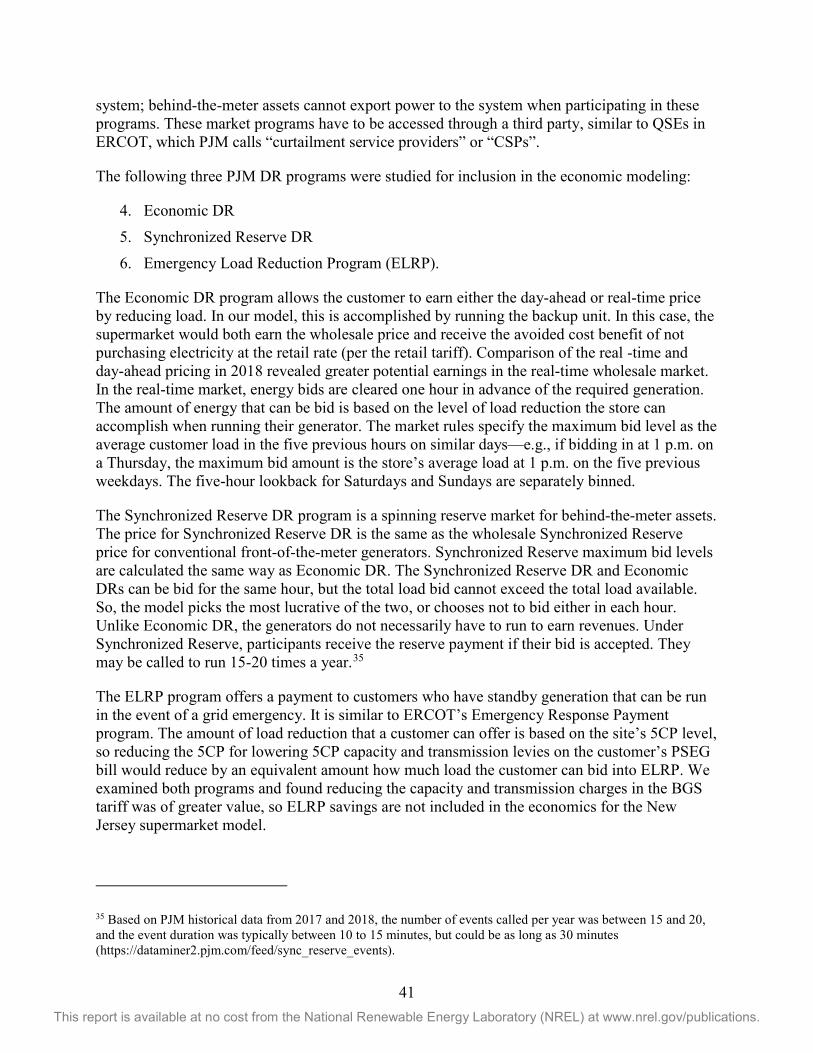
41 This report is available at no cost from the National Renewable Energy Laboratory (NREL) at www.nrel.gov/publications.
system; behind-the-meter assets cannot export power to the system when participating in these programs. These market programs have to be accessed through a third party, similar to QSEs in ERCOT, which PJM calls “curtailment service providers” or “CSPs”.
The following three PJM DR programs were studied for inclusion in the economic modeling:
4. Economic DR 5. Synchronized Reserve DR 6. Emergency Load Reduction Program (ELRP).
The Economic DR program allows the customer to earn either the day-ahead or real-time price by reducing load. In our model, this is accomplished by running the backup unit. In this case, the supermarket would both earn the wholesale price and receive the avoided cost benefit of not purchasing electricity at the retail rate (per the retail tariff). Comparison of the real -time and day-ahead pricing in 2018 revealed greater potential earnings in the real-time wholesale market. In the real-time market, energy bids are cleared one hour in advance of the required generation. The amount of energy that can be bid is based on the level of load reduction the store can accomplish when running their generator. The market rules specify the maximum bid level as the average customer load in the five previous hours on similar days—e.g., if bidding in at 1 p.m. on a Thursday, the maximum bid amount is the store’s average load at 1 p.m. on the five previous weekdays. The five-hour lookback for Saturdays and Sundays are separately binned.
The Synchronized Reserve DR program is a spinning reserve market for behind-the-meter assets. The price for Synchronized Reserve DR is the same as the wholesale Synchronized Reserve price for conventional front-of-the-meter generators. Synchronized Reserve maximum bid levels are calculated the same way as Economic DR. The Synchronized Reserve DR and Economic DRs can be bid for the same hour, but the total load bid cannot exceed the total load available. So, the model picks the most lucrative of the two, or chooses not to bid either in each hour. Unlike Economic DR, the generators do not necessarily have to run to earn revenues. Under Synchronized Reserve, participants receive the reserve payment if their bid is accepted. They may be called to run 15-20 times a year.35
The ELRP program offers a payment to customers who have standby generation that can be run in the event of a grid emergency. It is similar to ERCOT’s Emergency Response Payment program. The amount of load reduction that a customer can offer is based on the site’s 5CP level, so reducing the 5CP for lowering 5CP capacity and transmission levies on the customer’s PSEG bill would reduce by an equivalent amount how much load the customer can bid into ELRP. We examined both programs and found reducing the capacity and transmission charges in the BGS tariff was of greater value, so ELRP savings are not included in the economics for the New Jersey supermarket model.
35 Based on PJM historical data from 2017 and 2018, the number of events called per year was between 15 and 20, and the event duration was typically between 10 to 15 minutes, but could be as long as 30 minutes (https://dataminer2.pjm.com/feed/sync_reserve_events).
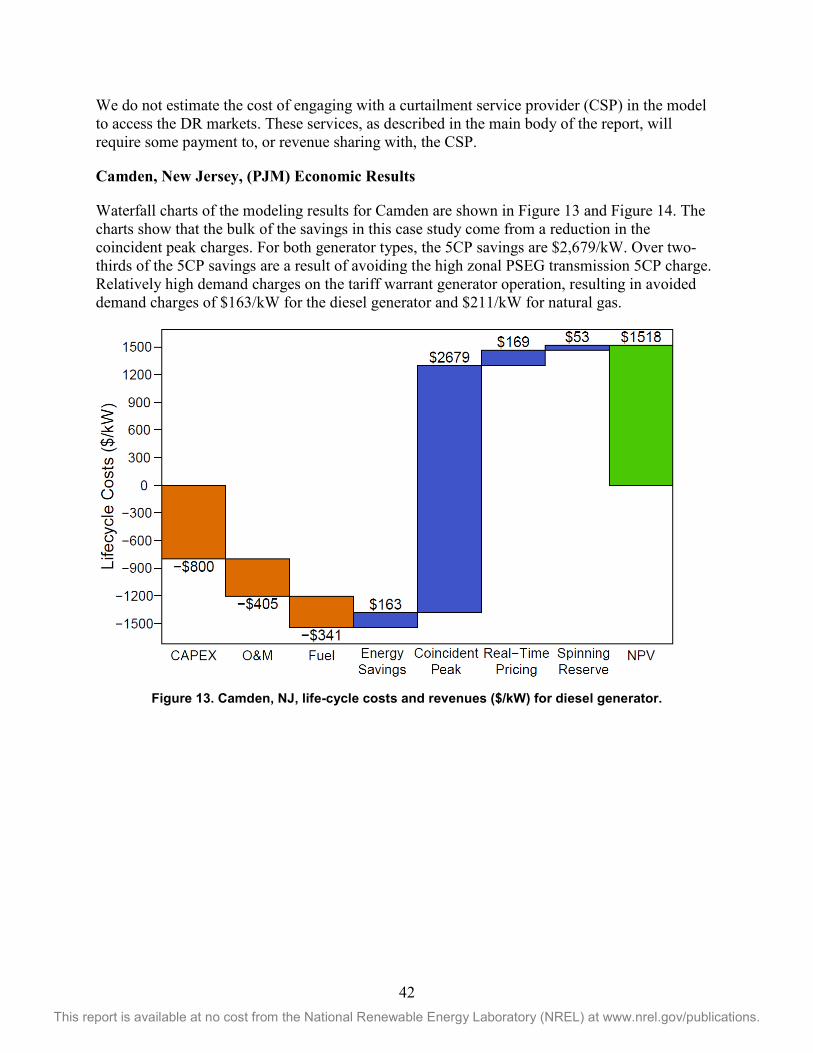
42 This report is available at no cost from the National Renewable Energy Laboratory (NREL) at www.nrel.gov/publications.
We do not estimate the cost of engaging with a curtailment service provider (CSP) in the model to access the DR markets. These services, as described in the main body of the report, will require some payment to, or revenue sharing with, the CSP.
Camden, New Jersey, (PJM) Economic Results
Waterfall charts of the modeling results for Camden are shown in Figure 13 and Figure 14. The charts show that the bulk of the savings in this case study come from a reduction in the coincident peak charges. For both generator types, the 5CP savings are $2,679/kW. Over two-thirds of the 5CP savings are a result of avoiding the high zonal PSEG transmission 5CP charge. Relatively high demand charges on the tariff warrant generator operation, resulting in avoided demand charges of $163/kW for the diesel generator and $211/kW for natural gas.
Figure 13. Camden, NJ, life-cycle costs and revenues ($/kW) for diesel generator.
43 This report is available at no cost from the National Renewable Energy Laboratory (NREL) at www.nrel.gov/publications.
Figure 14.Camden, NJ, life-cycle costs and revenues ($/kW) for natural gas generator.
PJM market programs, wholesale real-time pricing, and spinning reserve, also contribute to total revenues. The total life-cycle revenues for both generator types exceed the ownership costs of backup power. The diesel generator has a net positive life-cycle cost of $1,518/kW, and the natural gas generator’s is $1,476. Therefore, in this case study, the backup assets are found to cost-effective investments without considering their primary purpose of insurance against grid outages.
44 This report is available at no cost from the National Renewable Energy Laboratory (NREL) at www.nrel.gov/publications.
Appendix D. PV + BESS Sidebar The focus of this paper is a comparative analysis of backup generation using either diesel or natural gas generators. The main body of this paper compares reliability and economic of the two fuel types, assessing backup generator ownership costs and potential grid-interactive revenue potential. Combined solar photovoltaic (PV) plus battery energy storage systems (PV + BESS) are additional distributed energy assets that might be located behind the meter at retail locations and may interact economically with the generators.
The economics of PV + BESS were tested in the three case studies. The economic outlook for these technologies were examined separately from the backup generator. If they were found to be cost-effective, their impact on revenues from grid-paralleling operation of the backup generator were then determined. The PV system is assumed to have a 25-year useful life, so a 25-year analysis period is selected.
For the Texas case study, PV + BESS are not found to be cost effective, nor are they found to be cost effective for the Florida case under the interruptible rate tariff. However, for the New Jersey case study, it is cost effective to install 200 kW-DC of PV and a 95 kW, 274 kWh battery based on the modeled supermarket’s rate tariff. Over an assumed useful life of 25 years, the PV + BESS system has a net present value of $285,000 after tax. The savings include avoided energy purchases, a reduction in monthly demand charges, and reduced capacity and transmission coincident peak (5CP) charges.
The avoided utility costs that result in PV + BESS being cost effective are also part of the revenue potential identified by the backup generators in the body of the report. An analysis was conducted to see how the combined PV, BESS, and backup generator would operate and what impact this hybrid system would have on the revenue potential relative to the generator alone.
For the New Jersey case study, Table A17 shows the life-cycle revenues and avoided costs for three different configurations: PV + BESS alone, diesel generator alone, and PV + BESS + generator as a hybrid system. The values in the table are total life cycle over 20 years in units of $1,000, and are before tax.
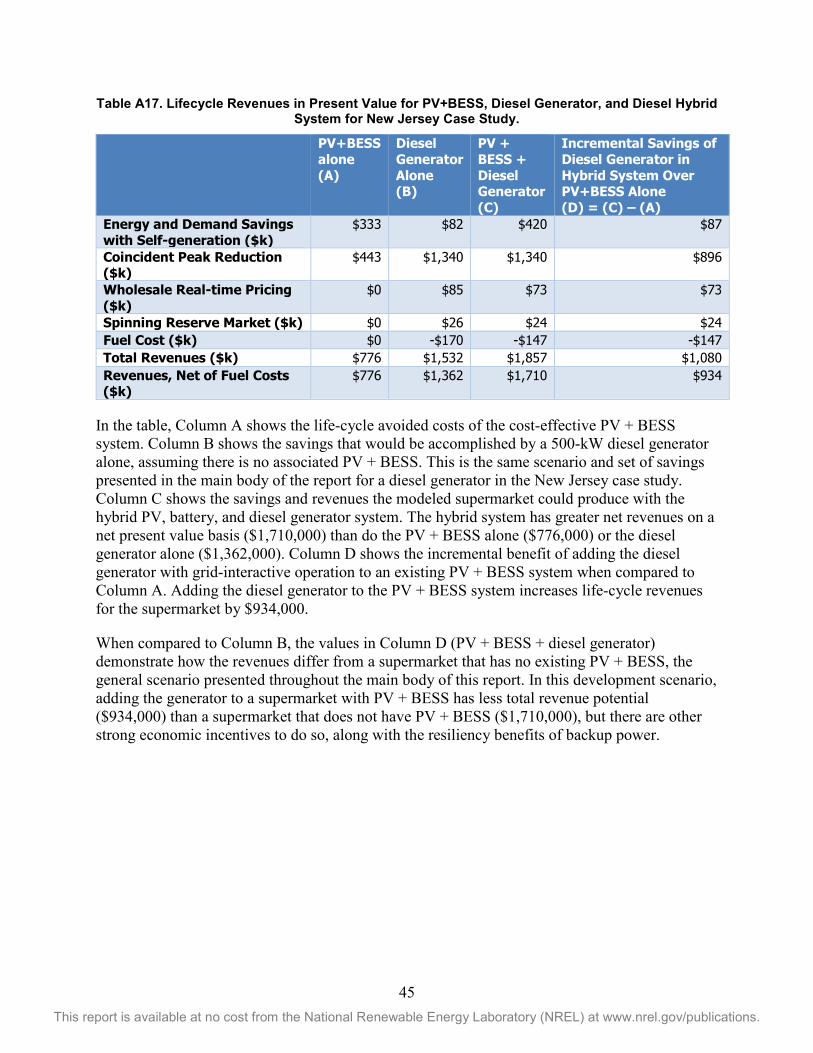
45 This report is available at no cost from the National Renewable Energy Laboratory (NREL) at www.nrel.gov/publications.
Table A17. Lifecycle Revenues in Present Value for PV+BESS, Diesel Generator, and Diesel Hybrid System for New Jersey Case Study.
PV+BESS alone (A)
Diesel Generator Alone (B)
PV + BESS + Diesel Generator (C)
Incremental Savings of Diesel Generator in Hybrid System Over PV+BESS Alone (D) = (C) – (A)
Energy and Demand Savings with Self-generation ($k)
$333 $82 $420 $87
Coincident Peak Reduction ($k)
$443 $1,340 $1,340 $896
Wholesale Real-time Pricing ($k)
$0 $85 $73 $73
Spinning Reserve Market ($k) $0 $26 $24 $24 Fuel Cost ($k) $0 -$170 -$147 -$147 Total Revenues ($k) $776 $1,532 $1,857 $1,080 Revenues, Net of Fuel Costs ($k)
$776 $1,362 $1,710 $934
In the table, Column A shows the life-cycle avoided costs of the cost-effective PV + BESS system. Column B shows the savings that would be accomplished by a 500-kW diesel generator alone, assuming there is no associated PV + BESS. This is the same scenario and set of savings presented in the main body of the report for a diesel generator in the New Jersey case study. Column C shows the savings and revenues the modeled supermarket could produce with the hybrid PV, battery, and diesel generator system. The hybrid system has greater net revenues on a net present value basis ($1,710,000) than do the PV + BESS alone ($776,000) or the diesel generator alone ($1,362,000). Column D shows the incremental benefit of adding the diesel generator with grid-interactive operation to an existing PV + BESS system when compared to Column A. Adding the diesel generator to the PV + BESS system increases life-cycle revenues for the supermarket by $934,000.
When compared to Column B, the values in Column D (PV + BESS + diesel generator) demonstrate how the revenues differ from a supermarket that has no existing PV + BESS, the general scenario presented throughout the main body of this report. In this development scenario, adding the generator to a supermarket with PV + BESS has less total revenue potential ($934,000) than a supermarket that does not have PV + BESS ($1,710,000), but there are other strong economic incentives to do so, along with the resiliency benefits of backup power.
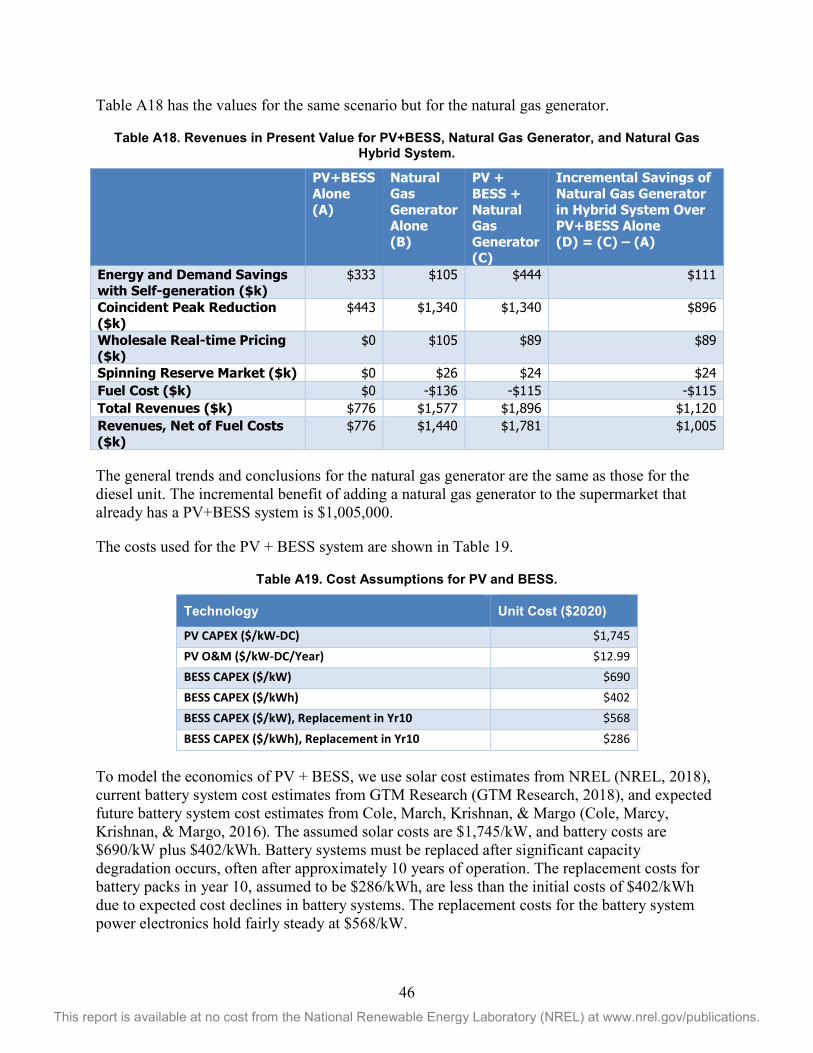
46 This report is available at no cost from the National Renewable Energy Laboratory (NREL) at www.nrel.gov/publications.
Table A18 has the values for the same scenario but for the natural gas generator.
Table A18. Revenues in Present Value for PV+BESS, Natural Gas Generator, and Natural Gas Hybrid System.
PV+BESS Alone (A)
Natural Gas Generator Alone (B)
PV + BESS + Natural Gas Generator (C)
Incremental Savings of Natural Gas Generator in Hybrid System Over PV+BESS Alone (D) = (C) – (A)
Energy and Demand Savings with Self-generation ($k)
$333 $105 $444 $111
Coincident Peak Reduction ($k)
$443 $1,340 $1,340 $896
Wholesale Real-time Pricing ($k)
$0 $105 $89 $89
Spinning Reserve Market ($k) $0 $26 $24 $24 Fuel Cost ($k) $0 -$136 -$115 -$115 Total Revenues ($k) $776 $1,577 $1,896 $1,120 Revenues, Net of Fuel Costs ($k)
$776 $1,440 $1,781 $1,005
The general trends and conclusions for the natural gas generator are the same as those for the diesel unit. The incremental benefit of adding a natural gas generator to the supermarket that already has a PV+BESS system is $1,005,000.
The costs used for the PV + BESS system are shown in Table 19.
Table A19. Cost Assumptions for PV and BESS.
Technology Unit Cost ($2020)
PV CAPEX ($/kW-DC) $1,745 PV O&M ($/kW-DC/Year) $12.99 BESS CAPEX ($/kW) $690 BESS CAPEX ($/kWh) $402 BESS CAPEX ($/kW), Replacement in Yr10 $568 BESS CAPEX ($/kWh), Replacement in Yr10 $286
To model the economics of PV + BESS, we use solar cost estimates from NREL (NREL, 2018), current battery system cost estimates from GTM Research (GTM Research, 2018), and expected future battery system cost estimates from Cole, March, Krishnan, & Margo (Cole, Marcy, Krishnan, & Margo, 2016). The assumed solar costs are $1,745/kW, and battery costs are $690/kW plus $402/kWh. Battery systems must be replaced after significant capacity degradation occurs, often after approximately 10 years of operation. The replacement costs for battery packs in year 10, assumed to be $286/kWh, are less than the initial costs of $402/kWh due to expected cost declines in battery systems. The replacement costs for the battery system power electronics hold fairly steady at $568/kW.

47 This report is available at no cost from the National Renewable Energy Laboratory (NREL) at www.nrel.gov/publications.
Over the 25-year analysis period, it is assumed that BESS will be replaced in year 10 and that the second BESS lasts for the remaining duration of the analysis period. Additionally, federal tax incentives for PV, the investment tax credit (ITC), and five-year modified accelerated cost recovery system (5-yr MACRS), are included. A 26% ITC for PV is assumed for 2020, based on the current incentive schedule. A seven-year MACRS is applied to the BESS.
It is important though that since we include the tax incentives for PV, that we also look at the economic revenues of PV, the potential for avoiding electricity purchases from the utility, also from an “after tax” perspective. For a business, utility expenses, like all operating expenses, are tax deductible. So, in this section, the impact of PV and BESS investments is determined on an after-tax basis, assuming a 21% federal corporate tax rate.
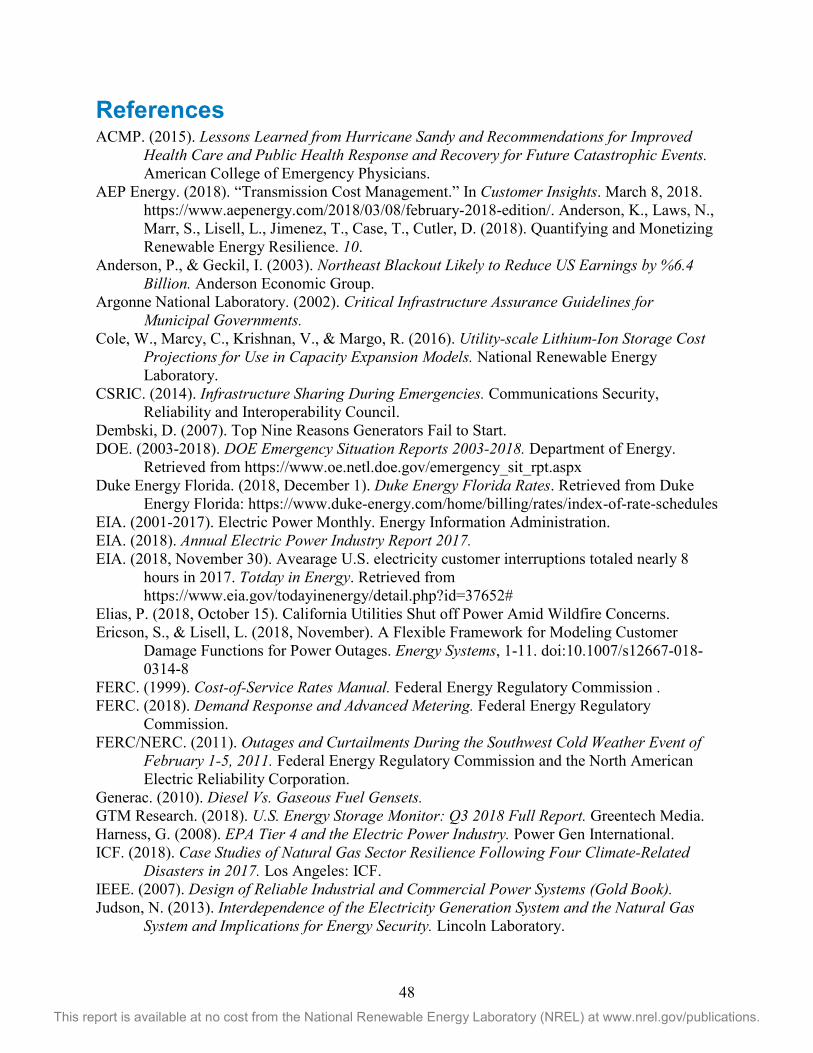
48 This report is available at no cost from the National Renewable Energy Laboratory (NREL) at www.nrel.gov/publications.
References ACMP. (2015). Lessons Learned from Hurricane Sandy and Recommendations for Improved
Health Care and Public Health Response and Recovery for Future Catastrophic Events. American College of Emergency Physicians.
AEP Energy. (2018). “Transmission Cost Management.” In Customer Insights. March 8, 2018. https://www.aepenergy.com/2018/03/08/february-2018-edition/. Anderson, K., Laws, N., Marr, S., Lisell, L., Jimenez, T., Case, T., Cutler, D. (2018). Quantifying and Monetizing Renewable Energy Resilience. 10.
Anderson, P., & Geckil, I. (2003). Northeast Blackout Likely to Reduce US Earnings by %6.4 Billion. Anderson Economic Group.
Argonne National Laboratory. (2002). Critical Infrastructure Assurance Guidelines for Municipal Governments.
Cole, W., Marcy, C., Krishnan, V., & Margo, R. (2016). Utility-scale Lithium-Ion Storage Cost Projections for Use in Capacity Expansion Models. National Renewable Energy Laboratory.
CSRIC. (2014). Infrastructure Sharing During Emergencies. Communications Security, Reliability and Interoperability Council.
Dembski, D. (2007). Top Nine Reasons Generators Fail to Start. DOE. (2003-2018). DOE Emergency Situation Reports 2003-2018. Department of Energy.
Retrieved from https://www.oe.netl.doe.gov/emergency_sit_rpt.aspx Duke Energy Florida. (2018, December 1). Duke Energy Florida Rates. Retrieved from Duke
Energy Florida: https://www.duke-energy.com/home/billing/rates/index-of-rate-schedules EIA. (2001-2017). Electric Power Monthly. Energy Information Administration. EIA. (2018). Annual Electric Power Industry Report 2017. EIA. (2018, November 30). Avearage U.S. electricity customer interruptions totaled nearly 8
hours in 2017. Totday in Energy. Retrieved from https://www.eia.gov/todayinenergy/detail.php?id=37652#
Elias, P. (2018, October 15). California Utilities Shut off Power Amid Wildfire Concerns. Ericson, S., & Lisell, L. (2018, November). A Flexible Framework for Modeling Customer
Damage Functions for Power Outages. Energy Systems, 1-11. doi:10.1007/s12667-018-0314-8
FERC. (1999). Cost-of-Service Rates Manual. Federal Energy Regulatory Commission . FERC. (2018). Demand Response and Advanced Metering. Federal Energy Regulatory
Commission. FERC/NERC. (2011). Outages and Curtailments During the Southwest Cold Weather Event of
February 1-5, 2011. Federal Energy Regulatory Commission and the North American Electric Reliability Corporation.
Generac. (2010). Diesel Vs. Gaseous Fuel Gensets. GTM Research. (2018). U.S. Energy Storage Monitor: Q3 2018 Full Report. Greentech Media. Harness, G. (2008). EPA Tier 4 and the Electric Power Industry. Power Gen International. ICF. (2018). Case Studies of Natural Gas Sector Resilience Following Four Climate-Related
Disasters in 2017. Los Angeles: ICF. IEEE. (2007). Design of Reliable Industrial and Commercial Power Systems (Gold Book). Judson, N. (2013). Interdependence of the Electricity Generation System and the Natural Gas
System and Implications for Energy Security. Lincoln Laboratory.
49 This report is available at no cost from the National Renewable Energy Laboratory (NREL) at www.nrel.gov/publications.
Kirchner, M. (2012). Understanding Backup Power System Fuel Choices. Consulting-Specifying Engineer. Retrieved from https://www.csemag.com/articles/understanding-backup-power-system-fuel-choices/
LaCammare, K., Eto, J., Dunn, L., & Sohn, M. (2018). Improving the Estimated Cost of Sustained Power Interruptions to Electricity Customers. Lawrence Berkeley National Laboratory.
Laws, N. D., Anderson, K., DiOrio, N. A., Li , X., & McLaren, J. (2018). Impacts of Valuing Resilience on Cost-Optimal PV and Storage Systems for Commercial Buildings. 127, 896-909. Retrieved from https://www.sciencedirect.com/science/article/pii/S0960148118305305
Lazard. (2017, November). Lazard's Levelized Csot of Eenrgy Analysis-Version 11.0. Retrieved from Lazard & Col, Limited: https://www.lazard.com/media/450337/lazard-levelized-cost-of-energy-version-110.pdf
Liss, W., & Rowley, P. (2018). Assessment of Natural Gas and Electric Distribution Service Reliability. Gas Technology Institute.
Mrowca, B. (2011). Emergency Diesel Generator Failure Review 1999 - 2001. Information Systems Laboratories.
National Hurricane Center. (2018). Costliest U.S. Tropical Cyclones Tables Updated. National Oceanic and Atmospheric Administration.
Natural Gas Council. (2017). Natural Gas Systems: Reliable & Resilient. Natural Gas Council. NERC. (2017). Special Reliability Assessment: Potential Bulk Power System Impacts Due to
Sever Disruptions on the Natural Gas System. North American Electric Reliability Corporation.
NESCAUM. (2012). Air Quality, Electricity, and Back-up Stationary Diesel Engines in the Northeast. Northeast States for Coordinated Air Use Management.
NFPA. (2019). NFPA 110 Standard for Emergency and Standby Power Systems. National Fire Protection Association.
NREL. (2018). Annual Technology Baseline 2018. National Renewable Energy Laboratory. Retrieved from http://www.nrel.gov/analysis/data_tech_baseline.html
Nuclear Energy Institute. (2013). Regulatory Assessment Performance Indicator Guideline. Nuclear Energy Institute.
Philips, J. A., Wallace, K. E., Kudo, T. Y., & Eto, J. H. (2016). Onsite and Electric Power Backup Capabilities at Critical Infrastructure Facilities in the United States. Argonne National Laboratory.
PHMSA. (2018). Incident / Accident Data from Gas Distribution, Gas Gathering, Gas Transmission, Hazardous Liquids, LNG, and UNGS Operators. Pipeline and Hazardous Materials Safety Administration.
Preston, B. L., Backhaus, S. N., Ewers, M., Phillips, J. A., Silva-Monroy, C. A., Dagle, J. E., . . . King, J. T. (2016). Resilience of the U.S. Electricity System: A Multi-Hazard Perspective. Argonne National Laboratory.
PSEG (Public Service Electric and Gas Company). (2018). Tariff For Electric Service. B.P.U.N.J. No. 16 Electric. October 30, 2018. Newark, New Jersey. https://nj.pseg.com/aboutpseg/regulatorypage/-/media/AE1954F025B4491FAFA40DA3E1ACF9A7.ashx.Public Utility Commission of Texas. (2019). REP - Retail Electric Providers Certification and Reporting. Retrieved
50 This report is available at no cost from the National Renewable Energy Laboratory (NREL) at www.nrel.gov/publications.
from Public Utility Commission of Texas: https://www.puc.texas.gov/industry/electric/business/rep/rep.aspx
Robinson, D., Atcitty, C., Zuffranieri, J., & Arent, D. (2006). Impact of Distributed Energy Resources on the Reliability of a Critical Telecommunications Facility. Sandia National Laboratory.
Robinson, J. (n.d.). PowerOutage.us. Retrieved from PowerOutage.us Ryan, N., Larsen, K., & Black, P. (2002). Smaller, Closer, Dirtier: Diesel Backup Generators in
California. Environmental Defence Fund. Schroeder, J. (2018). Enhanced Component Performance Study: Emergency Diesel Generators
1998-2016. Idahoe National Laboratory. Smith, C., Donovan, M., & Bartos, M. (1990). Reliability Survey of 600- to 1800-kW Diesel and
Gas-Turbine Generating Units. 26(4). Stansberry, Matt. (2014). “Diesel Exhaust After Treatment for Data Centers.” May 2014. Uptime
Institute. Accessed January 25, 2019: https://journal.uptimeinstitute.com/diesel-exhaust-treatment-data-centers/.
Victory, N. (2006). Report and Recommendations of the Independent Panel Reviewing the Impact of Hurricane Katrina on Communications Networks. Wiley Rein & Gielding.


