Embed Size (px)
Citation preview
Enhanced Cycling Stability in the Anion Redox MaterialP3-Type Zn-Substituted Sodium Manganese OxideStephanie F. Linnell,[a, b] Moritz Hirsbrunner,[c] Saki Imada,[d] Giannantonio Cibin,[e]
Aaron B. Naden,[a] Alan V. Chadwick,[f] John T. S. Irvine,[a, b] Laurent C. Duda,[c] andA. Robert Armstrong*[a, b]
Sodium layered oxides showing oxygen redox activity arepromising positive electrodes for sodium-ion batteries (SIBs).However, structural degradation typically results in limitedreversibility of the oxygen redox activity. Herein, the effect ofZn-doping on the electrochemical properties of P3-type sodiummanganese oxide, synthesised under air and oxygen is inves-tigated for the first time. Air-Na0.67Mn0.9Zn0.1O2 and Oxy-Na0.67Mn0.9Zn0.1O2 exhibit stable cycling performance between1.8 and 3.8 V, each maintaining 96% of their initial capacity
after 30 cycles, where Mn3+/Mn4+ redox dominates. Increasingthe voltage range to 1.8–4.3 V activates oxygen redox. For thematerial synthesised under air, oxygen redox activity is basedon Zn, with limited reversibility. The additional transition metalvacancies in the material synthesised under oxygen result inenhanced oxygen redox reversibility with small voltage hyste-resis. These results may assist the development of high-capacityand structurally stable oxygen redox-based materials for SIBs.
1. Introduction
The efficient use of renewable energy sources such as wind andsolar is crucial for a sustainable future. However, these areintermittent and may be localized geographically, and there-fore, energy storage systems are required to allow for thestorage and release of energy when the supply is not matchedby the demand.[1] Rechargeable batteries are considered apromising solution, providing they can deliver an efficient, cost-
effective, and sustainable storage strategy on a large-scale. Inthis respect, SIBs are promising candidates, owing to the lowcost and abundance of sodium and ability to store andtransport SIBs at 0 V.[2–4]
Layered sodium transition metal oxides, NaxMyO2 (0.4�x�1.0, and M= transition metal ion(s)) have become the positiveelectrode materials of choice for SIBs. These layered oxides canadopt the O3, P2 and P3 polymorphs, in which the Na+ ionscan be accommodated in either octahedral (O) or trigonalprismatic (P) sites and the number describes the number ofMO2 layers in the unit cell.[5] These materials tend to exhibitstructural transformations at high voltages, between the P-typeand O-type phases, induced by gliding of the MO2 layers uponinsertion/extraction of Na+ ions and, in the case of Mn-basedmaterials, because of the presence of Jahn-Teller active Mn3+
ions. These distortions lead to large unit cell volume changesand lattice strain, which is detrimental to the cyclingperformance.[6] The possibility of obtaining additional capacityin Mn-based materials originating from oxygen redox chemistryhas attracted considerable attention.[4,7] For example Na4/7[&1/
7Mn6/7]O2 (where & represents a transition metal vacancy),contains Mn vacancies and therefore O 2p nonbonding orbitalswhich enable reversible oxygen redox.[7] Upon cycling Na4/7[&1/
7Mn6/7]O2, its layered structure and P3-type oxygen stackingsequence (ABBCCA) are maintained.[8,9] Consequently, Na4/7[&1/
7Mn6/7]O2 shows more reversible oxygen redox compared withother sodium-based oxygen redox active materials with negli-gible voltage hysteresis and can deliver a specific capacity of upto ~200 mAhg� 1.[7,10,11] However, Na4/7[&1/7Mn6/7]O2 shows acapacity retention of ~63% over 60 cycles when both cationand anion redox reactions are used.[7,11] Therefore, to enhancethe long-term cyclability of these materials over the highvoltage regions, several different approaches have beenadopted to improve the structural integrity. Substitution of Mnby electrochemically active elements, like Ni2+, Fe3+ or Co3+,
[a] Dr. S. F. Linnell, Dr. A. B. Naden, Prof. J. T. S. Irvine, Dr. A. R. ArmstrongSchool of ChemistryUniversity of St AndrewsSt Andrews, Fife, KY16 9ST, United KingdomE-mail: [email protected]
[b] Dr. S. F. Linnell, Prof. J. T. S. Irvine, Dr. A. R. ArmstrongThe Faraday InstitutionQuad One, Harwell Science and Innovation Campus, Didcot, OX11 0RA,United Kingdom
[c] M. Hirsbrunner, Dr. L. C. DudaDepartment of Physics and Astronomy, Division of Molecular andCondensed Matter PhysicsUppsala UniversityUppsala, S-75120, Sweden
[d] Prof. S. ImadaFaculty of Electrical Engineering and ElectronicsKyoto Institute of TechnologySakyo, Kyoto 606-8585, Japan
[e] Dr. G. CibinDiamond Light Source LtdDiamond House Harwell Science & Innovation Campus, Didcot, Oxfordshire,OX11 0DE, United Kingdom
[f] Prof. A. V. ChadwickSchool of Physical SciencesUniversity of KentCanterbury, Kent, CT2 7NH, United KingdomSupporting information for this article is available on the WWW underhttps://doi.org/10.1002/celc.202200240© 2022 The Authors. ChemElectroChem published by Wiley-VCH GmbH. Thisis an open access article under the terms of the Creative CommonsAttribution License, which permits use, distribution and reproduction in anymedium, provided the original work is properly cited.
ChemElectroChem
www.chemelectrochem.org
Research Articledoi.org/10.1002/celc.202200240
ChemElectroChem 2022, 9, e202200240 (1 of 14) © 2022 The Authors. ChemElectroChem published by Wiley-VCH GmbH
Wiley VCH Dienstag, 07.06.2022
2211 / 252891 [S. 232/245] 1
facilitates the electron transfer between the O 2p states andtransition metal 3d bands, typically via a reductive couplingmechanism, thereby stabilizing the oxygen redox activity.[12–15]
Doping with electrochemically inactive elements, Li+, Mg2+, andZn2+, forms ionic Li� O, Mg� O and Zn� O bonds, such that theelectrons in these bonds are localized on the oxygen anions,creating O 2p nonbonding orbitals which participate in thecharge compensation mechanism.[16–21]
A previous study reported the substitution of Mn3+ ions byMg2+ ions to stabilize the P3-type structure.[22] P3-Na0.67Mn0.8Mg0.2O2 synthesised under air and quenched, exhib-ited an oxygen redox process on charge at 4.15 V with largevoltage hysteresis, whereas when synthesised under oxygenand slow cooled, the material contained 4% vacancies andexhibited enhanced oxygen redox reversibility at 4.2 V. Thetransition metal vacancies in Oxy-Na0.67Mn0.8Mg0.2O2, enabledunpaired O 2p orbitals independent of the substituted Mg toform, which stabilized the P3 structure upon Na+ ion extractionand reduced the structural transformation to the O’3 structureupon Na+ ion insertion.[22]
Substitution using more electronegative Zn2+ ions (Paulingelectronegativity values: Zn 1.65 and Mg 1.31, respectively) hasalso been used to suppress the Jahn-Teller distortion by dilutingthe Mn3+ ions. Doping with Zn2+ ions stabilized the structure ofP2-Na0.67Mn0.6Fe0.3Zn0.1O2 upon cycling, resulting in superiorelectrochemical properties when compared with those of theundoped P2-Na0.67Mn0.6Fe0.4O2 material.[23] Similarly, Yang andco-workers have explored a series of Zn-doped P2-Na0.66Ni0.33-xZnxMn0.67O2 (x=0, 0.07, 0.14) materials that exhibit improvedelectrochemical performance, smoother voltage profiles andreduced structural transformation from the P2 to P’2 structure,compared with P2-Na0.66Ni0.33Mn0.67O2.
[24,25] Bai et al. studied theeffects of Zn doping in P2-Na2/3Mn7/9Zn2/9O2. This phasebehaved in an analogous manner to the Mg-substituted P2-Na0.67Mg0.28Mn0.72O2 material,[26] as well as showing the partic-ipation of oxygen anions in the charge compensation mecha-nism without the release of O2.
[20] Despite their similarities, Na2/3Mn7/9Zn2/9O2 revealed cation migration, leading to poor cyclingperformance and density functional theory (DFT) calculationsdemonstrated that the oxygen redox activity originates fromthe presence of a nonbonding O 2p state.[20]
Driven by the efficiency of doping with Zn in stabilizing thestructures of P2-type materials, we have studied the effects ofZn-doping on P3-type Na0.67Mn0.9Zn0.1O2, in both the absenceand presence of transition metal vacancies. Na0.67Mn0.9Zn0.1O2,synthesised under air and quenched, contains very fewtransition metal vacancies, and exhibits oxygen redox withsignificant voltage hysteresis. By contrast, Na0.67Mn0.9Zn0.1O2,synthesised under oxygen and slow cooled, contains 6%vacancies and shows enhanced oxygen redox reversibility,demonstrating the advantages of vacancies. Structural analysisindicates that the good cycling performance is due to the stableframework structure of P3-Na0.67Mn0.9Zn0.1O2.
2. Results and Discussion
2.1. Characterization of Air-Na0.67Mn0.9Zn0.1O2 andOxy-Na0.67Mn0.9Zn0.1O2
P3-type Na0.67Mn0.9Zn0.1O2 are based on the P3 layeredNa4/7[&1/7Mn6/7]O2 material in which Mn ions are substituted byZn ions.[7,27] The powder X-ray diffraction (PXRD) patterns of Air-Na0.67Mn0.9Zn0.1O2 and Oxy-Na0.67Mn0.9Zn0.1O2 can be fully in-dexed to an ideal P3 structure with the space group R3m,where Na+ ions occupy trigonal prismatic sites, and Mn and Znions are in octahedral sites with ABBCCA oxygen stacking, asillustrated in Figure S1. All diffraction peaks are well-fitted byRietveld refinement using this model for Air-Na0.67Mn0.9Zn0.1O2
and Oxy-Na0.67Mn0.9Zn0.1O2 and the profile fits are shown inFigure 1(a, b), respectively. The refined structural parametersare presented in Table S1. These results show that the unit cellvolume of Oxy-Na0.67Mn0.9Zn0.1O2 (121.75(3) Å3) is smaller thanthat of Air-Na0.67Mn0.9Zn0.1O2 (122.08(2) Å3), associated with acontraction in the a parameter. Since a is strongly correlatedwith the M� O bond length, this is consistent with a higher Mnoxidation state in Oxy-Na0.67Mn0.9Zn0.1O2. This could arise eitherbecause of variation in the Na content or the presence oftransition metal vacancies. Since the refined Na occupancies(Table S1) for these materials are essentially the same, it isreasonable to assume that the contraction in a is due tovacancies on the Mn sites in Oxy-Na0.67Mn0.9Zn0.1O2. Synthesis ofNa0.67Mn0.9Zn0.1O2 under more oxidizing conditions results in theuptake of more oxygen, raising the average Mn oxidation statecloser to Mn4+ which generates vacancies on the Mn sites forcharge compensation, as reported in a range of relatedsystems.[5,18,24–28] The refined occupancies (Table S1) reveal thatOxy-Na0.67Mn0.9Zn0.1O2 contains 6% vacancies,Na0:67Mn
þ3:710:85 Zn0:09&0:06O2 while Air-Na0.67Mn0.9Zn0.1O2 contains
very few transition metal vacancies, Na0:62Mnþ3:530:9 Zn0:1O2: How-
ever, it should be noted that that a small amount of vacanciescould form at 625 °C in air despite quenching the material.[31]
As-synthesised Air-Na0.67Mn0.75Zn0.25O2 was examined bypowder neutron diffraction. A number of reflections areunindexed on the basis of the simple P3 model and can beindexed on the basis of a superlattice model (space group Cm),in which Zn2+ ions are in the centre of a honeycomb arrange-ment surrounded by Mn ions (Figure S2). The profile fit andcorresponding refined structural parameters are presented inFigure S2 and Table S2, respectively. Given the size differencebetween Mn4+ (0.53 Å) and Zn2+ (0.74 Å) ions,[32] it is expectedthat Air-Na0.67Mn0.9Zn0.1O2 and Oxy-Na0.67Mn0.9Zn0.1O2 will exhibitsimilar ordering behaviour. Weak superlattice reflections arediscernible in the XRD patterns but there is insufficient contrastbetween Mn and Zn to permit refinement. Previous work hasdemonstrated the importance of honeycomb-type cation order-ing on stable oxygen redox activity in Na2RuO3.
[33]
The morphologies of Air-Na0.67Mn0.9Zn0.1O2 and Oxy-Na0.67Mn0.9Zn0.1O2 are shown in Figure 1(c) and (d), respectively,exhibiting agglomerated primary particles of around 100 nm insize. The SEM micrographs show that the different syntheticconditions did not have any discernible effect on the
ChemElectroChemResearch Articledoi.org/10.1002/celc.202200240
ChemElectroChem 2022, 9, e202200240 (2 of 14) © 2022 The Authors. ChemElectroChem published by Wiley-VCH GmbH
Wiley VCH Dienstag, 07.06.2022
2211 / 252891 [S. 233/245] 1
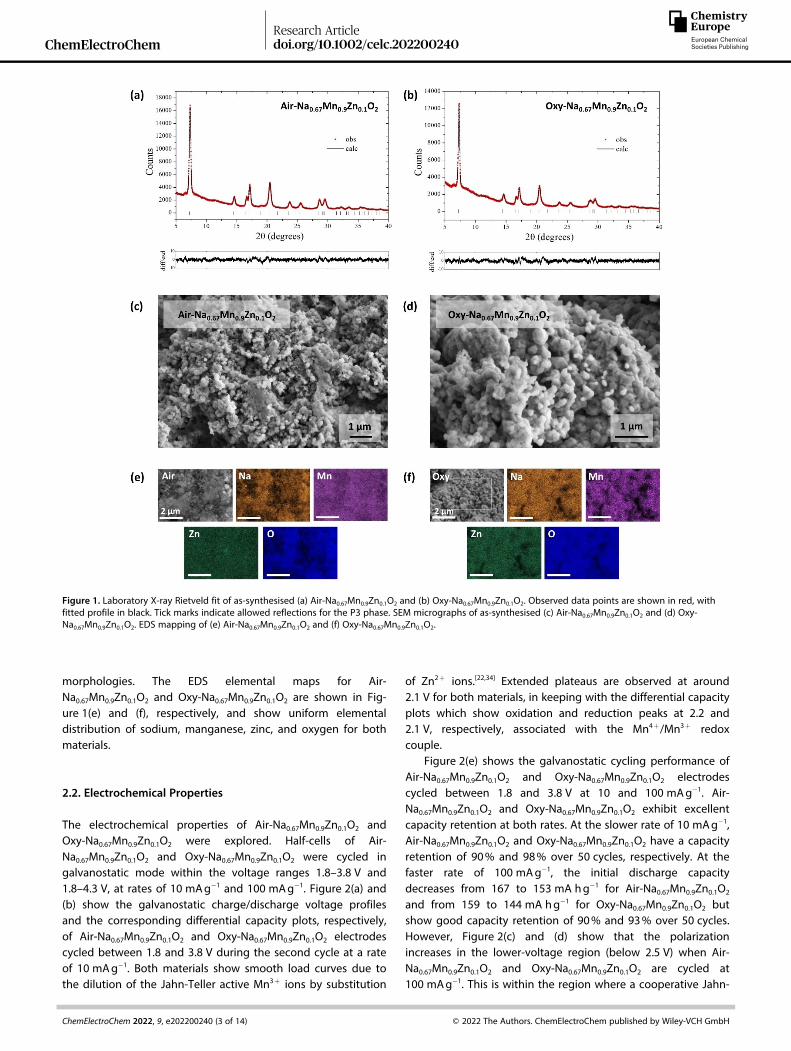
morphologies. The EDS elemental maps for Air-Na0.67Mn0.9Zn0.1O2 and Oxy-Na0.67Mn0.9Zn0.1O2 are shown in Fig-ure 1(e) and (f), respectively, and show uniform elementaldistribution of sodium, manganese, zinc, and oxygen for bothmaterials.
2.2. Electrochemical Properties
The electrochemical properties of Air-Na0.67Mn0.9Zn0.1O2 andOxy-Na0.67Mn0.9Zn0.1O2 were explored. Half-cells of Air-Na0.67Mn0.9Zn0.1O2 and Oxy-Na0.67Mn0.9Zn0.1O2 were cycled ingalvanostatic mode within the voltage ranges 1.8–3.8 V and1.8–4.3 V, at rates of 10 mAg� 1 and 100 mAg� 1. Figure 2(a) and(b) show the galvanostatic charge/discharge voltage profilesand the corresponding differential capacity plots, respectively,of Air-Na0.67Mn0.9Zn0.1O2 and Oxy-Na0.67Mn0.9Zn0.1O2 electrodescycled between 1.8 and 3.8 V during the second cycle at a rateof 10 mAg� 1. Both materials show smooth load curves due tothe dilution of the Jahn-Teller active Mn3+ ions by substitution
of Zn2+ ions.[22,34] Extended plateaus are observed at around2.1 V for both materials, in keeping with the differential capacityplots which show oxidation and reduction peaks at 2.2 and2.1 V, respectively, associated with the Mn4+/Mn3+ redoxcouple.
Figure 2(e) shows the galvanostatic cycling performance ofAir-Na0.67Mn0.9Zn0.1O2 and Oxy-Na0.67Mn0.9Zn0.1O2 electrodescycled between 1.8 and 3.8 V at 10 and 100 mAg� 1. Air-Na0.67Mn0.9Zn0.1O2 and Oxy-Na0.67Mn0.9Zn0.1O2 exhibit excellentcapacity retention at both rates. At the slower rate of 10 mAg� 1,Air-Na0.67Mn0.9Zn0.1O2 and Oxy-Na0.67Mn0.9Zn0.1O2 have a capacityretention of 90% and 98% over 50 cycles, respectively. At thefaster rate of 100 mAg� 1, the initial discharge capacitydecreases from 167 to 153 mA hg� 1 for Air-Na0.67Mn0.9Zn0.1O2
and from 159 to 144 mA hg� 1 for Oxy-Na0.67Mn0.9Zn0.1O2 butshow good capacity retention of 90% and 93% over 50 cycles.However, Figure 2(c) and (d) show that the polarizationincreases in the lower-voltage region (below 2.5 V) when Air-Na0.67Mn0.9Zn0.1O2 and Oxy-Na0.67Mn0.9Zn0.1O2 are cycled at100 mAg� 1. This is within the region where a cooperative Jahn-
Figure 1. Laboratory X-ray Rietveld fit of as-synthesised (a) Air-Na0.67Mn0.9Zn0.1O2 and (b) Oxy-Na0.67Mn0.9Zn0.1O2. Observed data points are shown in red, withfitted profile in black. Tick marks indicate allowed reflections for the P3 phase. SEM micrographs of as-synthesised (c) Air-Na0.67Mn0.9Zn0.1O2 and (d) Oxy-Na0.67Mn0.9Zn0.1O2. EDS mapping of (e) Air-Na0.67Mn0.9Zn0.1O2 and (f) Oxy-Na0.67Mn0.9Zn0.1O2.
ChemElectroChemResearch Articledoi.org/10.1002/celc.202200240
ChemElectroChem 2022, 9, e202200240 (3 of 14) © 2022 The Authors. ChemElectroChem published by Wiley-VCH GmbH
Wiley VCH Dienstag, 07.06.2022
2211 / 252891 [S. 234/245] 1
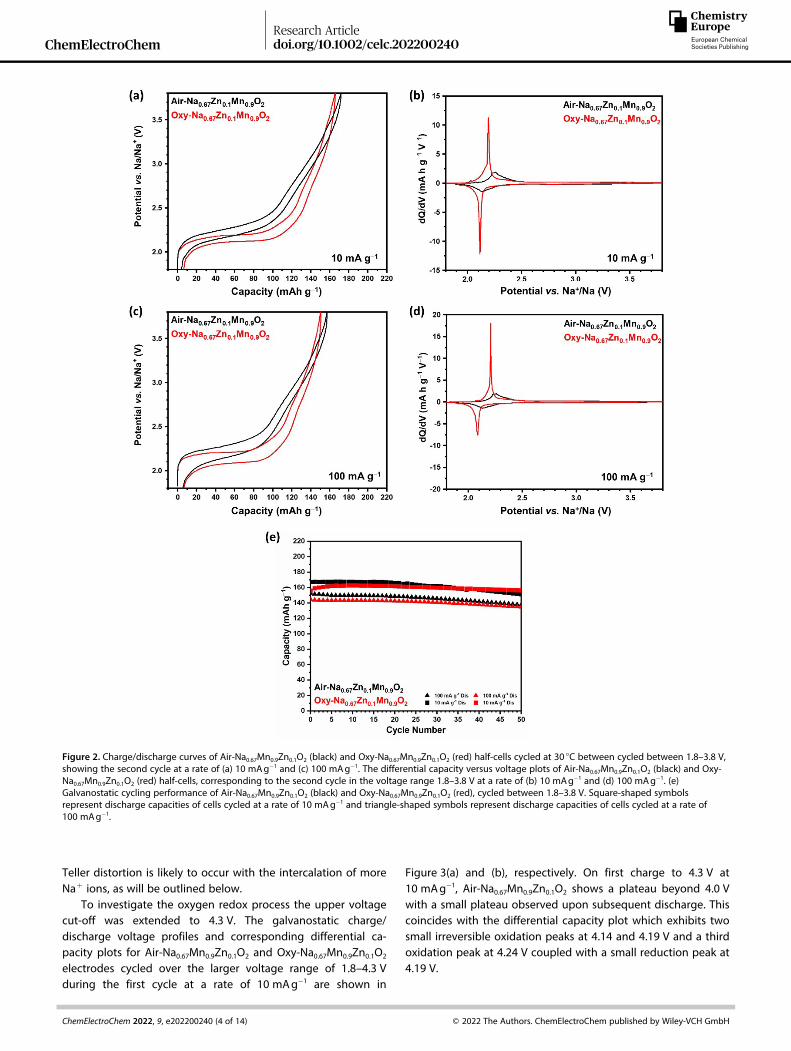
Teller distortion is likely to occur with the intercalation of moreNa+ ions, as will be outlined below.
To investigate the oxygen redox process the upper voltagecut-off was extended to 4.3 V. The galvanostatic charge/discharge voltage profiles and corresponding differential ca-pacity plots for Air-Na0.67Mn0.9Zn0.1O2 and Oxy-Na0.67Mn0.9Zn0.1O2
electrodes cycled over the larger voltage range of 1.8–4.3 Vduring the first cycle at a rate of 10 mAg� 1 are shown in
Figure 3(a) and (b), respectively. On first charge to 4.3 V at10 mAg� 1, Air-Na0.67Mn0.9Zn0.1O2 shows a plateau beyond 4.0 Vwith a small plateau observed upon subsequent discharge. Thiscoincides with the differential capacity plot which exhibits twosmall irreversible oxidation peaks at 4.14 and 4.19 V and a thirdoxidation peak at 4.24 V coupled with a small reduction peak at4.19 V.
Figure 2. Charge/discharge curves of Air-Na0.67Mn0.9Zn0.1O2 (black) and Oxy-Na0.67Mn0.9Zn0.1O2 (red) half-cells cycled at 30 °C between cycled between 1.8–3.8 V,showing the second cycle at a rate of (a) 10 mAg� 1 and (c) 100 mAg� 1. The differential capacity versus voltage plots of Air-Na0.67Mn0.9Zn0.1O2 (black) and Oxy-Na0.67Mn0.9Zn0.1O2 (red) half-cells, corresponding to the second cycle in the voltage range 1.8–3.8 V at a rate of (b) 10 mAg� 1 and (d) 100 mAg� 1. (e)Galvanostatic cycling performance of Air-Na0.67Mn0.9Zn0.1O2 (black) and Oxy-Na0.67Mn0.9Zn0.1O2 (red), cycled between 1.8–3.8 V. Square-shaped symbolsrepresent discharge capacities of cells cycled at a rate of 10 mAg� 1 and triangle-shaped symbols represent discharge capacities of cells cycled at a rate of100 mAg� 1.
ChemElectroChemResearch Articledoi.org/10.1002/celc.202200240
ChemElectroChem 2022, 9, e202200240 (4 of 14) © 2022 The Authors. ChemElectroChem published by Wiley-VCH GmbH
Wiley VCH Dienstag, 07.06.2022
2211 / 252891 [S. 235/245] 1
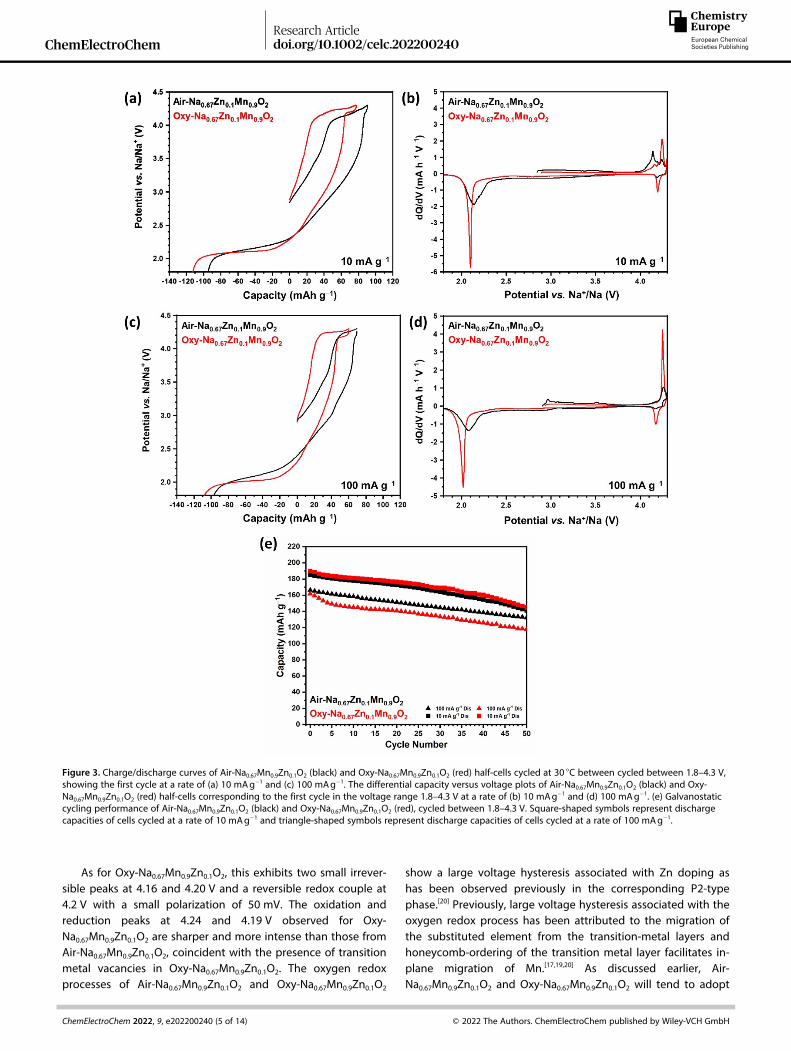
As for Oxy-Na0.67Mn0.9Zn0.1O2, this exhibits two small irrever-sible peaks at 4.16 and 4.20 V and a reversible redox couple at4.2 V with a small polarization of 50 mV. The oxidation andreduction peaks at 4.24 and 4.19 V observed for Oxy-Na0.67Mn0.9Zn0.1O2 are sharper and more intense than those fromAir-Na0.67Mn0.9Zn0.1O2, coincident with the presence of transitionmetal vacancies in Oxy-Na0.67Mn0.9Zn0.1O2. The oxygen redoxprocesses of Air-Na0.67Mn0.9Zn0.1O2 and Oxy-Na0.67Mn0.9Zn0.1O2
show a large voltage hysteresis associated with Zn doping ashas been observed previously in the corresponding P2-typephase.[20] Previously, large voltage hysteresis associated with theoxygen redox process has been attributed to the migration ofthe substituted element from the transition-metal layers andhoneycomb-ordering of the transition metal layer facilitates in-plane migration of Mn.[17,19,20] As discussed earlier, Air-Na0.67Mn0.9Zn0.1O2 and Oxy-Na0.67Mn0.9Zn0.1O2 will tend to adopt
Figure 3. Charge/discharge curves of Air-Na0.67Mn0.9Zn0.1O2 (black) and Oxy-Na0.67Mn0.9Zn0.1O2 (red) half-cells cycled at 30 °C between cycled between 1.8–4.3 V,showing the first cycle at a rate of (a) 10 mAg� 1 and (c) 100 mAg� 1. The differential capacity versus voltage plots of Air-Na0.67Mn0.9Zn0.1O2 (black) and Oxy-Na0.67Mn0.9Zn0.1O2 (red) half-cells corresponding to the first cycle in the voltage range 1.8–4.3 V at a rate of (b) 10 mAg� 1 and (d) 100 mAg� 1. (e) Galvanostaticcycling performance of Air-Na0.67Mn0.9Zn0.1O2 (black) and Oxy-Na0.67Mn0.9Zn0.1O2 (red), cycled between 1.8–4.3 V. Square-shaped symbols represent dischargecapacities of cells cycled at a rate of 10 mAg� 1 and triangle-shaped symbols represent discharge capacities of cells cycled at a rate of 100 mAg� 1.
ChemElectroChemResearch Articledoi.org/10.1002/celc.202200240
ChemElectroChem 2022, 9, e202200240 (5 of 14) © 2022 The Authors. ChemElectroChem published by Wiley-VCH GmbH
Wiley VCH Dienstag, 07.06.2022
2211 / 252891 [S. 236/245] 1
honeycomb-type cation ordering as revealed by the powderneutron diffraction data of Air-Na0.67Mn0.75Zn0.25O2 (Figure S2)and since Zn is substituted for Mn, it is likely that in-planemigration of Mn and/or the partial reversible migration of Znbetween transition-metal and Na+ ion layers may occur in thehigh-voltage region, leading to the observed voltagehysteresis.[20,35]
Increasing the upper voltage cut off to 4.3 V (Figure 3)results in a greater capacity compared to the smaller voltagerange (1.8–3.8 V, Figure 2), arising from the oxygen redox.However, it is challenging to quantify the discharge capacity asa function of redox source as the oxygen redox associated withthe Zn doping occurs at roughly 2.7 V on discharge, whereMn3+/Mn4+ redox also occurs. Therefore, we evaluated howmuch of the discharge capacity occurs over the high voltageregion, between 3.8–4.3 V. For Air-Na0.67Mn0.9Zn0.1O2, 3.5% ofthe discharge capacity occurs within this voltage windowwhereas for Oxy-Na0.67Mn0.9Zn0.1O2, almost 2.5 times more(8.4%) capacity is observed, arising from oxygen redox due tothe presence of transition metal vacancies, demonstrating thatthe vacancies provide an additional source of capacity derivedfrom oxygen redox. However, cycling over the wider voltagerange, 1.8–4.3 V, leads to a reduced capacity retention of 76%for both materials when cycled at a rate of 10 mAg� 1 over50 cycles. When cycled at the faster rate of 100 mAhg� 1, the
initial discharge capacity decreases from 185.1 to 166.4 mAhg� 1
for Air-Na0.67Mn0.9Zn0.1O2 and from 189.9 to 161.8 mAhg� 1 forOxy-Na0.67Mn0.9Zn0.1O2 and with reduced capacity retention of80% and 73% over 50 cycles for Air-Na0.67Mn0.9Zn0.1O2 and Oxy-Na0.67Mn0.9Zn0.1O2, respectively.
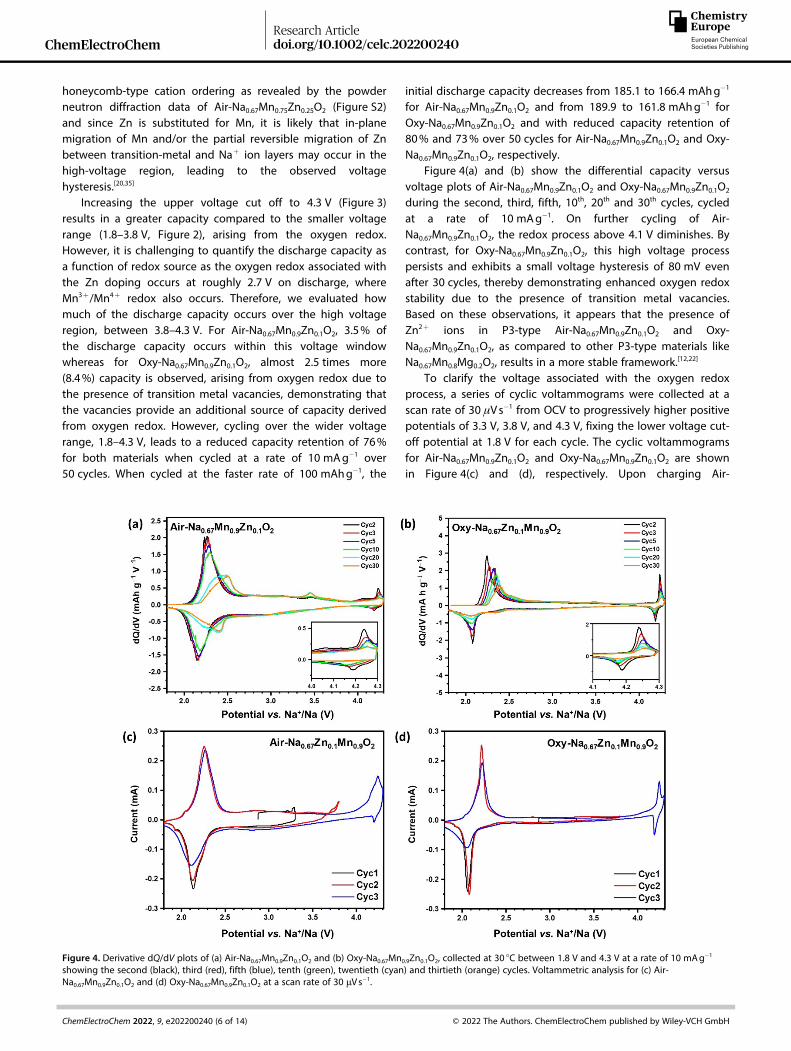
Figure 4(a) and (b) show the differential capacity versusvoltage plots of Air-Na0.67Mn0.9Zn0.1O2 and Oxy-Na0.67Mn0.9Zn0.1O2
during the second, third, fifth, 10th, 20th and 30th cycles, cycledat a rate of 10 mAg� 1. On further cycling of Air-Na0.67Mn0.9Zn0.1O2, the redox process above 4.1 V diminishes. Bycontrast, for Oxy-Na0.67Mn0.9Zn0.1O2, this high voltage processpersists and exhibits a small voltage hysteresis of 80 mV evenafter 30 cycles, thereby demonstrating enhanced oxygen redoxstability due to the presence of transition metal vacancies.Based on these observations, it appears that the presence ofZn2+ ions in P3-type Air-Na0.67Mn0.9Zn0.1O2 and Oxy-Na0.67Mn0.9Zn0.1O2, as compared to other P3-type materials likeNa0.67Mn0.8Mg0.2O2, results in a more stable framework.[12,22]
To clarify the voltage associated with the oxygen redoxprocess, a series of cyclic voltammograms were collected at ascan rate of 30 μVs� 1 from OCV to progressively higher positivepotentials of 3.3 V, 3.8 V, and 4.3 V, fixing the lower voltage cut-off potential at 1.8 V for each cycle. The cyclic voltammogramsfor Air-Na0.67Mn0.9Zn0.1O2 and Oxy-Na0.67Mn0.9Zn0.1O2 are shownin Figure 4(c) and (d), respectively. Upon charging Air-
Figure 4. Derivative dQ/dV plots of (a) Air-Na0.67Mn0.9Zn0.1O2 and (b) Oxy-Na0.67Mn0.9Zn0.1O2, collected at 30 °C between 1.8 V and 4.3 V at a rate of 10 mAg� 1
showing the second (black), third (red), fifth (blue), tenth (green), twentieth (cyan) and thirtieth (orange) cycles. Voltammetric analysis for (c) Air-Na0.67Mn0.9Zn0.1O2 and (d) Oxy-Na0.67Mn0.9Zn0.1O2 at a scan rate of 30 μVs� 1.
ChemElectroChemResearch Articledoi.org/10.1002/celc.202200240
ChemElectroChem 2022, 9, e202200240 (6 of 14) © 2022 The Authors. ChemElectroChem published by Wiley-VCH GmbH
Wiley VCH Dienstag, 07.06.2022
2211 / 252891 [S. 237/245] 1
Na0.67Mn0.9Zn0.1O2 from OCV to 3.3 V and then discharging to1.8 V, two reduction peaks are observed at 1.93 and 2.13 V. Onsubsequent cycling, two oxidation peaks are observed at 2.04and 2.26 V, coupled with the reduction peaks at 1.94 and2.13 V, consistent with the Mn3+/Mn4+ redox couple. On thethird cycle, an oxidation peak at 4.24 V is coupled to a smallreduction peak at 4.20 V and a second smaller, broad reductionpeak at around 2.8 V, arising from oxygen redox associated withZn doping. Air-Na0.67Mn0.8Zn0.2O2 exhibits essentially the sameprocesses but a more pronounced reduction peak at 2.76 V, asshown in Figure S3, due to the presence of more Zn2+ ions. ForOxy-Na0.67Mn0.9Zn0.1O2, sharp oxidation and reduction peaks areobserved on the second cycle at 2.22 and 2.08 V, respectively,associated with the Mn3+/Mn4+ redox couple. Increasing thevoltage range to 4.3 V, reveals a sharp redox couple withoxidation and reduction peaks at 4.24 and 4.19 V, respectively,showing small polarization which may be associated with thepresence of transition metal vacancies in the Oxy-Na0.67Mn0.9Zn0.1O2 material.
2.3. Structural evolution of Air-Na0.67Mn0.9Zn0.1O2 andOxy-Na0.67Mn0.9Zn0.1O2
To reveal the structural changes of Air-Na0.67Mn0.9Zn0.1O2 andOxy-Na0.67Mn0.9Zn0.1O2 during electrochemical cycling, ex-situPXRD studies were performed. PXRD patterns were collected onthe Air-Na0.67Mn0.9Zn0.1O2 and Oxy-Na0.67Mn0.9Zn0.1O2 electrodesat various states of charge and discharge, are shown inFigure S4 (a) and (b), respectively. Rietveld refinements wereperformed, and the fits obtained are shown in Figure 5. Therefined structural parameters are given in Tables S3 and S4 forAir-Na0.67Mn0.9Zn0.1O2 and Oxy-Na0.67Mn0.9Zn0.1O2, respectively.
The PXRD patterns of Air-Na0.67Mn0.9Zn0.1O2 and Oxy-Na0.67Mn0.9Zn0.1O2 charged to 3.8 V (CH3.8 V) and 4.3 V (CH4.3 V)were fitted in the R3m space group, demonstrating that the P3structure was maintained upon Na+ ion extraction. On charg-ing, the a unit cell parameter, which is dominated by the TM� Obond length, contracted for both materials, as expected fromthe oxidation of residual Mn3+ to Mn4+ ions. By contrast the cunit cell parameter expanded slightly for both materialsbecause the screening effect of Na+ ions is reduced upon Na+
ion extraction, resulting in increased Coulombic repulsion. Thisresults in a minimal reduction of the unit cell volume for Air-Na0.67Mn0.9Zn0.1O2 (2.06%) and Oxy-Na0.67Mn0.9Zn0.1O2 (1.38%),after charge to 4.3 V. There was only a hint of conversion to theO3 phase when Air-Na0.67Mn0.9Zn0.1O2 was charged to 4.3 Vwhilst for Oxy-Na0.67Mn0.9Zn0.1O2, the P3 phase was fullymaintained.
Upon Na+ ion insertion, the PXRD patterns of Air-Na0.67Mn0.9Zn0.1O2 and Oxy-Na0.67Mn0.9Zn0.1O2 discharged to 1.8 Vafter charge to 3.8 V (CYC3.8V) reveals a transformation to theO’3 phase, with only a minor amount of the P3 phase remainingfor Air-Na0.67Mn0.9Zn0.1O2, but complete conversion to the O’3phase for Oxy-Na0.67Mn0.9Zn0.1O2. After discharge to 1.8 Vfollowing charge to 4.3 V (CYC4.3V), both materials showedcomplete transformation to the O’3 phase (space group C2/m).
The ratio between the unit cell parameters, a/b for the Air-Na0.67Mn0.9Zn0.1O2 and Oxy-Na0.67Mn0.9Zn0.1O2 electrodes afterdischarge to 1.8 V are 1.86 and 1.89, respectively. While thesevalues are greater than
p3, and indicative of Jahn-Teller
distortion which causes structural irreversibility, it can beassumed that this distortion has been suppressed through Zn-doping.[36] Na+ ion insertion into the P3 phase causesCoulombic repulsion between the Na and Mn cations and thestructural transformation via layer gliding to O’3 occurs tominimize this repulsion.[36] In addition, these data show that thepresence of transition metal vacancies does not influence thestructural evolution since the same structural transformationwas observed for Air-Na0.67Mn0.9Zn0.1O2 and Oxy-Na0.67Mn0.9Zn0.1O2. The phase transformation (P3!O’3) was alsoaccompanied by an expansion in the unit cell volume for Air-Na0.67Mn0.9Zn0.1O2 (4.01%) and Oxy-Na0.67Mn0.9Zn0.1O2 (4.29%).Mariyappan et al. reported a similar small change in the unitcell volume for Zn-doped NaNi0.45Zn0.05Mn0.4Ti0.1O2, comparedwith the large unit cell volume reduction (>25%) observed forNaNi0.5Mn0.4Ti0.1O2.
[37] Therefore, it is reasonable to assume thatthe presence of Zn2+ ions suppresses the unit cell volumechanges on cycling, resulting in enhanced cyclability (Figure 4).
2.4. Evolution of electronic structure of Air-Na0.67Mn0.9Zn0.1O2
and Oxy-Na0.67Mn0.9Zn0.1O2
To further verify the oxygen redox process beyond 4.10 V, theoxidation states of manganese during the first cycle wereinvestigated by ex-situ X-ray absorption spectroscopy (XAS).Data were collected on the Air-Na0.67Mn0.9Zn0.1O2 and Oxy-Na0.67Mn0.9Zn0.1O2 electrodes at various states of charge anddischarge, Figure S4 (a) and (b), respectively, as well asmanganese foil, Mn2O3 and MnO2 reference compounds withmanganese formal oxidation states of 0, +3, and +4,respectively. The Mn K-edge X-ray absorption near edgestructure (XANES) spectra for Mn2O3 and MnO2 referencecompounds and the Air-Na0.67Mn0.9Zn0.1O2 electrodes are com-pared in Figure 6(a) and the Oxy-Na0.67Mn0.9Zn0.1O2 electrodes inFigure 6(c). Comparing the reference compound MnO2 to theXANES spectrum obtained for pristine Air-Na0.67Mn0.9Zn0.1O2
(Figure 6(b)), it is evident that the pristine material predom-inantly contains Mn4+ ions with contributions from Mn3+ whichagrees with the average oxidation state determined fromRietveld analysis. The XANES data for the Air-Na0.67Mn0.9Zn0.1O2
electrodes after charging to 3.8 V and 4.3 V, essentially overlapwith those of pristine Air-Na0.67Mn0.9Zn0.1O2, indicating littleparticipation of Mn ions in the charge transfer reaction.Figure 6(b) reveals small shifts towards higher energy uponcharging, indicating the oxidation of residual Mn3+ to Mn4+
ions. At the end of discharge after charging to 3.8 V and 4.3 V,the XANES spectra shift slightly to lower edge energies, ascompared to the pristine material, demonstrating the expectedreduction of Mn ions.
The Oxy-Na0.67Mn0.9Zn0.1O2 electrodes (Figure 6(c)) presentthe same trend, suggesting that the evolution of the Mnoxidation state is the same and uninfluenced by the presence
ChemElectroChemResearch Articledoi.org/10.1002/celc.202200240
ChemElectroChem 2022, 9, e202200240 (7 of 14) © 2022 The Authors. ChemElectroChem published by Wiley-VCH GmbH
Wiley VCH Dienstag, 07.06.2022
2211 / 252891 [S. 238/245] 1
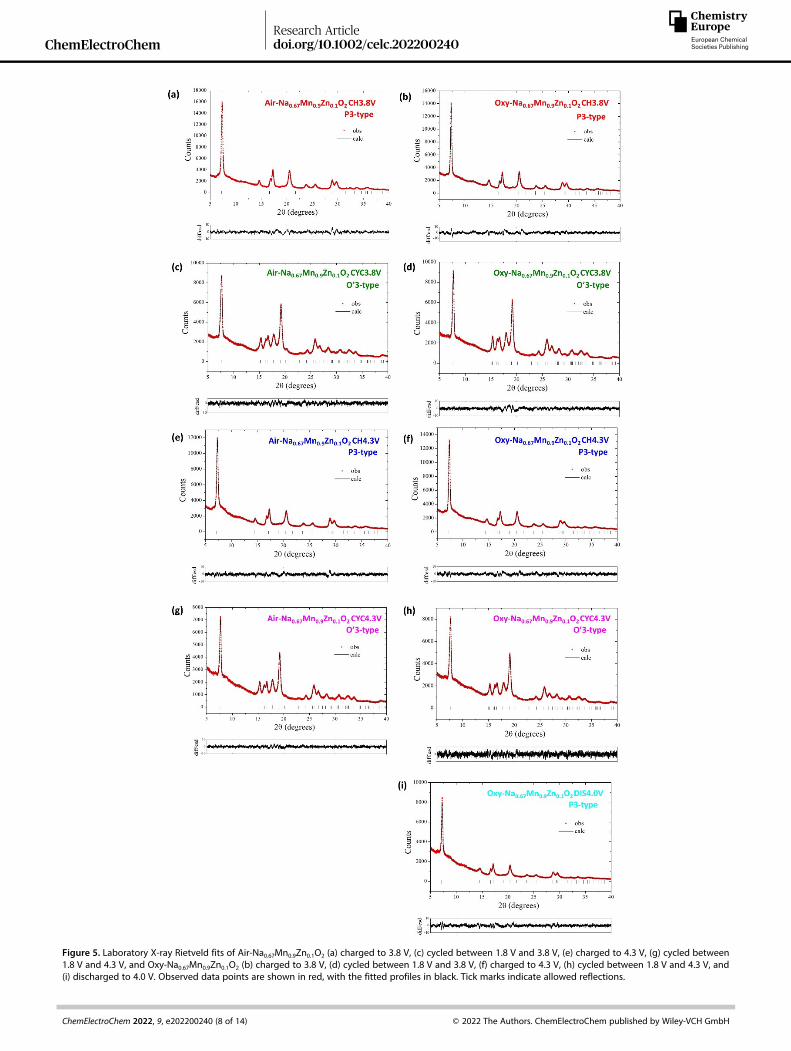
Figure 5. Laboratory X-ray Rietveld fits of Air-Na0.67Mn0.9Zn0.1O2 (a) charged to 3.8 V, (c) cycled between 1.8 V and 3.8 V, (e) charged to 4.3 V, (g) cycled between1.8 V and 4.3 V, and Oxy-Na0.67Mn0.9Zn0.1O2 (b) charged to 3.8 V, (d) cycled between 1.8 V and 3.8 V, (f) charged to 4.3 V, (h) cycled between 1.8 V and 4.3 V, and(i) discharged to 4.0 V. Observed data points are shown in red, with the fitted profiles in black. Tick marks indicate allowed reflections.
ChemElectroChemResearch Articledoi.org/10.1002/celc.202200240
ChemElectroChem 2022, 9, e202200240 (8 of 14) © 2022 The Authors. ChemElectroChem published by Wiley-VCH GmbH
Wiley VCH Dienstag, 07.06.2022
2211 / 252891 [S. 239/245] 1
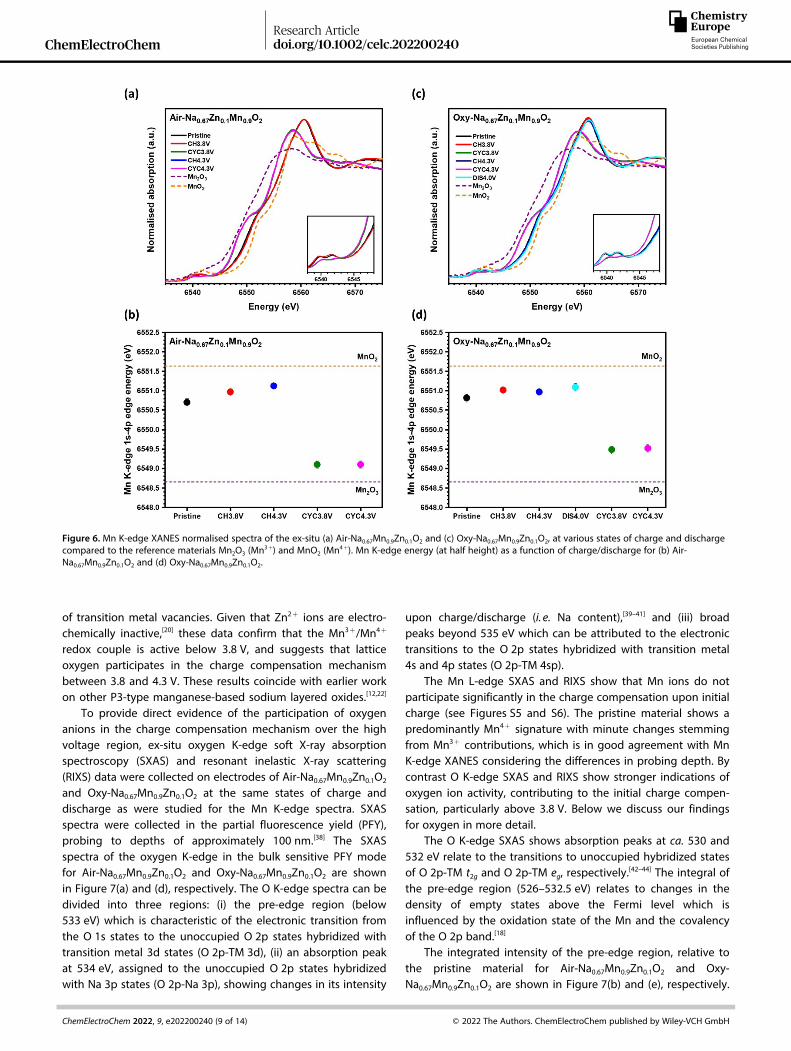
of transition metal vacancies. Given that Zn2+ ions are electro-chemically inactive,[20] these data confirm that the Mn3+/Mn4+
redox couple is active below 3.8 V, and suggests that latticeoxygen participates in the charge compensation mechanismbetween 3.8 and 4.3 V. These results coincide with earlier workon other P3-type manganese-based sodium layered oxides.[12,22]
To provide direct evidence of the participation of oxygenanions in the charge compensation mechanism over the highvoltage region, ex-situ oxygen K-edge soft X-ray absorptionspectroscopy (SXAS) and resonant inelastic X-ray scattering(RIXS) data were collected on electrodes of Air-Na0.67Mn0.9Zn0.1O2
and Oxy-Na0.67Mn0.9Zn0.1O2 at the same states of charge anddischarge as were studied for the Mn K-edge spectra. SXASspectra were collected in the partial fluorescence yield (PFY),probing to depths of approximately 100 nm.[38] The SXASspectra of the oxygen K-edge in the bulk sensitive PFY modefor Air-Na0.67Mn0.9Zn0.1O2 and Oxy-Na0.67Mn0.9Zn0.1O2 are shownin Figure 7(a) and (d), respectively. The O K-edge spectra can bedivided into three regions: (i) the pre-edge region (below533 eV) which is characteristic of the electronic transition fromthe O 1s states to the unoccupied O 2p states hybridized withtransition metal 3d states (O 2p-TM 3d), (ii) an absorption peakat 534 eV, assigned to the unoccupied O 2p states hybridizedwith Na 3p states (O 2p-Na 3p), showing changes in its intensity
upon charge/discharge (i. e. Na content),[39–41] and (iii) broadpeaks beyond 535 eV which can be attributed to the electronictransitions to the O 2p states hybridized with transition metal4s and 4p states (O 2p-TM 4sp).
The Mn L-edge SXAS and RIXS show that Mn ions do notparticipate significantly in the charge compensation upon initialcharge (see Figures S5 and S6). The pristine material shows apredominantly Mn4+ signature with minute changes stemmingfrom Mn3+ contributions, which is in good agreement with MnK-edge XANES considering the differences in probing depth. Bycontrast O K-edge SXAS and RIXS show stronger indications ofoxygen ion activity, contributing to the initial charge compen-sation, particularly above 3.8 V. Below we discuss our findingsfor oxygen in more detail.
The O K-edge SXAS shows absorption peaks at ca. 530 and532 eV relate to the transitions to unoccupied hybridized statesof O 2p-TM t2g and O 2p-TM eg, respectively.
[42–44] The integral ofthe pre-edge region (526–532.5 eV) relates to changes in thedensity of empty states above the Fermi level which isinfluenced by the oxidation state of the Mn and the covalencyof the O 2p band.[18]
The integrated intensity of the pre-edge region, relative tothe pristine material for Air-Na0.67Mn0.9Zn0.1O2 and Oxy-Na0.67Mn0.9Zn0.1O2 are shown in Figure 7(b) and (e), respectively.
Figure 6. Mn K-edge XANES normalised spectra of the ex-situ (a) Air-Na0.67Mn0.9Zn0.1O2 and (c) Oxy-Na0.67Mn0.9Zn0.1O2, at various states of charge and dischargecompared to the reference materials Mn2O3 (Mn
3+) and MnO2 (Mn4+). Mn K-edge energy (at half height) as a function of charge/discharge for (b) Air-
Na0.67Mn0.9Zn0.1O2 and (d) Oxy-Na0.67Mn0.9Zn0.1O2.
ChemElectroChemResearch Articledoi.org/10.1002/celc.202200240
ChemElectroChem 2022, 9, e202200240 (9 of 14) © 2022 The Authors. ChemElectroChem published by Wiley-VCH GmbH
Wiley VCH Dienstag, 07.06.2022
2211 / 252891 [S. 240/245] 1
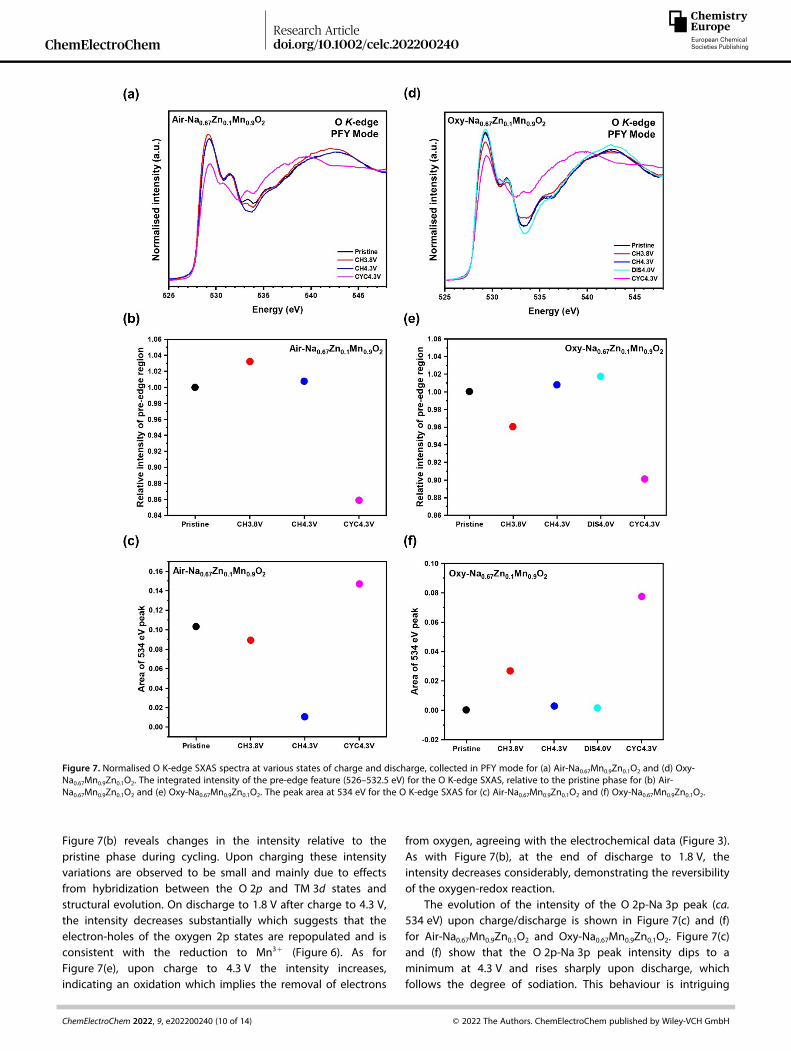
Figure 7(b) reveals changes in the intensity relative to thepristine phase during cycling. Upon charging these intensityvariations are observed to be small and mainly due to effectsfrom hybridization between the O 2p and TM 3d states andstructural evolution. On discharge to 1.8 V after charge to 4.3 V,the intensity decreases substantially which suggests that theelectron-holes of the oxygen 2p states are repopulated and isconsistent with the reduction to Mn3+ (Figure 6). As forFigure 7(e), upon charge to 4.3 V the intensity increases,indicating an oxidation which implies the removal of electrons
from oxygen, agreeing with the electrochemical data (Figure 3).As with Figure 7(b), at the end of discharge to 1.8 V, theintensity decreases considerably, demonstrating the reversibilityof the oxygen-redox reaction.
The evolution of the intensity of the O 2p-Na 3p peak (ca.534 eV) upon charge/discharge is shown in Figure 7(c) and (f)for Air-Na0.67Mn0.9Zn0.1O2 and Oxy-Na0.67Mn0.9Zn0.1O2. Figure 7(c)and (f) show that the O 2p-Na 3p peak intensity dips to aminimum at 4.3 V and rises sharply upon discharge, whichfollows the degree of sodiation. This behaviour is intriguing
Figure 7. Normalised O K-edge SXAS spectra at various states of charge and discharge, collected in PFY mode for (a) Air-Na0.67Mn0.9Zn0.1O2 and (d) Oxy-Na0.67Mn0.9Zn0.1O2. The integrated intensity of the pre-edge feature (526–532.5 eV) for the O K-edge SXAS, relative to the pristine phase for (b) Air-Na0.67Mn0.9Zn0.1O2 and (e) Oxy-Na0.67Mn0.9Zn0.1O2. The peak area at 534 eV for the O K-edge SXAS for (c) Air-Na0.67Mn0.9Zn0.1O2 and (f) Oxy-Na0.67Mn0.9Zn0.1O2.
ChemElectroChemResearch Articledoi.org/10.1002/celc.202200240
ChemElectroChem 2022, 9, e202200240 (10 of 14) © 2022 The Authors. ChemElectroChem published by Wiley-VCH GmbH
Wiley VCH Dienstag, 07.06.2022
2211 / 252891 [S. 241/245] 1
because it also would be compatible with the creation andrefilling of electron holes due to pure oxygen redox (i. e. notrelated to direct Mn� O bonding). Depopulation of a non-bonding orbital is thus expected to occur above 3.8 V.
Oxygen K-edge RIXS has previously proved to be a powerfulprobe for studying the effect of oxygen redox in batteries,[12]
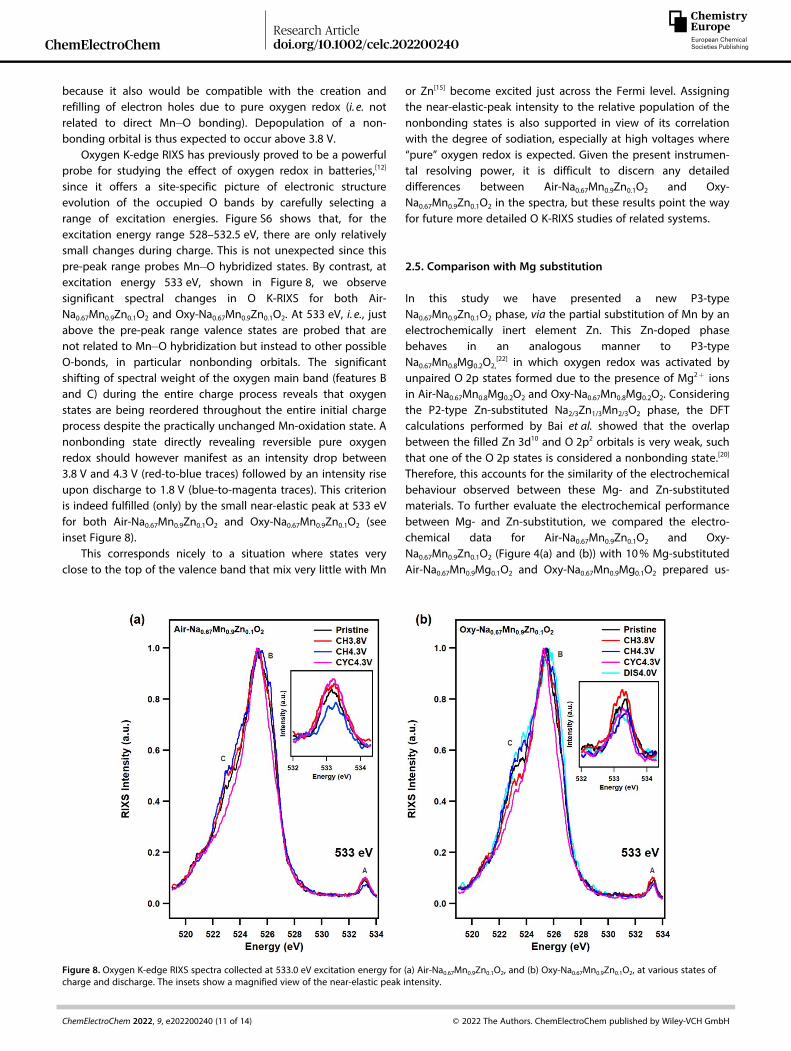
since it offers a site-specific picture of electronic structureevolution of the occupied O bands by carefully selecting arange of excitation energies. Figure S6 shows that, for theexcitation energy range 528–532.5 eV, there are only relativelysmall changes during charge. This is not unexpected since thispre-peak range probes Mn� O hybridized states. By contrast, atexcitation energy 533 eV, shown in Figure 8, we observesignificant spectral changes in O K-RIXS for both Air-Na0.67Mn0.9Zn0.1O2 and Oxy-Na0.67Mn0.9Zn0.1O2. At 533 eV, i. e., justabove the pre-peak range valence states are probed that arenot related to Mn� O hybridization but instead to other possibleO-bonds, in particular nonbonding orbitals. The significantshifting of spectral weight of the oxygen main band (features Band C) during the entire charge process reveals that oxygenstates are being reordered throughout the entire initial chargeprocess despite the practically unchanged Mn-oxidation state. Anonbonding state directly revealing reversible pure oxygenredox should however manifest as an intensity drop between3.8 V and 4.3 V (red-to-blue traces) followed by an intensity riseupon discharge to 1.8 V (blue-to-magenta traces). This criterionis indeed fulfilled (only) by the small near-elastic peak at 533 eVfor both Air-Na0.67Mn0.9Zn0.1O2 and Oxy-Na0.67Mn0.9Zn0.1O2 (seeinset Figure 8).
This corresponds nicely to a situation where states veryclose to the top of the valence band that mix very little with Mn
or Zn[15] become excited just across the Fermi level. Assigningthe near-elastic-peak intensity to the relative population of thenonbonding states is also supported in view of its correlationwith the degree of sodiation, especially at high voltages where“pure” oxygen redox is expected. Given the present instrumen-tal resolving power, it is difficult to discern any detaileddifferences between Air-Na0.67Mn0.9Zn0.1O2 and Oxy-Na0.67Mn0.9Zn0.1O2 in the spectra, but these results point the wayfor future more detailed O K-RIXS studies of related systems.
2.5. Comparison with Mg substitution
In this study we have presented a new P3-typeNa0.67Mn0.9Zn0.1O2 phase, via the partial substitution of Mn by anelectrochemically inert element Zn. This Zn-doped phasebehaves in an analogous manner to P3-typeNa0.67Mn0.8Mg0.2O2,
[22] in which oxygen redox was activated byunpaired O 2p states formed due to the presence of Mg2+ ionsin Air-Na0.67Mn0.8Mg0.2O2 and Oxy-Na0.67Mn0.8Mg0.2O2. Consideringthe P2-type Zn-substituted Na2/3Zn1/3Mn2/3O2 phase, the DFTcalculations performed by Bai et al. showed that the overlapbetween the filled Zn 3d10 and O 2p2 orbitals is very weak, suchthat one of the O 2p states is considered a nonbonding state.[20]
Therefore, this accounts for the similarity of the electrochemicalbehaviour observed between these Mg- and Zn-substitutedmaterials. To further evaluate the electrochemical performancebetween Mg- and Zn-substitution, we compared the electro-chemical data for Air-Na0.67Mn0.9Zn0.1O2 and Oxy-Na0.67Mn0.9Zn0.1O2 (Figure 4(a) and (b)) with 10% Mg-substitutedAir-Na0.67Mn0.9Mg0.1O2 and Oxy-Na0.67Mn0.9Mg0.1O2 prepared us-
Figure 8. Oxygen K-edge RIXS spectra collected at 533.0 eV excitation energy for (a) Air-Na0.67Mn0.9Zn0.1O2, and (b) Oxy-Na0.67Mn0.9Zn0.1O2, at various states ofcharge and discharge. The insets show a magnified view of the near-elastic peak intensity.
ChemElectroChemResearch Articledoi.org/10.1002/celc.202200240
ChemElectroChem 2022, 9, e202200240 (11 of 14) © 2022 The Authors. ChemElectroChem published by Wiley-VCH GmbH
Wiley VCH Dienstag, 07.06.2022
2211 / 252891 [S. 242/245] 1
ing the same synthesis conditions (see Section 2.1) and theirdQ/dV plots are shown in Figure S8 (a) and (b), respectively.These results show almost identical results for the materialssynthesised in air (Figures 4(a) and S8 (a)). For the materialssynthesised under oxygen, the reversibility of the oxygen redoxprocess centred around 4.2 V, diminishes after 20 cycles forOxy-Na0.67Mn0.9Mg0.1O2 (Figure S8 (b)), whereas Oxy-Na0.67Mn0.9Zn0.1O2 (Figure 4(b)) shows enhanced oxygen redoxreversibility at 4.2 V, even after 30 cycles, demonstrating thestabilizing role of Zn2+ ions in the presence of transition metalvacancies on the oxygen redox reversibility.
As for the structural evolution, the Mg-substituted materialssimilarly show that the P3 phase is essentially maintained aftercharge to 4.3 V. Whereas on subsequent discharge to 1.8 V,Na0.67Mn0.8Mg0.2O2 reveals reduced transition to the O’3 phase,with 14% and 57% of the P3 phase maintained in Air-Na0.67Mn0.8Mg0.2O2 and Oxy-Na0.67Mn0.8Mg0.2O2, respectively.[22]
Despite showing complete conversion to the O’3 phase uponNa+ insertion, the Zn-substituted materials exhibit enhancedelectrochemical performance. Thus, suggesting that substitu-tion of Mn for Zn over Mg, provides a more stable frameworkfor Na+ ion insertion/extraction.
3. Conclusion
The P3 layered Zn-substituted Na0.67Mn0.9Zn0.1O2 material wasprepared under both air and oxygen, and contain virtually zeroand 6% transition metal vacancies, respectively. Based on theelectrochemical tests and electronic structural analysis, bothmaterials exhibit oxygen redox over the high-voltage region(above 3.8 V). In the absence of vacancies, Na0.63Mn0.9Zn0.1O2
exhibits large voltage hysteresis from nonbonding O 2p statesdue to Zn-substitution. As for Na0.67Mn0.86Zn0.09&0.06O2, thevacancies in the transition metal layer play an important role inproducing unpaired O 2p states which enhances the reversi-bility of oxygen redox. Ultimately, P3-Na0.67Mn0.86Zn0.09&0.06O2
delivers greater oxygen redox stability compared to Mg-substituted P3-Na0.67Mn0.8Mg0.2O2.
[22] It has been reported that inO3-NaNi0.45M0.05Mn0.4Ti0.1O2, (M=Mg2+, Zn2+, Cu2+) the Zn dopedmaterial displayed the best cycling stability.[37] The lack of d-electrons for Mg2+, which can enable π� p bonding withneighbouring oxygen atoms, led to the poorest cyclability,leading to easier Mg migration during cycling. This observation,combined with the results presented here, suggests that thedevelopment of Zn-doped materials could lead to oxygen redoxactive positive electrodes with enhanced stability.
Experimental Section
Materials Synthesis
A stoichiometric amount of sodium carbonate (Na2CO3, FischerChemistry, �99.5%) was dissolved in deionized water, then addeddrop-wise to a solution of manganese(II) acetate tetrahydrate(Mn(CH3CO2)2 · 4H2O, Aldrich, �99%) and zinc acetate dihydrate(Zn(CH3CO2)2 · 2H2O, Sigma-Aldrich, �99%) while stirring. The
solution was stirred for 10 min before the water was removed usinga rotary evaporator. The powder was then heated to 300 °C at arate of 5 °Cmin� 1 for 12 h. To prepare Air-Na0.67Mn1-xZnxO2 (x=0.1,0.2, 0.25), the resulting powder was heated to 625 °C at a rate of5 °Cmin� 1 for 3 h under air and then quenched. Whereas Oxy-Na0.67Mn1-xZnxO2 (x=0.1, 0.2) was formed by heating the powder to625 °C at a rate of 5 °C min-1 under oxygen and cooling to 50 °C at arate of 5 °Cmin� 1. The as-synthesised materials were stored in anargon filled glovebox.
Characterization
PXRD patterns were collected on a PANalytical Empyrean diffrac-tometer, using MoKα1,2 radiation (λ=0.7107 Å) with a Zr β-filter andX’celerator detector. Data were collected at room temperature inthe 2θ range, 5.0–40.0 ° over 24 h per scan with a step size of0.0084° and 4189 steps and a time per step of 20.6 s. Samples wereloaded into glass capillaries (0.7 mm diameter) in an argon filledglovebox. A time-of-flight powder neutron diffraction pattern of as-synthesised Air-Na0.67Mn0.75Zn0.25O2 was obtained on the Polarisdiffractometer at ISIS at the Rutherford Appleton Laboratory.Diffraction data were refined using the Rietveld method usingTopas Academic V6.[45] SEM and EDS analysis were performed onthe as-synthesised materials using a Schottky field-emission gunscanning electron microscopy (FEG-SEM, FEI Scios dualbeam)equipped with an EDAX Octane Plus EDS detector for composi-tional analysis.
Electrochemical measurements and ex-situ characterization
In order to evaluate the electrochemical properties, positive electro-des were prepared by mixing 75 wt% of the active material, eitherAir-Na0.67Mn1-xZnxO2 or Oxy-Na0.67Mn1-xZnxO2 (x=0.1, 0.2), with15 wt% super C65 carbon and 10 wt% Solef 5130 binder (modifiedpolyvinylidene fluoride, PVDF) in n-methyl-2-polyvinylidene whichwere cast onto aluminium foil using a doctor blade. The driedelectrodes were pressed and punched into 13 mm diameter discsbefore being dried at 80 °C under vacuum. Typical cast electrodeloadings were 2.6 mgcm� 2. CR2325 coin cells were assembled in anargon filled glovebox consisting of a positive disk electrode, sodiummetal as a counter/reference electrode, a glass fibre separator(Whatman, GF/F) soaked in electrolyte (1 M NaPF6 in ethylenecarbonate/diethyl carbonate (1 : 1 v/v%), Kishida). Galvanostaticcharge/discharge cycling, and voltage scans (linear sweep voltam-metry) were collected in a temperature-controlled environment at30 °C using a Biologic BCS-805 battery cycler.
For ex-situ characterization of electrodes 80 wt% of active material(Air-Na0.67Mn0.9Zn0.1O2 or Oxy-Na0.67Mn0.9Zn0.1O2) was mixed with20 wt% super C65 carbon, with no binder in an argon filledglovebox for 15 minutes using a pestle and mortar. For PXRD andXAS ex-situ measurements, Swagelok type cells were assembled asdescribed above, using typical powder electrode loadings of~30 mgcm� 2, in an argon filled glovebox. Swagelok cells werecycled at 30 °C using a Biologic MacPile II system in galvanostaticmode. The positive electrodes were recovered from the Swagelokcells after cycling in an argon filled glovebox, washed with drydimethyl carbonate (DMC, Sigma Aldrich, �99%) three times anddried under vacuum overnight. PXRD measurements were carriedout as described above. Manganese K-edge (6.5390 keV) XASspectra were acquired in transmission mode on B18 beamline atDiamond Light Source, UK. The powdered samples (9 mg of activematerial) were ground for 20 minutes with cellulose (150 mg) andpressed into 13 mm diameter pellets, and then sealed intoaluminium bags in an argon filled glovebox. XAS spectra of themanganese metal foil were acquired simultaneously with the
ChemElectroChemResearch Articledoi.org/10.1002/celc.202200240
ChemElectroChem 2022, 9, e202200240 (12 of 14) © 2022 The Authors. ChemElectroChem published by Wiley-VCH GmbH
Wiley VCH Dienstag, 07.06.2022
2211 / 252891 [S. 243/245] 1
experimental samples. All spectra were acquired in triplicate foreach sample. XAS spectra were aligned, merged and normalizedusing the program Athena.[46,47] For ex-situ Mn L-edge and O K-edgeSXAS and RIXS measurements, CR2325 coin cells were assembled asdescribed above, except that Solupor membranes were used andsoaked with electrolyte. The electrodes were extracted and rinsedwith DMC three times and left to dry under vacuum overnight.Spectra were collected at the C-branch of beamline BL27SU atSpring 8 in Japan.[48] To obtain SXAS spectra at the Mn L-edge andO K-edge, the PFY and TEY signals were measured simultaneouslyat a resolution of about 0.1 eV. PFY was detected using an energydispersive soft X-ray analyser and TEY was recorded using thesample drain current detected by a pico-ammeter. O K-RIXS spectrawere collected with a spectrometer of a varied-line-spacing planecylindrical grating design in first order of diffraction at a combinedresolution of about 0.4 eV. The vertical (horizontal) beam size atsample point is about 10 μm (200 μm).
Acknowledgements
The authors are grateful for the provision of beam time on B18 atthe Diamond Light Source (as part of the Energy Materials BlockAllocation Group SP14239) and on BL27SU at Spring 8 (ProposalNumber: 2021A1425). We gratefully acknowledge technical sup-port of the Spring 8 user support, particularly beamline scientistKiyofumi Nitta. This work was supported by the FaradayInstitution (grant number FIRG018). The authors gratefullyacknowledge support from the Engineering and Physical SciencesResearch Council (EPSRC), grants EP/L017008/1, EP/R023751/1 andEP/T019298/1.
Conflict of Interest
The authors declare no conflict of interest.
Data Availability Statement
The data that support the findings of this study are availablefrom the corresponding author upon reasonable request.
Keywords: Anion redox chemistry · Layered compounds ·Positive electrode material · Sodium · Transition metal vacancies
[1] M. Armand, J.-M. Tarascon, Nature 2008, 451, 652–657.[2] J. Y. Hwang, S. T. Myung, Y. K. Sun, Chem. Soc. Rev. 2017, 46, 3529–3614.[3] N. Yabuuchi, K. Kubota, M. Dahbi, S. Komaba, Chem. Rev. 2014, 114,
11636–11682.[4] N. Tapia-ruiz, A. R. Armstrong, H. Alptekin, M. A. Amores, H. Au, J. Barker,
R. Boston, W. R. Brant, J. M. Brittain, Y. Chen, M. Chhowalla, Y. Choi,S. I. R. Costa, M. C. Ribadeneyra, S. A. M. Dickson, E. I. Eweka, J. D.Forero-saboya, C. P. Grey, Z. Li, S. F. L. Mertens, R. Mogensen, L.Monconduit, D. M. C. Ould, R. G. Palgrave, P. Poizot, A. Ponrouch, S.Renault, E. M. Reynolds, A. Rudola, R. Sayers, D. O. Scanlon, S. Sen, V. R.Seymour, B. Silv, G. S. Stone, C. I. Thomas, M. Titirici, J. Tong, T. J. Wood,D. S. Wright, R. Younesi, J. Phys. Energy 2021, 3, 031503.
[5] C. Delmas, C. Fouassier, P. Hagenmuller, Phys. B+C 1980, 99, 81–85.[6] S. Kumakura, Y. Tahara, S. Sato, K. Kubota, S. Komaba, Chem. Mater.
2017, 29, 8958–8962.
[7] B. Mortemard de Boisse, S. ichi Nishimura, E. Watanabe, L. Lander, A.Tsuchimoto, J. Kikkawa, E. Kobayashi, D. Asakura, M. Okubo, A. Yamada,Adv. Energy Mater. 2018, 8, S1–S7.
[8] B. Song, M. Tang, E. Hu, O. J. Borkiewicz, K. M. Wiaderek, Y. Zhang, N. D.Phillip, X. Liu, Z. Shadike, C. Li, L. Song, Y. Y. Hu, M. Chi, G. M. Veith, X. Q.Yang, J. Liu, J. Nanda, K. Page, A. Huq, Chem. Mater. 2019, 31, 3756–3765.
[9] Y. Li, X. Wang, Y. Gao, Q. Zhang, G. Tan, Q. Kong, S. Bak, G. Lu, X. Q.Yang, L. Gu, J. Lu, K. Amine, Z. Wang, L. Chen, Adv. Energy Mater. 2019,9, 1–9.
[10] A. Tsuchimoto, X. Shi, K. Kawai, B. M. De Boisse, J. Kikkawa, D. Asakura,M. Okubo, A. Yamada, Nat. Commun. 2021, 12, 1–7.
[11] E. Adamczyk, V. Pralong, Chem. Mater. 2017, 29, 4645–4648.[12] E. J. Kim, L. A. Ma, L. C. Duda, D. M. Pickup, A. V. Chadwick, R. Younesi,
J. T. S. Irvine, A. Robert Armstrong, ACS Appl. Energ. Mater. 2020, 3, 184–191.
[13] E. Jeong, K. Mofredj, D. M. Pickup, A. V. Chadwick, J. T. S. Irvine, A. R.Armstrong, J. Power Sources 2021, 481, 229010 (1–10).
[14] K. Dai, J. Mao, Z. Zhuo, Y. Feng, W. Mao, G. Ai, F. Pan, Y. Chuang, G. Liu,W. Yang, Nano Energy 2020, 74, 104831 (1–7).
[15] C. Hakim, N. Sabi, L. A. Ma, M. Dahbi, D. Brandell, K. Edström, L. C. Duda,I. Saadoune, R. Younesi, Commun. Chem. 2020, 3, DOI 10.1038/s42004-020-0257-6.
[16] K. Du, J. Zhu, G. Hu, H. Gao, Y. Li, J. B. Goodenough, Energy Environ. Sci.2016, 9, 2575–2577.
[17] R. A. House, U. Maitra, M. A. Pérez-Osorio, J. G. Lozano, L. Jin, J. W.Somerville, L. C. Duda, A. Nag, A. Walters, K. J. Zhou, M. R. Roberts, P. G.Bruce, Nature 2020, 577, 502–508.
[18] U. Maitra, R. A. House, J. W. Somerville, N. Tapia-Ruiz, J. G. Lozano, N.Guerrini, R. Hao, K. Luo, L. Jin, M. A. Pérez-Osorio, F. Massel, D. M.Pickup, S. Ramos, X. Lu, D. E. McNally, A. V. Chadwick, F. Giustino, T.Schmitt, L. C. Duda, M. R. Roberts, P. G. Bruce, Nat. Chem. 2018, 10, 288–295.
[19] B. Song, E. Hu, J. Liu, Y. Zhang, X. Q. Yang, J. Nanda, A. Huq, K. Page, J.Mater. Chem. A 2019, 7, 1491–1498.
[20] X. Bai, M. Sathiya, B. Mendoza-Sánchez, A. Iadecola, J. Vergnet, R.Dedryvère, M. Saubanère, A. M. Abakumov, P. Rozier, J.-M. Tarascon,Adv. Energy Mater. 2018, 8, 1802379.
[21] A. Konarov, J. H. Jo, J. U. Choi, Z. Bakenov, H. Yashiro, J. Kim, S. T.Myung, Nano Energy 2019, 59, 197–206.
[22] E. J. Kim, L. A. Ma, D. M. Pickup, A. V. Chadwick, R. Younesi, P. Maughan,J. T. S. Irvine, A. R. Armstrong, ACS Appl. Energ. Mater. 2020, DOI10.1021/acsaem.0c01352.
[23] H. Xu, J. Zong, X. Liu, Ionics 2018, 24, 1939–1946.[24] X. Wu, G. L. Xu, G. Zhong, Z. Gong, M. J. McDonald, S. Zheng, R. Fu, Z.
Chen, K. Amine, Y. Yang, ACS Appl. Mater. Interfaces 2016, 8, 22227–22237.
[25] X. Wu, J. Guo, D. Wang, G. Zhong, M. J. McDonald, Y. Yang, J. PowerSources 2015, 281, 18–26.
[26] N. Yabuuchi, R. Hara, K. Kubota, J. Paulsen, S. Kumakura, S. Komaba, J.Mater. Chem. A 2014, 2, 16851–16855.
[27] B. Song, M. Tang, E. Hu, O. J. Borkiwicz, K. M. Wiaderek, Y. Zhang, N. D.Phillip, X. Liu, Z. Shadike, C. Li, L. Song, Y. Hu, M. Chi, G. M. Veith, X. Q.Yang, J. Liu, J. Nanda, K. Page, A. Huq, Chem. Mater. 2019, 31, S1–S12.
[28] A. D. Robertson, A. R. Armstrong, P. G. Bruce, Chem. Mater. 2001, 13,2380–2386.
[29] A. R. Armstrong, A. J. Paterson, A. D. Robertson, P. G. Bruce, Chem.Mater. 2002, 14, 710–719.
[30] A. D. Robertson, A. R. Armstrong, A. J. Paterson, M. J. Duncan, P. G.Bruce, J. Mater. Chem. 2003, 13, 2367–2373.
[31] X. Liu, G. Zhong, Z. Xiao, B. Zheng, W. Zuo, K. Zhou, Nano Energy 2020,76, 104997.
[32] R. D. Shannon, Acta Crystallogr. 1976, A32, 751–767.[33] B. Mortemard De Boisse, G. Liu, J. Ma, S. I. Nishimura, S. C. Chung, H.
Kiuchi, Y. Harada, J. Kikkawa, Y. Kobayashi, M. Okubo, A. Yamada, Nat.Commun. 2016, 7, 1–9.
[34] J. Billaud, G. Singh, A. R. Armstrong, E. Gonzalo, V. Roddatis, M. Armand,T. Rojo, P. G. Bruce, Energy Environ. Sci. 2014, 7, 1387–1391.
[35] Y. Wang, L. Wang, H. Zhu, J. Chu, Y. Fang, L. Wu, L. Huang, Y. Ren, C. J.Sun, Q. Liu, X. Ai, H. Yang, Y. Cao, Adv. Funct. Mater. 2020, 30, 1–9.
[36] J.-P. Parant, R. Olazcuaga, M. Devalette, C. Fouassier, P. Hagenmuller, J.Solid State Chem. 1971, 3, 1–11.
[37] S. Mariyappan, T. Marchandier, F. Rabuel, A. Iadecola, G. Rousse, A. V.Morozov, A. M. Abakumov, J. M. Tarascon, Chem. Mater. 2020, 32, 1657–1666.
ChemElectroChemResearch Articledoi.org/10.1002/celc.202200240
ChemElectroChem 2022, 9, e202200240 (13 of 14) © 2022 The Authors. ChemElectroChem published by Wiley-VCH GmbH
Wiley VCH Dienstag, 07.06.2022
2211 / 252891 [S. 244/245] 1

[38] D. Asakura, E. Hosono, Y. Nanba, H. Zhou, J. Okabayashi, C. Ban, P. A.Glans, J. Guo, T. Mizokawa, G. Chen, A. J. Achkar, D. G. Hawthron, T. Z.Regier, H. Wadati, AIP Adv. 2016, 6, 035105-1-8.
[39] W. B. Wu, D. J. Huang, J. Okamoto, A. Tanaka, H. J. Lin, F. C. Chou, A.Fujimori, C. T. Chen, Phys. Rev. Lett. 2005, 94, 146402-1-4.
[40] T. Kroll, M. Knupfer, J. Geck, C. Hess, T. Schwieger, G. Krabbes, C. Sekar,D. R. Batchelor, H. Berger, B. Büchner, Phys. Rev. B: Condens. MatterMater. Phys. 2006, 74, 1–6.
[41] H. Hirsh, Y. Li, J.-H. Cheng, R. Shimizu, M. Zhang, E. Zhao, Y. S. Meng, J.Electrochem. Soc. 2021, 168, 040539.
[42] K. Luo, M. R. Roberts, R. Hao, N. Guerrini, D. M. Pickup, Y. S. Liu, K.Edström, J. Guo, A. V. Chadwick, L. C. Duda, P. G. Bruce, Nat. Chem.2016, 8, 684–691.
[43] K. Luo, M. R. Roberts, N. Guerrini, N. Tapia-Ruiz, R. Hao, F. Massel, D. M.Pickup, S. Ramos, Y. S. Liu, J. Guo, A. V. Chadwick, L. C. Duda, P. G. Bruce,J. Am. Chem. Soc. 2016, 138, 11211–11218.
[44] M. Okubo, A. Yamada, ACS Appl. Mater. Interfaces 2017, 9, 36463–36472.[45] A. A. Coelho, J. Appl. Crystallogr. 2018, 51, 210–218.[46] B. Ravel, M. Newville, J. Synchrotron Radiat. 2005, 12, 537–541.[47] B. Ravel, M. Newville, Phys. Scr. 2005, T115, 1007–1010.[48] H. Ohashi, E. Ishiguro, Y. Tamenori, H. Kishimoto, M. Tanaka, M. Irie, T.
Tanaka, T. Ishikawa, Nucl. Instruments and Methods Phys. Res. A 2001,467–468, 529–532.
Manuscript received: March 3, 2022Revised manuscript received: March 29, 2022Accepted manuscript online: April 20, 2022
ChemElectroChemResearch Articledoi.org/10.1002/celc.202200240
ChemElectroChem 2022, 9, e202200240 (14 of 14) © 2022 The Authors. ChemElectroChem published by Wiley-VCH GmbH
Wiley VCH Dienstag, 07.06.2022
2211 / 252891 [S. 245/245] 1