Embed Size (px)
Citation preview
Enhanced hydrogen generation by cocatalytic Ni and
NiO nanoparticles loaded on graphene oxide sheets
Abiye Kebede Agegnehu1, Chun-Jern Pan1, John Rick1, Jyh-Fu Lee3, Wei-Nien Su2, John Rick, Bing-Joe Hwang1,3
1Nanoelectrochemistry Laboratory, Department of Chemical Engineering, National Taiwan University of Science and Technology,
2Graduate Institute of Applied Science and Technology #43 Keelung Road, Section 4,Taipei, 106. National Taiwan University of
Science and Technology
3. National Synchrotron Radiation Research Center, Hsinchu 30076, Taiwan
WHEC2012- Toronto June 04, 2012
Presenter: Abiye Kebede Agegnehu
(Doctoral student)

Outline
Introduction
Experimental
Results and discussion
Conclusions
WHEC2012- Toronto June 4, 2012 2
Introduction
WHEC2012- Toronto June 4, 2012 3
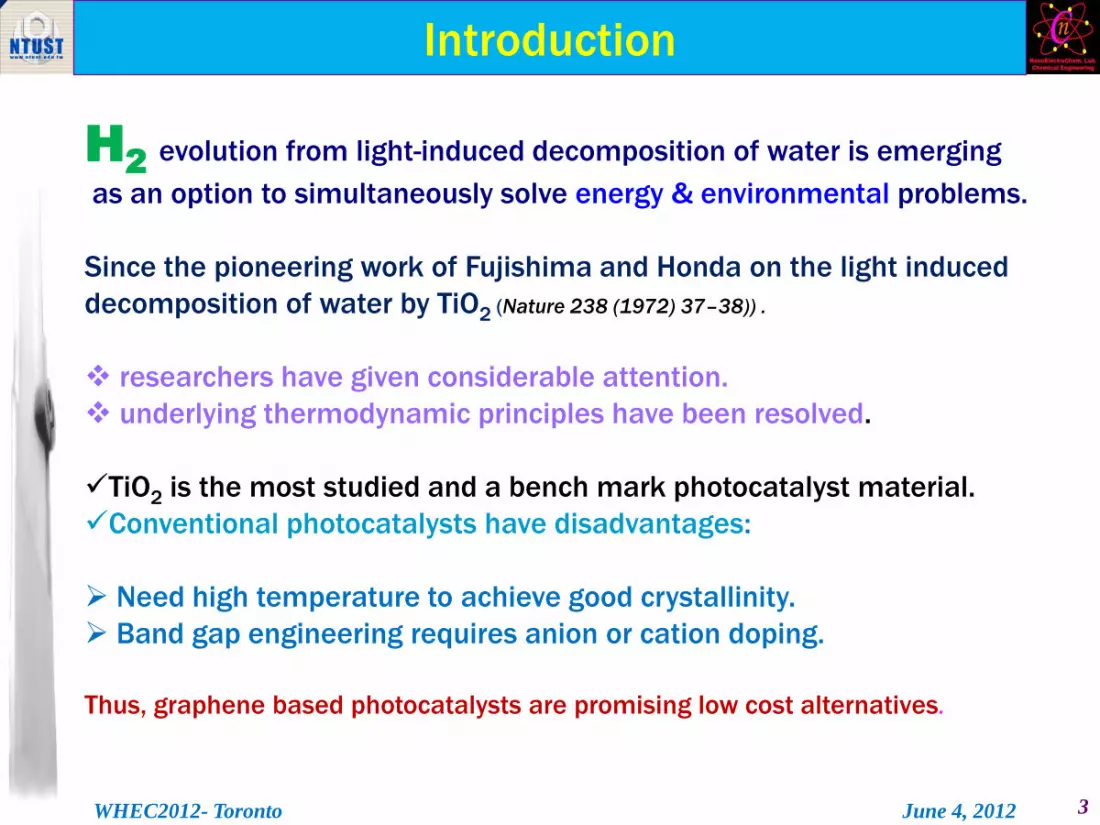
H2 evolution from light-induced decomposition of water is emerging
as an option to simultaneously solve energy & environmental problems.
Since the pioneering work of Fujishima and Honda on the light induced
decomposition of water by TiO2 (Nature 238 (1972) 37–38)) .
researchers have given considerable attention.
underlying thermodynamic principles have been resolved.
TiO2 is the most studied and a bench mark photocatalyst material.
Conventional photocatalysts have disadvantages:
Need high temperature to achieve good crystallinity.
Band gap engineering requires anion or cation doping.
Thus, graphene based photocatalysts are promising low cost alternatives.
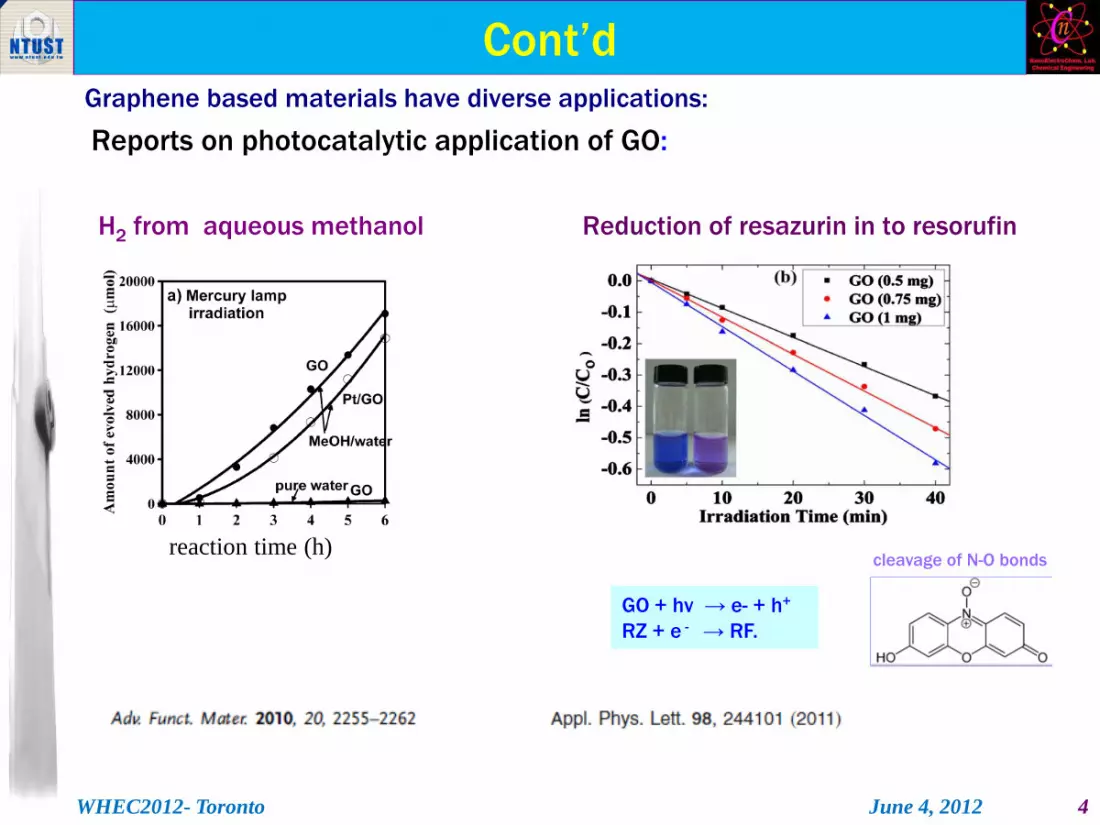
Cont’d Graphene based materials have diverse applications:
Reports on photocatalytic application of GO:
H2 from aqueous methanol Reduction of resazurin in to resorufin
WHEC2012- Toronto June 4, 2012 4
reaction time (h)
GO + hv → e- + h+
RZ + e - → RF.
RZ RF cleavage of N-O bonds

Experimental Section
WHEC2012- Toronto June 4, 2012 5
Experimental
I. GO by modified Hummers’ method
2g graphite and 2g NaNO3 in to 92 ml Conc. H2SO4 (ice bath)
6g KMnO4 gradually added and stirred for 90 min
The ice bath removed and stirred at 34 ⁰C for 30 min
92 ml DI water was slowly added and stirred at 98 ⁰C for 15 min
Diluted by adding 280 ml DI water slowly
Terminated by adding 17 ml H2O2
Multiple washing in DI water using membrane
Dried by using freeze drier

Cont’d
II. Loading Ni and NiO
WHEC2012- Toronto June 4, 2012 6
0.1g GO dispersed in
10 ml DI water
Ni(NO3)2 ·6H2O (3 % ) added
and stirred (1 hr).
Ni2+/GO solution
2.5mM solution of NaBH4
added while stirring washed
with DI water after 8 hrs.
Ni/GO
Dried at 80 ⁰ & sintered in
air at 200 ⁰C for 1 hr.
NiO/GO

Results and discusion
WHEC2012- Toronto June 4, 2012 7
Fig. (a) XRD pattern of PG, and GO;
(b) plot of (αE)1/2 vs photon energy
(eV) for GO; (c) C1s XPS of GO
(d) Raman of PG and GO.
XRD at 2θ= 26.3⁰ is characteristic PG
A new peak at 2θ = 12⁰ appears
Indicates GO formation
UV –Vis shows band gap of 2 - 2.8 eV
C 1s XPS: three main C-components
(C-C : 284.6 eV), (C-O: 286.6 eV), &
(C(O)O: 288.0 eV).
The ID/IG of GO > ID/IG of PG
also depicts the its oxidation.
(d)

Cont’d
WHEC2012- Toronto June 4, 2012 8
(d) Low magnification HRTEM and (e) HR TEM images
of GO, (f) SAED pattern of random GO sheets.
Wrinkled GO sheets (d) have a d- spacing of 0.43
nm (e &f).
consistently indicate moderate oxidation

Cont’d
WHEC2012- Toronto June 4, 2012 9
Fig. (a)TEM image and (b) SAED pattern of Ni/GO.
~ 2 nm Ni nanoparticles uniformly dispersed on GO.
The ring pattern corresponds to the characteristic
(111) and (220) plans of Ni.

Cont’d
WHEC2012- Toronto June 4, 2012 10
Fig. (c) TEM image and SAED pattern of NiO/GO
~ 2.5 nm NiO nanoparticles dispersed on GO.
SAED pattern exhibits characteristic plans of NiO.

Cont’d
WHEC2012- Toronto June 4, 2012 11
Fig. Ni K-edge XANES spectra
The lower intensity of Ni/GO peak (b)
compared to (a), & (d) shows
the effective reduction of Ni2+.
Rather similar features with that of Ni
metal foil (e).
Spectra (c) shows the formation of
NiO after annealing
(a, d, and e are used as references).

Cont’d
WHEC2012- Toronto June 4, 2012 12
Fig. Ni K-edge FT-EXAFS spectra.
EXAFS data also confirms Ni & NiO formation
Ni-Ni peak at 2.5 Å (b) has similar features
with Ni metal foil (e).
Two main peaks below 3.5 Å are typical
of NiO.
Ni-Ni bonds at 2.9 Å (d) &
Ni-O bonds at 2 Å (d)

H2 evolution activity
13
Fig. (a) Total H2 produced, (b) H2 evolution rate per hour
The cocatalyst loading enhanced the rate.
Ni: ~ 7 fold compared to GO
NiO: ~ 4 fold
Attributed to the difference in the barrier for the electron
Crossing the interface.
the interface.
WHEC2012- Toronto June 4, 2012

Cont’d
14
Band structure and proposed Mechanism:
Fig. (a) Schematics of Ni/GO band structure;
(b) Proposed mechanism for H2 evolution.
CB = - 0.52 V & VB = 1.48 – 2.28 V
(vs. NHE).
The Fermi level of Ni = 0.51 V (vs. NHE).
However; shifts to more negative potential
The photogenerated e- react with H+
The holes scavenged by methanol.
no H2 evolution observed from pure water
implying more efficient Catalyst is probably
required.
WHEC2012- Toronto June 4, 2012

Conclusions
Photocatalytic H2 evolution from aqueous methanol can be enhanced by
loading cocatalysts Ni and NiO.
Ni /GO exhibited the highest activity attributed to easy trapping of the
photogenerated electrons by Ni than by NiO.
The lowest activity of GO may be due to electron-hole recombination.
The study indicated that the cocatalyst loading on graphene based
materials can be utilized to design noble composite materials possessing
unique properties.
WHEC2012- Toronto June 4, 2012 15

16


![Common sheets[6]](https://img.pdfslide.net/doc/110x75/63577c0b5108319c8703cb30/common-sheets6.jpg)


