Embed Size (px)
Citation preview
ENVIRONMENTAL AND SOCIAL IMPACTS
ASSESSMENT REPORT
RIVER TERMINAL PROJECT AT MUKTERPUR, MUNSHIGANJ
Prepared by Bangladesh Centre for Advanced Studies for Summit Alliance Port Limited
This Environmental and Social Impacts Assessment Report is a document of the borrower prepared by Bangladesh Centre for Advanced Studies. The views expressed herein do not necessarily represent those of IDCOL’s Board of Directors, management or Staff, and may be preliminary in nature. If you have any observation on the document or the Project, please feel free to contact Mr. Raihan Uddin Ahmed, Environmental Specialist, IDCOL through [email protected] or [email protected].
ENVIRONMENTAL AND SOCIAL IMPACTS
ASSESSMENT
RIVER TERMINALPROJECT, MUKTERPUR, MUNSHIGANJ
Summit Alliance Port Limited
Draft Version
November 2014
Prepared by
BANGLADESH CENTRE FOR ADVANCED STUDIES House 10, Road 16A, Gulshan-1, Dhaka-1212, Bangladesh Tel: (880-2) 8851237, 8851986, 8852217, 8852904; Fax: (880-2) 8851417 E-mail: [email protected] Website: www.bcas.net
i
TABLE OF CONTENTS
Executive summary 1-6
Chapter-1
INTROUCTION
1.1 Background 7
1.2 Project Area 9
1.3 Extent of the Study 10
1.4 Project Objective 10
1. 5 Scope of Work 11
1.6 Methodology 12
1.7 Limitation of the Study 14
1.8 The EIA Team 14
1.9 Acknowledgement 15
Chapter-2
POLICY, LEGAL AND ADMINISTRATIVE FRAMEWORK
2.1 Bangladesh Environmental Policy, Regulations, and Guidelines 16
2.2 National Environmental Policy, 1992 16
2.3 National Environment Management Action Plan (NEMAP), 1995 17
2.4 The Environment Conservation Act, 1995 18
2.5 Environment Conservation Rules, 1997 18
2.6 The ESIA Guidelines for Industry, 1997 19
2.7 Environmental and Social Requirements of the ADB 21
Chapter 3
DESCRIPTION OF THE PROPOSED PROJECT SITE
3.1 Project 24
3.1.2 Type and Category 24
3.1.3 Basic information 25
3.1.4 Project Rationale 26
3.1.5 Project Location 28
ii
3.1.6 Surrounding of the project 31
3.2 Project Layout 32
3.2.1 Pilled Structure 32
3.2.2 Embankment 34
3.2.3 Bathymetry Study 35
3.2.4 Master Layout Plan 36
3.2.5 Location of the Site & Surrounding Land 37
3.2.6 River network between Chittagong and SAPL’s Depot in Dalesswari 37
3.2.7 The Air Shed of the project area 38
3.3 Suitability of the site 39
3.3.1 Accessibility 39
3.3.2 Environmental considerations 40
3.3.3 Water supply 40
3.3.4 Drainage system 40
3.3.5 Transportation 41
3.3.6 Access Road to the project 41
3.3.7 Technology and Major Components of the Project 42
3.3.8 Administration Buildings 45
3.3.9 Sub-station 46
3.3.10 Site Fencing 46
Chapter 4:
BASELINE ENVIRONMENTAL CONDITIONS
4.1 Project Site 48
4.1.2 General Consideration 48
4.2 Physical Environment 48
4.2.1 Physical Environment Surrounding the Project Site 49
4.2.2 Bounding the Impact Area 50
4.3 Climate 51
4.3.1 Rainfall 52
4.3.2 Relative Humidity 53
4.3.3 Wind Speed 53
4.3.4 Wind roses for the proposed SAPLRT project area 56
4.3.5 Ambient Air Temperature 57
iii
4.5 Air Quality 60
4.6 Noise Level 63
4.7 Traffic Situation 67
4.7.1 River Traffic of Dalesswary 69
4.8 Water Quality 71
4.8.1 Surface Water Quality 72
4.8.2 Ground Water 73
4.9 Topography of the Project Site 76
4.10 Seismicity 79
4.11 Biological Environment 83
4. 12 Protected Areas, Wildlife Sanctuaries, Game Reserves 93
4.13 Environmental and social Survey 93
4.13.1 Administrative Areas 93
4.13.2 Land Use 94
4.13.3 Demographic Characteristics of the Project Area 94
4.13.4 Population 94
4.13.5 Household 94
4.13.6 Literacy 94
4.14 Utility Services in the Project Area 95
4.14.1 Sources of Drinking Water 95
4.14.2 Electricity 95
4.14.3 Health 96
4.14.4 Waste Disposal 96
4.14.5 Emergency Services 96
4.14.6 Occupation and Source of Income of Population 96
4.14.7 Ethnic and Religious composition of the Population in the Project Area 97
4.14.8 Archaeological Heritage and Relics 97
Chapter-5
ANTCIPATED ENVIRONMENTAL IMPACTS AND MITIGATION MEASURES
5.0 Environmental Impacts 98
5.1 Environmental Impacts during Pre-Operation Phase 98
5. 2 Environmental Impacts during Construction Phase 98
iv
5.2.1 Impact on Environmental Resources 99
5.2.2 Ambient Air Quality Standards 100
5.2.3 Impact on Noise Levels 100
5.2.4 Impact of HFO 103
5.2.5 Impact on Surface Water Quality 103
5.2.6 Impact on Ground Water Quality 103
5.2.7 Impact on Ecological Resources 104
5.2.8 Occupational Health and Safety Impacts 104
5.2.9 Traffic, Transport, Road and River Safety 105
5.2.10 Waste Generation and Disposal 106
5.2.11 Accommodation Facility 106
5.2.12 Sewerage Management: 106
5.3 Environmental Impacts during Operation Phase
5.3.1 Wastewater and Waste 108
5.3.2 Hazardous Material and Oil Management 109
5.3.3 Impact on Road Infrastructure and Traffic 109
5.3.4 Air Pollution 111
5.3.5 Air Dispersion Modeling 112
5.3.6 Modeling Methodology 112
5.3.7: Background air quality data and wind roses for 4 months 115
5.3.8: Noise Pollution 117
5.3.9 Noise impacts and modeling 119
5.3.10 Noise modeling results 121
5.3.11 Solid waste 122
5.3.12 Liquid waste and lube oil disposal 123
5.3.13 Sanitary waste-water 123
5.4 Environmental Impacts during Decommissioning Phase
5.5 Occupational Health and Safety Impact 124
5.5.1 Exposure to Electro Magnetic Field 124
5.5.2 Fire and Explosion Hazards 125
5.5.3 General Safety 125
Chapter-6
ANALYSIS OF ALTERNATIVES
6.1 ‘No Project’ Alternative 126
v
6.2 Analysis of Technology 126
6.3 Analysis of Site Alternatives 127
6.4 Location and Area of Available Land 127
6.5 Distances from Major Infrastructure 131
6.6 Vulnerability to Natural Calamity 132
6.7 Environmental and social aspects 133
6.8 Comparative Valuation of the Proposed Sites 133
Chapter-7
INFORMATION DISCLOSURE, CONSULTATION AND PARTICIPATION
7.1 Information disclosure 134
7.2 Stakeholder’s Consultation 135
7.3 Consultation and Participation Mechanism 135
7.4 Stakeholders’ Participation 136
7.5 The Results of Consultation Meeting and Concerns Raised 146
Chapter-8
GRIEVANCE REDRESS MECHANISM
8.1 Grievance Redress Mechanism 149
8.2 Stakeholders Engagement Plan 149
8.3 Resources and Responsibilities 150
8.3.1 port Level Resource and Responsibilities 151
8.3.2 Corporate Level Resource and Responsibilities 151
8.4 Reporting 152
8.4.1 Internal Reporting 152
8.4.2 External Reporting 152
8.4.3 Sample Grievance Reporting Form 153
8.4.5 Disclosure 153
Chapter 9
SOCIO ECONOMIC SURVEY
9.1 Socio-Demographic Characteristic of the Project Area 154
9.2 Age Distribution of the Population and Marital Status 154
9.3 Educational Status 155
9.4 Occupation and Employment 156
vi
9.5 Percentage Distribution of Household Heads by Main Occupation 158
9.6 Household Income, Expenditure and Distribution 159
9.7 Economic Status 160
9.8 Involvement with NGOs/CBOs 162
9.9 Housing Structures 162
9.10 Survey of Environmental Issues 164
9.11 Sources of Water Pollution 165
9.12 Sources of Noise Pollution 166
9.13 Sources of Air Pollution 167
9.14 Respondents’ Awareness and Perception 168
9.15 Project Affected People 169
9.16 Expectation for Assistance from the Government/Project to Mitigate Losses 169
9.17 Perceived Positive Impacts of the Project 170
9.18 Morbidity in the Study Area 171
9.19 Average Number of People Affected by Different Diseases 173
9.20 Sources of Treatment 174
Chapter-10
ENVIRONMENTAL MANAGEMENT PLAN
10.1 Environmental Management Plan 176
10.1.1 Construction Phase 176
10.1.2 Operation Phase 179
10.1.3 Decommissioning Phase 185
Chapter-11
INSTITUTIONAL ARRANGEMENT AND ENVIRONMENTAL MONITORING
11.1 Institutional Requirements 187
11.1.1 Environmental and Social Monitoring Unit 187
11.1.2 Composition of Environmental and Social Monitoring Unit 188
11.1.3 Environmental Training 189
11.2 Environmental Monitoring 189
11.2.1 Environmental Monitoring Parameters 190
11.3 Environmental Monitoring and Management Budget 192
11.4 Financial Arrangement for Environmental Monitoring and Management 193
11.5 Environmental Monitoring and Management Reporting 194
vii
Chapter 12
EMERGENCY RESPONSE AND DISASTER MANAGEMENT PLAN
12.1 Emergency Response 195
12.1.1 Six Steps in Emergency Response 196
12.1.2 Reporting Incidents and Accidents 197
12.1.3 Approaches to Emergency Response 197
12.2 Disaster Management Plan 199
12.3 Environment, Health and Safety (EHS) 200
12.4 Fire Hazard& Fire Evacuation Plan 201
Chapter 13
CONCLUSIONS AND RECOMMENDATIONS 204
List of Tables
Table 3.1: Basic data on SAPLRT is given below 25
Table 3.2: SAPL RT Equipment details 45
Table 4.1 Monthly Average Rainfall in the project area (2003- 2012) 52
Table 4.2 Average Monthly Relative Humidity in last 6 years 53
Table 4.3 Monthly Prevailing Wind Speed and Direction in Knots of Dhaka 53
Table 4.4 Monthly Ambient Temperature in 2004, 2005 and 2006 58
Table 4.5 Monthly Ambient Temperature in 2007, 2008 and 2009 58
Table 4.6 Monthly Ambient Temperature in 2010, 2011 and 2012 59
Table 4.7 Ambient Air Quality Analysis of the project area 61
Table 4.8 : Measured Noise level at the project site in different locations at day 64
Table 4.9 : Average Noise level at the project site in different locations at night 65
Table 4.10: Acceptable Noise Level(Bangladesh gazette: September 7, 2006) 66
Table 4.11: Standards of noise level of DoE, GOB and WB 66
Table: 4.12 shows traffic composition by vehicle type at day time 68
Table: 4. 13 shows traffic composition by vehicle type at Night Time 68
Table 4.14 a: Daleswari River Traffic survey, August 2014(Day time) 70
Table 4.14 b: Daleswari River Traffic survey, August 2014(Night time) 71
Table-4.15: Surface Water quality (limited parameters) of the Dhaleshwary River 72
Table 4.16: Characteristics of effluent from a nearby Textile Mill 73
Table-4.17: Ground Water quality (limited parameters) of Project Site 74
Table 4.18: Identified aquatic flora in the study area 84
viii
Table 4.19: Identified terrestrial flora in the study area 86
Table 4.20: Identified aquatic fauna (+ fish) in the study area 89
Table 4.21: Identified terrestrial fauna in the study area 91
Table 5.1: National Ambient Air Quality Standards (NAAQS) for Bangladesh 100
Table 5.2: OSHA noise exposure limits for the work environment 101
Table 5.3: Noise Levels Generated By Construction Equipment 102
Table 5.4: Various items with their quantities and operation 111
Table 5.5: Measured baseline concentrations of Pollutants. 116
Table 5.6: Ground level concentrations 116
Table 5.7: Project highest concentration (g/m3) 117
Table 5.8: List of Equipment Planned to be Used during Operation Phase 118
Table 5.9: At 85 dB noise input (for each Engine) 121
Table 5.10: Standards of noise level 121
Table 5.11: The combined noise levels at locations 122
Table 6.1: Comparison of sites with respect to location, area and communication 128
Table 6.2: Comparison of sites with respect to Communication and other suitability 130
Table 6.3: Comparison of sites with respect to distance from major infrastructure 131
Table 6.4: Land price of short-listed sites ambient concentration 133
Table 8.1: Stakeholder engagement plan 150
Table 8.2: Contact detail of resource persons 151
Table 8.3 : Sample Grievance Reporting Form 153
Table-9.1: Average Family Size and Sex Ratio of Household Members 154
Table-9.2: Age Distribution of Household Members 154
Table-9.3: Educational Status of Household Members of Study Area 156
Table-9.4: Percentage Distribution of Primary Occupation 157
Table-9.5: Percentage Distribution of Household Heads by Main Occupation 158
Table-9.6: Average Annual Income and Expenditure Per Household 159
Table-9.7: Percentage of Annual Income of Households from Different Sources 160
Table-9.8: Economic Status of Households 161
Table-9.9: Percentage Distribution of Households Involvement in NGOs/CBO 162
Table-9.10: Percentage Distribution of Households Surveyed by Housing Structure 163
Table-9.11: Percentage Distribution of Households Surveyed Showing the Status 164
Table-9.12: Percentage Distribution of Households Surveyed for Status 165
Table-9.13: Percentage Distribution of Households Surveyed for Status of Noise 166
Table-9.14: Percentage Distribution of Households Surveyed for Status of Air 167
ix
Table-9.15: Percentage Distribution of Households having knowledge on project 169
Table-9.16: Percentage Distribution of Households Surveyed Affected due to the 131 169
Table-9.17: Percentage Distribution of Households for Make up the Loss 170
Table-9.18: Percentage Distribution of Households Demanding Help 170
Table-9.19: Percentage Distribution of Households Surveyed Expecting Positive 171
Table-9.20: Percentage Distribution of Households Surveyed for Affected People 172
Table-9.21: Average Number of People Affected by Different Diseases 173
Table-9.22: Percentage Distribution of Households Surveyed by Source of Treatment 174
Table 10.1: Potential impacts and mitigation measures at Construction phase 177
Table 10.2: Potential impacts and mitigation measures at operation phase 180
Table 10.3: Potential impacts and mitigation measures at decommissioning phase 186
Table 11.1: Monitoring parameters and frequency of monitoring during trial run 191
Table 11.2: Monitoring parameters and frequency of monitoring during operation phase 191
Table 11.3: An annual tentative budget for environmental monitoring (Operation Phase) 193
Table 11.4: Reporting schedule 194
List of Figure
Fig. 1.1: Location of the proposed project site in the Google map 9
Fig. 2.1: Process of ESIA Approval and ECC at DoE 20
Fig. 3.1: Cost Comparison (River vs Road and Rail ) for export 27
Fig. 3.2: Location of the proposed project site on a Satellite image 28
Fig. 3.3: Location of SAPLRT within Munshigonj Upazila 29
Fig: 3.4: Location of SAPLRT with respect to Bangladesh 30
Fig. 3.5: Layout of piled structure and embankment 33
Fig. 3.6: Embankment structure (source: Photo site visit August 27, 2014 34
Fig. 3.7: Typical cross section piles structure 35
Fig 3.8 : Bathymetric survey result at the project site (2014) 35
Fig 3.9: Master Layout Plan of SAPL 36
Fig 3.10: The navigation routes in Bangladesh (Source: BIWTA) 38
Fig 3.11: Air shed area of 5 kms radius and 1 Km radius of the project 39
Fig 3.12: Fixed Cargo Cranes (FCCs) will be fitted on fixed pedestals 43
Fig. 3.13: Reach Stackers used for handling of containers 43
Fig 3.14: Fork lifts 44
Fig. 4.1: Wind rose diagram for the month of January-March 56
Fig. 4.2: Wind rose diagram for the month of July-September 57
x
Fig. 4.3: Monthly (a) maximum and (b) minimum temperature (°C) of Dhaka 59
Fig.4.4: Base noise level mapping at the site and the neighboring service road 66
Fig. 4.5: Traffic volume counted by BCAS representative at the project site 68
Fig. 4.6: Road Traffic counted by Vehicle type at night 69
Fig. 4.7a: Digital survey of existing Topography (Dimension Map) 76
Fig 4.7b: Digital survey of existing Topography (R.L Map) 76
Fig 4.7c: Digital survey of existing Topography (Area Map) 77
Fig. 4.7d: Digital survey of existing Topography (Location Map) 77
Fig. 4.7 e: Digital survey of existing Topography (Topography Map) 78
Fig. 4.8: Digital Elevation Model of Bangladesh 78
Fig. 4.9: Regional tectonic setup of Bangladesh with respect 80
Fig. 4.10: Digital Elevation Model (DEM) of Bangladesh 81
Fig 4.11: Earthquake Zoning Map of Bangladesh 82
Fig. 4.12: Distribution of terrestrial floral species in the project site 88
Fig 4.13: Occupation status in Munshigonj 95
Fig.5.1: NOx Wind rose for January 2012 115
Fig. 5.2: NOx Wind rose for April 2012 115
Fig.5.3: NOx Wind rose for July 2012 115
Fig. 5.4: NOx Wind rose for October 2012T 115
Fig.6.1: Overview quay structure - outreach of Fixed Cargo Cranes 126
Fig.9.1: Age distribution of the household 155
Fig. 9.2: Educational status 156
Fig. 9.3: Distribution of primary education 157
Fig. 9.4: Distribution of Household as a main occupation 158
Fig. 9.5: Source of annual household income 160
Fig. 9.6:Distribution of household economic status 161
Fig. 9.7: Distribution of housing structure 163
Fig. 9.8: Status of environmental problem 165
Fig. 9.9: Status of water pollution 166
Fig. 9.10: Status of noise pollution 167
Fig. 9.11: Status of air pollution 168
Fig. 9.12: Distribution of household disease 172
Fig. 9.13: People affected by different disease 173
Fig. 9.14: Sources of treatment 174
Fig.12.1 : Illustrates an Example System Approach to Jetty 198
xi
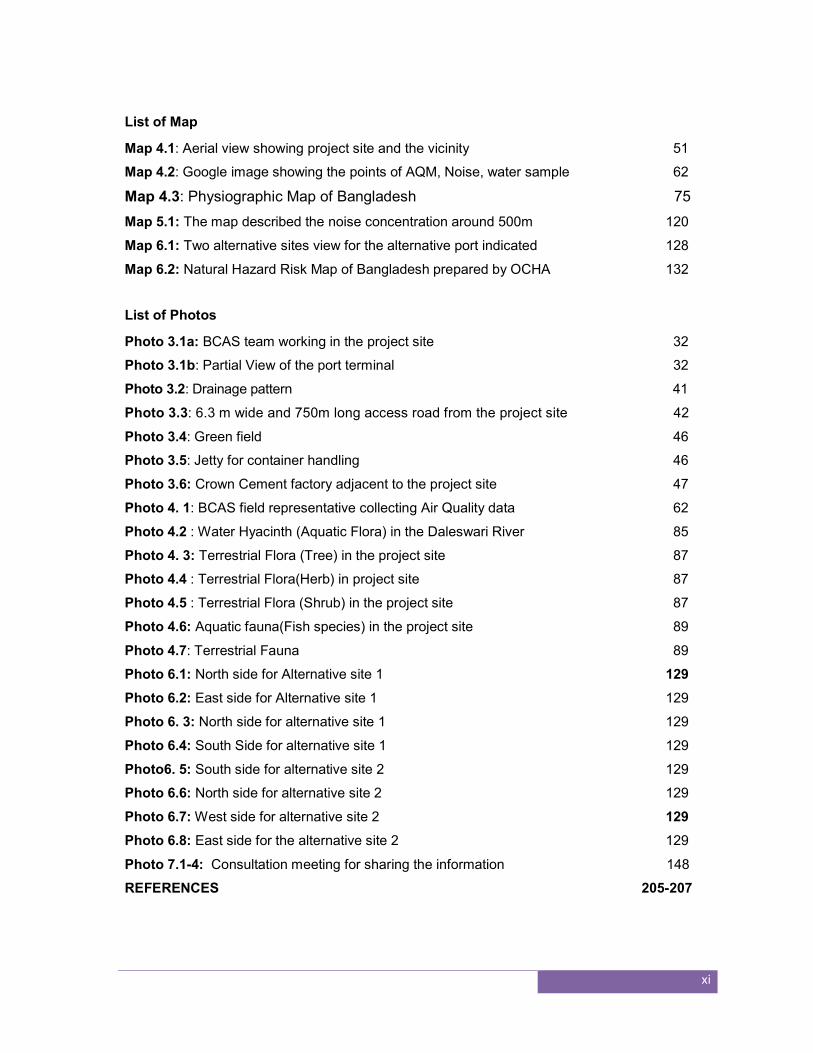
List of Map
Map 4.1: Aerial view showing project site and the vicinity 51
Map 4.2: Google image showing the points of AQM, Noise, water sample 62
Map 4.3: Physiographic Map of Bangladesh 75
Map 5.1: The map described the noise concentration around 500m 120
Map 6.1: Two alternative sites view for the alternative port indicated 128
Map 6.2: Natural Hazard Risk Map of Bangladesh prepared by OCHA 132
List of Photos
Photo 3.1a: BCAS team working in the project site 32
Photo 3.1b: Partial View of the port terminal 32
Photo 3.2: Drainage pattern 41
Photo 3.3: 6.3 m wide and 750m long access road from the project site 42
Photo 3.4: Green field 46
Photo 3.5: Jetty for container handling 46
Photo 3.6: Crown Cement factory adjacent to the project site 47
Photo 4. 1: BCAS field representative collecting Air Quality data 62
Photo 4.2 : Water Hyacinth (Aquatic Flora) in the Daleswari River 85
Photo 4. 3: Terrestrial Flora (Tree) in the project site 87
Photo 4.4 : Terrestrial Flora(Herb) in project site 87
Photo 4.5 : Terrestrial Flora (Shrub) in the project site 87
Photo 4.6: Aquatic fauna(Fish species) in the project site 89
Photo 4.7: Terrestrial Fauna 89
Photo 6.1: North side for Alternative site 1 129
Photo 6.2: East side for Alternative site 1 129
Photo 6. 3: North side for alternative site 1 129
Photo 6.4: South Side for alternative site 1 129
Photo6. 5: South side for alternative site 2 129
Photo 6.6: North side for alternative site 2 129
Photo 6.7: West side for alternative site 2 129
Photo 6.8: East side for the alternative site 2 129
Photo 7.1-4: Consultation meeting for sharing the information 148
REFERENCES 205-207
xii
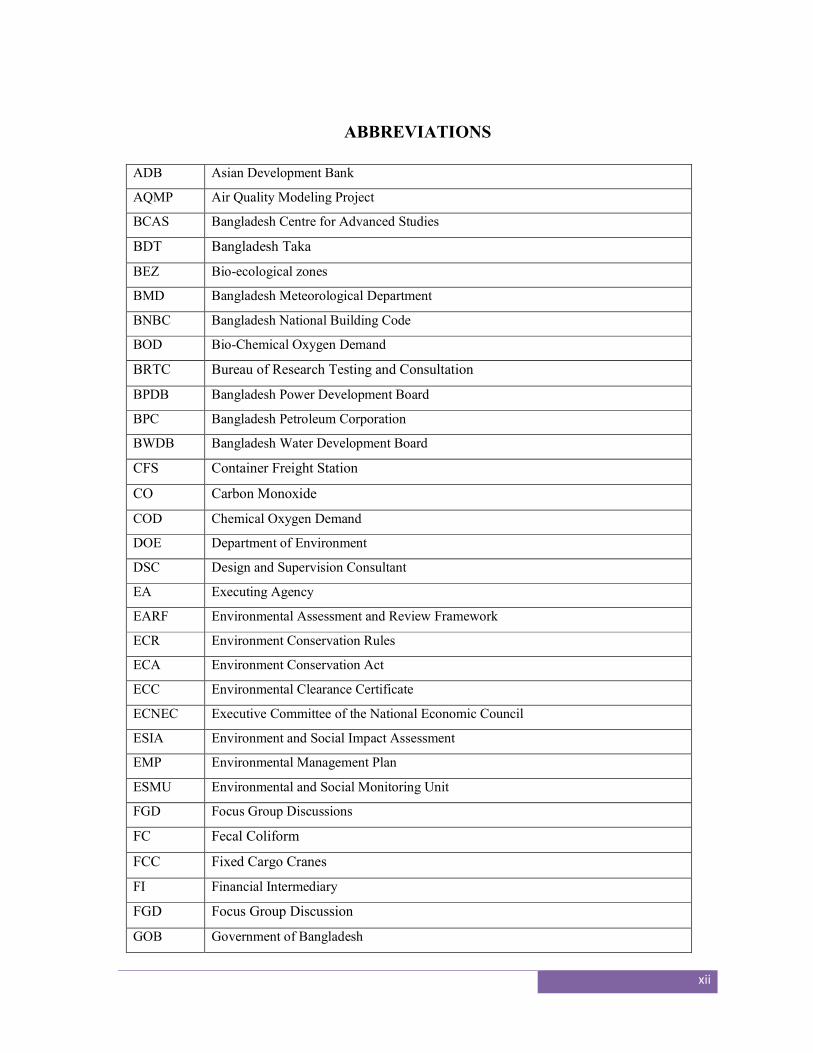
ABBREVIATIONS
ADB Asian Development Bank
AQMP Air Quality Modeling Project
BCAS Bangladesh Centre for Advanced Studies
BDT Bangladesh Taka
BEZ Bio-ecological zones
BMD Bangladesh Meteorological Department
BNBC Bangladesh National Building Code
BOD Bio-Chemical Oxygen Demand
BRTC Bureau of Research Testing and Consultation
BPDB Bangladesh Power Development Board
BPC Bangladesh Petroleum Corporation
BWDB Bangladesh Water Development Board
CFS Container Freight Station
CO Carbon Monoxide
COD Chemical Oxygen Demand
DOE Department of Environment
DSC Design and Supervision Consultant
EA Executing Agency
EARF Environmental Assessment and Review Framework
ECR Environment Conservation Rules
ECA Environment Conservation Act
ECC Environmental Clearance Certificate
ECNEC Executive Committee of the National Economic Council
ESIA Environment and Social Impact Assessment
EMP Environmental Management Plan
ESMU Environmental and Social Monitoring Unit
FGD Focus Group Discussions
FC Fecal Coliform
FCC Fixed Cargo Cranes
FI Financial Intermediary
FGD Focus Group Discussion
GOB Government of Bangladesh
xiii
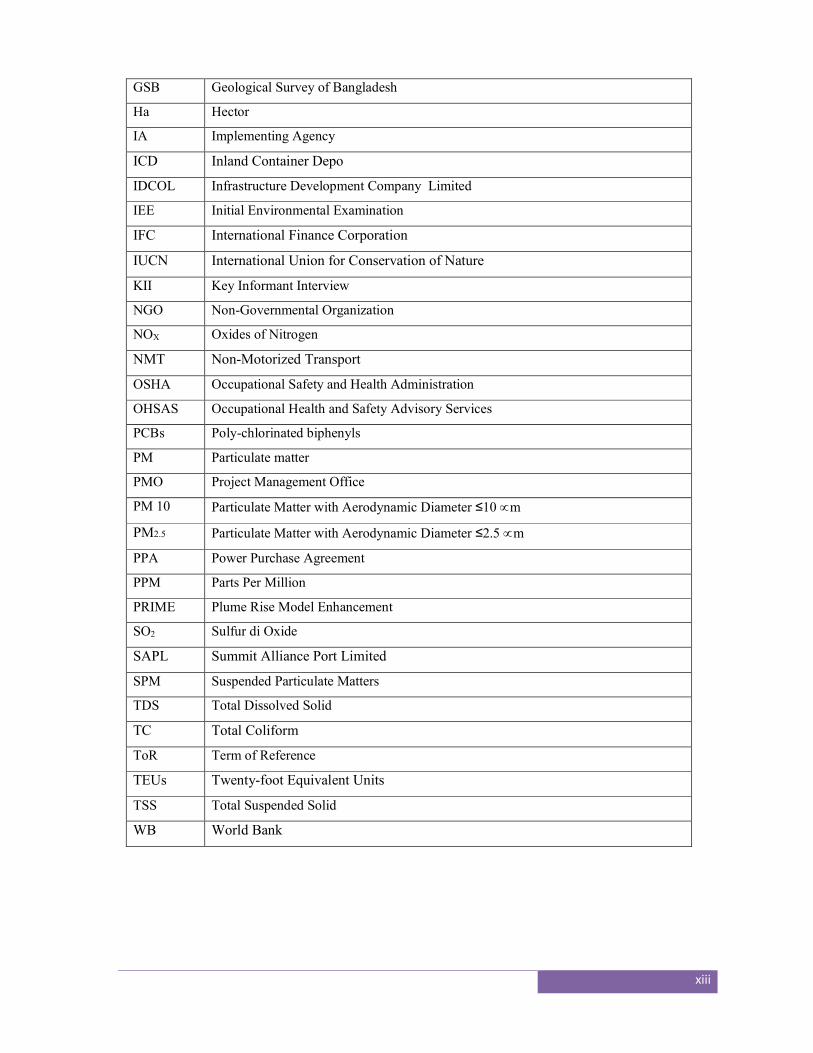
GSB Geological Survey of Bangladesh
Ha Hector
IA Implementing Agency
ICD Inland Container Depo
IDCOL Infrastructure Development Company Limited
IEE Initial Environmental Examination
IFC International Finance Corporation
IUCN International Union for Conservation of Nature
KII Key Informant Interview
NGO Non-Governmental Organization
NOX Oxides of Nitrogen
NMT Non-Motorized Transport
OSHA Occupational Safety and Health Administration
OHSAS Occupational Health and Safety Advisory Services
PCBs Poly-chlorinated biphenyls
PM Particulate matter
PMO Project Management Office
PM 10 Particulate Matter with Aerodynamic Diameter ≤10 m
PM2.5 Particulate Matter with Aerodynamic Diameter ≤2.5 m
PPA Power Purchase Agreement
PPM Parts Per Million
PRIME Plume Rise Model Enhancement
SO2 Sulfur di Oxide
SAPL Summit Alliance Port Limited
SPM Suspended Particulate Matters
TDS Total Dissolved Solid
TC Total Coliform
ToR Term of Reference
TEUs Twenty-foot Equivalent Units
TSS Total Suspended Solid
WB World Bank
1
EXECUTIVE SUMMARY
SAPL is proposing building of a river port including an inland container depot. The project
is proposed at a location on Munshiganj about 30 km from Dhaka on a 5.9 ha own land on
the bank of the Dhaleshwary River, approximately 30km south of Dhaka. The proposed
river terminal is located in West Muktarpur Village of Panchasar Union under Munshiganj
Sadar Upazila of Munshiganj on a 14.5 acre plot of land on the northern bank of the
Dhaleshwary River. The GPS coordinates of the plot is N 23°34′28″ and E 90°30′43″.
The port will have a handling capacity of 120,000 TEU and a storage capacity of 2,500
TEU. The project includes the acquisition of five second-hand and/or new vessels with
100-140 TEUs capacity to operate between Chittagong and Dhaka. The Danish company
Seaport Innovations has been hired for design, supervising management and other
recommendations (e.g. IT, organization). Civil construction is done by Beehive Engineers
Ltd from Bangladesh. Commercial operation date is expected to start end of 2014.
A range of specialized machineries will be used for the operation of the river terminal and
container freight station (CFS). These include Fixed Cargo Cranes (FCC), Reach
Stackers, and other related container handling equipment. Specially designed flat-bottom
barges with shallow drafts will be used for transportation of containers between Dhaka and
Chittagong. During full-scale operation, the river terminal will be capable of handling up to
120,000 containers of TEUs (Twenty-foot Equivalent Units) and FEUs (Forty-foot
Equivalent Units) annually.
Export and import oriented cargoes and containers will be consolidated at the project site
and then these will be transported to Chittagong port and other areas using specially built
barges. Import cargo from Chittagong will be unloaded at the river terminal, and will be
delivered to destinations in the greater Dhaka area. No refueling of the barges will be done
at the proposed river terminal. The existing road from Ponchoboti to West Muktarpur
Bridge will be used for transportation cargo and containers to and from the river terminal.
The proposed river terminal will not handle any passenger vessel.
2
The proposed project falls under the “red category” project according to the Environment
Conservation Rules 1997, and require carrying out of Environmental and Social Impact
Assessment (ESIA). The ESIA of the proposed project has been carried out following the
guidelines (GoB, 1997) of the Department of Environment (DoE), and the relevant
operational policies and guidelines of the World Bank and the Asian Development Bank.
As part of the ESIA, baseline surveys (physical, ecological and socio-economic) of areas
surrounding the project site have been carried out. The approach taken to carry out the
baseline survey was to identify the project activities during both construction and
operational phases and screen for the most applicable or sensitive environmental and
social impacts the project activities might have. Based on this the environmental data like
air quality, noise level measurements and surface and ground water analysis has been
carried out. Apart from these the baseline information on flora and fauna of the project
area has also been carried out. Secondary literature was used for identifying the climatic
condition of the project area. For identifying the socio-economic baseline of the area a
sample survey was carried out in the area. As part of the disclosure and public
consultation process five focus group discussions (FGDs), 8 Key Informant Interview
(KIIs), one large consultation meeting and several informal meetings have also been
carried out
The SAPL RT project site is located on the northern bank of the Dhaleshwary River, very
close to the Muktarpur Bridge. The proposed project area of 14.5 acres site was earlier
owned by the cement manufacturing company Holcim. It was later used by the GoB during
the construction of the Muktarpur Bridge. The SAPL bought the land from Holcim for the
proposed project. The areas surrounding the project site are primarily industrial in nature.
A wide range of industries are present in areas surrounding the project site, including
cement factories, chemical industries, garment factories, cold storage, and textile mills.
Ideal Textile Mills is located on the eastern side and a ship building yard is located on the
western side of the project site. A relatively narrow approach road (about 6m wide)
connects the project site with the Muktarpur bridge road. The village areas of West
Muktarpur have tin shed houses; electricity and gas supply are available in the area. Low-
lying land near the village areas are used for agriculture.
3
The existing road from Ponchoboti to Muktarpur Bridge and the Dhaleshwary River will be
used for transportation of cargo/ containers to and from the proposed river terminal. During
construction phase, some construction materials are also likely to be transported through
the road and river. Because of its importance, road and river condition survey, road and
river traffic survey were carried out.
The existing road from Ponchoboti (Narayanganj) to West Muktarpur (Munshiganj) is
about 10 km in length. The geometric configuration of roadway is found to be 2-lane
undivided and without any geometric treatment. In general, the condition of the road is
poor. The road is narrow along many stretches, the road pavement has suffered significant
damage, there is no drainage facility along many stretches, and there are no traffic signs
along the road. At present due to the presence of high concentration of labor intensive
garment and other industries, uncontrolled movement of pedestrians, non-motorized and
motorized vehicles, the corridor is operating at very low level of service.
Incremental traffic due to the port activities is an important issue as the traffic in the
existing roads are high and any increase may hamper the transportation and
communication of the area. Traffic data were collected from on-spot surveys at three key
locations (Ponchoboti, Kashipur, and West Muktarpur) along the roadway during
September 2014. In general traffic along the roadway is dominated by NMT (non-
motorized transport) and 3-wheelers. Other important vehicle types include mini-bus,
trucks, pick-ups, motor cycle and freight vehicles. Among the spots surveyed, Ponchoboti
was the busiest. Over 1000 vehicles of different types crossed this point each hour (in
either direction) during both morning and afternoon. The river transport is dominated the
sand loader and passenger carrying launches. Both road traffic and river traffic was found
high in the baseline surveys. During the port operation there is need for proper traffic
management by the project sponsors. A traffic plan based on staggered incoming and
outgoing container trucks and a communication system needs to be in place in order to
avoid traffic congestion on the access road.
The water quality in the Dhaleshwary river water in the immediate vicinity of the project
4
site contains elevated concentration of a number of contaminants that most likely come
both from domestic sources (e.g., TC, FC, NH3) and industrial sources (NH3, BOD, COD,
Sulfate, Lead). Water from Dhaleshwary was analyzed and was found polluted with many
of the individual concentration levels of the pollutants higher than the DOE standards.
There will be minimal waste water discharge from the operations of the port. There will be
generation of some spent lubricant which will be disposed through DOE contractors.
Baseline Air quality is major problem in the project area. There is a number of cement
industries located near the proposed project which is primary reason for high
concentrations particulate matter. The most significant being the concentration of PM10 in
the in and in the vicinity of the project area resulting from the particulate matter generated
by these cement plants. The existing baseline air quality was found to be already
exceeding the national ambient air quality standards for SPM as well as PM10
significantly. On the other hand, CO, SOx and NOx concentrations have been found to be
well within the national standards. The air dispersion modeling using AERMOD shows that
the predicted PM10 concentration mainly from the 2MW diesel generator is approximately
0.08 microgram per cubic meter. Since the baseline concentration is high the modeled
concentration is 146% higher than the DOE standards.
The baseline noise level measurements show that the noise level on the access road side
is highest and is higher than the DOE standards. The noise level in the neighborhood of
the project site is higher than that within the site. The noise level within the project site is
within the acceptable limit prescribed by the Department of Environment for industrial
area. The noise dispersion model results reveal that the nearest household receptors
living approximately 100 meters away from the project site will be exposed to 32-42 dBA
which is within the limits set by the DOE.
Over the years of industrialization of this area the biodiversity of the area has been altered.
The previously flood plain ecology has been changed. Most of the river-bank areas have
well established industrial structures and current ecological feature of these areas seems
to be very minimal. There are only some adaptive floral and faunal diversity now observed.
5
Water pollution from industrial and domestic sources has also affected the aquatic
biodiversity.
The common aquatic floral species in the study areas include Water hyacinth, Khudipana,
Kalmi, and Helencha. Most terrestrial floral species particularly the trees and shrubs are
cultivated and planted and these have commercial values. No aquatic tree and aquatic
shrub were indentified within the study area. A total of 41 floral species have been
identified, which include 18 tree, 17 herb, and 6 shrub species. A total of 32 aquatic faunal
species have been identified in the study area, which include one amphibian, three reptile,
four avis, one mammal, and 23 freshwater fish. A total of 56 terrestrial faunal species have
been identified in the study area, which include four amphibia, nine reptile, 33 avis and 10
mammals. No threatened floral species has been identified in the study areas; however,
some threatened wildlife and fish species have been identified in and around the proposed
project site.
A socio-economic survey was carried out over a radius of 1km and a sample size was
100.This survey report gives a more in-depth insight into the urban population. The
population is large in the survey area, with the percentage of children being less in number
as compared to the percentage being in the adolescent and old age group. The
educational status in this area is much better than areas in the rural setting. There is a
higher population of students who have achieved the higher secondary certificate. The
primary occupation of the area comprises of business, services and overseas
employment. Agricultural practices are minimal as compared to rural areas though they
have better irrigation facilities. The household income is higher in the urban area as
compared to rural areas. Likewise, the household expenditure in this area is more
compared rural setting. Majority of the expenditure includes food, clothing, education and
healthcare. The economic status of the people is far better than those living in the smaller
urban growth areas. The housing structure is better; availability of food, clothing, medicine,
transport facilities is also very good. They also have better access to amenities and
infrastructure such as sanitation, market, bus stand, school, drinking water etc. The health
condition of the study area is far better than the rural area population and smaller urban
centers mainly because of the industrialization and good road and waterway connectivity.
They suffer from fewer diseases and they have better accessibility to medicine facilities.
6
The households in the study area have more access to electricity and also to natural gas
along with other sources.
The environmental issues in the project area are more degraded as compared to rural
areas. A small percentage of the population in the survey area has problems with noise
pollution. Water and noise pollution is of any form is not a problem for the population in the
area. The respondents’ in the study area are aware about the project and they feel that the
project will provide them with more employment opportunity.
An Environment Management Plan (EMP) has been furnished. The primary objective of
EMP is to record environmental impacts resulting from the project activities and to ensure
implementation of the identified “mitigation measures” in order to reduce adverse impacts
and enhance positive impacts from specific project activities. Besides, it would also
address any unexpected or unforeseen environmental impacts that may arise during
construction and operation phases of the project.
A Monitoring Plan has been included with the primary objective of monitoring key
environmental parameters to assess the impacts on a regular basis and keep the records.
This will help the project sponsors to take corrective actions so that there is minimal
impact on the environment and continued improvement. Apart from monitoring key
environmental parameters there is need for strong monitoring of traffic flow during the
operation phase of the project.
Recommendations
It has been found that most of the adverse impacts resulting from the proposed project
during both construction and operational phases could be minimized if appropriate
mitigation measures are taken. Accordingly, mitigation and abatement measures to reduce
or eliminate potential adverse impacts and to enhance beneficial impacts have been
suggested. A monitoring program needs to be put in place to ascertain that the potential
impacts have been predicted adequately and that suggested mitigation measures are
effective in minimizing adverse impacts. A detailed environment management plan (EMP),
including a monitoring program has been developed. It is also recommended that the EMP
be effectively implemented in order to identify any changes in the predicted impacts and
take appropriate measures to off-set any unexpected adverse effects.
7
Chapter-1
INTRODUCTION
1.1 Background
SAPL is developing a river depot project that consists of an inland container depot
(located on 5.9 ha owned land at the Dhaleshwary River, approx. 30km south of Dhaka)
with a handling capacity of 120,000 TEU p.a. and a storage capacity of 2,500 TEU. The
project includes the acquisition of five second-hand and/or new vessels with 100-140
TEUs capacity to operate between Chittagong and Dhaka. The Danish company Seaport
Innovations has been hired for design, supervising management and other
recommendations (e.g. IT, organization). Civil construction is done by Beehive Engineers
Ltd from Bangladesh. Commercial operation date is expected to start end of 2014.
The operations of Chittagong port, the main hub of country’s external trade, include
clearance of dry cargo from the port in three forms of transportation – road, rail and river
ways. However, available data suggest that the share of water transport is decreasing
compared to road transport, primarily due to lack of proper infrastructure. The share of
road transportation is increasing despite the fact that waterways are the most fuel efficient
mode of freight transport. Water transportation reduces at least 40 percent cost, compared
to roads or rail transportation; barge shipments are 10 to 15 percent less expensive than
truck or tail (SAPL RT, 2011).
According to an Asian Development Bank report, Bangladesh’s GDP can grow by more
than 1 percent and foreign trade by 20 percent, if the inland water transportation system is
made effective, efficient, competitive and free of bureaucratic influence.
Considering these issues, Summit Alliance Port Limited River Terminal (SAPLRT) is
developing a river depot project that consists of an inland container depot (located on 5.9
ha owned land at the Dholeswari River, approx. 30km south of the Central Business
8
District of Dhaka) with a handling capacity of 120,000 TEU p.a. and a storage capacity of
2,500 TEU.
The project includes the acquisition of five second-hand vessels with 100-140 TEU
capacity to operate between Chittagong and Dhaka. Second hand vessels are easier to
acquire in the short term and are available at this moment. SAPL also considers acquiring
one or two newly built vessels.
The Project will be developed, constructed and operated under the same legal entity as
the existing operations. The Danish company Seaport Innovations has been hired for
design, supervising management and other recommendations (e.g. IT, organisation). Civil
construction is being done by Beehive Engineers Ltd from Bangladesh, with whom the
Summit Group has worked before.
Commercial operation date was expected mid 2014, but is delayed. SAPL expects the
commercial date of operation in the last quarter of 2014. The project has been initiated by
SAP’s subsidiary Cemcor. SAPL decided for internal reasons to change the name of the
project owner into SAPL. All rights and obligations have been taken over by SAPL.
SAPLRT has appointed Bangladesh Centre for Advanced studies (BCAS) as a
Consultation for carrying out the Environmental and Social Impact Assessment (ESIA) of
the proposed project. In response to the request, BCAS has carried out the ESIA of the
proposed inland container river terminal project. The EIA has been carried out following
the guidelines (GoB, ECR 1997) of the Department of Environment (DoE, GoB) and
relevant safeguard policies of ADB and operational Procedures of the World Bank.
9
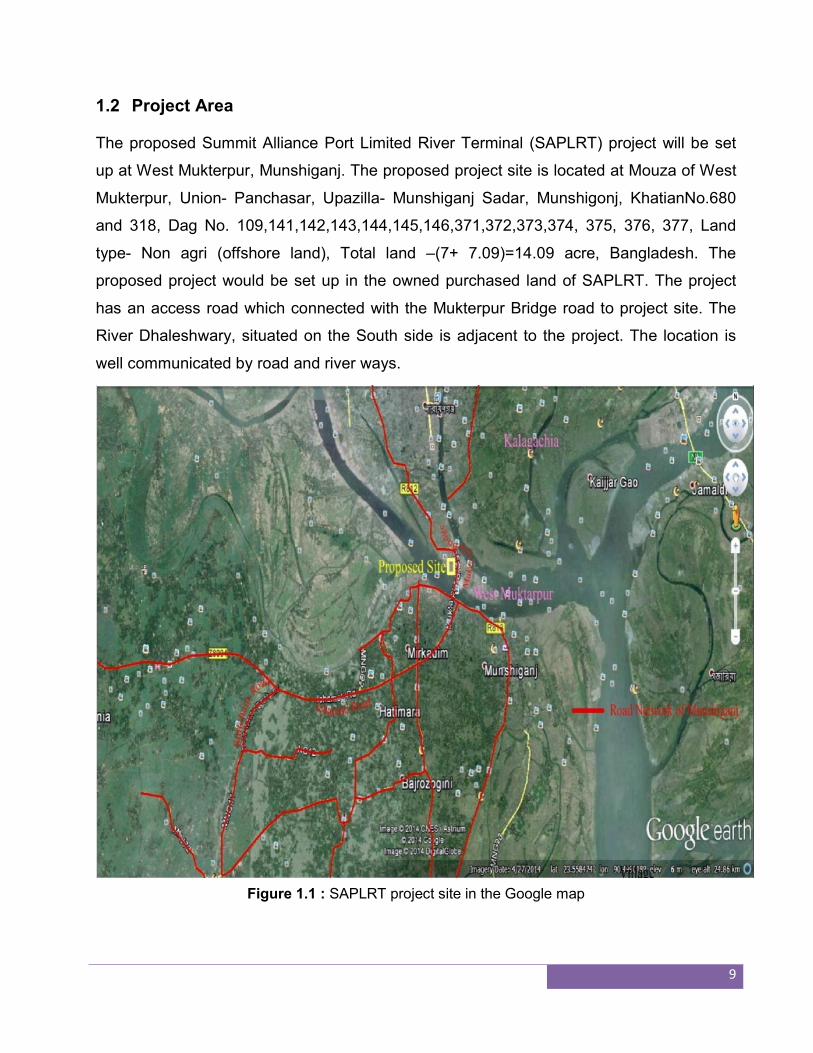
1.2 Project Area
The proposed Summit Alliance Port Limited River Terminal (SAPLRT) project will be set
up at West Mukterpur, Munshiganj. The proposed project site is located at Mouza of West
Mukterpur, Union- Panchasar, Upazilla- Munshiganj Sadar, Munshigonj, KhatianNo.680
and 318, Dag No. 109,141,142,143,144,145,146,371,372,373,374, 375, 376, 377, Land
type- Non agri (offshore land), Total land –(7+ 7.09)=14.09 acre, Bangladesh. The
proposed project would be set up in the owned purchased land of SAPLRT. The project
has an access road which connected with the Mukterpur Bridge road to project site. The
River Dhaleshwary, situated on the South side is adjacent to the project. The location is
well communicated by road and river ways.
Figure 1.1 : SAPLRT project site in the Google map
10
1.3 Extent of the Study
Bangladesh Environmental Conservation Rules (ECR, 1997) and ADB Safeguard Policy
Statement (SPS) 2009 require that the environmental and social impacts of development
projects are identified and assessed as part of the planning and design process. Based on
the magnitude of potential adverse impacts, mitigation measures are to be planned before
starting the implementation of the project. This is done through the environmental
assessment process, which has become an integral part of lending operations and project
development and implementation worldwide.
Bangladesh Centre for Advanced Studies (BCAS) will carry out detailed Environmental
and Social Impact Assessment (ESIA) to comply with DoE Guidelines as well as the ADB
Safeguard Policy Statement (SPS) 2009 for the proposed Summit Alliance Port Limited
River Terminal (SAPLRT) on BOO basis.
1.4 Project Objective
The objective is to carry out a due diligence of the SAPL’s River Depot Project by carrying
out an Environmental and Social Impact Assessment (ESIA) which will include baseline
data collection and analysis to identify the anticipated environmental and social impacts
due to the project and suggest mitigation actions that needs to be taken complying with
the DOE regulations 1997, ADB SPS 2009 and IFC Performance Standards.
A technical review on all technical data provided by SAPL relevant to the
preparation of the ESIA.
Review legal and policy frameworks applicable to the preparation of the ESIA
(Bangladesh Environmental Conservation Act 1995 and Regulations 1997IFC
performance standards, Equator Principles of FMO,ILO conventions, World Bank
Group EHS guidelines ADB SPS 2009 and IDCOL’s ESSF);
Review Compliance of the TOR provided by IDCOL
Preparation of the ESIA document
11
Obtaining of the Environmental Clearance from the Department of Environment;
Obtaining the acceptance of the ESIA report by IDCOL
1. 5 SCOPE OF WORK
The description of the environment and social baseline conditions are made
encompassing all relevant current baseline data on the environmental and social
characteristics of the study area including physical, biological, ecological and social
environments. In the backdrop of the above scenarios, the relevant regulations and
standards governing environmental quality, health and safety, protection of sensitive
areas, protection of endangered species, land use control, land acquisition, compensation,
etc. at every level are described.
In action to the above, an analysis was conducted of reasonable alternatives in meeting
the ultimate objects of the project including the ‘no action’ alternative, site alternatives and
alternative means of meeting the energy requirements.
Viewed against these, all significant impacts were identified and evaluated including
atmospheric emissions and changes in ambient air quality, discharge of effluent and
ambient water quality impacts, changes in ambient noise and local land use patterns,
impacts of the project and its activates on the community’s access to social infrastructure
(e .g. potable water, health centers, school, irrigation and extension services), and local
developments.
A socio-economic study was undertaken through sample survey within 1 km radius of the
project to assess the demographic distribution, household income and expenditure and
type of employment etc. of the local community.
One of the major aspects covered in the ESIA is the stakeholder’s consultation. These
consultations were through Focused Group Discussion (FGD) with various groups
including women, KII wit key stakeholders. At the draft stage of the ESIA a general
12
consultation meeting was held to discuss the various findings and get their opinion on the
findings and incorporate their concerns in the ESIA.
Following identification of potential impacts mitigation measures has been suggested
including an Environmental, Safety and Social Management Plan (ESSMP) to mitigate
negative impacts has been developed, including a detailed Environmental and Social
Management Plan with feasible and cost-effective measures to prevent or reduce
significant negative impacts to an acceptable level, and containing detailed implementation
plans, monitoring indicators and clear allocation of responsibility among project sponsors
construction contractors, government agencies, and community-based organization. In
addition, Grievance Redress Mechanism (GRM), Disaster Management Plan and impact
of climate change on the project has been included.
1.6 Methodology
Based on the above Scope of Work, the study built upon the baseline survey carried out
by BCAS as Environment and Social Consultant for the Environmental and Social Impact
Assessment (ESIA) during August- September 2014. The ESIA exercise resulted in a
stand-alone report together with a schedule devised by and as per the requirement of DoE
and IDCOL.
This ESIA have been carried out primary data generated during the period from August-
September 2014 by BCAS. Secondary data was obtained from various sources and field
visits. Several field visits had been undertaken to the project location with a view to collect
the baseline data and public consultations, the following steps were followed and
biodiversity including:
Understanding the technical aspects of the proposed River Terminal Container Depot
through secondary literature and consultations
Collection and confirmation of environmental baseline data on air, water, noise flora
and fauna.
13
Identification of potential environmental impacts and evaluating the consequences
through using a checklist method;
Identification of impacts was undertaken using Checklist Matrix and Issues forecasting
tabular methods and modeling if required;
Review of the adequacy and efficiency of proposed mitigation measures for the
proposed SAPLRT project through public consultations;
For the socio-economic study primary data collection from 30% of the total households
within 1 km radius of the project area included in the baseline study carried out by
BCAS. The criterion for choosing 30% of households within 1 km radius of the project
site is based on the expected results of getting a profile of the area. Additionally, since
the area is in a mixed commercial cum rural zone the number of household and
business institutions are numerous in numbers therefore the survey target group was a
mix of rural and commercial households. A number of Focus Group Discussions
(FGDs) with the different categories of stakeholders were held including women;
Formulation of a monitoring plan for both environmental and social issues. This will
be done through primary data collection with emphasis on the tenure of the settlement
and the state of the displaced persons livelihood;
Detailed survey work was undertaken throughout the impact zone (1km radius) of the
project air-shed to inform the preparation of the land use map. During the mapping
exercise, in-depth consultations with local stakeholders were carried out to aide accurate
identification of suitable plots. Use of maps and also utilization of the historic maps was
undertaken for identifying the plots and ground level. Field verification was undertaken
by the team leader after the field data collection. Updated GIS version was applied to
finalize the land use map; and
This ESIA report has been prepared with the following documents:
Asian Development Bank (ADB), Safeguard Policy Statement, June 2009;
14
Department of Environment (DoE), Ministry of Environment and Forest,
Government of the People’s Republic of Bangladesh, EIA Guidelines for Mix zone
Industrial and residential, June 1997.
EHS guidelines for River Terminal Container Depot of IFC.
1.7 Limitation of the Study
The initial baseline were data collected for inclusion in the ESIA study which has been
conducted within a limited time frame due to the requirement of the project to go into
commercial operation within the month of October, 2014. Additionally, the inclusion of
more stakeholders’ consultations could have enriched the ESIA. However, the ESIA has
been prepared with an emphasis to cover all important environmental and social impacts
and formulate pragmatic recommendations for mitigating any adverse environmental
impacts.
1.8 The EIA Team
The ESIA team comprises of the following:
1. Dr. Moinul Islam Sharif, EIA Expert Team Leader
2. Dr. M. Eusuf, Air Dispersion Modeling Expert Member
3. Khandaker Mainuddin, Economist Member
4. Mr. Osman Goni Shawkat, Sociologist Project Coordinator
5. Mr. Shaker Ali, Noise Modeling Expert Member
6. Mr. Bakul Mia, GIS and Mapping Expert Member
7. Mr. Moniruzzaman, Field Surveyor Member
8. Mr. ZH Khan, Field Surveyor Member
9. Mr. Sohel, Data Analyst and SPSS expert Member
10. Ms. Dil Meher Banu, DTP Incharge Member
15
1.9 Acknowledgement
In preparing the ESIA, various stakeholders were consulted. It comprises a number of
government agencies, West Mukterpur Union Parisad, NGOs, Financing Organizations,
Bangladesh Inland Water Transport Authority(BIWTA), Bangladesh Water Transport
Corporation(BIWTC), Bangladesh Meteorological Department (BMD), Soil Resource
Development Institute (SRDI), Bangladesh Bureau of Statistics (BBS), Bangladesh Water
Development Board (BWDB), Department of Environment (DOE), Munshigonj and Dhaka,
West Mukterpur Govt. Primary School, Department of Agriculture Extension (DAE),
Department of Roads and Highways, Fire Service and Civil Defense Office, and
Munshigonj Fisheries Officer etc. The ESIA team is grateful to these stakeholders for their
contribution to enrich the ESIA report and present the accurate the data in the concern
section of the report.
16
Chapter 2
POLICY, LEGAL AND ADMINISTRATIVE FRAMEWORK
Regulatory requirements in relation to the protection and conservation of the environment
and various environmental resources, as well as the protection of the social environment
from adverse impacts associated with project activities have been set out by the
Government of Bangladesh (GoB) as well as the Asian Development Bank (ADB). These
requirements are summarized below.
2.1 Bangladesh Environmental Policy, Regulations, and Guidelines
2.2 National Environmental Policy, 1992
The Bangladesh National Environmental Policy, approved in May 1992, sets out the basic
framework for environmental action together with a set of broad sectoral action guidelines.
Key elements of the Policy are:
Maintaining ecological balance and ensuring sustainable development of the country
through protection and conservation of the environment;
Protecting the country from natural disasters;
Identifying and regulating all activities that pollute and destroy the environment;
Ensuring environment-friendly development in all sectors;
Ensuring sustainable and environmentally sound management of the natural
resources; and
Maintaining active association, as far as possible, with all international initiatives
related to environment.
The Policy, inter alia, seeks to ensure that transport systems, including roads and inland
waterways, do not pollute the environment or degrade resources. The Policy states that an
Environmental and Social Impact Assessment (ESIA) should be conducted before projects
commence.
17
2.3 National Environment Management Action Plan (NEMAP), 1995
The National Environmental Management Action Plan (NEMAP) is a wide-ranging and
multi-faceted plan, which builds on and extends the statements set out in the National
Environmental Policy. NEMAP was developed to address issues and management
requirements during the period 1995 to 2005, and sets out the framework through which
various decisions, plans, legislative measures, rules and regulations toward safeguarding
the environment and natural resources including those of biological diversities are to be
implemented. NEMAP was developed based on the following broad objectives:
Identification of key environmental issues affecting Bangladesh;
Identification of actions necessary to halt or reduce the rate of environmental
degradation;
Improvement of the natural environment;
Conservation of habitats and bio-diversity;
Promotion of sustainable development; and
Improvement of the quality of life of the people.
To this end, it has grouped all the relevant necessary actions under four headings:
institutional, sectoral, location-specific and long-term issues. The institutional aspects reflect
the need for inter-sectoral cooperation to tackle environmental problems that need new and
appropriate institutional mechanisms at national and local levels. The sectoral aspects
reflect the way the Ministries and agencies are organized and make it easier to identify the
agency to carry out the recommended actions. The location-specific aspect focuses on
particularly acute environmental problems at local levels that need to be addressed on a
priority basis. The long-term issues include environmental degradation of such degree that it
might become more serious and threatening than they seem to be if their cognizance is not
immediately taken.
According to the NEMAP, the GoB environmental policy makes specific statements on
energy and fuel, including the aim to “Reduce and discourage the use of those fuels that
pollute the environment and encourage the use of fuels that are environmentally sound
and less harmful.”
18
2.4 The Environment Conservation Act, 1995 (subsequent amendments in
2000 and 2002)
The provisions of the Act authorize the Director General (DG) of Department of
Environment to undertake any activity he deems fit and necessary to conserve and
enhance the quality of environment and to control, prevent and mitigate pollution. The
main highlights of the act are:
Declaration of Ecologically Critical Areas;
Obtaining Environmental Clearance Certificate;
Regulation with respect to vehicles emitting smoke harmful for the environment;
Regulation of development activities from an environmental perspective;
Promulgation of standards for quality of air, water, noise, and soils for different
areas and for different purposes;
Promulgation of acceptable limits for discharging and emitting waste; and
Formulation of environmental guidelines relating to control and mitigation of
environmental pollution, conservation and improvement of environment.
2.5 Environment Conservation Rules, 1997 (subsequent amendments in 2002
and 2003)
The Environment Conservation Rules, 1997 are the first set of rules promulgated under
the Environment Conservation Act, 1995. These Rules provide for, inter alia, the following:
The national Environmental Quality Standards (EQS) for ambient air, surface water,
groundwater, drinking water, industrial effluents, emissions, noise and vehicular
exhaust;
Categorization of industries, development projects and other activities on the basis
of actual (for existing industries/development projects/activities) and anticipated (for
proposed industries/development projects/activities) pollution load;
Procedure for obtaining environmental clearance;
Requirement for undertaking IEE and EIA as well as formulating EMP according to
categories of industries/development projects/activities; and
19
Procedure for damage-claim by persons affected or likely to be affected due to
polluting activities or activities causing hindrance to normal civic life.
Depending upon location, size and severity of pollution loads, projects/activities have been
classified in the Environmental Conservation Rules (ECRs) into four categories:
1. Green
2. Orange A
3. Orange B
4. Red
The corresponding category related to container port and associated infrastructure (e.g.
the construction of a container depot and an access road) is included under:
Schedule-1, Red Category:
Item 6: Container Depot; and Item 64: includes construction.
The Rules also incorporate “inclusion lists” of projects requiring varying degrees of
environmental investigation e.g. all new projects under the ‘red’ category generally will
require a two-step assessment procedure. Firstly, an Initial Environmental Examination
(IEE) will be required for site clearance, and secondly, if warranted, a full Environmental
and Social Impact Assessment (ESIA) for technical clearance. This IEE has been carried
out following the TOR provided by SAPL and also on the basis of the Terms of Reference
(ToR) for the ESIA (in Annex 12) , which were approved by DoE, in accordance with the
requirements of the ECRs, toward obtaining an ‘Environmental Clearance Certificate’ for
the proposed project.
2.6 The ESIA Guidelines for Industry, 1997
The ESIA Guidelines is a handbook comprising procedures for preparing an ESIA and for
reviewing an ESIA for the benefit of the development partners, ESIA Consultants,
reviewers, and academics. While preparing these guidelines, the present environmental
status as well as the need for rapid economic development of Bangladesh has been
considered. These considerations have essentially resulted in simpler procedures to be
followed for preparing and/or reviewing an EIA.
20
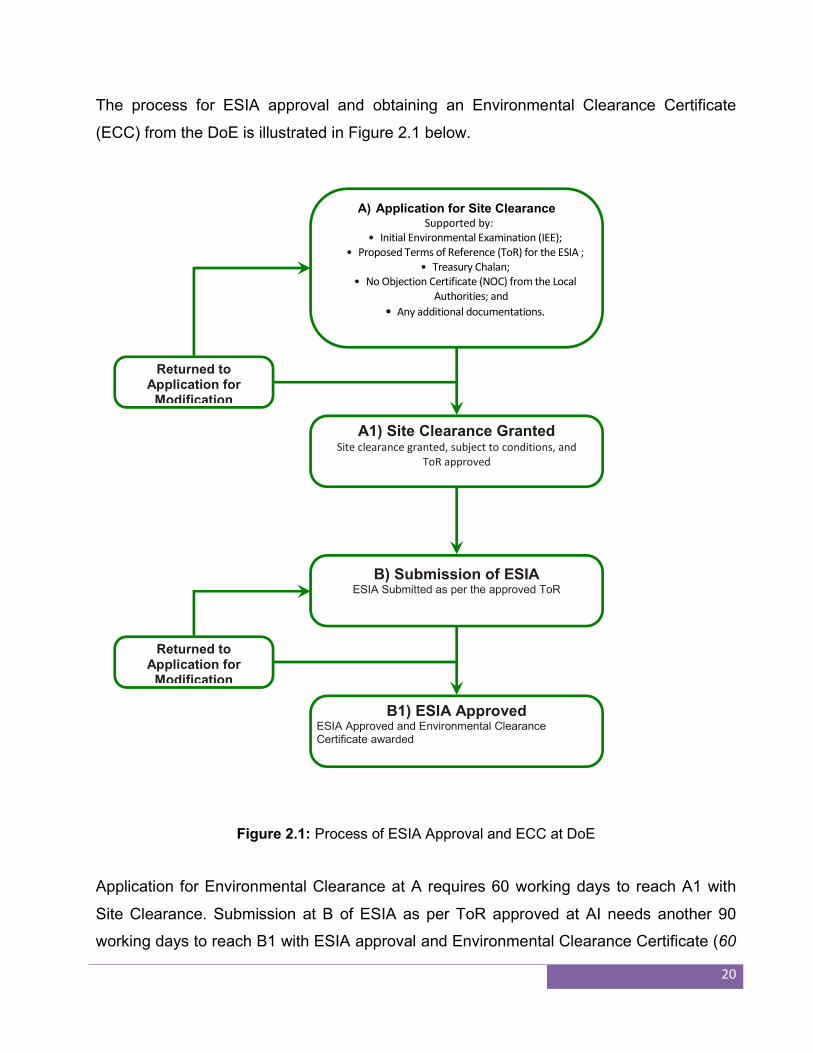
The process for ESIA approval and obtaining an Environmental Clearance Certificate
(ECC) from the DoE is illustrated in Figure 2.1 below.
Figure 2.1: Process of ESIA Approval and ECC at DoE
Application for Environmental Clearance at A requires 60 working days to reach A1 with
Site Clearance. Submission at B of ESIA as per ToR approved at AI needs another 90
working days to reach B1 with ESIA approval and Environmental Clearance Certificate (60
A) Application for Site Clearance Supported by:
• Initial Environmental Examination (IEE); • Proposed Terms of Reference (ToR) for the ESIA ;
• Treasury Chalan; • No Objection Certificate (NOC) from the Local
Authorities; and
• Any additional documentations.
A1) Site Clearance Granted Site clearance granted, subject to conditions, and
ToR approved
Returned to Application for
Modification
B) Submission of ESIA ESIA Submitted as per the approved ToR
B1) ESIA Approved ESIA Approved and Environmental Clearance Certificate awarded
Returned to Application for
Modification
21
working days for ESIA approval and 30 working days for ECC after the applicant/project
sponsor completes the formalities as specified in the ESIA approval letter and reports to
DoE). ECC issued through such a process remains valid for 1 (one) year, after which
renewal is necessary. During stages between A and A1 and between B and B1,
observations are made and the applicant may be asked for modification of his/her
information/data/reports submitted to DoE for necessary clearance.
2.7 Environmental and Social Requirements of the Asian Development Bank
The Asian Development Bank (ADB) Safeguard Policy Statement (‘the SPS’) 2009 sets
out the requirements for ADB’s operations to undertake an environmental assessment for
projects funded by the bank. The goal of the SPS is to promote the sustainability of project
outcomes through protecting the environment and people from potential adverse impacts.
The overall objectives of the SPS are to:
avoid adverse impacts of projects on the environment and affected people, where
possible;
minimize, mitigate, and/or compensate for adverse project impacts on the environment
and affected people when avoidance is impossible; and
help borrowers/clients strengthen their safeguard systems and develop the capacity to
manage environmental and social risks.
The SPS sets out the ADB policy objectives, scope and triggers, and principles for
following three key safeguard areas:
Environmental Safeguards;
Involuntary Resettlement Safeguards along with those vis-à-vis Land Acquisition; and
Indigenous Peoples Safeguards.
ADB implements the SPS through the safeguard review procedures as outlined in Section
F1/OP of its Operation Manual (OM) and the documents cited therein. However, the third
area of the above three areas is beyond the scope of IEE consideration for this particular
project (SAPLRT) as the project area does not involve any indigenous peoples1.
1 As defined by the Asian Development Bank policy on Indigenous Peoples, April 1998.
22
According to ADB Operation Manual activated since 2010, a proposed project is assigned
to one of the following categories depending on the significance of the potential
environmental impacts and risks:
Category A – a proposed project is classified as category A if it is likely to have significant
adverse environmental impacts that are irreversible, diverse, or unprecedented. These
impacts may affect an area larger than the sites or facilities subject to physical works. An
environmental and Social Impact Assessment (ESIA), including an Environmental
Management Plan (EMP), is required.
Category B – a proposed project is classified as category B if its potential adverse
environmental impacts are less adverse than those of category A projects. These impacts
are site-specific, few if any of them are irreversible, and in most cases mitigation measures
can be designed more readily than for category A projects. An initial environmental
examination (IEE), including an EMP, is required.
Category C – a proposed project is classified as category C if it is likely to have minimal or
no adverse environmental impacts. An ESIA or IEE is not required, although
environmental implications need to be reviewed.
Category FI – a proposed project is classified as category FI if it involves the investment of
ADB funds to, or through, a financial intermediary (refer to paragraphs 53–58, Safeguard
Review Procedures, Operational Procedures, ADB Operations Manual).
A project’s environment category is determined by the category of its most environmentally
sensitive component, including direct, indirect, induced, and cumulative impacts. Each
proposed project is scrutinized as to its type, location, scale, sensitivity and the magnitude
of its potential environmental impacts. The level of detail and comprehensiveness of the
ESIA or IEE are commensurate with the significance of the potential impacts and risks.
The proposed Summit Alliance Port Limited River Terminal (SAPLRT) project falls under
Category B according to ADB environmental categorization of projects, as the potential
exists for significant adverse environmental impacts but there are no irreversible impacts
and environmental and social impacts of the proposed project can be mitigated which is
23
not the case in Category A projects. Therefore, for the proposed project an Initial
Environmental Examination (IEE) including an EMP will be required.
The IEE must include an Environmental Management Plan (EMP) that outlines specific
mitigation measures, environmental monitoring requirements, and related institutional
arrangements, including budget requirements. Loan agreements include specific
environmental covenants that describe environmental requirements, including the EMP. The
provisions for the EMP must also be fully reflected in the project administration
memorandums. To ensure proper and timely implementation of the EMP and adherence to
the agreed environmental covenants,
With regards socio-economic impacts, ADB screens all projects to determine whether or
not they involve Involuntary Resettlement or have potential impacts on Indigenous
Peoples. A project’s involuntary resettlement category is determined by the category of its
most sensitive component in terms of involuntary resettlement impacts. The Involuntary
Resettlement Impacts of an ADB-supported project are considered significant if “...200 or
more persons experience major impacts, which are defined as (i) being physically
displaced from housing, or (ii) losing 10% or more of their productive assets (income
generating).” The level of detail and comprehensiveness of the Resettlement Action Plan
(RAP) are commensurate with the significance of the potential impacts and risks. A
proposed project is assigned to one of the following categories depending on the
significance of the probable involuntary resettlement impacts:
24
Chapter 3
DESCRIPTION OF THE PROPOSED PROJECT
3.1 Project
SAPL is developing a river depot project that consists of an inland container depot located
on 14.5 acre owned land at the Dholeswari River, approx. 30km south of Dhaka) with a
handling capacity of 120,000 TEUs p.a. and a storage capacity of 2,500 TEUs. The project
includes the acquisition of five second-hand and/or new vessels with 100-140 TEU
capacity to operate between Chittagong and Dhaka. The Danish company Seaport
Innovations has been hired for design, supervising management and other
recommendations (e.g. IT, organization). Civil construction is done by Beehive Engineers
Ltd from Bangladesh. Commercial operation date is expected to start mid 2014.
FMO and IDCOL are considering providing senior loans of resp. USD 20.51 million and
USD 10 million to be used for the realization of the Project. FMO and IDCOL and
commissioned Royal Haskoning DHV to provide a technical review, an environmental and
social review, a market review and certifying milestones during construction and review
disbursement requests.
The objective is to carry out a due diligence of the SAPL’s River Depot Project by
reviewing and verifying the project, identifying compliance gaps, mitigation and follow-up
actions and outlining a managing/monitoring regime.
3.1.2 Type and Category of the Project
The Summit Alliance Port Limited River Terminal Authority has intended to establish a
container depot on the bank of Dalesswari River and obtained Environmental Site Clearance
Certificate from Department of Environment (DoE) Vide Letter No.
30.59.56.4.24.240713/admin/clearance-07; Date 26.11.2013 and the approval from
Bangladesh Inland Water Transport Authority (BIWTA) vide letter No.18. 765. 045 .00.
00.062. 2010/admin/clearance/630; Date: 11.02.2014.
According to ADB SPS, 2009 and ADB Environmental Assessment Guidelines 2003, the
project will fall under Category–B and according to Department of Environment (DoE),
25
Bangladesh the project will fall under Category A (Red) which requires an ESIA including an
EMP.
There are no particularly sensitive ecological, cultural and archeological sites in the area. The
terminal port will not involve any relocation of human settlement, as the project is situated on
the purchased vacant land of private individuals based on willing sellers and buyer
negotiations without any undue influence from the buyer. The area enjoys necessary
infrastructure facilities, which include transport, electricity, telecommunication etc. For all
construction activities for the port, the provisions of Bangladesh National Building Code
(BNBC) have been followed that include structural designs and seismicity tolerance. All the
relevant social and environmental risks and potential impacts have been taken due care of as
part of the assessment in compliance of the Performance Standards and Safeguard Policy
Statement (SPS) set by the World Bank and ADB besides following the guidelines set forth
by DoE, Bangladesh
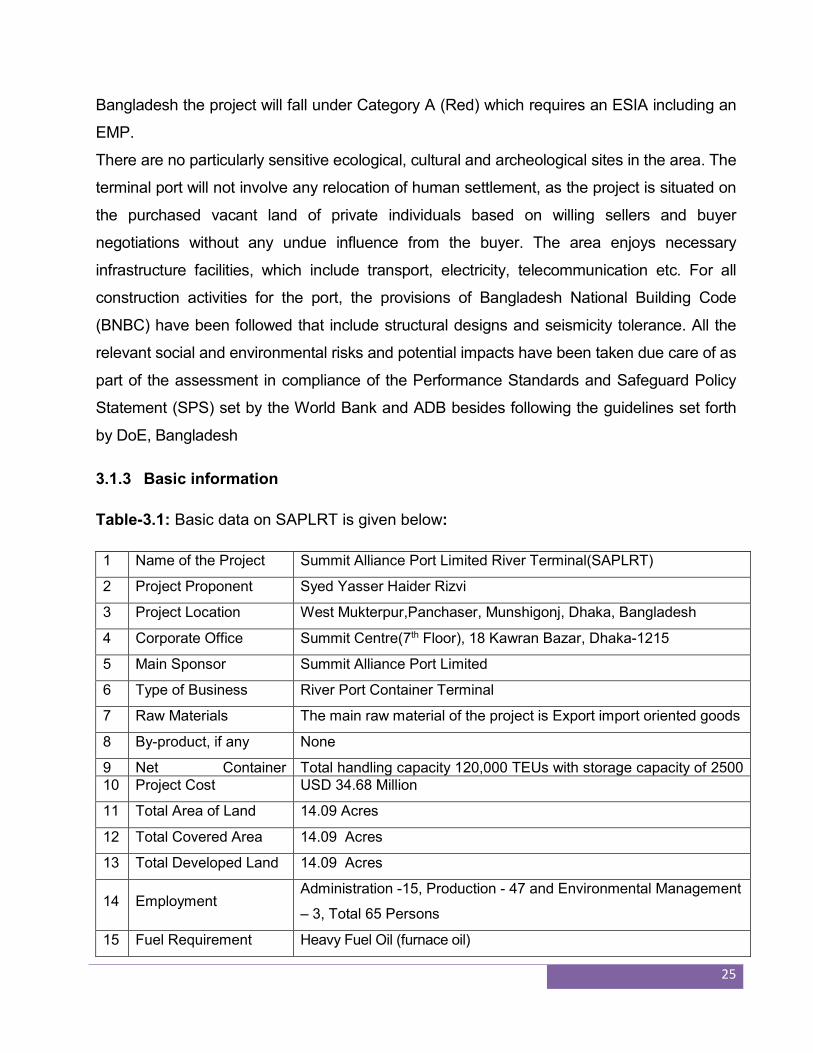
3.1.3 Basic information
Table-3.1: Basic data on SAPLRT is given below:
1 Name of the Project Summit Alliance Port Limited River Terminal(SAPLRT)
2 Project Proponent Syed Yasser Haider Rizvi
3 Project Location West Mukterpur,Panchaser, Munshigonj, Dhaka, Bangladesh
4 Corporate Office Summit Centre(7th Floor), 18 Kawran Bazar, Dhaka-1215
5 Main Sponsor Summit Alliance Port Limited
6 Type of Business River Port Container Terminal
7 Raw Materials The main raw material of the project is Export import oriented goods
8 By-product, if any None
9 Net Container Total handling capacity 120,000 TEUs with storage capacity of 2500 10 Project Cost USD 34.68 Million
11 Total Area of Land 14.09 Acres
12 Total Covered Area 14.09 Acres
13 Total Developed Land 14.09 Acres
14 Employment Administration -15, Production - 47 and Environmental Management
– 3, Total 65 Persons
15 Fuel Requirement Heavy Fuel Oil (furnace oil)
26
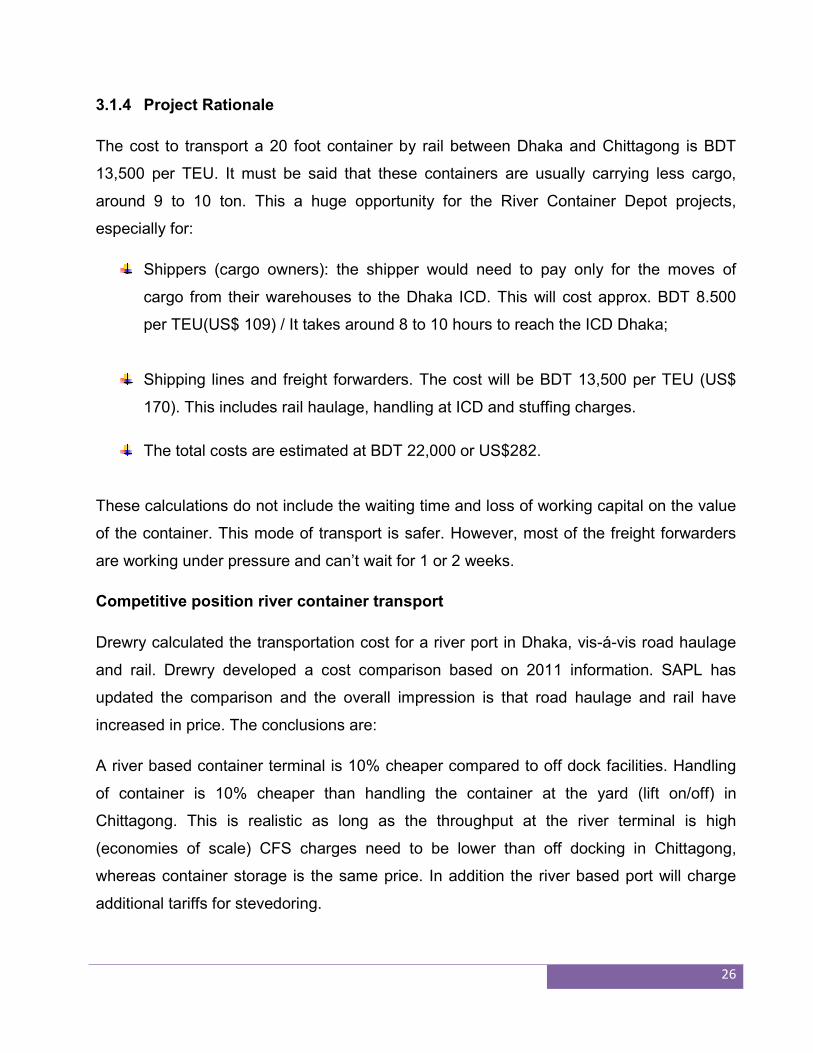
3.1.4 Project Rationale
The cost to transport a 20 foot container by rail between Dhaka and Chittagong is BDT
13,500 per TEU. It must be said that these containers are usually carrying less cargo,
around 9 to 10 ton. This a huge opportunity for the River Container Depot projects,
especially for:
Shippers (cargo owners): the shipper would need to pay only for the moves of
cargo from their warehouses to the Dhaka ICD. This will cost approx. BDT 8.500
per TEU(US$ 109) / It takes around 8 to 10 hours to reach the ICD Dhaka;
Shipping lines and freight forwarders. The cost will be BDT 13,500 per TEU (US$
170). This includes rail haulage, handling at ICD and stuffing charges.
The total costs are estimated at BDT 22,000 or US$282.
These calculations do not include the waiting time and loss of working capital on the value
of the container. This mode of transport is safer. However, most of the freight forwarders
are working under pressure and can’t wait for 1 or 2 weeks.
Competitive position river container transport
Drewry calculated the transportation cost for a river port in Dhaka, vis-á-vis road haulage
and rail. Drewry developed a cost comparison based on 2011 information. SAPL has
updated the comparison and the overall impression is that road haulage and rail have
increased in price. The conclusions are:
A river based container terminal is 10% cheaper compared to off dock facilities. Handling
of container is 10% cheaper than handling the container at the yard (lift on/off) in
Chittagong. This is realistic as long as the throughput at the river terminal is high
(economies of scale) CFS charges need to be lower than off docking in Chittagong,
whereas container storage is the same price. In addition the river based port will charge
additional tariffs for stevedoring.
27
Current Freight charge by waterway from Dhaka to Chittagong port (single trip) are
estimated at TEU 150 US dollar Single trip) and 300 US dollar (Round trip). Source:
Station Manger, Pangaon Inland Container Terminal (ICT)
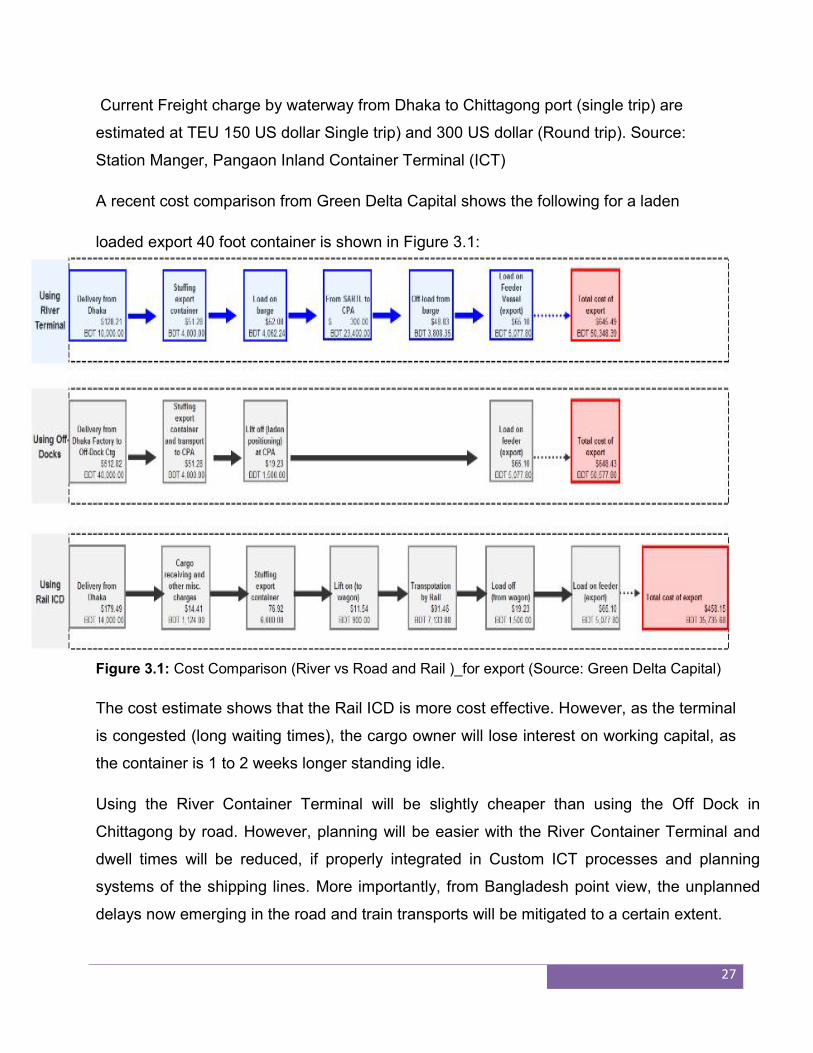
A recent cost comparison from Green Delta Capital shows the following for a laden
loaded export 40 foot container is shown in Figure 3.1:
Figure 3.1: Cost Comparison (River vs Road and Rail )_for export (Source: Green Delta Capital)
The cost estimate shows that the Rail ICD is more cost effective. However, as the terminal
is congested (long waiting times), the cargo owner will lose interest on working capital, as
the container is 1 to 2 weeks longer standing idle.
Using the River Container Terminal will be slightly cheaper than using the Off Dock in
Chittagong by road. However, planning will be easier with the River Container Terminal and
dwell times will be reduced, if properly integrated in Custom ICT processes and planning
systems of the shipping lines. More importantly, from Bangladesh point view, the unplanned
delays now emerging in the road and train transports will be mitigated to a certain extent.
28
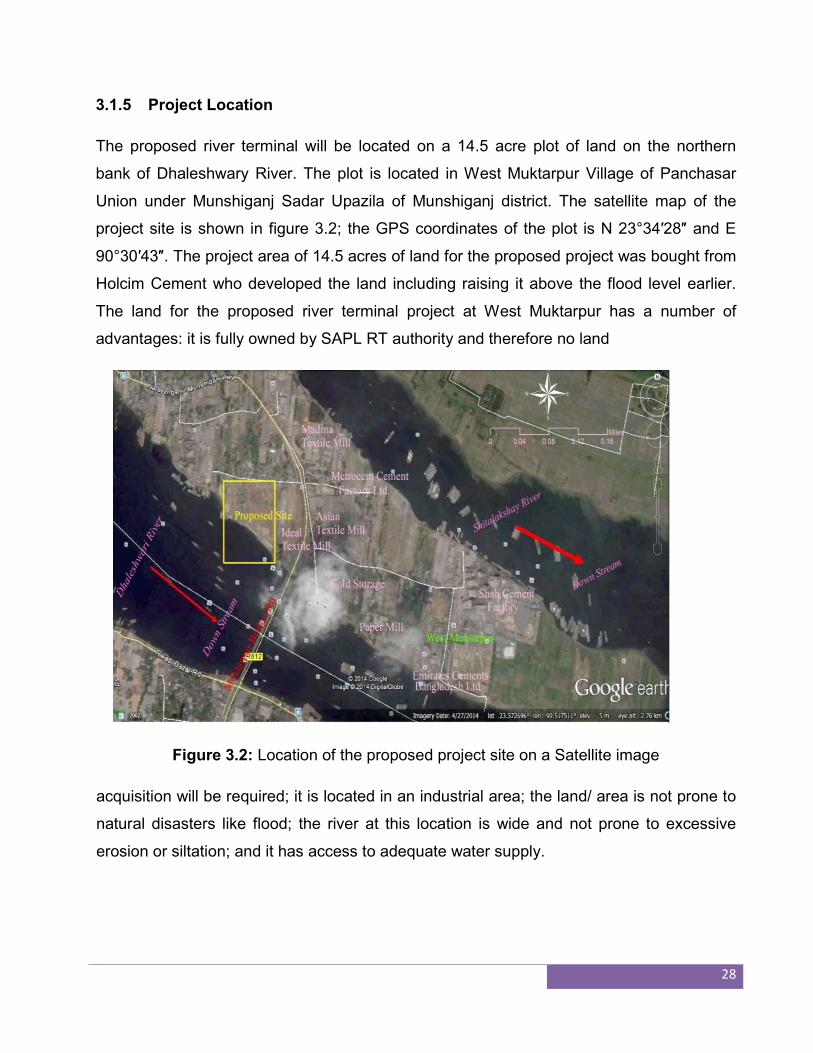
3.1.5 Project Location
The proposed river terminal will be located on a 14.5 acre plot of land on the northern
bank of Dhaleshwary River. The plot is located in West Muktarpur Village of Panchasar
Union under Munshiganj Sadar Upazila of Munshiganj district. The satellite map of the
project site is shown in figure 3.2; the GPS coordinates of the plot is N 23°34′28″ and E
90°30′43″. The project area of 14.5 acres of land for the proposed project was bought from
Holcim Cement who developed the land including raising it above the flood level earlier.
The land for the proposed river terminal project at West Muktarpur has a number of
advantages: it is fully owned by SAPL RT authority and therefore no land
Figure 3.2: Location of the proposed project site on a Satellite image
acquisition will be required; it is located in an industrial area; the land/ area is not prone to
natural disasters like flood; the river at this location is wide and not prone to excessive
erosion or siltation; and it has access to adequate water supply.
29
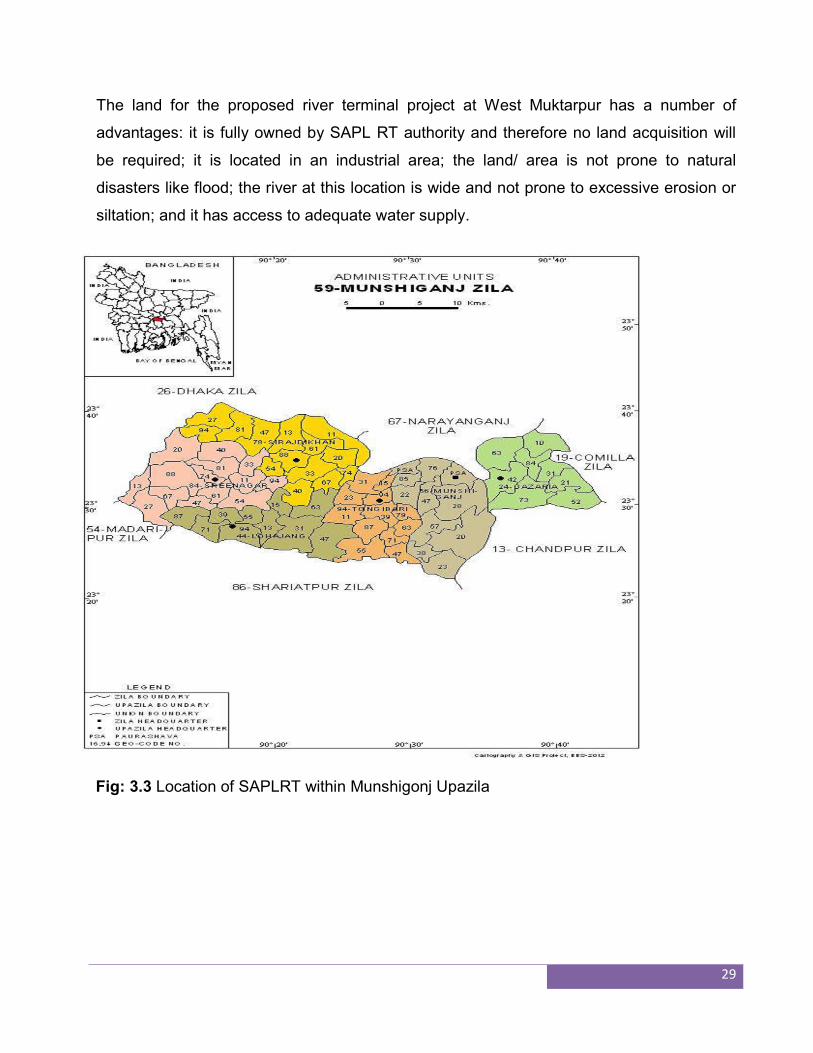
The land for the proposed river terminal project at West Muktarpur has a number of
advantages: it is fully owned by SAPL RT authority and therefore no land acquisition will
be required; it is located in an industrial area; the land/ area is not prone to natural
disasters like flood; the river at this location is wide and not prone to excessive erosion or
siltation; and it has access to adequate water supply.
Fig: 3.3 Location of SAPLRT within Munshigonj Upazila
30
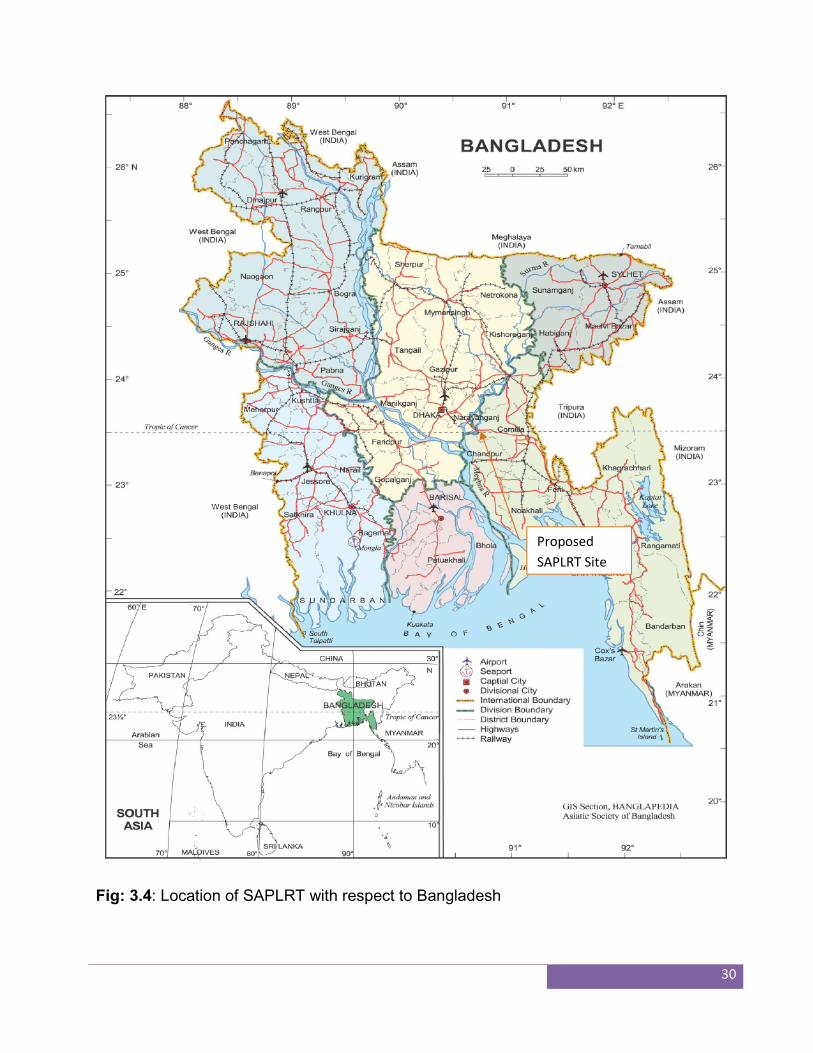
Fig: 3.4: Location of SAPLRT with respect to Bangladesh
Proposed
SAPLRT Site
31
3.1.6 Surrounding of the project:
1. East side : Mukterpur Bridge, Potato cold storage, riverside road, Muterpur police
station and Emirate cement factory, Holsim cement factory
2. South side : Daleswary river, opposite to the riverside is Munshigonj town, auto rice
mills and brickfield
3. North side : Ideal industries limited, open space, Mukterpur bridge, Akij Match
Factory, Shah Cement factory and Garments, Sitalkkha River,
Basundhara Cement factory
4. West Side : Settlement, Crown cement factory, potato processing industry,
Toll Plaza of Mukterpur bridge, Ship Dockyard
In addition to these, different types of industries are present in this area and new industries
are being set up. Among major industries, six cement factories, two textiles mills, two
chemical factories, one match factory, four cold storages, and one paper mill have been
identified. The major industries in the area include Asian Group of Industries (Asian Textile
Mills; Ideal Textile Mills, Dewan Ice and Cold storage, Tongibari Cold Storage, Ali Cold
Storage, Nishan Cold storage, Aman food industries (under construction), Shah Cement
Factory, Emirates Cement Bangladesh Ltd., Metrocem Cement, Active Hime Chemical
Industry, Akij Match Factory, and Madina Dying and Fabrics Ltd. BCAS team are working
in the project site is shown under the following photos.
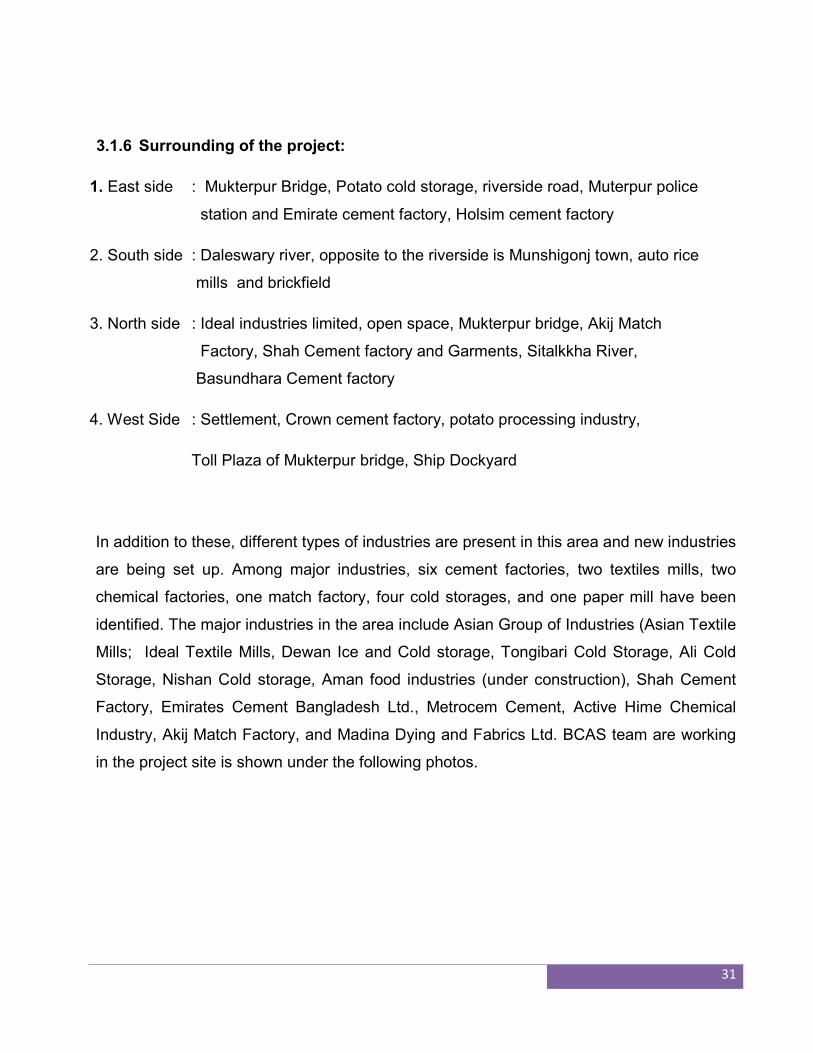
32
Photo 3.1 A: BCAS team working in the project site Photo 3.1 B: Partial View of the port terminal
3.2 Project Layout
3.2.1 Pilled Structure
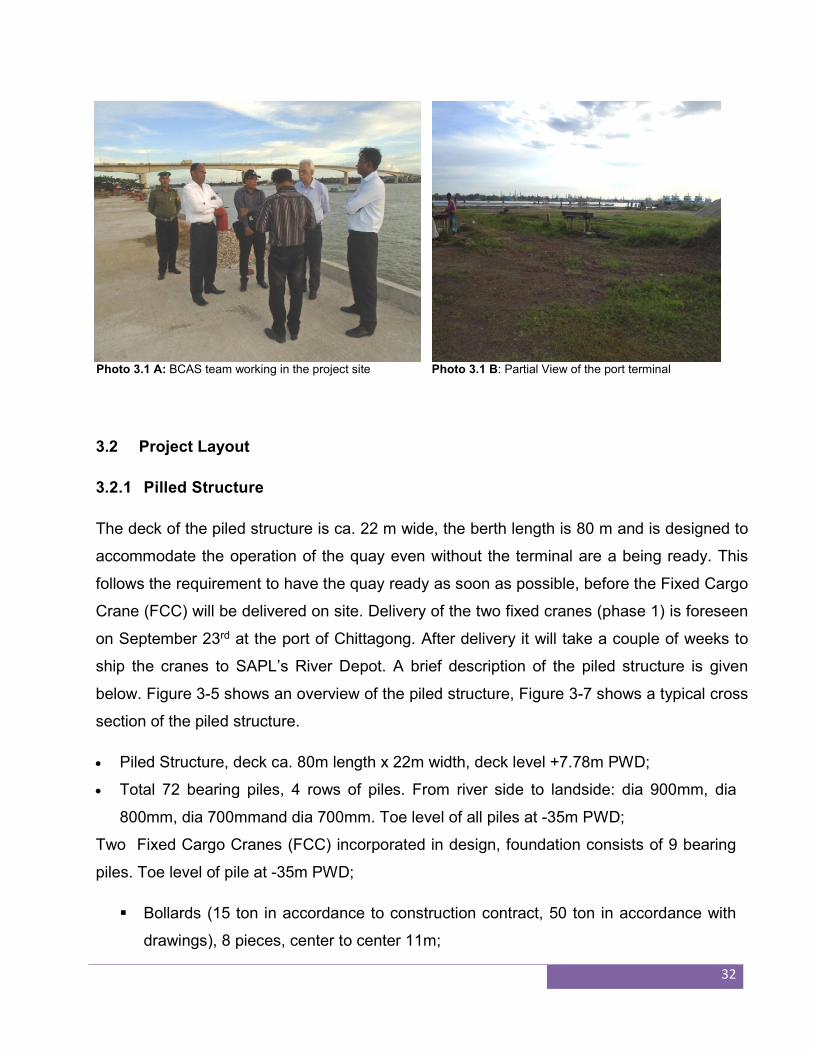
The deck of the piled structure is ca. 22 m wide, the berth length is 80 m and is designed to
accommodate the operation of the quay even without the terminal are a being ready. This
follows the requirement to have the quay ready as soon as possible, before the Fixed Cargo
Crane (FCC) will be delivered on site. Delivery of the two fixed cranes (phase 1) is foreseen
on September 23rd at the port of Chittagong. After delivery it will take a couple of weeks to
ship the cranes to SAPL’s River Depot. A brief description of the piled structure is given
below. Figure 3-5 shows an overview of the piled structure, Figure 3-7 shows a typical cross
section of the piled structure.
Piled Structure, deck ca. 80m length x 22m width, deck level +7.78m PWD;
Total 72 bearing piles, 4 rows of piles. From river side to landside: dia 900mm, dia
800mm, dia 700mmand dia 700mm. Toe level of all piles at -35m PWD;
Two Fixed Cargo Cranes (FCC) incorporated in design, foundation consists of 9 bearing
piles. Toe level of pile at -35m PWD;
Bollards (15 ton in accordance to construction contract, 50 ton in accordance with
drawings), 8 pieces, center to center 11m;
33
Rubber fender SA 400H with separate horizontal fender system in front of the piled
deck structure (steel frame of ‘H’ piles with wooden fender);
At the rear side (land side) a retaining wall with run-on slab. Wall consists of
reinforced concrete with horizontal PVC pipes to avoid large water pressures;
There is no scour protection foreseen on the slope under the deck/piled structure. If
in the future a lot of erosion occurs, the slope may need to be protected.
Fig. 3.5: Layout of piled structure and embankment (source: master plan layout 27-03-13
In Dhaleshwary river Channel & Buriganga (upstream ), there is no history of bank erosion
/ scour (under water) nor even significant as consulted from the final Design Report for
inland container River Terminal, Pangaon. Dhaka in September 1995. There is a
possibility of local scouring due to propellers revolution during vessels berthing and un-
berthing as well as waves from the playing vessels in the channel. Hence, in order to
make the slope beneath the Deck Stable, after dredging of riverbed along the fender line
up to – 5.0m PWD providing draft depth for the calling, vessel appropriate measures will
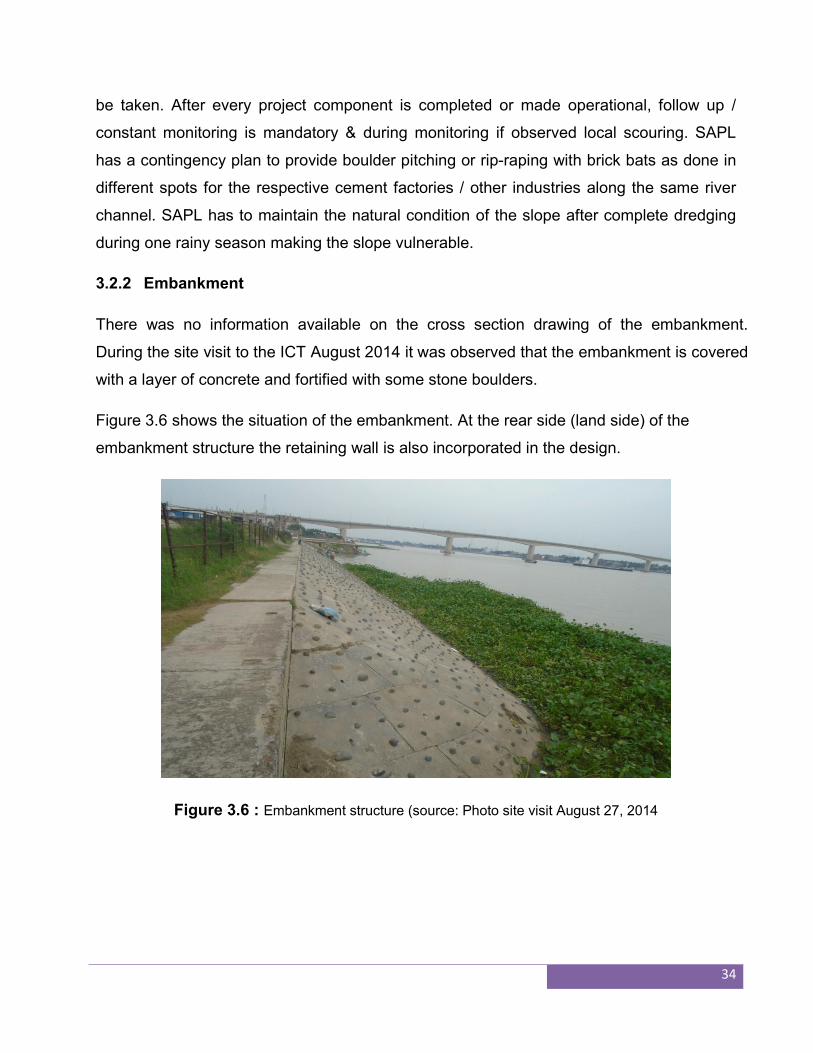
34
be taken. After every project component is completed or made operational, follow up /
constant monitoring is mandatory & during monitoring if observed local scouring. SAPL
has a contingency plan to provide boulder pitching or rip-raping with brick bats as done in
different spots for the respective cement factories / other industries along the same river
channel. SAPL has to maintain the natural condition of the slope after complete dredging
during one rainy season making the slope vulnerable.
3.2.2 Embankment
There was no information available on the cross section drawing of the embankment.
During the site visit to the ICT August 2014 it was observed that the embankment is covered
with a layer of concrete and fortified with some stone boulders.
Figure 3.6 shows the situation of the embankment. At the rear side (land side) of the
embankment structure the retaining wall is also incorporated in the design.
Figure 3.6 : Embankment structure (source: Photo site visit August 27, 2014
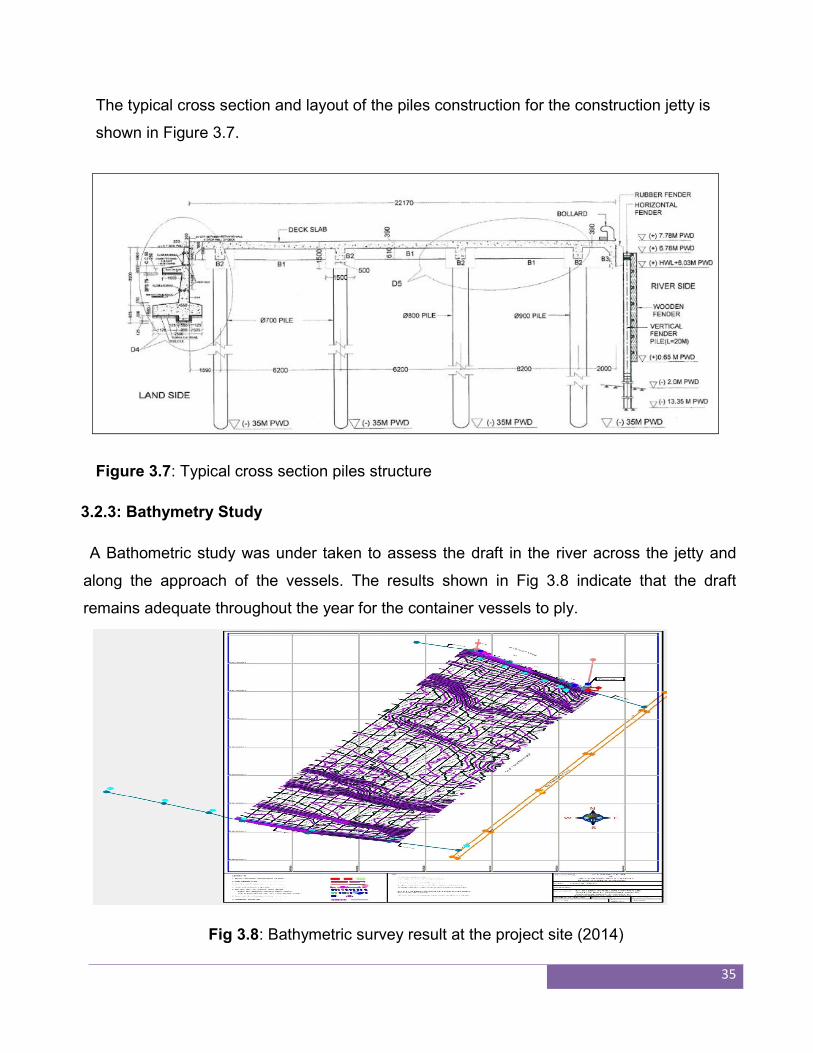
35
The typical cross section and layout of the piles construction for the construction jetty is
shown in Figure 3.7.
Figure 3.7: Typical cross section piles structure
3.2.3: Bathymetry Study
A Bathometric study was under taken to assess the draft in the river across the jetty and
along the approach of the vessels. The results shown in Fig 3.8 indicate that the draft
remains adequate throughout the year for the container vessels to ply.
Fig 3.8: Bathymetric survey result at the project site (2014)
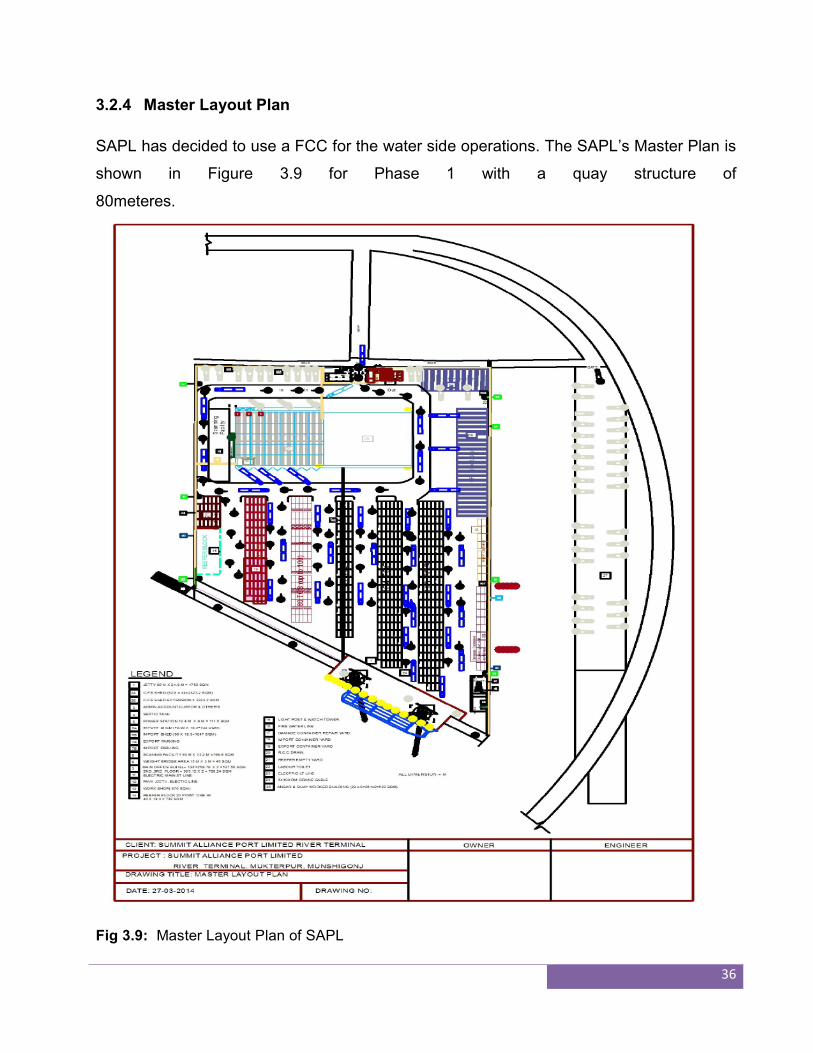
36
3.2.4 Master Layout Plan
SAPL has decided to use a FCC for the water side operations. The SAPL’s Master Plan is
shown in Figure 3.9 for Phase 1 with a quay structure of
80meteres.
Fig 3.9: Master Layout Plan of SAPL
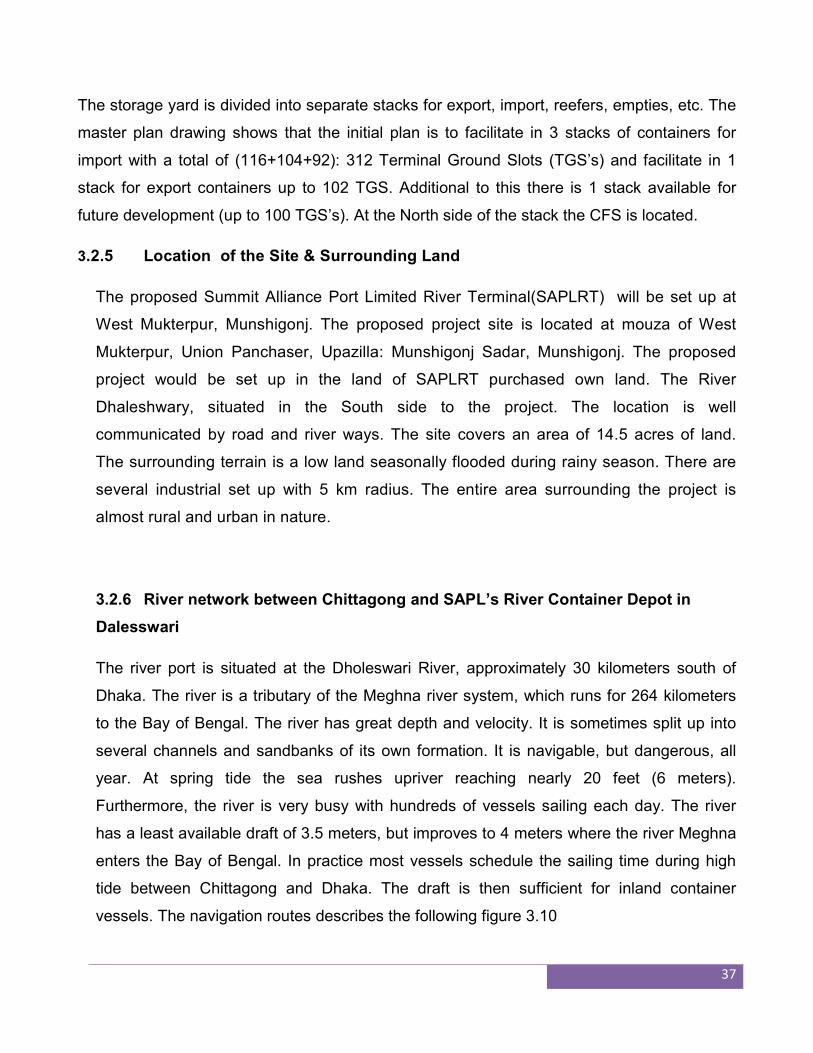
37
The storage yard is divided into separate stacks for export, import, reefers, empties, etc. The
master plan drawing shows that the initial plan is to facilitate in 3 stacks of containers for
import with a total of (116+104+92): 312 Terminal Ground Slots (TGS’s) and facilitate in 1
stack for export containers up to 102 TGS. Additional to this there is 1 stack available for
future development (up to 100 TGS’s). At the North side of the stack the CFS is located.
3.2.5 Location of the Site & Surrounding Land
The proposed Summit Alliance Port Limited River Terminal(SAPLRT) will be set up at
West Mukterpur, Munshigonj. The proposed project site is located at mouza of West
Mukterpur, Union Panchaser, Upazilla: Munshigonj Sadar, Munshigonj. The proposed
project would be set up in the land of SAPLRT purchased own land. The River
Dhaleshwary, situated in the South side to the project. The location is well
communicated by road and river ways. The site covers an area of 14.5 acres of land.
The surrounding terrain is a low land seasonally flooded during rainy season. There are
several industrial set up with 5 km radius. The entire area surrounding the project is
almost rural and urban in nature.
3.2.6 River network between Chittagong and SAPL’s River Container Depot in
Dalesswari
The river port is situated at the Dholeswari River, approximately 30 kilometers south of
Dhaka. The river is a tributary of the Meghna river system, which runs for 264 kilometers
to the Bay of Bengal. The river has great depth and velocity. It is sometimes split up into
several channels and sandbanks of its own formation. It is navigable, but dangerous, all
year. At spring tide the sea rushes upriver reaching nearly 20 feet (6 meters).
Furthermore, the river is very busy with hundreds of vessels sailing each day. The river
has a least available draft of 3.5 meters, but improves to 4 meters where the river Meghna
enters the Bay of Bengal. In practice most vessels schedule the sailing time during high
tide between Chittagong and Dhaka. The draft is then sufficient for inland container
vessels. The navigation routes describes the following figure 3.10
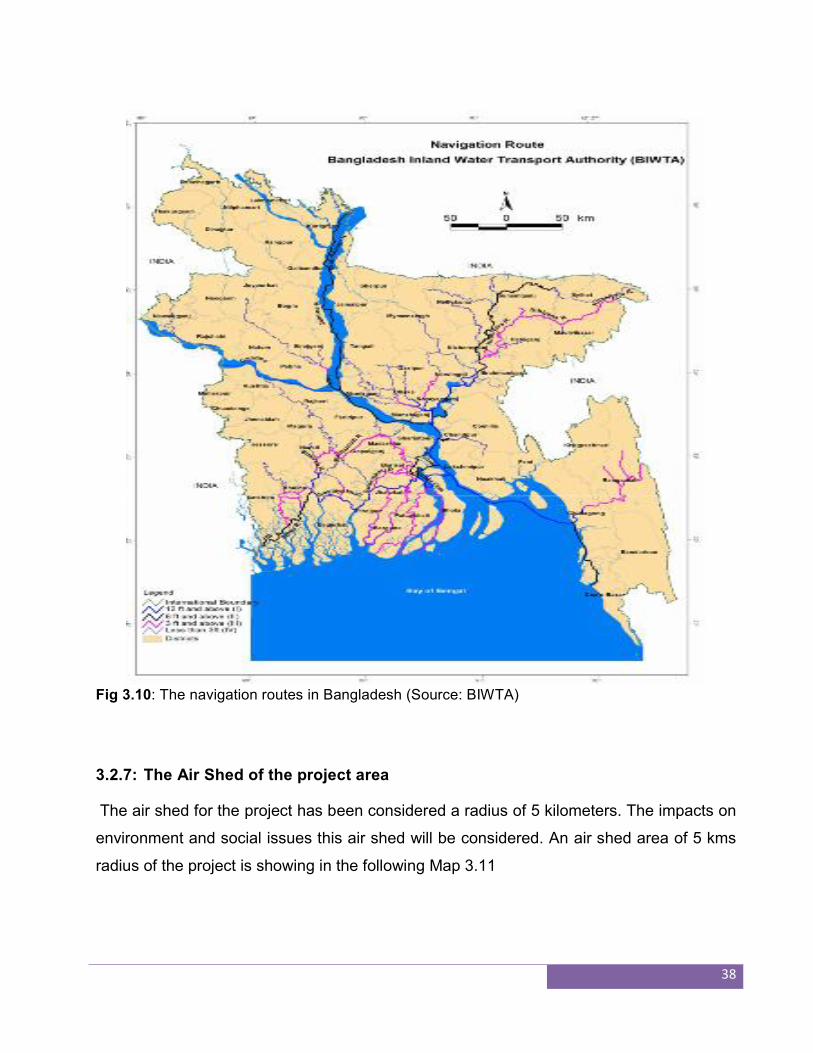
38
Fig 3.10: The navigation routes in Bangladesh (Source: BIWTA)
3.2.7: The Air Shed of the project area
The air shed for the project has been considered a radius of 5 kilometers. The impacts on
environment and social issues this air shed will be considered. An air shed area of 5 kms
radius of the project is showing in the following Map 3.11
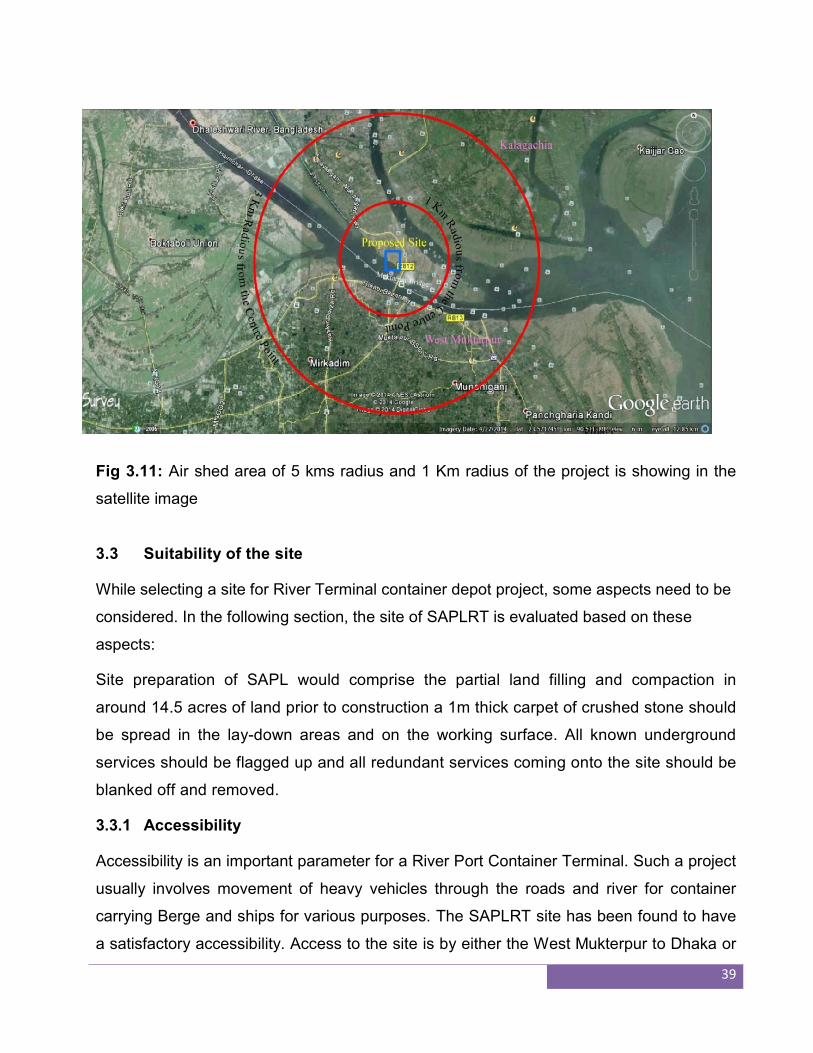
39
Fig 3.11: Air shed area of 5 kms radius and 1 Km radius of the project is showing in the
satellite image
3.3 Suitability of the site
While selecting a site for River Terminal container depot project, some aspects need to be
considered. In the following section, the site of SAPLRT is evaluated based on these
aspects:
Site preparation of SAPL would comprise the partial land filling and compaction in
around 14.5 acres of land prior to construction a 1m thick carpet of crushed stone should
be spread in the lay-down areas and on the working surface. All known underground
services should be flagged up and all redundant services coming onto the site should be
blanked off and removed.
3.3.1 Accessibility
Accessibility is an important parameter for a River Port Container Terminal. Such a project
usually involves movement of heavy vehicles through the roads and river for container
carrying Berge and ships for various purposes. The SAPLRT site has been found to have
a satisfactory accessibility. Access to the site is by either the West Mukterpur to Dhaka or
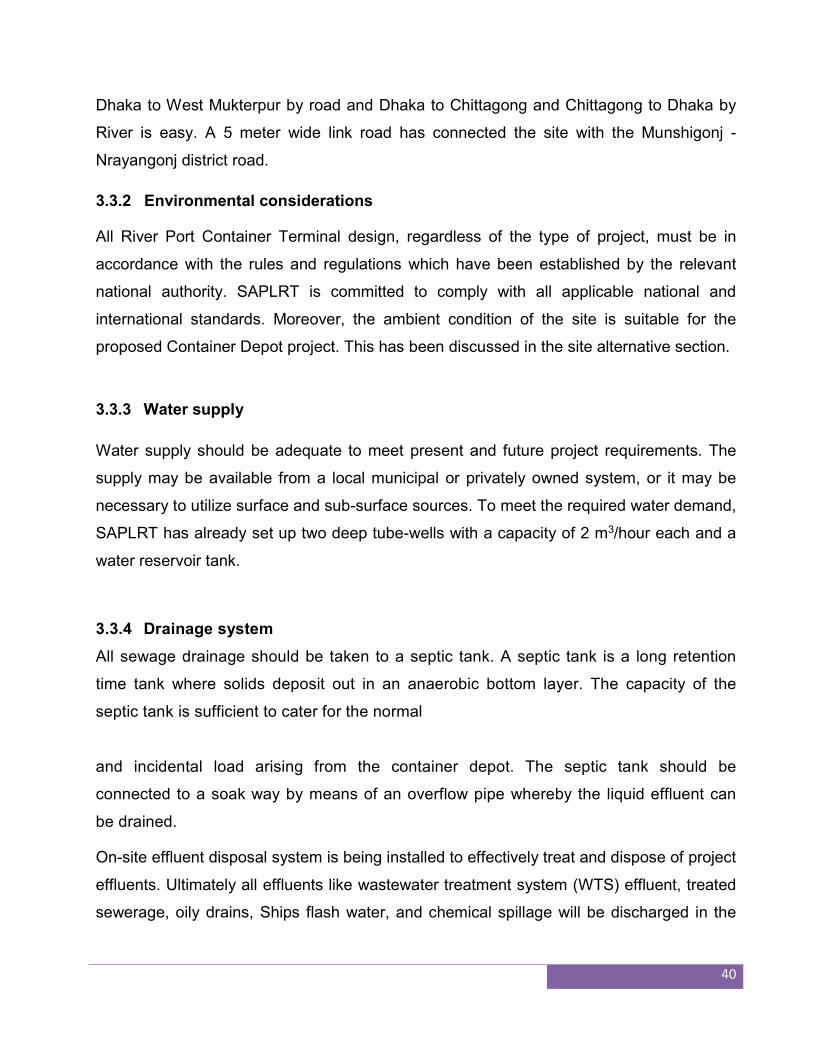
40
Dhaka to West Mukterpur by road and Dhaka to Chittagong and Chittagong to Dhaka by
River is easy. A 5 meter wide link road has connected the site with the Munshigonj -
Nrayangonj district road.
3.3.2 Environmental considerations
All River Port Container Terminal design, regardless of the type of project, must be in
accordance with the rules and regulations which have been established by the relevant
national authority. SAPLRT is committed to comply with all applicable national and
international standards. Moreover, the ambient condition of the site is suitable for the
proposed Container Depot project. This has been discussed in the site alternative section.
3.3.3 Water supply
Water supply should be adequate to meet present and future project requirements. The
supply may be available from a local municipal or privately owned system, or it may be
necessary to utilize surface and sub-surface sources. To meet the required water demand,
SAPLRT has already set up two deep tube-wells with a capacity of 2 m3/hour each and a
water reservoir tank.
3.3.4 Drainage system
All sewage drainage should be taken to a septic tank. A septic tank is a long retention
time tank where solids deposit out in an anaerobic bottom layer. The capacity of the
septic tank is sufficient to cater for the normal
and incidental load arising from the container depot. The septic tank should be
connected to a soak way by means of an overflow pipe whereby the liquid effluent can
be drained.
On-site effluent disposal system is being installed to effectively treat and dispose of project
effluents. Ultimately all effluents like wastewater treatment system (WTS) effluent, treated
sewerage, oily drains, Ships flash water, and chemical spillage will be discharged in the
41
river after treatment in the wastewater treatment port. The photo is a part of drainage
which is under construction.
It is recommended that the surface water and foul drainage systems should be separate
and should be designed in accordance with BS EN 752 Parts 1 to 4 "Drain and sewer
systems outside buildings". Manhole and chamber covers should be heavy duty
throughout.
3.3.5 Transportation
The roads should be designed to be capable of carrying all the vehicles likely to be used
during construction and throughout the life of the project including articulated vehicles
and transporters used for the removal and replacement of major items of the project.
Truck and Car parking and hard standing areas should be of similar construction to the
roads. The road pavements should be of reinforced concrete and in conformity with
relevant British or equivalent Bangladesh National Code of Practice.
3.3.6 Access Road to the project
Vehicular access to the project site will be provided by the development of a 750 m long
access road to connect the main road of Munshigonj to Dhaka district highway. The
access road is being funded by SAPL but the construction is being undertaken by
Bangladesh Bridge Authority.
Photo 3.2: Drainage pattern
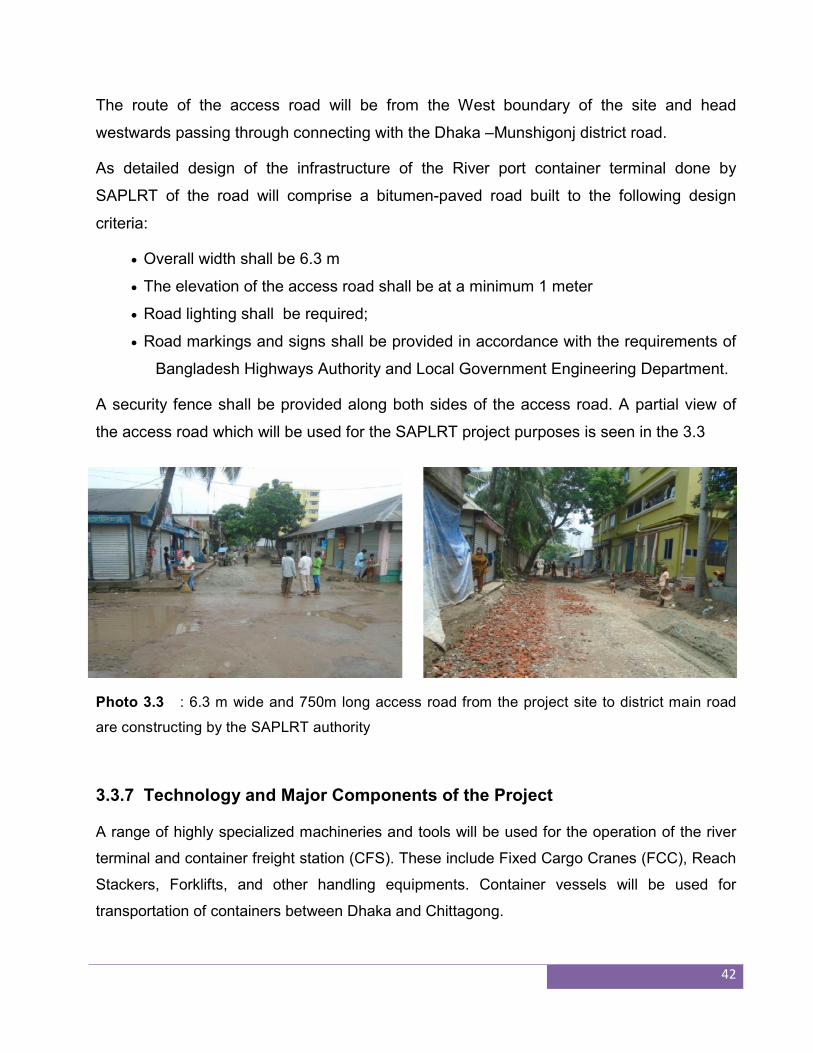
42
The route of the access road will be from the West boundary of the site and head
westwards passing through connecting with the Dhaka –Munshigonj district road.
As detailed design of the infrastructure of the River port container terminal done by
SAPLRT of the road will comprise a bitumen-paved road built to the following design
criteria:
Overall width shall be 6.3 m
The elevation of the access road shall be at a minimum 1 meter
Road lighting shall be required;
Road markings and signs shall be provided in accordance with the requirements of
Bangladesh Highways Authority and Local Government Engineering Department.
A security fence shall be provided along both sides of the access road. A partial view of
the access road which will be used for the SAPLRT project purposes is seen in the 3.3
Photo 3.3 : 6.3 m wide and 750m long access road from the project site to district main road
are constructing by the SAPLRT authority
3.3.7 Technology and Major Components of the Project
A range of highly specialized machineries and tools will be used for the operation of the river
terminal and container freight station (CFS). These include Fixed Cargo Cranes (FCC), Reach
Stackers, Forklifts, and other handling equipments. Container vessels will be used for
transportation of containers between Dhaka and Chittagong.
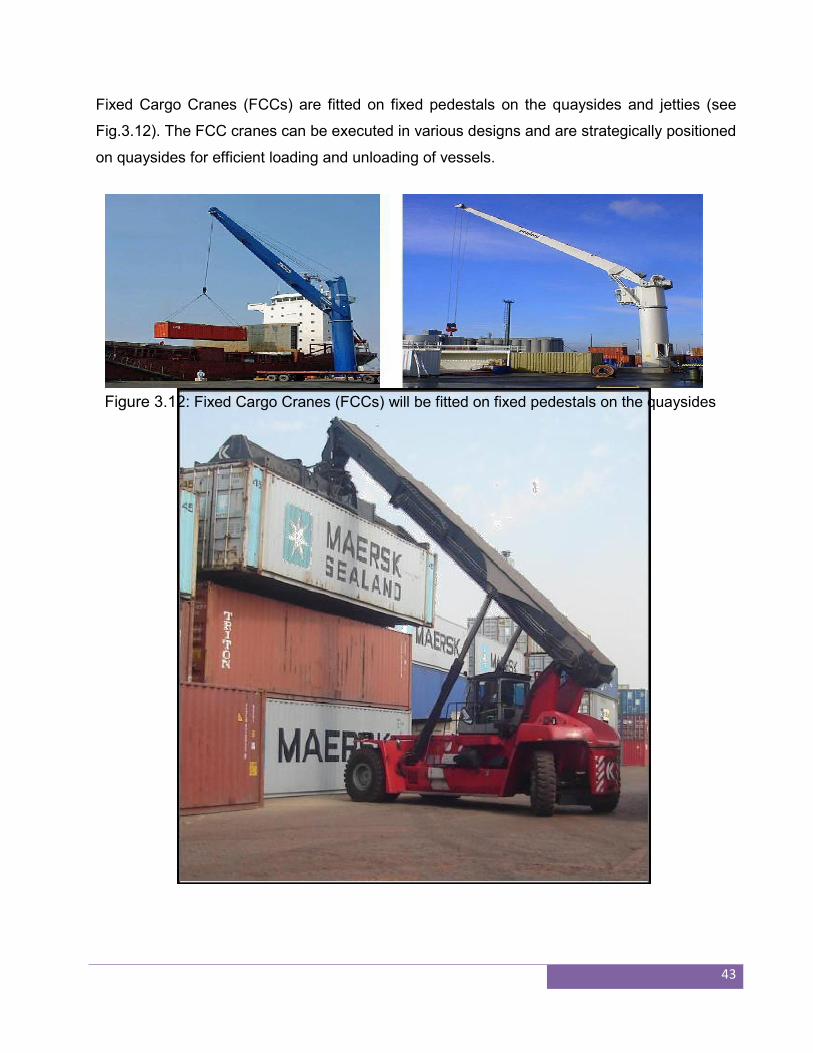
43
Fixed Cargo Cranes (FCCs) are fitted on fixed pedestals on the quaysides and jetties (see
Fig.3.12). The FCC cranes can be executed in various designs and are strategically positioned
on quaysides for efficient loading and unloading of vessels.
Figure 3.12: Fixed Cargo Cranes (FCCs) will be fitted on fixed pedestals on the quaysides
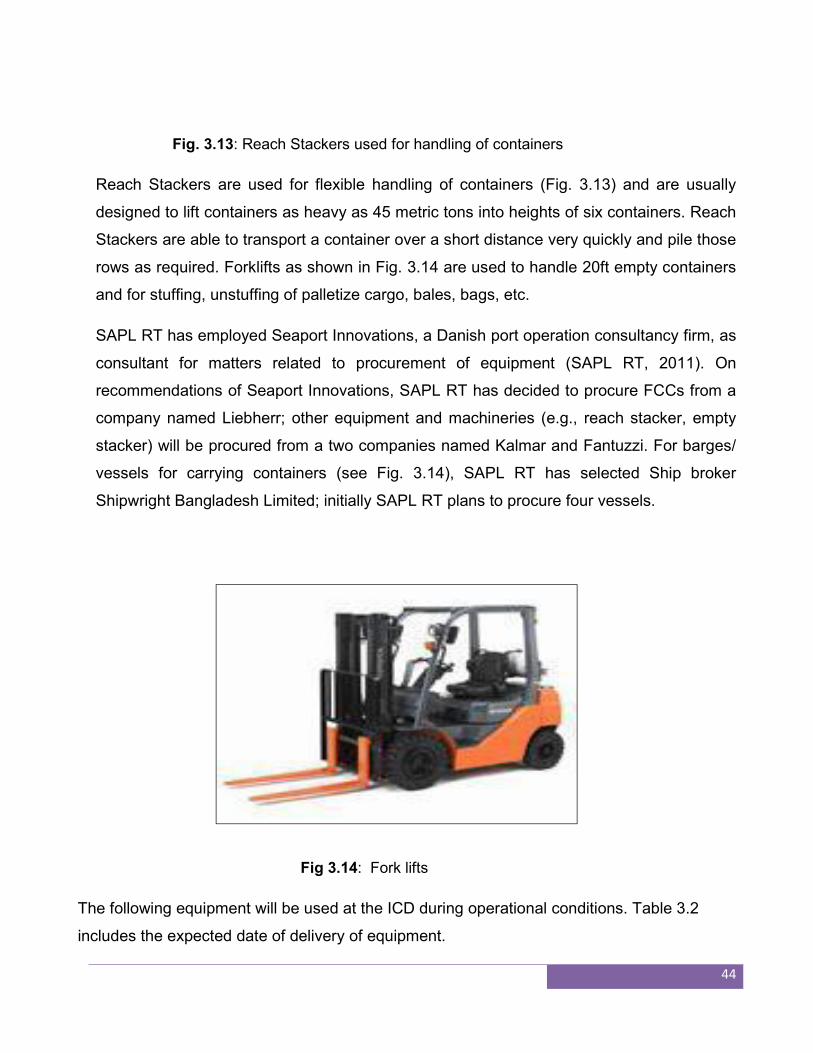
44
Fig. 3.13: Reach Stackers used for handling of containers
Reach Stackers are used for flexible handling of containers (Fig. 3.13) and are usually
designed to lift containers as heavy as 45 metric tons into heights of six containers. Reach
Stackers are able to transport a container over a short distance very quickly and pile those
rows as required. Forklifts as shown in Fig. 3.14 are used to handle 20ft empty containers
and for stuffing, unstuffing of palletize cargo, bales, bags, etc.
SAPL RT has employed Seaport Innovations, a Danish port operation consultancy firm, as
consultant for matters related to procurement of equipment (SAPL RT, 2011). On
recommendations of Seaport Innovations, SAPL RT has decided to procure FCCs from a
company named Liebherr; other equipment and machineries (e.g., reach stacker, empty
stacker) will be procured from a two companies named Kalmar and Fantuzzi. For barges/
vessels for carrying containers (see Fig. 3.14), SAPL RT has selected Ship broker
Shipwright Bangladesh Limited; initially SAPL RT plans to procure four vessels.
Fig 3.14: Fork lifts
The following equipment will be used at the ICD during operational conditions. Table 3.2
includes the expected date of delivery of equipment.
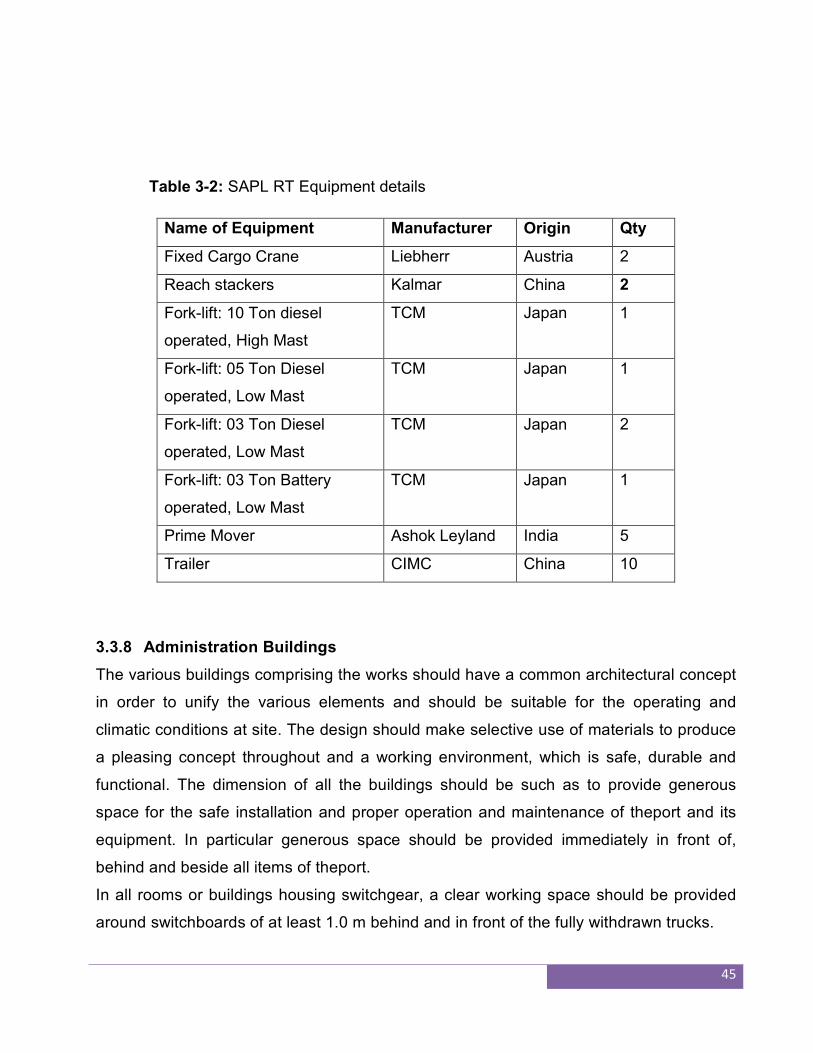
45
Table 3-2: SAPL RT Equipment details
Name of Equipment Manufacturer Origin Qty
Fixed Cargo Crane Liebherr Austria 2
Reach stackers Kalmar China 2
Fork-lift: 10 Ton diesel
operated, High Mast
TCM Japan 1
Fork-lift: 05 Ton Diesel
operated, Low Mast
TCM Japan 1
Fork-lift: 03 Ton Diesel
operated, Low Mast
TCM Japan
2
Fork-lift: 03 Ton Battery
operated, Low Mast
TCM Japan
1
Prime Mover Ashok Leyland India 5
Trailer CIMC China 10
3.3.8 Administration Buildings
The various buildings comprising the works should have a common architectural concept
in order to unify the various elements and should be suitable for the operating and
climatic conditions at site. The design should make selective use of materials to produce
a pleasing concept throughout and a working environment, which is safe, durable and
functional. The dimension of all the buildings should be such as to provide generous
space for the safe installation and proper operation and maintenance of theport and its
equipment. In particular generous space should be provided immediately in front of,
behind and beside all items of theport.
In all rooms or buildings housing switchgear, a clear working space should be provided
around switchboards of at least 1.0 m behind and in front of the fully withdrawn trucks.
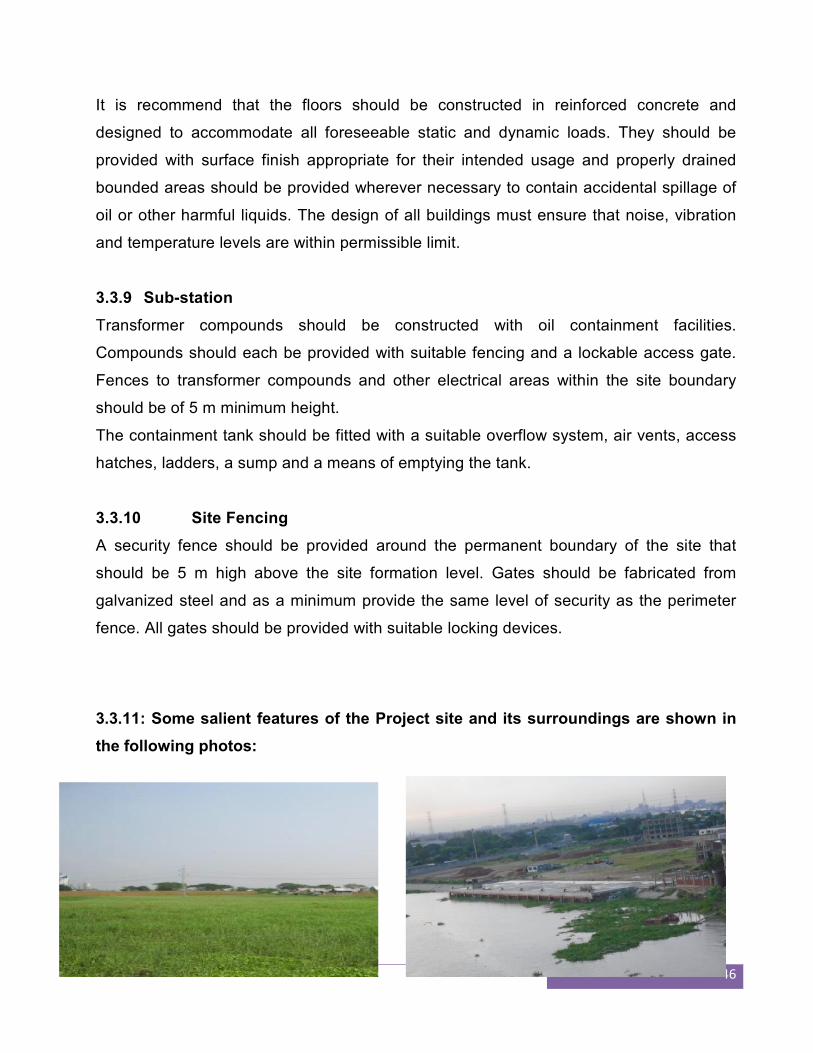
46
It is recommend that the floors should be constructed in reinforced concrete and
designed to accommodate all foreseeable static and dynamic loads. They should be
provided with surface finish appropriate for their intended usage and properly drained
bounded areas should be provided wherever necessary to contain accidental spillage of
oil or other harmful liquids. The design of all buildings must ensure that noise, vibration
and temperature levels are within permissible limit.
3.3.9 Sub-station
Transformer compounds should be constructed with oil containment facilities.
Compounds should each be provided with suitable fencing and a lockable access gate.
Fences to transformer compounds and other electrical areas within the site boundary
should be of 5 m minimum height.
The containment tank should be fitted with a suitable overflow system, air vents, access
hatches, ladders, a sump and a means of emptying the tank.
3.3.10 Site Fencing
A security fence should be provided around the permanent boundary of the site that
should be 5 m high above the site formation level. Gates should be fabricated from
galvanized steel and as a minimum provide the same level of security as the perimeter
fence. All gates should be provided with suitable locking devices.
3.3.11: Some salient features of the Project site and its surroundings are shown in
the following photos:
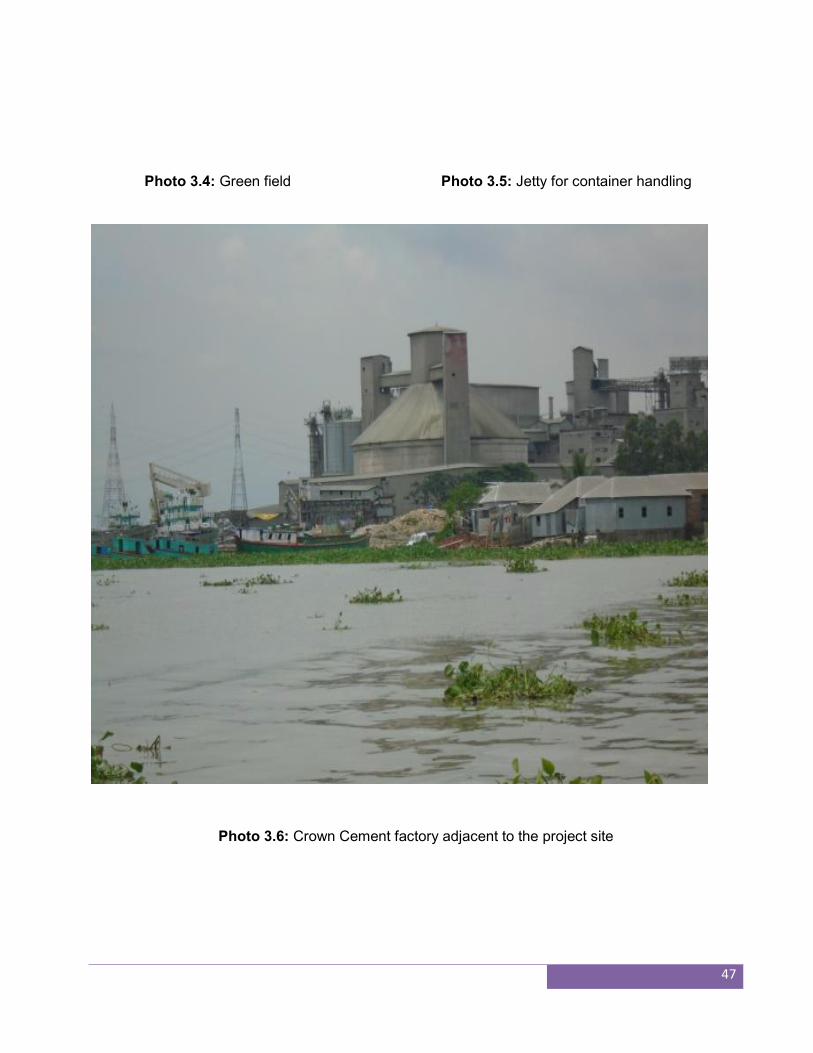
47
Photo 3.4: Green field Photo 3.5: Jetty for container handling
Photo 3.6: Crown Cement factory adjacent to the project site
48
Chapter 4
DESCRIPTION OF BASELINE ENVIRONMENTAL AND
SOCIAL CONDITIONS
4.1 Project Site
One of the most important tasks of the ESIA was to assess the existing environmental
conditions of the project site and its surrounding areas in order to establish a “baseline”,
against which potential environmental and social impacts due to the implementation of the
project would be predicted and assessed. In order to establish the baseline environment,
detailed physical, ecological and socio-economic surveys have been carried out
surrounding the project site. This chapter provides a description of the baseline physical,
ecological and socio-economic condition of the project area and its surroundings
4.1.2 General Consideration
The main objective of examining the present environment is to provide an environmental
baseline against which potential impacts from construction and operational phases of any
project can be compared. A second important function of establishing a baseline for
parameters such as air, soil and water quality is to ensure that any problems arising from
existing sources are not erroneously attributed to the project under study. In the present
study the different environmental components examined for setting baseline conditions of
the project area, are physico-chemical, biological and socio-economical. In physico-
chemical component, parameters included are land, water quality, air quality, climate, and
noise.
4.2 Physical Environment
49
As part of the ESIA, detail field surveys have been carried out in areas (West Muktarpur and
Chor Sayedpur) surrounding the project site. The survey data have been used to identify
important physical installations surrounding the project site. In addition, traffic survey and
condition survey of the road from Ponchoboti to Muktarpur Bridge have been carried out.
This road will be used for transportation of cargo and containers to and from the proposed
SAPLRT.
Water quality of Dhaleshwary River close to the riverbank at the proposed site has been
assessed. Ambient air quality and noise level within the project site have also been
measured in order to record existing conditions of the project site.
Analyses of these data and maps together with the nature of project activities provide useful
insight into possible environmental impacts of the proposed project. This Section provides a
description of the physical environment of the areas within and surrounding the project site;
subsequently, the possible impacts of the proposed project activities have been evaluated
against the baseline condition
4.2.1 Physical Environment Surrounding the Project Site
The proposed river terminal will be located on a 14.5 acre plot of land on the northern bank
of Dhaleshwary River. The plot is located in West Muktarpur Village of Panchasar Union
under Munshiganj Sadar Upazila of Munshiganj district. Figure 4.1 shows the proposed
project site and broader areas surrounding the site, including the Dhaleshwary and
Shitalakhya Rivers, on a Google image of the area; the GPS coordinates of the plot is N
23°34′ 28′′ and E 90°30′ 43′′. As shown in Fig. 4.1, the general area is a relatively narrow
strip of land, which is bounded by Shitalakha River to the north and Dhaleshwary River to
the south.
The two rivers meet and continue to the east as Dhaleshwary River. As a part of the
baseline study, areas within about 3 km radius of the project site were surveyed in order to
identify and record major physical features, e.g., location of human habitations, industries,
markets, river, road network, other physical infrastructure the SAPL RT project site is
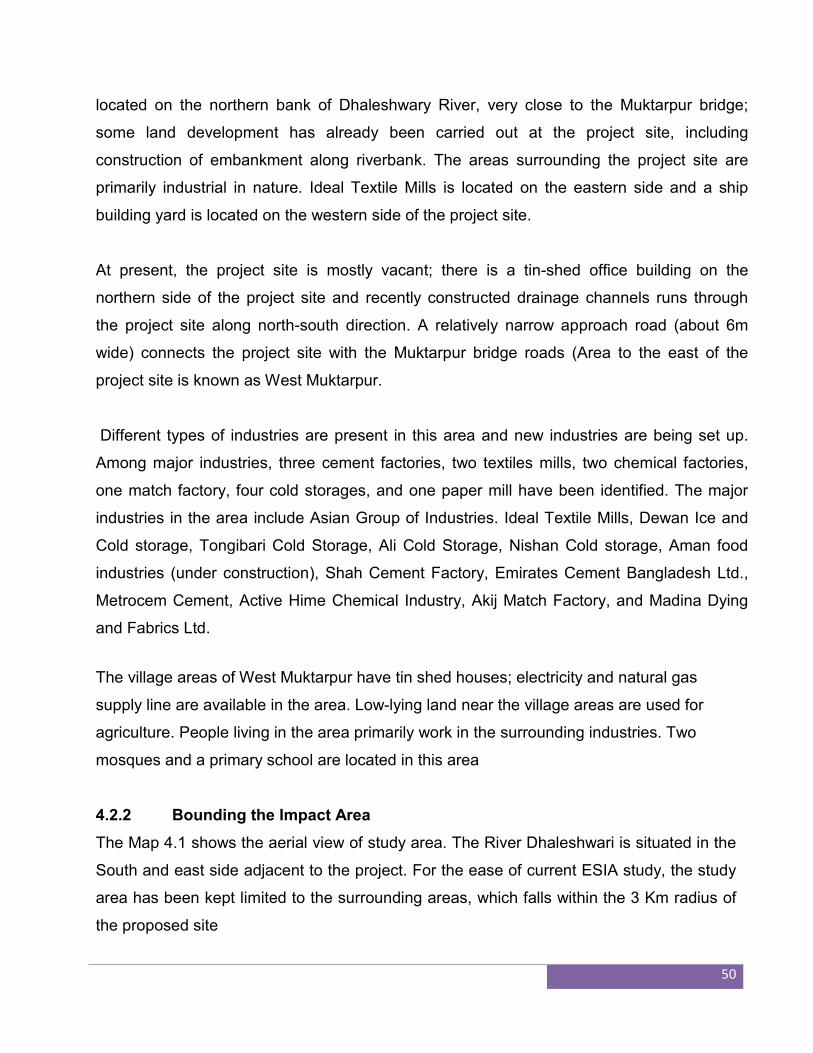
50
located on the northern bank of Dhaleshwary River, very close to the Muktarpur bridge;
some land development has already been carried out at the project site, including
construction of embankment along riverbank. The areas surrounding the project site are
primarily industrial in nature. Ideal Textile Mills is located on the eastern side and a ship
building yard is located on the western side of the project site.
At present, the project site is mostly vacant; there is a tin-shed office building on the
northern side of the project site and recently constructed drainage channels runs through
the project site along north-south direction. A relatively narrow approach road (about 6m
wide) connects the project site with the Muktarpur bridge roads (Area to the east of the
project site is known as West Muktarpur.
Different types of industries are present in this area and new industries are being set up.
Among major industries, three cement factories, two textiles mills, two chemical factories,
one match factory, four cold storages, and one paper mill have been identified. The major
industries in the area include Asian Group of Industries. Ideal Textile Mills, Dewan Ice and
Cold storage, Tongibari Cold Storage, Ali Cold Storage, Nishan Cold storage, Aman food
industries (under construction), Shah Cement Factory, Emirates Cement Bangladesh Ltd.,
Metrocem Cement, Active Hime Chemical Industry, Akij Match Factory, and Madina Dying
and Fabrics Ltd.
The village areas of West Muktarpur have tin shed houses; electricity and natural gas
supply line are available in the area. Low-lying land near the village areas are used for
agriculture. People living in the area primarily work in the surrounding industries. Two
mosques and a primary school are located in this area
4.2.2 Bounding the Impact Area
The Map 4.1 shows the aerial view of study area. The River Dhaleshwari is situated in the
South and east side adjacent to the project. For the ease of current ESIA study, the study
area has been kept limited to the surrounding areas, which falls within the 3 Km radius of
the proposed site
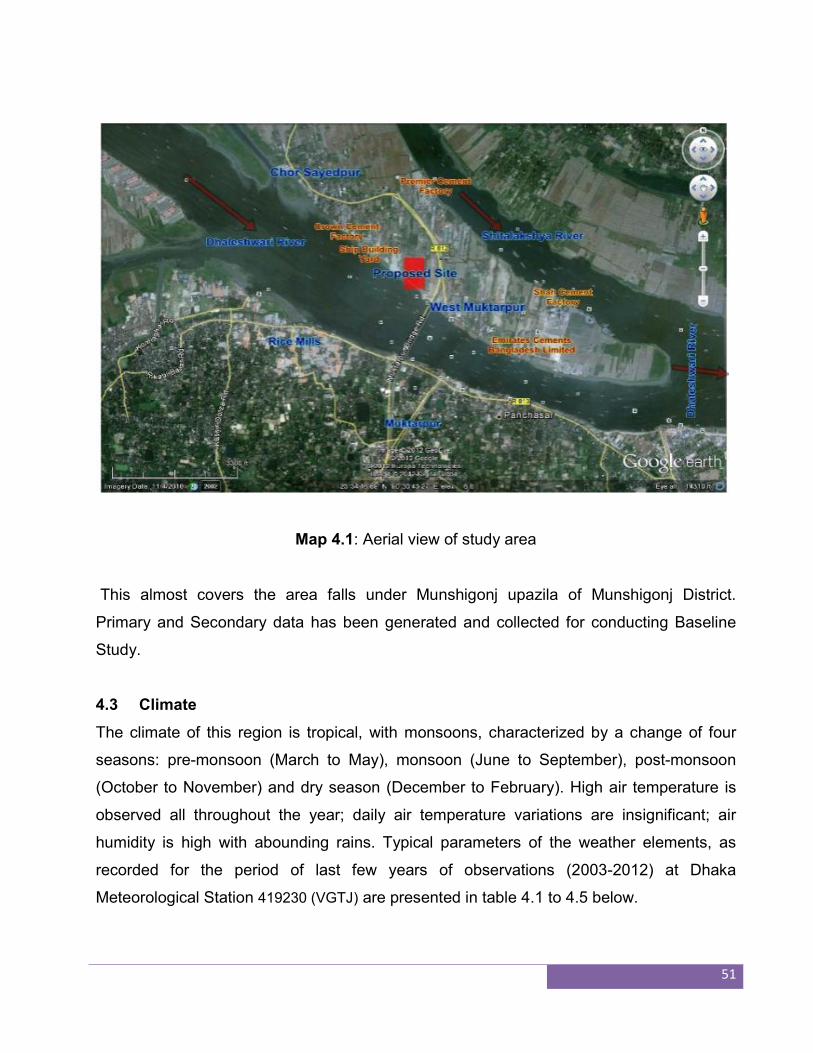
51
Map 4.1: Aerial view of study area
This almost covers the area falls under Munshigonj upazila of Munshigonj District.
Primary and Secondary data has been generated and collected for conducting Baseline
Study.
4.3 Climate
The climate of this region is tropical, with monsoons, characterized by a change of four
seasons: pre-monsoon (March to May), monsoon (June to September), post-monsoon
(October to November) and dry season (December to February). High air temperature is
observed all throughout the year; daily air temperature variations are insignificant; air
humidity is high with abounding rains. Typical parameters of the weather elements, as
recorded for the period of last few years of observations (2003-2012) at Dhaka
Meteorological Station 419230 (VGTJ) are presented in table 4.1 to 4.5 below.
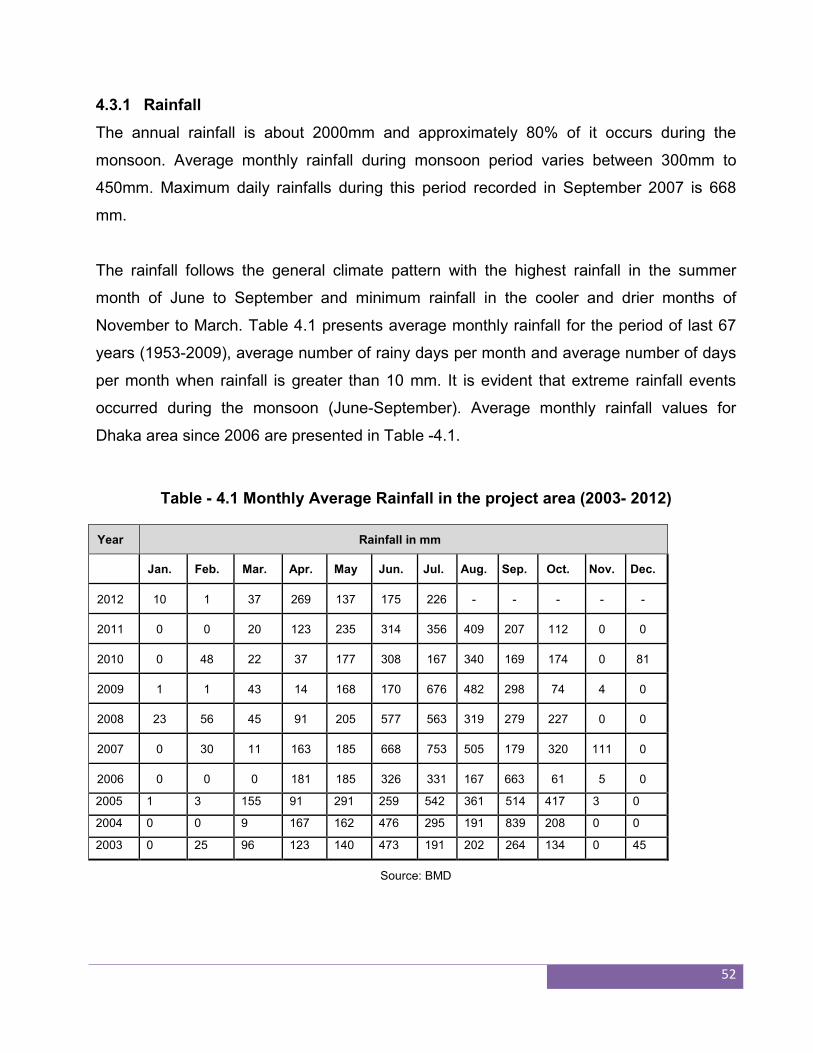
52
4.3.1 Rainfall
The annual rainfall is about 2000mm and approximately 80% of it occurs during the
monsoon. Average monthly rainfall during monsoon period varies between 300mm to
450mm. Maximum daily rainfalls during this period recorded in September 2007 is 668
mm.
The rainfall follows the general climate pattern with the highest rainfall in the summer
month of June to September and minimum rainfall in the cooler and drier months of
November to March. Table 4.1 presents average monthly rainfall for the period of last 67
years (1953-2009), average number of rainy days per month and average number of days
per month when rainfall is greater than 10 mm. It is evident that extreme rainfall events
occurred during the monsoon (June-September). Average monthly rainfall values for
Dhaka area since 2006 are presented in Table -4.1.
Table - 4.1 Monthly Average Rainfall in the project area (2003- 2012)
Year Rainfall in mm
Jan. Feb. Mar. Apr. May Jun. Jul. Aug. Sep. Oct. Nov. Dec.
2012 10 1 37 269 137 175 226 - - - - -
2011 0 0 20 123 235 314 356 409 207 112 0 0
2010 0 48 22 37 177 308 167 340 169 174 0 81
2009 1 1 43 14 168 170 676 482 298 74 4 0
2008 23 56 45 91 205 577 563 319 279 227 0 0
2007 0 30 11 163 185 668 753 505 179 320 111 0
2006 0 0 0 181 185 326 331 167 663 61 5 0
2005 1 3 155 91 291 259 542 361 514 417 3 0
2004 0 0 9 167 162 476 295 191 839 208 0 0
2003 0 25 96 123 140 473 191 202 264 134 0 45
Source: BMD
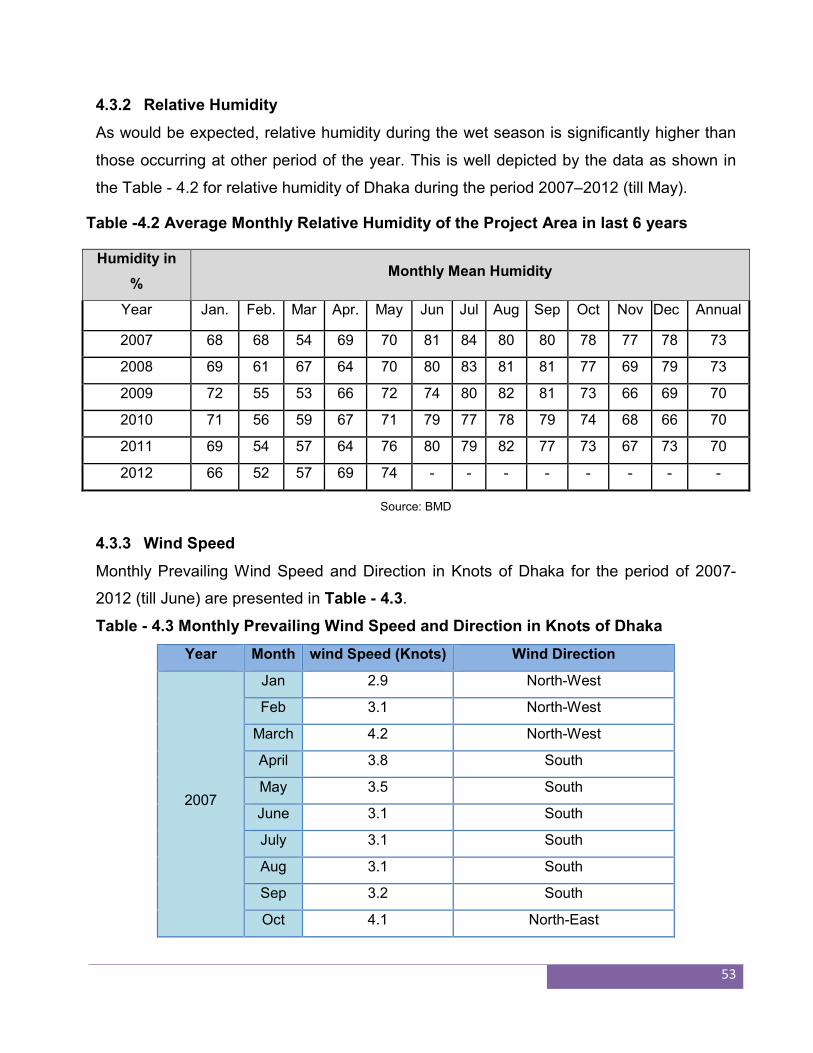
53
4.3.2 Relative Humidity
As would be expected, relative humidity during the wet season is significantly higher than
those occurring at other period of the year. This is well depicted by the data as shown in
the Table - 4.2 for relative humidity of Dhaka during the period 2007–2012 (till May).
Table -4.2 Average Monthly Relative Humidity of the Project Area in last 6 years
Humidity in
% Monthly Mean Humidity
Year Jan. Feb. Mar Apr. May Jun Jul Aug Sep Oct Nov Dec Annual
2007 68 68 54 69 70 81 84 80 80 78 77 78 73
2008 69 61 67 64 70 80 83 81 81 77 69 79 73
2009 72 55 53 66 72 74 80 82 81 73 66 69 70
2010 71 56 59 67 71 79 77 78 79 74 68 66 70
2011 69 54 57 64 76 80 79 82 77 73 67 73 70
2012 66 52 57 69 74 - - - - - - - -
Source: BMD
4.3.3 Wind Speed
Monthly Prevailing Wind Speed and Direction in Knots of Dhaka for the period of 2007-
2012 (till June) are presented in Table - 4.3.
Table - 4.3 Monthly Prevailing Wind Speed and Direction in Knots of Dhaka
Year Month wind Speed (Knots) Wind Direction
2007
Jan 2.9 North-West
Feb 3.1 North-West
March 4.2 North-West
April 3.8 South
May 3.5 South
June 3.1 South
July 3.1 South
Aug 3.1 South
Sep 3.2 South
Oct 4.1 North-East
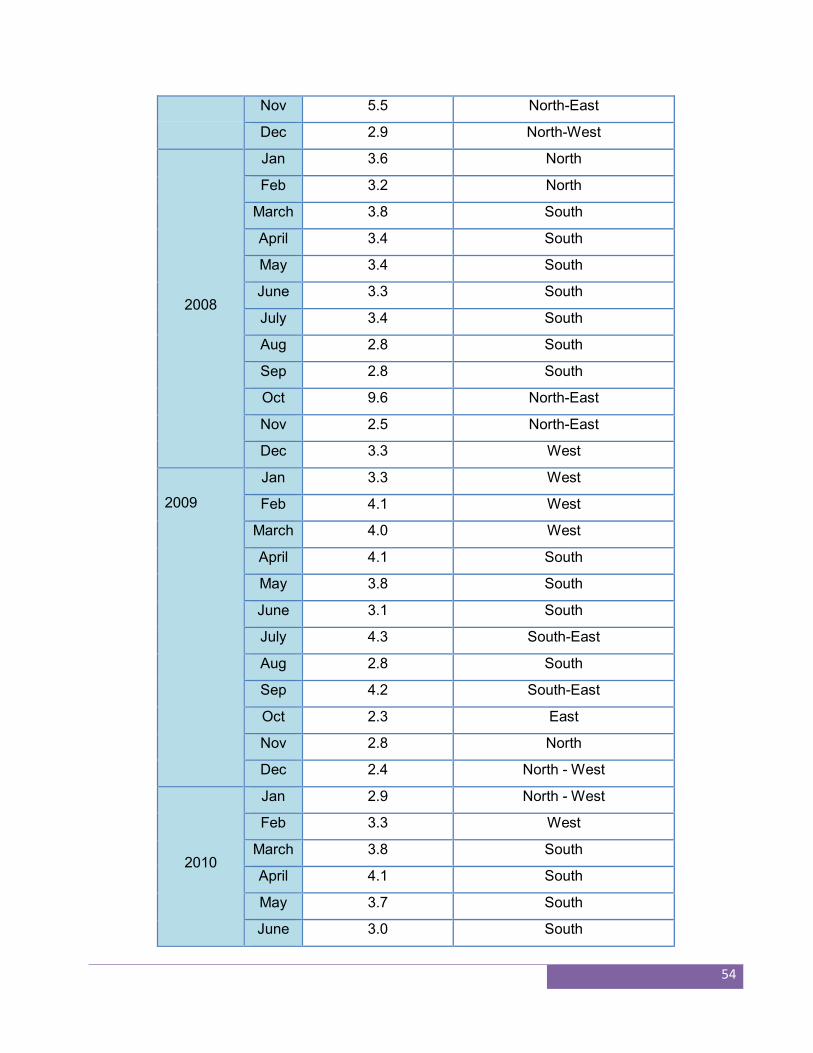
54
Nov 5.5 North-East
Dec 2.9 North-West
2008
Jan 3.6 North
Feb 3.2 North
March 3.8 South
April 3.4 South
May 3.4 South
June 3.3 South
July 3.4 South
Aug 2.8 South
Sep 2.8 South
Oct 9.6 North-East
Nov 2.5 North-East
Dec 3.3 West
2009
Jan 3.3 West
Feb 4.1 West
March 4.0 West
April 4.1 South
May 3.8 South
June 3.1 South
July 4.3 South-East
Aug 2.8 South
Sep 4.2 South-East
Oct 2.3 East
Nov 2.8 North
Dec 2.4 North - West
2010
Jan 2.9 North - West
Feb 3.3 West
March 3.8 South
April 4.1 South
May 3.7 South
June 3.0 South
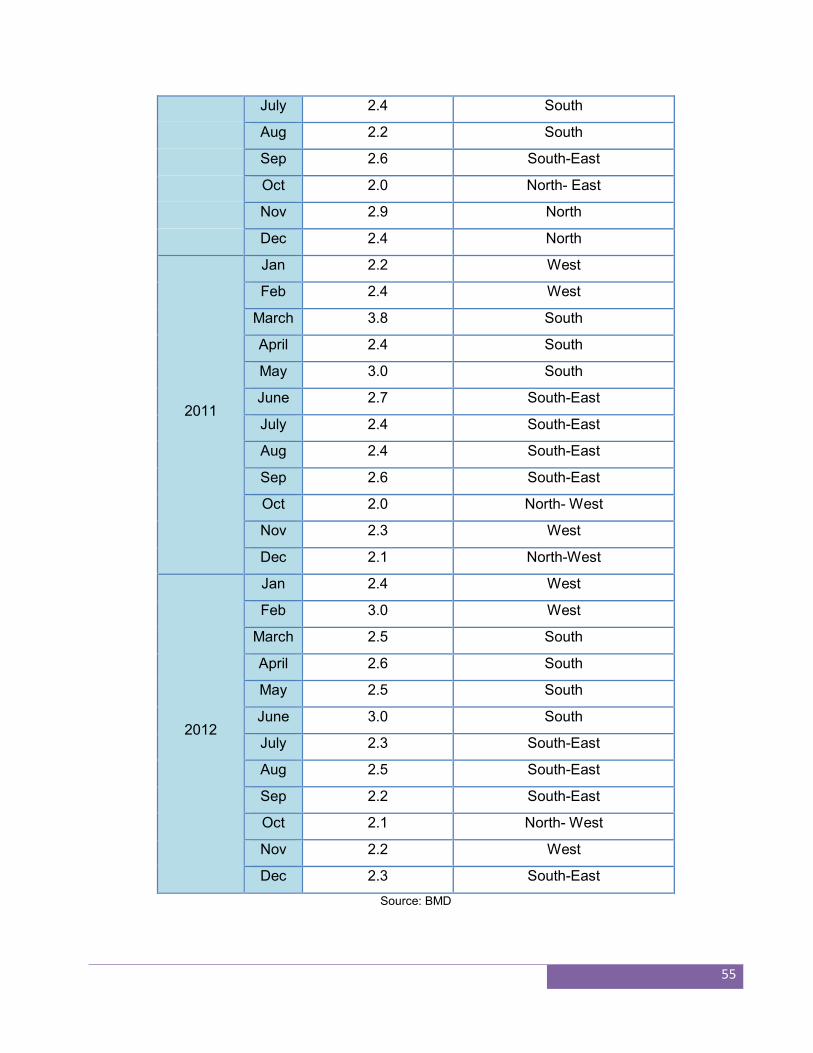
55
July 2.4 South
Aug 2.2 South
Sep 2.6 South-East
Oct 2.0 North- East
Nov 2.9 North
Dec 2.4 North
2011
Jan 2.2 West
Feb 2.4 West
March 3.8 South
April 2.4 South
May 3.0 South
June 2.7 South-East
July 2.4 South-East
Aug 2.4 South-East
Sep 2.6 South-East
Oct 2.0 North- West
Nov 2.3 West
Dec 2.1 North-West
2012
Jan 2.4 West
Feb 3.0 West
March 2.5 South
April 2.6 South
May 2.5 South
June 3.0 South
July 2.3 South-East
Aug 2.5 South-East
Sep 2.2 South-East
Oct 2.1 North- West
Nov 2.2 West
Dec 2.3 South-East
Source: BMD
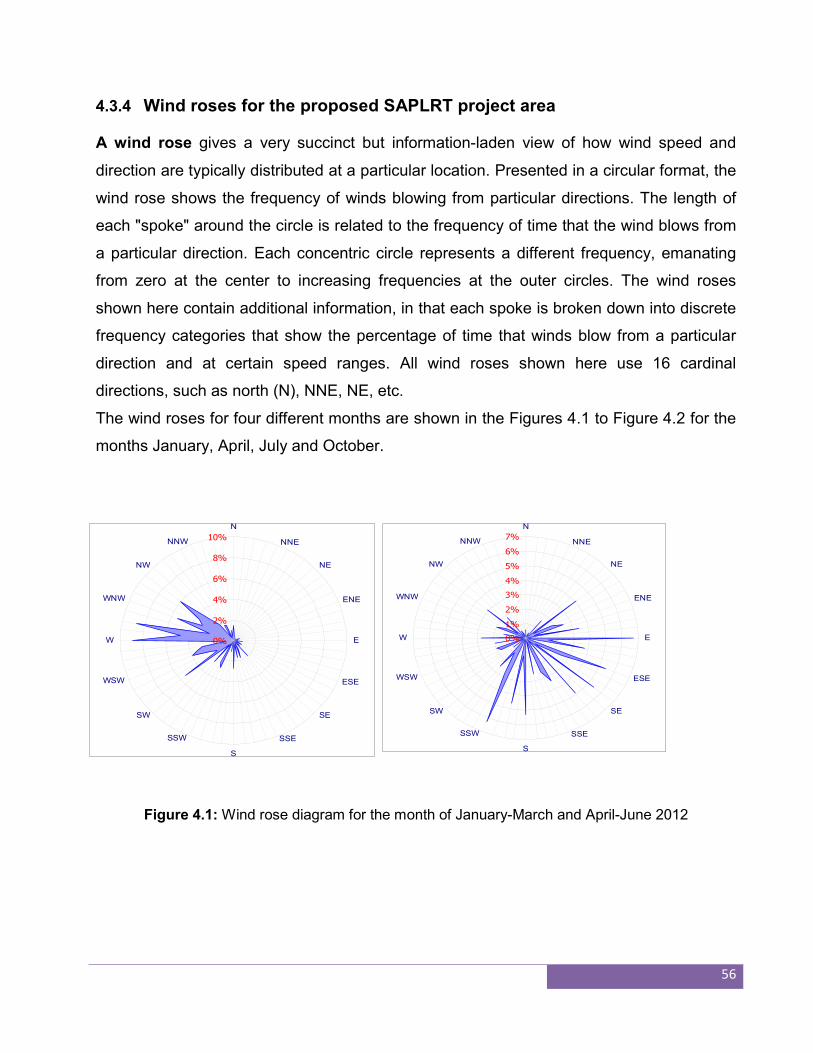
56
0%
1%
2%
3%
4%
5%
6%
7%
N
NNE
NE
ENE
E
ESE
SE
SSE
S
SSW
SW
WSW
W
WNW
NW
NNW
0%
2%
4%
6%
8%
10%
N
NNE
NE
ENE
E
ESE
SE
SSE
S
SSW
SW
WSW
W
WNW
NW
NNW
4.3.4 Wind roses for the proposed SAPLRT project area
A wind rose gives a very succinct but information-laden view of how wind speed and
direction are typically distributed at a particular location. Presented in a circular format, the
wind rose shows the frequency of winds blowing from particular directions. The length of
each "spoke" around the circle is related to the frequency of time that the wind blows from
a particular direction. Each concentric circle represents a different frequency, emanating
from zero at the center to increasing frequencies at the outer circles. The wind roses
shown here contain additional information, in that each spoke is broken down into discrete
frequency categories that show the percentage of time that winds blow from a particular
direction and at certain speed ranges. All wind roses shown here use 16 cardinal
directions, such as north (N), NNE, NE, etc.
The wind roses for four different months are shown in the Figures 4.1 to Figure 4.2 for the
months January, April, July and October.
Figure 4.1: Wind rose diagram for the month of January-March and April-June 2012
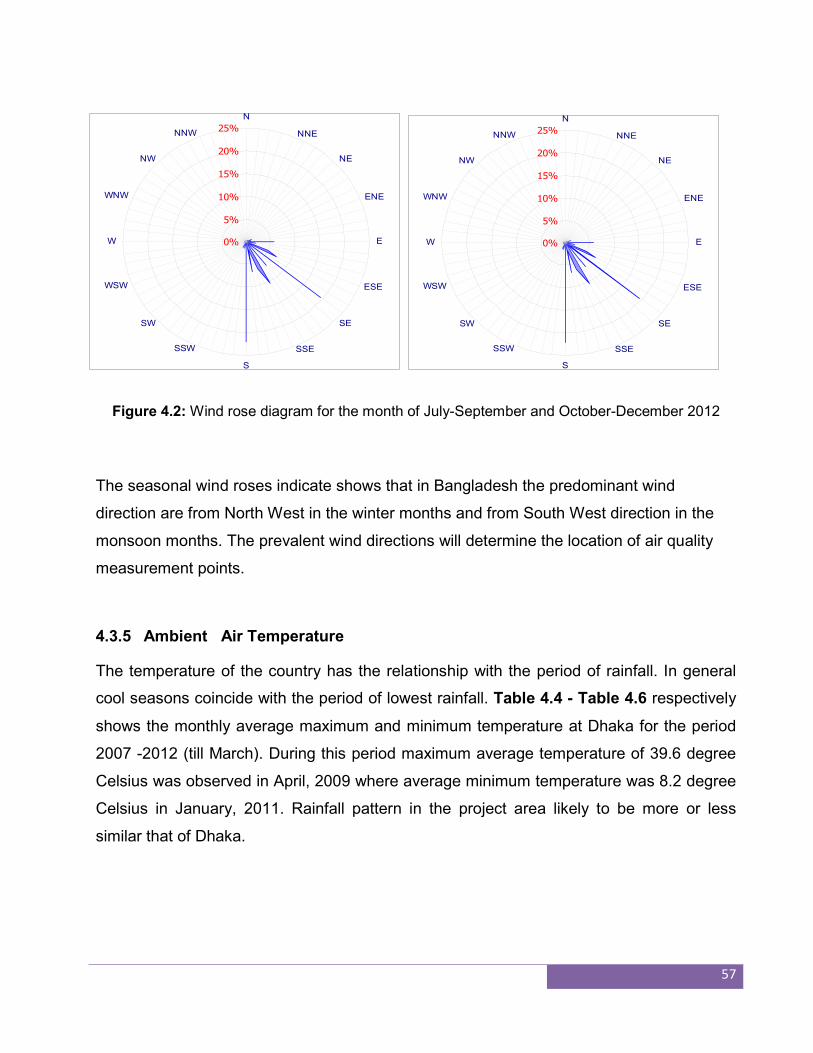
57
0%
5%
10%
15%
20%
25%
N
NNE
NE
ENE
E
ESE
SE
SSE
S
SSW
SW
WSW
W
WNW
NW
NNW
0%
5%
10%
15%
20%
25%
N
NNE
NE
ENE
E
ESE
SE
SSE
S
SSW
SW
WSW
W
WNW
NW
NNW
Figure 4.2: Wind rose diagram for the month of July-September and October-December 2012
The seasonal wind roses indicate shows that in Bangladesh the predominant wind
direction are from North West in the winter months and from South West direction in the
monsoon months. The prevalent wind directions will determine the location of air quality
measurement points.
4.3.5 Ambient Air Temperature
The temperature of the country has the relationship with the period of rainfall. In general
cool seasons coincide with the period of lowest rainfall. Table 4.4 - Table 4.6 respectively
shows the monthly average maximum and minimum temperature at Dhaka for the period
2007 -2012 (till March). During this period maximum average temperature of 39.6 degree
Celsius was observed in April, 2009 where average minimum temperature was 8.2 degree
Celsius in January, 2011. Rainfall pattern in the project area likely to be more or less
similar that of Dhaka.
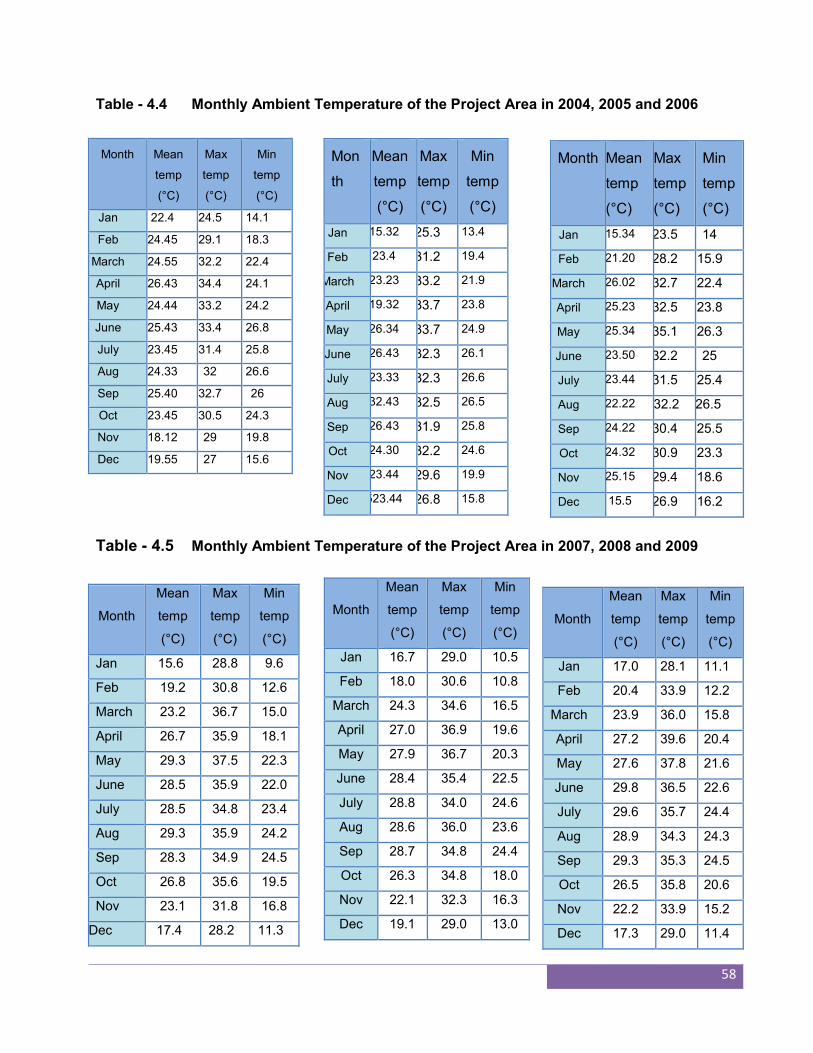
58
Table - 4.4 Monthly Ambient Temperature of the Project Area in 2004, 2005 and 2006
Table - 4.5 Monthly Ambient Temperature of the Project Area in 2007, 2008 and 2009
Mon
th
Mean
temp
(°C)
Max
temp
(°C)
Min
temp
(°C)
Jan 15.32 25.3 13.4
Feb 23.4 31.2 19.4
March 23.23 33.2 21.9
April 19.32 33.7 23.8
May 26.34 33.7 24.9
June 26.43 32.3 26.1
July 23.33 32.3 26.6
Aug 32.43 32.5 26.5
Sep 26.43 31.9 25.8
Oct 24.30 32.2 24.6
Nov 23.44 29.6 19.9
Dec 523.44 26.8 15.8
Month Mean
temp
(°C)
Max
temp
(°C)
Min
temp
(°C)
Jan 15.34 23.5 14
Feb 21.20 28.2 15.9
March 26.02 32.7 22.4
April 25.23 32.5 23.8
May 25.34 35.1 26.3
June 23.50 32.2 25
July 23.44 31.5 25.4
Aug 22.22 32.2 26.5
Sep 24.22 30.4 25.5
Oct 24.32 30.9 23.3
Nov 25.15 29.4 18.6
Dec 15.5 26.9 16.2
Month Mean
temp
(°C)
Max
temp
(°C)
Min
temp
(°C)
Jan 22.4 24.5 14.1
Feb 24.45 29.1 18.3
March 24.55 32.2 22.4
April 26.43 34.4 24.1
May 24.44 33.2 24.2
June 25.43 33.4 26.8
July 23.45 31.4 25.8
Aug 24.33 32 26.6
Sep 25.40 32.7 26
Oct 23.45 30.5 24.3
Nov 18.12 29 19.8
Dec 19.55 27 15.6
Month
Mean
temp
(°C)
Max
temp
(°C)
Min
temp
(°C)
Jan 17.0 28.1 11.1
Feb 20.4 33.9 12.2
March 23.9 36.0 15.8
April 27.2 39.6 20.4
May 27.6 37.8 21.6
June 29.8 36.5 22.6
July 29.6 35.7 24.4
Aug 28.9 34.3 24.3
Sep 29.3 35.3 24.5
Oct 26.5 35.8 20.6
Nov 22.2 33.9 15.2
Dec 17.3 29.0 11.4
Month
Mean
temp
(°C)
Max
temp
(°C)
Min
temp
(°C)
Jan 15.6 28.8 9.6
Feb 19.2 30.8 12.6
March 23.2 36.7 15.0
April 26.7 35.9 18.1
May 29.3 37.5 22.3
June 28.5 35.9 22.0
July 28.5 34.8 23.4
Aug 29.3 35.9 24.2
Sep 28.3 34.9 24.5
Oct 26.8 35.6 19.5
Nov 23.1 31.8 16.8
Dec 17.4 28.2 11.3
Month
Mean
temp
(°C)
Max
temp
(°C)
Min
temp
(°C)
Jan 16.7 29.0 10.5
Feb 18.0 30.6 10.8
March 24.3 34.6 16.5
April 27.0 36.9 19.6
May 27.9 36.7 20.3
June 28.4 35.4 22.5
July 28.8 34.0 24.6
Aug 28.6 36.0 23.6
Sep 28.7 34.8 24.4
Oct 26.3 34.8 18.0
Nov 22.1 32.3 16.3
Dec 19.1 29.0 13.0
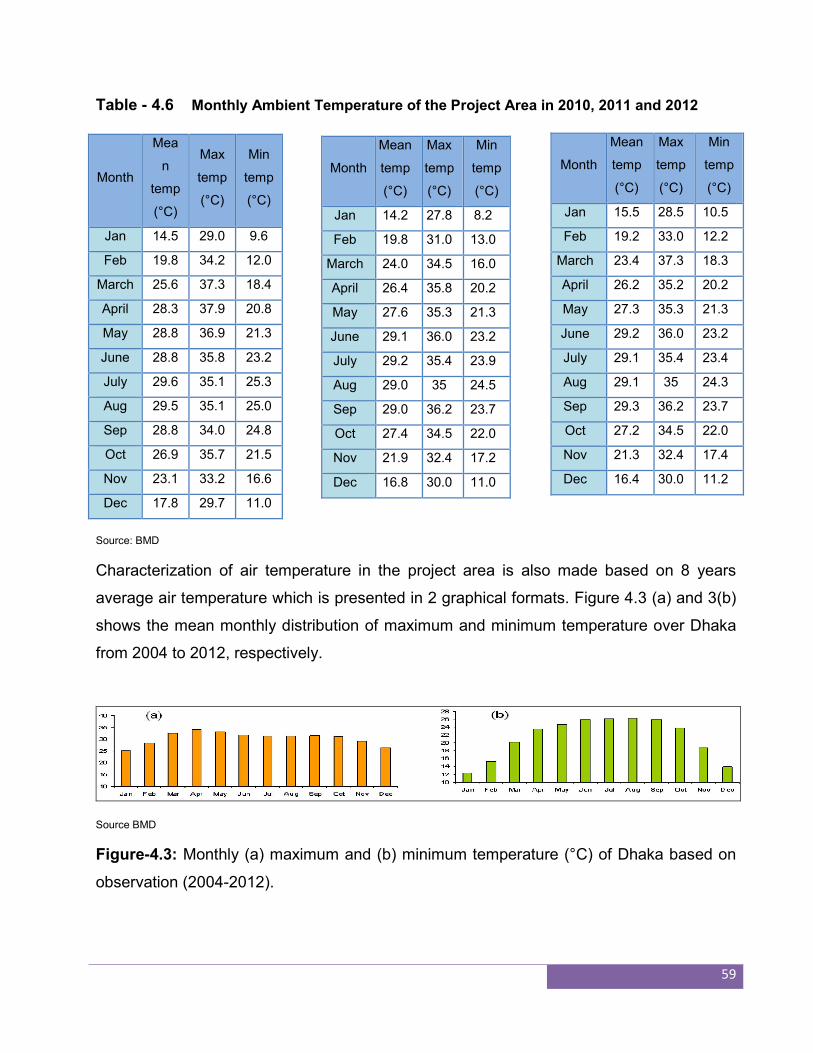
59
Table - 4.6 Monthly Ambient Temperature of the Project Area in 2010, 2011 and 2012
Source: BMD
Characterization of air temperature in the project area is also made based on 8 years
average air temperature which is presented in 2 graphical formats. Figure 4.3 (a) and 3(b)
shows the mean monthly distribution of maximum and minimum temperature over Dhaka
from 2004 to 2012, respectively.
Source BMD
Figure-4.3: Monthly (a) maximum and (b) minimum temperature (°C) of Dhaka based on
observation (2004-2012).
Month
Mea
n
temp
(°C)
Max
temp
(°C)
Min
temp
(°C)
Jan 14.5 29.0 9.6
Feb 19.8 34.2 12.0
March 25.6 37.3 18.4
April 28.3 37.9 20.8
May 28.8 36.9 21.3
June 28.8 35.8 23.2
July 29.6 35.1 25.3
Aug 29.5 35.1 25.0
Sep 28.8 34.0 24.8
Oct 26.9 35.7 21.5
Nov 23.1 33.2 16.6
Dec 17.8 29.7 11.0
Month
Mean
temp
(°C)
Max
temp
(°C)
Min
temp
(°C)
Jan 15.5 28.5 10.5
Feb 19.2 33.0 12.2
March 23.4 37.3 18.3
April 26.2 35.2 20.2
May 27.3 35.3 21.3
June 29.2 36.0 23.2
July 29.1 35.4 23.4
Aug 29.1 35 24.3
Sep 29.3 36.2 23.7
Oct 27.2 34.5 22.0
Nov 21.3 32.4 17.4
Dec 16.4 30.0 11.2
Month
Mean
temp
(°C)
Max
temp
(°C)
Min
temp
(°C)
Jan 14.2 27.8 8.2
Feb 19.8 31.0 13.0
March 24.0 34.5 16.0
April 26.4 35.8 20.2
May 27.6 35.3 21.3
June 29.1 36.0 23.2
July 29.2 35.4 23.9
Aug 29.0 35 24.5
Sep 29.0 36.2 23.7
Oct 27.4 34.5 22.0
Nov 21.9 32.4 17.2
Dec 16.8 30.0 11.0
60
The monthly average temperature variation in Dhaka division has remained largely
uniform over the last 8 years. There have been hotter days in some years but it had
negligible effect on the average the temperature over this period.
4.5 Air Quality
Air quality in the Dhaka City and its neighborhoods is deteriorating both from natural and
manmade causes. It is one of the most dangerous and common kind of environmental
pollution that is reported in most industrial towns and metropolitan city in Bangladesh.
Major atmospheric pollution is caused by human induced activities like - burning fossil
fuels, industrial processors, construction works and agriculture, transportation industry. In
the rural areas however the ambient air quality is relatively good. It is assumed that
accepting the small areas near the urban growth centre air quality in the most of the area
would be far below the Environmental Quality Standards of Bangladesh. It is necessary for
ESIA to establish the baseline air quality specially the PM concentration to determine the
air shed of the project area.
BCAS has conducted a 24 hours continuous air quality monitoring for 5 days in the project
area. The monitoring result of the air quality collected is shown in Table 4.9. It shows that
the ambient air quality in terms of PM10 and SPM is higher than the NAAQs level, NOx
and SO2 are considered to quite good and still has reasonable buffer/assimilation capacity
to absorb air pollutants to a certain extent. These are within the prescribed limit of the
National Air quality Standards. The distances of measurements points from the centre of
the project area is shown in Table 4.7 and Map 4.2. The measuring equipment used were
high volume air quality analyzer for PM10 and state of the art SO2, NO2 and CO analyzers.
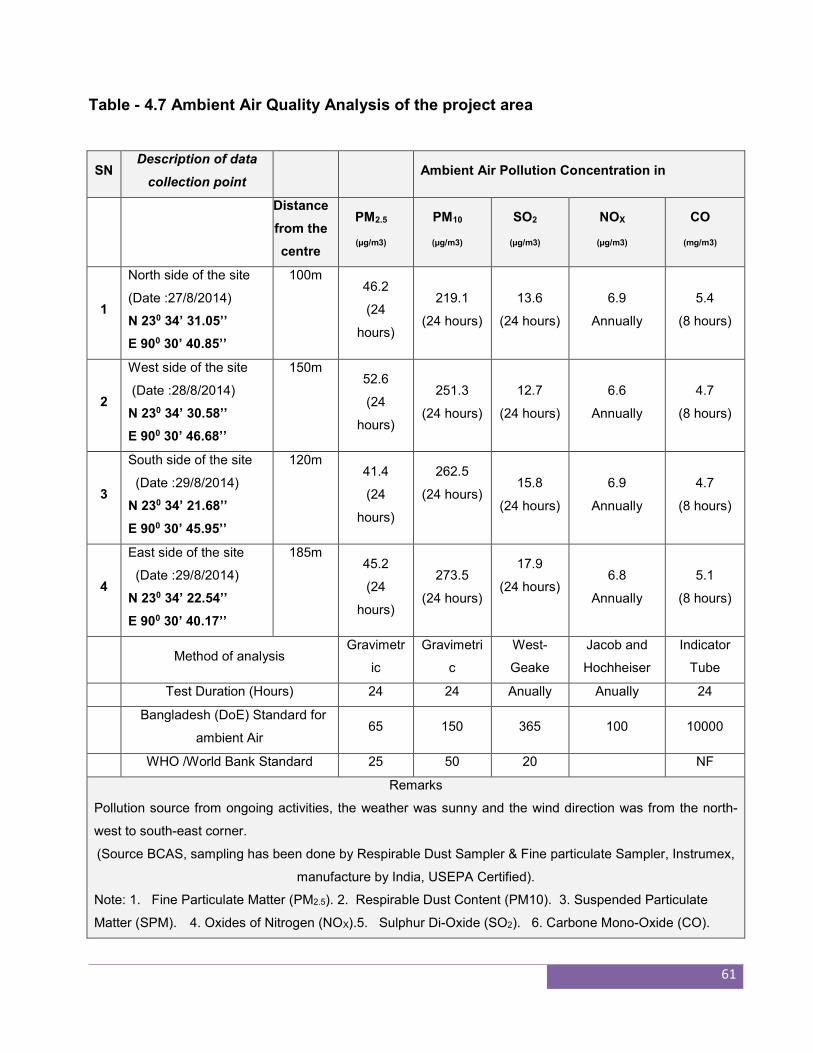
61
Table - 4.7 Ambient Air Quality Analysis of the project area
SN Description of data
collection point
Ambient Air Pollution Concentration in
Distance
from the
centre
PM2.5
(µg/m3)
PM10
(µg/m3)
SO2
(µg/m3)
NOX
(µg/m3)
CO
(mg/m3)
1
North side of the site
(Date :27/8/2014)
N 230 34’ 31.05’’
E 900 30’ 40.85’’
100m 46.2
(24
hours)
219.1
(24 hours)
13.6
(24 hours)
6.9
Annually
5.4
(8 hours)
2
West side of the site
(Date :28/8/2014)
N 230 34’ 30.58’’
E 900 30’ 46.68’’
150m 52.6
(24
hours)
251.3
(24 hours)
12.7
(24 hours)
6.6
Annually
4.7
(8 hours)
3
South side of the site
(Date :29/8/2014)
N 230 34’ 21.68’’
E 900 30’ 45.95’’
120m 41.4
(24
hours)
262.5
(24 hours)
15.8
(24 hours)
6.9
Annually
4.7
(8 hours)
4
East side of the site
(Date :29/8/2014)
N 230 34’ 22.54’’
E 900 30’ 40.17’’
185m 45.2
(24
hours)
273.5
(24 hours)
17.9
(24 hours)
6.8
Annually
5.1
(8 hours)
Method of analysis Gravimetr
ic
Gravimetri
c
West-
Geake
Jacob and
Hochheiser
Indicator
Tube
Test Duration (Hours) 24 24 Anually Anually 24
Bangladesh (DoE) Standard for
ambient Air 65 150 365 100 10000
WHO /World Bank Standard 25 50 20 NF
Remarks
Pollution source from ongoing activities, the weather was sunny and the wind direction was from the north-
west to south-east corner.
(Source BCAS, sampling has been done by Respirable Dust Sampler & Fine particulate Sampler, Instrumex,
manufacture by India, USEPA Certified).
Note: 1. Fine Particulate Matter (PM2.5). 2. Respirable Dust Content (PM10). 3. Suspended Particulate
Matter (SPM). 4. Oxides of Nitrogen (NOX).5. Sulphur Di-Oxide (SO2). 6. Carbone Mono-Oxide (CO).
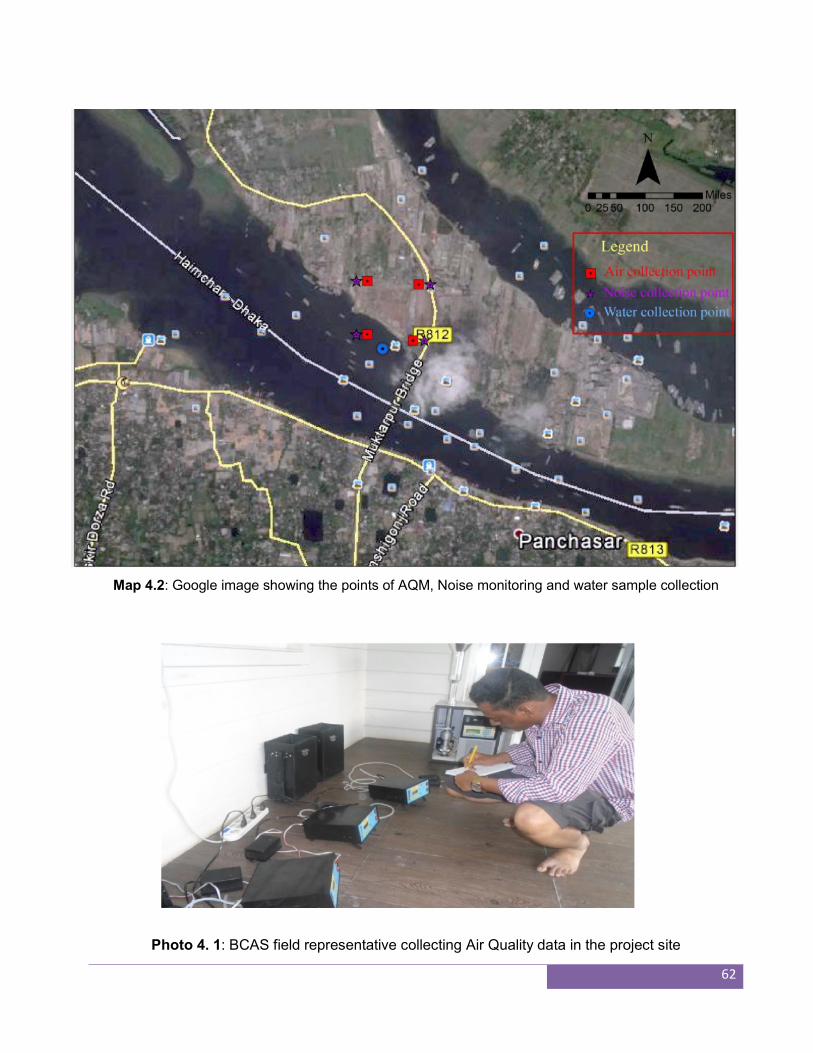
62
Map 4.2: Google image showing the points of AQM, Noise monitoring and water sample collection
Photo 4. 1: BCAS field representative collecting Air Quality data in the project site
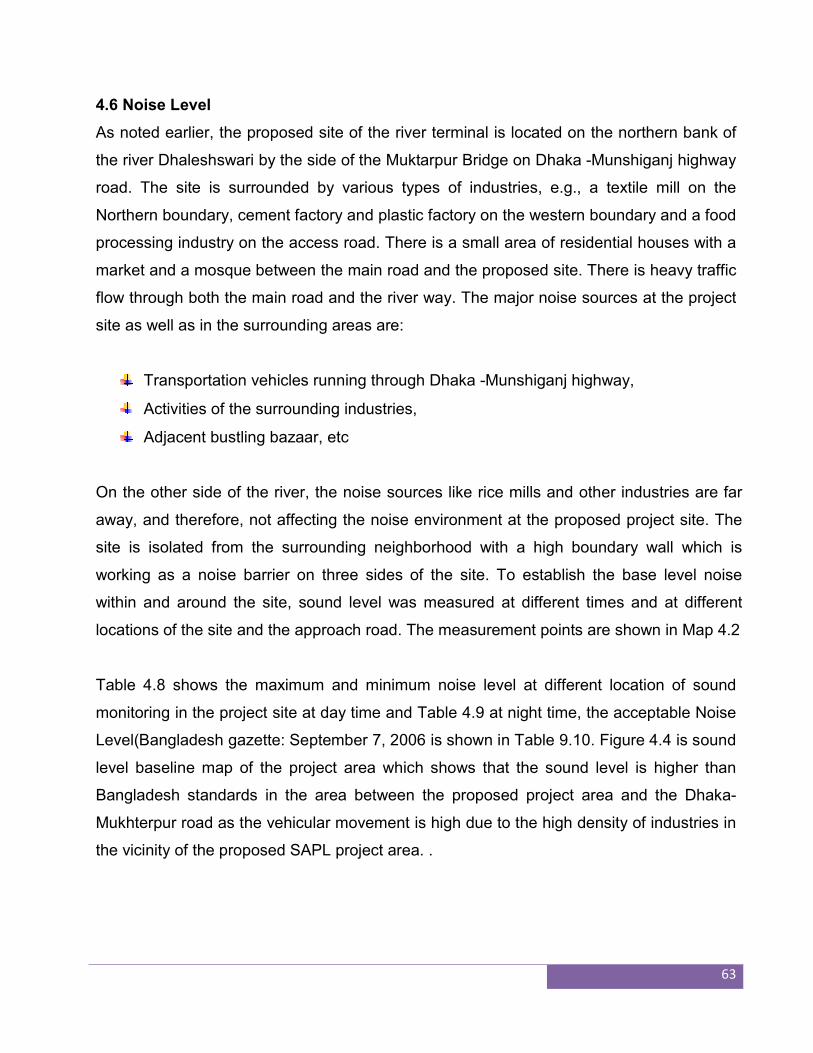
63
4.6 Noise Level
As noted earlier, the proposed site of the river terminal is located on the northern bank of
the river Dhaleshswari by the side of the Muktarpur Bridge on Dhaka -Munshiganj highway
road. The site is surrounded by various types of industries, e.g., a textile mill on the
Northern boundary, cement factory and plastic factory on the western boundary and a food
processing industry on the access road. There is a small area of residential houses with a
market and a mosque between the main road and the proposed site. There is heavy traffic
flow through both the main road and the river way. The major noise sources at the project
site as well as in the surrounding areas are:
Transportation vehicles running through Dhaka -Munshiganj highway,
Activities of the surrounding industries,
Adjacent bustling bazaar, etc
On the other side of the river, the noise sources like rice mills and other industries are far
away, and therefore, not affecting the noise environment at the proposed project site. The
site is isolated from the surrounding neighborhood with a high boundary wall which is
working as a noise barrier on three sides of the site. To establish the base level noise
within and around the site, sound level was measured at different times and at different
locations of the site and the approach road. The measurement points are shown in Map 4.2
Table 4.8 shows the maximum and minimum noise level at different location of sound
monitoring in the project site at day time and Table 4.9 at night time, the acceptable Noise
Level(Bangladesh gazette: September 7, 2006 is shown in Table 9.10. Figure 4.4 is sound
level baseline map of the project area which shows that the sound level is higher than
Bangladesh standards in the area between the proposed project area and the Dhaka-
Mukhterpur road as the vehicular movement is high due to the high density of industries in
the vicinity of the proposed SAPL project area. .
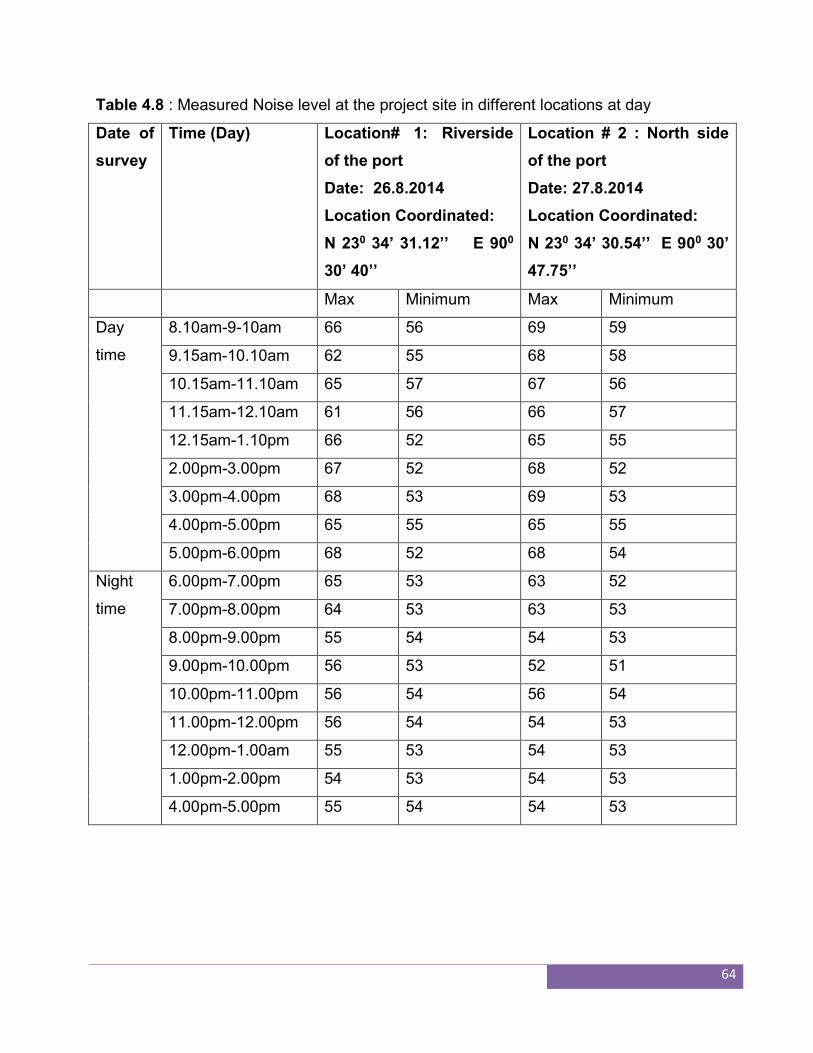
64
Table 4.8 : Measured Noise level at the project site in different locations at day
Date of
survey
Time (Day) Location# 1: Riverside
of the port
Date: 26.8.2014
Location Coordinated:
N 230 34’ 31.12’’ E 900
30’ 40’’
Location # 2 : North side
of the port
Date: 27.8.2014
Location Coordinated:
N 230 34’ 30.54’’ E 900 30’
47.75’’
Max Minimum Max Minimum
Day
time
8.10am-9-10am 66 56 69 59
9.15am-10.10am 62 55 68 58
10.15am-11.10am 65 57 67 56
11.15am-12.10am 61 56 66 57
12.15am-1.10pm 66 52 65 55
2.00pm-3.00pm 67 52 68 52
3.00pm-4.00pm 68 53 69 53
4.00pm-5.00pm 65 55 65 55
5.00pm-6.00pm 68 52 68 54
Night
time
6.00pm-7.00pm 65 53 63 52
7.00pm-8.00pm 64 53 63 53
8.00pm-9.00pm 55 54 54 53
9.00pm-10.00pm 56 53 52 51
10.00pm-11.00pm 56 54 56 54
11.00pm-12.00pm 56 54 54 53
12.00pm-1.00am 55 53 54 53
1.00pm-2.00pm 54 53 54 53
4.00pm-5.00pm 55 54 54 53
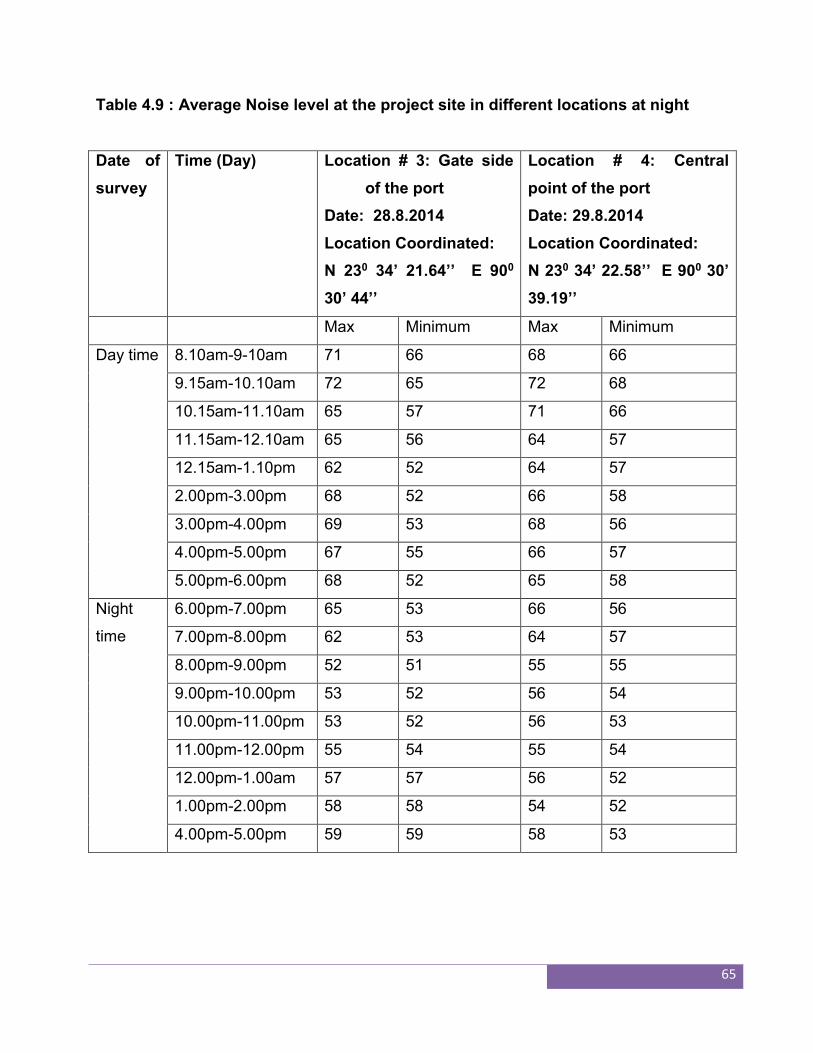
65
Table 4.9 : Average Noise level at the project site in different locations at night
Date of
survey
Time (Day) Location # 3: Gate side
of the port
Date: 28.8.2014
Location Coordinated:
N 230 34’ 21.64’’ E 900
30’ 44’’
Location # 4: Central
point of the port
Date: 29.8.2014
Location Coordinated:
N 230 34’ 22.58’’ E 900 30’
39.19’’
Max Minimum Max Minimum
Day time 8.10am-9-10am 71 66 68 66
9.15am-10.10am 72 65 72 68
10.15am-11.10am 65 57 71 66
11.15am-12.10am 65 56 64 57
12.15am-1.10pm 62 52 64 57
2.00pm-3.00pm 68 52 66 58
3.00pm-4.00pm 69 53 68 56
4.00pm-5.00pm 67 55 66 57
5.00pm-6.00pm 68 52 65 58
Night
time
6.00pm-7.00pm 65 53 66 56
7.00pm-8.00pm 62 53 64 57
8.00pm-9.00pm 52 51 55 55
9.00pm-10.00pm 53 52 56 54
10.00pm-11.00pm 53 52 56 53
11.00pm-12.00pm 55 54 55 54
12.00pm-1.00am 57 57 56 52
1.00pm-2.00pm 58 58 54 52
4.00pm-5.00pm 59 59 58 53
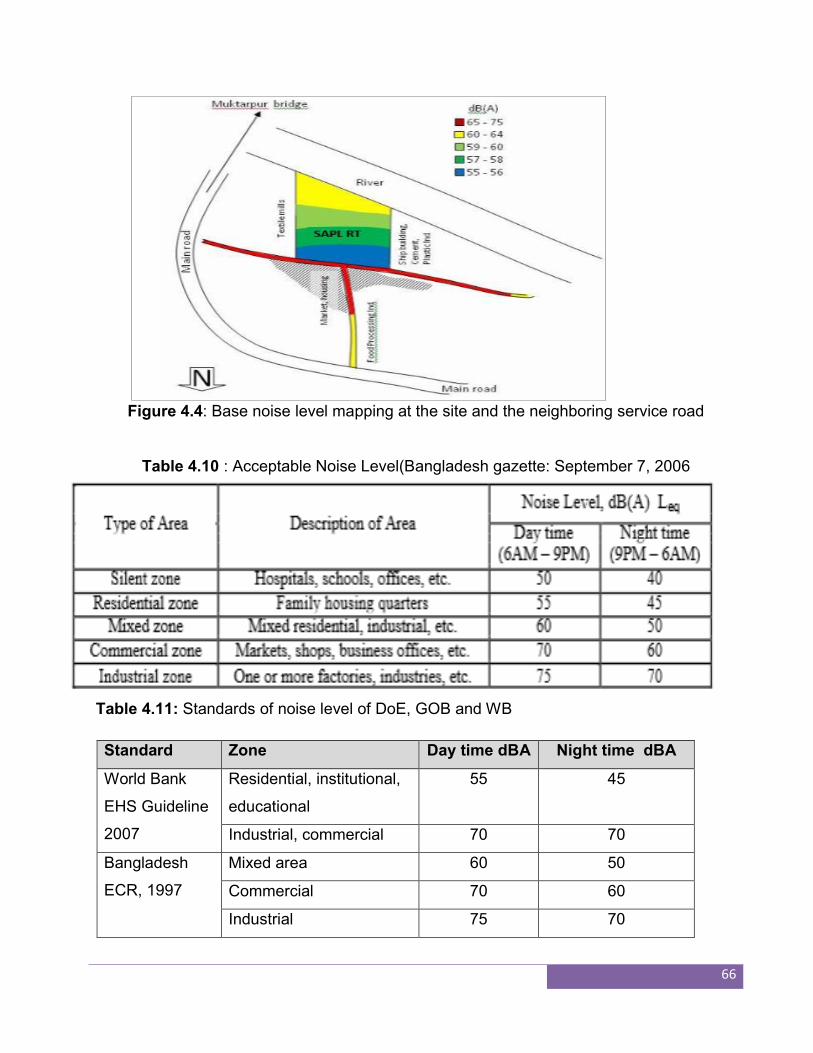
66
Figure 4.4: Base noise level mapping at the site and the neighboring service road
Table 4.10 : Acceptable Noise Level(Bangladesh gazette: September 7, 2006
Table 4.11: Standards of noise level of DoE, GOB and WB
Standard Zone Day time dBA Night time dBA
World Bank
EHS Guideline
2007
Residential, institutional,
educational
55 45
Industrial, commercial 70 70
Bangladesh
ECR, 1997
Mixed area 60 50
Commercial 70 60
Industrial 75 70
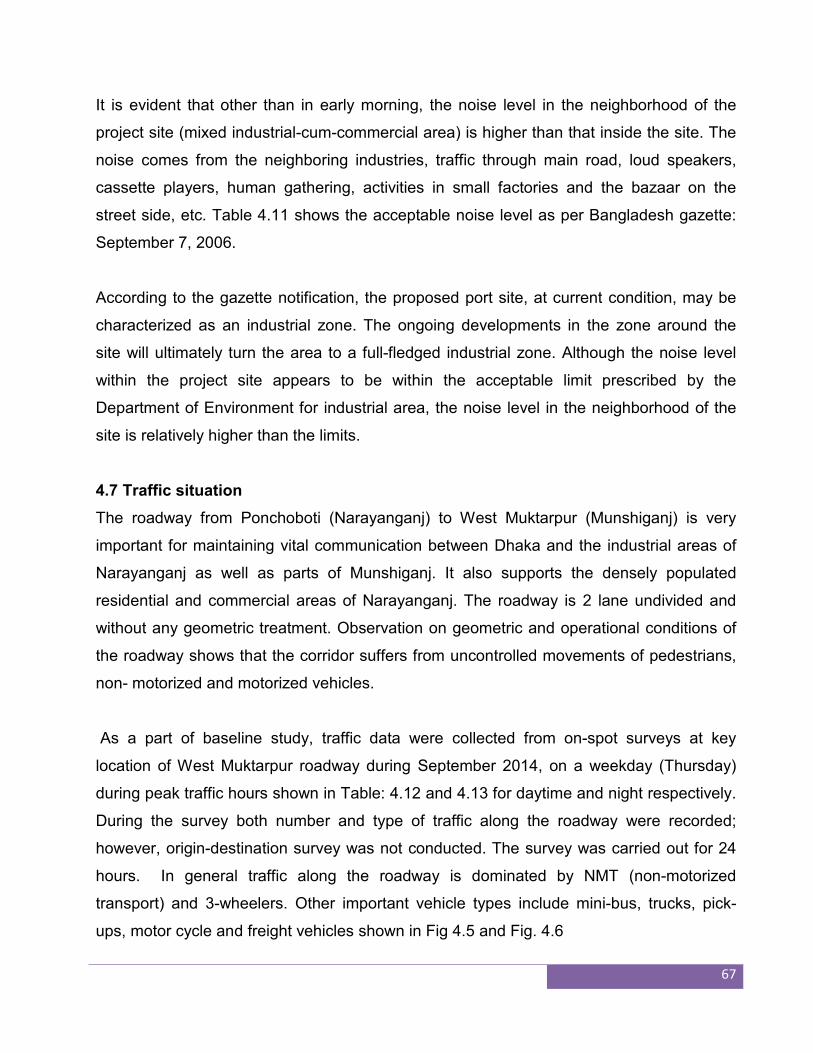
67
It is evident that other than in early morning, the noise level in the neighborhood of the
project site (mixed industrial-cum-commercial area) is higher than that inside the site. The
noise comes from the neighboring industries, traffic through main road, loud speakers,
cassette players, human gathering, activities in small factories and the bazaar on the
street side, etc. Table 4.11 shows the acceptable noise level as per Bangladesh gazette:
September 7, 2006.
According to the gazette notification, the proposed port site, at current condition, may be
characterized as an industrial zone. The ongoing developments in the zone around the
site will ultimately turn the area to a full-fledged industrial zone. Although the noise level
within the project site appears to be within the acceptable limit prescribed by the
Department of Environment for industrial area, the noise level in the neighborhood of the
site is relatively higher than the limits.
4.7 Traffic situation
The roadway from Ponchoboti (Narayanganj) to West Muktarpur (Munshiganj) is very
important for maintaining vital communication between Dhaka and the industrial areas of
Narayanganj as well as parts of Munshiganj. It also supports the densely populated
residential and commercial areas of Narayanganj. The roadway is 2 lane undivided and
without any geometric treatment. Observation on geometric and operational conditions of
the roadway shows that the corridor suffers from uncontrolled movements of pedestrians,
non- motorized and motorized vehicles.
As a part of baseline study, traffic data were collected from on-spot surveys at key
location of West Muktarpur roadway during September 2014, on a weekday (Thursday)
during peak traffic hours shown in Table: 4.12 and 4.13 for daytime and night respectively.
During the survey both number and type of traffic along the roadway were recorded;
however, origin-destination survey was not conducted. The survey was carried out for 24
hours. In general traffic along the roadway is dominated by NMT (non-motorized
transport) and 3-wheelers. Other important vehicle types include mini-bus, trucks, pick-
ups, motor cycle and freight vehicles shown in Fig 4.5 and Fig. 4.6
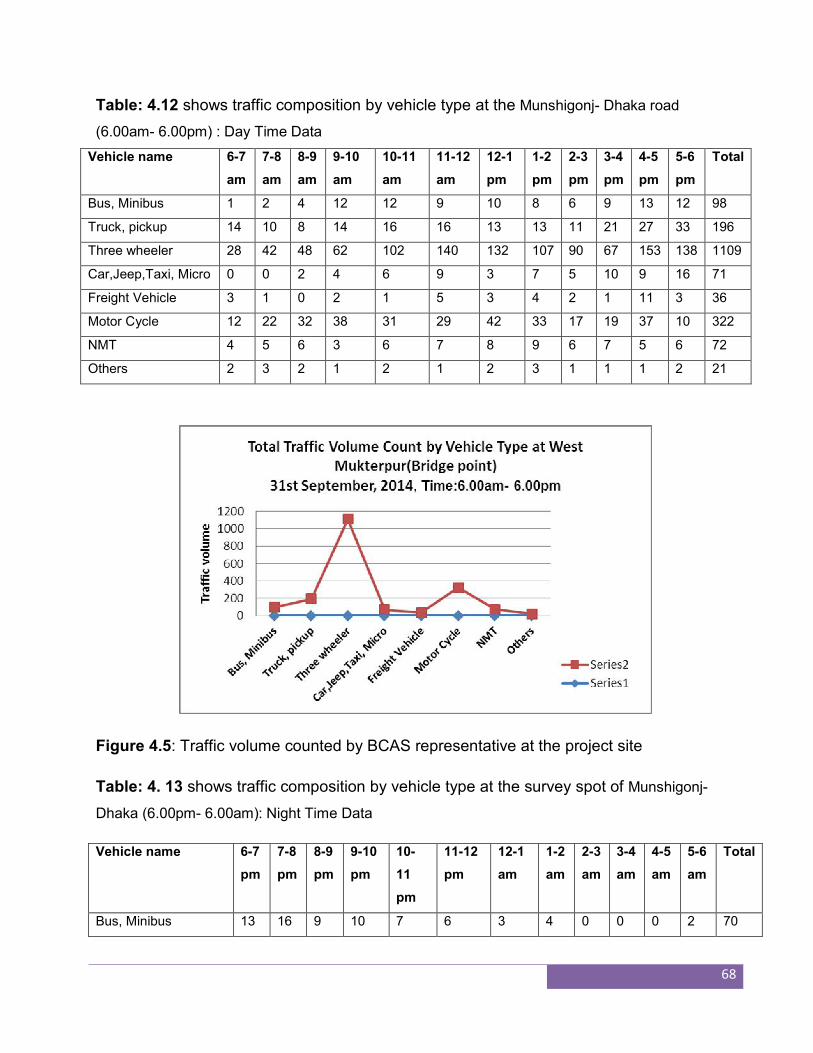
68
Table: 4.12 shows traffic composition by vehicle type at the Munshigonj- Dhaka road
(6.00am- 6.00pm) : Day Time Data
Vehicle name 6-7
am
7-8
am
8-9
am
9-10
am
10-11
am
11-12
am
12-1
pm
1-2
pm
2-3
pm
3-4
pm
4-5
pm
5-6
pm
Total
Bus, Minibus 1 2 4 12 12 9 10 8 6 9 13 12 98
Truck, pickup 14 10 8 14 16 16 13 13 11 21 27 33 196
Three wheeler 28 42 48 62 102 140 132 107 90 67 153 138 1109
Car,Jeep,Taxi, Micro 0 0 2 4 6 9 3 7 5 10 9 16 71
Freight Vehicle 3 1 0 2 1 5 3 4 2 1 11 3 36
Motor Cycle 12 22 32 38 31 29 42 33 17 19 37 10 322
NMT 4 5 6 3 6 7 8 9 6 7 5 6 72
Others 2 3 2 1 2 1 2 3 1 1 1 2 21
Figure 4.5: Traffic volume counted by BCAS representative at the project site
Table: 4. 13 shows traffic composition by vehicle type at the survey spot of Munshigonj-
Dhaka (6.00pm- 6.00am): Night Time Data
Vehicle name 6-7
pm
7-8
pm
8-9
pm
9-10
pm
10-
11
pm
11-12
pm
12-1
am
1-2
am
2-3
am
3-4
am
4-5
am
5-6
am
Total
Bus, Minibus 13 16 9 10 7 6 3 4 0 0 0 2 70
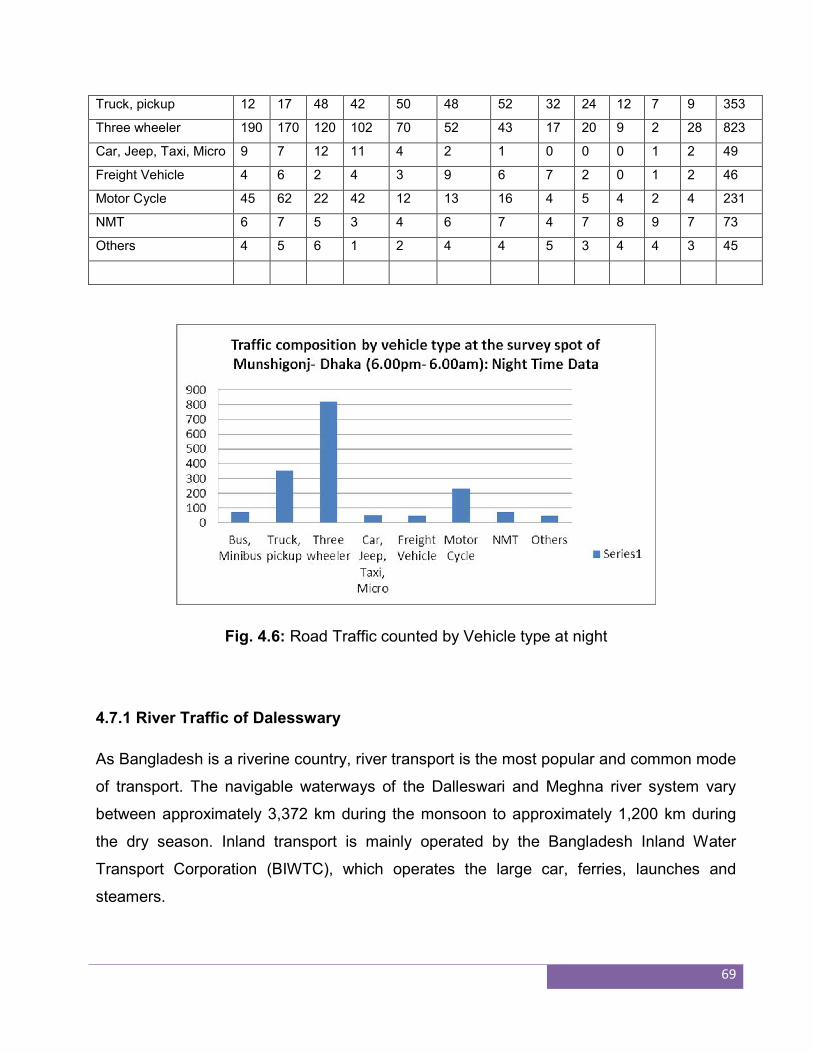
69
Truck, pickup 12 17 48 42 50 48 52 32 24 12 7 9 353
Three wheeler 190 170 120 102 70 52 43 17 20 9 2 28 823
Car, Jeep, Taxi, Micro 9 7 12 11 4 2 1 0 0 0 1 2 49
Freight Vehicle 4 6 2 4 3 9 6 7 2 0 1 2 46
Motor Cycle 45 62 22 42 12 13 16 4 5 4 2 4 231
NMT 6 7 5 3 4 6 7 4 7 8 9 7 73
Others 4 5 6 1 2 4 4 5 3 4 4 3 45
Fig. 4.6: Road Traffic counted by Vehicle type at night
4.7.1 River Traffic of Dalesswary
As Bangladesh is a riverine country, river transport is the most popular and common mode
of transport. The navigable waterways of the Dalleswari and Meghna river system vary
between approximately 3,372 km during the monsoon to approximately 1,200 km during
the dry season. Inland transport is mainly operated by the Bangladesh Inland Water
Transport Corporation (BIWTC), which operates the large car, ferries, launches and
steamers.
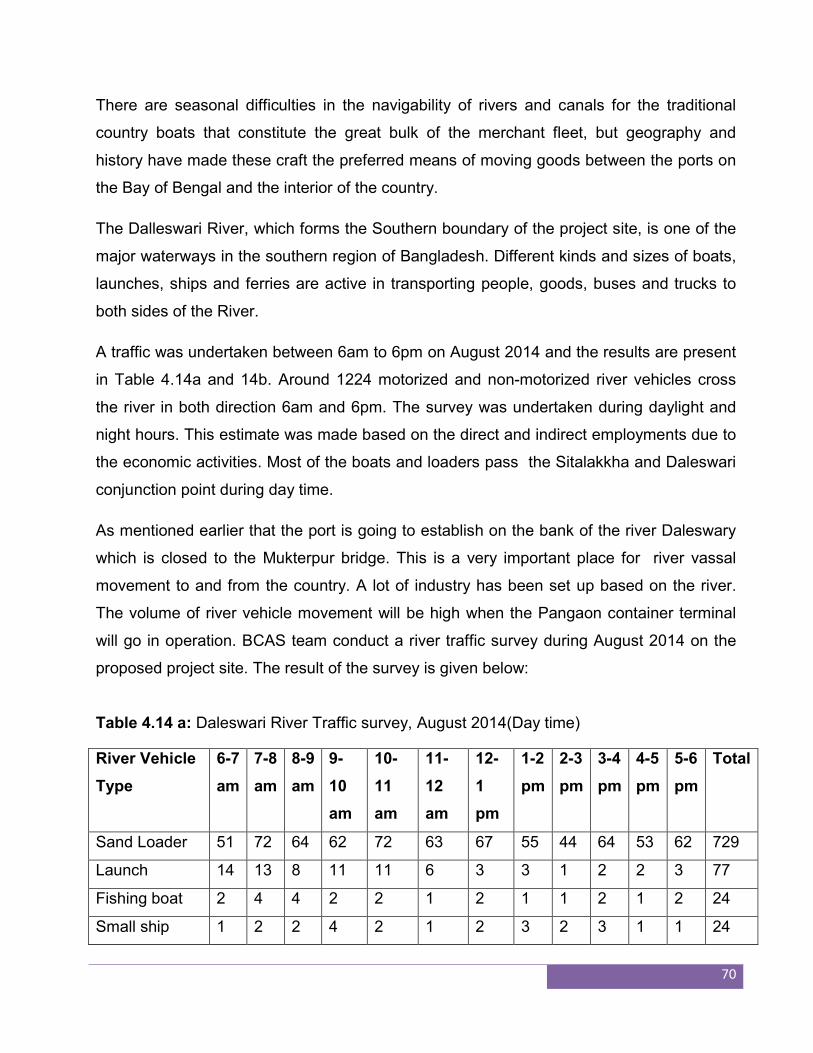
70
There are seasonal difficulties in the navigability of rivers and canals for the traditional
country boats that constitute the great bulk of the merchant fleet, but geography and
history have made these craft the preferred means of moving goods between the ports on
the Bay of Bengal and the interior of the country.
The Dalleswari River, which forms the Southern boundary of the project site, is one of the
major waterways in the southern region of Bangladesh. Different kinds and sizes of boats,
launches, ships and ferries are active in transporting people, goods, buses and trucks to
both sides of the River.
A traffic was undertaken between 6am to 6pm on August 2014 and the results are present
in Table 4.14a and 14b. Around 1224 motorized and non-motorized river vehicles cross
the river in both direction 6am and 6pm. The survey was undertaken during daylight and
night hours. This estimate was made based on the direct and indirect employments due to
the economic activities. Most of the boats and loaders pass the Sitalakkha and Daleswari
conjunction point during day time.
As mentioned earlier that the port is going to establish on the bank of the river Daleswary
which is closed to the Mukterpur bridge. This is a very important place for river vassal
movement to and from the country. A lot of industry has been set up based on the river.
The volume of river vehicle movement will be high when the Pangaon container terminal
will go in operation. BCAS team conduct a river traffic survey during August 2014 on the
proposed project site. The result of the survey is given below:
Table 4.14 a: Daleswari River Traffic survey, August 2014(Day time)
River Vehicle
Type
6-7
am
7-8
am
8-9
am
9-
10
am
10-
11
am
11-
12
am
12-
1
pm
1-2
pm
2-3
pm
3-4
pm
4-5
pm
5-6
pm
Total
Sand Loader 51 72 64 62 72 63 67 55 44 64 53 62 729
Launch 14 13 8 11 11 6 3 3 1 2 2 3 77
Fishing boat 2 4 4 2 2 1 2 1 1 2 1 2 24
Small ship 1 2 2 4 2 1 2 3 2 3 1 1 24
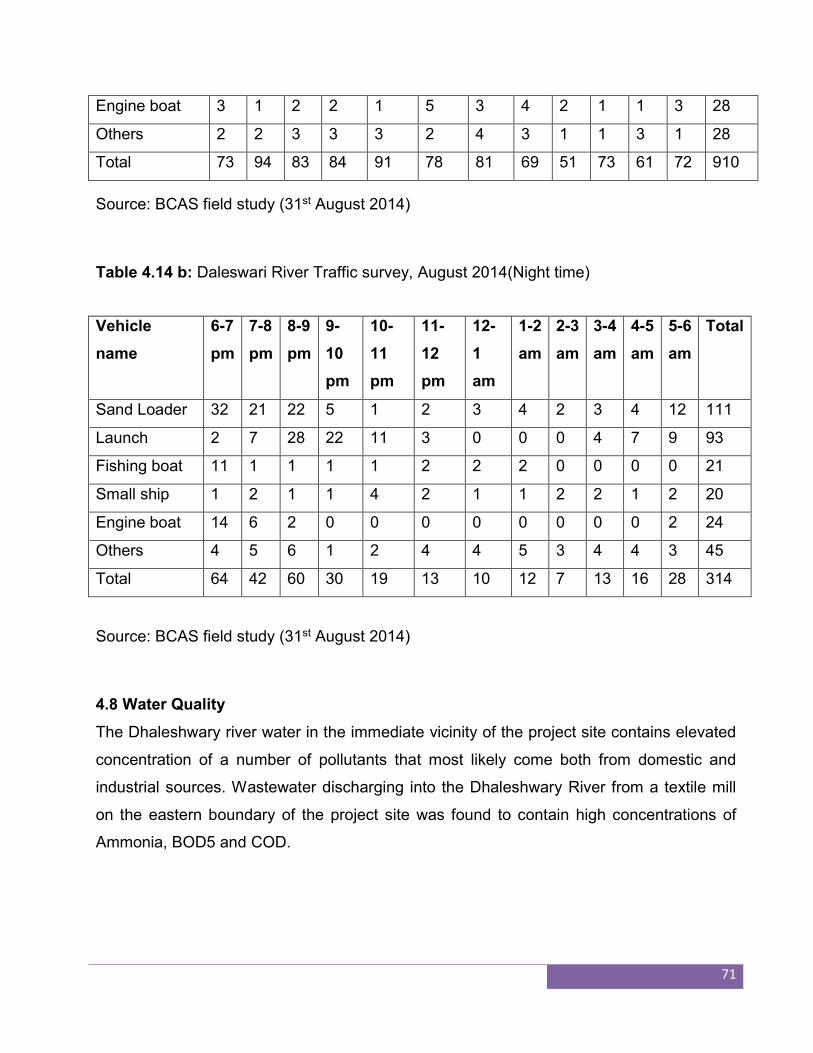
71
Source: BCAS field study (31st August 2014)
Table 4.14 b: Daleswari River Traffic survey, August 2014(Night time)
Source: BCAS field study (31st August 2014)
4.8 Water Quality
The Dhaleshwary river water in the immediate vicinity of the project site contains elevated
concentration of a number of pollutants that most likely come both from domestic and
industrial sources. Wastewater discharging into the Dhaleshwary River from a textile mill
on the eastern boundary of the project site was found to contain high concentrations of
Ammonia, BOD5 and COD.
Engine boat 3 1 2 2 1 5 3 4 2 1 1 3 28
Others 2 2 3 3 3 2 4 3 1 1 3 1 28
Total 73 94 83 84 91 78 81 69 51 73 61 72 910
Vehicle
name
6-7
pm
7-8
pm
8-9
pm
9-
10
pm
10-
11
pm
11-
12
pm
12-
1
am
1-2
am
2-3
am
3-4
am
4-5
am
5-6
am
Total
Sand Loader 32 21 22 5 1 2 3 4 2 3 4 12 111
Launch 2 7 28 22 11 3 0 0 0 4 7 9 93
Fishing boat 11 1 1 1 1 2 2 2 0 0 0 0 21
Small ship 1 2 1 1 4 2 1 1 2 2 1 2 20
Engine boat 14 6 2 0 0 0 0 0 0 0 0 2 24
Others 4 5 6 1 2 4 4 5 3 4 4 3 45
Total 64 42 60 30 19 13 10 12 7 13 16 28 314
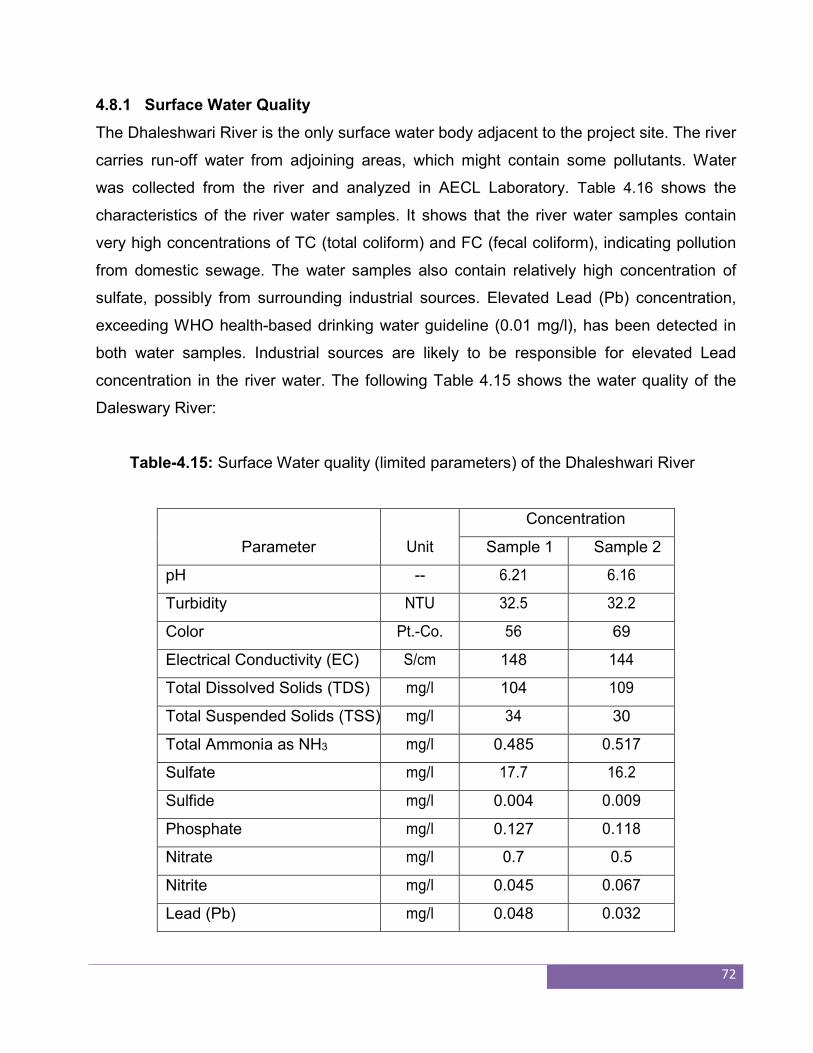
72
4.8.1 Surface Water Quality
The Dhaleshwari River is the only surface water body adjacent to the project site. The river
carries run-off water from adjoining areas, which might contain some pollutants. Water
was collected from the river and analyzed in AECL Laboratory. Table 4.16 shows the
characteristics of the river water samples. It shows that the river water samples contain
very high concentrations of TC (total coliform) and FC (fecal coliform), indicating pollution
from domestic sewage. The water samples also contain relatively high concentration of
sulfate, possibly from surrounding industrial sources. Elevated Lead (Pb) concentration,
exceeding WHO health-based drinking water guideline (0.01 mg/l), has been detected in
both water samples. Industrial sources are likely to be responsible for elevated Lead
concentration in the river water. The following Table 4.15 shows the water quality of the
Daleswary River:
Table-4.15: Surface Water quality (limited parameters) of the Dhaleshwari River
Parameter Unit
Concentration
Sample 1 Sample 2
pH -- 6.21 6.16
Turbidity NTU 32.5 32.2
Color Pt.-Co. 56 69
Electrical Conductivity (EC) S/cm 148 144
Total Dissolved Solids (TDS) mg/l 104 109
Total Suspended Solids (TSS) mg/l 34 30
Total Ammonia as NH3 mg/l 0.485 0.517
Sulfate mg/l 17.7 16.2
Sulfide mg/l 0.004 0.009
Phosphate mg/l 0.127 0.118
Nitrate mg/l 0.7 0.5
Nitrite mg/l 0.045 0.067
Lead (Pb) mg/l 0.048 0.032
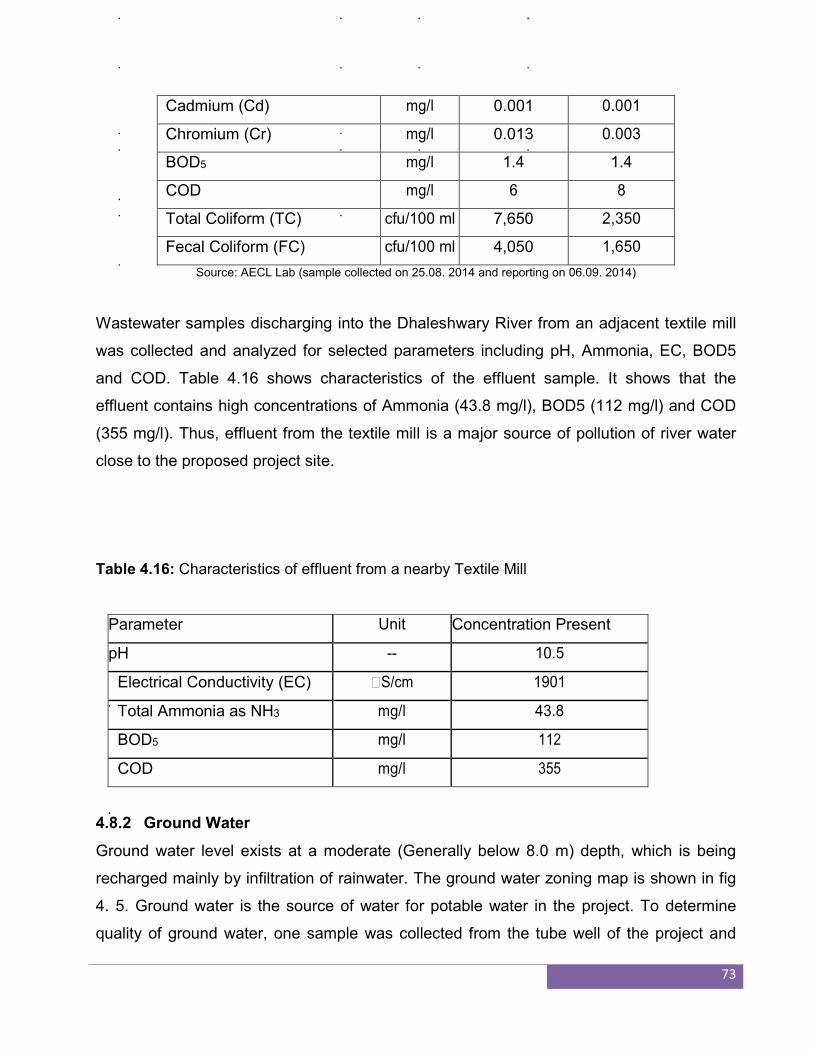
73
Cadmium (Cd) mg/l 0.001 0.001
Chromium (Cr) mg/l 0.013 0.003
BOD5 mg/l 1.4 1.4
COD mg/l 6 8
Total Coliform (TC) cfu/100 ml 7,650 2,350
Fecal Coliform (FC) cfu/100 ml 4,050 1,650
Source: AECL Lab (sample collected on 25.08. 2014 and reporting on 06.09. 2014)
Wastewater samples discharging into the Dhaleshwary River from an adjacent textile mill
was collected and analyzed for selected parameters including pH, Ammonia, EC, BOD5
and COD. Table 4.16 shows characteristics of the effluent sample. It shows that the
effluent contains high concentrations of Ammonia (43.8 mg/l), BOD5 (112 mg/l) and COD
(355 mg/l). Thus, effluent from the textile mill is a major source of pollution of river water
close to the proposed project site.
Table 4.16: Characteristics of effluent from a nearby Textile Mill
Parameter Unit Concentration Present
pH -- 10.5
Electrical Conductivity (EC) S/cm 1901
Total Ammonia as NH3 mg/l 43.8
BOD5 mg/l 112
COD mg/l 355
4.8.2 Ground Water
Ground water level exists at a moderate (Generally below 8.0 m) depth, which is being
recharged mainly by infiltration of rainwater. The ground water zoning map is shown in fig
4. 5. Ground water is the source of water for potable water in the project. To determine
quality of ground water, one sample was collected from the tube well of the project and
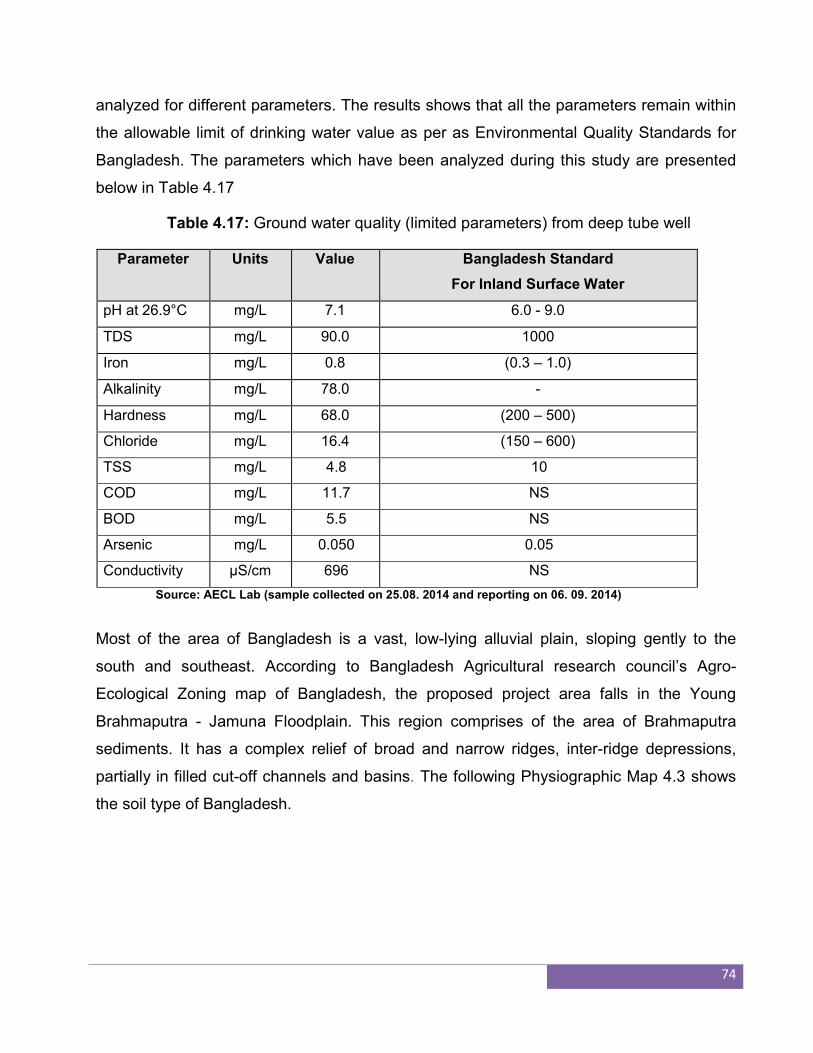
74
analyzed for different parameters. The results shows that all the parameters remain within
the allowable limit of drinking water value as per as Environmental Quality Standards for
Bangladesh. The parameters which have been analyzed during this study are presented
below in Table 4.17
Table 4.17: Ground water quality (limited parameters) from deep tube well
Parameter Units Value Bangladesh Standard
For Inland Surface Water
pH at 26.9°C mg/L 7.1 6.0 - 9.0
TDS mg/L 90.0 1000
Iron mg/L 0.8 (0.3 – 1.0)
Alkalinity mg/L 78.0 -
Hardness mg/L 68.0 (200 – 500)
Chloride mg/L 16.4 (150 – 600)
TSS mg/L 4.8 10
COD mg/L 11.7 NS
BOD mg/L 5.5 NS
Arsenic mg/L 0.050 0.05
Conductivity µS/cm 696 NS
Source: AECL Lab (sample collected on 25.08. 2014 and reporting on 06. 09. 2014)
Most of the area of Bangladesh is a vast, low-lying alluvial plain, sloping gently to the
south and southeast. According to Bangladesh Agricultural research council’s Agro-
Ecological Zoning map of Bangladesh, the proposed project area falls in the Young
Brahmaputra - Jamuna Floodplain. This region comprises of the area of Brahmaputra
sediments. It has a complex relief of broad and narrow ridges, inter-ridge depressions,
partially in filled cut-off channels and basins. The following Physiographic Map 4.3 shows
the soil type of Bangladesh.
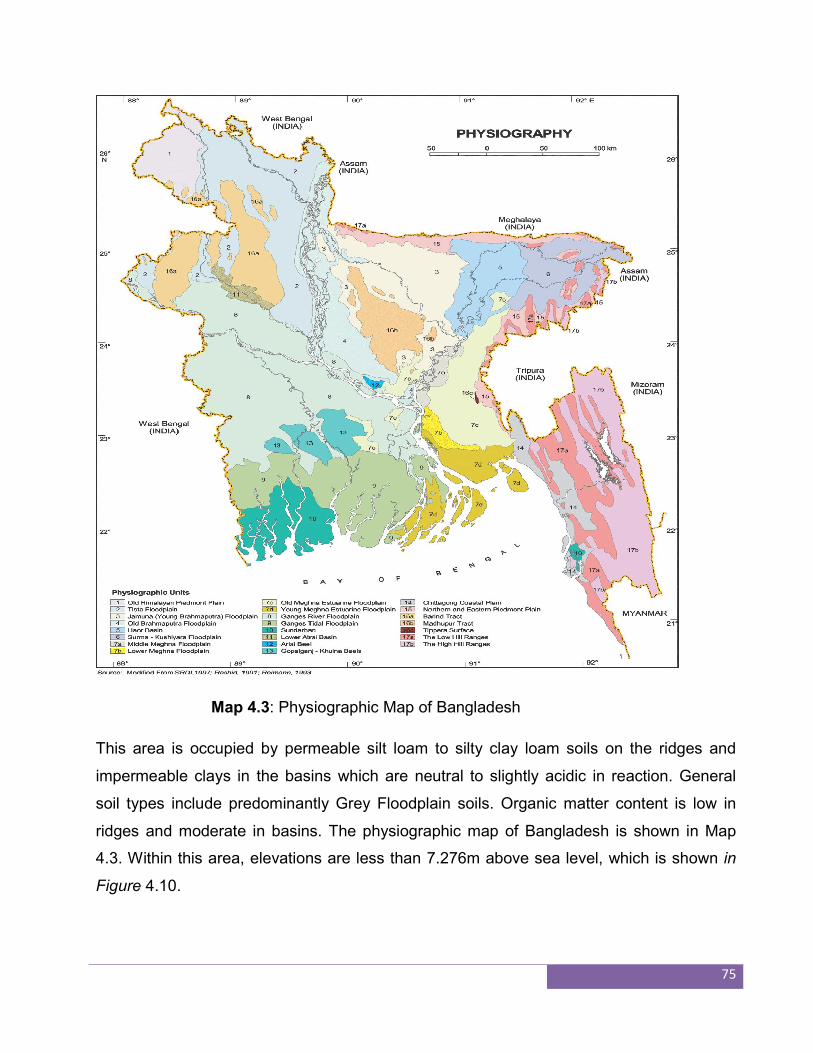
75
Map 4.3: Physiographic Map of Bangladesh
This area is occupied by permeable silt loam to silty clay loam soils on the ridges and
impermeable clays in the basins which are neutral to slightly acidic in reaction. General
soil types include predominantly Grey Floodplain soils. Organic matter content is low in
ridges and moderate in basins. The physiographic map of Bangladesh is shown in Map
4.3. Within this area, elevations are less than 7.276m above sea level, which is shown in
Figure 4.10.
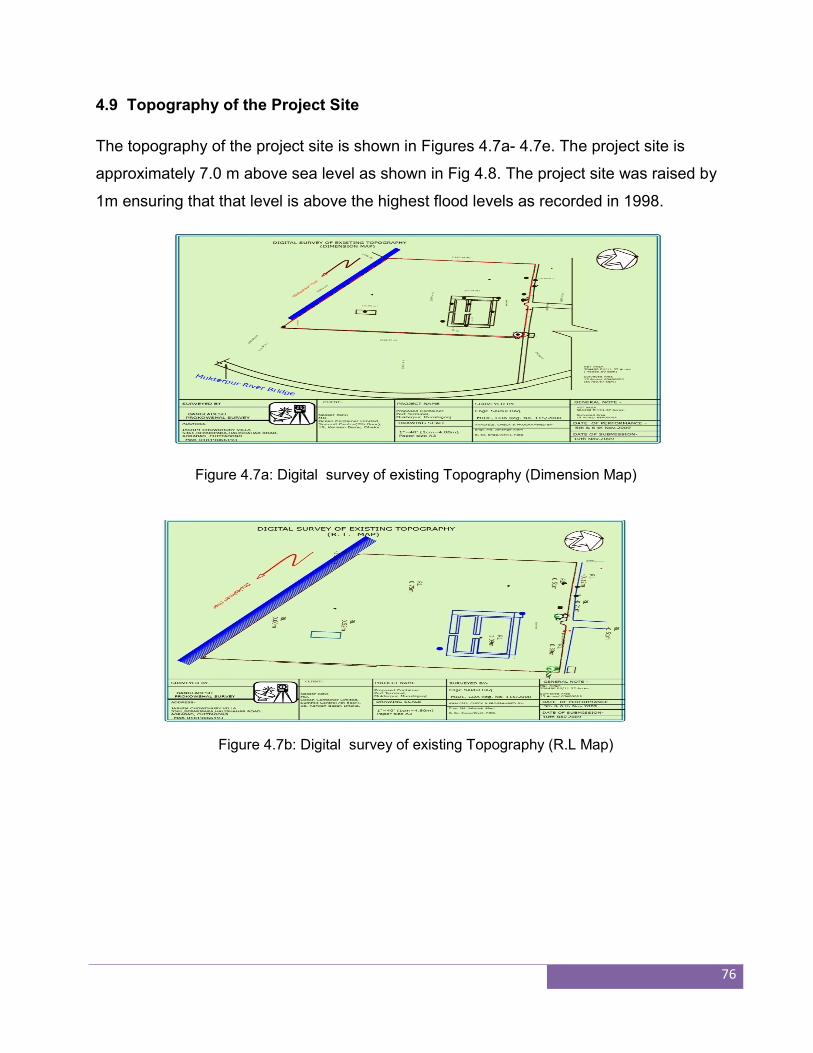
76
4.9 Topography of the Project Site
The topography of the project site is shown in Figures 4.7a- 4.7e. The project site is
approximately 7.0 m above sea level as shown in Fig 4.8. The project site was raised by
1m ensuring that that level is above the highest flood levels as recorded in 1998.
Figure 4.7a: Digital survey of existing Topography (Dimension Map)
Figure 4.7b: Digital survey of existing Topography (R.L Map)
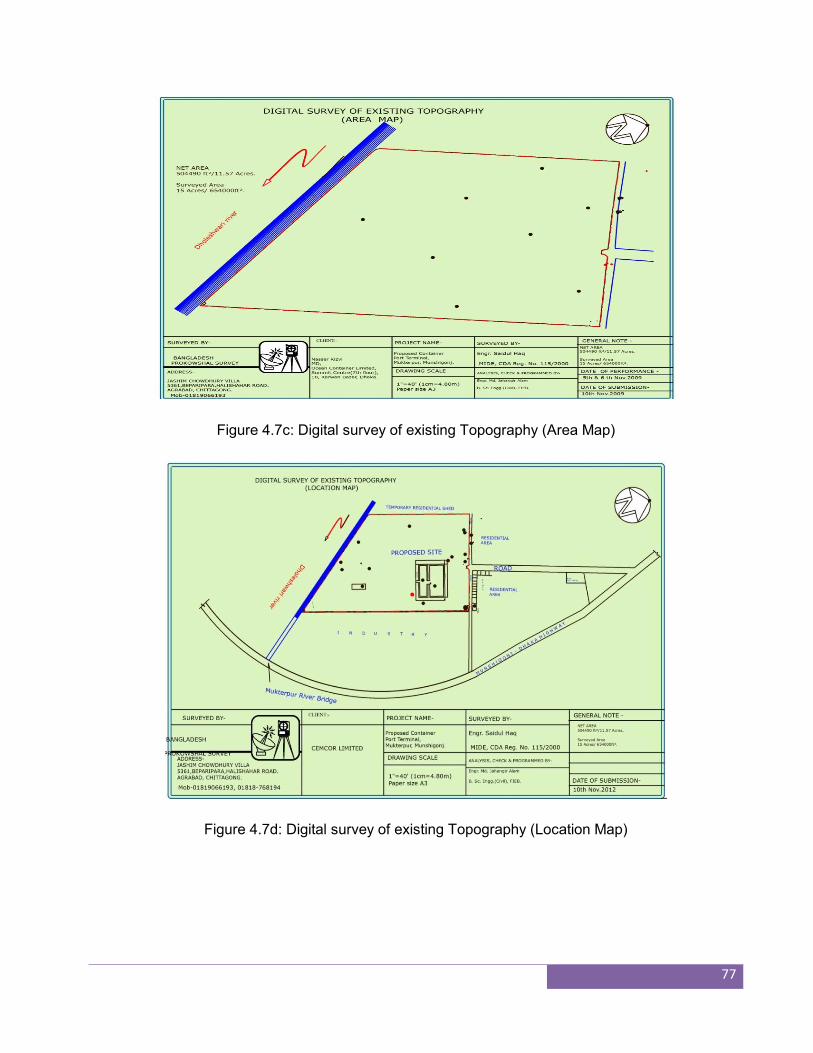
77
Figure 4.7c: Digital survey of existing Topography (Area Map)
Figure 4.7d: Digital survey of existing Topography (Location Map)
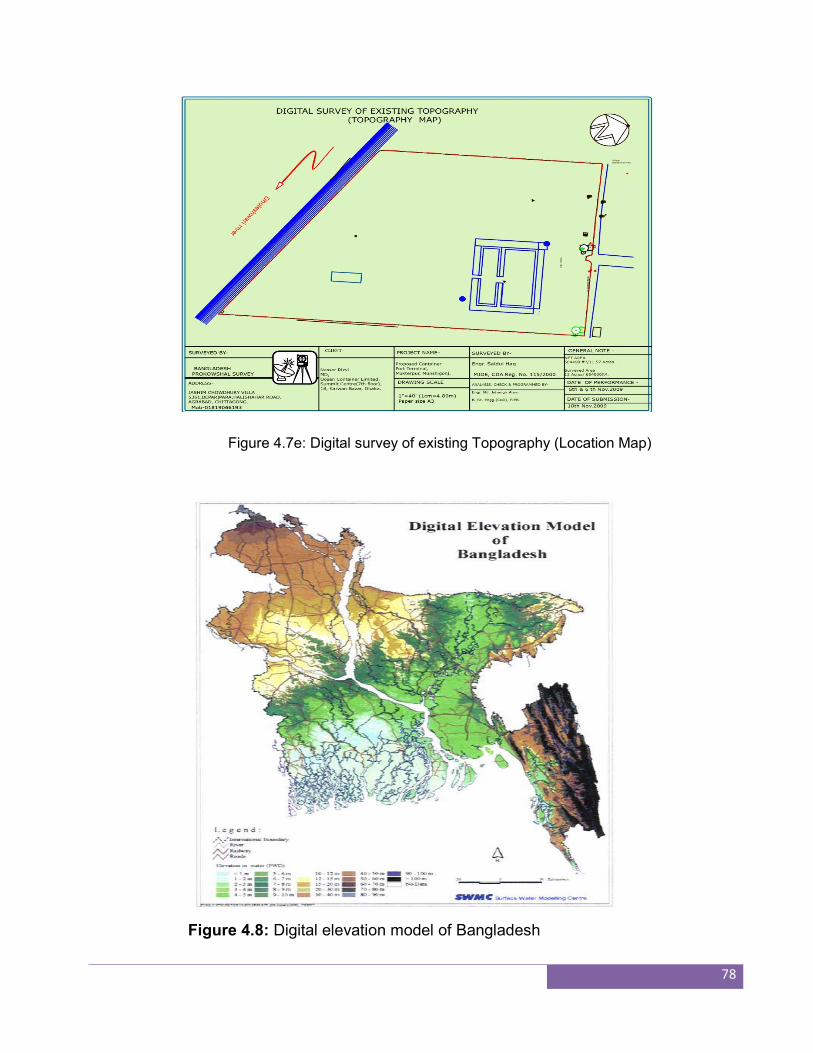
78
Figure 4.7e: Digital survey of existing Topography (Location Map)
Figure 4.8: Digital elevation model of Bangladesh
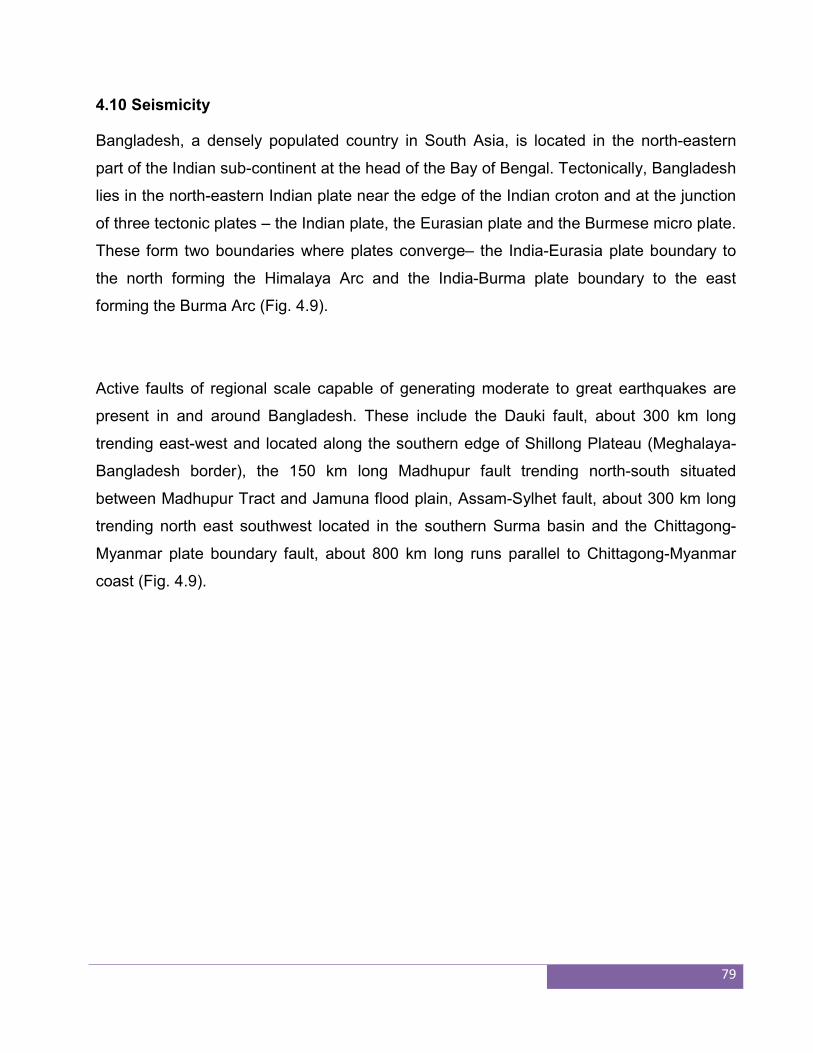
79
4.10 Seismicity
Bangladesh, a densely populated country in South Asia, is located in the north-eastern
part of the Indian sub-continent at the head of the Bay of Bengal. Tectonically, Bangladesh
lies in the north-eastern Indian plate near the edge of the Indian croton and at the junction
of three tectonic plates – the Indian plate, the Eurasian plate and the Burmese micro plate.
These form two boundaries where plates converge– the India-Eurasia plate boundary to
the north forming the Himalaya Arc and the India-Burma plate boundary to the east
forming the Burma Arc (Fig. 4.9).
Active faults of regional scale capable of generating moderate to great earthquakes are
present in and around Bangladesh. These include the Dauki fault, about 300 km long
trending east-west and located along the southern edge of Shillong Plateau (Meghalaya-
Bangladesh border), the 150 km long Madhupur fault trending north-south situated
between Madhupur Tract and Jamuna flood plain, Assam-Sylhet fault, about 300 km long
trending north east southwest located in the southern Surma basin and the Chittagong-
Myanmar plate boundary fault, about 800 km long runs parallel to Chittagong-Myanmar
coast (Fig. 4.9).
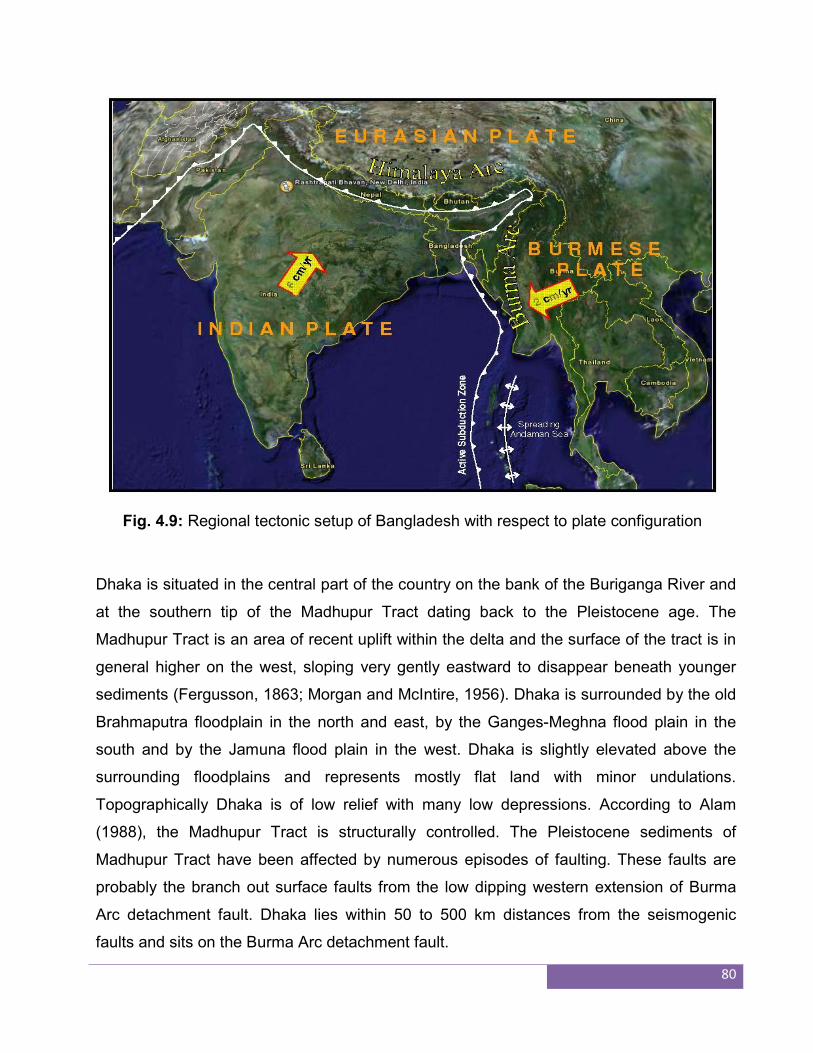
80
Fig. 4.9: Regional tectonic setup of Bangladesh with respect to plate configuration
Dhaka is situated in the central part of the country on the bank of the Buriganga River and
at the southern tip of the Madhupur Tract dating back to the Pleistocene age. The
Madhupur Tract is an area of recent uplift within the delta and the surface of the tract is in
general higher on the west, sloping very gently eastward to disappear beneath younger
sediments (Fergusson, 1863; Morgan and McIntire, 1956). Dhaka is surrounded by the old
Brahmaputra floodplain in the north and east, by the Ganges-Meghna flood plain in the
south and by the Jamuna flood plain in the west. Dhaka is slightly elevated above the
surrounding floodplains and represents mostly flat land with minor undulations.
Topographically Dhaka is of low relief with many low depressions. According to Alam
(1988), the Madhupur Tract is structurally controlled. The Pleistocene sediments of
Madhupur Tract have been affected by numerous episodes of faulting. These faults are
probably the branch out surface faults from the low dipping western extension of Burma
Arc detachment fault. Dhaka lies within 50 to 500 km distances from the seismogenic
faults and sits on the Burma Arc detachment fault.
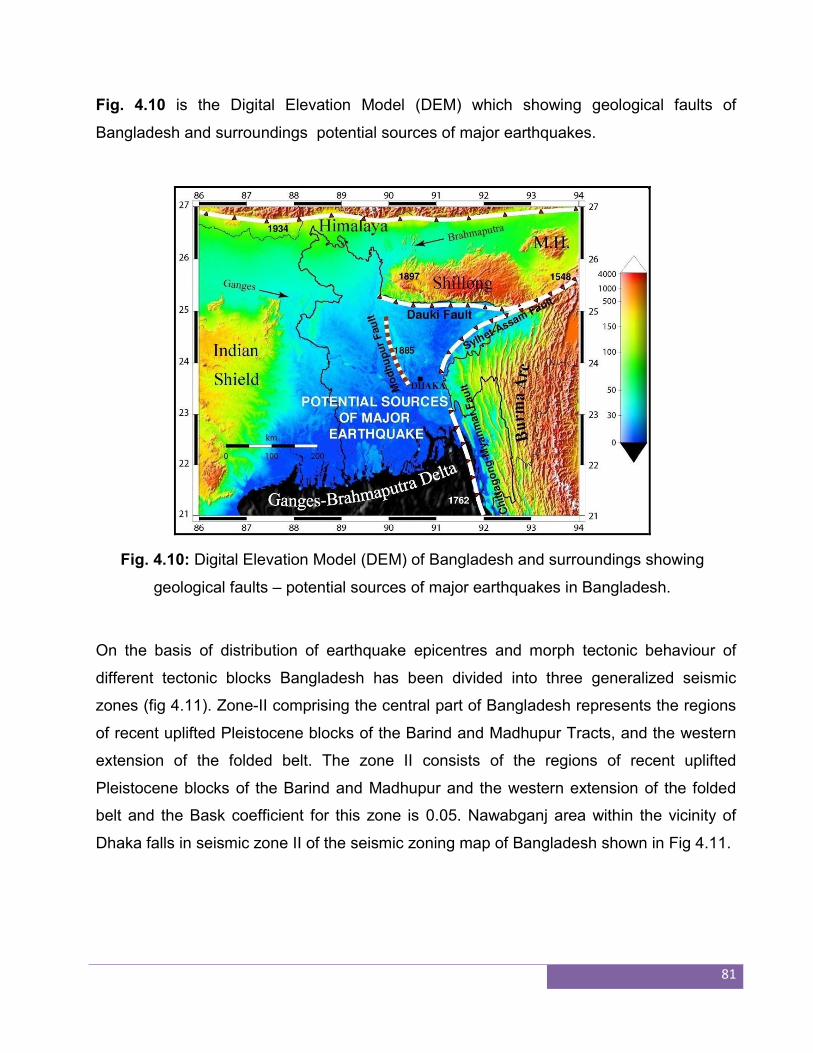
81
Fig. 4.10 is the Digital Elevation Model (DEM) which showing geological faults of
Bangladesh and surroundings potential sources of major earthquakes.
Fig. 4.10: Digital Elevation Model (DEM) of Bangladesh and surroundings showing
geological faults – potential sources of major earthquakes in Bangladesh.
On the basis of distribution of earthquake epicentres and morph tectonic behaviour of
different tectonic blocks Bangladesh has been divided into three generalized seismic
zones (fig 4.11). Zone-II comprising the central part of Bangladesh represents the regions
of recent uplifted Pleistocene blocks of the Barind and Madhupur Tracts, and the western
extension of the folded belt. The zone II consists of the regions of recent uplifted
Pleistocene blocks of the Barind and Madhupur and the western extension of the folded
belt and the Bask coefficient for this zone is 0.05. Nawabganj area within the vicinity of
Dhaka falls in seismic zone II of the seismic zoning map of Bangladesh shown in Fig 4.11.
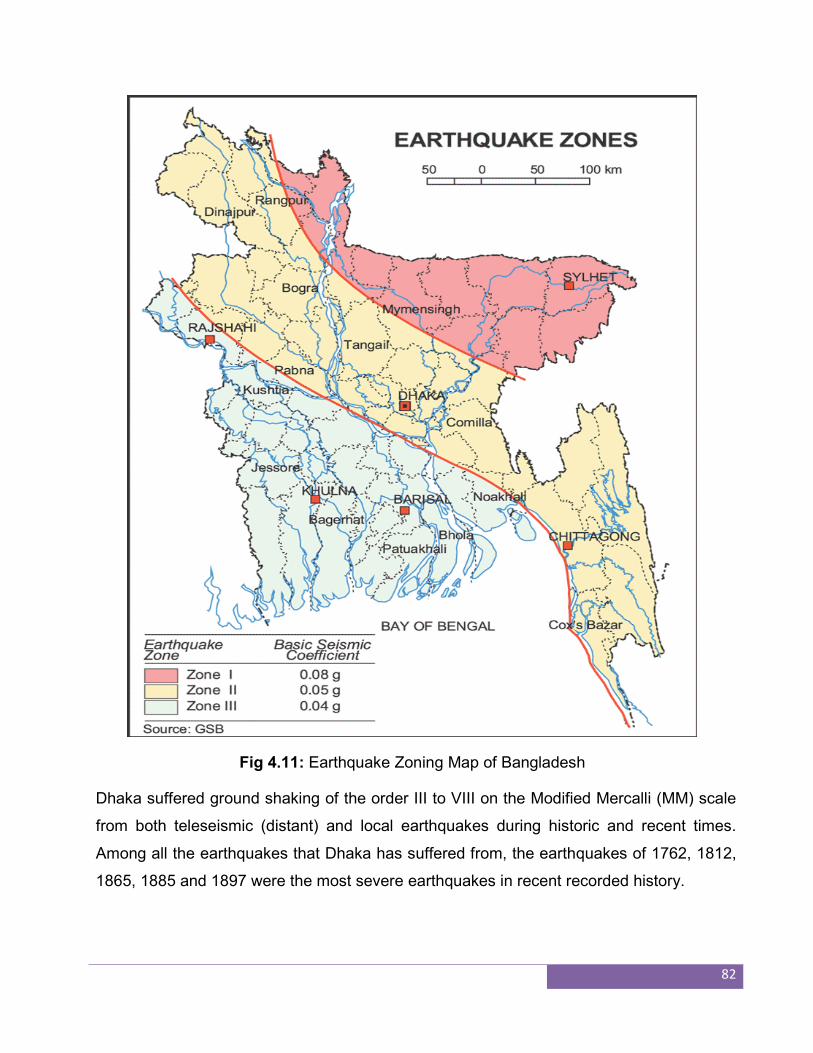
82
Fig 4.11: Earthquake Zoning Map of Bangladesh
Dhaka suffered ground shaking of the order III to VIII on the Modified Mercalli (MM) scale
from both teleseismic (distant) and local earthquakes during historic and recent times.
Among all the earthquakes that Dhaka has suffered from, the earthquakes of 1762, 1812,
1865, 1885 and 1897 were the most severe earthquakes in recent recorded history.
83
4.11 Biological Environment
An ecological survey was carried out as a part of the ESIA in order to assess the floral and
faunal diversity in areas surrounding the proposed project site on the bank of the
Dhaleshwary River. The main purposes of the ecological survey were:
to enlist the port and wildlife species with their national and international status,
to enlist critically endangered, rare and threatened flora and fauna species,
to investigate the distribution and abundance of flora and fauna including fish species,
and
to make an assessment of the impacts for the proposed project activities on the
ecological environment.
Floral and faunal diversity fluctuate seasonally due to environmental reasons. Seasonal
survey (spanning over a year) could provide detailed information on ecological diversity for
the study area. However, in the present study, a survey was conducted in August-
September 2014 during daytime. The ecologist of the EIA team visited the areas
surrounding the project site (approximately 5 km surrounding the project site) to collect
first hand information on floral and faunal diversity. Literature review and informal
interviews with local people were also conducted as a part of the study. Faunal and
mammalian survey was done through visual search and also through discussion with local
people. Aural and visual search were the main survey method for ornithological survey.
Fish and fishery information were collected through field study, fishermen interview as well
as local fish market survey. Floral survey was conducted through visual and rapid field
surveys.
Floral and Faunal Diversity
Flora
The proposed project is in a rural setting with greenery. This includes homesteads,
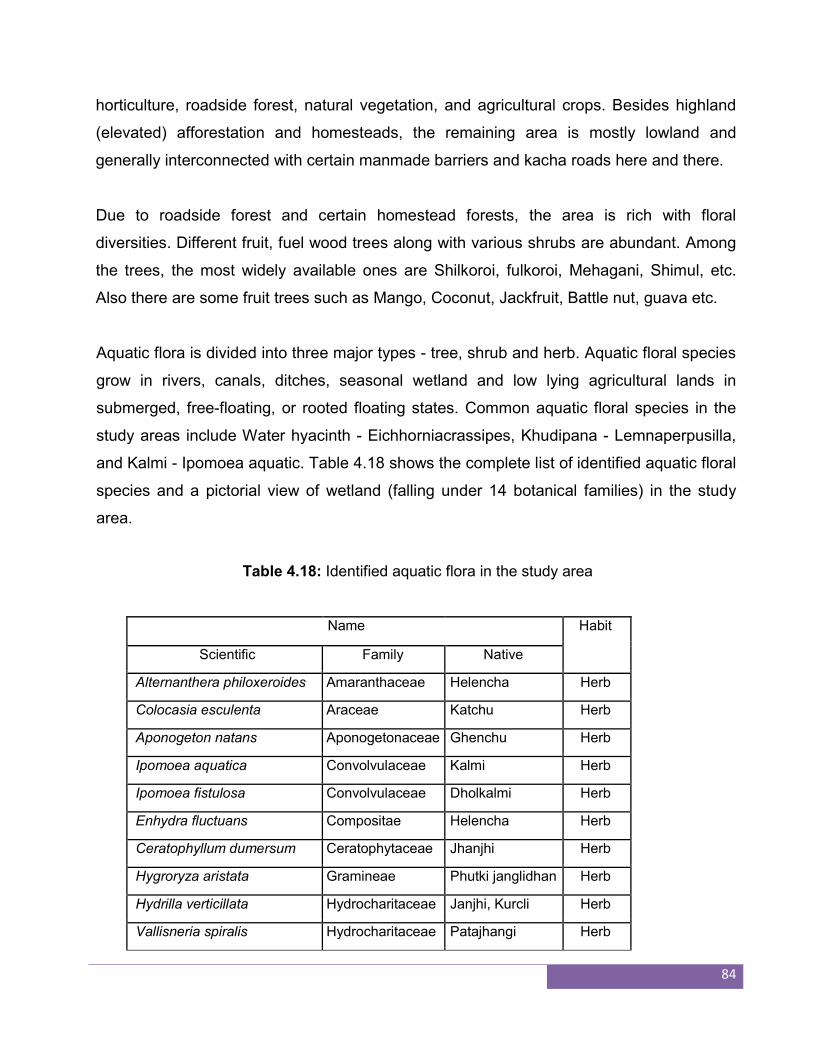
84
horticulture, roadside forest, natural vegetation, and agricultural crops. Besides highland
(elevated) afforestation and homesteads, the remaining area is mostly lowland and
generally interconnected with certain manmade barriers and kacha roads here and there.
Due to roadside forest and certain homestead forests, the area is rich with floral
diversities. Different fruit, fuel wood trees along with various shrubs are abundant. Among
the trees, the most widely available ones are Shilkoroi, fulkoroi, Mehagani, Shimul, etc.
Also there are some fruit trees such as Mango, Coconut, Jackfruit, Battle nut, guava etc.
Aquatic flora is divided into three major types - tree, shrub and herb. Aquatic floral species
grow in rivers, canals, ditches, seasonal wetland and low lying agricultural lands in
submerged, free-floating, or rooted floating states. Common aquatic floral species in the
study areas include Water hyacinth - Eichhorniacrassipes, Khudipana - Lemnaperpusilla,
and Kalmi - Ipomoea aquatic. Table 4.18 shows the complete list of identified aquatic floral
species and a pictorial view of wetland (falling under 14 botanical families) in the study
area.
Table 4.18: Identified aquatic flora in the study area
Name Habit
Scientific Family Native
Alternanthera philoxeroides Amaranthaceae Helencha Herb
Colocasia esculenta Araceae Katchu Herb
Aponogeton natans Aponogetonaceae Ghenchu Herb
Ipomoea aquatica Convolvulaceae Kalmi Herb
Ipomoea fistulosa Convolvulaceae Dholkalmi Herb
Enhydra fluctuans Compositae Helencha Herb
Ceratophyllum dumersum Ceratophytaceae Jhanjhi Herb
Hygroryza aristata Gramineae Phutki janglidhan Herb
Hydrilla verticillata Hydrocharitaceae Janjhi, Kurcli Herb
Vallisneria spiralis Hydrocharitaceae Patajhangi Herb
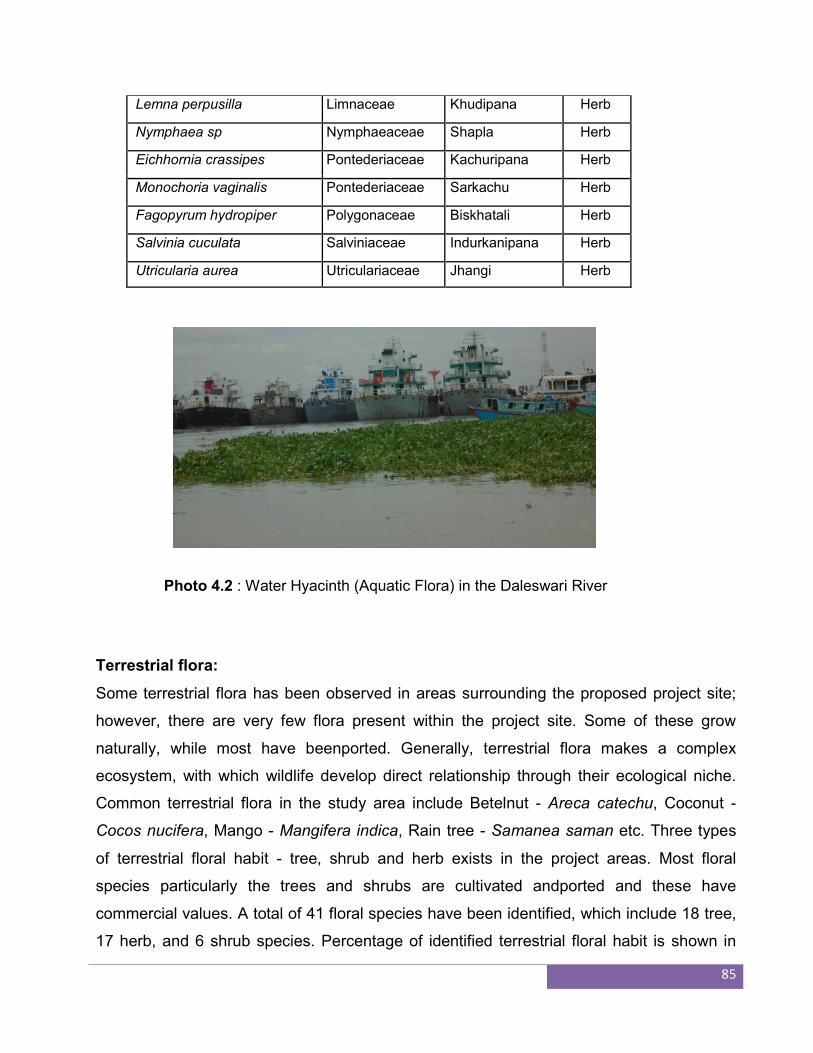
85
Lemna perpusilla Limnaceae Khudipana Herb
Nymphaea sp Nymphaeaceae Shapla Herb
Eichhornia crassipes Pontederiaceae Kachuripana Herb
Monochoria vaginalis Pontederiaceae Sarkachu Herb
Fagopyrum hydropiper Polygonaceae Biskhatali Herb
Salvinia cuculata Salviniaceae Indurkanipana Herb
Utricularia aurea Utriculariaceae Jhangi Herb
Photo 4.2 : Water Hyacinth (Aquatic Flora) in the Daleswari River
Terrestrial flora:
Some terrestrial flora has been observed in areas surrounding the proposed project site;
however, there are very few flora present within the project site. Some of these grow
naturally, while most have beenported. Generally, terrestrial flora makes a complex
ecosystem, with which wildlife develop direct relationship through their ecological niche.
Common terrestrial flora in the study area include Betelnut - Areca catechu, Coconut -
Cocos nucifera, Mango - Mangifera indica, Rain tree - Samanea saman etc. Three types
of terrestrial floral habit - tree, shrub and herb exists in the project areas. Most floral
species particularly the trees and shrubs are cultivated andported and these have
commercial values. A total of 41 floral species have been identified, which include 18 tree,
17 herb, and 6 shrub species. Percentage of identified terrestrial floral habit is shown in
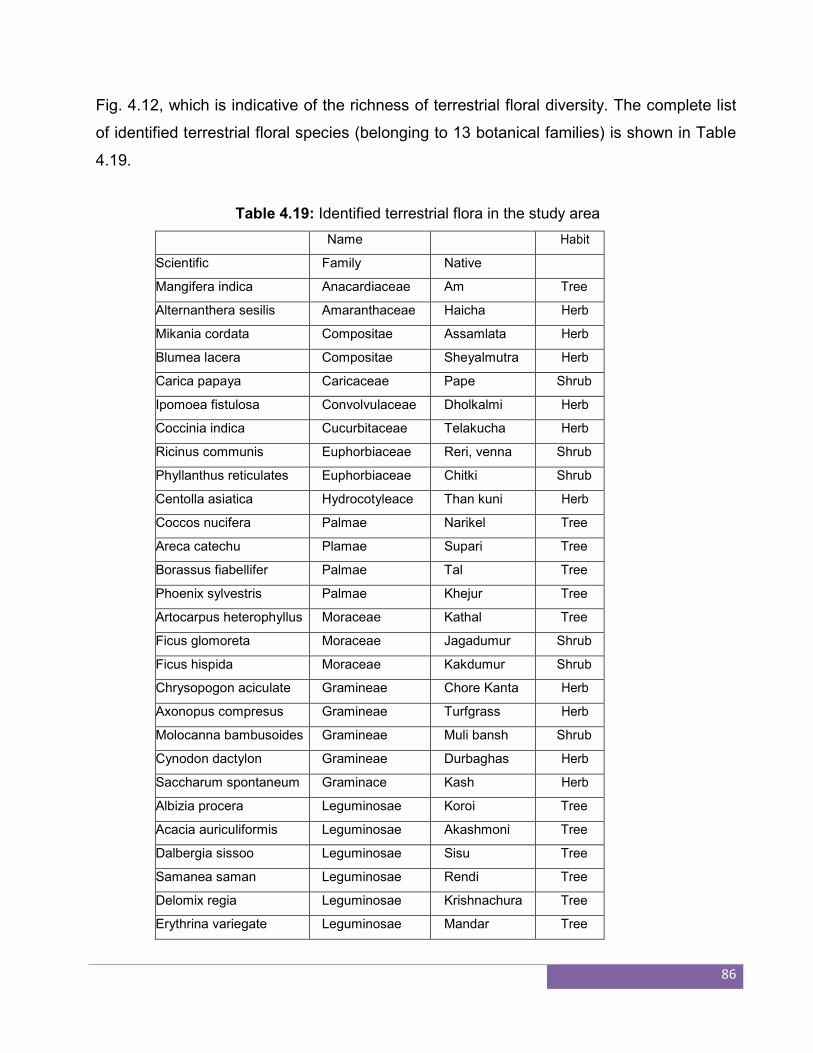
86
Fig. 4.12, which is indicative of the richness of terrestrial floral diversity. The complete list
of identified terrestrial floral species (belonging to 13 botanical families) is shown in Table
4.19.
Table 4.19: Identified terrestrial flora in the study area
Name Habit
Scientific Family Native
Mangifera indica Anacardiaceae Am Tree
Alternanthera sesilis Amaranthaceae Haicha Herb
Mikania cordata Compositae Assamlata Herb
Blumea lacera Compositae Sheyalmutra Herb
Carica papaya Caricaceae Pape Shrub
Ipomoea fistulosa Convolvulaceae Dholkalmi Herb
Coccinia indica Cucurbitaceae Telakucha Herb
Ricinus communis Euphorbiaceae Reri, venna Shrub
Phyllanthus reticulates Euphorbiaceae Chitki Shrub
Centolla asiatica Hydrocotyleace Than kuni Herb
Coccos nucifera Palmae Narikel Tree
Areca catechu Plamae Supari Tree
Borassus fiabellifer Palmae Tal Tree
Phoenix sylvestris Palmae Khejur Tree
Artocarpus heterophyllus Moraceae Kathal Tree
Ficus glomoreta Moraceae Jagadumur Shrub
Ficus hispida Moraceae Kakdumur Shrub
Chrysopogon aciculate Gramineae Chore Kanta Herb
Axonopus compresus Gramineae Turfgrass Herb
Molocanna bambusoides Gramineae Muli bansh Shrub
Cynodon dactylon Gramineae Durbaghas Herb
Saccharum spontaneum Graminace Kash Herb
Albizia procera Leguminosae Koroi Tree
Acacia auriculiformis Leguminosae Akashmoni Tree
Dalbergia sissoo Leguminosae Sisu Tree
Samanea saman Leguminosae Rendi Tree
Delomix regia Leguminosae Krishnachura Tree
Erythrina variegate Leguminosae Mandar Tree
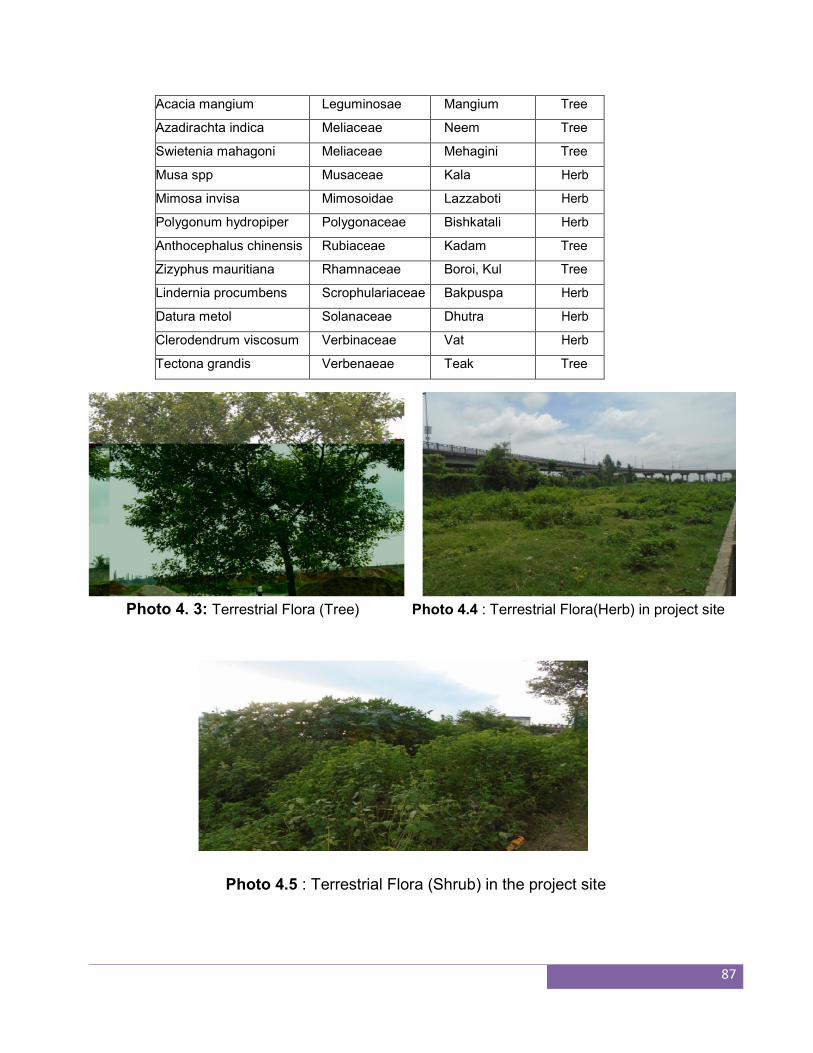
87
Acacia mangium Leguminosae Mangium Tree
Azadirachta indica Meliaceae Neem Tree
Swietenia mahagoni Meliaceae Mehagini Tree
Musa spp Musaceae Kala Herb
Mimosa invisa Mimosoidae Lazzaboti Herb
Polygonum hydropiper Polygonaceae Bishkatali Herb
Anthocephalus chinensis Rubiaceae Kadam Tree
Zizyphus mauritiana Rhamnaceae Boroi, Kul Tree
Lindernia procumbens Scrophulariaceae Bakpuspa Herb
Datura metol Solanaceae Dhutra Herb
Clerodendrum viscosum Verbinaceae Vat Herb
Tectona grandis Verbenaeae Teak Tree
Photo 4. 3: Terrestrial Flora (Tree) Photo 4.4 : Terrestrial Flora(Herb) in project site
Photo 4.5 : Terrestrial Flora (Shrub) in the project site
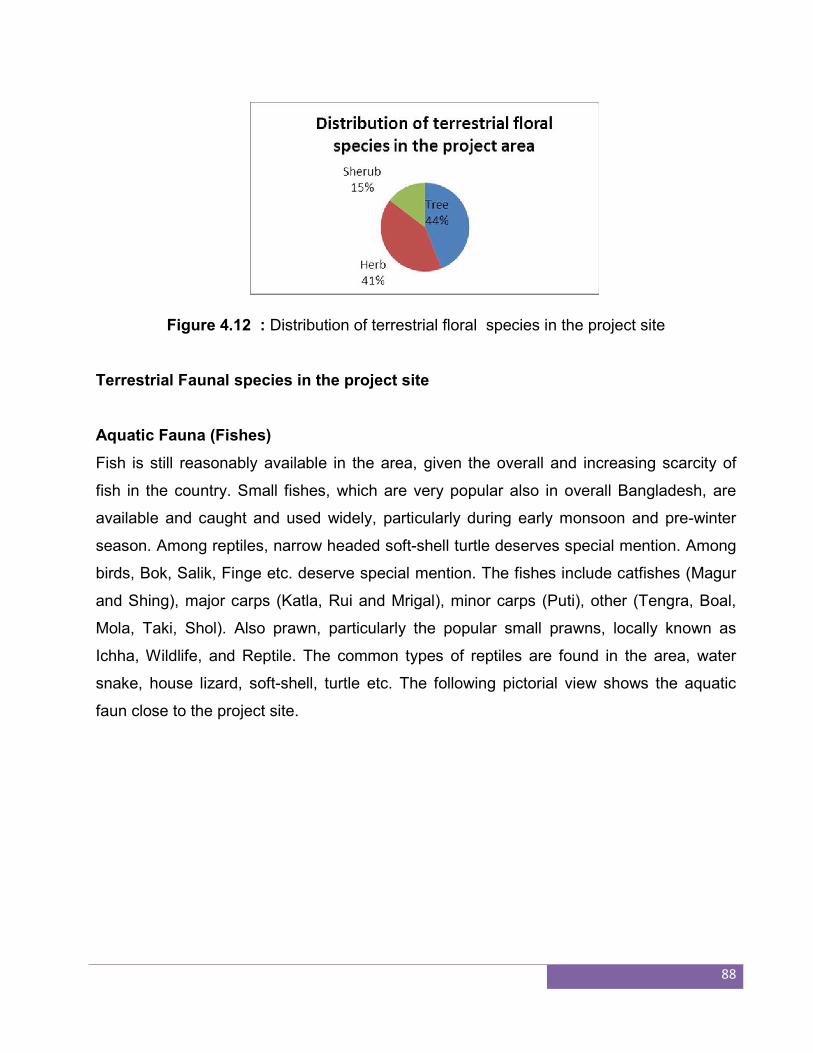
88
Figure 4.12 : Distribution of terrestrial floral species in the project site
Terrestrial Faunal species in the project site
Aquatic Fauna (Fishes)
Fish is still reasonably available in the area, given the overall and increasing scarcity of
fish in the country. Small fishes, which are very popular also in overall Bangladesh, are
available and caught and used widely, particularly during early monsoon and pre-winter
season. Among reptiles, narrow headed soft-shell turtle deserves special mention. Among
birds, Bok, Salik, Finge etc. deserve special mention. The fishes include catfishes (Magur
and Shing), major carps (Katla, Rui and Mrigal), minor carps (Puti), other (Tengra, Boal,
Mola, Taki, Shol). Also prawn, particularly the popular small prawns, locally known as
Ichha, Wildlife, and Reptile. The common types of reptiles are found in the area, water
snake, house lizard, soft-shell, turtle etc. The following pictorial view shows the aquatic
faun close to the project site.
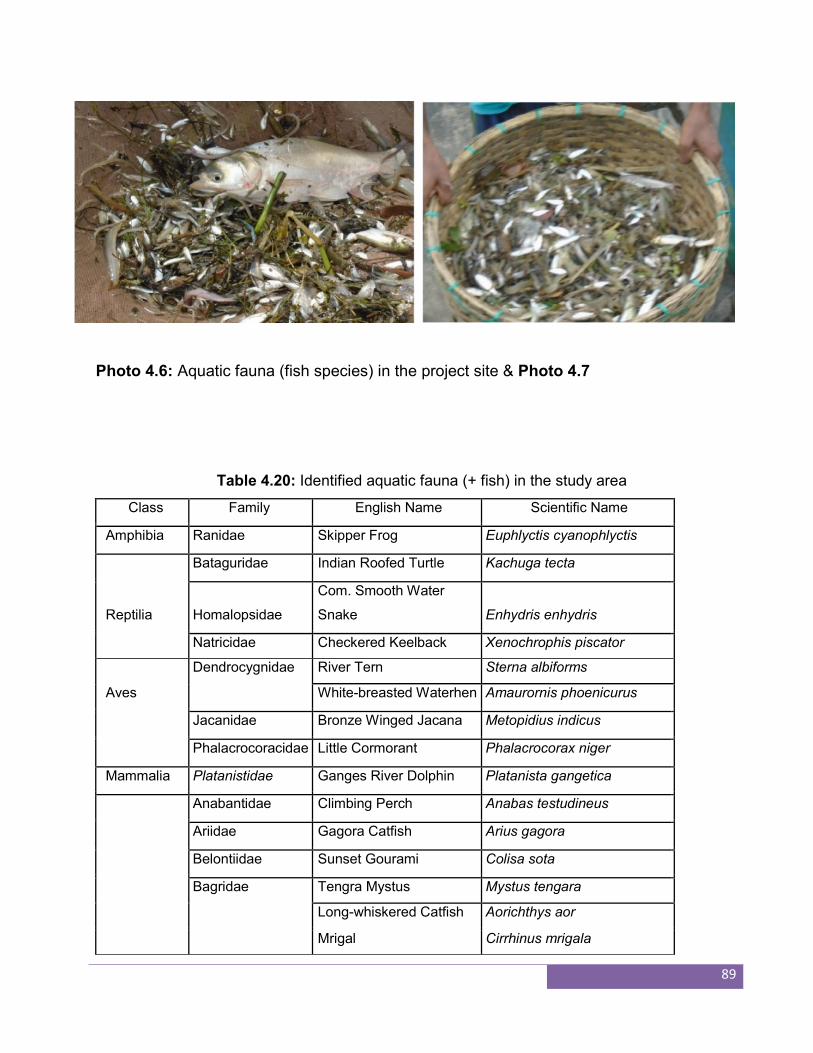
89
Photo 4.6: Aquatic fauna (fish species) in the project site & Photo 4.7
Table 4.20: Identified aquatic fauna (+ fish) in the study area
Class Family English Name Scientific Name
Amphibia Ranidae Skipper Frog Euphlyctis cyanophlyctis
Bataguridae Indian Roofed Turtle Kachuga tecta
Reptilia
Homalopsidae
Com. Smooth Water
Snake Enhydris enhydris
Natricidae Checkered Keelback Xenochrophis piscator
Dendrocygnidae River Tern Sterna albiforms
Aves White-breasted Waterhen Amaurornis phoenicurus
Jacanidae Bronze Winged Jacana Metopidius indicus
Phalacrocoracidae Little Cormorant Phalacrocorax niger
Mammalia Platanistidae Ganges River Dolphin Platanista gangetica
Anabantidae Climbing Perch Anabas testudineus
Ariidae Gagora Catfish Arius gagora
Belontiidae Sunset Gourami Colisa sota
Bagridae Tengra Mystus Mystus tengara
Long-whiskered Catfish Aorichthys aor
Mrigal Cirrhinus mrigala
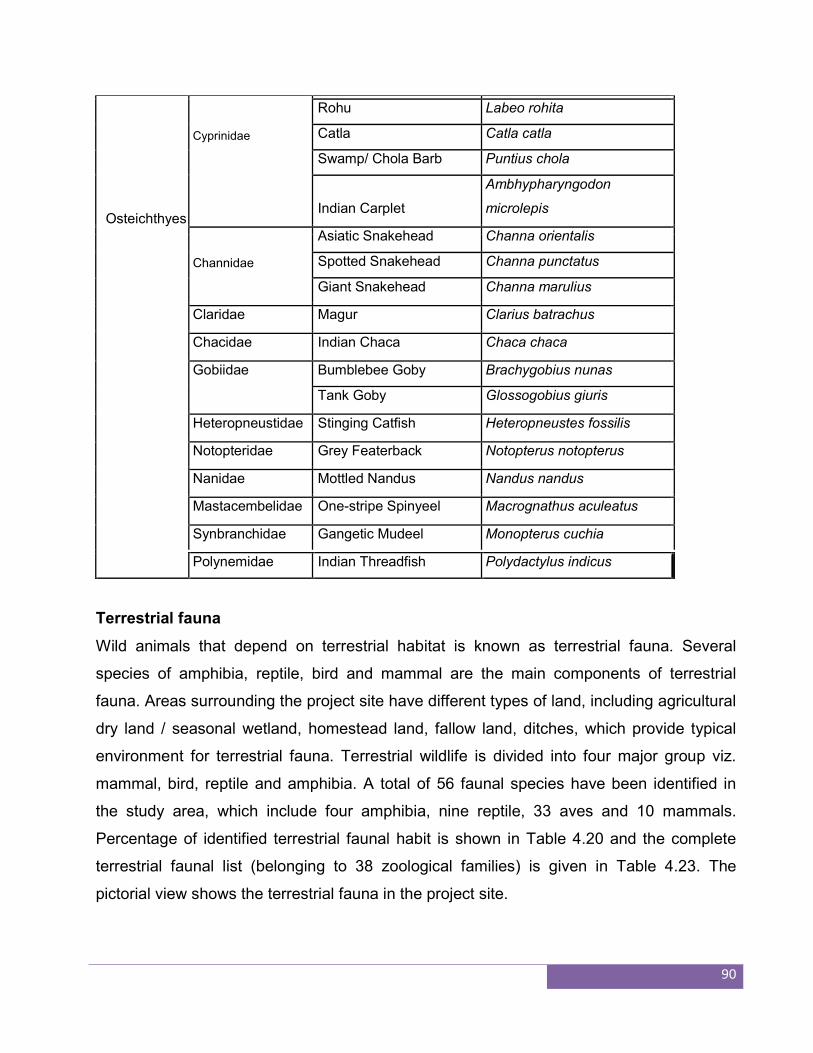
90
Rohu Labeo rohita
Cyprinidae Catla Catla catla
Swamp/ Chola Barb Puntius chola
Osteichthyes Indian Carplet
Ambhypharyngodon
microlepis
Asiatic Snakehead Channa orientalis
Channidae Spotted Snakehead Channa punctatus
Giant Snakehead Channa marulius
Claridae Magur Clarius batrachus
Chacidae Indian Chaca Chaca chaca
Gobiidae Bumblebee Goby Brachygobius nunas
Tank Goby Glossogobius giuris
Heteropneustidae Stinging Catfish Heteropneustes fossilis
Notopteridae Grey Featerback Notopterus notopterus
Nanidae Mottled Nandus Nandus nandus
Mastacembelidae One-stripe Spinyeel Macrognathus aculeatus
Synbranchidae Gangetic Mudeel Monopterus cuchia
Polynemidae Indian Threadfish Polydactylus indicus
Terrestrial fauna
Wild animals that depend on terrestrial habitat is known as terrestrial fauna. Several
species of amphibia, reptile, bird and mammal are the main components of terrestrial
fauna. Areas surrounding the project site have different types of land, including agricultural
dry land / seasonal wetland, homestead land, fallow land, ditches, which provide typical
environment for terrestrial fauna. Terrestrial wildlife is divided into four major group viz.
mammal, bird, reptile and amphibia. A total of 56 faunal species have been identified in
the study area, which include four amphibia, nine reptile, 33 aves and 10 mammals.
Percentage of identified terrestrial faunal habit is shown in Table 4.20 and the complete
terrestrial faunal list (belonging to 38 zoological families) is given in Table 4.23. The
pictorial view shows the terrestrial fauna in the project site.
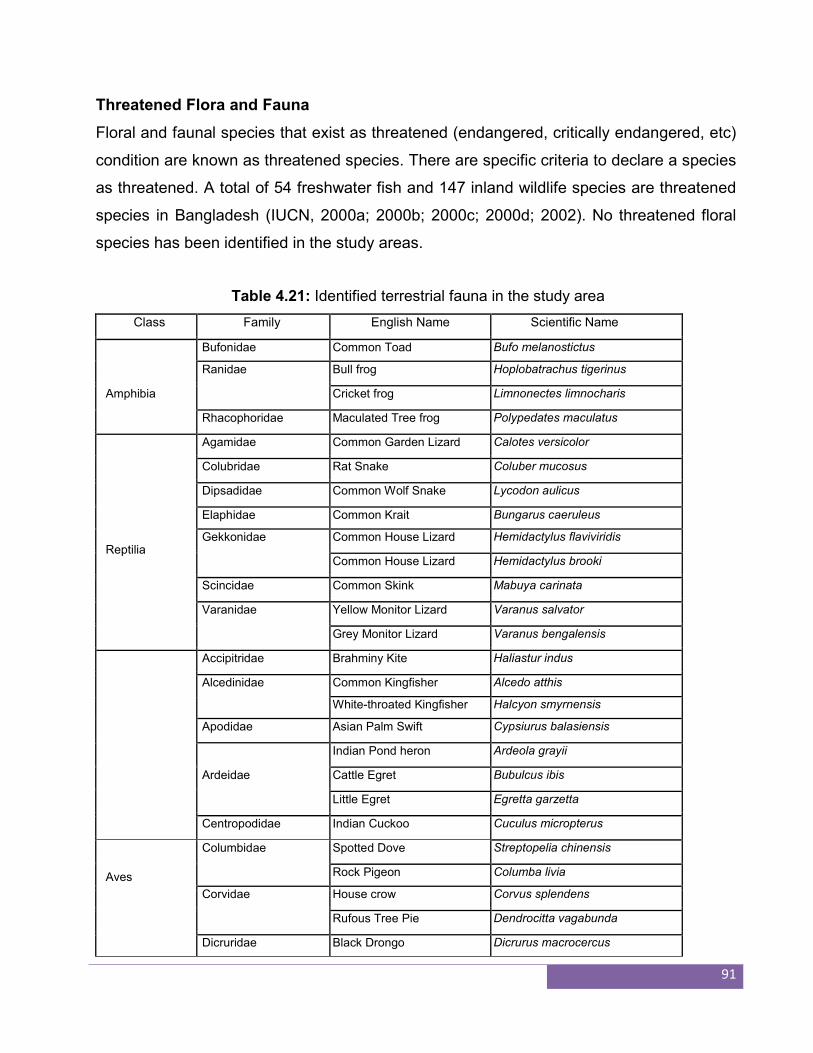
91
Threatened Flora and Fauna
Floral and faunal species that exist as threatened (endangered, critically endangered, etc)
condition are known as threatened species. There are specific criteria to declare a species
as threatened. A total of 54 freshwater fish and 147 inland wildlife species are threatened
species in Bangladesh (IUCN, 2000a; 2000b; 2000c; 2000d; 2002). No threatened floral
species has been identified in the study areas.
Table 4.21: Identified terrestrial fauna in the study area
Class Family English Name Scientific Name
Bufonidae Common Toad Bufo melanostictus
Ranidae Bull frog Hoplobatrachus tigerinus
Amphibia
Cricket frog Limnonectes limnocharis
Rhacophoridae Maculated Tree frog Polypedates maculatus
Agamidae Common Garden Lizard Calotes versicolor
Colubridae Rat Snake Coluber mucosus
Dipsadidae Common Wolf Snake Lycodon aulicus
Elaphidae Common Krait Bungarus caeruleus
Reptilia Gekkonidae Common House Lizard Hemidactylus flaviviridis
Common House Lizard Hemidactylus brooki
Scincidae Common Skink Mabuya carinata
Varanidae Yellow Monitor Lizard Varanus salvator
Grey Monitor Lizard Varanus bengalensis
Accipitridae Brahminy Kite Haliastur indus
Alcedinidae Common Kingfisher Alcedo atthis
White-throated Kingfisher Halcyon smyrnensis
Apodidae Asian Palm Swift Cypsiurus balasiensis
Indian Pond heron Ardeola grayii
Ardeidae
Cattle Egret Bubulcus ibis
Little Egret Egretta garzetta
Centropodidae Indian Cuckoo Cuculus micropterus
Columbidae Spotted Dove Streptopelia chinensis
Aves Rock Pigeon Columba livia
Corvidae House crow Corvus splendens
Rufous Tree Pie Dendrocitta vagabunda
Dicruridae Black Drongo Dicrurus macrocercus
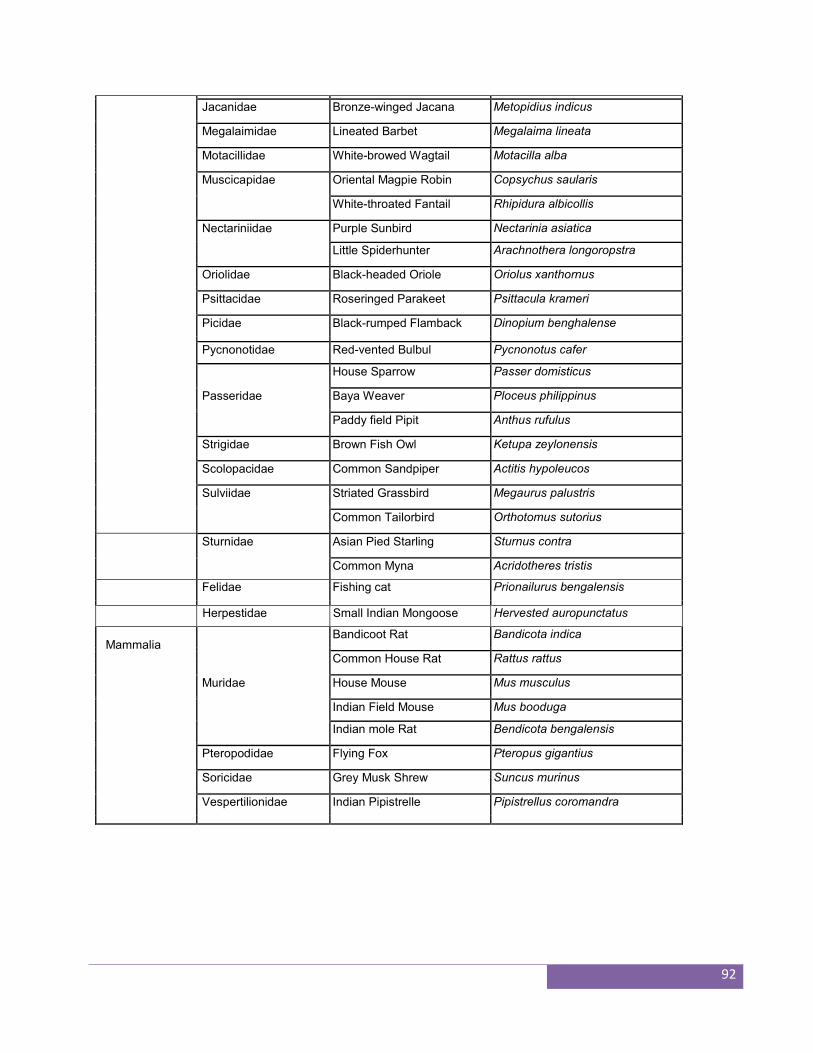
92
Jacanidae Bronze-winged Jacana Metopidius indicus
Megalaimidae Lineated Barbet Megalaima lineata
Motacillidae White-browed Wagtail Motacilla alba
Muscicapidae Oriental Magpie Robin Copsychus saularis
White-throated Fantail Rhipidura albicollis
Nectariniidae Purple Sunbird Nectarinia asiatica
Little Spiderhunter Arachnothera longoropstra
Oriolidae Black-headed Oriole Oriolus xanthornus
Psittacidae Roseringed Parakeet Psittacula krameri
Picidae Black-rumped Flamback Dinopium benghalense
Pycnonotidae Red-vented Bulbul Pycnonotus cafer
House Sparrow Passer domisticus
Passeridae
Baya Weaver Ploceus philippinus
Paddy field Pipit Anthus rufulus
Strigidae Brown Fish Owl Ketupa zeylonensis
Scolopacidae Common Sandpiper Actitis hypoleucos
Sulviidae Striated Grassbird Megaurus palustris
Common Tailorbird Orthotomus sutorius
Sturnidae Asian Pied Starling Sturnus contra
Common Myna Acridotheres tristis
Felidae Fishing cat Prionailurus bengalensis
Herpestidae Small Indian Mongoose Hervested auropunctatus
Mammalia Bandicoot Rat Bandicota indica
Common House Rat Rattus rattus
Muridae
House Mouse Mus musculus
Indian Field Mouse Mus booduga
Indian mole Rat Bendicota bengalensis
Pteropodidae Flying Fox Pteropus gigantius
Soricidae Grey Musk Shrew Suncus murinus
Vespertilionidae Indian Pipistrelle Pipistrellus coromandra
93
4. 12 Protected Areas, Wildlife Sanctuaries, Game Reserves
Protected area (PA)
Protect Area (PA) refers to an area of land and/or sea especially dedicated to the protection and
maintenance of biological diversity, and of natural and associated cultural resources, and managed
through legal or other effective means i.e., PA is predominantly a natural area established and
managed in perpetuity, through legal or customary regimes, primarily to conserve their natural
resources (IUCN, 1990). No PA exists at or near any of the study areas.
National Park (NP)
It is a reserved land, usually declared and owned by a national government, protected from
most human development and pollution. No NP exists at or near the proposed project sites.
Game reserve (GR)
It is an area of land set aside for maintenance of wildlife for tourism or hunting purposes. No
GR exists at or near the study areas.
Ecologically Critical Area (ECA)
It is an environmental protection zone, defined by the Government of Bangladesh under the
Bangladesh Environment Conservation Act, 1995, where ecosystem is considered to be
threatened to reach a critical state. No ECA exists at or near the study areas.
4.13 Environment and social survey
As part of the Environmental & Social Impact Assessment (ESIA) of the proposed River
Terminal project, a social and environmental baseline study was carried out in areas
surrounding the project site i.e. West Mukterpur village. This has been done on the basis
of several surveys around the locality as well as Munshigonj Upazila Profile. Bangladesh
Bureau of Statistics (BBS), Banglapedia, concerned books and periodicals were also
consulted. Household Questionnaire survey, FGDs and KIIs etc.
4.13.1 Administrative Areas
Area and location: The upazila occupies an area of 131.00 sq. km. It is located between
230 29’ and 230 37' north latitudes and between 900 34' and 900 43' east longitudes. The
94
upazila is bounded on the north by Bandar of upazila of narayanganj zila, on east by
Daudkandi upazila of comilla zila, on the south by Matlab upazila of chandpur zila and on
the west by Tongibari upazila.
Munshiganj zila, formerly a subdivision under Dhaka zila, was established in 1984. The
zila consists of 6 upazilas, 67 unions, 564 mauzas, 919 villages, 2 paurashavas, 18 wards
and 73 mahallas. The upazilas are Gazaria, Tongibari, Serajdikhan, Lohajang,
Sreenagar and Munshiganj Sadar. The main rivers are Dhaleshwari, Ichamati and
Kaliganga. The Upazila consists of 14 union parishads, 178 mouzas and 305 villages.
4.13.2 Land Use
Total cultivable land is 18208.01 hectares. Among them fallow land is 6272.76 hectares;
single crop 47.5%, double crop 37.8% and treble crop land 14.7%.
4.13.3 Demographic Characteristics of the Project Area
4.13.4 Population
Total population as per Munshigonj Upazila Complex within the project area is 269189 of
which 49.31% are male and 50.69% are female. The project site is situated in West
Mukterpur village and according to the Panchasar union, the population is about 4200 of
which about 50% is male and 38% is female with 12% population of 18.
4.13.5 Household
The number of household of Munshigonj Upazila is 47411. Majority of housing in this area
are of pacca, semi-pacca, semi-permanent building i.e. walls made of 5 inch brick works
and corrugated iron roof. In case of West Mukterpur number of household is about 1050;
38.67% of the households are pacca, 50% semi-pacca and 11.33% kacha. The
homestead areas are relatively medium.
4.13.6 Literacy
According to the Banglapedia within the study area have an average literacy rate of
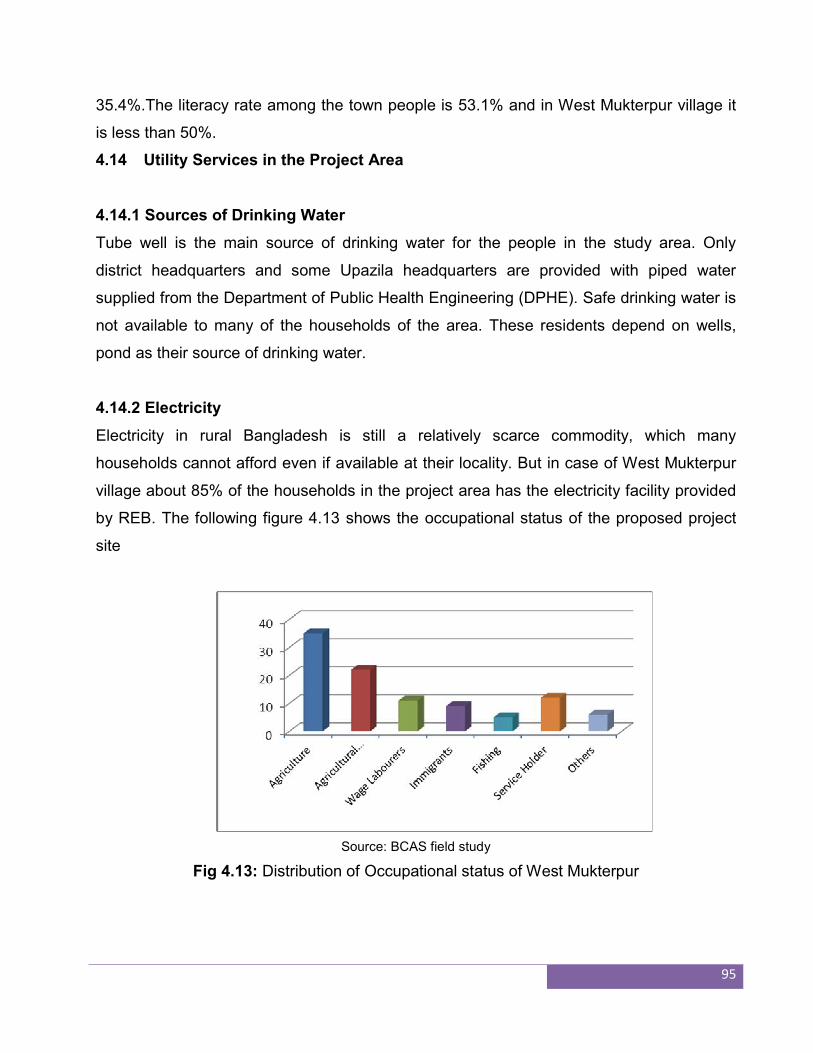
95
35.4%.The literacy rate among the town people is 53.1% and in West Mukterpur village it
is less than 50%.
4.14 Utility Services in the Project Area
4.14.1 Sources of Drinking Water
Tube well is the main source of drinking water for the people in the study area. Only
district headquarters and some Upazila headquarters are provided with piped water
supplied from the Department of Public Health Engineering (DPHE). Safe drinking water is
not available to many of the households of the area. These residents depend on wells,
pond as their source of drinking water.
4.14.2 Electricity
Electricity in rural Bangladesh is still a relatively scarce commodity, which many
households cannot afford even if available at their locality. But in case of West Mukterpur
village about 85% of the households in the project area has the electricity facility provided
by REB. The following figure 4.13 shows the occupational status of the proposed project
site
Source: BCAS field study
Fig 4.13: Distribution of Occupational status of West Mukterpur
96
4.14.3 Health
District Hospitals and Upazila Health Complexes are located at each district and Upazila of
the project area. There are also a large number of private clinics located in each district
town, which are within a few kilometers from the project area. But such kinds of health
facilities are totally unavailable in West Mukterpur where the site is situated.
4.14.4 Waste Disposal
There are some facilities for garbage or hazardous waste dumping in each municipality
area of the district. There is some facility exists for garbage or hazardous waste dumping
in the total project area. On the other hand, the local people throw the waste beside the
road and nearest river Dalessari.
4.14.5 Emergency Services
There is one firefighting station located at both Munshigonj and Nawabganj Upazila. Since
the firefighting station at Narayangonj is closer to West Mukterpur village; this firefighting
station response to the firefighting emergency services required in the village. This
firefighting station is about 4 km away from Project Site village.
4.14.6 Occupation and Source of Income of Population
As in other parts of the country, the majority of the population in project area is engaged in
agriculture. Altogether 22.1% of the population is engaged in Agriculture. Agricultural
labourers are of 13.27% of the population. 4.5% of the population is engaged in wage
labour, only 1.98 % of the population are engaged in fishing, 4.37% of the population are
engaged in weaving, 12.2% of the population is engaged in business. 18.54% of the
population is engaged in different services and the others are involved in handloom,
transport etc. in the Munshigonj Upazila. In Munshigonj, 45% people are engaged in
agriculture & agricultural labourers are of 22%; 11% people are engaged in wage labour
and about 10% of service holders are found. About 5% of the population is engaged in
97
fishing. Many people is working abroad from this area as in our study about 7% people are
immigrants or working abroad. Fig 4.14 is presents the occupation in Munshigonj
4.14.7 Ethnic and Religious composition of the Population in the Project Area
The majority of the population in the Munshigonj Upazila is Muslim (>77%) followed by
Hindus (20.74%), Christian (2.04%), Buddhist (0.01%) and others 0.01%. In Munshigonj
about 85% of the population is Muslim, about 10% of the population is Hindu and rest of
the population is Buddhist & Christian.
4.14.8 Archaeological Heritage and Relics
No archeological heritage or such is found in the Panchsar union and the surrounding of
the project site.
98
Chapter-5
ANTCIPATED ENVIRONMENTAL IMPACTS AND MITIGATION
MEASURES
5.0 Environmental Impacts
A prepared an Environmental Assessment Checklist was used to screen the proposed
Project for determining the tentative environmental impact through this ESIA.
The environmental impacts of the River Terminal Container Depot can be divided into
three phases:
a. Pre-operation phase
b. Operation Phase
c. Post-operation phase or decommissioning phase
5.1 Environmental Impacts during Pre-Operation Phase
The major activities during the pre-operation phase of the proposed River Terminal included
site preparation and land filling. These activities were already completed during the baseline
survey carried out in August 2014. The impacts on environment from various activities during
construction phase of the Project have been described in the following sections.
5. 2 Environmental Impacts during Construction Phase
The activities carried out during the construction phase were (a) mobilization of equipment,
materials and personnel; piling and bank protection works; (b) Construction of embankment
and yard facilities; (c) Construction of drainage facilities; (d) Construction of internal roads;
(e) Construction of buildings and related civil facilities; and (f) Electro-mechanical works.
These activities except for construction of the office building were found completed during the
baseline study in August 2014.
Impact on Topography
During construction of the proposed Project, the topography of the Project site will change
due to leveling of uneven Jetty site as well as container yard land filling to increase the
99
height. The filling will involve raising the 14 acres of the project site by 1.5 meters
therefore there would be some loss of biodiversity because of filling operation through loss
of some vegetation. Therefore the restoration of the lost biodiversity will have to done by
the project sponsors.
In order to restore the loss in biodiversity due to the pre-construction phase and the
construction phase it is suggested that plantation of trees, of local species, along the
boundary wall of the project be undertaken. This will compensate for the loss in
biodiversity.
Impact on Micro-Climate
The Project involves no deforestation and/or removal of significant vegetation. So, the
significant increase of local temperature is not anticipated, impact on climate is not
anticipated.
5.2.1 Impact on Environmental Resources
Impact on Air quality
During the construction phase of the proposed Jetty and container depot, the important
sources of emissions would include those being generated from the operations of
construction equipment and machineries, vehicles carrying construction materials to the
site and taking construction debris out of the site. If construction equipment, such as stone
(aggregate) crushers are used at the site, this may result in significant emission of
particulate matter during its operation. Since construction of the proposed River Terminal
Container Depot is likely to involve significant earthworks, increase in particulate matters
in air from wind-blown dust is also a concern.
Localized and temporary air pollution may be generated from the remaining civil
construction works. The air pollution generated from these activities is likely to be localized
(affecting immediate surroundings of the emission source/ project site). The number of
project-related vehicles is likely to be small compared to the existing traffic in the area. The
emission of gaseous CO, NOx, SOx from the heavy trucks and earth moving equipment
are expected to be within Bangladesh vehicular emission standards.
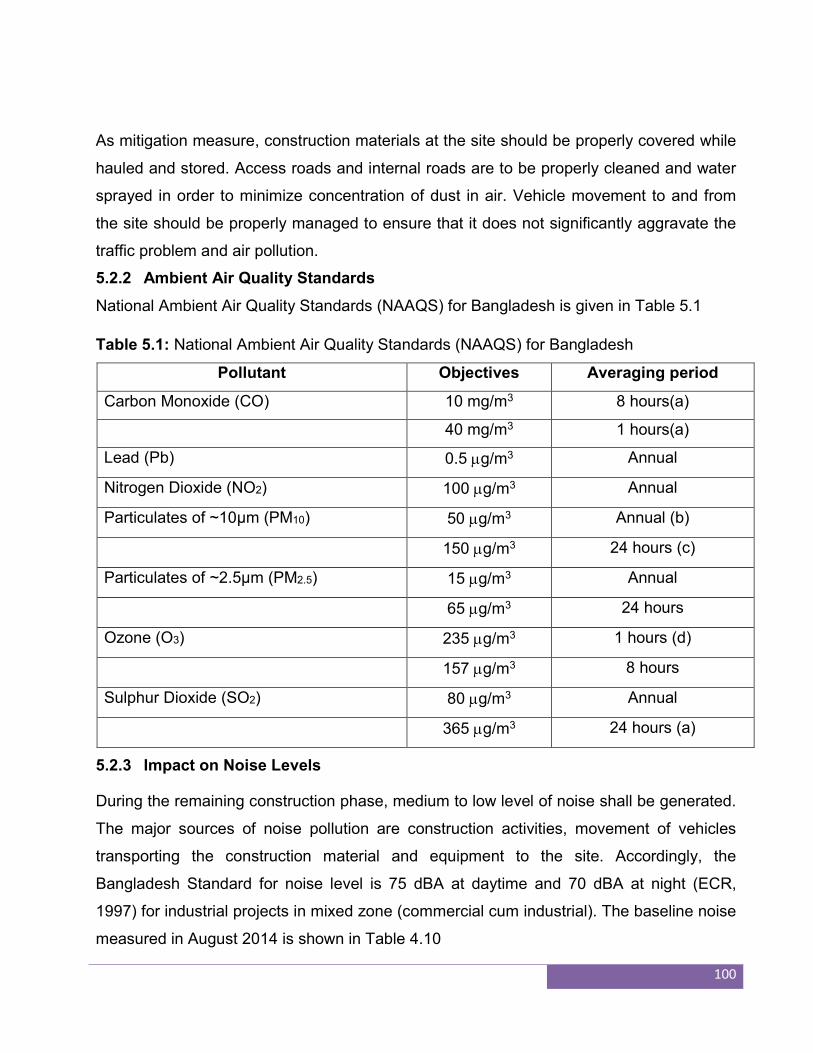
100
As mitigation measure, construction materials at the site should be properly covered while
hauled and stored. Access roads and internal roads are to be properly cleaned and water
sprayed in order to minimize concentration of dust in air. Vehicle movement to and from
the site should be properly managed to ensure that it does not significantly aggravate the
traffic problem and air pollution.
5.2.2 Ambient Air Quality Standards
National Ambient Air Quality Standards (NAAQS) for Bangladesh is given in Table 5.1
Table 5.1: National Ambient Air Quality Standards (NAAQS) for Bangladesh
Pollutant Objectives Averaging period
Carbon Monoxide (CO) 10 mg/m3 8 hours(a)
40 mg/m3 1 hours(a)
Lead (Pb) 0.5 g/m3 Annual
Nitrogen Dioxide (NO2) 100 g/m3 Annual
Particulates of ~10µm (PM10) 50 g/m3 Annual (b)
150 g/m3 24 hours (c)
Particulates of ~2.5µm (PM2.5) 15 g/m3 Annual
65 g/m3 24 hours
Ozone (O3) 235 g/m3 1 hours (d)
157 g/m3 8 hours
Sulphur Dioxide (SO2) 80 g/m3 Annual
365 g/m3 24 hours (a)
5.2.3 Impact on Noise Levels
During the remaining construction phase, medium to low level of noise shall be generated.
The major sources of noise pollution are construction activities, movement of vehicles
transporting the construction material and equipment to the site. Accordingly, the
Bangladesh Standard for noise level is 75 dBA at daytime and 70 dBA at night (ECR,
1997) for industrial projects in mixed zone (commercial cum industrial). The baseline noise
measured in August 2014 is shown in Table 4.10
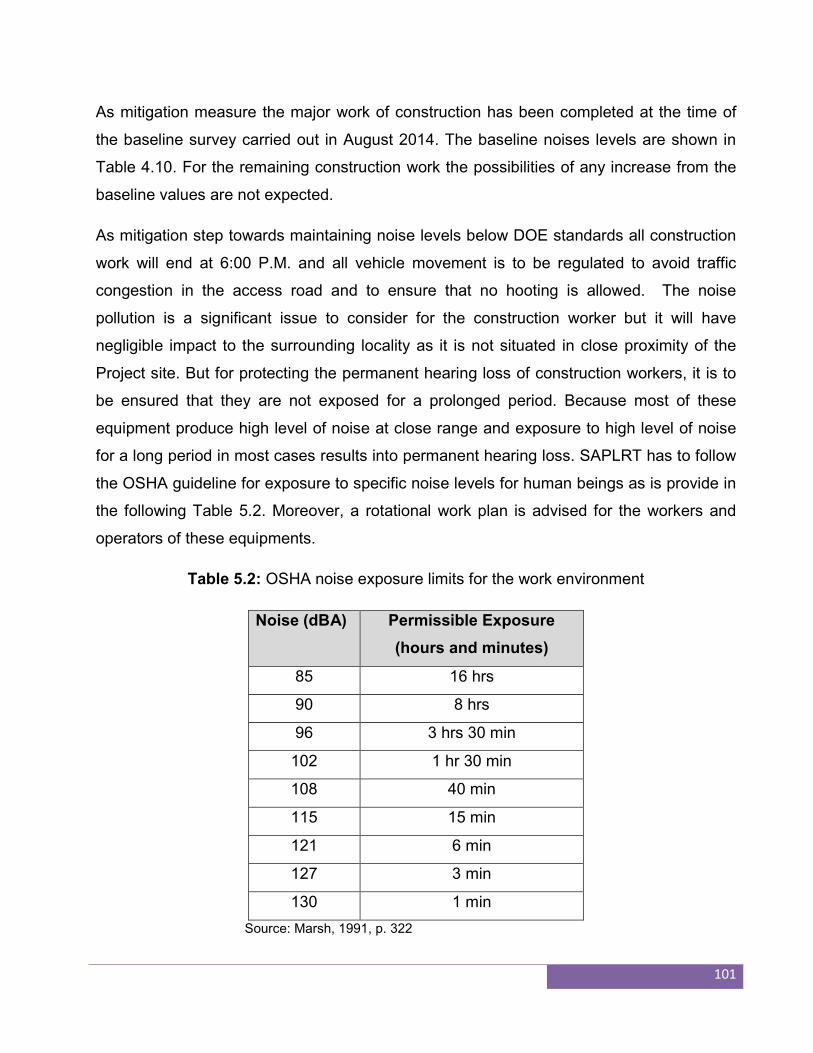
101
As mitigation measure the major work of construction has been completed at the time of
the baseline survey carried out in August 2014. The baseline noises levels are shown in
Table 4.10. For the remaining construction work the possibilities of any increase from the
baseline values are not expected.
As mitigation step towards maintaining noise levels below DOE standards all construction
work will end at 6:00 P.M. and all vehicle movement is to be regulated to avoid traffic
congestion in the access road and to ensure that no hooting is allowed. The noise
pollution is a significant issue to consider for the construction worker but it will have
negligible impact to the surrounding locality as it is not situated in close proximity of the
Project site. But for protecting the permanent hearing loss of construction workers, it is to
be ensured that they are not exposed for a prolonged period. Because most of these
equipment produce high level of noise at close range and exposure to high level of noise
for a long period in most cases results into permanent hearing loss. SAPLRT has to follow
the OSHA guideline for exposure to specific noise levels for human beings as is provide in
the following Table 5.2. Moreover, a rotational work plan is advised for the workers and
operators of these equipments.
Table 5.2: OSHA noise exposure limits for the work environment
Noise (dBA) Permissible Exposure
(hours and minutes)
85 16 hrs
90 8 hrs
96 3 hrs 30 min
102 1 hr 30 min
108 40 min
115 15 min
121 6 min
127 3 min
130 1 min
Source: Marsh, 1991, p. 322
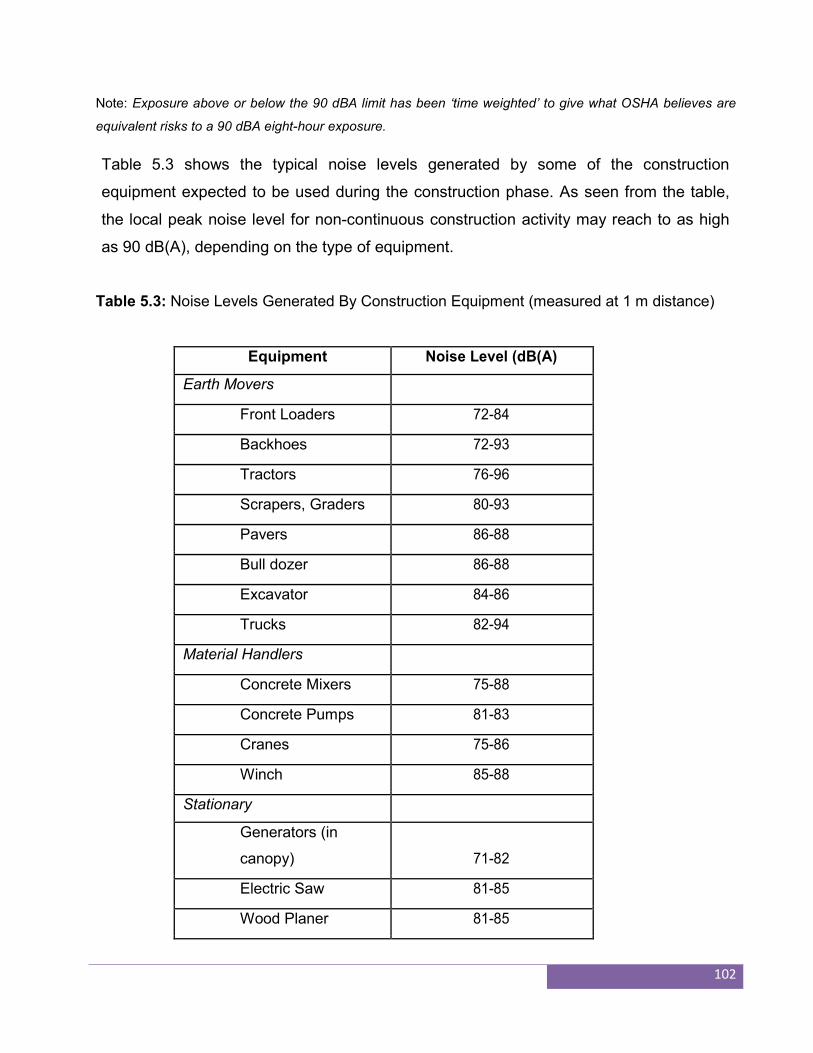
102
Note: Exposure above or below the 90 dBA limit has been ‘time weighted’ to give what OSHA believes are
equivalent risks to a 90 dBA eight-hour exposure.
Table 5.3 shows the typical noise levels generated by some of the construction
equipment expected to be used during the construction phase. As seen from the table,
the local peak noise level for non-continuous construction activity may reach to as high
as 90 dB(A), depending on the type of equipment.
Table 5.3: Noise Levels Generated By Construction Equipment (measured at 1 m distance)
Equipment Noise Level (dB(A)
Earth Movers
Front Loaders 72-84
Backhoes 72-93
Tractors 76-96
Scrapers, Graders 80-93
Pavers 86-88
Bull dozer 86-88
Excavator 84-86
Trucks 82-94
Material Handlers
Concrete Mixers 75-88
Concrete Pumps 81-83
Cranes 75-86
Winch 85-88
Stationary
Generators (in
canopy) 71-82
Electric Saw 81-85
Wood Planer 81-85
103
5.2.4 Impact of HFO
HFO required to run the generator will be procured from Bangladesh Petroleum
Corporation (BPC) by Tanker Lorries. The takers will unload the HFO into the storage
tanks of the project. There may be spillages during the unloading operation. Adequate
preventive measures will be needed to ensure that no spillage of HFO will take place into
the surrounding environment.
5.2.5 Impact on Surface Water Quality
The construction and operation of the proposed Project will have major impact on the
surface and ground water quality in the Project area. Contamination to water bodies may
result due to oil spilling during construction activities and/or surface runoff from the
construction site to the nearby water body. Turbidity levels of the immediate water body
may increase, if the surface runoff from the river terminal container depot cannot be
controlled. As mitigation measure there should be a containment tank installed of 1.5 times
the HFO storage capacity in order to prevent accidental leakage of HFO.
Spent lubricating oil will be generated during the construction period from the heavy
construction equipment like the tractors, piling equipment and cranes. The spent oil should
be collected and put into drums and sold to outside contractors.
5.2.6 7[Impact on Ground Water Quality
Ground water pollution can take place, if chemical substances and oily waste get leached
by precipitation of water and percolate to the ground water table. Reducing spilling at the
construction site will minimize the chances of leaching chemicals to the ground water.
There will be minimal use of chemicals in the construction phase of the project. However,
there will be generation of spent lubricant which if allowed to leach into the ground water
can have significant to the ground water contamination in the long run. Adequate
management of of the spent lubricant collection and disposal through contractors who are
authorized to recycle or dump in Government approved landfills.
104
5.2.7 Impact on Ecological Resources
Impact on Terrestrial Ecology
There is no designated wildlife sanctuary, wetland or reserve forest in the close vicinity of
the proposed container depot. The Project activities do not associate with any type of
disturbance to terrestrial ecology.
Impact on Wild Life
The faunal species in the project area is mainly of those associated with manmade habitat.
As there is no wild life that faces extinction (Reference IUCN Red List) in the project area,
no adverse impact on wild life is expected. As the project will not have any high tension
transmission line the possibilities of electrification of birds will be none.
Impact on Aquatic Ecology
Aquatic ecology can be affected due to surface runoff. During the construction phase there
will be little potentials of chemical use and therefore the runoff from the project area in the
river Dalweswari. There are chances of surface runoff during construction activity to
adjacent water body Dhaleshwary River. The only possible is spent lubricating oil from the
construction equipment. This has been discussed. The surface runoff should be routed to
the sedimentation pond to avoid the river water pollution.
5.2.8 Occupational Health and Safety Impacts
Implementation of Occupational Health and Safety Programme as outlined in the IFC EHS
guidelines needs to be complied with to address all aspects of workers health and safety
in relation to the construction period of the project. Job specific medicals checkup for all
employees is mandatory. The employees newly recruited must be given EHS training prior
to resumption of work.
SAPLRT authority will need to prepare an Occupational Health and Safety Manual which
must cover the following issues:
Policy and Objectives;
Appointment of qualified EHS specialist(s)
105
Detailed section wise OHS guidelines
Details of how rules and updates (if required) will be communicated to workers
Identification and risk assessment of hazardous activities and high risk areas;
Emergency Response Plan;
Training on Emergency Response Plan;
Safe working methods for hazardous activities;
Ensure all personnel are provided with all required Personal Protective Equipment
(PPE) for the environment they are in and the tasks they are performing;
Implementation of a Grievance Redress Mechanism;
Implementation of a Lock-out Tag-out program; and
Reporting and investigation procedure for all severe and minor accidents, and near
misses.
Ensuring all subcontractors (if any) sign and agree to the site EHS Plan. Provide training
for all subcontractors to ensure site procedures are fully understood and complied with.
5.2.9 Traffic, Transport, Road and River Safety
Road traffic flows to and from the Project site is going to increase during the remaining
part of the construction phase due to increased movement of vehicles carrying
construction materials, equipment and machinery, and personnel. During the construction
remaining construction phase, traffic disturbance needs to be minimized by avoiding high-
density areas, proper traffic signs, ensuring using designated access roads and avoiding
road blockage through traffic volume management.
In addition, there is a potential risk of the access road being adversely affected during
carrying of construction equipment. The 25feet width of highway from Dhaka to Muktarpur
is designed to bear 10-12 Ton. This is adequate for the transportation of the construction
equipment. However, the access road from the highway to the project site will need
upgrading. In order to minimize the risk due to increase traffic of heavy Lories and trucks
it is recommended that the movements should be done in the night time but with care.
106
5.2.10 Waste Generation and Disposal
Construction Debris, Waste and House- keeping Arrangement
Project construction activities will result in generation of considerable amount of inert solid
wastes, including lumber, excess concrete, metal and glass scrap, and empty containers
used for non-hazardous substances. Management of these wastes will be the
responsibility of the Contractors as recommended in the EMP section of this report.
Typical management practice includes proper temporary storage of waste and debris, and
good housekeeping of work areas. No part of this construction waste should be mixed with
the domestic solid waste. Separation of saleable solid waste through screening process
and dispose to the secondary users can be mitigation measures. Rest of the insignificant
waste shall be disposed in a safe manner.
5.2.11 Accommodation Facility
There were no accommodation facilities in the project area during the construction phase
as all the workers belonged to that area.
5.2.12 Sewerage Management:
As mentioned in the previous section there were no workers shed existing in the project
site during the baseline study in August 2014. According to the project sponsors all the
workers are from the local area and no accommodation facilities were provided. Therefore,
the requirement of an elaborate sewerage disposal system was not required. However,
adequate numbers sanitary latrines and soak pits were installed for the workers during the
construction phase. For this purpose, a wastewater generation rate of 50 litres per capita
per day has been assumed for 50 to 100 workers.
Wastewater generated from different construction activities is not likely to be significant in
volume. Disposal of such waste water may be carried out by draining them in the
municipal drainage system.
107
5.3 Environmental Impacts during Operation Phase
Typical environmental issues related to operation phase of the proposed project
operations include (IFC, 2007):
(i) Wastewater and waste management;
(ii) Hazardous material and oil management;
(iii) Air emissions;
(iv) Noise; and
(v) Biodiversity.
For the proposed SAPL RT project, other important issues include impact of the project on
transport and communication (especially on road traffic), employment and economy in
general.
Typical effluents associated with port activities may include storm-water and sewage from
port operations, sewage, ballast water (e.g., from oil tankers), bilge water, and vessel-
cleaning wastewater from ships (IFC, 2007). Hazardous material at port typically includes
hazardous cargo, oil, fuel and hazardous materials used in different maintenance
activities. Spills may occur due to accidents, equipment failure, improper cargo transfer or
fueling.
The most significant sources of air pollutants from port operations typically include
combustion emissions from ships’ propulsion and auxiliary engines and boilers, followed
by combustion source emissions from vehicles and land-based engines and boilers (IFC,
2007). Volatile organic compounds (VOC) may also be emitted from fuel storage and
transfer.
108
Typical noise sources in ports include cargo handling, vehicular traffic, and loading/
unloading of containers and ships. Activities that could affect biodiversity include
maintenance dredging and disposal of dredge spoils, and discharge of ballast water and
sediment from ships. While assessing the possible project impacts during its operational
phase, the nature of operation of the proposed SAPL RT should be kept in mind. The
important issues include the following:
o The proposed river terminal will be used for transportation of cargo/ container to and
from Chittagong; it will not handle any passenger vessel. Import cargo from
Chittagong will be unloaded at the river terminal, and will be delivered to destinations
in the greater Dhaka, primarily through the Ponchoboti-Muktarpur road.
o No fueling/ refueling activities will be carried out at the proposed river terminal; these
will be handled at Chittagong. The proposed river terminal will not have any fuel
storage facility.
The major environmental issues/ impacts resulting from the operation of the proposed
river terminal are discussed below.
5.3.1 Wastewater and Waste
Because of small-scale operation (initially 2 vessels, and 8 vessels at the peak of its
operation) and absence of passenger vessels, the volume of sewage, ballast water, bilge
water, and vessel-cleaning wastewater from the barges to be used for shipment of cargo/
container at the SAPL RT would be small. Besides, there will be separate system for
disposal of storm-water and sewage from the river terminal operations. However,
improper disposal of ship waste/ wastewater may lead to pollution. Hence proper
management of ship and terminal waste/ wastewater is of utmost importance for
prevention of environmental pollution, particularly water pollution.
109
As discussed in previous chapter the Dhaleshwary river water in the immediate vicinity of
the project site contains elevated concentration of a number of contaminants that most
likely come both from domestic (e.g., TC, FC, NH3) and industrial sources (NH3, BOD,
COD, Sulfate, Lead). For example, effluent discharged from a textile mill, located
adjacent to the proposed project site, contains high concentrations of Ammonia (43.8
mg/l), BOD5 (112 mg/l) and COD (355 mg/l). Thus, effluents from industrial and domestic
sources surrounding the project site are major sources of pollution of the river water close
to the project site. Enforcement of existing environmental regulations and regular
monitoring by concerned authorities are required for identification of sources and
management of such pollution in and around the project area.
5.3.2 Hazardous Material and Oil Management
The proposed SAPL RT has been designed keeping in mind the fast-growing RGM sector
which has high volumes of both import and export. The river terminal is not likely to handle
any hazardous material. Besides, fueling operations will not be carried out at the terminal
(it will be handled at Chittagong), and there will be no fuel storage facility at the proposed
river terminal for fueling of the container vessels. This will significantly reduce the risk of oil
spills and related hazards.
The regular fuel handling will be the diesel used in the power generation. The diesel
storage tank capacity is estimated to be 2000 liter. There are potentials of leakage from
this diesel storage tank therefore there is a need to install a containment tank having a
capacity of 1.5 times the maximum storage capacity of 2000 liters.
There is requirement of management of different types of oil and fuel used in different
maintenance activities. The spent lubricating oils should be stored in drums and disposed
through outside authorized contractors for either recycling or dumping in approved
landfills.
5.3.3 Impact on Road Infrastructure and Traffic
Majority of the garments industries in Bangladesh is located at Gazipur, Savar, and
Narayanganj. The existing road from Ponchoboti to Muktarpur bridge will be used for
110
transportation of cargo and containers to and from the proposed SAPL RT. As noted
earlier, the physical condition of the 10 km road from Ponchoboti to Muktarpur Bridge is
poor; the road is narrow and the road pavement is damaged along many stretches of the
road.
Traffic survey revealed that the road is very busy, particularly at Ponchoboti; over 1000
vehicles of different types cross this point each hour (in either direction) during both
morning and afternoon, which include about 200 trucks, pick-up and freight vehicles. The
project proponent has estimated that about 325 trucks will travel to and from the river
terminal in 24 hours through the Ponchoboti-Muktarpur road during its operational phase.
The incremental traffic to be generated by the proposed project is significant. Additionally,
other ongoing development activities in the surrounding area will further deteriorate the
traffic and road condition. Renovation and expansion of the Ponchoboti-Muktarpur road is
urgently needed for the greater interest of the area. The Government is planning to initiate
a project for the expansion of this road. During field surveys in August 2014 by BCAS, it
was observed that up gradation and expansion works of the road has been initiated and
has progressed significantly.
In spite of up gradation of the access road there is requirement by SAPRL to regulate the
incoming and outgoing traffic from the project area by:
1. Staggering the inflow and outflow of traffic. The container trucks carrying outward
cargo should be allowed to unload during the first half of the time allowed for truck
movement and the trucks loading with inward cargo should be allowed in the second
half. This will ease congestion on the access road.
2. Maintaining time of loading and unloading of the container trucks optimizing time to the
extent possible. This will add flexibility to the overall traffic management.
3. Control through mobile phone communication with drivers of incoming and outgoing
trucks for better management of road traffic to avoid congestion on the access road
due to the activities of the river port operations.
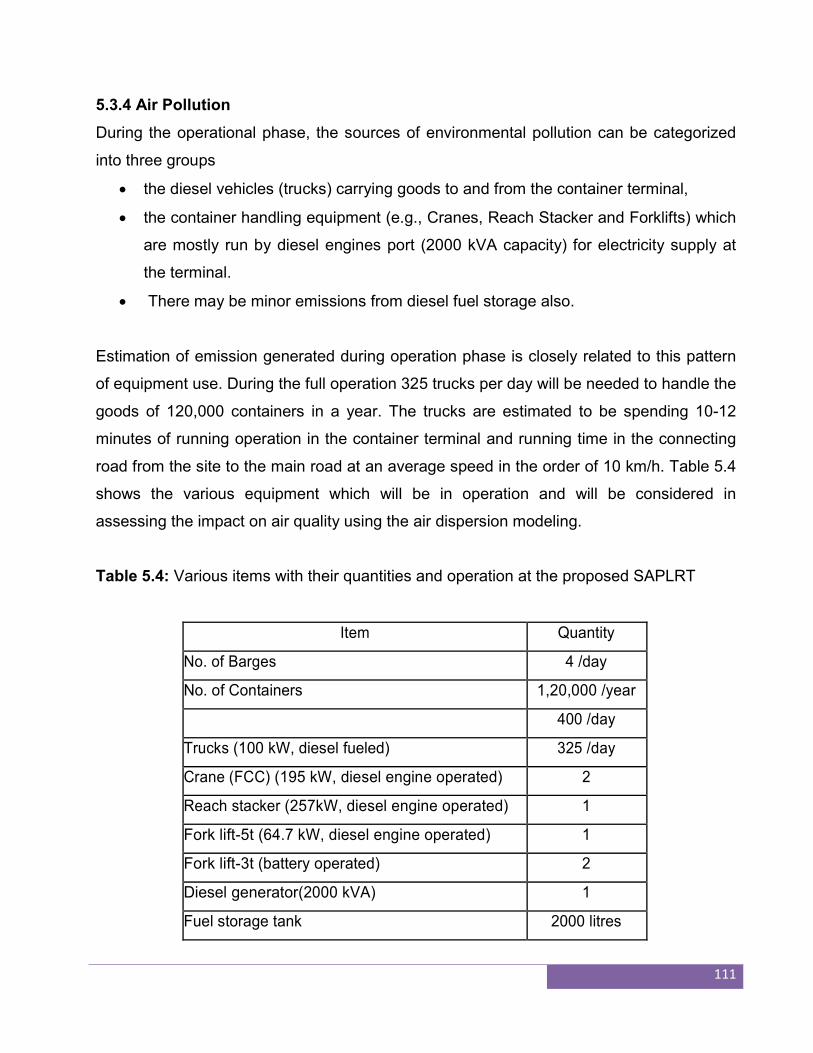
111
5.3.4 Air Pollution
During the operational phase, the sources of environmental pollution can be categorized
into three groups
the diesel vehicles (trucks) carrying goods to and from the container terminal,
the container handling equipment (e.g., Cranes, Reach Stacker and Forklifts) which
are mostly run by diesel engines port (2000 kVA capacity) for electricity supply at
the terminal.
There may be minor emissions from diesel fuel storage also.
Estimation of emission generated during operation phase is closely related to this pattern
of equipment use. During the full operation 325 trucks per day will be needed to handle the
goods of 120,000 containers in a year. The trucks are estimated to be spending 10-12
minutes of running operation in the container terminal and running time in the connecting
road from the site to the main road at an average speed in the order of 10 km/h. Table 5.4
shows the various equipment which will be in operation and will be considered in
assessing the impact on air quality using the air dispersion modeling.
Table 5.4: Various items with their quantities and operation at the proposed SAPLRT
Item Quantity
No. of Barges 4 /day
No. of Containers 1,20,000 /year
400 /day
Trucks (100 kW, diesel fueled) 325 /day
Crane (FCC) (195 kW, diesel engine operated) 2
Reach stacker (257kW, diesel engine operated) 1
Fork lift-5t (64.7 kW, diesel engine operated) 1
Fork lift-3t (battery operated) 2
Diesel generator(2000 kVA) 1
Fuel storage tank 2000 litres
112
5.3.5 Air Dispersion Modeling
As per terms of reference provided by IDCOL air dispersion modeling needs to be done.
The activities at the proposed project will be intermittent in nature with the generators and
the handling equipment being operated as and when required. In order to make the most
conservative estimate it will be assumed that all the equipment will operate 24 hours a
day.
Model Selection
Though, according to USEPA (www.epa.gov/scram001/7thconf/aermod_mep.pdf),
AERMOD and ISC-PRIME had a similar evaluation outcome for the full year Bowline Point
data, featuring buoyant steam electric plant releases, with no significant differences in
model performance, AERMOD model, version 09292, has been selected for this study as
it is currently the preferred model
AERMOD is a steady-state plume model. In the stable boundary layer (SBL), the
concentration distribution is assumed to be Gaussian in both the vertical and horizontal. In
the convective boundary layer (CBL), the horizontal distribution is assumed to be
Gaussian, but the vertical distribution is described with a bi-Gaussian probability density
function (p.d.f.). Additionally, in the CBL, AERMOD treats “plume lofting,” whereby a
portion of plume mass, released from a buoyant source, rises to and remains near the top
of the boundary layer before becoming mixed into the CBL. AERMOD also tracks any
plume mass that penetrates into elevated stable layer, and then allows it to re-enter the
boundary layer when and if appropriate.
5.3.6 Modeling Methodology
1. Model Setup
AERMOD was used with the following setup:
a) A model domain of 7.5 km by 7.5 km centered on the stack (0.0, 0.0) and 500m
grid spacing’s using Cartesian Co-ordinates.
b) Assumption of no terrain as the site surrounding the proposed plant is essentially
flat with no hilly areas.
113
c) Surface roughness lengths between 0.1m and 0.3m depending on the seasons
were used to account for the primary flows of concern across relatively flat areas.
d) Building wake effects were not included as the heights of the nearest buildings
were not sufficient to influence emissions.
2. Meteorological data requirement
The meteorological data used in the dispersion model is of fundamental importance as it
drives the transport and dispersion of the air pollutants in the atmosphere. The most
critical parameters are wind direction, which determines the initial direction of transport of
pollutants from their sources; wind speed, which dilutes the plume in the direction of
transport and determines the travel time from source to receptor; and atmospheric
turbulence, which indicates the dispersive ability of the atmosphere.
All meteorological stations used to collect data for dispersion modeling purposes must use
an anemometer that has a stall speed of 0.5 m/s or less.
For the AERMOD dispersion model, two meteorological files (surface file and profile file)
are needed. The meteorological parameters required for the surface file are:
H = sensible heat flux (W/m2)
u* = surface friction velocity (m/s)
w* = convective velocity scale (m/s)
VPTG = vertical potential temperature gradient in the 500 m layer above PBL
Zic = height of convectively-generated boundary layer (m)
Zim = height of mechanically-generated boundary layer (m)
L = Monin-Obukhov length (m)
zo = surface roughness length (m)
Bo = Bowen ratio
r = Albedo
114
Ws = wind speed (m/s)
Wd = wind direction (degrees)
zref = reference height for Ws and Wd (m)
temp = temperature (K)
ztemp = reference height for temp (m)
The meteorological parameters required for the profile file are:
height = measurement height (m)
top = 1, if this is the last (highest) level for this hour, or 0 otherwise
WDnn = wind direction at the current level (degrees)
WSnn = wind speed at the current level (m/s)
TTnn = temperature at the current level (°C)
SAnn = F2 (degrees)
SWnn = Fw (m/s)
The data files (both) should include hourly average values for the above parameters.
Wind speed, wind direction, ambient temperature, cloud cover, solar radiation, pressure,
relative humidity and precipitation rate can be directly measured, but other parameters
need to be determined indirectly using other meteorological parameters with empirical
formulae.
Preparation of meteorological data
1. Friction velocity, Monin-Obukhov length and surface roughness length
Surface characteristics in the form of albedo, surface roughness and Bowen ratio are
standard values depending on the season. Standard meteorological observations (wind
speed, wind direction, temperature, and cloud cover) for the site have been procured from
the Bangladesh Meteorological Department (BMD) and are used to calculate the PBL
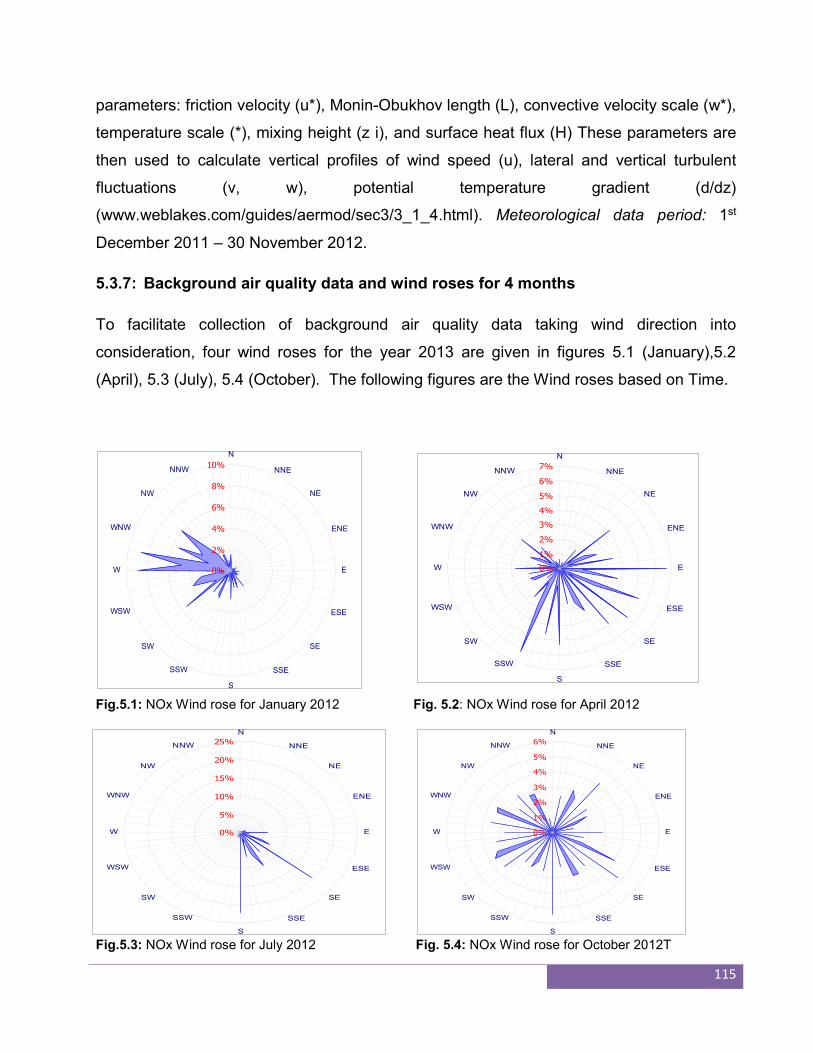
115
0%
2%
4%
6%
8%
10%
N
NNE
NE
ENE
E
ESE
SE
SSE
S
SSW
SW
WSW
W
WNW
NW
NNW
0%
1%
2%
3%
4%
5%
6%
7%
N
NNE
NE
ENE
E
ESE
SE
SSE
S
SSW
SW
WSW
W
WNW
NW
NNW
0%
5%
10%
15%
20%
25%
N
NNE
NE
ENE
E
ESE
SE
SSE
S
SSW
SW
WSW
W
WNW
NW
NNW
0%
1%
2%
3%
4%
5%
6%
N
NNE
NE
ENE
E
ESE
SE
SSE
S
SSW
SW
WSW
W
WNW
NW
NNW
parameters: friction velocity (u*), Monin-Obukhov length (L), convective velocity scale (w*),
temperature scale (*), mixing height (z i), and surface heat flux (H) These parameters are
then used to calculate vertical profiles of wind speed (u), lateral and vertical turbulent
fluctuations (v, w), potential temperature gradient (d/dz)
(www.weblakes.com/guides/aermod/sec3/3_1_4.html). Meteorological data period: 1st
December 2011 – 30 November 2012.
5.3.7: Background air quality data and wind roses for 4 months
To facilitate collection of background air quality data taking wind direction into
consideration, four wind roses for the year 2013 are given in figures 5.1 (January),5.2
(April), 5.3 (July), 5.4 (October). The following figures are the Wind roses based on Time.
Fig.5.1: NOx Wind rose for January 2012 Fig. 5.2: NOx Wind rose for April 2012
Fig.5.3: NOx Wind rose for July 2012 Fig. 5.4: NOx Wind rose for October 2012T
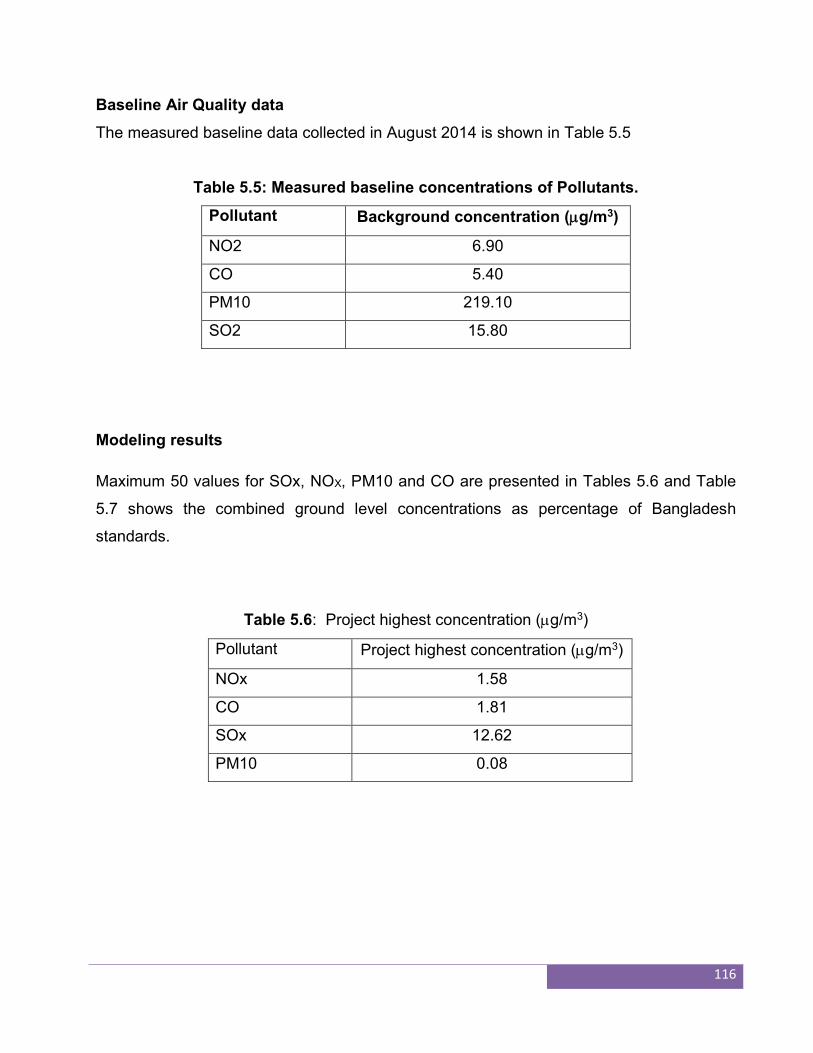
116
Baseline Air Quality data
The measured baseline data collected in August 2014 is shown in Table 5.5
Table 5.5: Measured baseline concentrations of Pollutants.
Pollutant Background concentration (g/m3)
NO2 6.90
CO 5.40
PM10 219.10
SO2 15.80
Modeling results
Maximum 50 values for SOx, NOX, PM10 and CO are presented in Tables 5.6 and Table
5.7 shows the combined ground level concentrations as percentage of Bangladesh
standards.
Table 5.6: Project highest concentration (g/m3)
Pollutant Project highest concentration (g/m3)
NOx 1.58
CO 1.81
SOx 12.62
PM10 0.08
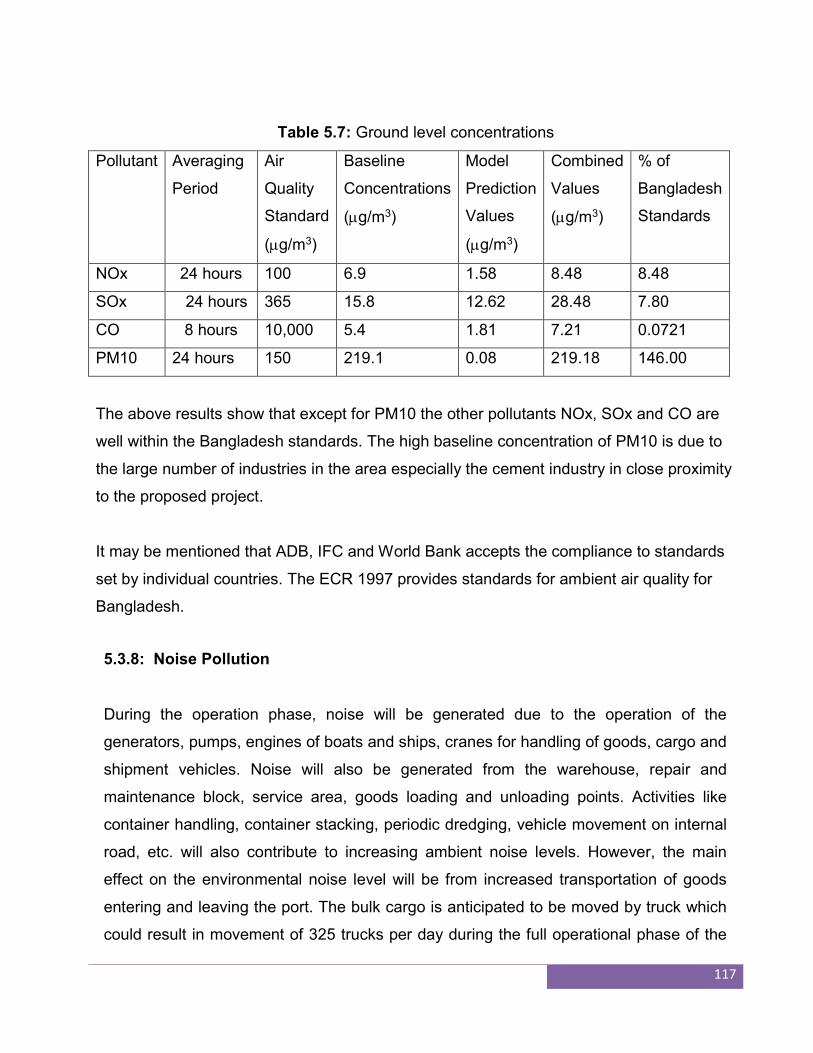
117
Table 5.7: Ground level concentrations
Pollutant Averaging
Period
Air
Quality
Standard
(g/m3)
Baseline
Concentrations
(g/m3)
Model
Prediction
Values
(g/m3)
Combined
Values
(g/m3)
% of
Bangladesh
Standards
NOx 24 hours 100 6.9 1.58 8.48 8.48
SOx 24 hours 365 15.8 12.62 28.48 7.80
CO 8 hours 10,000 5.4 1.81 7.21 0.0721
PM10 24 hours 150 219.1 0.08 219.18 146.00
The above results show that except for PM10 the other pollutants NOx, SOx and CO are
well within the Bangladesh standards. The high baseline concentration of PM10 is due to
the large number of industries in the area especially the cement industry in close proximity
to the proposed project.
It may be mentioned that ADB, IFC and World Bank accepts the compliance to standards
set by individual countries. The ECR 1997 provides standards for ambient air quality for
Bangladesh.
5.3.8: Noise Pollution
During the operation phase, noise will be generated due to the operation of the
generators, pumps, engines of boats and ships, cranes for handling of goods, cargo and
shipment vehicles. Noise will also be generated from the warehouse, repair and
maintenance block, service area, goods loading and unloading points. Activities like
container handling, container stacking, periodic dredging, vehicle movement on internal
road, etc. will also contribute to increasing ambient noise levels. However, the main
effect on the environmental noise level will be from increased transportation of goods
entering and leaving the port. The bulk cargo is anticipated to be moved by truck which
could result in movement of 325 trucks per day during the full operational phase of the
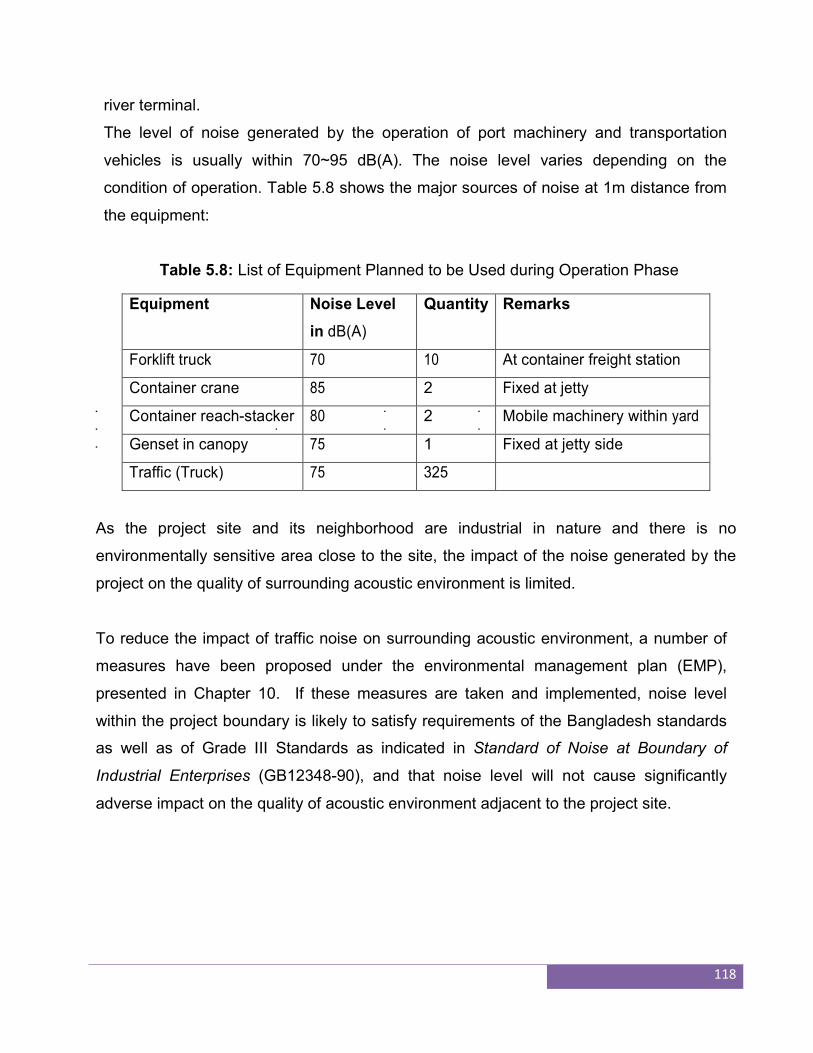
118
river terminal.
The level of noise generated by the operation of port machinery and transportation
vehicles is usually within 70~95 dB(A). The noise level varies depending on the
condition of operation. Table 5.8 shows the major sources of noise at 1m distance from
the equipment:
Table 5.8: List of Equipment Planned to be Used during Operation Phase
As the project site and its neighborhood are industrial in nature and there is no
environmentally sensitive area close to the site, the impact of the noise generated by the
project on the quality of surrounding acoustic environment is limited.
To reduce the impact of traffic noise on surrounding acoustic environment, a number of
measures have been proposed under the environmental management plan (EMP),
presented in Chapter 10. If these measures are taken and implemented, noise level
within the project boundary is likely to satisfy requirements of the Bangladesh standards
as well as of Grade III Standards as indicated in Standard of Noise at Boundary of
Industrial Enterprises (GB12348-90), and that noise level will not cause significantly
adverse impact on the quality of acoustic environment adjacent to the project site.
Equipment Noise Level
in dB(A)
Quantity Remarks
Forklift truck 70 10 At container freight station
Container crane 85 2 Fixed at jetty
Container reach-stacker 80 2 Mobile machinery within yard
Genset in canopy 75 1 Fixed at jetty side
Traffic (Truck) 75 325
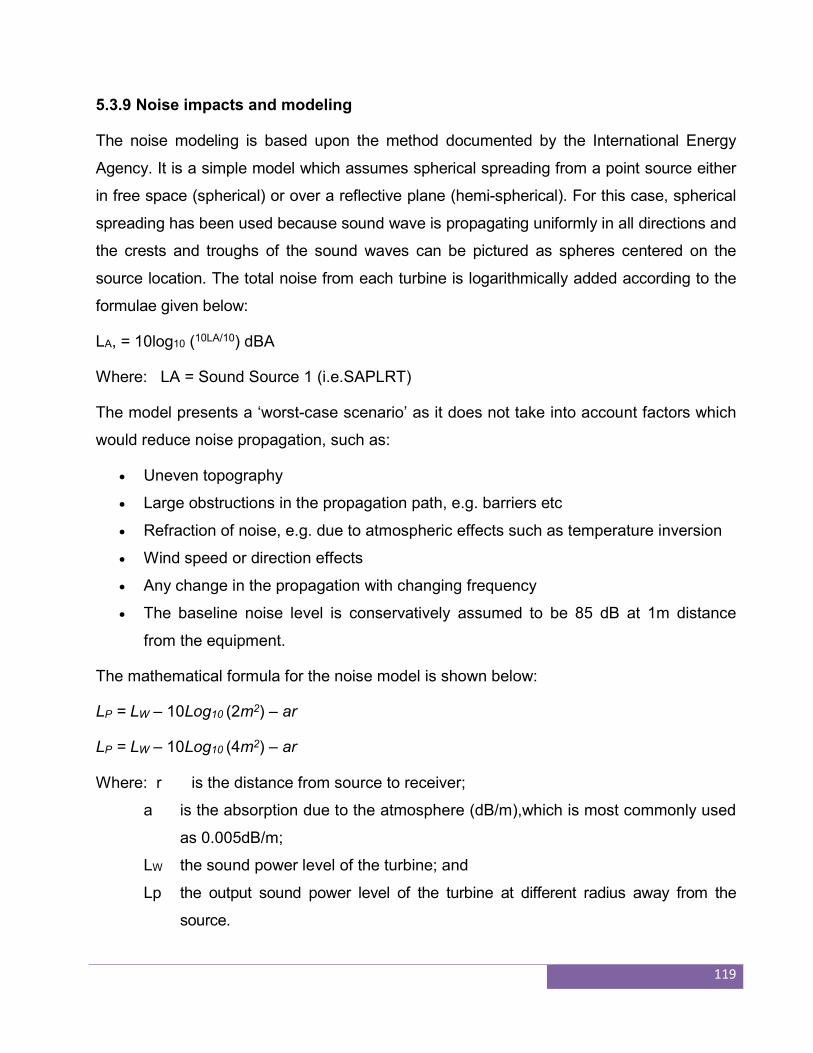
119
5.3.9 Noise impacts and modeling
The noise modeling is based upon the method documented by the International Energy
Agency. It is a simple model which assumes spherical spreading from a point source either
in free space (spherical) or over a reflective plane (hemi-spherical). For this case, spherical
spreading has been used because sound wave is propagating uniformly in all directions and
the crests and troughs of the sound waves can be pictured as spheres centered on the
source location. The total noise from each turbine is logarithmically added according to the
formulae given below:
LA, = 10log10 (10LA/10) dBA
Where: LA = Sound Source 1 (i.e.SAPLRT)
The model presents a ‘worst-case scenario’ as it does not take into account factors which
would reduce noise propagation, such as:
Uneven topography
Large obstructions in the propagation path, e.g. barriers etc
Refraction of noise, e.g. due to atmospheric effects such as temperature inversion
Wind speed or direction effects
Any change in the propagation with changing frequency
The baseline noise level is conservatively assumed to be 85 dB at 1m distance
from the equipment.
The mathematical formula for the noise model is shown below:
LP = LW – 10Log10 (2m2) – ar
LP = LW – 10Log10 (4m2) – ar
Where: r is the distance from source to receiver;
a is the absorption due to the atmosphere (dB/m),which is most commonly used
as 0.005dB/m;
LW the sound power level of the turbine; and
Lp the output sound power level of the turbine at different radius away from the
source.
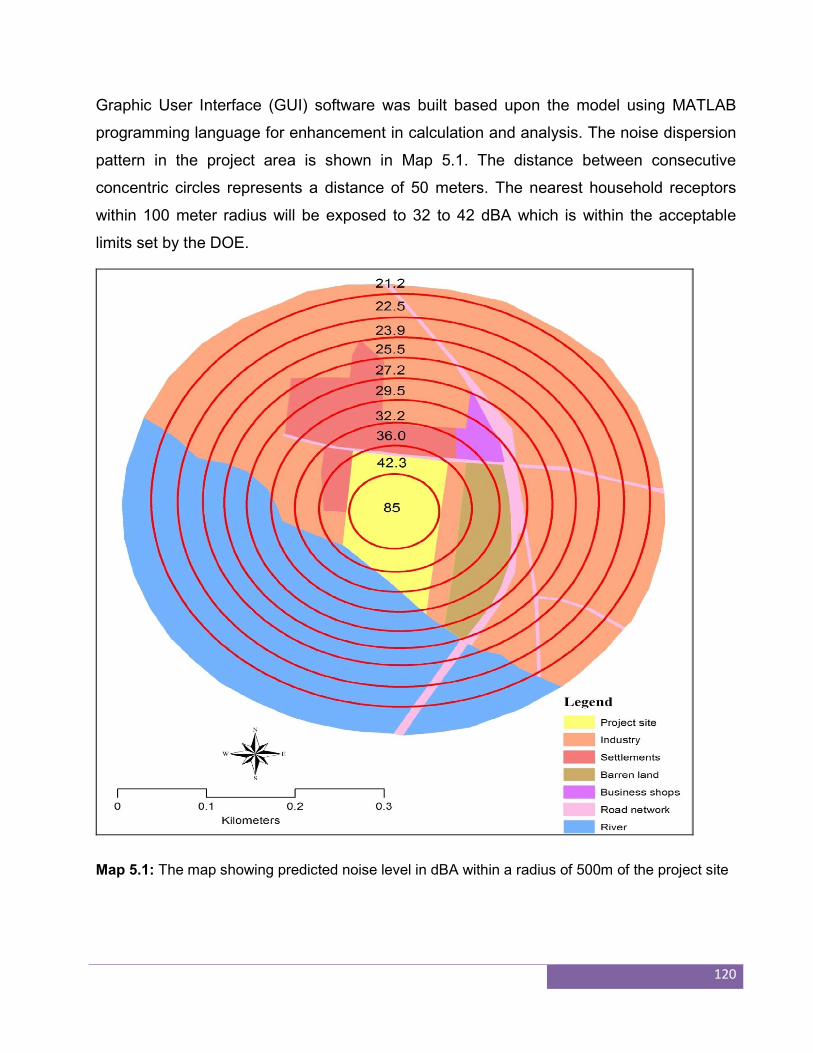
120
Graphic User Interface (GUI) software was built based upon the model using MATLAB
programming language for enhancement in calculation and analysis. The noise dispersion
pattern in the project area is shown in Map 5.1. The distance between consecutive
concentric circles represents a distance of 50 meters. The nearest household receptors
within 100 meter radius will be exposed to 32 to 42 dBA which is within the acceptable
limits set by the DOE.
Map 5.1: The map showing predicted noise level in dBA within a radius of 500m of the project site
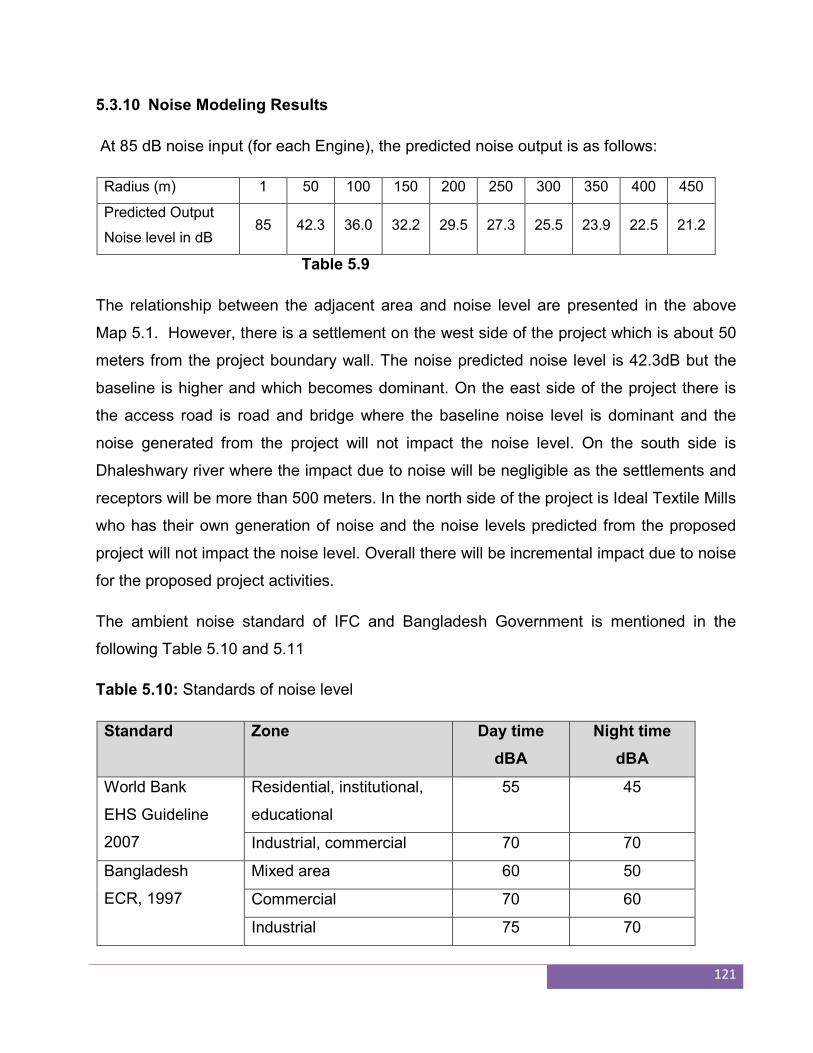
121
5.3.10 Noise Modeling Results
At 85 dB noise input (for each Engine), the predicted noise output is as follows:
Radius (m) 1 50 100 150 200 250 300 350 400 450
Predicted Output
Noise level in dB 85 42.3 36.0 32.2 29.5 27.3 25.5 23.9 22.5 21.2
Table 5.9
The relationship between the adjacent area and noise level are presented in the above
Map 5.1. However, there is a settlement on the west side of the project which is about 50
meters from the project boundary wall. The noise predicted noise level is 42.3dB but the
baseline is higher and which becomes dominant. On the east side of the project there is
the access road is road and bridge where the baseline noise level is dominant and the
noise generated from the project will not impact the noise level. On the south side is
Dhaleshwary river where the impact due to noise will be negligible as the settlements and
receptors will be more than 500 meters. In the north side of the project is Ideal Textile Mills
who has their own generation of noise and the noise levels predicted from the proposed
project will not impact the noise level. Overall there will be incremental impact due to noise
for the proposed project activities.
The ambient noise standard of IFC and Bangladesh Government is mentioned in the
following Table 5.10 and 5.11
Table 5.10: Standards of noise level
Standard Zone Day time
dBA
Night time
dBA
World Bank
EHS Guideline
2007
Residential, institutional,
educational
55 45
Industrial, commercial 70 70
Bangladesh
ECR, 1997
Mixed area 60 50
Commercial 70 60
Industrial 75 70
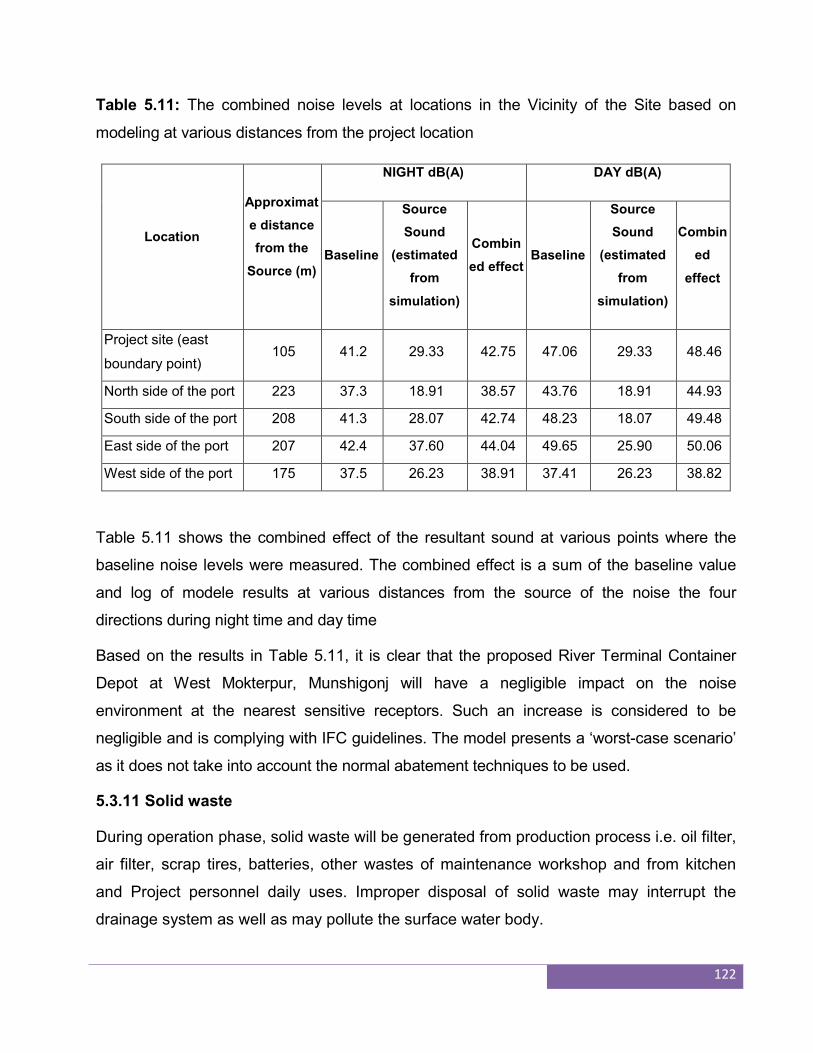
122
Table 5.11: The combined noise levels at locations in the Vicinity of the Site based on
modeling at various distances from the project location
Location
Approximat
e distance
from the
Source (m)
NIGHT dB(A) DAY dB(A)
Baseline
Source
Sound
(estimated
from
simulation)
Combin
ed effect Baseline
Source
Sound
(estimated
from
simulation)
Combin
ed
effect
Project site (east
boundary point) 105 41.2 29.33 42.75 47.06 29.33 48.46
North side of the port 223 37.3 18.91 38.57 43.76 18.91 44.93
South side of the port 208 41.3 28.07 42.74 48.23 18.07 49.48
East side of the port 207 42.4 37.60 44.04 49.65 25.90 50.06
West side of the port 175 37.5 26.23 38.91 37.41 26.23 38.82
Table 5.11 shows the combined effect of the resultant sound at various points where the
baseline noise levels were measured. The combined effect is a sum of the baseline value
and log of modele results at various distances from the source of the noise the four
directions during night time and day time
Based on the results in Table 5.11, it is clear that the proposed River Terminal Container
Depot at West Mokterpur, Munshigonj will have a negligible impact on the noise
environment at the nearest sensitive receptors. Such an increase is considered to be
negligible and is complying with IFC guidelines. The model presents a ‘worst-case scenario’
as it does not take into account the normal abatement techniques to be used.
5.3.11 Solid waste
During operation phase, solid waste will be generated from production process i.e. oil filter,
air filter, scrap tires, batteries, other wastes of maintenance workshop and from kitchen
and Project personnel daily uses. Improper disposal of solid waste may interrupt the
drainage system as well as may pollute the surface water body.
123
SAPLRT has to confirm the compliance of good house-keeping policy and procedure.
Personnel should be trained accordingly. Two separate waste bins should be placed to
collect the daily waste as organic and inorganic. All plastic materials would be sald to DOE
enlisted secondary users for recycling. Biodegradable waste could be compost and later
use as fertilizer.
It is already mentioned that SAPLRT is found to consider the waste management issue
with due importance. Already they have introduced a number of dustbins including the
approach of separating the waste at source.
5.3.112 Liquid waste and lube oil disposal
Main liquid waste of the proposed port seems to be lube oil. So, there is possibility of oil
spillage during the following incidences:
oil spill during unloading from tankers;
leakage from storage tanks;
leakage from transfer pipes;
leakage from machines during operation; and
oil spill during maintenance of machines.
Spillage of oil will be collected in a tank and pass through three tanks and finally send to
the process where a polymer will be added to separate the oil from water. The separated
oil will be collected in drums and sold to DOE approved recyclers. SAPLRT will not
procure poly-chlorinated biphenyls (PCBs) transformer oil. Pure hydrocarbon mineral oil
will be used for transformers, current transformers, potential transformers and capacitors
under the project which will not have any adverse environmental impacts.
5.3.13 Sanitary waste-water
Sanitary wastewater will be generated from the office and dormitory building, which will be
treated by septic tank connected with soak pit. SAPLRT has informed that they are will
adopt septic tank and soak pit by considering the required standards of best practices as
are applicable for 100 persons.
124
5.4 Environmental Impacts during Decommissioning Phase
The major environmental impacts during post-operation or decommissioning phase of a
Container Depot are noise and vibration; solid waste generation and leakage of spent
lube-oil and other raw materials; dust generation; and risk of human health and property.
As the demolition workers are likely to lead to significant deterioration of the acoustic
environment, carrying out the demolition work at day time can be a mitigation measure. In
case of waste and leakage of spent lube-oil and other raw materials, SAPLRT has to make
sure proper collection and disposal. To address the dust generation due to demolition
work, watering in bare area can be an option. For mitigating the risk of human health and
property damage, vehicles as are to be used in demolition work, have to be operated with
due care
.
5.5 Occupational Health and Safety Impact
Occupational health and safety risks and mitigation measures during construction,
operations are similar to those of other large industrial facilities. According to Environment,
Health and Safety (EHS) Guidelines of IFC, the major occupational health and safety
issues relevant with the Project are as follows:
5.5.1 Exposure to Electro Magnetic Field
In a port, the workers have a high exposure to electro-magnetic field (EMF) than the
general public due to working in proximity to electric power generators, equipment and
connecting high-voltage transmission lines. SAPLRT has planned to provide earthling
network around the generator room. Mesh system is expected to be used as safety
measure.
125
5.5.2 Fire and Explosion Hazards
The daily activities of port include store, transfer and use large quantities of fuels;
therefore, careful handling is necessary to mitigate fire and explosion risks. To avoid the
risk of fire and explosion hazard, SAPLRT has to arrange sufficient number of fire
protection equipments like buckets, fire extinguishers, fire water tank should be provided
for emergency needs. At the site, the safety and emergency manual should be accessible
to all employees.
5.5.3 General Safety
To reduce the risk of general accidents, SAPLRT has planned to provide personal
protective equipments like safety gloves, helmet, mufflers etc. during construction period
and during the maintenance work while the port is in operation.
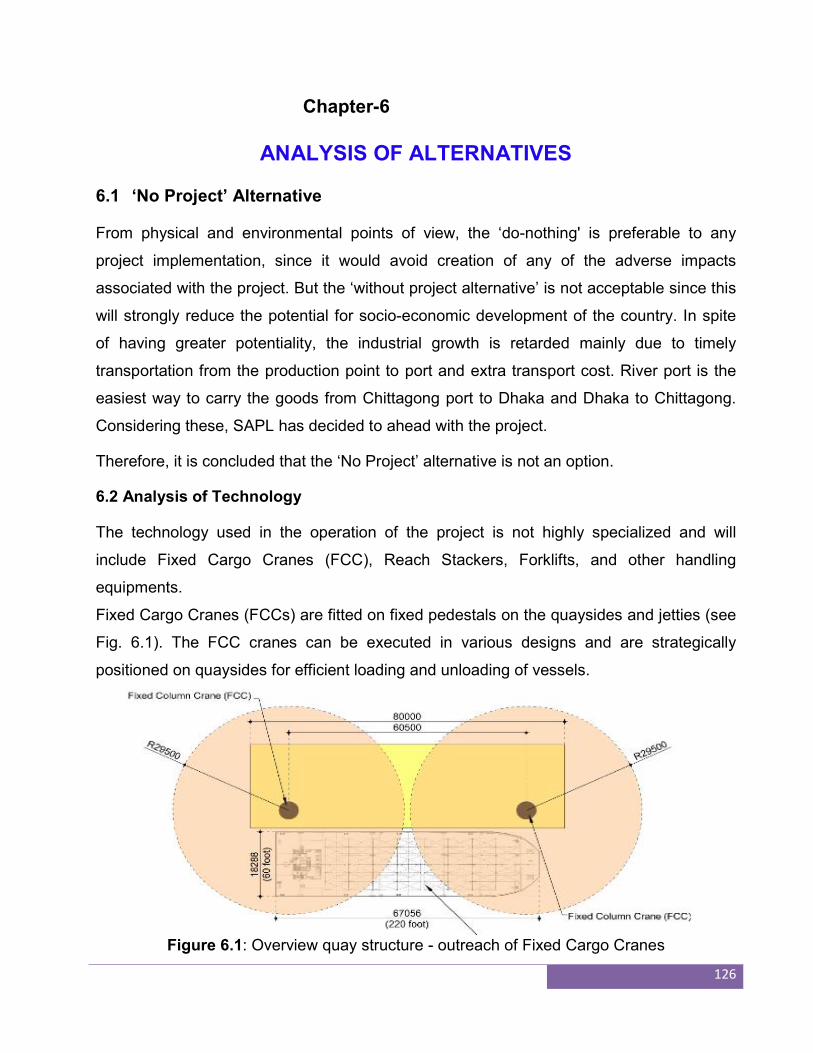
126
Chapter-6
ANALYSIS OF ALTERNATIVES
6.1 ‘No Project’ Alternative
From physical and environmental points of view, the ‘do-nothing' is preferable to any
project implementation, since it would avoid creation of any of the adverse impacts
associated with the project. But the ‘without project alternative’ is not acceptable since this
will strongly reduce the potential for socio-economic development of the country. In spite
of having greater potentiality, the industrial growth is retarded mainly due to timely
transportation from the production point to port and extra transport cost. River port is the
easiest way to carry the goods from Chittagong port to Dhaka and Dhaka to Chittagong.
Considering these, SAPL has decided to ahead with the project.
Therefore, it is concluded that the ‘No Project’ alternative is not an option.
6.2 Analysis of Technology
The technology used in the operation of the project is not highly specialized and will
include Fixed Cargo Cranes (FCC), Reach Stackers, Forklifts, and other handling
equipments.
Fixed Cargo Cranes (FCCs) are fitted on fixed pedestals on the quaysides and jetties (see
Fig. 6.1). The FCC cranes can be executed in various designs and are strategically
positioned on quaysides for efficient loading and unloading of vessels.
Figure 6.1: Overview quay structure - outreach of Fixed Cargo Cranes
127
Reach Stackers are used for flexible handling of containers and are usually designed to lift
containers as heavy as 45 metric tons into heights of six containers. Reach Stackers are
able to transport a container over a short distance very quickly and pile those rows as
required. The straightforward operation of loading and unloading do not have any
technology alternative.
6.3 Analysis of Site Alternatives
Analysis of Site Alternatives (AoA) helps to identify potentially viable project locations and
provide comparative cost, effectiveness, and risk assessments of each site to a baseline;
this baseline is typically the proposed operating system.
In identification of project site for a River port terminal depot, some parameters are taken
into consideration like:
i) availability of river navigation in terms of adequate draft all round the year
ii) availability of adequate river front space for the river port,
iii) availability of fuel transport facility through sea and road,
iv) availability of infrastructure facility (electricity, telecommunication, etc).
v) availability of land transport parking spaces etc.
vi) availability of wide road connection to carry the container by road
vii) environmental and social suitability
6.4 Location and Area of Available Land
During site visit, information about alternative sites considered was assessed. Based on
the available information two alternative sites were selected for further analysis. Table 6.1
and in Google Map 6.1
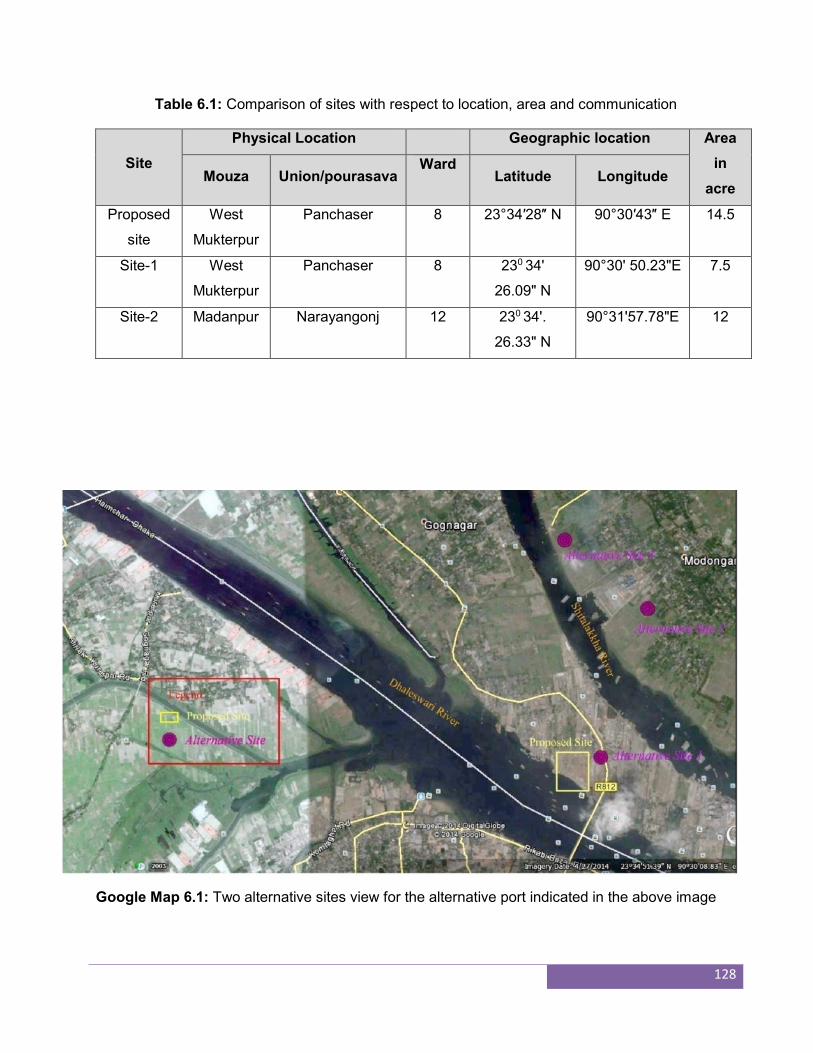
128
Table 6.1: Comparison of sites with respect to location, area and communication
Site
Physical Location Geographic location Area
in
acre Mouza Union/pourasava
Ward Latitude Longitude
Proposed
site
West
Mukterpur
Panchaser 8 23°34′28″ N 90°30′43″ E 14.5
Site-1 West
Mukterpur
Panchaser 8 230 34'
26.09" N
90°30' 50.23"E 7.5
Site-2 Madanpur Narayangonj 12 230 34'.
26.33" N
90°31'57.78"E 12
Google Map 6.1: Two alternative sites view for the alternative port indicated in the above image
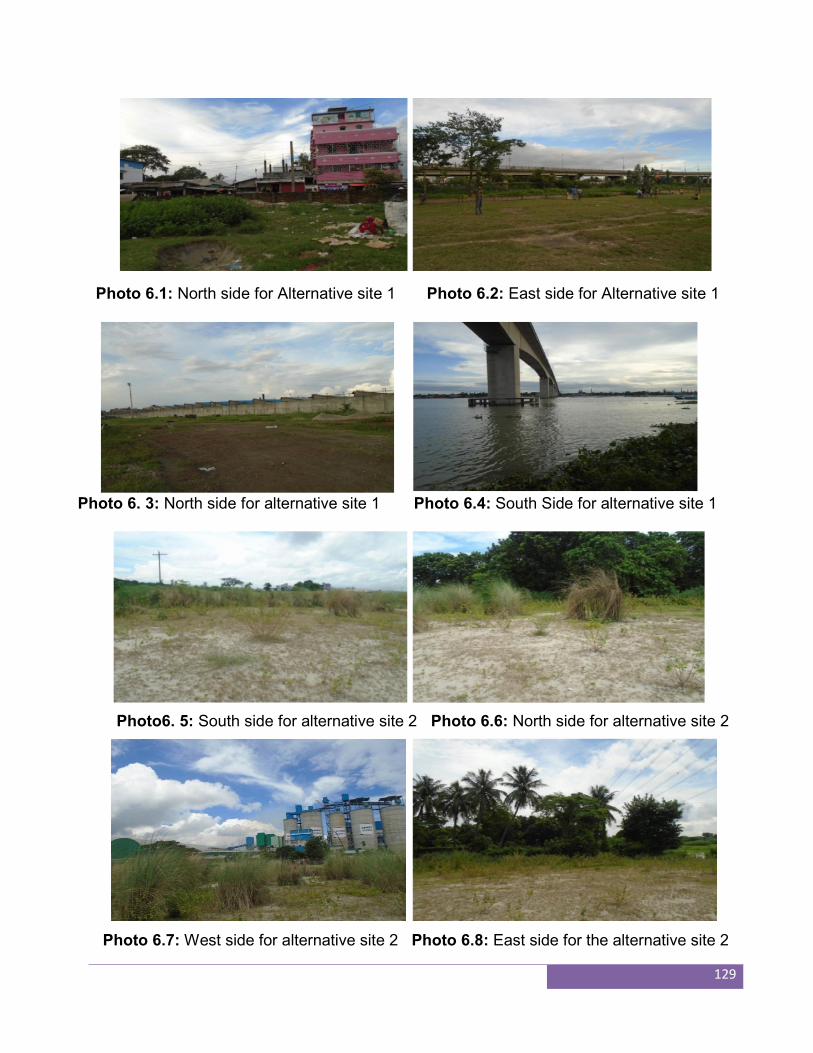
129
Photo 6.1: North side for Alternative site 1 Photo 6.2: East side for Alternative site 1
Photo 6. 3: North side for alternative site 1 Photo 6.4: South Side for alternative site 1
Photo6. 5: South side for alternative site 2 Photo 6.6: North side for alternative site 2
Photo 6.7: West side for alternative site 2 Photo 6.8: East side for the alternative site 2
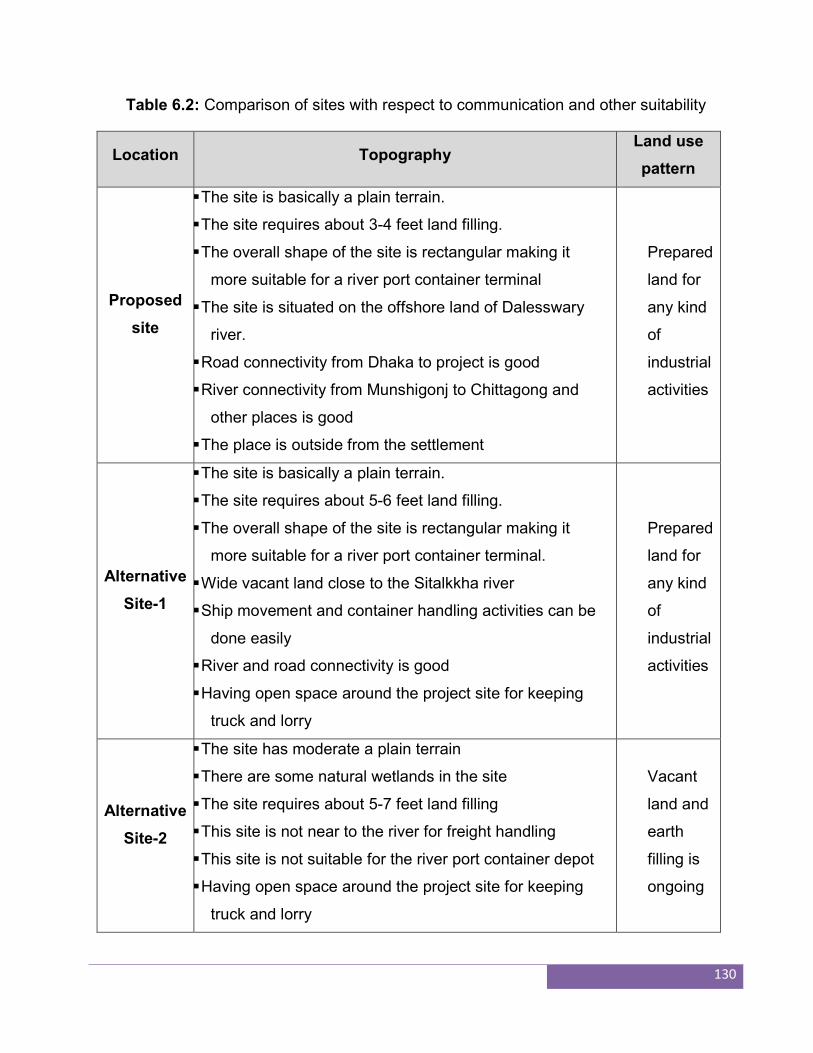
130
Table 6.2: Comparison of sites with respect to communication and other suitability
Location Topography Land use
pattern
Proposed
site
The site is basically a plain terrain.
The site requires about 3-4 feet land filling.
The overall shape of the site is rectangular making it
more suitable for a river port container terminal
The site is situated on the offshore land of Dalesswary
river.
Road connectivity from Dhaka to project is good
River connectivity from Munshigonj to Chittagong and
other places is good
The place is outside from the settlement
Prepared
land for
any kind
of
industrial
activities
Alternative
Site-1
The site is basically a plain terrain.
The site requires about 5-6 feet land filling.
The overall shape of the site is rectangular making it
more suitable for a river port container terminal.
Wide vacant land close to the Sitalkkha river
Ship movement and container handling activities can be
done easily
River and road connectivity is good
Having open space around the project site for keeping
truck and lorry
Prepared
land for
any kind
of
industrial
activities
Alternative
Site-2
The site has moderate a plain terrain
There are some natural wetlands in the site
The site requires about 5-7 feet land filling
This site is not near to the river for freight handling
This site is not suitable for the river port container depot
Having open space around the project site for keeping
truck and lorry
Vacant
land and
earth
filling is
ongoing
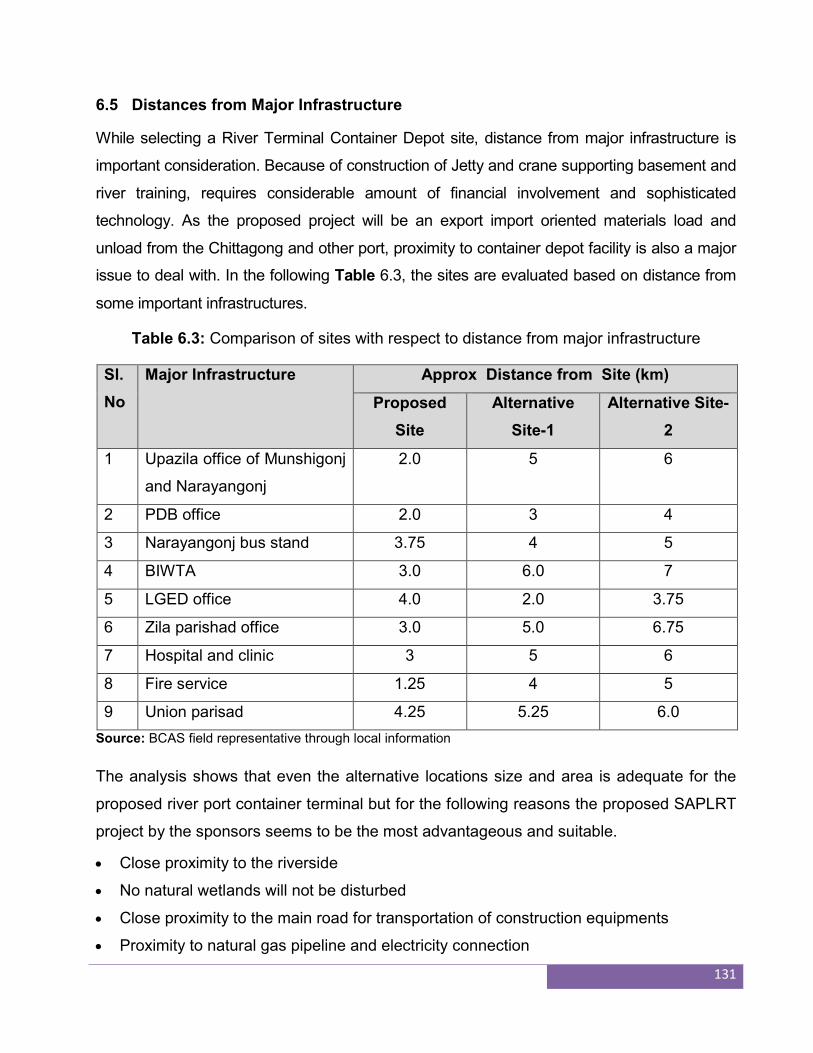
131
6.5 Distances from Major Infrastructure
While selecting a River Terminal Container Depot site, distance from major infrastructure is
important consideration. Because of construction of Jetty and crane supporting basement and
river training, requires considerable amount of financial involvement and sophisticated
technology. As the proposed project will be an export import oriented materials load and
unload from the Chittagong and other port, proximity to container depot facility is also a major
issue to deal with. In the following Table 6.3, the sites are evaluated based on distance from
some important infrastructures.
Table 6.3: Comparison of sites with respect to distance from major infrastructure
Sl.
No
Major Infrastructure Approx Distance from Site (km)
Proposed
Site
Alternative
Site-1
Alternative Site-
2
1 Upazila office of Munshigonj
and Narayangonj
2.0 5 6
2 PDB office 2.0 3 4
3 Narayangonj bus stand 3.75 4 5
4 BIWTA 3.0 6.0 7
5 LGED office 4.0 2.0 3.75
6 Zila parishad office 3.0 5.0 6.75
7 Hospital and clinic 3 5 6
8 Fire service 1.25 4 5
9 Union parisad 4.25 5.25 6.0
Source: BCAS field representative through local information
The analysis shows that even the alternative locations size and area is adequate for the
proposed river port container terminal but for the following reasons the proposed SAPLRT
project by the sponsors seems to be the most advantageous and suitable.
Close proximity to the riverside
No natural wetlands will not be disturbed
Close proximity to the main road for transportation of construction equipments
Proximity to natural gas pipeline and electricity connection
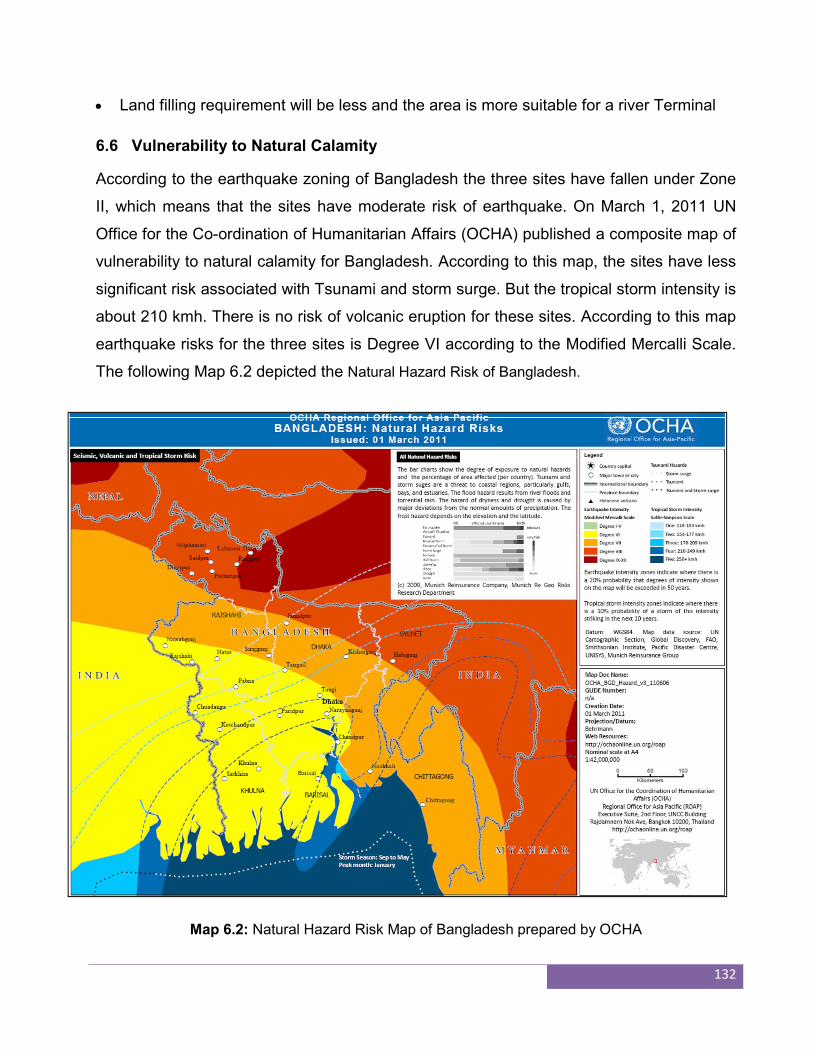
132
Land filling requirement will be less and the area is more suitable for a river Terminal
6.6 Vulnerability to Natural Calamity
According to the earthquake zoning of Bangladesh the three sites have fallen under Zone
II, which means that the sites have moderate risk of earthquake. On March 1, 2011 UN
Office for the Co-ordination of Humanitarian Affairs (OCHA) published a composite map of
vulnerability to natural calamity for Bangladesh. According to this map, the sites have less
significant risk associated with Tsunami and storm surge. But the tropical storm intensity is
about 210 kmh. There is no risk of volcanic eruption for these sites. According to this map
earthquake risks for the three sites is Degree VI according to the Modified Mercalli Scale.
The following Map 6.2 depicted the Natural Hazard Risk of Bangladesh.
Map 6.2: Natural Hazard Risk Map of Bangladesh prepared by OCHA
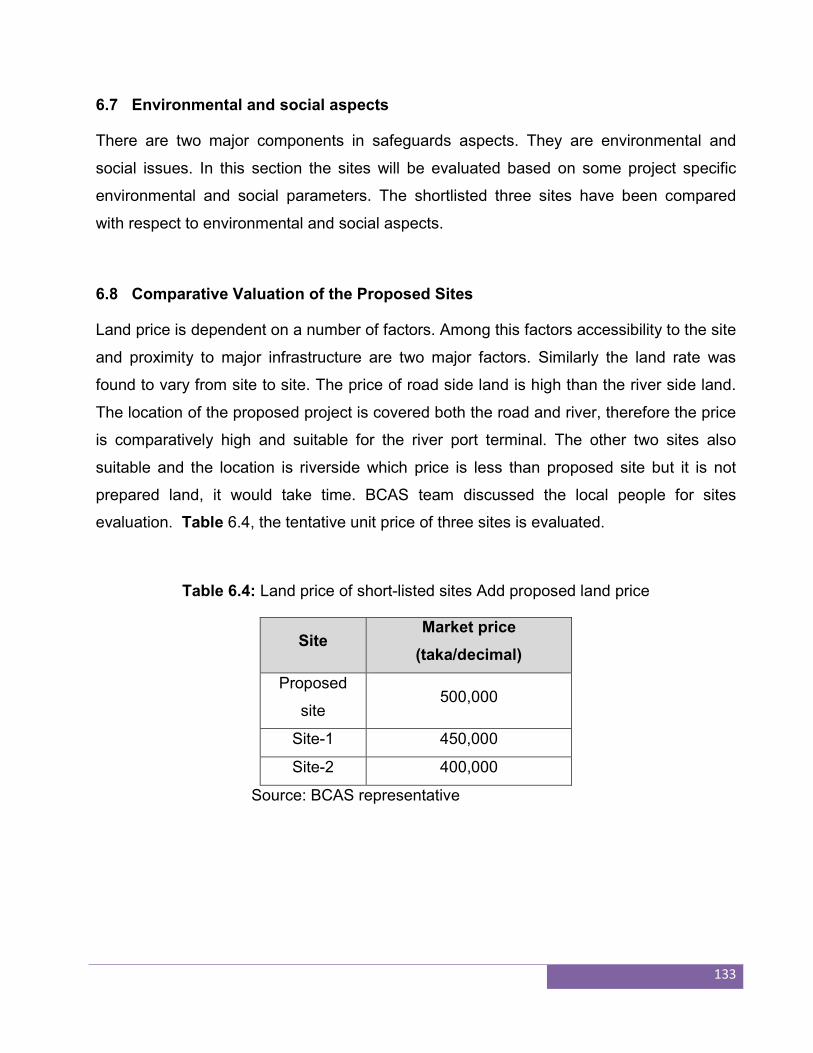
133
6.7 Environmental and social aspects
There are two major components in safeguards aspects. They are environmental and
social issues. In this section the sites will be evaluated based on some project specific
environmental and social parameters. The shortlisted three sites have been compared
with respect to environmental and social aspects.
6.8 Comparative Valuation of the Proposed Sites
Land price is dependent on a number of factors. Among this factors accessibility to the site
and proximity to major infrastructure are two major factors. Similarly the land rate was
found to vary from site to site. The price of road side land is high than the river side land.
The location of the proposed project is covered both the road and river, therefore the price
is comparatively high and suitable for the river port terminal. The other two sites also
suitable and the location is riverside which price is less than proposed site but it is not
prepared land, it would take time. BCAS team discussed the local people for sites
evaluation. Table 6.4, the tentative unit price of three sites is evaluated.
Table 6.4: Land price of short-listed sites Add proposed land price
Site Market price
(taka/decimal)
Proposed
site 500,000
Site-1 450,000
Site-2 400,000
Source: BCAS representative
134
Chapter-7
INFORMATION DISCLOSURE, CONSULTATION AND PARTICIPATION
7.1 Information disclosure
During baseline survey an information disclosure about the project was carried out in the
project area. The approach was based on a combination of formal, informal meetings, key
informant interview (KII) and focus group discussions (FGDs). The formal meetings were
held through prior notice and invitation of the households, district administration, local
administration, Civil Defense Fire Service, Bangladesh Inland Water Transport Corporation,
Fisheries Office, TNO, local member etc. The following groups identified for disclosure:
Project Affected People
Government agencies connected with the project
Local elites and academicians of the area
Closest households and commercial institutions of the project site
Local NGOs working in the area
The methodology used for the disclosure process was as follows:
Preliminary Informal meetings with various categories of people and households
were completed
Several formal meetings specifically including all categories of People in the project
site
One large public consultation meeting which included all the peoples,
representatives from the project impacted areas, district and local administration,
as well as other community representatives including prominent local people,
lawyers, journalists and academicians.
135
7.2 Stakeholder’s Consultation
The objectives of the consultations were as follows:
dissemination of information about the project among the stakeholders;
have a better understanding of existing environmental conditions and their
concerns;
aware stakeholders to contribute meaningfully to in different phases of project;
reduce psychological distance between project sponsor and stakeholders; and
ensure the sustainability of the project.
Stakeholder consultation meeting is an important part of the ESIA study. The main
objective of the consultation meeting is to apprise the local inhabitants about the Proposed
Project and to seek their opinion regarding the tentative impacts. It is a fundamental
principle of any environmental assessment study. The inclusion of the feedback of public
consultation helps to ensure that the decision making process is equitable and fair and
leads to more informed choice and better environmental outcomes. The findings from the
public consultations carried out as a part the ESIA study were utilized in the development
of the EMP, especially in identifying the significant impacts of the proposed project and
developing the corresponding mitigation measures.
7.3 Consultation and Participation Mechanism
Public consultation has been carried out during different activities in the Project cycle, using
different techniques such as public meeting, small group meeting, informal meeting as per
social environment and procedures of BCAS. During the consultations the stakeholders
were informed about the project in general and in particular about the following:
1. Finalization of the Project plan.
2. Summit Alliance Port Limited River Terminal (SAPLRT) design standards in
relation to the applicable international standards.
3. Environmental and Social impacts due to the project and mitigations suggested in
the draft ESIA.
136
4. Health Impacts and their mitigation as part of the Environmental Management
Plan (EMP).
5. Measures taken to avoid public utilities and other social infrastructure such as
school, hospital, roads, etc as well as to generate employment opportunities, and
assist with the development of a small enterprise.
6. Other impacts associated with Access Road with an approach to minimize and
mitigate the effects of increased traffic due to the project.
7.4 Stakeholders’ Participation
A series of public consultation activities were undertaken by BCAS representative. These
included rapid appraisal and discussion with the groups of Project Affected People and
community leaders. Exchange the opinion with the local people, knowing individual
perception. Results of Stakeholders consultation through KII and FGDs are given below:
1. KII with the Thana Nirbahi Officer (TNO)
Mrs. Saraban Tahura
Thana Nirbahi Officer, Munshigonj Upazila Sadar, Munshigonj
Date: 31 August, 2014
Cell No.: 01927 432 442
According to the local government structure of Bangladesh Government, West Mukterpur
is a village of Panchaser Union under the jurisdiction of Munshigonj District. The
administrative authority of the village is the Upazila Parishad. As a part of consultation with
local government representative, there were consultations with Mrs. Saraban Tahura,
Thana Nirbahi Officer (TNO).
The following were the discussing issues:
The interviewee was aware about the proposed River Terminal of SAPLRT at West
Mokterpur which will be established by Summit Alliance Group
The interviewee raised concerns about the existing high particulate matter
concentration in the area and recommended that the proposed project should ensure
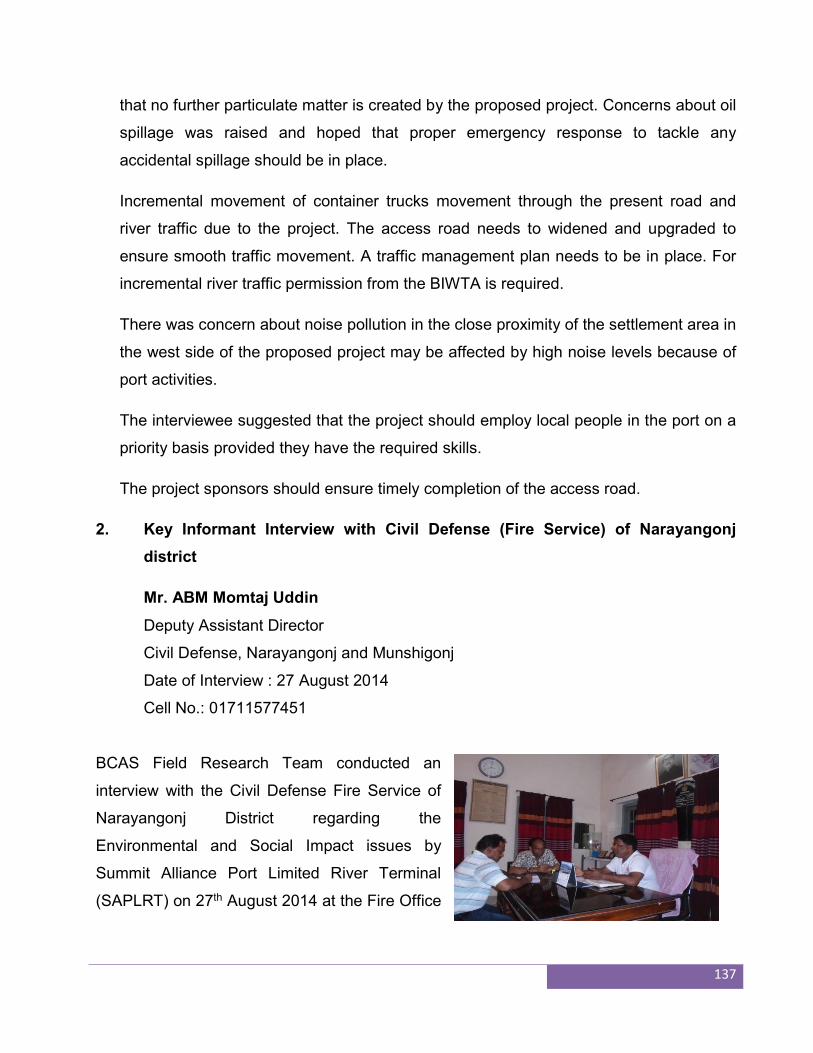
137
that no further particulate matter is created by the proposed project. Concerns about oil
spillage was raised and hoped that proper emergency response to tackle any
accidental spillage should be in place.
Incremental movement of container trucks movement through the present road and
river traffic due to the project. The access road needs to widened and upgraded to
ensure smooth traffic movement. A traffic management plan needs to be in place. For
incremental river traffic permission from the BIWTA is required.
There was concern about noise pollution in the close proximity of the settlement area in
the west side of the proposed project may be affected by high noise levels because of
port activities.
The interviewee suggested that the project should employ local people in the port on a
priority basis provided they have the required skills.
The project sponsors should ensure timely completion of the access road.
2. Key Informant Interview with Civil Defense (Fire Service) of Narayangonj
district
Mr. ABM Momtaj Uddin
Deputy Assistant Director
Civil Defense, Narayangonj and Munshigonj
Date of Interview : 27 August 2014
Cell No.: 01711577451
BCAS Field Research Team conducted an
interview with the Civil Defense Fire Service of
Narayangonj District regarding the
Environmental and Social Impact issues by
Summit Alliance Port Limited River Terminal
(SAPLRT) on 27th August 2014 at the Fire Office
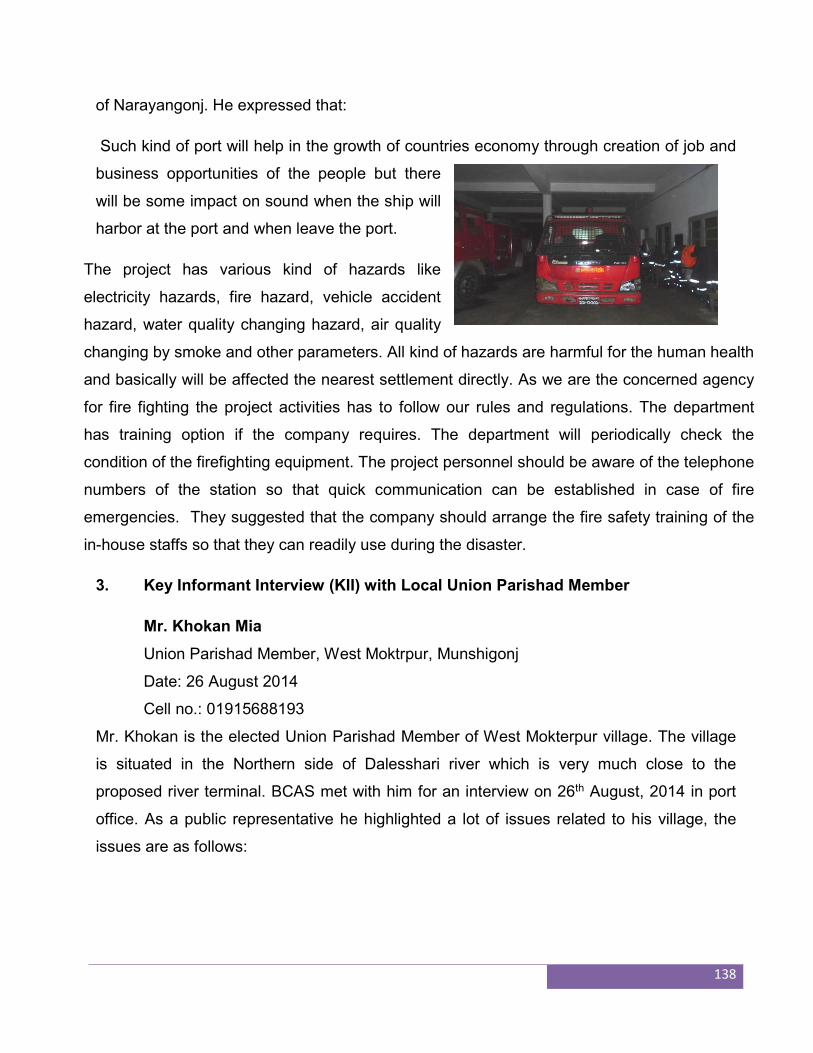
138
of Narayangonj. He expressed that:
Such kind of port will help in the growth of countries economy through creation of job and
business opportunities of the people but there
will be some impact on sound when the ship will
harbor at the port and when leave the port.
The project has various kind of hazards like
electricity hazards, fire hazard, vehicle accident
hazard, water quality changing hazard, air quality
changing by smoke and other parameters. All kind of hazards are harmful for the human health
and basically will be affected the nearest settlement directly. As we are the concerned agency
for fire fighting the project activities has to follow our rules and regulations. The department
has training option if the company requires. The department will periodically check the
condition of the firefighting equipment. The project personnel should be aware of the telephone
numbers of the station so that quick communication can be established in case of fire
emergencies. They suggested that the company should arrange the fire safety training of the
in-house staffs so that they can readily use during the disaster.
3. Key Informant Interview (KII) with Local Union Parishad Member
Mr. Khokan Mia
Union Parishad Member, West Moktrpur, Munshigonj
Date: 26 August 2014
Cell no.: 01915688193
Mr. Khokan is the elected Union Parishad Member of West Mokterpur village. The village
is situated in the Northern side of Dalesshari river which is very much close to the
proposed river terminal. BCAS met with him for an interview on 26th August, 2014 in port
office. As a public representative he highlighted a lot of issues related to his village, the
issues are as follows:
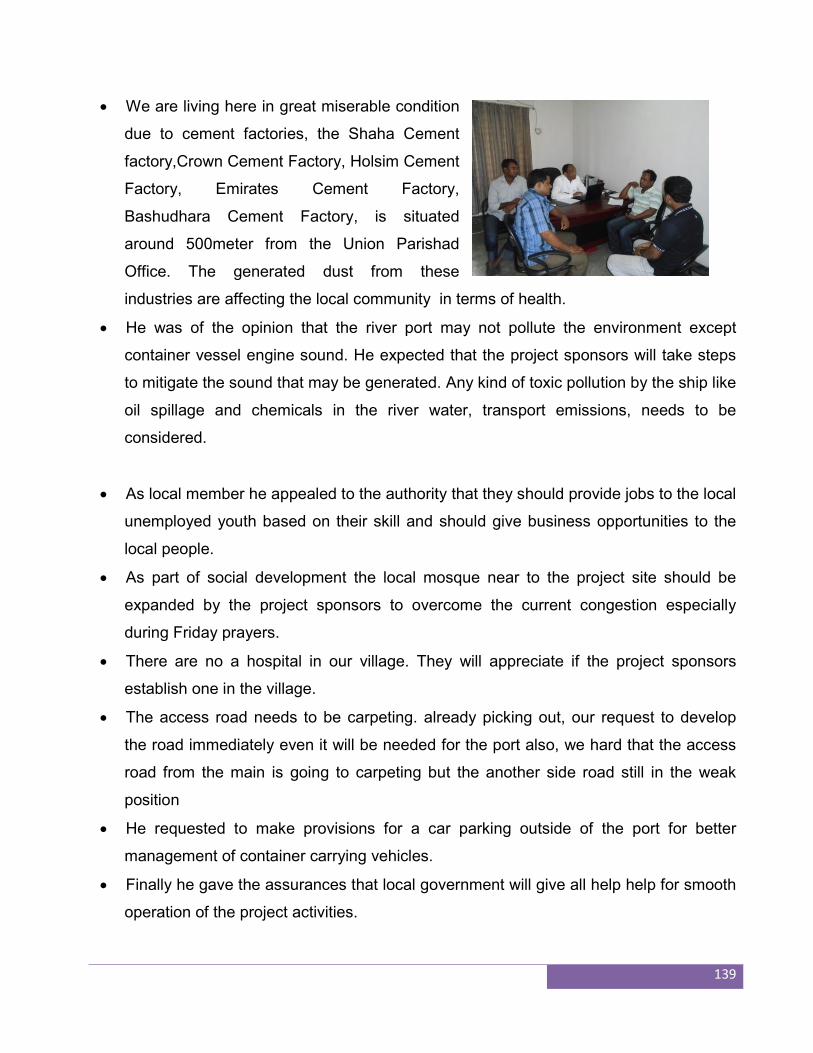
139
We are living here in great miserable condition
due to cement factories, the Shaha Cement
factory,Crown Cement Factory, Holsim Cement
Factory, Emirates Cement Factory,
Bashudhara Cement Factory, is situated
around 500meter from the Union Parishad
Office. The generated dust from these
industries are affecting the local community in terms of health.
He was of the opinion that the river port may not pollute the environment except
container vessel engine sound. He expected that the project sponsors will take steps
to mitigate the sound that may be generated. Any kind of toxic pollution by the ship like
oil spillage and chemicals in the river water, transport emissions, needs to be
considered.
As local member he appealed to the authority that they should provide jobs to the local
unemployed youth based on their skill and should give business opportunities to the
local people.
As part of social development the local mosque near to the project site should be
expanded by the project sponsors to overcome the current congestion especially
during Friday prayers.
There are no a hospital in our village. They will appreciate if the project sponsors
establish one in the village.
The access road needs to be carpeting. already picking out, our request to develop
the road immediately even it will be needed for the port also, we hard that the access
road from the main is going to carpeting but the another side road still in the weak
position
He requested to make provisions for a car parking outside of the port for better
management of container carrying vehicles.
Finally he gave the assurances that local government will give all help help for smooth
operation of the project activities.
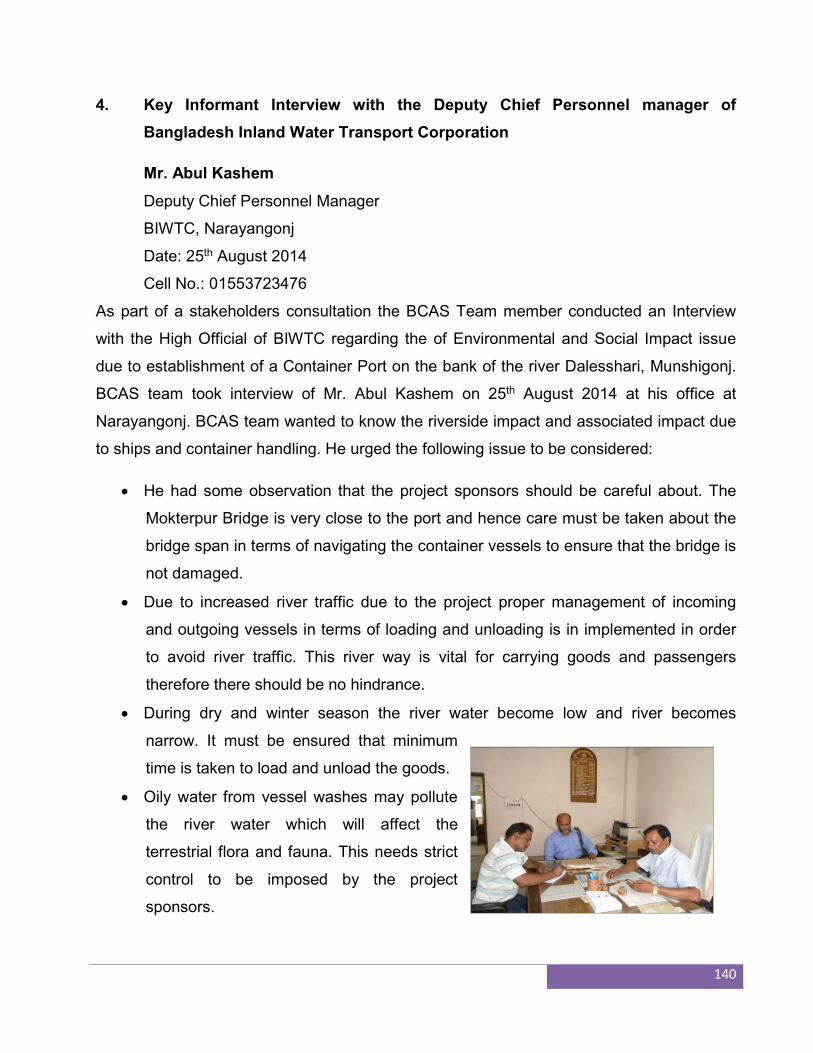
140
4. Key Informant Interview with the Deputy Chief Personnel manager of
Bangladesh Inland Water Transport Corporation
Mr. Abul Kashem
Deputy Chief Personnel Manager
BIWTC, Narayangonj
Date: 25th August 2014
Cell No.: 01553723476
As part of a stakeholders consultation the BCAS Team member conducted an Interview
with the High Official of BIWTC regarding the of Environmental and Social Impact issue
due to establishment of a Container Port on the bank of the river Dalesshari, Munshigonj.
BCAS team took interview of Mr. Abul Kashem on 25th August 2014 at his office at
Narayangonj. BCAS team wanted to know the riverside impact and associated impact due
to ships and container handling. He urged the following issue to be considered:
He had some observation that the project sponsors should be careful about. The
Mokterpur Bridge is very close to the port and hence care must be taken about the
bridge span in terms of navigating the container vessels to ensure that the bridge is
not damaged.
Due to increased river traffic due to the project proper management of incoming
and outgoing vessels in terms of loading and unloading is in implemented in order
to avoid river traffic. This river way is vital for carrying goods and passengers
therefore there should be no hindrance.
During dry and winter season the river water become low and river becomes
narrow. It must be ensured that minimum
time is taken to load and unload the goods.
Oily water from vessel washes may pollute
the river water which will affect the
terrestrial flora and fauna. This needs strict
control to be imposed by the project
sponsors.
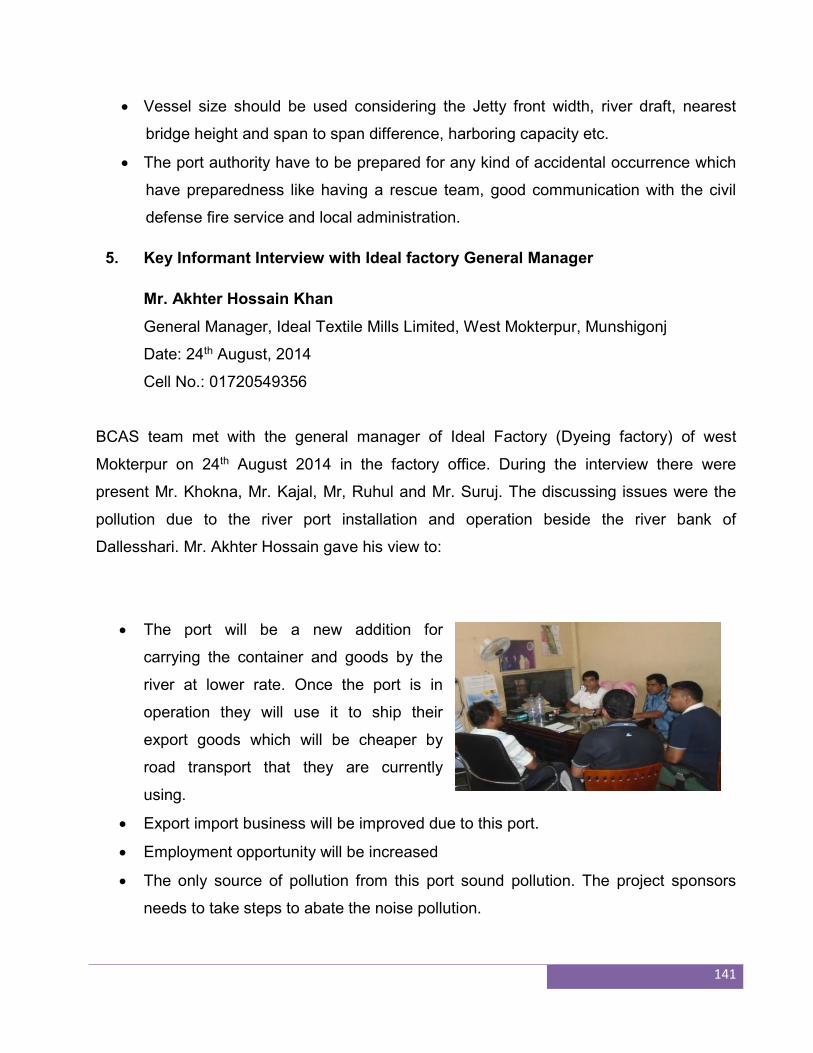
141
Vessel size should be used considering the Jetty front width, river draft, nearest
bridge height and span to span difference, harboring capacity etc.
The port authority have to be prepared for any kind of accidental occurrence which
have preparedness like having a rescue team, good communication with the civil
defense fire service and local administration.
5. Key Informant Interview with Ideal factory General Manager
Mr. Akhter Hossain Khan
General Manager, Ideal Textile Mills Limited, West Mokterpur, Munshigonj
Date: 24th August, 2014
Cell No.: 01720549356
BCAS team met with the general manager of Ideal Factory (Dyeing factory) of west
Mokterpur on 24th August 2014 in the factory office. During the interview there were
present Mr. Khokna, Mr. Kajal, Mr, Ruhul and Mr. Suruj. The discussing issues were the
pollution due to the river port installation and operation beside the river bank of
Dallesshari. Mr. Akhter Hossain gave his view to:
The port will be a new addition for
carrying the container and goods by the
river at lower rate. Once the port is in
operation they will use it to ship their
export goods which will be cheaper by
road transport that they are currently
using.
Export import business will be improved due to this port.
Employment opportunity will be increased
The only source of pollution from this port sound pollution. The project sponsors
needs to take steps to abate the noise pollution.
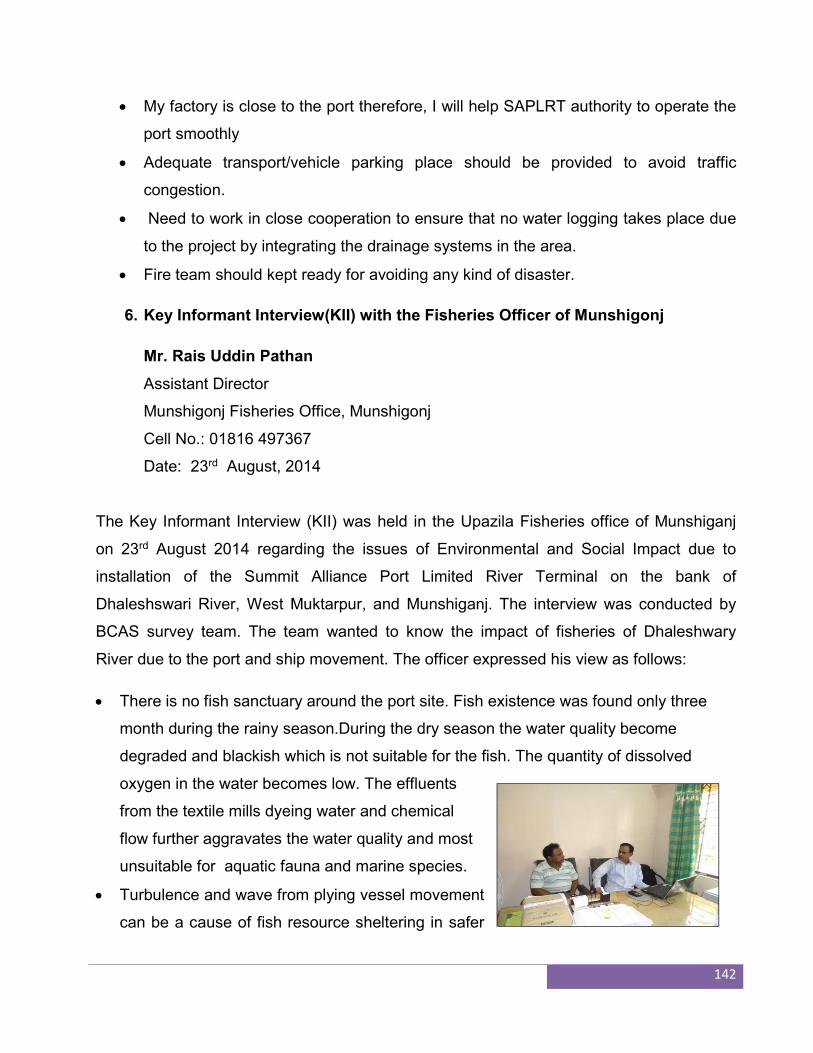
142
My factory is close to the port therefore, I will help SAPLRT authority to operate the
port smoothly
Adequate transport/vehicle parking place should be provided to avoid traffic
congestion.
Need to work in close cooperation to ensure that no water logging takes place due
to the project by integrating the drainage systems in the area.
Fire team should kept ready for avoiding any kind of disaster.
6. Key Informant Interview(KII) with the Fisheries Officer of Munshigonj
Mr. Rais Uddin Pathan
Assistant Director
Munshigonj Fisheries Office, Munshigonj
Cell No.: 01816 497367
Date: 23rd August, 2014
The Key Informant Interview (KII) was held in the Upazila Fisheries office of Munshiganj
on 23rd August 2014 regarding the issues of Environmental and Social Impact due to
installation of the Summit Alliance Port Limited River Terminal on the bank of
Dhaleshswari River, West Muktarpur, and Munshiganj. The interview was conducted by
BCAS survey team. The team wanted to know the impact of fisheries of Dhaleshwary
River due to the port and ship movement. The officer expressed his view as follows:
There is no fish sanctuary around the port site. Fish existence was found only three
month during the rainy season.During the dry season the water quality become
degraded and blackish which is not suitable for the fish. The quantity of dissolved
oxygen in the water becomes low. The effluents
from the textile mills dyeing water and chemical
flow further aggravates the water quality and most
unsuitable for aquatic fauna and marine species.
Turbulence and wave from plying vessel movement
can be a cause of fish resource sheltering in safer
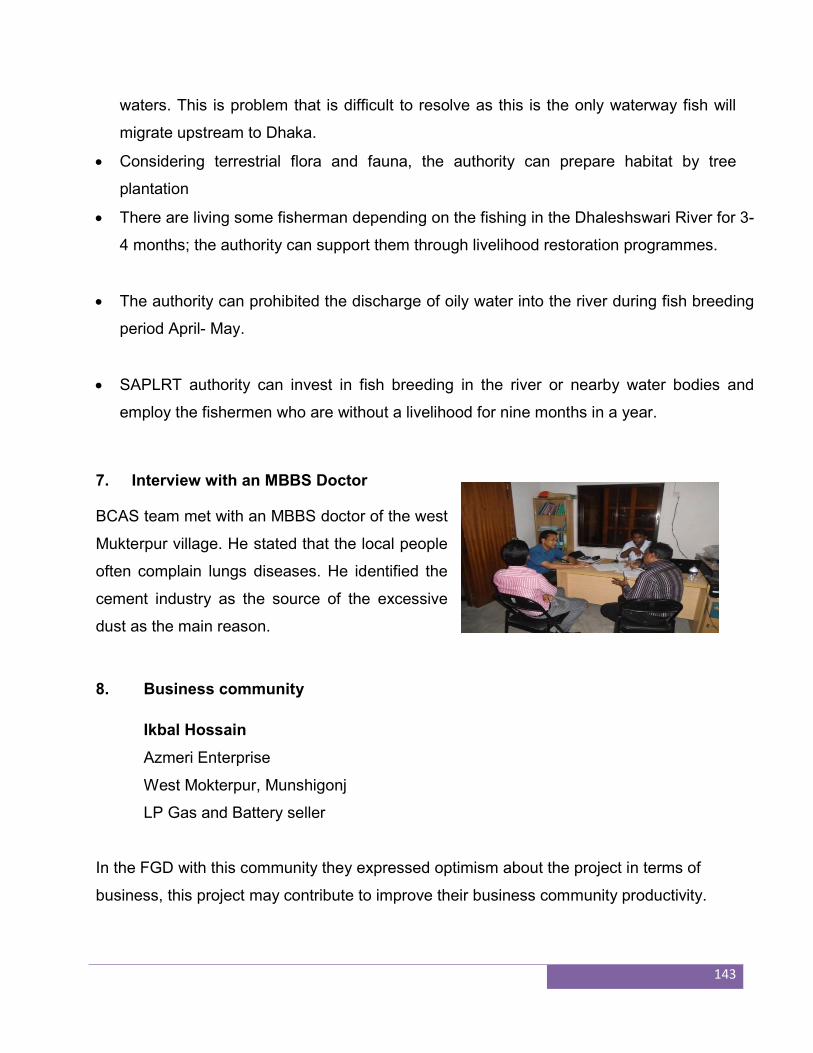
143
waters. This is problem that is difficult to resolve as this is the only waterway fish will
migrate upstream to Dhaka.
Considering terrestrial flora and fauna, the authority can prepare habitat by tree
plantation
There are living some fisherman depending on the fishing in the Dhaleshswari River for 3-
4 months; the authority can support them through livelihood restoration programmes.
The authority can prohibited the discharge of oily water into the river during fish breeding
period April- May.
SAPLRT authority can invest in fish breeding in the river or nearby water bodies and
employ the fishermen who are without a livelihood for nine months in a year.
7. Interview with an MBBS Doctor
BCAS team met with an MBBS doctor of the west
Mukterpur village. He stated that the local people
often complain lungs diseases. He identified the
cement industry as the source of the excessive
dust as the main reason.
8. Business community
Ikbal Hossain
Azmeri Enterprise
West Mokterpur, Munshigonj
LP Gas and Battery seller
In the FGD with this community they expressed optimism about the project in terms of
business, this project may contribute to improve their business community productivity.
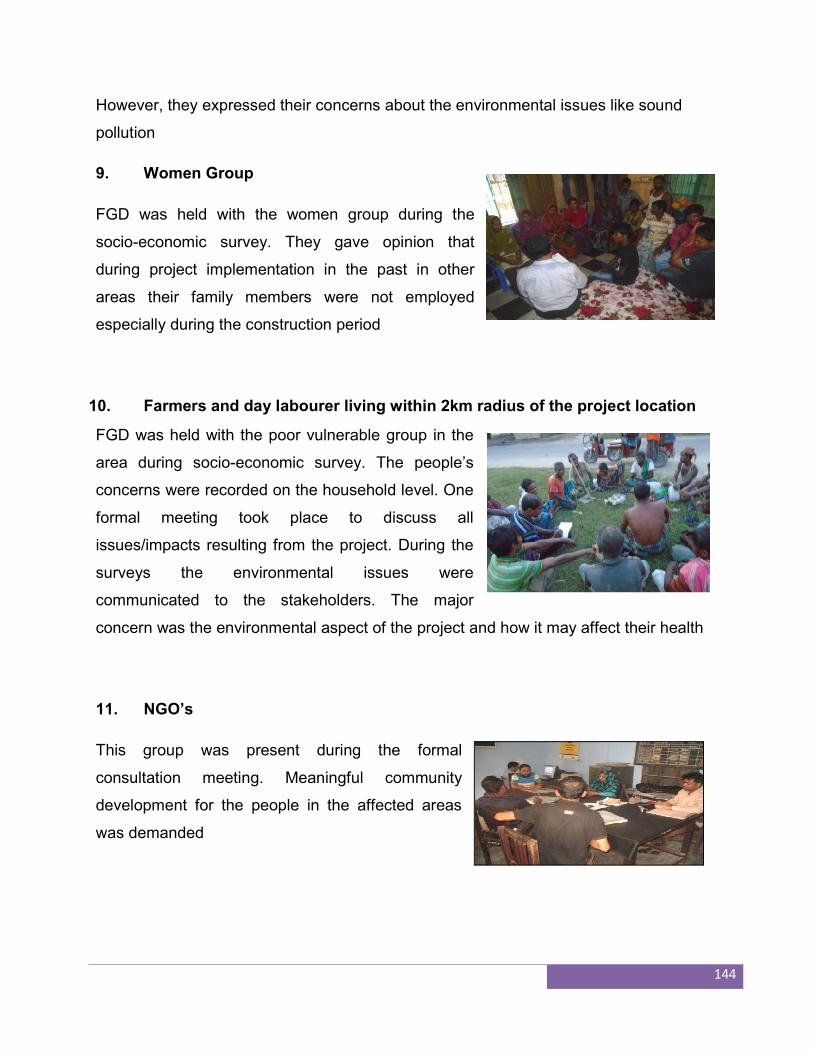
144
However, they expressed their concerns about the environmental issues like sound
pollution
9. Women Group
FGD was held with the women group during the
socio-economic survey. They gave opinion that
during project implementation in the past in other
areas their family members were not employed
especially during the construction period
10. Farmers and day labourer living within 2km radius of the project location
FGD was held with the poor vulnerable group in the
area during socio-economic survey. The people’s
concerns were recorded on the household level. One
formal meeting took place to discuss all
issues/impacts resulting from the project. During the
surveys the environmental issues were
communicated to the stakeholders. The major
concern was the environmental aspect of the project and how it may affect their health
11. NGO’s
This group was present during the formal
consultation meeting. Meaningful community
development for the people in the affected areas
was demanded
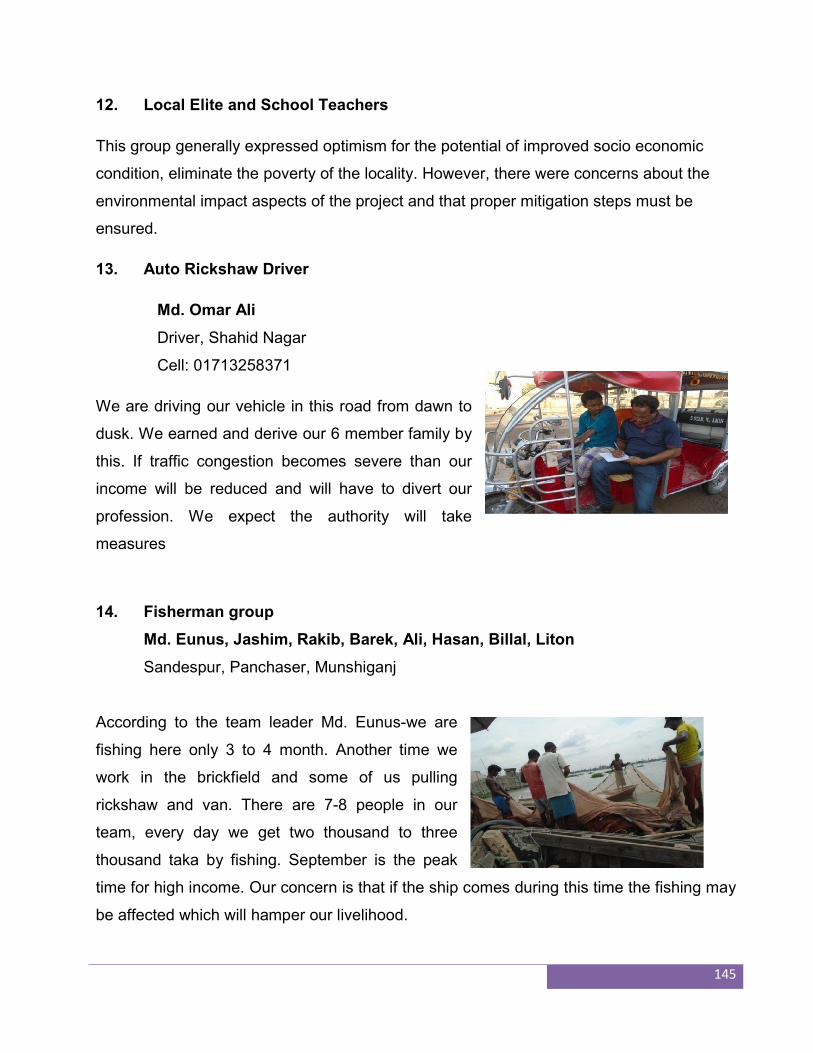
145
12. Local Elite and School Teachers
This group generally expressed optimism for the potential of improved socio economic
condition, eliminate the poverty of the locality. However, there were concerns about the
environmental impact aspects of the project and that proper mitigation steps must be
ensured.
13. Auto Rickshaw Driver
Md. Omar Ali
Driver, Shahid Nagar
Cell: 01713258371
We are driving our vehicle in this road from dawn to
dusk. We earned and derive our 6 member family by
this. If traffic congestion becomes severe than our
income will be reduced and will have to divert our
profession. We expect the authority will take
measures
14. Fisherman group
Md. Eunus, Jashim, Rakib, Barek, Ali, Hasan, Billal, Liton
Sandespur, Panchaser, Munshiganj
According to the team leader Md. Eunus-we are
fishing here only 3 to 4 month. Another time we
work in the brickfield and some of us pulling
rickshaw and van. There are 7-8 people in our
team, every day we get two thousand to three
thousand taka by fishing. September is the peak
time for high income. Our concern is that if the ship comes during this time the fishing may
be affected which will hamper our livelihood.
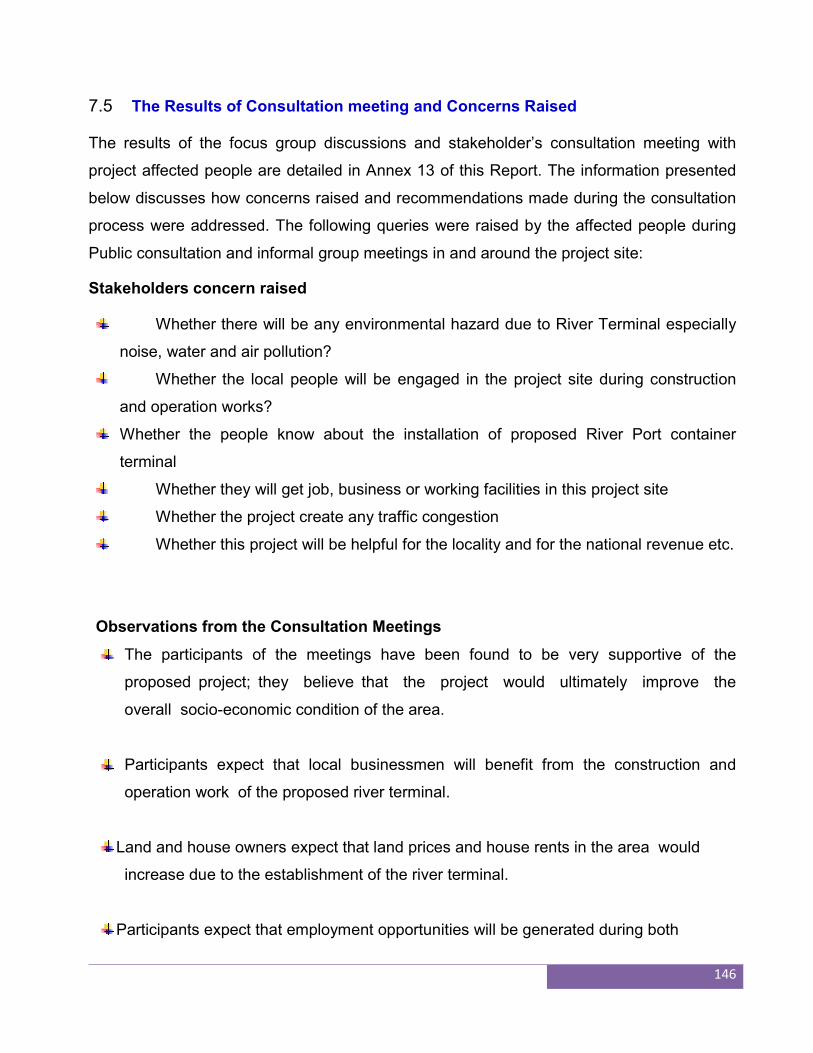
146
7.5 The Results of Consultation meeting and Concerns Raised
The results of the focus group discussions and stakeholder’s consultation meeting with
project affected people are detailed in Annex 13 of this Report. The information presented
below discusses how concerns raised and recommendations made during the consultation
process were addressed. The following queries were raised by the affected people during
Public consultation and informal group meetings in and around the project site:
Stakeholders concern raised
Whether there will be any environmental hazard due to River Terminal especially
noise, water and air pollution?
Whether the local people will be engaged in the project site during construction
and operation works?
Whether the people know about the installation of proposed River Port container
terminal
Whether they will get job, business or working facilities in this project site
Whether the project create any traffic congestion
Whether this project will be helpful for the locality and for the national revenue etc.
Observations from the Consultation Meetings
The participants of the meetings have been found to be very supportive of the
proposed project; they believe that the project would ultimately improve the
overall socio-economic condition of the area.
Participants expect that local businessmen will benefit from the construction and
operation work of the proposed river terminal.
Land and house owners expect that land prices and house rents in the area would
increase due to the establishment of the river terminal.
Participants expect that employment opportunities will be generated during both
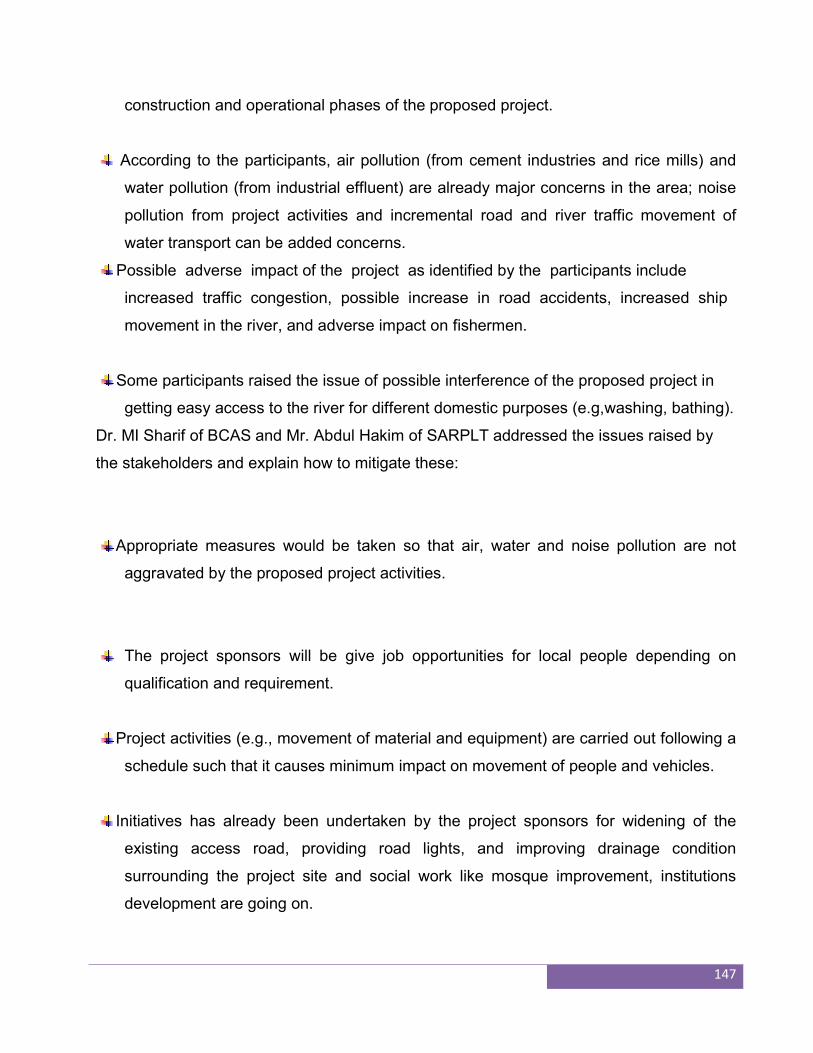
147
construction and operational phases of the proposed project.
According to the participants, air pollution (from cement industries and rice mills) and
water pollution (from industrial effluent) are already major concerns in the area; noise
pollution from project activities and incremental road and river traffic movement of
water transport can be added concerns.
Possible adverse impact of the project as identified by the participants include
increased traffic congestion, possible increase in road accidents, increased ship
movement in the river, and adverse impact on fishermen.
Some participants raised the issue of possible interference of the proposed project in
getting easy access to the river for different domestic purposes (e.g,washing, bathing).
Dr. MI Sharif of BCAS and Mr. Abdul Hakim of SARPLT addressed the issues raised by
the stakeholders and explain how to mitigate these:
Appropriate measures would be taken so that air, water and noise pollution are not
aggravated by the proposed project activities.
The project sponsors will be give job opportunities for local people depending on
qualification and requirement.
Project activities (e.g., movement of material and equipment) are carried out following a
schedule such that it causes minimum impact on movement of people and vehicles.
Initiatives has already been undertaken by the project sponsors for widening of the
existing access road, providing road lights, and improving drainage condition
surrounding the project site and social work like mosque improvement, institutions
development are going on.
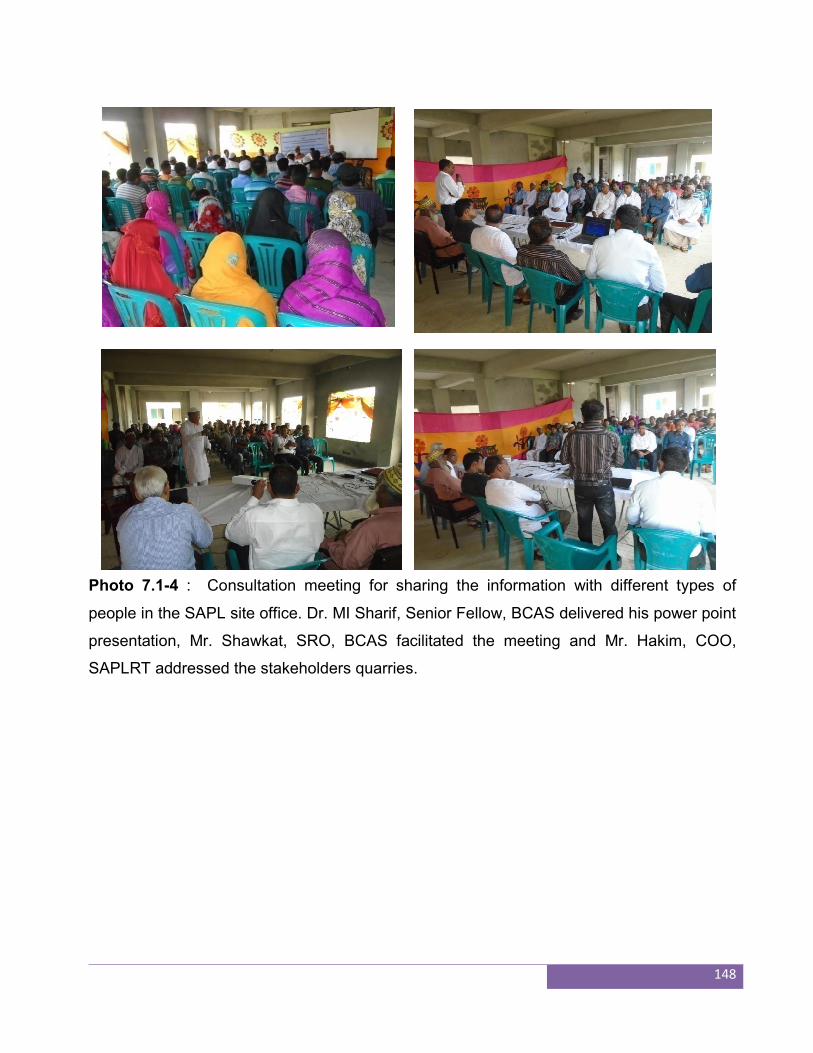
148
Photo 7.1-4 : Consultation meeting for sharing the information with different types of
people in the SAPL site office. Dr. MI Sharif, Senior Fellow, BCAS delivered his power point
presentation, Mr. Shawkat, SRO, BCAS facilitated the meeting and Mr. Hakim, COO,
SAPLRT addressed the stakeholders quarries.
149
Chapter-8
GRIEVANCE REDRESS MECHANISM
8.1 Grievance Redress Mechanism
The objective of a grievance procedure is to ensure all comments and complaints from any
project stakeholder, including local/regional authorities, residents of nearby residential
areas, SAPLRT employees and other interested parties, are acknowledged and
responded to within a reasonable timeframe.
SAPLRT will accept all comments and complaints associated with the project. The
comments and complaints will be summarized and listed in a Complaints/Comments Log
Book. Any person or organization may send comments and/or complaints in person or via
post, email or facsimile using the contact information.
All comments and complaints will be responded to either verbally or in writing, in
accordance with preferred method of communication specified by the complaint in the
Comments and Complaints Form. All grievances will be registered and acknowledged
within 5 days and responded to within 20 working days. SAPLRT will keep a grievance log
and report on grievance management, as part of half-yearly project progress reports,
available at SAPLRT website www- saplbd.com and on request at the project office
8.2 Stakeholders Engagement Plan
SAPLRT stakeholder’s engagement will take place in a variety of contexts, and using a
range of vehicles. Against this background, engagement will include consultation, joint
planning, capacity building, partnerships, community-based monitoring and reporting.
Table 8.1 presents the scope and duration of existing and planned stakeholder
engagement initiatives.
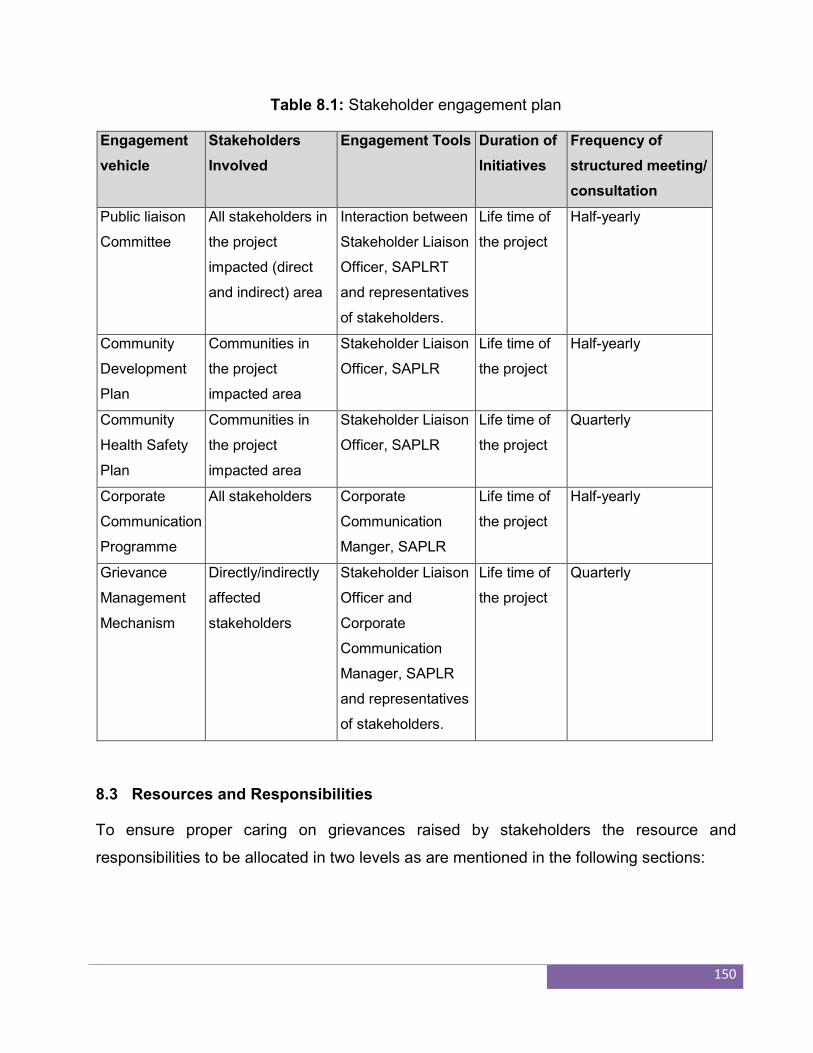
150
Table 8.1: Stakeholder engagement plan
Engagement
vehicle
Stakeholders
Involved
Engagement Tools Duration of
Initiatives
Frequency of
structured meeting/
consultation
Public liaison
Committee
All stakeholders in
the project
impacted (direct
and indirect) area
Interaction between
Stakeholder Liaison
Officer, SAPLRT
and representatives
of stakeholders.
Life time of
the project
Half-yearly
Community
Development
Plan
Communities in
the project
impacted area
Stakeholder Liaison
Officer, SAPLR
Life time of
the project
Half-yearly
Community
Health Safety
Plan
Communities in
the project
impacted area
Stakeholder Liaison
Officer, SAPLR
Life time of
the project
Quarterly
Corporate
Communication
Programme
All stakeholders Corporate
Communication
Manger, SAPLR
Life time of
the project
Half-yearly
Grievance
Management
Mechanism
Directly/indirectly
affected
stakeholders
Stakeholder Liaison
Officer and
Corporate
Communication
Manager, SAPLR
and representatives
of stakeholders.
Life time of
the project
Quarterly
8.3 Resources and Responsibilities
To ensure proper caring on grievances raised by stakeholders the resource and
responsibilities to be allocated in two levels as are mentioned in the following sections:
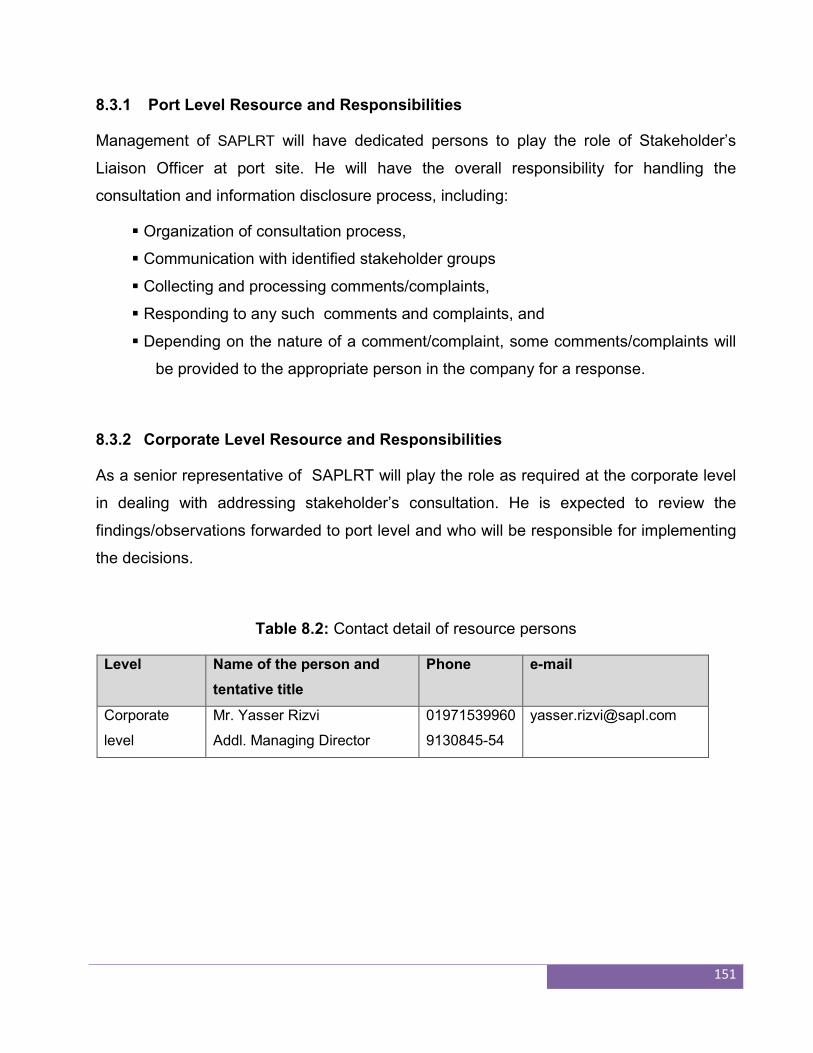
151
8.3.1 Port Level Resource and Responsibilities
Management of SAPLRT will have dedicated persons to play the role of Stakeholder’s
Liaison Officer at port site. He will have the overall responsibility for handling the
consultation and information disclosure process, including:
Organization of consultation process,
Communication with identified stakeholder groups
Collecting and processing comments/complaints,
Responding to any such comments and complaints, and
Depending on the nature of a comment/complaint, some comments/complaints will
be provided to the appropriate person in the company for a response.
8.3.2 Corporate Level Resource and Responsibilities
As a senior representative of SAPLRT will play the role as required at the corporate level
in dealing with addressing stakeholder’s consultation. He is expected to review the
findings/observations forwarded to port level and who will be responsible for implementing
the decisions.
Table 8.2: Contact detail of resource persons
Level Name of the person and
tentative title
Phone e-mail
Corporate
level
Mr. Yasser Rizvi
Addl. Managing Director
01971539960
9130845-54
152
8.4 Reporting
There is requirement of two tiers reporting as are discussed briefly in the following section.
8.4.1 Internal Reporting
Local reporting relevant to the stakeholder’s engagement will be undertaken under the
corporate Communication Programme. At a corporate level, stakeholder’s engagement will
be reported in Annual Reports and in other relevant corporate documentation.
Management reporting on the stakeholder’s engagement will take place through the
Stakeholder’s Liaison Officer. The Corporate Communication Manager will receive a
quarterly report on engagement activities.
8.4.2 External Reporting
External Reporting means the reporting requirement for external client including funding
agency, government and other regulatory bodies and so on. SAPLR will provide
stakeholders Engagement Report to them according to the requirement of them.
Corporate Communication Manager is expected to manage the external reporting
requirement also.
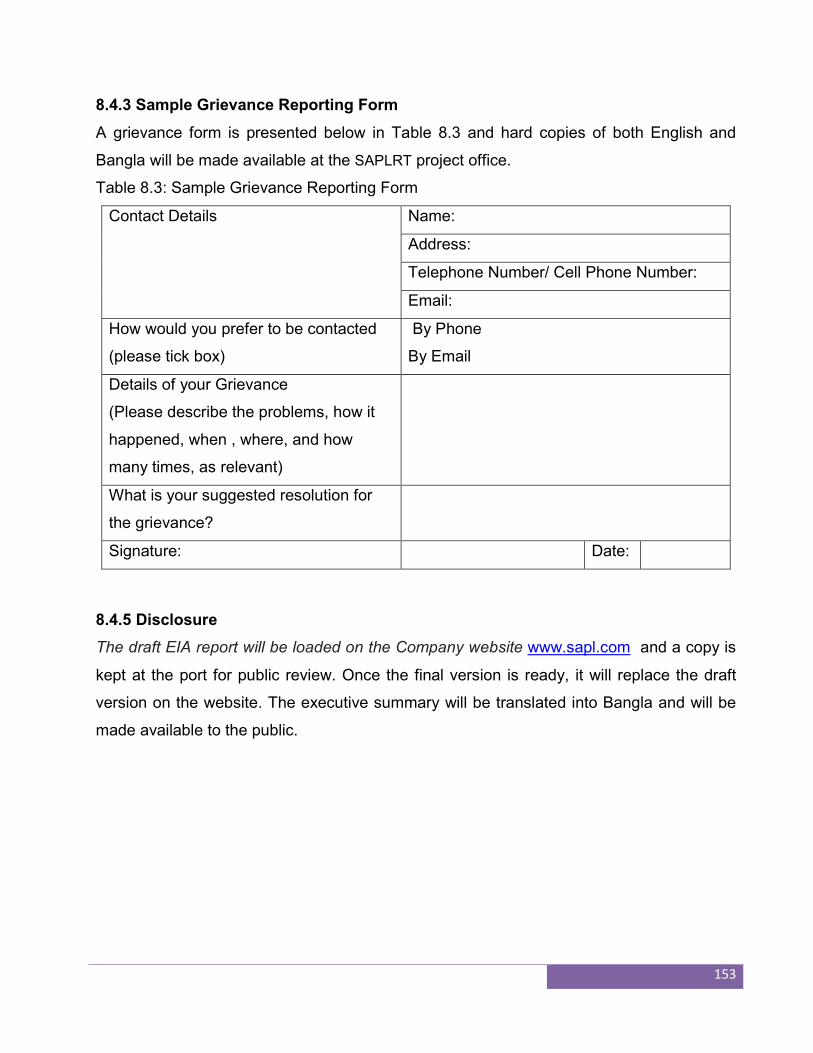
153
8.4.3 Sample Grievance Reporting Form
A grievance form is presented below in Table 8.3 and hard copies of both English and
Bangla will be made available at the SAPLRT project office.
Table 8.3: Sample Grievance Reporting Form
Contact Details Name:
Address:
Telephone Number/ Cell Phone Number:
Email:
How would you prefer to be contacted
(please tick box)
By Phone
By Email
Details of your Grievance
(Please describe the problems, how it
happened, when , where, and how
many times, as relevant)
What is your suggested resolution for
the grievance?
Signature: Date:
8.4.5 Disclosure
The draft EIA report will be loaded on the Company website www.sapl.com and a copy is
kept at the port for public review. Once the final version is ready, it will replace the draft
version on the website. The executive summary will be translated into Bangla and will be
made available to the public.
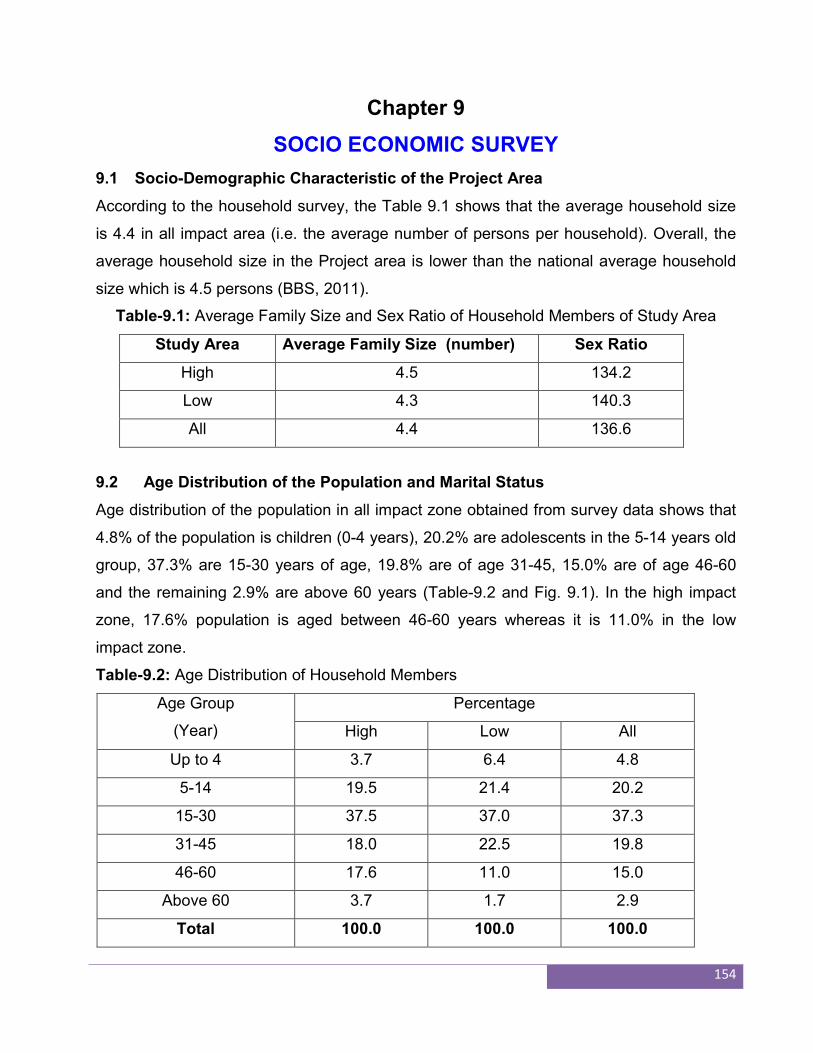
154
Chapter 9
SOCIO ECONOMIC SURVEY
9.1 Socio-Demographic Characteristic of the Project Area
According to the household survey, the Table 9.1 shows that the average household size
is 4.4 in all impact area (i.e. the average number of persons per household). Overall, the
average household size in the Project area is lower than the national average household
size which is 4.5 persons (BBS, 2011).
Table-9.1: Average Family Size and Sex Ratio of Household Members of Study Area
Study Area Average Family Size (number) Sex Ratio
High 4.5 134.2
Low 4.3 140.3
All 4.4 136.6
9.2 Age Distribution of the Population and Marital Status
Age distribution of the population in all impact zone obtained from survey data shows that
4.8% of the population is children (0-4 years), 20.2% are adolescents in the 5-14 years old
group, 37.3% are 15-30 years of age, 19.8% are of age 31-45, 15.0% are of age 46-60
and the remaining 2.9% are above 60 years (Table-9.2 and Fig. 9.1). In the high impact
zone, 17.6% population is aged between 46-60 years whereas it is 11.0% in the low
impact zone.
Table-9.2: Age Distribution of Household Members
Age Group
(Year)
Percentage
High Low All
Up to 4 3.7 6.4 4.8
5-14 19.5 21.4 20.2
15-30 37.5 37.0 37.3
31-45 18.0 22.5 19.8
46-60 17.6 11.0 15.0
Above 60 3.7 1.7 2.9
Total 100.0 100.0 100.0
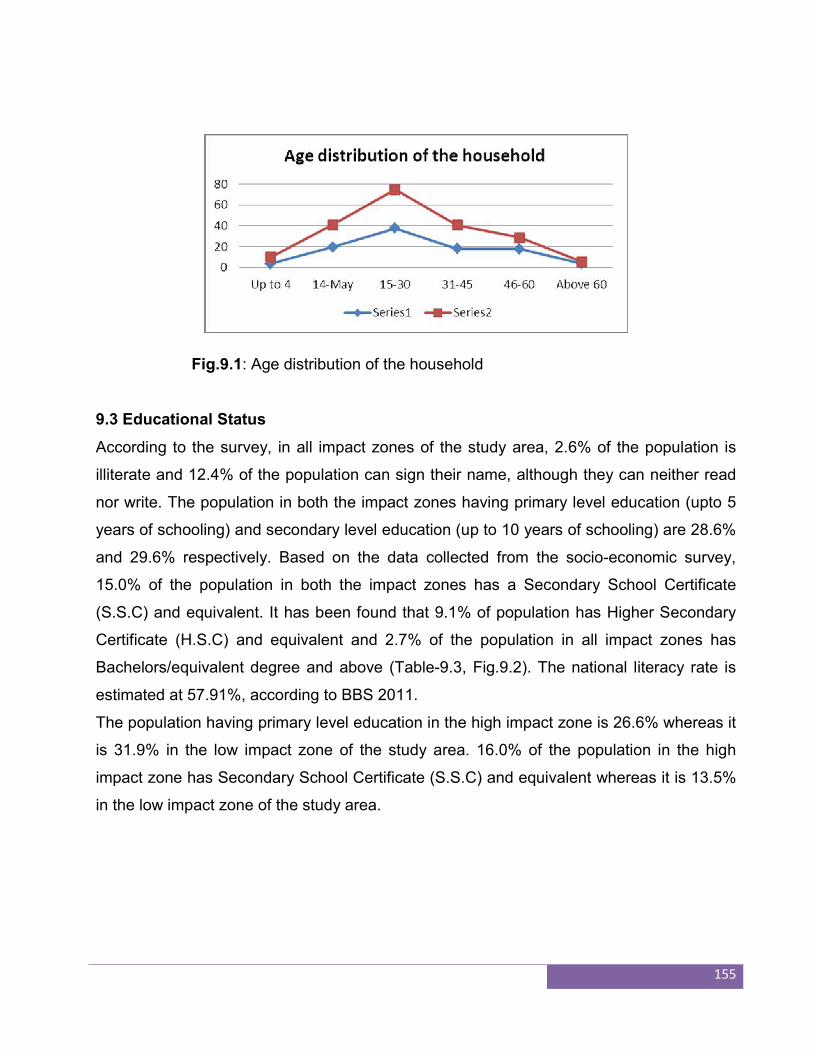
155
Fig.9.1: Age distribution of the household
9.3 Educational Status
According to the survey, in all impact zones of the study area, 2.6% of the population is
illiterate and 12.4% of the population can sign their name, although they can neither read
nor write. The population in both the impact zones having primary level education (upto 5
years of schooling) and secondary level education (up to 10 years of schooling) are 28.6%
and 29.6% respectively. Based on the data collected from the socio-economic survey,
15.0% of the population in both the impact zones has a Secondary School Certificate
(S.S.C) and equivalent. It has been found that 9.1% of population has Higher Secondary
Certificate (H.S.C) and equivalent and 2.7% of the population in all impact zones has
Bachelors/equivalent degree and above (Table-9.3, Fig.9.2). The national literacy rate is
estimated at 57.91%, according to BBS 2011.
The population having primary level education in the high impact zone is 26.6% whereas it
is 31.9% in the low impact zone of the study area. 16.0% of the population in the high
impact zone has Secondary School Certificate (S.S.C) and equivalent whereas it is 13.5%
in the low impact zone of the study area.
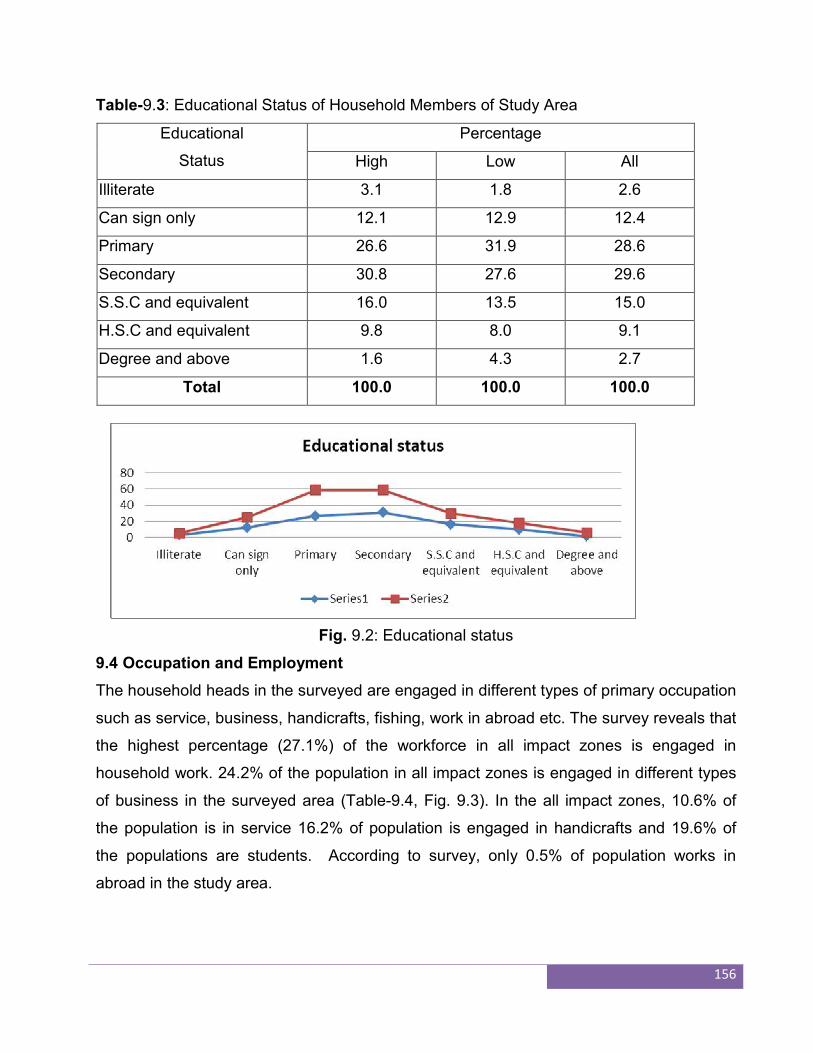
156
Table-9.3: Educational Status of Household Members of Study Area
Educational
Status
Percentage
High Low All
Illiterate 3.1 1.8 2.6
Can sign only 12.1 12.9 12.4
Primary 26.6 31.9 28.6
Secondary 30.8 27.6 29.6
S.S.C and equivalent 16.0 13.5 15.0
H.S.C and equivalent 9.8 8.0 9.1
Degree and above 1.6 4.3 2.7
Total 100.0 100.0 100.0
Fig. 9.2: Educational status
9.4 Occupation and Employment
The household heads in the surveyed are engaged in different types of primary occupation
such as service, business, handicrafts, fishing, work in abroad etc. The survey reveals that
the highest percentage (27.1%) of the workforce in all impact zones is engaged in
household work. 24.2% of the population in all impact zones is engaged in different types
of business in the surveyed area (Table-9.4, Fig. 9.3). In the all impact zones, 10.6% of
the population is in service 16.2% of population is engaged in handicrafts and 19.6% of
the populations are students. According to survey, only 0.5% of population works in
abroad in the study area.
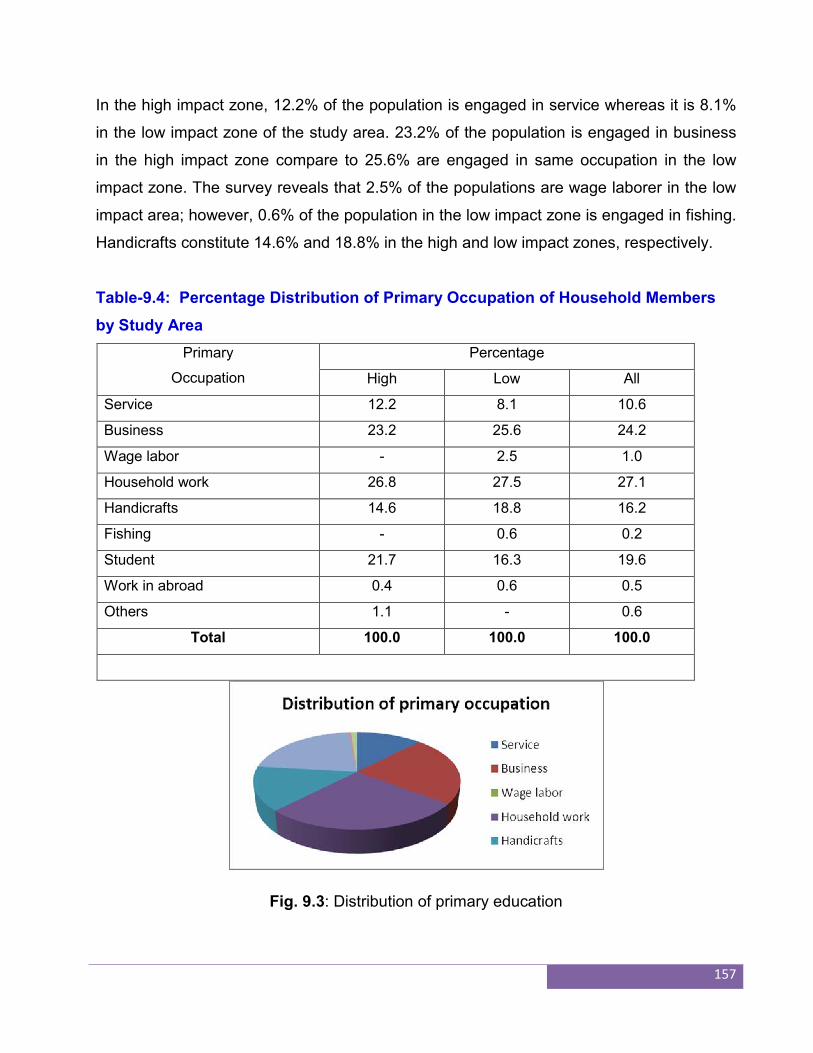
157
In the high impact zone, 12.2% of the population is engaged in service whereas it is 8.1%
in the low impact zone of the study area. 23.2% of the population is engaged in business
in the high impact zone compare to 25.6% are engaged in same occupation in the low
impact zone. The survey reveals that 2.5% of the populations are wage laborer in the low
impact area; however, 0.6% of the population in the low impact zone is engaged in fishing.
Handicrafts constitute 14.6% and 18.8% in the high and low impact zones, respectively.
Table-9.4: Percentage Distribution of Primary Occupation of Household Members
by Study Area
Primary
Occupation
Percentage
High Low All
Service 12.2 8.1 10.6
Business 23.2 25.6 24.2
Wage labor - 2.5 1.0
Household work 26.8 27.5 27.1
Handicrafts 14.6 18.8 16.2
Fishing - 0.6 0.2
Student 21.7 16.3 19.6
Work in abroad 0.4 0.6 0.5
Others 1.1 - 0.6
Total 100.0 100.0 100.0
Fig. 9.3: Distribution of primary education
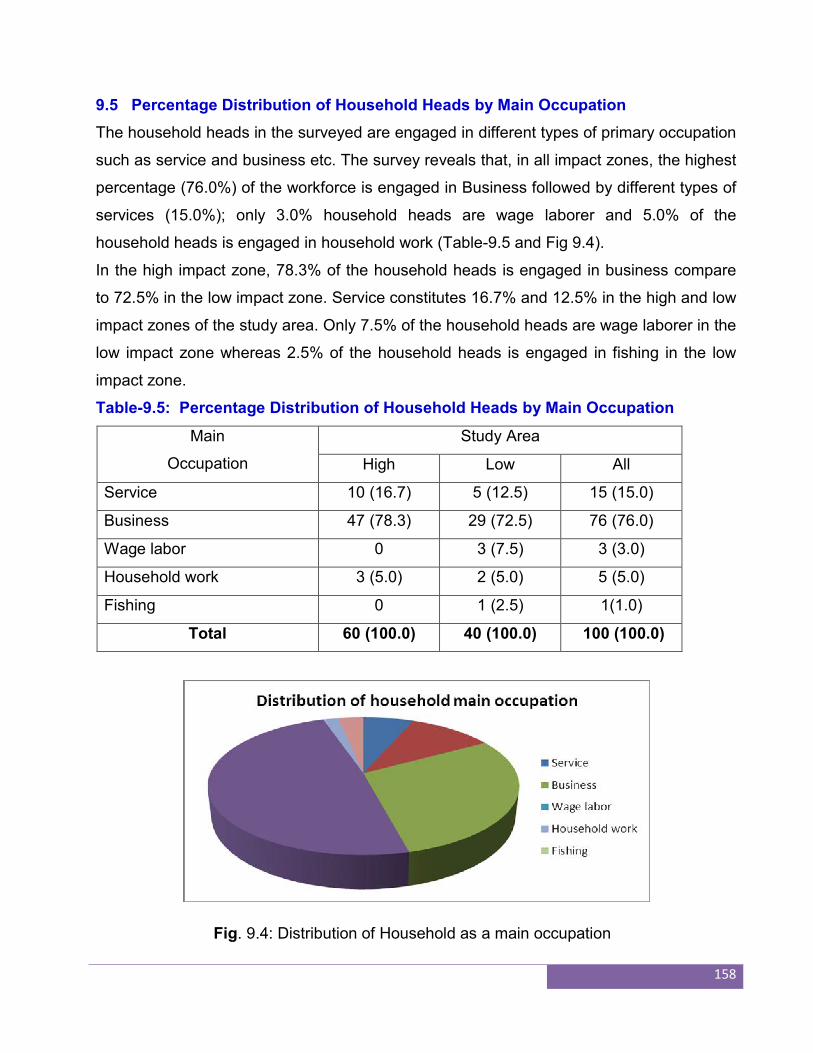
158
9.5 Percentage Distribution of Household Heads by Main Occupation
The household heads in the surveyed are engaged in different types of primary occupation
such as service and business etc. The survey reveals that, in all impact zones, the highest
percentage (76.0%) of the workforce is engaged in Business followed by different types of
services (15.0%); only 3.0% household heads are wage laborer and 5.0% of the
household heads is engaged in household work (Table-9.5 and Fig 9.4).
In the high impact zone, 78.3% of the household heads is engaged in business compare
to 72.5% in the low impact zone. Service constitutes 16.7% and 12.5% in the high and low
impact zones of the study area. Only 7.5% of the household heads are wage laborer in the
low impact zone whereas 2.5% of the household heads is engaged in fishing in the low
impact zone.
Table-9.5: Percentage Distribution of Household Heads by Main Occupation
Main
Occupation
Study Area
High Low All
Service 10 (16.7) 5 (12.5) 15 (15.0)
Business 47 (78.3) 29 (72.5) 76 (76.0)
Wage labor 0 3 (7.5) 3 (3.0)
Household work 3 (5.0) 2 (5.0) 5 (5.0)
Fishing 0 1 (2.5) 1(1.0)
Total 60 (100.0) 40 (100.0) 100 (100.0)
Fig. 9.4: Distribution of Household as a main occupation
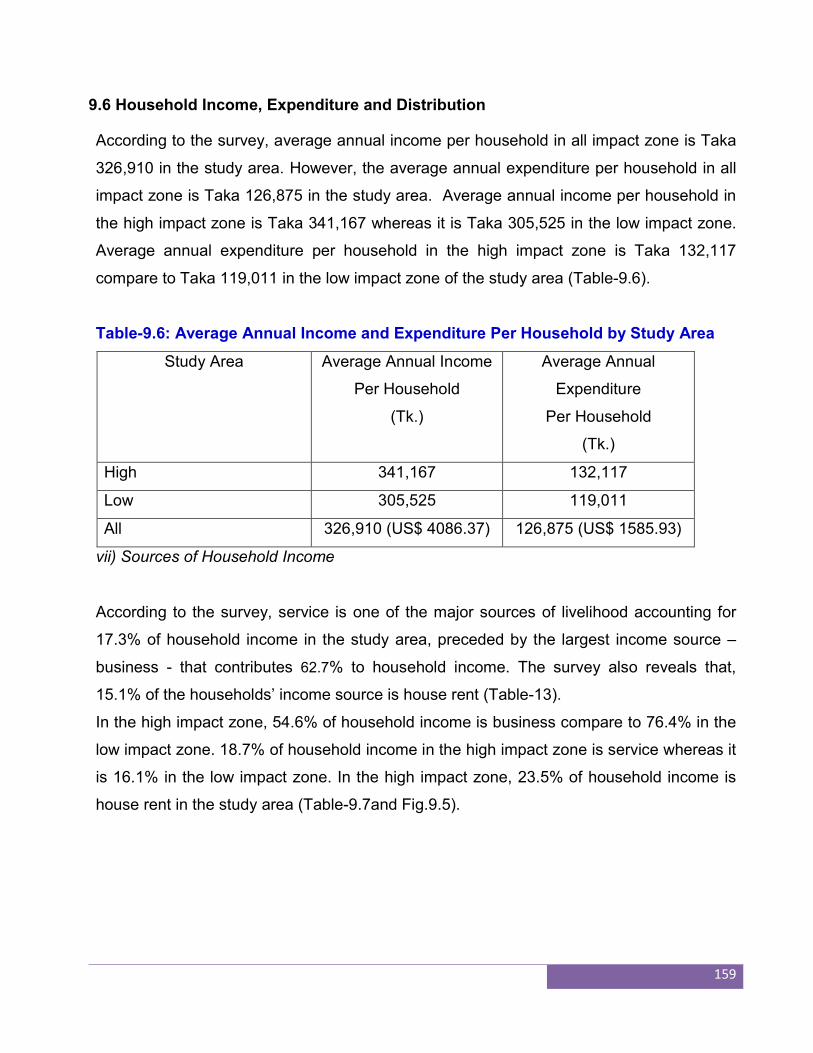
159
9.6 Household Income, Expenditure and Distribution
According to the survey, average annual income per household in all impact zone is Taka
326,910 in the study area. However, the average annual expenditure per household in all
impact zone is Taka 126,875 in the study area. Average annual income per household in
the high impact zone is Taka 341,167 whereas it is Taka 305,525 in the low impact zone.
Average annual expenditure per household in the high impact zone is Taka 132,117
compare to Taka 119,011 in the low impact zone of the study area (Table-9.6).
Table-9.6: Average Annual Income and Expenditure Per Household by Study Area
Study Area Average Annual Income
Per Household
(Tk.)
Average Annual
Expenditure
Per Household
(Tk.)
High 341,167 132,117
Low 305,525 119,011
All 326,910 (US$ 4086.37) 126,875 (US$ 1585.93)
vii) Sources of Household Income
According to the survey, service is one of the major sources of livelihood accounting for
17.3% of household income in the study area, preceded by the largest income source –
business - that contributes 62.7% to household income. The survey also reveals that,
15.1% of the households’ income source is house rent (Table-13).
In the high impact zone, 54.6% of household income is business compare to 76.4% in the
low impact zone. 18.7% of household income in the high impact zone is service whereas it
is 16.1% in the low impact zone. In the high impact zone, 23.5% of household income is
house rent in the study area (Table-9.7and Fig.9.5).
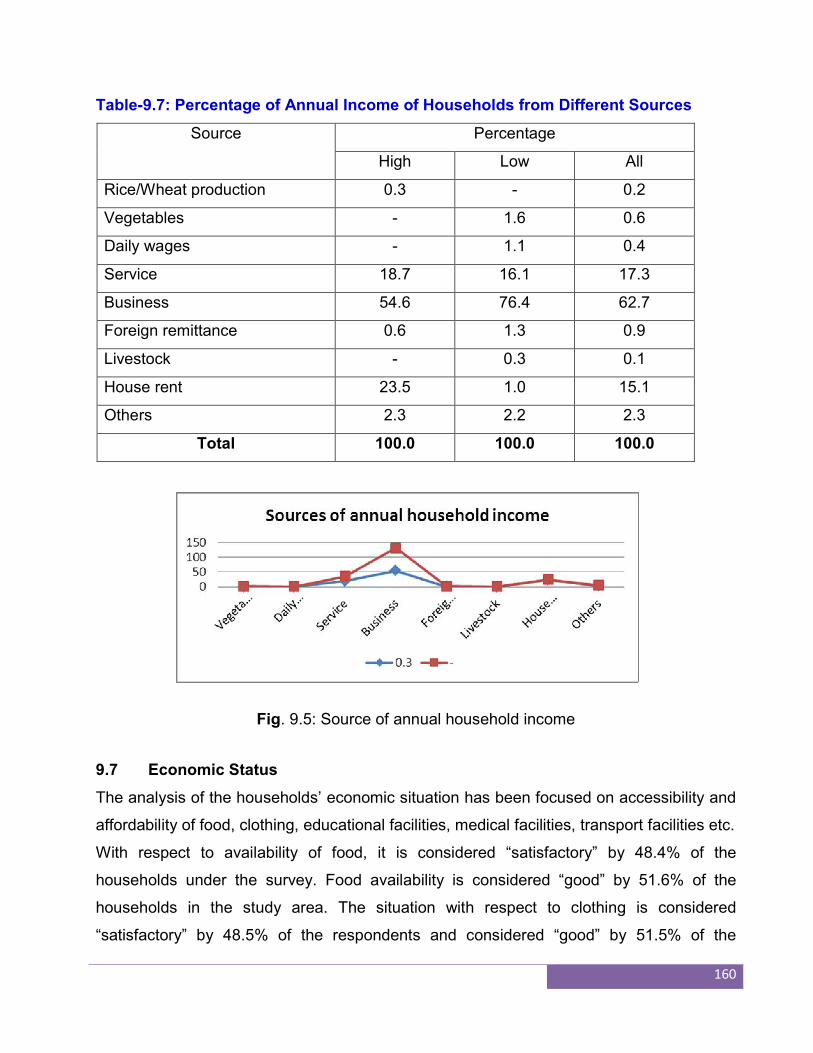
160
Table-9.7: Percentage of Annual Income of Households from Different Sources
Source Percentage
High Low All
Rice/Wheat production 0.3 - 0.2
Vegetables - 1.6 0.6
Daily wages - 1.1 0.4
Service 18.7 16.1 17.3
Business 54.6 76.4 62.7
Foreign remittance 0.6 1.3 0.9
Livestock - 0.3 0.1
House rent 23.5 1.0 15.1
Others 2.3 2.2 2.3
Total 100.0 100.0 100.0
Fig. 9.5: Source of annual household income
9.7 Economic Status
The analysis of the households’ economic situation has been focused on accessibility and
affordability of food, clothing, educational facilities, medical facilities, transport facilities etc.
With respect to availability of food, it is considered “satisfactory” by 48.4% of the
households under the survey. Food availability is considered “good” by 51.6% of the
households in the study area. The situation with respect to clothing is considered
“satisfactory” by 48.5% of the respondents and considered “good” by 51.5% of the
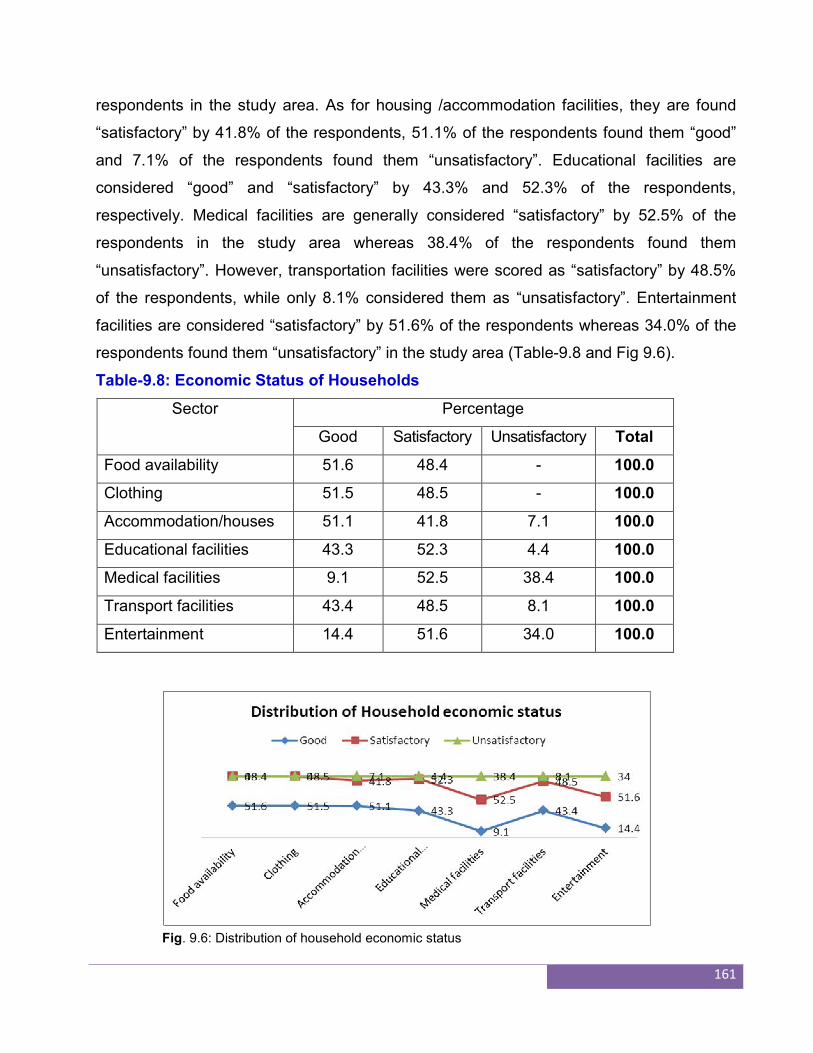
161
respondents in the study area. As for housing /accommodation facilities, they are found
“satisfactory” by 41.8% of the respondents, 51.1% of the respondents found them “good”
and 7.1% of the respondents found them “unsatisfactory”. Educational facilities are
considered “good” and “satisfactory” by 43.3% and 52.3% of the respondents,
respectively. Medical facilities are generally considered “satisfactory” by 52.5% of the
respondents in the study area whereas 38.4% of the respondents found them
“unsatisfactory”. However, transportation facilities were scored as “satisfactory” by 48.5%
of the respondents, while only 8.1% considered them as “unsatisfactory”. Entertainment
facilities are considered “satisfactory” by 51.6% of the respondents whereas 34.0% of the
respondents found them “unsatisfactory” in the study area (Table-9.8 and Fig 9.6).
Table-9.8: Economic Status of Households
Sector Percentage
Good Satisfactory Unsatisfactory Total
Food availability 51.6 48.4 - 100.0
Clothing 51.5 48.5 - 100.0
Accommodation/houses 51.1 41.8 7.1 100.0
Educational facilities 43.3 52.3 4.4 100.0
Medical facilities 9.1 52.5 38.4 100.0
Transport facilities 43.4 48.5 8.1 100.0
Entertainment 14.4 51.6 34.0 100.0
Fig. 9.6: Distribution of household economic status
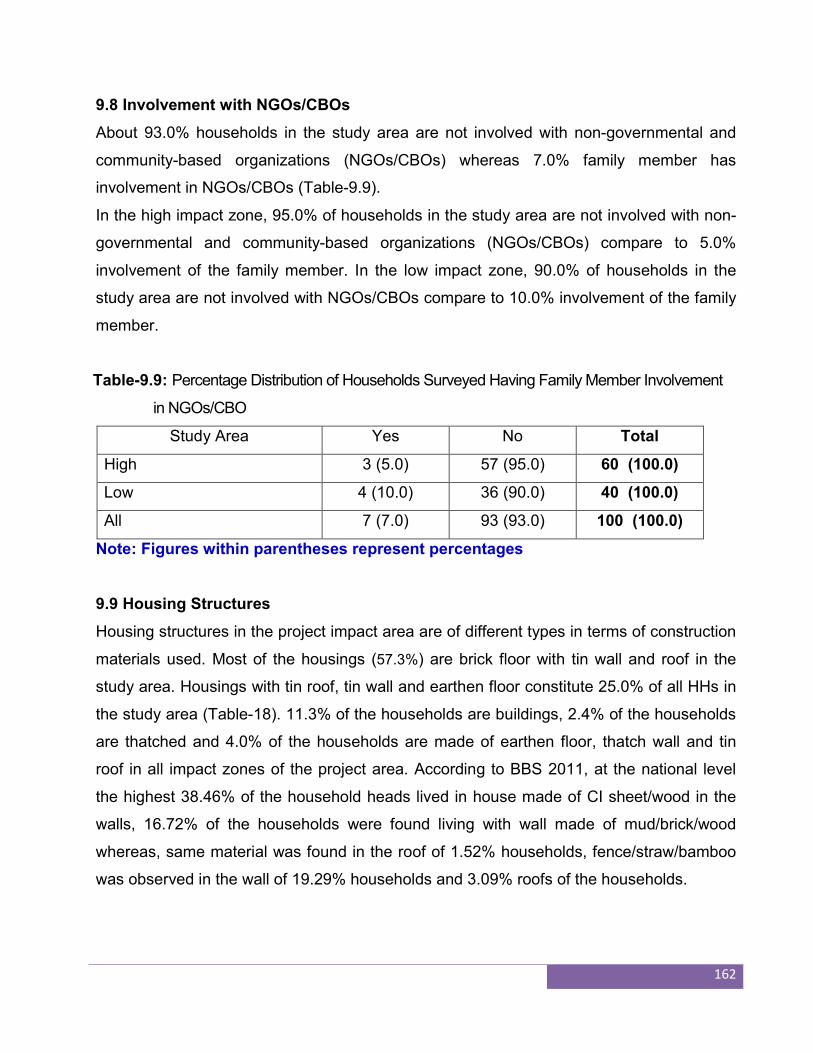
162
9.8 Involvement with NGOs/CBOs
About 93.0% households in the study area are not involved with non-governmental and
community-based organizations (NGOs/CBOs) whereas 7.0% family member has
involvement in NGOs/CBOs (Table-9.9).
In the high impact zone, 95.0% of households in the study area are not involved with non-
governmental and community-based organizations (NGOs/CBOs) compare to 5.0%
involvement of the family member. In the low impact zone, 90.0% of households in the
study area are not involved with NGOs/CBOs compare to 10.0% involvement of the family
member.
Table-9.9: Percentage Distribution of Households Surveyed Having Family Member Involvement
in NGOs/CBO
Study Area Yes No Total
High 3 (5.0) 57 (95.0) 60 (100.0)
Low 4 (10.0) 36 (90.0) 40 (100.0)
All 7 (7.0) 93 (93.0) 100 (100.0)
Note: Figures within parentheses represent percentages
9.9 Housing Structures
Housing structures in the project impact area are of different types in terms of construction
materials used. Most of the housings (57.3%) are brick floor with tin wall and roof in the
study area. Housings with tin roof, tin wall and earthen floor constitute 25.0% of all HHs in
the study area (Table-18). 11.3% of the households are buildings, 2.4% of the households
are thatched and 4.0% of the households are made of earthen floor, thatch wall and tin
roof in all impact zones of the project area. According to BBS 2011, at the national level
the highest 38.46% of the household heads lived in house made of CI sheet/wood in the
walls, 16.72% of the households were found living with wall made of mud/brick/wood
whereas, same material was found in the roof of 1.52% households, fence/straw/bamboo
was observed in the wall of 19.29% households and 3.09% roofs of the households.
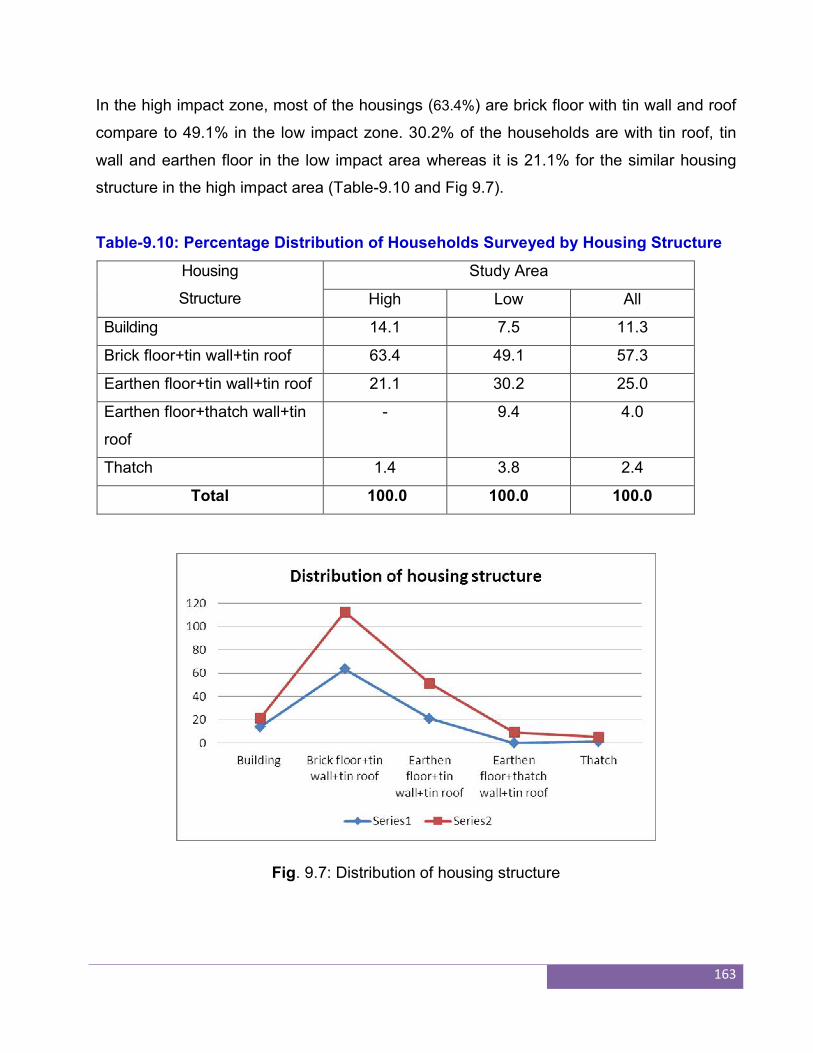
163
In the high impact zone, most of the housings (63.4%) are brick floor with tin wall and roof
compare to 49.1% in the low impact zone. 30.2% of the households are with tin roof, tin
wall and earthen floor in the low impact area whereas it is 21.1% for the similar housing
structure in the high impact area (Table-9.10 and Fig 9.7).
Table-9.10: Percentage Distribution of Households Surveyed by Housing Structure
Housing
Structure
Study Area
High Low All
Building 14.1 7.5 11.3
Brick floor+tin wall+tin roof 63.4 49.1 57.3
Earthen floor+tin wall+tin roof 21.1 30.2 25.0
Earthen floor+thatch wall+tin
roof
- 9.4 4.0
Thatch 1.4 3.8 2.4
Total 100.0 100.0 100.0
Fig. 9.7: Distribution of housing structure
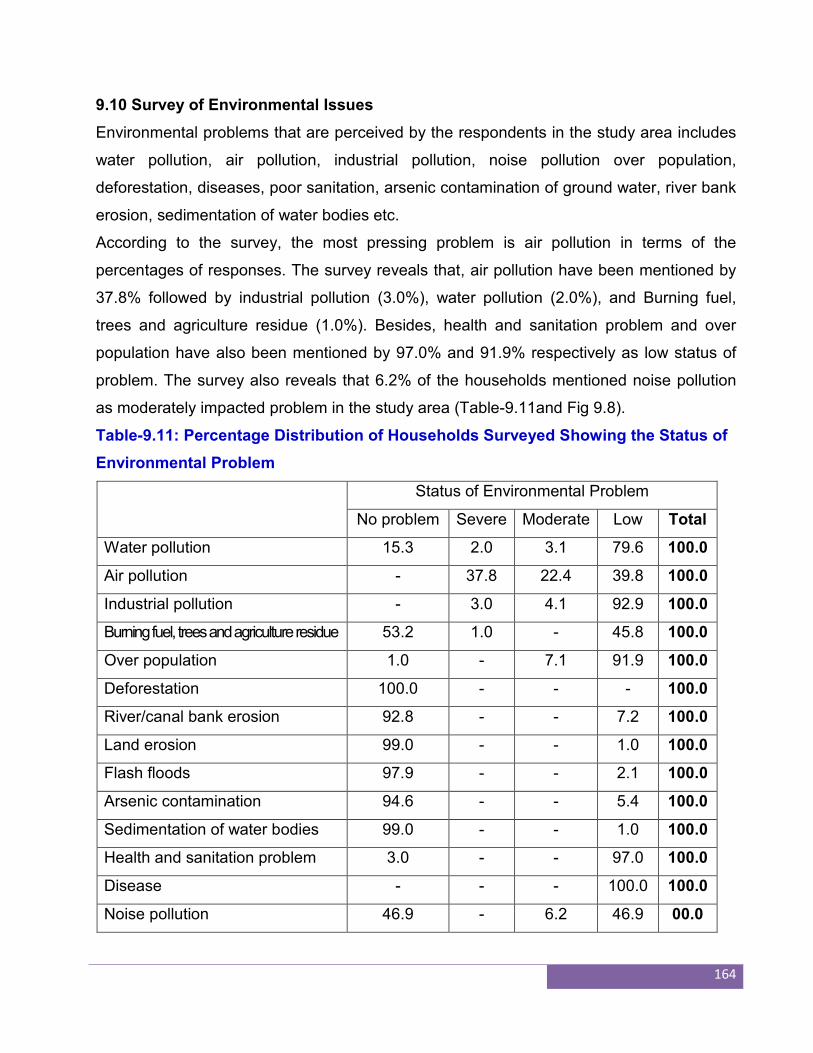
164
9.10 Survey of Environmental Issues
Environmental problems that are perceived by the respondents in the study area includes
water pollution, air pollution, industrial pollution, noise pollution over population,
deforestation, diseases, poor sanitation, arsenic contamination of ground water, river bank
erosion, sedimentation of water bodies etc.
According to the survey, the most pressing problem is air pollution in terms of the
percentages of responses. The survey reveals that, air pollution have been mentioned by
37.8% followed by industrial pollution (3.0%), water pollution (2.0%), and Burning fuel,
trees and agriculture residue (1.0%). Besides, health and sanitation problem and over
population have also been mentioned by 97.0% and 91.9% respectively as low status of
problem. The survey also reveals that 6.2% of the households mentioned noise pollution
as moderately impacted problem in the study area (Table-9.11and Fig 9.8).
Table-9.11: Percentage Distribution of Households Surveyed Showing the Status of
Environmental Problem
Status of Environmental Problem
No problem Severe Moderate Low Total
Water pollution 15.3 2.0 3.1 79.6 100.0
Air pollution - 37.8 22.4 39.8 100.0
Industrial pollution - 3.0 4.1 92.9 100.0
Burning fuel, trees and agriculture residue 53.2 1.0 - 45.8 100.0
Over population 1.0 - 7.1 91.9 100.0
Deforestation 100.0 - - - 100.0
River/canal bank erosion 92.8 - - 7.2 100.0
Land erosion 99.0 - - 1.0 100.0
Flash floods 97.9 - - 2.1 100.0
Arsenic contamination 94.6 - - 5.4 100.0
Sedimentation of water bodies 99.0 - - 1.0 100.0
Health and sanitation problem 3.0 - - 97.0 100.0
Disease - - - 100.0 100.0
Noise pollution 46.9 - 6.2 46.9 00.0

165
Fig. 9.8: Status of environmental problem
9.11 Sources of Water Pollution
Respondents attribute water pollution to different sources including human waste, water
transport, animal waste etc. Industrial waste has been identified by 1.0% of the
respondents as the most pressing source of water pollution in the study area; other
sources identified as low by the respondents include human waste (54.5%), urban waste
(95.8%) and pollution from water transport is 54.1% in all impact zones of the study area
(Table-9.12 and Fig. 9.9).
Table-9.12: Percentage Distribution of Households Surveyed for Status of Water Pollution
Source Status of Water Pollution Problem
No problem Severe Moderate Low Total
Industrial waste 7.1 - 1.0 91.9 100.0
Human waste 45.5 - - 54.5 100.0
Water transport 45.9 - - 54.1 100.0
Chemical
feature/personnel
84.7 - - 15.3 100.0
Siltation 100.0 - - - 100.0
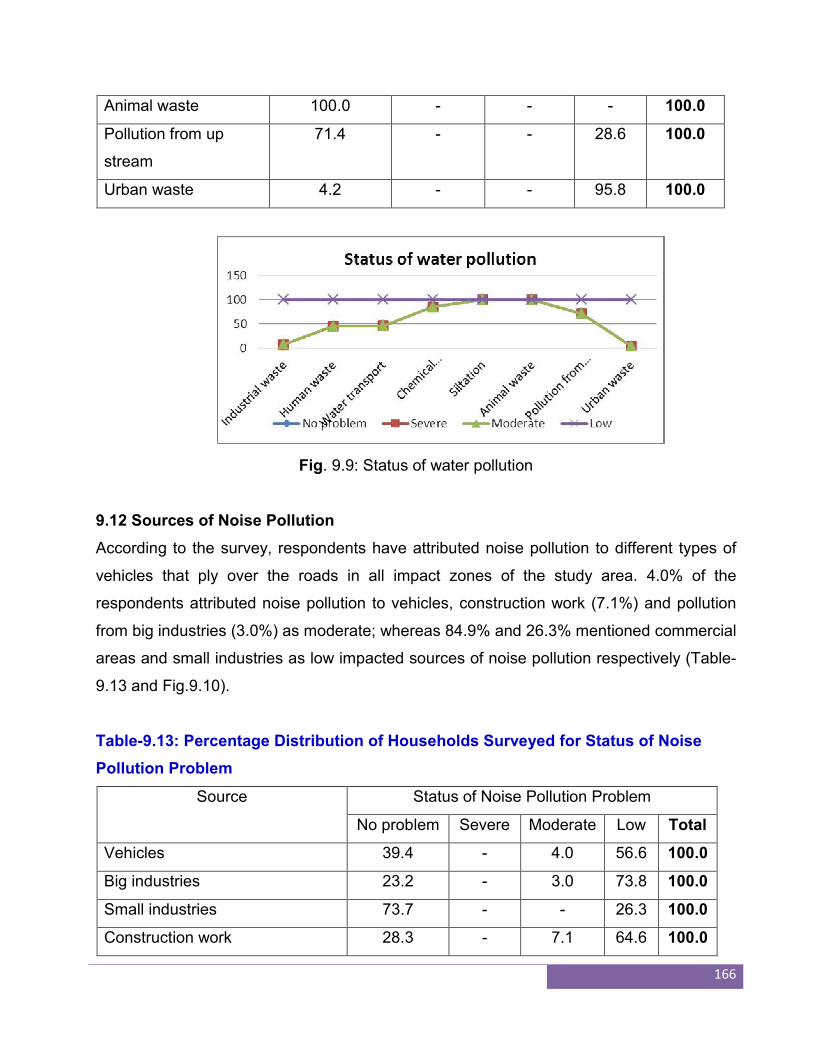
166
Animal waste 100.0 - - - 100.0
Pollution from up
stream
71.4 - - 28.6 100.0
Urban waste 4.2 - - 95.8 100.0
Fig. 9.9: Status of water pollution
9.12 Sources of Noise Pollution
According to the survey, respondents have attributed noise pollution to different types of
vehicles that ply over the roads in all impact zones of the study area. 4.0% of the
respondents attributed noise pollution to vehicles, construction work (7.1%) and pollution
from big industries (3.0%) as moderate; whereas 84.9% and 26.3% mentioned commercial
areas and small industries as low impacted sources of noise pollution respectively (Table-
9.13 and Fig.9.10).
Table-9.13: Percentage Distribution of Households Surveyed for Status of Noise
Pollution Problem
Source Status of Noise Pollution Problem
No problem Severe Moderate Low Total
Vehicles 39.4 - 4.0 56.6 100.0
Big industries 23.2 - 3.0 73.8 100.0
Small industries 73.7 - - 26.3 100.0
Construction work 28.3 - 7.1 64.6 100.0
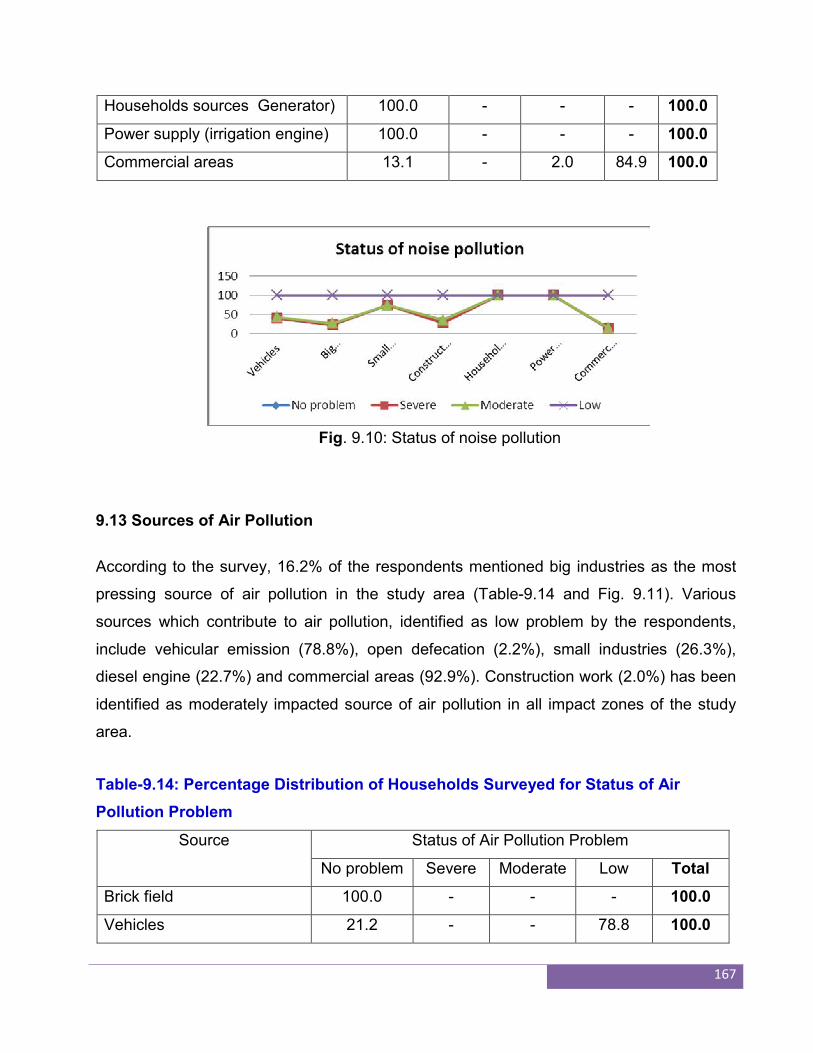
167
Households sources Generator) 100.0 - - - 100.0
Power supply (irrigation engine) 100.0 - - - 100.0
Commercial areas 13.1 - 2.0 84.9 100.0
Fig. 9.10: Status of noise pollution
9.13 Sources of Air Pollution
According to the survey, 16.2% of the respondents mentioned big industries as the most
pressing source of air pollution in the study area (Table-9.14 and Fig. 9.11). Various
sources which contribute to air pollution, identified as low problem by the respondents,
include vehicular emission (78.8%), open defecation (2.2%), small industries (26.3%),
diesel engine (22.7%) and commercial areas (92.9%). Construction work (2.0%) has been
identified as moderately impacted source of air pollution in all impact zones of the study
area.
Table-9.14: Percentage Distribution of Households Surveyed for Status of Air
Pollution Problem
Source Status of Air Pollution Problem
No problem Severe Moderate Low Total
Brick field 100.0 - - - 100.0
Vehicles 21.2 - - 78.8 100.0
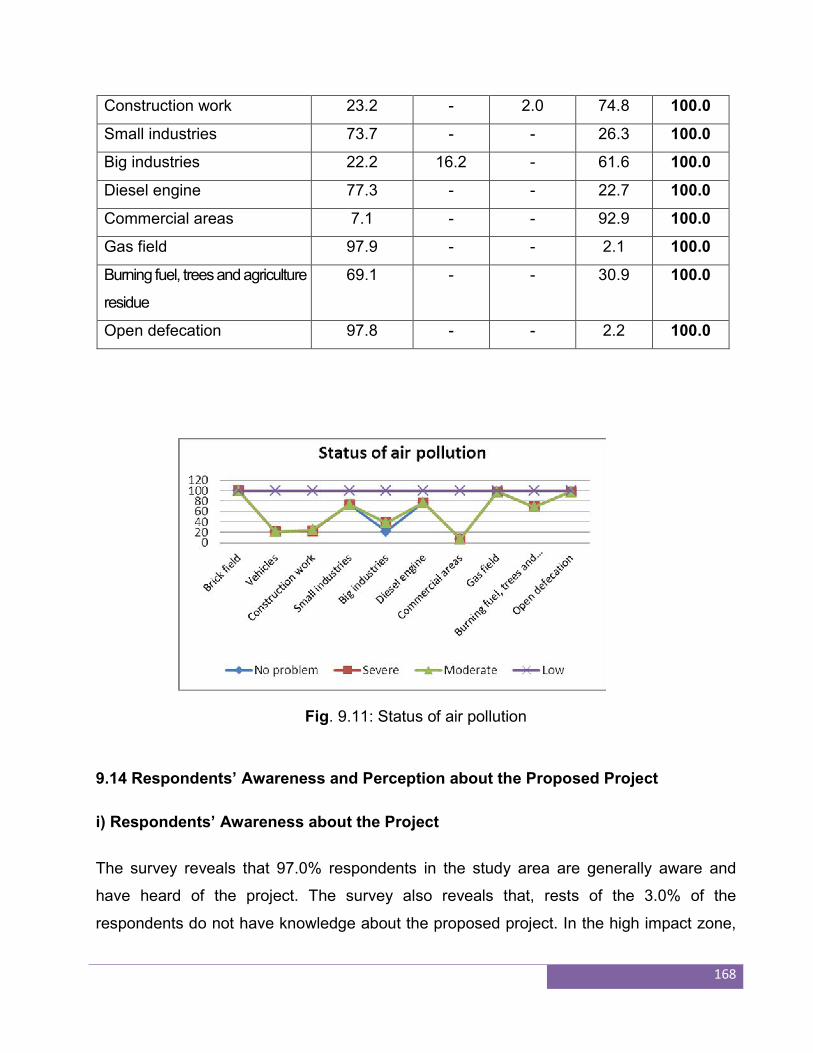
168
Construction work 23.2 - 2.0 74.8 100.0
Small industries 73.7 - - 26.3 100.0
Big industries 22.2 16.2 - 61.6 100.0
Diesel engine 77.3 - - 22.7 100.0
Commercial areas 7.1 - - 92.9 100.0
Gas field 97.9 - - 2.1 100.0
Burning fuel, trees and agriculture
residue
69.1 - - 30.9 100.0
Open defecation 97.8 - - 2.2 100.0
Fig. 9.11: Status of air pollution
9.14 Respondents’ Awareness and Perception about the Proposed Project
i) Respondents’ Awareness about the Project
The survey reveals that 97.0% respondents in the study area are generally aware and
have heard of the project. The survey also reveals that, rests of the 3.0% of the
respondents do not have knowledge about the proposed project. In the high impact zone,
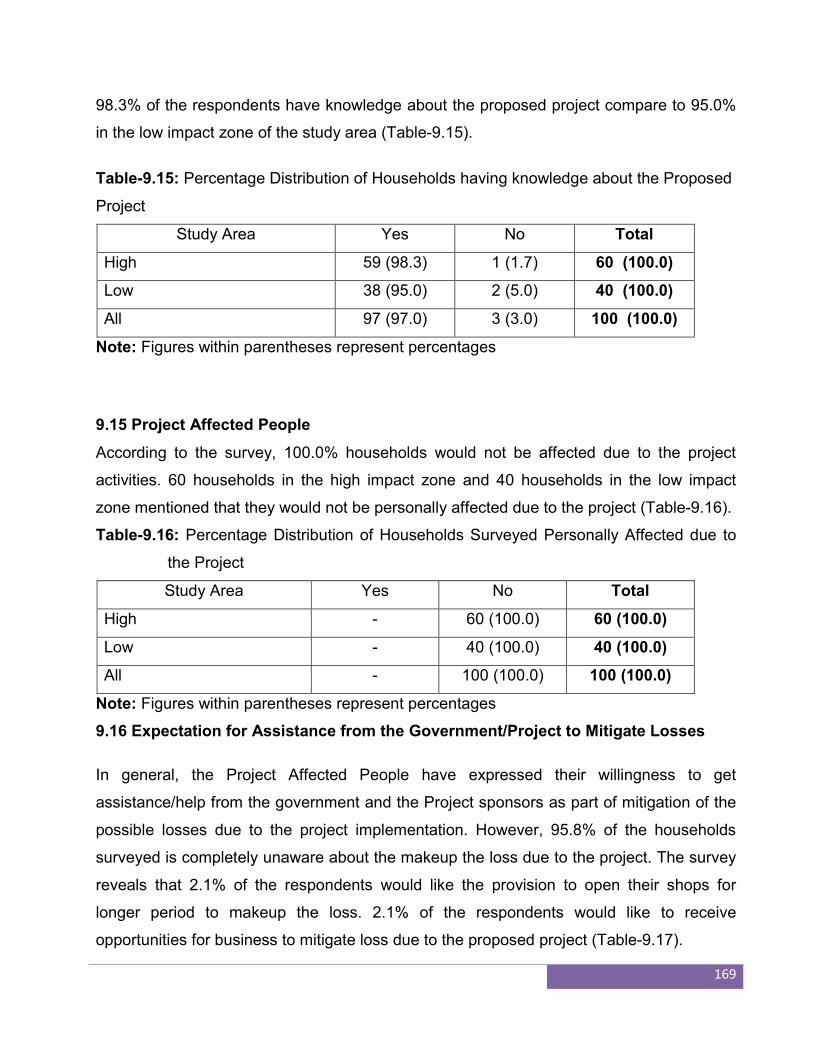
169
98.3% of the respondents have knowledge about the proposed project compare to 95.0%
in the low impact zone of the study area (Table-9.15).
Table-9.15: Percentage Distribution of Households having knowledge about the Proposed
Project
Study Area Yes No Total
High 59 (98.3) 1 (1.7) 60 (100.0)
Low 38 (95.0) 2 (5.0) 40 (100.0)
All 97 (97.0) 3 (3.0) 100 (100.0)
Note: Figures within parentheses represent percentages
9.15 Project Affected People
According to the survey, 100.0% households would not be affected due to the project
activities. 60 households in the high impact zone and 40 households in the low impact
zone mentioned that they would not be personally affected due to the project (Table-9.16).
Table-9.16: Percentage Distribution of Households Surveyed Personally Affected due to
the Project
Study Area Yes No Total
High - 60 (100.0) 60 (100.0)
Low - 40 (100.0) 40 (100.0)
All - 100 (100.0) 100 (100.0)
Note: Figures within parentheses represent percentages
9.16 Expectation for Assistance from the Government/Project to Mitigate Losses
In general, the Project Affected People have expressed their willingness to get
assistance/help from the government and the Project sponsors as part of mitigation of the
possible losses due to the project implementation. However, 95.8% of the households
surveyed is completely unaware about the makeup the loss due to the project. The survey
reveals that 2.1% of the respondents would like the provision to open their shops for
longer period to makeup the loss. 2.1% of the respondents would like to receive
opportunities for business to mitigate loss due to the proposed project (Table-9.17).
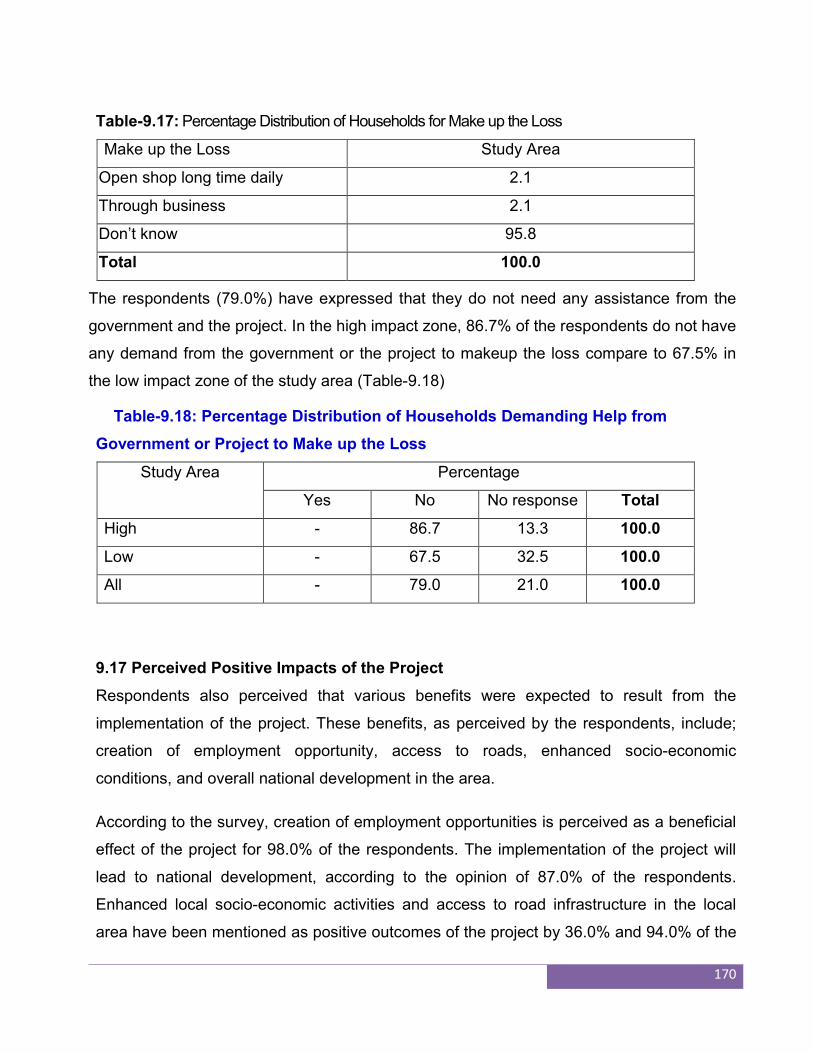
170
Table-9.17: Percentage Distribution of Households for Make up the Loss
Make up the Loss Study Area
Open shop long time daily 2.1
Through business 2.1
Don’t know 95.8
Total 100.0
The respondents (79.0%) have expressed that they do not need any assistance from the
government and the project. In the high impact zone, 86.7% of the respondents do not have
any demand from the government or the project to makeup the loss compare to 67.5% in
the low impact zone of the study area (Table-9.18)
Table-9.18: Percentage Distribution of Households Demanding Help from
Government or Project to Make up the Loss
Study Area Percentage
Yes No No response Total
High - 86.7 13.3 100.0
Low - 67.5 32.5 100.0
All - 79.0 21.0 100.0
9.17 Perceived Positive Impacts of the Project
Respondents also perceived that various benefits were expected to result from the
implementation of the project. These benefits, as perceived by the respondents, include;
creation of employment opportunity, access to roads, enhanced socio-economic
conditions, and overall national development in the area.
According to the survey, creation of employment opportunities is perceived as a beneficial
effect of the project for 98.0% of the respondents. The implementation of the project will
lead to national development, according to the opinion of 87.0% of the respondents.
Enhanced local socio-economic activities and access to road infrastructure in the local
area have been mentioned as positive outcomes of the project by 36.0% and 94.0% of the
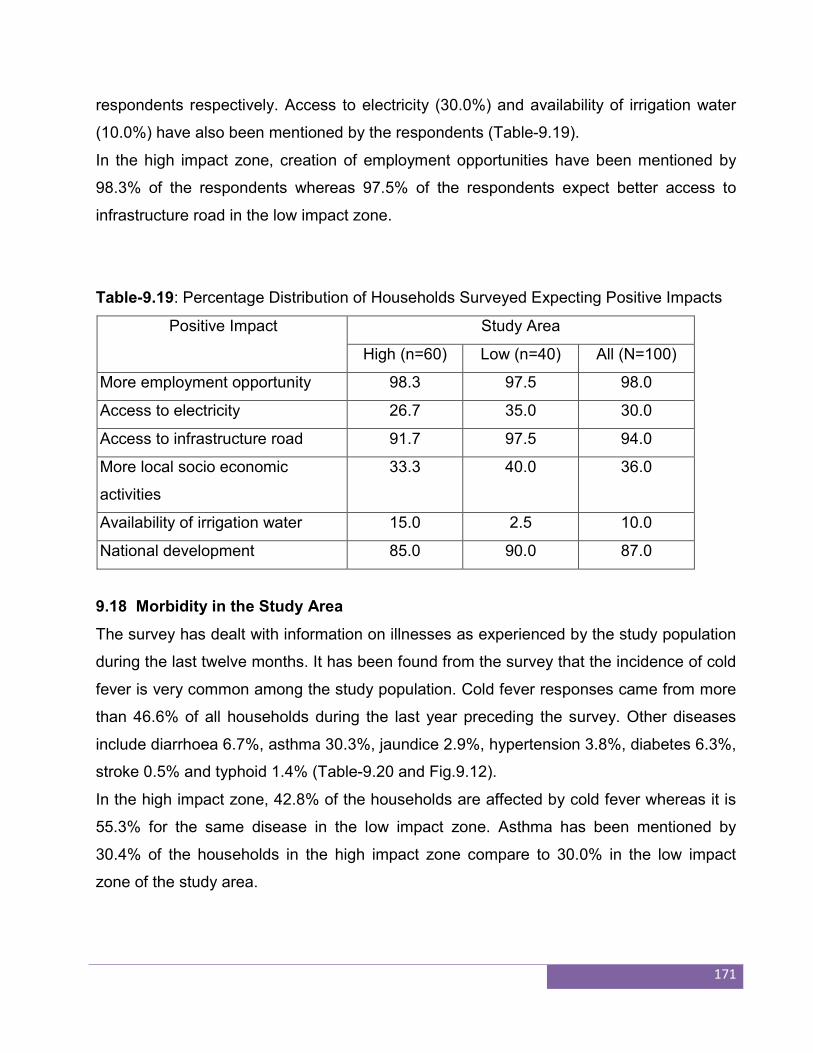
171
respondents respectively. Access to electricity (30.0%) and availability of irrigation water
(10.0%) have also been mentioned by the respondents (Table-9.19).
In the high impact zone, creation of employment opportunities have been mentioned by
98.3% of the respondents whereas 97.5% of the respondents expect better access to
infrastructure road in the low impact zone.
Table-9.19: Percentage Distribution of Households Surveyed Expecting Positive Impacts
Positive Impact Study Area
High (n=60) Low (n=40) All (N=100)
More employment opportunity 98.3 97.5 98.0
Access to electricity 26.7 35.0 30.0
Access to infrastructure road 91.7 97.5 94.0
More local socio economic
activities
33.3 40.0 36.0
Availability of irrigation water 15.0 2.5 10.0
National development 85.0 90.0 87.0
9.18 Morbidity in the Study Area
The survey has dealt with information on illnesses as experienced by the study population
during the last twelve months. It has been found from the survey that the incidence of cold
fever is very common among the study population. Cold fever responses came from more
than 46.6% of all households during the last year preceding the survey. Other diseases
include diarrhoea 6.7%, asthma 30.3%, jaundice 2.9%, hypertension 3.8%, diabetes 6.3%,
stroke 0.5% and typhoid 1.4% (Table-9.20 and Fig.9.12).
In the high impact zone, 42.8% of the households are affected by cold fever whereas it is
55.3% for the same disease in the low impact zone. Asthma has been mentioned by
30.4% of the households in the high impact zone compare to 30.0% in the low impact
zone of the study area.
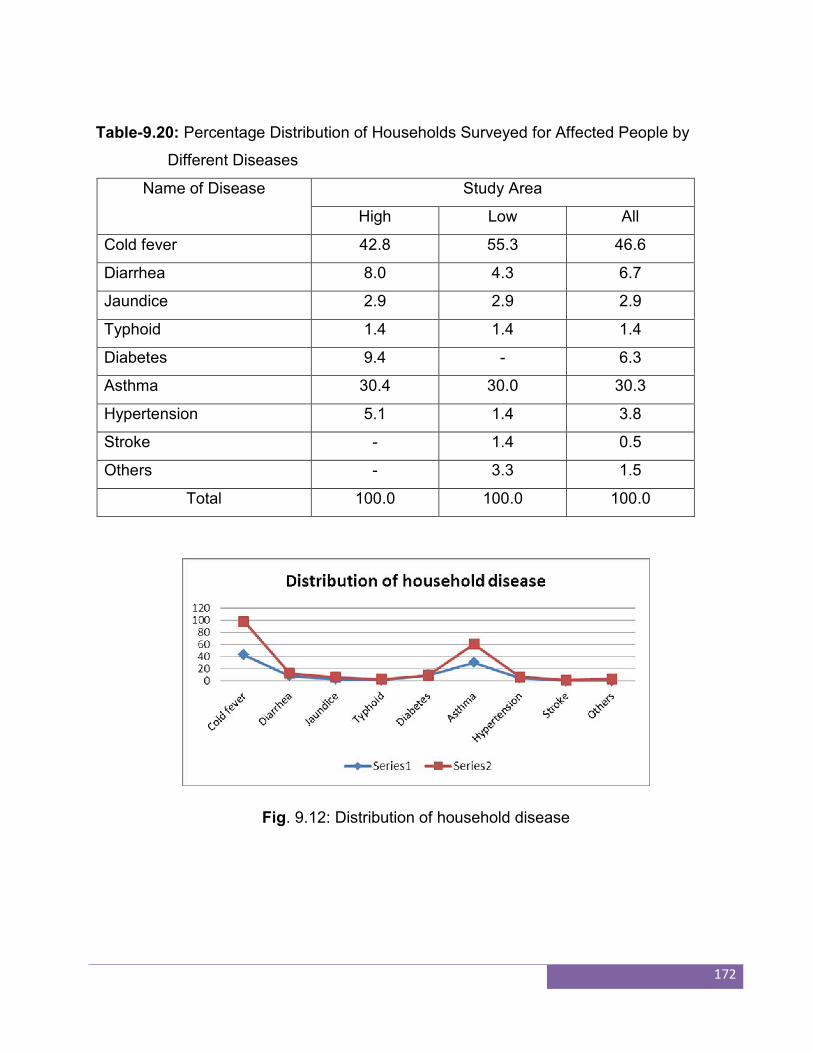
172
Table-9.20: Percentage Distribution of Households Surveyed for Affected People by
Different Diseases
Name of Disease Study Area
High Low All
Cold fever 42.8 55.3 46.6
Diarrhea 8.0 4.3 6.7
Jaundice 2.9 2.9 2.9
Typhoid 1.4 1.4 1.4
Diabetes 9.4 - 6.3
Asthma 30.4 30.0 30.3
Hypertension 5.1 1.4 3.8
Stroke - 1.4 0.5
Others - 3.3 1.5
Total 100.0 100.0 100.0
Fig. 9.12: Distribution of household disease
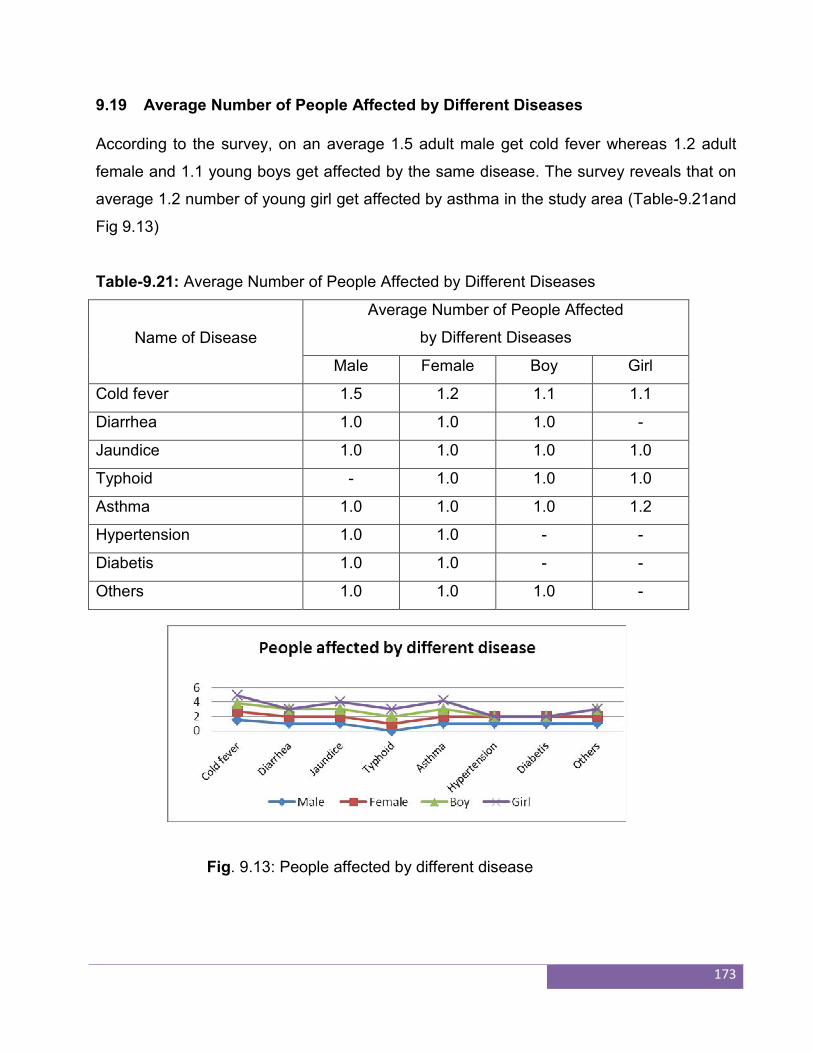
173
9.19 Average Number of People Affected by Different Diseases
According to the survey, on an average 1.5 adult male get cold fever whereas 1.2 adult
female and 1.1 young boys get affected by the same disease. The survey reveals that on
average 1.2 number of young girl get affected by asthma in the study area (Table-9.21and
Fig 9.13)
Table-9.21: Average Number of People Affected by Different Diseases
Name of Disease
Average Number of People Affected
by Different Diseases
Male Female Boy Girl
Cold fever 1.5 1.2 1.1 1.1
Diarrhea 1.0 1.0 1.0 -
Jaundice 1.0 1.0 1.0 1.0
Typhoid - 1.0 1.0 1.0
Asthma 1.0 1.0 1.0 1.2
Hypertension 1.0 1.0 - -
Diabetis 1.0 1.0 - -
Others 1.0 1.0 1.0 -
Fig. 9.13: People affected by different disease
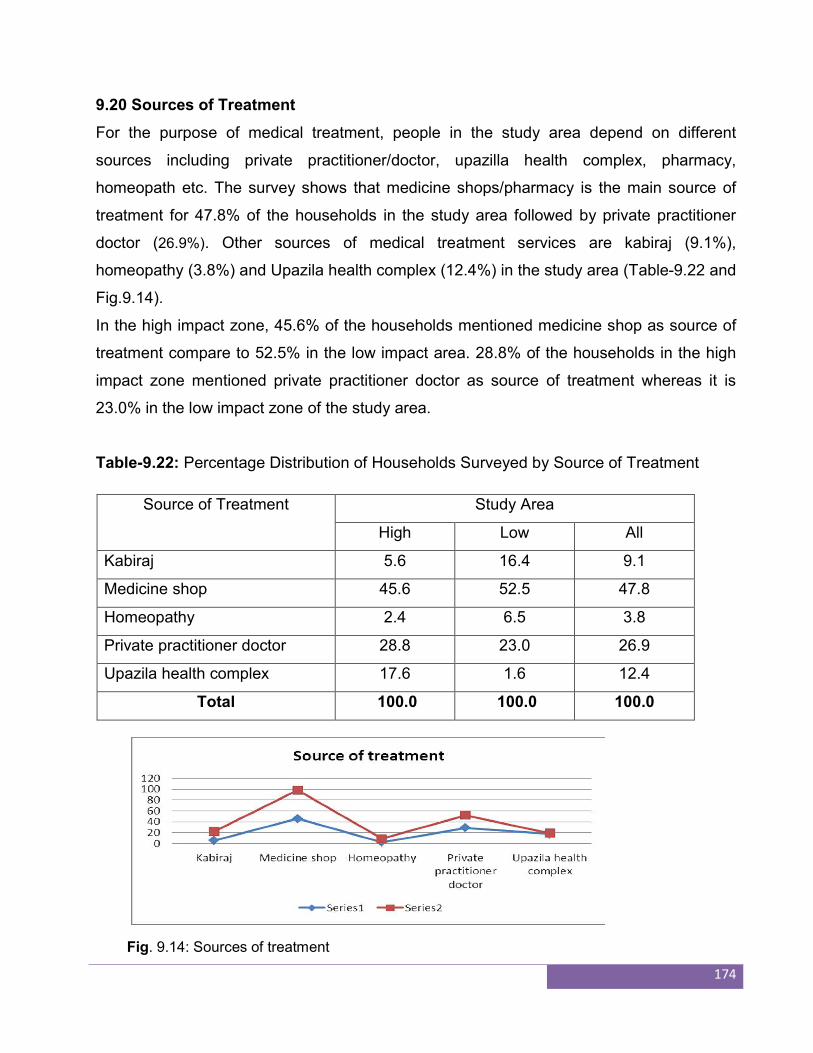
174
9.20 Sources of Treatment
For the purpose of medical treatment, people in the study area depend on different
sources including private practitioner/doctor, upazilla health complex, pharmacy,
homeopath etc. The survey shows that medicine shops/pharmacy is the main source of
treatment for 47.8% of the households in the study area followed by private practitioner
doctor (26.9%). Other sources of medical treatment services are kabiraj (9.1%),
homeopathy (3.8%) and Upazila health complex (12.4%) in the study area (Table-9.22 and
Fig.9.14).
In the high impact zone, 45.6% of the households mentioned medicine shop as source of
treatment compare to 52.5% in the low impact area. 28.8% of the households in the high
impact zone mentioned private practitioner doctor as source of treatment whereas it is
23.0% in the low impact zone of the study area.
Table-9.22: Percentage Distribution of Households Surveyed by Source of Treatment
Source of Treatment Study Area
High Low All
Kabiraj 5.6 16.4 9.1
Medicine shop 45.6 52.5 47.8
Homeopathy 2.4 6.5 3.8
Private practitioner doctor 28.8 23.0 26.9
Upazila health complex 17.6 1.6 12.4
Total 100.0 100.0 100.0
Fig. 9.14: Sources of treatment
175
Conclusion:
This survey report gives a more in-depth insight into the urban population. The population
is large in the survey area, with the percentage of children being less in number as
compared to the percentage being in the adolescent and old age group. The educational
status in this area is much better than areas in the rural setting. There is a higher
population of students who have achieved the higher secondary certificate. The primary
occupation of the area comprises of business, services and overseas employment.
Agricultural practices are minimal as compared to rural areas though they have better
irrigation facilities.
The household income is higher in the urban area as compared to rural areas. Likewise,
the household expenditure in this area is more. Majority of the expenditure includes food,
clothing, education and healthcare. The economic status of the people is far better than
those living in the rural areas. The housing structure is better; availability of food, clothing,
medicine, transport facilities is also very good. They also have better access to amenities
and infrastructure such as sanitation, market, bus stand, school, drinking water etc. The
health condition of the study area is far better than the rural area population. They suffer
from fewer diseases and they have better accessibility to medicine facilities. The
households in the study area have more access to electricity and also to natural gas along
with other sources and have good road connectivity.
The environmental issues in the project area are not that severe as compared to rural
areas. A very small percentage of the population in the survey area has problems with
noise pollution. Pollution from particulate matter is of major concern for the area. dust and
of any form is not a problem for the population in the area. The respondents’ in the study
area are aware about the project and they feel that the project will provide them with more
employment opportunity.
176
Chapter-10
ENVIRONMENTAL MANAGEMENT PLAN (EMP)
10.1 Environmental Management Plan
Environmental Management Plan (EMP) of the Summit Alliance Port Limited River
Terminal (SAPLRT) project is to record the environmental impacts resulting from the
project activities and to ensure implementation of the “mitigation measures” identified
earlier in order to reduce adverse impacts and enhance positive impacts from specific
project activities. Besides, it would also address any unexpected or unforeseen
environmental impacts that may arise during construction and operation phase of the
Container Depot River Terminal.
The EMP should clearly mention:
the measures to be taken during both construction and operation phases of the
Project to eliminate or offset adverse environmental impacts or to reduce them to
acceptable levels;
the actions needed to implement these measures;
a monitoring plan to assess the effectiveness of the mitigation measures employed.
Environmental management and monitoring activities of the proposed container depot
Project could be divided into management and monitoring during:
Construction phase
Operation phase
Decommissioning phase
10.1.1 Construction Phase
The environmental management plan should be carried out as an integrated part of the
project planning and execution. It must not be seen merely as an activity limited to
monitoring a regulating activities against a pre-determined checklist of required actions.
Rather it must interact dynamically as project implementation proceeds, dealing flexibly
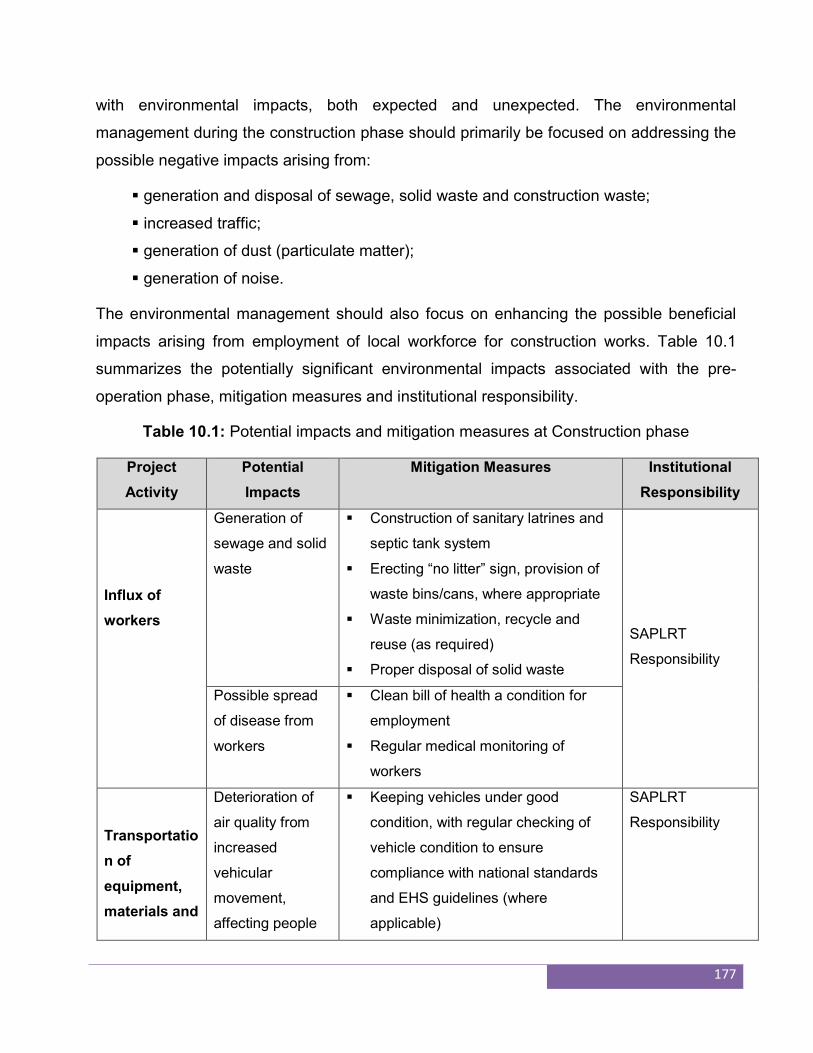
177
with environmental impacts, both expected and unexpected. The environmental
management during the construction phase should primarily be focused on addressing the
possible negative impacts arising from:
generation and disposal of sewage, solid waste and construction waste;
increased traffic;
generation of dust (particulate matter);
generation of noise.
The environmental management should also focus on enhancing the possible beneficial
impacts arising from employment of local workforce for construction works. Table 10.1
summarizes the potentially significant environmental impacts associated with the pre-
operation phase, mitigation measures and institutional responsibility.
Table 10.1: Potential impacts and mitigation measures at Construction phase
Project
Activity
Potential
Impacts
Mitigation Measures Institutional
Responsibility
Influx of
workers
Generation of
sewage and solid
waste
Construction of sanitary latrines and
septic tank system
Erecting “no litter” sign, provision of
waste bins/cans, where appropriate
Waste minimization, recycle and
reuse (as required)
Proper disposal of solid waste
SAPLRT
Responsibility
Possible spread
of disease from
workers
Clean bill of health a condition for
employment
Regular medical monitoring of
workers
Transportatio
n of
equipment,
materials and
Deterioration of
air quality from
increased
vehicular
movement,
affecting people
Keeping vehicles under good
condition, with regular checking of
vehicle condition to ensure
compliance with national standards
and EHS guidelines (where
applicable)
SAPLRT
Responsibility
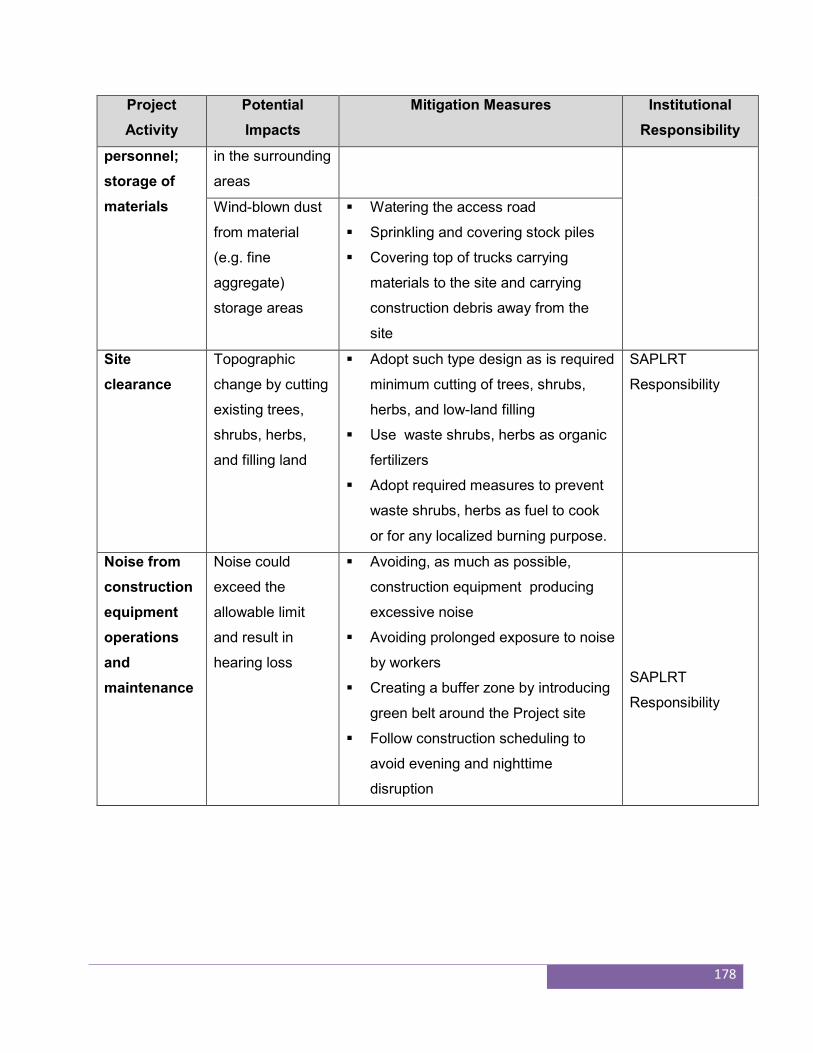
178
Project
Activity
Potential
Impacts
Mitigation Measures Institutional
Responsibility
personnel;
storage of
materials
in the surrounding
areas
Wind-blown dust
from material
(e.g. fine
aggregate)
storage areas
Watering the access road
Sprinkling and covering stock piles
Covering top of trucks carrying
materials to the site and carrying
construction debris away from the
site
Site
clearance
Topographic
change by cutting
existing trees,
shrubs, herbs,
and filling land
Adopt such type design as is required
minimum cutting of trees, shrubs,
herbs, and low-land filling
Use waste shrubs, herbs as organic
fertilizers
Adopt required measures to prevent
waste shrubs, herbs as fuel to cook
or for any localized burning purpose.
SAPLRT
Responsibility
Noise from
construction
equipment
operations
and
maintenance
Noise could
exceed the
allowable limit
and result in
hearing loss
Avoiding, as much as possible,
construction equipment producing
excessive noise
Avoiding prolonged exposure to noise
by workers
Creating a buffer zone by introducing
green belt around the Project site
Follow construction scheduling to
avoid evening and nighttime
disruption
SAPLRT
Responsibility
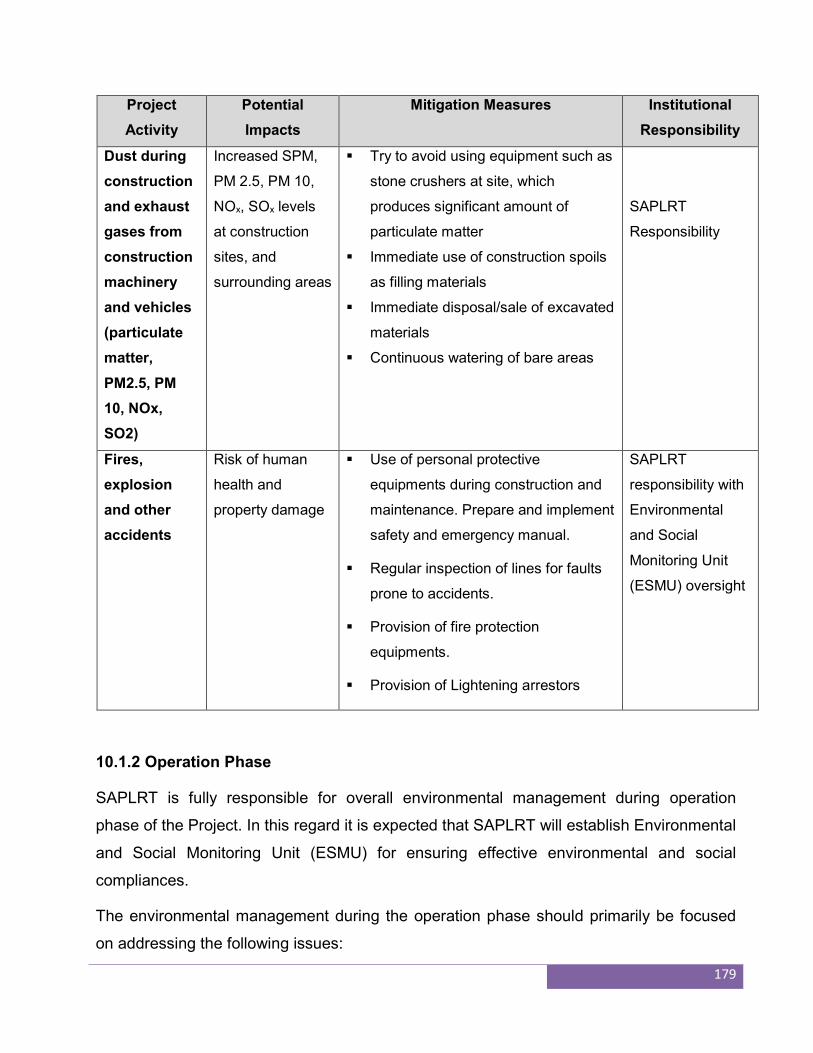
179
Project
Activity
Potential
Impacts
Mitigation Measures Institutional
Responsibility
Dust during
construction
and exhaust
gases from
construction
machinery
and vehicles
(particulate
matter,
PM2.5, PM
10, NOx,
SO2)
Increased SPM,
PM 2.5, PM 10,
NOx, SOx levels
at construction
sites, and
surrounding areas
Try to avoid using equipment such as
stone crushers at site, which
produces significant amount of
particulate matter
Immediate use of construction spoils
as filling materials
Immediate disposal/sale of excavated
materials
Continuous watering of bare areas
SAPLRT
Responsibility
Fires,
explosion
and other
accidents
Risk of human
health and
property damage
Use of personal protective
equipments during construction and
maintenance. Prepare and implement
safety and emergency manual.
Regular inspection of lines for faults
prone to accidents.
Provision of fire protection
equipments.
Provision of Lightening arrestors
SAPLRT
responsibility with
Environmental
and Social
Monitoring Unit
(ESMU) oversight
10.1.2 Operation Phase
SAPLRT is fully responsible for overall environmental management during operation
phase of the Project. In this regard it is expected that SAPLRT will establish Environmental
and Social Monitoring Unit (ESMU) for ensuring effective environmental and social
compliances.
The environmental management during the operation phase should primarily be focused
on addressing the following issues:
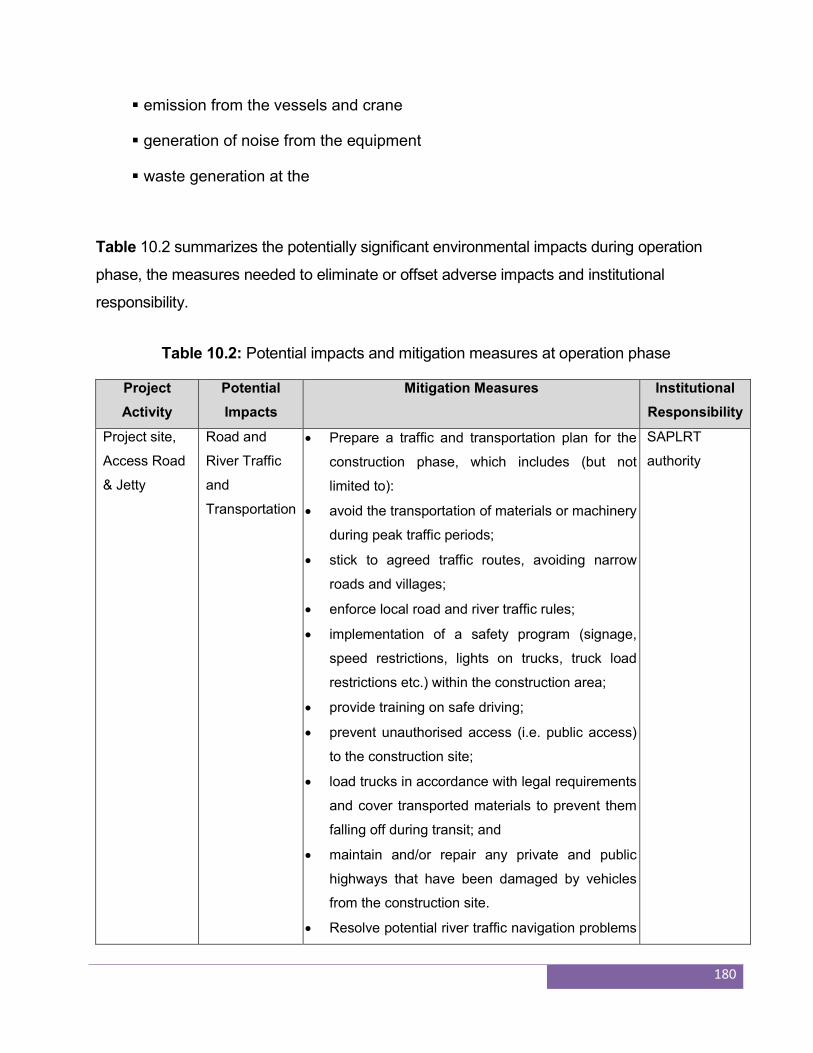
180
emission from the vessels and crane
generation of noise from the equipment
waste generation at the
Table 10.2 summarizes the potentially significant environmental impacts during operation
phase, the measures needed to eliminate or offset adverse impacts and institutional
responsibility.
Table 10.2: Potential impacts and mitigation measures at operation phase
Project
Activity
Potential
Impacts
Mitigation Measures Institutional
Responsibility
Project site,
Access Road
& Jetty
Road and
River Traffic
and
Transportation
Prepare a traffic and transportation plan for the
construction phase, which includes (but not
limited to):
avoid the transportation of materials or machinery
during peak traffic periods;
stick to agreed traffic routes, avoiding narrow
roads and villages;
enforce local road and river traffic rules;
implementation of a safety program (signage,
speed restrictions, lights on trucks, truck load
restrictions etc.) within the construction area;
provide training on safe driving;
prevent unauthorised access (i.e. public access)
to the construction site;
load trucks in accordance with legal requirements
and cover transported materials to prevent them
falling off during transit; and
maintain and/or repair any private and public
highways that have been damaged by vehicles
from the construction site.
Resolve potential river traffic navigation problems
SAPLRT
authority
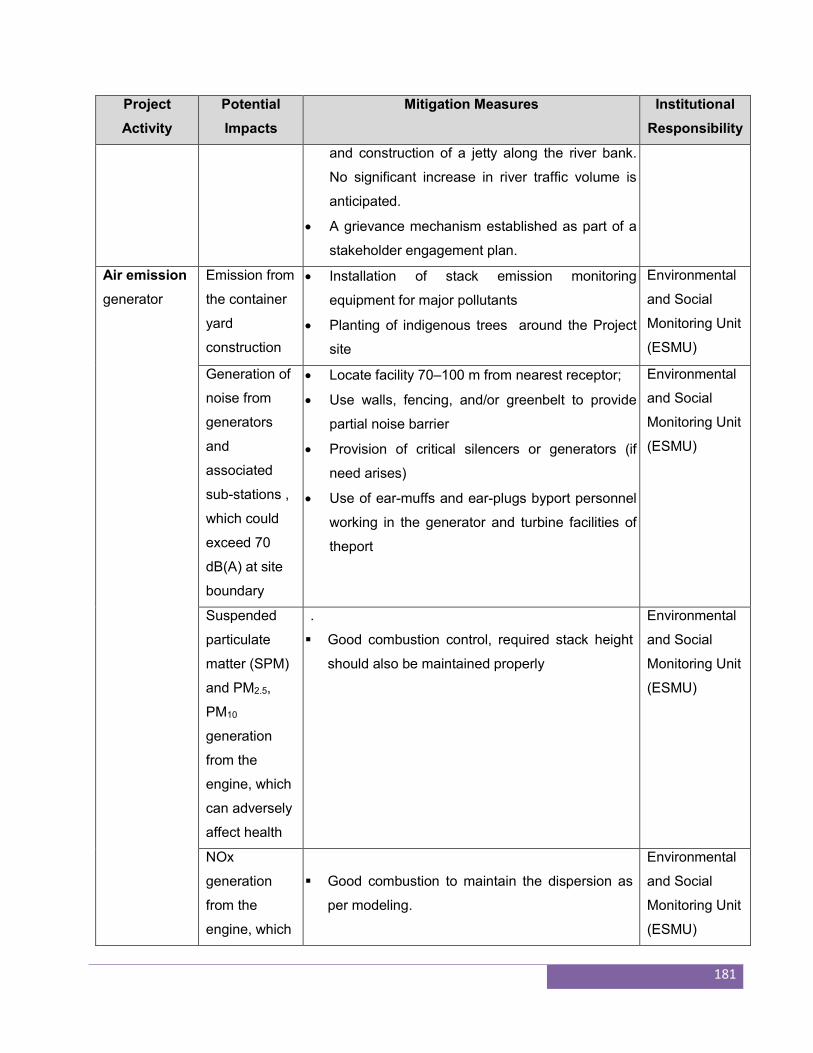
181
Project
Activity
Potential
Impacts
Mitigation Measures Institutional
Responsibility
and construction of a jetty along the river bank.
No significant increase in river traffic volume is
anticipated.
A grievance mechanism established as part of a
stakeholder engagement plan.
Air emission
generator
Emission from
the container
yard
construction
Installation of stack emission monitoring
equipment for major pollutants
Planting of indigenous trees around the Project
site
Environmental
and Social
Monitoring Unit
(ESMU)
Generation of
noise from
generators
and
associated
sub-stations ,
which could
exceed 70
dB(A) at site
boundary
Locate facility 70–100 m from nearest receptor;
Use walls, fencing, and/or greenbelt to provide
partial noise barrier
Provision of critical silencers or generators (if
need arises)
Use of ear-muffs and ear-plugs byport personnel
working in the generator and turbine facilities of
theport
Environmental
and Social
Monitoring Unit
(ESMU)
Suspended
particulate
matter (SPM)
and PM2.5,
PM10
generation
from the
engine, which
can adversely
affect health
.
Good combustion control, required stack height
should also be maintained properly
Environmental
and Social
Monitoring Unit
(ESMU)
NOx
generation
from the
engine, which
Good combustion to maintain the dispersion as
per modeling.
Environmental
and Social
Monitoring Unit
(ESMU)
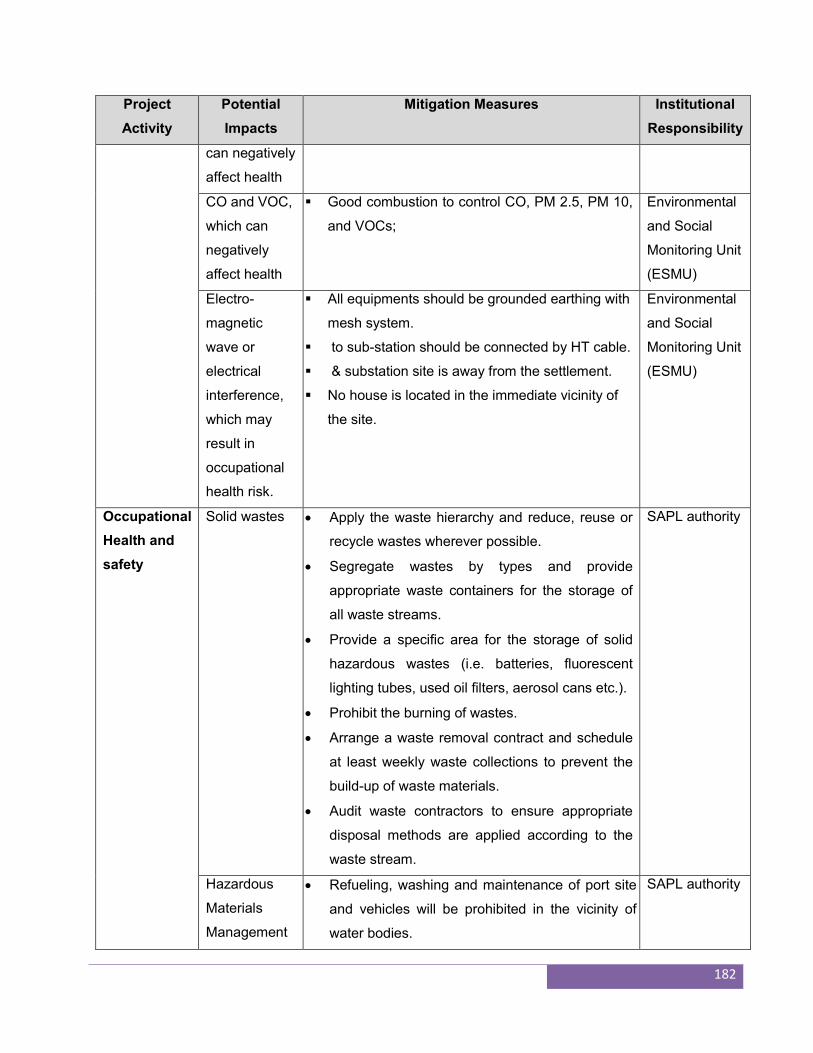
182
Project
Activity
Potential
Impacts
Mitigation Measures Institutional
Responsibility
can negatively
affect health
CO and VOC,
which can
negatively
affect health
Good combustion to control CO, PM 2.5, PM 10,
and VOCs;
Environmental
and Social
Monitoring Unit
(ESMU)
Electro-
magnetic
wave or
electrical
interference,
which may
result in
occupational
health risk.
All equipments should be grounded earthing with
mesh system.
to sub-station should be connected by HT cable.
& substation site is away from the settlement.
No house is located in the immediate vicinity of
the site.
Environmental
and Social
Monitoring Unit
(ESMU)
Occupational
Health and
safety
Solid wastes Apply the waste hierarchy and reduce, reuse or
recycle wastes wherever possible.
Segregate wastes by types and provide
appropriate waste containers for the storage of
all waste streams.
Provide a specific area for the storage of solid
hazardous wastes (i.e. batteries, fluorescent
lighting tubes, used oil filters, aerosol cans etc.).
Prohibit the burning of wastes.
Arrange a waste removal contract and schedule
at least weekly waste collections to prevent the
build-up of waste materials.
Audit waste contractors to ensure appropriate
disposal methods are applied according to the
waste stream.
SAPL authority
Hazardous
Materials
Management
Refueling, washing and maintenance of port site
and vehicles will be prohibited in the vicinity of
water bodies.
SAPL authority
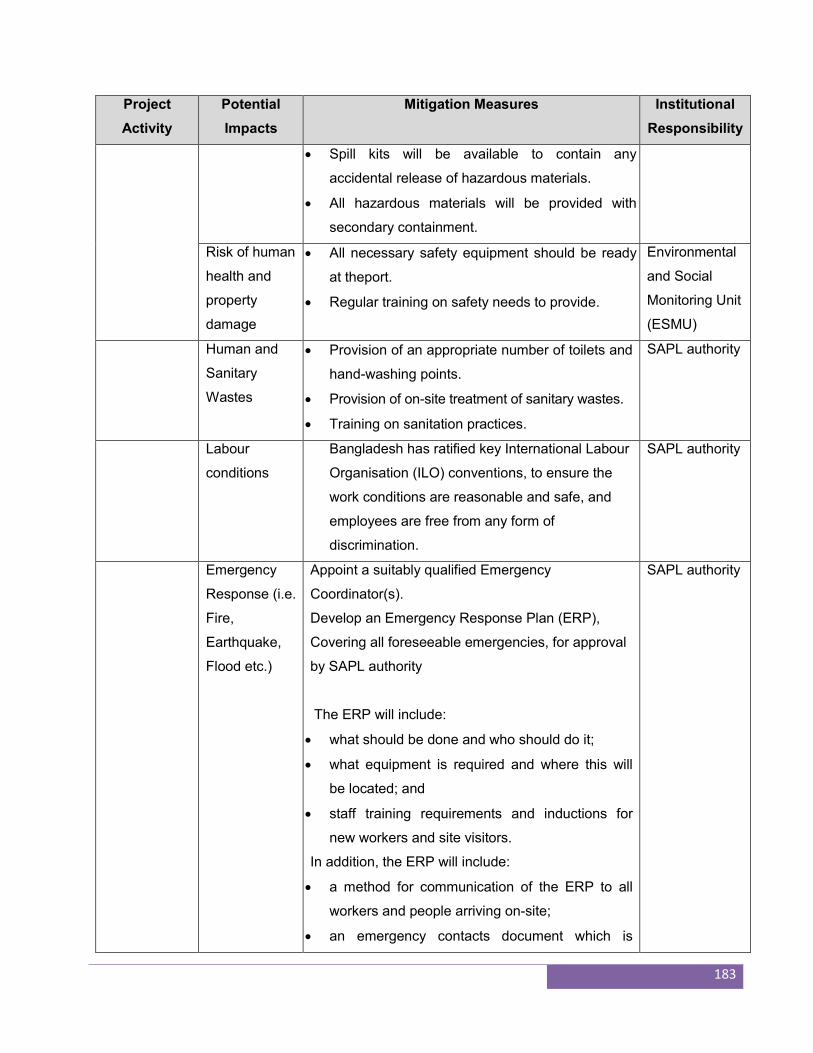
183
Project
Activity
Potential
Impacts
Mitigation Measures Institutional
Responsibility
Spill kits will be available to contain any
accidental release of hazardous materials.
All hazardous materials will be provided with
secondary containment.
Risk of human
health and
property
damage
All necessary safety equipment should be ready
at theport.
Regular training on safety needs to provide.
Environmental
and Social
Monitoring Unit
(ESMU)
Human and
Sanitary
Wastes
Provision of an appropriate number of toilets and
hand-washing points.
Provision of on-site treatment of sanitary wastes.
Training on sanitation practices.
SAPL authority
Labour
conditions
Bangladesh has ratified key International Labour
Organisation (ILO) conventions, to ensure the
work conditions are reasonable and safe, and
employees are free from any form of
discrimination.
SAPL authority
Emergency
Response (i.e.
Fire,
Earthquake,
Flood etc.)
Appoint a suitably qualified Emergency
Coordinator(s).
Develop an Emergency Response Plan (ERP),
Covering all foreseeable emergencies, for approval
by SAPL authority
The ERP will include:
what should be done and who should do it;
what equipment is required and where this will
be located; and
staff training requirements and inductions for
new workers and site visitors.
In addition, the ERP will include:
a method for communication of the ERP to all
workers and people arriving on-site;
an emergency contacts document which is
SAPL authority
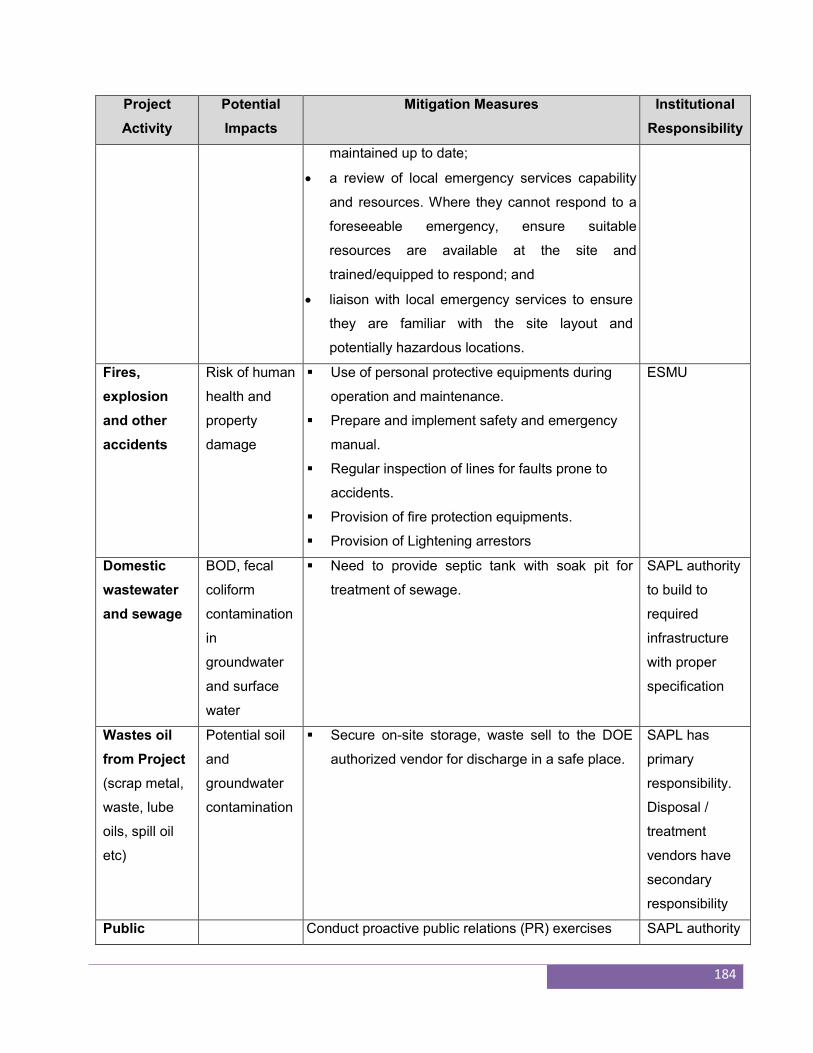
184
Project
Activity
Potential
Impacts
Mitigation Measures Institutional
Responsibility
maintained up to date;
a review of local emergency services capability
and resources. Where they cannot respond to a
foreseeable emergency, ensure suitable
resources are available at the site and
trained/equipped to respond; and
liaison with local emergency services to ensure
they are familiar with the site layout and
potentially hazardous locations.
Fires,
explosion
and other
accidents
Risk of human
health and
property
damage
Use of personal protective equipments during
operation and maintenance.
Prepare and implement safety and emergency
manual.
Regular inspection of lines for faults prone to
accidents.
Provision of fire protection equipments.
Provision of Lightening arrestors
ESMU
Domestic
wastewater
and sewage
BOD, fecal
coliform
contamination
in
groundwater
and surface
water
Need to provide septic tank with soak pit for
treatment of sewage.
SAPL authority
to build to
required
infrastructure
with proper
specification
Wastes oil
from Project
(scrap metal,
waste, lube
oils, spill oil
etc)
Potential soil
and
groundwater
contamination
Secure on-site storage, waste sell to the DOE
authorized vendor for discharge in a safe place.
SAPL has
primary
responsibility.
Disposal /
treatment
vendors have
secondary
responsibility
Public Conduct proactive public relations (PR) exercises SAPL authority
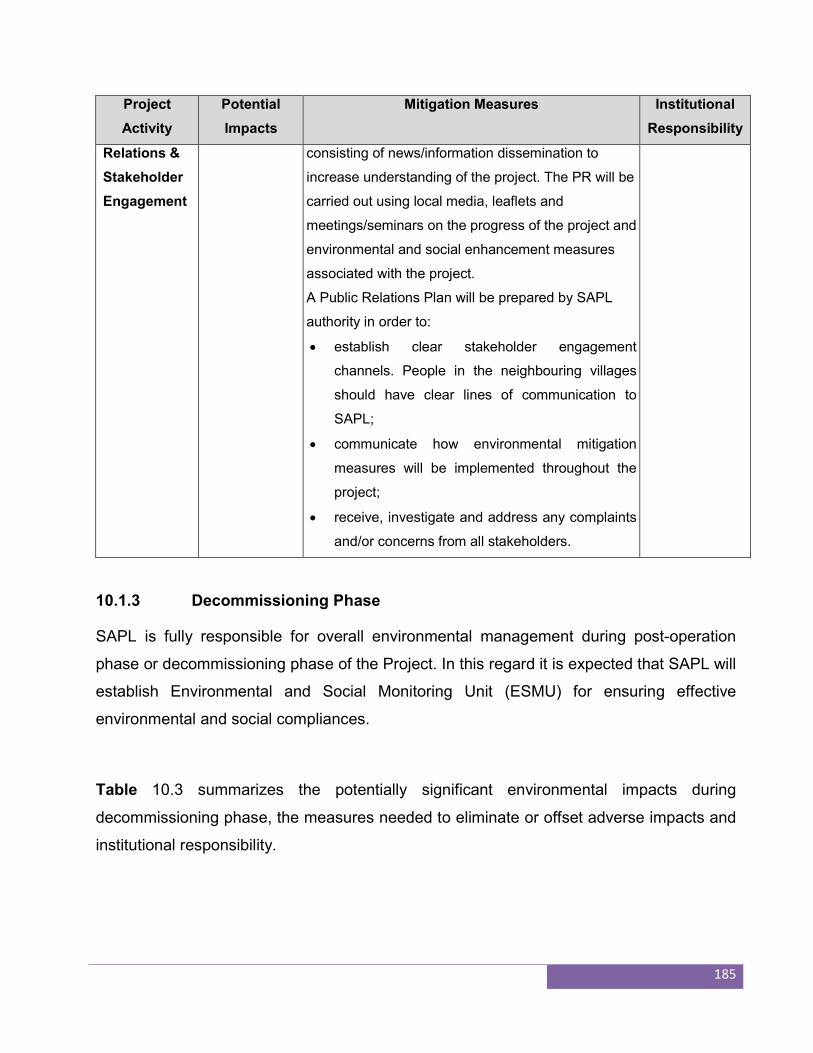
185
Project
Activity
Potential
Impacts
Mitigation Measures Institutional
Responsibility
Relations &
Stakeholder
Engagement
consisting of news/information dissemination to
increase understanding of the project. The PR will be
carried out using local media, leaflets and
meetings/seminars on the progress of the project and
environmental and social enhancement measures
associated with the project.
A Public Relations Plan will be prepared by SAPL
authority in order to:
establish clear stakeholder engagement
channels. People in the neighbouring villages
should have clear lines of communication to
SAPL;
communicate how environmental mitigation
measures will be implemented throughout the
project;
receive, investigate and address any complaints
and/or concerns from all stakeholders.
10.1.3 Decommissioning Phase
SAPL is fully responsible for overall environmental management during post-operation
phase or decommissioning phase of the Project. In this regard it is expected that SAPL will
establish Environmental and Social Monitoring Unit (ESMU) for ensuring effective
environmental and social compliances.
Table 10.3 summarizes the potentially significant environmental impacts during
decommissioning phase, the measures needed to eliminate or offset adverse impacts and
institutional responsibility.
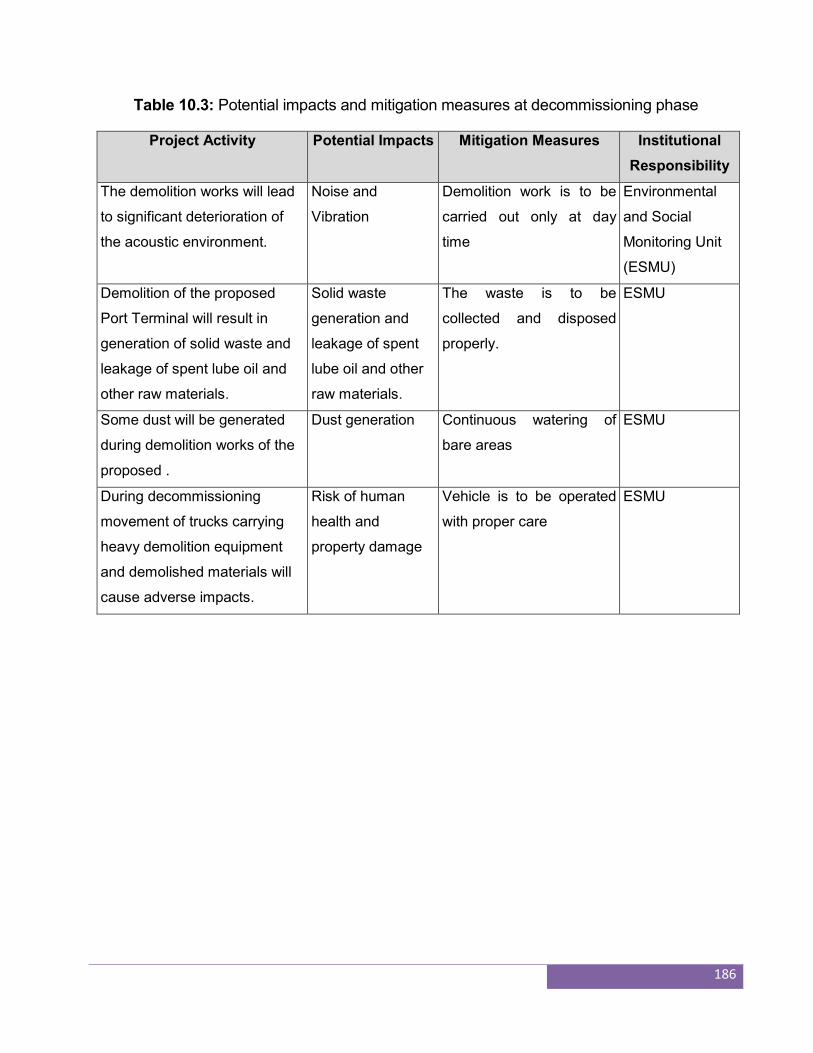
186
Table 10.3: Potential impacts and mitigation measures at decommissioning phase
Project Activity Potential Impacts Mitigation Measures Institutional
Responsibility
The demolition works will lead
to significant deterioration of
the acoustic environment.
Noise and
Vibration
Demolition work is to be
carried out only at day
time
Environmental
and Social
Monitoring Unit
(ESMU)
Demolition of the proposed
Port Terminal will result in
generation of solid waste and
leakage of spent lube oil and
other raw materials.
Solid waste
generation and
leakage of spent
lube oil and other
raw materials.
The waste is to be
collected and disposed
properly.
ESMU
Some dust will be generated
during demolition works of the
proposed .
Dust generation Continuous watering of
bare areas
ESMU
During decommissioning
movement of trucks carrying
heavy demolition equipment
and demolished materials will
cause adverse impacts.
Risk of human
health and
property damage
Vehicle is to be operated
with proper care
ESMU
187
Chapter-11 INSTITUTIONAL ARRANGEMENT AND ENVIRONMENTAL
MONITORING
11.1 Institutional Requirements
For ensuring the construction and operation of the River Port Container Depot according
to the required compliance, there should be designated entity/institution or unit. The
institution will be fully responsible to maintain the safeguard compliances. SAPLRT
authority has realized the importance of establishing a separate entity for environmental
monitoring and management. So, to maintain the environmental and social compliances,
SAPLRT authority has planned to establish an individual compliance unit operating under
the guidance of Head of Operation. They are planning to name the unit as Environmental
and Social Monitoring Unit (ESMU). The detail of the ESMU has been discussed in the
following sections.
11.1.1 Environmental and Social Monitoring Unit
SAPLRT authority is in principal obligated to relevant national and international
environmental and social compliances and standards. It has informed that it will try to
maintain all relevant compliances during construction and operational phases. In doing so,
it has planned to form ESMU as is mentioned in the earlier section. The duties of the
ESMU will include to:
ensure environmental and social safeguard compliances;
coordinate environmental monitoring process;
act as liaison with the public, local organizations and government;
ensure and supervise record keeping, data storage for follow-up actions;
monitor hazardous materials storage and handling;
promote environmental awareness and safety measures; and
188
prepare environmental management and periodic monitoring reports as required
by IDCOL, DOE and ADB .
11.1.2 Composition of Environmental and Social Monitoring Unit
The ESMU will be based on three tiers operational mechanism. It will be led by Head of
Operation of the Container Terminal River Port. Head of Operation will serve as General
Manager (Planning, Administration and Safeguard Compliance). Under his guidance there
will be one Compliance Manager, who will be supported by two Compliance Officers. One
Compliance Officer will be responsible for all sorts of environmental aspects and
standards and another one will be assigned to maintain social and occupational health and
safety aspects and standards.
Consulting services will be mobilized as necessary to assist in initial operations, to ensure
that the ESMU will be self-sufficient for EMP implementation, submission of progress
reports, and preparation of environmental assessment for subsequent construction works.
Additional third-party services may be employed by the SAPL as necessary. Qualified and
experienced construction contractor will be responsible for implementation of mitigation
measures during the construction phase.
To look after the EHS aspects during the Construction Phase, SAPLRT authority has
already deployed an EHS Officer having Master Degree in Environmental Engineering.
Based on the performance, he will be extended for the Operation Phase or a new EHS
officer will be recruited. The major responsibilities of the EHS Officer are as follows:
Monitor the environmental, health, safety, fire protection and emergency response
matters;
Ensure the compliance of the Department of Environment;
Ensure the compliance of other external stakeholders;
Monitor the implementation of the EMP;
Develop standard operational procedure (SOP) for EHS aspects;
Conduct safety inspections; provide safety training to promote a safe working
environment for the employees.
189
11.1.3 Environmental Training
Training is an integral part of a preventive strategy. Environmental and disaster
management training will be required to ensure proper implementation of effective
environmental management and monitoring plan; and disaster management plan.
However, training could be organized by ESMU involving relevant staff. As a trainer,
competent Consultant can be outsourced. Important training under the spectrum of ESMU
needs to include:
Training on fire fighting;
Training on environmental regulations and standards;
Staff training on environmental monitoring;
Training on environmental health and safety measure.
11.2 Environmental Monitoring
Environmental monitoring is an essential component of environmental management plan,
as it provides the basic scenario of the impact of the project on baseline condition. The
prime objectives of environmental monitoring are:
assess the effectiveness of proposed mitigation measures by comparing
monitoring result with baseline data/environmental standards;
identify the extent of environmental impact;
determine project compliance with regulatory requirements;
adopt remedial action and further mitigation measures if found to be necessary.
During the Construction Phase, the construction contractor will ensure that activities like
land leveling, clearing work, access road construction, putting proper traffic signals etc.
have been accomplished properly to minimize the level of impact. This in turn has to be
monitored by the Compliance Manager and Compliance Officers of ESMU of the
Container Depot, in operation phase. Preventive maintenance should be carried out to
190
identify and resolve problems related to cooling oil, gaskets, circuit breakers, vibration
measurements, and other monitoring activities at regular intervals. Monitoring of oil water
separation and sanitary waste treatment should be done periodically to avoid water
pollution. Other environmental good practices include noise abatement, maintaining
hygienic conditions, maintenance of fire and safety equipment etc. and clearing of grass
should be done periodically and medium height teleportation around the substation wall
should be done at the port areas.
SAPLRT authority should develop a working relationship with the DOE by undertaking a
joint monitoring program to monitor ambient air quality and also to assess whether there
exists any significant noise problem; or they may exchange data and information or submit
periodic report on self monitoring to the DOE or as the situation may require.
The proposed monitoring program should be in compliance with national environmental
standards. The importance of this monitoring program is also for ensuring that theport
does not create adverse environmental changes in the area and provide a database of
operations and maintenance, which can be utilized if unwarranted complaints are made.
11.2.1 Environmental Monitoring Parameters
Environmental monitoring requires set of parameters that could be conveniently
measured, assessed and evaluated periodically to observe the trends of change in base
line environmental quality. A list of possible parameters to be tested, sample number and
sampling frequency are given in Table 11.1.
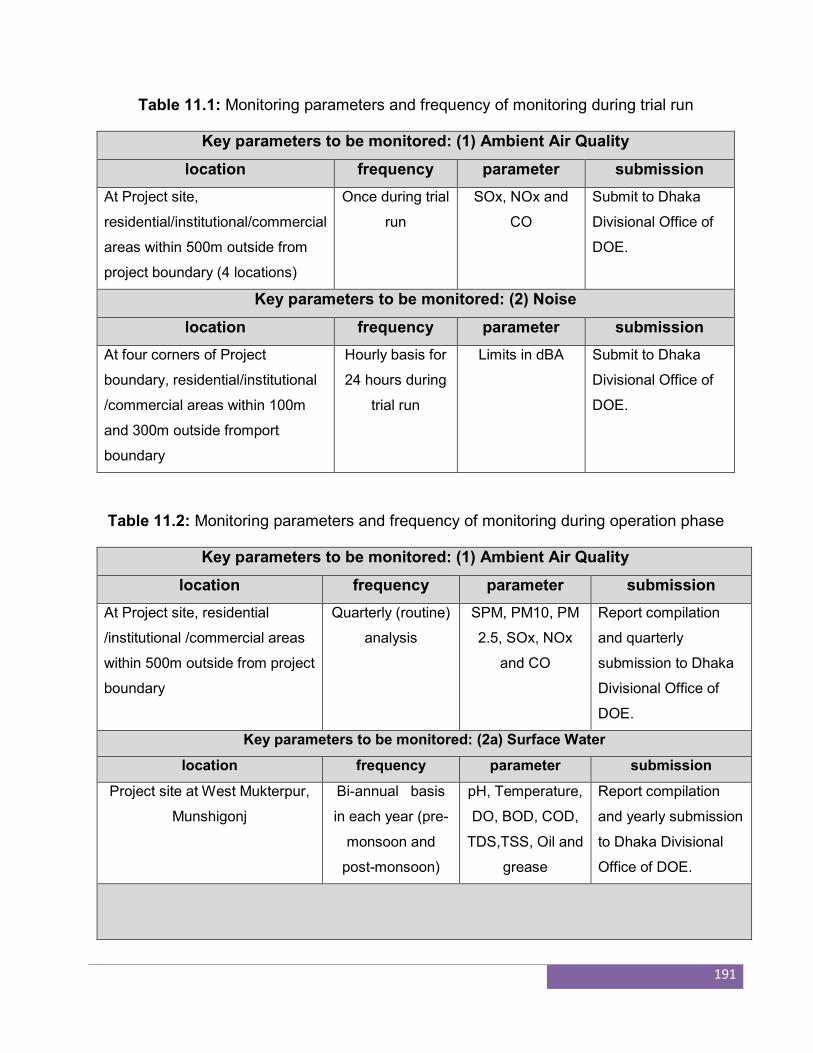
191
Table 11.1: Monitoring parameters and frequency of monitoring during trial run
Key parameters to be monitored: (1) Ambient Air Quality
location frequency parameter submission
At Project site,
residential/institutional/commercial
areas within 500m outside from
project boundary (4 locations)
Once during trial
run
SOx, NOx and
CO
Submit to Dhaka
Divisional Office of
DOE.
Key parameters to be monitored: (2) Noise
location frequency parameter submission
At four corners of Project
boundary, residential/institutional
/commercial areas within 100m
and 300m outside fromport
boundary
Hourly basis for
24 hours during
trial run
Limits in dBA Submit to Dhaka
Divisional Office of
DOE.
Table 11.2: Monitoring parameters and frequency of monitoring during operation phase
Key parameters to be monitored: (1) Ambient Air Quality
location frequency parameter submission
At Project site, residential
/institutional /commercial areas
within 500m outside from project
boundary
Quarterly (routine)
analysis
SPM, PM10, PM
2.5, SOx, NOx
and CO
Report compilation
and quarterly
submission to Dhaka
Divisional Office of
DOE.
Key parameters to be monitored: (2a) Surface Water
location frequency parameter submission
Project site at West Mukterpur,
Munshigonj
Bi-annual basis
in each year (pre-
monsoon and
post-monsoon)
pH, Temperature,
DO, BOD, COD,
TDS,TSS, Oil and
grease
Report compilation
and yearly submission
to Dhaka Divisional
Office of DOE.
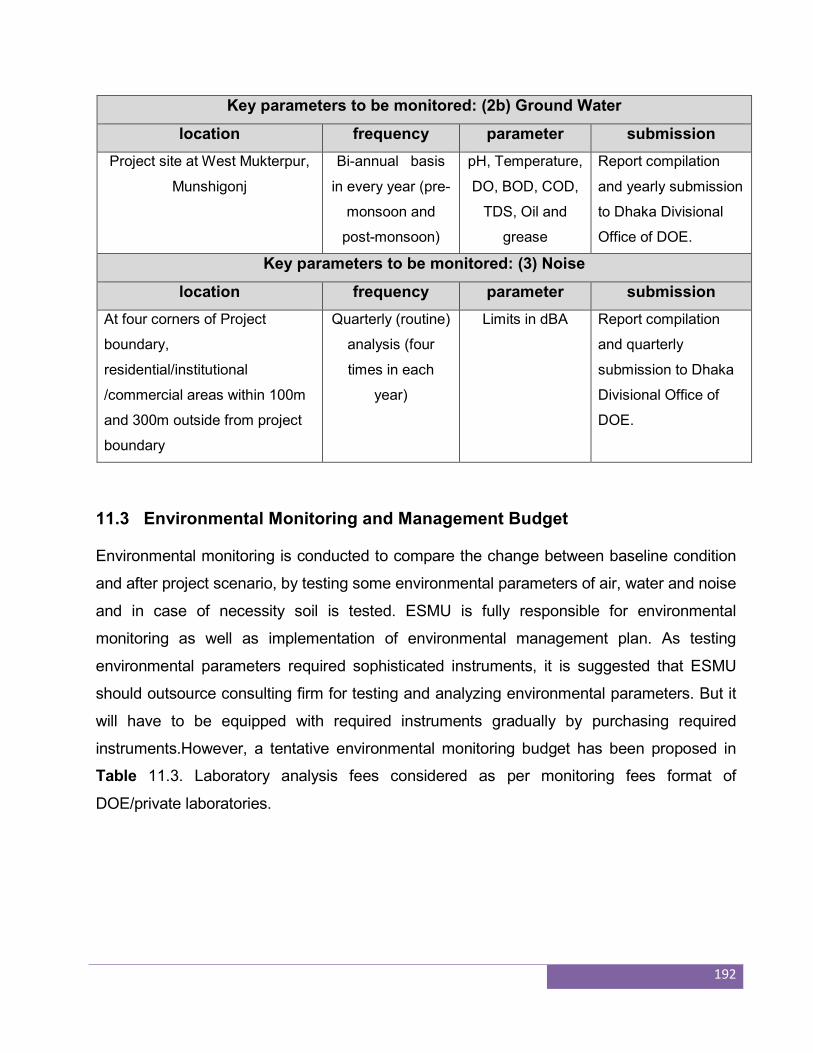
192
Key parameters to be monitored: (2b) Ground Water
location frequency parameter submission
Project site at West Mukterpur,
Munshigonj
Bi-annual basis
in every year (pre-
monsoon and
post-monsoon)
pH, Temperature,
DO, BOD, COD,
TDS, Oil and
grease
Report compilation
and yearly submission
to Dhaka Divisional
Office of DOE.
Key parameters to be monitored: (3) Noise
location frequency parameter submission
At four corners of Project
boundary,
residential/institutional
/commercial areas within 100m
and 300m outside from project
boundary
Quarterly (routine)
analysis (four
times in each
year)
Limits in dBA Report compilation
and quarterly
submission to Dhaka
Divisional Office of
DOE.
11.3 Environmental Monitoring and Management Budget
Environmental monitoring is conducted to compare the change between baseline condition
and after project scenario, by testing some environmental parameters of air, water and noise
and in case of necessity soil is tested. ESMU is fully responsible for environmental
monitoring as well as implementation of environmental management plan. As testing
environmental parameters required sophisticated instruments, it is suggested that ESMU
should outsource consulting firm for testing and analyzing environmental parameters. But it
will have to be equipped with required instruments gradually by purchasing required
instruments.However, a tentative environmental monitoring budget has been proposed in
Table 11.3. Laboratory analysis fees considered as per monitoring fees format of
DOE/private laboratories.
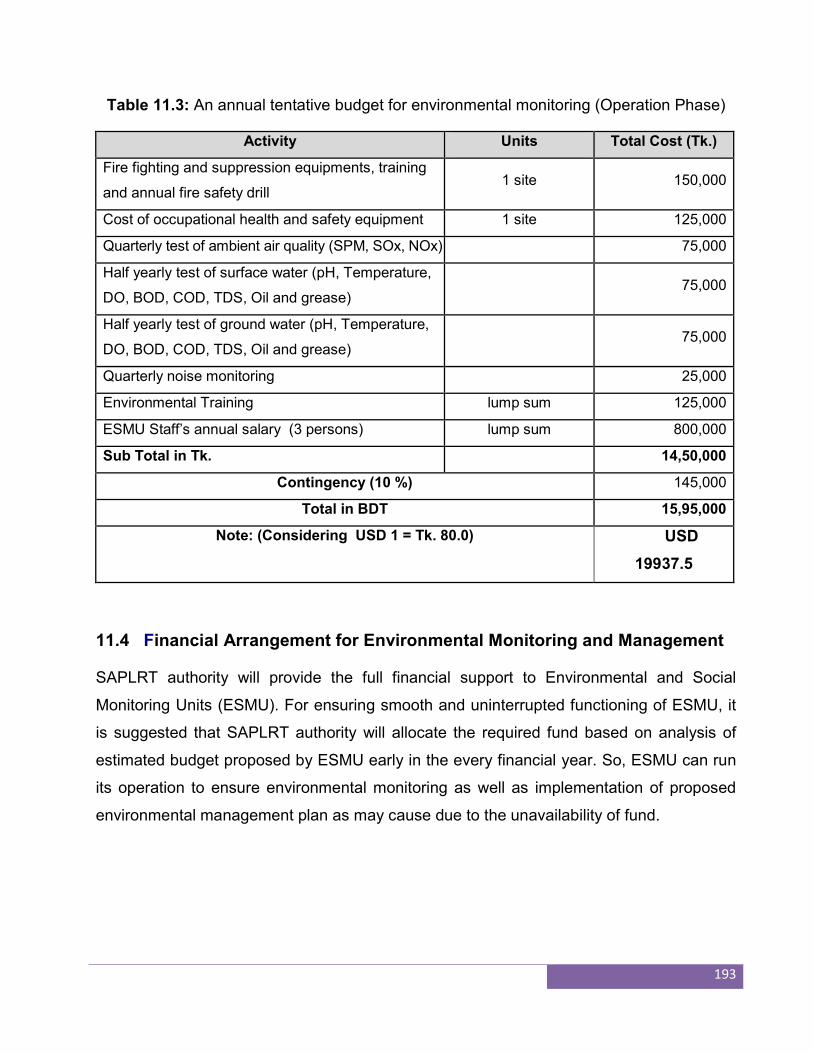
193
Table 11.3: An annual tentative budget for environmental monitoring (Operation Phase)
Activity Units Total Cost (Tk.)
Fire fighting and suppression equipments, training
and annual fire safety drill 1 site 150,000
Cost of occupational health and safety equipment 1 site 125,000
Quarterly test of ambient air quality (SPM, SOx, NOx) 75,000
Half yearly test of surface water (pH, Temperature,
DO, BOD, COD, TDS, Oil and grease) 75,000
Half yearly test of ground water (pH, Temperature,
DO, BOD, COD, TDS, Oil and grease) 75,000
Quarterly noise monitoring 25,000
Environmental Training lump sum 125,000
ESMU Staff’s annual salary (3 persons) lump sum 800,000
Sub Total in Tk. 14,50,000
Contingency (10 %) 145,000
Total in BDT 15,95,000
Note: (Considering USD 1 = Tk. 80.0) USD
19937.5
11.4 Financial Arrangement for Environmental Monitoring and Management
SAPLRT authority will provide the full financial support to Environmental and Social
Monitoring Units (ESMU). For ensuring smooth and uninterrupted functioning of ESMU, it
is suggested that SAPLRT authority will allocate the required fund based on analysis of
estimated budget proposed by ESMU early in the every financial year. So, ESMU can run
its operation to ensure environmental monitoring as well as implementation of proposed
environmental management plan as may cause due to the unavailability of fund.
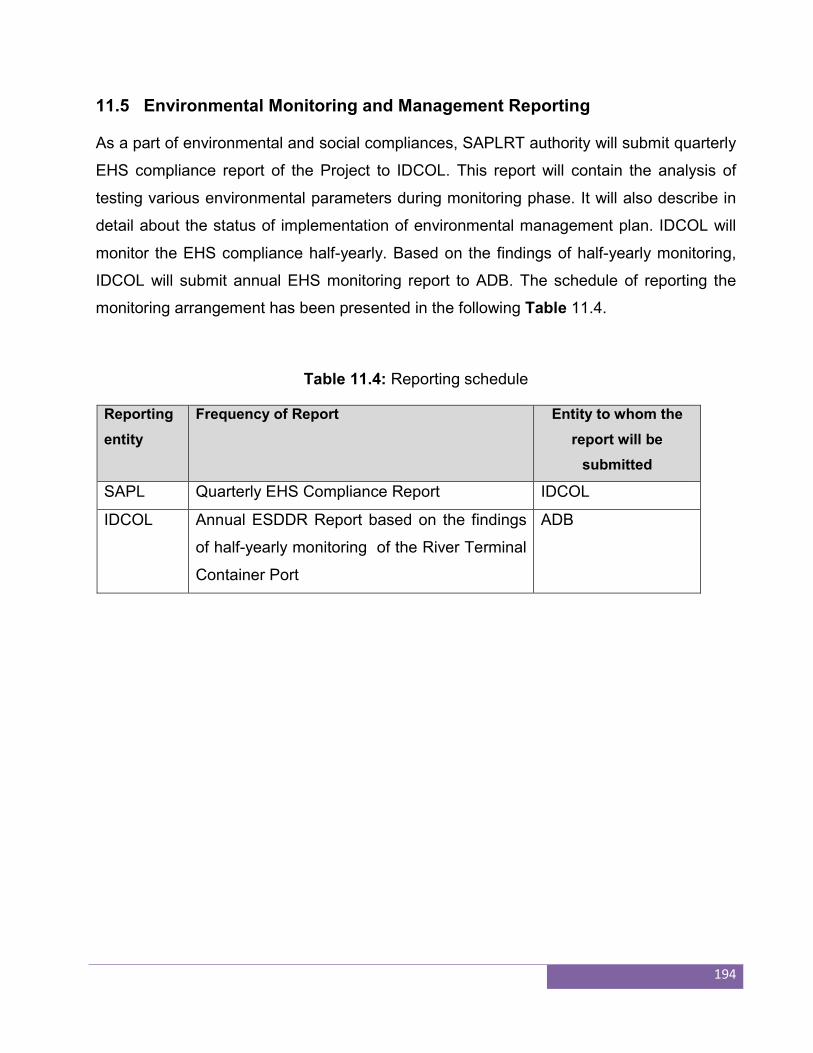
194
11.5 Environmental Monitoring and Management Reporting
As a part of environmental and social compliances, SAPLRT authority will submit quarterly
EHS compliance report of the Project to IDCOL. This report will contain the analysis of
testing various environmental parameters during monitoring phase. It will also describe in
detail about the status of implementation of environmental management plan. IDCOL will
monitor the EHS compliance half-yearly. Based on the findings of half-yearly monitoring,
IDCOL will submit annual EHS monitoring report to ADB. The schedule of reporting the
monitoring arrangement has been presented in the following Table 11.4.
Table 11.4: Reporting schedule
Reporting
entity
Frequency of Report Entity to whom the
report will be
submitted
SAPL Quarterly EHS Compliance Report IDCOL
IDCOL Annual ESDDR Report based on the findings
of half-yearly monitoring of the River Terminal
Container Port
ADB
195
Chapter 12
EMERGENCY RESPONSE AND DISASTER MANAGEMENT PLAN
12.1 Emergency Response
The initial response to an incident is a critical step in the overall emergency response.
Like all other Industries and installations, River Terminal Container Depot facilities must
have adequate measures against accidents or incidents to meet the emergency. The
purpose of having an Emergency Response Plan (ERP) is to:
Assist personnel in determining the appropriate response to emergencies.
Provide personnel with established procedures and guidelines.
Notify the appropriate Company Emergency Response Team personnel and
regulatory/ Govt. agencies.
Manage public and media relations.
Notify the next-to-kin of accident victims.
Promote inter-departmental Communications to ensure a “Companywide” Co-ordinated
emergency response.
Minimize the effects that disruptive events can have on company operations by
reducing recovery times and costs.
Respond to immediate requirements to safeguard the subtending environment and
community.
Generally, the initial response is guided by three priorities Ranked in importance these
priorities are:
1. People
2. Property
3. Environment
Emergency Response Procedures will identify who does what and when in the event of an
emergency. Responsibility for who is in charge and their coordination of emergency
actions shall be identified. Nature of Emergency & Hazardous Situations may be of any
or all of the following categories:
196
I. Emergency
Fire,
Explosion,
Electric shock
Medical emergency
II. Natural Disasters
Storm/ typhoon/ tornados
Cloud burst lightning
Sudden Tidal Surge and Cyclone
Sudden Flooding
Earth Quake
Fire
III. External Factors
Food poisoning/water poisoning,
Sabotage, and
War.
12.1.1: Six Steps in Emergency Response
Step-1
a) Determine the potential hazards associated with the incident, substance or
circumstances and take appropriate action identify the type and qualities of
dangerous goods involved and any known associated hazards.
b) Determine potential hazards stemming from local conditions such as inclement
weather water bodies etc. and ensure that the initial response team is aware of
these conditions.
Step-2
Determine the source/cause of the event resulting to the emergency and prevent
further losses.
197
Step-3
Conduct an assessment of the incident site for any further information on hazards or
remedies.
Step-4
Initiate redress procedures.
Step-5
Report the incidence its nature cause impact applied redress procedures and any
further assistance required etc. to the appropriate company, government and/or land
owner.
Step-6
Take appropriate steps with respect to hazards to wildlife, other resources and
addressing public and media concerns and issues, as applicable. Response priorities
are to protect human lives, property and the environment.
12.1.2 Reporting Incidents and Accidents
All accidents and near-miss incidents shall be investigated to determine what caused the
problem and what action is required to prevent a recurrence. Employees required to
perform investigations shall be trained in accident investigation techniques. The
incident/accident investigation should be a fact-finding exercise rather than faultfinding.
The investigations will focus on collection of evidence to find out the “root cause” of the
incident. The recommendations of the investigation report are implemented in phases.
12.1.3 Approaches to Emergency Response
For this project, emergency response systems should be in place to deal with dangerous
goods uncontrolled releases of dust and gaseous emission, natural calamities fires burns
and injuries. There are to be trained emergency response teams, specific contingency
plans and incidence specific equipment packages in place to cope with these types of
emergencies. In case of an emergency incident occur, immediate action must be taken to
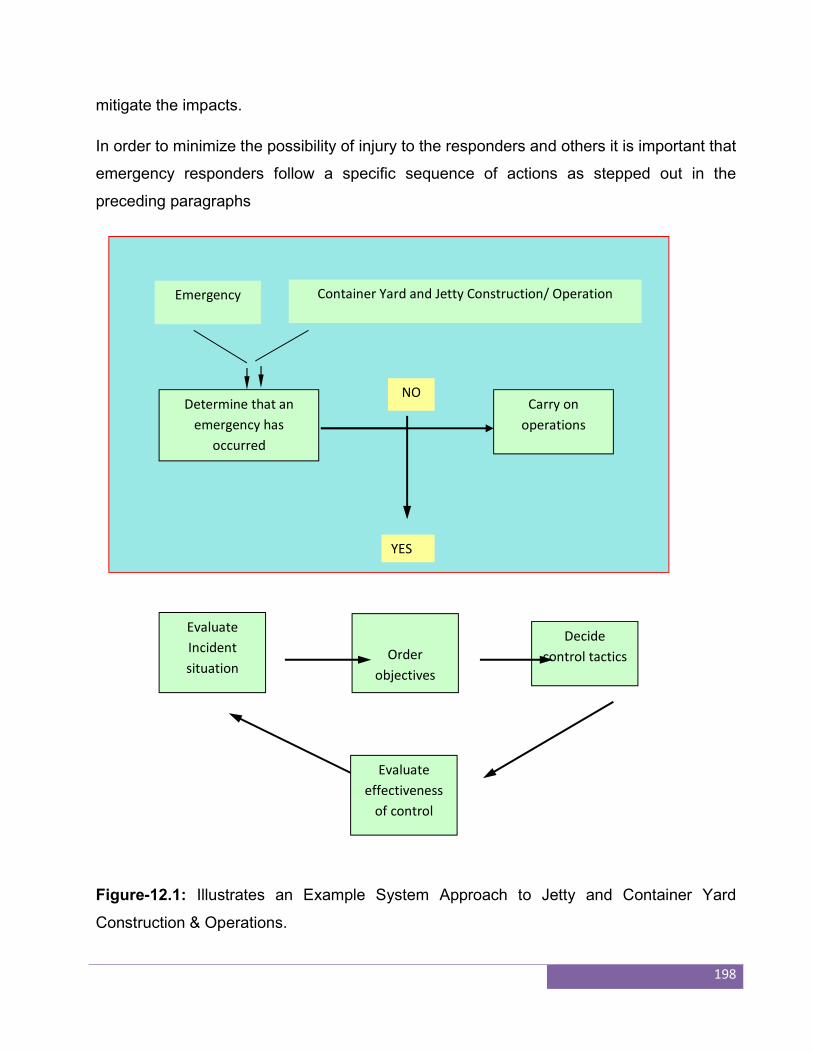
198
mitigate the impacts.
In order to minimize the possibility of injury to the responders and others it is important that
emergency responders follow a specific sequence of actions as stepped out in the
preceding paragraphs
Figure-12.1: Illustrates an Example System Approach to Jetty and Container Yard
Construction & Operations.
Container Yard and Jetty Construction/ Operation Emergency
Services
Determine that an
emergency has
occurred
Carry on
operations
NO
YES
Evaluate
Incident
situation
Order
objectives
Decide
control tactics
Evaluate
effectiveness
of control
199
12.2 Disaster Management Plan
In normal operation of the project, when all environmental protection equipment works
according to design specification, then there would be no environmental problems for the
present project site.
Disaster (to certain degree) may occur if the environmental protection equipment fails to
work at normal condition. This situation may arise for any of the following causes-
When Terminal runs at abnormal situation e.g. if emission level increases than its
normal level or if the engines give unwanted noise than normal level
If liquid waste over flows and pollutes the surroundings
Therefore, appropriate management plan should have to be taken by the project
proponent to prevent any unwanted disaster in the project. In this regard, there should be
a provision to stop the production immediately during any process failure as discussed
above.
The disaster management plan should consist of preventive measures including, among
others, the following.
Formulation and strict implementation of safety codes and measures;
Periodic inspection of safety relief valves provided with pressure vessels and
equipment;
Preventive maintenance;
Aware the workers about electric shock
Declaring the factory a “no smoking zone”
Mock drills by the fire fighting cells/ groups
Provision and inspection of firefighting equipment and fire hydrant system in all the
sections;
Proper training of the employees about the importance of codes;
200
Training the employees and the residents of the surrounding villages about the
actions to be taken during an accident, disaster etc.
It is imperative to develop entire facility environment policy and display necessary
documentation for ease in accessing information. Some of these documents include:
Emergency contacts;
Emergency response procedures for fires
The facilities operations and monitoring are carried out under the management and help
from both the employees and relevant government lead agencies. In order to take care of
any hazards the following control should be adopted:
All safety precautions and provisions covering the general cleanliness of the entire
facility down to, ventilation, lighting, sanitary, waste collection, smoke detector, heat
detector, sand bucket, water bucket, fire blanket, first aid box provision, adequate
fire extinguishers and site security by fencing.
12.3 Environment, Health and Safety (EHS)
Health and safety aspects of the entire facility should be given due attention. Protective
devices as provided should continuously be used within the unit’s operations to ensure the
safety of the natural resources and boat owners is guaranteed.
The maintenance of Material Safety Data Sheets (MSDS) will be followed to ensure safety
all section of the facility that chemicals are utilized.
An Environment, Health and Safety register is essential for monitoring of performance of
the entire facility community in relation to the environment. The management will use this
as a self-auditing tool. This register should include:
Fire extinguisher servicing records
EHS meeting schedules and training records
201
Electrical installations
Generator inspection and maintenance records
Waste disposal records
Inventory records (fuels, paints, cleaning agent
Emergency response procedure.
Record off all incidents, accidents, near miss etc.
12.4 Fire Hazard & Fire Evacuation Plan
Fire hazards such as large quantities of fuel, combustible/flammable liquids, electrical
hazards and combustible dusts. Although fires are not a daily occurrence, they usually will
cause severe property damage and business interruption. Sometimes the fire protection
equipment systems have not received attention since they were installed. If these systems
are needed, however, they are counted upon to perform reliably and protect vital port
equipment from fire. Fire protection systems are a combination of mechanical and electrical
components and, like power generation equipment, need regular attention.
In addition, some people in charge of fire protection do not have an adequate knowledge of
necessary inspection and testing frequencies, or they use the minimum frequencies
prescribed by their authority having jurisdiction. For example, some jurisdictions only require
annual water flow alarm tests on sprinkler systems, a frequency which is considered
inadequate by most fire protection professionals.
The information contained in this part is based on the current standards established by the
National Fire Protection Association (NFPA); the most widely used in North America, and
generally accepted guidelines. Most fire protection systems are designed and installed
according to these standards. Unfortunately, information on inspection, testing and
maintenance is not contained in a single standard but is contained within the various system-
specific standards, making it cumbersome and difficult to obtain an overview of the tasks
which need to be accomplished.
202
Other codes and standards such as UBC, UFC, BOCA, OSHA and MSHA also address
fire protection, but their contents are usually based on NFPA documents and may not
address testing/maintenance requirements. Members on the NFPA technical committees
comprise a wide range of fire protection expertise and include representatives from
manufacturers, testing laboratories, users, authorities having jurisdiction and insurance
companies. Adherence to NFPA standards will satisfy most jurisdictions and insurance
companies.
Suitable fire protection and detection systems shall be provided designed to the
requirements of National Fire Protection Association (NFPA) standards. Gas detection
systems and alarms shall also be included.
Fire protection shall consist of wet pipe, automatic deluge systems, hydrants, CO2 gas
flooding systems, and portable extinguishers of CO2 and dry powder in sufficient
quantities.
Areas to be covered by fixed protection installations shall be included but not be limited to:
All oil filled transformers
Gas engine
Lube oil system
Cable areas
Storage areas.
The gas engines are to be protected against fire by a CO2 total flood system within the
enclosures. The only other significant fire risks are associated with the lube oil systems on
the gas engines, cable areas, stores and with oil contained within transformers. Such
systems will be protected from fires by water deluge sprays. All necessary systems are
required to be fire 'protected' with suitable extinguishing agents. Additional protections are
to be provided by a ring main and hydrant system with hose/equipment cabinets located at
strategic points. This ring main shall be provided with suitable section valves located in
valve pits.
203
The firefighting water will be taken from the fire tank and will be pumped by a dedicated
electric pump with a diesel powered back-up pump available in case of electrical failure.
Pressure in the firefighting mains is maintained using an electric jockey pump.
A site wide fire and gas detection system will be provided to initiate the fire protection and
alarms. Manual "break glass" fire alarms shall also be situated at strategic locations
around the site and inside the buildings.
A modern electronic fully addressable master fire alarm panel shall be located in the
Central Control Room. All local fire panels shall be linked into the master fire alarm panel.
This master panel should have a separate section for the gas detection system. A repeater
panel should be provided in the site gatehouse to allow swift identification of the affected
fire zone to incoming local fire-fighting appliances. This master fire panel shall be provided
with its own dedicated battery system.
204
Chapter 13
CONCLUSIONS
The ESIA carried out for Summit Alliance Port Limited River Terminal (SAPLRT) has
shown that the environmental and social impact of the project is manageable. The project
is of significant importance as it will expedite the export of goods to Chittagong port which
otherwise is more expensive and risky. In addition the customs formalities will be done at
the project site which will reduce shipment time as it will avoid port congestion at
Chittagong.
It is recommended that for implementing the EMP and Grievance Redress Mechanism the
institutional arrangement suggested in the ESIA is put in place.
205
References
1. Asian Development Bank’s (ADB’s) Safeguard Policy Statement (SPS, 2009).
2. BBS (2005): Bangladesh Bureau of Statistics (BBS), Government of People’s Republic of
Bangladesh.
3. BBS (2006): Bangladesh Population Census, Community Series Zila: Narayangonj,
Bangladesh Bureau of Statistics (BBS), Planning Division, Ministry of Planning,
Government of the Peoples’ Republic of Bangladesh.
4. BBS (2006): Bangladesh Population Census, Community Series Zila: Narayangonj,
Bangladesh Bureau of Statistics (BBS), Planning Division, Ministry of Planning,
Government of the Peoples’ Republic of Bangladesh.
5. BBS (2006): Bangladesh Population Census, Community Series Zila: Munshigonj,
Bangladesh Bureau of Statistics (BBS), Planning Division, Ministry of Planning,
Government of the Peoples’ Republic of Bangladesh.
6. BBS (2011): Bangladesh Population Census, Community Series Zila: Munshigonj,
Bangladesh Bureau of Statistics (BBS), Planning Division, Ministry of Planning,
Government of the Peoples’ Republic of Bangladesh
7. BCAS (1996): Socio-economic Survey in Reedland Forest area, Reedland Afforestration
Project in Sylhet Forest Division (Report).
8. BCAS (2005-2006): Bangladesh Centre for Advanced Studies, Information Technology
Division.
9. BPDB (2005-2006): Bangladesh Power Development Board, Annual Report. Geoscientific
Activities for Mineral Study (2004-2008).
10. GoB (1982): Government of the People’s Republic of Bangladesh, Acquisition &
Requisition of Immovable Property Ordinance.
11. GoB (1989): Government of the People’s Republic of Bangladesh, Property (Emergency)
Acquisition Act.
12. GoB (2002): Planning Commission, Government of Bangladesh.
13. Government of East Pakistan (1970): “East Pakistan District gazetteers,” SNH Rizvi, edits,
East Pakistan Government Press, Dhaka.
14. GoB (1997), Environmental Conservation Rules 1997, Department of
Environment, Ministry of Environment and Forest, Government of the People’s
Republic of Bangladesh, June 1997.
206
15. GoB (1997a), EA Guidelines for Industries, Department of Environment, Ministry of
Environ ment and Forest, Government of the People’s Republic
ofBangladesh, June 1997.
16. IFC (2006): International Finance Corporation, Land Acquisition & Involuntary Resettlement
Meghnaghat Port EIA Report, 1997.. IFC 2007), Environmental, Health, and Safety
Guidelines for Ports, Harbors, and Terminals, International Finance Corporation,
April, 200
17. IUCN Bangladesh (2002), Bio-ecological Zones of Bangladesh.
18. The World Conservation Union, Bangladesh Country Office, Dhaka, Bangladesh.
pp. 139.
19. IUCN Bangladesh (2000a), Red book of Threatened Amphibians and Reptiles
of Bangladesh. IUCN-Bangladesh, House 11, Road 138, Gulshan 1, Dhaka,
Bangladesh. Pp.
20. IUCN Bangladesh (2000b), Red book of Threatened Birds of Bangladesh. IUCN-
Bangladesh, House 11, Road 138, Gulshan 1, Dhaka, Bangladesh. Pp. 116.
21. IUCN Bangladesh (2000d), Red book of Threatened Fishes of Bangladesh. 11,
Road 138, Gulshan 1, Dhaka, Bangladesh. Pp. 116.
22. MOF (2006), Bangladesh Economic Review, Economic Adviser’s Wing, Finance Division,
Ministry of Finance, Government of People’s Republic of Bangladesh.
23. NEP (1996): Government of People’s Republic of Bangladesh, Ministry of Power Energy
and Mineral Resources.
24. Private Communication (2005-2006): Information from Rural IndustrieRahman, A. Atiq
and Haider R. (1994) Environment and Development in Bangladesh, Vol. 1, University
Press Limited, Dhaka.
207
25. Rashid, Harun er. (1991): Geography of Bangladesh, published by the University Press
Limited, Dhaka.
26. WB (2007): The World Bank Operation Manual: Involuntary Resettlement
27www.adb.org/documents/guidelines/environmental_assessment/environmental_categorizatio
n.pdf
28. World Bank (2004a), Good Practice Note: Using Poverty and Social Impact
Analysis to Support Development Policy Operations, Washington, D.C., USA.
29. World Bank (2004b), Involuntary Resettlement Sourcebook, Planning and
Implementation of Development Projects, Washington, D.C., USA.
30. World Bank (1999a) Pollution Prevention and Abatement Handbook 1998:
Toward Cleaner Production, Washington, D.C., USA
31. World Bank (1999b) Operational Policies, OP - 4.01: Environmental Assessment,
The World Bank, Washington, D.C., USA.
32. World Bank (1997), Roads and the Environment: A Handbook, World Bank
Technical Paper No. 376, Edited by: Koji Tsunokawa and Christopher Habon.


