Embed Size (px)
Citation preview
UN
IT
ED
N
AT
IO
NS
E
NV
IR
ON
ME
NT
P
RO
GR
AM
ME
A key question that relates to the very broad and intensive use of metals is whether society needs to be concerned about long-term supplies of any or many of them. This is a many-faceted question that cannot be answered quickly or unequivocally. To address it, the Global Metal Flows Working Group envisions a series of six reports, of which this is the third one ad-dressing environmental risks and challenges of anthropogenic met-als fl ows and cycles.
This report, compiled by a group of international experts, focuses on the impact of metals on the en-vironment as well as on their life cycle energy use. Currently, pri-mary metals production is respon-sible for 7 – 8 % of the total global energy use as well as for severe local environmental impacts. The report suggests to apply best available techniques and to in-crease recycling of metals, which not only requires signifi cantly less energy per kg metal produced than primary production but also helps decreasing the overall local impacts of mining. However, even if recycling rates are increased, rising global demand for many metals will remain a huge envi-ronmental challenge in the next decades worldwide.
Published in April 2013
EnvironmEntal risks and ChallEngEs of anthropogEniC mEtals flows and CyClEs
For more information, contact:Resource Panel Secretariat UNEP DTIESustainable Consumptionand Production Branch15 rue de Milan75441 Paris CEDEX 09FranceTel: +33 1 44 37 14 50Fax: +33 1 44 37 14 74E-mail: [email protected] www.unep.org/resourcepanel
DTI/1534/PAISBN: 978-92-807-3266-5

About the UNEP Division of Technology,Industry and Economics
The UNEP Division of Technology, Industry and Economics (DTIE) helps governments, local authorities and decision-makers in business and industry to develop and implement policies and practices focusing on sustainable development.
The Division works to promote:> sustainable consumption and production,> the effi cient use of renewable energy,> adequate management of chemicals,> the integration of environmental costs in development policies.
The Offi ce of the Director, located in Paris, coordinates activities
through:
> The International Environmental Technology Centre - IETC (Osaka, Shiga), which implements integrated waste, water and disaster management programmes, focusing in particular on Asia.
> Sustainable Consumption and Production (Paris), which promotes sustainable consumption and production patterns as a contribution to human development through global markets.
> Chemicals (Geneva), which catalyzes global actions to bring about the sound management of chemicals and the improvement of chemical safety worldwide.
> Energy (Paris and Nairobi), which fosters energy and transport policies for sustainable development and encourages investment in renewable energy and energy effi ciency.
> OzonAction (Paris), which supports the phase-out of ozone depleting substances in developing countries and countries with economies in transition to ensure implementation of the Montreal Protocol.
> Economics and Trade (Geneva), which helps countries to integrate environmental considerations into economic and trade policies, and works with the fi nance sector to incorporate sustainable development policies.
UNEP DTIE activities focus on raising awareness,
improving the transfer of knowledge and information,
fostering technological cooperation and partnerships, and
implementing international conventions and agreements.
For more information,see www.unep.fr
AcknowledgmentsEditor: International Resource Panel, Working Group on the Global Metal Flows
Lead author: Ester van der Voet, University of Leiden, Netherlands; Chapter editors: Ester van der Voet, Leiden University, Netherlands; Reijo Salminen,Geological Survey Finland, Finland; Matthew Eckelman, North Eastern University, Boston, USA; Gavin Mudd, Monash University, Australia; Terry Norgate, CSIRO Minerals Down Under Flagship, Australia; Roland Hischier, EMPA, Switzerland; Contributing authors: Job Spij-ker, National Institute for Public Health and the Environment, Netherlands; Martina Vijver, Leiden University, Netherlands; Olle Selinus, Linneaus University, Sweden; Leo Posthuma, National Institute for Public Health and the Environment, Netherlands; Dick de Zwart, National Institute for Public Health and the Environment, Netherlands; Dik van de Meent, Radboud University Nijmegen, Netherlands; Markus Reuter, Outotec Oyj, Espoo, Finland; Ladji Tikana, German Copper Development Association, Germany; Sonia Valdivia, UNEP, France; Patrick Wäger, EMPA, Swit-zerland; Michael Hauschild, Technical University of Denmark, Denmark; Arjan de Koning, Leiden University, Netherlands.
The following people have contributed by reviewing draft versions of the report and providing valuable information and comments (Alphabeti-cal): John Atherton, International Council on Mining and Metals; Caroline Braibant, European Precious Metals Federation; Clare Broadbent, World Steel Association; Peter Campbell, Université du Québec, Institut National de la Recherche Scientifi que, Canada; Sandra Carey, Interna-tional Molybdenum Association; Grant Darrie, International Chromium Development Association; Katrien Delbeke, European Copper Institute; Johannes Drielsma, Euromines; Alain Dubreuil, Natural Resources Canada, Canada; Maria Amelia Enriquez, Federal University of Pará State, Brazil; Kevin Farley, Manhattan College, USA; Thomas Graedel, Yale University, USA; Edgar Hertwich, Norwegian University of Science and Technology, Norway, Paola Kistler, Rio Tinto, Switzerland; Christian Leroy, European Aluminium Association; Eirik Nordheim, European Alu-minium Association; Jerome Nriagu, University of Michigan, USA, Jozef M. Pacyna, Norwegian Institute for Air Research, Norway; Claudia Peña, Chilean Research Centre for Mining and Metallurgy, Chile; Patrick van Sprang, Arche Consulting Brussels, Belgium; Sangwon Suh, University of California, USA; Frans Vollenbroek, European Commission, Belgium; Pia Voutilainen, Scandinavian Copper Development Association, Finland and (further) representatives of the following organisations: Codelco, Euromines, European Aluminium Association, European Precious Metals Federation, International Chromium Development Association, International Copper Association, International Council on Mining and Metals, International Molybdenum Association, International Zinc Association, Rio Tinto, and World Steel Association.
The report went through several rounds of peer-review coordinated in an effi cient and constructive way by Jacqueline Aloisi de Larderel together with the International Resource Panel Secretariat. Valuable comments were received from several anonymous reviewers in this process. The prepa-ration of this report also benefi ted from discussions with many colleagues at various meetings.
Special thanks go to Ernst Ulrich von Weizsäcker and Ashok Khosla as Co-Chairs of the International Resource Panel for their continuing support and encouragement, as well as to the members of the International Resource Panel and its Steering Committee for their dedication and commit-ment and additional helpful comments.
Special thanks also go to Melanie Studer (Leiden University, Netherlands) for her support during the fi nal stages of the document preparation. Shaoyi Li, Tomas Marques and Philip Strothmann, UNEP, provided valuable input and comments; the International Resource Panel’s Secretariat coordinated the preparation of this report. Sibylle Schmidtchen and the team from 3f design were instrumental in creating and editing the fi gures and graphics.
The main responsibility for errors remains with the authors.
UNEP promotes environ-
mentally sound practices globally and in its own activities.
Please print this publication – when printing is necessary – on recycling
paper or FSC certi� ed paper. Our distri-bution policy aims to reduce UNEP’s
carbon footprint.
The report should be referenced as follows: UNEP (2013) Environmental Risks and Challenges of Anthropogenic Metals Flows and Cycles, A Report of the Working Group on the Global Metal Flows to the International Resource Panel. van der Voet, E.; Salminen, R.; Eckelman, M.; Mudd, G.; Norgate, T.; Hischier, R.
Copyright © United Nations Environment Programme, 2013
This publication may be reproduced in whole or in part and in any form for educational or nonprofi t purposes without special permission from the copyright holder, provided acknowledgement of the source is made. UNEP would appreciate receiving a copy of any publication that uses this publication as a source.
No use of this publication may be made for resale or for any other commercial purpose whatsoever without prior permission in writing from the United Nations Environment Programme.
Design/layout: 3f design, cover concept, UNEP.
Photos: iStockphoto.com: background title/page 14 © gitches, title 1 © oneclearvision, title 2 © Marco Hegner, title 3 © Milos Peric, title 4 © DNY 59, page 4 © Ermin Rothenberger, page 24 © Phil Augustavo, page 30 © Rob Belknap, page 46 © Bart Coenders, page 46 © Wooden Dinosaur, page 56 © manfredxy, page 72 © iofoto, page 74 © ugur bariskan, page 94 © Don Wilkie, page 116 © Bart van den Dikkenberg, page 127 © Daniel Schoenen, page 128 © Ugurhan Betin, page 144 © Cliff Parnell, page 155 © Zsolt Biczó, page 162 © Ben Klaus, page 190 © Justin Bryant, page 207 © Rob Broek, page 220 © Judy Kennamer. Others: see captions.
DisclaimerThe designations employed and the presentation of the material in this publication do not imply the expression of any opinion whatsoever on the part of the United Nations Environment Programme concerning the legal status of any country, territory, city or area or of its authorities, or concerning delimitation of its frontiers or boundaries. Moreover, the views expressed do not necessarily represent the decision or the stated policy of the United Nations Environment Programme, nor does citing of trade names or commercial processes constitute endorsement.
ISBN: 978-92-807-3266-5Job Number: DTI/1534/PA

EnvironmEntal risks and ChallEngEs of anthropogEniC mEtals flows and CyClEs*
* This is report 3 of the Global Metal Flows Working Group of the International Resource Panel of UNEP.

2
Environmental Risks and Challenges of Anthropogenic Metals Flows and Cycles
Foreword
Metals are an essential part of our econo-my as core raw materials for infrastructure and manufacturing of products. Demand is expected to remain strong in the future: in developing countries because of rapid industrialization, and in developed countries because modern technologies will require the use of metals. Meanwhile renewable ener-gy technologies – as part of the transition to an inclusive green economy – are generally more metals intensive than fossil fuel ones.
This report from the UNEP-hosted Interna-tional Resource Panel, Environmental Risk and Challenges of Anthropogenic Metals Flows and Cycles, gives a clear picture of the potential environmental impacts of metals at different stages of the life-cycle while link-ing with other areas of resource use such as water, food production and energy.
For example, mining can have significant impacts on local ecosystems and landscapes through mining wastes or the pollution of ground- and surface water.
Meanwhile, in a less visible manner, the high energy consumption of metals production adds significant pressure on the global envi-ronment through the emission of greenhouse gases.
In addition the complex environmental foot-prints of metals, and inadequate final waste treatment are cause for concern at the end-of-life stage.
This report concludes that recycling is a positive example towards an integrat-ed approach – for example, producing met-als from ore consumes around two orders of magnitude more energy per kg produced metal when compared with recycled metals.
Many possibilities exist that can help to improve recycling rates of metals and increase secondary production — and thus resource efficiency – such as applying best available techniques across the metals value chain and improving product design by designing for resource efficiency.
Handling metals in a sustainable way also means responding to the economic realities, challenges and needs, as well as the impera-tives of the social agenda of equity, employ-ment and human well-being. Only a system-ic approach can live up to the challenges of sustainable development in the 21st century.
Strengthening the science policy interface was a key outcome of the recent Rio+20 Sum-mit in Brazil—this report by the Panel is an important contribution to that in respect to a core natural resource: namely metals.
Achim Steiner
UN Under-Secretary General and Executive Director UNEP
Nairobi, Kenya

3
Environmental Risks and Challenges of Anthropogenic Metals Flows and Cycles
Preface
Any resource that is extracted and used in our economy and society has potential environ-mental impacts. The same is true for metals, whose environmental footprints are likely to become even more visible in the future due to the steadily increasing demand for metals both in developed and developing countries. Opti-mizing metals systems and life-cycles from a point of view of environmental impacts is there-fore an integral part of an urgently needed sus-tainable metals management.
After having analyzed issues of metal stocks in society and recycling rates and recycling condi-tions and opportunities, the International Re-source Panel, hosted by UNEP and established in 2007, therefore decided to address the envi-ronmental and energy issues related to the use and the production of metals. This is inscribed in the Panel’s mission to contribute to a bet-ter understanding of how to decouple econom-ic growth from environmental degradation and escalating resource use. The present report on environmental impacts of metals is part of a series of six reports produced by the Panel’s Working Group on Global Metal Flows, which aim at identifying non-prescriptive policy op-tions to improve recycling, sustainable mining and metals utilization through authoritative sci-entific assessments of global metal flows.
Pressures on the environment and human health occur during the whole life cycle of met-als. Mining and refining of metals for example, can cause local environmental and health prob-lems due to the release of toxic substances into the ground- and surface water. Moreover these processes contribute to environmental prob-lems on a global scale as they are very energy intensive and presently use about 8% of the to-tal global energy supply.
The increasing share of metal emissions to the environment coming from non-metal sourc-es such as fossil fuels and phosphate fertiliz-er or from final metal waste streams entails another significant danger for the environ-ment and human health. A sustainable metals management, using metals to further sustain-able development while avoiding environmental impacts as well as side-effects, is an exciting challenge for society.
An increased share of recycling of metals can be expected to alleviate some of the adverse environmental pressures from the use and pro-duction of metals. However, increased recy-cling rates alone will not be sufficient but need to be accompanied by a levelling off of the de-mand curve for metals. On a local level, sub-stantial efforts in the prevention of adverse lo-cal impacts modelled on the example of some more progressive mining companies will re-main of significant importance. For these and any other measures seeking to promote a sus-tainable metals management, it is of great im-portance to take into account the links with other areas of resource use, such as water, food production and energy.
Providing a scientific baseline knowledge on these impacts from metals use and pointing out options on how to reduce them is urgent, regarding the fact that environmental impacts of metals will be increasing in the future due to the rapidly rising demand for metals, to the de-velopment of metal intensive renewable energy technologies and the shift to a metal produc-tion based on lower grade ores, which is caus-ing a further rise in energy intensity of extrac-tion and production processes. Because of the crucial role of metals for society, now and in the future, we need to secure their supply and to understand how to minimize the environ-mental impacts associated with their produc-tion and use.
We are very grateful to lead author Ester van der Voet and to all the other experts that con-tributed to this report for the relevant data and analysis presented, which we feel will certainly be of support to decision-makers in the mis-sion to reduce environmental impacts in an era of growing demand of and greater dependence on metals.
Dr. Ernst Ulrich von WeizsäckerEmmendingen, Germany
Dr. Ashok KhoslaNew Delhi, India
Co-Chairs, International Resource Panel
4
Environmental Risks and Challenges of Anthropogenic Metals Flows and Cycles

5
Environmental Risks and Challenges of Anthropogenic Metals Flows and Cycles
Table of Contents
Foreword and Preface _______________________________________________________________ 2
Table of Contents ___________________________________________________________________ 5
Abstract _______________________________________________________________________ 12
Executive Summary ________________________________________________________________ 15
1 Introduction and Scope of Study ___________________________________________________ 25
2 Metals in the Environment ________________________________________________________ 31
3 Metals in Society: Sources of Metals Emissions ______________________________________ 57
4 Metals Production and Energy Use _________________________________________________ 75
5 Impacts Related to the Production and Use of Metals ________________________________ 95
6 Life Cycle Impacts of Metals _____________________________________________________ 125
7 Conclusions and Recommendations ______________________________________________ 157
8 References ____________________________________________________________________ 163
Annex 1 Metals in the Environment _______________________________________________ 191
Annex 2 Processes Determining Bio-availability of Metals ___________________________ 194
Annex 3 Impacts of Deficiencies and Overdoses of Metals on Human Health ____________ 197
Annex 4 Applications of Metals in Society __________________________________________ 206
Annex 5 Ore Grades and Ore Grade Declines _______________________________________ 207
Annex 6 Life Cycle Assessment Methodology _______________________________________ 214
Annexes References _______________________________________________________________ 219
Abbreviations and Acronyms _______________________________________________________ 222
International Resource Panel _______________________________________________________ 230
Global Metal Flows Working Group __________________________________________________ 230

6
Environmental Risks and Challenges of Anthropogenic Metals Flows and Cycles
List of Figures
Figure 1 Anthropogenic mobilization of metals compared to natural mobilization (Adapted from Klee and Graedel, 2004). ____________________________________ 16
Figure 2 Global energy consumption in PJ/y of primary metal production (Norgate and Jahanshahi, 2010). __________________________________________ 17
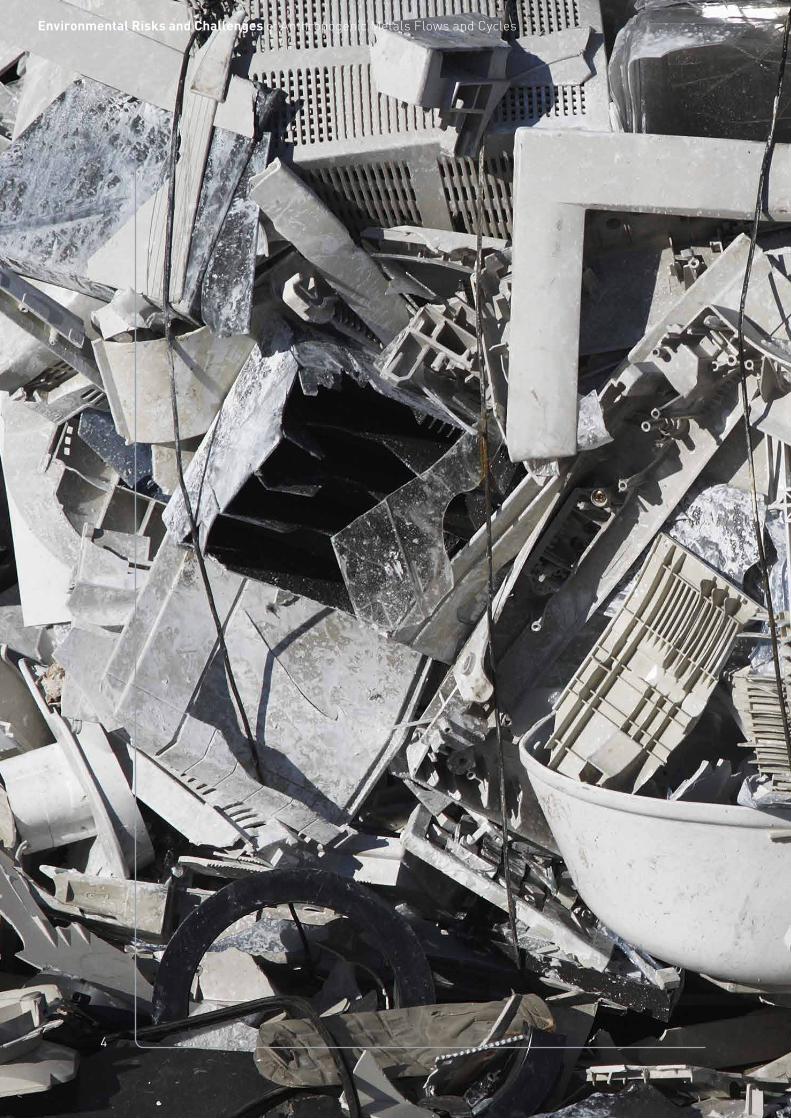
Figure 3 Global warming potential related to three types of cars, broken down into the various life-cycle stages (Habermacher, 2010). ______________________________ 18
Figure 4 Material requirements for global electricity systems, to provide the 2007 world electricity production (18.8 E12 kWh), under various electricity mixes (Kleijn et al., 2011). ______________________________________________________ 19
Figure 2.1 Ni concentration in the uppermost 25 cm minrogenic soil layer in Europe ac-cording to the Geochemical Atlas of Europe (Salminen, 2005). _________________ 37
Figure 2.2 Total As concentration of top soil samples in the USA (Gustavsson et al., 2001). Number of samples is 1323 representing sampling density 1 sample per 6000 km2 38
Figure 2.3 The geological part of the biogeochemical cycle (De Vos and Tarvainen, 2006) ____ 39
Figure 2.4 Dominance of anthropogenic (red) versus natural (green) mobilization globally for iron on a 1º x 1º grid (Rauch, 2010). _____________________________________ 43
Figure 2.5 Hypothetical presentation of the OCEE curves of all individual organisms in a given environment (adapted from Waeterschoot et al. 2003). __________________ 49
Figure 2.6 Use of a cumulative Species Sensitivity Distribution function to derive the toxic pressure PAF for a given concentration C of a certain metal (Posthuma et al., 2002). __________________________________________________ 50
Figure 2.7 Spatial variance in acute toxic pressures of cadmium and lead at steady state soil concentrations with current depositions, resulting from CLRTAP emission and deposition scenario’s, assuming that acute toxic pressures are 1:1 related to species loss (De Zwart et al., 2010). ______________________________________ 52
Figure 2.8 Similar to Figure 2.7, but now with the 99th percentile of predicted loss of spe-cies at steady state with current depositions for the combined effect of cadmi-um and lead (De Zwart et al., 2010). ________________________________________ 53
Figure 3.1 The Metal Wheel, showing carrier metals and their co-elements as they occur in ores naturally (Reuter et al, 2005) _______________________________________ 58
Figure 3.2 The lead (left) and copper (right) smelters at Mt Isa, Queensland, Australia, viewed from the downtown area (Photo courtesy Gavin M. Mudd, April 2010) _____ 62
Figure 3.3 PEC/PNEC for four metals in Dutch agricultural soil, based on the Maximum Permissible Concentration for soils (van der Voet et al., 2000). _________________ 64
Figure 3.4 Stocks and flows of lead in natural and human reservoirs, and the global flows of metal among reservoirs (Rauch and Graedel 2007, Rauch and Pacyna 2009). __ 68

7
Environmental Risks and Challenges of Anthropogenic Metals Flows and Cycles
Figure 3.5 Sand dump 20, West Rand gold field, Johannesburg – note the dust from the tailings and large flow of AMD-rich water in the front pipe (Photo courtesy Gavin M. Mudd, October 2010) ______________________________ 70
Figure 3.6 Closed and rehabilitated mine site in Keretti, Finland. Today a golf course (Photo courtesy, Outokumpu Mining Museum, August 2003) ___________________ 71
Figure 4.1 Examples of direct and indirect energy inputs during the life cycle of a generic metal __________________________________________________________________ 75
Figure 4.2 Open pit copper mine, Bingham Canyon, Utah, USA (Photo courtesy Wikipedia, 2005 (right) and Jon Bower, 2010 (left)) _____________________________________ 77
Figure 4.3 Underground mining (Photo courtesy www.barrick.com) ______________________ 77
Figure 4.4 Ratio of actual to theoretical energy consumption for metal extraction (Norgate and Jahanshahi, 2010). __________________________________________ 79
Figure 4.5 Flows of zinc into and out of the United States (Johnson and Graedel, 2008) _____ 80
Figure 4.6 Life cycle energy required for primary production, selected metals (Adapted from Barkas (2009) as reported in Eckelman (2010)). _________________ 83
Figure 4.7 Embodied energy for primary metal production (Norgate and Jahanshahi, 2010). _ 83
Figure 4.8 Global energy consumption for primary metal production (Norgate and Jahanshahi, 2010). __________________________________________ 84
Figure 4.9 Effect of ore grade and liberation size on embodied energy for copper produc-tion (Norgate and Haque, 2010). ___________________________________________ 87
Figure 4.10 Effect of ore grade on stage-by stage energy consumption for copper produc-tion (Norgate and Jahanshahi, 2006). _______________________________________ 88
Figure 4.11 Effect of ore grade on energy expended for mining, milling and concentration at global nickel mines (Eckelman, 2010) ____________________________________ 88
Figure 4.12 Long-term trends in ore grades at some giant Cu mines (Crowson, 2012) _______ 89
Figure 4.13 Approximate relative trends in Cu ore grades over 30 years from initial produc-tion for some major mines (adapted from Crowson, 2012) _____________________ 90
Figure 4.14 Current and practical minimum annual energy consumption for the US mining and mineral processing sector (Data from U.S. DoE, 2007). ____________________ 92
Figure 5.1 The Minerals Cycle (IIED & WBCSD, 2002). __________________________________ 96
Figure 5.2 Minimum reported waste rock for some metal sectors of the Australian mining industry (left) (Data from Mudd, 2010); Canadian waste rock by underground/open cut mining (right) (Data from Natural Resources Canada, var.). ____________ 97

8
Environmental Risks and Challenges of Anthropogenic Metals Flows and Cycles
Figure 5.3 Human toxicity potential of various metal production solid wastes (Norgate and Haque, 2009) ___________________________________________________________ 99
Figure 5.4 Reported water consumption during base metal and uranium ore processing versus ore grade (Mudd, 2008). ___________________________________________ 102
Figure 5.5 Contribution of processing stages to annual embodied water for metal produc-tion in Australia (Norgate and Aral, 2009). _________________________________ 102
Figure 5.6 Examples of acid and metalliferous drainage impacts on surface water re-sources: former Rum Jungle U-Cu mine, Northern Territory (Photo courtesy Gavin M. Mudd, July 2007) (top left); Boac River, downstream of failed tailings dam at former Marinduque Cu mine, Philippines (Photo courtesy Oxfam Aus-tralia, March 2004) (top right); severe AMD pollution from the former Mt Oxide Cu mine, Queensland (Photo courtesy MiningLegacies, 2008); ongoing AMD pollution from former coal mines in the Neath-Greta area, Hunter Valley (Pho-to courtesy Col Maybury, June 2006) (bottom right). _________________________ 103
Figure 5.7 Greenhouse gas emissions for the production of various metals, Australian sit-uation (Norgate et al., 2007). _____________________________________________ 105
Figure 5.8 Average kg CO2 /kWh for different sources (www.worldsteel.org). _____________ 110
Figure 5.9 Efficiency comparison between a simple EFF3-motor and an optimized one with copper rotor (Fassbinder, 2004). _____________________________________ 111
Figure 5.10 Overview of Greenhouse Gas Emissions for the different phases of the Super-LightCar (SLC) car relative to a reference model (Krinke et al., 2009). __________ 112
Figure 5.11 Comparison of total and bioavailable toxicity results for red mud (Norgate and Haque, 2009). ______________________________________________ 117
Figure 5.12 Potential annual global greenhouse reductions for various technologies (Norgate and Jahanshahi, 2010). _________________________________________ 120
Figure 6.1 The LCA framework according to the ISO 14040 / 14044 series (ISO, 2006a) _____ 126
Figure 6.2 Cradle-to-gate contribution of 1 kg of metal to emissions of greenhouse gases (in CO2-equivalent) and emissions of toxic substances (in kg 1,2 dichloroethane equivalent), relative to Mn (=1) (UNEP, 2010a). ______________________________ 147
Figure 6.3 Global warming potential related to three types of cars, broken down into the various life-cycle stages (Habermacher, 2010). _____________________________ 149
Figure 6.4 Cumulative energy requirement related to three types of cars, broken down into the various life-cycle stages (Habermacher, 2010) ______________________ 150
Figure 6.5 Contribution of global production of metals to global GHG emissions, normal-ised to Rh production (=1) (UNEP, 2010a). __________________________________ 152
Figure 6.6 Demand for metals for various electricity generating technologies, compared to the present global electricity mix, logarithmic scale (Kleijn et al., 2011) ______ 153
Figure 6.7 Demand for metals for the global electricity system under various scenario as-sumptions (Kleijn et al., 2011) ____________________________________________ 154

9
Environmental Risks and Challenges of Anthropogenic Metals Flows and Cycles
Figure A1.1 Nickel concentrations in terrestrial moss in the Central Barents Region. High Ni values in Kola Peninsula are due to Ni smelters at Monchegorsk, Nikel and Zapoljarny and in the area of Ural mountains to Ni bearing ultramafic rock in-trusions (Salminen et al. 2004). __________________________________________ 191
Figure A1.2 Spatial variance of chronic toxic pressure (expressed as multi-substance Po-tentially Affected Fraction msPAF of species) exerted by anthropogenic enrich-ments of metals in Dutch top soils (Spijkers et al., 2011b). ___________________ 193
Figure A5.1 Changing ore types for copper mining (Gerst, 2008) _________________________ 208
Figure A5.2 Long-term trends in processed copper ore grades for select countries (data from Crowson, 2012; Mudd, 2010a, Mudd, 2010b; Ruth, 1995; USBoM, var.; USGS, var.) ____________________________________________________________ 209
Figure A5.3 Long-term trends in processed gold ore grades for select countries (data from CMSA, 2010; Craig & Rimstidt, 1998; Machado & Figueiroa, 2001; Mudd, 2007; Natural Resources Canada, var., including updated data for Australia to 2010) __ 210
Figure A5.4 Long-term trends in processed nickel ore grades for select countries (data from Mudd, 2010b) ______________________________________________________ 211
Figure A5.5 Long-term trends in processed uranium ore grades for select countries (data updated from Mudd and Diesendorf, 2008; Mudd and Diesendorf 2010) (note logarithmic scale for ore grade) _____________________________________ 211
Figure A5.6 Recent trends in processed platinum group element (PGE) ore grades for se-lect companies (Mudd, 2012) _____________________________________________ 212
Figure A5.7 Long-term trends in ore grades at some giant Cu mines (Crowson, 2012) ______ 212
Figure A5.8 Approximate relative trends in Cu ore grades over 30 years from initial produc-tion for some major mines (adapted from Crowson, 2012) ____________________ 213
Figure A6.1 The LCA framework according to the ISO 14040/14044 series (ISO, 2006a) ______ 214

10
Environmental Risks and Challenges of Anthropogenic Metals Flows and Cycles
List of Tables
Table 2.1 Average values of the metal concentrations in different constituents of Earth’s crust and some surficial deposits. _________________________________________ 35
Table 2.2 Median values (% or mg/kg) and the range of metal concentrations of soils from some international geochemical mapping projects ______________________ 36
Table 2.3 Percentage of metals extracted by aqua regia (AR) and acid ammonium acetate (potentially bioavailable) in agricultural top soil in Northern Europe. (Data from Reimann et al., 2003). __________________________________________ 38
Table 2.4 Ratio human cycle vs. natural cycle according to various authors. ______________ 41
Table 2.5 Proposed safety factors to correct for a lack of sufficient toxicity data to de-rive PNECs. The safety factors are intended to compensate for the uncertainty in the PNEC-assessment generated by a lack of reliable experimental toxicity data (modified from TGD) (Data from European Commission, 2006). ____________ 45
Table 2.6 Threshold and guide values (mg/kg) from the Finnish legislation for contami-nated soil (Decree 214/2007) and aqua regia extractable (recommended ana-lytical method by the Decree) median, 90th percentile and maximum values of European top soil (Salminen et al., 2005). Values of Sb, As and Hg are total concentrations __________________________________________________________ 47
Table 2.7 Classification of metals by their status as essential element (Adapted from EPA, 2007). _____________________________________________________________ 48
Table 2.8 Diseases at state of deficiency respectively toxicity caused by the same ele-ment (selected elements) (Data from Selinus et al., 2005). ____________________ 54
Table 3.1 Average total and unit pollutant emissions per year for copper projects in Australia and Chile (Data from Mudd, 2009a; NPI, 2010; Chilean corporate re-port, var.). ______________________________________________________________ 61
Table 3.2 Average total and unit pollutant emissions to air per year for uranium projects in Australia (Data from Mudd 2009a; NPI, 2010) ______________________________ 62
Table 3.3 Global emissions of metals to the environment, ca. 1988, in 10^6 kg/year (Data from Reimann et al., 2003) __________________________________________ 65
Table 3.4 Emissions and losses compared to annual production of metals, ca. 1988, in 10^6 kg/year ___________________________________________________________ 66
Table 3.5 A comparison of estimated global anthropogenic emissions of trace metals in the mid-1990s with emissions from natural sources (emissions in 10^3 tonnes/year) (Nriagu, 1998; Pacyna and Pacyna, 2001 _______________________________ 67
Table 3.6 A comparison of global emissions to the atmosphere as calculated by Nriagu & Pacyna (1988) and Pacyna & Pacyna (2001) _________________________________ 67
Table 3.7 Global emissions to the atmosphere from natural sources, Richardson et al. (2001) compared to Nriagu & Pacyna (1988). ______________________________ 67

11
Environmental Risks and Challenges of Anthropogenic Metals Flows and Cycles
Table 4.1 Average diesel consumption in open large cut mines around the world (Mudd, 2009a) __________________________________________________________ 76
Table 4.2 Average primary energy needed for virgin metal production cradle-to-gate ______ 81
Table 4.3 Energy use for common metal recycling processes (adapted and expanded from Norgate, 2004) _____________________________________________________ 85
Table 4.4 Ranges of energy savings of recycling for various ferrous and non-ferrous metals (adapted from Norgate, 2004). ______________________________________ 86
Table 5.1 Reported water consumption during mineral and metal processing (Mudd, 2008) with data derived from the sustainability reports of 36 companies in 20 countries for a period ranging from 1 to 15 years. ________________________ 101
Table 5.2 Principal environmental aspects and impacts of the major metal extraction stages. _______________________________________________________________ 108
Table 5.3 Major hazardous components in waste electrical and electronic equipment (Cui and Forssberg, 2003). _______________________________________________ 115
Table 6.1 Overview of available LCI data for primary and/or secondary metal production __ 129
Table A1.1 Ratios of topsoil/subsoil for some metals in Europe (De Vos et al. 2006) ________ 192
Table A2.1 Metal speciation – examples of metal forms found in surface waters (Campbell and Chapman, 2006). __________________________________________ 194
Table A3.1 Some selected examples of arsenic poisoning from drinking water worldwide. In addition to these are for example Argentina, New Zealand, Brazil, Ghana, Zimbabwe, Japan, Chile, France, UK, Sweden (Data from Selinus et al., 2005) ___ 202
Table A4.1 Applications of the metals _______________________________________________ 206
Table A6.1 Table with Metal recycling loop type examples (Dubreuil et al., 2010) __________ 216

12
Environmental Risks and Challenges of Anthropogenic Metals Flows and Cycles
Abstract
Metals and their compounds are part of the fabric of modern society due to their unique properties, such as their conductivity, mal-leability, hardness, lustre, or recyclability. These properties impart a variety of func-tionality in various present products as well as future “sustainability” enabling solutions. Most of the highly-valued products of modern technology, such as computers, MRI scan-ners, aircraft engines, and satellites would be impossible without metals. Nonetheless, their production and use, as is true for all re-sources that we extract and use, are associ-ated with potential environmental impacts. In this report, an assessment is made of the literature on metals flows and cycles in na-ture and in society, the way they are connect-ed, and the potential impacts related to them. Four areas of attention emerge from this as-sessment as important information for a sus-tainable metals management.
1. Local impacts of mining. Mining can cause environmental and health prob-lems due to leaching of toxic substances into the ground- and surface water. Min-ing can also cause ecosystem degrada-tion. Accidents, e. g. related to tailings dam breaches, can be the cause of severe local surface water pollution. Although mines will always be a manifestation in the local landscape, such adverse im-pacts can be prevented to a large extent, and remediated after closure of the mine. The progressive mining companies are placing a substantial effort to prevent these adverse impacts.
2. Life cycle energy use. Mining and espe-cially refining of metals is very energy intensive and presently uses about 8 % of the total global energy supply, leading to GHG emissions. In the future, renew-able energy technologies applying metals and their compounds/alloys will assist to lower energy related GHG emissions. In addition, the life cycle energy use of met-als can be reduced. Industry has devel-oped BAT systems and other measures increasing energy and entropy efficiency as far as is theoretically possible and could improve performance substantially. For the same functionality, the energy gains of reducing the weight in the use phase may outweigh the energy use as-sociated with the production. In addition, life cycle energy use can be decreased by increasing recycling: secondary produc-tion is much less energy intensive than primary production. Despite those developments, the overall amount of energy used for metals pro-duction can be expected to increase. The present trend in demand for most metals is still steeply upwards. Establishing in-frastructure in developing economies will rise the demand for bulk metals. Novel technologies will lead to an increasing demand for specialty metals. Moreover, the coming energy transition may lead to a demand increase of both bulk metals and specialty metals, since renewable energy technologies are generally more metals intensive than fossil fuel based technologies. On the other hand, pro-cess efficiency of mining and refining is increasing, lowering thereby the energy requirement. At the same time, however, the tendency to process lower grades of ore to meet increasing demand leads to a higher energy requirement per kg of metals.

13
Environmental Risks and Challenges of Anthropogenic Metals Flows and Cycles
3. Non-metal sources. An increasing share of metal emissions to the environment comes from non-metal sources such as fossil fuels and phosphate fertilizer. For some metals this is presently the major source. Especially in agriculture, closed loop accumulation can lead to high con-centrations of metals in soils. A sustaina-ble metals management therefore should include these sources as well.
4. The need for a final sink. For certain met-als, a reduced demand leads to an over-supply due to their chemical/geological/designed linkage to valuable carrier met-als or other materials. Oversupply also occurs for metals with a former high level of use, where old stocks entering the waste stage form a potential but no long-er wanted source of secondary material. But even for metals with rising demand, thermodynamics dictate that cycles can never be completely closed. Those final waste streams need to be immobilized in order to prevent them from being emitted to the environment.
Recycling is an option that can mitigate three out of four of these areas, and that is specifi-cally relevant for metals: metals can be re-cycled almost indefinitely, with little loss in their technical attributes regardless of the number of times recycled. It reduces the need for primary production with all related impacts of mining and refining. It slows down the need for exploiting low grade ores. Sec-ondary production, including collection and transport, is much less energy intensive and therefore can reduce energy requirements significantly. It should be possible to increase recycling substantially by designing metal systems with this purpose, including not only recycling technologies but also product de-sign. Major benefits can be expected from an increased share of secondary production. However, primary production can be reduced substantially only when secondary produc-tion approaches demand. For this, increased recycling rates are insufficient: a leveling off of the demand curve is required. This is un-likely to occur in the next decades, but can be anticipated in the more distant future. More-over, secondary sources may not be avail-able in large quantities in every part of the world: developing countries still lag behind in building up their infrastructure. This, too, is changing rapidly now.
Finally, a sustainable metals management should not be defined in isolation. There are many links with other areas of resource use, such as water, food production and energy that have to be taken into account. To design such a sustainable metals management, us-ing metals to further sustainable develop-ment while avoiding environmental impacts as well as side-effects, is an exciting chal-lenge for society.

14
Environmental Risks and Challenges of Anthropogenic Metals Flows and Cycles

15
Environmental Risks and Challenges of Anthropogenic Metals Flows and Cycles
Executive Summary
Metals and their compounds have been used in society for millenia because of their unique properties, such as conductivity,malleability, hardness, and lustre. Most of the highly-val-ued products of modern technology, such as computers, MRI scanners, aircraft engines, and weather satellites would be impossi-ble without metals. Also, metals play an essential role in renewable energy technolo-gies, that are being developed to reduce our dependency on fossil fuels and at the same time reduce greenhouse gas emissions.
Nonetheless, their production and use, as is true for all resources that we extract and use, are associated with potential or actu-al environmental impacts. Optimizing met-als systems and life-cycles from a point of view of environmental impacts is therefore an integral part of a sustainable metals man-agement. The environmental impacts relat-ed to metals is the topic of this report. Other aspects such as economic or social issues are equally important from a sustainable development point of view. Technology, cru-cial as it is, will not on its own address the risk adequately, and broader risk manage-ment strategies are called for. These aspects, however, are not treated in this publication.
The number of metals in the periodic system is large. For this report, we concentrate on a selection of metals, starting from the long list of elements as covered in the first report of the Global Metal Flows Working Group on Metal Stocks in Society. Based on three cri-teria, (1) data availability, (2) societal rel-evance and (3) environmental relevance we come to the following selection: Al (alumin-ium), As (arsenic), Au (gold), Cd (cadmium), Co (cobalt), Cr (chromium), Cu (copper), Fe (iron), Hg (mercury), Mo (molybdenum), Ni (nickel), Pb (lead), Pd (palladium), Pt (plati-num), Rh (rhodium), Sn (tin), Zn (zinc).
Metals in the Environment
Research into the environmental pro-cesses related to metals is long-standing and has led to a large number of publica-tions, as is summarized in Chapter 2. Met-als are an essential part of the environment and they are necessary to all living organ-isms. The anthropogenic input can, how-ever, disturb the natural balance serious-ly. Metals from natural as well as anthropo-genic sources can accumulate in soils and sediments. They enter the food web via plant uptake and through bio-accumulatiaccumu-lation, which may lead to high concentrations in animals, including humans, in the top of the food chain. Many metals are essential for life. Their intake rate has an optimum. Below that, deficiency symptoms occur, and above it, adverse impacts could occur. Whether or not such impacts occur depends on a num-ber of variables, amongst others speciation, compound, soil characteristics etc.
Impacts on human health occur mostly at the local scale. Such impacts have already led to policies enforcing a reduction in the application of metals such as As, Cd and Hg. Environmental metal concentrations gen-erally are higher now than some centuries back due to losses from anthropogenic met-al cycles. The anthropogenic mobilization of metals has increased the magnitude of metal cycles, sometimes with a fraction but in other cases with factors above 100. Figure 1 shows this.
This does not imply that environmental flows and concentrations have multiplied by the same amount. For the most part, the mined metals end up in appliances in society that hardly interact with the environment. Emis-sions of metals to the environment, excluding landfill, have been estimated to be roughly in the same order of magnitude as the natural sources, weathering and volcanic activity.

16
Environmental Risks and Challenges of Anthropogenic Metals Flows and Cycles
Figure 1
Anthropogenic mobilization of elements
compared to natural
mobilization (Adapted from
Klee and Graedel, 2004).
0.0001 0.001 0.01 0.1 1 10 100 1,000 10,000 100,000 1,000,000 10,000,000
Log of Anthropogenic vs. Natural Dominance
Si – SiliconBr – Bromine
Mg – MagnesiumK – PotassiumRb – Rubidium
Ca – CalciumTl – Thallium
Co – CobaltP – Phosphor
Al – AluminiumN – Nitrogen
Ta – TantalumGa – GalliumCe – Cerium
C – CarbonPr – Praseodymium
Gd – GadoliniumTi – TitaniumTb –Terbium
Sr – StrontiumTh – Thorium
Sm –SamariumB – Boron
Nd – NeodymiumEr – Erbium
Sc – ScandiumTm –Thulium
La – LanthanumBe – BerylliumEu – EuropiumSe – SeleniumYb – YtterbiumCd – Cadmium
Y – YttriumMn –ManganeseDy – Dysprosium
Lu – LutetiumLi – Lithium
Nb – NiobiumZr – Zirconium
F – FluorineMo – Molybdenum
Hf – HafniumS – Sulfur
Ba – BariumHo – Holmium
In – IndiumZn – Zinc
Ge – GermaniumU – Uranium
V – VanadiumAs – Arsenic
I – IodineCs – Caesium
Ag – SilverFe – Iron
Ni – NickelW – Tungsten
Sn – TinPb – Lead
Bi – BismutCu – Copper
Sb – AntimonyPd – PalladiumTe – TelluriumHg – Mercury
Ru – RutheniumCr – Chromium
Rh – RhodiumAu –Gold
Pt – PlatinumRe – Rhenium
He – HeliumIr – Iridium
Os – Osmium

17
Environmental Risks and Challenges of Anthropogenic Metals Flows and Cycles
Potential Life Cycle Impacts of Metals
As a general rule, the metals which are pro-duced in large quantities have a lower cra-dle-to-gate impact per kg than those being produced in small quantities. The difference between the global warming potential of a kg of Fe and a kg of Rh is five orders of magni-tude. When multiplied with the annual pro-duction, however, Fe is still the metal with the highest impact potential.
Important impacts of the metals’ life cycles, as shown in Chapters 4, 5 and 6, occur in the first stages of the life cycle: mining, benefici-ation, metal extraction and refining. Potential environmental impacts of primary metal min-ing and extraction revolve around water (con-sumption and quality aspects), mine wastes (tailings and waste rock), and energy sourc-es (direct such as diesel and indirect such as coal-fired electricity) with the associated air emissions (sulfur dioxide, greenhouse gas-es, dusts and particulates). At the local lev-el, mining can have large impacts related to human health and to the degradation of land-scape and ecosystems, via mining waste and tailings, process emissions and accidents. Much can be, and in many cases has been, done to reduce these impacts. At the global level, important potential impacts of metal production are related to the use of energy, as outlined in Chapter 4. The energy require-ment for producing metals is considerable, as can be seen in Figure 2.
Altogether, the primary production of metals presently contributes 7 – 8 % to total global energy consumption. In the future, this may increase as a result of the processing of low-er grade ores, leading to an increase in en-ergy use. The energy efficiency of production processes can be, and is being, increased substantially. The energy required for sec-ondary production is several orders of mag-nitude less. An increased share of secondary production therefore could reduce energy re-lated potential impacts of metals production substantially.
In the use stage of the life cycle, it is difficult to attribute impacts to metals in metal con-taining products. Only corrosion from stocks-in-use exposed to the weather is clearly re-lated to the metals themselves. This is be-coming a more noticeable source of emis-sions, since stocks-in-use are growing and point source emissions declining, as a gener-al trend. Besides this, main potential impacts in the use phase are related, again, to ener-gy use. Such impacts generally refer to the product, not the materials embedded in it. Occasionally it is possible to pinpoint a spe-cific role for metals in a comparative sense. For example, it can be concluded that, while aluminium production requires more energy than steel production, energy can be saved in the use phase by using aluminium instead of steel as a base material for cars. An example from Chapter 6 is shown in Figure 3, where the battery electric vehicles (BEV) show an advantage over the standard cars (ICE in
Figure 2
Global energy consumption in PJ/y of primary
metal production (Norgate and Jahanshahi,
2010).
0 5000 10000 15000 20000 25000
Extraction and refining
Mining and mineral processing
Steel
Aluminium
Base metals
Global energy consumption (PJ/y)
18
Environmental Risks and Challenges of Anthropogenic Metals Flows and Cycles
Figure 3). GHG emissions in the production phase are higher than for a “standard” car, but emissions in the use phase (light blue, Energy & Emissions in the graph) are much lower.
ICE = Internal Combustion Engine
BEV = Battery Electric Vehicles
LV = Lightweight Vehicle
BL = Baseline
Metals are used in many new technologies. Especially renewable energy technologies can be regarded as beneficial for the environ-ment because by using them, emissions re-lated to fossil fuel use are avoided. In those technologies, metals play a crucial role. When comparing those new technologies with conventional fossil fuel based energy production, the reduction of GHG emissions in the energy generating process is evident.
However, the upscaling of such technologies on a global scale may lead to side-effects in the life-cycle. The metal intensity of renew-able energy technologies is generally larger than that of fossil fuel based energy. Figure 4
shows the demand for a number of metals for electricity generation at the global level, where the 2007 global electricity production is assumed to be produced with different pro-duction mixes. Iron is not present in Figure 4, but it shows the same relative increase as nickel, with which it is used to produce steel.
Figure 3
Global warming potential related
to three types of cars, broken
down into the various life-cycle stages
(Habermacher, 2010).
0.00 0.05 0.10 0.15 0.20 0.25
BEV Compact LW Alu
BEV Compact LW Plastic
BEV Compact BL
ICE Compact BL
BEV City LW Alu
BEV City LW Plastic
BEV City BL
ICE City BL
BEV Mini LW Alu
BEV Mini LW Plastic
BEV Mini BL
ICE Mini BL
kg CO2-eq/vkm
Disposal car
Maintenance car
Energy & Emissions
Battery
Drivetrain
Glider
Road

19
Environmental Risks and Challenges of Anthropogenic Metals Flows and Cycles
CCS: current (2007) mix extended with carbon capture and storage on fossil fuel based powerplants
Non-fossil: mix of solar, wind and hydropower
IEA Blue Map: mix according to Shell Blue Map scenario, in-cluding fossil fuels as well as renewable energy sources.
This upscaling will therefore lead to an in-creased demand for metals, and therefore a faster depletion of existing mines.
In the end-of-life stage, impacts could occur via final waste treatment. Metals are emitted
to the atmosphere (incineration), to surface water (waste water treatment) and especially end up in landfills, where there is a risk they may leach into the environment. Increasing recycling rates in some cases already can be observed to reduce landfill of metals.
Figure 4
Material requirements for global electricity
systems, to provide the 2007 world electricity
production (18.8 E12 kWh),
under various electricity mixes
(Kleijn et al., 2011)
0 1000 2000 3000 4000 5000 6000
IEA BLUE Map Mix
non-fossil
CCS
current mix
Aluminium
Nickel
Copper
Zinc
Tin
Molybdenum
Silver
Uranium
Gg/y

20
Environmental Risks and Challenges of Anthropogenic Metals Flows and Cycles
Metals in a Larger Context
Studies to support prioritisation of a materi-als or resource policy, as summarized in the International Resource Panel’s report on “As-sessing the Environmental Impacts of Con-sumption and Production”, come to the con-clusion that, compared to other materials, metals have a high impact per kg. However, other materials are used in far higher quan-tities. Agricultural resources, especially of animal origin, and fossil fuels are important contributors to environmental impacts; met-als at the moment play a modest role.
In the future, it is possible that metals will become relatively more visible from an envi-ronmental impact point of view, for the fol-lowing reasons:
■ The demand for metals is rising rapidly, much more so than the demand for agri-cultural products.
■ A shift towards a renewable energy system implies that the metal intensity of energy production will increase even faster.
■ In future, the energy intensity of the pro-duction of metals is expected to increase if production, as the current trend suggests, is shifting to lesser grade ores. Lower ore grades lead to exponentially more energy use in the production of metals. For some metals, this trend is already visible and for others it may become apparent over the next decades.
It is difficult to estimate to what extent these events will occur, what the result of this feed-back loop will be and to what extent it will be mitigated by increased exploration, cleaner processes, increased secondary production and substitution. Process efficiency increas-es continually, be it slowly. Recycling rates are increasing, which is a promising devel-opment. Technologies to increase those even more are being developed and may substan-tially reduce the need for primary production, and therefore the potential impacts connect-ed with that.
Developments differ per metal. For metals with a declining use, such as As, Cd, Hg and to some extent Pb, emissions from old stocks dominate, which will decline gradually over time. A complicating factor is that, in as far they are produced as by-products of other metals, their potential supply does not de-crease with decreasing demand. This implies we may be entering an era where metals are mined and stored instead of used. For metals with a rising demand, a trend is already vis-ible that recycling rates are increasing. Due to the time delay caused by the residence time in societal stocks, the share of second-ary production remains low as long as total demand keeps rising. This means that emis-sions related to mining, production and use will probably rise as well, although at a lower pace than production itself.
Because both population and welfare are in-creasing and energy will to a large extent re-main dependent on fossil fuels over the next decades, a further rise of the emissions from non-metal sources can be anticipated.
Research Required to Support a Sustainable Metals Management
While there is a large body of knowledge available for metals, there are some gaps that are important to fill in order to make meaningful forecasts and estimate the effec-tiveness as well as the side-effects of certain changes in management.
■ In the area of environmental fate, toxic-ity and impacts research has progressed most. Nevertheless, it is not complete. Especially the impacts of the presence of a mix of metals/metal compounds is yet unclear, as is stated in Chapter 2 of this report.
■ In the area of the anthropogenic cycles and their links to the environment, there are many studies at the national or regional level. Information at the global level is be-coming available, but needs to be expand-ed and linked to all the regional and na-

21
Environmental Risks and Challenges of Anthropogenic Metals Flows and Cycles
tional information. A further cooperation and finetuning between the research with regard to anthropogenic cycles and natural cycles is very relevant. If we are to develop measures and policies to reduce impacts of metals while at the same time keeping their functionality, it is essential that we know the origins of metal-related prob-lems, both in general and more specific.
■ LCA data and studies on metals and met-al containing products are available. They could be improved and added to. LCI data could be improved over the whole chain, but especially on recycling and final waste management processes. The debate around allocation of multi-metal produc-tion should be solved somehow. In LCIA, the calculation of toxicity impact factors for metals is still a field under development.
■ Combining the life cycle approach with a global level assessment, enabling to in-clude issues of scale as well as enabling to detect side-effects at the global lev-el, is very important to obtain a picture of the overall effectiveness and soundness of certain improvement options, be they technological improvements, substitutions or whole new ways of providing functions. Such a Life Cycle Sustainability Assess-ment is still in its earliest stages.
■ Important knowledge is still missing in the linkages that exist between different types of resources: metals, energy, water, and maybe others. This refers both to the re-sources needed in the chain of the metals (e. g., energy for refining) and to the fact that metals are in some cases mined as a by-product of other materials (mostly oth-er metals, but sometimes other materials, e. g. mercury production from natural gas). In scenario explorations for the future, this is essential knowledge. It requires an in-terdisciplinary approach and the coopera-tion of researchers from different fields to build up this type of knowledge.
■ The effectiveness of measures and poli-cies to reduce impacts of metals is also an
area of research where there are still many gaps. Effectiveness as well as side-effects of product and process design, of substitu-tion and of new applications, of local reme-diation, of waste management and of recy-cling should be investigated further, using a life-cycle approach, both at the micro-level and at the macro-level.
A Sustainable Metals Management
A sustainable metals management has many different aspects. Sustainability includes eco-nomic, social and environmental aspects. All these should be included when outlin-ing such a management. In this report, some outlines are sketched based on environmen-tal considerations only. The IRP Global Metal Flows Working Group will develop a report on policy issues in a broader sense. The recom-mendations formulated here form one of the inputs, other inputs will come from the other reports of the Global Metal Flows Working Group.
Because metals, once in the environment, disappear from it only with geological pro-cesses and therefore at a very slow rate, a sustainable metals management should re-duce emissions of metals to the biosphere to a level that approaches rates of geologi-cal reprocessing. At the same time, a reduc-tion of the metals’ potential life cycle impacts could be beneficial for a number of environ-mental impact categories, most notably GHG emissions related to the high energy require-ment of metal production.
Life CycleOptions to reduce potential impacts over the life cycle are, generally speaking: substitu-tion, dematerialization, and recycling. In ad-dition, metals can reduce impacts in their ap-plication in various technologies, for example in renewable energy systems.
■ Metals have an important function in new energy systems, thus contributing to a re-duction of GHG emissions. It should be kept in mind, however, that implement-
22
Environmental Risks and Challenges of Anthropogenic Metals Flows and Cycles
ing these technologies at pages scale will probably lead to a reduced availability of high quality ores. Hence the production of these metals will become more increas-ingly energy intensive, which in turn reduc-es resource productivity.
■ Substitution of metals by other materi-als could be an option to consider. How-ever, side-effects must then be considered as well: these substitutes are not without their own environmental and supply is-sues, and an assessment should be made of the benefits of such a substitution in all cases. Moreover, the use of metals in new technologies is often essential, and there-fore substitution will come at the expense of either resource efficiency losses or functionality.
■ Dematerialisation, in the context of a sus-tainable metals management, would mean using less metals in the product to ful-fill the same functions. This would reduce potential life cycle impacts accordingly. Again, one has to be aware of potential side-effects.
■ Recycling rates for many metals are at present low, but rising. System optimi-zation and design for recycling can help much to further increase recycling rates. Secondary production in general takes much less energy than primary production, therefore, increasing the share of second-ary production in the total supply would re-duce energy use substantially.
In all cases, information is needed over the whole life-cycle to assess whether or not specific options are preferable over others.
Mining and ProductionMining industries have developed better and more cost-effective approaches to reduce the environmental impacts of metal production. These need to be implemented by all mining companies. They include:
■ Reclamation of disturbed land.
■ Treatment and stabilisation of metal-bear-ing soils.
■ Prevention and treatment of contaminated water.
■ Controls on the amount and character of emissions to the atmosphere.
The energy use of primary production is a major cause of potential impacts. Reducing this is therefore of major importance. Energy efficiency increase can be achieved by the fol-lowing changes:
■ A significant process efficiency increase could yet be made. A potential factor 2 – 20 reduction in energy use per kg produced metal, all else being equal, is mentioned in Chapter 4.
■ Increase of secondary production, which generally takes two or more orders of magnitude less energy per kg produced.
■ Use of waste streams (fly ash, sludges and suchlike) as sources of metals, especially if a variety of metals can be recovered from them.
Waste Management and RecyclingIn many places in the world, waste treatment can be improved greatly. One example is the upgrading of present environmentally harm-ful informal treatment of electronic waste, another is lengthening the life span of prod-ucts by repair. Recycling, in addition to reduc-ing energy use, reduces the amount of final waste to be treated. Nevertheless, thermody-namics, in particular the 2nd Law of Ther-modynamics, prohibits within a reasonable economic framework the complete closure of the materials cycle. Hence there will al-ways be losses from the production and use of metals, and there will always be a need to make up for these losses by primary produc-tion from metallic ores. Old, unwanted stocks of metals no longer used entering the waste stage also can be seen as unavoidable losses from the cycle. Finally, by-product metal re-serves no longer demanded but still excavat-

23
Environmental Risks and Challenges of Anthropogenic Metals Flows and Cycles
ed must be stored in some way. This implies that a sustainable metals management also should include a final waste treatment. Since metals cannot be destroyed, the only way to prevent them from causing environmental impacts is to remove possible pathways to sensitive receptors so that they do not pose unacceptable risks: immobilize them and landfill or store them.
Non-metal SourcesNon-metal sources of metals to the environ-ment such as fossil fuels or fertilizer are in-creasing in importance, both relatively and absolutely, and are difficult to address since their use is inherently dissipative. Neverthe-less they should be addressed in a sustaina-ble metals management. A reduction of their use is one option. The shift to a renewable energy system, although leading to a higher metal demand, will at the same time lead to a reduction of fossil fuel use. A reduction of phosphate fertilizer use is not likely to occur in the near future. Nevertheless, phosphate rock is a scarce resource in its own right, and solutions may have to be found to solve that problem anyway. A shift to a less animal product-intensive diet will certainly be a step in the right direction.
GeneralMetals are the ideal type of resource for clos-ing cycles: they do not degrade and can be recycled virtually indefinitely. Approaching a situation where cycles of metals are indeed to a large extent closed is only possible when the demand for metals levels off: a rela-tive de-coupling between economic develop-ment and the use of metal resources. Only in that case can secondary production catch up with the demand and will it be possible to substantially reduce primary production and therefore the energy requirement for metals production. This situation is yet far away. De-veloping economies are now building up their infrastructure, and the approaching energy transition also will lead to a growing demand. Nevertheless, closing cycles as far as possi-ble is essential for a sustainable metals man-agement on the long term.
It is clear that a sustainable metals manage-ment cannot be defined in isolation. A global issue like this is linked to many other issues at the global level: population and welfare in-crease, the concurrent expected rise in de-mand for food, water and energy, the avail-ability of metals and other non-renewable materials, the shift to a renewable energy system, dietary choices etc. Linkages exist between demand and supply for all major re-sources, and the present scale of production and consumption is such that constraints are becoming apparent in all corners. A sustain-able metals management therefore should be part of an overall effort to steer society to-wards a more sustainable development.

24
Environmental Risks and Challenges of Anthropogenic Metals Flows and Cycles

25
Environmental Risks and Challenges of Anthropogenic Metals Flows and Cycles
1. Introduction
Authors: Ester van der Voet, Reijo Salmin-en, Matthew Eckelman, Terry Norgate, Gavin Mudd, Roland Hischier, Job Spijker, Marti-na Vijver, Olle Selinus, Leo Posthuma, Dick de Zwart, Dik van de Meent, Markus Reuter, Ladji Tikana, Sonia Valdivia, Patrick Wäger, Michael Hauschild, Arjan de Koning
1.1 Aim and Scope
This report is the third report of UNEP’s In-ternational Resource Panel’s (IRP) Global Metal Flows Working Group, and is published jointly with the Working Group Environmen-tal Impacts. In this report, literature with re-gard to the environmental impacts of metals and their use is brought together, and con-clusions are drawn with regard to the im-pacts themselves, their causes, and possible options to reduce them. All conclusions are based on existing literature; no new research is conducted for this report. Economic and social aspects of metal use are not treated in this report.
Metals are an important category of resourc-es. Their unique properties make them in-valuable for a number of applications. Their demand, in general, is increasing. Most im-portant developments at the moment are the
building up of the infrastructure in rapidly developing economies, leading to steeply ris-ing demand for steel and alloys and other bulk-metals, and the rapid progress in elec-tronics – mobile phones, television screens etc. – conquering the world, leading to an in-creasing demand of a wide variety of metals. A third development, that has not yet led to large changes but is bound to become impor-tant in the future, is the need for new energy technologies to make the transition to a more sustainable and less fossil-fuel-based energy system. These new technologies, too, result in an increase in the demand for metals.
Lately, reports on the potential future scar-city of metals have been published. Scarcity, a subject of significant debate, is not the topic of this report, since it is covered in the oth-er reports of the Global Metal Flows Working Group. The current report treats environmen-tal impacts, based on a large body of litera-ture. The two topics, however, are linked to a certain extent, as will be made apparent in this report. The same is true for potential solu-tions: recycling, if conducted properly, not only contributes to reduce scarcity problems, but also to a reduction of environmental impacts.
Metals are a specific group of elements from an environmental point of view. As ele-ments, they do not degrade in the environ-ment but accumulate in soils, sediments and seas, and disappear from the biosphere only
Report 1 – Metal Stocks in Society
Report 2a – Recycling Rates of Metals
Report 2b – Metal Recycling – Opportunities, Limits, Infrastructure
Report 3 – Environmental Risks and Challenges of Anthropogenic Metals Flows and Cycles
Report 4 – Future Demand Scenarios for Metals
Report 5 – Critical Metals and Metal Policy Options
The first five reports form the necessary basis for the last report.

26
Environmental Risks and Challenges of Anthropogenic Metals Flows and Cycles
via geological processes. Since the mobiliza-tion of metals is greatly increased by mining, the biogeochemical cycles of metals have a large anthropogenic contribution. Metals do not just enter the environment via their min-ing and use as such. Important emissions originate from the involuntary use of metals, as a contaminant in other materials such as phosphate fertilizer and fossil fuels. For some metals, these are presently more important sources of emissions than the metals cycles themselves. On the other hand, the mobiliza-tion and use of metals goes hand in hand with a number of environmental impacts related to the use of energy, water and auxiliary materi-als. If lower grade ores are processed, these impacts can become more important.
All these aspects are covered in this report with the overall objective to present a bal-anced and complete picture reflecting the current state of knowledge regarding envi-ronmental impacts related to metals. The report is meant to provide useful informa-tion for policy makers, stakeholders from the metals and mining industry, as well as for scientists.
1.2 Choice of Metals
The number of metals in the periodic table is large. For this report, we focus on a selection of metals.
The selection, starting from the long list of elements as covered in the first report of the Global Metal Flows Working Group on “Metal Stocks in Society” (UNEP 2010b), is based on the following criteria:
■ Data availability
■ Societal relevance
■ Environmental relevance
1.2.1 Data AvailabilityAn important starting point is the list of met-als covered in the other reports of the Global Metal Flows Working Group. In their first re-port (UNEP 2010b), the following metals were included. The report refers to stocks of met-als in society, and is relevant for an estimate of emissions:
Ag (silver), Al (aluminium), Au (gold), Cd (cad-mium), Co (cobalt), Cr (chromium), Cu (cop-per), Fe (iron), Hg (mercury), Mg (magne-sium), Mn (manganese), Mo (molybdenum), Ni (nickel), Pb (lead), Pd (palladium), Pt (plat-inum), Rh (rhodium), Sb (antimony), Sn (tin), Ti (titanium), W (tungsten), Zn (zinc).
A next source of information concerns lit-erature on metals in the environment, since this report deals with environmental impacts. A few global inventories have been made of metal concentrations in environmental com-partments, but there is an extensive overview of metals in the environment in Europe: the Geochemical Atlas of Europe (Salminen et al., 2005). In this comprehensive publication, all of the above metals are included as well, except for Au, Pd, Pt and Rh. Since Au, Pd, Pt and Rh are very stable, their bio-availabilities are small. In addition, many more are includ-ed – in total 67 elements (including a number of non-metals). These data refer to concen-trations of metals in soils, surface water and sediments and are relevant for the environ-mental assessment. It is not possible to nar-row down based on this publication.
A third source of information is information about the impacts of the metals. A lot of this information is collected in Life Cycle Impact Assessment (combined fate, exposure and toxicity data) and in Life Cycle Inventory data-bases (life-cycle wide extractions and emis-sions of all sorts of substances of the min-ing, production, use and waste management processes of the metals). In the most com-prehensive LCA Impact Assessment list, the CML 2000 list (Guinée et al., 2002) a number of metals have a toxicity potential. This prob-ably implies that for these metals no-effect

27
Environmental Risks and Challenges of Anthropogenic Metals Flows and Cycles
level or TDI data are available as well. Out of the list of metals put forward by the Global Metal Flows Working Groups first report, the following metals are covered: Cd, Co, Cr, Cu, Hg, Mn, Mo, Ni, Pb, Sb, Sn, Zn. In addition, toxicity potentials for human and ecosystem health are available for Tl (thallium), As (ar-senic), Be (beryllium), Se (selenium), and V (vanadium).
Metals are included in various Life Cycle In-ventory databases. By far the most complete one is the Ecoinvent database. This database includes mining, refining and production data of a wide array of metals. The list of met-als included in the first report of the Global Metal Flows Working Group is included in the Ecoinvent database, except for Sb, Ti and W. In addition, data are available regarding Dy (dysprosium), Nd (neodymium), Pr (pra-seodymium), Ga (gallium), and In (indium). Ecoinvent also includes some data for sec-ondary production: for Al, Ag, Au, Cu, Ni, Pd, Pt, Rh and steel.
Overall, a narrowing down of the list based on information gaps is not indicated.
1.2.2 Societal RelevanceSocietal relevance is related to the availability of metals and the importance of their appli-cations. This criterion is rather difficult, be-cause there is always the possibility of sub-stitution. Nevertheless, we look at two sub-criteria here:
■ Magnitude of use.
■ Reported scarcity on the market.
Fe is the metal that is used in the largest quantities. Al is a good second, followed by a group of Cu, Zn, Pb, Cr, Ni. It is important to include these metals just because of the scale of their use. Not all of them are related to toxicity problems, but they all do have an environmental impact via their life cycle, es-pecially the energy requirement.
Market scarcity is more related to metals that are present in ores in small quantities. It is partly a geological issue, but it is also deter-mined by economics, politics and social fac-tors. Some scarcity assessments have been made, including a number of precious and specialty metals. Not just present, but also future scarcity issues are relevant: new tech-nologies related to solar and wind energy generation, and fast growing products such as cell phones, computers, electric motors for cars etc. contain a high number of such metals. The topic is gaining interest world-wide.
The most extensive scarcity assessment presently available is from Nagasaka (2008). Metals covered in this publication are not di-rectly relevant from an environmental impact point of view, but are interesting because of their societal relevance. Out of the metals se-lected in the previously mentioned Report on Metal Stocks in Society, the following are in-cluded: Co, Cr, Cu, Fe, Mn, Mo, Ni, Pb, Pd, Pt, Sn, Zn. In their report on critical materials, the European Commission (European Com-mission, 2011) has listed Sb, In, Be, Mg, Co, Nb, PGMs (platinum group metals, includ-ing Pt, Pd and Rh), Ga, Rare earths (including the lanthanides, Sc (scandium) and Y (yttri-um)), Ge (germanium), Ta (tantalum) and W. This list addresses also potential future sup-ply risks.
A third, relevant issue in relation to societal relevance is
■ The management of the metals.
To set up a sound management it is impor-tant to acknowledge their origins: the ther-modynamic link between metals as they oc-cur in ores together. This has environmental implications as well, via the choice of produc-tion technology, the choice for application of these metals in products, and the implica-tions this has for recycling technologies. This implies assessing co-product and by-product metals together with the main carrier metals. For our choice of metals, it means we have

28
Environmental Risks and Challenges of Anthropogenic Metals Flows and Cycles
to cover both carrier and co-product and by-product metals to obtain a relevant picture.
1.2.3 Environmental RelevanceThe environmental relevance is the most im-portant criterion, since this report is about the environmental impacts of metals. Sub-criteria in this criterion are the following:
■ Inherent and environmental toxicity of the metals themselves.
■ Disruption of natural metal cycles.
■ Life-cycle impacts of metals.
■ Local impacts related to mining and smelting.
Inherent and Environmental ToxicityA number of metals are known to have toxic impacts when they are released into the en-vironment. Among those are (compounds of) As, Au, Bi, Cd, Cr, Hg, Ir (iridium), Pb, Pd, Pt, Rh, Sb and Tl (e. g. Wolterbeek and Verburg 2001). If we add information out of the Life Cycle Impact Assessment, we can add Ag, Be, V, Mo, Co and Ni. Toxicity potentials for these metals (human toxicity, problem oriented ap-proach) are relatively high. These toxicity po-tentials are expressed in relative terms and are related to the emission of 1 kg of a cer-tain metal (Rosenbaum et al., 2008). They in-clude environmental fate, exposure and toxic impacts, and thus they provide a good com-parative picture of the environmental toxic-ity. Many of these metals are not on the list of the Global Metal Flows Working Groups first report.
Disruption of Natural CyclesSeveral publications have indicated the mag-nitude of the anthropogenic metals cycle compared to the natural cycle (Benjamin et al., 1992; Ayres, 1992), or the magnitude of the emissions from society compared to nat-ural flows (Nriagu & Pacyna, 1988; Pacyna et al., 1995; Olendrzinsky et al., 1996). From these publications, we consider Pb, Hg, Ag, Sb, Se, As, Mo, Zn, Cu, and Cd as important
metals. All are included in the first report of the Global Metal Flows Working Group, ex-cept As.
Life Cycle Impacts of MetalsSignificant impacts are related to the use of energy to mine and refine the metals. While it is clear that the impacts per kg are highest for metals that appear in their ore in low con-centrations, it has also been shown that due to the sheer magnitude of their cycles the production of bulk metals still has the larg-est impact. Other impacts refer to the use of water, to emissions of pollutants to air and surface water, and to leaching from land-filled waste. Cradle-to-gate impacts per kg are very large for PGM metals, but impacts of metals worldwide are dominated by iron and steel, followed by Al, Cr, Cu, Ni, Zn etc. From this point of view, the bulkier metals should be selected, maybe supplemented by some metals that have a rapidly rising demand, an especially high energy use, or are associated with declining ore grades. This could be an argument to include metals such as Mg and Ti as well.
Local Impacts Related to MiningMining in many cases presents risks of local landscape degradation, loss of ecosystems and pollution. This is hardly a distinguishing criterion. However, Au is a special case – en-vironmental and social problems related to artisanal and small-scale mining are rela-tively widespread.

29
Environmental Risks and Challenges of Anthropogenic Metals Flows and Cycles
1.2.4 Metals Included in the Assessment of this ReportBased on the above, we come to a selection of metals to include in this report. The choice is restricted to the list of metals of the first report of the Global Metal Flows Working Group, mostly for practical reasons, with one exception: the metalloid As, which is high-ly toxic and very relevant for a discussion on historical contamination.
(1) Bulk metals: Al, Cr, Cu, Fe, Ni, Pb, Sn, Zn
■ Data availability good, for both environ-ment and society.
■ Important for society, environmental im-portance also large, via cradle-to-gate impacts.
■ A number of their by-products can be in-cluded as well (see (4).
(2) Some smaller scale metals specifically as-sociated with environmental problems, often produced as co- or by-products: As, Cd, Hg
■ Data availability good, for both environ-ment and society.
■ Although their use is decreasing or at least not increasing, they are still environmen-tally important due to their high toxicity or the problems related with contaminated sites.
(3) Some rare/precious/specialty by-product metals with potential for increase in use: the PGMs (Pt, Pd, Rh), Au, and in addition Co and Mo.
■ Data lack may be occurring, but some data is at least available for both environment and society.
■ Their use is increasing, per kg cradle-to-gate impacts are often very high, will be-come more important for society as well as for the environment.
■ Their selection allows us to address its is-sue of co- and by-production and the envi-ronmental relevance.
(4) Co- and by-products of bulk metals: in as far they are not covered in the above lists, in-formation about them will be included ad hoc whenever relevant, but they are not assessed systematically. For the ones that do occur in the list above, their link with the carrier met-al production should be acknowledged. This is relevant especially for Chapters 4, 5 and 6, where technologies for production and recy-cling and life cycle impacts come into the pic-ture.
This leaves us with a list of 17 metals: Al, As, Au, Cd, Co, Cr, Cu, Fe, Hg, Mo, Ni, Pb, Pd, Pt, Rh, Sn, Zn. They will be assessed in this re-port.
1.3 Structure of the Report
In the report, various aspects with regard to environmental impacts of metals are covered.
In Chapter 2, the huge body of literature re-lated to metals in the environment and re-lated risks is reviewed. Natural cycles and the anthropogenic addition to those, concen-trations in various environmental compart-ments, combined with data on acceptable and no-effect levels will give an insight in the extent to which the presence of metals actu-ally poses environment and health problems.
Chapter 3 is dedicated to sources of metal emissions. These can be natural, but most-ly they are anthropogenic. The nature of these emissions has changed over time, from mainly industrial point sources to mainly dif-fusive sources unrelated to the actual min-ing, refining and use of the metals them-selves. Other sources seem to have become more important. Also in this chapter, we treat legacy contamination: the emission of metals from abandoned mining or production sites.

30
Environmental Risks and Challenges of Anthropogenic Metals Flows and Cycles
Because this appears to be a very important issue, Chapter 4, is dedicated to the energy requirement of metals cycles. Not so much the emission of the metals themselves but the cradle-to-gate impacts related to the use of energy to mine and refine them seems to be an increasingly important cause of envi-ronmental impacts. This is explored in Chap-ter 4.
In Chapter 5, other impacts related to met-als are covered. This covers the whole life cycle: impacts related to mining, to refining, to production, use and waste management. Although the picture is still global, these impacts are relevant especially at the local scale. They cover, among others, land deg-radation, water use, water quality deteriora-tion, air quality problems. Also, the effects of mitigating measures, including demateriali-zation, product and process design, substitu-tion and recycling are treated. This enables to comment on options for a more sustainable metals management, at least from the point of view of environmental impacts.
In Chapter 6, all these impacts are brought together and integrated into a view on Life Cycle Impacts related to metals. For this, an important aspect is the Life Cycle Impact As-sessment: the translation of all kinds of im-pacts into a limited number of impact cate-gories at midpoint or endpoint level, and the aggregation of those different impacts into a single score. Also, the availability of Life Cy-cle Inventory data is investigated and data gaps are identified.
Finally, in Chapter 7, conclusions are drawn and recommendations are made with regard to the environmental impacts of metals and options to reduce those, based on the infor-mation from the previous chapters.

31
Environmental Risks and Challenges of Anthropogenic Metals Flows and Cycles
2. Metals in the Environment
Reijo Salminen, Job Spijker, Martina Vijver, Matthew Eckelman, Olle Selinus, Leo Post-huma, Dick de Zwart, Dik van de Meent.
2.1 Natural Concentration of Metals in the Environment, Local and Global
2.1.1 Characterization of MetalsMetals are present in various forms: as el-ements, as alloys and as compounds. The form wherein they occur determines their chemical and physical properties. From a perspective of determining risks for hu-man and ecosystem health, it is important to make that distinction. Elementary metals seldom are harmful for humans or in the en-vironment. Metals in certain oxidation state, some ionic forms, and compounds, such as organo-metallic compounds can be essen-tial (such as proteins) or harmful. Therefore, it should always be carefully defined what we mean when we are talking about harmful-ness of metals in the environment. Following chapters characterize metals in a very gen-eral level and the harmful speciation of ele-ments is not described separately.
Major metals: Fe, Cu, Zn, Al, Ni, Cr, Pb, Sn
Iron (Fe)Iron is one of the major metallic elements of the Earth’s crust. As a main element it takes part in almost all natural and man-caused geochemical processes. In magmatic differ-entiation, iron is enriched in ultramafic and mafic rocks; and also in mafic volcanic rocks. Acid and alkaline igneous rocks, limestones, and sandstones have relatively low Fe con-tents. In oxidizing conditions, iron oxides and hydroxides yield sedimentary iron ores, later-ites, and the illuvial zone in podzols. In reduc-ing conditions, iron precipitates as sulfides,
carbonates, or phosphates. In the biosphere, Fe abundance is relatively high, and Fe is an essential element for life.
Copper (Cu) Copper is a common metal found in both nat-ural geogenic and anthropogenic systems. Geochemically it behaves similarly with a big group of elements such as Fe, Ni, Co, Zn, Pd, and Ag. As a chalcophile element it ex-hibits typically as sulfides. During magmatic and volcanic processes, copper is enriched in late solutions, which give rise to, for exam-ple, porphyry copper or volcanic exhalative ores, in which chalcopyrite (CuFeS2) is the most common mineral. In exogenic sedimen-tary ore processes Cu is also one of the most important elements. Copper is a biologically active trace element and important for life; either a lack or an abundance of Cu may be dangerous for many organisms. Copper is widely used in different industries. In the bio-sphere and hydrosphere, Cu is relatively mo-bile. Therefore Cu in biosphere is distributed more evenly than in the lithosphere.
Zinc (Zn)Zinc is a relatively widely distributed metal in the Earth’s crust. In bedrock, it replaces Fe and Mg in the crystal lattices of silicates. In magmatic differentiation, its behaviour is controlled by the crystallization of ferromag-nesian minerals and sulfides. In bedrock the distribution of Zn is quite uniform. The high-est Zn concentrations are in carbonatites of surficial and mesoabyssal alkaline forma-tions and also in shales. In soils, zinc is very mobile, but it is easily adsorbed on Fe, Mn, and Al hydroxides and organic complexes. In stream waters, elevated Zn concentrations are connected with organic and non-organ-ic colloids. Zinc is an essential element for plants and animals, but it is toxic in excess. Anthropogenic contamination by Zn can be intensive in areas of (abandoned) mine sites and metal production industries.
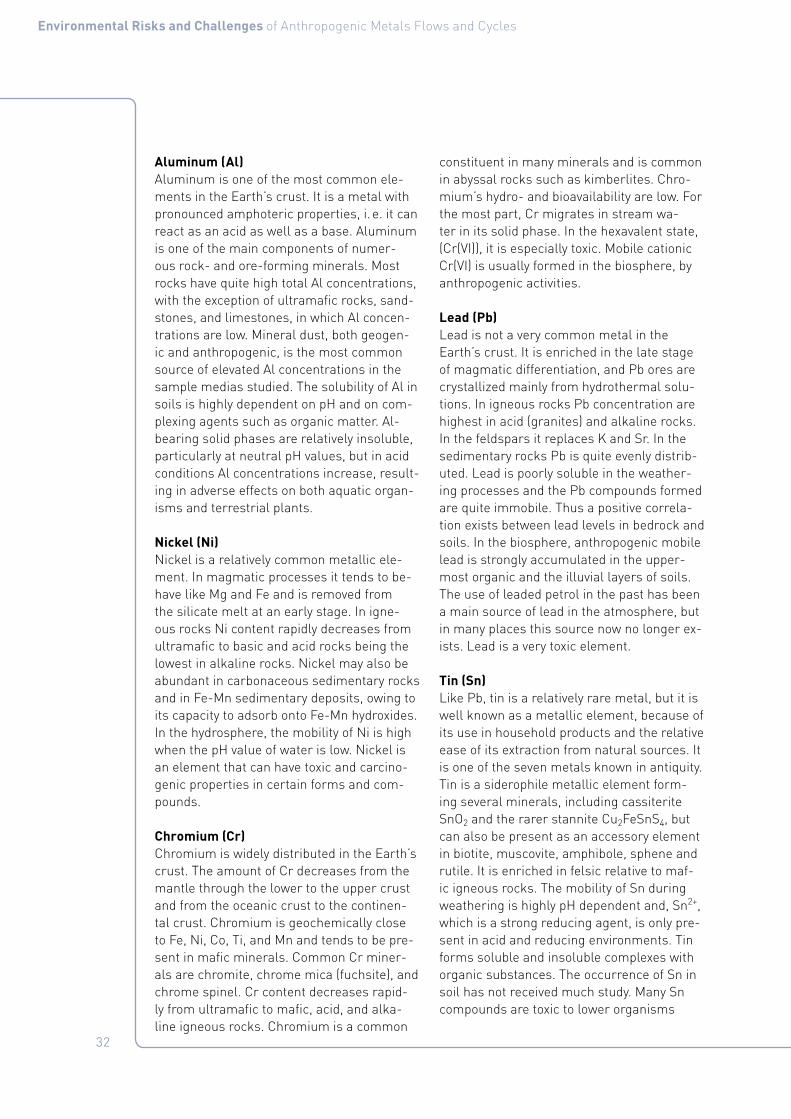
32
Environmental Risks and Challenges of Anthropogenic Metals Flows and Cycles
Aluminum (Al)Aluminum is one of the most common ele-ments in the Earth’s crust. It is a metal with pronounced amphoteric properties, i. e. it can react as an acid as well as a base. Aluminum is one of the main components of numer-ous rock- and ore-forming minerals. Most rocks have quite high total Al concentrations, with the exception of ultramafic rocks, sand-stones, and limestones, in which Al concen-trations are low. Mineral dust, both geogen-ic and anthropogenic, is the most common source of elevated Al concentrations in the sample medias studied. The solubility of Al in soils is highly dependent on pH and on com-plexing agents such as organic matter. Al-bearing solid phases are relatively insoluble, particularly at neutral pH values, but in acid conditions Al concentrations increase, result-ing in adverse effects on both aquatic organ-isms and terrestrial plants.
Nickel (Ni)Nickel is a relatively common metallic ele-ment. In magmatic processes it tends to be-have like Mg and Fe and is removed from the silicate melt at an early stage. In igne-ous rocks Ni content rapidly decreases from ultramafic to basic and acid rocks being the lowest in alkaline rocks. Nickel may also be abundant in carbonaceous sedimentary rocks and in Fe-Mn sedimentary deposits, owing to its capacity to adsorb onto Fe-Mn hydroxides. In the hydrosphere, the mobility of Ni is high when the pH value of water is low. Nickel is an element that can have toxic and carcino-genic properties in certain forms and com-pounds.
Chromium (Cr)Chromium is widely distributed in the Earth’s crust. The amount of Cr decreases from the mantle through the lower to the upper crust and from the oceanic crust to the continen-tal crust. Chromium is geochemically close to Fe, Ni, Co, Ti, and Mn and tends to be pre-sent in mafic minerals. Common Cr miner-als are chromite, chrome mica (fuchsite), and chrome spinel. Cr content decreases rapid-ly from ultramafic to mafic, acid, and alka-line igneous rocks. Chromium is a common
constituent in many minerals and is common in abyssal rocks such as kimberlites. Chro-mium’s hydro- and bioavailability are low. For the most part, Cr migrates in stream wa-ter in its solid phase. In the hexavalent state, (Cr(VI)), it is especially toxic. Mobile cationic Cr(VI) is usually formed in the biosphere, by anthropogenic activities.
Lead (Pb)Lead is not a very common metal in the Earth’s crust. It is enriched in the late stage of magmatic differentiation, and Pb ores are crystallized mainly from hydrothermal solu-tions. In igneous rocks Pb concentration are highest in acid (granites) and alkaline rocks. In the feldspars it replaces K and Sr. In the sedimentary rocks Pb is quite evenly distrib-uted. Lead is poorly soluble in the weather-ing processes and the Pb compounds formed are quite immobile. Thus a positive correla-tion exists between lead levels in bedrock and soils. In the biosphere, anthropogenic mobile lead is strongly accumulated in the upper-most organic and the illuvial layers of soils. The use of leaded petrol in the past has been a main source of lead in the atmosphere, but in many places this source now no longer ex-ists. Lead is a very toxic element.
Tin (Sn)Like Pb, tin is a relatively rare metal, but it is well known as a metallic element, because of its use in household products and the relative ease of its extraction from natural sources. It is one of the seven metals known in antiquity. Tin is a siderophile metallic element form-ing several minerals, including cassiterite SnO2 and the rarer stannite Cu2FeSnS4, but can also be present as an accessory element in biotite, muscovite, amphibole, sphene and rutile. It is enriched in felsic relative to maf-ic igneous rocks. The mobility of Sn during weathering is highly pH dependent and, Sn2+, which is a strong reducing agent, is only pre-sent in acid and reducing environments. Tin forms soluble and insoluble complexes with organic substances. The occurrence of Sn in soil has not received much study. Many Sn compounds are toxic to lower organisms

33
Environmental Risks and Challenges of Anthropogenic Metals Flows and Cycles
Metals specifically associated with environmental problems, often produced as co or by-products: Hg, Cd, As, Au
Mercury (Hg)Mercury is a mobile but not very widely dis-tributed and not very common metal. Geo-chemically it behaves similarly to Cd, Zn, Au, Ag, and Tl. In mineral lattices, Hg replaces mainly Zn and Cd, and it may be a constituent in ore deposits, particularly in gold minerali-zations. In sulfide mineralizations, cinnabar (HgS) is the most common Hg mineral. Mer-cury differs from other elements because of its ability to vaporize under natural surface conditions. The volatility of Hg facilitates its migration, and it may reflect the deep struc-tures of the bedrock. Very high accumula-tions of Hg are known in gas, oil, and coal deposits. High Hg contents are also known to occur in phosphates and manganese ores. Very low levels of Hg characterize igneous rocks. In younger sedimentary rocks, Hg con-centrations are on average higher than in the older crystalline rocks. The geochemis-try of Hg is characterized by the formation of organo-mercury compounds that are quite stable in aqueous media. The transformation of these compounds, especially methylation, plays an important role in the Hg cycle in the environment. Mercury is a very toxic element, and the methylation processes especially have been associated with environmental ca-tastrophes by Hg poisoning.
Cadmium (Cd)Cadmium is a rare and widely dispersed met-al. Its geochemical properties are close to Zn, In, and Hg. Cadmium is, for the most part, found as an admixture with other elements in different sulfides (especially in Zn ores). Elevated Cd contents are very often found in carbonates, kaolins, phosphorites, and fossil fuels. Although Cd concentrations are low in the Earth’s crust, it is very important in exo-genic processes, because of its mobility in aquatic and gaseous phases and its capacity to accumulate in different media in the bio-sphere. Cadmium is a very toxic and carcino-
genic element. It is emitted into the air and water by mining and metal smelting, and by industries using cadmium in nickel-cadmi-um batteries (nicad), alloys, paints, and plas-tics. The burning of oil and waste produc-es air-borne Cd. Cadmium is also released from phosphate fertilizers and from sewage sludge.
Arsenic (As)Arsenic is a trace element with semimetal properties. High As concentrations are typi-cal for sulfide ores, and arsenopyrite is also an indicative mineral for most gold minerali-zations. Its content in different igneous rocks is quite low and stable. Variation of As con-centrations is higher in sedimentary rocks. The highest As concentrations are found in schists and shales (black shales and coals). It is a toxic element and it is more abundant in surficial deposits than in the bedrock. The main sources of anthropogenic As are pro-cessing of ores, non-ferrous metallurgy, heat energy production, and agriculture.
Gold (Au)Gold is very scarce in the earth, but it occurs in many different kinds of rocks and in many different geological environments. It is found as the free metal and in tellurides. Gold is al-most always associated with pyrite (and some other sulfides) hiding in their mineral lat-tice or as native metal in quartz veins. Gold is found also in alluvial deposits as nuggets of Au alloys. Though it is extremely resist-ant to weathering it occurs in sea water in the amount of 0.1 to 2 mg/ton, depending on the location of the sample. Gold is one of the metals less active and it is not absorbed well by the body and its compounds are not nor-mally particularly toxic.

34
Environmental Risks and Challenges of Anthropogenic Metals Flows and Cycles
By-product metals with potentially increasing use: Pt, Pd, Rh, Co, Mo.
Platinum Group Metals (Pt, Pd, Rh)Platinum group metals occur together and often natively in small quantities in ultra-mafic and mafic rocks. Platinum is a silvery-white metal, when pure, and is malleable and ductile. The metal does not oxidize in air at any temperature, but is corroded by halo-gens, cyanides, sulfur, and caustic alkalis. It is insoluble in hydrochloric and nitric acid, but dissolves when they are mixed as aqua regia, forming chloroplatinic acid. In the fine-ly divided state platinum is an excellent cata-lyst, used much in fuel cells and in antipollu-tion devices for automobiles. Platinum group metals do not normally cause problems to biota as they are unreactive, however, some PGMs compounds should be regarded as tox-ic. The main anthropogenic source at present corresponds to the use of catalytic convertors in the exhaust systems of automobiles.
Cobalt (Co)Cobalt belongs to the Fe group and it is closely related to Ni and PGMs. It is com-mon as accessory element in many minerals. Most common host minerals are pyrite, pyr-rhotite, magnetite and femic silicates (such as amphiboles and pyroxenes). Cobalt values decrease from ultramafic and mafic rocks to-wards acid and alkaline rocks. In sedimenta-ry rocks, Co contents are higher in claystones than in limestones. High Co values are typi-cal for poly-metallic sulfide ores, and also for caustobioliths and carbon-bearing rocks. In the biosphere, Co is common, but the values are rather low in the hydrosphere. Cobalt is an essential element for vital function, but at the same time it is a toxic one; both its abun-dance and deficiency are equally harmful.
Molybdenum (Mo)Molybdenum is a metallic element that oc-curs in small amounts in the Earth’s crust. In magmatic differentiation it is enriched in late stages in granites, pegmatites, and hy-drothermal formations, and in alkaline rocks. Geochemically Mo resembles Cu, W, U, and rare earth elements. Molybdenum is a com-mon constituent in sedimentary sulphur-rich carbonaceous rocks, clays, and caustobio-liths. It plays a very important biological role because of its high mobility in the biosphere. Metal-organic Mo compounds are especial-ly mobile in the hydrosphere. Molybdenum is widely used in the metal industries and is important in surficial deposits. Mo plays a vi-tal role in the biological process of nitrogen fixation. It is an essential element also for the human metabolism. Both deficiency and abundance can cause health problems.

35
Environmental Risks and Challenges of Anthropogenic Metals Flows and Cycles
2.1.2 Natural Background ConcentrationsThere are no exact data about the abundanc-es of metals in the Earth’s crust, but esti-mates are available in the geochemical lit-erature (Reiman & Garrett, 2005). Estimates which look today most reliable are compiled in Table 2.1. In some cases several values are given (min-max), showing the variation of es-timates. In most cases the recent estimates
do not differ too much. Table 2.2 shows measured median values and the ranges of metal abundances from Europe and the USA. In waters, metal concentrations in solution depend very much on pH, Eh, presence of other elements, dissolved organic particles and colloidal particles. In all media, natural variation of metals is large and depends on the matrix as can be seen in Table 2.2.
Table 2.1
Average values of the metal
concentrations in different
constituents of Earth’s crust and
some surficial deposits.
Metal Lithosphere %
Soil %
Stream water µg/L
Sea water µg/L
Biota %
Fe 3.09 w1) – 5.332) 0.42) 402) 52) 2.22)
Al 7.741) 7.102) 1602) 12) 6.12)
Metal Lithosphere mg/kg
Soil mg/kg
Stream water µg/L
Sea water µg/L
Biota mg/kg
Zn 521) 607) 202) 12) – 4.94) 462)
Cu 14.31) – 532) 157) 72) 0.252) 302)
Ni 18.61) – 562) 52) 2.52) 0.52) 102)
Cr 351) – 932) 702) 12) 0.252) 502)
Pb 122) – 205) 122) 0.032) 1.02) 0.0082)
Sn 2.16) 37) < 0.58) 1.19)
Hg 0.042) 0.022) 0.072) 0.032) 0.22)
Cd 0.101) 0.352) 0.023) 0.072) 162)
As 1.81) 62) 43) 22) 32)
Au < 0.001 < 0.001 0.00110)
Pt < 0.001 < 0.001
Pd < 0.001 < 0.001
Rh < 0.001 < 0.001
Co 105) – 231) 82) 0.32) 0.024) 222)
Mo 1.41) 1.22) 0.53) 104) 12)
1) Wedepohl, 19952) Ivanov, 19963) Koljonen, 1992
4) Lide, 19965) Taylor&McLennan, 19956) Rudnick & Gao, 2003
7) Salminen, 20058) Neal and Robson, 20009) Kabata-Pendias, 2001
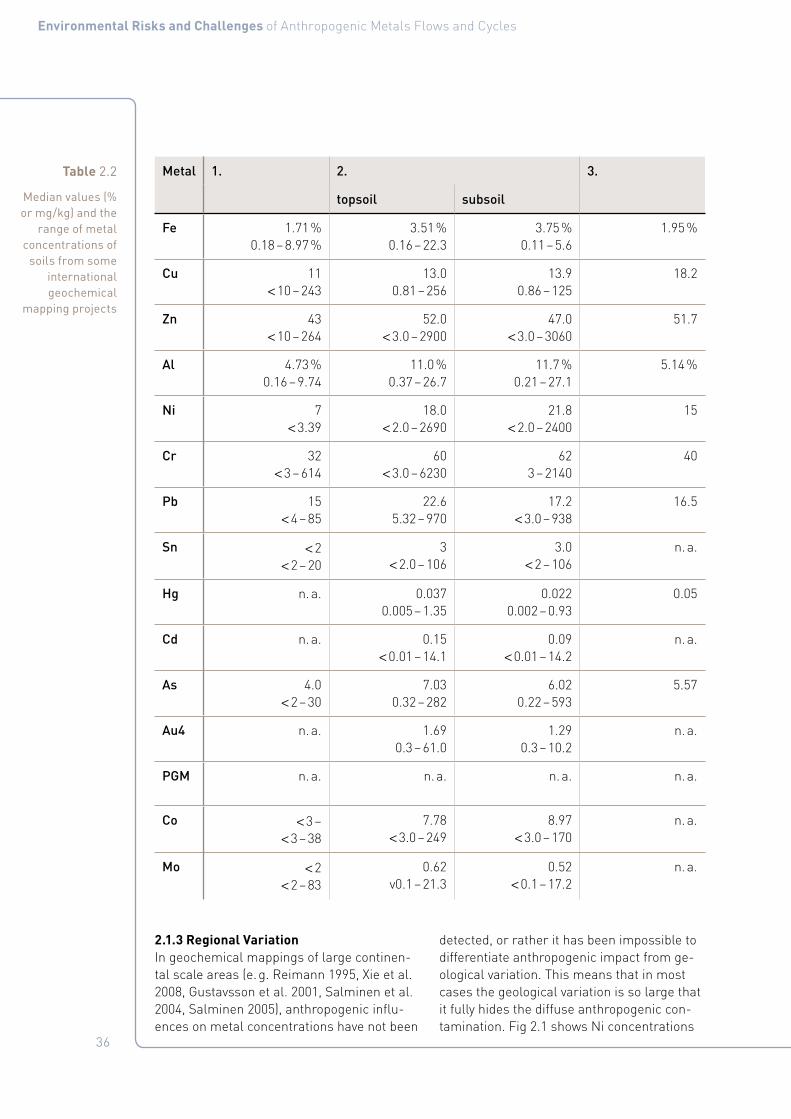
36
Environmental Risks and Challenges of Anthropogenic Metals Flows and Cycles
2.1.3 Regional VariationIn geochemical mappings of large continen-tal scale areas (e. g. Reimann 1995, Xie et al. 2008, Gustavsson et al. 2001, Salminen et al. 2004, Salminen 2005), anthropogenic influ-ences on metal concentrations have not been
detected, or rather it has been impossible to differentiate anthropogenic impact from ge-ological variation. This means that in most cases the geological variation is so large that it fully hides the diffuse anthropogenic con-tamination. Fig 2.1 shows Ni concentrations
Table 2.2
Median values (% or mg/kg) and the
range of metal concentrations of
soils from some international geochemical
mapping projects
Metal 1. 2. 3.
topsoil subsoil
Fe 1.71 % 0.18 – 8.97 %
3.51 % 0.16 – 22.3
3.75 % 0.11 – 5.6
1.95 %
Cu 11 < 10 – 243
13.0 0.81 – 256
13.9 0.86 – 125
18.2
Zn 43 < 10 – 264
52.0 < 3.0 – 2900
47.0 < 3.0 – 3060
51.7
Al 4.73 % 0.16 – 9.74
11.0 % 0.37 – 26.7
11.7 % 0.21 – 27.1
5.14 %
Ni 7 < 3.39
18.0 < 2.0 – 2690
21.8 < 2.0 – 2400
15
Cr 32 < 3 – 614
60 < 3.0 – 6230
62 3 – 2140
40
Pb 15 < 4 – 85
22.6 5.32 – 970
17.2 < 3.0 – 938
16.5
Sn < 2 < 2 – 20
3 < 2.0 – 106
3.0 < 2 – 106
n. a.
Hg n. a. 0.037 0.005 – 1.35
0.022 0.002 – 0.93
0.05
Cd n. a. 0.15 < 0.01 – 14.1
0.09 < 0.01 – 14.2
n. a.
As 4.0 < 2 – 30
7.03 0.32 – 282
6.02 0.22 – 593
5.57
Au4 n. a. 1.69 0.3 – 61.0
1.29 0.3 – 10.2
n. a.
PGM n. a. n. a. n. a. n. a.
Co < 3 – < 3 – 38
7.78 < 3.0 – 249
8.97 < 3.0 – 170
n. a.
Mo < 2 < 2 – 83
0.62 v0.1 – 21.3
0.52 < 0.1 – 17.2
n. a.

37
Environmental Risks and Challenges of Anthropogenic Metals Flows and Cycles
4
6
8
11
18
26
32
42
87
Nickel mg/kg
1000 Kilometers5000
Canary Islands
< 2
4
8
13
21
30
42
57
74
93
116
142
170
202
237
2690
of top soils in Europe. Low Ni values in north-ern Europe are due to the presence of glacio-genic deposits as soil parent material. Soil is often sandy and during glaciation processes the soil parent material was depleted in met-als. In the rest of Europe, soil parent mate-rial is most often composed of weathering products of the crust, and the exogenic geo-logical processes have not had such a strong influence on metal concentrations. High Ni concentrations in SE Europe are due to mafic and ultramafic intrusions. Fig. 2.2 shows the large variation of As ion top soils in the USA. This is aloso strongly controlled by the geo-logical formations of different age.
Figure 2.1
Ni concentration in the uppermost
25 cm minrogenic soil layer in Europe
according to the Geochemical
Atlas of Europe (Salminen, 2005).

38
Environmental Risks and Challenges of Anthropogenic Metals Flows and Cycles
11.0
10.2
9.5
8.9
8.3
7.7
7.2
6.7
6.3
5.8
5.4
5.1
4.7
4.4
4.1
3.8
3.6
3.3
3.1
Arsenic PPM
1000 Kilometers5000
In contrast to the regional scale, the influ-ence of emissions from point sources is of-ten strong and easily detectable at a short distance (up to tens of kilometres) from the source. The Ni smelters of the Kola Penin-sula are a good example. However, in some cases geological variation can also lead to values as high as those resulting from very strong anthropogenic contamination (see An-nex 1).
In many cases only a part of the metals in soils and bedrock are in the chemical form which make them biologically active. The amounts of metal that can be leached from mineral grains in soils and rocks are of-ten measured by strong acid extraction (e. g. aqua regia or 7M nitric acid). The actual bio-available concentration is sometime estimat-ed using extraction by weak acids such as acid ammonium acetate. Table 2.3 shows the percentage of metal that was leached from agricultural soil samples by aqua regia and by acid ammonium acetate extraction in the Baltic Sea region. In many cases less than one percent of metal was in extractable form. Differences between topsoil and bottom soil were small but in most cases metal extract-ability in top soil was a little bit higher. Arse-nic was an
exception: the bioavailable concentrations of top soil were not available, but in subsoil some 20 % was in extractable form.
Figure 2.2
Total As concentration of top soil samples
in the USA (Gustavsson et al., 2001).
Number of samples is 1323
representing sampling density
1 sample per 6000 km2.
Table 2.3
Percentage of metals extracted
by aqua regia (AR) and acid
ammonium acetate
(potentially bioavailable) in
agricultural top soil in Northern
Europe. (Data from Reimann et
al., 2003).
Metal AR Bioavailable
Fe 62.12 0.26
Cu 78.79 4.65
Zn 76.74 3.49
Al 14.29 0.18
Ni 80.81 1.01
Cr 37.50 0.41
Pb 49.41 3.88
Co 77.36 3.40

39
Environmental Risks and Challenges of Anthropogenic Metals Flows and Cycles
2.2 Natural Cycling of Metals
2.2.1 Biogeochemical CyclingHuman society uses many chemical com-pounds for the production of goods, health care and agriculture. These chemical com-
pounds can be either synthetically produced or be of natural origin. The latter group is mostly comprised of metals (including metal-loids like arsenic and antimony). These met-als are a part of a natural biogeochemical cy-cle of elements. Within this cycle the metals are exchanged between the geosphere, hy-drosphere and biosphere.
In this section we will give a short overview of the concepts of the biogeochemical cycle and how this cycle is altered by human ac-tivity. It will present common geochemical knowledge, rather than a complete scientific review.
Figure 2.3 depicts a conceptual overview of the cyclic processes in the earth’s crust and on its surface. Earth’s inner magma, con-taining many elements including metals, is brought to the surface as rocks by upheaval, outcropping and volcanic activity. Weathering
of these rocks releases the metals into the surface environment. The metals are trans-ported in and between compartments, like the ocean, the atmosphere, soils and ground-water. Finally they are deposited and buried again. Subsidence of these sediments to the Earth’s inner sphere completes the cycle.
When metals are part of the surface com-partments, they interact with the hydrosphere and biosphere. It is during this stage of the cycle that metals are part of the human en-vironment and biota in which they can have their beneficial and adverse effects.
Figure 2.3
The geological part of the
biogeochemical cycle (De Vos and Tarvainen, 2006)

40
Environmental Risks and Challenges of Anthropogenic Metals Flows and Cycles
2.2.2 ProcessesMetals can be mobilized when the geochemi-cal character of their environment changes. During the weathering metals are released by chemical, mechanical or biological pro-cesses. For example, the rocks exposed to rainwater, which is slightly acid by nature, are slowly chemically “dissolved”. Anoth-er example is the weathering as caused by plants. Their roots are mechanically “break-ing” rocks and by excreting acids and met-al chelators they slowly “dissolve” the rock matrix. Another mechanism of mobilization involves volatilization during volcanic activity. The hot vapours emitted from these volca-noes release metals to the atmosphere.
When metals are mobilized they are exposed to chemical processes such as oxidation and reduction, complexation and sorption. The oxidation state determines the fate and bio-logical significance of the metal. The form of a metal depends on the oxidation poten-tial, the pH and the chemical composition of the environment in which the metal occurs. Altering this environment can also alter the oxidation potential and as consequence the stable form, or speciation, of the metal. For instance, the reduction of organic litter can lower the oxidation potential, with the result that free metal ions are deposited as sulfides. Free metal ions can form complexes with other substances within the environment, for example complexes with dissolved or-ganic matter which enhance the solubility of the metals. Furthermore, metals can be ad-sorbed to particles, either as part of the solid phase or suspended in air or water. These complexation and adsorption reactions are two interacting processes.
When metals are part of the water phase, ei-ther in solution or adsorbed to suspended particles, or when they are volatilized or sus-pended in the atmosphere, they will be trans-ported over large distances and between the different reservoirs of the earth system.
2.2.3 Biological InteractionFor biotic systems the understanding of met-al speciation is important if one wants to look at the effects of the present metal concen-trations. For Zn, Cu and Cd we know that the bioavailability of metals is strongly related to the presence of the free metal ions in aque-ous solution. Metals adsorbed or complexed are in general not directly available for bio-logical uptake. Additionally, changes in the oxidation state (e. g. Cr (VI)) and interaction with micro-organisms (methylation of mercu-ry (CH3Hg)+ ) are processes which have a pro-found influence on bioavailability.
However, organisms have the ability to change the redox state of the metals. By changing the redox state, the speciation of the metals is changed as well. Hence, if or-ganisms can alter the speciation of the met-als in their immediate environment, they ad-ditionally alter the extent in which this metal is bioavailable. Many metals are required for the proper function of enzyme systems. However, they will be toxic when concentra-tions exceed the range for optimal function of these enzymes.
Another way biota can alter metal speciation, thus altering availability, is by changing their local environment. For example, bacteria have the ability to reduce the local environ-ment and change its redox state. This reduc-tion can lead to the formation of precipitates, e. g. sulfides, which decrease the concentra-tion of free metal ions. Bacteria can also re-duce the pH of solutions. The acidification enhances the dissolution rate of rock and lib-erates metal ions in solution.

41
Environmental Risks and Challenges of Anthropogenic Metals Flows and Cycles
2.2.4 Human InfluenceAs shown in the previous paragraph, metals are part of the natural biogeochemical cycle. That this cycle is significantly altered by hu-man interaction is no longer the subject of debate but is more or less regarded as fact. The uncertainty of this alteration lies in the extent of the human influence. Due to our limited understanding of the complex natu-ral processes, as mentioned above, and how they interact with anthropogenic alteration, and also the lack of a good global inventory for metals, it is difficult to make good predic-tions of the magnitude by which humans have changed the biogeochemical cycle.
Human activity alters this biogeochemical cy-cle in two ways, both interrelated. First we al-ter the rate at which metals become availa-ble, and second, we change the form in which the metals occur in our environment, i. e. their speciation. Humans isolate metals by mining and extraction from the earth crust. During the smelting and refining of these metals, many trace elements are collected in deposited waste and landfilled, suspended as dust in air, or volatilized in the vapor phase. The final product is also ‘released’ to the en-vironment. Almost every metal will degrade by corrosion when it is exposed to air and wa-ter, albeit at very slow rates. Therefore, many final products will very slowly degrade to a less useful form until they are disposed as waste, if not upgraded by, for example, recy-cling.
The form, or speciation, of metals is also al-tered by refining and producing metal based, or metal containing, products. For example, the use of tetraethyl lead as an anti-knock agent in gasoline was a source of lead to the environment. Another example is the release of copper-ions to soils as part of the Bor-deaux Mixture, a fungicide used during the growing of grapes. On the other hand, the al-loying of metals by humans greatly reduc-es their mobility. Changes in the environ-ment, as a result of human activity, can also alter the speciation of metals. For example groundwater extraction, for drinking water or agricultural purpose, can lower the ground-
water table. This results in a change of the redox environment. Subsequently elements, which were otherwise not available, can be released to ground- and surface water. For instance, the release of the metalloid arse-nic as a result of groundwater extraction is a great threat for human health in India, Bang-ladesh and Mongolia.
Another example is acidification of the en-vironment especially via acid precipitation. Watershed acidification can change the pH of soil and water and affect their speciation in aqueous solution (see e. g. Nelson and Campbell 1991).
Table 2.4
Ratio human cycle vs. natural
cycle according to various authors.
Metal Ayres (1996), from Galloway (1982)
Azar (1996)
Klee & Graedel, (2004)
Fe 1.4 8.9
Cu 14 24 5.9
Zn 23 8.3 0.9
Al 0.048 0.4
Ni 4 4.8 2.3
Cr 2 4.6 139
Pb 333 12 5.2
Sn 11 3.5
Hg 6.5 18.5
Cd 20 3.9 0.2
As 4 0.33 1.7
Au 504
Pt 1049
Pd 108
Rh 555
Co 0.1
Mo 8.5 0.3

42
Environmental Risks and Challenges of Anthropogenic Metals Flows and Cycles
The numbers in the Table 2.4 represent the ratio between human and natural mobiliza-tion of metals. Human cycling mainly is de-termined by the mining and fixing of the met-als in societal stocks, but also by the mining of fossil fuels and other resources where-in metals occur as contaminants. The num-bers are different, sometimes widely differ-ent, among the three sources. Possibly this is due to very large uncertainties in the data of the natural cycle, since the amount of mining is quite well documented over the years. Dif-ferences may also be found in the definition of “mobilization”. Another reason for the dif-ferences may be the time – the investigations span over two decades, and mining of met-als has significantly changed in that period. Different use patterns are also a likely rea-son since for most metals human extraction has increased over that period, while some of the ratios are considerably lower for the later years.
Differences aside, it can be concluded that for all metals in the list the human cycle is significant compared to the natural cycle, and in many cases the human transfer of metals is orders of magnitude larger. Especially for the precious metals, Au and the PGMs, the natural cycle is negligible compared to the human cycle.
The presence of a large human cycle does not necessarily imply large emissions to the environment, and certainly not equally large ones. As is concluded in the report on “Metal Stocks in Society” by the Global Metal Flows Working Group, most of the mined metals ac-cumulate in stocks in society. For the most part, these stocks are rather immobile, simi-lar to geological stocks. Nevertheless some dissipative applications and waste streams can represent large emissions of metals rela-tive to their natural cycles. Emissions of met-als will be treated in Chapter 3.

43
Environmental Risks and Challenges of Anthropogenic Metals Flows and Cycles
2.3 Behaviour of Anthropogenically released metals
2.3.1 Anthropogenic ContributionWhereas metals exist naturally in waters, soils, and sediments, emissions and accu-mulation from anthropogenic sources can vastly alter the concentrations of metals in the environment, relative to the natural back-ground.
This is particularly true for metals where the scale of anthropogenic mobilization is much higher than that of natural mobilization of metal. Klee and Graedel (2004) developed an index to compare these two rates. This global level assessment was extended to local con-ditions by Rauch (Rauch 2010), who mapped the level of anthropogenic or natural domi-nance for several base metals, for the entire globe (Figure 2.4).
One line of research on anthropogenic metal concentrations in the environment is based on substance flow analysis, or tracking a par-ticular metal as it flows through the econo-my and eventually into the environment. This research starts with an inventory of emis-
sions from metal sources (Pacyna and Pacy-na 2001, Nriagu 1979) and models how these metals will move through air, water, and soils, where metals will be deposited, and how this deposition will alter the baseline concentration of metals in the local environ-ment (see e. g. Guinée et al. 1999, Eckelman and Graedel 2007). Tracking metals in this way allows researchers to establish scenar-ios about future economic activities and es-timate how much metal pollution may occur, but this method also requires a large amount of information, particularly in creating an in-ventory of all anthropogenic sources of emis-sions. This line of research is followed up in Chapter 3.
The other, much larger and well-established field of scientific analysis of anthropogenic metal concentrations has worked in the op-posite direction: from sink to source. Sam-
ples are taken in different locations where metal concentrations are particularly high relative to background levels, such as sedi-ments near coastal cities, and then modeling is used to try to discover the time and place that the original metal emissions took place
Figure 2.4
Dominance of anthropogenic
(red) versus natural (green)
mobilization globally for iron on a 1º x 1º grid
(Rauch, 2010).
-6.1 – -1
-1 – -0.1
-0.1 – 0.1
0.1 – 1
1 – 6.9
Fe K-G Index

44
Environmental Risks and Challenges of Anthropogenic Metals Flows and Cycles
(Förstner et al. 1979). In examining histori-cal emissions of metal, researchers have looked at the concentrations of metals in ice cores, peat bogs, and aquatic sediments as a historical record of anthropogenic emis-sions of metal (Nriagu 1996). A famous study of lead looked at concentrations in ice cores from Greenland to show that during the times of the Roman Empire, smelters producing the metal emitted enough lead to increase concentrations in the Northern Hemisphere to more than four times background levels. Lead levels in ice collapsed with the empire, rising again markedly with the dawn of in-dustrialization and peaking in the 1970s, then declining as lead was phased out of gasoline/petrol and other products (Murozomi et al. 1969; Nriagu 1996).
More recent research has made use of com-plex fate and transport computer models, starting with measurements of metal dep-osition or concentrations, and running the model backwards to determine the origi-nal sources of the emissions. This method has been used in particular to study the at-mospheric emissions of mercury (Jaffe and Strode 2008, Selin and Jacob 2008).
In summary, metals are part of the natural biogeochemical cycle and play an important role in the industrialized human society. Hu-man activity alters this biogeochemical cycle by increasing the rate in which some met-als become available together with processes which alter the form in which metals are pre-sent in the environment. That human activity has its influence on the biogeochemical cycle is generally accepted. However, the uncer-tainties in the extent to which the cycle is in-fluenced are still under scrutiny.
2.3.2 Environmental Properties of MetalsThe initial measurements of contaminants during site investigations are usually to-tal concentrations of contaminants. Results from daily practice show that a certain level of metal contamination can be toxic and pre-sent a significant risk, while at the same to-tal level but under different conditions, met-al contamination may prove to be harmless (Sauvé et al. 2000). This shows that bioavail-ability cannot simply be defined in one term, because it is a composite concept. In 2002 the United States of America National Re-search Council published a report on bioa-vailability on soils (National Research Coun-cil, 2002) which was usefully summarized by Ehlers and Luthy (2003). The report notes that the term bioavailability has been defined by various disciplines and goes on to state that this has led to some confusion over the term and that therefore further definitions will be avoided. Instead the report focuses on bioavailability processes, which are the bio-logical, chemical and physical processes that result in an organism being exposed to a con-taminant present in the soil. These process-es are: release of the contaminant from the solid phase, transport of the contaminant to and across a biological membrane and, in-corporation into a living organism. To create an unequivocal understanding of metal bio-availability, it is separated into three specified processes (Dickson et al. 1994): chemical, biological and toxicological availability. This is elaborated further in Annex 2. In all three steps of the metal bioavailability process, metals can occur in available and non-avail-able forms. The partitioning of metals among the different phases, solid versus soluble, is specific for each metal species and depend-ent on many soil and pore water properties and organism-specific characteristics (e. g. abilities of uptake, uptake routes, detoxifica-tion and excretion strategies).

45
Environmental Risks and Challenges of Anthropogenic Metals Flows and Cycles
2.4 ERA, No-effect Levels, Optimal Levels, Deficiency Levels, and Acceptable Levels.
2.4.1 Environmental Risk AssessmentThe standard for Environmental Risk As-sessment in the EU is based on a number of EU regulations, brought together within the framework of REACH (European Com-mission, 2006). Commission Regulation (EC) 1488/94 (EC, 1994a) which is supported by a Technical Guidance Document-TGD (part 2, European Commission, 2003) sets out the methods for carrying out an EU risk assess-ment. In short, the Technical Guidance Docu-ment describes how ecotoxicological (effect) data and measured and/or modeled expo-sure concentrations should be derived. This approach yields the so-called PEC/PNEC-ratio in which PEC = Predicted Environmen-tal Concentration and PNEC = Predicted No Effect Concentration. If the PEC/PNEC-ratio is larger than 1, it is assumed that there is a potential risk of adverse effects. PNECs are primarily derived on the basis of laborato-ry generated toxicity data. Depending on the number of species and the number of trophic levels for which experimental data are avail-able, variable safety factors are used to derive PNECs (see Table 2.5).
The table shows that the magnitude of the safety factor takes into consideration the quantity of data available for a substance. Safety factors are a tool to deal with uncer-tainty that exists when extrapolating from a limited data set to potential effect levels in an ecosystem. The table follows the gener-al principle that availability of more and high quality data reduces uncertainty, and thus al-lows for a lowering of the safety factor. Within the EU Water Framework Directive (WFD), in its Annex V section 1.2.6. “Procedure for the setting of chemical quality standards by Member States”, the same approach is given to obtain safety assessment factors for set-ting environmental quality standards for the surface waters.
Within the EU-framework much effort is put into the preparation of Risk Assessment Re-ports (RARs) for individual priority substanc-es. Basically, the procedures described in the TGD for the preparation of the RARs are designed to assess (hydrophobic) organic compounds. Polar organic, ionized organic acids and bases, polymers, as well as met-als and metalloids require case by case con-siderations to optimize the risk assessment of these compounds and to ensure that the basic philosophy behind the procedures de-Table 2.5
Proposed safety factors to correct
for a lack of sufficient toxicity
data to derive PNECs. The
safety factors are intended to
compensate for the uncertainty
in the PNEC-assessment
generated by a lack of reliable
experimental toxicity data
(modified from TGD ) (Data
from European Commission,
2006).
Available data Safety factor
≥ 1 acute EC50 from each of 3 trophic levels 1000
1 chronic NOEC (either fish, daphnid, or representative organisms for saline waters), additional to the 3 acute EC50
100
2 chronic NOECs from species representing 2 trophic levels, additional to the 3 acute EC50
50
Chronic NOECs from ≥ 3 species representing 3 trophic levels, additional to the 3 acute EC50
10
Other cases, which allow more precise safety factors to be calculated and applied
1 – 5

46
Environmental Risks and Challenges of Anthropogenic Metals Flows and Cycles
scribed in the TGD, and meant to protect man and the environment, are met with sufficient certainty. This requires amongst other con-siderations the application of compound-spe-cific models to predict adverse effects and actual exposure of man and biota. In the case of metals, one of the promising models for use in the risk assessment procedures is the Biotic Ligand Model (BLM). The Biotic Ligand Model can be used to predict metal toxic-ity on the basis of metal speciation in aquatic systems. Binding constants on the epithelial surface of the organisms are derived, and re-lated to acute or chronic effects.
BLMs have been used in the metal risk as-sessment reports to derive PEC/PNEC ratios that are corrected for bioavailability on either the PEC-side or the PNEC-side. As a matter of course, information on the water charac-teristics of the specific water body, as well as well-documented information on the media in which aquatic toxicity testing was conduct-ed, need to be available to enable proper im-plementation of the bioavailability correction
by means of BLMs. BLM-normalized toxic-ity data can then be used further to construct the Species Sensitivity distribution (SSD) and to derive the site-specific effect concentra-tions. BLMs thus allow comparison of the PEC-bioavailable directly to the PNEC-bioa-vailable, normalized to the same geochemi-cal conditions. Following the TGD (2003), the PNEC is taken as the HC5 (Hazardous Con-centration at which 95 % of the species in an ecosystem are assumed to be protect-ed against the adverse effects of the chemi-cal) divided by the safety factor. As this HC5 is based on a limited number of toxicity data, a number of additional uncertainties may exist.
2.4.2 Natural Concentrations versus Acceptable LevelsDefined action limits of metal concentrations in soils and waters are needed for practical operations. However, these limit values of metal concentrations defined in the legisla-tion vary greatly from country to country. For certain single elements, the difference may by even an order of magnitude. The legis-

47
Environmental Risks and Challenges of Anthropogenic Metals Flows and Cycles
lation is evolving all the time, as more rel-evant information becomes available. Thus comparison between natural concentrations of metals and acceptable levels defined by the authorities is difficult. One of the new-est legislations comes from Finland where a new Decree was accepted in 2007 (the Gov-ernment Decree on the Assessment of Soil Contamination and Remediation Needs, 214/2007). It was preceded by a twenty years discussion among the authorities, scientists and different interest groups. Finally, in addi-tion to strict action limits, a risk assessment plays a very strong role in defining the con-tamination degree of soil. The threshold and guideline values are based on a risk assess-ment carried out on a general level, in which various reference values for soil concentra-tions are derived, describing both negligible and maximum acceptable risks to the envi-ronment and human health. Furthermore, a register of local natural background val-ues should be created to support local risk assessment, and especially to determine whether cleaning up a site makes sense (Reinikainen 2007).
As an example, in Table 2.6 the action limits for metals included in the Finnish Decree
are compared with the data from Geochemi-cal Atlas of Europe (Salminen et al. 2005). On a European scale, the most problematic element is arsenic, for which half of the ob-served natural values are higher than the threshold value. Additionally, there are rather large regions with too high As values in many countries. It has been estimated that about 60 – 100 million people in India and Bangla-desh are currently at risk as a result of drink-ing arsenic-contaminated waters. Arsenico-sis is also prevalent in certain areas of PR China (Xinjiang, Inner Mongolia and Taiwan Province of China), Vietnam and recently Ne-pal. For these endemic areas, the major ar-senic exposure pathway is believed to be from drinking contaminated groundwater whereas the contribution of arsenic from food is rela-tively low (Ng et al., 2003).
For the other elements, natural concentra-tion values higher than the given action levels represent scattered single sites. In soils, the least problematic metal is mercury, although in aquatic environment it is ranked as one of the most problematic metals. However, the maximum observed natural values for each element are much higher than the given ac-tion limits.
Table 2.6
Threshold and guide values
(mg/kg) from the Finnish
legislation for contaminated soil (Decree 214/2007)
and aqua regia extractable
(recommended analytical method
by the Decree) median, 90th
percentile and maximum values
of European top soil (Salminen
et al., 2005). Values of Sb, As and Hg are total concentrations
Element Thresh-old value
Lower guide value
Higher guide value
Topsoil Europe
Median Value of the 90th percentile
Maximum
Arsenic (As) 5 50 100 5.0 20 562
Mercury (Hg) 0.5 2 5 0.04 0.1 1.35
Cadmium (Cd) 1 10 20 0.15 0.48 14.1
Cobalt (Co) 20 100 250 7.0 17.0 255
Chromium (Cr) 100 200 300 22 53 2340
Copper (Cu) 100 150 200 12 33 239
Lead (Pb) 60 200 750 15 38 886
Nickel (Ni) 50 100 150 14 41 2560
Zinc (Zn) 200 250 400 48 96 2270

48
Environmental Risks and Challenges of Anthropogenic Metals Flows and Cycles
2.4.3 EssentialityMany metals and metalloids are required for biological life, and therefore their presence in the ambient environment has actually shaped the natural ecosystem. The metals that are classified as being essential to flora and fau-na are given in table 2.7.
Bioaccumulation of essential metals is a natural process required by living organisms for metabolism and growth. Many organisms have developed effective means of regulating internal essential metal concentrations with-in quite narrow ranges (homeostasis). Home-ostatic mechanisms (such as induction of
stress proteins) can even play a role in the detoxification of non-essential metals such as Cd, Pb, or Hg. In terms of adverse effects, it is accepted that essentiality should be viewed as part of the overall dose-response relationship, recognizing that the shape of this relationship can vary among organisms
and for given subpopulations. In this respect, the principle of optimal concentration range of essential elements (OCEE) is advocated, as graphically shown in Figure 2.5.
Table 2.7
Classification of metals by
their status as essential element
(Adapted from EPA, 2007).
Metal Essential (known requirement for health and function)
Beneficial (but not known to be essential)
Nonessential (and not known to be beneficial)
Plants Animals Plants Animals
Al X
As X
Ba X
Cd X
Cr X
Co X X
Cu X X
Pb X
Mn X X
Hg X
Mo X X
Ni X X
Se X X
Ag X
V X
Zn X X

49
Environmental Risks and Challenges of Anthropogenic Metals Flows and Cycles
The inner envelope of these curves represents the No Risk Area (NRA) for that given environment in which all organ-isms are protected from both toxicity and deficiency.
This principle states that ecosystem func-tioning is impaired both below and above the OCEE. Impairment of ecosystem functioning is further complicated by evolutionary pro-cesses, which may shift the OCEE. Evolution is contingent upon genetic variability and en-vironmental conditions, and as populations are not genetically homogeneous across their distribution ranges, they can locally undergo evolutionary processes that result in modi-fied dose-response relationships (Morgan and Morgan 1988). Two generic mechanisms may be identified by which organisms cope with excessive metal burdens in their native (non-disturbed) habitat: adaptation and accli-mation. Adaptation involves heritable, geneti-cally determined, induced resistance result-ing from directional selection during mul-tigenerational exposure histories. Acclima-tion results from stress responses during the lifetime of an individual, the traits of which may be lost if the stressor is withdrawn. To further complicate and complete the picture, it should be kept in mind that the toxicity of certain metal elements is associated with
deficiency of other elements. For example, increased Zn, Cu, and Ni toxicity can be as-sociated with Fe deficiency (Saxe et al. 2001), and increased Pb and Zn toxicity can be re-lated to P deficiency (Jager et al. 2003, Vijver et al. 2003; Didden 2003). Also, the behavior of plant species in response to nutrient de-ficiencies varies, and this behavior can af-fect the uptake of metal elements (Løkke and Van Gestel 1998). All these factors need to be taken into consideration when assessing the impact of chemical interactions of metals at background levels with biotic species.
Figure 2.5
Hypothetical presentation of
the OCEE curves of all individual
organisms in a given
environment (adapted from
Waeterschoot et al. 2003).
Optimal Conditions for Life
0.005 0.05 0.5 5 50 500 5000
NRA Zn
Fresh Water
Dissolved Zn, µg/l

50
Environmental Risks and Challenges of Anthropogenic Metals Flows and Cycles
2.5 Effects of Metals in the Environment
There are two main sources of metals in the environment: (i) natural (geologic, biologic) and (ii) anthropogenic. The natural factors, also called diffuse dispersion of metals, in-fluence everywhere varying much from place to place. High impacts of anthropogenic met-al pollution on local environments have been detected in restricted areas surrounding sources such as abandoned mine sites, the refining industry and other human activities which produce metal emissions.
2.5.1 Effects of Metals on Ecosystems
Calculation of Toxic Pressure on EcosystemsToxic effects of chemical substances on eco-systems are commonly expressed in terms of their combined toxic pressure, which meas-ures the fraction of species that is exposed to harmful concentrations. As explained in the standard work by Posthuma et al. (2002),
toxic pressure calculation makes use of SSD of toxic chemicals. Not all biological species are equally sensitive to a chemical, so that the toxic impact of a chemical on different species can be represented by a statistical (cumulative) distribution function of ecotoxic-ity test results: the Species Sensitivity Distri-bution (SSD), generally assumed log-normal.
Log-normal SSDs are characterized by the average toxicity (expressed as log(NOEC) or log(EC50)) of all tested species and the standard deviation. Cumulative SSDs express the fraction of species Fc with a sensitivity to the chemical greater than a certain concen-tration value c, and can be used to find the fraction of species for which a given concen-tration in the environment exceeds a critical effect level (Figure 2.6). This is the so-called Potentially Affected Fraction of species. PAF is referred to as the toxic pressure that the concentration of the chemical in the environ-ment exerts on the ecosystem. A higher PAF implies a higher fraction of potentially affect-ed species.
Figure 2.6
Use of a cumulative
Species Sensitivity
Distribution function to derive
the toxic pressure PAF for a given
concentration C of a certain metal (Posthuma et al.,
2002).
0.0
0.2
0.4
0.6
0.8
1.0
NOEC data
Species Sensitivity Distribution
543210-1-2-3
Cumulative probability
Log Concentration (mg.kg-1)
HazardAssessment PAF
EQC HC5
The other use, to set Environmental Quality Criteria (EQC) for toxic compounds is also given, yielding the Hazardous Concen-tration for 5 % of the species (HC5). Note that the acute SSD of a compound is positioned to the right of the chronic SSD of the same compound. Though compound-specific shifts can be determined, a gross pattern is that the acute SSD is shifted one log-unit to the right (a factor of 10).

51
Environmental Risks and Challenges of Anthropogenic Metals Flows and Cycles
Toxic pressure has been demonstrated to re-late closely to biodiversity. Posthuma and De Zwart (2006) studied the association between predicted acute toxic pressures and species loss in surface water samples, and found that mixture-associated species loss was asso-ciated with predicted acute toxic pressures. The same authors (Posthuma et al., 2011) further studied the direct association be-tween predicted and observed fractions of affected species in differently contaminated sediment sites. Predicted and observed frac-tions of species appeared to co-vary closely. Hence, toxic pressure values provide insight into the fraction of species being affected in the field.
SSDs can be based on chronic NOECs (of-ten used for setting environmental qual-ity standards e. g. in the Netherlands) or on acute EC50s (proposed use for e. g. calcu-lating Ecotoxicity Effect Factors in Life Cycle Impact Assessment) or other test endpoints, expressing different levels of ecotoxic impact. By virtue of choice, SSDs can thus be tailored to the risk assessment context. Acute toxic pressures show the clearest association be-tween toxic pressure and fractions of species affected. Toxic pressure data can be used for ranking and mapping of expected impact lev-els, e. g. on the European or national scale (Figures 2.7 and 2.8).
Toxic pressure can be determined per chem-ical (for one chemical compound; single-substance PAF or ssPAF), or for a number of chemicals combined (multiple chemicals, e. g. all metals in soil; multi-substance PAF or msPAF). Aggregation of toxic pressures over compounds is obtained using classical mixture toxicity models, related to modes of action of the chemicals (De Zwart and Post-huma, 2006).
Toxic pressure calculation is informative in terms of risks or expected impacts when the toxic pressure is derived not from total con-centrations, but from reactive or even bio-available concentrations in the environment. Spijker et al. (2011a) and Mol et al. (2010, in prep.) have shown that the man-made “en-
richment” can be directly estimated using the 0.43 M HNO3-extractable fraction of met-als in top soils. Toxic pressures derived with this fraction reflect the upper estimate of the man-induced increase of local toxic pressure. De Vries et al. (2007) and Posch and De Vries (2009) have demonstrated how relevant con-centrations of metals in top soil can be relat-ed to rates of atmospheric deposition, which, in turn, can be related to release rates of metals to the environment.
Below, an example is provided to show the spatial variability and variance of risks and impacts of man-induced metal exposures in soils resulting from diffuse emissions. Simi-lar assessments can be made for aquatic and sediment systems. Note that toxic pressures calculated for point sources and dump sites are substantially higher, and are not present-ed here. Note further, that one of the uncer-tainties in the methodology is the exposure assessment of metals. Major differences in exposure level at the same total concentra-tion may occur due to substrate character-istics. Given these uncertainties, toxic pres-sures provide an indication of relative hazard differences amongst compounds or amongst contaminated environmental samples.
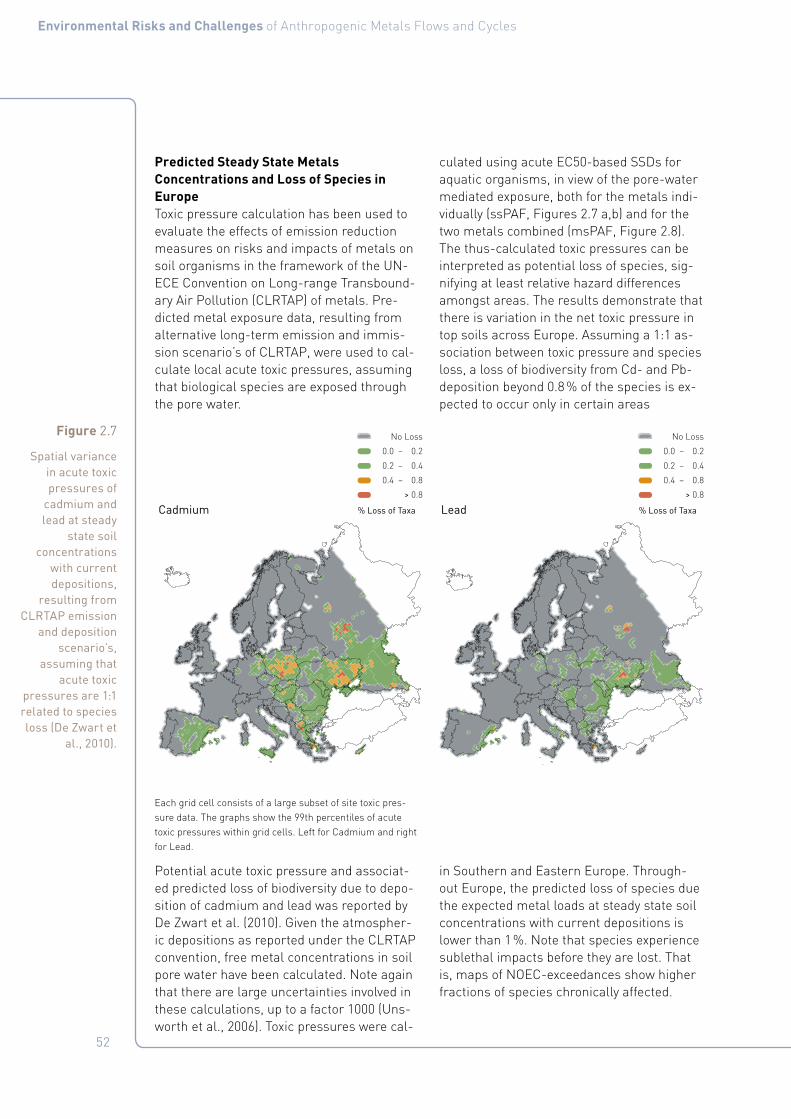
52
Environmental Risks and Challenges of Anthropogenic Metals Flows and Cycles
Predicted Steady State Metals Concentrations and Loss of Species in EuropeToxic pressure calculation has been used to evaluate the effects of emission reduction measures on risks and impacts of metals on soil organisms in the framework of the UN-ECE Convention on Long-range Transbound-ary Air Pollution (CLRTAP) of metals. Pre-dicted metal exposure data, resulting from alternative long-term emission and immis-sion scenario’s of CLRTAP, were used to cal-culate local acute toxic pressures, assuming that biological species are exposed through the pore water.
Each grid cell consists of a large subset of site toxic pres-sure data. The graphs show the 99th percentiles of acute toxic pressures within grid cells. Left for Cadmium and right for Lead.
Potential acute toxic pressure and associat-ed predicted loss of biodiversity due to depo-sition of cadmium and lead was reported by De Zwart et al. (2010). Given the atmospher-ic depositions as reported under the CLRTAP convention, free metal concentrations in soil pore water have been calculated. Note again that there are large uncertainties involved in these calculations, up to a factor 1000 (Uns-worth et al., 2006). Toxic pressures were cal-
culated using acute EC50-based SSDs for aquatic organisms, in view of the pore-water mediated exposure, both for the metals indi-vidually (ssPAF, Figures 2.7 a,b) and for the two metals combined (msPAF, Figure 2.8). The thus-calculated toxic pressures can be interpreted as potential loss of species, sig-nifying at least relative hazard differences amongst areas. The results demonstrate that there is variation in the net toxic pressure in top soils across Europe. Assuming a 1:1 as-sociation between toxic pressure and species loss, a loss of biodiversity from Cd- and Pb-deposition beyond 0.8 % of the species is ex-pected to occur only in certain areas
in Southern and Eastern Europe. Through-out Europe, the predicted loss of species due the expected metal loads at steady state soil concentrations with current depositions is lower than 1 %. Note that species experience sublethal impacts before they are lost. That is, maps of NOEC-exceedances show higher fractions of species chronically affected.
Figure 2.7
Spatial variance in acute toxic pressures of
cadmium and lead at steady
state soil concentrations
with current depositions,
resulting from CLRTAP emission
and deposition scenario’s,
assuming that acute toxic
pressures are 1:1 related to species loss (De Zwart et
al., 2010).
% Loss of Taxa
No Loss
0.0 – 0.2
0.2 – 0.4
0.4 – 0.8
> 0.8
% Loss of Taxa
No Loss
0.0 – 0.2
0.2 – 0.4
0.4 – 0.8
> 0.8
Cadmium/Lead
LeadCadmium % Loss of Taxa
No Loss
0.0 – 0.2
0.2 – 0.4
0.4 – 0.8
> 0.8

53
Environmental Risks and Challenges of Anthropogenic Metals Flows and Cycles
2.5.2 Potential Impacts of Metals on Health and Environment, Local and GlobalThe impacts of metals on health differ greatly depending on the metal and also the region or country. Perhaps the most important fac-tor is the natural environment or local and regional geology (bedrock, soils and water). This is often referred to as the forgotten half of environmental medicine affecting almost all people on the globe. Therefore a discipline named medical geology has developed in re-cent years involving geoscientists, toxicolo-gists, epidemiologists, pathologists, biolo-gists and others. Medical geology involves the study of the relationship between natural ge-ological factors and health problems in man and animals, and of the influence of ordinary environmental factors on the geographical distribution of such health problems. Medical geology is therefore a broad and complicated subject, which requires interdisciplinary con-tributions from different scientific fields if the problems are to be understood, mitigated or resolved.
Metals are naturally present in the environ-ment, and most of them are essential to bio-logical function. Living organisms get the metals needed for their biological functions in the diet and drinking water. Sometimes there is a lack of some essential metal, e. g. iron, and we need to add it for maintaining full health. Sometimes metals in the envi-ronment constitute one category of threats to human or ecosystem health. Sometimes one finds places were metals naturally are so abundant that they reach toxic levels and the places themselves are dangerous for hu-mans. As potentially toxic we understand metals whose effects are harmful to living organisms and, of course, to people. Metals appear in several forms often with vastly dif-ferent biological effects, as will be stressed below under lead. Metals in organo-metallic compounds are often even more toxic than dissolved inorganic metal ions. Metals, since they are chemical elements, never degrade, which means they cannot be broken down or metabolized and in this way disappear. They can be washed out, be part of waste, stored in landfills or incorporated into harmless mineral forms, but they still remain in the environment.
Figure 2.8
Similar to Figure 2.7, but now
with the 99th percentile of
predicted loss of species at steady
state with current depositions for
the combined effect of cadmium
and lead (De Zwart et al.,
2010).
% Loss of Taxa
No Loss
0.0 – 0.2
0.2 – 0.4
0.4 – 0.8
> 0.8
% Loss of Taxa
No Loss
0.0 – 0.2
0.2 – 0.4
0.4 – 0.8
> 0.8
Cadmium/Lead
LeadCadmium % Loss of Taxa
No Loss
0.0 – 0.2
0.2 – 0.4
0.4 – 0.8
> 0.8

54
Environmental Risks and Challenges of Anthropogenic Metals Flows and Cycles
Most of the metals discussed in the current report are essential in different amounts for biological functions of organisms (e. g., co-balt, copper, manganese, molybdenum, zinc, nickel, and vanadium). They are so called mi-cronutrients. At high concentrations, how-ever, all metals negatively influence organ-isms. The large scale introduction of metals in society, the technosphere, and eventually into the biosphere, has in some cases given rise to toxic effects. Cadmium, mercury, lead, copper, and other metals have all been con-nected to various toxic effects in living organ-isms. Of these, arsenic, mercury, cadmium and lead do not seem to serve any biological functions in living organisms (this is how-ever a matter of discussion). Table 2.8 illus-trates the fact that most elements can cause diseases either they are too low or too high in concentrations.
In the living cells metals are bound to pro-teins, where they serve specific functions as components in e. g. enzymes. The copper and iron atoms in proteins give the cells their ca-
pacity e. g. to bind and transport oxygen and to oxidize the food, and thus serve key func-tions in the energy metabolism of the cells. Zinc serves as catalyst in enzymes that are active in the buildup of the hereditary materi-al, DNA. Special metals such as molybdenum and manganese have key tasks in photosyn-thesis and nitrogen metabolism. In all cases metal ions bind to oxygen, nitrogen or sul-phur atoms. When metals are causing toxic effects they also then bind to proteins but in ways that block the function of the target pro-teins. It is again their affinity for the oxygen, nitrogen or sulphur atoms in proteins that explains the toxicity.
In Annex 3, effects of both deficiencies and overdoses of metals on human health are de-scribed in more detail.
Table 2.8
Diseases at state of deficiency respectively
toxicity caused by the same
element (selected elements) (Data from Selinus et
al., 2005).
Element Deficiency Toxicity
Iron Anaemia Haemochromatosis
Copper Anaemia, ”Sway back“ Chronic copper poisoning, Wilson-, Bedlington-disease
Zinc Dwarf growth, Retarded development of gonads, Akrodermatitis entero pathica
Metallic fever, Diarrhoea
Cobalt Anaemia, ”White liver disease“
Heart failure, Polycythaemia
Magnesium Dysfunction of gonads, Convulsions, Malformations of the skeleton, Urolithiasis
Ataxia
Chromium Disturbances in the glucose metabolism
Kidney damage(Nephritis)
Selenium Liver nechrosis, Muscular dystrophy (”White muscle disease“)
”Alkali disease“, ”Blind staggers“
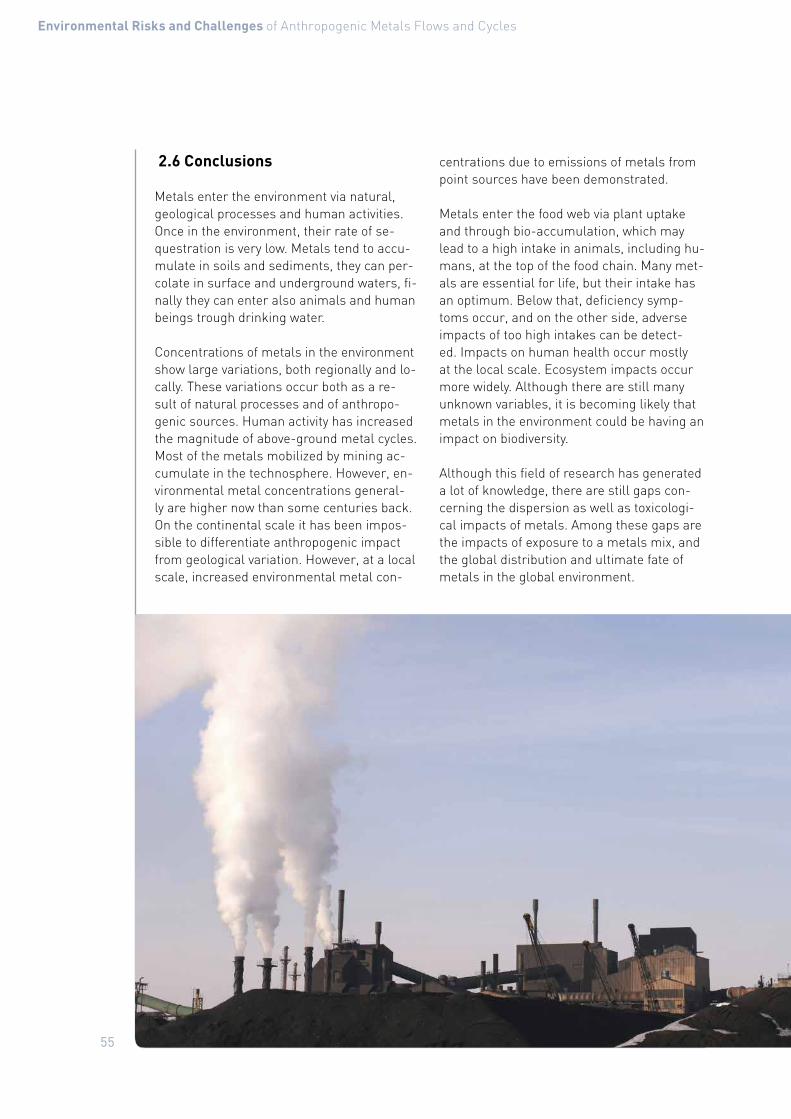
55
Environmental Risks and Challenges of Anthropogenic Metals Flows and Cycles
2.6 Conclusions
Metals enter the environment via natural, geological processes and human activities. Once in the environment, their rate of se-questration is very low. Metals tend to accu-mulate in soils and sediments, they can per-colate in surface and underground waters, fi-nally they can enter also animals and human beings trough drinking water.
Concentrations of metals in the environment show large variations, both regionally and lo-cally. These variations occur both as a re-sult of natural processes and of anthropo-genic sources. Human activity has increased the magnitude of above-ground metal cycles. Most of the metals mobilized by mining ac-cumulate in the technosphere. However, en-vironmental metal concentrations general-ly are higher now than some centuries back. On the continental scale it has been impos-sible to differentiate anthropogenic impact from geological variation. However, at a local scale, increased environmental metal con-
centrations due to emissions of metals from point sources have been demonstrated.
Metals enter the food web via plant uptake and through bio-accumulation, which may lead to a high intake in animals, including hu-mans, at the top of the food chain. Many met-als are essential for life, but their intake has an optimum. Below that, deficiency symp-toms occur, and on the other side, adverse impacts of too high intakes can be detect-ed. Impacts on human health occur mostly at the local scale. Ecosystem impacts occur more widely. Although there are still many unknown variables, it is becoming likely that metals in the environment could be having an impact on biodiversity.
Although this field of research has generated a lot of knowledge, there are still gaps con-cerning the dispersion as well as toxicologi-cal impacts of metals. Among these gaps are the impacts of exposure to a metals mix, and the global distribution and ultimate fate of metals in the global environment.

56
Environmental Risks and Challenges of Anthropogenic Metals Flows and Cycles

57
Environmental Risks and Challenges of Anthropogenic Metals Flows and Cycles
3. Metals in society: sources of metals emissionsAuthors: Ester van der Voet, Gavin Mudd, Reijo Salminen
3.1 Applications of metals
Metals have a wide variety of applications, re-lated to their unique properties. Among oth-ers, their electrical and thermal conductivity, their malleability, their luster and density are properties that make them valuable and suit-able for certain applications. An overview is given in Annex 4. These applications are cru-cial for the functioning of our present society. When considering possibilities to reduce the use of metals in general, and specific metals in particular, substitutability is an important issue. In some of the applications, metals can be replaced by other materials easily, but in many, substitution is difficult, or the substi-tute will be another metal. This puts some boundaries on options to reduce emissions (see Section 3.6).
The applications themselves, as well as the upstream processes of mining, refining and manufacturing, and the downstream pro-cesses of waste management, cause emis-sions of metals to the environment. These emissions are the subject of Chapter 3. In Section 3.2, investigations of stocks and flows of metals will be discussed. In Section 3.3, the emissions related to those stocks and flows are treated. Section 3.4 describes emissions from legacy contaminations. Sec-tion 3.5 discusses some expectations for fu-ture developments in metal emissions. In Section 3.6 options to reduce emissions are treated. Emissions of other substances in the life cycle, such as GHG emissions, particulate matter (PM, SOx, NOx and many others), as well as impacts on land, water and biodiver-sity are discussed in Chapter 5.
3.2 Stocks and flows of metals in society
As established in Chapter 2, humans mo-bilize metals in large quantities. The natu-ral cycles in many cases are dwarfed by the anthropogenic flows. This is not necessarily related to large emissions and environmen-tal problems. In this chapter, the relation be-tween anthropogenic metal cycles and the environmental flows of metals is explored. Other impacts related to the anthropogenic metals cycles, for example due to the use of energy or the landscape impacts of mining, are treated in Chapters 4 and 5.
The various main minerals are described by the Metal Wheel as depicted in Figure 3.1, presented by the inner circle. These main minerals are always associated with a suite of minor elements as shown. Some of these have high value and some (presently) little, but due to evolving technology this is con-stantly changing. The metallurgical industry is in a constant process of optimizing the ex-tractive metallurgy of the elements consider-ing thermodynamics, technology and eco-nomics. The metallurgical infrastructure and this deep knowledge reflected by the Metal Wheel makes the recovery of these elements possible. The outside ring shows those ele-ments that ultimately report to the low value benign residues that are an inevitable prod-uct of any metal production. While many of the valuable metals are recovered in suitable systems if Best Available Technology is used, the residues deport some of these elements as is dictated by thermodynamics, physics and the applied technological limitations. If the containment of the residues of the green ring is not done well, this has an impact on the environment and is a main topic of dis-cussion in this document. Therefore suc-cinctly this diagram shows that if one needs indium, germanium, gallium, PGMs for sus-tainability enabling products one has to mine certain base metals represented by the inner carrier circle. This obviously has environmen-tal impacts if the deportment of elements to the green circle is not well controlled. This shows clearly that the linkages are complex

58
Environmental Risks and Challenges of Anthropogenic Metals Flows and Cycles
and have to be well understood to optimize the complete system and hence to drive Re-source Efficiency.
A large number of publications exists with re-gard to individual anthropogenic metals cy-cles, in the tradition of material flow analy-sis (MFA) or rather substance flow analysis (SFA). Metals covered in those assessments are Fe, Al, Cu, Zn, Pb, Cr, Ni, Cd, Hg, Sb, Ag, Mo, Mn, W and PGMs (Graedel et al., 2004;
Chen et al., 2001; Daigo et al., 2007; Daigo et al., 2009; Daigo et al., 2010; DeMarco et al., 2005; Elshkaki, 2007; Geyer et al., 2007; Gor-
don et al., 2003; Gordon et al., 2004; Graedel et al., 2002; Graedel et al., 2005; Guo et al., 2010; Guo & Song, 2008; Harpel & Graedel, 2008; Hatayama et al., 2010; Igarashi et al., 2007; Izard & Müller, 2007; Johnson et al., 2005; Kapur, 2006; Kapur et al., 2003; Lan-zano et al., 2006; Mao et al., 2008; Nakajima
Figure 3.1
The Metal Wheel, showing carrier
metals and their co-elements as
they occur in ores naturally (Reuter
et al, 2005)
Carrier metalsBulk metals, generally of lower value
Co-elements that have considerable own production infrastructureValuable to high economic value; some used in high tech applications
Co-elements that have no, or limited own production infrastructureMostly highly valuable, high tech metals e. g. essential in electronics
Co-elements that end up in residues, or as emissionsCostly because of waste mangement or end-of-pipe measures
Sulfide andOxide Ores
Sulfide Ores
OxideOres
Sn
Al
Ni
Li
Zn
Pb
Fe
Cr
MgMn
Cu
Ca/Si
Ca/Si
Ca/Si
Ca/Si
Ca/Si
V
V
V
B
In
In
Ir
Ir
V
Au
Au
Au
Mg
Mg
Mg
Mg
Mg
Co
Co
Co
Co
Cu
Cu
Cu
Cu
Cu
Cu
Cr
Cr
Cr
Cr
Pt
PtPd Rh
Ru
Ru
Se
Se
RhPbAg
Ag
Ag
Ag
Al
Al
Al
Al
Al
Pb
Pb
Pb
Li
Te
Te
Ge
Ga
Rh Os
Os
NiBi
Bi
Bi
Br
Ti
Ti
Tl
Mg
MoZn
ZnW
As
As
As
Cd
Cl
Ga
As
As
As
Zn
Zn
Nb
Sn
Sn
Fe
Fe
Fe
Fe
Fe
Fe
Fe
Fe
Fe
Hg
Hg
Hg
Zn
Sb
Sb
Sb
Sb
Ni
Nb
Zr
Ta
Ta
Ni Mn
Mn
Mn
Mn
MnInterconnectedCarrier Metal
Cycles

59
Environmental Risks and Challenges of Anthropogenic Metals Flows and Cycles
et al., 2007; Nakajima et al., 2008; Oda et al., 2010; Reck et al., 2006; Saurat & Bringezu, 2008;, Spatari et al., 2002; Spatari et al., 2003; Spatari et al., 2005; Tanimoto et al., 2010; van Beers et al., 2004; Wang et al., 2008; Yell-ishetty et al., 2010). This includes most of the target metals in this report. Mostly, these studies cover one country, but some include continents or even global estimates. Sev-eral of these publications originate from the STAF-project conducted at Yale University, covering global flows of metal cycles for a number of metals.
Most of these publications are drafted from a point of view of resource conservation and management. Underlying questions are: where do the mined metals end up, how can we improve the efficiency of metal cycles, is it possible to improve resource availability by recycling or mining urban stocks, and such-like. Emissions are often not specified, and the relation with the environmental flows is not established. Nevertheless, data from these studies could be used as a starting point to specify emissions, especially related to industrial production and to corrosion from metal stocks-in-use, combined with emission factors.
Another group of SFA-studies is motivated from environmental problems. These have different underlying questions: what is the source of metal pollution in agricultural soils, what is the origin of metals in sediments, how can it be explained that the environmen-tal concentrations do not go down while the metals cycles become more efficient? The scope of metals covered in these publications is somewhat smaller: Cu, Zn, Pb, Cr, Ni, Cd and Hg (Annema et al., 1995; Bergback et al., 1994; Bergback et al., 2000; Boehme & Pan-ero, 2003; Cain et al., 2007; De Cerreno et al., 2002; Elshkaki et al., 2004; Guinée et al., 1999; Hansen & Lassen, 2003; Hawkins et al., 2006; Hendriks et al., 2010; Kwonpongsagoon et al., 2007; Lindqvist & Eklund, 2001; Ma et al., 2007; Sörme et al., 2001(a) Sörme et al., 2001(b); van der Voet et al., 1994; van der Voet et al. (eds.), 2000). The very large scale met-als Fe and Al are not included in these stud-
ies – no doubt due to the fact that these met-als are present in the environment in large quantities and their presence in the environ-ment is generally not associated with envi-ronmental impacts. Also, some smaller scale metals are not included. For those as well, supply constraints will be more urgent than impacts related to flows of these metals in the environment.
While the first group of studies focuses on the major flows of metals, we can observe that the second group include minor flows as well, and include other materials such as fossil fuels, phosphate fertiliser, cement, sewage sludge and sometimes (ores of) other metals, wherein the target metal occurs as a contaminant. Early studies, focusing on river basins, conclude that the importance of in-dustrial point sources for emissions to sur-face water declines, while on the other hand, diffusive “dissipative” sources become more important (Ayres & Rod, 1986; Stigliani et al., 1993). This is confirmed by later studies (e. g., van der Voet et al. (eds.), 2000). “Diffusive sources” is a wide area of metal applications. It may refer to applications of the metal that are inherently dissipative, such as metals in paints, pesticides or wood preservatives, directly entering the environment. It may also refer to applications of other materials, wherein the metal occurs as a contaminant. Some fertilisers appear to be an important source for rising concentrations of metals in agricultural soils. Fossil fuels are the source of a variety of metal emissions to the atmos-phere. In a series of studies in the 1990s, the importance of stocks in society is signaled, not just as a potential secondary source of the material, but also as a source of emis-sions: copper and zinc roofs, lead sheet, fences and all kinds of metal structures ex-posed to the weather are contributors to the emissions to the environment (Sörme et al., 2001; Elshkaki et al., 2004), especially to the surface water.
In Section 3.3, the different sources of envi-ronmental flows are investigated and com-pared.

60
Environmental Risks and Challenges of Anthropogenic Metals Flows and Cycles
3.3 Emissions of metals
3.3.1 Natural sourcesMetals are essential constituents of every natural material in lithosphere, hydrosphere and biosphere. The concentration level of most metals in natural media is very low (in the order of mg/kg or even µg/kg). Excep-tions are major elements such as Al and Fe (measured in g/kg or even %). In some places metals are enriched in geological formations such as ore deposits or rock types includ-ing naturally anomalous abundances of met-als. The order of magnitude of the enrich-ment factor, compared to the average of the Earth’s crust, is around 1000 in ore depos-its. Normally the dimension of ore deposits is small and the volume of emissions from them is small and local, although contrast to the surrounding areas may be high. Certain rock types such as ultramafic rocks or some shales which normally include high Ni, Co, Cr, (enrichment factor around 100) and Fe may cover large areas and thus cause rela-tively high concentrations of metals in rather large areas.
Metals are mostly tightly bound in the lat-tices of minerals that were formed under higher pressure and temperature conditions than those now prevailing at the Earth’s sur-face. Thus there is a tendency for miner-als to change to forms that are stable under the prevailing conditions. This takes place via weathering processes when the lattice structures break down and the metal ions are liberated. Weathering takes place in solid bedrock and mineral soils. In soils, the soil-forming processes are the major factors to move metal ions tightly bound in mineral lat-tices into soil water solution. Minerals have different susceptibilities to weathering and thus knowledge of the original mineral is es-sential when the liberation of metals, for ex-ample into bioavailable forms, is estimated.
In addition to chemical weathering, met-als are distributed from solid rock and soil as minerogenic dust into air. This is a part of diffuse distribution of metals, but in the dust
metals are normally inert and still bound in mineral lattices. On the other hand, small grain size of dust particles enhances much chemical weathering and metals will change to chemically active form rather quickly. Met-al concentrations of terrestrial moss are of-ten erroneously considered to indicate only anthropogenic airborne contamination, but part of the metals in moss samples comes from the dust derived from the local geogenic sources, as is discussed in Chapter 2.
Finally, metal ions liberated from originally inert minerals migrate towards groundwa-ter and surface water, and are transported to oceans. On their way to oceans metal ions can be freely available for biological processes.
Changes in oxidizing and/or pH conditions, whether due to natural processes (flooding, erosion) or anthropogenic can mobilize metal ions which are in an inert form. A good ex-ample refers to the problems in Bangladesh related to As in the groundwater. The high concentrations of As, from natural sources, cause health problems. Although the exact mechanism by which the arsenic is trans-ferred to the water is not yet fully understood, one explanation may be that drilling wells through As bearing geological strata and fol-lowing lowering of groundwater caused oxi-dizing conditions and got As to dissolve from mineral lattices to the water.
Probably all metals are necessary to some biological processes, although no role has yet been identified for some metals such as Pb, Cd and As. The change of metals to bio-available form can be a result of natural geo-genic process or some anthropogenic fac-tor. However, differentiation between natural and anthropogenic influences is often diffi-cult; both components may be present at the same time in the same place. In some cases, a natural source may become an anthropo-genic source. In the case of mining it is quite clear that the material in the tailings area is a result of anthropogenic process, despite the fact that the metal concentration is much lowered during the processes leading to tail-

61
Environmental Risks and Challenges of Anthropogenic Metals Flows and Cycles
ings production. In the ore deposit before mining started, the source is natural. Howev-er, the problem is much more complicated in areas where soils naturally have metal con-centrations higher than action limits defined by the authorities (e. g., the case of arsenic).
3.3.2 Emissions from point sources
Emissions from mining and smeltingMining can cause major land disturbances through clearing, excavation and placement of mine waste (tailings, waste rock, smelter slags), truck and vehicle emissions, contam-inated water releases (direct and indirect), and process plant emissions. Most of these emissions refer to other pollutants, but part of these are emissions of the metals them-selves. Metal emissions are most promi-nently to air and water, with mine wastes to land commonly excluded unless it gener-ates airborne dust or allows escape of lea-chate or seepage to adjacent ecosystems. In Chapter 5, this is addressed more extensive-ly. Metal emissions may also occur in case of accidents. Especially tailings dam failure re-sults in emissions of metals and other sub-stances used in the mining industry, such as cyanide (IIED and WBCSD, 2002).
In countries such as the United States of America, Canada and Australia, as well as many across Europe, there are now statu-tory protocols that require major industry fa-cilities to monitor, estimate and report their
pollutant emissions annually to government. In Australia this is called the National Pol-lutant Inventory (NPI), while in Canada it is the National Pollutant Release Inventory (NPRI) or the Toxic Release Inventory (TRI) in the USA. In Europe there is the Industri-al Emissions Directive (IED) and the Euro-pean Pollutant Release and Transfer Reg-ister (E-PRTR). Pollutant release inventory systems have been in operation for almost a decade (or more in some cases), and provide a data rich source of emissions data from mining – although such studies are surpris-ingly relatively rare to date. A nice example can be found at http://www.cec.org/Page.asp?PageID=751&SiteNodeID=1097 which was developed by the Taking Stock Initiative of the Commission for Environmental Co-operation (CEC) to assess emissions for the North American continent.
Two metals are briefly reviewed, namely cop-per and uranium, using mines and data from Australia and Chile. All copper projects in-clude the four stages of primary copper metal production (mining, milling, smelting and re-fining), while both uranium projects produce relatively pure uranium oxide. The primary metrics adopted are total and unit pollutant emissions per year or per metal produced,
shown in Tables 3.1 and 3.2. The tables show other emissions besides metals as well.
Table 3.1
Average total and unit pollutant
emissions per year for copper
projects in Australia and
Chile (Data from Mudd, 2009a;
NPI, 2010; Chilean corporate
report, var.).
Project Tonnes per year Kilograms per tonne copper
Cu SO2 PM10 As SO2 PM10 As
Project 1 893,952 101,199 524 498 115.2 0.62 0.57
Project 2 386,639 184,094 1,263 332 490.7 1.08 0.91
Project 3 # 175,216 1,988 976 0.52 12.9 5.30 0.003
Project 4 71,967 84,543 1,234 498 1,220.5 16.65 6.81
# Project 3 refers to a copper-uranium-gold-silver producer, but given that copper is the dominant metal at ~75 % of revenue, all emissions have been allocated to copper for this example.

62
Environmental Risks and Challenges of Anthropogenic Metals Flows and Cycles
For the copper projects chosen, both the pro-duction scale and the total and unit emis-sions vary significantly. This is largely related to the extent of pollution control and envi-ronmental management at each site, espe-cially for the smelter and refinery stages. For example, Project 3 in South Australia cap-tures sulfur dioxide and produces sulfuric acid which is used elsewhere on site (main-ly in the hydrometallurgical sections of the project). Project 1, 2 and 4 sites are also old, amongst the oldest continually operat-ing copper mines in the world, and hence the community expectations, environmental reg-ulation and pollution controls are still evolv-ing. For example, SO2 capture has historical-ly been a lower priority in Australia due to its relative isolation and lower concentration of processing industries.
At numerous old and operating mining pro-jects around the world, the legacy of point source pollutant emissions has sometimes led to impacts such as elevated metal expo-sures to adjacent mining communities. The Mt Isa mining complex in western Queens-land, Australia, has mined and smelted lead-zinc-silver ore since 1931, as well as paral-lel copper mining and smelting since 1953. After considerable debate and studies, recent research has shown that the elevated blood lead concentrations in young children of Mt Isa is clearly related to historic and ongoing emissions from the Mt Isa mining and smelt-er complex (Taylor et al., 2010). The Mt Isa smelting complex, viewed from the downtown region, is shown in Figure 3.2.
Table 3.2
Average total and unit pollutant emissions to
air per year for uranium projects in Australia (Data
from Mudd 2009a; NPI, 2010)
Note: Metals includes As, Cr3+, Cr6+, Cu, Pb,
Ni, Be, Cd, Co, Mn, Zn and Hg; Organics in-cludes PAHs, VOCs,
cumene, benzene, toluene, ethylbenzene
and xylene.
Project Tonnes per year Kilograms per tonne uranium oxide
U3O8 SO2 PM10 NOx CO Met-als
Or-gan-ics
SO2 PM10 NOx CO Met-als
Or-gan-ics
Project 5 4,854 133 500 958 349 1.28 82.92 27.9 101.7 202.0 72.6 0.26 18.1
Project 6 812 0.64 195 76 47 0.122 10.4 0.8 242.8 94.3 58.9 0.15 12.9
Figure 3.2
The lead (left) and copper
(right) smelters at Mt Isa,
Queensland, Australia,
viewed from the downtown area (Photo courtesy Gavin M. Mudd,
April 2010)

63
Environmental Risks and Challenges of Anthropogenic Metals Flows and Cycles
Emissions from industrial processesPoint sources from industry related to met-als are often unrelated to the life cycle of the metals themselves. Primary metal produc-tion causes emissions to surface water, but generally in small amounts. Moreover, Indus-try emissions have often reduced drastically over the last 20 years due to emission reduc-tion management systems, induced voluntar-ily or by governments.
For a number of metals, the phosphate rock industry is a significant source of emissions to surface water. Phosphate rock contains metals, such as Cd, Cr, Cu, Ni and Pb, as trace contaminants. Other industries causing metal emissions to surface water are diverse – petrochemical industry, ceramics industry, fabrication of pesticides and pharmaceuti-cals, alloy production, coating, food process-ing, pigment production and many others. Very specific sources refer to shipyards (cop-per) or chlor-alkali production (mercury) who are users rather than producers of metals.
Emissions to air are mainly caused by the use of fossil fuels, especially coal. Fossil fuels, as fossilized biomass, contain trace amounts of metals that are emitted at incineration. Pow-er plants are therefore an important source of emissions of metals, in addition to other industrial users. Again, emissions to air are mainly due to sources unrelated to the pro-duction and use of the metals themselves.
Emissions from waste management processesA substantial fraction of the metals used ends up as waste. This can be recycled, but most of it still ends up in landfills. The land-filling of waste causes leaching of metals to the groundwater. Incineration of metals may lead to emissions to the atmosphere. Incin-eration takes place in waste incinerators, but also in less controlled circumstances, such as in the informal treatment of electronic waste (e. g., Wong et al., 2007).
A significant source of emissions of met-als to the environment is waste water treat-ment. Metals end up in waste water via all kinds of sources, industrial as well as do-mestic, and tend to get concentrated in waste water treatment (Chang et al., 1984; Dai et al., 2007). Their origins can be traced back to specific industrial sources, or to diffusive sources such as corrosion from pipes, the human metabolism, and rainwater contain-ing metals corroded from construction ele-ments (Lundqvist & Eklund, 2001, Sörme et al., 2001, Annema et al., 1995). Since met-als cannot be degraded, they either end up in the effluent or in the sewage sludge. Effluent is added to surface water, while the sludge generally ends up on landfills or soils. Sludge incineration can create an interesting closed-loop cycle of metals when the waste water from the incineration process is treated again with the sewage water (van der Voet et al., 1989).

64
Environmental Risks and Challenges of Anthropogenic Metals Flows and Cycles
3.3.3 Emissions from diffusive sources
Emissions from use processesAs in industrial production processes, emis-sions of metals from fossil fuels take also place in use processes. The main source in the use phase is traffic. Trace contaminants of metals are still present in transportation fuels.
Other emissions from products in use refer to corrosion of metals from metal surfaces ex-posed to the environment: roofs, fences, gut-ters etc. The use of metals in paints, sprays and pesticides also leads to emissions to the environment: the so-called dissipative appli-cations, where the use of the product equals the emission to the environment.
Finally, a group of applications related to ag-riculture cause emissions to the environ-ment: the use of phosphate fertilizer wherein metals occur as trace contaminants, and the use of metals such as copper and zinc in ani-mal feed. These emissions lead to cycles in agriculture: metals being taken up by plants used as animal feed, ending up in manure which is used on the land, leading to increas-ing concentrations in agricultural soil. Even relatively small additions to the cycle thus may lead to high concentrations (e. g. Van der Voet et al., 2000). Figure 3.3 shows the effect of “closed loop accumulation” on Dutch agri-cultural soils: the steady state represents the
situation when the 1990 metals management is continued indefinitely. These calculations, however, do not specify the amount of time involved in reaching such a steady state – for that, a more elaborate dynamic model would be required. Due to the large uncertainty re-lated with “steady-state calculations” and the importance of bio-availability, recent risk assessment practices have assessed accu-mulations after 100 years accumulation and include bio-availability. The resulting refined predicted exposure levels are similar to the measured exposures levels.
Note that for zinc, the PNEC value has been revised recently (ECB 2008). With the revised PNEC, no exceedance of MPC would be predicted even in the steady state.
Figure 3.3
PEC/PNEC for four metals
in Dutch agricultural
soil, based on the Maximum
Permissible Concentration
for soils (van der Voet et al., 2000). 0 1 2 3 4 5 6 7
steady state
1990
Zinc
Lead
Copper
Cadmium
PEC/PNEC
MPC

65
Environmental Risks and Challenges of Anthropogenic Metals Flows and Cycles
3.3.4 Quantifying global emissions from natural and anthropogenic sourcesA survey from some time ago was made by Nriagu & Pacyna (1988) to estimate met-al emissions at the global level. This can be compared with the addition of metals to the environment by natural sources. In this table, the median values have been taken.
The numbers vary, of course, per metal, and it should be noted that the estimates have high uncertainty margins. Neverthe-less, it can be concluded that the emissions are roughly in the same order of magnitude as the natural sources, excluding landfill. If landfill is included, this is more – almost one order of magnitude. One can debate whether or not landfilled metals count as emissions to the environment – that may depend on the quality and management of the landfills. Cer-tainly they represent losses from the anthro-pogenic metals cycles. Mining and smelter waste is a significant post in total landfill, and ranges from about one quarter to two thirds.
a) including mining/smelter waste
Table 3.3
Global emissions of metals to the
environment, ca. 1988, in 10^6 kg/year (Data from Reimann et al.,
2003)
Metal Weath-ering & volcan-ic (Azar, 1996, from Nriagu, 1990)
Total emis-sions (ex landfill)
Total chain losses (emis-sions + landfill)a
Emis-sions to air (Nriagu & Pa-cyna, 1988)
Emis-sions to surface water (Nriagu & Pa-cyna, 1988)
Emission to soil (Nriagu & Pacy-na, 1988, landfill exclud-ed)
Landfill mining/ smelter waste (Nriagu & Pa-cyna, 1988)
Other landfill
Ratio natural/societal ex land-fill
Ratio natural/societal inc land-fill
As 110.0 67.3 157.7 18.8 41.0 7.5 15.9 74.6 0.6 1.4
Cd 5.3 20.4 44.8 7.6 9.4 3.5 5.8 18.6 3.9 8.4
Cr 830.0 264.8 1068.5 30.5 142.0 92.4 – 803.7 0.3 1.3
Cu 380.0 242.5 2218.4 35.4 112.0 95.2 1117.0 858.9 0.6 5.8
Hg 1.4 10.1 18.3 3.6 4.6 2.0 1.9 6.4 7.2 13.1
Mo 15.0 34.4 116.2 3.3 11.0 20.2 13.9 67.9 2.3 7.7
Ni 300.0 227.7 585.2 55.7 113.0 59.1 91.5 266.0 0.8 2.0
Pb 290.0 505.1 1768.9 332.4 138.0 34.8 502.5 761.3 1.7 6.1
Sb 9.9 29.2 79.5 3.5 18.0 7.7 32.0 18.4 2.9 8.0
Zn 910.0 713.6 2601.9 131.9 226.0 355.7 872.0 1016.3 0.8 2.9

66
Environmental Risks and Challenges of Anthropogenic Metals Flows and Cycles
Another comparison that can be made, is that between emissions and the annual pro-duction of metals. This can be seen in Table 3.4 below.
For As, Cd and Hg, annual emissions and losses are actually higher than annual pro-duction. These three metals were already in decline in 1988 – emissions from old stocks probably dominate, in addition to emissions from non-metal sources. Also for the oth-er metals, emissions are surprisingly high compared to annual production. This is most probably due to the contribution of non-metal sources. Van der Voet (1996) has shown that for both copper and cadmium in the Nether-lands in 1990, over 90 % of emissions comes from non-intentional and trace applications. For total losses from the chain, including landfill, this is different. It can be concluded from Table 3.4 that losses are high compared to production: the combined result of emis-sions from non-metal sources and the very low recycling rates at that time.
These numbers are from 1988 publication, quite some time ago. There have been sig-nificant changes since that time. In the first place, many industries have reduced emis-
sions to air and surface water. In the sec-ond place, changes have taken place in the demand for metals. Some have increased, others – notably As, Cd and Hg – have de-creased. Some sources, nowadays recog-nized as important, are not included, such as corrosion and dissipative applications. Some sources have dwindled, such as tetra-ethyl lead as an additive to gasoline, lead-ing to substantially lower Pb emissions to the atmosphere. In the third place, certain types of emissions were not included in the 1988 inventory, such as corrosion losses from metal stocks-in-use. Finally, landfill has de-creased for a number of metals because re-cycling has increased, leading to a reduc-tion of total losses from the chains. Reck et al. (2008) show that for Ni primary production has increased significantly, while landfill had been reduced somewhat at the same time. For Cr, the amount of landfill (excluding min-ing, for which there is no 1988 estimate) has decreased while production has increased (Johnson et al., 2006).
Table 3.4
Emissions and losses compared
to annual production of
metals, ca. 1988, in 10^6 kg/year
Metal Total emissions ex landfill (Reimann et al., 2003)
Total emission inc landfill (Reimann et al., 2003)
Primary produc-tion (USGS, data for 1988)
Emissions over pri-mary production (Reimann et al., 2003)
Total losses over primary production (Reimann et al., 2003)
As 67.3 157.8 61 1.1 2.6
Cd 20.4 44.4 20 1.0 2.2
Cr 264.8 620.5 3870 0.1 0.2
Cu 242.5 2218.4 8720 0.0 0.3
Hg 10.1 18.3 6.8 1.5 2.7
Mo 34.4 115.8 113 0.3 1.0
Ni 227.7 585.2 952 0.2 0.6
Pb 505.1 1820.9 3420 0.1 0.5
Sb 29.2 79.5 105 0.3 0.8
Zn 713.6 2601.4 6770 0.1 0.4

67
Environmental Risks and Challenges of Anthropogenic Metals Flows and Cycles
Two more recent studies are relevant in this respect. The first is by Pacyna & Pacyna (2001). They give estimates for anthropogen-ic metal emissions at the global level for the mid-1990s and compare those to emissions from natural sources. Their summary table is presented below, as Table 3.5
These numbers are lower, but they are not comparable to the 1988 overview, since they include less sources of emissions and are limited to emissions to the atmosphere. The conclusion however that anthropogenic and natural sources of emissions are rough-ly of the same order of magnitude does not change. A more direct comparison between the two studies can be made by consider-ing only emissions to the atmosphere, as is shown in Table 3.6
In almost all cases, the mid-1990s estimate of Pacyna & Pacyna is lower, indicating that emissions to the atmosphere have been re-duced in that decade.
A relevant second later study is the study by Richardson et al. (2001) on emissions of a great many metals to the atmosphere shows considerably higher estimates for natural emissions than the estimates of Nriagu & Pacyna. Table 3.7 shows this.
Table 3.5
A comparison of estimated global
anthropogenic emissions of trace metals
in the mid-1990s with
emissions from natural sources
(emissions in 10^3 tonnes/
year) (Nriagu, 1998; Pacyna and
Pacyna, 2001
Trace metal
Anthropo-genic emissions
Natural emissions (median values)
Ratio anthro-pogenic/ natural emissions
As 5.0 12.0 0.42
Cd 3.0 1.3 2.3
Cr 14.7 44.0 0.33
Cu 25.9 28.0 0.93
Hg 2.2 2.5 0.88
Mn 11.0 317.0 0.03
Mo 2.6 3.0 0.87
Ni 95.3 30.0 3.2
Pb 119.3 12.0 9.9
Sb 1.6 2.4 0.67
Se 4.6 9.3 0.49
V 240.0 28.0 8.6
Zn 57.0 45.0 1.3
Table 3.6
A comparison of global
emissions to the atmosphere as
calculated by Nriagu & Pacyna
(1988) and Pacyna & Pacyna (2001)
Metal Emissions to air (Nriagu & Pacyna, 1988)
Emissions to air (Pacyna & Pacyna, 2001)
As 18.8 5.0
Cd 7.6 3.0
Cr 30.5 14.7
Cu 35.4 25.9
Hg 3.6 2.2
Mo 3.3 2.6
Ni 55.7 95.3
Pb 332.4 119.3
Sb 3.5 1.6
Zn 131.9 57.0
Table 3.7
Global emissions to the
atmosphere from natural sources, Richardson et al. (2001) compared
to Nriagu & Pacyna (1988).
Metal Global mean natural emission to atmos-phere, 106 kg/year, Richardson et al. (2001).
Global median natu-ral emission to at-mosphere, 106 kg/year, Nriagu & Pa-cyna (1988).
Cd 41 1.1
Cu 2000 27.7
Pb 1800 12
Hg 58 2.5
Ni 1800 30
Zn 5900 45

68
Environmental Risks and Challenges of Anthropogenic Metals Flows and Cycles
The difference is not caused by changes in metal fluxes over the years, but seems to be due to certain flows that were not taken into account by Nriagu and Pacyna. It would im-ply that anthropogenic emissions are rela-tively unimportant compared to natural ones. However, the most important flow seems to be the flow of metals in soil particles being blown into the atmosphere. This dominates the numbers for copper, lead and nickel and contributes about half to cadmium and zinc. For mercury, the main source is volcanic ac-tivity and evasion from soils. The metal emis-sions in soil particles are calculated from the amount of particles emitted and the con-centration of metals in soils. Metals in soils originate from natural sources, but also from anthropogenic ones. Although arising from a natural process, this flow therefore cannot be counted as of natural origins.
A complete, “anthrobiogeochemical” pic-ture of stocks of metals in various environ-mental compartments, and the flows of met-als among them, was compiled for lead in a series of recent papers (Rauch and Graedel 2007, Rauch and Pacyna 2009). This research provides a clear view of the importance of an-thropogenic sources in the loading of metals into air, waters, and soils (Figure 3.4).
Assessments like these enable quantify-ing the link between the societal flows and stocks of metals and the flows and stocks in the environment at the global level. They also show, in very general terms, what could be done to isolate the societal cycle further from the natural cycle – a de-coupling at the el-emental level.
Figure 3.4
Stocks and flows of lead in natural
and human reservoirs, and the global flows of metal among
reservoirs (Rauch and Graedel
2007, Rauch and Pacyna 2009).
TerrestrialBiomass1.7E4
Mantle
1.2E11
Core
7.7E11
Soil 8E6Cont.Regolith3,7E9
Freshwater
1.1E4
Oceans
3E3 OceansBiomass3E3
Cont. MarginRegolith3.1E9SeafloorRegolith3.1E9
Fossil FuelResources1.7E4
AgriculturalBiomass14
MineralResources1.5E6
OceanicCrust3.2E9
Production
360
Fabrication
450
Use
2.5E4
Discard Mgt.
210
Earth Orbit0.000
Atmosphere5.2
Moon2.7E6
0.000
0.0000.000
140
4.1
36
85
61 230 0.0
0.81232
14
1.6 431.7
820
13 130
1.81.8
2.5
490
940
940
150 5.2
56
450
26
0.6
25 6.4
0.956
4.3E36.5E3
1.4E3
3.7E3
1.6E39.8E3
600
580
150
2981
1.2E3
1.1E3
2.9E6
6E3
Consolidated Crust Upper Crust8.7E10Middle Cont. Crust7.5E10
Lower Cont. Crust3.2E10
25% - 50%50% - 75%75% - 100%> 100%
0% - 25%
UncertaintyFlows: Gg Pb | yr
Stocks: Gg Pb
: Change in Net Stocks
No estimate
>

69
Environmental Risks and Challenges of Anthropogenic Metals Flows and Cycles
3.4 Legacy Contamination
The primary purpose of mining has always been (and remains) to produce metals use-ful for society. Historically, there was virtually no environmental management in practice, since production was foremost. From the late 1960s an awareness began to emerge that there was a need for environmental regula-tion of mining (as well as all major industry). However, by this time there were numerous sites across the world which had closed and left a serious legacy of ongoing environmen-tal contamination (e. g., Chilean Copper Com-mission & UNEP-DTIE, 2001).
The legacy problems of mining were most fa-mously articulated by scholar Georgius Ag-ricola in his seminal work ‘De Re Metalli-ca’, published in 1556 shortly after his pass-ing. Although Agricola (1556) was a passion-ate advocate of mining’s benefit to society, he readily acknowledged pollution problems from old mine sites:
“… the strongest argument of the detrac-tors is that the fields are devastated by mining operations … Also they argue that the woods and groves are cut down, for there is need of an endless amount of wood for timbers, machines, and the smelting of metals. And when the woods and groves are felled, then are exterminated the beasts and birds, very many of which furnish a pleasant and agreeable food for man. Further, when the ores are washed, the water which has been used poisons the brooks and streams, and either destroys the fish or drives them away. Therefore the inhabitants of these regions, on account of the devastation of their fields, woods, groves, brooks and riv-ers, find great difficulty in procuring the necessaries of life … Thus it is said, it is clear to all that there is greater detriment from mining than the value of the metals which the mining produces.”
There are a variety of important mecha-nisms for pollutant emissions from legacy or abandoned mine sites, including air (dust), soil, surface water, groundwater or through uptake by biota. Soil and wind erosion is-sues are important, depending on climatic conditions (dry, alpine, temperate or tropi-cal). However, perhaps the greatest issue from legacy mines is acid and metalliferous drainage or acid minedrainage (AMD) (see Da Rosa, 1997; Taylor & Pape, 2007). When sulfidic rock is exposed to water and oxygen, a bioprocess may take place and the sulfide is oxidized and produces acidity. This acid in turn reacts with the rock and puts metals in solution. The leachate can cause exten-sive impacts if it reaches aquatic ecosystems. These impacts were particularly noted by Ag-ricola and others in central European mines of the Middle Ages, with some regions like the Tinto region of southern Spain famous for such pollution lasting centuries.
Given the exponential growth in mining over the past two centuries, the cumulative scale of the environmental legacies from old and abandoned mine sites has also grown rap-idly. An important example of the problems of legacy mines can be found in the former gold fields around Johannesburg, where gold was mined for almost a century without ma-jor environmental management and regula-tion. The ore often contained low grade urani-um, and hence the mining activities effective-ly generated low level radioactive waste also as well as gold tailings. The various suburbs of Johannesburg, especially informal settle-ments, are built around these large tailings piles – many of which need urgent remedia-tion to address wind-blown dust problems as well as major AMD problems, shown in Fig-ure 3.5.

70
Environmental Risks and Challenges of Anthropogenic Metals Flows and Cycles
Around the world there are countless for-mer mines which closed long ago but are still leaching AMD into adjacent surface waters or infiltrating into groundwater. For example:
■ Witwatersrand Basin, South Africa (Mc-Carthy, 2010; Winde and Sandham, 2004) – over 120 years of intensive gold mining (including uranium by-products) has left a massive legacy of AMD, closely inter-spersed with the large population centre of Johannesburg and surrounding settle-ments. The impacts on water resources will be long-lasting and extremely difficult to remediate.
■ Mt Lyell, Tasmania, Australia (Koehnken, 1997) – over a century of copper-gold-sil-ver mining, including local smelting for some 75 years, has led to extreme AMD impacts around the mine area, as well as AMD associated with decades of tailings disposal to the Queen and King Rivers (the tailings delta on Macquarie Harbour is readily visible in Google Earth).
■ United States (Da Rosa et al., 1997) – by the 1990s, major regions of the USA were suffering from AMD impacts, including the extensive mining along the full extent of the Rocky Mountains (from New Mexico to Montana), the coal mining in Appalachian Mountains of the east, and numerous oth-er mines which are so polluting they are listed by the SuperFund for large scale re-mediation (e. g. Summitville, Butte, etc.).
Presently, there are many examples of good practice around the world: sites that are re-mediated and where the landscape has been restored after the closure of the mine. New ways for remediation are debated in the min-ing sector and become part of public policy (for example, US-EPA, 2005). Examples on restoration of abandoned mines are provided in Figure 3.6.
Nevertheless, legacy contamination remains an issue that needs attention in many places in the world.
Figure 3.5
Sand dump 20, West Rand gold field,
Johannesburg – note the dust
from the tailings and large flow of AMD-rich water in the front pipe (Photo courtesy Gavin M. Mudd,
October 2010)

71
Environmental Risks and Challenges of Anthropogenic Metals Flows and Cycles
3.5 Future Emissions of Metals
What is to be expected for the future devel-opment of metal emissions? Various trends, going in various directions, will contrib-ute. Since developments differ for the differ-ent metals, the outcome of these combined trends may also be different per metal.
For most of the bulkier metals such as alu-minium, copper, iron, nickel, chromium and zinc, demand is still increasing, especially through the rapid growth of large develop-ing economies (Wang et al., 2008; Reck et al., 2010). The demand for some of the small-er-scale metals, for example PGM related to new technologies, is rising very rapidly, and for others it may do so in the future. Ceteris paribus, emissions related to their mining and production can be expected to increase accordingly.
On the other hand, industrial processes have become substantially cleaner and more re-source-efficient over the past decades. This
ongoing process will have a reducing effect on the level of emissions.
An increase in recycling rates can be expect-ed as well – trends for a number of metals are in the right direction, and new technolo-gies are becoming available to enable a high-er recycling rate (see Chapter 5). This implies the increase in primary production, with its concurrent emissions, will be lower. Landfill of metal containing waste may be expected to decline further. Legacy contamination is a problem that will be around for some time: leaching from old polluted sites can go on for a long time if they are not addressed.
Some uses of metals are being phased out. As is shown by Elshkaki et al. (2004) for lead, van der Voet et al. (1994) for cadmium and Maxson (2004) for mercury, this may have un-intended consequences. Metals produced as a by-product have an inelastic supply: their mining will not automatically follow the de-mand but depends on the demand for the “main” material. A declining demand com-
Figure 3.6
Closed and rehabilitated
mine site in Keretti, Finland.
Today a golf course (Photo
courtesy, Outokumpu
Mining Museum, August 2003)

72
Environmental Risks and Challenges of Anthropogenic Metals Flows and Cycles
bined with a steady supply leads to lower market prices, which in turn may lead to a collapse of recycling activities. In practice, this is more subtle – as the Metals Wheel from section 3.2 shows, metals are co-pro-duced from almost all ores and sometimes the total production of metals for which there is a sufficient demand is what makes the activity economically viable. Which metal is the main product and which the by-products may vary, and may also change over time. In most cases, if there is no demand for the by-product, it will not be extracted from the ore. Still, it is mined with the ore and if not used it ends up in a waste stream. For lead, which is not a by-product but is already recycled to a large extent, a reduction in demand may have a similar effect: the supply from sec-ondary sources may become larger than the demand. Due to the slow discarding of old stocks in society, the supply from second-ary material will eventually, over a period of years to decades, become larger than the de-mand, having the same effect. This may lead to increasing landfill of metal waste. This
phenomenon may be observed for more met-als when the demand goes down and recy-cling increases.
With regard to the emissions from non-metal sources, no decreasing trend is to be expect-ed in the near future. Since both population and welfare is still rising and the penetra-tion of renewable energy technology is slow, the use of fossil fuels and of fertilizer is not expected to decrease. Since these diffusive sources are presently very important, it is not to be expected that metal emissions will be reduced in an overall sense.

73
Environmental Risks and Challenges of Anthropogenic Metals Flows and Cycles
3.6 Measures to Combat Metal Emissions
Most of the metal cycles are already quite efficient in their production and use stage. Cleaner production, an ongoing process in industry, may reduce emissions in the pro-duction phase even further, while reducing dissipative applications of metals will reduce emissions in the use phase. With regards to mining, the principal sources of emissions of metals are dust (mine and mill), vehi-cle exhaust fumes as well as those indirect-ly caused by consumption of electricity, fuels and chemicals.
In the waste stage, however, a lot of progress still can be made. Preventing metals from entering the waste stage is a first possibility: increased recycling. This is discussed further in Chapter 5. Two reports of the Global Metal Flows Working Group are dedicated to that (UNEP, 2011; UNEP, 2013). A second step is preventing metals in waste from being emit-ted to the surface water or the air. Filters on waste incinerators catch metals before they are emitted into the atmosphere. The result-ing ash then can be landfilled. In sewage treatment, metals can be taken out of the ef-fluent – they will then end up in the sewage sludge which is mostly landfilled.
The abovementioned measures shift the problem from emissions into surface water and the atmosphere to landfill. Landfills can be controlled to a large extent, preventing the metals from leaching into the groundwater. The main issue remains, however, that every atom of metals mined has to end up some-where. Recycling for 100 % is a physical as well as economic impossibility. Metals, as el-ements, cannot be degraded and once they enter the biosphere they disappear from it only via geological processes. Therefore, in a sound metals management the search for a sound sink is an essential part (e. g., Scoullos et al, 2001; van der Voet et al., 1994), such as putting metal waste back into the mines, or store waste metals somewhere as a stock for future use.
High priority should be given to addressing the emissions from non-metal sources. This is also the most challenging aspect. Fos-sil fuels and fertilizer are used widely and by definition diffusively. Point sources such as coal fired power plants are the least difficult to address – converting air emissions to a solid waste stream of fly ash containing met-als. A shift towards renewable energy sourc-es, also desirable because of other reasons, will make a big difference here. Reducing fer-tilizer use, although effective (Kwonpongsa-goon et al., 2007) is even more difficult, as is finding other less polluted sources of phos-phate, which also is desirable because of oth-er reasons (Cordell, 2010).
3.7 Conclusions
This chapter has dealt with metal emissions: their extent, their sources and their develop-ment. Emissions of other substances relat-ed to the metals’ life cycle are discussed in Chapter 5.
Emissions of metals from society to the envi-ronment, including emissions to atmosphere, emissions to water and diffusive emissions to soil, have been estimated to be roughly in the same order of magnitude as the natural sources, weathering and volcanic activity.
These emissions are increasingly dominated by non-metal sources, especially fossil fuels and phosphate rock, because (1) industrial point source emissions from the metals in-dustry have been addressed in many places and (2) non-metal sources continue to in-crease. Since both population and welfare are increasing and energy will to a large extent remain dependent of fossil fuels over the next decades, a further rise of these emissions can be anticipated.
Landfill of metal containing waste is a larg-er flow, but overall it is not increasing so much. Partly this may be due to a better met-als management in mining and refining, but mostly this can be attributed to the increased recycling. In the future, a further reduction

74
Environmental Risks and Challenges of Anthropogenic Metals Flows and Cycles
can be expected when recycling rates in-crease.
Developments differ a lot per metal. For met-als with a declining use (As, Cd, Hg and to some extent Pb), emissions from old stocks dominate. An end-of-life management for metals like these is indicated, focusing not only on closing cycles but also on a final sink to store unretrievable and unwanted waste streams. For metals with a growing demand, a trend is already visible that recycling rates are increasing. Due to time lag, the share of secondary production remains low as long as total demand keeps rising. This means that emissions related to mining, production and use will probably rise as well, although at a lower pace than production itself.

75
Environmental Risks and Challenges of Anthropogenic Metals Flows and Cycles
4. Metals Production and Energy Use
Authors: Matthew Eckelman, Gavin Mudd, Terry Norgate
4.1 Introduction
While metals are a technologically invaluable class of materials, they can require signifi-cant amounts of energy to produce. Energy use occurs throughout the life cycle of metals (figure 4.1) and is generally much higher for primary (or virgin) production than for sec-ondary (recycled) production.
The production of metals from their associ-ated ores typically involves several stages, in-cluding mining, mineral processing/concen-trating, metal extraction and refining. In each stage, impurities are separated and removed and the concentration of metal in the final product increases. Platinum that starts out at an ore grade (or geologic concentration) of 0.1 % may be processed into metal with a fi-nal purity of 99.9 %. For some applications, such as cast iron piping, the required purity of these final products is not stringent, while for others, such as electronic components or high-performance aerospace parts, purity
requirements can reach 99.9999 %. Refining metals to this level of purity requires repeat-ed, precisely controlled melting and high lev-els of energy use, which is an important rea-son for the high cost of these materials.
Energy use in the metals sector occurs through direct use of fuels, such as combus-tion of coal to produce heat, or through the use of electricity, which is itself largely pro-duced through fossil fuel combustion. In or-der to evaluate both of these forms of ener-gy use together, one must consider primary energy use, or the total amount of raw fuel (including renewable sources) used over the entire production chain, which then accounts for the loss of energy during the production and distribution of electricity.
Energy use has long been a crucial factor in the mining and production of metals. Ancient mines relied on wood and charcoal to sepa-rate metal from its associated ore, resulting in local deforestation. With the tremendous rise in metal production that accompanied the industrial revolution and later the post-WWII economic boom, the scale of energy use required to fuel that production also in-creased and is now global in nature. The fer-rous and non-ferrous metals industry is re-sponsible for approximately 20 % of all indus-trial energy use worldwide (IEA, 2009)
Figure 4.1
Examples of direct and
indirect energy inputs during
the life cycle of a generic metal
Ore Mining &Processing
Smelting &Refining
Manufacture &Fabrication
Use inProducts
Recycling orDisposal
INDIRECT ENERGY INPUTS
Production offlotation agents
Production ofacids andsolvents
Production of fabrication equipment
Production ofjet fuel
Road infra-structure for collection trucs
DIRECT ENERGY INPUTS
Blasting or crushing
Electricity and heat
Electricity Combustionin jet energy
Heat for remelting

76
Environmental Risks and Challenges of Anthropogenic Metals Flows and Cycles
There are important physical and chemi-cal reasons for the high energy consumption associated with metal production. Physical parameters such as the ore grade and the depth of a metal deposit dictate how much ore must be mined and how far it must travel to produce a unit of metal, both of which have significant energy use implications. Chemi-cally, nearly all metals found in nature are bound in chemically stable minerals as op-posed to existing in a purely metallic state. This means that there is a minimum amount of energy needed to produce each metal, and that no amount of innovation or technologi-cal progress will allow humans to pass this thermodynamic limit. The chemical property of Gibbs free energy is the ultimate measure of chemical stability, but the heat of forma-tion normally dictates the minimum energy requirements for a process. For example, the thermodynamic energy required for the pro-duction of 1 kg of aluminium from alumina is 31.2 MJ/kg compared to 7.3 MJ/kg for the reduction of iron oxide to iron. This difference partly explains the higher energy consump-tion required for the production of alumini-um compared to iron and steel. Exergy is an-other important concept for analyzing met-al production processes, which tracks flows and losses but also accounts for the inher-ent quality of the energy being used, as 1 MJ of electricity can do more physical work than 1 MJ of heat (Dewulf et al., 2008).
4.2 Sources of Energy Use for Primary Metal Production
4.2.1 Mining and Mineral ProcessingMetal energy use begins with mining, and takes many forms. Mining is carried out through open cut or underground extraction techniques. In open cut (or open pit) mines where ores are relatively close to the surface, such as the Bingham Canyon copper mine (the world’s largest in physical size, see Fig-ure 4.2), the overburden (soil layers) are re-moved using heavy machinery, energy dense explosives and huge excavation machines are used to loosen rock, and a large fleet of haul trucks is used to bring the ores to the sur-face, thereby requiring large inputs of diesel and relatively minor amounts of electricity. A compilation of data on diesel consumption in open cut mining is given in Table 4.1.
§ Includes the Goldstrike, Cortez, Yanacocha, Newmont-Nevada, Porgera, Dome, Granny Smith, Kalgoorlie West, St Ives, Agnew, SuperPit, Jundee, Tarkwa, Damang, Inti Raymi, Bald Mountain, Misima and Kidston Au mines.
‡ Only includes Codelco Norte (most large Cu mines are Cu-Au; or alternately underground mines only, e. g. Mt Isa, El Teniente). Other large Cu only mines, such as those in Arizona, do not report site specific data (e. g. formerly Phelps Dodge, now part of Freeport-McMoRan Copper and Gold Inc).
# Includes the Freeport-Grasberg, Escondida, Alumbrera, Batu Hijau and Highland Valley Cu-Au mines.
Table 4.1
Average diesel consumption in open large cut mines around
the world (Mudd, 2009a)
Years of Data
Mt rock/year L diesel/t rock
average min. max. average min. max.
Gold mines§
62 56.7 13.0 199 0.68 0.33 1.18
Copper mines‡
3 394 321.1 432 0.88 0.81 1.00
Copper- Gold mines#
15 202 40.0 360 0.64 0.38 1.18
Overall average
80 96.6 13.0 432 0.68 0.33 1.18

77
Environmental Risks and Challenges of Anthropogenic Metals Flows and Cycles
Underground mines require even more energy to bring ore to the surface because of their greater depth. The TuaTona gold mine in South Africa reaches nearly four kilometers down – miners must descend in a cage for an hour to reach the mining site. Underground mining can be done through shafts, declines or adits, depending on scale, topography, ore geometry, geotechnical and economic considerations. Digging a hole this deep requires large quantities of diesel and elec-tricity to run lifts, conveyers, and some times pumps to pull water out of deep mines.
To bring one tonne of rock up from a deep mine 1 km below the surface requires a theo-retical minimum of nearly 10 MJ, equivalent to the gross energy content of 0.25 L of diesel fuel, and this number is directly proportion-al to the depth of the mine and the mass of the ore hauled to the surface. In practice, the amount of energy use is many times more than the theoretical minimum, with the ex-act amount of fuel and electricity required depending on the mine depth, the scale of the operation, and the mining methods em-ployed.
Figure 4.2
Open pit copper mine, Bingham
Canyon, Utah, USA (Photo
courtesy Wikipedia, 2005
(right) and Jon Bower, 2010 (left))
Figure 4.3
Underground mining (Photo
courtesy www.barrick.com)

78
Environmental Risks and Challenges of Anthropogenic Metals Flows and Cycles
Once ore reaches the surface, it can under-go several processing or beneficiation steps to remove the non-metallic waste rock, or gangue, each of which requires energy. Initial screening of ore to remove unusable boul-ders uses only moderate amounts of electric-ity to run conveyors and diesel fuel for heavy machinery. Much more significant is the en-ergy (electricity) used for crushing and grind-ing large chunks of ore into smaller, more easily processed grains, a process gener-ally known as milling. Ore is milled down to the liberation size, which is the particle size necessary to produce separate particles of either valuable mineral or gangue that can be removed from the ore (as tailings) with an acceptable efficiency by a commercial unit process. Crushing produces material typi-cally coarser than 5 mm and consumes rela-tively low levels of energy, while grinding (or milling) produces very fine products (often below 0.1 mm) and is very energy intensive. Liberation size does not imply pure miner-al species, but rather an economic trade-off between grade and recovery. Obviously the finer the liberation size for a particular min-eral, the finer the ore must be ground, result-ing in higher energy consumption. Figure 4.9 shows how energy requirements increase as the liberation size decreases for the milling of copper ores. It should be noted that fine-grained ores are not necessarily low grade. On the contrary, some high grade ores are fine-grained, such as the McArthur River lead-zinc deposit in the Northern Territory of Australia.
Lastly, particles of some metal ores, such as iron or zinc, may be further concentrat-ed through flotation, where the non-metal-lic grains are separated out through set-tling while metallic grains are carried to the water surface through foams or other flota-tion agents. This process is water-intensive but does not require much direct energy but rather requires energy indirectly in pumping water to the site.
4.2.2 Metal Extraction and RefiningOnce metal ores have been mined and suit-ably processed or beneficiated, the miner-als they contain are physically or chemically transformed with the goal of extracting the metal contained within. There are two main classes of technology for metal extraction. The choice as to which processing route is used is invariably based on economic consid-erations, which are strongly influenced by is-sues such as ore grade and mineral type.
Pyrometallurgy involves heating of metal concentrates at high temperatures, in order to strip the metal from its associated mineral constituents; this process requires combust-ing fossil fuels for heating furnaces or elec-tricity to power an electric arc furnace. There are several types of pyrometallurgy, which have different energy considerations. Calci-nation, a thermal treatment process, can be used for example to drive off water from ore or to break down carbonate minerals. Roast-ing, which involves chemical reactions be-tween the ore and hot air, is often done to oxidize sulfidic ores. Pyrometallurgy that re-sults in a molten product is called smelting, which typically takes place at higher temper-atures than simple roasting or calcining. For some ores, the chemical reactions induced by pyrometallurgy are exothermic, that is, they release energy stored up in the chemical bonds as heat, and thus can be accomplished with little to no external energy. Oxidation of sulfide ores is a common example. Endother-mic reactions, on the other hand, require en-ergy inputs in order to proceed, and thus heat must be provided, generally from fossil fuel combustion. For some ores, reducing agents must also be added to help remove impuri-ties from the metal. If the reductant is car-bon, usually in the form of coal or coke, this will further add to the fossil energy burden of pyrometallurgy.

79
Environmental Risks and Challenges of Anthropogenic Metals Flows and Cycles
Hydrometallurgy consists of treating ores or concentrates with liquid solutions in order to separate metals from other mineral constitu-ents. This is generally done by leaching, for example by piling the ore into large mounds or heaps, or feeding the ore into tanks, and dissolving the metal out of the ores using strongly reactive solutions such as cyanide, ammonia, or sulfuric acid. For heap leach-ing of copper ores, this step is completed in the open air in large engineered piles, while for other ores, such as gold ores, the process can take place within a hydrometallurgical plant. Leaching does not generally take place at high temperature, but can require high pressures, such as the high-pressure acid leaching (HPAL) process for nickel laterite ores, which requires energy to maintain. For some ores, pyrometallurgical processes such as calcining or roasting may be performed prior to leaching.
Refining of the metal may be necessary af-ter smelting or leaching steps, depending on the intended application. Many refining pro-cesses are electrochemical in nature, and so consume electricity, though some diesel and other fuels may also be used. The most com-mon refining process is solvent extraction/electrowinning, where the metal of interest is further separated by extraction with solvents in an aqueous solution, which is then sub-jected to an electric field and the metal ions are deposited on the cathode of the electro-lytic cell. This can also take place in a molten salt solution, as for aluminium and magne-sium. Electro-refining is a related process where an impure metallic anode is dissolved in the electrolyte and then plated onto the cathode again using strong electric fields. For some metals, the amount of electric-ity needed to run a modern-scale refinery is quite large, and for this reason, many refiner-ies are situated close to cheap and abundant sources of hydropower.
The ratios of actual energy consumption dur-ing the metal extraction stage to theoreti-cal energy consumption (derived from the heat of formation) for various metals, derived from various published sources, are shown in Figure 4.4. This figure shows that there is considerable scope for reducing the energy consumption for primary metal production by focusing on the metal extraction stage of the metal production life cycle.
Note that the ratio’s in Figure 4.4 represent potential im-provements compared to the theoretical heat needed for for-mation of metals, and are not related to actual technologies.
Figure 4.4
Ratio of actual to theoretical
energy consumption for metal extraction
(Norgate and Jahanshahi,
2010).
0 5 10 15 20 25 30
Titanium
Magnesium
Aluminium
Iron
Zinc
Lead
Nickel
Copper
Actual energy/Theoretical energy

80
Environmental Risks and Challenges of Anthropogenic Metals Flows and Cycles
4.2.3 Fabrication and ManufacturingAfter metal has been refined, it is melted and cast into some kind of shape, commonly an ingot or a billet. These forms are conveni-ent for transport but are often not the ac-tual shapes of metal that are needed for fi-nal products. Metal that requires shaping is then sent to a fabrication plant, where it is turned into semi-products such as sheets, coils, bars, or pipes. These are then sent out to manufacturers, who further shape the metal into a final product, such as a washing machine. All of these fabrication and manu-facturing steps require energy, mostly in the form of electricity.
4.2.4 TransportationThe chain of production of metals can re-quire significant amounts of transportation. Ores and concentrates are dense materials that are processed at significant scales. At the mine site, energy is required to transport material using trucks or conveyor systems. Metal production facilities are distributed all over the world, and ores, concentrates, and intermediate products are frequently shipped internationally. In some cases, metal mines, smelters, and refineries are all located in a single place, bringing external transportation energy costs to a minimum. In many instanc-es, however, metal is mined in one country or region, transported by train to the coast, if necessary, loaded onto barges, and shipped on to another location. Per unit of contained metal, transport energy use is highest for moving raw ore, as this requires moving the waste rock portion of the ore as well, and for this reason it is rarely done. Transport also applies to metals once they are incorporated into final products and shipped to consumers (figure 4.5).
Figure 4.5
Flows of zinc into and out of the United States (Johnson and
Graedel, 2008)
Oceania
2.1
120
Net Import USA: 540
240210
4204.1
1.5
9.3
190
Middle East
CIS
AsiaMexico
Africa
Canada
Europe
Latin America & the Caribbean
All Values in Gg Zn/yr
Inflows
Outflows

81
Environmental Risks and Challenges of Anthropogenic Metals Flows and Cycles
4.2.5 Life Cycle Energy Use for Primary ProductionOver the past several decades, many re-searchers and companies have carried out environmental assessments of the full pro-duction chain for various metals. This re-search has largely focused on energy use, but other environmental impacts such as water use or emissions of greenhouse gases are also commonly considered.
Primary data on life cycle energy use for virgin metal production have been compiled in various life cycle inventory databases, which ensure that each value has transpar-ent assumptions and consistent system
boundaries. All of the metals considered in this report have been investigated (table 4.2) but for many metals, including elements being increasingly used in high-tech applica-tions, no robust analyses of primary energy use exist. Various methods have been pro-posed for extrapolating energy use for one metal to other metals, based on patterns of co-production, enthalpies of formation, ore grades, or prices (Ashby, 2009). Most primary metal operations produce multiple co-prod-ucts; in this case, it is most common to allocate energy use to individual products according to their relative prices.
Table 4.2
Average primary energy needed
for virgin metal production
cradle-to-gate
Metal/Product Primary Energy MJ/kg
Notes References
Aluminium 190 – 230 EAA; ecoinvent v2.2; Bath ICE v2.0
Antimony 140 ecoinvent v2.2
Cadmium 17 ecoinvent v2.2
Cerium 350 Bayan Obo, China Koltun and Tharumarajah, 2010
Chromium 83 Bath ICE v2.0
Cobalt 130 ecoinvent v2.2
Copper 30 – 90 Multiple routes Kupfer Institute; ecoinvent v2.2; Bath ICE v2.0
Ferrochromium 37 68 % Cr ecoinvent v2.2
Ferromanganese 23 75 % Mn ecoinvent v2.2
Ferronickel 160 25 % Ni ecoinvent v2.2
Gadolinium 2,200 Bayan Obo, China Koltun and Tharumarajah, 2010
Gallium 3,000 Semiconductor grade
ecoinvent v2.2
Gold 310,000 ecoinvent v2.2
Indium 2,600 ecoinvent v2.2
Iron/Steel 20 – 25 Low-alloyed worldsteel, ecoinvent v2.2; Ashby, 2009
Lanthanum 220 Bayan Obo, China Koltun and Tharumarajah, 2010

82
Environmental Risks and Challenges of Anthropogenic Metals Flows and Cycles
Table 4.2 _b
Average primary energy needed
for virgin metal production
cradle-to-gate
Metal/Product Primary Energy MJ/kg
Notes References
Lead 25 – 50 ecoinvent v2.2; Bath ICE v2.0; GaBi
Lithium 380 – 850 ecoinvent v2.2
Magnesium 270 – 350 ecoinvent v2.2; Ashby, 2009
Manganese 52 – 59 ecoinvent v2.2; Bath ICE v2.0
Mercury 90 – 180 Liquid ecoinvent v2.2; Bath ICE v2.0
Molybdenum 15 – 380 ecoinvent v2.2; Bath ICE v2.0
Neodymium 390 Bayan Obo, China Koltun and Tharumarajah, 2010
Nickel 180 – 200 Class I ecoinvent v2.2, Eckelman 2010
Palladium 180,000 ecoinvent v2.2
Platinum 190,000 ecoinvent v2.2
Praseodymium 220 Bayan Obo, China Koltun and Tharumarajah, 2010
Rhodium 560,000 ecoinvent v2.2
Silicon 1,000 – 1,500
Electronics-grade ecoinvent v2.2
Silver 1,500 ecoinvent v2.2
Stainless (304) 57 – 68 ISSF ecoinvent v2.2
Tantalum 4,400 Capacitor-grade ecoinvent v2.2
Tellurium 160 Semiconductor-grade
ecoinvent v2.2
Tin 250 – 320 ecoinvent v2.2; Bath ICE v2.0
Titanium 360 – 750 Norgate et al., 2007; Bath ICE v2.0
Vanadium 3,700 Bath ICE v2.0
Yttrium 760 – 1,500 Bayan Obo, China Koltun and Tharumarajah, 2010; Bath ICE v2.0
Zinc 49 – 55 IZA; ecoinvent v2.2
Zirconium 1,600 Bath ICE v2.0
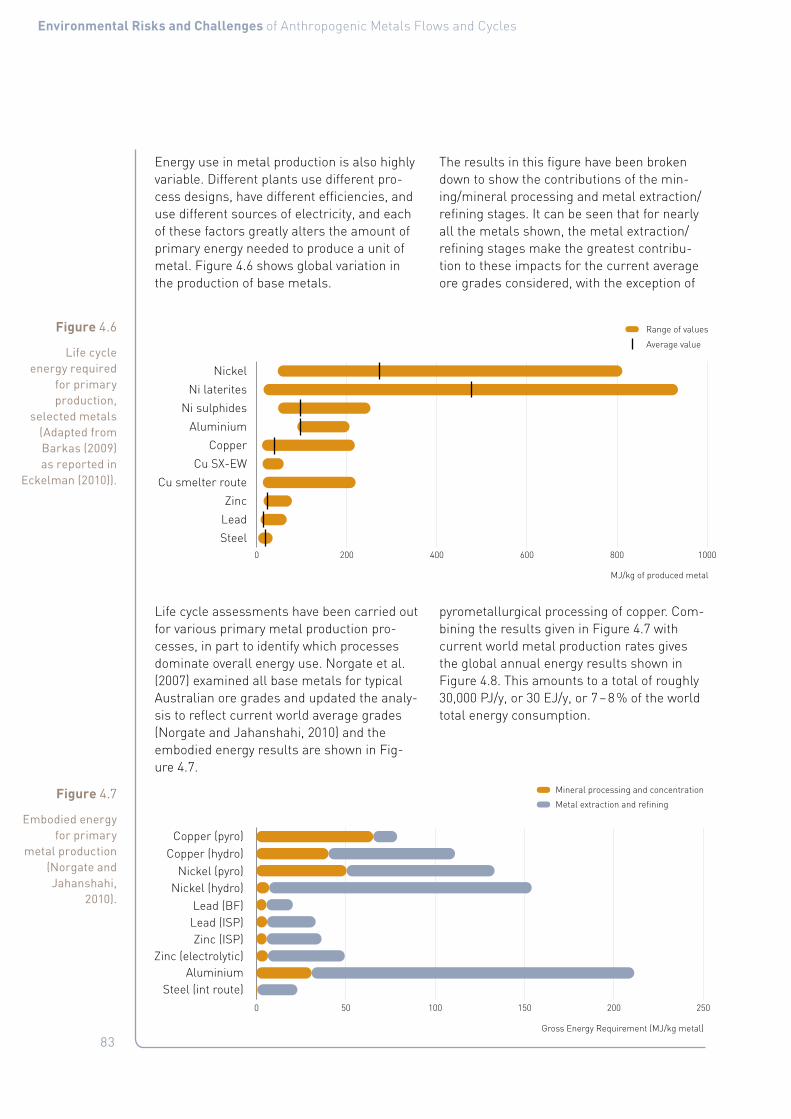
83
Environmental Risks and Challenges of Anthropogenic Metals Flows and Cycles
Energy use in metal production is also highly variable. Different plants use different pro-cess designs, have different efficiencies, and use different sources of electricity, and each of these factors greatly alters the amount of primary energy needed to produce a unit of metal. Figure 4.6 shows global variation in the production of base metals.
Life cycle assessments have been carried out for various primary metal production pro-cesses, in part to identify which processes dominate overall energy use. Norgate et al. (2007) examined all base metals for typical Australian ore grades and updated the analy-sis to reflect current world average grades (Norgate and Jahanshahi, 2010) and the embodied energy results are shown in Fig-ure 4.7.
The results in this figure have been broken down to show the contributions of the min-ing/mineral processing and metal extraction/refining stages. It can be seen that for nearly all the metals shown, the metal extraction/refining stages make the greatest contribu-tion to these impacts for the current average ore grades considered, with the exception of
pyrometallurgical processing of copper. Com-bining the results given in Figure 4.7 with current world metal production rates gives the global annual energy results shown in Figure 4.8. This amounts to a total of roughly 30,000 PJ/y, or 30 EJ/y, or 7 – 8 % of the world total energy consumption.
Figure 4.6
Life cycle energy required
for primary production,
selected metals (Adapted from Barkas (2009) as reported in
Eckelman (2010)).
0 200 400 600 800 1000
Steel
Lead
Zinc
Cu smelter route
Cu SX-EW
Copper
Aluminium
Ni sulphides
Ni laterites
Nickel
Range of values
Average value
MJ/kg of produced metal
Figure 4.7
Embodied energy for primary
metal production (Norgate and Jahanshahi,
2010).
0 50 100 150 200 250
Metal extraction and refining
Mineral processing and concentration
Steel (int route)Aluminium
Zinc (electrolytic)Zinc (ISP)
Lead (ISP)Lead (BF)
Nickel (hydro)Nickel (pyro)
Copper (hydro)Copper (pyro)
Gross Energy Requirement (MJ/kg metal)

84
Environmental Risks and Challenges of Anthropogenic Metals Flows and Cycles
The results presented above indicate that efforts to reduce the energy consumption of primary metal production should main-ly focus on the metal extraction stage of the metal life cycle, and that there is consider-able scope to make significant reductions here, particularly for steel and aluminium. While the contribution of the mining and min-eral processing stages to energy consump-tion and GHG emissions can be expected to increase in the future as outlined above, and will present opportunities for reducing these impacts by improving the energy efficiency of comminution (that is, breaking up the ore, primarily through crushing and grinding), these opportunities will still be appreciably less than those from the metal extraction and refining stages.
4.3 Energy Required for Secondary Production
The production of metal from scrap material, or secondary production, generally requires much less energy than for primary produc-tion, as many fewer steps are involved. Sec-ondary metal must be re-melted into ingots or other metal products, and is usually mixed with virgin material in an electric arc furnace to control key composition parameters. As the scrap material portion is already in me-tallic form, much less energy is needed to re-duce the metal. All of the energy used in min-ing, milling, concentrating, and transporting ore to a smelter is also avoided when recy-
cling metals. The energy benefits of recycling are thus particularly significant for metals with a high heat of formation (such as alu-minium) or for low ore-grade metals (such as platinum) where large quantities of ore must be excavated and processed to produce one unit of metal.
There are also added energy costs: metal scrap must be collected, sorted, and separat-ed from any potential sources of contamina-tion. Fabrication and manufacturing facilities produce “new scrap” that is fairly homogene-ous and does not require any energy-inten-sive separation processes. End-of-life scrap, on the other hand, is heterogeneous and dis-persed and must be collected, shredded, and sorted from other material waste streams. Both operations have energy costs: diesel fuel to run the collection trucks and trains, and electricity to run large-scale sorting ma-chinery. What is collected and sorted from end-of-life scrap can be contaminated in var-ious ways, through surface treatment, alloy-ing, or adhesion to other materials for exam-ple. Depending on the metal and the contam-inant, additional energy can be expended to purify the scrap, through pyrolysis or incin-eration. Materials that are not separated dur-ing remelting become incorporated as tramp elements. Primary energy costs for different recycling processes are shown in Table 4.3.
Figure 4.8
Global energy consumption for
primary metal production
(Norgate and Jahanshahi,
2010).
0 5000 10000 15000 20000 25000
Extraction and refining
Mining and mineral processing
Steel
Aluminium
Base metals
Global energy consumption (PJ/y)

85
Environmental Risks and Challenges of Anthropogenic Metals Flows and Cycles
Table 4.3
Energy use for common
metal recycling processes
(adapted and expanded from Norgate, 2004)
Recycling Stage Metal/Product Primary Energy
MJ/kg product
References
Deconstruction Steel 0.9 ecoinvent v2.2
Collection Al packaging 0.3 Quinterz et al. (2001)
Ni-Cd batteries 7.4 Lankey & McMichael (1999)
Sorting Al packaging 0.4 Quinterz et al. (2001)
Collection and Sorting Ni-Cd batteries 1.8 Rydh & Karlstrom (2002)
Iron scrap old 0.7 ecoinvent (2010)
Shredding Steel/tinplate 0.8 Grant et al. (2001)
Misc. scrap 0.5 Woldt et al. (2002), Chapman and Roberts (1983)
Misc. scrap 0.6 Jackel et al. (2002)
E-scrap 0.9 ecoinvent v2.2
Mechanical Processing Al packaging 2.7 Quinterz et al. (2001)
Magnetic Separation Ferrous scrap 20 Chapman and Roberts (1983)
Sink-float Al packaging 2.9 Quinterz et al. (2001)
Wire Separation Cu wire 3 Chapman and Roberts (1983)
Drying Misc. scrap 0.2 – 1.5 Chapman and Roberts (1983)
Pyrolysis/Incineration Al packaging 2.4 Quinterz et al. (2001)
Sweating Furnace Misc. scrap 2 – 10 Chapman and Roberts (1983)
Remelting Al packaging 9.3 Quinterz et al. (2001)
Al 5.0 Das et al. (2004)
Fe 6.3 Schifo & Radia (2004)
All processes Al scrap new 5.6 EAA (2008)
Al scrap mixed 7.7 EAA (2008)
Li-ion batteries 12 ecoinvent v2.2
Ni-Cd batteries 4.9 Rydh & Karlstrom (2002)

86
Environmental Risks and Challenges of Anthropogenic Metals Flows and Cycles
The energy benefits of recycling depend on the metal and the technological context, and research into this topic has been conduct-ed for several decades. Early studies were done in 1970s by Kellogg (1977) and Kusik and Kenehan (1978), which examined alu-minium, copper, iron and steel, lead, nickel, stainless steel, tin, titanium, and zinc. At this time, many companies, industry groups, and local governments also started publishing figures on energy savings. These figures were generally quite close to those reported by in-dependent analysts, as compiled by Powell (1983).
Since then, improvements in energy effi-ciency and development of new technology, as well as changes in prices, have shifted results. Researchers and industry analysts have continuously updated and expanded our understanding of the energy benefits of metal recycling, with a summary of results com-piled in Table 4.4. Other environmental con-siderations related to metal recycling are dis-cussed in Chapter 5.
Table 4.4
Ranges of energy savings of recycling for various ferrous
and non-ferrous metals (adapted
from Norgate, 2004).
Metal/Product
% Savings References
Aluminium 90 – 97 Norgate & Rankin (2002), Gaballah and Kanari (2001), Quinkert et al. (2001), International Aluminium Insti-tute (2011), Chapman and Roberts (1983)
Copper 84 – 88 Norgate and Rankin (2002), Gaballah and Kanari (2001)
Gold 98 ecoinvent v2.2
Lead 55 – 65 Norgate and Rankin (2002), Gaballah and Kanari (2001)
Magnesium 97 USEPA (1994)
Nickel 90 Norgate and Rankin (2002)
Palladium 92 – 98 ecoinvent v2.2
Platinum 95 ecoinvent v2.2
Rhodium 98 ecoinvent v2.2
Silver 96 ecoinvent v2.2
Steel 60 – 75 Norgate and Rankin (2002), Gaballah and Kanari (2001)
Stainless Steel (304) 68 Johnson et al. (2008), Eckelman (2010)
Titanium 67 Chapman and Roberts (1983)
Zinc 60 – 75 Norgate and Rankin (2002), Gaballah and Kanari (2001)
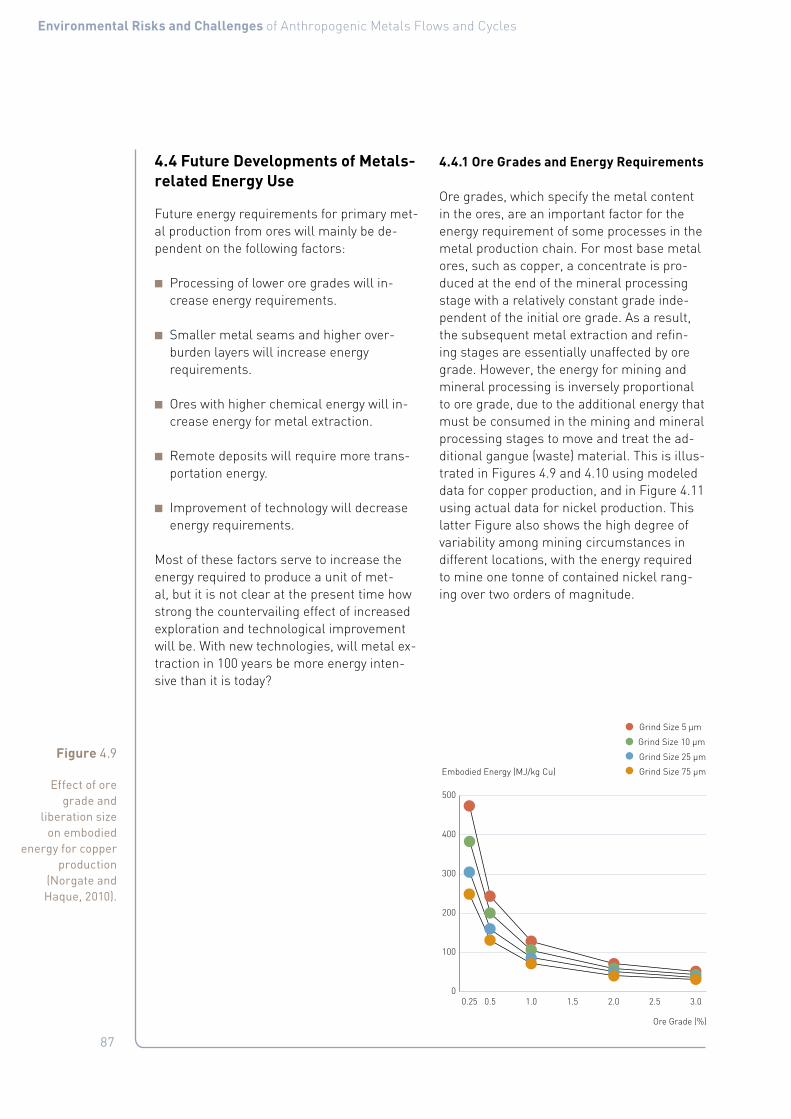
87
Environmental Risks and Challenges of Anthropogenic Metals Flows and Cycles
4.4 Future Developments of Metals-related Energy Use
Future energy requirements for primary met-al production from ores will mainly be de-pendent on the following factors:
■ Processing of lower ore grades will in-crease energy requirements.
■ Smaller metal seams and higher over-burden layers will increase energy requirements.
■ Ores with higher chemical energy will in-crease energy for metal extraction.
■ Remote deposits will require more trans-portation energy.
■ Improvement of technology will decrease energy requirements.
Most of these factors serve to increase the energy required to produce a unit of met-al, but it is not clear at the present time how strong the countervailing effect of increased exploration and technological improvement will be. With new technologies, will metal ex-traction in 100 years be more energy inten-sive than it is today?
4.4.1 Ore Grades and Energy Requirements
Ore grades, which specify the metal content in the ores, are an important factor for the energy requirement of some processes in the metal production chain. For most base metal ores, such as copper, a concentrate is pro-duced at the end of the mineral processing stage with a relatively constant grade inde-pendent of the initial ore grade. As a result, the subsequent metal extraction and refin-ing stages are essentially unaffected by ore grade. However, the energy for mining and mineral processing is inversely proportional to ore grade, due to the additional energy that must be consumed in the mining and mineral processing stages to move and treat the ad-ditional gangue (waste) material. This is illus-trated in Figures 4.9 and 4.10 using modeled data for copper production, and in Figure 4.11 using actual data for nickel production. This latter Figure also shows the high degree of variability among mining circumstances in different locations, with the energy required to mine one tonne of contained nickel rang-ing over two orders of magnitude.
Figure 4.9
Effect of ore grade and
liberation size on embodied
energy for copper production
(Norgate and Haque, 2010).
0
100
200
300
400
500
Grind Size 5 µm
Grind Size 10 µm
Grind Size 25 µm
Grind Size 75 µm
3.02.52.01.51.00.50.25
Embodied Energy (MJ/kg Cu)
Ore Grade (%)

88
Environmental Risks and Challenges of Anthropogenic Metals Flows and Cycles
Figure 4.10
Effect of ore grade on stage-by stage energy
consumption for copper production
(Norgate and Jahanshahi,
2006).0 10 20 30 40 50 60 70 80
Gross Energy Requirement (MJ/kg Cu)
0.5 % Cu
1.0 % Cu
2.0 % Cu
3.0 % Cu
Refining
Smelting
Mineral Processing
Mining
Figure 4.11
Effect of ore grade on energy
expended for mining, milling
and concentration at global nickel
mines (Eckelman, 2010)
0
200
400
600
800
200800 400 600 800 1000 1200 1400
1000
1200
0
1
2
3
4
5
6
7
8
9
1400
0
200
400
600
800
200800 400 600 800 1000 1200 1400
1000
1200
0
1
2
3
4
5
6
7
8
9
1400
GJ/t contained Ni
cumulative Mg contained Ni
% ore grade% ore grade
ore gradeLaterites
Sulfides

89
Environmental Risks and Challenges of Anthropogenic Metals Flows and Cycles
4.4.2 Ore Grade ReductionsHistorically, the long-term trend in the grades of ores processed has declined for numerous metals, often substantially in the first half of the twentieth century and more slowly in recent decades, depending on the metal. In general, the synthesis of extensive production statistics remains relatively un-common, although a range of recent papers have published data on trends for copper, uranium, gold, nickel and platinum group metals of varying historical lengths. There are a range of factors which need to be con-sidered in understanding the drivers behind ore grade reductions, as these are crucial in any projection of the likely future trends in ore grades.
The ore grades processed at any given time are a complex function of available technolo-gy, prevailing prices, demand-supply balanc-es, ore types, ongoing exploration success or sometimes even social or environmental
constraints. In general, growing demand, im-proving technology and exploration success has continued to ensure reliable and relative-ly cheap supply (in real terms). This has al-lowed the gradual lowering of cut-off grades, the grade at which it is economic to process ore, and a substantial expansion of annual global production.
In Annex 5, examples are shown of declining ore grades for a number of metals, including a discussion on the specific reasons for that.
For copper, a recent paper by Crowson (Crowson, 2012) includes a remarkable range of data on Cu mining and ore grades for se-lect mines and fields around the world. Some century-old Chilean and USA Cu mines are shown in Figure 4.12, with relative trends in ore grades over 30 years from initial produc-tion for several large Cu mines shown in Fig-ure 4.13.
Figure 4.12
Long-term trends in ore grades at
some giant Cu mines (Crowson,
2012)
0.5
1.0
1.5
2.0
2.5
3.0
0
Ray
El Teniente
Chuquicamata
Chino
Bingham Canyon
20051995198519751965195519451935192519151905
% Copper in Ore milled

90
Environmental Risks and Challenges of Anthropogenic Metals Flows and Cycles
As can be seen for the metals shown, there is a range of reliable data showing a gener-al long-term decline in the average grades of ores being processed. These declines have been achieved based on the intersec-tion of new technology (e. g. sulfide flota-tion, carbon-in-pulp, nickel laterites), grow-ing demand (all examples used have gener-ally strong and sustained growth patterns through the twentieth century, with excellent prospects for continued demand in the twen-ty-first century) and exploration success. The exploration success is driven primarily by two factors – discovery of new deposits and the inverse grade-tonnage relationship for most deposit styles. In many countries, there is still ongoing success in finding new deposits, ei-
ther in new regions or in known mining fields (especially for major mining countries such as Australia, Canada, Chile etc). For most mineral deposits, as the ore grade declines, the size of the deposit increases – sometimes exponentially (eg. porphyry Cu deposits). As such, a lower cutoff grade for economic min-ing and processing leads to a substantial in-crease in contained metal(s) – as mine scale increases commensurately, this leads to a reduction in the unit cost of production due to economies of scale. Historically, the real price of many metals (and minerals) actually declined throughout the twentieth century as a result of these combined factors (see data from (Kelly et al., 2010).
Figure 4.13
Approximate relative trends
in Cu ore grades over 30 years
from initial production for
some major mines (adapted from Crowson,
2012)
20
0
40
60
80
100
120
Toquepala
Ray
Pima
Ertsberg/Grasberg
Granisle
Gibraltar
Escondida
El Abra
Cuajone
Chuquicamata
Candelaria
Cananaea
Bingham Canyon
Bethlehem
30th25th20th15th10th First four
Cu ore grade
year after start of exploitation

91
Environmental Risks and Challenges of Anthropogenic Metals Flows and Cycles
Although complete statistical data are rare-ly published for reported resources by coun-try for a variety of metals, it is common that these are lower grade than current pro-cessing (see Mudd, 2010a, b, 2012; Mudd & Diesendorf, 2010). The grades of new dis-coveries can be quite variable, as evidenced by uranium in Canada, but in general most new deposits are typically lower in grade. Al-though exploration can try and target ‘high grade’ ores and deposit types, the inverse grade-tonnage relationship dictates that to meet expected future demands for metals requires lower grade ores to achieve large scale production (which is effectively what is presently happening; eg. copper, gold). Over-all, this further reinforces the view that ore grades will continue to decline, albeit more gradually in the future than in the past.
Finally, the remaining key aspects of ores be-ing processed are the refractory nature and levels of impurities present. For some met-als, such as lead-zinc or nickel, ore types are becoming more complex and difficult to process, due to factors such as fine-grained sulfide mineralogy or the increasing process-ing of Ni laterite ore. To enable development, this has been accompanied by new technol-ogy development, such as the fine grinding and specialised flotation technology for the difficult ores at the McArthur River zinc mine in Australia (see (Mudd, 2010a) or use of high pressure acid leaching technology for nick-el laterite ores (see (Mudd, 2010b). At some sites, impurities such as arsenic prevent a deposit being developed (eg. Armstrong Ni mine failure, Australia; see (Mudd, 2010b), or places strict conditions on saleable products (eg. alumina in iron ore).
In summary, in almost every metals sector of the global mining industry for which reli-able long-term data is available (as shown above), ore grade declines have been sub-stantial throughout the twentieth century but are likely to be slower in the future. The only real anomaly is uranium, which shows an in-crease due to the rich Saskatchewan mines, though these are offset by the very low grade mines in Namibia. Increasingly, gradually
more complex ore types are also being pro-cessed – commonly requiring more intensive processing to extract metals.
4.5 Measures to Reduce Metals-related Energy Use
4.5.1 Increasing Energy Efficiency in the Primary Metals SectorMetal production facilities are extreme-ly large installations that require significant capital investment. Older plants and process designs tend to be less efficient but they can be kept online for decades as newer, more efficient plants are built, which is one reason for the large variation in energy use in met-al production around the world. In general, however, the overall energy intensity of metal production tends to decrease with time, as newer technologies are introduced and older ones are upgraded to be more efficient. In the 1980s, for example, the average energy used to produce one unit of steel in China de-creased by more than 8 %, while other major producing countries experienced smaller re-ductions.
The metal extraction and processing stage has been repeatedly shown to be the most energy-intensive portion of metal production. Several research papers have examined the metals sector in major producing countries and asked how much energy could be saved if every country used the best technology avail-able. For example, the U.S. steel industry might be able to reduce its energy consump-tion by 20 % in adopting the most efficient processes globally (Worrell et al., 1997).
While metal extraction and refining is the most energy-intensive process in the met-al production life cycle, there are also many energy efficiency opportunities within the mining and mineral processing sector. Fig-ure 4.14 shows the current annual energy consumption of this sector in the US, broken down into the various processing steps. The practical minimum energy consumption is also shown in this figure for the various steps for comparison, based on current technology.

92
Environmental Risks and Challenges of Anthropogenic Metals Flows and Cycles
It is apparent from this figure that comminu-tion accounts for the majority of the energy consumed by this sector. Therefore in order to reduce the energy intensity consequenc-es of decreasing ore grades (requiring more processing of waste rock per unit of metal), the emphasis should be on reducing commi-nution energy.
Some approaches to reduce the energy used in comminution include:
■ Comminute less material – ore sorting, pre-concentration, improved mining prac-tices to reduce dilution by waste.
■ Comminute more efficiently – optimizing the design of comminution circuits includ-ing process control, use of more energy-
efficient comminution equipment, such as high pressure grinding rolls, stirred mills.
■ Do less comminution – less liberation of the valuable mineral to achieve higher re-covery at the expense of lower concentrate grade (more metal and gangue to be sepa-rated in smelting and refining stages).
■ Direct processing of ore – this is the ex-treme case of the preceding approach where no (or very little) comminution is done – either pyrometallurgically or hydrometallurgically.
■ More comminution in the blasting (mining) stage.
Figure 4.14
Current and practical
minimum annual energy
consumption for the US mining
and mineral processing sector
(Data from U.S. DoE, 2007).
0 100 200 300 400 500
Practical minimum
Current practice
Grinding
DieselEquipment
AncillaryOperations
Ventilation
Separations
Digging
Blasting
Crushing
Drilling
Dewatering
Annual energy consumption (PJ/y)

93
Environmental Risks and Challenges of Anthropogenic Metals Flows and Cycles
Current opportunities for reducing future en-ergy consumption include (Albanese & Mc-Gagh, 2011):
■ New technologies for reducing grinding and comminution energy.
■ More efficient conveyor and (automated) transportation systems.
■ Improved ventilation systems for under-ground mines (or reduced ventilation in automated mines).
■ Advances in mineral flotation and concentration.
■ Development of in-situ leaching processes.
■ Improved on-line analysis to improve accu-rate enforcement of cut-off grades.
■ Underground or in-pit sorting to reduce the amount of material moved.
Some of the current technology development work of large mining companies in the above areas is aimed at achieving step-change re-ductions in energy consumption. One of the most advanced of these approaches is the development and application of more ener-gy-efficient comminution equipment. There are several new technologies which may of-fer energy savings if incorporated optimally into comminution circuits. Two of these are stirred mills and high pressure grinding rolls (HPGR):
■ High Pressure Grinding Rolls – energy sav-ings ranging from 15 to 30 per cent com-pared with former comminution circuits have been achieved with industrial ma-chines grinding cement clinker and lime-stone. The broader use of HPGR for metal-liferous minerals has only been considered more recently. Initial concerns over wear rate of the rolls have been addressed, and as a result there are strong signs of in-creasing interest particularly in the pro-cessing of gold, copper and iron ores.
■ Stirred Mills – three stirred mill types have gained industry acceptance for fine and ul-tra-fine grinding duties; these are the tow-er mill, the Isa Mill and the detritor mill. The first two mills are vertical stirred mills with steel spirals and long pins respec-tively to agitate the mill charge, while the latter mill is a large horizontal stirred mill with discs as stirrers. It has been reported that stirred mills are up to 50 % more en-ergy-efficient than conventional ball mills for products finer than 100 μm.
It is unclear at this point how the two oppos-ing trends for primary metal production de-scribed in this section – increasing energy use from declining ore grades and decreas-ing energy use from efficiency measures and advances in technology – will balance each other in the future. In the medium-term, de-mand for primary metals seems unlikely to decrease in any significant way, and so en-ergy use in the mining and metal extraction sectors will continue to be an important envi-ronmental consideration.
4.5.2 Increasing Secondary Production and Improving Material EfficiencyFrom Section 4.3, it is clear that secondary production of metals is much less energy in-tensive than primary production, with ener-gy savings ranging from 55 % (lead) to 98 % (palladium). An obvious way to reduce energy use related to metals production is therefore to increase secondary production, focusing on sources of scrap, such as new scrap from manufacturing and fabrication operations, that do not require energy-intensive sort-ing and separation steps. Options for this are discussed in Chapter 5. Other measures such as direct reuse of metals, for structural ap-plications for example, or recycling without melting will significantly reduce the energy use associated with secondary metal produc-tion (WellMet2050). As the use of metals and the use of energy are linked through the con-cept of embodied energy, material efficiency measures for metals may also save energy through designing metal products with long-er lifetimes, reducing losses in production, decreasing the use of metals to provide a giv-
94
Environmental Risks and Challenges of Anthropogenic Metals Flows and Cycles
en service, substituting one material for an-other (in general it takes more energy to pro-duce metals than it does to produce ceramic and plastic materials that may substitute for them), or by providing the service in an alto-gether different way. Several of these options are discussed in Chapter 6.
4.6 Conclusions
The energy use related to primary metals production is considerable, making up near-ly 20 % of all industrial energy use global-ly, and 7 – 8 % of the total global energy use. The gross energy requirement (GER) of pri-mary production varies from 20 MJ (steel) to 200,000 MJ (platinum) per kg of metal pro-duced. This energy requirement is, among others, dependent on the ore grade, the concentration of the metal in the ore. If ore grades decline, the energy requirement in-creases exponentially. A trend of declining ore grades is currently visible for some met-als, such as gold, copper and nickel. For oth-ers, it is expected to arise in the coming dec-ades. The reasons for this downgoing trend are various. Technological progress, mak-ing it possible to mine lower grade ores in an economically viable way, is one. Another is the availability of high-grade ores, which usu-ally is much lower than low-grade ores. Also,
there is a clear linkage with the market scar-city and pricing issue, which is not debated in this report but is a topic of some of the other reports of the Global Metal Flows Working Group.
Improvements in metal mining and process-ing technology act as an opposing force to rising energy use in the mining and metals sector. Process improvement using currently available technology can increase energy ef-ficiency considerably. A maximum of a fac-tor 2 – 20 energy efficiency improvement is theoretically available, not based on present technology. Future technological develop-ments will realize some of this potential.
Additional energy savings can be realized through increased efforts in recovering and recycling metals. Secondary production re-quires significantly less energy than primary production. While secondary sources will not completely satisfy society’s demand for metal in a world where cities and infrastructure are growing fast, for nearly every metal there is considerable potential for increased recovery. Improving the management and processing of secondary metals will improve the energy efficiency of the metals sector overall.

95
Environmental Risks and Challenges of Anthropogenic Metals Flows and Cycles
5. Impacts Related to the Production and Use of Metals
Authors: Gavin Mudd, Terry Norgate, Markus Reuter, Ladji Tikina, Sonia Valdivia
Minimizing the creation of residues and vari-ous environmental footprints is the objective of the metals processing and recycling indus-tries. This chapter is divided into two sec-tions: the first discussing various impacts of the primary metals processing industry (i. e. link between mining and metal production) and the second discussing recycling (i. e. link between product design, end-of-life and met-al/energy production). It is the endeavour of the metal industry to optimize the use of all materials, metals, alloys, etc., minimizing the ultimate residue creation, implying that flue dusts, sludges, slags, slimes etc. are final-ly dumped if they have no present economic value. In other words, a key objective in ma-terials and metals processing is resource ef-ficiency.
It is the innovation of the metals process-ing industry (primary, secondary and recy-cling industries) that squeezes the last bit of metal from any material, leaving behind as benign as possible material to be dumped, while minimizing the energy consumption. Minimization of energy is implied here to be relative to the amount minimally and thermo-dynamically required to produce metal from primary and secondary/recycling sources. This chapter is based on the understanding that minimizing systemic losses of resources is constrained by thermodynamics as well as economic considerations. Industrial process-es require a minimum of energy to run. Re-ducing energy and materials losses in these processes may at one point become econom-ically unsustainable, long before the thermo-dynamic minimum is reached. (Meskers et al., 2008).

96
Environmental Risks and Challenges of Anthropogenic Metals Flows and Cycles
5.1 Impacts of Mining and Primary Extraction
Mining and metals extraction is typically a cyclical activity, starting with exploration for economic mineral deposits, development and operation, finishing with closure and rehabili-tation and leading back to exploration for the next deposit. Furthermore, given that most metals can be recycled after use; further links can be made in the overall cycle. A con-ceptual view of the life cycle for minerals and metals is shown in Figure 5.1.
The environmental impacts of the mining and extraction of metals therefore need to be considered across all of these stages of the mining cycle. In general, the move from exploration to development and operations leads to considerably greater environmental impacts, with the smelting stage a particu-larly challenging stage. Following rehabilita-tion of the original mine site, impacts should
reduce significantly, assuming the works are effective and sustainable.
The primary aspects of environmental im-pacts for each of the primary metal extrac-tion stages are summarised in Table 5.1, highlighting the importance of sound envi-ronmental monitoring and assessment. Fur-ther detailed reviews of each of these stages can be found in a variety of papers, reports and studies, most notably Da Rosa (1997), IIED & WBCSD (2002), Spits & Trudinger (2008), Kempton et al. (2010).
The major issues revolve around water (con-sumption and quality aspects), mine wastes (tailings and waste rock), energy sources (direct such as diesel, and indirect such as coal-fired electricity) and air emissions (sul-fur dioxide, greenhouse gases, dusts and particulates). These will each be briefly re-viewed.
Figure 5.1
The Minerals Cycle (IIED &
WBCSD, 2002).
Disposal
Re-Use
Re-manufacturing
Recycling Exploration
Emissions Wastes
Ore extracted
Mine closed
Land reclamationinitiated
Land available forother uses
Mine sitedevelopment
Mine site closureand rehabilitation
Some industrialminerals solddirectly(such as salt and sand)
Consumption-use
Incorporation into products
Return to theenvironment
Semi-fabrication and fabrication
Extractionmining
Smelting andrefining Milling, washing,
grading, concentrating

97
Environmental Risks and Challenges of Anthropogenic Metals Flows and Cycles
5.1.1 Solid Waste IssuesOne of the major legacies associated with most of the long-term environmental impacts of mining and metal extraction is mine waste. There are two main types – tailings and waste rock. Tailings are the finely crushed and pro-cessed ore which has had the metal (or met-als) of interest extracted, and are normal-ly discharged by slurry pipelines into engi-neered impoundments (or commonly called tailings dams). Waste rock is the rock which has no economic value of metal(s) of inter-est, but which is extracted during the min-ing process and requires disposal and man-agement. Underground mining typically has a low ratio of waste rock to ore (less than 1:5), while open cut mining has a high ratio (typi-cally greater than 3:1). Mining produces large amounts of waste rock because the ore is only a fraction of the total volume of material mined. Waste rock disposal areas are com-monly one of the most visible aspects of a surface mine, and the disposal of large
amounts of waste rock poses tremendous challenges for the mining industry.
Given the strong trend towards large scale open cut mines over the past 60 years, com-bined with growing mineral production, the amount of waste rock from mining has be-gun in the case of some metals to grow ex-ponentially around the world. Some individ-ual mines now mine in excess of 300 mil-lion tonnes (Mt) of waste rock annually (along with some 80 – 120 Mt of ore), such as Codel-co Norte and Escondida in Chile and Gras-berg in West Papua. A graph of the minimum reported waste rock for metals in Australia is shown in Figure 5.2, although not all waste rock is reported in the copper and gold sec-tors. Unfortunately, no waste rock data is re-ported for the nickel, iron ore and lead-zinc-silver sectors – despite waste rock from iron ore mining likely to be of the order of a billion tonnes per year. In addition, national totals for Canada are included in Figure 5.2.
Figure 5.2a
Minimum reported waste
rock for some metal sectors of
the Australian mining industry
(Data from Mudd, 2010).
Black Coal (Mm3)
Gold (Mt)
Brown Coal (Mm3)
Uranium (Mt)
Diamonds (Mt)
Copper (Mt)
40
0
120
160
80
200
0
1,200
1,000
800
400
200
1,400
600
1,600
Waste Rock (Cu, Diamonds, U, Brown Coal) Waste Rock (Gold, Black Coal
20001985197019551940192519101895
Australia

98
Environmental Risks and Challenges of Anthropogenic Metals Flows and Cycles
The tailings dams associated with some of the largest mills, such as open pit copper mines can cover areas of tens of square kilo-metres and be a hundred metres deep. Some tailings dams present reclamation challeng-es even more significant than those present-ed by waste rock (Hudson et al., 1999). Tail-ings may have concentrations of sulfides that are greater than those in the waste rock, and furthermore, because tailings are composed of small mineral particles resulting from the milling operation, they can react with air and water more readily than waste rock. There-fore the potential to develop acidic conditions in sulfide-rich tailings is very high. Tailings are saturated with water upon disposal, and if not prevented or controlled, acidic waters (a form of acid mine drainage – see later) can seep from their base.
Figure 5.2b
Canadian waste rock by underground/
open cut mining (right) (Data
from Natural Resources
Canada, var.).
Uranium — Underground
Gold – Open Cut
Uranium — Open Cut
Gold – Underground
Copper
20
40
0
100
120
60
80
140
2000 2005 20101995199019851980197519701965
Waste Rock (Mt)

99
Environmental Risks and Challenges of Anthropogenic Metals Flows and Cycles
Seepage from tailings can be prevented or minimised by placing an impermeable bar-rier, such as clay, at the bottom of the dam before tailings disposal. If tailings dams are not satisfactorily stabilised, erosion by both wind and water can take place (International Commission on Large Dams, 2001). Because tailings contain high volumes of fine-grained material, wind can easily pick up and trans-port dust from the surface of a tailings dam, which can give rise to human toxicity and eco-toxicity impacts. If tailings are eroded by surface water runoff which then enters wa-terways, metallic minerals can be dispersed into these waterways.
Slags produced in the smelting and refining stage of the metal life cycle are metal-bear-ing and may contain elevated concentrations of metals, including lead and arsenic. The actual composition and form of slag will vary
depending on the type of ore and smelting technology used. Because of their glassy na-ture, much of the metals contained in slags are not bio-available, and slags are therefore not generally as significant a potential source of metals released into the environment as mine wastes and tailings. The main problems with slags are the physical disturbances and aesthetic impacts associated with large slag piles that cannot support vegetation (Hud-son et al., 1999). Particulate matter (dust) in smelter stack gas emissions may contain metals and have an adverse effect on human health.
The human toxicity impacts of a number of smelting and refining slags and dusts are compared with various mineral process-ing solid wastes (all emitted to soil) in Fig-ure 5.3. It should be noted that theses re-sults also take into account fate in addition
Figure 5.3
Human toxicity potential of
various metal production solid wastes (Norgate
and Haque, 2009a)
a noting that many of these intermediate
products are fur-ther processed due
to their economic value transforming
them into benign fi-nal materials.
0 100 200 300 400 500 600 700 800
Human toxicity (kg 1,4-DCBeq/kg)
Becher neutralisation residue
Becher iron oxide residue
Cu electrorefining slimes
Cu fire refining slag
Cu converting dust
Cu converting slag
Cu matte smelting dust
Cu matte smelting slag
Pb/Zn ISF slag
Pb blast furnace slag
Pb/Zn sulphide tailings
Ni sulphide tailings
Cu sulphide tailings #3
Cu sulphide tailings #2
Cu sulphide tailings #1
Red mud

100
Environmental Risks and Challenges of Anthropogenic Metals Flows and Cycles
to toxicity. However, despite being labelled as toxic in Figure 5.3, some wastes such as copper slimes are still valuable and may be processed further to recover metal. This ex-ample serves to illustrate that if wastes have value and are processed further such that their toxicity is mitigated, they can be consid-ered as intermediates rather than wastes. A waste is only a waste if it potentially ends up in a dump because it has no economic value.
5.1.2 Land Issues Mining can cause physical disturbances to the landscape, the most obvious of which is generally the removal of vegetation, which alters the availability of food and shelter for wildlife. Open pit mining disturbs larger ar-eas than underground mining, and thus has larger visual and physical impacts. Soils bar-ren of vegetation are particularly susceptible to erosion, which can lead to further damage of the environment. Wind erosion in particu-lar can cause particulate matter (dust) to be-come airborne and have an adverse effect on human health. Some of the land impacts of open cut mining are:
■ Topography and land scenario chang-es due to digging of open pits and dump-ing of overburden rock mass in the form of heaps.
■ The land use in the surrounding areas may be affected due to the impacts of mining on the water system.
■ The drainage pattern of the surface under-goes a change due to the alterations in the surface topography.
While some land impacts of underground mining are:
■ Changes in topography and drainage pat-tern, if subsidence occurs.
■ Disturbances in the effective land use due to changes in the surface, sub-surface and underground water bodies.
5.1.3 Water IssuesMining and metals production are a large consumer of water, as well as having the po-tential to cause major impacts on ground-water and surface water resources. In gen-eral, water is required for processing ore, dust suppression and potable purposes. De-pending on the scale, water consumption for mining projects can easily be in the order of gigalitres (GL) per year (even > 10 GL/year). Furthermore, given the large area of many mining projects, careful management of run-off water is often critical in minimising en-vironmental impacts of any offsite discharg-es. To achieve this, mines often include large water or retention ponds to store potentially contaminated runoff waters, which can then be used in dust suppression or processing (depending on specific mine factors). A sum-mary of typical water consumption involved in processing is given in Table 5.2, with an ex-ample of the relationship between process-ing water and ore grade shown in Figure 5.4. Operations such as grinding, flotation, gravity concentration, dense medium separation and hydrometallurgical processes all consume substantial amounts of water. Figure 5.5 shows the annual embodied water results for metal production in Australia broken down into the three main processing stages. This figure clearly shows that the mineral pro-cessing stage makes the greatest contribu-tion to the embodied water for metal produc-tion. Therefore, considerable attention should be given to the minimization of water usage, implying that detailed water system analyses and process control solutions should be part of any mining and mineral producing compa-ny. Of importance is not only water usage but also the quality of the water used.

101
Environmental Risks and Challenges of Anthropogenic Metals Flows and Cycles
a If one mine is removed from the data (five points), which ranges from 28 to 48 kL/t ore and 5,800 to 9,442 kL/t Au, the average and standard deviation become 1.372 and 1.755 kL/t ore and 609 and 1,136 kL/kg Au, respectively.
Table 5.1
Reported water consumption
during mineral and metal
processing (Mudd, 2008) with data derived from the sustainability
reports of 36 companies
in 20 countries for a period
ranging from 1 to 15 years.
Mineral/metal Total number of years of data
v. ore throughput (e. G. kL/t ore)
v. ore grade (e. G. kL/t metal)
Average SD Average SD
Bauxite (kL/t bauxite) 17 1.09 0.44 – –
Black coal (kL/t coal) 18 0.30 0.26 – –
Copper (kL/t ore; kL/t Cu) 48 1.27 1.03 172 154
Copper-gold (kL/t ore; kL/t Cu) 42 1.22 0.49 116 114
Diamonds (kL/t ore; kL/carat) 11 1.32 0.32 0.477 0.170
Gold (kL/t ore; kL/kg Au)a 311a 1.96a 5.03a 716a 1,417a
Zinc ± lead ± silver ± copper ± gold (kL/t ore; kL/t Zn ±Pb ± CU ±)
28 2.67 2.81 29.2 28.1
Nickel (sulfide) (kL/t ore; kL/t Ni) 33 1.01 0.26 107 87
Platinum group (kL/t ore; kL/kg PGM) 30 0.94 0.66 260 162
Uranium (kL/t ore; kL/t U3O8) 24 1.36 2.47 505 387

102
Environmental Risks and Challenges of Anthropogenic Metals Flows and Cycles
The majority of water used by the minerals industry is sourced from purpose-built dams, rivers, lakes and groundwater sources of sev-eral kinds, including artesian water. Some-times the supply is located some distance from the mine site, requiring the use of pur-pose-built pipelines. If operations are small scale ones, water may be supplied by trucks
with additional CO2 emissions being gener-ated. Mining operations may have a signifi-cant impact on local and regional ground-water systems (Hair, 2003) particularly when mining progresses below the groundwater table, creating a groundwater “sink” and al-tering the local flow regime. In localities defi-cient in surface water (e. g. when evaporation
Figure 5.4
Reported water consumption
during base metal and uranium
ore processing versus ore grade
(Mudd, 2008).
Ore Grade (% Cu, % Ni, % Pb ± Zn ± Cu, kg/t U3O8)
Embodied Water (L/kg Cu, L/kg Ni, L/kg Pb ± Zn ± Cu, L/kg U3O8)
40 8 10 12 16 24 280
100
200
0
300
400
500
600
800
700
900
1000
1100
Copper
Copper-Gold
Nickel
Lead-Zinc-Silver
Zinc±Copper±Lead
Uranium
0
100
200
4
Figure 5.5
Contribution of processing
stages to annual embodied
water for metal production
in Australia (Norgate and
Aral, 2009). 0 100 200 300 400 500
Indirect
Direct
Metalproduction
Mineralprocessing
Mining
Annual embodied water (GL/y)

103
Environmental Risks and Challenges of Anthropogenic Metals Flows and Cycles
rates exceed rainfall or surface water stor-ages (dams) are not reliable) operations may rely on artesian waters that may be sourced a considerable distance from the mining opera-tion itself. Many mining operations use water unsuitable for agriculture and re-use water within the constraints imposed by quality re-quirements, water availability, and discharge considerations. On the other hand, the loca-tion of some mining operations means that they must compete with other demands such as agriculture and communities on the water supply.
One of the most critical areas of water is the potential impacts mining and metal extrac-tion can have on water quality. These impacts can be due to direct discharges of contami-nated water (such as retention ponds or free runoff from the mine area), seepage from ponds or tailings dams, or seepage from mine wastes. If there are sulfidic minerals contained in the ore and/or waste rock, when these are exposed to an abundance of water
and oxygen in the surface environment they will oxidise to form sulfuric acid – which in turn leaches out numerous metals and salts. The leachate or seepage from sulfide oxida-tion is commonly known as acid mine drain-age or AMD, and is acutely toxic to aquatic ecosystems. In some circumstances, howev-er, there are alkaline rocks present and the leachate may be circum-neutral (i. e. pH ~6 to 8), and thus the more general term used for all such polluted drainage from mining is called ‘acid and metalliferous drainage’ (AMD) (Taylor and Pape, 2007).
As already discussed in Chapter 3, the gener-ation of AMD is a major, long-term problem for all sulfidic mine wastes, since the oxida-tion processes can last up to tens, hundreds or even thousands of years (Kempton et al., 2010). Around the world there are countless former mines which closed long ago but are still leaching AMD into adjacent surface wa-ters or infiltrating into groundwater. Exam-ples of AMD are shown in Figure 5.6.
Figure 5.6
Examples of acid and metalliferous drainage impacts on surface water
resources: former Rum Jungle U-Cu
mine, Northern Territory (Photo courtesy Gavin M. Mudd, July
2007) (top left); Boac River,
downstream of failed tailings
dam at former Marinduque Cu
mine, Philippines (Photo courtesy
Oxfam Australia, March 2004) (top
right); severe AMD pollution
from the former Mt Oxide Cu
mine, Queensland (Photo courtesy
MiningLegacies, 2008); ongoing AMD pollution
from former coal mines in
the Neath-Greta area, Hunter Valley (Photo courtesy Col
Maybury, June 2006) (bottom
right).
104
Environmental Risks and Challenges of Anthropogenic Metals Flows and Cycles
If not properly managed, erosion of mineral-ised waste rock into surface drainages may lead to metal-bearing sediments in water-ways. This situation can be potentially harm-ful, particularly if the metals are “bioavaila-ble” (i. e. in a chemical form that allows them to be easily released from the sediments into water). High sediment concentrations in-crease the turbidity of natural waters, re-ducing the light available to aquatic plants for photosynthesis. High sediment loads can also decrease the depth of streams, result-ing in greater risk of flooding during times of high stream flow.
Metal pollution is caused if typical heavy met-als like arsenic, cobalt, copper, cadmium, lead, silver and zinc contained in minerals or used to separate the target product (e. g. mercury used to extract gold) come in con-tact with water. Metals are leached out and carried downstream. Leaching can be ac-celerated by low pH conditions such as are created by AMD. Marine pollution occurs if sub-aqueous tailings disposal is implement-ed; this practice is illegal in many countries but it is still used in several countries of the developing world. Pollution of groundwater resulting from leakage of metals and chemi-cals disposed, e. g., in tailings, can also affect the ecosystems and the health of the local population if not properly controlled. Pollu-tion problems have the potential to go beyond the drinking water supply, and also affect the food quality. Erosion caused by disturbed soil and rocks as a result of construction ac-tivities and the operation of open pits, tail-ings and landfills can contribute to signifi-cant negative environmental impacts if not controlled. It includes the possible collapse of river banks, destabilization of structures such as bridges and roads and cause influx of water and substantial amounts of sediments flowing into streams, rivers and lakes. Land-slides and coastal erosion are other potential negative impacts from erosion and sedimen-tation.
In-situ mining (i. e. the extraction of metal(s) from ore deposit by leaching into a chemi-cal solution) is increasingly being used in the mining industry. For an ore deposit to be amenable to in-situ mining it must occur within permeable materials, such as sands or sandstones, be saturated (i. e. within an aquifer or groundwater system), and be con-fined above and below by low permeability materials (such as clays or shales). Such a geological configuration gives rise to the po-tential for escape of these solutions outside the ore zone, which can lead to contamina-tion of surrounding groundwater systems (Mudd, 1998) The control of movement of the chemical leaching solution (lixiviant) within the aquifer is the most critical part of the in-situ mining process.
5.1.4 Air IssuesThe issue of climate change and global warming has focused attention on green-house gas emissions associated with the use of fossil fuels. The minerals and metal pro-duction sector uses fossil fuels as both di-rect and indirect energy sources (e. g. diesel for mining operations, electricity for crush-ing and grinding, natural gas, coal and oil in smelting) as well as a reductant (e. g. coal and coke in smelting). The life cycle-based greenhouse gas emissions (expressed as Global Warming Potential) for the production of various metals are shown in Figure 5.7. New and emerging technologies to reduce the energy consumption of the various metal production life cycle stages discussed in the previous chapter will have a parallel effect on the greenhouse gas emissions from these stages as well.

105
Environmental Risks and Challenges of Anthropogenic Metals Flows and Cycles
The main air issues with regard to smelting are related to the smelter stack emissions. Smelter stack gas emissions may contain particulate matter with metals such as arse-nic, copper, cadmium, antimony, zinc, chro-mium, lead and selenium. In the past, sulfur dioxide has been the most common emission of concern from the smelting of metal sulfide concentrates, because it reacts with atmos-pheric water vapour to form sulfuric acid or “acid rain”. The acidic conditions that develop in the soils where the acid rain precipitates can harm existing vegetation and prevent new vegetation from growing. Most modern smelting plants use processes and tech-nologies that drastically reduce particulate and sulfur dioxide emissions. For example, many plants now capture these sulfur dioxide emissions in acid plants with recovery effi-ciencies as high as 99.9 percent of the sulfur emitted (Hudson et al, 1999). In some cases, the emissions from older smelters may have affected human health, with elevated levels of lead in blood being measured in residents of some communities located near lead-zinc smelters. Here, too, a reduction in smelter emissions has been observed to lead to re-duced lead blood levels (Canadian Ministry of Environment, 2009).
5.1.5 Biodiversity IssuesBiodiversity is best understood as the living world’s capacity to change – variability – and the wealth of biological forms and process-es that derive as a result – variety. Biodiver-sity is therefore found everywhere, albeit in different concentrations and configurations. Measuring the impacts of mining on biodi-versity, including marine biodiversity, and defining their effects and implications pre-sents certain challenges. The key question is: which proxy is best, as not all species are of equal value. Some species will increase, oth-ers will decrease, and some will not change at all following mining disturbance (assuming the entire ecosystem is not being removed) (IIED & WBCSD, 2002). The mining and min-erals sector typically occupies less than 1 % of a country’s territory (EEA, 2010) and is not necessarily the most important influence on biodiversity in a particular region. Figures released by the National Parks and Wildlife Service in Australia (Leigh and Briggs, 1992) suggest that mining was responsible for 1.1 % of presumed extinctions of endangered plant species, compared with 38.2 % attribut-ed to grazing and 49.4 % to agriculture. Nev-ertheless, mining does almost always have the potential to significantly impact on biodi-versity, and in some cases the effects can be irreversible.
Figure 5.7
Greenhouse gas emissions for
the production of various metals,
Australian situationa
(Norgate et al., 2007).
a Note that the Aus-tralian energy mix
contains a large share of coal-based
power generation. In other coun-
tries, this situation may be different
and a high energy use may not auto-
matically trans-late into high GHG
emissions.
0 5 10 15 20 25
Metal extraction and refining
Mineral processing and concentration
Steel (int route)
Aluminium
Zinc (electrolytic)
Zinc (ISP)
Lead (ISP)
Lead (BF)
Nickel (hydro)
Nickel (pyro)
Copper (hydro)
Copper (pyro)
GWP (kg CO2-eq/kg metal)

106
Environmental Risks and Challenges of Anthropogenic Metals Flows and Cycles
As noted earlier, the removal of vegetation from a mine site can alter the availability of food and shelter for wildlife. Increased acid-ity in waterways as a result of unabated AMD can destroy living organisms. Many fish are highly sensitive to even mildly acidic waters and cannot breed at pH levels below five. Furthermore, juvenile fish are more sensi-tive than adult fish, and the presence of some metals in the water may affect critical repro-ductive and growth stages of fish (Maranda et al., 2003).
Sediment arising from erosion of waste rock piles and tailings can clog riverbeds and smother watershed vegetation, wildlife habitat and aquatic organisms. On a broad-er scale, mining may impact biodiversity by changing species composition and structure. For example AMD and high metal concentra-tions in rivers generally result in an impov-erished aquatic environment. Some species of algae and invertebrates are more tolerant of high metals and acid exposure and may, in fact, thrive in less competitive environments. Exotic species (e. g. weedy plants and insect pests) may thrive while native species decline (Maranda et al., 2003). The impact of mining on biodiversity also needs to be thought of in relation to ‘the miner or human footprint’ – the pressures induced by the human commu-nities connected with mining activities. For example, at Mount Isa in Queensland, the hu-man footprint extends 500 kilometres around the township (Yencken and Wilkinson, 2000).
5.1.6 Impurities During Mining and Metals ExtractionA further issue which is receiving increas-ing attention is impurities in metal products – the presence of deleterious metals (or other pollutants) in various mine wastes or prod-uct streams. For example, elevated arse-nic in copper concentrates can lead to major airborne arsenic emissions during smelting, and limits are now being placed on arse-nic concentrations in copper concentrates to avoid this problem (rather than dealing with the emission or cost of pollution control). The REACH (Registration, Evaluation, Authorisa-tion, and Restriction of Chemical substances) Regulation recently introduced in the Euro-pean Community is an example of legisla-tion that will be of particular relevance here. One of the main purposes in developing the REACH legislation was to provide informa-tion on the hazards that the large number of substances that have been manufactured and placed on the market in Europe pose to human health and the environment (http://ec.europa.eu/environment/chemicals/reach/reach_intro.htm).

107
Environmental Risks and Challenges of Anthropogenic Metals Flows and Cycles
5.1.7 Artisanal and Small-scale Mining While the mining industry is mainly seen as the domain of large companies, in many parts of the world, particularly developing countries, minerals are extracted by artisanal and small-scale mining. There is no widely accepted definition of artisanal and small-scale mining (ASM), and the term can be used to cover a broad spectrum of activities. Artisanal mining is commonly considered to involve only individuals or families and is purely manual, while small-scale mining is more extensive and usually more mechanised (IIED & WBCSD, 2002). It has been estimat-ed that throughout the world ASM involves in the order of 13 – 20 million people from over 50 developing countries directly, and that it affects the livelihoods of a further 80 – 100 million people (IIED & WBCSD, 2002; EITI, 2009). Artisanal and small-scale miners ex-tract a broad range of minerals, although in many countries, most of them produce gold due to it being relatively easy to extract and refine. It has been reported (IIED & WBCSD, 2002, p. 318; Geoviden, 2007) that ASM ac-counts for 15 – 20 % of the world’s non-fuel mineral production.
The main environmental impacts of ASM for precious metals (especially gold) are consid-ered (IIED & WBCSD, 2002) to be:
■ Mercury pollution.
■ Cyanide pollution.
■ Direct dumping of tailings and effluents into rivers.
■ Threats from improperly constructed tail-ings dams.
■ River damage in alluvial areas.
■ River siltation.
■ Erosion damage and deforestation.
■ Landscape destruction.
Many consider the use of mercury by gold miners as the activity of greatest concern by ASM. As many of these ASM operations are often subsistence activities, the miners tend to focus more on immediate concerns rath-er than the long-term consequences of their activities. As a result, ASM tends to have a greater environmental impact per unit of out-put than modern mining enterprises (IIED & WBCSD, 2002). However, given the signifi-cantly greater mineral production by large-scale mining compared to small-scale min-ing, the bulk of the environmental impacts (particularly mining waste) from the global production of primary metals is due to large-scale mining despite improved environmen-tal management of these operations over the last decade or two.

108
Environmental Risks and Challenges of Anthropogenic Metals Flows and Cycles
5.1.8 Summary Table 5.2 shows the most important impacts of the different mining and extraction pro-cesses.
Table 5.2
Principal environmental
aspects and impacts of the
major metal extraction stages.
Mining Stage
Major Inputs
Major Outputs
Land Water Air Biodiversity
Exploration vehicles, drill-ing, energy (die-sel, electricity), geophysics sur-veying, surface sampling, water, drilling fluids, roads
drill cuttings, rock samples, rock core, dust, water
clearing, erosion, visual
surface water, groundwater, quantity, quality (acid mine drain-age)
particulates (dust), visibility, vehicle emis-sions, green-house gases
biodiversity loss,weeds, road toll
Development energy (diesel, electricity), infra-structure (water, sewage, roads), construction, buildings, chemi-cals (explosives, reagents)
waste rock, ve-hicle emissions, greenhouse gas-es, water, dust
clearing, erosion, visual
surface water, groundwater, quantity, quality (acid mine drain-age)
particulates (dust), visibility, vehicle emis-sions, green-house gases
biodiversity loss, isolation, weeds, road toll
Mining & mineral processing
energy (die-sel, electricity), chemicals (ex-plosives, rea-gents), water
tailings, waste rock, vehi-cle emissions, greenhouse gas-es, water, toxic substances, dust
clearing, erosion, visual
surface water, groundwater, quantity, quality (acid mine drain-age), toxic sub-stances (eg. cya-nide emissions)
particulates (dust), visibility, vehicle emis-sions, green-house gases, toxic substances
biodiversity loss, isolation, weeds, road toll
Smelting energy (die-sel, electricity), chemicals (rea-gents), water
slag waste, sulfur diox-ide, greenhouse gases, toxic sub-stances, dust
visual surface water, groundwater, quantity, quality (acid mine drain-age), toxic sub-stances
particulates (dust), visibil-ity, sulfur diox-ide, greenhouse gases, toxic sub-stances
polluted eco-systems, weeds, road toll
Refining energy (die-sel, electricity), chemicals (rea-gents), water
solid waste, greenhouse gases, toxic sub-stances
visual surface water, groundwater, quantity, quality (acid mine drain-age), toxic sub-stances
greenhouse gases, toxic sub-stances
polluted ecosys-tems
Closure energy (diesel, electricity), water
waste rock, ve-hicle emissions, greenhouse gas-es, water, dust
stable (?) stable (?) stable (?) stable (?)

109
Environmental Risks and Challenges of Anthropogenic Metals Flows and Cycles
Crucial issues to the mining industry are:
■ The management of water and water qual-ity by, among others, use of water recy-cling technology. It would reduce impacts even more to use solar power to drive wa-ter purification plants, use BAT for solids liquids separation (www.outotec.com) etc. to optimize this.
■ Acid mine drainage (AMD) from waste rock dumps and tailings, which can continue long after the mine has closed.
■ Optimization of process efficiency and technology to maximise recovery of metal(s) from a given ore deposit, while at the same time minimising waste.
■ The disposal of waste rock, which results because the ore is only a fraction of the to-tal volume of material mined, particularly due to the strong trend towards large scale open cut mines and the trend to process-ing lower ore grades.
■ Emissions of greenhouse gases over the entire primary metal production chain, as well as particulate matter and sulfur diox-ide in smelter stack gases, although the use of sulfuric acid plants in most modern smelting plants has largely eliminated sul-fur dioxide emissions from these plants.
■ Introduction of innovative bio-processes during the operations to create new eco-systems adapted to new conditions and at the closure of the project to restore the biodiversity, land and landscape, where feasible.
5.2 Impacts of Use
Metals and their compounds are being used in products because of their unique physi-cal and chemical properties and therefore the functionality they impart to the product. While it is relatively straightforward to allo-cate the impacts of mining and production to materials, in this case metals, this is not so straightforward for the impacts in the use phase. Metals are then applied in a product, and any use phase impacts are related to the product, not the material it is composed out of. The only impacts that can be directly re-lated to the material is the emissions from corrosion in the use phase. These have been treated in Chapter 3. The other use phase im-pacts are mostly related to energy. The appli-cation of metals may contribute to the use of energy, but it can also decrease energy use depending on the application.
In this section, a number of metal applica-tions in various types of environmentally ben-eficial technologies that enable sustainable and resource efficient solutions are treated in Sections 5.2.1 and 5.2.2, and the embodied energy and energy use related to the prod-ucts which in general promote resource effi-ciency in Sections 5.2.3 to 5.2.6. In Chapter 6, some examples are given of LCA studies of metal containing products, where it can be detected how much alternatives containing more, less or different metals contribute to specific environmental impact categories.
The energy requirement of products in their use-phase is related to the functionality of the product in question. For example, a light-er aluminium/magnesium/carbon fibre con-taining car uses less fuel and hence miti-gates the use of these energy intensive met-als. Product design is therefore essential to optimise the product with regard to energy use, and metals may play a role in that.
Of considerable importance is the use of metals in, for example, renewable energy and battery technologies, and therefore can be regarded as environmentally beneficial and sustainability enabling. Renewable energy

110
Environmental Risks and Challenges of Anthropogenic Metals Flows and Cycles
prevents the use of fossil fuels with concur-rent emissions to the environment as dis-cussed with examples below.
In this section, some examples of metals’ ap-plications will be discussed. The environ-mental impact of metals is determined for an important part by their application. Metals, due to their properties, fulfil certain functions in a product that are difficult to replace, and as this chapter shows in some cases allow for a reduction of emissions as well. Moreo-ver, the same properties allow for their excel-lent recyclability.”
5.2.1 Metals and Rare Earths in the Energy SectorFigure 5.8 gives an overview of average CO2eq/kWh data for various energy gener-ation sources. Especially for enabling the technology within the renewable sector, vari-ous metals play an important role, hence en-abling the change of the energy mix to lower carbon footprints. This section discusses some of these important “sustainability” ena-bling metals. Some of these metals may be scarce on the market; therefore their recov-ery at end-of-life is of strategic importance. This will also from a life cycle perspective mitigate the footprint of the recovery of these metals.
Copper CablesModern social and business life would be im-possible without electricity, available instantly at the point of use. A cost calculation in rela-tionship to the energy loss and the conduc-tor cross section shows that the bigger the cross section of the conductor the higher the energy efficiency is. With the right material
choice the above-mentioned efficiency can be further optimized. For instance copper has the second best electrical conductivity after silver and is therefore a material of choice for power generation, transmission, distribu-tion and use. Electricity conducted by copper encounters much less resistance compared to any other commonly used metal; its elec-trical conductivity is 60 % higher than that of aluminium. It is assumed (European Copper Institute, www.eurocopper.org) that “the judi-cious use of 1 tonne of copper in the energy sector makes it possible to reduce CO2 emis-sions by 200 tonnes per year on average”.
Rare EarthsRare earths (RE) are a collection of chemi-cal elements which the lanthanide series of elements in the periodic table (atomic num-bers 57 through 71) and also include yttri-um (atomic number 39). They are abundant in the earth’s crust, but often they are found in quantities that are uneconomically mined. Most of the production currently takes place in China. A small but growing share of the production is located elsewhere, for example in Australia, USA and South Africa (McGill, 2005). Of importance is the use of rare earth elements in various sustainable energy gen-eration applications such as wind mills, elec-tricity generators etc.
For energy generation in wind mills, neo-dymium, dysprosium and terbium are used in powerful permanent magnets. Quoting below from a World Steel Association case study on windmills (www.worldsteel.org/dms/inter-netDocumentList/case-studies/Wind-energy-case-study/document/Wind%20energy%20case%20study.pdf), the use of this application
Figure 5.8
Average kg CO2/kWh for different
sources (www.worldsteel.org).
0.0 0.2 0.4 0.6 0.8 1.0
Wind
Natural gasOil
Nuclear
Coal
-97 %-95 % -98 %
kg CO2-eq/kWh

111
Environmental Risks and Challenges of Anthropogenic Metals Flows and Cycles
has an important impact over its use-phase not only in energy supply, but the excellent recycling properties of steel ensure a high re-source efficiency for these at the end of their lives. Dismantling the magnets (which is rel-atively easy) will also lead to excellent reuse/recycling possibilities of these valuable mag-netic materials.
“The Horns Rev offshore wind farm is one of the world’s largest. It was installed in 2002 in the North Sea, 14 km west of the coast of Denmark. The location provides some of the best conditions for wind energy. The wind farm has 80 2MW wind turbines, which are 70m tall and have an estimated lifetime of 20 years. These turbines are made primarily of steel, with high-strength steel foundations. The 28,000 tonnes of steel in the turbines ac-counts for 79 % of all materials used in the wind farm. An estimated 13,000 GWh of elec-tricity will be generated during the lifetime of the farm. If this energy replaces global aver-age electricity the lifetime CO2 saving pro-vided by the farm is nearly 6.5 million tonnes. Using LCA, it is estimated that 6 GWh of en-ergy is required to construct, operate and dismantle a turbine.a” This example high-lights the contribution that metals make to the development and use of renewable en-ergy technologies by reducing inputs through enhanced functionality.
REs also have important applications in bat-tery technology. Lanthanum is used as a cat-alyst in fuel cells, while it is also used in for example rechargeable Nickel Metal Hydride batteries (NiMH). Related to this is the use of a variety of REs in the phosphors of energy efficient lighting such as praseodymium and europium or terbium and yttrium in colour electronic screens, LCDs etc., having marked lower energy consumption than the usual light bulbs society has been using over the last century.
a http://www.altprofits.com/ref/se/re/we/we.html
5.2.2 Metals and Rare Earths in Electric Motors and BatteriesIn electric motors and other components steel, aluminium and copper are large-ly used. Many comparative studies (Fass-binder, 2004b; Parasiliti et al, 2004; Mano-haran et al, 2010) show that optimising the use phase by reducing wasteful heat loss is critical for such applications. For exam-ple, increasing the quantity of copper us-age improves efficiency by reducing waste-ful heat loss. This means less energy demand per unit of output which means fewer green-house gas emissions that are associated with climate change. Motor modelling by a num-ber of manufacturers had shown that further optimisation of motors would yield overall loss reductions from 15 to 20 % compared to standard solutions (Fassbinder, 2004). In the U.S.A. alone, a one percent increase in motor efficiency would save 20 billion kWh (20 TWh) per year.
The use of REs in electric motors is impor-tant for the automotive sector, especially for electric motors (McGill, 2005). It is clear that the impact of these metals on the transport sector especially during the use phase is of utmost importance. An issue will be to recov-er these at the end-of-life of these vehicles to ensure maximum resource efficiency.
Figure 5.9
Efficiency comparison
between a simple EFF3-motor and
an optimized one with copper
rotor (Fassbinder, 2004).
72 %
76 %
80 %
84 %
88 %
92 %
Aluminium
Copper
9kW8kW7kW6kW5kW4kW3kW2kW1kW
Efficiency
Output Power

112
Environmental Risks and Challenges of Anthropogenic Metals Flows and Cycles
Metals have a very important role in bat-tery technology, providing the functional-ity required in various applications used daily (Bernardes et al. 2004, Briffaerts et al. 2009, Müller and Friedrich 2006, Sayilgan et al., 2009, Xua 2008).
5.2.3 Automotive SectorLowering the carbon footprint of the auto-motive sector can be driven by lowering ve-hicle weight which lowers energy consump-tion over its life time (Koffler and Rohde-Brandenburger, 2010; Bertram et al, 2009; Das, 2000). There are various initiatives in this regard, which range from multi-material concepts to new steel types being used. Also not to be forgotten is that these new designs will also become part of the electric vehicles of the future. Reaching high recycling rates for these vehicles is required (dictated by EU legislation) to maximize the resource effi-ciency.
Multi-Material Lightweight ConceptThe objective of a recent project by the auto-motive industry in Europe (Krinke et al., 2009) was to develop a SuperLightCar (SLC) design that lower the carbon footprint over the life of the product, in spite of the multi-material light weight design which may contain mate-rials that have a higher embodied energy, as shown in Figure 5.10.
Advanced High-Strength Steel Car ConceptThe functionality of the multi-material con-cept clearly shows the environmental bene-fits of such innovative designs. Another path towards this is the mono-metal Advanced High-Strength Steel car concept, which uses innovative steels to bring about a lowering in weight, which has been reported to save 2.2 tonnes of CO2eq, or 5 %, over its lifetime (www.worldsteel.org/dms/internetDocumen-tList/case-studies/Automotive-case-study/document/Automotive%20case%20study.pdf).
5.2.4 Metals in InfrastructureThe importance of metals in infrastructure goes without saying i. e. steel in buildings, bridges, transport infrastructure etc. For ex-ample, bridges such as the Millau Viaduct in France (which is the longest cable-stayed road bridge in the world with a length of 2460 and with 343 m also the world’s high-est bridge, containing 65,000 tonnes of steel) shorten transport routes with associated de-crease in CO2 footprints. Their galvanic pro-tection by zinc ensures that the steel remains durable (mitigates corrosion) and delivers its service over the 100 years of modern bridges’ designed life time.
Figure 5.10
Overview of Greenhouse
Gas Emissions for the different
phases of the SuperLightCar
(SLC) car relative to a reference
model (Krinke et al., 2009).
-2000 -1000 0 1000 2000 3000 4000 5000 6000
SLC – BIW
Reference
Complete Life Cycle
End-of-Life
Use-Phase
Production
Greenhouse Gas Emissions (CO2-eq/kg)

113
Environmental Risks and Challenges of Anthropogenic Metals Flows and Cycles
Aluminium also plays a key role in infra-structure. Its corrosion resistance minimiz-es maintenance. Furthermore the building of light weight structures are possible due to the high strength-to-weight ratio. Finally, high recycling rates of up to 95 % from build-ings make it possible to tap into the around 200 million tonnes of aluminium in buildings. (The International Aluminium Institute, www.world-aluminium.org).
5.2.5 Light Metals for Transport and PackagingLight metals (aluminium, magnesium and titanium) are increasingly being used in transport and packaging applications due to their unique properties such as lightness, strength, corrosion resistance and formabil-ity. While these metals have high energy and greenhouse gas footprints for their produc-tion, their light weight results in significant energy and greenhouse gas savings over oth-er metals such as steel during the use stage (in transport applications) of their life cycle. While aluminium has been used in transport applications for some time, the use of mag-nesium in these applications is increasing. The use of titanium in aerospace applications is also increasing. Aluminium is also used extensively for the protection and storage of food and beverages as well as medicines and cosmetics, typically in the form of cans or foil. It provides an impermeable metal barrier to light, ultra-violet rays, water vapour, oils and fats, oxygen and micro-organisms. Alu-minium drinking cans are the most recycled packaging product in the world.
5.2.6 Metals Enable Sustainability and Resource Efficiency during their Use PhaseThe above-mentioned examples show that it is not only the material content of the prod-uct that has to be considered during the use phase but rather to the system output and how the product and system is designed and how its use/functionality promotes sustain-ability. It is obvious that the slogan here for example for copper wires is “use more metal e. g. copper to be efficient and therefore sus-tainable”. On a first view this sounds some-how contradictory to the above-mentioned
general understanding of “less is more”, when talking about material efficiency.
Therefore the above examples (showing the importance of aluminium, copper, steel, tita-nium and rare-earths) answer the following questions that are of interest in this regard:
■ Metals and metal compounds/materials enable sustainability in the products that they use, therefore they contribute sub-stantially to the theme “decoupling eco-nomic growth from environmental deg-radation” or in other words resource efficiency.
■ Metals used smartly in various appli-cations ensure less energy demand worldwide.
■ Technology and its development and the use of metals/compounds/alloys/multi-materials ensure “greener” energy pro-duction through for example wind-, solar-, geothermal-, or wave power generation. Hence, metals and their applications en-able the change of the energy mix which is crucial to resource efficiency.
■ Products, their design and system design affect material use and recycling to facili-tate resource efficiency.
An overall systemic picture is required to best evaluate the most “sustainable” con-cepts, products, designs, processing systems etc. There is an important link to design that maximizes the recovery of metals and metal containing compounds from end of life goods. This will be the brief focus of section 5.3, to show, that once the materials have success-fully gone through their use phase and deliv-ered their respective impacts, recycling can recover these to improve the resource effi-ciency.

114
Environmental Risks and Challenges of Anthropogenic Metals Flows and Cycles
5.3 Impacts of Recycling
Recycling feeds metals back into the re-source cycle, hence replaces primary mate-rial and thereby prevents impacts related to primary production from occurring. These impacts include large energy savings with concurrent emissions reduction (see Chapter 4), as well as avoidance of some of the risks related to mining, as well as lowering the embodied energy of products. However, there can also be negative environmental impacts associated with metal recycling, although these are generally outweighed by the posi-tive impacts mentioned.
A resource efficient society will therefore maximize the recycling of metals to lower the general footprint. However, various issues af-fect and limit the efficiency of recycling (Reu-ter et al., 2005 and Reuter 2011):
■ Recycling is a complex function of numer-ous parameters such as best available technology, product design, economics, separation physics/thermodynamics, sort-ing, and process dynamics, among others. To minimize losses to landfill and maxi-mize resource efficiency these have to be understood well in a techno-economic context.
■ Product design, product complexity, the number of elements in the product and the way they are connected influence among others the recyclate qualities, the recycling rate and the degree of down cycling.
■ The recycling infrastructure and technol-ogy determines the ultimate recovery of metals, materials and energy. This has to be well guarded by legislation; well-con-ceived policy based on technological and thermodynamic argumentation will maxi-mize resource efficiency.
■ Any geographic region in the world want-ing to secure metal supplies for high tech products must among others take consid-erable care to safeguard a metal/material infrastructure in order to maximize recov-
ery of metals from post-consumer prod-ucts (EC 2001&2002, and European Parlia-ment and Council Directive (EC, 1994, 1999, 2000, 2002, 2003), Committee EV, 2012; Ontario Electronic Stewardship, 2008). Only first principles and engineering system analysis suffices to provide answers to this rather complex techno-economic problem. This depth will reveal true recycling rates of for example scarce metals from con-sumer products to safeguard supply.
■ A well-designed collection system has to be in place to minimize losses and leak-age from the system. For industrial waste, collection is easy and to a large extent al-ready is taken care of, driven by sufficient-ly high value recyclates due to high metal and material prices. For household waste a collection system is more complicated as various degrees of collection exist global-ly. Aspects to be optimized are energy/fuel usage during collection, collection infra-structure, as well as activities to motivate people to cooperate, amongst other things and its acceptance, amongst other things (Wäger et al. 2011).
Waste electrical and electronic equip-ment (WEEE) is one of the fastest growing waste streams globally. The composition of WEEE depends on the type and the age of the equipment. For example, WEEE for in-formation technology and telecommunica-tions systems contain a higher amount of precious metals than scrap from household appliances. Generally WEEE contains about 40 – 60 % metal, with iron/steel, copper and aluminium being the main metallic compo-nents, but also may contain lead, nickel, zinc and other metals (Critical raw materials for the EU 2010, UNEP, 2010c). Major categories of hazardous materials and components of WEEE are shown in Table 5.3. Due to its haz-ardous materials content, WEEE may cause environmental problems involving the release of these materials into air, soil or water dur-ing the waste management phase if it is not properly treated. Many countries in the world have drafted legislation to improve the reuse, recycling and other forms of recovery of such

115
Environmental Risks and Challenges of Anthropogenic Metals Flows and Cycles
wastes to reduce disposal, such as the Direc-tive on the Waste from Electrical and Elec-tronic Equipment adopted by the European Parliament in 2003.
Recovering and recycling the numerous met-als in batteries will ensure that the metals and compounds in this important resource do not go lost to landfill (Bernardes et al. 2004, Briffaerts et al. 2009, Müller and Friedrich 2006, Sayilgan et al., 2009, Xua 2008).
Table 5.3
Major hazardous components in
waste electrical and electronic
equipment (Cui and Forssberg,
2003).
Materials and components Description
Batteries Heavy metals such as lead, mercury and cadmium are present in batteries
Cathode ray tubes (CRTs) Lead in the cone glass and fluorescent coating cover the inside of panel glass
Mercury containing components, such as switches
Mercury is used in thermostats, sensors, relays and switches (eg. on printed circuit boards and in measu-ring equipment and discharge lamps); it is also used in medical equipment, data transmission, telecom-munication and mobile phones
Asbestos waste Asbestos waste has to be treated selectively
Toner cartridges, liquid and pasty, as well as colour toner
Toner and toner cartridges have to be removed from any separately collected WEEE
Printed circuit boards In printed circuit boards, cadmium occurs in certain components, such as SMD chip resistors, infrared detectors and semiconductors
Polychlorinated biphenyl (PCB) containing capacitors
PCB-containing capacitors have to be removed for safe destruction
Liquid crystal displays (LCDs) LCDs of a surface greater than 100 cm2 have to be removed from WEEE
Plastics containing halogenated flame retardants
During incineration/combustion of the plastics halo-genated flame retardants can produce toxic compo-nents
Equipment containing CRC, HCFC or HFCs
CFCs present in the foam and the refrigerating cir-cuit must be properly extracted and destroyed; HCFC or CFCs present in the foam and refrigerating circuit must be properly extracted and destroyed or recycled
Gas discharge lamps Mercury has to be removed

116
Environmental Risks and Challenges of Anthropogenic Metals Flows and Cycles
In addition, recycling systems and technology can create their own impacts, which include the following (Williams et al. 2008, Wäger et al 2011, Sepúlveda et al. 2010):
■ Poor collection or lack of take-back sys-tems can lead to dumping waste and end-of-life products to uncontrolled landfill.
■ Leakage from the recycling system can di-rect for example e-waste to back yard op-erations which have shown a large impact on health. There are efforts to improve this situation (Chi et al., 2011).
■ Due to complex designs and thermody-namic laws economically low value resi-dues, recyclates and waste are created that are dumped, potentially to be leached by water to report to the environment.
The Metal Wheel (Figure 3.1, Chapter 3) shows that many sustainability enabling met-als are connected to various base metals and hence their supply is linked to the demand of
the base metals. Due to this linkage of minor elements to base metals, recycling plays an important role to replenish these and satisfy the large demand for these in modern prod-ucts.

117
Environmental Risks and Challenges of Anthropogenic Metals Flows and Cycles
5.4 Impacts of Final Waste Disposal
As discussed in the previous section, ther-modynamics and especially the 2nd Law of Thermodynamics prohibits within a reason-able economic framework the closure of the materials loop. However, with a well de-signed system and technology contained in it, it will be possible to minimize losses espe-cially if it is linked to good product design, in-formed and sustainable consumer behaviour and best practice/technology linked to good and reasonable global legislation.
Nevertheless, there will be losses from the materials processing and energy recovery system requiring waste disposal in some lim-ited form as shown for the fluff fraction after shredding in the previous section. The two main waste disposal options are landfill and waste-to-energy.
Landfill involves burying the waste, some-times in abandoned mines, quarries or pits. Although metals and their compounds may leach out into the soil and contaminate near-by water bodies, modern landfill designs in-clude thick bottom liners and leachate (liquid run-off) collection systems that minimise this problem. Furthermore, only a small fraction of the metals found in soils and in natural waters is generally bioavailable (i. e. capa-ble of being taken up by an organism). This is because the larger fraction is usually bound with reacting chemicals in the environment. Laboratory toxicity tests are conducted with artificial media by which all or most of the
metal is made bioavailable and these tests therefore tend to overestimate the toxicity of metals in the environment. It is the toxic-ity of the bioavailable fraction that should be used to categorise and rank the hazards of metal wastes. New leaching tests are being developed to address this issue and Figure 5.11 compares human toxicity and ecotoxicity results for red mud (the solid waste stream from bauxite processing) based on total and bioavailable metal concentrations (Norgate and Haque, 2009).
Waste-to-Energy involves subjecting the waste to combustion so as to convert it into residue and gaseous products. Strictly speaking, only the organic materials in the waste are combusted, but the non-combust-ed materials can also undergo a transforma-tion under the influence of the heat released. The residue consists mainly of ash, soot and inert particles and is generally treated and disposed of as a hazardous waste as it may contain heavy metals (Aucott et al, 2010) and other toxic materials. The gaseous emissions from incineration depend on composition of the initial waste, but generally included gases such as CO, CO2, NOx and SO2, mineral dust (fly ash), metals and organic molecules (e. g. soot). Waste-to-Energy facilities are usually equipped with flue gas treatment systems to reduce all these emissions to levels that usu-ally fall well within the levels required by leg-islation (Münster and Lund 2010, Pavlas et al. 2010, Stehlik 2009, Yang et al. 2007).
Figure 5.11
Comparison of total and
bioavailable toxicity results for red mud (Norgate and Haque, 2009).
0 1 2 3 4 5
Bioavailable
Total
Ecotoxicity(terrestrial)
Ecotoxicity(fresh water)
Human toxicity
Human or ecotoxicity (kg 1,4-DCBeq /kg)

118
Environmental Risks and Challenges of Anthropogenic Metals Flows and Cycles
5.5 Measures to Reduce Impacts of all Life Cycle Stages
Some of the environmental impacts occur-ring over the life cycle of metal production and use have been outlined in the preceding sections. A number of options for reducing some of these impacts over the entire metal production and use life cycle are discussed below.
5.5.1 MiningMany opportunities for avoiding the above en-vironmental impacts exist at the mine plan-ning stage. Specific measures to reduce en-vironmental impacts are typically agreed, together with stakeholders, during impact assessment and permiting procedures. Pre-ventive measures might typically include (Nelson, 2011; Borden, 2011);
■ Siting of ventilation and infrastructure to minimise their effects on land, biodiversi-ty, water.
■ Storage and maintenance of topsoil for lat-er use in site rehabilitation.
■ Interception and redirection of surface and stormwater flows to avoid contamination.
■ Capture and treatment of drainage and run-off water as required.
■ Revegetation of disturbed areas.
■ Selective handling and placement and consolidation of wastes to reduce possible sources of contamination.
■ Design and construction of waste dumps to minimise run-on and erosion and pro-mote run-off.
■ Control of noise air blast, ground vibration, and dust emissions.
■ Integrated closure planning including flooding, capping or covering of wastes as required.
With regard to artisanal mining, the Commu-nities and Small-scale Mining (CASM) ini-tiative was launched in 2001. The CASM is a global networking and co-ordination facility with a stated mission “ to reduce poverty by improving the environmental, social and eco-nomic performance of artisanal and small-scale mining in developing countries (http://artisanalmining.org/casm). CASM has devel-oped comprehensive stategies to mitigate the environmental impacts of ASM.
5.5.2 Mineral ProcessingThe international mining industry has learnt many lessons over the last decades that have helped to develop leading practice tailings management in Australia (Commonwealth of Australia, 2007). Drawing from a range of tailings storage facility failures and incidents, the main causes were:
■ Lack of control of the water balance.
■ Lack of control of construction.
■ A general lack of understanding of the fea-tures that control safe operations.
Tailings containment wall failures were (in order of prevalence) due to:
■ Slope instability
■ Earthquake loading
■ Overtopping
■ Inadequate foundations
■ Seepage
The European Commission Reference Docu-ment on Best Available Techniques for Man-agement of Tailings and Waste Rock in Min-ing Activities (EC, 2009) describes, with ex-amples, some of the practices employed to minimise the impacts of mine tailings.
While there are a number of approaches that potentially can be made to reduce the wa-ter consumption of the mineral processing

119
Environmental Risks and Challenges of Anthropogenic Metals Flows and Cycles
stage, the most promising would appear to be (Norgate and Aral, 2009):
■ Water treatment and re-use.
■ Water quality “fit for purpose”.
■ Dry processing.
5.5.3 Water Treatment and Re-useThe treatment and re-use of process and mine waters are now becoming a significant means of minimising overall water consump-tion as well as minimising the volume of con-taminated water that may require treatment prior to discharge. The effect of recycled wa-ter properties on plant performance, includ-ing issues regarding the recycle of organ-ic molecules, inorganic and microbiological species, and the build-up of collectors, must be considered prior to implementing a water recycling process. The appropriate treatment process depends on the characteristics of the water, the environmental discharge require-ments, the economics of water re-use and the value of water.
Water Quality “Fit for Purpose”Water supply issues have seen many min-ing and mineral processing operations shift-ing to poorer quality make-up waters (e. g. seawater, saline waters, grey water, treated and partially treated sewage and industrial effluents). This can have adverse effects on process water quality and the performance of mineral processing operations. In gen-eral, water quality is relevant whenever the chemical nature of the mineral surface is im-portant, e. g. flotation. However, high qual-ity water is not always required. The quality of water can range from very high quality to poor quality hard water (high levels of dis-solved calcium and magnesium) from un-derground aquifers and to even lower quality saline groundwatera and seawater (very high levels of dissolved solids including sodium chloride). Therefore the water strategy that is most appropriate for mining and mineral processing operations to reduce raw or fresh
a Some underground water is much more saline than sea-water, a phenomenon well known in Western Australia.
water consumption is to use water that is “fit for purpose”, i. e. water quality matched to application.
Dry processingWhile increased water treatment and re-use is an obvious option to help reduce the water footprint of mining and mineral processing operations, a more radical alternative is dry, or near-dry processing. Dry separation pro-cesses used now and in the past include:
■ Screening (which can also be done wet).
■ Classification by winnowing.
■ Classification by air cyclones.
■ Shape sorting on shaking tables.
■ Magnetic separation (which can also be done wet).
■ Electrical separation.
■ Gravity and dense medium separation (which can also be done wet).
■ Ore sorting, by optical, conductivity, radio-metric, or X-ray luminescence properties.
Dry processing routes are not without their problems, with the main one being dust, but another problem is the low throughput of most of the current processes, as well as low energy efficiency and poor selectivity in some cases. Nevertheless, the challenge to reduce water use in the minerals industry has led to renewed interest in dry processing. Other water reduction technologies include float-ing modules to reduce evaporation and paste thickeners (Norgate and Aral, 2009).

120
Environmental Risks and Challenges of Anthropogenic Metals Flows and Cycles
5.5.4 Metal Extraction and RefiningAs pointed out earlier, one of the main im-pacts of the metal extraction and refining stage is the emission of greenhouse gases associated with the use of fossil fuels as fuel and carbon sources. Some of the options re-ferred to in the previous chapter for reduc-ing the energy consumption of primary metal production will also have a corresponding ef-fect on greenhouse gas emissions. The esti-mated potential reductions in annual global greenhouse gas emissions for a number of new and emerging technologies, particularly for iron/steel and aluminium production, are shown in Figure 5.12.
5.5.5 Product Use, Recycling and System OptimizationThe complex interactions between product design, best available techniques and recy-cling systems have a direct impact on recy-cling efforts and thus resource efficiency, as outlined in the IRP’s recent report on “Metal Recycling – Limits, Opportunities, Infrastruc-ture” (UNEP 2013). To maximize resource ef-ficiency requires rigorous models that evalu-ate and show in first principles where and how the resource efficiency can be achieved both technologically and economically while minimizing the impact of metals and materi-als (Van Schaik & Reuter, 2007, Reuter, 2011 & Krinke et al., 2009).
A first principles basis can suggest solutions if there are, if not, radical alternatives should
be found within the boundaries of physics and economics.
If significant reductions are to be achieved in this stage of the metal life cycle, it is essen-tial that the combined efforts of all stake-holders take place (producers, suppliers, consumers, policy makers). The following is-sues are being considered in this regard un-der a number of initiatives:
■ Re-think the relationship consumer/supplier.
■ Exchange/replacement-service.
■ Deposit on some small electronic goods to cover costs of the take-back system and processing into recyclates.
■ Incentive regulatory directives towards producers, suppliers and consumers emu-lating those of the European Parliament.
■ Various end of life legislations, e. g. the EU WEEE-Directive.
■ Global initiatives such as the StEP-lnitia-tive of UN (Solving the E-waste Problem), which has as a goal to harmonizes e-waste recycling globally, understand the role of hand sorting and the informal market in recycling etc.
Figure 5.12
Potential annual global
greenhouse reductions for various
technologies (Norgate and Jahanshahi,
2010).
0 500 1000 1500 2000
Drained cathode cell
Direct smelting of ironwith top gas heat recovery
Dry granulation, waste heatrecovery and cement extender
Dry granulationand waste heat recovery
Biomass (20 %) –with by-product credits
Biomass (20 %) –without by-product credits
50 % improvement incomminution energy efficiency
Annual greenhouse gas reductions (Mt CO2-eq/y)

121
Environmental Risks and Challenges of Anthropogenic Metals Flows and Cycles
■ Eco-design and design for recycling and sustainability in order to maximize re-source efficiency.
■ Technology improvement both for produc-tion and end of life recovery, however, this is limited to what thermodynamics and technology can provide within a reasona-ble technological framework (Cui and For-ssberg 2003, Cui and Zhang 2008, Floyd 2005, Fraunholcz 2004, Froelich et al. 2007, Genaidy et al. 2009, Gielen and Moriguchi 2002, Hoang et al. 2009, Kepplinger et al. 2009, Leczo 2009, Matusewicz et al., 2008, Shent et al. 1999).
■ Development of a worldwide modern recy-cling economy with well designed system structure and harmonized legislation that promotes best practice.
While the above points specifically refer to metals and recycling, the sludges and resi-dues from for example the water system also contain among others metals, materials, or-ganic, pharmaceutical residues etc., which also could and should be processed rather than just sent to landfill. These considera-tions obviously depend on local legislation and economics and have to be analyzed case by case.
However, a true system analysis to increase the resource efficiency will in future consid-er the linkages between the different sys-tems that produce metals, residues, sludg-es, slags, ashes, scrap etc. so that contained metals can be recovered, while producing be-nign products.
It is therefore of increasing importance to analyze the interaction of the material flow system with the water and other systems as shown by a recent analysis of the water sys-tem south of Rotterdam Harbour (The Neth-erlands). A detailed model based system analysis of water quality as a function of vari-ous materials and available processing in-frastructure was done with an optimisation simulation model, analyzing the flow of vari-ous metal containing compounds in residues
originating from the water processing sys-tem and investigating the optimal manner in which these can be treated in metallurgi-cal and energy recovery infrastructure (Van Schaik et al., 2010).
This rigorous physics/technology based ap-proach enables the pinpointing of the prob-lems in the bigger system, which via its first principles engineering basis also provides economic solutions to mitigate these issues and above all maximize the resource effi-ciency.
5.5.6 SubstitutionSolid materials can conveniently be subdi-vided into two groups – metals (and alloys and compounds) and non-metals (ceramics, polymers/plastics, glass, wood). These vari-ous solid materials differ in their physical properties largely as a result of differences in their atomic/molecular structure. Many non-metals are cheaper and lighter than met-als, are usually easy to shape, and are be-ing increasingly used in transport and other applications. Metals on the other hand are generally more recyclable than non-metals. Another significant advantage of metals over non-metals is their ability to deform plasti-cally under stress. The reasons for substitut-ing materials in an existing product are many and varied and include (Cornish, 1990):
■ New production routes become available.
■ New materials become available.
■ Reduction of cost.
■ Impact of new legislation (eg. health, environment).
■ Supply of key material is unreliable.
■ Reducing dependence on imports.
■ Wider performance limits needed to satisfy new markets.

122
Environmental Risks and Challenges of Anthropogenic Metals Flows and Cycles
Some representative examples of materials substitution are:
■ Abundant materials for more scarce ones – aluminium can be used in place of cop-per in electrical applications, or ceramics in place of high-temperature alloys in tur-bine engines.
■ Non-metals for metals – plastics can be used in place of zinc or aluminium in some structural applications, or glass for metals in containers.
■ Renewable materials for non-renewable materials – wood can be used instead of metallic materials for some constructional purposes.
■ Synthetic materials for natural materials – synthetic diamond in cutting and polishing applications.
■ Composite materials for monolithic materials.
There are specific situations where substitu-tion does not work at all, generally because the scale of use or the cost requirements cannot be met by any other material. For ex-ample, no material could replace steel in structural applications in buildings.
In terms of reducing the environmental im-pact of metal production and use, materials substitution involves the replacement of a po-tentially hazardous metal or processing route by one that is less problematic. Some exam-ples of metal substitution have been report-ed by Graedel (2002), including the replace-ment of lead with bismuth in ammunition and the use of lead-free electronic solder. How-ever, while the principle of materials substi-tution is simple, its implementation is often not straightforward, noting that bismuth is mainly sourced from lead ores! The materi-al flows are altered by substitution, and this may create other problems (e. g. resource supply) in various parts of the materials cy-cle. For example, Graedel (2002) has pointed out that while modest use of bismuth ammu-
nition has obvious local environmental ben-efits, its universal use in place of lead am-munition would not be sustainable for some time as this would require an increase in the current mining rate of bismuth by a factor of about fifty. Furthermore, it would not avoid environmental problems because of the min-ing of co-occurring lead in the same ore. It is clear that the selection or substitution of materials should not be done by assum-ing that adequate supplies of a material will automatically be available. Many processes, once established, are in use for decades and resources sufficient to maintain such a time span should be assured (Graedel, 2002).
Another factor that should be borne in mind when considering materials substitution is the time required to effectively implement such a substitution. This time period may be substantial because of the requirements of examining alternative materials, of develop-ing design and reliability data, and evaluating the substitute in a manufacturing environ-ment. For small consumer products this time can be short, while for key industrial pro-cesses it can be several decades. In addition, the proposed substitute material may require new processing methods or may influence related technologies that interact with its in-tended use. Think for example of the well es-tablished lead-tin solder being replaced by other solders that may fail – this could have catastrophic consequences.
5.5.7 Final Waste treatmentWaste prevention is a first option to prevent emissions from waste treatment. Options for improving re-use and recycling have been discussed above.
Waste to energy and incineration in the waste hierarchy is the next preferable option. How-ever, for metals the hierarchy may not be representing the ideal order. Metals do not degrade, nor are they reduced by incinera-tion. The first and preferable option is to use pre-treatment and classification to stop as much of the metals of concern as possible from entering the waste-to-energy plant in the first place. Because the scope for this op-

123
Environmental Risks and Challenges of Anthropogenic Metals Flows and Cycles
tion is generally limited, the second option is to decrease their bioavailability. This may achieved by further immobilisation of the col-lected dust, ashes and slags after combus-tion. Lack of space for landfills is reportedly (European Commission, 2002) forcing some countries to use such residues for civil works and similar purposes, but the leachability of metals in residues should constrain this kind of material recycling. Outotec for instance has Top Submerged Lance (TSL) technology that melts the bottom ash of a waste to en-ergy plant in Seoul (South Korea) to produce material for producing pavement bricks and the like (Matusewicz & Reuter 2008).
Treatment of these materials for example in a furnace to melt them to produce benign slags used for building mitigates this. As the economic environment changes and land be-comes more valuable these high temperature and other solutions will become more attrac-tive, especially also to improve the image of the industry in this regard.
Landfill is the least preferable option in the waste hierarchy used for EU waste policy, nevertheless for metals it may be the only fi-nal disposal there is. Traditional landfill will likely disappear as dictated by legislation such as “European Parliament and Council Directive 1999/31/EC of the European par-liament and of the council of 26 April 1999 on the landfilling of waste”. The World Busi-ness Council for Sustainable Development (WBCSD) vision (WBCSD, 2010) is similar and will have landfill be phased out by 2020, that “Closing the Loop” will be part of daily life and by 2050 “Not a particle of waste” will be the norm. Considering the whole material cycle, it would be clear that reaching mini-mum landfill would require the optimization of the complete system. The impact of land-fill should in future diminish if society is to achieve its goal of minimizing waste. Landfill is a “unit operation” just like any other, which will be optimized according to best practice.
5.6 Conclusions
The first stages of the life cycle – mining, beneficiation, metal extraction and refining – produce a range of solid, liquid and gase-ous waste streams. Elements not recovered in the metal production process report to these streams. Many of these waste streams contain valuable elements and compounds that could potentially be recovered, as well as elements and compounds of no real val-ue. A number of these elements and com-pounds are toxic and can cause environmen-tal problems and health-related problems for humans if not well managed on mining and smelter/refinery sites.
The most important environmental impacts of primary metal mining and extraction re-volve around water (consumption and qual-ity aspects), mine wastes (tailings and waste rock), energy sources (direct such as diesel and indirect such as coal-fired electricity) and the associated air emissions (sulfur dioxide, greenhouse gases, dusts and particulates). Wider implementation of a number of so-called Best Available Techniques is needed to reduce the environmental impacts of metal production, use and disposal. Scientific and technological research and development, fo-cused on understanding the underlying pro-cesses associated with these impacts, is an essential component to provide the founda-tion for new, cost-effective improvements. These will build on the lessons already learned from past environmental experienc-es. Such approaches would likely include a wider adoption of the following techniques:
■ Reclamation of disturbed land.
■ Treatment and stabilisation of metal-bear-ing soils.
■ Prevention and treatment of contaminated water.
■ Controls on the amount and character of emissions to the atmosphere.

124
Environmental Risks and Challenges of Anthropogenic Metals Flows and Cycles
■ Optimal system design to maximize re-source efficiency.
■ Minimising waste and recycling raw mate-rials and by-products.
■ Balanced approaches for the supply of minerals and metals and environmental protection are complex and demanding, and if society is to achieve such a balance, it will require a combined effort on the part of all stakeholders (producers, suppliers, consumers, policy makers, recyclers).
Water is an extremely important issue to the mining industry as it is to society in general. To maximize resource efficiency it is obvious that the water recycling system should be linked to the recycling and metals/recycling system, not only to conserve water but also the maximize metal recovery and hence max-imize the resource efficiency. This is a key is-sue for the future: resource efficiency will be maximized by integrating different systems and also understanding the physics, technol-ogy and economics of this in detail.
In the use stage, it is difficult to attribute im-pacts to metal-containing products. Main impacts are related to energy use. Impacts refer to the product, not the material: only occasionally is it possible to pinpoint a spe-cific role for metals, and then only compara-tively. Metals are used in many new technolo-gies. Especially renewable energy technolo-gies, where metals play a specific role, can be regarded as beneficial for the environment since they avoid emissions related to fossil fuel use. The up-scaling of such technolo-gies on a global scale however may lead to impacts in the chain: the use of lesser grade ores leads to exponential rises in the energy required to produce the metals, lowering re-source efficiency.
Minimizing the creation of waste streams and their associated environmental im-pacts, while at the same time maximizing the amount of valuable metal(s) recovered from a given ore deposit, is the primary objec-tive of the metals processing and recycling
industries. Recycling rates are increasing, but could be increased far more if a systems optimization, including also product design, would be adopted. However, thermodynam-ics, in particular the 2nd Law of Thermody-namics, prohibits within a reasonable eco-nomic framework the complete closure of the materials cycle. Hence there will always be losses from the production and use of met-als, and there will always be a need to make up for these losses by primary production from metallic ores. While there may be op-portunities to substitute other materials for metals in some applications, these may not be without their own environmental and sup-ply issues. Furthermore, metals are generally more recyclable than non-metals. Unavoid-able losses and leakages from the cycle will always occur due to physics, which means that a sustainable metals management must always include a final waste treatment option such as waste-to-energy, waste processing, incineration etc. Since metals and their com-pounds cannot be destroyed, the only way to prevent them from entering the environment is to remove possible pathways to sensitive receptors so they do not pose unaccepta-ble risks: immobilize them and landfill them where they cannot reach the environment.
As shown above, metals have an important function in enabling sustainable solutions in the future to lower society’s footprint. Their role is therefore critical and hence their re-covery at the lowest possible footprint is the norm that society and industry must be striv-ing for.

125
Environmental Risks and Challenges of Anthropogenic Metals Flows and Cycles
6. Life Cycle Impacts of Metals
Authors: Roland Hischier, Patrick Wäger, Mi-chael Hauschild
6.1 Introduction
According to the Division of Technology, In-dustry and Economics of United Nations En-vironmental Programme (UNEP) industrial development will only be truly sustainable if it is built on firm ecological foundations. UNEP provides in this context substantive support to national and regional initiatives through its global programme on Sustainable Consump-tion, Cleaner Production as well as in the UNEP/SETAC Life Cycle Initiative (a joint effort of UNEP and SETAC). Europe e. g. adopted in 2001 a sustainable development strategy (EC, 2007), expanded in 2006 to the new member countries as well.
In this context, the concept of “Life Cycle Thinking” (LCT) constitutes the basis of this initiative and got an important element of the European environmental policy. According to JRC (2007), LCT is “the process of taking into account in decision making, as far as possible and for example, all resources consumed and all environmental and health pressures that are associated with the life cycle of a product, considering the extraction of resources, pro-duction, use, re-use, transport, recycling, and ultimate waste disposal”. The main objective that LCT is trying to achieve is the prevention of burden shifting – in the sense of minimiz-ing the impacts at one product stage without resulting in an increase in another stage (EC, 2010b); i. e. is representing a life cycle ap-proach. Such a life cycle approach can help us to make choices that are optimized in a life cycle perspective. It implies that everyone in the whole chain of a product’s life cycle, from cradle to grave, has a responsibility and a role to play, taking into account all the relevant im-pacts on the economy, the environment and the society. The impacts of all life cycle stages
need to be considered comprehensively by the citizens, the companies and the governments, when they make decisions on consumption and production patterns, policies and man-agement strategies. A life cycle approach en-ables product designers, service providers, government agents and individuals to make choices for the longer term and with consid-eration of all environmental media. Life cycle approaches enable to detect shifting problems from one life cycle stage to another, from one environmental medium (for example air qual-ity) to another (for example water or land), and from one impact category (for example global warming) to another (for example land use).
Many decisions in practice are already based on life cycle approaches, like e. g. consumer purchasing decisions via ecolabels, company reports on environmental and social issues, business design of products and services via life cycle assessments (LCA) studies, design for environment (DfE), total cost of owner-ship calculations, or management systems that are orientated toward products or facili-ties. Particularly relevant for metals is the design of technologies for primary and sec-ondary production, which can be guided by LCA (Stewart et al., 2003; Stewart & Petrie, 2006). Furthermore government policy mak-ing by involving a wide range of stakehold-ers (e. g. via product panels) or through inte-grated product policy (IPP) approaches goes in a similar direction. Within all these differ-ent practical applications, the LCA method proves to be a key factor for a successful im-plementation and application.
In Section 6.2, the LCA methodology is de-scribed in general and specific points in rela-tion to (primary/secondary) metal production are highlighted. Section 6.3 deals with the Life Cycle Inventory and lists the most impor-tant datasets on processes in the metals life cycle. Section 6.4 is dedicated to Life Cycle Impact assessment and the relevant issues in that stage of the LCA methodology for met-als. Section 6.5 treats some LCA case stud-ies related to metals, and in Section 6.6 some conclusions and recommendations are for-mulated.

126
Environmental Risks and Challenges of Anthropogenic Metals Flows and Cycles
6.2 LCA Methodology
Annex 6 contains a description of the LCA methodology. A brief summary is also made below. According to the standards 14040 and 14044 of the International Organization for Standardization, ISO (ISO, 2006a and ISO, 2006b), four phases – as shown in Figure 6.1 – are distinguished within an LCA study:
■ Goal and scope definition: The scope, in-cluding system boundary and level of de-tail, of an LCA depends on the subject and the intended use of the study. The depth and the breadth of LCA can differ consider-ably depending on the goal of a particular LCA (ISO 2006b).
■ Life cycle inventory analysis (LCI): It is the second phase of LCA. It is an inventory of input/output data with regard to the sys-tem being studied. It involves the collection of the data necessary to meet the goals of the defined study (ISO, 2006b).
■ Life cycle impact assessment (LCIA): It is the third phase of the LCA. The purpose of this third step is to provide additional in-formation to help assess a product sys-tem’s inventory results so as to better un-derstand and evaluate the magnitude and significance of the potential environmental impacts related to the inventory data col-lected in the 2nd step (ISO, 2006a and ISO, 2006b).
■ Interpretation: It is the final phase of the LCA. Here, the findings of either the inven-tory analysis or the impact assessment, or both, are evaluated in relation to the defined goal and scope in order to reach conclusions and recommendations (ISO, 2006a).
According to the respective ISO standards (ISO, 2006a and ISO, 2006b), LCA is a relative and iterative approach, based on transpar-ency and comprehensiveness. Relative, as an LCA is always structured around a functional unit that defines what is examined. All fur-ther activities then take place relative to this functional unit. Iterative, as shown in Figure 6.1, all steps are related to each other (i. e. each step is using the outcomes of the other steps) … and thus, only passing several times across the various steps results in the end in comprehensiveness. As almost all life cycles of products include processes that occur all over the world, a high-quality, global environ-mental inventory database is essential to en-sure sound and credible results of LCA stud-ies.
In relation to the topic of this report – i. e. the production and use of various metals – the goal and scope of the therefore relevant LCA studies is the examination of the impacts of the production of a specific amount (e. g. 1 kg or 1 tonne) of either of the metals covered by this report – produced out of the respective ore, or via an adequate recycling procedure, out of appropriate scrap – a so-called cradle-to-gate assessment. As soon as not only the production, but a complete life cycle of a met-al for a specific use context is taken into ac-count, the goal and scope step has to ensure that all functionalities of the metal for this context are taken into account and adequate-ly covered by choosing an appropriate func-tional unit as well as the system boundaries. This is particularly the case when the goal of the study is a comparison e. g. of different metals or of metals and other materials ful-filling a certain function like a panel in a car body. Here it is essential for the relevance of the study results that the compared quanti-ties fulfil the same function.
Figure 6.1
The LCA framework
according to the ISO 14040/14044
series (ISO, 2006a)
Goal and scope definition
Inventory analysis Interpretation
Impact assessment

127
Environmental Risks and Challenges of Anthropogenic Metals Flows and Cycles
It is important to realize that LCA is not the appropriate tool for risk assessments based on local situations. For that, other tools exist, as treated in Chapter 2. LCA uses information out of risk assessment in its impact assess-ment (LCIA, see section 6.4) to enable com-parison between alternative, even in the ab-sence of local data. LCA therefore is not the most suitable tool to assess local impacts of mining. It is, however, the most suitable tool to obtain a picture of the impacts over the total life cycle of a product or service, wher-ever (and whenever) these impacts may take place, since it integrates over all processes in the life cycle and over all environmental im-pacts.

128
Environmental Risks and Challenges of Anthropogenic Metals Flows and Cycles
6.3 LCI Data
6.3.1 Available Inventory DataThe following table gives an overview of avail-able LCI data for those metals covered by this report here. The table is the result of a thor-ough literature and internet research by the authors of this chapter and additions from industrial sources. LCI data are unit pro-cess data: they record all inputs of environ-mental and economic goods (raw materials and products) and all outputs of co-products, waste and emissions to produce a unit of product or service. The cradle-to-grave prod-uct chain is composed out of such unit pro-cesses. Most processes in LCI databases are production processes, but consumption and waste management processes are includ-ed as well. Thus, a specification is made of all environmental interventions (extractions, emissions and land use) related to the prod-uct or services being assessed. This overview then is submitted to the Life Cycle Impact As-sessment procedure (see Section 6.4).
Table 6.1 lists the most important databases on metal production. They include all steps from mining until the production of the re-fined material. Data on consumption and waste management often are not included, although these can be quite relevant. In some cases, data on secondary production (metal production from scrap) are available as well. This enables a comparison between prima-ry and secondary production of metals. Other organisations may have relevant data as well, especially industry associations.

129
Environmental Risks and Challenges of Anthropogenic Metals Flows and Cycles
Metal Data pub-lisher
Form Data characterisation/description Further remarks
U I R System boundaries Covered technology Data source(s)
Iron (Fe) and steel
CSIRO miner-als (reported in Norgate et al. 2007).
X Cradle-to-gate, i. e. from the iron ore ex-traction to the pro-duced steel.
Integrated route (blast furnace, BF) and basic oxygen furnace (BOF) steel.
Process data based on various, mainly lit-erature, sources.
–
ecoinvent Cen-tre (reported in Classen et al. 2009).
X X X Cradle-to-gate, i. e. from the iron ore ex-traction resp. the col-lection of iron scrap to the produced primary, secondary steel.
Primary & second-ary production; using blast furnace, basic oxygen furnace steel.
Main sources: Roth et al. (1999) and IPPC (2000).
Split into 12 different datasets.
European Life Cycle Data-base (ELCD) v2.0 (available free of charge in the internet); worldsteel data supersedes this data.
X Cradle-to-gate, i. e. from the iron ore ex-traction to the pro-duced steel and in-cludes the end-of-life recycling of the steel products.
Primary & second-ary production; us-ing blast furnace and electric arc furnace steel.
EUROFER resp. worldsteel data, mod-elled for average Eu-ropean or Global situ-ation, based on data from various sources.
Split into 4 product datasets (hot rolled coil, sections, hot dip galva-nised steel and stain-less steel).
World Steel Associa-tion (worlds-teel) (avail-able in case of study-specif-ic request at worldsteel.org – Methodol-ogy report 2011 also available for download).
X Cradle-to-gate, i. e. from the iron ore ex-traction to the pro-duced steel. Also cra-dle-to-gate including end-of-life recycling of the steel products (net credit).
50 sites operated by 16 companies, includ-ing blast furnace op-erations, electric arc furnace operations, and direct reduction operations participat-ed in the study. The companies contrib-uting data to the LCI study account for over 25 % of global crude steel production. Ad-ditional sites and companies are cur-rently being added to the database.
Primary data from member companies (see “covered technol-ogy”).
Datasets for 15 prod-ucts – representing the main finished products of the steel industry. Included are hot rolled coil (with and without pickling), cold rolled coil (with and without finishing), hot dip and electrically galvanised sheet, painted sheet, tinplate and tin-free sheet, tubes, sections, plate, rebar/wire rod, and engineering steels.
PE INTERNA-TIONAL GaBi 5 (2011).
X X Cradle-to-gate and unit process data.
EAF route – Special-ity steel.
ThyssenKrupp AG, 2004. Best Available Tech-niques in the Ferrous Metals Processing In-dustry – Endentwurf 2005. Best Available Tech-niques Reference Document on the Pro-duction of Iron and Steel., 2001. UCLCI database EUROFER worldsteel.
163 data sets of differ-ent steel and alloyings.
See also GaBi Model-ling Principles 2011.
Copper (Cu)
CSIRO miner-als (reported in Norgate et al. 2007).
X Cradle-to-gate, i. e. from the copper ore extraction to the pro-duced copper.
Smelting/converting and electro-refining resp. heap leaching with subsequent sol-vent extraction/elec-trowinning (SX/EW).
Process data based on various, mainly lit-erature, sources.
–
Table 6.1
Overview of available LCI data
for primary and/or secondary
metal production

130
Environmental Risks and Challenges of Anthropogenic Metals Flows and Cycles
Metal Data pub-lisher
Form Data characterisation/description Further remarks
U I R System boundaries Covered technology Data source(s)
Copper (Cu)
ecoinvent Cen-tre (reported in Classen et al. 2009).
X X X Cradle-to-gate, i. e. from the ore extrac-tion resp. the collec-tion of copper scrap to the produced primary, secondary copper.
The production is modelled for global situation, based on data from various sources.
Split into 24 different datasets.
European Cop-per Institute (ECI).
(available in case of study specific re-quest at www.copper-life-cy-cle.org).
X X Cradle to gate i. e. from the copper ore to copper cathode (here allocation due to multiproduct ore is applied) as well as to copper products tube, sheet and wire. The study represents the European average mix reference year 2005.
Mining, concentrat-ing, Primary and sec-ondary production in-cluding smelting, con-verting, fire refining and electrorefining. Hydroroute (leaching, solvent extraction and electrowinning is in-cluded). Coverage is more than 90 %.
Primary data from member companies (11 mining compa-nies, 7 smelter and major fabricators). Additionally imports into Europe (from America, Asia and Russia) is included in.
Datasets for copper cathodes and semi-fin-ished products (copper tube, copper sheet and copper wire). Secondary scrap for the cathode production and clean scrap for the semi pro-duction (except for wire) is considered.
International Copper Asso-ciation (ICA) (available in case of study specific re-quest at www.copper-life-cy-cle.org).
X Cradle to gate i. e. from the copper ore to primary copper cath-ode (here allocation due to multiproduct ore is applied). The study represents the world average mix reference year 2005-2009.
Mining, concentrat-ing, Primary produc-tion including smelt-ing, converting, fire refining and electrore-fining. Hydroroute (leaching, solvent ex-traction and electrow-inning is included). Coverage is nearly 30 % production mass based or 60 % region-al coverage based.
Worldwide Primary data from member companies (22 min-ing sites, 14 smelting sites and 11 leach-ing/solvent extraction sites).
Global Dataset for pri-mary copper cathodes.
Kennecott (re-ported in Ken-necott, 2004).
X Cradle-to-gate, i. e. from the ore extrac-tion (in Kennecott’s Bingham Canyon Mine) to the produced Cu cathode.
Flash smelting fur-nace, followed by two further furnaces, in order to produce 99.6 % purity Cu.
Company data. Only LCIA results pub-lished.
PE INTERNA-TIONAL GaBi 5 (2011).
X X Cradle-to-gate and unit process data.
Various Primary and secondary routes.
Outokumpu Technol-ogy, 2004. Mitsubishi Materials, 2004. Gresik Smelter – cop-per production in In-donesia, 2004. National Mining Asso-ciation, 1999-2004. Mining Pollution In-ventory in Australia, 2002-2003. Reference Document on Best Available Techniques in the Non Ferrous Metal Indus-try, 2000. ECI.
53 data sets of different copper qualities.
See also GaBi Model-ling Principles 2011.
Zinc (Zn) CSIRO miner-als (reported in Norgate et al. 2007).
X Cradle-to-gate, i. e. from the lead-zinc ore extraction to the pro-duced zinc.
Electrolytic process with imperial smelt-ing process.
Process data based on various, mainly lit-erature, sources.
–

131
Environmental Risks and Challenges of Anthropogenic Metals Flows and Cycles
Metal Data pub-lisher
Form Data characterisation/description Further remarks
U I R System boundaries Covered technology Data source(s)
Zinc (Zn) ecoinvent Cen-tre (reported in Classen et al. 2009).
X X X Cradle-to-gate, i. e. from the ore extrac-tion (lead-zinc ore) to the produced primary zinc (secondary zinc is not taken into ac-count).
Primary production – mix of 20 % pyro- and 80 % hydrometallur-gical processes – of high-grade (SHG) pri-mary zinc.
Values taken from Ayres et al. (2002), Xiao et al. (2003), IPPC (2001) and EEA (1999b).
Split into 3 different datasets (whereof the primary zinc dataset represents the use of zinc in coating process-es and is not suitable for comparison of prod-ucts containing zinc in a high degree).
European Life Cycle Database (ELCD) v2.0 (available free of charge in the internet).
X Cradle-to-gate, i. e. from the ore extrac-tion to the produced high grade zinc.
Primary production – mix of 10 % pyro- and 90 % hydrometallur-gical processes – of high-grade (SHG) pri-mary zinc.
International Zinc As-sociation (IZA), based on data from various sources.
1 single dataset – rep-resenting 32 % of global zinc production activi-ties in 2005.
International Zinc Associa-tion 2009.
X X LCI data for primary zinc (ingot at refin-ery gate), providing data for the “cradle-to-gate” system – zinc ore at the mine site to the production of primary zinc and shipment of zinc in-got from the gate of facility where it is pro-duced Reference year 2005/6.
Data collection effort included zinc mining and smelting opera-tions. The technologi-cal coverage for zinc smelting included both electrometallur-gical and pyro-met-allurgical production routes. The dominant route world-wide is the electrometallur-gical production route.
Primary date from IZA member companies Mining – A total seven companies represent-ing nineteen sites provided data on zinc mining which rep-resented 44 % of the global zinc mine pro-duction volume for the reference year 2005 Smelting – a total of 10 companies rep-resenting seventeen sites provided the data. The participating companies represent-ed approximately 3.38 million tons of refined zinc (3.27 million tons in form of special high grade zinc and 0.1 million tons in form of prime western zinc or cathode zinc). This data coverage rep-resents 32 % of the global zinc production volume for the refer-ence year 2005.
Zinc Environmental Profile (cradle to gate) published with select LCI data and related LCIA data.
In addition environmen-tal profile published for zinc sheet with LCI and LCIA data.
Primary Zinc data sub-mitted to US LCI Data-base and ELCD.
Internal studies done on tier 2 products.
PE INTERNA-TIONAL GaBi 5 (2011).
X X Cradle-to-gate and unit process data.
electrometallurgical smelting – roasting, leaching, purification, electrolysis and melt-ing of a high grade zinx ingot.
The Production of Zinc, 2007. IZA. Reference Document on Best Available Techniques in the Non Ferrous Metal Indus-try, 2000. MIM Environment and Community Report, 2002.
high grade zinc and re-distilled zinc.
Alumini-um (Al)
CSIRO miner-als (reported in Norgate et al. 2007).
X Cradle-to-gate, i. e. from the bauxite ore extraction to the pro-duced aluminium.
Bayer refining, fol-lowed by Hall-Heroult smelting.
Process data based on various, mainly lit-erature, sources.
–

132
Environmental Risks and Challenges of Anthropogenic Metals Flows and Cycles
Metal Data pub-lisher
Form Data characterisation/description Further remarks
U I R System boundaries Covered technology Data source(s)
Alumini-um (Al)
ecoinvent Cen-tre (reported in Classen et al. 2009).
X X X Cradle-to-gate, i. e. from the bauxite ex-traction resp. the col-lection of aluminium scrap to the produced primary, secondary aluminium.
Primary & second-ary production; us-ing Bayer process for Al(OH)3, Hall-Héroult cells with prebaked C-anodes or Söderberg-anodes for primary al-uminium production; aluminium melting furnace for secondary production.
Production is mod-elled for the Euro-pean situation, pri-marily based on data from EAA (2000) and personal communi-cations. The mining represents a world-wide situation, based on Mori&Adelhardt (1998).
Split into 11 different datasets.
European Life Cycle Database (ELCD) v2.0 (available free of charge in the internet).
X Cradle-to-gate, i. e. from the bauxite ex-traction resp. the col-lection of aluminium scrap to the supplied aluminium (mix).
Primary & secondary production as a mix – including Bauxite mining, alumina and subsequent alumini-um production.
European Alumini-um Association (EAA), based on various sources.
Split into 2 different datasets for semi-fin-ished products, one for sheet and one for profile.
Forthcoming – ecoinvent v3 (2012).
X X X Cradle-to-gate, i. e. from bauxite ore ex-traction to the prima-ry aluminium casting; with industry specific regional power mix “children” datasets.
Mining, refining, smelting (inc anode production), casting.
IAI 2010 life cycle in-ventory data, with an-nual updates based on key IAI collected data: energy intensity (refining & smelting), power mix/fuel mix, PFC emissions, net anode consumption.
Split into 8 datasets: Bauxite Mine Operation. Aluminium Hydroxide Production. Aluminium Oxide Pro-duction. Aluminium Production, Wrought Alloy. Anode Production (Paste). Anode Production (Prebake). Aluminium Production (Søderberg). Aluminium Production (Prebake). Plus regional power mix.
European Alu-minium As-sociation (reported in EAA, 2008). http://www.alueurope.eu/wp-content/up-loads/2011/08/EAA_Environ-mental_pro-file_report-May081.pdf
X Cradle-to-gate, i. e. from the bauxite ex-traction resp. the col-lection of aluminium scrap to the produced primary, secondary aluminium.
Primary & second-ary production; us-ing Bayer process for Al(OH)3, Hall-Héroult cells with prebaked C-anodes or Söderberg-anodes for primary al-uminium production; aluminium melting furnace for secondary production.
Primary data through surveys covering the year 2005 and focus-sing respectively on alumina production (6 sites), on anode (16) and paste (6) pro-duction and on elec-trolysis and casting (27 pre-brake and 8 Söderberg). Coverage for each step 90 %.
Datasets for 6 pro-cesses – representing primary aluminium pro-duction, semi-finished aluminium produc-tion (sheet, foil, profile), clean process scrap melting, and recycling of special scrap and end of life aluminium products.
PE INTERNA-TIONAL GaBi 5 (2011).
X X Cradle-to-gate and unit process data.
AA, EAA, Alukey.com. Gesamtverband der deutschen Aluminiu-mindustrie e. V., 2006. European Aluminium Association, written communication, 2006. EAA Environmental Profile Report for the EU Aluminium Indus-try, EAA, April 2008.
175 data sets of differ-ent aluminium alloys sheets and profiles.
See also GaBi Model-ling Principles 2011.

133
Environmental Risks and Challenges of Anthropogenic Metals Flows and Cycles
Metal Data pub-lisher
Form Data characterisation/description Further remarks
U I R System boundaries Covered technology Data source(s)
Nickel (Ni)
CSIRO miner-als (reported in Norgate et al. 2007).
X Cradle-to-gate, i. e. from the nickel ore extraction to the pro-duced nickel.
Flash furnace smelt-ing with Sherritt-Gor-don refining (in case of sulphide ore), pres-sure acid leaching with SX/EW (in case of laterite ore).
Process data based on various, mainly lit-erature, sources.
–
ecoinvent Cen-tre (reported in Classen et al. 2009).
X X X Cradle-to-gate, i. e. from the ore extrac-tion (part of nickel-copper ore) to the produced primary nickel (secondary nickel is not taken into account).
Primary production – mix of pyro- and hydrometallurgical processes – of class I primary nickel.
Data mainly based on Hilbrans & Hinrichs (1999), plus descrip-tion taken from Ker-foot (1997).
1 single dataset – rep-resenting a world-wide average production of class I nickel.
Nickel Institute (results re-ported on web-site, method-ology reported in Nickel Insti-tute, 2001).
X X Cradle-to-gate, i. e. from the ore extrac-tion to the produced primary nickel prod-ucts.
Primary production – including under-ground and surface mining (sulphidic and lateritic ores), benefi-ciation, primary ex-traction and refining by pyro- and hydro-metallurgical pro-cesses.
Primary data through surveys from 9 com-panies, representing 55 % of world produc-tion.
Datasets for 3 products – representing class I nickel, nickel oxide and ferronickel.
PE INTERNA-TIONAL GaBi 5 (2011).
X X Cradle-to-gate. 5 countries represent the nickel produc-tion mix according to the country-specific parameters and the different process-ing applications. The Australian route was modelled based on the procedure at two mines belonging to WMC Resources Ltd., the largest Australian nickel producing com-pany. The modelling of the Russian route is based on literature and personally com-municated informa-tion from the Rus-sian company. MMC Norilsk Nickel Group, the largest nickel pro-ducer worldwide. The Canadian route was modelled using indus-trial data from Cana-dian nickel producers and is adjusted with current literature. The nickel produced in South Africa is a by-product out of the precious metal pro-duction.
WMC Resources Ltd.
MMC Norilsk Nickel Group.
Minecost: World Mine Cost Data Exchange Inc., World Mine Cost Data Exchange Inc., http://www.mine-cost.com/datalst.htm, Wilmington/USA, 2000 – 2004.
Reference Document on Best Available Techniques in the Non Ferrous Metal Indus-try, European Com-mission, http://eippcb.jrc.ec.europa.eu, Se-ville/Spain, 2000.
Canadian nickel pro-ducers and is adjust-ed with current lit-erature.
Nickel and ferro nickel.

134
Environmental Risks and Challenges of Anthropogenic Metals Flows and Cycles
Metal Data pub-lisher
Form Data characterisation/description Further remarks
U I R System boundaries Covered technology Data source(s)
Lead (Pb) CSIRO miner-als (reported in Norgate et al. 2007).
X Cradle-to-gate, i. e. from the lead-zinc ore extraction to the pro-duced lead.
Lead blast furnace with imperial smelt-ing process.
Process data based on various, mainly lit-erature, sources.
–
ecoinvent Cen-tre (reported in Classen et al. 2009).
X X X Cradle-to-gate, i. e. from the ore extrac-tion (lead-zinc ore) resp. the collection of lead scrap to the pro-duced primary, sec-ondary lead.
Primary & second-ary production; using the sinter/blast fur-nace (ISP) and direct smelting process for primary production, remelting of lead acid batteries for second-ary production.
Values taken from Ayres et al. (2002), Xiao et al. (2003), IPPC (2001) and EEA (1999a).
Split into 5 datasets – among them, one rep-resenting the primary production, one for the secondary produc-tion and a third dataset representing the sup-ply mix of lead used in Europe (i. e. 25 % prima-ry/75 % secondary).
European Life Cycle Database (ELCD) v2.0 (available free of charge in the internet).
X Cradle-to-gate, i. e. from the ore extrac-tion to the produced primary lead.
Lead blast furnace with imperial smelt-ing process.
Dataset created for the ELCD database from PE Internation-al, using their own da-tabase.
1 single dataset.
PE INTERNA-TIONAL GaBi 5 (2011).
X X Cradle-to-gate, The inventory is repre-senting the produc-tion of primary lead produce imperial Smelting Furnace.
Primary production of lead requires the smelting of lead-bearing ores to pro-duce lead bullion that is then refined. Most primary lead smelters have a complex refin-ing process associat-ed with them and as-sociated processes to recover other metals from the ore as well, such as zinc, silver or gold.
World Mine Cost Data Exchange Inc., 2000-2004. Minerals Yearbook, 2001-2004. MIM Environment and Community Report, 2002. Reference Document on Best Available Techniques in the Non Ferrous Metal Indus-try, 2000.
Different regions.
Molybde-num (Mo)
ecoinvent Cen-tre (reported in Classen et al. 2009).
X X X Cradle-to-gate, i. e. from the ore extrac-tion (copper-molyb-denite ore) to the pro-duced primary mo-lybdenum (secondary molybdenum is not taken into account).
Primary production – mix of 20 % pyro- and 80 % hydrometallurgi-cal processes (using the respective data from the zinc process as proxy!) – of high-grade primary molyb-denum.
The production is modelled for global situation, based on data from various sources.
Split into 8 datasets – among them 1 dataset, representing the Euro-pean consumption mix.
International Molybdenum Association, IMOA (avail-able from IMOA website www.imoa.info).
X Cradle-to-gate, i. e. from ore extraction to intermediate and final molybdenum prod-ucts.
Mix of underground and open pit mining and current technolo-gies used for ore con-centration and sub-sequent production of roasted molybdenite concentrate (RMC), RMC briquettes, fer-romolyb-denum, and pure molybdenum oxide.
Primary data from IMOA member com-panies (see “covered technology”).
Split into 4 data sets.

135
Environmental Risks and Challenges of Anthropogenic Metals Flows and Cycles
Metal Data pub-lisher
Form Data characterisation/description Further remarks
U I R System boundaries Covered technology Data source(s)
Molybde-num (Mo)
PE INTERNA-TIONAL GaBi 5 (2011).
X X Cradle-to-gate. On demand.
Chromi-um (Cr)
ecoinvent Cen-tre (reported in Classen et al. 2009).
X X X Cradle-to-gate, i. e. from the ore extrac-tion (extraction of chromite ore) to the produced primary chromium (secondary chromium is not tak-en into account).
Primary produc-tion – mix of electro-lytic production (via ferro-chromium) and alumina-thermic re-duction of chromium chemicals.
Data mainly based on Adelhardt & Antre-kowitsch (1998), as well as on IPPC (2001), IPPC (2002), Papp (1994) and EEA (1999).
1 single dataset – rep-resenting the Europe-an consumption mix in 1994 of chromium.
PE INTERNA-TIONAL GaBi 5 (2011).
X X Cradle-to-gate. Ore-Concentrate- smelter – electric arc furnace.
BHP – Sustainability Report 2003, 2003. Information on: Ferro-chrome, 2003. Reference Document on Best Available Techniques in the Non Ferrous Metal Indus-try, European Com-mission, http://eippcb.jrc.ec.europa.eu, Se-ville/Spain, 2000.
Tin (Sn) ecoinvent Cen-tre (reported in Classen et al. 2009).
X X X Cradle-to-gate, i. e. from the ore extrac-tion to the produced primary tin (secondary tin is not taken into account).
Primary production via electro refining of smelted tin minerals.
Values are calculated, based on assumptions and theoretical mod-els (taken from Graf (1997)).
1 single dataset – rep-resenting the summed-up efforts of mining, benefication, smelting and final refining.
PE INTERNA-TIONAL GaBi 5 (2011).
X X Cradle-to-gate. Ore- beneficiation-melting-Refining The data set repre-sents the 6 largest Tin producing countries: Indonesia, Peru, Ma-laysia, Brazil, China, Belgium and Thailand focusing on the main technologies, the re-gion specific charac-teristics and/or im-port statistics.
Carlin, J. F. Jr., 2009 Minerals Yearbook, U.S. Geological Sur-vey (USGS), Tin, USA, 2011. World Mine Cost Data Exchange Inc., 2000-2004. Minerals Yearbook, 2001 – 2004. MIM Environment and Community Report, 2002. Reference Document on Best Available Techniques in the Non Ferrous Metal Indus-try, 2000.
Mercury (Hg)
ecoinvent Cen-tre (reported in Althaus et al. 2009).
X X X Cradle-to-gate, i. e. from the ore extrac-tion to the produced primary mercury (sec-ondary mercury is not taken into account).
Primary production in furnaces, of open-pit mined, hand-sorted and crushed Hg-con-taining mineral.
Data source Simon (2001) used for the furnace step – pre-ceding steps are based on analogies with other mining ac-tivities.
1 single dataset – rep-resenting the summed-up efforts of min-ing, beneficiation and smelting.

136
Environmental Risks and Challenges of Anthropogenic Metals Flows and Cycles
Metal Data pub-lisher
Form Data characterisation/description Further remarks
U I R System boundaries Covered technology Data source(s)
Cadmium (Cd)
ecoinvent Cen-tre (reported in Classen et al. 2009).
X X X Cradle-to-gate, i. e. from the ore extrac-tion (part of zinc-lead ore) to the produced primary cadmium (secondary cadmium is not taken into ac-count).
Treatment of cadmi-um sludge from hy-drometallurgical zinc operations and subse-quent refining by elec-trolysis.
Global average data, based mainly on in-formation in Schulte-Schrepping & Piscator (2002).
1 single dataset – rep-resenting the produc-tion of primary Cd (99.9 %) on a global av-erage.
PE INTERNA-TIONAL GaBi 5 (2011).
X X Cradle-to-gate, Ce-mentation and fil-tration-Redisolution. Electrolysis.
Cadmium is a by-product of zinc pro-duction. There are two main zinc production routes used world-wide: From zinc-cad-mium ore via hydro-metallurgical route to cadmium metal, from zinc-cadmium ore via pyrometallurgi-cal route to cadmium metal.
A.C. Tolcin, S. M. Weaver, L.D. Miller, Mineral Yearbook 2009 – Cadmium [Ad-vanced Release], U.S. Geological Survey (USGS), 2011. Sustainability Report 2010, Nyrstar, 2010.
Gold (Au) ecoinvent Cen-tre (reported in Classen et al. 2009).
X X X Cradle-to-gate, i. e. from the gold ore ex-traction resp. the col-lection of gold-con-taining scrap to the produced primary, secondary gold.
Country-specific pri-mary production pro-cesses of the 9 most important countries that produced gold/gold-silver. Current technologies from these countries are represented.
Various environmen-tal reports of the min-ing companies in the 9 countries taken into account.
Split into 13 datasets – among them 1 dataset representing the Global consumption mix.
PE INTERNA-TIONAL GaBi 5 (2011).
X X Cradle-to-gate. The use of water-based solutions to extract and recover metals such as gold is called #hydromet-allurgy.# Gold mining operations use very dilute solutions of so-dium cyanide (NaCN), typically in the range of 0.01 % and 0.05 % cyanide (100 to 500 parts per million).
Outokumpu Technol-ogy, 2004. Mitsubishi Materials, 2004. Stoffmengenflüsse und Energiebedarf bei der Gewinnung aus-gewählter minerali-scher Rohstoffe. Gresik Smelter – cop-per production in In-donesia, 2004. National Mining Asso-ciation, 1999 – 2004. Non-ferrous metals market, 1992 – 2004.
Platinum Group Metal Platinum (Pt) Pal-ladium (Pd) Rho-dium (Rh)
ecoinvent Cen-tre (reported in Classen et al. 2009).
X X X Cradle-to-gate, i. e. from the PGM (plati-num group metal) ore extraction resp. the collection of PGM-containing scrap to the produced primary, secondary platinum, palladium resp. rho-dium.
Primary & second-ary production; using a pyrometallurgical process, followed by a refining step (mix of selective precipitation & solvent extraction) for the primary pro-duction, pyrometallur-gical refining of spoilt automotive catalysts for the secondary pro-duction.
Country-specific pri-mary datasets for the two main produc-ing countries (Russia, South Africa), based on Hochfeld (1997) – data from current recycling activities in Germany, again based on Hochfeld (1997).
Split into 4 datasets (for each of the three met-als) – among them 1 dataset each time rep-resenting the respective European consump-tion mix.
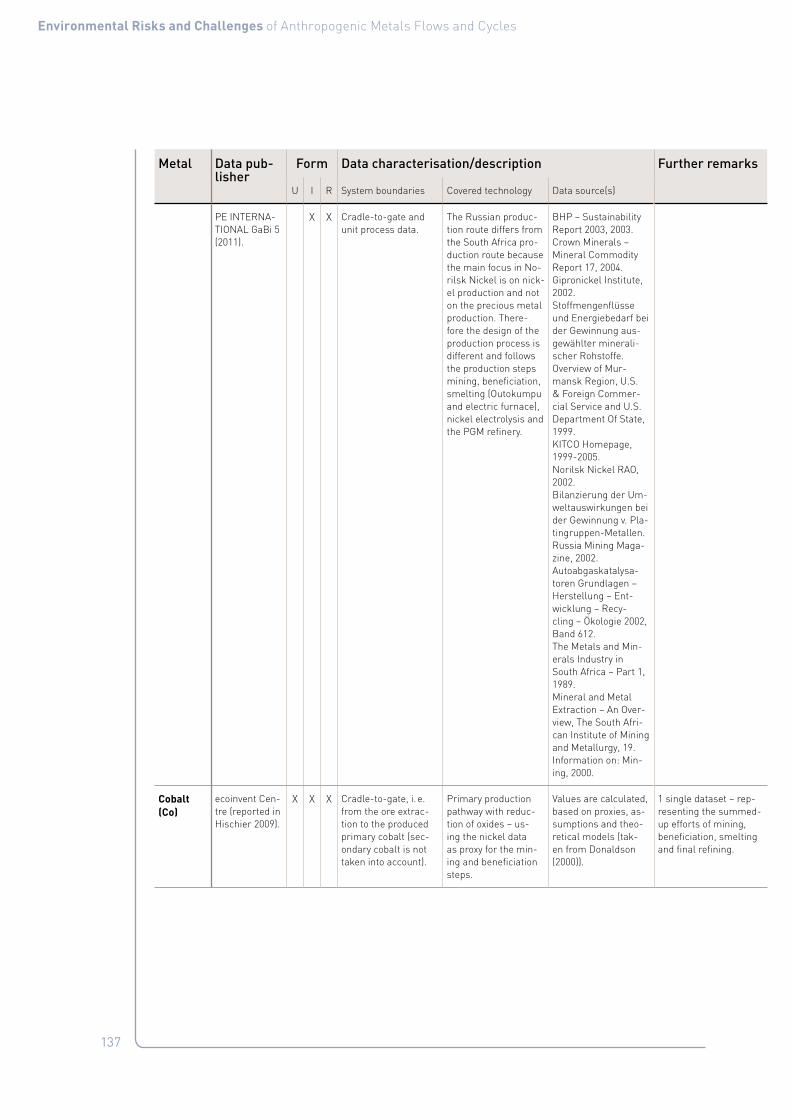
137
Environmental Risks and Challenges of Anthropogenic Metals Flows and Cycles
Metal Data pub-lisher
Form Data characterisation/description Further remarks
U I R System boundaries Covered technology Data source(s)
PE INTERNA-TIONAL GaBi 5 (2011).
X X Cradle-to-gate and unit process data.
The Russian produc-tion route differs from the South Africa pro-duction route because the main focus in No-rilsk Nickel is on nick-el production and not on the precious metal production. There-fore the design of the production process is different and follows the production steps mining, beneficiation, smelting (Outokumpu and electric furnace), nickel electrolysis and the PGM refinery.
BHP – Sustainability Report 2003, 2003. Crown Minerals – Mineral Commodity Report 17, 2004. Gipronickel Institute, 2002. Stoffmengenflüsse und Energiebedarf bei der Gewinnung aus-gewählter minerali-scher Rohstoffe. Overview of Mur-mansk Region, U.S. & Foreign Commer-cial Service and U.S. Department Of State, 1999. KITCO Homepage, 1999-2005. Norilsk Nickel RAO, 2002. Bilanzierung der Um-weltauswirkungen bei der Gewinnung v. Pla-tingruppen-Metallen. Russia Mining Maga-zine, 2002. Autoabgaskatalysa-toren Grundlagen – Herstellung – Ent-wicklung – Recy-cling – Ökologie 2002, Band 612. The Metals and Min-erals Industry in South Africa – Part 1, 1989. Mineral and Metal Extraction – An Over-view, The South Afri-can Institute of Mining and Metallurgy, 19. Information on: Min-ing, 2000.
Cobalt (Co)
ecoinvent Cen-tre (reported in Hischier 2009).
X X X Cradle-to-gate, i. e. from the ore extrac-tion to the produced primary cobalt (sec-ondary cobalt is not taken into account).
Primary production pathway with reduc-tion of oxides – us-ing the nickel data as proxy for the min-ing and beneficiation steps.
Values are calculated, based on proxies, as-sumptions and theo-retical models (tak-en from Donaldson (2000)).
1 single dataset – rep-resenting the summed-up efforts of mining, beneficiation, smelting and final refining.

138
Environmental Risks and Challenges of Anthropogenic Metals Flows and Cycles
Metal Data pub-lisher
Form Data characterisation/description Further remarks
U I R System boundaries Covered technology Data source(s)
PE INTERNA-TIONAL GaBi 5 (2011).
X X Cradle-to-gate and unit process data.
The Cobalt mix of the three available tech-nology routes of the four production coun-tries Norway, Canada, Australia, and South Africa is made up of 28 % Norway, 43 % Canada, 27 % Aus-tralia and 2 % South Africa. Statistical data of the composition are taken from the pro-duction statistics of the „Cobalt Develop-ment Institutes“. In-cluded in the model are the country spe-cific mining condi-tions, Cobalt refining as well as transports to the refining coun-tries.
On demand.
Arsenic (As)
- - - - -
Legend: U = unit process inventory data / I = cumulative inventory data / R = LCIA results
139
Environmental Risks and Challenges of Anthropogenic Metals Flows and Cycles
6.3.2 Coverage of the Various Data Sources
GeneralAs described in chapter 4, metals require sig-nificant amounts of energy along their pro-duction chain, to be produced – but in func-tion of the actual usage, this could also be true for the use phase, as well as in the sub-sequent recycling and/or end-of-life activi-ties. Consequently, the energy consump-tion along the whole production chain is an important element to be taken into account here. As elaborated already in details in the preceding chapter 5, “mining, beneficia-tion, metal extraction and refining produc-es a range of solid, liquid and gaseous waste streams. […] The main environmental im-pacts of primary metal mining and extraction revolve around water (consumption and qual-ity aspects), mine wastes (tailings and waste rock), energy sources (direct such as diesel and indirect such as coal-fired electricity) and the associated air emissions (sulfur dioxide, greenhouse gases, dusts and particulates)”. Hence, in the following the various data sources reported in Table 6.1 are – as far as this is possible with the support of the provid-ed/published information – further examined and analysed in accordance with these points taken from chapters 4 and 5. The analysis is done according to the data sources, and not according to the individual metals, as data sources reporting more than one metal use usually a common framework/approach for the inventorisation of these various metals.
European Life Cycle Database (ELCD) v2.0According to the authors from the JRC in Is-pra (reported in the SimaPro implementation of this database) “the ELCD core database (version v2.0) comprises Life Cycle Inventory (LCI) data from front-running EU-level busi-ness associations and other sources for key materials, energy carriers, transport, and waste management. Focus is laid on data quality, consistency, and applicability. The re-spective data sets are officially provided and approved by the named industry association. ” And further down it is stated at the same place of the database as a “Disclaimer”, that “so far only internally reviewed and only part-
ly harmonized LCI data sets are provided in this second version of the ELCD database. All data sets are carefully selected, of high quality and in line with ISO 14040 and 14044, but are not to be considered as official refer-ence data sets.” In other words, the data in the ELCD database are not all based on the same methodology report/the same meth-odological assumptions, but each industrial association – delivering data to this database – has been using its specific methodology/its specific methodological choices. And thus, it is not possible to describe here general prin-ciples for the three specific aspects (water, mine waste, energy) that are further detailed here. Instead, such a description has to be established on the level of the description of the various industry association data (see be-low).
Ecoinvent Data v2General. The general objective/goal of ecoin-vent is “to provide generic background data to be used in an LCA of products and process-es” (Frischknecht et al., 2007). In Classen et al. (2009) it is stated further that “ecoinvent datasets on metal production are not meant to be used directly to analyse the metal pro-ducing processes nor can ecoinvent data be used to compare similar alloys of the same metals”. Thereby, the data relate to either the year 2000 (those data established in the framework of ecoinvent v1 … and not updat-ed for the version v2) or then the year 2004/5 (those data newly integrated into ecoinvent v2). Since the various metal markets can be seen as global, additional datasets for other regions have been established as well, in or-der to be able to calculate respective produc-tion mixes for the European supply. As far as possible, co-production processes are mod-elled within ecoinvent, taking into account the actual composition of ores. Allocation is usu-ally done by economic revenue (Classen et al., 2009).
Water. In general, the water consumption is taken into account in ecoinvent; split into the amount of cooling water (as one single el-ementary flow “water, cooling, unspecified natural origin”) and the amount of process

140
Environmental Risks and Challenges of Anthropogenic Metals Flows and Cycles
water (split into 7 elementary flows – “wa-ter, lake”, “water, river”, “water, salt, ocean”, “water, salt, sole”, “water, turbine use, un-specified natural origin”, “water, unspecified natural origin”, and “water, well, in ground”) that is recorded separately for each unit pro-cess step. However, the methodology re-port of ecoinvent (Frischknecht et al., 2007) doesn’t contain any special chapter dealing in more details with the modelling of water con-sumption/use.
Mine waste. The tailings issue is taken into account since the version v2.1 (i. e. sulphid-ic, uranium and hard coal tailings includ-ing emissions data, e. g. for acid rock drain-age (ARD)). A detailed description of the used tailings models for the sulphidic tailings can be found in part XIV of the metals report of ecoinvent (Classen et al., 2009).
Energy. Information about the energy con-sumption of the various production steps is included on the most detailed level possible, and linked to the respective energy produc-tion data within the ecoinvent database. The data about the amount of the consumed en-ergy are taken from various sources (for de-tails, see respective chapters of report Clas-sen et al., 2009); the data for the provision of the respective type of energy (i. e. heat resp. electricity) are taken from the energy part within the database (described e. g. in Bauer et al. 2007).
European Aluminium Association (EAA)General. According to EAA (2008), the report “provides up-to-date life cycle inventory data (LCI) for aluminium production and trans-formation processes in Europe. This report and the associated LCI data have been de-veloped in full reference to the 2 relevant ISO standards ISO 14040 and 14044.” The goal of this report is an update to the 2005 situa-tion – showing average data for the European aluminium production. Data have been col-lected from the various member companies. According to EAA (2008) allocation has been avoided as far as possible by the application of the system expansion principle. Finally, the cumulative inventory data have been calcu-
lated by using the GaBi database and its con-tent.
Water. In general, the water consumption is taken into account in the EAA data; howev-er, only split into the amount of fresh resp. sea water. A distinction between process and cooling water is not done here.
Mine waste. No such data have been collect-ed and/or reported, as these are considered irrelevant for bauxite mining.
Energy. Information about the energy con-sumption of the various production steps is included on a rather detailed level, dis-tinguishing between various fuel sourc-es as well as the input amount of electricity and linked to the respective energy produc-tion data within the GaBi database for the calculation(s).
European Copper Institute (ECI)General. The scope of the ECI study is “the building of a cradle-to-gate life cycle invento-ry and life cycle assessment from the extrac-tion of the copper ore at the mine to the pro-duction of copper products (tube, sheet, wire) through the production of primary and sec-ondary copper cathodes”.
The geographical scope is the European mar-ket mix (primary and secondary cathode pro-duced in Europe and cathode imported to Eu-rope resp. copper semis produced in Europe). The data sampling include annual represent-ative data for the year 2005, representing an average of all production sites and technolo-gies relevant for Europe. The study meets the requirements of the ISO 14040 and ISO 14044 standards as it has been stated by a critical review. System expansion as well as alloca-tion has been used to isolate the LCI and the impact share of copper, because of the asso-ciated metals in the copper ore. Finally, the cumulative inventory data have been calcu-lated by using the GaBi database and its con-tent.
Water. In general, the water consumption is taken into account in the ECI data; however,

141
Environmental Risks and Challenges of Anthropogenic Metals Flows and Cycles
only split into the amount of river resp. sur-face water. A distinction between process and cooling water is not done here.
Mine waste. Due to the fact that impacts for tailings, waste rock as well as overburden are under discussion in the international LCA community, these data don’t contain such in-formation.
Energy. Information about the energy con-sumption of the various production steps is included on a detailed, step-by-step level, distinguishing e. g. the input amount of elec-tricity (on a site-specific level) and linked to the energy production data within the GaBi database for the calculation(s).
International Molybdenum Association (IMOA)General. Data represent global average cra-dle-to-gate data for roasted molybdenite con-centrate (RMC) in powder form, RMC in bri-quette form, and ferromolybdenum in chip form from a 2008 study commissioned by the International Molybdenum Association and performed by Four Elements Consulting, LLC. One objective of the study was to provide high-quality, technologically and temporally representative data on molybdenum prod-ucts to life cycle management or LCA prac-titioners to use in such studies. Nine mem-ber companies contributed data from 21 fa-cilities that include primary and by-product mining and conversion facilities located in Europe, North America, and South America. 2007 process data on energy and materials consumed and environmental outputs were collected in detailed questionnaires. The data represented 52 % of the total molybdenum produced in the world and 75 % of western world production (which includes all produc-tion with the exception of molybdenum from China, Mongolia, and CIS). Co-production processes take into account the actual com-position of ores as reported by IMOA member companies.
Water. Water consumption has been tak-en into account in the inventories. Its origin has not been specified so is reported only as
coming from an unspecified origin. A distinc-tion between process and cooling water is not done here.
Mine waste. Emissions from waste rock and tailings and related emissions are included in the data.
Energy. Information about the energy con-sumption of the various production steps is included on a detailed, step-by-step level, for detailed energy usage from mining to con-centration (beneficiation), to roasting into RMC, and further transformation into RMC briquettes and ferromolybdenum. For both sets of data, the energy consumption data has been linked to the respective energy pro-duction data to obtain cumulative inventory results, provided to the public.
Nickel InstituteGeneral. According to Nickel Institute (2000), the report “provide the Nickel Industry with a current LCA of three nickel products (i. e. Class 1 nickel metal, Nickel oxide, and Fer-ronickel), using current, robust data on nickel production.” The study is in accordance with the ISO standards about LCA. Data, rep-resenting western world production (plus Cuba), have been collected from the vari-ous member companies and may be used for benchmarking purposes as well. The collect-ed data represent about 55 and 87 % of the respective global production. A cut-off cri-teria of 99.5 % mass of inputs resp. outputs is applied in each major process step. Con-cerning the allocation issue, the principle of a partitioning on a mass basis (of the metal in the coproducts) is applied to the data. Finally, the cumulative inventory data have been cal-culated by using the TEAM software and its database content.
Water. Water consumption is taken into ac-count in the Nickel Institute data; According to the input categories in the Nickel Institute data, only a split according to the origin of the water (e. g. public network, river, well, sea resp. unspecified water) is done; but no dis-tinction between process and cooling water is made. However, further down in the Nickel
142
Environmental Risks and Challenges of Anthropogenic Metals Flows and Cycles
Insitute (2000) it is mentioned that not only the source of water, but also the type of wa-ter (process/cooling) is distinguished.
Mine waste. The Nickel institute data distin-guish three types of solid material output – i. e. “waste rock and backfill”, “tailings and process residues” and “solid materials: oth-ers” – however, no further treatment of these materials is taken into account.
Energy. Information about the energy con-sumption of the various production steps is included on a detailed, step-by-step level, distinguishing between various fuel sources as well as the input amount of electricity (on a national, partly even site-specific level) and linked to the energy production data within the TEAM database for the calculation(s).
World Steel Association (worldsteel)General. According to the extract of the worldsteel report “LCA Methodology Report”, published on the worldsteel website (worlds-teel, 2011), the objective of this project was to “update the steel industry’s LCI database and improve the already rigorous LCI methodolo-gy for steel products”. The study is in accord-ance with the ISO standards about LCA. ‘Cra-dle to gate’ data are provided forall the major raw materials, energy usage, air and water emissions, and wastes for 15 different steel products. Data is also provided as cradle-to-gate including (net) end-of-life recycling credits. Primary data is collected from the various worldsteel member companies.
For simplification, around 40 major flow cat-egories (inputs and outputs) are provided free of charge to those requesting the data; the full LCI will be provided on request. Accord-ing to worldsteel (2011), both worldwide and regional averages (currently only EU; North American data is being developed) are avail-able provided that a minimum of three sites contributed data for that product. According to worldsteel (2011) allocation principles have been applied along the supply chain for steel products. Finally, cumulative inventory data have been calculated by using the GaBi data-base and its content.
Water. In general, water consumption is tak-en into account in the worldsteel data. How-ever, no distinction is made between the amount of fresh and sea water, nor a distinc-tion between process and cooling water.
Mine waste. Overburden from mining has been reported as ‘deposited material’.
Energy. Information about the energy con-sumption of the various production steps is included, distinguishing between various fuel sources as well as the input amount of elec-tricity and linked to the respective energy production data within the GaBi database for the calculation(s).
6.3.3 AllocationAn important issue in the LCI stage is alloca-tion. This refers to the allocation of the vari-ous environmental interventions to the dif-ferent economic outputs of a multi-output process. In the field of metals, this is very often the case: from most ores, not one but several or even many metals are produced. It is then important to decide on how to al-locate the emissions and extractions of the previous chain to those different metals. Vari-ous options exist and are applied, and each has their own advantages and drawbacks. There is no “correct” option, as allocation is a choice. It is however of great influence on the outcomes, as different options can lead to totally different and even opposite result. For example, economic allocation will put most of the burden on small-scale but expensive pre-cious metals such as platinum, while mass allocation will shift the burden to the bulkier metals such as nickel or copper. In LCA-stud-ies involving metals it is therefore important to pay attention to how allocation is treat-ed, since this is of the utmost importance for the comparability of the results between case studies. A sensitivity analysis is indicat-ed when metals contribute significantly to the impacts.
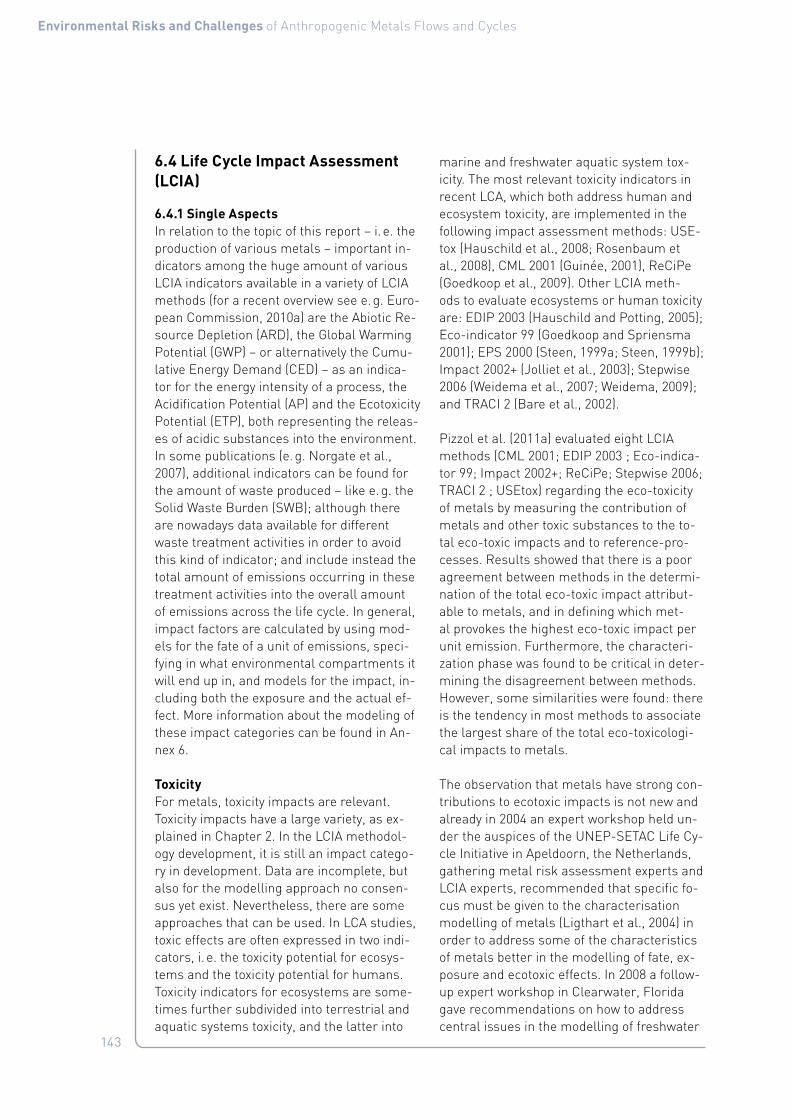
143
Environmental Risks and Challenges of Anthropogenic Metals Flows and Cycles
6.4 Life Cycle Impact Assessment (LCIA)
6.4.1 Single Aspects In relation to the topic of this report – i. e. the production of various metals – important in-dicators among the huge amount of various LCIA indicators available in a variety of LCIA methods (for a recent overview see e. g. Euro-pean Commission, 2010a) are the Abiotic Re-source Depletion (ARD), the Global Warming Potential (GWP) – or alternatively the Cumu-lative Energy Demand (CED) – as an indica-tor for the energy intensity of a process, the Acidification Potential (AP) and the Ecotoxicity Potential (ETP), both representing the releas-es of acidic substances into the environment. In some publications (e. g. Norgate et al., 2007), additional indicators can be found for the amount of waste produced – like e. g. the Solid Waste Burden (SWB); although there are nowadays data available for different waste treatment activities in order to avoid this kind of indicator; and include instead the total amount of emissions occurring in these treatment activities into the overall amount of emissions across the life cycle. In general, impact factors are calculated by using mod-els for the fate of a unit of emissions, speci-fying in what environmental compartments it will end up in, and models for the impact, in-cluding both the exposure and the actual ef-fect. More information about the modeling of these impact categories can be found in An-nex 6.
ToxicityFor metals, toxicity impacts are relevant. Toxicity impacts have a large variety, as ex-plained in Chapter 2. In the LCIA methodol-ogy development, it is still an impact catego-ry in development. Data are incomplete, but also for the modelling approach no consen-sus yet exist. Nevertheless, there are some approaches that can be used. In LCA studies, toxic effects are often expressed in two indi-cators, i. e. the toxicity potential for ecosys-tems and the toxicity potential for humans. Toxicity indicators for ecosystems are some-times further subdivided into terrestrial and aquatic systems toxicity, and the latter into
marine and freshwater aquatic system tox-icity. The most relevant toxicity indicators in recent LCA, which both address human and ecosystem toxicity, are implemented in the following impact assessment methods: USE-tox (Hauschild et al., 2008; Rosenbaum et al., 2008), CML 2001 (Guinée, 2001), ReCiPe (Goedkoop et al., 2009). Other LCIA meth-ods to evaluate ecosystems or human toxicity are: EDIP 2003 (Hauschild and Potting, 2005); Eco-indicator 99 (Goedkoop and Spriensma 2001); EPS 2000 (Steen, 1999a; Steen, 1999b); Impact 2002+ (Jolliet et al., 2003); Stepwise 2006 (Weidema et al., 2007; Weidema, 2009); and TRACI 2 (Bare et al., 2002).
Pizzol et al. (2011a) evaluated eight LCIA methods (CML 2001; EDIP 2003 ; Eco-indica-tor 99; Impact 2002+; ReCiPe; Stepwise 2006; TRACI 2 ; USEtox) regarding the eco-toxicity of metals by measuring the contribution of metals and other toxic substances to the to-tal eco-toxic impacts and to reference-pro-cesses. Results showed that there is a poor agreement between methods in the determi-nation of the total eco-toxic impact attribut-able to metals, and in defining which met-al provokes the highest eco-toxic impact per unit emission. Furthermore, the characteri-zation phase was found to be critical in deter-mining the disagreement between methods. However, some similarities were found: there is the tendency in most methods to associate the largest share of the total eco-toxicologi-cal impacts to metals.
The observation that metals have strong con-tributions to ecotoxic impacts is not new and already in 2004 an expert workshop held un-der the auspices of the UNEP-SETAC Life Cy-cle Initiative in Apeldoorn, the Netherlands, gathering metal risk assessment experts and LCIA experts, recommended that specific fo-cus must be given to the characterisation modelling of metals (Ligthart et al., 2004) in order to address some of the characteristics of metals better in the modelling of fate, ex-posure and ecotoxic effects. In 2008 a follow-up expert workshop in Clearwater, Florida gave recommendations on how to address central issues in the modelling of freshwater

144
Environmental Risks and Challenges of Anthropogenic Metals Flows and Cycles
ecotoxicity of metals in LCIA (Diamond et al., 2010). The metal characteristics that are not well addressed in current characterisation models for ecotoxicity are in particular the fact that in contrast to organic compounds, metals do not degrade in the environment and this means that in principle they are pre-sent infinitely after emission. The fact that the bioavailability of metals and hence their ability to expose organisms and cause toxic effects changes after emission is not well captured by current characterisation mod-els that are mainly based on risk assessment models developed for organic compounds. The ability of metals to appear in the environ-ment in different forms (species), depend-ing on the characteristics of the surrounding conditions thus has an important influence on the bioavailability and the resulting toxic-ity of the metal. In practice it is mainly the free ion that is toxic, and often it is but a very small fraction of the dissolved metal in water that is present as the free ion (Christiansen et al., 2011). Inclusion of the speciating be-haviour of metals in freshwater has recently
been addressed in the development of new freshwater ecotoxicity characterisation fac-tors intended to be implemented in the USE-tox model (Gandhi et al., 2010 and 2011).
Pizzol and co-workers also evaluated LCIA methods (CML 2001; EDIP 2003; Eco-indica-tor 99; Impact 2002+; ReCiPe; Stepwise 2006; TRACI 2 non carcinogens ; USEtox) applied to human toxicity (Pizzol 2011b). The results also here showed poor or no agreement be-tween the methods. The differences are due mainly to the number of metals included in each method and to the technique used to calculate the characterization factors. Re-sults obtained with USEtox, which today is recommended as the best model for LCIA on human toxicity despite high uncertainties, show no apparent correlation with results calculated with other methods.

145
Environmental Risks and Challenges of Anthropogenic Metals Flows and Cycles
Resource Extraction and DepletionCompared to emissions, environmental im-pacts related to depletion of resources are in an early stage of development. No generally accepted assessment method exists for these issues. Several approaches are outlined, in-cluding mostly fossil fuels and sometimes metals. For this report, no attempt has been made to apply depletion potentials, as the fo-cus is on environmental impacts.
Land and Water UseLand use and land use change is presently under debate in the LCA community. This is-sue has come up especially in relation to the assessment of biofuels. It has led to much progress in the area of consequential LCA (see section 6.5). With regard to water, a re-cent activity is the development of water foot-prints (van der Hoek et al., 2011). These in-clude all cradle-to-gate water extractions, specified in grey, green and blue water, con-nected to certain products or services. Pres-ently, no water footprints of metals yet are agreed on. It is, however, a relevant issue and it is worthwhile to follow developments in that area.
6.4.2 Weighing and Ranking of Results LCA studies generate environmental impact score results for a number of very differ-ent categories of impact. In the comparison between impacts of different metals, there may be trade-offs between the impact cat-egories, i. e. one metal has lower impacts in GWP but another metal has lower impacts in ARD. Comparisons thus call for a ranking of the different impact categories or even a quantitative weighting of the impact catego-ries allowing the LCA practitioner to aggre-gate the weighted results across the impact categories and arrive at one score represent-ing the environmental cradle-to-gate impact per kg metal. Both for ranking and weighing there is no consensus about how to rank or weigh and not even about the criteria to ap-ply and how to apply them (Finnveden et al., 2009). This is a strongly value-based part of the LCA, and according to the ISO standards for LCA, weighting is not allowed in LCA stud-ies supporting comparative assertions to be
disclosed to the public (ISO, 2006a and ISO, 2006b). Weighting is not always a necessary step – often, the information out of the LCIA is sufficient. Sometimes it is, for example when one indicator of environmental perfor-mance needs to be compiled. The ISO recom-mendation is then to use various options to show the sensitivity of the results for different weighting approaches. Weighting, like allo-cation, can have a large influence on the out-comes.
The impact categories can be defined ad midpoint-level, i. e. for all of them the cat-egory indicator is chosen as some interme-diate point in the impact pathway between emission and damage to the areas of protec-tion (Human health, Natural environment and Resources). Examples of such midpoint im-pact categories are Global warming poten-tial, Eutrophication potential, Toxicity poten-tial etc. Another school in characterisation modelling is the Endpoint or Damage school that chooses the indicator at the level of the area of protection and thereby includes the whole impact pathway in the characterisa-tion model. Recent years have seen the de-velopment of several LCIA methods including characterisation at both midpoint and end-point level (e. g. the Japanese LIME meth-od (Itsubo et al., 2003) and the Dutch ReCiPe model (Goedkoop et al., 2009). With endpoint methods the need for ranking or weighing is much reduced – there are only three indicator results per metal (damage to human health, damage to natural environment and damage to resources). This simplification, however, comes at the expense of an increased uncer-tainty. The impact pathway connecting the typical midpoint indicator to the area of pro-tection is often very uncertain, and the mid-point-to-endpoint characterisation models are therefore generally associated with a high level of uncertainty (in particular for impacts on a global scale and with long time horizons like climate change).

146
Environmental Risks and Challenges of Anthropogenic Metals Flows and Cycles
6.4.3 Scaling up LCA Results to the Global LevelLCA is a methodology that is developed for micro-scale assessments: a single function-al unit. The assumption is then, that changes at this scale are too small to have an impact on the wider economy. When assessing op-tions for change for the future, this assump-tion in many cases won’t hold. In such cases, arrangements must be made to estimate the wider impacts. For this, various approach-es have been developed. One is the so-called hybrid-LCA (see e. g. Suh and Huppes, 2005), linking the product system to an Input Output model at the (supra)national level. Another is the development of consequential LCA (see e. g. Ekvall and Weidema, 2004 – a paper with a comprehensive overview of further publi-cations dealing with consequential model-ling), where changes at the macro-scale are translated down to the micro-scale. This last form of LCA is used often in assessments of bio-energy, as a response to the debate on food competition (see e. g. van der Voet, 2010 – a comprehensive review paper about recent studies in this area).
However, when we are looking at the global level, even such approaches will leave rel-evant aspects out of the picture. A newly emerged concept is that of Life Cycle Sus-tainability Assessment, LCSA (Heijungs et al., 2010). The concept is as yet rather undefined, but the aim is clear: to enable analysis at the global, or at least larger, scale level while maintaining the essential and valuable LCA view, the cradle-to-grave chain or life cycle approach. Only at the global level we can see what it truly means to use new technologies, new materials or to replace one system with another. At the global level we see the short-comings of the single-focus assessments and scenario development. Graedel & van der Voet (2010) point to the linkages between the main resources of the world: land, water, energy and materials. In order to mobilise one for human use, the others are needed as well, and there may be developments and linkages that are spiralling out of control.
This issue is crucial for sustainable develop-ment as well as resource efficiency, and is as yet hardly explored. Some first global assess-ments have been made with regard to met-als, which will be discussed in Section 6.5.
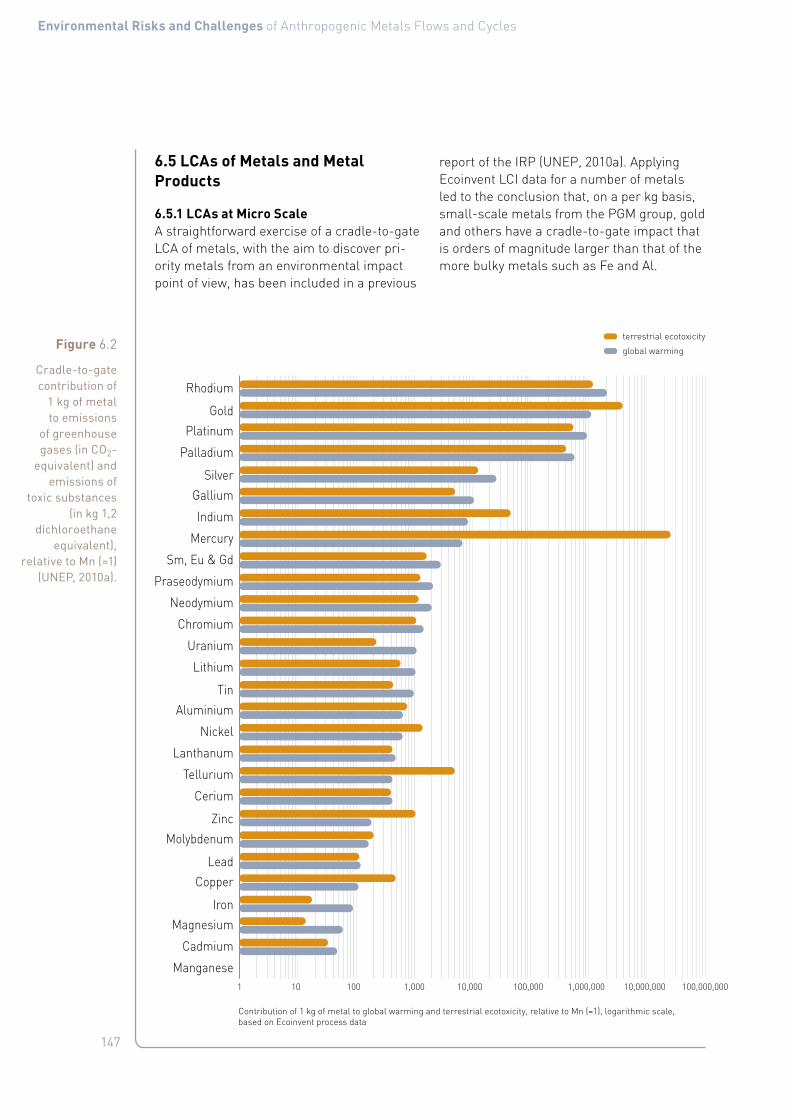
147
Environmental Risks and Challenges of Anthropogenic Metals Flows and Cycles
6.5 LCAs of Metals and Metal Products
6.5.1 LCAs at Micro ScaleA straightforward exercise of a cradle-to-gate LCA of metals, with the aim to discover pri-ority metals from an environmental impact point of view, has been included in a previous
report of the IRP (UNEP, 2010a). Applying Ecoinvent LCI data for a number of metals led to the conclusion that, on a per kg basis, small-scale metals from the PGM group, gold and others have a cradle-to-gate impact that is orders of magnitude larger than that of the more bulky metals such as Fe and Al.
Figure 6.2
Cradle-to-gate contribution of
1 kg of metal to emissions
of greenhouse gases (in CO2-
equivalent) and emissions of
toxic substances (in kg 1,2
dichloroethane equivalent),
relative to Mn (=1) (UNEP, 2010a).
1 100,000,00010,000,0001,000,000100,00010,0001,00010010
global warming
terrestrial ecotoxicity
Manganese
Cadmium
Magnesium
Iron
Copper
Lead
Molybdenum
Zinc
Cerium
Tellurium
Lanthanum
Nickel
Aluminium
Tin
Lithium
Uranium
Chromium
Neodymium
Praseodymium
Sm, Eu & Gd
Mercury
Indium
Gallium
Silver
Palladium
Platinum
Gold
Rhodium
Contribution of 1 kg of metal to global warming and terrestrial ecotoxicity, relative to Mn (=1), logarithmic scale, based on Ecoinvent process data

148
Environmental Risks and Challenges of Anthropogenic Metals Flows and Cycles
However, such a simple comparison of the LCA results of 1 kg of metals is generally not very useful, as the same amount of different types of metals can be used to fulfil very dif-ferent purposes and objectives. Thus a more detailed discussion, but based on a differ-ent approach would make much more sense. Starting point for such a discussion should be the life cycle perspective of a (metal contain-ing) product; i. e. its split into production (in-cluding extraction and refinement of metals), use phase and end-of-life treatment (e. g. re-cycling). While the production phase can be considered in all cases as rather similar (i. e. we have to extract, refine a certain amount of one or several metals that then – via more or less intermediate steps – are “put together” to a specific product), the use phase can be very different, i. e.
(i) A use phase with a considerable energy consumption – resulting usually in the fact that the use phase has the main en-vironmental impact.
(ii) A use phase with almost no energy con-sumption – resulting usually in the fact that the production phase gets much more important, even dominant.
(iii) A use phase with an energy production – i. e. the use of these materials in infra-structure for energy (heat/electricity) pro-duction.
On a general level, there exists a huge bunch of different application examples (LCA stud-ies) for each of these three types. However, interesting in the context of this report here are only those examples that report in details about the impacts related to the respective employed metals. However, a first literature review by the authors of this chapter has not yielded studies that report about these im-pacts (i. e. those of the used metals) as op-posed to the total impacts. Hence, the follow-ing two examples – dealing with mobility and ICT (information and communication tech-nology) – are mainly based on work from the chapter authors; here it was possible for the authors to have a more detailed insight.

149
Environmental Risks and Challenges of Anthropogenic Metals Flows and Cycles
Case No. 1 – “Mobility”In the last couple of years, LCA studies in the area of mobility gained again more im-portance – mainly due to the discussion of alternatives to the currently used internal combustion engines (ICE). In the framework of her work about electro passenger cars, Habermacher (2010) made an extensive re-view of existing LCA studies not only about electro mobility, but also about convention-al cars; showing in both cases that there are various such studies available. More impor-tant is however the fact that Habermacher (2010) – in line with further publications from the same research group (e. g. Althaus and Gauch 2010; Notter et al. 2010) – makes a clear distinction between the – from the en-gine independent part of a car – called “glid-er” and the parts that depend on the type of engine, called “powertrain”. The study fo-cuses on mini, city and compact cars – i. e. on cars of the size of a Smart, up to the Golf class. Here the “glider” represents about
75 % of the total weight – containing 82 % of the totally used steel, 6 % of the aluminium, 32 % of the non-ferrous metals and 77 % of the plastics (Habermacher, 2010).
In terms of Global Warming Potential (GWP) and Cumulative Energy Demand (CED), Habermacher (2010) shows the following pic-tures for the three different car sizes (mini cars, represented by a Smart/city cars, rep-resented by a Fiat 500/compact cars, repre-sented by a Golf VI) examined.
Figure 6.3
Global warming potential related
to three types of cars, broken
down into the various life-cycle stages
(Habermacher, 2010).
0.00 0.05 0.10 0.15 0.20 0.25
BEV Compact LW Alu
BEV Compact LW Plastic
BEV Compact BL
ICE Compact BL
BEV City LW Alu
BEV City LW Plastic
BEV City BL
ICE City BL
BEV Mini LW Alu
BEV Mini LW Plastic
BEV Mini BL
ICE Mini BL
kg CO2-eq/vkm
Disposal car
Maintenance car
Energy & Emissions
Battery
Drivetrain
Glider
Road

150
Environmental Risks and Challenges of Anthropogenic Metals Flows and Cycles
From these two figures it could be clearly seen that the use phase is dominating – not only in case of the traditional, internal com-bustion engine (ICE), but also in case of the battery electric vehicle (BEV). Within the in-frastructure, i. e. the car itself, the drivetrain seems to have a slightly higher impact than the glider – then (as shown especially by the three ICE cases) the proportion is rather 1:2 instead of 1:3 as in case of the weight. More detailed information concerning the impor-tance of the used metals (in relation to the environmental impact) can’t be found in the examined literature – for this, additional cal-culations would be required.
Figure 6.4
Cumulative energy
requirement related to three
types of cars, broken down
into the various life-cycle stages
(Habermacher, 2010)
0.0 0.5 1.0 1.5 2.0 2.5 3.0 3.5 4.0
BEV Compact LW Alu
BEV Compact LW Plastic
BEV Compact BL
ICE Compact BL
BEV City LW Alu
BEV City LW Plastic
BEV City BL
ICE City BL
BEV Mini LW Alu
BEV Mini LW Plastic
BEV Mini BL
ICE Mini BL
MJ/vkm
Disposal car
Maintenance car
Energy & Emissions
Battery
Drivetrain
Glider
Road

151
Environmental Risks and Challenges of Anthropogenic Metals Flows and Cycles
Case No. 2 – “ICT”Another important area for the application of a broad variety of metals is the Information and Communication Technology (ICT). Prob-ably the most often examined device within this sector is the traditional desktop Personal Computer (desktop PC). One of the first – and since then often cited – studies about a desk-top PC has been established in 1998 (Atlantic Consulting 1998). Since then, a broad variety of different LCA studies on desktop PCs have been carried out (e. g. Choi et al. (2006), Hik-wama (2005), Duan et al. (2008), Tekawa et al. (1997), Williams (2004) or Yao et al. 2010). Also in large databases (like e. g. the ecoin-vent database), such a dataset can be found nowadays.
A comparison of the Desktop PCs reported in Kemna et al. (2005), Hikwama (2005) and Duan et al. (2009), by calculating these sys-tems with the database ecoinvent data v2.0 as a background system, and a subsequent comparison of all these systems, shows a rather similar picture for all described PCs in comparison to the one reported in ecoin-vent data v2 (Hischier et al. 2007). The re-sults show less than 10 % difference between the model with the highest impact (original ecoinvent data) and the one with the lowest impact (EuP model, reported in Kemna et al. (2005)); despite their rather big difference in the degrees of details concerning the actual modelling of the composition of such a desk-top PC model.
Hence, for a more detailed analysis of the desktop PC, the model in the database ecoin-vent can be used, as it represents all these various models as well. Such an analysis (es-tablished in the software tool Simapro, using the LCIA method “Eco-Indicator’99”) shows that the main environmental impact of a Desktop PC is due to the various printed wir-ing boards (PWBs) and the Power Supply unit (PSU); together responsible for about 70 % of the overall impact of a Desktop PC (without a screen!). On the other hand, the metallic housing (about 8 kg of steel) that is respon-sible for almost 70 % of the total weight, rep-resents only about 5 % of the overall environ-
mental impact. Within the two above men-tioned modules (PWBs, PSU), the electronic components – and there especially the vari-ous integrated circuits (ICs) that are part of the device – are responsible for the high im-pact of these two components.
Having a look on the level of the basic ma-terials (i. e. metals, fuels, plastics, etc.), the picture shows the highest environmental im-pact for the precious metals (palladium, gold and silver) with almost 50 % of the overall im-pact. Copper, similar as for steel, has only a very minor impact (less than 3 %), although it can be found in much higher quantities within a Desktop PC than the precious metals. All in all, these analysis results show the facts from figure 6.2, i. e. that producing precious metals has a much higher environmental im-pact than producing base metals like steel, aluminium or copper.

152
Environmental Risks and Challenges of Anthropogenic Metals Flows and Cycles
6.5.2 LCA Approaches at Macro ScaleThe per-kg impacts as visualised in Figure 6.2 can be multiplied by the annual global production of the metals to obtain an indica-tion of global impacts related to metals pro-duction. Figure 6.5 shows the results of such an exercise: global annual production of met-als multiplied by their global warming po-tential. Compared to Figure 6.2, the order of metals based on their contribution to GHG emissions is different: the bulky metals con-tribute most. Their scale of production ap-parently is so much larger that it more than compensates for the lower per kg impacts.
As discussed above, these numbers come from an LCI database and refer to the micro-level. In an attributional sense, they could be used at the global level, although with care. In a consequential approach, for forecasts and predictions, they are unsuitable. Never-theless, it gives an indication – added togeth-er, the total amounts to roughly 10 % of total global GHG emissions, which is a little on the high side but not way off.
Figure 6.5
Contribution of global production
of metals to global GHG emissions,
normalised to Rh production (=1) (UNEP, 2010a).
1 10 100 100,000 1,000,000 10,000,000
RhodiumPalladiumTelluriumCadmium
NeodymiumSm, Eu & Gd
IndiumLanthanum
MercuryCeriumGallium
ManganeseLithium
MagnesiumUranium
MolybdenumPlatinum
TinLead
SilverCopper
ZincPraseodymium
GoldNickel
AluminiumChromium
Iron
10,0001,000
Contribution of global production of metals to global GHG emissions, normalised to Rh production (=1), logarithmic scale, based on Ecoinvent process data and USGS production data

153
Environmental Risks and Challenges of Anthropogenic Metals Flows and Cycles
Kleijn et al. (2010) and (2011) have assessed, using a life-cycle approach, what the conse-quences would be for the use of materials if a shift to renewable energy systems would be made. They concluded that renewable ener-gy systems in all cases are far more resource intensive than the present, fossil fuel based system. Specialty metals such as Pt, Ag and Nd, with a high per kg impact, would be sub-ject to steeply rising demand assuming cer-tain technologies would be implemented on a large scale. Even more would the demand for bulkier metals like Cu, Cr, Al and Fe rise, re-quired to build up the infrastructure.
Figure 6.6
Demand for metals for
various electricity generating
technologies, compared to the
present global electricity mix,
logarithmic scale (Kleijn et al., 2011)
0.01
0.001
0.1
1*
10
100
1000
10000
* Present Global Electricity Mix
Win
d
Sola
r
Biomas
s Woo
d CHP
Biomas
s Rap
e See
d
Hydro
Nuclea
r
Oil and
CCSOil
Natur
al G
as an
d CCS
Natur
al G
as
Coal a
nd C
SSCoal
Uranium
Silver
Molybdenum
Tin
Zinc
Copper
Aluminium
Nickel
Iron

154
Environmental Risks and Challenges of Anthropogenic Metals Flows and Cycles
In various global scenarios, this would work out as depicted in Figure 6.7 below.
CCS: current (2007) mix extended with carbon capture and storage on fossil fuel based powerplants
Non-fossil: mix of solar, wind and hydropower
IEA Blue Map: mix according to Shell Blue Map scenario, in-
cluding fossil fuels as well as renewable energy sources.
It is to be expected that the increased de-mand will lead to scarcity problems on the market as well as increased environmental impacts, especially if combined with the in-sight of Chapter 4, that future metal produc-tion may require increasing amounts of en-ergy.
Figure 6.7
Demand for metals for the
global electricity system under
various scenario assumptions
(Kleijn et al., 2011)
0 1000 2000 3000 4000 5000 6000
IEA BLUE Map Mix
non-fossil
CCS
current mix
Aluminium
Nickel
Copper
Zinc
Tin
Molybdenum
Silver
Uranium
Gg/y

155
Environmental Risks and Challenges of Anthropogenic Metals Flows and Cycles
6.6 Conclusions and Outlook
Life cycle assessments of metal containing products currently give controversial results. This is due especially to the high energy in-tensity of production processes versus the high energy consumption and/or produc-tion of many products in use; but also due to the fact that the use of a metal usually does not result in direct emissions (to air, wa-ter or soil) of the metal itself; whereas min-ing, smelting and refining can displace large masses of metal compounds that do not necessarily result in large emissions either (to air, water or soil). Finally, only complete product LCAs can successfully take into ac-count the benefits generated by the use of metals to supply a particular functional unit (e. g., energy savings due to durability, con-ductivity, etc.).
The production of different metals has differ-ent potentials to impact the environment. As a general rule, production of the metals be-ing produced in large quantities has a lower per kg impact than production of those be-
ing produced in small quantities. The differ-ence between the global warming potential of producing a kg of Fe and a kg of Rh is five orders of magnitude. When multiplied with the annual production, however, Fe produc-tion still presents the most potential for en-vironmental impacts. The potential impact of using these metals within single devices – as shown with the example of the Desktop PC – can however look very different.
Studies to support prioritisation of a mate-rials or resource policy come to the conclu-sion that, compared to other production pro-cesses, metals production has a high impact per kg produced (van der Voet et al, 2005). However, other materials are produced in far higher quantities. UNEP (2010a) conclude in a report for the IRP that agricultural resourc-es, especially of animal origin, have most im-pact on the environment, next to fossil fuels. Although this is not likely to change, it is pos-sible that metals will become relatively more important from an environmental impact point of view, for the following reasons:

156
Environmental Risks and Challenges of Anthropogenic Metals Flows and Cycles
■ The demand for most metals is rising rap-idly, much more so than the demand for agricultural products. For bulk-metals such as iron, copper and aluminium the expected increase is related to the build-ing-up of the infrastructure system in de-veloping economies. For the smaller met-als the rapid increase in complexity in and demand for electronics is a relevant trend.
■ As shown above, a shift towards a renewa-ble energy system implies that the materi-al, and especially metal, intensity of energy production will increase substantially.
■ In future, the energy intensity of the pro-duction of metals is expected to increase due to the use of lesser grade ores.
To what extent these events will occur, whether this feedback loop will spiral out of control and to what extent it will be mitigated by increased exploration, cleaner and more energy efficient processes, increased second-ary production and other things is difficult to estimate.
Last but not least, the overview in chapters 6.3 and 6.4 shows that LCA data for a broad variety of metals are already available. From the in this report taken into account list of metals, only one element (Arsenic) is not rep-resented in chapter 6.3 with at least one in-ventory dataset. On the other hand, those metals for which several datasets are avail-able (like e. g. for copper and steel) show that there are sometimes rather large differenc-es between these various data sources – in terms of the shown degree of details (e. g. are unit process data published, or only cumula-tive inventory data?), but also in terms of the reported LCIA results. Here, common efforts from the various actors in the LCA commu-nity are requested in order to come one step ahead … a step that ideally leads (for each single metal) to comprehensive, industry-based, transparently documented inventory data that can then be integrated in a consist-ent way into the different existing LCA data-bases and software tools; allowing all LCA practitioners to do LCA studies based on the same basic inventory data for these impor-tant materials.

157
Environmental Risks and Challenges of Anthropogenic Metals Flows and Cycles
7. Conclusions and Recommendations
Authors: Ester van der Voet, Reijo Salmin-en, Matthew Eckelman, Terry Norgate, Gavin Mudd, Roland Hischier, Job Spijker, Marti-na Vijver, Olle Selinus, Leo Posthuma, Dick de Zwart, Dik van de Meent, Markus Reuter, Ladji Tikana, Sonia Valdivia, Patrick Wäger, Michael Hauschild, Arjan de Koning
Metals are used in society since millennia. They are used because of their unique prop-erties, such as their conductivity, malleability, hardness or lustre, in a variety of functions. Metals fulfill an explicit role in many new technologies, including renewable energy technologies required to transform the ener-gy system into a more sustainable direction. Nevertheless, their production and use, as is true for all resources that we extract and use, is associated with environmental impacts. Optimizing metals systems and life-cycles from a point of view of environmental impacts is therefore an integral part of a sustainable metals management.
7.1 Present Situation
Metals, once they enter the environment, tend to accumulate in soils and sediments. They enter the food web via plant uptake and through bio-accumulation can sometimes lead to high concentrations in animals, in-cluding humans, in the top of the food chain. Many metals are essential for life. Their in-take has an optimum – below that, deficiency symptions may occur, and above it, adverse impacts of too high intakes might show. En-vironmental metal concentrations general-ly are higher now than some centuries back due to the anthropogenic mobilization of metals, which has increased the magnitude of metal cycles, sometimes with a fraction but in other cases with factors above 100.
Emissions of metals to the environment have been estimated to be in the same order of magnitude as the natural sources of emis-sions, weathering and volcanic activity. Those emissions are increasingly dominated by dif-fusive sources (stocks-in-use) and non-metal sources, especially fossil fuels and phosphate rock.
Important impacts of the metals’ life cycles occur in the first stages of the life cycle: min-ing, beneficiation, metal extraction and refin-ing. The most important environmental im-pacts of primary metal mining and extraction revolve around water (consumption and qual-ity aspects), mine wastes (tailings and waste rock), and energy sources (direct such as die-sel and indirect such as coal-fired electric-ity) with the associated air emissions (sulfur dioxide, greenhouse gases, dusts and partic-ulates).
A large part of the environmental impacts of metal production is related to energy. The GER per kg of produced metal ranges from 20 (Fe) to 200 (Al) MJ/kg. Altogether, the pri-mary production of metals contributes ca. 8 % to total global energy consumption. In the fu-ture, if society needs to access lower grade ores, energy use is expected to increase sub-stantially. The energy required for secondary production is two or more orders of magni-tude less. An increased share of secondary production therefore would reduce energy re-lated impacts substantially.
In the use stage of the life cycle, it is difficult to attribute impacts to metals in metal con-taining products. Only corrosion from stocks-in-use exposed to the weather is clearly re-lated to the metals themselves. This is be-coming, in a relative sense, a more important source of emissions, since stocks-in-use are growing and point source emissions declin-ing, as a general trend. Besides this, main impacts in the use phase are related, again, to energy use. Impacts refer to the product, not the material: only occasionally is it possi-ble to pinpoint a specific role for metals, and then only comparatively.
158
Environmental Risks and Challenges of Anthropogenic Metals Flows and Cycles
Metals are used in many new technologies. Especially renewable energy technologies, where metals play a specific and often cru-cial role, can be regarded as beneficial for the environment since by using them, emissions related to fossil fuel use are avoided. The up-scaling of such technologies on a global scale however may lead to impacts in the chain.
In the waste stage, impacts occur via final waste treatment. Metals are emitted to the atmosphere (incineration), to surface water (waste water treatment) and especially end up in landfills, where there is a risk they may leach into the environment. Increasing recy-cling rates in some cases already can be ob-served to reduce landfill of metals.
Life cycle assessment studies of metal con-taining products show that main impacts of the metals life cycle occur in the mining and refining stages. This is due to emissions and waste from mining, but especially to the very high energy intensity of those process-es. As a general rule, the metals being pro-duced in large quantities have a lower per kg impact than those being produced in small quantities. The difference between the global warming potential of a kg of Fe and a kg of Rh is five orders of magnitude. When multi-plied with the annual production, however, Fe is still the metal with the highest environ-mental impact potential.
Studies to support prioritisation of a materi-als or resource policy come to the conclusion that, compared to other materials, metals have a high impact per kg to produce. How-ever, other materials are used in far higher quantities. Agricultural resources, especially of animal origin, and fossil fuels are impor-tant contributors to environmental impacts; metals at the moment play a modest role.
7.2 Expected Future Developments
In the future, it is possible that metals will become relatively more important from an environmental impact point of view, for the following reasons:
■ Presently, the demand for metals is rising rapidly and this trend is expected to con-tinue for the next decades.
■ A shift towards a renewable energy system implies the material, and especially metal, intensity of energy production will increase even faster.
■ In future, the energy intensity of the pro-duction of metals may increase as a re-sult of mining lesser grade ores. For some metals, a trend of decreasing ore grades is visible, and for more it may become visible over the next decades.
To what extent these events will occur, what will be the result of this feedback loop and to what extent it will be mitigated by increased exploration, cleaner processes, increased secondary production and substitution is dif-ficult to estimate. Process efficiency increas-es continually but slowly. Recycling rates are increasing, which is a promising develop-ment. Technologies to increase those even more are being developed and may substan-tially reduce the need for primary production, and therefore the impacts connected with that.
Developments differ per metal. For metals with a declining use (As, Cd, Hg and to some extent Pb), emissions from old stocks domi-nate, which will decline gradually over time. For metals with a rising demand, a trend is already visible that recycling rates are in-creasing. Due to the time delay, the share of secondary production remains low as long as total demand keeps rising. This means that emissions related to mining, production and use will probably rise as well, although at a lower pace than production itself.

159
Environmental Risks and Challenges of Anthropogenic Metals Flows and Cycles
Since both population and welfare are in-creasing and energy will to a large extent re-main dependent of fossil fuels over the next decades, a further rise of the emissions from non-metal sources can be anticipated, to some extent modified by exhaust gas clean-ing.
7.3 Knowledge Gaps
While there is a large body of knowledge available for metals, yet there are some gaps that it is important to fill in order to make meaningful forecasts and estimate the effec-tiveness as well as the side-effects of certain changes in management.
■ In the area of environmental fate, toxic-ity and impacts research has progressed most. Nevertheless, it is not complete. Es-pecially the impacts of the presence of a mix of metals is yet unclear.
■ In the area of the anthropogenic cycles and their links to the environment, there are many studies at the national or regional level. Information at the global level is be-coming available, but needs to be expand-ed and linked to all the regional and na-tional information. A further cooperation and finetuning between the research with regard to anthropogenic cycles and natural cycles is very relevant. If we are to develop measures and policies to reduce impacts of metals while at the same time keeping their functionality, it is essential that we know the origins of metal-related prob-lems, both in general and more specific.
■ LCA data and studies on metals and met-al containing products are available. They could be improved and added to. LCI data especially on recycling and final waste management processes could be im-proved, and allocation of multi-metal pro-duction be solved somehow. In LCIA, toxic-ity factors for metals is still a field under development.
■ Combining the life cycle approach with a global level assessment, enabling to in-clude issues of scale as well as enabling to detect side-effects at the global lev-el, is very important to obtain a picture of the overall effectiveness and soundness of certain improvement options, be they technological improvements, substitutions or whole new ways of providing functions. Such a life cycle sustainability assessment is still in its earliest stages.
■ Important knowledge is still missing in the linkages that exist between different types of resources: metals, energy, water, and maybe others. In scenario explora-tions for the future, this is essential knowl-edge. It requires an interdisciplinary ap-proach and the cooperation of researchers from different fields to build up this type of knowledge.

160
Environmental Risks and Challenges of Anthropogenic Metals Flows and Cycles
7.4 Steering Toward a Sustainable Metals Management
Since metals, once in the environment, dis-appear only at a very slow rate, a sustainable metals management should reduce emis-sions of metals to a level that keeps pace with that. At the same time, a reduction of the metals’ life cycle impacts could be bene-ficial for a number of environmental impacts, most notably GHG emissions related to the high energy requirement of metal production.
Mining and ProductionBetter and more cost-effective approaches are available and, as some companies al-ready do, should be implemented on a global scale to reduce the environmental impacts of metal production. Risk management strate-gies will have to be developed to address the environmental risks as identified in Chap-ter 2, including:
■ Reclamation of disturbed land.
■ Treatment and stabilisation of metal-bear-ing soils.
■ Prevention and treatment of contaminated water.
■ Controls on the amount and character of emissions to the atmosphere.
Such approaches are already practiced by mining companies, and should be adopted at the global level. A risk management however should include but not be limited to techno-logical constructs.
The energy use of primary production is a major cause of impacts. Reducing this would therefore be of major importance. Energy ef-ficiency increase can be achieved by the fol-lowing changes:
■ A significant process efficiency increase could yet be made, leading to a factor 2 – 20 reduction in energy use per kg pro-duced metal, all else being equal.
■ Increase of secondary production, which generally takes two or more orders of magnitude less energy per kg produced.
■ Use of waste streams (fly ash, sludges and suchlike) as sources of metals, especially if a variety of metals can be recovered from them.
Such measures, too, are already practiced by responsible industries. They could be adopt-ed at the global level to a substantial reduc-tion in energy use.
UseCorrosion losses can be reduced by reduc-ing the metal surface exposed to the envi-ronment, either by substitution or by techni-cal measures such as coating. It should be kept in mind, however, that while there may be opportunities to substitute other materials for metals in some applications, these may not be without their own environmental and supply issues. Substitution of metals in new technologies is mostly counterproductive – it will come at the expense of either a reduc-tion of resource efficiency or loss or function-ality. Metals also have an important function in new energy systems, thus contributing to a reduction of impacts. It should be kept in mind, however, that if implementing these technologies at a large scale will lead to a large increase in the demand for these met-als, and consequently to a reduced availabili-ty of high quality ores, the production of these metals will become increasingly energy in-tensive, which reduces resource productivity.
Recycling and Waste ManagementIn many places in the world, waste treat-ment can be improved greatly. One example is the upgrading of present environmental-ly harmful informal treatment of electron-ics waste. Minimizing the creation of waste streams and their associated environmen-tal impacts, while at the same time maximiz-ing the amount of valuable metal(s) recovered from a given ore deposit, is the primary ob-jective of the metals processing and recycling industries.

161
Environmental Risks and Challenges of Anthropogenic Metals Flows and Cycles
Recycling rates are increasing, but could be increased far more if a systems optimiza-tion, including also product design, would be adopted. Linking water recycling systems to the recycling and metals/recycling system, not only to conserve precious water but also to maximize metal recovery and hence maxi-mize the resource efficiency. Even so, sec-ondary production can only provide a small portion of total supply if the demand for met-als keeps on rising, especially in developing countries where the anthropogenic stock of metals is still small. Real changes towards closing anthropogenic metal cycles can only be made if demand slows down and an equi-librium situation settles in.
Even in such a case, thermodynamics, in particular the 2nd Law of Thermodynam-ics, prohibits within a reasonable econom-ic framework the complete closure of the materials cycle. Hence there will always be losses from the production and use of met-als, and there will always be a need to make up for these losses by primary production from metallic ores. Unavoidable losses from the cycle means that a sustainable met-als management also should include a final waste treatment. Also from the point of view of old, unwanted stocks of metals no longer used entering the waste stage, a final waste treatment should be designed. Since met-als cannot be destroyed, the only way to pre-vent them from entering the environment is to immobilize them and landfill or store them where they cannot reach the environment.
Non-metal SourcesNon-metal sources such as fossil fuels or fertilizer are increasing in importance, both relatively and absolutely, and are difficult to address since their use is inherently dissipa-tive. Nevertheless they should be addressed in a sustainable metals management. A re-duction of their use is one option. The shift to a renewable energy system, although leading to a higher metal demand, will at the same time lead to a reduction of fossil fuel use. A reduction of phosphate fertilizer use is not likely to occur in the near future. Neverthe-less, phosphate rock is a scarce resource in
its own right, and solutions may have to be found to solve that problem anyway. A shift to a less animal product-intensive diet will cer-tainly be a step in the right direction.
GeneralTo provide global society with the metals it needs, it is important to make projections of future demand. Various scenarios, using dif-ferent assumptions, should be explored to obtain insight in how demand may develop for a variety of metals. This will enable to es-timate not only where we may encounter is-sues of availability, but also how metal relat-ed environmental impacts may change over time. Such scenarios should include, next to demand, assumptions on technology devel-opment in mining and industry, and on waste management and especially recycling. The question when and at what level demand will stabilize is a crucial one. So is the question which metals are really essential and which ones may be replaced by other as yet lesser used metals or materials. New technologies will have to be developed, and accordingly used, which is a time and resource consum-ing effort.
Metals are the ideal type of resource for closing cycles: they do not degrade and can be recycled virtually indefinitely. Approach-ing a situation where cycles of metals are in-deed to a large extent closed is only possible when the demand for metals levels off: a de-coupling between economic development and the use of metal resources. Only in that case can secondary production catch up with the demand and will it be possible to substantial-ly reduce primary production and therefore the energy requirement for metals produc-tion. This situation is yet far away. Developing economies are now building up their infra-structure, and the approaching energy transi-tion also will lead to a growing demand. Nev-ertheless, it has to be the long term goal for a sustainable metals management.
It is clear that a sustainable metals manage-ment cannot be defined in isolation. A global issue like this is linked to many other issues at the global level: population and welfare in-

162
Environmental Risks and Challenges of Anthropogenic Metals Flows and Cycles
crease, the concurrent expected rise in de-mand for food, water and energy, the availa-bility of metals and other non-renewable ma-terials, the shift to a renewable energy sys-tem, dietary choices etc. etc. Linkages exist between demand and supply for all major re-sources, and the present scale of production and consumption is such that constraints are becoming apparent in all corners. A sustain-able metals management therefore should be part of an overall effort to steer society to-wards a more sustainable development.

163
Environmental Risks and Challenges of Anthropogenic Metals Flows and Cycles
8. References
1. Agricola, G. 1556. De Re Metallica. Translated by Hoover H.C., and L.H. Hoover, 1950, the Mining Magazine, London. Reprinted in 1950. New York: Dover Publications.
2. Albanese & McGagh (2011) “Future Trends in Mining” in: SME Mining Engi-neering Handbook, 3rd Edition.
3. Althaus, H.J., and Gauch M. 2010. Ver-gleichende Ökobilanz individueller Mo-bilität: Elektromobilität versus konven-tionelle Mobilität mit Bio- und fossilen Treibstoffen. Dübendorf, Switzerland: Life Cycle Assessment and Modelling, EMPA.
4. Althaus, H.J., and M. Classen. 2005. Life cycle inventories of metals and method-ological aspects of inventorying material resources in Ecoinvent. International Journal of Life Cycle Assessment 10: 43 – 49.
5. Althaus, H.J., M. Chudacoff, R. Hischier, N. Jungbluth, M. Osses, and A. Primas. 2007. Life cycle inventories of chemi-cals. Dübendorf, Switzerland: EMPA, Swiss Centre for Life Cycle Inventories.
6. Annema, J.A., E.M. Paardekooper, H. Booij, L.F.C.M. van Oers, E. van der Voet, and P.A.A. Mulder. 1995. Stofstroomana-lyse van zes zware metalen – gevol-gen van autonome ontwikkelingen en maatregelen. Report no. 601014010Bil-thoven, Netherlands: National Institute for Public Health and the Environment. http://www.rivm.nl/dsresource?objectid=rivmp:15497&type=org&disposition=inline. Last accessed May 2012.
7. Anon. 2004. Miners get tick in Council of Australian Governments (COAG) water initiative. Australian Journal of Mining July/August, p.30.
8. Ashby, M.F. 2009. Materials and the environment: Eco-informed material choice. Burlington, Massachussets, United States: Butterworth.
9. Atlantic Consulting, and Institut for Product Development of the Technical University of Denmark (IPU). 1998. LCA Study of the product group personal computers in the EU ecolabel scheme. London: Atlantic Consulting.
10. Aucott, M., A. Namboodiripad, A. Cal-darelli, K. Frank, and H. Gross. 2010. Estimated quantities and trends of cadmium, lead, and mercury in US mu-nicipal solid waste based on analysis of incinerator ash. Water, Air, Soil Pollu-tion: 349 – 355.
11. Ayres, R.U. 1992. Toxic heavy metals: materials cycle optimization. Proceed-ings of the National Academy of Sci-ences of the United States of America (PNAS) 89: 815 – 820.
12. Ayres, R.U. 1996. Statistical measures of unsustainability. Ecological Econom-ics 19: 239 – 255.
13. Ayres, R.U. 1997. Metals recycling: eco-nomic and environmental implications. Resources, Conservation and Recy-cling 21: 145 – 173.
14. Ayres, R.U., and S.R. Rod. 1986. Pat-terns of pollution in the Hudson-Raritan basin. Science and Policy for Sustain-able Development 28(4): 14 – 43.
15. Azar, C., J. Holmberg, and K. Lindgren. 1996. Socio-ecological indicators for sustainability. Ecological Economics 18: 89 – 112.
16. Bare, J.C., G. Norris, D. Pennington, and T. E. Mckone. 2002. TRACI – the Tool for the Reduction and Assessment of Chemical and other environmental Impacts. Journal of Industrial Ecology 6: 49 – 78.

164
Environmental Risks and Challenges of Anthropogenic Metals Flows and Cycles
17. Barkas. J.P. 2009. Patterns of energy consumption and greenhouse gas emis-sion across primary base metals pro-duction. Joint ILZSG-ICSG-INSG energy and climate change policy seminar. Lisbon.
18. Bath Inventory of Carbon & Energy (ICE). Inventory of Carbon and Energy (ICE) v2.0. Bath, United Kingdom: Sus-tainable Energy Research Team (SERT), University of Bath. http://www.bath.ac.uk/mech-eng/sert/embodied. Last accessed May 2011.
19. Bauer, C., R. Bolliger, B. Burger, R. Dones, M. Faist Emmenegger, R. Frischknecht, T. Heck, N. Jungbluth, and A. Röder. 2007. Life cycle inven-tories of energy systems: results for current systems in Switzerland and other UCTE Countries. Dübendorf, Switzerland: Swiss Centre for Life Cycle Inventories.
20. Benjamin, M.M., Honeyman, B.D. 1992. Trace Metals. In: Butcher, S.S., R.J. Charlson, G.H Orians, and G.W. Wolfe (Eds.). Global biogeochemical cycles. London: Academic Press.
21. Bergbäck, B., K. Johansson, and U. Mohlander. 2000. Urban metal flows, a case study of Stockholm. Water, Air, and Soil Pollution 1: 3 – 24.
22. Bergbäck, B., S. Anderberg, and U. Lohm. 1994. Accumulated environ-mental impact: the case of cadmium in Sweden. The Science of the Total Envi-ronment 145: 13 – 28.
23. Bernardes, A.M., D.C.R. Espinosa, and J.A.S Tenório. 2004. Recycling of batter-ies: a review of current processes and technologies. Journal of Power Sources 130: 291 – 298.
24. Bertram, M., K. Buxmann, and P. Furrer. 2009. Analysis of greenhouse gas emis-sions related to aluminium transport applications. International Journal of Life Cycle Assessment 14(1): 62 – 69.
25. Bindler, R., I. Renberg, and J. Kla-minder. 2008. Bridging the gap between ancient metal pollution and contempo-rary biogeochemistry. Journal of Pale-olimnology 40: 755 – 770.
26. Boehme, S. and M. Panero. 2003. Pollu-tion prevention and management strate-gies for cadmium in the New York / New Jersey harbor. A report for the Harbor Consortium of the New York Academy of Sciences. New York: New York Academy of Sciences.
27. Borden, R. 2011. Waste Disposal and Contamination Management. In: Dar-ling, P. (Ed.). SME Mining Engineering Handbook (3rd Edtion). Englewood, Col-orado, United States: Society for Mining, Metallurgy, and Exploration (SME)
28. Boustead, I. and G.F. Hancock. 1979. Handbook of Industrial Energy Analy-sis. Chichester, United Kingdom: Ellis Horwood Ltd.
29. Briffaerts, K., C. Spirinckx, A. Van der Linden, and K. Vrancken. 2009. Waste battery treatment options: compar-ing their environmental performance. Waste Management 29: 2321 – 2331.
30. Cain, A., S. Disch, C. Twaroski, J. Reindl, and C.R. Case. 2007. Substance flow analysis of mercury intentionally used in products in the United States. Journal of Industrial Ecology 11(3): 61 – 75.
31. Campbell, P.G.C., P.M. Chapman, and B.A. Hale. 2006. Risk assessment of metals in the environment. In: Harrison, R.M. and R.E. Hester (Eds.). Chemicals in the Environment: Assessing and Managing Risk. Cambridge: Royal Soci-ety of Chemistry, 102 – 131.

165
Environmental Risks and Challenges of Anthropogenic Metals Flows and Cycles
32. Canadian Ministry of the Environment. 2009. Profiles on Remediation Projects, Teck Cominco Lead-Zinc smelter. http://www.env.gov.bc.ca/epd/remediation/project-profiles/pdf/teck-cominco.pdf, accessed september 2012.
33. Cerreño, A.L.C., M. Panero and S. Boe-hme. 2002. Pollution prevention and management strategies for mercury in the New York/New Jersey harbor. New York: New York Academy of Sciences.
34. Chang, A.C., J.E. Warneke, A.L. Page and L.J. Lund. 1984. Accumulation of heavy metals in sewage sludge-treated soils. Journal of Environment Quality 13(1): 87 – 91.
35. Chapman, P.F., and F. Roberts. 1983. Metal resources and energy. London: Butterworth and Co.
36. Chemistry Daily. 2010. Factsheet on Gold. http://www.chemistrydaily.com/chemistry/Gold. Last accessed october 2010.
37. Chen, W., S. Lei and Q. Yi. 2010. Sub-stance flow analysis of aluminium in mainland China for 2001, 2004 and 2007: exploring its initial sources, eventual sinks and the pathways linking them. Resources, Conservation and Recy-cling 54: 557 – 570.
38. Chi, X., M. Streicher-Porte, M.Y.L., Wang, M.A. Reuter. 2011. Informal elec-tronic waste recycling: a sector review with special focus on China. Waste Management 31: 731 – 742.
39. Chilean Copper Commission and UNEP-DTIE. 2001. Abandoned Mines. Prob-lems, Issues and Policy Challenges for Decision Makers. Workshop report of the first Pan-American workshop on abandoned mines, Santiago de Chile, 18 june 2001.
40. Choi, B.C., H.S. Shin, S.Y. Lee, and T. Hur. 2006. Life cycle assessment of a personal computer and its effective recycling rate. International Journal of Life Cycle Assessment 11: 122 – 128.
41. Christiansen, K.S., P.E. Holm, O.K. Borggaard, and M.Z. Hauschild. 2011. Addressing speciation in the effect fac-tor for characterisation of freshwater ecotoxicity – the case of copper. Interna-tional Journal of Life Cycle Assessment 16(8): 761 – 773.
42. Classen, M., H.J. Althaus, S. Blaser, G. Doka, N. Jungbluth, M. Tuchschmid. 2009. life cycle inventories of metals. Dübendorf, Switzerland: Swiss Centre for Life Cycle Inventories.
43. Codelco (National Copper Corporation of Chile). 2012. Annual sustainability reports. Years 2000 to 2009. Codelco, Santiago, Chile. www.codelco.cl. Last accessed May 2012.
44. Commission for Environmental Co-operation (CEC). 2012. Taking Stock: North American Pollutant Releases and Transfers. AT http://www.cec.org/Page.asp?PageID=751&SiteNodeID=1097, ac-cessed september 2012.
45. Committee EV-019 E-waste. 2012. Draft Australian/New Zealand Standard Col-lection, storage, transport and treat-ment of used electrical and electronic equipment (to be AS/NZS 5377:20XX). http://www.globalpsc.net/wp-content/uploads/2012/03/ASNZS5377_Collec-tion_storage-transport_treatment_of_WEEE_DRAFT_03121.pdf, accessed september 2012.
46. Commonwealth of Australia. 2007. Tail-ings management handbook. Leading Practice Sustainable Development Pro-gramme for the Mining Industry. Can-berra: Department of Industry, Tour-ism and Resources, Commonwealth

166
Environmental Risks and Challenges of Anthropogenic Metals Flows and Cycles
of Australia. http://www.ret.gov.au/resources/Documents/LPSDP/LPSDP-TailingsHandbook.pdf. Last accessed May 2012.
47. Cordell, D. 2010. The story of phospho-rus: sustainability implications of global phosphorus scarcity for food secu-rity. PhD thesis. Linköping, Sweeden: Linköping University. http://liu.diva-por-tal.org/smash/get/diva2:291760/FULL-TEXT01. Last accessed May 2012.
48. Cornish, E.H. 1990. Materials and the designer. Cambridge: University Press.
49. Crommentuijn, T., D. Sijm, J. De Bruijn, M. Van den Hoop, K. Van Leeuwen, and E.J. Van de Plassche. 2000. Maximum permissible and negligible concentra-tions for metals and metalloids in the Netherlands, taking into account back-ground concentrations. Journal of Envi-ronmental Management 60: 121 – 143.
50. Crowson, P. 2011. Changing copper yields and ore grades. Mining Journal October: 26 – 39.
51. Crowson, P. 2012. Some observations on copper yields and ore grades. Resourc-es Policy 37(1): 59 – 72.
52. Cui, J., and E. Forssberg. 2003. Me-chanical recycling of waste electric and electronic equipment: A review. Journal of Hazardous Materials 99: 243 – 263.
53. Cui, J., and L. Zhang. 2008. Metallurgi-cal recovery of metals from electronic waste: A review. Journal of Hazardous Materials 158: 228 – 256.
54. Da Rosa, C.D., J.S. Lyon, and P.M. Hock-er (Eds). 1997. Golden Dreams, Poi-soned Streams: How Reckless Mining Pollutes America’s Waters, and How We Can Stop It. Washington DC: Mineral Policy Center (MPC), p 279.
55. Dai, J., M. Xu, J. Chen, X. Yang, and Z. Ke. 2007. PCDD/F, PAH and heavy metals in the sewage sludge from six wastewater treatment plants in Beijing, China. Chemosphere 66 (2): 353 – 361.
56. Daigo, I., S. Hashimoto, Y. Matsuno, and Y. Adachi. 2009. Material stocks and flows accounting for copper and copper-based alloys in Japan. Resources, Con-servation and Recycling 53: 208 – 217.
57. Daigo, I., Y. Igarashi, Y. Matsuno, and Y. Adachi. 2007. Accounting for steel stock in Japan. ISIJ International 47(7): 1065 – 1069.
58. Daigo, I., Y. Matsuno, and Y. Adachi. 2010. Substance flow analysis of chro-mium and nickel in the material flow of stainless steel in Japan. Resources, Conservation and Recycling 54: 851 – 863.
59. Das, S. 2000. The life-cycle impacts of aluminium body-in-white automo-tive material. Journal of Metals 52(8): 41 – 44.
60. Das, S., W. Long, H. Hayden, J. Green, and W.H. Hunt. 2004. Energy implica-tions of the changing world of alu-minium metal supply. Journal of Metals 56(8) 14 – 17.
61. De Vos, W., T. Tarvainen (Eds.), R. Salm-inen, S. Reeder, B. De Vivo, A. Demetria-des, S. Pirc, M.J. Batista, K. Marsina, R.T. Ottesen, P.J. O’Connor, M. Bidovec, A. Lima, U. Siewers, B. Smith, H. Taylor, R. Shaw, I. Salpeteur, V. Gregorausk-iene, J. Halamic, I. Slaninka, K. Lax, P. Gravesen, M. Birke, N. Breward, E.L. Ander, G. Jordan, M. Duris, P. Klein, J. Locutura, A. Bellan, A. Pasieczna, J. Lis, A. Mazreku, A. Gilucis, P. Heitz-mann, G. Klaver, and V. Petersell. 2006. Geochemical atlas of Europe. Part 2
167
Environmental Risks and Challenges of Anthropogenic Metals Flows and Cycles
– Interpretation of geochemical maps, additional tables, figures, maps and related publications. Espoo, Finland: Geological Survey of Finland, p 692.
62. De Vries, W., S. Lofts, E. Tipping, M. Meili, J.E. Groenenberg, and G. Schütze. 2007. Impact of soil properties on criti-cal concentrations of cadmium, lead, copper, zinc and mercury in soil and soil solution in view of ecotoxicological ef-fects. Reviews of Environmental Con-tamination and Toxicology 191: 47 – 89.
63. De Zwart, D., and L. Posthuma. 2006. Complex mixture toxicity for single and multiple species: proposed methodolo-gies. Environmental Toxicology and Chemistry 24: 2665 – 2672.
64. De Zwart, D., D. Van de Meent, M. Posch, J. Slootweg, J.P. Hettelingh. 2010. Loss of species due to cad-mium and lead depositions in Europe. In: Slootwek, J., M. Posh and J.P. Hettelingh (Eds.). Status report 2010: progress in the modelling of critical thresholds and dynamic modelling, including impacts on vegetation in europe. Bilthoven, Netherlands: Coordi-nation Centre for Effects (CCE), National Institute for Public Health and the Envi-ronment. http://www.rivm.nl/dsresource?objectid=rivmp:24445&type=org&disposition=inline. Last accessed May 2012.
65. De Zwart, D., S.D. Dyer, L.L.Posthuma, and C.P. Hawkins. 2006. Use of predic-tive models to attribute potential effects of mixture toxicity and habitat alteration on the biological condition of fish as-semblages. Ecological Applications 16: 1295 – 1310.
66. DeMarco, O., G. Lagioia, and A. Paiano, 2005. The circulation of mercury in the Italian economy. Forum Ware Interna-tional 2: 1 – 7.
67. Dewulf J, Van Langenhove H, Muys B, Bruers S, Bakshi BR, Grubb GF, Paulus DM, and Sciubba E, 2008. Exergy: Its Po-tential and Limitations in Environmental Science and Technology.”Environmental Science & Technology 42(7): 2221 – 2232.
68. Di Toro, D.M., H.E. Allen, H.L. Bergman, S.J. Meyer, P.R. Paquin, R.C. Santore. 2001. Biotic ligand model of the acute toxicity of metals. 1. Technical basis. Environmental Toxicology and Chemis-try 20: 2383 – 2396.
69. Diamond, M.L., N. Gandhi, W.J. Adams, J. Atherton, S.P. Bhavsar, C. Bulle, P.G.C. Campbell, A. Dubreuil, A. Fair-brother, K. Farley, A. Green, J. Guinee, M.Z. Hauschild, M.A.J. Huijbregts, S. Humbert, K.S. Jensen, O. Jolliet, M. Margni, J.C. McGeer, W.J.G.M. Peijnen-burg, R.K. Rosenbaum, D. van de Meent, and M.G. Vijver. 2010. The Clearwater consensus: the estimation of metal hazard in fresh water. International Journal of Life Cycle Assessment 15(2): 143 – 147.
70. Dickson, K.L., J.P. Giesy, L. Wolfe. 1994. Bioavailability: physical, chemical and biological interactions. Boca Raton, Florida: CRC Press.
71. Didden, W. 2003. Oligochaetes. In: Markert B.A., A.M. Breure, and H.G. Zechmeister H.G. (Eds). Bioindicators and biomonitors. Amsterdam: Elsevier Science Ltd.
72. Doka, G. 2009. Life Cycle Inventory of the disposal of lignite spoil, coal spoil and coal tailings. St.Gallen, Switzer-land: Doka Life Cycle, p 18.
73. Dones, R., C. Bauer, G. Doka. 2009. Kernenergie. In: Bauer C (Ed.). Sachbi-lanzen von Energiesystemen: Grundla-gen für den ökologischen Vergleich von Energiesystemen und den Einbezug

168
Environmental Risks and Challenges of Anthropogenic Metals Flows and Cycles
von Energiesystemen in Ökobilanzen für die Schweiz. Dübendorf, Switzer-land: Swiss Centre for Life Cycle Inven-tories.
74. Duan, H., M. Eugster, R. Hischier, M. Streicher-Porte, and L. Jinhui. 2009. Life cycle assessment study of a chi-nese desktop personal computer. Sci-ence of the Total Environment 407(5): 1755 – 1764.
75. Dubreuil, A., S.B. Young, J. Atherton, T.P. Glora. 2010. Metals recycling maps and allocation procedures in life cycle as-sessment. International Journal of Life Cycle Assessment 15: 621 – 634.
76. Eckelman, M.J. 2010. Facility-level energy and greenhouse gas assessment of the global nickel industry. Resources, Conservation and Recycling 54(4): 256 – 266.
77. Eckelman, M.J., and T. E. Graedel. 2007. Silver emissions and their environmen-tal impacts: a multilevel assessment. Environmental Science & Technology 41(17): 6283 – 6289.
78. Ecoinvent. 2010. Ecoinvent database for life cycle analysis of emissions and materials. Data version 2.2. Dübendorf, Switzerland: Swiss Center for Life Cycle Inventories.
79. Ekvall, T., and B. Weidema. 2004. Sys-tem boundaries and input data in con-sequential life cycle inventory analysis. International Journal of Life Cycle Assessment 9: 161 – 171.
80. Elshkaki, A., and E. Van der Voet. 2006. The consequences of the use of plati-num in new technologies on its avail-ability and on other metals cycles. In: Loeffe, C.V. (Ed.). Conservation and Re-cycling of Resources: A New Research. New York: Nova Science Publisher.
81. Elshkaki, A., E. van der Voet, M. van Holderbeke, and V. Timmermans. 2004. The environmental and economic con-sequences of the developments of lead stocks in the Dutch economic system. Resources, Conservation and Recy-cling 42: 133 – 154.
82. Environmental Protection Agency (EPA). 2007. Framework for metals risk as-sessment. EPA document 120/R-07/001. Washington DC, USA: Environmental Protection Agency.
83. European Aluminium Association (EEA). 2008. Environmental profile report for the European aluminium industry: life cycle inventory data for aluminium pro-duction and transformation processes in Europe. Brussels, Belgium, European Aluminium Association (EEA). http://www.alueurope.eu/wp-content/up-loads/2011/08/EAA_Environmental_pro-file_report-May081.pdf. Last accessed in May 2012.
84. European Commission (EC). 1994. Di-rective 94/62/EC of the European parlia-ment and of the Council of 20 Decem-ber 1994 on packaging and packaging waste. Official Journal of the European Communities L365/10.
85. European Commission (EC). 1999. Di-rective 1999/31/EC of the European Parliament and the Council of 26 April 1999 on the landfilling of waste. Official Journal of the European Communities L182/1.
86. European Commission (EC). 2000. Di-rective 2000/53/EC of the European Par-liament and the Council of 18 Septem-ber 2000 on end of life vehicles. Official Journal of the European Communities L 269/34.

169
Environmental Risks and Challenges of Anthropogenic Metals Flows and Cycles
87. European Commission (EC). 2001. Inte-grated Pollution Prevention and Control (IPPC): Reference Document on Best Available Techniques (BREF) in the non ferrous metals industries. Ispra, Italy: European Commission, Joint Research Centre (JRC), Institute for Environment and Sustainability. http://eippcb.jrc.ec.europa.eu/reference/BREF/nfm_bref_1201.pdf. Last accessed May 2012.
88. European Commission (EC). 2002. Heavy metals in waste (final report). DG ENV, E3 Project, Denmark. Brussels: Euro-pean Commission. http://ec.europa.eu/environment/waste/studies/pdf/heavy_metalsreport.pdf. Last accessed in May 2012.
89. European Commission (EC). 2003a. Directive 2002/95/EC of the European Parliament and of the Council of 27 Jan-uary 2003 on the restriction of the use of certain hazardous substances in electri-cal and electronic equipment (RoHS). Official Journal of the European Com-munities L 37/19.
90. European Commission (EC). 2003b. Di-rective 2002/96/EC of the European par-liament and of the Council of 27 January 2003 on waste electrical and electronic equipment (WEEE). Official Journal of the European Communities L 37/24.
91. European Commission (EC). 2006. Regulation (EC) no 1907/2006 of the European parliament and of the council of 18 December 2006 concerning the Registration, Evaluation, Authorisation and Restriction of Chemicals (REACH), establishing a European Chemicals Agency, amending Directive 1999/45/EC and repealing Council Regulation (EEC) No 793/93 and Commission Regulation (EC) No 1488/94 as well as Council Di-rective 76/769/EEC and Commission Di-rectives 91/155/EEC, 93/67/EEC, 93/105/EC and 2000/21/EC. Official Journal of the European Union L 396.
92. European Commission (EC). 2007. Recommendations for life cycle based indicators for sustainable consumption and production in the european union outcomes of the 3rd international life cycle thinking workshop on “sustain-ability and decoupling indicators: life cycle based approaches”. Ispra, Italy: European Commission, Joint Research Centre (JRC), Institute for Environment and Sustainability.
93. European Commission (EC). 2009. Ref-erence Document on Best Available Techniques (BREF) for management of tailings and waste-rock in mining activi-ties. Ispra, Italy: European Commission, Joint Research Centre (JRC), Institute for Environment and Sustainability. http://eippcb.jrc.ec.europa.eu/refer-ence/BREF/mmr_adopted_0109.pdf. Last accessed May 2012.
94. European Commission (EC). 2010. Criti-cal raw materials for the EU: Report of the Ad-hoc Working Group on defining critical raw materials. Brussels: Euro-pean Commission. http://ec.europa.eu/enterprise/policies/raw-materials/files/docs/report-b_en.pdf. Last accessed May 2012.
95. European Commission (EC). 2010a. Analysis of existing environmental im-pact assessment methodologies for use in life cycle assessment. In: European Commission (Ed.). ILCD Handbook – International Reference Life Cycle Data System. Ispra, Italy: European Commis-sion, Joint Research Centre (JRC), Insti-tute for Environment and Sustainability.
96. European Commission (EC). 2010b. Framework and requirements for life cycle impact assessment models and indicators. In: European Commission (Ed). ILCD Handbook – International Reference Life Cycle Data System. Ispra, Italy: European Commission, Joint Research Centre (JRC), Institute for Environment and Sustainability.

170
Environmental Risks and Challenges of Anthropogenic Metals Flows and Cycles
97. European Commission (EC). 2010c. Life Cycle Thinking and Assessment. Ispra, Italy: European Commission, Joint Re-search Centre (JRC), Institute for Envi-ronment and Sustainability.
98. European Commission (EC). 2011 (in preperation). Recommendations based on existing environmental impact as-sessment models and factors for life cycle assessment in a European context. In: European Commission (Ed.). ILCD Handbook – International Reference Life Cycle Data System. Ispra, Italy: European Commission, Joint Research Centre (JRC), Institute for Environment and Sustainability.
99. European Commission (EC). 2011. Com-munication from the Commission to the European Parliament, the Council, the European Economic and Social Commit-tee and the Committee of the Regions, tackling the challenges in commodity markets and on raw materials. Brus-sels, Belgium: European Commission. http://eur-lex.europa.eu/LexUriServ/LexUriServ.do?uri=COM:2011:0025:FIN:EN:PDF. Last accessed May 2012.
100. European Environment Agency (EEA). 2010. The European Environment State and Outlook 2010: Land Use. Copen-hagen: European Topic Centre on Land use and spatial informaton (ETC/LUSI), European Environment Agency.
101. Extractive Industries Transparency Ini-tiative (EITI). 2009. Advancing the EITI in the mining sector, A consultationg with stakeholders. Oslo, Norway: Extractive Industries Transparency Initiative. http://eiti.org/files/MINING%20Compressed.pdf. Last accessed May 2012.
102. Falkenmark, M. 1998. Dilemma when entering the 21st century – rapid change but lack of sense of urgency. Water Policy 1: 421 – 436.
103. Fassbinder, S. 2004. Eine runde Sache – Kupferrotoren. www.de-online.info Last accessed May 2012.
104. Finnveden, G., M.Z. Hauschild, T. Ekvall, J. Guinée, R. Heijungs, S. Hellweg, A. Koehler, D. Pennington, and S. Suh. 2009. Recent developments in life cycle assessment. Journal of Environmental Management 91(1): 1 – 21.
105. Floyd, J.M. 2005. Converting an idea into a worldwide business commercial-izing smelting technology. Metallurgical Transactions 36(5): 557 – 575.
106. Förstner, U., G. Wittmann, F. Prosi, J. Van Lierde, and E. Goldberg. 1979. Metal pollution in the aquatic environment. Berlin: Springer-Verlag.
107. Fraunholcz, N. 2004. Separation of waste plastics by froth flotation – a review, Part I. Minerals Engineering 17: 261 – 268.
108. Frischknecht, R., N. Jungbluth, H.J. Alt-haus, G. Doka, R. Dones, R. Hischier, S. Hellweg, T. Nemecek, G. Rebitzer, M. Spielmann. 2007. Overview and methodology. Dübendorf, Switzerland: Swiss Centre for Life Cycle Inventories.
109. Froelich, D., E. Maris, N. Haoues, L. Chemineau, H. Renard, F. Abraham, R. Lassartesses. 2007. State of the art of plastic sorting and recycling: feedback to vehicle design. Minerals Engineer-ing 20: 902 – 912.
110. Gaballah, I., and N. Kanari. 2001. Re-cycling Policy in the European Union. Journal of Metals November: 24 – 27.
111. Galloway, J.N., J.D. Thornton, S.A. Nor-ton, H.L. Volchok, and R.A.N. McLean. 1982. Trace metals in the atmospheric deposition: a review and assessment. Atmospheric Environment 16(7): 1677 – 1700.

171
Environmental Risks and Challenges of Anthropogenic Metals Flows and Cycles
112. Gandhi, N., M.L. Diamond, D. van de Meent, M.A.J. Huijbregts, W.J.G.M Pei-jnenburg, and J. Guinee. 2010. New method for calculating comparative toxicity potential of cationic metals in freshwater: application to copper, nick-el, and zinc. Environmental Science & Technology 44: 5195 – 5201.
113. Genaidy, A.M., R. Sequeira, T. Tolaymat, J. Kohler, and M. Rinder. 2009. Evi-dence-based integrated environmental solutions for secondary lead smelters: pollution prevention and waste mini-mization technologies and practices. Science of the Total Environment 407: 3239 – 3268.
114. Geovinden. 2007. Small-scale gold min-ing in developing countries. Geovinden (Geology and Geography) No. 2. Copen-hagen: Geocenter. http://www.geus.dk/program-areas/common/geoviden-2-2007-uk.pdf. Last accessed May 2012.
115. Gerst, M.D., 2008. Revisiting the cumu-lative grade-tonnage relationship for major copper ore types. Economic Geol-ogy 103: 615 – 628.
116. Geyer, R., J. Davis, J. Ley, J. He, R. Clift, A. Kwan, M. Sansom, and T. Jackson. 2007. Time-dependent material flow analysis of iron and steel in the UK. Part 1: production and consumption, trends 1970 – 2000. Resources, Conser-vation and Recycling 51: 101 – 117.
117. Gielen, D., and Y. Moriguchi. 2002. CO2 in the iron and steel industry: an analys is of Japanese emission reduction poten-tials. Energy Policy 30: 849 – 863.
118. Goedkoop, M., R. Heijungs, M. Huij-bregts, A. De Schryver, J. Struijs, and R. van Zelm. 2009. ReCiPe 2008 – A life cycle impact assessment method which comprises harmonised category indica-tors at the midpoint and the endpoint level. The Hague, Netherlands: Vrom.
http://www.pre-sustainability.com/download/misc/ReCiPe_main_report_fi-nal_27-02-2009_web.pdf. Last accessed May 2012.
119. Goedkoop, M., R. Spriensma. 2001. The Eco-indicator 99: A damage oriented method for life cycle impact assess-ment. Amerfoort, Netherlands: PRö Consultants B.V. http://www.pre-sus-tainability.com/download/misc/EI99_an-nexe_v3.pdf. Last accessed May 2012.
120. Gordon, R.B., R.J. Lifset, M. Bertram, B. Reck, S. Spatari, and T.E. Graedel. 2004. Where is all the zinc going: the stocks and flows project, Part 2. Journal of the Minerals, Metals and Materials Soci-ety 56(1): 24 – 29.
121. Gordon, R.B., T.E. Graedel, M. Bertram, K. Fuse, R. Lifset, H. Rechberger, and S. Spatari. 2003. The characterization of technological zinc cycles. Resourc-es, Conservation and Recycling 39: 107 – 135.
122. Graedel, T. 2002. Material substitution: a resource supply perspective. Resourc-es, Conservation and Recycling 34: 107 – 115.
123. Graedel, T.E., D. van Beers, M. Bertram, K. Fuse, R.B. Gordon, A. Gritsinin, E.M. Harper, A. Kapur, R.J. Klee, R. Lifset, L. Memon, and S. Spatari. 2005. The multi-level cycle of anthropogenic zinc. Jour-nal of Industrial Ecology 9(3): 67 – 90.
124. Graedel, T.E., M. Bertram, A. Kapur, B. Reck, and S. Spatari. 2004. Exploratory data analysis of the multilevel anthro-pogenic copper cycle. Environmental Science & Technology 38: 1253 – 1261
125. Graedel, T.E., M. Bertram, K. Fuse, R.B. Gordon, R. Lifset, H. Rechberger, and S. Spatari. 2002. The contemporary Euro-pean copper cycle: the characterization of technological copper cycles. Ecologi-cal Economics 42: 9 – 26.

172
Environmental Risks and Challenges of Anthropogenic Metals Flows and Cycles
126. Grant, T., K. James, S. Lundie, and K. Sonneveld. 2001. Report for life cycle assessment for paper and packaging waste management scenarios in Vic-toria. Melbourne, Australia: Ecorecycle Victoria.
127. Guinée, J. 2001. Handbook on life cycle assessment e operational guide to the ISO standards. International Journal of Life Cycle Assessment 6: 255.
128. Guinée, J., J. van den Bergh, J. Boelens, P. Fraanje, G. Huppes, P. Kandelaars, T. Lexmond, S. Moolenaar, A. Olsthoorn, and H. Udo de Haes. 1999. Evaluation of risks of metal flows and accumulation in economy and environment. Ecological Economics 30(1): 47 – 65.
129. Guinée, J.B. (Ed.). 2002. Handbook on life cycle assessment, operational guide to the ISO standards. Dordrecht, Netherlands: Kluwer Academic Publish-ers.
130. Guinée, J.B., R. Heijungs, G. Huppes, R. Kleijn, A. de Koning, L. van Oers, A. Wegner Sleeswijk, S. Suh, H.A. Udo de Haes, H. de Bruijn, R. van Duin, M.A.J. Huijbregts. 2001. Handbook on life cycle assessment: An operational guide to the ISO standards. Dordrecht, Nether-lands: Kluwer Academic Publishers.
131. Guo, X., and Y. Song. 2008. Substance flow analysis of copper in China. Re-sources, Conservation and Recy-cling 52: 874 – 882.
132. Guo, X., J. Zhong, Y. Song, and Q. Tian. 2010. Substance flow analysis of zinc in China. Resources, Conservation and Recycling 54: 171 – 177.
133. Gustavsson, N., B. Bølviken, D.B. Smith, and R.C. Severson. 2001. Geochemical landscapes of the conterminous united states – new map presentations for 22 elements. U.S. Geological Survey Pro-
fessional Paper 1648. Reston, Virginia, USA: USGS. http://pubs.usgs.gov/pp/p1648/p1648.pdf. Last accessed May 2012.
134. Habermacher, F. 2011. Modeling ma-terial inventories and environmental impact of electric passenger cars. Mas-ter Thesis. Zürich, Switzerland: Depart-ment of Environmental Sciences, Swiss Federal Institutes of Technology Zürich (ETHZ).
135. Hair, I. 2003. Groundwater issues in the mining industry. Proceedings of the Water in Mining Conference, Brisbane, 173 – 179.
136. Hansen, E., and C. Lassen. 2003. Expe-rience with the use of substance flow analysis in Denmark. Journal of Indus-trial Ecology 6(3 – 4): 201 – 219.
137. Hatayama, H., I. Daigo, Y. Matsuno, and Y. Adachi. 2010. Outlook of the world steel cycle based on the stock and flow dynamics. Environmental Science & Technology 44: 6457 – 6463.
138. Hauschild, M., and H. Wenzel. 1998. Environmental assessment of prod-ucts. Volume 2 – scientific background. London, United Kingdom: Champan & Hall, p 584.
139. Hauschild, M., and J. Potting. 2005. Spatial differentiation in life cycle im-pact assessment – the EDIP2003 meth-odology. Environmental News no. 80. Copenhagen: The Danish Ministry of the Environment, Environmental Pro-tection Agency. http://www2.mst.dk/udgiv/publications/2005/87-7614-579-4/pdf/87-7614-580-8.pdf. Last accessed May 2012.

173
Environmental Risks and Challenges of Anthropogenic Metals Flows and Cycles
140. Hauschild, M.Z., M. Huijbregts, O. Jol-liet, M. MacLeod, M. Margni, D.V. van de Meent, R.K. Rosenbaum, T.E. Mckone. 2008. Building a model based on scien-tific consensus for life cycle impact as-sessment of chemicals: the search for harmony and parsimony. Environmental Science & Technology 42: 7032 – 7037.
141. Hawkins, T.R., H.S. Matthews, and C. Hendrickson. 2006. Closing the loop on cadmium, an assessment of the material cycle of cadmium in the U.S. International Journal of Life Cycle As-sessment 11(1): 38 – 48.
142. Heijungs, R., G. Huppes, J.B. Guinee. 2010. Life cycle assessment and sus-tainability analysis of products, materi-als and technologies. Toward a scientific framework for sustainability life cycle analysis. Polymer Degradation and Stability 95(3): 422 – 428.
143. Helsen, L., E. Van den Bulck, J.S. Hery. 1998. Total recycling of CCA treated wood waste by low-temperature pyroly-sis. Waste Management 18: 571 – 578.
144. Hikwama, B.P. 2005. Life cycle assess-ment of a personal computer. PhD The-sis. Queensland, Australia: University of Southern Queensland.
145. Hischier, R. 2007. Life cycle invento-ries of packaging and graphical paper. Ecoinvent v2.0 report No. 11. Dübendorf, Switzerland: Swiss Centre for Life Cycle Inventories.
146. Hischier, R., B. Weidema, H.J. Althaus, G. Doka, R. Dones, R. Frischknecht, S. Hellweg, S. Humbert, N. Jungbluth, T. Köllner, Y. Loerincik, M. Margni, and T. Nemecek. 2010. Implementation of life cycle impact assessment methods. Ecoinvent v2.2 report No. 3. Dübendorf, Switzerland: Swiss Centre for Life Cycle Inventories.
147. Hischier, R., M. Classen, M. Lehmann, and W. Scharnhorst. 2007. Life cycle in-ventories of electric and electronic equi-pement: production, use and disposal. Ecoinvent v2.0 report No. 18. Dübendorf, Switzerland: Swiss Centre for Life Cycle Inventories.
148. Hjortenkrans, D. 2008. Road traffic met-als – sources and emissions. PhD the-sis. Kalmar, Sweden: Kalmar University.
149. Hoang, J., M.A. Reuter, R. Matusewicz, S. Hughes, and N. Piret. 2009. Top submerged lance direct zinc smelting. Minerals Engineering 22: 742 – 751.
150. Hudson, T., F. Fox, and G. Plumlee. 1999. Metal mining and the environment. Alexandria, Viriginia, USA: American Geological Institute. http://www.agiweb.org/environment/publications/metals-full.pdf. Last accessed May 2012.
151. Intergovernmental Panel on Climate Change (IPCC). 2007. IPCC climate change fourth assessment report: Climate Change 2007. Geneva, Swit-zerland: Intergovernmental Panel on Climate Change (IPCC). http://www.ipcc.ch/ipccreports/assessments-reports.htm. Last accessed May 2012.
152. International Commission on Large Dams. 2001. Tailings dams: risk of dangerous occurrences: lessons learnt from practical experiences. Bulletin of the International Commission on Large Dams, volume 121.
153. International Energy Agency (IEA). 2010. Energy balances of non-OECD coun-tries: 2009. Paris: International Energy Agency.

174
Environmental Risks and Challenges of Anthropogenic Metals Flows and Cycles
154. International Institute for Environment & Development (IIED), and World Busi-ness Council for Sustainable Develop-ment (WBCSD). 2002. Breaking new ground: mining, minerals and sustain-able development. London, United Kingdom: Earthscan.
155. International Stainless Steel Forum (ISSF). 2009. Life cycle inventory (LCI) of 304 Stainless Steel. Brussels, Belgium: International Stainless Steel Forum (ISSF). http://www.worldstainless.org/About+stainless/Ss+and+he/LCI. Last accessed May 2012.
156. International Standardization Organiza-tion (ISO). 2006a. Environmental man-agement – life cycle assessment: princi-ples and framework: European Standard EN ISO 14040. Geneva, Switzerland: International Standardization Organiza-tion (ISO).
157. International Standardization Or-ganization (ISO). 2006b. Environmental management – life cycle assessment: requirements and guidelines. European Standard EN ISO 14044. Geneva, Swit-zerland: International Standardisation Organisation (ISO).
158. International Zinc Association (IZA). 2009. Life cycle inventory of primary zinc production. Brussels, Belgium: Interna-tional Zinc Associaiton. http://www.zinc.org/sustainability/resourceserve/life_cy-cle_inventory_lci_of_primary_zinc_pro-duction. Last accessed May 2012.
159. Itsubo, N., and A. Inaba. 2003. A New LCA Method: LIME has been completed. International Journal of Life Cycle As-sessment 8(5): 305.
160. Ivanov, V.V. 1996. Ekologicheskaya geokhimia elementov. Ekologia 1 – 6.
161. Izard, C.F., and D.B. Müller. 2010. Tracking the devil’s metal: Historical global and contemporary U.S. tin cycles. Resources, Conservation and Recy-cling 54: 1436 – 1441.
162. J. Johnson, and T.E. Graedel. 2008. The Hidden Trade of metals in the United States. Journal of Industrial Ecol-ogy 12(5 – 6): 739 – 753.
163. Jackel, H.G., G. Schubert, and S. Sander. 2002. Size reduction of scrap by means of horizontal shaft shredders of the swing hammer type. In: Björkman, B., C. Samuelsson, and J.O. Wikström. Pro-ceeding of the Conference Recycling and Waste Treatment in Mineral and Metal Processing: Technical and Eco-nomic Aspects. Lulea, Sweden.
164. Jaffe, D., and S. Strode. 2008. Sources, fate and transport of atmospheric mer-cury from Asia. Environmental Chemis-try 5(2): 121 – 126.
165. Jager, T., R.H.L.J. Fleuren, E.A. Hogen-doorn, and G. De Korte. 2003. Elucidat-ing the routes of exposure for organic chemicals in the earthworm, Eiseniaan-drei (Oligochaeta). Environmental Sci-ence & Technology 37: 3399 – 3404.
166. Johnson, J., B.K. Reck, T. Wang, and T.E. Graedel. 2008. The energy benefit of stainless steel recycling. Energy Policy 36: 181 – 92.
167. Johnson, J., J. Jirikowic, M. Bertram, D. van Beers, R.B. Gordon, K. Henderson, R.J. Klee, T. Lanzano, R. Lifset, L. Etjen, and T.E. Graedel. 2005. contemporary anthropogenic silver cycle: a multilevel analysis. Environmental Science & Technology 39: 4655 – 4665.

175
Environmental Risks and Challenges of Anthropogenic Metals Flows and Cycles
168. Jolliet, O., M. Margni, R. Charles, S. Humbert, J. Payet, G. Rebitzer, and R. Rosenbaum. 2003a. IMPACT 2002+: a new life cycle impact assessment meth-odology. International Journal of Life Cycle Assessment 8: 324 – 330.
169. Kabata-Pendias, A. 2001. Trace ele-ments in soils and plants. Boca Raton, Florida: CRC Press, p 413.
170. Kapur, A. 2006. The future of the red metal: a developing country perspective from India. Resources, Conservation and Recycling 47: 160 – 182.
171. Kapur, A., M. Bertram, S. Spatari, K. Fuse, and T.E. Graedel. 2003. The con-temporary copper cycle of Asia. Journal of Material Cycles and Waste Manage-ment 5: 143 – 156.
172. Kellogg, H.H. 1977. Sizing up the energy requirements for producing primary materials. Engineering and Mining Journal 178(4): 61 – 65.
173. Kemna, R., M. van Elburg, W. Li, and R. van Holsteijn. 2005. Methodology Study Eco-design of Energy-using Products (MEEUP): product cases report. Delft, Netherlands: VHK – Van Holsteijn en Kemna BV.
174. Kempton, H., T.A. Bloomfield, J.L. Hanson, and P. Limerick. 2010. Policy guidance for identifying and effectively managing perpetual environmental impacts from new hard rock mines. Environmental Science & Policy 13(6): 558 – 566.
175. Kepplinger, W.L. 2009. Actual state of smelting-reduction processes in iron-making. Stahl und Eisen 129(7): 43 – 51.
176. Klee, R.J., and T.E. Graedel. 2004. Ele-mental cycles: a status report on human or natural dominance. Annual Review of Environment and Resources 29(1): 69 – 107.
177. Kleijn, R., and E. van der Voet. 2010. Resource constraints in a hydrogen economy based on renewable energy sources: an exploration. Renewable and Sustainable Energy Reviews 14 (9): 2784 – 2797.
178. Kleijn, R., E. van der Voet, G.J. Kramer, L. van Oers, and C. van der Giesen. 2011. Metal requirements of low-car-bon power generation. Energy 36(9): 5640 – 5648.
179. Koehnken, L. 1997. Mount lyell remedia-tion research and demonstration pro-gram: final report. Supervising Scientist Report 126.Canberra ACT, Australia: Supervising Scientist, p 104.
180. Koljonen, T. (Ed.) 1992. The Geochemi-cal atlas of Finland, Part 2: Till. Espoo, Finland: Geological Survey of Finland, p 218.
181. Koltun, P., and A. Tharumarajah. 2010. LCA study of rare earth metals for mag-nesium alloy applications. Materials Science Forum 654 – 656(1): 803 – 806.
182. Koppler, C, and K. Rohde-Branden-burger. 2010. On the calculation of fuel savings through lightweight design in automotive life cycle assessments. International Journal of Life Cycle As-sessment 15: 128 – 135.
183. Krinke, S., A. Van Schaik, M.A. Reuter, J. Stichling, J. Pflieger, N. Dsouza, T. Volz. 2009. Life cycle assessment and recycling of innovative multimaterial applications. Final presentation at Volk-swagen’s unveiling of SuperLightCar Body-in-White at the end of 6th Frame-work EU project, Wolfsburg, Germany (26th June 2009).
184. Kupfer Institute. 2005. Life cycle analy-sis for copper products. Düsseldorf, Germany: Kupfer Institute. http://www.kupfer-institut.de/front_frame/pdf/LCI-6-7.pdf. Last accessed May 2012.

176
Environmental Risks and Challenges of Anthropogenic Metals Flows and Cycles
185. Kusik, C.L. and C.B. Kenehan. 1978. En-ergy use patterns for metal recycling. Washington: U.S. Bureau of Mines.
186. Kwonpongsagoon, S., D.T. Waite, S.J. Moore, and P.H. Brunner. 2007. A sub-stance flow analysis in the southern hemisphere: cadmium in the Austral-ian economy. Clean Technologies and Environmental Policy 9: 175 – 187.
187. Landner, L., and R. Reuther (Eds.) 2004. Metals in society and in the en-vironment: a critical review of current knowledge on fluxes, speciation, bio-vailability and risk for adverse effects of copper, chromium, nickel and zinc. Dodrecht: Kluwer Academic Publishers, p 407.
188. Lankey, R. and F. McMichael. 1999. Rechargeable battery management and recycling: A green design educational module. Pittsburgh, Pennsylvania, USA: Carnegie Mellon University. http://gdi.ce.cmu.edu/gd/education/Battery.pdf. Last accessed May 2012.
189. Lanzano, T., M. Bertram, M. de Palo, C. Wagner, K. Zyla, and T.E. Graedel. 2006. The contemporary European silver cycle. Resources, Conservation and Recycling 46: 27 – 43.
190. Leczo, T. 2009. HIsmelt® technology: the future of ironmaking. Iron & Steel Tech-nology March: 33 – 39.
191. Leigh, J., and J. Briggs. 1992. Rare or threatened Australian plants. Canberra, Australia: Australian National Parks and Wildlife Service.
192. Lide, D.R. (Ed.) 1996. CRC Handbook of Chemistry and Physics (77th edition). Boca Raton, Florida: CRC Press.
193. Ligthart. T., L. Aboussouan, D. van de Meent, M. Schönnenbeck, M. Haus-child, K. Delbeke, J. Struijs, A. Russell, H. Udo de Haes, J. Atherton, W. van Tilborg, C. Karman, R. Korenromp, G. Sap, A. Baukloh, A. Dubreuil, W. Adams, R. Heijungs, O. Jolliet, A. de Koning, P. Chapman, F. Verdonck, R. van der Loos, R. Eikelboom, and J. Kuyper. 2004. Dec-laration of Apeldoorn on LCIA of non-ferrous metals. http://media.leidenuniv.nl/legacy/declaration_of_apeldoorn.pdf. Last accessed October 2011.
194. Lindqvist-Östblom, A., and M. Eklund. 2001. Cadmium in sewage sludge in a Swedish region: sources and reduction opportunities. Environmental Engineer-ing and Policy 2: 145 – 154.
195. Løkke H., and C.A.M. Van Gestel. 1998. Handbook of Soil Invertebrate Toxic-ity Tests. Chichester, United Kingdom: Wiley.
196. Lottermoser, B.G., and P.M. Ashley. 2006. Physical dispersion of radioactive mine waste at the rehabilitated radium hill uranium mine site, South Australia. Australian Journal of Earth Scienc-es 53(3): 485 – 499.
197. Ma, H., M. Hung, and P. Chen. 2007. A systemic health risk assessment for the chromium cycle in Taiwan. Environment International 33: 206 – 218.
198. Manoharan, S., N. Devarajan, M. Deiva-sahayam, and G. Ranganathan. 2010. A comparative analysis of performance characteristics of 2.2 kW 3 phase in-duction motor using DAR and DCR technology. International Journal of Computer and Electrical Engineering 2/3: 496 – 505.
199. Månsson, N., B. Bergbäck, and L. Sörme. 2008. Phasing out cadmium, lead, and mercury – effects on urban stocks and flows. Journal of Industrial Ecology 13(1): 94 – 111.

177
Environmental Risks and Challenges of Anthropogenic Metals Flows and Cycles
200. Mao, J.S., J. Dong, and T.E. Graedel. 2008. The multilevel cycle of anthropo-genic lead II: results and discussion. Resources, Conservation and Recy-cling 52: 1050 – 1057.
201. Matusewicz, R., and M.A. Reuter. 2008. The role of Ausmelt’s TSL in recycling and closing the material loop. Proceed-ings of the REWAS2008, Global Sym-posium on Recycling, Waste Treatment and Clean Technology. Cancun, Mexico: The Minerals, Metals & Materials Soci-ety (TMS), 951 – 962.
202. Maxson, P. 2004. Mercury flows in Europe and the world: the impact of decommissioned chlor-alkali plants. Brussels, Belgium: European Commis-sion. http://ec.europa.eu/environment/chemicals/mercury/pdf/report.pdf. Last accessed May 2012.
203. McCarthy, T. 2010. The impact of acid mine drainage in South Africa. South African Journal of Science 107(5/6).
204. McGill, I. 2005. Rare Earth Elements, Ullmann’s Encyclopaedia of Industrial Chemistry. Weinheim, Germany: Wiley-VCH, p 46.
205. Meskers, C., M.A. Reuter, U. Boin, A. Kvithyld. 2008. A fundamental metric for metal recycling applied to coated mag-nesium. Metallurgical Transactions B 39(3): 500 – 517.
206. Miranda, M., P. Burris, J. Bincang, P. Shearman, J. Briones, A. La Vina, and S. Menard. 2003. Mining and critical eco-systems: mapping the risks. Washington DC: World Resources Institute. http://pdf.wri.org/mining_critical_ecosystems_full.pdf. Last accessed May 2012.
207. Mol, G., J. Spijker, G. Roskam, and G. Klaver. 2011 (in prepration). The reactiv-ity of trace element enrichments in the soil.
208. Mol, G., P.F.M. Van Gaans, J. Spijker, G. Van der Veer, G. Klaver, and G. Roskam. 2010. Geochemische atlas van Neder-land. Alterra-report 2069. Wageningen, Netherlands: Alterra.
209. Morel, F.M.M. 1983. Complexation: trace metals and microorganisms. New York: Wiley & Sons, Inc.
210. Morgan, J.E, and Morgan, A.J. 1988. Earthworms as biological monitors of Cd, Cu, Pb, and Zn in metallifer-ous soils. Environmental Pollution 54: 123 – 138.
211. Mudd, G.M. 2008. Sustainability report-ing and water resources: a preliminary assessment of embodied water and sustainable mining. Mine Water & the Environment 27(3): 136 – 144.
212. Mudd, G.M. 2009a. Prediction of green-house gas emissions for the Olympic Dam mega-expansion. Melbourne, Victoria, Australia: Department of Civil Engineering, Monash University. http://users.monash.edu.au/~gmudd/files/2009-04-CO2-Pred-v-ODam.pdf. Last accessed May 2012.
213. Mudd, G.M. 2009b. Sustainability report-ing and mining: an assessment of the state of play for environmental indica-tors. Proceedings of the SDIMI 2009 – 4th International Conference on Sus-tainable Development Indicators in the Minerals Industry. Gold Coast, Queens-land, Australia: Australasian Institute of Mining and Metallurgie (AusIMM), July 2009, 377 – 391.
214. Mudd, G.M. 2009c. The sustainability of mining in Australia: key production trends and their environmental implica-tions for the future. Melbourne, Victoria, Australia: Department of Civil Engineer-ing, Monash University and Mineral

178
Environmental Risks and Challenges of Anthropogenic Metals Flows and Cycles
Policy Institute. http://users.monash.edu.au/~gmudd/files/SustMining-Aust-Report-2009-Master.pdf. Last accessed May 2012.
215. Mudd, G.M. 2010a. The environmental sustainability of mining in Australia: key mega-trends and looming constraints. Resources Policy 35(2): 98 – 115.
216. Mudd, G.M. 2010b. Global trends and environmental issues in nickel mining: sulfides versus laterites. Ore Geology Reviews 38(1 – 2): 9 – 26.
217. Mudd, G.M. 2012. Key trends in the re-source sustainability of platinum group elements. Ore Geology Reviews 46(1): 106 – 117.
218. Mudd, G.M., and M. Diesendorf. 2008. Sustainability of uranium mining and milling: towards quantifying resources and eco-efficiency. Environmental Sci-ence & Technology 42(7): 2624 – 2630.
219. Mudd, G.M., and M. Diesendorf. 2010. Uranium mining, nuclear power and sustainability – rhetoric versus reality. Proceedings of the Sustainable Mining 2010 Conference. Kalgoorlie, Western Australia, Australia: Australasian In-stitute of Mining and Metallurgie (Aus-IMM), August 2010, 315 – 340.
220. Müller, T., B. Friedrich. 2006. Develop-ment of a recycling process for nickel-metal hydride batteries. Journal of Power Sources 158: 1498 – 1509.
221. Münster, M., Lund, H. 2010. Comparing waste-to-energy technologies by ap-plying energy system analysis. Waste Management 30(7): 1251 – 1263.
222. Murozomi, M., T. J. Chow, and C. C. Pat-terson. 1969. Chemical concentrations of pollutant lead aerosols, terrestrial dusts and seasalts in Greenland and Antarctic snow strata. Geochimica Cos-mochimica Acta 33: 1247 – 1294.
223. Nagasaka, T., K. Nakano, Y. Kondo, S. Murakami, K. Yokoyama, K. Nakajima, and I. Daigo. 2008. Study on global flow of metals: an example of material recy-cling. Tsukuba, Japan: National Institute for Material Science.
224. Nakajima, K., K. Yokoyama, and T. Na-gasaka. 2008. substance flow analysis of manganese associated with iron and steel flow in japan. ISIJ internation-al 48(4): 549 – 553.
225. Nakajima, K., K. Yokoyama, Y. Matsuno, and T. Nagasaka. 2007. Substance flow analysis of molybdenum associated with iron and steel flow in japanese economy. ISIJ International 47(3): 510 – 515.
226. National Pollutant Inventory (NPI). 2010. National Pollutant Inventory (NPI): online database. Canberra, Australia: Department of Sustainability, Environ-ment, Water, Population & Communi-ties (DSEWPC), Australian Government. www.npi.gov.au. Last accessed May 2012.
227. Neal, C., and Robson, A.J. 2000. A sum-mary of river water quality data col-lected within the land-ocean interaction Study: core data for eastern U.K. rivers draining to the North Sea. The Science of the Total Environment 251: 585 – 665.
228. Nelson, M.G. 2011. Site environmental considerations. In: Darling, P. (Ed.). SME mining engineering handbook (3rd Edi-tion). Englewood, Colorado, USA: Soci-ety for Mining, Metallurgy, and Explora-tion (SME).
229. Nelson, W.O., and P.G.C. Campbell. 1991. The effects of acidification on the geochemistry of Al, Cd, Pb and Hg in freshwater environments: a literature review. Environmental Pollution 71: 91 – 130.

179
Environmental Risks and Challenges of Anthropogenic Metals Flows and Cycles
230. Ng, J.C., J. Wang, and A. Shraim. 2003. A global health problem caused by arsenic from natural sources. Chemos-phere 52: 1353 – 1359.
231. Nickel Institute. 2000. Life cycle assess-ment of nickel products: final report. Prepared for the Nickel Industry LCA Group by Ecobalance Inc. Bethesda, Maryland, USA: Nickel Institute.
232. Norgate, T.E. 2004. Metal Recycling: An assessment using life cycle energy con-sumption as a sustainability indicator. Report DMR-2616. Clayton South, Victo-ria, Australia: Commonwealth Scientific and Industrial Research Organisation (CSIRO) Minerals.
233. Norgate, T.E. 2010. Deteriorating ore resources: energy and water impacts. In: Graedel, T., and E. van der Voet (Eds.). Linkages of Sustainability. Cam-bridge, Massachussets, USA: MIT Press, 131 – 148.
234. Norgate, T.E., and W.J. Rankin. 2002. The role of metals in sustainable de-velopment. Proceedings of the Green Processing 2002. Cairns, Austrailia: Australasian Institute of Mining and Metallurgie (AusIMM), May 2002, 49 – 55.
235. Norgate, T.E., and R. Lovel. 2006. Sus-tainable water use in minerals and metal production. Proceedings of the Green Processing Conference. New-castle, Australia: Australasian Institute of Mining and Metallurgie (AusIMM), 133 – 141.
236. Norgate, T.E., and S. Jahanshahi. 2006. Energy and greenhouse gas implications of deteriorating quality ore reserves. 5th Australian Conference on Life Cycle As-sessment. Melbourne, Australia: Aus-trlian Life Cylcle Assessment Society.
237. Norgate, T.E., S. Jahanshahi, and W.J. Rankin. 2007. Assessing the environ-mental impact of metal production processes. Journal of Cleaner Produc-tion 15: 838 – 848.
238. Norgate, T.E., and H. Aral. 2009. To-wards sustainable water use in the minerals industry: opportunities and technologies. Sustainable Development Conference. Adelaide, Australia: Miner-als Council of Australia, October 2009.
239. Norgate, T.E., and N. Haque. 2009. Using life cycle analysis to assess the toxicity impacts of waste streams from metal production processes. Sustain-able Development Indicators in the Minerals Industry (SDIMI) Conference. Gold Coast, Queensland, Australia: Aus-tralasian Institute of Mining and Metal-lurgie (AusIMM), July 2009.
240. Norgate, T.E, and N. Haque. 2010. En-ergy and greenhouse gas impacts of mining and mineral processing opera-tions. Journal of Cleaner Production 18: 266 – 274.
241. Norgate, T.E., and S. Jahanshahi. 2010. Improving the sustainability of primary metal production: the need for a life cycle approach. Proceedings of the XXV International Mineral Processing Con-gress. Brisbane, Australia: 3575 – 3584.
242. Notter D.A., M. Gauch, R. Widmer, P. Wäger, A. Stamp, R. Zah, and H.J. Althaus. 2010. Contribution of Li-Ion batteries to the environmental impact of electric vehicles. Environmental Sci-ence & Technology 44: 6550 – 6556.
243. Nriagu, J.O. 1979. Global inventory of natural and anthropogenic emissions of trace metals to the atmosphere. Na-ture 279(5712): 409 – 411.
244. Nriagu, J.O. 1996. A history of global metal pollution. Science 272(5259): 223 – 224.

180
Environmental Risks and Challenges of Anthropogenic Metals Flows and Cycles
245. Nriagu, J.O., and J.M. Pacyna. 1988. Quantitative assessment of worldwide contamination of air, water and soils by trace metals. Nature 333: 134 – 139.
246. Oda, T., I. Daigo, Y. Matsuno, and Y. Adachi. 2010. Substance flow and stock of chromium associated with cyclic use of steel in Japan. ISIJ Internation-al 50(2): 314 – 323.
247. Olendrzynski, K., S. Anderberg, J. Bar-tnicki, J.M. Pacyna, and W. Stigliani. 1996. Atmospheric emissions and depo-sitions of cadmium, lead, and zinc in Europe during the period 1955 – 1987. Environmental Reviews 4: 300 – 320.
248. Ongondo, F.O., I.D. Williams, T.J. Cher-rett. 2011. How are WEEE doing? A global review of the management of electrical and electronic wastes. Waste Management 31: 714 – 730.
249. Ontario Electronic Stewardship. 2008. Final Waste Electrical & Electronic Equipment (WEEE) Program Plan. http://www.ene.gov.on.ca/stdprod-consume/groups/lr/@ene/@subject/@wastediversion/documents/nativedocs/stdprod_078627.pdf, accessed septem-ber 2012.
250. Orth, A., N. Anastasijevic, and H. Eich-berger. 2007. Low CO2 emission tech-nologies for iron and steelmaking as well as titania slag production. Minerals Engineering 20: 854 – 861.
251. Outotec. 2012. HSC Chemistry 7.0, 1974 – 2010. www.outotec.com. Last ac-cessed May 2012.
252. Pacyna, E.G., J.M. Pacyna, F. Steenhu-isen, and S. Wilson. 2006. Global an-thropogenic mercury emission inventory for 2000. Atmospheric Environment 40: 4048 – 4063.
253. Pacyna, E.G., J.M. Pacyna, K. Sund-seth, J. Munthe, K. Kindbom, S. Wilson, F. Steenhuisen, and P. Maxson. 2010. Global emission of mercury to the at-mosphere from anthropogenic sources in 2005 and projections to 2020. Atmos-pheric Environment 44: 2487 – 2499.
254. Pacyna, J.M., and E.G. Pacyna. 2001. An assessment of global and regional emissions of trace metals to the at-mosphere from anthropogenic sources worldwide. Environmental Reviews 9: 269 – 298.
255. Pacyna, J.M., M.T. Scholtz, and Y.F.A. Li. 1995. Global budget of trace metal sources. Environmental Reviews 3: 145 – 159.
256. Parasiliti, F., M. Villani, C. Paris, O. Wal-ti, G. Songini, A. Novello, and T. Rossi. 2004. Three-phase induction motor efficiency improvements with die-cast copper rotor cage and premium steeel. Proceedings of the SPEEDAM Confer-ence. Capri, Italy, June 2004, 338 – 343.
257. Pavlas, M., M. Touš, L. Bébar, and P. Stehlík. 2010. Waste to energy: an evaluation of the environmental impact. Applied Thermal Engineering 30(16): 2326 – 2332.
258. Persson, K., M. Broström, J. Carlsson, A. Nordin, and R. Backman. 2007. High temperature corrosion in a 65MW waste to energy plant. Fuel Processing Tech-nology 88: 1178 – 1182.
259. Pimentel, D. 1973. Food production and the energy crisis. Science 182: 443 – 449.
260. Pizzol, M., P. Christensen, J. Schmidt, and M. Thomsen. 2011a. Eco-toxicolog-ical impact of “metals” on the aquatic and terrestrial ecosystem: a comparison between eight different methodologies for Life Cycle Impact Assessment (LCIA). Journal of Cleaner Production 19: 687 – 698.

181
Environmental Risks and Challenges of Anthropogenic Metals Flows and Cycles
261. Pizzol, M., P. Christensen, J. Schmidt, and M. Thomsen. 2011b. Impacts of “metals” on human health: a compari-son between nine different methodolo-gies for Life Cycle Impact Assessment (LCIA). Journal of Cleaner Produc-tion 19: 646 – 656.
262. Plant, J., D. Smith, B. Smith, and L. Williams. 2001. Environmental geo-chemistry at the global scale. Applied Geochemistry 16. 1291 – 1308
263. PlasticsEurope. 2008. The Compelling Facts about Plastics 2007: An analysis of plastics production, demand and recovery for 2007 in Europe. Brussels, Belgium: PlasticsEurope. http://www.plasticseurope.org/cust/documentre-quest.aspx?DocID=45113. Last accessed May 2012.
264. Posch, M., W. De Vries. 2009. Dynamic modelling of metals – time scales and target loads. Environmental Modelling & Software 24: 86 – 95.
265. Posthuma, L., D. De Zwart, J. Postma, B. Reeze. 2011. KRW-maatlat mac-rofauna voor zoet getijdenwater (R8): nadere analyses. Report no. 607080001. Bilthoven, Netherlands: National Insti-tute for Public Health and the Environ-ment. http://www.rivm.nl/dsresource?objectid=rivmp:49081&type=org&disposition=inline. Last accessed May 2012.
266. Posthuma, L., D. De Zwart. 2006. Pre-dicted effects of toxicant mixtures are confirmed by changes in fish species assemblages in Ohio, USA, rivers. Envi-romental Toxicology and Chemistry 25: 1094 – 1105.
267. Posthuma, L., G.W. Suter, T.P. Traas (Eds.). 2002. Species Sensitivity Distri-butions in Ecotoxicology. Boca Raton, Florida: Lewis Publishers, p 587.
268. Powell, J. 1983. A comparison of the energy savings from the use of second-ary materials. Resources, Conservation & Recycling 6(1 – 2): 27 – 32.
269. Quinkertz, R., G. Rombach, and D. Liebig. 2001. A scenario to optimise the energy demand of aluminium produc-tion depending on the recycling quota. Resources, Conservation and Recy-cling 33: 217 – 234.
270. Rauch, J. 2010. Global Spatial Indexing of the Human Impact on Al, Cu, Fe, and Zn Mobilization. Environmental Science & Technology 44(15): 5728 – 5734.
271. Rauch, J., and J. Pacyna. 2009. Earth’s global Ag, Al, Cr, Cu, Fe, Ni, Pb, and Zn cycles. Global Biogeochemical Cy-cles 23(2): GB2001.
272. Rauch, J.N., and T.E. Graedel. 2007. Earth’s anthrobiogeochemical cop-per cycle. Global Biogeochemical Cy-cles 21(2): GB2010
273. Reck, B., D. Müller, K. Rostowski, and T.E. Graedel. 2008. Anthropogenic nickel cycle: insights into use, trade, and recy-cling. Environmental Science & Tech-nology 42: 3394 – 3400.
274. Reck, B., M. Chambon, S. Hashimoto, and T.E. Graedel. 2010. Global stainless steel cycle exemplifies China’s rise to metal dominance. Environmental Sci-ence & Technology 44: 3940 – 3946.
275. Reimann, C., and R.G. Garrett. 2005. Geochemical background – concept and reality. Science of the Total Environ-ment 350: 12 – 27.
276. Reimann, C., M. Äyräs, V.A. Chekushin, I. Bogatyrev, R. Boyd, P. Caritat, R. de Dutter, T.E. Finne, J.H. Halleraker, Ø. Jæger, G. Kashulina, H. Niskavaara, O. Lehto, V. Pavlov, M.L. Räisänen, T.

182
Environmental Risks and Challenges of Anthropogenic Metals Flows and Cycles
Strand, T. Volden. 1998. Environmental geochemical atlas of the Central Bar-ents region. Trondheim, Norway: Geo-logical Survey of Norway.
277. Reinikainen, J. 2007. Maaperän kynnys- ja ohjearvojen määritysperusteet [Deri-vation basis of threshold and guideline values for soil]. The Finnish Environ-ment 23: 164.
278. Reuter, M.A. 2011. Limits of design for recycling and “sustainability”: a review. Waste and Biomass Valorisation 2: 183 – 208.
279. Reuter, M.A., U.M.J. Boin, A. van Schaik, E.V. Verhoef, K. Heiskanen, Y. Yang, G. Georgalli, G. 2005. The metrics of mate-rial and metal ecology, harmonizing the resource, technology and environmen-tal cycles. Amsterdam: Elsevier.
280. Richardson, G.M., I.A. Mitchell, M. Mah-Paulson, T. Hackbarth, and R.G. Garrett. 2003. Natural emissions of mercury to the atmosphere in Canada. Environ-mental Reviews 11: 17 – 36.
281. Richardson, G.M., R. Garrett, I. Mitch-ell, M. Mah-Paulson, and T. Hackbarth. 2001. Critical review on natural global and regional emissions of six trace metals to the atmosphere. Ottawa, Canada: Risklogic Scientific Services Inc. http://www.echa.europa.eu/docu-ments/10162/13630/vrar_appendix_p2_en.pdf. Last accessed May 2012.
282. Rosenbaum, R.K., T.M. Bachmann, L. Swirsky Gold, M.A.J. Huijbregts, O. Jol-liet, R. Juraske, A. Koehler, H.F. Larsen, M. MacLeod, M. Margni, T.E. McKone, J. Payet, M. Schumacher, D. van de Meent, and M. Hauschild. 2008. Usetox – the UNEP-SETAC toxicity model: recom-mended characterisation factors for hu-man toxicity and fresh water ecotoxicity in life cycle impact assessment. Inter-national Journal of Life Cycle Assess-ment 13: 532 – 546.
283. Rudnick, R.L., and S. Gao. 2003. Compo-sition of the continental crust. In: Rob-erta, R.J. (Ed.). The Crust, Volume 3: Treatise on Geochemistry. Amsterdam: Elsevier-Pergamon, 1 – 64.
284. Rydh, C., and M. Karlstrom. 2002. Life cycle inventory of recycling portable nickel-cadmium batteries. Resourc-es, Conservation and Recycling 34: 289 – 309.
285. Salminen, R. (Ed.), M.J. Batista, M. Bidovec, A. Demetriades, B. De Vivo., W. De Vos, M. Duris, A. Gilucis, V. Gregorauskiene, J. Halamic, P. Heitz-mann, A. Lima, G. Jordan, G. Klaver, P. Klein, J. Lis, J. Locutura, K. Marsina, A. Mazreku, P.J. O’Connor, S.Å. Olsson, R.T. Ottesen, V. Petersell, J.A. Plant, S. Reeder, I. Salpeteur, H. Sandström, U. Siewers, A. Steenfelt, and T. Tarvainen. 2005. Geochemical atlas of Europe. Part 1 – background information, methodology and maps. Espoo, Finland: Geological Survey of Finland, p 526.
286. Salminen, R., A. Kousa, R.T. Ottesen,O. Selinus, E. Steinnes, T. Tarvainen, and B. Öhlander. 2008. Environmental geology. Episodes 31(1): 155 – 163.
287. Salminen, R., V. Chekushin, M. Tenhola, I. Bogatyrev, S.P. Glavatskikh, E. Fedoto-va, V. Gregorauskiene, G. Kashulina, H. Niskavaara, A. Polischuok, K. Rissanen, L. Selenok, O. Tomilina, L. Zhdanova. 2004. Geochemical atlas of Eastern Barents region. Amsterdam: Elsevier.
288. Sandhi, N., M.L. Diamond, M.A.J. Huij-bregts, J. Guinèe, W.J.G.M. Peijnenburg, and D. van de Meent. 2011. Implications of considering metal bioavailability in estimates of freshwater ecotoxicity: examination of two case studies. Inter-national Journal of Life Cycle Assess-ment, 16(8): 774 – 787.
183
Environmental Risks and Challenges of Anthropogenic Metals Flows and Cycles
289. Saurat, M., and S. Bringezu. 2008. Platinum group metal flows of europe, Part 1: global supply, use in industry, and shifting of environmental Impacts. Journal of Industrial Ecology 12(5/6): 754 – 767.
290. Sauvé, S., W. Hendershot, H.E. Allen. 2000. Solid-solution partitioning of met-als in contaminated soils: dependence on pH, total metal burden and organic matter. Environmental Science & Tech-nology 34: 1125 – 1131.
291. Saxe, J.K., C.A. Impellitteri, W.J.G.M. Peijnenburg, and H.W. Allen. 2001. A novel model describing heavy metal concentrations in the earthworm Eise-niaandrei. Environmental Science and Technology 35: 4522 – 4529.
292. Sayilgan, E., T. Kukrer, G. Civelekoglu, F. Ferella, A. Akcil, F. Veglio, and M. Kitis. 2009. A review of technologies for the recovery of metals from spent alkaline and zinc-carbon batteries. Hydrometal-lurgy 97: 158 – 166.
293. Schifo, J., and J. Radia. 2004. Theo-retical/best practice energy use in metalcasting operations. Indianapolis, Indiana: Keramida Environmental, Inc. http://www1.eere.energy.gov/indus-try/metalcasting/pdfs/doebestprac-tice_052804.pdf. Last accessed May 2012.
294. Scoullos, M.J. (Ed.), G.H. Vonkeman, I. Thornton, and Z. Makuch. 2001. Mer-cury – cadmium – lead: handbook for sustainable heavy metals policy and regulation. Dordrecht: Kluwer Academ-ic Publishers.
295. Selin, N., and D. Jacob. 2008. Sea-sonal and spatial patterns of mercury wet deposition in the United States: Constraints on the contribution from North American anthropogenic sources. Atmospheric Environment 42(21): 5193 – 5204.
296. Selinus, O., B. Alloway, J.A. Centeno, R.B. Finkelman, R. Fuge, U. Lindh, and P. Smedley (Eds.) 2005. Essentials of Medical Geology. Amsterdam: Elsevier, p 820.
297. Selinus, O., B. Finkelman, and J. Cen-teno (Eds.) 2010. Medical Geology: a re-gional synthesis. Heidelberg Germany: Springer, p 392.
298. Seppälä, J., M. Posch, M. Johansson, and J.P. Hettelingh. 2006. Country-dependent characterisation factors for acidification and terrestrial eutrophica-tion based on accumulated exceedance as an impact category indicator. Inter-national Journal of Life Cycle Assess-ment 11: 403 – 416.
299. Sepúlveda, A., M. Schluep, F.G. Renaud, M. Streicher, R. Kuehr, C. Hagelüken, A.C. Gerecke. 2010. A review of the envi-ronmental fate and effects of hazardous substances released from electrical and electronic equipments during recycling: Examples from China and India. En-vironmental Impact Assessment Re-view 30: 28 – 41.
300. Shent, H., R.J. Pugh, and E. Forssberg. 1999. A review of plastics waste recy-cling and the flotation of plastics. Re-sources Conservation and Recycling 25: 85 – 109.
301. Sörme, L., B. Bergbäck, and U. Lohm. 2001. Goods in the anthroposphere as a metal emission source. Water, Air & Soil Pollution 1: 213 – 227.
302. Spatari, S., M. Bertram, K. Fuse, T.E. Graedel, and E. Shelov. 2003. The con-temporary European zinc cycle: 1-year stocks and flows. Resources, Conserva-tion and Recycling 39: 137 – 160.
184
Environmental Risks and Challenges of Anthropogenic Metals Flows and Cycles
303. Spatari, S., M. Bertram, R.B. Gordon, K. Henderson, and T.E. Graedel. 2005. Twentieth century copper stocks and flows in North America: a dynamic anal-ysis. Ecological Economics 54: 37 – 51.
304. Spijker, J., G. Mol, and L. Posthuma. 2011b. Regional ecotoxicological haz-ards associated with anthropogenic enrichment of heavy metals. Environ-mental Geochemistry and Health 33(4): 409 – 426.
305. Spijker., J, G. Mol, and R.G. Van der Veen. 2011a (in press). Assessing heavy metal enrichments in the top soil. A case study for the major soil types in the Netherlands. Applied Geochemistry.
306. Spitz, K., and J. Trudinger. 2008. Mining and the environment: from ore to met-al. London, United Kingdom: CRC Press, Taylor & Francis Group, p 891.
307. Steen, B. 1999a. A Systematic approach to Environmental Strategies in Product development (EPS). Version 2000 – Gen-eral System Characteristics, 4. Göte-burg, Sweden: Chalmers University of Technology, Centre for Environmental Assessment of Products and Material Systems (CPM).
308. Steen, B. 1999b. A Systematic approach to Environmental Strategies in Product development (EPS). Version 2000 – Mod-els and Data of the Default Methods, 5. Göteburg, Sweden: Chalmers University of Technology, Centre for Environmental Assessment of Products and Material Systems (CPM).
309. Stehlik, P. 2009. Contribution to ad-vances in waste-to-energy technolo-gies. Journal of Cleaner Production 17: 919 – 931.
310. Stewart, M., L. Basson & J.G. Petrie. 2003. Evolutionary design for environ-ment in minerals processing. Trans IChemE 2003(81)(Part B): 341 – 351.
311. Stewart, M. & J.G. Petrie. 2006. A Process Systems Approach to Life Cycle Inventories for Minerals. Jour-nal of Cleaner Production (2006)14: 1042 – 1056.
312. Stigliani, W.M., P.R. Jaffé, and S. Ander-berg. 1993. Heavy metal pollution in the Rhine basin. Environmental Science & Technology 27(5): 786 – 793.
313. Struijs, J., D. Van de Meent, W.J.G.M. Peijnenburg, M.A.G.T. Van den Hoop, and T. Crommentuijn. 1997. Added risk approach to derive maximum permis-sible concentrations for heavy metals, how to take into account the natural background levels? Ecotoxicology and Environmental Safety 37: 112 – 118.
314. Suh, S., and G. Huppes. 2005. Methods for life cycle inventory of a product. Journal of Cleaner Production 13(7): 687 – 697.
315. Tabayashi, H., I. Daigo, Y. Matsuno, and Y. Adachi. 2009. Development of a dynamic substance flow model of zinc in Japan. ISIJ International 49(8): 1265 – 1271.
316. Tanimoto, A.H., X. Gabarrell Durany, G. Villalba, and A. Caldeira Pires. 2010. Material flow accounting of the copper cycle in Brazil. Resources, Conserva-tion and Recycling 55: 20 – 28.
317. Taylor, J., and S. Pape (Eds.) 2007. Man-aging acid and metalliferous drainage: leading practice sustainable develop-ment program for the mining industry. Canberra, Australia: Australian Govern-ment, Commonwealth Department of Industry, Tourism and Resources, p 107.
318. Taylor, M.P., A.K. Mackay, K.A. Hudson-Edwards, and E. Holz. 2010. Soil Cd, Cu, Pb and Zn contaminants around Mount Isa City, Queensland, Australia: Poten-tial Sources and Risks to Human Health. Applied Geochemistry 25: 841 – 855.

185
Environmental Risks and Challenges of Anthropogenic Metals Flows and Cycles
319. Taylor, S.R., and S.M. McLennan. 1995. The geochemical evolution of the conti-nental crust. Reviews of Geophysics 22: 241 – 265.
320. Tekawa, M., S. Miyamoto, and A. Inaba. 1997. Life cycle assessment: an ap-proach to environmentally friendly PCs. Proceeding of the IEEE International Symposium on Electronics and the Environment, San Francisco, California, United States, 125 – 130.
321. Tenhola, M., R. Salminen, and A. Eronen. 2000. Results of C-horizon soil samples: technical report from the catchment stage of Barents Eco-geochemistry project. Report No. S/41/0000/2/2000. Espoo, Finland: Geo-logical Survey of Finland.
322. U.S. Department of Energy. 2007. Mining industry energy bandwidth study. Indus-trial Technologies Program. Washington DC: U.S. Department of Energy. http://www1.eere.energy.gov/manufacturing/industries_technologies/mining/pdfs/mining_bandwidth.pdf. Last accessed May 2012.
323. U.S. Environmental Protection Agency (US-EPA). 2005. Mine site cleanup for brownfields redevelopment: a three-part primer. Washington DC: U.S. Envi-ronmental Protection Agency, Office of Solid Waste and Emergency Response, Brownfields and Land Revitalization Technology Support Center, p 89.
324. U.S. Environmental Protection Agency (USEPA). 1994. Background document to 12.12 of AP-42, 5th ed., vol. 1, Wash-ington, DC.
325. Udo de Haes, H.A., G. Finnveden, M. Goedkoop, M.Z. Hauschild, E.G. Hertwich, P. Hofstetter, O. Jolliet, W. Klöpffer, W. Krewitt, E. Lindeijer, R. Mu-eller-Wenk, I. Olsen, D.W. Pennington, J. Potting, and B. Steen. 2002. Life-cycle
impact assessment: striving towards best practice. Brussels, Belgium: So-ciety of Environmental Toxicology and Chemistry (SETAC).
326. United Nations Environment Pro-gramme (UNEP). 2010a. Assessing the environmental impacts of consump-tion and production: priority products and materials. Hertwich, E., E. van der Voet, S. Suh, A. Tukker, M. Huijbregts, P. Kazmierczyk, M. Lenzen, J. McNeely, Y. Moriguchi. Paris: International Re-source Panel (IRP), United Nations En-vironment Programme (UNEP). http://www.unep.fr/shared/publications/pdf/DTIx1262xPA-PriorityProductsAndMa-terials_Report.pdf. Last accessed May 2012.
327. United Nations Environment Pro-gramme (UNEP). 2010b. Metal stocks in society: scientific synthesis. Gerst M.D., T. E. Graedel, A. Dubreuil, M. Gerst, S. Hashimoto, Y. Moriguchi, D. Müller, C. Pena, J. Rauch, T. Sinkala, and G. Sonnemann. Paris: International Resource Panel (IRP), United Nations Environment Programme(UNEP). http://www.unep.org/resourcepanel/Por-tals/24102/PDFs/Metalstocksinsociety.pdf. Last accessed May 2012.
328. United Nations Environment Pro-gramme (UNEP). 2010c. Recycling from e-waste to Resource. Paris: United Nations Environment Programme (UNEP). http://www.unep.org/PDF/PressReleases/E-Waste_publication_screen_FINALVERSION-sml.pdf. Last accessed May 2012.
329. United Nations Environment Pro-gramme (UNEP). 2011. Recycling rates of metals. Graedel, T.E., J. Allwood, J.P. Birat, B.K. Reck, S.F. Sibley, G. Sonnemann, M. Buchert, C. Hagelüken. Paris: International Resource Panel (IRP), United Nations Environment

186
Environmental Risks and Challenges of Anthropogenic Metals Flows and Cycles
Programme (UNEP). http://www.unep.org/resourcepanel/Portals/24102/PDFs/Metals_Recycling_Rates_110412-1.pdf. Last accessed May 2012.
330. United Nations Environment Pro-gramme (UNEP). 2013 (in preperation). Metal recycling: opportunities, limits, infrastructure. M.A. Reuter. Paris: Inter-national Resource Panel (IRP), United Nations Environment Programme.
331. Unsworth, E. R., K. W. Warnken, H. Zhang, W. Davison, F. Black, J. Buffle, J. Cao, R. Cleven, J. Galceran, P. Gunkel, E. Kalis, D. Kistler, H.P. van Leeuwen, M. Martin, S. Noël, Y. Nur, N. Odzak, J. Puy, W. van Riemsdijk, L. Sigg, E. Temminghoff, M. Tercier-Waeber, S. Toepperwien, R.M. Town, L. Weng, and H. Xue. 2006. Model predictions of metal speciation in freshwaters compared to measurements by in situ techniques. Environmental Science & Technology 40(6): 1942 – 1949.
332. Van Beers, D., M. Bertram, K. Fuse, S. Spatari, and T.E. Graedel. 2004. The contemporary Oceania zinc cycle: one-year stocks and flows. Journal of Mate-rial Cycles and Waste Management 6: 125 – 141.
333. Van der Veer, G. 2006. Geochemical soil survey of the Netherlands: atlas of major and trace elements in topsoil and parent material; assessment of natural an anthropogenic enrichment factors. PhD thesis. Utrecht: Utre-cht University. Koninklijk Nederlands Aardrijkskundig Genootschap. http://igitur-archive.library.uu.nl/disserta-tions/2006-1011-200742. Last acessed May 2012.
334. Van der Voet E., L.F.C.M. van Oers, S. Moll, H. Schütz, S. Bringezu, S. de Bruyn, M. Sevenster, G. Warringa. 2005. Policy review on decoupling: develop-ment of indicators to assess decoupling of economic development and environ-
mental pressure in the EU-25 and AC-3 countries. CML rapport 166. Leiden, Netherlands: Institute of Environmen-tal Sciences (CML), Leiden University. https://openaccess.leidenuniv.nl/bit-stream/handle/1887/11934/11_587_047.pdf?sequence=1. Last accessed May 2012.
335. Van der Voet, E. 1996. Substances from cradle to grave: development of a meth-odology for the analysis of substances flows through the economy and the en-vironment of a region: with case studies on cadmium and nitrogen compounds. Dissertation Leiden University. Leiden, Netherlands: Institute of Environmen-tal Sciences (CML), Leiden University. https://openaccess.leidenuniv.nl/bit-stream/handle/1887/8097/11_504_030.pdf?sequence=1. Last accessed May 2012.
336. Van der Voet, E., J.B. Guinée, and H.A. Udo de Haes (Eds.) 2000. Heavy metals: a problem solved? Methods and models to evaluate policy strategies for heavy metals. Dordrecht: Kluwer Academic Publishers.
337. Van der Voet, E., L. van Egmond, R. Kleijn, and G. Huppes. 1994. Cadmium in the European community, a policy oriented analysis. Waste Management and Research 12: 507 – 526.
338. Van der Voet, E., R.J. Leifset, L. Luo. 2010. Life-cycle assessment of biofuels, convergence and divergence. Biofu-els 1(3): 435 – 449.
339. Van der Voet, E., W.G. van der Naald, J.B. Guinée, G. Huppes, P. Koppert, and J.F. Feenstra. 1989. Stroomschema’s voor stoffen in economie en milieu van Nederland en Zuid-Holland Part IIa: Cadmium. Report CML/IVM. Leiden, Netherlands: Institute of Environmen-tal Sciences (CML), Leiden University.

187
Environmental Risks and Challenges of Anthropogenic Metals Flows and Cycles
https://openaccess.leidenuniv.nl/bit-stream/handle/1887/11475/11_521_092.pdf?sequence=1. Last accessed May 2012.
340. Van Schaik A., and M.A. Reuter. 2007. The use of fuzzy rule models to link automotive design to recycling rate calculation. Minerals Engineering 20: 875 – 890.
341. Van Schaik, A., and M.A. Reuter. 2004. The time-varying factors influencing the recycling rate of products. Resources, Conservation and Recycling 40(4): 301 – 328.
342. Van Schaik, A., and M.A. Reuter. 2010. Dynamic modelling of e-waste recycling system performance based on prod-uct design. Minerals Engineering 23: 192 – 210.
343. Van Schaik, A., M.A. Reuter, H. Van Stokkom, J. Jonk, and V. Witter. 2010. Management of the web of water and Web of materials. Minerals Engineer-ing 23: 157 – 174.
344. Van Straalen, N.M., M.H. Donker, M.G. Vijver, and C.A.M. van Gestel. 2005. Bio-availability of contaminants estimated from uptake rates into soil inverte-brates. Environmental Pollution 136: 409 – 417.
345. Vijver, M.G., and A. de Koning. 2007. Quantifying HC5 using BLMs for Cu in different water types according differ-ent extrapolation options: sensitivity and uncertainty analysis. CML rapport 175. Leiden, Netherlands: Institute of Environmental Sciences (CML), Leiden University.
346. Vijver, M.G., J.P.M. Vink, C.J.H. Mier-mans, C.A.M. Van Gestel. 2003. Oral sealing using glue: a new method to distinguish between intestinal and dermal uptake of metals in earthworms. Soil Biology and Biochemistry 35: 125 – 132.
347. Vijver, M.G., J.P.M. Vink, H.T. Wolter-beek, and C.A.M. van Gestel. 2005. Surface adsorption of metals onto earthworms and isopods is negligible compared to absorption in the body. Science of the Total Environment 340: 271 – 280.
348. Vijver, M.G., J.P.M. Vink, T. Jager, H.T. Wolterbeek, N.M. van Straalen, and C.A.M. van Gestel. 2005. Biphasic elimi-nation and uptake kinetics of Zn and Cd in the earthworm lumbricus rubel-lus exposed to contaminated floodplain soil. Soil Biology and Biochemistry 1843 – 1851.
349. Vijver, M.G., R.P. Lanno, N.M. van Straal-en, C.A.M. van Gestel, and W.J.G.M. Peijnenburg. 2004. Internal metal se-questration and its ecotoxicological relevance: a review. Environmental Sci-ence & Technology 38: 4705 – 4712.
350. Von Gleich, A., R.U. Ayres, and S. Gössling Reisemann. 2006. Sustain-able metals management: securing our future – steps towards a closed loop economy. Dordrecht, Netherlands: Springer.
351. Waeterschoot, H., F. Van Assche, L. Regoli, I. Schoeters, and K. Delbeke. 2003. Metals in perspective. Journal of Environmental Monitoring 5: 95 – 102.
352. Wäger, P.A., R. Hischier, and M. Eugster. 2011. Environmental impacts of the Swiss collection and recovery systems for Waste Electrical and Electronic Equipment (WEEE): A follow-up. Sci-ence of the Total Environment 409: 1746 – 1756.

188
Environmental Risks and Challenges of Anthropogenic Metals Flows and Cycles
353. Wang, T., D.B. Müller, and T.E. Graedel. 2007. Forging the anthropogenic iron cycle. Environmental Science & Tech-nology 41: 5120 – 5129.
354. Wang, T., J. Mao, J. Johnson, B.K. Reck, and T.E. Graedel. 2008. Anthropogenic metal cycles in China. Journal of Mate-rial Cycles and Waste Management 10: 188 – 197.
355. Wedepohl, K.H. 1995. The composition of the continental crust. Geochimica et Cosmochimica Acta 59: 1217 – 1232.
356. Weidema, B.P. 2009. Using the budget constraint to monetarise impact assess-ment results. Ecological Economics 68: 1591 – 1598.
357. Weidema, B.P., M.Z. Hauschild, and O. Jolliet. 2007. Preparing characterisation methods for endpoint impact assess-ment. In: Weidema B.P., M. Wesnæs, J. Hermansen, T. Kristensen, N. Halberg, P. Eder, L Delgado. 2008. Environmental improvement potentials of meat and dairy products. Sevilla, Spain: European Commission, Joint Research Center (JRC), Institute for Prospective Techno-logical Studies (IPTS).
358. WellMet2050 Project, University of Cambridge. http://www.lcmp.eng.cam.ac.uk/wellmet2/introduction, accessed September 2012.
359. West, J. 2011. Decreasing metal ore grades: are the really being driven by the depletion of high-grade deposits? Journal of Industrial Ecology 15(2): 165 – 168.
360. Williams, E.D. 2004. Energy intensity of computer manufacturing: hybrid assessment combining process and economic input-output methods. En-vironmental Science & Technology 38: 6166 – 6174.
361. Williams, E.D., R. Kahhat, B. Allenby, E. Kavazanjian, J. Kim, M. Xu. 2008. Envi-ronmental, social, and economic im-plications of global reuse and recycling of personal computers. Environmental Science & Technology 42: 6446 – 6454.
362. Winde, F., and L. Sandham. 2004. Urani-um pollution of South African streams: an overview of the situation in gold areas of the Witwatersrand. GeoJour-nal 61: 131 – 149.
363. Woldt, D., G. Schubert, and G. Jackel. 2002. Low speed rotary shears and shredders in size reduction of scrap metals and metalliferous wastes. Proceeding of the Conference Recy-cling and Waste Treatment in Mineral and Metal Processing: Technical and Economic Aspects. Lulea, Sweden 285 – 296.
364. Wolterbeek, H.T, and T.G. Verburg. 2001. Predicting metal toxicity revisited: general properties vs. specific effects. Science of the Total Environment 279: 87 – 115.
365. Wong, M.H., S.C. Wu, W.J. Deng, X.Z. Yu, Q. Luo, A.O.W. Leung, C.S.C. Wong, W.J. Luksemburg, and A.S. Wong. 2007. Export of toxic chemicals: a review of the case of uncontrolled electronic-waste recycling. Environmental Pollu-tion 149(2): 131 – 140.
366. World Business Council for Sustain-able Development (WBCSD). 2010. Vision 2050, the new agenda for busi-ness. Geneva, Switzerland: World Business Council for Sustainable Development (WBCSD). http://www.wbcsd.org/Pages/Adm/Download.aspx?ID=320&ObjectTypeId=7. Last ac-cessed May 2012.

189
Environmental Risks and Challenges of Anthropogenic Metals Flows and Cycles
367. Worldsteel Association. 2010. IISI life cycle inventory study for steel industry products: executive summary. Available by request on-line at http://www.world-steel.org. Last accessed October 2010.
368. Worldsteel Association. 2011. Sustain-ability indicators. Brussels, Belgium: Worldsteel Association. http://www.worldsteel.org/steel-by-topic/sustaina-ble-steel/sustainability-indicators.html. Last accessed May 2012.
369. Worrell, E., L. Price, N. Martin, J. Farla, and R. Schaeffer. 1997. Energy intensity in the iron and steel industry: a compar-ison of physical and economic indica-tors. Energy Policy 25(7 – 9): 727 – 744.
370. Xie, X., Y. Wang, Q. Zhang, G. Zhou, H. Cheng, D. Liu, Z. Cheng, and S. Xu. 2008. Multi-scale geochemical map-ping in China. Geochemistry: Explora-tion, Environment, Analysis 8(3 – 4): 333 – 341.
371. Xua, J., H.R. Thomas, R.W. Francis, K.R. Lumb, J. Wang, B. Liang. 2008. A review of processes and technologies for the recycling of lithium-ion secondary bat-teries. Journal of Power Sources 177: 512 – 527.
372. Yang, Y., M.J.A. Pijnenborg, M.A. Reu-ter, and J. Verwoerd. 2007. Analysis of transport phenomena and combus-tion modelling of rotary kiln hazardous waste incinerators. International Jour-nal of Progress in Computational Fluid Dynamics 7(1): 25 – 39.
373. Yao, M.A., T.G. Higgs, M.J. Cullen, S. Stewart, and T.A. Brady. 2010. Compara-tive assessment of life cycle assessment methods used for personal computers. Environmental Science & Technol-ogy 44(19): 7335 – 7346.
374. Yellishetty, M., P.G. Ranjith, and A. Tharumarajah. 2010. Iron ore and steel production trends and material flows in the world: is this really sustainable? Resources, Conservation and Recy-cling 54: 1084 – 1094.
375. Yencken, D., and D. Wilkinson. 2000. Resetting the compass: Australia’s journey towards sustainability. Victoria, Australia: Commonwealth Scientific and Industrial Research Organisation (CSIRO).

190
Environmental Risks and Challenges of Anthropogenic Metals Flows and Cycles

191
Environmental Risks and Challenges of Anthropogenic Metals Flows and Cycles
9. Annexes
Annex 1 Metals in the Environment
Metals in the environment have natural as well as anthropogenic origins. Elevated con-centrations usually are due to anthropogen-ic activities, but sometimes also have natu-ral origins. Figure A1.1 shows an example of that: the high Ni values (same levels as in the Kola Peninsula) in the area of the Ural moun-tains in the East are due to large ultramafic rock intrusions that have high Ni concentra-tions (up to 0.2 %) despite the absence of an-thropogenic impacts.
Figure A1.1
Nickel concentrations
in terrestrial moss in the
Central Barents Region. High Ni
values in Kola Peninsula are due
to Ni smelters at Monchegorsk,
Nikel and Zapoljarny and
in the area of Ural mountains
to Ni bearing ultramafic
rock intrusions (Salminen et al.
2004).
Saint-PetersburgHelsinki
Oulu
Rovaniemi
Arkhangelsk
Kotlas
Narjan-Mar
Kirkenes
Murmansk
Petrozavodsk
Vorkufa
300 Kilometers150150 0
0.561 (0%)
0.781 (1%)
0.855 (2%)
0.954 (5%)
1.050 (10%)
1.130 (15%)
1.260 (25%)
1.370 (35%)
1.610 (50%)
1.920 (65%)
2.310 (75%)
3.210 (85%)
4.000 (90%)
7.370 (95%)
14.000 (98%)
23.400 (99%)
77.300 (100%)
Nickel mg/kg Nickel mg/kg
0.40 (0%)
0.64 (1%)
0.72 (2%)
0.83 (5%)
0.93 (10%)
1.02 (15%)
1.16 (25%)
1.28 (35%)
1.54 (50%)
1.88 (65%)
2.30 (75%)
3.28 (85%)
4.14 (90%)
7.81 (95%)
15.10 (98%)
25.20 (99%)
83.90 (100%)

192
Environmental Risks and Challenges of Anthropogenic Metals Flows and Cycles
As a result of anthropogenic activities, but also as a result of exogenic geological pro-cesses, some metals have become enriched in the topmost part of soil layer. In Europe, only Hg, Cd, Pb and Mo show slight enrich-ment in top soils (Table A1.1). Among these, Hg, Cd and Pb can be considered to reflect anthropogenic influence. For the other ele-ments in consideration the topsoil/subsoil ra-tio is 0.9 – 1.1., i. e. no remarkable enrichment or depletion was detected.
A detailed study of top soil and subsoil sam-ples of the Netherlands is based on top- and subsoil measurements of metals in rural are-as, as presented in geochemical atlases (Van der Veer, 2006; Mol et al., 2010). These soils have been subject to a past diffuse emission – deposition process, at least since the onset of the industrial age. This study can be seen as validation of the European-scale CLRTAP study (see section 2.5.1 of the report).
The toxic pressure associated with the an-thropogenic enrichment of top soils with Cd, Cu, Pb and Zn and their local mixtures was calculated using chronic ecotoxicity data sets (NOECs). This choice was made, since envi-ronmental protection policies for toxic com-pounds use the so-called ‘95 %-protection criterion’ to set soil quality standards. This criterion concentration is known as the HC5 (Hazardous Concentration for 5 % of the spe-cies, Potentially Affected Fraction, PAF, of 0.05, or 5 %) and represents the situation where the fraction of species not exposed to a concentration exceeding a No Effect Con-centration is 0.95 (95 %). The HC5 is calculat-
ed as the 5th percentile of the metal’s chronic SSD. The study focused on the upper limit of risks imposed by top-soil enrichment. That is: local risks will be lower since the enrich-ment will in part be unavailable for uptake due to sorption to the soil matrix. Note that the Dutch study differs from the CLRTAP re-sults presented in Chapter 2, in that there the toxic pressure assessment is based on EC50-ecotoxicity values, to present probable spe-cies loss rather than exceedance of no-effect levels.
The metal enrichments in the diffusely ex-posed top soils exert low chronic toxic pres-sures on ecosystems – commonly less than on 5 % of the species i. e. more than 95 % of the species fully protected – and varies spa-tially among the five major Dutch litholo-gies (Figure A1.2). Combined chronic toxic pressures typically range between 1 and 5 % chronic toxic pressure, that is: the multi-sub-stance Potentially Affected Fraction (msPAF) is 1 – 5 %, with higher chronic toxic pressures (up to approximately 8 percent) in those peaty soils that were loaded with household waste in medieval times. Held against Netherlands soil quality targets, which are set to reach the protection of at least 95 % of the species against effects of “added” compounds (Crom-mentuijn et al. 2000; Struijs et al. 1997), the diffuse enrichments do not generally fail on this goal for metals (both separate and in mixtures). Chronic and acute SSDs often dif-fer by a factor of – on average – approximate-ly 10, with the chronic SSD positioned left of the acute SSD. That is, the acute toxic pres-sure is often (much) lower than the chronic value. Due to this, it is evident that the acute toxic pressures of the enrichments (and thus associated species loss) of Dutch top soil en-richments must be lower than the typical range of 1 – 5 % of the species, which is in line with the findings of the European study.
Table A1.1
Ratios of topsoil/subsoil for some metals in Europe
(De Vos et al. 2006)
Element Ratio top/sub soil
TOC 2.585
Hg 1.660
Cd 1.477
Pb 1.364
Mo 1.105

193
Environmental Risks and Challenges of Anthropogenic Metals Flows and Cycles
The figure refers to mixtures of Cd, Cu, Pb and Zn. Boxplots of the lithology-specific variances of chronic toxic pressure exerted by anthropogenic enrichments of metals in Dutch top soils (mixtures of Cd, Cu, Pb and Zn). Note that chronic toxic pressure of 5 % implies full protection of 95 % of the species.
In conclusion, diffuse metal emissions have resulted in the long term in metal enrich-ments in the environment. These can be pre-dicted based on emission data and fate mod-eling (European study), and verified by geo-chemical baseline studies on top and subsoil (Dutch study). The predicted diffuse anthro-pogenic enrichments currently exert acute toxic pressures which are in some areas of Europe predicted to affect at a maximum 1 % of the soil species but usually far less, while the measured enrichments induce chron-ic toxic pressure (far) below the often-used 95 %-protection criterion set in the regula-tion of substances and emissions. At the 95 % protection limit itself, the fraction of species acutely affected is far less than 5 %. Toxic pressure values can be presented in a single
value for a whole mixture found or expect-ed at a site. That is, a geochemical atlas of all metals can be summarized into a single toxic pressure map, or two maps: one show-ing acute toxic pressures and associated with major ecological impacts (in terms of species loss), and one showing chronic toxic pres-sures through which the success of chemical management policies for diffuse emissions can be evaluated (in terms of reaching policy protection objectives). The European example can be worked out for more metals, different geographies, and for different scenarios of metal use. For example, a comparison could be made of the ecotoxicological risks under various metal use and re-use regimes, when emission-deposition scenarios are available.
Figure A1.2
Spatial variance of chronic
toxic pressure (expressed as
multi-substance Potentially
Affected Fraction msPAF of
species) exerted by anthropogenic
enrichments of metals in Dutch
top soils (Spijkers et al., 2011b).
Peat
Sand
Mar. Clay
Fluv. Clay
Loess
< 1%
1 – 5%
> 5%
0.09
0.04
0.03
0.03
0.02
Soil TypesPAF Class
PAF (–)

194
Environmental Risks and Challenges of Anthropogenic Metals Flows and Cycles
Annex 2 Processes Determining Bio-availability of Metals
Chemical availabilityChemical availability is a physico-chemical-ly driven supply process. The impact of met-als on the environment is closely related to the form in which the metal occurs, so-called metal speciation. By speciation of a metal in soil, the total content of the metal is par-titioned over both the solid and the solu-tion phase. In the solid phase, metals ex-ist as precipitates (e. g. ferro sulfides and crystalline FeS, FeS2 and Fe3S4, manganese sulfides), adsorbed on reactive soil surfac-es and occluded or bound into soil minerals. Metals in the soil solution can exist as free metal ion or as species bound to inorganic and organic complexes. Table A2.1 shows an example of different metal forms as found in surface waters and soil solutions.
Table A2.1
Metal speciation – examples of
metal forms found in surface
waters (Campbell and Chapman,
2006).
Species Examples
Free metal ions Al3+(H2O)6
Cu2+(H2O)6
Hydroxo-complexes AlOH2+, Al(OH)+2, Al(OH)-4 FeOH2+, Fe(OH)+2, Fe(OH)-4
Cu(OH)02
Simple inorganic complexes AIF2+, AIF+2
CdCl+, CdCl02, CdCl-
3
HgCl2,HgOHCl0
CuCO0 3
CdSO0 4
Simple organic complexes synthetic
Cu-EDTA2- Cd-NTA1-
natural Cd-alanine Cd-citrate Fe-siderophore
Polymeric organic complexes Al, Fe, Cu, Pb or Hg – fulvic or humic acids

195
Environmental Risks and Challenges of Anthropogenic Metals Flows and Cycles
The metal concentration in the solution phase (of the soils or sediment) is regulated by adsorption; in a more or less descending order of affinity (Wijdeveld and Smits 1997) metals are bound to:
■ Organic matter (particulate and dissolved humic substances having many active car-boxylic and phenolic hydroxyl groups, high-ly depending on the origin and history of the organic matter (Senesi 1992).
■ Hydrous iron oxides (Fe(OOH), amorphous goethite).
■ Oxides of manganese (MnO2, amorphous birnessite).
■ Aluminium hydroxide and silicates (Al(OH)3, amorphous, gibbsite, Al(SiO2)3, amorphous allophanes).
■ Clay minerals (e. g. the dominant clay min-erals in many Dutch soils are illite, kaolin-ite, vermiculite and bentonite. The metal-sorption capacity of clay minerals varies among the various minerals and is based on the density of negative charges on the clay surface).
■ Calcium carbonate (amorphous, calcite).
Parameters that Control the Metal FormsEnvironmental conditions control the sorption of metals. One of the major factors influenc-ing metal speciation is the acidity (pH) of the soil. An increase in pH changes the solid-so-lution partitioning of cations towards the sol-id phase, and hence the mobility and availa-bility of cations generally decreases. Another controlling factor is the available amount of sorption sites related to the cation-exchange capacity of a soil and the amount of competi-tively sorbed cations, especially calcium. High binding coefficients and nonlinear adsorption of metals are typical features that tend to in-crease over time due to increased chemical binding, precipitation, and inclusion of metals into solid matrices (aging). Aging is also im-pacted by most of the factors affecting metal speciation.
When many cations compete for the same sorption sites, the solid-solution partitioning of cations shifts towards the solution phase, and hence the mobility and availability of cations generally increases. Metal partition-ing over the different sorption phases is as-sumed to be in equilibrium. Depletion of one of the metal species may occur, mostly the free metal ion activity because it reflects the chemical reactivity of a metal and is rapidly taken up by organisms. Disequilibrium due to depletion may lead to a new equilibrium situ-ation. The time in which a new equilibrium is established depends on the total dissolved metal concentration and the concentration and nature of the ligands present in the so-lution. The release of free ion (Me2+ or Me2+ (H2O)), replenished from metals bound to in-organic ligands in the solution (e. g. MeOH, MeCl2), requires only seconds, whereas the release of metals from the solid phase to-wards the solution phase takes days rather than hours. In conclusion, total metal con-centrations in soil include non-bioavailable forms. All loosely-bound metal species in the soil are in equilibrium with each other, how-ever equilibration time depends on the nature of the ligand present.
To summarize, the main factors affecting metal speciation and interaction with biota include:
■ Oxidation potential—redox conditions.
■ Salinity.
■ Competing ions.
■ Acidity (pH).
■ Nature of sorbent phases and their sur-face areas.
■ Surface site densities.
■ Colloid formation.

196
Environmental Risks and Challenges of Anthropogenic Metals Flows and Cycles
Biological AvailabilityMetals in the solution phase reflect the spe-cies being chemically most available and are likely to be of most importance for uptake by organisms. However up to now, no consist-ent relationship has been found between any metal species and either bioaccumulation or toxicity. This is because biological avail-ability is a physiologically driven uptake pro-cess. The biologically available metal fraction is the fraction actually taken up by organ-isms. The magnitude of metal accumulation depends on the metal supply of the soil and the demand of soil organisms for metal up-take. Which metal species in the soil can be taken up by organisms is organism-specific and influenced by the possible uptake routes. Quantification of exposure routes of metals for terrestrial invertebrates is difficult and cannot yet be done accurately (Belfroid and Van Gestel 1999). From an ecological point of view, two metal uptake routes, or a combina-tion of them, may be envisaged for soil inver-tebrates. Firstly, metal uptake via the perme-able external surfaces was distinguished. The direct source of importance of this uptake route is metals in pore water. Secondly, metal uptake via the oral route was distinguished. Metal uptake via the oral route includes pos-sible modification of metal speciation by gut conditions. This route includes uptake via drinking, soil and food ingestion. Via drinking, metal uptake is indirectly from pore water, possibly following modification of the pore water depending on gut conditions. Upon soil and food ingestion the metal uptake is indi-rectly from solid phases, possibly following modification by gut conditions. When focus-ing on bioaccumulation, problems around metal availability (such as which species are chemically reactive and how fast is metal re-plenishment) and metal bioavailability (such as which metal species are bioavailable, the contribution of uptake routes, and the physi-ological need for essential metals) are inte-grated and overcome.
Toxicological AvailabilityToxicological availability is the toxico-dynamic behavior of metals inside organisms. Accu-mulated metals are distributed throughout the organism’s body, and can be sequestrat-ed in a biologically available form or isolated metabolically to be no longer toxicologically available. At cellular level, the internal metal speciation which can be found in an organism is (Vijver et al. 2004):
■ Free ionic form or complexed ion species (e. g. CdCl2, CdCl+, CdCl3-).
■ In the active centre of functional proteins (e. g. hemoglobin, hemocyanine), low mo-lecular weight peptides, in the active cen-tre of enzymes.
■ To low molecular weight organic acids (e. g. citrate).
■ To metallothionein, to transport pro-teins (e. g. ferritin), or other sequestration proteins.
■ As intracellular granules or extracellular granules.
These biochemical mechanisms serve to pre-vent the organism against accumulation of reactive metal species, and they might also have an impact on the accumulation lev-el reached in organisms during exposure. In theory, when the storage compartment is in-ert and an infinitive sink, this will be reflect-ed in linear uptake curves. When the stor-age compartment has a dynamic equilibrium with the labile compartment and elimination from the storage occurs, a saturation type accumulation curve can be seen. Adverse effects will occur whenever the metal up-take flux exceeds elimination or storage flux, and the metals bioaccumulate in excess over the metabolically required pool or exceed a threshold concentration at the specific site of action.

197
Environmental Risks and Challenges of Anthropogenic Metals Flows and Cycles
Annex 3 Impacts of Deficiencies and Overdoses of Metals on Human Health
In this Annex, health effects of some select-ed metals are described and a few examples of concrete impacts are provided. However it is necessary to remember that the geological background varies very much and has no po-litical borders. Therefore in most cases local health effects of these metals are the same wherever they occur in the world. Arsenic is such an example demonstrating that lo-cal poisoning from local drinking water from wells in the forests of Scandinavia has the same effect as in the huge mass poisoning in Bangladesh and West Bengal. Therefore it is not possible to distinguish local effects from global effects.
IronIron can be found in meat, whole meal prod-ucts, potatoes and vegetables. The human body absorbs iron in animal products fast-er than iron in plant products. Iron is an es-sential part of hemoglobin; the red colour-ing agent of the blood that transports oxygen through our bodies. Iron may cause conjunc-tivitis, choroiditis, and retinitis if it contacts and remains in the tissues. Chronic inhala-tion of excessive concentrations of iron oxide fumes or dusts may result in development of a benign pneumoconiosis, called siderosis. No physical impairment of lung function has been associated with siderosis. Inhalation of excessive concentrations of iron oxide may enhance the risk of lung cancer development in workers exposed to pulmonary carcino-gens. A more common problem for humans is iron deficiency, which leads to anaemia. A man needs an average daily intake of 7 mg of iron and a woman 11 mg; a normal diet will generally provide all that is needed.
CopperCopper is naturally present in food, drinking water and all environmental compartments. Copper is an essential element and adverse effects are related to deficiencies as well as overdoses.
The concentration of copper in the body is strictly and efficiently regulated by homeo-static mechanisms. Systemic effects ensue but the capacity of the homeostasis is ex-ceeded. The major control mechanism is gastrointestinal absorption and biliary excre-tion into faeces. Liver has an important role in the maintenance of the copper homeosta-sis. The failure to maintain homeostasis may lead to adverse effects resulting either from deficiency or excess. Copper deficiency caus-es more and far severe adverse health effects than copper toxicity (WHO, 1998 and SCHER, 2008).
At least 12 major proteins require copper as an integral part of their structure (WHO, 19984). Specific adverse consequences from copper deficiency in humans have been ob-served in measures of cardiovascular func-tion, bone metabolism, lipid levels, and im-munological parameters indicative of im-paired immune function (Copper risk assess-ment report, 2007).
Effects of Cu deficiency in animals have also been extensively studied in several parts of the world because it is a problem mainly for sheep and cattle production. Copper supple-mentations to animal feed are common prac-tice: pigs, cattle, chicken farms as well as fish farms (SCAN, 2003).
Effects from excess after single doses have been observed in humans as nausea and other gastrointestinal irritation effects due to high copper concentration in drinking wa-ter (above the WHO drinking water limit of 2 mg/l). After repeated oral dosing at elevat-ed levels, liver, forestomach and kidneys are target organs of copper toxicity (Copper risk assessment report, 2007 and SCHER, 2008).
To cope against copper deficiency, WHO (1998) set a lower safe threshold level for copper at 20 µg Cu/kg body weight/day for adults and at 50 µg Cu/kg body weight/day for children. From the copper Risk Assessment, no conclusive Deficiency Effect Level (DEL) was derived but dietary intake of 1 mg Cu/day was shown to be sufficient to maintain

198
Environmental Risks and Challenges of Anthropogenic Metals Flows and Cycles
the copper balance (Stern, 2007 and SCHER, 2008).
In the copper RA report, a long-term No Ob-served Adverse Effect Level (NOAEL) value was derived from existing animal studies and allowed to calculate a systemic safe thresh-old value of 0.16 mg/kg body weight/day (or 0.041 mg/kg body weight as internal dose (25 % gastro-intestinal absorption)). For a person of 70 kg this would correspond to an upper limit of 11.4 mg/person/day for ingest-ed copper (Cross, 2007 and SCHER, 2008). A 10 mg/person/day as upper safe value of was also concluded by several other independent national and international commissions (IOM, 2001; WHO 2004 and 2008).
ZincZinc is a trace element that is essential for human health. When people absorb too lit-tle zinc they can experience symptoms of zinc deficiency e. g.: a loss of appetite, decreased sense of taste and smell, slow wound heal-ing and skin sores. Zinc-shortages can even cause birth defects. An important effect of zinc deficiency is the reduction in immune response, leading notably in children to in-creased frequency of mortality through in-fectious disease (Zinc investigators’ collabo-rative group, 1999, 2000; Brooks et al 2005; Shankar et al 2000). Zinc deficiency is a ma-jor health problem at a global scale: it has been estimated by FAO that approximate-ly one third of the world’s population lives in countries that have a high risk of zinc defi-ciency (IZiNCG 2004). For this reason, ma-jor efforts are being undertaken by the world community to fight zinc deficiency in develop-ing countries (WHO-UNICEF 2004).
Zinc deficiency can be a danger to unborn and newborn children (Samuelson et al., 2011). Diabetes presents one example of the use of geochemistry in medical geolo-gy. Childhood diabetes is almost exclusive-ly of the insulin-dependent type (type1). A case control study in Sweden was designed comparing zinc contained in biogeochemi-cal samples from different areas. The results showed that a high water concentration of
zinc was associated with a significant de-crease in risk. This provides evidence that a low groundwater content of zinc, which may reflect long-term exposure through drinking water, may be associated with later develop-ment of childhood onset diabetes.
Although humans can handle proportionally large concentrations of zinc, too much zinc can still cause major health problems, such as stomach cramps, skin irritations, vomit-ing, nausea and anemia. Very high levels of zinc can damage the pancreas and disturb the protein metabolism, and cause arterio-sclerosis. Extensive exposure to zinc chloride can cause respiratory disorders.
AluminiumAluminium is one of the most widely used metals and also one of the most common el-ements in the earth's crust. Aluminium may be leached from the ground under acidic con-ditions, like in connection with acid rain, and have harmful effects on local organisms. Hu-man intake of aluminium is predominantly through food, both due to natural content and in some countries also through food additives used to preserve food. Less than 0,1 % is nor-mally absorbed from the stomach and intes-tines, the rest passing through. There are no health effects associated with normal intake of aluminium in food or water. People on spe-cific medications will take in larger quantities of aluminium. Workers employed in alumin-ium production may experience respiratory problems, usually linked to some of the sub-stances released during production.
Aluminium can cause problems for kidney patients when it enters the body during kid-ney dialyses. This condition is now well rec-ognised and prevented through control of al-uminium concentration in the water used.
The Joint Expert Committee on Food Addi-tives (JECFA), an UN WHO/FAO body has re-cently (June 2011) revised the Provisional Tol-erable Weekly Intake limit (PTWI) for alumini-um to 2 mg/kg body weight/week.

199
Environmental Risks and Challenges of Anthropogenic Metals Flows and Cycles
NickelNickel is a compound that occurs in the en-vironment at different levels, dependent on location. Some foodstuffs naturally contain small amounts of nickel. Chocolate and oats are known to contain higher quantities than some other food. Some plants are known to accumulate nickel and as a result the nick-el uptake from these plants could be signifi-cant. In summary, Humans may be exposed to nickel by breathing air, drinking water, eat-ing food or smoking cigarettes. Skin contact with nickel-releasing items – may also result in nickel exposure, but uptake by the dermal route is negligible and would not result in significant systemic exposure. In small quan-tities nickel may be essential to humans, al-though this is difficult to demonstrate given the pervasiveness of low levels of nickel ex-posure. Allergic reactions such as skin rash-es, can occur as a result of prolonged and in-timate exposure with nickel-releasing items, mainly from jewelry.
Inhalation exposure to high levels of nickel compounds found during the processing and refining of sulfidic nickel ores has resulted in higher chances of development of lung and nose cancer. Exposure to nickel carbonyl can cause several immediate effects (e. g. head-aches, weakness, nausea, vomiting, etc.) as well as delayed effects (e. g., pneumonia, res-piratory failure, cerebral edema, death, etc.). This compound is used in the Mond nickel re-fining process and exposure is strictly con-trolled. A few case reports of asthma asso-ciated with exposure to water soluble com-pounds exist. Adverse reproductive develop-mental effects have been observed in rats orally exposed to high levels of nickel sulfate. However, studies of female refinery workers in Russia have not shown adverse reproduc-tive effects to be associated with nickel expo-sures.
Nickel compounds have been listed by the National Toxicology Program (NTP) as known human carcinogens while nickel metal is listed as being reasonably anticipated to be carcinogenic. The International Agency for Research on Cancer (IARC) has listed nick-
el compounds within group 1 (there is suffi-cient evidence for carcinogenicity in humans) and nickel metal within group 2B (agents which are possibly carcinogenic to humans). OSHA does not regulate nickel as a carcin-ogen. Only certain nickel compounds have been demonstrated to be carcinogenic, and carcinogenicity is restricted to the inhala-tion route of exposure. A recently conducted animal study demonstrated that nickel metal was not carcinogenic by the inhalation route of exposure. This result is consistent with the lack of evidence of increased respiratory can-cer risks in workers with predominant nickel metal exposures.
ChromiumPeople can be exposed to chromium through breathing, eating or drinking and through skin contact with chromium or chromium compounds. The level of chromium in air and water is generally low. In drinking wa-ter the level of chromium is usually low as well, but contaminated well water may con-tain the dangerous chromium(VI); hexava-lent chromium. For most people eating food that contains chromium(III) is the main route of chromium uptake, as chromium(III) occurs naturally in many vegetables, fruits, meats, yeasts and grains. Various ways of food prep-aration and storage may alter the chromium contents of food. Chromium(III) is an essen-tial nutrient for humans and shortages may cause heart conditions, disruptions of me-tabolisms and diabetes. But the uptake of too much chromium(III) can cause health effects as well, for instance skin rashes.
Chromium(VI) is known to cause various health effects. Some health problems that are caused by chromium(VI) are skin rashes, upset stomachs and ulcers, respiratory prob-lems, weakened immune systems, kidney and liver damage, alteration of genetic ma-terial, carcinogenicity, dermatitis, asthmatic bronchitis, bronchospasms and edema. The health hazards associated with exposure to chromium are thus dependent on its oxida-tion state. The metal form is of low toxicity.

200
Environmental Risks and Challenges of Anthropogenic Metals Flows and Cycles
LeadLead can enter the human body through up-take of food, water and air. Foods such as fruit, vegetables, meats, grains, seafood, soft drinks and wine may contain significant amounts of lead. Cigarette smoke also contains small amounts of lead. Lead can enter (drinking) water through corrosion of pipes. This is more likely to happen when the water is slightly acidic. That is why public water treatment sys-tems are now required to carry out pH-adjust-ments in water that will serve drinking pur-poses. Lead can enter a foetus through the placenta of the mother. Because of this it can cause serious damage to the nervous system and the brains of unborn children. For as far as we know, lead fulfils no essential function in the human body; it can merely do harm af-ter uptake from food, air or water.
Lead can cause several unwanted effects, such as disruption of the biosynthesis of hae-moglobin and anaemia, rise in blood pres-sure, kidney damage, miscarriages and sub-tle abortions, disruption of nervous sys-tems, brain damage, declined fertility of men through sperm damage, diminished learning abilities of children, behavioural disruptions of children, such as aggression, impulsive behavior and hyperactivity
Fortunately, lead in the environment has strongly declined in recent years. This has been also observed in marine species. The concentration of lead in fish and blue mus-sel in the Baltic Sea has shown a decreasing trend since the early 1980’s. The main rea-son is obviously to be found in the successful measures, which have been taken in order to lower emissions from industries. Another im-portant reason is the increasingly restricted legislation by authorities, which has result-ed in an increased use of unleaded gasoline in cars. The average level of lead in blood of both children and adults fits very well to the amount of used lead. Both correlates have shown a significant decline from late seven-ties. We know that low lead levels negative-ly influence processes of heme synthesis. In slightly higher amounts, Pb may cause alter-ations in the central nervous system. Moni-
toring of Pb levels in children at risk is thus very important.
One important factor in the effects of lead is the speciation and mode of occurrence. An excellent example of this can be seen in Swe-den and Greece. In both countries there are ancient mining areas which have been mined for more than 1000 years: Falun in Sweden, Lavrion in Greece. Both these areas have been mined for lead. The total soil lead con-tents in the cities are in both cases extremely high. However the uptake of lead into veg-etables and people are almost zero in Falun and in Lavrion the uptake is extremely high causing several diseases, mental effects, etc. and the blood lead contents in children are normally very high. The reason for this is that although the total lead contents in soils are the same, the lead is not bioavailable in Fa-lun and is bioavailable in Lavrion. This result shows that the bioavailability, bioaccessabil-ity and geoavailability must be taken into ac-count looking at the health effects of metals in the environment.
TinTin is mainly applied in various organic sub-stances. The organo-tin compounds are the most dangerous forms of tin for humans. De-spite the dangers, they are applied in a great number of industries, such as the paint in-dustry and the plastic industry, and in agri-culture through pesticides. The number of applications of organic tin substances is still increasing, despite the fact that we know the consequences of tin poisoning.
The effects of organic tin substances can vary. They depend upon the kind of substance that is present and the organism that is ex-posed to it. Triethyltin is the most dangerous organic tin substance for humans. Humans can absorb organo-tin compounds through food and breathing and through the skin.
The uptake of organo-tin compounds can cause acute effects as well as long-term ef-fects. Acute effects are eye and skin irrita-tions, headaches, stomachaches, sickness and dizziness, severe sweating, breathless-

201
Environmental Risks and Challenges of Anthropogenic Metals Flows and Cycles
ness and urination problems. Long-term ef-fects are depressions, liver damage, mal-functioning of immune systems, chromosom-al damage, shortage of red blood cells, brain damage (causing anger, sleeping disorders, forgetfulness and headaches)
MercuryMetallic mercury is used in a variety of household products, such as barometers, thermometers and fluorescent light bulbs. The mercury in these devices is trapped and usually does not cause any health problems. However, when a thermometer breaks a sig-nificantly high exposure to mercury through breathing will occur for a period of time while it vaporizes. This can cause harmful ef-fects, such as nerve, brain and kidney dam-age, lung irritation, eye irritation, skin rashes, vomiting and diarrhoea.
Mercury has a number of effects on humans, that can be simplified into the following main effects: Disruption of the nervous system, damage to brain functions, DNA damage and chromosomal damage, allergic reactions, re-sulting in skin rashes, tiredness and head-aches, negative reproductive effects, such as sperm damage, birth defects and miscar-riages. Damaged brain functions can cause degradation of learning abilities, personal-ity changes, tremors, vision changes, deaf-ness, lack of muscle coordination and mem-ory loss. Chromosomal damage is known to cause mongolism.
Mercury compounds were the causes of sev-eral serious early environmental hazards. Over a period in the 1960’s the concentrations of mercury in fish in Swedish lakes increased and fishing in many lakes was outlawed. The reason is that during the period when there was a deposition of mercury, pools of mercu-ry were built up in the soils. From these pools mercury can become mobile (methylation of mercury) and once more affect living organ-isms. In 50 % of the Swedish lakes (40 000 lakes) pikes have mercury contents exceed-ing 0.5 mg/kg which is the limit recommend-ed by Codex Alimentarius (United Nations).
Large amounts of mercury are used for arti-sanal gold mining in several developing coun-tries. Mercury is used during gold mining to dissolve gold dust in sand, thereby forming amalgam. Pure gold is then produced by heat-ing the amalgam so that mercury evaporates and is emitted to the air, leaving the pure gold behind. In the Amazon alone, some two thou-sand tonnes of mercury have been emitted in this way during the two latest decades. Most of this mercury has been imported from Eu-rope. The fish in the gold mining areas get in-creased levels of mercury, thereby poisoning the local population, whose staple food is fish. The gold miners are also exposed to mercury vapour, especially when amalgam is heated. The mercury emissions to the air contribute to the global burden of mercury. There is a law in Brazil against using mercury for gold mining. In spite of this, the gold miners are the main contributors to mercury emissions in Brazil.
CadmiumCadmium accumulates in the human body, especially in the kidneys. According to cur-rent knowledge, kidney damage (renal tubu-lar damage) is probably the critical health effect, both in the general population and in occupationally exposed workers. The accu-mulation of cadmium in the kidney (in the re-nal cortex) leads to dysfunction of the kidney with impaired reabsorption of, for instance, proteins, glucose, and amino acids. It is esti-mated that 1 percent of all smoking women in Sweden with low body iron levels may ex-perience adverse kidney effects due to cad-mium load. Both human and animal studies indicate that skeletal damage (osteoporosis) may be a critical effect of cadmium expo-sure. Lung changes primarily characterised by chronic obstructive airway disease may follow high occupational exposure. Early mi-nor deterioration in ventilatory function may progress, with continued cadmium exposure, to respiratory inadequacy. An increased mor-tality rate from obstructive lung disease has been seen in workers with high exposure in the past. Other effects of cadmium exposure are: disturbances in calcium metabolism, hy-percalciuria and formation of stones in the kidney.

202
Environmental Risks and Challenges of Anthropogenic Metals Flows and Cycles
ArsenicThe public health concern for environmental exposure to arsenic has been widely recog-nized for decades. However, recent human activities such as drilling for water in arse-nic containing aquifers have resulted in even greater arsenic exposures and the potential increase for chronic arsenic poisoning on a worldwide basis. This is especially the case in China, Taiwan Province of China, Thailand, Mexico, Chile, and India. The sources of ar-senic exposure vary from burning of arsenic-rich coal (China) and mining activities (Malay-sia, Japan) to the ingestion of arsenic-con-taminated drinking water (Taiwan Province of China, Philippines, Mexico, Chile).
The groundwater arsenic contamination in Bangladesh and the West Bengal Delta of In-dia has received the greatest international attention due to the large number of people potentially exposed and the high prevalence of arsenic-induced diseases (Table A3.1). Re-cent estimates suggest that as many as 20 to 30 million people are at risk from drinking arsenic-contaminated water in Bangladesh, which is obtained from the millions of tube wells that appear to be contaminated with naturally occurring arsenic. Several epidemi-ological studies have documented the glob-al impact of arsenic contamination and the characterization of the sources of exposure.
Table A3.1
Some selected examples of arsenic
poisoning from drinking water
worldwide. In addition to these are for example
Argentina, New Zealand, Brazil, Ghana,
Zimbabwe, Japan, Chile, France,
UK, Sweden (Data from Selinus et
al., 2005)
Country or region Year of discovery
Contents in ground-water (μg As/L)
Number of people at risk for cancer
Taiwan Province of China 1950 10 – 1820 200 000
Chile 1971 900 – 1040 437 000
Hungary 1774 10 – 176 220 000
Bangladesh 1980s < 1 – 4700 100 000 000
India, West Bengal 1980s < 10 – 3900 1 000 000
Thailand, Ronpibool 1980s 1 – 5000 1000
China, Xinjiang 1980s 1 – 8000 100 000
Argentina 1981 100 – 1000 2 000 000
Mexico 1983 10 – 4100 400 000
Peru 1984 500 250 000
USA 1988 10 – 48000 ?
China, Inner Mongolia 1990 1 – 2400 600 000
Bolivia 1997 No data 20 000
Vietnam 2001 1 – 3050 Millions
Romania 2001 10 – 176 36 000
Nepal 2002 -456 ?

203
Environmental Risks and Challenges of Anthropogenic Metals Flows and Cycles
The ingestion of As by humans can cause a variety of disorders, including skin lesions (e. g., hyperpigmentation, melanosis, kera-tosis), respiratory system problems (e. g., chronic cough, shortness of breath, bronchi-tis), nervous system effects (e. g., neuropathy, neurobehavioral, weakened memory, lower IQ, decreased attention), cancers of differ-ent organs (e. g., skin, lung, bladder), and reproductive effects (e. g., pregnancy com-plications, fetus abnormalities, premature deliveries, reduced birth weight). There are, in addition, potential links to heart disease and diabetes, but further evidence is need-ed to support these relationships. Approach-es available to document chronic As expo-sure include analysis of As levels in drink-ing water, and measurement of urinary, nail, hair and blood As levels (biological monitor-ing). It has been shown that even low level As-exposures may affect human health, with greater effects in malnourished people. Re-cent evidence also implicates ethnic origin as a potential variable when determining As ef-fects. It is becoming clear that a drinking wa-ter quality guideline of 50 µg/L As is not pro-tective, and while guidelines have decreased (to 25 µg/L in Canada and 10 µg/L USA and WHO), attempts to lower them to ≤ 5 µg/L (Canada) must be encouraged. Because groundwater can contain high levels of As, most groundwater sources used for drinking water should be tested for As. If total As con-centrations are above 5 µg/L, then it is sug-gested that biological monitoring should be carried out. This includes measuring As lev-els in urine, blood, toenails and hair.
Perhaps the single most characteristic ef-fect of long-term oral exposure to inorganic arsenic is a pattern of skin changes. These include a darkening of the skin and the ap-pearance of small lesions on the palms, soles, and torso. Chronic arsenic exposure from oral ingestion and inhalation has been associated with a variety of internal cancers involving the gastrointestinal tract, urinary bladder, lung, liver, and kidney. Research has also pointed to significantly higher standard-ized mortality rates for cancers of the blad-
der, kidney, skin, and liver in many areas of arsenic pollution.
Chronic arsenic toxicity due to drinking of ar-senic-contaminated groundwater has been recently reported from many Asian countries. Of these, the catastrophic health problems caused by arsenic in the well waters of Bang-ladesh and West Bengal, India have been front page stories in newspapers, on televi-sion, and in scientific journals. Although esti-mates as to how many people are at risk vary, there is no question that it runs into the tens of millions in Bangladesh alone, and in West Bengal it is suspected that about 6 million people are exposed to arsenic-contaminat-ed drinking water above the 50 ppb As level. This situation has been called the “greatest mass poisoning in history”. What is not often reported is that the tens of millions of people exposed to arsenic in Bangladesh represent only a portion of the people who are at risk worldwide. Dangerously high levels of arsenic have been reported in water supplies of com-munities in Argentina, Austria, Brazil, Cana-da, China, Ghana, Greece, Hungary, Iceland, India, Japan, Korea, Malaysia, Mexico, Inner Mongolia, Nepal, Romania, Taiwan Province of China, Vietnam, Zimbabwe, and the U.S.
CobaltAs cobalt is widely dispersed in the environ-ment humans may be exposed to it by breath-ing air, drinking water and eating food that contains cobalt. Skin contact with soil or wa-ter that contains cobalt may also enhance ex-posure. Cobalt is not often freely available in the environment, but when cobalt ions are not bound to soil or sediment particles, the up-take by plants and animals is higher and ac-cumulation in plants and animals may occur.
Cobalt is a part of vitamin B12, which is es-sential for human health. The total daily in-take of cobalt is variable and may be as much as 1 mg, but mostly it will pass through the body unadsorbed, except that in vitamine B12. Ruminants require cobalt for growth and vitality and therefore ionic cobalt supplemen-tation may be useful in veterinary practice.

204
Environmental Risks and Challenges of Anthropogenic Metals Flows and Cycles
However, too high concentrations of co-balt may damage human health. When we breathe in too high concentrations of cobalt through air we experience lung effects, such as asthma and pneumonia. Health effects that are a result of the uptake of high con-centrations of cobalt are vomiting and nau-sea, vision problems, heart problems and thyroid damage. Health effects may also be caused by radiation of radioactive cobalt iso-topes. This can cause sterility, hair loss, vom-iting, bleeding, diarrhoea, coma and even death. This radiation is sometimes used with cancer-patients to destroy tumors. These pa-tients also suffer from hair loss, diarrhea and vomiting. Cobalt dust may cause an asthma-like disease with symptoms ranging from cough, shortness of breath and dyspnea to decreased pulmonary function, nodular fibro-sis, permanent disability, and death. Expo-sure to cobalt may cause weight loss, der-matitis, and respiratory hypersensitivity. The International Agency for Research on Can-cer (IARC) has listed cobalt and cobalt com-pounds within group 2B (agents which are possibly carcinogenic to humans). ACGIH has placed cobalt and inorganic compounds in category A3 (Experimental animal carcinogen – the agent is carcinogenic in experimental animals at a relatively high dose, by route(s), histologic type(s), or by mechanism(s) that are not considered relevant to worker expo-sure.) Cobalt has been classified to be carci-nogenic to experimental animals by the Fed-eral Republic of Germany.
MolybdenumWith regard to effects of increased Mo-lev-els on humans, there are several studies that have described some adverse effects on peo-ple that are chronically exposed to elevated levels of molybdenum (liver dysfunction of workmen chronically exposed in a Soviet Mo-Cu plant, and signs of gout among inhabit-ants of Mo-rich areas of Armenia). The rele-vance and reliability of the conclusions made in these studies, however, are questionable.
There is a specific phenomenon that is spe-cifically associated to ruminants, and which is generally known as molybdenosis. Molyb-denosis is found only in ruminants such as cattle, deer and sheep, and is caused by mo-lybdenum induced copper deficiency. It is not found in non-ruminants. Effects in cattle cor-respond with symptoms observed when di-etary copper is deficient e. g. diarrhoea, alo-pecia (loss of hair), achromatrichia (change in hair colour), reduced milk yield and loss of body weight. In short, molybdenosis is cop-per deficiency (hypocuprosis), caused by the formation of insoluble copper – thiomolyb-date complexes that can be formed in the “unique ecosystem” of the rumen of rumi-nants. Individual experimental studies with cattle have demonstrated that toxicity symp-toms related to molybdenum-induced copper deficiency are either reduced or totally dis-appear after the addition of adequate copper to the diet (Clawson et al., 1972). Also in field studies, toxicity symptoms in cattle associ-ated with an increased intake of molybde-num either reduced or disappeared simply by addition of supplementary copper. Smolders and Buekers (2009) conducted an in depth re-view of the Cu:Mo ratios at which molybdeno-sis is observed in cattle, and concluded that a dietary Cu-Mo ratio of 1.30 was sufficient-ly protective against molybdenosis for cattle. Available literature data on molybdenosis for other ruminants (field data on sheep, deer) confirmed that molybdenosis in these ani-mals only occurred at a Cu-Mo ratio well be-low 1.30 (i. e., between 0.07 and 0.8).

205
Environmental Risks and Challenges of Anthropogenic Metals Flows and Cycles
Molybdenosis has not been observed in non-ruminants as their gastro-intestinal system does not involve the conditions and the mi-cro-organisms found in the rumen of rumi-nants. Nonetheless, molybdenosis is a well-recognised phenomenon that has been ob-served in the field, and that requires proper assessment. The onset of molybdenosis is highly dependent of the dietary copper level, its bioavailability to the ruminant and the di-etary Cu:Mo ratio. Through the addition of copper to the diet, however, the occurrence of copper deficiency (i. e., molybdenosis) can be prevented.
An illustrative example of the complexity of diagnosing trace element imbalances in ani-mals, especially wild animals, is the dis-ease in moose (Alces alces L.) appearing in an area in Southwest Sweden from about 1985. Affected animals showed a number of symptoms if they were found alive. Behavio-ral disturbances with apathy and pathologi-cal locomotion, loss of appetite, diarrhoea, emaciation, discoloration and loss of hair and opacities in the cornea and lens of one or both eyes were described in sick animals. In the dead animal post mortem examina-tions revealed lesions of the mucosa on the gastro-intestinal tract like oedema, hyper-emia, hemorrhage and erosive lesions. The heart was dilated and flabby and myocardial lesions were seen macroscopically. The gas-tro-intestinal changes indicated a viral etiol-ogy of the disease but other findings do not support this and still no virus have been de-tected that could be responsible for the dis-ease. An indication of the ethiology was found in measurements of trace elements in livers and kidneys from yearling moose sampled all over Sweden during the normal hunting peri-ods in 1982, 1988, 1992 and 1994. The results showed that from 1982, before the outbreak of the disease, to later samplings the hepat-ic concentrations of Se and especially Mo in-creased in the affected area whereas Cu, Cd and some other elements decrease in con-centration. These results were different from
the neighboring areas during the same peri-od. The plausible explanation for this discrep-ancy in the fact that the Alvsborg county was heavily limes to counteract the effects of acid rain that had caused damage to local forest and aquatic ecosystems. The increase in soil pH after liming however, altered the bioavail-ability of various trace elements, and as such may have altered the Cu:Mo ratio in soil, sur-face waters and grass down to a level below the “safe” threshold value. The hypothesis that the liming-induced effect on trace metal bioavailability resulted in hypocuprosis/mo-lybdenosis, is supported by the fact that the majority of symptoms and pathological signs found in the moose could be explained by de-creased activity of Cu-containing enzymes.
Other Cu-deficiency problems that are re-lated to low Cu:Mo ratio’s have earlier been suspected and reported from North Ameri-ca in moose (Alces alces gigas) in Alaska and from Africa in Grant’s gazelle (Gazelle granti) in the Rift valley in Kenya.

206
Environmental Risks and Challenges of Anthropogenic Metals Flows and Cycles
Annex 4 Applications of Metals in Society
The most important applications of the met-als considered in this report are listed in the table below (main source: USGS).
Table A4.1
Applications of the metals
Metal Most important applications
Fe 98 % is forged into steel, used in construction, transportation, machinery and equipment, cans and containers, a wide variety of consumer products
Al transportation (automobiles, airplanes, trucks, railcars, marine vessels, etc.); packaging (cans, foil, etc.); construction (windows, doors, siding, etc); consumer durables (appliances, cooking utensils, etc.); electrical transmission lines; ma-chinery
Cu power transmission and generation; building wiring; telecommunication; electri-cal and electronic products; industrial machinery; consumer and general products
Zn coating, galvanising, alloys (bronze and brass) in construction materials; stabilis-er, pigment and micronutrient
Pb industrial and transport (SLI) batteries, ammunition, lead sheet, pigments and stabilizers
Cr stainless steel and non-ferrous alloys; plating of metals, pigments, leather pro-cessing, catalysts, surface treatments, and refractories
Ni In stainless and ferrous and non-ferrous alloys and superalloys, and in electro-plating. Used in transportantion, construction, machinery, electrical equipment, household appliances.
Sn coatings, alloys, solder
Hg dentistry, switches and lighting, industrial applications such as in production pro-cess of PVC
Cd batteries, pigments, coatings, stabiliser
As wood preservative, pesticide
Au jewelry, electronics, financial reserves
PGM jewelry; catalytic converters; industrial catalysts; electronics and electronic equip-ment; fiberglass; LCD screens; dentistry
Mo alloying agent in steel, cast iron, and superalloys, also added to chromium, co-lumbium (niobium), manganese, nickel, tungsten, or other alloy metals; chemical applications, including catalysts, lubricants, and pigments
Co rechargeable battery electrodes; superalloys; airbags in automobiles; catalysts for the petroleum and chemical industries; cemented carbides (also called hardmetals) and diamond tools; corrosion- and wear-resistant alloys; drying agents for paints, varnishes, and inks; dyes and pigments; ground coats for porcelain enamels; high-speed steels; magnetic recording media; magnets; steel-belted radial tires

207
Environmental Risks and Challenges of Anthropogenic Metals Flows and Cycles
Annex 5 Ore Grades and Ore Grade Declines
Historically, the long-term trend in the grades of ores processed has declined for numerous metals, often substantially in the first half of the twentieth century and more slowly in recent decades, depending on the metal. In general, the synthesis of extensive production statistics remains relatively un-common, although a range of recent papers have published data on trends for copper, uranium, gold, nickel and platinum group metals of varying historical lengths. There are a range of factors which need to be con-sidered in understanding the drivers behind ore grade decline, as these are crucial in any projection of the likely future trends in ore grades.
The ore grades processed at any given are a complex function of available technology, prevailing prices, demand-supply balanc-es, ore types, ongoing exploration success or sometimes even social or environmental constraints. In general, growing demand, im-proving technology and exploration success has continued to ensure reliable and relative-ly cheap supply (in real terms). This has al-lowed the gradual lowering of cut-off grades, the grade at which it is economic to process ore, and a substantial expansion of annual global production.
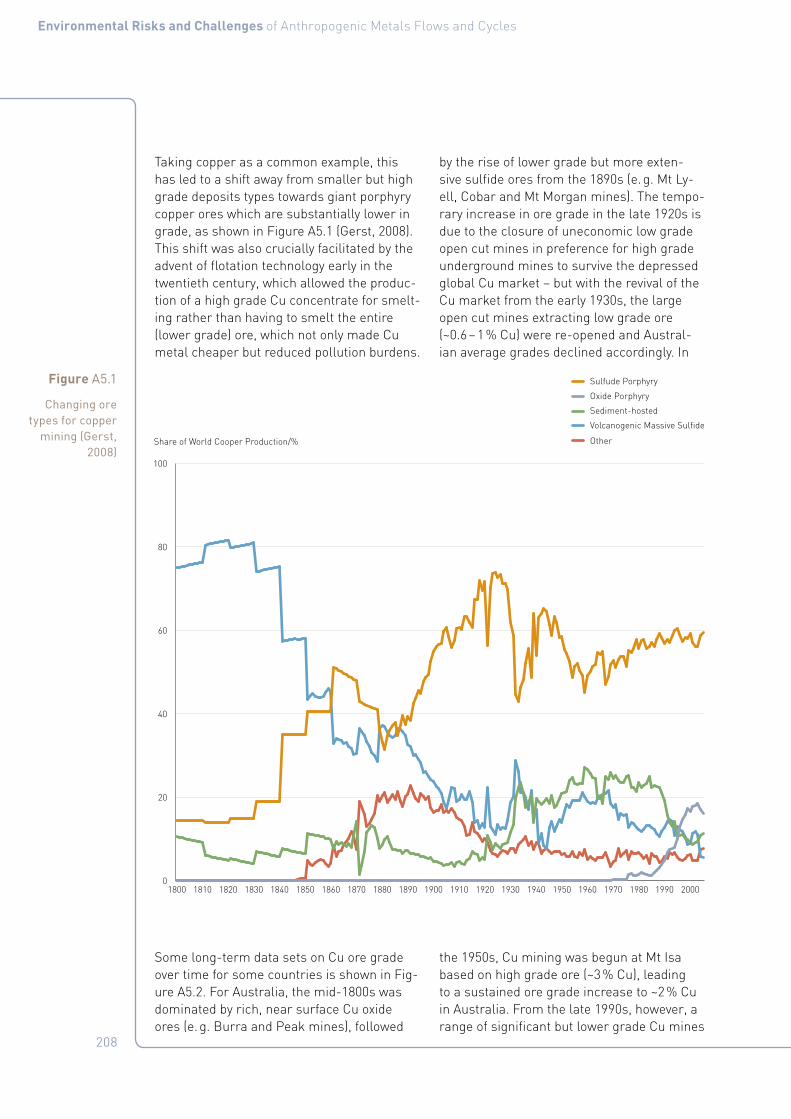
208
Environmental Risks and Challenges of Anthropogenic Metals Flows and Cycles
Taking copper as a common example, this has led to a shift away from smaller but high grade deposits types towards giant porphyry copper ores which are substantially lower in grade, as shown in Figure A5.1 (Gerst, 2008). This shift was also crucially facilitated by the advent of flotation technology early in the twentieth century, which allowed the produc-tion of a high grade Cu concentrate for smelt-ing rather than having to smelt the entire (lower grade) ore, which not only made Cu metal cheaper but reduced pollution burdens.
Some long-term data sets on Cu ore grade over time for some countries is shown in Fig-ure A5.2. For Australia, the mid-1800s was dominated by rich, near surface Cu oxide ores (e. g. Burra and Peak mines), followed
by the rise of lower grade but more exten-sive sulfide ores from the 1890s (e. g. Mt Ly-ell, Cobar and Mt Morgan mines). The tempo-rary increase in ore grade in the late 1920s is due to the closure of uneconomic low grade open cut mines in preference for high grade underground mines to survive the depressed global Cu market – but with the revival of the Cu market from the early 1930s, the large open cut mines extracting low grade ore (~0.6 – 1 % Cu) were re-opened and Austral-ian average grades declined accordingly. In
the 1950s, Cu mining was begun at Mt Isa based on high grade ore (~3 % Cu), leading to a sustained ore grade increase to ~2 % Cu in Australia. From the late 1990s, however, a range of significant but lower grade Cu mines
Figure A5.1
Changing ore types for copper
mining (Gerst, 2008)
0
20
40
60
80
100
Other
Volcanogenic Massive Sulfide
Sediment-hosted
Oxide Porphyry
Sulfude Porphyry
200019901980197019601950194019301920191019001890188018701860185018401830182018101800
Share of World Cooper Production/%

209
Environmental Risks and Challenges of Anthropogenic Metals Flows and Cycles
were developed, leading to a gradual decline in recent ore grades approaching near his-toric lows of ~0.7 % Cu. Although ‘high grade’ Cu deposits can still be found (e. g. DeGrus-sa, WA), these are invariably much smaller in contained Cu than their larger but lower grade counterparts. In general, the grades of most remaining Cu deposits are of similar or lower grades to current producing mines, suggesting that, if production is to be main-tained or increased, ore grades as mined and processed are unlikely to increase again in the future but will very gradually decline, al-beit at a much slower rate than the 1800s and early twentieth century. Similar histories are important in understanding the evolution of Cu mining and ore grades in the USA, Can-ada and elsewhere around the world. That is, the intersection of demand, technology and exploration.
For comparison, ore grade trends are shown for gold in Figure A5.3, nickel in Figure A5.4, uranium in Figure A5.5 and platinum group metals in Figure A5.6. For gold, the decline in ore grade is about an order of magnitude over the past century, from about 20 g/t Au around 1900 to between 1 – 3 g/t Au by 2010. The past 30 years has seen a major expan-sion in world gold mining to record levels based on a sustained higher gold price (es-pecially in real terms) as well as the new pro-cess technology of carbon-in-pulp, which al-lows extremely efficient use of cyanide to ex-tract the gold – combined, this has facilitated a major lowering in ore grades (see Figure A5.3). The long-term declines in Ni grades is less pronounced than copper or gold, but still significant for some countries (e. g. New Caledonia). Of perhaps greater importance is the increasing shift to more complex Ni
Figure A5.2
Long-term trends in processed
copper ore grades for select
countries (data from Crowson,
2012; Mudd, 2010a, Mudd, 2010b; Ruth,
1995; USBoM, var.; USGS, var.)
0
4
8
12
16
20
24
28
1770 1800 1830 1860 1890 1920 1950 1980 2010
Spain
India
UK
USA
Canada
Australia
Ore Grade (% Cu)

210
Environmental Risks and Challenges of Anthropogenic Metals Flows and Cycles
laterite ores, which require more intensive processing than their sulfide cousins. The global trends in U ore grades are typically a very gradual decline, allowing for the rela-tive production from the countries shown in Figure A5.5, although Canada is the exception – its average U ore grade increased from the 1980s due to the rich deposits being devel-oped in Saskatchewan (~0.5 – 20 % U3O8) and the closure of the low grade (~0.1 % U3O8) El-liot Lake field in Ontario in 1996. There are still numerous low grade U deposits across
Canada, and if these are included in future U supply, ore grades will gradually decline (de-pending on the sequence of new mines and their respective grades). In Australia, most deposits are low grade (~0.02 – 0.3 % U3O8), dominated by the super-giant Olympic Dam Cu-U-Au-Ag-REE resource at ~0.03 % U3O8. The past decade has also seen gradual ore grade declines for many PGE companies and their respective mines, often related to ore types and mine configurations being devel-oped, such as Platreef versus Merensky reefs in the Bushveld Complex (see (Mudd, 2012).
Figure A5.3
Long-term trends in processed gold
ore grades for select countries
(data from CMSA, 2010;
Craig & Rimstidt, 1998; Machado
& Figueiroa, 2001; Mudd,
2007; Natural Resources
Canada, var., including updated data for Australia
to 2010)
0
10
20
30
40
50
Brazil
USA
South Africa
Canada
Australia
2010199019701950193019101890187018501835
Gold Ore Grade (g/t Au)

211
Environmental Risks and Challenges of Anthropogenic Metals Flows and Cycles
Figure A5.4
Long-term trends in processed
nickel ore grades for select
countries (data from Mudd,
2010b)
0
2
4
6
8
10
12
New Caledonia
Canada
Australia
20101995197519551935191518951875
Ore Grade (% Ni)
Figure A5.5
Long-term trends in processed uranium ore
grades for select countries
(data updated from Mudd and
Diesendorf, 2008; Mudd and
Diesendorf 2010) (note logarithmic
scale for ore grade)
0.01
0.1
1
10
2010200520001995199019851980197519701965196019551950
Ore Grade (% U3O8) USA
South Africa
Namibia
Mongolia
Canada
Australia

212
Environmental Risks and Challenges of Anthropogenic Metals Flows and Cycles
Figure A5.6
Recent trends in processed
platinum group element (PGE) ore grades for
select companies (Mudd, 2012)
2
3
4
5
6
7
8
Aquarius Platinus
Northam
Impala
Lonmin
Anglo Platinum
20092007200520032001199919971995
PGE Ore Grade (4E g/t) PGE Ore Grade (4E g/t)
0
5
10
15
20
25
North American Palladium
EastPlats
Stillwater
Taimyr Peninsula
African Rainbow Minerals
201020082006200420022000199819961994
Figure A5.7
Long-term trends in ore grades at
some giant Cu mines (Crowson,
2012)
0,5
1,0
1,5
2,0
2,5
3,0
Ray
El Teniente
Chuquicamata
Chino
Bingham Canyon
20051995198519751965195519451935192519151905
% Copper in Ore milled

213
Environmental Risks and Challenges of Anthropogenic Metals Flows and Cycles
For copper, a recent paper by (Crowson, 2012) includes a remarkable range of data on Cu mining and ore grades for select mines and fields around the world. Some century-old Chilean and USA Cu mines are shown in Figure A5.7, with relative trends in ore grades over 30 years from initial production for sev-eral large Cu mines shown in Figure A5.8.
Figure A5.8
Approximate relative trends
in Cu ore grades over 30 years
from initial production for
some major mines (adapted from Crowson,
2012)
20
0
40
60
80
100
120
Toquepala
Ray
Pima
Ertsberg/Grasberg
Granisle
Gibraltar
Escondida
El Abra
Cuajone
Chuquicamata
Candelaria
Cananaea
Bingham Canyon
Bethlehem
30th25th20th15th10th First four
Cu ore grade
year after start of exploitation
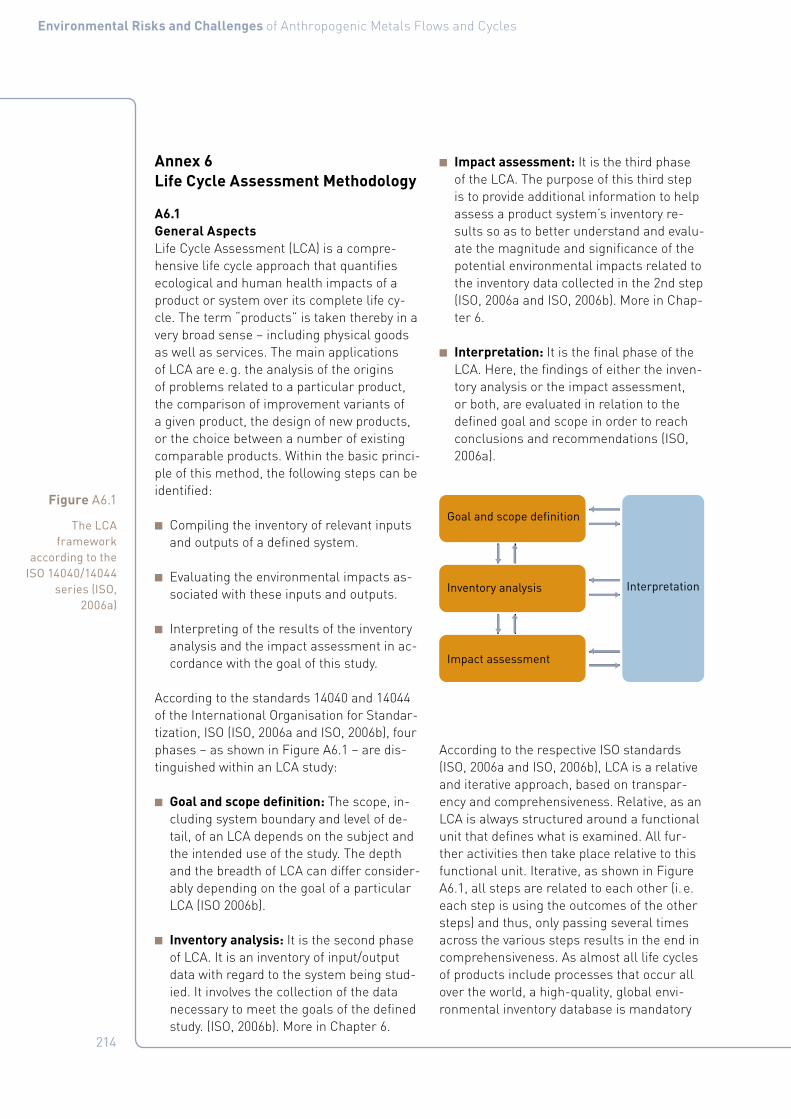
214
Environmental Risks and Challenges of Anthropogenic Metals Flows and Cycles
Annex 6 Life Cycle Assessment Methodology
A6.1 General AspectsLife Cycle Assessment (LCA) is a compre-hensive life cycle approach that quantifies ecological and human health impacts of a product or system over its complete life cy-cle. The term “products” is taken thereby in a very broad sense – including physical goods as well as services. The main applications of LCA are e. g. the analysis of the origins of problems related to a particular product, the comparison of improvement variants of a given product, the design of new products, or the choice between a number of existing comparable products. Within the basic princi-ple of this method, the following steps can be identified:
■ Compiling the inventory of relevant inputs and outputs of a defined system.
■ Evaluating the environmental impacts as-sociated with these inputs and outputs.
■ Interpreting of the results of the inventory analysis and the impact assessment in ac-cordance with the goal of this study.
According to the standards 14040 and 14044 of the International Organisation for Standar-tization, ISO (ISO, 2006a and ISO, 2006b), four phases – as shown in Figure A6.1 – are dis-tinguished within an LCA study:
■ Goal and scope definition: The scope, in-cluding system boundary and level of de-tail, of an LCA depends on the subject and the intended use of the study. The depth and the breadth of LCA can differ consider-ably depending on the goal of a particular LCA (ISO 2006b).
■ Inventory analysis: It is the second phase of LCA. It is an inventory of input/output data with regard to the system being stud-ied. It involves the collection of the data necessary to meet the goals of the defined study. (ISO, 2006b). More in Chapter 6.
■ Impact assessment: It is the third phase of the LCA. The purpose of this third step is to provide additional information to help assess a product system’s inventory re-sults so as to better understand and evalu-ate the magnitude and significance of the potential environmental impacts related to the inventory data collected in the 2nd step (ISO, 2006a and ISO, 2006b). More in Chap-ter 6.
■ Interpretation: It is the final phase of the LCA. Here, the findings of either the inven-tory analysis or the impact assessment, or both, are evaluated in relation to the defined goal and scope in order to reach conclusions and recommendations (ISO, 2006a).
According to the respective ISO standards (ISO, 2006a and ISO, 2006b), LCA is a relative and iterative approach, based on transpar-ency and comprehensiveness. Relative, as an LCA is always structured around a functional unit that defines what is examined. All fur-ther activities then take place relative to this functional unit. Iterative, as shown in Figure A6.1, all steps are related to each other (i. e. each step is using the outcomes of the other steps) and thus, only passing several times across the various steps results in the end in comprehensiveness. As almost all life cycles of products include processes that occur all over the world, a high-quality, global envi-ronmental inventory database is mandatory
Figure A6.1
The LCA framework
according to the ISO 14040/14044
series (ISO, 2006a)
Goal and scope definition
Inventory analysis Interpretation
Impact assessment

215
Environmental Risks and Challenges of Anthropogenic Metals Flows and Cycles
to ensure sound and credible results of LCA studies.
In relation to the topic of this report – i. e. the production of various metals – the goal and scope of the therefore relevant LCA stud-ies is the examination of the impacts of the production of a specific amount (e. g. 1 kg or 1 tonne) of either of the metals covered by this report – produced out of the respective ore, or via an adequate recycling procedure, out of appropriate scrap. As soon as not only the production, but a complete life cycle of a metal for a specific use context is taken into account, the goal & scope step has to ensure that all functionalities of the metal for this context are taken into account and adequately covered by choosing an appropriate function-al unit as well as the system boundaries.
A6.2 Life Cycle Inventory (LCI)
As mentioned above, this is the second phase of LCA, resulting in an inventory of input/output data with regard to the system be-ing studied. Input data are energy and mate-rial amounts consumed in the various pro-cess steps, from the extraction of the metal-containing ores, across the various benefica-tion and concentration steps, up to the final supply of one unit (i. e. one kg, one tonne) of a metal to the (global) metal market. On the output side, the amount of emissions to air, water and soil, the amount of waste water and waste, is recorded as detailed as possi-ble for the same process steps as the above mentioned input data.
In relation to the topic of this report – i. e. the production of various metals – a critical ele-ment can be identified on the input side. Then in both cases (i. e. production of primary met-als out of ores, resp. production of secondary metals out of scrap), complex systems have to be calculated as ores as well as scrap of-ten represent a mixture of various metallic compounds – and thus, allocation issues get important. Dubreuil et al. (2010) reports that representatives from ferrous and non-ferrous metal groups agreed on a “consensus map-ping presentation of a general allocation ap-proach and the identification of harmonized metrics”. The developed approach distin-guishes between four different cases (called “recycling map models”); each of them rep-resenting another, typical life cycle of a met-al. A table in Dubreuil et al. (2010) gives some example for each of the four types – table that is shown here in Table A6.2.

216
Environmental Risks and Challenges of Anthropogenic Metals Flows and Cycles
However, so far there are no generally ac-cepted, accurate allocation factors available for an application of these four above de-scribed models – hence, as mentioned in Du-breuil et al. (2010), “important work needs to be done” to achieve such factors. But despite this lack, several LCA and/or LCI studies about the here examined metals exist and are
published; using their own, specific allocation factors. More details can be found in Chap-ter 6, describing in details the available LCI data sources.
Table A6.1
Table with Metal recycling loop type examples
(Dubreuil et al., 2010)
Type 1 Closed metal loop
Type 2 Alloy loop
Type 3 Transfer to another metal pool
Type 4 Metallurgical re-separation
Steel scrap is recy-cled by a minimill where it is remelt-ed and formed into semi-products.
Stainless steel al-loys are retained in a distinct metal pool. Constituents include iron, chro-mium, nickel and other elements.
Nickel in low-al-loy steel is recycled into the steel loop, where it is retained in dilute fractions in the steel pool.
Gold and plati-num group met-als are retained in copper-rich metal-lic fractions during electronic equip-ment recycling. At the copper smelter, these other metals are separated and refined.
Steel scrap is re-cycled by an inte-grated mill where the recycled metal is blended with pri-mary metal coming from the blast fur-nace into the basic oxygen furnace.
Aluminum-magne-sium alloy used for beverage cans is re-cycled as a distinct pool. The purity and properties of the al-loy are managed and preserved.
Chromium coating on steel is recycled into the steel loop, where it is retained in dilute fractions in the steel pool.
Zinc used for gal-vanizing follows the steel onto which it is coated. Dur-ing steel recycling, zinc is separated to electric arc fur-nace dust, which is treated to remove cadmium. Zinc is then recovered in an Imperial Smelting Furnace.
Copper in appli-cations where it is nearly pure is recy-cled back to semi-fabricators, where it is remelted and re-formed into semi-products.
Brass is a copper-zinc alloy that is collected and recycled to retain alloy properties.
Due to inefficiencies in physical separa-tion, copper particles are entrained with the steel recycling flow. Once melted, copper cannot be removed economically from the steel.

217
Environmental Risks and Challenges of Anthropogenic Metals Flows and Cycles
A6.3 Life Cycle Impact Assessment (LCIA)In the Life Cycle Impact Assessment (LCIA) phase, the third step of the ISO framework, the emissions and resource data collected in the preceding LCI step are translated into indicators that represent environment and health impacts as well as resource scarcity. This is based on factors which represent the impact per unit emission or resource con-sumption. These factors are generally calcu-lated using models (European Commission, 2010b); however, over the last two to three decades a broad variety of such LCIA fac-tors has been developed and published. A, still not complete, overview of this broad va-riety of LCIA factors can be found e. g. in the ecoinvent database; as the developers of this database try to publish for the user a clear guidance how to use the various LCIA factors/methods in combination with the data from the ecoinvent database; described in the re-port from Hischier et al. (2010).
In the framework of the International Ref-erence Life Cycle Data System (ILCD) hand-book – a series of technical documents that provide detailed guidance on all the steps re-quired conducting a Life Cycle Assessment (LCA) – the European Commission’s Joint Re-search Centre (EC-JRC) started in 2010, after a thorough analysis of the existing approach-es (European Commission, 2010a and 2010b) a public consultation phase on recommend-ed methods for the Life Cycle Impact Assess-ment. A first draft of a report with recom-mended LCIA factors was distributed in the LCA community and a workshop was held in Brussels in October 2010.
In relation to the topic of this report – i. e. the production of various metals – important indicators among the huge amount of vari-ous LCIA indicators available in a variety of LCIA methods (for a recent overview see e. g. European Commission, 2010a) are the Re-source Depletion, the Global Warming Poten-tial (GWP) – or alternatively the Cumulative Energy Demand (CED) – as an indicator for the energy intensity of a process, the Acidi-fication Potential (AP) and/or the Ecotoxicity
Potential (ETP), both representing the releas-es of highly acid substances into the environ-ment. In some publications (e. g. Norgate et al., 2007) you still can find also indicators for the amount of waste produced – like e. g. the Solid Waste Burden (SWB); although there are nowadays data available for different waste treatment activities in order to avoid this kind of indicator; and include instead the total amount of emissions occurring in these treatment activities into the overall amount of emissions across the life cycle. According to the report from the ILCD team about rec-ommended LCIA factors (European Commis-sion, 2011– [not yet published AND NOT TO BE CITED!]), the following modelling is rec-ommended for these above mentioned single impact assessment factors:
■ Resources Depletion: For the resource depletion topic, the report recommends using the 2004 update of the factors for the depletion of abiotic resources report-ed in the EDIP 97 LCIA method, described in Hauschild and Wenzel (1998), resp. in Hauschild and Potting (2005). This is a model that takes into account fossil fuels and minerals, and it represents the per-son-reserve, meaning the quantity of the resource available to an average world citizen. For the calculation of the charac-terisation factors, the amount extracted is divided by the global production of the ref-erence year (2004) and weighted according to the economically viable reserves of this material.
■ Global Warming Potential (GWP): For the GWP, the recommendation favourites the “default” 100 year baseline model for greenhouse gases, according to the IPCC report from 2007 (IPCC, 2007). The IPCC factor is used in all LCIA methods that take into account GWP – although not all of the methods use the latest version of the IPCC report. Among the three perspectives (20, 100 and 500 years), the 100 year baseline is commonly used; this is also the time ho-rizon used e. g. for the Kyoto protocol or further policy work in the area of climate change.

218
Environmental Risks and Challenges of Anthropogenic Metals Flows and Cycles
■ Acidification Potential (AP): For the AP, the European Commission is suggesting to use the so called “Accumulated Exeed-ance”, developed by Seppälä and co-work-ers. This method does not only take into account the dispersion of an emission in the atmosphere, but also the sensitivity of the ecosystem receiving the (addition-al) deposition due to the emission (Sep-pälä et al., 2006), and uses this method to calculate the European country-depend-ent characterisation factors. The atmos-pheric transport and deposition model to land area and major lakes/rivers is deter-mined using the EMEP model – a detailed model for long-range transport of air pol-lutants in Europe – combined with a Euro-pean critical load database for sulphur and nitrogen depositions in Europe. However, so far not much LCA software tools have integrated this approach for a practical application.
■ Ecotoxicity Potential (ETP): For the ETP, the recently developed, common interna-tional framework for toxicity categories (Rosenbaum et al., 2008) has been used. This approach results from a consensus building effort amongst related model-lers and, hence, the underlying principles reflect thus common and agreed recom-mendations from these experts. The model accounts for all important parameters in the impact pathway as identified by a sys-tematic model comparison within the con-sensus process. The model addresses the freshwater part of the environment prob-lem and includes the vital model elements in a scientifically up-to-date way. USEtox has also been set up to model a global de-fault continent. In USEtox, a distinction is made between interim and recommended characterization factors, reflecting the lev-el of expected reliability of the calculations in a qualitative way. Ecotoxicological char-acterisation factors for ‘metals’, ‘dissoci-ating substances’ and ‘amphiphilics’ (e. g. detergents) are all classified as interim in USEtox (Rosenbaum et al. 2008).
In case of the Cumulative Energy Demand (CED), the European Commissions doesn’t recommend any factor (resp. is indirectly rec-ommending dealing with these resources similar as with mineral/metallic resources). The consumption of fossil fuels is also part of the above described ARD factor for the resource depletion. In the same time, CED analysis has a rather long tradition; and the indicator has been created – as reported e. g. in Hischier et al. (2010) – already in the early seventies after the first oil price crisis (Bou-stead and Hancock, 1979, Pimentel 1973). In the same time, CED is widely used as a screening indicator for environmental im-pacts (Hischier et al., 2010). For this report, the definition for the CED from the ecoin-vent database, based on the respective docu-ment from the German Industry Association (VDI) has been used. However, opposite to the ecoinvent database that shows the vari-ous factors of the CED in an non-aggregated form; for the purpose of this study, all these values have been aggregated into one single number – the “Total Cumulative Energy De-mand”. More details about this issue can be found in Hischier et al. (2010).A specific issue in LCIA is aggregation. Most LCA studies end up with a number of indi-cators on different environmental impacts, either at midpoint level or at endpoint level. A next possible step is aggregating them all into one indicator for environmental perfor-mance. This step requires normalisation and weighting. The weighting step is subjective and (therefore) controversial. The ISO guide-line for LCA states that weighting is not per-mitted in case of comparative studies. LCA researchers are hesitant to apply this step at all, because of the subjectivity of its nature. In many cases, there is no need for it. Some-times there is, and then various options exist for attributing weights to specific impact cat-egories. Political (stakeholder) weighting and (scientific) panel weighting are two options.
It should be noted that some LCIA methods have an inherent weighting. These come up with single scores that have a weighting pro-cedure behind them that is invisible for the user.

219
Environmental Risks and Challenges of Anthropogenic Metals Flows and Cycles
Annexes References
1. Brooks, W.A, M. Santosham, A. Naheed, D. Goswami D, M.A. Wahed, M. Diener-Wst, A.S.G. Faruque, and R.E. Black. 2005. Effect of weekly zinc supplements on incidence of pneumonia and diarrhoea in children younger than 2 years in an urban, low-income population in Bangla-desh: randomised controlled trial. Lancet 366(9490): 999 – 1004.
2. Chamber of Mines of South Africa (CMSA). 2010. Facts and Figures 2010. Chamber of Mines of South Africa (CMSA), Johannesburg, South Africa, 40 p. http://www.bullion.org.za/Publica-tions/Facts&Figures2009/F&F2009.pdf. Last accessed May 2012.
3. Clawson W.J., A.L. Lesperance, V.R. Bohman, and D.C. Layhee. 1972. Inter-relationship of dietary molybdenum and copper on growth and tissue composition of cattle. Journal of Animal Science 34: 516 – 520.
4. Craig, J.R., and J.D. Rimstidt. 1998. Gold Production History of the United States. Ore Geology Reviews 13: 407 – 464.
5. Crowson, P. 2012. Some Observations on Copper Yields and Ore Grades. Resourc-es Policy 37(1): 59 – 72.
6. European Commissions Scientific Com-mittee for Animal Nutrition (SCAN). 2003. Opinion of the Scientific Committee for Animal Nutrition on the use of copper in feeding stuffs. European Commissions Scientific Committee for Animal Nutri-tion, Brussels, Belgium.
7. European Copper Institute. 2007. Eu-ropean Union Copper Risk Assess-ment. http://echa.europa.eu/docu-ments/10162/13630/vrar_effects_en.rtf. Last accessed May 2012.
8. Gerst, M.D. 2008. Revisiting the Cumu-lative Grade-Tonnage Relationship for Major Copper Ore Types. Economic Geol-ogy 103(3): 615 – 628.
9. Institute of Medicine (IOM). 2001. Di-etary reference intakes for vitamin A, vitamin K, arsenic, boron, chromium, copper,iodine, iron, manganese, molyb-denum, nickel, silicon, vanadium and zinc. Washington DC: National Academy Press.
10. International Zinc Nutrition Consultative Group (IZiNCG). 2004. Assessment of the risk of zinc deficiency in population and options for its control. Food nutrition bul-letin 25: 94 – 203.
11. Kelly, T.D., G.R. Matos, D.A. Buckingham, C.A. DiFrancesco, K.E. Porter, C. Berry, M. Crane, T. Goonan, and J. Sznopek. 2011. Historical Statistics for Mineral and Material Commodities in the United States. US Geological Survey (USGS), Data Series 140, Reston, Virginia, USA. minerals.usgs.gov/ds/2005/140/. Last ac-cessed April 2011.
12. Krewski, D., R.A. Yokel, E. Nieboer, D. Borchelt, J. Cohen, J. Harry, S. Kacew, J. Lindsay, A.M. Mahfounz, V. Rondeau. 2007. Human Health Risk Assessment for Aluminium, Aluminium Oxide and Alu-minium Hydroxide. Journal of Toxicology and Environmental Health 10 (1): 1 – 269.
13. Machado, I.F, and S.FD.M. Figueiroa. 2001. 500 Years of Mining in Brazil: A Brief Review. Resources Policy 27: 9 – 24.
14. Mudd, G.M, and M. Diesendorf. 2010. Uranium Mining, Nuclear Power and Sustainability: Rhetoric versus Reality. Proceedings of the Sustainable Mining 2010 Conference, Australasian Institute of Mining and Metallurgie (AusIMM), Kalgoorlie, Western Australia, Australia, August 2010, 315 – 340.

220
Environmental Risks and Challenges of Anthropogenic Metals Flows and Cycles
15. Mudd, G.M. 2007. Global Trends in Gold Mining: Towards Quantifying Environ-mental and Resource Sustainability? Resources Policy 32(1 – 2): 42 – 56.
16. Mudd, G.M. 2010a. The Environmental Sustainability of Mining in Australia: Key Mega-Trends and Looming Constraints. Resources Policy 35(2): 98 – 115.
17. Mudd, G.M. 2010b. Global Trends and Environmental Issues in Nickel Mining: Sulfides Versus Laterites. Ore Geology Reviews 38(1 – 2): 9 – 26.
18. Mudd, G.M. 2012. Key Trends in the Re-source Sustainability of Platinum Group Elements. Ore Geology Reviews 46 (1): 106 – 117.
19. Mudd, G.M., and M. Diesendorf. 2008. Sustainability of Uranium Mining and Milling: Towards Quantifying Resources and Eco-Efficiency. Environmental Sci-ence and Technology 42(7): 2624 – 2630.
20. Natural Resources Canada (NRC). 2012. Canadian Minerals Yearbook. Years 1944 to 2009. Mining Sector, Natural Re-sources Canada (NRC), Ottawa, Ontario, Canada. www.nrcan-rncan.gc.ca/mms-smm/busi-indu/cmy-amc-eng.htm. Last accessed May 2012.
21. Ruth, M. 1995. Thermodynamic Con-straints on Optimal Depletion of Copper and Aluminum in the United States: A Dy-namic Model of Substitution and Techni-cal Change. Ecological Economics 15(3): 197 – 213.
22. Samuelson, U,. S. Oikarinen, H. Hyoty, and J. Ludvigsson. 2011. Low zinc in drinking water is associate with the risk of type 1 diabetes in children. Pediatric diabetes 12(3) 156 – 164.

221
Environmental Risks and Challenges of Anthropogenic Metals Flows and Cycles
23. Scientific Committee on Health and Environmental Risks (SCHER). 2008. Cop-per, Copper II sulphate pentahydrate, Copper(I)oxide, Copper(II)oxide, Dicopper chloride trihydroxide. http://echa.europa.eu/documents/10162/17228/scher_opin-ion_hh_en.pdf. Last accessed May 2012.
24. Shankar A.H., B. Genton, M. Baisor, J. Paino, S. Tamja, T. Adiguma, L. Wu, L. Rare, D. Bannon, J.M. Tielsch, M.P. Alp-ers, K.P. West. 2010. The influence of zinc supplementation on morbidity due to Plasmodium falciparum: a randomized trial in preschool children in Papua New Guinea. American Journal of Tropical Medicine and Hygiene 62: 663 – 669.
25. Smolders, E., and J. Buekers. 2009. Tox-icity and Bioavailability of Molybdenum in Terrestrial Environments: Micro-organ-isms. Draft Report to the International Molybdenum Association (IMOA). Division Soil and Water Management, Katholieke Universiteit Leuven, Belgium.
26. U.S. Bureau of Mines (USBM). Minerals Yearbook. Years 1933 to 2009. U.S. Bu-reau of Mines USBM, U.S. USA. http://minerals.usgs.gov/minerals/pubs/usbm-myb.html. Last accessed May 2012.
27. United Nations Children's Fund (UNICEF)/World Health Organization (WHO). 2004. Clinical Management of Acute Diarrhoea. United Nations Chil-dren's Fund (UNICEF)/World Health Or-ganization (WHO) Joint statement. http://whqlibdoc.who.int/hq/2004/WHO_FCH_CAH_04.7.pdf. Last accessed May 2012.
28. US Geological Survey (USGS). Minerals Yearbook. Years 1994 to 2009. US Geolog-ical Survey (USGS), Reston, Virginia, USA. minerals.usgs.gov/minerals/pubs/myb.html. Last accessed May 2012.
29. World Health Organization (WHO). 1998. International Programme on Chemical Safety (IPCS) Environmental Health Cri-teria for copper 200. http://www.inchem.org/documents/ehc/ehc/ehc200.htm. Last accessed May 2012.
30. World Health Organization (WHO). 2004. WHO Guidelines for Drinking-water Quality. http://www.who.int/water_sanita-tion_health/dwq/GDWQ2004web.pdf. Last accessed May 2012.
31. World Health Organization (WHO). 2008. WHO Guidelines for Drinking-water Qual-ity. http://www.who.int/water_sanitation_health/dwq/fulltext.pdf. Last accessed May 2012.
32. World Health Organization (WHO). 2011. Evaluation of certain food additives and contaminants; Seventy-fourth report of the Joint Fao/WHO Expert Committee on Food Additives. WHO Technical Report series 966. http://whqlibdoc.who.int/trs/WHO_TRS_966_eng.pdf. Last accessed May 2012.
33. Zinc Investigators’ Collaborative Group. 1999. Prevention of diarrhea and pneu-monia by zinc supplementation in chil-dren in developing countries: Pooled analysis of randomized controlled trials. Journal of Pediatrics 135(6): 689 – 697.
34. Zinc Investigators’ Collaborative Group. 2000. Therapeutic effects of oral zinc in acute and persistent diarrhea in children in developing countries: pooled analysis of randomized controlled trials. Ameri-can Journal of Clinical Nutrition 72(6): 1516 – 1522.

222
Environmental Risks and Challenges of Anthropogenic Metals Flows and Cycles
Abbreviations and Acronyms
ACGIH American Conference Of Industrial Hygienists
AMD Acid Mine Drainage
AP Acidification Potential
AR Aqua Regia
ARD Abiotic Resource Depletion
ASM Artisanal And Small-Scale Mining
BAT Best Available Technology
BEV Battery Electric Vehicles
BF Blast Furnace
BIW Body-In-White
BL Baseline
BLM Biotic Ligand Model
BOF Basic Oxygen Furnace
BREF Best Available Technique Reference Notes
C Concentration
CASM Communities And Small-Scale Mining
CCS Carbon Capture Storage
CED Cumulative Energy Demand
CLRTAP Long-Range Transboundary Air Pollution
CML Institute Of Environmental Sciences Of Leiden University
CRT Cathode Ray Tubes
CSIRO Commonwealth Scientific And Industrial Research Organisation
DEL Deficiency Effect Level
DfE Design For Environment
DfR Design For Recycling
DNA Deoxyribonucleic Acid
DRI Direct Reduced Iron
EAA European Aluminium Association
EAF Electric Arc Furnace
EC50 Half Maximal Effective Concentration
ECI European Copper Institute
223
Environmental Risks and Challenges of Anthropogenic Metals Flows and Cycles
EEE Electric And Electronic Equipment
EFF3 Standard Efficiency
Eh Activity Of Electrons
ELCD European Life Cycle Database
EoL End-Of-Life
E-PRTR European Pollutant Release And Transfer Register
EQC Environmental Quality Criteria
ETP Ecotoxicity Potential
EU European Union
FAO Food And Agriculture Organisation Of The United Nations
GER Gross Energy Requirement
GHG Greenhouse Gas
GWP Global Warming Potential
HC5 Hazardous Concentration For 5 % Of The Species
HPAL High-Pressure Acid Leaching
HPGR High Pressure Grinding Rolls
IARC International Agency For Research On Cancer
IC Integrated Circuit
ICE Internal Combustion Engine
ICT Information And Communication Technology
IEA Blue Map Mix According To Shell Blue Map Scenario, Including Fossil Fuels As Well As Renewable Energy Sources
IED Industrial Emissions Directive
ILCD International Reference Life Cycle Data System
IMOA International Molybdenum Association
IPCC Inter-Governmental Panel On Climate Change
IPP Integrated Product Policy
IRP International Resource Panel
ISO International Organization For Standardization
ISP Imperial Smelting Process
IZA International Zinc Association

224
Environmental Risks and Challenges of Anthropogenic Metals Flows and Cycles
JECFA Joint Expert Committee On Food Additives
JRC Joint Research Centre
K-G index Klee-Graedel Human vs. Nature Dominance Index
LCA Life Cycle Assessment
LCDs Liquid Crystal Display
LCI Life Cycle Inventory
LCIA Life Cycle Impact Assessment
LCT Life Cycle Thinking
LW Lightweight
MFA Material Flow Analysis / Accounting
MPC Maximum Permissible Concentration
msPAF Multiple Substance PAF
NOAEL No Observed Adverse Effect Level
NOEC No Effect Concentration
NPI National Pollutant Inventory
NPRI National Pollutant Release Inventory
NRA No Risk Area
NTP National Toxicology Program
OCEE Optimal Concentration Range Of Essential Elements
OEM Original Equipment Manufacture
OSHA United States Occupational Safety And Health Administration
PAF Potentially Affected Fraction
PC Personal Computer
PEC Predicted Environmental Concentration
PGM Platinum Group Metal
pH Potential Hydrogen
PM Particle matter
PM10 Particle matters of 10 micrometers or less
PNEC Predicted No Effect Concentration
PSU Power Supply Unit
PTWI Provisional Tolerable Weekly Intake Limit
PWB Printed Wiring Board
RARs Risk Assessment Reports

225
Environmental Risks and Challenges of Anthropogenic Metals Flows and Cycles
RE Rare Earths
REACH Registration, Evaluation, Authorisation, And Restriction Of Chemical Sub-stances
RMC Roasted Molybdenite Concentrate
SD Standard Deviation
SETAC Society Of Environmental Toxicology And Chemistry
SFA Substance Flow Analysis
SHG Special High Grade
SLC Super Light Car
SMD Surface Mount Device
SSD Species Sensitivity Distribution
ssPAF Single Substance PAF
StEP-lnitiative of UN Solving The E-Waste Problem
SWB Solid Waste Burden
SX/EW Solvent Extraction/Electrowinning
TGD Technical Guidance Document
TRI Toxic Release Inventory
TSL Top Submerged Lance
UNECE Nited Nations Economic Commission For Europe
UNEP United Nation Environment Programme
USA United States Of America
US-EPA United States Environmental Protection Agency
USSR Union Of Soviet Socialist Republics
WBCSD World Business Council For Sustainable Development
WEEE Waste Electrical And Electronic Equipment
WFD Water Framework Directive
WHO World Health Organization
WtoE Waste-To-Energy

226
Environmental Risks and Challenges of Anthropogenic Metals Flows and Cycles
Unitscm centimetre (10-2 metres)
CO2-eq carbon dioxide equivalents
g gram
Gg gigagram (109 gram)
GJ gigajoule (109 joules)
GL gigalitre (109 litres)
GWh gigawatt hour (109 watt hour)
kg kilogram (103 gram)
kL kilolitre (103 litre)
km kilometre (103 metre)
kt kilotonne (109 gram)
kWh kilowatt hour (103 watt hour)
J joule
L litre
Ln natural logarithm
Log logarithm
mg milligram (10-3 gram)
MJ megajoule (106 joules)
mm millimetre (10-3 metres)
Mt megatonne (1012 gram)
PJ petajoule (1015 joules)
ppb part-per-billion
t tonne (106 gram)
TWh terawatt hour (1012 watt hour)
vkm vehicle kilometre
y year
µg microgram (10-6 gram)
µm micrometre (10-6 meter)

227
Environmental Risks and Challenges of Anthropogenic Metals Flows and Cycles
CH3Hg+ methyl mercury
Ag silver
Al aluminum
Al(OH)3 aluminium hydroxide
AL2O2 aluminium oxide
As arsenic
Au gold
Be beryllium
Cd cadmium
CdCl2 cadmium chloride
Co cobalt
CO2 carbon dioxide
Cr chromium
Cr(VI) hexavalent chromium
Cu copper
Cu2FeSnS4 stannite
CuFeS2 chalcopyrite
Dy dysprosium
Fe iron
Fe(O2H) hydrous iron oxides
Fe3S4 iron sulfide
FeO iron oxide
FeS iron sulfide
FeS2 iron disulfide
Ga gallium
Ge germanium
HCFC hydrochlorofluorocarbon
HFC hyrdofluorocarbon
Hg mercury
HgS cinnabar
HNO3 nitric acid
Chemical Abbreviations

228
Environmental Risks and Challenges of Anthropogenic Metals Flows and Cycles
In indium
Ir iridium
MeCl2 methylene chloride
MeOH methanol
Mg magnesium
Mn manganese
MnO2 oxides of manganese
Mo molybdenum
Nd neodymium
Ni nickel
NiMH nickel metal dydride
NOx nitrogen oxide
Pb lead
PP polypropylene
PE polyethylene
PVC polyvinyl chloride
PCB polychlorinated biphenyl
Pd palladium
Pr praseodymium
Pt platinum
Rh rhodium
Sb antinomy
Sc scandium
Se selenium
SIO2 silicon dioxide
Sn tin
Sn2+ tin stanious
SnO2 cassiterite
SO2 sulfur dioxide
SOx sulfur oxide
SS stainless steel
Ta tantalum
Ti titanium

229
Environmental Risks and Challenges of Anthropogenic Metals Flows and Cycles
Tl thallium
TOC troodos ophiolite complex
U3O8 triuranium octoxide
V vanadium
W tungsten
Y yttrium
Zn zinc

230
Environmental Risks and Challenges of Anthropogenic Metals Flows and Cycles
International Resource Panel
As our economies have grown, so has the use of materials and resources. In an increas-ingly globalised economy, the challenge for policy-makers is to streamline actions for ensuring a more sustainable management of resources, both renewable and non-renew-able. There are existing measures such as policies on climate change and biodiversi-ty that tackle certain aspects of the global resource issues. However a holistic approach to resources management is needed to better identify their interlinkages and gaps in a sys-temic way.
The establishment of the International Resource Panel, or Resource Panel for short, is a first step towards addressing this need. Hosted at UNEP, the Resource Panel was officially launched in November 2007 to pro-vide the scientific impetus for decoupling economic growth and resource use from environmental degradation.
The objectives of the Resource Panel are to provide independent, coherent and authorita-tive scientific assessments of policy relevance on the sustainable use of natural resources and in particular their environmental impacts over the full life cycle as well as to contribute to a better understanding of how to decou-ple economic growth from environmental degradation.
This work builds on and contributes to other related international initiatives, including the 10-Year Framework of Programmes on Sustainable Consumption and Production (10YFP) and the Green Economy Initiative.
Global Metal Flows Working Group
Economic development is deeply coupled with the use of metals. The growing demand for metals implies a permanent pressure on the resource base. Metals are resources that have a high value and in principle can be easily reused and recycled. Reuse and recy-cling activities of metals on a global scale can contribute to closing the loops, turn waste into resources, and are expected to thereby reduce environmental impacts, safeguard the availability of metals, minimize metal prices, and promote meaningful and safe jobs for poor people in developing countries.
The Global Metal Flows Working Group aims at contributing to the promotion of reuse and recycling of metals and the establishment of an international sound material-cycle society by providing scientific and authoritative assessment studies on the global flows of metals. Expected results include revealing potentials for increasing the resource efficiency of metal flows at the national and international level.

About the UNEP Division of Technology,Industry and Economics
The UNEP Division of Technology, Industry and Economics (DTIE) helps governments, local authorities and decision-makers in business and industry to develop and implement policies and practices focusing on sustainable development.
The Division works to promote:> sustainable consumption and production,> the effi cient use of renewable energy,> adequate management of chemicals,> the integration of environmental costs in development policies.
The Offi ce of the Director, located in Paris, coordinates activities
through:
> The International Environmental Technology Centre - IETC (Osaka, Shiga), which implements integrated waste, water and disaster management programmes, focusing in particular on Asia.
> Sustainable Consumption and Production (Paris), which promotes sustainable consumption and production patterns as a contribution to human development through global markets.
> Chemicals (Geneva), which catalyzes global actions to bring about the sound management of chemicals and the improvement of chemical safety worldwide.
> Energy (Paris and Nairobi), which fosters energy and transport policies for sustainable development and encourages investment in renewable energy and energy effi ciency.
> OzonAction (Paris), which supports the phase-out of ozone depleting substances in developing countries and countries with economies in transition to ensure implementation of the Montreal Protocol.
> Economics and Trade (Geneva), which helps countries to integrate environmental considerations into economic and trade policies, and works with the fi nance sector to incorporate sustainable development policies.
UNEP DTIE activities focus on raising awareness,
improving the transfer of knowledge and information,
fostering technological cooperation and partnerships, and
implementing international conventions and agreements.
For more information,see www.unep.fr
AcknowledgmentsEditor: International Resource Panel, Working Group on the Global Metal Flows
Lead author: Ester van der Voet, University of Leiden, Netherlands; Chapter editors: Ester van der Voet, Leiden University, Netherlands; Reijo Salminen,Geological Survey Finland, Finland; Matthew Eckelman, North Eastern University, Boston, USA; Gavin Mudd, Monash University, Australia; Terry Norgate, CSIRO Minerals Down Under Flagship, Australia; Roland Hischier, EMPA, Switzerland; Contributing authors: Job Spij-ker, National Institute for Public Health and the Environment, Netherlands; Martina Vijver, Leiden University, Netherlands; Olle Selinus, Linneaus University, Sweden; Leo Posthuma, National Institute for Public Health and the Environment, Netherlands; Dick de Zwart, National Institute for Public Health and the Environment, Netherlands; Dik van de Meent, Radboud University Nijmegen, Netherlands; Markus Reuter, Outotec Oyj, Espoo, Finland; Ladji Tikana, German Copper Development Association, Germany; Sonia Valdivia, UNEP, France; Patrick Wäger, EMPA, Swit-zerland; Michael Hauschild, Technical University of Denmark, Denmark; Arjan de Koning, Leiden University, Netherlands.
The following people have contributed by reviewing draft versions of the report and providing valuable information and comments (Alphabeti-cal): John Atherton, International Council on Mining and Metals; Caroline Braibant, European Precious Metals Federation; Clare Broadbent, World Steel Association; Peter Campbell, Université du Québec, Institut National de la Recherche Scientifi que, Canada; Sandra Carey, Interna-tional Molybdenum Association; Grant Darrie, International Chromium Development Association; Katrien Delbeke, European Copper Institute; Johannes Drielsma, Euromines; Alain Dubreuil, Natural Resources Canada, Canada; Maria Amelia Enriquez, Federal University of Pará State, Brazil; Kevin Farley, Manhattan College, USA; Thomas Graedel, Yale University, USA; Edgar Hertwich, Norwegian University of Science and Technology, Norway, Paola Kistler, Rio Tinto, Switzerland; Christian Leroy, European Aluminium Association; Eirik Nordheim, European Alu-minium Association; Jerome Nriagu, University of Michigan, USA, Jozef M. Pacyna, Norwegian Institute for Air Research, Norway; Claudia Peña, Chilean Research Centre for Mining and Metallurgy, Chile; Patrick van Sprang, Arche Consulting Brussels, Belgium; Sangwon Suh, University of California, USA; Frans Vollenbroek, European Commission, Belgium; Pia Voutilainen, Scandinavian Copper Development Association, Finland and (further) representatives of the following organisations: Codelco, Euromines, European Aluminium Association, European Precious Metals Federation, International Chromium Development Association, International Copper Association, International Council on Mining and Metals, International Molybdenum Association, International Zinc Association, Rio Tinto, and World Steel Association.
The report went through several rounds of peer-review coordinated in an effi cient and constructive way by Jacqueline Aloisi de Larderel together with the International Resource Panel Secretariat. Valuable comments were received from several anonymous reviewers in this process. The prepa-ration of this report also benefi ted from discussions with many colleagues at various meetings.
Special thanks go to Ernst Ulrich von Weizsäcker and Ashok Khosla as Co-Chairs of the International Resource Panel for their continuing support and encouragement, as well as to the members of the International Resource Panel and its Steering Committee for their dedication and commit-ment and additional helpful comments.
Special thanks also go to Melanie Studer (Leiden University, Netherlands) for her support during the fi nal stages of the document preparation. Shaoyi Li, Tomas Marques and Philip Strothmann, UNEP, provided valuable input and comments; the International Resource Panel’s Secretariat coordinated the preparation of this report. Sibylle Schmidtchen and the team from 3f design were instrumental in creating and editing the fi gures and graphics.
The main responsibility for errors remains with the authors.
UNEP promotes environ-
mentally sound practices globally and in its own activities.
Please print this publication – when printing is necessary – on recycling
paper or FSC certi� ed paper. Our distri-bution policy aims to reduce UNEP’s
carbon footprint.
The report should be referenced as follows: UNEP (2013) Environmental Risks and Challenges of Anthropogenic Metals Flows and Cycles, A Report of the Working Group on the Global Metal Flows to the International Resource Panel. van der Voet, E.; Salminen, R.; Eckelman, M.; Mudd, G.; Norgate, T.; Hischier, R.
Copyright © United Nations Environment Programme, 2013
This publication may be reproduced in whole or in part and in any form for educational or nonprofi t purposes without special permission from the copyright holder, provided acknowledgement of the source is made. UNEP would appreciate receiving a copy of any publication that uses this publication as a source.
No use of this publication may be made for resale or for any other commercial purpose whatsoever without prior permission in writing from the United Nations Environment Programme.
Design/layout: 3f design, cover concept, UNEP.
Photos: iStockphoto.com: background title/page 14 © gitches, title 1 © oneclearvision, title 2 © Marco Hegner, title 3 © Milos Peric, title 4 © DNY 59, page 4 © Ermin Rothenberger, page 24 © Phil Augustavo, page 30 © Rob Belknap, page 46 © Bart Coenders, page 46 © Wooden Dinosaur, page 56 © manfredxy, page 72 © iofoto, page 74 © ugur bariskan, page 94 © Don Wilkie, page 116 © Bart van den Dikkenberg, page 127 © Daniel Schoenen, page 128 © Ugurhan Betin, page 144 © Cliff Parnell, page 155 © Zsolt Biczó, page 162 © Ben Klaus, page 190 © Justin Bryant, page 207 © Rob Broek, page 220 © Judy Kennamer. Others: see captions.
DisclaimerThe designations employed and the presentation of the material in this publication do not imply the expression of any opinion whatsoever on the part of the United Nations Environment Programme concerning the legal status of any country, territory, city or area or of its authorities, or concerning delimitation of its frontiers or boundaries. Moreover, the views expressed do not necessarily represent the decision or the stated policy of the United Nations Environment Programme, nor does citing of trade names or commercial processes constitute endorsement.
ISBN: 978-92-807-3266-5Job Number: DTI/1534/PA

UN
IT
ED
N
AT
IO
NS
E
NV
IR
ON
ME
NT
P
RO
GR
AM
ME
A key question that relates to the very broad and intensive use of metals is whether society needs to be concerned about long-term supplies of any or many of them. This is a many-faceted question that cannot be answered quickly or unequivocally. To address it, the Global Metal Flows Working Group envisions a series of six reports, of which this is the third one ad-dressing environmental risks and challenges of anthropogenic met-als fl ows and cycles.
This report, compiled by a group of international experts, focuses on the impact of metals on the en-vironment as well as on their life cycle energy use. Currently, pri-mary metals production is respon-sible for 7 – 8 % of the total global energy use as well as for severe local environmental impacts. The report suggests to apply best available techniques and to in-crease recycling of metals, which not only requires signifi cantly less energy per kg metal produced than primary production but also helps decreasing the overall local impacts of mining. However, even if recycling rates are increased, rising global demand for many metals will remain a huge envi-ronmental challenge in the next decades worldwide.
Published in April 2013
EnvironmEntal risks and ChallEngEs of anthropogEniC mEtals flows and CyClEs
For more information, contact:Resource Panel Secretariat UNEP DTIESustainable Consumptionand Production Branch15 rue de Milan75441 Paris CEDEX 09FranceTel: +33 1 44 37 14 50Fax: +33 1 44 37 14 74E-mail: [email protected] www.unep.org/resourcepanel
DTI/1534/PAISBN: 978-92-807-3266-5