Embed Size (px)
Citation preview
African Journal of
Environmental Science and
Technology
Volume 9 Number 5, May 2015
ISSN 1996-0786
ABOUT AJEST The African Journal of Environmental Science and Technology (AJEST) (ISSN 1996-0786) is published monthly (one volume per year) by Academic Journals.
African Journal of Environmental Science and Technology (AJEST) provides rapid publication (monthly) of articles in all areas of the subject such as Biocidal activity of selected plant powders, evaluation of biomass gasifier, green energy, Food technology etc. The Journal welcomes the submission of manuscripts that meet the general criteria of significance and scientific excellence. Papers will be published shortly after acceptance. All articles are peer-reviewed
Submission of Manuscript
Please read the Instructions for Authors before submitting your manuscript. The manuscript files should be given the last name of the first author Click here to Submit manuscripts online If you have any difficulty using the online submission system, kindly submit via this email [email protected]. With questions or concerns, please contact the Editorial Office at [email protected].
Editors Oladele A. Ogunseitan, Ph.D., M.P.H. Professor of Public Health & Professor of Social Ecology Director, Industrial Ecology Research Group University of California Irvine, CA 92697-7070, USA. Prof. Sulejman Redzic Faculty of Science of the University of Sarajevo 33-35 Zmaja od Bosne St., 71 000 Sarajevo, Bosnia and Herzegovina. Dr. Guoxiang Liu Energy & Environmental Research Center (EERC), University of North Dakota (UND) 15 North 23rd Street, Stop 9018, Grand Forks, North Dakota 58202-9018 USA.
Associate Editors Dr. Suping Zhou Institute of Agricultural and Environmental Research Tennessee State University Nashville, TN 37209, USA
Dr. Hardeep Rai Sharma Assistant Professor, Institute of Environmental Studies Kurukshetra University, Kurukshetra, PIN-136119 Haryana, India Phone:0091-9034824011 (M) Dr. Ramesh Chandra Trivedi Chief Environmental Scientist DHI (India) Wateer & Environment Pvt Ltd, B-220, CR Park, New Delhi - 110019, India.
Prof. Okan Külköylüoglu Department of Biology, Faculty of Arts and Science, Abant Izzet Baysal University, BOLU 14280, TURKEY
Dr. Hai-Linh Tran Korea (AVCK) Research Professor at National Marine Bioenergy R&D Consortium, Department of Biological Engineering - College of Engineering, Inha University, Incheon 402-751, Korea
Editorial Board Dr Dina Abbott University of Derby,UK Area of Expertise: Gender, Food processing and agriculture, Urban poverty Dr. Jonathan Li University of Waterloo, Canada Area of Expertise: Environmental remote sensing, Spatial decision support systems for informal settlement Management in Southern Africa Prof. Omer Ozturk The Ohio State University Department of Statistics, 1958 Neil Avenue, Columbus OH, 43210, USA Area of Expertise: Non parametric statistics, Ranked set sampling, Environmental sampling Dr. John I. Anetor Department of Chemical Pathology, College of Medicine, University of Ibadan, Ibadan, Nigeria Area of Expertise: Environmental toxicology & Micronutrient metabolism (embracing public health nutrition) Dr. Ernest Lytia Molua Department of Economics and Management University of Buea, Cameroon Area of Expertise: Global warming and Climate change, General Economics of the environment Prof. Muhammad Iqbal Hamdard University, New Delhi, India Area of Expertise: Structural & Developmental Botany, Stress Plant Physiology, and Tree Growth Prof. Paxie W Chikusie Chirwa Stellenbosch University, Department of Forest & Wood Science,South Africa Area of Expertise: Agroforestry and Soil forestry research, Soil nutrient and Water dynamics Dr. Télesphore SIME-NGANDO CNRS, UMR 6023, Université Blaise Pascal Clermont-Ferrand II, 24 Avenue des Landais 63177 Aubière Cedex,France Area of Expertise: Aquatic microbial ecology
Dr. Moulay Belkhodja Laboratory of Plant Physiology Faculty of Science University of Oran, Algeria Area of Expertise: Plant physiology, Physiology of abiotic stress, Plant biochemistry, Environmental science, Prof. XingKai XU Institute of Atmospheric Physics Chinese Academy of Sciences Beijing 100029, China Area of Expertise: Carbon and nitrogen in soil environment, and greenhouse gases Prof. Andrew S Hursthouse University of the West of Scotland, UK Area of Expertise: Environmental geochemistry; Organic pollutants; Environmental nanotechnology and biotechnology Dr. Sierra Rayne Department of Biological Sciences Thompson Rivers University Box 3010, 900 McGill Road Kamloops, British Columbia, Canada Area of Expertise: Environmental chemistry Dr. Edward Yeboah Soil Research Institute of the Council for Scientific and Industrial Research (CSIR), Ghana Area of expertise: Soil Biology and Biochemistry stabilization of soil organic matter in agro-ecosystems Dr. Huaming Guo Department of Water Resources & Environment, China University of Geosciences, Beijing, China Area of Expertise: Groundwater chemistry; Environmental Engineering Dr. Bhaskar Behera Agharkar Research Institute, Plant Science Division, G.G. Agarkar Road, Pune-411004, India Area of Expertise: Botany, Specialization: Plant physiology & Biochemistry Prof. Susheel Mittal Thapar University, Patiala, Punjab, India Area of Expertise: Air monitoring and analysis
Dr. Jo Burgess Rhodes University Dept of Biochem, Micro & Biotech, Grahamstown, 6140, South Africa Area of Expertise: Environmental water quality and Biological wastewater treatment Dr. Wenzhong Shen Institute of heavy oil, China University of Petroleum, Shandong, 257061, P. R.,China Area of Expertise: Preparation of porous materials, adsorption, pollutants removal Dr. Girma Hailu African Highlands Initiative P. O. Box 26416 Kampala, Uganda Area of Expertise: Agronomy, Entomology, Environmental science (Natural resource management) Dr. Tao Bo Institute of Geographic Science and Natural Resources, C.A.S 11A Datun Road Anwai Beijing 100101,China Area of Expertise: Ecological modeling, Climate change impacts on ecosystem Dr. Adolphe Zézé Ecole Supérieure d’Agronomie, Institut National Polytechnique,Côte d’Ivoire Houphouet Boigny BP 1313 Yamoussoukro, Area of Expertise: Molecular ecology, Microbial ecology and diversity, Molecular diversity, Molecular phylogenie Dr. Parshotambhai Kanani Junagadh Agricultural University Dept.of agril.extension, college of agriculture,moti bagh,j.a.u Junagadh 362001 Qujarat, India Area of Expertise: Agril Extension Agronomy Indigenous knowledge, Food security, Traditional healing, resource Dr. Orish Ebere Orisakwe Nigeria Area of Expertise: Toxicology
Dr. Christian K. Dang University College Cork, Ireland
Area of Expertise: Eutrophication, Ecological stoichiometry, Biodiversity and Ecosystem Functioning, Water pollution
Dr. Ghousia Begum Indian Institute of Chemical Technology, India Area of Expertise: Toxicology, Biochemical toxicology, Environmental toxicology, Environmental biology
Dr. Walid A. Abu-Dayyeh Sultan Qaboos University Department of Mathematics and statistics/ Al-Koud/ Sultanate of Oman, Oman Area of Expertise: Statistics Dr. Akintunde Babatunde Centre for Water Resources Research, Department of Civil Engineering, School of Architecture, Landscape and Civil Engineering, Newstead Building, University College Dublin, Belfield, Dublin, Area of Expertise: Water and wastewater treatment, Constructed wetlands, adsorption, Phosphorus removal Ireland Dr. Ted L. Helvoigt ECONorthwest 99 West 10th Avenue, Suite 400, Eugene, Oregon 97401, Area of Expertise: Forest & Natural Resource Economics; Econometrics; Operations Research USA Dr. Pete Bettinger University of Georgia Warnell School of Forestry and Natural Resources, Area of Expertise: Forest management, planning, and geographic information systems. USA Dr. Mahendra Singh Directorate of Wheat Research Karnal, India Area of Expertise: Plant pathology
Prof. Adesina Francis Adeyinka
Obafemi Awolowo University Department of Geography, OAU, Ile-Ife, Nigeria Area of Expertise: Environmental resource management and monitoring Dr. Stefan Thiesen Wagner & Co Solar Technology R&D dept. An der Berghecke 20, Germany Area of Expertise: Climate change, Water management Integrated coastal management & Impact studies, Solar energy Dr. Leo C. Osuji University of Port Harcourt Department of Industrial Chemistry, Area of Expertise: Environmental/petroleum chemistry and toxicology Nigeria Dr. Brad Fritz Pacific Northwest National Laboratory 790 6th Street Richland WA, USA Area of Expertise: Atmospheric measurements & groundwater-river water interaction Dr. Mohammed H. Baker Al-Haj Ebrahem Yarmouk University Department of Statistics , Yarmouk University, Irbid - Jordan Area of Expertise: Applied statistics Dr. Ankur Patwardhan Lecturer, Biodiversity Section, Dept. of Microbiology,Abasaheb Garware College, Karve Road,Deccan Gymkhana, Pune-411004. and Hon. Secretary, Research and Action in Natural Wealth Administration (RANWA), Pune-411052, India Area of Expertise: Vegetation ecology and conservation, Water pollution Prof. Gombya-Ssembajjwe William Makerere University P.O.Box 7062 KAMPALA, Uganda Area of Expertise: Forest Management
Dr. Bojan Hamer
Ruđer Bošković Institute, Center for Marine Research, Laboratory for Marine Molecular Toxicology Giordano Paliaga 5, HR-52210 Rovinj, Croatia Area of Expertise: Marine biology, Ecotoxicology, Biomarkers of pollution, Genotoxicity, Proteomics Dr. Mohideen Wafar National Institute of Oceanography, Dona Paula, Goa 403 004, India Area of Expertise: Biological Oceanography Dr. Will Medd Lancaster University, UK Area of Expertise: Water consumption, Flood,Infrastructure, Resilience, Demand management Dr. Liu Jianping Kunming University of Science and Technology Personnel Division of Kunming University of Science and Technology, Wenchang Road No 68, Kunming city, Yunnan Province, China Area of Expertise: Application technology of computer Dr. Timothy Ipoola OLABIYI Coventry University Faculty of Business, Environment & Society, CV1 5FB, Coventry, UK Area of Expertise: Crop protection, nematology, organic agriculture Dr. Ramesh Putheti Research Scientist-Actavis Research and development 10065 Red Run Blvd.Owings mills,Maryland,USA. Area of Expertise: Analytical Chemistry,PharmaceuticalResearch & develoment,Environmental chemistry and sciences Prof. Yung-Tse Hung Professor, Department of Civil and Environmental Engineering, Cleveland State University, Cleveland, Ohio, 44115 USA Area of Expertise: Water and waste treatment, hazardous waste, industrial waste and water pollution control
Dr. Harshal Pandve Assistant Professor, Dept. of Community Medicine, Smt. Kashibai Navale Medical College, Narhe, Pune, Maharashtra state, India Area of Expertise: Public health, Environmental Health, Climate Change Dr. SIEW-TENG ONG Department of Chemical Science, Faculty of Science, Universiti Tunku Abdul Rahman, Jalan Universiti, Bandar Barat, 31900 Kampar, Perak, Malaysia, Area of Expertise: Environmental Chemistry, Physical and Analytical Chemistry, Liquid Crystals Synthesis and Characterization Dr. SATISH AMBADAS BHALERAO Environmental Science Research Laboratory, Department of Botany Wilson College, Mumbai - 400 007 Area of Expertise: Botany (Environmental Botany)
Dr. PANKAJ SAH Department of Applied Sciences, Higher College of Technology (HCT) Al-Khuwair, PO Box 74, PC 133 Muscat,Sultanate of Oman Area of Expertise: Biodiversity,Plant Species Diversity and Ecosystem Functioning,Ecosystem Productivity,Ecosystem Services,Community Ecology,Resistance and Resilience in Different Ecosystems, Plant Population Dynamics Dr. Bensafi Abd-El-Hamid Department of Chemistry, Faculty of Sciences, Abou Bekr Belkaid University of Tlemcen, P.O.Box 119, Chetouane, 13000 Tlemcen, Algeria. Area of Expertise: Environmental chemistry, Environmental Engineering, Water Research. Dr. Surender N. Gupta Faculty, Regional Health and Family Welfare Training Centre, Chheb, Kangra-Himachal Pradesh, India. Pin-176001. Area of Expertise: Epidemiologist
Instructions for Author
Electronic submission of manuscripts is strongly encouraged, provided that the text, tables, and figures are included in a single Microsoft Word file (preferably in Arial font).
The cover letter should include the corresponding author's full address and telephone/fax numbers and should be in an e-mail message sent to the Editor, with the file, whose name should begin with the first author's surname, as an attachment.
Article Types Three types of manuscripts may be submitted:
Regular articles: These should describe new and carefully confirmed findings, and experimental procedures should be given in sufficient detail for others to verify the work. The length of a full paper should be the minimum required to describe and interpret the work clearly. Short Communications: A Short Communication is suitable for recording the results of complete small investigations or giving details of new models or hypotheses, innovative methods, techniques or apparatus. The style of main sections need not conform to that of full-length papers. Short communications are 2 to 4 printed pages (about 6 to 12 manuscript pages) in length.
Reviews: Submissions of reviews and perspectives covering topics of current interest are welcome and encouraged. Reviews should be concise and no longer than 4-6 printed pages (about 12 to 18 manuscript pages). Reviews are also peer-reviewed.
Review Process
All manuscripts are reviewed by an editor and members of the Editorial Board or qualified outside reviewers. Authors cannot nominate reviewers. Only reviewers randomly selected from our database with specialization in the subject area will be contacted to evaluate the manuscripts. The process will be blind review. Decisions will be made as rapidly as possible, and the journal strives to return reviewers’ comments to authors as fast as possible. The editorial board will re-review manuscripts that are accepted pending revision. It is the goal of the AJFS to publish manuscripts within weeks after submission.
Regular articles
All portions of the manuscript must be typed double- spaced and all pages numbered starting from the title page.
The Title should be a brief phrase describing the contents of the paper. The Title Page should include the authors' full names and affiliations, the name of the corresponding author along with phone, fax and E-mail information. Present addresses of authors should appear as a footnote.
The Abstract should be informative and completely self- explanatory, briefly present the topic, state the scope of the experiments, indicate significant data, and point out major findings and conclusions. The Abstract should be 100 to 200 words in length.. Complete sentences, active verbs, and the third person should be used, and the abstract should be written in the past tense. Standard nomenclature should be used and abbreviations should be avoided. No literature should be cited. Following the abstract, about 3 to 10 key words that will provide indexing references should be listed.
A list of non-standard Abbreviations should be added. In general, non-standard abbreviations should be used only when the full term is very long and used often. Each abbreviation should be spelled out and introduced in parentheses the first time it is used in the text. Only recommended SI units should be used. Authors should use the solidus presentation (mg/ml). Standard abbreviations (such as ATP and DNA) need not be defined.
The Introduction should provide a clear statement of the problem, the relevant literature on the subject, and the proposed approach or solution. It should be understandable to colleagues from a broad range of scientific disciplines.
Materials and methods should be complete enough to
allow experiments to be reproduced. However, only truly new procedures should be described in detail; previously published procedures should be cited, and important modifications of published procedures should be mentioned briefly. Capitalize trade names and include the manufacturer's name and address. Subheadings should be used. Methods in general use need not be described in detail.
Results should be presented with clarity and precision. The results should be written in the past tense when describing findings in the authors' experiments. Previously published findings should be written in the present tense. Results should be explained, but largely without referring to the literature. Discussion, speculation and detailed interpretation of data should not be included in the Results but should be put into the Discussion section.
The Discussion should interpret the findings in view of the results obtained in this and in past studies on this topic. State the conclusions in a few sentences at the end of the paper. The Results and Discussion sections can include subheadings, and when appropriate, both sections can be combined.
The Acknowledgments of people, grants, funds, etc should be brief.
Tables should be kept to a minimum and be designed to be as simple as possible. Tables are to be typed double- spaced throughout, including headings and footnotes. Each table should be on a separate page, numbered consecutively in Arabic numerals and supplied with a heading and a legend. Tables should be self-explanatory without reference to the text. The details of the methods used in the experiments should preferably be described in the legend instead of in the text. The same data should not be presented in both table and graph form or repeated in the text.
Figure legends should be typed in numerical order on a separate sheet. Graphics should be prepared using applications capable of generating high resolution GIF, TIFF, JPEG or Powerpoint before pasting in the Microsoft Word manuscript file. Tables should be prepared in Microsoft Word. Use Arabic numerals to designate figures and upper case letters for their parts (Figure 1). Begin each legend with a title and include sufficient description so that the figure is understandable without reading the text of the manuscript. Information given in legends should not be repeated in the text.
References: In the text, a reference identified by means of an author‘s name should be followed by the date of the reference in parentheses. When there are more than two authors, only the first author‘s name should be mentioned, followed by ’et al‘. In the event that an author cited has had two or more works published during the same year, the reference, both in the text and in the reference list, should be identified by a lower case letter like ’a‘ and ’b‘ after the date to distinguish the works.
Examples:
Abayomi (2000), Agindotan et al. (2003), (Kelebeni, 1983), (Usman and Smith, 1992), (Chege, 1998;
1987a,b; Tijani, 1993,1995), (Kumasi et al., 2001) References should be listed at the end of the paper in alphabetical order. Articles in preparation or articles submitted for publication, unpublished observations, personal communications, etc. should not be included in the reference list but should only be mentioned in the article text (e.g., A. Kingori, University of Nairobi, Kenya, personal communication). Journal names are abbreviated according to Chemical Abstracts. Authors are fully responsible for the accuracy of the references.
Examples:
Chikere CB, Omoni VT and Chikere BO (2008). Distribution of potential nosocomial pathogens in a hospital environment. Afr. J. Biotechnol. 7: 3535-3539.
Moran GJ, Amii RN, Abrahamian FM, Talan DA (2005). Methicillinresistant Staphylococcus aureus in community-acquired skin infections. Emerg. Infect. Dis. 11: 928-930.
Pitout JDD, Church DL, Gregson DB, Chow BL, McCracken M, Mulvey M, Laupland KB (2007). Molecular epidemiology of CTXM-producing Escherichia coli in the Calgary Health Region: emergence of CTX-M-15-producing isolates. Antimicrob. Agents Chemother. 51: 1281-1286.
Pelczar JR, Harley JP, Klein DA (1993). Microbiology: Concepts and Applications. McGraw-Hill Inc., New York, pp. 591-603.
Short Communications
Short Communications are limited to a maximum of two figures and one table. They should present a complete study that is more limited in scope than is found in full-length papers. The items of manuscript preparation listed above apply to Short Communications with the following differences: (1) Abstracts are limited to 100 words; (2) instead of a separate Materials and Methods section, experimental procedures may be incorporated into Figure Legends and Table footnotes; (3) Results and Discussion should be combined into a single section. Proofs and Reprints: Electronic proofs will be sent (e- mail attachment) to the corresponding author as a PDF file. Page proofs are considered to be the final version of the manuscript. With the exception of typographical or minor clerical errors, no changes will be made in the manuscript at the proof stage.

Fees and Charges: Authors are required to pay a $550 handling fee. Publication of an article in the African Journal of Environmental Science and Technology is not contingent upon the author's ability to pay the charges. Neither is acceptance to pay the handling fee a guarantee that the paper will be accepted for publication. Authors may still request (in advance) that the editorial office waive some of the handling fee under special circumstances
Copyright: © 2015, Academic Journals. All rights Reserved. In accessing this journal, you agree that you will access the contents for your own personal use but not for any commercial use. Any use and or copies of this Journal in whole or in part must include the customary bibliographic citation, including author attribution, date and article title.
Submission of a manuscript implies: that the work described has not been published before (except in the form of an abstract or as part of a published lecture, or thesis) that it is not under consideration for publication elsewhere; that if and when the manuscript is accepted for publication, the authors agree to automatic transfer of the copyright to the publisher.
Disclaimer of Warranties
In no event shall Academic Journals be liable for any special, incidental, indirect, or consequential damages of any kind arising out of or in connection with the use of the articles or other material derived from the AJEST, whether or not advised of the possibility of damage, and on any theory of liability. This publication is provided "as is" without warranty of any kind, either expressed or implied, including, but not limited to, the implied warranties of merchantability, fitness for a particular purpose, or non-infringement. Descriptions of, or references to, products or publications does not imply endorsement of that product or publication. While every effort is made by Academic Journals to see that no inaccurate or misleading data, opinion or statements appear in this publication, they wish to make it clear that the data and opinions appearing in the articles and advertisements herein are the responsibility of the contributor or advertiser concerned. Academic Journals makes no warranty of any kind, either express or implied, regarding the quality, accuracy, availability, or validity of the data or information in this publication or of any other publication to which it may be linked.
International Journal of Medicine and Medical Sciences
African Journal of Environmental Science and Technology
Table of Contents: Volume 9 Number 5, May 2015
ARTICLES
Effect of gas recirculation intensity and various temperatures on hydrogenotrophic methanogens activity in chemostat fermentation using H2/CO2 as substrate Olga Yolande Ako and Yutaka Kitamura
Assessment of effluents discharged from textiles industries in selected villages in Kaduna State, Nigeria Mohammed Ahmed Emigilati, Ibrahim Ishiaku, Badaru Yahaya Usman, Garba Inuwa Kuta and Kudu Dangana
Influence of lokpa cattle market wastes on agricultural soil quality Chinyere G. C., Osuocha K. U. and Imo Chinedu
Assessment of microbiological quality of drinking water treated with chlorine in the Gwalior city of Madhya Pradesh, India Makhmoor Rather Ahmad, Ahanger Faroz Ahmad and Sharma Harendra K
Gumbel Weibull distribution function for Sahel precipitation modeling and predicting: Case of Mali Kya Abraham Berthe, Abdramane B and Setephan Reichenbach
Assessment of physico-chemical and bacteriological quality of drinking water at sources and household in Adama Town, Oromia Regional State, Ethiopia Temesgen Eliku and Hameed Sulaiman
Evaluation of selected wetland plants for removal of chromium from tannery wastewater in constructed wetlands, Ethiopia Tadesse Alemu Terfie and Seyoum Leta Asfaw
Local blacksmiths’s activity in the west region of Cameroon and their contribution to the development of micro hydroelectric power plants in that region Kengne Signe Elie B., O. Hamandjoda, Tekounegning and Nganhou. J.
Table of Contents: Volume 9 Number 5, May 2015
Accessibility and utilization of mobile phones for governance of water resources in the Lake Victoria Basin: Constraints and opportunities in Tanzania H. J. Mongi, A. N. Mvuma, S. Kucel, A. J. Tenge and M. Gabriel The Niger Delta wetland ecosystem: What threatens it and why should we protect it? Chidumeje Ndidi Patience Okonkwo, Lalit Kumar and Subhashni Taylor Reinventing new systems of crop production in time of agro-ecological change in Burkina Faso Gabin Korbéogo Characterization of biosurfactant produced from submerged fermentation of fruits bagasse of yellow cashew (Anacardium occidentale) using Pseudomonas aeruginosa Iroha Okechukwu K., Njoku Obi U., Ogugua Victor N. and Okpashi Victor E. Challenges of adoption of urine-diversion dry toilets technology as sanitation option by coastal communities of Mkuranga District in Tanzania Aloyce W. Mayo and Twaha Mubarak Prospects of using whole rice husk for the production of dense and hollow bricks Chukwudebelu, J. A., Igwe, C. C. and Madukasi, E. I. Lead uptake of water plants in water stream at Kiteezi landfill site, Kampala (Uganda) Dana Jill Mugisa, Noble Banadda, Nicholas Kiggundu and R. Asuman
Vol. 9(5), pp. 379-382, May 2015
DOI: 10.5897/AJEST2014.1801
Article Number: EF9B5D552102
ISSN 1996-0786
Copyright © 2015
Author(s) retain the copyright of this article
http://www.academicjournals.org/AJEST
African Journal of Environmental Science and Technology
Full Length Research Paper
Effect of gas recirculation intensity and various temperatures on hydrogenotrophic methanogens
activity in chemostat fermentation using H2/CO2 as substrate
Olga Yolande Ako1* and Yutaka Kitamura2
1UFR des Sciences et Gestion de l'Environment, University of Nangui Abrogoua, Abidjan, Côte d’Ivoire.
2Graduate School of Life and Environmental Sciences, University of Tsukuba, Japan.
Received 2 October, 2014; Accepted 24 February, 2015
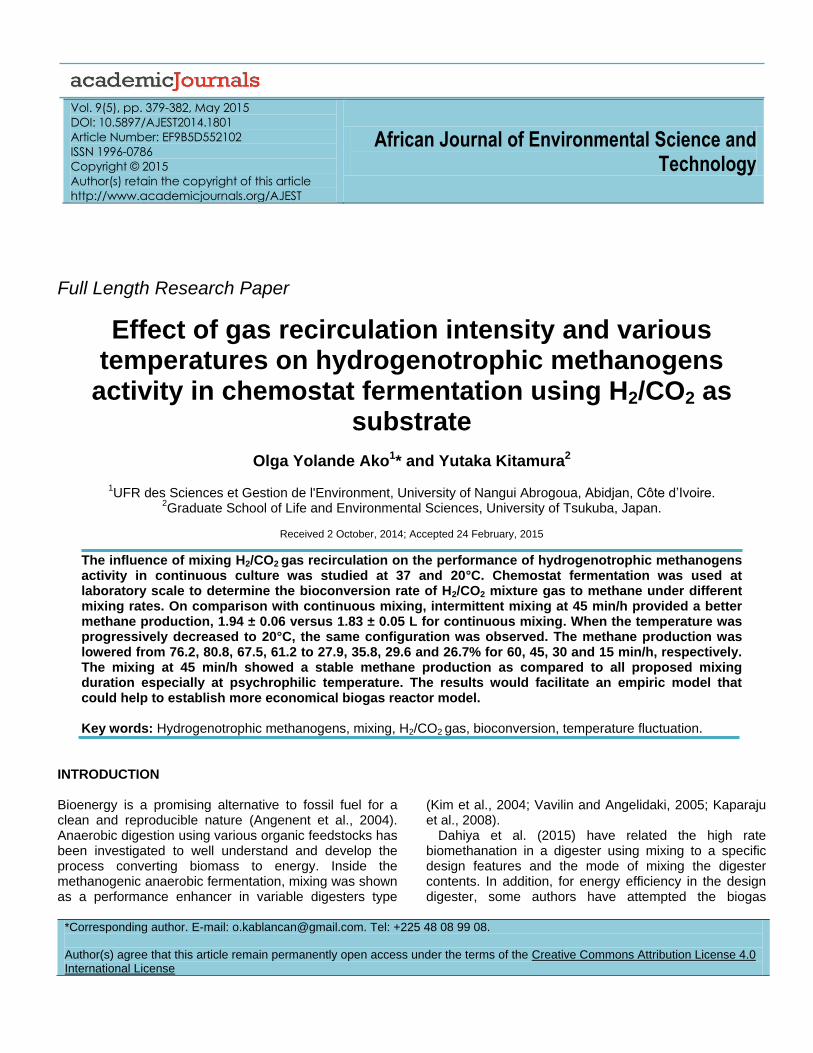
The influence of mixing H2/CO2 gas recirculation on the performance of hydrogenotrophic methanogens activity in continuous culture was studied at 37 and 20°C. Chemostat fermentation was used at laboratory scale to determine the bioconversion rate of H2/CO2 mixture gas to methane under different mixing rates. On comparison with continuous mixing, intermittent mixing at 45 min/h provided a better methane production, 1.94 ± 0.06 versus 1.83 ± 0.05 L for continuous mixing. When the temperature was progressively decreased to 20°C, the same configuration was observed. The methane production was lowered from 76.2, 80.8, 67.5, 61.2 to 27.9, 35.8, 29.6 and 26.7% for 60, 45, 30 and 15 min/h, respectively. The mixing at 45 min/h showed a stable methane production as compared to all proposed mixing duration especially at psychrophilic temperature. The results would facilitate an empiric model that could help to establish more economical biogas reactor model. Key words: Hydrogenotrophic methanogens, mixing, H2/CO2 gas, bioconversion, temperature fluctuation.
INTRODUCTION Bioenergy is a promising alternative to fossil fuel for a clean and reproducible nature (Angenent et al., 2004). Anaerobic digestion using various organic feedstocks has been investigated to well understand and develop the process converting biomass to energy. Inside the methanogenic anaerobic fermentation, mixing was shown as a performance enhancer in variable digesters type
(Kim et al., 2004; Vavilin and Angelidaki, 2005; Kaparaju et al., 2008).
Dahiya et al. (2015) have related the high rate biomethanation in a digester using mixing to a specific design features and the mode of mixing the digester contents. In addition, for energy efficiency in the design digester, some authors have attempted the biogas
*Corresponding author. E-mail: [email protected]. Tel: +225 48 08 99 08. Author(s) agree that this article remain permanently open access under the terms of the Creative Commons Attribution License 4.0 International License
380 Afr. J. Environ. Sci. Technol. recirculation for mixing (Karim et al., 2005a) and compare the system with other mode of mixing (Karim et al., 2005b).
Although, the biogas recirculation technology is experienced, there is still incertitude on the effect of mixing combined with factors such as limiting organic loading rate and temperature when gas H2/CO2 is recirculated as unique substrate on methanogens activity during methanogenesis. From economics view, anaero-bic fermentation has demonstrated its capability to pro-duce a useful byproduct, the vitamin B12 (Yang et al., 2004), but no research has yet be done on the effect of mixing on vitamin B12 production in methanogenesis. Thus, the present study aimed to determine the methane production especially with acclimated mesophi-lic methanogenic culture cultivated at different mixing variations using recycling H2/CO2 as unique substrate and mixing source; then because the mesophilic tem-perature range represents the methanogens optimal activity temperature range (Bouallagui, 2004), the effect of temperature variation will be associated with the mixing variation.
MATERIALS AND METHODS
At laboratory scale, anaerobic sludge from a municipal anaerobic wastewater treatment plant was acclimated for 8 months under H2/CO2 (80:20, v/v) as unique substrate. Under epifluorescence microscopy analysis, the sludge presented long rod-shaped cells and cocci with a uniform blue-autofluorescence color (data not shown). The anaerobic growth culture was partitioned equitably (500 mL/reactor) in the four chemostat reactors for an experimental continuous cultivation.
Experimental procedures
The media composed of mineral nutrients and trace metals and also the protocol were identical with those used by Ako et al. (2008). The mineral nutrients and trace metals were separately boiled, cooled and sparged with mixture gas H2/CO2 (80:20, v/v) to remove O2 traces. The pH values were 7.95 and 6.93 for mineral nutrients and trace metals, respectively. Nutrients and trace metals were applied to the growth of four reactors using a HRT set at 12 days for optimal hydrogenotrophic methanogens operation condition.
At mesophilic temperature (37°C)
The four chemostat reactors with acclimated hydrogenotrophic methanogens were connected to four aluminum tedlar gas bag containing H2/CO2 (80:20, v/v) gas supply at the rate of 12 L/reactor/d. The mixing inside each reactor was realized using four airtight pumps at 0.08 MPa and different mixing durations: 60, 45, 30 and 15 min/h. The daily gas production and composition were monitored at steady state cultivation; the pH and volatiles solids (VS) were measured for seven days.
At psychrophilic temperature (20°C)
The procedure is similar to the one use at mesophilic temperature
and the chemostat reactors temperature was progressively decreased (-1°C/day) until it reached 20°C. Under 20°C, the chemostat steady state was realized then the biogas production and composition, pH and VS were monitored for 7 days.
Analysis methods
The pH was measured in situ with a pH-meter TPX-90 (Toko Chemical Laboratories Co. Ltd). The biogas composition was measured by GC-14B Shimadzu gas chromatograph, equipped with a thermal conductivity detector, connected to a C-R8A data analyzer. A high performance column packed with 50/80 mesh Porapak Q was used. The temperature of the injection column and detector was set at 100, 50 and 100°C, respectively. Argon was used as carrier gas at a flow rate of 50 mL/min and a pressure of 0.5 MPa.
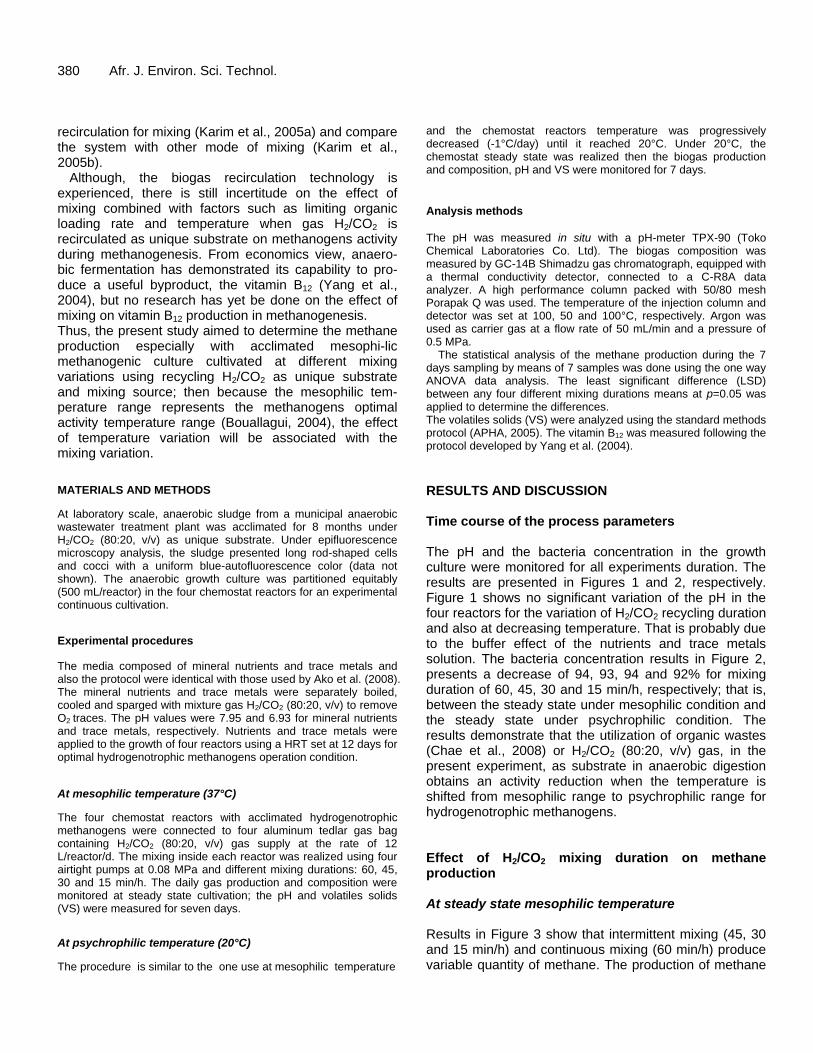
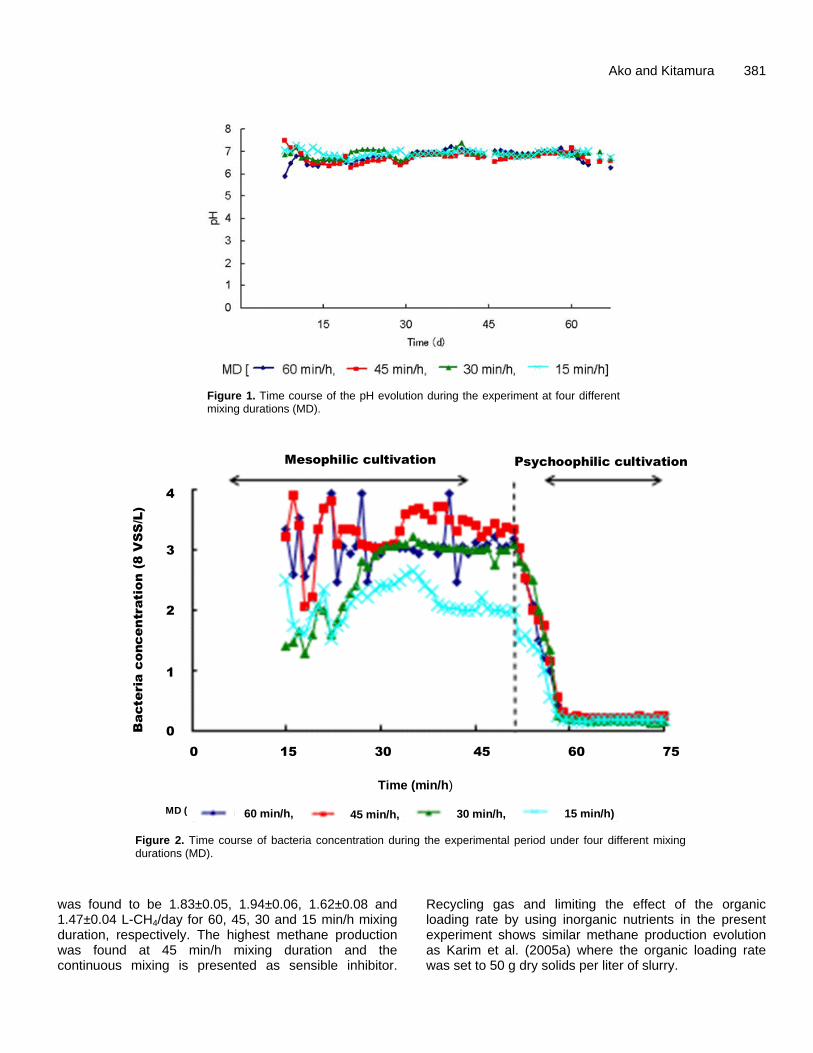
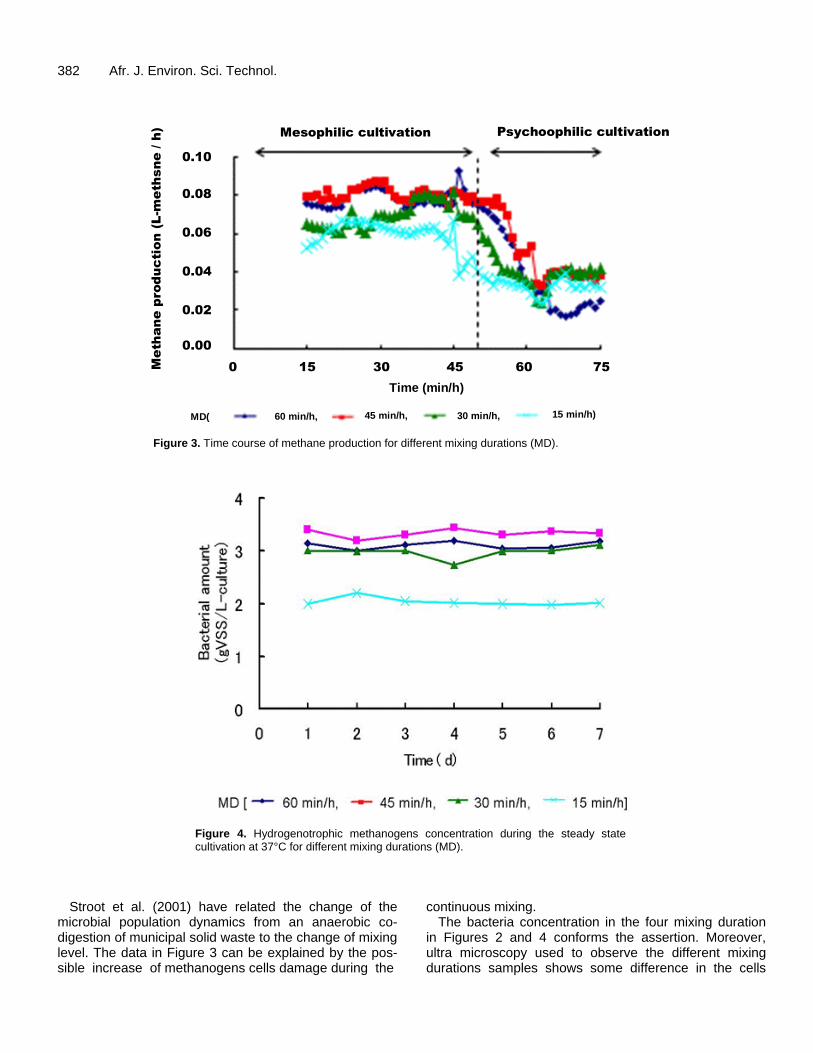
The statistical analysis of the methane production during the 7 days sampling by means of 7 samples was done using the one way ANOVA data analysis. The least significant difference (LSD) between any four different mixing durations means at p=0.05 was applied to determine the differences. The volatiles solids (VS) were analyzed using the standard methods protocol (APHA, 2005). The vitamin B12 was measured following the protocol developed by Yang et al. (2004). RESULTS AND DISCUSSION Time course of the process parameters The pH and the bacteria concentration in the growth culture were monitored for all experiments duration. The results are presented in Figures 1 and 2, respectively. Figure 1 shows no significant variation of the pH in the four reactors for the variation of H2/CO2 recycling duration and also at decreasing temperature. That is probably due to the buffer effect of the nutrients and trace metals solution. The bacteria concentration results in Figure 2, presents a decrease of 94, 93, 94 and 92% for mixing duration of 60, 45, 30 and 15 min/h, respectively; that is, between the steady state under mesophilic condition and the steady state under psychrophilic condition. The results demonstrate that the utilization of organic wastes (Chae et al., 2008) or H2/CO2 (80:20, v/v) gas, in the present experiment, as substrate in anaerobic digestion obtains an activity reduction when the temperature is shifted from mesophilic range to psychrophilic range for hydrogenotrophic methanogens. Effect of H2/CO2 mixing duration on methane production At steady state mesophilic temperature Results in Figure 3 show that intermittent mixing (45, 30 and 15 min/h) and continuous mixing (60 min/h) produce variable quantity of methane. The production of methane
Ako and Kitamura 381
Figure 1. Time course of the pH evolution during the experiment at four different mixing durations (MD).
Mesophilic cultivation Psychoophilic cultivation
MD (
0 15 30 45 60 75
60 min/h, 45 min/h, 30 min/h, 15 min/h)
Time (min/h)
Ba
cte
ria
c
onc
en
tratio
n (8
V
SS
/L)
4
3
2
1
0
Figure 2. Time course of bacteria concentration during the experimental period under four different mixing durations (MD).
was found to be 1.83±0.05, 1.94±0.06, 1.62±0.08 and 1.47±0.04 L-CH4/day for 60, 45, 30 and 15 min/h mixing duration, respectively. The highest methane production was found at 45 min/h mixing duration and the continuous mixing is presented as sensible inhibitor.
Recycling gas and limiting the effect of the organic loading rate by using inorganic nutrients in the present experiment shows similar methane production evolution as Karim et al. (2005a) where the organic loading rate was set to 50 g dry solids per liter of slurry.
382 Afr. J. Environ. Sci. Technol.
Mesophilic cultivation Psychoophilic cultivation
MD(
0 15 30 45 60 75
60 min/h, 45 min/h, 30 min/h, 15 min/h)
Time (min/h)
Me
th
an
e p
rod
uc
tio
n (L
-m
eth
sn
e / h
)
0.10
0.08
0.06
0.04
0.02
0.00
Figure 3. Time course of methane production for different mixing durations (MD).
Figure 4. Hydrogenotrophic methanogens concentration during the steady state cultivation at 37°C for different mixing durations (MD).
Stroot et al. (2001) have related the change of the microbial population dynamics from an anaerobic co-digestion of municipal solid waste to the change of mixing level. The data in Figure 3 can be explained by the pos-sible increase of methanogens cells damage during the
continuous mixing. The bacteria concentration in the four mixing duration
in Figures 2 and 4 conforms the assertion. Moreover, ultra microscopy used to observe the different mixing durations samples shows some difference in the cells
Ako and Kitamura 383
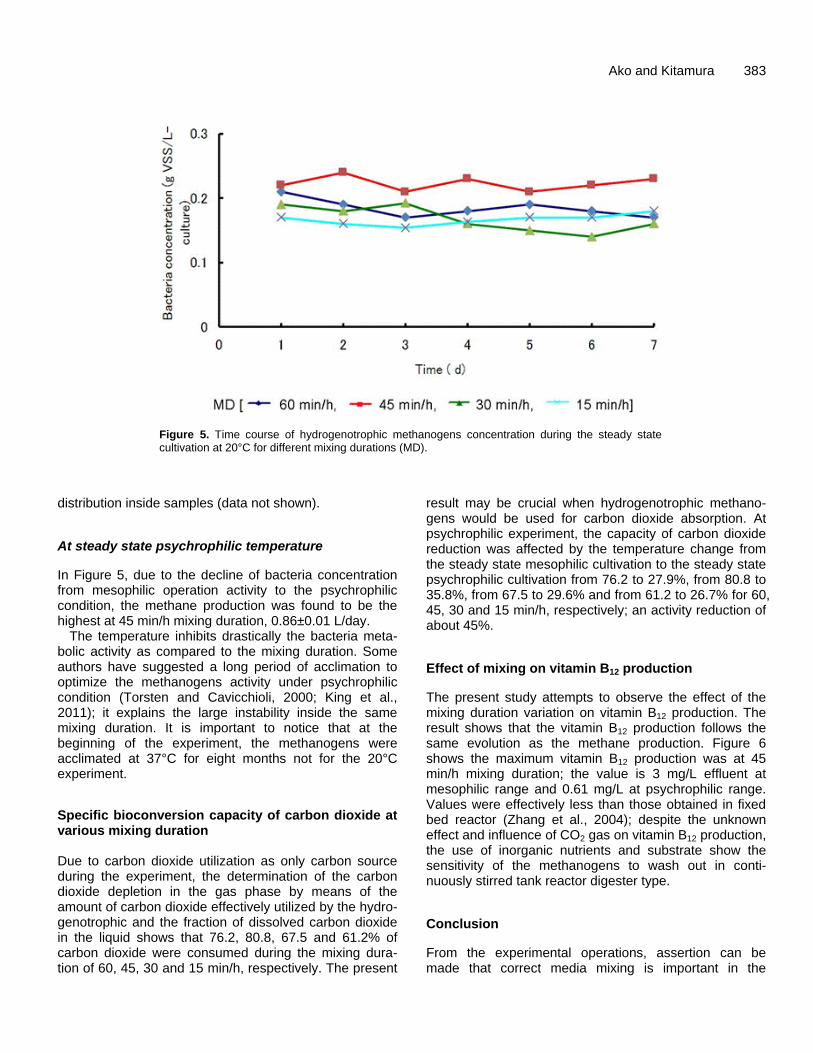
Figure 5. Time course of hydrogenotrophic methanogens concentration during the steady state cultivation at 20°C for different mixing durations (MD).
distribution inside samples (data not shown).
At steady state psychrophilic temperature
In Figure 5, due to the decline of bacteria concentration from mesophilic operation activity to the psychrophilic condition, the methane production was found to be the highest at 45 min/h mixing duration, 0.86±0.01 L/day.
The temperature inhibits drastically the bacteria meta-bolic activity as compared to the mixing duration. Some authors have suggested a long period of acclimation to optimize the methanogens activity under psychrophilic condition (Torsten and Cavicchioli, 2000; King et al., 2011); it explains the large instability inside the same mixing duration. It is important to notice that at the beginning of the experiment, the methanogens were acclimated at 37°C for eight months not for the 20°C experiment.
Specific bioconversion capacity of carbon dioxide at various mixing duration Due to carbon dioxide utilization as only carbon source during the experiment, the determination of the carbon dioxide depletion in the gas phase by means of the amount of carbon dioxide effectively utilized by the hydro-genotrophic and the fraction of dissolved carbon dioxide in the liquid shows that 76.2, 80.8, 67.5 and 61.2% of carbon dioxide were consumed during the mixing dura-tion of 60, 45, 30 and 15 min/h, respectively. The present
result may be crucial when hydrogenotrophic methano-gens would be used for carbon dioxide absorption. At psychrophilic experiment, the capacity of carbon dioxide reduction was affected by the temperature change from the steady state mesophilic cultivation to the steady state psychrophilic cultivation from 76.2 to 27.9%, from 80.8 to 35.8%, from 67.5 to 29.6% and from 61.2 to 26.7% for 60, 45, 30 and 15 min/h, respectively; an activity reduction of about 45%.
Effect of mixing on vitamin B12 production
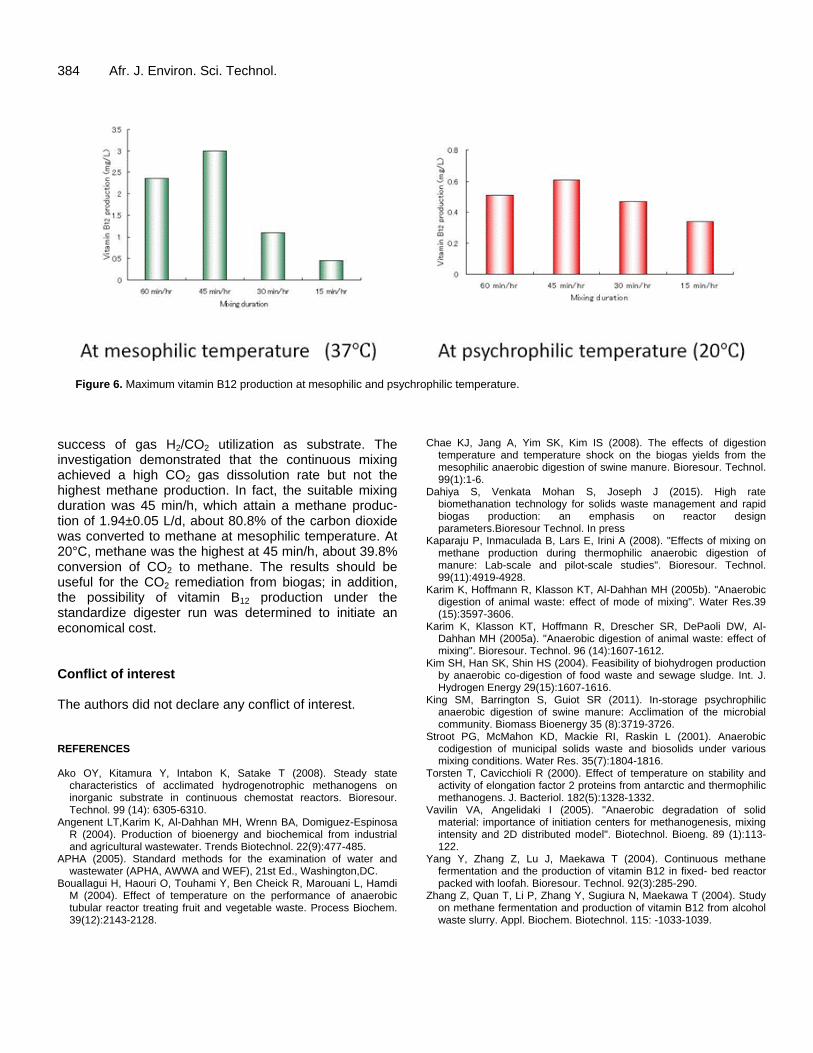
The present study attempts to observe the effect of the mixing duration variation on vitamin B12 production. The result shows that the vitamin B12 production follows the same evolution as the methane production. Figure 6 shows the maximum vitamin B12 production was at 45 min/h mixing duration; the value is 3 mg/L effluent at mesophilic range and 0.61 mg/L at psychrophilic range. Values were effectively less than those obtained in fixed bed reactor (Zhang et al., 2004); despite the unknown effect and influence of CO2 gas on vitamin B12 production, the use of inorganic nutrients and substrate show the sensitivity of the methanogens to wash out in conti-nuously stirred tank reactor digester type.
Conclusion
From the experimental operations, assertion can be made that correct media mixing is important in the
384 Afr. J. Environ. Sci. Technol.
Figure 6. Maximum vitamin B12 production at mesophilic and psychrophilic temperature.
success of gas H2/CO2 utilization as substrate. The investigation demonstrated that the continuous mixing achieved a high CO2 gas dissolution rate but not the highest methane production. In fact, the suitable mixing duration was 45 min/h, which attain a methane produc-tion of 1.94±0.05 L/d, about 80.8% of the carbon dioxide was converted to methane at mesophilic temperature. At 20°C, methane was the highest at 45 min/h, about 39.8% conversion of CO2 to methane. The results should be useful for the CO2 remediation from biogas; in addition, the possibility of vitamin B12 production under the standardize digester run was determined to initiate an economical cost. Conflict of interest The authors did not declare any conflict of interest. REFERENCES Ako OY, Kitamura Y, Intabon K, Satake T (2008). Steady state
characteristics of acclimated hydrogenotrophic methanogens on inorganic substrate in continuous chemostat reactors. Bioresour. Technol. 99 (14): 6305-6310.
Angenent LT,Karim K, Al-Dahhan MH, Wrenn BA, Domiguez-Espinosa R (2004). Production of bioenergy and biochemical from industrial and agricultural wastewater. Trends Biotechnol. 22(9):477-485.
APHA (2005). Standard methods for the examination of water and wastewater (APHA, AWWA and WEF), 21st Ed., Washington,DC.
Bouallagui H, Haouri O, Touhami Y, Ben Cheick R, Marouani L, Hamdi M (2004). Effect of temperature on the performance of anaerobic tubular reactor treating fruit and vegetable waste. Process Biochem. 39(12):2143-2128.
Chae KJ, Jang A, Yim SK, Kim IS (2008). The effects of digestion temperature and temperature shock on the biogas yields from the mesophilic anaerobic digestion of swine manure. Bioresour. Technol. 99(1):1-6.
Dahiya S, Venkata Mohan S, Joseph J (2015). High rate biomethanation technology for solids waste management and rapid biogas production: an emphasis on reactor design parameters.Bioresour Technol. In press
Kaparaju P, Inmaculada B, Lars E, Irini A (2008). "Effects of mixing on methane production during thermophilic anaerobic digestion of manure: Lab-scale and pilot-scale studies". Bioresour. Technol. 99(11):4919-4928.
Karim K, Hoffmann R, Klasson KT, Al-Dahhan MH (2005b). "Anaerobic digestion of animal waste: effect of mode of mixing". Water Res.39 (15):3597-3606.
Karim K, Klasson KT, Hoffmann R, Drescher SR, DePaoli DW, Al-Dahhan MH (2005a). "Anaerobic digestion of animal waste: effect of mixing". Bioresour. Technol. 96 (14):1607-1612.
Kim SH, Han SK, Shin HS (2004). Feasibility of biohydrogen production by anaerobic co-digestion of food waste and sewage sludge. Int. J. Hydrogen Energy 29(15):1607-1616.
King SM, Barrington S, Guiot SR (2011). In-storage psychrophilic anaerobic digestion of swine manure: Acclimation of the microbial community. Biomass Bioenergy 35 (8):3719-3726.
Stroot PG, McMahon KD, Mackie RI, Raskin L (2001). Anaerobic codigestion of municipal solids waste and biosolids under various mixing conditions. Water Res. 35(7):1804-1816.
Torsten T, Cavicchioli R (2000). Effect of temperature on stability and activity of elongation factor 2 proteins from antarctic and thermophilic methanogens. J. Bacteriol. 182(5):1328-1332.
Vavilin VA, Angelidaki I (2005). "Anaerobic degradation of solid material: importance of initiation centers for methanogenesis, mixing intensity and 2D distributed model". Biotechnol. Bioeng. 89 (1):113-122.
Yang Y, Zhang Z, Lu J, Maekawa T (2004). Continuous methane fermentation and the production of vitamin B12 in fixed- bed reactor packed with loofah. Bioresour. Technol. 92(3):285-290.
Zhang Z, Quan T, Li P, Zhang Y, Sugiura N, Maekawa T (2004). Study on methane fermentation and production of vitamin B12 from alcohol waste slurry. Appl. Biochem. Biotechnol. 115: -1033-1039.
Vol. 9(5), pp. 385-389, May 2015
DOI: 10.5897/AJEST2014.1786
Article Number: 09C3DD852127
ISSN 1996-0786
Copyright © 2015
Author(s) retain the copyright of this article
http://www.academicjournals.org/AJEST
African Journal of Environmental Science and Technology
Full Length Research Paper
Assessment of effluents discharged from textiles industries in selected villages in Kaduna State, Nigeria
Mohammed Ahmed Emigilati1*, Ibrahim Ishiaku2, Badaru Yahaya Usman1, Garba Inuwa Kuta1 and Kudu Dangana3
1Department of Geography, Federal University of Technology Minna, Niger State Nigeria.
2Department of Geography, Federal University Birnin-Kebbi, Kebbi State, Nigeria.
3Department of Geography, IBBU Lapai, Niger State Nigeria.
Received 4 September, 2014; Accepted 18 March, 2015
A major serious source of pollution is the industrial effluent discharge by the process industries into the water bodies. Industrial effluent consists of water with varieties of potentially harmful substances. The study analysed the public health effects of effluents discharged from Kaduna textile industry into the waters of river Kaduna. Physicochemical qualities of effluents at the downstream were assessed. Parameters measured include pH, temperature, electrical conductivity, depth, turbidity, biological oxygen demand (BOD), dissolved oxygen, chemical oxygen demand, nitrate, sulphate, acidity, alkalinity, organic matter and carbon levels and these were simultaneously monitored in the river using standard methods. Unacceptable, high levels of the parameters were observed in the four sampling points during the study period and are severally outside the compliance levels of the Federal Environmental Protection Agency (FEPA) Guidelines and World Health Organization (WHO) tolerance limits for domestic uses. The study recommend the need for the intervention of appropriate regulatory agencies to ensure production of high quality treated final effluents by wastewater treatment facilities in selected villages of Kaduna Key words: Pollution, textile industry, industrial effluent and water quality.
INTRODUCTION The water we drink is essential ingredient for our wellbeing and a healthy life but unfortunately, polluted water and air are common throughout the world (European Public Health Alliance, 2009). All people, whatever their stages of development, social and economic condition, have the right to have access to drinking-water in quantities and of a quality equal to their basic needs (WHO, 2004). Over the last three decades, there has been increasing global
concern over the public health impacts attributed to water pollution, in particular, the global burden of disease. It is estimates that about a quarter of the diseases facing mankind today occur due to prolonged exposure to water pollution. Most of these water pollution-related diseases are however not easily detected most especially in developing countries and may be acquired during childhood and manifested later in adulthood. The discharge of
*Corresponding author. E-mail: [email protected]. Tel: +2347032950192. Author(s) agree that this article remain permanently open access under the terms of the Creative Commons Attribution License 4.0 International License
386 Afr. J. Environ. Sci. Technol. industrial effluent into water bodies is one of the main causes of environmental pollution and degradation in many cities, especially in developing countries. Many of these industries lack liquid and solid waste regulations and proper disposal facilities, including the harmful waste. Such waste may be infectious, toxic or radioactive (WHO, 2004).
Industrial pollution is one of the problems presently facing Kaduna State in Nigeria due to concentration of textile manufacturing industries. The industries together with municipal effluents ultimately polluted water in the river. The water pollution may infect our food in addition to groundwater contamination when used to irrigate crops and this poses great risks to public health.
In an attempt to contribute to the understanding of the nature of the problems, this study undertook a comparative analysis of textile industries effluent discharge in Kundende, Rigasa, Nasarawa and Kakuri in relation to acceptable limit of world health organisation in Kaduna State, Nigeria.
Statement of problems A major serious source of pollution is the industrial effluent discharge by the process industries into the water bodies. Industrial effluent consists of water with varieties of potentially harmful substances. The wastewater is a by-product of utilized portable water (domestic wastewater) or industrial process water (industrial wastewater). In the process industries, water could be used as coolant, process water and raw material, etc. It is also used in purification of either the raw materials or finished products. In the process of usage, industrial water becomes polluted and contaminated with various substances it comes in contact with. The discharge of such wastewater or industrial effluents into water bodies such as streams, rivers, lakes, seas, oceans or farmland, etc., could be hazardous to man, aquatic lives, plants and every other living things that derive their water from the polluted sources (Dix, 1981). Effluent discharge from industries, especially from textile industries in Kaduna town has been on the increase on daily basis. Its effective
management has constantly been a problem to the industrialists, the community and the government of Kaduna. Adverse effect of these to human health, biodiversity and agricultural farmlands are now eminent. The question that readily comes to mind is how consumable are surrounding rivers in relation to world health organization standard. It is therefore significant in environmental management and decision making to assess and evaluate the magnitude of negative impact. Aim and objectives The aim of this study was to assess the quality of effluents discharge in river Kaduna in comparison with WHO
accepted limit. In specific, the objectives are: To compare the quantity of pollutants in the water with the acceptable limits of WHO; to assess the rate at which chemical related effluents discharged from the industry affect the quality of water. RESEARCH METHODOLOGY Study area Kaduna is the capital of Kaduna State. It has always been the seat of government right from the time of colonial rule in Nigeria. It was the capital of then, northern religion when the country was divided into twelve (12) states; it became the capital of the emergent north central state. Kaduna was first developed as an army encampment and later grew to become a cosmopolitan city. The city, located on the Kaduna River, is a trade centre
Kaduna occupies an approximate total land area of 3,080 km2
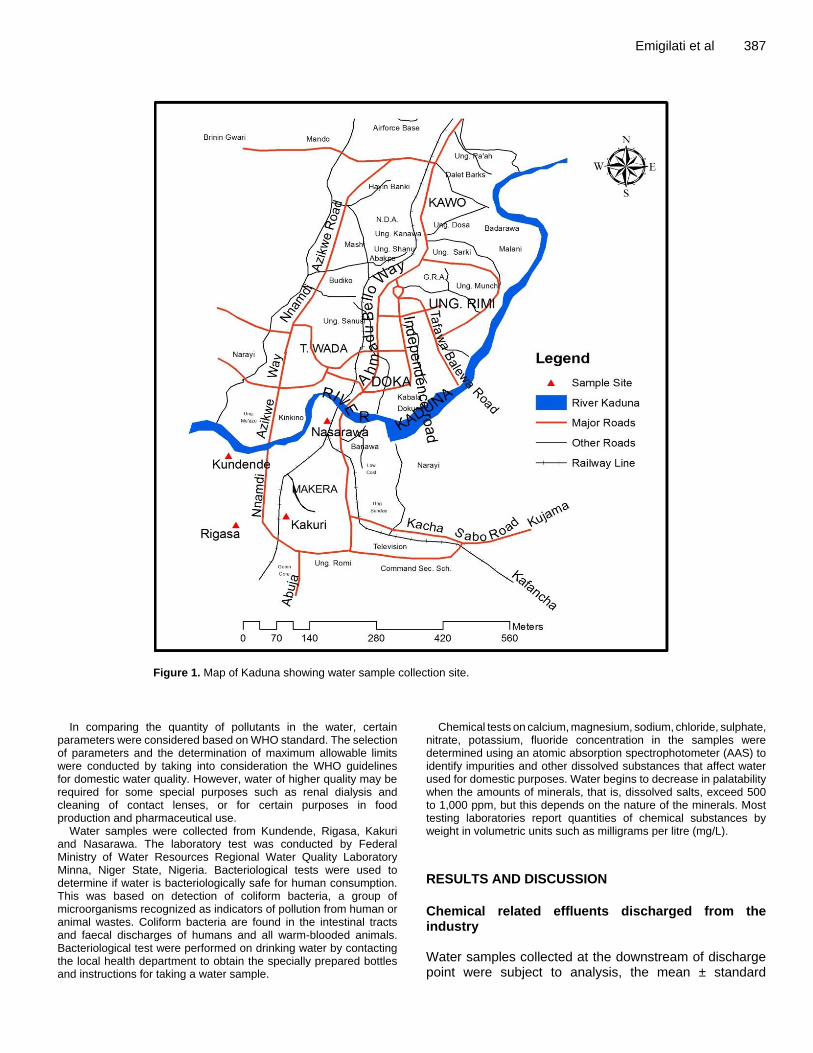
and also has an estimated population in the 1991 census of about 711,155. The recent 2006 population census estimated Kaduna as 1,458, 900. The river Kaduna takes it source from the Kujama hills in the Jos plateau and flows for 210 km before reaching Kaduna town. It crosses the city dividing it into north and south area. Beyond Kaduna, the river flows about 100 km into the Shiroro dam areas. The river is joined on its course by three tributaries which include river SarkiPawa, Tubo/Damari and Dinya, the Shiroro. It continues to flow for 200 km and finally discharges into the river Niger on the Northern shores of Pategi (Figure 1). The entire study was designed to involve three different stages which included: 1. Preliminary studies: it involved collection of reports and preparation of maps. 2. Field work which involved collection of water samples. 3. Analysis and report writing: it involved laboratory analysis of sample. In the first stage, reconnaissance and a pilot survey was conducted before the definition and mapping of the study area. Thereafter, the sampling strategies/procedures were designed with the required instruments of investigation. At the data collection stage, all the selected villages were identified and water sample collected. This was followed by data analysis stage, where data collated were summarized and presented including composite water sample test from laboratory analysis where the following parameters were tested: temperature, dissolved oxygen, turbidity, conductivity, total dissolved solid, pH, fluoride (F), manganese (Mn
+), ammonia (NH3),
nitrate (NO3-2
), sulphate (SO4-2
), nitrite (NO2-), sodium (Na
+),
Potassium (K+), alkalinity, calcium, chloride (Cl
-), magnesium
(Mg2+
), bicarbonate and carbonate (CO32). The data collected from
the sources of water segments established within the villages were subjected to one-way analysis of variance (ANOVA). ANOVA was also used to test for existence of significant variation between groups of water quality parameters and among the four designated sources of water. Quantity of pollutants in the water and acceptable limits of National Standard and WHO In comparing the quantity of pollutants in the water with the acceptable limits of National Standard and WHO, the selection of parameters and the determination of maximum allowable limits were computed and shown in Table 1 taking into consideration the WHO guidelines for domestic water quality.
Emigilati et al 387
Figure 1. Map of Kaduna showing water sample collection site.
In comparing the quantity of pollutants in the water, certain parameters were considered based on WHO standard. The selection of parameters and the determination of maximum allowable limits were conducted by taking into consideration the WHO guidelines for domestic water quality. However, water of higher quality may be required for some special purposes such as renal dialysis and cleaning of contact lenses, or for certain purposes in food production and pharmaceutical use.
Water samples were collected from Kundende, Rigasa, Kakuri and Nasarawa. The laboratory test was conducted by Federal Ministry of Water Resources Regional Water Quality Laboratory Minna, Niger State, Nigeria. Bacteriological tests were used to determine if water is bacteriologically safe for human consumption. This was based on detection of coliform bacteria, a group of microorganisms recognized as indicators of pollution from human or animal wastes. Coliform bacteria are found in the intestinal tracts and faecal discharges of humans and all warm-blooded animals. Bacteriological test were performed on drinking water by contacting the local health department to obtain the specially prepared bottles and instructions for taking a water sample.
Chemical tests on calcium, magnesium, sodium, chloride, sulphate, nitrate, potassium, fluoride concentration in the samples were determined using an atomic absorption spectrophotometer (AAS) to identify impurities and other dissolved substances that affect water used for domestic purposes. Water begins to decrease in palatability when the amounts of minerals, that is, dissolved salts, exceed 500 to 1,000 ppm, but this depends on the nature of the minerals. Most testing laboratories report quantities of chemical substances by weight in volumetric units such as milligrams per litre (mg/L).
RESULTS AND DISCUSSION
Chemical related effluents discharged from the industry Water samples collected at the downstream of discharge point were subject to analysis, the mean ± standard
388 Afr. J. Environ. Sci. Technol.
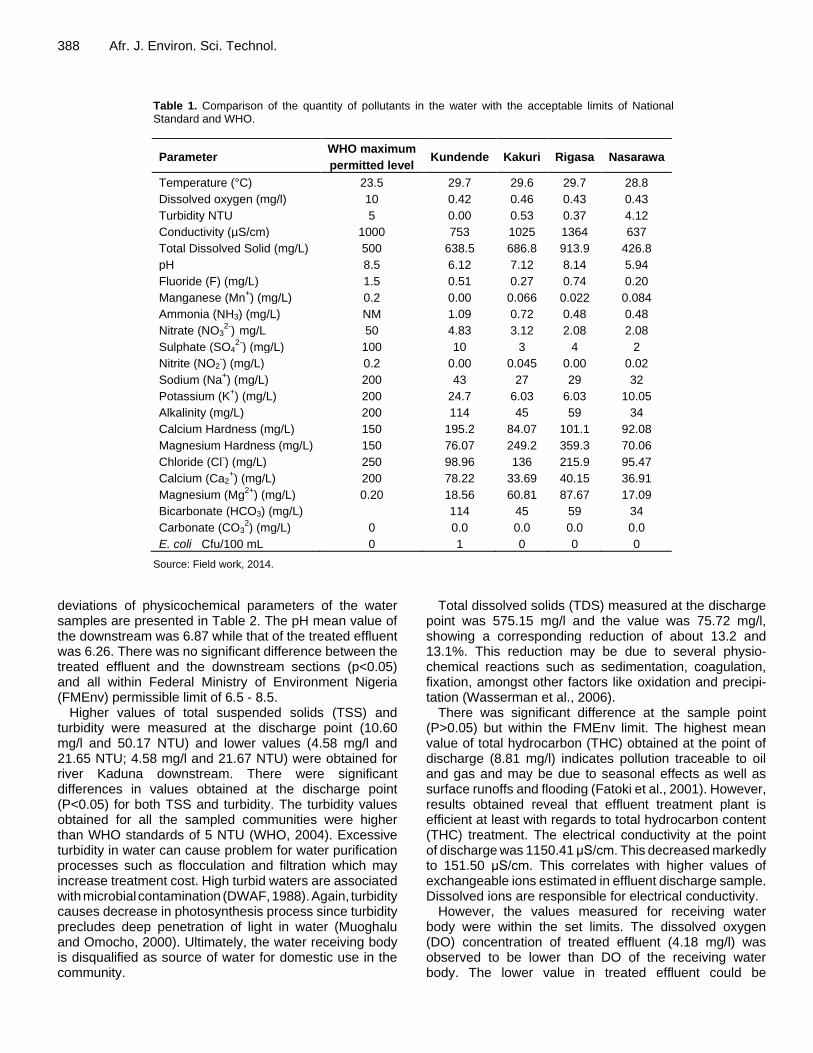
Table 1. Comparison of the quantity of pollutants in the water with the acceptable limits of National Standard and WHO.
Parameter WHO maximum
permitted level Kundende Kakuri Rigasa Nasarawa
Temperature (°C) 23.5 29.7 29.6 29.7 28.8
Dissolved oxygen (mg/l) 10 0.42 0.46 0.43 0.43
Turbidity NTU 5 0.00 0.53 0.37 4.12
Conductivity (µS/cm) 1000 753 1025 1364 637
Total Dissolved Solid (mg/L) 500 638.5 686.8 913.9 426.8
pH 8.5 6.12 7.12 8.14 5.94
Fluoride (F) (mg/L) 1.5 0.51 0.27 0.74 0.20
Manganese (Mn+) (mg/L) 0.2 0.00 0.066 0.022 0.084
Ammonia (NH3) (mg/L) NM 1.09 0.72 0.48 0.48
Nitrate (NO32-
) mg/L 50 4.83 3.12 2.08 2.08
Sulphate (SO42-
) (mg/L) 100 10 3 4 2
Nitrite (NO2-) (mg/L) 0.2 0.00 0.045 0.00 0.02
Sodium (Na+) (mg/L) 200 43 27 29 32
Potassium (K+) (mg/L) 200 24.7 6.03 6.03 10.05
Alkalinity (mg/L) 200 114 45 59 34
Calcium Hardness (mg/L) 150 195.2 84.07 101.1 92.08
Magnesium Hardness (mg/L) 150 76.07 249.2 359.3 70.06
Chloride (Cl-) (mg/L) 250 98.96 136 215.9 95.47
Calcium (Ca2+) (mg/L) 200 78.22 33.69 40.15 36.91
Magnesium (Mg2+
) (mg/L) 0.20 18.56 60.81 87.67 17.09
Bicarbonate (HCO3) (mg/L) 114 45 59 34
Carbonate (CO32) (mg/L) 0 0.0 0.0 0.0 0.0
E. coli Cfu/100 mL 0 1 0 0 0
Source: Field work, 2014.
deviations of physicochemical parameters of the water samples are presented in Table 2. The pH mean value of the downstream was 6.87 while that of the treated effluent was 6.26. There was no significant difference between the treated effluent and the downstream sections (p<0.05) and all within Federal Ministry of Environment Nigeria (FMEnv) permissible limit of 6.5 - 8.5.
Higher values of total suspended solids (TSS) and turbidity were measured at the discharge point (10.60 mg/l and 50.17 NTU) and lower values (4.58 mg/l and 21.65 NTU; 4.58 mg/l and 21.67 NTU) were obtained for river Kaduna downstream. There were significant differences in values obtained at the discharge point (P<0.05) for both TSS and turbidity. The turbidity values obtained for all the sampled communities were higher than WHO standards of 5 NTU (WHO, 2004). Excessive turbidity in water can cause problem for water purification processes such as flocculation and filtration which may increase treatment cost. High turbid waters are associated with microbial contamination (DWAF, 1988). Again, turbidity causes decrease in photosynthesis process since turbidity precludes deep penetration of light in water (Muoghalu and Omocho, 2000). Ultimately, the water receiving body is disqualified as source of water for domestic use in the community.
Total dissolved solids (TDS) measured at the discharge point was 575.15 mg/l and the value was 75.72 mg/l, showing a corresponding reduction of about 13.2 and 13.1%. This reduction may be due to several physio-chemical reactions such as sedimentation, coagulation, fixation, amongst other factors like oxidation and precipi-tation (Wasserman et al., 2006).
There was significant difference at the sample point (P>0.05) but within the FMEnv limit. The highest mean value of total hydrocarbon (THC) obtained at the point of discharge (8.81 mg/l) indicates pollution traceable to oil and gas and may be due to seasonal effects as well as surface runoffs and flooding (Fatoki et al., 2001). However, results obtained reveal that effluent treatment plant is efficient at least with regards to total hydrocarbon content (THC) treatment. The electrical conductivity at the point of discharge was 1150.41 μS/cm. This decreased markedly to 151.50 μS/cm. This correlates with higher values of exchangeable ions estimated in effluent discharge sample. Dissolved ions are responsible for electrical conductivity.
However, the values measured for receiving water body were within the set limits. The dissolved oxygen (DO) concentration of treated effluent (4.18 mg/l) was observed to be lower than DO of the receiving water body. The lower value in treated effluent could be
Emigilati et al 389
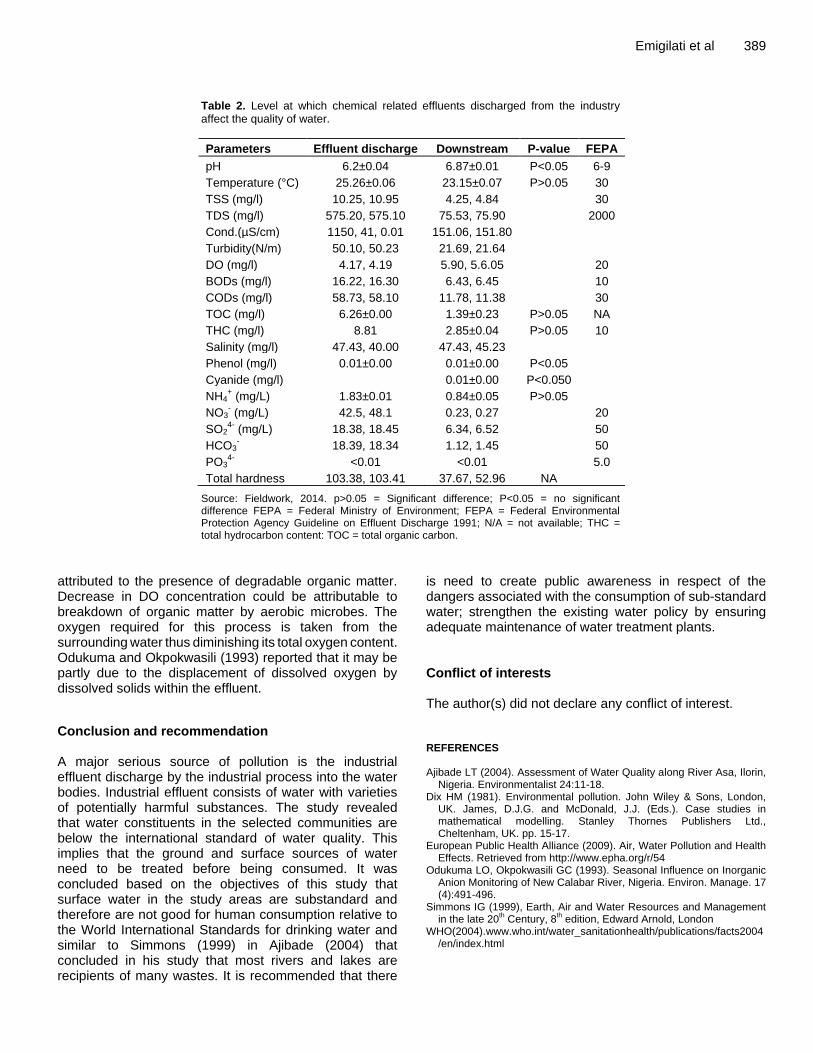
Table 2. Level at which chemical related effluents discharged from the industry affect the quality of water.
Parameters Effluent discharge Downstream P-value FEPA
pH 6.2±0.04 6.87±0.01 P<0.05 6-9
Temperature (°C) 25.26±0.06 23.15±0.07 P>0.05 30
TSS (mg/l) 10.25, 10.95 4.25, 4.84 30
TDS (mg/l) 575.20, 575.10 75.53, 75.90 2000
Cond.(µS/cm) 1150, 41, 0.01 151.06, 151.80
Turbidity(N/m) 50.10, 50.23 21.69, 21.64
DO (mg/l) 4.17, 4.19 5.90, 5.6.05 20
BODs (mg/l) 16.22, 16.30 6.43, 6.45 10
CODs (mg/l) 58.73, 58.10 11.78, 11.38 30
TOC (mg/l) 6.26±0.00 1.39±0.23 P>0.05 NA
THC (mg/l) 8.81 2.85±0.04 P>0.05 10
Salinity (mg/l) 47.43, 40.00 47.43, 45.23
Phenol (mg/l) 0.01±0.00 0.01±0.00 P<0.05
Cyanide (mg/l) 0.01±0.00 P<0.050
NH4+ (mg/L) 1.83±0.01 0.84±0.05 P>0.05
NO3- (mg/L) 42.5, 48.1 0.23, 0.27 20
SO24-
(mg/L) 18.38, 18.45 6.34, 6.52 50
HCO3- 18.39, 18.34 1.12, 1.45 50
PO34-
<0.01 <0.01 5.0
Total hardness 103.38, 103.41 37.67, 52.96 NA
Source: Fieldwork, 2014. p>0.05 = Significant difference; P<0.05 = no significant difference FEPA = Federal Ministry of Environment; FEPA = Federal Environmental Protection Agency Guideline on Effluent Discharge 1991; N/A = not available; THC = total hydrocarbon content: TOC = total organic carbon.
attributed to the presence of degradable organic matter. Decrease in DO concentration could be attributable to breakdown of organic matter by aerobic microbes. The oxygen required for this process is taken from the surrounding water thus diminishing its total oxygen content. Odukuma and Okpokwasili (1993) reported that it may be partly due to the displacement of dissolved oxygen by dissolved solids within the effluent.
Conclusion and recommendation A major serious source of pollution is the industrial effluent discharge by the industrial process into the water bodies. Industrial effluent consists of water with varieties of potentially harmful substances. The study revealed that water constituents in the selected communities are below the international standard of water quality. This implies that the ground and surface sources of water need to be treated before being consumed. It was concluded based on the objectives of this study that surface water in the study areas are substandard and therefore are not good for human consumption relative to the World International Standards for drinking water and similar to Simmons (1999) in Ajibade (2004) that concluded in his study that most rivers and lakes are recipients of many wastes. It is recommended that there
is need to create public awareness in respect of the dangers associated with the consumption of sub-standard water; strengthen the existing water policy by ensuring adequate maintenance of water treatment plants. Conflict of interests The author(s) did not declare any conflict of interest. REFERENCES Ajibade LT (2004). Assessment of Water Quality along River Asa, Ilorin,
Nigeria. Environmentalist 24:11-18. Dix HM (1981). Environmental pollution. John Wiley & Sons, London,
UK. James, D.J.G. and McDonald, J.J. (Eds.). Case studies in mathematical modelling. Stanley Thornes Publishers Ltd., Cheltenham, UK. pp. 15-17.
European Public Health Alliance (2009). Air, Water Pollution and Health Effects. Retrieved from http://www.epha.org/r/54
Odukuma LO, Okpokwasili GC (1993). Seasonal Influence on Inorganic Anion Monitoring of New Calabar River, Nigeria. Environ. Manage. 17 (4):491-496.
Simmons IG (1999), Earth, Air and Water Resources and Management in the late 20
th Century, 8
th edition, Edward Arnold, London
WHO(2004).www.who.int/water_sanitationhealth/publications/facts2004/en/index.html
Vol. 9(5), pp. 390-395, May 2015
DOI: 10.5897/AJEST2014.1768
Article Number: xxxxxx
ISSN 1996-0786
Copyright © 2015
Author(s) retain the copyright of this article
http://www.academicjournals.org/AJEST
African Journal of Environmental Science and Technology
Full Length Research Paper
Influence of lokpa cattle market wastes on agricultural soil quality
Chinyere G. C*, Osuocha K. U. and Imo Chinedu
Department of Biochemistry, Abia State University, Uturu, Nigeria.
Received 8 August, 2014; Accepted 23 March, 2015
This paper examined the influence of Lokpa cattle market waste on soil properties. Soil samples were collected from the Central, 3 and 6 m Northwards, Southwards, Eastwards and Westwards of Lokpa cattle market, Umuneochi Local Government Area of Abia State, Nigeria at a depth of 0 to 25 cm (Sample A) and 26 to 50 cm (Sample B) from each spot while the control samples were collected from an unimpacted area devoid of cattle rearing activities. Results of the physicochemical activities show that cattle waste soil had low acid pH range of 4.02 to 5.83 while soil moisture ranged from 14.90 to 21.58, Organic carbon ranged from 1.92 to 2.83. The enzymatic activities of cattle waste soil were found to be higher (P<0.05) than the control. This however could be due to input from the cattle waste leading to increased enzymatic activities. The pH of the cattle waste soils were found to be lower than the control, hence proper care should be taken in the quantity of these waste applied to farms as they can increase soil acidity. The presence of cattle dung could be responsible for the general changes observed. Key words: Cattle, waste, market, soil, quality.
INTRODUCTION Soil constitutes a dynamic system within which series of changes constantly occur. These changes directly affect the composition, properties and productive potentials of the soil. Oriola and Hammed (2012) reported that soil as a component of landscapes occupies a central position in the landscape balance due to its diverse functions. Soil conditions, constraints on soil quality play an important role on agricultural output and productivity. Livestock production in developing countries has increased rapidly during the last decades (Steinfeld and Chilonda, 2006). In Nigeria and in most developing countries, for animals
like cattle and other animals of that type, special markets are kept for them and various activities within the market may affect the soil (Nwaugo et al., 2008). Large quantities of wastes are produced annually in these areas. Oriola and Hammed (2012) reported that the quantity and quality of animal waste are affected by diet composition. These waste materials such as cattle excreta and associated feed losses, wash-water and other materials represent valuable resources that can replace significant amounts of inorganic fertilizers (Leha, 1998).
Animal wastes in the form of manures are valuable *Corresponding Author: [email protected]. Author(s) agree that this article remain permanently open access under the terms of the Creative Commons Attribution License 4.0 International License
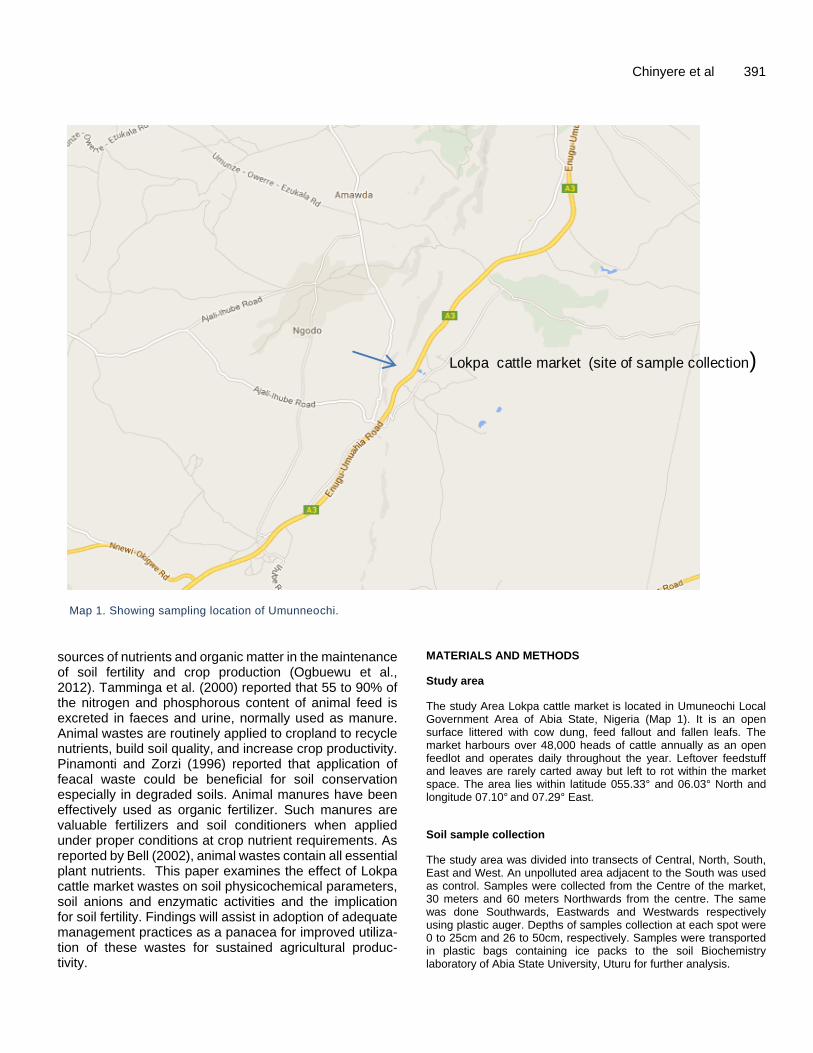
Chinyere et al 391
Lokpa cattle market (site of sample collection)
Map 1. Showing sampling location of Umunneochi.
sources of nutrients and organic matter in the maintenance of soil fertility and crop production (Ogbuewu et al., 2012). Tamminga et al. (2000) reported that 55 to 90% of the nitrogen and phosphorous content of animal feed is excreted in faeces and urine, normally used as manure. Animal wastes are routinely applied to cropland to recycle nutrients, build soil quality, and increase crop productivity. Pinamonti and Zorzi (1996) reported that application of feacal waste could be beneficial for soil conservation especially in degraded soils. Animal manures have been effectively used as organic fertilizer. Such manures are valuable fertilizers and soil conditioners when applied under proper conditions at crop nutrient requirements. As reported by Bell (2002), animal wastes contain all essential plant nutrients. This paper examines the effect of Lokpa cattle market wastes on soil physicochemical parameters, soil anions and enzymatic activities and the implication for soil fertility. Findings will assist in adoption of adequate management practices as a panacea for improved utiliza-tion of these wastes for sustained agricultural produc-tivity.
MATERIALS AND METHODS
Study area
The study Area Lokpa cattle market is located in Umuneochi Local Government Area of Abia State, Nigeria (Map 1). It is an open surface littered with cow dung, feed fallout and fallen leafs. The market harbours over 48,000 heads of cattle annually as an open feedlot and operates daily throughout the year. Leftover feedstuff and leaves are rarely carted away but left to rot within the market space. The area lies within latitude 055.33° and 06.03° North and longitude 07.10°
and 07.29° East.
Soil sample collection
The study area was divided into transects of Central, North, South, East and West. An unpolluted area adjacent to the South was used as control. Samples were collected from the Centre of the market, 30 meters and 60 meters Northwards from the centre. The same was done Southwards, Eastwards and Westwards respectively using plastic auger. Depths of samples collection at each spot were 0 to 25cm and 26 to 50cm, respectively. Samples were transported in plastic bags containing ice packs to the soil Biochemistry laboratory of Abia State University, Uturu for further analysis.
392 Afr. J. Environ. Sci. Technol. Determination of soil physicochemical parameters
Soil Temperature was determined at the site of soil sample collection using mercury in glass thermometer as described by APHA (1998). Soil pH was measured using fresh soil samples according to the methods described by Bates (1954). Similarly soil moisture content was deter-mined according to the procedure described by APHA (1998). Soil Electrical Conductivity was obtained using conductivity meter in 1:2 soil/water ratio as described by Whitney (1998).
Soil Organic Carbon was obtained according to the procedure presented by Walkely and Black (1934) while soil cation exchange capacity (CEC), sulphur (SO4
2-),
phosphate (PO42-
), nitrate (NO3) were determined by the method of Dewis and Freitas (1970) and soil calcium carbonate determined by the method of Buuman et al. (1996).
Determination of soil enzymatic activities
The soil enzymes determined were Dehydrogenase, Urease, Hydrogen peroxidase and Alkaline phosphatase. Soil Urease activity was obtained according to the method of Tabatabai and Bremner (1972). Similarly, soil Alkaline Phosphatase, Dehydrogenase and acid Phosphatase activities were determined by the methods described by Tabatabai (1982) while Hydrogen Peroxidase activity was obtained by the method of Alef and Nannipieri (1995).
Statistical analysis Data collected were subjected to statistical analyses using One Way Analysis of Variance (ANOVA) procedure and difference in means were separated using standard students t - Test. Values were mean ± standard deviation of triplicate determinations. Mean in the same column having different alphabet were statistically significantly (p<0.05).
RESULTS AND DISCUSSION
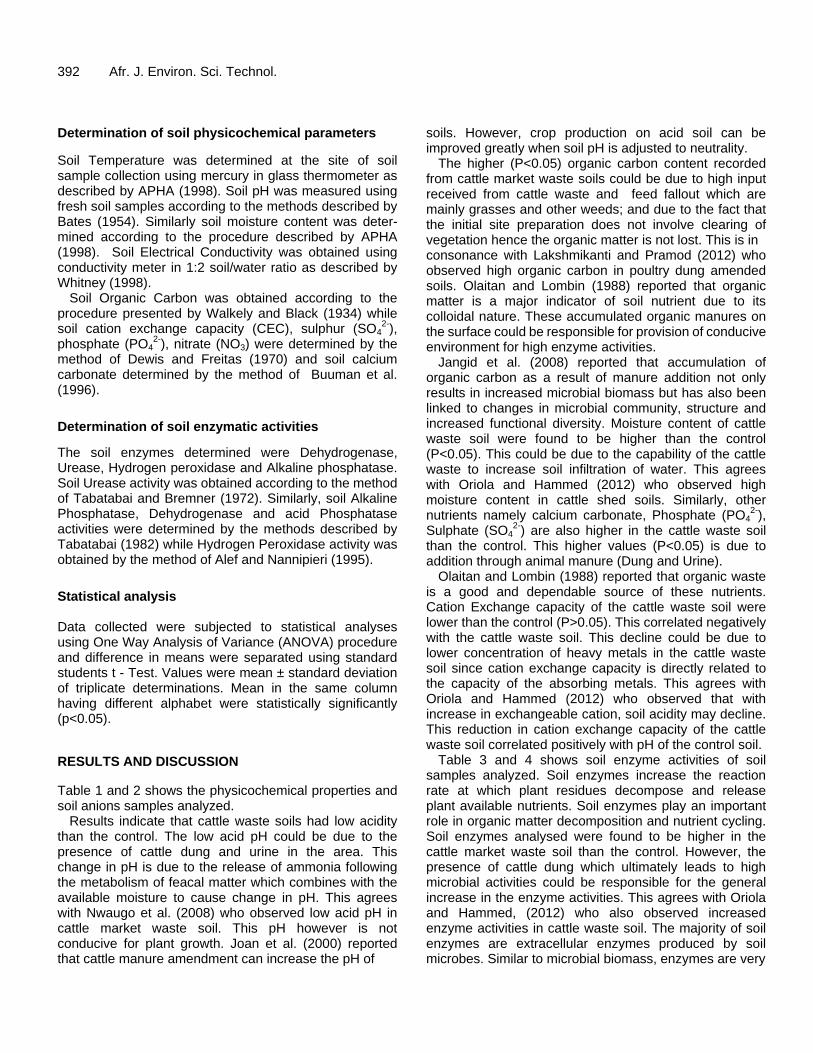
Table 1 and 2 shows the physicochemical properties and soil anions samples analyzed.
Results indicate that cattle waste soils had low acidity than the control. The low acid pH could be due to the presence of cattle dung and urine in the area. This change in pH is due to the release of ammonia following the metabolism of feacal matter which combines with the available moisture to cause change in pH. This agrees with Nwaugo et al. (2008) who observed low acid pH in cattle market waste soil. This pH however is not conducive for plant growth. Joan et al. (2000) reported that cattle manure amendment can increase the pH of
soils. However, crop production on acid soil can be improved greatly when soil pH is adjusted to neutrality.
The higher (P<0.05) organic carbon content recorded from cattle market waste soils could be due to high input received from cattle waste and feed fallout which are mainly grasses and other weeds; and due to the fact that the initial site preparation does not involve clearing of vegetation hence the organic matter is not lost. This is in consonance with Lakshmikanti and Pramod (2012) who observed high organic carbon in poultry dung amended soils. Olaitan and Lombin (1988) reported that organic matter is a major indicator of soil nutrient due to its colloidal nature. These accumulated organic manures on the surface could be responsible for provision of conducive environment for high enzyme activities.
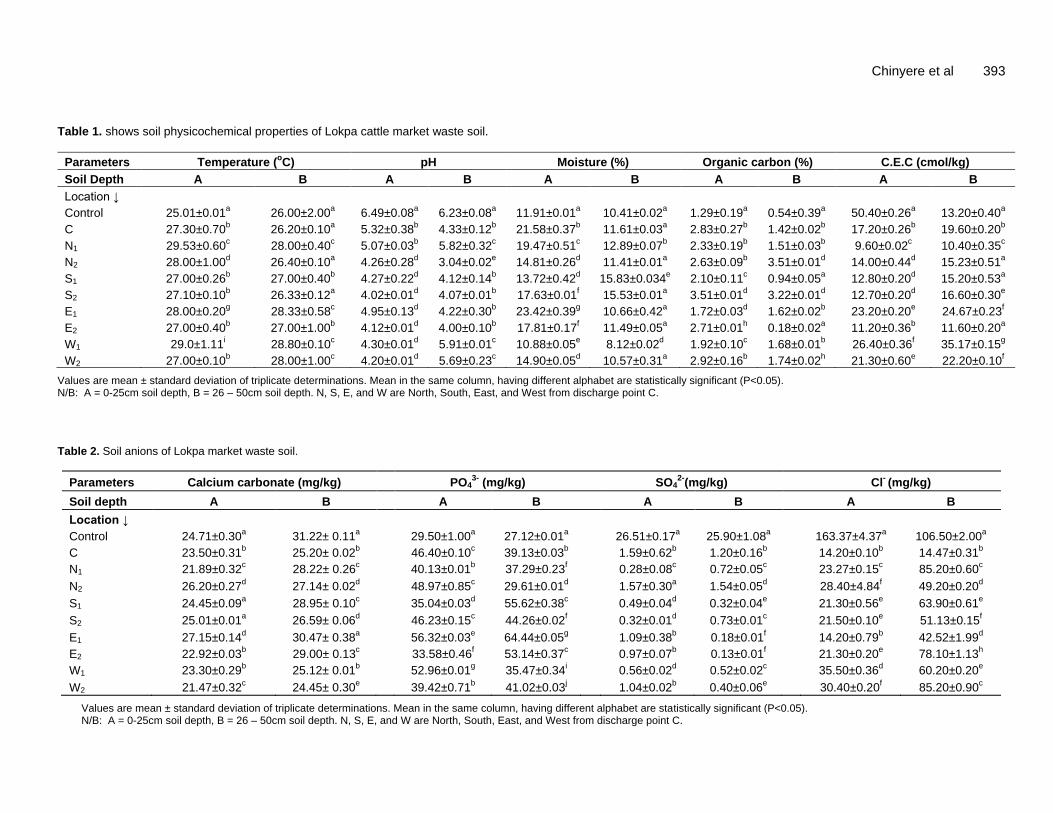
Jangid et al. (2008) reported that accumulation of organic carbon as a result of manure addition not only results in increased microbial biomass but has also been linked to changes in microbial community, structure and increased functional diversity. Moisture content of cattle waste soil were found to be higher than the control (P<0.05). This could be due to the capability of the cattle waste to increase soil infiltration of water. This agrees with Oriola and Hammed (2012) who observed high moisture content in cattle shed soils. Similarly, other nutrients namely calcium carbonate, Phosphate (PO4
2-),
Sulphate (SO42-
) are also higher in the cattle waste soil than the control. This higher values (P<0.05) is due to addition through animal manure (Dung and Urine).
Olaitan and Lombin (1988) reported that organic waste is a good and dependable source of these nutrients. Cation Exchange capacity of the cattle waste soil were lower than the control (P>0.05). This correlated negatively with the cattle waste soil. This decline could be due to lower concentration of heavy metals in the cattle waste soil since cation exchange capacity is directly related to the capacity of the absorbing metals. This agrees with Oriola and Hammed (2012) who observed that with increase in exchangeable cation, soil acidity may decline. This reduction in cation exchange capacity of the cattle waste soil correlated positively with pH of the control soil.
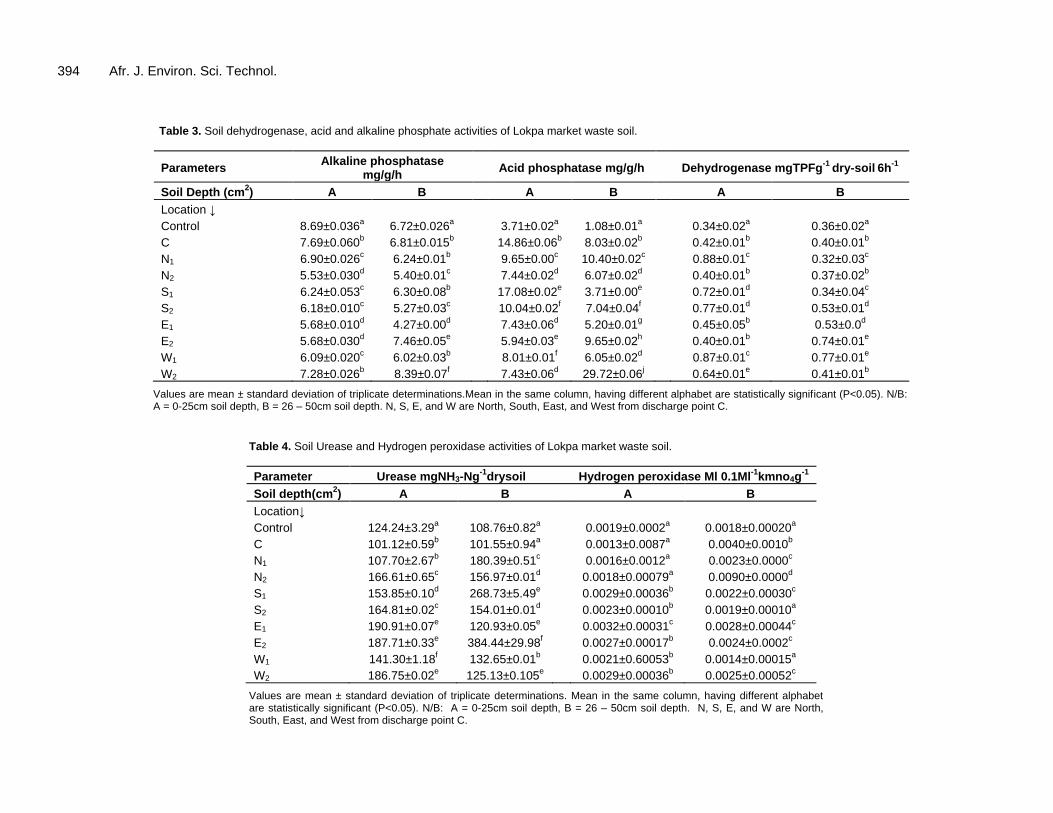
Table 3 and 4 shows soil enzyme activities of soil samples analyzed. Soil enzymes increase the reaction rate at which plant residues decompose and release plant available nutrients. Soil enzymes play an important role in organic matter decomposition and nutrient cycling. Soil enzymes analysed were found to be higher in the cattle market waste soil than the control. However, the presence of cattle dung which ultimately leads to high microbial activities could be responsible for the general increase in the enzyme activities. This agrees with Oriola and Hammed, (2012) who also observed increased enzyme activities in cattle waste soil. The majority of soil enzymes are extracellular enzymes produced by soil microbes. Similar to microbial biomass, enzymes are very
Chinyere et al 393 Table 1. shows soil physicochemical properties of Lokpa cattle market waste soil.
Parameters Temperature (oC) pH Moisture (%) Organic carbon (%) C.E.C (cmol/kg)
Soil Depth A B A B A B A B A B
Location ↓
Control 25.01±0.01a 26.00±2.00
a 6.49±0.08
a 6.23±0.08
a 11.91±0.01
a 10.41±0.02
a 1.29±0.19
a 0.54±0.39
a 50.40±0.26
a 13.20±0.40
a
C 27.30±0.70b 26.20±0.10
a 5.32±0.38
b 4.33±0.12
b 21.58±0.37
b 11.61±0.03
a 2.83±0.27
b 1.42±0.02
b 17.20±0.26
b 19.60±0.20
b
N1 29.53±0.60c 28.00±0.40
c 5.07±0.03
b 5.82±0.32
c 19.47±0.51
c 12.89±0.07
b 2.33±0.19
b 1.51±0.03
b 9.60±0.02
c 10.40±0.35
c
N2 28.00±1.00d 26.40±0.10
a 4.26±0.28
d 3.04±0.02
e 14.81±0.26
d 11.41±0.01
a 2.63±0.09
b 3.51±0.01
d 14.00±0.44
d 15.23±0.51
a
S1 27.00±0.26b 27.00±0.40
b 4.27±0.22
d 4.12±0.14
b 13.72±0.42
d 15.83±0.034
e 2.10±0.11
c 0.94±0.05
a 12.80±0.20
d 15.20±0.53
a
S2 27.10±0.10b 26.33±0.12
a 4.02±0.01
d 4.07±0.01
b 17.63±0.01
f 15.53±0.01
a 3.51±0.01
d 3.22±0.01
d 12.70±0.20
d 16.60±0.30
e
E1 28.00±0.20g 28.33±0.58
c 4.95±0.13
d 4.22±0.30
b 23.42±0.39
g 10.66±0.42
a 1.72±0.03
d 1.62±0.02
b 23.20±0.20
e 24.67±0.23
f
E2 27.00±0.40b 27.00±1.00
b 4.12±0.01
d 4.00±0.10
b 17.81±0.17
f 11.49±0.05
a 2.71±0.01
h 0.18±0.02
a 11.20±0.36
b 11.60±0.20
a
W1 29.0±1.11i 28.80±0.10
c 4.30±0.01
d 5.91±0.01
c 10.88±0.05
e 8.12±0.02
d 1.92±0.10
c 1.68±0.01
b 26.40±0.36
f 35.17±0.15
g
W2 27.00±0.10b 28.00±1.00
c 4.20±0.01
d 5.69±0.23
c 14.90±0.05
d 10.57±0.31
a 2.92±0.16
b 1.74±0.02
h 21.30±0.60
e 22.20±0.10
f
Values are mean ± standard deviation of triplicate determinations. Mean in the same column, having different alphabet are statistically significant (P<0.05). N/B: A = 0-25cm soil depth, B = 26 – 50cm soil depth. N, S, E, and W are North, South, East, and West from discharge point C.
Table 2. Soil anions of Lokpa market waste soil.
Parameters Calcium carbonate (mg/kg) PO43-
(mg/kg) SO42-
(mg/kg) Cl- (mg/kg)
Soil depth A B A B A B A B
Location ↓
Control 24.71±0.30a 31.22± 0.11
a 29.50±1.00
a 27.12±0.01
a 26.51±0.17
a 25.90±1.08
a 163.37±4.37
a 106.50±2.00
a
C 23.50±0.31b 25.20± 0.02
b 46.40±0.10
c 39.13±0.03
b 1.59±0.62
b 1.20±0.16
b 14.20±0.10
b 14.47±0.31
b
N1 21.89±0.32c 28.22± 0.26
c 40.13±0.01
b 37.29±0.23
f 0.28±0.08
c 0.72±0.05
c 23.27±0.15
c 85.20±0.60
c
N2 26.20±0.27d 27.14± 0.02
d 48.97±0.85
c 29.61±0.01
d 1.57±0.30
a 1.54±0.05
d 28.40±4.84
f 49.20±0.20
d
S1 24.45±0.09a 28.95± 0.10
c 35.04±0.03
d 55.62±0.38
c 0.49±0.04
d 0.32±0.04
e 21.30±0.56
e 63.90±0.61
e
S2 25.01±0.01a 26.59± 0.06
d 46.23±0.15
c 44.26±0.02
f 0.32±0.01
d 0.73±0.01
c 21.50±0.10
e 51.13±0.15
f
E1 27.15±0.14d 30.47± 0.38
a 56.32±0.03
e 64.44±0.05
g 1.09±0.38
b 0.18±0.01
f 14.20±0.79
b 42.52±1.99
d
E2 22.92±0.03b 29.00± 0.13
c 33.58±0.46
f 53.14±0.37
c 0.97±0.07
b 0.13±0.01
f 21.30±0.20
e 78.10±1.13
h
W1 23.30±0.29b 25.12± 0.01
b 52.96±0.01
g 35.47±0.34
i 0.56±0.02
d 0.52±0.02
c 35.50±0.36
d 60.20±0.20
e
W2 21.47±0.32c 24.45± 0.30
e 39.42±0.71
b 41.02±0.03
j 1.04±0.02
b 0.40±0.06
e 30.40±0.20
f 85.20±0.90
c
Values are mean ± standard deviation of triplicate determinations. Mean in the same column, having different alphabet are statistically significant (P<0.05). N/B: A = 0-25cm soil depth, B = 26 – 50cm soil depth. N, S, E, and W are North, South, East, and West from discharge point C.
394 Afr. J. Environ. Sci. Technol.
Table 3. Soil dehydrogenase, acid and alkaline phosphate activities of Lokpa market waste soil.
Parameters Alkaline phosphatase
mg/g/h
Acid phosphatase mg/g/h
Dehydrogenase mgTPFg-1
dry-soil 6h
-1
Soil Depth (cm2) A B A B A B
Location ↓
Control 8.69±0.036a 6.72±0.026
a 3.71±0.02
a 1.08±0.01
a 0.34±0.02
a 0.36±0.02
a
C 7.69±0.060b 6.81±0.015
b 14.86±0.06
b 8.03±0.02
b 0.42±0.01
b 0.40±0.01
b
N1 6.90±0.026c 6.24±0.01
b 9.65±0.00
c 10.40±0.02
c 0.88±0.01
c 0.32±0.03
c
N2 5.53±0.030d 5.40±0.01
c 7.44±0.02
d 6.07±0.02
d 0.40±0.01
b 0.37±0.02
b
S1 6.24±0.053c 6.30±0.08
b 17.08±0.02
e 3.71±0.00
e 0.72±0.01
d 0.34±0.04
c
S2 6.18±0.010c 5.27±0.03
c 10.04±0.02
f 7.04±0.04
f 0.77±0.01
d 0.53±0.01
d
E1 5.68±0.010d 4.27±0.00
d 7.43±0.06
d 5.20±0.01
g 0.45±0.05
b 0.53±0.0
d
E2 5.68±0.030d 7.46±0.05
e 5.94±0.03
e 9.65±0.02
h 0.40±0.01
b 0.74±0.01
e
W1 6.09±0.020c 6.02±0.03
b 8.01±0.01
f 6.05±0.02
d 0.87±0.01
c 0.77±0.01
e
W2 7.28±0.026b 8.39±0.07
f 7.43±0.06
d 29.72±0.06
j 0.64±0.01
e 0.41±0.01
b
Values are mean ± standard deviation of triplicate determinations.Mean in the same column, having different alphabet are statistically significant (P<0.05). N/B: A = 0-25cm soil depth, B = 26 – 50cm soil depth. N, S, E, and W are North, South, East, and West from discharge point C.
Table 4. Soil Urease and Hydrogen peroxidase activities of Lokpa market waste soil.
Parameter Urease mgNH3-Ng-1
drysoil Hydrogen peroxidase Ml 0.1Ml-1
kmno4g-1
Soil depth(cm2) A B A B
Location↓
Control 124.24±3.29a 108.76±0.82
a 0.0019±0.0002
a 0.0018±0.00020
a
C 101.12±0.59b 101.55±0.94
a 0.0013±0.0087
a 0.0040±0.0010
b
N1 107.70±2.67b 180.39±0.51
c 0.0016±0.0012
a 0.0023±0.0000
c
N2 166.61±0.65c 156.97±0.01
d 0.0018±0.00079
a 0.0090±0.0000
d
S1 153.85±0.10d 268.73±5.49
e 0.0029±0.00036
b 0.0022±0.00030
c
S2 164.81±0.02c 154.01±0.01
d 0.0023±0.00010
b 0.0019±0.00010
a
E1 190.91±0.07e 120.93±0.05
e 0.0032±0.00031
c 0.0028±0.00044
c
E2 187.71±0.33e 384.44±29.98
f 0.0027±0.00017
b 0.0024±0.0002
c
W1 141.30±1.18f 132.65±0.01
b 0.0021±0.60053
b 0.0014±0.00015
a
W2 186.75±0.02e 125.13±0.105
e 0.0029±0.00036
b 0.0025±0.00052
c
Values are mean ± standard deviation of triplicate determinations. Mean in the same column, having different alphabet are statistically significant (P<0.05). N/B: A = 0-25cm soil depth, B = 26 – 50cm soil depth. N, S, E, and W are North, South, East, and West from discharge point C.
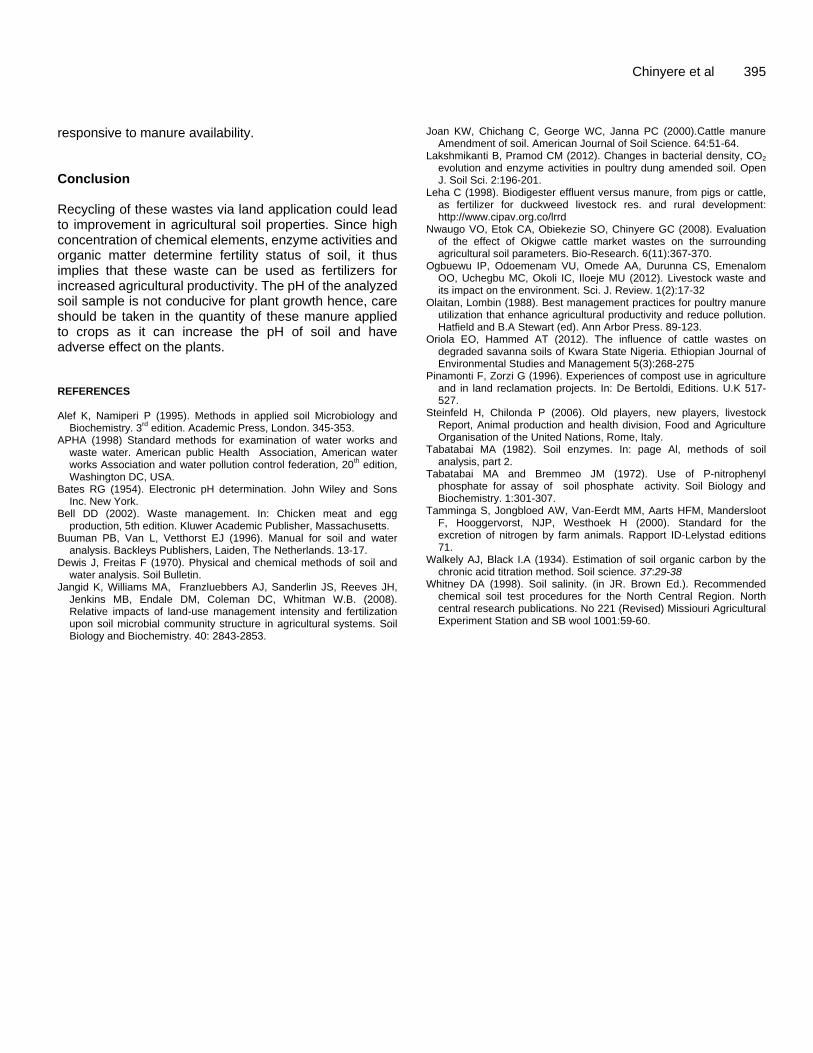
responsive to manure availability. Conclusion Recycling of these wastes via land application could lead to improvement in agricultural soil properties. Since high concentration of chemical elements, enzyme activities and organic matter determine fertility status of soil, it thus implies that these waste can be used as fertilizers for increased agricultural productivity. The pH of the analyzed soil sample is not conducive for plant growth hence, care should be taken in the quantity of these manure applied to crops as it can increase the pH of soil and have adverse effect on the plants. REFERENCES Alef K, Namiperi P (1995). Methods in applied soil Microbiology and
Biochemistry. 3rd
edition. Academic Press, London. 345-353. APHA (1998) Standard methods for examination of water works and
waste water. American public Health Association, American water works Association and water pollution control federation, 20
th edition,
Washington DC, USA. Bates RG (1954). Electronic pH determination. John Wiley and Sons
Inc. New York. Bell DD (2002). Waste management. In: Chicken meat and egg
production, 5th edition. Kluwer Academic Publisher, Massachusetts. Buuman PB, Van L, Vetthorst EJ (1996). Manual for soil and water
analysis. Backleys Publishers, Laiden, The Netherlands. 13-17. Dewis J, Freitas F (1970). Physical and chemical methods of soil and
water analysis. Soil Bulletin. Jangid K, Williams MA, Franzluebbers AJ, Sanderlin JS, Reeves JH,
Jenkins MB, Endale DM, Coleman DC, Whitman W.B. (2008). Relative impacts of land-use management intensity and fertilization upon soil microbial community structure in agricultural systems. Soil Biology and Biochemistry. 40: 2843-2853.
Chinyere et al 395 Joan KW, Chichang C, George WC, Janna PC (2000).Cattle manure
Amendment of soil. American Journal of Soil Science. 64:51-64. Lakshmikanti B, Pramod CM (2012). Changes in bacterial density, CO2
evolution and enzyme activities in poultry dung amended soil. Open J. Soil Sci. 2:196-201.
Leha C (1998). Biodigester effluent versus manure, from pigs or cattle, as fertilizer for duckweed livestock res. and rural development: http://www.cipav.org.co/lrrd
Nwaugo VO, Etok CA, Obiekezie SO, Chinyere GC (2008). Evaluation of the effect of Okigwe cattle market wastes on the surrounding agricultural soil parameters. Bio-Research. 6(11):367-370.
Ogbuewu IP, Odoemenam VU, Omede AA, Durunna CS, Emenalom OO, Uchegbu MC, Okoli IC, Iloeje MU (2012). Livestock waste and its impact on the environment. Sci. J. Review. 1(2):17-32
Olaitan, Lombin (1988). Best management practices for poultry manure utilization that enhance agricultural productivity and reduce pollution. Hatfield and B.A Stewart (ed). Ann Arbor Press. 89-123.
Oriola EO, Hammed AT (2012). The influence of cattle wastes on degraded savanna soils of Kwara State Nigeria. Ethiopian Journal of Environmental Studies and Management 5(3):268-275
Pinamonti F, Zorzi G (1996). Experiences of compost use in agriculture and in land reclamation projects. In: De Bertoldi, Editions. U.K 517-527.
Steinfeld H, Chilonda P (2006). Old players, new players, livestock Report, Animal production and health division, Food and Agriculture Organisation of the United Nations, Rome, Italy.
Tabatabai MA (1982). Soil enzymes. In: page Al, methods of soil analysis, part 2.
Tabatabai MA and Bremmeo JM (1972). Use of P-nitrophenyl phosphate for assay of soil phosphate activity. Soil Biology and Biochemistry. 1:301-307.
Tamminga S, Jongbloed AW, Van-Eerdt MM, Aarts HFM, Mandersloot F, Hooggervorst, NJP, Westhoek H (2000). Standard for the excretion of nitrogen by farm animals. Rapport ID-Lelystad editions 71.
Walkely AJ, Black I.A (1934). Estimation of soil organic carbon by the chronic acid titration method. Soil science. 37:29-38
Whitney DA (1998). Soil salinity. (in JR. Brown Ed.). Recommended chemical soil test procedures for the North Central Region. North central research publications. No 221 (Revised) Missiouri Agricultural Experiment Station and SB wool 1001:59-60.
Vol. 9(5), pp. 396-401, May 2015
DOI: 10.5897/AJEST2015.1893
Article Number: DB3B82252152
ISSN 1996-0786
Copyright © 2015
Author(s) retain the copyright of this article
http://www.academicjournals.org/AJEST
African Journal of Environmental Science and Technology
Full Length Research Paper
Assessment of microbiological quality of drinking water treated with chlorine in the Gwalior city of Madhya
Pradesh, India
Makhmoor Rather Ahmad1, Ahanger Faroz Ahmad2* and Sharma Harendra K1
1Indira Gandhi Academy of Environmental Education Research and Ecoplanning, Jiwaji University Gwalior, Madhya
Pradesh, 474011, India. 2Department of Environmental Sciences/Centre of Research for Development, University of Kashmir, Srinagar, Jammu
and Kashmir, 190006, India.
Received 13 February, 2015; Accepted 23 March, 2015
The quality of drinking water at the point of delivery to the consumer is crucial in safeguarding consumer’s health. The current study was undertaken to assess the changes in residual chlorine content with distance in water distribution system in Gwalior city of Madhya Pradesh and assess its relation with the occurrence of total and faecal coliforms. Water samples were collected from the exit point of the treatment plant and taps at consumer households at an interval of 1 to 2 km. A total of 56 water samples were tested to determine residual chlorine content and presence of total and fecal coliforms using standard methods. Average concentrations of residual chlorine from all sampling location were between 0.08 to 0.98 mg/L. Total coliform was found at most of the sampling locations in the range of 0.82 to 7.15 MPN/100 ml. The fecal coliform at all sampling locations was found in the range of 0 to 4.10 MPN/100 ml. With time, the residual chlorine in the transported water dechlorinates. After covering some distance, the residual chlorine of the water was completely diminished thereby supporting massive microbial growth. The study proposed the likely causes of the transit dechlorination of water and recommended carrying out compulsory chlorination at water sources while maintaining reasonable residuals at the consumers’ end to eliminate the bacteriological contamination. Key words: Residual chlorine, total and fecal coliforms, drinking water chlorination, water contamination.
INTRODUCTION Water is an indispensible component of the environment. The quality of drinking water has a direct link with the human health and providing clean water to the consumers is one of the most important public health priorities (UNCED, 1992). Drinking water should have high quality
so that it can be consumed without threat of immediate or long term adverse impacts to human health. Good and adequate water supply services are the most critical prerequisite for public health and well-being (Eassa and Mahmood, 2012). Many water resources in developing
*Corresponding author. E-mail: [email protected]. Author(s) agree that this article remain permanently open access under the terms of the Creative Commons Attribution License 4.0 International License
countries are unhealthy because they contain harmful physical, chemical and biological agents (WHO, 2011). To maintain good health, water should be safe to drink and meet the local standards for taste, odor and appearance (Cheesbrough, 2000).
Microbial water quality is one of the most important aspects of drinking water in relation to the diseases caused by the water. Detection of indicator bacteria in drinking water means the presence of pathogenic
organisms that are the source of waterborne diseases (Macler and Merkel, 2000). Such diseases can have large scale ramifications for tshe human health (Egoz et al., 1991; Macler et al., 2000). Microbiological water quality is deteriorating day by day due to unplanned industriali-zation, urban sprawl, reckless development and faulty water distribution systems (Varale and Varale, 2012). Microbiological contamination of such kinds has been reported worldwide (Dowidar et al., 1990; Mroz et al., 1994; Appleyared, 1996; Zacheus et al., 2001).
Over large parts of the world, humans drink untreated water that contains pathogens or unacceptable levels of dissolved and suspended pollutants (Hashmi et al., 2009). Such polluted water is not suitable for drinking because it may cause widespread acute and chronic diseases resulting in large number of deaths in many developing countries like India. Over 100 million people do not have access to an adequate supply of safe water for household consumption while 300 millions lack proper sanitary means for excreta disposal (Bern et al., 1992). In 2004, 1.1 billion people were lacking access to improved water sources, which is nearly 17% of the world’s population (UNCED, 2012). According to WHO, every year 1.8 million people die from diarrheal diseases including cholera. 88% of the diarrheal disease is attributed to the contaminated water supply and inadequate sani-tation (WHO, 2011). Over 1.3 million people die of malaria every year and there are 1.5 million cases of hepatitis-A each year (WHO, 2004).
Microbiological examination of the drinking water mainly covers detection of coliforms and total bacterial count. Coliforms are common bacteria that exist in the intestines of human beings and mammals, and excreted out in the dejection. If large quantities of coliforms are present in the water, it is a prominent indicator of possible contamination caused by dejection of human beings or mammals (Haydar et al., 2009). In developed countries, it is often regulated that coliforms must be undetectable in drinking water (Uriu-Hare et al., 1995). Coliforms detection helps to determine whether the water is well disinfected or polluted by foreign substances, in order to ensure the safety of drinking water for people (Payment, 1999). The presence of coliform organisms indicates the biological contamination of drinking water (Khan et al., 2012). Too high total bacterial count means that the water is not perfectly disinfected and the water has already been polluted by microbes (Batterman et al.,
Ahmad et al 397 2000).
Chlorination is practiced at the most of filtration plants as a mean of water disinfection, and it is supplied to the public via distribution network (WHO, 2003). As a result of low cost and effectiveness of chlorine against pathogenic microorganisms, it is a chemical of choice in many countries including India (Lienyao et al. 2004). It is added to drinking water to disinfect pathogenic micro-organisms. Chlorine residuals of drinking water have long been recognized as an excellent indicator for studying water quality in the distribution network (Lienyao et al., 2004). The presence of any disinfectant residue reduces the microorganism level and frequency of occurrence at the consumer’s taps (Olivieri et al., 1986). Addition of chlorine in different water treatment plant is a common practice, but it is not sufficient to ensure the safety of water. The maintenance of chlorine residue is needed at all points in the distribution system supplied with chlorine as disin-fectant (Kitazawa, 2006).
The current study was carried out to determine the levels of residual chlorine in treated drinking water, as it is transported to different locations through pipelines from water treatment plant and its relation to the occurrence of total and faecal coliforms at Gwalior city of Madhya Pradesh. MATERIALS AND METHODS Study area
The present study was carried out in the Gwalior city, which is a
historical city of the state of Madhya Pradesh, India. The present population of the city is about nine lacs and it is expected to increase to 14.40 lacs by the year 2024. Gwalior city has two Water Treatment Plants (Old and New) located at Motijheel built in 1930 and 1986, respectively. These plants have undergone expansions from time to time in conjunction with the development of the city to meet the growing water demand. These plants provide potable drinking water to the major portion of the city through an extensive network of underground pipes. In these circumstances there is always a possibility of the microbiological contamination of the drinking water due to the seepage and intrusion from the adjacent underground sewers.
Sample collection and analysis
Water samples were collected from treatment plants and consumer
ends at a regular interval of 1 to 2 km (APHA, 2005; Collins and Lyne, 1985). Standard analytical methods for the enumeration of microbiological parameters of water were used as prescribed by the American Public Health Association series of Standard Methods of Examination of Water and Effluent (APHA, 2005).The total coliform and faecal coliform counts were determined by multiple tube fermentation technique. For the enumeration of total coliforms, lauryle tryptose broth (LTB) was used for the presumptive test and brilliant green lactose broth (BGLB) for confirmation and for the enumeration of faecal coliforms, EC medium was used. Results were expressed in terms of most probable number (MPN). Residual chlorine was determined by DPD (N, N-diethyl-p-phenylene
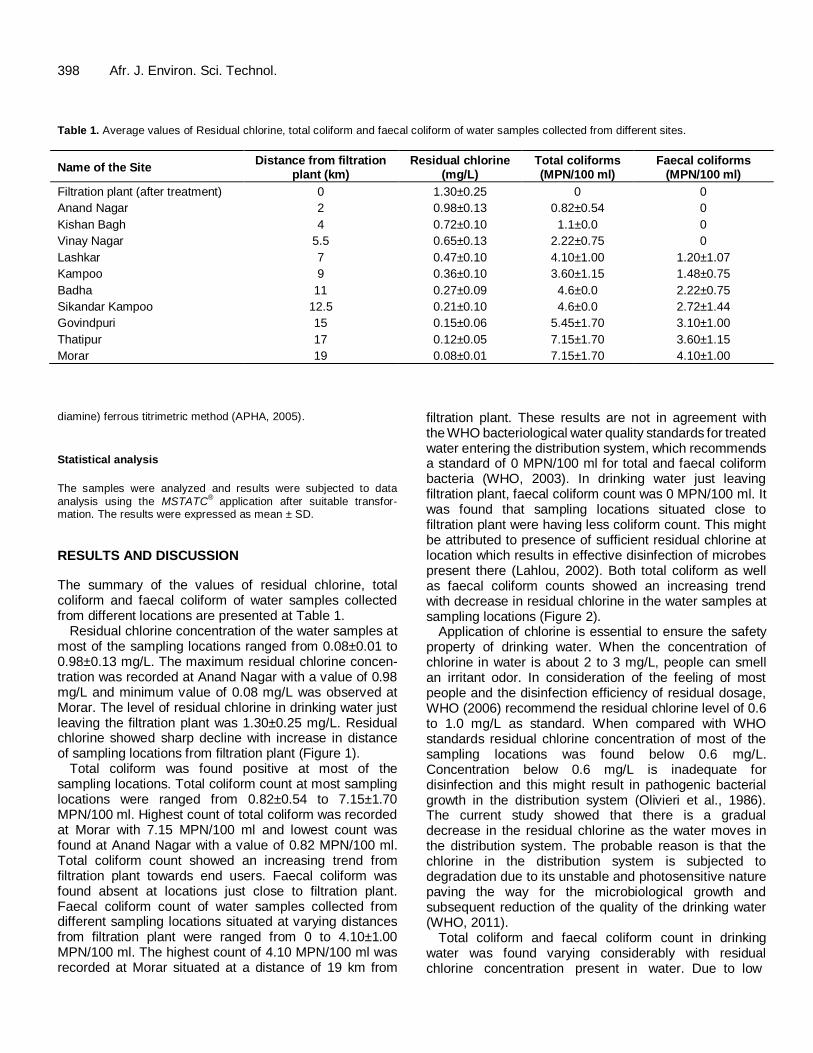
398 Afr. J. Environ. Sci. Technol. Table 1. Average values of Residual chlorine, total coliform and faecal coliform of water samples collected from different sites.
Name of the Site Distance from filtration
plant (km) Residual chlorine
(mg/L) Total coliforms (MPN/100 ml)
Faecal coliforms (MPN/100 ml)
Filtration plant (after treatment) 0 1.30±0.25 0 0
Anand Nagar 2 0.98±0.13 0.82±0.54 0
Kishan Bagh 4 0.72±0.10 1.1±0.0 0
Vinay Nagar 5.5 0.65±0.13 2.22±0.75 0
Lashkar 7 0.47±0.10 4.10±1.00 1.20±1.07
Kampoo 9 0.36±0.10 3.60±1.15 1.48±0.75
Badha 11 0.27±0.09 4.6±0.0 2.22±0.75
Sikandar Kampoo 12.5 0.21±0.10 4.6±0.0 2.72±1.44
Govindpuri 15 0.15±0.06 5.45±1.70 3.10±1.00
Thatipur 17 0.12±0.05 7.15±1.70 3.60±1.15
Morar 19 0.08±0.01 7.15±1.70 4.10±1.00
diamine) ferrous titrimetric method (APHA, 2005).
Statistical analysis
The samples were analyzed and results were subjected to data
analysis using the MSTATC®
application after suitable transfor-mation. The results were expressed as mean ± SD.
RESULTS AND DISCUSSION
The summary of the values of residual chlorine, total coliform and faecal coliform of water samples collected from different locations are presented at Table 1.
Residual chlorine concentration of the water samples at most of the sampling locations ranged from 0.08±0.01 to 0.98±0.13 mg/L. The maximum residual chlorine concen-tration was recorded at Anand Nagar with a value of 0.98 mg/L and minimum value of 0.08 mg/L was observed at Morar. The level of residual chlorine in drinking water just leaving the filtration plant was 1.30±0.25 mg/L. Residual chlorine showed sharp decline with increase in distance of sampling locations from filtration plant (Figure 1).
Total coliform was found positive at most of the sampling locations. Total coliform count at most sampling locations were ranged from 0.82±0.54 to 7.15±1.70 MPN/100 ml. Highest count of total coliform was recorded at Morar with 7.15 MPN/100 ml and lowest count was found at Anand Nagar with a value of 0.82 MPN/100 ml. Total coliform count showed an increasing trend from filtration plant towards end users. Faecal coliform was found absent at locations just close to filtration plant. Faecal coliform count of water samples collected from different sampling locations situated at varying distances from filtration plant were ranged from 0 to 4.10±1.00 MPN/100 ml. The highest count of 4.10 MPN/100 ml was recorded at Morar situated at a distance of 19 km from
filtration plant. These results are not in agreement with the WHO bacteriological water quality standards for treated water entering the distribution system, which recommends a standard of 0 MPN/100 ml for total and faecal coliform bacteria (WHO, 2003). In drinking water just leaving filtration plant, faecal coliform count was 0 MPN/100 ml. It was found that sampling locations situated close to filtration plant were having less coliform count. This might be attributed to presence of sufficient residual chlorine at location which results in effective disinfection of microbes present there (Lahlou, 2002). Both total coliform as well as faecal coliform counts showed an increasing trend with decrease in residual chlorine in the water samples at sampling locations (Figure 2).
Application of chlorine is essential to ensure the safety property of drinking water. When the concentration of chlorine in water is about 2 to 3 mg/L, people can smell an irritant odor. In consideration of the feeling of most people and the disinfection efficiency of residual dosage, WHO (2006) recommend the residual chlorine level of 0.6 to 1.0 mg/L as standard. When compared with WHO standards residual chlorine concentration of most of the sampling locations was found below 0.6 mg/L. Concentration below 0.6 mg/L is inadequate for disinfection and this might result in pathogenic bacterial growth in the distribution system (Olivieri et al., 1986). The current study showed that there is a gradual decrease in the residual chlorine as the water moves in the distribution system. The probable reason is that the chlorine in the distribution system is subjected to degradation due to its unstable and photosensitive nature paving the way for the microbiological growth and subsequent reduction of the quality of the drinking water (WHO, 2011).
Total coliform and faecal coliform count in drinking water was found varying considerably with residual chlorine concentration present in water. Due to low
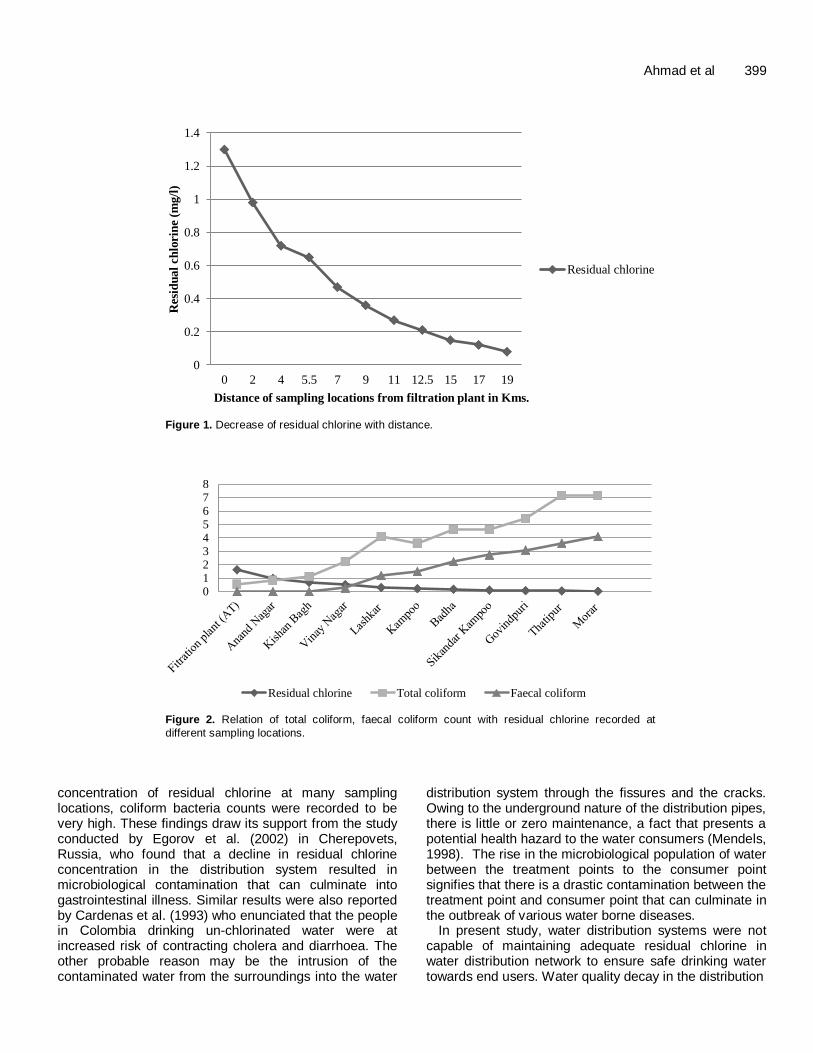
Ahmad et al 399
Figure 1. Decrease of residual chlorine with distance.
Figure 2. Relation of total coliform, faecal coliform count with residual chlorine recorded at
different sampling locations.
concentration of residual chlorine at many sampling locations, coliform bacteria counts were recorded to be very high. These findings draw its support from the study conducted by Egorov et al. (2002) in Cherepovets, Russia, who found that a decline in residual chlorine concentration in the distribution system resulted in microbiological contamination that can culminate into gastrointestinal illness. Similar results were also reported by Cardenas et al. (1993) who enunciated that the people in Colombia drinking un-chlorinated water were at increased risk of contracting cholera and diarrhoea. The other probable reason may be the intrusion of the contaminated water from the surroundings into the water
distribution system through the fissures and the cracks. Owing to the underground nature of the distribution pipes, there is little or zero maintenance, a fact that presents a potential health hazard to the water consumers (Mendels, 1998). The rise in the microbiological population of water between the treatment points to the consumer point signifies that there is a drastic contamination between the treatment point and consumer point that can culminate in the outbreak of various water borne diseases.
In present study, water distribution systems were not capable of maintaining adequate residual chlorine in water distribution network to ensure safe drinking water towards end users. Water quality decay in the distribution
0
0.2
0.4
0.6
0.8
1
1.2
1.4
0 2 4 5.5 7 9 11 12.5 15 17 19
Resi
du
al
ch
lorin
e (
mg
/l)
Distance of sampling locations from filtration plant in Kms.
Residual chlorine
012345678
Residual chlorine Total coliform Faecal coliform
400 Afr. J. Environ. Sci. Technol. network can be caused by properties of pipeline materials, hydraulic conditions, biofilm thickness, excessive network leakages, corrosion of parts, and intermittent service (Lee and Schwab, 2005). The need of the hour is to carry out the regular surveillance and maintenance of water distri-bution systems in order to reduce breakage of pipelines and intrusion of the contaminated water into the distribution system. Interruption in the water supply should be
minimized. Prescribed residual chlorine level should be maintained in the distribution system to check the growth of the microorganism to alleviate their potential health hazard.
Conclusion
The present study enunciated that monitoring of water quality is essential to ensure adequate free residual chlorine at the consumer end. Residual chlorine level of the water supply for public use decreases with distance owing to the unstable and photo-sensitive nature of the chlorine. It can be concluded that treatment applied to water at the filtration plant in the locality is not enough to absolutely eradicate microorganisms. Moreover, the microbial population rises with relative increase in distance from filtration plant reducing the quality of the drinking water for human consumption. The result of this study will help government and allied agencies to take appropriate action with regard to chlorination practices and the maintenance of the distribution systems to alleviate the negative consequences of using the water having ample microorganism growth.
Conflict of Interest
The author(s) did not declare any conflict of interest.
ACKNOWLEGEMENTS
The authors pay their sincere gratitude to the Director, Indira Gandhi Academy of Environmental Education Research and Ecoplanning, Jiwaji University Gwalior for providing necessary facilities and invaluable suggestions during the course of this research work. REFERENCES
American Public Health Association (APHA) (2005). Standard methods
for the examination of water and wastewater. Washington: American
Public Health Association. Appleyared SJ (1996). Impact of liquid waste disposal on potable
groundwater resources near Perth, Western Australia. Environ. Geol.
28:106-10. Batterman S, Zhang L, Wang S (2000). Quenching of chlorination
disinfection by-product formation in drinking water by hydrogen
peroxide. Water Res. 34(5):1652-1658. Bern C, Martines J, Zoysa I, Glass RI (1992). The magnitude of the
global problem of diarrhea disease: a ten year update. Bull. World
Health Organ. 26:157-168. Cardenas V, Saad C, Varona M, Linero M (1993). Waterborne cholera
in Riohacha, Colombia. Bull. Public Am. Health Organ. 27(4):313-
330. Cheesbrough M (2000). District Laboratory Practice for Tropical
Countries, Part 2. Cambridge University Press, Cambridge. 143-154.
Collins CH, Lyne PM (1985). Microbiological methods. London: Butterworth.
Dowidar A, Yosef YA, Merdan AI, Abdel-Monem MH, Diab AM (1990).
Bacterial contamination of water wells in wadi el-Sheikh area, in southern Sinai. J. Egypt Public Health Assoc. 65:119-34.
Eassa AM, Mahmood AA (2012). An Assessment of the treated water
quality for some drinking water supplies at Basrah. J. Basrah Res. (Sci.). 38(3):95-105.
Egorov A, Ford T, Tereschenko A, Drizhd N, Segedevich I, Fourman V
(2002). Deterioration of drinking water quality in the distribution system and gastrointestinal morbidity in a Russian city. Int. J. Environ. Health R. 12(3): 221-233.
Egoz N, Shmilovitz M, Kretzer B, Lucian M, Porat V, Raz R (1991). An outbreak of Shigella sonnei infection due to contamination of a municipal water supply in northern Israel. J. Infect. 22: 87-93.
Hashmi I, Farooq S, Qaiser S (2009). Chlorinationand water quality
monitoring within a public drinking water supply in Rawalpindi Cantt. (Westridge and Tench) area, Pakistan. Environ. Monit. Assess. 158:393-403.
Haydar S, Arshad M, Aziz JA (2009). Evaluation of drinking water quality in urban areas of Pakistan: A case study of Southern Lahore. Pak. J. Engg. Appl. Sci. 5:16-23.
Khan S, Shahnaz M, Jehan N, Rehman S, Shah MT, Din I (2012). Drinking Water Quality and Human Health Risk in Charsadda District, Pakistan. J. Clean. Prod. 12:1-9.
Kitazawa H (2006). Keeping residual chlorine and decreasing unpleasant odor caused by disinfection of tap water. Water Supp. 6(2):193-199.
Lahlou ZM (2002). Water quality in distribution systems. Tech Brief. A national drinking water clearing house fact sheet. West Virginia University.
Lee Y, Schwab N (2005). Comparative Study of Chemical Disinfection in Drinking Water Supplies. Water Cond. Purifi. 13:1- 6.
Lienyao L, Chungsying L, Shyang-Lai K (2004). Spatial diversity of
chlorine residual in a drinking water distribution system. J. Environ. Eng. 130:1263-1268.
Macler AB, Merkel CJ (2000). Current knowledge on groundwater
microbial pathogens and their control. Hydrogeol. J. 8: 29–40. Mendels P (1998). Dealing With Disaster and a Fragile Infrastructure.
New York Times, January 12.
Mroz Jr. RC, Pillai SD (1994). Bacterial populations in the groundwater on the US-Mexico border in El Paso County, Texas. South Med. J. 87:1214-1217.
Olivieri VP, Snead MC, Kruse CW, Kawata KM (1986). Stability and effectiveness of chlorine disinfectants in water distribution systems. Environ. Health Persp. 69:15-29.
Payment P (1999). Poor efficacy of residual chlorine disinfectant in drinking water to inactivate waterborne pathogens in distribution system. Can. J. Microbiol. 45:709-715.
UNCED (1992). Protection of the Quality and Supply of Freshwater Resources: Application of Integrated Approaches to the Development, Management and Use of Water Resources. The
United Nations Conference on Environment and Development. Chapter 18, Agenda 21.
UNCED (2012). Protection of the Quality and Supply of Freshwater
Resources: Application of Integrated Approaches to the Development, Management and Use of Water Resources. The United Nations Conference on Environment and Development.
Chapter 18, Agenda 21. Uriu-Hare JY, Swan SH, Bui LM, Neutra RR, Keen CL (1995). Drinking
water source and reproductive outcomes in Sprague–Dawley rats.
Reprod. Toxicol. 9(6):549-561. Varale A, Varale Y (2012). Residual chlorine concentrations in
underground water samples collected from tube wells of Nipani

Town. Univers. J. Environ. Res. Technol. 2(1):105-107. WHO (2003). Ontario Drinking-water Quality Standards, Objectives and
Guidelines Technical Support Document for Ontario Drinking Water
Standards. Objectives and Guidelines, Ministry of the Environment. WHO (2004). Guidelines for drinking-water quality: vol 1,
recommendations, 3rd edtion. World Health Organization, Geneva.
WHO (2006). Guidelines for Drinking-water Quality, 1st Addendum Vl.1.Recommendations. 3rd Edition, Electronic version for the web. http://www.who.int/water_sanitation_health/dwq/gdwq0506.pdf.
Ahmad et al 401 WHO (2011). Manganese in drinking water. Background document for
development of WHO guidelines for drinking water quality. WHO/SDE/WSH/03.04/104/REV/1. http/www.lwb.mw/online
watermonitoring.htm. Zacheus OM, Lehtola MJ, Korhonen LK, Martikainen PJ (2001). Soft
deposits, the key site for microbial growth in drinking water
distribution networks. Water Res. 35: 1757–1765.
Vol. 9(5), pp. 405-412, May 2015
DOI: 10.5897/AJEST2014.1826
Article Number: A2CA1B852125
ISSN 1996-0786
Copyright © 2015
Author(s) retain the copyright of this article
http://www.academicjournals.org/AJEST
African Journal of Environmental Science and Technology
Full Length Research Paper
Gumbel Weibull distribution function for Sahel precipitation modeling and predicting: Case of Mali
Kya Abraham Berthe1*, Abdramane B1 and Setephan Reichenbach2
1Optical Spectroscopy and Sciences of Atmospheres Laboratory (LOSSA).
2Department of Computer Science and Engineering, University of Nebraska-Lincoln, Nebraska, United States.
Received 15 November, 2014; Accepted 6 March, 2015
Climate change, trend of precipitation variation is greatly affected by Sahel countries economy in general and Mali in particular, which increased the social instability in recent years. In this paper, we proposed Gumbel Weibull distribution function for modeling and predicting the precipitation of Mali. The methodology is composed of two steps: parameters computations and estimations. We computed the parameters using four computations methods such as: method of moments (MOM), maximum likelihood method (MLM), method of least squares (MLS) and probability weighted moments (PWM). To estimate the best method, firstly we used several good fit tests like: Kolmogorov-Smirnov (Ks), Chi-square, Anderson-Darling and D-index to analyze each method parameters, then the ratio of the standard error to return period for final estimation. For simulation, daily data of the period, 1949 to 2006 provided by Mali Meteorology Department of four localities (Kayes, Koutiala, Mopti and Hombori) was used. Results of simulations were suitable for Anderson-Darling good fit technique and PWM for Koutial, Mopti and Hombori precipitation; and MLS for Kayes precipitation. The plotting of the return period of the precipitations for PWM and MLS in the 1000 years has also confirmed this result. Key words: Rainfall modeling and predicting, Gumbel and Weibull distribution function, method of moments (MOM), maximum likelihood method (MLM), method of least squares (MLS) and probability weighted moments (PWM) parameters optimization, statistical analysis, good fit test estimation.
INTRODUCTION Sahel climate is characterized by strong climatic varia-tions of temperature, humidity and precipitation (Foxa and Rockstrom, 2003; Kandji et al., 2006). In Sahel countries generally and Mali in particular, economy depends mainly on agriculture, so these variations and the lack of efficient policy in environment management increase the poverty and affect social instability (food insecurity, migration, social conflicts, etc.).
An efficient management of under and over ground water is a key factor for agriculture sustainability which depends mostly on the precipitation. For farmers, precipitation is the main parameter, because it directly affects their incomes (Udual and Ini, 2012). Researches on modeling, prediction and forecasting climate mitigation in general and precipitations in particular are necessary conditions to increase agriculture production.
*Corresponding author. E-mail: [email protected]. Author(s) agree that this article remain permanently open access under the terms of the Creative Commons Attribution License 4.0 International License
406 Afr. J. Environ. Sci. Technol.
Although researches have been done in the field of rainfall modeling and predicting, the complexity of the trend climate mitigation makes it remain a challenge mainly for Sahel countries. Analysis of rainfall data strongly depends on its availability and distribution pattern. It has long been a topic of interest in the fields of meteorology to establish a statistical probability distribu-tion that can provide a good estimation.
Mali climate represent a better sample for Sahel climate variation studies, because of its geographic position. Mali climate is straddling to the sub-tropical band called the Sahel; in which northern parts reach well into the dry Sahara desert, while the southern regions experience a wetter, more tropical, climate. The seasonal rainfall in Mali is controlled by the movement of the tropical rain (also known as the Inter-Tropical Conversion Zone, ITCZ) which oscillate between the northern and southern tropics over the course of a year, and brings rainfall to the southern regions of Mali between June and October, peaking in August. Seasonal temperature varia-tions are large, and differ in their patterns for different parts of the country (Jones et al., 2005).
The analysis and modeling of rainfall data based on time frequency trend is very complex (Phien, 1987; Manik and Datta, 1998; Zhang, 2003; Cousineau et al., 2004). The recent years have seen the increasing use of statistical theory (Vivekanandan, 2013). Gumbel distribu-tion function approach the latest innovation based on statistical theory. This distribution with cumulative proba-bility can be used to estimate the magnitudes of floods with different return periods, because of the simplicity with which the quantiles can be calculated. FREQUENCY ANALYSIS Sites description The four sites have been selected based on the availability of long period data and their position. This climate is mainly characterized by a high variability of inter-annual and inter-decadal times-scales, which can make long-term trend difficult to be identify. The selected four sites represent the complexity of rainfall in Mali. 1. Mopti (14°:406’27N) capital of the fifth administrative region of Mali, limited by Tombouctou in the north and Segou region to the southwest and Burkina Faso to the southeast. The Niger River crosses Mopti, makes this region in terms of water, a well-irrigate; so agriculture is well-developed, with also a particular successful fishing activities and shepherd. Mopti serves as an important commercial crossroads between Mali’s north, south and bordering nations. Tourism is also-developed, notably in the cities of Djenne and Mopti. 2. Hombori (15°142’297N) is a small town in the community of Douentza in Mopti region, situated on the national road 15 highway linking Mopti to Gao and Kidal regions. This small commune is the gate of Sahara. The climate in Hombori differs from other sites, the lack of important precipitation activity and continuous aquifer can be tapped by deep wells making the provision of drinking water in the commune difficult. 3. Kayes (4°1126’46N), the main city of the first administrative area of Mali is crossed by Senegal River, the region is bordered by the
countries of Mauritania at the north, Senegal at the west, Guinea at south and region of Koulikoro in the east. At the Guinean border, the climate is rather wet, but becomes Sudanian and later Sahelian to the north. 4. Koutiala (12°528’44N) is situated in Sikasso region (southern-most), the third region of Mali. This region receives more rain than any other Malian regions. Koutiala is the heartland of the cotton production in West African regions. The quantity and the quality of cotton produce in the area makes this site the second industrial city of Mali.
Data analysis
To reduce the complexity of analysis, we used regression analysis. Regression analysis is a process of fitting a function to a set of data points. Curve fitting with polynomials is done with polyfit function which uses the least squares method. Polyfit function finds the coefficients of a polynomial representing the data; used them to find new values of the data.
Based on year cumulated precipitation
Figure 1 represent the year-to-year cumulated precipitation, blue curve represented the record data and the red one is the best polynomial fit of the recorded data used polyfit function. It illustrates the downward trend for total precipitation, with minimum in the 1980s followed by small increases in the 1990s.
The downward trend is more important for Mopti, Kayes and Hombori. From 1990, there was a small increase followed by decreases to 2004 except for Kayes (Figure 1c). The decrease of precipitation is observed in all the sites in the period of 1950 to 1980. This decrease is more important for Koutiala and Hombori. A relative increase was observed for the period of 1990 to 2000. The drought (1980’s to 1990’s) decimated the livestock (20 to 50%), caused scarcities of water and food, and increased immigration and social conflicts between famers and shepherds.
Based on the number of rain days in year
From Figure 2, it is noted that the trend of number of rainfall days is downward for Mopti, Kayes and smaller for Koutaila and Hombori, with a minimum situated in the interval 1980 to1995.
A small increasing of the precipitation (Figure 1) is observed at the end of 1990s for all the sites. The global trend for both curves (Figures 1 and 2) is the reduction of precipitation and the number of precipitation days. Figures 1 and 2 show the variation on trend of the precipitation and the number of rainfall days for 56-year period. A period of particularly high rainfall (cumulate precipitation and number of rain days) occurred in the early 1950s, whilst the early 80s were very dry, causing widespread dryness in Mali and other Sahelian countries. Precipitation has recovered to some extent for all sites since 90s, but the increase has been quickly followed by the decrease in 2000. It is recommended that an efficient under-ground management policy to compensate this reduction of precipitation should be made.
PROPOSED METHOD: GUMBEL DISTRIBUTION FUNCTION
Since 1970, attention of the research on climate modeling has been focused on the discrete distribution function provides by Lagrangian distributions (Vivekanndan, 2013; Consul et al., 1972; 1973; Heathcote et al., 2004). This distribution function is been found more general in nature and wider in scope. Gumbel distribution is the latest innovations for climate modeling. It can be represented as follows (Consul et al., 1972; Heathcote et al., 2004):
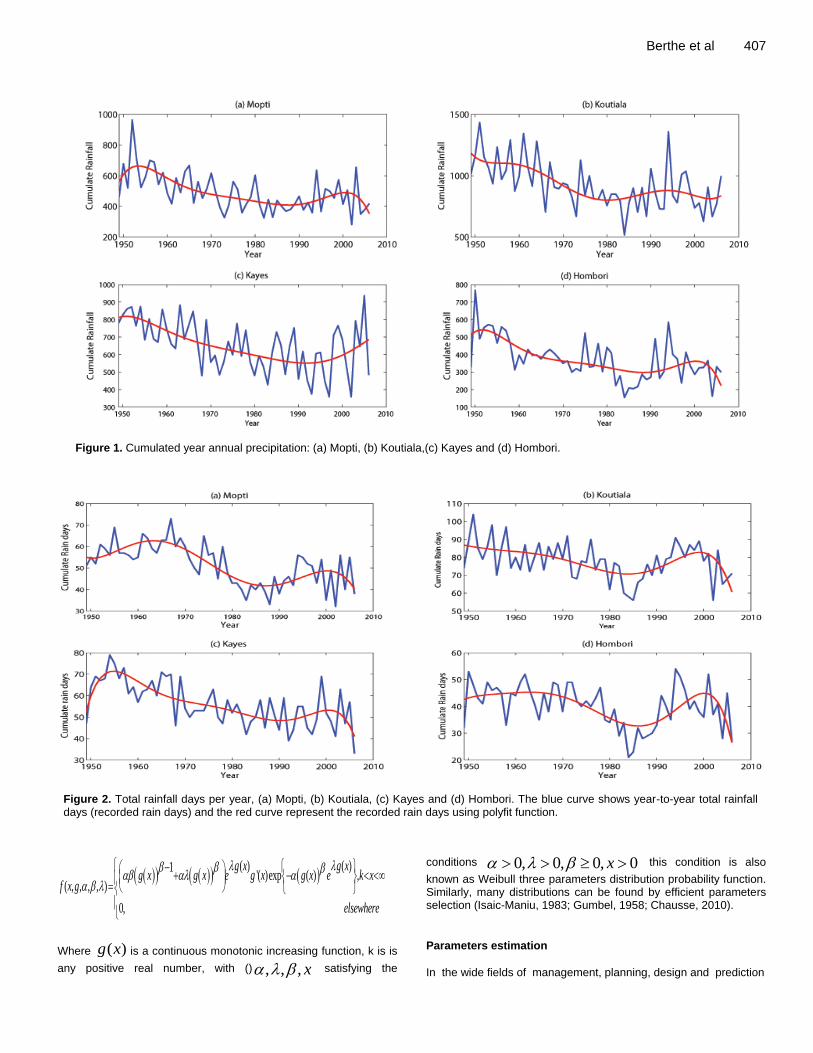
Berthe et al 407
Figure 1. Cumulated year annual precipitation: (a) Mopti, (b) Koutiala,(c) Kayes and (d) Hombori.
Figure 2. Total rainfall days per year, (a) Mopti, (b) Koutiala, (c) Kayes and (d) Hombori. The blue curve shows year-to-year total rainfall days (recorded rain days) and the red curve represent the recorded rain days using polyfit function.
Where is a continuous monotonic increasing function, k is is
any positive real number, with () satisfying the
conditions
this condition is also
known as Weibull three parameters distribution probability function. Similarly, many distributions can be found by efficient parameters selection (Isaic-Maniu, 1983; Gumbel, 1958; Chausse, 2010).
Parameters estimation
In the wide fields of management, planning, design and prediction
( ) ( )1
'( )exp ( ) ,( , , , , ) (3.1)
0,
g x g xg x g x e g x g x e k x
f x g
elsewhere
( )g x
, , , x
0, 0, 0, 0x
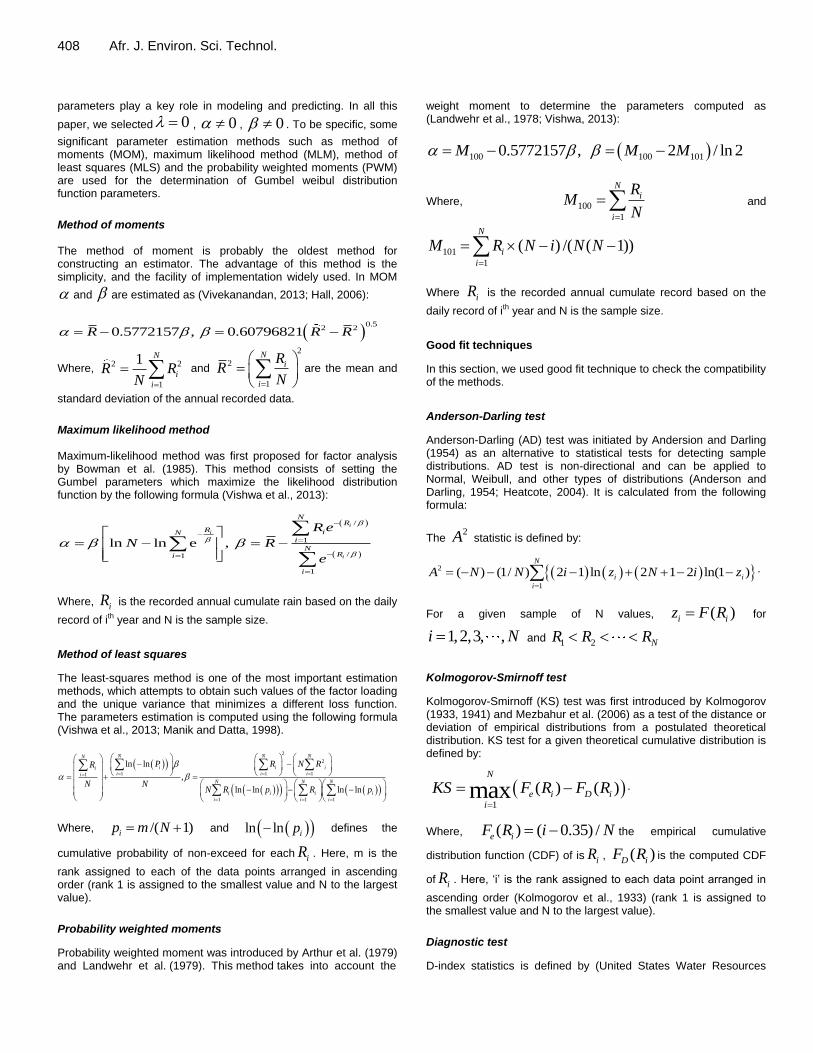
408 Afr. J. Environ. Sci. Technol. parameters play a key role in modeling and predicting. In all this
paper, we selected , , . To be specific, some
significant parameter estimation methods such as method of moments (MOM), maximum likelihood method (MLM), method of least squares (MLS) and the probability weighted moments (PWM) are used for the determination of Gumbel weibul distribution function parameters.
Method of moments The method of moment is probably the oldest method for constructing an estimator. The advantage of this method is the simplicity, and the facility of implementation widely used. In MOM
and are estimated as (Vivekanandan, 2013; Hall, 2006):
Where,
and are the mean and
standard deviation of the annual recorded data.
Maximum likelihood method Maximum-likelihood method was first proposed for factor analysis by Bowman et al. (1985). This method consists of setting the Gumbel parameters which maximize the likelihood distribution function by the following formula (Vishwa et al., 2013):
Where, is the recorded annual cumulate rain based on the daily
record of ith year and N is the sample size.
Method of least squares
The least-squares method is one of the most important estimation methods, which attempts to obtain such values of the factor loading and the unique variance that minimizes a different loss function. The parameters estimation is computed using the following formula (Vishwa et al., 2013; Manik and Datta, 1998).
Where, and defines the
cumulative probability of non-exceed for each . Here, m is the
rank assigned to each of the data points arranged in ascending order (rank 1 is assigned to the smallest value and N to the largest value).
Probability weighted moments
Probability weighted moment was introduced by Arthur et al. (1979) and Landwehr et al. (1979). This method takes into account the
weight moment to determine the parameters computed as (Landwehr et al., 1978; Vishwa, 2013):
Where, and
Where is the recorded annual cumulate record based on the
daily record of ith year and N is the sample size.
Good fit techniques
In this section, we used good fit technique to check the compatibility of the methods.
Anderson-Darling test
Anderson-Darling (AD) test was initiated by Andersion and Darling (1954) as an alternative to statistical tests for detecting sample distributions. AD test is non-directional and can be applied to Normal, Weibull, and other types of distributions (Anderson and Darling, 1954; Heatcote, 2004). It is calculated from the following formula:
The statistic is defined by:
.
For a given sample of N values, for
and
Kolmogorov-Smirnoff test
Kolmogorov-Smirnoff (KS) test was first introduced by Kolmogorov (1933, 1941) and Mezbahur et al. (2006) as a test of the distance or deviation of empirical distributions from a postulated theoretical distribution. KS test for a given theoretical cumulative distribution is defined by:
.
Where, the empirical cumulative
distribution function (CDF) of is , is the computed CDF
of . Here, ‘i’ is the rank assigned to each data point arranged in
ascending order (Kolmogorov et al., 1933) (rank 1 is assigned to the smallest value and N to the largest value).
Diagnostic test
D-index statistics is defined by (United States Water Resources
0 0 0
0.5
2 20.5772157 , 0.60796821 (3,2)R R R
2 2
1
1 N
i
i
R RN
2
2
1
Ni
i
RR
N
/
1
/1
1
ln ln e , (3,3)
i
i
i
NR
R iNi
NRi
i
R e
N R
e
iR
2
2
1 1 11
1 1 1
ln ln
, (3,4)
ln ln ln ln
N N NN
i i iii i ii
N N N
i i i i
i i i
P R N RR
N NN R p R p
/( 1)ip m N ln ln ip
iR
100 100 1010.5772157 , 2 / ln 2 (3,5)M M M
100
1
Ni
i
RM
N
101
1
( ) /( ( 1))N
i
i
M R N i N N
iR
2A
2
1
( ) (1/ ) 2 1 ln 2 1 2 ln(1 ) (3,6)N
i i
i
A N N i z N i z
( )i iz F R
1,2,3, ,i N1 2 NR R R
1
( ) ( ) (3,7)maxN
e i D i
i
KS F R F R
( ) ( 0.35) /e iF R i N
iR ( )D iF R
iR
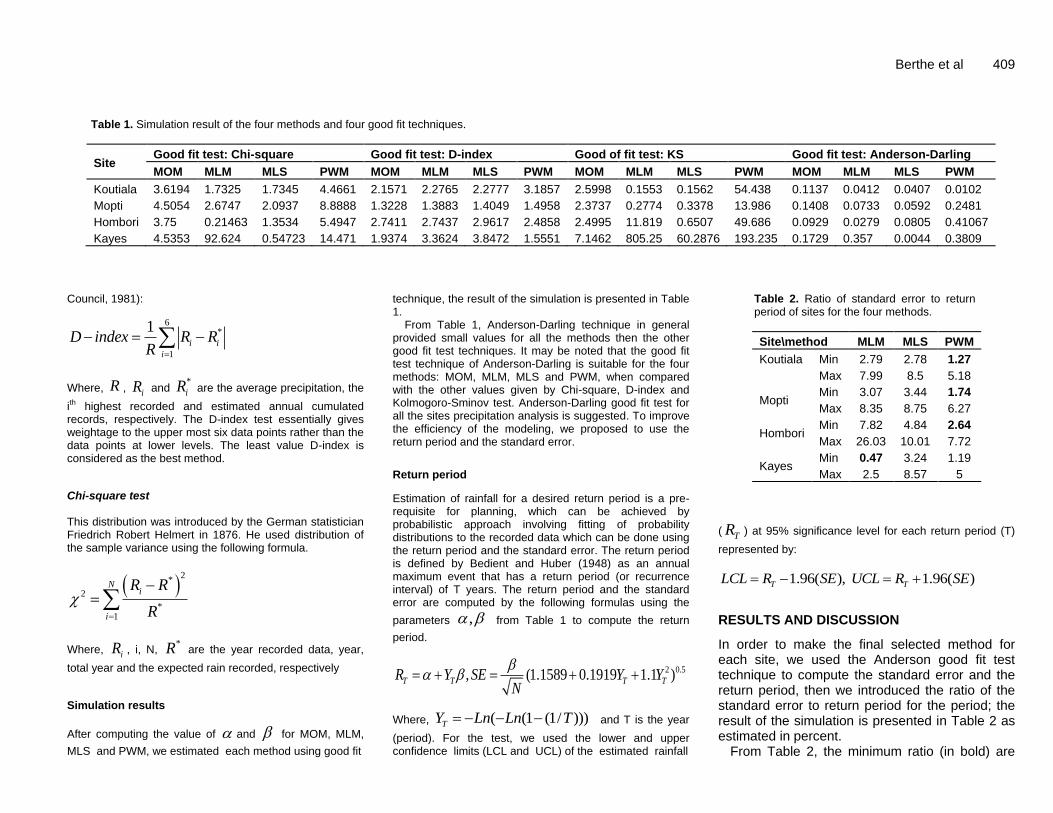
Berthe et al 409
Table 1. Simulation result of the four methods and four good fit techniques.
Site Good fit test: Chi-square Good fit test: D-index Good of fit test: KS Good fit test: Anderson-Darling
MOM MLM MLS PWM MOM MLM MLS PWM MOM MLM MLS PWM MOM MLM MLS PWM
Koutiala 3.6194 1.7325 1.7345 4.4661 2.1571 2.2765 2.2777 3.1857 2.5998 0.1553 0.1562 54.438 0.1137 0.0412 0.0407 0.0102
Mopti 4.5054 2.6747 2.0937 8.8888 1.3228 1.3883 1.4049 1.4958 2.3737 0.2774 0.3378 13.986 0.1408 0.0733 0.0592 0.2481
Hombori 3.75 0.21463 1.3534 5.4947 2.7411 2.7437 2.9617 2.4858 2.4995 11.819 0.6507 49.686 0.0929 0.0279 0.0805 0.41067
Kayes 4.5353 92.624 0.54723 14.471 1.9374 3.3624 3.8472 1.5551 7.1462 805.25 60.2876 193.235 0.1729 0.357 0.0044 0.3809
Council, 1981):
Where, , and are the average precipitation, the
ith highest recorded and estimated annual cumulated
records, respectively. The D-index test essentially gives weightage to the upper most six data points rather than the data points at lower levels. The least value D-index is considered as the best method.
Chi-square test This distribution was introduced by the German statistician Friedrich Robert Helmert in 1876. He used distribution of the sample variance using the following formula.
Where, , i, N, are the year recorded data, year,
total year and the expected rain recorded, respectively
Simulation results
After computing the value of and for MOM, MLM,
MLS and PWM, we estimated each method using good fit
technique, the result of the simulation is presented in Table 1.
From Table 1, Anderson-Darling technique in general provided small values for all the methods then the other good fit test techniques. It may be noted that the good fit test technique of Anderson-Darling is suitable for the four methods: MOM, MLM, MLS and PWM, when compared with the other values given by Chi-square, D-index and Kolmogoro-Sminov test. Anderson-Darling good fit test for all the sites precipitation analysis is suggested. To improve the efficiency of the modeling, we proposed to use the return period and the standard error.
Return period
Estimation of rainfall for a desired return period is a pre-requisite for planning, which can be achieved by probabilistic approach involving fitting of probability distributions to the recorded data which can be done using the return period and the standard error. The return period is defined by Bedient and Huber (1948) as an annual maximum event that has a return period (or recurrence interval) of T years. The return period and the standard error are computed by the following formulas using the
parameters from Table 1 to compute the return
period.
Where, and T is the year
(period). For the test, we used the lower and upper confidence limits (LCL and UCL) of the estimated rainfall
Table 2. Ratio of standard error to return period of sites for the four methods.
Site\method MLM MLS PWM
Koutiala
Min 2.79 2.78 1.27
Max 7.99 8.5 5.18
Mopti Min 3.07 3.44 1.74
Max 8.35 8.75 6.27
Hombori Min 7.82 4.84 2.64
Max 26.03 10.01 7.72
Kayes Min 0.47 3.24 1.19
Max 2.5 8.57 5
( ) at 95% significance level for each return period (T)
represented by:
RESULTS AND DISCUSSION
In order to make the final selected method for each site, we used the Anderson good fit test technique to compute the standard error and the return period, then we introduced the ratio of the standard error to return period for the period; the result of the simulation is presented in Table 2 as estimated in percent.
From Table 2, the minimum ratio (in bold) are
6*
1
1 (3,8)i i
i
D index R RR
RiR
*
iR
2
*
2
*1
Ni
i
R R
R
iR *R
,
2 0.5, (1.1589 0.1919 1.1 ) (3.10)T T T TR Y SE Y YN
( (1 (1/ )))TY Ln Ln T
TR
1.96( ), 1.96( ) (3.11)T TLCL R SE UCL R SE
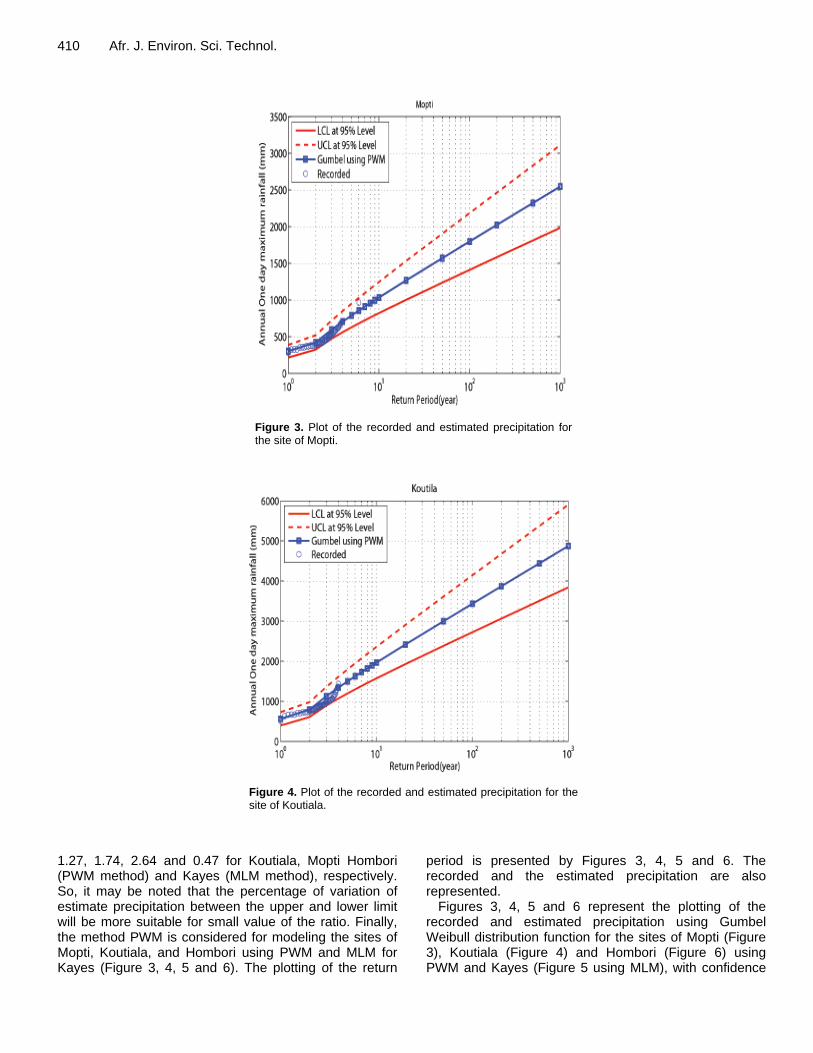
410 Afr. J. Environ. Sci. Technol.
Figure 3. Plot of the recorded and estimated precipitation for the site of Mopti.
Figure 4. Plot of the recorded and estimated precipitation for the site of Koutiala.
1.27, 1.74, 2.64 and 0.47 for Koutiala, Mopti Hombori (PWM method) and Kayes (MLM method), respectively. So, it may be noted that the percentage of variation of estimate precipitation between the upper and lower limit will be more suitable for small value of the ratio. Finally, the method PWM is considered for modeling the sites of Mopti, Koutiala, and Hombori using PWM and MLM for Kayes (Figure 3, 4, 5 and 6). The plotting of the return
period is presented by Figures 3, 4, 5 and 6. The recorded and the estimated precipitation are also represented.
Figures 3, 4, 5 and 6 represent the plotting of the recorded and estimated precipitation using Gumbel Weibull distribution function for the sites of Mopti (Figure 3), Koutiala (Figure 4) and Hombori (Figure 6) using PWM and Kayes (Figure 5 using MLM), with confidence
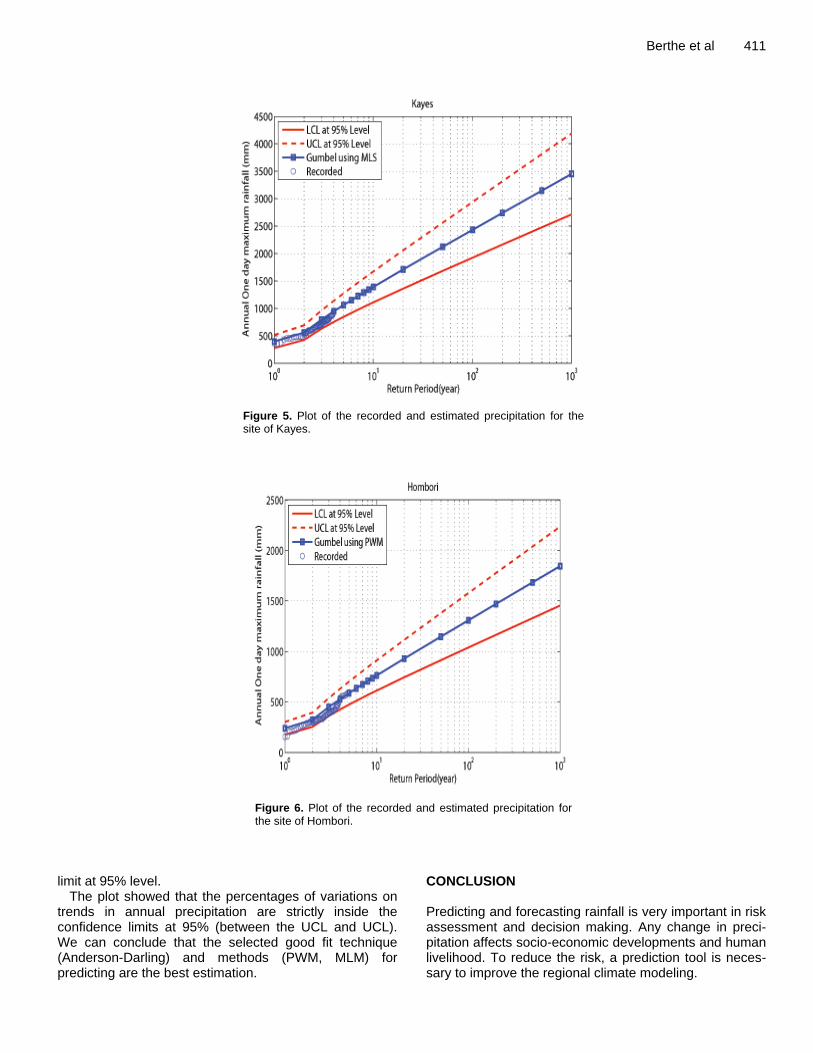
Berthe et al 411
Figure 5. Plot of the recorded and estimated precipitation for the site of Kayes.
Figure 6. Plot of the recorded and estimated precipitation for the site of Hombori.
limit at 95% level.
The plot showed that the percentages of variations on trends in annual precipitation are strictly inside the confidence limits at 95% (between the UCL and UCL). We can conclude that the selected good fit technique (Anderson-Darling) and methods (PWM, MLM) for predicting are the best estimation.
CONCLUSION Predicting and forecasting rainfall is very important in risk assessment and decision making. Any change in preci-pitation affects socio-economic developments and human livelihood. To reduce the risk, a prediction tool is neces-sary to improve the regional climate modeling.
412 Afr. J. Environ. Sci. Technol.
Based on the limitation of the frequency analysis (Figures 1 and 2) due to the complexity of rainfall analysis, we proposed Gumbel Weibull probability function through the four methods of parameters computation (MLM, MLS, PWM and MOM). The four good fit tests are also used to estimate the efficient method. The results of the good test show the efficiency of Anderson-Darling techniques as compared to the Komorov-smirnov, D-Index and Chi-square proposed techniques. The results of the minimum ratio show the efficiency of PWM method for Koutial, Mopti and Hombori and MLM for Kayes precipitation modeling and predicting. The plotting results of the estimated and the recorded precipitation, show the efficiency of the selected method and test technique (Figures 3, 4, 5 and 6). Conflict of interests The authors did not declare any conflict of interest. REFERENCES Anderson TW, Darling DA (1954). A test of Goodness of fit. J. Am. Stat.
Assoc. 49(268):765-769. Arthur JG, Maciunas JL, Matalas NC, Wallis JR (1979). Probability
Weighted Moments: Definition and Relation to Parameters of several Distributions Expressable in Inverse Form. Water Resour. Res. 15(5):1049-1055.
Bedient P, Huber W (1948). Hydrology and Flooding, Analysis. Addison Wesley Publishing Co.
Bowman KO, Shenton LR (1985). John Wiley and Sons Canada. 5:467-453.
Chausse P (2010). Computing Generalized Method of Moments and Generalized Empirical Likelihood with R." J. Stat. Softw. 34(11):1-35.
Consul PC, Shenton LR (1972). Use of Lagrangian expansion for generating generalized Probability distribution. SIAM J. Appl. Math. 23(2):239-248.
Consul PC, Shenton LR (1973). Some interesting properties of Lagrangian stributions. Commun. Statist. Simul. Computat. 2(3):263-272
Cousineau D, Brown S, Heathcote A (2004). Fitting distributions using maximum likelihood: Methods and packages. Behav. Res. Methods Instrum. Comput. 36 (4):742-756.
Foxa P, Rockstrom J (2003). Supplemental irrigation of dry-spell mitigation of rainfall agriculture in the Sahel. Agric. Water Manage. 61:29-50.
Gumbel EJ (1958). The Statistics of Extremes, New York: Columbia University Press.
Hall AR (2006). Generalized Method of Moments (Advanced Texts in Econometrics). Oxford University Press.
Heathcote A, Brown S, Cousineau D (2004). QMPE: Estimating Lognormal, Wald and Weibull RT distributions with a parameter dependent lower bound. Behav. Res. Methods Instrum. Comput. 36:277-290.
Helmert FR (1876). Ueber fie Wahrscheinlichkeit der Potenzsummen der Potenzsummen der Beobachtungsfehler und uber einige damit im Zusammenhange stehende Frragen. Zeitschrift für Mathematik und Physik 21:S.102-219.
Isaic-Maniu A (1983). Metoda Weibull - aplicatii, Ed. Academiei, Bucharest.
Jones PD, Osborn TJ, Briffa KR, Folland CK, Horton B, Alexander LV,
Parker DE, Niasse M (2005). Climate Induced Water Conflict Risks in West Africa: Recognizing and coping with increased climate impacts on shared watercourses. An International Workshop organized by centre for study of Civil War, International Peace research institute, Oslo (PRIO) and Centre for International Environmental and Climate research at University of Oslo (CICERO) for the global environmental change and human security program (GECHS).
Kandji ST, Verchot L, Mackenson J (2006). Climate change and Variability in the Sahel Region: Impacts and Adaptation Strategies in the Agricultural Sector. World Agroforestry Centre/United Nations Environment Programme.
Kolmogorov AN (1941). Confidence limits for an unknown distribution function. Annals of Mathematical Statistics. 12:461-463.
Kolmogorov AN (1933). Sulla Determinazione empirica di une legge di distribuzione. Giornale dell’Istituto Italiano degli Attuari. 4: 83-91.
Landwehr JM , Matalas NC, Wallis JR (1978). Some comparisons of flood statistics in real and log space. Water Resour. Res. 4(5): 902-920.
Landwehr JM, Matalas NC, Wallis JR (1979). Probability weighted moments compared with some traditional techniques in estimating Gumbel parameters and quantiles, Water Resour. Res. 15(5):1055-1106
Manik D, Datta SK (1998). A comparative study of estimation of extreme value. J. River Behav. Control 25(1):41-47.
Mezbahur R, Larry MP, Herbert CH (2006). A modified Anderson-Darling Test for uniformity. Bull. Malays. Math. Sci. Soc. 20(1):11-16.
Phien HN (1987). A review of methods of parameter estimation for the extreme value type–1 distribution. J. Hydraulics 90 (3 & 4): 251-268.
Udual CUI, Ini DE (2012). Analysis of Rainfall Trends in Akwa Idom State, Nigeria. J. Environ. Earth Sci. 2(8):60-70.
United States Water Resources Council (USWRC) (1981). Guidelines for determining flood flow frequency, Bulletin. 17B:50
Vishwa N M, Diwinder K A (2013). Exact Modelling and Analytical Study of Annual Maximum Rainfall with Gumbel and Frechet Distributions Using Parameter Estimation Techniques World of Sciences Journal. (02).
Vivekanandan N (2013). Inter-comparison of parameters of Gumbel Distribution for Rainfall Frequency Analysis. J. Environ. Sci. Comput. Sci. Eng. Technol. 2(4):1336-1346.
Zhang J (2002). Powerful goodness-of-fit tests based on the likelihood ratio. J. R. Stat. Soc. 64(2):281-294.
Vol. 9(5), pp. 413-419, May 2015
DOI: 10.5897/AJEST2014.1827
Article Number: CB2823452157
ISSN 1996-0786
Copyright © 2015
Author(s) retain the copyright of this article
http://www.academicjournals.org/AJEST
African Journal of Environmental Science and Technology
Full Length Research Paper
Assessment of physico-chemical and bacteriological quality of drinking water at sources and household in
Adama Town, Oromia Regional State, Ethiopia
Temesgen Eliku1* and Hameed Sulaiman2
1Environmental Science Program, College of Natural and Computational Sciences, Wollega University, P.O. Box 395,
Nekemte, Ethiopia 2College of Science, Sultan Qaboos University, P.O. Box 36, PC 123, Al Khoudh, Muscat, Sultanate of Oman.
Received 17 November, 2014; Accepted 12 March, 2015
Water quality is a critical factor affecting human health and welfare. This study aimed at examining the physico-chemical and bacteriological quality of drinking water in Adama town. A total of 107 triplicate water samples were examined; 1 from inlet point (raw water), 1 from outlet (the water after treatment, 1 from reservoir (treated water stored), 52 from pipe water and 52 from systematically selected household’s containers. Six physico-chemical parameters namely temperature, turbidity, pH, free chlorine residual (FCR), nitrate, fluoride and three bacteriological parameters: total coliform (TC), fecal coliform (FC) and fecal streptococci (FS) were analyzed. Temperature was average of 23.30, 21.23 and 22.57°C at the inlet, outlet and reservoir sampling points, respectively, which were above WHO and national standard limits of <15°C. Concerning FCR, at the outlet, FCR was 0.78 mg/l which was in the WHO recommended limit of 0.6-1 mg/L and at reservoir sampling point, the FCR was 0.35 mg/l which was in the WHO and national standard limit of 0.2-0.5 mg/L. The average concentration of TC, FC and FS at the inlet point was 196, 142 and 117 cfu/100 ml, respectively. On the other hand, at the outlet and reservoir sampling points, no indicator bacteria were found. In all pipe water samples, pH values were within the recommended limit (6.5-8). In the pipeline, 82.7 and 92.3% of sampling sites were found acceptable based on WHO and National standard for FC and FS counts, respectively. In household water container, 55.8 and 71.1% were in the acceptable limit of WHO and National standard for FC and FS, respectively. Pearson correlation analysis indicates that a significant positive correlation between TC/temperature (r = 0.809063) and a significant negative correlation exist between TC and FCR (r = -0.689336) in tap water samples. Using Pearson’s correlation coefficient, TC was found to be positively and significantly related to FC (r = 0.836887) and FS (r = 0.674766), FC was found to be positively and significantly correlated to FS (r = 0.84345) in household water. Key words: Physico-chemical parameter, bacteriological quality, pipe water, household water, total coliform (TC), fecal coliform (FC), fecal streptococci (FS).
INTRODUCTION Water is the vital resource for development and essential for all economic activities. It is a very precious resource of this planet as it is an established source of life. Water
is considered as one of the nutrients, although it yields no calories, yet it enters into structural composition of cell and is an essential component of diet.
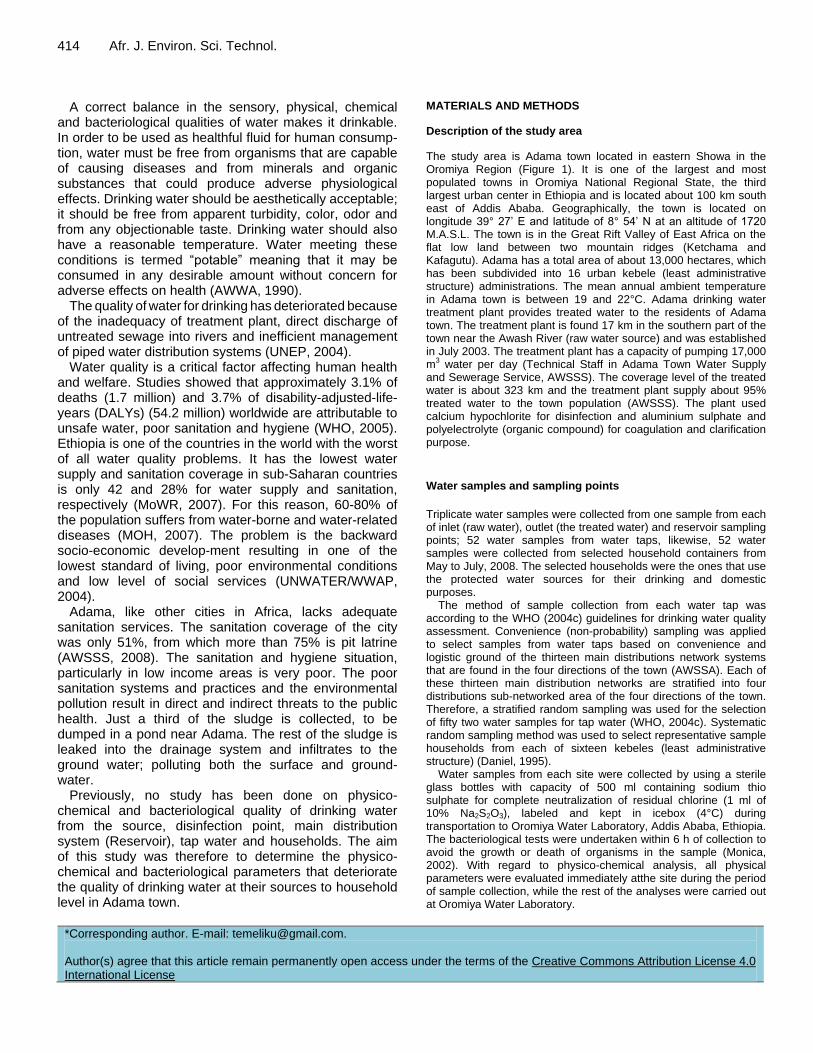
414 Afr. J. Environ. Sci. Technol.
A correct balance in the sensory, physical, chemical and bacteriological qualities of water makes it drinkable. In order to be used as healthful fluid for human consump-tion, water must be free from organisms that are capable of causing diseases and from minerals and organic substances that could produce adverse physiological effects. Drinking water should be aesthetically acceptable; it should be free from apparent turbidity, color, odor and from any objectionable taste. Drinking water should also have a reasonable temperature. Water meeting these conditions is termed “potable” meaning that it may be consumed in any desirable amount without concern for adverse effects on health (AWWA, 1990).
The quality of water for drinking has deteriorated because of the inadequacy of treatment plant, direct discharge of untreated sewage into rivers and inefficient management of piped water distribution systems (UNEP, 2004).
Water quality is a critical factor affecting human health and welfare. Studies showed that approximately 3.1% of deaths (1.7 million) and 3.7% of disability-adjusted-life-years (DALYs) (54.2 million) worldwide are attributable to unsafe water, poor sanitation and hygiene (WHO, 2005). Ethiopia is one of the countries in the world with the worst of all water quality problems. It has the lowest water supply and sanitation coverage in sub-Saharan countries is only 42 and 28% for water supply and sanitation, respectively (MoWR, 2007). For this reason, 60-80% of the population suffers from water-borne and water-related diseases (MOH, 2007). The problem is the backward socio-economic develop-ment resulting in one of the lowest standard of living, poor environmental conditions and low level of social services (UNWATER/WWAP, 2004).
Adama, like other cities in Africa, lacks adequate sanitation services. The sanitation coverage of the city was only 51%, from which more than 75% is pit latrine (AWSSS, 2008). The sanitation and hygiene situation, particularly in low income areas is very poor. The poor sanitation systems and practices and the environmental pollution result in direct and indirect threats to the public health. Just a third of the sludge is collected, to be dumped in a pond near Adama. The rest of the sludge is leaked into the drainage system and infiltrates to the ground water; polluting both the surface and ground-water.
Previously, no study has been done on physico-chemical and bacteriological quality of drinking water from the source, disinfection point, main distribution system (Reservoir), tap water and households. The aim of this study was therefore to determine the physico-chemical and bacteriological parameters that deteriorate the quality of drinking water at their sources to household level in Adama town.
MATERIALS AND METHODS
Description of the study area
The study area is Adama town located in eastern Showa in the Oromiya Region (Figure 1). It is one of the largest and most populated towns in Oromiya National Regional State, the third largest urban center in Ethiopia and is located about 100 km south east of Addis Ababa. Geographically, the town is located on longitude 39° 27’ E and latitude of 8° 54’ N at an altitude of 1720 M.A.S.L. The town is in the Great Rift Valley of East Africa on the flat low land between two mountain ridges (Ketchama and Kafagutu). Adama has a total area of about 13,000 hectares, which has been subdivided into 16 urban kebele (least administrative structure) administrations. The mean annual ambient temperature in Adama town is between 19 and 22°C. Adama drinking water treatment plant provides treated water to the residents of Adama town. The treatment plant is found 17 km in the southern part of the town near the Awash River (raw water source) and was established in July 2003. The treatment plant has a capacity of pumping 17,000 m
3 water per day (Technical Staff in Adama Town Water Supply
and Sewerage Service, AWSSS). The coverage level of the treated water is about 323 km and the treatment plant supply about 95% treated water to the town population (AWSSS). The plant used calcium hypochlorite for disinfection and aluminium sulphate and polyelectrolyte (organic compound) for coagulation and clarification purpose.
Water samples and sampling points
Triplicate water samples were collected from one sample from each of inlet (raw water), outlet (the treated water) and reservoir sampling points; 52 water samples from water taps, likewise, 52 water samples were collected from selected household containers from May to July, 2008. The selected households were the ones that use the protected water sources for their drinking and domestic purposes.
The method of sample collection from each water tap was according to the WHO (2004c) guidelines for drinking water quality assessment. Convenience (non-probability) sampling was applied to select samples from water taps based on convenience and logistic ground of the thirteen main distributions network systems that are found in the four directions of the town (AWSSA). Each of these thirteen main distribution networks are stratified into four distributions sub-networked area of the four directions of the town. Therefore, a stratified random sampling was used for the selection of fifty two water samples for tap water (WHO, 2004c). Systematic random sampling method was used to select representative sample households from each of sixteen kebeles (least administrative structure) (Daniel, 1995).
Water samples from each site were collected by using a sterile glass bottles with capacity of 500 ml containing sodium thio sulphate for complete neutralization of residual chlorine (1 ml of 10% Na2S2O3), labeled and kept in icebox (4°C) during transportation to Oromiya Water Laboratory, Addis Ababa, Ethiopia. The bacteriological tests were undertaken within 6 h of collection to avoid the growth or death of organisms in the sample (Monica, 2002). With regard to physico-chemical analysis, all physical parameters were evaluated immediately atthe site during the period of sample collection, while the rest of the analyses were carried out at Oromiya Water Laboratory.
*Corresponding author. E-mail: [email protected]. Author(s) agree that this article remain permanently open access under the terms of the Creative Commons Attribution License 4.0 International License
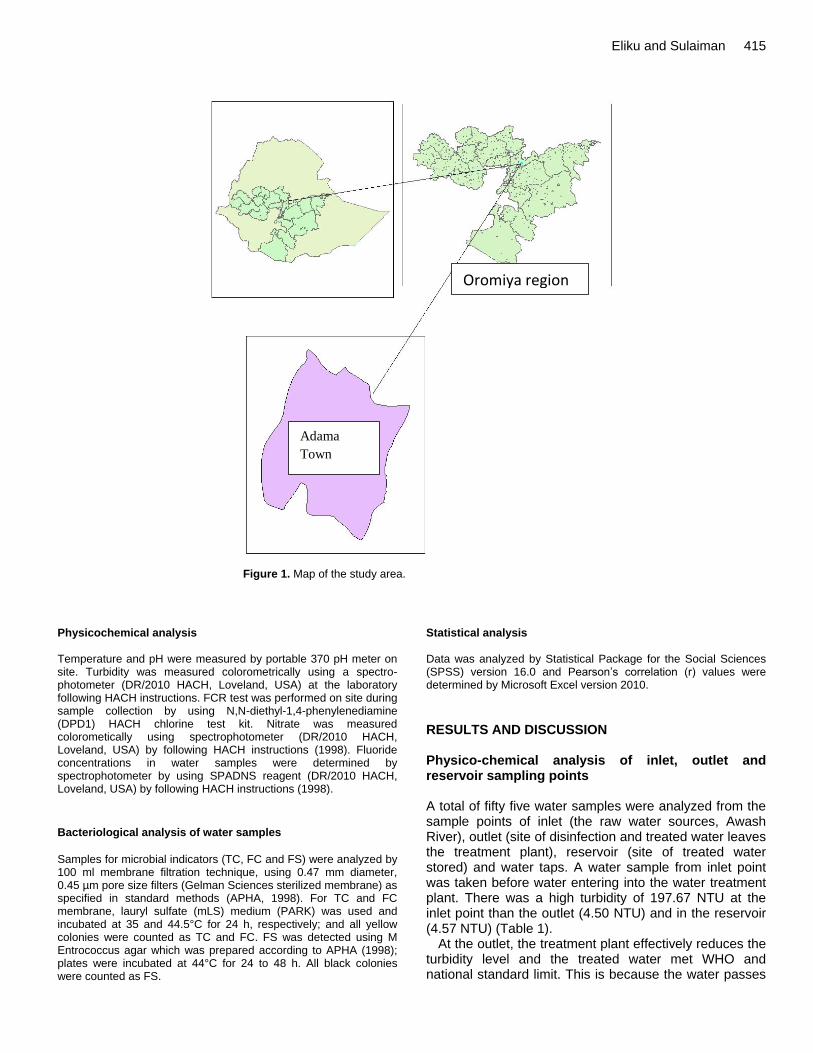
Eliku and Sulaiman 415
Figure 1. Map of the study area.
Physicochemical analysis Temperature and pH were measured by portable 370 pH meter on site. Turbidity was measured colorometrically using a spectro-photometer (DR/2010 HACH, Loveland, USA) at the laboratory following HACH instructions. FCR test was performed on site during sample collection by using N,N-diethyl-1,4-phenylenediamine (DPD1) HACH chlorine test kit. Nitrate was measured colorometically using spectrophotometer (DR/2010 HACH, Loveland, USA) by following HACH instructions (1998). Fluoride concentrations in water samples were determined by spectrophotometer by using SPADNS reagent (DR/2010 HACH, Loveland, USA) by following HACH instructions (1998).
Bacteriological analysis of water samples
Samples for microbial indicators (TC, FC and FS) were analyzed by 100 ml membrane filtration technique, using 0.47 mm diameter, 0.45 µm pore size filters (Gelman Sciences sterilized membrane) as specified in standard methods (APHA, 1998). For TC and FC membrane, lauryl sulfate (mLS) medium (PARK) was used and incubated at 35 and 44.5°C for 24 h, respectively; and all yellow colonies were counted as TC and FC. FS was detected using M Entrococcus agar which was prepared according to APHA (1998); plates were incubated at 44°C for 24 to 48 h. All black colonies were counted as FS.
Statistical analysis Data was analyzed by Statistical Package for the Social Sciences (SPSS) version 16.0 and Pearson’s correlation (r) values were determined by Microsoft Excel version 2010.
RESULTS AND DISCUSSION Physico-chemical analysis of inlet, outlet and reservoir sampling points A total of fifty five water samples were analyzed from the sample points of inlet (the raw water sources, Awash River), outlet (site of disinfection and treated water leaves the treatment plant), reservoir (site of treated water stored) and water taps. A water sample from inlet point was taken before water entering into the water treatment plant. There was a high turbidity of 197.67 NTU at the inlet point than the outlet (4.50 NTU) and in the reservoir (4.57 NTU) (Table 1).
At the outlet, the treatment plant effectively reduces the turbidity level and the treated water met WHO and national standard limit. This is because the water passes
Adama
Town
Oromiya region
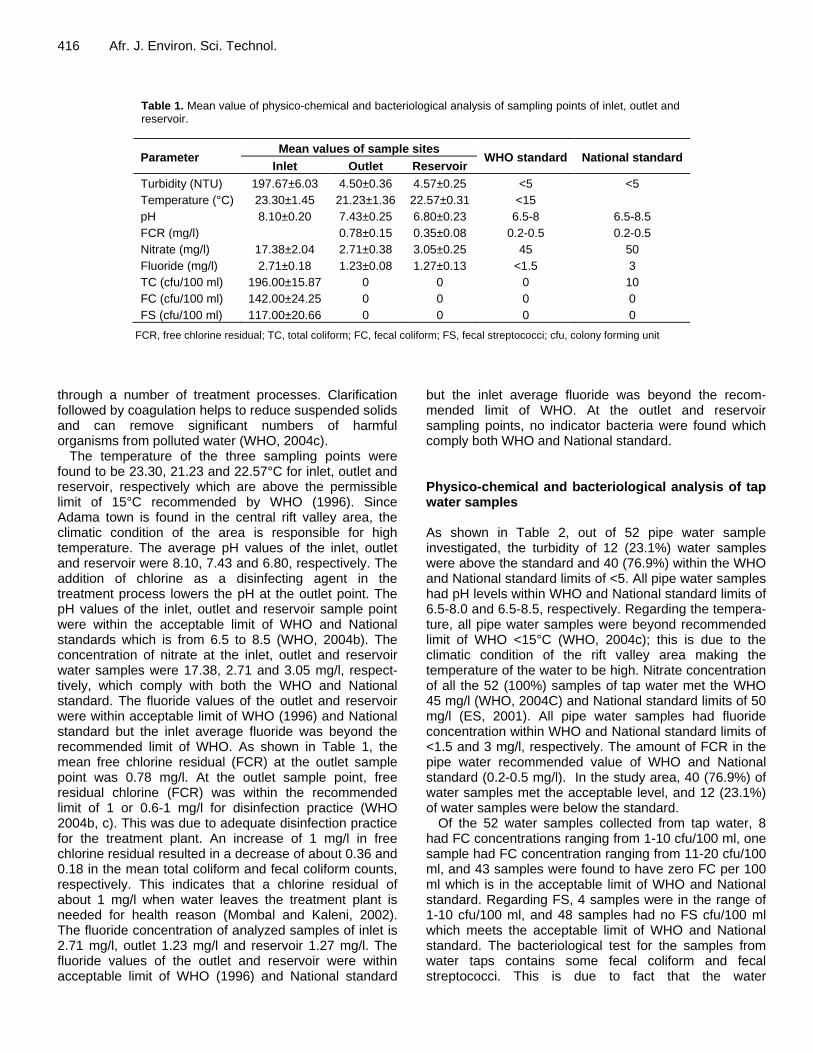
416 Afr. J. Environ. Sci. Technol.
Table 1. Mean value of physico-chemical and bacteriological analysis of sampling points of inlet, outlet and reservoir.
Parameter Mean values of sample sites
WHO standard National standard Inlet Outlet Reservoir
Turbidity (NTU) 197.67±6.03 4.50±0.36 4.57±0.25 <5 <5
Temperature (°C) 23.30±1.45 21.23±1.36 22.57±0.31 <15
pH 8.10±0.20 7.43±0.25 6.80±0.23 6.5-8 6.5-8.5
FCR (mg/l) 0.78±0.15 0.35±0.08 0.2-0.5 0.2-0.5
Nitrate (mg/l) 17.38±2.04 2.71±0.38 3.05±0.25 45 50
Fluoride (mg/l) 2.71±0.18 1.23±0.08 1.27±0.13 <1.5 3
TC (cfu/100 ml) 196.00±15.87 0 0 0 10
FC (cfu/100 ml) 142.00±24.25 0 0 0 0
FS (cfu/100 ml) 117.00±20.66 0 0 0 0
FCR, free chlorine residual; TC, total coliform; FC, fecal coliform; FS, fecal streptococci; cfu, colony forming unit
through a number of treatment processes. Clarification followed by coagulation helps to reduce suspended solids and can remove significant numbers of harmful organisms from polluted water (WHO, 2004c).
The temperature of the three sampling points were found to be 23.30, 21.23 and 22.57°C for inlet, outlet and reservoir, respectively which are above the permissible limit of 15°C recommended by WHO (1996). Since Adama town is found in the central rift valley area, the climatic condition of the area is responsible for high temperature. The average pH values of the inlet, outlet and reservoir were 8.10, 7.43 and 6.80, respectively. The addition of chlorine as a disinfecting agent in the treatment process lowers the pH at the outlet point. The pH values of the inlet, outlet and reservoir sample point were within the acceptable limit of WHO and National standards which is from 6.5 to 8.5 (WHO, 2004b). The concentration of nitrate at the inlet, outlet and reservoir water samples were 17.38, 2.71 and 3.05 mg/l, respect-tively, which comply with both the WHO and National standard. The fluoride values of the outlet and reservoir were within acceptable limit of WHO (1996) and National standard but the inlet average fluoride was beyond the recommended limit of WHO. As shown in Table 1, the mean free chlorine residual (FCR) at the outlet sample point was 0.78 mg/l. At the outlet sample point, free residual chlorine (FCR) was within the recommended limit of 1 or 0.6-1 mg/l for disinfection practice (WHO 2004b, c). This was due to adequate disinfection practice for the treatment plant. An increase of 1 mg/l in free chlorine residual resulted in a decrease of about 0.36 and 0.18 in the mean total coliform and fecal coliform counts, respectively. This indicates that a chlorine residual of about 1 mg/l when water leaves the treatment plant is needed for health reason (Mombal and Kaleni, 2002). The fluoride concentration of analyzed samples of inlet is 2.71 mg/l, outlet 1.23 mg/l and reservoir 1.27 mg/l. The fluoride values of the outlet and reservoir were within acceptable limit of WHO (1996) and National standard
but the inlet average fluoride was beyond the recom-mended limit of WHO. At the outlet and reservoir sampling points, no indicator bacteria were found which comply both WHO and National standard. Physico-chemical and bacteriological analysis of tap water samples As shown in Table 2, out of 52 pipe water sample investigated, the turbidity of 12 (23.1%) water samples were above the standard and 40 (76.9%) within the WHO and National standard limits of <5. All pipe water samples had pH levels within WHO and National standard limits of 6.5-8.0 and 6.5-8.5, respectively. Regarding the tempera-ture, all pipe water samples were beyond recommended limit of WHO <15°C (WHO, 2004c); this is due to the climatic condition of the rift valley area making the temperature of the water to be high. Nitrate concentration of all the 52 (100%) samples of tap water met the WHO 45 mg/l (WHO, 2004C) and National standard limits of 50 mg/l (ES, 2001). All pipe water samples had fluoride concentration within WHO and National standard limits of <1.5 and 3 mg/l, respectively. The amount of FCR in the pipe water recommended value of WHO and National standard (0.2-0.5 mg/l). In the study area, 40 (76.9%) of water samples met the acceptable level, and 12 (23.1%) of water samples were below the standard.
Of the 52 water samples collected from tap water, 8 had FC concentrations ranging from 1-10 cfu/100 ml, one sample had FC concentration ranging from 11-20 cfu/100 ml, and 43 samples were found to have zero FC per 100 ml which is in the acceptable limit of WHO and National standard. Regarding FS, 4 samples were in the range of 1-10 cfu/100 ml, and 48 samples had no FS cfu/100 ml which meets the acceptable limit of WHO and National standard. The bacteriological test for the samples from water taps contains some fecal coliform and fecal streptococci. This is due to fact that the water
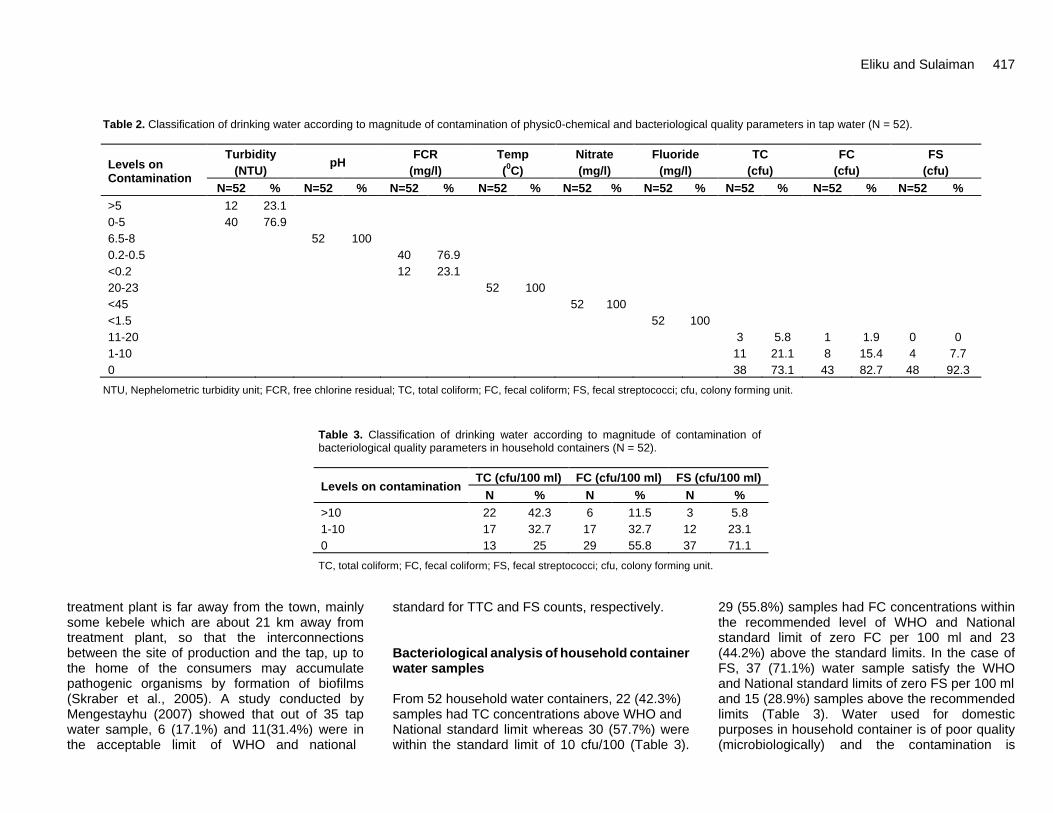
Eliku and Sulaiman 417
Table 2. Classification of drinking water according to magnitude of contamination of physic0-chemical and bacteriological quality parameters in tap water (N = 52).
Levels on Contamination
Turbidity
(NTU) pH
FCR
(mg/l)
Temp
(0C)
Nitrate
(mg/l)
Fluoride
(mg/l)
TC
(cfu)
FC
(cfu)
FS
(cfu)
N=52 % N=52 % N=52 % N=52 % N=52 % N=52 % N=52 % N=52 % N=52 %
>5 12 23.1
0-5 40 76.9
6.5-8 52 100
0.2-0.5 40 76.9
<0.2 12 23.1
20-23 52 100
<45 52 100
<1.5 52 100
11-20 3 5.8 1 1.9 0 0
1-10 11 21.1 8 15.4 4 7.7
0 38 73.1 43 82.7 48 92.3
NTU, Nephelometric turbidity unit; FCR, free chlorine residual; TC, total coliform; FC, fecal coliform; FS, fecal streptococci; cfu, colony forming unit.
Table 3. Classification of drinking water according to magnitude of contamination of bacteriological quality parameters in household containers (N = 52).
Levels on contamination TC (cfu/100 ml) FC (cfu/100 ml) FS (cfu/100 ml)
N % N % N %
>10 22 42.3 6 11.5 3 5.8
1-10 17 32.7 17 32.7 12 23.1
0 13 25 29 55.8 37 71.1
TC, total coliform; FC, fecal coliform; FS, fecal streptococci; cfu, colony forming unit.
treatment plant is far away from the town, mainly some kebele which are about 21 km away from treatment plant, so that the interconnections between the site of production and the tap, up to the home of the consumers may accumulate pathogenic organisms by formation of biofilms (Skraber et al., 2005). A study conducted by Mengestayhu (2007) showed that out of 35 tap water sample, 6 (17.1%) and 11(31.4%) were in the acceptable limit of WHO and national
standard for TTC and FS counts, respectively. Bacteriological analysis of household container water samples From 52 household water containers, 22 (42.3%) samples had TC concentrations above WHO and National standard limit whereas 30 (57.7%) were within the standard limit of 10 cfu/100 (Table 3).
29 (55.8%) samples had FC concentrations within the recommended level of WHO and National standard limit of zero FC per 100 ml and 23 (44.2%) above the standard limits. In the case of FS, 37 (71.1%) water sample satisfy the WHO and National standard limits of zero FS per 100 ml and 15 (28.9%) samples above the recommended limits (Table 3). Water used for domestic purposes in household container is of poor quality (microbiologically) and the contamination is
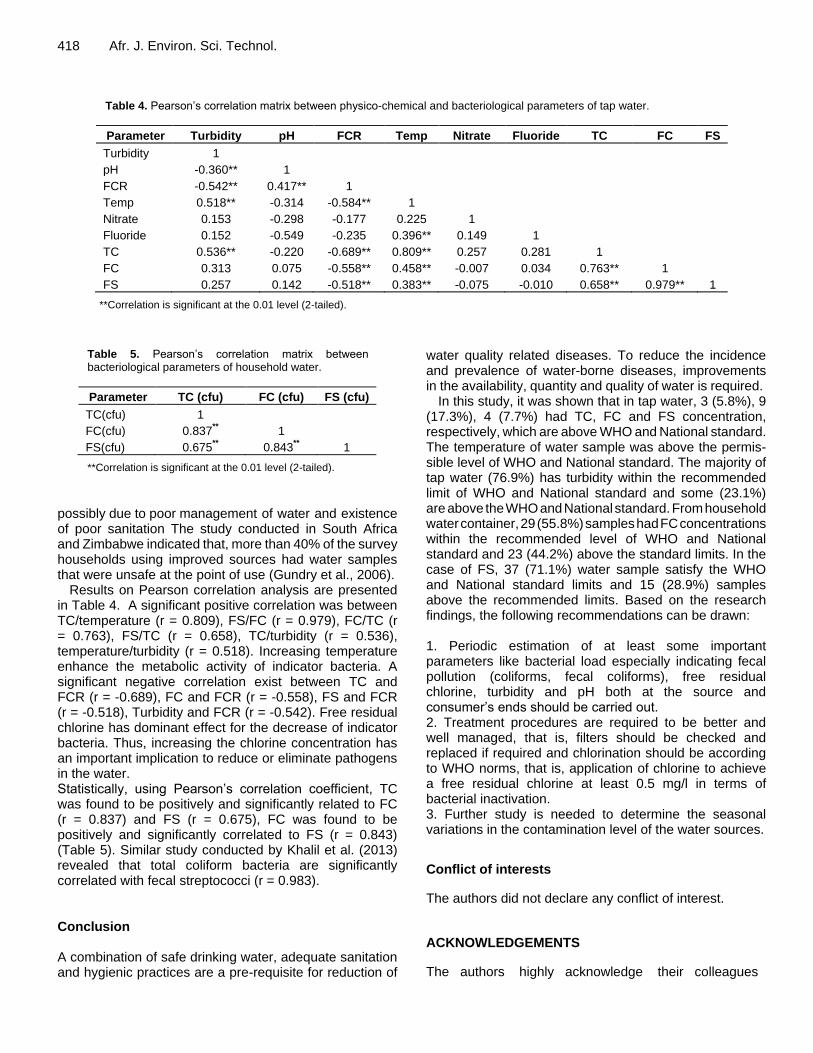
418 Afr. J. Environ. Sci. Technol.
Table 4. Pearson’s correlation matrix between physico-chemical and bacteriological parameters of tap water.
Parameter Turbidity pH FCR Temp Nitrate Fluoride TC FC FS
Turbidity 1
pH -0.360** 1
FCR -0.542** 0.417** 1
Temp 0.518** -0.314 -0.584** 1
Nitrate 0.153 -0.298 -0.177 0.225 1
Fluoride 0.152 -0.549 -0.235 0.396** 0.149 1
TC 0.536** -0.220 -0.689** 0.809** 0.257 0.281 1
FC 0.313 0.075 -0.558** 0.458** -0.007 0.034 0.763** 1
FS 0.257 0.142 -0.518** 0.383** -0.075 -0.010 0.658** 0.979** 1
**Correlation is significant at the 0.01 level (2-tailed).
Table 5. Pearson’s correlation matrix between bacteriological parameters of household water.
Parameter TC (cfu) FC (cfu) FS (cfu)
TC(cfu) 1
FC(cfu) 0.837** 1
FS(cfu) 0.675
** 0.843
** 1
**Correlation is significant at the 0.01 level (2-tailed).
possibly due to poor management of water and existence of poor sanitation The study conducted in South Africa and Zimbabwe indicated that, more than 40% of the survey households using improved sources had water samples that were unsafe at the point of use (Gundry et al., 2006).
Results on Pearson correlation analysis are presented in Table 4. A significant positive correlation was between TC/temperature (r = 0.809), FS/FC (r = 0.979), FC/TC (r = 0.763), FS/TC (r = 0.658), TC/turbidity (r = 0.536), temperature/turbidity (r = 0.518). Increasing temperature enhance the metabolic activity of indicator bacteria. A significant negative correlation exist between TC and FCR (r = -0.689), FC and FCR (r = -0.558), FS and FCR (r = -0.518), Turbidity and FCR (r = -0.542). Free residual chlorine has dominant effect for the decrease of indicator bacteria. Thus, increasing the chlorine concentration has an important implication to reduce or eliminate pathogens in the water. Statistically, using Pearson’s correlation coefficient, TC was found to be positively and significantly related to FC (r = 0.837) and FS (r = 0.675), FC was found to be positively and significantly correlated to FS (r = 0.843) (Table 5). Similar study conducted by Khalil et al. (2013) revealed that total coliform bacteria are significantly correlated with fecal streptococci (r = 0.983). Conclusion A combination of safe drinking water, adequate sanitation and hygienic practices are a pre-requisite for reduction of
water quality related diseases. To reduce the incidence and prevalence of water-borne diseases, improvements in the availability, quantity and quality of water is required.
In this study, it was shown that in tap water, 3 (5.8%), 9 (17.3%), 4 (7.7%) had TC, FC and FS concentration, respectively, which are above WHO and National standard. The temperature of water sample was above the permis-sible level of WHO and National standard. The majority of tap water (76.9%) has turbidity within the recommended limit of WHO and National standard and some (23.1%) are above the WHO and National standard. From household water container, 29 (55.8%) samples had FC concentrations within the recommended level of WHO and National standard and 23 (44.2%) above the standard limits. In the case of FS, 37 (71.1%) water sample satisfy the WHO and National standard limits and 15 (28.9%) samples above the recommended limits. Based on the research findings, the following recommendations can be drawn: 1. Periodic estimation of at least some important parameters like bacterial load especially indicating fecal pollution (coliforms, fecal coliforms), free residual chlorine, turbidity and pH both at the source and consumer’s ends should be carried out. 2. Treatment procedures are required to be better and well managed, that is, filters should be checked and replaced if required and chlorination should be according to WHO norms, that is, application of chlorine to achieve a free residual chlorine at least 0.5 mg/l in terms of bacterial inactivation. 3. Further study is needed to determine the seasonal variations in the contamination level of the water sources.
Conflict of interests
The authors did not declare any conflict of interest.
ACKNOWLEDGEMENTS
The authors highly acknowledge their colleagues
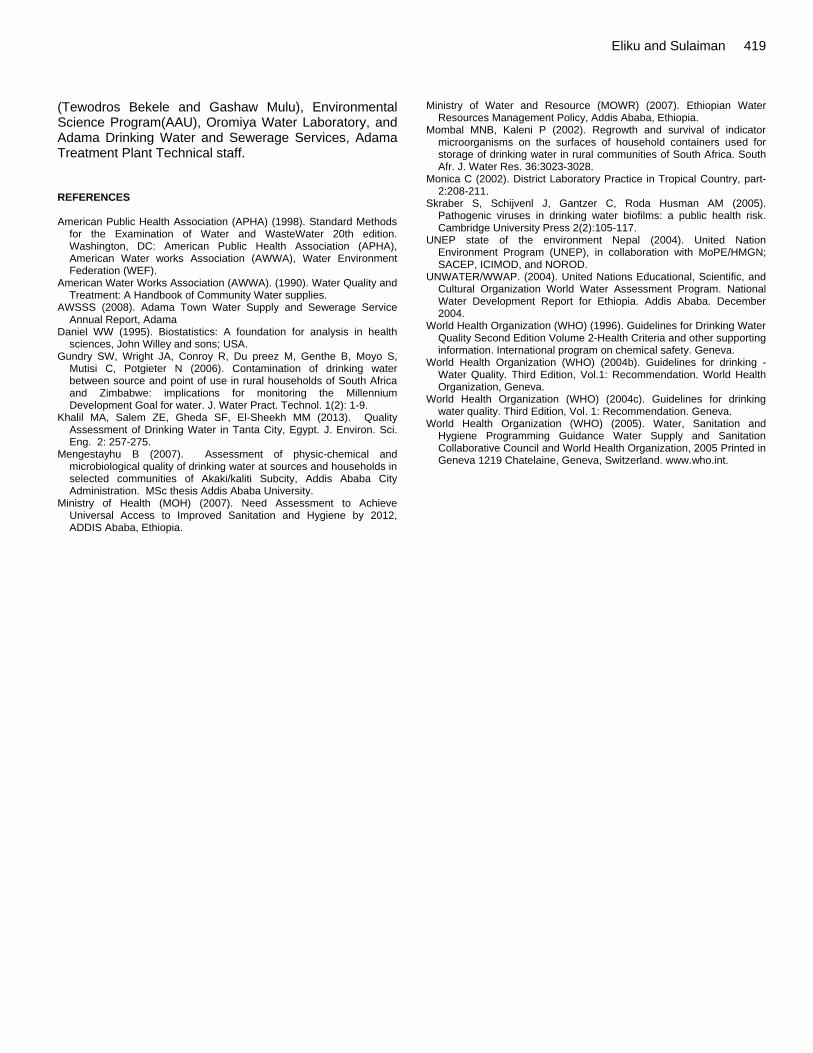
(Tewodros Bekele and Gashaw Mulu), Environmental Science Program(AAU), Oromiya Water Laboratory, and Adama Drinking Water and Sewerage Services, Adama Treatment Plant Technical staff. REFERENCES American Public Health Association (APHA) (1998). Standard Methods
for the Examination of Water and WasteWater 20th edition. Washington, DC: American Public Health Association (APHA), American Water works Association (AWWA), Water Environment Federation (WEF).
American Water Works Association (AWWA). (1990). Water Quality and Treatment: A Handbook of Community Water supplies.
AWSSS (2008). Adama Town Water Supply and Sewerage Service Annual Report, Adama
Daniel WW (1995). Biostatistics: A foundation for analysis in health sciences, John Willey and sons; USA.
Gundry SW, Wright JA, Conroy R, Du preez M, Genthe B, Moyo S, Mutisi C, Potgieter N (2006). Contamination of drinking water between source and point of use in rural households of South Africa and Zimbabwe: implications for monitoring the Millennium Development Goal for water. J. Water Pract. Technol. 1(2): 1-9.
Khalil MA, Salem ZE, Gheda SF, El-Sheekh MM (2013). Quality Assessment of Drinking Water in Tanta City, Egypt. J. Environ. Sci. Eng. 2: 257-275.
Mengestayhu B (2007). Assessment of physic-chemical and microbiological quality of drinking water at sources and households in selected communities of Akaki/kaliti Subcity, Addis Ababa City Administration. MSc thesis Addis Ababa University.
Ministry of Health (MOH) (2007). Need Assessment to Achieve Universal Access to Improved Sanitation and Hygiene by 2012, ADDIS Ababa, Ethiopia.
Eliku and Sulaiman 419 Ministry of Water and Resource (MOWR) (2007). Ethiopian Water
Resources Management Policy, Addis Ababa, Ethiopia. Mombal MNB, Kaleni P (2002). Regrowth and survival of indicator
microorganisms on the surfaces of household containers used for storage of drinking water in rural communities of South Africa. South Afr. J. Water Res. 36:3023-3028.
Monica C (2002). District Laboratory Practice in Tropical Country, part-2:208-211.
Skraber S, Schijvenl J, Gantzer C, Roda Husman AM (2005). Pathogenic viruses in drinking water biofilms: a public health risk. Cambridge University Press 2(2):105-117.
UNEP state of the environment Nepal (2004). United Nation Environment Program (UNEP), in collaboration with MoPE/HMGN; SACEP, ICIMOD, and NOROD.
UNWATER/WWAP. (2004). United Nations Educational, Scientific, and Cultural Organization World Water Assessment Program. National Water Development Report for Ethiopia. Addis Ababa. December 2004.
World Health Organization (WHO) (1996). Guidelines for Drinking Water Quality Second Edition Volume 2-Health Criteria and other supporting information. International program on chemical safety. Geneva.
World Health Organization (WHO) (2004b). Guidelines for drinking -Water Quality. Third Edition, Vol.1: Recommendation. World Health Organization, Geneva.
World Health Organization (WHO) (2004c). Guidelines for drinking water quality. Third Edition, Vol. 1: Recommendation. Geneva.
World Health Organization (WHO) (2005). Water, Sanitation and Hygiene Programming Guidance Water Supply and Sanitation Collaborative Council and World Health Organization, 2005 Printed in Geneva 1219 Chatelaine, Geneva, Switzerland. www.who.int.
Vol. 9(5), pp. 420-427, May 2015
DOI: 10.5897/AJEST2014.1793
Article Number: D2FF33852160
ISSN 1996-0786
Copyright © 2015
Author(s) retain the copyright of this article
http://www.academicjournals.org/AJEST
African Journal of Environmental Science and Technology
Full Length Research Paper
Evaluation of selected wetland plants for removal of chromium from tannery wastewater in constructed
wetlands, Ethiopia
Tadesse Alemu Terfie* and Seyoum Leta Asfaw
Center for Environmental Science, Addis Ababa University, Ethiopia.
Received 22 September, 2014; Accepted 18 March, 2015
Wastewater from leather processing industries is very complex and leads to water pollution if discharged untreated, especially due to its high organic loading and chromium content. In this study, the phytoremediation efficiency of selected wetland plant species in subsurface flow (SSF) constructed wetlands receiving tannery wastewater was investigated. Four pilot units were vegetated with Cyprus alternifolius, Typha domingensis, Parawaldeckia karaka and Borassus aethiopum and a fifth unit was left as unvegetated (control). The treatment performance of the systems for total Cr, chemical oxygen demand (COD), biochemical oxygen demand (BOD) and nitrogen under a 5 day hydraulic retention time were analyzed based on HACH manual. The Cr in the plant tissue was analyzed through oven dried milled, weighed, digested and analyzed using atomic absorption spectrophotometer (AAS.) The wastewater analysis showed that Cr in the effluent was reduced up to 99.3% for an inlet average Cr loading rate of 40 mg/L, COD was reduced up to 80% for an inlet organic loading varying between 2202 and 8100 mg/L and BOD5 was reduced up to 77% for an inlet organic loading varying between 650 and 1950 mg/L. NO3 and NH3-N removal achieved 57 and 82%, respectively. Roots accumulate significantly higher Cr in all plant species when compared with shoots. B. aethiopium and P. karaka shows higher Cr translocation factor than the others. Constructed wetlands are cost effective and environmentally friendly treatment methods in tropical climate hence can be used as an alternative treatment method in developing countries. Key words: Species in subsurface flow (SSF) constructed wetland, tannery wastewater, chromium uptake, chromium translocation, bioaccumulation factor.
INTRODUCTION Agro-processing industrial sector in Ethiopia is now the fastest growing center, which offers substantial challenges for the environment and public health. Leather tanning has
been ranked as one of the most polluting activities due to the high growth rate and weak regulatory mechanisms. There are more than 26 tanning industries of which 90%
*Corresponding author. E-mail: [email protected]. Author(s) agree that this article remain permanently open access under the terms of the Creative Commons Attribution License 4.0 International License
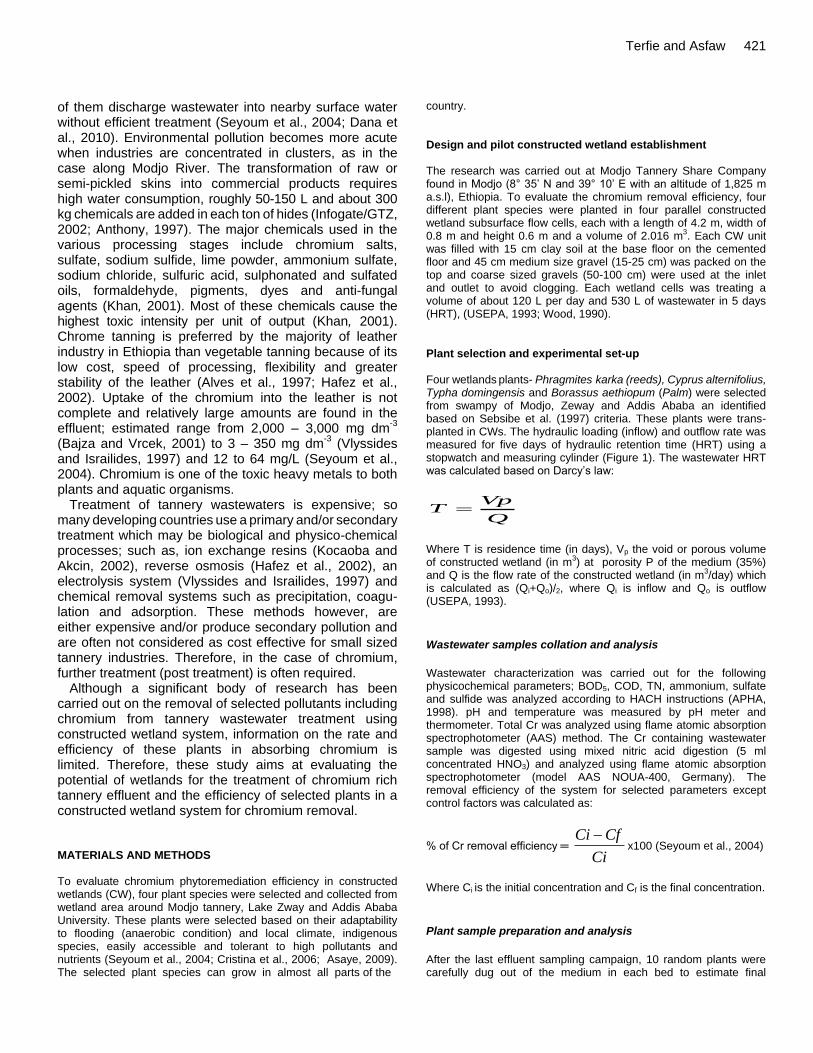
of them discharge wastewater into nearby surface water without efficient treatment (Seyoum et al., 2004; Dana et al., 2010). Environmental pollution becomes more acute when industries are concentrated in clusters, as in the case along Modjo River. The transformation of raw or semi-pickled skins into commercial products requires high water consumption, roughly 50-150 L and about 300 kg chemicals are added in each ton of hides (Infogate/GTZ, 2002; Anthony, 1997). The major chemicals used in the various processing stages include chromium salts, sulfate, sodium sulfide, lime powder, ammonium sulfate, sodium chloride, sulfuric acid, sulphonated and sulfated oils, formaldehyde, pigments, dyes and anti-fungal agents (Khan, 2001). Most of these chemicals cause the highest toxic intensity per unit of output (Khan, 2001). Chrome tanning is preferred by the majority of leather industry in Ethiopia than vegetable tanning because of its low cost, speed of processing, flexibility and greater stability of the leather (Alves et al., 1997; Hafez et al., 2002). Uptake of the chromium into the leather is not complete and relatively large amounts are found in the effluent; estimated range from 2,000 – 3,000 mg dm
-3
(Bajza and Vrcek, 2001) to 3 – 350 mg dm-3
(Vlyssides and Israilides, 1997) and 12 to 64 mg/L (Seyoum et al., 2004). Chromium is one of the toxic heavy metals to both plants and aquatic organisms.
Treatment of tannery wastewaters is expensive; so many developing countries use a primary and/or secondary treatment which may be biological and physico-chemical processes; such as, ion exchange resins (Kocaoba and Akcin, 2002), reverse osmosis (Hafez et al., 2002), an electrolysis system (Vlyssides and Israilides, 1997) and chemical removal systems such as precipitation, coagu-lation and adsorption. These methods however, are either expensive and/or produce secondary pollution and are often not considered as cost effective for small sized tannery industries. Therefore, in the case of chromium, further treatment (post treatment) is often required.
Although a significant body of research has been carried out on the removal of selected pollutants including chromium from tannery wastewater treatment using constructed wetland system, information on the rate and efficiency of these plants in absorbing chromium is limited. Therefore, these study aims at evaluating the potential of wetlands for the treatment of chromium rich tannery effluent and the efficiency of selected plants in a constructed wetland system for chromium removal. MATERIALS AND METHODS To evaluate chromium phytoremediation efficiency in constructed wetlands (CW), four plant species were selected and collected from wetland area around Modjo tannery, Lake Zway and Addis Ababa University. These plants were selected based on their adaptability to flooding (anaerobic condition) and local climate, indigenous species, easily accessible and tolerant to high pollutants and nutrients (Seyoum et al., 2004; Cristina et al., 2006; Asaye, 2009). The selected plant species can grow in almost all parts of the
Terfie and Asfaw 421 country. Design and pilot constructed wetland establishment The research was carried out at Modjo Tannery Share Company found in Modjo (8° 35’ N and 39° 10’ E with an altitude of 1,825 m a.s.l), Ethiopia. To evaluate the chromium removal efficiency, four different plant species were planted in four parallel constructed wetland subsurface flow cells, each with a length of 4.2 m, width of 0.8 m and height 0.6 m and a volume of 2.016 m
3. Each CW unit
was filled with 15 cm clay soil at the base floor on the cemented floor and 45 cm medium size gravel (15-25 cm) was packed on the top and coarse sized gravels (50-100 cm) were used at the inlet and outlet to avoid clogging. Each wetland cells was treating a volume of about 120 L per day and 530 L of wastewater in 5 days (HRT), (USEPA, 1993; Wood, 1990).
Plant selection and experimental set-up Four wetlands plants- Phragmites karka (reeds), Cyprus alternifolius, Typha domingensis and Borassus aethiopum (Palm) were selected from swampy of Modjo, Zeway and Addis Ababa an identified based on Sebsibe et al. (1997) criteria. These plants were trans-planted in CWs. The hydraulic loading (inflow) and outflow rate was measured for five days of hydraulic retention time (HRT) using a stopwatch and measuring cylinder (Figure 1). The wastewater HRT was calculated based on Darcy’s law:
Q
VpT
Where T is residence time (in days), Vp the void or porous volume of constructed wetland (in m
3) at porosity P of the medium (35%)
and Q is the flow rate of the constructed wetland (in m3/day) which
is calculated as (Qi+Qo)/2, where Qi is inflow and Qo is outflow (USEPA, 1993).
Wastewater samples collation and analysis
Wastewater characterization was carried out for the following physicochemical parameters; BOD5, COD, TN, ammonium, sulfate and sulfide was analyzed according to HACH instructions (APHA, 1998). pH and temperature was measured by pH meter and thermometer. Total Cr was analyzed using flame atomic absorption spectrophotometer (AAS) method. The Cr containing wastewater sample was digested using mixed nitric acid digestion (5 ml concentrated HNO3) and analyzed using flame atomic absorption spectrophotometer (model AAS NOUA-400, Germany). The removal efficiency of the system for selected parameters except control factors was calculated as:
% of Cr removal efficiency ═ Ci
CfCi x100 (Seyoum et al., 2004)
Where Ci is the initial concentration and Cf is the final concentration.
Plant sample preparation and analysis
After the last effluent sampling campaign, 10 random plants were carefully dug out of the medium in each bed to estimate final
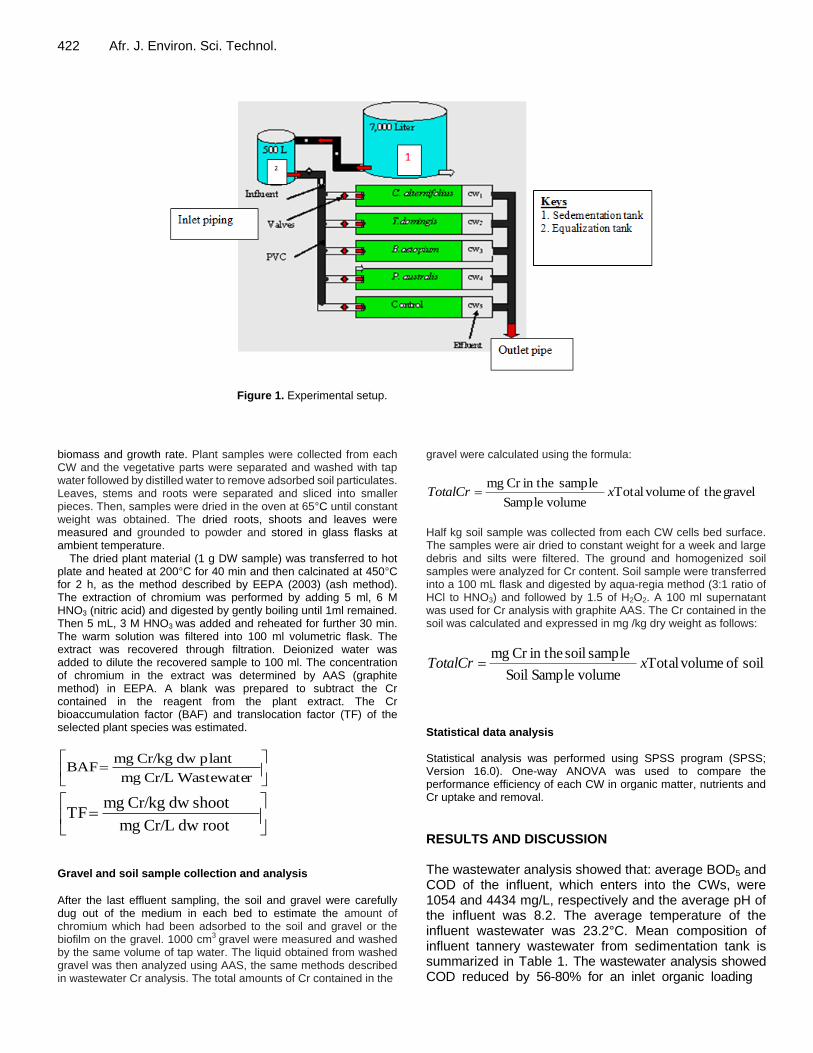
422 Afr. J. Environ. Sci. Technol.
Figure 1. Experimental setup.
biomass and growth rate. Plant samples were collected from each CW and the vegetative parts were separated and washed with tap water followed by distilled water to remove adsorbed soil particulates. Leaves, stems and roots were separated and sliced into smaller pieces. Then, samples were dried in the oven at 65°C until constant weight was obtained. The dried roots, shoots and leaves were measured and grounded to powder and stored in glass flasks at ambient temperature.
The dried plant material (1 g DW sample) was transferred to hot plate and heated at 200°C for 40 min and then calcinated at 450°C for 2 h, as the method described by EEPA (2003) (ash method). The extraction of chromium was performed by adding 5 ml, 6 M HNO3 (nitric acid) and digested by gently boiling until 1ml remained. Then 5 mL, 3 M HNO3
was added and reheated for further 30 min.
The warm solution was filtered into 100 ml volumetric flask. The extract was recovered through filtration. Deionized water was added to dilute the recovered sample to 100 ml. The concentration of chromium in the extract was determined by AAS (graphite method) in EEPA. A blank was prepared to subtract the Cr contained in the reagent from the plant extract. The Cr bioaccumulation factor (BAF) and translocation factor (TF) of the selected plant species was estimated.
r WastewateCr/L mg
plant dw Cr/kg mg BAF
root dw Cr/L mg
shoot dw Cr/kg mg TF
Gravel and soil sample collection and analysis
After the last effluent sampling, the soil and gravel were carefully dug out of the medium in each bed to estimate the amount of chromium which had been adsorbed to the soil and gravel or the biofilm on the gravel. 1000 cm
3 gravel were measured and washed
by the same volume of tap water. The liquid obtained from washed gravel was then analyzed using AAS, the same methods described in wastewater Cr analysis. The total amounts of Cr contained in the
gravel were calculated using the formula:
gravel theof volumeTotal volumeSample
sample in theCr mgxTotalCr
Half kg soil sample was collected from each CW cells bed surface. The samples were air dried to constant weight for a week and large debris and silts were filtered. The ground and homogenized soil samples were analyzed for Cr content. Soil sample were transferred into a 100 mL flask and digested by aqua-regia method (3:1 ratio of HCl to HNO3) and followed by 1.5 of H2O2. A 100 ml supernatant was used for Cr analysis with graphite AAS. The Cr contained in the soil was calculated and expressed in mg /kg dry weight as follows:
soil of volumeTotal volumeSample Soil
sample soil in theCr mgxTotalCr
Statistical data analysis Statistical analysis was performed using SPSS program (SPSS; Version 16.0). One-way ANOVA was used to compare the performance efficiency of each CW in organic matter, nutrients and Cr uptake and removal.
RESULTS AND DISCUSSION The wastewater analysis showed that: average BOD5 and COD of the influent, which enters into the CWs, were 1054 and 4434 mg/L, respectively and the average pH of the influent was 8.2. The average temperature of the influent wastewater was 23.2°C. Mean composition of influent tannery wastewater from sedimentation tank is summarized in Table 1. The wastewater analysis showed COD reduced by 56-80% for an inlet organic loading
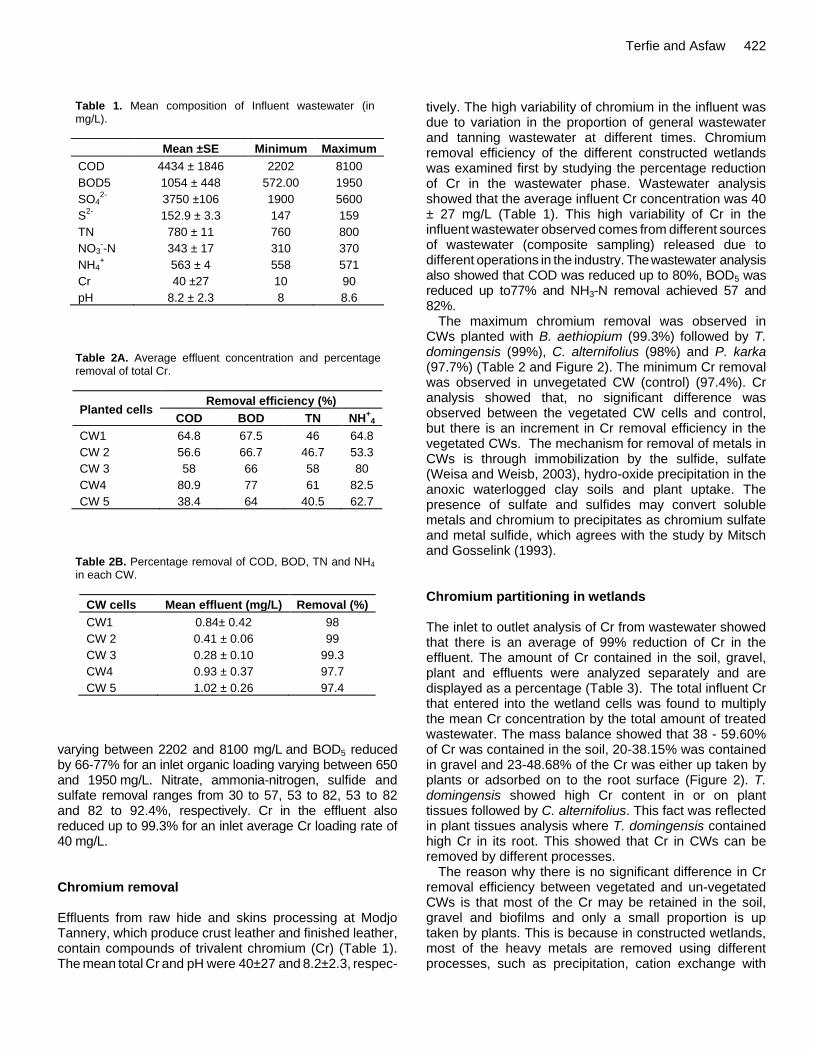
Table 1. Mean composition of Influent wastewater (in mg/L).
Mean ±SE Minimum Maximum
COD 4434 ± 1846 2202 8100
BOD5 1054 ± 448 572.00 1950
SO42-
3750 ±106 1900 5600
S2-
152.9 ± 3.3 147 159
TN 780 ± 11 760 800
NO3--N 343 ± 17 310 370
NH4+ 563 ± 4 558 571
Cr 40 ±27 10 90
pH 8.2 ± 2.3 8 8.6
Table 2A. Average effluent concentration and percentage removal of total Cr.
Planted cells Removal efficiency (%)
COD BOD TN NH+
4
CW1 64.8 67.5 46 64.8
CW 2 56.6 66.7 46.7 53.3
CW 3 58 66 58 80
CW4 80.9 77 61 82.5
CW 5 38.4 64 40.5 62.7
Table 2B. Percentage removal of COD, BOD, TN and NH4 in each CW.
CW cells Mean effluent (mg/L) Removal (%)
CW1 0.84± 0.42 98
CW 2 0.41 ± 0.06 99
CW 3 0.28 ± 0.10 99.3
CW4 0.93 ± 0.37 97.7
CW 5 1.02 ± 0.26 97.4
varying between 2202 and 8100 mg/L and BOD5 reduced by 66-77% for an inlet organic loading varying between 650 and 1950 mg/L. Nitrate, ammonia-nitrogen, sulfide and sulfate removal ranges from 30 to 57, 53 to 82, 53 to 82 and 82 to 92.4%, respectively. Cr in the effluent also reduced up to 99.3% for an inlet average Cr loading rate of 40 mg/L. Chromium removal Effluents from raw hide and skins processing at Modjo Tannery, which produce crust leather and finished leather, contain compounds of trivalent chromium (Cr) (Table 1). The mean total Cr and pH were 40±27 and 8.2±2.3, respec-
Terfie and Asfaw 422 tively. The high variability of chromium in the influent was due to variation in the proportion of general wastewater and tanning wastewater at different times. Chromium removal efficiency of the different constructed wetlands was examined first by studying the percentage reduction of Cr in the wastewater phase. Wastewater analysis showed that the average influent Cr concentration was 40 ± 27 mg/L (Table 1). This high variability of Cr in the influent wastewater observed comes from different sources of wastewater (composite sampling) released due to different operations in the industry. The wastewater analysis also showed that COD was reduced up to 80%, BOD5 was reduced up to77% and NH3-N removal achieved 57 and 82%.
The maximum chromium removal was observed in CWs planted with B. aethiopium (99.3%) followed by T. domingensis (99%), C. alternifolius (98%) and P. karka (97.7%) (Table 2 and Figure 2). The minimum Cr removal was observed in unvegetated CW (control) (97.4%). Cr analysis showed that, no significant difference was observed between the vegetated CW cells and control, but there is an increment in Cr removal efficiency in the vegetated CWs. The mechanism for removal of metals in CWs is through immobilization by the sulfide, sulfate (Weisa and Weisb, 2003), hydro-oxide precipitation in the anoxic waterlogged clay soils and plant uptake. The presence of sulfate and sulfides may convert soluble metals and chromium to precipitates as chromium sulfate and metal sulfide, which agrees with the study by Mitsch and Gosselink (1993). Chromium partitioning in wetlands The inlet to outlet analysis of Cr from wastewater showed that there is an average of 99% reduction of Cr in the effluent. The amount of Cr contained in the soil, gravel, plant and effluents were analyzed separately and are displayed as a percentage (Table 3). The total influent Cr that entered into the wetland cells was found to multiply the mean Cr concentration by the total amount of treated wastewater. The mass balance showed that 38 - 59.60% of Cr was contained in the soil, 20-38.15% was contained in gravel and 23-48.68% of the Cr was either up taken by plants or adsorbed on to the root surface (Figure 2). T. domingensis showed high Cr content in or on plant tissues followed by C. alternifolius. This fact was reflected in plant tissues analysis where T. domingensis contained high Cr in its root. This showed that Cr in CWs can be removed by different processes.
The reason why there is no significant difference in Cr removal efficiency between vegetated and un-vegetated CWs is that most of the Cr may be retained in the soil, gravel and biofilms and only a small proportion is up taken by plants. This is because in constructed wetlands, most of the heavy metals are removed using different processes, such as precipitation, cation exchange with
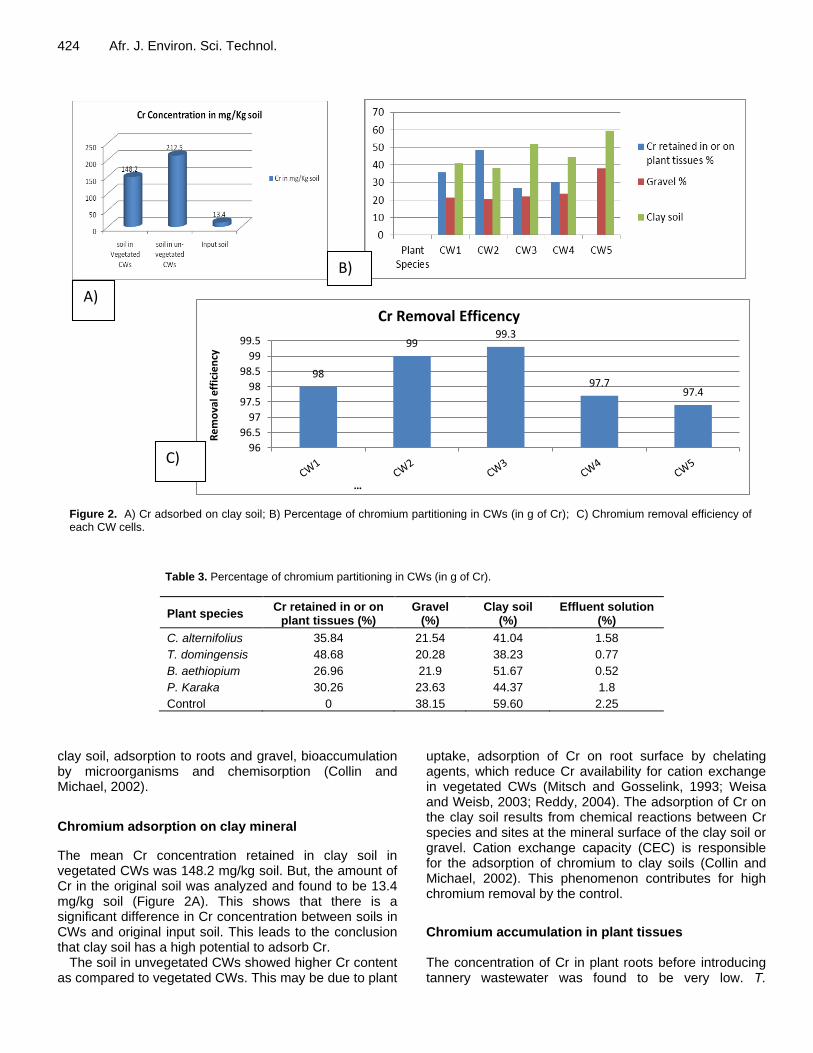
424 Afr. J. Environ. Sci. Technol.
Figure 2. A) Cr adsorbed on clay soil; B) Percentage of chromium partitioning in CWs (in g of Cr); C) Chromium removal efficiency of each CW cells.
Table 3. Percentage of chromium partitioning in CWs (in g of Cr).
Plant species Cr retained in or on
plant tissues (%) Gravel
(%) Clay soil
(%) Effluent solution
(%)
C. alternifolius 35.84 21.54 41.04 1.58
T. domingensis 48.68 20.28 38.23 0.77
B. aethiopium 26.96 21.9 51.67 0.52
P. Karaka 30.26 23.63 44.37 1.8
Control 0 38.15 59.60 2.25
clay soil, adsorption to roots and gravel, bioaccumulation by microorganisms and chemisorption (Collin and
Michael, 2002).
Chromium adsorption on clay mineral
The mean Cr concentration retained in clay soil in vegetated CWs was 148.2 mg/kg soil. But, the amount of Cr in the original soil was analyzed and found to be 13.4 mg/kg soil (Figure 2A). This shows that there is a significant difference in Cr concentration between soils in CWs and original input soil. This leads to the conclusion that clay soil has a high potential to adsorb Cr.
The soil in unvegetated CWs showed higher Cr content as compared to vegetated CWs. This may be due to plant
uptake, adsorption of Cr on root surface by chelating agents, which reduce Cr availability for cation exchange in vegetated CWs (Mitsch and Gosselink, 1993; Weisa and Weisb, 2003; Reddy, 2004). The adsorption of Cr on the clay soil results from chemical reactions between Cr species and sites at the mineral surface of the clay soil or gravel. Cation exchange capacity (CEC) is responsible for the adsorption of chromium to clay soils (Collin and Michael, 2002). This phenomenon contributes for high chromium removal by the control.
Chromium accumulation in plant tissues The concentration of Cr in plant roots before introducing tannery wastewater was found to be very low. T.
A)
98
99 99.3
97.7 97.4
96
96.5
97
97.5
98
98.5
99
99.5
Re
mo
val e
ffic
ien
cy
…
Cr Removal Efficency
B)
C)
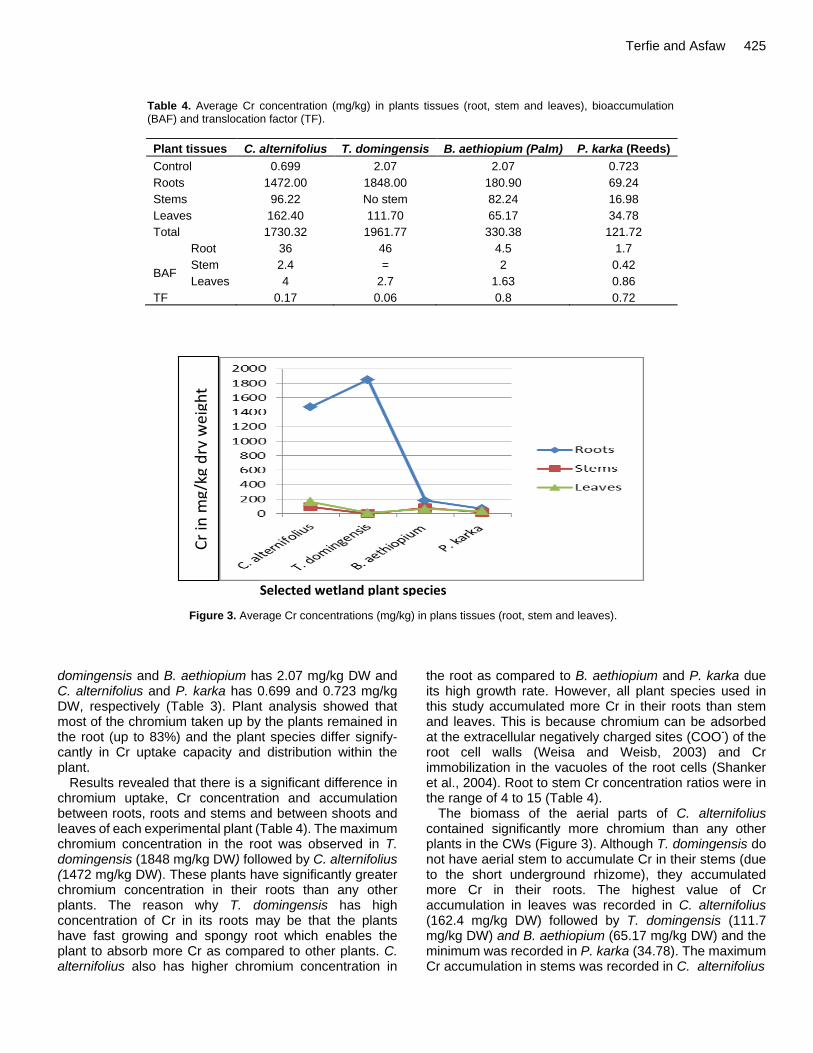
Terfie and Asfaw 425
Table 4. Average Cr concentration (mg/kg) in plants tissues (root, stem and leaves), bioaccumulation (BAF) and translocation factor (TF).
Plant tissues C. alternifolius T. domingensis B. aethiopium (Palm) P. karka (Reeds)
Control 0.699 2.07 2.07 0.723
Roots 1472.00 1848.00 180.90 69.24
Stems 96.22 No stem 82.24 16.98
Leaves 162.40 111.70 65.17 34.78
Total 1730.32 1961.77 330.38 121.72
BAF
Root 36 46 4.5 1.7
Stem 2.4 = 2 0.42
Leaves 4 2.7 1.63 0.86
TF 0.17 0.06 0.8 0.72
Figure 3. Average Cr concentrations (mg/kg) in plans tissues (root, stem and leaves).
domingensis and B. aethiopium has 2.07 mg/kg DW and C. alternifolius and P. karka has 0.699 and 0.723 mg/kg DW, respectively (Table 3). Plant analysis showed that most of the chromium taken up by the plants remained in the root (up to 83%) and the plant species differ signify-cantly in Cr uptake capacity and distribution within the plant.
Results revealed that there is a significant difference in chromium uptake, Cr concentration and accumulation between roots, roots and stems and between shoots and leaves of each experimental plant (Table 4). The maximum chromium concentration in the root was observed in T. domingensis (1848 mg/kg DW) followed by C. alternifolius (1472 mg/kg DW). These plants have significantly greater chromium concentration in their roots than any other plants. The reason why T. domingensis has high concentration of Cr in its roots may be that the plants have fast growing and spongy root which enables the plant to absorb more Cr as compared to other plants. C. alternifolius also has higher chromium concentration in
the root as compared to B. aethiopium and P. karka due its high growth rate. However, all plant species used in this study accumulated more Cr in their roots than stem and leaves. This is because chromium can be adsorbed at the extracellular negatively charged sites (COO
-) of the
root cell walls (Weisa and Weisb, 2003) and Cr immobilization in the vacuoles of the root cells (Shanker et al., 2004). Root to stem Cr concentration ratios were in the range of 4 to 15 (Table 4).
The biomass of the aerial parts of C. alternifolius contained significantly more chromium than any other plants in the CWs (Figure 3). Although T. domingensis do not have aerial stem to accumulate Cr in their stems (due to the short underground rhizome), they accumulated more Cr in their roots. The highest value of Cr accumulation in leaves was recorded in C. alternifolius (162.4 mg/kg DW) followed by T. domingensis (111.7 mg/kg DW) and B. aethiopium (65.17 mg/kg DW) and the minimum was recorded in P. karka (34.78). The maximum Cr accumulation in stems was recorded in C. alternifolius
Cr
in m
g/kg
dry
wei
ght
Selected wetland plant species
426 Afr. J. Environ. Sci. Technol. (96.22 mg/kg DW) and the minimum was recorded in P. karka (16.98). All plants leaves accumulated more Cr than stems, this might be during translocation up wards; Cr destination is the leaf, where it is stored. Selection of potential chromium phytoextractor plant Chromium bioaccumulation factor (BAF) Chromium uptake in different parts of the plants was calculated using the bioaccumulation factor (BAF). According to Nandakumar et al. (1995), the BAF provides an index of the ability of the plant to accumulate a particular metal with respect to its concentration in the medium. The roots of all plants have the greatest tendency to concentrate Cr than stems and leaves. Statistical data analysis showed that there is also a significant difference in BAF between roots of experimental plants. T. domingensis had a higher BAF than any of the experimental plants followed by C. alternifolius. The Cr BAF in roots of T. domingensis is 46 times and C. alternifolius is 36 times greater than in the surrounding wastewater; whereas B. aethiopum and P. karka showed the least BAF (4.5 and 1.7, respectively) (Table 4).
The findings in this study showed that plant roots accumulated more Cr than shoots and have a higher bioaccumulation factor. Shoot bioaccumulation factor for Cr were less than 3 for all plant species. Plants with a bioaccumulation factor greater than 1 will remove metals in wastewater with each plant harvest (Ghejua et al., 2009). Therefore, the selected plants have the potential to remove Cr contaminated effluents, however P. karka showed a lower BAF (<1). The highest chromium accumu-lation and concentration in roots, compared with stems, is due to Cr immobilization in the vacuoles of the root cells (Shanker et al., 2004). The results of this study concur with those reported by other researchers, who reported high chromium accumulation in roots (Shanker et al., 2004; Ghejua et al., 2009). Chromium translocation factor (TF) The moment wetland plants translocate metals from root to aerial tissue, they accumulated in stems and leaves. The degree of upward translocation is dependent on the plant species and the particular metal (Shanker et al., 2004). Uptake of metals into root cells, the point of entry into living tissues, is the first step for the process of phytoextraction. However, for phytoextraction to occur continuously, metals must also be transported from the root to the shoot. The highest TF is assumed by B. aethiopium and followed by P. karka, which showed their higher Cr translocation efficiency (Table 4). These plants have high biomass per meter square area than Typha and Cyprus. This fact is reflected in the Cr and nutrient
removal efficiency in the water phase of parallel study, where B. aethiopium has the highest Cr removal efficiency and P. karka has the highest BOD5, COD and nitrogen removal efficiency (Table 1).
Plants with high BAF coupled with high TF values are efficient in the removal of Cr from CWs because harvesting the areal part removes Cr from the system. Plants must have the ability to translocate Cr from the root to the shoot, in order for a plant to continue absorp-tion of Cr from the medium, since a higher concentration of Cr in the root is toxic to plants (Skeffington et al., 1976; Perk, 2006). Translocation may reduce Cr concentration, and thus reduce toxicity potential to the root and it is also one of the mechanisms of resistance to Cr, because the high concentration of Cr will be lost during harvesting or leaf fall.
It is important to note that, in the total amount of chromium ions associated with the root; only a part is absorbed into cells. A significant ion fraction is physically adsorbed at the extracellular negatively charged sites (COO
-) of the root cell walls (Lasat, 2000). The cell wall-
bound fraction cannot be translocated to the shoots, therefore, cannot be removed by harvesting shoot biomass (phytoextraction). Thus, it is possible that a plant exhibiting significant metal accumulation into the root, expresses a limited capacity for phytoextraction. To support this, Blaylock and Huang (1999) concluded that the limiting step for metal phytoextraction is the long distance translocation from roots to shoots. Chromium tolerance of the selected plant species The concentration of chromium in the plants and whether they appear healthy or not can indicate the tolerance of that plant to the metal concerned, and therefore their potential for phytoremediation (Mant et al., 2006). During the study period, B. aethiopium and P. karka did not shown signs of toxicity. They tolerated high Cr concentration in the tannery wastewater ranging from 8 to 95 mg/L total Cr. However, C. alternifolius and T. domingensis leaves and some stems of C. alternifolius died after being exposed to a high Cr content of tannery wastewater (95 mg/L). The ability of B. aethiopium and P. karka to withstand greater concentrations was by minimizing these effects which indicate plants tolerance to the chromium. The ability of the plants to stay healthy and their grow rate is also an important factor in the choice of plants for phytoremediation. Tolerance to metals in plants may be achieved by sequestering them in tissues or cellular compartments (e.g. central vacuoles) that are insensitive to metals and adsorbed at the extracellular negatively charged sites (COO
-) of the root
cell walls (Weisa and Weisb, 2003). The translocation of excessive metals into old leaves before their shedding and detoxification by roots may also be considered as tolerance mechanisms (Ernst et al., 1992).
Conclusion The purpose of this study was to investigate the phytoremediation efficiency of selected wetland plant species in subsurface flow (SSF) constructed wetlands receiving tannery wastewater. Constructed wetland systems can be used to treat high-strength Cr rich tannery wastewater. SSF constructed wetlands planted with C. alternifolius, T. domingensis, B. aethiopium and P. karka are capable of removing Cr and organic pollutants from tannery wastewater. In terms of BOD and nutrient removal, CWs with vegetation showed better removal efficiency than un-vegetated CWs. However, there was no significant difference in Cr removal efficiency between the control and vegetated CWs. The Cr removal efficiency of vegetated CWs ranged from 97.7% at CW4 to 99.3% at CW2. Plant roots accumulated more Cr than shoots and have a higher bioaccumulation factor than leaves and stems. P. karake and B. aethiopium were the plants that establish successfully and show higher BOD5, COD and nutrient removal. Reeds can tolerance Cr and stay healthy and therefore continue to grow in the system. The removal efficiency of Cr in CWs is higher than organic matter, therefore should be used as a tertiary treatment for efficient removal of both Cr and organic matter. Conflict of interests The authors did not declare any conflict of interest. REFERENCES Alves MM, Gonzalez CG, Guedes D, Carvalho R, Castanheira JM, Sol
Pereira MC, Vasconcelos LAT (1993). Chromium Removal in Tannery Wastewaters: ‘Polishing’, Pinus Sylvestris Bark. Water Res. 27(8):1333-1338.
Anthony DC (1997). Modern Tanning Chemistry, British School of Leather Technology, Nene College of higher education, Boughton Green Road. Mountain Park Northampton, UK NN2 7AL. Chemical Society Review. pp. 111-126.
APHA (1998). Standard Methods for the Examination of Water and Wastewater: Twentieth ed. American Public Health Association/ American Water Works Association/Water Environment Federation; Washington DC; USA.
Asaye K (2009). Evaluation of Selected Plant Species for the Treatment of Tannery Effluent in a Constructed Wetland System; (Unpublished Thesis), AAU, Addis Ababa. Avilable at: en.wikipidia.org/winki/ITRC.
Bajza Z, Vreck IV (2001). Water Quality Analysis of Mixture Obtained From Tannery Waste Effluent. Ecotoxicol. Environ. Saf. 50(1):15-18.
Collin B, Michael C (2002). Environmental Chemistry; 4th ed. New York.
Cristina SCC, Rangel AOS, Castro PML (2006). Constructed Wetland System Vegetated With Different Plant Applied to the Treatment of Tannery Wastewater. Water Res. 41(8):1790-1798.
Dana TH, Quangb LN, Chiemc NH, Brixd H (2010).Treatment of high-strength wastewater in tropical constructed wetlands planted with Sesbania sesban: Horizontal subsurface flow versus vertical downflow. Ecol. Eng. 37:711-720.
EEPA (2003). Environmental Protection Authority. Annual Report; Addis Ababa, Ethiopia.
Terfie and Asfaw 427 Ernst WHO, Verkleij JAC, Schat H (1992). Metal Tolerance in Plants.
Acta Bot. Neerl. 41:229-248. Ghejua M, Balcub I, Ciopeca M (2009). Analysis of Hexavalent
Chromium Uptake by Plants in Polluted Soils, Ovidius University Press, Romania. Volume 20, Number 1, Pp. 127-131,
Hafez AI, El-Manharawy MS, Khedr MA (2002). RO Membrane Removal of Unreacted Chromium from Spent Tanning Effluent: A Pilot- Scale Study, Part 2.
Infogate/GTZ (2002). Treatment of Tannery wastewater. Germen Appropriate Technology (GATE) information system. Available at: http://www.gtz.de/gate/gateid.afp.
Khan AG (2001). Relationships between Chromium Biomagnification Ratio, Accumulation Factor, and Mycorrhizae in Plants Growing on Tannery Effluent-Polluted Soil. Environ. Int. 26: 417-423.
Kocaoba S, Akcin G (2002). Removal and Recovery of Chromium and Chromium Speciation with MINTEQA2. Talanta 57: 23-30.
Lasat M (2000). The Use of Plants for the Removal of Toxic Metals from Contaminated Soil; American Association for the Advancement of Science: Environmental Science and Engineering Fellow.
Mant C, Costa S, Williams J, and Tambourgi E (2005). Studies of Removal of Chromium by Model Constructed Wetland. Braz. J. Chem. Eng. 22(3): 381-387.
Mitsch WJ, Gosselink JG (1993). Wetlands, 2nd
Edition. Van Nostar and Reinhold, New York.
Nandakumar PBA, Dushenkov V, Motto H, and Raskin I (1995). Phytoremediation: The Use of Plants to Remove Heavy Metals from Soils. Environ. Sci. Technol. 29:1232-1238.
Perk MVD (2006). Soil and Water Contamination: From Molecular to Catchments Scale. London; JK.
Reddy K (2004). Nitrification-Denitrification at the Plant Root–Sediment Interface in Wetlands. Limnol. Oceanogr. 34 (6):1004-1013.
Sebsibe D, Sue E, Inga H (1997). Flora of Ethiopia and Eritrea; Hydrocharitaceae to Arecaceae. Addis Abeba Ethiopia. Vol. 6. and Vol. 7.
Seyoum L, Fasil A, Gumaelius L, Dalhammar G (2004). Biological Nitrogen and Organic Matter Removal from Tannery Wastewater in Pilot Plant Operations in Ethiopia. Appl. Microbiol. Biotechnol. 66(3):333-339.
Shanker AK, Djanaguiraman M, Sudhagar R, Chandrashekar CN, Pathmanabhan G (2004). Differential antioxidative response of ascorbate glutathione pathway enzymes and metabolites to chromium speciation stress in green gram (Vigna radiata (L.) R. Wilczek. cv CO 4) roots. Plant Sci. 166 (4): 1035-1043.
Skeffington R, Shwery PA, Peterson PJ (1976). Chromium Uptake and Transport in Barely Seedlings (Hordeum vulgare L.). Planta (Ber) 132:209-214.
USEPA (1993). Subsurface Flow Constructed Wetland for Wastewater Treatment. A Technology Assessment. EPA/832/R/93/008.
Vlyssides A, Israilides CJ (1997). Detoxification of Tannery Waste Liquors with an Electrolysis System. Environ. Pollut. 97(1-2):147- 152.
Weisa JS, Weisb P (2003). Metal Uptake, Transport and Release by Wetland Plants: Implications for Phytoremediation and Restoration. Environ. Int. 30(5):685-700.
Wood A (1990). Constructed Wetlands For Wastewater Treatment - Engineering And Design Considerations; In: Cooper, P. F. and Findlater, (eds) (1990); Constructed wetlands in water pollution control. pp. 481-494.
Vol. 9(5), pp. 428-437, May 2015
DOI: 10.5897/AJEST2014.1798
Article Number: 73A85C652162
ISSN 1996-0786
Copyright © 2015
Author(s) retain the copyright of this article
http://www.academicjournals.org/AJEST
African Journal of Environmental Science and Technology
Full Length Research Paper
Local blacksmiths’s activity in the west region of Cameroon and their contribution to the development of
micro hydroelectric power plants in that region
Kengne Signe Elie B.1*, O. Hamandjoda2, Tekounegning3 and Nganhou. J.2
1Laboratory of Energy Research, Institute of Geological and Mining Research, BP 4110 Yaoundé, Cameroon.
2ENSP University of Yaoundé, I BP 8390 Yaoundé, Cameroon.
3Faculty of Agronomy and Agricultures Sciences, University of Dschang, BP 110, Dschang, Cameroon.
Received 25 September, 2014; Accepted 18 March, 2015
As a result of the nature of pollutant and exhaustible of fossils energies, developed countries have made use of renewable energy sources to make effective their energy systems. To stow on that vision in Cameroon, the promotion of micro-hydroelectric powers plants (MHPP) is a priority and any contribution to its ease is beneficial. The objective of this study is to characterize some main forges in the west region of Cameroon and show their technical input in the development of MHPP in that region. The survey was conducted in January, 2014. Socioeconomic data related to blacksmiths and main features were studied by the use of questionnaires, direct interviews, site observations and measurements. Main results show that the first forges was set in the Foto village in 1850 by blacksmiths from Nigeria. The studied forges are of traditional (62.5%) and modern type (37.5%). More than 50 products belonging to the main use sectors are manufactured, adapted and/or repaired. The main problems identified are acquisition of raw materials, the lack of equipment and limited technical knowledge. The blacksmiths has been involved in MHPP facilities since 1997, the installation year of the pilot MHPP with the participation of local craftsmen. Civil engineering structures, hydroelectric unit, transportation and distribution equipment are built by local blacksmiths using as much maximum materials as possible. This is often a source of malfunction. Thus, funding of local craftsman and equipment by the government or other agencies can render the forges useful for sustainable development in the west region of Cameroon. Key words: Study, blacksmiths, micro hydroelectricity, funding, Cameroon.
INTRODUCTION All developed countries have made use of renewable energy sources to make effective their energy systems. Energy from micro-hydroelectric powers plants (MHPP)
has been an important component of renewable energy for countries which have the potential. For Cameroon to carry out this vision, the promotion of MHPP is a priority
*Corresponding author. E-mail: [email protected]. Author(s) agree that this article remain permanently open access under the terms of the Creative Commons Attribution License 4.0 International License
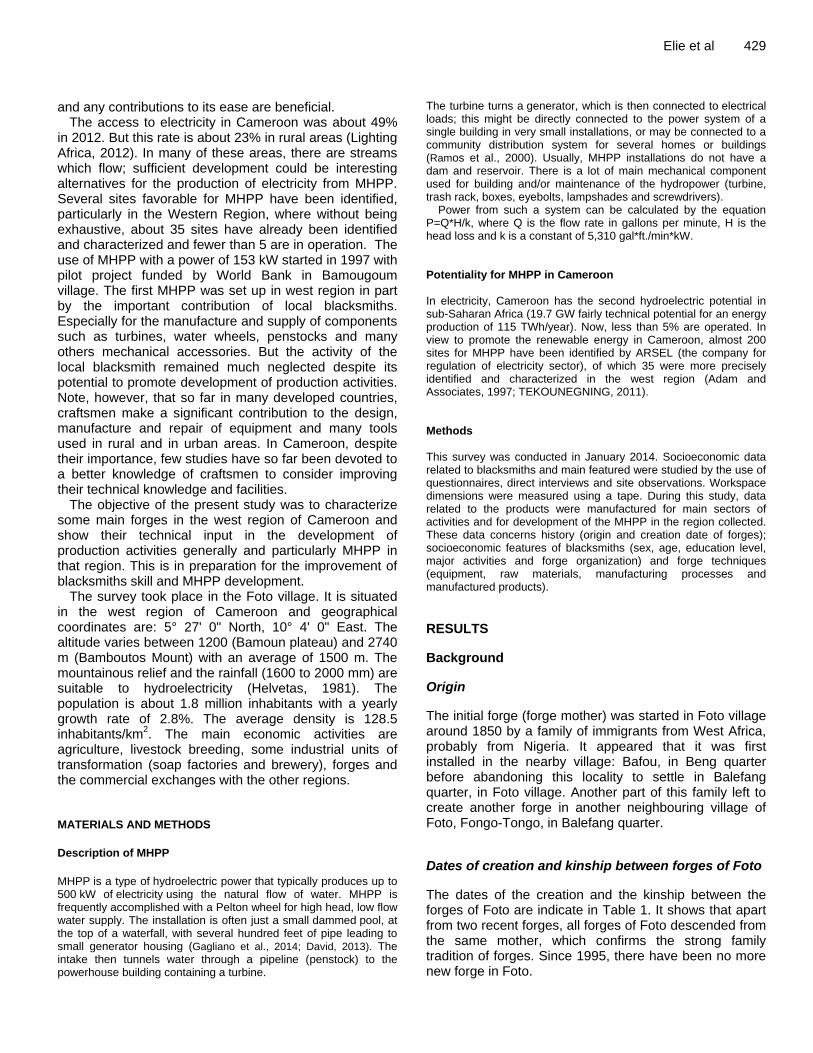
and any contributions to its ease are beneficial.
The access to electricity in Cameroon was about 49% in 2012. But this rate is about 23% in rural areas (Lighting Africa, 2012). In many of these areas, there are streams which flow; sufficient development could be interesting alternatives for the production of electricity from MHPP. Several sites favorable for MHPP have been identified, particularly in the Western Region, where without being exhaustive, about 35 sites have already been identified and characterized and fewer than 5 are in operation. The use of MHPP with a power of 153 kW started in 1997 with pilot project funded by World Bank in Bamougoum village. The first MHPP was set up in west region in part by the important contribution of local blacksmiths. Especially for the manufacture and supply of components such as turbines, water wheels, penstocks and many others mechanical accessories. But the activity of the local blacksmith remained much neglected despite its potential to promote development of production activities. Note, however, that so far in many developed countries, craftsmen make a significant contribution to the design, manufacture and repair of equipment and many tools used in rural and in urban areas. In Cameroon, despite their importance, few studies have so far been devoted to a better knowledge of craftsmen to consider improving their technical knowledge and facilities.
The objective of the present study was to characterize some main forges in the west region of Cameroon and show their technical input in the development of production activities generally and particularly MHPP in that region. This is in preparation for the improvement of blacksmiths skill and MHPP development.
The survey took place in the Foto village. It is situated in the west region of Cameroon and geographical coordinates are: 5° 27' 0" North, 10° 4' 0" East. The altitude varies between 1200 (Bamoun plateau) and 2740 m (Bamboutos Mount) with an average of 1500 m. The mountainous relief and the rainfall (1600 to 2000 mm) are suitable to hydroelectricity (Helvetas, 1981). The population is about 1.8 million inhabitants with a yearly growth rate of 2.8%. The average density is 128.5 inhabitants/km
2. The main economic activities are
agriculture, livestock breeding, some industrial units of transformation (soap factories and brewery), forges and the commercial exchanges with the other regions. MATERIALS AND METHODS
Description of MHPP
MHPP is a type of hydroelectric power that typically produces up to 500 kW of electricity using the natural flow of water. MHPP is frequently accomplished with a Pelton wheel for high head, low flow water supply. The installation is often just a small dammed pool, at the top of a waterfall, with several hundred feet of pipe leading to small generator housing (Gagliano et al., 2014; David, 2013). The intake then tunnels water through a pipeline (penstock) to the powerhouse building containing a turbine.
Elie et al 429 The turbine turns a generator, which is then connected to electrical loads; this might be directly connected to the power system of a single building in very small installations, or may be connected to a community distribution system for several homes or buildings (Ramos et al., 2000). Usually, MHPP installations do not have a dam and reservoir. There is a lot of main mechanical component used for building and/or maintenance of the hydropower (turbine, trash rack, boxes, eyebolts, lampshades and screwdrivers).
Power from such a system can be calculated by the equation P=Q*H/k, where Q is the flow rate in gallons per minute, H is the head loss and k is a constant of 5,310 gal*ft./min*kW. Potentiality for MHPP in Cameroon In electricity, Cameroon has the second hydroelectric potential in sub-Saharan Africa (19.7 GW fairly technical potential for an energy production of 115 TWh/year). Now, less than 5% are operated. In view to promote the renewable energy in Cameroon, almost 200 sites for MHPP have been identified by ARSEL (the company for regulation of electricity sector), of which 35 were more precisely identified and characterized in the west region (Adam and Associates, 1997; TEKOUNEGNING, 2011). Methods This survey was conducted in January 2014. Socioeconomic data related to blacksmiths and main featured were studied by the use of questionnaires, direct interviews and site observations. Workspace dimensions were measured using a tape. During this study, data related to the products were manufactured for main sectors of activities and for development of the MHPP in the region collected. These data concerns history (origin and creation date of forges); socioeconomic features of blacksmiths (sex, age, education level, major activities and forge organization) and forge techniques (equipment, raw materials, manufacturing processes and manufactured products).
RESULTS
Background
Origin
The initial forge (forge mother) was started in Foto village around 1850 by a family of immigrants from West Africa, probably from Nigeria. It appeared that it was first installed in the nearby village: Bafou, in Beng quarter before abandoning this locality to settle in Balefang quarter, in Foto village. Another part of this family left to create another forge in another neighbouring village of Foto, Fongo-Tongo, in Balefang quarter.
Dates of creation and kinship between forges of Foto
The dates of the creation and the kinship between the forges of Foto are indicate in Table 1. It shows that apart from two recent forges, all forges of Foto descended from the same mother, which confirms the strong family tradition of forges. Since 1995, there have been no more new forge in Foto.
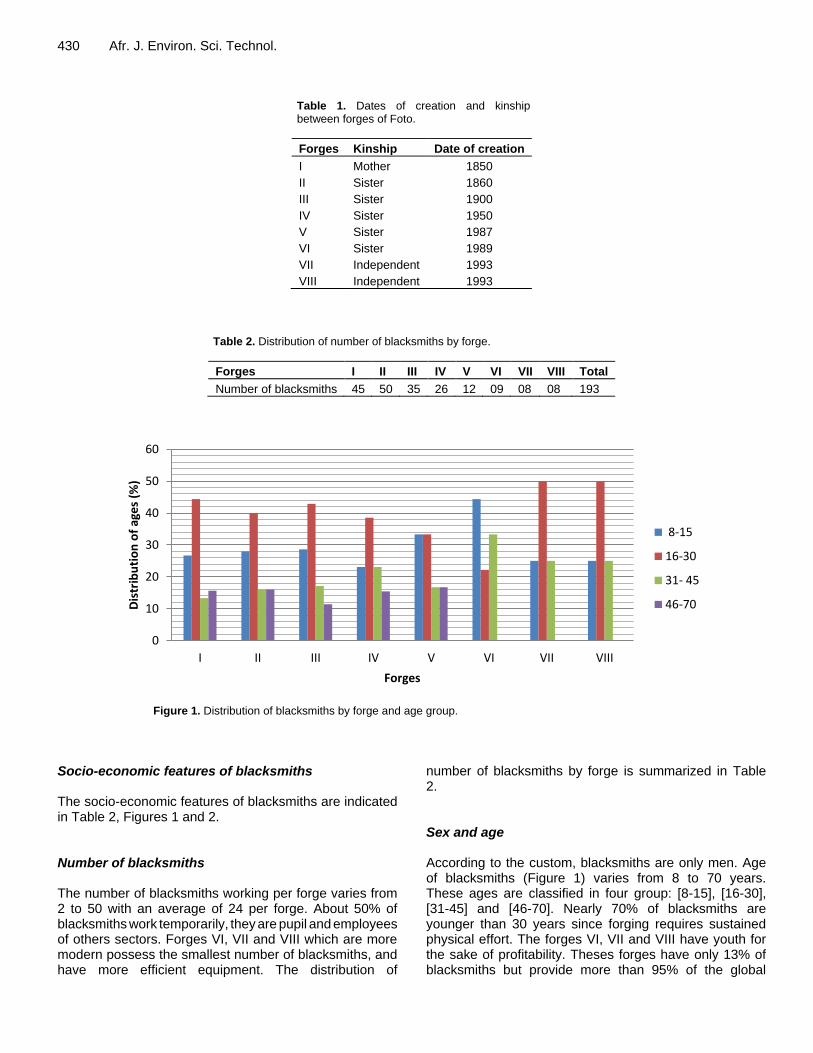
430 Afr. J. Environ. Sci. Technol.
Table 1. Dates of creation and kinship between forges of Foto.
Forges Kinship Date of creation
I Mother 1850
II Sister 1860
III Sister 1900
IV Sister 1950
V Sister 1987
VI Sister 1989
VII Independent 1993
VIII Independent 1993
Table 2. Distribution of number of blacksmiths by forge.
Forges I II III IV V VI VII VIII Total
Number of blacksmiths 45 50 35 26 12 09 08 08 193
Figure 1. Distribution of blacksmiths by forge and age group.
Socio-economic features of blacksmiths The socio-economic features of blacksmiths are indicated in Table 2, Figures 1 and 2. Number of blacksmiths The number of blacksmiths working per forge varies from 2 to 50 with an average of 24 per forge. About 50% of blacksmiths work temporarily, they are pupil and employees of others sectors. Forges VI, VII and VIII which are more modern possess the smallest number of blacksmiths, and have more efficient equipment. The distribution of
number of blacksmiths by forge is summarized in Table 2. Sex and age According to the custom, blacksmiths are only men. Age of blacksmiths (Figure 1) varies from 8 to 70 years. These ages are classified in four group: [8-15], [16-30], [31-45] and [46-70]. Nearly 70% of blacksmiths are younger than 30 years since forging requires sustained physical effort. The forges VI, VII and VIII have youth for the sake of profitability. Theses forges have only 13% of blacksmiths but provide more than 95% of the global
0
10
20
30
40
50
60
I II III IV V VI VII VIII
Dis
trib
uti
on
of
age
s (%
)
Forges
8-15
16-30
31- 45
46-70
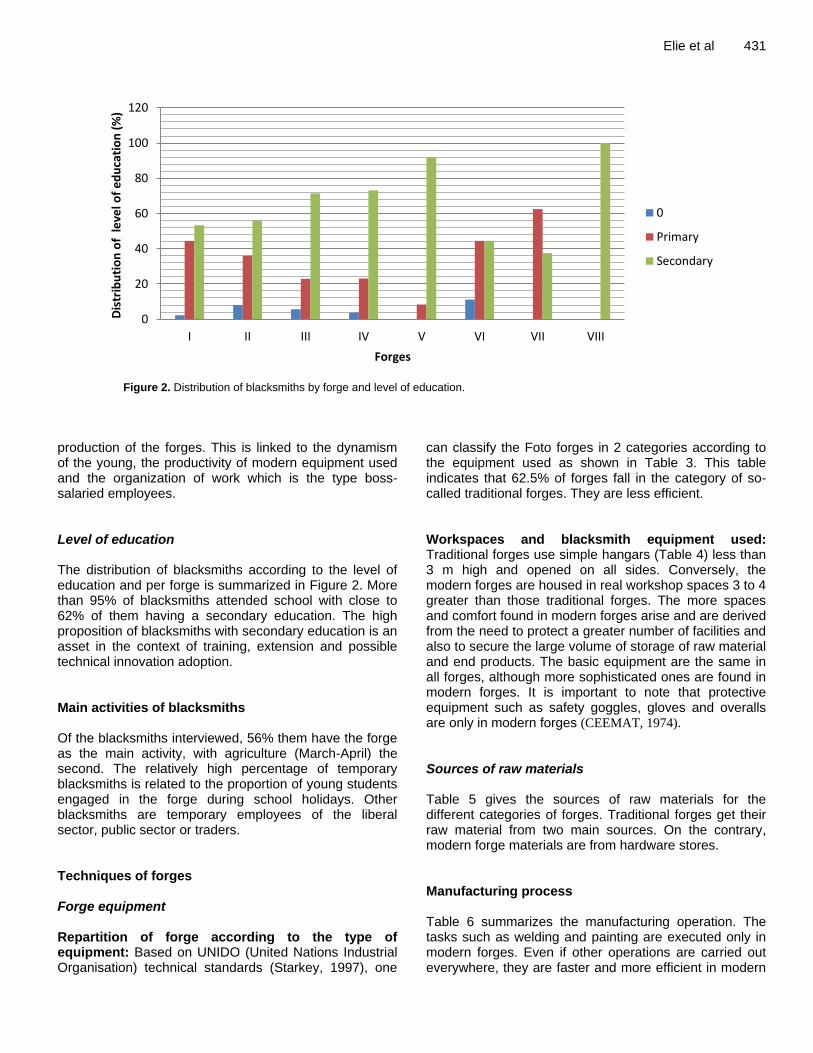
Elie et al 431
Figure 2. Distribution of blacksmiths by forge and level of education.
production of the forges. This is linked to the dynamism of the young, the productivity of modern equipment used and the organization of work which is the type boss-salaried employees. Level of education The distribution of blacksmiths according to the level of education and per forge is summarized in Figure 2. More than 95% of blacksmiths attended school with close to 62% of them having a secondary education. The high proposition of blacksmiths with secondary education is an asset in the context of training, extension and possible technical innovation adoption. Main activities of blacksmiths Of the blacksmiths interviewed, 56% them have the forge as the main activity, with agriculture (March-April) the second. The relatively high percentage of temporary blacksmiths is related to the proportion of young students engaged in the forge during school holidays. Other blacksmiths are temporary employees of the liberal sector, public sector or traders. Techniques of forges Forge equipment Repartition of forge according to the type of equipment: Based on UNIDO (United Nations Industrial Organisation) technical standards (Starkey, 1997), one
can classify the Foto forges in 2 categories according to the equipment used as shown in Table 3. This table indicates that 62.5% of forges fall in the category of so-called traditional forges. They are less efficient. Workspaces and blacksmith equipment used: Traditional forges use simple hangars (Table 4) less than 3 m high and opened on all sides. Conversely, the modern forges are housed in real workshop spaces 3 to 4 greater than those traditional forges. The more spaces and comfort found in modern forges arise and are derived from the need to protect a greater number of facilities and also to secure the large volume of storage of raw material and end products. The basic equipment are the same in all forges, although more sophisticated ones are found in modern forges. It is important to note that protective equipment such as safety goggles, gloves and overalls are only in modern forges (CEEMAT, 1974). Sources of raw materials Table 5 gives the sources of raw materials for the different categories of forges. Traditional forges get their raw material from two main sources. On the contrary, modern forge materials are from hardware stores. Manufacturing process Table 6 summarizes the manufacturing operation. The tasks such as welding and painting are executed only in modern forges. Even if other operations are carried out everywhere, they are faster and more efficient in modern
0
20
40
60
80
100
120
I II III IV V VI VII VIII
Dis
trib
uti
on
of
leve
l of
ed
uca
tio
n (
%)
Forges
0
Primary
Secondary
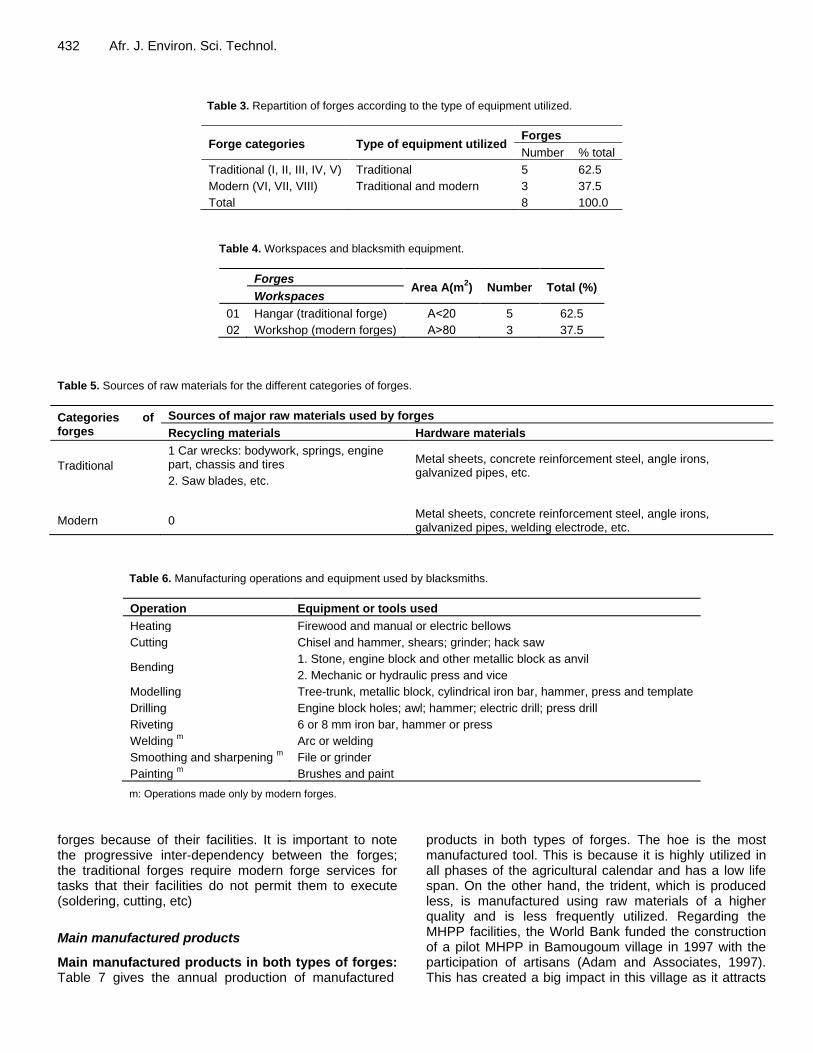
432 Afr. J. Environ. Sci. Technol.
Table 3. Repartition of forges according to the type of equipment utilized.
Forge categories Type of equipment utilized Forges
Number % total
Traditional (I, II, III, IV, V) Traditional 5 62.5
Modern (VI, VII, VIII) Traditional and modern 3 37.5
Total 8 100.0
Table 4. Workspaces and blacksmith equipment.
Forges
Area A(m2) Number Total (%)
Workspaces
01 Hangar (traditional forge) A˂20 5 62.5
02 Workshop (modern forges) A˃80 3 37.5
Table 5. Sources of raw materials for the different categories of forges.
Categories of forges
Sources of major raw materials used by forges
Recycling materials Hardware materials
Traditional
1 Car wrecks: bodywork, springs, engine part, chassis and tires
2. Saw blades, etc.
Metal sheets, concrete reinforcement steel, angle irons, galvanized pipes, etc.
Modern 0 Metal sheets, concrete reinforcement steel, angle irons, galvanized pipes, welding electrode, etc.
Table 6. Manufacturing operations and equipment used by blacksmiths.
Operation Equipment or tools used
Heating Firewood and manual or electric bellows
Cutting Chisel and hammer, shears; grinder; hack saw
Bending 1. Stone, engine block and other metallic block as anvil
2. Mechanic or hydraulic press and vice
Modelling Tree-trunk, metallic block, cylindrical iron bar, hammer, press and template
Drilling Engine block holes; awl; hammer; electric drill; press drill
Riveting 6 or 8 mm iron bar, hammer or press
Welding m
Arc or welding
Smoothing and sharpening m
File or grinder
Painting m
Brushes and paint
m: Operations made only by modern forges.
forges because of their facilities. It is important to note the progressive inter-dependency between the forges; the traditional forges require modern forge services for tasks that their facilities do not permit them to execute (soldering, cutting, etc)
Main manufactured products
Main manufactured products in both types of forges: Table 7 gives the annual production of manufactured
products in both types of forges. The hoe is the most manufactured tool. This is because it is highly utilized in all phases of the agricultural calendar and has a low life span. On the other hand, the trident, which is produced less, is manufactured using raw materials of a higher quality and is less frequently utilized. Regarding the MHPP facilities, the World Bank funded the construction of a pilot MHPP in Bamougoum village in 1997 with the participation of artisans (Adam and Associates, 1997). This has created a big impact in this village as it attracts
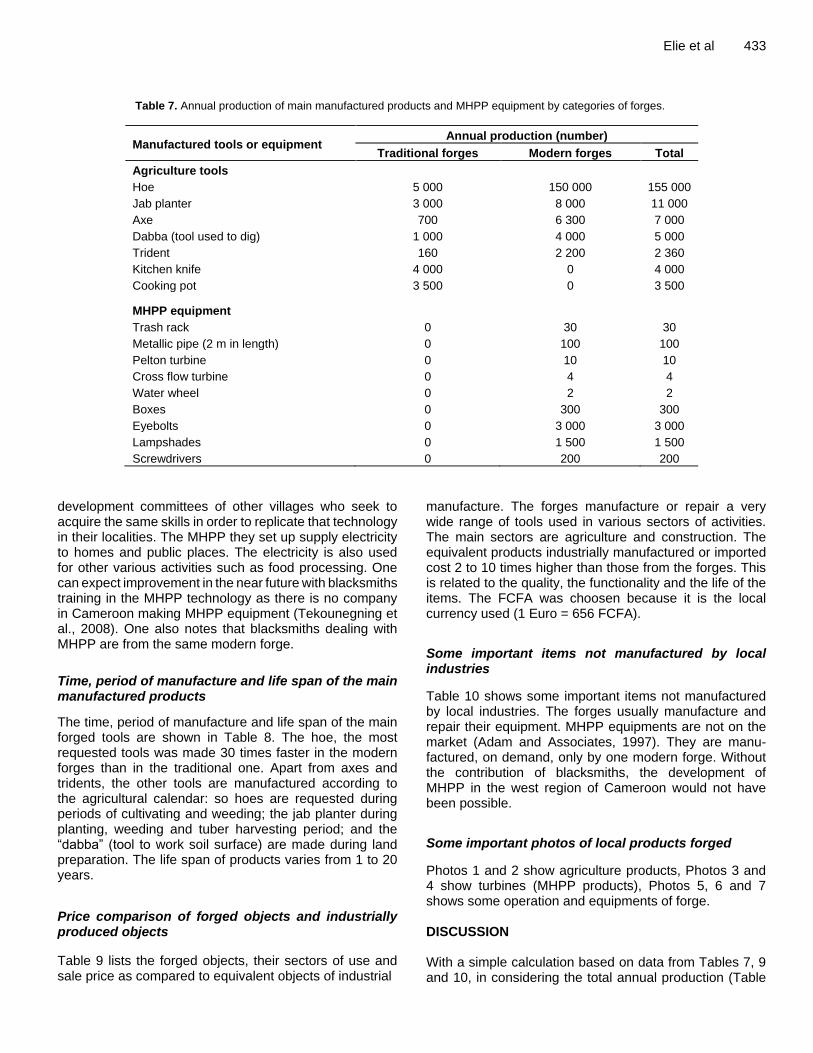
Elie et al 433
Table 7. Annual production of main manufactured products and MHPP equipment by categories of forges.
Manufactured tools or equipment Annual production (number)
Traditional forges Modern forges Total
Agriculture tools
Hoe 5 000 150 000 155 000
Jab planter 3 000 8 000 11 000
Axe 700 6 300 7 000
Dabba (tool used to dig) 1 000 4 000 5 000
Trident 160 2 200 2 360
Kitchen knife 4 000 0 4 000
Cooking pot 3 500 0 3 500
MHPP equipment
Trash rack 0 30 30
Metallic pipe (2 m in length) 0 100 100
Pelton turbine 0 10 10
Cross flow turbine 0 4 4
Water wheel 0 2 2
Boxes 0 300 300
Eyebolts 0 3 000 3 000
Lampshades 0 1 500 1 500
Screwdrivers 0 200 200
development committees of other villages who seek to acquire the same skills in order to replicate that technology in their localities. The MHPP they set up supply electricity to homes and public places. The electricity is also used for other various activities such as food processing. One can expect improvement in the near future with blacksmiths training in the MHPP technology as there is no company in Cameroon making MHPP equipment (Tekounegning et al., 2008). One also notes that blacksmiths dealing with MHPP are from the same modern forge.
Time, period of manufacture and life span of the main manufactured products
The time, period of manufacture and life span of the main forged tools are shown in Table 8. The hoe, the most requested tools was made 30 times faster in the modern forges than in the traditional one. Apart from axes and tridents, the other tools are manufactured according to the agricultural calendar: so hoes are requested during periods of cultivating and weeding; the jab planter during planting, weeding and tuber harvesting period; and the “dabba” (tool to work soil surface) are made during land preparation. The life span of products varies from 1 to 20 years.
Price comparison of forged objects and industrially produced objects
Table 9 lists the forged objects, their sectors of use and sale price as compared to equivalent objects of industrial
manufacture. The forges manufacture or repair a very wide range of tools used in various sectors of activities. The main sectors are agriculture and construction. The equivalent products industrially manufactured or imported cost 2 to 10 times higher than those from the forges. This is related to the quality, the functionality and the life of the items. The FCFA was choosen because it is the local currency used (1 Euro = 656 FCFA).
Some important items not manufactured by local industries
Table 10 shows some important items not manufactured by local industries. The forges usually manufacture and repair their equipment. MHPP equipments are not on the market (Adam and Associates, 1997). They are manu-factured, on demand, only by one modern forge. Without the contribution of blacksmiths, the development of MHPP in the west region of Cameroon would not have been possible.
Some important photos of local products forged
Photos 1 and 2 show agriculture products, Photos 3 and 4 show turbines (MHPP products), Photos 5, 6 and 7 shows some operation and equipments of forge. DISCUSSION With a simple calculation based on data from Tables 7, 9 and 10, in considering the total annual production (Table
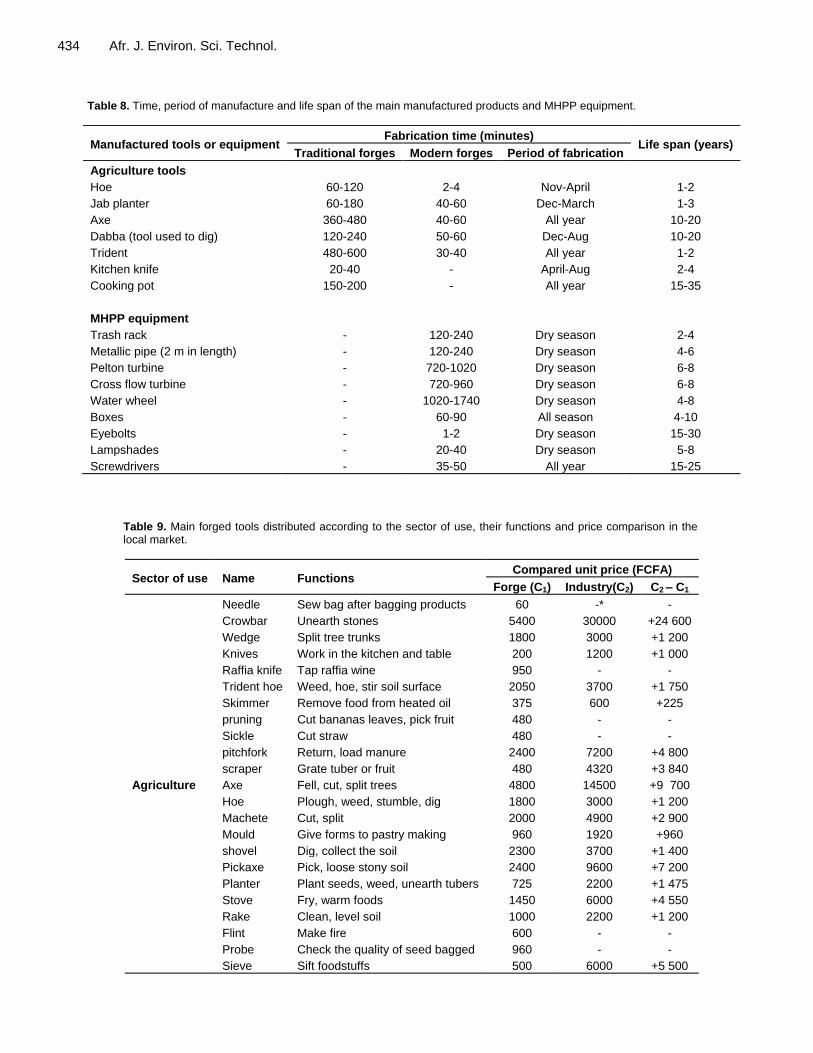
434 Afr. J. Environ. Sci. Technol.
Table 8. Time, period of manufacture and life span of the main manufactured products and MHPP equipment.
Manufactured tools or equipment Fabrication time (minutes)
Life span (years) Traditional forges Modern forges Period of fabrication
Agriculture tools
Hoe 60-120 2-4 Nov-April 1-2
Jab planter 60-180 40-60 Dec-March 1-3
Axe 360-480 40-60 All year 10-20
Dabba (tool used to dig) 120-240 50-60 Dec-Aug 10-20
Trident 480-600 30-40 All year 1-2
Kitchen knife 20-40 - April-Aug 2-4
Cooking pot 150-200 - All year 15-35
MHPP equipment
Trash rack - 120-240 Dry season 2-4
Metallic pipe (2 m in length) - 120-240 Dry season 4-6
Pelton turbine - 720-1020 Dry season 6-8
Cross flow turbine - 720-960 Dry season 6-8
Water wheel - 1020-1740 Dry season 4-8
Boxes - 60-90 All season 4-10
Eyebolts - 1-2 Dry season 15-30
Lampshades - 20-40 Dry season 5-8
Screwdrivers - 35-50 All year 15-25
Table 9. Main forged tools distributed according to the sector of use, their functions and price comparison in the local market.
Sector of use Name Functions Compared unit price (FCFA)
Forge (C1) Industry(C2) C2 – C1
Agriculture
Needle Sew bag after bagging products 60 -* -
Crowbar Unearth stones 5400 30000 +24 600
Wedge Split tree trunks 1800 3000 +1 200
Knives Work in the kitchen and table 200 1200 +1 000
Raffia knife Tap raffia wine 950 - -
Trident hoe Weed, hoe, stir soil surface 2050 3700 +1 750
Skimmer Remove food from heated oil 375 600 +225
pruning Cut bananas leaves, pick fruit 480 - -
Sickle Cut straw 480 - -
pitchfork Return, load manure 2400 7200 +4 800
scraper Grate tuber or fruit 480 4320 +3 840
Axe Fell, cut, split trees 4800 14500 +9 700
Hoe Plough, weed, stumble, dig 1800 3000 +1 200
Machete Cut, split 2000 4900 +2 900
Mould Give forms to pastry making 960 1920 +960
shovel Dig, collect the soil 2300 3700 +1 400
Pickaxe Pick, loose stony soil 2400 9600 +7 200
Planter Plant seeds, weed, unearth tubers 725 2200 +1 475
Stove Fry, warm foods 1450 6000 +4 550
Rake Clean, level soil 1000 2200 +1 200
Flint Make fire 600 - -
Probe Check the quality of seed bagged 960 - -
Sieve Sift foodstuffs 500 6000 +5 500
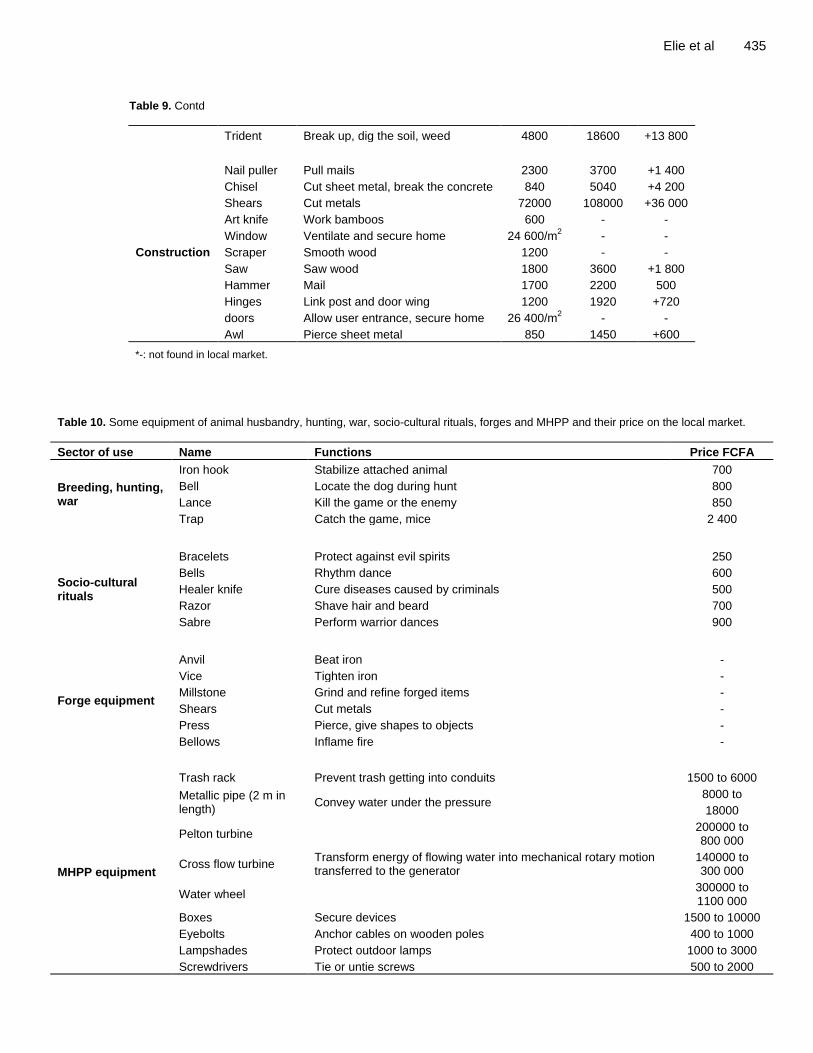
Elie et al 435
Table 9. Contd
Trident Break up, dig the soil, weed 4800 18600 +13 800
Construction
Nail puller Pull mails 2300 3700 +1 400
Chisel Cut sheet metal, break the concrete 840 5040 +4 200
Shears Cut metals 72000 108000 +36 000
Art knife Work bamboos 600 - -
Window Ventilate and secure home 24 600/m2 - -
Scraper Smooth wood 1200 - -
Saw Saw wood 1800 3600 +1 800
Hammer Mail 1700 2200 500
Hinges Link post and door wing 1200 1920 +720
doors Allow user entrance, secure home 26 400/m2 - -
Awl Pierce sheet metal 850 1450 +600
*-: not found in local market.
Table 10. Some equipment of animal husbandry, hunting, war, socio-cultural rituals, forges and MHPP and their price on the local market.
Sector of use Name Functions Price FCFA
Breeding, hunting, war
Iron hook Stabilize attached animal 700
Bell Locate the dog during hunt 800
Lance Kill the game or the enemy 850
Trap Catch the game, mice 2 400
Socio-cultural rituals
Bracelets Protect against evil spirits 250
Bells Rhythm dance 600
Healer knife Cure diseases caused by criminals 500
Razor Shave hair and beard 700
Sabre Perform warrior dances 900
Forge equipment
Anvil Beat iron -
Vice Tighten iron -
Millstone Grind and refine forged items -
Shears Cut metals -
Press Pierce, give shapes to objects -
Bellows Inflame fire -
MHPP equipment
Trash rack Prevent trash getting into conduits 1500 to 6000
Metallic pipe (2 m in length)
Convey water under the pressure 8000 to
18000
Pelton turbine
Transform energy of flowing water into mechanical rotary motion transferred to the generator
200000 to 800 000
Cross flow turbine 140000 to 300 000
Water wheel 300000 to 1100 000
Boxes Secure devices 1500 to 10000
Eyebolts Anchor cables on wooden poles 400 to 1000
Lampshades Protect outdoor lamps 1000 to 3000
Screwdrivers Tie or untie screws 500 to 2000
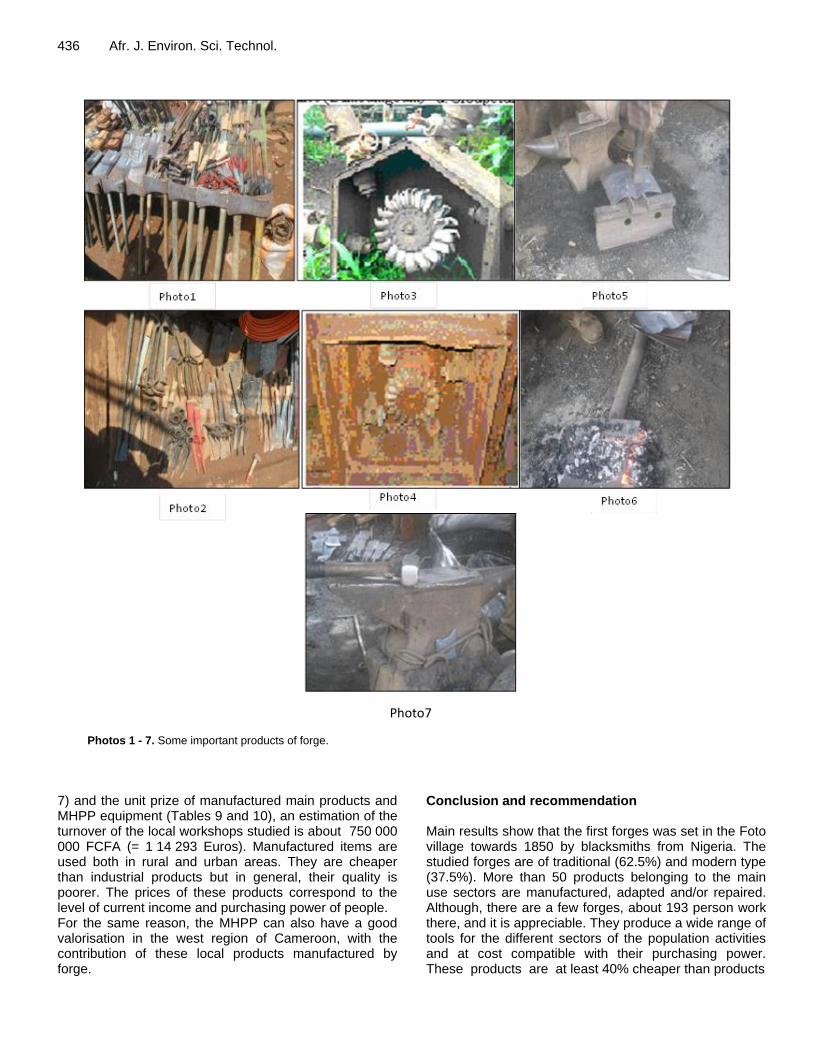
436 Afr. J. Environ. Sci. Technol.
Photos 1 - 7. Some important products of forge.
7) and the unit prize of manufactured main products and MHPP equipment (Tables 9 and 10), an estimation of the turnover of the local workshops studied is about 750 000 000 FCFA (= 1 14 293 Euros). Manufactured items are used both in rural and urban areas. They are cheaper than industrial products but in general, their quality is poorer. The prices of these products correspond to the level of current income and purchasing power of people. For the same reason, the MHPP can also have a good valorisation in the west region of Cameroon, with the contribution of these local products manufactured by forge.
Conclusion and recommendation Main results show that the first forges was set in the Foto village towards 1850 by blacksmiths from Nigeria. The studied forges are of traditional (62.5%) and modern type (37.5%). More than 50 products belonging to the main use sectors are manufactured, adapted and/or repaired. Although, there are a few forges, about 193 person work there, and it is appreciable. They produce a wide range of tools for the different sectors of the population activities and at cost compatible with their purchasing power. These products are at least 40% cheaper than products
Photo7
from industries. The value of production is unrelated to investment but is usually high for rural areas.
Actually, the State of Cameroon promotes renewable energies, of which MHPP is an essential component (Law No. 2011/022 on 14
th December 2011 governing electricity
sector in Cameroon). The contribution of local blacksmiths is very interesting to boost MHPP in Cameroon, with regards to the west region. Local forges have a lot of potential in the production of MHPP components in general and particularly the turbines and water wheels, penstocks and many other mechanical accessories.
More than 95% of blacksmiths attended school with close to 62% of them having a secondary education. The high proposition of blacksmiths with secondary education is an asset in the context of training, extension and possible technical innovation adoption. The areas for improvement should also focus on better organization of forges, equipment and training of blacksmiths. This is left government and non-governmental organizations. Conflict of interests The authors did not declare any conflict of interest. ACKNOWLEDGEMENTS The authors thank the blacksmiths of Foto, without the collaboration of whom this work would not have been possible.
Elie et al 437 REFERENCES Adam H and Associates (1997). Pico-hydro in Cameroon. On behalf of
ESMAP, World Bank, Washington DC, USA. 8 South moor Rd, Oxford OX2 6Rd, UK.
CEEMAT (1974). Manual of motorization of tropical cultures. Ministère de la cooperation, Paris France. 1(5281):661 pp.
http://www.inshp.org/Img_Lib/UploadImg/201232712109370.pdf Helvetas, S. (1981). Manuel technique pour l’Approvisionnement en
Eau des zones Rurales MiNAGRi. Litghting Africa (2012). Report of Cameroon Politic lighting Africa.
Yaoundé Cameroon. Starkey P, Blary D, Le Thiec G (1997). Systèmes d’attelage et matériels
à traction animale. Lengericher H Allemagne. 278 pp. Tekounegning, T. (2011). Modernization of the Production components
and transmission Lines of the bapi Village micro Hydroelectric Power Plant. Journal of Applied Science & Engineering Technology, 4.
Tekounegning, O., Hamandjoda, O., Ndzana, B., Lucien, M., & Nganhou, J. (2009). Constraints of micro hydroelectric power plants in the west region of Cameroon. Global Journal of Engineering Research, 8(1 and 2):27-33.
Ramos H, Betâmio de Almeida A (2000). Guidelines for design of small hydropower plants. Western Regional Energy Agency & Network and Department of Economic Development. https://fenix.tecnico.ulisboa.pt/downloadFile/3779576926045/
Gagliano A, Tina G M, Nocera F, Patania F (2014). Technical and Economic Perspective for Repowering of Micro Hydro Power Plants: a Case Study of an Early XX Century Power Plant. Energy Procedia. 62: 512-521.
David Kilama Okot (2013). Review of small hydropower technology . Renewable and Sustainable Energy Reviews. 26 : 515–520.
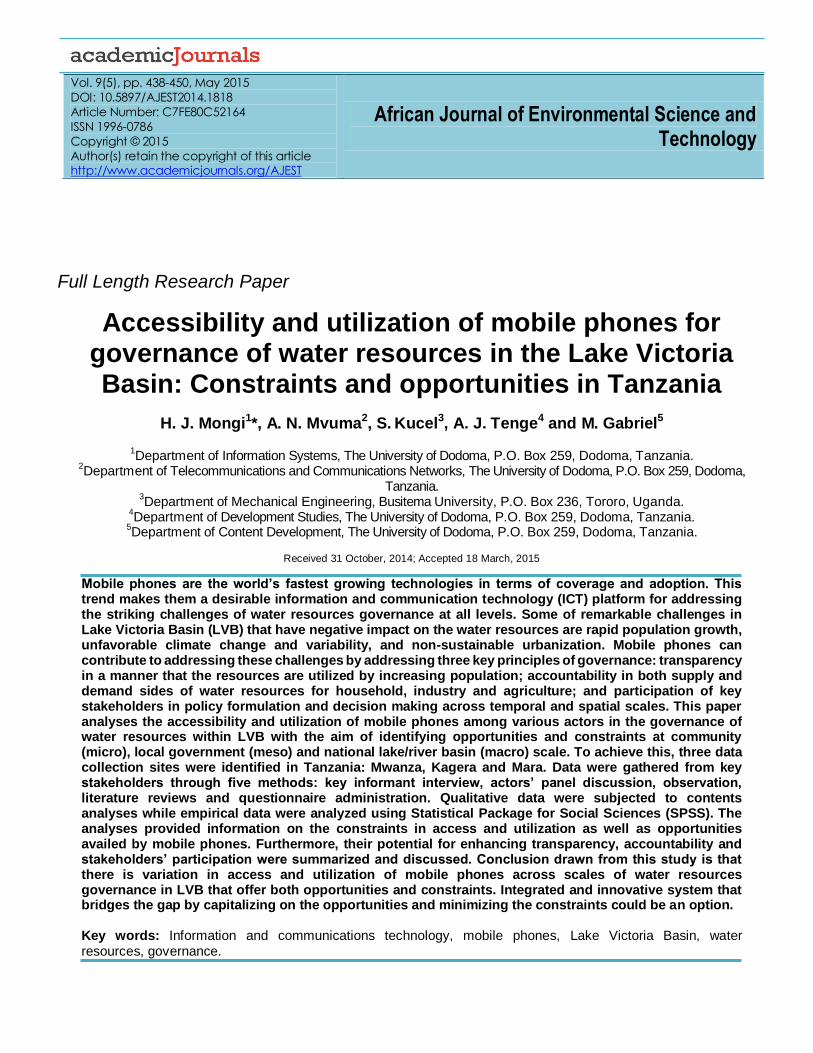
Vol. 9(5), pp. 438-450, May 2015
DOI: 10.5897/AJEST2014.1818
Article Number: C7FE80C52164
ISSN 1996-0786
Copyright © 2015
Author(s) retain the copyright of this article http://www.academicjournals.org/AJEST
African Journal of Environmental Science and Technology
Full Length Research Paper
Accessibility and utilization of mobile phones for governance of water resources in the Lake Victoria Basin: Constraints and opportunities in Tanzania
H. J. Mongi1*, A. N. Mvuma2, S. Kucel3, A. J. Tenge4 and M. Gabriel5
1Department of Information Systems, The University of Dodoma, P.O. Box 259, Dodoma, Tanzania.
2Department of Telecommunications and Communications Networks, The University of Dodoma, P.O. Box 259, Dodoma,
Tanzania. 3Department of Mechanical Engineering, Busitema University, P.O. Box 236, Tororo, Uganda.
4Department of Development Studies, The University of Dodoma, P.O. Box 259, Dodoma, Tanzania.
5Department of Content Development, The University of Dodoma, P.O. Box 259, Dodoma, Tanzania.
Received 31 October, 2014; Accepted 18 March, 2015
Mobile phones are the world’s fastest growing technologies in terms of coverage and adoption. This trend makes them a desirable information and communication technology (ICT) platform for addressing the striking challenges of water resources governance at all levels. Some of remarkable challenges in Lake Victoria Basin (LVB) that have negative impact on the water resources are rapid population growth, unfavorable climate change and variability, and non-sustainable urbanization. Mobile phones can contribute to addressing these challenges by addressing three key principles of governance: transparency in a manner that the resources are utilized by increasing population; accountability in both supply and demand sides of water resources for household, industry and agriculture; and participation of key stakeholders in policy formulation and decision making across temporal and spatial scales. This paper analyses the accessibility and utilization of mobile phones among various actors in the governance of water resources within LVB with the aim of identifying opportunities and constraints at community (micro), local government (meso) and national lake/river basin (macro) scale. To achieve this, three data collection sites were identified in Tanzania: Mwanza, Kagera and Mara. Data were gathered from key stakeholders through five methods: key informant interview, actors’ panel discussion, observation, literature reviews and questionnaire administration. Qualitative data were subjected to contents analyses while empirical data were analyzed using Statistical Package for Social Sciences (SPSS). The analyses provided information on the constraints in access and utilization as well as opportunities availed by mobile phones. Furthermore, their potential for enhancing transparency, accountability and stakeholders’ participation were summarized and discussed. Conclusion drawn from this study is that there is variation in access and utilization of mobile phones across scales of water resources governance in LVB that offer both opportunities and constraints. Integrated and innovative system that bridges the gap by capitalizing on the opportunities and minimizing the constraints could be an option. Key words: Information and communications technology, mobile phones, Lake Victoria Basin, water resources, governance.
Mongi et al 439 INTRODUCTION The ecosystem for information and communication
technologies (ICTs) has been rapidly changing in the contemporary world. According to Selwhn (2002), it consists of a wide range of technological applications; digital broadcast technologies; telecommunications technologies as well as electronic information processing and resources. ICTs handle both information and telecommunication– including symbols, data, voice, images and video. Common ICT technologies are the internet, radio, television, mobile phones, fixed phones and all computers (mainframes, desktops, laptops, palmtops and tablets). A mobile phone is one of the mobile devices in the group of ICTs. Other devices include PDAs, wireless tablets and mobile com-puters (Jones and Marsden, 2006; Islam and Masum, 2010).
Mobile technology has been leading with new innovations. Mobile phone research and innovation have brought better brands, better portability and providing various func-tionalities depending on affordability, usability and intero-perability (Ally, 2007; Jones and Marsden, 2006). Mobile phones can provide rigorous data gathering capability using voice-based technique, wireless internet gateway (WIG) or unstructured supplementary service data (USSD). Although when the first products were available in the market, the technology was afforded by wealth people, today it is an important item for every household if not every individual. Ordinary person in the rural area such as a farmer, a fishermen or a livestock keeper can afford owning one. Recent statistics indicate that of the world‟s seven billion people, six billion have mobile phones (UN News Centre, 2013). According to the International Telecommunication Union (ITU), the mobile phone adoption has far exceeded the total populations in many developing countries. Tanzania has recently recorded 59.2% mobile penetration rate (MDI, 2013). It is estimated that more than 80% of the world‟s population is covered by a mobile network, while in Africa alone; more than 600 million people have access to mobile phone services (InfoDev, 2013).
Mobile phones are changing the way people perform and interact across economic sectors. Writing in the context of agriculture sector, Loudon (2009) argue that mobile phones can provide data transfer functionalities enabling data sharing between and within the systems. Mobile phones can also be converged with other ICTs like radio and TV to respond to key issues like access to weather forecasts, cropping options as well as market information. Authors in the intersection between ICT and environment have shown that mobile technology can minimize the effect of environmental degradation. Ospina and Heeks (2010) contribute on the redundancy aspect of
ICTs; that is, the potential to increase the availability of resources. Redundancy concept has varying implications for computer and human beings. To the computer or mobile phone as a computing device, redundancy leads to ineffi-cient utilization of resources, for example storing the same file in different folders. To human beings, redundancy is a good thing. In this context, Unhelkar (2009) simply define redundancy as “surplus capacity”. For example, a mobile phone can enhance achievement of multiple
objectives. These include improving access to financial capital which in turn may enhance access to infrastructures for efficient water use, improved systems for water distribution and also markets that are linked to water use efficiency (UNEP, 2010; Schuchardt et al., 2004). Mobile phones also can provide for rapid response through swift access and mobilization of financial assets (Duncombe and Boateng, 2009). Mobile phone services such as m-Banking and m-Finance can improve the speed and efficiency with which local communities and general public at large can be mobilized to respond to water resource challenges. Geographic information systems‟ enabled mobile phones enhance communication, access to relevant location data, and mobilization of physical, economic and social resources that stakeholders may need to organize themselves while performing their roles in governing the water resources (World Bank, 2013; ITU, 2011).
Governance is often considered a central issue in water resources especially in the developing countries. According to Mbilinyi et al. (2007), governance is a system of administering and exercising power in democratic, trans-parency, strategic and ethical principles. Under this system, the entire society or concerned group of people are involved in planning, implementing and decision making processes. Rogers and Hall (2003) argue that governance is intensely a political term that refers to effective implementation of socially acceptable allocation and
regulation. According to Wong (2009), participation is a core principle of good governance. To achieve sustainability especially within water resources, such participation should be made to happen through meetings, discussions and face-to-face communication at different levels (Mbilinyi et al., 2007). It is through these ways that potential value of the resource to the community and the environment is informed (Medalye and Hubbart, 2008).
Water resources challenges are location specific, although six categories of issues are often mentioned: inadequate water quality (Tebbutt, 1998), competing users, increasing demand amidst declining supply (WRG2030, 2009), climate change, (USDA, 2010; Sehlke, 2008; Frantz, nd), land-use change (Sehlke, 2008) and institutional
*Corresponding author. E-mail: [email protected]. Author(s) agree that this article remain permanently open access under the terms of the Creative Commons Attribution License 4.0 International License
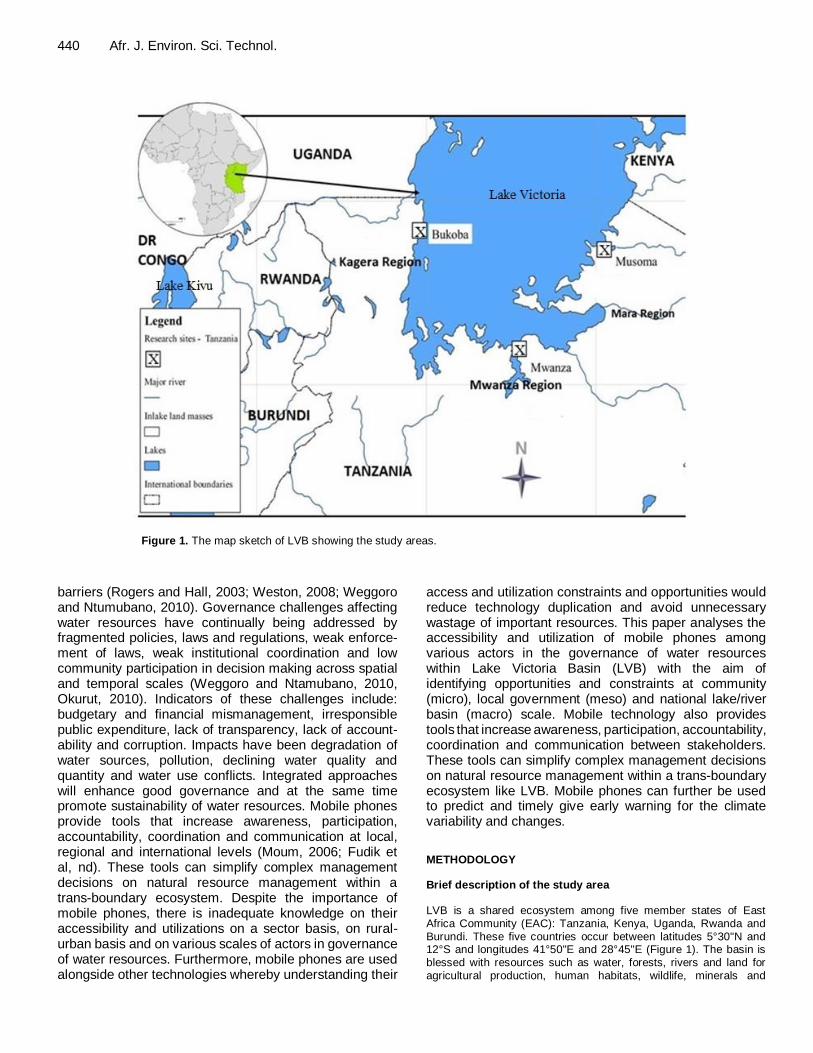
440 Afr. J. Environ. Sci. Technol.
Figure 1. The map sketch of LVB showing the study areas.
barriers (Rogers and Hall, 2003; Weston, 2008; Weggoro and Ntumubano, 2010). Governance challenges affecting water resources have continually being addressed by fragmented policies, laws and regulations, weak enforce-ment of laws, weak institutional coordination and low community participation in decision making across spatial and temporal scales (Weggoro and Ntamubano, 2010, Okurut, 2010). Indicators of these challenges include: budgetary and financial mismanagement, irresponsible public expenditure, lack of transparency, lack of account-ability and corruption. Impacts have been degradation of water sources, pollution, declining water quality and quantity and water use conflicts. Integrated approaches will enhance good governance and at the same time promote sustainability of water resources. Mobile phones provide tools that increase awareness, participation, accountability, coordination and communication at local, regional and international levels (Moum, 2006; Fudik et al, nd). These tools can simplify complex management decisions on natural resource management within a trans-boundary ecosystem. Despite the importance of mobile phones, there is inadequate knowledge on their accessibility and utilizations on a sector basis, on rural-urban basis and on various scales of actors in governance of water resources. Furthermore, mobile phones are used alongside other technologies whereby understanding their
access and utilization constraints and opportunities would reduce technology duplication and avoid unnecessary wastage of important resources. This paper analyses the accessibility and utilization of mobile phones among various actors in the governance of water resources within Lake Victoria Basin (LVB) with the aim of identifying opportunities and constraints at community (micro), local government (meso) and national lake/river basin (macro) scale. Mobile technology also provides tools that increase awareness, participation, accountability, coordination and communication between stakeholders. These tools can simplify complex management decisions on natural resource management within a trans-boundary ecosystem like LVB. Mobile phones can further be used to predict and timely give early warning for the climate variability and changes.
METHODOLOGY Brief description of the study area
LVB is a shared ecosystem among five member states of East Africa Community (EAC): Tanzania, Kenya, Uganda, Rwanda and Burundi. These five countries occur between latitudes 5°30"N and 12°S and longitudes 41°50"E and 28°45"E (Figure 1). The basin is blessed with resources such as water, forests, rivers and land for agricultural production, human habitats, wildlife, minerals and
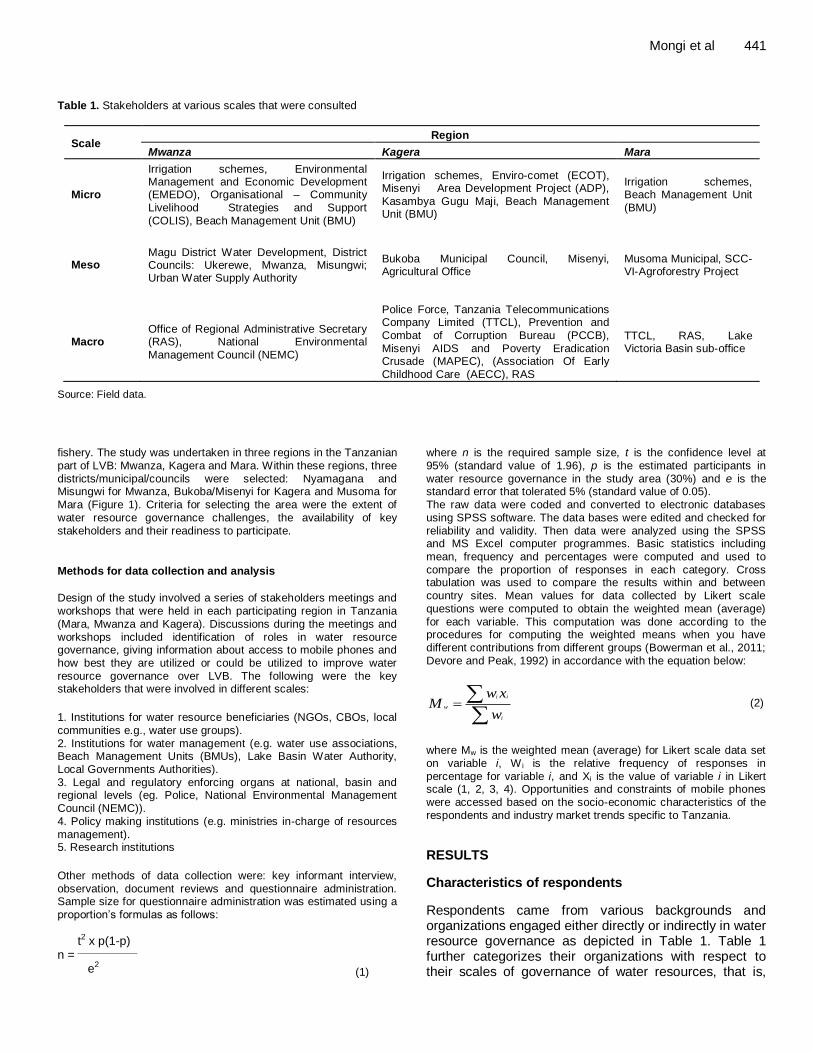
Mongi et al 441 Table 1. Stakeholders at various scales that were consulted
Scale Region
Mwanza Kagera Mara
Micro
Irrigation schemes, Environmental Management and Economic Development (EMEDO), Organisational – Community Livelihood Strategies and Support (COLIS), Beach Management Unit (BMU)
Irrigation schemes, Enviro-comet (ECOT), Misenyi Area Development Project (ADP), Kasambya Gugu Maji, Beach Management Unit (BMU)
Irrigation schemes, Beach Management Unit (BMU)
Meso Magu District Water Development, District Councils: Ukerewe, Mwanza, Misungwi; Urban Water Supply Authority
Bukoba Municipal Council, Misenyi, Agricultural Office
Musoma Municipal, SCC- VI-Agroforestry Project
Macro Office of Regional Administrative Secretary (RAS), National Environmental Management Council (NEMC)
Police Force, Tanzania Telecommunications Company Limited (TTCL), Prevention and Combat of Corruption Bureau (PCCB), Misenyi AIDS and Poverty Eradication Crusade (MAPEC), (Association Of Early Childhood Care (AECC), RAS
TTCL, RAS, Lake Victoria Basin sub-office
Source: Field data.
fishery. The study was undertaken in three regions in the Tanzanian part of LVB: Mwanza, Kagera and Mara. Within these regions, three districts/municipal/councils were selected: Nyamagana and Misungwi for Mwanza, Bukoba/Misenyi for Kagera and Musoma for
Mara (Figure 1). Criteria for selecting the area were the extent of water resource governance challenges, the availability of key stakeholders and their readiness to participate.
Methods for data collection and analysis
Design of the study involved a series of stakeholders meetings and
workshops that were held in each participating region in Tanzania (Mara, Mwanza and Kagera). Discussions during the meetings and workshops included identification of roles in water resource governance, giving information about access to mobile phones and how best they are utilized or could be utilized to improve water resource governance over LVB. The following were the key stakeholders that were involved in different scales:
1. Institutions for water resource beneficiaries (NGOs, CBOs, local
communities e.g., water use groups). 2. Institutions for water management (e.g. water use associations, Beach Management Units (BMUs), Lake Basin Water Authority, Local Governments Authorities). 3. Legal and regulatory enforcing organs at national, basin and regional levels (eg. Police, National Environmental Management Council (NEMC)). 4. Policy making institutions (e.g. ministries in-charge of resources
management). 5. Research institutions
Other methods of data collection were: key informant interview, observation, document reviews and questionnaire administration. Sample size for questionnaire administration was estimated using a proportion‟s formulas as follows:
(1)
where n is the required sample size, t is the confidence level at 95% (standard value of 1.96), p is the estimated participants in water resource governance in the study area (30%) and e is the standard error that tolerated 5% (standard value of 0.05).
The raw data were coded and converted to electronic databases using SPSS software. The data bases were edited and checked for reliability and validity. Then data were analyzed using the SPSS and MS Excel computer programmes. Basic statistics including mean, frequency and percentages were computed and used to compare the proportion of responses in each category. Cross tabulation was used to compare the results within and between country sites. Mean values for data collected by Likert scale
questions were computed to obtain the weighted mean (average) for each variable. This computation was done according to the procedures for computing the weighted means when you have different contributions from different groups (Bowerman et al., 2011; Devore and Peak, 1992) in accordance with the equation below:
(2)
where Mw is the weighted mean (average) for Likert scale data set on variable i, W i is the relative frequency of responses in percentage for variable i, and Xi is the value of variable i in Likert scale (1, 2, 3, 4). Opportunities and constraints of mobile phones were accessed based on the socio-economic characteristics of the respondents and industry market trends specific to Tanzania.
RESULTS
Characteristics of respondents
Respondents came from various backgrounds and organizations engaged either directly or indirectly in water resource governance as depicted in Table 1. Table 1 further categorizes their organizations with respect to their scales of governance of water resources, that is,
t2 x p(1-p) n = e2
i i
w
i
w xM
w
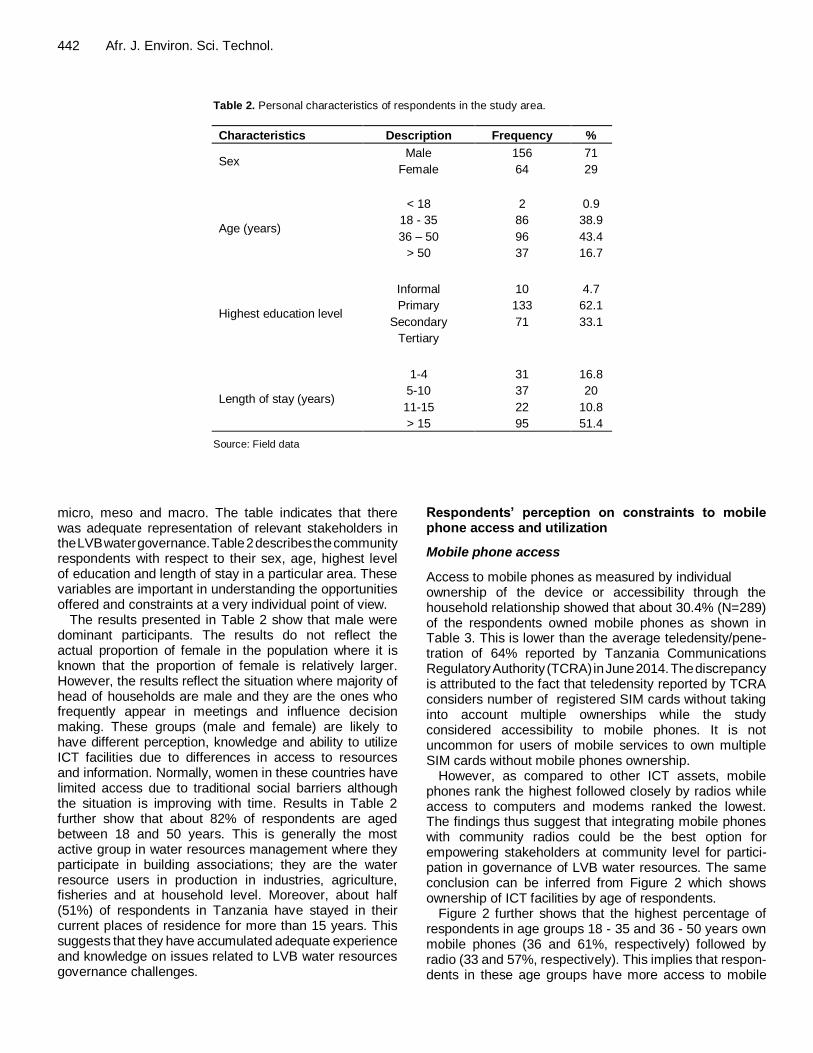
442 Afr. J. Environ. Sci. Technol.
Table 2. Personal characteristics of respondents in the study area.
Characteristics Description Frequency %
Sex Male 156 71
Female 64 29
Age (years)
< 18 2 0.9
18 - 35 86 38.9
36 – 50 96 43.4
> 50 37 16.7
Highest education level
Informal 10 4.7
Primary 133 62.1
Secondary 71 33.1
Tertiary
Length of stay (years)
1-4 31 16.8
5-10 37 20
11-15 22 10.8
> 15 95 51.4
Source: Field data
micro, meso and macro. The table indicates that there was adequate representation of relevant stakeholders in the LVB water governance. Table 2 describes the community respondents with respect to their sex, age, highest level of education and length of stay in a particular area. These variables are important in understanding the opportunities offered and constraints at a very individual point of view.
The results presented in Table 2 show that male were dominant participants. The results do not reflect the actual proportion of female in the population where it is known that the proportion of female is relatively larger. However, the results reflect the situation where majority of head of households are male and they are the ones who frequently appear in meetings and influence decision making. These groups (male and female) are likely to have different perception, knowledge and ability to utilize ICT facilities due to differences in access to resources and information. Normally, women in these countries have limited access due to traditional social barriers although the situation is improving with time. Results in Table 2 further show that about 82% of respondents are aged between 18 and 50 years. This is generally the most active group in water resources management where they participate in building associations; they are the water resource users in production in industries, agriculture, fisheries and at household level. Moreover, about half (51%) of respondents in Tanzania have stayed in their current places of residence for more than 15 years. This suggests that they have accumulated adequate experience and knowledge on issues related to LVB water resources governance challenges.
Respondents’ perception on constraints to mobile phone access and utilization
Mobile phone access
Access to mobile phones as measured by individual ownership of the device or accessibility through the household relationship showed that about 30.4% (N=289) of the respondents owned mobile phones as shown in Table 3. This is lower than the average teledensity/pene-tration of 64% reported by Tanzania Communications Regulatory Authority (TCRA) in June 2014. The discrepancy is attributed to the fact that teledensity reported by TCRA considers number of registered SIM cards without taking into account multiple ownerships while the study considered accessibility to mobile phones. It is not uncommon for users of mobile services to own multiple SIM cards without mobile phones ownership.
However, as compared to other ICT assets, mobile phones rank the highest followed closely by radios while access to computers and modems ranked the lowest. The findings thus suggest that integrating mobile phones with community radios could be the best option for
empowering stakeholders at community level for partici-pation in governance of LVB water resources. The same conclusion can be inferred from Figure 2 which shows ownership of ICT facilities by age of respondents.
Figure 2 further shows that the highest percentage of respondents in age groups 18 - 35 and 36 - 50 years own mobile phones (36 and 61%, respectively) followed by radio (33 and 57%, respectively). This implies that respon-dents in these age groups have more access to mobile
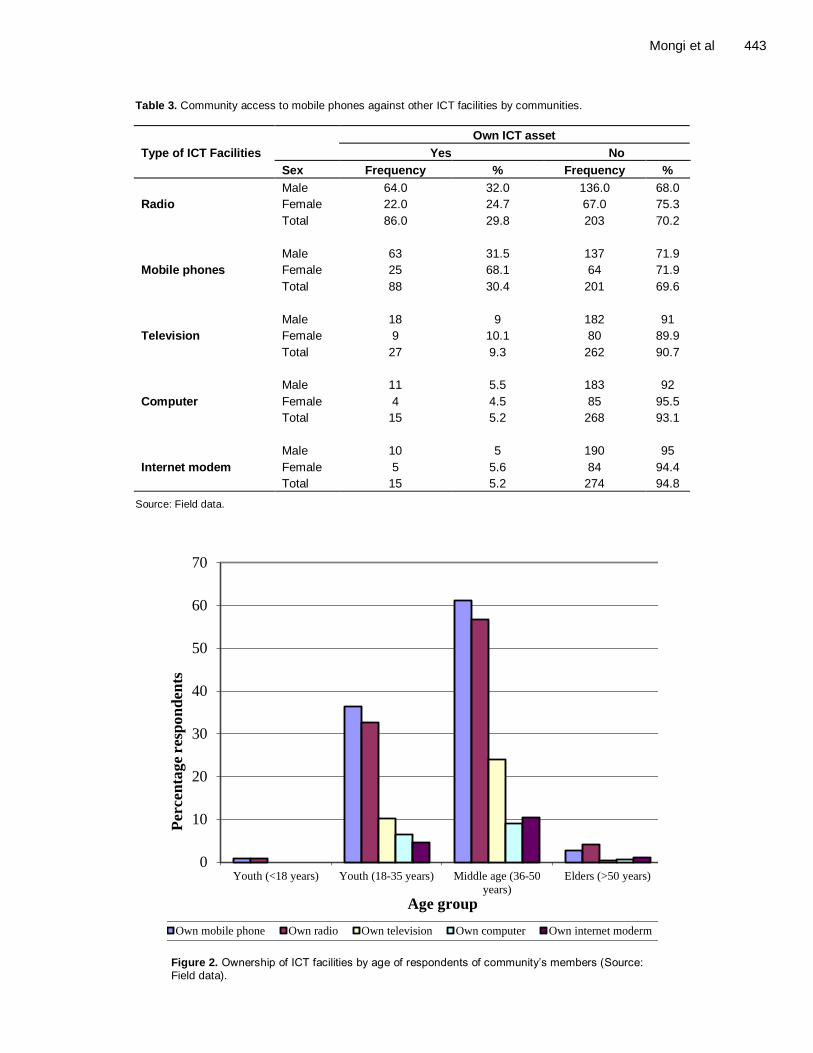
Mongi et al 443
Table 3. Community access to mobile phones against other ICT facilities by communities.
Type of ICT Facilities
Own ICT asset
Yes No
Sex Frequency % Frequency %
Radio
Male 64.0 32.0 136.0 68.0
Female 22.0 24.7 67.0 75.3
Total 86.0 29.8 203 70.2
Mobile phones
Male 63 31.5 137 71.9
Female 25 68.1 64 71.9
Total 88 30.4 201 69.6
Television
Male 18 9 182 91
Female 9 10.1 80 89.9
Total 27 9.3 262 90.7
Computer
Male 11 5.5 183 92
Female 4 4.5 85 95.5
Total 15 5.2 268 93.1
Internet modem
Male 10 5 190 95
Female 5 5.6 84 94.4
Total 15 5.2 274 94.8
Source: Field data.
Figure 2. Ownership of ICT facilities by age of respondents of community‟s members (Source: Field data).
0
10
20
30
40
50
60
70
Youth (<18 years) Youth (18-35 years) Middle age (36-50
years)
Elders (>50 years)
Percen
tag
e r
esp
on
den
ts
Age group
Own mobile phone Own radio Own television Own computer Own internet moderm
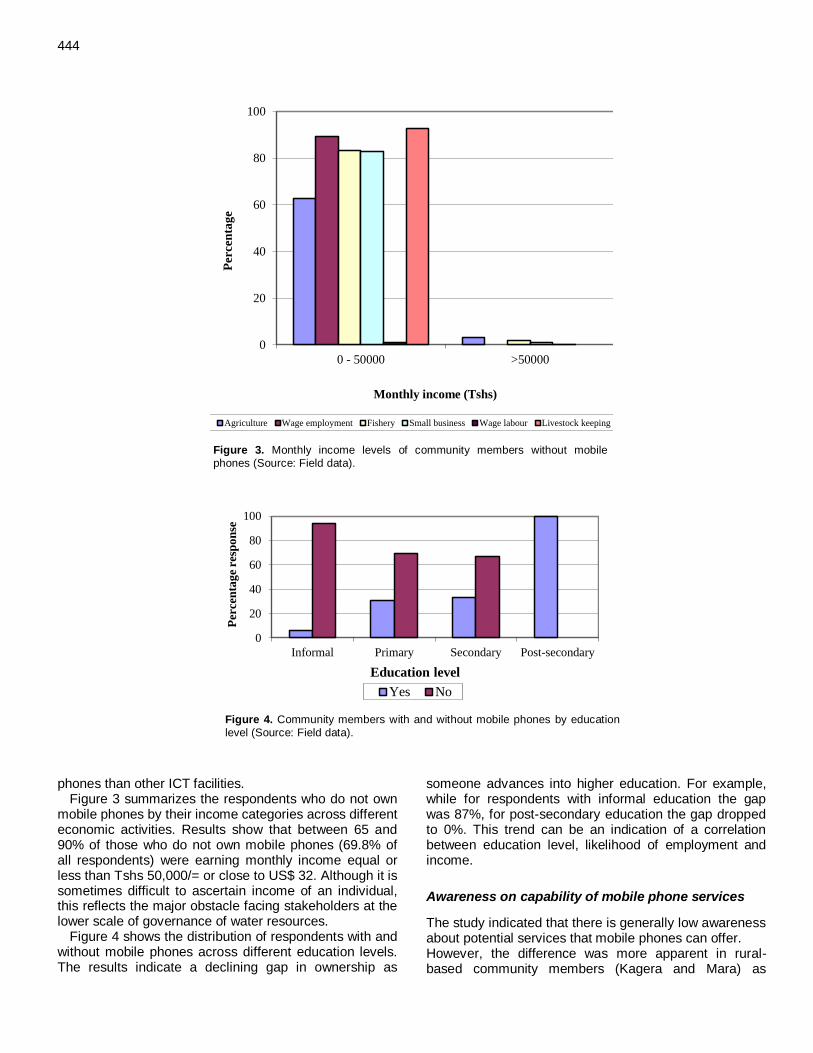
444
Figure 3. Monthly income levels of community members without mobile phones (Source: Field data).
Figure 4. Community members with and without mobile phones by education
level (Source: Field data).
phones than other ICT facilities. Figure 3 summarizes the respondents who do not own
mobile phones by their income categories across different economic activities. Results show that between 65 and 90% of those who do not own mobile phones (69.8% of all respondents) were earning monthly income equal or less than Tshs 50,000/= or close to US$ 32. Although it is sometimes difficult to ascertain income of an individual, this reflects the major obstacle facing stakeholders at the lower scale of governance of water resources.
Figure 4 shows the distribution of respondents with and without mobile phones across different education levels. The results indicate a declining gap in ownership as
someone advances into higher education. For example, while for respondents with informal education the gap was 87%, for post-secondary education the gap dropped to 0%. This trend can be an indication of a correlation between education level, likelihood of employment and income.
Awareness on capability of mobile phone services
The study indicated that there is generally low awareness about potential services that mobile phones can offer. However, the difference was more apparent in rural-based community members (Kagera and Mara) as
0
20
40
60
80
100
0 - 50000 >50000
Percen
tag
e
Monthly income (Tshs)
Agriculture Wage employment Fishery Small business Wage labour Livestock keeping
0
20
40
60
80
100
Informal Primary Secondary Post-secondary
Percen
tag
e r
esp
on
se
Education level
Yes No
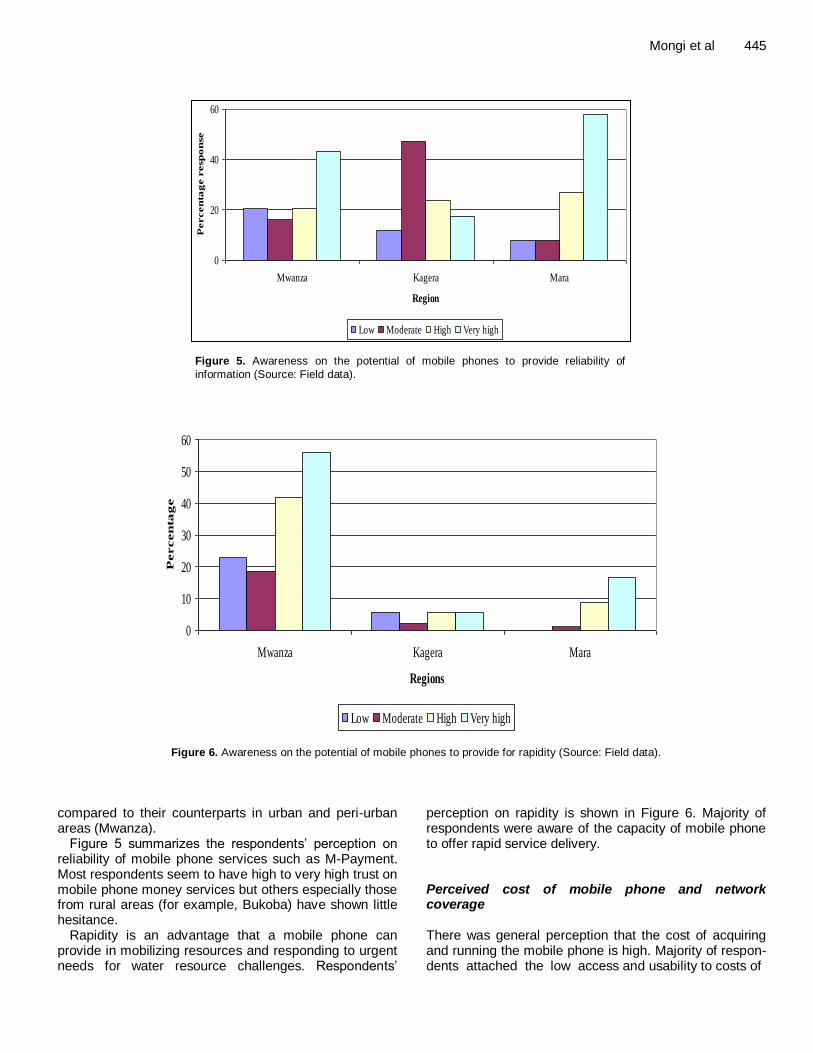
Mongi et al 445
Figure 5. Awareness on the potential of mobile phones to provide reliability of
information (Source: Field data).
Figure 6. Awareness on the potential of mobile phones to provide for rapidity (Source: Field data).
compared to their counterparts in urban and peri-urban areas (Mwanza).
Figure 5 summarizes the respondents‟ perception on reliability of mobile phone services such as M-Payment. Most respondents seem to have high to very high trust on mobile phone money services but others especially those from rural areas (for example, Bukoba) have shown little hesitance.
Rapidity is an advantage that a mobile phone can provide in mobilizing resources and responding to urgent needs for water resource challenges. Respondents‟
perception on rapidity is shown in Figure 6. Majority of respondents were aware of the capacity of mobile phone to offer rapid service delivery. Perceived cost of mobile phone and network coverage There was general perception that the cost of acquiring and running the mobile phone is high. Majority of respon-dents attached the low access and usability to costs of
0
20
40
60
Mwanza Kagera Mara
Region
Percen
tag
e r
esp
on
se
Low Moderate High Very high
0
10
20
30
40
50
60
Mwanza Kagera Mara
Regions
Percen
tag
e
Low Moderate High Very high
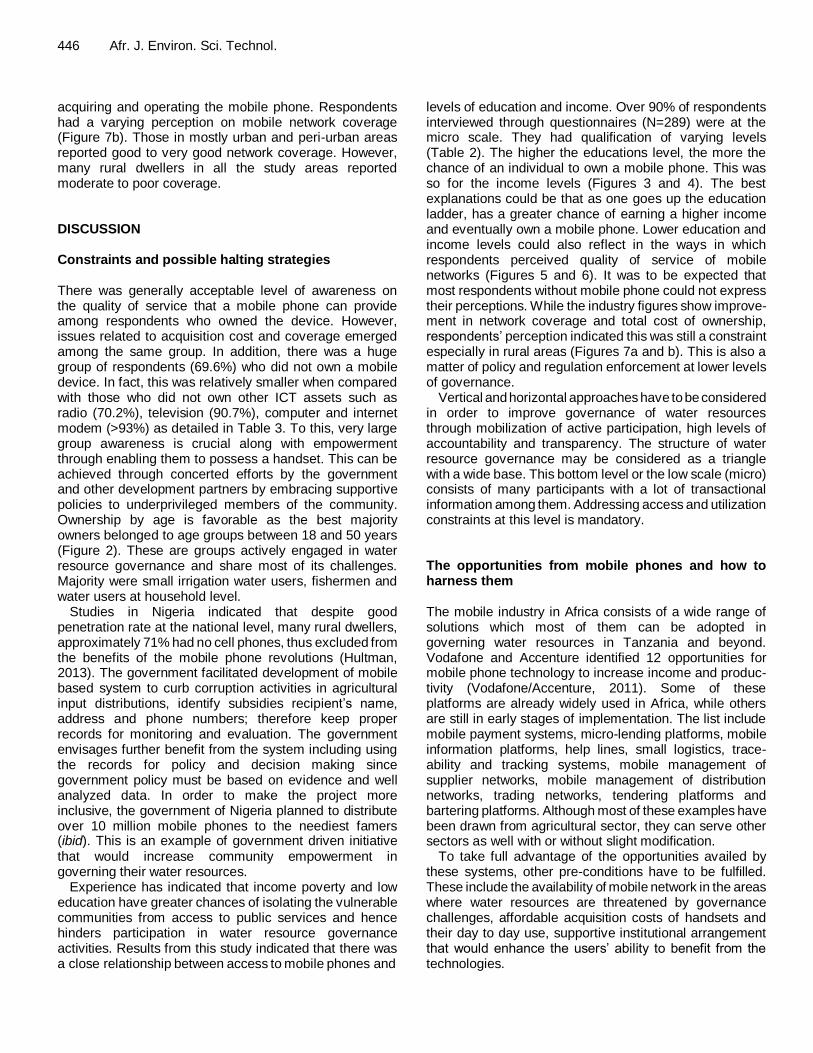
446 Afr. J. Environ. Sci. Technol. acquiring and operating the mobile phone. Respondents had a varying perception on mobile network coverage (Figure 7b). Those in mostly urban and peri-urban areas reported good to very good network coverage. However, many rural dwellers in all the study areas reported moderate to poor coverage. DISCUSSION Constraints and possible halting strategies There was generally acceptable level of awareness on the quality of service that a mobile phone can provide among respondents who owned the device. However, issues related to acquisition cost and coverage emerged among the same group. In addition, there was a huge group of respondents (69.6%) who did not own a mobile device. In fact, this was relatively smaller when compared with those who did not own other ICT assets such as radio (70.2%), television (90.7%), computer and internet modem (>93%) as detailed in Table 3. To this, very large group awareness is crucial along with empowerment through enabling them to possess a handset. This can be achieved through concerted efforts by the government and other development partners by embracing supportive policies to underprivileged members of the community. Ownership by age is favorable as the best majority owners belonged to age groups between 18 and 50 years (Figure 2). These are groups actively engaged in water resource governance and share most of its challenges. Majority were small irrigation water users, fishermen and water users at household level.
Studies in Nigeria indicated that despite good penetration rate at the national level, many rural dwellers, approximately 71% had no cell phones, thus excluded from the benefits of the mobile phone revolutions (Hultman, 2013). The government facilitated development of mobile based system to curb corruption activities in agricultural input distributions, identify subsidies recipient‟s name, address and phone numbers; therefore keep proper records for monitoring and evaluation. The government envisages further benefit from the system including using the records for policy and decision making since government policy must be based on evidence and well analyzed data. In order to make the project more inclusive, the government of Nigeria planned to distribute over 10 million mobile phones to the neediest famers (ibid). This is an example of government driven initiative that would increase community empowerment in governing their water resources.
Experience has indicated that income poverty and low education have greater chances of isolating the vulnerable communities from access to public services and hence hinders participation in water resource governance
activities. Results from this study indicated that there was a close relationship between access to mobile phones and
levels of education and income. Over 90% of respondents interviewed through questionnaires (N=289) were at the micro scale. They had qualification of varying levels (Table 2). The higher the educations level, the more the chance of an individual to own a mobile phone. This was so for the income levels (Figures 3 and 4). The best explanations could be that as one goes up the education ladder, has a greater chance of earning a higher income and eventually own a mobile phone. Lower education and income levels could also reflect in the ways in which respondents perceived quality of service of mobile networks (Figures 5 and 6). It was to be expected that most respondents without mobile phone could not express their perceptions. While the industry figures show improve-ment in network coverage and total cost of ownership, respondents‟ perception indicated this was still a constraint especially in rural areas (Figures 7a and b). This is also a matter of policy and regulation enforcement at lower levels of governance.
Vertical and horizontal approaches have to be considered in order to improve governance of water resources through mobilization of active participation, high levels of accountability and transparency. The structure of water resource governance may be considered as a triangle with a wide base. This bottom level or the low scale (micro) consists of many participants with a lot of transactional information among them. Addressing access and utilization constraints at this level is mandatory. The opportunities from mobile phones and how to harness them The mobile industry in Africa consists of a wide range of solutions which most of them can be adopted in governing water resources in Tanzania and beyond. Vodafone and Accenture identified 12 opportunities for mobile phone technology to increase income and produc-tivity (Vodafone/Accenture, 2011). Some of these platforms are already widely used in Africa, while others are still in early stages of implementation. The list include mobile payment systems, micro-lending platforms, mobile information platforms, help lines, small logistics, trace-ability and tracking systems, mobile management of
supplier networks, mobile management of distribution networks, trading networks, tendering platforms and
bartering platforms. Although most of these examples have been drawn from agricultural sector, they can serve other sectors as well with or without slight modification.
To take full advantage of the opportunities availed by these systems, other pre-conditions have to be fulfilled. These include the availability of mobile network in the areas where water resources are threatened by governance
challenges, affordable acquisition costs of handsets and their day to day use, supportive institutional arrangement that would enhance the users‟ ability to benefit from the technologies.
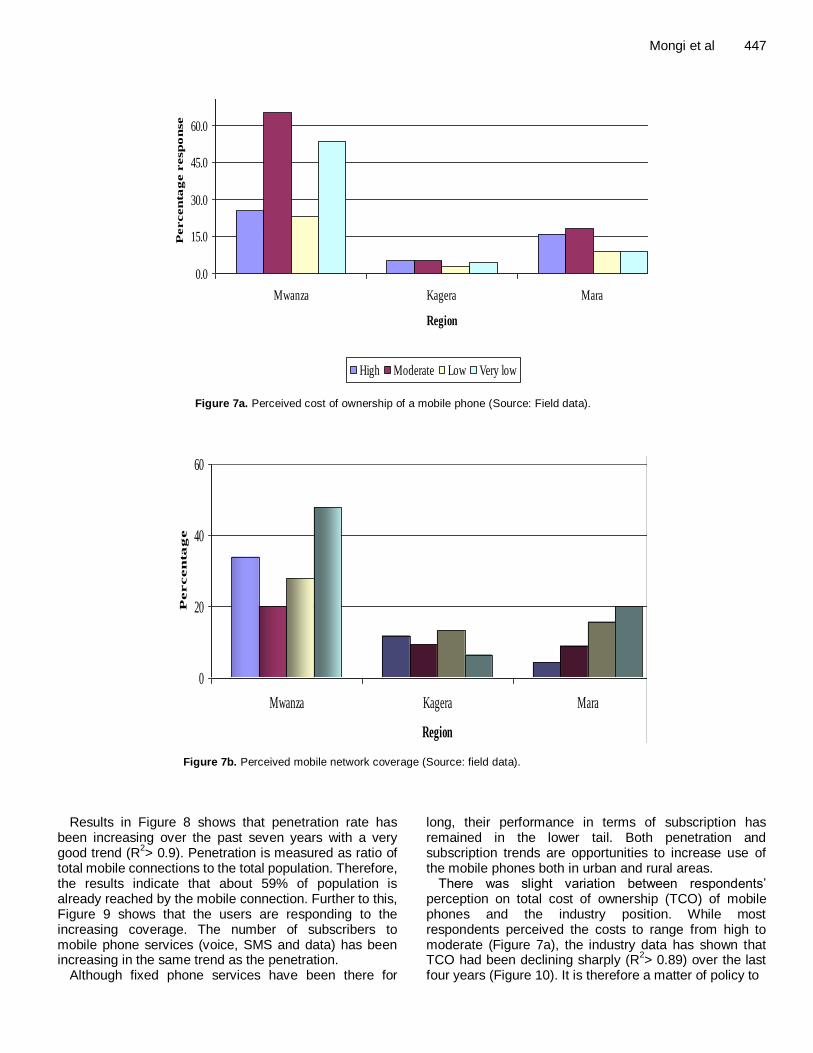
Mongi et al 447
Figure 7a. Perceived cost of ownership of a mobile phone (Source: Field data).
Figure 7b. Perceived mobile network coverage (Source: field data).
Results in Figure 8 shows that penetration rate has been increasing over the past seven years with a very good trend (R
2> 0.9). Penetration is measured as ratio of
total mobile connections to the total population. Therefore, the results indicate that about 59% of population is already reached by the mobile connection. Further to this, Figure 9 shows that the users are responding to the increasing coverage. The number of subscribers to mobile phone services (voice, SMS and data) has been increasing in the same trend as the penetration.
Although fixed phone services have been there for
long, their performance in terms of subscription has remained in the lower tail. Both penetration and subscription trends are opportunities to increase use of the mobile phones both in urban and rural areas.
There was slight variation between respondents‟ perception on total cost of ownership (TCO) of mobile phones and the industry position. While most respondents perceived the costs to range from high to moderate (Figure 7a), the industry data has shown that TCO had been declining sharply (R
2> 0.89) over the last
four years (Figure 10). It is therefore a matter of policy to
0.0
15.0
30.0
45.0
60.0
75.0
Mwanza Kagera Mara
Region
Percen
tag
e r
esp
on
se
High Moderate Low Very low
0
20
40
60
Mwanza Kagera Mara
Region
Percen
ta
ge
Poor Moderate Good Very good
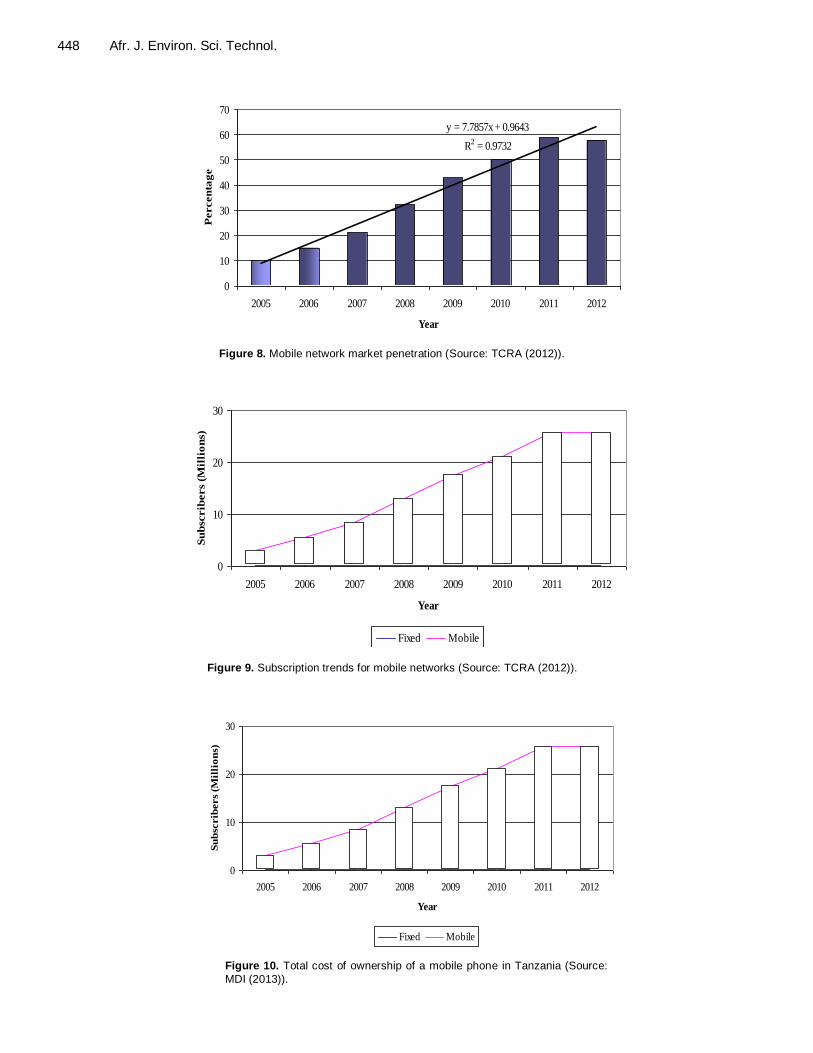
448 Afr. J. Environ. Sci. Technol.
Figure 8. Mobile network market penetration (Source: TCRA (2012)).
Figure 9. Subscription trends for mobile networks (Source: TCRA (2012)).
Figure 10. Total cost of ownership of a mobile phone in Tanzania (Source:
MDI (2013)).
y = 7.7857x + 0.9643
R2 = 0.9732
0
10
20
30
40
50
60
70
2005 2006 2007 2008 2009 2010 2011 2012
Year
Percen
tag
e
0
10
20
30
2005 2006 2007 2008 2009 2010 2011 2012
Year
Su
bsc
rib
ers
(Mil
lio
ns)
Fixed Mobile
0
10
20
30
2005 2006 2007 2008 2009 2010 2011 2012
Year
Su
bsc
rib
ers
(Mil
lio
ns)
Fixed Mobile
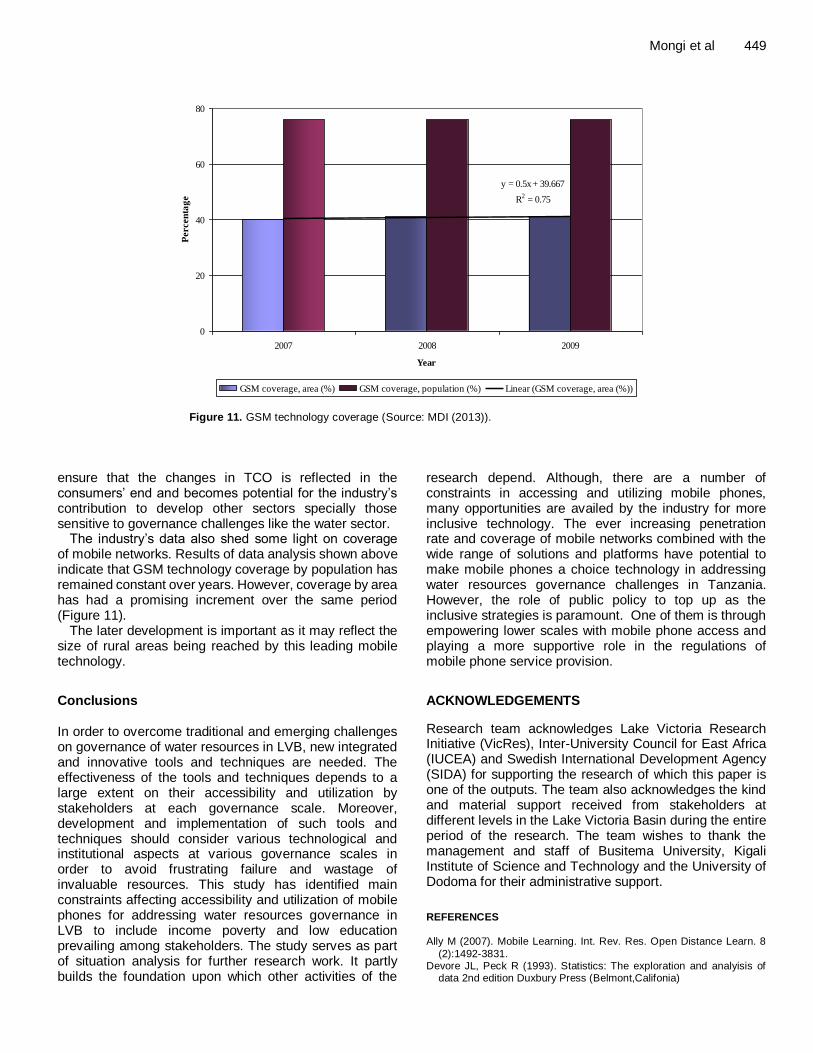
Mongi et al 449
Figure 11. GSM technology coverage (Source: MDI (2013)).
ensure that the changes in TCO is reflected in the
consumers‟ end and becomes potential for the industry‟s contribution to develop other sectors specially those sensitive to governance challenges like the water sector.
The industry‟s data also shed some light on coverage of mobile networks. Results of data analysis shown above indicate that GSM technology coverage by population has remained constant over years. However, coverage by area has had a promising increment over the same period (Figure 11).
The later development is important as it may reflect the size of rural areas being reached by this leading mobile technology.
Conclusions In order to overcome traditional and emerging challenges on governance of water resources in LVB, new integrated and innovative tools and techniques are needed. The effectiveness of the tools and techniques depends to a large extent on their accessibility and utilization by stakeholders at each governance scale. Moreover, development and implementation of such tools and techniques should consider various technological and institutional aspects at various governance scales in order to avoid frustrating failure and wastage of invaluable resources. This study has identified main constraints affecting accessibility and utilization of mobile phones for addressing water resources governance in LVB to include income poverty and low education prevailing among stakeholders. The study serves as part of situation analysis for further research work. It partly builds the foundation upon which other activities of the
research depend. Although, there are a number of constraints in accessing and utilizing mobile phones, many opportunities are availed by the industry for more inclusive technology. The ever increasing penetration rate and coverage of mobile networks combined with the wide range of solutions and platforms have potential to make mobile phones a choice technology in addressing water resources governance challenges in Tanzania. However, the role of public policy to top up as the inclusive strategies is paramount. One of them is through empowering lower scales with mobile phone access and playing a more supportive role in the regulations of mobile phone service provision.
ACKNOWLEDGEMENTS
Research team acknowledges Lake Victoria Research Initiative (VicRes), Inter-University Council for East Africa (IUCEA) and Swedish International Development Agency (SIDA) for supporting the research of which this paper is one of the outputs. The team also acknowledges the kind and material support received from stakeholders at different levels in the Lake Victoria Basin during the entire period of the research. The team wishes to thank the management and staff of Busitema University, Kigali Institute of Science and Technology and the University of Dodoma for their administrative support.
REFERENCES Ally M (2007). Mobile Learning. Int. Rev. Res. Open Distance Learn. 8
(2):1492-3831. Devore JL, Peck R (1993). Statistics: The exploration and analyisis of
data 2nd edition Duxbury Press (Belmont,Califonia)
y = 0.5x + 39.667
R2 = 0.75
0
20
40
60
80
2007 2008 2009
Year
Percen
tag
e
GSM coverage, area (%) GSM coverage, population (%) Linear (GSM coverage, area (%))
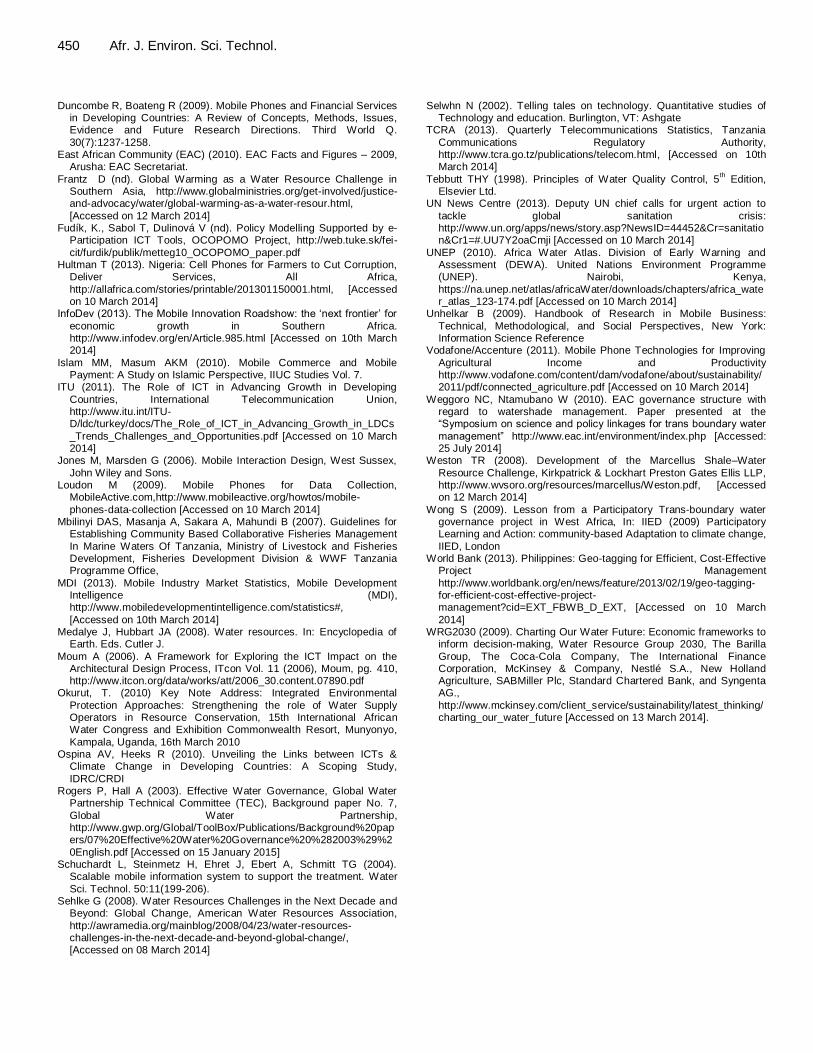
450 Afr. J. Environ. Sci. Technol. Duncombe R, Boateng R (2009). Mobile Phones and Financial Services
in Developing Countries: A Review of Concepts, Methods, Issues, Evidence and Future Research Directions. Third World Q.
30(7):1237-1258. East African Community (EAC) (2010). EAC Facts and Figures – 2009,
Arusha: EAC Secretariat.
Frantz D (nd). Global Warming as a Water Resource Challenge in Southern Asia, http://www.globalministries.org/get-involved/justice-and-advocacy/water/global-warming-as-a-water-resour.html,
[Accessed on 12 March 2014] Fudík, K., Sabol T, Dulinová V (nd). Policy Modelling Supported by e-
Participation ICT Tools, OCOPOMO Project, http://web.tuke.sk/fei-
cit/furdik/publik/metteg10_OCOPOMO_paper.pdf Hultman T (2013). Nigeria: Cell Phones for Farmers to Cut Corruption,
Deliver Services, All Africa,
http://allafrica.com/stories/printable/201301150001.html, [Accessed on 10 March 2014]
InfoDev (2013). The Mobile Innovation Roadshow: the „next frontier‟ for
economic growth in Southern Africa. http://www.infodev.org/en/Article.985.html [Accessed on 10th March 2014]
Islam MM, Masum AKM (2010). Mobile Commerce and Mobile Payment: A Study on Islamic Perspective, IIUC Studies Vol. 7.
ITU (2011). The Role of ICT in Advancing Growth in Developing
Countries, International Telecommunication Union, http://www.itu.int/ITU-D/ldc/turkey/docs/The_Role_of_ICT_in_Advancing_Growth_in_LDCs
_Trends_Challenges_and_Opportunities.pdf [Accessed on 10 March 2014]
Jones M, Marsden G (2006). Mobile Interaction Design, West Sussex,
John Wiley and Sons. Loudon M (2009). Mobile Phones for Data Collection,
MobileActive.com,http://www.mobileactive.org/howtos/mobile-
phones-data-collection [Accessed on 10 March 2014] Mbilinyi DAS, Masanja A, Sakara A, Mahundi B (2007). Guidelines for
Establishing Community Based Collaborative Fisheries Management
In Marine Waters Of Tanzania, Ministry of Livestock and Fisheries Development, Fisheries Development Division & WWF Tanzania Programme Office,
MDI (2013). Mobile Industry Market Statistics, Mobile Development Intelligence (MDI), http://www.mobiledevelopmentintelligence.com/statistics#,
[Accessed on 10th March 2014] Medalye J, Hubbart JA (2008). Water resources. In: Encyclopedia of
Earth. Eds. Cutler J.
Moum A (2006). A Framework for Exploring the ICT Impact on the Architectural Design Process, ITcon Vol. 11 (2006), Moum, pg. 410, http://www.itcon.org/data/works/att/2006_30.content.07890.pdf
Okurut, T. (2010) Key Note Address: Integrated Environmental
Protection Approaches: Strengthening the role of Water Supply Operators in Resource Conservation, 15th International African Water Congress and Exhibition Commonwealth Resort, Munyonyo,
Kampala, Uganda, 16th March 2010 Ospina AV, Heeks R (2010). Unveiling the Links between ICTs &
Climate Change in Developing Countries: A Scoping Study,
IDRC/CRDI Rogers P, Hall A (2003). Effective Water Governance, Global Water
Partnership Technical Committee (TEC), Background paper No. 7,
Global Water Partnership, http://www.gwp.org/Global/ToolBox/Publications/Background%20papers/07%20Effective%20Water%20Governance%20%282003%29%2
0English.pdf [Accessed on 15 January 2015] Schuchardt L, Steinmetz H, Ehret J, Ebert A, Schmitt TG (2004).
Scalable mobile information system to support the treatment. Water
Sci. Technol. 50:11(199-206). Sehlke G (2008). Water Resources Challenges in the Next Decade and
Beyond: Global Change, American Water Resources Association,
http://awramedia.org/mainblog/2008/04/23/water-resources-challenges-in-the-next-decade-and-beyond-global-change/, [Accessed on 08 March 2014]
Selwhn N (2002). Telling tales on technology. Quantitative studies of
Technology and education. Burlington, VT: Ashgate TCRA (2013). Quarterly Telecommunications Statistics, Tanzania
Communications Regulatory Authority, http://www.tcra.go.tz/publications/telecom.html, [Accessed on 10th March 2014]
Tebbutt THY (1998). Principles of Water Quality Control, 5th Edition,
Elsevier Ltd. UN News Centre (2013). Deputy UN chief calls for urgent action to
tackle global sanitation crisis: http://www.un.org/apps/news/story.asp?NewsID=44452&Cr=sanitation&Cr1=#.UU7Y2oaCmji [Accessed on 10 March 2014]
UNEP (2010). Africa Water Atlas. Division of Early Warning and Assessment (DEWA). United Nations Environment Programme (UNEP). Nairobi, Kenya,
https://na.unep.net/atlas/africaWater/downloads/chapters/africa_water_atlas_123-174.pdf [Accessed on 10 March 2014]
Unhelkar B (2009). Handbook of Research in Mobile Business:
Technical, Methodological, and Social Perspectives, New York: Information Science Reference
Vodafone/Accenture (2011). Mobile Phone Technologies for Improving
Agricultural Income and Productivity http://www.vodafone.com/content/dam/vodafone/about/sustainability/2011/pdf/connected_agriculture.pdf [Accessed on 10 March 2014]
Weggoro NC, Ntamubano W (2010). EAC governance structure with regard to watershade management. Paper presented at the “Symposium on science and policy linkages for trans boundary water
management” http://www.eac.int/environment/index.php [Accessed: 25 July 2014]
Weston TR (2008). Development of the Marcellus Shale–Water
Resource Challenge, Kirkpatrick & Lockhart Preston Gates Ellis LLP, http://www.wvsoro.org/resources/marcellus/Weston.pdf, [Accessed on 12 March 2014]
Wong S (2009). Lesson from a Participatory Trans-boundary water governance project in West Africa, In: IIED (2009) Participatory Learning and Action: community-based Adaptation to climate change,
IIED, London World Bank (2013). Philippines: Geo-tagging for Efficient, Cost-Effective
Project Management
http://www.worldbank.org/en/news/feature/2013/02/19/geo-tagging-for-efficient-cost-effective-project-management?cid=EXT_FBWB_D_EXT, [Accessed on 10 March
2014] WRG2030 (2009). Charting Our Water Future: Economic frameworks to
inform decision-making, Water Resource Group 2030, The Barilla
Group, The Coca-Cola Company, The International Finance Corporation, McKinsey & Company, Nestlé S.A., New Holland Agriculture, SABMiller Plc, Standard Chartered Bank, and Syngenta AG.,
http://www.mckinsey.com/client_service/sustainability/latest_thinking/charting_our_water_future [Accessed on 13 March 2014].
Vol. 9(5), pp. 451- 463, May 2015
DOI: 10.5897/AJEST2014.1841 Article Number: 2B3416852458
ISSN 1996-0786
Copyright © 2015
Author(s) retain the copyright of this article
http://www.academicjournals.org/AJEST
African Journal of Environmental Science and Technology
Review
The Niger Delta wetland ecosystem: What threatens it and why should we protect it?
Chidumeje Ndidi Patience Okonkwo*, Lalit Kumar and Subhashni Taylor
School of Environmental and Rural Science, University of New England, Armidale, NSW, 2351, Australia.
Received 9 December, 2014; Accepted 20 April, 2015
The Niger Delta wetland ecosystem is of high economic importance to the local dwellers and the nation in general. The region is rich in both aquatic and terrestrial biodiversity and serves as a main source of livelihood for rural dwellers as well as stabilizing the ecosystem. Tremendous changes have occurred recently in the Niger Delta wetlands due to anthropogenic activities, thus raising awareness on the need for effective monitoring, protection and conservation of the wetland ecosystem. A good knowledge of the services provided by wetland ecosystems is an important key for an effective ecosystem management. The aim of this paper therefore was to review the importance of wetland resources, their threats and the need to protect them. This review shows that the region is rich in biodiversity of high economic importance to national development, and has been under severe threat from human activities, especially pollution. It is recommended that effective monitoring be employed using modern techniques such as GIS and remote sensing in the conservation and management of this important ecosystem. Key words: Niger Delta, wetland, ecosystem.
INTRODUCTION The Niger Delta region Located on the Atlantic coast of Southern Nigeria, the Niger Delta lies within the lower reaches of the Niger river, extending between latitudes 05°19′34″N 06°28′15″E and 5.32611°N 6.47083°E (World Geodetic System, 1984). The average monthly temperature of the region is 27°C, and an annual rainfall ranging from 3000 to 4500 mm. There are two distinct seasons with the wet season
occurring from July to September and the dry season from December to February (World Bank, 1995). The Niger Delta is made up of nine states (Figure 1) and home to some 30 million people, approximately 22% of the country’s population (2006 census).
The Delta is among the 10 largest in the world, with a coastline of about 450 km which ends at Imo river
*Corresponding author. E-mail: [email protected]. Author(s) agree that this article remain permanently open access under the terms of the Creative Commons Attribution License 4.0 International License
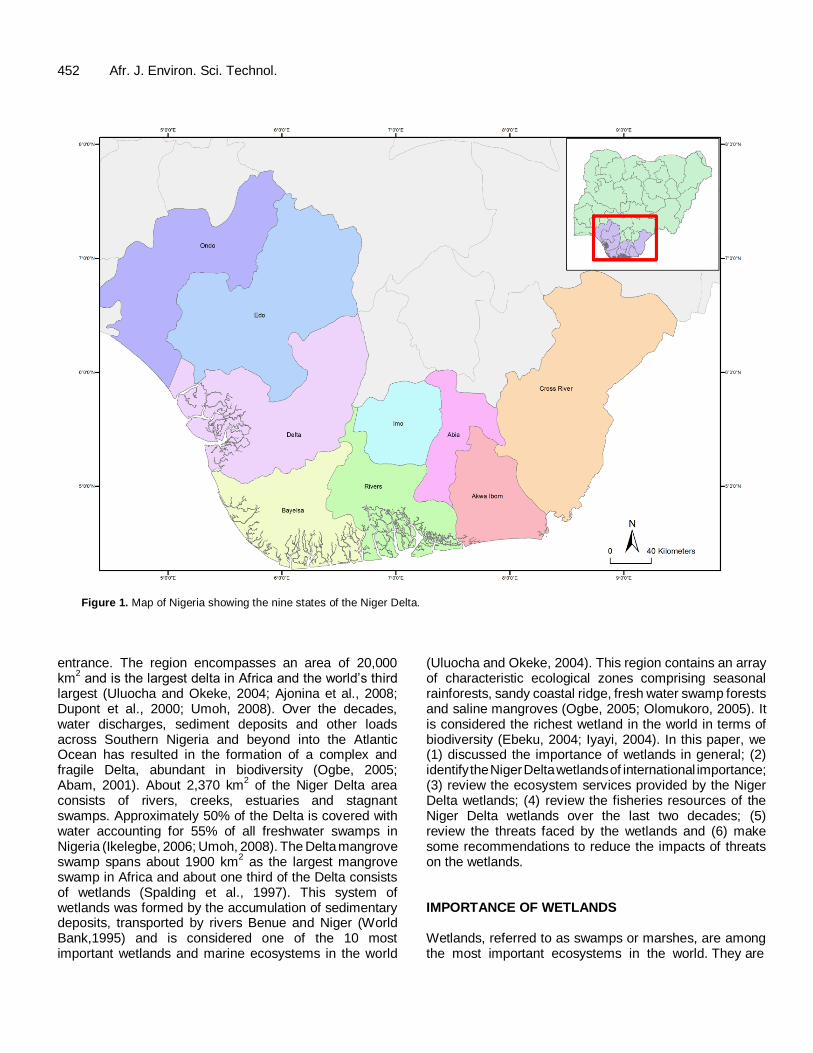
452 Afr. J. Environ. Sci. Technol.
Figure 1. Map of Nigeria showing the nine states of the Niger Delta.
entrance. The region encompasses an area of 20,000 km
2 and is the largest delta in Africa and the world’s third
largest (Uluocha and Okeke, 2004; Ajonina et al., 2008; Dupont et al., 2000; Umoh, 2008). Over the decades, water discharges, sediment deposits and other loads across Southern Nigeria and beyond into the Atlantic Ocean has resulted in the formation of a complex and fragile Delta, abundant in biodiversity (Ogbe, 2005; Abam, 2001). About 2,370 km
2 of the Niger Delta area
consists of rivers, creeks, estuaries and stagnant swamps. Approximately 50% of the Delta is covered with water accounting for 55% of all freshwater swamps in Nigeria (Ikelegbe, 2006; Umoh, 2008). The Delta mangrove swamp spans about 1900 km
2 as the largest mangrove
swamp in Africa and about one third of the Delta consists of wetlands (Spalding et al., 1997). This system of wetlands was formed by the accumulation of sedimentary deposits, transported by rivers Benue and Niger (World Bank,1995) and is considered one of the 10 most important wetlands and marine ecosystems in the world
(Uluocha and Okeke, 2004). This region contains an array of characteristic ecological zones comprising seasonal rainforests, sandy coastal ridge, fresh water swamp forests and saline mangroves (Ogbe, 2005; Olomukoro, 2005). It is considered the richest wetland in the world in terms of biodiversity (Ebeku, 2004; Iyayi, 2004). In this paper, we (1) discussed the importance of wetlands in general; (2) identify the Niger Delta wetlands of international importance; (3) review the ecosystem services provided by the Niger Delta wetlands; (4) review the fisheries resources of the Niger Delta wetlands over the last two decades; (5) review the threats faced by the wetlands and (6) make some recommendations to reduce the impacts of threats on the wetlands. IMPORTANCE OF WETLANDS Wetlands, referred to as swamps or marshes, are among the most important ecosystems in the world. They are
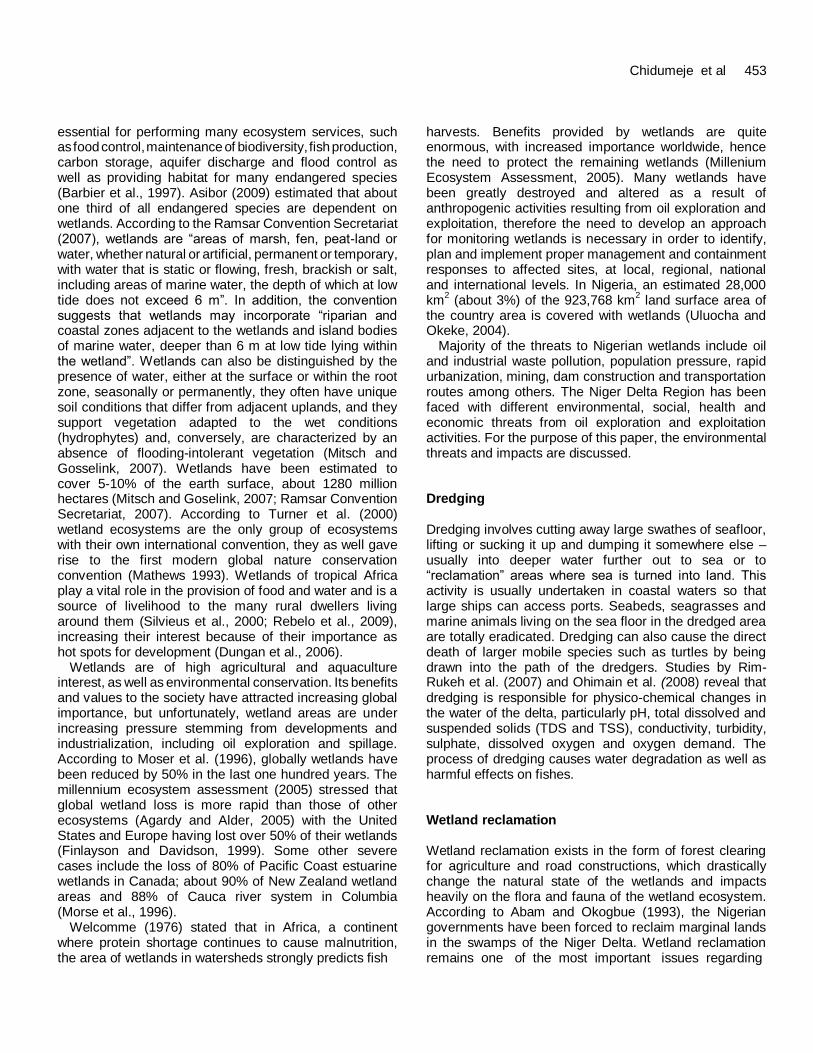
essential for performing many ecosystem services, such as food control, maintenance of biodiversity, fish production, carbon storage, aquifer discharge and flood control as well as providing habitat for many endangered species (Barbier et al., 1997). Asibor (2009) estimated that about one third of all endangered species are dependent on wetlands. According to the Ramsar Convention Secretariat (2007), wetlands are “areas of marsh, fen, peat-land or water, whether natural or artificial, permanent or temporary, with water that is static or flowing, fresh, brackish or salt, including areas of marine water, the depth of which at low tide does not exceed 6 m”. In addition, the convention suggests that wetlands may incorporate “riparian and coastal zones adjacent to the wetlands and island bodies of marine water, deeper than 6 m at low tide lying within the wetland”. Wetlands can also be distinguished by the presence of water, either at the surface or within the root zone, seasonally or permanently, they often have unique soil conditions that differ from adjacent uplands, and they support vegetation adapted to the wet conditions
(hydrophytes) and, conversely, are characterized by an absence of flooding-intolerant vegetation (Mitsch and Gosselink, 2007). Wetlands have been estimated to cover 5-10% of the earth surface, about 1280 million hectares (Mitsch and Goselink, 2007; Ramsar Convention Secretariat, 2007). According to Turner et al. (2000) wetland ecosystems are the only group of ecosystems with their own international convention, they as well gave rise to the first modern global nature conservation convention (Mathews 1993). Wetlands of tropical Africa play a vital role in the provision of food and water and is a source of livelihood to the many rural dwellers living around them (Silvieus et al., 2000; Rebelo et al., 2009), increasing their interest because of their importance as hot spots for development (Dungan et al., 2006).
Wetlands are of high agricultural and aquaculture interest, as well as environmental conservation. Its benefits and values to the society have attracted increasing global importance, but unfortunately, wetland areas are under increasing pressure stemming from developments and industrialization, including oil exploration and spillage. According to Moser et al. (1996), globally wetlands have been reduced by 50% in the last one hundred years. The millennium ecosystem assessment (2005) stressed that global wetland loss is more rapid than those of other ecosystems (Agardy and Alder, 2005) with the United States and Europe having lost over 50% of their wetlands (Finlayson and Davidson, 1999). Some other severe cases include the loss of 80% of Pacific Coast estuarine wetlands in Canada; about 90% of New Zealand wetland areas and 88% of Cauca river system in Columbia (Morse et al., 1996).
Welcomme (1976) stated that in Africa, a continent where protein shortage continues to cause malnutrition, the area of wetlands in watersheds strongly predicts fish
Chidumeje et al 453 harvests. Benefits provided by wetlands are quite
enormous, with increased importance worldwide, hence the need to protect the remaining wetlands (Millenium Ecosystem Assessment, 2005). Many wetlands have been greatly destroyed and altered as a result of anthropogenic activities resulting from oil exploration and exploitation, therefore the need to develop an approach for monitoring wetlands is necessary in order to identify, plan and implement proper management and containment responses to affected sites, at local, regional, national and international levels. In Nigeria, an estimated 28,000 km
2 (about 3%) of the 923,768 km
2 land surface area of
the country area is covered with wetlands (Uluocha and Okeke, 2004).
Majority of the threats to Nigerian wetlands include oil and industrial waste pollution, population pressure, rapid urbanization, mining, dam construction and transportation routes among others. The Niger Delta Region has been faced with different environmental, social, health and economic threats from oil exploration and exploitation activities. For the purpose of this paper, the environmental threats and impacts are discussed. Dredging Dredging involves cutting away large swathes of seafloor, lifting or sucking it up and dumping it somewhere else – usually into deeper water further out to sea or to “reclamation” areas where sea is turned into land. This activity is usually undertaken in coastal waters so that large ships can access ports. Seabeds, seagrasses and marine animals living on the sea floor in the dredged area are totally eradicated. Dredging can also cause the direct death of larger mobile species such as turtles by being drawn into the path of the dredgers. Studies by Rim-Rukeh et al. (2007) and Ohimain et al. (2008) reveal that dredging is responsible for physico-chemical changes in the water of the delta, particularly pH, total dissolved and suspended solids (TDS and TSS), conductivity, turbidity, sulphate, dissolved oxygen and oxygen demand. The process of dredging causes water degradation as well as harmful effects on fishes. Wetland reclamation Wetland reclamation exists in the form of forest clearing for agriculture and road constructions, which drastically change the natural state of the wetlands and impacts heavily on the flora and fauna of the wetland ecosystem. According to Abam and Okogbue (1993), the Nigerian governments have been forced to reclaim marginal lands in the swamps of the Niger Delta. Wetland reclamation remains one of the most important issues regarding
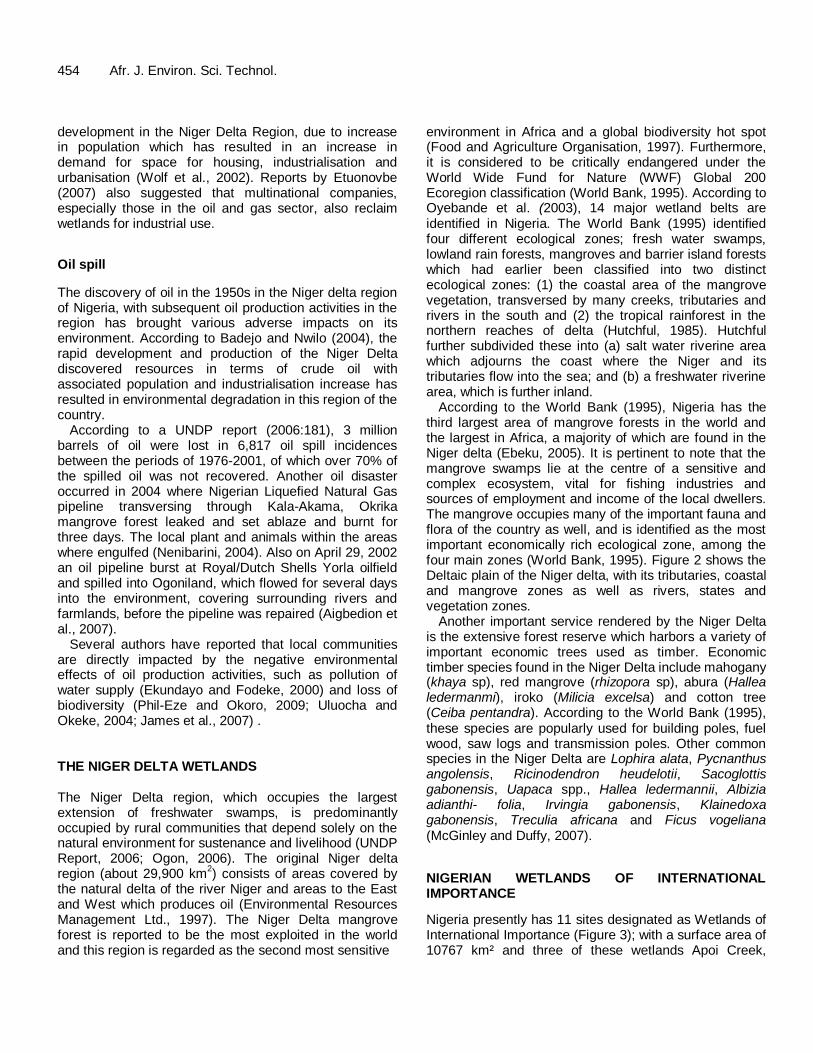
454 Afr. J. Environ. Sci. Technol. development in the Niger Delta Region, due to increase in population which has resulted in an increase in demand for space for housing, industrialisation and urbanisation (Wolf et al., 2002). Reports by Etuonovbe (2007) also suggested that multinational companies, especially those in the oil and gas sector, also reclaim wetlands for industrial use.
Oil spill
The discovery of oil in the 1950s in the Niger delta region of Nigeria, with subsequent oil production activities in the region has brought various adverse impacts on its environment. According to Badejo and Nwilo (2004), the rapid development and production of the Niger Delta discovered resources in terms of crude oil with associated population and industrialisation increase has resulted in environmental degradation in this region of the country.
According to a UNDP report (2006:181), 3 million barrels of oil were lost in 6,817 oil spill incidences between the periods of 1976-2001, of which over 70% of the spilled oil was not recovered. Another oil disaster occurred in 2004 where Nigerian Liquefied Natural Gas pipeline transversing through Kala-Akama, Okrika mangrove forest leaked and set ablaze and burnt for three days. The local plant and animals within the areas where engulfed (Nenibarini, 2004). Also on April 29, 2002 an oil pipeline burst at Royal/Dutch Shells Yorla oilfield and spilled into Ogoniland, which flowed for several days into the environment, covering surrounding rivers and farmlands, before the pipeline was repaired (Aigbedion et al., 2007).
Several authors have reported that local communities are directly impacted by the negative environmental effects of oil production activities, such as pollution of water supply (Ekundayo and Fodeke, 2000) and loss of biodiversity (Phil-Eze and Okoro, 2009; Uluocha and Okeke, 2004; James et al., 2007) . THE NIGER DELTA WETLANDS The Niger Delta region, which occupies the largest extension of freshwater swamps, is predominantly occupied by rural communities that depend solely on the natural environment for sustenance and livelihood (UNDP Report, 2006; Ogon, 2006). The original Niger delta region (about 29,900 km
2) consists of areas covered by
the natural delta of the river Niger and areas to the East and West which produces oil (Environmental Resources Management Ltd., 1997). The Niger Delta mangrove
forest is reported to be the most exploited in the world and this region is regarded as the second most sensitive
environment in Africa and a global biodiversity hot spot (Food and Agriculture Organisation, 1997). Furthermore, it is considered to be critically endangered under the World Wide Fund for Nature (WWF) Global 200 Ecoregion classification (World Bank, 1995). According to Oyebande et al. (2003), 14 major wetland belts are identified in Nigeria. The World Bank (1995) identified four different ecological zones; fresh water swamps, lowland rain forests, mangroves and barrier island forests which had earlier been classified into two distinct ecological zones: (1) the coastal area of the mangrove vegetation, transversed by many creeks, tributaries and rivers in the south and (2) the tropical rainforest in the northern reaches of delta (Hutchful, 1985). Hutchful further subdivided these into (a) salt water riverine area which adjourns the coast where the Niger and its tributaries flow into the sea; and (b) a freshwater riverine area, which is further inland.
According to the World Bank (1995), Nigeria has the third largest area of mangrove forests in the world and the largest in Africa, a majority of which are found in the Niger delta (Ebeku, 2005). It is pertinent to note that the mangrove swamps lie at the centre of a sensitive and complex ecosystem, vital for fishing industries and sources of employment and income of the local dwellers. The mangrove occupies many of the important fauna and flora of the country as well, and is identified as the most important economically rich ecological zone, among the four main zones (World Bank, 1995). Figure 2 shows the Deltaic plain of the Niger delta, with its tributaries, coastal and mangrove zones as well as rivers, states and vegetation zones.
Another important service rendered by the Niger Delta is the extensive forest reserve which harbors a variety of important economic trees used as timber. Economic timber species found in the Niger Delta include mahogany (khaya sp), red mangrove (rhizopora sp), abura (Hallea ledermanmi), iroko (Milicia excelsa) and cotton tree (Ceiba pentandra). According to the World Bank (1995), these species are popularly used for building poles, fuel wood, saw logs and transmission poles. Other common species in the Niger Delta are Lophira alata, Pycnanthus angolensis, Ricinodendron heudelotii, Sacoglottis
gabonensis, Uapaca spp., Hallea ledermannii, Albizia adianthi- folia, Irvingia gabonensis, Klainedoxa gabonensis, Treculia africana and Ficus vogeliana (McGinley and Duffy, 2007).
NIGERIAN WETLANDS OF INTERNATIONAL IMPORTANCE
Nigeria presently has 11 sites designated as Wetlands of International Importance (Figure 3); with a surface area of 10767 km² and three of these wetlands Apoi Creek,
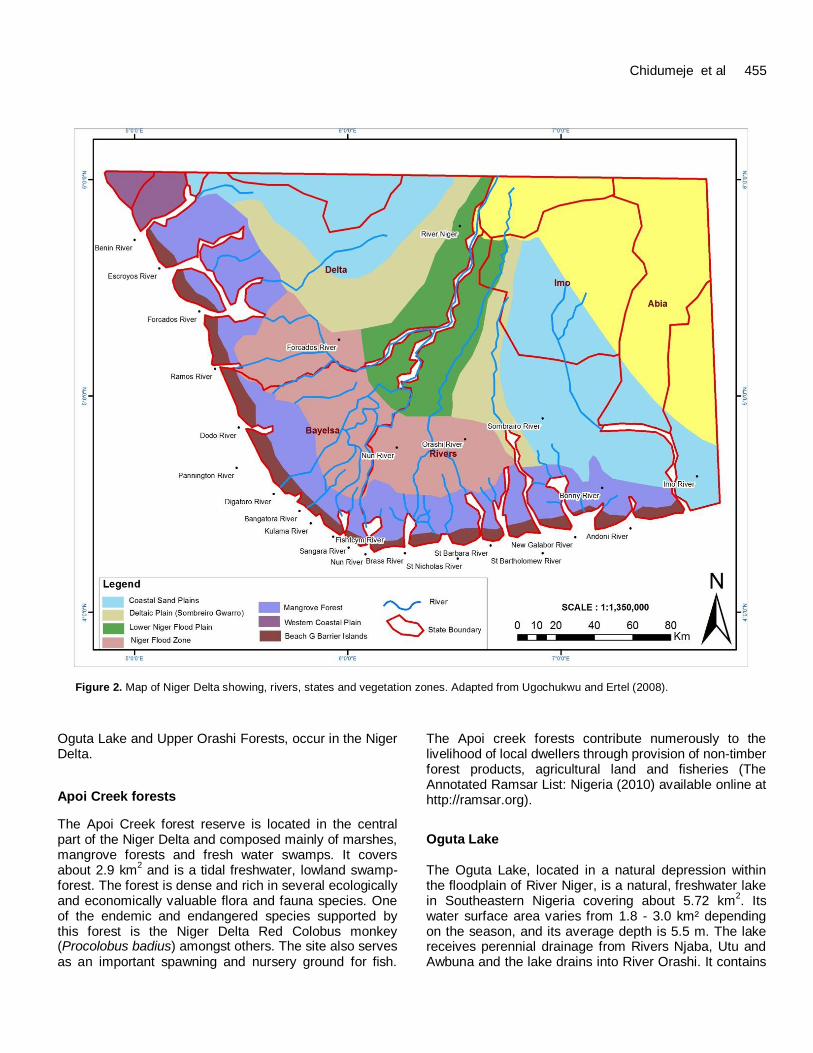
Chidumeje et al 455
Figure 2. Map of Niger Delta showing, rivers, states and vegetation zones. Adapted from Ugochukwu and Ertel (2008).
Oguta Lake and Upper Orashi Forests, occur in the Niger Delta.
Apoi Creek forests
The Apoi Creek forest reserve is located in the central part of the Niger Delta and composed mainly of marshes, mangrove forests and fresh water swamps. It covers about 2.9 km
2 and is a tidal freshwater, lowland swamp-
forest. The forest is dense and rich in several ecologically and economically valuable flora and fauna species. One of the endemic and endangered species supported by this forest is the Niger Delta Red Colobus monkey (Procolobus badius) amongst others. The site also serves as an important spawning and nursery ground for fish.
The Apoi creek forests contribute numerously to the livelihood of local dwellers through provision of non-timber forest products, agricultural land and fisheries (The Annotated Ramsar List: Nigeria (2010) available online at http://ramsar.org).
Oguta Lake The Oguta Lake, located in a natural depression within the floodplain of River Niger, is a natural, freshwater lake in Southeastern Nigeria covering about 5.72 km
2. Its
water surface area varies from 1.8 - 3.0 km² depending on the season, and its average depth is 5.5 m. The lake receives perennial drainage from Rivers Njaba, Utu and Awbuna and the lake drains into River Orashi. It contains
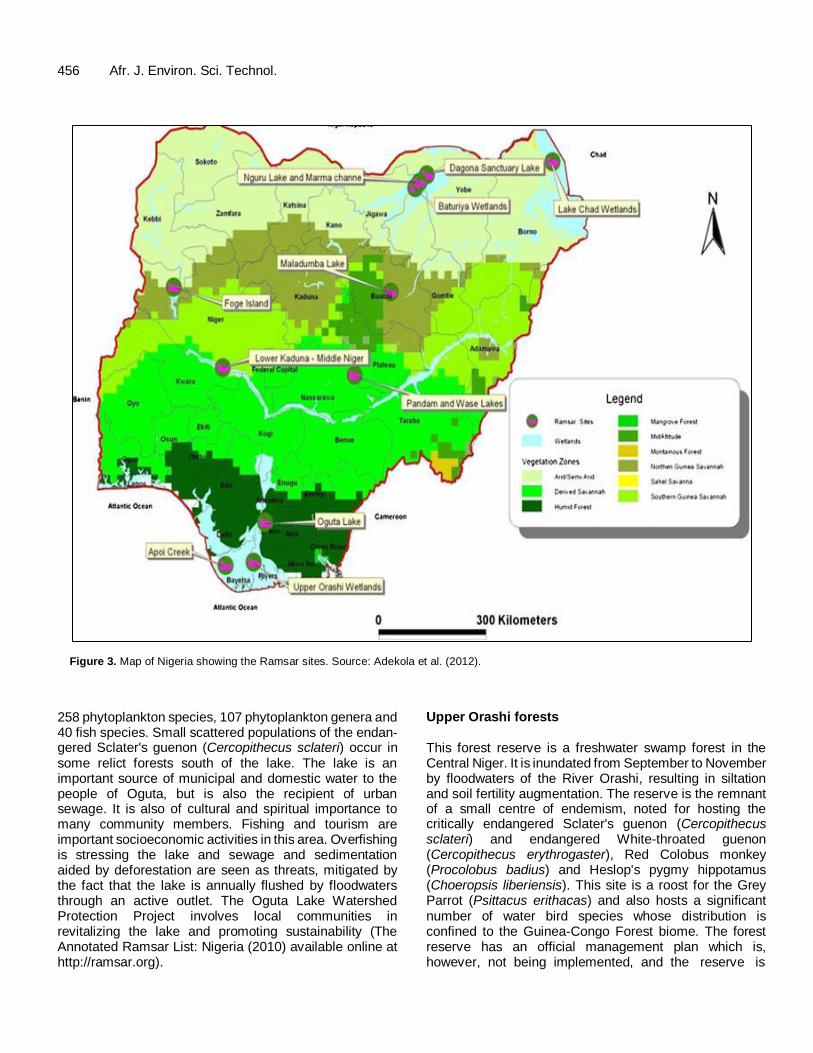
456 Afr. J. Environ. Sci. Technol.
Figure 3. Map of Nigeria showing the Ramsar sites. Source: Adekola et al. (2012).
258 phytoplankton species, 107 phytoplankton genera and 40 fish species. Small scattered populations of the endan-gered Sclater's guenon (Cercopithecus sclateri) occur in some relict forests south of the lake. The lake is an important source of municipal and domestic water to the people of Oguta, but is also the recipient of urban sewage. It is also of cultural and spiritual importance to many community members. Fishing and tourism are important socioeconomic activities in this area. Overfishing is stressing the lake and sewage and sedimentation aided by deforestation are seen as threats, mitigated by the fact that the lake is annually flushed by floodwaters through an active outlet. The Oguta Lake Watershed Protection Project involves local communities in revitalizing the lake and promoting sustainability (The Annotated Ramsar List: Nigeria (2010) available online at http://ramsar.org).
Upper Orashi forests This forest reserve is a freshwater swamp forest in the Central Niger. It is inundated from September to November by floodwaters of the River Orashi, resulting in siltation and soil fertility augmentation. The reserve is the remnant of a small centre of endemism, noted for hosting the critically endangered Sclater's guenon (Cercopithecus sclateri) and endangered White-throated guenon
(Cercopithecus erythrogaster), Red Colobus monkey (Procolobus badius) and Heslop's pygmy hippotamus (Choeropsis liberiensis). This site is a roost for the Grey Parrot (Psittacus erithacas) and also hosts a significant number of water bird species whose distribution is confined to the Guinea-Congo Forest biome. The forest reserve has an official management plan which is, however, not being implemented, and the reserve is
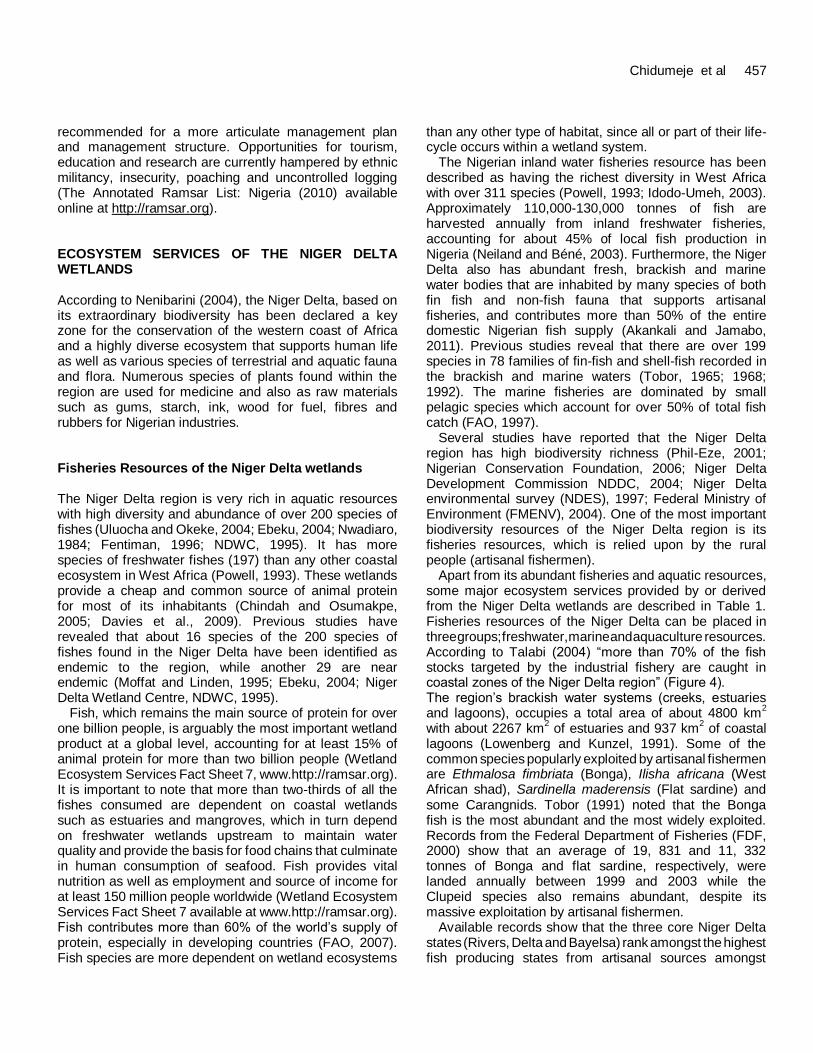
recommended for a more articulate management plan and management structure. Opportunities for tourism, education and research are currently hampered by ethnic militancy, insecurity, poaching and uncontrolled logging (The Annotated Ramsar List: Nigeria (2010) available online at http://ramsar.org). ECOSYSTEM SERVICES OF THE NIGER DELTA WETLANDS According to Nenibarini (2004), the Niger Delta, based on its extraordinary biodiversity has been declared a key zone for the conservation of the western coast of Africa and a highly diverse ecosystem that supports human life as well as various species of terrestrial and aquatic fauna and flora. Numerous species of plants found within the region are used for medicine and also as raw materials such as gums, starch, ink, wood for fuel, fibres and rubbers for Nigerian industries. Fisheries Resources of the Niger Delta wetlands The Niger Delta region is very rich in aquatic resources with high diversity and abundance of over 200 species of fishes (Uluocha and Okeke, 2004; Ebeku, 2004; Nwadiaro, 1984; Fentiman, 1996; NDWC, 1995). It has more species of freshwater fishes (197) than any other coastal ecosystem in West Africa (Powell, 1993). These wetlands provide a cheap and common source of animal protein for most of its inhabitants (Chindah and Osumakpe, 2005; Davies et al., 2009). Previous studies have revealed that about 16 species of the 200 species of fishes found in the Niger Delta have been identified as endemic to the region, while another 29 are near endemic (Moffat and Linden, 1995; Ebeku, 2004; Niger Delta Wetland Centre, NDWC, 1995).
Fish, which remains the main source of protein for over one billion people, is arguably the most important wetland product at a global level, accounting for at least 15% of animal protein for more than two billion people (Wetland Ecosystem Services Fact Sheet 7, www.http://ramsar.org). It is important to note that more than two-thirds of all the fishes consumed are dependent on coastal wetlands such as estuaries and mangroves, which in turn depend on freshwater wetlands upstream to maintain water quality and provide the basis for food chains that culminate in human consumption of seafood. Fish provides vital nutrition as well as employment and source of income for at least 150 million people worldwide (Wetland Ecosystem Services Fact Sheet 7 available at www.http://ramsar.org). Fish contributes more than 60% of the world’s supply of protein, especially in developing countries (FAO, 2007). Fish species are more dependent on wetland ecosystems
Chidumeje et al 457 than any other type of habitat, since all or part of their life-cycle occurs within a wetland system.
The Nigerian inland water fisheries resource has been described as having the richest diversity in West Africa with over 311 species (Powell, 1993; Idodo-Umeh, 2003). Approximately 110,000-130,000 tonnes of fish are
harvested annually from inland freshwater fisheries, accounting for about 45% of local fish production in Nigeria (Neiland and Béné, 2003). Furthermore, the Niger Delta also has abundant fresh, brackish and marine water bodies that are inhabited by many species of both fin fish and non-fish fauna that supports artisanal fisheries, and contributes more than 50% of the entire domestic Nigerian fish supply (Akankali and Jamabo, 2011). Previous studies reveal that there are over 199 species in 78 families of fin-fish and shell-fish recorded in the brackish and marine waters (Tobor, 1965; 1968; 1992). The marine fisheries are dominated by small pelagic species which account for over 50% of total fish catch (FAO, 1997).
Several studies have reported that the Niger Delta region has high biodiversity richness (Phil-Eze, 2001; Nigerian Conservation Foundation, 2006; Niger Delta Development Commission NDDC, 2004; Niger Delta environmental survey (NDES), 1997; Federal Ministry of Environment (FMENV), 2004). One of the most important biodiversity resources of the Niger Delta region is its fisheries resources, which is relied upon by the rural people (artisanal fishermen).
Apart from its abundant fisheries and aquatic resources, some major ecosystem services provided by or derived from the Niger Delta wetlands are described in Table 1. Fisheries resources of the Niger Delta can be placed in
three groups; freshwater, marine and aquaculture resources. According to Talabi (2004) “more than 70% of the fish stocks targeted by the industrial fishery are caught in coastal zones of the Niger Delta region” (Figure 4). The region’s brackish water systems (creeks, estuaries and lagoons), occupies a total area of about 4800 km
2
with about 2267 km2 of estuaries and 937 km
2 of coastal
lagoons (Lowenberg and Kunzel, 1991). Some of the common species popularly exploited by artisanal fishermen are Ethmalosa fimbriata (Bonga), Ilisha africana (West African shad), Sardinella maderensis (Flat sardine) and some Carangnids. Tobor (1991) noted that the Bonga fish is the most abundant and the most widely exploited. Records from the Federal Department of Fisheries (FDF, 2000) show that an average of 19, 831 and 11, 332 tonnes of Bonga and flat sardine, respectively, were landed annually between 1999 and 2003 while the Clupeid species also remains abundant, despite its massive exploitation by artisanal fishermen.
Available records show that the three core Niger Delta states (Rivers, Delta and Bayelsa) rank amongst the highest fish producing states from artisanal sources amongst
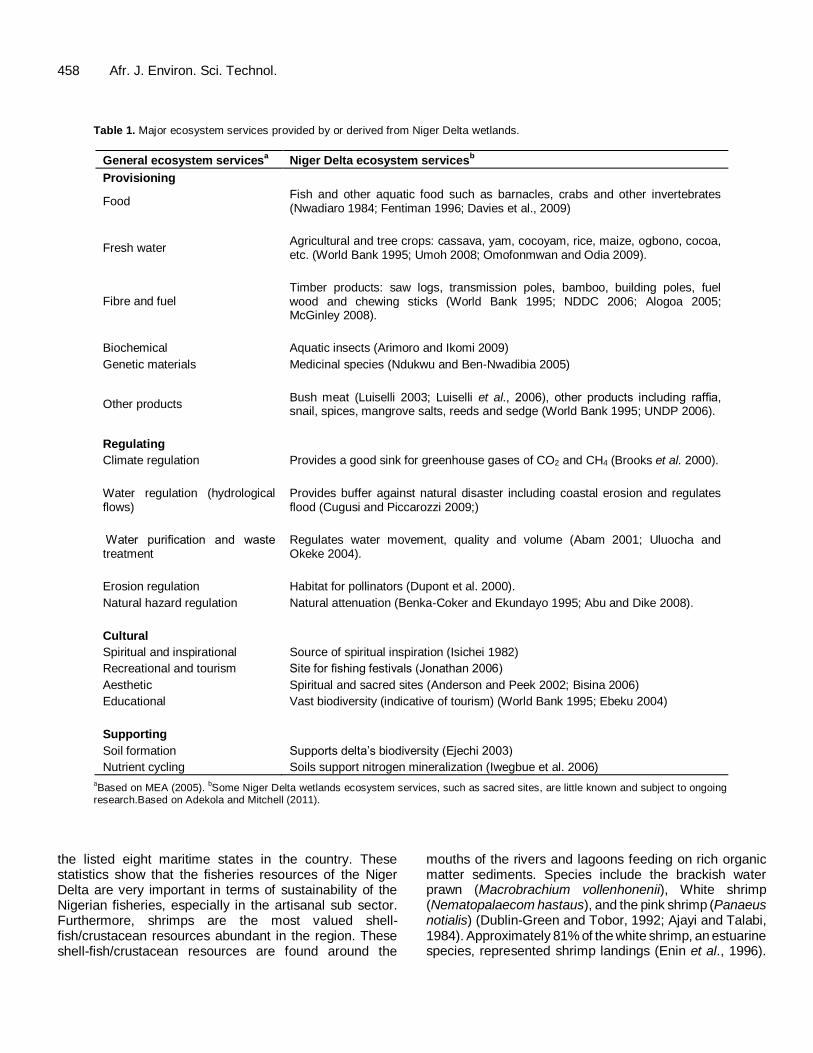
458 Afr. J. Environ. Sci. Technol.
Table 1. Major ecosystem services provided by or derived from Niger Delta wetlands.
General ecosystem servicesa Niger Delta ecosystem services
b
Provisioning
Food Fish and other aquatic food such as barnacles, crabs and other invertebrates (Nwadiaro 1984; Fentiman 1996; Davies et al., 2009)
Fresh water Agricultural and tree crops: cassava, yam, cocoyam, rice, maize, ogbono, cocoa, etc. (World Bank 1995; Umoh 2008; Omofonmwan and Odia 2009).
Fibre and fuel Timber products: saw logs, transmission poles, bamboo, building poles, fuel wood and chewing sticks (World Bank 1995; NDDC 2006; Alogoa 2005; McGinley 2008).
Biochemical Aquatic insects (Arimoro and Ikomi 2009)
Genetic materials Medicinal species (Ndukwu and Ben-Nwadibia 2005)
Other products Bush meat (Luiselli 2003; Luiselli et al., 2006), other products including raffia, snail, spices, mangrove salts, reeds and sedge (World Bank 1995; UNDP 2006).
Regulating
Climate regulation Provides a good sink for greenhouse gases of CO2 and CH4 (Brooks et al. 2000).
Water regulation (hydrological flows)
Provides buffer against natural disaster including coastal erosion and regulates flood (Cugusi and Piccarozzi 2009;)
Water purification and waste treatment
Regulates water movement, quality and volume (Abam 2001; Uluocha and Okeke 2004).
Erosion regulation Habitat for pollinators (Dupont et al. 2000).
Natural hazard regulation Natural attenuation (Benka-Coker and Ekundayo 1995; Abu and Dike 2008).
Cultural
Spiritual and inspirational Source of spiritual inspiration (Isichei 1982)
Recreational and tourism Site for fishing festivals (Jonathan 2006)
Aesthetic Spiritual and sacred sites (Anderson and Peek 2002; Bisina 2006)
Educational Vast biodiversity (indicative of tourism) (World Bank 1995; Ebeku 2004)
Supporting
Soil formation Supports delta’s biodiversity (Ejechi 2003)
Nutrient cycling Soils support nitrogen mineralization (Iwegbue et al. 2006) aBased on MEA (2005).
bSome Niger Delta wetlands ecosystem services, such as sacred sites, are little known and subject to ongoing
research.Based on Adekola and Mitchell (2011).
the listed eight maritime states in the country. These statistics show that the fisheries resources of the Niger Delta are very important in terms of sustainability of the Nigerian fisheries, especially in the artisanal sub sector. Furthermore, shrimps are the most valued shell-fish/crustacean resources abundant in the region. These shell-fish/crustacean resources are found around the
mouths of the rivers and lagoons feeding on rich organic matter sediments. Species include the brackish water prawn (Macrobrachium vollenhonenii), White shrimp (Nematopalaecom hastaus), and the pink shrimp (Panaeus notialis) (Dublin-Green and Tobor, 1992; Ajayi and Talabi, 1984). Approximately 81% of the white shrimp, an estuarine species, represented shrimp landings (Enin et al., 1996).
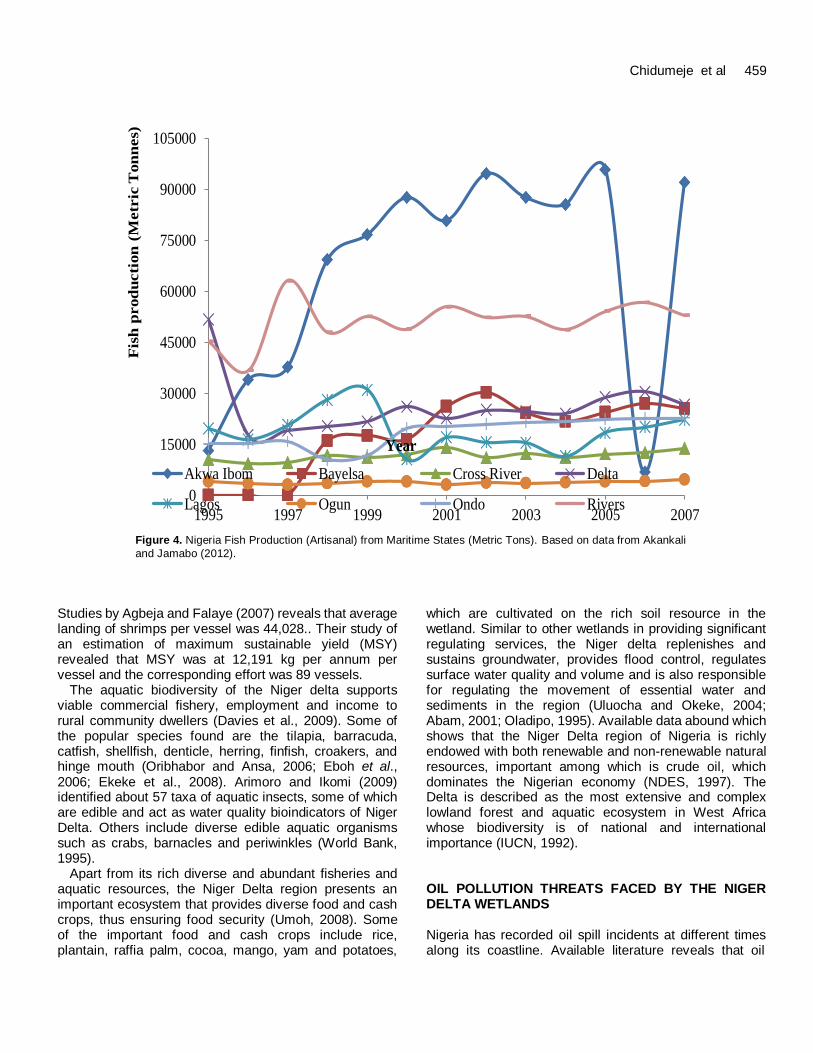
Chidumeje et al 459
Figure 4. Nigeria Fish Production (Artisanal) from Maritime States (Metric Tons). Based on data from Akankali
and Jamabo (2012).
Studies by Agbeja and Falaye (2007) reveals that average landing of shrimps per vessel was 44,028.. Their study of an estimation of maximum sustainable yield (MSY) revealed that MSY was at 12,191 kg per annum per vessel and the corresponding effort was 89 vessels.
The aquatic biodiversity of the Niger delta supports viable commercial fishery, employment and income to rural community dwellers (Davies et al., 2009). Some of the popular species found are the tilapia, barracuda, catfish, shellfish, denticle, herring, finfish, croakers, and hinge mouth (Oribhabor and Ansa, 2006; Eboh et al., 2006; Ekeke et al., 2008). Arimoro and Ikomi (2009) identified about 57 taxa of aquatic insects, some of which are edible and act as water quality bioindicators of Niger Delta. Others include diverse edible aquatic organisms such as crabs, barnacles and periwinkles (World Bank, 1995).
Apart from its rich diverse and abundant fisheries and aquatic resources, the Niger Delta region presents an important ecosystem that provides diverse food and cash crops, thus ensuring food security (Umoh, 2008). Some of the important food and cash crops include rice, plantain, raffia palm, cocoa, mango, yam and potatoes,
which are cultivated on the rich soil resource in the wetland. Similar to other wetlands in providing significant regulating services, the Niger delta replenishes and sustains groundwater, provides flood control, regulates surface water quality and volume and is also responsible for regulating the movement of essential water and sediments in the region (Uluocha and Okeke, 2004; Abam, 2001; Oladipo, 1995). Available data abound which shows that the Niger Delta region of Nigeria is richly endowed with both renewable and non-renewable natural resources, important among which is crude oil, which dominates the Nigerian economy (NDES, 1997). The Delta is described as the most extensive and complex lowland forest and aquatic ecosystem in West Africa whose biodiversity is of national and international importance (IUCN, 1992). OIL POLLUTION THREATS FACED BY THE NIGER DELTA WETLANDS Nigeria has recorded oil spill incidents at different times along its coastline. Available literature reveals that oil
0
15000
30000
45000
60000
75000
90000
105000
1995 1997 1999 2001 2003 2005 2007
Fis
h p
rod
ucti
on
(M
etr
ic T
on
nes)
Year
Akwa Ibom Bayelsa Cross River Delta
Lagos Ogun Ondo Rivers
460 Afr. J. Environ. Sci. Technol. spillage routinely occurs in the Niger Delta region, despite its fragile ecosystem and biodiversity. According to Dublin -Green et al. (1998) about 5,334 reported cases of crude oil spillage occurred between 1976 and 1997, with an estimated 2.8 million barrels of oil released into estuaries, inland and coastal waters, land and swamps of Nigeria.
The associated impacts of oil spills in mangrove vegetation and coastal waters cannot be overemphasized. Generally, oil spills in Nigeria are not reported, as they are considered “minor” spills. Major spills recorded in the coastal zone are the Texaco Funiwa-5 blowout in 1980 of about 400,000 barrels, GOCON’s Escravos spill in 1978 of about 300,000 barrels and SPDC’s Forcados Terminal tank failure in 1978 of about 580,000 barrels. Others are those of the Jesse Fire Incident with a loss of about 1,000 people and the Idoho Oil Spill in January 1998, of about 40,000 barrels and the Abudu pipe line in 1982 of about 18,818 barrels. Nigeria's largest spill was an offshore well-blow out in January 1980 when an estimated 200,000 barrels of oil (8.4million US gallons) spilled into the Atlantic Ocean from an oil industry facility, damaging 340 ha of mangrove (Nwilo and Badejo, 2005). Annon (2006) described Nigeria’s Niger Delta as one of the world’s most severely impacted ecosystem by petroleum, with an estimate of 9 to 13 million barrels of oil spilled in the Niger Delta ecosystem in the past 53 years, 50 times the volume spilled in the Exxon Valdez Oil Spill in Alaska in 1989 (Leschine et al., 1993; Weiner et al., 1997). Others include the Okoma pipeline spillage in 1985, the Bomu 11 blowout in 1970, the Oyakana pipeline spillage of 1980 and the Oshaka pipeline of 1993, among others.
Between 1976 and 1996 a total of 4,647 incidents resulted in the spill of approximately 2,369,470 barrels of oil into the environment. An estimated 1,820,410.5 barrels (77%) of this quantity was lost to the environment. About 549,060 barrels of oil, representing 23.17% of the total oil spilt into the environment, was recovered. The heaviest recorded spill so far occurred in 1979 and 1980 with a net volume of 694,117 barrels and 600,511 barrels, respect-tively (Department of Petroleum Resources (DPR 1991).
Oil spills pose one of the greatest environmental challenges globally, constituting harmful effects on both human health and aquatic organisms. Fishing resources can be damaged through physical contamination, bio-accumulation, and damaging of spawning grounds, as well as habitat destruction, depending on the circumstances of the spill and time of response. Many coastal communities are affected.
A summary of major pollutants released from oil industries into the environment has been highlighted by Ukoli (2005) as follows:
i) Pollutants from petroleum refining activities which includes: Phenol, suspended solids, oil and grease, hydro-carbons and total suspended solids, cyanide and sulphide,
ii) Oil exploration and oil production activities causing changes to the physical and chemical properties of the wetlands such as changes in temperature, turbidity, drilling muds, biological oxygen demand, heavy metals, salinity and pH. THE NEED TO PROTECT WETLANDS The Ramsar convention on wetlands was established at the international level to protect wetlands (Frazier, 1999). Public attitudes towards wetlands are changing rapidly, with laws set out to protect them. For example, the United States has a National Policy on net loss of wetlands; projects that eliminate one must replace it with another area of similar wetland. The law also states that higher priority be given to avoid wetland loss (before compensa-tion) (NRC 2001). Therefore, wetlands and estuaries are receiving more attention and protection from the public following many years of degradation arising from eutrophic-cation, dredge and fill operations, subsidence/erosion, urban development toxic pollutants, and impoundments (Morris et al., 2002). The need to protect wetlands cannot be overemphasized, based on these following important reasons. i) Wetlands are among the most fertile, productive ecosystems in the world, rivalling the likes of tropical rainforests and coral reefs (www.ramsar.org). ii) Two thirds of all fish consumed worldwide are dependent on coastal wetlands at some stage in their life cycle (www.ramsar.org). iii) Annual fish and seafood production in swamps and marshes worldwide has been estimated at an average of nine tons per km
2, 259 ha or 640 acres) (www.ramsar.org).
Recommendations
Industries, including agriculture, should improve their best management practices to reduce the effects of non-point source pollution on wetlands and the surrounding environments. International organizations, such as IUCN and UNEP, oil companies, the federal ministry of environment, Nigeria Oil Spill Detection and Response Agency (NOSDRA) and NESREA should put strict regulatory policies and sanctions on pollution. Acts and legislations should be put in place by appropriate national environmental bodies. Villagers should report as early as possible any case of oil spill. Quality control of pesticides and chemicals used for agricultural purposes should be carried out. Preventing oil pollution through adequate monitoring of oil pipelines and oil wells, as well as illegal discharge of toxic wastes and crude oil into water bodies can be effectively achieved by employing GIS and remote sensing techniques.
CONCLUSION
This paper has reviewed the importance of the Niger delta coastal wetlands in terms of its fisheries biodiversity, as well as its economic, social and cultural services, and the need to conserve the region from anthropogenic activities arising from oil activities which leads to biodiversity loss. Statistics show that fisheries production from the Niger delta states has declined over the years. It is recommended that international bodies, oil companies as well as the federal government should put in place strict policies to mitigate wetland pollution and degradation. Also recommended is the adoption of the use of appropriate tools, such as GIS and remote sensing, to ensure adequate monitoring of the Niger Delta coastal wetlands, considering its importance to the Nigerian natural resource and fisheries sectors.
Conflict of interest The authors did not declare any conflict of interest. REFERENCES
Abam TKS (2001). Regional hydrological research perspectives in the
Niger Delta. Hydrol Sci. 46:13–25.
Abam TKS, Okogbue CO (1993). Utilization of marginal lands for construction in the Niger Delta. Bull. of the Int. Association of Engr. Geology 48: pp. 5-14
Abu GO, Dike PO (2008). A study of natural attenuation processes involved in a microcosm model of a crude oil-impacted wetland sediment in the Niger Delta. Biores Technol. 99: 4761–4767.
Adekola O, Mitchell G (2011) .The Niger Delta wetlands: threats to ecosystem services, Their importance to dependent communities and possible management measures, Intl J. Biodiversity Science,
Ecosystem Services & Management, 7:1, 50-68. Adekola O, Morardet S, De-Groot RS, Grelot F (2012). Economic value
of provisioning services and livelihood dependence on the Ga-
Mampe wetland, South Africa. 13th IWRA World Water Congress. Agardy T, Alder J (2005). Coastal Systems. In Millennium Ecosystem
Assessment. Vol. 1,
Ecosystems and Human Wellbeing: Current State and Trends. Findings of the Conditions and Trends Working Group.Washington, D.C: Island Press
Aigbedion I, Iyayi SE Agbeboh GU (2007). Prospect Assessment and Risk Analysis: Example from Niger Delta, Nigeria Basin, World Applied Science Journal, 2(6):569-574.
Ajonina G, Diamé A, Kairo J (2008). Current status and conservation of mangroves in Africa: an overview. World Rainforest Mov Bull [Internet]. [cited 2014 March 13]; 133. Available from: http: //
wrmbulletin.wordpress.com/2008/08/25/current-status-and-conservation-of-mangroves-in-africa-an-overview.
Akankali JA, Jamabo NA (2012) Effects of Flooding and Erosion on
Fisheries Resources in Niger Delta, Nigeria European Journal of Scientific Research ISSN 1450-216X Vol. 90 No 1 November, , pp.14-25© EuroJournals Publishing, Inc.
Alogoa AJ (2005). A history of the Niger Delta: an historical interpretation of Ijo oral tradition. Port Harcourt (Nigeria): Onyoma Research Publications.
Anderson MG, Peek PM (2002). Ways of the rivers: arts and environment of the Niger Delta. 1st ed. Los Angeles (CA): University
Chidumeje et al 461
of California Los Angeles, Fowler. Annon (2006). Niger Delta Natural Resource Damage Assessment and
Restoration Project. Phase 1– Scoping Report. Federal Ministry of
Environment, Abuja Nigeria Conservation Foundation,Lagos. Arimoro FO, Ikomi RB (2009). Ecological integrity of upper Warri River,
Niger Delta using aquatic insects as bioindicators. Ecol Indic. 9:455–
461. Agbeja YE, Falaye AE ( 2007). Economic Analysis of Industrial Shrimp
Fishery in Nigeria. J Fis Intl, 2: 171-177.
Asibor G (2009). Wetlands: values, uses and challenges. A Paper presented to the Nigerian Environmental Society at the Petroleum Training Institute, Effurun, 21stNovember, 2009.
Barbier EB, Acreman M, Knowler D (1997). Economic Valuation of Wetlands, A Guide for Policy Makers and Planners Ramsar Convention Bureau, Gland, Switzerland.
Bisina J (2006). Environmental degradation in the Niger Delta. Port Harcourt (Nigeria): Niger Delta Environmental Roundtable Hotel Presidential Port Harcourt.
Benka-Coker MO, Ekundayo JA (1995). Effects of an oil spill on soil physico-chemical properties of a spill site in the Niger Delta area of Nigeria. Environ Monit Assess. 36:93–104.
Brook BW, O'Grady JJ, Chapman, AP, Burgman MA, Akçakaya H R,
Frankham R (2000). Predictive accuracy of population viability analysis in conservation biology. Nature 404:385-387.
Chindah AC, Osuamkpe A (2008). The fish assemblage of the lower
Bonny River, Niger Delta, Nigeria. Afr J Ecol. 32:58–65. Chinweze C, Abiola G, Onyeri I, Echetebu CK, Jideani C (2012) Oil And
Gas Activities And The Nigerian Environment 'IAIA12 Conference
Proceedings 'Energy Future The Role of Impact Assessment 32nd
Annual Meeting of the International Association for Impact Assessment 27 May -1 June 2012, Centro de Congresso da
Alfândega, Porto Portugal (www.iaia.org). Cugusi B, Piccarozzi M (2009). Environmental change and human
mobility. A thematic literature and organisational review. Paper
presented at: International Conference: Towards the G8 Summit Climate Change and Human Mobility in Africa Dialogue for a Strategic Cooperation Between Italy and Africa; 2009 Apr 21; Rome,
Italy Davies RM, Davies OA, Abowei JFN (2009). The status of fish storage
technologies in Niger Delta Nigeria. Am J Sci Res.1:55–63.
Department of Petroleum Resources (DPR) (1991). Environmental Guidelines and Standards for the Petroleum Industry, DPR, Lagos.
Dublin-Green, CO, Nwankwo, JN, Irechukwu, DO (1998). Effective
regulation and management of the issues in the petroleum industry in Nigeria. Paper presented at: SPE International Conference on Health, Safety and Environment in Oil and Gas Exploration and
Production; 1998 Jun 7–10; Caracas, Venezuela. Dugan PJ (ed) 1990. Wetland conservation: A review of current issues
and required action IUCN, Gland, Switzerland.
Dugan P, Dey MM, Sugunan VV (2006). Fisheries and water productivity in tropical river basins: enhancing food security and livelihoods by managing water for fish. Agric Water Manage.80:262-
275. Dupont LM, Jahns S, Marret F, Ning S (2000). Vegetation change in
equatorial West Africa: time-slices for the last 150 ka. Palaeogeogr
Palaeoclimatol Palaeoecol. 155:95–122. Economic Valuation of Wetlands: A Guide for Policy Makers and
Planners. www.ramsar.org
Ebeku KSA (2004). Biodiversity conservation in Nigeria: an appraisal of the legal regime in relation to the Niger Delta area of the country. J Environ Law. 16:361–375.
Eboh L, Mepba HD, EkpoMB (2006). Heavy metal contaminants and processing effects on the composition, storage stability and fatty acid profiles of five common commercially available fish species in Oron
Local Government, Nigeria. Food Chem. 51:115–118 Egbagbe E (2009). Investment opportunities in the Niger Delta Region –
infrastructure. Paper presented at: Regenerating the Niger Delta
forum. Challenges and opportunities; 2009 Jul 7; London, UK. Ejechi BO (2003). Microbial deterioration of partially submerged service
462 Afr. J. Environ. Sci. Technol.
timbers in a tropical inter-tidal zone. Int Biodeterior
Biodegradation.97:490–497. Ekeke BA, Davies OA, Alfred-Ockiya JF (2008). Sand dredging impact
on fish catch in Bonny River Estuary, Nigeria. Environ Res J. 2:299–305.
Ekundayo EO, Fodeke VO (2000). Microbial densities and physico-
chemical qualities of some crude oil flow stations saver pit effluents in the Niger Delta Basin of Southern Nigeria Environmental Monitoring and Assessment. 65(3): 523 – 530.
Environmental Resources Management Ltd. (1997), Environmental and Socioeconomic Characteristics of the Niger Delta. ERML, Lagos.
Etuonovbe AK (2007). Coastal Settlement and Climate Changes The
Effects of Climatic Change / Sea Level Rise on the People of Awoye in Ondo State Nigeria. A paper presented at the FIG working week 2007, in Hong Kong.
Fentiman A (1996). The anthropology of oil: the impact of the oil industry on a fishing community in the Niger Delta. Soc Justice. Winter: 23.
Fingas M (2001). The basics of oil spill cleanup. Lewis Publishers. Finlayson CM, Davidson NC. (1999). Global Review of Wetland
Resources and Priorities for Wetland Inventory. Ramsar Bureau Contract 56. Gland (Switzerland): Ramsar Convention Bureau.
Food and Agriculture Organisation of the United Nations (FAO) (1997). Review of the State of the World Fishery Resource: Marine Resource. FAO Fisheries Circular No. 920 Firm/C920, Rome , 173pp
Frazier S (1999). Ramsar Sites Overview: A Synopsis of the World's Wetlands of International Importance. Wageningen (Netherlands): Wetlands International. (27 October 2008;
www.wetlands.org/RSIS/Publications/enovervw.pdf). GESAMP (IMO/FAO/UNESCO/WMO/WHO/IAEA/UN/UNEP) Joint
Group of Experts on the Scientific Aspects of Marine Pollution)
(1993). Impact of Oil and Related Chemicals and Wastes on the Marine Environment. Rep. Stud. GESAMP (50): 180pp.
Hutchful E (1985). Oil Companies and environmental pollution in
Nigeria.In Political Economy of Nigeria, ed. In Claude Ake, pp.113–140.London and Lagos: Longman.
Idodo-Umeh G (2003). Freshwater Fishes of Nigeria (Taxonomy,Ecological Notes, Diets and Utlization). Idodo-Umeh
Publ. Ltd., Benin-City, Nigeria, 232pp. Ikelegbe A (2006). The economy of conflict in the oil rich Niger Delta
region of Nigeria. Afr Asian Stud. 5:23–56 Isirimah NO (2000) Soils and Environmental Pollution Management,
Nichdano Publishers, Owerri.
Isichei E (1982). Varieties of Christian experience in Nigeria. London (UK): Macmillan Press.
Iwegbue CMA, Ekakitie AO, Egun AC ( 2006). Mineralization of nitrogen
in wetlands soils of the Niger Delta amended with water hyacinth (Eichhornia sp.). Waste Int J Soil Sci. 1:258–263.
James GK, Adegoke JO, Saba E, Nwilo P, Akinyede J. ( 2007).
Satellite-based assessment of the extent and changes in the mangrove ecosystem of the Niger Delta. Mar Geod. 30:249–267.
Jonathan G. (2006). Bayelsa State Nigeria: background infor- mation
[Internet]. Bayelsa (Nigeria): Bayelsa Council for Arts and Culture. Leschine TM, McGee J, Gaunt R (1993). Federal on-scene
Coordinator’s report T/V Exxon Valdez Oil Spill, vol. I. Department of
Transportation, Springfield, Virginia. Lowernbeg U, Kunzel T (1991). Investigation on the trawl fishery of the
Cross River Estuary, Nigeria. J. Appl. Ichthyol., 7:44-53.
Luiselli L (2003). Comparative abundance and population structure of sympatric Afrotropical tortoises in six rainforest areas: the differential effects of “traditional veneration” and of “sub- sistence hunting” by
local people. Acta Oecol. 24:157–163. Luiselli L, Politano E, Lea J (2006). Assessment of the vulnerable status
of Kinixys homeana (Testudines: Testudinidae) for the IUCN Red
List. Chelonian Conserv Biol. 5:130-138. International Union for Conservation of Nature (IUCN) (1992). Coastal
and marine, biodiversity report for UNEP: Identification establishment
and management of specially protected areas in the WACAF region, Gland, Switzerland.
Iyayi F (2004). An integrated approach to development in the Niger
Delta. A paper prepared for the Centre for Democracy and Development (CDD)
Li J (2002) Spill Management for the Toronto AOC: The City of Toronto Study. Report and factsheet prepared for the Great Lakes Sustainability Fund, Burlington, Ontario, Canada.
Matthews GVT (1993). The Ramsar Convention on Wetlands: its history and development. In: Luthi E, Ramsar, editors. Gland ( Switzerland): Ramsar Convention Bureau.
McGinley M (2008). Niger Delta swamp forests. In: Cleveland CJ, editor. Encyclopedia of earth. Washington (DC): Environmental Information Coalition, National Council for Science and the
Environment. McGinley M, Duffy JE (2007). Species diversity. In Encyclo- pedia of
Earth, ed. Cutler J Cleveland. Washington DC: Environmental
Information Coalition, National Council for Sci- ence and the Environment
Millenium Ecosystem Assesment (2005).Ecosystems and Human Well-
Being:Wetlands and Water Synthesis. World Recourses Institute,Washington,DC.
Mitsch WJ, Gosselink JG (2007). Wetlands. 4th ed. Hoboken (NJ): Wiley
Mmom PC (2003). The Niger Delta: A spatial Perspective to its Development. Port Harcourt. Zelon Enterprises.
Moffat D, Linden O (1995). Perception and reality: assessing priorities
for sustainable development in the Niger River Delta. Ambio. 24:527–538.
Moser M, Prentice C, Frazier S (1996). A global Overview of wetland
loss and degradation. In proceedings of the sixth meeting of the conference of contracting parties of the Ramsar Convention. Vol.10 March 19-27,Brisbane, Austarlia. Gland, Switzerland : Ramsar
Convention Bureau. National Population Commission. (2006). 2006 population and housing
census of the federal republic of Nigeria 2006 census: priority tables.
Abuja (Nigeria): National Population Commission. National Research Council. (NRC)2001. Compensating for Wetland
Losses under the Clean Water Act. National Academy Press.
Niger Delta Development Commission (NDDC). Nigerian Conservation Foundation. 2006. Niger Delta named most polluted ecosystem [Internet]. Lagos (Nigeria): Nigerian Conservation Foundation.
Niger Delta Environmental Survey (NDES) (1997). Environmental and Socio-economic Characteristics , second phase of field re-port, Vol. 1, 10 July 1997. Environmental Resource Manager Limited. Nigeria
Country Analysis Brief 2005. Report published by the Energy Information Administration (EIA), USA Government Department of Energy, April 2005.
NDWC, Niger Delta Wetland Centre (1995). Biodiversity management of the Niger Delta region, a field report, 5 June 1995.
Ndukwu BC, Ben-Nwadibia NB (2005). Ethnomedicinal aspects of
plants used as spices and condiments in the Niger Delta area of Nigeria. Ethnobot Leafl Int Web J [Internet]. [cited 2014 March 15]. Available from: http://www.ethnoleaflets.com/leaflets/niger.htm.
Neiland AE, Béné C (2003). Review of river fisheries valuation in West and Central Africa. Water, Ecosystem and Fisheries Review Workshop, Organised by the World Fish Centre, Phnom Penh, 15-17
Feb., 65pp. Nenibarini Z (2004). Impacts of Extractive Industries on the Biodiversity
of the Niger Delta. National Workshop on Coastal and Marine
Biodiversity Management. NNPC, Nigerian National Petroleum Coperation, Monthly Petroleum Information. September, Lagos, Nigeria, 1984:53
Nigerian Conservation Foundation, WWF UK and International Union for Conservation of Nature (IUCN), Commission on Environmental, Economic and Social Policy, with Federal Ministry of Environment
(Abuja), "Niger Delta Natural Resources Damage Assessment and Restoration Project Scoping Report", May 2006
Nigerian Population Commission (NPC) (2006). Report of National
Census of 2006 Ntukekpo DS (1996). Spillage: Bane of Petroleum. Report published in
Ultimate Water Technology & Environment. Nwadiaro C (1984). The longitudinal distribution of macroinvertebrates
and fish in a lower Niger Delta river (River Sombreiro) in Nigeria.
Aquat Ecol. 18:133–140. Nwilo PC, Badejo OT (2005). Oil spill problems and management in the
Niger Delta. Paper presented at International Oil Spill Conference,
Miami, Florida, USA, May 2005. Oil and Gas Journal 2005. Oil and gas reserves in the Niger Delta of Nigeria. Oil and Gas Journal, 103 (41), November, 67–75.
Nwilo PC, Badejo OT (2004) Management of Oil Spill Dispersal Along the Nigerian Coastal Areas, Department of Surveying and Geoinformatics, University of Lagos.
Odiete WO (1999): Environ Phy animal pollollution. Inno Obonna and Associates, Lagos, 261 p.
Ogbe MO (2005). Biological resource conservation: a major tool for
poverty reduction in Delta State. A key note address delivered at the Delta State maiden Council meeting on Environment with all stakeholders held at Nelrose Hotel, Delta State, Nigeria between 28th
and 29th September, 2005, 16p.
Ogon EK (2006) Natural resource abundance in Nigeria: from dependence to development. Resources Policy, 33, 168-174.
Ogon P (2006). Land and forest resource use in the Niger Delta: issues
in regulation and sustainable management. Berkeley (CA): Green Governance Project, Institute of International Studies, UC.
Ohimain EI,. Imoobe TOT, Bawo DDS (2008). Changes in water
physico-chemical properties following the dredging of an oil well access canal in the Niger Delta. World J. Agric. Sc., 4: 752-758.
Oladipo EO (1995). An indication of abrupt change of rainfall and it
potential impact on energy development in Nigeria. In: Umolu JC, editor. Global climate change: impact on energy development. Lagos (Nigeria): DAMTECH Nigeria Limited .p. 30–42
Olomukoro JO (2005). Environmental pollution and its implication in Nigeria. A paper presented at the Delta State maiden council meeting on Environment with all stakeholders held at Nelrose Hotel, Delta
State, Nigeria Between 28th and 29th September, 2005, 23p. Omofonmwan SI, Odia LO (2009). Oil exploitation and conflict in the
Niger-Delta region of Nigeria. J Hum Ecol. 26:25–30.
Onuoha F (2007) Poverty, pipeline vandalisation/explosion and human security: Integrating disaster management into poverty reduction in Nigeria African Security Review 16.2: 95-108.
Oribhabor BJ, Ansa EJ (2006). Organic waste reclamation, recycling and re-use in integrated fish farming in the Niger Delta.J Appl Sci
Environ Manage. 10:47–53
Oyebande L, Obot, EO, Bdiliya HH, Oshunsanya CO (2003): An Inventory Of Wetlands in Nigeria. World Conservation Union – IUCN, West African Regional Office Ouagadougou, Burkina Faso.
Petroconsultants (1996). Petroleum exploration and production database: Houston, Texas, Petroconsultants, Inc., [database available from Petroconsultants, Inc., P.O. Box 740619, Houston, TX
77274-0619]. Phil-Eze PO, Okoro IC (2009). Sustainable biodiversity conservation in
the Niger Delta: a practical approach to conservation site selection.
Biodivers Conserv. 18:1247–1257 Powell C B (1993). Sites and species of conservation interest in the
Central Axis of the Niger Delta (Section C), report submitted to the
Natural Resources Conservation Council of Nigeria, Biodiversity Unit, Rivers State University of Science and Technology, Port Harcourt, Nigeria.
Ramsar Convention Secretariat (RCS) (2007) Wise use of wetlands: a conceptual framework for the wise use of wetlands Ramsar handbooks for the wise use of wetlands. 3rd edn. Ramsar
Convention Secretariat Gland, Switzerland.
Chidumeje et al 463 Rim-Rukeh A, Koyeme J, Ikhifa GO Okokoyo PA (2006). Chemistry of
harvested rainwater in the refinery area of Warri, Nigeria between November,
2003 and October, 2005. Int. J. Chem. 16 (2): 65-74. Robinson, D (1996). Ogoni: The Struggle
Continues. Geneva: World Council of Churches.
Rebelo LM, McCartney M, Finlayson C. ( 2009). Wetlands of Sub-Saharan Africa: distribution and contribution of agricultureto livelihoods. Wetlands Ecol Manage. 18:557–572.
Salau DA (1993). Environmental Crisis and Development in Nigeria, No 13, University of Port Harcourt Inaugural Lecture series.
Silvius MJ, Oneka M, Verhagen A. (2000). Wetlands: lifeline for people
at the edge. Phys Chem Earth B Hydrol Oceans Atmos. 25:645–652. Spalding M, F. Blasco C. Field, 1997. World Mangrove Atlas. The
International Society for Mangrove Ecosystems, Okinawa, Japan .
178 pp Tobor JG (1997). The Fish Industry in Nigeria: Status and Potential for
Self Sufficiency in Fish Production. Nigeria Institute of Maritime
NIOMR Technical Paper, 54: 34 The Annotated Ramsar List: Nigeria (2010) available online at
http://ramsar.org). Turner RK, van den Bergh JCJM, Söderqvist T, BarendregtA, van der
Straaten J, Maltby E, van Ierland EC. 2000 Ecological-economic analysis of wetlands: scientific integration for management and policy. Ecol Econ. 35:7-23
Ukoli MK (2005). Environmental Factors in the Management of the Oil and Gas Industry in Nigeria. Retrieved from www.cenbank.org.
Uluocha N, Okeke I (2004) Implications of wetlands degradation for
water resources management: lessons from Nigeria. Geo. J 61:151. Umoh SG (2008). The promise of wetland farming; evidence from
Nigeria. Agric J. 3:107–112.
United Nations Development Programme (UNDP). (2006). Niger Delta human development report. Lagos (Nigeria): United Nations Development Programme.
United Nations Environmental Programme (UNEP) (2007). The status of the Nigerian Coastal Zones. Retrieved online from www.unep.org/abdjanconvention/docs. on march 3rd, 2014.
Uzoka O (2002). Chairman, House Committee on Solid Minerals, National Assembly, Nigeria, Interview with Thisday Newspapers.
Weiner A, Berg C, Gerlach T, Grunblatt J, Holbrook K, Kuwanda M (1997). “The Exxon Valdez Oil Spill, vol. I. Department of
Transportation, Springfield, Virginia. Valdez Oil Spill: Habitat Protection as a Restoration Strategy”. Rest Ecol 5(1): 44-55.
Were JLR (2001) Cross-Niger transition forests (AT0106). Report to the World Wildlife Fund (WWF).
Wolf CP, Emerh I EA, Okosi PH (2002). Community impact assessment
of lower Niger River dredging. In: Comparing Rivers: the Mississippi and the Niger – the Fifth Randall L Gibson Tulane University – US Army Corps of Engineers Conference on the Mississippi River French
Quarter of New Orleans (LA). New Orleans (LA): Tulane University. World Bank (2005). The Niger River Basin: A Vision for Sustainable
Management. The World Geodetic System (WGS) (1984).
World Bank. (1995). Defining an environmental strategy for the Niger Delta. Nigeria: World Bank Industry and Energy Operations Division, West Central Africa Department.
Vol. 9(5), pp. 464-472, May 2015
DOI: 10.5897/AJEST2012.046
Article Number: 8A2A34352464
ISSN 1996-0786
Copyright © 2015
Author(s) retain the copyright of this article
http://www.academicjournals.org/AJEST
African Journal of Environmental Science and Technology
Full Length Research Paper
Reinventing new systems of crop production in time of agro-ecological change in Burkina Faso
Gabin Korbéogo
Department of Sociology, University of Ouagadougou, Burkina Faso.
Received 29 February, 2012; Accepted 25 March, 2015
During the last decade, great floods, destructive winds, desertification and grain shortages in Burkina Faso have spotlighted agro-ecological change as a crucial challenge for achieving sustainable development in eastern part of the country especially in the Gourma region. In fact, the new agro-ecological order has reshaped and transformed geographical representations, land tenure and norms and techniques of crops production in this auto-subsistence agrarian society of Gourmantche. In response to the current agro-ecological and social framework, local farmers have invented methods of crop production: the zaï techniques which enable the maintenance or restoration of the soil fertility, rotational practice (combining or mixing food and cash crops in the same field), shifting cultivation as well as the fragmentation of households in order to optimize the productivity of manpower in nuclear families. These technological innovations allow local farmers to manage sustainably their landscape. Key words: Agro-ecological change, auto-subsistence, innovations, farming strategies, Burkina Faso, West Africa.
INTRODUCTION Climate change is a critical issue for humanity and a great challenge to social and biological life reproduction. On the global scale, the tropical deforestation had already been dealt with by the 1850s as a “problem” and as a “phenomenon demanding urgent and concerted state intervention” (Grove, 2006). The late nineteenth century was the opening era of the colonization
1 (of many
1The colonization of the Gourma kingdom has been formalized by a
protectorate agreement, signed in 1895 by the French colonizers and chief
Bantchande.
West African countries) of which the main objective consisted in providing for raw materials and manpower to Western industrialization. Hence, this imperialist project and its inherent commoditization drawing of local natural resources leading to a revolution of ecological paradigms. This ideological revolution in Man-Nature interface was characterized by the move from bio-centric paradigm – in which human being and nature are interconnected by symbiotic relations (Haudricourt, 1962; Fairhead and Leach, 1996; Rival, 1997; Descola, 2000; Ouédraogo, 2006) – to the anthropocentric paradigm in which the
*Corresponding author. E-mail: [email protected]. Author(s) agree that this article remain permanently open access under the terms of the Creative Commons Attribution License 4.0 International License
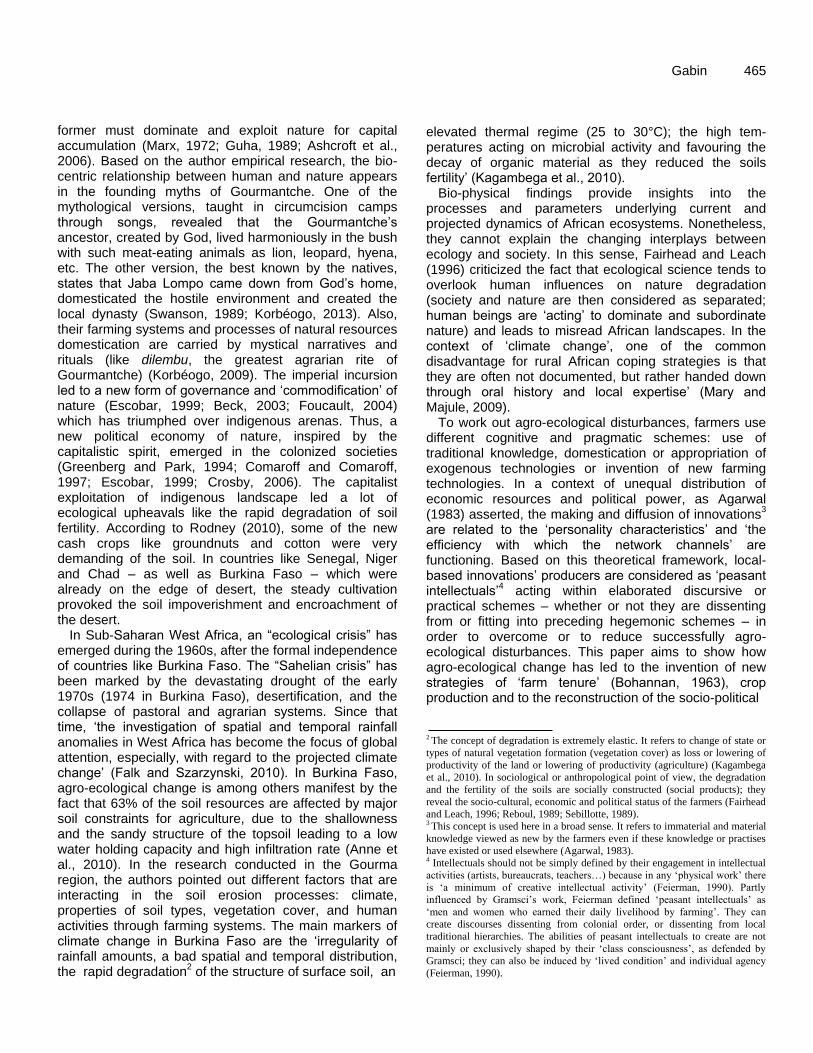
former must dominate and exploit nature for capital accumulation (Marx, 1972; Guha, 1989; Ashcroft et al., 2006). Based on the author empirical research, the bio-centric relationship between human and nature appears in the founding myths of Gourmantche. One of the mythological versions, taught in circumcision camps through songs, revealed that the Gourmantche‟s ancestor, created by God, lived harmoniously in the bush with such meat-eating animals as lion, leopard, hyena, etc. The other version, the best known by the natives, states that Jaba Lompo came down from God‟s home, domesticated the hostile environment and created the local dynasty (Swanson, 1989; Korbéogo, 2013). Also, their farming systems and processes of natural resources domestication are carried by mystical narratives and rituals (like dilembu, the greatest agrarian rite of Gourmantche) (Korbéogo, 2009). The imperial incursion led to a new form of governance and „commodification‟ of nature (Escobar, 1999; Beck, 2003; Foucault, 2004) which has triumphed over indigenous arenas. Thus, a new political economy of nature, inspired by the capitalistic spirit, emerged in the colonized societies (Greenberg and Park, 1994; Comaroff and Comaroff, 1997; Escobar, 1999; Crosby, 2006). The capitalist exploitation of indigenous landscape led a lot of ecological upheavals like the rapid degradation of soil fertility. According to Rodney (2010), some of the new cash crops like groundnuts and cotton were very demanding of the soil. In countries like Senegal, Niger and Chad – as well as Burkina Faso – which were already on the edge of desert, the steady cultivation provoked the soil impoverishment and encroachment of the desert.
In Sub-Saharan West Africa, an “ecological crisis” has emerged during the 1960s, after the formal independence of countries like Burkina Faso. The “Sahelian crisis” has been marked by the devastating drought of the early 1970s (1974 in Burkina Faso), desertification, and the collapse of pastoral and agrarian systems. Since that time, „the investigation of spatial and temporal rainfall anomalies in West Africa has become the focus of global attention, especially, with regard to the projected climate change‟ (Falk and Szarzynski, 2010). In Burkina Faso, agro-ecological change is among others manifest by the fact that 63% of the soil resources are affected by major soil constraints for agriculture, due to the shallowness and the sandy structure of the topsoil leading to a low water holding capacity and high infiltration rate (Anne et al., 2010). In the research conducted in the Gourma region, the authors pointed out different factors that are interacting in the soil erosion processes: climate, properties of soil types, vegetation cover, and human activities through farming systems. The main markers of climate change in Burkina Faso are the „irregularity of rainfall amounts, a bad spatial and temporal distribution, the rapid degradation
2 of the structure of surface soil, an
Gabin 465 elevated thermal regime (25 to 30°C); the high tem-peratures acting on microbial activity and favouring the decay of organic material as they reduced the soils fertility‟ (Kagambega et al., 2010).
Bio-physical findings provide insights into the processes and parameters underlying current and projected dynamics of African ecosystems. Nonetheless, they cannot explain the changing interplays between ecology and society. In this sense, Fairhead and Leach (1996) criticized the fact that ecological science tends to overlook human influences on nature degradation (society and nature are then considered as separated; human beings are „acting‟ to dominate and subordinate nature) and leads to misread African landscapes. In the context of „climate change‟, one of the common disadvantage for rural African coping strategies is that they are often not documented, but rather handed down through oral history and local expertise‟ (Mary and Majule, 2009).
To work out agro-ecological disturbances, farmers use different cognitive and pragmatic schemes: use of traditional knowledge, domestication or appropriation of exogenous technologies or invention of new farming technologies. In a context of unequal distribution of economic resources and political power, as Agarwal (1983) asserted, the making and diffusion of innovations
3
are related to the „personality characteristics‟ and „the efficiency with which the network channels‟ are functioning. Based on this theoretical framework, local-based innovations‟ producers are considered as „peasant intellectuals‟
4 acting within elaborated discursive or
practical schemes – whether or not they are dissenting from or fitting into preceding hegemonic schemes – in order to overcome or to reduce successfully agro-ecological disturbances. This paper aims to show how agro-ecological change has led to the invention of new strategies of „farm tenure‟ (Bohannan, 1963), crop production and to the reconstruction of the socio-political
2 The concept of degradation is extremely elastic. It refers to change of state or
types of natural vegetation formation (vegetation cover) as loss or lowering of
productivity of the land or lowering of productivity (agriculture) (Kagambega
et al., 2010). In sociological or anthropological point of view, the degradation
and the fertility of the soils are socially constructed (social products); they
reveal the socio-cultural, economic and political status of the farmers (Fairhead
and Leach, 1996; Reboul, 1989; Sebillotte, 1989). 3 This concept is used here in a broad sense. It refers to immaterial and material
knowledge viewed as new by the farmers even if these knowledge or practises
have existed or used elsewhere (Agarwal, 1983). 4 Intellectuals should not be simply defined by their engagement in intellectual
activities (artists, bureaucrats, teachers…) because in any ‘physical work’ there
is ‘a minimum of creative intellectual activity’ (Feierman, 1990). Partly
influenced by Gramsci’s work, Feierman defined ‘peasant intellectuals’ as
‘men and women who earned their daily livelihood by farming’. They can
create discourses dissenting from colonial order, or dissenting from local
traditional hierarchies. The abilities of peasant intellectuals to create are not
mainly or exclusively shaped by their ‘class consciousness’, as defended by
Gramsci; they can also be induced by ‘lived condition’ and individual agency
(Feierman, 1990).
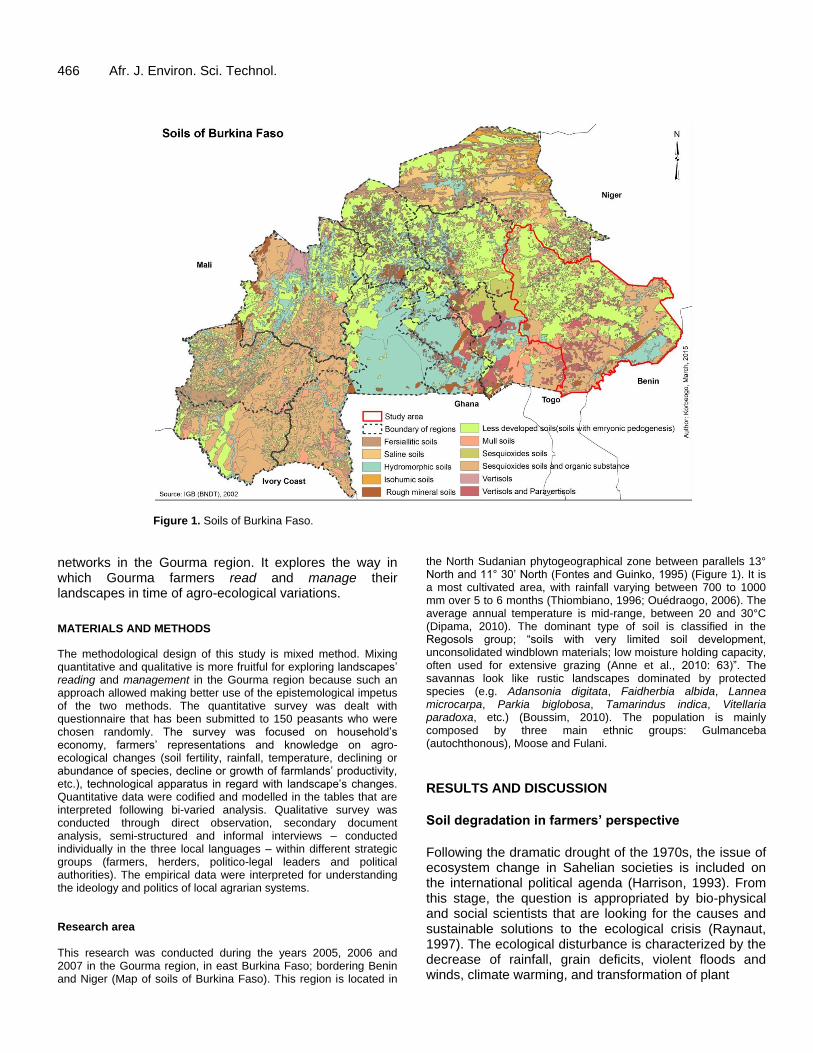
466 Afr. J. Environ. Sci. Technol.
Figure 1. Soils of Burkina Faso.
networks in the Gourma region. It explores the way in which Gourma farmers read and manage their landscapes in time of agro-ecological variations.
MATERIALS AND METHODS
The methodological design of this study is mixed method. Mixing quantitative and qualitative is more fruitful for exploring landscapes‟ reading and management in the Gourma region because such an approach allowed making better use of the epistemological impetus of the two methods. The quantitative survey was dealt with questionnaire that has been submitted to 150 peasants who were chosen randomly. The survey was focused on household‟s economy, farmers‟ representations and knowledge on agro-ecological changes (soil fertility, rainfall, temperature, declining or abundance of species, decline or growth of farmlands‟ productivity, etc.), technological apparatus in regard with landscape‟s changes. Quantitative data were codified and modelled in the tables that are interpreted following bi-varied analysis. Qualitative survey was conducted through direct observation, secondary document analysis, semi-structured and informal interviews – conducted individually in the three local languages – within different strategic groups (farmers, herders, politico-legal leaders and political authorities). The empirical data were interpreted for understanding the ideology and politics of local agrarian systems. Research area This research was conducted during the years 2005, 2006 and 2007 in the Gourma region, in east Burkina Faso; bordering Benin and Niger (Map of soils of Burkina Faso). This region is located in
the North Sudanian phytogeographical zone between parallels 13° North and 11° 30‟ North (Fontes and Guinko, 1995) (Figure 1). It is a most cultivated area, with rainfall varying between 700 to 1000 mm over 5 to 6 months (Thiombiano, 1996; Ouédraogo, 2006). The average annual temperature is mid-range, between 20 and 30°C (Dipama, 2010). The dominant type of soil is classified in the Regosols group; “soils with very limited soil development, unconsolidated windblown materials; low moisture holding capacity, often used for extensive grazing (Anne et al., 2010: 63)”. The savannas look like rustic landscapes dominated by protected species (e.g. Adansonia digitata, Faidherbia albida, Lannea microcarpa, Parkia biglobosa, Tamarindus indica, Vitellaria paradoxa, etc.) (Boussim, 2010). The population is mainly composed by three main ethnic groups: Gulmanceba (autochthonous), Moose and Fulani.
RESULTS AND DISCUSSION
Soil degradation in farmers’ perspective
Following the dramatic drought of the 1970s, the issue of ecosystem change in Sahelian societies is included on the international political agenda (Harrison, 1993). From this stage, the question is appropriated by bio-physical and social scientists that are looking for the causes and sustainable solutions to the ecological crisis (Raynaut, 1997). The ecological disturbance is characterized by the decrease of rainfall, grain deficits, violent floods and winds, climate warming, and transformation of plant
Table 1. Indicators of soil infertility in farmers‟ perceptions.
Indicators Frequency (%)
Emergency of weeds 23.7
Decrease of productivity 46.5
Whitening / flushing of soil 14.3
Rapid drying of soil after rain 8.5
No response 7
Total 100
Source: Korbéogo, G. quantitative survey, 2005.
diversity (Koechlin, 1997; Crate and Nuttall, 2009). Even if the issue of agro-ecological change is basically a bio-physical phenomenon, socio-anthropology can explore its sociocultural indicators in local arenas and the adaptation strategies of social actors.
In the Gourma region, to make better use of available lands and select appropriate cultures, farmers use their cultural, economic, and historical patterns as well as the local „plants signalling‟ (signalisation végétale) (Le Roy Ladurie, 1982), constituted by herbs, flowers, soil‟s color and texture, termites and amphibians. To corroborate this statement, the Table 1 shows basic criteria of soil degradation in Gourma farmers‟ perspective. The distribution of percentages highlights the decline of crop productivity as the first criterion of farmland degradation. A fifty years old peasant, an inhabitant of Momba village, testifies to that:
„Ah! When you are used to growing and then you suffer during one year, two years and you cannot feed your family, you know that the land is exhausted and must seek another solution. Thus, the area that the father cultivated to feed his family, the son is obliged to triple this area today, because the soil degradation, in order to expect to make both ends meet‟
5
Therefore, the decrease of productivity – locally evaluated within the quantity of the harvest –appears to be one of the indicators most frequently used by farmers to determine the quality of a soil. However, the diversity of plants also guides farmers in determining the agronomic qualities of their field. According to Gourmantche farming experience, Striga hermontheca, Corchorus olitorius, and Eragrostis tremula are „weeds‟ that announce the landscape aridification.
Nevertheless, these species are useful in local economy: S. hermontheca is exclusively used as grass for livestock while C. olitorius and E. tremula are used for human diet and for sweep of houses. In contrast, great trees like V. paradoxa, Acacia gourmaensis, and Ficus 5 Namoano, B: Personal Interview held in Fada N’Gourma on 1/04/05.
Gabin 467 sycomorus as well as grasses like Andropogon gayanus, Pennisetum pedicellatum and Eulesine india reflect the agronomic qualities of the farms. Farmers‟ agronomic skills are generated by individual and collective experiences. A young farmer (30 years old) witnesses:
„To recognize the fertility of the soils I look at the color of their, and especially the type and the size of the plants that grow there. If the plants are high such as V. paradoxa or A. gayanus, I know that if I sow on the land I will get good harvest. I have learned it from my father, but I have also done my own experience by watching the vegetation condition‟
6.
Then, the transformation of the „color of the soil‟ can also help determine farm productivity. Thus, the turn of the soil color from „black‟ to „red‟ or „white‟ is a sign of its exhaustion. The elder of the blacksmith community of Natiaboani, 25 miles from Fada N‟Gourma city, attests:
„When you cultivate a „dark‟ fertile farm and years after the soil turns as „red‟ as a forge, you know that you must find another plot if you do not want to get poor-harvest. A good farmer must be careful to all the signs of the surrounding environment; this awareness has been taught by our fathers through the daily agricultural practices. The forge as well as the field is like our soul‟
7
The connection between the necessity of preserving the „cultural soul of tradition‟, embodied in the forge, and agricultural fertility reflects the cultural dimension of fertility. This means that many components of peasants‟ life inform their perceptions and practices of farming. For example, the soil ability to absorb water after a rain – measured by their ability to move easily on the landscape during rainy season – allows farmers of Sietugu or Balere homelands to know if their fields are deteriorated or not. The soils of the two localities are sandy-clay soils and impracticable after great rains. The elders of Gourma homelands told that in the late 1960s they could not move by bicycle or go out of their village during seven or 10 days.
Although, since late 1980s, they can move on their landscape just three or five days after rains. So, during the author investigations, when clouds started gathering, he was told to leave the village if ever he had meetings in other villages. Otherwise, he should be compelled to extend his stay for five more days. According to his informants, the length of their isolation demonstrates the degradation of their farmlands.
In addition, the assessments on the fertility of farms vary according to the agricultural systems of production. In accordance with the two types of cropping systems we
6 Tankoano A, Personal Interview held in Namungu on 24/11/07. 7 Ouoba Y: Personal Interview held in Momba on 20/11/07.
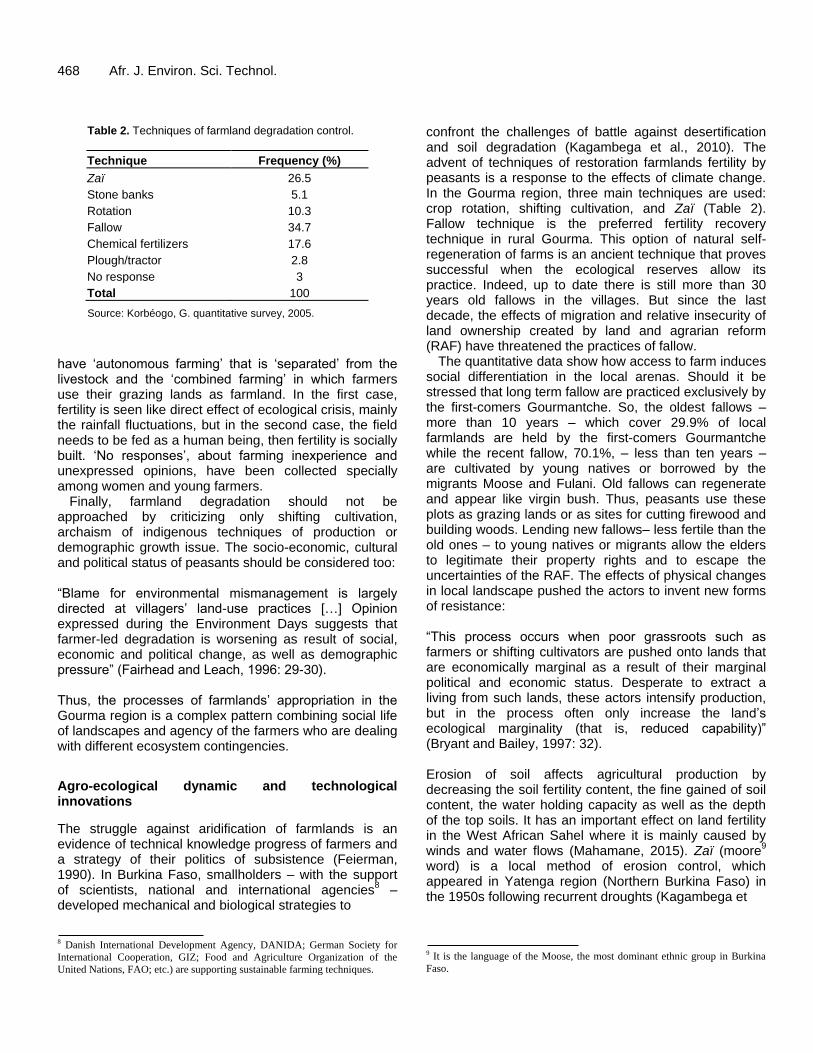
468 Afr. J. Environ. Sci. Technol.
Table 2. Techniques of farmland degradation control.
Technique Frequency (%)
Zaï 26.5
Stone banks 5.1
Rotation 10.3
Fallow 34.7
Chemical fertilizers 17.6
Plough/tractor 2.8
No response 3
Total 100
Source: Korbéogo, G. quantitative survey, 2005.
have „autonomous farming‟ that is „separated‟ from the livestock and the „combined farming‟ in which farmers use their grazing lands as farmland. In the first case, fertility is seen like direct effect of ecological crisis, mainly the rainfall fluctuations, but in the second case, the field needs to be fed as a human being, then fertility is socially built. „No responses‟, about farming inexperience and unexpressed opinions, have been collected specially among women and young farmers.
Finally, farmland degradation should not be approached by criticizing only shifting cultivation, archaism of indigenous techniques of production or demographic growth issue. The socio-economic, cultural and political status of peasants should be considered too: “Blame for environmental mismanagement is largely directed at villagers‟ land-use practices […] Opinion expressed during the Environment Days suggests that farmer-led degradation is worsening as result of social, economic and political change, as well as demographic pressure” (Fairhead and Leach, 1996: 29-30). Thus, the processes of farmlands‟ appropriation in the Gourma region is a complex pattern combining social life of landscapes and agency of the farmers who are dealing with different ecosystem contingencies.
Agro-ecological dynamic and technological innovations
The struggle against aridification of farmlands is an evidence of technical knowledge progress of farmers and a strategy of their politics of subsistence (Feierman, 1990). In Burkina Faso, smallholders – with the support of scientists, national and international agencies
8 –
developed mechanical and biological strategies to
8 Danish International Development Agency, DANIDA; German Society for
International Cooperation, GIZ; Food and Agriculture Organization of the
United Nations, FAO; etc.) are supporting sustainable farming techniques.
confront the challenges of battle against desertification and soil degradation (Kagambega et al., 2010). The advent of techniques of restoration farmlands fertility by peasants is a response to the effects of climate change. In the Gourma region, three main techniques are used: crop rotation, shifting cultivation, and Zaï (Table 2). Fallow technique is the preferred fertility recovery technique in rural Gourma. This option of natural self-regeneration of farms is an ancient technique that proves successful when the ecological reserves allow its practice. Indeed, up to date there is still more than 30 years old fallows in the villages. But since the last decade, the effects of migration and relative insecurity of land ownership created by land and agrarian reform (RAF) have threatened the practices of fallow.
The quantitative data show how access to farm induces social differentiation in the local arenas. Should it be stressed that long term fallow are practiced exclusively by the first-comers Gourmantche. So, the oldest fallows – more than 10 years – which cover 29.9% of local farmlands are held by the first-comers Gourmantche while the recent fallow, 70.1%, – less than ten years – are cultivated by young natives or borrowed by the migrants Moose and Fulani. Old fallows can regenerate and appear like virgin bush. Thus, peasants use these plots as grazing lands or as sites for cutting firewood and building woods. Lending new fallows– less fertile than the old ones – to young natives or migrants allow the elders to legitimate their property rights and to escape the uncertainties of the RAF. The effects of physical changes in local landscape pushed the actors to invent new forms of resistance:
“This process occurs when poor grassroots such as farmers or shifting cultivators are pushed onto lands that are economically marginal as a result of their marginal political and economic status. Desperate to extract a living from such lands, these actors intensify production, but in the process often only increase the land‟s ecological marginality (that is, reduced capability)” (Bryant and Bailey, 1997: 32). Erosion of soil affects agricultural production by decreasing the soil fertility content, the fine gained of soil content, the water holding capacity as well as the depth of the top soils. It has an important effect on land fertility in the West African Sahel where it is mainly caused by winds and water flows (Mahamane, 2015). Zaï (moore
9
word) is a local method of erosion control, which appeared in Yatenga region (Northern Burkina Faso) in the 1950s following recurrent droughts (Kagambega et 9 It is the language of the Moose, the most dominant ethnic group in Burkina
Faso.
al., 2010; Lenhardt et al., 2014). This traditional technique was improved by a local farmer who participated to a study visit organised in Mali by Oxfam international (Kaboré and Reij, 2004). „Zaï is drawn from “zaïegre” which means in moore language „to get up early and hurry to prepare one‟s land‟ (Kaiser et al., 2010). This agricultural
10 technique is mainly promoted by a
Non-government organization, called “6S” (savoir se servir de la saison sèche au Sahel) and Naam networks (Harrison,1991). In Burkina Faso, zaï is one the best „achievements of smallholder farmers in the Central Plateau that stand out as one of the best examples of how to achieve progress in land reclamation in the Sahel‟ (Lenhardt et al., 2014). How does this method work? In fact, farmers dig small holes– with right distance between them – in their fields that they fulfill with well-rotted manure or compost before closing with earth taken from the holes. Then, they sow immediately just before or soon after the first good rain. Zaï technique has overcome contingencies of large arid farms in Yatenga region. It enhances the capture of rainfall and runoff water, the protection of seeds and organic matter, concentration of fertility and increase of agricultural productivity (Hien et al., 2010; Lenhardt et al., 2014; Kagambega et al., 2010). Studies carried out by Environment and Agricultural Research Institute (INERA) of Burkina Faso revealed that Zaï improves the productivity of 86% in Central Burkina Faso. However, this technique needs much manpower
11 (it requires
between 300 and 400 h of work to treat one hectare) and material resources in order to dig the holes and to gather straw, organic waste and water. Throughout Yadse (Moose from Yatenga) migration and agricultural public institutions – the local committee for land management (Commission villageoise de gestion des terroirs), created by the National program for land management (Programme National de Gestion des Terroirs) –this technique has been promoted in rural Gourma during the late 1980. Nowadays, the zaï has a relative success among the erosion control techniques of mainly in Moose communities. „We had to teach farmers how to cultivate, how to make furrows to retain water, how to apply zaï technique, and 10 Kaiser et al. (2010) have identified 2 types of Zaï: agricultural zaï and
forestry zaï. The former consists in digging pits (water microsheds) in parallel
or alternate rows and putting seeds with organic material into the holes. The
latter refers to the process in which the farmlands ‘lie in fallow after 4-5 years
of continuous zaï cultivation’. So, ‘within 10-20 years, rich woody and
herbaceous vegetation emerges, forming a matrix for the production of
economically valuable species’. This paper refers to agricultural zaï which is
the well-known and the more applied technique in the Gourma region. 11 The technique is essentially manual. According to Kaiser et al. (2010), 60
working days are necessary to prepare 1 hectare land with the improved zaï
technique.
Gabin 469 how to plough the field instead of burning the grass. Grasses must be buried in the soil when ploughing or we must bury it in the ground. Many people practice the traditional technique but they think it is a modern one. This is not true! Local fertilizers are better than the modern ones‟
12.
Besides, the zaï, peasants used the method of „stone banks‟ to fight against erosion. It consists in laying stones in rows on the surface of the field in order to retain the rainy water. These anti-erosion techniques, which were promoted by external actors or migrants, are less practiced by the Gourmantche because of its demand in material means and manpower. Subsequently, such techniques are mainly used by the peasants, can have the help of his association or cooperation.
The last agricultural technique for soil erosion control is the utilization of plough or tractor. In the context of soil degradation, the plough and the tractor – with their toothed actions – are means of working which enable to scrape or break up of the upper of the soils in order to improve their capacity of water penetration and permit a „good soil-water-plant balance‟ (Kagambega et al., 2010). The farmlands‟ scarification or subsoiling (depth of 10 cm to more than 30 cm) cannot be carried out with the flimsy traditional hoes. These two mechanical tools (plough and tractor) were introduced in rural Gourma during the colonial era. According to the archives of the local prefecture ploughs have been introduced in the Gourma region in 1949 by colonial agricultural centres in order to facilitate farming activities and to increase the production of raw materials for Western industries. After the colonial regime, the plough is still used by small number households. It is the case of mister Segda, one of the first rice producers and plough‟s users of the Gourma region (Korbéogo, 2009; Korbéogo 2013). Accumulation of social, cultural and economic capital – through his prosperous trade and livestock – allowed him to access the technological innovations in local farming systems in the colonial context. But since late 1990s, with the promotion of cotton production, this technique has been relatively popularized in rural Gourma. Thus, 70% of the households surveyed have a plough, bought in most cases with the cotton revenues. But, we can note that natives and migrants Moose are the largest users of the plough unlike the former who have a negative opinion of this instrument. A septuagenarian Gourmantche peasant notices: „The Moose who have borrowed land to produce cotton and using a plough have degraded the land within a period of five years and still wanted more land. Under
12 Koidima, J: Personal interview held in Nienduga on 01/9/05.
470 Afr. J. Environ. Sci. Technol. these conditions it is difficult to continue to give people who do not take good care of the land! And if you continue giving them more lands, they or their children may one day claim ownership ever their old fields left fallow. And this will create problems between us‟
13.
Such a correlation between plough use and land degradation – contrary to Brunhes Delamarre and Haudricourt observations (2000) – coincides with the results of scientific experiments conducted in West Africa (Harrison, 1991). Indeed, the extension of plough use has induced rapid degradation of cotton fields and an expansion of land use. This social competition for land use is characterized by a correlative affirmation of indigenous land rights and discursive or physical conflicts between the hosts Gourmantche and their clients Moose. It is the reason why technological innovations in local agriculture can lead to significant social changes in term of land management and social differentiation (Blaikie and Brookfield, 1987; Chambers, 1983; Kirk, 1999; Lenhardt et al., 2014). Then, if the processes of innovation implementation are misconceived and mislead they can increase the technological and social exclusion of poor farmers in developing countries. So, without „forms of assistance‟ (to access labor, tools and inputs) (Lenhardt et al., 2014) as well as without political and social network precarious households cannot adopt sustainable farming techniques. Small-scale response to degraded and politicised environment Access to domestic labor force is becoming more and more a though issue due to the process of social individuation in rural Gourma. Although, the generalization of polygamy within peasants, whatever their religion, allows them to cope with the effects of family fragmentation and manpower scarcity. As Boserup has mentioned:“(...) the institution of polygamy is a significant element in the process of economic development in regions where additional land is available for cultivation under the long fallow system (Boserup, 2010:390)”. This social process is linked to the development of cash crops and to the strategies of land accumulation by the Gourmantche first-settlers. „We have to break up the units of production per household because if all the members of our family work in the same field people can feel less concerned. I experienced farm labor in a large group with my family. We were at least four married men, but sometimes some
13 Thiombiano, H: Personal interview held in Namungu on 04/5/05.
people dealt with personal matters while others cultivated for family; and ultimately this result into frustrations. But if you are with your wife and children, if you do not work hard your family will not get food. So I gave plots to each married son and they worked very well. It is also a duty for a father to give farmland to his children in order to prevent land appropriation by the government or migrants‟
14.
In this perspective, Gourmantche peasants shorten the time of land use in order to conquest the virgin bush or their lineage oldest fallows. So, the signs of recent agricultural settlement (plow furrows or trees regeneration) legitimate their property rights over the land and prevent new-comers access to lands. This form of land rights appropriation based on labor (that is, cutting down the bush, fighting wild animals, planting trees, cultivation of the land, etc), in the sense John Locke theory of property, is frequent in rural West Africa (Lentz, 2006). In this case, the fallow is not a response to the deterioration of soil fertility but a strategy to reinforce autochthonous land tenure. Therefore, the recent fallows–between five and ten years - are transferred to new applicants so as to allow the first-comers to clear new farms. This strategy of farmlands management that is in force in Gourma frontier societies, also observed by Doevenspeck (2004), prevents the political clients (Moose and Fulani) to expand illicitly their farms beyond the boundaries of the borrowed fields. This strategy is also an institutional arrangement (Ostrom, 1990) that enable the first-comers Gourmantche to maintain their socio-political supremacy on the new-comers and create the bases of local socio-political institutions.
Moreover, the individuation of land rights devolution in rural Gourma is characterized by the affirmation of heritage within the patriclan (in a nuclear scale: from father to his sons) and the decline of the traditional adelphic system of heritage (in a lineage scale) (Korbéogo, 2010). Conclusion Ecological change is an old problem induced by the pervasive use of natural resources that has threatened the equilibrium of ecosystems in the world. In West Africa, and mainly in Burkina Faso, this bio-physical fragility has been intensified by colonization which challenged the green social security (Cunningham, 2001) that occurred in rural landscapes. Thereby, peasants have to produce adaptive strategies in order to deal with the constraints of the new ecological order. In the dynamic
14 Thiombiano, T., Interview held in Natiaboani on 23/4/05.
of a continuing scientific enterprise initiated by contemporary scholars (Chambers, 1983; Comaroff and Comaroff, 1987; Feierman, 1990), this article is an attempt to explore the „history‟ and „consciousness of intellectuals‟ in a West African farming society. It pulls out the genius of Gourmantche peasants to interpret and manage the current ecological contingencies of their society.
In response to the current agro-ecological and social framework, local farmers have invented pragmatic and sustainable processes of crop production: the rotation of crops (rotating food and cash crops in the same field), the zaï technique which reinforces the soils fertility, shifting cultivation as well as the fragmentation of households in order to increase the productivity of manpower in small units of production. Nevertheless, these different technical and social strategies of desertification control are implemented in accordance with local structural principles as well as with peasants‟ beliefs and practical sense. Thus, local farmers should not be considered like subjects dealing passively with external ideologies and technical protocols; instead, they should be regarded as inventive citizens dealing with external ideologies and ecological patterns. Therefore, the ongoing climate change has led to the invention of new strategies of land tenure, crop production and is contributing to the recon-struction of the socio-political links in local arenas. The capacity of action and resistance of peasants – through the making of „practical knowledge‟ or local „know-how‟ to mitigate ecological variability – legitimates their attribute of „intellectuals‟ defended by Feierman (1987).
In conclusion, he state that sustainable responses to agro-ecological change in Sahelian West Africa should take into account the stakes of local agrarian systems, markets‟ forces, as well as collective experience and actors‟ agency. So, „history‟ or long term experience and everyday active innovations are ingeniously woven by „peasant intellectuals‟ to enlighten their farming systems. The dynamic and conscious negotiation of these driving forces strengthens farmers‟ abilities to read and manage sustainably rural landscapes.
Conflict of interest
The authors did not declare any conflict of interest.
ACKNOWLEDGEMENTS
The author gratefully acknowledges the reviewers, Aderemi Ajala, Natewindé Sawadogo and Moussa Kambiré for their relevant comments as well as Issa Sory for his generous help for the drawing of the map of soils of Burkina Faso.
Gabin 471 REFERENCES Agarwal B (1983). Diffusion of rural innovations. Some analytical issues
and the case of wood-burning stoves. World Development 11(4):359-376.
Anne CAT, Runge J, Kampmann D (2010). Soils of West Africa: agronomic constraints and degradation. In: Thiombiano A, Kampmann D (Eds), Biodiversity Atlas of West Africa. Tome II, Vol. II. Burkina Faso, Pliezhausen, Druckerei Grammlich, Ouagadougou & Frankfurt/Main: 56-63.
Ashcroft B, Griffiths G, Helen T (2006). The post-colonial studies reader. Routledge, London/New York.
Beck U (2001). La société du risque. Flammarion, Paris. Berry S (1989).Social institutions and access to resources. Africa 59(1):
41-55. Blaikie P, Brookfield H (1987).Land degradation and society. Methuen,
London. Bohannan P (1963). „Land‟, „tenure‟ and land-tenure. In: Biebuyck D
(Ed.), African agrarian systems. Oxford University Press, London: 101-115.
Boserup E (2010). The economics of polygamy. In: Grinker RR, Lubkemann S C, Steiner C B (Eds), Perspectives on Africa. Blackwell, Malden, MA: 389-398.
Boussim J (2010). Phytogeographical territories [Burkina Faso].In: Thiombiano A, Kampmann D (Eds), Biodiversity Atlas of West Africa. Tome II, Vol. II. Burkina Faso, Pliezhausen, Druckerei Grammlich, Ouagadougou & Frankfurt/Main: 152-155.
Bryant R L, Bailey S (1997).Third World Political Ecology. Routledge, London & New-York.
Chambers R (1983). Rural development: Putting the last first. Longmans, London.
Comaroff J L, Comaroff J (1997). Of revelation and revolution. The dialectics of modernity on a South African frontier. Volume II. Chicago, University of Chicago Press.
Comaroff J L, Comaroff J (1987). The madman and the migrant: work and labor inthe historical consciousness of a South African people. American Ethnologist 14 (2): 191-209.
Crate S A, Nuttall M (2009). Anthropology and Climate Change: From Encounters to Actions. Left Coast Press, London.
Crosby A W (2006).Ecological imperialism. In: Ashcroft B, Griffiths G, Tiffin H (Eds), The post-colonial studies reader. Routledge, London & New York:494-497.
Cunningham AB (2001). Applied ethnobotany. People, wild plant use and conservation. Earthscan, London & Sterling.
Descola P (2000). L‟anthropologie et la question de la nature. In: Abélès M, Charles L, Jeudy H-P, Kaloara B (Eds), L‟environnement en perspective. Contextes et représentations de l‟environnement. L‟Harmattan, Paris: 61-83.
Dipama JM (2010). Hydrology [Burkina Faso]. In: Thiombiano A, Kampmann D (Eds), Biodiversity Atlas of West Africa. Tome II, Vol. II. Burkina Faso, Pliezhausen, Druckerei Grammlich, Ouagadougou & Frankfurt/Main: 134-137.
Doevenspeck M (2004). Migrations rurales, accès au foncier et rapports interethniques au sud du Borgou (Bénin). Une approche méthodologique plurielle. Afrika Spectrum 39 (3):359-380.
Escobar A (1995). Encountering development: The making and unmaking of the third world. Princeton University Press, Princeton.
Fairhead J, Leach M (1996). Misreading the African landscape. Cambridge University Press, Cambridge.
Falk U, Szarzynski J (2010). Sub-Saharan West Africa climate and precipitation regime. In: Thiombiano A, Kampmann D (Eds), Biodiversity Atlas of West Africa. Tome II, Vol. II. Burkina Faso, Pliezhausen, Druckerei Grammlich, Ouagadougou and Frankfurt/Main: 44-51.
Feierman S (1990). Peasant intellectuals. Anthropology and history in Tanzania. University Press of Wisconsin, Wisconsin & London.
Fontes J, Guinko S (1995). Vegetation and Land Use‟s Map of Burkina Faso. Explanatory note. Ministry of French Cooperation, Toulouse, France.
Foucault M (2004). Sécurité, territoire, population. Cours au college de
472 Afr. J. Environ. Sci. Technol.
France. 1977-1978. Seuil/Gallimard, Paris. Greenberg J B, Park T K (1994). Political ecology. Journal Political
Ecology 1:1-12. Grove R (2006). Green imperialism. In: Ashcroft B, Griffiths G, Tiffin H
(Eds), The post-colonial studies reader. Routledge, London & New York: 498-500.
Guha R (1989). Radical American Environmentalism and Wilderness Preservation. A Third World Critique. Environmental Ethics 11: 71-83.
Hann CM (1998). Introduction: the embeddedness of property. In: Hann C M (Ed.), Property relations: renewing the anthropological tradition. Cambridge University Press, Cambridge: 1-47.
Harrison P (1979).Inside the third world. The classic account of poverty in the developing countries. Penguin Books, London.
Haudricourt A G (1962). La culture des plantes, la domestication des animaux et le traitement d‟autrui. L‟Homme 2(1):40-50.
Haudricourt AG, Brunhes Delamarre M J (2000). L‟homme et la charrue à travers le monde. La Renaissance du Livre, Tournai.
Hien E, Kaboré W T, Masse D, Dugue P (2010). Sustainable Farming Systems in the Sub-Sahelian Zone of Burkina Faso - Key Factors. Sustentabilidade em Debate: 127-139.
Kaboré D, Reij C (2004). The emergence and spreading of an improved traditional soil and water conservation practice in Burkina Faso. EPTD Discussion Paper 114. International Food Policy Research Institute, Washington, DC.
Kagambega FW, Kaiser D, Konaté S, Linsenmair E K, Lepage M, Thiombiano A, Boussim J (2010). Ecological restoration of degraded zones. In: Thiombiano A, Kampmann D (Eds), Biodiversity Atlas of West Africa. Tome II, Vol. II. Burkina Faso, Pliezhausen, Druckerei Grammlich, Ouagadougou & Frankfurt/Main: 434-443.
Kaiser D, Konaté S, Linsenmair K E, Lepage M (2010). Zaï “get up early and hurry to prepare your land. In: Thiombiano A, Kampmann D (Eds), Biodiversity Atlas of West Africa. Tome II, Vol. II. Burkina Faso, Pliezhausen, Druckerei Grammlich, Ouagadougou & Frankfurt/Main: 496-497.
Kirk M (1999). Land tenure, technological change and resources use. Transformation processes in african agrarian systems. Peter Lang, Frankfurt am Main.
Koechlin J (1997). Ecological conditions and degradation factors in the Sahel. In: Raynaut C (Ed.), Societies and nature in the Sahel, London & New York, Routledge: 12-36.
Korbéogo G (2009). La sécurité foncière comme compétence politique. Institutions, normes sociales et accès aux ressources naturelles au Gourma (Burkina Faso). PhD, Johannes Gutenberg University of Mainz, Germany.
Korbéogo G (2010). Localiser des identités mobiles. Migration, ethnicité et dynamiques foncières au Gourma. In: Zongo M (Ed.), Les enjeux autour de la diaspora burkinabé. Burkinabè à l‟étranger, étrangers au Burkina Faso. L‟Harmattan, Paris: 251-272.
Korbéogo G (2013). Pouvoir et accès aux ressources naturelles au Burkina Faso. La topographie du pouvoir. L‟Harmattan, Paris.
Lenhardt A, Glennie J, Intscher N, Ali A, (with Morin G) (2014). A greener Burkina - Sustainable farming techniques, land reclamation and improved livelihoods. Development Progress Case Study Report (Environment).
Le Roy Ladurie E (1982). Montaillou, village occitan. De 1294 à 1324.
Gallimard, Paris. Lentz C (2006). First-comers and late-comers: indigenous theories of
land ownership in West African savanna. In: Kuba R, Lentz C (Eds), Land and politics of belonging in West Africa. Brill, Leiden & Boston: 35-56.
Madiéga Y G, (1978). Le Nord gulma précolonial: origine des dynasties, approche de la société. Doctoral thesis, University Paris I, Paris, France.
Mahamane M (2015). Assessing soil erosion risk in the Tillabery landscape, Niger. Afr. J. Environ. Sci. Technol.Vol. 9(3): 176-191.
Marx K (1972). La première critique de l‟économie politique. Union Générale d‟Editions, Paris.
Mary A L, Majule A E (2009). Impacts of climate change, variability and adaptation strategies on agriculture in semi-arid areas of Tanzania: The case of Manyoni District in Singida Region, Tanzania. Afr. J. Environ. Sci. Technol. 3 (8):206-218.
Ostrom E (1990). Governing the Commons. The Evolution of Institution for Collective Action. Cambridge University Press, Cambridge.
Ouédraogo A (2006). Diversité et dynamique de la végétation ligneuse dans la partie orientale du Burkina Faso. PhD thesis, University of Ouagadougou, Burkina Faso.
Ouédraogo J B (2006). Africa: Human nature as historical process. In: Tazi N (Ed.), Keywords / nature. For different kind of globalization. Other Press New, York: 3-35.
Raynaut C (1997) (Ed.). Societies and nature in the Sahel. Routledge, London and New York.
Reboul C (1989). Monsieur le Capital et Madame la Terre. Fertilité agronomique et fertilité économique. EDI-INERA, Paris.
Rival L (1997). Trees, from symbols of life and regeneration to political artefacts. In: Rival L, (Ed.). The social life of trees. Anthropological perspectives on tree symbolism. Berg, Oxford & New York: 1-36.
Rodney W (2010). How Europe underdeveloped Africa. In: Grinker RR, Lubkemann S C, Steiner C B (Eds), Perspectives on Africa. Blackwell, Malden, MA: 439-449.
Sebillotte M (1989). Fertilité et système de production. INERA, Paris. Swanson R (1985). Gourmantche ethnoanthropology. University Press
of America Boston, Boston.
Vol. 9(5), pp. 473-481, May 2015
DOI: 10.5897/AJEST2015.1898
Article Number: F85413452466
ISSN 1996-0786
Copyright © 2015
Author(s) retain the copyright of this article
http://www.academicjournals.org/AJEST
African Journal of Environmental Science and Technology
Full Length Research Paper
Characterization of biosurfactant produced from submerged fermentation of fruits bagasse of yellow
cashew (Anacardium occidentale) using Pseudomonas aeruginosa
Iroha Okechukwu K., Njoku Obi U., Ogugua Victor N. and Okpashi Victor E.*
Department of Biochemistry, University of Nigeria, Nsukka.
Received 17 February, 2015; Accepted 25 March, 2015
Biosurfactants are amphiphilic compounds produced by bacteria and fungi to reduce surface and interfacial tension. This work was designed to produce biosurfactants from the fermentation of submerge cashew bagasse (Anacardium occidentale) using a microorganism Pseudomonas aeruginosa. The proximate components of the biosurfactant was determined. Results show that yellow cashew fruit bagasse contains lipid (11.34 ± 0.16%), protein (26.67 ± 0.66%), carbohydrate (49.37 ± 0.60%), moisture (5.78 ± 0.17%), ash (2.70 ± 0.04%) and fibre (2.86 ± 0.09%). Biosurfactants activity was characterized based on emulsification index and oil displacement capacity. The yield of biosurfactants was, 0.71 g; when only cashew was used; 0.93 g for cashew and glucose and nutrient broth 0.12 g respectively. The preliminary biochemical characterization revealed that the biosurfactants contained carbohydrates and lipids designated as glycolipids. The biosurfactants showed antimicrobial activity against a range of Gram positive and Gram negative bacteria strains with diameters of zone and growth inhibition: Escherichia coli, 38.70 ± 1.30 mm; Staphylococcus aureus, 38.00 ± 2.94 mm; Klebsiella, 31.00 ± 2.20 mm and Bacillus cereus, 28.70 ± 1.70 mm. These results suggest that cashew fruits bagasse serve as cheap carbon source for the production of glycolipid biosurfactants with useful industrial applications. Key words: Biosurfactants, fruit bagasse, yellow cashew, characterization and Pseudomonas aeruginosa.
INTRODUCTION In recent years, industries have generated large amount of tropical agricultural residues. Their disposal causes several environmental problems such as accidental oil spillage or deliberate oil spillage occasion by vandals in
the form of bunker. There has been an increased trend towards efficient utilization of agro industrial residues like oil cakes, wheat bran, soya bean waste, sesame waste, coconut waste, and cashew bagasse (Saharan et al.,
*Corresponding author. E-mail: [email protected]. Author(s) agree that this article remain permanently open access under the terms of the Creative Commons Attribution License 4.0 International License
474 Afr. J. Environ. Sci. Technol. 2011). These residual by-products serve as ideal substrates for fermentation processes to produce different important compounds (Rosenberg, 1986). Most agricultural products are utilized as source of raw materials. They produce large quantities of biosufactants, contain large amount of applicable proteins and carbo-hydrates such as glycoprotien with some amount of oil residues. The facilities used for the storage and preservation of this plant produce are either not available or inadequate.
Some surfactants are synthetic molecules that concentrate at interfaces and decrease surface and interfacial tension (Rosenberg and Ron, 1999). These compounds find applications in wide variety of industrial production as emulsions, foams, detergents, wetting agents, dispersers or solubilization agent of phosphorus (Desai and Banat 1997; Banat et al., 2000). However, biosurfactant are derived from microorganisms and act as surface-active compounds; there are attracting attention as they offer several advantages over chemical surfactants, such as low toxicity, inherent good biode-gradability and ecological acceptability (Banat, 2000; Samadhan et al., 2014). Biosurfactants are active compounds produced from microbial cells surfaces or excreted extracellularly by varieties of microorganisms (Jamal et al., 2012). They possess hydrophilic and hydrophobic moieties that reduce surface and interfacial tensions in colloidal. Also, surfactant molecules that adsorb at liquid-liquid interfaces, decrease the enthalpy and contribute to the overall free energy by reducing the tendency of the emulsion to destabilize by accumulating at the interface between two immiscible fluids (Saharan et al., 2011; Okpashi et al., 2013). Biosurfactants are classified based on their chemical structures and the organisms that produce them (Gomaa, 2012). They are helpful in the uptake and utilization of hydrocarbons to facilitate the biodegradation of toxic hydrocarbons. Other advantages include eco-friendly nature, high foaming capacity, and efficiency at variable temperatures, pH and salt concentrations (Salihu et al., 2009; Chandran and Das, 2010).
Interest towards these biomolecules has increased considerably, recently, they serve as potential fluids for many applications in industries such as petroleum, pharmaceutical, cosmetic, biomedical and food pro-cessing (Haba et al., 2003; Emine and Aysun, 2009). Large scale production of biosurfactants is achievable by finding cheap and renewable substrates; efficient microorganisms, optimization of the growth medium composition and conditions (Plaza et al., 2011; Jamal et al., 2012). Cashew (Anacardium occidentale) is widely grown and consumed by human. Often, due to lack of cashew marked in Nigeria, cashew is wasted and the bagasse that are rich in sugars, proteins and mineral salts are disposed as waste (Adebowale et al., 2011). This waste product is an interesting and inexpensive re-
newable carbon source for microbial fermentation to reducing bulk wastage of fruits. Among the microorganisms used in biosurfactant production, Pseudomonas species are the best known to grow in various substrates to produce rhamnolipids (Chandran and Das, 2010). This research work aimed to utilize cashew (A. occidentale) bagasse as substrates for P. aeruginosa to produce biosurfactants thereby converting low cost waste materials of environmental into products of superior value.
MATERIALS AND METHODS
Plant materials
Yellow cashew (A. occidentale) fruits bagasse was used as plant materials for this study. The cashew apples were collected from Ubogidi cashew plantation in Nsukka Local Government Area, Enugu state, Nigeria.
Preparation of plant material
The yellow cashew fruits bagasse was washed with normal saline and manually crushed to remove the juice using a pestle and mortar. The bagasse was air-dried for 4 days and pounded into powder. The powdered bagasse was packaged in an air-tight polythene bag and stored at room temperature.
Proximate composition
The proximate composition of the yellow cashew bagasse was determined using the method described by AOAC (1990).
Microorganism P. aeruginosa was used in this study. The microorganism was obtained from the Culture and isolation Unit of the Department of Microbiology, University of Nigeria, Nsukka.
Preparation of P. aeruginosa growth culture
This process was achieved by adopting the method described by Atlas et al. (2010). Under a sterile working environment, A loop-full of P. aeruginosa colony from the culture medium in the Petri dish was inoculated into 100.0 mL nutrient broth contained in a 250 mL conical flask. The inoculum was shaken and left undisturbed for 4 h after which 1 ml of the inoculum was collected in a flamed environment and the absorbance was read at 600 nm using spectrophotometer. The readings were taken three times at 2 h interval. Growth was indicated by increase in absorbance. This primary inoculum was grown until the optical density reached to 1.459 kg/cm
3 and was used to inoculate the various fermentation
media at 2% (v/v); that is 2 ml of inoculum for every 100 mL of media.
Screening of culture broth and P. aeruginosa
The growth of the organism was monitored by taking plate counts on nutrient agar. The plates were inoculated with 0.1 mL via serial dilutions using pour plate method described by Willey et al. (2013).
The plates were incubated for 24 h before the colonies were counted.
Extraction of biosurfactants
Biosurfactants produced were extracted using the method described by Suresh et al. 2012). The various culture media were centrifuged at 4000 rpm for 20 min to remove bacterial cells. The supernatant was precipitated by acidification to pH 2.0 with
hydrochloric acid (HCl) and stored at 4C overnight. The precipitate was collected for centrifugation at 4000 rpm for 20 min. Equal volume of chloroform: methanol (2:1) mixture was added. The resulting mixture was vortex for mixing. The contents were centrifuged at 4000 rpm for 20 min upon which the solvent was evaporated by air drying at 40
oC.
Characterization of isolated biosurfactant
The isolated biosurfactants from the various culture broth supernatants were analyzed for carbohydrate, protein and lipid content. Chemical composition of the biosurfactant was analyzed following standard methods. Carbohydrate content of the biosurfactant was determined by the anthrone reagent method as described by Spiro (1966). D-glucose was used as standard. Lipid content was estimated adopting the procedure of Folch et al. (1956). Protein content was determined using bovine serum albumin as a standard following the method of Lowry et al. (1951).
Antibacterial activity assay
The antimicrobial activity of the biosurfactant was studied against different Gram positive and Gram negative bacteria. The antibacterial activity was evaluated by agar disc diffusion method. Sterile discs of 0.6 cm diameter was soaked in biosurfactant and methanol were assayed on the surface of a Mueller-Hinton agar inoculated with the test microorganisms. After incubation period of 24 h at 25-37°C, the diameters of zones of inhibition were measured. The same solvents used to obtain the extract were used as negative controls. Standard antibiotics loaded on discs were used as positive controls.
Oil spreading test
The oil displacement test is a method used to measure the diameter of the clear zone, which occurs after dropping a surfactant-containing solution on an oil-water interphase. The binomial diameter allows an evaluation of the surface tension reduction efficiency of a given biosurfactant. The oil displacement test was done by adding 50 mL of distilled water to a Petri dish with a diameter of 15 cm. After that, 20 μl of oil was dropped onto the surface of the water, followed by the addition of 10 μl of cell culture supernatant. The diameter and the clear halo visualized under visible light were measured after 30 s (Rodrigues et al., 2006).
Emulsification test
The emulsification test was carried out as described by Balogun and Fagade (2010). Sterile biosurfactant solution (1.0 mL) was added into each test-tube (in a set of three) containing 2.0 mL of the substrates (crude oil, olive oil and kerosene). The content of the tubes were vigorously shaken for uniformity for 2 min and left undisturbed for 24 h. The volume of oil that separated after 24 h was measured, that is, the ability of a molecule to form emulsion.
Iroha et al 475 Their emulsification index after 24 h (E24) was determined and expressed as percentage of height of emulsified layer in centimeter divided by total height of the liquid column in centimeters. Emulsification index of value greater than 50% was indicative of a positive result:
Haemolysis test
The hemolysis test was carried out as an indicator of biosurfactant activity using blood agar plates as described by Carrillo et al. (1996). Human blood was collected by swabbing and tying a tourniquet on the upper arm. Then a sterile needle was used to collect blood from the visible vein. The microorganisms were screened by plating on blood agar plates containing 5% (v/v) human blood and incubated at room temperature for twenty-four hours. A clear zone (zone of hemolysis) around the colonies after this period was indicative of biosurfactants.
Stability tests
Stability studies were carried out by the procedure described by Chandran and Das (2010). The cell-free broth was obtained by centrifuging the cultures at 4000 revolutions per minute (rpm) for 20 minThe pH of the biosurfactant (4.0 mL) was adjusted to 2.0, 4.0, 6.0, 8.0 and 10.0 using sodium hydroxide (NaOH) or hydrochloric acid (HCl) after which the emulsification index (E24) was determined. To test the heat stability of the biosurfactant, the broth was maintained at different temperatures (10-100°C) in a water bath for fifteen minutes, cooled at room temperature and emulsification index (E24) was determined. Stability was also analyzed with sodium chloride salt concentrations ranging from 0 to 20% w/v.
Carbohydrate content
The carbohydrate content of the isolated biosurfactant was analyzed by the anthrone method described by Umeji et al. (2010). A quantity 2.0 mL of the biosurfactant was added into appropriately labeled sterile test tubes, after which distilled water 3 mL and 10.0 mL of 0.2% solution of anthrone reagent (containing 0.2% anthrone in 95% H2SO4) was added to each of the test tubes. The absorbance of each of the preparation was read at 520 nm against a blank composed of distilled water and anthrone reagent. 2 g/l of glucose was used as the standard:
Protein content
A known weight, 0.5 g of oven-dried sample was placed into 30 ml Kjeldahl flask and 15.0 ml of concentrated H2SO4 was added with 1 g of the catalyst mixture. The mixture was heated cautiously in digestion rack under a fume cupboard until a greenish solution appeared. After the digest was cleared, it was heated further for 30 minand allowed to cool. About 10.0 ml of distilled water was added to avoid caking. The mixture was transferred to the Kjeldahl distillation apparatus. A receiver flask containing 5.0 ml of boric acid was placed under the condenser of the distillation apparatus. Ten
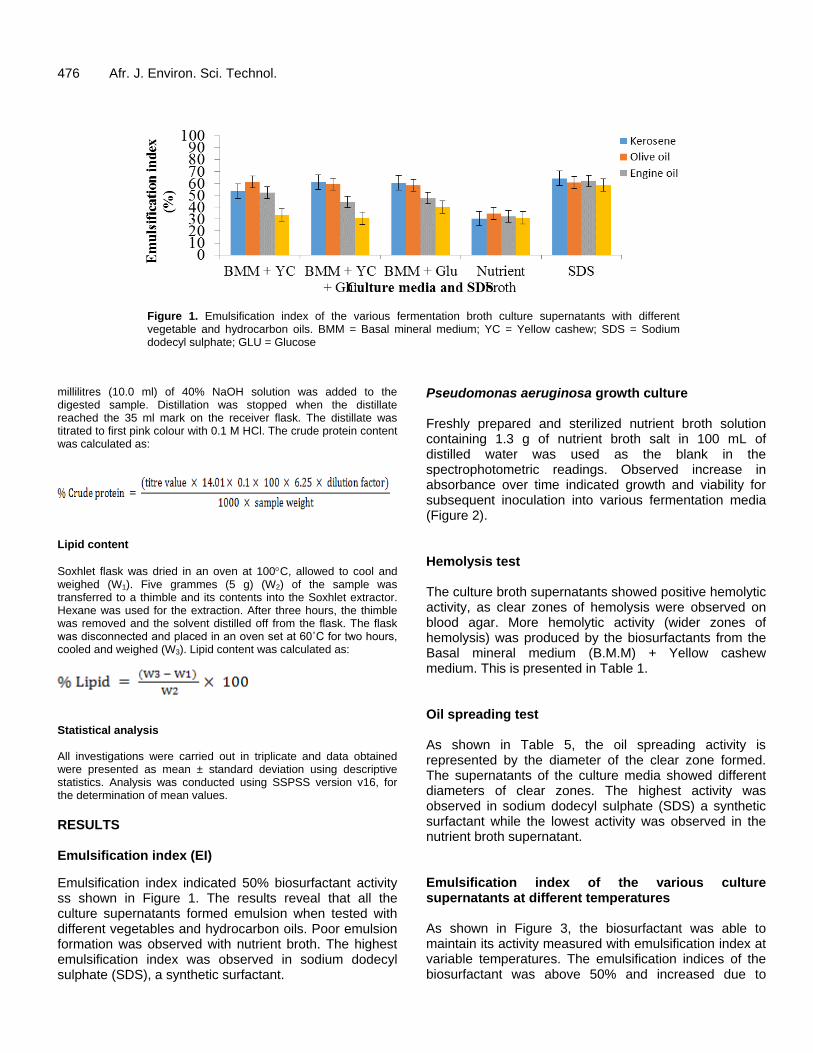
476 Afr. J. Environ. Sci. Technol.
Figure 1. Emulsification index of the various fermentation broth culture supernatants with different vegetable and hydrocarbon oils. BMM = Basal mineral medium; YC = Yellow cashew; SDS = Sodium dodecyl sulphate; GLU = Glucose
millilitres (10.0 ml) of 40% NaOH solution was added to the digested sample. Distillation was stopped when the distillate reached the 35 ml mark on the receiver flask. The distillate was titrated to first pink colour with 0.1 M HCl. The crude protein content was calculated as:
Lipid content
Soxhlet flask was dried in an oven at 100C, allowed to cool and weighed (W1). Five grammes (5 g) (W2) of the sample was transferred to a thimble and its contents into the Soxhlet extractor. Hexane was used for the extraction. After three hours, the thimble was removed and the solvent distilled off from the flask. The flask was disconnected and placed in an oven set at 60˚C for two hours, cooled and weighed (W3). Lipid content was calculated as:
Statistical analysis All investigations were carried out in triplicate and data obtained were presented as mean ± standard deviation using descriptive statistics. Analysis was conducted using SSPSS version v16, for the determination of mean values. RESULTS Emulsification index (EI)
Emulsification index indicated 50% biosurfactant activity ss shown in Figure 1. The results reveal that all the culture supernatants formed emulsion when tested with different vegetables and hydrocarbon oils. Poor emulsion formation was observed with nutrient broth. The highest emulsification index was observed in sodium dodecyl sulphate (SDS), a synthetic surfactant.
Pseudomonas aeruginosa growth culture Freshly prepared and sterilized nutrient broth solution containing 1.3 g of nutrient broth salt in 100 mL of distilled water was used as the blank in the spectrophotometric readings. Observed increase in absorbance over time indicated growth and viability for subsequent inoculation into various fermentation media (Figure 2). Hemolysis test The culture broth supernatants showed positive hemolytic activity, as clear zones of hemolysis were observed on blood agar. More hemolytic activity (wider zones of hemolysis) was produced by the biosurfactants from the Basal mineral medium (B.M.M) + Yellow cashew medium. This is presented in Table 1. Oil spreading test As shown in Table 5, the oil spreading activity is represented by the diameter of the clear zone formed. The supernatants of the culture media showed different diameters of clear zones. The highest activity was observed in sodium dodecyl sulphate (SDS) a synthetic surfactant while the lowest activity was observed in the nutrient broth supernatant. Emulsification index of the various culture supernatants at different temperatures As shown in Figure 3, the biosurfactant was able to maintain its activity measured with emulsification index at variable temperatures. The emulsification indices of the biosurfactant was above 50% and increased due to
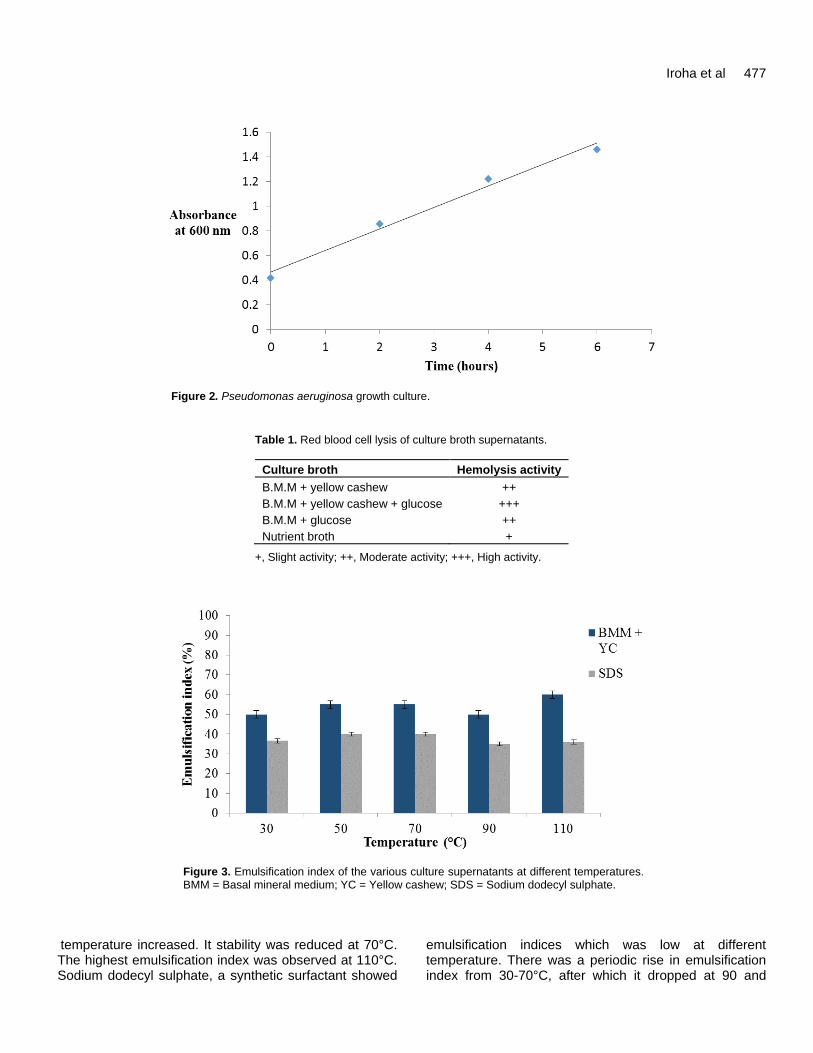
Iroha et al 477
Figure 2. Pseudomonas aeruginosa growth culture.
Table 1. Red blood cell lysis of culture broth supernatants.
Culture broth Hemolysis activity
B.M.M + yellow cashew ++
B.M.M + yellow cashew + glucose +++
B.M.M + glucose ++
Nutrient broth +
+, Slight activity; ++, Moderate activity; +++, High activity.
Figure 3. Emulsification index of the various culture supernatants at different temperatures. BMM = Basal mineral medium; YC = Yellow cashew; SDS = Sodium dodecyl sulphate.
temperature increased. It stability was reduced at 70°C. The highest emulsification index was observed at 110°C. Sodium dodecyl sulphate, a synthetic surfactant showed
emulsification indices which was low at different temperature. There was a periodic rise in emulsification index from 30-70°C, after which it dropped at 90 and
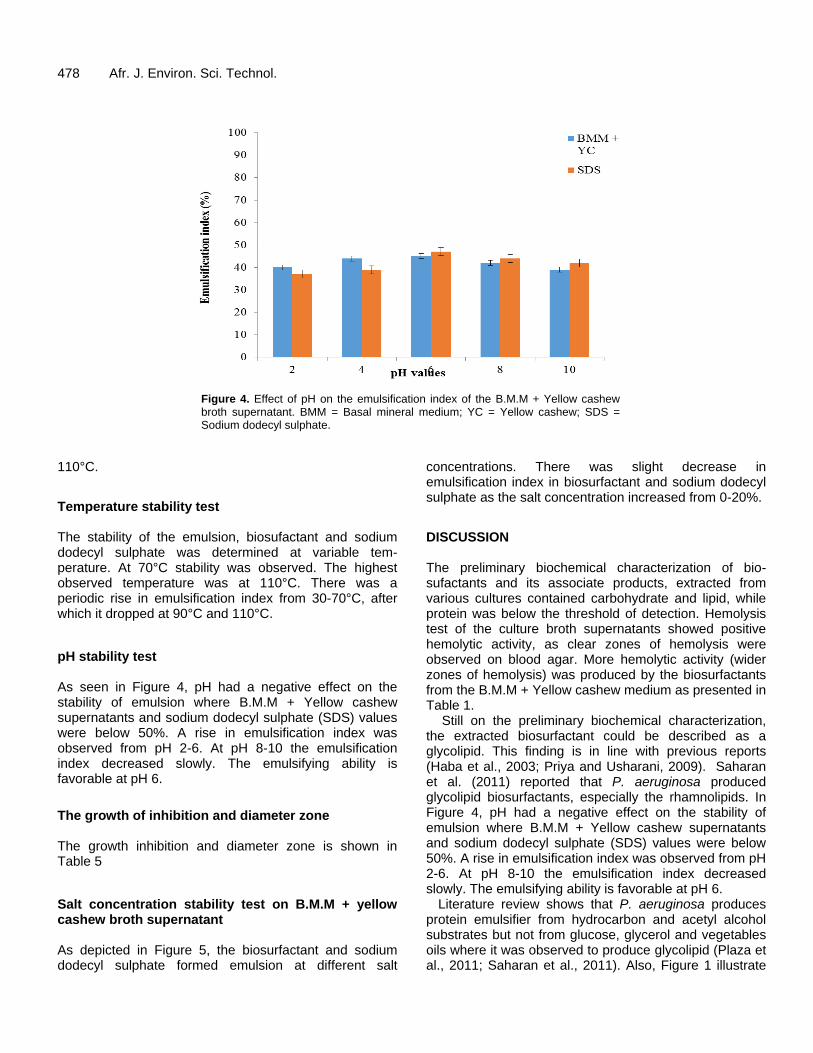
478 Afr. J. Environ. Sci. Technol.
Figure 4. Effect of pH on the emulsification index of the B.M.M + Yellow cashew broth supernatant. BMM = Basal mineral medium; YC = Yellow cashew; SDS = Sodium dodecyl sulphate.
110°C.
Temperature stability test The stability of the emulsion, biosufactant and sodium dodecyl sulphate was determined at variable tem-perature. At 70°C stability was observed. The highest observed temperature was at 110°C. There was a periodic rise in emulsification index from 30-70°C, after which it dropped at 90°C and 110°C.
pH stability test As seen in Figure 4, pH had a negative effect on the stability of emulsion where B.M.M + Yellow cashew supernatants and sodium dodecyl sulphate (SDS) values were below 50%. A rise in emulsification index was observed from pH 2-6. At pH 8-10 the emulsification index decreased slowly. The emulsifying ability is favorable at pH 6.
The growth of inhibition and diameter zone The growth inhibition and diameter zone is shown in Table 5
Salt concentration stability test on B.M.M + yellow cashew broth supernatant As depicted in Figure 5, the biosurfactant and sodium dodecyl sulphate formed emulsion at different salt
concentrations. There was slight decrease in emulsification index in biosurfactant and sodium dodecyl sulphate as the salt concentration increased from 0-20%.
DISCUSSION The preliminary biochemical characterization of bio-sufactants and its associate products, extracted from various cultures contained carbohydrate and lipid, while protein was below the threshold of detection. Hemolysis test of the culture broth supernatants showed positive hemolytic activity, as clear zones of hemolysis were observed on blood agar. More hemolytic activity (wider zones of hemolysis) was produced by the biosurfactants from the B.M.M + Yellow cashew medium as presented in Table 1.
Still on the preliminary biochemical characterization, the extracted biosurfactant could be described as a glycolipid. This finding is in line with previous reports (Haba et al., 2003; Priya and Usharani, 2009). Saharan et al. (2011) reported that P. aeruginosa produced glycolipid biosurfactants, especially the rhamnolipids. In Figure 4, pH had a negative effect on the stability of emulsion where B.M.M + Yellow cashew supernatants and sodium dodecyl sulphate (SDS) values were below 50%. A rise in emulsification index was observed from pH 2-6. At pH 8-10 the emulsification index decreased slowly. The emulsifying ability is favorable at pH 6.
Literature review shows that P. aeruginosa produces protein emulsifier from hydrocarbon and acetyl alcohol substrates but not from glucose, glycerol and vegetables oils where it was observed to produce glycolipid (Plaza et al., 2011; Saharan et al., 2011). Also, Figure 1 illustrate
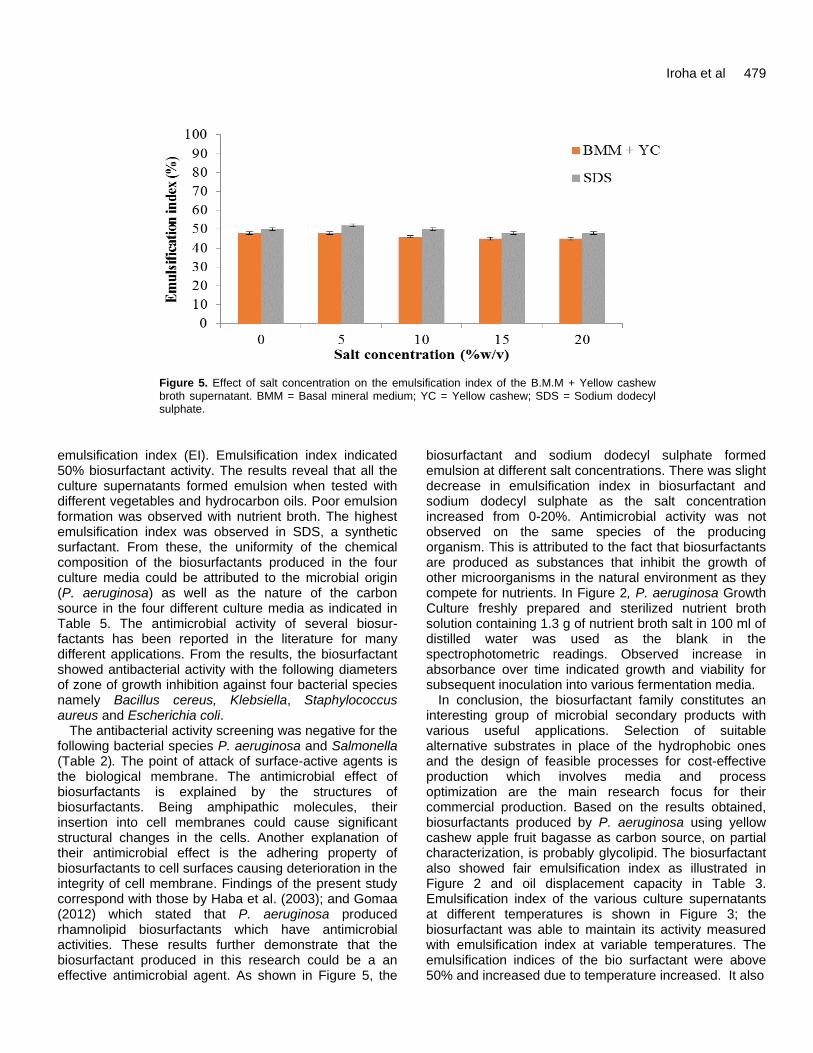
Iroha et al 479
Figure 5. Effect of salt concentration on the emulsification index of the B.M.M + Yellow cashew broth supernatant. BMM = Basal mineral medium; YC = Yellow cashew; SDS = Sodium dodecyl sulphate.
emulsification index (EI). Emulsification index indicated 50% biosurfactant activity. The results reveal that all the culture supernatants formed emulsion when tested with different vegetables and hydrocarbon oils. Poor emulsion formation was observed with nutrient broth. The highest emulsification index was observed in SDS, a synthetic surfactant. From these, the uniformity of the chemical composition of the biosurfactants produced in the four culture media could be attributed to the microbial origin (P. aeruginosa) as well as the nature of the carbon source in the four different culture media as indicated in Table 5. The antimicrobial activity of several biosur-factants has been reported in the literature for many different applications. From the results, the biosurfactant showed antibacterial activity with the following diameters of zone of growth inhibition against four bacterial species namely Bacillus cereus, Klebsiella, Staphylococcus aureus and Escherichia coli.
The antibacterial activity screening was negative for the following bacterial species P. aeruginosa and Salmonella (Table 2). The point of attack of surface-active agents is the biological membrane. The antimicrobial effect of biosurfactants is explained by the structures of biosurfactants. Being amphipathic molecules, their insertion into cell membranes could cause significant structural changes in the cells. Another explanation of their antimicrobial effect is the adhering property of biosurfactants to cell surfaces causing deterioration in the integrity of cell membrane. Findings of the present study correspond with those by Haba et al. (2003); and Gomaa (2012) which stated that P. aeruginosa produced rhamnolipid biosurfactants which have antimicrobial activities. These results further demonstrate that the biosurfactant produced in this research could be a an effective antimicrobial agent. As shown in Figure 5, the
biosurfactant and sodium dodecyl sulphate formed emulsion at different salt concentrations. There was slight decrease in emulsification index in biosurfactant and sodium dodecyl sulphate as the salt concentration increased from 0-20%. Antimicrobial activity was not observed on the same species of the producing organism. This is attributed to the fact that biosurfactants are produced as substances that inhibit the growth of other microorganisms in the natural environment as they compete for nutrients. In Figure 2, P. aeruginosa Growth Culture freshly prepared and sterilized nutrient broth solution containing 1.3 g of nutrient broth salt in 100 ml of distilled water was used as the blank in the spectrophotometric readings. Observed increase in absorbance over time indicated growth and viability for subsequent inoculation into various fermentation media.
In conclusion, the biosurfactant family constitutes an interesting group of microbial secondary products with various useful applications. Selection of suitable alternative substrates in place of the hydrophobic ones and the design of feasible processes for cost-effective production which involves media and process optimization are the main research focus for their commercial production. Based on the results obtained, biosurfactants produced by P. aeruginosa using yellow cashew apple fruit bagasse as carbon source, on partial characterization, is probably glycolipid. The biosurfactant also showed fair emulsification index as illustrated in Figure 2 and oil displacement capacity in Table 3. Emulsification index of the various culture supernatants at different temperatures is shown in Figure 3; the biosurfactant was able to maintain its activity measured with emulsification index at variable temperatures. The emulsification indices of the bio surfactant were above 50% and increased due to temperature increased. It also
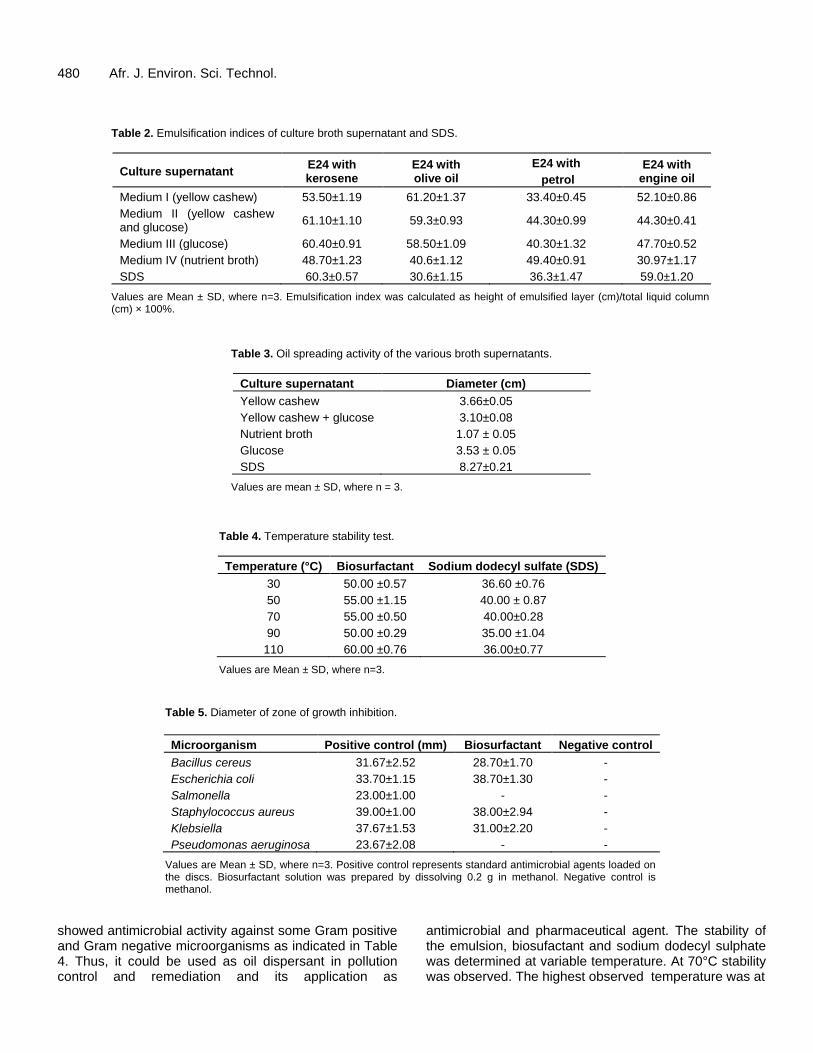
480 Afr. J. Environ. Sci. Technol.
Table 2. Emulsification indices of culture broth supernatant and SDS.
Culture supernatant E24 with kerosene
E24 with olive oil
E24 with
petrol
E24 with engine oil
Medium I (yellow cashew) 53.50±1.19 61.20±1.37 33.40±0.45 52.10±0.86
Medium II (yellow cashew and glucose)
61.10±1.10 59.3±0.93 44.30±0.99 44.30±0.41
Medium III (glucose) 60.40±0.91 58.50±1.09 40.30±1.32 47.70±0.52
Medium IV (nutrient broth) 48.70±1.23 40.6±1.12 49.40±0.91 30.97±1.17
SDS 60.3±0.57 30.6±1.15 36.3±1.47 59.0±1.20
Values are Mean ± SD, where n=3. Emulsification index was calculated as height of emulsified layer (cm)/total liquid column (cm) × 100%.
Table 3. Oil spreading activity of the various broth supernatants.
Culture supernatant Diameter (cm)
Yellow cashew 3.66±0.05
Yellow cashew + glucose 3.10±0.08
Nutrient broth 1.07 ± 0.05
Glucose 3.53 ± 0.05
SDS 8.27±0.21
Values are mean ± SD, where n = 3.
Table 4. Temperature stability test.
Temperature (°C) Biosurfactant Sodium dodecyl sulfate (SDS)
30 50.00 ±0.57 36.60 ±0.76
50 55.00 ±1.15 40.00 ± 0.87
70 55.00 ±0.50 40.00±0.28
90 50.00 ±0.29 35.00 ±1.04
110 60.00 ±0.76 36.00±0.77
Values are Mean ± SD, where n=3.
Table 5. Diameter of zone of growth inhibition.
Microorganism Positive control (mm) Biosurfactant Negative control
Bacillus cereus 31.67±2.52 28.70±1.70 -
Escherichia coli 33.70±1.15 38.70±1.30 -
Salmonella 23.00±1.00 - -
Staphylococcus aureus 39.00±1.00 38.00±2.94 -
Klebsiella 37.67±1.53 31.00±2.20 -
Pseudomonas aeruginosa 23.67±2.08 - -
Values are Mean ± SD, where n=3. Positive control represents standard antimicrobial agents loaded on the discs. Biosurfactant solution was prepared by dissolving 0.2 g in methanol. Negative control is methanol.
showed antimicrobial activity against some Gram positive and Gram negative microorganisms as indicated in Table 4. Thus, it could be used as oil dispersant in pollution control and remediation and its application as
antimicrobial and pharmaceutical agent. The stability of the emulsion, biosufactant and sodium dodecyl sulphate was determined at variable temperature. At 70°C stability was observed. The highest observed temperature was at
110°C. There was a periodic rise in emulsification index from 30-70°C, after which it dropped at 90°C and 110°C. Table 4 explains the temperature stability. The yield and chemical composition of the biosurfactant may have been influenced by the physicochemical nature of the carbon source (yellow cashew apple fruit bagasse) and the microorganism (P. aeruginosa) used in the production. Hence, yellow cashew apple is a fairly good substrate for biosurfactant (glycolipid) production by P. aeruginosa.
Conflict of interest
The authors did not declare any conflict of interest. REFERENCES Adebowale BA, Olubamiwa O, Ogunjobi MAK (2011). Substitution value
of sundried cashew apple bagasse in the diets of Clarias gariepinus. Int. Res. J. Agric. Sci. Soil Sci. 1(7):268-272.
Association of Official Analytical Chemists (1990). Method of analysis (15
th edition). Arlington, V.A. pp. 54-55.
Atlas RM (2010). Handbook of Microbiology media (4th edition). Taylor
and Francis Group, LLC. New York. pp. 1440-1441. Balogun SA, Fagade OE (2010). Emulsifying bacteria in produce water
from Niger Delta, Nigeria. Afr. J. Microbiol. Res. 14(9):730-734. Banat IM (2000), “Biosurfactants, more in demand than ever” Bio-future,
198, 44. Banat IM, Makkar RS, Cameotra SS (2000). “Potential commercial
applications of microbial surfactants.” Appl. Microbial. Biotechnology. 53(5):495-508.
Carrillo PG, Mardaraz C, Pitta-Alvarez SI, Giulietti AM (1996). Isolation and selection of biosurfactant producing bacteria. World J. Microbiol. Biotechnol. 12:82-84.
Chandran P, Das N (2010). Biosurfactant production and diesel oil degradation by yeast species Trichosporon asahii isolated from petroleum hydrocarbon contaminated soil. Int. J. Eng. Sci. Technol. 2(12):6942-6953.
Desai JD, Banat IM (1997) “Microbial production of surfactants and their commercial potential.”Microbiology. Mol. Biol. Review.; 61(1):47-64.
Emine Y, Aysun E (2009). Screening the antimicrobial activity of biosurfactants produced by microorganisms isolated from refinery wastewaters. J. Appl. Biolog. Sci. 3(2):163-168.
Folch JM, Lees M, Stanly HS (1956). A simple method for the isolation and quantification of total lipids from animal tissues. J. Biolog. Chem. 226:497-509.
Gomaa E Z (2012). Antimicrobial activity of a biosurfactant produced by Bacillus licheniformis strain M104 grown on whey. Afr. J. Microbiol. Res. 6(20):4396-4403.
Haba E, Pinazo A, Jauregui O, Espuny MJ, Infante MR, Manresa A (2003). Physicochemical characterization and antimicrobial properties of rhamnolipids produced by Pseudomonas aeruginosa 47T2 NCBIM 40044. Biotechnol. Bioeng. 81:316-322.
Iroha et al 481 Jama P, Nawawi WM, Alam MZ (2012). Optimum medium components
for biosurfactant production by Klebsiella pneumonia WMF02 utilizing sludge palm oil as a substrate. Austr. J. Basic Appl. Sci. 6(1):100-108.
Lowry OH, Rosebrough NJ, Farr AL, Randall RJ (1951). Protein measurement with the folin phenol reagent. J. Biol. Chemistry, 193:265-275.
Okpashi VE, OU Njoku, VN Ogugua, EA Ugian (2013). Characterization of fluted pumpkin (telfiariaoccidentalis hook f) seeds oil emulsion. The Int. J. Eng. Sci. 2:36-38.
Płaza GA, Pacwa-Płociniczak M, Piotrowska-Seget Z, Jangid K, Wilk, KA (2011). Agroindustrial wastes as unconventional substrates for growing of Bacillus strains and production of biosurfactant. Environ. Protect. Eng. 37(3):65-71.
Priya T, Usharani G (2009). Comparative study for biosurfactant production by using Bacillus subtilis and Pseudomonas aeruginosa. Bot. Res. Int. 2(4):284-287.
Rodrigues LR, Teixeira JA, Van der Mei HC, Oliveira R (2006). Physiochemical and functional characterization of a biosurfactant produced by Lactococcus lactis 53. Colloidal Surf. B. 49(1):79 - 86.
Rosenberg E (1986) “Microbial biosurfactants.” Critic. Rev. Biotechnol. 3:109
Rosenberg E, Ron EZ (1999). “High molecular-mass microbial surfactants.” Application Microbiology Biotechnology. 52(2):154-620.
Saharan BS, Sahu RK, Sharma D (2011). A review on biosurfactants: fermentation, current developments and perspectives. Genet. Eng. Biotechnol. J. 29:1-14.
Salihu A, Abdulkadir I, Almustapha MN (2009). An investigation for potential development on biosurfactants. Biotechnol. Mol. Biol. Reviews. 3(5):111-117.
Samadhan Waghmode, Chandrashekhar Kulkarni, Sneha Shukla, Priyanka Sursawant, Chaitanya Velhal (2014). Low Cost Production of Biosurfactant from Different Substrates and Their Comparative Study with Commercially Available Chemical Surfactant. Int. J. Sci. Technol. Res. 3(3):146-149.
Spiro RG (1966). Analysis of sugar found in glycoproteins. Methods in Enzymol. 8:7-9.
Suresh CR, Lohitnath T, Mukesh DJ (2012). Production and characterization of biosurfurctant from Bacillus subtilis MTCC 441. Adv. Appl. Sci. Res. 3(3): 1827-1831.
Umeji AA, Onwurah INE, Anyanwu CU (2010). Isolation and characterization of biosurfactant produced by a diculture of Pseudomonas spp and Azotobacter vinelandii. Nig. J. Biochem. Mol. Biol. 25(2):78-85.
Willey J, Sherwood L, Wolverton C (2013). Prescotts Microbiology. 9th
edition. McGraw Hill Education, USA.
Vol. 9(5), pp. 482-492, May 2015
DOI: 10.5897/AJEST2014.1779
Article Number: 80D910752468
ISSN 1996-0786
Copyright © 2015
Author(s) retain the copyright of this article
http://www.academicjournals.org/AJEST
African Journal of Environmental Science and Technology
Full Length Research Paper
Challenges of adoption of urine-diversion dry toilets technology as sanitation option by coastal
communities of Mkuranga District in Tanzania
Aloyce W. Mayo* and Twaha Mubarak
Department of Water Resources Engineering, University of Dar es Salaam, Tanzania.
Received 21 August, 2014; Accepted 8 April, 2015
Mkuranga District council in collaboration with African Medical and Research Foundation (AMREF) introduced ecological sanitation option using urine-diversion dry toilets (UDDT) to the community between 2007 and 2009, which was later declared unsuccessful. This study analyzed factors that hindered the uptake of UDDT by the community by assessing the project implementation strategy. Techniques used for the study were questionnaire, interviews, observation and focus group discussion while respondents were government official and the community at the household level. The study reveals that the literacy level in Mkuranga district is 79.1%, but only 40.6% had some knowledge of ecological sanitation although only 9% proves that. About 52% of the respondents are using conventional pit latrines, but 27.3% have no toilet facilities. There was no evidence of adoption of UDDT technology at household level and only one of the seven UDDTs constructed by the project is operational. There was no sufficient evidence to suggest that Mkuranga District has sufficiently supported the project through supervision, advocacy and addressing community requirements. As a result, the idea came in top-bottom approach which failed because communities were not adequately involved in the project. Key words: Ecological sanitation, urine-diversion dry toilets, adoption, community participation, Tanzania.
INTRODUCTION In many towns and rural areas of the world today, people live and raise their children in highly polluted environments (Muench, 2009). Urban and peri-urban areas in developing countries are among the worst polluted and disease ridden habitats of the world. Much of this pollution, which leads to high rates of disease and death, is caused by lack of toilets and inadequate sanitation services (COHRE et al., 2008). The lack of sufficient or adequate services is a result of many factors, including inadequate financial
resources, insufficient water and lack of space, difficult soil conditions and limited institutional capabilities. As population increases, the need for safe, sustainable and affordable sanitation systems will be even more critical (UNESCO/IHP, 2006).
In their Joint Monitoring Programme, UNICEF and WHO (2013) have reported that an estimated 2.5 billion people around the world do not have access to improved sanitation, the majority of those (90%) live in rural areas
*Corresponding author. E-mail: [email protected]. Author(s) agree that this article remain permanently open access under the terms of the Creative Commons Attribution License 4.0 International License
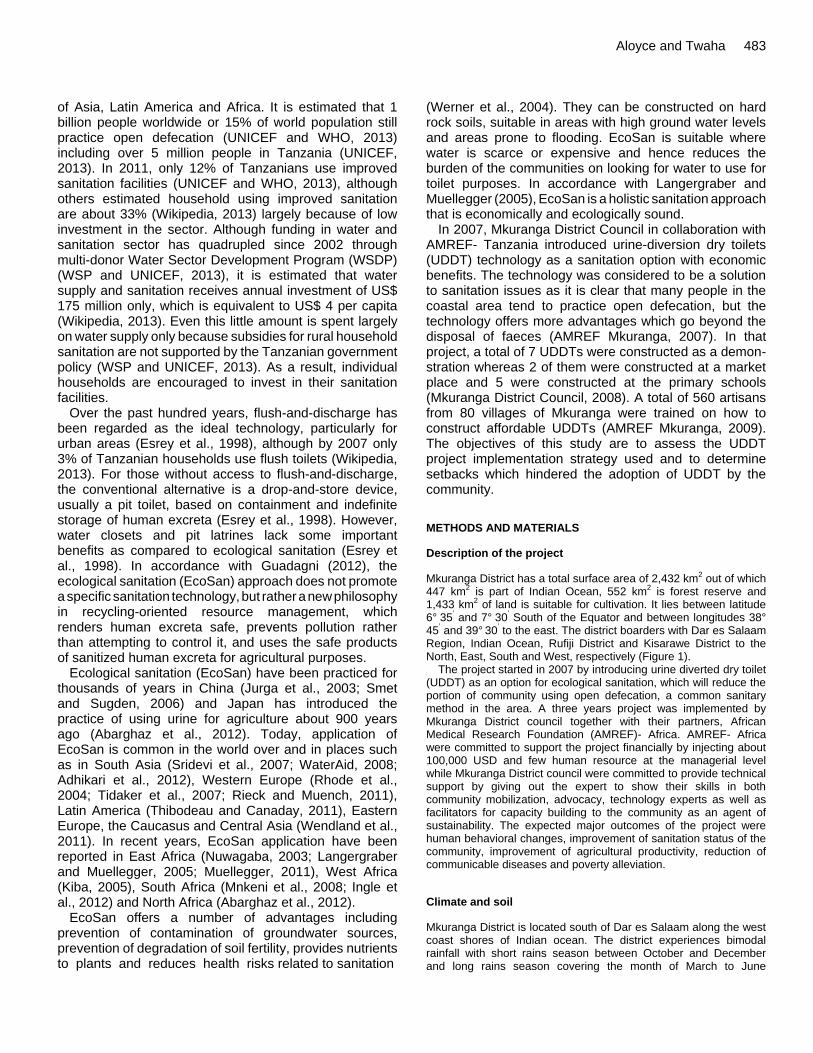
of Asia, Latin America and Africa. It is estimated that 1 billion people worldwide or 15% of world population still practice open defecation (UNICEF and WHO, 2013) including over 5 million people in Tanzania (UNICEF, 2013). In 2011, only 12% of Tanzanians use improved sanitation facilities (UNICEF and WHO, 2013), although others estimated household using improved sanitation are about 33% (Wikipedia, 2013) largely because of low investment in the sector. Although funding in water and sanitation sector has quadrupled since 2002 through multi-donor Water Sector Development Program (WSDP) (WSP and UNICEF, 2013), it is estimated that water supply and sanitation receives annual investment of US$ 175 million only, which is equivalent to US$ 4 per capita (Wikipedia, 2013). Even this little amount is spent largely on water supply only because subsidies for rural household sanitation are not supported by the Tanzanian government policy (WSP and UNICEF, 2013). As a result, individual households are encouraged to invest in their sanitation facilities.
Over the past hundred years, flush-and-discharge has been regarded as the ideal technology, particularly for urban areas (Esrey et al., 1998), although by 2007 only 3% of Tanzanian households use flush toilets (Wikipedia, 2013). For those without access to flush-and-discharge, the conventional alternative is a drop-and-store device, usually a pit toilet, based on containment and indefinite storage of human excreta (Esrey et al., 1998). However, water closets and pit latrines lack some important benefits as compared to ecological sanitation (Esrey et al., 1998). In accordance with Guadagni (2012), the ecological sanitation (EcoSan) approach does not promote a specific sanitation technology, but rather a new philosophy in recycling-oriented resource management, which renders human excreta safe, prevents pollution rather than attempting to control it, and uses the safe products of sanitized human excreta for agricultural purposes.
Ecological sanitation (EcoSan) have been practiced for thousands of years in China (Jurga et al., 2003; Smet and Sugden, 2006) and Japan has introduced the practice of using urine for agriculture about 900 years ago (Abarghaz et al., 2012). Today, application of EcoSan is common in the world over and in places such as in South Asia (Sridevi et al., 2007; WaterAid, 2008; Adhikari et al., 2012), Western Europe (Rhode et al., 2004; Tidaker et al., 2007; Rieck and Muench, 2011), Latin America (Thibodeau and Canaday, 2011), Eastern Europe, the Caucasus and Central Asia (Wendland et al., 2011). In recent years, EcoSan application have been reported in East Africa (Nuwagaba, 2003; Langergraber and Muellegger, 2005; Muellegger, 2011), West Africa (Kiba, 2005), South Africa (Mnkeni et al., 2008; Ingle et al., 2012) and North Africa (Abarghaz et al., 2012).
EcoSan offers a number of advantages including
prevention of contamination of groundwater sources, prevention of degradation of soil fertility, provides nutrients to plants and reduces health risks related to sanitation
Aloyce and Twaha 483 (Werner et al., 2004). They can be constructed on hard rock soils, suitable in areas with high ground water levels and areas prone to flooding. EcoSan is suitable where water is scarce or expensive and hence reduces the burden of the communities on looking for water to use for toilet purposes. In accordance with Langergraber and Muellegger (2005), EcoSan is a holistic sanitation approach that is economically and ecologically sound.
In 2007, Mkuranga District Council in collaboration with AMREF- Tanzania introduced urine-diversion dry toilets (UDDT) technology as a sanitation option with economic benefits. The technology was considered to be a solution to sanitation issues as it is clear that many people in the coastal area tend to practice open defecation, but the technology offers more advantages which go beyond the disposal of faeces (AMREF Mkuranga, 2007). In that project, a total of 7 UDDTs were constructed as a demon-stration whereas 2 of them were constructed at a market place and 5 were constructed at the primary schools (Mkuranga District Council, 2008). A total of 560 artisans from 80 villages of Mkuranga were trained on how to construct affordable UDDTs (AMREF Mkuranga, 2009). The objectives of this study are to assess the UDDT
project implementation strategy used and to determine setbacks which hindered the adoption of UDDT by the community.
METHODS AND MATERIALS
Description of the project
Mkuranga District has a total surface area of 2,432 km2 out of which
447 km2 is part of Indian Ocean, 552 km
2 is forest reserve and
1,433 km2 of land is suitable for cultivation. It lies between latitude
6° 35
’ and 7°
30
’ South of the Equator and between longitudes 38°
45’ and 39°
30
’ to the east. The district boarders with Dar es Salaam
Region, Indian Ocean, Rufiji District and Kisarawe District to the North, East, South and West, respectively (Figure 1).
The project started in 2007 by introducing urine diverted dry toilet (UDDT) as an option for ecological sanitation, which will reduce the portion of community using open defecation, a common sanitary method in the area. A three years project was implemented by Mkuranga District council together with their partners, African Medical Research Foundation (AMREF)- Africa. AMREF- Africa were committed to support the project financially by injecting about 100,000 USD and few human resource at the managerial level while Mkuranga District council were committed to provide technical support by giving out the expert to show their skills in both community mobilization, advocacy, technology experts as well as facilitators for capacity building to the community as an agent of sustainability. The expected major outcomes of the project were human behavioral changes, improvement of sanitation status of the community, improvement of agricultural productivity, reduction of communicable diseases and poverty alleviation.
Climate and soil
Mkuranga District is located south of Dar es Salaam along the west coast shores of Indian ocean. The district experiences bimodal rainfall with short rains season between October and December and long rains season covering the month of March to June
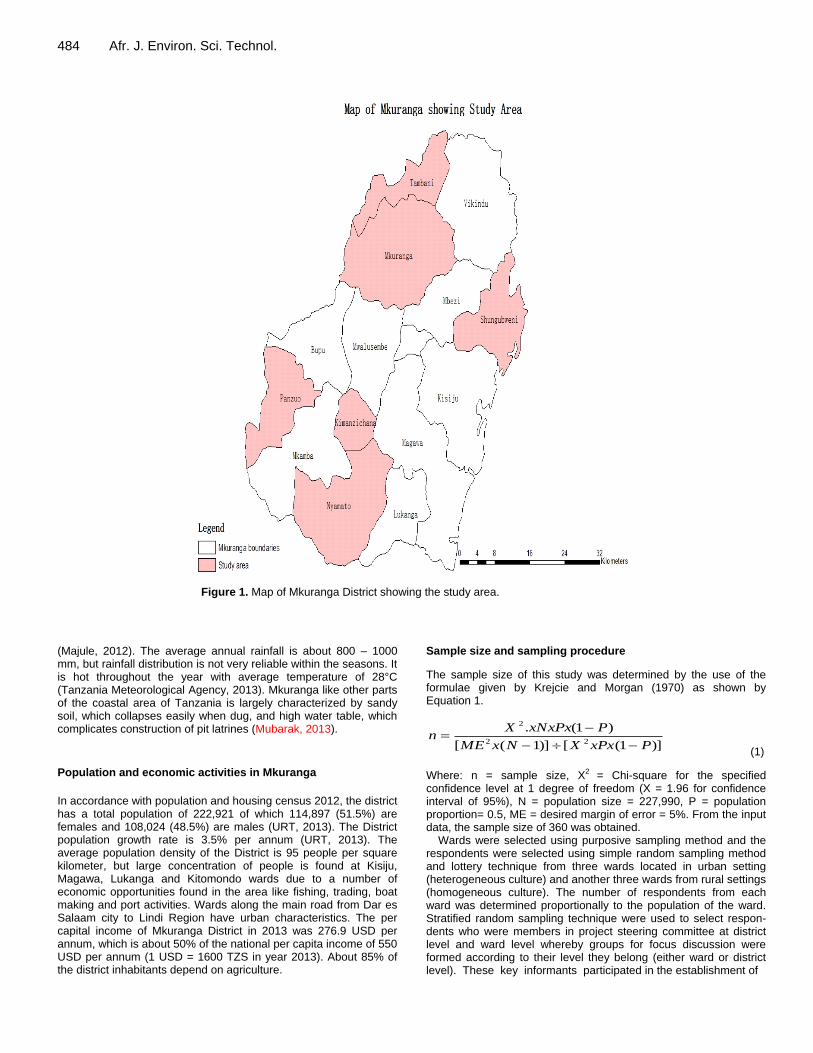
484 Afr. J. Environ. Sci. Technol.
Figure 1. Map of Mkuranga District showing the study area.
(Majule, 2012). The average annual rainfall is about 800 – 1000 mm, but rainfall distribution is not very reliable within the seasons. It is hot throughout the year with average temperature of 28°C (Tanzania Meteorological Agency, 2013). Mkuranga like other parts of the coastal area of Tanzania is largely characterized by sandy soil, which collapses easily when dug, and high water table, which complicates construction of pit latrines (Mubarak, 2013).
Population and economic activities in Mkuranga
In accordance with population and housing census 2012, the district has a total population of 222,921 of which 114,897 (51.5%) are females and 108,024 (48.5%) are males (URT, 2013). The District population growth rate is 3.5% per annum (URT, 2013). The average population density of the District is 95 people per square kilometer, but large concentration of people is found at Kisiju, Magawa, Lukanga and Kitomondo wards due to a number of economic opportunities found in the area like fishing, trading, boat making and port activities. Wards along the main road from Dar es Salaam city to Lindi Region have urban characteristics. The per capital income of Mkuranga District in 2013 was 276.9 USD per annum, which is about 50% of the national per capita income of 550 USD per annum (1 USD = 1600 TZS in year 2013). About 85% of the district inhabitants depend on agriculture.
Sample size and sampling procedure
The sample size of this study was determined by the use of the formulae given by Krejcie and Morgan (1970) as shown by Equation 1.
(1) ………………………………………………)]1([)]1([
)1(.22
2
PxPxXNxME
PxNxPxXn
(1)
Where: n = sample size, X2
= Chi-square for the specified confidence level at 1 degree of freedom (X = 1.96 for confidence interval of 95%), N = population size = 227,990, P = population proportion= 0.5, ME = desired margin of error = 5%. From the input data, the sample size of 360 was obtained.
Wards were selected using purposive sampling method and the respondents were selected using simple random sampling method and lottery technique from three wards located in urban setting (heterogeneous culture) and another three wards from rural settings (homogeneous culture). The number of respondents from each ward was determined proportionally to the population of the ward. Stratified random sampling technique were used to select respon-dents who were members in project steering committee at district level and ward level whereby groups for focus discussion were formed according to their level they belong (either ward or district level). These key informants participated in the establishment of
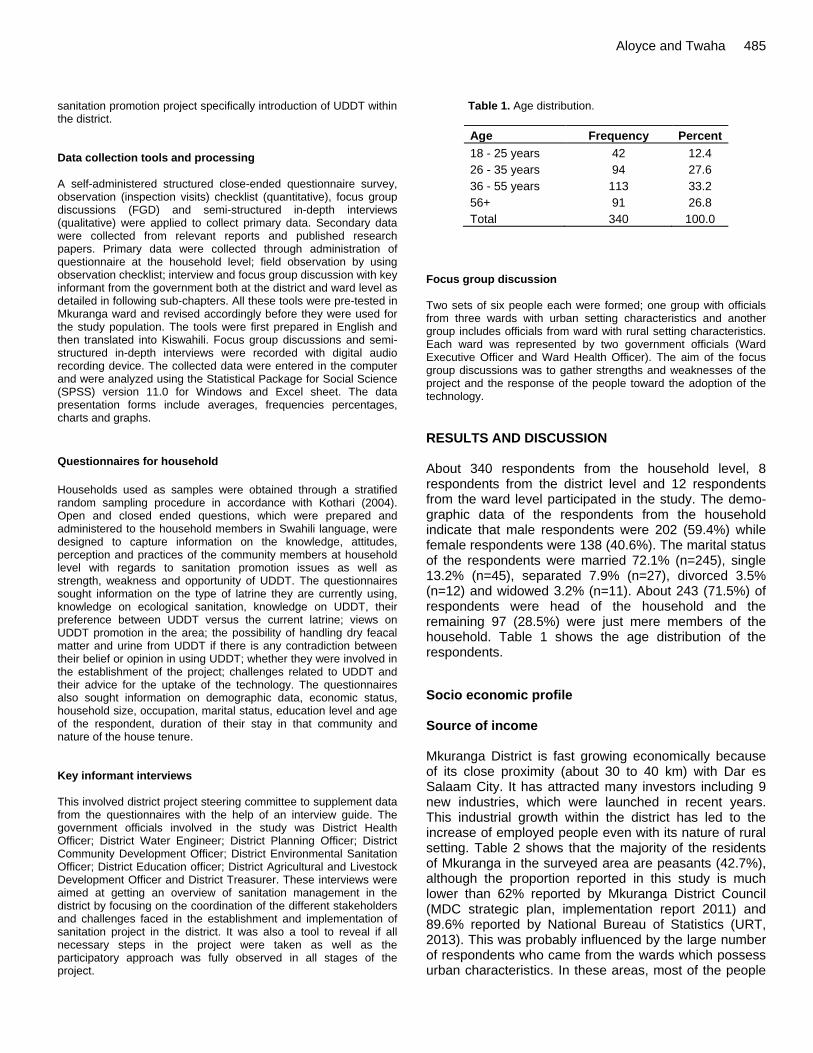
sanitation promotion project specifically introduction of UDDT within the district. Data collection tools and processing A self-administered structured close-ended questionnaire survey, observation (inspection visits) checklist (quantitative), focus group discussions (FGD) and semi-structured in-depth interviews (qualitative) were applied to collect primary data. Secondary data were collected from relevant reports and published research papers. Primary data were collected through administration of questionnaire at the household level; field observation by using observation checklist; interview and focus group discussion with key informant from the government both at the district and ward level as detailed in following sub-chapters. All these tools were pre-tested in Mkuranga ward and revised accordingly before they were used for the study population. The tools were first prepared in English and then translated into Kiswahili. Focus group discussions and semi-structured in-depth interviews were recorded with digital audio recording device. The collected data were entered in the computer and were analyzed using the Statistical Package for Social Science (SPSS) version 11.0 for Windows and Excel sheet. The data presentation forms include averages, frequencies percentages, charts and graphs.
Questionnaires for household
Households used as samples were obtained through a stratified random sampling procedure in accordance with Kothari (2004). Open and closed ended questions, which were prepared and administered to the household members in Swahili language, were designed to capture information on the knowledge, attitudes, perception and practices of the community members at household level with regards to sanitation promotion issues as well as strength, weakness and opportunity of UDDT. The questionnaires sought information on the type of latrine they are currently using, knowledge on ecological sanitation, knowledge on UDDT, their preference between UDDT versus the current latrine; views on UDDT promotion in the area; the possibility of handling dry feacal matter and urine from UDDT if there is any contradiction between their belief or opinion in using UDDT; whether they were involved in the establishment of the project; challenges related to UDDT and their advice for the uptake of the technology. The questionnaires also sought information on demographic data, economic status, household size, occupation, marital status, education level and age of the respondent, duration of their stay in that community and nature of the house tenure. Key informant interviews This involved district project steering committee to supplement data from the questionnaires with the help of an interview guide. The government officials involved in the study was District Health Officer; District Water Engineer; District Planning Officer; District Community Development Officer; District Environmental Sanitation Officer; District Education officer; District Agricultural and Livestock Development Officer and District Treasurer. These interviews were aimed at getting an overview of sanitation management in the district by focusing on the coordination of the different stakeholders and challenges faced in the establishment and implementation of sanitation project in the district. It was also a tool to reveal if all necessary steps in the project were taken as well as the participatory approach was fully observed in all stages of the project.
Aloyce and Twaha 485
Table 1. Age distribution.
Age Frequency Percent
18 - 25 years 42 12.4
26 - 35 years 94 27.6
36 - 55 years 113 33.2
56+ 91 26.8
Total 340 100.0
Focus group discussion Two sets of six people each were formed; one group with officials from three wards with urban setting characteristics and another group includes officials from ward with rural setting characteristics. Each ward was represented by two government officials (Ward Executive Officer and Ward Health Officer). The aim of the focus group discussions was to gather strengths and weaknesses of the project and the response of the people toward the adoption of the technology.
RESULTS AND DISCUSSION About 340 respondents from the household level, 8 respondents from the district level and 12 respondents from the ward level participated in the study. The demo-graphic data of the respondents from the household indicate that male respondents were 202 (59.4%) while female respondents were 138 (40.6%). The marital status of the respondents were married 72.1% (n=245), single 13.2% (n=45), separated 7.9% (n=27), divorced 3.5% (n=12) and widowed 3.2% (n=11). About 243 (71.5%) of respondents were head of the household and the remaining 97 (28.5%) were just mere members of the household. Table 1 shows the age distribution of the respondents.
Socio economic profile Source of income Mkuranga District is fast growing economically because of its close proximity (about 30 to 40 km) with Dar es Salaam City. It has attracted many investors including 9 new industries, which were launched in recent years. This industrial growth within the district has led to the increase of employed people even with its nature of rural setting. Table 2 shows that the majority of the residents of Mkuranga in the surveyed area are peasants (42.7%), although the proportion reported in this study is much lower than 62% reported by Mkuranga District Council (MDC strategic plan, implementation report 2011) and 89.6% reported by National Bureau of Statistics (URT, 2013). This was probably influenced by the large number of respondents who came from the wards which possess urban characteristics. In these areas, most of the people
486 Afr. J. Environ. Sci. Technol.
Table 2. Occupational distribution.
Occupation Number of respondents Marginal percentage
Employed 103 35.8
Petty business 38 13.2
Other small industries 24 8.3
Peasant 123 42.7
Total 288 100.0
Table 3. Educational level.
Level Number of respondents Percent
Primary school 130 38.2
Secondary school 98 28.8
Tertiary education 41 12.0
Illiterate 71 20.8
are engaged in employment and business. About 62% of those employed are unskilled laborers who earn less than Tshs 150,000/=(about USD 94 in 2013) per month. Self-employment is largely through petty businesses, which may only sustain them in very basic needs such as food and house supplies. Peasants in Mkuranga District own small farms where they cultivate short term crops such as cassava, and perennial crops such as coconuts, mangoes and oranges. Peasants also engage in other economic activities such as fishing whose contribution to their income was not established (MDC report, 2011).
Education level
Table 3 shows that the literacy level is 79.1% (38.2% for primary school, 28.8% for secondary school and 12.0% for tertiary education), which is sufficient for the introduction of new knowledge. Data from the National Bureau of Statistics (TDHS, 2011) indicate that literacy level varies from 78 to 83% depending on the level of urbanization of the area, gender and geographical zones, suggesting that Mkuranga District has the lowest literacy level in Tanzania. In the latest National sensor carried out in 2012, it was reported that only 43% of Mkuranga District residents are literate owing to low rate (51%) of children enrolment rate. It is worth to note that educational level of the community is one of the factors determining the success of a community projects in terms of planning, designing and implementation of new project. Fruman et al. (2012) reported that education was identified as one of the most crucial factors that will lead to acceptance and use of UDDT in rural Georgia. Tumwebaze and Niwabaga (2011) reported that respondents with secondary and tertiary education were 2 to 5 times more likely to adopt to ecological sanitation than respondents with primary
education. In another study, Nuwabaga (2003) observed that Ecosan coverage was low among people with primary education level (0.4%) than people with tertiary education (13%). House tenure Data from National Bureau from Statistics indicate that only about 20.8% of houses in Mkuranga district are roofed with corrugated iron sheets or tiles, while others (79.2%) are largely thatched roof houses (URT, 2013). Similar findings were reported by Torell and Mmochi (2006) who observed that most residents of Mkuranga District live in poor and simple houses thatched by coconut leaves or grass, poles, and mud walls on earth floors. The houses are also largely comprised of a mixture of huts with walls made of mud and wooden poles (94.7%), as well as conventional bricks and block houses (5.3%), which are traditionally found in wards of urban characteristics like Mkuranga town. Many people in the district are of low income with 89.6% depending on subsistence agriculture for their livelihood. Only 0.6% of the population is connected to electricity. As a result, 98% of the population is depending on charcoal and firewood as a source of energy (URT, 2013). It was observed that about 57.4% of the respondents own houses, whereas 42.7% of the respondents are living as tenants. Most of the tenants (79%) are found in wards, with urban characteristics and the majority of tenants (65%) are employees who normally shift from one working station to another. House tenure is very important aspect in designing the sanitation project as its implementation will need decision, consent and resource investment from the owner of the house either by having a mutual agreement with the tenants or the owner to incur all the “sanitation investments” cost on his structure. Sanitation (UDDT) project Project organization Figure 2 shows the organizational framework of the project. During interview with key informants, it was revealed that the setup of the project meant to be fully participatory as
Figure 2. Project hierarchy.
Table 4. Types of latrines used in the study area.
S/N Type of latrine Percent of
respondents
1 Cistern flush toilet 5.6
2 Conventional pit latrines 52.1
3 Ventilated Improved Pit Latrines
13.2
4 Pour flush toilets 1.8
5 No latrines 27.3
every level at the local government in the district was included. These include councilors, head of departments and steering committee members, which comprises of various professionals at the district level; such as Ward Executive Officers (WEOs), Village Executive officers (VEOs) as well as community member under the title of Trainer of Trainee (TOTs), Community Own Resource Person (CORPs) and the Village Health Workers (VHWs).
The steering committee members at the district level and members of the community (trainers of trainees, community own resource persons and village health workers) were involved in daily activities of the project, but other stakeholders participated only in meetings. In focus group discussions, key informants (District Health Officer, District Planning Officer and District Water
Engineer) revealed that the project was mainly supervised by only few members of the steering committee, but there was no evidence suggesting that councilors and heads of departments and ward leaders were involved in the supervision of the project. It was also observed that village executive officers worked as either trainers of trainees or community own resource persons instead of project supervisors at village level in order to earn allowances, which compromised the quality of the work.
Aloyce and Twaha 487 Status of latrine use
Table 4 shows that the majority of the respondents (52.1%) are using conventional pit latrines. Other types of latrines used in the study area include ventilated improved pit latrines (13.2%), cistern flush toilet (5.6%) and pour flush toilet (1.8%), but no single UDDT was found at household level. In fact, in the whole study area, the only operational UDDT was found at a primary school, which was one of the seven UDDTs constructed by the project. The remaining six UDDTs constructed during project implementation as demonstration toilets were out of use, which suggests that the technology was completely abandoned instead of being adopted.
It is worth mentioning that the type of sanitation options used by the respondents is related to availability of water in the area and the level of economy and education of the users. For example, water closets were found in Mkuranga town where level of income of community is high and water is available for flushing wastes although tap water in Mkuranga town is unreliable. In wards located in rural areas where water supply is not available, conventional pit latrines are common. In accordance with national population and housing sensors carried out in 2012, only 8.7% of households in Mkuranga District use piped or protected well/spring water as the main source of drinking water (URT, 2013), which is comparable to the proportion of households using cistern and poor flush toilets (7.4%).
The results also show that 27.3% of respondents do not have latrines, suggesting that they are probably using open defecation because community latrines are not available in the area. These findings are similar to those reported by the National Bureau of Statistics (TDHS, 2011) which reported that 22% of household do not have latrine, but differs with those of MDC report (2011) who reported that only 8% of the household do not have latrine. Other reports indicate that over 60% of Mkuranga District households do not have latrines particularly near coastal areas (Towell and Mmochi, 2006). The records from Joint Monitoring Programme conducted by UNICEF and WHO (2013) suggest that in 2011 about 16% of people in rural Tanzania practice open defecation. It is therefore evident that sanitation situation in Mkuranga district is below the average sanitation level of rural Tanzania. Some of the potential reasons are the level of literacy (43%) of Mkuranga District residents, which is among the lowest in the country.
It is worth noting that 69.3% of households, which do not have toilet, are located in a coastal ward of Shungubweni, suggesting that they are using beaches of Indian Ocean for defecation. This factor along with sandy soils in the area, which complicate excavation and construction of the pits, was mentioned by 68% of the steering committee members during interview and focus group discussions. Fortunately, UDDTs do not require deep pits suggesting that soil type is not the cause of failure of the project. It was further observed that about
COUNCILORS
STEERING COMMITTEE CMT
VEO’s WEO's
TOT’s CORP’s
VHW’s
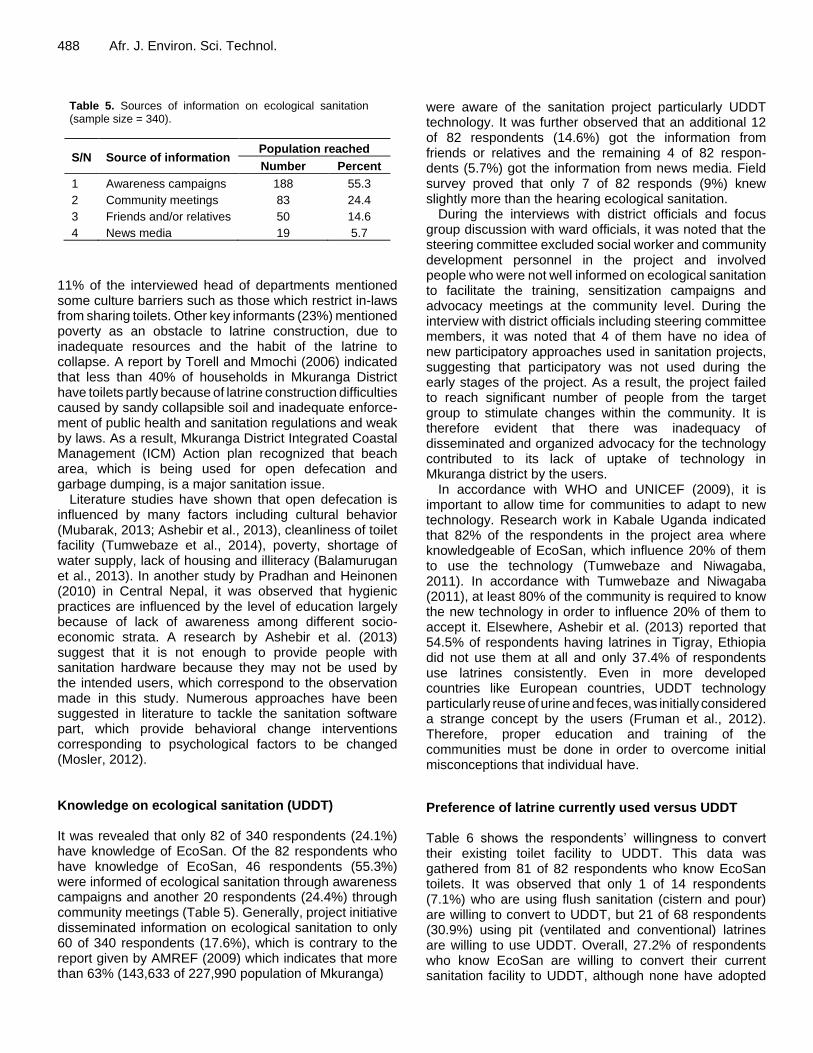
488 Afr. J. Environ. Sci. Technol.
Table 5. Sources of information on ecological sanitation (sample size = 340).
S/N Source of information Population reached
Number Percent
1 Awareness campaigns 188 55.3
2 Community meetings 83 24.4
3 Friends and/or relatives 50 14.6
4 News media 19 5.7
11% of the interviewed head of departments mentioned some culture barriers such as those which restrict in-laws from sharing toilets. Other key informants (23%) mentioned poverty as an obstacle to latrine construction, due to inadequate resources and the habit of the latrine to collapse. A report by Torell and Mmochi (2006) indicated that less than 40% of households in Mkuranga District have toilets partly because of latrine construction difficulties caused by sandy collapsible soil and inadequate enforce-ment of public health and sanitation regulations and weak by laws. As a result, Mkuranga District Integrated Coastal Management (ICM) Action plan recognized that beach area, which is being used for open defecation and garbage dumping, is a major sanitation issue.
Literature studies have shown that open defecation is influenced by many factors including cultural behavior (Mubarak, 2013; Ashebir et al., 2013), cleanliness of toilet facility (Tumwebaze et al., 2014), poverty, shortage of water supply, lack of housing and illiteracy (Balamurugan et al., 2013). In another study by Pradhan and Heinonen (2010) in Central Nepal, it was observed that hygienic practices are influenced by the level of education largely because of lack of awareness among different socio-economic strata. A research by Ashebir et al. (2013) suggest that it is not enough to provide people with sanitation hardware because they may not be used by the intended users, which correspond to the observation made in this study. Numerous approaches have been suggested in literature to tackle the sanitation software part, which provide behavioral change interventions corresponding to psychological factors to be changed (Mosler, 2012). Knowledge on ecological sanitation (UDDT) It was revealed that only 82 of 340 respondents (24.1%) have knowledge of EcoSan. Of the 82 respondents who have knowledge of EcoSan, 46 respondents (55.3%) were informed of ecological sanitation through awareness campaigns and another 20 respondents (24.4%) through community meetings (Table 5). Generally, project initiative disseminated information on ecological sanitation to only 60 of 340 respondents (17.6%), which is contrary to the report given by AMREF (2009) which indicates that more than 63% (143,633 of 227,990 population of Mkuranga)
were aware of the sanitation project particularly UDDT technology. It was further observed that an additional 12 of 82 respondents (14.6%) got the information from friends or relatives and the remaining 4 of 82 respon-dents (5.7%) got the information from news media. Field survey proved that only 7 of 82 responds (9%) knew slightly more than the hearing ecological sanitation.
During the interviews with district officials and focus group discussion with ward officials, it was noted that the steering committee excluded social worker and community development personnel in the project and involved people who were not well informed on ecological sanitation to facilitate the training, sensitization campaigns and advocacy meetings at the community level. During the interview with district officials including steering committee members, it was noted that 4 of them have no idea of new participatory approaches used in sanitation projects, suggesting that participatory was not used during the early stages of the project. As a result, the project failed to reach significant number of people from the target group to stimulate changes within the community. It is therefore evident that there was inadequacy of disseminated and organized advocacy for the technology contributed to its lack of uptake of technology in Mkuranga district by the users.
In accordance with WHO and UNICEF (2009), it is important to allow time for communities to adapt to new technology. Research work in Kabale Uganda indicated that 82% of the respondents in the project area where knowledgeable of EcoSan, which influence 20% of them to use the technology (Tumwebaze and Niwagaba, 2011). In accordance with Tumwebaze and Niwagaba (2011), at least 80% of the community is required to know the new technology in order to influence 20% of them to accept it. Elsewhere, Ashebir et al. (2013) reported that 54.5% of respondents having latrines in Tigray, Ethiopia did not use them at all and only 37.4% of respondents use latrines consistently. Even in more developed countries like European countries, UDDT technology particularly reuse of urine and feces, was initially considered a strange concept by the users (Fruman et al., 2012). Therefore, proper education and training of the communities must be done in order to overcome initial misconceptions that individual have.
Preference of latrine currently used versus UDDT Table 6 shows the respondents’ willingness to convert their existing toilet facility to UDDT. This data was gathered from 81 of 82 respondents who know EcoSan toilets. It was observed that only 1 of 14 respondents (7.1%) who are using flush sanitation (cistern and pour) are willing to convert to UDDT, but 21 of 68 respondents (30.9%) using pit (ventilated and conventional) latrines are willing to use UDDT. Overall, 27.2% of respondents who know EcoSan are willing to convert their current sanitation facility to UDDT, although none have adopted
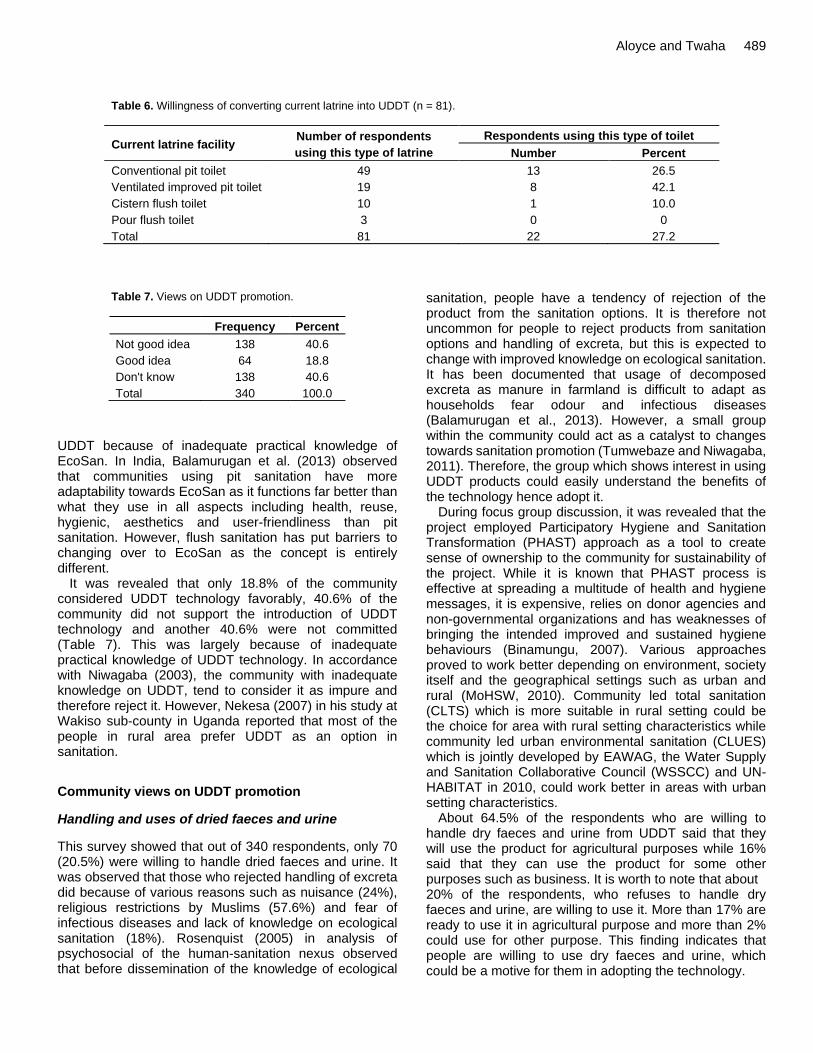
Aloyce and Twaha 489
Table 6. Willingness of converting current latrine into UDDT (n = 81).
Current latrine facility Number of respondents
using this type of latrine
Respondents using this type of toilet
Number Percent
Conventional pit toilet 49 13 26.5
Ventilated improved pit toilet 19 8 42.1
Cistern flush toilet 10 1 10.0
Pour flush toilet 3 0 0
Total 81 22 27.2
Table 7. Views on UDDT promotion.
Frequency Percent
Not good idea 138 40.6
Good idea 64 18.8
Don't know 138 40.6
Total 340 100.0
UDDT because of inadequate practical knowledge of EcoSan. In India, Balamurugan et al. (2013) observed that communities using pit sanitation have more adaptability towards EcoSan as it functions far better than what they use in all aspects including health, reuse, hygienic, aesthetics and user-friendliness than pit sanitation. However, flush sanitation has put barriers to changing over to EcoSan as the concept is entirely different.
It was revealed that only 18.8% of the community considered UDDT technology favorably, 40.6% of the community did not support the introduction of UDDT technology and another 40.6% were not committed (Table 7). This was largely because of inadequate practical knowledge of UDDT technology. In accordance with Niwagaba (2003), the community with inadequate knowledge on UDDT, tend to consider it as impure and therefore reject it. However, Nekesa (2007) in his study at Wakiso sub-county in Uganda reported that most of the people in rural area prefer UDDT as an option in sanitation.
Community views on UDDT promotion
Handling and uses of dried faeces and urine
This survey showed that out of 340 respondents, only 70 (20.5%) were willing to handle dried faeces and urine. It was observed that those who rejected handling of excreta did because of various reasons such as nuisance (24%), religious restrictions by Muslims (57.6%) and fear of infectious diseases and lack of knowledge on ecological sanitation (18%). Rosenquist (2005) in analysis of psychosocial of the human-sanitation nexus observed that before dissemination of the knowledge of ecological
sanitation, people have a tendency of rejection of the product from the sanitation options. It is therefore not uncommon for people to reject products from sanitation options and handling of excreta, but this is expected to change with improved knowledge on ecological sanitation. It has been documented that usage of decomposed excreta as manure in farmland is difficult to adapt as households fear odour and infectious diseases
(Balamurugan et al., 2013). However, a small group within the community could act as a catalyst to changes towards sanitation promotion (Tumwebaze and Niwagaba, 2011). Therefore, the group which shows interest in using UDDT products could easily understand the benefits of the technology hence adopt it.
During focus group discussion, it was revealed that the project employed Participatory Hygiene and Sanitation Transformation (PHAST) approach as a tool to create sense of ownership to the community for sustainability of the project. While it is known that PHAST process is effective at spreading a multitude of health and hygiene messages, it is expensive, relies on donor agencies and non-governmental organizations and has weaknesses of bringing the intended improved and sustained hygiene behaviours (Binamungu, 2007). Various approaches proved to work better depending on environment, society itself and the geographical settings such as urban and rural (MoHSW, 2010). Community led total sanitation (CLTS) which is more suitable in rural setting could be the choice for area with rural setting characteristics while community led urban environmental sanitation (CLUES) which is jointly developed by EAWAG, the Water Supply and Sanitation Collaborative Council (WSSCC) and UN-HABITAT in 2010, could work better in areas with urban setting characteristics.
About 64.5% of the respondents who are willing to handle dry faeces and urine from UDDT said that they will use the product for agricultural purposes while 16% said that they can use the product for some other purposes such as business. It is worth to note that about 20% of the respondents, who refuses to handle dry faeces and urine, are willing to use it. More than 17% are ready to use it in agricultural purpose and more than 2% could use for other purpose. This finding indicates that people are willing to use dry faeces and urine, which could be a motive for them in adopting the technology.
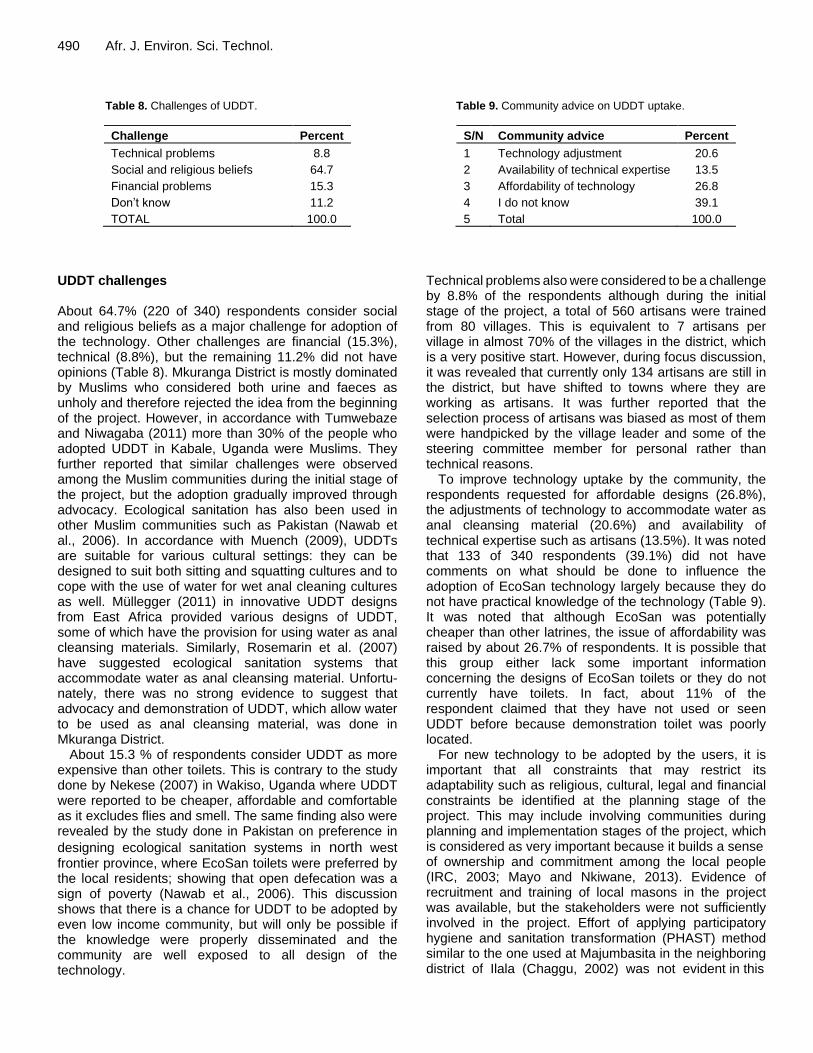
490 Afr. J. Environ. Sci. Technol.
Table 8. Challenges of UDDT.
Challenge Percent
Technical problems 8.8
Social and religious beliefs 64.7
Financial problems 15.3
Don’t know 11.2
TOTAL 100.0
UDDT challenges About 64.7% (220 of 340) respondents consider social and religious beliefs as a major challenge for adoption of the technology. Other challenges are financial (15.3%), technical (8.8%), but the remaining 11.2% did not have opinions (Table 8). Mkuranga District is mostly dominated by Muslims who considered both urine and faeces as unholy and therefore rejected the idea from the beginning of the project. However, in accordance with Tumwebaze and Niwagaba (2011) more than 30% of the people who adopted UDDT in Kabale, Uganda were Muslims. They further reported that similar challenges were observed among the Muslim communities during the initial stage of the project, but the adoption gradually improved through advocacy. Ecological sanitation has also been used in other Muslim communities such as Pakistan (Nawab et al., 2006). In accordance with Muench (2009), UDDTs are suitable for various cultural settings: they can be designed to suit both sitting and squatting cultures and to cope with the use of water for wet anal cleaning cultures as well. Müllegger (2011) in innovative UDDT designs from East Africa provided various designs of UDDT, some of which have the provision for using water as anal cleansing materials. Similarly, Rosemarin et al. (2007) have suggested ecological sanitation systems that accommodate water as anal cleansing material. Unfortu-nately, there was no strong evidence to suggest that advocacy and demonstration of UDDT, which allow water to be used as anal cleansing material, was done in Mkuranga District.
About 15.3 % of respondents consider UDDT as more expensive than other toilets. This is contrary to the study done by Nekese (2007) in Wakiso, Uganda where UDDT were reported to be cheaper, affordable and comfortable as it excludes flies and smell. The same finding also were revealed by the study done in Pakistan on preference in
designing ecological sanitation systems in north west frontier province, where EcoSan toilets were preferred by the local residents; showing that open defecation was a sign of poverty (Nawab et al., 2006). This discussion shows that there is a chance for UDDT to be adopted by even low income community, but will only be possible if the knowledge were properly disseminated and the
community are well exposed to all design of the technology.
Table 9. Community advice on UDDT uptake.
S/N Community advice Percent
1 Technology adjustment 20.6
2 Availability of technical expertise 13.5
3 Affordability of technology 26.8
4 I do not know 39.1
5 Total 100.0
Technical problems also were considered to be a challenge by 8.8% of the respondents although during the initial stage of the project, a total of 560 artisans were trained from 80 villages. This is equivalent to 7 artisans per village in almost 70% of the villages in the district, which is a very positive start. However, during focus discussion, it was revealed that currently only 134 artisans are still in the district, but have shifted to towns where they are working as artisans. It was further reported that the selection process of artisans was biased as most of them were handpicked by the village leader and some of the steering committee member for personal rather than technical reasons.
To improve technology uptake by the community, the respondents requested for affordable designs (26.8%), the adjustments of technology to accommodate water as anal cleansing material (20.6%) and availability of technical expertise such as artisans (13.5%). It was noted that 133 of 340 respondents (39.1%) did not have comments on what should be done to influence the adoption of EcoSan technology largely because they do not have practical knowledge of the technology (Table 9). It was noted that although EcoSan was potentially cheaper than other latrines, the issue of affordability was raised by about 26.7% of respondents. It is possible that this group either lack some important information concerning the designs of EcoSan toilets or they do not currently have toilets. In fact, about 11% of the respondent claimed that they have not used or seen UDDT before because demonstration toilet was poorly located.
For new technology to be adopted by the users, it is important that all constraints that may restrict its adaptability such as religious, cultural, legal and financial constraints be identified at the planning stage of the project. This may include involving communities during planning and implementation stages of the project, which is considered as very important because it builds a sense of ownership and commitment among the local people (IRC, 2003; Mayo and Nkiwane, 2013). Evidence of recruitment and training of local masons in the project was available, but the stakeholders were not sufficiently involved in the project. Effort of applying participatory hygiene and sanitation transformation (PHAST) method similar to the one used at Majumbasita in the neighboring district of Ilala (Chaggu, 2002) was not evident in this
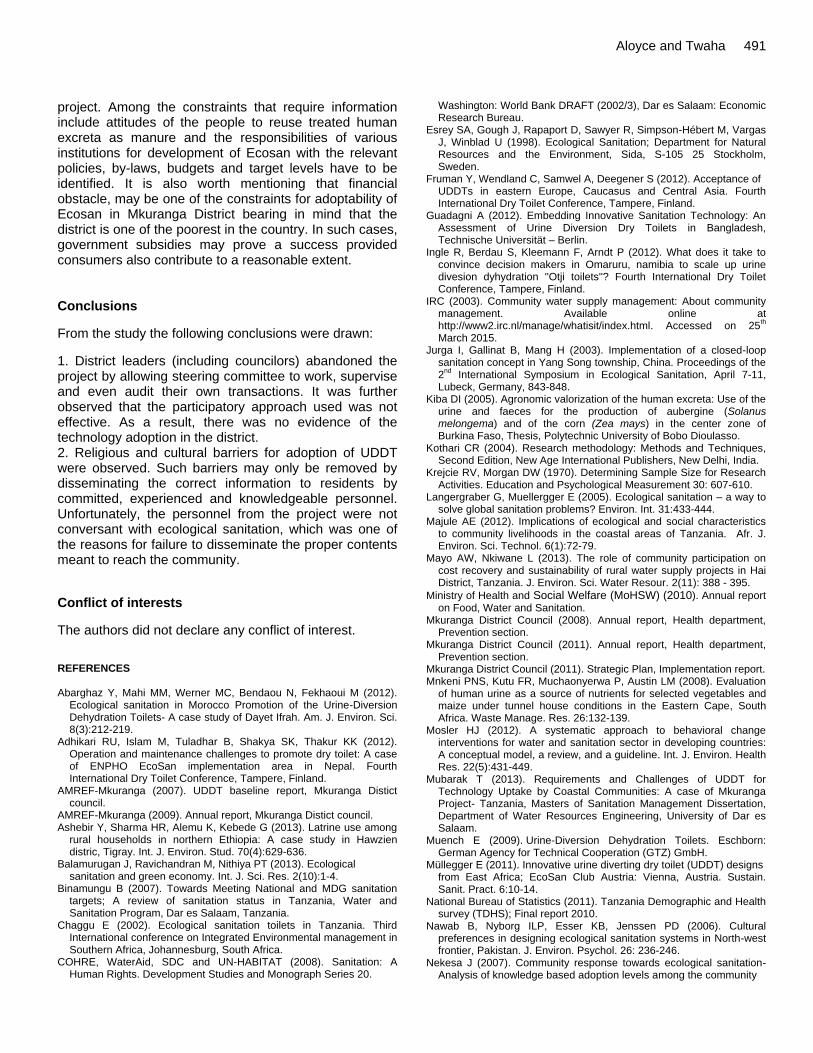
project. Among the constraints that require information include attitudes of the people to reuse treated human excreta as manure and the responsibilities of various institutions for development of Ecosan with the relevant policies, by-laws, budgets and target levels have to be identified. It is also worth mentioning that financial obstacle, may be one of the constraints for adoptability of Ecosan in Mkuranga District bearing in mind that the district is one of the poorest in the country. In such cases, government subsidies may prove a success provided consumers also contribute to a reasonable extent. Conclusions
From the study the following conclusions were drawn:
1. District leaders (including councilors) abandoned the project by allowing steering committee to work, supervise and even audit their own transactions. It was further observed that the participatory approach used was not effective. As a result, there was no evidence of the technology adoption in the district. 2. Religious and cultural barriers for adoption of UDDT were observed. Such barriers may only be removed by disseminating the correct information to residents by committed, experienced and knowledgeable personnel. Unfortunately, the personnel from the project were not conversant with ecological sanitation, which was one of the reasons for failure to disseminate the proper contents meant to reach the community.
Conflict of interests
The authors did not declare any conflict of interest. REFERENCES Abarghaz Y, Mahi MM, Werner MC, Bendaou N, Fekhaoui M (2012).
Ecological sanitation in Morocco Promotion of the Urine-Diversion Dehydration Toilets- A case study of Dayet Ifrah. Am. J. Environ. Sci. 8(3):212-219.
Adhikari RU, Islam M, Tuladhar B, Shakya SK, Thakur KK (2012). Operation and maintenance challenges to promote dry toilet: A case of ENPHO EcoSan implementation area in Nepal. Fourth International Dry Toilet Conference, Tampere, Finland.
AMREF-Mkuranga (2007). UDDT baseline report, Mkuranga Distict council.
AMREF-Mkuranga (2009). Annual report, Mkuranga Distict council. Ashebir Y, Sharma HR, Alemu K, Kebede G (2013). Latrine use among
rural households in northern Ethiopia: A case study in Hawzien distric, Tigray. Int. J. Environ. Stud. 70(4):629-636.
Balamurugan J, Ravichandran M, Nithiya PT (2013). Ecological sanitation and green economy. Int. J. Sci. Res. 2(10):1-4.
Binamungu B (2007). Towards Meeting National and MDG sanitation targets; A review of sanitation status in Tanzania, Water and Sanitation Program, Dar es Salaam, Tanzania.
Chaggu E (2002). Ecological sanitation toilets in Tanzania. Third International conference on Integrated Environmental management in Southern Africa, Johannesburg, South Africa.
COHRE, WaterAid, SDC and UN-HABITAT (2008). Sanitation: A Human Rights. Development Studies and Monograph Series 20.
Aloyce and Twaha 491
Washington: World Bank DRAFT (2002/3), Dar es Salaam: Economic Research Bureau.
Esrey SA, Gough J, Rapaport D, Sawyer R, Simpson-Hébert M, Vargas J, Winblad U (1998). Ecological Sanitation; Department for Natural Resources and the Environment, Sida, S-105 25 Stockholm, Sweden.
Fruman Y, Wendland C, Samwel A, Deegener S (2012). Acceptance of UDDTs in eastern Europe, Caucasus and Central Asia. Fourth International Dry Toilet Conference, Tampere, Finland.
Guadagni A (2012). Embedding Innovative Sanitation Technology: An Assessment of Urine Diversion Dry Toilets in Bangladesh, Technische Universität – Berlin.
Ingle R, Berdau S, Kleemann F, Arndt P (2012). What does it take to convince decision makers in Omaruru, namibia to scale up urine divesion dyhydration ''Otji toilets''? Fourth International Dry Toilet Conference, Tampere, Finland.
IRC (2003). Community water supply management: About community management. Available online at http://www2.irc.nl/manage/whatisit/index.html. Accessed on 25
th
March 2015. Jurga I, Gallinat B, Mang H (2003). Implementation of a closed-loop
sanitation concept in Yang Song township, China. Proceedings of the 2
nd International Symposium in Ecological Sanitation, April 7-11,
Lubeck, Germany, 843-848. Kiba DI (2005). Agronomic valorization of the human excreta: Use of the
urine and faeces for the production of aubergine (Solanus melongema) and of the corn (Zea mays) in the center zone of Burkina Faso, Thesis, Polytechnic University of Bobo Dioulasso.
Kothari CR (2004). Research methodology: Methods and Techniques, Second Edition, New Age International Publishers, New Delhi, India.
Krejcie RV, Morgan DW (1970). Determining Sample Size for Research Activities. Education and Psychological Measurement 30: 607-610.
Langergraber G, Muellergger E (2005). Ecological sanitation – a way to solve global sanitation problems? Environ. Int. 31:433-444.
Majule AE (2012). Implications of ecological and social characteristics to community livelihoods in the coastal areas of Tanzania. Afr. J. Environ. Sci. Technol. 6(1):72-79.
Mayo AW, Nkiwane L (2013). The role of community participation on cost recovery and sustainability of rural water supply projects in Hai District, Tanzania. J. Environ. Sci. Water Resour. 2(11): 388 - 395.
Ministry of Health and Social Welfare (MoHSW) (2010). Annual report on Food, Water and Sanitation.
Mkuranga District Council (2008). Annual report, Health department, Prevention section.
Mkuranga District Council (2011). Annual report, Health department, Prevention section.
Mkuranga District Council (2011). Strategic Plan, Implementation report. Mnkeni PNS, Kutu FR, Muchaonyerwa P, Austin LM (2008). Evaluation
of human urine as a source of nutrients for selected vegetables and maize under tunnel house conditions in the Eastern Cape, South Africa. Waste Manage. Res. 26:132-139.
Mosler HJ (2012). A systematic approach to behavioral change interventions for water and sanitation sector in developing countries: A conceptual model, a review, and a guideline. Int. J. Environ. Health Res. 22(5):431-449.
Mubarak T (2013). Requirements and Challenges of UDDT for Technology Uptake by Coastal Communities: A case of Mkuranga Project- Tanzania, Masters of Sanitation Management Dissertation, Department of Water Resources Engineering, University of Dar es Salaam.
Muench E (2009). Urine-Diversion Dehydration Toilets. Eschborn: German Agency for Technical Cooperation (GTZ) GmbH.
Müllegger E (2011). Innovative urine diverting dry toilet (UDDT) designs from East Africa; EcoSan Club Austria: Vienna, Austria. Sustain. Sanit. Pract. 6:10-14.
National Bureau of Statistics (2011). Tanzania Demographic and Health survey (TDHS); Final report 2010.
Nawab B, Nyborg ILP, Esser KB, Jenssen PD (2006). Cultural preferences in designing ecological sanitation systems in North-west frontier, Pakistan. J. Environ. Psychol. 26: 236-246.
Nekesa J (2007). Community response towards ecological sanitation- Analysis of knowledge based adoption levels among the community
492 Afr. J. Environ. Sci. Technol.
of Kasanje subcount, Wakiso district (Uganda), Project Report, SNV Uganda, West Nile portfolio.
Nuwagaba A (2003). Assessment of factors that influence household’s choice of sanitation technologies and excreta re-use (EcoSan), Kampala, Water and Sanitation Program, Makerere Institute of social research.
Pradhan S, Heinonen TH (2010). Knowledge and awareness of eco-sanitation in central Nepal: A questionnaire survey. Environ. Dev. Sustain. 12: 713-726.
Rhode L, Stintzing AR, Steineck S (2004). Ammonia emissions after application of human urine to a clay soil for barley growth. Nutr. Cycl. Agroecosyst., 68:191-198.
Rieck C, Muench E (2011). Technology review of urine diversion dehydration toilets (UDDTs), Design principles, urine and faeces management, Eschborn, Germany; Available at http://www.ecosanres.org/discussion_group.htm. Accessed on 25
th
March 2015. Rosemarin A, Kvarnström E, Subbaraman M, Ganapathy V, Dagerskog
L, Pasupathiraj K (2007). Ecosan systems that accommodate anal washing. Sustainable Water Management, Issue 2-2007. Available at http://www2.gtz.de/Dokumente/oe44/ecosan/en-analwashing- 2007.pdf. Accessed on 25
th March 2015.
Rosenquist LED (2005). A psychosocial analysis of the human-sanitation nexus. J. Environ. Psychol. 25(3): 335-346.
Smet J, Sugden S (2006). Ecological Sanitation: Well Factsheet. Available at http://www.lboro.ac.uk/well/resources/fact-sheets/fact-sheets-htm/Ecological%20sanitation.htm. Accessed on 25
th March
2015. Sridevi G, Srinivasamurthy CA, Bhaskar S, Viswanath S (2009).
Evaluation of source separated human urine (ALW) as a source of nutrients for banana cultivation and impact on quality parameter. J. Agric. Biol. Sci. 4:44-48.
Tanzania Meteorological Agency (2013). Mean monthly temperature and rainfall variation data.
Thibodeau C, Canaday C (2011). Elegant yet economical urine diverting dry toilets in Equador. Sustain. Sanit. Pract. 6: 23-28.
Tidaker P, Mattsson B, Jonsson H (2007). Environmental impact of wheat production using human urine and mineral fertilizers- a scenario study. J. Clean Prod. 15: 52-62.
Torell E, Mmochi A (2006). Mkuranga Governance Baseline, Coastal Resources Center, University of Rhode Island, p. 18.
Tumwebaze IK, Niwagaba CB (2011). Ecological sanitation uptake knowledge, beliefs and practices in Kabale Municipality, Kabale district; The future of Water, Sanitation and hygiene; Innovation, adaptation and engagement in changing World; 35
th WEDC
international conference, University of Loughborough, UK.
Tumwebaze IK, Niwagaba CB, Günther I, Mosler HJ (2014).
Determinants of households' cleaning intention for shared toilets: Case of 50 slums in Kampala, Uganda. Habitat International, 108-113.
UNESCO/IHP (2006). Capacity building for ecological sanitation; Concepts for ecologically sustainable sanitation in formal and continuing education. International Hydrological Programme (IHP) of the United Nations Educational, Scientific and Cultural Organisation (UNESCO); 1 rue Miollis, 75732 Paris Cedex 15, France and the Deutsche Gesellschaft für Technische Zusammenarbeit (GTZ) GmbH Dag Hammarskjöld Weg 1-5, 65760 Eschborn, Germany.
United Nations Children Education Fund (UNICEF) (2013). Water, Sanitation and Hygiene: WASH - Fast Facts. Available at http://www.unicef.org/tanzania/WASH_factsheet.pdf. Accessed on 25
th March 2015.
United Nations Children Education Fund (UNICEF) and World Health Organization (WHO) (2013). Progress on Sanitation and Drinking Water – 2013 Update. WHO and UNICEF Joint Monitoring Programme for Water and Sanitation. Available online at http://www.who.int/iris/bilstream/10665/81245/1/9789241505390_eng.pdf. Accessed on 25
th March 2015.
United Republic of Tanzania (URT) (2013). Population and Housing Census 2012. population Distribution by Administrative Areas. national Bureau of Statistics, Dar es Salaam, March 2013.
Water and Sanitation Program (WSP) and United Nations Children Education Fund (UNICEF) (2013). Water Supply and Sanitation in Tanzania: Turning Finance into services for 2015 and beyond. An AMCOW Country Status Overview. Available at http://www.wsp.org/sites/wsp.org/files/publications/CSO-Tanzania.pdf. Accessed on 25
th March 2015.
WaterAid (2008). Ecological sanitation latrines: The experience of Nepal. Fieldwork paper. WaterAid in Nepal, Kathmandu, Nepal. Available at WaterAid webpage. Accessed on 25
th March 2015.
Wendland C, Deegener S, Jorritsma F (2011). Experiences with urine diverting dry toilets (UDDTs) for households, schools and kindergarten in Eastern Europe, the Caucasus and Central Asia. Sustain. Sanit. Pract. 6:16-22.
Wikipedia (2013). Water supply and sanitation in Tanzania. Available at http://en.wikipedia.org/wiki/Water_supply_and_sanitation_in_Tanzania. Accessed on 25
th March 2015.
Vol. 9(5), pp. 493-501, May 2015
DOI: 10.5897/AJEST2013.1631
Article Number: ADDCEEF52472
ISSN 1996-0786
Copyright © 2015
Author(s) retain the copyright of this article
http://www.academicjournals.org/AJEST
African Journal of Environmental Science and Technology
Full Length Research Paper
Prospects of using whole rice husk for the production of dense and hollow bricks
Chukwudebelu, J. A.*, Igwe, C. C. and Madukasi, E. I.
Department of Chemical, Fibre and Environmental Technology, Federal Institute of Industrial Research Oshodi, Lagos Nigeria.
Receive 28 November, 2013; Accepted 25 March, 2015
One of the main reasons for the continued increase in the deficit of affordable housing in Nigeria is the high cost of brick made from sand and ordinary Portland cement (OPC). Finding a replacement for cement to assure sustainability is crucial as the raw materials used in making cements which are naturally occurring are depleting. Rice husk was milled and sieved to reduce the size to 0.020 mm. The moisture content of the rice husk was 9.98%, bulk density was 609.61g cm
-3 and the ash content was
18.74%. Rice husk was wetted for 3, 6, 9, 12, 15 and 21 h and mixed with slaked lime at the ratios of 1:1, 3:1, 2:3 and 3:2. The composite was molded in cylindrical and rectangular mold using mechanical and hydraulic press. The compressive strength (CS) (N/mm
2) was tested at ages of 7, 14 and 21 days. The
results show higher compressive strength in 1:1 as the bricks ages and also greater strength when wetted for 15 h. For 15 h wetting, 1:1 had CS (N/mm
2) of 2.59, 6.07 and 11.23. If well optimized, rice husk
can be an excellent material for brick production thereby presenting a good alternative to OPC. Key words: Hollow bricks, dense bricks, rice husk, compressive strength, molds.
INTRODUCTION It is common knowledge that the demand for affordable housing grows at a faster pace than its supply in practically all countries of the world. Nigeria’s housing deficit presents one of the very touching scenarios even within the context of developing countries (Basorun and Fadairo, 2012). According to Alitheia (2012), the national housing deficit rose from 7 million units in 1991 to between 12 and 15 million units in 2008; and currently stands at 17 million units (Adegboye, 2012). Unfortu-nately, there is indication that the deficit will continue to mount.
While the United Nations estimates that Nigeria’s population would reach 289 million by 2050, the United States Census Bureau projects that the country’s population will hit 264 million by 2050 (Nkah 2009). If so, Nigeria will then be the 8th most populous country in the world.
Rapid growth in population creates demand pressure towards shelter and efficient supply and distribution of basic utilities and services for the city dwellers. In most of Nigeria’s urban centres, the problem of housing is not only restricted to quantity but also to the poor quality of
*Corresponding author. E-mail: [email protected]. Author(s) agree that this article remain permanently open access under the terms of the Creative Commons Attribution License 4.0 International License
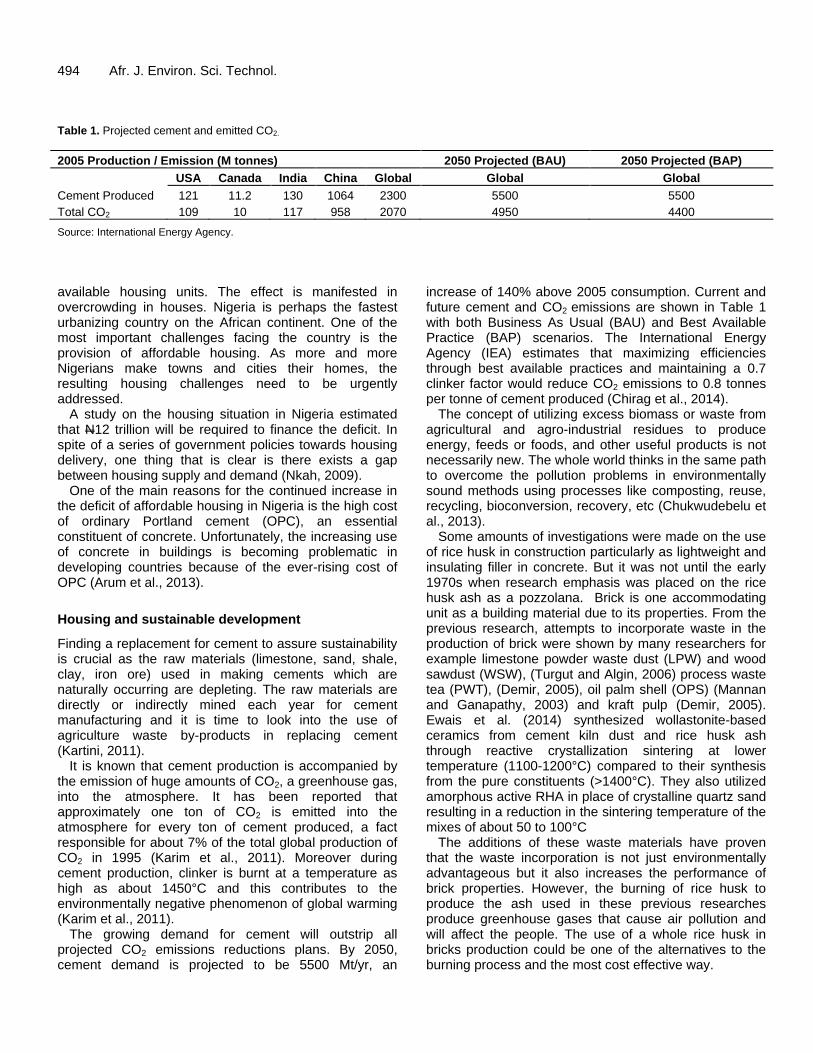
494 Afr. J. Environ. Sci. Technol. Table 1. Projected cement and emitted CO2.
2005 Production / Emission (M tonnes) 2050 Projected (BAU) 2050 Projected (BAP)
USA Canada India China Global Global Global
Cement Produced 121 11.2 130 1064 2300 5500 5500
Total CO2 109 10 117 958 2070 4950 4400
Source: International Energy Agency.
available housing units. The effect is manifested in overcrowding in houses. Nigeria is perhaps the fastest urbanizing country on the African continent. One of the most important challenges facing the country is the provision of affordable housing. As more and more Nigerians make towns and cities their homes, the resulting housing challenges need to be urgently addressed.
A study on the housing situation in Nigeria estimated that N12 trillion will be required to finance the deficit. In spite of a series of government policies towards housing delivery, one thing that is clear is there exists a gap between housing supply and demand (Nkah, 2009).
One of the main reasons for the continued increase in the deficit of affordable housing in Nigeria is the high cost of ordinary Portland cement (OPC), an essential constituent of concrete. Unfortunately, the increasing use of concrete in buildings is becoming problematic in developing countries because of the ever-rising cost of OPC (Arum et al., 2013).
Housing and sustainable development
Finding a replacement for cement to assure sustainability is crucial as the raw materials (limestone, sand, shale, clay, iron ore) used in making cements which are naturally occurring are depleting. The raw materials are directly or indirectly mined each year for cement manufacturing and it is time to look into the use of agriculture waste by-products in replacing cement (Kartini, 2011).
It is known that cement production is accompanied by the emission of huge amounts of CO2, a greenhouse gas, into the atmosphere. It has been reported that approximately one ton of CO2 is emitted into the atmosphere for every ton of cement produced, a fact responsible for about 7% of the total global production of CO2 in 1995 (Karim et al., 2011). Moreover during cement production, clinker is burnt at a temperature as high as about 1450°C and this contributes to the environmentally negative phenomenon of global warming (Karim et al., 2011).
The growing demand for cement will outstrip all projected CO2 emissions reductions plans. By 2050, cement demand is projected to be 5500 Mt/yr, an
increase of 140% above 2005 consumption. Current and future cement and CO2 emissions are shown in Table 1 with both Business As Usual (BAU) and Best Available Practice (BAP) scenarios. The International Energy Agency (IEA) estimates that maximizing efficiencies through best available practices and maintaining a 0.7 clinker factor would reduce CO2 emissions to 0.8 tonnes per tonne of cement produced (Chirag et al., 2014).
The concept of utilizing excess biomass or waste from agricultural and agro-industrial residues to produce energy, feeds or foods, and other useful products is not necessarily new. The whole world thinks in the same path to overcome the pollution problems in environmentally sound methods using processes like composting, reuse, recycling, bioconversion, recovery, etc (Chukwudebelu et al., 2013).
Some amounts of investigations were made on the use of rice husk in construction particularly as lightweight and insulating filler in concrete. But it was not until the early 1970s when research emphasis was placed on the rice husk ash as a pozzolana. Brick is one accommodating unit as a building material due to its properties. From the previous research, attempts to incorporate waste in the production of brick were shown by many researchers for example limestone powder waste dust (LPW) and wood sawdust (WSW), (Turgut and Algin, 2006) process waste tea (PWT), (Demir, 2005), oil palm shell (OPS) (Mannan and Ganapathy, 2003) and kraft pulp (Demir, 2005). Ewais et al. (2014) synthesized wollastonite-based ceramics from cement kiln dust and rice husk ash through reactive crystallization sintering at lower temperature (1100-1200°C) compared to their synthesis from the pure constituents (>1400°C). They also utilized amorphous active RHA in place of crystalline quartz sand resulting in a reduction in the sintering temperature of the mixes of about 50 to 100°C
The additions of these waste materials have proven that the waste incorporation is not just environmentally advantageous but it also increases the performance of brick properties. However, the burning of rice husk to produce the ash used in these previous researches produce greenhouse gases that cause air pollution and will affect the people. The use of a whole rice husk in bricks production could be one of the alternatives to the burning process and the most cost effective way.
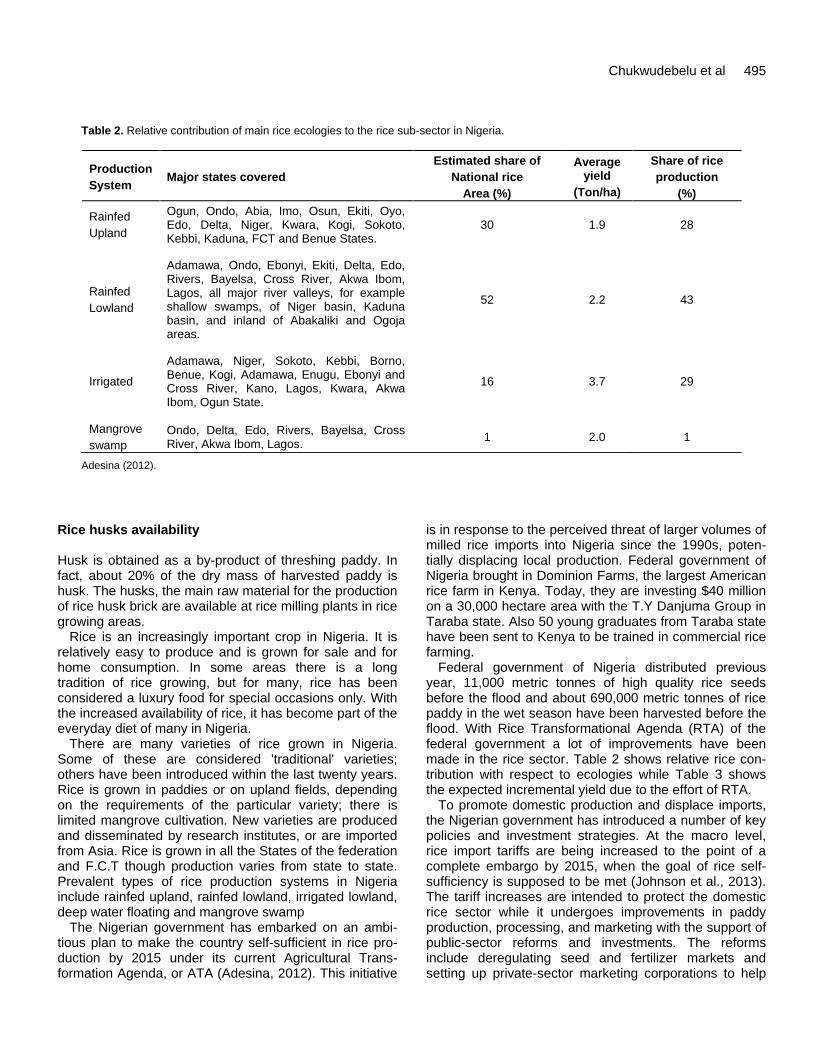
Chukwudebelu et al 495
Table 2. Relative contribution of main rice ecologies to the rice sub-sector in Nigeria.
Production
System Major states covered
Estimated share of
National rice
Area (%)
Average yield
(Ton/ha)
Share of rice
production
(%)
Rainfed
Upland
Ogun, Ondo, Abia, Imo, Osun, Ekiti, Oyo, Edo, Delta, Niger, Kwara, Kogi, Sokoto, Kebbi, Kaduna, FCT and Benue States.
30 1.9 28
Rainfed
Lowland
Adamawa, Ondo, Ebonyi, Ekiti, Delta, Edo, Rivers, Bayelsa, Cross River, Akwa Ibom, Lagos, all major river valleys, for example shallow swamps, of Niger basin, Kaduna basin, and inland of Abakaliki and Ogoja areas.
52 2.2 43
Irrigated
Adamawa, Niger, Sokoto, Kebbi, Borno, Benue, Kogi, Adamawa, Enugu, Ebonyi and Cross River, Kano, Lagos, Kwara, Akwa Ibom, Ogun State.
16 3.7 29
Mangrove
swamp
Ondo, Delta, Edo, Rivers, Bayelsa, Cross River, Akwa Ibom, Lagos.
1 2.0 1
Adesina (2012).
Rice husks availability Husk is obtained as a by-product of threshing paddy. In fact, about 20% of the dry mass of harvested paddy is husk. The husks, the main raw material for the production of rice husk brick are available at rice milling plants in rice growing areas.
Rice is an increasingly important crop in Nigeria. It is relatively easy to produce and is grown for sale and for home consumption. In some areas there is a long tradition of rice growing, but for many, rice has been considered a luxury food for special occasions only. With the increased availability of rice, it has become part of the everyday diet of many in Nigeria.
There are many varieties of rice grown in Nigeria. Some of these are considered 'traditional' varieties; others have been introduced within the last twenty years. Rice is grown in paddies or on upland fields, depending on the requirements of the particular variety; there is limited mangrove cultivation. New varieties are produced and disseminated by research institutes, or are imported from Asia. Rice is grown in all the States of the federation and F.C.T though production varies from state to state. Prevalent types of rice production systems in Nigeria include rainfed upland, rainfed lowland, irrigated lowland, deep water floating and mangrove swamp
The Nigerian government has embarked on an ambi-tious plan to make the country self-sufficient in rice pro-duction by 2015 under its current Agricultural Trans-formation Agenda, or ATA (Adesina, 2012). This initiative
is in response to the perceived threat of larger volumes of milled rice imports into Nigeria since the 1990s, poten-tially displacing local production. Federal government of Nigeria brought in Dominion Farms, the largest American rice farm in Kenya. Today, they are investing $40 million on a 30,000 hectare area with the T.Y Danjuma Group in Taraba state. Also 50 young graduates from Taraba state have been sent to Kenya to be trained in commercial rice farming.
Federal government of Nigeria distributed previous year, 11,000 metric tonnes of high quality rice seeds before the flood and about 690,000 metric tonnes of rice paddy in the wet season have been harvested before the flood. With Rice Transformational Agenda (RTA) of the federal government a lot of improvements have been made in the rice sector. Table 2 shows relative rice con-tribution with respect to ecologies while Table 3 shows the expected incremental yield due to the effort of RTA.
To promote domestic production and displace imports, the Nigerian government has introduced a number of key policies and investment strategies. At the macro level, rice import tariffs are being increased to the point of a complete embargo by 2015, when the goal of rice self-sufficiency is supposed to be met (Johnson et al., 2013). The tariff increases are intended to protect the domestic rice sector while it undergoes improvements in paddy production, processing, and marketing with the support of public-sector reforms and investments. The reforms include deregulating seed and fertilizer markets and setting up private-sector marketing corporations to help
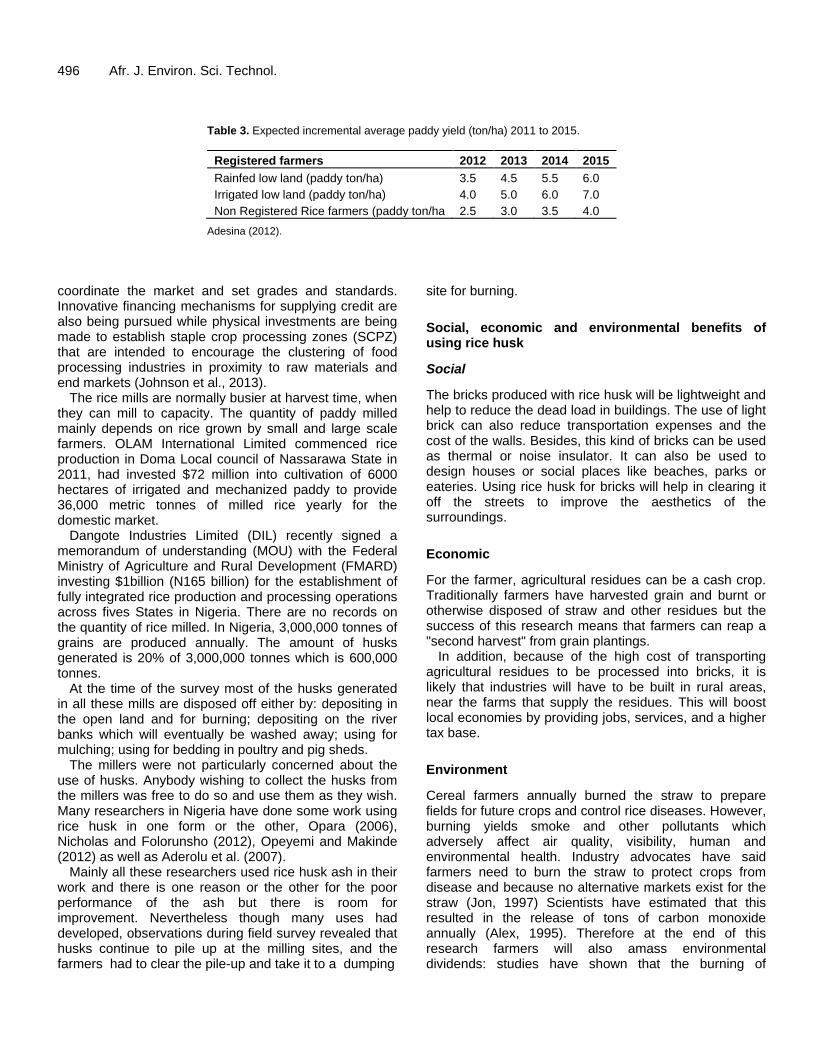
496 Afr. J. Environ. Sci. Technol.
Table 3. Expected incremental average paddy yield (ton/ha) 2011 to 2015.
Registered farmers 2012 2013 2014 2015
Rainfed low land (paddy ton/ha) 3.5 4.5 5.5 6.0
Irrigated low land (paddy ton/ha) 4.0 5.0 6.0 7.0
Non Registered Rice farmers (paddy ton/ha 2.5 3.0 3.5 4.0
Adesina (2012).
coordinate the market and set grades and standards. Innovative financing mechanisms for supplying credit are also being pursued while physical investments are being made to establish staple crop processing zones (SCPZ) that are intended to encourage the clustering of food processing industries in proximity to raw materials and end markets (Johnson et al., 2013).
The rice mills are normally busier at harvest time, when they can mill to capacity. The quantity of paddy milled mainly depends on rice grown by small and large scale farmers. OLAM International Limited commenced rice production in Doma Local council of Nassarawa State in 2011, had invested $72 million into cultivation of 6000 hectares of irrigated and mechanized paddy to provide 36,000 metric tonnes of milled rice yearly for the domestic market.
Dangote Industries Limited (DIL) recently signed a memorandum of understanding (MOU) with the Federal Ministry of Agriculture and Rural Development (FMARD) investing $1billion (N165 billion) for the establishment of fully integrated rice production and processing operations across fives States in Nigeria. There are no records on the quantity of rice milled. In Nigeria, 3,000,000 tonnes of grains are produced annually. The amount of husks generated is 20% of 3,000,000 tonnes which is 600,000 tonnes.
At the time of the survey most of the husks generated in all these mills are disposed off either by: depositing in the open land and for burning; depositing on the river banks which will eventually be washed away; using for mulching; using for bedding in poultry and pig sheds.
The millers were not particularly concerned about the use of husks. Anybody wishing to collect the husks from the millers was free to do so and use them as they wish. Many researchers in Nigeria have done some work using rice husk in one form or the other, Opara (2006), Nicholas and Folorunsho (2012), Opeyemi and Makinde (2012) as well as Aderolu et al. (2007).
Mainly all these researchers used rice husk ash in their work and there is one reason or the other for the poor performance of the ash but there is room for improvement. Nevertheless though many uses had developed, observations during field survey revealed that husks continue to pile up at the milling sites, and the farmers had to clear the pile-up and take it to a dumping
site for burning.
Social, economic and environmental benefits of using rice husk
Social
The bricks produced with rice husk will be lightweight and help to reduce the dead load in buildings. The use of light brick can also reduce transportation expenses and the cost of the walls. Besides, this kind of bricks can be used as thermal or noise insulator. It can also be used to design houses or social places like beaches, parks or eateries. Using rice husk for bricks will help in clearing it off the streets to improve the aesthetics of the surroundings.
Economic
For the farmer, agricultural residues can be a cash crop. Traditionally farmers have harvested grain and burnt or otherwise disposed of straw and other residues but the success of this research means that farmers can reap a "second harvest" from grain plantings.
In addition, because of the high cost of transporting agricultural residues to be processed into bricks, it is likely that industries will have to be built in rural areas, near the farms that supply the residues. This will boost local economies by providing jobs, services, and a higher tax base.
Environment
Cereal farmers annually burned the straw to prepare fields for future crops and control rice diseases. However, burning yields smoke and other pollutants which adversely affect air quality, visibility, human and environmental health. Industry advocates have said farmers need to burn the straw to protect crops from disease and because no alternative markets exist for the straw (Jon, 1997) Scientists have estimated that this resulted in the release of tons of carbon monoxide annually (Alex, 1995). Therefore at the end of this research farmers will also amass environmental dividends: studies have shown that the burning of
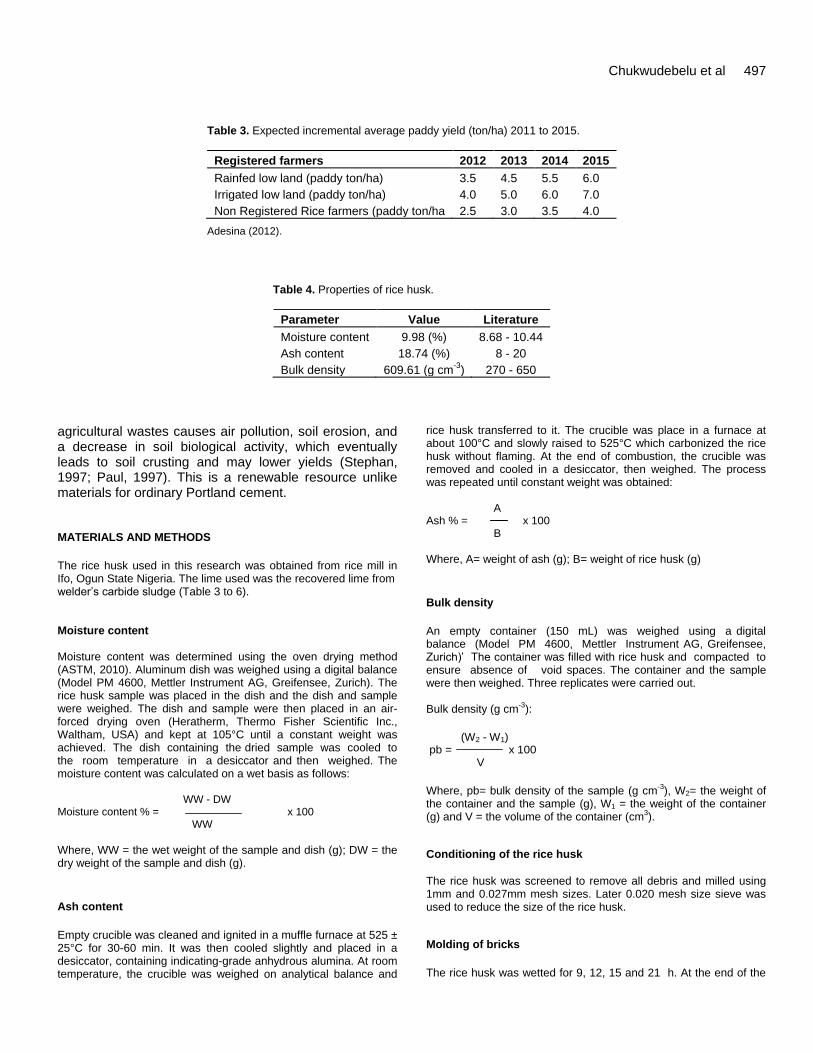
Chukwudebelu et al 497
Table 3. Expected incremental average paddy yield (ton/ha) 2011 to 2015.
Registered farmers 2012 2013 2014 2015
Rainfed low land (paddy ton/ha) 3.5 4.5 5.5 6.0
Irrigated low land (paddy ton/ha) 4.0 5.0 6.0 7.0
Non Registered Rice farmers (paddy ton/ha 2.5 3.0 3.5 4.0
Adesina (2012).
Table 4. Properties of rice husk.
Parameter Value Literature
Moisture content 9.98 (%) 8.68 - 10.44
Ash content 18.74 (%) 8 - 20
Bulk density 609.61 (g cm-3
) 270 - 650
agricultural wastes causes air pollution, soil erosion, and a decrease in soil biological activity, which eventually leads to soil crusting and may lower yields (Stephan, 1997; Paul, 1997). This is a renewable resource unlike materials for ordinary Portland cement. MATERIALS AND METHODS
The rice husk used in this research was obtained from rice mill in Ifo, Ogun State Nigeria. The lime used was the recovered lime from welder’s carbide sludge (Table 3 to 6). Moisture content Moisture content was determined using the oven drying method (ASTM, 2010). Aluminum dish was weighed using a digital balance (Model PM 4600, Mettler Instrument AG, Greifensee, Zurich). The rice husk sample was placed in the dish and the dish and sample were weighed. The dish and sample were then placed in an air-forced drying oven (Heratherm, Thermo Fisher Scientific Inc., Waltham, USA) and kept at 105°C until a constant weight was achieved. The dish containing the dried sample was cooled to the room temperature in a desiccator and then weighed. The moisture content was calculated on a wet basis as follows: WW - DW Moisture content % = x 100 WW Where, WW = the wet weight of the sample and dish (g); DW = the dry weight of the sample and dish (g).
Ash content
Empty crucible was cleaned and ignited in a muffle furnace at 525 ± 25°C for 30-60 min. It was then cooled slightly and placed in a desiccator, containing indicating-grade anhydrous alumina. At room temperature, the crucible was weighed on analytical balance and
rice husk transferred to it. The crucible was place in a furnace at about 100°C and slowly raised to 525°C which carbonized the rice husk without flaming. At the end of combustion, the crucible was removed and cooled in a desiccator, then weighed. The process was repeated until constant weight was obtained: A Ash % = x 100 B Where, A= weight of ash (g); B= weight of rice husk (g)
Bulk density
An empty container (150 mL) was weighed using a digital balance (Model PM 4600, Mettler Instrument AG, Greifensee, Zurich)’ The container was filled with rice husk and compacted to ensure absence of void spaces. The container and the sample were then weighed. Three replicates were carried out. Bulk density (g cm
-3):
(W2 - W1) pb = x 100 V Where, pb= bulk density of the sample (g cm
-3), W2= the weight of
the container and the sample (g), W1 = the weight of the container (g) and V = the volume of the container (cm
3).
Conditioning of the rice husk
The rice husk was screened to remove all debris and milled using 1mm and 0.027mm mesh sizes. Later 0.020 mesh size sieve was used to reduce the size of the rice husk.
Molding of bricks
The rice husk was wetted for 9, 12, 15 and 21 h. At the end of the
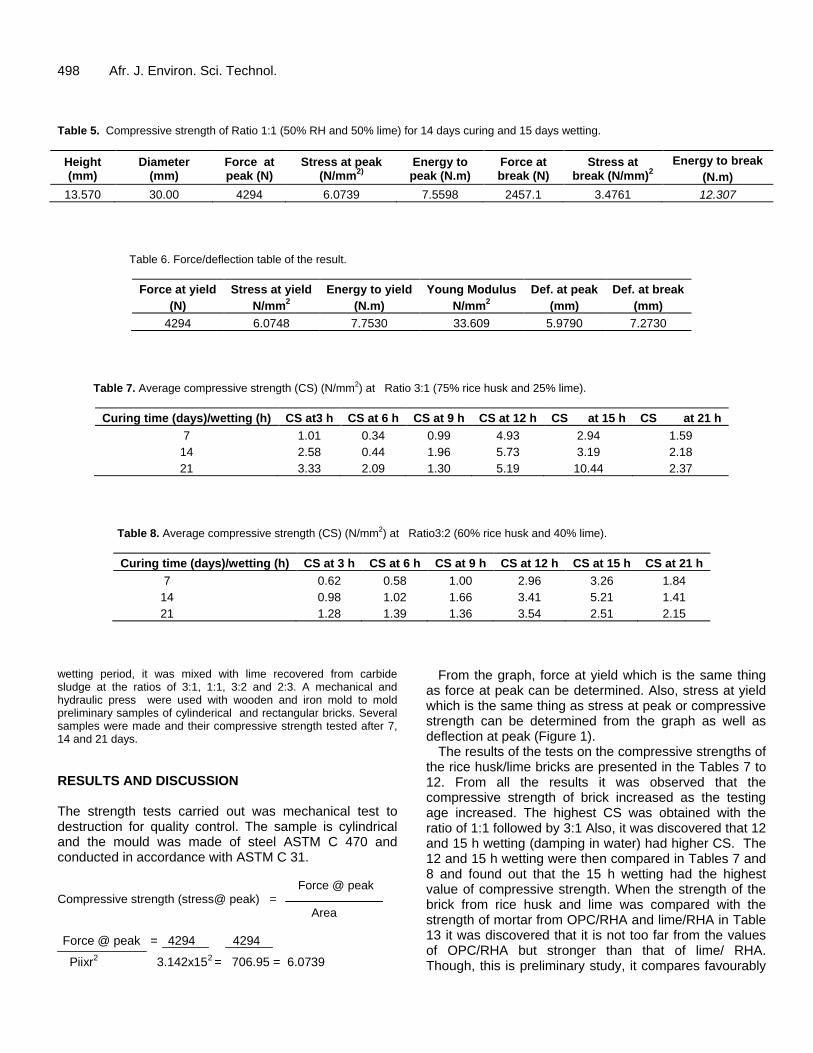
498 Afr. J. Environ. Sci. Technol. Table 5. Compressive strength of Ratio 1:1 (50% RH and 50% lime) for 14 days curing and 15 days wetting.
Height (mm)
Diameter (mm)
Force at peak (N)
Stress at peak (N/mm
2)
Energy to peak (N.m)
Force at break (N)
Stress at break (N/mm)
2
Energy to break
(N.m)
13.570 30.00 4294 6.0739 7.5598 2457.1 3.4761 12.307
Table 6. Force/deflection table of the result.
Force at yield
(N)
Stress at yield
N/mm2
Energy to yield
(N.m)
Young Modulus
N/mm2
Def. at peak
(mm)
Def. at break
(mm)
4294 6.0748 7.7530 33.609 5.9790 7.2730
Table 7. Average compressive strength (CS) (N/mm2) at Ratio 3:1 (75% rice husk and 25% lime).
Curing time (days)/wetting (h) CS at3 h CS at 6 h CS at 9 h CS at 12 h CS at 15 h CS at 21 h
7 1.01 0.34 0.99 4.93 2.94 1.59
14 2.58 0.44 1.96 5.73 3.19 2.18
21 3.33 2.09 1.30 5.19 10.44 2.37
Table 8. Average compressive strength (CS) (N/mm2) at Ratio3:2 (60% rice husk and 40% lime).
Curing time (days)/wetting (h) CS at 3 h CS at 6 h CS at 9 h CS at 12 h CS at 15 h CS at 21 h
7 0.62 0.58 1.00 2.96 3.26 1.84
14 0.98 1.02 1.66 3.41 5.21 1.41
21 1.28 1.39 1.36 3.54 2.51 2.15
wetting period, it was mixed with lime recovered from carbide sludge at the ratios of 3:1, 1:1, 3:2 and 2:3. A mechanical and hydraulic press were used with wooden and iron mold to mold preliminary samples of cylinderical and rectangular bricks. Several samples were made and their compressive strength tested after 7, 14 and 21 days.
RESULTS AND DISCUSSION The strength tests carried out was mechanical test to destruction for quality control. The sample is cylindrical and the mould was made of steel ASTM C 470 and conducted in accordance with ASTM C 31. Force @ peak Compressive strength (stress@ peak) = Area Force @ peak = 4294 4294
Piixr2 3.142x152 = 706.95 = 6.0739
From the graph, force at yield which is the same thing as force at peak can be determined. Also, stress at yield which is the same thing as stress at peak or compressive strength can be determined from the graph as well as deflection at peak (Figure 1).
The results of the tests on the compressive strengths of the rice husk/lime bricks are presented in the Tables 7 to 12. From all the results it was observed that the compressive strength of brick increased as the testing age increased. The highest CS was obtained with the ratio of 1:1 followed by 3:1 Also, it was discovered that 12 and 15 h wetting (damping in water) had higher CS. The 12 and 15 h wetting were then compared in Tables 7 and 8 and found out that the 15 h wetting had the highest value of compressive strength. When the strength of the brick from rice husk and lime was compared with the strength of mortar from OPC/RHA and lime/RHA in Table 13 it was discovered that it is not too far from the values of OPC/RHA but stronger than that of lime/ RHA. Though, this is preliminary study, it compares favourably
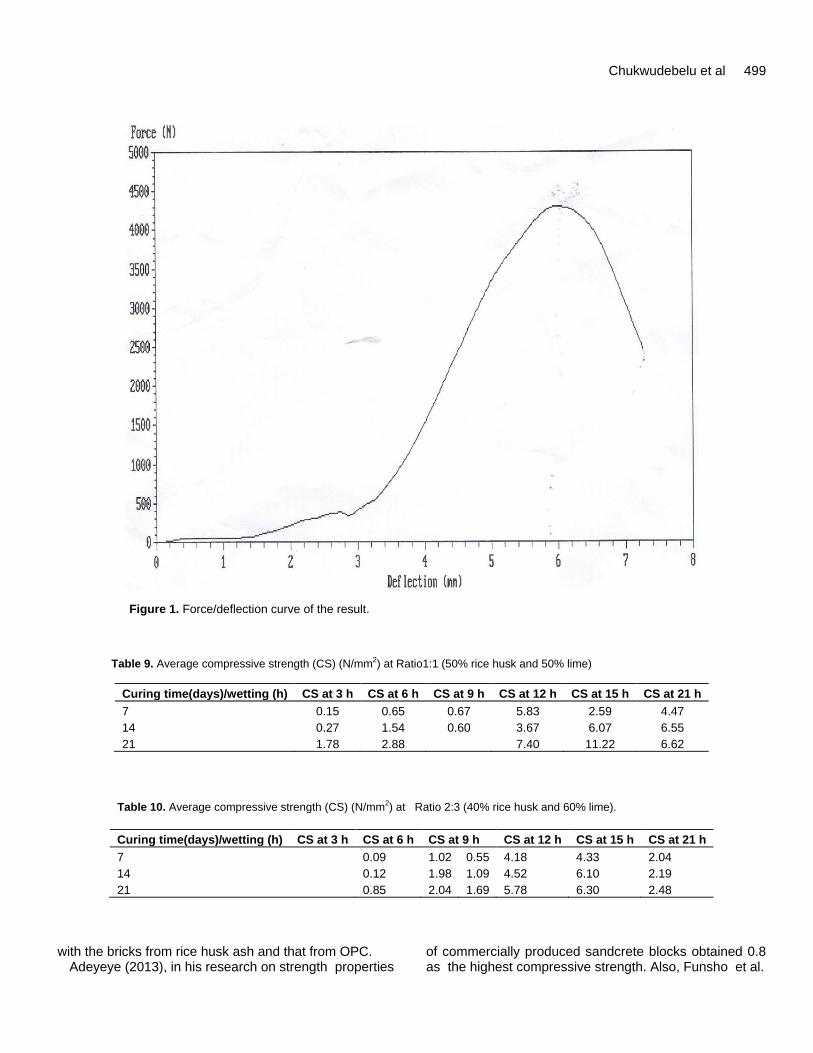
Chukwudebelu et al 499
Figure 1. Force/deflection curve of the result.
Table 9. Average compressive strength (CS) (N/mm2) at Ratio1:1 (50% rice husk and 50% lime)
Curing time(days)/wetting (h) CS at 3 h CS at 6 h CS at 9 h CS at 12 h CS at 15 h CS at 21 h
7 0.15 0.65 0.67 5.83 2.59 4.47
14 0.27 1.54 0.60 3.67 6.07 6.55
21 1.78 2.88 7.40 11.22 6.62
Table 10. Average compressive strength (CS) (N/mm2) at Ratio 2:3 (40% rice husk and 60% lime).
Curing time(days)/wetting (h) CS at 3 h CS at 6 h CS at 9 h CS at 12 h CS at 15 h CS at 21 h
7 0.09 1.02 0.55 4.18 4.33 2.04
14 0.12 1.98 1.09 4.52 6.10 2.19
21 0.85 2.04 1.69 5.78 6.30 2.48
with the bricks from rice husk ash and that from OPC.
Adeyeye (2013), in his research on strength properties of commercially produced sandcrete blocks obtained 0.8 as the highest compressive strength. Also, Funsho et al.
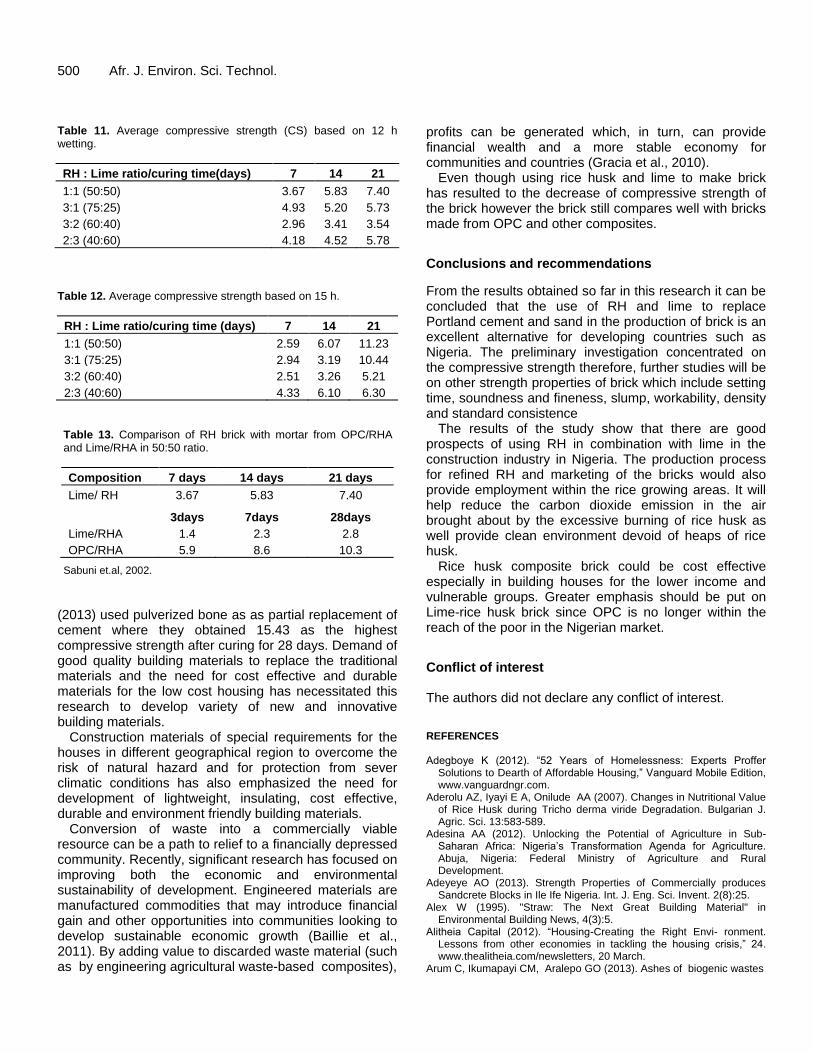
500 Afr. J. Environ. Sci. Technol. Table 11. Average compressive strength (CS) based on 12 h wetting.
RH : Lime ratio/curing time(days) 7 14 21
1:1 (50:50) 3.67 5.83 7.40
3:1 (75:25) 4.93 5.20 5.73
3:2 (60:40) 2.96 3.41 3.54
2:3 (40:60) 4.18 4.52 5.78
Table 12. Average compressive strength based on 15 h.
RH : Lime ratio/curing time (days) 7 14 21
1:1 (50:50) 2.59 6.07 11.23
3:1 (75:25) 2.94 3.19 10.44
3:2 (60:40) 2.51 3.26 5.21
2:3 (40:60) 4.33 6.10 6.30
Table 13. Comparison of RH brick with mortar from OPC/RHA and Lime/RHA in 50:50 ratio.
Composition 7 days 14 days 21 days
Lime/ RH 3.67 5.83 7.40
3days 7days 28days
Lime/RHA 1.4 2.3 2.8
OPC/RHA 5.9 8.6 10.3
Sabuni et.al, 2002.
(2013) used pulverized bone as as partial replacement of cement where they obtained 15.43 as the highest compressive strength after curing for 28 days. Demand of good quality building materials to replace the traditional materials and the need for cost effective and durable materials for the low cost housing has necessitated this research to develop variety of new and innovative building materials.
Construction materials of special requirements for the houses in different geographical region to overcome the risk of natural hazard and for protection from sever climatic conditions has also emphasized the need for development of lightweight, insulating, cost effective, durable and environment friendly building materials.
Conversion of waste into a commercially viable resource can be a path to relief to a financially depressed community. Recently, significant research has focused on improving both the economic and environmental sustainability of development. Engineered materials are manufactured commodities that may introduce financial gain and other opportunities into communities looking to develop sustainable economic growth (Baillie et al., 2011). By adding value to discarded waste material (such as by engineering agricultural waste-based composites),
profits can be generated which, in turn, can provide financial wealth and a more stable economy for communities and countries (Gracia et al., 2010).
Even though using rice husk and lime to make brick has resulted to the decrease of compressive strength of the brick however the brick still compares well with bricks made from OPC and other composites.
Conclusions and recommendations
From the results obtained so far in this research it can be concluded that the use of RH and lime to replace Portland cement and sand in the production of brick is an excellent alternative for developing countries such as Nigeria. The preliminary investigation concentrated on the compressive strength therefore, further studies will be on other strength properties of brick which include setting time, soundness and fineness, slump, workability, density and standard consistence
The results of the study show that there are good prospects of using RH in combination with lime in the construction industry in Nigeria. The production process for refined RH and marketing of the bricks would also provide employment within the rice growing areas. It will help reduce the carbon dioxide emission in the air brought about by the excessive burning of rice husk as well provide clean environment devoid of heaps of rice husk.
Rice husk composite brick could be cost effective especially in building houses for the lower income and vulnerable groups. Greater emphasis should be put on Lime-rice husk brick since OPC is no longer within the reach of the poor in the Nigerian market.
Conflict of interest The authors did not declare any conflict of interest. REFERENCES Adegboye K (2012). ―52 Years of Homelessness: Experts Proffer
Solutions to Dearth of Affordable Housing,‖ Vanguard Mobile Edition, www.vanguardngr.com.
Aderolu AZ, Iyayi E A, Onilude AA (2007). Changes in Nutritional Value of Rice Husk during Tricho derma viride Degradation. Bulgarian J. Agric. Sci. 13:583-589.
Adesina AA (2012). Unlocking the Potential of Agriculture in Sub-Saharan Africa: Nigeria’s Transformation Agenda for Agriculture. Abuja, Nigeria: Federal Ministry of Agriculture and Rural Development.
Adeyeye AO (2013). Strength Properties of Commercially produces Sandcrete Blocks in Ile Ife Nigeria. Int. J. Eng. Sci. Invent. 2(8):25.
Alex W (1995). "Straw: The Next Great Building Material" in Environmental Building News, 4(3):5.
Alitheia Capital (2012). ―Housing-Creating the Right Envi- ronment. Lessons from other economies in tackling the housing crisis,‖ 24. www.thealitheia.com/newsletters, 20 March.
Arum C, Ikumapayi CM, Aralepo GO (2013). Ashes of biogenic wastes
—Pozzolanicity, prospects for use and effects on some engineering properties of concrete. Mater. Sci. Applicat. 4:521-527.
Baillie C, Matovic D, Thamae T, Vaja S (2011). Waste-based composites poverty reducing solutions to environmental problems. Resour. Conserv. Recycl. 55(11):973-978.
Basorun JO, Fadairo G (2012). ―Government Challenges in Housing the Urban Poor in Ado-Ekiti, Nigeria,‖ J. Sust. Soc. 1(2) 31-35.
Chirag DM, Hirak SS, Jay JL, Darshan MM (2014). Compressive and Tensile Strength of Concrete Containing Rice-Husk Ash and Coir Fibers‖. A.D.Patel Institute of Technology, Anand Gujarat Technological University, Ahmedabad.
Chukwudebelu JA, Igwe CC, Taiwo, OE, Tojola OB (2013). Recovery of pure slaked lime from carbide sludge: Case study of Lagos state, Nigeria. Afr. J. Environ. Sci. Technol. 7(6):490-495.
Demir I (2005). ―An investigation on the production of construction brick with processed waste tea‖, Building and Environment, 41, 1274-1278.
Ewais, Emad MM, Ahmed, Yasser MZ, El-Amir, Ahmed AM, El-Didamony, Hamdy. (2014). Cement kiln dust/rice husk ash as a low temperature route for wollastonite processing. Epitőanyag jsbcm, 66(3):69-80.
Federal Republic of Nigeria. (2006) Accelerated Rice Production in the Niger River Basin.TCP/NIR/3303 Main Report and Working Papers.
Funsho F, Efe I, Chris F (2013). Low-cost construction through the use of pulverizedbone foamed aerated concrete (PB-FAC). Civil Environ. Res. 3(10)107, www.iiste.org.
Garcia D, lopez,J, Balart R, Ruseckaite R, Stefani P (2010). Composites based on sintering rice husk waste tire, rubber mixtures. Mater. Design 28(7)2234-2238.
Jon M (1997). "Rice fields may burn in spring: Bill promises to help farmers, not hurt air," The Sacramento Bee.
Johnson M, Takeshima H, Gyimah-Brempong K (2013). Assessing the potential and policy alternatives for achieving rice competitiveness and growth in Nigeria. The International Food Policy Research Institute (IFPRI). Development strategy and Governance Division, IFPRI Discussion Paper 01301 November, 2013.
Chukwudebelu et al 501 Karim MR, Zain MFM, Jamil M, Lai FC, Islam MN (2011). ―Necessity
and Opportunity of Sustainable Concrete from Malaysia’s Waste Materials,‖ Australian Journal of Basic and Applied Sciences, 5(5) 998-1006.
Kartini K (2011). Rice husk ash – pozzolanic material for sustainability. International Journal of Applied Science and Technology 1 (6) 169.
Mannan ,M. A. and Ganapathy, C. (2003), ―Concrete from agricultural waste oil palm shell (OPS)‖, Build. Environ. 39 (4) Elsevier.
Nicholas AM, Folorunsho OA (2012). Utilizing Rice Husk Briquettes in Firing Crucible Furnace for Low Temperature Melting Metals in Nigeria. ETASR - Engineering, Technol. Appl. Sci. 2(4)26-268
Nkah V (2009).The Economy Magazine Nigeria’s housing deficit: Balancing the equation.
Opara PN (2006). Usability of rice husk in the production of roofing sheets. J. Agric. Soc. Res. 6(1).
Opeyemi DA, Makinde OO (2012). The Suitability of Partial Replacement of Cement with Rice Husk Ash and Bone Powder in Concrete Structures. Inter. J. Emerging Technol. Adv. Eng. 2(9)261.
Paul R (1997). "Effect of Annual Burn No-Till Wheat on Soil Organic Matter Content and Bulk Density." Agricultural Research Service report number: 0000078618.
Sabuni WB, Syagga PM, Dulo SO, Kamau GN (2002). Rice Husk Ash Cement – An alternative pozzolana cement for Kenyan building Industry. J. Civil Eng. JKUAT 8:13-26.
Stephan A (1997). "Is burning an effective management practice for the pacific northwest cereal region?" Agricultural Research Service report number: 0000061281.
Turgut P, Algin HM (2006). Limestone dust and wood sawdust as brick material‖. Build. Environ. 42:3399-3403.
Vol. 9(5), pp. 502-507, May 2015
DOI: 10.5897/AJEST2014.1800
Article Number: 6F4373752477
ISSN 1996-0786
Copyright © 2015
Author(s) retain the copyright of this article http://www.academicjournals.org/AJEST
African Journal of Environmental Science and Technology
Full Length Research Paper
Lead uptake of water plants in water stream at Kiteezi landfill site, Kampala (Uganda)
Dana Jill Mugisa1, Noble Banadda1*, Nicholas Kiggundu1 and R. Asuman2
1Department of Agricultural Bio-Systems Engineering, Makerere University, P. O. Box 7062, Kampala, Uganda.
2Chemistry Laboratory, Uganda Industrial Research Institute, P. O. Box 7086, Kampala, Uganda.
Received 29 September, 2014; Accepted 8 April, 2015
The purpose of this study was twofold: (i) to quantify the lead (Pb) uptake by two water plants reeds (Phragmites australis) and papyrus (Cyperus papyrus) in water stream at Kiteezi landfill site, Kampala (Uganda) and (ii) to compare the two species in Pb uptake downstream. As such, leachate samples were collected at the inlet and outlet of the waste water treatment plant (WWTP) at Kiteezi landfill site. A total of 6 plant samples of both plant species, P. australis and C. papyrus, were picked from three different sites at intervals of 10, 20 and 30 m taken from the exit point of the WWTP, as the reference point. All samples were taken to the laboratory for analysis in a cool container. The concentration of Pb in the samples was measured using the atomic absorption spectrometer (AAS), Perkin Elmer Model. The obtained data was analyzed using descriptive statistics and two-way Anova. The results showed that there was no significant difference (P > 0.05) in the mean Pb content up taken by both plants (reeds and papyrus). Significant quantities of Pb were present in the plants in the range of 1.68 to 5.46 mg/100 g. The removal efficiency of the plants was found to be 12.4 times higher than WWTP. The highest concentrations of Pb were found downstream at a distance of 30 m away from the reference point. Although, the plants were generalized as having equal uptake levels, the two species had different mechanisms with reeds being accumulators and papyrus being excluders. Therefore, reeds are preferable phytoremediators since when harvested by cutting as practiced by some communities in Uganda, the Pb can easily be removed from the environment. Key words: Lead-uptake, excluders, accumulators, phytoremediation, leachates and Kiteezi.
INTRODUCTION Leachate from dumping sites, especially open dumps, contain heavy metals which compromise water quality (Kamarudzaman et al., 2011). Heavy metals are some of the causes of contamination in the environment. They are some trace elements and also defined as elements with metallic properties and atomic number greater than 20. It is a term that can also include light elements such as
copper, with an atomic weight of 63. Heavy metals are commonly known for their toxicity. Despite the fact that some heavy metals such as chromium, copper, iron and zinc are essential for life in small quantities, others such as lead and cadmium do not have a vital function and could be harmful to organisms even in small concen-trations (Nhapi et al., 2012).
*Corresponding author. E-mail: [email protected]. Author(s) agree that this article remain permanently open access under the terms of the Creative Commons Attribution License 4.0 International License
Heavy metal contamination is usually a result of various human activities such as mining and smelting, metalliferous electroplating, internal combustion engine operation, energy and fuel production, fertilizer and pesticide application and the generation of municipal solid waste. Metals enter the municipal solid waste stream from different sources. These include batteries, house dust and paint chips, light bulbs, consumer electronics, ceramics, lead foils such as wine bottle closures, used motor oils, plastics, some inks and also glass (Woodbury, 1992). Movement of these contaminants into non conta-minated areas as dust or leachates through the soil is one of the ways that contaminate the ecosystems (Tangahu et al., 2011). Since metals are not easily biodegraded, eliminating them from the environment, necessitates their removal. Currently, not even highly industrialized countries can afford to clean up conta-minated sites. For example in Germany, 30% of the soils from contaminated areas are cleaned up in soil remedia-tion facilities, while the rest is stored untreated in waste disposal facilities (Csaba, 2011).
Various methods are being adopted to free the environment from these kinds of contaminants, though majority of them are expensive and not very efficient. Chemical technologies generate large volumetric sludge and thus higher costs. Thermal technologies degrade the valuable component of the soils (Tangahu et al., 2011), hence making the methods not the most efficient. Recent concerns regarding the environmental contamination have led to the discovery of adequate methods to assess the presence and mobility of metals in soil, water and wastewater (Shtangeeva et al., 2004). Currently, phytoremediation, which is the use of special species of plants to remove heavy metals from soil and water, has become an effective and affordable technological solution in the extraction of metals from soil. This is basically because the method is environmentally friendly and cost effective. This method takes advantage of the unique and selective uptake capabilities of plant root systems, together with translocation, bioaccumulation and degradation abilities of the entire plant body. Many species of plants have been successful in absorbing lead, cadmium, arsenic and various radionuclides from soils.
For example Kim et al. (2003) studied heavy metal accumulation in Polygonum thunbergii and the soil from Man-Kyung River watershed, Korea, and noted that there was detectable presence of heavy metals in the plant in the order of Zn (2427.3 µg/g) > Cu (863.2 µg/g) > Pb (320.8 µg/g) > Cd (7.4 and 10.1 µg/g) in only the stem and root respectively). The soil samples contained detectable zinc (24.5 µg/g) > lead (17.5 µg/g) > copper (8.4 µg/g) with undetectable cadmium content. This study rendered the plant a very good phyto-extractor. Odong et al. (2013), also studied a range of macrophyte plants to see if anyone was able to clean up waste water and absorb toxic matter from abattoir effluent that is a major source of pollution entering Lake Victoria, in his study,
Dana et al 503 papyrus and weeds were tested and it was found that papyrus was able to remove the highest concentration of four grams of phosphorus per kilogram dry weight from the waste water.
Lead as a metal occurs naturally in the earth, it has many industrial uses and is found in trace amounts everywhere in the environment. It is a very toxic and dangerous metal when ingested in the human body. In humans, exposure to lead can result in biological effects such as problems in the synthesis of gastrointestinal tract, joints, reproductive system and acute chronic damage to the nervous system, depending on the level and duration of the exposure. Research has proven that lead contributes to 0.2% of all deaths and 0.6% of all disability in life globally (WHO, 2009). Developing fetus and infants are more sensitive to the effects than the adults.
Land filling is the primary means of disposal of both residual municipal solid waste and many hazardous wastes in Uganda. According to Ngategize (2000), the current and only landfill site in Kampala is at Kiteezi. It is further situated within a human settlement community, where it has caused social discomfort and environmental pollution. During the process of land filling, waste is subjected to aerobic decomposition which creates social tensions among the communities near the landfills especially odour pollution, flies, vermin and pests (Sabiiti and Katongole, 2012). It is against this background, that this study’s main objective was twofold: (i) to quantify the lead uptake by the two water plants, reeds (Phragmites australis) and papyrus (Cyperus papyrus) in water stream at Kiteezi landfill site, Kampala (Uganda) and (ii) to compare the two species in Pb uptake downstream and as a result suggest which of the species should be promoted to improve the water quality downstream: (i) to quantify the lead (Pb) uptake by the two reeds in the water stream and (ii) to compare the two species in Pb uptake downstream. MATERIALS AND METHODS
Study area
This study was conducted in Kiteezi landfill site, located at the north of Kampala City, an average distance of 12 km from the city central. Kiteezi landfill site serves the 5 divisions of Kampala, namely, Kampala Central, Nakawa, Lubaga, Makindye and Kawempe. The present access to the site from Kampala City is through Kampala-
Gayaza road (about 9 km), then branch off to the left from Mpererwe and follow the road heading to Namulonge for about 4 km. Currently, it is the only landfill site at which Kampala’s solid waste is disposed. The neighboring areas of Kiteezi land fill include: Kasangati, Kawempe, Nangabo, Namalere, Bulamoiro, Buye and Kalerwe.
Geographically, Kiteezi is located at latitude: 0° 25' 0" and longitude: 32° 34' 00" as depicted in Map 1. The site was opened in 1996 and it covers an area of 29 acres. By then, KCCA in 2007
acquired an additional six acres to the south of the existing landfill for expansion purposes.
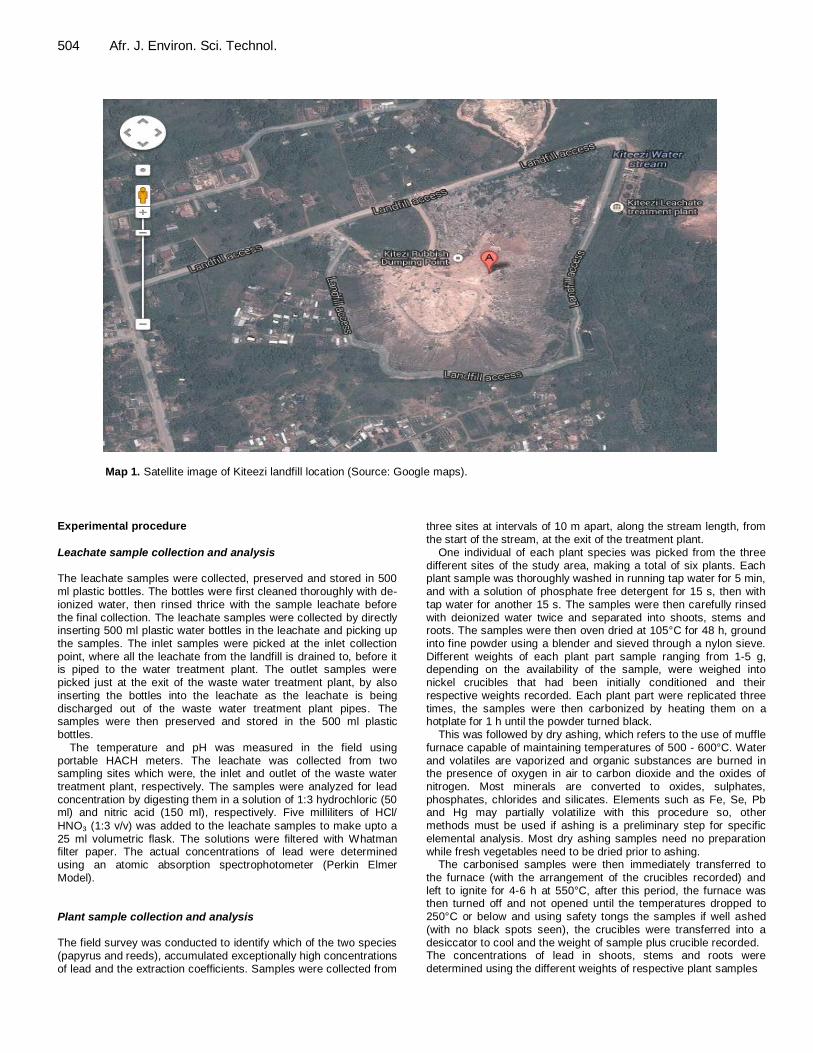
504 Afr. J. Environ. Sci. Technol.
Map 1. Satellite image of Kiteezi landfill location (Source: Google maps).
Experimental procedure
Leachate sample collection and analysis The leachate samples were collected, preserved and stored in 500 ml plastic bottles. The bottles were first cleaned thoroughly with de-ionized water, then rinsed thrice with the sample leachate before
the final collection. The leachate samples were collected by directly inserting 500 ml plastic water bottles in the leachate and picking up the samples. The inlet samples were picked at the inlet collection point, where all the leachate from the landfill is drained to, before it is piped to the water treatment plant. The outlet samples were picked just at the exit of the waste water treatment plant, by also inserting the bottles into the leachate as the leachate is being discharged out of the waste water treatment plant pipes. The samples were then preserved and stored in the 500 ml plastic bottles.
The temperature and pH was measured in the field using portable HACH meters. The leachate was collected from two sampling sites which were, the inlet and outlet of the waste water treatment plant, respectively. The samples were analyzed for lead concentration by digesting them in a solution of 1:3 hydrochloric (50 ml) and nitric acid (150 ml), respectively. Five milliliters of HCl/
HNO₃ (1:3 v/v) was added to the leachate samples to make upto a
25 ml volumetric flask. The solutions were filtered with Whatman filter paper. The actual concentrations of lead were determined using an atomic absorption spectrophotometer (Perkin Elmer Model). Plant sample collection and analysis The field survey was conducted to identify which of the two species (papyrus and reeds), accumulated exceptionally high concentrations of lead and the extraction coefficients. Samples were collected from
three sites at intervals of 10 m apart, along the stream length, from the start of the stream, at the exit of the treatment plant.
One individual of each plant species was picked from the three different sites of the study area, making a total of six plants. Each plant sample was thoroughly washed in running tap water for 5 min, and with a solution of phosphate free detergent for 15 s, then with tap water for another 15 s. The samples were then carefully rinsed
with deionized water twice and separated into shoots, stems and roots. The samples were then oven dried at 105°C for 48 h, ground into fine powder using a blender and sieved through a nylon sieve. Different weights of each plant part sample ranging from 1-5 g, depending on the availability of the sample, were weighed into nickel crucibles that had been initially conditioned and their respective weights recorded. Each plant part were replicated three times, the samples were then carbonized by heating them on a hotplate for 1 h until the powder turned black.
This was followed by dry ashing, which refers to the use of muffle furnace capable of maintaining temperatures of 500 - 600°C. Water and volatiles are vaporized and organic substances are burned in the presence of oxygen in air to carbon dioxide and the oxides of nitrogen. Most minerals are converted to oxides, sulphates, phosphates, chlorides and silicates. Elements such as Fe, Se, Pb and Hg may partially volatilize with this procedure so, other methods must be used if ashing is a preliminary step for specific
elemental analysis. Most dry ashing samples need no preparation while fresh vegetables need to be dried prior to ashing.
The carbonised samples were then immediately transferred to the furnace (with the arrangement of the crucibles recorded) and left to ignite for 4-6 h at 550°C, after this period, the furnace was then turned off and not opened until the temperatures dropped to 250°C or below and using safety tongs the samples if well ashed (with no black spots seen), the crucibles were transferred into a
desiccator to cool and the weight of sample plus crucible recorded. The concentrations of lead in shoots, stems and roots were determined using the different weights of respective plant samples
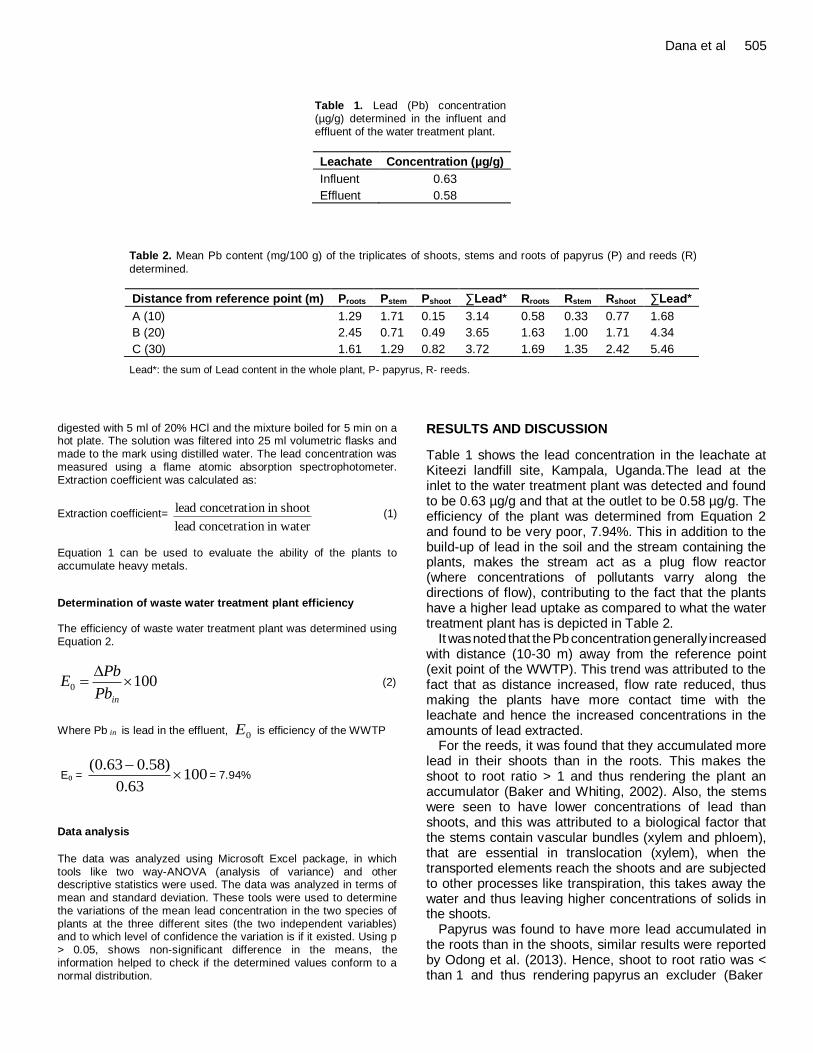
Dana et al 505
Table 1. Lead (Pb) concentration (µg/g) determined in the influent and effluent of the water treatment plant.
Leachate Concentration (µg/g)
Influent 0.63
Effluent 0.58
Table 2. Mean Pb content (mg/100 g) of the triplicates of shoots, stems and roots of papyrus (P) and reeds (R)
determined.
Distance from reference point (m) Proots Pstem Pshoot ∑Lead* Rroots Rstem Rshoot ∑Lead*
A (10) 1.29 1.71 0.15 3.14 0.58 0.33 0.77 1.68
B (20) 2.45 0.71 0.49 3.65 1.63 1.00 1.71 4.34
C (30) 1.61 1.29 0.82 3.72 1.69 1.35 2.42 5.46
Lead*: the sum of Lead content in the whole plant, P- papyrus, R- reeds.
digested with 5 ml of 20% HCl and the mixture boiled for 5 min on a hot plate. The solution was filtered into 25 ml volumetric flasks and made to the mark using distilled water. The lead concentration was measured using a flame atomic absorption spectrophotometer. Extraction coefficient was calculated as:
Extraction coefficient=
in wateron concetrati lead
shootin on concetrati lead (1)
Equation 1 can be used to evaluate the ability of the plants to accumulate heavy metals.
Determination of waste water treatment plant efficiency
The efficiency of waste water treatment plant was determined using Equation 2.
1000
inPb
PbE (2)
Where Pb in is lead in the effluent, 0E is efficiency of the WWTP
E₀ = 10063.0
)58.063.0(
= 7.94%
Data analysis
The data was analyzed using Microsoft Excel package, in which tools like two way-ANOVA (analysis of variance) and other descriptive statistics were used. The data was analyzed in terms of mean and standard deviation. These tools were used to determine the variations of the mean lead concentration in the two species of plants at the three different sites (the two independent variables) and to which level of confidence the variation is if it existed. Using p
> 0.05, shows non-significant difference in the means, the information helped to check if the determined values conform to a normal distribution.
RESULTS AND DISCUSSION
Table 1 shows the lead concentration in the leachate at Kiteezi landfill site, Kampala, Uganda.The lead at the inlet to the water treatment plant was detected and found to be 0.63 µg/g and that at the outlet to be 0.58 µg/g. The efficiency of the plant was determined from Equation 2 and found to be very poor, 7.94%. This in addition to the build-up of lead in the soil and the stream containing the plants, makes the stream act as a plug flow reactor (where concentrations of pollutants varry along the directions of flow), contributing to the fact that the plants have a higher lead uptake as compared to what the water treatment plant has is depicted in Table 2.
It was noted that the Pb concentration generally increased with distance (10-30 m) away from the reference point (exit point of the WWTP). This trend was attributed to the fact that as distance increased, flow rate reduced, thus making the plants have more contact time with the leachate and hence the increased concentrations in the amounts of lead extracted.
For the reeds, it was found that they accumulated more lead in their shoots than in the roots. This makes the shoot to root ratio > 1 and thus rendering the plant an accumulator (Baker and Whiting, 2002). Also, the stems were seen to have lower concentrations of lead than shoots, and this was attributed to a biological factor that the stems contain vascular bundles (xylem and phloem), that are essential in translocation (xylem), when the transported elements reach the shoots and are subjected to other processes like transpiration, this takes away the water and thus leaving higher concentrations of solids in the shoots.
Papyrus was found to have more lead accumulated in the roots than in the shoots, similar results were reported by Odong et al. (2013). Hence, shoot to root ratio was < than 1 and thus rendering papyrus an excluder (Baker
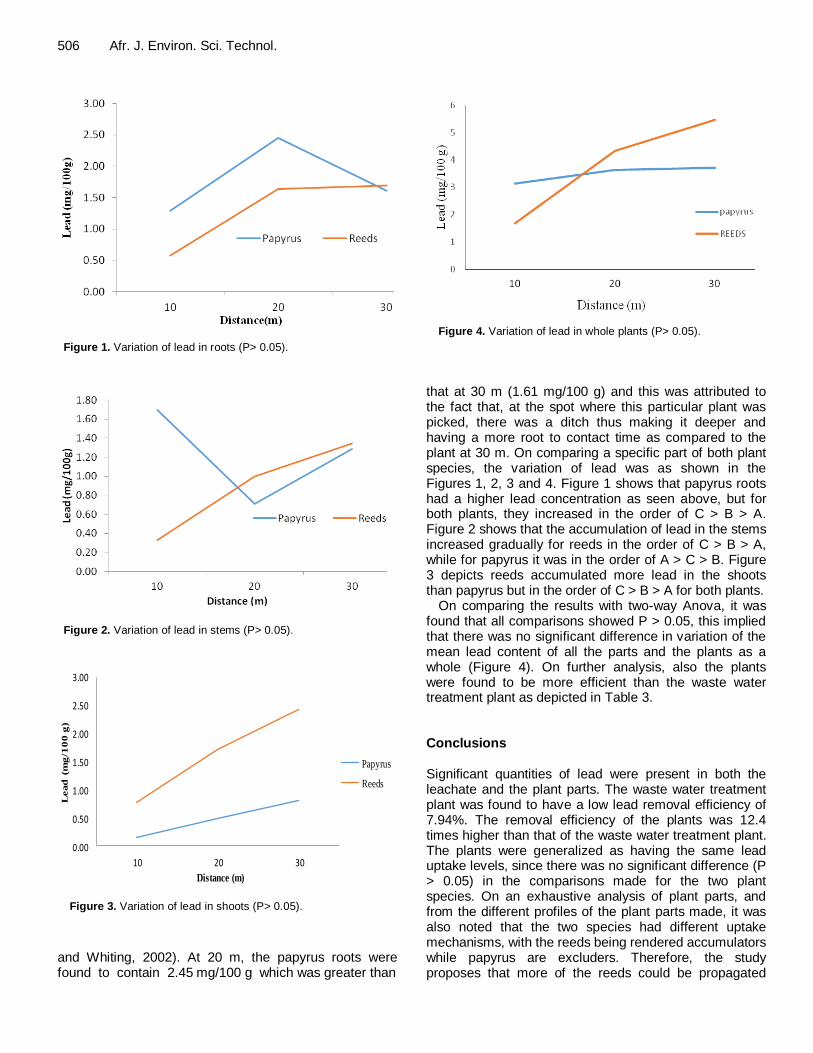
506 Afr. J. Environ. Sci. Technol.
Figure 1. Variation of lead in roots (P> 0.05).
Figure 2. Variation of lead in stems (P> 0.05).
Figure 3. Variation of lead in shoots (P> 0.05).
and Whiting, 2002). At 20 m, the papyrus roots were found to contain 2.45 mg/100 g which was greater than
Figure 4. Variation of lead in whole plants (P> 0.05).
that at 30 m (1.61 mg/100 g) and this was attributed to the fact that, at the spot where this particular plant was picked, there was a ditch thus making it deeper and having a more root to contact time as compared to the plant at 30 m. On comparing a specific part of both plant species, the variation of lead was as shown in the Figures 1, 2, 3 and 4. Figure 1 shows that papyrus roots had a higher lead concentration as seen above, but for both plants, they increased in the order of C > B > A. Figure 2 shows that the accumulation of lead in the stems increased gradually for reeds in the order of C > B > A, while for papyrus it was in the order of A > C > B. Figure 3 depicts reeds accumulated more lead in the shoots than papyrus but in the order of C > B > A for both plants.
On comparing the results with two-way Anova, it was found that all comparisons showed P > 0.05, this implied that there was no significant difference in variation of the mean lead content of all the parts and the plants as a whole (Figure 4). On further analysis, also the plants were found to be more efficient than the waste water treatment plant as depicted in Table 3. Conclusions Significant quantities of lead were present in both the leachate and the plant parts. The waste water treatment plant was found to have a low lead removal efficiency of 7.94%. The removal efficiency of the plants was 12.4 times higher than that of the waste water treatment plant. The plants were generalized as having the same lead uptake levels, since there was no significant difference (P > 0.05) in the comparisons made for the two plant species. On an exhaustive analysis of plant parts, and from the different profiles of the plant parts made, it was also noted that the two species had different uptake mechanisms, with the reeds being rendered accumulators while papyrus are excluders. Therefore, the study proposes that more of the reeds could be propagated
0.00
0.50
1.00
1.50
2.00
2.50
3.00
10 20 30
Lead (m
g/1
00
g)
Distance (m)
Papyrus
Reeds 0.00
0.20
0.40
0.60
0.80
1.00
1.20
1.40
1.60
1.80
10 20 30
LEAD (MG/10
0G)
DISTANCE (M)
Papyrus ReedsA B
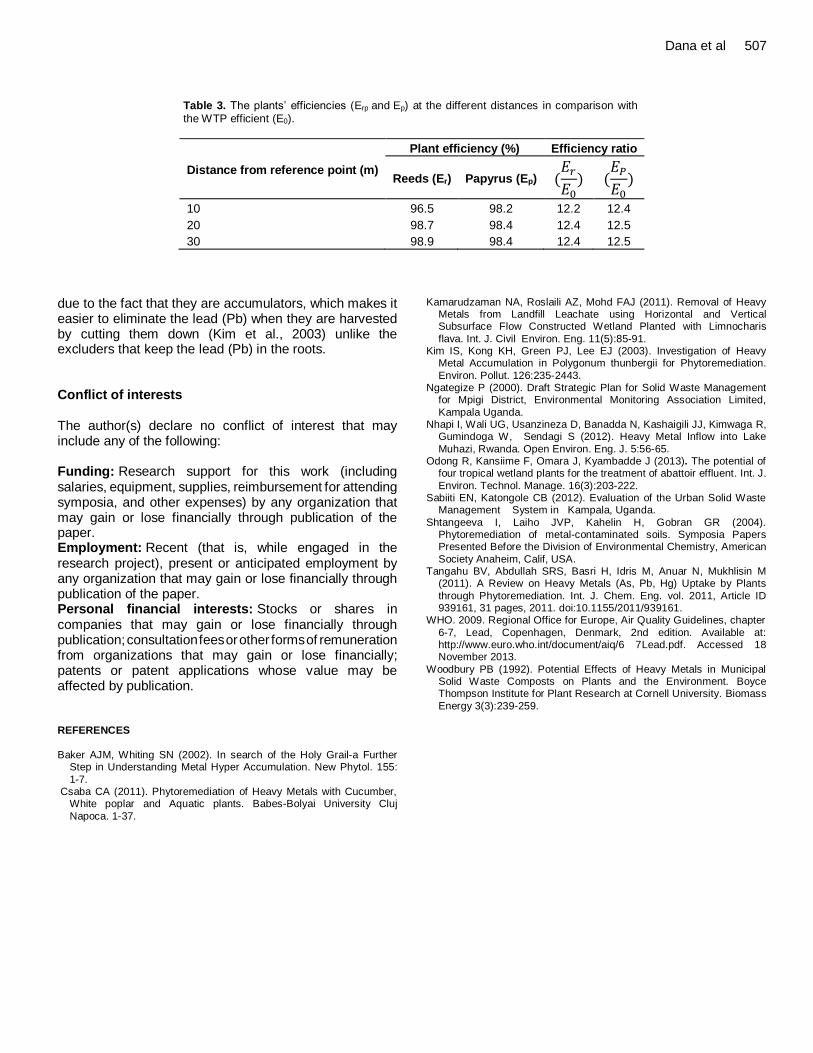
Dana et al 507
Table 3. The plants’ efficiencies (Erp and Ep) at the different distances in comparison with the WTP efficient (E0).
Distance from reference point (m)
Plant efficiency (%) Efficiency ratio
Reeds (Er) Papyrus (Ep)
10 96.5 98.2 12.2 12.4
20 98.7 98.4 12.4 12.5
30 98.9 98.4 12.4 12.5
due to the fact that they are accumulators, which makes it easier to eliminate the lead (Pb) when they are harvested by cutting them down (Kim et al., 2003) unlike the excluders that keep the lead (Pb) in the roots. Conflict of interests The author(s) declare no conflict of interest that may include any of the following: Funding: Research support for this work (including salaries, equipment, supplies, reimbursement for attending symposia, and other expenses) by any organization that may gain or lose financially through publication of the paper. Employment: Recent (that is, while engaged in the research project), present or anticipated employment by any organization that may gain or lose financially through publication of the paper. Personal financial interests: Stocks or shares in companies that may gain or lose financially through publication; consultation fees or other forms of remuneration from organizations that may gain or lose financially; patents or patent applications whose value may be affected by publication. REFERENCES
Baker AJM, Whiting SN (2002). In search of the Holy Grail-a Further
Step in Understanding Metal Hyper Accumulation. New Phytol. 155:
1-7. Csaba CA (2011). Phytoremediation of Heavy Metals with Cucumber,
White poplar and Aquatic plants. Babes-Bolyai University Cluj
Napoca. 1-37.
Kamarudzaman NA, Roslaili AZ, Mohd FAJ (2011). Removal of Heavy Metals from Landfill Leachate using Horizontal and Vertical Subsurface Flow Constructed Wetland Planted with Limnocharis
flava. Int. J. Civil Environ. Eng. 11(5):85-91. Kim IS, Kong KH, Green PJ, Lee EJ (2003). Investigation of Heavy
Metal Accumulation in Polygonum thunbergii for Phytoremediation.
Environ. Pollut. 126:235-2443. Ngategize P (2000). Draft Strategic Plan for Solid Waste Management
for Mpigi District, Environmental Monitoring Association Limited,
Kampala Uganda. Nhapi I, Wali UG, Usanzineza D, Banadda N, Kashaigili JJ, Kimwaga R,
Gumindoga W, Sendagi S (2012). Heavy Metal Inflow into Lake
Muhazi, Rwanda. Open Environ. Eng. J. 5:56-65. Odong R, Kansiime F, Omara J, Kyambadde J (2013). The potential of
four tropical wetland plants for the treatment of abattoir effluent. Int. J.
Environ. Technol. Manage. 16(3):203-222. Sabiiti EN, Katongole CB (2012). Evaluation of the Urban Solid Waste
Management System in Kampala, Uganda.
Shtangeeva I, Laiho JVP, Kahelin H, Gobran GR (2004). Phytoremediation of metal-contaminated soils. Symposia Papers Presented Before the Division of Environmental Chemistry, American
Society Anaheim, Calif, USA. Tangahu BV, Abdullah SRS, Basri H, Idris M, Anuar N, Mukhlisin M
(2011). A Review on Heavy Metals (As, Pb, Hg) Uptake by Plants
through Phytoremediation. Int. J. Chem. Eng. vol. 2011, Article ID 939161, 31 pages, 2011. doi:10.1155/2011/939161.
WHO. 2009. Regional Office for Europe, Air Quality Guidelines, chapter
6-7, Lead, Copenhagen, Denmark, 2nd edition. Available at: http://www.euro.who.int/document/aiq/6 7Lead.pdf. Accessed 18 November 2013.
Woodbury PB (1992). Potential Effects of Heavy Metals in Municipal Solid Waste Composts on Plants and the Environment. Boyce Thompson Institute for Plant Research at Cornell University. Biomass
Energy 3(3):239-259.

African Journal of
Environmental Science and
Technology
Related Journals Published by Academic Journals Journal of Ecology and the Natural Environment Journal of Bioinformatics and Sequence Analysis Journal of General and Molecular Virology International Journal of Biodiversity and Conservation Journal of Biophysics and Structural Biology Journal of Evolutionary Biology Research


