Embed Size (px)
Citation preview
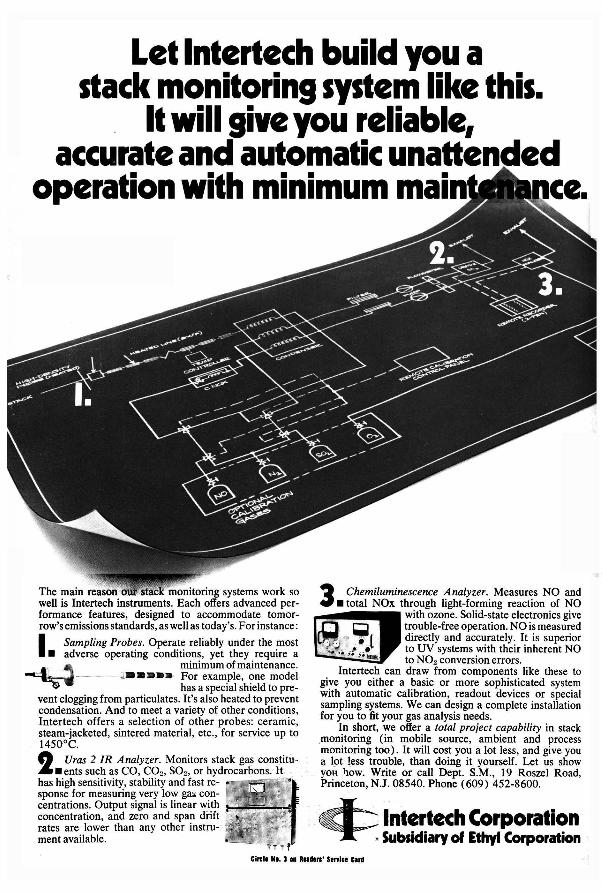
Let Intertech build you a stack monitoring system like this.
It will give you reliable, accurate and automatic unatte
operation with minimum mai
lI1""lU.UU.l1/S systems work so well is Intertech instruments. Each advanced performance features, designed to accommodate tomorrow's emissions standards, as well as today's. For instance:
I Sampling Probes. Operate reliably under the most • adverse operating conditions, yet they require a
~ minimum of maintenance.
.---- -.1. ••••• For example, one model has a special shield to pre
vent clogging from particulates. It's also heated to prevent condensation. And to meet a variety of other conditions, Intertech offers a selection of other probes: ceramic, steam-jacketed, sintered material, etc., for service up to 1450°C. ft Uras 2 lR Analyzer. Monitors stack gas constitu·· ~.ents such as CO, CO2, S02, or hydrocarbons..·lt has high sensitivity, stability and fast response for measuring very low ga~ concentrations. Output signal is linear with concentration, and zero and span drift rates are lower than any other instrument available.
TT T
3 Chemiluminescence Analyzer. Measures NO and • total NOx through light-forming reaction of NO
with ozone. Solid-state electronics give trouble-free operation. NO is measured directly and accurately. It is superior to UV systems with their inherent NO to NOz conversion errors.
Intertech can draw from components like these to give you either a basic or more sophisticated system with automatic calibration, readout devices or special sampling systems. We can design a complete installation for you to fit your gas analysis needs.
In short, we offer a total project capability in stack monitoring (in mobile source, ambient and process mOnitoring too). It will cost you a lot less, and give you II lot less trouble, than doing it yourself. Let us show YOH 'tow. Write or call Dept. S.M., 19 Roszel Road, Princeton, N.J. 08540. Phone (609) 452-8600.
___ Intertech Corporation • Subsidiary of Ethyl Corporation
Cin:11 NI. S II Rudl'" SI"I .. C.rd
66th APCA ANNUAL MEETING
June 24-28,1973 Chicago, Ill.
EXHIBITORS
SEE EGlltG FOR METEOROLOGICAL VISIBILITY lit DEW POINT INSTRUMENTS!
Ideally suited for:
• Nuclear Plant Sites • Air Pollution Studies • Weather Studies • And More
See EG&G ad on page 564 on The Meteorological Monitoring System that measures dew point and visibility and meets Federal Regulations. EG&G will have both the Model 207 Forward Scatter Meter and the Model 110 Weather Station at the APCA Show, as well as the Model 880 General Purpose Dew Point Analyzer.
BOOTH 1213 See Advertisement on Page 564 CIRCLE 27
AEROCHEM RESEARCH LABORATORIES. INC. P.O. BOX 12. PRINCETON. NEW JERSEY 08540
Multifunctional Chemiluminescence Air Pollution Analyzers for the measurement of NO, NO" N02, and 0), in ambient air. automobile exhausts. stack gas emissions and research. Special features include multifunctional capability. linearity over useful range of 0.002 to 10.000 PPM. completely self-contained operating with room air, automatic or manual operation, bench or rack mounting. lightweight and competitive cost.
BOOTH 1105 CIRCLE 30
WALLACE-FISHER INSTRUMENT CO. UNIQUE PARTICULATE TAPE SAMPLERS lit ACCESSORIES Model 2500-Automatic. accurate & reproducible. Out
. put directly proportional to the COH/looo' value. All solid state electronics & automatic zero. Leak proof. selfaligning head. Modular plug-together construction. Model 2700-Mechanical features of 2500 but for manual evaluation of tape. Model 2600-General purpose test instrument for air sampling instrumentation to detect leaks where output depends on now rate. Electronic now rate controller-Will maintain a constant now rate within a given pressure drop range. For all instruments.
BOOTH 1305 CIRCLE 32
SAMPLING/MONITORING INSTRUMENTS FOR AIR. NOISE lit WATER POLLUTION Research Appliance Company (RAC) manufactures' & supplies a wide variety of precision instruments & automated systems for sampling/monitoring environmental pollutants. RAC products displayed at the APCA Exhibition include AMBIENT AIR & PROCESS EMISSIONS EQUIPMENT: RAC Train Staksamplr, Stack Monitor . Stack Gas Train. AmbieQt Air Sampling Kits. Model 5000 AISI Filter Tape Monitor, Dual-Tape Fluoride Sampler & Hi-Vol Sampler: NOISE MEASURING/MONITORING EQUIPMENT: line of Sound Pressure Level Meters, including Personal Noise Dosimeters: WATER POLLUTION SAMPLING KITS: line of prepackaged Water Testing Reagent Kits. Literature on other RAC products also is available.
BOOTH 905-906 See Advertisement on Paoe 503
VERSATILITY IS THE KEY WORD AT THE TECHNICON BOOTH
CIRCLE 14
Featured at the APCA show is the Technicon "Monitor System" for measuring more than 30 key air and ' water quality parameters. In addition to continuous monitoring of ambient air. this instrument also monitors--'on a continuous basis- waterways. plant efnuent and process streams.
An accessory sampler also permits the Monitor System to analyze large numbers of impinged air samples as well as discrete water samples.
BOOTH 908-909 See Advertisement on Page 559 CIRCLE 13
NEW CEA INSTRUMENTS CALIBRATOR IS LOW COST AND ULTRA PORTABLE
This is the first lightweight. truly portable unit which will calibrate any continuous ambient air pollution monitor regardless of its air now-available at a cost far less than you'd expect! It will calibrate any parameter for which a permeation tube is available. Easy to operate. Carry it by a shoulder strap to all on-site locations. Operates on A.C. current or internal 18-hour rechargeable batteries. A cigarette lighter adapter is provided also.
BOOTH 1411-1413 CIRCLE 22
66th APCA ANNUAL MEETING
June 24-28,1973 Chicago, Ill.
EXHIBITORS
GASES FOR AIR POLLUTION CONTROL WORK
Do you need standard reference gases or mi xtures for air pollution control work? Mixtures like Propane in Air, Carbon Dioxide in Nitrogen, Carbon Monoxide in Nitrogen or Nitrogen Dioxide in Nitrogen. Our free catalog lists over 100 pure gases, an infinite number of mixtures. Also ask about our computerized blending.' Union Carbide Corporation, Linde Division, 270 Park Avenue, New York, New York 10017. Phone (201)753-5800.
BOOTH 310 See Advertisement on Page 501 CIRCLE 26
SIMPLE, EFFECTIVE CHEMICAL APC METHOD EXPLAINED!
At the Carus Chemical booth, technical people will show how the Cairox® Method solves a number of odorous and toxic emission problems. Easily and economically! All it involves is adding ~airox (potassium permanganate) to buffered scrubber solutions. Works on phenol , hydrogen sulfide, mercaptans, aldehydes, ketones, amines, sulfur dioxide, others. Get facts and discuss examples of low-cost types of scrubbers to use.
BOOTH 400-40 1
ACE GLASS INCORPORATED FOR ENVI RONMENTAL GLASSWARE
CIRCLE 35
'See the new, Instatherm heated, glass lined probe with controller and temperature selector.
Ace also offers a complete line of impingers, cyclones, filters and grab sampling flasks.
For the most functional ambient air sampling manifolds or for your special needs, come to Booth 5 I 5 and ask for PAUL, NORM, or JAY.
BOOTH 515 CIRCLE 37
478 Environmental Science & Technology
MIRAN AMBIENT AIR MONITOR FOR OSHA COMPLIANCE TESTING OF VAPORS
The MIRAN Portable Gas Analyzer is capable of determining vapor concentrations of a majority of the 400 toxic materials on the OSHA li st. Compliance testing can be made quickly- directly in the working area with no need to collect "bag" samples. Concentration contours can be prepared, the efficiency of ventilation systems checked and records made for lega l purposes. See the MIRAN Ambient Air Monitor.
BOOTH 1206
PERISTALTIC PUMPS-OUTSTANDING PERFORMANCE, LESS IN COST
CIRCLE 12
Scientific Industries offers 2, 4, or 6 channel self-priming pumps that will outperform ... offer more . .. and cost a lot less than competitive pumps. Available with either fixed or variable speed motors. Multichannel feature permits pumping the same or different fluids at various rates ... simultaneously. Our unique "Interposer" membrane provides tube life up to 6 months, or 4000 hours of continuous operation. Accurate flow. Write for complete information. See them at the A.P.C.A. Show.
Scientific Industries, Inc. , ISO Harricks Road, Mineola, New York 11 501
\
BOOTH 1000
THERMO ELECTRON CORP. "WORLD'S LARGEST MANUFACTURER OF CHEMILUMINESCENCE ANALYZERS"
CIRCLE 29
Come see our latest instruments and systems for continuous monitoring of the ambient air and source emissions.
BOOTH 1006 See Advertisment on Page 510 CIRCLE 39
Environmental Science & Technology Volume 7, Number 6, June 1973
M ,... m ::. N ,... '" I '" ,... ... € ,... (!) « :I: f-CIl w
512
485
494
CONTENTS
Interview
489 Joseph Lawler tell s of Camp Dresser & McKee's role in consulting engineering
Features
504
51 2
Outlook
494
497
498
500
502
Rendering plant odors are controllableEPA's Carey, Murthy and Prof. Bethea
Storing hot water from utilities in wells is explored by GE's Meyer and Prof, Todd
Removing sulfur from fuel oil for clean fuel is possible technically but costly
State government poli cymakers question federal preemption in environmental laws
Commerce report forecasts international trade effects of U. S. antipollution laws
Waste water reuse will be commonplace in industry in 1985 zero discharge time
Printing inks cured by uv light lessen air emissions and energy requirements
Departments
478 Research briefs
481 Editorial
482 Letters
483 Currents
51 7 Editorial policy and author's guide
558 I ndustry trends
560 New products
562 New literature
563 Books
565 Meeting guide
566 Classified section
567 Consulting services
©Copyr ighl 1973 by Ihe American Chemical Society ES&T ON MICROF ILM : This publication is available on microfilm. For information, write to: Microlilm. Special Issues
Sales. ACS. 1155 161h 51.. N.W. Washington. D.C. 20036 SUBSCRIPTION SERVICE : Send all new and renewal subscriptions with paymen! to: Dll ice ollhe ContrOller. 1155
16th St. . N.W .. Washington. D.C . 20036. Subscriptions should be renewed promptly 10 avoid a break in the series. All correspondence end lelephone calls regarding changes of address, claims lor missing issues, subscriplion service, the status of records and accounts should be directed to: Manager, Membership and Subscription Services, American Chemical Society, P,O. Box 3337. Columbus. Ohio 43210. Telephone (614) 42 t -7230. On changes of address, include both o ld and new addresses with l i P code numbers. accompanied by mailing label from a recent Issue. Allow four weeks for change to become effective.
SU BSCRIPTION RATES 1973: Members, domestic and foreign . I year 56.00: nonmembers. domestic and foreign $9.00. Postage: Canada and Pan American Union, $4.00: all other countries. $5.00. Single copies: curr6flt issues, $ 1.50: ra tes for back issues or volumes are available from Special Issues Sales Department. 1155 161h St. , f'o4 .W .. Washington. D ,C. 20036. Claims for missing numbers will not be allowe<l (1) il loss was due to failure 01 notice 01 change in address to be received before the date specilied above. (2) if received more than sixty days from date 01 Issue plus time normally req uired lor postal delivery 01 journal and c laim. or (3) if the reason for the claim is " issue misingfromfiles." '
Those interested in joining the American Chemical Society should wri te to Admissions Department of Washington Ottice
Published monthly. with additional Pol lution Cootrol Directory in October. by the American Chemicat Society, from 20th and Northampton Sts .. Easton. Pa. 18Q.42. Executive ollices. Editorial Headquarters, 1155 16th 51., N.W., WashInglOO. 0 .<;. 20036. Advert ising ollice: 142 East Ave .. Norwalk, Conn. 06851. Second-ctass postage paid at Washington. D.C. and at additionat mailing ollices.
The American Chemical Society assumes no responsibility for the statements and opinions advanced Dy contributors to ils publ ications
Volume 7, Number 6, J un~ 1973 477
)1N~lJ ~ 1"N' ,mnf'll llll1l7
J.. > l.' ~ t;H,

RESEARCH BRIEFS
The measurement 01 uttraviolet radiation intensity in photochemical smog studies is undertaken by John R. Holmes, Robert J. O'Brien, and James H. Crabtree at the California Air Resources Laboratory, and by Thomas A. Hecht and John H. Seinleld at Cal Tech 519
Abandonment of the " fictitious" parameter kd as a measure of the light intensity in a smog chamber is urged. A k, factor, the absolute photolysis rate of NOz, is more accurate.
Robert F, Thomas and Robert L. Booth at the National Environmental Research Center in Cincinnati discuss the selective electrode measurement of ammonia in water and wastes 523
Ammonia in surface waters, sewage samples, and saline waters is measured with an ammonia selective electrode. This method is preferable to the indophenol blue method.
The collection and determination 01 sulfur dioxide by combining permeation with the West-Gaeke procedure are worked out by Kenneth D. Reiszner and Philip W. West, Louisiana State University 526
A method to measure average pollutant concentrations directly for a desired study period is developed for sampling and determining sulfur dioxide in the ambient atmosphere. The procedure is simpler than previous methods and requires less equipment .
Kyong C, Chun and James E. Quon at Northwestern University study the capacity oflerric oxide particles to oxidize sullur dioxide in the air 532
The heterogeneous oxidation of sulfur dioxide in air by ferric oxide particles, generated by the combustion of iron pentacarbonyl , is investigated. The reactor's capacity is 62.2 m/ mg Fe03.
Stimulated biodegradation of oil slicks using oleophilic fertilizers is studied by Ronald M. Atlas and Richard Bartha at Rutgers University 538
A combination of paraffinized urea and octylphosphate is used to promote oil biodegradation in laboratory experiments and in field trials. The practical application of this principle to oil cleanups appears to be feasible.
Yoshinari Ambe at Tokyo Metropolitan University examines a method to determine alkylbenzenesulfonate (ABS) in bottom sediment 542
A new method for the analysis of alkylbenzensulfonate (ASS) in river. lake, and sea bottoms is examined and its applicability verified . Concentrations of methylene blue active substance are determined and MSAS/ ASS ratios compared to find the net content of ASS.
This issue contains no papers for which there is supplementary material in microform.
478 Environmental Science & Technology
The permeation 01 sullur dioxide through polymeric stack sampling interlaces Is carried out by Charles E. Rodes, Richard M. Felder, and James K. Ferrell at North Carolina State University 545
The use of a cylindrical polymeric tube as a permeable interface between a stack and a continuous ambient sulfur dioxide monitor is investigated. Results indicate the tube is a promising device for stack monitoring.
Chemiluminescent reactions of peroxyacetyl nitrate and ozone with triethylamine as a possible atmospheric monitor for peroxyacetyl nitrate are studied by James N. Pitts, Jr., Hartmut Fuhr , Jellrey S. Gallney, and John W. .,eters at the University of California, Riverside 550
Chemiluminescence spectra from the gas phase reactions of peroxyacetyl nitrate (PAN) and ozone with triethylamine are obtained at atmospheric pressure. Concentrations of PAN as low as 6 ppb are detected by this method.
NOTES
Earl J. Roberts and Stanley P. Rowland at the Southern Regional Research Laboratories in New Orleans discuss the removal 01 mercury from aqueous solutions by nitrogen-containing chemically modilied cotton 552
The eflectiveness is studied of cotton cellulose modified with 2-diethylaminoethyl or 2-aminoethyl substituents in removing mercury from aqueous solutions in concentrations above 1000 ppb. It was more effective than three other celluloses.
CORRESPONDENCE
An earlier paper on the Identifying sources 01 lead contamination by stable Isotope techniques is criticized by E. B. Rilkin and Gary Ter Haar 01 the Ethyl Corp., and responded to by the original authors, M. B. Rabinowitz and G. W. Wetherill of the University of California, Los Angeles 555
Credits: 487 (center column). Battelle-Northwest; 487 (right column), Fabian Bachrach; 495, Shell-Fotc; 513. Dawn Leland
Cover: Norman Favin
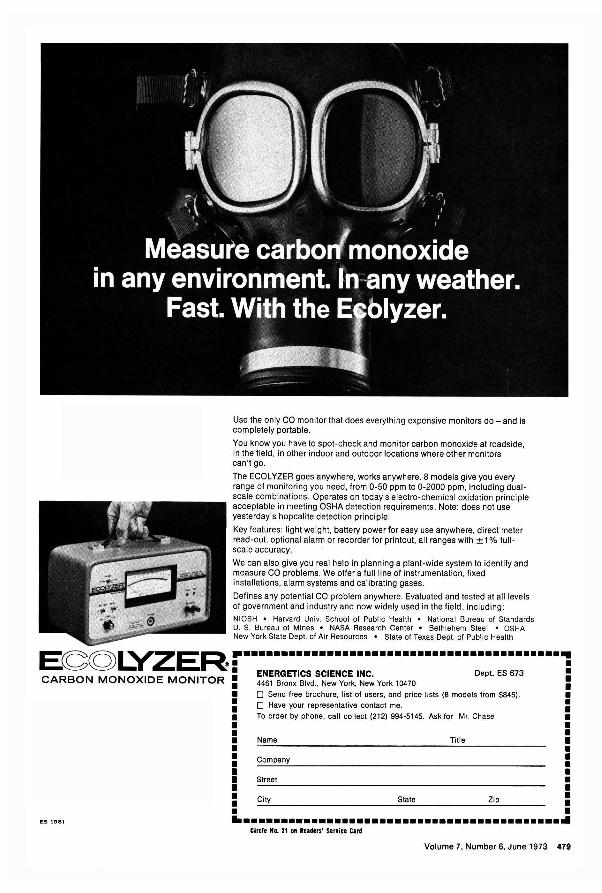
Use the only CO monitor that does everything expensive monitors do - and is completely portable.
You know you have to spot-check and monitor carbon monoxide at roadside, in the field, in other indoor and outdoor locations where other monitors can't go.
The ECOL YZER goes anywhere, works anywhere. 8 models give you every range of monitoring you need, from 0-50 ppm to 0-2000 ppm, including dualscale combinations. Operates on today's electro-chemical oxidation prinCiple acceptable in meeting OSHA detection requirements. Note: does not use yesterday's hopcalite detection principle.
Key features: light weight, battery power for easy use anywhere, direct meter read-out, optional alarm or recorder for printout, all ranges with ±1 % fullscale accuracy.
We can also give you real help in planning a plant-wide system to identify and measure CO problems. We offer a full line of instrumentation, fixed installations, alarm systems and calibrating gases.
Defines any potential CO problem anywhere. Evaluated and tested at all levels of government and industry and now widely used in the field, including:
NIOSH • Harvard Univ. School of Public Health • National Bureau of Standards U. S. Bureau of Mines • NASA Research Center • Bethlehem Steel • OSHA New York State Dept. of Air Resources • State of Texas Dept. of Public Health
EcGgL'YZER •..........................................• CARBON MONOXIDE MONITOR ENERGETICS SCIENCE INC_ Dept_ ES 673
4461 Bronx Blvd., New York, New York 10470
ES 1981
o Send free brochure, list of users, and price lists (8 models from $845). o Have your representative contact me. To order by phone, calt collect (212) 994-5145. Ask for Mr. Chase
Name Title
Company
Street
City State Zip
•••••••••••••••••••••••••••••••••••••••••••• Circle N •. 21 on Readers' Service Cud
Volume 7, Number 6, June 1973 479
The Federal Water Pollution Control Act Amendments of 1972 and the Clean Air Act Amendments of 1970 have put almost all industry into the pollution control business. Perhaps you're included. If so, you know that clean water and clean air have become two of your most important products.
NUS Corporation is a specialist in cleaning air and in cleaning and recycling water.
Through our Cyrus Wm. Rice Division, we've been solving environmental problems for industry, utilities and government since 1918. With a professional staff of over 400 engineers, scientists and management experts, NUS Corporation has the personnel and laboratory facilities to do the entire environmental engineering job, or any part of it.
We can provide problem analysis, plant stack and meteorological monitoring, terrestrial and aquatic biological surveys, laboratory analysis, systems design, construction management, compliance reporting and a continuing monitoring program. We can work closely with your engineering staff on any single phase or the overall project.
To find out more about NUS Environmental Services, please write for literature.
To use NUS to help solve your water and air pollution problems, contact our Vice President, Corporate Development.
If you're ready for NUS, we're ready for you.
[jj~Y§ 4 Research Place · Rockville , Maryland 20850 . Phone (301) 948·7010
Circle "I . • I. R .. ,,"' S,nie, Carll
480 Environmental Science & Technology
Editor: James J. Morgan WASHINGTON EDITDRIAL STAFF Managing Editor : Stanton S. Miller Assistant Editor: H. Martin Malin, Jr. Assistant Editor: Carol Knapp Lewicke Assistant Editor: William ·S. Forester
MANUSCRIPT REVIEWING Associate Editor: Norma Yess
MANUSCRIPT EDITING Associate Production Manager:
Charlotte C. Sayre
ART AND PRODUCTION Head: Bacil Guiley Associate Production Manager:
Leroy L. Corcoran Art Director: Norman Favin Layout and Production: Dawn Leland
Advisory Board: P. L. Brezonik, R. F. Christman, G. F. Hidy, DavictJenkins, P. L. McCarty, Charles R. O'Melia, John H. Seinfeld, John W. Winchester
Published by the AMERICAN CHEMICAL SOCIETY tt5516th Street, N.W. Washington, D.C. 20036
Executive Director: Robert W. Cairns
PUBLIC AFFAIRS AND CDMMUNICATION DIVISION
Director: Richard L. Kenyon
ADVERTISING MANAGEMENT Centcom, Ltd . For offices and advertisers, see page 570
Please send research manuscripts to Manuscript Reviewing , feature manuscripts to Managing Editor.
For author's guide and editorial policy, see this issue, page 517 or write Norma Yess, Manuscript Reviewing Office.
I n each paper with more than one author, the name of the author to whom inquiries should be addressed carries a numbered footnote reference .
EDITORIAL
Keeping up the air cleanup front On one hand we are told that the air is getting cleaner and we wonder if it is really so. On the other, we hear of relaxation of standards and time extensions for deadlines, and we wonder how the two can be compatible.
On the basis of monitoring data, EPA says that the air is cleaner today than it was in the past. There is a 50% improvement in the SOx level as well as a 20% improvement in the particulate matter level in urban areas, but no measurable progress in nonurban areas. The SOx improvement is based on monitoring data from 32 urban areas of a 1964 level in comparison with a 1971 level. The particulate matter improvement is based on 12-year data-a comparison of a 1960 level and a 1971 level for 116 urban areas.
But the clean fuels policy needed to meet the U.S. mandated cleanup goal by mid-decade doesn't seem to be in the cards. There may not be enough fuel to go around, let alone clean fuel. Governors in various states with dirty air areas may have to extend their deadlines, at least those specified in the secondary standards which, after all, are required only at a reasonable time after achievement of the primary standard by mid-1975.
Research results have now upset standards already set. Revisions in the NOx analytical procedure, the proposed relaxation of the secondary standard for SOx, and the one-year extension granted to auto manufacturers come to mind.
The air degradation issue remains unsettled. One view maintains that the "protect and enhance" language in the preamble of the legislation should be read and applied together in a real-time situation. Then, in dirty air areas both the protection and enhancement would apply; in pristine areas the air could be protected but not enhanced. Hence, it has been suggested that the anti degradation issue is not needed and no more time should be spent on it. Simplistic language, simplistic tests, and simplistic examples seem long overdue.
Later this month, at the annual meeting of the Air Pollution Control Association, more technical progress will become apparent.
Volume 7, Number 6, June 1973 481
~()II~ti()" (]()"tp()I St8PtS With ~vlll'tiv9 MV9itvpi9g And , effective po llution monitoring isn't viable unless you can be assured of quality data on an immediate, real-time basis. That's what EMRTelemetry Systems are all about. We 're data gathering experts (and have been for 25 years) ... with systems that are automatic and virtually operation free ... that can reduce miles of environmental data and report out-of· tolerance situations immediately ... systems that can automatically analyze as many as 50 parameters at locations that are many miles from your central station.
Let us show you how!
EMR Telemetry Weston Instruments, Inc. Box 304 t, Sarasota, Florida 33578 813·958-0811
Circle No. 20 on Readers' Service Card
482 Environmental Science & Technology
LETTERS
Incineration or pyrolysis
Dear Sir: I n the feature article en· titled "Solid waste disposal: incineration or pyrolysis" (ES&T, April 1973, pp 308-12), the author makes a statement which is not borne out by fact. On page 310, he refers to Federal regulations requiring new incinerators to emit flue gas with a particulate matter concentration not greater than 0.08 gr/ scf, corrected to 12% CO2 .
Mr. Fife does not point out that this regulation covers only dry filterable particulate matter, and does not include the solubles which are gath· ered by the impingers in the sam· piing train . Under previous regulations, this emission figure was higher, since it used to include all particulate, dry and soluble. Continuing on , he states flatly that "Starved-air systems meet this requirement without gas cleaning equipment , while conventional furnaces require wet scrubbers or electrostatic precipitators with 99% efficiency for compliance." This statement is misleading as well as false.
Obviously, Mr. Fife did not dO all his homework before making that statement. I cannot speak for other incinerator manufacturers, but I can say that we at Federal Enterprises do make a conventional, retort· type incinerator, which can and does meet the regulations referred to in the article.
Our units have been tested in vari· ous sizes in locations throughout the country, and they have consistently met the codes. In addition, they have met the 0.08 gr / scf restriction not only when measured as dry particulate, but when total particulates were considered , as well.
I was distressed to think that an uninformed individual reading Mr. Fife 's article might pass a blanket judgment against so-called "conven· tional" incinerators, based on these statements. I was also distressed to see that Federal Enterprises ' name was not shown on the list of incinerator manufacturers, since we manufacture what is considered by some to be the highest quality conventional-type incinerator built today.
c. R. Ragland Vice·president Federal Enterprises, Inc. Nixa, Mo. 65714
Dear Sir: We noted, with a great deal of interest, Mr. Fife's paper entitled "Solid waste disposal: incineration or pyrolysis" (ES&T, April 1973, pp 308-12). The technical content of his paper was excellent, but omits any mention of the DEVCO system of pyrolysis.
The complete DEVCO system, developed over a period of five years , includes front-end separation of cor· rugated fiber and mixed paper fiber - pyrolysis of the reject material then separation of the char into the inert, ferrous, nonferrous, and carbon elements. The system is capable of producing a little over 1 Ib of steam (400 psi saturated) for every pound of refuse , and recovery of storable carbon fuel.
DEVCO has the largest operating pyrolysis system in the world, capable of receiving and processing refuse at the rate of 7'/2 tons/ hr. This system has been in operation for almost two years in Flushing, N.Y. (the front-end separation subsystems were tested, in pilot plants located in Upland , Calif., and Brooklyn, N.Y).
The Federal EPA, New York State Environmental Conservation, New York City EPA personnel plus representatives from numerous other states and cities have visited the Flushing plant and witnessed it in operation .
DEVCO is currently in negotiations for full-scale systems in several locations. We anticipate a sales vol· ume of $18 million this year.
DEVCO plans to own and operate most of its plants , under contracts with municipalities for dumping fees , in most cases, below present costs. Revenue sharing, in the form of recycled material sales rebates, is offered on a negotiated basis.
Numerous studies have shown that pyrolysis is the most controllable means of refuse reduction, offering resalable by-products and low capital costs as advantages, while keeping in pace with current ecological conservation goals.
Key patent claims are pending on the DEVCO system. W. Wayne Morgan Vice·president Devco Management Inc. New York, N.Y. 10022
WASHINGTO N
President Nixon's energy message proposed taking at least three major steps that could have serious environmental consequences. He ordered the Interior Department to seek to triple offshore acreage under federal oil and gas leases, recommended the licensing of offshore deep water ports, and appealed for swift action on an Alaskan oil pipeline. All three proposals have come under fire from environmentalists. As to other actions, the report scrapped restraints on oil imports, proposed that Congress remove federal price ceilings from new natural gas supplies and extend the investment tax credit to cover drilling for new oil and gas fields. Mr. Nixon, in the report, also promised to renew his 1971 request for an overall Department of Natural Resources.
The EPA has taken action to clean up one of the country's largest single sources of air pollution-the U.S. Steel complex in Gary, Ind. The U.S. Steel Gary Works and the Universal Atlas Cement Division of U.S. Steel Buffington Harbor Station were issued a 3D-day notice that they were violating federally enforceable state air regulations . The notice claimed that more than 70,000 tons of particulate matter per year were being emitted at 21 different sites within the U.S. Steel complex. The EPA also has proposed that states set up procedures, prior to construction of stationary source facilities that may generate significant amounts of auto traffic. The proposal would assure that standards set up by the Clean Air Act amendments of 1970 would be maintain~d in the vicinity of a major new facility.
New lorms lor waste water disposal permits have been issued by the Environmental Protection Agency. A Standard Form "A" is to be used by cities with populations of more than 10,000. A Standard Form "C" is to be used by businesses and industries that already have filed Short Form "C" or " D" il their discharges total more than 50,000 gal a day, contain toxic substances, or affect the waters of another state. As of April 23, permits also are required for dump-ing waste materials into the oceans. Exceptions to this requirement are municipal or industrial sewage out-
CURRENTS
falls that are required to have waste water discharge permits under the Water Pollution Control amendments of 1972.
EPA's new acting head, Robert W. Fri , says he will not keep the directorship longer than two months. Fri , formerly number two man at EPA, accepted the post temporarily after
EPA 's Fri
William D. Ruckelshaus was picked by President Nixon to head up the FBI. Fri says he plans to leave EPA soon to return to his previous job as a partner at McKinsey and Co ., Inc.
More mine-scarred land will be reclaimed lor recreational purposes. The Interior Department has awarded four additional grants under its program. A $329,355 matching grant for Whitley County, Ky., will be used to help create a 334-acre multilacility park from lands now badly scarred by strip mining. In King County, Wash., a $300,000 grant will cover half the cost of reclaiming 19 acres of surfacemined land near Redondo Beach that will be used as a recreational area. A $126,710 grant was awarded to Spokane County, Wash., to help officials there convert 24 acres of abandoned gravel pit land into a recreational park. And Kellogg, Idaho, was awarded $69 ,167 to help prepare a 26-acre mine tailings deposit area on the South Fork of the Coeur d'Alene River for public and school recreational use.
The Tennessee Valley Authority has started construction work on a $32-million program to improve air pollution control at its Johnsonville, Tenn., steam plant. The project calls for electrostatic precipitators to be added to all 10 generating units at the plant to meet new Tennessee standards Ipr controlling emissions of fly ash particles. The lirst stage of the work will be to install precipitators on the plant's lour largest generating units.
The Illinois Senate rejected the appointment 01 Mary Lee Leahy as director of the state EPA. Illinois Governor Dan Walker charged that "the politics of protecting the special interests and the politicians" are responsible lor the Senate rejection . According to the Governor, Mrs. Leahy, during her 100 days in office, questioned pollution control programs in Chicago: The city was not complying with a citystate agreement to provide the state with data Irom surveillance and investigations; much of the city 's equipment, purchased with $1 million 01 federal funds, was lying around unused; the city was keeping secret results of investigations on individual polluters; the city did not supply the state with records of citizen complaints; and the 1973 grant application to the Federal Government did not include goals to abate pollution. The governor is reporting the situation to the Federal Government.
Michigan's Wayne County Department of Health is suing I nternational Salt Co . (Detroit) for excessive emissions of salt. The company, operating the world's largest salt mine, is charged with 18 violations of the county's regulation for emissions of salt dust and other related aerosols from open storage piles and salt processing and transporting activities. Language in the suit calls for shutdown of the mining and processing operations if the company fails to comply with temporary and permanent controls. A bill in the Nebraska legislature would give tax incentives to gasohola blend of 10% ethyl alcohol made from grain and 90% gasoline. Also, Farmland Industries (Kansas City , Mo.) , a farm cooperative representing about 500,000 Midwest farmers , is "actively conSidering the use of gasohol."
The right 01 the Pennsylvania Department 01 Environmental Resources (DER) to order coal mines to treat acid mine drainage which does not originate in their mines but which must be pumped out to enable the mines to operate was upheld in that state's supreme court. The precedent-setting decision , which reversed the opinion of a lower court that the state was depriving companies of the use of their property, will have an effect on
Volume 7, Number 6, June 1973 483
'81 a STAI:-O-u\l\\l\ " IIII161hB Pric, \\ \\,~
The AP-5000 ST AC-O-LATOR, the first modular source emissions sampler ever introduced and still the industry leader, is now available at a new low price. Here's the reason. So many ST AC-OLATORs are going up on smoke stacks allover the country, our production costs are coming down. And Scientific
Glass & Instruments I:. ~ wants to pass the sav-ings on to you. • ~~_ - _~rx~, ""3\
~1' - ' .
You can get our ~ , basic AP-5000 unit with a glass
ware train for sampling stack particulate
according to E.PA/ A.P.C.O., Method 5, for just $3396.00 . .. then add selected modules as you need them in order to comply with any or all stack emissions tests presently required by law.
484 Environmental Science & Technology
With the basic AP-5000 unit,you get: an
Circle No. 11 on Readers' Service Card
impinger case complete with 4 full size 500 ml impingers; filter oven
(excluding cyclone), with 4" diameter filter; control
unit used in all A.P.C.O. sampling methods; vacuum pump with carrying case; operating nomograph ; monorail support system ; 25 feet of umbilical cord and a 3-foot pitobe assembly with heated Pyrex glass inner liner. ,
And don't forget the ~L ~ special features available :,-only with STAC-O-LATOR-like our patented (U.S. Patent No. 3,707,832) Filter Support Assembly with a choice of three different filters . A lot of competitors have tried to copy its unique design and construction , but no one offers a unit that allows a higher degree of sample collection.
Call or write SG&I today for more information about the one and only STAC-OLATOR. And while you 're at it, find out about our 3-day comprehensive short course on stack sampling and laboratory analysis.
1r~1 Scientific Glass -..:I'J & Instruments, Inc. Telephone 713/ 928/ 5761 P.O. Box 18306, Houston, Texas 77023
environmental issues other than acid mine drainage, according to DER. Delaware's first pollution control bonds will finance waste treatment projects for the Industrial Chemicals and Specialty Chemicals plants of Allied Chemical Corp. The $9.2-million issue is the company's first venture into industrial-revenue-bond financing for pollution control.
A Florida county will have the "nation's most sophisticated solid waste shredding and resource recovery system on a municipal scale." The $6.8-million shredding , resource recovery, and landfill complex will handle solid waste disposal through the year 2000 in rapidly growing Brevard County which includes the Kennedy Space Center and Disney World. A $564,OOO-transfer station opened in Allegheny County, Pa. , last month . It's the first of four such stations. Partially operated by a federal EPA demonstration grant, the transfer station system could save $750,000 annually in waste handling costs . According to Pennsylvania officials, EPA's grant is the first such allocation for solid waste implementation in the U.S.
Twelve Ohio operators of coke oven facilities have been given 30 days by the state EPA to submit acceptable plans and schedules for cleanup of air pollution . The required timetables must outline when and how the facilities will meet applicable air pollution standards and regulations as set by the Federal Government and the Ohio EPA. The Illinois Pollution Control Board assessed Ralston-Purina Co. $7500 for odor and dust emissions and for operating without a permit from the Board. Evidence indicated that odor and dust nuisances had remained unabated for approximately 20 years . In Minnesota, a statewide regulation banning the use of asbestos in certain phases of construction work was approved. The regulation also requires the use of baghouse filters to prevent asbestos emissions from manufacturing pJants.
RESEARCH
"Lead may be essential for growth" and "no tie between lead in blood and lead in air" are recent findings from two studies. Klaus Schwarz of the UCLA School of Medicine is responsible for the first quote in a letter to
CURRENTS
the EPA on health effects of airborne lead . Over the past few years, Dr. Schwarz has been active in research that has led to the identification of chromium, selenium, tin, vanadium, fluorine, and silicon as elements necessary for growth and general development. The second quote comes from the final report of the worldwide research organization of the lead industry, the International Lead Zinc Research, I nco Philip Robinson, executive vice -president of the Lead I ndustries Assoc ., said, " The study clearly shows that removal of lead from gasoline would have no impact on the blood lead levels of the population."
CONSULTING
Geraghty & Miller, a firm of consulting groundwater specialists, is performing a 14-month study of groundwater contamination problems in 11 northeastern states which account for 26% of the nation 's population. Project leader David Miller says, " No one really knows how severe the groundwater { contamination problem is in the Northeast and one of the goals of the study is to put thiS problem in its proper perspective."
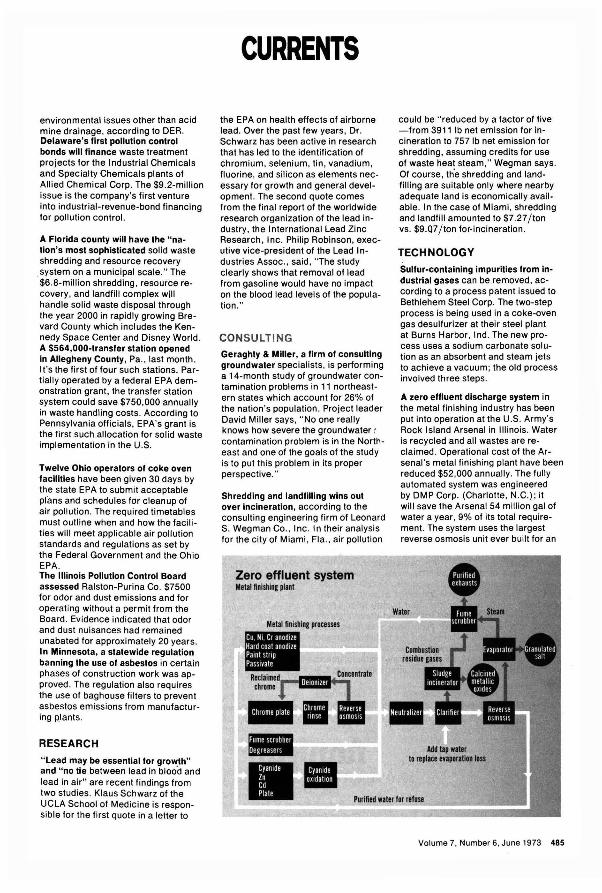
Shredding and landfilling wins out over incineration, according to the consulting engineering firm of Leonard S. Wegman Co., Inc. In their analysis for the city of Miami , Fla., air pollution
Zero effluent system Metal finishing plant
could be "reduced by a factor of five -from 3911 Ib net emission for incineration to 757 Ib net emission for shredding, assuming credits for use of waste heat steam," Wegman says. Of course, th'e shredding and landfilling are suitable only where nearby adequate land is economically available. In the case of Miami, shredding and landfill amounted to $7.27/ ton vs. $9.07/ton for-incineration .
TECHNOLOGY
Sulfur-containing impurities from industrial gases can be removed, according to a process patent issued to Bethlehem Steel Corp. The two-step process is being used in a coke-oven gas desulfurizer at their steel plant at Burns Harbor, Ind. The new process uses a sodium carbonate solution as an absorbent and steam jets to achieve a vacuum; the old process involved three steps.
A zero effluent discharge system in the metal finishing industry has been put into operation at the U.S. Army's Rock Island Arsenal in Illinois. Water is recycled and all wastes are reclaimed. Operational cost of the Arsenal 's metal finishing plant have been reduced $52,000 annually . The fully automated system was engineered by DMP Corp. (Charlotte , N.C.); it will save the Arsenal 54 million gal of water a year , 9% of its total requirement. The system uses the largest reverse osmosis unit ever bu ilt for an
Volume 7, Number 6, June 1973 485
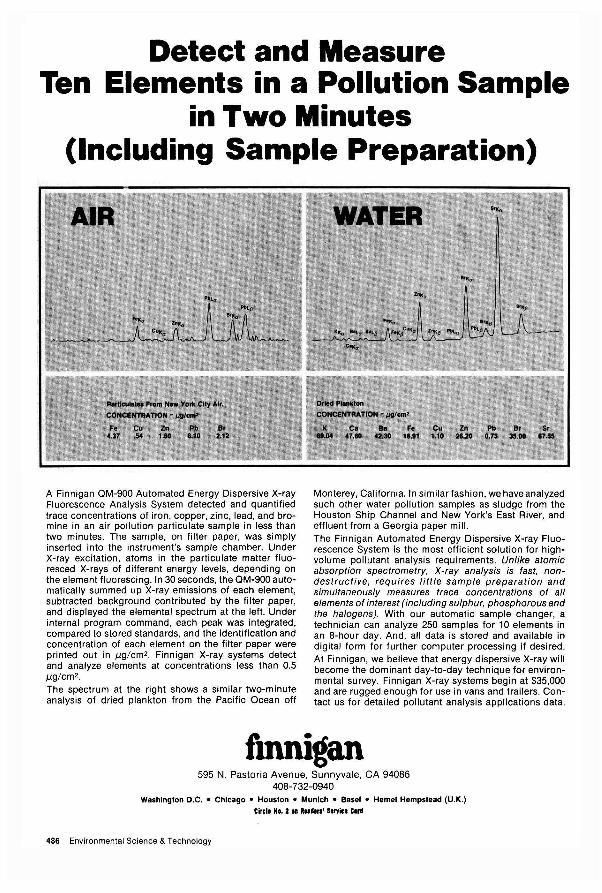
Detect and Measure Ten Elements in a Pollution Sample
in Two Minutes (Including Sample Preparation)
A Finnigan OM-900 Automated Energy Dispersive X-ray Fluorescence Analysis System detected and quantified trace concentrations of iron, copper, zinc, lead, and bromine in an air pollution particulate sample in less than two minutes. The sample, on filter paper, was simply inserted into the instrument's sample chamber. Under X-ray excitation, atoms in the particulate matter fluoresced X-rays of different energy levels, depending on the element fluorescing . In 30 seconds, the OM-900 automatically summed up X-ray emissions of each element, subtracted background contributed by the filter paper, and displayed the elemental spectrum at the left. Under internal program command, each peak was integrated, compared to stored standards, and the identification and concentration of each element on the filter paper were printed out in /lg/cm 2 . Finnigan X-ray systems detect and analyze elements at concentrations less than 0.5 /lg/cm 2.
The spectrum at the right shows a similar two-minute analysis of dried plankton from the Pacific Ocean off
Monterey, California. In similar fashion, we have analyzed such other water pollution samples as sludge from the Houston Ship Channel and New York's East River, and effluent from a Georgia paper mill. The Finnigan Automated Energy Dispersive X-ray Fluorescence System is the most efficient solution for highvolume pollutant analysis requirements. Unlike atomic absorption spectrometry, X-ray analysis is fast, nondestructive, requires little sample preparation and simultaneously measures trace concentrations of all elements of interest (including sulphur, phosphorous and the halogens). With our automatic sample changer, a technician can analyze 250 samples for 10 elements in an 8-hour day. And, all data is stored and available in digital form for further computer processing if desired. At Finnigan, we believe that energy dispersive X-ray will become the dominant day-to-day technique for environmental survey. Finnigan X-ray systems begin at $35,000 and are rugged enough for use in vans and trailers. Contact us for detailed pollutant analysis applications data.
flnnigan 595 N. Pastoria Avenue, Sunnyvale, CA 94086
408-732-0940 Washington D.C . • Chicago. Houston. Munich. Basel. Hemel Hempstead (U.K.)
Circle NO.2 II Re.dlrs' S.nici Carll
486 Environmental Science & Technology
industrial purpose; the units were manufactured by Osmonics, Inc. (Minneapolis , Minn.).
A 502 removal process, Ihe citrate process of the Bureau of Mines, is being installed in pilot plant stage at a lead smelter in Kellogg , Idaho. The process uses a water solution of citric acid and sodiu m citrate to absorb sulfur dioxide from the gas. Then hydrogen sulfide is added to the solution to procure elemental sulfur, a solid that is easy to ship or store.
An ozone generator and ultrasonic electrocoagulator is now available for water pollution control applications. Ozonair/ Canatraco Ltd. (Montreal, Que.) has a solid state highfrequency system which pretreats the waste water prior to ozonation. Referred to as Film Layer Purifying Chamber (FLPC), the system doubles the concentration of ozone by weight over earlier systems, has a modular design with a maximum capacity of 250,000 gpd , and is finding use in the treatment of waste waters from municipalities and food processors.
Harmful nitric oxide emissions Irom automobiles can be converted to harmless nitrogen gas with ruthenium catalysts, according to General Motors' researchers. These catalysts are of interest since they avoid the formation of the undesirable compound ammonia; unfortunately, ruthenium is a very rare material which has perhaps insurmountable durability problems for the automotive application. The passenger car gas turbine engine shows promise of meeting some of the restrictive 1976 federal emission standards, according to four GM engineers in a presentation at the American Society of Mechanical Engineers' Gas Turbine Conference. They caution that even with a major development commitment, it would be an ambitious task to develop a new turbine engine by the 1980's. NOx emissions from aircraft can be cut 30% by fuel modification, according to Esso Research and Engineering Co. This reduction involves the use of soluble organometallic derivatives which serve as heterogeneous reduction or decomposition catalysts. These additives may be useful in reducing emissions during takeoff .
CURRENTS
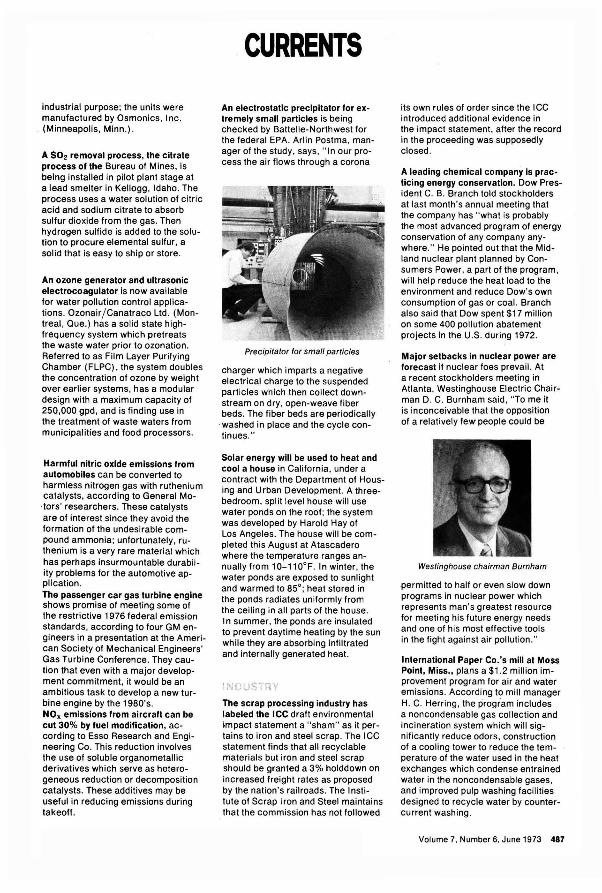
An electrostatic precipitator lor extremely small particles is being checked by Battelle-Northwest for the federal EPA. Arlin Postma, manager of the study, says, "In our process the air flows through a corona
Precipitator for small particles
charger which imparts a negative electrical charge to the suspended particles which then collect downstream on dry, open-weave fiber beds. The fiber beds are periodically
. washed in place and the cycle continues."
Solar energy will be used to heat and cool a house in California, under a contract with the Department of Housing and Urban Development. A threebedroom, split level house will use water ponds on the roof; the system was developed by Harold Hay of Los Angeles. The house will be completed this August at Atascadero where the temperature ranges annually from 10-11O°F. In winter , the water ponds are exposed to sunlight and warmed to 85°; heat stored in the ponds radiates uniformly from the ceiling in all parts of the house. In summer, the ponds are insulated to prevent daytime heating by the sun while they are absorbing infiltrated and internally generated heat.
'~.'nJs·"q\'
The scrap processing industry has labeled the ICC draft environmental impact statement a "sham" as it pertains to iron and steel scrap. The ICC statement finds that all recyclable materials but iron and steel scrap should be granted a 3% holddown on increased freight rates as proposed by the nation's railroads. The Institute of Scrap Iron and Steel maintains that the commission has not followed
its own rules of order since the ICC introduced additional evidence in the impact statement, after the record in the proceeding was supposedly closed.
A leading chemical company is practicing energy conservation. Dow President C. B. Branch told stockholders at last month's annual meeting that the company has "what is probably the most advanced program of energy conservation of any company anywhere." He pointed out that the Midland nuclear plant planned by Consumers Power, a part of the program, will help reduce the heat load to the environment and reduce Dow's own consumption of gas or coal. Branch also said that Dow spent $17 million on some 400 pollution abatement projects in the U.S. during 1972.
Major setbacks In nuclear power are lorecast if nuclear foes prevail. At a recent stockholders meeting in Atlanta, Westinghouse Electric Chairman D. C. Burnham said , "To me it is inconceivable that the opposition of a relatively few people could be
Westinghouse chairman Burnham
permitted to half or even slow down programs in nuclear power which represents man's greatest resource for meeting his future energy needs and one of his most effective tools in the fight against air pollution ."
International Paper Co.'s mill at Moss Point, Miss., plans a $1 .2 million improvement program for air and water emissions. According to mill manager H. C. Herring, the program includes a non condensable gas collection and incineration system which will significantly reduce odors , construction of a cooling tower to reduce the temperature of the water used in the heat exchanges which condense entrained water in the non condensable gases, and improved pulp washing facilities designed to recycle water by countercurrent washing.
Volume 7, Number 6, June 1973 487
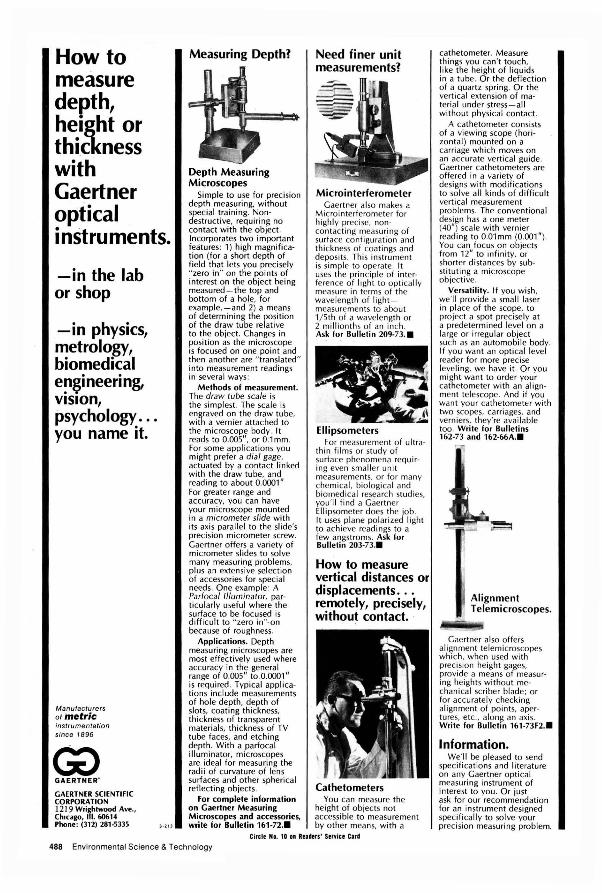
How to measure depth, height or thickness with Gaertner optical instruments.
-in the lab or shop
- i n physics, metrology, biomedical e~gineering, VISion, psychology ... you name it.
Manufacturers of metric instrumentation since 1896
G) GAERTNER'
GAERTNER SCIENTIFIC CORPORATION
~~,Ic~;,rin~t= Av • . , Phon.: (312) 281-5335 I ·'"
Measuring Depth?
Depth Measuring Microscopes
Simple to use for precision depth measuring. without special training. Nondestructive, requiring no contact with the object. Incorporates two important features: 1) high magnifi cation (for a short depth o f field that lets you precisely "zero in " on the points of interest on the object heing measured-the top and bottom of a ho le, for example, -and 2) a means of determining the position of the draw tube relati ve to the object. Changes in position as the microscope is focused on one point and then another are " translated" into measurement readings in several ways:
Methods of measurement. The draw tube scale is the simplest. The scale is engraved on the draw tube, with a vernier attached to the microscope body . It reads to O.DOS" , or O.l mm. For some appl ications you might prefer a dial gage, actuated by a contact linked with the draw tube, and reading to about 0.0001" For greater range and accuracy, you can have your microscope mounted in a micrometer slide with its axis parallel to the slide's precision micrometer screw. Gaertner offers a vari ety of micrometer slides to solve many measuring problems, plus an exten sive select ion of accessories for special needs. One example : A Parloca l Illuminator, particularly useful where the surface to be focused is difficult to " zero in "· on because of roughness.
Applications. Depth measuring microscopes are most effectively used where accuracy in the general range of O.DOS" to .0.0001" is required . Typical applications include measurements of hole depth, depth of slots, coat ing thickness, thickness of transparent materials, thickness of TV tube faces, and etching depth. With a parfocal illuminator, microscopes are idea l for measuring the radii of curvature of lens surfaces and other spherical reflecting objects.
For complete information on Gaertner Measuring Microscopes and accessories, write for Bulletin 161-72_.
Need finer unit measurements?
Microinterferometer Gaertner also makes a
Microinterferometer for highly precise. noncontacting measuring of surface configuration and th ickness of coatings and deposits. Thi s instrument is simple to operate. It uses the principle of interference of light to optica lly measure in terms of the wave length of lightmeasurements to about l / Sth of a wavelength or 2 millionths of an inch. Ask for Bulletin 209-73 . •
Ellipsometers For measurement of ultra
thin films or study of surface phenomena requiring even smaller unit measurements. or fo r many chemica l. biologica l and biomed ica l resea rch studies, you'" find a Gaertner Ellipsometer does the job. It uses plane polari zed light to achieve readings to a few angstroms. Ask for Bulletin 203-73 .•
How to measure ver:tical distances or displacements ... remotely, precisely, without contact.
Cathetometers You can measure the
height of objects no t accessible to measurement by other means, with a
Circlt HD. 10 I. Rtadtrs' StrYice Card
488 Environmental Science & Technology
cathetometer. Measure things you can't touch. like the height of liquids in a tube. O r the deflection of a quartz spring. Or the vertica l extension of material under stress-all without physical contact.
A cat he to meter consists of a viewi ng scope (horizontal ) mounted on a ca rri age which moves on an accurate vertica l guide. Gaertner cathetometers are o ffered in a variety of designs w ith modi f ications to solve all kind s of difficu lt verti ca l measurement prob lems. The conventional design has a one meter (40") scale with ve rnier reading to O.Olmm (0 .D01" ). You can focus on ob jects from 12" to infinity, or shorter di stances by substitutin g a microscope ob jecti ve .
Versatility. If you wish. we'" provide a sma ll laser in place of the scope, to pro ject a spot prec isely at a predetermined level on a large or irregular ob ject such as an automob ile body . If you want an optica l level reader for more precise leveling, we have it. Or you might want to order your cathetometer with an alignment telescope. And if you want your cathetometer with two scopes. carri ages, and verniers, they're ava ilable too. Write for Bu"etins 162-73 and 162-66A .•
Alignment Telemicroscopes.
Gaertner also offers ali gnment telemicroscopes w hich, when used wi th precision height gages, provide a means of measuring heights w ithout mechanica l sc riber blade; or for accurately checking ali gnment of points. apertures, etc.. along an axis. Write for Bulletin 161-73F2 .•
Information. We'" be pleased to send
spec ifi cat ions and literature on any Gaertner opti cal measuring instrument of interest to you. Or just ask for our recommendation for an instrument designed spec ifi ca ll y to solve your precision measuring problem.
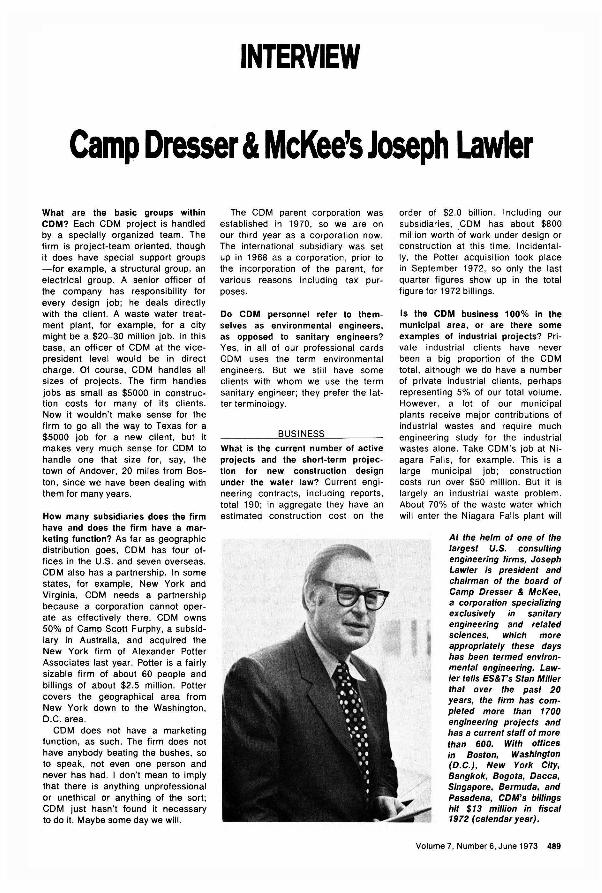
INTERVIEW
Camp Dresser & McKee's Joseph Lawler What are the basic groups within COM? Each CDM project is handled by a specially organized team. The firm is project-team oriented, though it does have special support groups -for example, a structural group, an electrical group. A senior officer of the company has responsibility for every design job; he deals directly with the client. A waste water treatment plant, for example, for a city might be a $20-30 million job. In this case, an officer of CDM at the vicepresident level would be in direct charge. Of course, CDM handles all sizes of projects. The firm handles jobs as small as $5000 in construction costs for many of its clients. Now it wouldn't make sense for the firm to go all the way to Texas for a $5000 job for a new client, but it makes very much sense for CDM to handle one that size for, say, the town of Andover, 20 miles from Boston, since we have been dealing with them for many years.
How many subsidiaries does the firm have and does the firm have a marketing function? As far as geographic distribution goes, CDM has four offices in the U.S. and seven overseas. CDM also has a partnership. In some states, for example, New York and Virginia, CDM needs a partnership because a corporation cannot operate as effectively there. CDM owns 50% of Camp Scott Furphy, a subsidiary in Australia, and acquired the New York firm of Alexander Potter Associates last year . Potter is a fairly sizable firm of about 60 people and billings of about $2.5 million. Potter covers the geographical area from New York down to the Washington, D.C. area.
CDM does not have a marketing function, as such. The firm does not have anybody beating the bushes, so to speak, not even one person and never has had . I don't mean to imply that there is anything unprofessional or unethical or anything of the sort; CDM just hasn't found it necessary to do it. Maybe some day we will.
The CDM parent corporation was established in 1970, so we are on our third year as a corporation now. The international subsidiary was set up in 1968 as a corporation, prior to the incorporation of the parent, for various reasons including tax purposes.
Do COM personnel refer to themselves as environmental engineers, as opposed to sanitary engineers? Yes, in all of our professional cards CDM uses the term environmental engineers. But we still have some clients with whom we use the term sanitary engineer; they prefer the latter terminology.
BUSINESS
What is the current number of active projects and the short-term projection for new construction design under the water law? Current engineering contracts, including reports, total 190; in aggregate they have an estimated construction cost on the
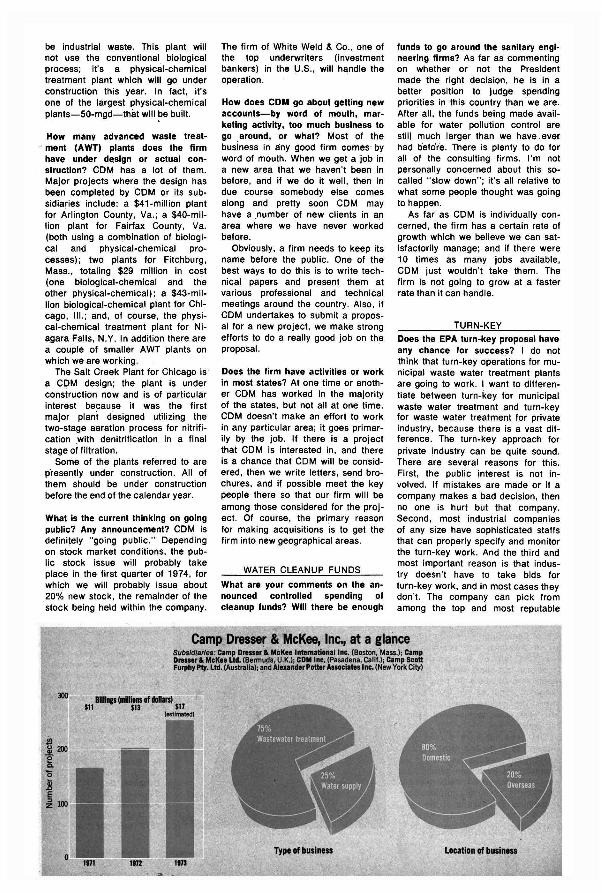
order of $2.0 billion. I ncluding our subsidiaries, CDM has about $800 million worth of work under design or construction at this time. I ncidentalIy, the Potter acquisition took place in September 1972, so only the last quarter figures show up in the total figure for 1972 billings.
Is the COM business 100% in the municipal area , or are there some examples of industrial projects? Private industrial clients have never been a big proportion of the CDM total , although we do have a number of private industrial clients, perhaps representing 5% of our total volume. However, a lot of our municipal plants receive major contributions of industrial wastes and require much engineering study for the industrial wastes alone. Take CDM's job at Niagara Falls , for example. This is a large municipal job; construction costs run over $50 million. But it is largely an industrial waste problem. About 70% of the waste water which will enter the Niagara Falls plant will
At the helm of one of the largest U.S. consulting engineering firms, Joseph Lawler is president and chairman of the board of Camp Dresser & McKee, a corporation specializing exclusively in sanitary engineering and related sciences, which more appropriately these days has been termed environmental engineering. Lawler tells ES&Ts Stan Miller that over the past 20 years, the firm has completed more than 1700 engineering projects and has a current staff of more than 600. With offices in Boston, Washington (D.C.), New York City, Bangkok, Bogota, Dacca, Singapore, Bermuda, and Pasadena, CDM's billings hit $13 million in fiscal 1972 (calendar year).
Volume 7, Number 6, June 1973 489
be industrial waste. This plant will not use the conventional biological process; it's a physical-chemical treatment plant which will go under construction this year. In fact, it's one of the larges.t physical-chemical plants-50-mgd-that will ~e built.
How many advanced waste treat-- ment (AWT) plants does the firm
have under design or actual construction? COM has a lot of them. Major projects where the design has been completed by COM or its subsidiaries include: a $41-million plant for Arlington County, Va.; a $40-million plant for Fairfax County, Va. (both using a combination of biological and physical-chemical processes); two plants for Fitchburg, Mass., totaling $29 million in cost (one biological-chemical and the other physical-chemical); a $43-million biological-chemical plant for Chicago, III.; and, of course, the physical-chemical treatment plant for Niagara Falls, N.Y. In addition there are a couple of smaller AWT plants on which we are working.
The Salt Creek Plant for Chicago is a COM design; the plant is under construction now and is of particular interest because it was the first major plant designed utilizing the two-stage aeration process for nitrification with denitrification in a final stage of filtration.
Some of the plants referred to are p'resently under construction. All of them should be under construction before the end of the calendar year.
What is the current thinking on going public? Any announcement? COM is definitely "going public." Depending on stock market cond itions, the public stock issue will probably take place in the first quarter of 1974, for which we will probably issue about 20% new stock, the remainder of the
'stock being held within the company.
The firm of White Weld & Co., one of the top underwriters (investment bankers) in the U.S., will handle the operation.
How does CDM go about getting new accounts-by word of mouth, marketing activity, too much business to go around, or what? Most of the business in a;ny good firm comes ' by word of mouth. When we get a job in a new area that we haven't been in before, and if we do it well, then in due course somebody else comes along and pretty soon COM may have a number of new clients in an area where we have never worked before.
Obviously, a firm needs to keep its name before the public. One of the best ways to do this is to write technical papers and present them at various professional and technical meetings around the country. Also, if COM undertakes to submit a proposal for a new project, we make strong efforts to do a really good job on the proposal.
Does the firm have activities or work in most states? At one time or another COM has worked in the majority of the states, but not all at one time. COM doesn't make an effort to work in any particular area; it goes primarily by the job. If there is a project that COM is interested in, and there is a chance that COM will be considered, then we write letters, send brochures, and if possible meet the key people there so that our firm will be among those considered for the project. Of course, the primary reason for making acquisitions is to get the firm into new geographical areas.
WATER CLEANUP FUNDS
What are your comments on the announced controlled spending of cleanup funds? Will there be enough
funds to go around the sanitary engineering firms? As far as commenting on whether or not the President made the right decision, he is in a better position to judge spending priorities in this country than we are. After all, the funds being made available for water pollution control are still much larger than we have . evef had befcire. There is plenty to do for all of the consulting firms. I'm not personally concerned about this socalled "slow down"; it's all relative to what some people thought was going to happen.
As far as COM is individually concerned, the firm has a certain rate of growth which we believe we can satisfactorily manage; and if there were 10 times as many jobs available, COM just wouldn't take them . The firm is not going to grow at a faster rate than it can handle.
TURN-KEY
Does the EPA turn-key proposal have any chance for success? I do not think that turn-key operations for municipal waste water treatment plants are going to work. I want to differentiate between turn-key for municipal waste water treatment and turn-key for waste water treatment for private industry, because there is a vast difference. The turn-key approach for private industry can be quite sound. There are several reasons for this. First, the public interest is not involved. If mistakes are made or if a company makes a bad decision, then no one is hurt but that company. Second, most industrial companies of any size have sophisticated staffs that can properly specify and monitor the turn-key work. And the third and most important reason is that industry doesn't have to take bids for turn-key work, and in most cases they don't. The company can pick from among the top and most reputable
Camp Dresser & McKee, Inc., at a glance
1 o I :::0 Z
Sub6ld/atf .. : Comp D_ • MilK .. 11IIII1IIItIo';"II.c. (BQston, ·Mass.); elmp DNlllr' Mel'" ~III. (BennurJa. U.K.!; eDM I.e. (Pasadena, calif.!; elmp Scott Fa"'" Ply. LIII. (Austral!a); ~n~ Allund,r PDltar AsIocIn.Inc. (Now York City)
Typ~ of buslnns Lilcation of buslnns
.. ACS
mem
bers
Non
mem
bers
~ ~ ~
. m
z m
m
~. ~ :
"' l{l
0
Z ~
ocn~Q)r-:5~
OJ
0 a.
;:; 8
::0<
3.;~:r-<OO
CD
OQ
)Q).
z~
~ !
:'
VI
5.. ,
,5:-
0
~~·<D .
... om~
3 !!!.
g. ~
~. ~ ~
OlO
l<1l
:rg-
»Oj
~5..36V1r-!!!.
'is 3
' @
.g ~ ~ g
3
g--:<
'<
3. r:n
'P
~ ~ »
5'
== z
di
....
-.c
;;-<
'<()Q
)
. ~ 0
~ 5
' m
; Q
) 5
' CD
0'
» c
cn
no
.-.zc-
al c:
3'
3 0
~ n
O.
Q)"
""'i-'
...
. CD
~
:::to
m-a
' cn
cn
Q)O
()::
:t.
a <D
~:I:
g .:-
' :::::
I ..
... o
o U
.S.$
S.o
o
o U.
S. $
9.00
o ""
Can
ada.
PUA
S $1
0.0
0
o "" C
anad
a. P
UAS
$ 13
.00
o P
aym
en
t e
ncl
ose
d (
pa
yab
le t
o A
me
rica
n C
he
mic
al
So
cie
ty).
o "" O
ther
Nat
ions
$11
.00
o ""
Oth
er N
atio
ns $
14.0
0
o B
ill m
e
o B
ill c
om
pa
ny.
Na
me
P
osi
tion
__
__
__
__
_ _
Yo
ur
Em
plo
yer _
__
__
__
__
__
__
__
__
__
__
__
_ _
Ad
dre
ss
0 H
om
e
o B
usi
ne
ss _
__
__
__
__
__
__
__
__
__
__
_
Cit
y S
tate
Z
ip _
__
_ _
Em
plo
yer'
s B
usin
ess:
0
Ma
nu
fact
uri
ng
0
Go
vern
me
nt
0 A
cad
em
ic
0 O
ther
__
__
_
If M
an
ufa
ctu
rer.
Typ
e o
f P
rod
uct
s P
rodu
ced _
__
__
__
__
__
__
_
*NO
TE
: S
ub
scri
ptio
ns
at
AC
S m
em
be
r ra
tes
are
for
pe
rso
na
l us
e o
nly
...
* Pa
yme
nt
mu
st b
e m
ade
in U
.S. c
urr
en
cy, b
y in
tern
ati
on
al
mo
ne
y or
der.
UN
ES
CO
co
up
on
s, U
.S.
ba
nk
dra
ft:
or
ord
er
thro
ug
h
you
r b
oo
k d
ea
ler
73
-A
l>rw
::!
ZZ
a<
.-~i II a-
i ~i =

BU
SIN
ES
S
RE
PLY
M
AIL
>
LLI ..... :::c!::!::! ..... ~
L&
.,C
Cen
en
....... :zC
C~
-::&
=LLI ~ :::c
:::::::i~ =
:z
::::::)C
ICL. ~
LLlCC :::c
LL
I ..... ::&
C
FIR
ST
C
LA
SS
P
ER
MIT
N
o.
14
11
-R
WASH
ING
TON
. D.C.
No
Po
stag
e S
tam
p N
ece
ssary if M
aile
d in th
e U
nite
d S
tate
s
PO
ST
AG
E
WIL
L
BE
PA
ID
BY
AM
ER
ICA
N
CH
EM
ICA
L S
OC
IET
Y
11
55
Six
tee
nth
Stre
et, N
.W.
Wa
sh
ing
ton
, D.C
. 20
03
6
AT
TN
: J
ME
DIN
A
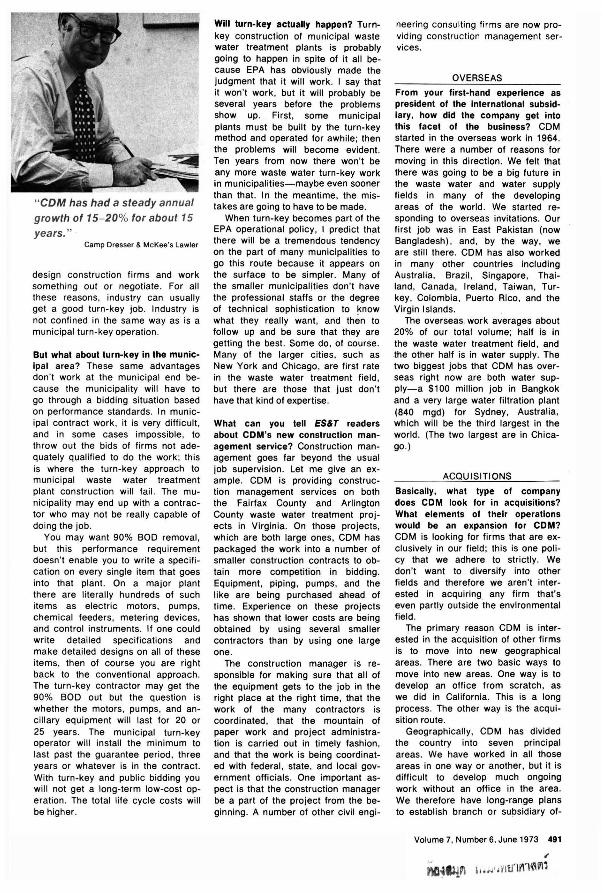
" CDM has had a steady annual gro wth of 15- 20% for about 15 years." .
Camp Dresser & McKee's Lawler
design construction firms and work something out or negotiate . For all these reasons. industry can usually get a good turn-key job. Industry is not confined in the same way as is a municipal turn-key operation .
But what about turn-key in the municipal area? These same advantages don't work at the municipal end because the municipality will have to go through a bidding situation based on performance standards. In municipal contract work , it is very difficult , and in some cases impossible, to throw out the bids of firms not adequately qualified to do the work; this is where the turn-key approach to municipal waste water treatment plant construction will fail. The municipality may end up with a contractor who may not be really capable of doing the job.
You may want 90% BOO removal, but this performance requirement doesn't enable you to write a specification on every single item that goes into that plant. On a major plant there are literally hundreds of such items as electric motors, pumps, chemical feeders , metering devices, and control instruments. If one could write detailed specifications and make detailed designs on all of these items, then of course you are right back to the conventional approach . The turn-key contractor may get the 90% BOO out but the question is whether the motors, pumps, and ancillary equipment will last for 20 or 25 years. The municipal turn-key operator will install the minimum to last past the guarantee period, three years or whatever is in the contract. With turn-key and public bidding you will not get a long-term low-cost operation. The total life cycle costs will be higher.
Will turn-key actually happen? Turnkey construction of municipal waste water treatment plants is probably going to happen in spite of it all because EPA has obviously made the judgment that it will work. I say that it won't work , but it will probably be several years before the problems show up. First, some municipal plants must be built by the turn-key method and operated for awhile; then the problems will become evident. Ten years from now there won't be any more waste water turn-key work in municipalities-maybe even sooner than that. In the meantime, the mistakes are going to have to be made.
When turn-key becomes part of the EPA operational policy, I predict that there will be a tremendous tendency on the part of many municipalities to go this route because it appears on the surface to be simpler. Many of the smaller municipalities don't have the professional staffs or the degree of technical sophistication to know what they really want, and then to follow up and be sure that they are getting the best. Some do, of course. Many of the larger cities, such as New York and Chicago, are first rate in the waste water treatment field , but there are those that just don't have that kind of expertise.
What can you tell ES&T readers about COM's new construction management service? Construction management goes far beyond the usual job supervision . Let me give an example. COM is providing construction management services on both the Fairfax County and Arlington County waste water treatment projects in Virginia. On those projects, which are both large ones, COM has packaged the work into a number of smaller construction contracts to obtain more competition in bidding . Equipment, piping , pumps, and the like are being purchased ahead of time. Experience on these projects has shown that lower costs are being obtained by using several smaller contractors than by using one large one.
The construction manager is responsible for making sure that all of the equipment gets to the job in the right place at the right time, that the work of the many contractors is coordinated, that the mountain of paper work and project administration is carried out in timely fashion , and that the work is being coordillated with federal , state, and local government officials. One important aspect is that the construction manager be a part of the project from the beginning. A number of other civil engi-
nee ring consulting firms are now providing construction management services.
OVERSEAS
From your first-hand experience as president of the international subsidIary, how did the company get into this facet of the business? COM started in the overseas work in 1964. There were a number of reasons for moving in this direction; We felt that there was going to be a big future in the waste water and water supply fields in many of the developing areas of the world. We started responding to overseas invitations. Our first job was in East Pakistan (now Bangladesh) , and, by the way, we are still there. COM has also worked in many other countries including Australia, Brazil , Singapore, Thailand , Canada, Ireland, Taiwan, Turkey, Colombia, Puerto Rico, and the Virgin Islands.
The overseas work averages about 20% of our total volume; half is in the waste water treatment field, and .the other half is in water supply. The two biggest jobs that COM has overseas right now are both water supply-a $100 million job in Bangkok and a very large water filtration plant (840 mgd) for Sydney, Australia, which will be the third largest in the world. (The two largest are in Chicago.)
ACQUISITIONS
Basically, what type of company does COM look for in acquisitions? What elements of their operations would be an expansion for COM? COM is looking for firms that are exclusively in our field; this is one policy that we adhere to strictly. We don't want to diversify into other fields and therefore we aren't interested in acquiring. any firm that's even partly outside the environmental field .
The primary reason COM is interested in the acquisition of other firms is to move into new geographical areas. There are two basic ways to move into new areas. One way is to develop an office from scratch, as we did in California. This is a long process. The other way is the acquisition route .
Geographically, COM has divided the country into seven principal areas. We have worked in all those .areas in one way or another, but it is difficult to develop much ongoing work without an office in the area. We therefore have long-range plans to establish branch or subsidiary of-
Volume 7, Number 6, June 1973 491
, M~I).J,Pl I .. N " )' l ijli11~VIi
Circle NO.1 on Rladers' Servict Card
492 Environmental Science & Technology
fices in each of these areas. Most of the proposed new offices will involve acquisitions, which , in turn , are tied in with our plans to go public.
Our most recent new office is in Washington , D.C. CDM has recently agreed in principle to acquire a firm in Singapore and one in Saigon; CDM would like to participate in the new redevelopment / reconstruction program in South Vietnam.
We also might be interested in acquiring companies which would complement our technical strengthscompanies which specialize , for example, in groundwater, irrigation , and R&D. The primary reason for CDM 's going public is to obtain the additional capital and public stock to enable us to move in these directions.
NEW TECHNOLOGY
To what extent are new processes being incorporated into the COM design projects? There has been much talk, particularly from EPA, that consultants are too much inclined to use the old "tried and true" methods, and that by going to the turn-key approach, more " innovative" designs will be forthcoming. The idea that turn-key will suddenly generate exotic new designs that consulting engineering firms cannot themselves produce is, in my opinion , sheer nonsense. Sure, consulting firms failed to turn out very many advanced designs in the past, but that was because there was little or no expressed need for them-water quality standards, by and large, didn't require such advanced designs in the past. But the better consulting firms are certainly turning out such designs today.
In the case of CDM, we like to think that our designs are as "innovative" as any being turned out today. We have a design review committee comprised of some of the top professionals in our firm . This committee keeps on top of all of the latest developments in the field .
As to some examples of new processes being incorporated into CDM projects, I have already mentioned the two-stage aeration process for the Salt Creek plant being constructed in Chicago, in which nitrification takes place in the second aeration stage. In a third stage, filtration, the nitrates will be reduced to nitrogen, passing off as nitrogen gas. This was the first major plant in the country to be designed using this process. One of the plants we have since designed for Fitchburg, Mass., utilizes a similar two-stage aeration process.
To what extent is COM involved in air pollution control and solid waste disposal projects? On the whole, CDM is not heavily involved in air pollution control. But the firm does a fair amount of work in the solid waste field. For example, CDM recently completed a major study for ErieNiagara Counties, which includes the city of Buffalo and hundreds of industries in the area. The study featured a computer program for collecting and transporting the wastes and for locating transfer stations.
CDM is currently serving as a consultant to a new company which has developed a very promising method of disposing of solid waste. The process involves shredding, baling, and encapsulating . The material is highly compressed and encased in heavy sheet plastic which is shrunk-fit. The blocks of compressed material have a density greater than that of water , and can be buried in landfills or in water and collected for reprocessing at some later time. Additionally , these blocks can be used to reclaim certain islands that are washing away, provided that proper perimeter protection is provided against wave action.
PERSONAL ASIDE
What was the most satisfying assignment in your long and varied professional career? 11 has not been any single assignment. Rather it has been the satisfaction of working on many projects over the years , starting with modest jobs and in later years being associated with some of the very largest projects of their type. The Sydney water treatment project , which will be one of the world 's largest, is an example. We were able to come up with a fairly unique plan, which is about to be carried out .
Starting way back in 1940, I was the firm 's first cooperative-work student, while an undergraduate civil engineering student at Northeastern University. You might say that I have had an opportunity to grow with the firm , because we had less than a dozen people in those days.
Starting out in the planning stages of some of these more complex projects and seeing them develop is really a lot of fun. I'm one of those guys who regularly work extra hours evenings and weekends. But then I play hard too ; last month I went big game hunting for ibex in the mountains of Iran . People sometimes ask me why I work so hard. I tell them, " Don't feel sorry for me; I love it. You should be so lucky!"
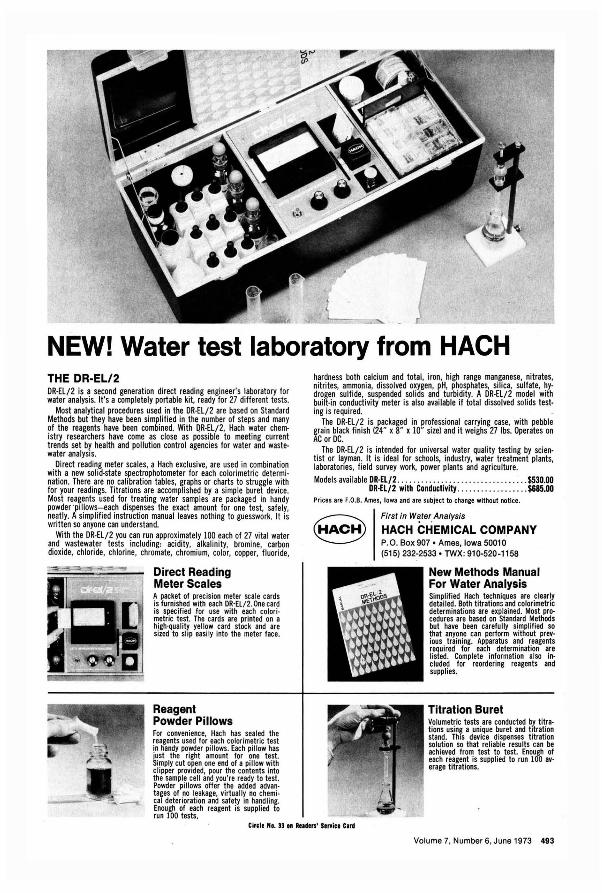
NEW! Water test laboratory from HACH THE DR-EL/2 DR·EL/2 is a second generation direct reading engineer's laboratory for water analysis. It's a completely portable kit, ready for 27 different tests.
Most analytical procedures used in the DR·EL/2 are based on Standard Methods but they have been simplified in the number of steps and many of the reagents have been combined. With QR·EL/2, Hach water chem· istry researchers have come as close as possible to meeting current trends set by health and pollution control agencies for water and waste· water analysis.
Direct reading meter scales, a Hach exclusive, are used in combination with a new solid·state spectrophotometer for each colorimetric determi· nation. There are no calibration tables, graphs or charts to struggle with for your readings. Titrations are accomplished by a simple buret device. Most rea~ents used for treating water samples are packaged in handy powder 'plllows- each dispenses the exact amount for one test, safely, neatly. A simplified instruction manual leaves nothing to guesswork. It is written so anyone can understand.
With the DR·EL/2 you can run approximately 100 each of 27 vital water and wastewater tests including: acidity, alkalinity, bromine, carbon dioxide, chloride, chlorine, chromate, chromium, color, copper, fluoride,
Direct Reading Meter Scales A packet of prec iSion meter scale cards is furnished with each DR·El / 2. One card is specified for use with each colori · metric test. The cards are printed on a high'quality yellow card stock and are sized to slip easily into the meter face.
Reagent Powder Pillows For convenience, Hach has sealed the reagents used for each colorimetr ic test in handy powder pillows. Each pillow has just the right amount for one test. Simply cut open one end of a pillow with clipper provided, pour the contents into the sample cell and you 're ready to test. Powder pillows offer the added advan· tages of no leakage, virtually no chemi· cal deterioration and safety in handling. Enough of each reagent is supplied to run 100 tests.
hardness both calcium and total, iron, high range manganese, nitrates, nitrites, ammonia, dissolved oxygen, pH, phosphates, silica, sulfate, hy· drogen sulfide, suspended solids and turbidity. A DR·EL/2 model with built·in conductivity meter is also available if total dissolved solids test· ing is required.
The DR·EL/2 is packaged in professional carrying case, with pebble grain black finish (24" x 8" x 10" size) and it weighs 27 Ibs. Operates on AC or DC.
The DR·EL/2 is intended for universal water quality testing by scien· tist or layman. It is ideal for schools, industry, water treatment plants, laboratories, field survey work, power plants and agriculture.
Models available DR·EL/2.. ......... .. ...... . .. ... . . ... . . . $530.00 DR·EL/2 with Conductivity .... .. .. ... ..... . . $685.00
Prices are F.O.B. Ame s, Iowa and are subject to change without notice.
First in W~terAnalysis
HACH CHEMICAL COMPANY P. O. Box 907 • Ames, Iowa 50010 (515) 232-2533' TWX: 910-520-1158
New Methods Manual For Water Analysis Simplified Hach techniques are clearly detailed. Both titrations and colorimetric determinations are explained. Most pro· cedures are based on Standard Methods but have been carefully simplified so that anyone can perform without prevo ious training. Apparatus and reagents required for each determination are listed. Complete information also in· cluded for reordering reagents and supplies.
Titration Buret Volumetric tests are conducted by titra·
~\~~~ .us~~fs a d~~:~~e d~~~~~:e~d m~:l:~~ solution so that reliable results can be achieved from test to test. Enough of each reagent is supplied to run 100 avo erage titrations.
Circl. HI. SJ II Read,rs' S.nice Carll
Volume 7, Number 6. June 1973 493
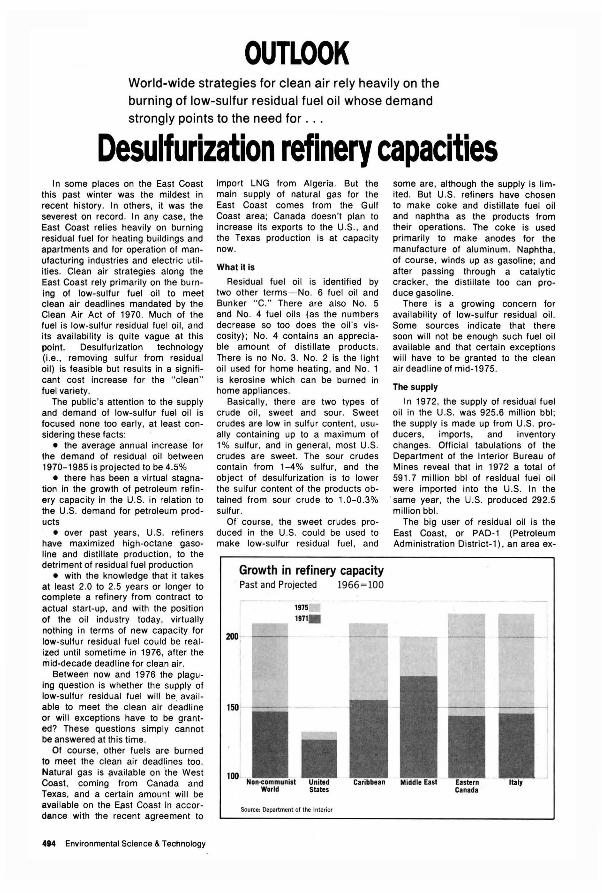
OUTLOOK World-wide strategies for clean air rely heavily on the burning of low-sulfur residual fuel oil whose demand strongly points to the need for ...
Desulfurization refinery capacities I n some places on the East Coast
this past winter was the mildest in recent history. In others, it was the severest on record . In any case, the East Coast relies heavily on burning residual fuel for heating buildings and apartments and for operation of manufacturing industries and electric utilities. Cleim air strategies along the East Coast rely primarily on the burning of low-sulfur fuel oil to meet clean air deadlines mandated by the Clean Air Act of 1970. Much of the fuel is low-sulfur residual fuel oil, and its availability is quite vague at this point. Desulfurization technology (i.e., removing sulfur from residual oil) is feasible but results in a significant cost increase for the " clean" fuel variety.
The public's attention to the supply and demand of low-sulfur fuel oil is focused none too early, at least considering these facts:
• the average annual increase for the demand of residual oil between 1970-1985 is projected to be 4.5%
• there has been a virtual stagnation in the growth of petroleum refinery capacity in the U.S. in relation to the U.S. demand far petroleum products
• over past years, U.S. refiners have maximized high-octane gasoline and distillate production, to the detriment of residual fuel production
• with the knowledge that it takes at least 2.0 to 2.5 years or longer to complete a refinery from contract to actual start-up, and with the position of the oil industry today, virtually nothing in terms of new capacity for low-sulfur residual fuel could be realized until sometime in 1976, after the mid-decade deadline for clean air.
Between now and 1976 the plaguing question is whether the supply of low-sulfur residual fuel will be. available to meet the clean air deadline or will exceptions have to be granted? These questions simply cannot be answered at this time.
Of course, other fuels are burned to meet the clean air deadlines too. Natural gas is i'!vailable on 'the West Coast , coming from Canada and Texas, and a certain amount will be available on the East Coast in accordance with the recent agreement to
494 Environmental Science & Technology
import LNG from Algeria. But the main supply of natural gas for the East Coast comes from the Gulf Coast area; Canada doesn't plan to increase its exports to the U.S., and the Texas production is at capacity now.
What It Is
Residual fuel oil is identified by two other terms-No. 6 fuel oil and Bunker "C." There are also No. 5 and No. 4 fuel oils (as the numbers decrease so too does the oil's viscosity); No. 4 contains an appreciable amount of distillate products. There is no NO. 3. No. 2 is the light oil used for home heating, and No.1 is kerosine which can be burned in home appliances.
Basically, there are two types of crude oil, sweet and sour. Sweet crudes are low in sulfur content , usually containing up to a maximum of 1% sulfur , and in general, most U.S. crudes are sweet. The sour crudes contain from 1-4% sulfur, and the object of desulfurization is to lower the sulfur content of the products obtained from sour crude to 1.0-0.3% sulfur.
Of course, the sweet crudes produced in the U.S. could be used to make low-sulfur residual fuel , and
Growth in refinery capacity Past and Projected 1966 = 100
1975 197t.
Source: Department of the Interior
some are, although the supply is limited. But U.S. refiners have chosen to make coke and distillate fuel oil and naphtha as the products from their operations. The coke is used primarily to make anodes for the manufacture of aluminum. Naphtha, of course, winds up as gasoline; and after passing through a catalytic cracker, the distillate too can produce gasoline.
There is a growing concern for availability of low-sulfur residual oil. Some sources indicate that there soon will not be enough such fuel oil available and that certain exceptions will have to be granted to the clean air deadline of mid-1975.
The supply
In 1972, the supply of residual fuel oil in the U.S. was 925.6 million bbl; the supply is made up from U.S. producers, imports, and inventory changes. Official tabulations of the Department of the Interior Bureau of Mines reveal that in 1972 a total of 591 .7 million bbl of residual fuel oil were imported into the U.S. In the same year, the U.S. produced 292.5 million bbl.
The big user of residual oil is the East Coast, or PAD-1 (Petroleum Administration District-1). an area ex-
Canada
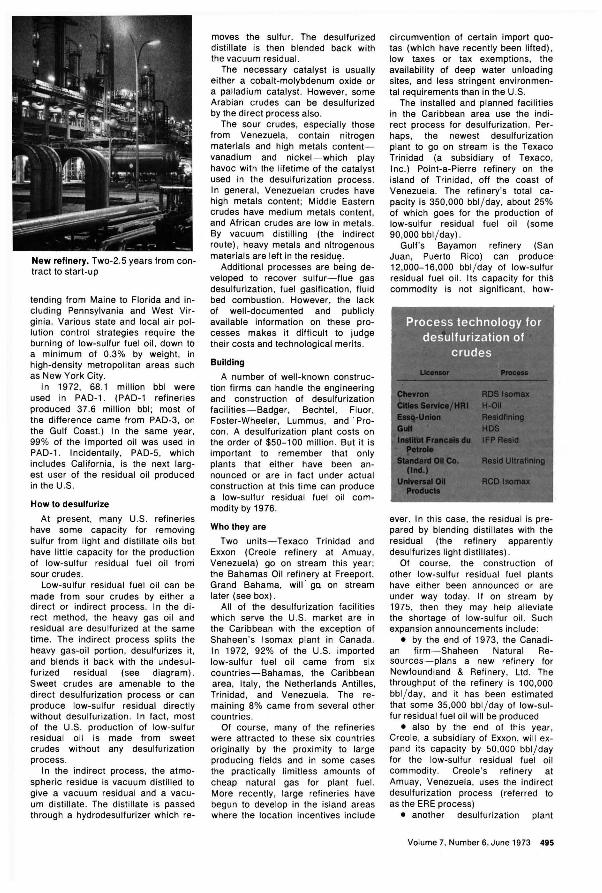
New refinery. Two-2.5 years from contract to start -u p
tending from Maine to Florida and including Pennsylvania and West Virginia. Various state and local air pollution control strategies require the burning of low-sulfur fuel oil, down to a minimum of 0.3% by weight, in high-density metropolitan areas such as New York City.
In 1972. 68.1 million bbl were used in PAD-I . (PAD-l refineries produced 37.6 million bbl; most of the difference came from PAD-3, on the Gulf Coast.) In the same year , 99% of the imported oil was used in PAD-I . Inc identally, PAD-5, which includes California, is the next largest user of the residual oil produced in the U.S.
How to desulfurize
At present, many U.S. refineries have some capacity for removing sulfur from light and distillate oils btlt have little capacity for the production of low-sulfur residual fuel oil from sour crudes.
Low-sulfur residual fuel oil can be made from sour crudes by either a direct or indirect process. In the direct method, the heavy gas oil and residual are desulfurized at the same time. The indirect process splits the heavy gas-oil portion, desulfurizes it, and blends it back with the undesulfurized residual (see diagram) . Sweet c rudes are amenable to the direct desulfurization process or can produce low-sulfur residual directly without desulfurization . In fact, most of the U.S. production of low-sulfur residual oil is made from sweet crudes without any desulfurization process.
In the indirect process, the atmospheric residue is vacuum distilled to give a vacuum residual and a vacuum distillate . The distillate is passed through a hydrodesulfurizer which re-
moves the sulfur. The desulfurized distillate is then blended back with the vacuum residual .
The necessary catalyst is usually either a cobalt-molybdenum oxide or a palladium catalyst. However, some Arabian crudes can be desulfurized by the direct process also.
The sour crudes, especially those from Venezuela, contain nitrogen materials and high metals content vanadium and nickel-which play havoc with the lifetime of the catalyst used in the desulfurization process. In general, Venezuelan crudes have high metals content ; Middle Eastern crudes have medium metals content , and African crudes are low in metals. By vacuum distilling (the indirect route), heavy metals and nitrogenous materials are left in the residue.
Additional processes are being developed to recover sulfur-flue gas desulfurization, fuel gasification, fluid bed combustion . However, the lack of well-documented and publicly available information on these processes makes it difficult to judge their costs and technological merits.
Building
A number of well-known construction firms can handle the engineering and construction of desulfurization facilities- Badger, Bechtel, Fluor, Foster-Wheeler, Lummus, and ' Procon. A desulfurization plant costs on the order of $50- 100 million. But it is important to remember that only plants that either have been announced or are in fact under actual construction at this time can produce a low-sulfur residual fuel oil commodity by 1976.
Who they are
Two units- Texaco Trinidad and Exxon (Creole refinery at Amuay, Venezuela) go on stream this year ; the Bahamas Oil refinery at Freeport , Grand Bahama, will ' go on stream later (see box).
All of the desulfurization facilities which serve the U.S. market are in the Caribbean with the exception of Shaheen' s Isomax plant in Canada. In 1972, 92% of the U.S. imported low-sulfur fuel oil came from si x countries-Bahamas, the Caribbean area, Italy, the Netherlands Antilles , Trinidad , and Venezuela. The remaining 8% came from several other countries.
Of course, many of the refineries were attracted to these six countr ies originally by the proximity to large producing fields and in some cases the practically limitless amounts of cheap natural gas for plant fuel. More recently , large refineries have begun to develop in the island areas where the location incentives include
circumvention of certain import quotas (which have recently been lifted), low taxes or tax exemptions, the availability of deep water unloading sites, and less stringent environmental reqUirements than in the U.S.
The installed and planned facilities in the Caribbean area use the indirect process for desulfurization. Perhaps, the newest desulfurization plant to go on stream is the Texaco Trinidad (a subsidiary of Texaco, Inc.) Point-a-Pierre refinery on the island of Trinidad , off the coast of Venezuela. The refinery's total capacity is 350,000 bbl / day, about 25% of which goes for the production of low-sulfur residual fuel oil (some 90,000 bbl / day) .
Gulf's Bayamon refinery (San Juan, Puerto Rico) can produce' 12,000-16,000 bbl / day of low-sulfur residual fuel oil. I ts capacity for this commodity is not significant , how-
ever. In this case, the residual is prepared by blending distillates with the residual (the refinery apparently desulfurizes light distillates).
Of course, the construction of other low-sulfur residual fuel plants have either been announced or are under way today. If on stream by 1975, then they may help alleviate the shortage of low-sulfur oil . Such expansion announcements include:
• by the end of 1973, the Canadian firm - Shaheen Natural Resources - plans a new refinery for Newfoundland & Refinery, Ltd. The throughput of the refinery is 100,000 bbl / day, and it has been estimated that some 35,000 bbl / day of low-sulfur residual fuel oil will be produced
• also by the end of thi s year , Creole, a subsidiary of Exxon, will expand its capacity by 50,000 bbl / day for the low-sulfur residual fuel oil commodity . Creole 's refinery at Amuay, Venezuela , uses the indirect desulfurization process (referred to as the ERE process)
• another desulfurization plant
Volume 7, Number 6, June 1973 495
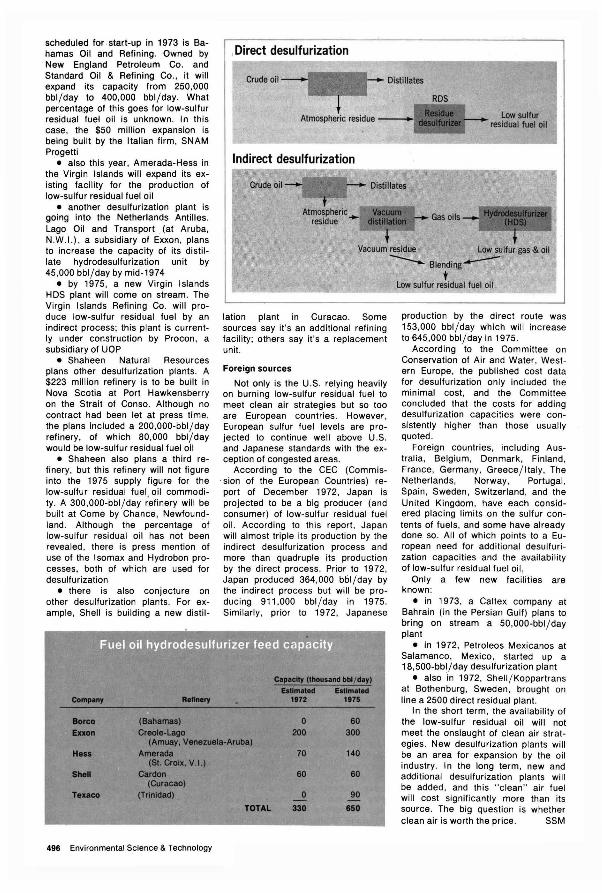
scheduled for ,start-up in 1973 is Bahamas Oil and Refining. Owned by New England Petroleum Co. and Standard Oil & Refining Co., it will expand its capacity from 250,000 bbl / day to 400,000 bbl/day. What percentage of this goes for low-sulfur residual fuel oil is unknown. In this case, the $50 million expansion is being built by the Italian firm, SNAM Progetti
' . also this year, Amerada-Hess in the Virgin Islands will expand its existing facility for the production of low-sulfur residual fuel oil
• another desulfurization plant is going into the Netherlands Antilles . Lago Oil and Transport (at Aruba, NW.I.), a subsidiary of Exxon, plans to increase the capacity of its distillate hydrodesulfurization unit by 45 ,000 bbl / day by mid-1974
• by 1975, a new Virgin Islands HDS plant will come on stream. The Virgin Islands Refining Co. will produce low-sulfur residual fuel by an indirect process; this plant is currently under construction by Procon , a subsidiary of UOP
• Shaheen Natural Resources plans other desulfurization plants. A $223 million refinery is to be built in Nova Scotia at Port Hawkensberry on the Strait of Conso. Although no contract had been let at press time, the plans included a 200,000-bbl / day refinery, of which 80,000 bbl / day would be low-sulfur residual fuel oil
• Shaheen also plans a third refinery , but this refinery will not figure into the 1975 supply figure for the low-sulfur residual fuel oil commodity. A 300,000-bbl / day ;efinery will be built at Come by Chance, Newfoundland . Although the percentage of low-sulfur residual oil has not been revealed , there is press mention of use of the I somax and Hydrobon processes, both of which are used for desulfurization
• there is also conjecture on other desulfurization plants. For example, Shell is building a new distil-
. ., ...
(Bahama) Creole-Lago
,Direct desulfurization
Crude oil Distillates
Indirect desulfurization
Low sulfur residual fuel oil
Crude oil Distillates
Atmospheric residue Gas oils
Vacuum residue Low sulfur gas -& oil
-- Blending-- '
lation plant in Curacao. Some sources say it 's an additional refining facility; others say it's a replacement unit.
Foreign sources
Not only is the U.S. relying heavily on burning low-sulfur residual fuel to meet clean air strategies but so too are European countries. However, European sulfur fuel levels are projected to continue well above U.S. and Japanese standards with the exception of congested areas.
According to the CEC (Commis' sion of the European Countries) report of December 1972, Japan is projected to be a big producer (and consumer) of low-sulfur residual fuel oi l. According to this report, Japan will almost triple its production by the indirect desulfurization process and more than quadruple its production by the direct process. Prior to 1972, Japan produced 364,000 bbl / day by the indirect process but will be producing 911 ,000 bbl / day in 1975. Similarly, prior to 1972, Japanese
--. . ..
o 200
80 300
t Low sulfur residual fuel oil
production by the direct route was 153,000 bbl / day which will increase to 645,000 bbl / day in 1975.
According to the Committee on Conservation of Air and Water , Western Europe, the published cost data for desulfurization only included the minimal cost , and the Committee concluded that the costs for adding desulfurization capacities were consistently higher than those usually quoted.
Foreign countries , including Australia, Belgium, Denmark, Finland, France, Germany, Greece/ Italy, The Netherlands, Norway, Portugal, Spain, Sweden, Switzerland , and the United Kingdom , have each considered placing limits on the sulfur contents of fuels , and some have already done so. All of which points to a European need for additional desulfuri zation capacities and the availability of low-sulfur residual fuel oil ,
Only a few new facilities are known:
• in 1973, a Caltex company at Bahrain (in the Persian Gulf) plans to bring on stream a 50,000-bbl / day plant
• in 1972, Petroleos Mexicanos at Salamanco, Mexico, started up a 18,500-bbl / day desulfurization plant
• also 'in 1972, Shell / Koppartrans at Bothenburg , Sweden , brought on line a 2500 direct residual plant.
(Amuay. Venezuela-Aruba) Amerada 70 140
In the short term, the availability of the low-sulfur residual oil will not meet the onslaught of clean air strategies. New desulfurization plants will be an area for expansion by the oil industry. In the long term, new and additional desulfurization plants will be added , and this " clean" air fuel will cost significantly more than its source. The big question is whether clean air is worth the price. SSM
(St. Crobc. V.I,) Cerdon
(Curacao) (Trinidad) .
496 Environmental Science & Technology
TOTAL
80
o 330
80
90 810
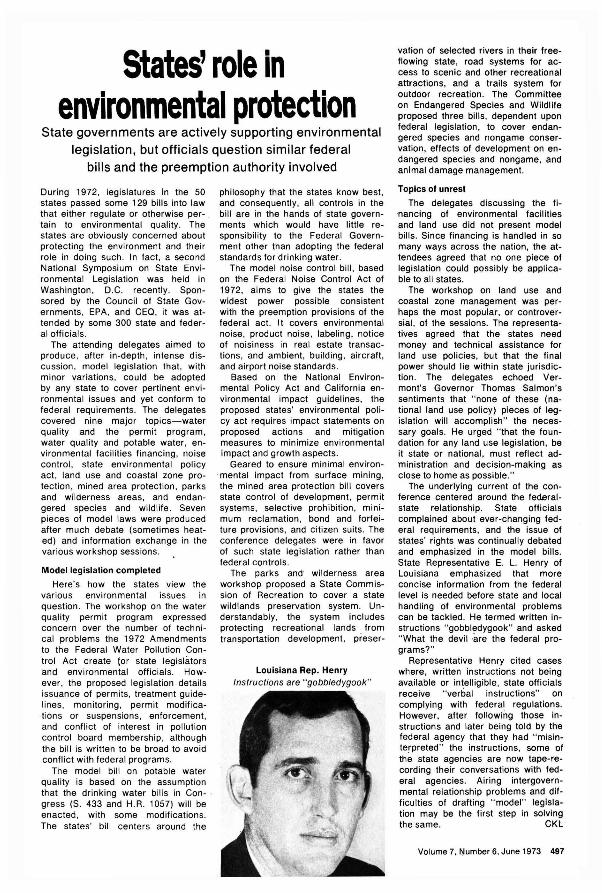
States' role in environmental protection
State governments are actively supporting environmental legislation, but officials question similar federal
bills and the preemption authority involved
During 1972, leg islatures in the 50 states passed some 129 bills in to law that either regulate or otherwise pertain to environmental quality. The states are obviously concerned about protecting the environment and their role in doing such . In fact , a second National Symposium on State Environmental Legislation was held in Washington , D.C. recently. Sponsored by the Council of State Governments, EPA, and CEQ, it was attended by some 300 state and federalofficials.
The attending delegates aimed to produce, after in-depth, intense discussion , model legislation that , with minor variations, could be adopted by any state to cover pertinent environmental issues and yet conform to federal requirements. The delegates covered nine major topics-water quality and the permit program , water quality and potable water , environmental facilities financing , noise control , state environmental policy act , land use and coastal zone protection , mined area protection , parks and wilderness areas, and endangered species and wildlife. Seven pieces of model laws were produ ced after much debate (sometimes heated) and information exchange in the various workshop sess ions.
Model legislation completed
Here 's how the states view the various environmental issues in question. The workshop on the water quality permit program expressed concern over the number of technical problems the 1972 Amendments to the Federal Water Pollution Control Act create for state legislators and environmental officials. However, the proposed legislation details issuance of permits, treatment guidelines, monitoring, permit modifications or suspensions, enforcement, and conflict of interest in pol lution control board membership, although the bill is written to be broad to avoid conflict with federal programs.
The model bill on potable water quality is based on the assumption that the drinking water bills in Con- . gress (S . 433 and H. R. 1057) will be enacted, with some modifications. The states' bill centers around the
philosophy that the states know best, and consequently , all controls in the bill are in the hands of state governments which would have little responsibility to the Federal Government other than adopting the federal standards for drinking water.
The model noise control bill, based on the Federal Noise Control Act of 1972, aims to give the states the widest power possible consistent with the preempt ion provisions of the federal act. It covers environmental noise, product noise, labeling , notice of noisiness in real estate transactions, and ambient , building , aircraft, and airport noise standards.
Based on the National Environmental Policy Act and California environmental impact guidelines, the proposed states' environmental policy act requires impact statements on proposed actions and mitigation measures to minimize environmental impact and growth aspects.
Geared to ensure minimal environ. mental impact from surface mining, the mined area protection bill covers state control of development, permit systems, selective prohibition , minimum reclamation , bond and forfeiture provisions, and citizen suits. The conference delegates were in favor of such state legislation rather than federal controls .
The parks and' wilderness area workshop proposed a State Commission of Recreation to cover a state wildlands preservation system . Understandably, the system includes protecting recreational lands from transportation development, preser-
Louisiana Rep. Henry Instructions are "gobbledygook"
vation of selected rivers in their freeflowing state, road systems for access to scenic and other recreational attractions, and a trails system for outdoor recreation . The Committee on Endangered Species and Wildlife proposed three bills , dependent upon federal legislation , to cover endangered species and nongame conservation, effects of development on endangered species and nongame, and animal damage management.
Topics of unrest
The delegates discussing the financing of environmental facilities and land use did not present model bills. Since financing is handled in so many ways across the nation, the attendees agreed that no one piece of legislation could possibly be applicable to all states.
The workshop on land use and coastal zone management was perhaps the most popular, or controversial, of the sessions. The representatives agreed that the states need money and technical assistance for land use policies, but that the final power should lie within state jurisdiction. The delegates echoed Vermont's Governor Thomas Salmon's sentiments that "none of these (national land use policy) pieces of legislation will accomplish" the necessary goals. He urged "that the foundation for any land use legislation, be it state or national, must reflect administration and decision-making as close to home as possible."
The underlying current of the conference centered around the federalstate relationship . State officials complained about ever-changing federal requirements. and the issue of states' rights was continually debated and emphasized in the model bi·lIs. State Representative E. L. Henry of Louisiana emphasized that more concise information from the federal level is needed before state and local handling of environmental problems can be tackled. He termed written instructions " gobbledygook" and asked " What the devil ·are the federal programs?"
Representative Henry cited cases where, written instructions not being available or intelligible, state officials receive " verbal instructions" on complying with federal regulations. However. after following those instructions and later being told by th'e federal agency that they had " misinterpreted" the instructions, some of the state agencies are now tape-recording their conversat ions with federal agencies. Airing intergovernmental relationship problems and difficulties of drafting "model" legislation may be the first step in solving the same. CKl
Volume 7. l\Iumber 6, June 1973 497
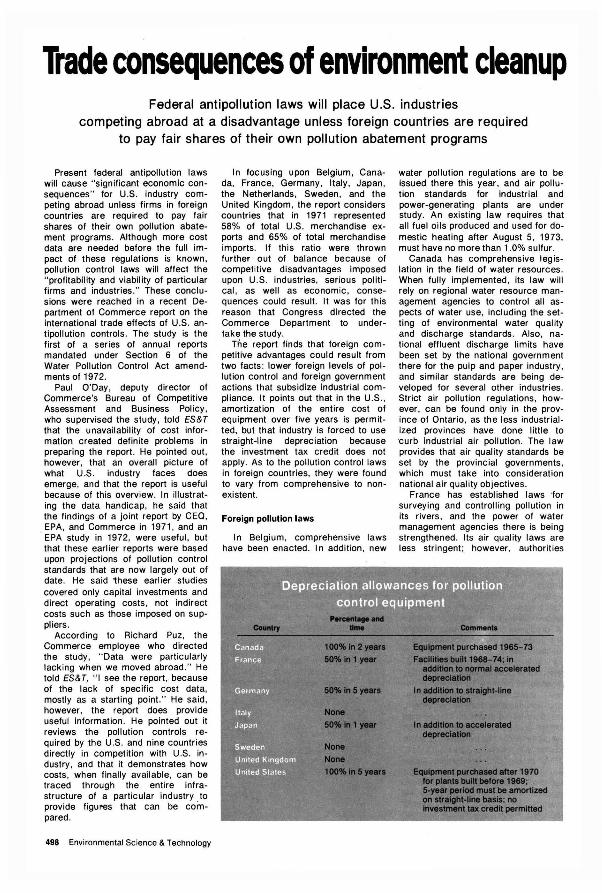
Trade consequences of environment cleanup Federal antipollution laws will place U.S. industries
competing abroad at a disadvantage unless foreign countries are required to pay fair shares of their own pollution abatement programs
Present federal antipollution laws will cause "~ignificant economic consequences" for U.S. industry competing abroad unless firms in foreign countries are required to pay fair shares of their own pollution abatement programs. Although more cost data are needed before the full impact of these regulations is known. pollution control laws will affect the "profitability and viability of particular firms and industries." These conclusions were reached in a recent Department of Commerce report on the international trade effects of U.S. antipollution controls. The study is the first of a series of annual reports mandated under Section 6 of the Water Pollution Control Act amendments of 1972.
Paul O'Day, deputy director of Commerce's Bureau of Competitive Assessment and Business Policy, who supervised the study, told ES&T that the unavailability of cost information created definite problems in preparing the report. He pointed out, however, that an overall picture of what U.S. industry faces does emerge, and that the report is useful because of this overview. In illustrating the data handicap, he said that the findings of a joint report by CEQ , EPA, and Commerce in 1971 , and an EPA study in 1972, were useful , but that these earlier reports were based upon projections of pollution control standards that are now largely out of date. He said 1hese earlier studies covered only capital investments and direct operating costs , not indirect costs such as those imposed on suppliers.
According to Richard Puz, the Commerce employee who directed the study, "Data were particularly lacking when we moved abroad." He told ES&T, "I see the report, because of the lack of specific cost data, mostly as a starting point." He said, however, the report does provide useful information . He pointed out it reviews the pollution controls required by the U.S. and nine countries directly in competition with U.S . industry, and that it demonstrates how costs , when finally available, can be traced through the entire infrastructure of a particular industry to provide figures that can be compared.
498 Environmental Science & Technology
In focusing upon Belgium, Canada, France, Germany, Italy, Japan , the Netherlands, Sweden, and the United Kingdom, the report considers countries that in 1971 represented 58% of total U.S. merchandise exports and 65% of total merchandise imports. If this ratio were thrown further out of balance because of competitive disadvantages imposed upon U.S. industries, serious political , as well as economic, consequences could result. It was for this reason that Congress directed the Commerce Department to undertake the study.
Tne report finds that foreign competitive advantages could result from two facts: lower foreign levels of pollution control and foreign government actions that subsidize industrial compliance. It points out that in the U.S., amortization of the entire cost of equipment over five years is permitted, but that industry is forced to use straight-line depreciation because the investment tax credit does not apply. As to the pollution control laws in foreign countries, they were found to vary from comprehensive to nonexistent.
Foreign pollution laws
In Belgium, comprehensive laws have been enacted. In addition, new
water pollution regulations are to be issued there this year, and air pollution standards for industrial and power-generating plants are under study. An existing law requires that all fuel oils produced and used for domestic heating after August 5, 1973, must have no more than 1.0% sulfur.
Canada has comprehensive legislation in the field of water resources. When fully implemented , its law will rely on regional water resource management agenc ies to control all aspects of water use, including the setting of environmental water quality and discharge standards. Also, national effluent discharge limits have been set by the national government there for the pulp and paper industry, and similar standards are being developed for several other industries. Strict air pollution regulations, however, can be found only in the province of Ontario, as the less industrialized provinces have done little to 'curb industrial air pollution. The law provides that air quality standards be set by the provincial governments, which must take into consideration national air quality objectives.
France has establ ished laws 'for surveying and controlling pollution in its rivers, and the power of water management agencies there is being strengthened. Its air quality laws are less stringent; however, authorities
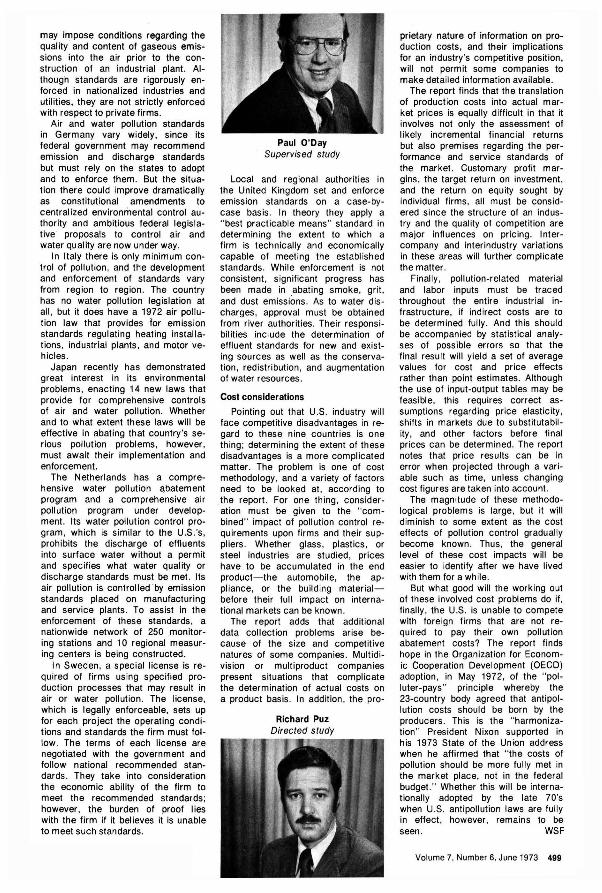
may impose conditions regarding the quality and content of gaseous emissions into the air prior to the construction of an industrial plant. Although standards are rigorously enforced in nationalized industries and utilities, they are not strictly enforced with respect to private firms.
Air and water pollution standards in Germany vary widely , since its federal government may recommend emission and discharge standards but must rely on the states to adopt and to enforce them . But the situation there could improve dramatically as constitutional amendments to centralized environmental control authority and ambitious federal legislative proposals to control air and water quality are now under way.
In Italy there is only minimum control of pollution, and the development and enforcement of standards vary from region to region. The country has no water pollution legislation at all , but it does have a 1972 air pollu tion law that provides ior emission standards regulating heating installations , industrial plants, and motor vehicles .
Japan recently has demonstrated great interest in its environmental problems, enacting 14 new laws that provide for comprehensive controls of air and water pollution. Whether and to what extent these laws will be effective in abating that country's serious pollution problems, however, must await their implementation and enforcement.
The Netherlands has a comprehensive water pollution abatement program and a comprehensive air pollution program under development. Its water pollution control program, which is similar to the U.S.'s, prohibits the discharge of effluents into surface water without a permit and specifies what water quality or discharge standards must be met. Its air pollution is controlled by emission standards placed on manufacturing and service plants. To assist In the enforcement of these standards , a nationwide network of 250 monitoring stations and 10 regional measuring centers is being constructed.
In Sweden, a special license is required of firms using specified production processes that may result in air or water pollut ion. The license, which is legally enforceable, sets up for each project the operating conditions and standards the firm must follow. The terms of each license are negotiated with the government and follow national recommended standards . They take into consideration the economic ability of the firm to meet the recommended standards; however, the burden of proof lies with the firm if it believes it is unable to meet such standards.
Pauf O'Oay Supervised study
Local and regional authorities in the United Kingdom set and enforce emission standards on a case-bycase basis. In theory they apply a "best practicable means" standard in determining the extent to which a firm is technically and economically capable of meeting the established standards. While enforcement is not consistent , significant progress has been made in abating smoke, grit , and dust emissions . As to water discharges , approval must be obtained from river authorities . Their responsibilities include the determination of effluent standards for new and existing sources as well as the conservation, redistribution, and augmentation of water resources .
Cost considerations
Pointing out that U.S. industry will face competitive disadvantages in regard to these nine countries is one thing ; determining the extent of these disadvantages is a more complicated matter. The problem is one of cost methodology, and a variety of factors need to be looked at, according to the report. For one thing, consideration must be given to the "com bined" impact of pollution control requirements upon firms and their suppliers. Whether glass, plastics , or steel industries are studied, prices have to be accumulated in the end product-the automobile, the appliance, or the building materialbefore their full impact on international markets can be known .
The report adds that additional data collection problems arise because of the size and competitive natures of some companies. MultidivISion or multiproduct companies present situations that complicate the determination of actual costs on a product basis. In addition , the pro-
Richard Puz Directed study
prietary nature of information on production costs. and their implications for an industry 's competitive position. will not permit some companies to make detailed information available.
The report finds that the translation of production costs into actual market prices is equally difficult in that it involves not only the assessment of likely incremental financial returns but also premises regarding the performance and service standards of the market. Customary profit margins. the target return on investment, and the return on equity sought by individual firms . all must be considered since the structure of an industry and the quality of competition are major influences on pricing. Intercompany and interindustry variations in these areas will further complicate the matter.
Finally, pollution-related material and labor inputs must be traced throughout the entire industrial infrastructure, if indirect costs are to be determined fully. And this should be accompanied by statistical analyses of possible errors so that the final result will yield a set of average values for cost and price effects rather than point estimates. Although the use of input-output tables may be feasible. this requires correct assumptions regarding price elasticity. shifts in markets due to substitutability , and other factors before final prices can be determined. The report notes that price results can be in error when projected through a variable such as time. unless changing cost figures are taken into account.
The magnitude of these methodological problems is large, but it will diminish to some extent as the cost effects of pollution control gradually become known . Thus, the general level of these cost impacts will be easier to identify after we have lived with them for a while.
But what good will the working out of these involved cost problems do if. finally, the U.S. is unable to compete with foreign firms that are not required to pay their own pollut ion abatement costs? The report finds hope in the Organization for Economic Cooperation Development (OECD) adoption , in May 1972, of the " polluter-pays " principle whereby the 23-country body agreed that antipollution costs should be born by the producers . This is the "harmonization" President Nixon supported in his 1973 State of the Union address when he affirmed that "the costs of pollution should be more fully met in the market place. not in the federal budget." Whether this will be internationally adopted by the late 70's when U.S. antipollution laws are fully in effect, however, remains to be seen. WSF
Volume 7, Number 6, June 1973 499
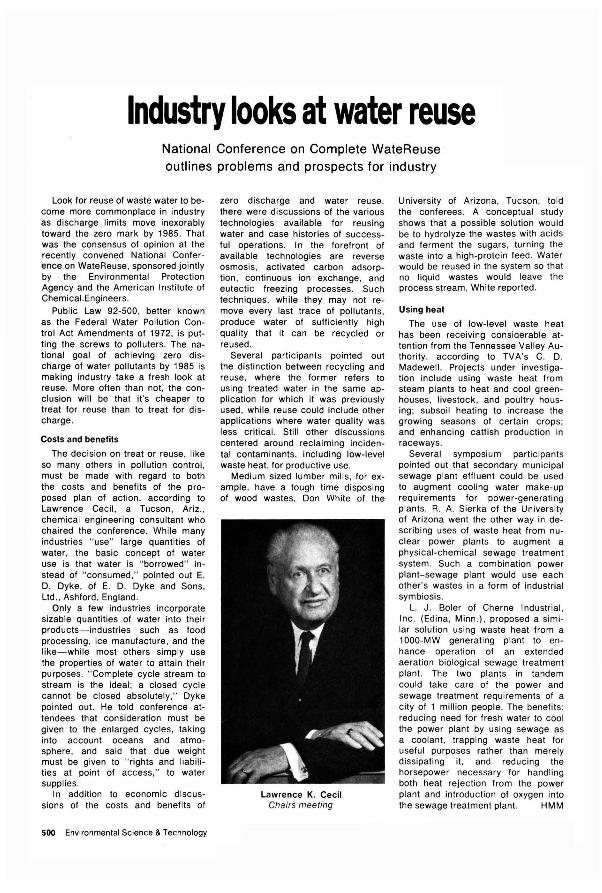
Industry looks at water reuse National Conference on Complete WateReuse outlines problems and prospects for industry
Look for reuse of waste water to become more commonplace in industry as discharge limits move inexorably toward the zero mark by 1985. That was the consensus of opinion at the recently convened National Conference on WateReuse, sponsored jointly by the Environmental Protection Agency and the American I nstitute of Chemical.Engineers.
Public Law 92-500, better known as the Federal Water Pollution Control Act Amendments of 1972, is putting the screws to polluters. The national goal of achieving zero discharge of water pollutants by 1985 is making industry take a fresh look at reuse. More often than not, the conclusion will be that it's cheaper to treat for reuse than to treat for discharge.
Costs and benefits
The decision on treat or reuse, like so many others in pollution control, must be made with regard to both the costs and benefits of the proposed plan of action, according to Lawrence Cecil , a Tucson, Ariz., chemical engineering consultant who chaired the conference. While many industries " use" large quantities of water, the basic concept of water use is that water is "borrowed" instead of " consumed ," pointed out E. D. Dyke, of E. D. Dyke and Sons, Ltd ., Ashford, England.
Only a few industries incorporate sizable quantities of water into their products-industries such as food processing, ice manufacture , and the like-while most others simply use the properties of water to attain their purposes. "Complete cycle stream to stream is the ideal; a closed cycle cannot be closed absolutely," Dyke pointed out. He told conference attendees that consideration must be given to the enlarged cycles, taking into account oceans and atmosphere, and said that due weight must be given to " rights and liabilities at point of access, " to water supplies.
I n addition to economic discussions of the costs and benefits of
500 Environmental Science & Technology
zero discharge and water reuse, there were discussions of the various technologies available for reusing water and case histories of successful operations. In the forefront of available technologies are reverse osmosis, activated carbon adsorption , continuous ion exchange, and eutectic freezing processes. Such techniques, while they may not remove every last trace of pollutants, produce water of sufficiently high quality that it can be recycled or reused.
Several participants pointed out the distinction between recycling and reuse , where the former refers to using treated water in the same application for which it was previously used , while reuse could include other applications where water quality was less critical. Still other discussions centered around reclaiming incidental contaminants, including low-level waste heat, for productive use.
Medium sized lumber mills, for example , have a tough time disposing of wood wastes, Don White of the
Lawrence K. Cecil Chairs meeting
University of Arizona, Tucson , told the conferees. A conceptual study shows that a possible solution would be to hydrolyze the wastes with acids and ferment the sugars, turning the waste into a high-protein feed . Water would be reused in the system so that no liquid wastes would leave the process stream, White reported.
Using heat
The use of low-level waste heat has been receiving considerable attention from the Tennessee Valley Authority, according to TVA's C. D. Madewell. Projects under investigation include using waste heat from steam plants to heat and cool greenhouses, livestock , and poultry housing; subsoil heating to increase the growing seasons of certain crops; and enhancing catfish production in raceways.
Several symposium participants pointed out that secondary municipal sewage plant effluent could be used to augment cooling water make-up requirements for power-generating plants. R. A. Sierka of the University of Arizona went the other way in describing uses of waste heat from nuclear power plants to augment a physical-chemical sewage treatment system. Such a combination power plant-sewage plant would use each other's wastes in a form of industrial symbiosis.
L. J . Boler of Cherne Industrial , Inc . (Edina, Minn .) , proposed a similar solution using waste heat from a 1000-MW generating plant to enhance operation of an extended aeration biological sewage treatment plant. The two plants in tandem could take care of the power and sewage treatment requirements of a city of 1 million people. The benefits: reducing need for fresh water to cool the power plant by using sewage as a coolant, trapping waste heat for useful purposes rather than merely dissipating it , and reducing the horsepower necessary for handling both heat rejection from the power plant and introduction of oxygen into the sewage treatment plant. HMM
The National Bureau of Standards makes exacting demands. So when they needed 400 cylinders of specialty gases for air pollution control work, Linde delivered. The National Bureau of Standards measured and certified the contents of these 400 cylinders and they are being used as a benchmark for specialty gases to be used in air pollution control.
If you would like to know how to obtain these -------------------------, S d d G f A . E .. A I . UNION CARBIDE CORPORATION
tan ar ases or utomotIve missIOns na ySIS, LINDE DIVISION, Dept. LB-EST.6 just write the Office of Standard Reference Materials, National Bureau of Standards, Washington, D.C. 20234. Ask for SRM 1665-1669 and SRM 1673-1675.
Whatever your specialty gas needs, you'll find that Linde measures up. For a free copy of our 108-page "Linde Specialty Gas Catalog," simply send in the coupon below .
•
GAS . • :, PRODUCTS
270 Park Avenue, New York, New York 10017
Gentlemen: Please send your 108 page catalog on specialty gases.
NAME
TITLE
COMPANY ______________________ ___
ADDRESS ________________________ _
CITY ___________ STATE __ ZII' __ Linde is a registered trademark of Union Carbide Corporation. _________________________ _
Circle HI. 25 ,. Readers' Stnice Cud
Volume 7, Number 6, June 1973 501
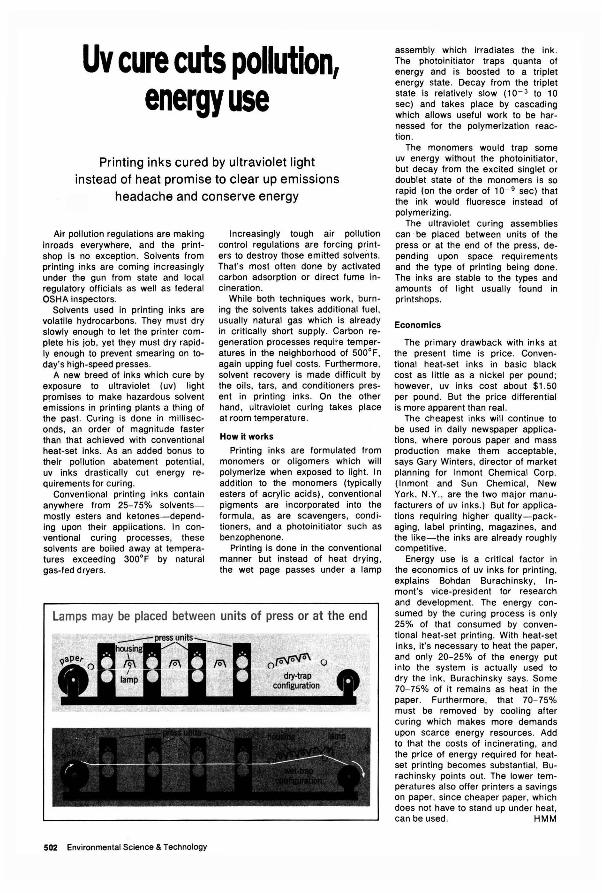
Uv cure cuts pollution, energy use
Printing inks cured by ultraviolet light instead of heat promise to clear up emissions
headache and conserve energy
Air pollution regulations are making inroads everywhere, and the printshop is no exception . Solvents from printing inks are coming increasingly under the gun from state and local regulatory officials as well as federal OSHA inspectors.
Solvents used in printing inks are volatile hydrocarbons. They must dry slowly enough to let the printer complete his job, yet they must dry rapidly enough to preven't smearing on today's high-speed presses.
A new breed of inks which cure by exposure to ultraviolet (uv) light promises to make hazardous solvent emissions in printing plants a thing of the past. Curing is done in milliseconds, an order of magnitude faster than that achieved with conventional heat-set inks. As an added bonus to their pollution abatement potential , uv inks drastically cut energy requirements for curing.
Conventional printing inks contain anywhere from 2S-7S% solventsmostl'y esters and ketones-depending upon their applications. In conventional curing processes, these solvents are boiled away at temperatures exceeding 300°F by natural gas-fed dryers.
Increasingly tough air pollution control regulations are forcing printers to destroy those emitted solvents. That's most often done by activated carbon adsorption or direct fume incineration .
While both techniques work , burning the solvents takes additional fuel , usually natural gas which is already in critically short supply. · Carbon regeneration processes require temperatures in the neighborhood of SOOoF, again upping fuel costs. Furthermore. solvent recovery is made difficult by the oils, tars, and conditioners present in printing inks. On the other hand, ultraviolet curing takes place at room temperature.
Howi! works
Printing inks are formulated from monomers or oligomers which will polymerize when exposed to light. In addition to the monomers (typically esters of acrylic acids), conventional pigments are incorporated into the formula, as are scavengers, conditioners, and a photoinitiator such as benzophenone.
Printing is done in the conventional manner but instead of heat drying , the wet page passes under a lamp
Lamps may be placed between units of press or at the end
502 Environmental Science & Technology
assembly which irradiates the ink. The photoinitiator traps quanta of energy and is boosted to a triplet energy state. Decay from the triplet state is relatively slow (10- 3 to 10 sec) and takes place by cascading which allows useful work to be harnessed for the polymerization reaction.
The monomers would trap some uv energy without the photoinitiator, but decay from the excited singlet or doublet state of the monomers is so rapid (on the order of 10- 9 sec) that the ink would fluoresce instead of polymerizing.
The ultraviolet curing assemblies can ' be placed between units of the press or at the end of the press, depending upon space requirements and the type of printing being done. The inks are stable to the types and amounts of light usually found in printshops.
Economics
The primary drawback with inks at the present time is price. Conventional heat-set inks in basic black cost as little as a nickel per pound; however, uv inks cost about $1 .50 per pound. But the price differential is more apparent than real.
The cheapest inks will continue to be used in daily newspaper applications, where porous paper and mass production make them acceptable, says Gary Winters, director of market planning for Inmont Chemical Corp. (Inmont and Sun Chemical , New York , N.Y., are the two major manufacturers of uv inks.) But for applications requiring higher quality-packaging, label printing, magazines, and the like-the inks are already roughly competitive.
Energy use is a critical factor in the economics of uv inks for printing, explains Bohdan Burachinsky, Inmont's vice-president for research and development. The energy consumed by the curing process is only 2S% of that consumed by conventional heat-set printing . With heat-set inks, it's necessary to heat the paper, and only 20-2S% of the energy put into the system is actually used to dry the ink, Burachinsky says. Some 70-7S% of it remains as heat in the paper. Furthermore, that 70-7S% must be removed by cooling after curing which makes more demands upon scarce energy resources . Add to that the costs of incinerating, and the price of energy required for heatset printing becomes substantial , Burachinsky points out. The lower temperatures also offer printers a savings on paper, since cheaper paper, which does not have to stand up under heat, can be used . HMM
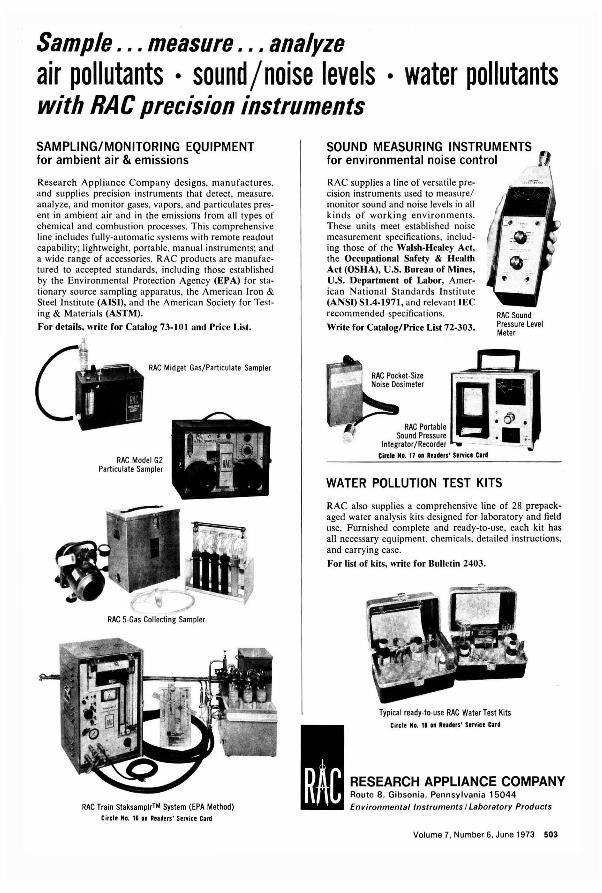
Sample . .. measure . .. analyze air pollutants · sound / noise levels · water pollutants with RAC precision instruments SAMPLING/MONITORING EQUIPMENT for ambient air & emissions
Research Appliance Company designs, manufactures. and supplies precision instruments that detect, measure. analyze, and monitor gases. vapors, and particulates present in ambient air and in the emissions from all types of chemical and combustion processes. This comprehensive line includes fully-automatic systems with remote readout capability; lightweight , portable. manual instruments; and a wide range of accessories. RAC products are manufactured to accepted standards, including those established by the Environmental Protection Agency (EPA) for stationary source sampling apparatus, the American Iron & Steel Institute (AISI), and the American Society for Testing & Materials (ASTM).
For details, write for Catalog 73-10 I and Price List.
RAC Midget Gas/Particulate Sampler
RAC Model G2 Particulate Sampler
RAC 5-Gas Collecting Sampler
RAC Train Staksamplr™ System (EPA Method) Circle No. 16 on Ruders' Service Card
SOUND MEASURING INSTRUMENTS for environmental noise control
RAC supplies a line of versatile precision instruments used to measure/ monitor sound and noise levels in all kinds of working environments. These units meet established noise measurement specifications. including those of the Walsh-Healey Act, the Occupational Safety & Health Act (OSHA), U.S. Bureau of Mines, U.S. Department of Labor, American National Standards Institute (ANSI) S1.4-1971, and relevant IEC recommended specifications.
Write for Catalog/Price List 72·303. RAC Sound Pressure Level Meter
g-- :61. RAC Portable I!!!I
Integ~~~r~~~~~~~~~ - --- • - -'; -Cirel. No. 17 •• Readers' Senice Clr~
WATER POLLUTION TEST KITS
RAC also supplies a comprehensive line of 28 prepack· aged water analysis kits designed for laboratory and field use. Furnished complete and ready-to-use, each kit has all necessary equipment. chemicals. detailed instructions, and carrying case.
For list of kits. write for Bulletin 2403.
Typical ready-to-use RAe Water Test Kits
Circle No. 11 In Reders' Service Car"
RESEARCH APPLIANCE COMPANY Route 8. Gibsonia, Pennsylvania 15044
IIIYI ... fnv;ronmentallnstruments / Laboratory Products
Volume 7. Number 6, June 1973 503
Rendering plants produce a variety of odorous emissions, depending on the types of raw material and process equipment used. Although both batch arid continuous rendering processes are in use, the latter are becoming more popular for economic reasons , especially for new installations. Modern continuous rendering plants generally emit less odor than established installations because they feature enclosed material handling systems. In addition, odor abatement equipment is frequently an integral part of the total plant package.
Without controls, rendering plant odors have been reported discernible at distances up to 20 miles from the source. Unfavorable atmospheric conditions serve to magnify the problem so that a serious public nuisance develops, as evidenced by the number of complaints received by air pollution control offices both in the U.S. and abroad .
As of January 1969, there were about 850 domestic rendering plants owned by some 772 firms (Table 1) . Approximately 460 of the total were operated by independent animal renders , 330 were controlled by the meat packing and poultry dressing industries, and the remaining 60 were owned by concerns with a variety of other interests. Some 275 of the plants controlled by meat packers also produce edible rendering products in separate locations at the same plant. There were 93 plants processing fish products and 11 feather mills not included in the above totals drawn from the most recent data available.
It is estimated that 20 new rendering plants will be installed in the U.S. each year. Virtually all will be replacement plants, and most will probably be of the continuous process type rather than of the older batch process tech nology.
All rendering plants, inedible grease and tallow producing works, and manufacturers and processors of animal and fish oil and by-product meal are in standard industrial classification (SIC) 2094. Processing of poultry wastes, including feather drying, logically falls in this category. Meat packing plants and captive or contract slaughtering houses (small game, on-premises canning and curing, and sausage and lard production excluded) are in SIC 2011. Although this includes abattoirs, blood meal production, and by-product hides, its primary group is food for human consumption and prepared feeds for animals and poultry.
The U.S. Environmental Protection Agency (EPA) is considering the development of standards of performance for new rendering plants in compliance with the Clean Air Act of 1970. The Act requires any control regulations to represent the best demonstrated technology, taking costs into consideration. One of the probable standards would be to limit the concentration of undiluted odors emitted from certain process equipment in any new or substantially modified rendering plant to no more than 200 odor units per standard cubic foot (ou / scf). An odor unit is defined as the quantity of any single odorous substance or a combination of substances which, when completely dispersed in 1 ft3 of odor-free air, is detectable by a median number of observers in a panel of eight or more persons. the odor concentration is determined by a modification of the ASTM D1391-57 observer panel technique which, in its present form, allows optional approaches to sampling and dilution.
A standard of 200 ou/ scf allows for increased odor levels which may result from substitution of distillate fuel oil when natural gas is unavailable for firing afterburners. Odor levels from oil combustion are usually slightly greater than those from burning natural gas. Because odor strength is so intrinsically related to the olfactory sensitivity of the "smeller," it is difficult to define the intensity of the proposed standard for any single individual. The vari-
504 Environmental Science & Technology
FEATURE
Odor controls for rendering plants
Methods for curbing odorous emissions
are used with varying degrees of success;
without controls, rendering plant
odors can be discernible at distances
up to 20 miles from the source
Robert M. Bethea Texas Tech University Lubbock, Tex. 79409
Belur N. Murthy Environmental Protection Agency
Research Triangle Park, N. C. 27711
Donald F. Carey Environmental Protection Agency
Washington , D.C. 20460
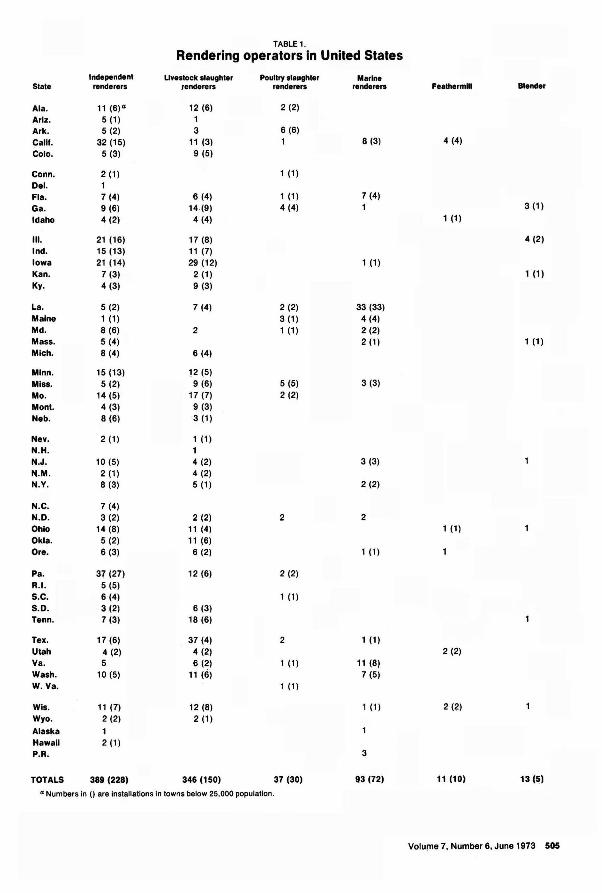
TABLE 1.
Rendering operators in United States
Independent Uv.llock sI.ughter Poullry ,laughter Marine Slale renderers ,enderers r.nd.,. ... rendere,. F •• lhermll Blender
Ala. 11 (6)a 12 (6) 2 (2)
Ariz. 5 (1) 1
Ark. 5 (2) 3 6 (6)
Calif. 32 (15) 11 (3) 1 8 (3) 4 (4)
Colo. 5 (3) 9 (5)
Conn. 2 (1) 1 (1)
Del. 1 Fla. 7 (4) 6 (4) 1 (1) 7 (4)
Ga. 9 (6) 14.(9) 4 (4) 1 3 (1)
Idaho 4 (2) 4 (4) 1 (1)
III. 21 (16) 17 (8) 4 (2) Ind. 15 (13) 11 (7) Iowa 21 (14) 29 (12) 1 (1) Kan. 7 (3) 2 (1) 1 (1)
Ky. 4 (3) 9 (3)
La. 5 (2) 7 (4) 2 (2) 33 (33) Maine 1 (1) 3 (1) 4 (4) Md. 8 (6) 2 1 (1) 2 (2) Mass. 5 (4) 2 (1) 1 (1) Mich. 8 (4) 6 (4)
Minn. 15 (13) 12 (5)
Miss. 5 (2) 9 (6) 5 (5) 3 (3)
Mo. 14 (5) 17 (7) 2 (2)
Mont. 4 (3) 9 (3) Neb. 8 (6) 3 (1)
Nev. 2 (1) 1 (1) N.H. 1 N.J. 10 (5) 4 (2) 3 (3)
~.M. 2 (1) 4 (2) N.Y. 8 (3) 5 (1) 2 (2)
N.C. 7 (4) N.D. 3 (2) 2 (2) 2 2 Ohio 14 (8) 11 (4) 1 (1) Okla. 5 (2) 11 (6) Ore. 6 (3) 6 (2) 1 (1)
Pa. 37 (27) 12 (6) 2 (2) R.I . 5 (5) S.C. 6 (4) 1 (1) S.D. 3 (2) 6 (3) Tenn. 7 (3) 18 (6)
Tex. 17 (6) 37 (4) 2 1 (1) Utah 4 (2) 4 (2) 2 (2) Va. 5 6 (2) 1 (1) 11 (8) Wash. 10 (5) 11 (6) 7 (5) W. Va. 1 (1)
Wis. 11 (7) 12 (8) 1 (1) 2 (2)
Wyo. 2 (2) 2 (1)
Alaska 1 HawaII 2 (1) P.R. 3
TOTALS 389 (228) 346 (150) 37 (30) 93 (72) 11 (10) 13 (5)
a Numbers In () are Installations in towns below 25,000 population.
Volume 7, Number 6, June 1973 505
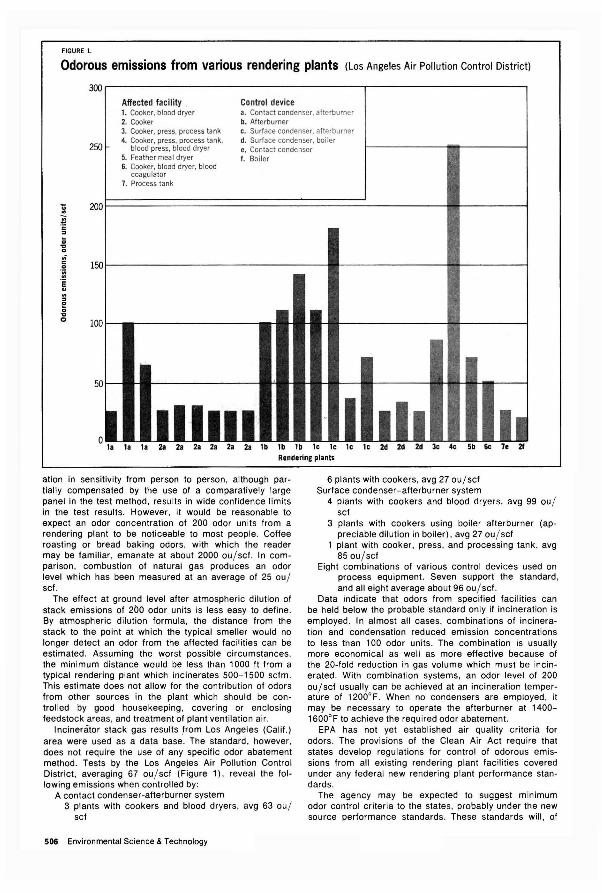
FIGURE 1.
Odorous emissions from various rendering plants (Los Angeles Air Pollution Control District)
300 Affected facility Control device 1. Cooker, blood dryer a. Contact condenser, afterburner 2. Cooker b. Afterburner 3. Cooker, press, process tank c. Surface condenser, afterburner
250 4. Cooker, press, process tank,
blood press, blood dryer d. Surface condenser, boiler e. Contact condenser
5. Feather meal dryer 6. Cooker, blood dryer, blood
coagula tor 7. Process tank
f. Boiler
:.: 200~===========================~----
~ " ;; ... o ,;; c
.~
.~
IWr----------------
.. " !! o ... o lOa
50
a 1. 1. 1. 2a 2a 2a 2. 2a 2a lb lb lb Ie Ie Ie Ie 2d 2d 2d 3e 4e Rendering plants
ation in sensitivity from person to person, although partially compensated by the use of a comparatively large panel in the test method, results in wide confidence limits in the test results. However, it would be reasonable to expect an odor concentration of 200 odor units from a rendering plant to be noticeable to most people. Coffee roasting or bread baking odors, with which the reader may be familiar, emanate at about 2000 ou/ scf . In comparison, combustion of natural gas produces an odor level which has been measured at an average of 25 ou/ scf.
The effect at ground level after atmospheric dilution of stack emissions of 200 odor units is less easy to define. By atmospheric dilution formula, the distance from the stack to the point at which the typical smeller would no longer detect an odor from the affected facilities can be estimated. Assuming the worst possible circumstances, the minimum distance would be less than 1000 ft from a typical rendering plant which incinerates 500-1500 scfm. This estimate does not allow for the contribution of odors from other sources in the plant which should be controlled by good housekeeping, covering or enclosing feedstock areas, and treatment of plant ventilation air .
Incinerator stack gas results .from Los Angeles (Cali!.) area were used as a data base. The standard , however, does not require the use of any specific odor abatement method. Tests by the Los Angeles Air Pollution Control District, averaging 67 ou / scf (Figure 1) , reveal the following emissions when controlled by:
A contact condenser-afterburner system 3 plants with cookers and blood dryers, avg 63 ou /
scf
506 Environmental Science & Technology
6 plants with cookers, avg 27 ou / scf Surface condenser-afterburner system
4 plants with cookers and blood dryers, avg 99 ou / scf
3 plants with cookers using boiler afterburner (appreciable dilution in boiler), avg 27 ou / scf
1 plant with cooker , press, and processing tank , avg 850u / scf
Eight combinations of various control devices used on process equipment. Seven support the standard, and all eight average about 96 ou / sct.
Data indicate that odors from specified facilities can be held below the probable standard only if incineration is employed. In almost all cases, combinations of incineration and condensation reduced emission concentrations to less than 100 odor units. The combination is usually more economical as well as more effective because of the 20-fold reduction in gas volume which must be incinerated. With combination systems, an odor level of 200 ou/scf usually can be achieved at an incineration temperature of 1200°F. When no condensers are employed, it may be necessary to operate the afterburner at 1400-1600°F to achieve the required odor abatement.
EPA has not yet established air quality criteria for odors. The provisions of the Clean Air Act require that states develop regulations for control of odorous emissions from all existing rendering plant facilities covered under any federal new rendering plant performance standards.
The agency may be expected to suggest minimum odor control criteria to the states, probably under the new source performance standards. These standards will, of
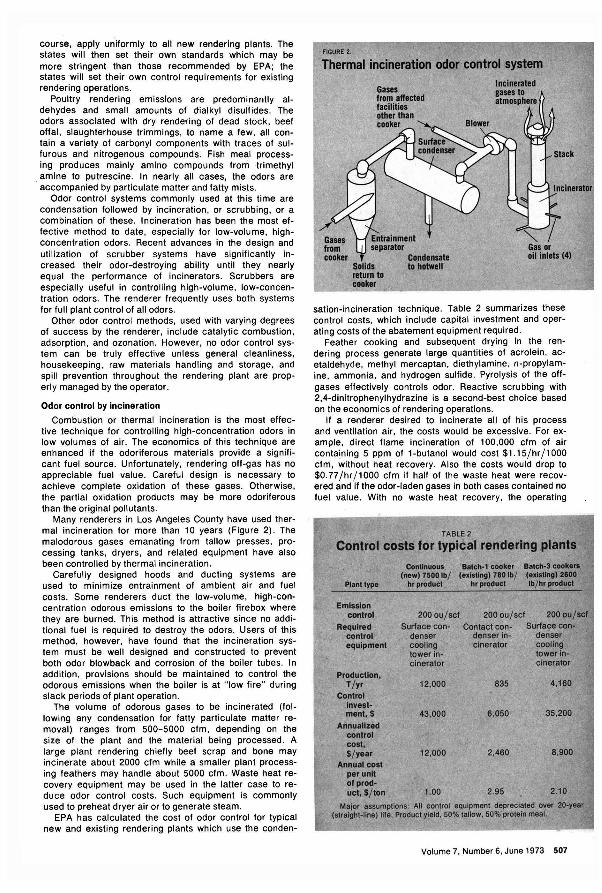
course, apply uniformly to ali new rendering plants. The states will . then set their own standards which may be more stringent than those recommended by EPA; the states will set their own control requirements for existing rendering operations.
Poultry rendering emissions are predominantly aldehydes and small amounts of dialkyl disulfides. The odors associated with dry rendering of dead stock, beef offal, slaughterhouse trimmings, to name a few, all contain a variety of carbonyl components with traces of sUlfurous and nitrogenous compounds. Fish meal processing produces mainly amino compounds from trimethyl amine to putrescine. In nearly all cases, the odors are accompanied by particulate matter and fatty mists.
Odor control systems commonly used at this time are condensation followed by incineration, or scrubbing, or a combination of these. Incineration has been the most effective method to date. especially for low-volume, highconcentration odors. Recent advances in the design and utilization of scrubber systems have significantly increased their odor-destroying ability until they nearly equal the performance of incinerators. Scrubbers are especially useful in controlling high-volume, low-concentration odors. The renderer frequently uses both systems for full plant control of all odors.
Other odor control methods, used with varying degrees of success by the renderer, include catalytic combustion, adsorption, and ozonation. However, no odor control system can be truly effective unless general cleanliness, housekeeping, raw materials handling and storage. and spill prevention throughout the rendering plant are properly managed by the operator.
Odor control by incineration
Combustion or thermal incineration is the most effective technique for controlling high-concentration odors in low volumes of air. The economics of this technique are enhanced if the odoriferous materials provide a significant fuel source. Unfortunately, rendering off-gas has no appreciable fuel value. Careful design is necessary to achieve complete oxidation of these gases. Otherwise, the partial oxidation products may be more odoriferous than the original pollutants.
Many renderers in Los Angeles County have used thermal incineration for more than 10 years (Figure 2). The malodorous gases emanating from tallow presses, processing tanks, dryers, and related equipment have also been controlled by thermal incineration.
Carefully designed hoods and ducting systems are used to minimize entrainment of ambient air and fuel costs. Some renderers duct the low-volume, high-concentration odorous emissions to the boiler firebox where they are burned. This method is attractive since no additional fuel is required to destroy the odors. Users of this method, however, have found that the incineration system must be well designed and constructed to prevent both odor blowback and corrosion of the boiler tubes. In addition, provisions should be maintained to control the odorous emissions when the boiler is at "low fire" during slack periods of plant operation.
The volume of odorous gases to be incinerated (following any condensation for fatty particulate matter removal) ranges from 500-5000 cfm, depending on the size of the plant and the material being processed. A large plant rendering chiefly beef scrap and bone may incinerate about 2000 cfm while a smaller plant processing feathers may handle about 5000 cfm. Waste heat recovery equipment may be used in the latter case to reduce odor control costs. Such equipment is commonly used to preheat dryer air or to generate steam.
EPA has calculated the cost of odor control for typical new and existing rendering plants which use the conden-
FIGURE 2.
Thermal incineration odor' control system
Gases from cooker
Solids murn to cooker
Incinelllted lases to atmosphere
sat ion-incineration technique. Table 2 summarizes these control costs. which include capital investment and operating costs of the abatement equipment required.
Feather cooking and subsequent drying in the rendering process generate large quantities of acrolein, acetaldehyde. methyl mercaptan, diethylamine. n-propylamine, ammonia, and hydrogen sulfide. Pyrolysis of the offgases effectively controls odor. Reactive scrubbing with 2,4-dinitrophenylhydrazine is a second-best choice based on the economics of rendering operations.
If a renderer desired to incinerate ali of his process and ventilation air, the costs would be excessive. For example, direct flame incineration of 100,000 cfm of air containing 5 ppm of 1-butanol would cost $1.15/hr/l000 cfm, without heat recovery. Also the costs would drop to $0.77/hr/l000 cfm if half of the waste heat were recovered and if the odor-laden gases in both cases contained no fuel value. With no waste heat recovery, the operating
TABLE 2
Control costs for typical rendering plants ConUnuous. Batcll-1 cooker
(new) 75001b/ ( .... tIng) 780 Ib/ pt.nttype hrplOduct hrproduct
Emission control 2000u/scf 2000u/scf 2ooou/scf
Required Surface con- Contact con- Surface con-control denser denser in- denser equipment cooling cinerator cooling'
tower in- tower in-cinerator cineralOr
Production. .T/yr 12,000 a35 4,160
Control Invest-ment •. S 43,000 6.050 35,200
Annualized control cost. S/year 12,000 2,460 8,900
Annual cost perunlt of prod-
2.95 uct. S/lOn 1.00 2.10
Major assumptions: All control eqUipment depreciated over 2O-year (straight-line) IWe. Product yield, 50% tallow, 50%' protein meal.
Volume 7. Number 6. June 1973 507
cost of direct-flame afterburners for controlling rendering plant odors was $0.64/ hr / 1000 cfm. However, this amount could be decreased to $0.27 / hr / 1000 cfm with proper heat exchange equipment.
Odor control by catalytic oxidation ·
Catalytic oxidation has the advantage of operating at lower temperatures and thus with a lower fuel cost than thermal incineration, but neither process is economical for heating large volumes of essentially zero Btu of air. In addition, catalytic oxidation requires a suitable catalyst which will be unaffected by either particulate matter or sulfur compounds. For efficient and economical control of odors by incineration, odor sources should be isolated; their emissions should be treated separately and not mixed with ventilation air.
Catalytic oxidation has not become popular in the rendering industry despite the obvious advantage of using
less fuel. The higher investment cost over a simple thermal incinerator is discouraging. The major deterrents, however, have been rapid catalyst poisoning with subsequent loss of activity and the inability to destroy rendering odors at temperatures lower than 1200°F. These conditions have made installations of catalytic afterburners in the Los Angeles area unsuccessful. Within a relatively short time, such installations have had to be operated like direct-fired afterburners at 1200°F or more. The Los Angeles County Air Pollution Control District states that direct-fired afterburners are ordinarily installed to incinerate smoke and organic aerosols that are difficult to burn . Emissions of this type are typical of rendering plants.
Wet scrubbing
Odor removal by gas scrubbing with water has problems as a control technique. Too many of the components already identified in rendering odors are essentially
508 Environmental Science & Technology
insoluble in water. Even if a suitable universally effective scrubbing solution could be found, the odor would merely be concentrated in the liquid phase and thus become a potential water pollution problem. Odor removal by wet scrubbing is a function of the residence time of the odorladen air in the scrubber, the available contact area, the solubility of the odorant in the water , and the concentration of the odor in the inlet gas stream.
Reactive scrubbing, as all types of chemical removal, requires that the contacting operation either yield inert precipitates upon reaction or form easily removable , nonodorous complexes. All such reaction products must then be amenable to the usual waste water treatment methods for proper disposal . Other problems are corrosion of the equipment, the necessity for maintaining the minimum effective concentration in the scrubbing fluid at all times, and considerable reagent costs. Examples of potential scrubbing reagents are KMn04, NaCIO, NaHS03, lime water, C1 2, and CI02; however, no single scrubbing reagent can effectively remove all the odorous compounds from meat or poultry rendering plants.
Rationale and criteria associated with designing effective reactive scrubbing systems for controlling rendering plant odors include preconditioning of air to remove particulate matter, removal of insoluble components by condensation or adsorption, and other steps for operational improvement of odor control scrubbers. There is also a need for low- to medium-pressure drop venturi scrubbers for gross particulate matter removal. (Removal of fine particles carrying odors requires high-energy (pressure drop) scrubbers, which are usually the venturi type.) Particulate matter can also be removed by a wide variety of wet collectors and impingement devices. Demisters prevent contact tower plugging by particulate-laden gas.
For five scrubber systems evaluated, the total operating costs were approximately $0.10/ hr / 1000 acfm; the air flows involved were 21,000-55 ,000 acfm. Approximatelya 1 OO-fold reduction in odor levels was achieved.
A Canadian rendering plant equipped with such a system was tested by EPA using modified ASTM D-1391-57 odor concentration determination methods. The scrubber inlet odor concentration ranged from 50,000-77,000 ou / scf, while the outlet concentration was 10-40 ou / sct. Sodium hypochlorite solution was used in a packed tower following a once-through venturi scrubber supplied with river water. An overall pressure drop of 10 in. of water was observed . About 10,000 cfm of the total 32,000 cfm handled was process air, largely from the blood and feather dryers; the remainder was ventilation air.
This particulate installation would be able to meet the EPA-proposed rendering plant standard of 200 ou/ scf , which requires that any dilution air must be taken into account. In this case the equivalent odor concentration would be about 128 ou / scf.
The initial operation of this scrubber used potassium permanganate as the oxidizing agent in the packed tower. The subsequent substitution of the sodium hypoChlorite reduced chemical costs and achieved slightly greater odor abatement. In addition, the earlier manganese dioxide residue removal problem was eliminated.
A comparison of several aqueous reagents for scrubbing indicated that, while potassium permanganate was uniformly effective in chemically oxidizing all the odoriferous substances, specific compounds were more efficiently removed by reagents depending on functional group reactions. The most effective reagents for amines, mercaptans, and aldehydes were , respectively, hydrochloric (or sulfur ic) acid, sodium (or calcium) hydroxide, and sodium (or calcium) bisulfite.
In reducing the odors of aldehydes, ketones, organic acids, and organic nitrogen and sulfur compounds produced during rendering and food processing by 80-98%,
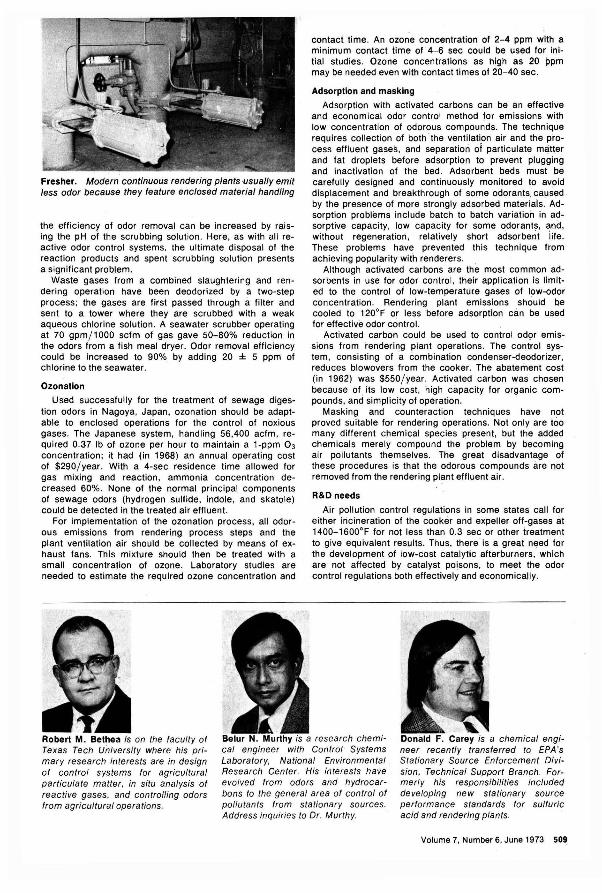
Fresher. Modern continuous rendering plants ·usually emit less odor because they feature enclosed material handling
the efficiency of odor removal can be increased by raising the pH oi the scrubbing solution. Here, as with all reactive odor control systems, the ultimate disposal of the reaction products and spent scrubbing solution presents a significant problem.
Waste gases from a combined slaughtering and rendering operation have been deodorized by a two-step process; the gases are first passed through a filter and sent to a tower where they are scrubbed with a weak aqueous chlorine solution. A seawater scrubber operating at 70 gpm/1000 scfm of gas gave 50-80% reduction in the odors from a fish meal dryer. Odor removal efficiency could be increased to 90% by adding 20 ± 5 ppm of chlorine to the seawater.
Ozonation
Used successfully for the treatment of sewage digestion odors in Nagoya, Japan, ozonation should be adaptable to enclosed operations for the control of noxious gases. The Japanese system, handling 56,400 acfm, required 0.37 Ib of ozone per hour to maintain a 1-ppm 0 3 concentration; it had (in 1968) an annual operating cost of $290/ year. With a 4-sec residence time allowed for gas mixing and reaction, ammonia concentration decreased 60%. None of the normal principal components of sewage odors (hydrogen sulfide, indole, and skatole) could be detected in the treated air effluent.
For implementation of the ozonation process , all odorous emissions from rendering process steps and the plant ventilation air should be collected by means of exhaust fans. This mixture should then be treated with a small concentration of ozone. Laboratory studies are needed to estimate the required ozone concentration and
contact time. An ozone concentration of 2-4 ppm with a minimum contact iime of ' 4-6 sec could be used for initial studies. Ozone concentrations as high as 20 ppm may be needed even with contact times of 20-40 sec.
Adsorption and masking
Adsorption with activated carbons can be an effective and economical odor control method for emissions with low concentration of odorous compounds. The technique requires collection of both ' the ventilation air and the process effluent gases, and separaiion oi particulate matter and fat droplets before adsorption to prevent plugging and inactivation of the bed. Adsorbent beds must be carefully designed and continuously monitored to avoid displacement and breakthrough of some odorants. caused by the presence of more strongly adsorbed materiais. Adsorption problems include batch to batch variation in adsorptive capacity, low capacity for some odorants, and, without regeneration, relatively short adsorbent life. These problems have prevented this technique from achieving popularity wiih renderers. .
Although activated carbons are the most common adsorbents in use for odor control, their application is limited to the control of low-temperature gases of low-odor concentration . Rendering plant emissions should pe cooled to 120°F or less before adsorption can be used for effective odor control.
Activated carbon could be used to control odor emis, sions from rendering plant operations. The control system, consisting of a combination condenser-deodorizer , reduces blowovers from the cooker. The abatement cost (in 1962) was $550/ year. Activated carbon was chosen because of its low cost, high capacity for organic compounds, and simplicity of operation.
Masking and counteraction techniques have not proved suitable for rendering operations. Not only are too many different chemical species present, but the added chemicals merely compound the 'problem by becoming air pollutants themselves. The great disadvantage of these procedures is that the odorous compounds are not removed from the rendering plant effluent air .
R&D needs
Air pollution control regulations in some states call for either incineration of the cooker and expeller off-gases at 1400-1600°F for nolless than 0.3 sec or other ireatment to give equivalent results. Thus, there is a great n~ed for the development of low-cost catalytic afterburners, which are not affected by catalyst poisons, to meet the odor control regulations both effectively and economically.
Robert M. Bethea is on the faculty of Texas Tech University where his primary research interests are in design of control systems for agricultural particulate matter, in situ analysis of reactive gases, and controlling odors from agricultural operations.
Belur Murthy is a research chemical engineer with Control ' Systems Laboratory, National Environmental Research Center. His interests have evolved from odors and hydrocarbons to the general area of control of pollutants from stationary sources. Address inquiries to Dr. Murthy.
Donald F. Carey is a chemical engineer recently transferred to EPA's Stationary Source Enforcement Division , Technical Support Branch. Formerly his responsibilities included developing new stationary source performance standards for sulfuric acid and rendering plants.
Volume 7, Number 6, June 1973 509
In the laboratory analysis of ambient air concentrations of NO and NOx nothing compares to the extreme sensitivity and accuracy of our
ModeI12A NO-NOx Chemiluminescent Gas AnaIyzsr ....----:-.-~
~> '~'. ,~
';';". ~ ( i w.! .~ I!!~ 0 ' i. -!
PORTABLE OZONE ANALYZER • EPA Approved Chemilumine •• ent Te.hnique
• Moter Readout • Re.harga.ble Battery or Line Operation
• SeH Contained Refillable Ethylene Supply
• Oete.tion Limit of 1 ppb
• Waigh. less than 15 lb.
• Minimum 8 hour. Operation in Portable Mode
• Re.order Output
Why be limited to measuring Ozone at one fixed location. Now you can lake YOUI measurements at exactly the place that YOU feel is important. All this with absolutely no sacrifice insensitivIty.
ANALYTICAL INSTRUMENT DEVELDPMENT,lNC. 250 South Franklin Street, West Chester, Pa. 19380
Phone: 1215) 692-4575
Cirele MI. 31 I. R •• lltn' S.nici C.rtl
510 Environmental Science & Technology
Another approach to the solution of rendering odor problems is the development and demonstration of regenerable package sorption systems. 'The advantages of such systems are simplicity of operation, applicability to a wide variety of installations, and economic acceptability to small processors. Engineering and economic feasibilities of using the combined adsorptionjregenerationincineration system for rendering plant odor control require detailed investigation, Of particular importance for the successful implementation of sorption systems is the removal of fatty particulate matter from the air and process streams prior to the package adsorption unit. This procedure is necessary to avoid plugging of the bed, thereby lengthening the time between required bed regenerations.
A coordinated research effort is also needed to find a scrubbing chemical or mixture which can be used for the wide variety of odorous compounds present. Sodium bisulfite or calcium perchlorate can be used to control the odors associated with aldehydes; lime water can be used to remove ammonia and mercaptans; hydrogen sulfide can be removed by potassium permanganate or sodium hypochlorite Which are effective oxidants for many other organics. This research should center on finding a scrubbing mixture which is highly effective, inexpensive, regenerable or recyclable, and amenable to standard waste water treatment operations. Concentration(s), pH value, residence time, mass transfer area, and contacting method (packed, spray, or tray tower) should be investigated, A preliminary study of these factors has been included in a research effort , supported by EPA and the Fats and Proteins Research Foundation, which is currently under way at the Research Institute of the Illinois Institute of Technology. The goal of this research is to develop an effective and economical method for rendering plant odor control.
Other possible research areas with potential for achieving economical control of odors from rendering operations are:
• investigation and development of economical, poison-resistant catalysts for application in more attractive catalytic incineration processes
• development of analytical techniques and instrumentation for identification and quantitive evaluation of the level of odorous pollutants in process streams and in effluent streams
• investigation of refrigeration or freezing as a means of minimizing decomposition and odor formation in materials prior to rendering
• study of solvent extraction 01 fats or other low-temperature processes as possible alternates to high-temperature cooking operations
• better housekeeping in plant operations,
Additional reading
Anderson, C, E., Adolf , H. R., "Odor Control in the Rendering and Food Processing Industries," Paper No. 71-22, 64th Annual Meeting, Air Pollution Control Association, Atlantic City, N.J., 1971.
Lundgren, D. A., Rees, L W. , Lehmann, L. D., "Odor Control by Chemical Oxidation: Cost, Efficiency, and Basis for Selection, " Paper No. 72-116, 65th Annual Meeting, Air Pollution Control Association , Miami Beach, Fla., 1972,
Mills, J. L, Danielson, J. A., Smith, L K. , "Control of Odors from Inedible Rendering and Fish Meal Reduction in Los Angeles County," Paper No. 67-10, 60th Annual Meeting, Air Pollution Control Association, Cleveland, Ohio, 1967, Murthy, B, N" "Odor Control by Wet Scrubbing: Selection of Reagents," Paper No, 73-275, 66th Annual Meeting, Air Pollution Control ASSOCiation, Chicago, III., 1973. Yocom, J. E., Duffee, R. A. , "Controlling Industrial Odors," Chem. Eng .. 77 (13),160-8 (1970).
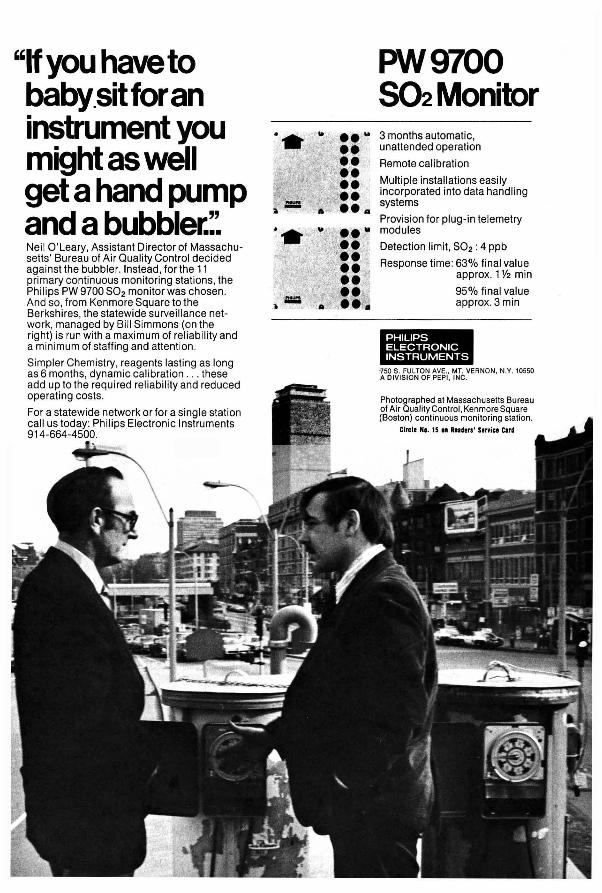
"H you have to baby.sit for an instrument you might as well get a hand pump and a bubbler.:: Neil O'Leary, Assistant Director of Massachusetts' Bureau of Air Quality Control decided against the bubbler. Instead, for the 11 primary continuous monitoring stations, the Philips PW 9700 S02 monitor was chosen . And so, from Kenmore Square to the Berkshires, the statewide surveillance network, managed by Bill Simmons (on the right) is run with a maximum of reliability and a minimum of staffing and attention .
Simpler Chemistry, reagents lasting as long as 6 months, dynamic calibration . .. these add up to the required reliability and reduced operating costs.
For a statewide network or for a single station call us today: Philips Electronic Instruments 914-664-4500.
PW9700 S02Monitor 3 months automatic, unattended operation
Remote calibration
Multiple installations easily incorporated into data handling systems
Provision for plug-in telemetry modules
Detection limit, S02 : 4 ppb
Response time: 63% final value approx. 1 % min
95% final value approx. 3 min
PHILIPS ELECTRONIC INSTRUMENTS
'750 S. FULTON AVE" MT. VERNON. N.Y. 10550 A DIVISION OF PEPI . INC.
Photographed at Massachusetts Bureau of Ai r Quality Control. Kenmore Square (Boston) continuous monitoring station.
Circl. NI. 15 011 Rllders' Service Card
FEATURE
Conserving energy with heat storage wells Charles F. Meyer
General Electric Co., Santa Barbara , Calif. 93102
David K. Todd University of California, Berkeley, Calif. 94705
Electric and gas utilities have embarked upon major campaigns to promote conservation of energy because of public pressure and the short supply of clean fuels. Con· struction of new central-station electric plants has encountered such severe resistance that the prospect of brownouts is very real. Much of this resistance relates to the thermal pollution which results from the need to dispose of roughly two units of low-quality (that is, low-temperature) heat energy for each unit of electrical energy that is generated .
Recent studies at General Electric's Center for Advanced Studies (TEMPO) show that thermal pollution could be greatly reduced and substantial energy conservation could result from large-scale application of a to.talenergy approach under which utilities would produce and market both electricity and useful heat.
Total-energy systems of relatively small capacity are well known. They are becoming popular for industries, apartment buildings, and large commercial complexes. Internal combustion engines, steam turbines, and gas turbines (more precisely, combustion turbines) are used to drive electrical generators. Exhaust heat, supplemented as necessary from auxiliary boilers, supplies steam or hot water for nearby space heating, cooling (via an absorption cycle) , hot water, and process heat requirements. A number of electric utilities are also in the district heating business. Consolidated Edison in New York City serves the largest such load.
This article covers the key question that arises in considering large-scale application of the total-energy approach: Is it feasible to store large amounts of high-quality by-product heat for several months, in order to match the production of the heat to seasonal demand for it? The answer to this question, employing a novel approach, appears to be affirmative .
Storage of relatively small amounts of heat has been accomplished by using hot water tanks, rocks or masonry, and materials that melt or vaporize. However, known methods are too expensive to be attractive for a large total-energy system.
The preliminary analysis described here indicates that large quantities of useful heat may be stored underground in special water weils , with more than three fourths of the heat being recoverable after 90 days. The economics appear quite favorable.
Hydrology and heat loss of a heat-storage well
For purposes of a preliminary analysis of the feasibility of storing heat underground, a 40,000 gph well was theoretically considered. Equivalent to about 1 mgd, this moderately large well is assumed to be roughly 500 ft deep, with the lower 100 ft penetrating a confined aquifer (Figure 1).
512 Environmental Science & Technology
The hydrology and the heat losses were examined for a 90-day cycle of hot water injection followed by withdrawal until the temperature of the withdrawn water was at an arbitrary lower limit. A 90-day period bridges the spring and the fall seasons, when space heating and air-conditioning loads may be too light to utilize all of the by-product heat from electric power generation.
Injected hot water will have markedly different physical properties from those of natural groundwater. Not only will the hot water be as much as 10% less dense than the cold groundwater, but its viscosity will be about one sixth that of the cold water being displaced . The viscosity ratio of two ..fluids in a porous medium directly affects the relative permeability of each , an effect referred to as the mobility ratio. The density and viscosity differences will cause the hot water to tend to override the cold water and to displace it from the top of the aquifer downward in a wedge shape (Figure 1) .
Hydrological assumptions include: The aquifer is confined, homogeneous, and has a porosity of 25%; there is no mixing at the hot-cold interface ; and the artesian head is sufficient to maintain water at 340°F in a liquid state, when water at this temperature is injected or withdrawn. Lateral displacement of the hot water due to natural flow of the groundwater was neglected .
Geohydrological assumptions upon which heat loss calculations are based are: The aquifer is 100 ft thick ; it is confined on top by a layer of clay; the unconfined aquifer above the clay is initially, and remains at, a temperature of 60°F; the initial temperature of the confined aquifer is 60°F, and its specific heat is 0.2 Btu / lb-oF.
An injection well at a steady flow of 1 mgd will receive in 90 days a total volume of 12.1 million ft3 of water , which will spread out into an inverted cone. For the stated assumptions, the top surface of the cone will form a circle with a radius of 600-700 ft . To store the equivalent volume of hot water above ground would require a tank of approximately 200 It in radius and 100 ft high , plus insulation . This comparison gives a clue to the attractiveness of storing heat in aquifers. A number of such tanks would be required, which would be aesthetically objectionable if above ground and too expensive to be feasible whether above or below ground . Wells , however, are unobtrusive and require very little land, but they can tap large volumes of underground storage space.
The required aquifers can be found in many-not all of the locations where the use of aquifers for heat storage might be considered. Hot wells appear to be quite acceptable environmentally if elementary precautions are taken 'to avoid locating them too close to producing water wells.
A complete heat transfer solution would require a three-dimensional transient calculation, which was not
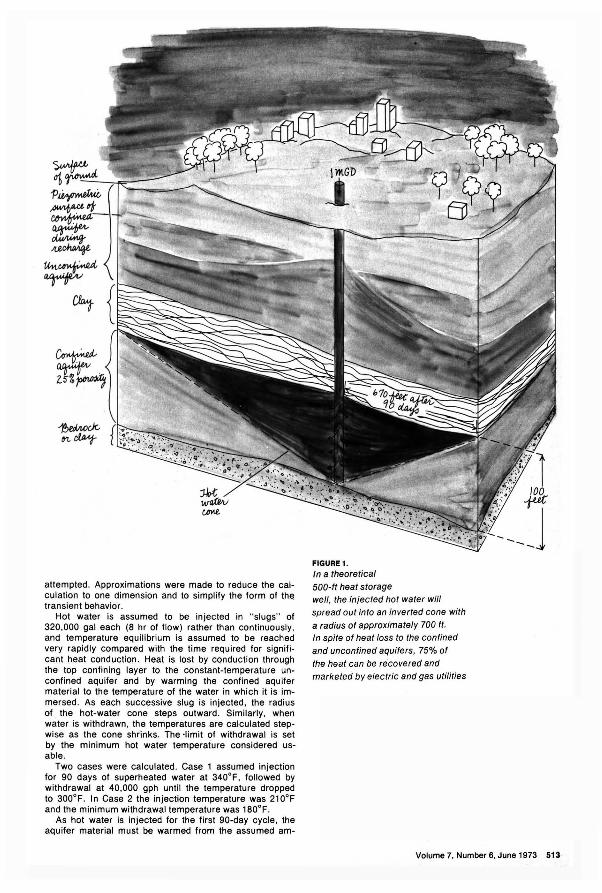
attempted. Approximations were made to reduce the calculation to one dimension and to simplify the form of the transient behavior.
Hot water is assumed to be injected in "slugs" of 320,000 gal each (8 hr of flow) rather than continuously , and temperature equilibrium is assumed to be reached very rapidly compared with the time required for significant heat conduction. Heat is lost by conduction through the top confining layer to the constant-temperature unconfined aquifer and by warming the confined aquifer material to the temperature of the water in which it is immersed. As each successive slug is injected, the radius of the hot-water cone steps outward. Similarly, when water is withdrawn, the temperatures are calculated stepwise as the cone shrinks. The 'Iimit of withdrawal is set by the minimum hot water temperature considered usable.
Two cases were calculated. Case 1 asSumed injection for 90 days of superheated water at 340°F , followed by withdrawal at 40,000 gph until the temperature dropped to 300°F. I n Case 2 the injection temperature was 210°F and the minimum withdrawal temperature was 180°F.
As hot water is injected for the first 90-day cycle, the aquifer material must be warmed from the assumed am-
FIGURE 1.
In a theoretical SOD-It heat storage well, the injected hot water will spread out into an inverted cone with
a radius of approximately 700 ft. In spite of heat loss to the conlined
and unconfined aquilers, 75% of the heat can be recovered and marketed by electric and gas utilities
Volume 7, Number 6, June 1973 513
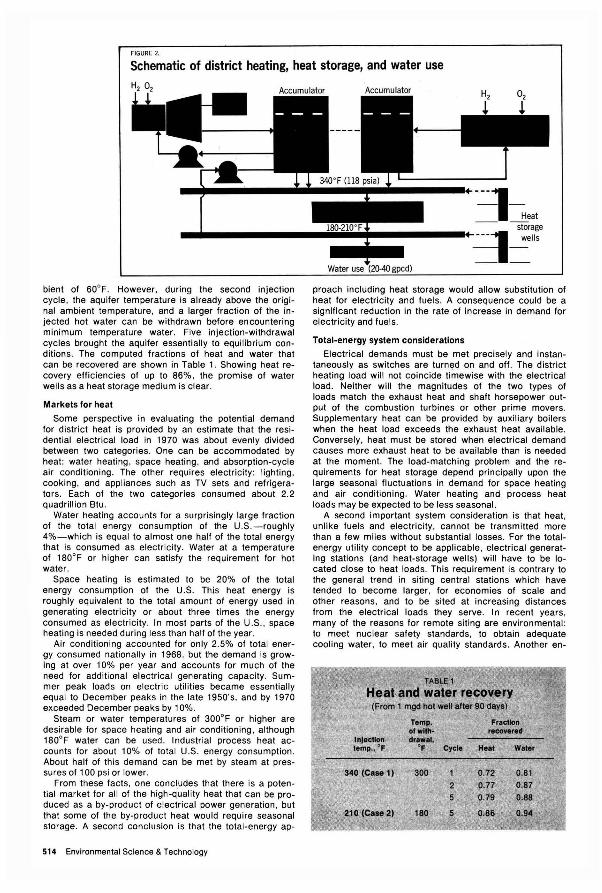
FIGURE 2.
Schematic of district heating, heat storage, and water use
---l-Heat
-- ----stOrage ------lIIIIIiiiiillli.----I+----l wells
bient of 60°F. However, during the second injection cycle, the aquifer temperature is already above the original ambient temperature, and a larger fraction of the injected hot water can be withdrawn before encountering minimum temperature water. Five injection-withdrawal cycles brought the aquifer essentially to equilibrium conditions. The computed fractions of heat and water that can be recovered are shown in Table 1. Showing heat recovery efficiencies of up to 86%, the promise of water wells as a heat storage medium is clear.
Markets for heat
Some perspective in evaluating the potential demand for district heat is provided by an estimate that the residential electrical load in 1970 was about evenly divided between two categories. One can be accommodated by heat: water heating, space heating, and absorption-cycle air conditioning. The other requires electricity: lighting, cooking , and appliances such as TV sets and refrigerators . Each of the two categories consumed about 2.2 quadrillion Btu .
Water heating accounts for a surprisingly large fraction of the total energy consumption of the U.S.-roughly 4%-which is equal to almost one half of the total energy that is consumed as electricity. Water at a temperature of 180°F or higher can satisfy the requirement for hot water.
Space heating is estimated to be 20% of the total energy consumption of the U.S. This heat energy is roughly equivalent to the total amount of energy used in generating electricity or about three times the energy consumed as electricity. In most parts of the U.S., space heating is needed during less than half of the year .
Air conditioning accounted for only 2.5% of total energy consumed nationally in 1968, but the demand is growing at over 10% per year and accounts for much of the need for additional electrical generating capacity. Summer peak loads on electric utilities became essentially equal to December peaks in the late 1950's, and by 1970 exceeded December peaks by 10%.
Steam or water temperatures of 300°F or higher are desirable for space heating and air conditioning , although 180°F water can be used . Industrial process heat accounts for about 10% of total U.S. energy consumption . About half of this demand can be met by steam at pressures of 100 psi or lower.
From these facts , one concludes that there is a potential market for all of the high-quality heat that can be produced as a by-product of electrical power generation, but that some of the by-product heat would require seasonal storage. A second conclusion is that the total-energy ap-
514 Environmental Science & Technology
Water use gpcd)
proach including heat storage would allow substitution of heat for electricity and fuels. A consequence could be a significant reduction in the rate of increase in demand for electricity and fuels .
Total-energy system considerations
Electrical demands must be met precisely and instantaneously as switches are turn~d on and off. The district heating load will not coincide timewise with the electrical load. Neither will the magnitudes of the two types of loads match the exhaust heat and shaft horsepower output of the combustion turbines or other prime movers. Supplementary heat can be provided by auxiliary boilers when the heat load exceeds the exhaust heat available. Conversely, heat 'must be stored when electrical demand causes more exhaust heat to be available than is needed at the moment. The load-matching problem and the requirements for heat storage depend principally upon the large seasonal fluctuations in demand for space heating and air conditioning . Water heating and process heat loads may be expected to be less seasonal.
A second important system consideration is that heat. unlike fuels and electricity , cannot be transmitted more than a few miles without substantial losses. For the totalenergy utility concept to be applicable, electrical generating stations (and heat-storage wells) will have to be located close to heat loads. This requirement is contrary to the general trend in siting central stations which have tended to become larger, for economies of scale and other reasons , and to be sited at increasing distances from the electrical loads they serve. In recent years, many of the reasons for remote siting are environmental : to meet nuclear safety standards, to obtain adequate cooling water, to meet air quality standards. Another en-
vironmental reason now being advanced for locating large generating stations at a considerable distance from the load area is to reduce the heat-island effect of cities.
That environmental considerations cannot be fully satisfied simply by building large plants at greater distances from load centers is evident from the difficulties that electric utilities are encountering in obtaining site and construction approval" for new plants. Another increasingly important difficulty is the opposi~ion on aesthetic grounds to construction of overhead transmission lines, particularly within cities.
Energy can be transmitted in the form of fuel, through pipelines, more cheaply than as electricity in overhead lines. The implications of this fact were explored at TEMPO. A number of alternative systems were synthesized and evaluated. As one of the alternatives, small generating stations would be located at substation sites. Clean fuel would be supplied via pipelines to combustion turbines, and electricity would be distributed via buried cables. Such a system appears to be quite acceptable , environmentally and economically. The concept is consistent with recent sharply upward trends in use of combustion turbines by electric utilities. Further exploration of the feasibility of a total-energy utility system, using the dispersed-turbine approach, appears to be amply justified.
Combustion turbines began in the early 1960's to be installed by electric utilities to handle peak loads. Combustion turbines cost much less than steam plants per kilowatt of capacity, but, in general, are less efficient. These factors favor peaking duty rather than base loading. Now, however, advanced combustion turbines appear destined for use as mid-range and even base-load prime movers, for several reasons. Their efficiency and reliability are becoming competitive with steam turbines. They can meet environmental requirements much more readily than can steam plants, because of their comparatively small size, flexibility of siting, and ability to operate without cooling water or towers. Boilers now require essentially the same clean fuels that are burned by combustion turbines. Turbines can be procured ·and installed in significantly shorter time than steam plants and have less impact on utility debt structures- some turbines are leased.
Combustion turbines now operate at thermal efficiencies of 25-35%. Their exhaust temperature is about 1000°F, which is also a typical throttle temperature for modern steam turbines. Rather than allowing exhaust heat to be wasted , combined-cycle plants employ heat exchangers (for example, boilers) to recover the exhaust heat, generate steam, and drive steam turbines. Overall efficiency is substantially improved, but the steam turbine system requires condensers and cooling water or towers. These can impose severe environmental problems. If the steam were used instead to supply heat loads, the environmental problems could be avoided.
Heat distribution
The more dense the electrical and heat loads, the more efficient will be the distribution of heat. The optimal size, number, and location of combustion turbines will be determined by the density and nature of the two loads to be served.
One heat distribution system that has been visualized includes two manifolds connecting heat sources and heat loads. One manifold would collect hot water or steam at about 340°F from the heat exchangers in the combustion-turbine exhausts and deliver it to the heat loads. The second manifold would return water at about 180°F to be reheated in the heat exchangers. A continuous circulation of water would be maintained in each manifold to minimize temperature variations with changes in the amounts of heat produced and consumed.
Space heating , air conditioning, process heat, and water heating loads would be served by heat exchangers on the customers' premises, fed from the 340° manifold and returning water to the 180° manifold. Heat would be supplemented by auxiliary boilers or stored in wells as necessary to balance the heat produced and the heat demanded.
A heat exchanger in the 1000° exhaust stream of a combustion turbine, with a water inlet temperature of 180°, could recover energy roughly equivalent to the shaft output of the turbine. To illustrate the approximate amounts of electricity , heat, and water involved, suppose that turbines driving 100,000 kW of electrical generating capacity are interconnected via the heat distribution manifolds. This electrical capacity might serve the average needs of 50,000 to 60,000 people, using a rough approximation based on total national generating capacity and population .
Assuming a 50% load factor , 1,200,000 kW-hr of electriCity and the same amount of heat would be produced per day. To absorb this amount of heat, 3 mgd of water would be required , at a temperature rise of 160°F (340-180°) . I n the climate of Philadelphia, Pa., the residential needs for space heating , air conditioning, and water heating of about 20,000 people could be served, allowing 30% loss in the heat distribution and storage system.
An advanced system
A more advanced system would employ hydrogen-oxygen turbines. That a "hydrogen economy" will evolve within the next one or two decades, due to the shortage of fossil fuels and other considerations, has been postulated by a number of investigators. Hydrogen and oxygen would be manufactured by splitting water.
The exhaust from a hydrogen-oxygen turbine would be pure steam. The turbine can be designed to exhaust at whatever temperature is dictated by heat-energy requirements, with corresponding backpressure on the turbine (at 340°F, 118 psi). Thus, a backpressure hydrogen-oxygen turbine could produce steam to be fed directly into a steam accumulator and then into the 340° manifold of a heat distribution system as shown in Figure 2. Since full thermodynamic credit can be taken for the heat in the exhaust, the effective efficiency of the hydrogen-oxygen turbine is very high in spite of the backpressure. Losses due to friction, auxiliary pumps, and leakage should amount to 10% or less. For energy conservation this approach is extremely attractive.
An intriguing feature of the hydrogen-oxygen turbine approach is that potable water will be recovered as the hydrogen and oxygen burn . In the illustration above, with turbines generating 1,200,000 kW-hr per day of electricity, about 140,000 gpd of pure water would be produced by the turbines and added to the 3 mgd of cooling water . Thus, water would become another salable by.-product . The 140,000 gpd of water would satisfy the hot water needs of 3500- 7000 people, at 20-40 gal per capita day. Water for this purpose could be withdrawn directly from the 180° manifold , piped into home hot water tanks, used, and wasted in the usual manner into sanitary sewers.
If the heat load were zero, three 1-mgd wells would be required to store the 3 mgd of hot water from 100,000 kW of turbine capacity . Conceivably, another three l-mgd wells would be required as sources of cool water , if none was available from other suitable sources. A reasonable assumption for estimating costs is that a total of four 1-mgd wells would suffice. The total cost of four l-mgd wells , cased and equipped with pumps, would be $200,000-300,000 plus a modest land cost. By way of comparison, a cooling tower at $20-40 per kW, for the steam portion of a combined-cycle plant, would cost $1,000,000-2,000,000 plus a substantial cost for land.
Volume 7, Number 6, June 1973 515
MSA's Carbon Monoxide Alarm warns you about
the killer you can't see. In parking garages, auto tunnels, and loading docks throughout the U.S .. the MSA' Carbon Monoxide Alarm is standing 24-hour guard duty. It's a rugged, no-nonsense instrument. It's simple to calibrate and maintain . It can be hooked up to activate ventilating fans, record CO levels on a recorder, and give a visual and audible alarm when preset levels of CO in air are reached. The CO Alarm can help you comply with OSHA and Clean Air laws, too.
For a large garage with a number of critical points to be monitored, MSA will provide a complete custom-built system including remote sensors. centralized analyzers, alarms, recorders, and devices to control fan operation or fan speed.
Write for case histories
To show how MSA can help you with CO monitoring problems, we'll send you some case-history
reports on installations in major parking garages.
Write for the case histories, and more complete information on specifications, to Mine Safety Appliances COl11-pany, Technical Products, 400 Penn Center Boulevard, Pittsburgh, Pa.15235.
Make sure/check MSA
'.,.\#1;1 See MSA at Booth 406, APCA
Circl. Nt. 4 '1 R •• H,,' S'l'Yice elf. 516 Environmental Science & Technology
To design and operate optimal systems that supply electricity, heat, and perhaps water is a major new problem to be faced by a utility contemplating the total-energy approach. Probably the institutional problem of discovering appropriate organizational, franchising, financial, and public-acceptance mechanisms is at least as formidable as the technical problem. However:
• hot water can in theory be stored in special water wells, and as much as 86% of the heat can be recovered after 90 days
• heat-storage wells may be the key to utilizing highquality heat produced as electricity is generated; the seasonal heat loads can, through heat storage, be matched to electrical demand. Total-energy utilities become feasible
• environmental considerations suggest that small generators located at substation sites may supplant construction of large distant stations and transmission lines. These small generators would be ideally suited to a totalenergy utility
• energy can be conserved and thermal pollution greatly reduced by adopting a total-energy approach , with heat storage .
Additional reading
Hausz, W., Leeth, G., Meyer, C., Eco-Energy; presented at the 1972 Intersociety Energy Conversion Engineering Conference, San Diego, Calif., September 25-29, 1972, IECEC Paper 72906; General Electric-TEMPO Paper P-596, Santa Barbara, Calif., 5 May 1972, 24 pp. A condensed version, "Eco-Energy Studies at TEMPO" appears in Nuclear Eng. Intern. , November 1972, pp 942-5. IECEC (7th Intersociety Energy Conversion Engineering Conference, 1972), ConI. Proc., Hilton Inn, San Diego, Calif., September 25-29, 1972, published by American Chemical Society, Washington, D.C. , 1972. Kazmann, Raphael G. , "Exotic Uses of Aquifers," ASCE J. Irrig. Drain . Div. , Vol. 97, No. IR3, Proc. Paper 8352, September 1971 , pp 515-22. NEMA, Third Bien. Survey Power Equip. Requirements U.S. Elec. Util. Indus. 1971-80, Power Equipment Div .. National Electrical Manufacturers Association Publication No. PE-3; Data complied by The Conference Board, New York, N.Y.; January 1972. Stanford Research I nstitute, "Patterns of Energy Consumption in the United States"; prepared by SRI, Menlo Park, Calif .. for the Office of Science and Technology, Executive Office of the President; U.S. Government Printing Office, Washington, D.C. January 1972.
Charles F, Meyer is project manager. TEMPO, General Electric Co. Center for Advanced Studies. He manages projects involving research in water resources. electric utility systems. and environmental quality. Currently. Mr. Meyer is responsible for a twoyear project to develop concepts and methodology for monitoring the quality of U.S. groundwater. Address inquiries to Mr. Meyer.
David K. Todd is professor of civil engineering at the University of California in Berkeley where he directs graduate student research in groundwater and surface water hydrology. He has served as consulting hydrologist for many firms in the U.S. as well as abroad. Dr. Todd also has written several books and numerous papers iri the field of hydrology and water resources.
Editorial policy Environmental Science & Technology reports on all aspects of the environment and its control by scientific, engineering, and political means. Contributions by authors outside the full-time staff of writers appear either as feature articles or current research papers. The purposes of features and research papers are different, however, and are outlined for the convenience of authors.
Feature articles. Manuscripts submitted for possible use as features should be broader in scope than "research papers. They need contain no new or original information, but should attempt to explain some aspect of the environment, pollution, or pollution control so that a heterogeneous readership, composed of technically trained people and others with responsibility for or interest in environmental control, can quickly grasp the essentials.
Feature articles receive some editing and presentation attention from the full-time staff and many of the guidelines detailed below for research manuscripts do not apply. Potential authors are encouraged to consult recent issues for the type of approach used in features and to contact the Managing Editor before embarking on the writing.
Current research papers. The research pages of ES&T are devoted to the publication of contributed and critically reviewed papers concerned with the fields of water, air, and waste chemistry, in particular, and with other scientific and technical fields which are relevant to the understanding and management of the quality of the water, air, and land environments. The research section attempts to serve the research interests of all scientists and engineers whose investigations and work fall within the broad field of environmental science and technology.
Contributed research papers will, in general, describe complete and fully interpreted results of original research. Review papers will be considered when they serve to provide new research approaches or stimulate further worthwhile research in a significant area.
Notes and Correspondence, as well as fulllength papers, will be published in the research section. Notes are shorter research reports describing preliminary results of unusual significance or studies of small scope. Correspondence is significant coinment on work published in ES&T; the authors ordinarily will be allowed to reply.
Current research author's guide This manuscript preparation guide is published to aid
authors in writing, and editors and reviewers in expediting, the review and publication of research manuscripts in Environmental Science & Technology. For a detailed discussion, with examples, of the major aspects of manuscript preparation, please refer to "Handbook for Authors of Papers in the Journals of the American Chemical Society!'
Abstracts
An abstract which will appear at the beginning of each paper must accompany each manuscript. Authors' abstracts frequently are used directly for Chemical A bstracts. Use between 100-150 words to give purpose, methods or procedures, significant new results, and conclusions. Write for literature searchers as well as journal readers.
Title
Use specific and informative titles. They should be as brief as possible, consistent with the need for defining the subject of the paper. If trade names are used, give generic names in parentheses. Key words in the title assist in ef· fective literature retrieval.
Authorship
List the first name, middle initial, and last name of each author. Omit professional and official titles. Give the complete mailing address where work was performed. If present address of author is different, include the new information in a footnote. In each paper with more than one
author, the name of the author to whom inquiries should be addressed carries a numbered footnote reference.
Text
Consult a current issue for general style. Assume your readers to be capable professionals not necessarily expert in your particular field . Historical summaries are seldom warranted. However, documentation and summary material should be sufficient to establish an adequate background. Divide the article into sections, each with an appropriate heading, but do not oversectionalize. The text should have only enough divisions to make organization effective and comprehensible without destroying the continuity of the text. Keep all information pertinent to a particular section within that section. Avoid repetition. Do not use footnotes ; include the information in the text.
Introduction. Discuss relationship of your work to previously published work, but do not repeat. If a recent article has summarized work on the subject, cite the summarizing article without repeating its individual citations. Apparatus. List devices only if of specialized nature. Reagents. List and describe preparation of special reagents only. Procedure. Omit details of procedures which are common knowledge to those in the field. Brief highlights of published procedures may be included, but details must be left to literature cited. Describe pertinent and critical factors involved in reactions so the method can be reproduced, but avoid excessive description. Results and discussion. Be complete but concise. Avoid nonpertinent comparisons or contrasts.
Volume 7, Number 6, June 1973 517
Tables, graphs, and illustrations
Avoid tables and graphs which duplicate information. In general, graphs are preferable to tables, if precise data are not required. Lengthy data tables usually are not necessary. However, certain types of articles-for example, those where correlation methods are compared-do require more than the usual quantity of data. Furnish tables with appropriate titles, and number them consecutively.
Manuscript requirements
Three complete, legible copies of the manuscript are required. They should be typed double- or triple-spaced on 8'h X 11 inch paper, with text, tables, and illustrations of a size that can be mailed to reviewers under one cover. Duplicated copies will be accepted only if very clear.
If pertinent references are unpublished, furnish copies of the work or sufficient information to enable reviewers to evaluate the manuscript.
Submit original drawings (or sharp glossy prints) of graphs and diagrams prepared on tracing cloth or plain paper. All lines, lettering, and numbering should be sharp and unbroken. If coordinate paper is used, use blue crosshatch lines as no other color will "screen out."
Typed lettering does not reproduce well; use black India ink and a lettering set for all letters, numbers, and symbols. On 8 x 10 inch copy, lettering should be at least 'h inch high and 0.017 inch thick-for example, with a Leroy lettering set, use template 120 C and pen No. O. Lettering on copy of other sizes should b.e in proportion. Label ordinates and abscissas of graphs along the axes and outside the graph proper.
Type tables (double-spaced lines, wide margins) on separate pages. Furnish charts and graphs in a form that can be photographically reproduced with ease. Photographs should be as large as possible, preferably 8 x 10 inches. Supply glossy prints of photographs. Sharp contrasts are essential.
Number all illustrations consecutively using Arabic numerals in the order of reference in the text. Include a typed list of captions and legends for all illustrations on a separate page.
If drawings are mailed under separate cover, identify by name of author and title of manuscript. Advise editor if drawings or photographs should be returned to the authors.
Prepare tables in consistent form , furnish each with an appropriate title, and number consecutively using Roman numerals in the order of reference in the text. Double space.
Nomenclature
The nomenclature should correspond, as closely as possible, to the style of Chemical Abstracts. Do not define terms in the text unless there is a particular need.
Use consistent units of measure (preferably metric). If nomenclature is specialized, include a "Nomencla
ture" section at the end of paper, giving definitions and dimensions for all terms. Write out names of Greek letters and special symbols in margin of manuscript at point of first use. If subscripts and superscripts are necessary, place them accurately. Avoid trivial names. Trade names should be capitalized and defined at point of first use. Identify typed letters and numbers which could be misinterpreted, for exam pie, one and the letter "I, " zero and the letter "0."
518 Environmental Science & Technology
Formulas and equations
Chemical formulas should correspond to the style of Chemical Abstracts. Chemical equations should be balanced and numbered consecutively along with mathematical equations. The mathematical portions of the paper should be as brief as possible, particularly where standard derivations and techniques are commonly available in standard works.
Safety
Authors are requested to call special attention-both in their manuscripts and in their correspondence with the editors-to safety considerations such as explosive tendencies, precautionary handling procedures, and toxicity.
Acknowledgment
Include essential credits in an "Acknowledgment" section at the end of the text, but hold to an absolute minimum. Give meeting presentation data or other information regarding the work reported (for example, financial support) in a note following Literature Cited.
References
Literature references should be listed in alphabetic order by author, patentee, or equivalent. "Anonymous" is not acceptable for authorship. If the author is unknown, list the reference by company, agency, or journal source. Do not number references. Within the text, references should be cited as follows: One author (Saltzman, 1954); two authors (Burnet and Stanley, 1959); more than two authors (Burnet et aI., 1959). Do not list references as "in press" unless they have been formally accepted for publication. Give complete information, as in examples, using Chemical A bstracts abbreviations for titles of periodicals.
For a periodical reference to be considered complete, it must contain the author's(s' ) complete name(s) , journal source, volume number, issue number (if any), the first and last page numbers of the article, and the year of issue. State if a reference is in a language other than English.
Give complete information when citing articles, books, patents, and the like, according to the following examples:
Altshuller, A. P., Division of Water, Air, and Waste Chemistry, 150th Meeting, ACS, Atlantic City, N.J. , September 1965.
Burnet, F. M., Stanley, W. M. , Eds., "The Viruses," Vol. 1, pp 609-15, Academic Press, New York, N.Y. , 1959.
Chen, D. H. T., MS thesis, University of Rhode Island, Kingston, R.I., 1961.
Handbook of Colorimetric Chemical Analytical Methods, 5th ed., pp 13-15, Tintometer Ltd., Salisbury, England (1959).
Luthy, R. V. (to California Research Corp.), U.S. Patent 2,855,444 (October 7, 1958).
Pollard, N. D., FMC Corp., Baltimore, Md., private com-munication, 1962.
Saltzman, B. E., Anal. Chem. , 26, 1949-55 (1954). Schmauch, L. J., Grubb, H. M., ibid., pp 308-11. U.S. Department of Health, Education and Welfare, Pub
lic Health Service, Cincinnati, Ohio, "Selected Methods for Measurement of Air Pollutants," 1965.
Send manuscripts to Environmental Science & Technology, 1155 Sixteenth St. N.W., Washington, D.C. 20036. Address feature manuscripts to Managing Editor; research manuscripts to Norma Yess, Manuscript Reviewing Office.
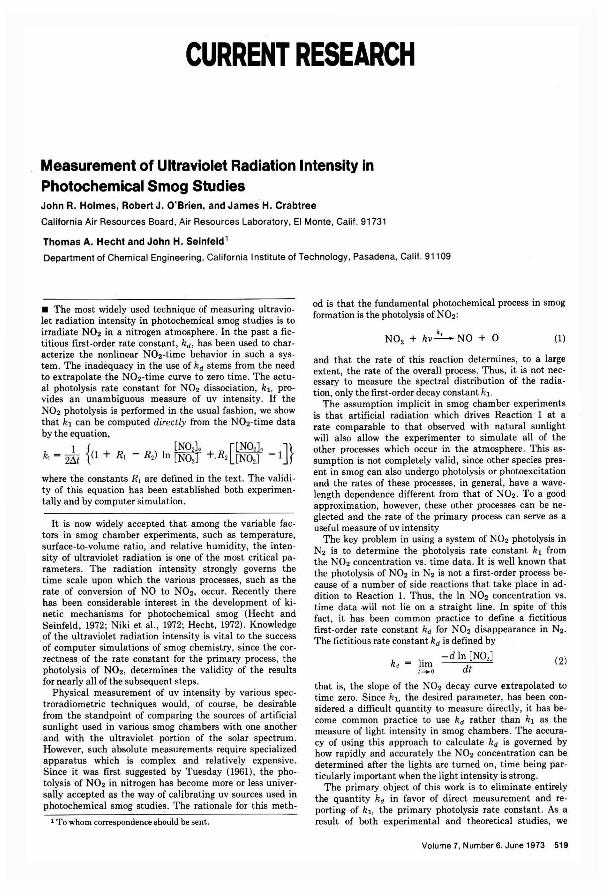
CURRENT RESEARCH
Measurement of Ultraviolet Radiation Intensity in Photochemical Smog Studies John R. Holmes, Robert J. O'Brien, and James' H. Crabtree
California Air Resources Board, Air Resources Laboratory, EI Monte, Calif. 91731
Thomas A. Hecht and John H. Seinfeld'
Department of Chemical Engineering, California Institute of Technology, Pasadena, Calif. 91109
• The most widely used technique of measuring ultravio· let radiation intensity in photochemical smog studies is to irradiate N02 in a nitrogen atmosphere. In the past a fico titious first·order rate constant, kd , has been used to char· acterize the nonlinear N02·time behavior in such a sys· tern . The inadequacy in the use of kd stems from the need to extrapolate the N02·time curve to zero time. The actu· al photolysis rate constant for N02 dissociation, kl, provides an unambiguous measure of uv intensity. If the N02 photolysis is performed in the usual fashion, we show that kl can be computed directly from the N02-time data by the equation,
1 { [NO,]. [[NO,]. ]} kl = 21lt (J + R, - R,) In [NO,] +.R, [NO,] -1
where the constants Ri are defined in the text. The validity of this equation has been established both experimentally and by computer simulation.
It is now widely accepted that among the variable factors in smog chamber experiments, such as temperature, surface-to-volume ratio, and relative humidity, the intensity of ultraviolet radiation is one of the most critical parameters. The radiation intensity strongly governs the time scale upon which the various processes, such as the rate of conversion of NO to NO" occur. Recently there has been considerable interest in the development of kinetic mechanisms for photochemical smog (Hecht and Seinfeld, 1972; Niki et ai., 1972; Hecht, 1972). Knowledge of the ultraviolet radiation intensity is vital to the success of computer simulations of smog chemistry, since the correctness of the rate constant for the primary process, the photolysis of NO" determines the validity of the results for nearly all of the subsequent steps.
Physical measurement of uv intensity by various spectroradiometric techniques would, of course, be desirable from the standpoint of comparing the sources of artificial sunlight used in various smog chambers with one another and with the ultraviolet portion of the solar spectrum. However, such absolute measurements require specialized apparatus which is complex and relatively expensive. Since it was first suggested by Tuesday (1961) , the photolysis of N02 in nitrogen has become more or less universally accepted as the way of calibrating uv sources used in photochemical smog studies. The rationale for this meth-
1 To whom correspondence should be sent.
od is that the fundamental photochemical process in smog formation is the photolysis ofN02:
k NO, + hv--"---- NO + 0 (1)
and that the rate of this reaction determines, to a large extent the rate of the overall process. Thus, it is not necessary'to measure the spectral distribution of the radia-tion, only the first-order decay constant kl . .
The assumption implicit in smog chamber experiments is that artificial radiation which drives Reaction 1 at a rate comparable to that observed with natural sunlight will also allow the experimenter to simulate all of the other processes which occur in the atmosphere. This assumption is not completely valid , since other species present in smog can also undergo photolysis or photoexcitation and the rates of these processes, in general, have a wavelength dependence different from that of N02. To a good approximation, however, these other processes can be neglected and the rate of the primary process can serve as a useful measure of uv intensity
The key problem in using a system of N02 photolysis in N2 is to determine the photolysis rate constant kl from the N02 concentration vs. time data. It is well known that the photolysis of N02 in N2 is not a first-order process because of a number of side reactions that take place in addition to Reaction 1. Thus, the In N02 concentration vs. time data will not lie on a straight line. In spite of this fact, it has been common practice to define a fictitious first-order rate constant kd for N02 disappearance in N2. The fictitious rate constant kd is defined by
. -d In [NO,] (2) kd = !~o dt
that is, the slope of the N02 decay curve extrapolated to time zero. Since kl, the desired parameter, has been considered a difficult quantity to measure directly, it has become common practice to use kd rather than kl as the measure of light intensity in smog chambers. The accuracy of using this approach to calculate kd is governed by how rapidly and accurately the N02 concentratIOn can be determined after the lights are turned on, time being particularly important when the light intensity is strong. .
The primary object of this work is to eliminate entirely the quantity kd in favor of direct measurement and reporting of kl, the primary photolysis rate constan~ . As a result of both experimental and theoretical studies, we
Volume 7. Number 6, June 1973 519
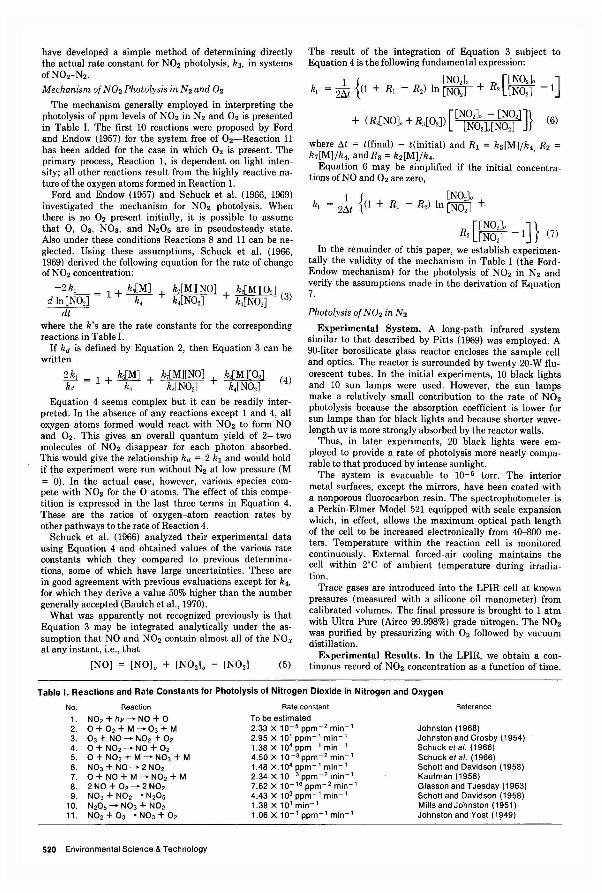
have developed a simple method of determining directly the actual rate constant for N02 photolysis, hI, in systems of N02-N2 •
Mechanism of N02 Photolysis in N2 and O2
The mechanism generally employed in interpreting the photolysis of ppm levels of N02 in N2 and O2 is presented in Table 1. The first 10 reactions were proposed by Ford and Endow (1957) for the system free of 02-Reaction 11 has been added for the case in which O2 is present. The primary process, Reaction 1, is dependent on light intensity; all other reactions result from the highly reactive nature of the oxygen atoms formed in Reaction L
Ford and Endow (1957) and Schuck et al. (1966, 1969) investigated the mechanism for N02 photolysis. When there is no O2 present initially, it is possible to assume that 0, 0 3, N03, and N20 5 are in pseudosteady state. Also under these conditions Reactions 8 and 11 can be neglected. Using these assumptions, Schuck et al. (1966, 1969) derived the following equation for the rate of change ofN02 concentration:
-2 hj = 1 + kelM] + k7[M][NO] + kdM][O,] (3) d In [N02] k, k,[NO,] k.[NO,]
dt where the k's are the rate constants for the corresponding reactions in Table 1.
If kd is defined by Equation 2, then Equation 3 can be written
2k[ = 1 + k,[M] + k7[M][N0] + k,[M][O,] (4) kd k, k,[NO,] k,[NO,]
Equation 4 seems complex but it can be readily interpreted. In the absence of any reactions except 1 and 4, all oxygen atoms formed would react with N02 to form NO and O2. This gives an overall quantum yield of 2-two molecules of N02 disappear for each photon absorbed. This would give the relationship kd = 2 kI and would hold if the experiment were run without N2 at low pressure (M = ·0). In the actual case, however, various species compete with N02 for the 0 atoms. The effect of this competition is expressed in the last three terms in Equation 4. These are the ratios of oxygen-atom reaction rates by other pathways to the rate of Reaction 4.
Schuck et al. (1966) analyzed their experimental data using Equation 4 and obtained values of the various rate constants which they compared to previous determinations, some of which have large uncertainties. These are in good agreement with previous evaluations except for k., for which they derive a value 50% higher than the number generally accepted (Baulch et aI., 1970).
What was apparently not recognized previously is that Equation 3 may be integrated analytically under the assumption that NO and N02 contain almost all of the NO. at any instant, i.e., that
[NO] = [NO]o + [NO,]o - [NO,] (5)
The result of the integration of Equation 3 subject to Equation 4 is the following fundamental expression:
1 { [NO,]o [[NO,]o] kl = 211t (1 + RI - R,) In [NO,] + R, [NO,] -1
[[NO,]o - [NO']]} ( + (R,[NO]o + R3[02]l [NO,],[NO,] 6)
where tJ.t = t(final) - t(initial) and RI = h5 [M]/k •. R2 = k7 [Ml/k., andR3 = h2 [Ml/h •.
Equation 6 may be simplified if the initial concentrations of NO and O2 are zero,
1 { [NO,]o kl = 211t (1 + RI - R,l In [N0
2] +
R2 n~g:jo -1]} (7) In the remainder of this paper, we establish experimen
tally the validity of the mechanism in Table I (the FordEndow mechanism) for the photolysis of N02 in N2 and verify the assumptions made in the derivation of Equation 7.
Photolysis of N02 in N2
Experimental System. A long-path infrared system similar to that described by Pitts (1969) was employed. A 90-liter borosilicate glass reactor encloses the sample cell and optics. The reactor is surrounded by twenty 20-W fluorescent tubes. In the initial experiments, 10 black lights and 10 sun lamps were used. However, the sun lamps make a relatively small contribution to the rate of N02 photolysis because the absorption coefficient is lower for sun lamps than for black lights and because shorter wavelength uv is more strongly absorbed by the reactor walls.
Thus, in later experiments, 20 black lights were employed to provide a rate of photolysis more nearly comparable to that produced by intense sunlight.
The system is evacuable to 10- 6 torr. The interior metal surfaces, except the mirrors, have been coated with a nonporous fluorocarbon resin. The spectrophotometer is a Perkin-Elmer Model 521 equipped with scale expansion which, in effect, allows the maximum optical path length of the cell to be increased electronically from 40- 800 meters. Temperature within the reaction cell is monitored continuously. External forced-air cooling maintains the cell within 2°e of ambient temperature during irradiation.
Trace gases are introduced into the LPIR cell at known pressures (measured with a silicone oil manometer) from calibrated volumes. The final pressure is brought to 1 atm with Ultra Pure (Airco 99.998%) grade nitrogen. The N02 was purified by pressurizing with O2 followed by vacuum distillation.
Experimental Results. In the LPIR, we obtain a continuous record of N02 concentration as a function of time.
Table I. Reactions and Rate Constants for Photolysis of Nitrogen Dioxide in Nitrogen and Oxygen
No. Reaction
1. NO, + hv ---+ NO + 0 2. 0 + 0, + M ---+ 03 + M 3. 03 + NO ---+ NO, + 0, 4. 0 + NO, ---+ NO + 0, 5. 0 + NO, + M ---+ N03 + M 6. N03 + NO ---+ 2 NO, 7. 0 + NO + M ---+ NO, + M 8. 2 NO + 0, ---+ 2 NO, 9. N03 + NO, ---+ N,05
10. N,05 ---+ N03 + NO, 11. NO, + 0 3 ---+ N03 + 0,
520 Environmental Science & Technology
Rate constant
To be estimated 2.33 X 10- 5 ppm-' min - ' 2.95 X 10' ppm-' min-' 1.38 X 10' ppm-' min-' 4.50 X 10⁻³ ppm- ' min-' 1.48 X.10' ppm-' min-' 2.34 X 10- 3 ppm- ' min-' 7.62 X 10-'0 ppm- ' min-' 4.43 X 10³ ppm-' min-' 1.38 X 10' min-' 1.06 X 10-' ppm - ' min-'
Reference
Johnston (1968) Johnston and Crosby (1954) Schuck etal. (1966) Schuck etal. (1966) Schott and Davidson (1958) Kaufman (1958) Glasson and Tuesday (1963) Schott and Davidson (1958) Mills and Johnston (1951) Johnston and Yost (1~49)
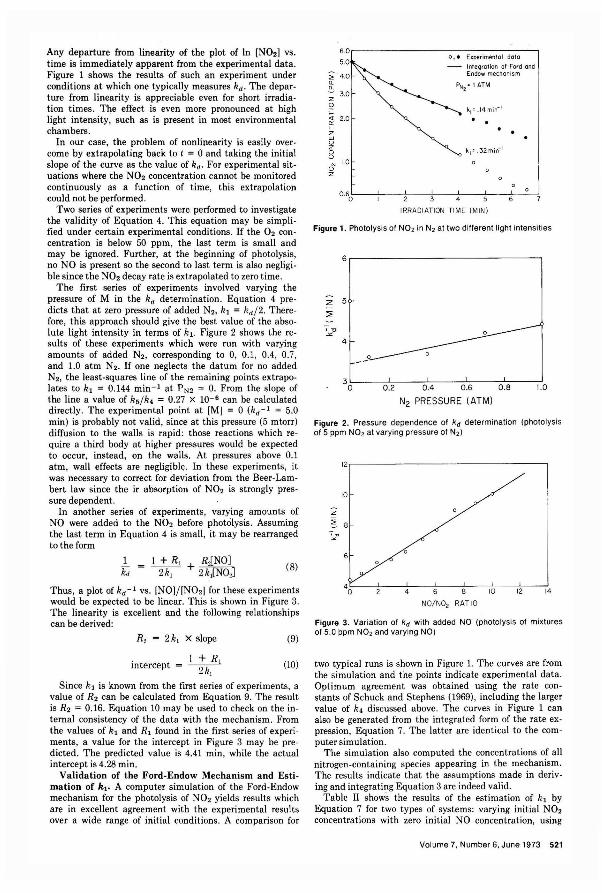
Any departure from linearity of the plot of In [N02] vs. time is immediately apparent from the experimental data. Figure 1 shows the results of such an experiment under conditions at which one typically measures kd • The departure from linearity is appreciable even for short irradiation times . The effect is even more pronounced at high light intensity, such as is present in most environmental chambers.
In our case, the problem of nonlinearity is easily overcome by extrapolating back to t = 0 and taking the initial slope of the curve as the value of kd • For experimental situations where the N02 concentration cannot be monitored continuously as a function of time, this extrapolation could not be performed.
Two series of experiments were performed to investigate the validity of Equation 4. This equation may be simplified under certain experimental conditions. If the O2 concentration is below 50 ppm, the last term is small and may be ignored. Further, at the beginning of photolysis, no NO is present so the second to last term is also negligible since the N02 decay rate is extrapolated to zero time.
The first series of experiments involved varying the pressure of M in the kd determination. Equation 4 predicts that at zero pressure of added N2, k1 = kd/2. Therefore, this approach should give the best value of the absolute light intensity in terms of k1. Figure 2 shows the results of these experiments which were run with varying amounts of added N2, corresponding to 0, 0.1, 0.4, 0.7, and 1.0 atm N2 • If one neglects the datum for no added N2, the least-squares line of the remaining points extrapolates to k1 = 0.144 min- 1 at PN2 = O. From the slope of the line a value of k5/ k. = 0.27 x 10- 6 can be calculated directly . The experimental point at [M] = 0 (kd -1 = 5.0 min) is probably not valid, since at this pressure (5 mtorr) diffusion to the walls is rapid: those reactions which require a third body at higher pressures would be expected to occur, instead, on the walls. At pressures above 0.1 atm, wall effects are negligible. In these experiments, it was necessary to correct for deviation from the Beer-Lambert law since the ir absorption of N O2 is strongly pressure dependent.
In another series of experiments, varying amounts of NO were added to the N02 before photolysis. Assuming the last term in Equation 4 is small, it may be rearranged to the form
1 _ 1 + R, + R,[NO] 7U - ~ 2 k,[NO,] (8)
Thus, a plot of k d - 1 vs. [NO]/ [N02 ] for these experiments would be expected to be linear. This is shown in Figure 3. The linearity is excellent and the following relationships can be derived:
R2 = 2k, X slope
. 1 + R, Intercept = ~
(9)
(10)
Since k1 is known from the first series of experiments, a value of R2 can be calculated from Equation 9. The result is R2 = 0.16. Equation 10 may be used to check on the internal consistency of the data with the mechanism . From the values of k1 and R1 found in the first series of experiments, a value for the intercept in Figure 3 may be predicted . The predicted value is 4.41 min, while the actual intercept is 4.28 min.
Validation of the Ford-Endow Mechanism and Estimation of h1• A computer simulation of the Ford -Endow mechanism for the photolysis of N02 yields results which are in excellent agreement with the experimental results over a wide range of initial conditions. A comparison for
i Q. Q.
3.0 z '2 ... <I 2.0 0: ... Z W U Z 0 u
B 1.0
z
0.6 a
0, . Experimental dato
- Integration of Ford and Endow mechanism
PNZ = IATM
4 5
IRRADI ATION TIM E (MINI
Figure 1. Photolysis of NO, in N, at two different light intensities
6.------------------------------,
z 5
="
30~--~O~.2~--~OL.4----~O~.6~--~O~.8~--~1.0
N2 PRESSURE (ATM)
Figure 2. Pressure dependence of kd determination (photolysis of 5 ppm N02 at varying pressure of N,)
12,-----------------------------------,
10
40L---~----~--~6~--~8~--~1~0----1~2----7,4·
NO/NO, RATIO
Figure 3. Variation of kd with added NO (photolysis of mixtures of 5.0 ppm NO, and varying NO)
two typical runs is shown in Figure 1. The curves are from the simulation and the points indicate experimental data. Optimum agreement was obtained using the rate constants of Schuck and Stephens (1969) , including the larger value of k. discussed above. The curves in Figure 1 can also be generated from the integrated form of the rate expression, Equation 7. The latter are identical to the computer simulation.
The simulation also computed the concentrations of all nitrogen-containing species appearing in the mechanism. The results indicate that the assumptions made in deriving and integrating Equation 3 are indeed valid.
Table II shows the results of the estimation of k1 by Equation 7 for two types of systems: varying initial N02
concentrations with zero initial NO concentration, using
Volume 7. Number 6, June 1973 521
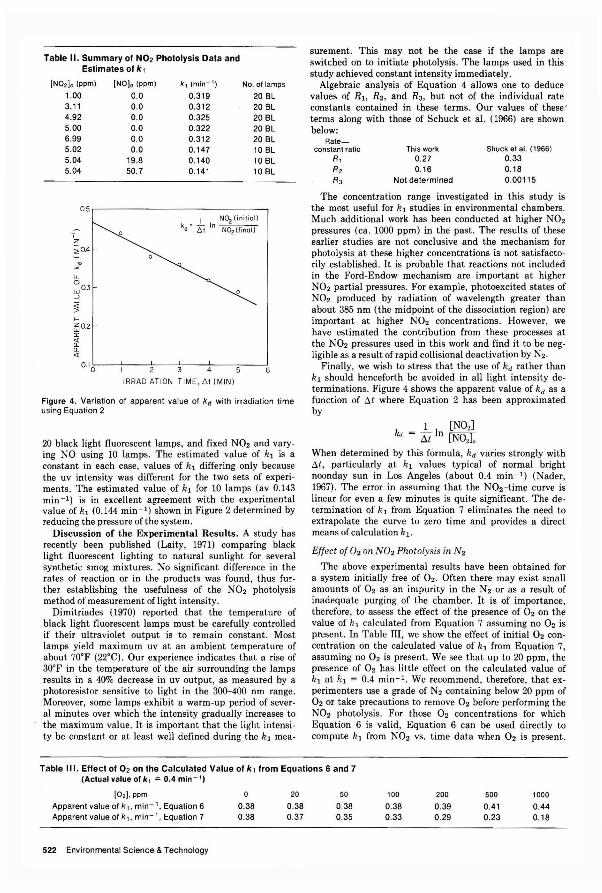
Table II. Summary of NO, Photolysis Data and Estimates of k,
[NO,]o (ppm) [NO]o (ppm) k, (min - ') No. of lamps
1.00 0.0 0.319 20 BL 3.11 0.0 0.312 20 BL 4.92 0.0 0.325 20 BL 5.00 0.0 0.322 20 BL 6.99 0.0 0.312 20 BL 5.02 0.0 0.147 10 BL 5.04 19.8 0.140 10 BL 5.04 50.7 0.141 10 BL
0.5 I N~(init i ol)
., kd" iii In NO, (final)
z iOA
~~
lL 0 w O.3
0 OJ ...J
~ f-r50.2 n: ii': a. <!
0.10 3 4 5 6
IRRADIATI ON T IME, 6 1 (MIN)
Figure 4. Variation of apparent value of kd with irradiation time using Equation 2
20 black light fluorescent lamps, and fixed N02 and varying NO using 10 lamps. The estimated value of hI is a constant in each case, values of h1 differing only because the uv intensity was different for the two sets of experiments. The estimated value of hI for 10 lamps (av 0.143 min -1) is in excelle·nt agreement with the experimental value of h1 (0.144 min - 1 ) shown in Figure 2 determined by reducing the pressure of the system.
Discussion of the Experimental Results. A study has recently been published (Laity, 1971) comparing black light fluorescent lighting to natural sunlight for several synthetic smog mixtures. No significant difference in the rates of reaction or in the products was found, thus further establishing the usefulness of the N02 photolysis method of measurement oflight intensity.
Dimitriades (1970) reported that the temperature of black light fluorescent lamps must be carefully controlled if their ultraviolet output is to remain constant. Most lamps yield maximum uv at an ambient temperature of about 70'F (22'C). Our experience indicates that a rise of 30'F in the temperature of the air surrounding the lamps results in a 40% decrease in uv output, as measured by a photoresistor sensitive to light in the 3()()-400 nm range. Moreover, some lamps exhibit a warm-up period of several minutes over which the intensity gradually increases to the maximum value. It is important that the light intensity be constant or at least well defined during the hI mea-
surement. This may not be the case if the lamps are switched on to initiate photolysis. The lamps used in this study achieved constant intensity immediately.
Algebraic analysis of Equation 4 allows one to deduce values of R1 , R2, and R3 , but not of the individual rate constants contained in these terms. Our values of these ' terms along with those of Schuck et al. (1966) are shown below:
Rate-constant ratio
R, R, R3
This work 0.27 0.16
Not determined
ShUCk et al. (1966) 0.33 0.18 0.00115
The concentration range investigated in this study is the most useful for h1 studies in environmental chambers. Much additional work has been conducted at higher N02 pressures (ca. 1000 ppm) in the past. The results of these earlier studies are not conclusive and the mechanism for photolysis at these higher concentrations is not satisfactorily established. It is probable that reactions not included in the Ford-Endow mechanism are important at higher N02 partial pressures. For example, photoexcited states of N02 produced by radiation of wavelength greater than about 385 nm (the midpoint of the dissociation region) are important at higher N02 concentrations. However, we have estimated the contribution from these processes at the N02 pressures used in this work and find it to be negligible as a result of rapid collisional deactivation by N2.
Finally, we wish to stress that the use of hd rather than h1 should henceforth be avoided in all light intensity determinations. Figure 4 shows the apparent value of hd as a function of Ilt where Equation 2 has been approximated by
1 [N02J kd = tlt In [N0
2] ,
When determined by this formula, hd varies strongly with Ilt , particularly at h1 values typical of normal bright noonday sun in Los Angeles (about 0.4 min - 1 ) (Nader, 1967). The error in assuming that the N02-time curve is linear for even a few minutes is quite significant. The determination of hI from Equation 7 eliminates the need to extrapolate the curve to zero time and provides a direct means of calculation h 1.
Effect of O2 on N02 Photolysis in N2
The above experimental results have been obtained for a system initially free of O2. Often there may exist small amounts of O2 as an impurity in the N2 or as a result of inadequate purging of the chamber. It is of importance, therefore, to assess the effect of the presence of O2 on the value of h1 calculated from Equation 7 assuming no O2 is present. In Table III, we show the effect of initial O2 concentration on the calculated value of hI from Equation 7, assuming no O2 is present. We see that up to 20 ppm, the presence of O2 has little effect on the calculated value of h1 at h1 = 0.4 min- 1 . We recommend, therefore, that experimenters use a grade of N2 containing below 20 ppm of O2 or take precautions to remove O2 before performing the N02 photolysis. For those O2 concentrations for which Equation 6 is valid, Equation 6 can be used directly to compute h1 from N02 vs. time data when O2 is present.
Table III. Effect of 0 , on the Calculated Value of k, from Equations 6 and 7 (Actual value of k, = 0.4 min - I)
[0, ). ppm
Apparent value of k I , min - I, Equation 6 Apparent value of k I , min- I , Equation 7
522 Environmental Science & Technology
o 0.38 0.38
20
0.38 0.37
50
0.38 0.35
100
0.38 0.33
200
0.39 0.29
500
0.41 0.23
1000
0.44 0.18
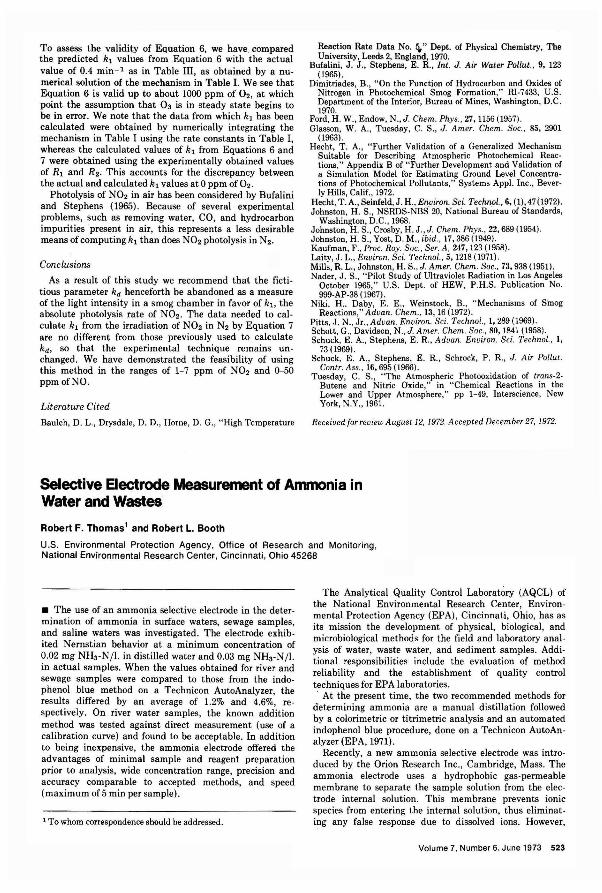
To assess the validity of Equation 6, we have compared the predicted hi values from Equation 6 with the actual value of 0.4 min- 1 as in Table III, as obtained by a nu· merical solution of the mechanism in Table I. We see that Equation 6 is valid up to about 1000 ppm of O2 , at which point the assumption that 0 3 is in steady state begins to be in error. We note that the data from which hi has been calculated were obtained by numerically integrating the mechanism in Table I using the rate constants in Table I, whereas the calculated values of hi from Equations 6 and 7 were obtained using the experimentally obtained values of Rl and R2 , This accounts for the discrepancy between the actual and calculated hi values at 0 ppm of O2 .
Photolysis of N02 in air has been considered by Bufalini and Stephens (1965) . Because of several experimental problems, such as removing water, CO, and hydrocarbon impurities present in air, this represents a less desirable means of computing hi than does N02 photolysis in N2.
Conclusions
As a result of this study we recommend that the ficti· tiousparameter hd henceforth be abandoned as a measure of the light intensity in a smog chamber in favor of hl, the absolute photolysis rate of N02. The data needed to cal· culate hi from the irradiation of N02 in N2 by Equation 7 are no different from those previously used to calculate hd' so that the experimental technique remains un· changed. We have demonstrated the feasibility of using this method in the ranges of 1-7 ppm of N02 and 0-50 ppm of NO.
Literature Cited
Baulch, D. L., Drysdale, D. D., Horne, D. G., "High Temperature
Reaction Rate Data No. q," Dept. of Physical Chemistry, The University, Leeds 2, England, 1970.
Bufalini, J . J., Stephens, E. R, Int. J . Air Water Pollut .. 9, 123 (1965).
Dimitriades, B. , "On the Function of Hydrocarbon and Oxides of Nitrogen in Photochemical Smog Formation," RI-7433, U.S. Department of the Interior, Bureau of Mines, Washington, D.C. 1970.
Ford, H. W., Endow, N. , J. Chern. Phys., 27, 1156 (1957) . Glasson, W. A., Tuesday, C. S., J. Amer. Chern. Soc., 85, 2901
(1963). Hecht, T. A., "Further Validation of a Generalized Mechanism
Suitable for Describing Atmospheric Photocbemical Reac· tions," Appendix B of "Further Development and Validation of a Simulation Model for Estimating Ground Level Concentra· tions of Photochemical Pollutants," Systems Appl. Inc., Bever· ly Hills, Calif. , 1972. .
Hecht, T. A., Seinfeld, J. H. , Environ. Sci. Technol. , 6, (1),47 (1972). Johnston, H. S., NSRDS·NBS· 20, National Bureau of Standards,
Washington, D.C., 1968. Johnston, H. S., Crosby, H. J., J. Chern . Phys., 22,689 (1954). Johnston, H. S., Yost, D. M., ibid., 17, 386 (1949). Kaufman, F., Proc. Roy. Soc., Ser. A, 247,123 (1958). Laity, J. L., Environ. Sci. Technol., 5, 1218 (1971). Mills, R L., Johnston, H. S., J. Amer. Chern. Soc .. 73,938 (1951). Nader, J. S., "Pilot Study of Ultraviolet Radiation in Los Angeles
October 1965," U.S. Dept. of HEW, P.H.S. Publication No. 999-Ap-38 (1967).
Niki. H .. Daby, E. E .. Weinstock, B. , "Mechanisms of Smog Reactions," Advan. Chern., 13,16 (1972) .
Pitts, J. N., Jr., Advan. Environ. 'Sci. Technol., 1,289 (1969) . Schott, G., Davidson, N., J. Amer. Chern . Soc., 80, 1841 (1958). Schuck, E. A., Stephens, E. R, Advan. Environ. Sci. Technol., 1,
73 (1969). Schuck, E. A., Stephens, E. R , Schrock, P. R., J. Air Poilu!.
Contr. Ass., 16,695 (1968). Tuesday, C. S., "The Atmospheric Photooxidation of trans-2-
Butene and Nitric Oxide," in "Chemical Reactions in the Lower and Upper Atmosphere," pp 1-49, Interscience, New York, N.Y., 1961.
Received for review August 12, 1972. Accepted December 27, 1972.
Selective Electrode Measurement of Ammonia in Water and Wastes
Robert F. Thomas' and Robert L. Booth
U.S. Environmental Protection Agency, Office of Research and Monitoring, National EnVironmental Research Center, Cincinnati, Ohio 45268
• The use of an ammonia selective electrode in the deter· mination of ammonia in surface waters, sewage samples, and saline waters was investigated . The electrode exhib· ited Nernstian behavior at a minimum concentration of 0.02 mg NH3-N/1. in distilled water and 0.03 mg NH3-N/1. in actual samples. When the values obtained for river and sewage samples were compared to those from the indo· phenol blue method on a Technicon AutoAnalyzer, the results differed by an average of 1.2% and 4.6%, reo spectively. On river water samples, the known addition method was tested against direct measurement (use of a calibration curve) and found to be acceptable. In addition to being inexpensive, the ammonia electrode offered the advantages of minimal sample and reagent preparation prior to analysis, wide concentration range, precision and accuracy comparable to accepted methods, and speed (maximum of5 min per sample).
1 To whom correspondence should be addressed.
The Analytical Quality Control Laboratory (AQCL) of the National Environmental Research Center, Environ· mental Protection Agency (EPA), Cincinnati, Ohio, has as its mission the development of physical, biological, and microbiological methods for the field and laboratory anal· ysis of water, waste water, and sediment samples. Addi· tional responsibilities include the evaluation of method reliability and the establishment of quality control techniques for EPA laboratories. . At the present time, the two recommended methods for
determining ammonia are a manual distillation followed by a colorimetric or titrimetric analysis and an automated indophenol blue procedure, done on a Technicon AutoAn· alyzer (EPA, 1971).
Recently, a new ammonia selective electrode was intro· duced by the Orion Research Inc. , Cambridge, Mass. The ammonia electrode uses a hydrophobic gas· permeable membrane to separate the sample solution from the elec· trode internal solution. This membrane prevents ionic species from entering the internal solution, thus eliminat· ing any false response due to dissolved ions. However,
Volume 7, Number 6, June 1973 523
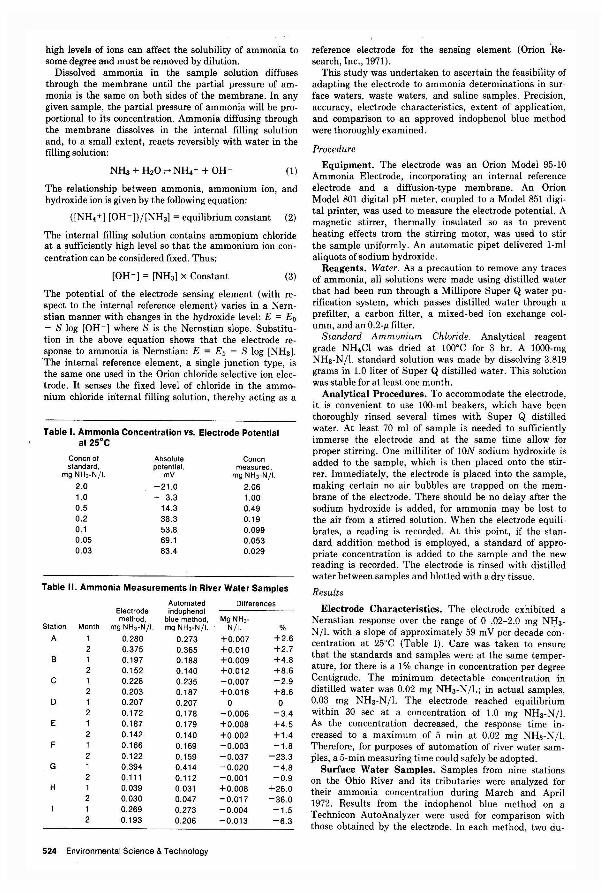
high levels of ions can affect the solubility of ammonia to some degree and must be removed by dilution.
Dissolved ammonia in the sample solution diffuses through the membrane until the partial pressure of ammonia is the same on both sides of the membrane. In any given sample, the partial pressure of ammonia will be proportional to its concentration. Ammonia diffusing through the membrane dissolves in the internal filling solution and, to a small extent, reacts reversibly with water in the filling solution:
NHa + H20 <=' NH.+ + OH - (1)
The relationship between ammonia, ammonium ion, and hydroxide ion is given by the following equation:
([NH.+J [OH - J)/[NHaJ = equilibrium constant (2)
The internal filling solution contains ammonium chloride at a sufficiently high level so that the ammonium ion concentration can be considered fixed. Thus:
[OH-J = [NHaJ x Constant (3)
The potential of the electrode sensing element (with respect to the internal reference element) varies in a Nernstian manner with changes in the hydroxide level: E = Eo - Slog [OH - J where S is the Nernstian slope. Substitution in the above equation shows that the electrode response to ammonia is Nernstian: E = E1 - Slog [NHaJ. 'The internal reference element, a single junction type, is the same one used in the Orion chloride selective ion electrode. It senses the fixed level of chloride in the ammonium chloride internal filling solution, thereby acting as a
Table I. Ammonia Concentration VS. Electrode Potential at 25°C
Con en Of Absolute Conen standard, potential, measured,
mg NH3·N/1. mV mg NH3-N/1.
2.0 -21.0 2.06 1.0 - 3.3 1.00 0.5 14.3 0.49 0.2 38.3 0.19 0.1 53.8 0.099 0.05 69.1 0.053 0.03 83.4 0.029
Table II. Ammonia Measurements in River Water Samples
Automated Differences Electrode indophenol method, blue method, Mg NH3'
Station Month mg NH3·N/1. mg NH3·N/1. N/1. %
A 0.280 0.273 +0.007 +2.6 2 0.375 0.365 +0.010 +2.7
B 1 0.197 0.188 +0.009 +4.8 2 0.152 0.140 +0.012 +8.6
C 1 0.228 0.235 -0,007 -2.9 2 0.203 0,187 +0.016 +8,6
D 0.207 0.207 0 0 2 0,172 0,178 -0,006 -3.4
E 0.187 0.179 +0,008 +4.5 2 0.142 0.140 +0,002 +1.4
F 0.166 0.169 -0.003 -1,8 2 0.122 0.159 -0.037 -23.3
G 0.394 0.414 -0.020 -4.8 2 0,111 0,112 -0.001 -0.9
H 1 0,039 0.031 +0.008 +26.0 2 0.030 0.047 -0.017 -36.0 1 0,269 0,273 -0.004 -1.5 2 0.193 0.206 -0,013 -6.3
524 Environmental Science & Technology
reference electrode for the sensing element (Orion 'Research, Inc., 1971),
This study was undertaken to ascertain the feasibility of adapting the electrode to ammonia determinations in surface waters, waste waters, and saline samples. Precision, accuracy, electrode characteristics, extent of application, and comparison to an approved indophenol blue method were thoroughly examined,
Procedure
Equipment. The electrode was an Orion Model 95-10 Ammonia Electrode, incorporating an internal reference electrode and a diffusion-type membrane. An Orion Model 801 digital pH meter, coupled to a Model 851 digital printer, was used to measure the electrode potential. A magnetic stirrer, thermally insulated so as to prevent heating effects trom the stirring motor, was used to stir the sample uniformly. An automatic pipet delivered 1-ml aliquots of sodium hydroxide.
Reagents. Water. As a precaution to remove any traces of ammonia, all solutions were made using distilled water that had been run through a Millipore Super Q water pu· rification system, which passes distilled water through a prefilter, a carbon filter, a mixed-bed ion exchange column, and an 0.2-1' filter.
Standard Ammonium Chloride. Analytical reagent grade NH.CI was dried at 100°C for 3 hr. A 1000-mg NHa-N/1. standard solution was made by dissolving 3.819 grams in 1.0 liter of Super Q distilled water. This solution was stable for at least one month.
Analytical Procedures. To accommodate the electrode, it is convenient to use 100-ml beakers, which have been thoroughly rinsed several times with Super Q distilled water. At least 70 ml of sample is needed to sufficiently immerse the electrode and at the same time allow for proper stirring. One milliliter of ION sodium hydroxide is added to the sample, which is then placed onto the stirrer. Immediately, the electrode is placed into the sample, making certain no air bubbles are trapped on the membrane of the electrode. There should be no delay after the sodium hydroxide is added, for ammonia may be lost to the air from a stirred solution. When the electrode equilibrates, a reading is recorded. At this point, if the standard addition method is employed, a standard of appropriate concentration is added to the sample and the new reading is recorded. The electrode is rinsed with distilled water between samples and blotted with a dry tissue.
Results
Electrode Characteristics. The electrode exhibited a Nernstian response over the range of 0 .02-2.0 mg NHaN /1. with a slope of approximately 59 m V per decade concentration at 25°C (Table I). Care was taken to ensure that the standards and samples were at the same temper· ature, for there is a 1% change in concentration per degree Centigrade. The minimum detectable concentration in distilled water was 0.02 mg NH3-N/I.; in actual samples, 0.03 mg NH3-N/1. The electrode reached equilibrium within 30 sec at a concentration of 1.0 mg NH3-N/1. As the concentration decreased, the response time in· creased to a maximum of 5 min at 0.02 mg NH3-N/1. Therefore, for purposes of automation of river water samples, a 5-min measuring time could safely be adopted.
Surface Water Samples. Samples from nine stations on the Ohio River and its tributaries were analyzed for their ammonia concentration during March and April 1972, Results from the indophenol blue method on a Technicon AutoAnalyzer were used for comparison with those obtained by the electrode. In each method, two du-
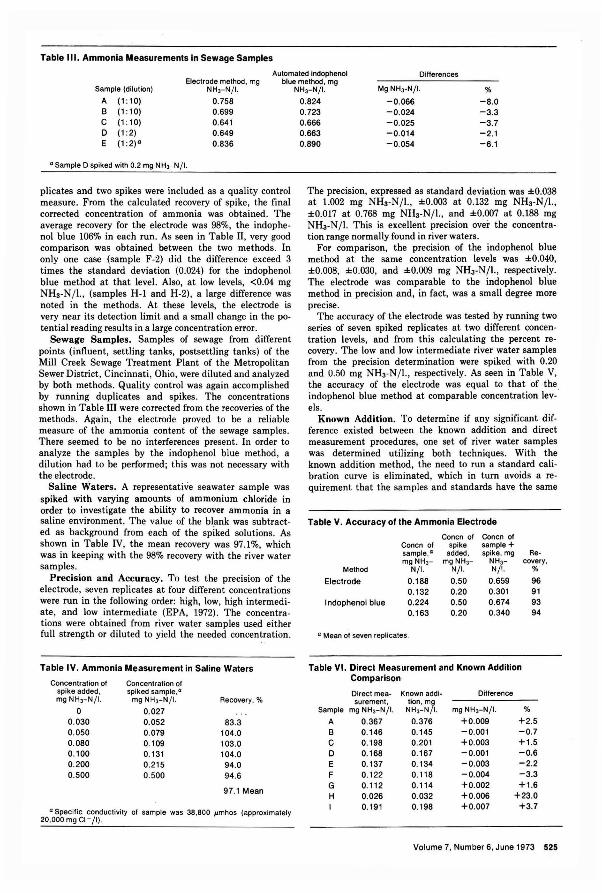
Table III. Ammonia Measurements in Sewage Samples
Automated indophenol Oifferences
Sample (dilution) Electrode method. mg blue method. mg
Mg NH3-N/I. NH3-N/1.
A (1 :10) 0.758 B (1 :10) 0.699 C (1 :10) 0.641 0 (1:2) 0.649 E (1 :2)" 0.836
"Sample D spiked with 0.2 mg NH3-N / 1.
plicates and two spikes were included as a quality control measure. From the calculated recovery of spike, the final corrected concentration of ammonia was obtained. The average recovery for the electrode was 98%, the indophenol blue 106% in each run. As seen in Table II, very good comparison was obtained between the two methods. In only one case (sample F -2) did the difference exceed 3 times the standard deviation (0.024) for the indophenol blue method at that level. Also, at low levels, <0.04 mg NHa-Nj l. , (samples H-1 and H-2) , a large difference was noted in the methods. At these levels, the electrode is very near its detection limit and a small change in the po· tential reading results in a large concentration error.
Sewage Samples. Samples of sewage from different points (influent, settling tanks, postsettling tanks) of the Mill Creek Sewage Treatment Plant of the Metropolitan Sewer District, Cincinnati, Ohio, were diluted and analyzed by both methods. Quality control was again accomplished by running duplicates and spikes. The concentrations shown in Table III were corrected from the recoveries of the methods. Again, the electrode proved to be a reliable measure of the ammonia content of the sewage samples. There seemed to be no interferences present. In order to analyze the samples by the indophenol blue method, a dilution had to be performed; this was not necessary with the electrode.
Saline Waters. A representative seawater sample was spiked with varying amounts of ammonium chloride in order to investigate the ability to recover ammonia in a saline environment. The value of the blank was subtracted as background from each of the spiked solutions. As shown in Table IV, the mean recovery was 97.1%, which was in keeping with the 98% recovery with the river water samples.
Precision and Accuracy. To test the precision of the electrode, seven replicates at four different concentrations were run in the following order: high, low, high intermediate, and low intermediate (EPA, 1972). The concentrations were obtained from river water samples used either full strength or diluted to yield the needed concentration.
Table IV. Ammonia Measurement in Saline Waters
Concentration of Concentration of spike added. spiked sample,a mg NH3-N / 1. mg NH3-N/ 1. Recovery, %
0 0.027 0.030 0.052 83.3 0.050 0.079 104.0 0.080 0.109 103.0 0.100 0.131 104.0 0.200 0.215 94.0 0.500 0.500 94.6
97 .1 Mean
C1 Specific conductivity of sample was 38,800 ",mhos (approximately 20.000mgCI - /I).
NH3-N/1. %
0.824 -0.066 -8.0 0.723 -0.024 -3.3 0.666 -0.025 -3.7 0.663 -0.014 -2.1 0.890 -0.054 -6.1
The precision, expressed as standard deviation was :i:0.038 at 1.002 mg NHa-Nj l., :i:0.003 at 0.132 mg NH3-Nj l., :i:0.017 at 0.768 mg NHa-Njl. , and :i:0.007 at 0.188 mg NHa-Nj l. This is excellent precision over the concentration range normally found in river waters.
For comparison, the precision of the indophenol blue method at the same concentration levels was :i:0.040, :i:0.008, :i:0.030, and :i:0.009 mg NHa-Njl., respectively. The electrode was comparable to the indophenol blue method in precision and, in fact, was a small degree more precise.
The accuracy of the electrode was tested by running two series of seven spiked replicates at two different concentration levels, and from this calculating the percent recovery. The low and low intermediate river water samples from the precision determination were spiked with 0.20 and 0.50 mg NHa-Nj l. , respectively. As seen in Table V, the accuracy of the electrode was equal to that of the indophenol blue method at comparable concentration levels.
Known Addition. To determine if any significant difference existed between the known addition and direct measurement procedures, one set of river water samples was determined utilizing both techniques. With the known addition method, the need to run a standard calibration curve is eliminated, which in tum avoids a requirement that the samples and standards have the same
Table V. Accuracy of the Ammonia Electrode
Conen of Conen of Conen of spike sample + sample,a added. spike. mg Re-mg NH3- mg NH3- NH3- covery,
Method N/1. N/ 1. N/1. %
Electrode 0.188 0.50 0.659 96 0.132 0.20 0.301 91
I ndophenol blue 0.224 0.50 0.674 93 0.163 0.20 0.340 94
a Mean of seven replicates.
Table VI. Direct Measurement and Known Addition Comparison·
Direct mea~ Known add i- Difference surement, tion. mg
Sample mg NH3-N / 1. NH3-N/ 1. mg NH3-N/ 1. %
A 0.367 0.376 +0.009 +2.5 B 0.146 0.145 -0.001 -0.7 C 0.198 0.201 +0.003 +1.5 0 0.168 0.167 -0.001 -0.6 E 0.137 0.134 -0.003 -2.2 F 0.122 0.118 -0.004 -3.3 G 0.112 0.114 +0.002 +1 .6 H 0.026 0.032 +0.006 +23.0
0.191 0.198 +0.007 +3.7
Volume 7. Number 6, June 1973 525
ionic strength and temperature. However, the slope at which the electrode is operating and the concentration of ammonia in the sample (within a factor of 10) must be known. As can be seen from Table VI, the two procedures gave comparable results and were interchangeable.
Automation. With certain provisions, the ammonia electrode can be adapted to automatic analysis. The major drawback is that some provision must be made for the addition of sodium hydroxide just prior to presentation of the sample to the electrode. This was overcome by using the ammonia electrode in conjunction with a Beaker Butler (FWPCA, 1970), an instrument for automating ion selective electrode analyses. The Beaker Butler was modified to provide for sodium hydroxide addition just prior to electrode immersion. Using a 5-min sampling period, acceptable results were obtained with standard solutions in distilled water.
Literature Cited
Environmental Protection Agency, National Environmental Research Center, Analytical Quality Control Laboratory, Cincinnati, Ohio, "Methods for Chemical Analysis of Water and Wastes." 1971.
Environmental Protection Agency, National Environmental Research Center, Analytical Quality Control Laboratory, Cincinnati , Ohio, " Handbook for Analytical Quality Control in Water and Wastewater Laboratories," March 1972.
Federal Water Pollution Control Administration, Div. of Water Quality Research , Analytical Quality Control Laboratory, Cincinnati, Ohio, "Evaluation Report 1: Automatic Beaker Sample Changer, " 1~7U.
Orio'n Research Inc., Cambridge, Mass., Instruction Manual, Ammonia Electrode Model 95-10, 1971.
Received for review August 3. 1972. Accepted December 1.5. 1972. Mention of commercial products is for identification only and does not constitute endorsement bv the En vironmental Protection Agency or th e U. S. Government. -
Collection and Determination of Sulfur Dioxide Incorporating Permeation and West-Gaeke Procedure Kenneth D. Relszner and Philip W. West 1
Environmental Sciences Institute. Coates Chemical Laboratories, Louisiana State University, Baton Rouge , La. 70803
• A method to measure average pollutant concentrations directly for a desired study period has been developed for sampling and determining sulfur dioxide in the ambient atmosphere. Sampling is accomplished by the permeation of the S02 through a silicone membrane. The permeated pollutant is trapped and stabilized as dichlorosulfitomercurate(II) and is subsequently determined by the WestGaeke procedure. Sampling pumps are not required because permeation is a physical phenomenon which occurs freely. Measured sample volumes are not required because rate of permeation is proportional to concentration. There are no known significant interferences; the procedures are simple and straightforward; the results are comparable with those obtained with present monitors; and the only equipment required, other than a spectrophotometer or filter photometer, is a permeation device costing less than $50. Because the analytical values relate to state or federal standards without recourse to statistical or other special mathematical study, the method is ideally suited for monitoring applications.
Federal as well as most municipal and state regulations that have been promulgated to establish ambient air quality standards for sulfur dioxide stipulate average concentrations for specified intervals of time. For example, the federal code requires that the average daily concentration must not exceed 365 Ilg/m3 for more than one day during a year and the average concentration for that year must not exceed 80 Ilg/m3 ("Federal Register," 1971). There is an obvious need for a direct, simple, and reliable method for determining average concentrations, whether it be for 12- or 24-hr periods or for a seven-day or even a 30-day average. Such a method has now been developed.
1 To whom correspondence should be addressed.
526 Environmental Science & Technology
The approach employs a sampling device based on the permeation principle and an analytical finish based on the West-Gaeke procedure for determining su lfur dioxide .
Most determinations of sulfur dioxide for air pollution monitoring require the use of relatively expensive equipment which uses a colorimetric method such as the WestGaeke procedure (West and Gaeke, 1956), a coulometric measurement, or possibly a conductometric determination made on samples that are continuously pulled through the apparatus for appropriate treatment and measurement. Alternatively, a gas chromotographic or flame photometric procedure may be used. Each sampling represents an investment of thousands of dollars necessary for equipment. The final processing of data to obtain values for average concentrations of pollutant requires further investment in time and talent . A simple approach that has been often used is the deployment of lead peroxide candles or sulfation plates, which serve as low-cost substitutes for the sophisticated but expensive S02 monitors . Unfortu~ nately, the lead peroxide candles do not measure concentration but instead give a measure only of the relative insult due to sulfur dioxide. They represent an "effects method" giving information somewhat similar to that obtained by corrosion coupons used in establishing the relative corrosiveness of the ambient atmosphere. The lead peroxide candle method suffers further because the final determination is based on the measurement of resultant lead sulfate, and this requires a relatively tedious turbidimetric, gravimetric, or colorimetric analysis.
A new method is now proposed which is simple, low in cost, essentially free of interferences, requires no complicated apparatus or availability of power, and may be employed for sampling times as short as 6 hr or as long as a week or more. Of special significance is the fact that this new method provides "integrated" values directly; therefore, average concentrations are provided for each expo-
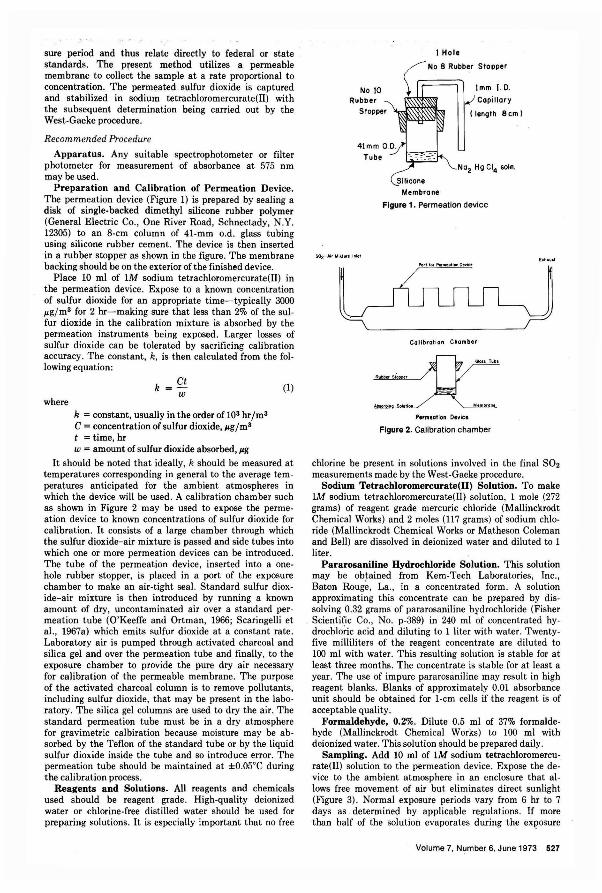
sure period and thus relate directly to federal or state standards. The p~esent method utilizes a permeable membrane to collect the sample at a rate proportional to concentration. The permeated sulfur dioxide is captured and stabilized in sodium tetrachloromercurate(II) with the subsequent determination being carried out by the West-Gaeke procedure.
Recommended Procedure
Apparatus. Any suitable spectrophotometer or filter photometer for measurement of absorbance at 575 nm maybe used.
Preparation and Calibration of Permeation Device. The permeation device (Figure 1) is prepared by sealing a disk of single-backed dimethyl silicone rubber polymer (General Electric Co., One River Road, Schnectady, N.Y. 12305) to an 8-cm column of 41-mm o.d. glass tubing using silicone rubber cement. The device is then inserted in a rubber stopper as shown in the figure. The membrane backing should be on the exterior of the finished device.
Place 10 ml of 1M sodium tetrachloromercurate(II) in the permeation device. Expose to a known concentration of sulfur dioxide for an appropriate time-typically 3000 I'g/ m3 for 2 hr-making sure that less than 2% of the sulfur dioxide in the calibration mixture is absorbed by the permeation instruments being exposed. Larger losses of sulfur dioxide can be tolerated by sacrificing calibration accuracy. The constant, k, is then calculated from the fol lowing equation:
where k
Ct w
k = constant, usually in the order of 103 hr /m3
C = concentration of sulfur dioxide, /Iog/m3
t = time, hr w = amount of sulfur dioxide absorbed, p.g
(1)
It should be noted that ideally, k should be measured at temperatures corresponding in general to the average temperatures anticipated for the ambient atmospheres in which the device will be used. A calibration chamber such as shown in Figure 2 may be used to expose the permeation device to known concentrations of ·sulfur dioxide for calibration. It consists of a large chamber through which the sulfur dioxide-air mixture is passed and side tubes into which one or more permeation devices can be introduced. The tube of the permeation device , inserted into a onehole rubber stopper, is placed in a port of the exposure chamber to make an air-tight seal. Standard sulfur dioxide-air mixture is then introduced by running a known amount of dry, uncontaminated air over a standard permeation tube (O'Keeffe and Ortman, 1966; Scaringelli et aI. , 1967a) which emits sulfur dioxide at a constant rate . Laboratory air is pumped through activated charcoal and silica gel and over the permeation tube and finally, to the exposure chamber to provide the pure dry air necessary for calibration of the permeable membrane. The purpose of the activated charcoal column is to remove pollutants, including sulfur dioxide, that may be present in the laboratory. The silica gel columns are used to dry the air. The standard permeation tube must be in a dry atmosphere for gravimetric calbiration because moisture may be absorbed by the Teflon of the standard tube or by the liquid sulfur dioxide inside the tube and so introduce error. The permeation tube should be maintained at ±0.05°C during the calibration process.
Reagents and Solutions. All reagents and chemicals used should be reagent grade. High-quality deionized water or chlorine-free distilled water should be used for preparing solutions. It is especially important that no free
No 10 Rubber
Stopper
41mm O.
Tube
I Hole
No 8 Rubber Slopper
Membrane
Imm I.D. Capillary
(lenQlh 8 em)
Figure 1. Permeation device
PortiO/" Pw,.,.,orionOev;ct E.hoU5!
L~----,J Calibration Chamber
SI r
Permeation Oevice
Figure 2. Calibration chamber
chlorine be present in solutions involved in the final S02 measurements made by the West-Gaeke procedure.
Sodium Tetrachloromercurate(II) Solution. To make 1M sodium tetrachloromercurate(II) solution, 1 mole (272 grams) of reagent grade mercuric chloride (Mallinckrodt Chemical Works) and 2 moles (117 grams) of sodium chloride (Mallinckrodt Chemical Works or Matheson Coleman and Bell) are dissolved in deionized water and diluted to 1 liter.
Pararosaniline Hydrochloride Solution. This solution may be obtained from Kern-Tech Laboratories, Inc., Baton Rouge, La., in a concentrated form. A solution approximating this concentrate can be prepared by dissolving 0.32 grams of pararosaniline hydrochloride (Fisher Scientific Co., No. p-389) in 240 ml of concentrated hydrochloric acid and diluting to 1 liter with water. Twentyfive milliliters of the reagent concentrate are diluted to 100 ml with water. This resulting solution is stable for at least three months. The concentrate is stable for at least a year. The use of impure pararosaniline may result in high reagent blanks. Blanks of approximately 0.01 absorbance unit should be obtained for 1-cm cells if the reagent is of acceptable quality.
Formaldehyde. 0.2%. Dilute 0.5 ml of 37% formaldehyde (Mallinckrodt Chemical Works) to 100 ml with deionized water. This solution should be prepared daily.
Sampling. Add 10 ml of 1M sodium tetrachloromercurate(ll) solution to the permeation device. Expose the device to the ambient atmosphere in an enclosure that allows free movement of air but eliminates direct sunlight (Figure 3). Normal exposure periods vary from 6 hr to 7 days as determined by applicable regulations. If more than half of the solution evaporates during the eXJlosure
Volume 7, Number 6, June 1973 527
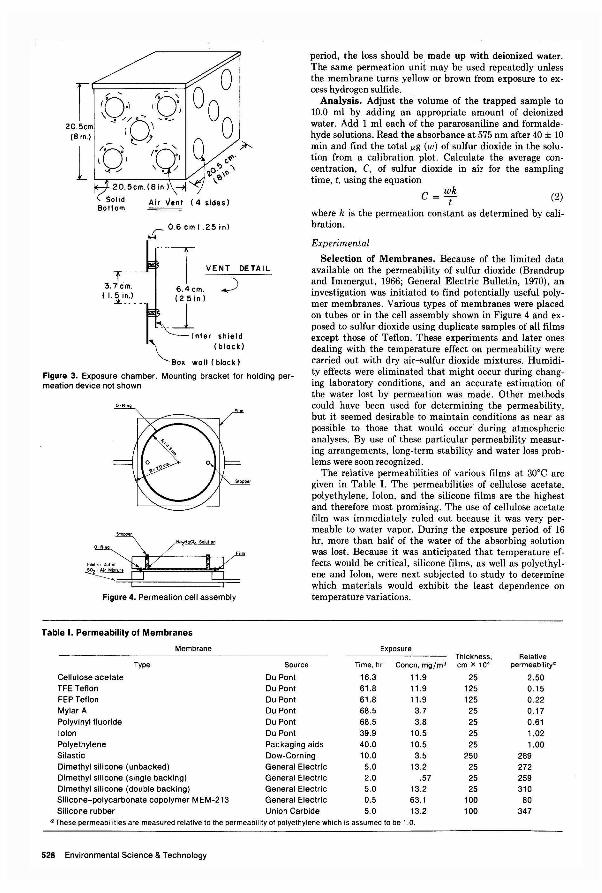
r 20.5cm
(8 in.)
1 0,,' '-:0-' ( .1 I 0
'\ • //0.... ...._ J - 0\ I ')
~ t:: IO~ \ I ,,/
r 0.6 cm( .25 in) 1>'0
period, the loss should be made up with deionized water. The same permeation unit may be used repeatedly unless the membrane turns yellow or brown from exposure to excess hydrogen sulfide.
Analysis. Adjust the volume of the trapped sample to 10.0 ml by adding an appropriate amount of deionized water. Add 1 ml each of the pararosaniline and formaldehyde solutions. Read the absorbance at 575 nm after 40 :l: 10 min and find the total Jig (w) of sulfur dioxide in the solution from a calibration plot. Calculate the average concentration, C, of sulfur dioxide in air for the sampling time, t, using the equation
C = ~k (2)
where k is the permeation constant as determined by calibration.
Experimental
VENT DETAIL Selection of Membranes. Because of the limited data
available on the permeability of sulfur dioxide (Brandrup and Immergut, 1966; General Electric Bulletin, 1970), an investigation was initiated to find potentially useful polymer membranes. Various types of membranes were placed on tubes or in the cell assembly shown in Figure 4 and exposed to sulfur dioxide using duplicate samples of all films except those of Teflon. These experiments and later ones dealing with the temperature effect on permeability were carried out with dry air-sulfur dioxide mixtures. Humidity effects were eliminated that might occur during changing laboratory conditions, and an accurate estimation of the water lost by permeation was made. Other methods could have been used for determining the permeability, but it seemed desirable to maintain conditions as near as possible to those that would occur· during atmospheric analyses. By use of these particular permeability measuring arrangements, long-term stability and water loss problems were soon recognized.
6.4 cm. (25 in)
~ Inter shield ~ (black)
80x wall (black) Figure 3. Exposure chamber. Mounting bracket for holding permeation device not shown
Figure 4. Permeation cell assembly
Table I. Permeability of Membranes
Cellulose acetate TFE Teflon FEP Teflon Mylar A Polyvinyl fluoride lolon Polyethylene Silastic
Type
Dimethyl silicone (unbacked)
Membrane
Dimethyl silicone (single backing) Dimethyl silicone (double backing) Silicone-polycarbonate copolymer MEM-213 Silicone rubber
Source
Du Pont Du Pont Du Pont Du Pont Du Pont Du Pont
The relative permeabilities of various films at 30·C are given in Table I. The permeabilities of cellulose acetate, polyethylene, Iolon, and the silicone films are the highest and therefore most promising. The use of cellulose acetate film was immediately ruled out because it was very permeable to water vapor. During the exposure period of 16 hr, more than half of the water of the absorbing solution was lost. Because it was anticipated that temperature effects would be critical, silicone films, as well as polyethylene and Iolon, were next subjected to study to determine which materials would exhibit the least dependence on temperature variations.
Exposure Thickness, Relative
Time, hr Conen, mg/m3 em X 104 permeabilitya
16.3 11.9 25 2.50 61.8 11.9 125 0.15 61.8 11.9 125 0.22 68.5 3.7 25 0.17 68.5 3.8 25 0.61 39.9 10.5 25 1.02
Packaging aids 40.0 10.5 25 1.00 Dow-Corning 10.0 3.5 250 289 General Electric 5.0 13.2 25 272 General Electric 2.0 .57 25 259 General Electric 5.0 13.2 25 310 General Electric 0.5 63.1 100 80 Union Carbide 5.0 13.2 100 347
a These permeabilities are measured relative to the permeability of polyethylene which is assumed to be 1.0.
528 Environmental Science & Technology
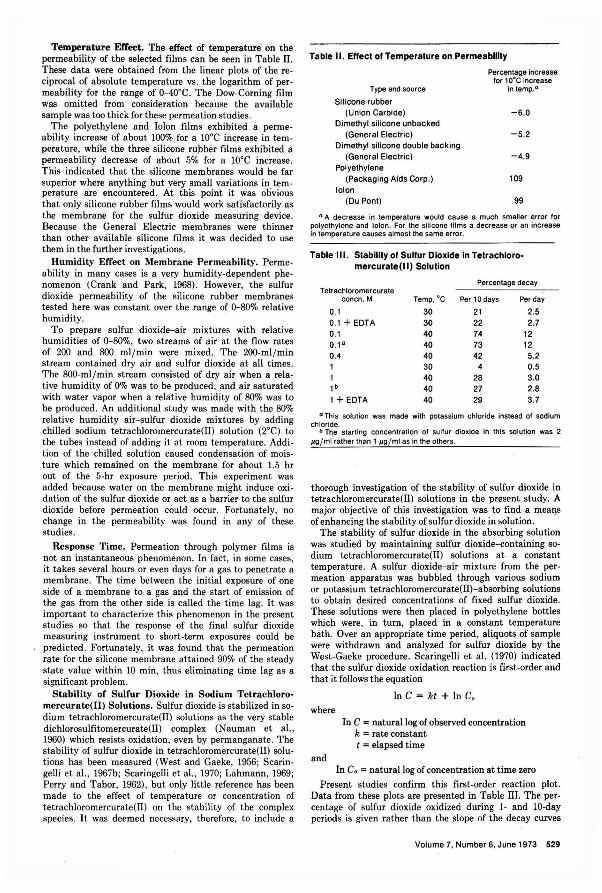
Temperature Effect. The effect of temperature on the permeability of the selected films can be seen in Table II. These data were obtained from the linear plots of the reciprocal of absolute temperature vs. the logarithm of permeability for the range of 0-40°C. The Dow-Corning film was omitted from consideration because the available sample was too thick for these permeation studies.
The polyethylene and Iolon films exhibited a permeability increase of about 100% for a 10°C increase in temperature, while the three silicone ru.bber films exhibited a permeability decrease of about 5% for a 10°C increase. This indicated that the silicone membranes would be far superior where anything but very small variations in temperature are encountered. At this point it was oovious that only silicone rubber films would work satisfactorily as the membrane for the sulfur dioxide measuring device . Because the General Electric membranes were thinner than other available silicone films it was decided to use them in the further investigations.
Humidity Effect on Membrane Permeability. Permeability in many cases is a very humidity-dependent phenomenon (Crank and Park, 1968). However, the sulfur dioxide permeability of the silicone rubber membranes tested here was constant over the range of 0-80% relative humidity. .
To prepare sulfur dioxide-air mixtures with relative humidities of 0-80%, two streams of air at the flow rates of 200 and 800 ml(min were mixed. The 200-ml(min stream contained dry air and sulfur dioxide at all times. The 800-ml(min stream consisted of dry air when a relative humidity of 0% was to be produced, and air saturated with water vapor when a relative humidity of 80% was to be produced . An additional study was made with the 80% relative humidity air-sulfur dioxide mixtures by adding chilled sodium tetrachloromercurate(1I) solution (2°C) to the tubes instead of adding it at room temperature. Addition of the chilled solution caused condensation of moisture which remained on the membrane for about 1.5 hr out of the 5-hr exposure period. This experiment was added because water on the membrane might induce oxidation of the sulfur dioxide or act as a barrier to the sulfur dioxide before permeation could occur. Fortunately, no change in the permeability was found in any of these studies.
Response Time. Permeation through polymer films is not an instantaneous phenomenon. In fact, in some cases, it takes several hours or even days for a gas to penetrate a membrane. The time between the initial exposure of one side of a membrane to a gas and the start of emission of the gas from the other side is called the time lag. It was important to characterize this phenomenon in the present studies so that the response of the final sulfur dioxide measuring instrument to short-term exposures could be predicted. Fortunately, it was found that the permeation rate for the silicone membrane attained 90% of the steady state value within 10 min, thus eliminating time lag as a significant problem.
Stability of Sulfur Dioxide in Sodium Tetrachloromercurate(Il) Solutions. Sulfur dioxide is stabilized in sodium tetrachloromercurate(II) solutions as the very stable dichlorosulfitomercurate(II) complex (Nauman et aI. , 1960) which resists oxidation, even by permanganate. The stability of sulfur dioxide in tetrachloromercurate(II) solutions has been measured (West and Gaeke, 1956; Scaringelli et aI. , 1967b; Scaringelli et aI., 1970; Lahmann, 1969; Perry and Tabor, 1962) , but only little reference has been made to the effect of temperature or concentration of tetrachloromercurate(II) on the stability of the complex species. It was deemed necessary, therefore, to include a
Table II. Effect of Temperature on Permeability
Type and source
Silicone rubber (Union Carbide)
Dimethyl silicone unbacked (General ElectriC)
Dimethyl silicone double backing (General Electric)
Polyethylene (Packaging Aids Corp.)
lolon (Du Pont)
Percentage increase for 10°C increase
in temp.a
-6.0
-5.2
-4.9
109
99
a A decrease in temperature would cause a much smaller error for polyethylene and lolon. For the silicone films a decrease or an increase in temperature causes almost the same error.
Table III. Siability of Sulfur Dioxide in Tetrachloromercurate(ll) Solution
Percentage decay Tetrachloromercurate
conen, M Temp,oC Per 10 days Per day
0.1 30 21 2.5 0.1 + EDTA 30 22 2.7 0.1 40 74 12 O.la 40 73 12 0.4 40 42 5.2 1 30 4 0.5
40 28 3.0 1· 40 27 2.8 1 + EDTA 40 29 3.7
a This solution was made with potassium chloride instead of sodium chloride.
b The starting concentration of sulfur dioxide in this solution was 2 I'IJ / ml rather than 1 p.g / ml as in the others. .
thorough investigation of the stability of sulfur dioxide in tetrachloromercurate(Il) solutions in the present study. A major objective of this investigation was to find a means of enhancing the stability of sulfur dioxide in solution.
The stability of sulfur dioxide in the absorbing solution was studied by maintaining sulfur dioxide-containing sodium tetrachloromercurate(Il) solutions at a constant temperature. A sulfur dioxide-air mixture from the permeation apparatus was bubbled through various sodium or potassium tetrachloromercurate(II)-absorbing solutions to obtain desired concentrations of fixed sulfur dioxide. These solutions were then placed in polyethylene bottles which were, in turn, placed in a constant temperature bath. Over an appropriate time period, aliquots of sample were withdrawn and analyzed for sulfur dioxide by the West-Gaeke procedure. Scaringelli et al. (1970) indicated that the sulfur dioxide oxidation reaction is first-order and that it follows the equation
where
and
In C = kt + In Co
In C = natural log of observed concentration k = rate constant t = elapsed time
In C. = natural log of concentration at time zero
Present studies confirm this first-order reaction plot. Data from these plots are presented in Table III. The percentage of sulfur dioxide oxidized during 1- and 10-day periods is given rather than the slope of the decay curves
Volume 7, Number 6, June 1973 529
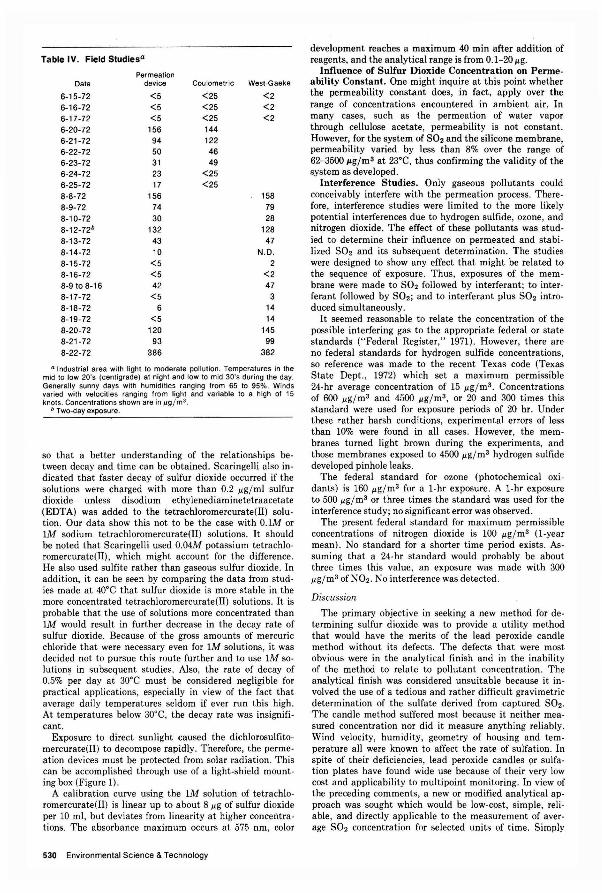
Table IV. Field Siudiesa
Permeation Date device Coulometric West-Gaeke
6-15-72 <5 <25 <2 6-16-72 <5 <25 <2 6-17-72 <5 <25 <2 6-20-72 156 144 6-21-72 94 122 6-22-72 50 46 6-23-72 31 49 6-24-72 23 <25 6-25-72 17 <25 8-8-72 156 158 8-9-72 74 79 8-10-72 30 28 8-12-72b 132 128 8-13-72 43 47 8-14-72 10 N.D. 8-15-72 <5 2 8-16-72 <5 <2 8-9 to 8-16 42 47 8-17-72 <5 3 8-18-72 6 14 8-19-72 <5 14 8-20-72 120 145 8-21-72 93 99 8-22-72 386 382
(l Industrial area with light to moderate pollution. Temperatures in the mid to low 20's (centigrade) at night and low to mid 30's during the day. Generally sunny days with humidities ranging from 65 to 95%. Winds varied with velocities ranging from light and variable to a high of 15 knots. Concentrations shown are in ~g/m3 .
b Two-day exposure .
so that a better understanding of the relationships between decay and time can be obtained. Scaringelli also in· dicated that faster decay of sulfur dioxide occurred if the solutions were charged with more than 0.2 Ilg!ml sulfur dioxide unless disodium ethylenediaminetetraacetate (EOTA) was added to the tetrachloromercurate(II) solution. Our data show this not to be the case with 0.1M or 1M sodium tetrachloromercurate(II) solutions. It should be noted that Scaringelli used 0.04M potassium tetrachloromercurate(II), which might account for the difference. He also used sulfite rather than gaseous sulfur dioxide. In addition, it can be seen by comparing the data from studies made at 40'C that sulfur dioxide is more stable in the more concentrated tetrachloromercurate(II) solutions. It is probable that the use of solutions more concentrated than 1M would result in further decrease in the decay rate of sulfur dioxide. Because of the gross amounts of mercuric chloride that were necessary even for 1M solutions, it was decided not to pursue this route further and to use 1M solutions in subsequent studies. Also, the rate of decay of 0.5% per day at 30'C must be considered negligible for practical applications, especially in view of the fact that average daily temperatures seldom if ever run this high. At temperatures below 30' C, the decay rate was insignificant.
Exposure to direct sunlight caused the dichlorosulfitomercurate(II) to decompose rapidly. Therefore, the permeation devices must be protected from solar radiation. This can be accomplished through use of a light-shield mounting box (Figure 1).
A calibration curve using the 1M solution of tetrachloromercurate(II) is linear up to about 8 IJ,g of sulfur dioxide per 10 ml, but deviates from linearity at higher concentrations. The absorbance maximum 'occurs at 575 nm, color
530 Environmental Science & Technology
development reaches a maximum 40 min after addition of reagents, and the analytical range is from 0.1-20 IJ,g.
Influence of Sulfur Dioxide Concentration on Permeability Constant. One might inquire at this point whether the permeability constant does, in fact, apply over the range of concentrations encountered in ambient air. In many cases, such as the permeation of water vapor through cellulose acetate, permeability is not constant. However, for the system of S02 and the silicone membrane, permeability varied by less than 8% over the range of 62-3500 p.g/m3 at 23'C, thus confirming the validity of the system as developed.
Interference Studies. Only gaseous pollutants could conceivably interfere with the permeation process. Therefore, interference studies were limited to the more likely potential interferences due to hydrogen sulfide, ozone, and nitrogen dioxide. The effect of these pollutants was studied to determine their influence on permeated and stabilized S02 and its subsequent determination. The studies were designed to show any effect that might be related to the sequence of exposure. Thus, exposures of the membrane were made to S02 followed by interferant; to interferant followed by S02; and to interferant plus S02 introduced simultaneously.
It seemed reasonable to relate the concentration of the possible interfering gas to the appropriate federal or state standards ("Federal Register," 1971). However, there are no federal standards for hydrogen sulfide concentrations, so reference was made to the recent Texas code (Texas State Dept., 1972) which set a maximum permissible 24-hr average concentration of 15 Ilg! mJ. Concentrations of 600 IJ,g! m3 and 4500 Ilg! m3, or 20 and 300 times this standard were used for exposure periods of 20 hr. Under these rather harsh conditions, experimental errors of less than 10% were found in all cases. However, the membranes turned light brown during the experiments, and those membranes exposed to 4500 IJ,g! m3 hydrogen sulfide developed pinhole leaks.
The federal standard for ozone (photochemical oxidants) is 160 Ilg!m3 for a 1-hr exposure. A 1-hr exposure to 500 Ilg! m3 or three times the standard was used for the interference study; no significant error was observed.
The present federal standard for maximum permissible concentrations of nitrogen dioxide is 100 Ilg! m3 (l-year mean). No standard for a shorter time period exists. Assuming that a 24-hr standard would probably be about three times this value, an exposure was made with 300 IJ,g!m3 of N02. No interference was detected.
Discussion
The primary objective in seeking a new method for determining sulfur dioxide was to provide a utility method that would have the merits of the lead peroxide candle method without its defects. The defects that were most obvious were in the analytical finish and in the inability of the method to relate to pollutant concentration. The analytical finish was considered unsuitable because it involved the use of a tedious and rather difficult gravimetric determination of the sulfate derived from captured S02. 'The candle method suffered most because it neither measured concentration nor did it measure anything reliably. Wind velocity, humidity, geometry of housing and temperature all were known to affect the rate of sulfation. In spite of their deficiencies, lead peroxide candles <;>r sulfation plates have found wide use because of their very low cost and applicability to multipoint monitoring. In view of the preceding comments, a new or modified analytical approach was sought which would be low-cost, simple, reliable, and directly applicable to the measurement of average S02 concentration for selected units of time. Simply
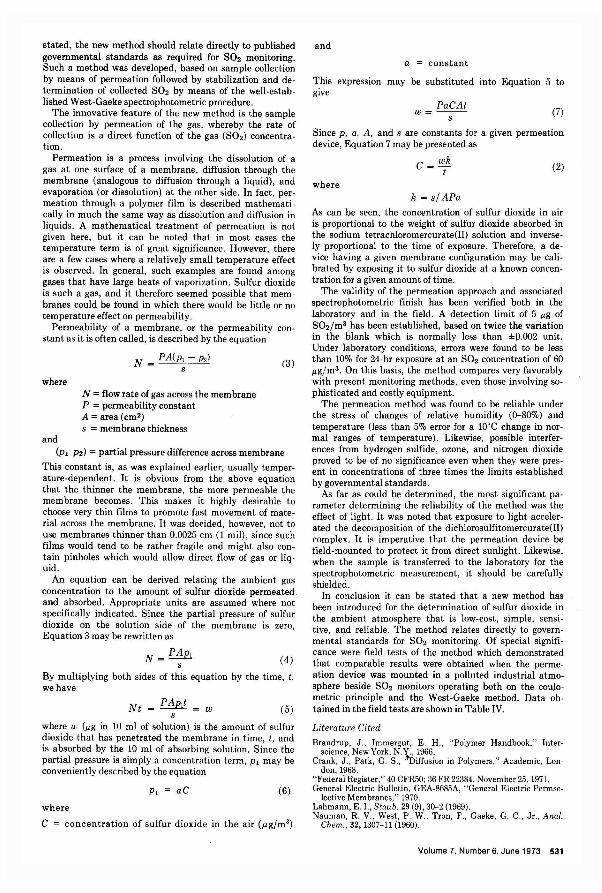
stated, the new method should relate directly to published governmental standards as required for S02 monitoring. Such a method was developed, based on sample collection by means of permeation followed by stabilization and de· termination of collected S02 by means of the well·estab· lished West·Gaeke spectrophotometric procedure.
The innovative feature of the new method is the sample collection by permeation of the gas, whereby the rate of collection is a direct function of the gas (S02) concentra· tion.
Permeation is a process involving the dissolution of a gas at one surface of a membrane, diffusion through the membrane (analogous to diffusion through a liquid), and evaporation (or dissolution) at the other side. In fact, per· meation through a polymer film is described mathemati· cally in much the same way as dissolution and diffusion in liquids. A mathematical treatment of permeation is not given here, but it can be noted that in most cases the temperature term is of great significance. However, there are a few cases where a relatively small temperature effect is observed. In general, such examples are found among gases that have large heats of vaporization. Sulfur dioxide is such a gas, and it therefore seemed possible that memo branes could be found in which there would be little or no temperature effect on permeability.
Permeability of a membrane, or the permeability con· stant as it is often called, is described by the equation
where
and
N = PA(p, - P2) s
N = flow rate of gas across the membrane P = permeability constant A = area (cm2) s = membrane thickness
(3)
(PrP2) = partial pressure difference across membrane
This constant is, as was explained earlier, usually temper. ature-dependent. It is obvious from the above equation that the thinner the membrane, the more permeable the membrane becomes. This makes it highly desirable to choose very thin films to promote fast movement of material across the membrane. It was decided, however, not to use membranes thinner than 0.0025 cm (1 mill, since such films would tend to be rather fragile and might also contain pinholes which would allow direct flow of gas or liquid.
An equation can be derived relating the ambient gas concentration to the amount of sulfur dioxide permeated, and absorbed. Appropriate units are assumed where not specifically indicated. Since the partial pressure of sulfur dioxide on the solution side of the membrane is zero, Equation 3 may be rewritten as
N = PAp, s (4)
By multiplying both sides of this equation by the time, t, we have
Nt = PAp,t = w s (5)
where w (I'g in 10 ml of solution) is the amount of sulfur dioxide that has penetrated the membrane in time, t, and is absorbed by the 10 ml of absorbing solution. Since the partial pressure is simply a concentration term, Pl may be conveniently described by the equation
p, = aC (6)
where
C = concentration of sulfur dioxide in the air (f.tg/m3)
and
a = constant
This expression may be substituted into Equation 5 to give
PaCAt w=~~
s (7)
Since p, a, A, and s are constants for a given permeation device, Equation 7 may be presented as
where
C = wk t
k = s/ APa
(2)
As can be seen, the concentration of sulfur dioxide in air is proportional to the weight of sulfur dioxide absorbed in the sodium tetrachloromercurate(II) solution and inversely proportional to the time of exposure. Therefore, a device having a given membrane configuration may be calibrated by exposing it to sulfur dioxide at a known concentration for a given amount of time.
The validity of the permeation approach and associated spectrophotometric finish has been verified both in the laboratory and in the field. A detection limit of 5 I'g of S02/m3 has been established, based on twice the variation in the blank which is normally less than ±O.002 unit. Under laboratory conditions, errors were found to be less than 10% for 24-hr exposure at an S02 concentration of 60 I'g/m3. On this basis, the method compares very favorably with present monitoring methods, even those involving sophisticated and costly equipment.
The permeation method was found to be reliable under the stress of changes of relative humidity (0-80%) and temperature (less than 5% error for a lOoe change in nor· mal ranges of temperature). Likewise, possible interferences from hydrogen sulfide, ozone, and nitrogen dioxide proved to be of no significance even when they were present in concentrations of three times the limits established by governmental standards.
As far as could be determined, the most significant parameter determining the reliability of the method was the effect of light. It was noted that exposure to light accelerated the decomposition of the dichlorosulfitomercurate(II) complex. It is imperative that the permeation device be field-mounted to protect it from direct sunlight. Likewise, when the sample is transferred to the laboratory for the spectrophotometric measurement, it should be carefully shielded.
In conclusion it can be stated that a new method has been introduced for the determination of sulfur dioxide in the ambient atmosphere that is low-cost, simple, sensitive, and reliable. The method relates directly to governmental standards for S02 monitoring. Of special significance were field tests of the method which demonstrated that comparable results were obtained when the permeation device was mounted in a polluted industrial atmosphere beside S02 monitors operating both on the couJo· metric principle and the West-Gaeke method. Data obtained in the field tests are shown in Table IV.
Literature Cited
Brandrup, J" Immergut. E. H., "Polymer Handbook," Inter· science, New York, N,Y" 1966.
Crank, J" Park, G, S" '''Diffusion in Polymers," Academic, London, 1968,
"Federal Register," 40 CFR50; 36 FR 22384, November 25,1971. General Electric Bulletin, G EA·8685A, "General Electric Permse
lective Membranes," 1970, Lahmann, E. I., Staub, 29 (9), 30-2 (1969), Nauman, R. V., West, p, W" Tron, F" Gaeke, G, C., Jr" Anal.
Chem" 32, 1307-11 (1960),
Volume 7, Number 6, June 1973 531
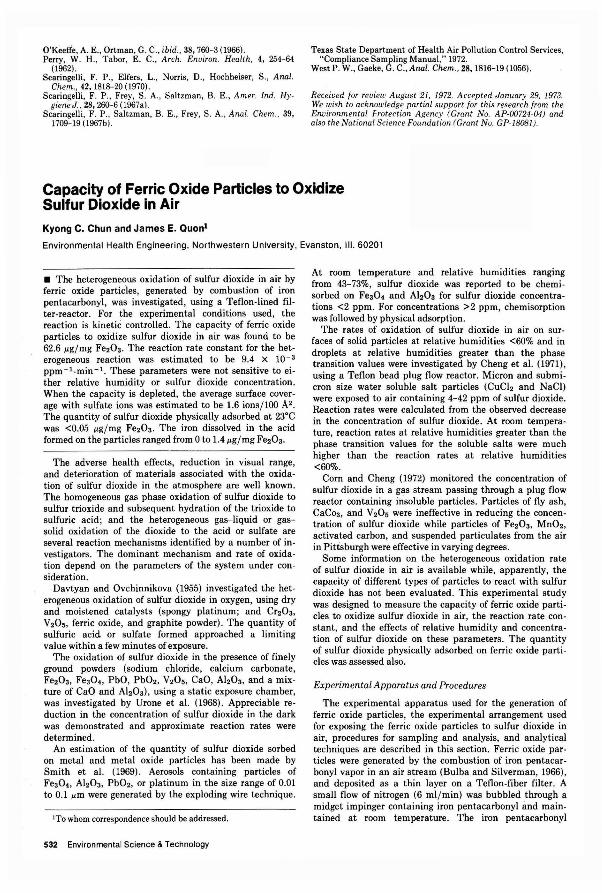
O'K"efte, A. E., Ortman, G. C., ibid. , 38,760-3 (1966). Perry, W. H., Tabor, E. C., Arch. Environ. Health, 4, 254- 64
(1962) . Scaringelli, F. P., Elfers, L., Norris, D., Hochheiser, S., Anal.
Chern., 42, 1818-20 (1970). Scaringelli, F. P. , Frey, S. A., Saltzman, B. E., Amer. Ind. Hy
giene J., 28,260- 6 (1967a). Scaringelli , F. P. , Saltzman, B. E., Frey, S. A., Anal. Chem., 39,
1709- 19 (1967b).
Texas State Department of Health Air Pollution Control Services, " Compliance Sampling Manual ," 1972.
West P. W. , Gaeke, G. C., Anal. Chern ., 28, 1816-19 (1056).
Received for review August 21, 1972. A ccepted January 29, 1973. We wish to acknowledge partial support for this research from the Environmental frotection Agency (Grant No. AP-00724-04) and also the National Science Foundation (Grant No. GP-18OS/).
Capacity of Ferric Oxide Particles to Oxidize Sulfur Dioxide in Air Kyong C. Chun and James E. Quonl
Environmental Health Engineering, Northwestern University, Evanston, III. 60201
• The heterogeneous oxidation of sulfur dioxide in air by ferric oxide particles, generated by combustion of iron pentacarbonyl, was investigated, using a Teflon-lined filter-reactor. For the experimental conditions used , the reaction is kinetic controlled. The capacity of ferric oxide particles to oxidize sulfur dioxide in air was found to be 62.6 p.g/mg FeZ03. The reaction rate constant for the heterogeneous reaction was estimated to be 9.4 X 10- 3 ppm - '_min - l . These parameters were not sensitive to either relative humidity or sulfur dioxide concentration. When the capacity is depleted, the average surface coverage with sulfate ions was estimated to be 1.6 ions/ 100 AZ. The quantity of sulfur dioxide physically adsorbed at 23°C was <0.05 p.g/mg FeZ03. The iron dissolved in the acid formed on the particles ranged from 0 to 1.4 p.g/ mg FeZ03.
The adverse health effects, reduction in visual range, and deterioration of materials associated with the oxidation of sulfur dioxide in the atmosphere are well known. The homogeneous gas phase oxidation of sulfur dioxide to sulfur trioxide and subsequent hydration of the trioxide to sulfuric acid; and the heterogeneous gas-liquid or gassolid oxidation of the dioxide to the acid or sulfate are several reaction mechanisms identified by a number of investigators . The dominant mechanism and rate of oxidation depend on the parameters of the system under consideration.
Davtyan and Ovchinnikova (1955) investigated the heterogeneous oxidation of sulfur dioxide in oxygen, using dry and moistened catalysts (spongy platinum; and CrZ03, Vz05, ferric oxide, and graphite powder). The quantity of sulfuric acid or sulfate formed approached a limiting value within a few minutes of exposure.
The oxidation of sulfur dioxide in the presence of finely ground powders (sodium chloride, calcium carbonate, FeZ03, Fe30., PbO, PbOz, VZ0 5, CaO, Ab03, and a mixture of CaO and A1,03), using a static exposure chamber, was investigated by Urone et al. (1968) . Appreciable reduction in the concentration of sulfur dioxide in the dark was demonstrated and approximate reaction rates were determined.
An estimation of the quantity of sulfur dioxide sorbed on metal and metal oxide particles has been made by Smith et al. (1969) . Aerosols containing particles of Fe30., A1,03, PbOz, or platinum in the size range of 0.01 to 0.1 p'm were generated by the exploding wire technique.
' To whom correspondence should be addressed.
532 Environmental Science & Technology
At room temperature and relative hum:idities ranging from 43-73%, sulfur dioxide was reported to be chemisorbed on Fe30. and Ab03 for sulfur dioxide concentrations <2 ppm. For concentrations >2 ppm, chemisorption was followed by physical adsorption.
The rates of oxidation of sulfur dioxide in air on surfaces of solid particles at relative humidities <60% and in droplets at relative humidities greater than the phase transition values were investigated hy Cheng et al. (1971), using a Teflon bead plug flow reactor. Micron and submicron size water soluble salt particles (CuClz and NaCl) were exposed to air containing 4-42 ppm of sulfur dioxide. Reaction rates were calculated from the observed decrease in the concentration of sulfur dioxide. At room temperature, reaction rates at relative humidities greater than the phase transition values for the soluble salts were much higher than the reaction rates at relative humidities <60%.
Corn and Cheng (1972) monitored the concentration of sulfur dioxide in a gas stream passing through a plug flow reactor containing insoluble particles. Particles of fly ash, CaC03, and V Z05 were ineffective in reducing the concentration of sulfur dioxide while particles of FeZ03, MnOz, activated carbon, and suspended particulates from the air in Pittsburgh were effective in varying degrees.
Some information on the heterogeneous oxidation rate of sulfur dioxide in air is available while, apparently, the capacity of different types of particles to react with sulfur dioxide has not been evaluated . This experimental study was designed to measure the capacity of ferric oxide particles to oxidize sulfur dioxide in air, the reaction rate constant, and the effects of relative humidity and concentration of sulfur dioxide on these parameters. The quantity of sulfur dioxide physically adsorbed on ferric oxide particles was assessed also.
Experimental Apparatus and Procedures
The experimental apparatus used for the generation of ferric oxide particles, the experimental arrangement used for exposing the ferric oxide particles to sulfur dioxide in air, procedures for sampling and analysis, and analytical techniques are described in this section. Ferric oxide particles were generated by the combustion of iron pentacarbonyl vapor in an air stream (Bulba and Silverman, 1966), and deposited as a thin layer on a Teflon-fiber filter . A small flow of nitrogen (6 ml/ min) was bubbled through a midget impinger containing iron pentacarbonyl and maintained at room temperature. The iron pentacarbonyl
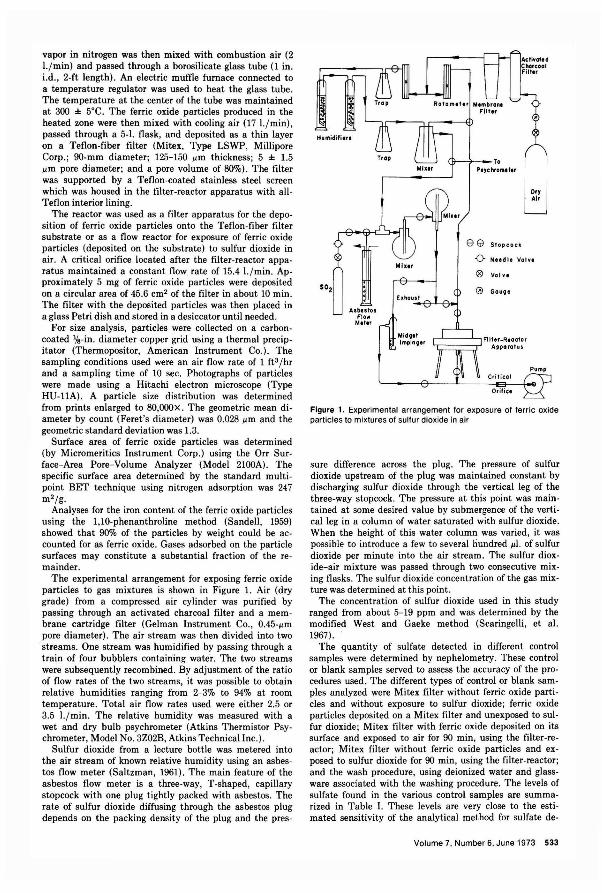
vapor in nitrogen was then mixed with combustion air (2 l.jmin) and passed through a borosilicate glass tube (1 in. i.d ., 2-ft length) . An electric muffle furnace connected to a temperature regulator was used to heat the glass tube. The temperature at the center of the tube was maintained at 300 '" 5°C. The ferric oxide particles produced in the heated zone were then mixed with cooling air (17 l.jmin) , passed through a 5-1. flask, and deposited as a thin layer on a Teflon-fiber filter (Mitex, Type LSWP, Millipore Corp.; 9O-mm diameter; 125-150 I'm thickness; 5 '" 1.5 I'm pore diameter; and a pore volume of 80%). The filter was supported by a Teflon-coated stainless steel screen which was housed in the filter-reactor apparatus with allTeflon interior lining.
The reactor was used as a filter apparatus for the deposition of ferric oxide particles onto the Teflon-fiber filter substrate or as a flow reactor for exposure of ferric oxide particles (deposited on the substrate) to sulfur dioxide in air . A critical orifice located after the filter-reactor apparatus maintained a constant flow rate of 15.4 I. / min. Approximately 5 mg of ferric oxide particles were deposited on a circular area of 45.6 cm2 of the filter in about 10 min. The filter with the deposited particles was then placed in a glass Petri dish and stored in a desiccator until needed.
For size analysis, particles were collected on a carboncoated lAl-in . diameter copper grid using a thermal precipitator (Thermopositor, American Instrument Co.). The sampling conditions used were an air flow rate of 1 ft3/hr and a sampling time of 10 sec. Photographs of particles were made using a Hitachi electron microscope (Type HV-llA) . A particle size distribution was determined from prints enlarged to 8O,OOOx. The geometric mean diameter by count (Feret's diameter) was 0.028 I'm and the geometric standard deviation was 1.3.
Surface area of ferric oxide particles was determined (by Micromeritics Instrument Corp.) using the Orr Surface-Area Pore-Volume Analyzer (Model 2100A) . The specific surface area determined by the standard multipoint BET technique using nitrogen adsorption was 247 m2 /g·
Analyses for the iron content of the ferric oxide particles using the l,10-phenanthroline method (Sandell, 1959) showed that 90% of the particles by weight could be accounted for as ferric oxide. Gases adsorbed on the particle surfaces may constitute a substantial fract ion of the remainder.
The experimental arrangement for exposing ferric oxide particles to gas mixtures is shown in Figure 1. Air (dry grade) from a compressed air cylinder was purified by passing through an activated charcoal filter and a membrane cartridge filter (Gelman Instrument Co., 0.45-l'm pore diameter). The air stream was then divided into two
. streams. One stream was humidified by passing through a train of four bubblers containing water. The two streams were subsequently recombined. By adjustment of the ratio of flow rates of the two streams, it was possible to obtain relative humidities ranging from 2- 3% to 94% at room temperature. Total air flow rates used were either 2.5 or 3.5 I. / min. The relative humidity was measured with a wet and dry bulb psychrometer (Atkins Thermistor Psychrometer, Model No. 3Z02B, Atkins Technical Inc.).
Sulfur dioxide from a lecture bottle was metered into the air stream of known relative humidity using an asbestos flow meter (Saltzman, 1961). The main feature of the asbestos flow meter is a three-way, T -shaped, capillary stopcock with one plug tightly packed with asbestos. The rate of sulfur dioxide diffusing through the asbestos plug depends on the packing density of the plug and the pres-
Humidifi.r.
Asbntos Flow
M.t,r
Midget Imping"
<It----;~-To Psychrometer
Dry Air
e @ Stopcock
-0 Need I, Valv.
® Yalve
~~~~~Fllttr_R.octor .., APporotu$
Figure 1. Experimental arrangement for exposure of ferric oxide particles to mixtures of sulfur dioxide in air
sure difference across the plug. The pressure of sulfur dioxide upstream of the plug was maintained constant by discharging sulfur dioxide through the vertical leg of the three-way stopcock. The pressure at this point was maintained at some desired value by submergence of the vertical leg in a column of water saturated with sulfur dioxide. When the height of this water column was varied, it was possible to introduce a few to several hundred 1'1. of sulfur dioxide per minute into the air stream. The sulfur dioxide-air mixture was passed through two consecutive mixing flasks . The sulfur dioxide concentration of the gas mixture was determined at this point.
The concentration of sulfur dioxide used in this study ranged from about 5-19 ppm and was determined by the modified West and Gaeke method (Scaringelli, et al. 1967) .
The quantity of sulfate detected in different control samples were determined by nephelometry. These control or blank samples served to assess the accuracy of the procedures used. The different types of control or blank samples analyzed were Mitex filter without ferric oxide particles and without exposure to sulfur dioxide; ferric oxide particles deposited on a Mitex filter and unexposed to sulfur dioxide; Mitex filter with ferric oxide deposited on its surface and exposed to air for 90 min, using the filter-reactor; Mitex filter without ferric oxide particles and exposed to sulfur dioxide for 90 min, using the filter-reactor ; and the wash procedure, using deionized water and glassware associated with the washing procedure. The levels of sulfate found in the various control samples are summarized in Table I. These levels are very close to the estimated sensitivity of the analytical method for sulfate de-
Volume 7, Number 6, June 1973 533
Table I. Sulfate Levels Detected in Different Types of Control Samples
Sulfur I'g/5 mg Fe,O, Relative dioxide humidity. con en, Sulfale Average
Control samples % ppm farmeda of group
Washing procedure. us- 15 ing deionized water 2 7 and glassware with 9 the washing proce- 3 dure
Mitex filter without fer- 12 ric oxide particles and 25 13 without exposure to 3 sulfur dioxide
Ferric oxide particles 12 deposited on a Mitex 5 filter and unexposed 20 14 to sulfur dioxide 20
16 3
Mitex filter without fer- 30 9.4 18 18 ric oxide particles and 48 10.1 3 exposed to sulfur di- 50 4.7 9 oxide for 90 min, us- 50 9.8 24 ing the filter-reactor 50 9.5 4
50 10.0 26 17
50 10.0 19 50 10.2 1 50 18.8 35 50 9.6 30 74 9.9 4 10 75 7.3 15 94 7.5 14 16 94· 10.3 18
Mitex filter with ferric 30 0.0 16 16 oxide deposited on its 50 0.0 18 18 surface and exposed to ai r for 90 min, us-ing the filter-reactor
a Sulfate in j.L9 per 5 mg Fe203 or in f.L9 per test when ferric oxide is absent. The estimated sensitivity of the analytical method used is 5 "'9 sulfate when 20-ml aliquots are-used.
termination and indicate the degree of extraneous particles which were introduced in the various steps of the procedure. The sulfate levels detected in the different control samples were small and adjustments to measurements were unnecessary. The flow rate of gas mixtures through the flow reactor was maintained constant at either 0.5 1./ min or 3 l.jmin by using a critical orifice between the reactor and the pump. These two flow rates correspond to interstitial gas velocities through the filter pores of 0.22 and 1.3 cm/sec. The corresponding particle Reynolds numbers based on a geometric mean diameter of 0.028 I'm were 4.1 x 10- 6 and 2.4 X 10- 5 and indicate laminar flow conditions.
In order to measure the rate of oxidation of sulfur dioxide and the quantity of sulfate formed, ferric oxide particles deposited on the filter substrate were exposed to gas mixtures for different time intervals ranging from 5 to 90 minutes. Immediately after the exposure, the filter substrate with ferric oxide particles was removed from the filter-reactor and submerged in 50 ml of deionized water in a 600-ml borosilicate glass beaker. The beaker was covered with a watch glass and the content was boiled gently for 90 min. The filter substrate was kept submerged throughout the boiling period using a flat, glass-coil tamper. At the end of the boiling period, the filter substrate was removed and rinsed with about 30 ml of deionized
534 Environmental Science & Technology
water. This rinse water was added to the beaker. The water used for extraction and the rinse water were boiled gently until the final volume was reduced to about 25 ml. The content of the beaker was then filtered through a membrane filter (MF-Millipore, Type GS, Millipore Corp.; 47-mm filter diameter; 0.22-l'm pore diameter) to remove the ferric oxide particles. The volume of the filtrate was adjusted to 50 ml with deionized water. Analyses of the filtrate for sulfate, dissolved iron, and pH were made. The ferric oxide particles deposited on a Teflonfiber filter were exposed to the sulfur dioxide-air mixture passing through the reactor.
Sulfate was determined by a modified nephelometric method (Kiley and Rogers, 1955) using a Hach Turbidimeter (Model 1860, Hach Chemical Co.). Soluble iron was determined either by the 1,10-phenanthroline method using a colorimeter (Spectronic 20, Bausch and Lomb) or by an atomic absorption spectrophotometer (maximum versatility, Model 82-500, Jarrell-Ash).
The quantity of sulfur dioxide physically adsorbed on ferric oxide particles was determined by measuring the quantity of sulfur dioxide desorbed from the particles. Desorption was achieved by using 5 liters of dry air (0.5 1./ min) to purge the filter-reactor after exposure of the ferric oxide particles to sulfur dioxide-air mixtures for periods ranging from 5 to 90 min. The desorbed sulfur dioxide was collected by bubbling the dry purge air through a bubbler containing potassium tetrachloromercurate.
For a given concentration of the chemical compound being determined, the accuracy was taken to be the maximum deviation of observed values from the line of best fit, using several calibration curves. Generally, the accuracy is in the order of 2-5% of the concentration of the chemical compound being determined. In absolute quantities, the determinations for sulfur dioxide, dissolved iron, and sulfate are accurate to approximately 0.5 I'g S02, 0.5 I'g Fe, and 51'g SO.2-, respectively.
Capacity Limited Heterogeneous Reaction
Heterogeneous reaction of sulfur dioxide with metal oxides and other types of particles to form sulfuric acid is recognized as one of several significant mechanisms of acid formation in the urban atmosphere. The catalytic activity of metal oxides, particularly those of the transition metals, is considered an important particulate property in the oxidation of sulfur dioxide. However, at ambient temperatures, the heterogeneous oxidation of sulfur dioxide on surfaces of nonhygroscopic metal oxide particles is not a true catalytic reaction. The active sites on the surfaces of particles become occupied by the products of reaction during the course of the reaction. These active sites are not available subsequently for further reaction, as would be the case in a true catalytic reaction. Hence, the oxidation of sulfur dioxide on the surfaces of ferric oxide particles is expected to form a finite quantity of acid; the quantity being proportional to the number of active sites originally available for reaction. The term "capacity limited heterogeneous reaction" is used here to designate this class of gas-solid reaction.
The capacity limited heterogeneous oxidation of sulfur dioxide on surfaces of ferric oxide particles at room temperature (23°C) may be regarded to consist of the following sequence of steps: (1) chemisorption of oxygen onto the surface sites, (2) diffusion of sulfur dioxide to the surface, (3) reaction between sulfur dioxide and chemisorbed oxygen to form sulfur trioxide, (4) hydration of sulfur trioxide to sulfuric acid, and (5) partial dissolution of ferric oxide by the sulfuric acid.
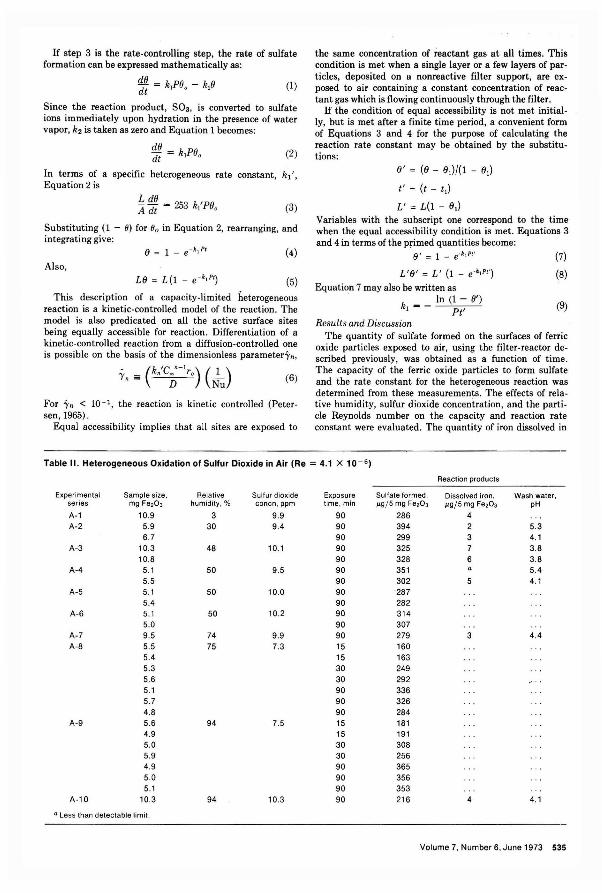
If step 3 is the rate-controlling step, the rate of sulfate formation can be expressed mathematically as:
dO dt = kJPO o - k,O (1)
Since the reaction product, S03, is converted to sulfate ions immediately upon hydration in the presence of water vapor, k2 is taken as zero and Equation 1 becomes:
(2)
In terms of a specific heterogeneous rate constant, hI', Equation 2 is
Ie dO - 253 k 'pn A dt - J U o (3)
Substituting (1 - 0) for 80 in Equation 2, rearranging, and integrating give:
(4) Also,
(5)
This description of a capacity-limited heterogeneous reaction is a kinetic-controlled model of the reaction. The model is also predicated on all the active surface sites being equally accessible for reaction. Differentiation of a kinetic-controlled reaction from a diffusion-controlled one is possible on the basis of the dimensionless parametedn,
(6)
For .yn < 10 - 1 , the reaction is kinetic controlled (Petersen, 1965).
Equal accessibility implies that all sites are exposed to
the same concentration of reactant gas at all times. This condition is met when a single layer or a few layers of particles, deposited on a nonreactive filter support, are exposed to air containing a constant concentration of reactant gas which is flowing continuously through the filter.
If the condition of equal accessibility is not met initially, but is met after a finite time period, a convenient form of Equations 3 and 4 for the purpose of calculating the reaction rate constant may be obtained by the substitutions:
L' = L(l - 6\) Variables with the subscript one correspond to the time when the equal accessibility condition is met. Equations 3 and 4 in terms of the primed quantities become:
L '6' = L' (1 _ e·k,Pt')
Equation 7 may also be written as . h = _ In (1 - (f)
J Pt' Results and Discussion
(7)
(8)
(9)
The quantity of sulfate formed on the surfaces of ferric oxide particles exposed to air, using the filter-reactor described previously, was obtained as a function of time. The capacity of the ferric oxide particles to form sulfate and the rate constant for the heterogeneous reaction was determined from these measurements. The effects of relative humidity, sulfur dioxide concentration, and the particle Reynolds number on the capacity and reaction rate constant were evaluated. The quantity of iron dissolved in
Table II. Heterogeneous Oxidation of Sulfur Dioxide in Air (Re = 4.1 X 10- 6)
Reaction products
Experimental Sample size, Relative Sulfur dioxide Exposure Sulfate formed, Dissolved iron, Wash water, series mg Fe203 humidity, % concn, ppm time, min I'g/5 mg Fe,O, I'g/5 mg Fe,O, pH
A-1 10.9 3 9.9 90 286 4 A-2 5.9 30 9.4 90 394 2 5.3
6.7 90 299 3 4.1 A-3 10.3 48 10.1 90 325 7 3.8
10.8 90 328 6 3.8 A-4 5.1 50 9.5 90 351 5.4
5.5 90 302 5 4.1 A-5 5.1 50 10.0 90 '287
5.4 90 282 A-6 5.1 50 10.2 90 314
5.0 90 307 A-7 9.5 74 9.9 90 279 3 4.4 A-8 5.5 75 7.3 15 160
5.4 15 163 5.3 30 249 5.6 30 292 5.1 90 336 5.7 90 326 4.8 90 284
A-9 5.6 94 7.5 15 181 4.9 15 191 5.0 30 308 5.9 30 256 4.9 90 365 5.0 90 356 5.1 90 353
A-10 10.3 94 10.3 90 216 4 4.1
a Less than detectable limit.
Volume 7, Number 6, June 1973 535
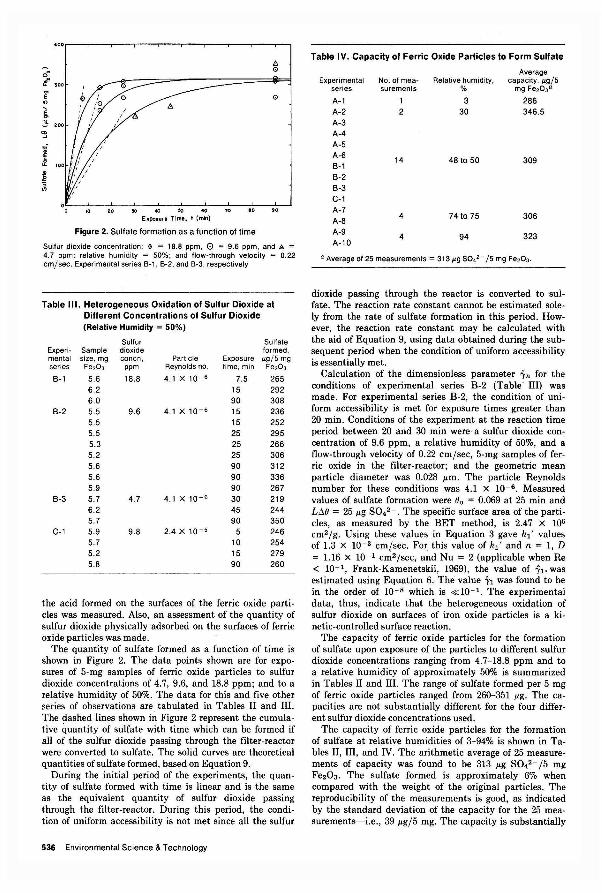
.00r---.---,---_r---r--~--_.----r_--,_--_r_,
o
OL-__ ~ __ ~ __ -L __ ~ __ ~ __ ~~ __ L_ __ ~ __ ~-J
o 10 20 30 40 '<> tlO 90
Exposure Time, t (min)
Figure 2. Sulfate formation as a function of time
Sulfur dioxide concentration: $ = 18.8 ppm, 0 = 9.6 ppm, and A = 4.7 ppm; relative humidity = 50%; and flow-through velocity :;;: 0.22 em/sec. Experimental series B-1, B-2, and B-3, respectively
Table III. Heterogeneous Oxidation of Sulfur Dioxide at Different Concentrations of Sulfur Dioxide (Relative Humidity = 50%)
Experi- Sample mental size, mg series Fe203
B-1 5.6
B-2
B-3
C-1
6.2 6.0 5.5 5.5 5.5 5.3 5.2 5.6 5.6 5.9 5.7 6.2 5.7 5.9 5.7 5.2 5.8
Sulfur dioxide conen,
ppm
18.8
9.6
4.7
9.8
Particle Reynolds no.
4.1 X 10 - 6
4.1 X 10- 6
4.1 X 10- 6
2.4 X 10- 5
Sulfate formed,
Exposure p.g/5 mg time. min Fe203
7.5 265 15 292 90 308 15 236 15 252 25 295 25 266 25 306 90 312 90 336 90 267 30 219 45 244 90 350
5 246 10 254 15 279 90 260
the acid formed on the surfaces of the ferric oxide particles was measured. Also, an assessment of the quantity of sulfur dioxide physically adsorbed on the surfaces of ferric oxide particles was made.
The quantity of sulfate formed as a function of time is shown in Figure 2. The data points shown are for exposures of 5-mg samples of ferric oxide particles to sulfur dioxide concentrations of 4.7, 9.6, and 18.8 ppm; and to a relative humidity of 50%. The data for this and five other series of observations are tabulated in Tables II and III. The dashed lines shown in Figure 2 represent the cumulative quantity of sulfate with time which can be formed if all of the sulfur dioxide passing through the filter-reactor were converted to sulfate. The solid curves are theoretical quantities of sulfate formed, based on Equation 9.
During the initial period of the experiments, the quantity of sulfate formed with time is linear and is the same as the equivalent quantity of sulfur dioxide passing through the filter-reactor. During this period, the condition of uniform accessibility is not met since all the sulfur
536 Environmental Science & Technology
Table IV. Capacity of Ferric Oxide Particles to Form Sulfate
Average Experimental No. of mea- Relative humidity, capacity, p.g/5
series surements % mg Fe203a
A-1 1 3 286 A-2 2 30 346.5 A-3 A-4 A-5 A-6 14 B-1
48 to 50 309
B-2 B-3 C-1 A-7 A-8
4 74 to 75 306
A-9 A-10
4 94 323
a Average of 25 measurements = 313 J,Lg 5042 - /5 mg Fe203.
dioxide passing through the reactor is converted to sulfate. The reaction rate constant cannot be estimated solely from the rate of sulfate formation in this period. However, the reaction rate constant may be calculated with the aid of Equation 9, using data obtained during the subsequent period when the condition of uniform accessibility is essentially met.
Calculation of the dimensionless parameter 'Yn for the conditions of experimental series B-2 (Table' III) was made. For experimental series B-2, the condition of uniform accessibility is met for exposure times greater than 20 min. Conditions of the experiment at the reaction time period between 20 and 30 min were·a sulfur dioxide con, centration of 9.6 ppm, a relative humidity of 50%, and a flow-through velocity of 0.22 em/sec, 5-mg samples of ferric oxide in the filter-reactor; and the geometric mean particle diameter was 0.028 I'm. The particle Reynolds number for these conditions was 4.1 x 10- 6 . Measured values of sulfate formation were ljo = 0.069 at 25 min and LtJ.O = 25 I'g SO.2 - . The specific surface area of the particles, as measured by the BET method, is 2.47 X 10⁶
cm2/g. Using these values in Equation 3 gave kl' values of 1.3 X 10⁻³ cm/sec. For this value of kl' and n = 1, D = 1.16 X 10- 1 c~2/sec, and Nu = 2 (applicable when Re < 10-1, Frank-Kamenetskii, 1969), the value of -rl' was estimated using Equation 6. The value 1'1 was found to be in the order of 10- 8 which is «10- 1 • The experimental data, thus, indicate that the heterogeneous oxidation of sulfur dioxide on surfaces of iron oxide particles is a kinetic-controlled surface reaction.
The capacity of ferric oxide particles for the formation of sulfate upon exposure of the particles to different sulfur dioxide concentrations ranging from 4.7- 18.8 ppm and to a relative humidity of approximately 50% is summarized in Tables II and III. The range of sulfate formed per 5 mg of ferric oxide particles ranged from 260-351 I'g. The capacities are not substantially different for the four different sulfur dioxide concentrations used.
The capacity of ferric oxide particles for the formation of sulfate at relative humidities of 3-94% is shown in Tables II, III, and IV. The arithmetic average of 25 measurements of capacity was found to be 313 I'g SO.2 - /5 mg Fe203. The sulfate formed is approximately 6% when compared with the weight of the original particles. The reproducibility of the measurements is good, as indicated by the standard deviation of the capacity for the 25 measurements-i.e., 39 I'g/5 mg. The capacity is substantially
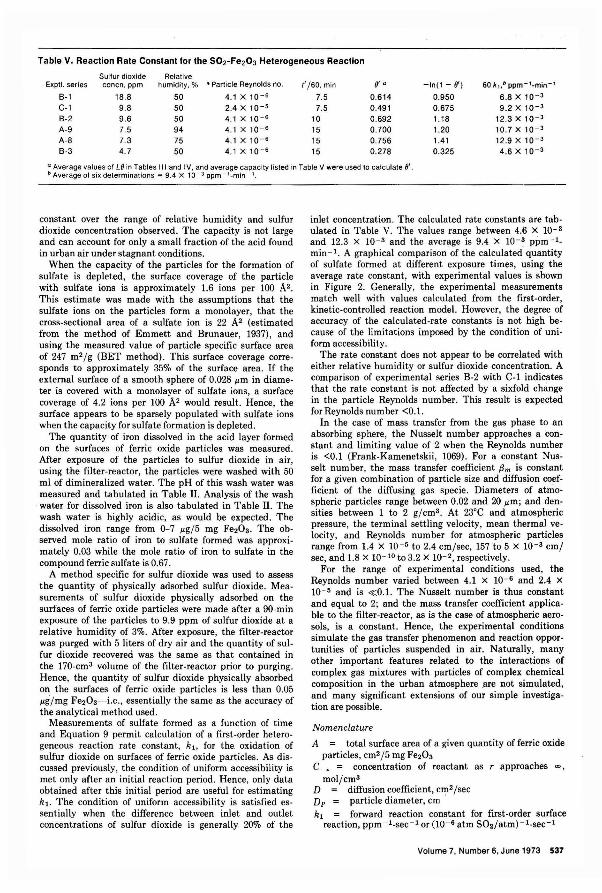
Table V. Reaction Rate Constant for the S02-Fe203 Heterogeneous Reaction
Sulfur dioxide Relative ExptJ. series conen, ppm humidity. % ' Particle Reynolds no. r' / 60. min 8' a -In(1 - 8') 60 klob ppm- 1_min- 1
B-1 18.8 50 4.1 X 10⁻⁶ 7.5 0.614 0.950 6.8 X 10⁻³
C-l 9.8 50 2.4 X 10⁻⁵ 7.5 0.491 0.675 9.2 X 10⁻³
B-2 9.6 50 4.1 X 10 - 6 10 0.692 1.18 12.3XlO-3
A-9 7.5 94 4.1 X 10- 6 15 0.700 1.20 10.7 X 10⁻³
A-8 7.3 75 4.1 X 10 - 6 15 0.756 1.41 12.9 X 10⁻³
B-3 4.7 50 4.1 X 10 - 6 15 0.278 0.325 4.6 X 10⁻³
a Average values of LO in Tables III and IV, and average capacity listed in Table V were used to calculate 0', b Average of six determinations = 9.4 X 10 - 3 ppm -l-min - 1.
constant over the range of relative humidity and sulfur dioxide concentration observed. The capacity is not large and can account for only a small fraction of the acid found in urban air under stagnant conditions.
When the capacity of the particles for the formation of sulfate is depleted, the surface coverage of the particle with sulfate ions is approximately 1.6 ions per 100 A2. This estimate was made with the assumptions that the sulfate ions on the particles form a monolayer, that the cross-sectional area of a sulfate ion is 22 A2 (estimated from the method of Emmett and Brunauer, 1937), and using the measured value of particle specific surface area of 247 m2/ g (BET method). This surface coverage corresponds to approximately 35% of the surface area. If the external surface of a smooth sphere of 0.028 I'm in diameter is covered with a monolayer of sulfate ions, a surface coverage of 4.2 ions per 100 A2 would result. Hence, the surface appears to be sparsely populated with sulfate ions when the capacity for sulfate formation is depleted.
The quantity of iron dissolved in the acid layer formed on the surfaces of ferric oxide particles was measured. After exposure of the particles to sulfur dioxide in air, using the filter-reactor, the particles were washed with 50 ml of dimineralized water. The pH of this wash water was measured and tabulated in Table II. Analysis of the wash water for dissolved iron is also tabulated in Table II. The wash water is highly acidic, as would be expected. The dissolved iron range from 0-7 I'g/ 5 mg Fe203. The observed mole ratio of iron to sulfate formed was approximately 0.03 while the mole ratio of iron to sulfate in the compound ferric sulfate is 0.67.
A method specific for sulfur dioxide was used to assess the quantity of physically adsorbed sulfur dioxide. Measurements of sulfur dioxide physically adsorbed on the surfaces of ferric oxide particles were made after a 90-min exposure of the particles to 9.9 ppm of sulfur dioxide at a relative humidity of 3%. After exposure, the filter-reactor was purged with 5 liters of dry air and the quantity of sulfur dioxide recovered was the same as that contained in the 170-cm3 volume of the filter-reactor prior to purging. Hence, the quantity of sulfur dioxide physically absorbed on the surfaces of ferric oxide particles is less than 0.05 wi/ mg Fe203-i.e., essentially the same as the accuracy of the analytical method used.
Measurements of sulfate formed as a function of time and Equation 9 permit calculation of a first-order heterogeneous reaction rate constant, hI , for the. oxidation of sulfur dioxide on surfaces of ferric oxide particles. As discussed previously, the condition of uniform accessibility is met only after an initial reaction period. Hence, only data obtained after this initial period are useful for estimating hI . The condition of uniform accessibility is satisfied essentially when the difference between inlet and outlet concentrations of sulfur dioxide is generally 20% of the
inlet concentration. The calculated rate constants are tabulated in Table V. The values range between 4.6 x 10⁻³ and 12.3 X 10- 3 and the average is 9.4 X 10⁻³ ppm -1_ min-I . A graphical comparison of the calculated' quantity of sulfate formed at different exposure times, using the average rate constant, with experimental values is shown in Figure 2. Generally, the experimental measurements match well with values calculated from the first-order, kinetic-controlled reaction model. However, the degree of accuracy of the calculated-rate constants is not high because of the limitations imposed by the condition of uniform accessibility.
The rate constant does not appear to be correlated with either relative humidity or sulfur dioxide concentration. A comparison of experimental series B-2 with C-1 indicates that the rate constant is not affected by a sixfold change in the particle Reynolds number. This result is expected for Reynolds number <0.1.
In the case of mass transfer from the gas phase to an absorbing sphere, the Nusselt number approaches a constant and limiting value of 2 when the Reynolds number is <0.1 (Frank-Kamenetskii, 1069). For a constant Nusselt number, the mass transfer coefficient Pm is constant for a given combination of particle size and diffusion coefficient of the diffusing gas specie. Diameters of atmospheric particles range between 0.02 and 20 I'm; and densities between 1 to 2 g/cm3 . At 23°C and atmospheric pressure, the terminal settling velocity, mean thermal velocity, and Reynolds number for atmospheric particles range from 1.4 X 10-' to 2.4 em/sec, 157 to 5 X 10⁻³ cm/ sec, and 1.8 X 10- 10 to 3.2 X 10- 2, respectively.
For the range of experimental conditions used, the Reynolds number varied between 4.1 X 10- 6 and 2.4 X
10- 5 and is «0.1. The Nusselt number is thus constant and equal to 2; and the mass transfer coefficient applicable to the filter-reactor, as is the case of atmospheric aerosols, is a constant. Hence, the experimental conditions simulate the gas transfer phenomenon and reaction opportunities of particles suspended in air. Naturally, many other important features related to the interactions of complex gas mixtures with particles of complex chemical composition in the urban atmosphere .are not simulated, and many Significant extensions of our simple investigation are possible.
Nomenclature
A total surface area of a given quantity of ferric oxide particles, cm2/ 5 mg Fe203
C.. = concentration of reactant as r approaches "', mol/cm3
D diffusion coefficient, cm2/sec Dp = particle diameter, cm . kl forward reaction constant for first-order surface
reaction, ppm -1_sec-l or (10- 6 atm S02/atm)-I-sec-1
Volume 7, Number 6, June 1973 537
backward reaction constant for the first-order sur-face reaction, sec-'
kn ' heterogeneous reaction rate constant based on the external surface area of smooth spheres, em (mol/ cm3 )'-n /sec
L total capacity of a given quantity offerric oxide par-ticles to form sulfate, p.g/5 mg Fe203
L' = L (1 - 0,) n = order of the heterogeneous reaction Nu Nusselt number for diffusion ({jmr 0/ D) P concentration of sulfur dioxide, ppm r = radial coordinate, em ro particle radius, em Re = particle Reynolds number (Dp'U/v) t time, sec t' - time with origin at h, (t - tt) U flow velocity, em/sec
Greek Letters
{jm mass transfer coefficient, em/sec in dimensionless parameter (kn' Cwin -'ro/ D· Nu) o fraction of surface sites occupied by sulfate ions or
sulfur trioxide molecules at time t 0, 0 at time t, 0' (0 - 0,)/(1 - 0,) 00 fraction of surface sites occupied by oxygen atoms
at time t kinematic viscosity cm2 /sec
Literature Cited
Bulba, E., Silverman, L., "A Recirculating Aerosol Tunnel," 59th Annual Meeting, Air Pollution Control Ass., Paper No. 82, San Francisco, Calif., June 1966.
Cheng, R T., Frohliger, J. 0., Corn, M., J. Air Pollut. Contr. Ass., 21, 138-42 (1971) .
Corn, M., Cheng, R . T., "Interaction of Sulfur Dioxide with Insoluble Suspended Particufate Matter," 65th Annual Meeting, Air Pollution Control Ass., Paper No. 72-126, Miami Beach, Fla., June 1972.
Davtyan, O. K., Ovchinnikova, E. N., Dokl. Akod. Nouk, USSR, 104,857-60 (1955).
Emmett, P. H., Brunauer, S., J. Amer. Che"!. Soc., 59, 1553-64 (1937).
Frank-Kamenetskii, D. A., "Diffusion and Heat Transfer in Chemical Kinetics," Plenum Press, New York-London, 1969, p 42.
Kiley, H. J., Rogers, L. B., Anal. Chem. , 27, 759-64 (1955). Petersen, E. E., "Chemical Reaction Analysis," Prentice-Hall,
Englewood Cliffs, N.J., 1965, pp 131-5. Saltzman, B. E.,Anal. Chem., 33,1100-1111 (1961). Sandell, E. B., "Colorimetric Determination of Traces of Met
als," Interscience, New York, N.Y., 1959, pp 537-42. Scaringelli, F. P., Saltzman, B. E., Frey, S. A., Anal. Chem., 39,
1709- 19 (1967). Smith, B. M., Wagman, J., Fish, B. R, Environ. Sci. Technol., 3,
588-92 (1969). Urone, P. H., Lutsep, H., Noyes, C. M., Parcher, J. F., ibid., 2,
611-18 (1968).
Received for review August 30, 1972. Accepted January 26, 1973. This study was supported, in part, by funds from the Bureau of Community and Environment Management , ECA, USPHS, Research Training Grant No. 5-T01-EC-OOOI4.
Stimulated Biodegradation of Oil Slicks Using Oleophilic Fertilizers
Ronald M. Atlas 1 and Richard Bartha2
Department of Biochemistry and Microbiology, Rutgers University, New Brunswick, N.J. 08903
• Biodegradation of polluting oil at sea is seriously limited by the scarcity of nitrogen and phosphorus. Since water-soluble sources of these elements would be ineffective in the ocean, oleophiiic compounds were screened to serve as fertilizers for oil slicks. A combination of paraffinized urea and octylphosphate promoted oil biodegradation, both in laboratory experiments and in field trials, to an extent that the practical application of this principle to oil cleanup appears feasible. The tested oleophilic fertilizer supplies nutrients to hydrocarbon-degrading microorganisms selectively and, in contrast to nitrate and phosphate salts, it does not trigger algal blooms.
The oceans of the world are currently being burdened by an estimated oil pollution load of 5- to lO-million metric tons per year (Blumer, 1973), and the resulting damage has caused widespread concern. Considerable research effort is being devoted to the prevention and control of oil spills (Joint Conferences on Prevention and Control of Oil Spills, 1969, 1971), but spills continue to occur. Theoretically, spilled oil can be cleaned up by various skimming devices, but prevailing weather conditions seldom allow this approach to succeed. Ignition is rarely feasible, both be-
1 Present address, Bioscience Section, Jet Propulsion Laboratory, California Institute of Technology, Pasadena, Calif.
2 To whom correspondence should be addressed.
538 Environmental Science & Technology
cause of safety considerations and because of the rapid evaporative loss of the low flash point components. The two remaining conventional measures, dispersion or sinking, are essentially cosmetic in nature. They merely render the oil less offensive but, in fact, increase the exposure of marine life to the pollutant and are for this reason best avoided (Blumer, 1973).
A novel approach to the cleanup of spilled oil attempts to stimulate its biodegradation. This process is the major natural mechanism for elimination of oil from the marine environment, but it occurs at a distressingly slow rate. To speed up this process is the ultimate aim of present research projects in various laboratories (Chem. Eng. News, 1970). Several commercial microbial inocula are being marketed for the purpose of oil biodegradation but, to date, no controlled studies have been published on the effectiveness of these products.
In the course of our studies on the limiting factors of oil biodegradation in natural seawater, we were impressed by the magnitude of the positive response to the addition of nitrate and phosphate supplements (Atlas and Bartha, 1972a). Seawater contains very low concentrations of nitrogen and phosphorus, and petroleum or petroleum products are also deficient in these essential nutrients. Nitrate and phosphate are excellent sources of these elements as long as the seawater is enclosed in a laboratory flask, but they may be useless or worse when applied in the open ocean. Because of their solubility in water, these salts can be expected to
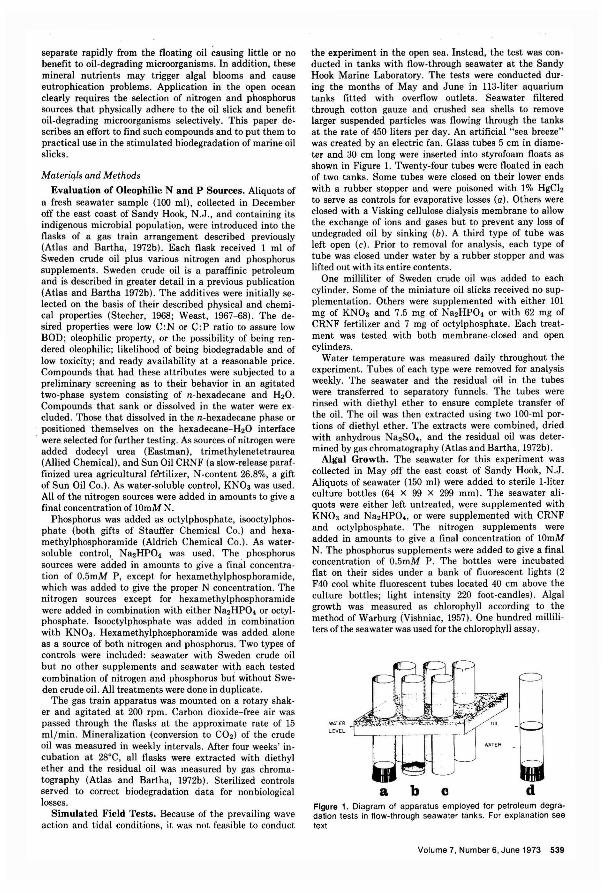
separate rapidly from the floating oil causing little or no benefit to oil-degrading microorganisms. In addition, these mineral nutrients may trigger algal blooms and cause eutrophication problems. Application in the open ocean clearly requires the selection of nitrogen and phosphorus sources that physically adhere to the oil slick and benefit oil-degrading microorganisms selectively. This paper describes an effort to find such compounds and to put them to practical use in the stimulated biodegradation of marine oil slicks.
Materiqls and Methods
Evaluation of Oleophilic Nand P Sources. Aliquots of a fresh seawater sample (100 m\), collected in December off the east coast of Sandy Hook, N.J., and containing its indigenous microbial population, were introduced into the flasks of a gas train arrangement described previously (Atlas and Bartha, I972b). Each flask received 1 ml of Sweden crude oil plus various nitrogen and phosphorus supplements. Sweden crude oil is a paraffinic petroleum and is described in greater detail in a previous publication (Atlas and Bartha 1972b). The additives were initially selected on the basis of their described physical and chemical properties (Stecher, 1968; Weast, 1967-68). The desired properties were low C: N or C: P ratio to assure low BOD; oleophilic property, or the possibility of being rendered oleophilic; likelihood of being biodegradable and of low toxicity; and ready availability at a reasonable price. Compounds that had these attributes were subjected to a preliminary screening as to their behavior in an agitated two-phase system consisting of n-hexadecane and H20. Compounds that sank or dissolved in the water were excluded. Those that dissolved in the n-hexadecane phase or positioned themselves on the hexadecane- H20 interface
. were selected for further testing. As sources of nitrogen were added dodecyl urea (Eastman), trimethylenetetraurea (Allied Chemical), and Sun Oil CRNF (a slow-release paraffinized urea agricultural feHilizer, N-content 26.8%, a gift of Sun Oil Co.). As water-soluble control, KNOs was used. All of the nitrogen sources were added in amounts to give a final concentration of 10mM N.
Phosphorus was added as octylphosphate, isooctylphosphate (both gifts of Stauffer Chemical Co.) and hexamethylphosphoramide (Aldrich Chemical Co.). As watersoluble control ,. Na2HPO. was used. The phosphorus sources were added in amounts to give a final concentration of 0.5mM P, except for hexamethylphosphoramide, which was added to give the proper N concentration. The. nitrogen sources except for hexamethylphosphoramide were added in combination with either Na2HPO. or octylphosphate. Isooctylphosphate was added in combination with KNOs. Hexamethylphosphoramide was added alone as a source of both nitrogen and phosphorus. Two types of controls were included: seawater with Sweden crude oil but no other supplements and seawater with each tested combination of nitrogen and phosphorus but without Sweden crude oil. All treatments were done in duplicate.
The gas train apparatus was mounted on a rotary shaker and agitated at 200 rpm. Carbon dioxide-free air was passed through the flasks at the approximate rate of 15 ml / min. Mineralization (conversion to C02) of the crude oil was measured in weekly intervals. After four weeks' in· cubation at 28°C, all flasks were extracted with diethyl ether and the residual oil was measured by gas chromatography (Atlas and Bartha, 1972b). Sterilized controls served to correct biodegradation data for non biological losses.
Simulated Field Tests. Because of the prevailing wave action and tidal conditions, it was not feasible to conduct
the experiment in the open sea. Instead, the test was conducted in tanks with flow-through seawater at the Sandy Hook Marine Laboratory. The tests were conducted during the months of May and June in 113-liter aquarium tanks fitted with overflow outlets. Seawater filtered through cotton gauze and crushed sea shells to remove larger suspended particles was flowing through the tanks at the rate of 450 liters per day. An artificial "sea breeze" was created by an electric fan. Glass tubes 5 em in diameter and 30 cm long were inserted into styrofoam floats as shown in Figure 1. Twenty-four tubes were floated in each of two tanks. Some tubes were closed on their lower ends with a rubber stopper and were poisoned with 1% HgCI, to serve as controls for evaporative losses (a). Others were closed with a Visking cellulose dialysis membrane to allow the exchange of ions and gases but to prevent any loss of undegraded oil by sinking (b). A third type of tube was left open (c). Prior to removal for analysis, each type of tube was closed under water by a rubber stopper and was lifted out with its entire contents.
One milliliter of Sweden crude oil was added to each cylinder. Some of the miniature oil slicks received no supplementation. Others were supplemented with either 101 mg of KN03 and 7.5 mg of Na2HPO. or with 62 mg of CRNF fertilizer and 7 mg of octylphosphate. Each treatment was tested with both membrane-closed and open cylinders.
Water temperature was measured daily throughout the experiment. Tubes of each type were removed for analysis weekly. The seawater and the residual oil in the tubes were transferred to separatory funnels. The tubes were rinsed with diethyl ether to ensure complete transfer of the oil. The oil was then extracted using two tOO-ml portions of diethyl ether. The extracts were combined, dried with anhydrous Na2SO., and the residual oil was determined by gas chromatography (Atlas and Bartha, 1972b).
Algal Growth. The seawater for this experiment was collected in May off the east coast of Sandy Hook, N.J. Aliquots of seawater (150 m\) were added to sterile I-liter culture bottles (64 x 99 x 299 mm). The seawater aliquots were either left untreated, were supplemented with KN03 and Na2HPO., or were supplemented with CRNF and octylphosphate. The nitrogen supplements were added in amounts to give a final concentration of 10mM N. The phosphorus supplements were added to give a final concentration of 0.5mM P. The bottles were incubated flat on their sides under a bank of fluorescent lights (2 F40 cool white fluorescent tubes located 40 cm above the culture bottles; light intensity 220 foot-candles). Algal growth was measured as chlorophyll according to the method of Warburg (Vishniac, 1957). One hundred milliliters of the seawater was used for the chlorophyll assay.
WATER
LEVEL
a b c d Figure 1. Diagram of apparatus employed for petroleum degradation tests in flow-through seawater tanks. For explanation see text
Volume 7, Number 6, June 1973 539
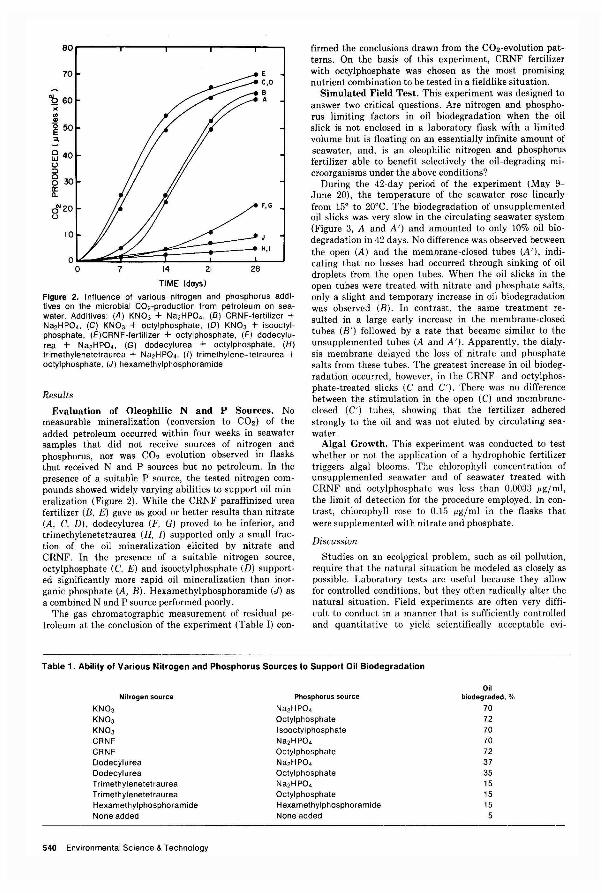
80~----~----~------T------r--"""
70
"12 60
" en .!! ~ 50 ::I,
~ 40 u :::> 830 a:: a.
0'20 u
10
7 14 21 28
TIME (days)
C,D
B A
F,G
H,I
Figure 2. Influence of various nitrogen and phosphorus additives on the microbial CO2-production from petroleum on seawater. Additives: (A) KN03 + Na2HPO •. (8) CRNF-fertilizer + Na2H PO •. (C) KN03 + octylphosphate. (0) KN03 + isooctylphosphate. (E)CRNF-fertilizer + octylphosphate. (F) dodecylurea + Na2HPO.. (G) dodecylurea + octylphosphate. (H) trimethylenetetraurea + Na2HPO •. (I) trimethylene-tetraurea + octylphosphate, (J) hexamethylphosphoramide
Results
Evaluation of Oleophilic Nand P Sources. No measurable mineralization (conversion to CO2) of the added petroleum occurred within four weeks in seawater samples that did not receive sources of nitrogen and phosphorus, nor was C02 evolution observed in flasks that received Nand P sources but no petroleum. In the presence of a suitable P source, the tested nitrogen compounds showed widely varying abilities to support oil mineralization (Figure 2), While the CRNF paraffinized urea fertilizer (B, E) gave as good or better results than nitrate (A, C, D), dodecylurea (F, G) proved to be inferior, and trimethylenetetraurea (H, J) supported only a small fraction of the oil mineralization elicited by nitrate and CRNF. In the presence of a suitable nitrogen source, octylphosphate (C, E) and isooctylphosphate (D) supported significantly more rapid oil mineralization than inorganic phosphate (A, B). Hexamethylphosphoramide (J) as a combined Nand P source performed poorly,
The gas chromatographic measurement of residual petroleum at the conclusion of the experiment (Table I) con-
firmed the conclusions drawn from the CO2-evolution patterns, On the basis of this experiment, CRNF fertilizer with octylphosphate was chosen as the most promising nutrient combination to be tested in a fieldlike situation,
Simulated Field Test. This experiment was designed to answer two critical questions. Are nitrogen and phosphorus limiting factors in oil biodegradation when the oil slick is not enclosed in a laboratory flask wi'th a limited volume but is floating on an essentially infinite amount of seawater, and, is an oleophilic nitrogen and phosphorus fertilizer able to benefit selectively the oil-degrading microorganisms under the above conditions?
During the 42-day period of the experiment (May 9-June 20), the temperature of the seawater rose linearly from 15° to 20°C. The biodegradation of unsupplemented oil slicks was very slow in the circulating seawater system (Figure 3, A and A') and amounted to only 10% oil biodegradation in 42 days. No difference was observed between the open (A) and the membrane-closed tubes (A'), indicating that no losses had occurred through sinking of oil droplets from the open tubes. When the oil slicks in the open tubes were treated with nitrate and phosphate salts, ' only a slight and temporary increase in oil biodegradation was observed (B). In contrast, the same treatment resulted in a large early increase in the membrane-closed tubes (B') followed by a rate that became similar to the unsupplemented tubes (A and A'). Apparently, the dialysis membrane delayed the loss of nitrate and phosphate salts from these tubes. The greatest increase in oil biodegradation occurred, however, in the CRNF- and octylphosphate-treated slicks (C and C'). There was no difference between the stimulation in the open (C) and membraneclosed (C') tubes, showing that the fertilizer adhered strongly to the oil and was not eluted by circulating seawater.
Algal Growth. This experiment was conducted to test whether or not the application of a hydrophobic fertilizer trigge~s algal blooms. The chlorophyll concentration of unsupplemented seawater and of seawater treated with CRNF and octylphosphate was less than 0.0033 I'g/ml, the limit of detection for the procedure employed. In contrast, chlorophyll rose to 0.15 I'g/ml in the flasks that were supplemented with nitrate and phosphate.
Discussion
Studies on an ecol,ogical problem, such as oil pollution, require that the natural situation be modeled as closely as possible. Laboratory tests are useful because they allow for controlled conditions, but they often radically alter the natural situation. Field experiments are often very difficult to conduct in a manner that is sufficiently controlled and quantitative to yield scientifically acceptable evi-
Table 1. Ability of Various Nitrogen and Phosphorus Sources to Support Oil Biodegradation
Nitrogen source
KN03 KN03 KN03 CRNF CRNF Dodecylurea Dodecylurea Trimethylenetetraurea Trimethylenetetraurea Hexamethylphosphoramide None added
540 Environmental Science & Technology
Phosphorus source
Na2HPO. Octylphosphate I sooctylphosphate Na2 HPO. Octylphosphate Na2HPO. Octylphosphate Na2HPO. Octylphosphate Hexamethylphosphoramide None added
Oil biodegraded, %
70 72 70 70 72 37 35 15 15 15 5
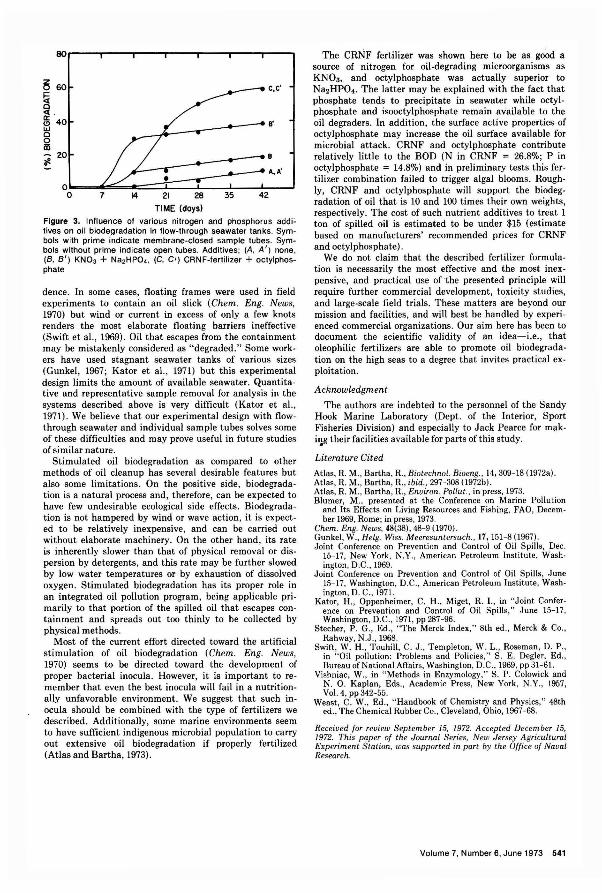
80
~ 60
fi C,C'
c « a:: 40 Cl w C
~ ~
20
A,A'
0 0 14 21 28 35 42
TIME (days)
Figure 3. Influence of various nitrogen and phosphorus addi' tives on oil biodegradation in flow-through seawater tanks. Symbols with prime indicate membrane-closed sample tubes. Symbols without prime indicate open tubes. Additives; (A , A ') none. (8, B') KN03 + Na2HPO,. (C. C') CRNF-fertilizer + octylphosphate
dence. In some cases, floating frames were used in field experiments to contain an oil slick (Chem. Eng. News, 1970) but wind or current in excess of only a few knots renders the most elaborate floating barriers ineffective (Swift et aI., 1969). Oil that escapes from the containment may be mistakenly considered as "degraded." Some workers have used stagnant seawater tanks of various sizes (Gunkel, 1967; Kator et aI., 1971) but this experimental design limits the amount of available seawater. Quantitative and representative sample removal for analysis in the systems described above is very difficult (Kator et aI., 1971). We believe that our experimental design with flowthrough seawater and individual sample tubes solves some of these difficulties and may prove useful in future studies of similar nature.
Stimulated oil biodegradation as compared to other methods of oil cleanup has several desirable features but also some limitations. On the positive side, biodegradation is a natural process and, therefore, can be expected to have few undesirable ecological side effects. Biodegradation is not hampered by wind or wave action, it is expected to be relatively inexpensive, and can be carried out without elaborate machinery. On the other hand, its rate is inherently slower than that of physical removal or dispersion by detergents, and this rate may be further slowed by low water temperatures or by exhaustion of dissolved oxygen. Stimulated biodegradation has its proper role in an integrated oil pollution program, being applicable primarily to that portion of the spilled oil that escapes containment and spreads out too thinly to be collected by physical methods.
Most of the current effort directed toward the artificial stimulation of oil biodegradation (Chem. Eng. News, 1970) seems to be directed toward the development of proper bacterial inocula. However, it is important to remember that even the best inocula will fail in a nutritionally unfavorable environment. We suggest that such inocula should be combined with the type of fertilizers we described. Additionally, some marine environments seem to have sufficient indigenous microbial population to carry out extensive oil biodegradation if properly fertilized (Atlas and Bartha, 1973).
The CRNF fertilizer was shown here to be as gOod a source of nitrogen for oil-degrading microorganisms as KNOa, and octylphosphate was actually superior to Na2HPO • . The latter may be explained with the fact that phosphate tends to precipitate in seawater while octylphosphate and isooctylphosphate remain available to the oil degraders. In addition, the surface active properties of octylphosphate may increase the oil surface available for microbial attack. CRNF and octylphosphate contribute relatively little to the BOD (N in CRNF = 26.8%; P in octylphosphate = 14.8%) and in preliminary tests this fertilizer combination failed to trigger algal blooms. Roughly, CRNF and octylphosphate will support the biodegradation of oil that is 10 and 100 times their own weights, respectively. The cost of such nutrient additives to treat 1 ton of spilled oil is estimated to be under $15 (estimate based on manufacturers' recommended prices for CRNF and octylphosphate) .
We do not claim that the described fertilizer formulation is necessarily the most effective and the most inexpensive, and practical use of the presented principle will require further commercial development, toxicity studies, and large-scale field trials. These matters are beyond our mission and facilities , and will best be handled by experienced commercial organizations. Our aim here has been to document the scientific validity of an idea-i.e., that oleophilic fertilizers are able to promote oil biodegradation on the high seas to a degree that invites practical exploitation.
Acknowledgment
The authors are indebted to the personnel of the Sandy Hook Marine Laboratory (Dept. of the Interior, Sport Fisheries Division) and especially to Jack Pearce for maki'lg their facilities available for parts of this study.
Literature Cited
Atlas, R. M., Bartha, R., Biotechnol. Bioeng .. 14, 309- 18 (1972a). Atlas, R. M .. Bartha, R., ibid .. 297-308 (I972b). Atlas, R. M., Bartha, R. , Environ. Pollut .. in press, 1973 . Blumer. M .. presented at the Conference on Marine Pollution
and Its Effects on Living Resources and Fishing, FAO. December 1969, Rome ; in press. 1973.
Chern. Eng. News. 48(38) . 48-9 (1970) . Gunkel. W .• Helg. Wiss. Meeresuntersuch .• 17, 151-8 (1967). Joint Conference on Prevention and Control of Oil Spills. Dec.
15-17. New York. N.Y .. American Petroleum Institute. Washington . D.C .• 1969.
Joint Conference on Prevention and Control of Oil Spills. June 15- 17. Washington. D.C. , American Petroleum Institute, Washington, D. C., 1971.
Kator, H ., Oppenheimer, C. H., Miget, R. I., in "Joint Conference on Prevention and Control of Oil Spills." June 15-17. Washington, D.C., 1971, pp 287-96.
Stecher, P. G. , Ed. , "The Merck Index," 8th ed. , Merck & Co. , Rahway, N.J., 1968.
Swift, W. H. . Touhill, C. J ., Templeton, W. L., Roseman, D. P. , in "Oil pollution: Problems and Policies," S. E. Degler, Ed. , Bureau of National Affairs, Washington, D.C., 1969. pp 31-61.
Vishniac, W. , in "Methods in Enzymology," S. P. Colowick and N. O. Kaplan, Eds. , Academic Press, New York, N.Y., 1957, Vol. 4, pp 342-55.
Weast, C. W. , Ed., " Handbook of Chemistry and Physics," 48th ed .• The Chemical Rubber Co .. Cleveland, Ohio, 1967- 68.
Received for review September 15, 1972. Accepted December 15. 1972. This paper of the Journal Series, New Jersey Agricultural Experiment Station. was supported in part by the Office of Naval Research.
Volume 7. Number 6, June 1973 541
Determination of Alkylbenzenesulfonate (ABS) in Bottom Sediment
Yoshinari Ambe
Department of Chemistry, Faculty of Science, Tokyo Metropolitan University, Setagayaku, Tokyo, Japan
• A new method for the analysis of alkylbenzenesulfonate (ABS) in bottom sediments of a polluted river, a lake, and the sea was examined and the availability of the method was verified. Methylene blue active substance (MBAS) was extracted from dried mud sample with methanolbenzene (1: 1) mixture. After the solvent was completely evaporated, the residue was dissolved into distilled water and the concentration of MBAS was determined according to a colorimetric method. The ratio ABS/MBAS in the MBAS was determined from the ratio of peak heights at wavenumber 1010 cm -1 and at 890 cm -1 of the infrared spectrum of MB-MBAS complex. Multiplying the value of MBAS by ABS/MBAS, the net content of ABS in the sediment was determined. Applying this method for the studies of polluted lake sediment and marine sediment, some geochemically interesting information on the process and rate of recent sedimentation in the lake and sea was obtained.
Alkylbenzenesulfonate (ABS), a main component of synthetic detergents, has been used for domestic and industrial purposes for more than 10 years in Japan. In Japan the amount of ABS consumed and discharged into the rivers and sewerage systems with waste waters during this period is estimated to be more than a million tons.
A part of ABS discharged into waterways in a soluble form or adsorbed on particulate matters in the water, is considered to be decomposed microbiologically, and the other part of the ABS finally goes to lakes or sea, where some of it will precipitate with particulate matter and accumulate in the bottom sediment.
The so-called hard type of ABS in synthetic detergents recently has been replaced by a more degradable soft type of ABS (LAS), and the concentration of ABS in natural waters has been somewhat reduced. The soft type of ABS, however, is also stable in the anaerobic condition in the bottom sediment of a polluted river or lake and will remain there for a long time.
Thus the bottom sediments of polluted water bodies are expected to contain ABS as a result of municipal pollution of water. An analytical method for determination of ABS in bottom sediment is examined in this paper.
While the concentration of ABS in river or lake waters is readily measurable (American Public Health Association, 1965) and there are many observation data, data on the measurement of the content of ABS in bottom sediment are lacking, supposedly because of the difficulty of the analysis of it in the mud and because ABS in the sediment has no apparent effect on our environment. The methylene blue colorimetric method, which is most commonly used for the analysis of ABS in water, cannot be used for sediment, because many kinds of interfering substances which form complex compounds with methylene blue are contained in the bottom mud. Though there are many modifications of the methylene blue colorimetric method (Longwell and Maniece, 1955; Abbot, 1962; Hill et aI., 1962) to eliminate such methylene blue active substance~ (MBAS) other than ABS in the water, the con-
542 Environmental Science & Technology
tents of such substances are so high in bottom mud that the application of these methods for the analysis of ABS in the sediments is difficult.
The separation of ABS from MBAS by thin layer chromatography was examined by Oba (1965), but his method was too complicated and difficult to apply for a large number of samples of sediments.
The author recently developed a simple method to find the ratio of ABS to MBAS from the infrared spectrum of MB-MBAS complex (Am be and Hanya, 1972). By application of that method to the analysis of ABS in bottom sediment, it became evident that the net content of ABS in the sediment could be easily determined.
Experimental
Samples. Bottom muds taken from the polluted river, a lake, and the sea by' an Ekman-Birge-type grab and a plastic pipe core sampler were used as analytical samples.
Analytical Procedure. The combined method of methylene blue colorimetry and infrared spectrometry was applied to the aqueous solution of the extract from the mud sample. The concentration of MBAS was determined colorimetrically, and the ratio of ABS to MBAS (ABS/ MBAS) was measured from the analysis of the infrared spectrum of the MB-MBAS complex. Multiplying the value of MBAS by ABS/MBAS, the content of net ABS in the sediment was obtained.
Extraction of MBAS. A wet sample of mud was centrifuged (3000 rpm, 30 min), and, after the supernatant water (interstitial water of the mud) was. separated for the analysis of MBAS in it, the precipitated mud was dried at room temperature. The dried mud sample was ground and sifted with a sieve of 0.25 mm mesh. Ten grams of the dried sample mud was placed in a flask on a water bath (80"C) and refluxed with 100 ml of methanol-benzene (1:1) solution for 1 hr. The extraction was repeated three times with fresh solvent under the same conditions. All of the solvent used for these three extractions was mixed up and completely evaporated in a beaker on the water bath. The residue containing ABS was dissolved with about 50 ml of hot distilled water, removed to a volumetric flask, and made up to 100 ml with distilled water.
Determination of MBAS. Ten milliliters of the above solution was placed in a separatory funnel, and 0.5 ml of O.lN H2S04 , 1 ml of 0.015% methylene blue aqueous solution, and 10 ml of 1,2-dichloroethane were added. The separatory funnel was shaken for 1 min with a shaker, and the complex formed between methylene blue (MB) and MBAS was extracted into a layer of 1,2-dichloroethane. After washing this organic solvent layer with 10 ml of aqueous solution containing O.01N H2S04 and 0.013% methylene blue, the blue-colored MB-MBAS complex solution was filtered through glass wool to exclude emulsified water in it.
The absorbance of the MB- MBAS complex solution was measured at 655 nm with a Hitachi EPU-2A-type spectrophotometer, and the concentration of MBAS in the sample was determined using DBS (dodecylbenzenesulfo-
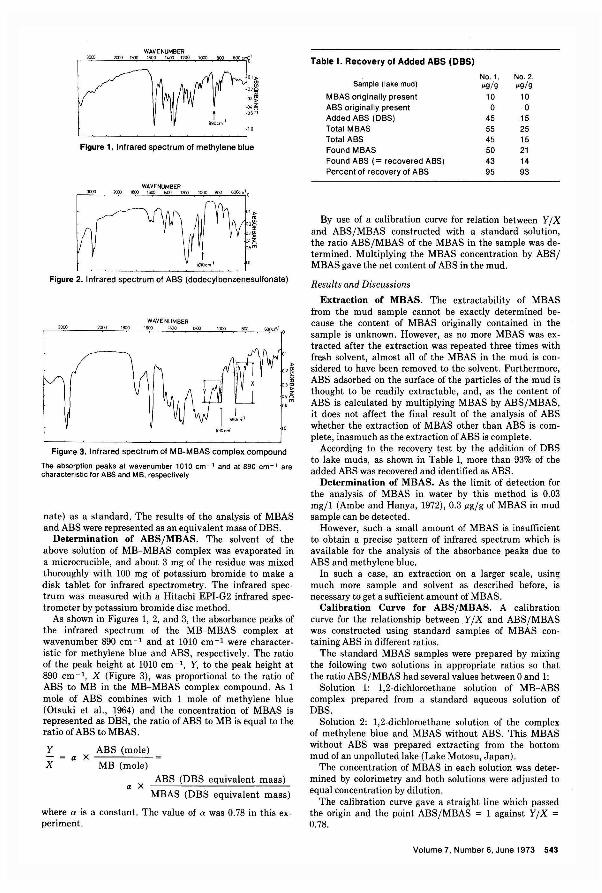
Figure 1. I nlrared spectrum 01 methylene blue
WAVENUMBER 110:) 1600 1400 1200
Figure 2. Inlrared spectrum 01 ABS (dodecylbenzenesullonate)
WAVENUMBER 1600 ltOO 120:)
,. 01~
3<" ,. ~~
05
Figure 3. Inlrared spectrum 01 MB-MBAS complex compound
The absorption peaks at wavenumber 1010 cm - 1 and at 890 cm- 1 are characteristic for ASS and M B, respectively
nate) as a standard. The results of the analysis of MBAS and ABS were represented as an equivalent mass of DBS.
Determination of ABSjMBAS. The solvent of the above solution of MB-MBAS complex was evaporated in a microcrucible, and about 3 mg of the residue was mixed thoroughly with 100 mg of potassium bromide to make a disk tablet for infrared spectrometry. The infrared spectrum was measured with a Hitachi EPI-G2 infrared spectrometer by potassium bromide disc method.
As shown in Figures 1, 2, and 3, the absorbance peaks of the infrared spectrum of the MB-MBAS complex at wavenumber 890 cm - 1 and at 1010 cm -1 were characteristic for methylene blue and ABS, respectively. The ratio of the peak height at 1010 cm -1, Y, to the peak height at 890 cm - 1, X (Figure 3), was proportional to the ratio of ABS to MB in the MB- MBAS complex compound. As 1 mole of ABS combines with 1 mole of methylene blue (Otsuki et aI., 1964) and the concentration of MBAS is represented as D'BS, the ratio of ABS to MB is equal to the ratio of ABS to MBAS.
Y ABS (mole) = a X
X MB (mole)
a X ABS (DBS equivalent mass)
MBAS (DBS equivalent mass)
where a is a constant. The value of a was 0.78 in this experiment.
Table I. Recovery of Added ABS (OBS)
No.1. No.2. Sample (lake mud) I'g/g I'g/g
MBAS originally present 10 10 ABS originally present 0 0 Added ABS (OBS) 45 15 Total MBAS 55 25 Total ABS 45 15 Found MBAS 50 21 Found ABS (= recovered ABS) 43 14 Percent of recovery 01 ABS 95 93
By use of a calibration curve for relation between Yj X and ABSjMBAS constructed with a standard solution, the ratio ABSjMBAS of the MBAS in the sample was determined. Multiplying the MBAS concentration by ABSj MBAS gave the net content of ABS in the mud.
Results and Discussions
Extraction of MBAS. The extractability of MBAS from the mud sample cannot be exactly determined because the content of MBAS originally contained in the sample is unknown. However, as no more MBAS was extracted after the extraction was repeated three times with fresh solvent, almost all of the MBAS in the mud is considered to have been removed to the solvent. Furthermore, ABS adsorbed on the surface of the particles of the mud is thought to be readily extractable, and, as the content of ABS is calculated by multiplying MBAS by ABSjMBAS, it does not affect the final result of the analysis of ABS whether the extraction of MBAS other than ABS is complete, inasmuch as the extraction of ABS is complete.
According to the recovery test by the addition of DBS to lake muds, as shown in Table I, more than 93% of the added ABS was recovered and identified as ABS.
Determination of MBAS. As the limit of detection for the analysis of MBAS in water by this method is 0.03 mgj1 (Ambe and Hanya, 1972), 0.3 p.gjg of MBAS in mud sample can be detected.
However, such a small amount of MBAS is insufficient to obtain a precise pattern of infrared spectrum which is available for the analysis of the absorbance peaks due to ABS and methylene blue.
In such a case, an extraction on a larger scale, using much more sample and solvent as described before, is necessary to get a sufficient amount of MBAS.
Calibration Curve for ABSjMBAS. A calibration curve for the relationship between YjX and ABSjMBAS was constructed using standard samples of MBAS containing ABS in different ratios.
The standard MBAS samples were prepared by mixing the following two solutions in appropriate ratios so that the ratio ABSjMBAS had several values between 0 and 1:
Solution 1: 1,2-dichloroethane solution of MB- ABS complex prepared from a standard aqueous solution of DBS.
Solution 2: 1,2-dichloroethane solution of the complex of methylene blue and MBAS without ABS. This MBAS without ABS was prepared extracting from the bottom mud of an unpolluted lake (Lake Motosu, Japan).
The concentration of MBAS in each solution was determined by colorimetry and both solutions were adjusted to equal concentration by dilution.
The calibration curve gave a straight line which passed the origin and the point ABSjMBAS = 1 against YjX = 0.78.
Volume 7. Number 6. June 1973 543
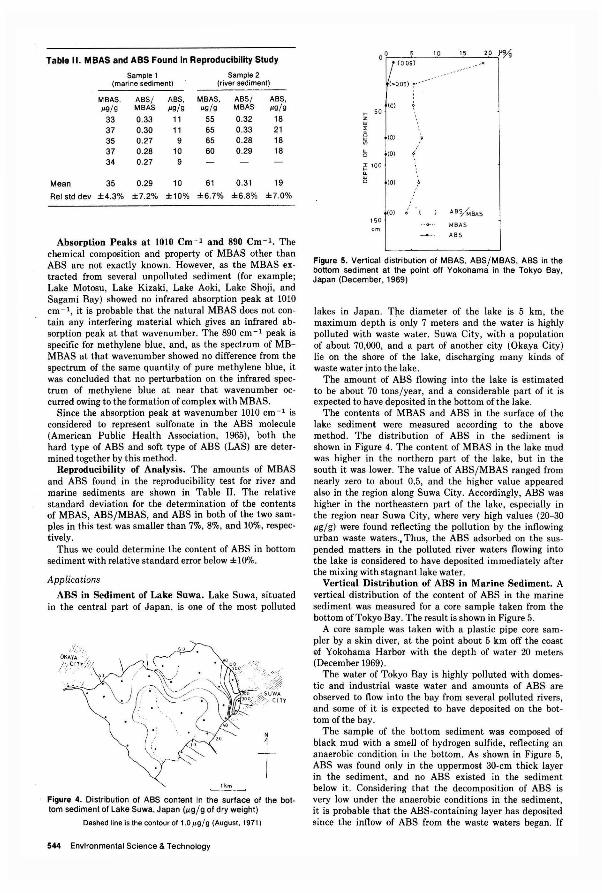
Table II. MBAS and ABS Found in Reproducibility Study
Mean
Rei std dev
Sample 1 (marine sediment)
MBAS. ABS/ ABS. 1'9/9 MBAS 1'9/9
33 0.33 11 37 0.30 11 35 0.27 9 37 0.28 10 34 0.27 9
35 0.29 10
±4.3% ±7.2% ±10%
Sample 2 (river sediment)
MBAS. ABS/ 1'9 / 9 MBAS
55 0.32 65 0.33 65 0.28 60 0.29
61 0.31
ABS. 1'9/9
18 21 18 18
19
±6.7% ±6.8% ±7.0%
Absorption Peaks at 1010 Cm - 1 and 890 Cm - 1 • The chemical composition and property of MBAS other than ABS are not exactly known. However, as the MBAS extracted from several unpolluted sediment (for example; Lake Motosu, Lake Kizaki , Lake Aoki, Lake Shoji, and Sagami Bay) showed no infrared absorption peak at 1010 cm - l , it is probable that the natural MBAS does not contain any interfering material which gives an infrared absorption peak at that wavenumber. The 890 cm -1 peak is specific for methylene blue, and, as the spectrum of MBMBAS at that wavenumber showed no difference from the spectrum of the same quantity of pure methylene blue, it was concluded that no perturbation on the infrared spectrum of methylene blue at near that wavenumber occurred owing to the formation of complex with MBAS.
Since the absorption peak at wavenumber 1010 cm - 1 is considered to represent sulfonate in the ABS molecule (American Public Health Association, 1965), both the hard type of ABS and soft type of ABS (LAS) are determined together by this method.
Reproducibility of Analysis. The amounts of MBAS and ABS found in the reproducibility test for river and marine sediments are shown in Table II. The relative standard deviation for the determination of the contents of MBAS, ABS/MBAS, and ABS in both of the two samples in this test was smaller than 7%, 8%, and 10%, respectively.
Thus we could determine the content of ABS in bottom sediment with relative standard error below ±IO%.
Applications
ABS in Sediment of Lake Suwa. Lake Suwa, situated in the central part of Japan, is one of the most polluted
t Figure 4. Distribution of ABS content in the surface of the bot· tom sediment of Lake Suwa, Japan (/lg / g of dry weight)
Dashed line is the contour of 1.01'9/ 9 (August, 1971)
544 Environmental Science & Technology
0 0 5 10 15 20 J'9,/o (009)
1<005)
10) ~ 50 z '" ~ is (0) ~ "- (0) 0
~ 100 "-to! (0) .'
(0) : ( AS;"'SAS 15 0
MBAS
Aas
Figure 5. Vertical distribution of MBAS, ABS/MBAS, ABS in the bottom sediment at the pOint off Yokohama in the Tokyo Bay, Japan (December , 1969)
lakes in Japan. The diameter of the lake is 5 km, the maximum depth is only 7 meters and the water is highly polluted with waste water. Suwa City, with a population of about 70,000, and a part of another city (Okaya City) lie on the shore of the lake, discharging many kinds of waste water into the lake.
The amount of ABS flowing into the lake is estimated to be about 70 tons/ year, and a considerable part of it is expected to have deposited in the bottom of the lake.
The contents of MBAS and ABS in the surface of the lake sediment were measured according to the above method. The distribution of ABS in the sediment is shown in Figure 4. The content of MBAS in the lake mud was higher in the northern part of the lake, but in the south it was lower. The value of ABS/ MBAS ranged from nearly zero to about 0.5, and the higher value appeared also in the region along Suwa City. Accordingly, ABS was higher in the northeastern part of the lake, especially in the region near Suwa City, where very high values (20-30 /lg/ g) were found reflecting the pollution by the inflowing urban waste waters., Thus, the ABS adsorbed on the sus· pended matters in the polluted river waters flowing into the lake is considered to have deposited immediately after the mixing with stagnant lake water.
Vertical Distribution of ABS in Marine Sediment. A vertical distribution of the content of ABS in the marine sediment was measured for a core sample taken from the bottom of Tokyo Bay. The result is shown in Figure 5.
A core sample was taken with a plastic pipe core sampler by a skin diver, at the point about 5 km off the coast Qf Yokohama Harbor with the depth of water 20 meters (December 1969) .
The water of Tokyo Bay is highly polluted with domestic and industrial waste water and amounts of ABS are observed to flow into the bay from severa l polluted rivers, and some of it is expected to have deposited on the bottom of the bay.
The sample of the bottom sediment was composed of black mud with a smell of hydrogen sulfide, reflecting an anaerobic condition in the bottom. As shown in Figure 5, ABS was found only in the uppermost 30-cm thick layer in the sediment, and no ABS existed in the sediment below it. Considering that the decomposition of ABS is very low under the anaerobic conditions in the sediment, it is probable that the ABS-containing layer has deposited since the inflow of ABS from the waste waters began. If
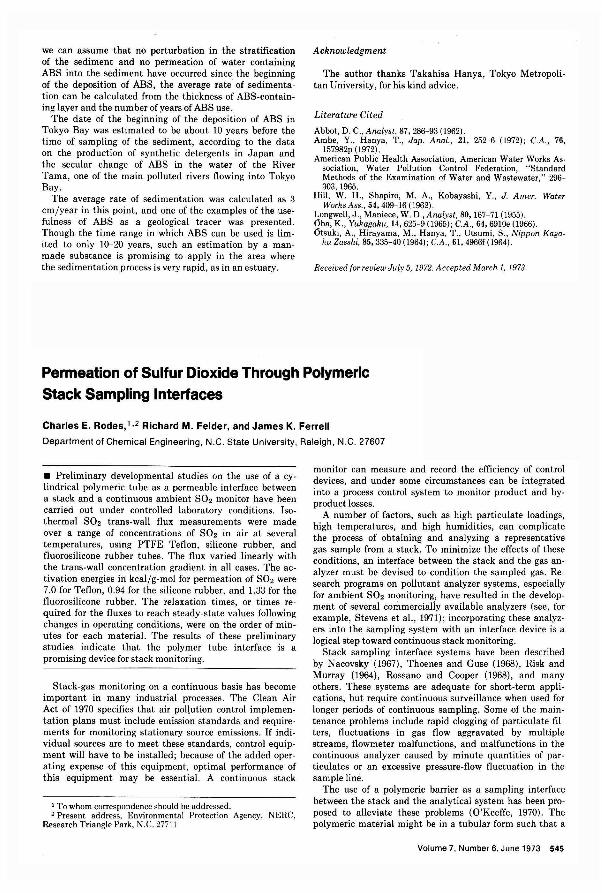
we can assume that no perturbation in the stratification of the sediment and no permeation of water containing ABS into the sediment have occurred since the beginning of the deposition of ABS, the average rate of sedimentation can be calculated from the thickness of ABS-containing layer and the num ber of years of ABS use.
The date of the beginning of the deposition of ABS in Tokyo Bay was estimated to be about 10 years before the time of sampling of the sediment, according to the data on the production of synthetic detergents in Japan and the secular change of ABS in the water of the River Tama, one of the main polluted rivers flowing into Tokyo Bay.
The average rate of sedimentation was calculated as 3 cm/year in this point, and one of the examples of the usefulness of ABS as a geological tracer was presented. Though the time range in which ABS can be used is limited to only 10- 20 years, such an estimation by a manmade substance is promising to apply in the area where the sedimentation process is very rapid, as in an estuary.
Acknowledgment
The author thanks Takahisa Hanya, Tokyo Metropolitan University, for his kind advice.
Literature Cited
Abbot, D. C., Analyst, 87, 286- 93 (1962). Ambe, Y., Hanya, 1'., Jap. Anal., 21, 252-6 (1972); C.A., 76,
157982p (1972). American Public Health Association, American Water Works As
sociation, Water Pollution Control Federation, "Standard Methods of the Examination of Water and Wastewater," 296-303,1965.
Hill, W. H., Shapiro, M. A., Kobayashi, Y., J. A mer. Water Works Ass., 54,409- 16 (1962).
Longwell, J., Maniece, W. D., Analyst, 80, 167-71 (1955). Oba, K., Yukagaku, 14,625- 9 (1965); C.A., 64, 6910e (1966). Otsuki, A., Hirayama, M., Hanya, 1'., Utsumi, S., Nippon Kaga-
ku Zasshi, 85, 335-40 (1964); C.A., 61, 4966f(l964).
Received for review July 5, 1972. Accepted March 1, 1973.
Permeation of Sulfur Dioxide Through Polymeric Stack Sampling Interfaces
Charles E. Rodes,l,2 Richard M. Felder, and James K. Ferrell
Department of Chemical Engineering, N.C. State University, Raleigh, N.C. 27607
• Preliminary developmental studies on the use of a cylindrical polymeric tube as a permeable interface between a stack and a continuous ambient S02 monitor have been carried out under controlled laboratory conditions. Isothermal S02 trans-wall flux measurements were made over a range of concentrations of S02 in air at several temperatures, using PTFE Teflon, silicone rubber, and fluorosilicone rubber tubes. The flux varied linearly with the trans-wall concentration gradient in all cases. The activation energies in kcal/g-mol for permeation of S02 were 7.0 for Teflon, 0.94 for the silicone rubber, and 1.33 for the fluorosilicone rubber. The relaxation times, or times required for the fluxes to reach steady-state values following changes in operating conditions, were on the order of minutes for each material. The results of these preliminary studies indicate that the polymer tube interface is a promising device for stack monitoring.
Stack-gas monitoring on a continuous basis has become important in many industrial processes. The Clean Air Act of 1970 specifies that air pollution control implementation plans must include emission standards and requirements for monitoring stationary source emissions. If individual sources are to meet these standards, control equipment will have to be installed; because of the added operating expense of this equipment, optimal performance of this equipment may be essential. A continuous stack
1 To whom correspondence should be addressed. 2 Present address, Environmental Protection Agency, NERC,
Research Triangle Park, N.C. 27711
monitor can measure and record the efficiency of control devices, and under some circumstances can be integrated into a process control system to monitor product and byproduct losses.
A number of factors, such as high particulate loadings, high temperatures, and high humidities, can complicate the process of obtaining and analyzing a representative gas sample from a stack. To minimize the effects of these conditions, an interface between the stack and the gas analyzer must be devised to condition the sampled gas. Research programs on pollutant analyzer systems, especially for ambient S02 monitoring, have resulted in the development of several commercially available analyzers (see, for example, Stevens et aI., 1971); incorporating these analyzers into the sampling system with an interface device is a logical step toward continuous stack monitoring.
Stack sampling interface systems have been described by Nacovsky(l967), Thoenes and Guse (1968), Risk and Murray (1964), Rossano and Cooper (1968), and many others. These systems are adequate for short-term applications, but require continuous surveillance when used for longer periods of continuous sampling. Some of the maintenance problems include rapid clogging of particulate filters, fluctuations in gas flow aggravated by multiple streams, flowmeter malfunctions, and malfunctions in the continuous analyzer caused by minute quantities of particulates or an excessive pressure-flow fluctuation in the sample line.
The use of a polymeric barrier as a sampling interface between the stack and the analytical system has been proposed to alleviate these problems (O'Keeffe, 1970). The polymeric material might be in a tubular form such that a
Volume 7, Number 6, June 1973 545
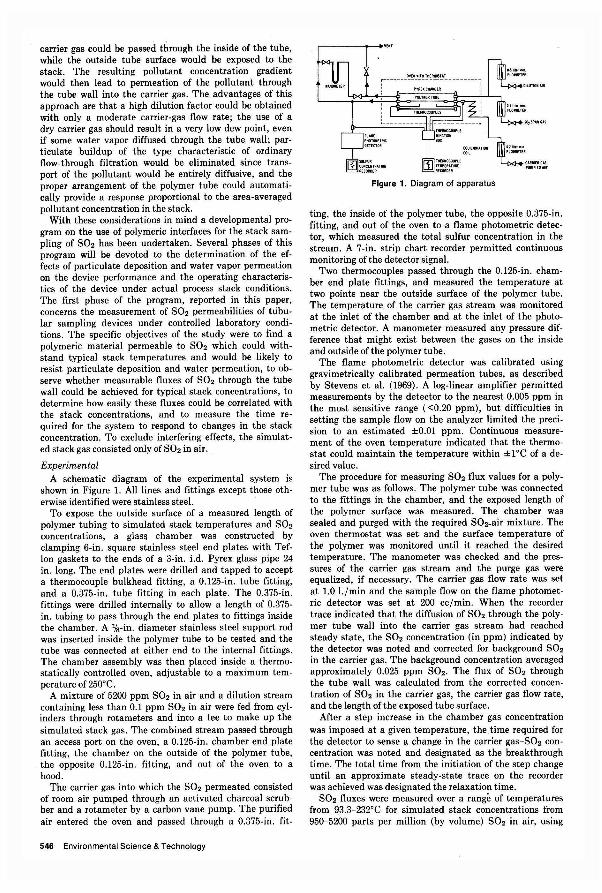
carrier gas could be passed through the inside of the tube, while the outside tube surface would be exposed to the stack. The resulting pollutant concentration gradient would then lead to permeation of the pollutant through the tube wall into the carrier gas. The advantages of this approach are that a high dilution factor could be obtained with only a moderate carrier-gas flow rate; the use of a dry carrier gas should result in a very low dew point, even if some water vapor diffused through the tube wall; particulate buildup of the type characteristic of ordinary flow-through filtration would be eliminated since transport of the pollutant would be entirely diffusive, and the proper arrangement of the polymer tube could automatically provide a response proportional to the area -averaged pollutant concentration in the stack.
With these considerations in mind a developmental program on the use of polymeric interfaces for the stack sampling of S02 has been undertaken. Several phases of this program will be devoted to the determination of the effects of particulate deposition and water vapor permeation on the device performance and the operating characteristics of the device under actual process stack conditions. The first phase of the program, reported in this paper, concerns the measurement of S02 permeabilities of tubular sampling devices under controlled laboratory conditions. The specific objectives of the study were to find a polymeric material permeable to S02 which could withstand typical stack temperatures and would be likely to resist particulate deposition and water permeation, to observe whether measurable fluxes of S02 through the tube wall could be achieved for typical stack concentrations, to determine how easily these fluxes could be correlated with the stack concentrations, and to measure the time required for the system to respond to changes in the stack concentration. To exclude interfering effects, the simulated stack gas consisted only of S02 in air.
Experimental A schematic diagram of the experimental system is
shown in Figure 1. All lines and fittings except those otherwise identified were stainless steel.
To expose the outside surface of a measured length of polymer tubing to simulated stack temperatures and S02 concentrations, a glass chamber was constructed by clamping 6-in. square stainless steel end plates with Teflon gaskets to the ends of a 3-in. i.d. Pyrex glass pipe 24 in. long. The end plates were drilled and tapped to accept a thermocouple bulkhead fitting, a 0.125-in. tube fitting, and a 0.375-in. tube fitting in each plate. The 0.375-in. fittings were drilled internally to allow a length of 0.375-in. tubing to pass through the end plates to fittings inside the chamber. A 'Is-in. diameter stainless steel support rod was inserted inside the polymer tube to be tested and the tube was connected at either end to the internal fittings. The chamber assembly was then placed inside a thermostatically controlled oven, adjustable to a maximum temperature of 250°C.
A mixture of 5200 ppm S02 in air and a dilution stream containing less than 0.1 ppm S02 in air were fed from cylinders through rota meters and into a tee to make up the simulated stack gas. The combined stream passed through an access port on the oven, a 0.125-in. chamber end plate fitting, the chamber on the outside of the polymer tube, the opposite 0.125-in. fitting, and out of the oven to a hood.
The carrier gas into which the S02 permeated consisted of room air pumped through an activated charcoal scrubber and a rotameter by a carbon vane pump. The purified air entered the oven and passed through a 0.375-in. fit-
546 Environmental Science & Technology
r---~---~~_I:T~!.H~~~~A~ - - - -----I : : ,
Figure 1. Diagram of apparatus
CARRlERG~
,PURIFIEDAIRI
ting, the inside of the polymer tube, the opposite 0.375-in. fitting, and out of the oven to a flame photometric detector, which measured the total sulfur concentration in the stream. A 7 -in. strip chart recorder permitted continuous monitoring of the detector signal.
Two thermocouples passed through the 0.125-in. chamber end plate fittings, and measured the temperature at two points near the outside surface of the polymer tube. The temperature of the carrier gas stream was monitored at the inlet of the chamber and at the inlet of the photometric detector. A manometer measured any pressure difference that might exist between the gases on the inside and outside of the polymer tube.
The flame photometric detector was calibrated using gravimetrically calibrated permeation tubes, as described by Stevens et al. (1969). A log-linear amplifier permitted measurements by the detector to the nearest 0.005 ppm in the most sensitive range «0.20 ppm), but difficulties in setting the sample flow on the analyzer limited the precision to an estimated ±0.01 ppm. Continuous measurement of the oven temperature indicated that the thermostat could maintain the temperature within ± 1°C of a desired value.
The procedure for measuring S02 flux values for a polymer tube was as follows. The polymer tube was connected to the fittings in the chamber, and the exposed length of the polymer surface was measured. The chamber was sealed and purged with the required S02-air mixture. The oven thermostat was set and the surface temperature of the polymer was monitored until it reached the desired temperature. The manometer was checked and the pressures of the carrier gas stream and the purge gas were equalized, if necessary. The carrier gas flow rate was set at 1.0 l./min and the sample flow on the flame photometric detector was set at 200 cc/min. When the recorder trace indicated that the diffusion of S02 through the polymer tube wall into the carrier gas stream had reached steady state, the S02 concentration (in ppm) indicated by the detector was noted and corrected for background S02 in the carrier gas. The background concentration averaged approximately 0.025 ppm S02. The flux of S02 through the tube wall was calculated from the corrected concentration of S02 in the carrier gas, the carrier gas flow rate, and the length of the exposed tube surface.
After a step increase in the chamber gas concentration was imposed at a given temperature, the time required for the detector to sense a change in the carrier gas-S02 concentration was noted and designated as the breakthrough time. The total time from the initiation of the step change until an approximate steady-state trace on the recorder was achieved was designated the relaxation time.
S02 fluxes were measured over a range of temperatures from 93.3- 232°C for simulated stack concentrations from 950-5200 parts per million (by volume) S02 in air, using
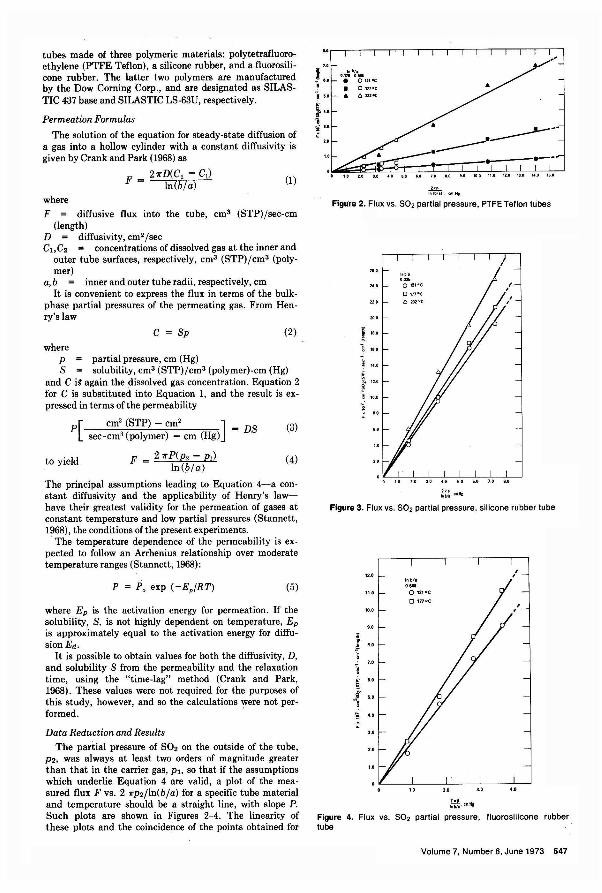
tubes made of three polymeric materials: polytetrafluoroethylene (PTFE Teflon), a silicone rubber, and a fluorosilicone rubber. The latter two polymers are manufactured by the Dow Corning Corp., and are designated as SILASTIC 437 base and SILASTIC LS-63U, respectively.
Permeation Formulas
The solution of the equation for steady-state diffusion of a gas into a hollow cylinder with a constant diffusivity is given by Crank and Park (1968) as
F 27rD(C2 - Cl)
= In(b/a) (1)
where F = diffusive flux into the tube, cm3 (STP)/sec-cm
(length) D diffusivity, cm2/sec CI ,C2 concentrations of dissolved gas at the inner and
outer tube surfaces, respectively, cm3 (STP)/cm3 (polymer)
a, b inner and outer tube radii, respectively, cm It is convenient to express the flux in terms of the bulk
phase partial pressures of the permeating gas. From Henry's law
C = Sp (2)
where P = partial pressure, cm (Hg) S solubility, cm3 (STP)/cm3 (polymer)-cm (Hg)
and C i~ again the dissolved gas concentration. Equation 2 for C is substituted into Equation 1, and the result is expressed in terms of the permeability
p[ cm' (STP) - em2
] = DS (3) sec-em' (polymer) - cm (Rg)
to yield F = 27rP(P2 - PI) In(b/o)
The principal assumptions leading to Equation 4-a constant diffusivity and the applicability of Henry's lawhave their greatest validity for the permeation of gases at constant temperature and low partial pressures (Stannett, 1968), the conditions of the present experiments.
The temperature dependence of the permeability is expected to follow an Arrhenius relationship over moderate temperature ranges (Stannett, 1968):
P = Po exp (-Ep/RT) (5)
where E p is the activation energy for permeation. If the solubility, S, is not highly dependent on temperature, Ep is approximately equal to the activation energy for diffusionEd.
It is possible to obtain values for both the diffusivity, D, and solubility S from the permeability and the relaxation time, using the "time-lag" method (Crank and Park, 1968). These values were not required for the purposes of this study, however, and so the calculations were not per-formed. '
Data Reduction and Results
The partial pressure of S02 on the outside of the tube, P2, was always at least two orders of magnitude greater than that in the carrier gas, PI, so that if the assumptions which underlie Equation 4 are valid, a plot of the measured flux F vs. 2 7rp2/ln(b/a) for a specific tube material and temperature should be a straight line, with slope P. Such plots are shown in Figures 2-4. The linearity of these plots and the coincidence of the points obtained for
--Inil/.
G.l7I 0._
• QUIt(:
• [J 1770e
• omlc
I ~~~~~.+'+':+'=-±J-o~ , .••.••.•
.l.!L Inlb/ll.cmHg
Figure 2. Flux VS. 502 partial pressure, PTFE Tellon tubes
! ", ~ { 12.0
~ -,
Figure 3, Flux vs. 502 partial pressure, silicone rubber tube
, 12.0 ,
Inb/l 0 .... o 121 0e 0 tnoc
I ~ ~ { ..
3.0
Figure 4. Flux vs. 502 partial pressure, Iluorosilicone rubber tube
Volume 7, Number 6, June 1973 547
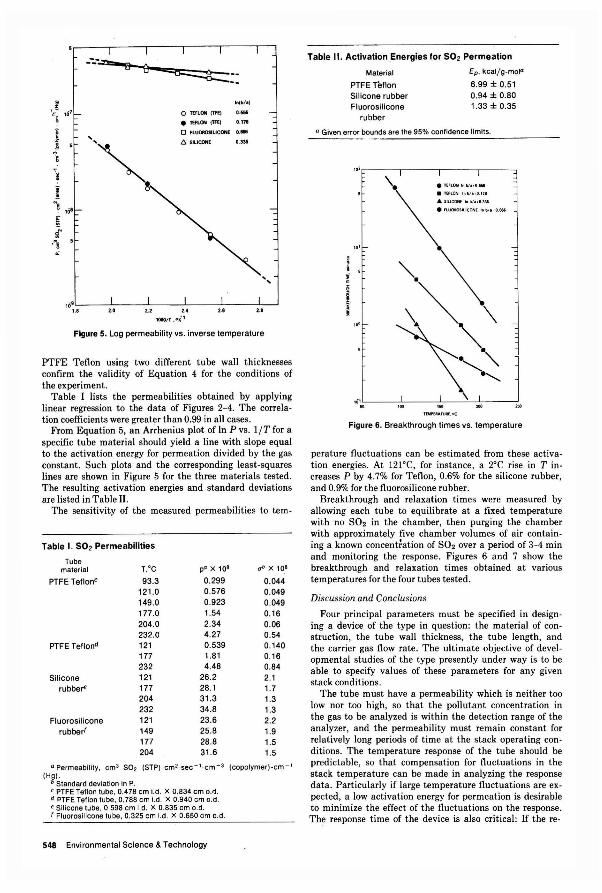
", i ! "!
~ ~N
·~S
.:
uj'
~bI'l
o TEFLON (m) D,SM
• TEflON ITFEJ 0.171
o FlUOflOSlLlCONE D .•
II SILICONE 0.336
.. .. 10lL __ ..L. __ -'-___ .l-__ ....L ___ L-l
1.' Z.Z Z.O
Figure 5. Log permeability vs. inverse temperature
PTFE Teflon using two different tube wall thicknesses confirm the validity of Equation 4 for the conditions of the experiment.
Table I lists the permeabilities obtained by applying linear regression to the data of Figures 2-4. The correlation coefficients were greater than 0.99 in all cases.
From Equation 5, an Arrhenius plot of In P vs. 1jT for a specific tube material should yield a line with slope equal to the activation energy for permeation divided by the gas constant. Such plots and the corresponding least-squares lines are shown in Figure 5 for the three materials tested. The resulting activation energies and standard deviations are listed in Table II.
The sensitivity of the measured permeabilities to tem-
Table I. 502 Per me abilities
Tube material
PTFE Tellone
PTFE Teflond
Silicone rubber"
Fluorosilicone rubber'
T:C 93.3
121.0 149.0 177.0 204.0 232.0 121 177 232 121 177 204 232 121 149 177 204
p" X 10' (fb X 108
0.299 0.044 0.576 0.049 0.923 0.049 1.54 0.16 2.34 0.06 4.27 0.54 0.539 0.140 1.81 0.16 4.48 0.84
26.2 2.1 28.1 1.7 31.3 1.3 34.8 1.3 23.6 2.2 25.8 1.9 28.8 1.5 31 .6 1.5
a Permeability, cm3 SOz (STP)-cmZ-sec- 1-cm- 3 {copolymer) .cm - 1
(H~ktandard deviation in P. , PTFE Teflon tube. 0.478 em Ld. X 0.834 em o.~. d PTFE Teflon tube. 0.788 em Ld. X 0.940 em o.d. , Silicone tube . 0.598 em Ld. X 0.835 em o.d. r Fluorosilieone tube. 0.325 em Ld. X 0.650 em o.d.
548 Environmental Science & Technology
Table II. Activation Energies for 502 Permeation
Material
PTFE Tellon Silicone rubber Fluorosilicone
rubber
Cp. keal / g-mol"
6.99 ± 0.51 0 .94 ± 0.80 1.33 ± 0.35
a Given error bounds are the 95% confidence limits.
, I I I
· '\:::: :,~;:,: • SILICONE lob/a 0335
• flUOllOSlllCONE Inblu06M
, -
". \ · or-
~ '" -
· ............ '" .-........
, I I
Figure 6. Breakthrough times vs. temperature
perature fluctuations can be estimated from these activation energies. At 121 'C, for instance, a 2°C rise in T increases P by 4.7% for Teflon, 0.6% for the silicone rubber, and 0.9% for the fluorosilicone rubber.
Breakthrough and relaxation times were measured by allowing each tube to equilibrate at a fixed temperature with no 802 in the chamber, then purging the chamber with approximately five chamber volumes of air containing a known concentration of 802 over a period of 3-4 min and monitoring the response. Figures 6 and 7 show the breakthrough and relaxation times obtained at various temperatures for the four tubes tested.
Discussion and Conclusions
Four principal parameters must be specified in designing a device of the type in question: the material of construction, the tube wall thickness, the tube length, and the carrier gas flow rate. The ultimate objective of developmental studies of the type presently under way is to be able to specify values of these parameters for any given stack conditions.
The tube must have a permeability which is neither too low nor too high, so that the pollutant concentration in the gas to be analyzed is within the detection range of the analyzer, and the permeability must remain constant for relatively long periods of time at the stack operating conditions. The temperature response of the tube should be predictable, so that compensation for fluctuations in the stack temperature can be made in analyzing the response data. Particularly if large temperature fluctuations are expected, a low activation energy for permeation is desirable to minimize the effect of the fluctuations on the response. The response time of the device is also critical: If the re-
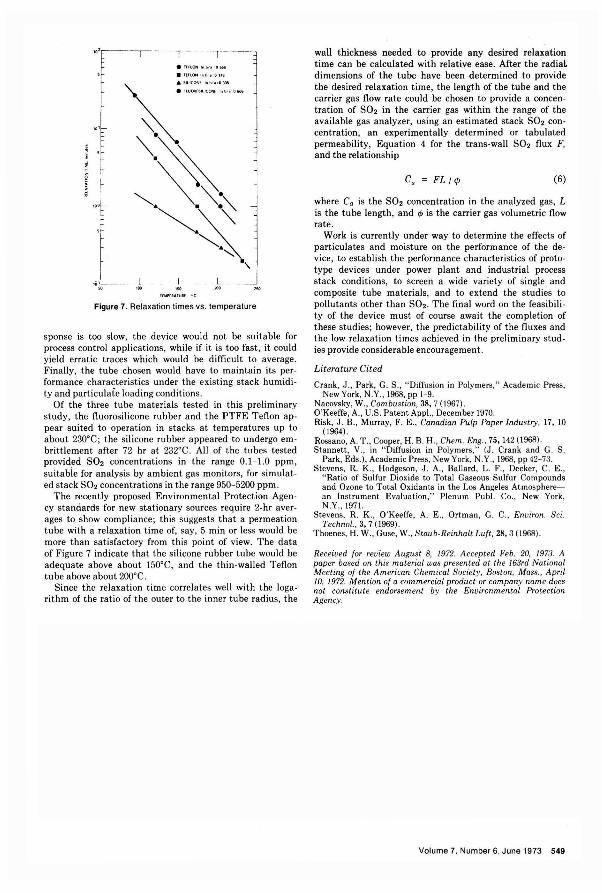
lii~-----. L
Figure 7. Relaxation times vs. temperature
sponse is too slow, the device would not be suitable for process control applications, while if it is too fast, it could yield erratic traces which would be difficult to average. Finally, the tube chosen would have to maintain its performance characteristics under the existing stack humidity and particulate loading conditions.
Of the three tube materials tested in this preliminary study, the fluorosilicone rubber and the PTFE Teflon appear suited to operation in stacks at temperatures up to about 230°C; the silicone rubber appeared to undergo embrittlement after 72 hr at 232°C . All of the tubes tested provided S02 concentrations "in the range 0.1-1.0 ppm, suitabie for analysis by ambient gas monitors, for simulated stack S02 concentrations in the range 950-5200 ppm.
The recently proposed Environmental Protection Agency standards for new stationary sources require 2-hr averages to show compliance; this suggests that a permeation tube with a relaxation time of, say, 5 min or less would be more than satisfactory from this point of view. The data of Figure 7 indicate that the silicone rubber tube would be adequate above about 150°C, and the thin-walled Teflon tube above about 200°C.
Since the relaxation time correlates well with the logarithm of the ratio of the outer to the inner tube radius, the
wall thickness needed to provide any desired relaxation time can be calculated with relative ease. After the radial dimensions of the tube have been determined to provide the desired relaxation time, the length of the tube and the carrier gas flow rate could be chosen to provide a concentration of S02 in the carrier gas within the range of the available gas analyzer, using an estimated stack S02 concentration, an experimentally determined or tabulated permeability, Equation 4 for the trans-wall S02 flux F, and the relationship
(6)
where Ca is the S02 concentration in the analyzed gas, L is the tube length, and q, is the carrier gas volumetric flow rate.
Work is currently under way to determine the effects of particulates and moisture on the performance of the device, to establish the performance characteristics of prototype devices under power plant and industrial process stack conditions, to screen a wide variety of single and composite tube materials, and to extend the studies to pollutants other than S02. The final word on the feasibility of the device must of course await the completion of these studies; however, the predictability of the fluxes and the low relaxation times achieved in the preliminary studies provide considerable encouragement.
Literature Cited
Crank, J., Park, G. S., " Diffusion in Polymers, " Academic Press, New York, N.Y., 1968, pp 1-9.
Nacovsky, W., Com bustion, 38,7 (1967). O'Keeffe, A., U.S. Patent Appl., Decem ber 1970. Risk, J. B., Murray, F. E., Canadian Pulp Paper Industry, 17,10
(1964). Rossano, A. T. , Cooper, H. B. H., Chem. Eng., 75, 142 (1968). Stannett, V. , in " Diffusion in Polymers," (J. Crank and G. S.
Park, Eds.), Academic Press, New York , N.Y., 1968, pp 42-73. Stevens, R. K., Hodgeson , J . A., Ballard, L. F., Decker, C. E.,
" Ratio of Su lfur Dioxide to Total Gaseous Sulfur Compounds and Ozone to Total Oxidants in the Los Angeles Atmospherean Instrument Evaluation," Plenum Publ. Co., New York, N.Y. , 1971.
Stevens, R. K. , O'Keeffe, A. E., Ortman, G. C., Environ. Sci. Technol., 3, 7 (1969).
Thoenes, H. W., Guse, W .. Staub-Reinhalt Luft, 28,3 (1968).
Received for review August 8, 1972. Accepted Feb. 20, 1973. A paper based on this material was presented at the 163rd National Meeting of the American Chemical Society, Boston, Mass., April 10, 1972. M ention of a commercial product or company name does not constitute endorsement by the Environmental Protection Agency.
Volume 7, Number 6, June 1973 549
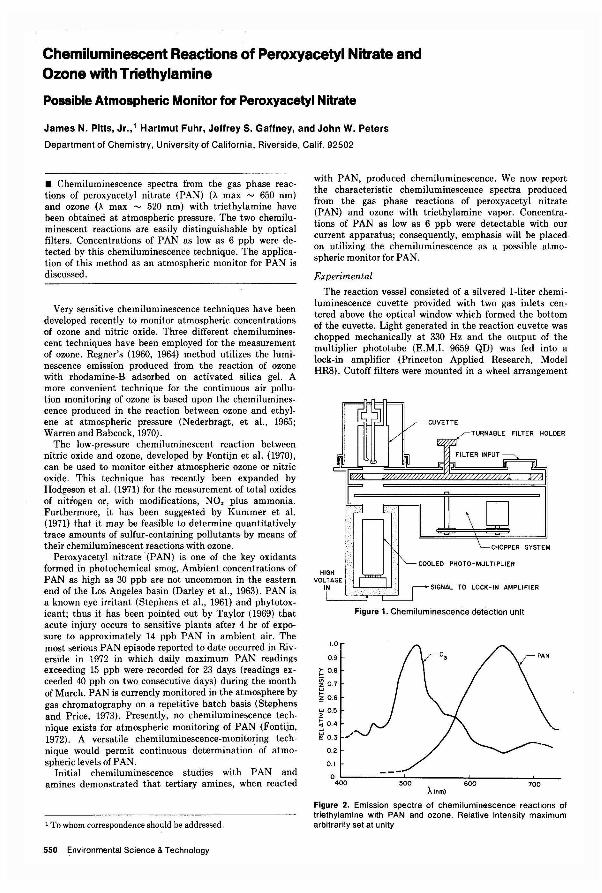
Chemiluminescent Reactions of Peroxyacetyl Nitrate and Ozone with Triethylamine
Possible Atmospheric Monitor for Peroxyacetyl Nitrate
James N. Pitts, Jr.,' Hartmut Fuhr, Jeffrey S. Gaffney, and John W. Peters
Department of Chemistry. University of California. Riverside. Calif. 92502
• Chemiluminescence spectra from the gas phase reac· tions of peroxyacetyl nitrate (PAN) (;\ max ~ 650 nm) and ozone (;\ max ~ 520 nm) with triethylamine have been obtained at atmospheric pressure. The two chemilu· minescent reactions are easily distinguishable by optical filters. Concentrations of PAN as low as 6 ppb were de· tected by this chemiluminescence technique. The application of this method as an atmospheric monitor for PAN is discussed.
Very sensitive chemiluminescence techniques have been developed recently to monitor atmospheric concentrations of ozone and nitric oxide. Three different chemiluminescent techniques have been employed for the measurement of ozone. Regner's (1960, 1964) method utilizes the luminescence emission produced from the reaction of ozone with rhodamine-B adsorbed on activated silica gel. A more convenient technique for the continuous air pollution monitoring of ozone is based upon the chemiluminescence produced in the reaction between ozone and ethylene at atmospheric pressure (Nederbragt, et aI., 1965; Warren and Babcock, 1970).
The low-pressure chemiluminescent reaction between nitric oxide and ozone, developed by Fontijn et al. (1970), can be used to monitor either atmospheric ozone or nitric oxide. This technique has recently been expanded by Hodgeson et al. (1971) for the measurement of total oxides of nitrogen or, with modifications, NO x plus ammonia. Furthermore, it has been suggested by Kummer et al. (1971) that it may be feasible to determine quantitatively trace amounts of sulfur-containing pollutants by means of their chemiluminescent reactions with ozone.
Peroxyacetyl nitrate (PAN) is one of the key oxidants formed in photochemical smog. Ambient concentrations of PAN as high as 30 ppb are not uncommon in the eastern end of the Los Angeles basin (Darley et aI., 1963). PAN is a known eye irritant (Stephens et aI. , 1961) and phytotoxicant; thus it has been pointed out by Taylor (1969) that acute injury occurs to sensitive plants after 4 hr of exposure to approximately 14 ppb PAN in ambient air. The most serious PAN episode reported to date occurred in Riverside in 1972 in which daily maximum PAN readings exceeding 15 ppb were recorded for 23 days (readings exceeded 40 ppb on two consecutive days) during the month of March. PAN is currently monitored in the atmosphere by gas chromatography on a repetitive batch basis (Stephens and Price, 1973). Presently, no chemiluminescence technique exists for atmospheric monitoring of PAN (Fontijn, 1972). A versatile chemiluminescence-monitoring technique would permit continuous determination of atmospheric levels of PAN.
Initial chemiluminescence studies with PAN and amines demonstrated that tertiary amines, when reacted
1 To whom correspondence should be addressed.
550 Environmental Science & Technology
with PAN, produced chemiluminescence. We now report the characteristic chemiluminescence spectra produced from the gas phase reactions of peroxyacetyl nitrate (PAN) and ozone with triethylamine vapor. Concentrations of PAN as low as 6 ppb were detectable with our current apparatus; consequently, emphasis will be placed on utilizing the chemiluminescence as a possible atmospheric monitor for PAN.
Experimental
The reaction vessel consisted of a silvered I-liter chemiluminescence cuvette provided with two gas inlets centered above the optical window which formed the bottom of the cuvette. Light generated in the reaction cuvette was chopped mechanically at 330 Hz and the output of the multiplier phototube (E.M.I. 9659 QD) was fed into a lock-in amplifier (Princeton Applied Research, Model HRB). Cutoff filters were mounted in a wheel arrangement
1.0
0.9
~ 0 .8
~ 0.7
'" ~ 0 .6
~ 0.5
~ 0.4 .J
~ 0.3 ",'
0.2
0.1
o 400
CUVETTE
TURNABLE FILTER HOLDER
FILTER INPUT
SYSTEM
PHOTO-MULTIPLIER
SIGNAL TO LOCK-IN AMPLIFIER
Figure 1. Chemiluminescence detection unit
600 700 Alnm)
Figure 2. Emission spectra of chemiluminescence reactions of triethylamine with PAN and ozone. Relative intensity maximum arbitrarily set at unity
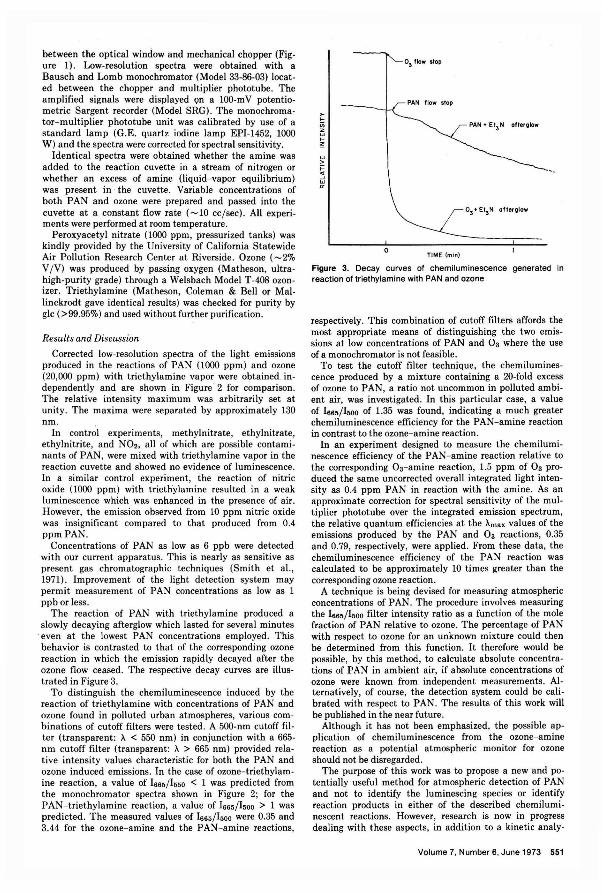
between the optical window and mechanical chopper (Figure 1). Low-resolution spectra were obtained with a Bausch and Lomb monochromator (Model 33-86-03) located between the chopper and multiplier phototube. The amplified signals were displayed on a 100-m V potentiometric Sargent recorder (Model SRG). The monochromator-multiplier phototube unit was calibrated by use of a standard lamp (G.E. quartz iodine lamp EPI-1452, 1000 W) and the spectra were corrected for spectral sensitivity.
Identical spectra were obtained whether the amine was added to the reaction cuvette in a stream of nitrogen or whether an excess of amine (liquid- vapor equilibrium) was present in the cuvette. Variable concentrations of both PAN and ozone were prepared and passed into the cuvette at a constant flow rate (~1O cc/ sec). All experiments were performed at room temperature.
Peroxyacetyl nitrate (1000 ppm, pressurized tanks) was kindly provided by the University of California Statewide Air Pollution Research Center at Riverside. Ozone (~2'70 V IV) was produced by passing oxygen (Matheson, ultrahigh-purity grade) through a Welsbach Model T-408 ozonizer. Triethylamine (Matheson, Coleman & Bell or Mallinckrodt gave identical results) was checked for purity by glc (>99.95%) and used without further purification.
Results and Discussion
Corrected low-resolution spectra of the light emISSIOns produced in the reactions of PAN (1000 ppm) and ozone (20,000 ppm) with triethylamine vapor were obtained. independently and are shown in Figure · 2 for comparison. The relative intensity maximum was arbitrarily set at unity. The maxima were separated by approximately 130 nm.
In control experiments, methyl nitrate, ethylnitrate, ethylnitrite, and N02 , all of which are possible contaminants of PAN, were mixed with triethylamine vapor in the reaction cuvette and showed no evidence of luminescence. In a similar control experiment, the reaction of nitric oxide (1000 ppm) with triethylamine resulted in a weak luminescence which was enhanced in the presence of air. However, the emission observed from 10 ppm nitric oxide was insignificant compared to that produced from 0.4 ppm PAN.
Concentrations of PAN as low as 6 ppb were detected with our current apparatus. This is nearly as sensitive as present gas chromatographic techniques (Smith et ai., 1971). Improvement of the light detection system may permit measurement of PAN concentrations as low as 1 ppb or less .
The reaction of PAN with triethylamine produced a slowly decaying afterglow which lasted for several minutes
. even at the lowest PAN concentrations employed. This behavior is contrasted to that of the corresponding ozone reaction in which the emission rapidly decayed after the ozone flow ceased. The respective decay curves are illustrated in Figure 3.
To distinguish the chemiluminescence induced by the reaction of triethylamine with concentrations of PAN and ozone found in polluted urban atmospheres, various combinations of cutoff filters were tested. A 500-nm cutoff filter (transparent: " < 550 nm) in conjunction with a 665-nm cutoff filter (transparent: " > 665 nm) provided relative intensity values characteristic for both the PAN and ozone induced emissions. In the case of ozone- triethylamine reaction, a value of 166./1050 < 1 was predicted from the monochromator spectra shown in Figure 2; for the PAN- triethylamine reaction, a value of 166./1,00 > 1 was predicted. The measured values of 1665/1.00 were 0.35 and 3.44 for the ozone- amine and the PAN- amine reactions,
o TIME (min)
Figure 3. Decay curves of chemiluminescence generated in reaction of triethylamine with PAN and ozone
respectively. This combination of cutoff filters affords the most appropriate means of distinguishing the two emissions at low concentrations of PAN and 0 3 where the use of a monochromator is not feasible.
To test the cutoff filter technique, the chemiluminescence produced by a mixture containing a 20-fold excess of ozone to PAN, a ratio not uncommon in polluted ambient air, was investigated. In this particular case, a value of 1665/1500 of 1.35 was found, indicating a much greater chemiluminescence efficiency for the PAN-amine reaction in contrast to the ozone-amine reaction.
In an experiment designed to measure the chemiluminescence efficiency of the PAN- amine reaction relative to the corresponding 03- amine reaction, 1.5 ppm of 0 3 produced the same uncorrected overall integrated light intensity as 0.4 ppm PAN in reaction with the amine. As an approximate correction for spectral sensitivity of the multiplier phototube over the integrated emission spectrum, the relative quantum efficiencies at the "max values of the emissions produced by the PAN and 0 3 reactions, 0.35 and 0.79, respectively, were applied. From these data, the chemiluminescence efficiency of the PAN reaction was calculated to be approximately 10 times greater than the corresponding ozone reaction.
A technique is being devised for measuring atmospheric concentrations of PAN. The procedure involves measuring the 1665/1s00 filter intensity ratio as a function of the mole fraction of PAN relative to ozone. The percentage of PAN with respect to ozone for an unknown mixture could then be determined from this function. It therefore would be possible, by this method, to calculate absolute concentrations of PAN in ambient air, if absolute concentrations of ozone were known from independent measurements. Alternatively, of course, the detection system could be calibrated with respect to PAN. The results of this work will be published in the near future.
Although it has not been emphasized, the possible application of chemiluminescence from the ozone-amine reaction as a potential atmospheric monitor for ozone should not be disregarded.
The purpose of this work was to propose a new and potentially useful method for atmospheric detection of PAN and not to identify the luminescing species or identify reaction products in either of the described chemiluminescent reactions. However, research is now in progress dealing with these aspects, in addition to a kinetic analy-
Volume 7, Number 6, June 1973 551
sis of the two reactions. The reaction of various tertiary amines and sulfides are also being examined for chemiluminescence efficiency.
Acknowledgment
The authors thank O. Clifton Taylor, Raymond T enorio, and Eugene A. Cardiff for the preparat ion and a generous supply of PAN.
Note Added in Proof. Chemiluminescence generated by bubbling PAN through a solution of triethylamine in acetone (1% V IV) was approximately twice as intense as that produced in the vapor phase reaction. The results were more reproducible in the liquid phase than in the vapor phase. Therefore, the liquid phase chemiluminescence seems to be more suitable for atmospheric monitoring applications.
Literature Cited
Darley, E. F., Kettner, K. A., Stephens, E. R., Anal. Chern ., 35, 591 (1 963).
Fontijn, A., International Conference on Chemiluminescence, University of Georgia , Athens, Ga ., October 10- 13, 1972.
Fontijn, A., Sabadell , A. ,I. , Ronco, R. J. , Anal. Chern ., 42,575 (1970) .
NOTES
Hodgeson, J. A., Bell, J. P . Rehme, K. A. Krost, K. J., Stevens, R. K., Joint Conference on Sensing of Environmental Pollutants, Palo Alto, Calif., November 8/ 10, 1971, AIAA Paper No. 71-1067.
Kummer, W. A., Pitts, J. N. , Jr., Steer, R. P ., Environ. Sci. Technol., 5,1045 (1971) .
Nederbragt, C. W. , Van der Horst, A., Van Duijn, T ., Nature, 206,87 (1965).
Regner, V. H., J. Geophys. Res. , 65,3975 (1960) . Regner, V. H., ibid., 69, 3795 (1964). Smith, R. G., Bryan , R. J ., Feldstein, M ., Levadie, B. , Miller, F.
A., Stephens, E . R. , Health Lab. Sci., 8, 48 (1971). Stephens, E. R., Darley, E . F., Taylor, O. C., Scott, W. E ., Int. J.
Air Water Poll., 4,79 (1 961). Stephens, E. R., Price, M. A. , J. Chern. Ed., in press (1973). Taylor, O. C. , J. Air Poll . Control Assoc., 19,347 (1969). Warren, G. J., Babcock, F., Rev. Sci. Instrum., 41, 280 (1970).
Received for review October 24, 1972. Accepted Fe bruary 2, 1973. This project has been financed in part with federal funds from the Environmental Protection Agency under grant number 800649. The contents do not necessarily reflect the views and polio cies of the Environmental Protection Agency, nor does mention of trade names or commercial product.~ constitute endorsement or recommendation for u .... H. F. thanks the Deutsche Forschungs· gemeinschaft for financial assistance.
Removal of Mercury from Aqueous Solutions by Nitrogen-COntaining Chemically Modified Cotton
Earl J. Roberts' and Stanley P. Rowland
Southern Regional Research Laboratories , New Orleans, La. 70179
• Four chemically modified cotton cell uloses were investigated for effectiveness in sorbing mercury (Hg2) from aqueous solutions. Effectiveness of these compositions was due to amine units of the following types: ethylenimine network polymer formed in the fibers, polyethylenimine sorbed on the filters , 2-diethylaminoethyl substituents in the cellulose, and 2-aminoethyl substituents in the cellulose. Cotton celluloses modified with 2-diethylaminoethyl or 2-aminoethyl substituents were the more effective compositions at concentrations of mercury above 1000 ppb. Cotton cellulose containing ethylenimine network polymer was most effective on the basis of the weight of the cellulosic composition. Sorbed mercury can be readily removed from the chemically modified cottons for recovery of the former and reuse of the latter.
Mercury may be removed from aqueous media by precipitation as the sulfide (Deriaz, 1963), by use of ion exchange resins (Koch and Biebing, 1969; Scholten and Prielipp, 1963; and Law, 1971), by reduction and separation as metallic mercury (C&EN, 1970), and by sorption on proteins such as wool (Friedman and Waiss, 1972).
This paper describes the effectiveness of four different chemically modified cotton celluloses for the removal of mercury from aqueous solutions. Unmodified cellulose is ineffective.
1 To whom correspondence should be addressed .
552 Environmental Science & Technology
Experimental
Preparation of Cotton Impregnated with Crosslinked Polyethylenimine (CPEI). A prepolymer was prepared by allowing a. mixture of 25 grams (0.25 mole) of 1,2-dichloroethane and 75 grams (1.75 moles) of ethylenimine to react for 16 hr in a water bath maintained at 25°C. Caution is exercised to control polymerization at this stage by efficient removal of heat. Cotton fabric impregnated with ethylenimine network polymer formed in situ was prepared as described by Roberts and Rowland (1971). The fabric was subjected to two cycles of immersion in a 20% ethanolic solution of the prepolymer and passed through squeeze rolls to a wet pickup of 95%. The impregnated fabric was allowed to dry and cure for 16 hr at room temperature. The cured fabric was washed in flowing tap water for 30 min and line-dried at room temperature. The add-on was 16%; the moisture content was 7.55%, and the nitrogen content was 2.75% on the dry basis. Aqueous solutions of the prepolymer may be used in place of ethanol solutions with similar results. Boiling the final fabric in water for 5-10 min increases its efficiency in removing mercury from aqueous solutions.
Preparation of O-(2-Diethylamino)ethyl (DEAE) Cotton. The DEAE cotton was prepared by subjecting cotton fabric to two cycles of immersion in a 1.0M solution of N,N-diethylaziridinium chloride (DAC), prepared as described by Roberts et al. (1971), and by passing the resultant material through squeeze rolls to a wet pickup of
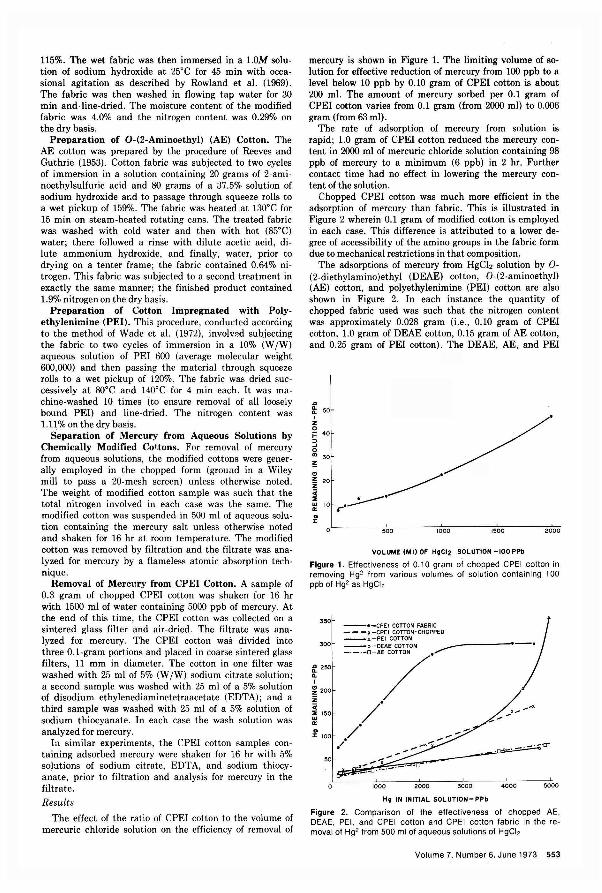
115%. The wet fabric was then immersed in a 1.0M solution of sodium hydroxide at 25'C for 45 min with occasional agitation as described by Rowland et al. (1969). The fabric was then washed in flowing tap water for 30 min and . line-dried. The moisture content of the modified fabric was 4.0% and the nitrogen content was 0.29% on the dry basis.
Preparation of O-(2-Aminoethyl) (AE) Cotton. The AE cotton was prepared by the procedure of Reeves and Guthrie (1953). Cotton fabric was subjected to two cycles of immersion in a solution containing 20 grams of 2-aminoethylsulfuric acid and 80 grams of a 37.5% solution of sodium hydroxide and to passage through squeeze rolls to a wet pickup of 159%. The fabric was heated at 130'C for 15 min on steam-heated rotating cans. The treated fabric was washed with cold water and then with hot (85'C) water; there followed a rinse with dilute acetic acid, dilute ammonium hydroxide, and finally, water, prior to drying on a tenter frame; the fabric contained 0.64% nitrogen. This fabric was subjected to a second treatment in exactly the same manner; the finished product contained 1.9% nitrogen on the dry basis.
Preparation of Cotton Impregnated with Polyethylenimine (PEl). This procedure, conducted according to the method of Wade et al. (1972), involved subjecting the fabric to two cycles of immersion in a 10% (W /W) aqueous solution of PEl 600 (average molecular weight 600,000) and then passing the material through squeeze rolls to a wet pickup of 120%. The fabric was dried successively at 8O'C and 140'C for 4 min each. It was machine-washed 10 times (to ensure removal of all loosely bound PEl) and line-dried. The nitrogen content was 1.11 % on the dry basis.
Separation of Mercury from Aqueous Solutions by Chemically Modified Cottons. For removal of mercury from aqueous solutions, the modified cottons were generally employed in the chopped form (ground in a Wiley mill to pass a 20-mesh screen) unless otherwise noted. The weight of modified cotton sample was such that the total nitrogen involved in each case was the same. The modified cotton was suspended in 500 ml of aqueous solution containing the mercury salt unless otherwise noted and shaken for 16 hr 8t room temperature. The modified cotton was removed by filtration and the filtrate was analyzed for mercury by a flameless atomic absorption technique.
Removal of Merc"ry from CPEI Cotton. A sample of 0.3 gram of chopped CPEI cotton was shaken for 16 hr with 1500 ml of water containing 5000 ppb of mercury. At the end of this time, the CPEI cotton was collected on a sintered glass filter and air-dried. The filtrate was analyzed for mercury. The CPEI cotton was divided into three 0.1-gram portions and placed in coarse sintered glass filters, 11 mm in diameter. The cotton in one filter was washed with 25 ml of 5% (W /W) sodium citrate solution; a second sample was washed with 25 ml of a 5% solution of disodium ethylenediaminetetraacetate (EDTA); and a third sample was washed with 25 ml of a 5% solution of sodium thiocyanate. In each case the wash solution was analyzed for mercury.
In similar experiments, the CPEI cotton samples containing adsorbed mercury were shaken for 16 hr with 5% solutions of sodium citrate, EDTA, and sodium thiocyanate, prior to filtration and analysis for mercury in the filtrate.
Results
The effect of the ratio of CPEI cotton to the volume of mercuric chloride solution on the efficiency of removal of
mercury is shown in Figure 1. The limiting volume of solution for effective reduction of mercury from 100 ppb to a level below 10 ppb by 0.10 gram of CPEI cotton is about 200 ml. The amount of mercury sorbed per 0.1 gram of CPEI cotton varies from 0.1 gram (from 2000 ml) to 0.006 gram (from 63 mI).
The rate of adsorption of mercury from solution is rapid; 1.0 gram of CPEI cotton reduced the mercury content in 2000 ml of mercuric chloride solution containing 98 ppb of mercury to a minimum (6 ppb) in 2 hr. Further contact time had no effect in lowering the mercury content of the solution.
Chopped CPEI cotton was much more efficient in the adsorption of mercury than fabric. This is illustrated in Figure 2 wherein 0.1 gram of modified cotton is employed in each case. This difference is attributed to a lower degree of accessibility of the amino groups in the fabric form due to mechanical restrictions in that composition.
The adsorptions of mercury from HgCl2 solution by 0-(2-diethylamino)ethyl (DEAE) cotton, 0-(2-aminoethyl) (AE) cotton, and polyethylenimine (PEl) cotton are also shown in Figure 2. In each instance the quantity of chopped fabric used was such that the nitrogen content was approximately 0.028 gram (i.e., 0.10 gram of CPEI cotton, 1.0 gram of DEAE cotton, 0.15 gram of AE cotton, and 0.25 gram of PEl cotton). The DEAE, AE, and PEl
... 8: 50 , z o i= 40 ::> -' o U) 30
" l:
500 loao 1500 2000
VOLUME (Mil OF HgCI2 SOLUTION -IOOPPb
Figure 1. Effectiveness of 0.10 gram of chopped CPEI cotton in removing Hg' from various volumes of solution containing 100 ppb of Hg2 as HgCl,
350
1 3001
~250 .. I
~ 200
Z .. ~ 150 OJ 0:
" :I: 100
--.-CPEI COTTON FABRIC - - -x-CPEI COTTON-CHOPPED __ .b._PEr COTTON =:=:r// ____
/ . 11." ....... 11.
./. ./
50 __
.--2000 3000 4000 5000
Hg IN INITIAL SOLUTION-PPb
Figure 2. Comparison of the effectiveness of chopped AE, DEAE, PEl, and CPEI cotton and CPEI cotton fabric in the removal of Hg2 from 500 ml of aqueous solutions of HgCl,
Volume 7, Number 6, June 1973 553
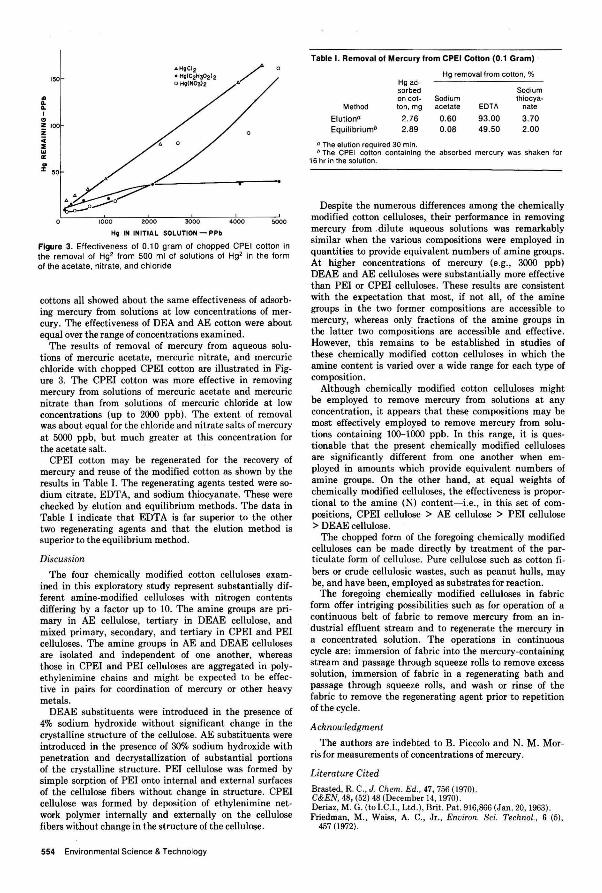
.. .. .. I
" Z 100 i C :I .. oz: .. :z: 50
o
~. 1000 2000
4Hg CI 2 • HoIC2H302)2 o Hg(N03;)2
3000
HV IN INITIAL SOLUTION - PPb
./
4000 5000
Figure 3. Effectiveness of 0.10 gram of chopped CPEI cotton in the removal of Hg' from 500 ml of solutions of Hg' in the form of the acetate. nitrate, and chloride
cottons all showed about the same effectiveness of adsorbing mercury from solutions at low concentrations of mercury. The effectiveness of DEA and AE cotton were about equal over the range of concentrations examined.
The results of removal of mercury from aqueous solutions of mercuric acetate, mercuric nitrate, and mercuric chloride with chopped CPEI cotton are illustrated in Figure 3. The CPEI cotton was more effective in removing mercury from solutions of mercuric acetate and mercuric nitrate than from solutions of mercuric chloride at low concentrations (up to 2000 ppb). The extent of removal was about equal for the chloride and nitrate salts of mercury at 5000 ppb, but much greater at this concentration for the acetate salt.
CPEI cotton may be regenerated for the recovery of mercury and reuse of the modified cotton as shown by the results in Table I. The regenerating agents tested were sodium citrate, EDTA, and sodium thiocyanate. These were checked by elution and equilibrium methods. The data in Table I indicate that EDT A is far superior to the other two regenerating agents and that the elution method is superior to the equilibrium method.
Discussion
The four chemically modified cotton celluloses examined in this exploratory study represent substantially different amine-modified cell uloses with nitrogen contents differing by a factor up to 10. The amine groups are primary in AE cellulose, tertiary in DEAE cellulose, and mixed primary, secondary, and tertiary in CPEI and PEl celluloses. The amine groups in AE and DEAE celluloses are isolated and independent of one another, whereas those in CPEI and PEl celluloses are aggregated in polyethylenimine chains and might be expected to be effective in pairs for coordination of mercury or other heavy metals.
DEAE substituents were introduced in the presence of 4% sodium hydroxide without significant change in the crystalline structure of the cellulose. AE substituents were introduced in the presence of 30% sodium hydroxide with penetration and decrystallization of substantial portions of the crystalline structure. PEl cellulose was formed by simple sorption of PEl onto internal and external surfaces of the cellulose fibers without change in structure. CPEI cellulose was formed by deposition of ethylenimine network polymer internally and externally on the cellulose fibers without change in the structure of the cellulose.
554 Environmental Science & Technology
Table I. Removaf of Mercury from CPEI Cotlon (0.1 Gram)
Hg removal from cotton, % Hg ad-sorbed Sodium on cot- Sodium thiocya-
Method ton, mg acetate EDTA nate
Elutiona 2.76 0.60 93.00 3.70 Equilibriumb 2.89 0.08 49.50 2.00
a The elution required 30 min . b The CPEI cotton containing the absorbed mercury was shaken for
16 hr in the solution .
Despite the numerous differences among the chemically modified cotton celluloses, their performance in removing mercury from .dilute aqueous solutions was remarkably similar when the various compositions were employed in quantities to provide equivalent numbers of amine groups. At higher concentrations of mercury (e.g., 3000 ppb) DEAE and AE cell uloses were substantially more effective than PEl or CPEI celluloses. These results are consistent with the expectation that most, if not all, of the amine groups in the two former compositions are accessible to mercury, whereas only fractions of the amine groups in the latter two compositions are accessible and effective. However, this remains to be established in studies of these chemically modified cotton cell uloses in which the amine content is varied over a wide range for each type of composition.
Although chemically modified cotton cell uloses might be employed to remove mercury from solutions at any concentration, it appears that these compositions may be most effectively employed to remove mercury from solutions containing 100-1000 ppb. In this range, it is questionable that the present chemically modified cell uloses are significantly different from one another when employed in amounts which provide equivalent numbers of amine groups. On the other hand, at equal weights of chemically modified celluloses, the effectiveness is proportional to the amine (N) content-i.e., in this set of compositions, CPEI cellulose > AE cellulose > PEl cellulose > DEAE cellulose.
The chopped form of the foregoing chemically modified cell uloses can be made directly by treatment of the particulate form of cellulose. Pure cellulose such as cotton fibers or crude cellulosic wastes, such as peanut hulls, may be, and have been, employed as substrates for reaction.
The foregoing chemically modified celluloses in fabric form offer intriging possibilities such as for operation of a continuous belt of fabric to remove mercury from an industrial effluent stream and to regenerate the mercury in a concentrated solution. The operations in continuous cycle are: immersion of fabric into the mercury-containing stream and passage through squeeze rolls to remove excess solution, immersion of fabric in a regenerating bath and passage through squeeze rolls, and wash or rinse of the fabric to remove the regenerating agent prior to repetition of the cycle.
Acknowledgment
The authors are indebted to B. Piccolo and N. M. Morris for measurements of concentrations of mercury.
Literature Cited
Brasted, R. C., J. Chern. Ed. , 47,756 (1970). C&EN, 48, (52) 48 (December 14, 1970) . Deriaz, M. G. (to I.C.I., Ltd.), Brit . Pat. 916,866 (Jan. 20, 1963). Friedman, M., Waiss, A. C., Jr., Environ. Sci. Technol. 6 (5)
457 (1972). ' ,
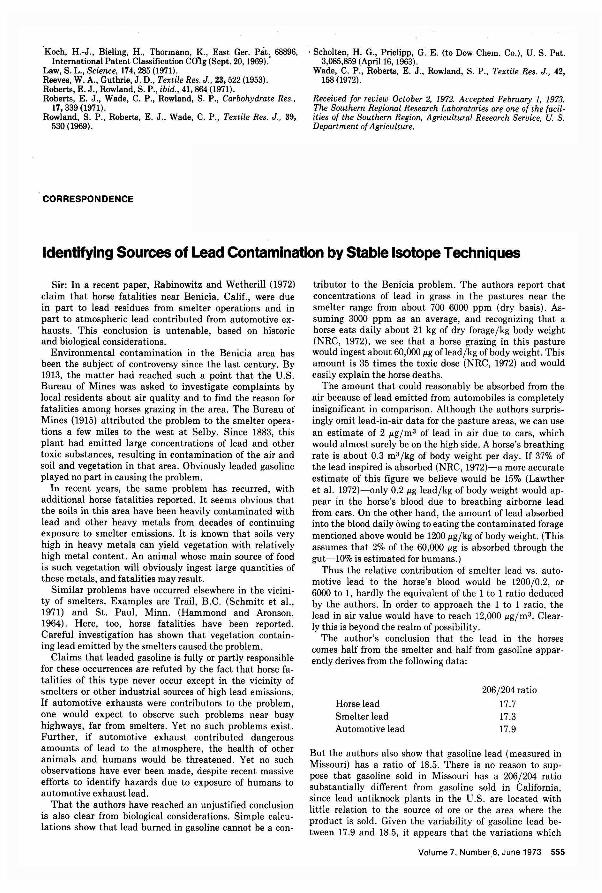
'Koch, H..J., Bieling, H., Thormann, K., East Ger. Pat, 68896, International Patent Classification COig (Sept. 20 1969).
Law, S. L., Science, 174,285 (1971). Reeves, W. A., Guthrie, J. D., Textile Res. J. , 23,522 (1953). Roberts, E. J., Rowland, S. P ., ibid., 41,864. (1971). Roberts, E. J., Wade, C. P., Rowland, S. P., Carbohydrate Res.,
17,339 (1971). Rowland, S. P., Roberts, E. J., Wade, C. P., Textile Res. J., 39,
530 (1969).
CORRESPONDENCE
, Scholten, H. G., Prielipp, G. E. (to Dow Chern. Co.), U. S. Pat. 3,085,859 (April 16, 1963).
Wade, C. P., Roberts, E. J., Rowland, S. P., Textile Res. J., 42, 158 (1972).
Received for review October 2, 1972. Accepted February 1, 1973. The Southern Regional Research Laboratories are one of the facil· ities of the Southern Region, Agricultural Research Service, U. S. Department of Agriculture.
Identifying Sources of Lead Contamination by Stable Isotope Techniques
Sir: In a recent paper, Rabinowitz and Wetherill (1972) claim that horse fatalities near Benicia, Calif., were due in part to lead residues from smelter operations and in part to atmospheric lead contributed from automotive ex· hausts. This conclusion is untenable, based on historic and biological considerations.
Environmental contamination in the Benicia area has been the subject of controversy since the last century. By 1913, the matter had reached such a point that the U.S. Bureau of Mines was asked to investigate complaints by local residents about air quality and to find the reason for fatalities among horses grazing in the area. The Bureau of Mines (1915) attributed the problem to the smelter opera· tions a few miles to the west at Selby. Since ISS3, this plant had emitted large concentrations of lead and other toxic substances, resulting in contamination of the air and soil and vegetation in that area. Obviously leaded gasoline played no part in causing the problem .
In recent years, the same problem has recurred, with additional horse fatalities reported. It seems obvious that the soils in this area have been heavily contaminated with lead and other heavy metals from decades of continuing exposure to smelter emissions. It is known that soils very high in heavy metals can yield vegetation with relatively high metal content. An animal whose main source of food is such vegetation will obviously ingest large quantities of these metals, and fatalities may result.
Similar problems have occurred elsewhere in the vicini· ty of smelters. Examples are Trail, B.C. (Schmitt et aI. , 1971) and St. Paul, Minn. (Hammond and Aronson, 1964). Here, too, horse fatalities have been reported. Careful investigation has shown that vegetation contain· ing lead emitted by the smelters caused the problem.
Claims that leaded gasoline is fully or partly responsible for these occurrences are refuted by the fact that horse fa· talities of this type never occur except in the vicinity of smelters or other industrial sources of high lead emissions. If automotive exhausts were contributors to the problem, one would expect to observe such problems near busy highways, far from smelters. Yet no such problems exist. Further, if automotive exhaust contributed dangerous amounts of lead to the atmosphere, the health of other animals and humans would be threatened. Yet no such observations have ever been made, despite recent massive efforts to identify hazards due to exposure of humans to automotive exhaust lead.
That the authors have reached an unjustified conclusion is also clear from biological considerations. Simple calcu· lations show that lead burned in gasoline cannot be a con·
tributor to the Benicia problem. The authors report that concentrations of lead in grass in the pastures near the smelter range from about 700-6000 ppm (dry basis). As· suming 3000 ppm as an average, and recognizing that a horse eats daily about 21 kg of dry forage/kg body weight (NRC, 1972), we see that a horse grazing in this pasture would ingest about 60,000 I'g of lead/kg of body weight. This amount is 35 times the toxic dose (NRC, 1972) and would easily explain the horse deaths.
The amount that could reasonably be absorbed from the air because of lead emitted from automobiles is completely insignificant in comparison. Although the authors surpris· ingly omit lead·in·air data for the pasture areas, we can use an estimate of 2 I'g/m3 of lead in air due to cars, which would almost surely be on the high side. A horse's breathing rate is about 0.3 m3/kg of body weight per day. If 37% of the lead inspired is absorbed (NRC, 1972)-a more accurate estimate of this figure we believe would be 15% (Lawther et al. 1972)-only 0.2 I'g lead/kg of body weight would ap· pear in the horse's blood due to breathing airborne lead from cars. On the other hand, the amount of lead absorbed into the blood daily owing to eating the contaminated forage mentioned above would be 1200 I'g/kg of body weight. (This assumes that 2% of the 60,000 I'g is absorbed through the gut-lO% is estimated for humans.)
Thus the relative contribution of smelter lead vs. auto· motive lead to the horse's blood would be 1200/0.2, or 6000 to 1, hardly the equivalent of the 1 to 1 ratio deduced by the authors. In order to approach the 1 to 1 ratio, the lead in air value would have to reach 12,000 I'g/m3 . Clear· ly this is beyond the realm of possibility.
The author's conclusion that the lead in the horses comes half from the smelter and half from gasoline appar· ently derives from the following data:
Horse lead Smelter lead Automotive lead
206/204 ratio
17.7 17.3 17.9
But the authors also show that gasoline lead (measured in Missouri) has a ratio of IS.5. There is no reason to sup· pose that gasoline sold in Missouri has a 206/204 ratio substantially different from gasoline sold in California, since lead antiknock plants in the U.S. are located with little relation to the source of ore or the area where the product is sold. Given the variability of gasoline lead be· tween 17.9 and IS.5, it appears that the variations which
Volume 7, Number 6, June 1973 555
form the basis of the authors' conclusions are too small to justify their conclusions.
Other scientists using isotope ratios for identifying sources of lead have also drawn erroneous conclusions. For example, Chow (1970) concluded from his work that lead in gasoline is of the Tertiary or older model age, and that little of it is made from Missouri ores. Yet manufacturers' records show that a substantial portion of lead are used by at least one U.S. antiknock manufacturer derives from Missouri, and the same is probably true of the other manufacturers!
In the Benicia case, the contamination of the soils with smelter emissions for nearly a century has no doubt caused wide variations in isotopic composition of lead in those soils, depending on the sources of are refined, the wind directions, and the extent to which soils in those areas have been turned over. A few measurements of the isotopic composition of soil lead or grass lead cannot accurately reflect the exposure of horses who have been grazing there for extended periods of time.
In general, the assumption that there are fixed, distinct isotopic ratios for gasoline-derived lead or soil lead is fallacious. Techniques using isotope ratios certainly have application, but only in limited cases. The Benicia case is not one of these situations, and the conclusions of Rabi-
Sir: We are well aware of the historical and widespread problem of lead poisoning of livestock from smelter effluent, as discussed by Rifkin and Ter Haar. There is no doubt that lead smelters are capable of introducing to the surrounding environment lethal levels of lead contamination, without significant contributions from other sources. The purpose of our short discussion was to evaluate the usefulness of lead isotopes in distinguishing between different sources of lead contamination. We investigated whether in this particular case and for these particular horses, this smelter was the sale source of lead to the poisoned horses or whether it was one of a number of isotopically distinguishable sources. Our data demonstrate that in this locale the smelter was one of two or more contributing sources.
As discussed in our paper, we recognized that neither the smelter emissions, nor local TEL have fixed isotopic compositions and certainly did not make the assumption, as stated by Rifkin and Ter Haar, that "there are fixed, distinct isotopic ratios" for these sources. It was necessary to establish these isotopic compositions for the time period under consideration. As explained previously, this was done by analysis of the lead isotopic composition and concentration in samples of annual grass selected to represent essentially pure smelter lead or automotive (TEL) lead. Since the sam pies were selected in this way, their lead concentrations cannot be used to estimate the average amount of lead consumed by the horses from these sources.
The three horses studied had not grazed on these pastures for "extended periods of time," but only seven to nine months, almost entirely just prior to our sampling. Therefore the isotopic composition measured may be expected to represent that contributed by the smelter during that interval, regardless of whether the smelter pro-
556 Environmental Science & Technology
nowitz and Wetherill as to the sources of lead poisoning are clearly undermined by the historic and biological facts that they failed to consider.
Literature Cited
Bureau of Mines, Rept. of Selby Smelter Commission, Bull. 98, Washington, D.C., 1915.
Chow, T. J., "Isotopic Identification of Industrial Pollutant Lead," Presented at Second Intern. Clean Air Congress of IUAPPA, December 6-11, 1970.
Hammond, P. B., Aronson, A. L .. Annals New York Acad. Sci. Ill. pp 595-611, 1964.
Lawther, P. J., Commins, B. T., McK. Ellison, J., Biles, B., "Airborne Lead and Its Uptake by Inhalation," presented at Zoological Society of London, January 27, 1972.
National Research Council, National Academy of Sciences, "Airborne Lead in Perspective," Washington, D.C., pp 67, 180, 1972.
Rabinowitz, M. B., Wetherill, G. W., Environ. Sci. Technol., 6, 705-9 (1972).
Schmitt, N., Brown, G., Devlin, E. L., Larsen, A. A., Douglas, E., Saville, J. W., Arch. Environ. Health, 23. 185-95 (1971).
Research & Development Department Ethyl Corp. Ferndale, Mich. 48220
E. B. Rifkin' Gary Ter Haar
1 To whom correspondence should be addressed.
duced lead of different isotopic composition at some time in the past. As found by Dedolph et al. (1970), and confirmed by Rabinowitz (1972) for this particular species, the contribution of soil lead to the edible portion of the grass was negligible relative to the airborne component for the grass and soil lead concentrations under consideration. In considering the Benicia pasture grasses in particular, Mueller and Stanley (1970) and Rains (1971) also concluded that very little of the lead in the tops of the grasses is from the soil. Our isotopic analyses of grass were determined on the entire plant eaten by the horses, including the stems. The concentrations .of lead in the soil and the grass at the pastures are similar. Therefore, although horses forage in such a way so as to ingest some soil, they consume more grass than soil, and the possible contribution of older lead from the soil is not very important.
The biological questions raised by Rifkin and Ter Haar go beyond the initial scope of our investigation, but we believe our published data and subsequent analyses may help to answer these questions. The quantity of lead in these horses is not as great as Rifkin and Ter Haar's estimates would suggest. Isotope dilution measurements of total lead content of bones, livers, and kidneys indicate 6-16 p.g/g on a fresh weight basis. Isotopic abundance ratios identify about half of this lead as coming from the smelter and eaten by the horses with their pasture grass. Measurements of a control group of horses which died of other causes in suburban Los Angeles, and which probably were exposed to similar quantities of automobile exhaust as the Benicia horses, showed concentrations of 1-5 p.g/g. This is about one quarter as much as the poisoned horses and it is plausible that this represents about as much lead as was in the horses' bodies before they were subjected to the additional exposure at these pastures.
So, in effect, the biological question raised by Rifkin
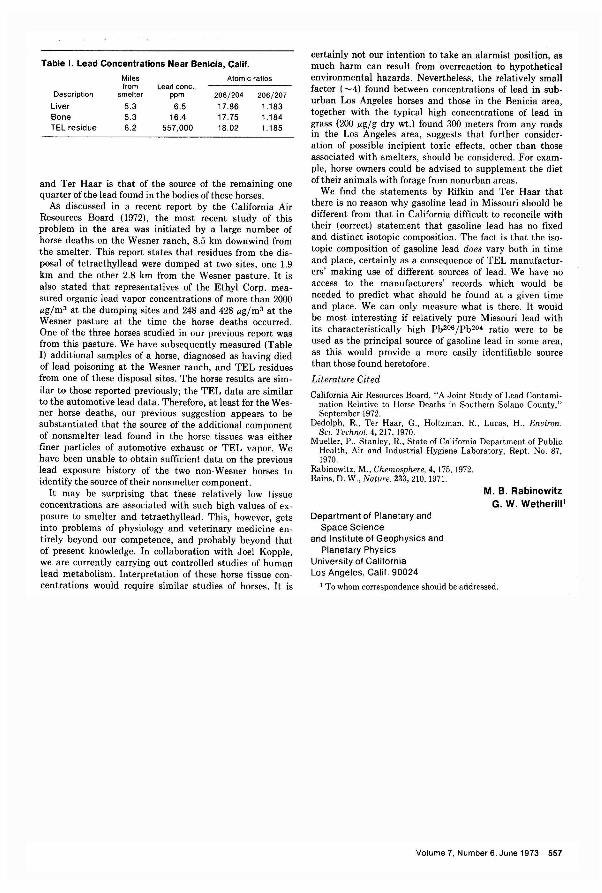
Table I. Lead Concentrations Near Benicia, Calif.
Miles Atomic ratios from Lead cone.,
Dascription smelter ppm 206/204 206/207 Liver 5.3 6.5 17.86 1.183 Bone 5.3 16.4 17.75 1.184 TEL residue 6.2 557,000 18.02 1.185
and Ter Haar is that of the source of the remaining one quarter of the lead found in the bodies of these horses.
As discussed in a recent report by the California Air Resources Board (1972), the most recent study of this problem in the area was initiated by a large number of horse deaths on the Wesner ranch, 8.5 km downwind from the smelter. This report states that residues from the disposal of tetraethyllead were dumped at two sites, one 1.9 km and the other 2.8 km from the Wesner pasture. It is also stated that representatives of the Ethyl Corp. measured organic lead vapor concentrations of more than 2000 I'gjm3 at the dumping sites and 248 and 428 I'gjm3 at the Wesner pasture at the time the horse deaths occurred. One of the three horses studied in our previous report was from this pasture. We have subsequently measured (Table I) additional samples of a horse, diagnosed as having died of lead poisoning at the Wesner ranch, and TEL residues from one of these disposal sites. The horse results are similar to those reported previously; the TEL data are similar to the automotive lead data. Therefore, at least for the Wesner horse deaths, our previous suggestion appears to be substantiated that the source of the additional component of nonsmelter lead found in the horse tissues was either finer particles of automotive exhaust or TEL vapor . We have been unable to obtain sufficient data on the previous lead exposure history of the two non -Wesner horses to identify the source of their nonsmelter component.
It may be surprising that these relatively low tissue concentrations are associated with such high values of exposure to smelter and tetraethyllead. This, however, gets into problems of physiology and veterinary medicine entirely beyond our competence, and probably beyond that of present knowledge. In collaboration with Joel Kopple. we are currently carrying out controlled studies of human lead metabolism. Interpretation of these horse tissue concentrations would require similar studies of horses. It is
certainly not our intention to 'take an alarmist position, as much harm can result from overreaction to hypothetical environmental hazards. Nevertheless, the relatively small factor (~4) found between concentrations of lead in suburban Los Angeles horses and those in the Benicia area, together with the typical high concentrations of lead in ~rass (200 I'g/g dry wt.) found 300 meters from any roads m the Los Angeles area, suggests that further consideration of possible incipient toxic effects, other than those associated with smelters, should be considered. For example, horse owners could be advised to supplement the diet of their animals with forage from non urban areas.
We find the statements by Rifkin and Ter Haar that there is no reason why gasoline lead in Missouri should be different from that in California difficult to reconcile with their (correct) statement that gasoline lead has no fixed and distinct isotopic composition. The fact is that the isotopic composition of gasoline lead does vary both in time and place, certainly as a consequence of TEL manufacturers' making use of different sources of lead. We have no access to the manufacturers' records which would be needed to predict what should be found at a given time and place. We can only measure what is there. It would be most interesting if relatively pure Missouri lead with its characteristically high Pb206 jPb204 ratio were to be used as the principal source of gasoline lead in some area, as this would provide a more easily identifiable source than those found heretofore.
Literature Cited
California Air Resources Board, "A Joint Study of Lead Contamination Relative to Horse Deaths in Southern Solano County," September 1972.
Dedolph. R, Ter Haar, G., Holtzman, R, Lucas, H., Environ. Sci. Techno!. 4,217,1970.
Mueller, P., Stanley, R, State of California Department of Public Health, Air and Industrial Hygiene Laboratory, Rept. No. 87 wrn. '
Rabinowitz, M., Chemosphere, 4, 175, 1972. Rains, D. W., Nature, 233,210,1971.
Department of Planetary and Space Science
and I nstitute of Geophysics and Planetary Physics
University of California Los Angeles, Calif. 90024
M. S, Rabinowitz G, W, Wetherill '
1 To whom correspondence should be addressed.
Volume 7, Number 6, June 1973 557
INDUSTRY TRENDS Ralph E. Phillips, Inc. (Los Angeles. Calif.), consulting engineers, has announced the formulation of an affiliate, Scientific Environmental Consulting Corp. (SECO). SECO will specialize in preparing environmental impact statements.
General Electric Co. has acquired a process license from Ecology, Inc. (Brooklyn, N.Y. ) to use Ecology's composting solid waste conversion system. Ecology has granted GE options to purchase up to 30% of Ecology, Inc's. outstanding shares. Under the agreement GE and Ecology, Inc. will submit joint proposals for the construction of solid waste conversion plants throughout the U.S. The plants will be operated by GE, which will also market end products of the plants.
The Heil Co. (Milwaukee, Wis.) has been awarded a $720,000 turn-key contract by the City of Great Falls, Mont., for the design, equipment, installation, and start-up of a solid waste reduction center . The reduction center will permit Great Falls to turn wasteland into park land .
Envirotech's Buell Div. has been awarded contracts totaling $6 million for electrostatic precipitators. Larger of two contracts is a $4-million order from Southern Electric Generating Co., a subsidiary of Alabama Power Co., for a 1,250,000-cfm precipitator to be installed at the utility's =2 unit of the E. C. Gaston Station, Wilsonville , Ala. Buell also received a $2 million contract from Gulf Power Co. for two precipitators. Each of the units will handle 250,000 cfm and will be installed at Gulf's Chattahoochee, Fla., Scholz plant.
The Carborundum Co.'s Pollution Control Div. has received a $2.6-million contract for electrostatic precipitators from Boise Cascade (Portland, Ore .) . The contract covers construction and installation of four dry-bottom-type precipitators at Boise's paper mills in St. Helens, Ore., and Wallula, Wash.
Universal Oil Products Co. (Des Plaines, III.) has signed an agreement with Chrysler Corp. to supply all of Chrysler's requirements for automobile exhaust emission control catalysts for five years beginning with the 1976-model year. UOP is building a catalyst manufacturing facility at Tulsa-Port of Catoosa, Okla. The agreement calls for UOP to supply Chrysler with a noble metal-activated monolithic catalyst.
558 Environmental Science & Technology
American Can Co. (Greenwich, Conn .) has created a new energy management department to develop and implement policies, programs, and procedures for efficient utilization and conservation of energy. American Can says it's the company's intention to place energy usage considerations on a high priority level in all future company operating decisions, just as environmental considerations command high priority treatment.
Browning-Ferris Industries, Inc. (Houston, Tex.) will file a registration statement for an underwritten secondary offering of approximately 1,750,000 shares of common stock by stockholders, principally former owners of businesses previously acquired by BF!. The company will not offer any shares.
Wheelabrator-Frye, Inc., M. DeMatteo Construction Co., and General Electric Co. have signed a series of agreements for $27-million steam raising incinerator in Saugus, Mass. Wheelabrator-Frye and M. DeMatteo Construction Co. will start construction immediately on the Wheelabrator-Von Roll energy conversion incinerator which will convert refuse to high-quality steam to be purchased by General Electric 's nearby Lynn plant. Project will have initial capacity of 1200 gpd municipal and commercial refuse and is expected to be in operation by early 1975.
Envirodyne, Inc. (Los Angeles , Calif.) has signed a definitive agreement, subject to regulatory approval , to merge Saxton & Kennedy Consulting Engineers, Inc. (Spokane, Wash.) into Envirodyne Futrell, Inc., a wholly owned Envirodyne subsidiary based in Washington. The agreement calls for payment up to a maximum of $313,000 to be made primarily in Envirodyne common stock, depending upon future Saxton & Kennedy earnings levels.
Chemical Construction Corp. plans to begin building the world's largest facility for the production of liquefied natural gas. The plant will liquefy 1 billion scf of gas/ day in Arzew, Algeria, for the U.S. East Coast market. The overall project, the largest yet approved for the import of LNG anywhere in the world , is valued at approximately $350 million for Chemico. The daily energy equivalent of LNG produced at plant is 200,000 barrels of crude oil , or 49,000 tons of coal.
Dearborn Chemical Div. of Chemed Corp. has formed Dearborn Environmental Engineers, an expansion of its Municipal-Industrial Waste Treatment Div. The organization will specialize in providing complete laboratory services, pollution control surveys, and treatability studies to governmental bodies and industries facing waste water treatment problems. The group will be headquartered in Dearborn's Lake Zurich, III. , research and ana
"Iyticallaboratories.
Predicasts, Inc. (Cleveland , Ohio), a business information research firm, has requested appropriate authorities in Washington to take action against the current practices of Chase Manhattan Bank in commercial sale of information and consulting. Predicasts believes these practices are improper, contrary to the public interest, and represent unfair competition.
Rexnord, Inc., formerly Rex Chainbelt, has combined alt of its environmental control operations into a new wholly owned subsidiary, Envirex, I nco The new subsidiary will have three operating units, the water quality control division, the newly formed air pollution control division, and the environmental sciences division, and a group made up of scientists and technical staff .
Kennecott Copper Corp. has awarded a $2-million contract to the Kellex Corp., an affiliate of The M. W. Kellogg Co., for construction of a 750-1t chimney at its McGill, Nev., smelter. The chimney is part of the company's program to meet federal and state ambient air quality standards. The project is under way and will be completed in approximatelv two years.
Holley, Kenney, Schott, Inc. (Pittsburgh, Pa.) has received a turn-key contract from the Jessop Steel Co. for a fume and dust control system at Jessop's Washington, Pa., specialty steel making plant. The system will trap airborne particulate matter generated by Jessop's three electric arc furnaces.
Combustion Engineering, Inc., through its subsidiary, Lummus Co., has been awarded a $30-million contract to design , engineer, and construct a 125-million scf synthetic nat
"ural gas plant for the South Jersey Gas Co. The proppsed plant, to be located in Gloucester County, N.J., will use technology based on the catalytic rich gas process.
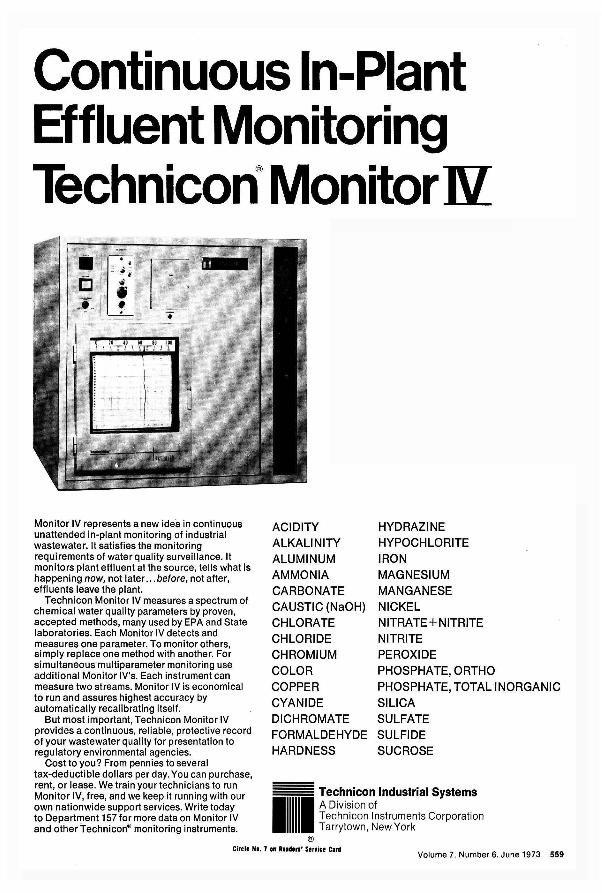
Continuous In-Plant Effluent Monitoring Technicon® Monitor nz:
Monitor IV represents a new idea in continuous unattended in-plant monitoring of industrial wastewater. It satisfies the monitoring requirements of water quality surveillance. It monitors plant effluent at the source, tells what is happening now, not later ... before, not after, effluents leave the plant.
Technicon Monitor IV measures a spectrum of chemical water quality parameters by proven, accepted methods, many used by EPA and State laboratories. Each Monitor IV detects and measures one parameter. To monitor others, simply replace one method with another. For simUltaneous multiparameter monitoring use additional Monitor IV's. Each instrument can measure two streams. Monitor IV is economical to run and assures highest accuracy by automatically recalibrating itself.
But most important, Technicon Monitor IV provides a continuous, reliable, protective record of your wastewater quality for presentation to regulatory environmental agencies.
Cost to you? From pennies to several tax-deductible dollars per day. You can purchase, rent, or lease. We train your technicians to run Monitor IV, free, and we keep it running with our own nationwide support services. Write today to Department 157 for more data on Monitor IV and other 'rechnicon8 monitoring instruments.
ACIDITY HYDRAZINE
ALKALINITY HYPOCHLORITE
ALUMINUM IRON
AMMONIA MAGNESIUM
CARBONATE MANGANESE
CAUSTIC (NaOH) NICKEL
CHLORATE NITRATE+NITRITE
CHLORIDE NITRITE
CHROMIUM PEROXIDE
COLOR PHOSPHATE,ORTHO COPPER PHOSPHATE, TOTAL INORGANIC
CYANIDE SILICA DICHROMATE SULFATE FORMALDEHYDE SULFIDE HARDNESS SUCROSE
Technicon Industrial Systems A Division of
®
Technicon Instruments Corporation Tarrytown, New York
Circle NI. 7 .11 Readers' Service Clrd Volume 7, Number 6, June 1973 559
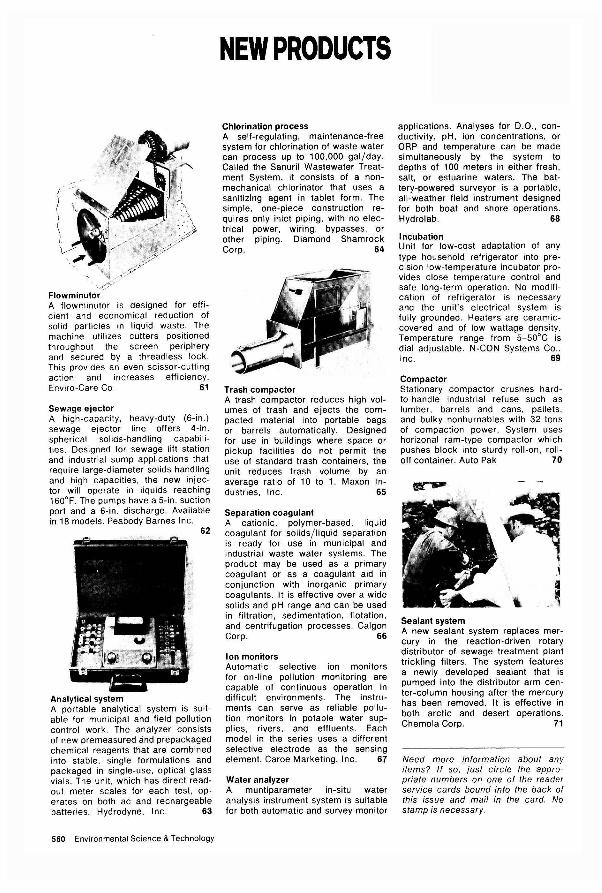
A flowminutor is designed for efficient and economical reduction of solid particles in liquid waste. The machine utilizes cutters positioned throughout the screen periphery and secured by a threadless lock. This provides an even scissor-cutting action and increases efficiency. Enviro-Care Co. 61
Sewage ejector A high-capacity, heavy-duty (6-in.) sewage ejector line offers 4-in. spherical solids-handling capabilities. Designed for sewage lift station and industrial sump applications that require large-diameter solids handling and high capacities, the new injector will operate in liquids reaching 160°F. The pumps have a 5-in. suction port and a 6-in. discharge. Available in 18 models. Peabody Barnes Inc.
62
Analytical system A portable analytical system is suitable for municipal and field pollution control work. The analyzer consists of new pre measured and prepackaged chemical reagents that are combined into stable, single formulations and packaged in single-use, optical glass vials. The unit, which has direct readout meter scales for each test, operates on both ac and rechargeable batteries. Hydrodyne, Inc. 63
560 Environmental Science & Technology
NEW PRODUCTS
Chlorination process A self-regulating, maintenance-free system for chlorination of waste water can process up to 100,000 gal/day. Called the Sanuril Wastewater Treatment System, it consists of a nonmechanical chlorinator that uses a sanitizing agent in tablet form. The simple, one-piece construction requires only inlet piping, with no electrical power, wiring, bypasses, or other piping. Diamond Shamrock Corp. 64
Trash compactor A trash compactor reduces high volumes of trash and ejects the compacted material into portable bags or barrels automatically. Designed for use in buildings where space or pickup facilities do not permit the use of standard trash containers, the unit reduces trash volume by an average ratio of 10 to 1. Maxon Industries, Inc. 65
Separation coagulant A cationic, polymer-based, liquid coagulant for solids/liquid separation is ready for use in municipal and industrial waste water systems. The product may be used as a primary coagulant or as a coagulant aid in conjunction with inorganic primary coagulants. It is effective over a wide solids and pH range and can be used in filtration, sedimentation, flotation, and centrifugation processes. Calgon Corp. 66
Ion monitors Automatic selective ion monitors for on-line pollution monitoring are capable of continuous operation in difficult environments. The instruments can serve as reliable pollution monitors in potable water supplies, rivers, and effluents. Each model in the series uses a different selective electrode as the sensing element. Caroe Marketing, Inc. 67
Water analyzer A muntiparameter in-situ water analysis instrument system is suitable for both automatic and survey monitor
applications. Analyses for D.O., conductivity, pH, ion concentrations, or ORP and temperature can be made simultaneously by the system to depths of 100 meters in either fresh, salt, or estuarine waters. The battery-powered surveyor is a portable, all-weather field instrument designed for both boat and shore operations. Hydrolab. 68
Incubation Unit for low-cost adaptation of any type household refrigerator into precision low-temperature incubator provides close temperature control and safe long-term operation. No modification of refrigerator is necessary and the unit's electrical system is fully grounded. Heaters are ceramiccovered and of low wattage density. Temperature range from 5_50°C is dial adjustable. N-CON Systems Co .. Inc. 69
Compactor Stationary compactor crushes hardto-handle industrial refuse such as lumber, barrels and cans, pallets, and bulky nonburnables with 32 tons of compaction power. System uses horizonal ram-type compactor which pushes block into sturdy roll-on, rolloff container. Auto Pak 70
Sealant system
~ I
.1 II
~ ~ A new sealant system replaces mercury in the reaction-driven rotary distributor of sewage treatment plant trickling filters. The system features a newly developed sealant that is pumped into the distributor arm center-column housing after the mercury has been removed. It is effective in both arctic and desert operations. Chemola Corp. 71
Need more information about any items? If so, just circle the appropriate numbers on one of the reader service cards bound into the back of this issue and mail in the card. No stamp is necessary.
Electrostatic precipitator Completely self-contained electrostatic precipitator will remove smoke, mist, dust, and other pollutants from the air. The unit can be incorporated into duct work or suspended free from the ceiling over particular problem areas. Two models are available which will handle 1500 or 3000 cfm. General Resource Corp. 72
Vibrating screen New line of 60-in. diameter screens is made of stainless steel wire cloths attached with polymeric bonding. Diameter of 60 in. compliments line of screens available previously only in 30- and 48-in. diameters. Multi-Metal Wire Cloth, Inc. 73
Moisture meter Moisture content of liquids such as fuels, solvents, and oils as well as of gases and solids can be measured on direct-reading instrument. Readings can be made in less than 1 min. No standardization is required. Multirange instrument allows measurements to be made as low as 0-300 ppm water, as high as 0-0.6% water. Sensitivity is 50 ppm water. Meter is portable, lightweight, and can be lineoperated in the lab or battery-operated in the field. Ericsen Instruments 74
Atomic absorption New atomic absorption spectrophotometer is top-of-the-line model which allows better analytical performance. Readout electronics uses signal averaging and integration to give optimum precision and detection limits. Spectrophotometer permits direct readout in concentration on electrical digits when using flameless or flame sampling devices. Perkin-Elmer 75
BOD meter Biochemical oxygen demand meter is designed for practical sewage plant applications. Unlike dissolved oxygen monitors, the unit indicates short term BOD in as little as 15 min after sample is gathered on mixed liquor or return sludge. Unit is selfcontained and automatic. Badger Meter, Inc. 76
Centrifugal concentrator New 60-in. centrifugal waste 'water concentrator is designed to handle large-volume hydraulic flows from 800-2000 gpm. Unit is suitable for effluent and water recycle streams from larger industrial plants. Concentrator removes suspended solids down to 10 Jl. SWECO, Inc. 77
Sulfur analyzer Atmospheric sulfur analyzer is designed for long-term unattended operation. Operating on gas chromatographic principles, analyzer separates and independently measures H2S/S02 and other vapor-state sulfur compounds in gases. TRACOR, Inc.
78
'·'lil.',h,e, ; 1 rea. . ofthe Unseen
Air that looks clean may not really be clean. .. the submicron particles are still there ... you just don't see them. - These small invisible particles are generated by all forms of combustion ... from automobiles, airplanes, incinerators, and smoke stacks ... they also result from complex gaseous reactions in the atmosphere. - Knowledge of submicron particles, their sources and transport mechanisms, is important to the understanding of air pollution and its abatement. - To further this knowledge and understanding of submicran particles and their relation to air pollution, the EnvironmentlOne Corporation provides the most advanced equipment available.
• Model Rich 100 Condensation Nuclei Monitor
A multipurpose instrument ideally suited to real time measurement of submicron airborne particle concentration.
• Diffusion-Denuder
Ancillary to the Model Rich 100 for the determination of characteristic size of submicron particles. Other instruments include:
Send for product information
• Portable/Semi-automatic Condensation Nuclei Monitor
• Portable/Photographic Submicron Particle Counter
Write for literature describing our measurement instruments or call (518) 346·6161.
envi ron ment one CORPORATION
PROTECTING MAN'S ENVIRONMENT 2773 Balltown Road Schenectady, New York 12309
Circle NI. 21 Dn Readers' Service Carll
Volume 7, Number 6, June 1973 561
NEW LITERATURE
Sound measurement. Quick-reference explanation of sound measurement for construction, mining, and industrial executives defines decibels and provides comparison ratings of common sound . Colt Industries, Quincy Compressor Div. 91
Cooling tower. New brochure describes Type 53 Crossflow cooling tower. Shows detailed cutaway drawings of construction and includes photographs of tower's components. Also described are redwood structural frame and fan decks, fiber glass fans, and water distribution systems. Ecodyne Cooling Products Co. 92
Standards solutions. Data sheets describing standardized solutions of 30 commonly determined metals includes compositions, catalog numbers, and prices. Samples are checked against National Bureau of Standards materials and designed for use in atomic absorption units. Fisher Scientilic Co. 93
Reverse osmosis. Two-page illustrated bulletin describes operating details of advanced Helical Tubular Segment (HTS-l 00) reverse osmosis unit. Bulletin contains details of tubular membrane 'and flow diagram. Philco Ford Corp. . 94
Materials handling fans. Bulletin describes centrifugal fans used primarily for pneumatic conveyance of materials, dust collection, and fume removal. Fans with capacity rated to 56,900 cfm, pressures to 20 in., and temperatures to 1000°F are available. Bulletin includes application data, selection chart , accessories, and performance charts. Aerovent Inc. 95
Exhaust analysis. Literature describes features and operation of system for analyzing v~hicular exhaust emission. System features various modular components and options for meeting 1972- 76 Federal Testing Procedures. Environmental Tectonics Corp. 96
Catalog. Folder describes grooved piping designed for power plant applications . Piping is applicable to basic water , air, and vacuum and drainage systems, as well as pollution control systems, fly ash slurry lines, cooling water, S02 removal, powdered coal conveyor piping, and other uses. Victaulic Co. of America. 97
562 Environmental Science & Technology
Diaphragm pumps. Four-'page technical bulletin describes company's line of high-pressure diaphragm pumps, specifically developed for water treatment and process applications. Bulletin contains pump features and chart for selection of proper pump. Materials of instruction and ordering information are also included. ' Neptune Chemical Pump Co. 98
Test equipment. One-page guide to environmental test equipment describes 18 types of cabinets, rooms, and systems. Bulletin presents abbreviated specifications for temperature, humidity, altitude, space, thermal shock, and clean environment chambers. Tenney Engineering Inc. 99
Environmental services. New 12-page brochure describes four assistance programs available to consulting engineers and waste water treatment managers. Programs include comprehensive start-up and training for new solids handling plants, guaranteed O&M program for existing treatment plants, computerized-based monitoring and analysis systems, and quarterly inspection and maintenance services. Envirotech , Inc. 100
Aerosols. Basic primer is designed to answer some of the most frequently asked questions about aerosols incl uding what they are, how they are formed, why they are hazardous, how they can be controlled , and other in-formation . Peabody Engineering Corp. 101
Catalog. Comprehensive 72-page catalog includes a 21-page OSHA reference section which provides most current information concerning requirements for accident prevention signs and warning tags as required by OSHA. Selon Name Plate Corp. 102
Electromagnetic water sensors. Paper discusses theory of operation and practical advantages and limitations of solid state electromagnetic water current transducers. Test data and system design graphs are included to allow a potential user to become familiar with , the various tradeoffs available. Marsh-McBirney, Inc. 103
Aerator bulletin. New aerator bulletin is constructed to aid process engineers in design and specification of company's aerator system for munici-
pal or industrial waste treatment. Contents include descriptive information and operation data. Kenics Corp.
104
pH equipment. Catalog describes complete line of pH meters, electrodes, and accessories including miniature models so small one will slip into a shirt pocket. Several are digital meters offering simplified operation, and one model has readabili ty to 0.001 unit over the entire 0-14 pH range. Kruger & Eckels, Inc, 105
Air samplers. New 12-page brochure describes complete line of high-volume air-sampling equipment collecting particles as small as 0.01 p. . BUl letin includes description of accessory equipment including filter holders, filter paper cartridges, transformers, timers, and programmers, as well as aluminum shelters. General Metal Works, Inc. 106
Newsletter. Environmentalists and scientists will find informative up-todate survey of instruments and techniques for monitoring air and water pollution in company's newsletter. Current issue features articles on packaged laboratories for water and waste water analysis, "how to" information on automatic EPA titrations, and rundowns on several instruments. Fisher Scientific Co. 107
Noise engineering. Illustrated 16-page report delves deeply into the subject of industrial noise-level criteria in relation to audiometric testing, hearing conservation, speech communication, and municipal zoning. Includes review of available modular acoustically rated components and preassembled acoustic structures and silencers with case histories. Industrial Acoustics Co., Inc. 108
Source sampling. Booklet describes company's gaseous source sampling service . Also discusses quarterly sampling school for training monitoring personnel. Nalco Chemical Co.
109
Need more information about any items? If so, just circle the appropriate numbers on one of the reader , service cards bound into the back of this issue and mail in the card. No stamp is necessary.
Pollution Engineering and Scientific Solutions. Euval S. Barrekette, Editor. xv + 784 pages. Plenum Publishing Corp., 227 West 17th St., New York, N.Y. 10011. 1973. $35, hard cover.
Interdisciplinary work offers shortand long-term engineering, scientific, and legal solutions to environmental problems. In this volume, the second in the Environmental Science Research series, authorities o~tline solutions to sulfur dioxide, propellant and explosive, and solid waste and noise pollution problems.
Air Pollution. D. H. Michael Bowen, Editor. v + 138 pages. American Chemical Society, ' 1155 16th St., N.W., Washington, D.C. 20036. 1973. $3.50, paper. $5 .95, hard cover.
Sequel to "Solid Wastes," the book contains articles on air pollution published in Environmental Science & Technology from 1969 through 1972. It features sections on laws and regulations, specific pollutants and standards, monitoring, control methods, and transportation .
Disposal of Refuse and Other Waste. John Skitt. xiv + 414 pages. Halsted Press, 605 Third Ave., New York, N.Y. 10016. 1973. $21.50 hard cover.
Book is an introduction to the subject of waste disposal. It considers the design of treatment plants and future developments in solid waste management. Controlled tipping of refuse, industrial solids and slurries, incineration, and the use of intermediate treatment plants in the transfer of bulk haulage to distant sites are discussed.
Who Speaks for Earth? Barbara Ward et al. 173 pages. W. W. Norton & Co., Inc., 55 Fifth Ave., New York, N.Y. 10003. 1973. $6.95, hard cover.
Series of lectures sponsored by the I nternational I nstitute for Environmental Affairs during the United Nations Conference on the Human Environment held in Stockholm in June 1972. Each lecture deals with a different aspect of the environmental problem. Besides Barbara Ward, Rene Dubos, Thor Heyerdahl, Gunnar Myrdal, Carmen Miro, Lord Zuckerman, and Aurelio Peccei contribute.
BOOKS
Progress in 'Hazardous Chemicals Handling and Disposal. Robert H. L. Howe, Editor. viii + 244 pages. Noyes Data Corp., Noyes Bldg., Park Ridge, N.J. 07656. 1972. $20, paper.
Book contains proceedings of symposium held in I ndianapolis last year. It deals with separation methods and subsequent handling and disposal of dangerous and toxic substances. Also, panel groups discuss at length the control of toxic materials in the food industry and the disposal and burning of plastic materials.
Water and Water Pollution Handbook. Vol. 4. Leonard L. Ciaccio. xi + 630 pages. Marcel Dekker, Inc., 93 Madison Ave., New York, N.Y. 10016.1973. $29.50, hard cover.
Volume 4 of this multivolume treatise on water and water systems presents instrumental techniques as applied to the detection of organic and inorganic substances and radioactive nuclides in natural waters and waste effluents . . Watering systems also are discussed. Author and subject indexes to all four volumes in the series are included.
Pollution Control in the Textile Industry. H. R. Jones. x + 323 pages. Noyes Data Corp., Park Ridge, N.J. 07656. 1973. $36, hard cover.
Based largely on government reports and surveys, book attempts to clarify the ways and means open to the textile processor who must keep his pollution at a minimum. It helps the manufacturers come to terms with problems arising from the fact that although many effluent wastes from textile mills are biodegradable, treatment costs are increasing and effluent 9ischarge requirements are becoming more stringent.
Engine Emissions: Pollutant Formation and Measurement. George S. Springer and Donald J. Patterson, Editors. xii + 371 pages. Plenum Publishing Corp., 227 West 17th St., New York, N.Y. 10011. 1973. $28.50, hard cover.
Offers survey of the current state of engine emissions science and a guide to relevant literature in the field. Work focuses on sources and mechanisms of emission formation within combustion engines, as well
as on measurement techniques. Spark ignition and diesel and aircraft engine processes are analyzed.
Cost Effectiveness in Pollution Control. Proceedings of the Fifth Annual Northeast Regional ,Antipollution Conference. iv + 332 pages. Technomic Publishing Co. , Inc., 265 W. State St., Westport, Conn. 06880. 1972. $20, paper.
Book attempts to assess the nationwide cost effectiveness of the EPA's effort to improve the nation's air quality by 1976. Thirty-eight emission categories :.vere studied, and cost/benefit ratios were determined as the measure of ,cost effectiveness for each category for which cost ihformation was available. Book concludes that the overall cost effective' ness of EPA strategy is within an acceptable range.
Mercury in the Environment: An Epidemiological and Toxicological Appraisal. Lars Friberg and Jaroslav
. Vostal, Editors. 215 pages. Chemical Rubber Co. Press, 18901 Cranwood Parkway, Cleveland, Ohio 44128. 1972. $22 .50, hard cover.
Written under contract with EPA and Department of Environmental Hygiene of the Karolinska Institute, Sweden, the book reviews available data on mercury toxicity. It focuses on information considered of special importance in understanding the toxic action of mercury, and on quantitative information in regard to mercury's effects on human beings and animals.
Coastal Zone Pollution Management. Billy L. Edge, Editor. vi + 282 pages. Office of Industrial and Municipal Relations, College of Engineering, Clemson University, Clemson, S.C. 29631. 1972. $8.00, paper.
Book is a reprint of speeches and papers presented at an EPA and Clemson University symposium on coastal zone pollution manag~ment held in Charleston last year. It seeks to identify the important problems that the Southeast faces in coastal zone pollution managemeni; io explain the role of national, regional, state, and local governmental agencies; and to indicate available techniques for solution of these problems.
Volume 7, Number 6, June 1973 563
Environment Chemistry. Stanley E. Manahan . v + 393 pages. Willard Grant Press. Inc .• 53 State St., Boston, Mass. 02109. 1972. $6.95, paper, $10, hard cover.
Designed as a textbook for courses dealing with environmental chemistry, it begins with the assumption that any serious attempt to solve environmental problems must involve the extensive use of chemicals and chemical processes. Organized around chemistries of the hydrosphere, the lithosphere, the atmosphere, and the biosphere, the book assumes the student has some · knowledge of analytical and organic chemistry.
Natural Environments: Studies in Theoretical and Applied Analysis. John V. Krutilla, Editor. viii + 352 pages. Johns Hopkins University Press, Baltimore, Md. 21218. 1973. $16.50, hard cover.
Contributors to the book express concern that many urgent questions of allocating and administering wild lands have been ill-explored. They seek to show that not all of the wild and scenic areas in nature need be altered in pursuit of material consumption objectives. The nine papers in the book represent a cross section
PRECISION
oi- current progress in Resources for the Future's natural environment program.
Environmental Pollution: A Survey Emphasing Physical and Chemical Principles. Laurent Hodges. xii + 370 pages. Holt , Rinehart, and Winston, Inc., 383 Madison Ave., New York , N.Y. 10017. 1973. $7.95 hard cover.
Book attempts to fill need for a one-volume scientific discussion of the major types of environmental pollution and their effects on man and the envirohment. It discusses air, noise, solid waste, and thermal and radiation pollution. Physical and chemical principles are emphasized more than biological and ecological principles. Designed as a textbook.
Directory of Environmental Information Sources. 2nd ed. Charles E. Thibeau , Editor. ix + 457 pages. Cahners Books, 89 Franklin St., Boston, Mass. 02110. 1972. $25, hard cover.
This in-depth directory contains current ihformation relating to ecological problems. With more than 3700 listings, 1000 of them new, this second edition reference work organizes data from widely scattered sources. It lists both public and private organizations that deal with the
environment, as well as documents and reports, periodicals, books, filmstrips, conferences, and published bibliographies.
Waste Disposal Control in the Fruit and Vegetable Industry. H. R. Jones. x + 261 pages. Noyes Data Corp., Park Ridge, N.J. 07656. 1973. $36, hard cover.
Based largely on authoritative government reports and surveys, book ciutlines ways the food processor can hold down pollution wastes. It considers in depth such topics as harvest, and delivery, food processing operations, waste treatment processes, water pollution abatement costs, and the impact of pollution .control on industry costs.
Lectures in Transportation Noise. Richard H. Lyon. vii + 259 pages. Grozier Publishing, Inc., Warren Ave., Harvard , Mass. , 01451. 1973. $20, paper.
The fundamentals of acoustic theory is explored as the basis of modern technology for noise measurement, production, and control. The author develops the concept of source-path-receiver analysis and applies it to today's major transportation noise sources-aircraft , sonic booms, automobiles, trucks, and rail vehicles.
IS AquaRator® THE
METEOROLOGICAL MONITORING SCIENTIFIC
Chemical Oxygen Demand ... results in two minutes COD determinations in two minutes! The AquaRator gives repeatable data-to ±aG/o or better-on water quality in time to take immediate corrective action. Uses inexpensive carbon dioxide instead of expensive or dangerous chemicals. Saves hours of personnel time.
Results are easily correlated with those of the standard COD method prescribed by the APHA, and are much more consistent than BOD tests. Applicable for rapid detection of process upset or product loss. Measures oxygen demand in the range of 10 to 300 mg per liter, higher ranges by simply diluting. Ask YOUI Precision Scientific Dealel lor a no-obligation demonstration, complete performance data, or write us. Precision Scientific Co., 3737 W. Cort/and St., Chicago, /fl. 60647.
Circle N. 5 •• Relders' Senice Clrll
564 Environmental Science & Technology
SYSTEM that measures dew point, visibility or particle
sampling to meet Federal Regulations
_for nuclear plant sites _air pollution studies _weather studies .and more MODEL 207 FORWARD SCATTER METER measures visual range 50 to 5,000 ft/200 to 20,000 ft .accurate in rain, snow _large sampling volume -simple field calibration _single point installation MODEL 110 WEATHER STATION measures ambient temp . and dew point _·80o F to +1200 F dew point .fast response _automatic standardizing -operation continuous and unattended For details, contact:
..... ~ ..... EG1l.G "........, ENVIRONMENTAL EQUIPMENT DIVISION 151 Bear Hill Road, Waltham, Mass. 02154 Tel. (617)890·3710 TWX (710) 324·7648 TELEX 92·3429
. Cirel. NI. 24 I' Readers' S.rvice Carll
June 20 Storrs, Conn. Wetland Conference. University of Connecticut
Write: T. Heifgott, University of Connecticut, Storrs, Conn. 06268
June 20-22 Columbus, Ohio 1973 Joint Automotive Control Conference. AIAA, AIChE, ASME, IEEE, ISA, TAPPI, ITE, and SCi
Conference will emphasize application to societal, economic, ecological, and biological systems. Contact: ASME, 345 E. 47 St., New York, N.Y. 10017
June 20-22 Boulder, Colo. Technical Council on Water Resources Planning and Management. American Society of Civil Engineers.
Theme is "Interdisciplinary Analysis of Water Resource Systems." Write: Herbert R. Hands, American Society of Civil Engineers, 345 E. 47 St., New York, N.Y. 10017
June 22-23 Dayton, Ohio Filth Ohio Valley Gas Chromatography Symposium. Ohio Valley Gas Chromatography Discussion Group
Contact: Ohio Valley GCDG, Attn: Jean Weaver, Station B, Box 8, Dayton, Ohio 45407
June 24-28 Chicago, III. Air Pollution Control Association. 66th Annual Meeting & Exhibition
Contact: Daniel R. Stearn, APCA, 4400 Fifth Ave., Pittsburgh, Pa. 15213
June 24-29 Philadelphia, Pa. American Society for Testing Materials. 76th Annual Meeting and Exposition
Contact: ASTM Meetings Dept., 1916 Race St., Philadelphia, Pa. 19103
June 26-29 Saskatoon, Sask., Canada Canadian Federation of Biological Societies. Annual Meeting
Write: D. T. Armstrong, Dept. of Physiology, Univ. of Western Ontario, London 72, Ont., Canada
July 2-6 Meriden, N.H. Oil and Other Hazardous Materials. Gordon Research Conferences
Other Gordon conferences in July include one on toxicology and safety evaluations and another on environmental sciences: air. Write: Gordon Research Conferences, Pastore Chemical Laboratory, University of Rhode Island, Kingston, R.I. 02881
July 3-5 Mexico City, Mexico Nuclear Energy Conference. American Nuclear Society
Write: ANS, 244 E. Ogden Ave., Hinsdale, III. 60521
MEETING GUIDE
July 9-11 Boulder, Colo. Salinity: A Critical Review of Causes and Control Conference. University of Colorado
Will cover causes and controls over growing salinity in water supplies. Contact: Bureau of Conferences and I nstitutes, Division of Continuing Education, University of Colorado, Boulder, Colo. 80302
July 16-19 San Diego, Calif . Environmental Control & Life Support Conference. SAE, ASME, and others
Will cover environmental control and waste management in spacecraft and marine environmental systems. Write: American Society of Mechanical Engineers, 345 E. 47 St., New York, N.Y. 10017
July 17-19 Montreal, Que., Canada 1973 Summer Computer Simulation Conference. AIChE, AMS, ISA, SCI, SHARE
For details: Lawrence Sash kin, Publicity /Publications Chairman, The Aerospace Corp., P.O. Box 92957, Los Angeles, Calif. 90009
July 17-19 Seattle, Wash. Conference on Ocean Resources as Related to Overall National Economic and Social Needs. National Oceanic and Atmospheric Administration
Write: Assistant Deputy Administrator, NOAA, Department of Commerce, Washington, D.C. 20230
July 18-20 Ann Arbor, Mich. Symposium on Wastewater Effluent Limits. University of Michigan and others
Designed to consider material of interest to water pollution scientists and administrators connected with both government and industry, water economists, and attorneys. Contact: John J. Gannon, School of Public Health, University of Michigan, Ann Arbor, Mich. 48104
July 24-26 Denver, Colo . Water Conditioning Association International. 28th Annual Convention and Exposition .
Contact: WCAI, 330 S. Naperville St. , Wheaton, III. 60187
August 1-3 Fort Collins, Colo. Development and Population Alternative Futures for the West. Seminar. Colorado State University
Will study the impacts and consequences of growth in the West as it affects the overall quality of life. Contact: Office of Conferences and Institutes, Center for Continuing Education, Colorado State Univ., Fort Collins, Colo. 80521
August 8-10 Atlanta, Ga. 1973 Cryogenic Engineering Conference. U.S. Department of Commerce
Overall theme of Energy and Environment. Write: Jack E. Jensen, Program Chairman, Brookhaven National Laboratory, 1 E. 4th, Upton, N.Y. 11973
August13-15 Philadelphia, Pa. National Conference on Environmental Engineering Education. Drexel University and others
Will formulate academic guidelines for training the next generation of environmental engineers. administrators, and technologists . Contact: Office of Continuing Professional Education, Drexel IJniversity, Philadelphia, Pa. 19104
August 13-17 Philadelphia. Pa. 8th Intersociety Energy Conversion Engineering Conference. ACS and others
Write: Arvin H. Smith. Thermo Electron Corp., 85 First Ave., Waltham. Mass. 02154
August 14-16 Boulder, Colo. Symposium on Instrumentation for Monitoring Air Quality. American Society for Testing and Materials and others
Critical overview 01 monitoring instrument performance. Contact: ASTM. 1916 Race St., Philadelphia, Pa. 19103
Courses June 21-Aug. 3 Houston, Tex. 15th Summer Session of Statistics in the Health Sciences. University of Texas
Will cover environmental health. population, and numerous other topiCS. Write: Summer Session of Statistics. University of Texas School of Public Health, P.O. Box 20186, Astrodome Station, Houston, Tex. 77025
June 22-23 Berkeley, Calif. Airport Noise Developments. University of California, Berkeley.
Deals with developments in control and reduction of noise exposure arising from aircraft operations at and near airports. Write: Continuing Education in Engineering, University of California Extension, 2223 Fulton St., Berkeley, Calif. 94720
June 26-27 Madison, Wis. Planning, Designing, and Implementing Cooperative-Areawide Solid Waste Management Systems. University of Wisconsin-Extension
Objective is to inform engineers. planners, and public works and government officials concerning the development of regionalized solid waste management systems. Fee: $95. Contact: Thomas P. Kunes, University of Wisconsin-Extension, 432 N. Lake St .. Madison, Wis. 53706
Volume 7. Number 6. June 1973 565
June 26-28 Nashville, Tenn. Process Design Techniques for Industrial Waste Treatment. Associated Water and Air Resource Engineers, Inc.
Fee is $150. Write: AWARE, Inc. , 2002 Richard Jones Rd. , Suite C304, Nashville, Tenn. 37215
July 1-6 Henniker, N .H. Viruses in the Water Environment. Engineering Foundation
Fee: $160. Write : Engineering Foundation, 345 E. 47 St., New York, N.Y. 10017
July 2-27 Boston , Mass. Summer Institute on Environmental Health. Harvard University
Write: Dade W. Moeller, Harvard School of Public Health , 665 Huntington Ave ., Boston, Mass. 02115
July 2-27 Oak Ridge, Tenn. Environmental Aspects of the Radiation Sciences. Oak Ridge Associated Universities . Also institutes at lato;tr dates on applied
ecology, energy sources for the future , and trace analysis for environmental pollutants. Write: L. K. Akers, Chairman , Special Training Division, Oak Ridge Associated Universities, P.O. Box 117, Oak Ridge, Tenn. 37830
CLASSIFIED SECTION
• POSITIONS OPEN
GROWTH POSITIONS ENVIRONMENTAL SYSTEMS
$12,000-$25,000 ENGINEERING-RESEARCH- MANAGEMENT
MARKETING-MANUFACTURING APPLICATION Fees company paid . Include pr("SCn( sab.ry , minimum salary requirement and location f1clI:ibiliry with resume . Environmental Systems Div., Long~rry Employment S:rvice, Inc., 650 Niles Baole Bldg ., Niles, Ohio 44446.
ENVIRONMENTAL PERSONNEL DESIGN-APPLICATIONS-MARKETING
SALES & SALES MANAGEMENT $12,000-$30,000
Many screened positions with the nation's finest companies Submit Resume or Call Collect
(617)E~6vll~6~OMfNT~erN~OF~SsIONS ~IV. Fee PERSONNEL SYSTEMS INTERNATIONAL, INC.
739 Boylston 51 ., Boston, Mass. 02116
CLASSIFIED ADVERTISING RATES Rate based on number of insertions used with· in 12 months from da le of first. insertion and not on the number of inchos used . Space in classified advertising cunnot be combined for frequency with ROP adverlisinj{. Classilied ad vertising accepted in inch multiples only.
Unit 1 inch
1 -T 3-T 6-T 12-T $48 $46 $45 S«
24-T $42
(Check Classified Advcrtisin~ Department for rales if advertisement is )ur~er t ha n 10".)
SHIPPING INSTRUCTIO NS, Send all matedal to Environmcnt.1 Science a Technology, Classlfilrd Dcp.rtmcnt, 1.2 Ell. An., Norwalk, Conn. 06851
566 Environmental Science & Technology
July 8-14 Sherburne, N.Y. Workshops on Environmental Concerns. N.Y. Department of Environmental Conservation and others.
Workshops designed to acquaint high school students with the major environmental problems confronting society today. Also held at later dates. Contact: Lauren Vredenburgh , Rogers Environmental Education Center, Sherburne, N.Y. 13460
July 15-20 Henniker, N.H. Energy Research-Alternatives for Policy and Management to Meet Regional and National Needs. Engineering Foundation
Fee: $160. Contact: Engineering Foundation, 345 E. 47 St.. New York , N.Y. 10017
July 15-28 Fort Collins, Colo. Fourth International School for Environmental Management. Westinghouse Power Systems Environmental Systems Department
Will train personnel from electric utility companies, generating industrials, and governmental agencies in the technological and legal aspects of environmental management. Write: Westinghouse Power Systems, J. H. Wright, Director, Environmental Systems Department, P.O. Box 355, Pittsburgh. Pa. 15230
ECOLOGICAL SCIENTISTS
The Rice D ivision of NUS Corporation (located in Pittsburgh, Penna.) is actively seeking additional staff within its Ecological Sciences Department. Our present staff incllldes over 40 aquatic a nd terrestrial biolog ists engaged in applied ecology research, defining basehne ecological information and ecological impact of proposed and existing facilities ranging from utilities to various industry and major construction. Most research involves extensive field collection a nd extensive lab analyses. Among our avai lable positions a .. e: Senior Project Director, as well as situations in Zooplankton taxonomy, marine ecology, l chthyoplankton tuxonomy, ornithology and field remote sensing. Candidates with graduate degrees preferred. Please send resume to:
Paul Morgan Rice Division, NUS Corporation 1910 Cochran Road Pittsburgh, Penna., 15220
NUS
July 16-20 University Park, Pa. Machinery Noise Control by Design Seminar. Pennsylvania State University
Will cover various types of noise sources typical of machinery and means of noise reduction. Write : Pennsylvania State University, Conference Center , J. Orvis Keller Bldg., University Park, Pa. 16802
July 16-20 Denver, Colo. Recycling of Food Processing Wastes. University of Denver
Other workshops to be held include engineering for air quality and noise pollution and control. Contact: Ray M. Wainwright, College of Engineering, University of Denver, Denver , Colo. 80210
July 30-August 10 Cambridge, Mass. Energy: A Unified View. Massachusetts Institute of Technology
Contact: Director of the Summer Session, MIT, Room E19-356, Cambridge. Mass. 02139
August 12-17 Denver, Colo. Process and Environmental Analytical Instrumentation. I nstrument Society of America
A concurrent course, "Sampling and Sampling Systems for Process and Environmental Instrumentation," is also offered . Fee: $300. Write: ISA, Education Department. 400 Stanwix St.. Pittsburgh , Pa.15222
HYDROLOGISTS Posit ions in volve hydrological consulting support for power plant site evaluation and development studies. Duties will entail assessment of ground water availability. surface run·off characteristics, flood conditions, water quality and water budgets for lakes and reser· voirs. Experience in shore protection and wave forces 0 11 off-shore structures. analytica l capa bility with FORTRAN knowledge, and statistical background is highly desirable. Positions ava ilable for new graduates to 5 years of experience. Wish to fill positions within one to four months.
OPPORTUNITIES NUS (formerly Nuclear Utility Services, Inc.) is an organ~zat~on of consuhing cnglllccrs and SClcnllsts engaged primarily in the energy and environmental field s. In slightly more than a decade, we've grown to become one of the largest independent consultants in these key areas and our expertise has gained national and internat ional recognition. We're headquartered in Rockville, Maryland, 15 miles north of Washington, D.C., with convenient living close to work, outstand ing academic illstitutions and easy access to the Capital. For the above position, send resume to Nancy Root, Personnel Administrator.
N US NUS CORPORATION # 4 Research Pllce
CORPORATION Rockville, Md. 21&se
.An tQu,,/ Opportunity Employe r

professional consulting services directory
CAMP DRESSER & McKEE Inc.
ENVIRONMENTAL ENGINEERS
One Center Plaza Boston. Mass. 02108
ENVIRONMENTAL TESTING • Air; stack sampling & complete analysis • Water: chemical , biological & bio-assay • Compliance Specialists • Legal Expertise • Nationwide Service
Member A.C. I. L., A. P. C.A., W. P. C.F.
Phone or write tor lIteratur •• Dept. JA ULTRACHEM CORP.
1150 Civic Drive, Walnut Creek, CA 94596 Telephone (415) 935-3115
NORTH AMERICAN WEATHER CONSULTANTS R. D. Elliott, J . T. W"lser, E. l. Hovind
Ct:rtified Consulting Meteorologists • Environmental Impact Studies • Site Surveys • Air Quality Monitoring
Sant~ Rarbara. Municipa l Airport, Goleta, CaHrornla 93017
Phone: 805-967-1246
"""'K I·· (~-i' U Jlan ENVIRONMENTAL ENGINEERS
- WATER & AIR POLLUTION CONTROL - WATER SUPPLY & TREATMENT -LIQUID & SOLID WASTES DISPOSAL - NOISE LEVEL CONTROL
STUDIES ' REPORTS' DESIGN CONSTRUCTION • OPERATION
1845 WALNUT ST. , PHILADELPH IA, PA. 19103 Tel .: (2 15) 561 ·5300
'""""' I . sample
analYZe evolvOls
chemical analysis • olomic obsotptioo
optical emis~ gO$ clYomatogrophy
inll'O'led HOY diffraction
mic roscopy bocteriology pesticides
ALPHA ANALYTICAL LABORATORIES D IVI S IO N OF A LPHA M ETALS. IN C
~'; wA'L" H ' ''I. fT .J ~ " ~,F.Vr: I 'V N F.W.It'''''[ V U'CKJ·' '" ''
Envlronmenta' Researeh f:I Ana'~sis
Complete laboratory, mobile and aerial monitoring services for water. air, land and noise problems.
Ana lytkal services for regu lation compliance. Testing • Monitoring . Gas chroma· tography . Atomic absorpt ion • Total organk carbon anal· ysis • Industrial hygiene • OSHA monitOring _ Noise testing _ Ecological st udies • Aerial infrar~ radiometry • Expert testimony
TCQNSULTATION AND LABORATORY SERVICES • Radionuclide Analysis • Bioassay • Environmental Studies • Health Physics Services • Low Level Tritium Counting • Whole Body Counting • Licensing Assistance (Mobile)
• Emergency Medical Planning
RADIATION MANAGEMENT CORPORATION UNIVERSITY CITY SCIENCE CENTER
3508 MARKET STREET, PHILADELPHIA, PA. 19104 Phone (21 5) 386-1805
ENVIRONMENTAL IMPACT REPORTS
APPLIED RESEARCH ENGINEERING CONSULTING
DIFFUSION METEOROLOGY ST ACK TESTING
MARINE TECHNOLOGY ANALYTICAL LABORATORIES
The Research Corporation of New England 125 Silas Deane Highway Wethersfield, Connecticut 06109
(203) 563-1431
NUCLEAR SERVICES
• Radioactive Waste Disposal • Health Physics Services • Decontamination • Licensing Consultation • Radiation Surveys • Radiation Safety Programs
RADIAC RESEARCH CORP. 261 Kent Avenue
Brooklyn, New York 11 211 Phone (212) 894-9050
NO EMISSION IMPOSSIBLE FOR US TO MONITOR New EPA standards are hard to keep up with. But we do. And we can tell you how you are doing. Before they do.
Ask, us for an estimate on stack sampling; ambient sampling in the plant to determine concentration profiles; diffusion modeling of emission from point sources in your plant. Concise, written report of results.
MONSANTO ENVIRO-CHEM SYSTEMS, INC. P.o. Box 8, Station B Dayton, Ohio 45407
Attn: D. B. Nelson - Tel: 513/268-3411
" Services 10 Public Works and to Industries with Emphasis on Environmental Compatibility"
... ~ METCALF & EDDY I ENGINEERS
~..,..: Pollution Control Studies and Systems Design Liquid Wastes • Soiid Wastes • Air Pollution • Environmental Planning
Statler Building, BQston, Mass, 02116. New York . Palo Alto. Chicago. New Haven
Volume 7, Number 6, June 1973 567
professional consulting services directory
TESTING LABORATORY COMPLETELY COMPUTERIZED NEUTRON ACTIVATION ANALYSIS
P.O. BOX 322
Atomic Absorption Mass Spectroscopy Emission Spectroscopy I R & UV Spectroscopy Anodic Stripping Voltammetry Gas Chromatography
ANN ARBOR, MICHIGAN 48107 313·665·3477
P.sticldes & Herblcld •• Biological Studl.s Trace Element Studies Environmental Sampling Water Pollution Air Pollution
In Plant & Stack Measurements
ENVIRONMENTAL RESEAR CH GROUP INC .
Fuel Engineering Company of New York • Process Emission Testing & Registration • Boiler Stack Tests • Ambient Air Monitoring e Environmental Impact Statements e Complete Fuel Testing Labora tories
1 0 WA L N U T P L ACE . TH O R NWOOD. N. Y . 10594 • (914) 76 9 ·7900
DAMES & MOORE Consultants in the Environmental and Applied Earth Sciences
Air Pollution, Water Pollution Solid and Liquid Waste Disposal
Environmental Studies for Nuclear Power Plants
Two Pennsylvania Plaza, New York, New York 10001 With Offices in 31 Principal Cities Throughout the Wo rld
Division of O' D. Kurtz Associates, Inc .
• 1I1"~" '! .nJ T{) .. ,,,i"_~I,.1 Tc."n~ for 1'"11,,,,"(1 Cumrul _ Rc".l"" c..h ,m.e. 1 :\, .. IY >I' (or he .. -" "",.1 •• f'C>fK.J C. ,
.. J"~I",ld .. ",,,I p<""kum I'ruJu.:(, . Ih.,., ... y ,,{ \\1.[« ."J Il.'.>!cw.rcr I",n~ Fi.h .,J F,ooJ
,~ . '" '" ~""' ''''' • h\l l u,~j,.t f,.IJ Su,,'<y '
- 11'1.110,« .. 1 C\I.hul .. n« _ hnvonmm;null n,p'" R<p~'" _ l!c. hll.nJS, (nyEnlu.ti"., _ s.,.rccn(n,< ,nJ Eull".,;".,,,i .',,, .. BJ{IC,J c. _ V<""". ry I'",!.", .. T,,.,,.,,,, E •. d u. !;oo _ W .. cr ooJ 1'" ... 1 Hy.~"n. ;",J S.n",,;".1
TOXICITY TESTING. FRESHWATER & MARINE SPECIES Fish and In vertebrates e Acute and Chronic Testing
Since 1968 • I ndustri al and Government Contracts AQUATIC SCIENCES INC. MORRIS H. ROBERTS, JR. Ph.D.
2624 N.w. 2nd Ave., Boca Raton, Flor ida 33432 - Phone (305) 391 ·0091
568 Environmental Science & Technology
ENGINEERING COMPANY
Waler Supply & Wastewater Facili ties
Power Plant Environmental Assessments
Water Quality Management
150 S. Wacker Drive· Chicago, III. 60606 (312) 855-7000
Laborataty and Process Development
Industrial Waste Water Contr04
Liquid and Solid Incineration
Air P04 lulion Contr04
In-plant Contr04 and Process Modiftcations
Desalination
CATALYTIC. INC. Consultants. [ncineers. Constructors
Environmental Systems Division 1528 Walnut Street, Philadefphia, PI. 19102
215-KI 51500
ENVIRONMENTAL CONTROL
KAISER ENGINEERS 300 LAKESIDE DRIVE OAKLAND CA 94604
CHICAGO PtTTSBURGH
UNIlED STAT£S TESTING COMPANY INC ]~ 5 ~ ". :. .& : , ",. ,,~,
!-Ie C't 'I J" 'J' R ~ on" I,,,, ~ (fG'5
Environmental Testing Specialists
• Dust Collection Measurements • Source Sampling • Combustion Eva luation • Complete Source Surveys • Code Compliance Investigatiogs ·lncine rator Eff~iencies A • Industrial Hygiene ., • Control Equipment Evaluation • Comolete Water Pollution Studies
fly'onmen'ai C"'''C''S 0,,/ Sl:::~ Allan Maxf'''ld c:)~ .. v 1:::-. I~O' 792 ~430 (509 946 s· s ~
THE BEN HOLT CO. !It SHih Like A . .... , P.saden., C.if. ltt l !
ENVIRONMENTAL • IMPACT STATEMENTS •
• ENGINEERING.
CROBAUGH LABORATORIES SINCE 1894
AIR AND WATER POLLUTION Sampling - Measurements
Analysis - Consulting
COMPLETE LABORATORY SERVICE Chemistry-Metallurgy-Spectroscopy
Particle Size Analysis-Atomic Absorption Infrared-Chromatography-X·Ray Diffraction
216-881-7320 3800 Perkins Ave.
Cleveland, Ohio 44114

. . . professional consulting services directory
WATER ANALYSIS Metals - Pesticides - T.O.C. - Etc.
Government approved procedures. Phone or write for furtl~,. information.
GALBRAITH LABORATORIES, Inc., Bo, 4187 Knoxville, Tenn. 37921. (615) 546--1335
BURGESS ANALYTICAL LABORATORY
Chemical Analyses For Environmental Studies
And Pollution Control
525A$hlond 51. , North Adams, MA 0 1247 Tel. 413/663·6769
POLLUTION TOTAL ANALYSIS & CONTROL
Write for information
J & W agro/eco LABORATORIES Drawer B, South Bay, Fla. 33493
Phone 305/996-3880
,fidld £ ct'i __ uo, 9'k 9 CONSULTING CHEMIST
• Monitoring and Impact Studies • Fteld Sur"llYS P.O. Box 203 • Applied AlK8arch Lexington, Mass. 02173 • O.S.H.A. (617) 646-0220 • Complete L. boratory Services
.,.... TELEDYNE OCCUPATIONAL HEALTH SERVICES
Consultants In
AIR AND WATER POLLUTION OCCUPATIONAL SAFETY INDUSTRIAL HYGIENE RADIATION SAFETY
Inspection Analysis
Sampling Evaluation
3708 Columbus Avenue Sandusky. Ohio 44870
(1)9) 627-1976
SAMPLING & ANAL V$IS Source ' Water' Ambient Air
fast, accu rate servi ce
&oid!spectro.ChemiCa( Laboratory
p.o. Box 500 • Golden, Colo. 80401
LEDOUX AND COMPANY ESTABLISHED-ISSO
. LET US ANALYZE YOUR INDUSTRIAL Pl.ANT EFFL.UENTS AND AIR FILTER SAMPLES
359 ALFRED AVE .• TEANECK, N.J. N.J. (201) 837·7160 • N.Y. (212) 947-0953
AEROVIRONMENT, INC. Environmental Impact Studies, Sit. Surveys
Consulting on Airflow. and Diflusion Monitoring Instrumentation
Air Pollution Control Method. Development 860 South Arroyo Parkway, Pasadena. California 91105
(213) 449-1392
STW TESTING, INC. Source testing & stack sampling specia l· ists. Performance. efficiency & compliance testin g
for Particulates. 501. NO" Particle sizing & on site trainin g P.O. Box 26212 Denver. Colo. 80226 Tel (303) 232-3299
POLLUTION CONTROL CONSULTANTS • Evaluation
Claytomii :~j;~~~!~~' Div. Morle:nnc!ln Monogement Syste ms (313) 352-3120 25711 Southfield Rd., Southfield, MI. 48075
I~... SCIENCE ~ ASSOCIATES, INC.
profe,,;onal con.ullanf. on mefeorological ;ntfrumenlra,ion '0
gOYernment, education, industry, and flte public
Sel.ction of the proper equipment depends on survey objectives,
techniques of onalysis, and funds available.
230 NASSAU STREET. BOX 230 N PRINCETON. NEW JERSEV 08540
TELEPHONE; 609·824-4470
JBFscfENTlFfC CORPORATION Water Analysis _ Atomic Absorption Chromatography . Sou rce Monitoring Soils Analys is . Oil -Water Separation
2 Ray Ave. ~~Hi~13~1rass. 01803
Environmental Engineering Industrial-Municipal- Water-Sewage
Solid Wastas Management Air Pollution Control- Power Engineering
Gibbs E! Hill. Inc. ENGI NEERS, DES IGNERS, CONSTRUCTORS
393 Sevenlh Avenue. New York, I'll Y 10001 A SubSidiary of Dravo Corporahon
ENVIRONMENTAL SERVICES I SYSTEMS • AMBIENT AIR MONITORING • SITE SURVEYS • METEOROLOGICAL ANALYSES • COOLING TOWER EFFECTS • AGENCY LIAISON AND EXPERT WITNESSES • MONITOR)NG AND DATA SYSTEMS
ENVIRONMENTAL SYSTEMS GROUP. P.O. BOX 3007 BOULDER, COLORADO 80303 • (303) 443·0384
WATER/ WASTEWATER
SPECIALISTS
• Industrial/municipal was~ surveys e Treatability studies • Complete laboratory services
7.' krtey An. New IN"lwick. N.J.""2 (201) 846-Il00
ECOLOGICAL ASSESSMENT SERVICES
Small. competent Staff Marine Biologists. Geologists, and Research Syst~ms Specialists-Available for EnVIronmental Impact Studies and De· tailed Atmospheric I Marine Systems Evaluation s; 85' vessel, helicopter and computers_
MARINE ECOLOGICAL INSTITUTE Attn: Robert E. Ross, Vice President
811 Hlrbor Blvd., Red.fod City California MDSS, (415) 364-276D
-£.....- FLU/DYNE _ I N GI N H IlIN G C O R P ==== :.W ~(1:~ 1 .1 .. ~~~11~S4L?' ~4
AIR EMISSION CONTROL System Design. Upgrading by Modification Developmenl for New Requirements Such al Fine Particle Control
R&D CONSUL TING • ANALYSIS
VACCINES
THE BIO-VIROlOGICAllABORATORIES Write for information
2045 Spafford Ave _. Wes t Palm Beac h. Fta 33401
Dr G H W adde l l . Olrector Ph one 305/686-0345
~(y.t-"t£~m LABORATORIES INC
545 CO'l1rwra 5t frllr-d,n lakes N J 8741; 20 A 13! 4774 20' 891 8787
• AtomiC Absorption • Optical EmiSSIon • <;.hemicill • X.roY Spectrometry
(onpiete An~ y oCdl S"'v en for Env 'O~"'H'ntc'l1 S'UdH \ & Pallullo Control
ENVIRONMENTAL POLLUTION CONTROL SERVICES
Galson
CHARLES R VELZY ASSOCIATES, INC.
CONSULTING ENGINEERS WATER POLLUTION CONTROL. SOLID WASTE DISPOSAL. AIR POLLUTION CONTROL. INDUSTRIAL WASTES·
DRAINAGE. WATER SUPPLY 350 Executive Boulevard
Elmsford, New York 10523 Mlneol., New York Babylon, New York
Volume 7, Number 6. June 1973 569
professional consulting services directory
YORK RESEARCH CORP. • Ambient Air Studies • Air & Water Pollution Control • Complete Analytical taboratory • Source Testing & Stack Sampling • Industrial Plant Investigations • Noi.e Level Studies • Combustion Studies
One Re.earch Drive Stamford, Conntcllcul 06906
(203) 125·1371
GEOLOGICAL SERVICE Testing & Monitoring Laboratones
Chemical • Atomic Absorption • - Infrared Emission Spect • Chromatographic • Microscopy
All Water Testing • Pollution • Quality Corrosion Control • Geothermal • Waste Disposal
1539 W. 16th Street (Z13) 436 4254 Long Beach, CA 90813
WASTE MGT. AND POLLUTION CONTROL H. G. Swope Consulting Chemi.t
ComultaUon. in-plant and inau3irial wasie $urDey", troubie-.,hooting. jealJibllity stualn. industrill/ and radio-adict! wasie treatment, operator training. analyses.
P.O. Box 1254, Madison, Wis. 53701 Tel: (608) 238-9966; (414) 963-5361
USE THE CONSULTANTS'
DIRECTORY RATES PER ISSUE
Six Twelve UNIT Issues Issues
I"Xlcol. $27 $26 1" X 2 col. 54 50 1" X 3 col. 78 70 2" X 1 col. 54 50 2" X 2 col. 100 91 4" X 1 col. 100 91
Your card may appear in every issue for one year, every issue for six months (consecutive issues), or every other issue for one year (alternate issues). Send your copy to
Joseph P. Stenza,
ENVIRONMENTAL SCItNCE
& TECHNOLOGY 142 East Ave.,
Norwalk, Conn. 06851
or call him at 203-853-4488.
570 Environmental Science & Technology
INDEX TO ADVERTISERS IN THIS ISSUE
ACE Glass Incorporated. . . . . . 476 'Heller Crative Advertising
Aero-Chem Research Laboratories . ... 475
Analytical I nstrument Development, Inc. .. . . . . . . . . .. 510
Mercer Associates
Brandt Associates Inc. 571
Carus Chemical Company 476 Ross Advertising Inc.
CEA Instruments . . 475 lHO Incorporated
Dohrmann Division of Envirotech . . ...... I BC
Bonfield Associates
EG&G ................. . . 475, 564 Renacciao AdvertiSing & Marketing, Inc.
EMR-Telemetry 482 Carol Marketing Associates
Energetics Science Inc. 479 Wilson, Ryan & leigh. Inc.
Environment/One Corp. 561 Devey, Thompson & Vignola Adv. .
Environmental Research Corp.. 492 Fischbein Advertising, Inc.
Finnigan Corporation 486 Bachrach Advertising
Gaertner Scientific Corporation. 488 Sidney Clayton Associates, Inc.
Hach Chemicai Co. 493 Wesley Day and Company Incorporated
Intertech Corporation ..... IFC Gaynor & Ducas Advertising
Mine Safety Appliance Company 516
Ketchum, Macleod & Grove Inc.
NUS Corporation 480 Ketchum, Macleod & Grove
Olympus Corporation of America 572
Kameny AssOCiates, Inc.
Philips Electronics . Instruments 511
J + M Condon, Inc. Precision Scientific Company 564
Tri-State Advertising Company, Inc.
REM SCientific, Inc. . .OBC Charles M. Barr
Research Appliance Company ......... 475, 503
W. F. Minnick & Associates
Scientific Glass & Instruments 484
Technical Marketing AssOCiates, Inc.
Scientific Industries, Inc. . . 476 Mandabach and Simms. Inc.
Technicon Instrument Corporation . . . .. 475, 559
Mediad Incorporated Thermo Electron ..... . ..... 476, 510
Ingalls Associates, Inc.
Union Carbide-Linde ....... 476, 501 Young & Rubicam International Inc.
Wallace-Fisher Instrument Co. 475 Wilks Scientific Corporation 476
Toft and Company, Inc.
PROFESSIONAL CONSULTING SERVICES DIRECTORY
CLASSIFIED SECTION 567-570
566
Advertising management for the American Chemical Society Publications
CENTCOM, LTD.
Edward P. Blanchard, President; Thomas N. .J. Koerwer, Executive Vice President, 142 East Avenue, Norwalk. Connecticut 06851 (Area Code 203) 853-4488
ADVERTISING SALES MANAGER Thomas N. J. Koerwer
SALES REPRESENTATIVES
Chicago 60601 . .. Eugene Eldridge. CENTCOM, LTD .• 307 North Michigan Avenue (Area Code 312)641·0890
Cleveland . . Michael Hayes, CENTCOM. LTD .. 20340 Center Ridge Rd., Rocky River. Ohio 44116. 216-331-2324
Denver ... Clay S. Holden. CENTCOM. LTD .. (213) 776-0552
Houston ... Michael Hayes. CENTCOM . LTD .• 216-3312324
Los Angeles 90045 ... Clay S. Holden. CENTCOM LTD .. Airport Arcade Bldg .• 8820 S. Sepulveda Blvd .. Suile 215. (Area Code 213) 776-0552
New York 10017 ... Anthony J. Giamanco. CENTCOM. LTD .. 60 E. 42nd Street. (Area Code .212) 972-9660
Norwalk 06851 Donald B. Davis. Anthony J. Giamanco. CENTCOM. LTD .. 142 East Avenue. (Area Code ~03) 853-4488
Philadelphia 19034 Anthony J. Giamanco . CENTCOM. LTD .. 535 Pennsylvania Avenue. Fort WaShington. Pa .. (Al ea Code 215) 643-2586
San Francisco . .. Clay S. Holden. CENTCOM LTD .. (Area Code 213) 776-0552
Great Britain and Western Europe Braylon Nichols, The American Magazine Group, 9 Warwick Street. London. W. 1, England. Telephone 437-5462
Japan . • • Haruo Morlbayashl, International Media Representatives. Ltd.. 1, Shibe-Kolohlracho. Mlnatoku, Tokyo
PRODUCTION DIRECTOR
Joseph P. Stenza
PRODUCTION ASSISTANT
Donna C. Bifano
ENVIRONMENT AL SCIENCE & TECHNOLOGY
READER SERVICE If you would like to receive any of the material made available by advertisers in this issue, circle the numbers on one of the attached cards corresponding to the number shown beneath each advertisement. The New Product and New Literature Digests also have corresponding numbers for each item_ This is a free service provided by ES&T_
Our WATER LAB gets most of its new business from the recommendations of satisfied customers.
That's a fact.
It's also a fact that we pay special attention to individual WATER ANALYSIS problems.
So don't wait for a referral, write for a brochure today.
(~- _BRANDT (~>-__ ASSOCIATES, INC.
Consulting Analytical Chemists
50 BLUE HEN DRIVE _ NEWARK, DELAWARE 19711
PHONE (302) 731-1550
Cirel, NI. 23 I. Reld,rs' StniCI elf'
Volume 7, Number 6, June 1973 571
ADVERTISED PRODUCTS: 1 2 3 4 5 6
16 17 18 19 20 21 31 32 33 34 35 36 46 47 48 49 50 51
7 8 9 10 11 12 13 14 15 n H ~ ~ m II U ~ ~
~ § ~ ~ U ~ 0 M ~
~ ~ ~ ~ ~ ~ ~ ~ ~
NEW PRODUCTS, NEW LITERATURE: 61 62 63 64 65 66 67 68 69 70 71 72 73 74 75 76 77 78 79 80 81 82 83 84 85 86 87 88 89 90 91 92 93 94 95 96 97 98 99 100 101 102 103 104 105
106 107 108 109 110 111 112 113 114 115 116 117 118 119 120 Name __________________________________ __
Position, ________________________________ _
Affiliation ________________________________ __
Address ________________________________ _
_____________________ Zip ______________ __
NATURE OF 0 Industrial Firm o Academic o Government BUSINESS 0 Other ________________________ _
FIRST CLASS Permit No. 25682
Philadelphia. Pa. 19101
BUSINESS REPLY MAIL No Postage Stamp Necessary if Mailed in the United States
POSTAGE WILL SE PAID SY-
ENVIRONMENTAL Science & Technology P. O. BOX 8639 PHILADELPHIA, PA. 19101
------------------------------------------ -------------._--------- ---vAnO-mOOuGR--------------------------
JUNE 1973 AUGUST 311 1973 ADVERTISED PRODUCTS: 1 2 3 4 5 6 8 9 10 11 12 13 14 15
16 17 18 19 20 21 22 23 24 25 26 27 28 29 ~
31 32 33 34 35 36 37 38 39 40 41 42 43 44 45 46 47 48 49 50 51 52 53 54 55 56 57 58 59 60
NEW PRODUCTS, NEW LITERATURE: 61 62 63 64 65 66 67 68 69 70 71 72 73 74 75 76 77 78 79 80 81 82 83 84 85 86 87 88 89 90 91 92 93 94 95 96 97 98 99 100 101 102 103 104 105
106 107 108 109 110 111 112 113 114 115 116 117 118 119 120 Name __________________________________ __
Positionl ________________________________ _
Affiliation ________________________________ __
Address ________________________________ _
_____________________ Zip ______________ __
NATURIE OF 0 Industrial Firm o Academic o Government BUSINESS 0 Other ________________________ _
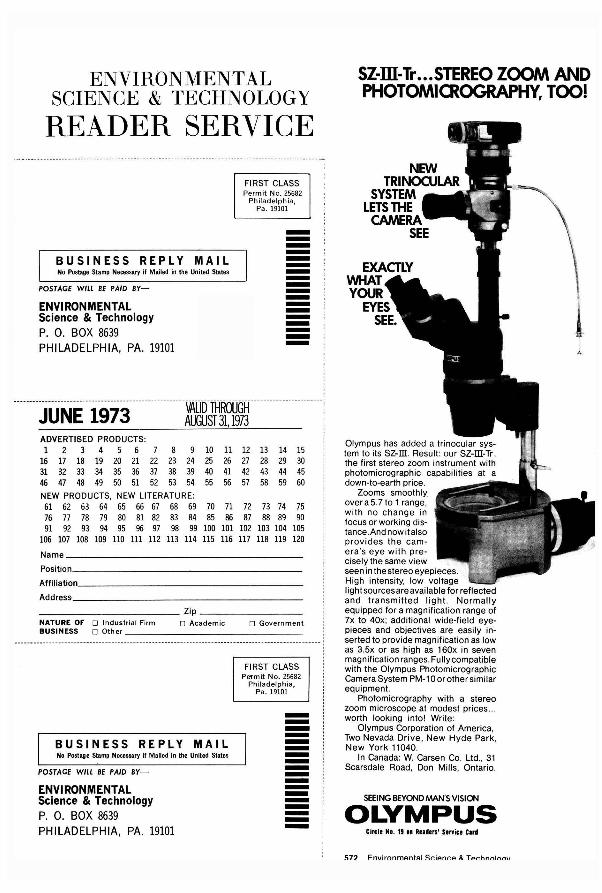
ENVIRONMENT AL SCIENCE & TECHNOLOGY
READER SERVICE
BUSINESS REPLY MAIL No Postage Stamp Necessary if Mailed in the United States
POSTAGE WILL BE PAID BY-
ENVIRONMENTAL Science & Technology P. O. BOX 8639 PHILADELPHIA, PA. 19101
FIRST CLASS Permit No. 25682
Philadelphia, Pa.19101
---------------------------------------- .- ._------- ----------- ---·------VArIDTAROUGH-----------------------
JUNE 1973 AUGUST 31, 1973 ADVERTISED PRODUCTS: 1 2 3 4 5 6 8 9 10 11 12 13 14 15
16 17 18 19 20 21 22 23 24 25 26 27 28 29 30 31 32 33 34 35 36 37 38 39 40 41 42 43 44 45 46 47 48 49 50 51 52 53 54 55 56 57 58 59 60
NEW PRODUCTS, NEW LITERATURE: 61 62 63 64 65 66 67 68 69 70 71 72 73 74 75 76 77 78 79 80 81 82 83 84 85 86 87 88 89 90 91 92 93 94 95 96 97 98 99 100 101 102 103 104 105
106 107 108 109 110 111 112 113 114 115 116 117 118 119 120 Name ________________________________________ _
Positionl ____________________ ~ ________________ _
Affiliation, _____________________________________ _
Address,· _______________________________________ _
____________ Zip ________ _
NATURE OF 0 Industrial Firm 0 Academic 0 Government BUSINESS 0 Other ___________________________ _
BUSINESS REPLY MAIL No Postage Stamp Necessary if Mailed 'in the United States
POSTAGE WILL BE PAID BY-
ENVIRONMENTAL Science & Technology P. O. BOX 8639 PHILADELPHIA, PA. 19101
FIRST CLASS Permit No. 25682
Philadelphia, Pa. 19101
------------------
sz-m-Tr .. . STEREO ZOOM AND PHOTOMICROGRAPHY, TOO!
EXACTLY \/\/HAT YOUR
EYES SEE.
Olympus has added a trinocular system to its SZ-m. Result: our SZ-ill-Tr. the first stereo zoom instrument with photomicrographic capabilities at a down-to-earth price.
Zooms smoothly over a 5.7 to 1 range. with no change in focus or working distance. And now il also provides the camera 's eye with precisely the same view seen in the stereo eyepieces, High intensity, low voltage lightsourcesareavailable for reflected and transmitted light. Normally equipped for a magnification range of 7x to 40x; additional wide-field eyepieces and objectives are easily inserted to provide magnification as low as 3.5x or as high as 160x in seven magnification ranges. Fullycompatible with the Olympus Photomicrographic Camera System PM-1 0 or other similar equipment.
Photomicrography with a stereo zoom microscope at modest prices .. worth looking into! Write:
Olympus Corporation of America. Two Nevada Drive, New Hyde Park. New York 11040.
In Canada: W. Carsen Co, Ltd" 31 Scarsdale Road, Don Mills, Ontario,
SEEING BEYOND MAN'S VISION
OLYMPUS Circle NI. 11 II Readers' S,nice Card
~72 FnvirnnmAnt::.1 Sr.iAnr:A .It TAl"'hnnlnn\l
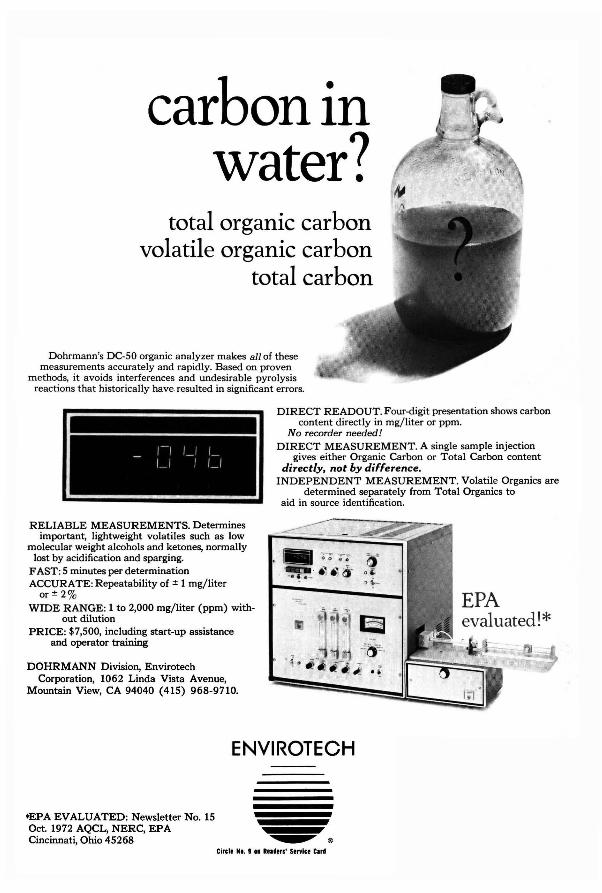
carbon in water?
total organic carbon volatile organic carbon
total carbon
Dohrmann's DC-50 organic analyzer makes all of these measurements accurately and rapidly. Based on proven
methods, it avoids interferences and undesirable pyrolysis reactions that historically have resulted in significant errors.
RELIABLE MEASUREMENTS. Determines important, lightweight volatiles such as low
molecular weight alcohols and ketones, normally lost by acidification and sparging.
FAST: 5 minutes per determination ACCURATE: Repeatability of ± 1 mg/liter
or± 2% WIDE RANGE: 1 to 2,000 mg/liter (ppm) with
out dilution PRICE: $7,500, including start-up assistance
and operator training
DOHRMANN Division, Envirotech Corporation, 1062 Linda Vista Avenue,
Mountain View, CA 94040 (415) 968-9710.
DIRECT READOUT. Four-digit presentation shows carbon content directly in mg/ liter or ppm.
No recorder needed! DIRECT MEASUREMENT. A single sample injection
gives either Organic Carbon or Total Carbon content directly, not by difference.
INDEPENDENT MEASUREMENT. Volatile Organics are determined separately from Total Organics to
aid in source identification.
ENVIROTECH
*EPA EVALUATED: Newsletter No. 15 Oct. 1972 AQCL, NERC, EPA Cincinnati, Ohio 45268
Cirel. NI. I II Re.fers' Senice Clf'
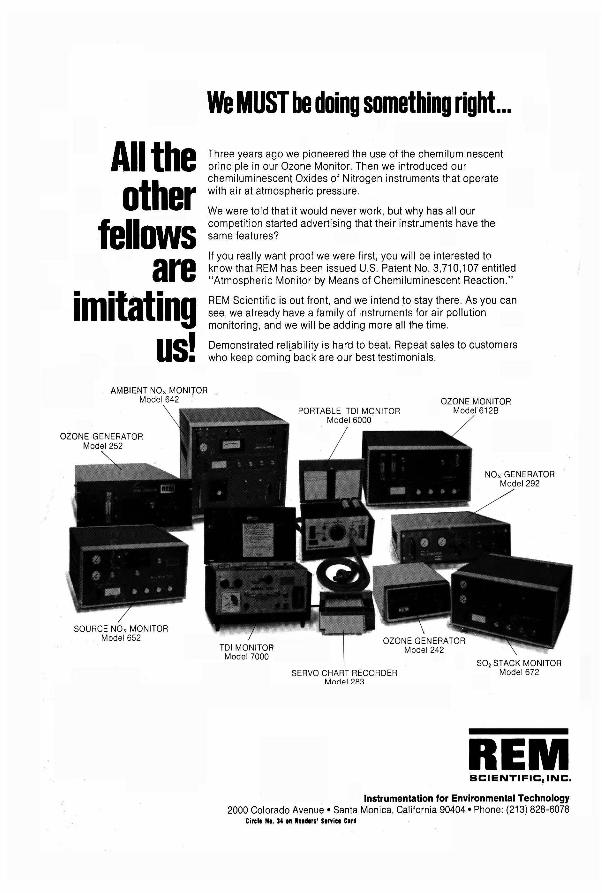
We MUST be doing something right. ..
All the other
fellows are
imitating us!
AMBIE:NT NO, MONITOR Model 642 .
OZONE GENERATOR Model 252
Three years ago we pioneered the use of the chemiluminescent principle in our Ozone Monitor. Then we introduced our chemiluminescent Oxides of Nitrogen instruments that operate with air at atmospheric pressure.
We were told that it would never work, but why has all our competition started advertising that their instruments have the same features?
If you really want proof we were first, you will be interested to know that REM has been issued U.S. Patent No.3, 710,107 entitled "Atmospheric Monitor by Means of Chemiluminescent Reaction."
REM Scientific is out front, and we intend to stay there. As you can see, we already have a family of instruments for air pollution monitoring, and we will be adding more all the time.
Demonstrated rellability is hard to beat. Repeat sales to customers who keep coming back are our best testimonials.
SERVO CHART RECORDER Mnrlpi ?R~
OZONE MONITOR 1612B
NO, GENERATOR Model 292
REM SCIENTIFIC,INC.
Instrumentation for Environmental Technology 2000 Colorado Avenue· Santa Monica, California 90404· Phone: (213) 828-6078
Circle No. 34 .n Readers' S.nice Clrd


![Vincentiana Vol. 36, No. 6 [Full Issue]](https://img.pdfslide.net/doc/110x75/631a40b51a1adcf65a0eff33/vincentiana-vol-36-no-6-full-issue.jpg)