Embed Size (px)
Citation preview

IPA 88-21.03
PROCEEDINGS INDONESIAN PETROLEUM ASSOCIATION Seventeenth Annual Convention, October 1988
EOR POTENTIAL OF INDONESIAN RESERVOIRS Peter Cockcroft *
Juni Anli ** Jennifer Duignan **
ABSTRACT
A number of Enhanced Oil Recovery processes have been and are being currently developed for increasing the ultimate recovery of oil and gas from depleted or partially depleted reservoirs. These EOR processes are commonly subdivided into chemical, thermal and miscible methods. A discussion of these methods and their applicability to Indonesian conditions is undertaken.
Many Indonesian oil fields are now in a mature stage of production with declining primary production.
With exploratory drilling currently at an ebb because of the low and uncertain oil price, and the statistical likelihood of finding new large fields diminishing, the importance of maximizing the development of existing reserves is increasing. This trend is occurring in mature areas such as North America, where EOR is contributing an ever-increasing percentage of total production. In Indonesia, very few EOR projects have been undertaken. However many existing reservoirs that have the physical criteria, when combined with the availability of essential raw materials, may lend themselves to efficient,viable EOR production. This paper discusses Indonesian reservoirs. These screening procedures include laboratory and computer simulation techniques as well as the utilization of basic geological, reservoir and fluid data.
ENHANCED OIL RECOVERY
In this paper, the term ”Enhanced Oil Recovery” is used in a broad sense. It covers a wide range of improved oil recovery techniques, from waterflooding to more sophisticated techniques such as chemical flooding (see Fig.1). Another term with a similar meaning that is gaining in popularity is Improved Oil Recovery.
The conventional oil recovery techniques include primary recoverymethods by natural flow and by artificial lift, as well as secondary recovery methods, which are typically waterflooding and pressure maintenance by water and/or gas injection.
* Independent Consultaqt, Jakarta. * * Husky Oil International, Calgary, Canada.
Secondary recovery methods, which are a relatively simple and inexpensive way to increase oil recovery, unfortunateiy have somebasic limits on recovery due to the retentive effects of the capillary forces in the reservoir rock, which result in an unrecoverable or residual oil saturation (Sor). This recovery limit varies with different reservoirs and different rock types, but an average value is in the range of 55% of the oil-in-place. However, in practice, this recovery limit is not often reached because the water volume that must be handled becomes very large, with the oil volume relatively small (i.e. a high watercut), that an economic limit to recovery is reached before complete sweepout is accomplished. This commonly occurs in Indonesia in the range of 20 to 45% of the oil-in-place. Thus there is an ample target for further improved or tertiary recovery.
In contrast, tertiary recovery methods are aimed at overcoming (eliminating or reducing) capillary forces (miscible, chemical etc.) between the oil and the iniectant in order to reduce residual oil Saturation (Sor) or to reduce viscous forces (thermal recovery) to improve the flow of fluids through the porous media to achieve higher oil recovery.
Both secondary and tertiary processes are site specific and a careful screening of the processes and an examina- tion of the implementation strategy of the selected process are extremely important in order to achieve and optimize the expected performance.
ENHANCED OIL RECOVERY METHODS
The terms ”Secondary” and ”Tertiary” (oil recovery) methods implies the sequence or timing of the imple- mentation of such methods. The normal sequence of events that one could postulate is as follows. Upon discovery of an oil field, it was placed on primary production until its economic limit is reached. If secondary recovery was implemented, first by water- flooding, and then by other more exotic methods such as miscible or chemical floods, these methods would be called tertiary recovery methods. Figure 1 (Aalund, 1988) represents the various enhanced oil recovery mechanisms and a traditional production sequence.
© IPA, 2006 - 17th Annual Convention Proceedings, 1988
74
Although a number of enhanced oil recovery methods have been recommended and tested over the years, economically attractive methods are still limited. Some of the methods that have been successfully implemented both technically and economically include waterflooding, hydrocarbon miscible flooding, C02 flooding and some thermal methods (cyclic steam stimulation, steam flooding).
Conventional Secondary Recovery Methods
Waterflooding is the most common method of secondary recovery. Many of the early waterfloods occurred as a result of accidental water injection by leaks from shallow water sands or by surface water entering drilled holes (Neil et al, 1983) The benefits of those accidental waterfloods did not go unnoticed and currently approximately half of the North America's oil production is attributable to waterflooding.
The increase in oil recovery by waterflooding results from displacement efficiency and volumetric sweep efficiency. Injected water maintains reservoir energy and displaces oil toward production wells ahead of advancing water. The efficiency of displacement is governed by the wetting characteristics of the proven medium. If the rock is water-wet, the injected water will have a strong affinity to pore surfaces. The oil can, therefore, more readily be displaced in this situation as compared to an oil-wetting situation where oil tends to resist separating from rock surfaces.
Due to the gravity forces and reservoir heterogeneity, the injected water would fail to contact the entire reservoir. The volumetric sweep efficiency of waterflood, which is a measure of the portion of the total reservoir contacted by the injected water, is calculated by multiplying areal sweep efficiency by vertical sweep efficiency.
In waterflooding, one could expect to see an oil bank forming inthe reservoir in the early stage of the flood, resulting in an increase in oil rates accompanied by reduction of watercut for aperiod of time. This is not necessarily the case in the pressuremaintenance by water injection in which the main objective is toinject external energy into the reservoir to prolong the reservoir's ability to produce oil. In this situation, watercut will continuously increase, but economic oil rates will also bemaintained for a considerably longer period of time than expecte- dunder the primary production.
Gas is also utilized for pressure maintenance. Crestal gas injection is a common technique where the reservoir structure issuitable, which not only could be effective in maintaining reservoir energy but also takes advantage of gravity segregation effects to maximize oil recovery.
Gas Miscible Flood
The coexistence of two or more fluid phases in a porous medium gives rise to capillary forces. The absolute magnitude of capillary forces in the petroleum reservoir are not large, but they are extremely important as they are primarily responsible for trapping a large portion of oil within the pores of the rock. If interfacial tension (capillary forces) can be eliminated between oil and displacing fluid, Sor can be reduced, thus more oil can be produced.
Miscible flooding processes involve injection of a solvent which dissolves in the oil when it contacts and forms a single liquid. The fluid then can flow through the reservoir more easily due to the increased oil phase saturation which results in improved oil permeability. The reduction in the oil viscosity due to the dissolution of solvent also improves the mobility of oil.
Hydrocarbon miscible floods are common in Canada, whereas C02 floods are more prevalent in the United States where C02 is more readily available.
The mechanisms of achieving miscibility is a complex matter and extensive laboratory phase behavior tests and computer phase behavior simulation are often required. Slim tube tests are commonly used to test the effectiveness of the miscible solvent in a dynamic situation. Core displacement tests are more time-consuming and expensive, but provide an opportunity to test thesolvent in a porous medium more representative of the actual reservoir than a slim tube sand pack.
In the case of a hydrocarbon miscible flood, the miscible solventmust be custom designed as the com- position of the reservoir oil affects the optimum composition of the miscible fluid. As the hydrocarbon miscible solvent is also a valuable commodity, the majority of miscible floods utilize the "solvent slug" method, inwhich, after placing a pre-determined (suffi- cient) amount of miscible solvent, a drive gas, typically a lean hydrocarbon gas which is miscible with the solvent slug, is injected. At the endof the flood, the large portion of the hydrocarbon phase left in the reservoir would be the lean gas with most of oil and solvent slug already recovered.
The multiple contact miscibility approach is commonly used as opposed to the first contact (or the line-of-sight) miscibility approach. In the multiple-contact miscibility (MCM) process, miscibility is generated in-situ as the injected fluid contacts oil and a phase behavior takes place. There are two types of MCM processes; the condensing-gas drive (or enriched-gas drive) and the vaporizing gas drive processes. In the condensing-gas drive process, the miscibility is achieved as a result of the transfer of the intermediate components from the solvent into the reservoir oil. In the vaporizing-gas drive process,

75
miscibility is achieved as a result of the vaporization of the intermediate components from the reservoir oil into the solvent. In the first contact miscibility approach, the composition of the miscible solvent is rich enough in the intermediates that the miscibility is unconditionally guaranteed on the initial contact with oil.
In a pinnacle reef reservoir, a vertical miscible flood technique is commonly used, in which a miscible solvent is injected into the crest to form a gravity-stable solvent blanket followed by a drive gas. In a horizontal flood situation, a water-alternating-gas (WAG) flood technique is commonly used to achieve the optimum velocity of miscible fluids and water to maximize the displacement and the sweep efficiencies.
The design of a Carbon Dioxide flood is just as complex as a miscible hydrocarbon flood. C02 is not miscible with reservoir oils on initial contact in most reservoirs. The C02 miscibility process is the vaporizing-gas drive in which the intermediate of the reservoir oil vaporize and transfer into the C02.
Carbon Dioxide achieves miscibility with the reservoir oil at pressures above the minimum miscibility pressure (MMP). The MMP is a function of the oil composition and the temperature, but as the reservoir temperature is generally considered to be a given constant, it is considered a direct function of the reservoir oil composition.
The Carbon dioxide flood procedure is much the same as the hydrocarbon miscible flood. It can be injected continuously or as "solvent slug" followed by a displacing drive gas. The WAG process is also common in horizontal carbon dioxide floods.
Chemical Flooding
Polymer, Alkaline, Surfactant/Polymer and Alkaline/Polymer/Co-surfactant flooding are the main chemical flooding processes available today and the technology in this area has advanced considerably in recent years.
Polymer Flooding
PGlymer flooding is an improved waterflooding technique in which high-molecular weight water-soluble polymers are added to water prior to injection to increase its ability to displace oil more efficiently. This is achieved as the polymer increases the viscosity of the injection water resulting in a more favorable oil-water mobility ratio in the reservoir. With the mobility control, improved sweep efficiency is expected. The method is also effective in stratified reservoirs and reservoirs in which a high degree of permeability variation exists. It is to be noted that polymer flooding improves the sweep efficiency, but does not reduce the residual oil saturation.
Alkaline Flooding
Alkaline chemicals such as sodium hydroxide, sodium orthosilicate and sodium carbonate react with petroleum acids and form in-situ surfactants. This causes some of the following favorable mechanisms which improve oil recovery: reduction of interfacial tension, emulsification of oil and alteration of wettability. Reduction of interfacial tension lowers the residual oil saturation significantly below waterflood residual. Emulsification of oil will result in improved sweep efficiency and the alteration of wettability toward more water-wetting improves relative permeability characteristics and also reduces residual oil saturation to some degree to improve oil recovery.
Surfactant/Polymer Flood
This process, also called microemulsion or micellar flooding, involves the injection of petroleum sulfonates to lower the interfacial tensions between injected fluid and the reservoir fluids. The surfactant is normally a small slug and is followed by water containing polymer to ensure that the surfactant slug maintains maximum contact with the reservoir oil with minimum degradation as it moves through the reservoir. After the placement of sufficient volumes of surfactant slug and polymer, the process normally reverts to waterflooding.
Alkaline/Polyrner/Co-surfactant Flooding
The injection of co-surfactant that is compatible with the natural surfactant produced by the Alkali-reservoir oil reaction is reported to optimize reduction of the interfacial tension. As a result, ultra-low interfacial tensions may be obtained which cannot be obtained by alkali or co-surfactant alone.
Chemical flooding processes are considered tlie least proven methods in the field of the EOR methods discussed this far. As in the case of miscible flooding, proper propagation of injected chemicals and maintaining their integrity are essential in a successful flood, but maintaining their integrity (effectiveness) is a complex matter as the injected chemicals not only disperses in the porous medium as they move ahead, they also tend to get adsorbed or consumed through chemical reactions with the formation rock surface and the formation water.
Polymers also face chemical loss problems whether they are used alone or in combination with other chemicals as discussed above. Mobility control by polymer, is therefore, not a simple process either.
In light of these potential problems and because the cost of chemicals are high, particularly surfactant and polymer, the potential for the chemical EOR processes is considered relatively low.

76
Thermal Recovery Processes
Thermal recovery processes have been used extensively in heavy oil reservoirs in the United States, Canada and Venezuela, with a major steamflood program in the Duri field, Central Sumatra. Viscosities of heavy oil ranges from 50 to several thousand centipoise and therefore an EOR process involving a reduction in viscosity is essential in any successful heavy oil recovery project.
There are several thermal recovery methods that have been used in heavy oil recovery as summarized below: - Cyclk steam stimulation ("Huff n' Puff") - Steamflooding - In-situ combustion (fireflooding) - Wellbore heating (electric, electro-magnetic, etc.) - Conduction heating
Among the above processes, only the cyclic steam stimulation and steamflooding have been used extensively on a commercial scale,
In a cyclic steam stimulation, a pre-determined amount of steam is injected into a well, and after a period of days of "soaking", the same well is placed on production. Reduced viscosity oil is then driven by the flashing of hot water back to steam as the reservoir pressure declines with production.
Typically, one cycle takes several months to a year and as many as 15 cycles may be employed before the process becomes uneconomic. Cyclic steam process is only effective for very small spacings (2 to 5 acres) in thick formations.
A steam stimulation project can be converted to a continuous steam injection project (steamflooding) after several cycles of steam stimulation. Steamflooding is more capital intensive and time-consuming, but it could achieve much greater oil recovery due to improved areal sweep efficiency.
In-situ combustion process has been extensively tested in the field, but the process is complex and is difficult to control. In this process, air, oxygen or oxygen-enriched air is injected and ignition is started in the formation. AS injection continues, a burning zone will move from the injection well to the producing well. Oil becomes less viscous as a result of the heat generated in the combustion process.
A major problem in this process is the generally poor sweep efficiency due to the generation of the combustion gas which tend to breakthrough to the producing wells at an early stage of the flood. Injection of water with air and/or oxygen improves both heat efficiency and the sweep efficiency to a degree, but there has not been many economically successful in-situ combustion projects reported to date.
EOR PROCESS SCREENING CRITERIA
Before applying technical screening criteria, some general considerations should be given to eliminate reservoirs not suitable for conventional secondary recovery methods (waterflooding and pressure mainte- nance by gas injection) as summarized below: - Low permeability - Permeability variations
areal variations vertical stratifications directional permeability
- Extensive fractures and faults - High oil viscosity - Small remaining reserves - Existence of bottom water - Existence of large primary gas cap
These initial screening guidelines for conventional secondary recovery methods also apply to tertiary methods. In general, oil reservoirs not suitable for water flooding are not adequate candidates for tertiary recovery processes. A reservoir with highprimary recovery factor due to strong natural water drive is usually not a good candidate for waterflooding.
Figures 2 and 3 (Taber,1985) provide EOR feasibility guidelines for basic reservoir properties such as permeabi- lity, oil viscosity and depth or pressure.
Table 1 (modified after National Petroleum Council, 1984 and Goodlet, 1986) also summarizes reservoir characteristics, fluid properties and reservoir rock-fluid prbperties as criteria for various EOR methods. Figure 4 (Agbi, 1980) is an outline of the logic for initial screening of sandstone rescrvoirs for EOR (tertiary) potential.
It is evident that numerous reservoir fluids and rock properties and the reservoir conditions have to be examined in order to select an optimum EOR process for a reservoir. It is also important to gain good knowledge on each EOR process before conducting a screening study so that the significance of each screening criterion is well understood.
Many of the screening criteria are the reservoir properties that are normally available for developed fields. However, the quality of available data has to be assessed, and if necessary, new data should be obtained.
The initial evaluation based on suggested screening criteria is followed by laboratory and field tests. For example, slimtube and coreflood tests are commonly used to determine the MMP for C02 flooding and confirm the reservoir pressure requirements. In-situ residual oil saturation can be confirmed by the log-injected-log or single well tracer tests. For chemical flooding, the selection of the optimum polymer, surfactant or alkaline and their optimum concentrations must be done in the laboratory. This phase is costly and time-consuming, but the results

77
of these tests provide firm grounds for process design as well.
DESIGN OF PRODUCTION MODELS The term production model used here incorporates the
3 major and interrelated components of EOR evaluation as follows: - the reservoir model - the operations model - the economic model
Secondary project evaluations can usually follow each step more or less sequentially. Tertiary project evaluation, being far more complex and costly to conduct, require constant checks and balances between the 3 areas in order to arrive at the optimum overall plan. It is beyond the scope of this paper to discuss operations and economics in detail, however, some of the important reservoir factors are described.
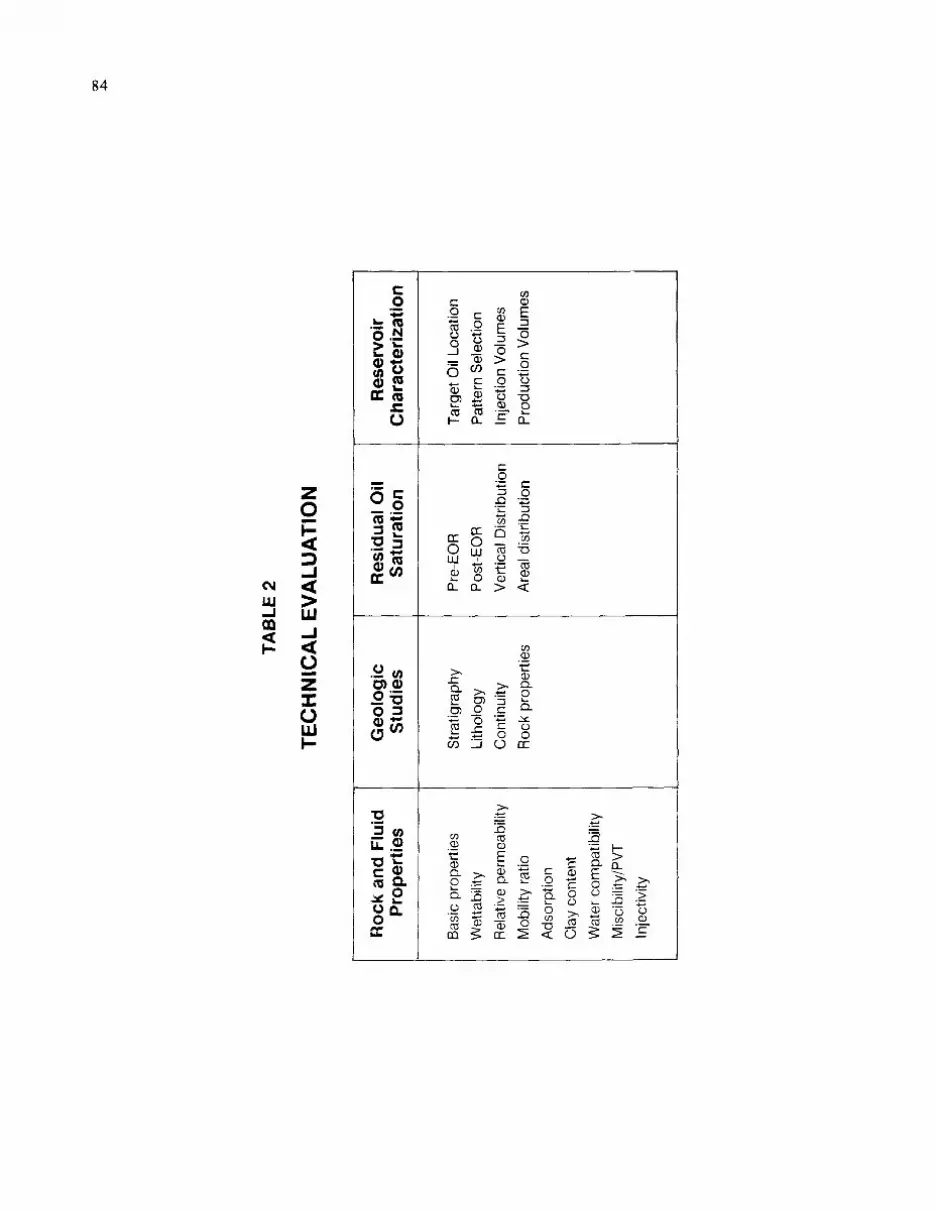
Table 2 provides a general guide to some of the factors that need to be addressed in reservoir modelling. The amount of laboratory, field and simulation work to investigate every aspect of the reservoir model can be
Chemical and miscible EOR methods require detailed analysis of all rock and fluid properties and actual process design will be based largely on the results of laboratory phase behavior, slimtube and stacked coreflood tests. Chemical adsorption is sometimes found to be a key factor limiting the effectiveness (and economics) of chemical EOR projects. Pseudo-miscible, miscible or compositional simulation is then used to apply the results form the laboratory work to actual reservoir conditions for pattern and injection volume design.
It is important to note that tertiary operations and economics are much more complex than for waterflood- ing. Field monitoring is especially critical during tertiary projects as injection volumes and compositions throughout the project life should be continually tailored to reflect the floods actual response.
ESTIMATING INCREMENTAL RECOVERY
Once a reservoir has passed the technical screening criteria for a specific process, an estimate of incremental recovery is required for preliminary feasibility studies.
prohibitive in terms of time and costs. Fortunately, for developed fields much of this data usually already exists.
useful means of determining which factors are (and aren’t) critical to the performance c valuation Prior to beginning expensive studies.
There are empirical and analytical available for determining waterflood efficiency with
recovery for various tertiary methods are available, however, they are at best, screening tools. Very detailed laboratory, field and simulation studies are required to
In addition, reservoir simulation Can be an extremely reasonable accuracy. Correlation to determine incremental
For waterflood studies, usually the most important factors are areal continuity and water compatibility. Pressure transient tests including pulse tests are excellent and relatively inexpensive ways of confirming reservoir continuity and locating faults and pool boundaries. Water compatibility should always be confirmed in the lab. Even though source and formation waters may appear very similar in composition, subtle differences can cause irreversible solids precipitation in the reservoir or cause corrosion of the wellbore and surface equipment. The composition and fraction of reservoir clays should also be investigated carefully. Fresh surface waters are often the cheapest source of injection water during the initial phases of waterflooding. Clay swelling and plugging can severely reduce injectivity even in formations with excellent permeability.
Tertiary reservoir evaluations are significantly more complex than waterflood evaluations. Residual oil saturation plays a major role in process design and overall economic feasibility. Estimates from coreflood studies or reservoir simulation often are optimistic as they represent idealized reservoir conditions. Methods such as log-inject- logging, sponge coring or pressure coring and single well tracer tests provide better estimates of actual reservoir fluids saturations. Table 3 provides a brief description of some of the methods available to determine residual oil saturation.
achieve a reasonable estimate of tertiary recovery potential. It is important to note that the high costs of materials associated with tertiary projects force economic viability to be more a function of slug or injectant requirements and less a function of the ultimate achievable recovery.
Secondary Recovery
Preliminary waterflood recovery estimates should address the combined effect of the following factors:
- primary recovery efficiency - connate water saturation - displacement efficiency - sweep efficiency - residual oil saturation - crude shrinkage
Figures 5a and 6b (Callaway, 1959) provide examples of how some of these factors impact recovery efficiency. From Figure 5b it can be seen that pools with low primary recoveries have the highest target for secondary reco- verable reserves. It should be noted, however, that poor primary performance can be indicative of a poor reservoir that may not be amenable to waterflooding. Connate water saturation and displacement and sweep efficiency (Figure 5a) are generally not known with much certainty unless coreflood tests and reservoir simulation studies

78
have been conducted. Even moderate values (i.e. 70% sweep, 30% water), when combined with other less than optimum factors can result in poor waterflood economics.
Figure 6a (Callaway,l959) and 6b (Prince, 1980) illustrate why the timing of the waterflood is important. There is a tendency, especially in times of low oil prices, to overtook the advantages of implementing a secondary project prior to exhausting a reservoirs primary energy. Both waterflood production rates and ultimate recovery are reduced by late start-up. The formation of an extensive secondary gas cap as a result of severe depletion can sometimes eliminate any waterflood potential a reservoir might have had.
Before discussing specific tertiary process recovery factors, it is worthwhile to estimate the benefits of such projects on a nation-wide scale. Figure 7 (Prince,l980) shows that Canada (whose remaining reserves base is similar to Indonesia’s) can double its production rate and add significant reserves in the future through tertiary methods. The fact that tertiary recovery projects are responsible for only 12%, and not over 30% of Canada’s total production today, as shown, is attributed to depressed oil prices since the reference study was conducted (Prince, 1980).
Figure 8 (Prince, 1980) shows example incremental recovery factors for tertiary projects above that achieved by both primary and secondary methods. The thermal techniques are expected to achieve the largest incremental benefit in heavy oil reservoirs. All other methods increase recovery by roughly 10 to 20% of the original oil in place. The average primary and secondary recovery factors for tertiary projects is estimated between 20 to 30% and ultimate recovery is estimated at roughly 40%. As EOR technology continues to improve in the future, it is expected that tertiary recovery will be implemented in pools with even higher conventional recavery factors.
Table 4 provides tertiary recovery equations used in past studies of national EOR potential (Lewin and Associates, 1976, Prince, 1980). Typical values of residual oil saturation after tertiary processes using these guidelines are shown in Table 5. This data is useful for broad studies of EOR potential but is of little value in estimating the potential for a specific process in a particular reservoir.
Table 6 (Taber et a1,1983) provides a range of incre- mental recoveries for various processes as a function of original and remaining oil in place. These values appear fairly consistent with those in Figure 8. It is interesting to note that the surfactant/polymer process appears to be one of the most attractive methods. In recent years more attention has been focussed on the benefits of adding small amounts of surfactant in various combinations to the alkaline and polymer processes.
ECONOMIC ANALYSIS
A considerable amount of research has been conducted in recent years to examine the impact of incentives, costs and oil price on EOR profitability. The information presented here will focus mainly on the costs for specific EOR processes in North America.
Table 7 presents typical costs for 4 five-spot pattern pilot projects including waterflooding (Carroll et al, 1986). Polymer flood costs are roughly 40% more than straight waterflood costs and steamflood costs are over 20OVo greater. Figure 8 (Prince, 1980) also shows the cost breakdown for different thermal, chemical and miscible projects. Waterfloods are typified by a high capital cost outlay at the start of the project whereas costs for a tertiary project are spread throughout the life of the project in the form of higher operating and materials costs. Capital costs for EOR projects can be relatively low if the existing well spacing is sufficient for EOR process (i.e. 40 acres or less). Though capital expenditures may be low, the laboratory and research work required to determine process feasibility and design can account for a significant portion of the total cost.
Figure 9 shows the sensitivity of economics to changes in each of the cost categories (Prince,l980). This figure illustrates the percentage of viable projects, if the base costs for individual variables as well as all variables together are increased by 25%. The miscible processes are by far the most sensitive to changes in costs, mainly due to the significantly larger contribution of the materials costs. Because miscible project economics rely heavily on the injected fluid volumes, considerable research to determine the optimum slug size is required prior to project implementation. The average chemical process economics appear to be relatively insensitive to costs, however, micro-emulsion, polymer and alkaline projects alone will be quite different. Almost 80% of the micro- emulsion project costs are attributed to the costs of the injected materials.
The costs per barrel of incremental oil for each process are shown in Table 8 (Taber et a1,1983). Obviously there is very little incentive to implement EOR projects at today’s low oil prices unless special tax or royalty considerations are made available. Another factor which is very important for any economic analysis for a particular project is the estimated production forecast. We have compared estimated recovery for typical exploration, waterflood, polymer-augmented waterflood, wet com- bustion thermal and carbon dioxide miscible projects (Figure 10). This illustration is assuming startup at the beginning of year 1, with all equipment and facilities in place, and no further physical enhancements to the project. Obviously this is not completely realistic, but it is interesting to note the different response times for different processes. The exploration (primary recovery)
79
example is taken from Wood Mackenzie’s Far East Oil Service, but is not risked nor is any lead time for the preliminary exploration phase (seismic,etc) of the hypo- thetical field included.
APPLICATIONS TO INDONESIAN OILFIELDS
A brief examination of published data from existing Indonesian oilfields has been undertaken. We considered only onshore oilfields, as both offshore fields are regarded by many to be too capital intensive for EOR technology, although Maxus and Arc0 have each two waterfloods currently active in the offshore Java Sea.
Data is not available for a detailed screening of Indonesian reservoirs, thus any conclusions reached are meant only as a guide in the absence of a complete data set.
Even though Indonesia is considered a mature oil producing country, very few EOR projects have been undertaken. The most active Indonesian operator in Enhanced Oil Recovery is the national oil company, Pertamina, who currently have active projects in North and South Sumatra as well as in Kalimantan.
North Sumatra
The North Sumatra Basin has been producing for over 100 years with total production of over 500 million barrels. The vast majority of oil-bearing reservoirs are sandstone at relatively shallow depths with ”light” oil. Figure 11 shows the distribution of major reservoir and fluid characteristics, which if lateral continuity of beds can be established, indicates that immiscible EOR methods are technically feasible. The major EOR project in North Sumatra, waterflooding in the Rantau field, has reportedly been successful, although the high gravity oil prevalent in the basin may have an adverse effect on the mobility ratio and thus be a limiting influence on waterfloods. Asamera’s Tualang field is also under a waterflood program.
The presence of this light oil could also prohibit thermal and alkaline chemical processes. However the good porosity and thickbeds should aid sweep efficiency. The availability of large quantities of carbon dioxide in North Sumatra is a factor in future EOR projects, although the low reservoir pressures are likely to limit any miscible flooding.
Central Sumatra
The Central Sumatra Basin is the most prolific in Indonesia, withcurrently over sixty fields in production. Only three EOR projects are currently active ( 2 water floods and 1 thermal project), with the Duri field steam- flood the most significant. The Duri field, with oil-in-place of over 6 billion barrels,
has estimated primary recovery of only 7.5 percent, thus leaving a large target for production through enhanced oil recovery. The operator, Caltex Pacific Indonesia, initiated periodic cyclic steam injection (”huff-and-puff”) in 1967, and larger steam and caustic flood pilots in 1975.
The producing sands have good porosity (average 36 Yo), permeability up to several darcies and high net/ gross sand ratios. The oil characteristics of 22 degree API gravity and 120 centipoise viscosity, when combined with the low primary recovery caused by lack of strong water drive, low GOR and reservoir temperature, eliminated many possible EOR methods, leaving high pressure steam injection as the most viable alternative to lower the oil viscosity and increase mobility. It is estimated that the steamflood will increase recovery from the primary recovery factor of 7.5 Yo to over 60 Yo of the oil-in-place. This project is expected to cost over one billion dollars, but is estimated to produce over three billion barrels of incremental EOR oil.
Again, almost all production is from sandstone reservoirs, but with average producing depth and oil gravity deeper and less respectively than in North Sumatra (Fig.l2), thus all EOR methods could potentially be applied in this basin, depending upon the particular field characteristics.
South Sumatra
The South Sumatra/ Jambi Basin has been explored more thoroughly and has the largest number of fields of any other in Indonesia. Current EOR projects are underway in the Tanjung Tiga, Jene, Pian and Kampong Minyak fields (waterfloods), with pressure maintenance through water injection in the Pendopo field, as well as a larger undertaking in the Limau/Belimbing trend likely to start in 1989. It is believed that Asamera plan water- floods in the Ramba ’B’ and Tanjung Laban fields. In the past, EOR studies and pilots have been examined in the Jambi area (Tempino and East Ketaling fields) but have not developed into active projects. A number of other fields have water and gas injection schemes, but are for pressure maintenance only, rather than for actual frontal movement. Fields in South Sumatra generally have a greater degree of faulting which can influence reservoir continuity and sweep efficiency, but reservoir and fluid characteristics (Fig. 13) do not indisputably eliminate any EOR process, although the absence of available Carbon Dioxide and the presence of high watercuts are limiting factors.
Java
The major onshore oil currently in production in the North-West Java basin is the Jatibarang field. This is a significant field, as it was discovered by Pertamina in 1969 and produces a 30 degree API, waxy, high pour point oil

80
from fractured andesites and tuffs. Distribution of producing depth and gravity of fields in this basin are shown in Figure 14.
The East Java basin was a prolific producer in the first half of this century (more than 150 million barrels of oil produced from over 30 fields), but with little production over the past twenty years. The producing reservoirs are shallow sandstones, with paraffinic oils, (gravities between 24 and 43 degree API) and carbon dioxide present in some fields.
Kutei Basin
The Kutei basin has been explored with different levels of activity for the past ninety years. The Sanga-Sanga field was discovered in 1898 and has produced more than 260 million barrels, while the other major oilfield in the basin, Handil, was discovered in 1973, and a full scale water- flood in 16 reservoirs begun in 1980 (Alibi,1982). Water injection is believed to be currently in excess of 150,000 barrels per day. A chemical flood pilot has been tried in Handil, however, although results have not been published. Residual oil saturation from selected cores is a low 26 - 29 percent, porosity is greater than 25 percent, which together with high oil recoveries from coreflood tests, indicated that chemical flooding, even in watered- out reservoirs, was feasible (Sureau et a1,1984). Figure 15 illustrates distribution of some reservoir and fluid characteristics.
Some of the potential problems include large primary gas caps, multiple sands of varying thickness (approxi- mately 300 over 2500 meters depth in Handil field), multiple completions, confusing correlations and low netlgross pay ratio over the full reservoir section.
Tarakan Basin
The majority of production has been from Pamusian, Bunyu and Sembakung fields and are characterized by strong water drive and multiple sands. Low gravity oil (18 degree API) has been produced in the Pamusian field, but primary recovery is estimated to be higher than fifty percent (Rowley, 1973) and a high watercut is noticeable in all fields .Again multiple sandstone reservoirs could cause flooding problems.
The feasibility of Secondary recovery in the Bunyu field is currently being studied.
Barito Basin
The Tanjung field, the largest field in this basin is currently undergoing a limited program of hot water injection to try and increase the mobility of the viscous (200 cp) paraffinic oil. The producing sands in the Barito basin are more conglomeratic than in other parts of
Indonesia with some lateral variations in permeability, which could effect sweep efficiency.
Irian Jaya
Over 95 percent of total production in Eastern Indonesia has been from the Salawati Basin, which currently produces over 25,000 barrels per day from a number of carbonate reservoirs. These oils are noted for their low bubble point, moderate viscosity and medium gravity. Strong water drive is prevalent, with over fifty percent primary recovery in some fields. Some potential problems with EOR techniques are the high water cut, reservoir heterogeneity and natural fractures, possibility of the carbonates being preferentially oil-wet, the unsuitable surfactant and alkaline flooding methods, and distance from sources of injection materials. However, tight spacing infill drilling has discovered previously unswept oil, thus a potential EOR target does exist. Figure 16 illustrates the frequency of some relevant reservoir and fluid characteristics of oilfields in the Salawati Basin.
Summary
Indonesia has very few active EOR projects compared to other oil producing countries of similar reserves base and maturity. The commonly-touted reasons for this are the small average field size, predominance of light oil, thin and multiple reservoirs, multiple completions, strong water drives and reservoir discontinuities. All of these reasons are valid for specific fields, but we have en- deavoured to show that Indonesian fields have many positive features for EOR production, such as good average porosity, fresh formation waters and undersa- turated oils. Our brief survey indicates that there is certainly technical potential for oil recovery by secondary and tertiary processes in Indonesia under appropriate economic conditions.
POTENTIAL INDONESIAN EOR TARGET
If analogies from other countries are used, in the absence of a detailed inventory of Indonesian reservoirs, an EOR target of 10 percent of original discovered oil- in-place (i.e. 7 billion barrels) is suggested. These potential reserves, with implementation of current technology, is not considered unrealistic as a target for secondary and tertiary production, especially when combined with infill drilling and production from current "marginal" fields. Obviously, more realistic estimates could be realized if a study such as those performed in the United States and Canada by the National Petroleum Council and the Canadian Energy Research Institute respectively, was undertaken.
However, experience in other countries have shown that economic incentives are necessary for these capital-

81
intensive EOR projects to be initiated and these reserves to be ”proved-up”.
A comparison of oil-in-place distribution of USA, Canada and Indonesia is shown in Figure 17. We have assumed less than 50% recovery (predominantly by secondary recovery and infill drilling) from ”bypassed” oil (Fig. 18a) - i.e. 4 Billion barrels from ”bypassed” oil, and approximately 5% recovery of OOIP by tertiary EOR methods from the ”residual” oil sector by tertiary EOR methods - i.e. 3 Billion barrels (Fig.18b). These assumptions are based upon research undertaken in USA and Canada by different Government sponsored studies (Prince, 1980, National Petroleum Council, 1984).
Canada has many similarities with Indonesia - pro- duction and remaining reserves are comparable, but Canada had 75 active tertiary recovery projects (not including heavy oil projects) in operation at the beginning of 1988, whereas Indonesia had only two. In addition, 27 more tertiary projects are planned ir, Canada in the near future. Husky Oil, a moderate sized Canadian company, for example, is operator for 50 EOR (secondary and tertiary) projects alone - approximately five times the total number in all of Indonesia. Current Canadian production ascribed to tertiary projects alone is 148,000 bopd. The major reason for this large number of EOR projects is that the Canadian Government provides economic (tax and royalty) incentives to the operators, as these projects are more capital intensive than conven- tional production methods.
Venezuela, is another mature producing country with an active EOR program and is currently producing 216,000 bopd from tertiary projects (Aalund, 1988).
ADVANTAGES OF EOR PRODUCTION
Tangible Benefits
As exploration has not been very successful in replacing Indonesia’s reserves during the past ten years, it may be practical to utilize Enhanced Oil Recovery methods to produce oil from existing fields. This activity could proceed concurrently with further exploration. Even if only fifty percent of the seven billion barrel target previously discussed were considered technically and economically viable to produce by increasing the viability of marginal fields and by EOR methods, a large amount of money would be injected into the Indonesian domestic economy.
Intangible benefits of EOR Operations
It is often overlooked that intangible benefits could flow on to the domestic economy if increased EOR production was promoted.
Increased Reserves - with EOR technology it will be possible to recover an increasing percentage of oil in place in existing reservoirs and newly discovered fields. The ensuing increase in recoverable reserves would expand Indonesia’s resource base andasset value.
Benefits to General Industry - The demand for Indonesian service industries for drilling, chemical supplies, facilities, and laboratories would be substantially increased. Enhanced Oil Recovery projects are more capital-intensive than conventional production methods thus more skilled manpower will be a direct result of these projects.
Technology Advances - an obvious by-product would be progress in domestic scientific research and knowledge in specific disciplines that are not currently at a high level of expertise in Indonesia. These technology advances also would have the effect of increasing the incremental reserves due to the implementation of processes that are not currently developed.
Transition to Alternate Energy Sources - Development of EOR projects provide more time for the transition to other energy sources such as coal and domestic gas.
Government Revenues - Taxes, both private and corporate, as well as direct contracts with Government departments and State-owned companies would be increased with these type of projects.
CONCLUSIONS
All the producing basins of Indonesia could, with existing EOR technology, increase their recoverable reserves. Site specific limitations for individual processes are present, but overall the reservoir and fluid charac- teristics are favorable for Enhanced or Improved Oil Recovery in Indonesia. However, suitable economic conditions are necessary for optimum development, as well as a fiscal regime that allows for the capital-intensive character and low upward potential of these projects .
In 1984, The U.S. National Petroleum Council stated: ”Oil production by enhanced recovery is more costly than production by most conventional methods. There are a few exceptions, such as high-cost frontier areas. Because of these high costs and the heavy front-end investment required for most EOR projects, economics are modest. Tax policies that reduce the value of oil realized by the producer will worsen the economics of enhanced oil recovery and decrease ultimate recovery from EOR development” (National Petroleum Council, 1984).
ACKNOWLEDGEMENTS
The authors wish to thank the management of Husky Oil International, Inc. for permission to present this paper.

82
REFERENCES
Alibi, 1982. Performance of the Handil Water Injection Scheme. Proceedings Indonesian Petroleum Asso- ciation Eleventh Annual Convention, June 1982.
Agbi, B., Mirkin, M., 1988. Enhanced Oil Recovery Potential in Alberta Conventional Crude Oil Reser- voirs, Applications Report AR-7, March 1980, Petro- leum Recovery Institute, Calgary, Alberta, Canada.
Aalund, L.A., 1988. EOR Projects Decline, but C02 Pushes Up Production, Oil & Gas Journal, May 18,
Callaway, F.H., 1959. Evaluation of Waterflood Pros pects. In : SPE Reprint Series No.2A, Waterflooding, November 1986, 103- 108.
Carroll, H.C. Jr., Linville, B. EOR: What Those New Reserves Will Cost, Petroleum Engineer International, November 1986, 24-30.
Goodlett, G.O., Honarpour, M.M., Carroll, H.B., Sarathi, P.S., 1986. Screening for EOR-1, Lab Eva- luation Requires Appropriate Techniques, Oil & Gas Journal, June 23, 1986, 24- 30.
Lewin and Associates, Inc., 1976, The Potential and Economics of Enhanced Oil Recovery, Washington
1988, 33-73.
D.C., prepared for Federal Energy Administration, April 1976.
National Petroleum Council, 1984, Enhanced Oil Reco- very, US Dept of Energy, Washington,D.C.
Neil, J.D., Chang, H.L., Geffen, T.M. 1983. Improved Oil Recovery, Interstate oil Compact Commission, Oklahoma.
Prince, J.P. 1980, Enhanced Oil Recovery Potential In Canada, Canadian Energy Research Institute Study No. 9, March 1980.
Sureau A., Murray, M & Alibi, 1984. Total Indonesie Handil Tertiary Recovery Chemical Flood Pilot, Proceedings Indonesian Petroleum Association Thir- teenth Annual Convention, May 1984.
Rowley,K.G., 1973. Rehabilitation and Development Tarakan Island, Proceedings Indonesian Petroleum Association Second Annual Convention, June 1973.
Taber, J.J., 1985, Enhanced Oil Recovery by Gas miscible Flooding, IEA Collaborative Report on EOR Sympo- sium, Tokyo.
Taber, J.J., Martin, F.D., 1983, Technical Screening Guides for the Enhanced Recovery of Oil, Society Petroleum Engineers # 12069, 58th Annual Technical Conference and Exhibition, San Francisco, C.A., 1983.

83
DCHI
DCOO
LU_ UJ
3 o< CCh O
LU>•
CC<DCLU
Rrr
erm
al 1
ion
Gas
Inj
ecin
g
XJ
al F
loo
o
Ch
emcr
ob
ial
2co
In S
itu
mb
ust
a
team
CO
Car
bo
Dio
xid
Hyd
roca
rbon
kalin
e
<
Pol
ymer
Su
rfac
tan
t
Un
it:
(0
Par
amel
Scr
eeni
i n
mCO
oo
to 3
4>2
5
inCO
<30
inCM
inCM
Eo
Oil
Gra
vit
<5,0
005,
000
VI
<15
<10
<90
<100
<40
Q.O
- 3 -
isco
sity
(
>
In S
itu O
i
ooo
si
=11,
500
3,00
0
VI
2,00
0
oooin
oo
oCM
<9,0
00
000'6>
Feet
Dep
th (
D)
N.C
.
A l
Al
Thi
nT
hin
o
o
O
z
Feet
c
tiick
ness
i -
Pay
Zon
e
<140
•
o
oz
oz
<200
<200
<200
u.o
"5:
empe
ratu
H
Res
ervo
i
1Al
COOC\J
A,
o
o
>0.2
0>0
.20
>0.
20
rO
Frac
t
D
Por
osity
150
Lnco
250
Oz
oz
oCM
oCM
o
2"<u
y, A
vera
gP
erm
eab
At
•
no
md-
ft
.—.
in
Tran
smis
<3,0
00<2
,000
1,50
0
VI
Q .
A l
psi
EC
n
ress
ure
(1
Q.
Res
ervo
i
Wo
rOW
>
Wo
rOV
forO
W
1
Wo
rOW
orO
Wre
fOW
Q_
Pref
WW
WW
or
OW
> ,
Wet
tabi
lit
il C
onte
nt
O
Min
imum
>0.0
80.
10
•
•
o
Frac
t
Q
Xo
CO
Pro
cess
(
* • -
n
Sta
rt
orm
atio
nS
alin
ity o
100,
000
V
o
oz
00,0
00
V
<100
,000
<100
,000
ppm
DS)
t
Bri
ne
ands
tone
co
ands
ton
CO
idst
one
Sar
ands
tor
CO
ands
tone
cond
ston
e
TO
co
San
dsto
neS
ands
tone
•
<DQ.>.
j ;oODC
o
o
o
o
o
o
arbo
nate
o
TO
o•eTO
O
bo n
ate
TO
o
0)
arbo
na
o
arbo
nate
o
Car
bona
te
8 a)
o
co-ocu
lat
enc3
CD
nsiv
&XCD
with
irso
CDCO
-—03QJCCD
O
;red
enc:oo8nj
s3
atur
eiln
1U
c tio
oa
T3
and
oo>,CD
SaCD
"iCLC/3cn
;eni
n
uj&
|Bn
c03E0)
j r
ing
tdu
r
i paj
0)
V)
g
3
o
;e f
aci
0)
H
co
Iicat
i
CLQ .
cr"njO.OLD
II
ia o
f ate
r' c
riO
ther
for
fie
w
dat
cand
isi
tior
&P100
oil
• ond
c
roCD
atur
CDQ .
E0)
co
CDQ .CD
" D
O
fCD"
</}
pres
W
E
limum
:es
mil
o
dei
MM
P
0)
li?COtn
ia a
re
&
cri
^ - .
sity
1
0
a
So)
ratio
n (
il sa
tu
0
ed
iIg
nor
LPG
cri -si-'
jre
Gas
ISS
Pre
Hio
h
LO
m
P
Roc
k an
d Fl
uid
Pro
per
ties
Bas
ic p
rope
rties
W
etta
bilit
y R
elat
ive
perm
eabi
lity
Mob
ility
ratio
A
dsor
ptio
n C
lay
cont
ent
Wat
er c
o m pa
t i b.i I
it y
Mis
cibi
lityi
PV
T ln
ject
ivity
TAB
LE 2
TEC
HN
ICA
L E
VA
LUA
TIO
N
Geo
logi
c S
tudi
es
Stra
tigra
phy
Lith
olog
y C
ontin
uity
Roc
k pr
oper
ties
Res
idu
al O
il S
atur
atio
n
Pre
-EO
R
Pos
t-EO
R
Ver
tical
Dis
tribu
tion
Are
al d
istri
butio
n
Res
ervo
ir
Ch
arac
teri
zatio
n
Targ
et O
il Lo
catio
n P
atte
rn S
elec
tion
Inje
ctio
n V
olum
es
Pro
duct
ion
Vol
umes

85
TABLE 3
METHODS OF RESIDUAL OIL SATURATION DETERMINATION ~
Conventional Methods Material Balance Calculation
Waterflood Calculations *
Conventional Core Analysis *
Advanced Methods Pressure Core *
Sponge Core *
Log-lnject-Log
Single Well Tracer Test
Description Volumetric oil-in-place less production
Oil saturation behind the flood front from laboratory rela- tive permeability date.
Oil saturation remaining in core after bit flushing causes mud filtrate invasion and de-pressurization (causes oil ex- p ul s io n)
Oil Saturation remaining in core after flushing but core remains at constant presure and no explusion occurs.
Core barrel is lined with preferentially oil-wet sponge which traps the expulsed oil during de-pressurization. Bit fluphing still accurs but the magnitude can be estimated by adding a tracer to the mud filtrate. Oil saturation is the sum of core and sponge oil saturations corrected for flushing.
Log response difference (usually pulsed neutron cap- ture), before and after the injection of water with a salinity contrast to the formation water, variation in response is used to calculate @Sw given a constant porosity and residual oil saturation.
Measures in-situ oil saturation over an area 10 to 20 feet from the wellbore. A chemical tracer (usually ethyl acetate) is injected and allowed to "soak" for a period of a few days. During this time, ethyl acetate partially hydrol- izes to become ethanol. Upon production, ethanol, being soluble only in water travels back to the wellbore in water phase while the ethyl acetate, being soluble in both oil and water travels through both phases. The time-velocity lad between the peak tracer concentrations is related to the oil saturation.

86
Primary/Secondary
(W
0 - 30
30 - 50
Recovery
TABLE 4
C02 Sweep Efficiency Yo
After Prim a r y After Szcondary
30 20
40 30
CALCULATION OF RESIDUAL OIL SATURATION AFTER VARIOUS PROCESSES
Process
Micro-emulsion
Alkaline Flooding
C02Miscible
Steam Drive >Viscosity 1000 cp < Viscosity 1000 cp
In Situ Cornbution' >Viscosity 40 cp < Viscosity 40 cp
Residua I Saturation After Tertiary ~ ~~~~
so, = 0.60(0.08) + 0.40 (sow)
So, = 0.50(0.15) + 0.50 (Sow)
Son = (0.20-0.40)* (0.08) + (0.08-0.60)* (Sow)
So, z: 0.35(0.08) + 0.35(0.30) + 0.30 (sow) So, 0.40(0.08) +0.35(0.25) + 0.25 (Sow)
so, = 0.30(0 00) t 0.30(0.35) + 0.40 (sow) so, = 0 35(0 00) + O 35(0.30) + 0.30 (sow)
C02 Sweep Efficiency Range
50 40 40

87
TABLE 5
RANGE OF RECOVERY FACTORS FOR TERTIARY PROCESSES
Process
Micro-emulsion
Alkaline
C02 Miscible (Low primaryisecond. rec.)
C02 Miscible (High primaryisecond. rec.)
Steam Drive (Viscosity > 1000 cp)
Steam Drive (Viscosity < 1000 cp)
In-Situ Combution (Viscosity > 40 cp)
In-Situ Combution (Viscosity < 40 cp)
Residual Oil Saturation After Tertiary (Yo)
Sorw = 40%
20.8
27.5
27.2
25.3
22.0
26.5
22.5
So,, = 60%
28.8
37.5
49.6
31.3
27.0
34.5
28.5

Go
Go
TAB
LE 6
INC
RE
ME
NTA
L P
RO
DU
CTI
ON
FR
OM
EN
HA
NC
ED
RE
CO
VE
RY
EO
R M
etho
d
Ste
am (p
urch
ase
fuel
) (le
ase
crud
e)
In-S
itu C
ombu
sion
Car
bon
Dio
xide
Sur
fact
ant/P
olym
er
Pol
ymer
Alk
alin
e
% o
f R
emai
ning
O
il in
Pla
ce
36-6
4 25
-45
28-3
9
15-1
9
30-4
3
4
Incr
emen
tal
Pro
duct
ion
5-35
5-25
5-25
10-2
0
5
% o
f O
rigi
nal
Oil
in P
lace
*
75-6
5
15-3
2
30-5
0
5 5
* 2
sets
of v
alue
s sh
own
from
diff
rent
sou
rces
.

89
TABLE 7
EXAMPLE EOR PILOT PROJECT COSTS ($US)
Costs for 2 112 Acre Waterflood Project Drill and complete 5 wells, inverted 5 spot Surface equipment Laboratory evaluation Operation cost for 2 year project (Utilities, labour, misc., $90.000/year
Total cost for Polymer Flood Drill and complete 5 wells, Inverted 5 spod Surface equipment Chemicals Chemicals transportaion Laboratory work prior to project Operation soct for 2 year project (Utilities, labour, misc., $1 25,00O/year)
Typical Cost for 2 112 Acre Mlcellar-Polymer Pllot Drill and complete 5 wells, Inverted 5 spot Surface equipment Chemical cost Chemicals transportation Laboratory work prior to project Operation cost for 2 year project (Utilities, labour, misc., $1 25,00O/year)
Estimated Cost For Steamflood
Drill and complete 5 wells, inverted 5 spot Surface equipment Laboratory work prior to project Operation cost for 2 year project ($200,00O/year)
306,270 57,520 10,000
180,000 Total 553,790
306,270 80,000 50,000
3,000 75,000
250,000 Total 764,270
306,270 83,950
200,000 13,000
180,000 250,000
Total 1,033,220
344,500 306,140
75,000 400,000
Total 1,125,640

EO
R M
etho
d
Ste
am (p
urch
ase
fuel
) (le
ase
crud
e)
In-S
itu C
ombu
stio
n
Car
bon
Dio
xide
Sur
fact
ant/P
olym
er
Pol
ymer
Alk
alin
e
TAB
LE 8
EN
HA
NC
ED
RE
CO
VE
RY
CO
STS
(U
S$/b
bl p
er in
crem
enta
l bar
rel)
Tota
l Pro
cess
*
27 -3
5 21
-28
25-3
6
26-3
9
35-4
6
22-2
8
Pro
cess
**
17-2
5 10
-1 7
14-2
5
16-2
7
20-3
0
6-1 6
10-1
2
lnje
ctan
t Cos
ts**
*
- 8-1 6
5-1 2
12-3
0
15-3
5
3-6
* **
Incl
udes
inje
ctan
t, in
vest
men
t, op
erat
ing,
all
taxe
s an
d ca
pita
l cos
t (1
5%R
OR
)
lnje
ctan
t plu
s in
vest
men
t and
ope
ratin
g co
st b
ut n
o fin
anci
al c
osts
lnje
ctan
t cos
ts o
nly
***

Enh
ance
d
I
" re
c ove
r y
I - r-------
Art
ific
ial
lift
1
Pum
p G
as
lift
E
tc.
-
I I
Te r t
i ar y
I L-,,,,,, +[I
reco
very
I
Pre
ssur
e m
aint
enan
ce
Wat
er
Gas
rei
njec
tion
Com
bust
ion
Hyd
roca
rbon
mis
cibl
e/
Cau
stic
/alk
alin
e M
icro
bia
l S
team
soa
k im
mis
cibl
e P
olym
er
Ele
ctro
mag
net
ic
Ste
am d
rive
C
02 m
isci
ble A
mm
isci
ble
Mic
ella
r po
lym
er
Foam
H
ot
wat
er f
loo
d
Nit
roge
n -
Flu
e ga
s
oil
reco
very
FIG
UR
E
1. -
Typ
ical
Rec
over
y Pr
oces
ses

92
A
I EOR METHOD
i oN- ii MISCIBLE
[NITROGENAND ]1 FLUE GAS
I C02 FLOODING II I SURFACTANT/
POLYMER
I POLYM ER
ALKALINE
I FIRE FLOOD
STEAM DRIVE
PERMEABILITY, millidorcy IO
, , , I , , , , I I 0 0 I 0 0 0
i J i l l , , , I , , I I , , , , I
NOT CRITICAL IF UNIFORM
I 0 . 0 0 0
I i i I J J~ , ]
NOT CRITICAL IF UNIFORM
HIGH ENOUGH FOR GOOD INJECTION RATES
] ~ / / / z J l ~ / y ' / / / / / / /, I~vVv~Vx.Y~ X X POSSIBLE:
, = A A ^ ^ A F ^ ~ / I / t :
PREFERRED ZONE
PREFERRED ZONE
B DEPTH , FEET
o 2 0 0 0 4 0 0 0 6 0 0 0 e o o o , o . o o o E o R M E T H O D I , I I I I I I I , I
(VAPORIZING) GAS DRIVE
(VAPORIZING) GAS DRIVE
I ~""' ~"~oo~ o.,v~' ~o~ o ~ N~' N 0' I ~ Z E E / / J ' I
(FIRST CONTACT MISCIBLE)
FIGURE 2 . - Tertiary EOR screening guide. A). Permeability criteria. B). Depth criteria for miscible gas flood. }.

93
OIL VISCOSITY - CENTIPOISE AT RESERVOIR CONDITIONS A
1000 10.000 IOO.OO0 1.ooo.o0o 0. I I .o 10 I00 EOR METHOD
C02 FLOODING m POLYMER
ALKALINE m FIRE FLOOO C I I I STEAM DRIVE m
DEPTH FEET -0 2000 4000 6000 8000 10.000
ED PRESSURE
B EOR METHOD
P R E F E R R E D Z O N E I , , I , I / I I
STEAM DRIVE L_1
FIGURE 3. - Tertiary EOR screening guide. A). Viscosity criteria. B). Depth criteria.

94
START t
-11 02 rnd cp
STEAM
STIMULATION
~~ STEAM
LEGEND
P EXAMPLE DECISION PATH
0 EXAMPLE DECISION
EXAMPLE PROCESS ID E NT I F IC AT 10 N
FIGURE 4 - Tertiary EOR Screening Flow Chart

95
W F R.F.(%OOIP)
. . . . . . . . . .
0 10 20 30 40 50 60 70
CONNATE WATER SATURATION (%I
FlGURE Sa. Effect of connate water on Waterflooding.
WF. R.F.(%OOIP)
0 5 10 15 20 25 30 35 40 45 50
B RI MARY R. F.(%OOI PI
FlGURE 5b. Effect of primary recovery factor on Waterflooding.

96
W F.R.F. (YoOOlP)
Bo/Bf
FlGURE 6a. - Effect of fluid characteristics on Waterflooding.
RESERVOIR PRESSURE
WATERFLOOD INITIATED EARLY
\ WATER FLOO D
RECOVERY FACTOR
FIGURE 6b - Effect of waterflood timing on ultimate recovery.

97
0 cu
0 0 In c
0 0 0 0
0
cu 0 0 cu
- w * 03 03 (r, c
cu 03 0) .-
a> b a, F
W M

98
THERMAL R troar)
dn It M
CHEMICAL RF (mo01P)
ll nl 40 41 i l l
ALKALINE YIcRo-EYUL8ION POLYYER TOlAL
CO2(SS) C02(CARE) HC(SS) HC(CARE) TOTAL
PRIMARY f 2NMRV TERTIARY
n TOTAL
THERMAL
STEAM CYCLE FIRE FLOW WEAM DRIVE
CHEMICAL % Of T0t.l coot
POLYMER MICI&EMULUON ALKALINE
MISCIBLE !& Of T0t.l coot
40 -
30 -
20 -
10-
0 2 co2
__
FIGURE 8. - Recovery and costs of tertiary methods

99
r------ n
\ I I
v)
0 a, 0 n a, 4 cd > 0
c,
-- L
- .- .c
s I I I I
0 0 F
0 0 0 0 Q a3 (0 d- N
m
m W 0 0
$4
z

100
n 0 3 W - 03 E L a, s t-
X
U 0 0
a,
- 'c L
+- s t
>r L
.- 2 L a
I
a-l
cu 0

101
Parcent of Fields
A Percent of Fields
36% 1 802
262
20%
162
10%
62
0%
Poz
1 02
0.1 1 10 1w .1w Oil Vmcoaity (cp)
35%
30%
25%
202
15%
l0Z
5%
0% <2W 1W 0W BW 1000 1200 1400 >14W
Producing Depth (m)
-
FIGURE 11 - Reservoir and fluid characteristics of Central Sumatra oil fields

102
60% ’ 402 -
so* -
202 -
102 -
Percent of Fields A
‘6 to 16 20 26 Porosity (4:
20%
15%
10%
5%
0%
30 36 ,36
Percent of Fields
~ 2 0 0 600 I000 1400 1800 ,2000
Producing Depth (rn)
Percent of Field8
0 2 y , / / / /
110 x)O 1000 ,1000
Permeability (md)
100%
80%
60%
40%
20%
0%
Percent of Field8
‘1
t20 30 40 50 60 i60
Oil Gravity (API)
-
FIGURE 12 - Reservoir and fluid characteristics of Central Sumatra oil fields

103
Percent of Fields Percent of Fields I
100 xK)o ,loo0 Permeability (md)
16%
14%
is+
10%
8%
6%
4%
2%
Porosity (%I
Percent of Fields
'I I 60%
40%
a05
10%
10%
on
Percent of Fiaids
'I
Oil Oravity (API)
Percent of Fiela8 80.fl-
D O .DO Oil Viscosity (cp)
FIGURE 13 - Reservoir and fluid characteristics of South Sumatra oil fields

104
Percent of Fields
40%
30%
20%
10%
0%
70%
60%
50%
40%
30%
20%
10%
0%
I / I I t
I
(200 600 1000 1400
Producing Depth (m)
Percent of Fields
1800 ,2000
I 1 - I I I I I
6 10 15 20 25 30 35 '35
Porosity (%)
FIGURE 14 - Reservoir characteristics of West Java onshore fields

Percent of Fields
105
25%
20%
15%
10%
5%
0% (200 600 1000 1400 1800 ,2000
Producing Depth (m)
Percent of Fields
1- 60%
50%
40%
30%
20%
10%
0%
I I
I I
V I
/ I
/ , (20 30 40 50 60
Oil Gravity (API)
FIGURE 15 - Reservoir/fluid characteristics of Kutei Basin onshore fields

106
40%
30%
20%
lO%
0%
P e r c e n t o f F i e l d s
<20 30 40 50 60
O i l G r a v i t y ( A P I )
P e r c e n t o f F i e l d s
30% -
25% -
20% -
15% -
10% - . ~
5%-
0%- (5 10 15 20 25 30
Porosity (%) 35 ~:35
Percent of Fields
30%
25%
20%
15%
10%
5%
0%
/
<200 600 1000 1400 1800 Producing Depth (m)
>2000
F I G U R E 16 - Reservoir/fluid characteristics o f Salawati Basin fields

+ D
istr
ibut
ion
of K
now
n O
il-in
-Pla
ce
in I
ndon
esia
Rem
aini
ng R
eser
ves
urn
Pro
duct
ion
12B
ill B
bl
Byp
asse
d O
il 15
Bill
Bbl
Res
idua
l Oil
37B
ill B
bl
Total
Kno
wn
Oil-
in-P
lace
: 7
2 B
ill B
bl
So
urc
e: E
IA 1
98
4,O
GJ
19
88
Dis
trib
utio
n of
Kno
wn
Oil-
in-P
lace
in
Can
ada
Tota
l Kno
wn
Oil-
in-P
lace
:50
Bill
Bbl
8W
rc.;C
ERI
1980
. OG
J l0
88
Dis
trib
utio
n of
Kno
wn
Oil-
in-P
lace
in
USA
Rem
aini
ng R
eaer
ves
Cum
Pro
duct
ion
Tota
l K
now
n O
il-in
-Pfa
ce:4
93
Bill
Bbl
Sou
rceB
rash
ear
1988
FIG
UR
E 1
7 -
Dis
trib
utio
n of
OO
IP in
Can
ada,
USA
and
Ind
ones
ia

108
Indonesia
Cum Prod , Reserves 12 Bil l Bbl
_ - Bypassed Oil
15 Bill Bbl
Possible recovery from "bypassed" oil sector
Indonesia
Bypassed Oil
Po tent ial 34 Bil l bbl
Immobile Oil 37 Bil l Bbl
Possible * 3 Bill Bbl
-.. -.-
8 Bil l Bbl
Recovery f rom "Residual" oil sector by tertiary EOR methods i I