Embed Size (px)
Citation preview
474� 2000 Estuarine Research Federation
Estuaries Vol. 23, No. 4, p. 474–487 August 2000
Epifaunal Communities Thrive in an Estuary with
Hypoxic Episodes
ALESSANDRA SAGASTI1
LINDA C. SCHAFFNER
J. EMMETT DUFFY
School of Marine ScienceVirginia Institute of Marine ScienceThe College of William and MaryGloucester Point, Virginia 23062-1346
ABSTRACT: We characterized the abundance and species composition of sessile and mobile epifaunal assemblages inthe York River, a tributary of the Chesapeake Bay, U.S., during the summer hypoxia seasons in 1996 and 1997. Wecollected communities on artificial substrates in two areas of the river that have historically experienced different ex-posure to hypoxia. Despite frequent hypoxic stress, epifauna formed dense communities in both areas. Dominant speciescomprised a range of phyla and included the polychaetes Polydora cornuta and Sabellaria vulgaris, the bryozoans Mem-branipora tenuis and Conopeum tenuissimum, the tunicate Molgula manhattensis, the barnacle Balanus improvisus, the anem-one Diadumene leucolena, and the hydroids Ectopleura dumortieri and Obelia bicuspidata. Common mobile species includedthe nudibranchs Cratena kaoruae and Doridella obscura, the amphipods Melita nitida and Paracaprella tenuis, the polychaeteNereis succinea, and the flatworm Stylochus ellipticus. We found few differences in species composition between the twoareas, even though one area usually experienced lower oxygen concentrations during hypoxic events, suggesting thathypoxia does not exclude any epifaunal species in the York River. We did find differences between the two study areasin percent cover and abundance of some species. While tunicates, hydroids, and anemones were equally abundant inboth areas during both study years, bryozoans and the polychaete S. vulgaris were more abundant in the area withgenerally higher oxygen, suggesting that they may be less tolerant of hypoxic stress. The polychaete P. cornuta was moreabundant in the area that usually had lower oxygen. These results suggest that many epifaunal species have high hypoxiatolerance, and most epifaunal species found in the lower York River are able to survive in hypoxic areas. Epifaunalspecies are not necessarily more susceptible to hypoxia than infaunal species in the York River. Epifaunal communitiesin areas with brief hypoxic episodes and moderate hypoxia (0.5–2 mg O2 l�1) can persist with little change in speciescomposition, and with few changes in abundance, as oxygen concentrations fall.
IntroductionEpifaunal animals can be conspicuous and im-
portant components of estuarine faunas (Caine1987; Schaffner 1990; Schaffner et al. In press).These animals serve as food for higher trophic lev-els (Kikuchi 1974; Pike and Lindquist 1994; Edgarand Shaw 1995), provide structural refuges frompredation for fish and invertebrates (Levy and Sul-livan 1994), and alter benthic-pelagic couplingprocesses by enhancing the deposition of organicmatter (Haven and Morales-Alamo 1966) or ben-thic boundary-layer flow dynamics (Wright et al.1987; Abelson et al. 1993). Some epifaunal suspen-sion-feeders can reduce the effects of eutrophica-tion and help to preserve water quality (Officer etal. 1982; Reeders et al. 1993).
Estuaries are increasingly exposed to low oxygenstress (hypoxia) (Diaz and Rosenberg 1995). Sci-entists differ on the exact definition of hypoxia,
1 Corresponding author; tele: 804/684-7744; e-mail: [email protected].
because oxygen requirements vary among animals(Modig and Olafsson 1998). Tyson and Pearson(1991) consider oxygen concentrations below 2mg O2 l�1 hypoxic, because at this level many fishesand other animals begin to feel stress. We will usethis definition as a guideline, although there arefew published data about oxygen concentrationsthat impact epifaunal animals. Hypoxia is spread-ing and growing more persistent globally becauseof anthropogenic eutrophication (Paerl et al.1998), and currently occurs in most major estuar-ies in the United States (Diaz and Rosenberg1995). Although many studies have shown majoreffects of hypoxia on infaunal animals (Diaz andRosenberg 1995), little is known about the effectsof hypoxia on epifauna. Among infaunal animals,hypoxia causes mortality (Rosenberg et al. 1991),changes in behavior (Diaz and Rosenberg 1995),and reductions in growth (Forbes and Lopez1990). Hypoxia can also lead to decreased biomassand diversity (Dauer et al. 1992; Llanso 1992; Ritterand Montagna 1999), and can change the species

Effects of Hypoxia on Estuarine Epifauna 475
abundance and species composition of infaunal as-semblages (Gaston 1985; Holland et al. 1987; Rit-ter and Montagna 1999).
Although many infaunal species are affected byhypoxic conditions, hypoxia tolerance variesamong phyla and orders (Theede et al. 1969; Ro-senberg et al. 1991) and even between species with-in a single order (McMahon and Russell-Hunter1978). For example, many polychaetes, platyhel-minths, and bivalves are highly tolerant and cansurvive hypoxia for weeks (Theede et al. 1969; Ro-senberg et al. 1991; Diaz and Rosenberg 1995)while many crustaceans and vertebrates are killedwithin hours or days (Diaz and Rosenberg 1995).The life history characteristics of infaunal speciesalso affect their response to hypoxia. Opportunis-tic species with high reproductive rates and widedispersal often exploit disturbed habitats (Grassleand Sanders 1973; Zajac and Whitlatch 1985). Inestuaries, hypoxic disturbance can increase theabundance of small, short-lived species and de-crease the abundance of large, long-lived species(Holland et al. 1987; Llanso 1992; Schaffner et al.1992). As a result, hypoxic areas often have lowerdiversity, abundance, and biomass of large infauna,but higher density and biomass of small infauna(Dauer et al. 1992; Diaz and Rosenberg 1995).
The intensity (oxygen concentration) and du-ration of hypoxia also determine its effects on in-faunal animals (Forbes and Lopez 1990; Diaz andRosenberg 1995). Many infaunal invertebrates cansurvive oxygen concentrations of 1 mg O2 l�1 (Ro-senberg et al. 1991), but few can survive a com-plete lack of oxygen (Diaz and Rosenberg 1995).Some species may tolerate mild hypoxia, but maynot be able to survive when oxygen concentrationsfall below a threshold oxygen level (Herreid 1980).Similarly, long hypoxic episodes have more severeconsequences than short episodes (Modig andOlafsson 1998). While some species reduce meta-bolic rates and switch to anaerobic metabolismduring short periods of hypoxia, and then recoveras the oxygen increases (Hochachka and Somero1984), extended periods of hypoxia kill even themost tolerant species by indirectly causing starva-tion (Diaz and Rosenberg 1995).
In contrast to infauna, little is known about theeffects of hypoxia on epifauna, especially sessileepifaunal species or mobile species that are toosmall to escape from hypoxic areas. Several char-acteristics of epifauna may make them more sus-ceptible than infauna to hypoxia. First, epifaunalspecies live in the water column where they are lesslikely than sediment-dwelling infauna to encounterlow-oxygen conditions, and where they may avoidthe toxic effects of H2S, which can increase themortality of infauna during hypoxia (Hagerman
1998). Therefore, epifauna are less likely to haveevolved adaptations to hypoxia and sulfide than in-faunal species (Hagerman 1998). Second, epifau-nal animals often live in dense, multispeciesclumps which may increase mortality. For example,in low-flow environments the high density of ani-mals in epifaunal clumps can lead to lower localoxygen concentrations. Although solitary musselshave high hypoxia tolerance, mussels living inclumps in a Danish fjord were among the first an-imals to die during a hypoxic episode because thehigh density of clumped mussels increased respi-ration and depleted oxygen locally ( Jorgensen1980). Stachowitsch (1984) also found that epifau-nal species living in clumps had high mortalityrates, but for different reasons. Sponges formedthe primary structural component in these clumps.Once the sponges died, other species on theclumps died from prolonged contact with deadsponges. Finally, in many temperate estuaries likethe Chesapeake Bay, peak growth and recruitmentperiods for epifauna occur in the summer (Abbe1987), coinciding with hypoxic episodes. In con-trast, peaks in growth and reproduction of infaunalanimals in temperate estuaries often occur duringspring and fall (Diaz 1984; Holland et al. 1977)when oxygen is high. Therefore, epifaunal growthand recruitment may be more severely affected byhypoxia than those of infauna.
In this study, we explored the effects of hypoxiaon epifaunal communities by characterizing thecommunity of sessile and mobile epifauna duringthe summer when hypoxia is most common. Ourobjectives were to compare the presence of speciesin deep areas, where hypoxia occurs, to the pres-ence of species in shallow areas where hypoxia isabsent, to determine if hypoxia may change thespecies composition of epifaunal communities inthe York River, and to compare the percent coverof sessile species and the abundance of mobile spe-cies in two deep areas of the York River with dif-fering exposure to hypoxia, to determine whetherhypoxia may change the abundance of epifaunalspecies in this system. This study is among the firstto characterize epifaunal communities exposed tohypoxia, and increases understanding of hypoxiceffects on ecosystems.
Materials and Methods
STUDY LOCATION
We conducted our study in the York River, a trib-utary of the Chesapeake Bay, U.S., where the tim-ing and spatial extent of hypoxia are relatively pre-dictable (Haas 1977; Kuo and Neilson 1987). Adeep channel (about 15–20 m) runs from themouth of the river to Gloucester Point (Fig. 1)

476 A. Sagasti et al.
Fig. 1. Sampling stations in the York River, Virginia. In each area, we placed stations at randomly chosen locations along the 15m depth contour.
(Kuo and Nielson 1987). During summer neaptides, low-oxygen water from the Chesapeake Bayoften collects in this channel and can create hyp-oxic conditions below 9 m (Pihl et al. 1992). Up-stream of Gloucester Point, shallower water depthsand reduced contact with low-oxygen Bay waterhave historically resulted in the reduced occur-rence of hypoxia (Sisson et al. 1991; Kuo et al.1993). Tidal currents enhance mixing of bottomand surface waters in the York River. This tidal mix-ing can reoxygenate deep water and prevent hyp-oxia during spring tides but not during weakerneap tides. Therefore, hypoxia usually occurs dur-ing neap tides in the summer (Haas 1977; Kuo etal. 1993). At the surface, oxygen concentrations inthe York River remain above 4 mg O2 l�1 (Kuo etal. 1993).
Epifaunal assemblages are abundant in threehabitats in the York River: relict oyster reefs, hy-droid mounds, and seagrass beds. Historically, theYork River had extensive oyster reefs. Althoughhealthy oysters are now rare, oyster shells still pro-vide substrate for epifaunal attachment (Rhein-hardt and Mann 1990). In addition, large accu-mulations (meters long) of the hydroid Sertulariaargentea are widespread in muddy areas, and thesefeatures support diverse communities of epifauna(Schaffner et al. In press). York River epifaunalspecies also attach to seagrass blades (Marsh 1973;Orth 1992) and can be found on the tube-tops ofpolychaetes and other infauna (Schaffner 1990).
STUDY DESIGN
To compare epifaunal communities growing inlow-oxygen versus high-oxygen conditions, we stud-ied two areas within the York River (Fig. 1). Bothareas have similar temperature and salinity (see Re-sults), but the downstream area has historically ex-perienced lower oxygen concentrations (Kuo et al.1993). In each area, we established sampling sta-tions located at randomly selected locations alongthe 15 m depth contour, where hypoxia occurs inthe summer. In 1996 we placed 8 stations (de-scribed below) in each area for a total of 16 sta-tions. In 1997, four new stations were added for atotal of 20 stations, with 10 stations in each area.In 1996, we lost the deployed equipment at half ofthe stations in each area as the summer pro-gressed, due to collisions with boats or other prob-lems. In 1997, each station was replaced as soon itwas discovered lost and we ended the year with allstations intact.
DESCRIPTION OF UPSTREAM AND DOWNSTREAMAREAS
Besides differences in oxygen, other differencesbetween the upstream and downstream areas mayaffect the interpretation of our results. The two ar-eas differ in location, which may affect recruit-ment. The downstream area is closer to the Ches-apeake Bay, which may be a source of epifaunallarvae for the York River. However, the speciesfound in this study also live in shallows along the

Effects of Hypoxia on Estuarine Epifauna 477
Fig. 2. Schematic of equipment at a station, showing thelocation of PVC frames, panels, and floats. We also show thelocation of a Hydrolab oxygen meter which was placed on se-lected stations (see Fig. 1).
length of the York River; these adults may also pro-vide a source of larvae that would be availablethroughout the entire river.
There are many similarities between the up-stream and downstream areas. The two areas havecomparable levels of chlorophyll (7–12 mg chlo-rophyll a l�1 upstream; 7–10 mg chlorophyll a l�1
downstream), nitrogen (1–5 �M NH4� upstream;
1–6 �M NH4� downstream), and phosphorus (0.5–
1.5 �M PO43� upstream; 0.5–1.5 �M PO4
3� down-stream) in the summer (Sin 1998), suggesting thatsuspended food availability is similar. Sedimentcomposition is similar in downstream and up-stream areas, consisting of silty clay (Nichols et al.1991) which may be important for species thatbuild tubes using sediments. Both areas have sim-ilar current speeds (Lin personal communication),with maximum current speeds of approximately30–40 cm s�1 during spring tides (Sisson et al.1991).
COLLECTION OF EPIFAUNA
Each sampling station consisted of a weightedPVC frame to which we attached test panels and asurface float (Fig. 2). In 1996 the PVC frame wasplaced approximately 0.5 m above the sediment.SCUBA divers observed that strong tidal currents
could push these frames down into the mud, so in1997 the PVC frames were placed 1–1.5 m abovethe sediment, where SCUBA divers confirmed thatthey remained suspended above the bottom.
Epifaunal communities were allowed to developon 10 � 10 cm sanded PVC panels attached in avertical orientation to the sediment surface. Eachframe had 16 possible panel locations; we placedthe test panels in randomly chosen locations oneach frame. We placed one panel at each stationin May 1996 and 1997, and then retrieved eachstation’s panel monthly, and replaced it with a new,clean panel. Therefore, for each year and each sta-tion, a set of panels was retrieved in June, July, Au-gust, and September, each of which was 1 mo old.The retrieval of each set of panels was timed tofollow a few days after neap tides, when hypoxicepisodes are most likely to occur.
To retrieve panels, we pulled the entire PVCframe and its attached panels out of the water byhand (1996) or with a mechanical winch (1997).Once on deck, panels were placed into 1-l contain-ers and held upright without dislodging or dam-aging epifauna. Individual containers were coveredwith 500-�m mesh to prevent mobile animals frommoving between panels and then kept in coolerswith ambient sea water until we examined them inthe laboratory.
In the laboratory, we estimated the percent cov-er of sessile epifaunal species using a point sam-pling technique (Sutherland and Karlson 1977).Briefly, 100 random points were traced onto a 10� 10 cm transparent surface and suspended abovea submerged panel. Live animals under each pointwere identified to the lowest possible taxon usinga dissecting microscope. If more than one speciesfell under a point (if one species was growing ontop of another), we counted all the species visibleunder that point. To estimate abundance of mobileepifauna, we scraped off the contents of each pan-el and sieved them through a 500-�m sieve, fixedthe animals in 10% buffered formalin with RoseBengal stain, and identified and counted all mo-bile animals with a dissecting microscope.
To determine whether mobile animals such ascrabs and nudibranchs became dislodged duringretrieval, we also compared the number of mobileanimals on panels retrieved by SCUBA to those onpanels retrieved using a winch. Ten extra panelswere placed at an upstream station in late June of1997. Two months later, we retrieved half of thesepanels by SCUBA, placing each panel and its as-sociated mobile fauna in a sealed bag before car-rying it to the surface. We retrieved the remainingfive panels from the surface using a winch. Panelswere then processed as described above, but onlymobile organisms were enumerated.

478 A. Sagasti et al.
OXYGEN MEASUREMENTS
To compare the physical environment of the up-stream and downstream areas, we used a combi-nation of data from ongoing Virginia Institute ofMarine Science studies and data from our stationsto record the oxygen concentration, salinity, andtemperature in each area. In 1996, temperature,salinity and dissolved oxygen in the downstreamarea were measured hourly from a moored buoyeast of Gloucester Point (Fig. 1). This buoy usedan array of Hydrolab Datasonde Multiprobes to re-cord conditions at multiple depths, including 13and 16 m. To estimate conditions at the depth ofour panels (14.5 m), we averaged the data from 13and 16 m.
In addition, we measured temperature, salinity,and dissolved oxygen hourly at the upstream areain 1996 and in both areas in 1997 using a HydrolabDatasonde Multiprobe at one station in each area(Fig. 1). The Hydrolab was suspended approxi-mately 15 cm above the PVC frame with the sen-sors oriented toward the frame (Fig. 2). To preventthe sensors from becoming fouled, each Hydrolabwas retrieved and replaced with a freshly calibratedHydrolab weekly. After retrieving a Hydrolab, wetested it against standards to make sure it was stillworking properly. Salinity readings never differedfrom standards by more than 0.5‰, nor temper-ature by more than 0.71�C, nor oxygen concentra-tion by more than 0.32 mg l�1. However, we lostdata periodically due to battery failure or sensorfailures. In 1996, oxygen data was not availablefrom the downstream area until June 21, and fromthe upstream area until June 15, so we are missingdata during much of the first month of this study.
To estimate the variation in physical character-istics between stations within an area, we visitedeach station on at least 5 d each month throughoutthe summer of 1996. Water collected 1 m abovethe bottom with a Niskin bottle was measured fortemperature and salinity using a thermometer anda refractometer (Leica model 10419). To measureoxygen concentration, an oxygen sensor (YSI Mod-el 58, calibrated daily) was lowered to 1 m abovethe bottom. Because we could not visit stations si-multaneously, these measurements span manyhours and different stages of the tidal cycle.
EPIFAUNA IN SHALLOW WATER AREAS
To document the species composition of epifau-na in shallow, high-oxygen parts of the York River,we surveyed 10 � 10 cm PVC panels (n � 8) dur-ing the summer of 1995. These panels were at-tached to a PVC frame located approximately 1 mbelow the surface at the Virginia Institute of Ma-rine Science pier in Gloucester Point (Fig. 1). Two
to three times per week from May through Septem-ber, we recorded the species composition of thesessile animals and scraped a 9–12 cm2 area of ahaphazardly chosen panel. We sieved the scrapedcommunity through a 500-�m sieve, fixed the sam-ple in 10% buffered formalin with Rose Bengalstain, and identified all animals to the lowest pos-sible taxon with a dissecting microscope.
STATISTICAL ANALYSIS
We tested for differences between upstream anddownstream abundances of each sessile speciesthat covered 5% of available panel space on at leastone sampling date and each mobile species thatwas present on at least 10% of panels on at least 2sampling dates. For each species, a 2-factor Model1 (fixed factor) ANOVA with factors date (panelretrieved in July, August, or September) and loca-tion (upstream or downstream) was performed.Because hypoxia did not occur during the June1997 deployment, and because we could not con-firm whether it occurred during much of the June1996 deployment, we did not include these monthsin the analyses. The response variable was eitherthe percent cover (for sessile species) or the num-ber of individuals per panel (for mobile species).Because many species were only abundant duringpart of the study, we included in the analysis onlymonths when a species had at least 5% cover in atleast one area of the river. A few species were onlyabundant during one month of the study; for thesespecies we performed a t-test with location as thefactor. To check the assumptions of these para-metric tests, a Cochran’s test for homogeneity ofvariance (Underwood 1997) and a Shapiro-Wilkestest for normality (Zar 1996) were performed foreach species. If a species did not meet the assump-tions of normality and homogeneity of variance, wetransformed the data by log(x � 1) or by squareroot (x � 0.5) and tested again for normality andhomogeneity of variance (Zar 1996). All speciesmet both assumptions of normality and homoge-neity of variance before we performed ANOVAs ort-tests.
In this study, we test the same null hypothesis(that there is no difference between upstream anddownstream areas) for various species. Each statis-tical test that we have performed is valid for eachspecies separately, and we consider an individualtest significant if � � 0.05. However, the overallexperiment error may have an increased likeli-hood of Type I errors, and to compensate for thisproblem we have adjusted alpha values using se-quential Bonferroni corrections (Peres-Neto1999). For each species we report the significancefrom uncorrected ANOVAs or t-tests, and the sig-nificance after sequential Bonferroni corrections

Effects of Hypoxia on Estuarine Epifauna 479
Fig. 3. Daily dissolved oxygen concentration for upstreamand downstream areas in 1996 and 1997. We averaged hourlydissolved oxygen measurements to provide daily averages. Alloxygen concentrations below the dashed reference line (2 mgO2 l�1) are considered hypoxic.
Fig. 4. Hourly dissolved oxygen concentrations for upstreamand downstream areas during two hypoxic episodes: June 22–28, 1996 and July 14–20, 1997.
(Peres-Neto 1999). We hope that reporting the re-sults arrived at by the two methods will better il-lustrate which species have the strongest evidenceof differences between upstream and downstream,and which species have weaker evidence.
To test for differences between panels retrievedby SCUBA and panels retrieved from the surfaceusing a winch, we performed t-tests on the abun-dance of each species, with the method of retrievalas the factor. We used Cochran’s homogeneity ofvariance test (Underwood 1997) and a Shapiro-Wilkes normality test (Zar 1996) to check the as-sumptions of parametric analysis. When a speciesdid not meet assumptions, we transformed thedata by log(x � 1) or by square root (x � 0.5)until the data met assumptions. Three species werefound on panels retrieved by winch, but not onpanels retrieved by SCUBA. For these species wecould not meet the assumptions of t-tests, and in-stead we compared the 95% confidence intervalsof samples collected by winch to see if they weresignificantly different from zero.
ResultsPHYSICAL ENVIRONMENT OF UPSTREAM AND
DOWNSTREAM AREAS
In 1996, hypoxic episodes (DO � 2 mg O2 l�1)were most severe during neap tides in late Juneand July (corresponding with July and August de-ployments), and less severe oxygen depletion oc-curred during neap tide in late August (Fig. 3).Hypoxia also occurred in September for brief pe-riods, but was not severe enough to cause averagedaily oxygen concentrations to fall below 2 mg O2
l�1. During the June and July episodes, average dai-ly oxygen concentrations remained below 2 mg O2
l�1 for approximately 1 wk. Hypoxia occurred inboth upstream and downstream areas, but reachedlower concentrations downstream (Fig. 4). For ex-ample, we can compare the number of days withminimum oxygen concentrations 2 mg O2 l�1, 1 mg O2 l�1, and 0.5 mg O2 l�1 upstream anddownstream during days when oxygen data is avail-able for both areas. We find lower oxygen down-stream during the July ( 2 mg O2 l�1: 11 d up-stream, 10 d downstream; 1 mg O2 l�1: 0 d up-stream, 6 d downstream; 0.5 mg O2 l�1: 0 d up-stream, 4 d downstream), August ( 2 mg O2 l�1:9 d upstream, 13 d downstream; 1 mg O2 l�1: 0d upstream, 6 d downstream; 0.5 mg O2 l�1: 0 dupstream, 3 d downstream) and September ( 2mg O2 l�1: 7 d upstream, 10 d downstream; 1mg O2 l�1: 1 d upstream, 4 d downstream) deploy-ments. There was not enough data to compare ox-ygen concentrations during the June deployment.
Hypoxia was less common in 1997 (Fig. 3), withonly one major hypoxic episode in mid-July, and aless severe episode in mid-August, correspondingwith July and August deployments. Again, hypoxiaoccurred in both areas of the river, but was moresevere downstream (Fig. 4). Once more, we cancompare the number of days with minimum oxy-gen concentrations of 2 mg O2 l�1, 1 mg O2
l�1, and 0.5 mg O2 l�1 upstream and downstreamduring days when oxygen data is available for bothareas. We find lower oxygen downstream duringthe July ( 2 mg O2 l�1: 3 d upstream, 5 d down-stream; 1 mg O2 l�1: 1 d upstream, 2 d down-stream; 0.5 mg O2 l�1: 0 d upstream, 1 d down-stream), August ( 2 mg O2 l�1: 5 d upstream, 14

480 A. Sagasti et al.
Fig. 5. Daily temperature and salinity for upstream anddownstream areas in 1996 and 1997. We averaged hourly mea-surements to provide daily averages.
d downstream; 1 mg O2 l�1: 3 d upstream, 5 ddownstream; 0.5 mg O2 l�1: 0 d upstream, 2 ddownstream), and September ( 2 mg O2 l�1: 2 dupstream, 8 d downstream) deployments. Therewas no hypoxia during the June deployment.
Temperature and salinity were similar from yearto year (Fig. 5). Temperatures rose steadily from15�C in May to approximately 26�C in September(Fig. 5). Salinity averaged 20‰, falling to 16‰during spring tides and rising to 24‰ during neaptides (Fig 5).
Because of travel time between stations, mea-surements at stations within a single area of theriver were separated by hours and were taken atdifferent stages of the tidal cycle. Still, measure-ments of temperature, salinity, and oxygen weresimilar, suggesting that physical conditions arealike at different stations within an area. Temper-ature varied by less than 1�C during 70% of ourmeasurements, and never differed by more than3�C. Salinity varied by less than 2‰ during 88%of our measurements, and never differed by morethan 4‰. Oxygen concentrations varied more, be-cause oxygen at a single location often changed byup to 4 mg O2 l�1 within just a few hours, less timethan it took for us to measure oxygen concentra-tions at all stations. However, within a single area(upstream or downstream), oxygen at stations that
we measured within 30 min of each other variedby 0.4 mg O2 l�1 or less during 75% of our mea-surements.
EPIFAUNAL COMMUNITIES
During this study, the species composition of epi-fauna at our stations (15 m deep) was similar tothat of shallow parts of the York River (Table 1).While shallow and deep areas shared 44 species,only 8 species were found exclusively in shallowareas and 2 species were found exclusively in deepareas (Table 1). Although there were many rarespecies, the community was often dominated by afew species. For example, of 17 sessile taxa presenton deep panels (Table 1), only 8 species in 1996and 9 species in 1997 covered 5% of available pan-el space on at least one sampling date during thestudy (Fig. 7). The average number of species perpanel was similar in both areas in the river (up-stream and downstream) (Fig. 6).
There were no significant differences in thenumber of mobile epifaunal animals between pan-els pulled through the water column with a winchand panels retrieved by SCUBA (p 0.5, t-tests)(Table 2), suggesting that mobile epifauna such assnails, nudibranchs, and crabs cling to panels rath-er than becoming dislodged during retrieval.Three taxa were only found in winch treatments,and could not be compared using t-tests (Table 2).However, for these taxa the 95% confidence inter-vals (mud crabs �0.17 to 2.57; Mitrella lunata�0.19 to 0.59; pycnogonids �0.38 to 1.18) includezero, suggesting that they also did not differ be-tween winch and SCUBA treatments. Thus, ourdata on mobile species from panels retrieved bywinch are unlikely to be biased.
Abundance of many epifaunal species differedsignificantly among dates in this seasonal environ-ment (Table 3), with similar trends in 1996 and1997 (Figs. 7 and 8). Early in the summer of bothyears, the polychaete Polydora cornuta constructedtubes that formed thick carpets on top of the bar-nacle Balanus improvisus and the tunicate Molgulamanhattensis. Over the course of the summer, bryo-zoans (Membranipora tenuis and Conopeum tenuissi-mum), the polychaete Sabellaria vulgaris, the anem-one Diadumene leucolena, and hydroids (Obelia bi-cuspidata and Ectopleura dumortieri) increased inabundance, while P. cornuta became less abundant.Most species were able to grow on top of otherspecies, and the community became a thick, com-plex matrix of several layers. Among mobile epi-fauna (Fig. 8), the oyster flatworm Stylochus ellipti-cus was abundant early in the summer of 1997. Theclamworm Nereis succinea was common throughoutboth summers. The nudibranch Doridella obscurawas particularly abundant when its prey, encrusting

Effects of Hypoxia on Estuarine Epifauna 481
TABLE 1. Presence/absence of epifauna at shallow (S, 2mm) and deep (D, 15 m) sites in the York River from Maythrough September. An X indicates that the species is presentat that depth.
Species S D
AnnelidsEteone heteropoda x xHydroides dianthus x xNereis succinea x xPodarkeopsis levifuscana xPolydora cornuta x xSabella microphthalma x xSabellaria vulgaris x xLepidonotus sublevis x1 x
BryozoansAnguinella palmata x xBowerbankia gracilis x xConopeum tenuissimum x xMembranipora tenuis x x
SpongesHalichondria bowerbanki xHaliclona spp. xLissodendoryx carolinesis xMicrociona prolifera x x
NemerteaUnidentified nemertean x x
CnidariansClytia cylindrica x xDiadumene leucolena x xEctopleura dumortieri x xHaliplanella luciae x xObelia bicuspidata x xSchizotricha tenella xSertularia argentea x x
ForaminiferaMilliamina fusca x x
FlatwormsEuplana gracilis x xStylochus ellipticus x x
CrustaceansBalanus eburneus xBalanus improvisus x xCallinectes sapidus x xCaprella penantis xCorophium sp. x xEdotea triloba x xErichthoneus brasiliensis x xEurypanopeus depressus x xGammarus mucronatus x xMelita appendiculata x xMelita nitida x xNeopanope sayi x xParacaprella tenuis x xParametopella cypris xPleusymptes glaber x xRhithropanopeus harrisii x xStenothoe minuta x x
TunicatesBotryllus schlosseri xMolgula manhattensis x x1 We observed this worm in shallow water, but do not have a
preserved specimen to confirm identification.
TABLE 1. Continued.
Species S D
MolluscsCratena kaoruae x xDoridella obscura x xMitrella lunata x xTenellia sp. x xUrosalpinx cinerea x xEupleura caudata x
PycnogonidsUnidentified pycnogonid x x
Fig. 6. Species richness (x̄ � SE) of epifauna from upstreamand downstream areas in 1996 and 1997.
bryozoans, were common in mid-summer. Wefound a number of species that seemed to be as-sociated with O. bicuspidata and E. dumortieri, in-cluding the nudibranchs Cratena kaoruae and Te-nellia sp., the caprellid amphipod Paracaprella ten-uis, and several other amphipods.
Of the dominant sessile species (8 total in 1996and 7 total in 1997) present during deploymentswhen hypoxia occurred, percent cover of 5 speciesin 1996 and 3 species in 1997 differed significantlybetween upstream and downstream sites (Table 3,Fig. 7). The bryozoan M. tenuis and the polychaeteS. vulgaris were more abundant in the upstreamarea, with generally higher oxygen, during bothyears (Table 3). The barnacle B. improvisus and thebryozoan C. tenuissimum were also significantlymore abundant upstream during 1996 (Table 3),but were not tested in 1997 because they weren’tabundant during months with hypoxia. Interesting-ly, however, the sessile species with the greatest per-cent cover in this community either reached great-er abundance downstream or had similar abun-dance in the two areas (Table 3, Fig. 7). Diadumeneleucolena, M. manhattensis, and O. bicuspidata hadsimilar abundance upstream and downstream dur-ing both years (Table 3). Together, these species

482 A. Sagasti et al.
Fig. 7. Percent cover (x̄ � SE) of sessile epifaunal speciesthat covered at least 5% of panels from upstream and down-stream areas at some point during the summer of 1996 (a) and1997 (b). Some error bars are difficult to see because standarderrors for some species were small.
TABLE 2. The mean number of mobile epifauna per panel (� SD) on panels pulled up through the water column with a winch (n� 5) and collected by hand using SCUBA (n � 5). All panels were located at an upstream station and had been deployed in theriver from June 25 to August 25, 1997. The t-statistic and p value for t-tests comparing panels retrieved by winch and panels retrievedby SCUBA are reported. Three species were found in only one treatment and did not meet the assumptions of t-tests; no statisticaltests were performed for these species.
Species Winch SCUBA t-statistic p
Cratena kaoruaeErichthoneus brasilensisMud crabMelita nitidaMitrella lunataNereis succineaParacaprella tenuisParametopella cyprisPycnogonidPleusymptes glaberStenthoe minutaStylochus ellipticus
3.2 (2.4)0.4 (0.5)1.2 (0.7)8.8 (7.1)0.2 (0.2)
88.8 (15.0)1,280 (998.0)
0.6 (0.9)0.4 (0.4)8.2 (7.8)2.4 (1.5)0.6 (0.9)
1 (1.7)0.6 (0.9)
05.6 (1.5)
083.6 (20.6)170 (130.2)0.2 (0.4)
01.8 (2.2)2.4 (2.6)0.2 (0.5)
�1.670.43
�0.51
�0.46�2.47�0.89
�1.710
�0.89
0.140.68
0.63
0.660.690.41
0.131.00.49
comprised more than 80% cover in July, August,and September (Fig. 7) of both years. In addition,E. dumortieri showed no significant differences in1997 (Table 3). During both years, P. cornuta wasmore abundant in the downstream area, with sig-nificant interaction effects suggesting that down-stream/upstream differences were greatest duringJuly when it was most abundant (Table 3).
Of the dominant mobile species (5 total in 1996and 6 total in 1997), abundance of only 1 speciesin 1996 and 2 species in 1997 differed significantlybetween upstream and downstream sites (Table 3,Fig. 8). The nudibranch D. obscura was more abun-dant upstream, where oxygen was generally higher,during both years (Table 3, Fig. 8). In 1997, thecaprellid amphipod P. tenuis was more abundantdownstream, where oxygen was generally lower(Table 3, Fig. 8).
When we adjust significance with sequentialBonferroni corrections (Peres-Neto 1999), we findthat, for some species, the differences between up-stream and downstream become insignificant (Ta-ble 3). For example, in 1996 differences betweenupstream and downstream for 1 species, the bryo-zoan M. tenuis, became insignificant, but differenc-es remained significant for 5 other species (Table3). In 1997, differences between upstream anddownstream became insignificant after sequentialBonferroni corrections for all species except thepolychaete P. cornuta (Table 3).
Discussion
In the lower York River, epifaunal animals ap-pear to be highly tolerant of hypoxia. Hypoxic ep-isodes with dissolved oxygen concentrations rang-ing from 0.2 mg O2 l�1 to 2 mg O2 l�1 occurredapproximately once a month throughout bothsummers, and lasted for 5–7 d at a time. In spiteof these episodes, epifaunal animals formed dense,
Effects of Hypoxia on Estuarine Epifauna 483
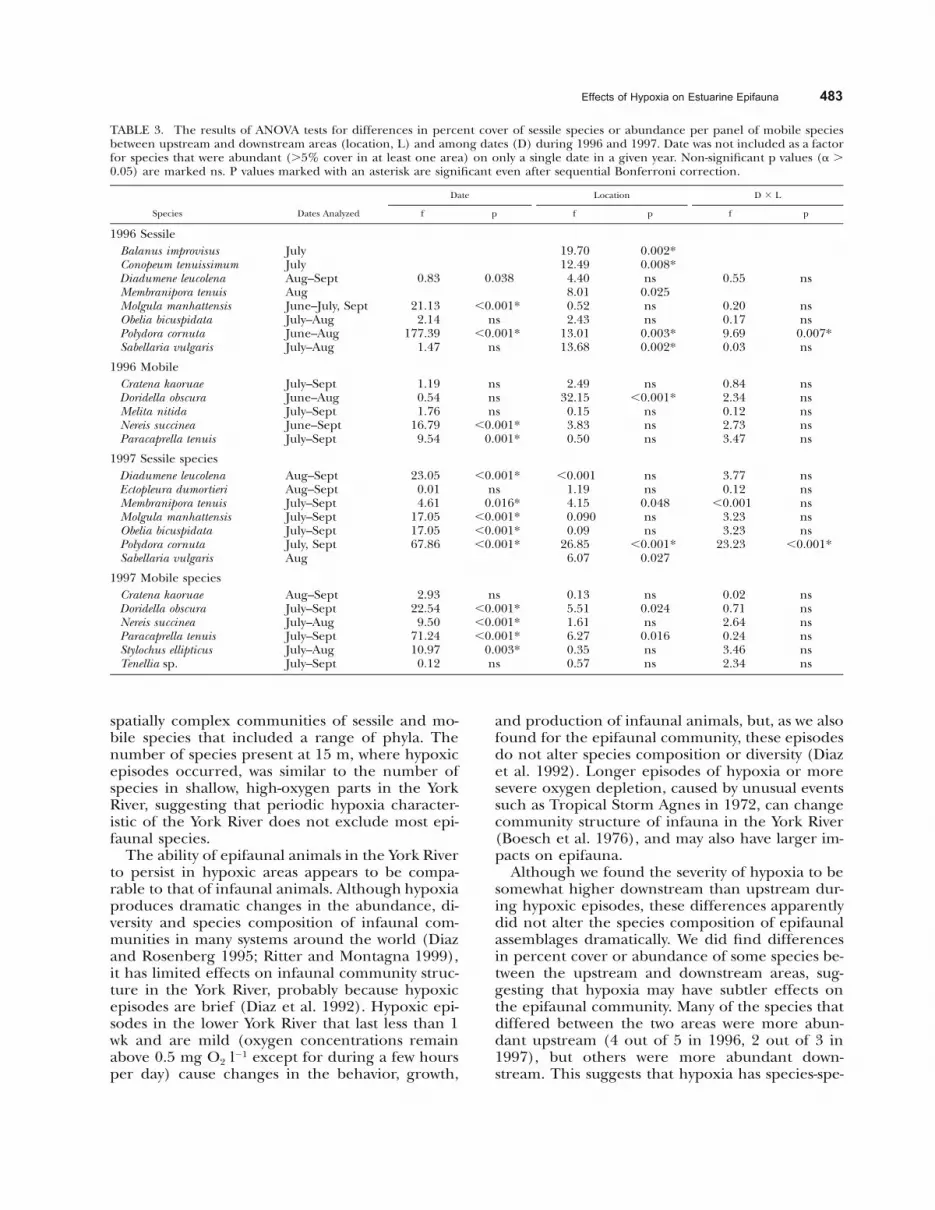
TABLE 3. The results of ANOVA tests for differences in percent cover of sessile species or abundance per panel of mobile speciesbetween upstream and downstream areas (location, L) and among dates (D) during 1996 and 1997. Date was not included as a factorfor species that were abundant (5% cover in at least one area) on only a single date in a given year. Non-significant p values (� 0.05) are marked ns. P values marked with an asterisk are significant even after sequential Bonferroni correction.
Species Dates Analyzed
Date
f p
Location
f p
D � L
f p
1996 SessileBalanus improvisusConopeum tenuissimumDiadumene leucolenaMembranipora tenuisMolgula manhattensisObelia bicuspidataPolydora cornutaSabellaria vulgaris
JulyJulyAug–SeptAugJune–July, SeptJuly–AugJune–AugJuly–Aug
0.83
21.132.14
177.391.47
0.038
0.001*ns
0.001*ns
19.7012.494.408.010.522.43
13.0113.68
0.002*0.008*ns
0.025nsns
0.003*0.002*
0.55
0.200.179.690.03
ns
nsns
0.007*ns
1996 MobileCratena kaoruaeDoridella obscuraMelita nitidaNereis succineaParacaprella tenuis
July–SeptJune–AugJuly–SeptJune–SeptJuly–Sept
1.190.541.76
16.799.54
nsnsns
0.001*0.001*
2.4932.150.153.830.50
ns0.001*
nsnsns
0.842.340.122.733.47
nsnsnsnsns
1997 Sessile speciesDiadumene leucolenaEctopleura dumortieriMembranipora tenuisMolgula manhattensisObelia bicuspidataPolydora cornutaSabellaria vulgaris
Aug–SeptAug–SeptJuly–SeptJuly–SeptJuly–SeptJuly, SeptAug
23.050.014.61
17.0517.0567.86
0.001*ns
0.016*0.001*0.001*0.001*
0.0011.194.150.0900.09
26.856.07
nsns
0.048nsns
0.001*0.027
3.770.12
0.0013.233.23
23.23
nsnsnsnsns
0.001*
1997 Mobile speciesCratena kaoruaeDoridella obscuraNereis succineaParacaprella tenuisStylochus ellipticusTenellia sp.
Aug–SeptJuly–SeptJuly–AugJuly–SeptJuly–AugJuly–Sept
2.9322.549.50
71.2410.970.12
ns0.001*0.001*0.001*
0.003*ns
0.135.511.616.270.350.57
ns0.024ns
0.016nsns
0.020.712.640.243.462.34
nsnsnsnsnsns
spatially complex communities of sessile and mo-bile species that included a range of phyla. Thenumber of species present at 15 m, where hypoxicepisodes occurred, was similar to the number ofspecies in shallow, high-oxygen parts in the YorkRiver, suggesting that periodic hypoxia character-istic of the York River does not exclude most epi-faunal species.
The ability of epifaunal animals in the York Riverto persist in hypoxic areas appears to be compa-rable to that of infaunal animals. Although hypoxiaproduces dramatic changes in the abundance, di-versity and species composition of infaunal com-munities in many systems around the world (Diazand Rosenberg 1995; Ritter and Montagna 1999),it has limited effects on infaunal community struc-ture in the York River, probably because hypoxicepisodes are brief (Diaz et al. 1992). Hypoxic epi-sodes in the lower York River that last less than 1wk and are mild (oxygen concentrations remainabove 0.5 mg O2 l�1 except for during a few hoursper day) cause changes in the behavior, growth,
and production of infaunal animals, but, as we alsofound for the epifaunal community, these episodesdo not alter species composition or diversity (Diazet al. 1992). Longer episodes of hypoxia or moresevere oxygen depletion, caused by unusual eventssuch as Tropical Storm Agnes in 1972, can changecommunity structure of infauna in the York River(Boesch et al. 1976), and may also have larger im-pacts on epifauna.
Although we found the severity of hypoxia to besomewhat higher downstream than upstream dur-ing hypoxic episodes, these differences apparentlydid not alter the species composition of epifaunalassemblages dramatically. We did find differencesin percent cover or abundance of some species be-tween the upstream and downstream areas, sug-gesting that hypoxia may have subtler effects onthe epifaunal community. Many of the species thatdiffered between the two areas were more abun-dant upstream (4 out of 5 in 1996, 2 out of 3 in1997), but others were more abundant down-stream. This suggests that hypoxia has species-spe-

484 A. Sagasti et al.
Fig. 8. Abundance (x̄ per panel � SE) of mobile species thatwere common in the summer of 1996 (a) and 1997 (b). Notevariation in scales.
cific effects on epifauna, supporting physiologicalstudies that show substantial differences in hypoxiatolerance between related taxa (Diaz and Rosen-berg 1995).
During both study years, several species had sim-ilar percent cover upstream and downstream.There are several possible reasons why these spe-cies were equally abundant in both areas. First, thedifference in oxygen concentration between up-stream and downstream areas may have been toosmall to change the abundance of these species.Hypoxia occurred in both areas but was approxi-mately 0.5 mg O2 l�1 lower in the downstream areaduring hypoxic episodes (Fig. 4). At oxygen con-centrations below 1 mg O2 l�1, small oxygen dif-ferences (0.1 mg O2 l�1 or greater) produce largechanges in the behavior and survival of many in-faunal animals (Diaz and Rosenberg 1995). Simi-larly, small oxygen differences ( 0.15 mg O2 l�1)can significantly change mortality and behavior ofepifaunal fish (Breitburg 1992). Thus, other stud-ies suggest that the oxygen differences we observedbetween sites could have been important for epi-faunal animals. If so, the differences were not suf-ficient to cause changes in percent cover. Second,some species may be especially tolerant of hypoxia.At least one species, the anemone D. leucolena, canswitch to anaerobic metabolic pathways duringhypoxia (Beattie 1971), which may allow it to tol-
erate low oxygen concentrations for long periodsof time. Another explanation for the similarity inabundance upstream and downstream for somespecies involves growth rates relative to our sam-pling frequency. Hypoxia may change abundance,but because hypoxic events are brief, populationsmight recover between episodes. Recovery couldoccur through growth and migration of existinganimals or by recruitment. Previous studies in theChesapeake Bay show that many epifaunal speciesgrow quickly, reaching adult size and maturity injust weeks (Abbe 1987). We have also observed rap-id growth of many species; for example, the tuni-cate M. manhattensis larvae can settle and grow toa diameter of 1–2 cm in just 1 wk. Therefore, someepifaunal species may grow quickly enough be-tween hypoxic episodes to compensate for any ef-fect of hypoxia on mortality or the ability to cap-ture space. If species were killed by hypoxia theycould have recovered through recruitment, withlarvae from shallow parts of the river colonizingdeep areas following hypoxia.
During both years, the tube-building worm, P.cornuta, was more abundant in the downstreamarea with generally lower oxygen. At times, P. cor-nuta covered almost 100% of downstream space,with tubes forming a carpet several centimetersthick (Fig. 9). In 1996, P. cornuta was most abun-dant in June and July deployments. Although wedon’t know the oxygen history of June panels, highabundance in July followed the worst recordedhypoxic episode. In 1997, P. cornuta was most abun-dant in July, again following the worst hypoxic ep-isode. The success of P. cornuta in the downstreamarea may be explained by its life history character-istics. P. cornuta also lives in degraded and dis-turbed areas in other systems (Noji and Noji 1991;Zajac 1991), and is dominant throughout the Ches-apeake Bay in early summer (Otsuka and Dauer1982). Often, it is the first species to colonize afterdisturbances (Noji and Noji 1991) suggesting thatit is opportunistic and takes advantage of distur-bances to capture space. We observed highly rapidgrowth and recruitment of P. cornuta; lawns of P.cornuta tubes 2–3 cm thick can develop in just afew weeks of exposure (Fig. 9). The short life spanand high fecundity of P. cornuta (Noji and Noji1991) may make it especially adapted for living ina stressful area like the lower York River. Similarly,infaunal species with fast growth and high recruit-ment often dominate in hypoxic areas (Diaz andRosenberg 1995).
Each year, some sessile species were more abun-dant upstream. Some of these species may requirehigher oxygen concentrations. They may also haveslower growth or recruitment that could prevent

Effects of Hypoxia on Estuarine Epifauna 485
Fig. 9. a) A clean panel before deployment. b) A panel ex-posed for 1 month, showing rapid growth of Polydora cornutatubes.
them from recovering from hypoxia as quickly asother species.
Mobile species also showed a variety of respons-es, with D. obscura more abundant upstream duringboth years, P. tenuis more abundant downstream in1997, and the majority of species showing no dif-ference between sites. In addition to possiblemechanisms used by sessile species to survive hyp-oxia, mobile animals may survive hypoxic episodesby migrating to shallow areas during hypoxia andreturning after oxygen concentrations rise. In thisstudy, they may simply have crawled up the ropesconnecting each station to the surface, avoidingperiods of low oxygen (but we did not gather evi-dence to support or refute this possibility).
It is also possible that differences between up-stream and downstream areas were related to somefactor other than oxygen. The two areas experi-ence similar temperatures, chlorophyll concentra-tions, nutrient concentrations, sediment composi-tion, and current speeds. Epifaunal adults live inshallow areas along the length of the river, sug-
gesting that larvae are available throughout the riv-er (but their relative abundance may differ). Al-though salinity differed slightly (0–3‰) betweenthe two sites in August and September 1996 (Fig.5), these differences were probably too small tochange species abundance between our sites, be-cause salinities at both sites were well within thetolerance range of most epifaunal species in theYork River. For example, many York River epifau-nal species live in salinities ranging from oligoha-line to polyhaline, including the barnacle B. im-provisus, the polychaetes P. cornuta and N. succinea,the flatworm S. ellipticus, and the anemone D. leu-colena (Cory 1967). Both bryozoans (M. tenuis andC. tenuissimum) common in this study have a lowersalinity limit of 6‰ and an upper limit near eu-haline conditions (Osburn 1944), while the tuni-cate Molgula manhattensis has a salinity range from5‰ to polyhaline (Cory 1967). The polychaete S.vulgaris has a distribution from mesohaline to po-lyhaline regions (Cory 1967), and the nudibranchsD. obscura and C. kaoruae both live in salinities aslow as 9‰ (Vogel 1977). Among the common ses-sile species in this study, only the hydroids O. bi-cuspidata and E. dumortieri are restricted to narrowsalinity ranges (Calder 1971), but we found no sig-nificant effects of location on abundances of thesespecies (Table 3). Among the common mobile epi-fauna in this study, only the amphipods Melita ni-tida and P. tenuis are near the limit of their salinityrange at our sites (Feeley and Waas 1971) (Table3). Thus, for most species it is unlikely that salinitydifferences between sites changed species abun-dance. Hypoxia is a more likely cause of the dif-ferences between upstream and downstream for acouple of reasons. First, hypoxia is the most obvi-ous physical difference between the two areas, andhas been shown to be an important factor in othercommunities around the world (Diaz and Rosen-berg 1995). Second, for some of the epifaunal spe-cies of the York River, we have observed significantmortality after exposure to hypoxia (1 mg O2 l�1)for several days, suggesting that hypoxia can haveimportant effects on these species.
This study was among the first to examine theeffect of hypoxia on epifaunal communities, andwe found similarities with results from infaunalcommunities. Although previous authors have sug-gested that epifaunal species may be particularlysusceptible to hypoxic stress ( Jorgensen 1980; Sta-chowitsch 1984; Hagerman 1998), we found that,like many infaunal species, many dominant epifau-nal species appear to have high tolerance for hyp-oxia.
Epifauna are important ecological componentsof estuaries. As hypoxia becomes increasingly wide-spread and persistent (Diaz and Rosenberg 1995),

486 A. Sagasti et al.
the species composition of estuaries may change.This study suggests that, unlike earlier predictions,epifauna are not necessarily more susceptible tooxygen stress than infauna. Epifaunal communitiesmay persist with relatively unchanged species com-position, but with some changes in abundance, asoxygen concentrations fall, at least in areas wherehypoxia is relatively mild and occurs for only shortepisodes.
ACKNOWLEDGMENTS
This work was funded by a National Science Foundation Mi-nority Fellowship, a Lerner Gray Grant from the American Mu-seum of Natural History, an Ann Kunkel Scholarship from theInternational Women’s Fishing Association, a Minor ResearchGrant from the College of William and Mary, and by the Vir-ginia Institute of Marine Science. We thank Dr. Albert Kuo ofthe Virginia Institute of Marine Science for providing us withhis lower York River oxygen data in 1996, and all the physicalsciences group for technical expertise and patience. We thankDr. Robert Diaz for lending us Hydrolab Datasonde Multipro-bes. We also thank the Benthic Processes group at the VirginiaInstitute of Marine Science and many other volunteers whohelped us in the field. This is contribution #2312 from the Vir-ginia Institute of Marine Science.
LITERATURE CITED
ABBE, G. R. 1987. Epifauna, p. 82–96. In K. L. Heck (ed.), Eco-logical Studies in the Middle Reach Chesapeake Bay: CalvertCliffs, Lecture Notes on Coastal and Estuarine Studies No. 23.Springer-Verlag, New York.
ABELSON, A. T., T. MILOH, AND Y. LOYA. 1993. Flow patterns in-duced by substrata and body morphologies of benthic organ-isms, and their role in determining the availability of foodparticles. Limnology and Oceanography 38:1116–1124.
BEATTIE, C. W. 1971. Respiratory adjustments of an estuarinecoelenterate to abnormal levels of environmental phosphateand oxygen. Comparative Biochemistry and Physiology 40:907–916.
BOESCH, D. F., R. J. DIAZ, AND R. W. VIRNSTEIN. 1976. Effects ofTropical Storm Agnes on soft-bottom macrobenthic commu-nities of the James and York Estuaries and the Lower Chesa-peake Bay. Chesapeake Science 17:246–259.
BREITBURG, D. L. 1992. Episodic hypoxia in the Chesapeake Bay:Interacting effects of recruitment, behavior and physical dis-turbance. Ecological Monographs 62:525–546.
CAINE, E. A. 1987. Potential effect of floating dock communitieson a South Carolina estuary. Journal of Experimental Marine Bi-ology and Ecology 108:83–91.
CALDER, D. R. 1971. Hydroids and Hydromedusae of SouthernChesapeake Bay. Virginia Institute of Marine Science, SpecialPapers in Marine Science. Gloucester Point, Virginia.
CORY, R. L. 1967. Epifauna of the Patuxent River Estuary, Mary-land, for 1963 and 1964. Chesapeake Science 8:71–89.
DAUER, D. M., A. J. RODI, AND J. A. RANASINGHE. 1992. Effectsof low dissolved oxygen events on the macrobenthos of thelower Chesapeake Bay. Estuaries 15:384–391.
DIAZ, R. J. 1984. Short term dynamics of the dominant annelidsin a polyhaline temperate estuary. Hydrobiologia 115:153–158.
DIAZ, R. J., R. J. NEUBAUER, L. C. SCHAFFNER, L. PIHL, AND S. P.BADEN. 1992. Continuous monitoring of dissolved oxygen inan estuary experiencing periodic hypoxia and the effect ofhypoxia on macrobenthos and fish. Science of the Total Environ-ment Supplement 1992:1055–1068.
DIAZ, R. J. AND R. ROSENBERG. 1995. Marine benthic hypoxia: Areview of its ecological effects and the behavioral responses
of benthic macrofauna. Oceanography and Marine Biology: AnAnnual Review 33:245–303.
EDGAR, G. J. AND C. SHAW. 1995. The production and trophicecology of shallow-water fish assemblages in southern Austra-lia. III. General relationships between sediments, seagrasses,invertebrates and fishes. Journal of Experimental Marine Biologyand Ecology 194:107–131.
FEELEY, J. B. AND M. L. WASS. 1971. The distribution and ecologyof the Gammaridea (Crustacea: Amphipoda) of the lowerChesapeake Estuaries. Virginia Institute of Marine Science,Special Papers in Marine Science. Gloucester Point, Virginia.
FORBES, T. L. AND G. R. LOPEZ. 1990. The effect of food con-centration, body size, and environmental oxygen tension onthe growth of the deposit-feeding polychaete, Capitella species1. Limnology and Oceanography 35:1535–1544.
GASTON, G. R. 1985. Effects of hypoxia on macrobenthos of theinner shelf off Cameron, Louisiana. Estuarine, Coastal and ShelfScience 20:603–613.
GRASSLE, J. F. AND H. L. SANDERS. 1973. Life histories and therole of disturbance. Deep-Sea Research 20:643–659.
HAAS, L. W. 1977. The effect of the spring-neap tidal cycle onthe vertical salinity structure of the James, York, and Rappa-hannock Rivers, Virginia, USA. Estuarine and Coastal MarineScience 5:485–490.
HAGERMAN, L. 1998. Physiological flexibility: A necessity for lifein anoxic and sulfidic habitats. Hydrobiologia 375/376:241–254.
HAVEN, D. S. AND R. MORALES-ALAMO. 1966. Aspects of biode-position by oyster feeders and other invertebrate filter feed-ers. Limnology and Oceanography 11:487–498.
HERREID, C. F. 1980. Hypoxia in invertebrates. Comparative Bio-chemistry and Physiology 67:311–320.
HOCHACHKA, P. W. AND G. N. SOMERO. 1984. Biochemical Ad-aptation. Princeton University Press, Princeton.
HOLLAND, A. F., N. K. MOUNTFORD, AND J. A. MIHURSKY. 1977.Temporal variation in upper bay mesohaline benthic com-munities: I. The 9-m mud habitat. Chesapeake Science 18:370–378.
HOLLAND, A. F., A. T. SHAUGHNESSY, AND M. H. HEIGEL. 1987.Long-term variation in Chesapeake Bay macrobenthos: Spa-tial and temporal patterns. Estuaries 10:227–245.
JORGENSEN, B. B. 1980. Seasonal oxygen depletion in the bottomwaters of a Danish fjord and its effects on the benthic com-munity. Oikos 34:68–76.
KIKUCHI, T. 1974. Japanese contributions on consumer ecologyin eelgrass (Zostera marina L.) beds, with special reference totrophic relationships and resources in inshore fisheries. Aqua-culture 4:145–160.
KUO, A. Y. AND B. J. NIELSON. 1987. Hypoxia and salinity inVirginia estuaries. Estuaries 10:277–283.
KUO, A. Y., B. J. NIELSON, J. M. BRUBAKER, AND E. P. RUZECKI.1993. Data Report: Hypoxia in the York River, 1991. VirginiaInstitute of Marine Science Data Report No. 47. GloucesterPoint, Virginia.
LEVY, J. M. AND K. M. SULLIVAN. 1994. Ecology of epibenthiccrustaceans in hardbottom marine communities of the Flori-da Keys. Bulletin of Marine Science 54:1078–1079.
LLANSO, R. J. 1992. Effects of hypoxia on estuarine benthos: Thelower Rappahannock River (Chesapeake Bay), a case study.Estuarine, Coastal and Shelf Science 35:491–515.
MARSH, G. A. 1973. The Zostera epifaunal community in the YorkRiver, Virginia. Chesapeake Science 14:87–97.
MCMAHON, R. F. AND W. D. RUSSELL-HUNTER. 1978. Respiratoryresponses to low oxygen stress in marine littoral and sublit-toral snails. Physiological Zoology 51:408–424.
MODIG, H. AND E. OLAFSSON. 1998. Responses of Baltic benthicinvertebrates to hypoxic events. Journal of Experimental MarineBiology and Ecology 229:133–148.
NICHOLS, M., S. C. KIM, AND C. M. BROWER. 1991. Sediment

Effects of Hypoxia on Estuarine Epifauna 487
Characterization of the Chesapeake Bay and its Tributaries.National Oceanic and Atmospheric Administration NationalEstuarine Inventory. Gloucester Point, Virginia.
NOJI, C. I. AND T. T. NOJI. 1991. Tube lawns of spionid poly-chaetes and their significance for recolonization of disturbedbenthic substrates: A review. Meeresforsch 33:235–246.
OFFICER, C. B., T. J. SMAYDA, AND R. MANN. 1982. Benthic filterfeeding: A natural eutrophication control. Marine Ecology Pro-gress Series 9:203–210.
ORTH, R. J. 1992. A perspective on plant-animal interactions inseagrasses: Physical and biological determinants influencingplant and animal abundance, p. 147–164. In D. M. John, S. J.Hawkins, and J. H. Price (eds.), Plant-animal Interactions inthe Marine Benthos. Clarendon Press, Oxford.
OSBURN, R. C. 1944. A Survey of the Bryozoa of ChesapeakeBay. Chesapeake Biological Laboratory Publication No. 63.Solomons Island, Maryland.
OTSUKA, C. M. AND D. M. DAUER. 1982. Fouling community dy-namics in Lynnhaven Bay, Virginia. Estuaries 5:10–22.
PAERL, H. W., J. L. PINCKNEY, J. M. FEAR, AND B. L. PEIERLS. 1998.Ecosystem responses to internal and watershed organic load-ing: Consequences for hypoxia in the eutrophying Neuse Riv-er Estuary, North Carolina USA. Marine Ecology Progress Series166:17–25.
PERES-NETO, P. R. 1999. How many statistical tests are too many?The problem of conducting multiple ecological inferences re-visited. Marine Ecology Progress Series 176:303–306.
PIHL, L., S. P. BADEN, R. J. DIAZ, AND L. C. SCHAFFNER. 1992.Hypoxia-induced structural changes in the diet of bottom-feeding fish and crustacea. Marine Biology 112:349–361.
PIKE, L. A. AND D. G. LINDQUIST. 1994. Feeding ecology of spot-tail pinfish (Diaplodus holbrooki) from an artificial reef in Ons-low Bay, North Carolina. Bulletin of Marine Science 55:363–374.
REEDERS, H. H., A. BIJ DE VAATE, AND R. NOORDHUIS. 1993. Po-tential of the zebra mussel (Dreissena polymorpha) for waterquality management, p. 439–451. In T. F. Nalepa and D. W.Schoesser (eds.), Zebra Mussels: Biology, Impacts and Con-trol. Lewis Publishers, Boca Raton, Florida.
RHEINHARDT, R. D. AND R. MANN. 1990. Temporal changes inepibenthic fouling community structure on a natural oysterbed in Virginia. Biofouling 2:13–25.
RITTER, C. AND P. A. MONTAGNA. 1999. Seasonal hypoxia andmodels of benthic response in a Texas Bay. Estuaries 22:7–20.
ROSENBERG, R. B., B. HELLMAN, AND B. JOHNSON. 1991. Hypoxictolerance of marine benthic fauna. Marine Ecology Progress Se-ries 79:127–131.
SCHAFFNER, L. C. 1990. Small-scale organism distributions andpatterns of species diversity: Evidence for positive interactionsin an estuarine benthic community. Marine Ecology Progress Se-ries 61:107–117.
SCHAFFNER, L. C., T. M. DELLAPENNA, E. K. HINCHEY, C. T. FRIED-RICHS, M. T. NEUBAUER, M. E. SMITH, AND S. A. KUEHL. Inpress. Physical energy regimes, sea-bed dynamics and organ-ism-sediment interactions along an estuarine gradient. In J. Y.Aller, S. A. Woodin, and R. C. Aller (eds.), Organism-sedi-ment Interactions. University of South Carolina Press, Colum-bia, South Carolina.
SCHAFFNER, L. C., P. JONSSON, R. J. DIAZ, R. ROSENBERG, AND P.
GAPCYNSKI. 1992. Benthic communities and bioturbation his-tory of estuarine and coastal systems: Effects of hypoxia andanoxia, p. 1001–1016. In R. A. Vollenweider, R. Marchetti, andR. Viviani (eds.), Marine Coastal Eutrophication. Science ofthe Total Environment, Supplement 1992. Elsevier SciencePublishers B.V., Amsterdam.
SIN, Y. 1998. Ecosystem analysis of water column processes inthe York River Estuary, Virginia. Historical records, field stud-ies and modelling analysis. Ph.D. Dissertation, College of Wil-liam and Mary, Gloucester Point, Virginia.
SISSON, G. M., A. Y. KUO, AND J. M. BRUBAKER. 1991. Data Report:Hypoxia in the York River, 1988–1989. Virginia Institute ofMarine Science Data Report No. 33. Gloucester Point, Virgin-ia.
STACHOWITSCH, M. 1984. Mass mortality in the Gulf of Trieste:The course of community destruction. Pubblicazioni della sta-zione zoologica di Napoli. I. Marine Ecology 5:243–264.
SUTHERLAND, J. P. AND R. H. KARLSON. 1977. Development andstability of the fouling community at Beaufort, North Caroli-na. Ecological Monographs 47:425–446.
THEEDE, H., A. PONAT, K. HIROKI, AND C. SCHLIEPER. 1969. Stud-ies on the resistance of bottom invertebrates to oxygen defi-ciency and hydrogen sulfide. Marine Biology 2:325–337.
TYSON, R. V. AND T. H. PEARSON. 1991. Modern and ancientcontinental shelf anoxia: An overview, p. 1–26. In R. V. Tysonand T. H. Pearson (eds.), Modern and Ancient ContinentalShelf Anoxia. Geological Society Special Publication No. 58,London.
UNDERWOOD, A. J. 1997. Experiments in Ecology: Their LogicalDesign and Interpretation Using Analysis of Variance. Cam-bridge University Press, Cambridge.
VOGEL, R. M. 1977. Shell-less opisthobranchs of Virginia andMaryland. Ph.D. Dissertation. Virginia Institute of Marine Sci-ence, Gloucester Point, Virginia.
WRIGHT, L. D., D. B. PRIOR, C. H. HOBBS, R. J. BYRNE, J. D. BOON,L. C. SCHAFFNER, AND M. O. GREEN. 1987. Spatial variabilityof bottom types in the lower Chesapeake Bay and adjoiningestuaries and inner shelf. Estuarine, Coastal and Shelf Science 24:765–784.
ZAJAC, R. N. 1991. Population ecology of Polydora ligni (Poly-chaeta: Spionidae). I. Seasonal variation in population char-acteristics and reproductive activity. Marine Ecology Progress Se-ries 77:197–206.
ZAJAC, R. N. AND R. B. WHITLATCH. 1985. A hierarchical ap-proach to modeling soft-bottom successional dynamics, p.265–276. In P. E. Gibbs (ed.), Proceedings of the NineteenthEuropean Marine Biology Symposium, Plymouth, Devon, UK16–21 September 1984. Cambridge University Press, Cam-bridge.
ZAR, J. H. 1996. Biostatistical Analysis, 3rd edition. Prentice Hall,Upper Saddle River, New Jersey.
SOURCE OF UNPUBLISHED MATERIAL
LIN, J. personal communication. Virginia Institute of Marine Sci-ence, P. O. Box 1346, Gloucester Point, Virginia 23062
Received for consideration, September 1, 1999Accepted for publication, March 2, 2000


