Embed Size (px)
Citation preview
PUBLISHED BY WWF-PHILIPPINESOCTOBER 2020
EPR SCHEmE ASSESSmENT FOR PLASTIC PACkAgINg WASTE IN THE PHILIPPINES
EXECUTIVE SUmmARYThis study, commissioned by the World Wide Fund for Nature (WWF) Philippines, is the first comprehensive scientific assessment and material flow analysis of plastic packaging waste in the Philippines. The evaluation framework of the report is built on a thorough analysis of the country’s waste reduction and management system, and recycling market for plastic waste. This serves as foundation for the proposed elements and components of an extended producer responsibility (EPR) scheme for the Philippines, including short- and medium- term actions that need to be taken to lay the foundations for EPR. EPR is an environmental policy approach that emerged in the 1990s and is now increasingly recognised around the world as a useful tool for accelerating the transition to sustainable waste management and a circular economy. It also encourages waste reduction and the development of more environmentally friendly packaging design. The basic approach of EPR is based on obliging businesses (i.e., manufacturers, importers, and sellers) to assume full responsibility for the products they offer to the public – not just during consumption but also during the end-of-life phase – or once their products have become waste. EPR works alongside and complements general waste management systems typically run by the government and its citizens.
Research and preparation of this report was undertaken by cyclos GmbH and AMH Philippines, Inc. cyclos GmbH, founded in 1993, is one of Germany’s leading waste management and material flow consulting companies specializing in strategy and policy development, auditing, compliance assurance, and research. AMH Philippines is an academe-linked engineering consultancy company founded in 1999 that provides technical advisory services, feasibility studies, preliminary engineering and detailed design, construction management and special studies requiring modelling and research. The study is part of WWF Philippines’ No Plastic in Nature Initiative – a multi-pronged program that aims to stop the flow of plastics entering nature by 2030. This will be done through a combination of actions and activities that eliminate unnecessary plastic; double reuse, recycling, and recovery; and ensure that remaining plastic are sourced responsibly. WWF engages the government (national and local), the business sector, and the general public through various programs for this initiative.
STATUS QUO: WASTE mANAgEmENT SYSTEm AND RECYCLINg mARkET FOR PLASTIC PACkAgINg WASTE IN THE PHILIPPINESResults from extensive research, data gathering, and consultations show three significant characteristics to shape the Philippine context:
1. High-value recyclable packaging is already separated from household waste to a limited extent and transferred to recycling systems. This applies especially to rigid HDPE, PP and PET. Extraction is largely informal and the subsequent value chain is based on a functioning market. A sizeable volume of these high-value recyclable packaging still ends up in disposal sites or leaked to the environment.
2. The recycling capacities of the Philippines are insufficient for the mentioned, locally generated, and high-value recyclables. Some recyclers and aggregators import and process imported recyclables, occupying large capacities.
3. Low-value and non-recyclables (e.g. all kinds of flexibles like films, sachets, and composites) are mostly disposed of and collected together with other residual wastes. So far, there is no systematic separation and recycling of the low-value recyclables. Depending on the locally prevailing collection and disposal system, all of these end up in sanitary landfills, dumpsites (unsanitary landfills), or are littered in the environment. The capacity of suitable disposal options via sanitary landfills is not sufficiently available across the country.
WWF-PHILIPPINES 2020
II
PLASTIC WASTE FLOW ANALYSISThis study adopted the same framework of a macro-scale Material Flow Analysis (MFA) for recyclable materials including plastics as the Japan International Cooperation Agency (JICA) in the “Study on Recycling Industry Development in the Republic of the Philippines” [JICA, 2008]. Additional collection and recycling streams, detailed waste characterization data, and flows per types of plastics were incorporated. Data from various government and private institutions, together with primary data, were used as starting points to generate key amounts and rates for plastics production, consumption, collection, recycling, recovery, disposal, and leakage. This study can be the basis of the current status of the Philippines’ plastic waste stream, and can be a reference point for future interventions to decrease the amount of plastics leaked into the environment, and improve recycling rates of plastics.
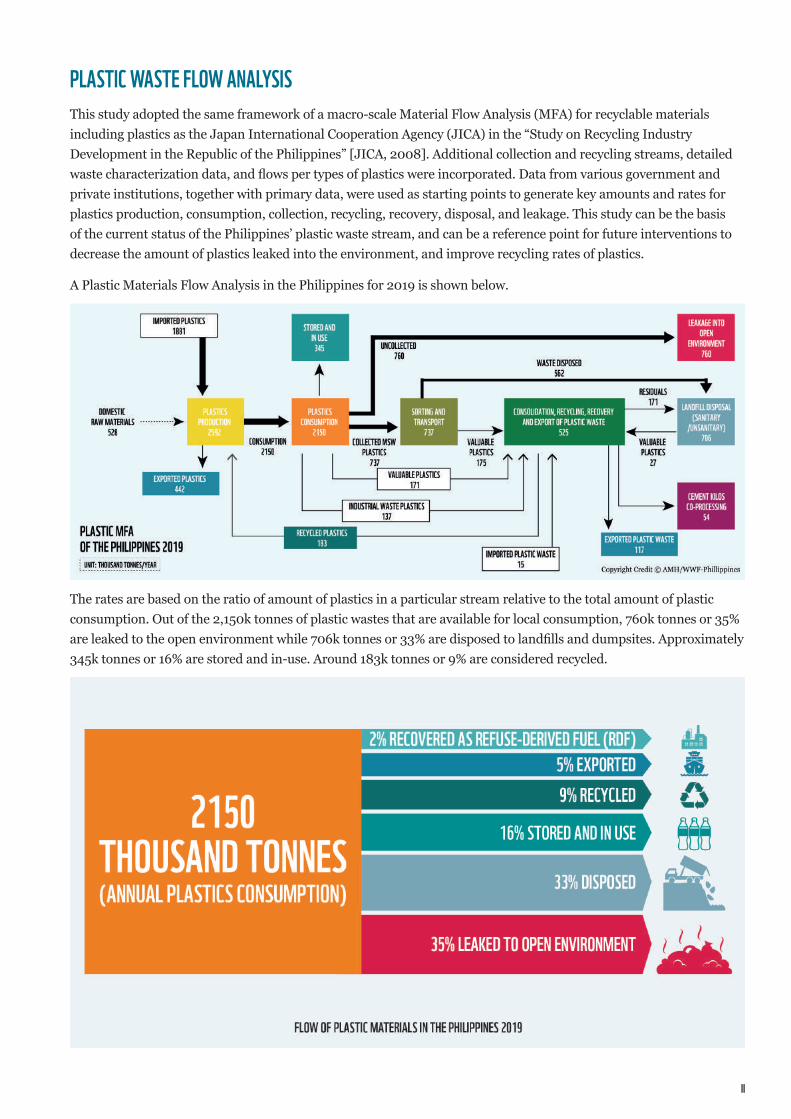
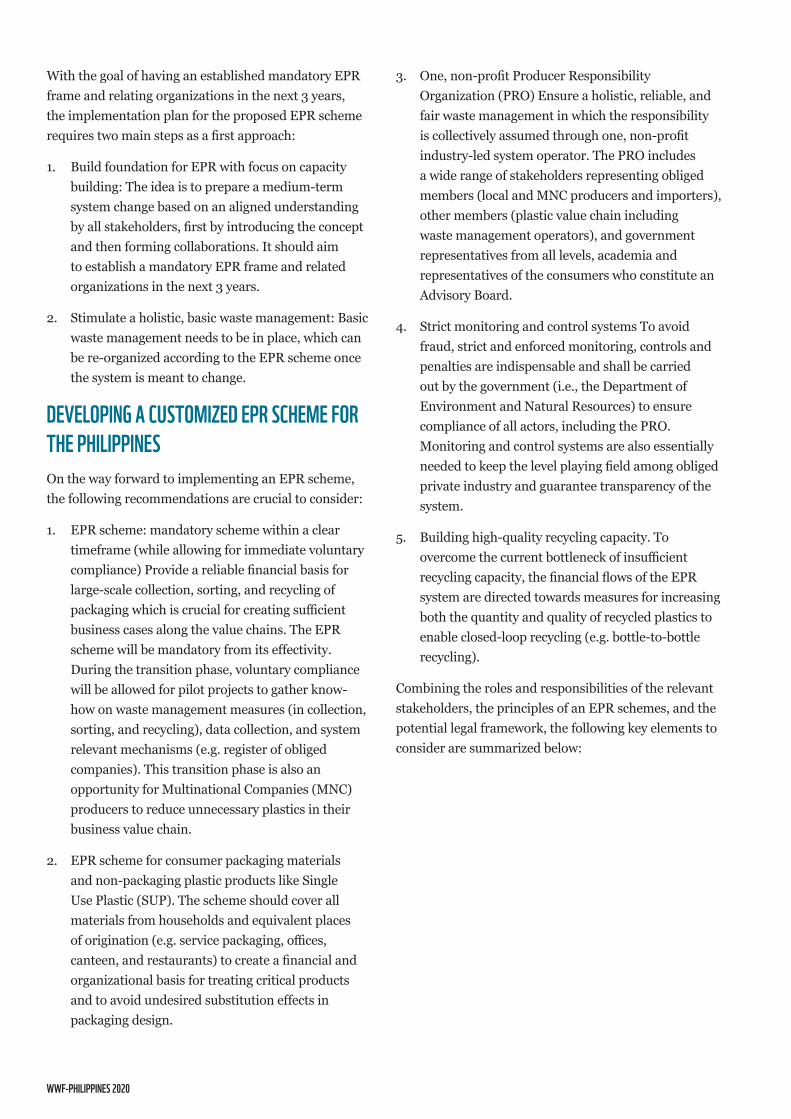
A Plastic Materials Flow Analysis in the Philippines for 2019 is shown below.
The rates are based on the ratio of amount of plastics in a particular stream relative to the total amount of plastic consumption. Out of the 2,150k tonnes of plastic wastes that are available for local consumption, 760k tonnes or 35% are leaked to the open environment while 706k tonnes or 33% are disposed to landfills and dumpsites. Approximately 345k tonnes or 16% are stored and in-use. Around 183k tonnes or 9% are considered recycled.
WWF-PHILIPPINES 2020
With the goal of having an established mandatory EPR frame and relating organizations in the next 3 years, the implementation plan for the proposed EPR scheme requires two main steps as a first approach:
1. Build foundation for EPR with focus on capacity building: The idea is to prepare a medium-term system change based on an aligned understanding by all stakeholders, first by introducing the concept and then forming collaborations. It should aim to establish a mandatory EPR frame and related organizations in the next 3 years.
2. Stimulate a holistic, basic waste management: Basic waste management needs to be in place, which can be re-organized according to the EPR scheme once the system is meant to change.
DEVELOPINg A CUSTOmIZED EPR SCHEmE FOR THE PHILIPPINESOn the way forward to implementing an EPR scheme, the following recommendations are crucial to consider:
1. EPR scheme: mandatory scheme within a clear timeframe (while allowing for immediate voluntary compliance) Provide a reliable financial basis for large-scale collection, sorting, and recycling of packaging which is crucial for creating sufficient business cases along the value chains. The EPR scheme will be mandatory from its effectivity. During the transition phase, voluntary compliance will be allowed for pilot projects to gather know-how on waste management measures (in collection, sorting, and recycling), data collection, and system relevant mechanisms (e.g. register of obliged companies). This transition phase is also an opportunity for Multinational Companies (MNC) producers to reduce unnecessary plastics in their business value chain.
2. EPR scheme for consumer packaging materials and non-packaging plastic products like Single Use Plastic (SUP). The scheme should cover all materials from households and equivalent places of origination (e.g. service packaging, offices, canteen, and restaurants) to create a financial and organizational basis for treating critical products and to avoid undesired substitution effects in packaging design.
3. One, non-profit Producer Responsibility Organization (PRO) Ensure a holistic, reliable, and fair waste management in which the responsibility is collectively assumed through one, non-profit industry-led system operator. The PRO includes a wide range of stakeholders representing obliged members (local and MNC producers and importers), other members (plastic value chain including waste management operators), and government representatives from all levels, academia and representatives of the consumers who constitute an Advisory Board.
4. Strict monitoring and control systems To avoid fraud, strict and enforced monitoring, controls and penalties are indispensable and shall be carried out by the government (i.e., the Department of Environment and Natural Resources) to ensure compliance of all actors, including the PRO. Monitoring and control systems are also essentially needed to keep the level playing field among obliged private industry and guarantee transparency of the system.
5. Building high-quality recycling capacity. To overcome the current bottleneck of insufficient recycling capacity, the financial flows of the EPR system are directed towards measures for increasing both the quantity and quality of recycled plastics to enable closed-loop recycling (e.g. bottle-to-bottle recycling).
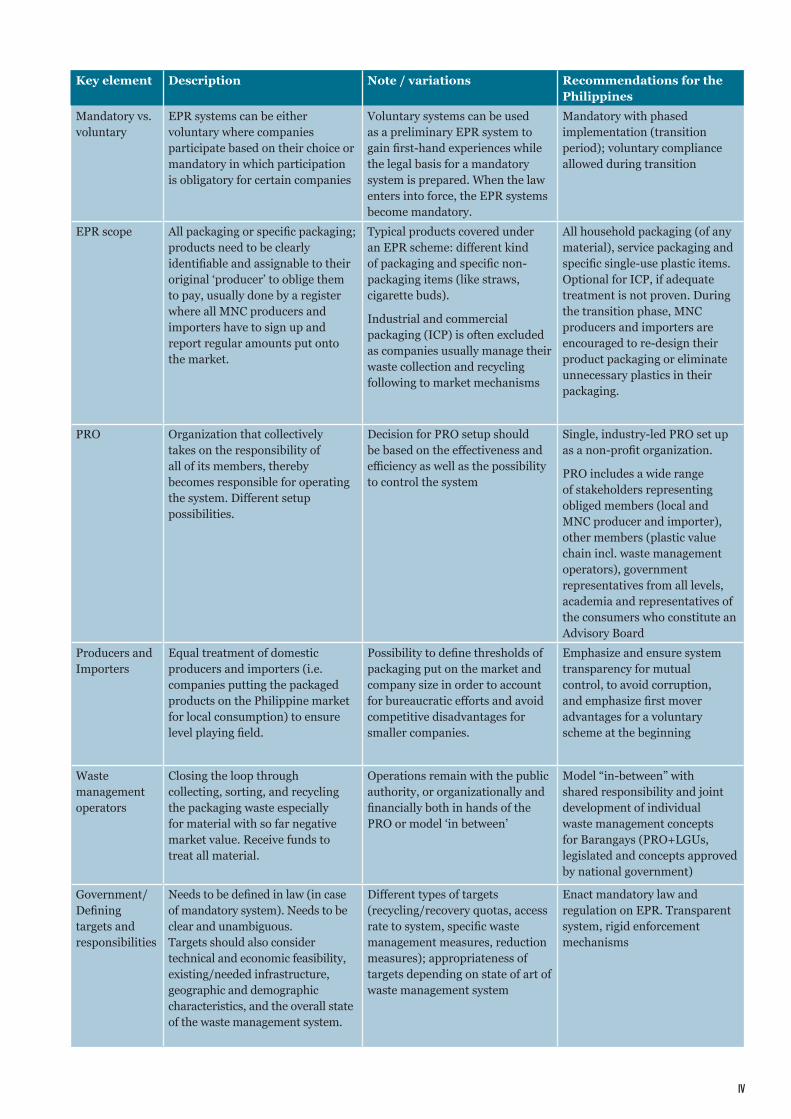
Combining the roles and responsibilities of the relevant stakeholders, the principles of an EPR schemes, and the potential legal framework, the following key elements to consider are summarized below:
IV
Key element Description Note / variations Recommendations for the Philippines
Mandatory vs. voluntary
EPR systems can be either voluntary where companies participate based on their choice or mandatory in which participation is obligatory for certain companies
Voluntary systems can be used as a preliminary EPR system to gain first-hand experiences while the legal basis for a mandatory system is prepared. When the law enters into force, the EPR systems become mandatory.
Mandatory with phased implementation (transition period); voluntary compliance allowed during transition
EPR scope All packaging or specific packaging; products need to be clearly identifiable and assignable to their original ‘producer’ to oblige them to pay, usually done by a register where all MNC producers and importers have to sign up and report regular amounts put onto the market.
Typical products covered under an EPR scheme: different kind of packaging and specific non-packaging items (like straws, cigarette buds).
Industrial and commercial packaging (ICP) is often excluded as companies usually manage their waste collection and recycling following to market mechanisms
All household packaging (of any material), service packaging and specific single-use plastic items. Optional for ICP, if adequate treatment is not proven. During the transition phase, MNC producers and importers are encouraged to re-design their product packaging or eliminate unnecessary plastics in their packaging.
PRO Organization that collectively takes on the responsibility of all of its members, thereby becomes responsible for operating the system. Different setup possibilities.
Decision for PRO setup should be based on the effectiveness and efficiency as well as the possibility to control the system
Single, industry-led PRO set up as a non-profit organization.
PRO includes a wide range of stakeholders representing obliged members (local and MNC producer and importer), other members (plastic value chain incl. waste management operators), government representatives from all levels, academia and representatives of the consumers who constitute an Advisory Board
Producers and Importers
Equal treatment of domestic producers and importers (i.e. companies putting the packaged products on the Philippine market for local consumption) to ensure level playing field.
Possibility to define thresholds of packaging put on the market and company size in order to account for bureaucratic efforts and avoid competitive disadvantages for smaller companies.
Emphasize and ensure system transparency for mutual control, to avoid corruption, and emphasize first mover advantages for a voluntary scheme at the beginning
Waste management operators
Closing the loop through collecting, sorting, and recycling the packaging waste especially for material with so far negative market value. Receive funds to treat all material.
Operations remain with the public authority, or organizationally and financially both in hands of the PRO or model ‘in between’
Model “in-between” with shared responsibility and joint development of individual waste management concepts for Barangays (PRO+LGUs, legislated and concepts approved by national government)
Government/ Defining targets and responsibilities
Needs to be defined in law (in case of mandatory system). Needs to be clear and unambiguous. Targets should also consider technical and economic feasibility, existing/needed infrastructure, geographic and demographic characteristics, and the overall state of the waste management system.
Different types of targets (recycling/recovery quotas, access rate to system, specific waste management measures, reduction measures); appropriateness of targets depending on state of art of waste management system
Enact mandatory law and regulation on EPR. Transparent system, rigid enforcement mechanisms
WWF-PHILIPPINES 2020
TABLE OF CONTENTS1.0 INTRODUCTION 1
2.0 WASTE mANAgEmENT SYSTEm AND RECYCLINg mARkET FOR PLASTIC PACkAgINg WASTE IN THE PHILIPPINES 22.1 PHILIPPINE SOLID WASTE mANAgEmENT 22.1.1 gOVERNmENT INSTITUTIONS AND LEgAL FRAmEWORk 22.1.2 SOLID WASTE mANAgEmENT INFRASTRUCTURE AND OPERATIONALISATION 112.1.3 PLASTICS RECYCLINg 222.1.4 PLASTIC WASTE RECOVERY AND TRADE 282.2 PLASTIC WASTE FLOW ANALYSIS 302.2.1 PLASTIC TYPES AND APPLICATIONS 302.2.2 PLASTIC WASTE COmPOSITION 312.2.3 PLASTIC WASTE FLOW ANALYSIS 332.3 SUmmARY AND ImPLICATIONS OF EPR SCHEmE IN THE PHILIPPINES 42
3.0 THEORY AND CONCEPTS OF EXTENDED PRODUCER RESPONSIBILITY 463.1 ECONOmIC INSTRUmENTS TO STEER WASTE mANAgEmENT 463.2 WORLD WIDE FUND FOR NATURE EPR PROJECT 51
4.0 PROPOSAL OF A CUSTOmIZED EPR SCHEmE FOR THE PHILIPPINES 524.1 EPR OBLIgATION 524.2 ROLE OF THE PRODUCER RESPONSIBILITY ORgANISATION 564.3 ROLE OF THE PRODUCERS AND ImPORTERS 664.4 ROLE OF THE CONSUmERS 694.5 ROLE OF THE WASTE mANAgEmENT OPERATORS 714.6 ROLE OF THE gOVERNmENT 754.7 SUmmARY: kEY ELEmENTS OF AN EPR SYSTEm 77
5.0 ImPLEmENTATION PLAN FOR PROPOSED EPR SCHEmE FOR THE PHILIPPINES 78
6.0 CONCLUSION 82
7.0 ANNEXES 837.1 OVERVIEW AmOUNT OF PRICES FOR RECYCLABLES BY LINIS-gANDA 837.2 OPEN DUmPSITES AND CONTROLLED DISPOSAL FACILITIES IN THE PHILIPPINES 857.3 SANITARY LANDFILLS IN THE PHILIPPINES 867.4 FURTHER RECYCLINg AND RECOVERY COmPANIES AND INITIATIVES 877.5 DTI- STARTINg A BUSINESS – JUNkSHOP & SCRAP BUSINESS 907.6 DATA SOURCES FOR mFA-CALCULATION 917.7 PLASTIC TYPES 927.8 PLASTIC mFA IN THE PHILIPPINES 957.9 SUmmARY FRAmEWORk CONDITIONS FOR EPR IN THE PHILIPPINES 987.10 COUNTRY SPECIFIC CONSIDERATIONS FOR EPR SCHEmE DESIgN, mEASURES 997.11 CONSIDERINg THE INFORmAL SECTOR 1017.12 COmPOSTABLE PACkAgINg 104
BIBLIOgRAPHY 107
gLOSSARY 111
VI
Copyright Credit © Freepik.com
ACkNOWLEDgEmENTSThis report was produced by Consortium Cyclos and AMH-MWTS, published by WWF Philippines
This study has been enriched by the great contribution of key stakeholders in the conducted stakeholder consultations and peer review. Their inputs have been taken into account by the authors BUT do not necessarily represent their opinions and positions. We are grateful for their contributions.
• Asia Brewery Inc.
• Benilde Hub of Innovation For Inclusion
• Break Free From Plastic Movement
• Clean Our Oceans Project
• Coca – Cola
• Department of Environment and Natural Resources – Biodiversity Management Bureau
• Department of Environment and Natural Resources – Environmental Management Bureau
• Department of Health – Food and Drug Administration
• Department of Interior and Local Government – Bureau of Local Government Supervision
• Department of Trade and Industry – Consumer Protection Group
• Ecowaste Coalition
• Global Alliance for Incinerator Alternatives
• Greenpeace Philippines
• Healthcare without Harm
• League of Cities of the Philippines
• League of Provinces
• Local Government of San Fernando City, Pampanga
• Max’s Group of Companies
• Mother Earth Foundation
• Natural Resources Development Corporation
• Nestle Philippines
• Office of Cong. Glona Labadlabad
• Office of Cong. Lord Allan Velasco
• Office of Cong. Rufus Rodriguez
• Office of Sen. Francis Pangilinan
• Office of the President – Office of the Deputy Executive Secretary
• PepsiCo
• Plastic Credit Exchange
• Pure Oceans
• Save Philippine Seas
• Shakey’s Restaurant
• Tetrapak Philippines
WWF is an independent conservation organisation, with over 30 million followers and a global network active in nearly 100 countries. Our mission is to stop the degradation of the planet’s natural environment and to build a future in which people live in harmony with nature, by conserving the world’s biological diversity, ensuring that the use of renewable natural resources is sustainable, and promoting the reduction of pollution and wasteful consumption.
Find out more at wwf.org.ph
Text © WWF Philippines 2020
All rights reserved
WWF-PHILIPPINES 2020
LIST OF FIgURESFIgURE 1: ORgANIZATIONAL STRUCTURE AND THE CORRESPONDINg FUNCTIONS OF
gOVERNmENT AgENCIES´ ROLES 3FIgURE 2: SOLID WASTE mANAgEmENT IN THE CITY LEVEL 4FIgURE 3: WASTE mANAgEmENT HIERARCHY FRAmEWORk AS BASIS FOR RA 9003
[NSWmC, 2018] 4FIgURE 4: LgUS WITH PLASTIC ORDINANCES IN THE PHILIPPINES 10FIgURE 5: SOLID WASTE mANAgEmENT INFRASTRUCTURE 11FIgURE 6: mRFS IN THE PHILIPPINES 13FIgURE 7: SORTINg STATION IN mARIkINA CITY (JANUARY 2016) 14FIgURE 8: COLLECTED RECYCLABLES IN mARIkINA CITY mRF (JANUARY 2016) 14FIgURE 9: PLASTIC DENSIFIER IN mARIkINA CITY mRF (JANUARY 2016) AND PLASTIC
WASTE IS TRANSFORmED INTO BAgS AND OTHER COmmODITIES (AT BRgY. HOLY SPIRIT mRF, FEBRUARY 2020) 14
FIgURE 10: STORAgE CAgES AS mRF [HOkSON, 2015] (LEFT); mRF SERVINg AS A COLLECTION POINT (NOVEmBER 2018) (RIgHT) 15
FIgURE 11: FLOW OF RECYCLABLE WASTES COLLECTED BY LINIS-gANDA 15FIgURE 12: OPEN DUmPSITE (mARCH 2019) (LEFT); SANITARY LANDFILL (OCTOBER
2018) (RIgHT) 16
Publishing office World Wide Fund for Nature Philippines (WWF Philippines)
Design by Avinaash Suresh Narayanan
© 1986 Panda symbol WWF – World Wide Fund For Nature (Formerly World Wildlife Fund) ® “WWF” is a WWF Registered Trademark. WWF-Philippines, 4/F JBD Plaza 65 Mindanao Avenue, Barangay Bagong Pag-Asa, Quezon City 1105Tel: (02) 8 920-7923 / 7926 / 7931 Fax: (02) 8 426-3927Email: [email protected] / [email protected]
For contact details and further information, please visit our international website at www.wwf.org.my
Cover photography: © 9Comeback - Freepik.com
VII
Copyright Credit © Dipshri - Freepik.com
FIgURE 13: mETRO CLARk SANITARY LANDFILL [FILBUILD, N.D.] 18FIgURE 14: STAkEHOLDERS PARTICIPATINg IN COLLECTION 20FIgURE 15: A TYPICAL COASTAL COmmUNITY IN THE PHILIPPINES (BROOkE’S POINT,
PALAWAN, 2012) 22FIgURE 16: HOPEX PLASTIC CREDIT EXCHANgE (PLASTIC CREDIT EXCHANgE, N.D.) 27FIgURE 17: COmPARISON OF TOTAL EXPORT AND ImPORT OF PLASTIC WASTES IN THE
PHILIPPINES 29FIgURE 18: gENERAL WASTE COmPOSITION OF THE STUDY AREAS 32FIgURE 19: WASTE PLASTIC COmPOSITION OF THE STUDY AREAS AT DISPOSAL SITE 32FIgURE 20: COmPOSITION OF PLASTIC WASTES DISPOSED IN STUDY AREAS 33FIgURE 21: gENERAL PLASTIC mFA IN THE PHILIPPINES (2019) 34FIgURE 22: SUmmARY OF PLASTIC mATERIALS FLOW IN THE PHILIPPINES (2019) 35FIgURE 23: PLASTIC CONSUmPTION PER TYPE (2019) 36FIgURE 24: POST-CONSUmER PLASTIC WASTE PER TYPE (2019) 37FIgURE 25: PHILIPPINE PLASTIC RECYCLINg AND RECOVERY STREAmS (2019) 38FIgURE 26: RECYCLED PLASTICS ([PPIA, 2014] 39FIgURE 27: DISTRIBUTION OF PLASTIC WASTE TO DIFFERENT DISPOSAL SITES (2019) 46FIgURE 28: DISPOSED PLASTIC WASTE PER TYPE IN THE PHILIPPINES 40FIgURE 29: PLASTIC WASTE LEAkAgE PER TYPE IN THE PHILIPPINES 41FIgURE 30: COmPOSITION OF PLASTICS FOUND IN LEAkAgE BASED ON THIS STUDY 41FIgURE 31: COLLECTIVE RESPONSIBILITY 49FIgURE 32: OVERCOmINg THE NET FINANCINg gAP FOR PLASTIC WASTE
mANAgEmENT [OCEAN CONSERVANCY, 2020] 51FIgURE 33: EPR SCHEmE STRUCTURE SHOWINg SINgLE AND mULTIPLE PROS 62FIgURE 34: INTERFACE FOR OBLIgED COmPANIES TO REgISTER AND REPORT 67FIgURE 35: TECHNICAL SUPPORTED mANUAL SORTINg IN PEkINg, CHINA; SOURCE:
CYCLOS 74FIgURE 36: SORTED PLASTIC FRACTIONS; SOURCE: CYCLOS 75FIgURE 37: OPEN DUmPSITES AND CONTROLLED DISPOSAL FACILITIES IN THE
PHILIPPINES 84 FIgURE 38: SANITARY LANDFILLS IN THE PHILIPPINES 85FIgURE 39: PLASTIC WASTE PROCESSINg FACILITIES IN THE PHILIPPINES 89FIgURE 40: DTI STARTINg A BUSINESS – JUNkSHOP & STARTINg A BUSINESS 90FIgURE 41: PLASTIC mFA IN THE PHILIPPINES (2019) 95FIgURE 42: DETAILED mFA OF PLASTIC WASTES IN THE PHILIPPINES (2019) 97FIgURE 43: INFORmAL WORkERS SORTINg OUT RECYCLABLES FROm DUmPSITES AND
AggREgATINg IT (SOURCE: AmH) 101FIgURE 44: LITTERINg ON A BEACH IN ACCRA (LEFT PICTURE), WEIgHINg OF
COLLECTED PET-BOTTLES AND DELIVERY / STORAgE IN BIg BAgS (CENTRE AND RIgHT PICTURE; TAkEN ACCRA, gHANA, BY CYCLOS) 103
WWF-PHILIPPINES 2020
LIST OF TABLESTABLE 1: LIST OF mOST ImPORTANT BILLS ADDRESSINg PLASTICS 7
TABLE 2: COLLECTION EFFICIENCIES PER REgION IN THE PHILIPPINES 12
TABLE 3: COLLECTION EFFICIENCIES OF STUDY SITES 12
TABLE 4: NUmBER OF DISPOSAL SITES IN THE PHILIPPINES 16
TABLE 5: CATEgORIES OF FINAL DISPOSAL FACILITIES - SANITARY LANDFILL
[NSWmC, 2006] 17
TABLE 6: TOTAL AREA AND CATEgORY OF THE SELECTED SLFS IN THE PHILIPPINES 17
TABLE 7: STAkEHOLDERS IN THE RECYCLINg INDUSTRY 19
TABLE 8: RESPONSIBILITY OF STAkEHOLDERS FOR RECYCLINg DEFINED BY RA 9003
AND ITS IRR [JICA, 2008] 23
TABLE 9: gOVERNmENT INCENTIVES AND THE RESPONSIBLE ORgANIZATIONS
[JICA, 2008] 25
TABLE 10: SUmmARY OF COmPANIES AND THEIR INITIATIVES 25
TABLE 11: LOCATION, CLASSIFICATION AND POPULATION DENSITY OF STUDY AREAS 31
TABLE 12: PLASTIC CONSUmPTION OF SELECTED COUNTRIES IN ASIA IN 2019
[EUROmAP, 2016] 36
TABLE 13: RECYCLINg RATES AND VOLUmES FOR kEY PLASTIC gRADES IN THE
PHILIPPINES IN 2019 39
TABLE 14: SUmmARY OF kEY RESULTS OF PLASTIC mFA (2019) 44
TABLE 15: EPR FEES AND gREEN TAXES IN COmPARISON 47
TABLE 16: COmPARINg COLLECTIVE AND INDIVIDUAL EPR SYSTEm 49
TABLE 17: COmPARINg mANDATORY AND VOLUNTARY EPR SCHEmES 53
TABLE 18: COmPARINg EPR FOR ALL PACkAgINg VS. PRO SPECIFIC PACkAgINg 55
TABLE 19: CATEgORIES OF PACkAgINg COVERED BY EU EPR SCHEmES, mODIFIED
AFTER [IEEP, 2017] 56
TABLE 20: COmPARISON INDUSTRY-LED VS. STATE-LED PRO 59
TABLE 21: COmPARINg FOR-PROFIT AND NON-PROFIT PROS 62
TABLE 22: EXAmPLE: EPR FEES FOR DIFFERENT PACkAgINg TYPES 64
TABLE 23: kEY ELEmENTS TO CONSIDER FOR AN EPR SCHEmE 77
TABLE 24: BUILD FOUNDATION FOR EPR WITH FOCUS ON CAPACITY BUILDINg 79
TABLE 25: STImULATE A HOLISTIC, BASIC WASTE mANAgEmENT 80
VIII
Copyright Credit © Jcomp - Freepik.com
TABLE 26: AmOUNT OF RECYCLABLE WASTES IN QUEZON CITY PURCHASED BY LINIS-
gANDA [QUEZON CITY EmPCI, 2019] 83
TABLE 27: AmOUNT OF RECYCLABLE WASTES IN mETRO mANILA PURCHASED BY
LINIS-gANDA 84
TABLE 28: PRICES OF RECYCLABLE PLASTIC WASTES FROm VARIOUS SITES SHOWINg
SIgNIFICANT DIFFERENCE IN DTI PRICE ESTImATES COmPARED TO ACTUAL
PRICES (PRICES IN PHP) 84
TABLE 29: ENERgY RECOVERY PLANTS IN THE PHILIPPINES 87
TABLE 30: PLASTIC DIVERSION CREDIT EQUIVALENT 87
TABLE 31: LIST OF INITIATIVES FROm DIFFERENT STAkEHOLDERS 88
TABLE 32: PLASTIC TYPES 96
TABLE 33: BREAkDOWN OF PLASTIC WASTES IN THE PHILIPPINES IN THOUSAND
TONNES (2019) 97
TABLE 34: BREAkDOWN OF PLASTIC WASTES IN THE PHILIPPINES IN THOUSAND
TONNES (2019] 98
TABLE 35: SUmmARY EPR ASSESSmENT FOR PHILIPPINES [WWF, CYCLOS, 2019 98
TABLE 36: COLLECTION OF PACkAgINg AND mATERIAL TYPES FROm HOUSEHOLD
WASTE THROUgH THE INFORmAL SECTOR 102
TABLE 37: ASPECTS TO CONSIDER UPON USINg BIODEgRADABLE PLASTICS 105
WWF-PHILIPPINES 2020
ACRONYmSAmH AmH PHILIPPINES, INC.
APmP ASSOCIATION OF PETROCHEmICAL mANUFACTURERS OF THE PHILIPPINES
BOI PHILIPPINE BOARD OF INVESTmENTS
CDF CONTROLLED DISPOSAL FACILITY
DENR DEPARTmENT OF ENVIRONmENT AND NATURAL RESOURCES
DOST DEPARTmENT OF SCIENCE AND TECHNOLOgY
DTI DEPARTmENT OF TRADE AND INDUSTRY
EmB ENVIRONmENT mANAgEmENT BUREAU
EPR EXTENDED PRODUCER RESPONSIBILITY
FmCg FAST mOVINg CONSUmER gOODS
HUC HIgHLY URBANIZED CITY
ITDI INDUSTRIAL TECHNOLOgY DEVELOPmENT INSTITUTE
JICA JAPAN INTERNATIONAL COOPERATION AgENCY
LgU LOCAL gOVERNmENT UNIT
mFA mATERIALS FLOW ANALYSIS
mNC mULTI-NATIONAL COmPANY
mRF mATERIALS RECOVERY FACILITY
mSW mUNICIPAL SOLID WASTE
mWTS mANILA WATER TOTAL SOLUTIONS CORPORATION
NCR NATIONAL CAPITAL REgION
NEDA NATIONAL ECONOmIC DEVELOPmENT AUTHORITY
NgO NON-gOVERNmENT ORgANIZATION
NSWmC NATIONAL SOLID WASTE mANAgEmENT COmmISSION
NSWmS NATIONAL SOLID WASTE mANAgEmENT STRATEgY
OD OPEN DUmPSITE
X
Copyright Credit © Jcomp - Freepik.com
PARmS PHILIPPINE ALLIANCE FOR RECYCLINg AND mATERIALS SUSTAINABILITY
PHP PHILIPPINE PESO
PPIA PHILIPPINE PLASTIC INDUSTRY ASSOCIATION, INC.
PRO PRODUCER RESPONSIBILITY ORgANISATION
PSA PHILIPPINE STATISTICS AUTHORITY
RA REPUBLIC ACT
RDF REFUSED-DERIVED FUEL
SLF SANITARY LANDFILL
SUP SINgLE-USE PLASTICS
SWm SOLID WASTE mANAgEmENT
TPD TONNES PER DAY
WACS WASTE ANALYSIS AND CHARACTERIZATION STUDY
WTE WASTE-TO-ENERgY
WWF-PHILIPPINES 2020
1. INTRODUCTIONPlastic pollution has reached gigantic dimensions worldwide and has caused serious consequences to marine life and well-being of society. Approximately 4.8 to 12.7 million tonnes of plastics are entering the ocean yearly [Jambeck et al., 2015]. The root causes of plastic waste leakage into the environment are the unabated production of new plastics and the lack of sound waste collection and treatment systems. Open dumping and littering of plastic waste do not only cause severe environmental and hygienic hazards but are also one of the main reasons for polluting terrestrial, waterways and oceans. In 2012, World Bank reported the global generation of 1.3 billion tonnes of solid waste in a year. With the rapid population growth and improvement of household income, the waste generation is expected to increase to 2.2 billion tonnes by the year of 2025 [Hoornweg and Bhadatata, 2012]. The annual cost of waste management is projected to rise from $205 billion to $375 billion, almost 83% of increase.
On a global scale, 32% of packaging waste leaks into the environment. In low-income countries, the costs for waste management comprises of, on average, 19% of the municipal budget, compared to only 4% in high-income countries [The World Bank, 2018]. Low- and middle-income countries often face budget shortfalls for waste management. The collection of packaging waste is essential for building up the reuse and recycling system towards a circular economy.
In the Philippines, plastic waste makes up a significant share of the overall generated waste. Despite government data on the shocking figures of waste generated each year, the recycling rate of post-consumption plastic packaging among Filipinos is still relatively low. Municipal Solid Waste (MSW) management is constantly challenged by the increasing amount of waste with the limited resources and infrastructures in place. Some of the major challenges include inadequacy of waste facilities due to constraints in funding and manpower, and the poorly implemented regulations for the recyclables market.
Extended Producer Responsibility (EPR) aims to reduce the economic and environmental burdens of waste management by extending the responsibility of producers to the end-of-life of their products. EPR has been widely implemented in European countries and draws positive results. However, there is currently no EPR system in place in the Philippines.
Very often the economic concern over environmental benefits is raised when it comes to the implementation of environmental policy, whether the environmental gains from the scheme or policy are sufficient to justify the adoption of a new scheme and its cost of operation and administration. The same question is highlighted for EPR schemes. A study on practical experiences of EPR schemes and programmes in other countries that draw on the effectiveness and gaps of EPR programmes implemented can therefore make a key contribution for Filipino decision-makers to identify approaches that are practicable, reasonably comprehensive, and that will yield meaningful results.
The evaluation framework is built on a thorough analysis of the Philippine waste management system and recycling market for plastic packaging waste,
IN THE PHILIPPINES,PLASTIC WASTE mAkES UP A
SIgNIFICANT SHARE OF THE OVERALL gENERATED WASTE.
EXTENDED PRODUCER RESPONSIBILITY (EPR)
AImS TO REDUCE THE ECONOmIC AND
ENVIRONmENTAL BURDENS OF WASTE mANAgEmENT
BY EXTENDINg THE RESPONSIBILITY OF
PRODUCERS TO THE END-OF-LIFE OF THEIR PRODUCTS
2
which serves as foundation for the proposed EPR scheme, that is triangulated from the contextual conditions and international experiences. The finding and strategic recommendations from the EPR schemes review and analysis help to strengthen WWF’s engagement with government and businesses towards achieving “No Plastic In Nature” by 2030.
Ultimately, the findings from the proposed study shall provide reference and support to government for the National Solid Waste Management Strategy, Local Solid Waste Management Plans, and the proposed National Plan of Action on Marine Litter. The study can also inform legislative reforms, or the crafting and development of new and innovative legislation.
2. WASTE mANAgEmENT SYSTEm AND RECYCLINg mARkET FOR PLASTIC PACkAgINg WASTE IN THE PHILIPPINESEPR schemes need to be tailored to the country-specific conditions. Thus, understanding the existing waste management system and recycling market is an essential prerequisite, including the legal structure and regulations that are in place with particular focus on plastic wastes. Moreover, a Plastic Material Flow Analysis (MFA) for quantifying the plastic inputs and outputs, and estimate recycling rates for the different plastic types provides further depth for subsequent EPR recommendations.
2.1 PHILIPPINE SOLID WASTE mANAgEmENT2.1.1 gOVERNmENT INSTITUTIONS AND LEgAL FRAmEWORkINSTITUTIONAL STRUCTURE OF SOLID WASTE mANAgEmENTThe National Solid Waste Management Commission (NSWMC) is the main government entity in charge of solid waste management policy making and monitoring implementation of law and national and local SWM plans. The basic framework for regulations and operations on solid waste management is hinged upon Republic Act (RA) No. 9003, or the Ecological Solid Waste Management Act of 2000. Aside from the law’s implementing rules and regulations (i.e., see DENR Administrative Order (DAO) No. 2001-34), there are also local ordinances related to various aspects of waste management.
Under the Office of the President, the NSWMC’s main duty is to prescribe policies to attain the objects of RA 9003 and to oversee the overall implementation of the solid waste management plans and programs. The NSWMC is led by the Department of Environment and Natural Resources (DENR) with fourteen government sectoral members and three private sectoral members. Representatives from the private sector consist of one member each from a non-governmental organization, the recycling industry, and the manufacturing and packaging industries.
WWF-PHILIPPINES 2020
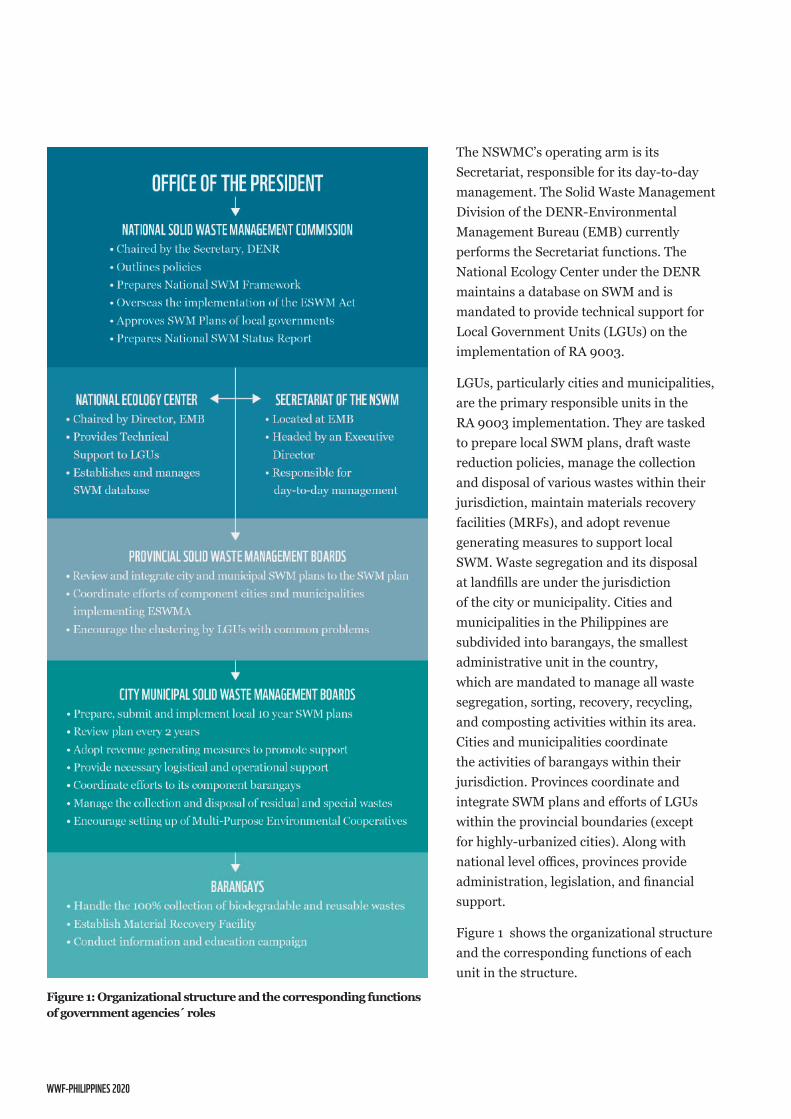
The NSWMC’s operating arm is its Secretariat, responsible for its day-to-day management. The Solid Waste Management Division of the DENR-Environmental Management Bureau (EMB) currently performs the Secretariat functions. The National Ecology Center under the DENR maintains a database on SWM and is mandated to provide technical support for Local Government Units (LGUs) on the implementation of RA 9003.
LGUs, particularly cities and municipalities, are the primary responsible units in the RA 9003 implementation. They are tasked to prepare local SWM plans, draft waste reduction policies, manage the collection and disposal of various wastes within their jurisdiction, maintain materials recovery facilities (MRFs), and adopt revenue generating measures to support local SWM. Waste segregation and its disposal at landfills are under the jurisdiction of the city or municipality. Cities and municipalities in the Philippines are subdivided into barangays, the smallest administrative unit in the country, which are mandated to manage all waste segregation, sorting, recovery, recycling, and composting activities within its area. Cities and municipalities coordinate the activities of barangays within their jurisdiction. Provinces coordinate and integrate SWM plans and efforts of LGUs within the provincial boundaries (except for highly-urbanized cities). Along with national level offices, provinces provide administration, legislation, and financial support.
Figure 1 shows the organizational structure and the corresponding functions of each unit in the structure.
Figure 1: Organizational structure and the corresponding functions of government agencies ́roles
4
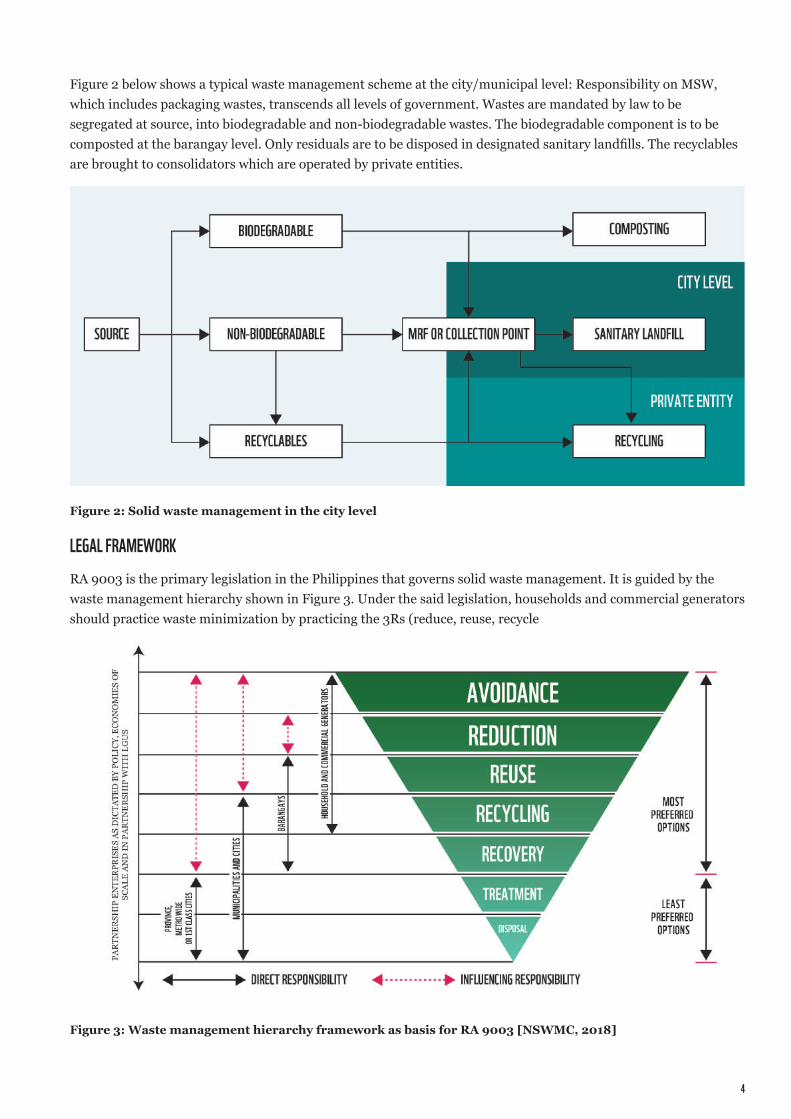
Figure 2 below shows a typical waste management scheme at the city/municipal level: Responsibility on MSW, which includes packaging wastes, transcends all levels of government. Wastes are mandated by law to be segregated at source, into biodegradable and non-biodegradable wastes. The biodegradable component is to be composted at the barangay level. Only residuals are to be disposed in designated sanitary landfills. The recyclables are brought to consolidators which are operated by private entities.
LEgAL FRAmEWORkRA 9003 is the primary legislation in the Philippines that governs solid waste management. It is guided by the waste management hierarchy shown in Figure 3. Under the said legislation, households and commercial generators should practice waste minimization by practicing the 3Rs (reduce, reuse, recycle
Figure 2: Solid waste management in the city level
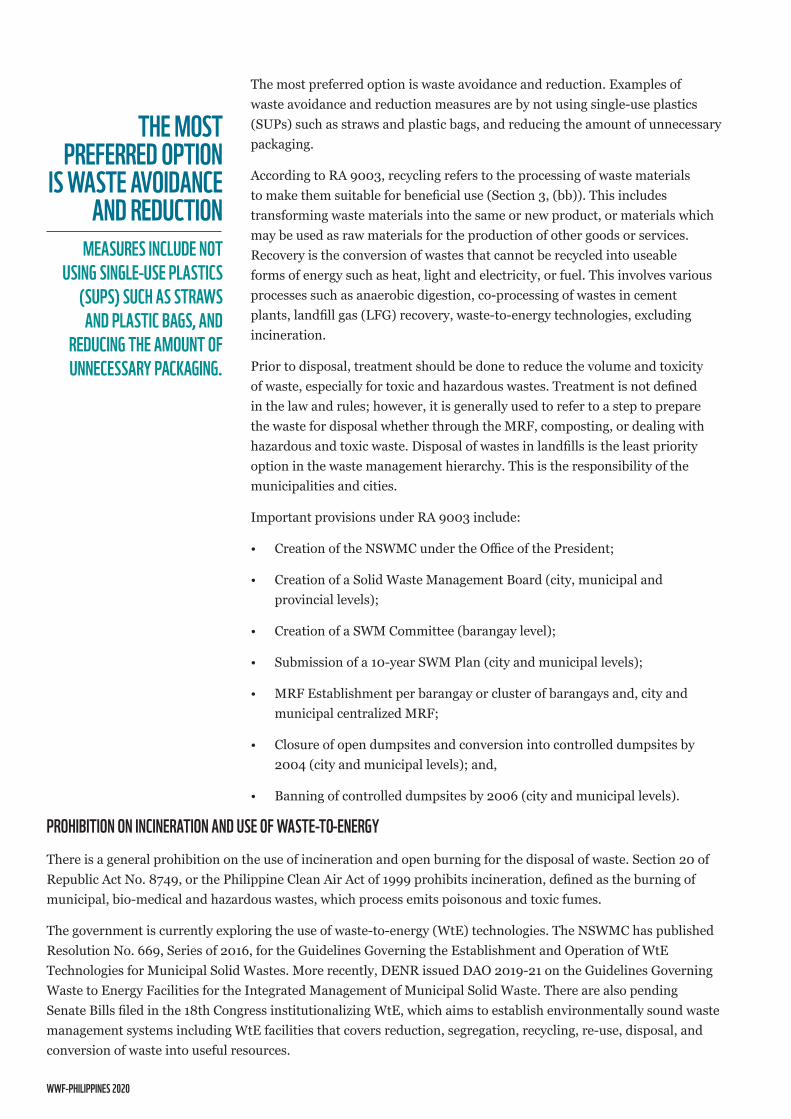
Figure 3: Waste management hierarchy framework as basis for RA 9003 [NSWMC, 2018]
WWF-PHILIPPINES 2020
The most preferred option is waste avoidance and reduction. Examples of waste avoidance and reduction measures are by not using single-use plastics (SUPs) such as straws and plastic bags, and reducing the amount of unnecessary packaging.
According to RA 9003, recycling refers to the processing of waste materials to make them suitable for beneficial use (Section 3, (bb)). This includes transforming waste materials into the same or new product, or materials which may be used as raw materials for the production of other goods or services. Recovery is the conversion of wastes that cannot be recycled into useable forms of energy such as heat, light and electricity, or fuel. This involves various processes such as anaerobic digestion, co-processing of wastes in cement plants, landfill gas (LFG) recovery, waste-to-energy technologies, excluding incineration.
Prior to disposal, treatment should be done to reduce the volume and toxicity of waste, especially for toxic and hazardous wastes. Treatment is not defined in the law and rules; however, it is generally used to refer to a step to prepare the waste for disposal whether through the MRF, composting, or dealing with hazardous and toxic waste. Disposal of wastes in landfills is the least priority option in the waste management hierarchy. This is the responsibility of the municipalities and cities.
Important provisions under RA 9003 include:
• Creation of the NSWMC under the Office of the President;
• Creation of a Solid Waste Management Board (city, municipal and provincial levels);
• Creation of a SWM Committee (barangay level);
• Submission of a 10-year SWM Plan (city and municipal levels);
• MRF Establishment per barangay or cluster of barangays and, city and municipal centralized MRF;
• Closure of open dumpsites and conversion into controlled dumpsites by 2004 (city and municipal levels); and,
• Banning of controlled dumpsites by 2006 (city and municipal levels).
PROHIBITION ON INCINERATION AND USE OF WASTE-TO-ENERgYThere is a general prohibition on the use of incineration and open burning for the disposal of waste. Section 20 of Republic Act No. 8749, or the Philippine Clean Air Act of 1999 prohibits incineration, defined as the burning of municipal, bio-medical and hazardous wastes, which process emits poisonous and toxic fumes.
The government is currently exploring the use of waste-to-energy (WtE) technologies. The NSWMC has published Resolution No. 669, Series of 2016, for the Guidelines Governing the Establishment and Operation of WtE Technologies for Municipal Solid Wastes. More recently, DENR issued DAO 2019-21 on the Guidelines Governing Waste to Energy Facilities for the Integrated Management of Municipal Solid Waste. There are also pending Senate Bills filed in the 18th Congress institutionalizing WtE, which aims to establish environmentally sound waste management systems including WtE facilities that covers reduction, segregation, recycling, re-use, disposal, and conversion of waste into useful resources.
THE mOST PREFERRED OPTION
IS WASTE AVOIDANCE AND REDUCTION
mEASURES INCLUDE NOT USINg SINgLE-USE PLASTICS
(SUPS) SUCH AS STRAWS AND PLASTIC BAgS, AND
REDUCINg THE AmOUNT OF UNNECESSARY PACkAgINg.
6
NATIONAL ACTION PLANSNational Solid Waste Management Strategy
The NSWMC through the DENR – EMB developed the National Solid Waste Management Strategy (NSWMS) for 2012-2016. The document provides medium-term plans to materialize the National SWM Framework, implement the provisions of RA 9003 and its implementing rules and regulations, and mainstream policies into the Philippine SWM sector. The strategy consists of seven (7) major and three (3) cross-cutting components, namely (NSWMC, 2012):
• Bridging policy gaps and harmonizing policies
• Capacity development, social marketing and advocacy
• Sustainable SWM financing mechanisms
• Creating economic opportunities
• Support for knowledge management on technology, innovation, and research
• Organizational development and enhancing inter-agency collaboration
• Compliance monitoring, enforcement, and recognition
• Cross-cutting issues: Good SWM governance, caring for vulnerable groups, reducing disaster and climate change risks
The Commission has yet to develop updated strategies after 2016. Nevertheless, NSWMC contributed in the development of the Philippine Development Plan for 2017 – 2020, as a member of the planning committee.
Philippine Development Plan
The Philippine Development Plan for 2017-2022 published by the National Economic and Development Authority (NEDA) targets a national solid waste diversion rate of 80% by 2022. This target is quite challenging given that the 2015 waste diversion rates in Metro Manila and outside Metro Manila were reported at only 48% and 46%, respectively. To achieve the targets, one of the key strategies is to improve solid waste management through the following activities (NEDA, 2017):
• Enforce the compliance of LGUs to RA 9003
• Promote the practice of 3Rs and proper waste management
• Promote strategic clustering of sanitary landfills and SWM technologies to address their large capital requirement, and allow low-income LGUs to pool their resources to finance such facilities
• Provide alternative livelihood activities for waste pickers in the remaining dumpsites identified for closure
In addition, sustainable consumption and production will be promoted thru the following activities
• Formulate a “polluters pay” policy and implement corresponding measures
• Establish a sustainable market for recyclables and recycled products
• Strengthen the certification and establish information systems for green products and services
• Strengthen the implementation of Philippine Green Jobs Act of 2016 (RA 10771)
• Promote green procurement in the public and private sectors
• Strengthen the promotion, development, transfer, and adoption of eco-friendly technologies, systems, and practices in the public and private sectors by increasing access to incentives and facilitating ease of doing business and other related transactions, among others
WWF-PHILIPPINES 2020
National Plan of Action on Marine Litter
The Philippine government, through the various DENR offices, is currently finalizing the National Plan of Action on Marine Litter [dated May 2020]. The National Plan of Action on Marine Litter is a strategic document that will provide overall direction, indicators, and targets to manage and minimize marine debris, including plastics. As of the date of this report, DENR is conducting public consultations to finalize the draft Plan. Among the activities that are being planned are the following: a) Establish science- and evidence-based baseline information on marine litter; b) Promote circular economy and support sustainable consumption and production (SCP) – with EPR as one of the schemes and methods to be used; c) Enhance recovery and recycling coverage and markets; d) Prevent leakage from collected or disposed waste; e) Implement a sea-based litter prevention and management program; and f) Institutionalize a management program for litter already existing in the marine/riverine environment. The plan also calls for the adoption of national level laws and policies to address marine litter, including improving recycling and waste management operations.
Specific regulations on the use of plastics
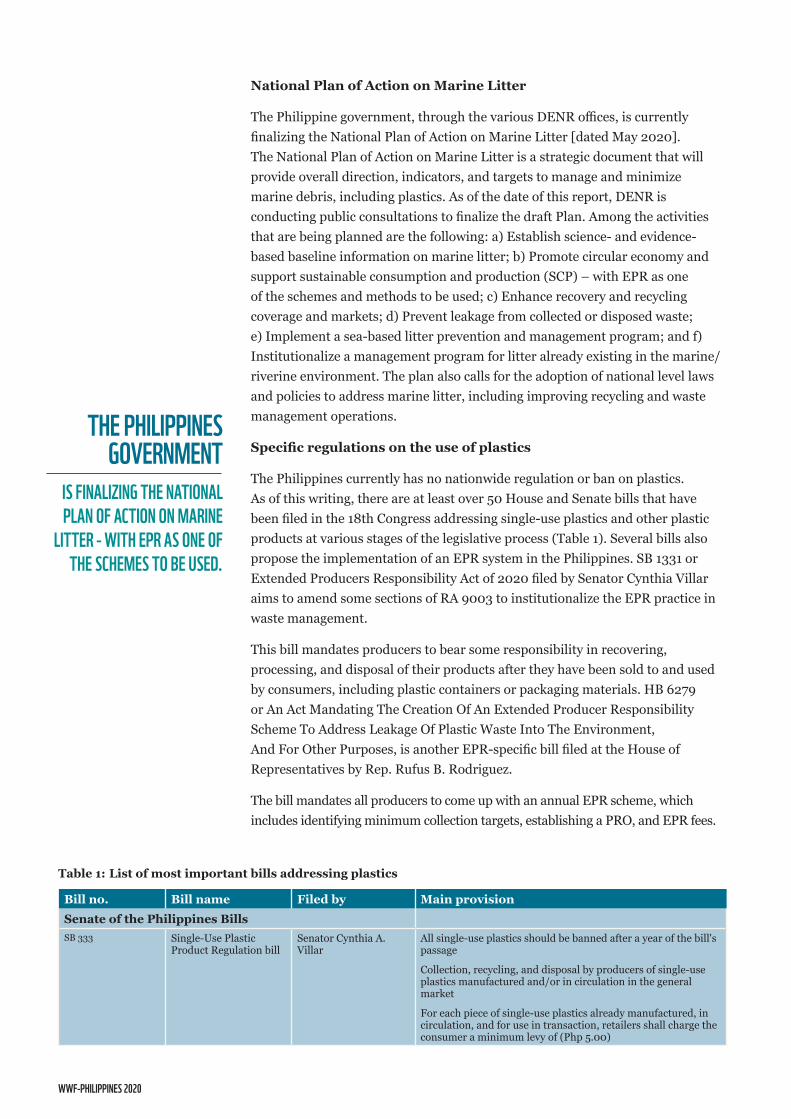
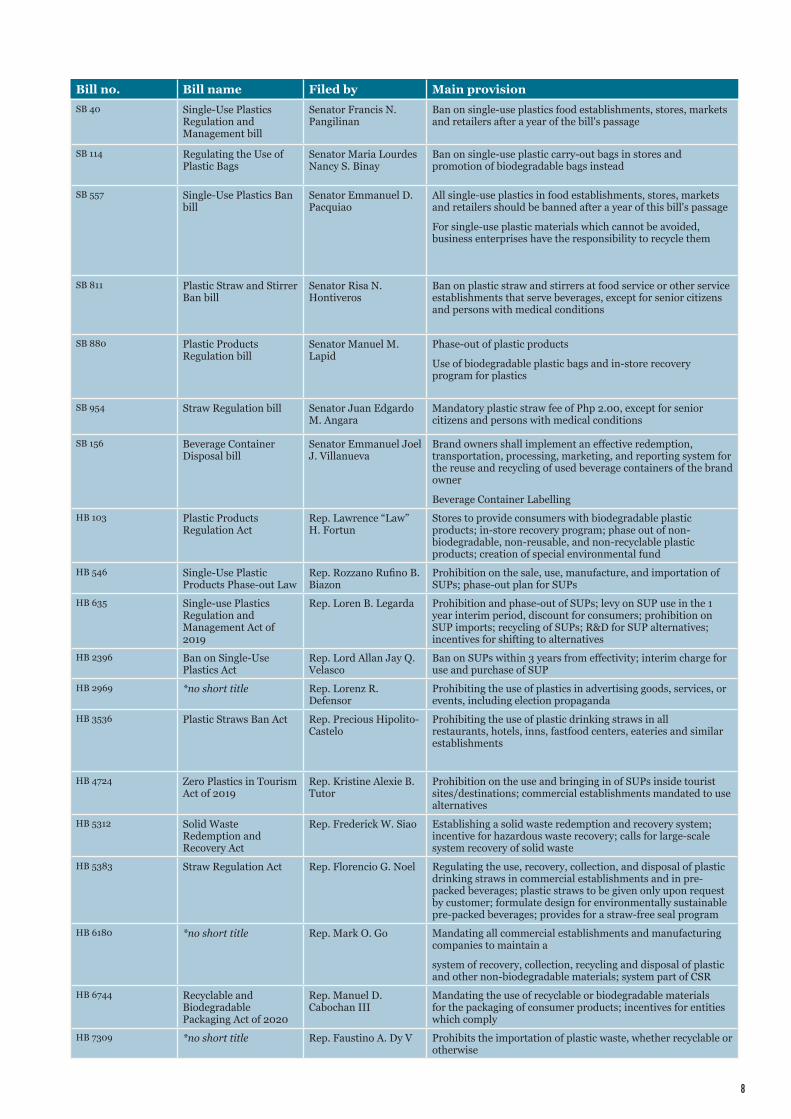
The Philippines currently has no nationwide regulation or ban on plastics. As of this writing, there are at least over 50 House and Senate bills that have been filed in the 18th Congress addressing single-use plastics and other plastic products at various stages of the legislative process (Table 1). Several bills also propose the implementation of an EPR system in the Philippines. SB 1331 or Extended Producers Responsibility Act of 2020 filed by Senator Cynthia Villar aims to amend some sections of RA 9003 to institutionalize the EPR practice in waste management.
This bill mandates producers to bear some responsibility in recovering, processing, and disposal of their products after they have been sold to and used by consumers, including plastic containers or packaging materials. HB 6279 or An Act Mandating The Creation Of An Extended Producer Responsibility Scheme To Address Leakage Of Plastic Waste Into The Environment, And For Other Purposes, is another EPR-specific bill filed at the House of Representatives by Rep. Rufus B. Rodriguez.
The bill mandates all producers to come up with an annual EPR scheme, which includes identifying minimum collection targets, establishing a PRO, and EPR fees.
Bill no. Bill name Filed by Main provisionSenate of the Philippines Bills SB 333 Single-Use Plastic
Product Regulation billSenator Cynthia A. Villar
All single-use plastics should be banned after a year of the bill's passage
Collection, recycling, and disposal by producers of single-use plastics manufactured and/or in circulation in the general market
For each piece of single-use plastics already manufactured, in circulation, and for use in transaction, retailers shall charge the consumer a minimum levy of (Php 5.00)
THE PHILIPPINES gOVERNmENT
IS FINALIZINg THE NATIONAL PLAN OF ACTION ON mARINE
LITTER - WITH EPR AS ONE OF THE SCHEmES TO BE USED.
Table 1: List of most important bills addressing plastics
Bill no. Bill name Filed by Main provisionSenate of the Philippines Bills SB 333 Single-Use Plastic
Product Regulation billSenator Cynthia A. Villar
All single-use plastics should be banned after a year of the bill's passage
Collection, recycling, and disposal by producers of single-use plastics manufactured and/or in circulation in the general market
For each piece of single-use plastics already manufactured, in circulation, and for use in transaction, retailers shall charge the consumer a minimum levy of (Php 5.00)
8
SB 40 Single-Use Plastics Regulation and Management bill
Senator Francis N. Pangilinan
Ban on single-use plastics food establishments, stores, markets and retailers after a year of the bill's passage
SB 114 Regulating the Use of Plastic Bags
Senator Maria Lourdes Nancy S. Binay
Ban on single-use plastic carry-out bags in stores and promotion of biodegradable bags instead
SB 557 Single-Use Plastics Ban bill
Senator Emmanuel D. Pacquiao
All single-use plastics in food establishments, stores, markets and retailers should be banned after a year of this bill's passage
For single-use plastic materials which cannot be avoided, business enterprises have the responsibility to recycle them
SB 811 Plastic Straw and Stirrer Ban bill
Senator Risa N. Hontiveros
Ban on plastic straw and stirrers at food service or other service establishments that serve beverages, except for senior citizens and persons with medical conditions
SB 880 Plastic Products Regulation bill
Senator Manuel M. Lapid
Phase-out of plastic products
Use of biodegradable plastic bags and in-store recovery program for plastics
SB 954 Straw Regulation bill Senator Juan Edgardo M. Angara
Mandatory plastic straw fee of Php 2.00, except for senior citizens and persons with medical conditions
SB 156 Beverage Container Disposal bill
Senator Emmanuel Joel J. Villanueva
Brand owners shall implement an effective redemption, transportation, processing, marketing, and reporting system for the reuse and recycling of used beverage containers of the brand owner
Beverage Container LabellingHB 103 Plastic Products
Regulation Act Rep. Lawrence “Law” H. Fortun
Stores to provide consumers with biodegradable plastic products; in-store recovery program; phase out of non-biodegradable, non-reusable, and non-recyclable plastic products; creation of special environmental fund
HB 546 Single-Use Plastic Products Phase-out Law
Rep. Rozzano Rufino B. Biazon
Prohibition on the sale, use, manufacture, and importation of SUPs; phase-out plan for SUPs
HB 635 Single-use Plastics Regulation and Management Act of 2019
Rep. Loren B. Legarda Prohibition and phase-out of SUPs; levy on SUP use in the 1 year interim period, discount for consumers; prohibition on SUP imports; recycling of SUPs; R&D for SUP alternatives; incentives for shifting to alternatives
HB 2396 Ban on Single-Use Plastics Act
Rep. Lord Allan Jay Q. Velasco
Ban on SUPs within 3 years from effectivity; interim charge for use and purchase of SUP
HB 2969 *no short title Rep. Lorenz R. Defensor
Prohibiting the use of plastics in advertising goods, services, or events, including election propaganda
HB 3536 Plastic Straws Ban Act Rep. Precious Hipolito-Castelo
Prohibiting the use of plastic drinking straws in all restaurants, hotels, inns, fastfood centers, eateries and similar establishments
HB 4724 Zero Plastics in Tourism Act of 2019
Rep. Kristine Alexie B. Tutor
Prohibition on the use and bringing in of SUPs inside tourist sites/destinations; commercial establishments mandated to use alternatives
HB 5312 Solid Waste Redemption and Recovery Act
Rep. Frederick W. Siao Establishing a solid waste redemption and recovery system; incentive for hazardous waste recovery; calls for large-scale system recovery of solid waste
HB 5383 Straw Regulation Act Rep. Florencio G. Noel Regulating the use, recovery, collection, and disposal of plastic drinking straws in commercial establishments and in pre-packed beverages; plastic straws to be given only upon request by customer; formulate design for environmentally sustainable pre-packed beverages; provides for a straw-free seal program
HB 6180 *no short title Rep. Mark O. Go Mandating all commercial establishments and manufacturing companies to maintain a
system of recovery, collection, recycling and disposal of plastic and other non-biodegradable materials; system part of CSR
HB 6744 Recyclable and Biodegradable Packaging Act of 2020
Rep. Manuel D. Cabochan III
Mandating the use of recyclable or biodegradable materials for the packaging of consumer products; incentives for entities which comply
HB 7309 *no short title Rep. Faustino A. Dy V Prohibits the importation of plastic waste, whether recyclable or otherwise
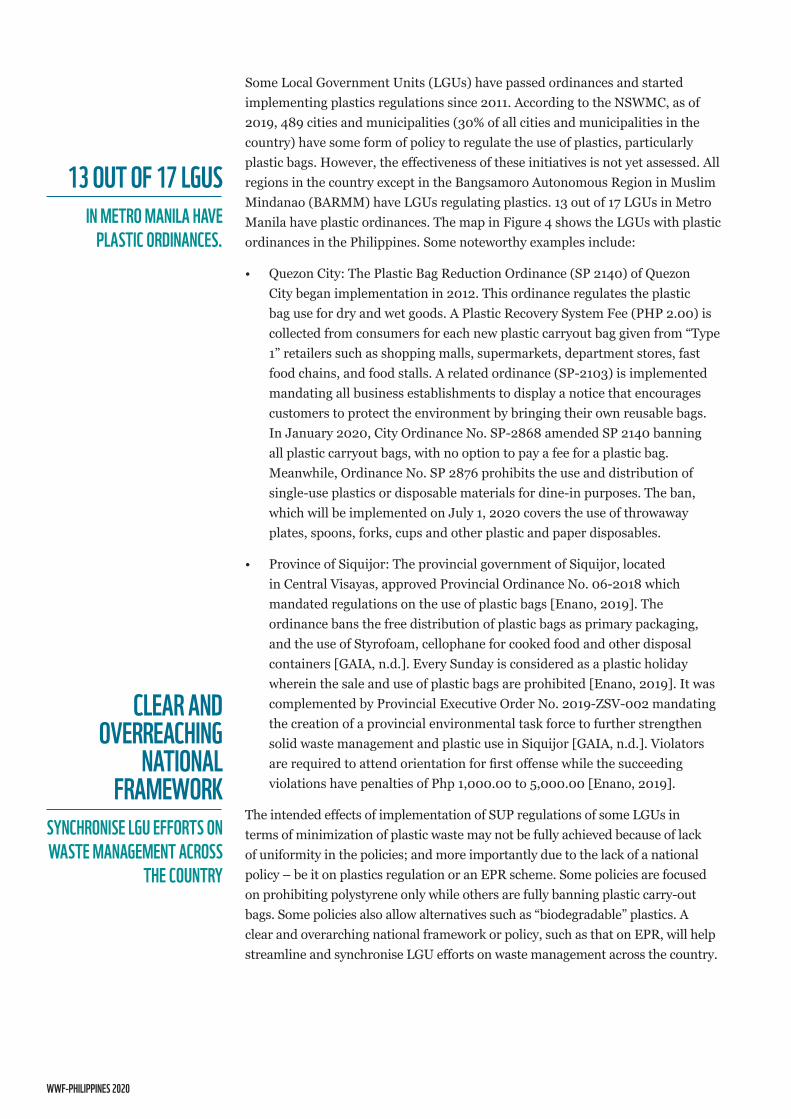
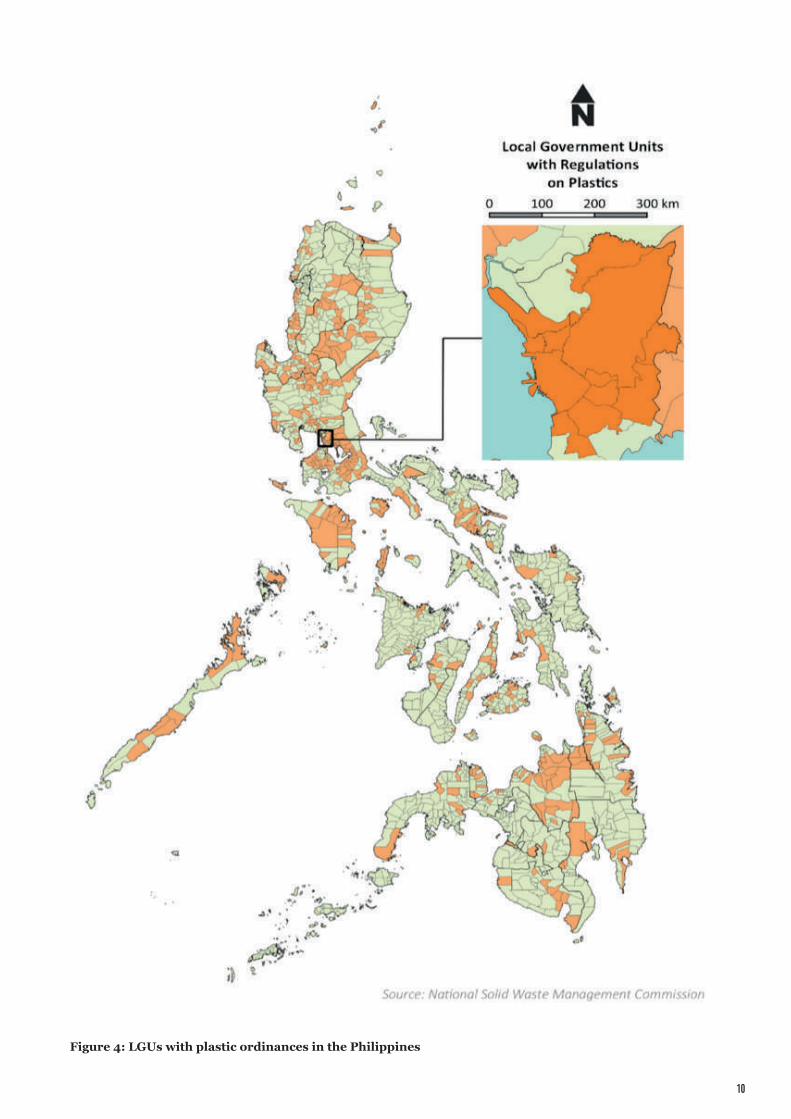
Some Local Government Units (LGUs) have passed ordinances and started implementing plastics regulations since 2011. According to the NSWMC, as of 2019, 489 cities and municipalities (30% of all cities and municipalities in the country) have some form of policy to regulate the use of plastics, particularly plastic bags. However, the effectiveness of these initiatives is not yet assessed. All regions in the country except in the Bangsamoro Autonomous Region in Muslim Mindanao (BARMM) have LGUs regulating plastics. 13 out of 17 LGUs in Metro Manila have plastic ordinances. The map in Figure 4 shows the LGUs with plastic ordinances in the Philippines. Some noteworthy examples include:
• Quezon City: The Plastic Bag Reduction Ordinance (SP 2140) of Quezon City began implementation in 2012. This ordinance regulates the plastic bag use for dry and wet goods. A Plastic Recovery System Fee (PHP 2.00) is collected from consumers for each new plastic carryout bag given from “Type 1” retailers such as shopping malls, supermarkets, department stores, fast food chains, and food stalls. A related ordinance (SP-2103) is implemented mandating all business establishments to display a notice that encourages customers to protect the environment by bringing their own reusable bags. In January 2020, City Ordinance No. SP-2868 amended SP 2140 banning all plastic carryout bags, with no option to pay a fee for a plastic bag. Meanwhile, Ordinance No. SP 2876 prohibits the use and distribution of single-use plastics or disposable materials for dine-in purposes. The ban, which will be implemented on July 1, 2020 covers the use of throwaway plates, spoons, forks, cups and other plastic and paper disposables.
• Province of Siquijor: The provincial government of Siquijor, located in Central Visayas, approved Provincial Ordinance No. 06-2018 which mandated regulations on the use of plastic bags [Enano, 2019]. The ordinance bans the free distribution of plastic bags as primary packaging, and the use of Styrofoam, cellophane for cooked food and other disposal containers [GAIA, n.d.]. Every Sunday is considered as a plastic holiday wherein the sale and use of plastic bags are prohibited [Enano, 2019]. It was complemented by Provincial Executive Order No. 2019-ZSV-002 mandating the creation of a provincial environmental task force to further strengthen solid waste management and plastic use in Siquijor [GAIA, n.d.]. Violators are required to attend orientation for first offense while the succeeding violations have penalties of Php 1,000.00 to 5,000.00 [Enano, 2019].
The intended effects of implementation of SUP regulations of some LGUs in terms of minimization of plastic waste may not be fully achieved because of lack of uniformity in the policies; and more importantly due to the lack of a national policy – be it on plastics regulation or an EPR scheme. Some policies are focused on prohibiting polystyrene only while others are fully banning plastic carry-out bags. Some policies also allow alternatives such as “biodegradable” plastics. A clear and overarching national framework or policy, such as that on EPR, will help streamline and synchronise LGU efforts on waste management across the country.
WWF-PHILIPPINES 2020
13 OUT OF 17 LgUSIN mETRO mANILA HAVE
PLASTIC ORDINANCES.
CLEAR AND OVERREACHINg
NATIONAL FRAmEWORk
SYNCHRONISE LgU EFFORTS ON WASTE mANAgEmENT ACROSS
THE COUNTRY
10
Figure 4: LGUs with plastic ordinances in the Philippines
WWF-PHILIPPINES 2020
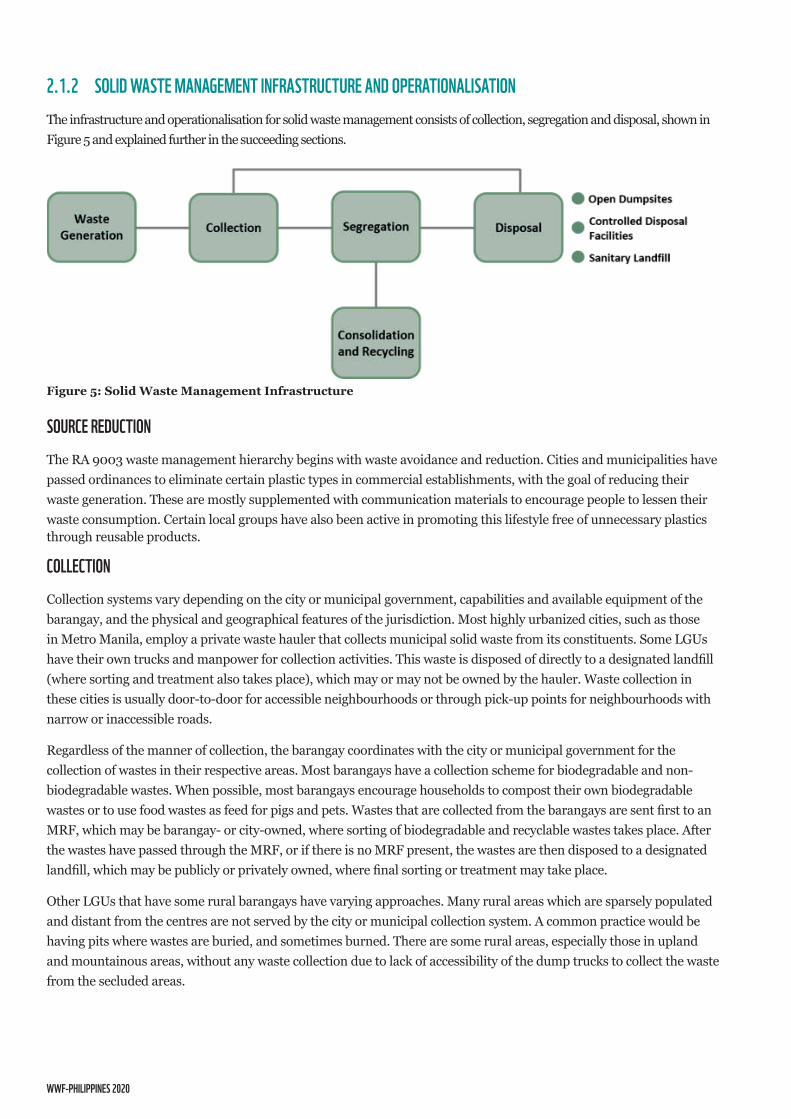
2.1.2 SOLID WASTE mANAgEmENT INFRASTRUCTURE AND OPERATIONALISATIONThe infrastructure and operationalisation for solid waste management consists of collection, segregation and disposal, shown in Figure 5 and explained further in the succeeding sections.
Figure 5: Solid Waste Management Infrastructure
SOURCE REDUCTIONThe RA 9003 waste management hierarchy begins with waste avoidance and reduction. Cities and municipalities have passed ordinances to eliminate certain plastic types in commercial establishments, with the goal of reducing their waste generation. These are mostly supplemented with communication materials to encourage people to lessen their waste consumption. Certain local groups have also been active in promoting this lifestyle free of unnecessary plastics through reusable products.
COLLECTIONCollection systems vary depending on the city or municipal government, capabilities and available equipment of the barangay, and the physical and geographical features of the jurisdiction. Most highly urbanized cities, such as those in Metro Manila, employ a private waste hauler that collects municipal solid waste from its constituents. Some LGUs have their own trucks and manpower for collection activities. This waste is disposed of directly to a designated landfill (where sorting and treatment also takes place), which may or may not be owned by the hauler. Waste collection in these cities is usually door-to-door for accessible neighbourhoods or through pick-up points for neighbourhoods with narrow or inaccessible roads.
Regardless of the manner of collection, the barangay coordinates with the city or municipal government for the collection of wastes in their respective areas. Most barangays have a collection scheme for biodegradable and non-biodegradable wastes. When possible, most barangays encourage households to compost their own biodegradable wastes or to use food wastes as feed for pigs and pets. Wastes that are collected from the barangays are sent first to an MRF, which may be barangay- or city-owned, where sorting of biodegradable and recyclable wastes takes place. After the wastes have passed through the MRF, or if there is no MRF present, the wastes are then disposed to a designated landfill, which may be publicly or privately owned, where final sorting or treatment may take place.
Other LGUs that have some rural barangays have varying approaches. Many rural areas which are sparsely populated and distant from the centres are not served by the city or municipal collection system. A common practice would be having pits where wastes are buried, and sometimes burned. There are some rural areas, especially those in upland and mountainous areas, without any waste collection due to lack of accessibility of the dump trucks to collect the waste from the secluded areas.
12
Table 2: Collection efficiencies per region in the Philippines
Table 3: Collection efficiencies of study sites
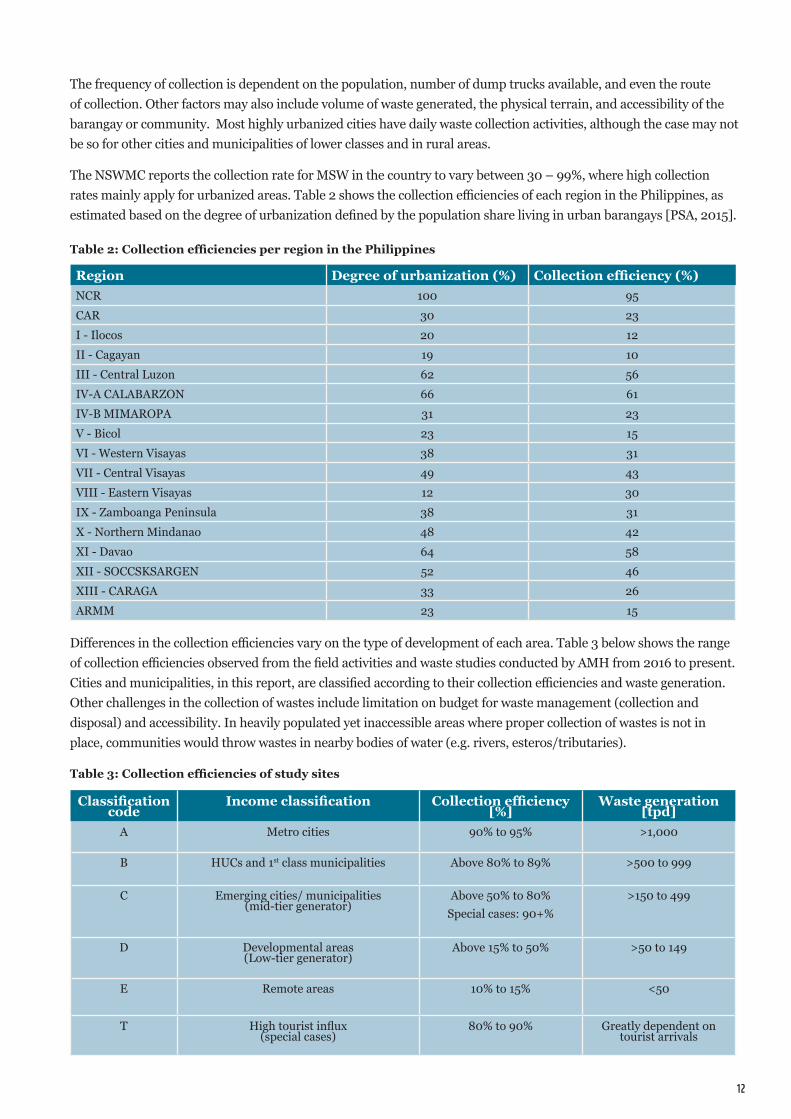
The frequency of collection is dependent on the population, number of dump trucks available, and even the route of collection. Other factors may also include volume of waste generated, the physical terrain, and accessibility of the barangay or community. Most highly urbanized cities have daily waste collection activities, although the case may not be so for other cities and municipalities of lower classes and in rural areas.
The NSWMC reports the collection rate for MSW in the country to vary between 30 – 99%, where high collection rates mainly apply for urbanized areas. Table 2 shows the collection efficiencies of each region in the Philippines, as estimated based on the degree of urbanization defined by the population share living in urban barangays [PSA, 2015].
Differences in the collection efficiencies vary on the type of development of each area. Table 3 below shows the range of collection efficiencies observed from the field activities and waste studies conducted by AMH from 2016 to present. Cities and municipalities, in this report, are classified according to their collection efficiencies and waste generation. Other challenges in the collection of wastes include limitation on budget for waste management (collection and disposal) and accessibility. In heavily populated yet inaccessible areas where proper collection of wastes is not in place, communities would throw wastes in nearby bodies of water (e.g. rivers, esteros/tributaries).
Classification code
Income classification Collection efficiency [%]
Waste generation [tpd]
A Metro cities 90% to 95% >1,000
B HUCs and 1st class municipalities Above 80% to 89% >500 to 999
C Emerging cities/ municipalities (mid-tier generator)
Above 50% to 80%Special cases: 90+%
>150 to 499
D Developmental areas (Low-tier generator)
Above 15% to 50% >50 to 149
E Remote areas 10% to 15% <50
T High tourist influx (special cases)
80% to 90% Greatly dependent on tourist arrivals
Region Degree of urbanization (%) Collection efficiency (%)NCR 100 95CAR 30 23I - Ilocos 20 12II - Cagayan 19 10III - Central Luzon 62 56IV-A CALABARZON 66 61IV-B MIMAROPA 31 23V - Bicol 23 15VI - Western Visayas 38 31VII - Central Visayas 49 43VIII - Eastern Visayas 12 30IX - Zamboanga Peninsula 38 31X - Northern Mindanao 48 42XI - Davao 64 58XII - SOCCSKSARGEN 52 46XIII - CARAGA 33 26ARMM 23 15
WWF-PHILIPPINES 2020
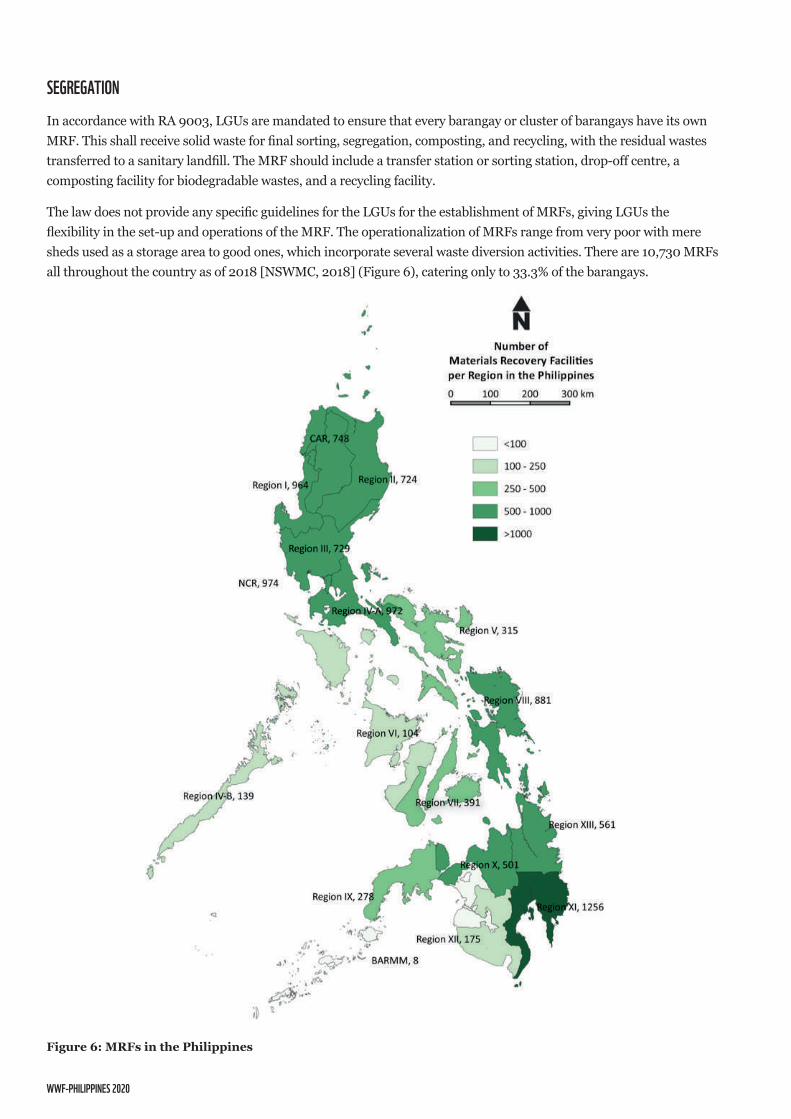
SEgREgATIONIn accordance with RA 9003, LGUs are mandated to ensure that every barangay or cluster of barangays have its own MRF. This shall receive solid waste for final sorting, segregation, composting, and recycling, with the residual wastes transferred to a sanitary landfill. The MRF should include a transfer station or sorting station, drop-off centre, a composting facility for biodegradable wastes, and a recycling facility.
The law does not provide any specific guidelines for the LGUs for the establishment of MRFs, giving LGUs the flexibility in the set-up and operations of the MRF. The operationalization of MRFs range from very poor with mere sheds used as a storage area to good ones, which incorporate several waste diversion activities. There are 10,730 MRFs all throughout the country as of 2018 [NSWMC, 2018] (Figure 6), catering only to 33.3% of the barangays.
Figure 6: MRFs in the Philippines
14
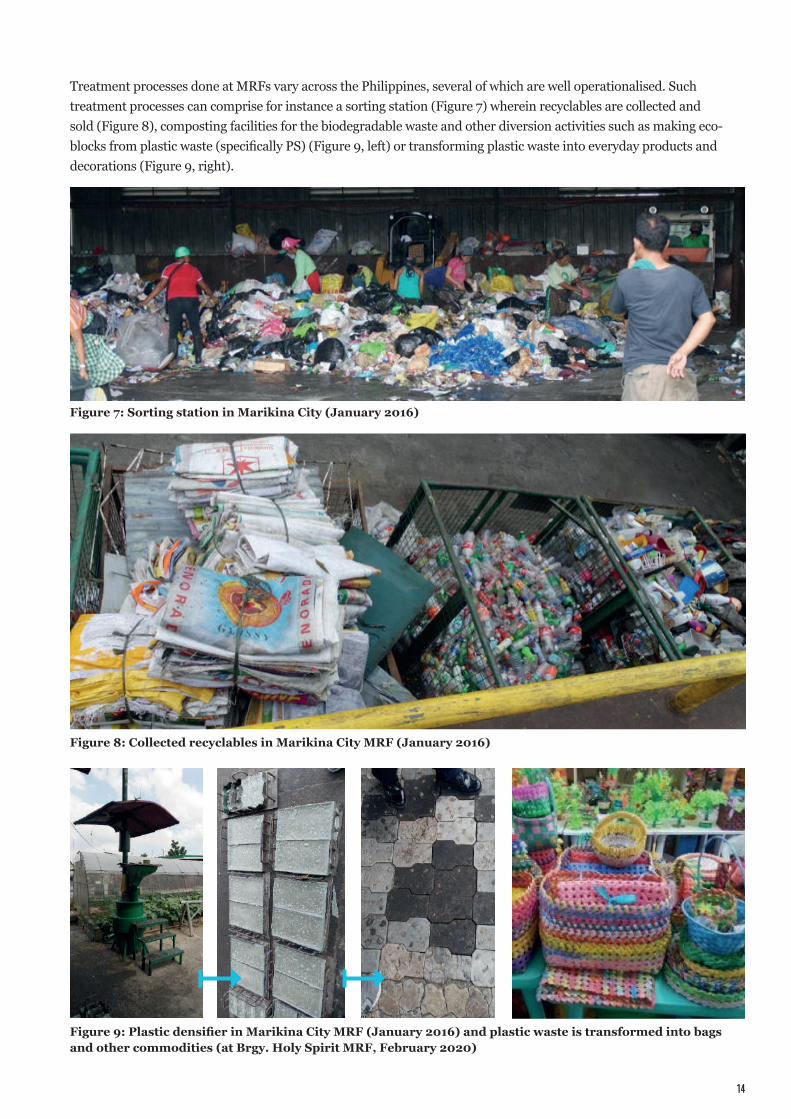
Treatment processes done at MRFs vary across the Philippines, several of which are well operationalised. Such treatment processes can comprise for instance a sorting station (Figure 7) wherein recyclables are collected and sold (Figure 8), composting facilities for the biodegradable waste and other diversion activities such as making eco-blocks from plastic waste (specifically PS) (Figure 9, left) or transforming plastic waste into everyday products and decorations (Figure 9, right).
Figure 7: Sorting station in Marikina City (January 2016)
Figure 8: Collected recyclables in Marikina City MRF (January 2016)
Figure 9: Plastic densifier in Marikina City MRF (January 2016) and plastic waste is transformed into bags and other commodities (at Brgy. Holy Spirit MRF, February 2020)
WWF-PHILIPPINES 2020
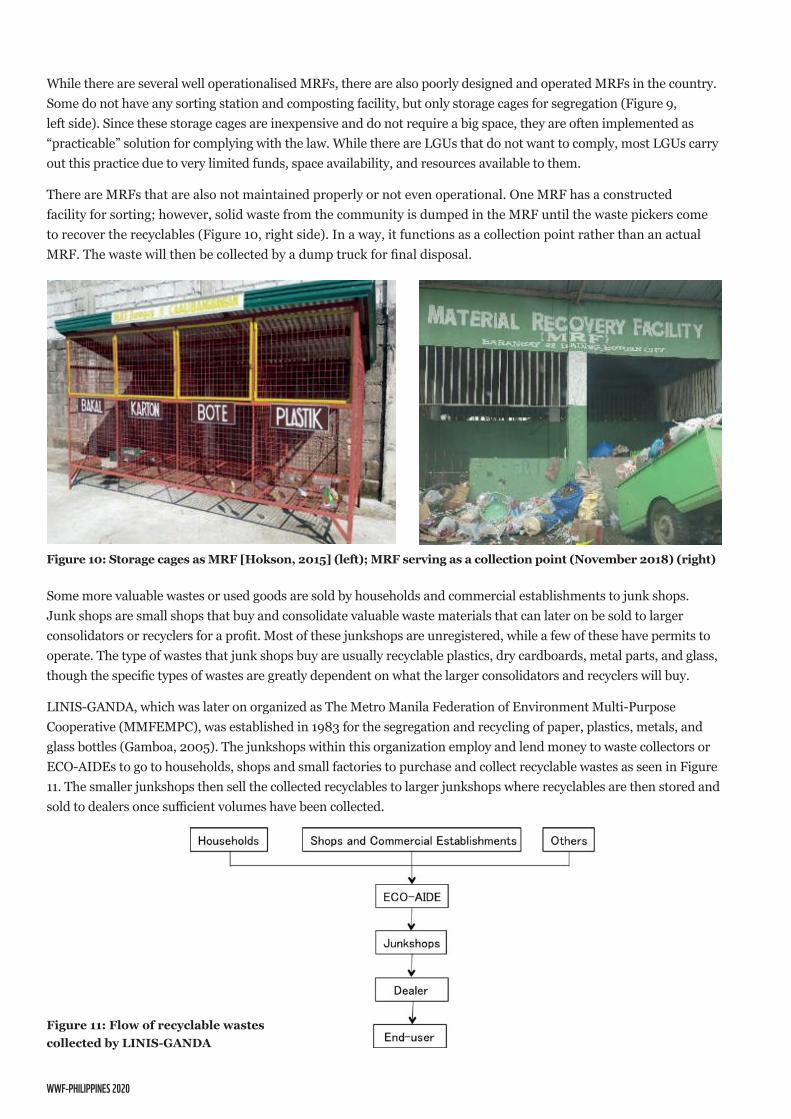
While there are several well operationalised MRFs, there are also poorly designed and operated MRFs in the country. Some do not have any sorting station and composting facility, but only storage cages for segregation (Figure 9, left side). Since these storage cages are inexpensive and do not require a big space, they are often implemented as “practicable” solution for complying with the law. While there are LGUs that do not want to comply, most LGUs carry out this practice due to very limited funds, space availability, and resources available to them.
There are MRFs that are also not maintained properly or not even operational. One MRF has a constructed facility for sorting; however, solid waste from the community is dumped in the MRF until the waste pickers come to recover the recyclables (Figure 10, right side). In a way, it functions as a collection point rather than an actual MRF. The waste will then be collected by a dump truck for final disposal.
Some more valuable wastes or used goods are sold by households and commercial establishments to junk shops. Junk shops are small shops that buy and consolidate valuable waste materials that can later on be sold to larger consolidators or recyclers for a profit. Most of these junkshops are unregistered, while a few of these have permits to operate. The type of wastes that junk shops buy are usually recyclable plastics, dry cardboards, metal parts, and glass, though the specific types of wastes are greatly dependent on what the larger consolidators and recyclers will buy.
LINIS-GANDA, which was later on organized as The Metro Manila Federation of Environment Multi-Purpose Cooperative (MMFEMPC), was established in 1983 for the segregation and recycling of paper, plastics, metals, and glass bottles (Gamboa, 2005). The junkshops within this organization employ and lend money to waste collectors or ECO-AIDEs to go to households, shops and small factories to purchase and collect recyclable wastes as seen in Figure 11. The smaller junkshops then sell the collected recyclables to larger junkshops where recyclables are then stored and sold to dealers once sufficient volumes have been collected.
Figure 11: Flow of recyclable wastes collected by LINIS-GANDA
Figure 10: Storage cages as MRF [Hokson, 2015] (left); MRF serving as a collection point (November 2018) (right)
16
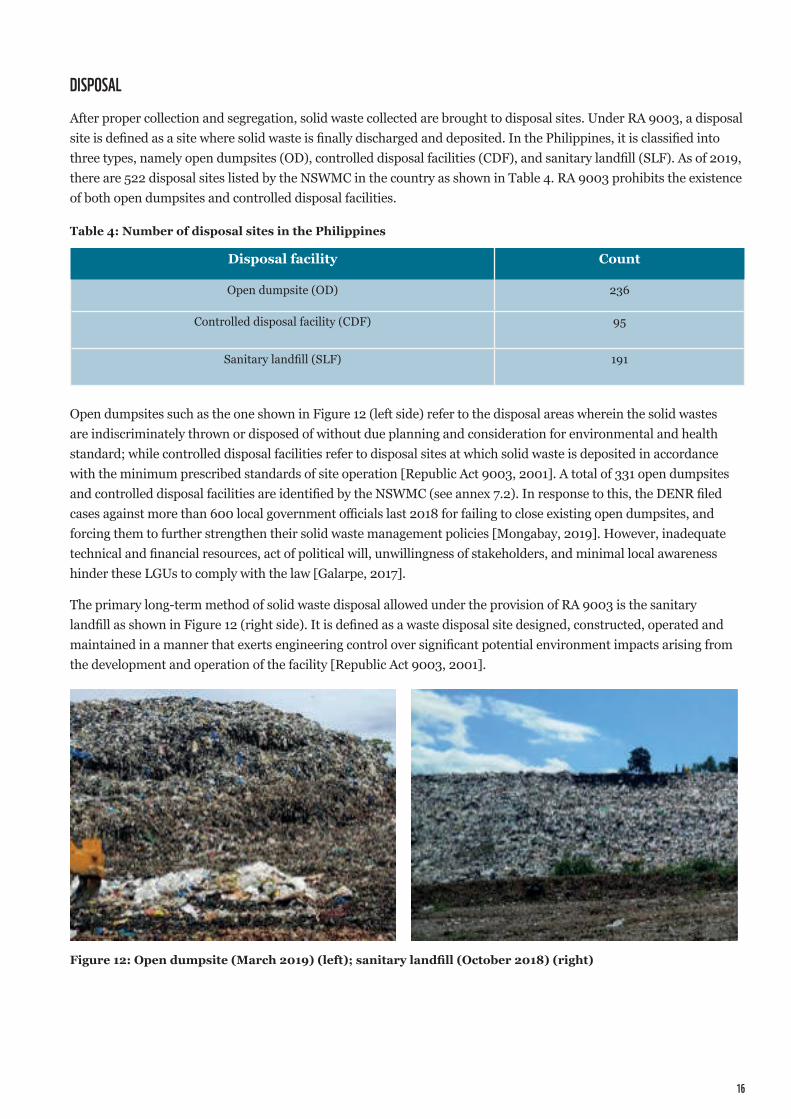
DISPOSALAfter proper collection and segregation, solid waste collected are brought to disposal sites. Under RA 9003, a disposal site is defined as a site where solid waste is finally discharged and deposited. In the Philippines, it is classified into three types, namely open dumpsites (OD), controlled disposal facilities (CDF), and sanitary landfill (SLF). As of 2019, there are 522 disposal sites listed by the NSWMC in the country as shown in Table 4. RA 9003 prohibits the existence of both open dumpsites and controlled disposal facilities.
Open dumpsites such as the one shown in Figure 12 (left side) refer to the disposal areas wherein the solid wastes are indiscriminately thrown or disposed of without due planning and consideration for environmental and health standard; while controlled disposal facilities refer to disposal sites at which solid waste is deposited in accordance with the minimum prescribed standards of site operation [Republic Act 9003, 2001]. A total of 331 open dumpsites and controlled disposal facilities are identified by the NSWMC (see annex 7.2). In response to this, the DENR filed cases against more than 600 local government officials last 2018 for failing to close existing open dumpsites, and forcing them to further strengthen their solid waste management policies [Mongabay, 2019]. However, inadequate technical and financial resources, act of political will, unwillingness of stakeholders, and minimal local awareness hinder these LGUs to comply with the law [Galarpe, 2017].
The primary long-term method of solid waste disposal allowed under the provision of RA 9003 is the sanitary landfill as shown in Figure 12 (right side). It is defined as a waste disposal site designed, constructed, operated and maintained in a manner that exerts engineering control over significant potential environment impacts arising from the development and operation of the facility [Republic Act 9003, 2001].
Disposal facility Count
Open dumpsite (OD) 236
Controlled disposal facility (CDF) 95
Sanitary landfill (SLF) 191
Table 4: Number of disposal sites in the Philippines
Figure 12: Open dumpsite (March 2019) (left); sanitary landfill (October 2018) (right)
WWF-PHILIPPINES 2020
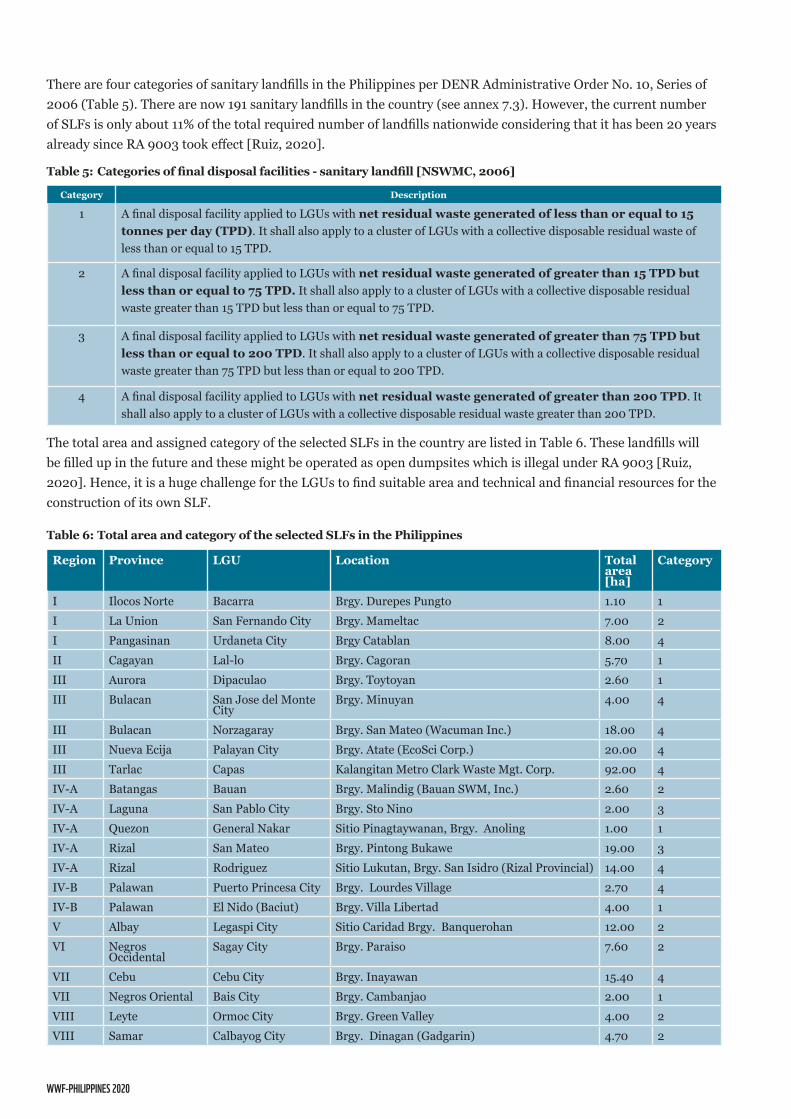
There are four categories of sanitary landfills in the Philippines per DENR Administrative Order No. 10, Series of 2006 (Table 5). There are now 191 sanitary landfills in the country (see annex 7.3). However, the current number of SLFs is only about 11% of the total required number of landfills nationwide considering that it has been 20 years already since RA 9003 took effect [Ruiz, 2020].
The total area and assigned category of the selected SLFs in the country are listed in Table 6. These landfills will be filled up in the future and these might be operated as open dumpsites which is illegal under RA 9003 [Ruiz, 2020]. Hence, it is a huge challenge for the LGUs to find suitable area and technical and financial resources for the construction of its own SLF.
Category Description
1 A final disposal facility applied to LGUs with net residual waste generated of less than or equal to 15 tonnes per day (TPD). It shall also apply to a cluster of LGUs with a collective disposable residual waste of less than or equal to 15 TPD.
2 A final disposal facility applied to LGUs with net residual waste generated of greater than 15 TPD but less than or equal to 75 TPD. It shall also apply to a cluster of LGUs with a collective disposable residual waste greater than 15 TPD but less than or equal to 75 TPD.
3 A final disposal facility applied to LGUs with net residual waste generated of greater than 75 TPD but less than or equal to 200 TPD. It shall also apply to a cluster of LGUs with a collective disposable residual waste greater than 75 TPD but less than or equal to 200 TPD.
4 A final disposal facility applied to LGUs with net residual waste generated of greater than 200 TPD. It shall also apply to a cluster of LGUs with a collective disposable residual waste greater than 200 TPD.
Region Province LGU Location Total area [ha]
Category
I Ilocos Norte Bacarra Brgy. Durepes Pungto 1.10 1I La Union San Fernando City Brgy. Mameltac 7.00 2I Pangasinan Urdaneta City Brgy Catablan 8.00 4II Cagayan Lal-lo Brgy. Cagoran 5.70 1III Aurora Dipaculao Brgy. Toytoyan 2.60 1III Bulacan San Jose del Monte
CityBrgy. Minuyan 4.00 4
III Bulacan Norzagaray Brgy. San Mateo (Wacuman Inc.) 18.00 4III Nueva Ecija Palayan City Brgy. Atate (EcoSci Corp.) 20.00 4III Tarlac Capas Kalangitan Metro Clark Waste Mgt. Corp. 92.00 4IV-A Batangas Bauan Brgy. Malindig (Bauan SWM, Inc.) 2.60 2IV-A Laguna San Pablo City Brgy. Sto Nino 2.00 3IV-A Quezon General Nakar Sitio Pinagtaywanan, Brgy. Anoling 1.00 1IV-A Rizal San Mateo Brgy. Pintong Bukawe 19.00 3IV-A Rizal Rodriguez Sitio Lukutan, Brgy. San Isidro (Rizal Provincial) 14.00 4IV-B Palawan Puerto Princesa City Brgy. Lourdes Village 2.70 4IV-B Palawan El Nido (Baciut) Brgy. Villa Libertad 4.00 1V Albay Legaspi City Sitio Caridad Brgy. Banquerohan 12.00 2VI Negros
OccidentalSagay City Brgy. Paraiso 7.60 2
VII Cebu Cebu City Brgy. Inayawan 15.40 4VII Negros Oriental Bais City Brgy. Cambanjao 2.00 1VIII Leyte Ormoc City Brgy. Green Valley 4.00 2VIII Samar Calbayog City Brgy. Dinagan (Gadgarin) 4.70 2
Table 5: Categories of final disposal facilities - sanitary landfill [NSWMC, 2006]
Table 6: Total area and category of the selected SLFs in the Philippines
Region Province LGU Location Total area [ha]
Category
18
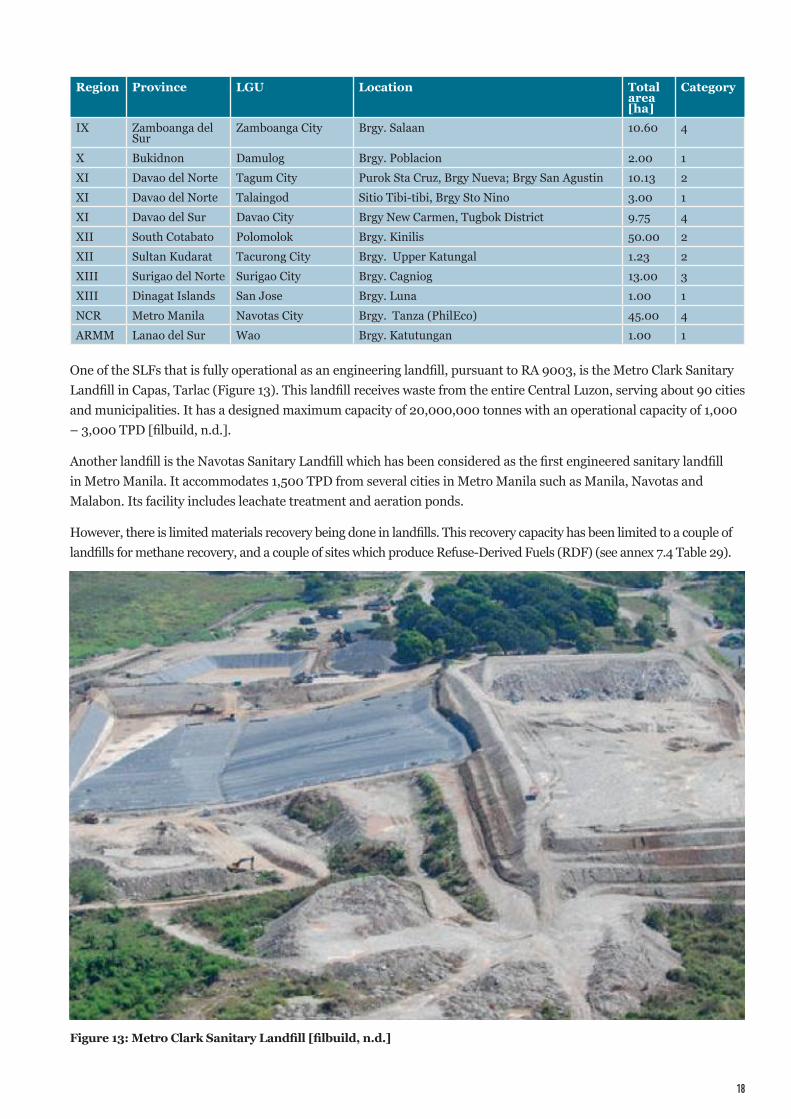
One of the SLFs that is fully operational as an engineering landfill, pursuant to RA 9003, is the Metro Clark Sanitary Landfill in Capas, Tarlac (Figure 13). This landfill receives waste from the entire Central Luzon, serving about 90 cities and municipalities. It has a designed maximum capacity of 20,000,000 tonnes with an operational capacity of 1,000 – 3,000 TPD [filbuild, n.d.].
Another landfill is the Navotas Sanitary Landfill which has been considered as the first engineered sanitary landfill in Metro Manila. It accommodates 1,500 TPD from several cities in Metro Manila such as Manila, Navotas and Malabon. Its facility includes leachate treatment and aeration ponds.
However, there is limited materials recovery being done in landfills. This recovery capacity has been limited to a couple of landfills for methane recovery, and a couple of sites which produce Refuse-Derived Fuels (RDF) (see annex 7.4 Table 29).
Figure 13: Metro Clark Sanitary Landfill [filbuild, n.d.]
IX Zamboanga del Sur
Zamboanga City Brgy. Salaan 10.60 4
X Bukidnon Damulog Brgy. Poblacion 2.00 1XI Davao del Norte Tagum City Purok Sta Cruz, Brgy Nueva; Brgy San Agustin 10.13 2XI Davao del Norte Talaingod Sitio Tibi-tibi, Brgy Sto Nino 3.00 1XI Davao del Sur Davao City Brgy New Carmen, Tugbok District 9.75 4XII South Cotabato Polomolok Brgy. Kinilis 50.00 2XII Sultan Kudarat Tacurong City Brgy. Upper Katungal 1.23 2XIII Surigao del Norte Surigao City Brgy. Cagniog 13.00 3XIII Dinagat Islands San Jose Brgy. Luna 1.00 1NCR Metro Manila Navotas City Brgy. Tanza (PhilEco) 45.00 4ARMM Lanao del Sur Wao Brgy. Katutungan 1.00 1
WWF-PHILIPPINES 2020
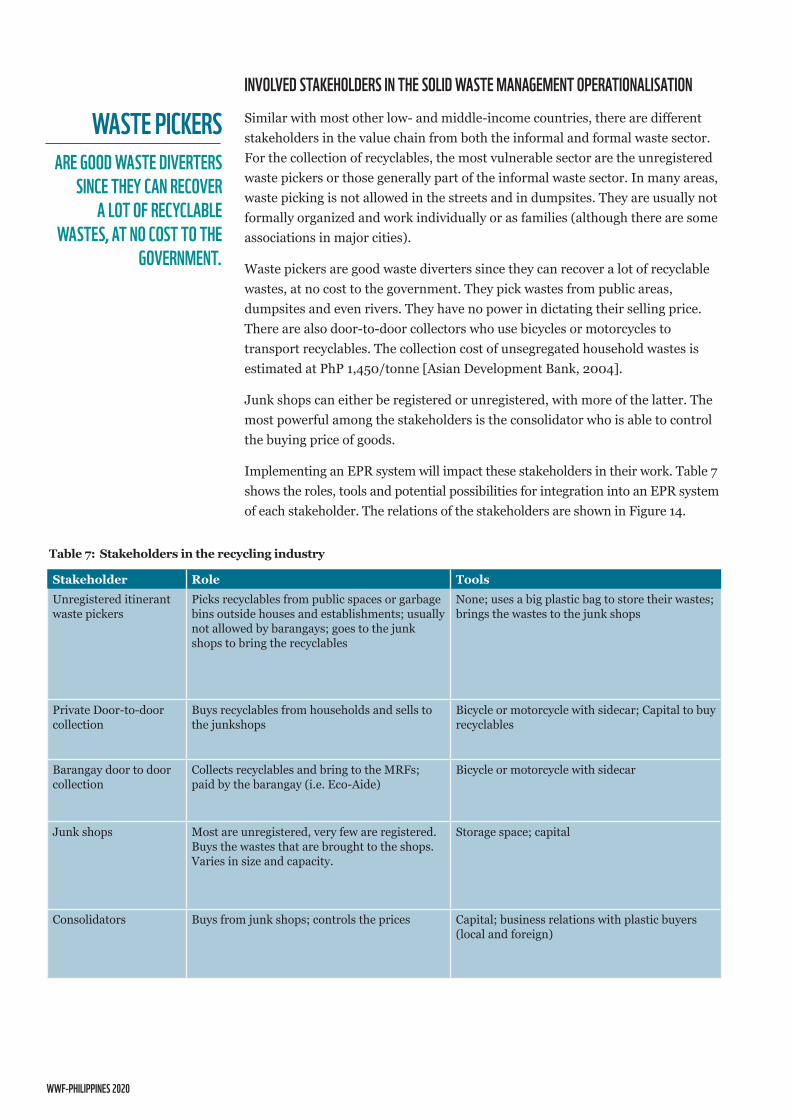
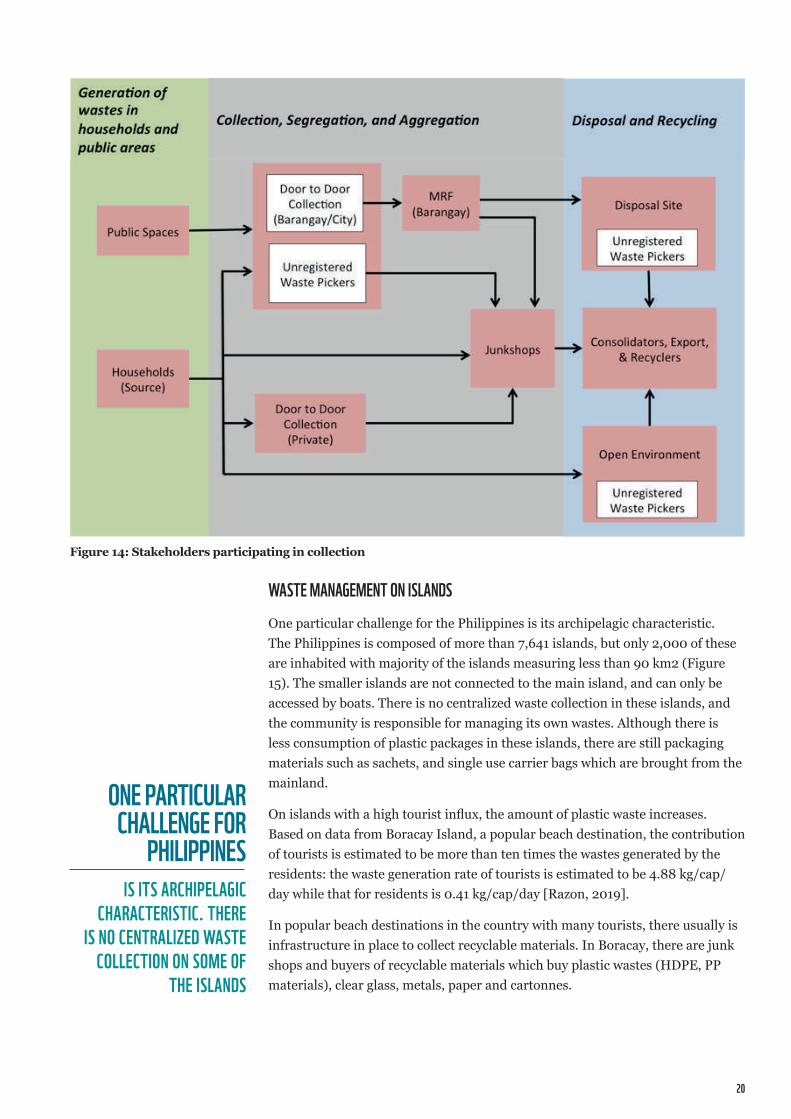
INVOLVED STAkEHOLDERS IN THE SOLID WASTE mANAgEmENT OPERATIONALISATIONSimilar with most other low- and middle-income countries, there are different stakeholders in the value chain from both the informal and formal waste sector. For the collection of recyclables, the most vulnerable sector are the unregistered waste pickers or those generally part of the informal waste sector. In many areas, waste picking is not allowed in the streets and in dumpsites. They are usually not formally organized and work individually or as families (although there are some associations in major cities).
Waste pickers are good waste diverters since they can recover a lot of recyclable wastes, at no cost to the government. They pick wastes from public areas, dumpsites and even rivers. They have no power in dictating their selling price. There are also door-to-door collectors who use bicycles or motorcycles to transport recyclables. The collection cost of unsegregated household wastes is estimated at PhP 1,450/tonne [Asian Development Bank, 2004].
Junk shops can either be registered or unregistered, with more of the latter. The most powerful among the stakeholders is the consolidator who is able to control the buying price of goods.
Implementing an EPR system will impact these stakeholders in their work. Table 7 shows the roles, tools and potential possibilities for integration into an EPR system of each stakeholder. The relations of the stakeholders are shown in Figure 14.
WASTE PICkERS ARE gOOD WASTE DIVERTERS
SINCE THEY CAN RECOVER A LOT OF RECYCLABLE
WASTES, AT NO COST TO THE gOVERNmENT.
Table 7: Stakeholders in the recycling industry
Stakeholder Role ToolsUnregistered itinerant waste pickers
Picks recyclables from public spaces or garbage bins outside houses and establishments; usually not allowed by barangays; goes to the junk shops to bring the recyclables
None; uses a big plastic bag to store their wastes; brings the wastes to the junk shops
Private Door-to-door collection
Buys recyclables from households and sells to the junkshops
Bicycle or motorcycle with sidecar; Capital to buy recyclables
Barangay door to door collection
Collects recyclables and bring to the MRFs; paid by the barangay (i.e. Eco-Aide)
Bicycle or motorcycle with sidecar
Junk shops Most are unregistered, very few are registered. Buys the wastes that are brought to the shops. Varies in size and capacity.
Storage space; capital
Consolidators Buys from junk shops; controls the prices Capital; business relations with plastic buyers (local and foreign)
20
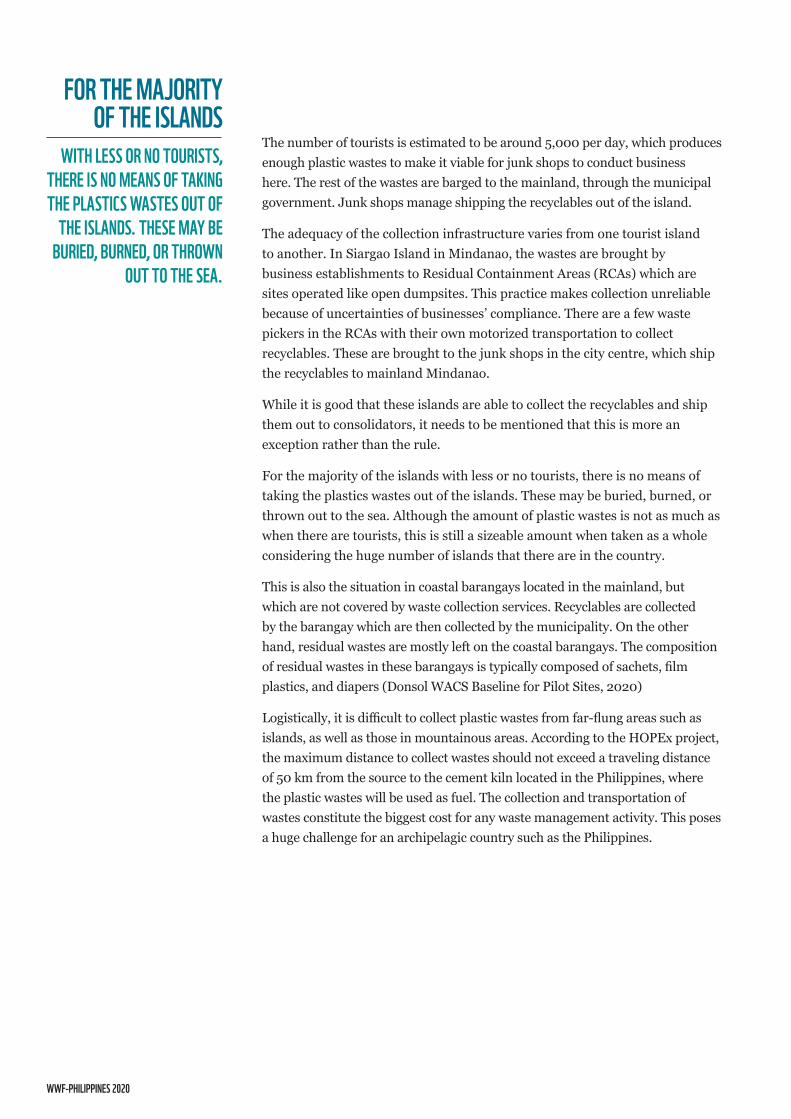
WASTE mANAgEmENT ON ISLANDSOne particular challenge for the Philippines is its archipelagic characteristic. The Philippines is composed of more than 7,641 islands, but only 2,000 of these are inhabited with majority of the islands measuring less than 90 km2 (Figure 15). The smaller islands are not connected to the main island, and can only be accessed by boats. There is no centralized waste collection in these islands, and the community is responsible for managing its own wastes. Although there is less consumption of plastic packages in these islands, there are still packaging materials such as sachets, and single use carrier bags which are brought from the mainland.
On islands with a high tourist influx, the amount of plastic waste increases. Based on data from Boracay Island, a popular beach destination, the contribution of tourists is estimated to be more than ten times the wastes generated by the residents: the waste generation rate of tourists is estimated to be 4.88 kg/cap/day while that for residents is 0.41 kg/cap/day [Razon, 2019].
In popular beach destinations in the country with many tourists, there usually is infrastructure in place to collect recyclable materials. In Boracay, there are junk shops and buyers of recyclable materials which buy plastic wastes (HDPE, PP materials), clear glass, metals, paper and cartonnes.
ONE PARTICULAR CHALLENgE FOR
PHILIPPINES IS ITS ARCHIPELAgIC
CHARACTERISTIC. THERE IS NO CENTRALIZED WASTE
COLLECTION ON SOmE OF THE ISLANDS
Figure 14: Stakeholders participating in collection
WWF-PHILIPPINES 2020
The number of tourists is estimated to be around 5,000 per day, which produces enough plastic wastes to make it viable for junk shops to conduct business here. The rest of the wastes are barged to the mainland, through the municipal government. Junk shops manage shipping the recyclables out of the island.
The adequacy of the collection infrastructure varies from one tourist island to another. In Siargao Island in Mindanao, the wastes are brought by business establishments to Residual Containment Areas (RCAs) which are sites operated like open dumpsites. This practice makes collection unreliable because of uncertainties of businesses’ compliance. There are a few waste pickers in the RCAs with their own motorized transportation to collect recyclables. These are brought to the junk shops in the city centre, which ship the recyclables to mainland Mindanao.
While it is good that these islands are able to collect the recyclables and ship them out to consolidators, it needs to be mentioned that this is more an exception rather than the rule.
For the majority of the islands with less or no tourists, there is no means of taking the plastics wastes out of the islands. These may be buried, burned, or thrown out to the sea. Although the amount of plastic wastes is not as much as when there are tourists, this is still a sizeable amount when taken as a whole considering the huge number of islands that there are in the country.
This is also the situation in coastal barangays located in the mainland, but which are not covered by waste collection services. Recyclables are collected by the barangay which are then collected by the municipality. On the other hand, residual wastes are mostly left on the coastal barangays. The composition of residual wastes in these barangays is typically composed of sachets, film plastics, and diapers (Donsol WACS Baseline for Pilot Sites, 2020)
Logistically, it is difficult to collect plastic wastes from far-flung areas such as islands, as well as those in mountainous areas. According to the HOPEx project, the maximum distance to collect wastes should not exceed a traveling distance of 50 km from the source to the cement kiln located in the Philippines, where the plastic wastes will be used as fuel. The collection and transportation of wastes constitute the biggest cost for any waste management activity. This poses a huge challenge for an archipelagic country such as the Philippines.
FOR THE mAJORITY OF THE ISLANDS
WITH LESS OR NO TOURISTS, THERE IS NO mEANS OF TAkINg THE PLASTICS WASTES OUT OF
THE ISLANDS. THESE mAY BE BURIED, BURNED, OR THROWN
OUT TO THE SEA.
22
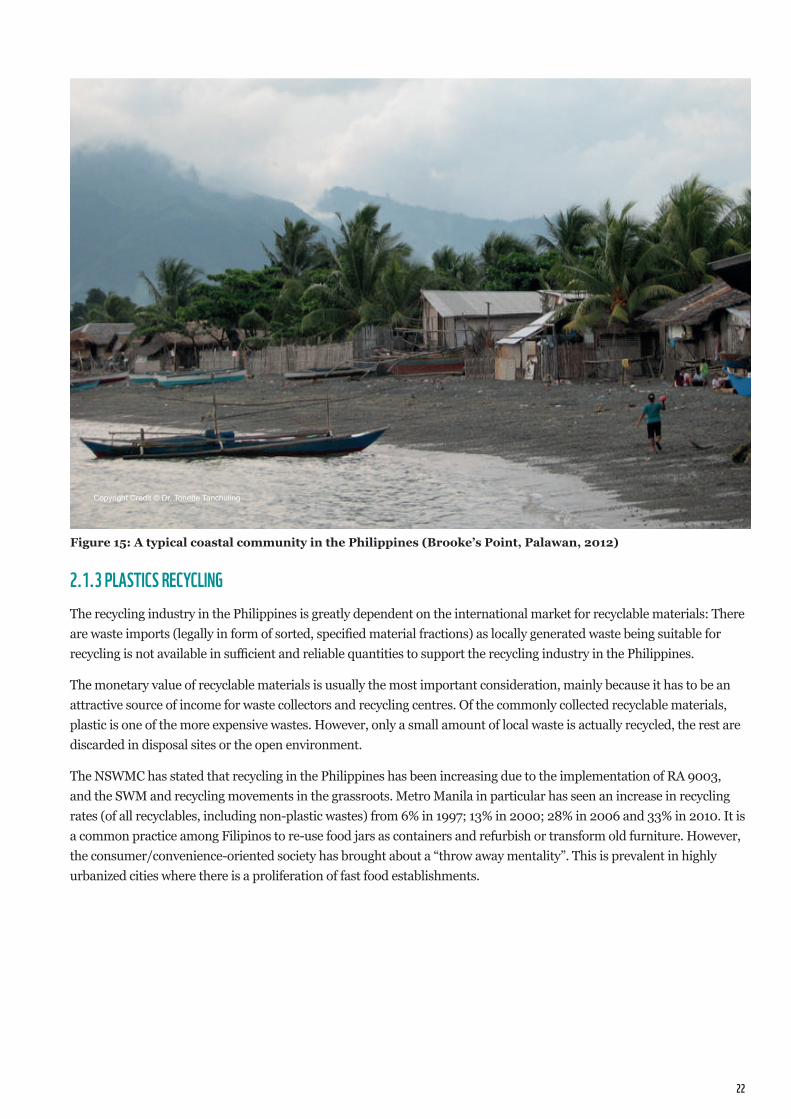
Figure 15: A typical coastal community in the Philippines (Brooke’s Point, Palawan, 2012)
2.1.3 PLASTICS RECYCLINgThe recycling industry in the Philippines is greatly dependent on the international market for recyclable materials: There are waste imports (legally in form of sorted, specified material fractions) as locally generated waste being suitable for recycling is not available in sufficient and reliable quantities to support the recycling industry in the Philippines.
The monetary value of recyclable materials is usually the most important consideration, mainly because it has to be an attractive source of income for waste collectors and recycling centres. Of the commonly collected recyclable materials, plastic is one of the more expensive wastes. However, only a small amount of local waste is actually recycled, the rest are discarded in disposal sites or the open environment.
The NSWMC has stated that recycling in the Philippines has been increasing due to the implementation of RA 9003, and the SWM and recycling movements in the grassroots. Metro Manila in particular has seen an increase in recycling rates (of all recyclables, including non-plastic wastes) from 6% in 1997; 13% in 2000; 28% in 2006 and 33% in 2010. It is a common practice among Filipinos to re-use food jars as containers and refurbish or transform old furniture. However, the consumer/convenience-oriented society has brought about a “throw away mentality”. This is prevalent in highly urbanized cities where there is a proliferation of fast food establishments.
Copyright Credit © Dr. Tonette Tanchuling
WWF-PHILIPPINES 2020
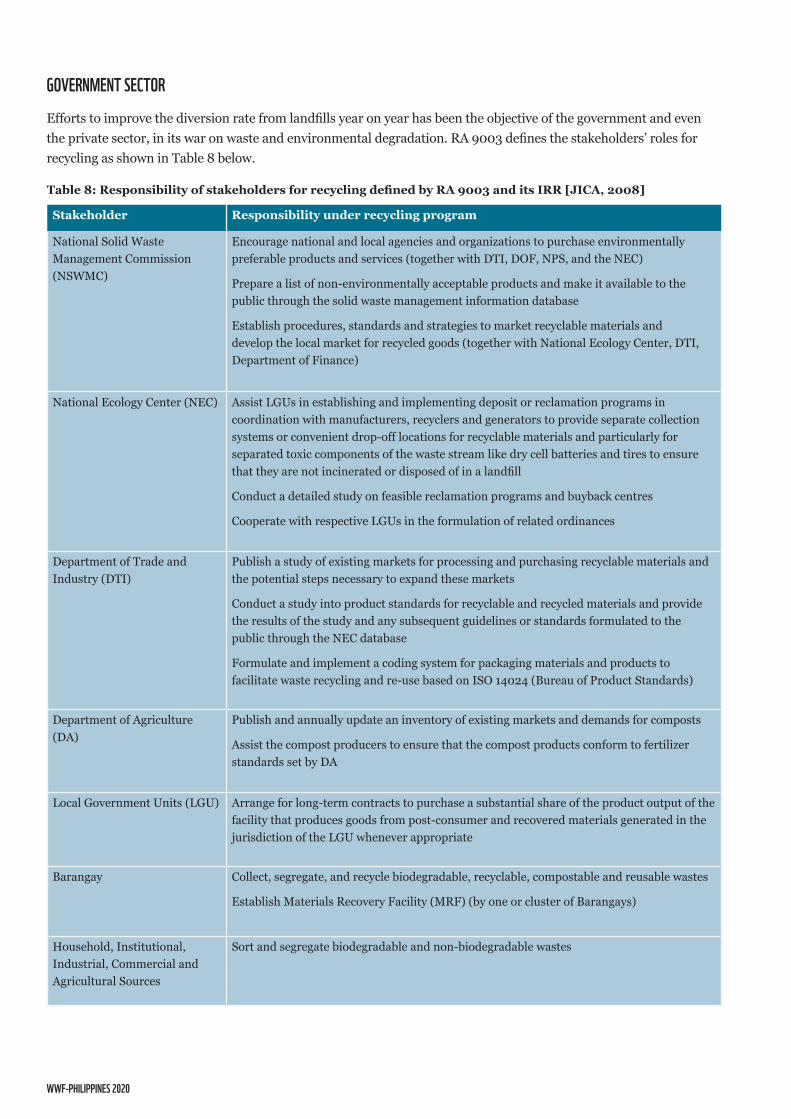
gOVERNmENT SECTOREfforts to improve the diversion rate from landfills year on year has been the objective of the government and even the private sector, in its war on waste and environmental degradation. RA 9003 defines the stakeholders’ roles for recycling as shown in Table 8 below.
Stakeholder Responsibility under recycling program
National Solid Waste Management Commission (NSWMC)
Encourage national and local agencies and organizations to purchase environmentally preferable products and services (together with DTI, DOF, NPS, and the NEC)
Prepare a list of non-environmentally acceptable products and make it available to the public through the solid waste management information database
Establish procedures, standards and strategies to market recyclable materials and develop the local market for recycled goods (together with National Ecology Center, DTI, Department of Finance)
National Ecology Center (NEC) Assist LGUs in establishing and implementing deposit or reclamation programs in coordination with manufacturers, recyclers and generators to provide separate collection systems or convenient drop-off locations for recyclable materials and particularly for separated toxic components of the waste stream like dry cell batteries and tires to ensure that they are not incinerated or disposed of in a landfill
Conduct a detailed study on feasible reclamation programs and buyback centres
Cooperate with respective LGUs in the formulation of related ordinances
Department of Trade and Industry (DTI)
Publish a study of existing markets for processing and purchasing recyclable materials and the potential steps necessary to expand these markets
Conduct a study into product standards for recyclable and recycled materials and provide the results of the study and any subsequent guidelines or standards formulated to the public through the NEC database
Formulate and implement a coding system for packaging materials and products to facilitate waste recycling and re-use based on ISO 14024 (Bureau of Product Standards)
Department of Agriculture (DA)
Publish and annually update an inventory of existing markets and demands for composts
Assist the compost producers to ensure that the compost products conform to fertilizer standards set by DA
Local Government Units (LGU) Arrange for long-term contracts to purchase a substantial share of the product output of the facility that produces goods from post-consumer and recovered materials generated in the jurisdiction of the LGU whenever appropriate
Barangay Collect, segregate, and recycle biodegradable, recyclable, compostable and reusable wastes
Establish Materials Recovery Facility (MRF) (by one or cluster of Barangays)
Household, Institutional, Industrial, Commercial and Agricultural Sources
Sort and segregate biodegradable and non-biodegradable wastes
Table 8: Responsibility of stakeholders for recycling defined by RA 9003 and its IRR [JICA, 2008]
24
There are recycling initiatives at the different levels of the government.
1. Barangays: RA 9003 states that each local government unit should develop and implement a Local Government Solid Waste Management Plan. The plan includes concrete measures to achieve the required minimum target of diverting 25% of the amount of solid waste disposal through reduce, reuse, recycling, composting and so forth. MRFs should also be established in every barangay or cluster of barangays for sorting of mixed wastes, recycling and composting. The residual wastes are transferred to a sanitary landfill. Some barangays have programs that promote separation recycling such as eco-brick making for non-load bearing wall/ perimeter wall construction or school beautification.
2. Cities and Municipalities: Some LGUs, such as Marikina and Zamboanga cities, have their own MRFs to store recyclable wastes (Figure 6). At the barangay level, the recyclables collected are sold to larger recycling facilities for further processing or used as feedstock for its own recycling initiative such as pavers. There are also some LGUs that coordinate with private companies to organize Recyclable Collection Events, where recyclers and end-users of recyclable wastes can purchase or accept recyclable wastes that local residents, shops and small factories bring.
3. Department of Trade and Industry (DTI): DTI, which facilitates waste recycling and reuse by producing guidelines for product standards for recyclable and recycled materials, published a guide for ease of application to the recycling industry (see annex 7.5). The Bureau of Product Standard under DTI (BPS-DTI) has prepared national products standards for blended hydraulic cement and recycled paper. It has also started to put a coding system on some of the manufactured plastic packaging, which will allow for faster segregation between the seven types of plastics (BPS-DTI, 2020).
4. Department of Science and Technology (DOST): DOST -Industrial Technology Development Institute (ITDI), the agency’s research arm, has also been developing waste recycling technologies to address the increasing waste generation (ITDI, 2020). The following are some examples of their proposed solutions:
A) Recycling of aluminium laminated film packaging wastes (composites): They are made into sandals and shopping bags with the help of some NGOs like Kabalihan Iisa ang Layunin Umunlad ang Sambayan (KILUS).
B) Recycling of Styrofoam Wastes: Styrofoam wastes, like food trays, are finely cut and mixed with cement-based mixtures to make light weight blocks, tiles, bricks and boards. The costs of lightweight block production using Styrofoam wastes in 2008 were as follows [JICA, 2008]:
• Capacity: 4.9 tonne/day
• Capacity: 107,086 Php/kg
• Production Cost: 9.57 Php/kg
• Selling Price: 15 Php/kg
C) Recycling of mixed plastic wastes as tiles and other low-cost construction materials: Mixed plastics such as polyethylene (PE), polypropylene (PP), and polystyrene (PS) will be characterized to determine a suitable proportion and the processes for the production of tiles and other low-cost construction materials. [DOST-ITDI, 2018]
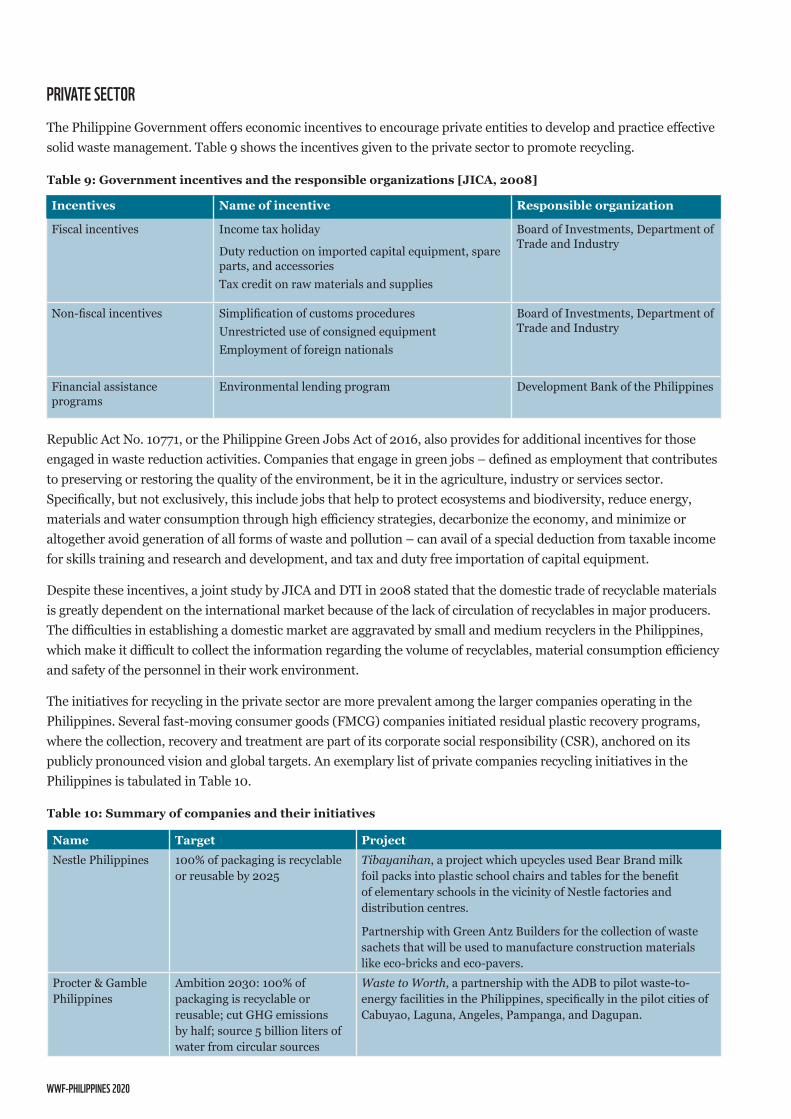
WWF-PHILIPPINES 2020
PRIVATE SECTORThe Philippine Government offers economic incentives to encourage private entities to develop and practice effective solid waste management. Table 9 shows the incentives given to the private sector to promote recycling.
Republic Act No. 10771, or the Philippine Green Jobs Act of 2016, also provides for additional incentives for those engaged in waste reduction activities. Companies that engage in green jobs – defined as employment that contributes to preserving or restoring the quality of the environment, be it in the agriculture, industry or services sector. Specifically, but not exclusively, this include jobs that help to protect ecosystems and biodiversity, reduce energy, materials and water consumption through high efficiency strategies, decarbonize the economy, and minimize or altogether avoid generation of all forms of waste and pollution – can avail of a special deduction from taxable income for skills training and research and development, and tax and duty free importation of capital equipment.
Despite these incentives, a joint study by JICA and DTI in 2008 stated that the domestic trade of recyclable materials is greatly dependent on the international market because of the lack of circulation of recyclables in major producers. The difficulties in establishing a domestic market are aggravated by small and medium recyclers in the Philippines, which make it difficult to collect the information regarding the volume of recyclables, material consumption efficiency and safety of the personnel in their work environment.
The initiatives for recycling in the private sector are more prevalent among the larger companies operating in the Philippines. Several fast-moving consumer goods (FMCG) companies initiated residual plastic recovery programs, where the collection, recovery and treatment are part of its corporate social responsibility (CSR), anchored on its publicly pronounced vision and global targets. An exemplary list of private companies recycling initiatives in the Philippines is tabulated in Table 10.
Name Target ProjectNestle Philippines 100% of packaging is recyclable
or reusable by 2025Tibayanihan, a project which upcycles used Bear Brand milk foil packs into plastic school chairs and tables for the benefit of elementary schools in the vicinity of Nestle factories and distribution centres.
Partnership with Green Antz Builders for the collection of waste sachets that will be used to manufacture construction materials like eco-bricks and eco-pavers.
Procter & Gamble Philippines
Ambition 2030: 100% of packaging is recyclable or reusable; cut GHG emissions by half; source 5 billion liters of water from circular sources
Waste to Worth, a partnership with the ADB to pilot waste-to-energy facilities in the Philippines, specifically in the pilot cities of Cabuyao, Laguna, Angeles, Pampanga, and Dagupan.
Incentives Name of incentive Responsible organization
Fiscal incentives Income tax holiday
Duty reduction on imported capital equipment, spare parts, and accessoriesTax credit on raw materials and supplies
Board of Investments, Department of Trade and Industry
Non-fiscal incentives Simplification of customs proceduresUnrestricted use of consigned equipmentEmployment of foreign nationals
Board of Investments, Department of Trade and Industry
Financial assistance programs
Environmental lending program Development Bank of the Philippines
Table 9: Government incentives and the responsible organizations [JICA, 2008]
Table 10: Summary of companies and their initiatives
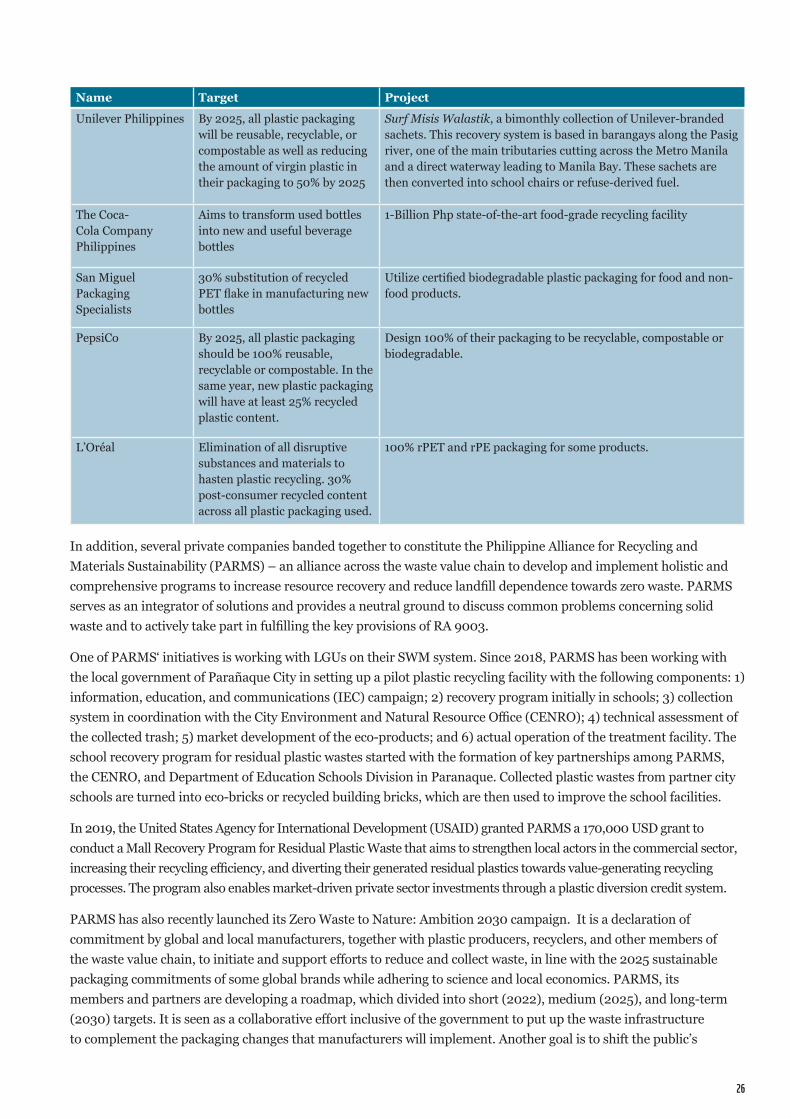
26
In addition, several private companies banded together to constitute the Philippine Alliance for Recycling and Materials Sustainability (PARMS) – an alliance across the waste value chain to develop and implement holistic and comprehensive programs to increase resource recovery and reduce landfill dependence towards zero waste. PARMS serves as an integrator of solutions and provides a neutral ground to discuss common problems concerning solid waste and to actively take part in fulfilling the key provisions of RA 9003.
One of PARMS‘ initiatives is working with LGUs on their SWM system. Since 2018, PARMS has been working with the local government of Parañaque City in setting up a pilot plastic recycling facility with the following components: 1) information, education, and communications (IEC) campaign; 2) recovery program initially in schools; 3) collection system in coordination with the City Environment and Natural Resource Office (CENRO); 4) technical assessment of the collected trash; 5) market development of the eco-products; and 6) actual operation of the treatment facility. The school recovery program for residual plastic wastes started with the formation of key partnerships among PARMS, the CENRO, and Department of Education Schools Division in Paranaque. Collected plastic wastes from partner city schools are turned into eco-bricks or recycled building bricks, which are then used to improve the school facilities.
In 2019, the United States Agency for International Development (USAID) granted PARMS a 170,000 USD grant to conduct a Mall Recovery Program for Residual Plastic Waste that aims to strengthen local actors in the commercial sector, increasing their recycling efficiency, and diverting their generated residual plastics towards value-generating recycling processes. The program also enables market-driven private sector investments through a plastic diversion credit system.
PARMS has also recently launched its Zero Waste to Nature: Ambition 2030 campaign. It is a declaration of commitment by global and local manufacturers, together with plastic producers, recyclers, and other members of the waste value chain, to initiate and support efforts to reduce and collect waste, in line with the 2025 sustainable packaging commitments of some global brands while adhering to science and local economics. PARMS, its members and partners are developing a roadmap, which divided into short (2022), medium (2025), and long-term (2030) targets. It is seen as a collaborative effort inclusive of the government to put up the waste infrastructure to complement the packaging changes that manufacturers will implement. Another goal is to shift the public’s
Name Target Project
Unilever Philippines By 2025, all plastic packaging will be reusable, recyclable, or compostable as well as reducing the amount of virgin plastic in their packaging to 50% by 2025
Surf Misis Walastik, a bimonthly collection of Unilever-branded sachets. This recovery system is based in barangays along the Pasig river, one of the main tributaries cutting across the Metro Manila and a direct waterway leading to Manila Bay. These sachets are then converted into school chairs or refuse-derived fuel.
The Coca-Cola Company Philippines
Aims to transform used bottles into new and useful beverage bottles
1-Billion Php state-of-the-art food-grade recycling facility
San Miguel Packaging Specialists
30% substitution of recycled PET flake in manufacturing new bottles
Utilize certified biodegradable plastic packaging for food and non-food products.
PepsiCo By 2025, all plastic packaging should be 100% reusable, recyclable or compostable. In the same year, new plastic packaging will have at least 25% recycled plastic content.
Design 100% of their packaging to be recyclable, compostable or biodegradable.
L’Oréal Elimination of all disruptive substances and materials to hasten plastic recycling. 30% post-consumer recycled content across all plastic packaging used.
100% rPET and rPE packaging for some products.
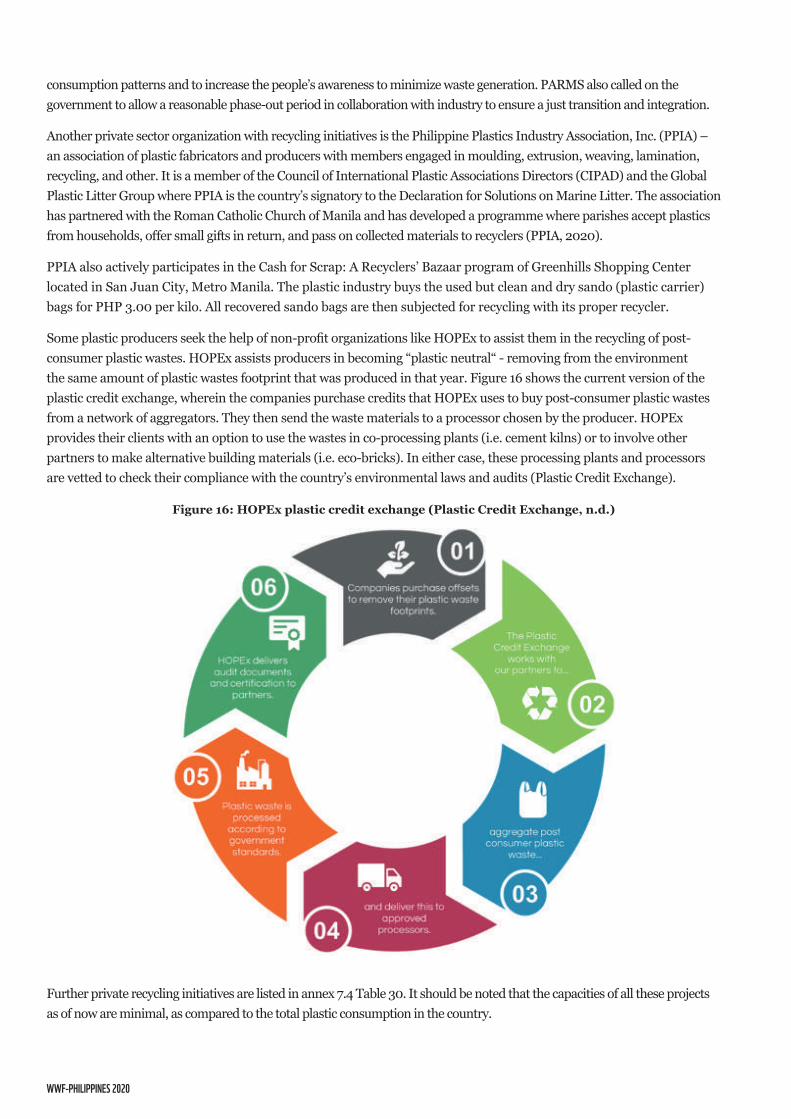
WWF-PHILIPPINES 2020
consumption patterns and to increase the people’s awareness to minimize waste generation. PARMS also called on the government to allow a reasonable phase-out period in collaboration with industry to ensure a just transition and integration.
Another private sector organization with recycling initiatives is the Philippine Plastics Industry Association, Inc. (PPIA) – an association of plastic fabricators and producers with members engaged in moulding, extrusion, weaving, lamination, recycling, and other. It is a member of the Council of International Plastic Associations Directors (CIPAD) and the Global Plastic Litter Group where PPIA is the country’s signatory to the Declaration for Solutions on Marine Litter. The association has partnered with the Roman Catholic Church of Manila and has developed a programme where parishes accept plastics from households, offer small gifts in return, and pass on collected materials to recyclers (PPIA, 2020).
PPIA also actively participates in the Cash for Scrap: A Recyclers’ Bazaar program of Greenhills Shopping Center located in San Juan City, Metro Manila. The plastic industry buys the used but clean and dry sando (plastic carrier) bags for PHP 3.00 per kilo. All recovered sando bags are then subjected for recycling with its proper recycler.
Some plastic producers seek the help of non-profit organizations like HOPEx to assist them in the recycling of post-consumer plastic wastes. HOPEx assists producers in becoming “plastic neutral“ - removing from the environment the same amount of plastic wastes footprint that was produced in that year. Figure 16 shows the current version of the plastic credit exchange, wherein the companies purchase credits that HOPEx uses to buy post-consumer plastic wastes from a network of aggregators. They then send the waste materials to a processor chosen by the producer. HOPEx provides their clients with an option to use the wastes in co-processing plants (i.e. cement kilns) or to involve other partners to make alternative building materials (i.e. eco-bricks). In either case, these processing plants and processors are vetted to check their compliance with the country’s environmental laws and audits (Plastic Credit Exchange).
Further private recycling initiatives are listed in annex 7.4 Table 30. It should be noted that the capacities of all these projects as of now are minimal, as compared to the total plastic consumption in the country.
Figure 16: HOPEx plastic credit exchange (Plastic Credit Exchange, n.d.)
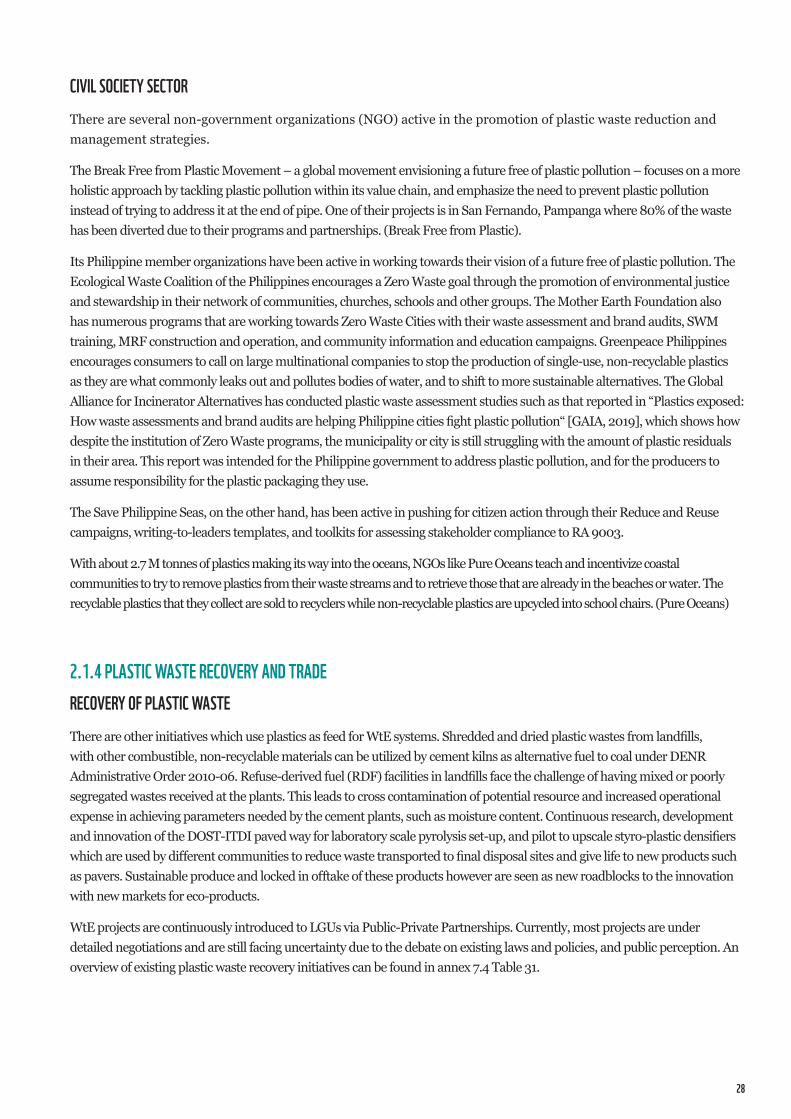
28
CIVIL SOCIETY SECTORThere are several non-government organizations (NGO) active in the promotion of plastic waste reduction and management strategies.
The Break Free from Plastic Movement – a global movement envisioning a future free of plastic pollution – focuses on a more holistic approach by tackling plastic pollution within its value chain, and emphasize the need to prevent plastic pollution instead of trying to address it at the end of pipe. One of their projects is in San Fernando, Pampanga where 80% of the waste has been diverted due to their programs and partnerships. (Break Free from Plastic).
Its Philippine member organizations have been active in working towards their vision of a future free of plastic pollution. The Ecological Waste Coalition of the Philippines encourages a Zero Waste goal through the promotion of environmental justice and stewardship in their network of communities, churches, schools and other groups. The Mother Earth Foundation also has numerous programs that are working towards Zero Waste Cities with their waste assessment and brand audits, SWM training, MRF construction and operation, and community information and education campaigns. Greenpeace Philippines encourages consumers to call on large multinational companies to stop the production of single-use, non-recyclable plastics as they are what commonly leaks out and pollutes bodies of water, and to shift to more sustainable alternatives. The Global Alliance for Incinerator Alternatives has conducted plastic waste assessment studies such as that reported in “Plastics exposed: How waste assessments and brand audits are helping Philippine cities fight plastic pollution“ [GAIA, 2019], which shows how despite the institution of Zero Waste programs, the municipality or city is still struggling with the amount of plastic residuals in their area. This report was intended for the Philippine government to address plastic pollution, and for the producers to assume responsibility for the plastic packaging they use.
The Save Philippine Seas, on the other hand, has been active in pushing for citizen action through their Reduce and Reuse campaigns, writing-to-leaders templates, and toolkits for assessing stakeholder compliance to RA 9003.
With about 2.7 M tonnes of plastics making its way into the oceans, NGOs like Pure Oceans teach and incentivize coastal communities to try to remove plastics from their waste streams and to retrieve those that are already in the beaches or water. The recyclable plastics that they collect are sold to recyclers while non-recyclable plastics are upcycled into school chairs. (Pure Oceans)
2.1.4 PLASTIC WASTE RECOVERY AND TRADERECOVERY OF PLASTIC WASTEThere are other initiatives which use plastics as feed for WtE systems. Shredded and dried plastic wastes from landfills, with other combustible, non-recyclable materials can be utilized by cement kilns as alternative fuel to coal under DENR Administrative Order 2010-06. Refuse-derived fuel (RDF) facilities in landfills face the challenge of having mixed or poorly segregated wastes received at the plants. This leads to cross contamination of potential resource and increased operational expense in achieving parameters needed by the cement plants, such as moisture content. Continuous research, development and innovation of the DOST-ITDI paved way for laboratory scale pyrolysis set-up, and pilot to upscale styro-plastic densifiers which are used by different communities to reduce waste transported to final disposal sites and give life to new products such as pavers. Sustainable produce and locked in offtake of these products however are seen as new roadblocks to the innovation with new markets for eco-products.
WtE projects are continuously introduced to LGUs via Public-Private Partnerships. Currently, most projects are under detailed negotiations and are still facing uncertainty due to the debate on existing laws and policies, and public perception. An overview of existing plastic waste recovery initiatives can be found in annex 7.4 Table 31.
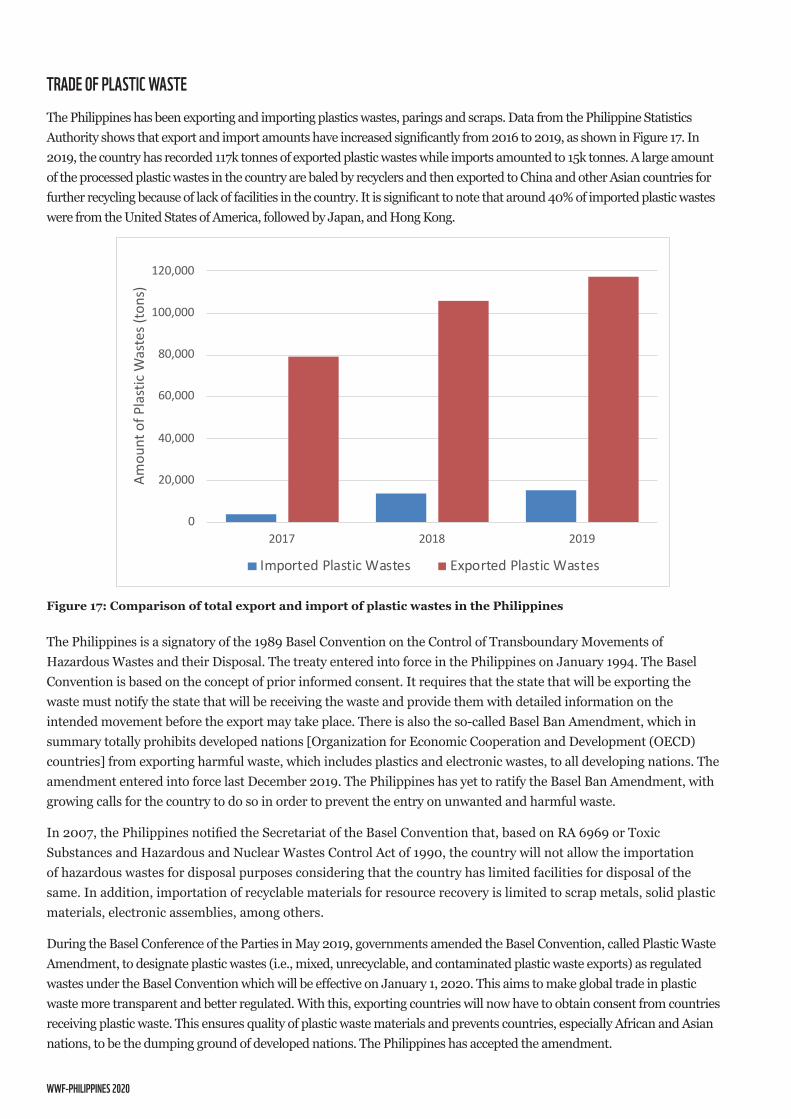
WWF-PHILIPPINES 2020
TRADE OF PLASTIC WASTEThe Philippines has been exporting and importing plastics wastes, parings and scraps. Data from the Philippine Statistics Authority shows that export and import amounts have increased significantly from 2016 to 2019, as shown in Figure 17. In 2019, the country has recorded 117k tonnes of exported plastic wastes while imports amounted to 15k tonnes. A large amount of the processed plastic wastes in the country are baled by recyclers and then exported to China and other Asian countries for further recycling because of lack of facilities in the country. It is significant to note that around 40% of imported plastic wastes were from the United States of America, followed by Japan, and Hong Kong.
The Philippines is a signatory of the 1989 Basel Convention on the Control of Transboundary Movements of Hazardous Wastes and their Disposal. The treaty entered into force in the Philippines on January 1994. The Basel Convention is based on the concept of prior informed consent. It requires that the state that will be exporting the waste must notify the state that will be receiving the waste and provide them with detailed information on the intended movement before the export may take place. There is also the so-called Basel Ban Amendment, which in summary totally prohibits developed nations [Organization for Economic Cooperation and Development (OECD) countries] from exporting harmful waste, which includes plastics and electronic wastes, to all developing nations. The amendment entered into force last December 2019. The Philippines has yet to ratify the Basel Ban Amendment, with growing calls for the country to do so in order to prevent the entry on unwanted and harmful waste.
In 2007, the Philippines notified the Secretariat of the Basel Convention that, based on RA 6969 or Toxic Substances and Hazardous and Nuclear Wastes Control Act of 1990, the country will not allow the importation of hazardous wastes for disposal purposes considering that the country has limited facilities for disposal of the same. In addition, importation of recyclable materials for resource recovery is limited to scrap metals, solid plastic materials, electronic assemblies, among others.
During the Basel Conference of the Parties in May 2019, governments amended the Basel Convention, called Plastic Waste Amendment, to designate plastic wastes (i.e., mixed, unrecyclable, and contaminated plastic waste exports) as regulated wastes under the Basel Convention which will be effective on January 1, 2020. This aims to make global trade in plastic waste more transparent and better regulated. With this, exporting countries will now have to obtain consent from countries receiving plastic waste. This ensures quality of plastic waste materials and prevents countries, especially African and Asian nations, to be the dumping ground of developed nations. The Philippines has accepted the amendment.
0
20,000
40,000
60,000
80,000
100,000
120,000
2017 2018 2019
Amou
nt o
f Pla
stic
Was
tes (
tons
)
Imported Plastic Wastes Exported Plastic Wastes
Figure 17: Comparison of total export and import of plastic wastes in the Philippines
30
2.2 PLASTIC WASTE FLOW ANALYSISThis study adopted the same framework of a macro-scale material flow analysis (MFA) for recyclable materials, including plastics, as the Japan International Cooperation Agency (JICA) in the “Study on Recycling Industry Development in the Republic of the Philippines” [JICA, 2008].
Additional collection and recycling streams, detailed waste characterization data, and flows per types of plastics were incorporated. The Philippines has experienced growth in population, economy, and urbanization from 2008 thus it is expected that plastics consumption and waste generation have increased (see annex 7.6 for the details of data sources and calculations).Data from various government and private institutions, together with primary data, were used as starting points to generate key amounts and rates for plastics production, consumption, collection, recycling, recovery, disposal, and leakage. There were difficulties in obtaining reliable data, however, especially from the industry and recycling sectors. Thus, this study used the available information together with best estimates, extrapolation and several assumptions. The results should not be treated as definitive, but these are all derived through a scientific methodology. It should be noted that, as of this writing, this is the first Philippine plastic waste MFA that has been conducted based on locally available data. This study can be the basis of the current status of the Philippines’ plastic waste stream, and can be a reference point for future interventions to decrease the amount of plastics leaked into the environment, and improve recycling rates of plastics.
2.2.1 PLASTIC TYPES AND APPLICATIONSThe seven plastic types, together with examples and whether they are being recycled or not, are shown in annex 7.7. The plastics MFA adopted this classification. Most of the household plastic wastes listed in the table are generated from packaging materials, though there are some plastic materials that are used as furniture or building materials. The plastic types were further differentiated into rigid and flexible packaging, wherein rigid packaging provides structure and resistance to damage, while flexible packaging are those that are light-weight alternatives to rigid packaging that can be folded easily like pouches and bags. Each packaging type is then separated into mono and multi, where in mono are products made of only one material type, while multi are products made with multiple materials:
• PET (polyethylene terephthalate) is one of the most commonly recycled plastic types. It is usually used as packaging bottles of beverages and medicines; however, PET can also be used as a non-packaging material since it can be made into clothing and carpet fibres. Most rigid PET packaging like bottles are recycled into polyester carpet fibre, luggage, and shoes, among others while flexible PET materials are not recycled.
• HDPE plastics (high-density polyethylene) plastics are usually used as packaging for food or drinks as they are not known to leak chemicals into food or drinks. Food and toiletries like shampoo, toothpaste and soap, as well as detergents and bleaches are usually sold in HDPE packaging. Some rigid HDPE materials that are non-packaging are plastic benches, tables, and recycling containers. Flexible HDPE are usually found in toothpaste containers and thick plastic shopping bags.
• PVC (polyvinyl chloride) is usually used in pipes and other plumbing fixtures. It contains chlorine which renders it potentially toxic when burned, which makes it more difficult to recycle. PVC is usually used in packaging as blister packs for medicines and some food packaging, but it is commonly used in pipes, credit cards, hoses and shrink wrap.
• LDPE (low-density polyethylene) plastics are semi-rigid, translucent, tough, and waterproof plastics. They are usually used in carrier bags, squeeze bottles, and general packaging for ordinary goods. They could also be used as the outer plastic layer of laminates or sachets used for powdered drinks. There is minimal recycling for LDPE in the Philippines.
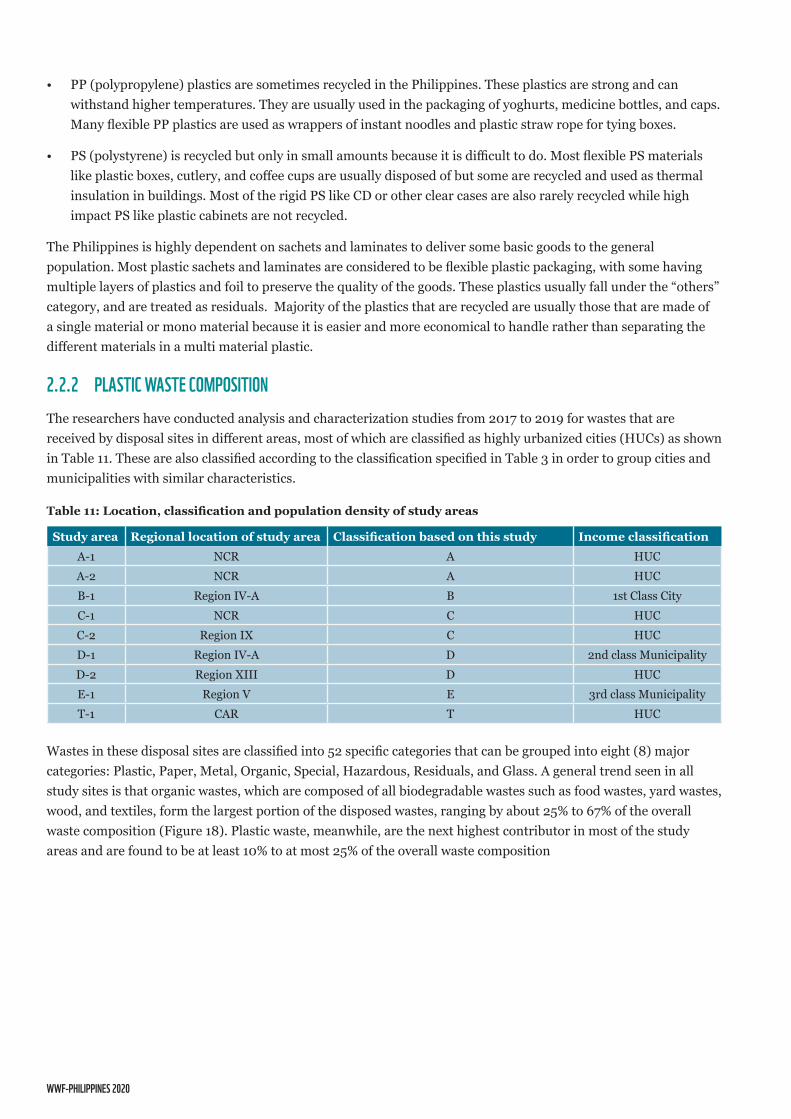
WWF-PHILIPPINES 2020
• PP (polypropylene) plastics are sometimes recycled in the Philippines. These plastics are strong and can withstand higher temperatures. They are usually used in the packaging of yoghurts, medicine bottles, and caps. Many flexible PP plastics are used as wrappers of instant noodles and plastic straw rope for tying boxes.
• PS (polystyrene) is recycled but only in small amounts because it is difficult to do. Most flexible PS materials like plastic boxes, cutlery, and coffee cups are usually disposed of but some are recycled and used as thermal insulation in buildings. Most of the rigid PS like CD or other clear cases are also rarely recycled while high impact PS like plastic cabinets are not recycled.
The Philippines is highly dependent on sachets and laminates to deliver some basic goods to the general population. Most plastic sachets and laminates are considered to be flexible plastic packaging, with some having multiple layers of plastics and foil to preserve the quality of the goods. These plastics usually fall under the “others” category, and are treated as residuals. Majority of the plastics that are recycled are usually those that are made of a single material or mono material because it is easier and more economical to handle rather than separating the different materials in a multi material plastic.
2.2.2 PLASTIC WASTE COmPOSITIONThe researchers have conducted analysis and characterization studies from 2017 to 2019 for wastes that are received by disposal sites in different areas, most of which are classified as highly urbanized cities (HUCs) as shown in Table 11. These are also classified according to the classification specified in Table 3 in order to group cities and municipalities with similar characteristics.
Wastes in these disposal sites are classified into 52 specific categories that can be grouped into eight (8) major categories: Plastic, Paper, Metal, Organic, Special, Hazardous, Residuals, and Glass. A general trend seen in all study sites is that organic wastes, which are composed of all biodegradable wastes such as food wastes, yard wastes, wood, and textiles, form the largest portion of the disposed wastes, ranging by about 25% to 67% of the overall waste composition (Figure 18). Plastic waste, meanwhile, are the next highest contributor in most of the study areas and are found to be at least 10% to at most 25% of the overall waste composition
Study area Regional location of study area Classification based on this study Income classificationA-1 NCR A HUCA-2 NCR A HUCB-1 Region IV-A B 1st Class CityC-1 NCR C HUCC-2 Region IX C HUCD-1 Region IV-A D 2nd class MunicipalityD-2 Region XIII D HUCE-1 Region V E 3rd class MunicipalityT-1 CAR T HUC
Table 11: Location, classification and population density of study areas
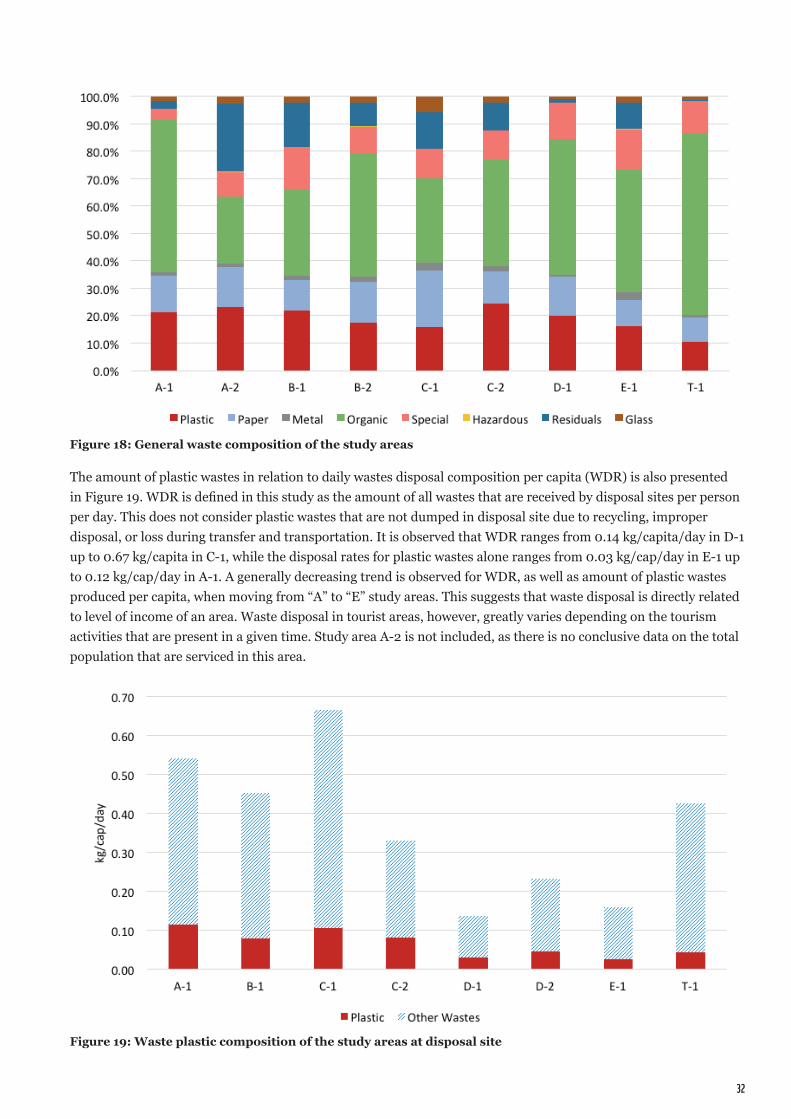
32
The amount of plastic wastes in relation to daily wastes disposal composition per capita (WDR) is also presented in Figure 19. WDR is defined in this study as the amount of all wastes that are received by disposal sites per person per day. This does not consider plastic wastes that are not dumped in disposal site due to recycling, improper disposal, or loss during transfer and transportation. It is observed that WDR ranges from 0.14 kg/capita/day in D-1 up to 0.67 kg/capita in C-1, while the disposal rates for plastic wastes alone ranges from 0.03 kg/cap/day in E-1 up to 0.12 kg/cap/day in A-1. A generally decreasing trend is observed for WDR, as well as amount of plastic wastes produced per capita, when moving from “A” to “E” study areas. This suggests that waste disposal is directly related to level of income of an area. Waste disposal in tourist areas, however, greatly varies depending on the tourism activities that are present in a given time. Study area A-2 is not included, as there is no conclusive data on the total population that are serviced in this area.
Figure 18: General waste composition of the study areas
Figure 19: Waste plastic composition of the study areas at disposal site
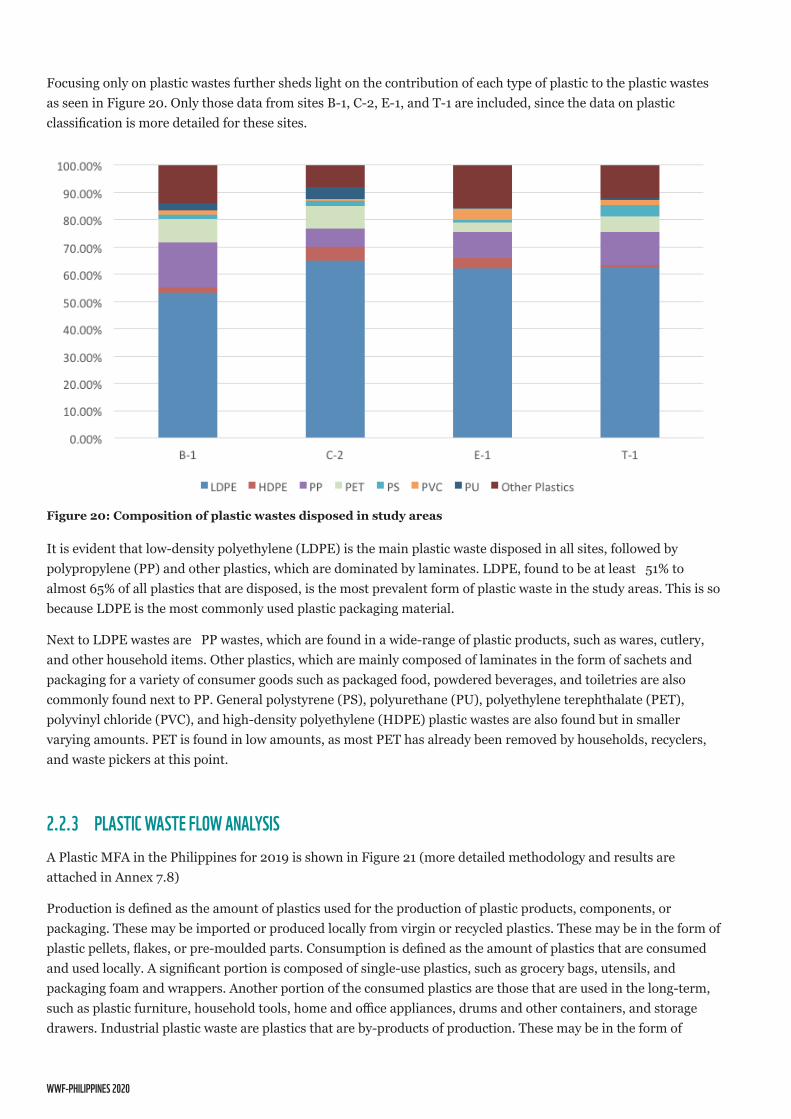
WWF-PHILIPPINES 2020
Focusing only on plastic wastes further sheds light on the contribution of each type of plastic to the plastic wastes as seen in Figure 20. Only those data from sites B-1, C-2, E-1, and T-1 are included, since the data on plastic classification is more detailed for these sites.
It is evident that low-density polyethylene (LDPE) is the main plastic waste disposed in all sites, followed by polypropylene (PP) and other plastics, which are dominated by laminates. LDPE, found to be at least 51% to almost 65% of all plastics that are disposed, is the most prevalent form of plastic waste in the study areas. This is so because LDPE is the most commonly used plastic packaging material.
Next to LDPE wastes are PP wastes, which are found in a wide-range of plastic products, such as wares, cutlery, and other household items. Other plastics, which are mainly composed of laminates in the form of sachets and packaging for a variety of consumer goods such as packaged food, powdered beverages, and toiletries are also commonly found next to PP. General polystyrene (PS), polyurethane (PU), polyethylene terephthalate (PET), polyvinyl chloride (PVC), and high-density polyethylene (HDPE) plastic wastes are also found but in smaller varying amounts. PET is found in low amounts, as most PET has already been removed by households, recyclers, and waste pickers at this point.
2.2.3 PLASTIC WASTE FLOW ANALYSISA Plastic MFA in the Philippines for 2019 is shown in Figure 21 (more detailed methodology and results are attached in Annex 7.8)
Production is defined as the amount of plastics used for the production of plastic products, components, or packaging. These may be imported or produced locally from virgin or recycled plastics. These may be in the form of plastic pellets, flakes, or pre-moulded parts. Consumption is defined as the amount of plastics that are consumed and used locally. A significant portion is composed of single-use plastics, such as grocery bags, utensils, and packaging foam and wrappers. Another portion of the consumed plastics are those that are used in the long-term, such as plastic furniture, household tools, home and office appliances, drums and other containers, and storage drawers. Industrial plastic waste are plastics that are by-products of production. These may be in the form of
Figure 20: Composition of plastic wastes disposed in study areas
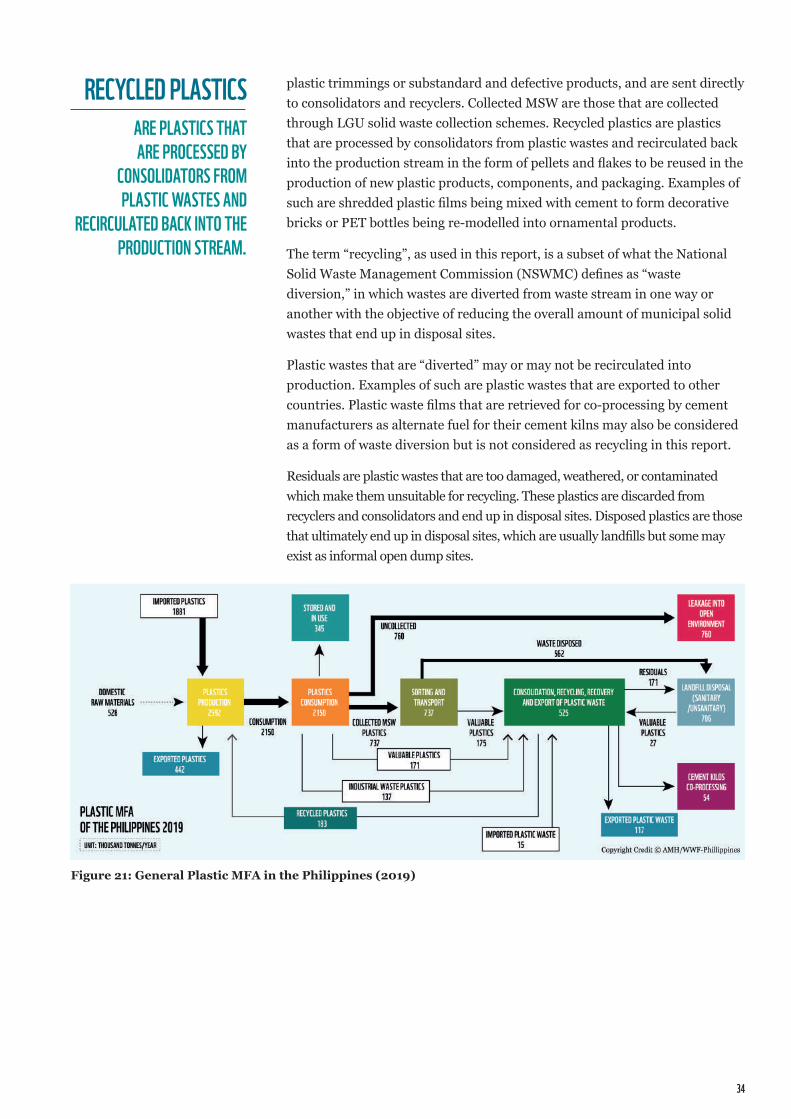
34
Figure 21: General Plastic MFA in the Philippines (2019)
plastic trimmings or substandard and defective products, and are sent directly to consolidators and recyclers. Collected MSW are those that are collected through LGU solid waste collection schemes. Recycled plastics are plastics that are processed by consolidators from plastic wastes and recirculated back into the production stream in the form of pellets and flakes to be reused in the production of new plastic products, components, and packaging. Examples of such are shredded plastic films being mixed with cement to form decorative bricks or PET bottles being re-modelled into ornamental products.
The term “recycling”, as used in this report, is a subset of what the National Solid Waste Management Commission (NSWMC) defines as “waste diversion,” in which wastes are diverted from waste stream in one way or another with the objective of reducing the overall amount of municipal solid wastes that end up in disposal sites.
Plastic wastes that are “diverted” may or may not be recirculated into production. Examples of such are plastic wastes that are exported to other countries. Plastic waste films that are retrieved for co-processing by cement manufacturers as alternate fuel for their cement kilns may also be considered as a form of waste diversion but is not considered as recycling in this report.
Residuals are plastic wastes that are too damaged, weathered, or contaminated which make them unsuitable for recycling. These plastics are discarded from recyclers and consolidators and end up in disposal sites. Disposed plastics are those that ultimately end up in disposal sites, which are usually landfills but some may exist as informal open dump sites.
RECYCLED PLASTICSARE PLASTICS THAT ARE PROCESSED BY
CONSOLIDATORS FROm PLASTIC WASTES AND
RECIRCULATED BACk INTO THE PRODUCTION STREAm.
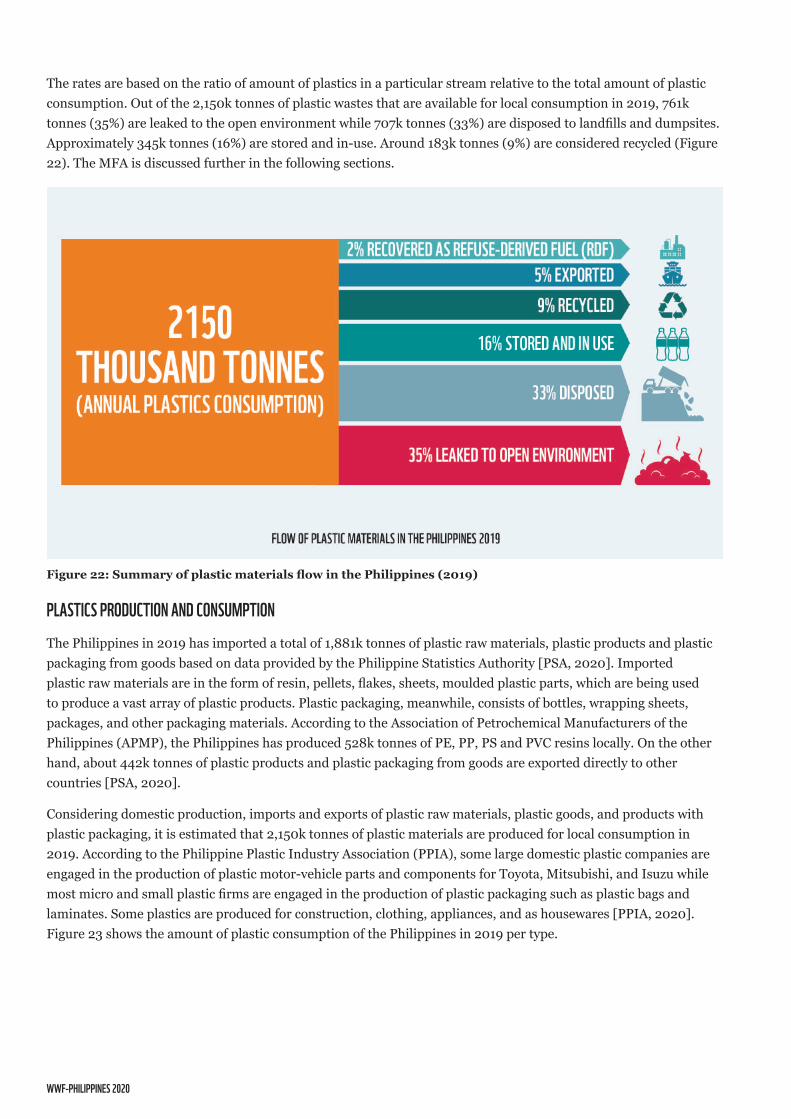
WWF-PHILIPPINES 2020
The rates are based on the ratio of amount of plastics in a particular stream relative to the total amount of plastic consumption. Out of the 2,150k tonnes of plastic wastes that are available for local consumption in 2019, 761k tonnes (35%) are leaked to the open environment while 707k tonnes (33%) are disposed to landfills and dumpsites. Approximately 345k tonnes (16%) are stored and in-use. Around 183k tonnes (9%) are considered recycled (Figure 22). The MFA is discussed further in the following sections.
PLASTICS PRODUCTION AND CONSUmPTIONThe Philippines in 2019 has imported a total of 1,881k tonnes of plastic raw materials, plastic products and plastic packaging from goods based on data provided by the Philippine Statistics Authority [PSA, 2020]. Imported plastic raw materials are in the form of resin, pellets, flakes, sheets, moulded plastic parts, which are being used to produce a vast array of plastic products. Plastic packaging, meanwhile, consists of bottles, wrapping sheets, packages, and other packaging materials. According to the Association of Petrochemical Manufacturers of the Philippines (APMP), the Philippines has produced 528k tonnes of PE, PP, PS and PVC resins locally. On the other hand, about 442k tonnes of plastic products and plastic packaging from goods are exported directly to other countries [PSA, 2020].
Considering domestic production, imports and exports of plastic raw materials, plastic goods, and products with plastic packaging, it is estimated that 2,150k tonnes of plastic materials are produced for local consumption in 2019. According to the Philippine Plastic Industry Association (PPIA), some large domestic plastic companies are engaged in the production of plastic motor-vehicle parts and components for Toyota, Mitsubishi, and Isuzu while most micro and small plastic firms are engaged in the production of plastic packaging such as plastic bags and laminates. Some plastics are produced for construction, clothing, appliances, and as housewares [PPIA, 2020]. Figure 23 shows the amount of plastic consumption of the Philippines in 2019 per type.
Figure 22: Summary of plastic materials flow in the Philippines (2019)
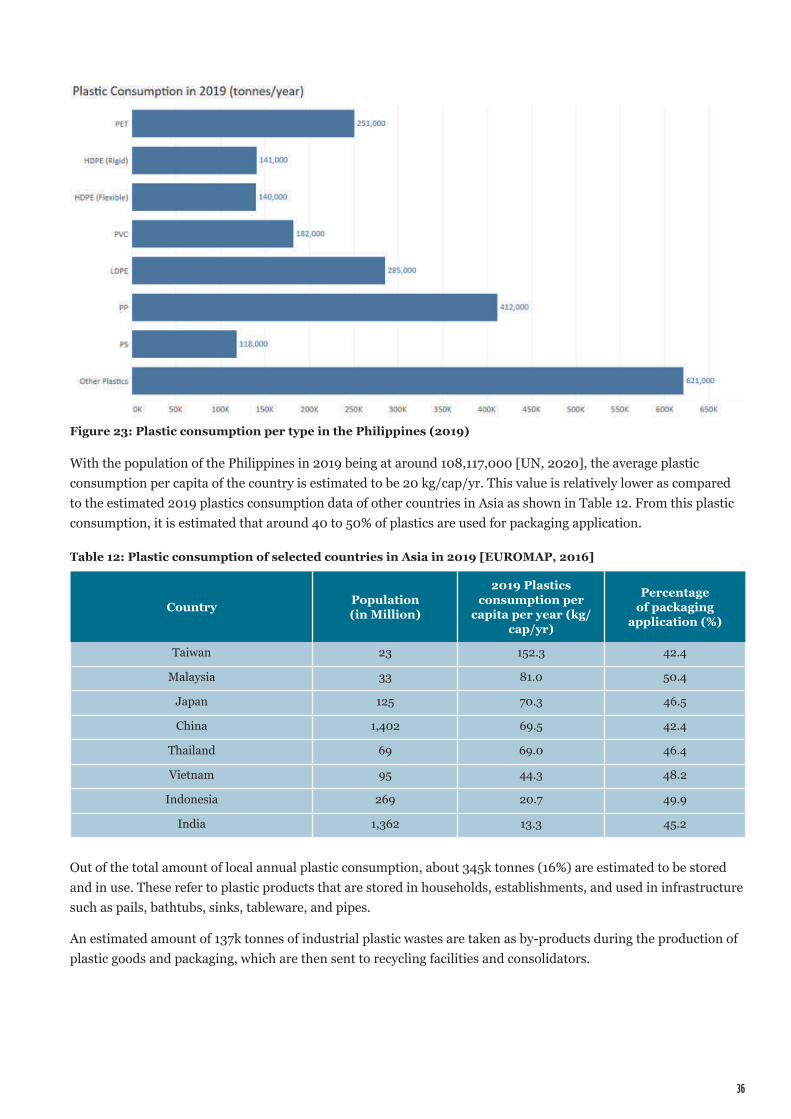
36
Figure 23: Plastic consumption per type in the Philippines (2019)
With the population of the Philippines in 2019 being at around 108,117,000 [UN, 2020], the average plastic consumption per capita of the country is estimated to be 20 kg/cap/yr. This value is relatively lower as compared to the estimated 2019 plastics consumption data of other countries in Asia as shown in Table 12. From this plastic consumption, it is estimated that around 40 to 50% of plastics are used for packaging application.
Out of the total amount of local annual plastic consumption, about 345k tonnes (16%) are estimated to be stored and in use. These refer to plastic products that are stored in households, establishments, and used in infrastructure such as pails, bathtubs, sinks, tableware, and pipes.
An estimated amount of 137k tonnes of industrial plastic wastes are taken as by-products during the production of plastic goods and packaging, which are then sent to recycling facilities and consolidators.
Table 12: Plastic consumption of selected countries in Asia in 2019 [EUROMAP, 2016]
Country Population (in Million)
2019 Plastics consumption per
capita per year (kg/cap/yr)
Percentage of packaging
application (%)
Taiwan 23 152.3 42.4
Malaysia 33 81.0 50.4
Japan 125 70.3 46.5
China 1,402 69.5 42.4
Thailand 69 69.0 46.4
Vietnam 95 44.3 48.2
Indonesia 269 20.7 49.9
India 1,362 13.3 45.2
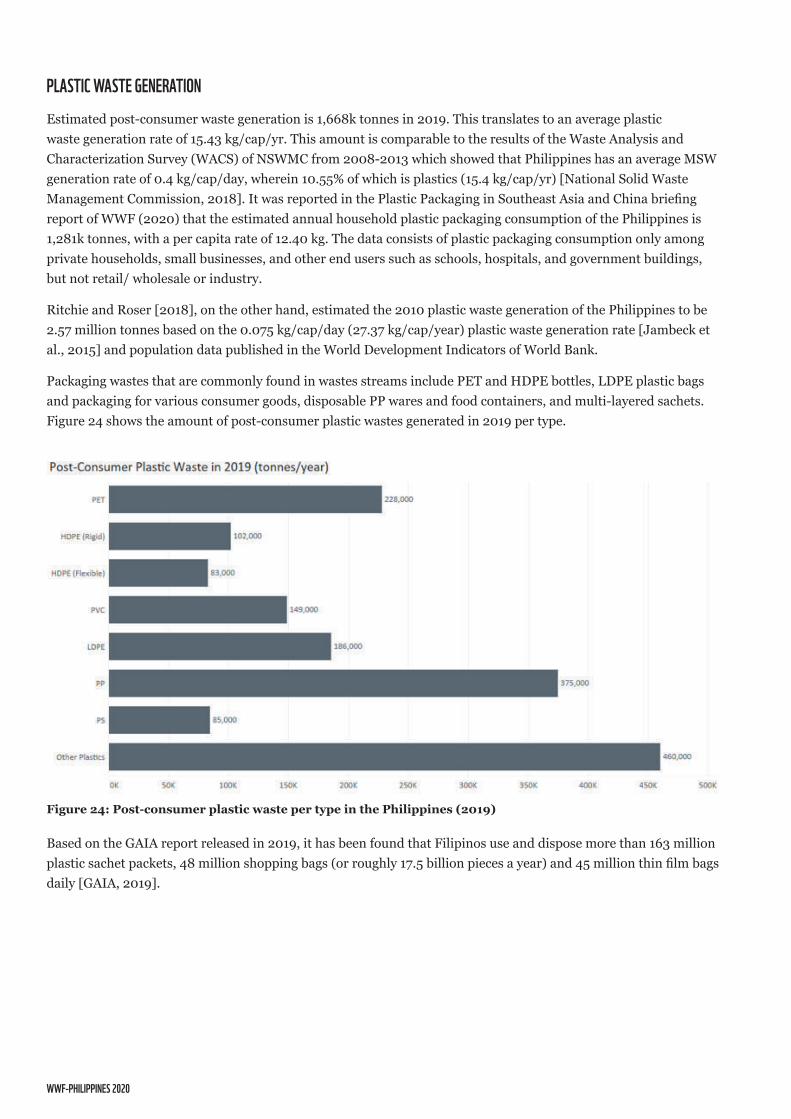
WWF-PHILIPPINES 2020
PLASTIC WASTE gENERATIONEstimated post-consumer waste generation is 1,668k tonnes in 2019. This translates to an average plastic waste generation rate of 15.43 kg/cap/yr. This amount is comparable to the results of the Waste Analysis and Characterization Survey (WACS) of NSWMC from 2008-2013 which showed that Philippines has an average MSW generation rate of 0.4 kg/cap/day, wherein 10.55% of which is plastics (15.4 kg/cap/yr) [National Solid Waste Management Commission, 2018]. It was reported in the Plastic Packaging in Southeast Asia and China briefing report of WWF (2020) that the estimated annual household plastic packaging consumption of the Philippines is 1,281k tonnes, with a per capita rate of 12.40 kg. The data consists of plastic packaging consumption only among private households, small businesses, and other end users such as schools, hospitals, and government buildings, but not retail/ wholesale or industry.
Ritchie and Roser [2018], on the other hand, estimated the 2010 plastic waste generation of the Philippines to be 2.57 million tonnes based on the 0.075 kg/cap/day (27.37 kg/cap/year) plastic waste generation rate [Jambeck et al., 2015] and population data published in the World Development Indicators of World Bank.
Packaging wastes that are commonly found in wastes streams include PET and HDPE bottles, LDPE plastic bags and packaging for various consumer goods, disposable PP wares and food containers, and multi-layered sachets. Figure 24 shows the amount of post-consumer plastic wastes generated in 2019 per type.
Figure 24: Post-consumer plastic waste per type in the Philippines (2019)
Based on the GAIA report released in 2019, it has been found that Filipinos use and dispose more than 163 million plastic sachet packets, 48 million shopping bags (or roughly 17.5 billion pieces a year) and 45 million thin film bags daily [GAIA, 2019].
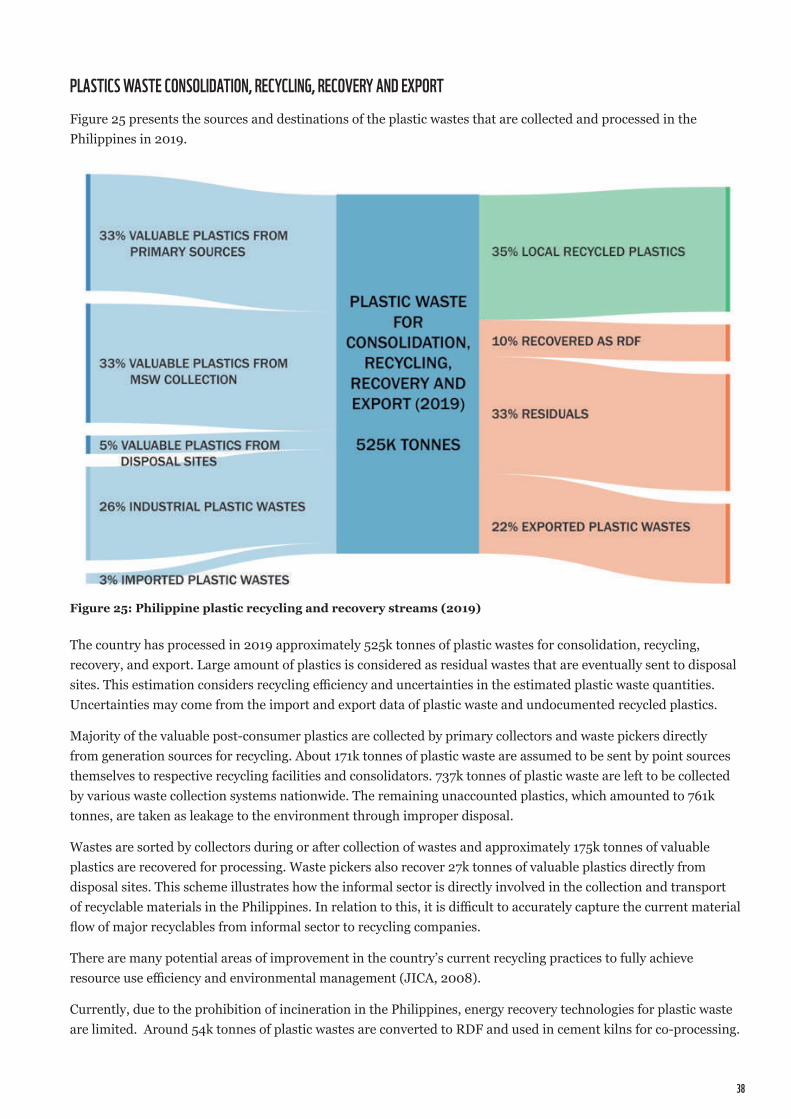
38
The country has processed in 2019 approximately 525k tonnes of plastic wastes for consolidation, recycling, recovery, and export. Large amount of plastics is considered as residual wastes that are eventually sent to disposal sites. This estimation considers recycling efficiency and uncertainties in the estimated plastic waste quantities. Uncertainties may come from the import and export data of plastic waste and undocumented recycled plastics.
Majority of the valuable post-consumer plastics are collected by primary collectors and waste pickers directly from generation sources for recycling. About 171k tonnes of plastic waste are assumed to be sent by point sources themselves to respective recycling facilities and consolidators. 737k tonnes of plastic waste are left to be collected by various waste collection systems nationwide. The remaining unaccounted plastics, which amounted to 761k tonnes, are taken as leakage to the environment through improper disposal.
Wastes are sorted by collectors during or after collection of wastes and approximately 175k tonnes of valuable plastics are recovered for processing. Waste pickers also recover 27k tonnes of valuable plastics directly from disposal sites. This scheme illustrates how the informal sector is directly involved in the collection and transport of recyclable materials in the Philippines. In relation to this, it is difficult to accurately capture the current material flow of major recyclables from informal sector to recycling companies.
There are many potential areas of improvement in the country’s current recycling practices to fully achieve resource use efficiency and environmental management (JICA, 2008).
Currently, due to the prohibition of incineration in the Philippines, energy recovery technologies for plastic waste are limited. Around 54k tonnes of plastic wastes are converted to RDF and used in cement kilns for co-processing.
Figure 25: Philippine plastic recycling and recovery streams (2019)
PLASTICS WASTE CONSOLIDATION, RECYCLINg, RECOVERY AND EXPORTFigure 25 presents the sources and destinations of the plastic wastes that are collected and processed in the Philippines in 2019.
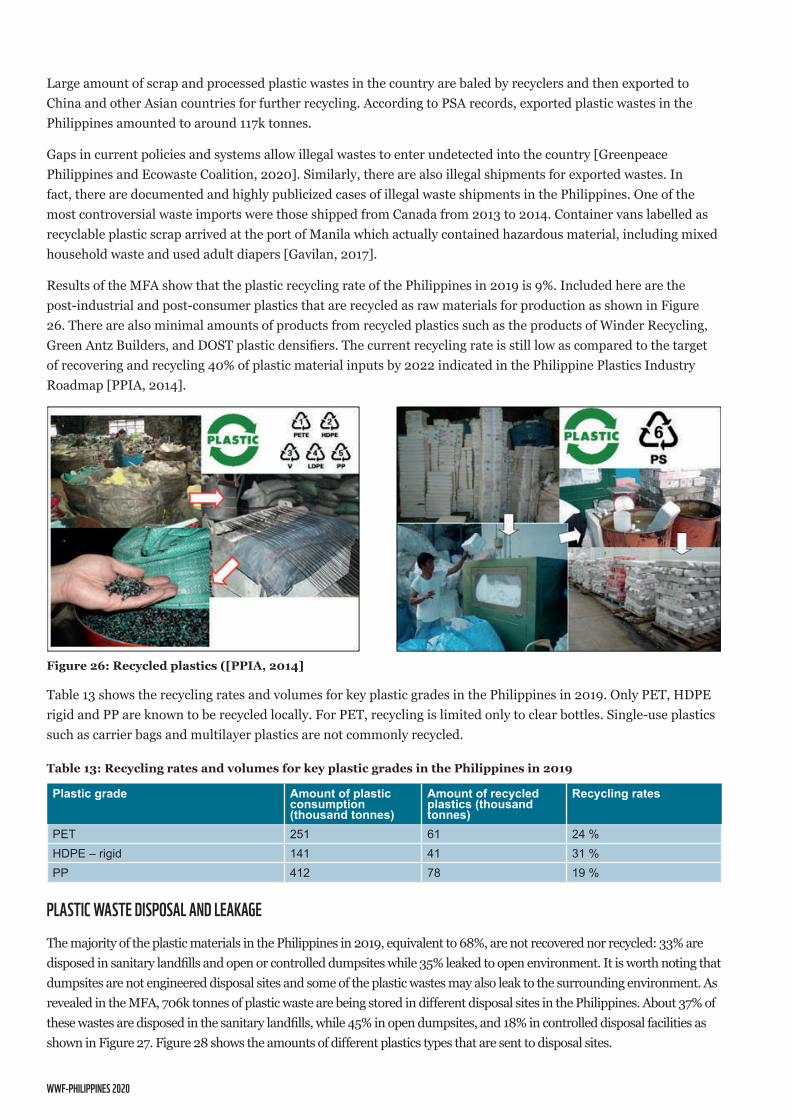
WWF-PHILIPPINES 2020
Large amount of scrap and processed plastic wastes in the country are baled by recyclers and then exported to China and other Asian countries for further recycling. According to PSA records, exported plastic wastes in the Philippines amounted to around 117k tonnes.
Gaps in current policies and systems allow illegal wastes to enter undetected into the country [Greenpeace Philippines and Ecowaste Coalition, 2020]. Similarly, there are also illegal shipments for exported wastes. In fact, there are documented and highly publicized cases of illegal waste shipments in the Philippines. One of the most controversial waste imports were those shipped from Canada from 2013 to 2014. Container vans labelled as recyclable plastic scrap arrived at the port of Manila which actually contained hazardous material, including mixed household waste and used adult diapers [Gavilan, 2017].
Results of the MFA show that the plastic recycling rate of the Philippines in 2019 is 9%. Included here are the post-industrial and post-consumer plastics that are recycled as raw materials for production as shown in Figure 26. There are also minimal amounts of products from recycled plastics such as the products of Winder Recycling, Green Antz Builders, and DOST plastic densifiers. The current recycling rate is still low as compared to the target of recovering and recycling 40% of plastic material inputs by 2022 indicated in the Philippine Plastics Industry Roadmap [PPIA, 2014].
Table 13 shows the recycling rates and volumes for key plastic grades in the Philippines in 2019. Only PET, HDPE rigid and PP are known to be recycled locally. For PET, recycling is limited only to clear bottles. Single-use plastics such as carrier bags and multilayer plastics are not commonly recycled.
PLASTIC WASTE DISPOSAL AND LEAkAgEThe majority of the plastic materials in the Philippines in 2019, equivalent to 68%, are not recovered nor recycled: 33% are disposed in sanitary landfills and open or controlled dumpsites while 35% leaked to open environment. It is worth noting that dumpsites are not engineered disposal sites and some of the plastic wastes may also leak to the surrounding environment. As revealed in the MFA, 706k tonnes of plastic waste are being stored in different disposal sites in the Philippines. About 37% of these wastes are disposed in the sanitary landfills, while 45% in open dumpsites, and 18% in controlled disposal facilities as shown in Figure 27. Figure 28 shows the amounts of different plastics types that are sent to disposal sites.
Plastic grade Amount of plastic consumption (thousand tonnes)
Amount of recycled plastics (thousand tonnes)
Recycling rates
PET 251 61 24 %HDPE – rigid 141 41 31 %PP 412 78 19 %
Figure 26: Recycled plastics ([PPIA, 2014]
Table 13: Recycling rates and volumes for key plastic grades in the Philippines in 2019
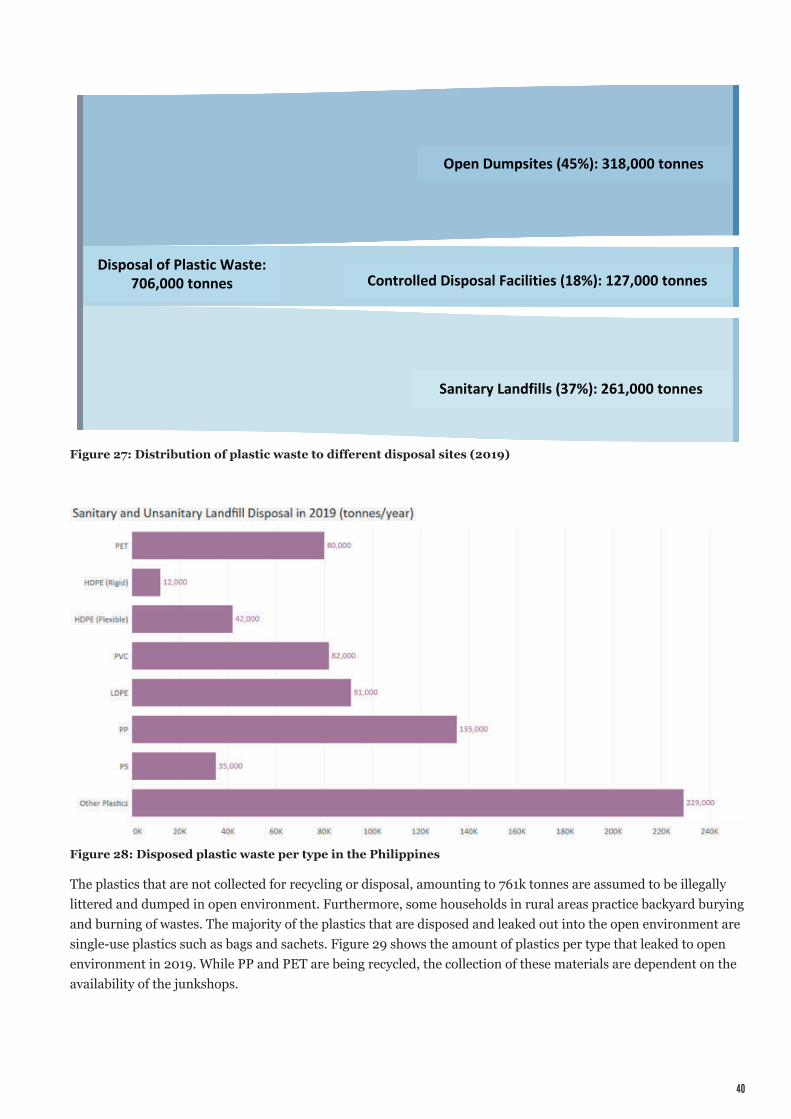
40
The plastics that are not collected for recycling or disposal, amounting to 761k tonnes are assumed to be illegally littered and dumped in open environment. Furthermore, some households in rural areas practice backyard burying and burning of wastes. The majority of the plastics that are disposed and leaked out into the open environment are single-use plastics such as bags and sachets. Figure 29 shows the amount of plastics per type that leaked to open environment in 2019. While PP and PET are being recycled, the collection of these materials are dependent on the availability of the junkshops.
Figure 27: Distribution of plastic waste to different disposal sites (2019)
Figure 28: Disposed plastic waste per type in the Philippines
Open Dumpsites (45%): 318,000 tonnes
Controlled Disposal Facilities (18%): 127,000 tonnesDisposal of Plastic Waste:
706,000 tonnes
Sanitary Landfills (37%): 261,000 tonnes
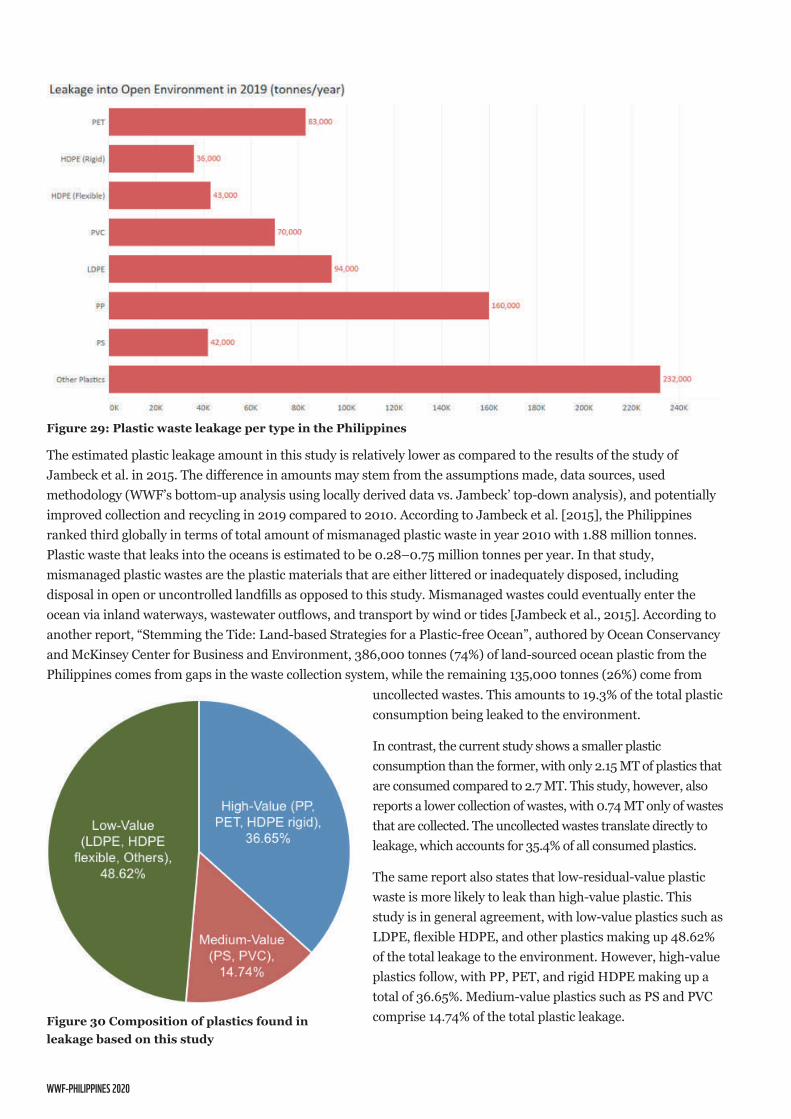
WWF-PHILIPPINES 2020
Figure 29: Plastic waste leakage per type in the Philippines
Figure 30 Composition of plastics found in leakage based on this study
The estimated plastic leakage amount in this study is relatively lower as compared to the results of the study of Jambeck et al. in 2015. The difference in amounts may stem from the assumptions made, data sources, used methodology (WWF’s bottom-up analysis using locally derived data vs. Jambeck’ top-down analysis), and potentially improved collection and recycling in 2019 compared to 2010. According to Jambeck et al. [2015], the Philippines ranked third globally in terms of total amount of mismanaged plastic waste in year 2010 with 1.88 million tonnes. Plastic waste that leaks into the oceans is estimated to be 0.28–0.75 million tonnes per year. In that study, mismanaged plastic wastes are the plastic materials that are either littered or inadequately disposed, including disposal in open or uncontrolled landfills as opposed to this study. Mismanaged wastes could eventually enter the ocean via inland waterways, wastewater outflows, and transport by wind or tides [Jambeck et al., 2015]. According to another report, “Stemming the Tide: Land-based Strategies for a Plastic-free Ocean”, authored by Ocean Conservancy and McKinsey Center for Business and Environment, 386,000 tonnes (74%) of land-sourced ocean plastic from the Philippines comes from gaps in the waste collection system, while the remaining 135,000 tonnes (26%) come from
uncollected wastes. This amounts to 19.3% of the total plastic consumption being leaked to the environment.
In contrast, the current study shows a smaller plastic consumption than the former, with only 2.15 MT of plastics that are consumed compared to 2.7 MT. This study, however, also reports a lower collection of wastes, with 0.74 MT only of wastes that are collected. The uncollected wastes translate directly to leakage, which accounts for 35.4% of all consumed plastics.
The same report also states that low-residual-value plastic waste is more likely to leak than high-value plastic. This study is in general agreement, with low-value plastics such as LDPE, flexible HDPE, and other plastics making up 48.62% of the total leakage to the environment. However, high-value plastics follow, with PP, PET, and rigid HDPE making up a total of 36.65%. Medium-value plastics such as PS and PVC comprise 14.74% of the total plastic leakage.
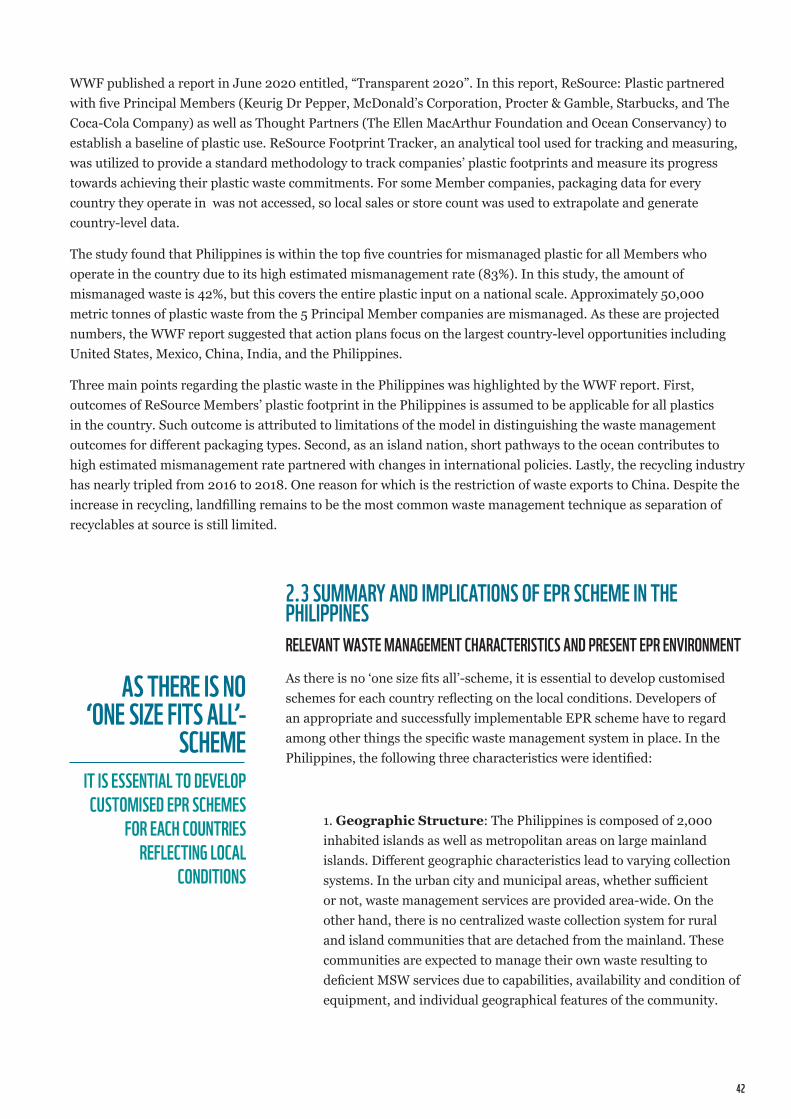
42
WWF published a report in June 2020 entitled, “Transparent 2020”. In this report, ReSource: Plastic partnered with five Principal Members (Keurig Dr Pepper, McDonald’s Corporation, Procter & Gamble, Starbucks, and The Coca-Cola Company) as well as Thought Partners (The Ellen MacArthur Foundation and Ocean Conservancy) to establish a baseline of plastic use. ReSource Footprint Tracker, an analytical tool used for tracking and measuring, was utilized to provide a standard methodology to track companies’ plastic footprints and measure its progress towards achieving their plastic waste commitments. For some Member companies, packaging data for every country they operate in was not accessed, so local sales or store count was used to extrapolate and generate country-level data.
The study found that Philippines is within the top five countries for mismanaged plastic for all Members who operate in the country due to its high estimated mismanagement rate (83%). In this study, the amount of mismanaged waste is 42%, but this covers the entire plastic input on a national scale. Approximately 50,000 metric tonnes of plastic waste from the 5 Principal Member companies are mismanaged. As these are projected numbers, the WWF report suggested that action plans focus on the largest country-level opportunities including United States, Mexico, China, India, and the Philippines.
Three main points regarding the plastic waste in the Philippines was highlighted by the WWF report. First, outcomes of ReSource Members’ plastic footprint in the Philippines is assumed to be applicable for all plastics in the country. Such outcome is attributed to limitations of the model in distinguishing the waste management outcomes for different packaging types. Second, as an island nation, short pathways to the ocean contributes to high estimated mismanagement rate partnered with changes in international policies. Lastly, the recycling industry has nearly tripled from 2016 to 2018. One reason for which is the restriction of waste exports to China. Despite the increase in recycling, landfilling remains to be the most common waste management technique as separation of recyclables at source is still limited.
2.3 SUmmARY AND ImPLICATIONS OF EPR SCHEmE IN THE PHILIPPINESRELEVANT WASTE mANAgEmENT CHARACTERISTICS AND PRESENT EPR ENVIRONmENTAs there is no ‘one size fits all’-scheme, it is essential to develop customised schemes for each country reflecting on the local conditions. Developers of an appropriate and successfully implementable EPR scheme have to regard among other things the specific waste management system in place. In the Philippines, the following three characteristics were identified:
1. Geographic Structure: The Philippines is composed of 2,000 inhabited islands as well as metropolitan areas on large mainland islands. Different geographic characteristics lead to varying collection systems. In the urban city and municipal areas, whether sufficient or not, waste management services are provided area-wide. On the other hand, there is no centralized waste collection system for rural and island communities that are detached from the mainland. These communities are expected to manage their own waste resulting to deficient MSW services due to capabilities, availability and condition of equipment, and individual geographical features of the community.
AS THERE IS NO ‘ONE SIZE FITS ALL’-
SCHEmEIT IS ESSENTIAL TO DEVELOP CUSTOmISED EPR SCHEmES
FOR EACH COUNTRIES REFLECTINg LOCAL
CONDITIONS
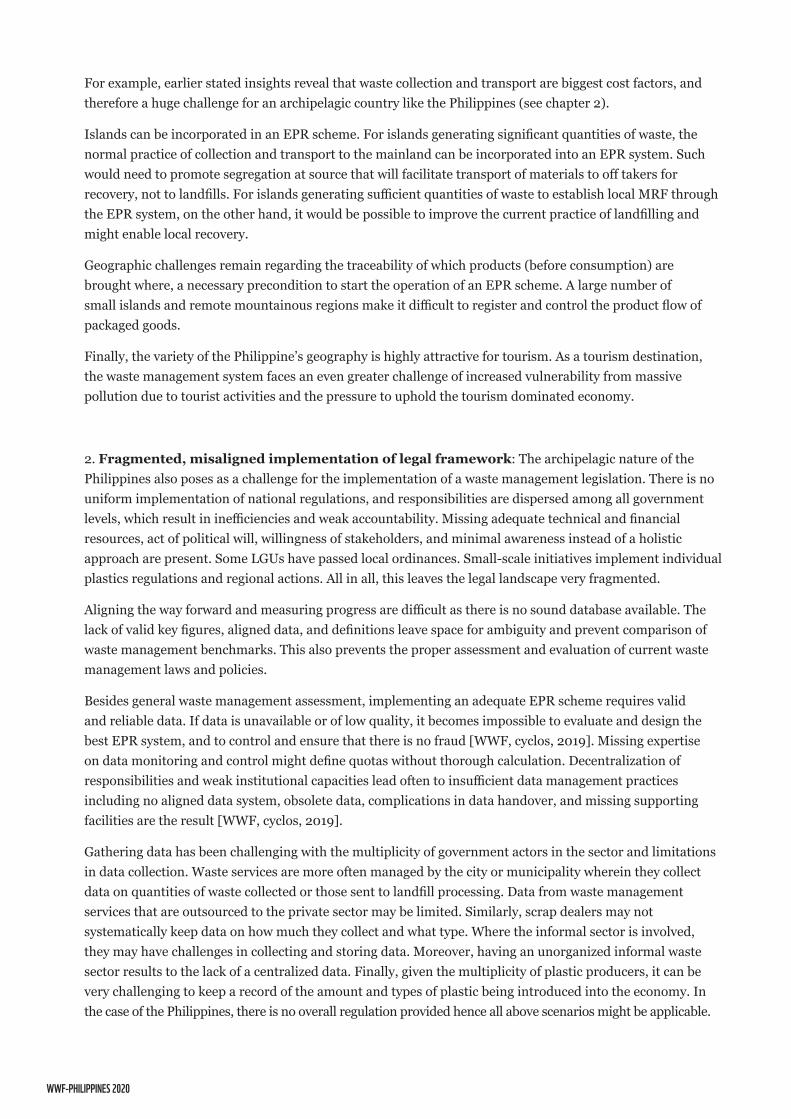
WWF-PHILIPPINES 2020
For example, earlier stated insights reveal that waste collection and transport are biggest cost factors, and therefore a huge challenge for an archipelagic country like the Philippines (see chapter 2).
Islands can be incorporated in an EPR scheme. For islands generating significant quantities of waste, the normal practice of collection and transport to the mainland can be incorporated into an EPR system. Such would need to promote segregation at source that will facilitate transport of materials to off takers for recovery, not to landfills. For islands generating sufficient quantities of waste to establish local MRF through the EPR system, on the other hand, it would be possible to improve the current practice of landfilling and might enable local recovery.
Geographic challenges remain regarding the traceability of which products (before consumption) are brought where, a necessary precondition to start the operation of an EPR scheme. A large number of small islands and remote mountainous regions make it difficult to register and control the product flow of packaged goods.
Finally, the variety of the Philippine’s geography is highly attractive for tourism. As a tourism destination, the waste management system faces an even greater challenge of increased vulnerability from massive pollution due to tourist activities and the pressure to uphold the tourism dominated economy.
2. Fragmented, misaligned implementation of legal framework: The archipelagic nature of the Philippines also poses as a challenge for the implementation of a waste management legislation. There is no uniform implementation of national regulations, and responsibilities are dispersed among all government levels, which result in inefficiencies and weak accountability. Missing adequate technical and financial resources, act of political will, willingness of stakeholders, and minimal awareness instead of a holistic approach are present. Some LGUs have passed local ordinances. Small-scale initiatives implement individual plastics regulations and regional actions. All in all, this leaves the legal landscape very fragmented.
Aligning the way forward and measuring progress are difficult as there is no sound database available. The lack of valid key figures, aligned data, and definitions leave space for ambiguity and prevent comparison of waste management benchmarks. This also prevents the proper assessment and evaluation of current waste management laws and policies.
Besides general waste management assessment, implementing an adequate EPR scheme requires valid and reliable data. If data is unavailable or of low quality, it becomes impossible to evaluate and design the best EPR system, and to control and ensure that there is no fraud [WWF, cyclos, 2019]. Missing expertise on data monitoring and control might define quotas without thorough calculation. Decentralization of responsibilities and weak institutional capacities lead often to insufficient data management practices including no aligned data system, obsolete data, complications in data handover, and missing supporting facilities are the result [WWF, cyclos, 2019].
Gathering data has been challenging with the multiplicity of government actors in the sector and limitations in data collection. Waste services are more often managed by the city or municipality wherein they collect data on quantities of waste collected or those sent to landfill processing. Data from waste management services that are outsourced to the private sector may be limited. Similarly, scrap dealers may not systematically keep data on how much they collect and what type. Where the informal sector is involved, they may have challenges in collecting and storing data. Moreover, having an unorganized informal waste sector results to the lack of a centralized data. Finally, given the multiplicity of plastic producers, it can be very challenging to keep a record of the amount and types of plastic being introduced into the economy. In the case of the Philippines, there is no overall regulation provided hence all above scenarios might be applicable.
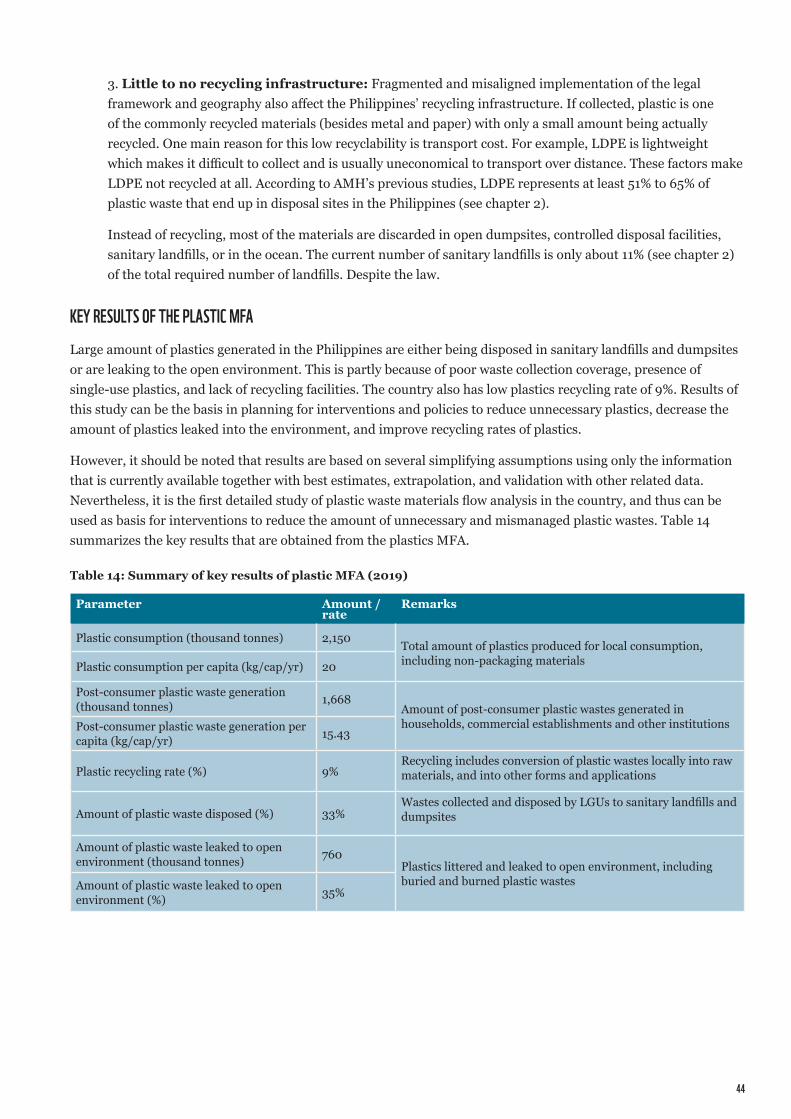
44
kEY RESULTS OF THE PLASTIC mFALarge amount of plastics generated in the Philippines are either being disposed in sanitary landfills and dumpsites or are leaking to the open environment. This is partly because of poor waste collection coverage, presence of single-use plastics, and lack of recycling facilities. The country also has low plastics recycling rate of 9%. Results of this study can be the basis in planning for interventions and policies to reduce unnecessary plastics, decrease the amount of plastics leaked into the environment, and improve recycling rates of plastics.
However, it should be noted that results are based on several simplifying assumptions using only the information that is currently available together with best estimates, extrapolation, and validation with other related data. Nevertheless, it is the first detailed study of plastic waste materials flow analysis in the country, and thus can be used as basis for interventions to reduce the amount of unnecessary and mismanaged plastic wastes. Table 14 summarizes the key results that are obtained from the plastics MFA.
Parameter Amount / rate
Remarks
Plastic consumption (thousand tonnes) 2,150 Total amount of plastics produced for local consumption, including non-packaging materialsPlastic consumption per capita (kg/cap/yr) 20
Post-consumer plastic waste generation (thousand tonnes) 1,668
Amount of post-consumer plastic wastes generated in households, commercial establishments and other institutionsPost-consumer plastic waste generation per
capita (kg/cap/yr) 15.43
Plastic recycling rate (%) 9%Recycling includes conversion of plastic wastes locally into raw materials, and into other forms and applications
Amount of plastic waste disposed (%) 33%Wastes collected and disposed by LGUs to sanitary landfills and dumpsites
Amount of plastic waste leaked to open environment (thousand tonnes) 760
Plastics littered and leaked to open environment, including buried and burned plastic wastesAmount of plastic waste leaked to open
environment (%) 35%
3. Little to no recycling infrastructure: Fragmented and misaligned implementation of the legal framework and geography also affect the Philippines’ recycling infrastructure. If collected, plastic is one of the commonly recycled materials (besides metal and paper) with only a small amount being actually recycled. One main reason for this low recyclability is transport cost. For example, LDPE is lightweight which makes it difficult to collect and is usually uneconomical to transport over distance. These factors make LDPE not recycled at all. According to AMH’s previous studies, LDPE represents at least 51% to 65% of plastic waste that end up in disposal sites in the Philippines (see chapter 2).
Instead of recycling, most of the materials are discarded in open dumpsites, controlled disposal facilities, sanitary landfills, or in the ocean. The current number of sanitary landfills is only about 11% (see chapter 2) of the total required number of landfills. Despite the law.
Table 14: Summary of key results of plastic MFA (2019)
WWF-PHILIPPINES 2020
PREVIOUS WASTE mANAgEmENT LANDSCAPE ANALYSIS BY CYCLOSBesides the present waste management landscape, a study was conducted by cyclos that assessed the Philippines in regard to implementing a mandatory EPR scheme in 2019. Criteria looked at were:
• General situation: political situation; legal and regulatory framework; income level and GDP; corruption; education and living standards; geographical conditions.
• Waste management situation: general waste management structure; financing of waste management; recycling of packaging waste; technical competencies; public awareness; controlling and monitoring systems; importance of the informal sector; experiences and data availability.
• Current status of EPR: existence of EPR laws for packaging; existence of EPR systems for other products and goods; existence of voluntary initiatives from the industry; existence of initiatives for EPR systems from the government; and support for introducing an EPR system through external experts.
Based on the results of this 2019 study, the following conclusions have been made:
For more information about this, see WWF and cyclos, ‘Legal Framework Study of Extended Producer Responsibility’ [2019]. The evaluation is summarized in a table in annex 7.9 and complements the current assessment of the waste management situation for the development of a tailored EPR scheme.
DEVELOPmENT APPROACHBased on the assessment of the present waste management characteristics and EPR environment, upcoming sub-chapters discuss a customized EPR scheme and strategy for the Philippines that focuses on generic capacity building for all relevant stakeholders. This will be done by explaining the different EPR scheme areas, paired with country examples.
“There are several initiatives from the consumer good companies and the industry in general, in co-operation with the government. However, the overall potential for successfully introducing an EPR system is regarded as not so high. This is rooted in the following reasons:
The stability for a sound management and an effective controlling are currently not yet given. Corruption and mismanagement are very prevalent, and it is not likely that the necessary controls will be introduced soon at the necessary interfaces and recycling is not given a high priority.
Moreover, there are about 2,000 inhabited islands which impede the introduction in a two-fold way. Firstly, it makes the implementation of an infrastructure for collection and recycling very difficult. Secondly, it is very difficult to register and control which packaged goods are brought to which islands and thus which goods are introduced where. However, as previously explained, this is a crucial pre-requisite for identifying the obligated companies and their respective quantities, which they need to pay for as part of the EPR system.
[…] Governments [with legal authority so-called police power)] theoretically has the power to determine requirements, which need to be fulfilled, however without specific monitoring, registration, certification and controlling, no successful implementation [of an EPR scheme] can be guaranteed.”
46
3. THEORY AND CONCEPTS OF EXTENDED PRODUCER RESPONSIBILITYThe following chapter introduced the theory and concepts of EPR Schemes. Details and recommendations for the Philippine context are elaborated later in the practical section of the report (see chapter 4).
3.1 ECONOmIC INSTRUmENTS TO STEER WASTE mANAgEmENTEconomic instruments are crucial to establish a sound financial and organizational basis for sustainable waste management and recycling. Generally, there are different types of economic instruments:
• Revenue-raising instruments which create a direct income from the industry and/or households through taxation or charges, like landfill tax, or municipal waste fees (green tax)
• Revenue providing instruments which create an indirect income for industry and/or households through reduction of charges or subsidies, like tax rebates or variable VAT rates (green tax)
• Non-revenue instruments which do not create government revenues but motivate the industry and/or households to improve their individual waste performance, as it is done for example through EPR schemes
Ideally, instruments from all three categories are implemented in a complementary fashion to establish a sound waste management of all waste stream (not limited to packaging). Generally, both green taxes and EPR can have steering functions.
Green taxes can steer raw materials, newly introduced materials and goods onto the market. These environmental taxes or import duties are charged on raw materials and goods. In these cases, most of the funds usually flow into the general public budget (upstream impact).
The steering function of EPR fees also covers the part when raw materials, materials and good are newly introduced onto the market. As the producer and importer decide in which packaging they will sell their goods, they determine the packaging design. A well-designed EPR system can influence these packaging choices, most effectively through making well-recyclable and/or packaging containing recyclates significantly cheaper than other packaging designs. Therefore, modulated EPR fees can be implemented. Moreover, waste avoidance through reducing unnecessary packaging elements can be targeted. Therefore, EPR systems – if designed that way –have upstream effects on the packaging supply chain.
Even more, EPR expands beyond this as EPR fees also impact the establishment of an operative system, meaning EPR can finance, amongst other things, infrastructure, communication, campaigns against littering and especially the design of covered products like packaging (up- and downstream impact).
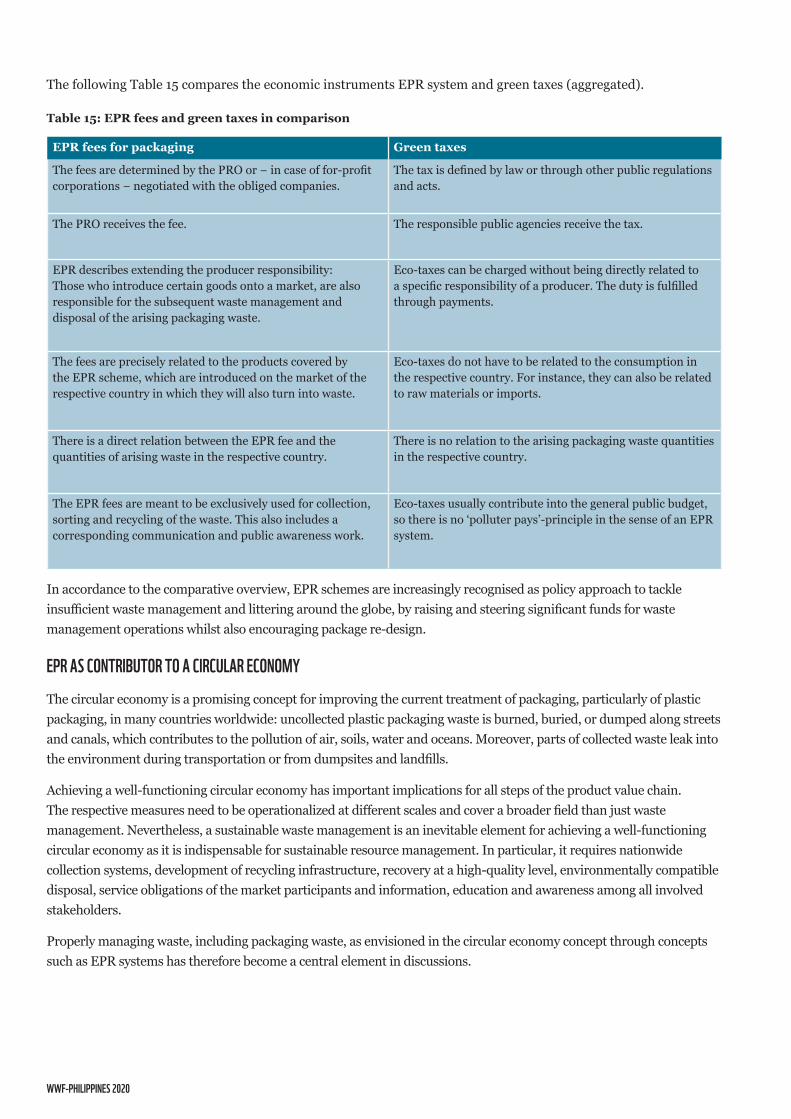
WWF-PHILIPPINES 2020
The following Table 15 compares the economic instruments EPR system and green taxes (aggregated).
EPR fees for packaging Green taxes
The fees are determined by the PRO or − in case of for-profit corporations − negotiated with the obliged companies.
The tax is defined by law or through other public regulations and acts.
The PRO receives the fee. The responsible public agencies receive the tax.
EPR describes extending the producer responsibility: Those who introduce certain goods onto a market, are also responsible for the subsequent waste management and disposal of the arising packaging waste.
Eco-taxes can be charged without being directly related to a specific responsibility of a producer. The duty is fulfilled through payments.
The fees are precisely related to the products covered by the EPR scheme, which are introduced on the market of the respective country in which they will also turn into waste.
Eco-taxes do not have to be related to the consumption in the respective country. For instance, they can also be related to raw materials or imports.
There is a direct relation between the EPR fee and the quantities of arising waste in the respective country.
There is no relation to the arising packaging waste quantities in the respective country.
The EPR fees are meant to be exclusively used for collection, sorting and recycling of the waste. This also includes a corresponding communication and public awareness work.
Eco-taxes usually contribute into the general public budget, so there is no ‘polluter pays’-principle in the sense of an EPR system.
Table 15: EPR fees and green taxes in comparison
In accordance to the comparative overview, EPR schemes are increasingly recognised as policy approach to tackle insufficient waste management and littering around the globe, by raising and steering significant funds for waste management operations whilst also encouraging package re-design.
EPR AS CONTRIBUTOR TO A CIRCULAR ECONOmYThe circular economy is a promising concept for improving the current treatment of packaging, particularly of plastic packaging, in many countries worldwide: uncollected plastic packaging waste is burned, buried, or dumped along streets and canals, which contributes to the pollution of air, soils, water and oceans. Moreover, parts of collected waste leak into the environment during transportation or from dumpsites and landfills.
Achieving a well-functioning circular economy has important implications for all steps of the product value chain. The respective measures need to be operationalized at different scales and cover a broader field than just waste management. Nevertheless, a sustainable waste management is an inevitable element for achieving a well-functioning circular economy as it is indispensable for sustainable resource management. In particular, it requires nationwide collection systems, development of recycling infrastructure, recovery at a high-quality level, environmentally compatible disposal, service obligations of the market participants and information, education and awareness among all involved stakeholders.
Properly managing waste, including packaging waste, as envisioned in the circular economy concept through concepts such as EPR systems has therefore become a central element in discussions.
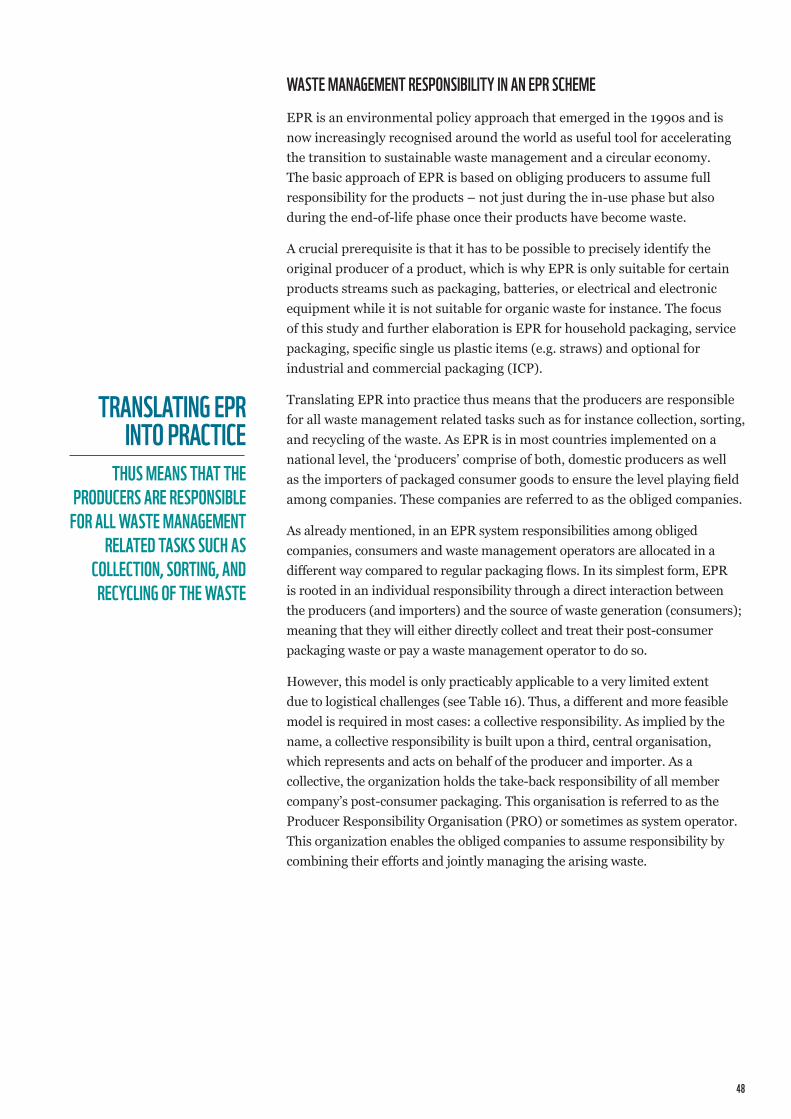
48
WASTE mANAgEmENT RESPONSIBILITY IN AN EPR SCHEmEEPR is an environmental policy approach that emerged in the 1990s and is now increasingly recognised around the world as useful tool for accelerating the transition to sustainable waste management and a circular economy. The basic approach of EPR is based on obliging producers to assume full responsibility for the products – not just during the in-use phase but also during the end-of-life phase once their products have become waste.
A crucial prerequisite is that it has to be possible to precisely identify the original producer of a product, which is why EPR is only suitable for certain products streams such as packaging, batteries, or electrical and electronic equipment while it is not suitable for organic waste for instance. The focus of this study and further elaboration is EPR for household packaging, service packaging, specific single us plastic items (e.g. straws) and optional for industrial and commercial packaging (ICP).
Translating EPR into practice thus means that the producers are responsible for all waste management related tasks such as for instance collection, sorting, and recycling of the waste. As EPR is in most countries implemented on a national level, the ‘producers’ comprise of both, domestic producers as well as the importers of packaged consumer goods to ensure the level playing field among companies. These companies are referred to as the obliged companies.
As already mentioned, in an EPR system responsibilities among obliged companies, consumers and waste management operators are allocated in a different way compared to regular packaging flows. In its simplest form, EPR is rooted in an individual responsibility through a direct interaction between the producers (and importers) and the source of waste generation (consumers); meaning that they will either directly collect and treat their post-consumer packaging waste or pay a waste management operator to do so.
However, this model is only practicably applicable to a very limited extent due to logistical challenges (see Table 16). Thus, a different and more feasible model is required in most cases: a collective responsibility. As implied by the name, a collective responsibility is built upon a third, central organisation, which represents and acts on behalf of the producer and importer. As a collective, the organization holds the take-back responsibility of all member company’s post-consumer packaging. This organisation is referred to as the Producer Responsibility Organisation (PRO) or sometimes as system operator. This organization enables the obliged companies to assume responsibility by combining their efforts and jointly managing the arising waste.
TRANSLATINg EPR INTO PRACTICE
THUS mEANS THAT THE PRODUCERS ARE RESPONSIBLE
FOR ALL WASTE mANAgEmENT RELATED TASkS SUCH AS
COLLECTION, SORTINg, AND RECYCLINg OF THE WASTE
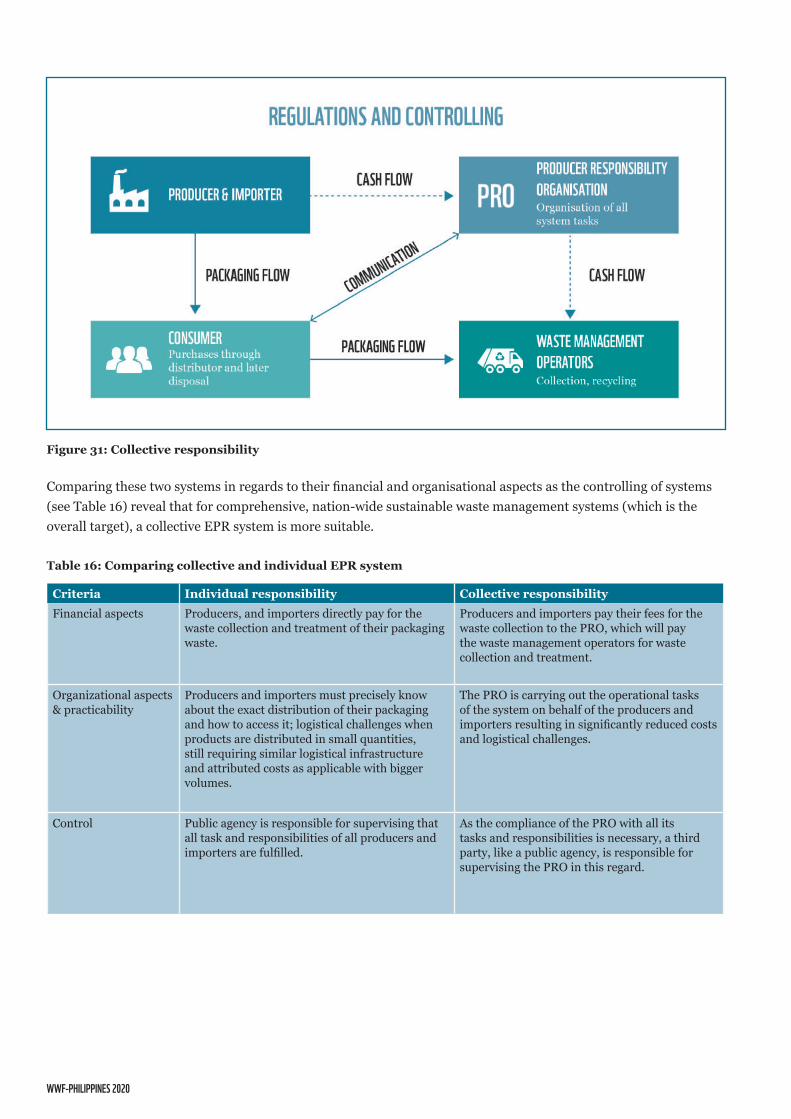
WWF-PHILIPPINES 2020
Comparing these two systems in regards to their financial and organisational aspects as the controlling of systems (see Table 16) reveal that for comprehensive, nation-wide sustainable waste management systems (which is the overall target), a collective EPR system is more suitable.
Criteria Individual responsibility Collective responsibilityFinancial aspects Producers, and importers directly pay for the
waste collection and treatment of their packaging waste.
Producers and importers pay their fees for the waste collection to the PRO, which will pay the waste management operators for waste collection and treatment.
Organizational aspects & practicability
Producers and importers must precisely know about the exact distribution of their packaging and how to access it; logistical challenges when products are distributed in small quantities, still requiring similar logistical infrastructure and attributed costs as applicable with bigger volumes.
The PRO is carrying out the operational tasks of the system on behalf of the producers and importers resulting in significantly reduced costs and logistical challenges.
Control Public agency is responsible for supervising that all task and responsibilities of all producers and importers are fulfilled.
As the compliance of the PRO with all its tasks and responsibilities is necessary, a third party, like a public agency, is responsible for supervising the PRO in this regard.
Figure 31: Collective responsibility
Table 16: Comparing collective and individual EPR system
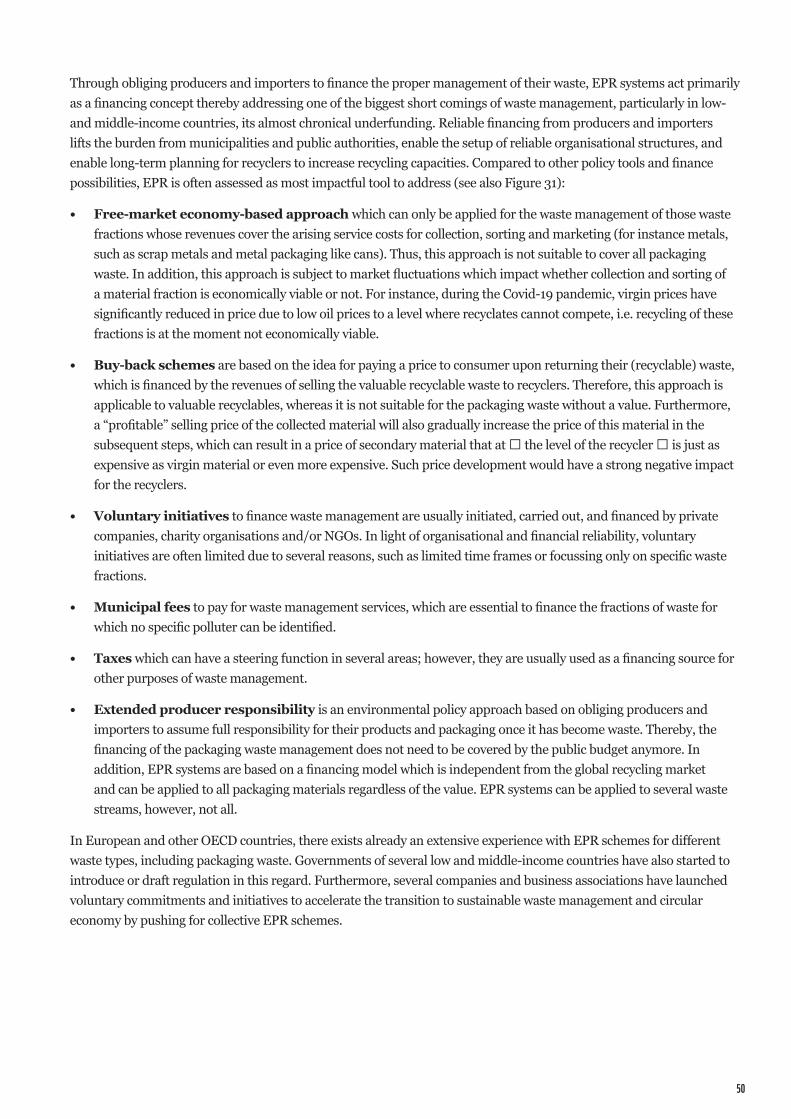
Through obliging producers and importers to finance the proper management of their waste, EPR systems act primarily as a financing concept thereby addressing one of the biggest short comings of waste management, particularly in low- and middle-income countries, its almost chronical underfunding. Reliable financing from producers and importers lifts the burden from municipalities and public authorities, enable the setup of reliable organisational structures, and enable long-term planning for recyclers to increase recycling capacities. Compared to other policy tools and finance possibilities, EPR is often assessed as most impactful tool to address (see also Figure 31):
• Free-market economy-based approach which can only be applied for the waste management of those waste fractions whose revenues cover the arising service costs for collection, sorting and marketing (for instance metals, such as scrap metals and metal packaging like cans). Thus, this approach is not suitable to cover all packaging waste. In addition, this approach is subject to market fluctuations which impact whether collection and sorting of a material fraction is economically viable or not. For instance, during the Covid-19 pandemic, virgin prices have significantly reduced in price due to low oil prices to a level where recyclates cannot compete, i.e. recycling of these fractions is at the moment not economically viable.
• Buy-back schemes are based on the idea for paying a price to consumer upon returning their (recyclable) waste, which is financed by the revenues of selling the valuable recyclable waste to recyclers. Therefore, this approach is applicable to valuable recyclables, whereas it is not suitable for the packaging waste without a value. Furthermore, a “profitable” selling price of the collected material will also gradually increase the price of this material in the subsequent steps, which can result in a price of secondary material that at ‒ the level of the recycler ‒ is just as expensive as virgin material or even more expensive. Such price development would have a strong negative impact for the recyclers.
• Voluntary initiatives to finance waste management are usually initiated, carried out, and financed by private companies, charity organisations and/or NGOs. In light of organisational and financial reliability, voluntary initiatives are often limited due to several reasons, such as limited time frames or focussing only on specific waste fractions.
• Municipal fees to pay for waste management services, which are essential to finance the fractions of waste for which no specific polluter can be identified.
• Taxes which can have a steering function in several areas; however, they are usually used as a financing source for other purposes of waste management.
• Extended producer responsibility is an environmental policy approach based on obliging producers and importers to assume full responsibility for their products and packaging once it has become waste. Thereby, the financing of the packaging waste management does not need to be covered by the public budget anymore. In addition, EPR systems are based on a financing model which is independent from the global recycling market and can be applied to all packaging materials regardless of the value. EPR systems can be applied to several waste streams, however, not all.
In European and other OECD countries, there exists already an extensive experience with EPR schemes for different waste types, including packaging waste. Governments of several low and middle-income countries have also started to introduce or draft regulation in this regard. Furthermore, several companies and business associations have launched voluntary commitments and initiatives to accelerate the transition to sustainable waste management and circular economy by pushing for collective EPR schemes.
50
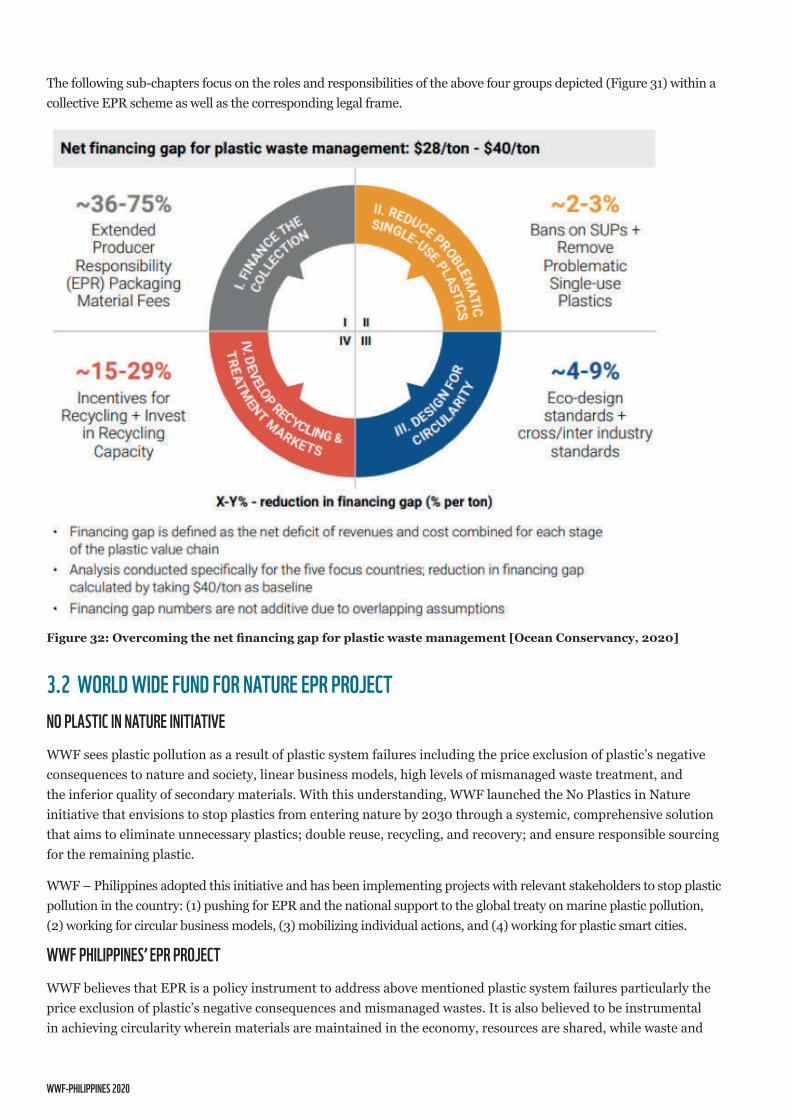
WWF-PHILIPPINES 2020
Figure 32: Overcoming the net financing gap for plastic waste management [Ocean Conservancy, 2020]
3.2 WORLD WIDE FUND FOR NATURE EPR PROJECT NO PLASTIC IN NATURE INITIATIVEWWF sees plastic pollution as a result of plastic system failures including the price exclusion of plastic’s negative consequences to nature and society, linear business models, high levels of mismanaged waste treatment, and the inferior quality of secondary materials. With this understanding, WWF launched the No Plastics in Nature initiative that envisions to stop plastics from entering nature by 2030 through a systemic, comprehensive solution that aims to eliminate unnecessary plastics; double reuse, recycling, and recovery; and ensure responsible sourcing for the remaining plastic.
WWF – Philippines adopted this initiative and has been implementing projects with relevant stakeholders to stop plastic pollution in the country: (1) pushing for EPR and the national support to the global treaty on marine plastic pollution, (2) working for circular business models, (3) mobilizing individual actions, and (4) working for plastic smart cities.
WWF PHILIPPINES’ EPR PROJECT WWF believes that EPR is a policy instrument to address above mentioned plastic system failures particularly the price exclusion of plastic’s negative consequences and mismanaged wastes. It is also believed to be instrumental in achieving circularity wherein materials are maintained in the economy, resources are shared, while waste and
The following sub-chapters focus on the roles and responsibilities of the above four groups depicted (Figure 31) within a collective EPR scheme as well as the corresponding legal frame.
52
negative impacts are designed out. Previous chapters have discussed the high plastic waste generation rate in the country, driven by high plastic production and low waste management. This leads to a call for an approach that would reduce/ eliminate unnecessary plastics and help intensify waste management as mandated by the Philippines’ national law, RA 9003 or the Ecological Solid Waste Management Act of 2000. Thus, WWF – Philippines sees EPR as an important policy instrument that would facilitate product re-design (thereby reducing unnecessary plastics for product integrity) and provide a financing model for waste management.
WWF’s EPR project aims to mobilize governments in target countries including the Philippines to incorporate EPR into their legal framework, and facilitate multi-national and regional corporates to take responsibility for end-of-life impacts of their products and packaging, as guided by a Science-based analysis. The Philippine team has been working with various government and business actors to generate support in pushing EPR scheme in the country. Drafting this EPR Scheme Assessment for Plastic Packaging Wastes in the Philippines, in consultation with key stakeholders, is one of the initiatives that WWF is implementing for this EPR project. After which, succeeding activities focus on increasing stakeholders’ awareness and support.
VOLUNTARY VS. mANDATORY EPR SCHEmEIn many countries, industry-led EPR initiatives, individual projects and structures (particularly from multinational manufacturers, producers and importers) are implemented. Such initiatives are voluntary. They range from small, one-time single projects to region-wide systems with long-term focus.
However, a holistic, reliable collection and recycling of all packaging regardless of market value and recyclability is expensive and can only be financed when all companies participate, which place packaging and packaged goods on the market. In an optimal system, all stakeholders participate, a level playing field is kept which avoids free-riders or competitive disadvantages. Therefore, private and public are often interested in implementing a mandatory EPR system (for comparison see Table 17)
4.1 EPR OBLIgATIONAs a fundamental and first action to develop an EPR scheme, it needs to be determined who has to participate and to what extent:
1. Voluntary vs. mandatory EPR scheme
2. All packaging vs. selected packaging
4. PROPOSAL OF A CUSTOmIZED EPR SCHEmE FOR THE PHILIPPINESBased on the gained insights about general waste management in the Philippines (see chapter 2) and international experience, an EPR approach has been developed in the following practical part of the report. To do so, the general situation is set into context with the EPR theory (see chapter 3) first, whereupon a customized EPR scheme gets developed.
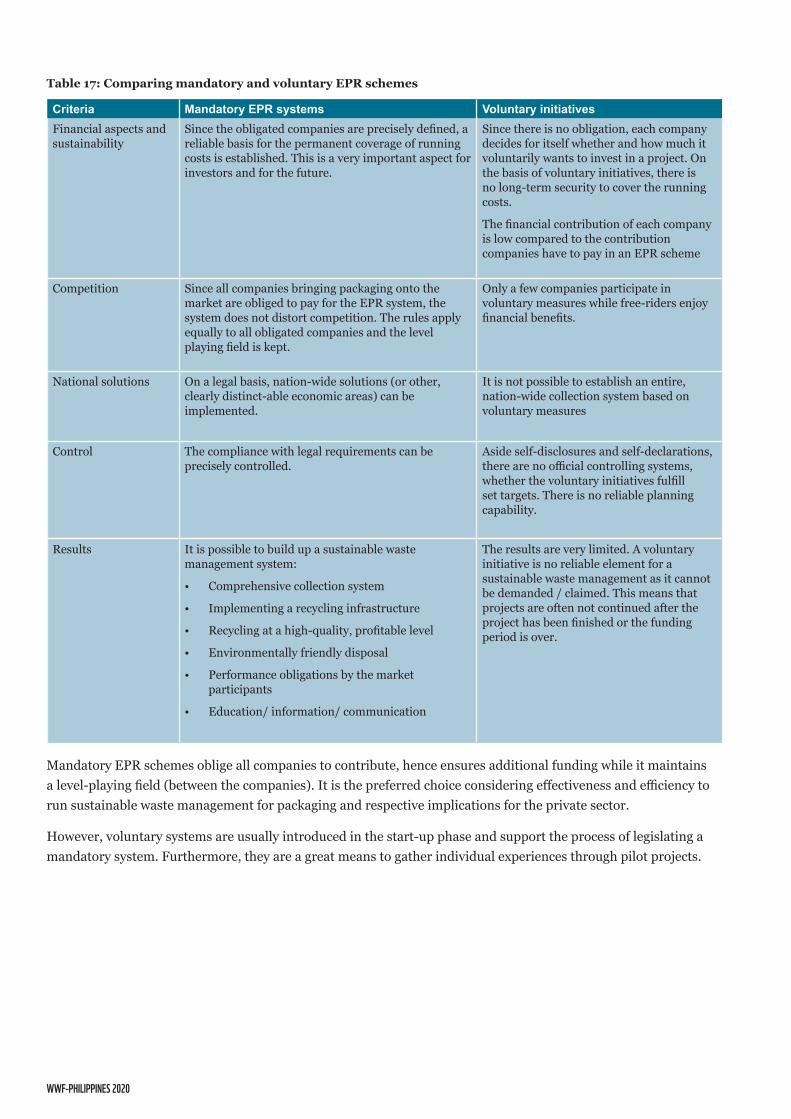
WWF-PHILIPPINES 2020
Criteria Mandatory EPR systems Voluntary initiativesFinancial aspects and sustainability
Since the obligated companies are precisely defined, a reliable basis for the permanent coverage of running costs is established. This is a very important aspect for investors and for the future.
Since there is no obligation, each company decides for itself whether and how much it voluntarily wants to invest in a project. On the basis of voluntary initiatives, there is no long-term security to cover the running costs.
The financial contribution of each company is low compared to the contribution companies have to pay in an EPR scheme
Competition Since all companies bringing packaging onto the market are obliged to pay for the EPR system, the system does not distort competition. The rules apply equally to all obligated companies and the level playing field is kept.
Only a few companies participate in voluntary measures while free-riders enjoy financial benefits.
National solutions On a legal basis, nation-wide solutions (or other, clearly distinct-able economic areas) can be implemented.
It is not possible to establish an entire, nation-wide collection system based on voluntary measures
Control The compliance with legal requirements can be precisely controlled.
Aside self-disclosures and self-declarations, there are no official controlling systems, whether the voluntary initiatives fulfill set targets. There is no reliable planning capability.
Results It is possible to build up a sustainable waste management system:
• Comprehensive collection system
• Implementing a recycling infrastructure
• Recycling at a high-quality, profitable level
• Environmentally friendly disposal
• Performance obligations by the market participants
• Education/ information/ communication
The results are very limited. A voluntary initiative is no reliable element for a sustainable waste management as it cannot be demanded / claimed. This means that projects are often not continued after the project has been finished or the funding period is over.
Table 17: Comparing mandatory and voluntary EPR schemes
Mandatory EPR schemes oblige all companies to contribute, hence ensures additional funding while it maintains a level-playing field (between the companies). It is the preferred choice considering effectiveness and efficiency to run sustainable waste management for packaging and respective implications for the private sector.
However, voluntary systems are usually introduced in the start-up phase and support the process of legislating a mandatory system. Furthermore, they are a great means to gather individual experiences through pilot projects.
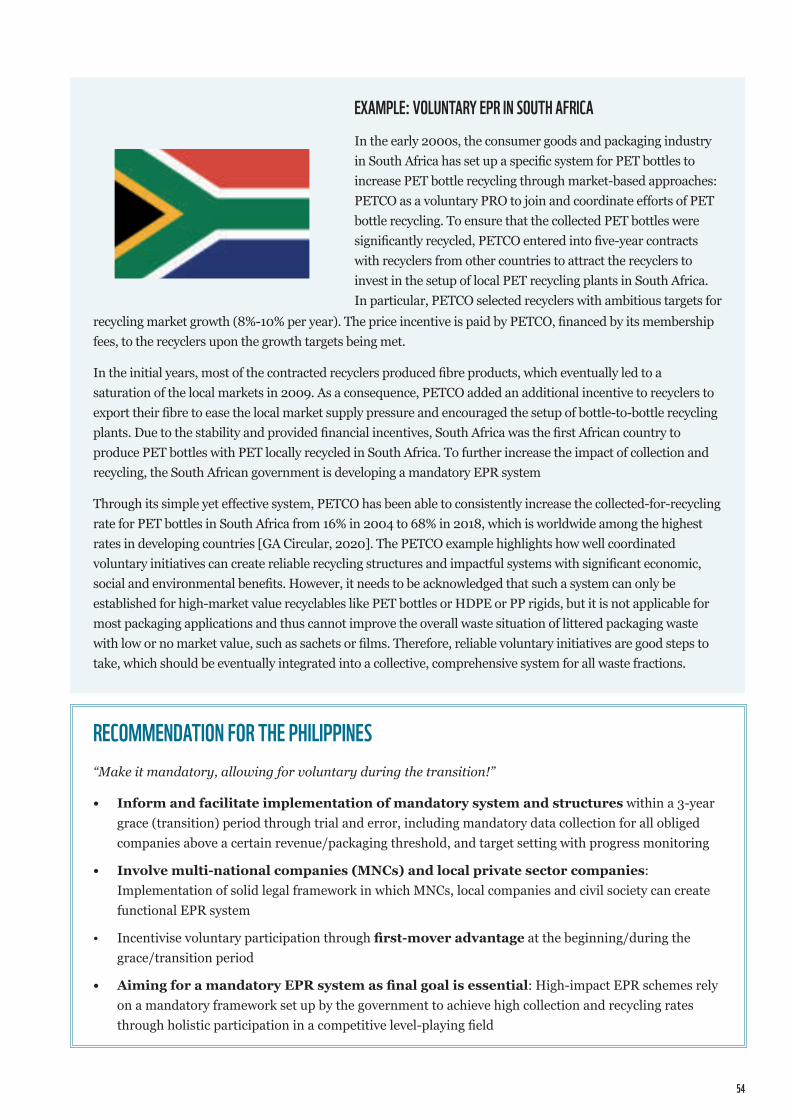
54
RECOmmENDATION FOR THE PHILIPPINES“Make it mandatory, allowing for voluntary during the transition!”
• Inform and facilitate implementation of mandatory system and structures within a 3-year grace (transition) period through trial and error, including mandatory data collection for all obliged companies above a certain revenue/packaging threshold, and target setting with progress monitoring
• Involve multi-national companies (MNCs) and local private sector companies: Implementation of solid legal framework in which MNCs, local companies and civil society can create functional EPR system
• Incentivise voluntary participation through first-mover advantage at the beginning/during the grace/transition period
• Aiming for a mandatory EPR system as final goal is essential: High-impact EPR schemes rely on a mandatory framework set up by the government to achieve high collection and recycling rates through holistic participation in a competitive level-playing field
EXAmPLE: VOLUNTARY EPR IN SOUTH AFRICAIn the early 2000s, the consumer goods and packaging industry in South Africa has set up a specific system for PET bottles to increase PET bottle recycling through market-based approaches: PETCO as a voluntary PRO to join and coordinate efforts of PET bottle recycling. To ensure that the collected PET bottles were significantly recycled, PETCO entered into five-year contracts with recyclers from other countries to attract the recyclers to invest in the setup of local PET recycling plants in South Africa. In particular, PETCO selected recyclers with ambitious targets for
recycling market growth (8%-10% per year). The price incentive is paid by PETCO, financed by its membership fees, to the recyclers upon the growth targets being met.
In the initial years, most of the contracted recyclers produced fibre products, which eventually led to a saturation of the local markets in 2009. As a consequence, PETCO added an additional incentive to recyclers to export their fibre to ease the local market supply pressure and encouraged the setup of bottle-to-bottle recycling plants. Due to the stability and provided financial incentives, South Africa was the first African country to produce PET bottles with PET locally recycled in South Africa. To further increase the impact of collection and recycling, the South African government is developing a mandatory EPR system
Through its simple yet effective system, PETCO has been able to consistently increase the collected-for-recycling rate for PET bottles in South Africa from 16% in 2004 to 68% in 2018, which is worldwide among the highest rates in developing countries [GA Circular, 2020]. The PETCO example highlights how well coordinated voluntary initiatives can create reliable recycling structures and impactful systems with significant economic, social and environmental benefits. However, it needs to be acknowledged that such a system can only be established for high-market value recyclables like PET bottles or HDPE or PP rigids, but it is not applicable for most packaging applications and thus cannot improve the overall waste situation of littered packaging waste with low or no market value, such as sachets or films. Therefore, reliable voluntary initiatives are good steps to take, which should be eventually integrated into a collective, comprehensive system for all waste fractions.
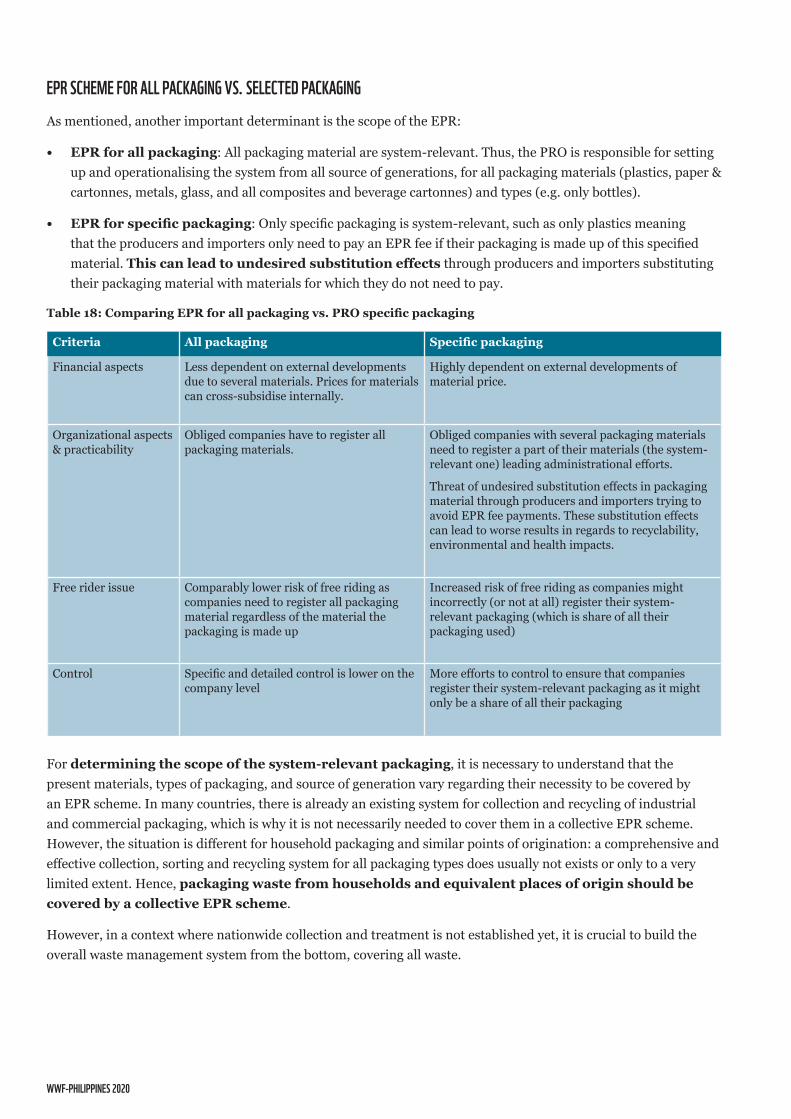
WWF-PHILIPPINES 2020
EPR SCHEmE FOR ALL PACkAgINg VS. SELECTED PACkAgINgAs mentioned, another important determinant is the scope of the EPR:
• EPR for all packaging: All packaging material are system-relevant. Thus, the PRO is responsible for setting up and operationalising the system from all source of generations, for all packaging materials (plastics, paper & cartonnes, metals, glass, and all composites and beverage cartonnes) and types (e.g. only bottles).
• EPR for specific packaging: Only specific packaging is system-relevant, such as only plastics meaning that the producers and importers only need to pay an EPR fee if their packaging is made up of this specified material. This can lead to undesired substitution effects through producers and importers substituting their packaging material with materials for which they do not need to pay.
For determining the scope of the system-relevant packaging, it is necessary to understand that the present materials, types of packaging, and source of generation vary regarding their necessity to be covered by an EPR scheme. In many countries, there is already an existing system for collection and recycling of industrial and commercial packaging, which is why it is not necessarily needed to cover them in a collective EPR scheme. However, the situation is different for household packaging and similar points of origination: a comprehensive and effective collection, sorting and recycling system for all packaging types does usually not exists or only to a very limited extent. Hence, packaging waste from households and equivalent places of origin should be covered by a collective EPR scheme.
However, in a context where nationwide collection and treatment is not established yet, it is crucial to build the overall waste management system from the bottom, covering all waste.
Criteria All packaging Specific packaging
Financial aspects Less dependent on external developments due to several materials. Prices for materials can cross-subsidise internally.
Highly dependent on external developments of material price.
Organizational aspects & practicability
Obliged companies have to register all packaging materials.
Obliged companies with several packaging materials need to register a part of their materials (the system-relevant one) leading administrational efforts.
Threat of undesired substitution effects in packaging material through producers and importers trying to avoid EPR fee payments. These substitution effects can lead to worse results in regards to recyclability, environmental and health impacts.
Free rider issue Comparably lower risk of free riding as companies need to register all packaging material regardless of the material the packaging is made up
Increased risk of free riding as companies might incorrectly (or not at all) register their system-relevant packaging (which is share of all their packaging used)
Control Specific and detailed control is lower on the company level
More efforts to control to ensure that companies register their system-relevant packaging as it might only be a share of all their packaging
Table 18: Comparing EPR for all packaging vs. PRO specific packaging
56
Table 19: Categories of packaging covered by EU EPR schemes, modified after [IEEP, 2017]
RECOmmENDATION FOR THE PHILIPPINESBuild system from the bottom to create systematic waste management of all packaging materials
• Determine scope of system-relevant packaging: Define all household packaging waste (incl. paper, plastic and metal packaging or its compositions), service packaging, originated from sources outside of households (e.g. To-go packaging) and specific non-packaging items as system-relevant (e.g. straws)
• Establish a systematic from the bottom collection system: Regarding household waste, separated collection will be too complicated if general collection is not ensured yet, therefore EPR should contribute to build general waste management system
• Establish further treatment (recycling or controlled disposal) of all waste
• Option: EPR could also include industrial and commercial packaging (ICP), if companies cannot prove own adequate organized recycling
EXAmPLE: EPR SCOPE IN THE EUWithin the EU, there are three distinct categories of system-relevant packaging covered by the PROs depend on the respective EPR scheme setup and legal framework (Table 19):
1. Only household packaging and packaging from equivalent places of origination
2. Commercial and industrial packaging only
3. Both commercial and industrial as well as household packaging and equivalent places of origination
It is not necessary to establish an EPR scheme if the packaging collection and recycling is already well-established and running as it is often the case for commercial and industrial packaging. Through including stakeholders from various steps of the supply chain in the management of the PRO and officially established cooperation with other actors, the PRO takes a holistic approach in regards to managing the system: All stakeholders are given the opportunity to impact the system and create a fair and impactful system. Moreover, the PRO becomes a platform for exchange between various steps of the supply chain and other stakeholders.
Household (H) / equivalent places of origination only
Commercial (C) / industrial (I) packaging only
H and C / I packaging
Belgium: Fost-Plus Belgium: Valipak Austria: ARAFrance: Citeo Bulgaria: EcopakSpain: Ecoembes (will collect commercial/industrial under voluntary agreement if local entities collect it)
Cyprus: Gren Dot CyprusCzech Republic: EKO-KOMEstonia: ETOAnd more
Germany: Der Grüne Punkt
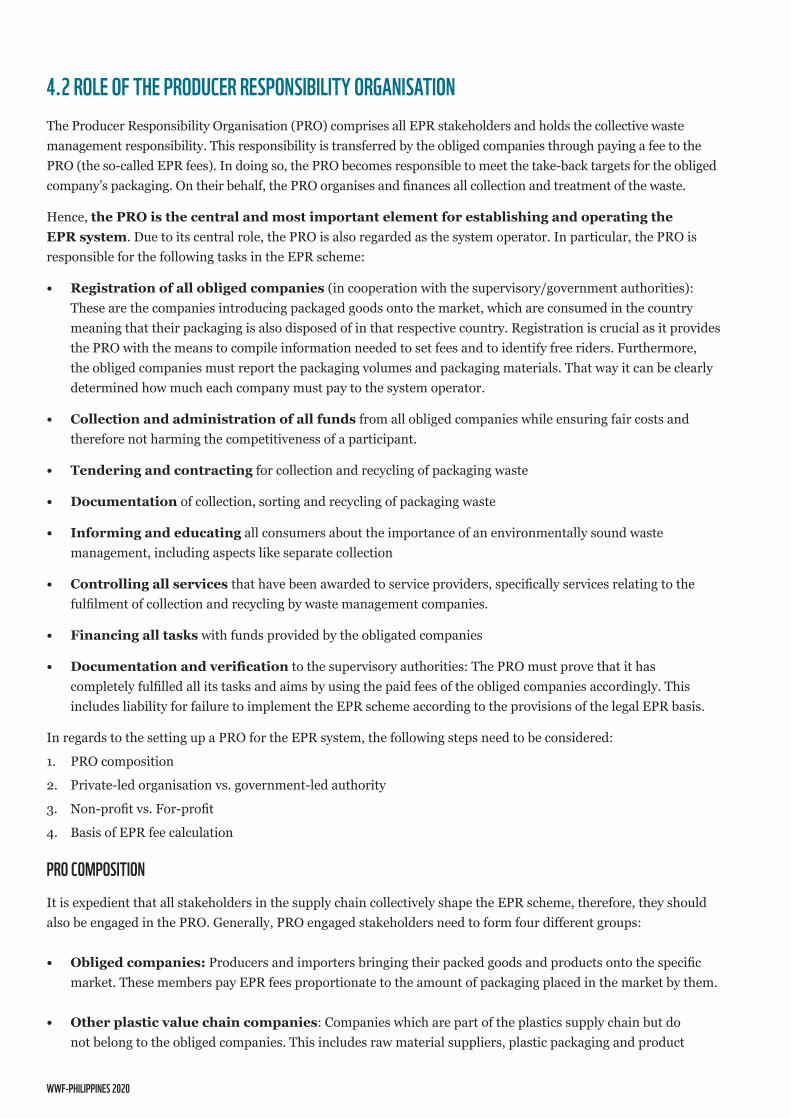
WWF-PHILIPPINES 2020
4.2 ROLE OF THE PRODUCER RESPONSIBILITY ORgANISATIONThe Producer Responsibility Organisation (PRO) comprises all EPR stakeholders and holds the collective waste management responsibility. This responsibility is transferred by the obliged companies through paying a fee to the PRO (the so-called EPR fees). In doing so, the PRO becomes responsible to meet the take-back targets for the obliged company’s packaging. On their behalf, the PRO organises and finances all collection and treatment of the waste.
Hence, the PRO is the central and most important element for establishing and operating the EPR system. Due to its central role, the PRO is also regarded as the system operator. In particular, the PRO is responsible for the following tasks in the EPR scheme:
• Registration of all obliged companies (in cooperation with the supervisory/government authorities): These are the companies introducing packaged goods onto the market, which are consumed in the country meaning that their packaging is also disposed of in that respective country. Registration is crucial as it provides the PRO with the means to compile information needed to set fees and to identify free riders. Furthermore, the obliged companies must report the packaging volumes and packaging materials. That way it can be clearly determined how much each company must pay to the system operator.
• Collection and administration of all funds from all obliged companies while ensuring fair costs and therefore not harming the competitiveness of a participant.
• Tendering and contracting for collection and recycling of packaging waste
• Documentation of collection, sorting and recycling of packaging waste
• Informing and educating all consumers about the importance of an environmentally sound waste management, including aspects like separate collection
• Controlling all services that have been awarded to service providers, specifically services relating to the fulfilment of collection and recycling by waste management companies.
• Financing all tasks with funds provided by the obligated companies
• Documentation and verification to the supervisory authorities: The PRO must prove that it has completely fulfilled all its tasks and aims by using the paid fees of the obliged companies accordingly. This includes liability for failure to implement the EPR scheme according to the provisions of the legal EPR basis.
In regards to the setting up a PRO for the EPR system, the following steps need to be considered:
1. PRO composition
2. Private-led organisation vs. government-led authority
3. Non-profit vs. For-profit
4. Basis of EPR fee calculation
PRO COmPOSITIONIt is expedient that all stakeholders in the supply chain collectively shape the EPR scheme, therefore, they should also be engaged in the PRO. Generally, PRO engaged stakeholders need to form four different groups:
• Obliged companies: Producers and importers bringing their packed goods and products onto the specific market. These members pay EPR fees proportionate to the amount of packaging placed in the market by them.
• Other plastic value chain companies: Companies which are part of the plastics supply chain but do not belong to the obliged companies. This includes raw material suppliers, plastic packaging and product
58
converters, designers, manufacturers, retailers and traders, and waste management operators for collection and recovery, especially recycling.
• Executive board: The PRO needs an executive board to manage the operative work, financial spending and controlling. This management can consist of one or several persons which can be either chosen by the members or externally appointed. Generally, it is recommended to appoint one chair and a vice chair.
• Advisory board (affiliated members): This includes representatives of the national government, municipalities, universities, NGOs, and other authorities. These institutions and organisations impact the work of the PRO as an advisory board and therefore need to be informed about recent developments and innovations, as well as similar updates. Their decision-making powers need to be decided in the respective, specific PRO set-up.
EXAmPLE: PRO COmPOSITION IN NETHERLANDSIn the Netherlands, every obliged company outing more than 50,000kg of packaging on the market must register with the PRO Afvalfonds (and thus become a member). The PRO is governed by a Board of Directors, who are appointed by the producers and importers. All directors are representation various industry associations of the supply chain.
To properly coordinate with the municipalities, the public authorities and ministries and other actors, Afvalfonds
established several third organisations, such Nedvang. Since December 2007, Nedvang, a non-profit organization, is the mediator between manufacturers, importers and retailers as well as recovery companies, municipalities, and national authorities. The tasks of Nedvang include monitoring the packaging market, and the recovery of packaging waste. Nedvang works for the waste fund and makes contracts with municipalities regarding the reporting of packaging waste, which is collected, sorted, and recycled.
Through including stakeholders from various steps of the supply chain in the management of the PRO and officially established cooperation with other actors, the PRO takes a holistic approach in regards to managing the system: All stakeholders are given the opportunity to impact the system and create a fair and impactful system. Moreover, the PRO becomes a platform for exchange between various steps of the supply chain and other stakeholders.
RECOmmENDATION FOR THE PHILIPPINES“Broad stakeholder engagement to design a common system tailored to the Philippine geographic and legislative diversity (both in legislative districts / political subdivisions as well as different political and governmental entities)”
• Include obliged companies: start with voluntary MNCs and local consumer good companies, include all producers and importers at a later mandatory stage.
• Include other plastic value chain members: waste management operators, local packaging producer and resin importers, representative of a consumer committee (group)
• Set up executive board: decision-making and executing management (up to 10 pax, representatives from obliged and other members) and chair (1 pax) appointed by advisory board.
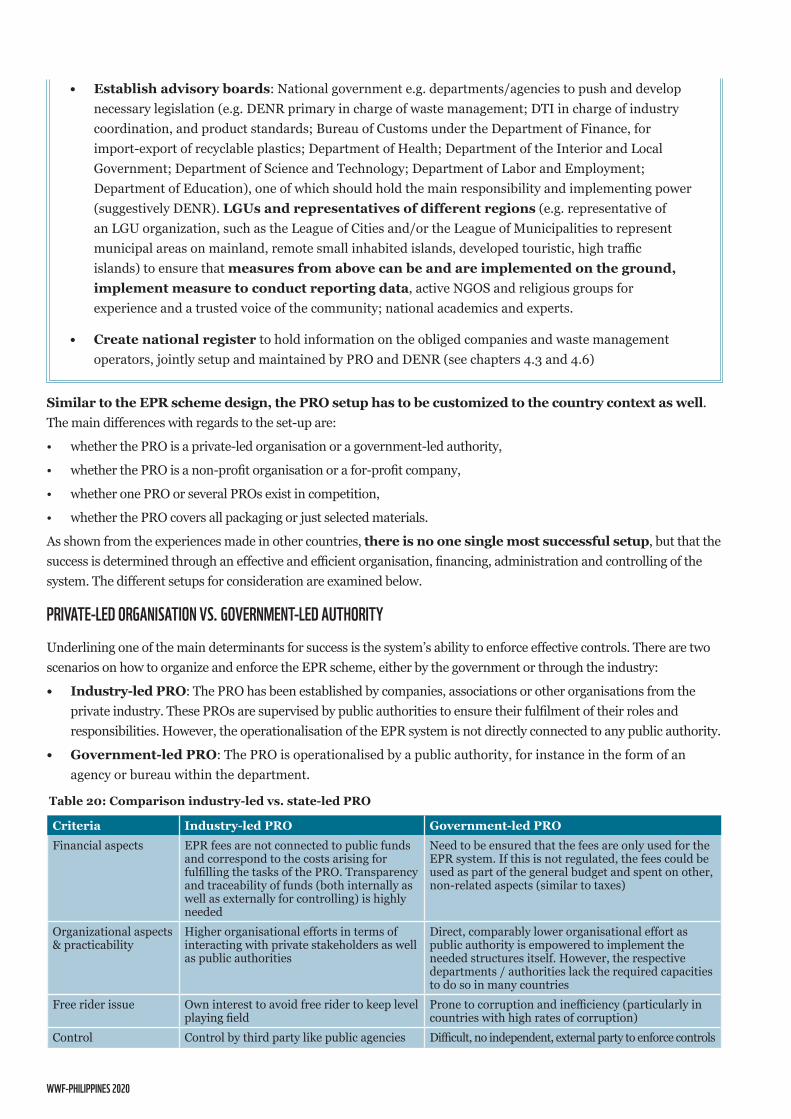
WWF-PHILIPPINES 2020
• Establish advisory boards: National government e.g. departments/agencies to push and develop necessary legislation (e.g. DENR primary in charge of waste management; DTI in charge of industry coordination, and product standards; Bureau of Customs under the Department of Finance, for import-export of recyclable plastics; Department of Health; Department of the Interior and Local Government; Department of Science and Technology; Department of Labor and Employment; Department of Education), one of which should hold the main responsibility and implementing power (suggestively DENR). LGUs and representatives of different regions (e.g. representative of an LGU organization, such as the League of Cities and/or the League of Municipalities to represent municipal areas on mainland, remote small inhabited islands, developed touristic, high traffic islands) to ensure that measures from above can be and are implemented on the ground, implement measure to conduct reporting data, active NGOS and religious groups for experience and a trusted voice of the community; national academics and experts.
• Create national register to hold information on the obliged companies and waste management operators, jointly setup and maintained by PRO and DENR (see chapters 4.3 and 4.6)
Similar to the EPR scheme design, the PRO setup has to be customized to the country context as well. The main differences with regards to the set-up are:
• whether the PRO is a private-led organisation or a government-led authority,
• whether the PRO is a non-profit organisation or a for-profit company,
• whether one PRO or several PROs exist in competition,
• whether the PRO covers all packaging or just selected materials.
As shown from the experiences made in other countries, there is no one single most successful setup, but that the success is determined through an effective and efficient organisation, financing, administration and controlling of the system. The different setups for consideration are examined below.
PRIVATE-LED ORgANISATION VS. gOVERNmENT-LED AUTHORITYUnderlining one of the main determinants for success is the system’s ability to enforce effective controls. There are two scenarios on how to organize and enforce the EPR scheme, either by the government or through the industry:
• Industry-led PRO: The PRO has been established by companies, associations or other organisations from the private industry. These PROs are supervised by public authorities to ensure their fulfilment of their roles and responsibilities. However, the operationalisation of the EPR system is not directly connected to any public authority.
• Government-led PRO: The PRO is operationalised by a public authority, for instance in the form of an agency or bureau within the department.
Criteria Industry-led PRO Government-led PROFinancial aspects EPR fees are not connected to public funds
and correspond to the costs arising for fulfilling the tasks of the PRO. Transparency and traceability of funds (both internally as well as externally for controlling) is highly needed
Need to be ensured that the fees are only used for the EPR system. If this is not regulated, the fees could be used as part of the general budget and spent on other, non-related aspects (similar to taxes)
Organizational aspects & practicability
Higher organisational efforts in terms of interacting with private stakeholders as well as public authorities
Direct, comparably lower organisational effort as public authority is empowered to implement the needed structures itself. However, the respective departments / authorities lack the required capacities to do so in many countries
Free rider issue Own interest to avoid free rider to keep level playing field
Prone to corruption and inefficiency (particularly in countries with high rates of corruption)
Control Control by third party like public agencies Difficult, no independent, external party to enforce controls
Table 20: Comparison industry-led vs. state-led PRO
60
There are both advantages and disadvantages to both PRO setup. However, assuming responsibility through an industry-led solution is more analogous to the original idea of actual producer responsibility. Comparing the approaches, an industry-led PRO has more advantages compared to a state-led PRO in terms of practicability. The latter is closely connected to a system of taxation and the funds may be used for other purposes. The main disadvantage is the difficulty to control as there is no independent and external party to enforce controls. Therefore, most PROs are industry-led.
EXAmPLE: INDUSTRY-LED PRO IN BELgIUm AND THE NETHERLANDSThe Belgian PRO “Fost Plus” was founded in 1994 as a voluntary initiative of the private sector shortly before the selective collection of household packaging waste was implemented throughout Belgium. In 1998, this private sector initiative receives an accreditation to fulfil the take-back obligation for its members – thereby, Fost Plus became a mandatory, industry-led PRO in Belgium. In 2018, more than 5,000 companies are registered with the PRO.
In the Netherlands, the Ministry of Infrastructure and the Environment, the Association of Netherlands Municipalities and the Packaging Industry signed the Packaging Agreement 2013-2022 which states, amongst other things the implementation of an EPR scheme. To collectively implement this, all parties agreed upon establishing an industry-led PRO: “Afvalfonds Verpakkingen”. Since then, Avfalfonds Verpakkingen is managed by representatives of the Dutch industry.
In both countries, the industry-led PROs have been implemented; in one case as a development of voluntary, already established initiatives and in the other as chosen model. In both cases, this enabled a system, in which the private industry can implement practicable solutions - that are realistic and doable for them - which conform with the requirements defined by the legal frameworks to ensure that the system fulfils defined environmental and social standards.
RECOmmENDATION FOR THE PHILIPPINES“Implement industry-led PRO”
• Establish PRO executive board constituted of representatives of obliged and other members: finance is independent of government funds and potential influence; PRO measures are designed in an effective, applicable way through waste management and by producers/importers themselves
• Establish PRO supervisory and advisory board and chairperson represents government and other stakeholders ensure applicability and enforcement of PRO measures on all levels and areas
• Ensure strong report and control mechanisms among EPR parties, to avoid corruption and foster compliance
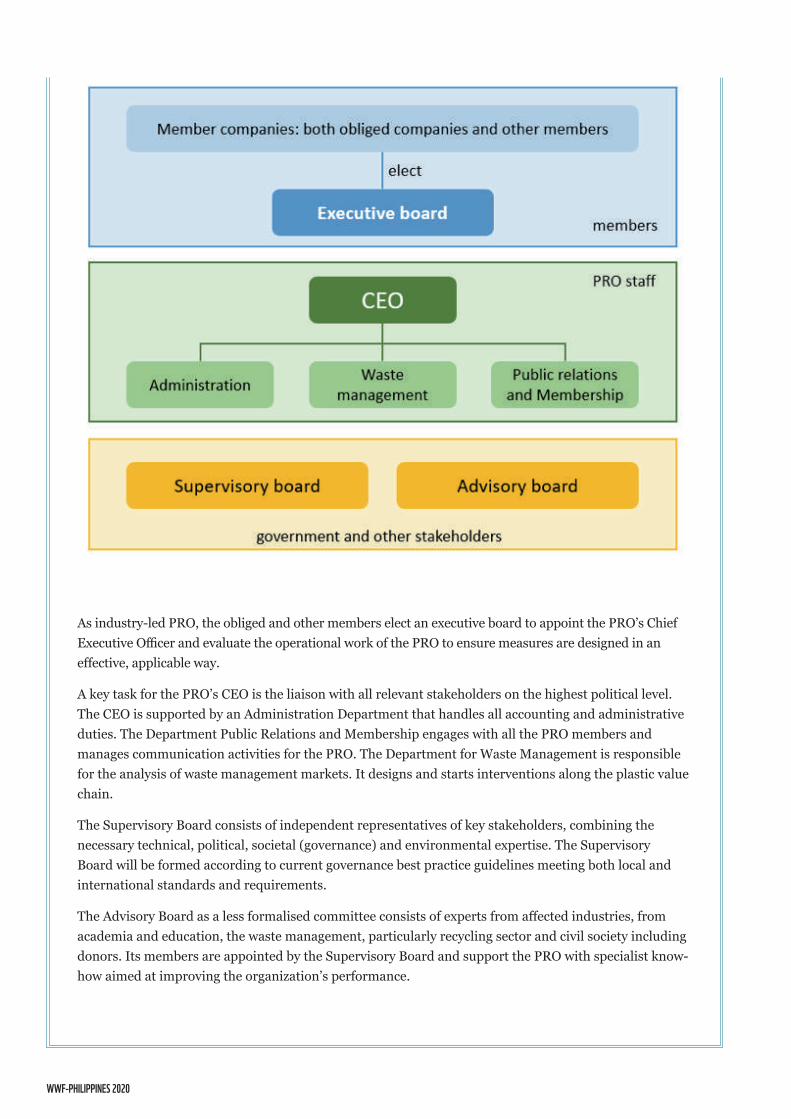
WWF-PHILIPPINES 2020
As industry-led PRO, the obliged and other members elect an executive board to appoint the PRO’s Chief Executive Officer and evaluate the operational work of the PRO to ensure measures are designed in an effective, applicable way.
A key task for the PRO’s CEO is the liaison with all relevant stakeholders on the highest political level. The CEO is supported by an Administration Department that handles all accounting and administrative duties. The Department Public Relations and Membership engages with all the PRO members and manages communication activities for the PRO. The Department for Waste Management is responsible for the analysis of waste management markets. It designs and starts interventions along the plastic value chain.
The Supervisory Board consists of independent representatives of key stakeholders, combining the necessary technical, political, societal (governance) and environmental expertise. The Supervisory Board will be formed according to current governance best practice guidelines meeting both local and international standards and requirements.
The Advisory Board as a less formalised committee consists of experts from affected industries, from academia and education, the waste management, particularly recycling sector and civil society including donors. Its members are appointed by the Supervisory Board and support the PRO with specialist know-how aimed at improving the organization’s performance.
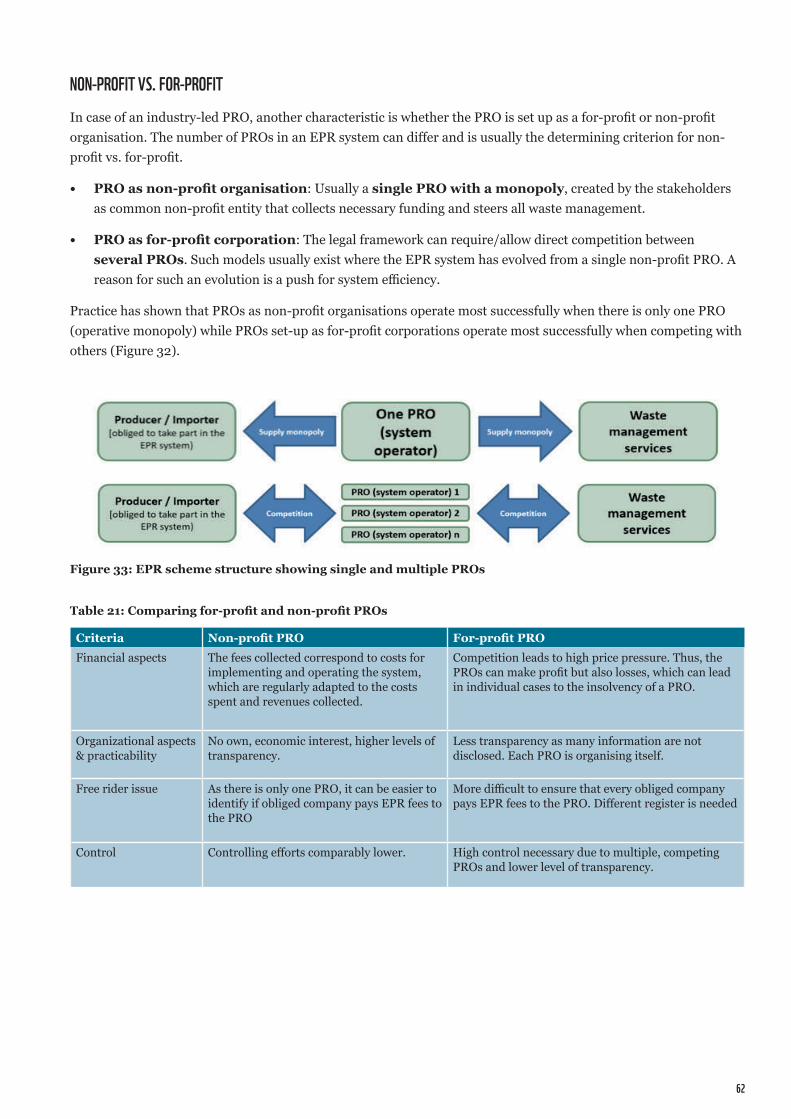
62
NON-PROFIT VS. FOR-PROFITIn case of an industry-led PRO, another characteristic is whether the PRO is set up as a for-profit or non-profit organisation. The number of PROs in an EPR system can differ and is usually the determining criterion for non-profit vs. for-profit.
• PRO as non-profit organisation: Usually a single PRO with a monopoly, created by the stakeholders as common non-profit entity that collects necessary funding and steers all waste management.
• PRO as for-profit corporation: The legal framework can require/allow direct competition between several PROs. Such models usually exist where the EPR system has evolved from a single non-profit PRO. A reason for such an evolution is a push for system efficiency.
Practice has shown that PROs as non-profit organisations operate most successfully when there is only one PRO (operative monopoly) while PROs set-up as for-profit corporations operate most successfully when competing with others (Figure 32).
Criteria Non-profit PRO For-profit PROFinancial aspects The fees collected correspond to costs for
implementing and operating the system, which are regularly adapted to the costs spent and revenues collected.
Competition leads to high price pressure. Thus, the PROs can make profit but also losses, which can lead in individual cases to the insolvency of a PRO.
Organizational aspects & practicability
No own, economic interest, higher levels of transparency.
Less transparency as many information are not disclosed. Each PRO is organising itself.
Free rider issue As there is only one PRO, it can be easier to identify if obliged company pays EPR fees to the PRO
More difficult to ensure that every obliged company pays EPR fees to the PRO. Different register is needed
Control Controlling efforts comparably lower. High control necessary due to multiple, competing PROs and lower level of transparency.
Figure 33: EPR scheme structure showing single and multiple PROs
Table 21: Comparing for-profit and non-profit PROs
WWF-PHILIPPINES 2020
EXAmPLE: SINgLE PRO AND NON-PROFIT IN JAPAN AND CHILEIn 1996, the Japanese PRO “Japan Containers and Packaging Recycling Association” (JCPRA) was founded as a non-profit organisation following the enactment of a respective legal basis. As the JCPRA has the operative monopoly, it is the single PRO. Due to Japan’s legal framework, the JCPRA falls into the jurisdiction of 5 ministries: (i) the Ministry of the Environment, (ii) the Ministry of the Economy, Trade and Industry, (iii) the Ministry of Finance, (iv) the Ministry of health, Labour and Welfare, and (v) the Ministry of Agriculture, Forestry and Fisheries. To coordinate between them and all other involved stakeholders, the JCPRA coordinates between the government, municipalities, consumers, obligated companies, recyclers and manufacturers using recyclates in their products. The participation of the municipalities is on a voluntary basis.
In Chile, a mandatory EPR system for packaging is currently in development and will come into effect in 2022. The PRO for household waste been initiated by the Food and Beverage
Association AB Chile even before the preliminary draft of the packaging decree passed through public consultation in June 2019. The first activities of this PRO focused on corporate governance, cost estimates, work with the environmental authority and the start of operation of a pilot involving various actors in the recycling chain, such as informal recyclers, municipalities, collection and recovery managers. In September 2019, a pilot recycling plan was formally started in the Providencia commune of the Santiago Metropolitan Region, which aims to carry out separate waste collection of packaging waste of eventually 90% of all properties in this commune. The experiences and data will serve as basis to roll out a large-scale implementation, which be a mandatory task from 2022 onwards. Both the future operation costs as well as the current costs for their pilot activities are fully covered by the fees paid by the members to finance the preparation, set up of the system (including the infrastructure) and the final operation.
RECOmmENDATION FOR THE PHILIPPINES“Create one non-profit, single PRO”
• Keep EPR simple to ensure it is not too complex to operate; and it is possible to save for future improvements all involved entities, measures, chain of command etc.
• Establish a single PRO which has a monopoly and can focus on effective handling of all materials, with cross-finance and holistic tracing system, for better understanding of the situation and development of the system
• Assessment of single PRO during the 3-year period. Government to decide if other PROs need to be established on a regular basis provided in the framework law
Once the EPR scope, PRO management and legal setup is defined and established, one of the first PRO activities is the design of the EPR fees. A necessary pre-condition is the presence of sufficient data on producer, importer, and waste management operations.
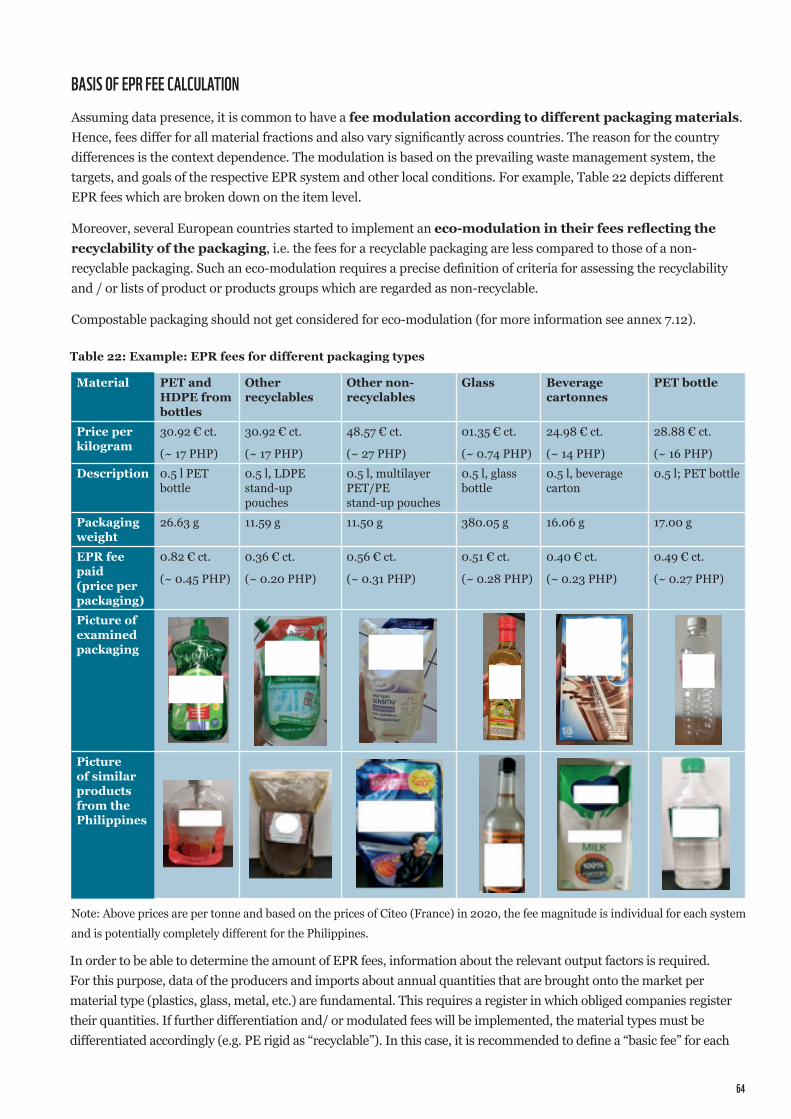
64
In order to be able to determine the amount of EPR fees, information about the relevant output factors is required. For this purpose, data of the producers and imports about annual quantities that are brought onto the market per material type (plastics, glass, metal, etc.) are fundamental. This requires a register in which obliged companies register their quantities. If further differentiation and/ or modulated fees will be implemented, the material types must be differentiated accordingly (e.g. PE rigid as “recyclable”). In this case, it is recommended to define a “basic fee” for each
BASIS OF EPR FEE CALCULATIONAssuming data presence, it is common to have a fee modulation according to different packaging materials. Hence, fees differ for all material fractions and also vary significantly across countries. The reason for the country differences is the context dependence. The modulation is based on the prevailing waste management system, the targets, and goals of the respective EPR system and other local conditions. For example, Table 22 depicts different EPR fees which are broken down on the item level.
Moreover, several European countries started to implement an eco-modulation in their fees reflecting the recyclability of the packaging, i.e. the fees for a recyclable packaging are less compared to those of a non-recyclable packaging. Such an eco-modulation requires a precise definition of criteria for assessing the recyclability and / or lists of product or products groups which are regarded as non-recyclable.
Compostable packaging should not get considered for eco-modulation (for more information see annex 7.12).
Note: Above prices are per tonne and based on the prices of Citeo (France) in 2020, the fee magnitude is individual for each system and is potentially completely different for the Philippines.
Material PET and HDPE from bottles
Other recyclables
Other non-recyclables
Glass Beverage cartonnes
PET bottle
Price per kilogram
30.92 € ct.
(~ 17 PHP)
30.92 € ct.
(~ 17 PHP)
48.57 € ct.
(~ 27 PHP)
01.35 € ct.
(~ 0.74 PHP)
24.98 € ct.
(~ 14 PHP)
28.88 € ct.
(~ 16 PHP)Description 0.5 l PET
bottle0.5 l, LDPE stand-up pouches
0.5 l, multilayer PET/PE stand-up pouches
0.5 l, glass bottle
0.5 l, beverage carton
0.5 l; PET bottle
Packaging weight
26.63 g 11.59 g 11.50 g 380.05 g 16.06 g 17.00 g
EPR fee paid (price per packaging)
0.82 € ct.
(~ 0.45 PHP)
0.36 € ct.
(~ 0.20 PHP)
0.56 € ct.
(~ 0.31 PHP)
0.51 € ct.
(~ 0.28 PHP)
0.40 € ct.
(~ 0.23 PHP)
0.49 € ct.
(~ 0.27 PHP)
Picture of examined packaging
Picture of similar products from the Philippines
Table 22: Example: EPR fees for different packaging types
WWF-PHILIPPINES 2020
material which is complemented by a recyclability criteria catalogue reflecting the actual recycling possibilities in the Philippines to evaluate a packaging’s recyclability (see the Dutch example below). Upon successful evaluation, a lower EPR fee has to be paid (bonus). The recyclability evaluation is done by the PRO or by independent third parties.
Given that the EPR fees have to finance all waste management processes of the packaging waste, waste management indicators have to be determined. These include costs for the registration, necessary sorting and recycling, as well as the proper disposal of residues. Based on extensive financing analysis of the waste management and disposal processes, the financial requirements can be calculated which is “matched” to the EPR fees. Experiences from other country, including France (see Table 22), show that plastics and composites require the highest EPR fees in relation to other materials, since the management of these materials (light, voluminous, only partially a positive market value, partly not recyclable) is comparatively expensive.
EXAmPLE: CONSIDERATIONS OF FEE CALCULATION BASIS IN THE NETHERLANDSTo further incorporate the recyclability of packaging as incentive into an EPR scheme, many established PROs have modulated their fees. In the Netherlands, such modulation is translated through a “recycling check”, which allows determining the recyclability through specific, comparably simple questions reflecting the existing recycling situation for the Dutch packaging waste:
• Is the packaging rigid?
• Is the packaging for medical products or does it have to go with minor chemical waste?
• Is the packaging free from oxo-degradable material?
• Is the packaging free from PVC or PVDC?
• Is the packaging free from silicone parts?
• Of what material is the largest component of the packaging made?
• What part of the packaging consists of PE, PP or PET (in % total weight)?
• Does the largest component consist exclusively of mono material without multilayers, coatings or fillers?
• Is the packaging larger than 5 cm and the contents less than or equal to five litres?
• Is the largest component of the packaging a colour other than black?
• Does the packaging have a label, sticker or sleeve?
• Which part of the packaging is covered by the label, sticker or sleeve (in % of front view)?
• Is the packaging with the label, sticker or sleeve sortable and recyclable according to the table in the Recycle Check?
• Is the packaging free from hot melt and non-washable adhesive?
• Is the packaging free from enclosed metal parts?
• Does the packaging not contain any opaque PET?
• Is the packaging not a PET tray?
Afvalfonds Verpakkingen chooses to reward the use of packaging that has good recyclability and not to sanction the use of other packaging. All plastic packaging that hasn’t that has good recyclability within the current systems of collection, sorting and recycling existing in the Netherlands nor generate a positive market value, are not qualified for the lower fee as yet.
66
The most important element to these question as basis for modulated fees is that they are reflecting the existing recycling possibilities in the respective country, i.e. certain elements, which might be recyclable in general, but are not recyclable in this specific country, are regarded as non-recyclable. Such tailored questions are a simply yet effective means to develop a tailored guide for modulated fees based on the actual circumstances present in the country.
4.3 ROLE OF THE PRODUCERS AND ImPORTERSIn an EPR scheme, producers and importers hold the responsibility for their products and used packaging in the post-consumer phase. Taking-back and appropriate treatment has to be ensured for such. Through a collective EPR scheme, this responsibility is transferred from the producers and importers to the Producer Responsibility Organisation (PRO) by paying an EPR fee. In elaborating the role of the producers and importers in an EPR scheme, this question arises: Why should producers and other companies be interested in implementing an EPR system? Some companies that place packaging and packaged goods on the market are concerned about the waste problem and have already agreed upon voluntary targets (especially the multinational corporations). Individual engagements potentially entail competitive disadvantages. Therefore, the companies are interested in implementing an EPR system. Through this system, they engage with the waste topic with a shared responsibility on a level playing field. Highlighting the start-up phase, companies which support the implementation of the EPR system since the beginning may also participate in the design of it. Beyond the start-up phase, the main contribution of the obliged producers and importers is the payment of the EPR fee. To identify obliged companies and how much EPR fee has to be paid, key information needs to be provided:
1. Definition of EPR system-relevant packaging (see 4.1 all packaging vs. selected packaging)2. Calculation basis of EPR fee (see 4.2 basis of fee calculation, like material recyclability)3. Quantity of packaging materials placed onto the market by the individual producer or importer
RECOmmENDATION FOR THE PHILIPPINES“Calculate fees based on material and recyclability of packaging to incentivise redesigning packaging”
• Implement registry for obliged companies to record packaging amounts and material put on the Philippine market.
• Set fees differ according to the material types (plastics, paper, metals, etc), the differences stem from recyclability which is mainly driven by the recycling infrastructure in place. For example: the process of glass recycling might be “easy”, but if there are no such glass recycling plant in a reasonable proximity, the recyclability of the material remains low in the Philippines
• Gather data on costs of waste management processes. The total costs are the baseline on which the EPR fees are based. These depend to a large extent on the existing and planned structure of the collection, sorting, and recycling as well as suitable disposal of residues
• Gather data to disclose important information about current recycling rates that are determinants for fee modulation. These data can stem from waste management operators and further sources: the frequency of material found in remote areas, e.g. ocean disposal which is especially handy for determining the fee height for non-packaging items like straws, which are difficult to trace back to the producer
• Improve packaging design focused on increased recyclability through modulation of fees according to the recyclability; producers and importers are incentivised to redesign packaging, for a fee bonus if their material is better recyclable
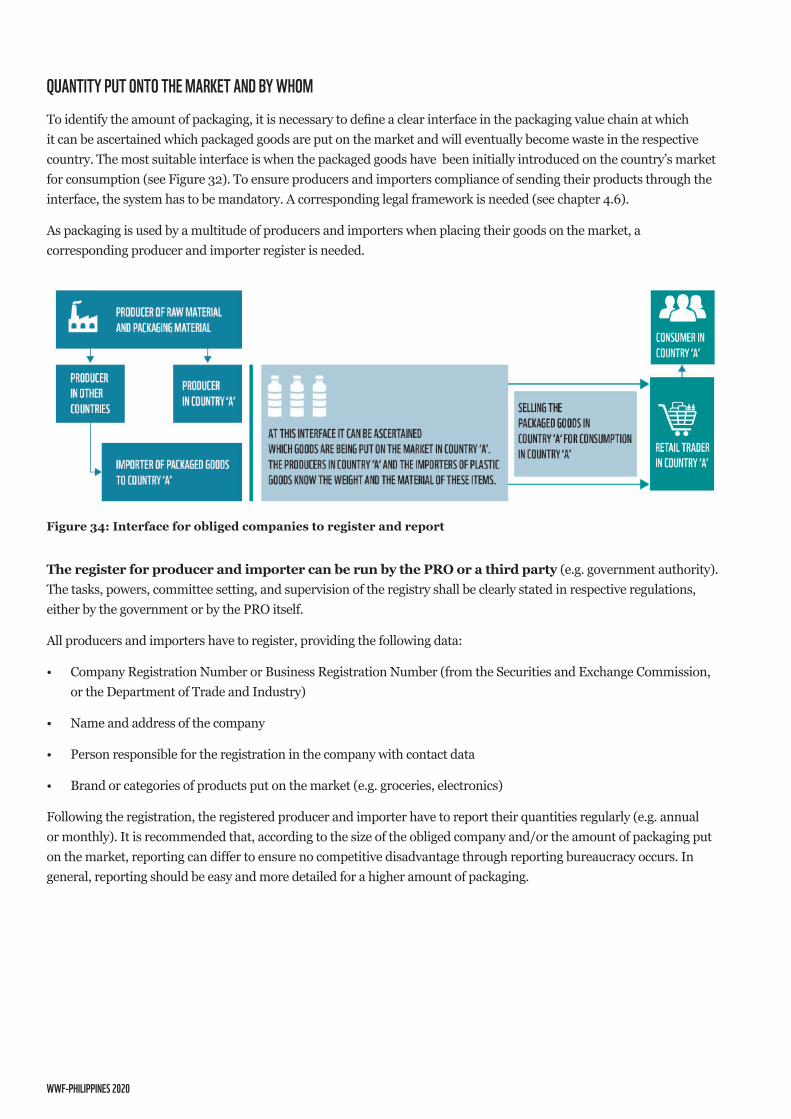
WWF-PHILIPPINES 2020
QUANTITY PUT ONTO THE mARkET AND BY WHOmTo identify the amount of packaging, it is necessary to define a clear interface in the packaging value chain at which it can be ascertained which packaged goods are put on the market and will eventually become waste in the respective country. The most suitable interface is when the packaged goods have been initially introduced on the country’s market for consumption (see Figure 32). To ensure producers and importers compliance of sending their products through the interface, the system has to be mandatory. A corresponding legal framework is needed (see chapter 4.6).
As packaging is used by a multitude of producers and importers when placing their goods on the market, a corresponding producer and importer register is needed.
The register for producer and importer can be run by the PRO or a third party (e.g. government authority). The tasks, powers, committee setting, and supervision of the registry shall be clearly stated in respective regulations, either by the government or by the PRO itself.
All producers and importers have to register, providing the following data:
• Company Registration Number or Business Registration Number (from the Securities and Exchange Commission, or the Department of Trade and Industry)
• Name and address of the company
• Person responsible for the registration in the company with contact data
• Brand or categories of products put on the market (e.g. groceries, electronics)
Following the registration, the registered producer and importer have to report their quantities regularly (e.g. annual or monthly). It is recommended that, according to the size of the obliged company and/or the amount of packaging put on the market, reporting can differ to ensure no competitive disadvantage through reporting bureaucracy occurs. In general, reporting should be easy and more detailed for a higher amount of packaging.
Figure 34: Interface for obliged companies to register and report
68
EXAmPLE: IDENTIFY PACkAgINg PUT ON THE mARkET IN gERmANY
Anyone marketing packaging materials in Germany must ensure beforehand that these packaging materials are disposed of correctly. To ensure the proper identification of these companies the Foundation Central Agency Packaging Register (Central Agency) with specific focus on increasing transparency and compliance. Every obliged companies, regardless if they are domestic producer or importer, are obliged to register with this agency.
The Central Agency is responsible for the registration of obliged companies, receipt and verification of data reports from them and PROs and therefore, as a result, for monitoring system participation of the obliged companies. In the event of non-registration, or of distribution of goods where the company has not correctly registered the brands they are distributing, there is a potential fine of up to €100,000 per case. In addition, it is conceivable that competitors will enforce the distribution ban by civil law. The Central Agency supervises the register, called LUCID packaging register, in which the companies register and enter their data Moreover, based on the non-confidential data, the Central Agency creates a public register accessible for everyone. This way, everyone can check whether a brand has been registered as their obliged to in Germany.
Particularly through its public availability (with the non-confidential data), the register creates not only the crucially needed data basis but also provides significant transparency to the entire EPR system as anyone (public authorities, consumers, producers, etc.) can check for registration of obliged companies and - in case of non-compliance - report them. This transparency of the register is essential for trust building for all involved stakeholders.
RECOmmENDATION FOR THE PHILIPPINES“PRO-led register of obliged companies”
• Rolled out by the PRO and enforced by mandatory legislation to ensure compliance and holistic participation
• Set up in close collaboration with import and trade department (Bureau of Customs and DTI, respectively) to oversee and identify obliged companies
• Registration and reporting process designed in a way that it is easily applicable by any company
• One-time registration of material, followed by regular reporting of quantities
• Ensure data transparency through publicly accessible data and uniform data collection (crucial prerequisite)
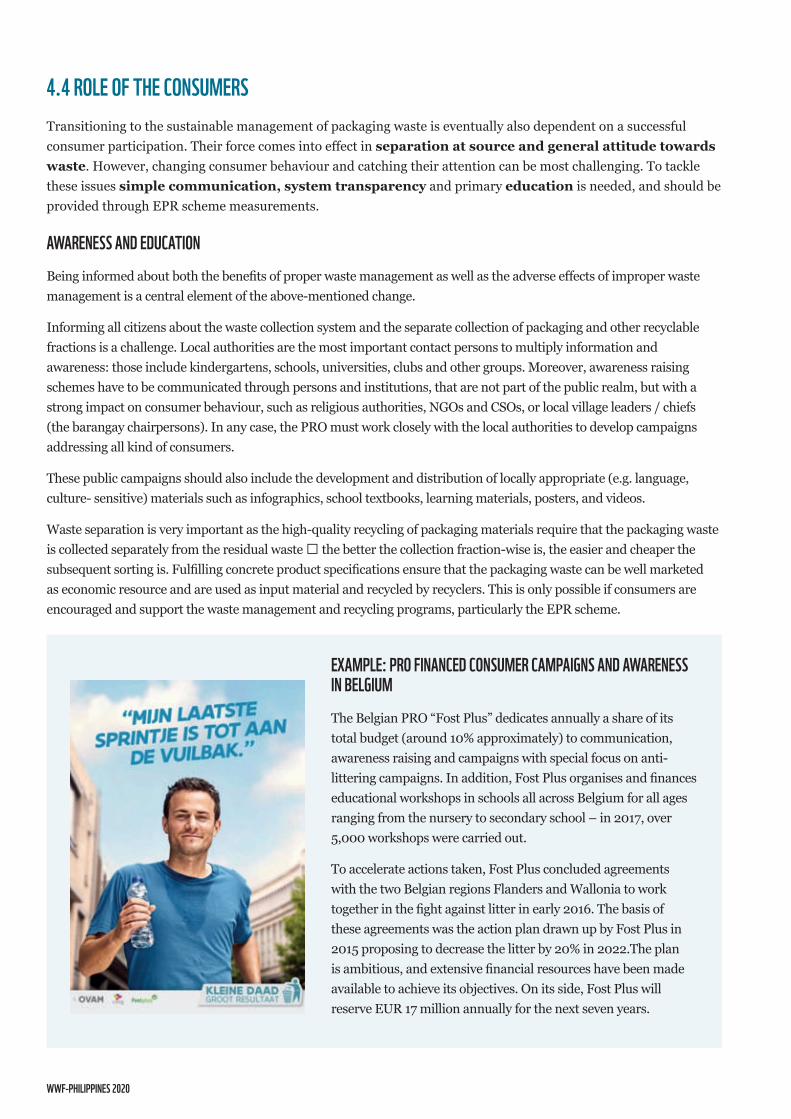
WWF-PHILIPPINES 2020
4.4 ROLE OF THE CONSUmERSTransitioning to the sustainable management of packaging waste is eventually also dependent on a successful consumer participation. Their force comes into effect in separation at source and general attitude towards waste. However, changing consumer behaviour and catching their attention can be most challenging. To tackle these issues simple communication, system transparency and primary education is needed, and should be provided through EPR scheme measurements.
AWARENESS AND EDUCATIONBeing informed about both the benefits of proper waste management as well as the adverse effects of improper waste management is a central element of the above-mentioned change.
Informing all citizens about the waste collection system and the separate collection of packaging and other recyclable fractions is a challenge. Local authorities are the most important contact persons to multiply information and awareness: those include kindergartens, schools, universities, clubs and other groups. Moreover, awareness raising schemes have to be communicated through persons and institutions, that are not part of the public realm, but with a strong impact on consumer behaviour, such as religious authorities, NGOs and CSOs, or local village leaders / chiefs (the barangay chairpersons). In any case, the PRO must work closely with the local authorities to develop campaigns addressing all kind of consumers.
These public campaigns should also include the development and distribution of locally appropriate (e.g. language, culture- sensitive) materials such as infographics, school textbooks, learning materials, posters, and videos.
Waste separation is very important as the high-quality recycling of packaging materials require that the packaging waste is collected separately from the residual waste ‒ the better the collection fraction-wise is, the easier and cheaper the subsequent sorting is. Fulfilling concrete product specifications ensure that the packaging waste can be well marketed as economic resource and are used as input material and recycled by recyclers. This is only possible if consumers are encouraged and support the waste management and recycling programs, particularly the EPR scheme.
EXAmPLE: PRO FINANCED CONSUmER CAmPAIgNS AND AWARENESS IN BELgIUmThe Belgian PRO “Fost Plus” dedicates annually a share of its total budget (around 10% approximately) to communication, awareness raising and campaigns with special focus on anti-littering campaigns. In addition, Fost Plus organises and finances educational workshops in schools all across Belgium for all ages ranging from the nursery to secondary school – in 2017, over 5,000 workshops were carried out.
To accelerate actions taken, Fost Plus concluded agreements with the two Belgian regions Flanders and Wallonia to work together in the fight against litter in early 2016. The basis of these agreements was the action plan drawn up by Fost Plus in 2015 proposing to decrease the litter by 20% in 2022.The plan is ambitious, and extensive financial resources have been made available to achieve its objectives. On its side, Fost Plus will reserve EUR 17 million annually for the next seven years.
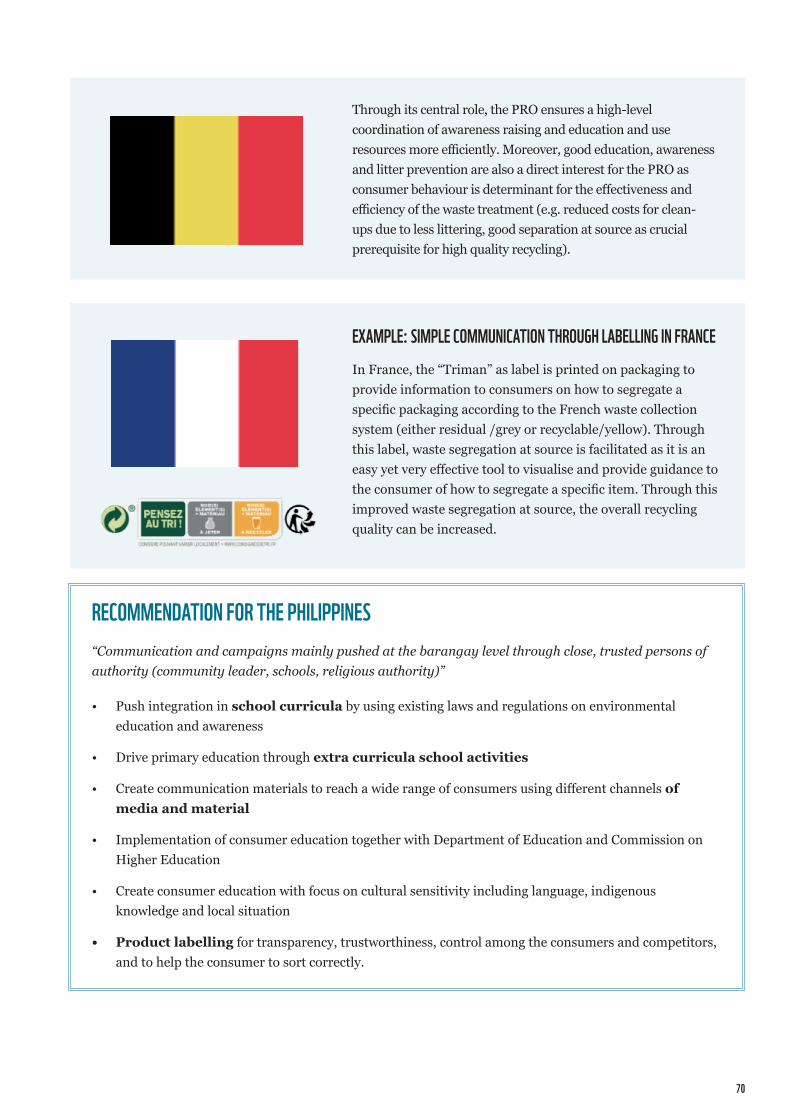
70
Through its central role, the PRO ensures a high-level coordination of awareness raising and education and use resources more efficiently. Moreover, good education, awareness and litter prevention are also a direct interest for the PRO as consumer behaviour is determinant for the effectiveness and efficiency of the waste treatment (e.g. reduced costs for clean-ups due to less littering, good separation at source as crucial prerequisite for high quality recycling).
EXAmPLE: SImPLE COmmUNICATION THROUgH LABELLINg IN FRANCEIn France, the “Triman” as label is printed on packaging to provide information to consumers on how to segregate a specific packaging according to the French waste collection system (either residual /grey or recyclable/yellow). Through this label, waste segregation at source is facilitated as it is an easy yet very effective tool to visualise and provide guidance to the consumer of how to segregate a specific item. Through this improved waste segregation at source, the overall recycling quality can be increased.
RECOmmENDATION FOR THE PHILIPPINES“Communication and campaigns mainly pushed at the barangay level through close, trusted persons of authority (community leader, schools, religious authority)”
• Push integration in school curricula by using existing laws and regulations on environmental education and awareness
• Drive primary education through extra curricula school activities
• Create communication materials to reach a wide range of consumers using different channels of media and material
• Implementation of consumer education together with Department of Education and Commission on Higher Education
• Create consumer education with focus on cultural sensitivity including language, indigenous knowledge and local situation
• Product labelling for transparency, trustworthiness, control among the consumers and competitors, and to help the consumer to sort correctly.
EXAmPLE: SHARED RESPONSIBILITY IN BELgIUm’S IN-BETWEEN mODEL Belgium’s PRO has contracts with all municipalities, in which the PRO specifies the collection of recyclables and organises where which waste is sorted. However, the actual collection of the waste is still a municipal task and is organised by the public authority.
WWF-PHILIPPINES 2020
EPR INFLUENCE ON PRICES AND CONSUmPTIONIt is expected that the obliged companies will transfer the EPR fees onto consumer good prices. Therefore, doubts may arise regarding consumer’s ability to cover significant increase of prices, especially for low-income population.
If the paid fees are broken down to the individual items, the amount is not significant and not noticeable for the single consumer. This is also evident in the following example: For a big plastic bottle with a weight of 25 g and based on an EPR fee of 300€ per tonne, the EPR fee per plastic bottle is only 0.75 EUR ct. (~ 0.4 PHP). Moreover, the costs are fairly distributed: Only these consumers, who buy packaged goods, pay for the subsequent collection and disposal of the packaging. Those who buy unpackaged goods do not pay at all. The fee depends on the respective weight and the material of the packaging. This is reflected in the total calculation as it can be observed that the fees are polluter related. The costs for operating the EPR system overall, which are covered through the EPR fees, depend on the regional circumstances.
4.5 ROLE OF THE WASTE mANAgEmENT OPERATORSTo close the loop of the EPR scheme, packaging needs to be collected, sorted and recycled, which is done by the waste management operators. For these activities they receive funds from the EPR system, channelled through the PRO. The financing enables and shall ensure recycling of all packaging, especially of currently non-valuable materials which are therefore not getting recycled.
If informal collection, sorting, and recycling prevails, it is important to consider the contribution of that sector to the success of the EPR scheme. Taking the local context into account, an EPR must develop how to integrate formal and informal waste sector workers that support the efficiency and profitability of all actors.
COLLECTIONDepending on a country’s past and present waste management system, the collection of an EPR scheme has to build upon and can be organized for example in the following ways:
• Waste management operations remain with the public authority. Obliged companies pay EPR fee to the PRO, who in turn pays for the entire waste management, but does not organise it on its own (e.g. all the money goes to the LGUs, who then ensure that the waste is taken to the sorting plants, and the operators of the sorting plants sell to the recyclers).
• Waste management operations are organisationally and financially in the hands of the PRO, who not only pays but also takes over the complete organisation, i.e. it concludes contracts with companies that collect, with sorting plants and so on. The system exists in parallel to the public waste collection, which remains responsible for other waste streams, not covered by the EPR scheme.
• Or waste management operations follow a model ‘in between’, where any variant is possible that shares the organization among PRO and the public authority, e.g. the LGUs continue to organise collection, but the PRO organises sorting.
72
RECOmmENDATION FOR THE PHILIPPINESDue to the country’s diverse waste management system a model ‘in-between’ is recommended as some public organized waste management operations are already present
• For example, city and municipal areas might just need technical extension or financial support to meet respective waste management targets; furthermore, collection is so far a municipal task and a shift of the organisation responsibility potentially creates more complications than a system improvement
• An organisation solely by the public-authorities, financed via the EPR scheme, is also assessed as not feasible for the Philippines, it is expected to be rather inefficient and implementation will be a challenge
• Moreover, through an in-between model, individual requirements can account for Philippines’ diversity: Waste management operations get designed on different levels, where the PRO engages with local private waste management operators and LGUS, developing individual concepts adequate for the present private operators and characteristics of the LGUs
• These concepts differ for and among islands and metropolitan areas, according to determining criteria like island size, population density, present infrastructure etc. (determinants to be developed by PRO)
• Yet the development of such concepts is imposed by national law and concepts need approval of a public authority, mainly to ensure compliance with set EPR targets
• After government approval, these concepts can get multiplied in areas with similar characteristics; clustering of LGUs is also possible
• Informal collection contributes significantly to Philippine’s current waste management system, it should be ensured that the sector’s integration is considered and applied in individual concepts
INTEgRATION OF THE INFORmAL SECTOREven if the informal sector significantly contributes to waste collection, sorting and recycling, from a waste management perspective, informal systems are usually inefficient as
• only valuables will be collected, while invaluable materials remain uncollected (waste picking, no cleaning service),
• collection occurs only in areas with demand for recyclables (in proximity to the facility and/ or trading point),
• formal collection of remaining waste will become more expensive (because valuables are already removed), and,
• informal collection and separation often contribute to littering.
Taking such circumstances into account, an EPR system must consider the integration of the formal and informal sector, that supports the efficiency and profitability of all actors.
Furthermore, it needs to be analysed which fractions in particular are collected by the informal sector prior to establishing an EPR system. Table 35 in annex 7.11 provides a first overview of packaging and material types that are usually collected by the informal sector and which not. Generally, all packaging and material types are collected which have a positive market value, i.e. revenues (e.g. per kg) can be generated with. Moreover, this also depends on the proximity of recycling structures or other places to sell the waste (e.g. waste banks, aggregators or brokers).
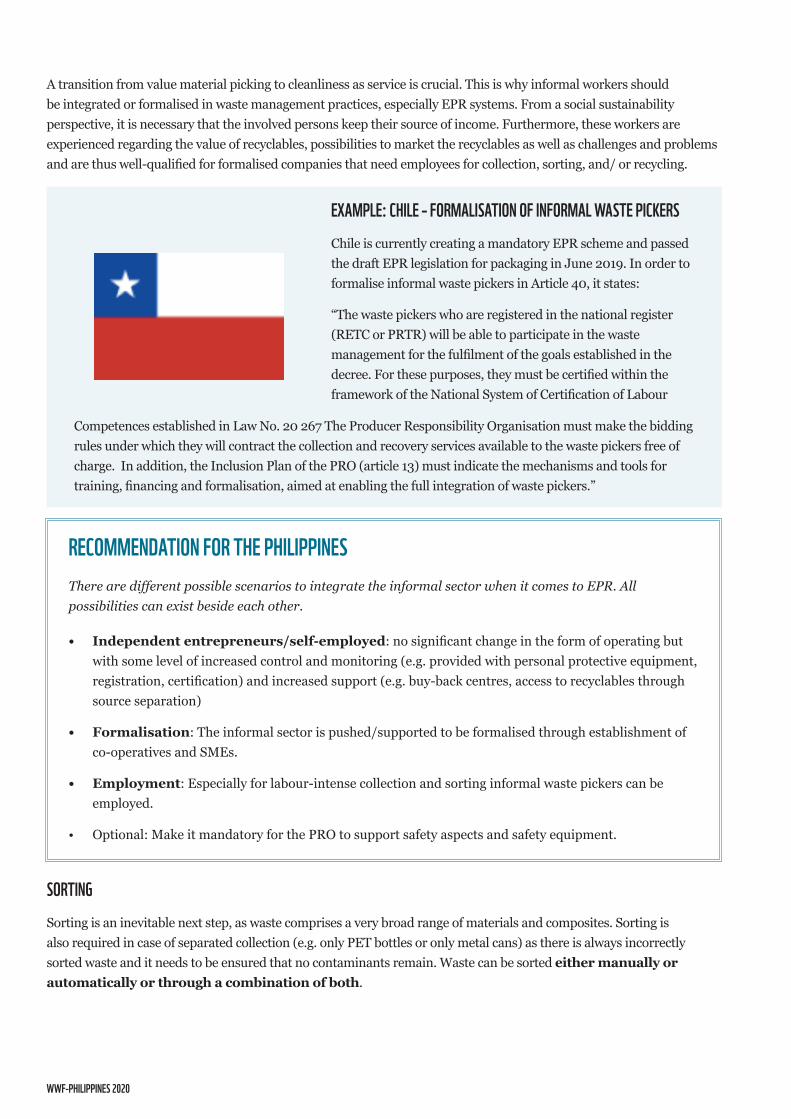
WWF-PHILIPPINES 2020
A transition from value material picking to cleanliness as service is crucial. This is why informal workers should be integrated or formalised in waste management practices, especially EPR systems. From a social sustainability perspective, it is necessary that the involved persons keep their source of income. Furthermore, these workers are experienced regarding the value of recyclables, possibilities to market the recyclables as well as challenges and problems and are thus well-qualified for formalised companies that need employees for collection, sorting, and/ or recycling.
SORTINgSorting is an inevitable next step, as waste comprises a very broad range of materials and composites. Sorting is also required in case of separated collection (e.g. only PET bottles or only metal cans) as there is always incorrectly sorted waste and it needs to be ensured that no contaminants remain. Waste can be sorted either manually or automatically or through a combination of both.
EXAmPLE: CHILE – FORmALISATION OF INFORmAL WASTE PICkERSChile is currently creating a mandatory EPR scheme and passed the draft EPR legislation for packaging in June 2019. In order to formalise informal waste pickers in Article 40, it states:
“The waste pickers who are registered in the national register (RETC or PRTR) will be able to participate in the waste management for the fulfilment of the goals established in the decree. For these purposes, they must be certified within the framework of the National System of Certification of Labour
Competences established in Law No. 20 267 The Producer Responsibility Organisation must make the bidding rules under which they will contract the collection and recovery services available to the waste pickers free of charge. In addition, the Inclusion Plan of the PRO (article 13) must indicate the mechanisms and tools for training, financing and formalisation, aimed at enabling the full integration of waste pickers.”
RECOmmENDATION FOR THE PHILIPPINESThere are different possible scenarios to integrate the informal sector when it comes to EPR. All possibilities can exist beside each other.
• Independent entrepreneurs/self-employed: no significant change in the form of operating but with some level of increased control and monitoring (e.g. provided with personal protective equipment, registration, certification) and increased support (e.g. buy-back centres, access to recyclables through source separation)
• Formalisation: The informal sector is pushed/supported to be formalised through establishment of co-operatives and SMEs.
• Employment: Especially for labour-intense collection and sorting informal waste pickers can be employed.
• Optional: Make it mandatory for the PRO to support safety aspects and safety equipment.
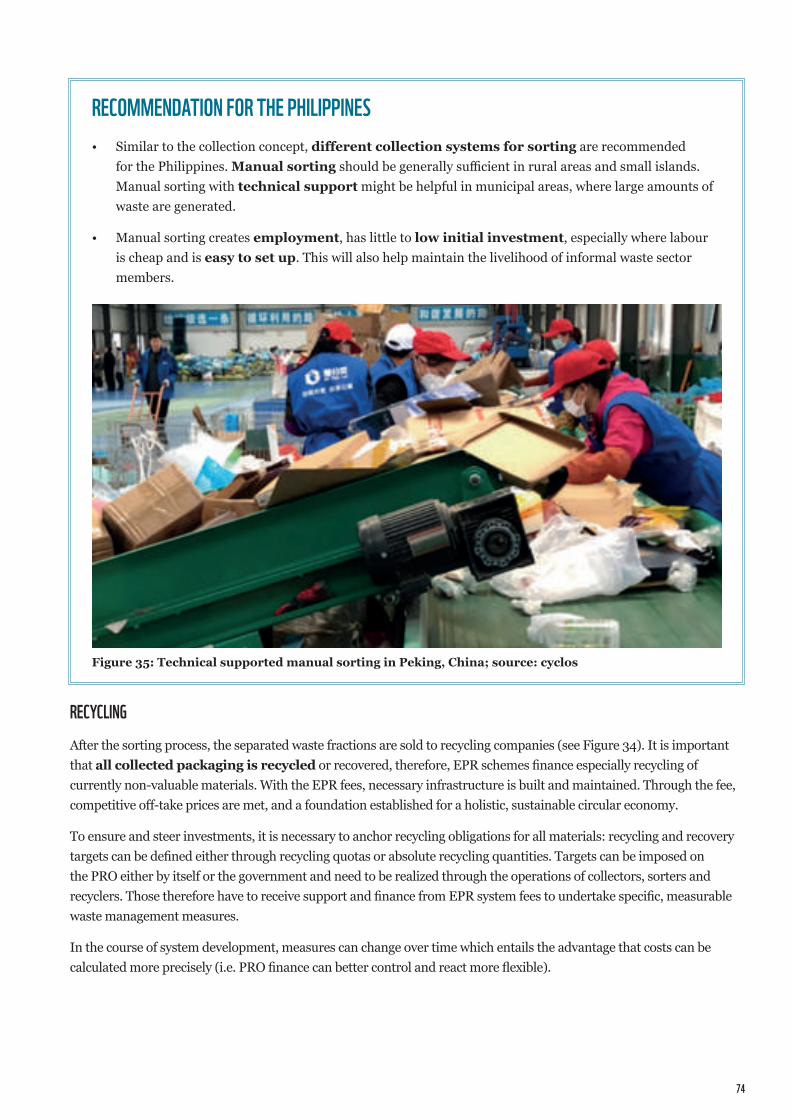
74
RECYCLINgAfter the sorting process, the separated waste fractions are sold to recycling companies (see Figure 34). It is important that all collected packaging is recycled or recovered, therefore, EPR schemes finance especially recycling of currently non-valuable materials. With the EPR fees, necessary infrastructure is built and maintained. Through the fee, competitive off-take prices are met, and a foundation established for a holistic, sustainable circular economy.
To ensure and steer investments, it is necessary to anchor recycling obligations for all materials: recycling and recovery targets can be defined either through recycling quotas or absolute recycling quantities. Targets can be imposed on the PRO either by itself or the government and need to be realized through the operations of collectors, sorters and recyclers. Those therefore have to receive support and finance from EPR system fees to undertake specific, measurable waste management measures.
In the course of system development, measures can change over time which entails the advantage that costs can be calculated more precisely (i.e. PRO finance can better control and react more flexible).
RECOmmENDATION FOR THE PHILIPPINES• Similar to the collection concept, different collection systems for sorting are recommended
for the Philippines. Manual sorting should be generally sufficient in rural areas and small islands. Manual sorting with technical support might be helpful in municipal areas, where large amounts of waste are generated.
• Manual sorting creates employment, has little to low initial investment, especially where labour is cheap and is easy to set up. This will also help maintain the livelihood of informal waste sector members.
Figure 35: Technical supported manual sorting in Peking, China; source: cyclos
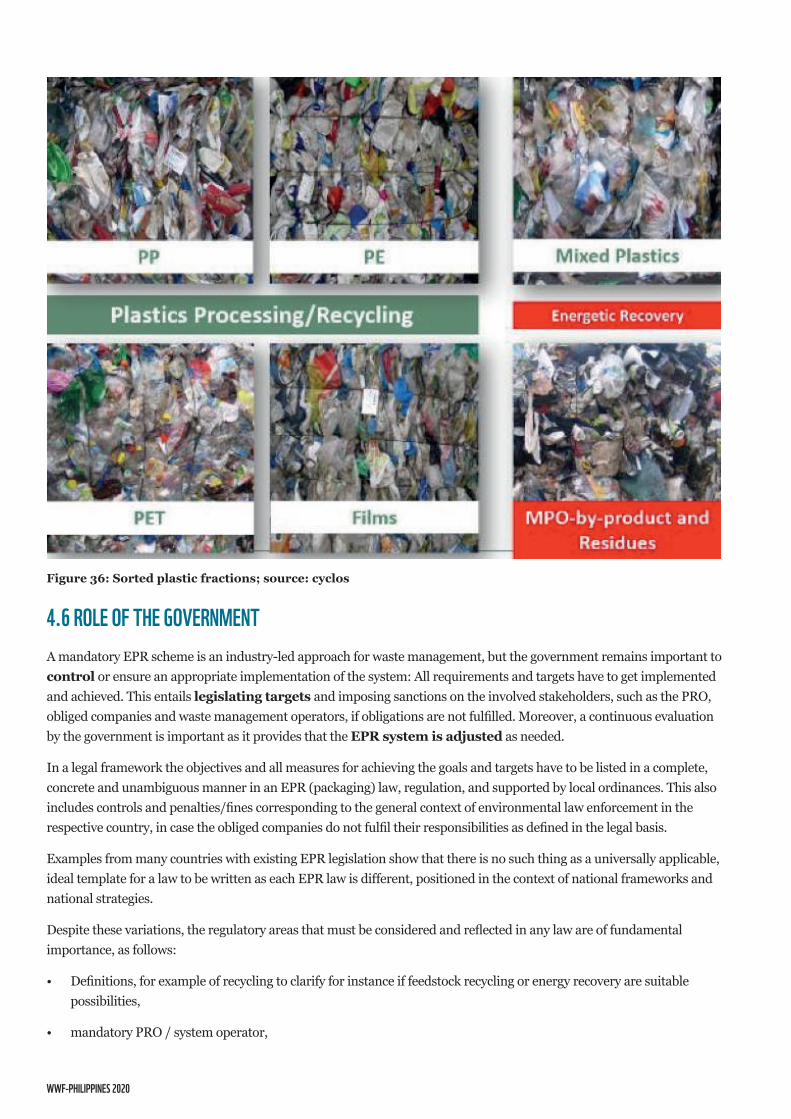
WWF-PHILIPPINES 2020
Figure 36: Sorted plastic fractions; source: cyclos
4.6 ROLE OF THE gOVERNmENTA mandatory EPR scheme is an industry-led approach for waste management, but the government remains important to control or ensure an appropriate implementation of the system: All requirements and targets have to get implemented and achieved. This entails legislating targets and imposing sanctions on the involved stakeholders, such as the PRO, obliged companies and waste management operators, if obligations are not fulfilled. Moreover, a continuous evaluation by the government is important as it provides that the EPR system is adjusted as needed.
In a legal framework the objectives and all measures for achieving the goals and targets have to be listed in a complete, concrete and unambiguous manner in an EPR (packaging) law, regulation, and supported by local ordinances. This also includes controls and penalties/fines corresponding to the general context of environmental law enforcement in the respective country, in case the obliged companies do not fulfil their responsibilities as defined in the legal basis.
Examples from many countries with existing EPR legislation show that there is no such thing as a universally applicable, ideal template for a law to be written as each EPR law is different, positioned in the context of national frameworks and national strategies.
Despite these variations, the regulatory areas that must be considered and reflected in any law are of fundamental importance, as follows:
• Definitions, for example of recycling to clarify for instance if feedstock recycling or energy recovery are suitable possibilities,
• mandatory PRO / system operator,
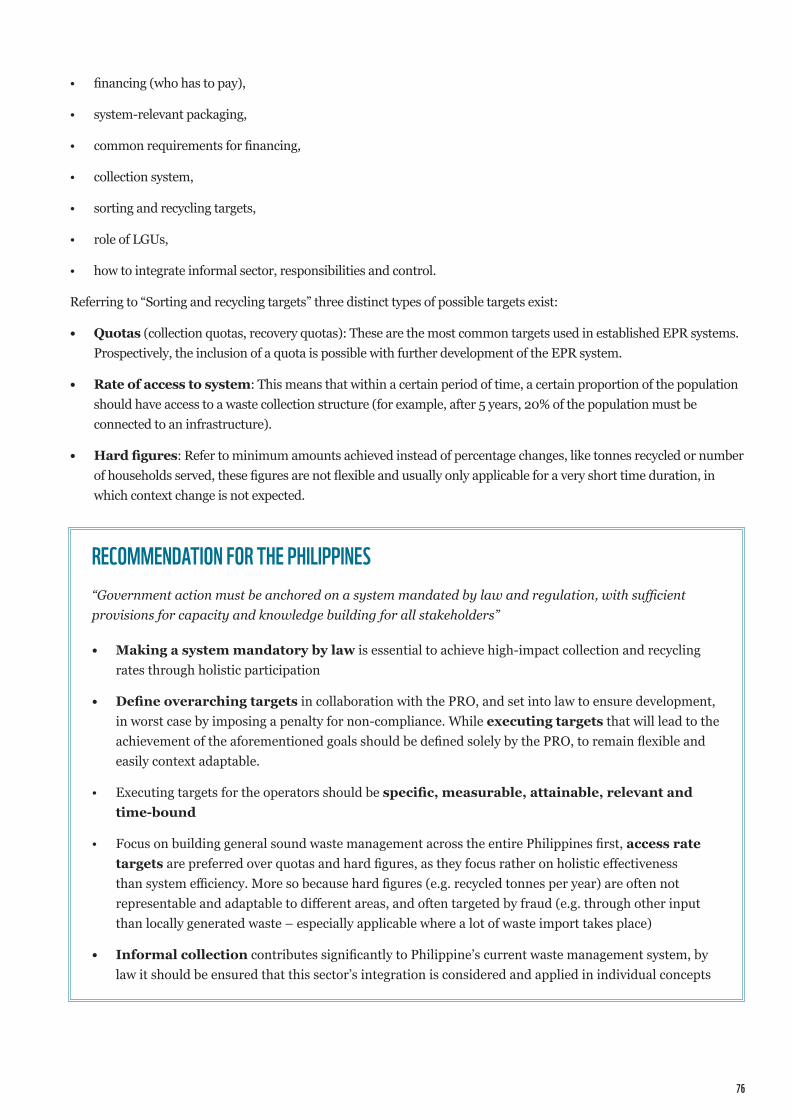
76
• financing (who has to pay),
• system-relevant packaging,
• common requirements for financing,
• collection system,
• sorting and recycling targets,
• role of LGUs,
• how to integrate informal sector, responsibilities and control.
Referring to “Sorting and recycling targets” three distinct types of possible targets exist:
• Quotas (collection quotas, recovery quotas): These are the most common targets used in established EPR systems. Prospectively, the inclusion of a quota is possible with further development of the EPR system.
• Rate of access to system: This means that within a certain period of time, a certain proportion of the population should have access to a waste collection structure (for example, after 5 years, 20% of the population must be connected to an infrastructure).
• Hard figures: Refer to minimum amounts achieved instead of percentage changes, like tonnes recycled or number of households served, these figures are not flexible and usually only applicable for a very short time duration, in which context change is not expected.
RECOmmENDATION FOR THE PHILIPPINES“Government action must be anchored on a system mandated by law and regulation, with sufficient provisions for capacity and knowledge building for all stakeholders”
• Making a system mandatory by law is essential to achieve high-impact collection and recycling rates through holistic participation
• Define overarching targets in collaboration with the PRO, and set into law to ensure development, in worst case by imposing a penalty for non-compliance. While executing targets that will lead to the achievement of the aforementioned goals should be defined solely by the PRO, to remain flexible and easily context adaptable.
• Executing targets for the operators should be specific, measurable, attainable, relevant and time-bound
• Focus on building general sound waste management across the entire Philippines first, access rate targets are preferred over quotas and hard figures, as they focus rather on holistic effectiveness than system efficiency. More so because hard figures (e.g. recycled tonnes per year) are often not representable and adaptable to different areas, and often targeted by fraud (e.g. through other input than locally generated waste – especially applicable where a lot of waste import takes place)
• Informal collection contributes significantly to Philippine’s current waste management system, by law it should be ensured that this sector’s integration is considered and applied in individual concepts
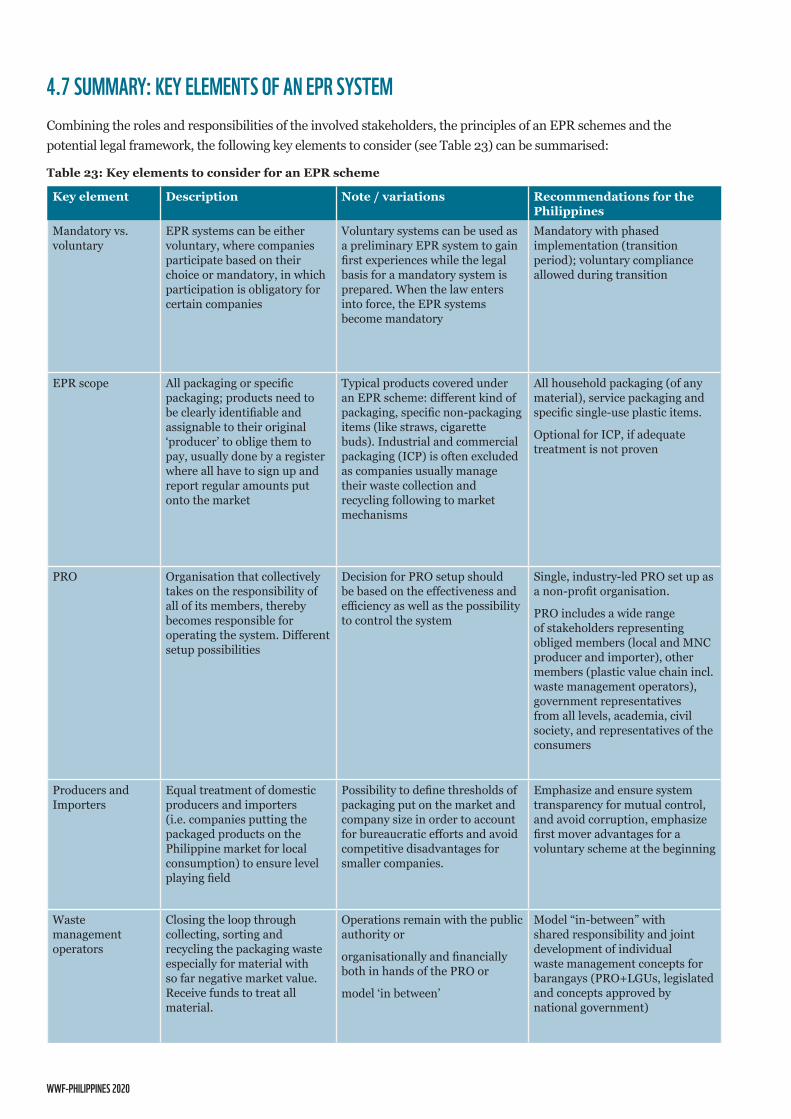
WWF-PHILIPPINES 2020
4.7 SUmmARY: kEY ELEmENTS OF AN EPR SYSTEmCombining the roles and responsibilities of the involved stakeholders, the principles of an EPR schemes and the potential legal framework, the following key elements to consider (see Table 23) can be summarised:
Key element Description Note / variations Recommendations for the Philippines
Mandatory vs. voluntary
EPR systems can be either voluntary, where companies participate based on their choice or mandatory, in which participation is obligatory for certain companies
Voluntary systems can be used as a preliminary EPR system to gain first experiences while the legal basis for a mandatory system is prepared. When the law enters into force, the EPR systems become mandatory
Mandatory with phased implementation (transition period); voluntary compliance allowed during transition
EPR scope All packaging or specific packaging; products need to be clearly identifiable and assignable to their original ‘producer’ to oblige them to pay, usually done by a register where all have to sign up and report regular amounts put onto the market
Typical products covered under an EPR scheme: different kind of packaging, specific non-packaging items (like straws, cigarette buds). Industrial and commercial packaging (ICP) is often excluded as companies usually manage their waste collection and recycling following to market mechanisms
All household packaging (of any material), service packaging and specific single-use plastic items.
Optional for ICP, if adequate treatment is not proven
PRO Organisation that collectively takes on the responsibility of all of its members, thereby becomes responsible for operating the system. Different setup possibilities
Decision for PRO setup should be based on the effectiveness and efficiency as well as the possibility to control the system
Single, industry-led PRO set up as a non-profit organisation.
PRO includes a wide range of stakeholders representing obliged members (local and MNC producer and importer), other members (plastic value chain incl. waste management operators), government representatives from all levels, academia, civil society, and representatives of the consumers
Producers and Importers
Equal treatment of domestic producers and importers (i.e. companies putting the packaged products on the Philippine market for local consumption) to ensure level playing field
Possibility to define thresholds of packaging put on the market and company size in order to account for bureaucratic efforts and avoid competitive disadvantages for smaller companies.
Emphasize and ensure system transparency for mutual control, and avoid corruption, emphasize first mover advantages for a voluntary scheme at the beginning
Waste management operators
Closing the loop through collecting, sorting and recycling the packaging waste especially for material with so far negative market value. Receive funds to treat all material.
Operations remain with the public authority or
organisationally and financially both in hands of the PRO or
model ‘in between’
Model “in-between” with shared responsibility and joint development of individual waste management concepts for barangays (PRO+LGUs, legislated and concepts approved by national government)
Table 23: Key elements to consider for an EPR scheme
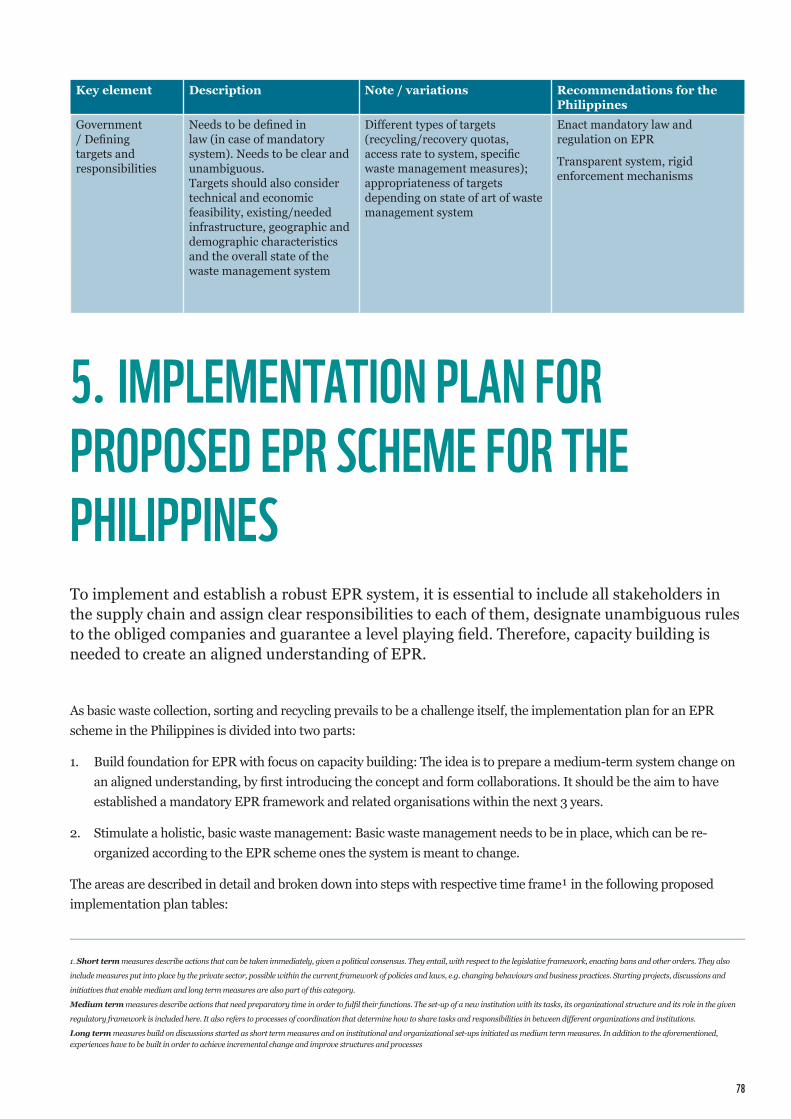
78
Key element Description Note / variations Recommendations for the Philippines
Mandatory vs. voluntary
EPR systems can be either voluntary, where companies participate based on their choice or mandatory, in which participation is obligatory for certain companies
Voluntary systems can be used as a preliminary EPR system to gain first experiences while the legal basis for a mandatory system is prepared. When the law enters into force, the EPR systems become mandatory
Mandatory with phased implementation (transition period); voluntary compliance allowed during transition
Government / Defining targets and responsibilities
Needs to be defined in law (in case of mandatory system). Needs to be clear and unambiguous. Targets should also consider technical and economic feasibility, existing/needed infrastructure, geographic and demographic characteristics and the overall state of the waste management system
Different types of targets (recycling/recovery quotas, access rate to system, specific waste management measures); appropriateness of targets depending on state of art of waste management system
Enact mandatory law and regulation on EPR
Transparent system, rigid enforcement mechanisms
5. ImPLEmENTATION PLAN FOR PROPOSED EPR SCHEmE FOR THE PHILIPPINES To implement and establish a robust EPR system, it is essential to include all stakeholders in the supply chain and assign clear responsibilities to each of them, designate unambiguous rules to the obliged companies and guarantee a level playing field. Therefore, capacity building is needed to create an aligned understanding of EPR.
As basic waste collection, sorting and recycling prevails to be a challenge itself, the implementation plan for an EPR scheme in the Philippines is divided into two parts:
1. Build foundation for EPR with focus on capacity building: The idea is to prepare a medium-term system change on an aligned understanding, by first introducing the concept and form collaborations. It should be the aim to have established a mandatory EPR framework and related organisations within the next 3 years.
2. Stimulate a holistic, basic waste management: Basic waste management needs to be in place, which can be re-organized according to the EPR scheme ones the system is meant to change.
The areas are described in detail and broken down into steps with respective time frame¹ in the following proposed implementation plan tables:
1. Short term measures describe actions that can be taken immediately, given a political consensus. They entail, with respect to the legislative framework, enacting bans and other orders. They also
include measures put into place by the private sector, possible within the current framework of policies and laws, e.g. changing behaviours and business practices. Starting projects, discussions and
initiatives that enable medium and long term measures are also part of this category.
Medium term measures describe actions that need preparatory time in order to fulfil their functions. The set-up of a new institution with its tasks, its organizational structure and its role in the given
regulatory framework is included here. It also refers to processes of coordination that determine how to share tasks and responsibilities in between different organizations and institutions.
Long term measures build on discussions started as short term measures and on institutional and organizational set-ups initiated as medium term measures. In addition to the aforementioned, experiences have to be built in order to achieve incremental change and improve structures and processes
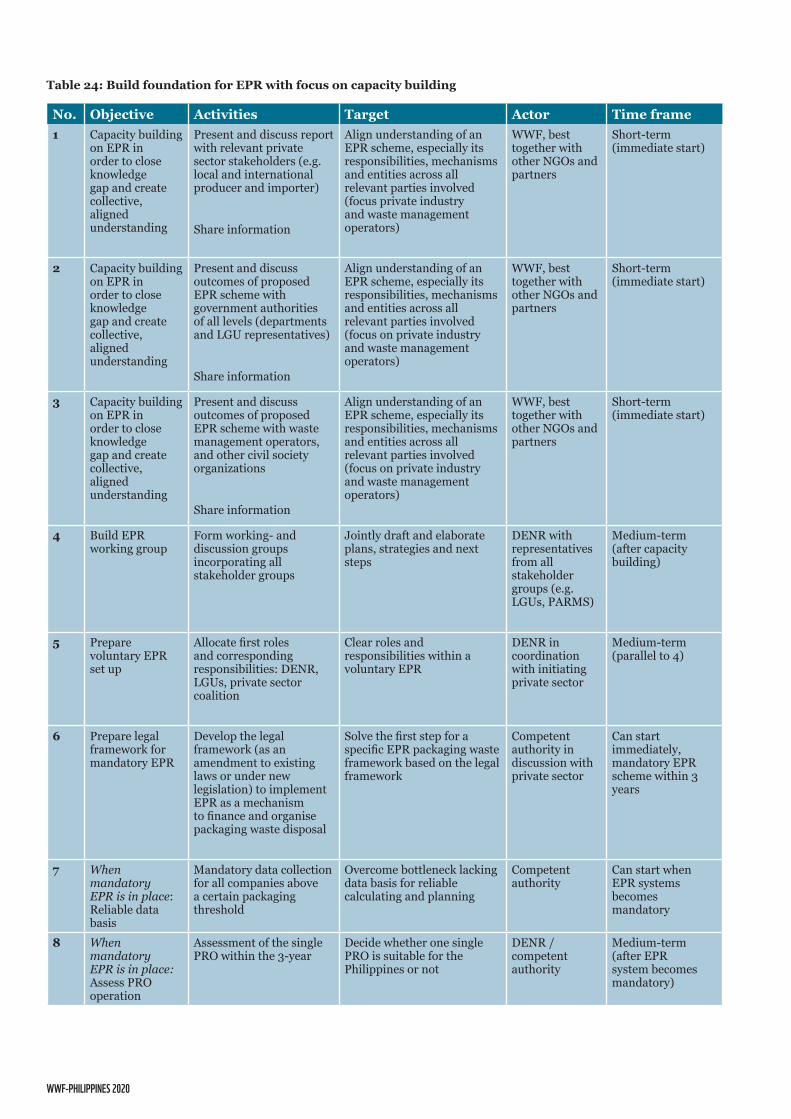
WWF-PHILIPPINES 2020
No. Objective Activities Target Actor Time frame1 Capacity building
on EPR in order to close knowledge gap and create collective, aligned understanding
Present and discuss report with relevant private sector stakeholders (e.g. local and international producer and importer)
Share information
Align understanding of an EPR scheme, especially its responsibilities, mechanisms and entities across all relevant parties involved (focus private industry and waste management operators)
WWF, best together with other NGOs and partners
Short-term (immediate start)
2 Capacity building on EPR in order to close knowledge gap and create collective, aligned understanding
Present and discuss outcomes of proposed EPR scheme with government authorities of all levels (departments and LGU representatives)
Share information
Align understanding of an EPR scheme, especially its responsibilities, mechanisms and entities across all relevant parties involved (focus on private industry and waste management operators)
WWF, best together with other NGOs and partners
Short-term (immediate start)
3 Capacity building on EPR in order to close knowledge gap and create collective, aligned understanding
Present and discuss outcomes of proposed EPR scheme with waste management operators, and other civil society organizations
Share information
Align understanding of an EPR scheme, especially its responsibilities, mechanisms and entities across all relevant parties involved (focus on private industry and waste management operators)
WWF, best together with other NGOs and partners
Short-term (immediate start)
4 Build EPR working group
Form working- and discussion groups incorporating all stakeholder groups
Jointly draft and elaborate plans, strategies and next steps
DENR with representatives from all stakeholder groups (e.g. LGUs, PARMS)
Medium-term (after capacity building)
5 Prepare voluntary EPR set up
Allocate first roles and corresponding responsibilities: DENR, LGUs, private sector coalition
Clear roles and responsibilities within a voluntary EPR
DENR in coordination with initiating private sector
Medium-term (parallel to 4)
6 Prepare legal framework for mandatory EPR
Develop the legal framework (as an amendment to existing laws or under new legislation) to implement EPR as a mechanism to finance and organise packaging waste disposal
Solve the first step for a specific EPR packaging waste framework based on the legal framework
Competent authority in discussion with private sector
Can start immediately, mandatory EPR scheme within 3 years
7 When mandatory EPR is in place: Reliable data basis
Mandatory data collection for all companies above a certain packaging threshold
Overcome bottleneck lacking data basis for reliable calculating and planning
Competent authority
Can start when EPR systems becomes mandatory
8 When mandatory EPR is in place: Assess PRO operation
Assessment of the single PRO within the 3-year
Decide whether one single PRO is suitable for the Philippines or not
DENR / competent authority
Medium-term (after EPR system becomes mandatory)
Table 24: Build foundation for EPR with focus on capacity building
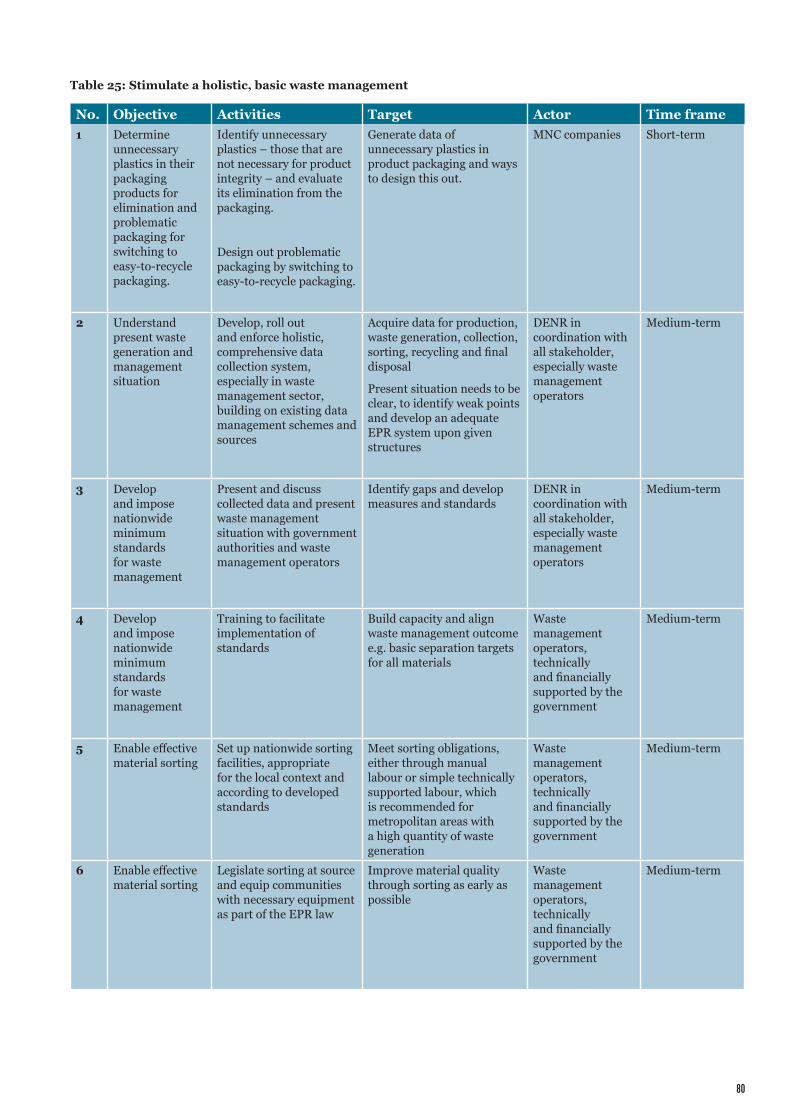
80
Table 25: Stimulate a holistic, basic waste management
No. Objective Activities Target Actor Time frame1 Determine
unnecessary plastics in their packaging products for elimination and problematic packaging for switching to easy-to-recycle packaging.
Identify unnecessary plastics – those that are not necessary for product integrity – and evaluate its elimination from the packaging.
Design out problematic packaging by switching to easy-to-recycle packaging.
Generate data of unnecessary plastics in product packaging and ways to design this out.
MNC companies Short-term
2 Understand present waste generation and management situation
Develop, roll out and enforce holistic, comprehensive data collection system, especially in waste management sector, building on existing data management schemes and sources
Acquire data for production, waste generation, collection, sorting, recycling and final disposal
Present situation needs to be clear, to identify weak points and develop an adequate EPR system upon given structures
DENR in coordination with all stakeholder, especially waste management operators
Medium-term
3 Develop and impose nationwide minimum standards for waste management
Present and discuss collected data and present waste management situation with government authorities and waste management operators
Identify gaps and develop measures and standards
DENR in coordination with all stakeholder, especially waste management operators
Medium-term
4 Develop and impose nationwide minimum standards for waste management
Training to facilitate implementation of standards
Build capacity and align waste management outcome e.g. basic separation targets for all materials
Waste management operators, technically and financially supported by the government
Medium-term
5 Enable effective material sorting
Set up nationwide sorting facilities, appropriate for the local context and according to developed standards
Meet sorting obligations, either through manual labour or simple technically supported labour, which is recommended for metropolitan areas with a high quantity of waste generation
Waste management operators, technically and financially supported by the government
Medium-term
6 Enable effective material sorting
Legislate sorting at source and equip communities with necessary equipment as part of the EPR law
Improve material quality through sorting as early as possible
Waste management operators, technically and financially supported by the government
Medium-term
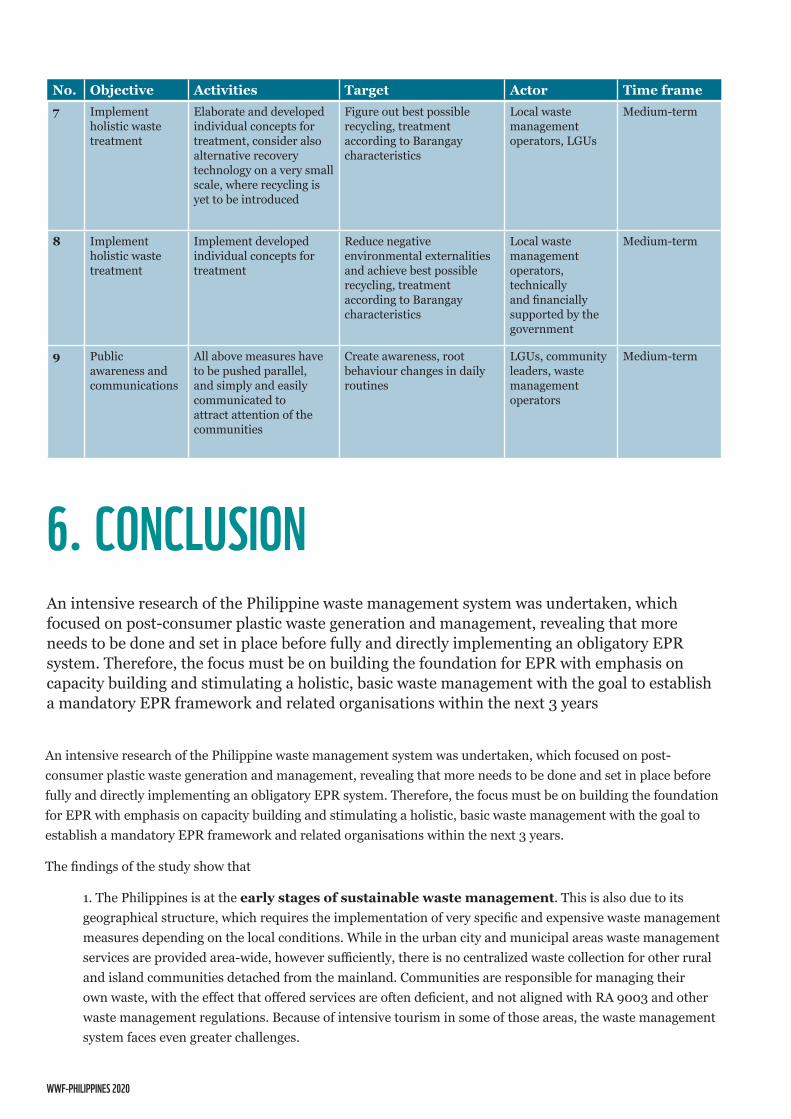
WWF-PHILIPPINES 2020
7 Implement holistic waste treatment
Elaborate and developed individual concepts for treatment, consider also alternative recovery technology on a very small scale, where recycling is yet to be introduced
Figure out best possible recycling, treatment according to Barangay characteristics
Local waste management operators, LGUs
Medium-term
8 Implement holistic waste treatment
Implement developed individual concepts for treatment
Reduce negative environmental externalities and achieve best possible recycling, treatment according to Barangay characteristics
Local waste management operators, technically and financially supported by the government
Medium-term
9 Public awareness and communications
All above measures have to be pushed parallel, and simply and easily communicated to attract attention of the communities
Create awareness, root behaviour changes in daily routines
LGUs, community leaders, waste management operators
Medium-term
6. CONCLUSION An intensive research of the Philippine waste management system was undertaken, which focused on post-consumer plastic waste generation and management, revealing that more needs to be done and set in place before fully and directly implementing an obligatory EPR system. Therefore, the focus must be on building the foundation for EPR with emphasis on capacity building and stimulating a holistic, basic waste management with the goal to establish a mandatory EPR framework and related organisations within the next 3 years
An intensive research of the Philippine waste management system was undertaken, which focused on post-consumer plastic waste generation and management, revealing that more needs to be done and set in place before fully and directly implementing an obligatory EPR system. Therefore, the focus must be on building the foundation for EPR with emphasis on capacity building and stimulating a holistic, basic waste management with the goal to establish a mandatory EPR framework and related organisations within the next 3 years.
The findings of the study show that
1. The Philippines is at the early stages of sustainable waste management. This is also due to its geographical structure, which requires the implementation of very specific and expensive waste management measures depending on the local conditions. While in the urban city and municipal areas waste management services are provided area-wide, however sufficiently, there is no centralized waste collection for other rural and island communities detached from the mainland. Communities are responsible for managing their own waste, with the effect that offered services are often deficient, and not aligned with RA 9003 and other waste management regulations. Because of intensive tourism in some of those areas, the waste management system faces even greater challenges.
No. Objective Activities Target Actor Time frame
82
> Approach to benefit a perspective EPR scheme: Identification of best waste management solutions, especially in rural areas. Islands can be incorporated in an EPR scheme. For islands generating significant quantities of waste, the normal practice of collection and transport to the mainland can be incorporated into an EPR system. Such would need to promote segregation at source and transport of materials to off takers for recovery. Islands generating sufficient quantities of waste to establish local MRF through the EPR system, it would be possible to improve the current practice of landfilling and might enable local recovery.
2. There is no uniformity in implementation of national regulations, and responsibilities are dispersed among all government levels. This results in inefficiencies and weak accountability. Missing adequate technical and financial resources, act of political will, willingness of stakeholders, and minimal awareness instead of a holistic approach are present. At the local level, some LGUs have passed local ordinances. Small-scale initiatives implement individual plastics regulations and regional actions. All in all, leaving the legal landscape very fragmented.
> Approach to benefit a perspective EPR scheme: When it comes to EPR a superordinate (national) legal framework is needed, so that the validity is anchored nationwide. Local requirements must be incorporated and aligned adequately into this structure. Simultaneously, the responsibilities in the system must be clearly defined.
3. Aligning the way forward and measuring progress are difficult as there is no sound database available. This became especially evident in the creation of the material flow analysis. The lack of valid key figures, aligned data and definitions leave space for ambiguity and prevent comparison of waste management benchmarks and the setting of precise and quantifiable targets and requirements for different stakeholders.
> Approach to benefit a perspective EPR scheme: To implement an adequate EPR scheme, reliable, solid, and transparent data are pre-requisites. If not available or only on a low quality, it becomes nearly impossible to evaluate and design the best EPR system, and to control and ensure that there is no fraud. To gather data, government actors may be seen as the primary source of data. However, this can be challenging, given the multiplicity of actors in the sector and limitations in data collection capacity.
4. In the Philippines there is only little to no recycling infrastructure. If collected, plastic is one of the common recyclable materials (besides metal and paper). However, only a small amount is actually recycled with a national plastic recycling rate at approximately 9%. Instead of recycling, most of the materials are discarded in open dumpsites, controlled disposal facilities, sanitary landfills or in the ocean. One third is said to be disposed while the remaining third leaks uncontrolled into the environment.
> Approach to benefit a perspective EPR scheme: This is partly because of poor waste collection coverage, presence of single-use plastics and lack of recycling facilities. The country also has low plastics recycling rate. The results of this study can be the basis in planning for interventions and policies to eliminate unnecessary plastics, decrease the amount of plastics leaked into the environment, and improve recycling rates of plastics especially in establishing a sound collection.
This study offers a science and evidence-based analysis for supporting the development and implementation of a future EPR system. For capacity building, the basics and recommendations presented for the design of an EPR system should be considered in the much-needed communication with stakeholders from all sectors on all levels, in order to establish a uniform understanding of EPR and to demonstrate the effects and opportunities along the waste packaging chain.
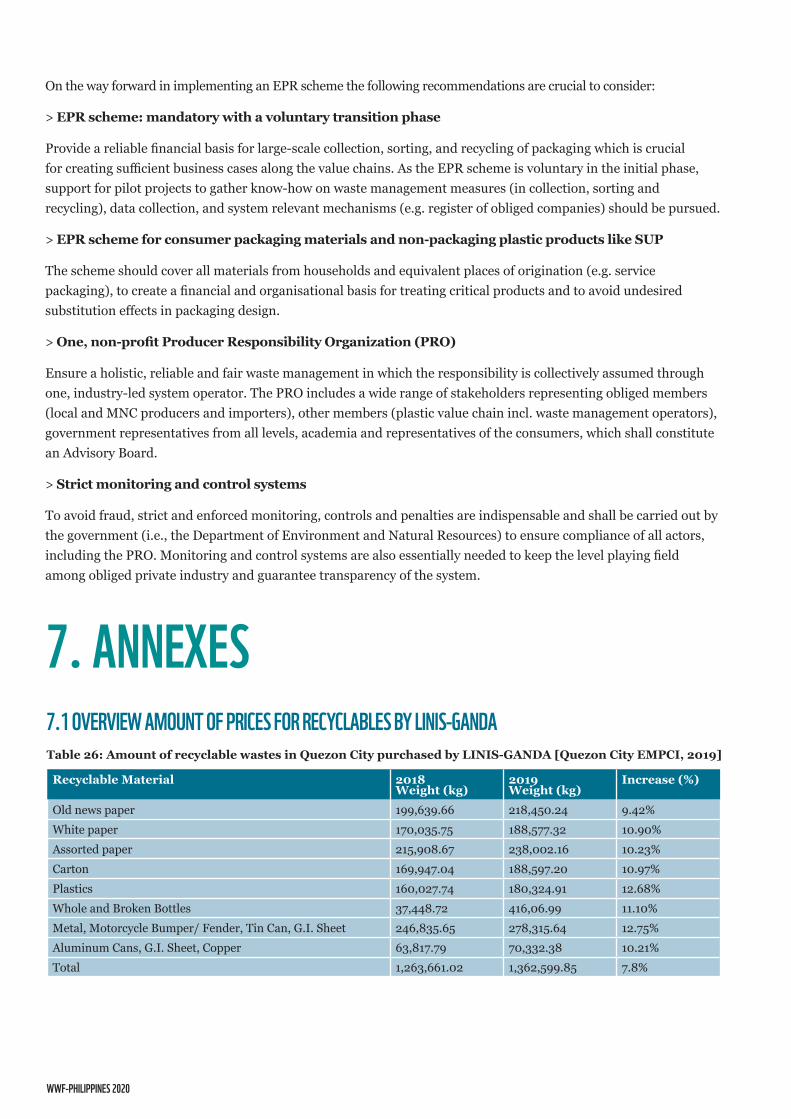
WWF-PHILIPPINES 2020
On the way forward in implementing an EPR scheme the following recommendations are crucial to consider:
> EPR scheme: mandatory with a voluntary transition phase
Provide a reliable financial basis for large-scale collection, sorting, and recycling of packaging which is crucial for creating sufficient business cases along the value chains. As the EPR scheme is voluntary in the initial phase, support for pilot projects to gather know-how on waste management measures (in collection, sorting and recycling), data collection, and system relevant mechanisms (e.g. register of obliged companies) should be pursued.
> EPR scheme for consumer packaging materials and non-packaging plastic products like SUP
The scheme should cover all materials from households and equivalent places of origination (e.g. service packaging), to create a financial and organisational basis for treating critical products and to avoid undesired substitution effects in packaging design.
> One, non-profit Producer Responsibility Organization (PRO)
Ensure a holistic, reliable and fair waste management in which the responsibility is collectively assumed through one, industry-led system operator. The PRO includes a wide range of stakeholders representing obliged members (local and MNC producers and importers), other members (plastic value chain incl. waste management operators), government representatives from all levels, academia and representatives of the consumers, which shall constitute an Advisory Board.
> Strict monitoring and control systems
To avoid fraud, strict and enforced monitoring, controls and penalties are indispensable and shall be carried out by the government (i.e., the Department of Environment and Natural Resources) to ensure compliance of all actors, including the PRO. Monitoring and control systems are also essentially needed to keep the level playing field among obliged private industry and guarantee transparency of the system.
7. ANNEXES7.1 OVERVIEW AmOUNT OF PRICES FOR RECYCLABLES BY LINIS-gANDATable 26: Amount of recyclable wastes in Quezon City purchased by LINIS-GANDA [Quezon City EMPCI, 2019]
Recyclable Material 2018 Weight (kg)
2019 Weight (kg)
Increase (%)
Old news paper 199,639.66 218,450.24 9.42%White paper 170,035.75 188,577.32 10.90%Assorted paper 215,908.67 238,002.16 10.23%Carton 169,947.04 188,597.20 10.97%Plastics 160,027.74 180,324.91 12.68%Whole and Broken Bottles 37,448.72 416,06.99 11.10%Metal, Motorcycle Bumper/ Fender, Tin Can, G.I. Sheet 246,835.65 278,315.64 12.75%Aluminum Cans, G.I. Sheet, Copper 63,817.79 70,332.38 10.21%Total 1,263,661.02 1,362,599.85 7.8%
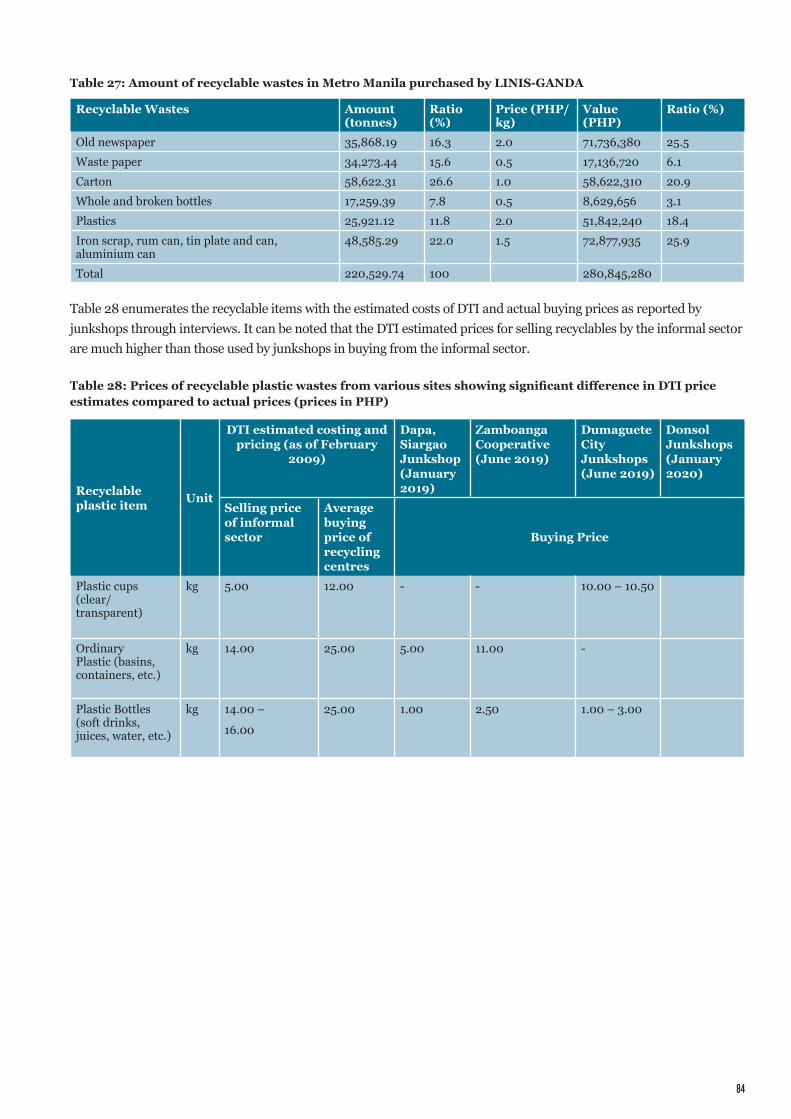
84
Table 28 enumerates the recyclable items with the estimated costs of DTI and actual buying prices as reported by junkshops through interviews. It can be noted that the DTI estimated prices for selling recyclables by the informal sector are much higher than those used by junkshops in buying from the informal sector.
Table 27: Amount of recyclable wastes in Metro Manila purchased by LINIS-GANDA
Table 28: Prices of recyclable plastic wastes from various sites showing significant difference in DTI price estimates compared to actual prices (prices in PHP)
Recyclable Wastes Amount (tonnes)
Ratio (%)
Price (PHP/kg)
Value (PHP)
Ratio (%)
Old newspaper 35,868.19 16.3 2.0 71,736,380 25.5Waste paper 34,273.44 15.6 0.5 17,136,720 6.1Carton 58,622.31 26.6 1.0 58,622,310 20.9Whole and broken bottles 17,259.39 7.8 0.5 8,629,656 3.1Plastics 25,921.12 11.8 2.0 51,842,240 18.4Iron scrap, rum can, tin plate and can, aluminium can
48,585.29 22.0 1.5 72,877,935 25.9
Total 220,529.74 100 280,845,280
Recyclable plastic item Unit
DTI estimated costing and pricing (as of February
2009)
Dapa, Siargao Junkshop (January 2019)
Zamboanga Cooperative (June 2019)
Dumaguete City Junkshops (June 2019)
Donsol Junkshops (January 2020)
Selling price of informal sector
Average buying price of recycling centres
Buying Price
Plastic cups (clear/ transparent)
kg 5.00 12.00 - - 10.00 – 10.50
Ordinary Plastic (basins, containers, etc.)
kg 14.00 25.00 5.00 11.00 -
Plastic Bottles (soft drinks, juices, water, etc.)
kg 14.00 –
16.00
25.00 1.00 2.50 1.00 – 3.00
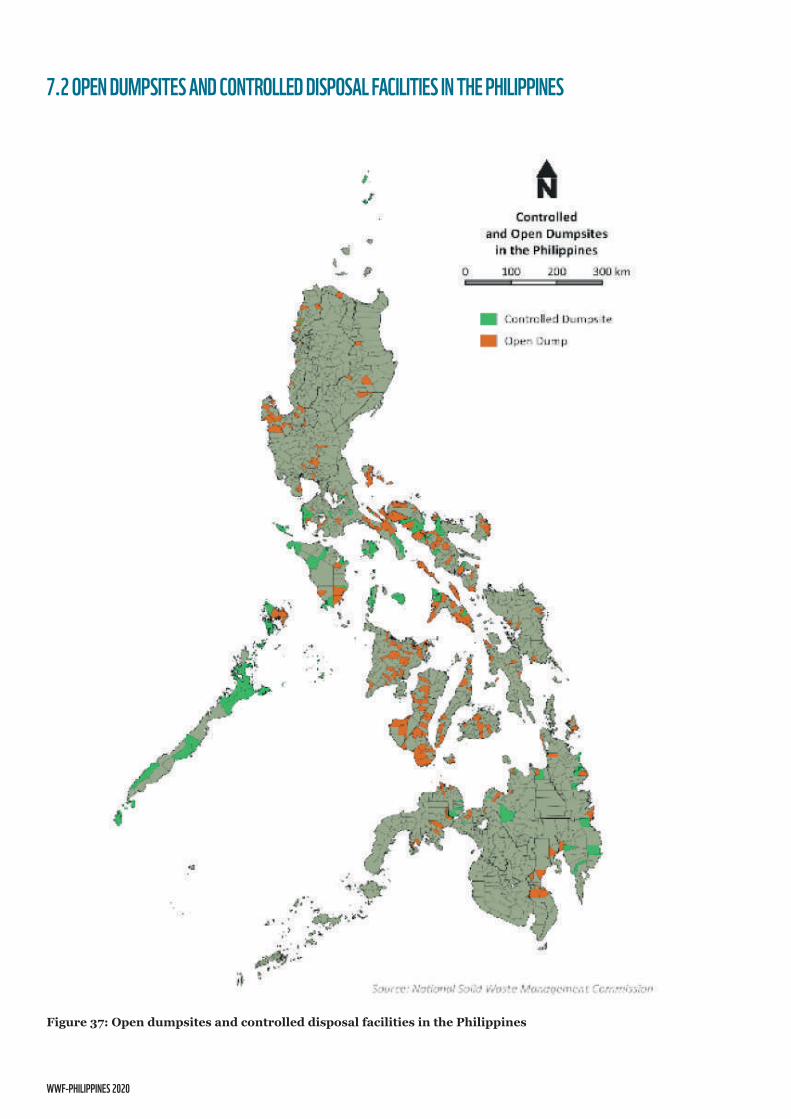
WWF-PHILIPPINES 2020
7.2 OPEN DUmPSITES AND CONTROLLED DISPOSAL FACILITIES IN THE PHILIPPINES
Figure 37: Open dumpsites and controlled disposal facilities in the Philippines
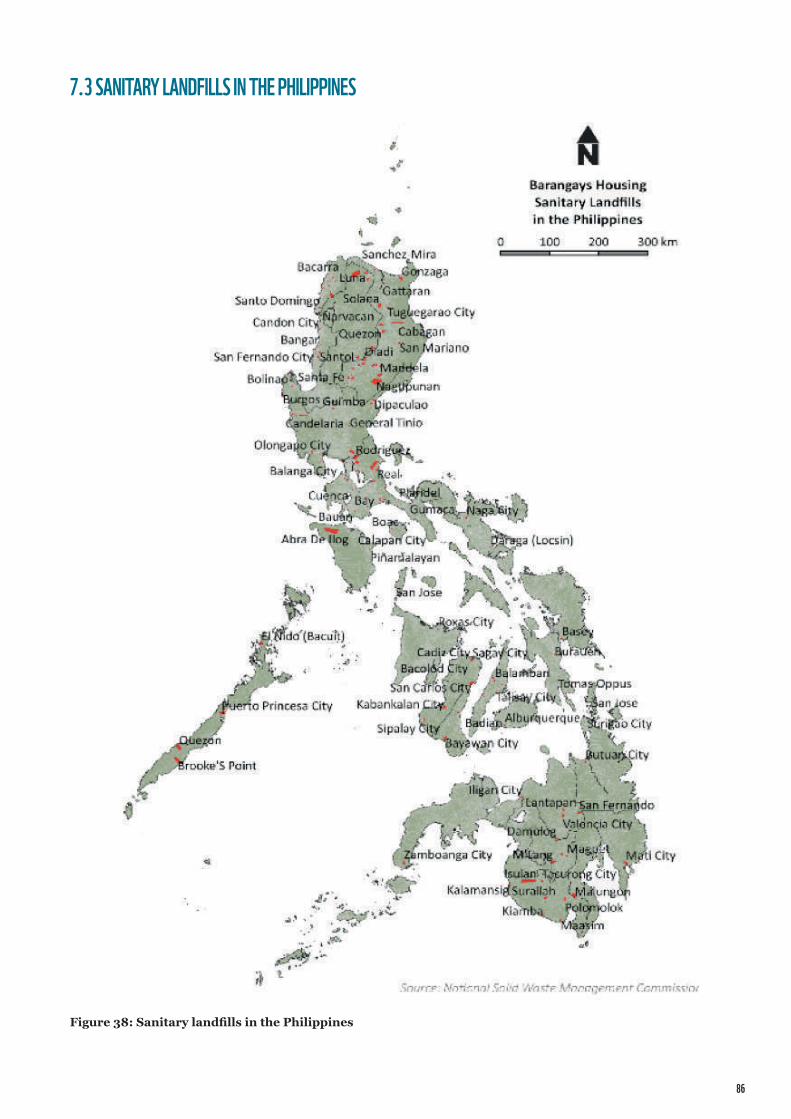
86
7.3 SANITARY LANDFILLS IN THE PHILIPPINES
Figure 38: Sanitary landfills in the Philippines
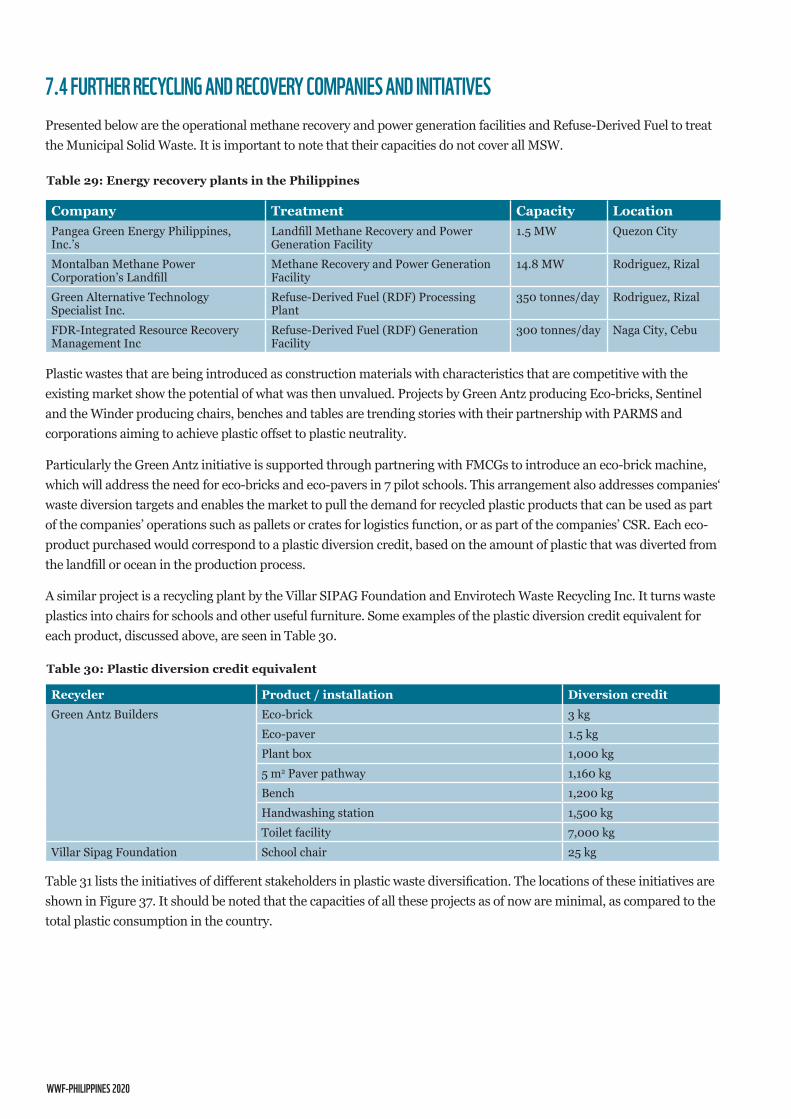
WWF-PHILIPPINES 2020
7.4 FURTHER RECYCLINg AND RECOVERY COmPANIES AND INITIATIVESPresented below are the operational methane recovery and power generation facilities and Refuse-Derived Fuel to treat the Municipal Solid Waste. It is important to note that their capacities do not cover all MSW.
Company Treatment Capacity LocationPangea Green Energy Philippines, Inc.’s
Landfill Methane Recovery and Power Generation Facility
1.5 MW Quezon City
Montalban Methane Power Corporation’s Landfill
Methane Recovery and Power Generation Facility
14.8 MW Rodriguez, Rizal
Green Alternative Technology Specialist Inc.
Refuse-Derived Fuel (RDF) Processing Plant
350 tonnes/day Rodriguez, Rizal
FDR-Integrated Resource Recovery Management Inc
Refuse-Derived Fuel (RDF) Generation Facility
300 tonnes/day Naga City, Cebu
Recycler Product / installation Diversion creditGreen Antz Builders Eco-brick 3 kg
Eco-paver 1.5 kgPlant box 1,000 kg5 m2 Paver pathway 1,160 kgBench 1,200 kgHandwashing station 1,500 kgToilet facility 7,000 kg
Villar Sipag Foundation School chair 25 kg
Table 29: Energy recovery plants in the Philippines
Table 30: Plastic diversion credit equivalent
Plastic wastes that are being introduced as construction materials with characteristics that are competitive with the existing market show the potential of what was then unvalued. Projects by Green Antz producing Eco-bricks, Sentinel and the Winder producing chairs, benches and tables are trending stories with their partnership with PARMS and corporations aiming to achieve plastic offset to plastic neutrality.
Particularly the Green Antz initiative is supported through partnering with FMCGs to introduce an eco-brick machine, which will address the need for eco-bricks and eco-pavers in 7 pilot schools. This arrangement also addresses companies‘ waste diversion targets and enables the market to pull the demand for recycled plastic products that can be used as part of the companies’ operations such as pallets or crates for logistics function, or as part of the companies’ CSR. Each eco-product purchased would correspond to a plastic diversion credit, based on the amount of plastic that was diverted from the landfill or ocean in the production process.
A similar project is a recycling plant by the Villar SIPAG Foundation and Envirotech Waste Recycling Inc. It turns waste plastics into chairs for schools and other useful furniture. Some examples of the plastic diversion credit equivalent for each product, discussed above, are seen in Table 30.
Table 31 lists the initiatives of different stakeholders in plastic waste diversification. The locations of these initiatives are shown in Figure 37. It should be noted that the capacities of all these projects as of now are minimal, as compared to the total plastic consumption in the country.
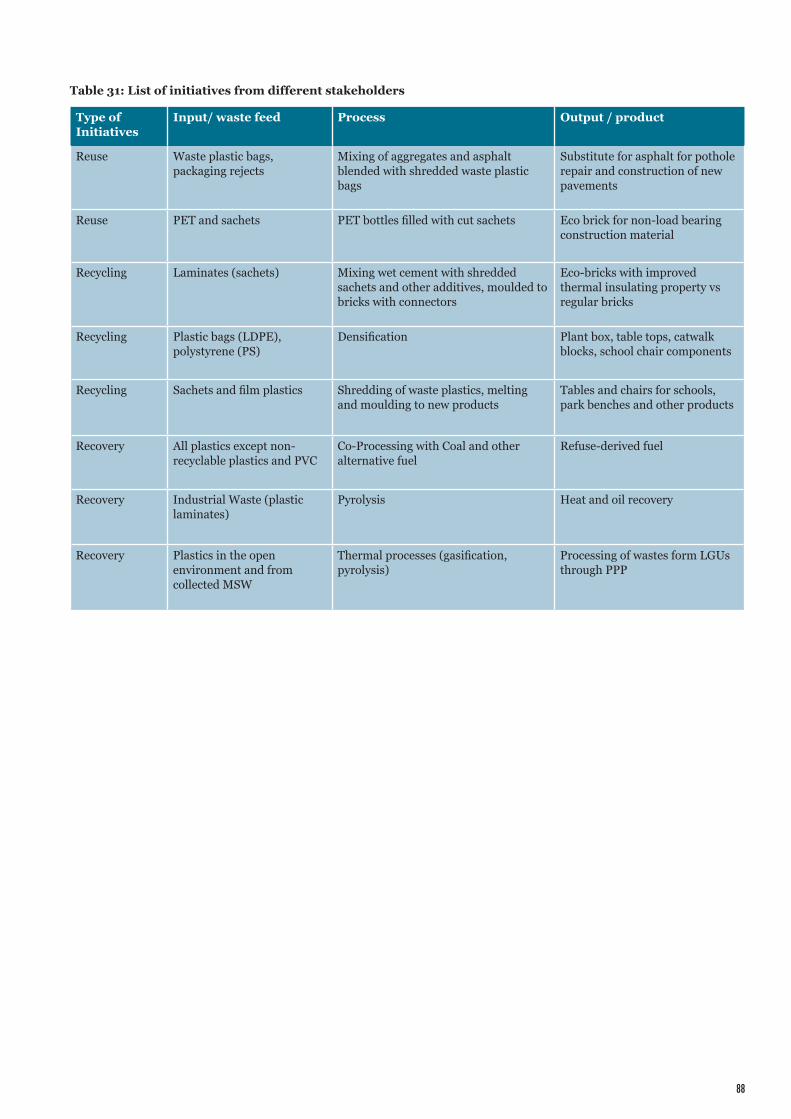
88
Type of Initiatives
Input/ waste feed Process Output / product
Reuse Waste plastic bags, packaging rejects
Mixing of aggregates and asphalt blended with shredded waste plastic bags
Substitute for asphalt for pothole repair and construction of new pavements
Reuse PET and sachets PET bottles filled with cut sachets Eco brick for non-load bearing construction material
Recycling Laminates (sachets) Mixing wet cement with shredded sachets and other additives, moulded to bricks with connectors
Eco-bricks with improved thermal insulating property vs regular bricks
Recycling Plastic bags (LDPE), polystyrene (PS)
Densification Plant box, table tops, catwalk blocks, school chair components
Recycling Sachets and film plastics Shredding of waste plastics, melting and moulding to new products
Tables and chairs for schools, park benches and other products
Recovery All plastics except non-recyclable plastics and PVC
Co-Processing with Coal and other alternative fuel
Refuse-derived fuel
Recovery Industrial Waste (plastic laminates)
Pyrolysis Heat and oil recovery
Recovery Plastics in the open environment and from collected MSW
Thermal processes (gasification, pyrolysis)
Processing of wastes form LGUs through PPP
Table 31: List of initiatives from different stakeholders
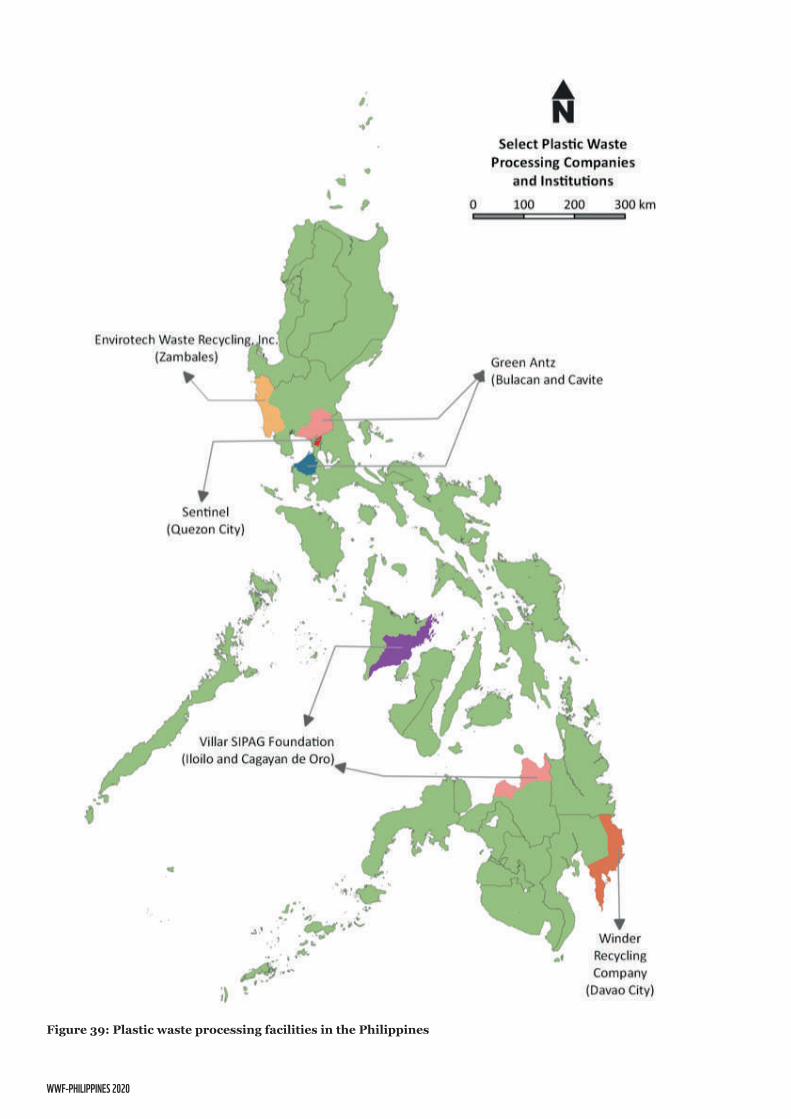
WWF-PHILIPPINES 2020
Figure 39: Plastic waste processing facilities in the Philippines
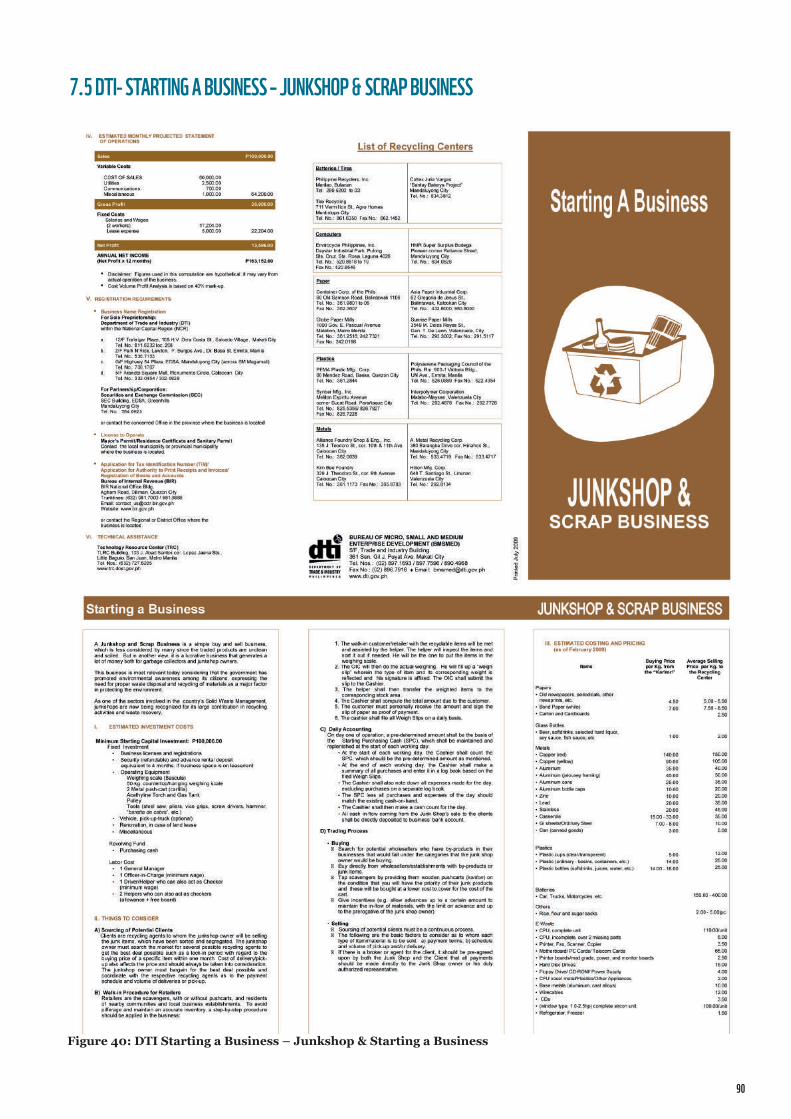
90
Figure 40: DTI Starting a Business – Junkshop & Starting a Business
7.5 DTI- STARTINg A BUSINESS – JUNkSHOP & SCRAP BUSINESS
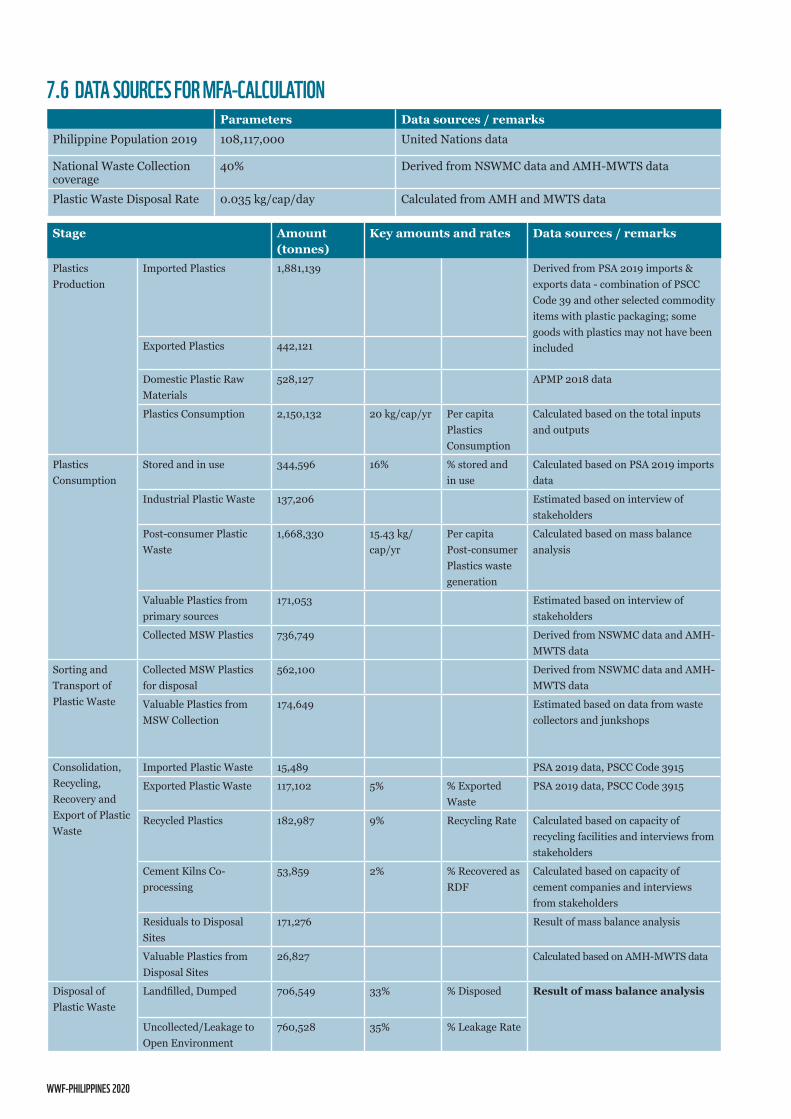
WWF-PHILIPPINES 2020
7.6 DATA SOURCES FOR mFA-CALCULATIONParameters Data sources / remarks
Philippine Population 2019 108,117,000 United Nations data
National Waste Collection coverage
40% Derived from NSWMC data and AMH-MWTS data
Plastic Waste Disposal Rate 0.035 kg/cap/day Calculated from AMH and MWTS data
Stage Amount (tonnes)
Key amounts and rates Data sources / remarks
Plastics Production
Imported Plastics 1,881,139 Derived from PSA 2019 imports & exports data - combination of PSCC Code 39 and other selected commodity items with plastic packaging; some goods with plastics may not have been includedExported Plastics 442,121
Domestic Plastic Raw Materials
528,127 APMP 2018 data
Plastics Consumption 2,150,132 20 kg/cap/yr Per capita Plastics Consumption
Calculated based on the total inputs and outputs
Plastics Consumption
Stored and in use 344,596 16% % stored and in use
Calculated based on PSA 2019 imports data
Industrial Plastic Waste 137,206 Estimated based on interview of stakeholders
Post-consumer Plastic Waste
1,668,330 15.43 kg/cap/yr
Per capita Post-consumer Plastics waste generation
Calculated based on mass balance analysis
Valuable Plastics from primary sources
171,053 Estimated based on interview of stakeholders
Collected MSW Plastics 736,749 Derived from NSWMC data and AMH-MWTS data
Sorting and Transport of Plastic Waste
Collected MSW Plastics for disposal
562,100 Derived from NSWMC data and AMH-MWTS data
Valuable Plastics from MSW Collection
174,649 Estimated based on data from waste collectors and junkshops
Consolidation, Recycling, Recovery and Export of Plastic Waste
Imported Plastic Waste 15,489 PSA 2019 data, PSCC Code 3915
Exported Plastic Waste 117,102 5% % Exported Waste
PSA 2019 data, PSCC Code 3915
Recycled Plastics 182,987 9% Recycling Rate Calculated based on capacity of recycling facilities and interviews from stakeholders
Cement Kilns Co-processing
53,859 2% % Recovered as RDF
Calculated based on capacity of cement companies and interviews from stakeholders
Residuals to Disposal Sites
171,276 Result of mass balance analysis
Valuable Plastics from Disposal Sites
26,827 Calculated based on AMH-MWTS data
Disposal of Plastic Waste
Landfilled, Dumped 706,549 33% % Disposed Result of mass balance analysis
Uncollected/Leakage to Open Environment
760,528 35% % Leakage Rate
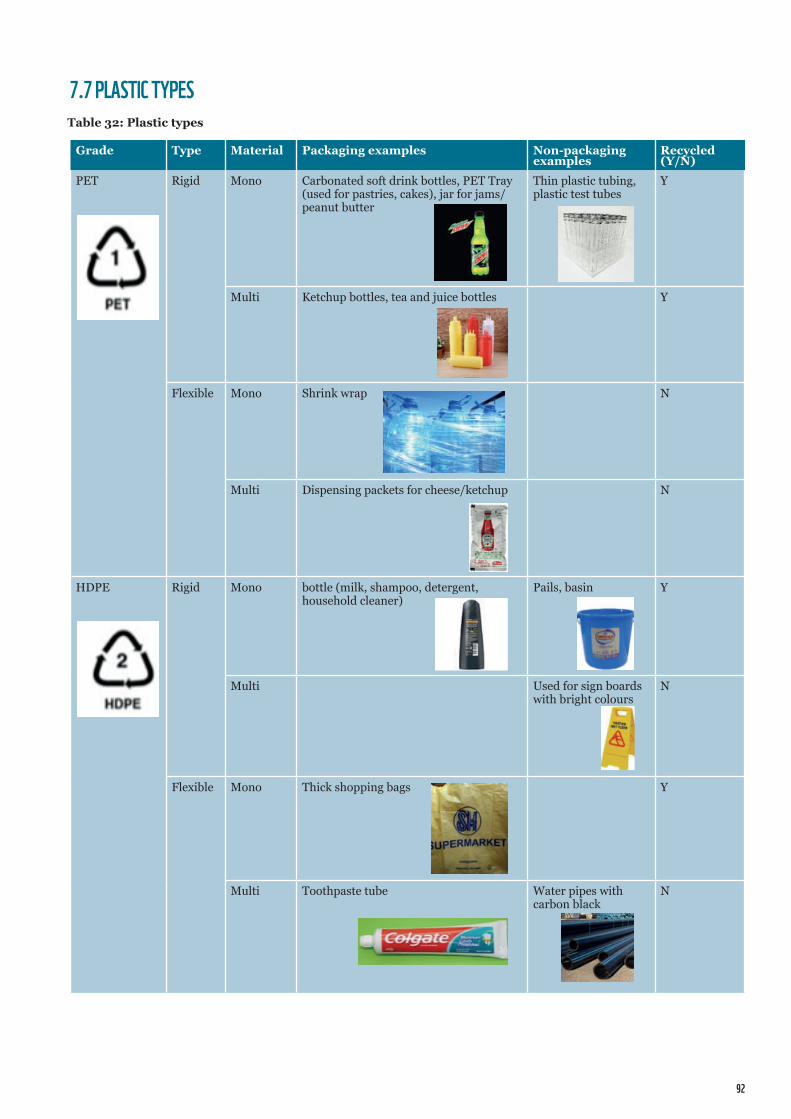
92
7.7 PLASTIC TYPESTable 32: Plastic types
Grade Type Material Packaging examples Non-packaging examples
Recycled (Y/N)
PET Rigid Mono Carbonated soft drink bottles, PET Tray (used for pastries, cakes), jar for jams/peanut butter
Thin plastic tubing, plastic test tubes
Y
Multi Ketchup bottles, tea and juice bottles Y
Flexible Mono Shrink wrap N
Multi Dispensing packets for cheese/ketchup N
HDPE Rigid Mono bottle (milk, shampoo, detergent, household cleaner)
Pails, basin Y
Multi Used for sign boards with bright colours
N
Flexible Mono Thick shopping bags Y
Multi Toothpaste tube Water pipes with carbon black
N

WWF-PHILIPPINES 2020
PVC Rigid Mono Credit card, binding element for books, pipes
N
Multi Medicine blister pack N
Flexible Mono Hotdog/processed meat packaging Shrink wrap, tamper resistance film
N
Multi Water/garden hose N
PP Rigid Mono "Tupperware", bottle caps, medicine bottle
Beverage cups, plastic spoon/fork/knife
Y
Multi Pipes with aluminium N
Flexible Mono Noodles wrapper Strapping roll, plastic straw rope
N
Multi Ketchup packets N
Grade Type Material Packaging examples Non-packaging examples
Recycled (Y/N)
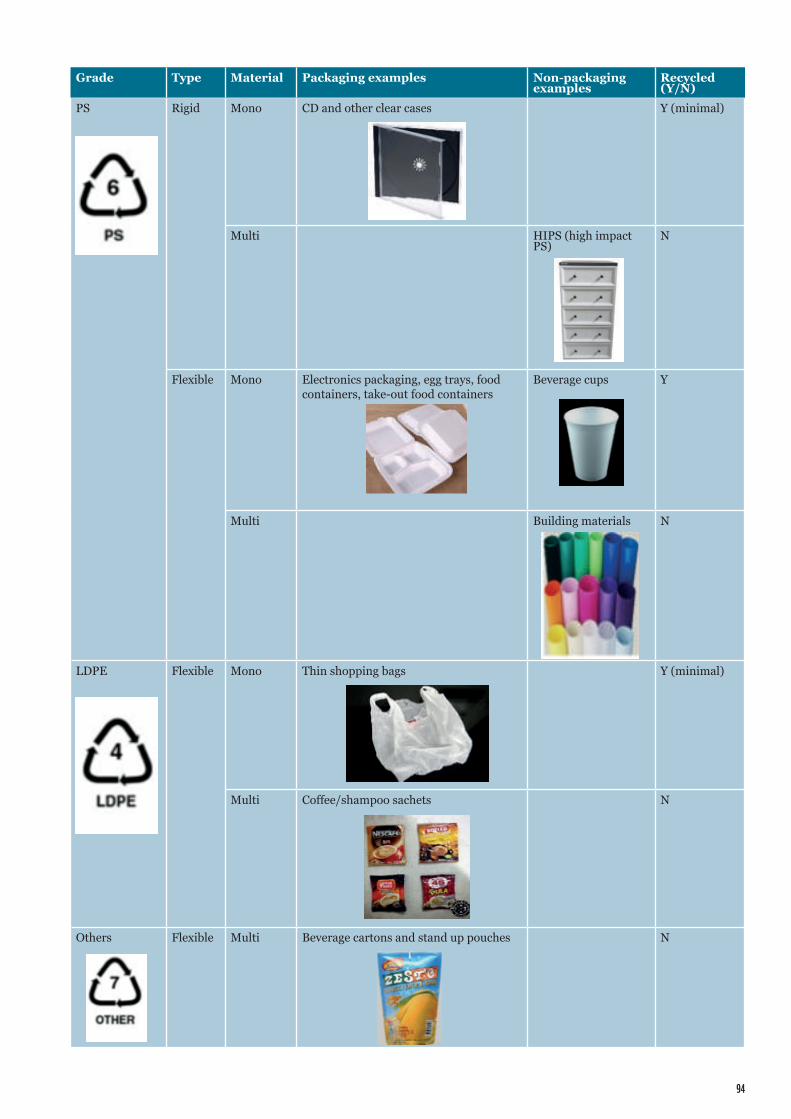
94
PS Rigid Mono CD and other clear cases Y (minimal)
Multi HIPS (high impact PS)
N
Flexible Mono Electronics packaging, egg trays, food containers, take-out food containers
Beverage cups Y
Multi Building materials N
LDPE Flexible Mono Thin shopping bags Y (minimal)
Multi Coffee/shampoo sachets N
Others Flexible Multi Beverage cartons and stand up pouches N
Grade Type Material Packaging examples Non-packaging examples
Recycled (Y/N)
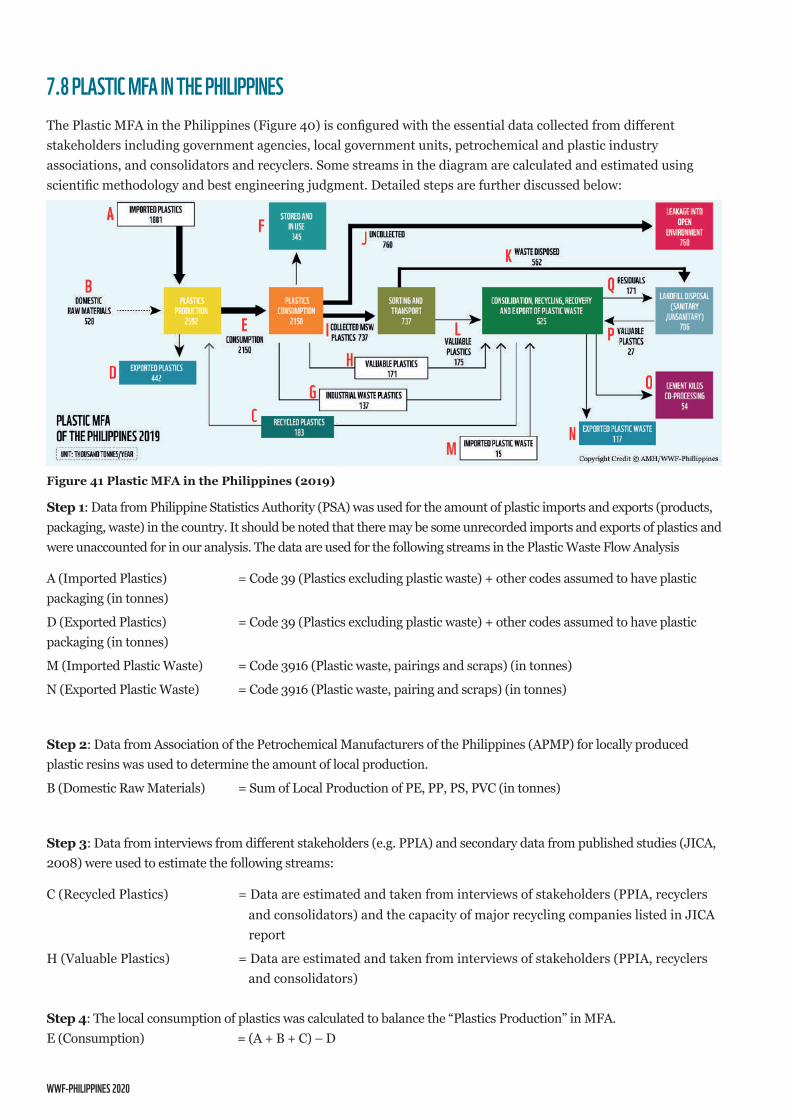
WWF-PHILIPPINES 2020
7.8 PLASTIC mFA IN THE PHILIPPINESThe Plastic MFA in the Philippines (Figure 40) is configured with the essential data collected from different stakeholders including government agencies, local government units, petrochemical and plastic industry associations, and consolidators and recyclers. Some streams in the diagram are calculated and estimated using scientific methodology and best engineering judgment. Detailed steps are further discussed below:
Figure 41 Plastic MFA in the Philippines (2019)
Step 1: Data from Philippine Statistics Authority (PSA) was used for the amount of plastic imports and exports (products, packaging, waste) in the country. It should be noted that there may be some unrecorded imports and exports of plastics and were unaccounted for in our analysis. The data are used for the following streams in the Plastic Waste Flow Analysis
A (Imported Plastics) = Code 39 (Plastics excluding plastic waste) + other codes assumed to have plastic packaging (in tonnes)
D (Exported Plastics) = Code 39 (Plastics excluding plastic waste) + other codes assumed to have plastic packaging (in tonnes)
M (Imported Plastic Waste) = Code 3916 (Plastic waste, pairings and scraps) (in tonnes)
N (Exported Plastic Waste) = Code 3916 (Plastic waste, pairing and scraps) (in tonnes)
Step 2: Data from Association of the Petrochemical Manufacturers of the Philippines (APMP) for locally produced plastic resins was used to determine the amount of local production.
B (Domestic Raw Materials) = Sum of Local Production of PE, PP, PS, PVC (in tonnes)
Step 3: Data from interviews from different stakeholders (e.g. PPIA) and secondary data from published studies (JICA, 2008) were used to estimate the following streams:
C (Recycled Plastics) = Data are estimated and taken from interviews of stakeholders (PPIA, recyclers and consolidators) and the capacity of major recycling companies listed in JICA report
H (Valuable Plastics) = Data are estimated and taken from interviews of stakeholders (PPIA, recyclers and consolidators)
Step 4: The local consumption of plastics was calculated to balance the “Plastics Production” in MFA. E (Consumption) = (A + B + C) – D
96
Step 5: From the combined data of PSA and APMP, the following stream was calculated:
F (Stored and In Use) = Selected imported plastic products + 0.1(Imported Raw + Domestic Raw) (in tonnes) : Selected imported plastics used for construction and portion of household and office products are assumed to be stored and in use : 10% of both domestic and imported raw materials (to account for PVC and PE commonly used for construction) which are assumed to be stored and in use Step 6: Data from coal consumption of major cement companies (Department of Energy, 2015) was used to account for
the contribution of plastics utilized as coal substitution.
O (Cement Kilns Co-processing) = Amount of Coal Used by Cement Companies x 0.016
: 1.6% of coal used for cement production is assumed to be substituted with plastics (10% for coal substitution x 20% for plastics as coal substitute x 80% efficiency)
G (Industrial Plastics) = Data taken from interviews of stakeholders including the assumption of about 80% of O comes from industrial waste
Step 7: The collection efficiency at a national scale was calculated using the factor of degree of urbanization and data from National Solid Waste Commission (NSWMC) in order to compute for the following stream:
I (Collected MSW Plastics) = (E – G – H) * 0.4
: Computed collection efficiency on a national scale is 40%
Step 8: Data from previous WACS projects of AMH was used to calculate the following streams:
K (Waste Disposed) = Population x Waste Disposal Rate (WDR) x 0.4 X 365 days / 1000 kg (in tonnes)
: Population of 110 million, WDR of 0.035 kg/cap/day (AMH field data from WACS in key cities) Collection efficiency on a national scale of 40%
P (Valuable Plastics) = (Valuable Plastic Rate x K) + Amount of plastics used for Refuse-Derived uel (RDF) (in tonnes)
: Valuable Plastic Rate of 2.39% (AMH field data from WACS in key cities)
: Amount of Plastics used for RDF is calculated to be around 13k tonnes using data from major cement companies
Step 9: The remaining streams were calculated to balance the MFA:
J (Uncollected) = E – (F + G + H + I)
L (Valuable Plastics) = I – K
Q (Residuals) = (C + G + H + L + M + P) – (N + O + Q)
: The computed value is cross-checked with the assumption of 70% efficiency, wherein 30% of the plastic waste are not properly utilized.
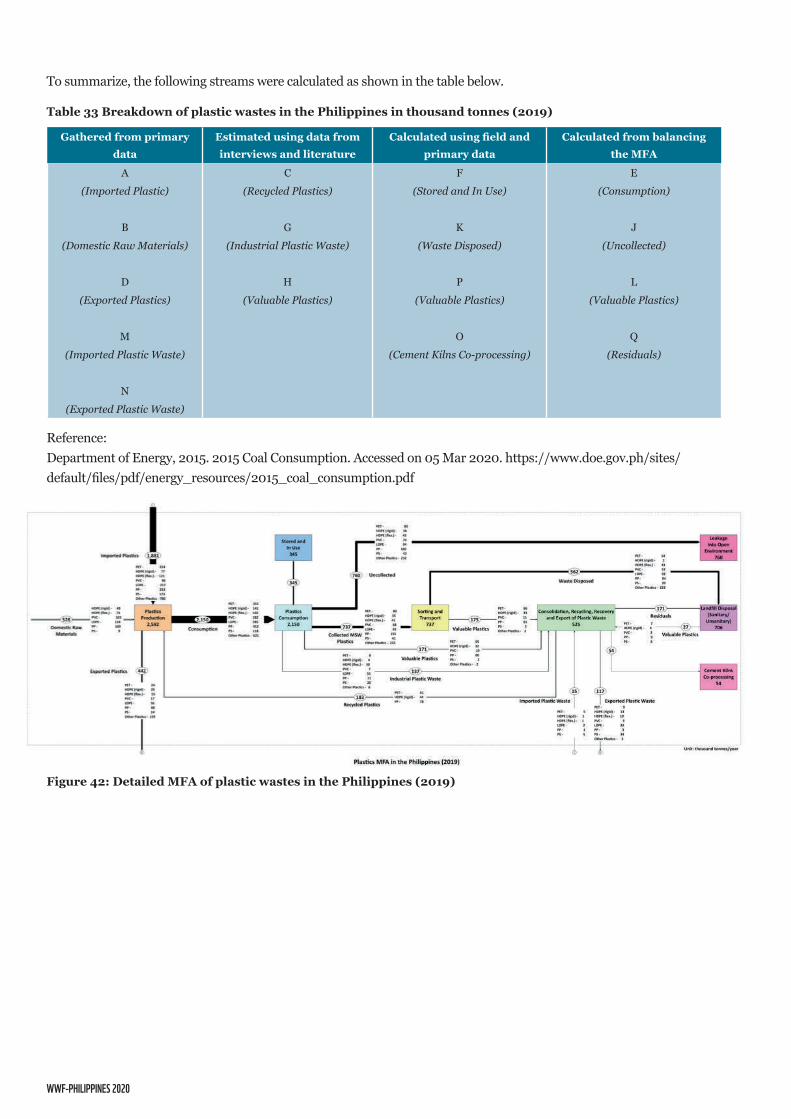
WWF-PHILIPPINES 2020
To summarize, the following streams were calculated as shown in the table below.
Reference: Department of Energy, 2015. 2015 Coal Consumption. Accessed on 05 Mar 2020. https://www.doe.gov.ph/sites/default/files/pdf/energy_resources/2015_coal_consumption.pdf
Table 33 Breakdown of plastic wastes in the Philippines in thousand tonnes (2019)
Figure 42: Detailed MFA of plastic wastes in the Philippines (2019)
Gathered from primary data
Estimated using data from interviews and literature
Calculated using field and primary data
Calculated from balancing the MFA
A(Imported Plastic)
B(Domestic Raw Materials)
D(Exported Plastics)
M(Imported Plastic Waste)
N(Exported Plastic Waste)
C(Recycled Plastics)
G(Industrial Plastic Waste)
H (Valuable Plastics)
F(Stored and In Use)
K(Waste Disposed)
P(Valuable Plastics)
O(Cement Kilns Co-processing)
E(Consumption)
J(Uncollected)
L(Valuable Plastics)
Q(Residuals)
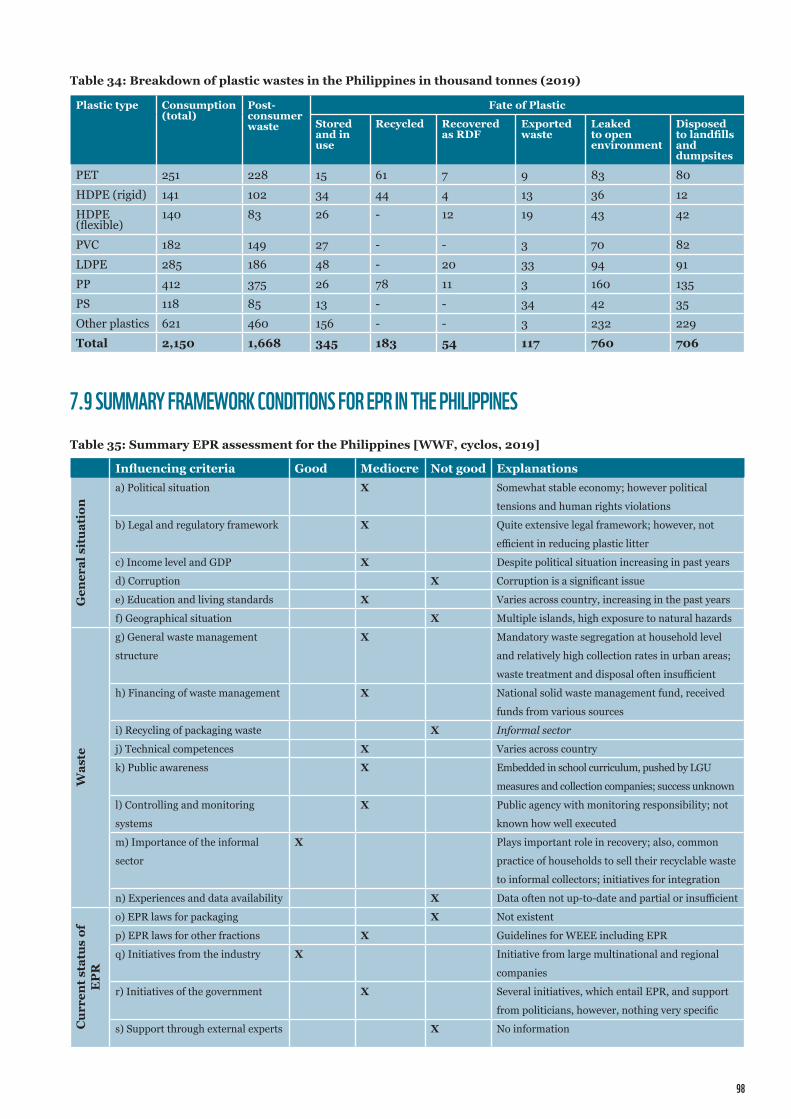
98
Table 34: Breakdown of plastic wastes in the Philippines in thousand tonnes (2019)
Table 35: Summary EPR assessment for the Philippines [WWF, cyclos, 2019]
Plastic type Consumption (total)
Post-consumer waste
Fate of Plastic
Stored and in use
Recycled Recovered as RDF
Exported waste
Leaked to open environment
Disposed to landfills and dumpsites
PET 251 228 15 61 7 9 83 80HDPE (rigid) 141 102 34 44 4 13 36 12HDPE (flexible)
140 83 26 - 12 19 43 42
PVC 182 149 27 - - 3 70 82LDPE 285 186 48 - 20 33 94 91PP 412 375 26 78 11 3 160 135PS 118 85 13 - - 34 42 35Other plastics 621 460 156 - - 3 232 229Total 2,150 1,668 345 183 54 117 760 706
7.9 SUmmARY FRAmEWORk CONDITIONS FOR EPR IN THE PHILIPPINES
Influencing criteria Good Mediocre Not good Explanations
Gen
eral
sit
uati
on
a) Political situation X Somewhat stable economy; however political
tensions and human rights violations
b) Legal and regulatory framework X Quite extensive legal framework; however, not
efficient in reducing plastic litter
c) Income level and GDP X Despite political situation increasing in past years
d) Corruption X Corruption is a significant issue
e) Education and living standards X Varies across country, increasing in the past years
f) Geographical situation X Multiple islands, high exposure to natural hazards
Was
te
g) General waste management
structure
X Mandatory waste segregation at household level
and relatively high collection rates in urban areas;
waste treatment and disposal often insufficient
h) Financing of waste management X National solid waste management fund, received
funds from various sources
i) Recycling of packaging waste X Informal sector
j) Technical competences X Varies across country
k) Public awareness X Embedded in school curriculum, pushed by LGU
measures and collection companies; success unknown
l) Controlling and monitoring
systems
X Public agency with monitoring responsibility; not
known how well executed
m) Importance of the informal
sector
X Plays important role in recovery; also, common
practice of households to sell their recyclable waste
to informal collectors; initiatives for integration
n) Experiences and data availability X Data often not up-to-date and partial or insufficient
Cur
rent
sta
tus
of
EP
R
o) EPR laws for packaging X Not existent
p) EPR laws for other fractions X Guidelines for WEEE including EPR
q) Initiatives from the industry X Initiative from large multinational and regional
companies
r) Initiatives of the government X Several initiatives, which entail EPR, and support
from politicians, however, nothing very specific
s) Support through external experts X No information
WWF PHILIPPINES 2020
7.10 COUNTRY SPECIFIC CONSIDERATIONS FOR EPR SCHEmE DESIgN, mEASURESCLImATE, SEASONSSeasonal climate and changes in the patterns of rain can influence waste management. Especially as the region is characterized by heavy monsoon rains, which negatively impact the operations and conditions on landfills. Floods discharge pollutant and high value materials and make the processes in stocks difficult. Furthermore, natural hazards stemming from the activities of the pacific rim make the region vulnerable to tsunami, cyclonic storms, and landslides. Those lead to extra waste occurrence from destroyed areas and extra challenges to uphold a waste management system in disrupted infrastructure. An EPR has to provide extra measures and emergency equipment for such crisis situations [WWF, cyclos, 2019]. Furthermore, inadequate waste management potentially also negatively reinforces the impacts of natural hazards: e.g. littered sachet packaging can clog the water runoff systems thereby being a main contributor to flooding events.
URBAN DEVELOPmENT
The Philippines has been one of Asia’s strong performers in urbanization over the years. The country experienced notable economic growth evidenced by the rising Gross Domestic Product. The change came along with employment creation, income growth, and strong urbanisation [WWF, cyclos, 2019]. Urbanization raises consumption level and inter alia the amount of waste generation per capita. Also, the composition of waste differs with usually a higher share of plastic packaging compared to rural areas. However, besides urban settlements tendency to be narrower, waste management services is often easier to access. It stems from better road infrastructure and low proximity of recycling businesses. Those factors mutually feature recycling activities: On recycler side, necessary input quantities and for waste generators low effort services are provided. Though, non-effectively implemented separation at source results in mixed municipal waste streams that hinder value creation and profitable recycling.
Hence, an EPR should create and focus on direct incentives, awareness campaigns, and education measures to encourage households, businesses, and institutions to improve their performance in waste separation and general reduction, reuse and recycling. Through this, the challenges from mixed municipal waste could be dealt with promising. As population cumulates in the urban areas, where the collection efficacy is already presentable the EPR measures would have a strong impact on overall improvement. The differences in urban and rural settlements need to be considered for the EPR design.
ImPACT OF POLICY BANS, PLANS, STRATEgIESTo effectively establish an EPR that fits to a country, any government strategies, laws and plans have to take the existing infrastructure and waste
AN EPR SHOULDCREATE AND FOCUS ON DIRECT
INCENTIVES, AWARENESS CAmPAIgNS, AND EDUCATION
mEASURES TO ENCOURAgE HOUSEHOLDS, BUSINESSES,
AND INSTITUTIONS TO ImPROVE THEIR
PERFORmANCE IN WASTE SEPARATION AND gENERAL
REDUCTION, REUSE AND RECYCLINg
100
7.10 COUNTRY SPECIFIC CONSIDERATIONS FOR EPR SCHEmE DESIgN, mEASURES
management systems into account. Dismantling the given system to build another one might adversely affect the progress. The focus of any strategy should be improvement and standardization, followed by multiplying it over the country. Any long-term political action should be in line with the EPR targets [UNESCAPE, Pune, India case, no date].
In that respect, frequently adopted bans for single-use plastic items and packaging should be assessed carefully. Besides providing necessary enforcement capacity, without the provision of environmental and economic alternatives, undesired substitutes may enter the market. Those can have similar effects or even be worse than the original products. As an example, fine material, almost woven like, PP bags entered the market in Kenya after PE plastic bags got banned for the consumer market. Those lifetimes are insignificant longer and the environmental effects similar to the banned PE bags. In Bangladesh an in 2002 imposed ban on plastic bags was repealed in 2010. After introducing jute bags as non-viable alternatives due to the high costs [UNESCAPE, no date]. Also, in a wider industrial context, policy action needs to be complemented by mitigation measures as small and medium sized companies may do not have the capacity to change production and have to close down [UNESCAPE, no date].
Although it might be sometimes necessary to relax or change certain policies to align with the new EPR direction. For example, in Thailand, it is currently not possible to use recycled plastic packaging for food items, which does not encourage the use of “second-life” plastic material (UNESPACE, no date). A different policy option would be setting quality standards for food packaging, that also allows the use for high quality recycled plastic.
CORRUPTIONCorruption and nepotism undermine a sound EPR in its establishment and running phase. Especially, the independence of PRO is crucial to run the system. Both have been observed in the Philippines on a rather low level, although there has been a gradual improvement in perceived corruption level in the country. The decline of trust on the actors of governance and the consequential poor economic condition were brought about by the systemic corruption among and between public officials and private organizations [WWF, cyclos, 2019]. Curbing those supports the appointing of adequate staff and executive, which are needed at all levels among all stakeholders to build an EPR successfully. To further feature the run of an EPR scheme, capacity building, and key performances indicators (KPIs) are pre-requisites. As much as recruiting local expertise is highly desirable, it can prove to be difficult if skills are not available and corruption is present in a weak enforcement environment. The Philippines has already some monitoring mechanisms and KPIs in place, although their enforcement capacity is assessed as quite limited [WWF, cyclos, 2019; UNDP, 2008]
CORRUPTION AND NEPOTISm
UNDERmINE A SOUND EPR IN ITS ESTABLISHmENT AND
RUNNINg PHASE
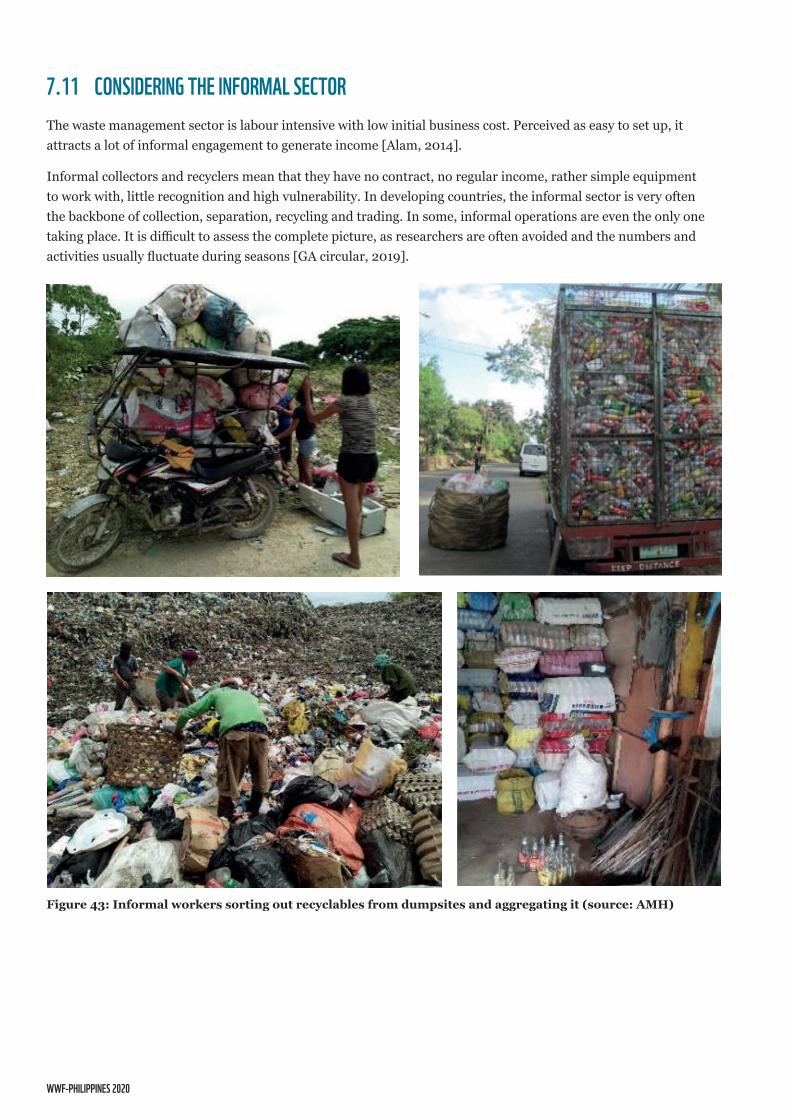
WWF-PHILIPPINES 2020
7.11 CONSIDERINg THE INFORmAL SECTORThe waste management sector is labour intensive with low initial business cost. Perceived as easy to set up, it attracts a lot of informal engagement to generate income [Alam, 2014].
Informal collectors and recyclers mean that they have no contract, no regular income, rather simple equipment to work with, little recognition and high vulnerability. In developing countries, the informal sector is very often the backbone of collection, separation, recycling and trading. In some, informal operations are even the only one taking place. It is difficult to assess the complete picture, as researchers are often avoided and the numbers and activities usually fluctuate during seasons [GA circular, 2019].
Figure 43: Informal workers sorting out recyclables from dumpsites and aggregating it (source: AMH)
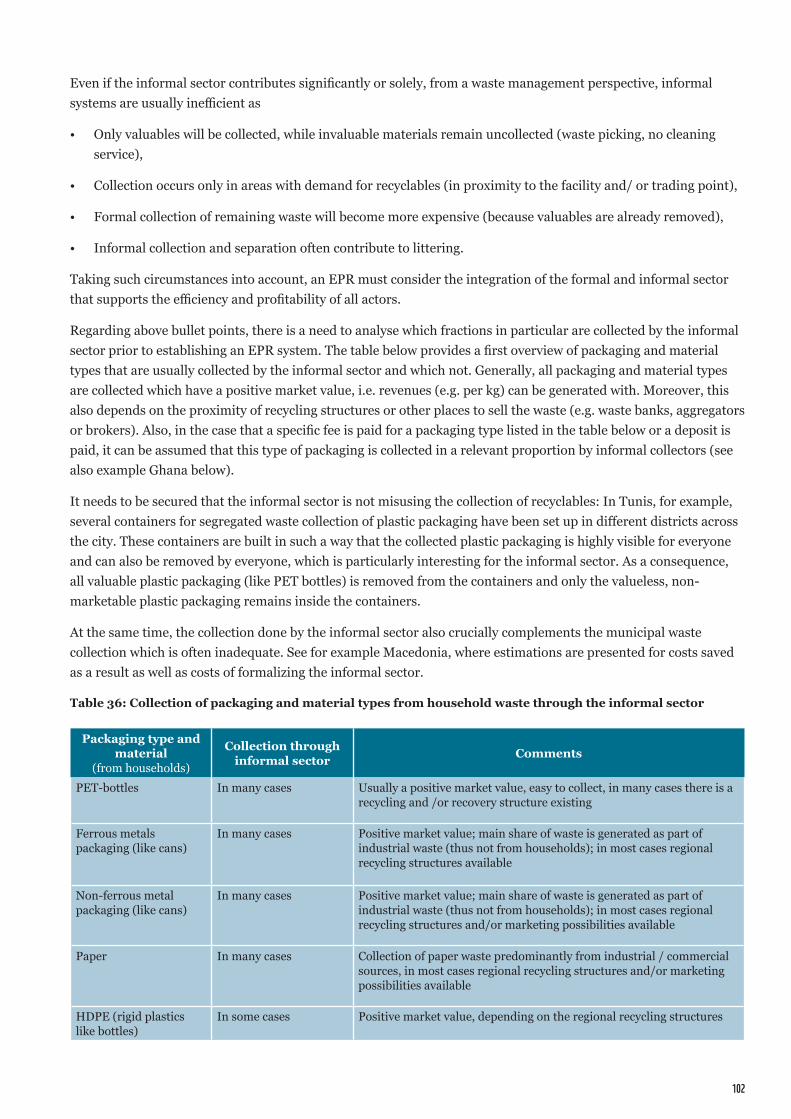
102
Even if the informal sector contributes significantly or solely, from a waste management perspective, informal systems are usually inefficient as
• Only valuables will be collected, while invaluable materials remain uncollected (waste picking, no cleaning service),
• Collection occurs only in areas with demand for recyclables (in proximity to the facility and/ or trading point),
• Formal collection of remaining waste will become more expensive (because valuables are already removed),
• Informal collection and separation often contribute to littering.
Taking such circumstances into account, an EPR must consider the integration of the formal and informal sector that supports the efficiency and profitability of all actors.
Regarding above bullet points, there is a need to analyse which fractions in particular are collected by the informal sector prior to establishing an EPR system. The table below provides a first overview of packaging and material types that are usually collected by the informal sector and which not. Generally, all packaging and material types are collected which have a positive market value, i.e. revenues (e.g. per kg) can be generated with. Moreover, this also depends on the proximity of recycling structures or other places to sell the waste (e.g. waste banks, aggregators or brokers). Also, in the case that a specific fee is paid for a packaging type listed in the table below or a deposit is paid, it can be assumed that this type of packaging is collected in a relevant proportion by informal collectors (see also example Ghana below).
It needs to be secured that the informal sector is not misusing the collection of recyclables: In Tunis, for example, several containers for segregated waste collection of plastic packaging have been set up in different districts across the city. These containers are built in such a way that the collected plastic packaging is highly visible for everyone and can also be removed by everyone, which is particularly interesting for the informal sector. As a consequence, all valuable plastic packaging (like PET bottles) is removed from the containers and only the valueless, non-marketable plastic packaging remains inside the containers.
At the same time, the collection done by the informal sector also crucially complements the municipal waste collection which is often inadequate. See for example Macedonia, where estimations are presented for costs saved as a result as well as costs of formalizing the informal sector.
Table 36: Collection of packaging and material types from household waste through the informal sector
Packaging type and material
(from households)
Collection through informal sector Comments
PET-bottles In many cases Usually a positive market value, easy to collect, in many cases there is a recycling and /or recovery structure existing
Ferrous metals packaging (like cans)
In many cases Positive market value; main share of waste is generated as part of industrial waste (thus not from households); in most cases regional recycling structures available
Non-ferrous metal packaging (like cans)
In many cases Positive market value; main share of waste is generated as part of industrial waste (thus not from households); in most cases regional recycling structures and/or marketing possibilities available
Paper In many cases Collection of paper waste predominantly from industrial / commercial sources, in most cases regional recycling structures and/or marketing possibilities available
HDPE (rigid plastics like bottles)
In some cases Positive market value, depending on the regional recycling structures
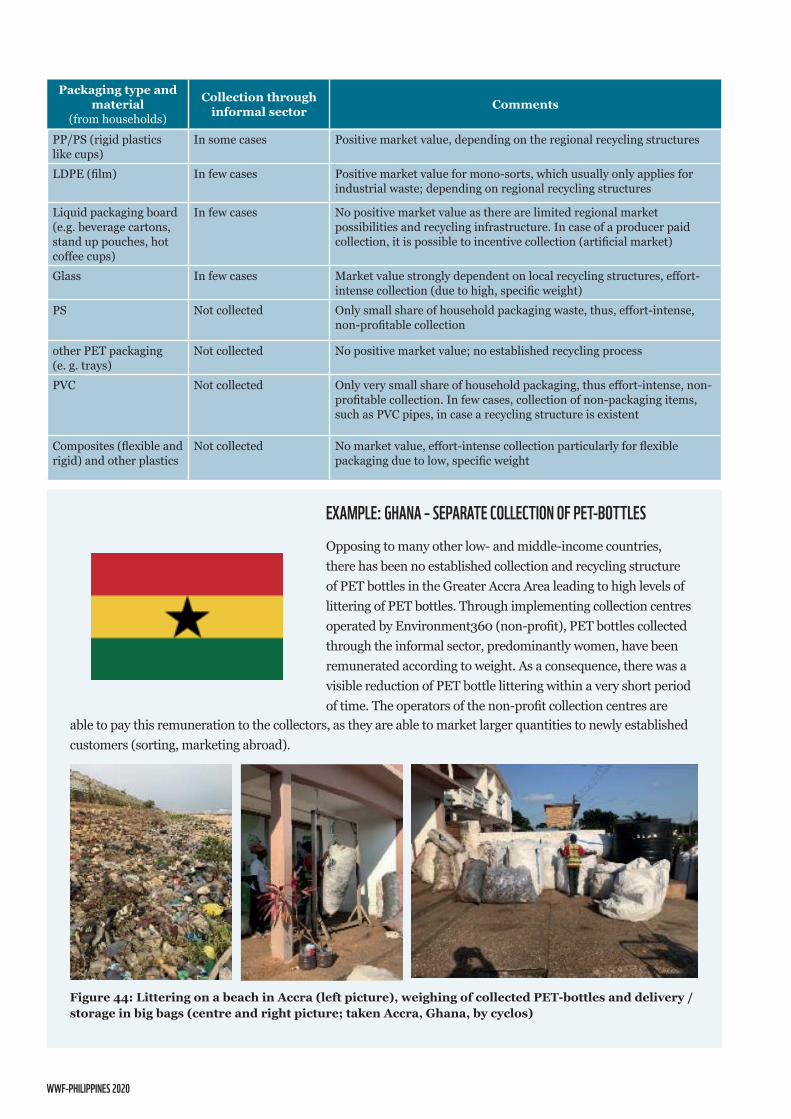
WWF-PHILIPPINES 2020
EXAmPLE: gHANA – SEPARATE COLLECTION OF PET-BOTTLESOpposing to many other low- and middle-income countries, there has been no established collection and recycling structure of PET bottles in the Greater Accra Area leading to high levels of littering of PET bottles. Through implementing collection centres operated by Environment360 (non-profit), PET bottles collected through the informal sector, predominantly women, have been remunerated according to weight. As a consequence, there was a visible reduction of PET bottle littering within a very short period of time. The operators of the non-profit collection centres are
Figure 44: Littering on a beach in Accra (left picture), weighing of collected PET-bottles and delivery / storage in big bags (centre and right picture; taken Accra, Ghana, by cyclos)
able to pay this remuneration to the collectors, as they are able to market larger quantities to newly established customers (sorting, marketing abroad).
Packaging type and material
(from households)
Collection through informal sector Comments
PP/PS (rigid plastics like cups)
In some cases Positive market value, depending on the regional recycling structures
LDPE (film) In few cases Positive market value for mono-sorts, which usually only applies for industrial waste; depending on regional recycling structures
Liquid packaging board (e.g. beverage cartons, stand up pouches, hot coffee cups)
In few cases No positive market value as there are limited regional market possibilities and recycling infrastructure. In case of a producer paid collection, it is possible to incentive collection (artificial market)
Glass In few cases Market value strongly dependent on local recycling structures, effort-intense collection (due to high, specific weight)
PS Not collected Only small share of household packaging waste, thus, effort-intense, non-profitable collection
other PET packaging (e. g. trays)
Not collected No positive market value; no established recycling process
PVC Not collected Only very small share of household packaging, thus effort-intense, non-profitable collection. In few cases, collection of non-packaging items, such as PVC pipes, in case a recycling structure is existent
Composites (flexible and rigid) and other plastics
Not collected No market value, effort-intense collection particularly for flexible packaging due to low, specific weight
104
EXAmPLE: mACEDONIA – THE FINANCIAL CONTRIBUTION OF WASTE COLLECTION BY THE INFORmAL SECTORWaste from packaging in Macedonia has high economic value, and it accounts for 15 % to 22 % of the total municipal waste quantities. It is estimated, that citizens on average generate about 50 kg per capita at annual level of packaging waste or about 115,000 tonnes (Ivanovski et. al, 2016). The informal sector plays a crucial role in regards to waste collection in Macedonia as 80% of the packaging waste being recycled in Macedonia is collected and selected by the informal waste pickers (Roma community). This equals around 12,840 tonnes or about 1.82% of the overall
municipal waste quantities in Macedonia and mainly accounts for PET packaging, iron and paper. On average, 3000 persons are engaged with informal picking daily.
In the existing work conditions, it was estimated, that the informal sector has saved, for the local authorities alone, about 1,045,033 Euros per year (because utilities do not have to collect, transport and dispose waste, which is a service they have already charged to the citizens). Savings are generated for transport, depending on the part of the process in which the material is collected from the informal pickers. [Sapuric et al., n.y.]
7.12 COmPOSTABLE PACkAgINgBiodegradable plastics are characterised by their ability to be degraded by microorganisms into water, carbon dioxide (or methane) and biomass under specified conditions. Biodegradable plastics can be manufactured from both fossil as well as renewable sources. The term is oftentimes also (incorrectly) used in reference to bio-based plastics. However, bio-based plastics are derived from renewable sources such as sugar cane and processed into plastic polymers like polyethylene. Bio-based plastics can be recycled just like conventional plastics or can be degradable – depending on their how they are manufactured. But they are not biodegradable by default. [PlasticsEurope, 2018]
Biodegradable plastics are used for a wide range of applications, such as organic waste collection (e.g. as kitchen waste bags), and agricultural purposes (e.g. as films). They can be foamed into packing materials, extruded, and injection-moulded in modified conventional machines. Different types of fillers can be used with the system, such as wood flour, lime, clay, or waste paper. Most of the applications for which they are used have a short or very short in-use phase. For instance, there are drinking straws and coffee capsules made of biodegradable plastics available. [PlasticsEurope, 2017].
To ensure that biological treatment, such as composting, is a sustainable waste management option, both the biodegradability and compostability as well as the resulting compost and digestate have to also comply with the appropriate standards.
In many countries the usage of bioplastics is currently considered (e.g. in Kenya or in Malaysia as part of the MPP) based on the assumption that the degradability of the plastics will be a solution to the issue of littered plastic waste. Looking to the current experiences, there are numerous problems associated to biodegradable plastics, there are several aspects to be considered:
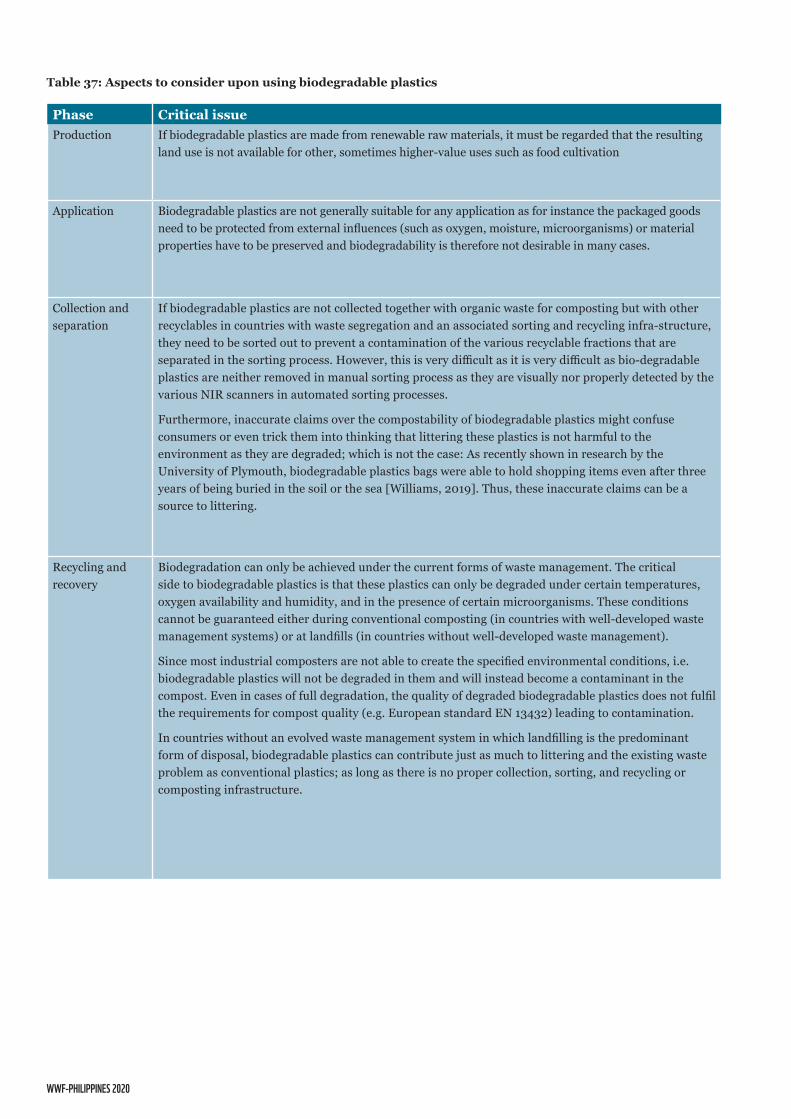
WWF-PHILIPPINES 2020
Phase Critical issueProduction If biodegradable plastics are made from renewable raw materials, it must be regarded that the resulting
land use is not available for other, sometimes higher-value uses such as food cultivation
Application Biodegradable plastics are not generally suitable for any application as for instance the packaged goods need to be protected from external influences (such as oxygen, moisture, microorganisms) or material properties have to be preserved and biodegradability is therefore not desirable in many cases.
Collection and separation
If biodegradable plastics are not collected together with organic waste for composting but with other recyclables in countries with waste segregation and an associated sorting and recycling infra-structure, they need to be sorted out to prevent a contamination of the various recyclable fractions that are separated in the sorting process. However, this is very difficult as it is very difficult as bio-degradable plastics are neither removed in manual sorting process as they are visually nor properly detected by the various NIR scanners in automated sorting processes.
Furthermore, inaccurate claims over the compostability of biodegradable plastics might confuse consumers or even trick them into thinking that littering these plastics is not harmful to the environment as they are degraded; which is not the case: As recently shown in research by the University of Plymouth, biodegradable plastics bags were able to hold shopping items even after three years of being buried in the soil or the sea [Williams, 2019]. Thus, these inaccurate claims can be a source to littering.
Recycling and recovery
Biodegradation can only be achieved under the current forms of waste management. The critical side to biodegradable plastics is that these plastics can only be degraded under certain temperatures, oxygen availability and humidity, and in the presence of certain microorganisms. These conditions cannot be guaranteed either during conventional composting (in countries with well-developed waste management systems) or at landfills (in countries without well-developed waste management).
Since most industrial composters are not able to create the specified environmental conditions, i.e. biodegradable plastics will not be degraded in them and will instead become a contaminant in the compost. Even in cases of full degradation, the quality of degraded biodegradable plastics does not fulfil the requirements for compost quality (e.g. European standard EN 13432) leading to contamination.
In countries without an evolved waste management system in which landfilling is the predominant form of disposal, biodegradable plastics can contribute just as much to littering and the existing waste problem as conventional plastics; as long as there is no proper collection, sorting, and recycling or composting infrastructure.
Table 37: Aspects to consider upon using biodegradable plastics
106
As indicated by current research, even in countries with an evolved waste management system – usually including EPR schemes – biodegradable plastics have not yet proven to support the circular economy goals. Biodegradable plastics usually need optimal conditions to dissolve into harmless fractions; conditions that normally cannot be found in the natural environment, but only in specific composting facilities as biodegradable plastics require certain temperatures, oxygen content and humidity which would be difficult to achieve in conventional composting and in no way possible to create on landfills. A functioning waste management system therefore remains a prerequisite in order to use biodegradable plastics. However, this is not given in most middle and low-income countries as well as a few high-income countries.
The usage of biodegradable plastics does not pose an advantage over conventional plastics, particularly in comparison to sturdy and long-lasting materials such or thick plastics suitable for reuse which have more advantages. Repeated usage of the material through recycling and even incineration [DUH, 2018] is often more environmentally friendly than the loss of the material through degradation.
RECOmmENDATION ON BIODEgRADABLE, BIO-BASED AND OXO-FRAgmENTABLE PLASTICS:The usage of biodegradable plastics is seen as problematic and is only recommended for limited application purposes including those which are in a direct connection with organic application sectors (e.g. agricultural foils remaining in the environment). It is crucial to ensure that these biodegradable plastics are degraded under the given climatic conditions within a short timeframe. For all other applications, the biodegradable plastics are not regarded as suitable, as they can only be degraded effectively under laboratory conditions.
The usage of bio-based plastics is not affected by this. However, it is important to note that farming the raw materials for manufacturing these bio-based plastics competes with farming of food. Moreover, they need to equal fossil-based plastics in the sense that they are not obstacles to recycling them.
Oxo-fragmentable plastics are plastics which can be characterized by the fast fragmentation after usage – however, they are not compostable i.e. the fragmented plastic particles in the environment remain as microplastics litter and contribute to environmental degradation. Thus, it is highly recommended not to use these plastics for any application; or even to ban them.
WWF-PHILIPPINES 2020
BIBLIOgRAPHYAlam, M., Siwar, C., Innocent, A. (2014). Waste Recycling in Malaysia Transition from Developing to Developed Country. Institute for Environment and Development (LESTARI), National University of Malaysia (UKM), Indian Journal of Education and Information Management, Vol 4 (1), October 2015.
AMH. (2020). Donsol WACS Baseline for Pilot Sites. Quezon City.
Asian Development Bank (2004). Cost of Solid Waste. In ADB, The Garbage Book Solid Waste Management in Metro Manila (p.54). Mandaluyong City: Asian Development Bank.
Blister pack. Available at: <https://upload.wikimedia.org/wikipedia/commons/8/8a/Pharmaceutical_Blister_Pack_b.png>
Bottle caps. Available at: <https://resource.co/sites/default/files/article_teaser_image/Bottle_caps.jpg>
Break Free from Plastic (no date). Available at: https://www.breakfreefromplastic.org/about/; accessed: 12 April 2020.
Business World (2019, August 27). Opinion. Retrieved from Business World: https://www.bworldonline.com/an-integrated-recycling-industry-for-sustainability/
CD cases. Available at: <https://www.blankmediaprinting.com/sites/default/files/JC_case_single.jpg>
Coffee sachets. Available at: < shorturl.at/cop34>
Basel Convention (1992). Text of the Convention Available at: http://www.basel.int/TheConvention/Overview/TextoftheConvention/tabid/1275/Default.aspx?fbclid=IwAR18fd6ULDRsp4w9P7dAr3t_jKrlkMsleKR8e5OVZkejiCSG2lU0usD40bo Accessed: 20 April 2020
Credit card. Available at: <https://www.pnb.com.ph/wp-content/uploads/Essentials-Mastercard1.png>
Department of Energy (2015). 2015 Coal Consumption. Available at: https://www.doe.gov.ph/sites/default/files/pdf/energy_resources/2015_coal_consumption.pdf. Accessed on 05 Mar 2020.
DUH (2018). Bioplastik – Mythen und Fakten. [pdf] Köln: Deutsche Umwelthilfe e.V. Available at: https://www.duh.de/fileadmin/user_upload/download/Projektinformation/Kreislaufwirtschaft/Verpackungen/180220_DUH_Infopapier_Bioplastik_de_eng.pdf.
Enano, J. O. (2019, May 20). Siquijor aims to become 1st province to regulate plastic use. Retrieved from Philippine Daily Inquirer: https://newsinfo.inquirer.net/1120915/siquijor-aims-to-become-1st-province-to-regulate-plastic-use.
EUROMAP (2016). Plastics Resin Production and Consumption in 63 Countries Worldwide (2009 – 2020). HYPERLINK “https://www.pagder.org/images/files/euromappreview.pdf” \t “_blank” https://www.pagder.org/images/files/euromappreview.pdf Accessed: April 14, 2020.
GA Circular (2019). Full Circle. Accelerating the Circular Economy for Post-Consumer PET bottles in Southeast Asia. [pdf] Available at: https://www.gacircular.com/full-circle/.
GAIA (no date). Plastic Bag Bans in the Philippines. [online] Available at: https://www.no-burn.org/bagbanph/: accessed 21 April 2020.
GAIA (2019). Plastics Exposed: How Waste Assessments and Brand Audits are Helping Philippine Cities Fight Plastic Pollution. Available at: https://www.no-burn.org/waba2019/ . accessed: December 18, 2019
108
Galarpe, V. R. (2017). Review on the Impacts of Waste Disposal Sites in the Philippines.
Gavilan, J. 2017. “Timeline: Canada garbage shipped to the Philippines,” Rappler https://www.rappler.com/newsbreak/iq/188654-timeline-canada-garbage-philippines (accessed 14 April 2020).
Greenpeace Philippines and Ecowaste Coalition (2020). Waste trade in the Philippines: How local and global policy instruments can stop the tide of foreign waste dumping in the country. Quezon City.
HDPE pipe. Available at: <https://cdn2.hubspot.net/hubfs/406615/pipes/hdpe-pipe-in-yard.png>
Hokson, J. A. (2015). on MRFs. The Line of Balance. Retrieved from: https://thelineofbalance.weebly.com/blog/on-mrfs
Hose. Available at: <https://www.juantambayan.com/oc-content/uploads/461/142377.jpg>
IEEP (2017). EPR in the EU Plastics Strategy and the Circular Economy: A focus on plastic packaging. [pdf] Available at: https://ieep.eu/uploads/articles/attachments/95369718-a733-473b-aa6b-153c1341f581/EPR%20and%20plastics%20report%20IEEP%209%20Nov%202017%20final.pdf?v=63677462324
IEEP (2019). How to implement extended producer responsibility (EPR). A briefing for governments and businesses. [pdf] IEEP commissioned by WWF.
Ivanovski, F., Sapuric, Z. and Dimitrovski, D. (2016). Functionality of Packaging Management in Macedonia. Journal of Environmental Protection and Ecology, 17(3), p. 1029 – 1036.
Jambeck, J. R., Geyer, R., Wilcox, C., Siegler, T. R., Perryman, M., Andrady, A.,& Law, K. L. (2015). Plastic waste inputs from land into the ocean. Science, 347(6223), 768-771.
JICA (2008). Study on Recycling Industry Development in the Republic of the Philippines Final. Report. HYPERLINK “https://openjicareport.jica.go.jp/pdf/11882396.pdf” \t “_blank” https://openjicareport.jica.go.jp/pdf/11882396.pdf Accessed: January 22, 2020.
Jensen, F. (2019). The Danish government’s plastics action plan – and bioplastic. [pdf] Presentation Frank Jensen (Ministry of Environment and Food of Denmark), Bioplastic Conference February 6th 2019. Available at https://plast.dk/wp-content/uploads/2019/02/Perspectives-on-biobased-and-biodegradable-plastics-in-relation-to-the-Danish-Plastic-Strategy_Frank_Jensen.pdf, last access 16 January 2020.
Ketchup packet. Available at: < shorturl.at/ejzDT>
Meat packaging. Available at: <https://www.provisioneronline.com/ext/resources/Issues/2019/February/0219NP_pkgtech.jpg?1552944336>
MEFD (2018). Plastik uden spild – Regeringens plastikhandlingsplan (Danish Plastic Action Plan). [pdf] Ministry of Environment and Food of Denmark (MEFD). Available at: https://mfvm.dk/fileadmin/user_upload/MFVM/Miljoe/Plastikhandlingsplan/Regeringens_plastikhandlingsplan_web_FINAL.pdf, last access 16 January 2020.
Megabox. Available at: <https://lh3.googleusercontent.com/proxy/N_UsN_wO48_RBUPuC996I3oZ7g4Puz8J-G4g7bHq9eQ303G7ZiRYx56BiGlnDCaTs-LFcmiVVRoIMG8BilHrQVkgabL7BQtJMGnLPiPIdg>
Mongabay (2019). Philippine mayors under fire from environment department over open dumpsites. Philippines.[online] Available at: https://news.mongabay.com/2019/12/philippine-mayors-under-fire-from-environment-department-over-open-dumpsites/; accessed 05 May 2020.
National Solid Waste Management Commission. (2019). Number of MRFs in the Philippines.xls
NEDA (2017). Philippine Development Plan 2017-2022. Available at: http://pdp.neda.gov.ph/wp-content/
WWF-PHILIPPINES 2020
uploads/2017/01/PDP-2017-2022-10-03-2017.pdf Accessed: 11 March 2020
Nestle Philippines (2019). Nestlé Philippines accelerates journey to a waste-free future. [online] Available at: https://www.nestle.com.ph/media/news/nestl%C3%A9-philippines-accelerates-journey-waste-free-future; accessed 05 May 2020.
Nikkei Asia (2019). Environment. Available at: https://asia.nikkei.com/Spotlight/Environment/Philippines-slams-the-door-on-world-s-plastic-waste; accessed 14 September 2019.
NSWMC. (2018). National Solid Waste MAnagement Status Report (2008-2018). Environmental Management Bureau, Department of Environment and Natural Resources.
NSWMC (2012). National Solid Waste Management Strategy 2012-2016. Available at: http://nswmc.emb.gov.ph/wp-content/uploads/2016/07/NSWM-Strategy-2012-2016.pdf.
Ocean Conservancy (2020). Plastics Policy Playbook. Strategies for a plastic-free ocean. [pdf] Available at https://act.oceanconservancy.org/wp-content/uploads/2019/10/Plastics-Policy-Playbook-10.17.19.pdf
Pail. Available at: <https://ph-test-11.slatic.net/p/447553412ec40450a13649ebfced337e.jpg >
Pancit wrappers. Available at: <https://2.bp.blogspot.com/_FyyDp761rNw/SwuNyfyr1cI/AAAAAAAACWw/Yg4FlOqv4cc/s1600/luckyme_pansit_canton_philippines.jpg>
Philippine Information Agency. (n.d.). Philippine Infomation Agency. Retrieved from Philippine Infomation Agency: https://pia.gov.ph/features/articles/1016192.
Plastic cup. Available at: <https://www.lansinpackaging.com/wp-content/uploads/2017/09/%E6%9C%AA%E6%A0%87%E9%A2%98-6-1.jpg>
PlasticsEurope (2017). View Paper On biodegradable plastics. [pdf] Brussels: Plastics Europe. Available at: https://www.plasticseurope.org/application/files/9915/1708/0417/20170824-view_paper_on_biodegradable_plastics_18_july_2017.pdf
PlasticsEurope (2018). Plastics – the Facts 2018. An analysis of European palstic production, demand and waste data. [pdf] Brussels: Plastics Europe. Available at: https://www.plasticseurope.org/application/files/6315/4510/9658/Plastics_the_facts_2018_AF_web.pdf
PP Pipes. Available at: < shorturl.at/nAKM0>
PPIA, DTI-BOI (2014). Philippine Plastics Industry Roadmap, October 2014.
PRO Europe (no date). Packaging waste legislation in Denmark. Available at https://www.pro-e.org/Denmark, last access 16 January 2020.
PS building material. Available at: <https://lh3.googleusercontent.com/proxy/uRX7G9xKO4shmx2wvSNBNnAjIKQzRHtIlOwvXsIjDAj1od2m1SVkZpQLI9Tj1tLNREEgkT1w6MTAXxL_awFhms7Exlx1zMRtfuU7FEwyi3xpJN94lto6UPRjmZPvsAAFThIOJUg>
PS cup. Available at: <https://morrisonsfoodservices.co.uk/wp-content/uploads/2013/08/10oz-polystyrene-cup-large.jpg.png>
PS food container. Available at: <https://image.made-in-china.com/2f0j00GdmaCtRFgEpe/PS-Foam-Plate-Take-Away-Food-Container-Making-Machine.jpg>
Razon, C. J. (2019). Carrying Capacity of Boracay Island (philppines) using Waste Mass Flow Analysis. 4th Symposium of the Asian Regional Branch of International Waste Working Group. Bangkok.
110
Republic Act 9003. (2001). AN ACT PROVIDING FOR AN ECOLOGICAL SOLID WASTE MANAGEMENT PROGRAM, CREATING THE NECESSARY INSTITUTIONAL MECHANISMS AND INCENTIVES, DECLARING CERTAIN ACTS PROHIBITED AND PROVIDING PENALTIES, APPROPRIATING FUNDS THEREFOR, AND FOR OTHER PURPOSES. Retrieved from The LawPhil Project: https://www.lawphil.net/statutes/repacts/ra2001/ra_9003_2001.html
Ritchie, H.; Roser, M. (2018) - “Plastic Pollution”. Published online at OurWorldInData.org. Retrieved from: https://ourworldindata.org/plastic-pollution ‘ [Online Resource] Accessed: April 14, 2020.
Ruiz, E. d. (2020). DENR: PH lacks sanitary landfills with only 108 nationwide.
Sapuric, Z.; Shkrijelj, S.; Josifovski, B. (n.y.). Informal sector inclusion in the sustainable waste management system as an opportunity for employment and social inclusion of vulnerable groups. [pdf] Founded by UK Government. Available at: http://www.financethink.mk/wp-content/uploads/2018/01/InformalSector_Waste_Final_EN.pdf, last access 16 January 2020.
Shampoo bottle. Available at: < shorturl.at/fosZ1>
Shopping bag (mono and thin). Available at: <https://i.pinimg.com/originals/84/f0/43/84f0431b3e6ced12b56042c25d9fddea.jpg>
Shrink wrap. Available at: <shorturl.at/wDLU9>
Strapping roll. Available at: <https://5.imimg.com/data5/SB/NH/MY-9859901/box-strapping-roll- 500x500.jpg>
Tetrapak. Available at: < https://imgusr.tradekey.com/p-7927491-20130517041624/zest-o-juice- drink.jpg>
Test tube. Available at: <https://i.ebayimg.com/images/g/JbkAAOSwE-9dpa0C/s-l400.jpg>
Toothpaste. Available at: <https://www.eppm.com/downloads/8350/download/shutterstock_746810077.jpg?cb=1bd9f2ebd80d394ab1ad93c10589205d>
UNESCAP (no date). Closing the Loop, Regional Policy Guideline.
Wet Floor sign. Available at: <https://5.imimg.com/data5/UP/JE/MY-19019995/caution-wet-floor-sign- 500x500-250x250.jpg>
WIEGO (no date). Waste Pickers.[online] Available at: https://www.wiego.org/informal-economy/occupational-groups/waste-pickers, accessed 14.02.2020.
Williams, A. (2019). Biodegradable bags can hold a full load of shopping three years after being discarded in the environment. [online] Available at: https://www.plymouth.ac.uk/news/biodegradable-bags-can-hold-a-full-load-of-shopping-three-years-after-being-discarded-in-the-environment.
World Bank (no date). Country Profile the Philippines. [online] Available at: https://data.worldbank.org/country/philippines?view=chart [online]; accessed 22 May 2019.
WWF (2020). Plastic Packaging in Southeast Asia and China. Available at: https://d2ouvy59p0dg6k.cloudfront.net/downloads/wwf_plastic_packaging_in_se_asia_2020_v8_0214_final_.pdf?fbclid=IwAR1SxebMQ9_6KR9TIKJ3FdaaxVYPZEQdD7fAd2iPFy_FkRhS055Oau0ED2Y Accessed: 24 February 2020
WWF, cyclos (2019). Legal Framework Study of Extended Producer Responsibility. August 2019 Final Draft. [pdf] cyclos GmbH commissioned by WWF Germany. Available at: https://d2ouvy59p0dg6k.cloudfront.net/downloads/framework_study_epr_cyclos___final.pdf, last access 16 January 2020.
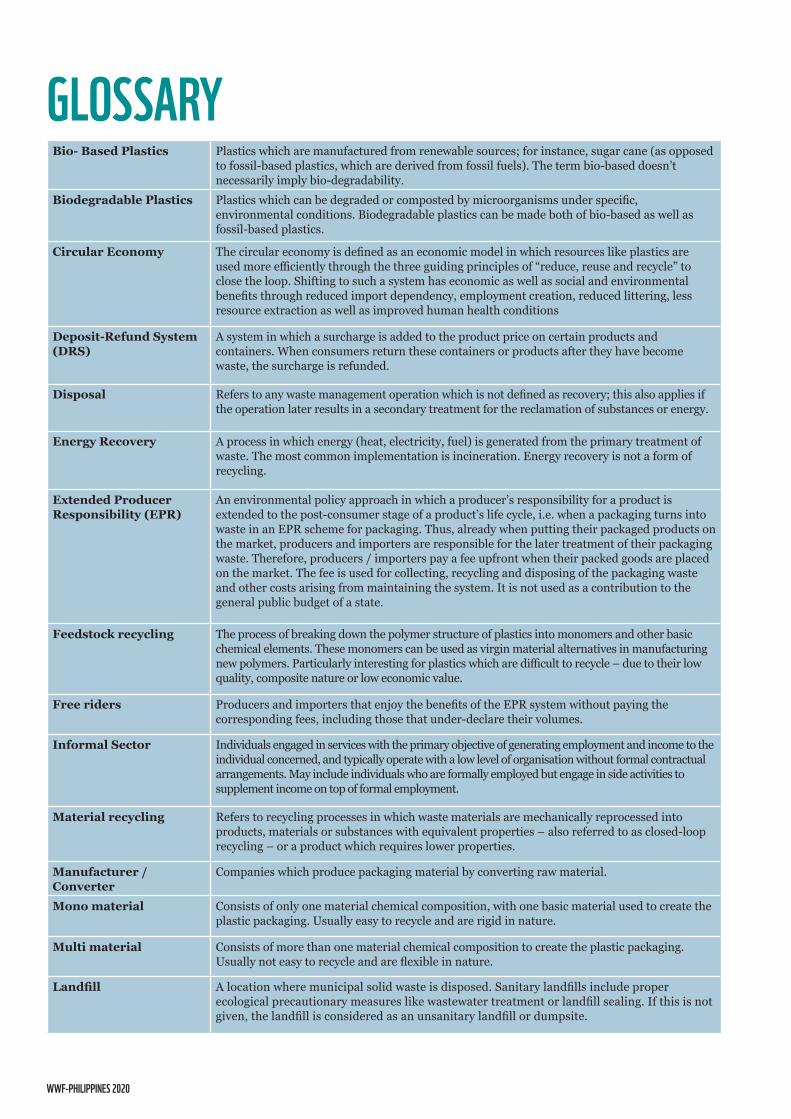
WWF-PHILIPPINES 2020
Bio- Based Plastics Plastics which are manufactured from renewable sources; for instance, sugar cane (as opposed to fossil-based plastics, which are derived from fossil fuels). The term bio-based doesn’t necessarily imply bio-degradability.
Biodegradable Plastics Plastics which can be degraded or composted by microorganisms under specific, environmental conditions. Biodegradable plastics can be made both of bio-based as well as fossil-based plastics.
Circular Economy The circular economy is defined as an economic model in which resources like plastics are used more efficiently through the three guiding principles of “reduce, reuse and recycle” to close the loop. Shifting to such a system has economic as well as social and environmental benefits through reduced import dependency, employment creation, reduced littering, less resource extraction as well as improved human health conditions
Deposit-Refund System (DRS)
A system in which a surcharge is added to the product price on certain products and containers. When consumers return these containers or products after they have become waste, the surcharge is refunded.
Disposal Refers to any waste management operation which is not defined as recovery; this also applies if the operation later results in a secondary treatment for the reclamation of substances or energy.
Energy Recovery A process in which energy (heat, electricity, fuel) is generated from the primary treatment of waste. The most common implementation is incineration. Energy recovery is not a form of recycling.
Extended Producer Responsibility (EPR)
An environmental policy approach in which a producer’s responsibility for a product is extended to the post-consumer stage of a product’s life cycle, i.e. when a packaging turns into waste in an EPR scheme for packaging. Thus, already when putting their packaged products on the market, producers and importers are responsible for the later treatment of their packaging waste. Therefore, producers / importers pay a fee upfront when their packed goods are placed on the market. The fee is used for collecting, recycling and disposing of the packaging waste and other costs arising from maintaining the system. It is not used as a contribution to the general public budget of a state.
Feedstock recycling The process of breaking down the polymer structure of plastics into monomers and other basic chemical elements. These monomers can be used as virgin material alternatives in manufacturing new polymers. Particularly interesting for plastics which are difficult to recycle – due to their low quality, composite nature or low economic value.
Free riders Producers and importers that enjoy the benefits of the EPR system without paying the corresponding fees, including those that under-declare their volumes.
Informal Sector Individuals engaged in services with the primary objective of generating employment and income to the individual concerned, and typically operate with a low level of organisation without formal contractual arrangements. May include individuals who are formally employed but engage in side activities to supplement income on top of formal employment.
Material recycling Refers to recycling processes in which waste materials are mechanically reprocessed into products, materials or substances with equivalent properties – also referred to as closed-loop recycling – or a product which requires lower properties.
Manufacturer / Converter
Companies which produce packaging material by converting raw material.
Mono material Consists of only one material chemical composition, with one basic material used to create the plastic packaging. Usually easy to recycle and are rigid in nature.
Multi material Consists of more than one material chemical composition to create the plastic packaging. Usually not easy to recycle and are flexible in nature.
Landfill A location where municipal solid waste is disposed. Sanitary landfills include proper ecological precautionary measures like wastewater treatment or landfill sealing. If this is not given, the landfill is considered as an unsanitary landfill or dumpsite.
gLOSSARY
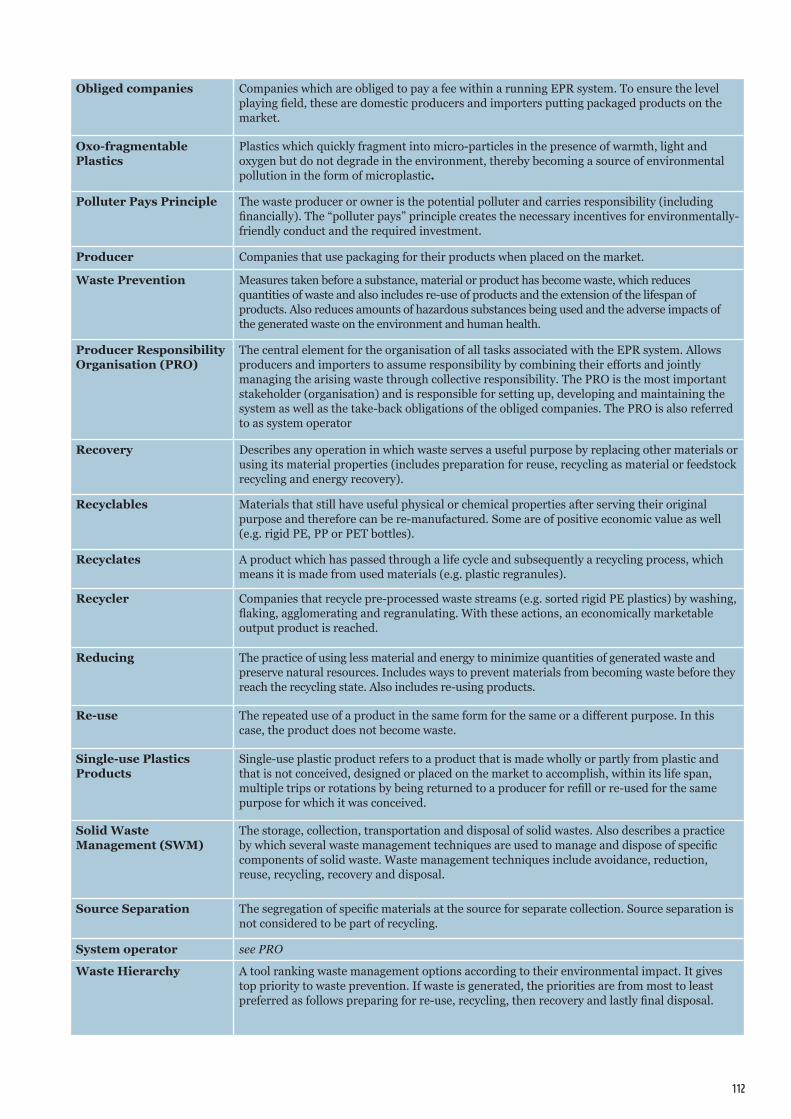
112
Obliged companies Companies which are obliged to pay a fee within a running EPR system. To ensure the level playing field, these are domestic producers and importers putting packaged products on the market.
Oxo-fragmentable Plastics
Plastics which quickly fragment into micro-particles in the presence of warmth, light and oxygen but do not degrade in the environment, thereby becoming a source of environmental pollution in the form of microplastic.
Polluter Pays Principle The waste producer or owner is the potential polluter and carries responsibility (including financially). The “polluter pays” principle creates the necessary incentives for environmentally-friendly conduct and the required investment.
Producer Companies that use packaging for their products when placed on the market.
Waste Prevention Measures taken before a substance, material or product has become waste, which reduces quantities of waste and also includes re-use of products and the extension of the lifespan of products. Also reduces amounts of hazardous substances being used and the adverse impacts of the generated waste on the environment and human health.
Producer Responsibility Organisation (PRO)
The central element for the organisation of all tasks associated with the EPR system. Allows producers and importers to assume responsibility by combining their efforts and jointly managing the arising waste through collective responsibility. The PRO is the most important stakeholder (organisation) and is responsible for setting up, developing and maintaining the system as well as the take-back obligations of the obliged companies. The PRO is also referred to as system operator
Recovery Describes any operation in which waste serves a useful purpose by replacing other materials or using its material properties (includes preparation for reuse, recycling as material or feedstock recycling and energy recovery).
Recyclables Materials that still have useful physical or chemical properties after serving their original purpose and therefore can be re-manufactured. Some are of positive economic value as well (e.g. rigid PE, PP or PET bottles).
Recyclates A product which has passed through a life cycle and subsequently a recycling process, which means it is made from used materials (e.g. plastic regranules).
Recycler Companies that recycle pre-processed waste streams (e.g. sorted rigid PE plastics) by washing, flaking, agglomerating and regranulating. With these actions, an economically marketable output product is reached.
Reducing The practice of using less material and energy to minimize quantities of generated waste and preserve natural resources. Includes ways to prevent materials from becoming waste before they reach the recycling state. Also includes re-using products.
Re-use The repeated use of a product in the same form for the same or a different purpose. In this case, the product does not become waste.
Single-use Plastics Products
Single-use plastic product refers to a product that is made wholly or partly from plastic and that is not conceived, designed or placed on the market to accomplish, within its life span, multiple trips or rotations by being returned to a producer for refill or re-used for the same purpose for which it was conceived.
Solid Waste Management (SWM)
The storage, collection, transportation and disposal of solid wastes. Also describes a practice by which several waste management techniques are used to manage and dispose of specific components of solid waste. Waste management techniques include avoidance, reduction, reuse, recycling, recovery and disposal.
Source Separation The segregation of specific materials at the source for separate collection. Source separation is not considered to be part of recycling.
System operator see PRO
Waste Hierarchy A tool ranking waste management options according to their environmental impact. It gives top priority to waste prevention. If waste is generated, the priorities are from most to least preferred as follows preparing for re-use, recycling, then recovery and lastly final disposal.
© 2020
Paper 100% recycled
© 1986 Panda symbol WWF – World Wide Fund For Nature (Formerly World Wildlife Fund) ® “WWF” is a WWF Registered Trademark.4/F JBD Plaza 65 Mindanao Avenue, Barangay Bagong Pag-Asa, Quezon City 1105
Tel: (02) 8 920-7923 / 7926 / 7931 Fax: (02) 8 426-3927
Email: [email protected] For contact details and further information, please visit our international website at www.wwf.org.ph
Back cover photography: © Npdstock - Freepik.com


